The Economic Impact of Art Theft
82
The Economic Impact of Art Theft A Quantitative Study of the Economic Effects of Art Theft on Art Prices and Returns Master's Thesis Cultural Economics and Entrepreneurship Erasmus School of History, Culture and Communication Erasmus University, Rotterdam, The Netherlands Jarrett Coomber Student no. 371778 [email protected] Supervisor: Dr. Christian Handke Second reader: Erwin Dekker July 19, 2013
-
Upload
khangminh22 -
Category
Documents
-
view
0 -
download
0
Transcript of The Economic Impact of Art Theft

The Economic Impact of Art Theft
A Quantitative Study of the Economic Effects of Art Theft on Art Prices
and Returns
Master's Thesis
Cultural Economics and Entrepreneurship
Erasmus School of History, Culture and Communication
Erasmus University, Rotterdam, The Netherlands
Jarrett Coomber
Student no. 371778
Supervisor: Dr. Christian Handke
Second reader: Erwin Dekker
July 19, 2013

2
Abstract
Major art thefts attract massive amounts of media attention while the works that are taken are
often worth vast sums of money. The media attention that follows is, in a way, free marketing
for the artist and their works. Like in other commodity markets, when an organization makes
major announcement, the market reacts. There is a supply and demand issue when artworks
are stolen. Essentially theft reduces the supply of the artist's works. And so how do prices for
other works by that artist react? Would they rise or fall? Is there a short or long term effect,
supposing that there even is an effect?
In addressing these questions, statistical analysis using SPSS was employed to compare
the compound annual returns from repeat sales of artworks as well as auction sales prior to and
following a theft. This was done over a short term period (six months and five years) and a long
term period (ten years and all known repeat sales) in which thirteen artists from twelve thefts
were subjected to analysis.
The results showed evidence of a five year "theft effect" whereby compound annual
returns and auction sales for the selected artist were higher than in the five years prior to the
theft. This "theft effect" was contingent on the history of the work itself, the popularity of the
artist, and if the artist had a high number of works previously stolen. However, it is possible for
the "theft effect" to be overshadowed by the "death effect" of an artist and art market swings.
The results from the analyses can have implications for art collectors, investors, auction houses,
gallery directors, insurance companies and researchers.
Key Words: art theft, repeat sale, compound annual return, "theft effect", independent
samples t-test, regression analysis

3
Table of Contents
The Economic Impact of Art Theft .......................................................................................................1
Abstract .............................................................................................................................................2
Table of Contents ...............................................................................................................................3
I. Introduction ....................................................................................................................................5
II. Literature review ...........................................................................................................................7
2.1 Studying Stolen Art ........................................................................................................................... 10
2.1.1 The Media Component .............................................................................................................. 11
2.1.2 MMFAI Index .............................................................................................................................. 13
2.1.3 Data Sources .............................................................................................................................. 14
2.2 Research Design ................................................................................................................................ 16
2.2.1 Threats to Validity ...................................................................................................................... 17
III. Experiment 1: Analysis of Pre- and Post-Theft Return Rates and Auction Prices ............................ 21
3.1 - Part 1: Long term effects of art theft (all repeat sales) .................................................................. 23
3.1.1 Experiment Design ..................................................................................................................... 23
3.1.2 Data Analysis .............................................................................................................................. 24
3.1.3 Discussion - Part 1 ...................................................................................................................... 31
3.2 - Part 2: Long term effects of art theft (10 years) ............................................................................. 32
3.2.1 Experiment Design ..................................................................................................................... 32
3.2.2 Data Analysis .............................................................................................................................. 33
3.2.3 Discussion - Part 2 ...................................................................................................................... 38
3.3 - Part 3: Short term effects of art theft (5 years) .............................................................................. 40
3.3.1 Experiment Design ..................................................................................................................... 40
3.3.2 Data Analysis .............................................................................................................................. 42
3.3.3 Discussion - Part 3 ...................................................................................................................... 48
3.4 - Part 4: Short term effects of art theft (6 months) .......................................................................... 50
3.4.1 Experiment Design ..................................................................................................................... 50
3.4.2 Data Analysis .............................................................................................................................. 50
3.4.3 Discussion - Part 4 ...................................................................................................................... 54
3.5 Conclusions: Experiment 1 ................................................................................................................ 55

4
IV. Experiment 2: Pre- and Post-Theft Regression Analysis for CAR's .................................................. 57
4.1 Data Analysis ..................................................................................................................................... 58
4.2 Conclusions: Experiment 2 ................................................................................................................ 66
V. Does Recovered Art Beat the Market? .......................................................................................... 68
VI. Legal Disputes ............................................................................................................................. 72
VII. Conclusions................................................................................................................................ 73
Appendix 1 ...................................................................................................................................... 76
References ....................................................................................................................................... 77

5
I. Introduction
Many people enjoy hearing about a major art heist. Countless films and stories have been
centered around the subject. In real life, they attract vast amounts of public interest and media
coverage that bring exposure to the artist, the work(s) taken, the institution, and even the city
or region where it took place. In a way, it is essentially free advertising for them to a mass
audience. Art theft is believed to be a $50 million to $5 billion (US) annual industry (Lawrence,
et al, 1988). Given these estimates, the media attention they receive and the frequency in
which they occur, it would be difficult not to assume that art theft has a broader impact on the
art market. This idea was the driving force behind the topic of this paper: to search for
economic effects that art theft may have on prices and returns on artworks in the art market.
Whether art is taken from public institutions such as museums or from private residences,
collectors and all members of the art market are generally aware of these incidents, especially
those that are published in the media. However, not all thefts are reported and so it is
impossible to know what the true numbers are. In the United States, it is estimated that 20 to
30% of thefts are reported while in Europe approximately 15% are reported (Ibid).
In conducting research for this paper, no articles or books were found directly linking
the economic effects of art theft to the value of works by the same artist or on the art market.
Many resources exist separately on both topics, however little, if anything, appears to be
written connecting art theft to the market value and returns of other artworks. It is not a
secret that some works carry incredibly high monetary values. This is one of the main factors in
their attractiveness towards thieves; they are physically light and relatively small objects that
are often worth enormous sums of money. Following a major art theft, there is usually a
massive amount of media interest that follows as well as a worldwide police investigation for
the thieves and the works taken. The Internet and social media now have an ever increasing
audience to whom these stories can reach.

6
The core of the research for this paper focuses on comparing the compound annual
rates of return for repeat sales and auction prices of other works by artists prior to and
following a well publicized theft over different periods of time (six months, five years, ten years,
and all known repeat sales). The key research question to be addressed is that, following a
major theft, what happens to auction prices and compound annual returns on repeat sales to
other works by the same artist? By running the sampled data through independent samples t-
tests and regression analyses, the main objective is to identify any signs of a "theft effect"
either short or long term (or both), or positive or negative. Perhaps no such definitive effect
will be found. The results of this paper will hopefully contribute to the growing body of
literature regarding art markets and inspire future research on the topic of art theft and value.
In writing this paper, one of the author's goals was to provide academics, art historians,
members of the art world including galleries, museums, dealers, auction houses and insurance
companies with an additional resource focused on the economic impact of art theft.
The structure of the paper is as follows: a literature review will discuss articles and texts
related to art theft and methods of studying art prices. This will be followed by a discussion on
the challenges of understanding and studying art theft. Two primary statistical experiments
will ensue and the threats to their validity will be examined. This will be followed by a brief
dialogue on how recovered art performs against the art market and financial markets. Legal
concerns on the acquisition of stolen art will follow and the paper will end with the overall
conclusions and references.

7
II. Literature review
Over the past several decades there has been increasing academic interest in the prices and
economic performance of artworks. Because of the heterogeneity of art, depicting accurate
models and patterns is exceptionally difficult compared to tracking homogenous commodities
in the stocks and bond markets. These discrepancies have allowed for sociological perspectives
and theories to further analyze the art market beyond prices and take a closer look at the social
construction of value in art. Often when art or items with strong heritage are stolen, the
cultural loss is far greater to the community than the financial loss. For example, a religious
icon of St. Irene was stolen from a Greek Orthodox church in Queens, New York, in 1991 and
upon its return it had been stripped of $800,000 worth of gold, jewels and other ornaments.
Despite the physical monetary loss, the church was overjoyed with its return as it represented a
unifying symbol of the congregation (Conklin 1994, pp. 16).
In measuring and tracking the monetary value of artworks, two statistical techniques are
most popular: repeat sales regressions and hedonic price models. The repeat sales regression
(RSR) technique has been used in several important art market studies by Baumol (1986),
Goetzmann (1993), and Mei and Moses (2002). The technique uses auction records for
artworks that have been sold more than once whereby indices and return percentages can be
constructed. This is normally done by dividing the resale price by the initial price and then
incorporating other factors like compound interest and currency conversion. Auction records
are more commonly used than gallery sales due to availability since many auction houses allow
their records to be publicly available. Mei and Moses (2002) used the RSR method to study the
performance of masterpieces in which they found that expensive paintings tend to
underperform the art market. Pesando (1993) found a similar result with prints. The main
advantage behind the other popular technique, hedonic regression, is that it accommodates for
"price-free" characteristics of objects, such as a size, subject matter, artist, etc. which repeat
sales regressions cannot (Ginsburgh, et al, 2006). There are drawbacks to using both, however.
For example, RSR's are downward biased from true portfolio returns because they use

8
geometric means rather than arithmetic means (Goetzmann & Peng, 2002). Geometric means
are used to calculate growth rates over time (for example, compound interest). The arithmetic
mean calculates the average value in a data set and is always greater than the geometric mean
unless all of the numbers are equal (algebra.com). Hedonic regressions are also susceptible to
misspecification of variables, which is a non-issue in repeat sales regressions (Ginsburg, et al,
2006).
Chanel, et al, (1996) make similar strong arguments for the advantages of hedonic
models primarily because they can take into account more information, such as physical
characteristics and prominence. They can also factor in single auction sales as well as repeat
sales of artworks. The authors point out that there can be problems in obtaining accurate
repeat sales data. Unless the artwork sold can be identified by its catalogue raisonné, there is
the possibility the title of the work was incorrectly translated from its language of origin. Many
works have commonly used titles such as "still life" or "nude", or its dimensions change because
of poor record keeping. It is also important to note that the data from repeat sales come from
public auctions and does not take into account private sales. Guerzoni (1994, as cited in
Chanel, et al, 1996) observed that works may be privately bought and sold between auction
sales, which could have an effect on future returns. These are all valid observations and
obvious risks in employing repeat sales data.
Czujack (1997) studied the performance of Picasso paintings at auction from 1963 to
1994 using hedonic regression. As dummy variables, she used dimensions of the artwork,
techniques and media, signature, the Zervos catalogue raisonné number, exhibitions they were
in, resale prices, pre-sale estimates, salesrooms, countries of sale, and several other factors
(but nothing involving art crime!). Agnello & Pierce (1996) also used hedonic regression to
examine financial returns, price determinants and genre effects in American art investment
from 1971 to 1992. Using a sample group of 66 American artists, they included dummy
variables such as when the artwork was sold at auction, the auction house, when the artist was
born and when/if he or she had died. Interestingly, the authors found that the four artists who

9
died during the period experienced positive real returns at auction. Likewise, so did the artists
who were alive after 1992 (except for Kenneth Noland). The authors were particularly
interested in seeing if the artist's choice in subject matter or styles of their paintings had any
effect on the returns. The average nominal sample rate of return was 9.3% however they
found that one can achieve higher rates if an investor chooses to purchase high-priced avant-
garde, still life and figure paintings. The higher returns on expensive avant-garde art is in
contrast to Pesando's (1993) findings that high priced works earn lower returns than low priced
works.
Ekelund, et al, (2000) found that there is evidence of a "death effect" in the prices of
artworks following the death of the artist. The authors wanted to examine if there was a
"supply induced" demand effect, whereby from a material goods perspective, there would be
certainty that an artist's production would effectively halt following their death. Using a sample
of 21 Latin-American artists who died between 1977 and 1996, they found that auction prices
for their works increased substantially following their death, but decreased soon after. Czujack
(1997) also found that there was a "death effect" for three years following Picasso's death in
1973 when prices for his works at auction rose more rapidly than the art market. This is
important to note as one of the thefts examined later involves works by Picasso that were
stolen around this time. There is also a supply and demand issue when works are stolen from
the market and so the experiments performed later in this paper will hopefully shed more light
on this issue by seeing how collectors react following a theft.
Campos and Barbosa (2008) found that prominence of artworks were a major factor in
determining prices as opposed to size and medium. In contrast, Rengers and Velthuis (2002)
found that the size and material used and the age and place of residence of the artist were
strong predictors of price. However, the authors ignored the possibility of theft or any other
type of art crime had been inflicted on the artist's oeuvre. Instead the authors focused on
three levels for price determinants: the work of art itself (physical characteristics), the artist
(age, sex, and place of residence), and the gallery (location, institutional affiliation, and age).

10
Anderson (1974) noted that "The history of ownership of an artwork can have a
surprisingly strong influence on prices realized at auction" (pp. 14). Works that come from a
dealer's stock do poorly compared to works that come from a collector's special collection. This
suggests that specific incidents or historical events play a role in the demand for an artwork.
For example, the owner of a recovered stolen artwork may be granted greater attention from
other collectors because of the tumultuous history involving the piece. Anderson (1974) also
points out that collectors and museums give little, if any, thought to reselling a piece once it is
acquired. A work may stay within a collection for generations before it is sold again. Compared
to financial market products, the reselling rate is extremely low. However, other consumption
benefits are incurred such as decorative and aesthetic-prestige services (Ibid). Upon calculating
an average annual price appreciation of 3.3% on paintings sold at auction between 1780 and
1970, Anderson (1974) concluded that the most important factors in price determination were
the year it was sold, its physical size and the reputation of the artist. He notes that there were
periods of higher appreciation than others. For example, impressionist paintings appreciated at
an annual rate of 18% between 1951 to 1969 and 10.4% for Old Masters. Interestingly, the
place of the sale and whether the artist was alive at the time of the sale were deemed
insignificant.
2.1 Studying Stolen Art
One of the most difficult challenges in conducting social science studies are sample selection
methods. In art markets, essentially all artworks, people, institutions and even events are
heterogeneous, thus further complicating sampling methods for quantitative experiments.
Many artworks sold at auction are publicly known and contain measurable components such as
prices and dates, however a significant amount of transactions remain private or are never
made publicly known making true perfect measurements virtually impossible. Obtaining
accurate information on art thefts is also very difficult. Many art thefts are never reported for
several reasons: museums may choose not to for fear of exposing vulnerabilities of its premises
to other potential thieves; thefts may also discourage potential donors who may feel that their
donations will not be safe; collectors may not report thefts because it could be that the works

11
or antiques were illegally imported and thus the owners would rather not alert government
authorities; reporting a theft may also reveal to authorities that the owner(s) or gallery had not
been paying tax on their holdings; or publicizing a theft may also encourage thieves to smuggle
the work out of the country. Similarly, a great deal of publicity might educate potential thieves
on the high value of other works kept in the victimized museum or gallery. The lack of
reporting increases the challenges that police face in tracking down the stolen art and the
general low risk of getting caught is appealing to prospective thieves (Conklin 1997, pp. 261).
Tracking the resale prices for recovered stolen works and constructing an pricing index
would have been an excellent way to look for trends in how a theft would affect a work's value.
However there are several key reasons that would threaten the validity of the results. Firstly,
the sample size of recovered works would be extremely small, perhaps even too small for
statistical relevance. For example, the Federal Bureau of Investigation estimates recovery rates
for works of art to be between 2 to 6 % (FBI, March 2012). Of these few recovered works, most
of them are returned to their rightful owners and museums and may never see an auction block
for centuries, if ever. This reduces the sample size to an incredibly small and essentially
insignificant amount compared to the number of works on the market. Secondly, according to
the FBI, hundreds of thousands of art crimes are reported annually, however only the high
profile cases earn media attention. Many more are also unreported, as mentioned earlier. For
example, in Italy each year there are between 20,000 to 30,000 thefts reported to authorities
(Ibid). There would be obvious privacy and legal issues in obtaining reported thefts from law
enforcement agencies thus making research into the field exceptionally challenging.
2.1.1 The Media Component
The media plays a crucial role in spreading information to audiences in the event of an art theft.
Art theft often makes for entertaining reading but also helps to inform the public and members
of the art world of the victimized works that have become "hot". Once photos of the artworks

12
have been distributed to news networks and other media channels, it becomes almost
impossible for these stolen works to be sold on the legitimate market. Nairne (2011) believes
that because of this, stolen art fetches a fraction, or around 10%, of its saleroom value on the
black market. Dealers, auction houses, collectors, appraisers and law enforcement agencies
would all be aware of these works and the artists who created them. Usually the media
sensationalizes the highest profile thefts; those that involve works of abnormally high market
value where huge risks are taken by the robbers to evade security systems and capture.
Because the awareness of such events in the art world, it would seem logical to assume that
they would have some kind of impact on prices and returns of works by the same artist or
perhaps artists of the same genre. After all, the art market, in spite of its unique characteristics,
still operates like other capitalist markets. When a Fortune 500 company makes a major public
announcement, such as a new product line or a change in management, its share holders react
and stock prices usually react. Hence, a theft is a different type of announcement to the art
world. Potential market reactions to a major art theft are:
Major art theft -> Media Exposure -> Higher prices and returns for other works by the artist
Major art theft -> Media Exposure -> Lower prices and returns for other works by the artist
Major art Theft -> Media Exposure -> No change for other works by the artist
The purpose of the statistical experiments that are performed later in this paper is to
determine which of the above scenarios show significant (or non-significant) differences in
prices and returns for other works by the artist prior to and following an art theft. The results
could have implications for participants in art markets such as collectors, dealers, auction
houses as well as insurance companies.
Supposing thefts do have an impact on the art market, this begs the question of
whether a major incident makes a mediocre artist more famous and how it would change the
value of their artworks. Assuming theft does bring the artist to new audiences, would the
degree of the increase in exposure be proportional to the change in the market value of their

13
works, whether positive or negative? The timing of the theft in relation to the perceived value
of the artist's works at that time would also be taken into consideration in the motivational
factors of the thieves. Art theft is a high risk, high reward activity, and so in weighing these
factors, the targeted works would need to be worth around their peak market value.
2.1.2 MMFAI Index
Due to the infrequency of transactions for artworks, a different form of market index is
required than indices used for stocks, bonds and commodities. Art and real estate are two
similar types of goods in this regard. For example, to calculate an annual average price for
artworks and real estate would be misleading as expensive or inexpensive works and properties
would skew the results. To overcome this, a repeat sales regression calculates the compound
annual return between repeated sales of the same art object or property, which is how the Mei
Moses Fine Art Index (MMFAI) calculates their indices (for a detailed explanation behind the
statistical techniques used in constructing the index, please refer to the methodology section of
Mei & Moses' (2002) article, "Art as an Investment and the Underperformance of
Masterpieces"). Much of the data in the proceeding statistical analyses was taken from the
MMFAI. According to its website (artasanasset.com) the MMFAI currently contains
approximately 30,000 price pairs for 20,000 works of art. The creators, Dr. Michael Moses and
Dr. Jianping Mei, claim that it is the largest database for the financial returns of transparent
transactions for individual works of art, to which it adds approximately 3,000 new pairs every
year (artasanasset.com).
For finding the price pairs used in the construction of the MMFAI, auction records were
taken from Christie's and Sotheby's catalogues from all over the world dating back to 1925 (and
beyond then, their predecessor firms). The New York Public Library, the Watson Library at the
Metropolitan Museum of Art, and various online auction transaction websites for auction price
histories are also consulted on a regular basis. "Bought-in" paintings at auction are not
included as bidding would have not reached the reservation price. MMFAI organizes the repeat
sales into the following major categories: American art prior to 1950, 19th Century and Old

14
Master, Impressionist and Modern, Post War and Contemporary, Latin American, British after
1850, and Traditional Chinese works. If there had been another separate private sale for a
piece, the creators claim to have used their best research to find the purchase price from any
auction house anywhere in the world at any point in time. In doing so, they argue that this is
the best approach to eliminating potential subjective sample bias.
A major strength of the MMFAI data is the length of time it covers. The indices are
constructed in various time spans such as 10 years, 25, 50 and so on. The average length of
time between a repeat sale is 22 years and the some objects have been resold up to seven
times, with some of the earliest original purchases dating back to the 17th century. The MMFAI
produces scatter plots for the compound annual return rates of the 150 artists with the most
repeat sales. Historical prices and exchange rates are used to convert prices into the currency
of the sale location based on information provided by Global Financial Data
(globalfinancialdata.com). Global Financial Data was also the source for other financial indexes
used in comparing the MMFAI to the U.S. based Standard & Poor's 500 total return index (S&P
500 TR) and the U.K based Financial Times All Shares total return index (FTAS-TR). The MMFAI
has been lauded by financial investment companies and numerous media outlets. Asia News
Network (China Daily) wrote, "Tracking the trading records of specific art pieces, the index (Mei
Moses) is an objective guide for investors and is rated by Morgan Stanley as one of the 10 most
important asset indexes in the world" (May 2012). MMFAI also releases monthly, quarterly and
annual tracking reports for global art sales focusing on risk, returns and correlations between
art and other asset classes (artasanasset.com).
2.1.3 Data Sources
In gathering data for the statistical analyses performed in this paper, the author of this paper
subscribed to a one-year membership with the MMFAI. The compound annual returns (CAR's)
from the scatter plots of the artists who were the target the high profile thefts selected for this
paper constituted the data of several of the independent samples t-test and regression analyses

15
performed later. For consistency, all of the CAR's used by the MMFAI assume that all purchases
were made on the last day of the year. Unfortunately, the scatter plots did not have an
exportable data set thus each CAR had to be obtained "manually" by estimating its numerical
value by examining the graphs. For example, below is a scatter plot of Monet's CAR's from
which data was collected over a ten year period for a regression analysis (artasanasset.com):
A screen shot was taken of each scatter plot from the MMFAI website (artasanasset.com) and
was then imported into Microsoft Paint where the lines were added. Each CAR was then
estimated to the nearest tenth of a decimal and collected in a Microsoft Excel spreadsheet. It
was a laborious task albeit a necessary one. Repeated emails and telephone calls to Mei,
Moses, and their customer service department to request more accurate data went
unanswered. Despite paying $250 (US) for a full year "Gold" membership, the author was very

16
unsatisfied with their service. As a result of the estimations, the degree for error increases
likely to within a range of 5 to 10%.
The other source of data used in the analysis came from the Blouin Art Sales Index
(artsalesindex.artinfo.com) which was used to collect one-time auction sale records. The
website is user friendly, charges no fees for usage, and is very good at conducting advanced
searches for sales records of specific artists, mediums of art, sale dates (which go back
decades), sale locations, and so on. There is no accounting for repeat sales, however, although
it would be possible to match some if desired.
2.2 Research Design
Two main experiments will be conducted in this paper to search for economic impacts of art
theft; the first will examine how several important anecdotal cases of art theft may have
affected the compound annual returns and auction prices of other works by the same artist and
compare them before and after the theft using independent samples t-tests. Different periods
of time will be covered; six months of auction prices for prints (before and after a theft), five
years using auction prices and CAR's (pre- and post-theft), ten years (using CAR's), and all CAR's.
Each test will only contain data concerning the specific artist. The hypothesis for this
experiment is that a major theft would cause, on average, higher compound annual returns in
the long term (ten year periods and all CAR's) and higher returns on repeat sales and auction
prices in the short term (five year and six month periods). The second experiment reexamines
three of the cases from the first experiment using linear regression. The selected cases were
initially analyzed in ten year periods in the first experiment, however in the second the periods
were shortened to five years to focus on any short term effects. The CAR's from each were
used to calculate a line of best fit with the goal being to identify any changes in the slope pre-
and post-theft.

17
2.2.1 Threats to Validity
There are several key threats to the validity of these experiments which are described below.
Despite both experiments being slightly different in design, these threats can be applied to
aspects of both.
a) Instrumentation
The primary method of measuring auction records is through monetary currencies. As
mentioned earlier, MMFAI recalibrated the auction records to current values by using historical
exchange rates and inflation rates from Global Financial Data. There is always the possibility,
however, that the auction house, MMFAI or Global Financial Data may have incorrectly entered
or made a miscalculation at some point. Concerning older auction record keeping practices, it
may be impossible to verify the accuracy of the entries as we search farther back in time. It is
important to note that a change in ownership or management of an auction house may affect
how records are kept. For example, it might occur where the buyer's premium is included in
the stated purchase price and other times only the hammer price may be listed.
b) Historical Events
Historical events, especially those that are unrelated to the treatment we wish to examine (art
theft in this case), can threaten the validity of experiments because they are often beyond the
control of the researcher (Cook & Campbell, 1979). Below are examples that are both related
and unrelated to the treatment.
i) Markets
Since artworks are a type of commodity that are traded in a market setting, they are also
subject to economic factors which directly affect buyers and sellers. Some factors affect all
markets while others are more market specific. The stock market collapse of 1929 which lead
to the Great Depression of the 1930's impacted the entire global economy. When the
economic situation began to improve after World War II, this also marked the beginning of a
steady rise in the prices of artworks. Mei and Moses (2013) argue that prior to this boom there

18
was a larger supply of art relative to demand, despite that a few "robber barons" of the time
were amassing huge collections. Following the Second World War, the world experienced
growth in both the number of high net worth individuals and the wealth they accumulated. At
this time the supply of artworks remained constant, or even decreased as a result of the robber
barons, and thus higher wealth contributed to higher prices for artworks as well as growth in
equities markets (Ibid).
Figure 1
(Graph obtained from Mei Moses Year End 2008 All Art Indexes)
In the figure above we can see a drop in both the MMFAI and the S&P 500 after 1929 with
steady growth beginning around 1950. The oil crisis of the early 1970's can also be seen in
drops in each market. The period of 1985 to 1990 saw the formation of a bubble in the art
market which subsequently burst while the S&P 500 was relatively unaffected. The Mei Moses
World All Art Index (MMWAAI) calculated that as a result of this bubble, the art market
dropped nearly 30% in 1991 (artasanasset.com). The "dot com" crash of the late 1990's can
also be seen to have affected the S&P 500 more so than the MMWAAI. Following the economic

19
recession of 2008, MMWAAI noted a decrease of 22.6% in the art market, the second largest
decline since the Great Depression (Ibid).
ii) Artistic Movements
As seen with all forms of art, innovative players can create or change genres just as audience
tastes can vary over time. Works by some artists may suddenly become popular with
collectors after being considered unfashionable for extended periods. For example, paintings
by Vincent van Gogh did not become desirable and appreciated until after his death and now
he has his own museum in Amsterdam. Provided that artistic movements are a natural
occurrence, it could happen that collectors would sell works considered to be out of fashion in
order to purchase new works of art, hence creating a repeat sale. This may help in explaining
why the average holding period for works of art, according to Mei and Moses, is 22 years
(artasanasset.com).
c) Sample selection
The selection of the sample group can be one of the most challenging and controversial
decisions in a quasi-experiment. There will always be opportunities for bias and sampling
methods can vary. The first main experiment of this paper focuses on the effects of specific
incidents of theft and their relation to other works by the same artist. These thefts are chosen
in a somewhat arbitrary method with emphasis on historical importance to the art world and
art market. It should be noted that all of the sampled artists from the thefts were male and
European. Most of the thefts took place in Europe while one was in the U.S. and two were in
Brazil. As a result, this paper therefore has a distinct Western bias in terms of sample selection.
As well, the earliest theft in these experiments took place in 1966 and the most recent one in
2010. The theft of art and antiquities has been happening for centuries (and even millennia)
and so the experiments and their results are more relevant to the modern day art market.
d) Mortality
Mortality "is a threat when an effect may be due to the different kinds of persons who dropped
out of a particular treatment group during the course of an experiment" (Cook & Campbell,

20
1979, pp. 53). As mentioned in the literature review, Ekelund, (et al, 2000) found evidence of a
"death effect" resulting in a short temporary rise auction prices for Latin American artists
between 1977 and 1996. Similarly, Czujack (1997) found a similar "death effect" with Picasso's
works in the three years following his death. Like the other threats to validity, this one also
needs to be taken seriously. In fact, one of the thefts chosen for analysis involved Picasso's
works around the time of his death. This is discussed in further detail later.

21
III. Experiment 1: Analysis of Pre- and Post-Theft Return Rates and
Auction Prices
The purpose of this experiment is to determine if there are any long or short term economic
effects to an artist's oeuvre following a major theft of their work(s). There are four parts to this
experiment: Part 1 is designed to look for long-term effects of a major art theft on the
compound annual returns of repeat sales from the same artist using all of their CAR's recorded
in the MMFAI; Part 2 will examine slightly shorter long term effects using CAR's over the ten
years prior to and following the theft; Part 3 will use auction prices from all auction houses
around the world for the five years prior to and following a theft (and in one special case, CAR's
from Renoir will be used to look at a particular theft from 2000). Part 4 will analyze auction
sales for prints by Picasso from Christie's and Sotheby's in London, England, six months prior to
and following a theft of his work(s). Independent samples t-tests using SPSS (version 21) will be
used in all four parts.
It is important to note that all of the artists sampled for analyses had died prior to their
respective theft and thus the possibility of the supply of new works by the artists effectively
ceased. Therefore their entire oeuvre would be an absolute number thus reinforcing the
economic principles of supply and demand. In theory, art theft reduces the supply of existing
works which should increase demand and hence prices and returns for works by the same
artist. This leads us to the hypothesis for the four parts of this experiment. Each part will test
the same hypothesis that the art theft in question would have a positive effect on compound
annual returns and auction prices for original works by the same artist. This "theft effect" will
be tested for statistically significant differences between the independent sample groups at a
95% level of confidence in each of the four parts (six months, five years, ten years, and all
repeat sales).

22
The most difficult challenge (and perhaps the most obvious potential source of bias) is
the selection of a particular theft to be analyzed. The process used to select a theft involved
several criteria:
The works stolen would need to be of a considerable monetary value
The theft itself must have received substantial media attention and be searchable on the
Internet and in textbooks.
The theft needed to be near a point in time where there would be enough CAR's and
auction sales both before and after it so that a relevant statistical analysis could be
conducted.
A major assumption regarding the thefts selected for analysis is that they received a
generous amount of media exposure and "buzz" in order for them to be implanted in the minds
of collectors and potential buyers, especially over the long-term. Some incidents may have
gone unnoticed by collectors or they might not have been collecting around the time of the
theft. Unfortunately, digitized print media archives are not yet very extensive and thus
searching for articles on major thefts that happened more than fifteen years ago is quite
difficult. For example, Google News Archive revealed a comprehensive amount of articles from
many news outlets on high profile art thefts from the past ten to fifteen years. Repeat sales of
artworks happen relatively infrequently and are dwarfed in comparison to the massive amount
of single auction sales for artworks and prints. For studying the long term effects of art theft, a
sufficient enough amount repeat sales would be needed to have occurred before and after a
theft. Performing independent samples t-tests using CAR's to investigate "theft effects" for a
theft that took place recently would not be an appropriate method. There is one exception in
Part 3 of this experiment involving a theft that occurred in Stockholm in 2000 which is included
in the short term (5 year) section. With the exception of the Stockholm theft, incorporating
archived digital print media with CAR's over a long period of time would have been impractical
at this point in time for statistical analysis. Hand collecting thousands, or tens of thousands of
auction records beyond the year 2000 and up to the present is beyond the scope of this paper.

23
The CAR's as calculated by Mei and Moses were deemed most suitable for studying the long
term economic effects while auction sales are better suited for short term effects. As more
older print sources become digitized, incorporating media into the analysis of CAR’s would
become more of a realistic possibility.
3.1 - Part 1: Long term effects of art theft (all repeat sales)
3.1.1 Experiment Design
Using all of the artist's CAR's collected from the MMFAI scatter-plots, in which some date back
to the 19th century up to just a few years ago, an independent samples t-test with a 95%
confidence level was used to determine if any significant statistical differences exist in the
sample group of CAR's by the targeted artist prior to and following a theft. Below are the three
thefts selected for the first long term analysis.
1) Dulwich Gallery, London, England - December 31, 1966.
During this robbery, thieves escaped with three Rembrandt paintings, including a
portrait of Jacob de Gheyn III, three paintings by Rubens and one by Gerrit Dou and Adam
Elsheimer (Rembrandt and Rubens are the artists to be analyzed in the experiment). This theft
is of particular interest because it marked the first time Rembrandt's portrait of Jacob de Gheyn
III was stolen. It has since been stolen and recovered three other times since then, in 1973,
1981, and 1983, making it the world's most frequently stolen painting according to the
Guinness Book of World Records (Esterow, 2011). This frequency and notoriety of the painting
would perhaps increase the chances of having some kind of long-standing effect on the public
and collectors.
2) Cezanne, "Bouilloire et Fruits", Boston, Massachusetts - 1978.

24
In 1978, seven paintings were stolen from a private residence in Boston, Massachusetts,
which made international headlines. One of these paintings included Cézanne's "Bouilloire et
Fruits". Robert Mardirosian, a retired Massachusetts lawyer, was convicted in 2008 of
possession of stolen goods (United States Dept. of Justice, 2010). The Cézanne was recovered
in 1999 with the help of the Art Loss Register which worked closely with the FBI and Swiss
authorities. Upon its recovery, the Cézanne painting was subsequently sold for $29.3 million.
The other paintings were eventually found and returned to their owner in the ten years
following the recovery of the Cézanne (Art Loss Register 2010). This particular theft was
selected because the recovery of famously stolen artworks is a rare occurrence, and so the
painting's recovery and subsequent auction sale in 1999 also drew a lot of media attention.
3) Isabella Gardner Museum, Boston, Massachusetts - March 18, 1990.
In what is considered the most prolific art theft in history (which also coincidentally took
place in Boston), thieves broke into the Isabella Gardner Museum in Boston on March 18, 1990,
taking thirteen pieces worth a present estimated value of $500-600 million USD (Esterow,
2009). Of the thirteen works stolen, five were drawings by Degas (who is the artist of interest
for this analysis). Three works by Rembrandt were also stolen during the raid including his only
seascape, however only two of his eighteen repeat sales occurred after this theft, which was
deemed too small and disproportionate to warrant a t-test. Vermeer's "The Concert" was
stolen during this raid. No arrests have been made since the theft and none of the works have
been recovered, although in March, 2013, the FBI announced that they have identified the men
involved in the crime (Valencia 2013).
3.1.2 Data Analysis
Below are the results from the independent samples t-tests using CAR's collected from the
artists of the thefts described above.

25
1) Rembrandt van Rijn - Dulwich Picture Gallery - 1966
Table 1(a) - Descriptive Group Statistics
Group CAR's Mean (%) Std. Deviation
Pre-Theft 8 4.44 2.01
Post-Theft 10 5.65 1.56
From the group statistics table above we can see that there were 8 repeat sales prior to the
1966 theft and 10 following it. The CAR mean increased by 1.21 and the standard deviation
decreased, indicating a tighter grouping of CAR's around the median. From this point of view, it
appears as though there might be a connection between the theft causing a higher average
return rate.
Table 1(b) - Independent Samples Test Results
Levene's Test t-test For Equality of Means
Sig. t df Sig. (2-tailed) Mean Diff.
Equal Var. Assumed 0.73 -0.49 16 0.64 -1.21
In the second column in the table above, Levene's Test For Equality of Variances tests as to
whether the conditions have the same or different amounts of variability between groups. A
value greater than 0.05 indicates that the variability between the conditions is roughly the
same ("Equal Variances Assumed"). A value lower than 0.05 tells us that the variability is not
the same ("Equal Variances Not Assumed"), which can cause problems for interpreting the
results (statistics-help-for-students.com). Fortunately, in this case the significance for the
Levene's Test is higher than 0.05. The t-statistic helps in determining where the p-value is
located on a normal distribution. The degrees of freedom is calculated by n - 2 because there is
two sets of data. With a t-statistic of -0.49 and 16 degrees of freedom, the p-value is
determined to be 0.64. Since the p-value is above the 0.05 confidence level threshold, we can
conclude that there is not a statistically significant difference between the pre- and post-theft

26
sample groups. This t-test tells us that despite that the post-theft mean is higher than the post-
theft mean, it has more to do with chance than the treatment (theft) having an effect on the
post-theft mean. Below is the scatter plot obtained from the MMFAI of Rembrandt van Rijn
CAR's (artasanasset.com). The vertical line represents the year in which the theft took place
(1966).
Figure 2
2) Peter Paul Rubens - Dulwich Picture Gallery - 1966
Table 2(a) - Descriptive Group Statistics
Group CAR's Mean (%) Std. Deviation
Pre-Theft 18 7.06 1.53
Post-Theft 13 0.76 2.83
Prior to the Dulwich robbery, Rubens had 18 repeat sales for an average return rate of 7.06%.
Following the robbery, he had 13 repeat sales for a mean of 0.76%, a decrease of 6.3%. The

27
standard deviation also increased after the theft, indicating a wider distribution around the
median. From these descriptive statistics, we can already see that the decrease in the mean
following the theft is inconsistent with the hypothesis. The inferential statistic calculations
below will identify if there was a significant difference in the relationship between the groups
or if the difference in the means was due to chance.
Table 2(b) - Independent Samples Test Results
Levene's Test t-test For Equality of Means
Sig. t df Sig. (2-tailed) Mean Diff.
Equal Var. Assumed 0.41 2.1 29 .04 6.3
The Levene's Test For Equality of Variances calculated a significance value of 0.414, and thus
greater than 0.05, meaning that variance between both groups is about equal. The t-statistic of
2.1 and 29 degrees of freedom reveal a p-value of 0.04, which is less than 0.05 and therefore
we can conclude that the difference between the groups is statistically significant. However,
because the post-theft mean is substantially lower supports the argument that the theft was a
factor in the decrease of the post-theft average return rate for Rubens' works. Below is the
scatter plot of Rubens' compound annual returns (artasanasset.com).

28
Figure 3
3) Cézanne - "Bouilloire et Fruits", Boston - 1978
Table 3(a) - Descriptive Group Statistics
Group CAR's Mean (%) Std. Deviation
Pre-Theft 20 8.55 11.1
Post-Theft 19 3.98 8.13
In the descriptive statistics table above, there were 20 repeat sales with an average return rate
of 8.55% prior to the 1978 theft and 19 repeat sales following for an average return rate of
3.98%. The standard deviation decreased after the theft suggesting a slightly more compact
grouping of CAR's around the median. Immediately upon looking at this table, we can see that
the average return decreased following the theft which is inconsistent with the hypothesis. The
t-test below will show if there is a significant difference between the groups.
Table 3(b) - Independent Samples Test Results

29
Levene's Test t-test For Equality of Means
Sig. T df Sig. (2-tailed) Mean Diff.
Equal Var. Assumed 0.82 1.46 37 0.15 4.57
The Levene's Test For Equality of Variances calculated a significance value of 0.82 meaning that
both the pre- and post-theft groups have a similar level of variance. The t-statistic of 1.46 and
the 37 degrees of freedom reveal a p-value of 0.15 and thus greater than 0.05. Therefore we
can conclude that there is not a significant statistical difference between the groups and that
the difference in the means is most likely random. Below is a scatter plot of all of Cézanne's
known CAR's according to the MMFAI (artasanasset.com).
Figure 4
4) Edgar Degas drawings - Gardner Museum, Boston - 1990
Table 4(a) - Descriptive Group Statistics

30
Group CAR's Mean (%) Std. Deviation
Pre-Theft 86 9.37 9.38
Post-Theft 32 7.1 7.38
From the descriptive statistics above, we see that Degas had 86 repeat sales prior to the 1990
theft which have an average return rate of 9.37%. Following the theft, he had 32 repeat sales
for an average return rate of 7.1%. The standard deviation decreased slightly following the
theft, signifying more clustering of CAR's around the median. This theft is not exactly very close
to the middle of Degas' repeat sales records, however the historical significance of the theft and
the attention it received deemed it worthy of analysis.
Table 4(b) - Independent Samples Test Results
Levene's Test t-test For Equality of Means
Sig. T df Sig. (2-tailed) Mean Diff.
Equal Var. Assumed 0.92 1.23 116 0.22 2.27
The Levene's Test For Equality of Variances calculated a significance value of 0.92, suggesting
that both groups have similar variances, despite one group having a larger sample size than the
other. The t-statistic of 1.23 and the 116 degrees of freedom account for a p-value of 0.22.
Therefore we can conclude that there is not a statistically significant difference between both
sample groups. Below is the scatter plot for all of Degas' recorded compound annual returns. It
is worth noting that the impact of the art bubble from 1990 is quite evident from this graph
(artasanasset.com).

31
Figure 5
3.1.3 Discussion - Part 1
From the four independent samples t-tests conducted above, none were consistent with the
hypothesis: that a major art theft would increase the returns for all subsequent repeat sales
over the long term for other works by the same artist. Only the result from the t-test for
Rubens revealed a significant difference in the pre- and post-theft means, and the average
return rate dropped substantially following the theft. This t-test presents argument in
opposition to the hypothesis that art theft actually decreases future return rates (in the long
term).

32
Table 5 - Summary: Part 1
Theft
N
(pre-)
Mean
(pre-)
N
(post-)
Mean
(post-)
Mean
Diff Levene's T-stat P val Hyp
Rembrandt 8 4.44 10 5.65 -1.21 E.V.A. -0.49 0.64 Rej.
Rubens 18 7.06 13 0.76 6.29 E.V.A. 2.1 0.04 Rej.
Cézanne 20 8.55 19 3.98 4.57 E.V.A. 1.46 0.15 Rej.
Degas 86 9.37 32 7.1 2.27 E.V.A. 1.23 0.22 Rej.
The Cézanne and Degas thefts also resulted in lower means following their respective
thefts however the treatment did not appear to be a factor. Rembrandt had a positive mean
increase following the 1966 Dulwich theft, however the t-test showed that this more likely due
to chance. As a treatment, specific art thefts appear to have little long-term effect on the
future return rates of works by the same artist following a major incident, with Rubens being an
exception. In fact, if any effect is perceived, it is that theft will most likely diminish future
returns judging by the difference in the pre-and post-theft means the Rubens' t-test result.
3.2 - Part 2: Long term effects of art theft (10 years)
3.2.1 Experiment Design
Similar to Part 1, this section will compare the CAR's of specific artists ten years prior to and
after a major theft in which at least one of their works were stolen. Based on the results from
previous part, it would appear that a single incident of theft does not have a lasting impact on
returns of future repeat sales of the same artist. The purpose of this section is to restrict the
periods before and after the theft to ten years in order to try and isolate any significant
differences between the two groups of CAR's. The thefts from Part 1 were not suitable for this
analysis as the number of recorded repeat sales for each artist was too low. Independent
samples t-tests at a 95% confidence level will be used. Below are the thefts that will be the
subject of the experiments.

33
1) Stephen Hahn Gallery, New York, New York - November 1969
In November of 1969, thieves stole seven paintings from the Stephen Hahn Gallery in New York
City including works by Cassatt, Monet, Pissarro and Rouault (Monet and Pissarro are the artists
selected for the t-tests). At the time, the paintings were estimated to be a combined value of
around $500,000 USD (Chakelian, 2012). This particular theft frequently appears in articles
discussing the greatest art thefts in history because it contains a certain twist of irony and
humour. Just as the thieves were picking the locks to a door of the gallery, Stephen Hahn was
discussing art theft in a conference meeting with the board of directors from the Art Directors
Association of America. Following the theft he joked that the thieves had a "conservative" taste
in art by not taking the abstract works in the gallery including one by Picasso (Ibid). This
example of irony and Hahn's self-deprecating style of humour has had a lasting impression on
art historians and media alike.
2) Palais des Papes, Avignon, France - January 31, 1976
In this instance of theft, thieves stole 118 works by Picasso from the Palais des Papes in
Avignon, France. It was the single largest incident of theft involving his works (BBC, 2007).
Picasso's works are frequently targeted by thieves as his pieces often command extremely high
prices in the art market. This theft occurred less than three years after Picasso died, and as
Czujack (1997) found that there was a rise in auction prices for his works in the three years
proceeding his death, this stolen collection would have been worth an exceptionally high
market value at the time.
3.2.2 Data Analysis
Below are the results from the independent samples t-tests conducted at a 95% confidence
level for the CAR's of the artists selected above in the ten years prior to and following the theft.

34
1) Monet - Stephen Hahn Gallery, New York, New York - 1969
Table 6(a) - Descriptive Group Statistics
Group CAR's Mean (%) Std. Deviation
Pre-Theft (1959 - 1969) 18 9.55 5.62
Post-Theft (1969 - 1979) 36 13.04 7.66
From the group statistics we can see that there were twice as many repeat sales in the ten
years after the theft than before. The increase in the means post-theft is consistent with the
hypothesis suggesting that works by Monet may have been in higher demand after this
incident.
Table 6(b) - Independent Samples Test Results
Levene's Test t-test For Equality of Means
Sig. t df Sig. (2-tailed) Mean Diff.
Equal Var. Assumed 0.17 -1.71 52 0.09 -3.48
The Levene's Test for Equality of Variances reveals that the variances between the groups were
approximately the same. The t-statistic of -1.71 is relatively far from the mean on the normal
distribution however we still conclude that the difference between the groups is not
statistically significant, albeit it is very close. Supposing this t-test was performed again with a
confidence level of 90%, then we could conclude that there is a probability of less than 10%
(but higher than 5%) that the difference between the two groups would not be statistically
significant. Below is the scatter plot of Monet's recorded CAR's. The vertical line in the middle
indicates the year of the theft, 1969 (artasanasset.com).

35
Figure 6
2) Pissarro - Stephen Hahn Gallery, New York, New York - 1969
Table 7(a) - Descriptive Group Statistics
Group CAR's Mean (%) Std. Deviation
Pre-Theft (1959 - 1969) 16 8.91 6.46
Post-Theft (1969 - 1979) 27 12.09 5.67
From the group statistics table above, there were 16 repeat sales prior to Pissarro's work being
taken from the Stephen Hahn Gallery theft and 27 following it. The mean for the CAR's
increased after the theft which is consistent with the hypothesis. The standard deviations of
both groups is also relatively similar and stable.
Table 7(b) - Independent Samples Test Results

36
Levene's Test t-test For Equality of Means
Sig. t df Sig. (2-tailed) Mean Diff.
Equal Var. Assumed 0.74 -1.69 41 0.10 -3.18
According the Levene's Test for Equality of Variances, the variance between both groups is
around the same level. The t-statistic of -1.69 and the 41 degrees of freedom reveal a p-value
of 0.10, and thus allowing us to conclude that there is not a statistically significant difference
between the groups at a confidence level of 95%. However, similar to the previous t-test
involving Monet, at a 90% confidence level, there would a statistically significant difference
between the groups. Since the original hypothesis was intended to determine a significant
difference at a 95% level of confidence, we must accept the null hypothesis, albeit the result
was close to supporting the original one. Below is the scatter of Pissarro's CAR's as collected by
the MMFAI (artasanasset.com).
Figure 7

37
2) Picasso - Palais des Papes, Avignon, France - 1976
Table 8(a) - Descriptive Group Statistics
Group CAR's Mean (%) Std. Deviation
Pre-Theft (1966 - 1976) 17 10.51 4.13
Post-Theft (1976 -1986) 50 12.11 8.05
From the group statistics we can see that there were a much higher number of repeat sales
following the 1976 theft (50) than before (17) and that the average return rate also increased
from 10.51 to 12.11%. This increase in the mean is so far consistent with the hypothesis. The
table below will tell us if there is a significant difference between the group. As mentioned
before, Picasso died in 1973 and thus his supply of new works effectively ceased. The large
difference in the number of repeat sales before and after the theft as well as the increase in the
average returns could be attributed more to his death in an attempt to achieve higher returns
which is what Czujack (1997) found with his auction sales.
Table 8(b) - Independent Samples Test Results
Levene's Test t-test For Equality of Means
Sig. t df Sig. (2-tailed) Mean Diff.
Equal Var. NOT Assumed 0.04 -1.06 54.36 0.30 -1.6
In the t-test results above we can observe that significance level from the Levene's Test for
Equality of Variances is less that 0.05, and therefore we do not assume that there is similar
variance of the CAR's around their respective mean for each group. When conducting
independent samples t-tests in SPSS, two rows of data appear in the output: one is for when
equal variances are assumed, and the other is when they are not. In this case, since the
difference in the variance within the groups is high, we read the bottom row of the SPSS output
(these are in the table above). With a t-statistic of -1.06 and 54.36 degrees of freedom, the p-
value for this t-test (0.30) is higher than 0.05 and therefore we can conclude that there is not a

38
statistically significant difference between the means of both groups. For the sake of
curiousity, had we read from the top row of the SPSS output, the p-value was 0.44 and our
conclusion would be the same. Below is scatter plot of Picasso's CAR's (artasanasset.com).
Figure 8
3.2.3 Discussion - Part 2
For each theft analyzed the pre- and post-theft sample groups did not show any statistically
significant differences at a 95% level of confidence. Therefore the results fail to show that the
treatment had any significant effect and thus failing to support the hypothesis, that higher
returns for repeat sales would result following a theft within a ten year time period.
Interestingly, however, was that the p-values for Monet and Pissarro were quite similar (0.09
and 0.10 respectively) and both works were taken in the same incident.

39
Table 9 - Summary: Part 2
Theft
N
(pre-)
Mean
(pre-)
N
(post-)
Mean
(post-)
Mean
Diff Levene's T-stat P val Hyp
Monet 18 9.55 36 13.04 -3.49 E.V.A. -1.71 0.09 Rej.
Pissarro 16 8.91 27 12.09 -3.18 E.V.A. -1.69 0.10 Rej.
Picasso 17 10.51 50 12.11 -1.6 E.V.N.A. -1.06 0.30 Rej.
Monet and Pissarro show similar figures in the means of the post-theft CAR's which both
increased in the ten years following the theft. Interestingly, they were also both impressionist
painters. If the t-tests were repeated for both artists with the confidence level set at 90%, then
based on their p-values the mean of the post-theft CAR's for both artists would be significantly
different than the mean of pre-theft CAR's. The fact that these results for these two artists are
so similar may be due to coincidence, however they may also provide some evidence that the
Stephen Hahn Gallery theft may have left an "impression" (excuse the pun) on collectors of
impressionist works, and in particular those who collected Monet and Pissarro around this
period of time.
In the Palais des Papes theft involving 118 works by Picasso, we can see in the table and
scatter plot above that there was a flurry of buying and selling activity in the ten years that
followed based on the number of post-theft repeat sales. However, as noted above, Picasso
died in 1973 and thus it is possible that the increase in the average CAR's following the theft
would have more to do with his death than the theft itself. As mentioned earlier, Czujack
(1997) found an increase in auction prices for Picasso relative to the art market following his
death which lasted for approximately three years. In fact, one may presume that this increase
in auction prices did not go unnoticed by the thief who stole the 118 works. The "death effect"
of three years is much shorter than the 10 year post-theft time span covered in this t-test, and
effectively ended around the same time as the theft (1976). Despite that the post-theft mean is
higher than the pre-theft mean, the p-value still indicates that there is not a significant
difference between the pre- and post-theft CAR's.

40
3.3 - Part 3: Short term effects of art theft (5 years)
3.3.1 Experiment Design
The purpose of Part 3 of this experiment is to shorten the period of time to five years (pre- and
post-theft) in an effort to isolate any potential short term "theft effects". Five famous incidents
of theft will be examined in this section, all of which took place after 2000. The first four will be
studied using auction prices for paintings and works on paper (prints and other forms of media
such as sculptures were not included) that were collected from auction houses worldwide using
the Blouin Art Sales Index. The fifth one will measure the change in CAR's for a theft that took
place in Stockholm in 2000 involving two works by Renoir. Despite that repeat sales happen far
less frequently than single auction sales, Renoir is ranked second in the MMFAI's list of artists
with the most repeat sales having 232 as of 2008 (artasanasset.com) and thus he was deemed
to have enough within a five year time span (before and after the theft) to warrant a relevant
statistical analysis. It should be noted that all of the five thefts below involved paintings being
stolen with the exception of Munch's "Scream" which is a work on paper. For this reason, the
auction records in the sample groups for the 2004 Munch theft include both paintings and
works on paper.
Like in Parts 1 and 2 of this experiment, independent samples t-tests will be applied to
each case. Since all of the thefts in this section took place more recently than all of the cases
previously examined, there is a stronger basis to assume that the dissemination of information
through the media regarding these incidents was wider and more accessible with the aid of the
Internet. All five cases can quickly be found and read about with a simple search. If any of the
results from the t-tests show significant differences between the means of the sample groups,
this could suggest that media related technology played a role in affecting the post-theft
auction prices and returns on the artists' other works. Below are the thefts to be examined.
1) Van Gogh Museum, Amsterdam, Netherlands - December 8, 2002

41
On December 8, 2002, thieves climbed to the roof of the Van Gogh Museum in Amsterdam and
through a skylight repelled down and took two works by van Gogh: "Congregation leaving the
reformed church in Nuenen" and "View of the sea at Scheveningen". The museum staff could
not put an immediate market value at the time, however the artist's works had recently been
selling for tens of millions of Euros. It was initially thought that they were stolen for a private
collector or for ransom. Neither were insured nor have they been recovered (Clements 2002).
2) Munch Museum, Oslo, Norway - August 22, 2004
Edvard Munch's "The Scream" and "Madonna" were both stolen from the Munch Museum on
August 22, 2004 (Lyall 2004). They were later recovered but it was the second time in ten years
that a version of "The Scream" had been stolen. Four original versions of "The Scream" exist,
three of which are in museums. In 2012 the fourth version (the only one in private hands) sold
for a record $107 million USD at Sotheby's in New York ($119,922,500 including the buyer's
premium) and was won by an anonymous telephone bidder. The theft in 2004 brought a
tremendous amount of publicity and without a doubt helped to spread the importance of the
work to a mass audience. This particular theft and subsequent record auction sale in 2012 was
one of the inspirations for the topic of this paper.
3) Museu de Chacara do Ceu, Rio de Janeiro, Brazil - February 24, 2006
On February 24, 2006, during the annual Carnival celebrations in Rio de Janeiro, Brazil, gunmen
stormed the Museu de Chacara do Ceu taking works by Picasso, Monet, Matisse, and Dali's
"The Two Balconies" (Dali is the focus of this t-test). The thieves escaped into the large crowd
outside while a samba band marched down the street playing music. The works were
considered to be the most valuable in the museum and staff at the time could not put an
estimated market value on them (Thompson 2006).

42
4) E.G. Burhle Foundation, Zurich, Switzerland - February 11, 2008
In what was considered to be the largest art robbery in Switzerland's history, and one of the
largest in Europe, three armed robbers stole four masterpieces which included Cézanne's "Boy
in the Red Waistcoat", Monet's "Poppy Field at Vetheuil", Van Gogh's "Blooming Chestnut
Branches" and Degas' "Ludovic Lepic and his Daughters" (Sturcke 2008). The paintings were
believed to be worth a combined £84 million. Out of the five thefts examined in this section,
this was the most recent one. For the purposes of this t-test, Cézanne is the artist in question.
5) National Museum, Stockholm, Sweden - December 22, 2000
On December 22, 2000, thieves broke into Sweden's National Museum in Stockholm stealing a
self-portrait by Rembrandt and two paintings by Renoir, "Young Parisian" and "Conversation",
worth an combined estimate of $30 million USD. They escaped by boat and distracted police at
the time of the break in by setting two cars on fire in distant parts in the city. It was thought
that they acted on commission for a private collector (BBC News, 2000). Of the five thefts to be
examined in this section, this is the only one that will use Renoir's CAR's from the MMFAI for
the t-test. This particular incident often appears on "greatest art heists" lists primarily due to
the pieces involved and the methods used for distraction and escape.
3.3.2 Data Analysis
Below are the results from the independent samples t-tests using auction records and CAR's
collected from the artists of the thefts described above.
1) Van Gogh - Van Gogh Museum, Amsterdam, Netherlands - 2002
Table 10(a) - Descriptive Group Statistics

43
Group Auction Sales Mean (USD) Std. Deviation
Pre-Theft (1997 - 2002) 16 $6,871,228.50 8,342,818.72
Post-Theft (2002 - 2007) 29 $4,542,081.86 12,317618.15
For this independent samples t-test, only auction sales for paintings by van Gogh were included
in the analysis. The Blouin Art Sales Index lists 16 paintings by Van Gogh sold at auction houses
worldwide in the five years prior to the theft for an average price of $6,871,228.50 USD.
Following the theft 29 works were sold at an average price of $4,542,081.86 USD. Based on
these results we can see that the average price fell after the theft which is inconsistent with the
hypothesis.
Table 10(b) - Independent Samples Test Results
Levene's Test t-test For Equality of Means
Sig. t df Sig. (2-tailed) Mean Diff.
Equal Var. Assumed 0.76 0.67 43 0.50 $2,329,146.64
According to the results from the t-test above, the Levene's Test for Equality of Variances
indicates that there the variance of both groups is similar. The t-statistic of 0.67 tells us that
within the normal distribution the p-value is 0.50, and therefore we can conclude that there is
not a statistically significant difference between the groups. The differences in the means are
more likely due to chance.
2) Munch - Munch Museum, Oslo, Norway - 2004
Table 11(a) - Descriptive Group Statistics
Group N Mean (USD) Std. Deviation
Pre-Theft (1999 - 2004) 45 $501,479.04 1,194,894.13
Post-Theft (2004 - 2009) 56 $2,386,563.29 6,578,760.68

44
For this t-test the sample groups were expanded to include both paintings and works on paper.
Munch's "Scream" is a work on paper and since this type of medium was stolen, other works on
paper created by Munch were included in the analysis. It should be noted that the record
setting auction sale of "The Scream" happened eight years after this particular theft and is not
included in the post-theft sample of auction prices. The pre-theft sample mean of $501,479.04
is lower than the post-theft mean of $2,386,563.29 which is consistent with the hypothesis.
The standard deviation of the post-theft group is much higher suggesting more variation
amongst the sample around the median.
Table 11(b) - Independent Samples Test Results
Levene's Test t-test For Equality of Means
Sig. t df Sig. (2-tailed) Mean Diff.
Equal Var. NOT Assumed 0.01 -2.10 59.48 0.04 -1,885,084.24
Based on the results from the t-test, the Levene's Test of Equality of Variances found that the
variances between the groups do not appear to be similar, which is a likely testament to the
difference between the standard deviations between the sample groups. Because of this, the
second row of the SPSS output table applies to this scenario. The t-statistic of -2.10 is far
enough away from the mean of the normal distribution to produce a p-value of 0.04. Therefore
we can conclude that there a statistically significant difference between both sample groups
which supports the original hypothesis.
3) Dali - Museu de Chacara do Ceu, Rio de Janeiro, Brazil - 2006
Table 12(a) - Descriptive Group Statistics
Group N Mean (USD) Std. Deviation
Pre-Theft (2001 - 2006) 54 $397,421.37 573,563.28
Post-Theft (2006 - 2011) 47 $1,381,509.47 3,350,527.12

45
For this independent samples t-test, only paintings by Dali were included in the sample groups.
The pre-theft group contained 54 auction records for an average sale price of $397,421.37
while the post-theft sample group containing 47 records had an average price of $1,381,509.47.
The increase in the post-theft mean is consistent with the hypothesis. Also note that the
standard deviation was much higher in the post-theft sample group which suggests a wider
range of auction prices.
Table 12(b) - Independent Samples Test Results
Levene's Test t-test For Equality of Means
Sig. t df Sig. (2-tailed) Mean Diff.
Equal Var. NOT Assumed 0.00 -1.99 48.35 0.05 -984,088.10
The Levene's Test for Equality of Variances confirms a difference in the variances between the
groups, in which the difference in the standard deviations also implies. Like the previous theft,
this leads us to use the second row of results produced by SPSS. The t-statistic (-1.99) is
relatively far from the mean of the normal distribution to purport a p-value of 0.05. Because
the p-value is at the 0.05 level of significance, we can conclude that there is a statistically
significant difference between the sample groups and therefore supports the hypothesis.
4) Cézanne - E.G. Burhle Foundation, Zurich, Switzerland - 2008
Table 13(a) - Descriptive Group Statistics
Group N Mean (USD) Std. Deviation
Pre-Theft (2003 - 2008) 25 $5,479,482.52 7,251,791.96
Post-Theft (2008 - 2013) 23 $3,353,422.65 4,378,830.06
For this particular theft involving one of Cézannes paintings, 25 auction records were collected
for the pre-theft sample group with an average price of $5,479,482.52. In the five years
following the theft, 23 auction sales for his paintings took place for an average price of

46
$3,353,422.65. The decrease in the average price is inconsistent with the hypothesis, although
it is worth pointing out that the size of the sample groups were relatively small and subject to
influence from outliers. The higher standard deviation in the pre-theft group can also attest to
this.
Table 13(b) - Independent Samples Test Results
Levene's Test t-test For Equality of Means
Sig. t df Sig. (2-tailed) Mean Diff.
Equal Var. Assumed 0.106 1.216 46 0.23 2,126,059.87
Despite the difference in the standard deviations above, the Levene's Test for Equality of
Variances shows a significance value greater than 0.05, therefore indicating that a similar
variance exists in each group. The t-statistic of 1.216 and 46 degrees of freedom reveals a p-
value of 0.23. Because the p-value is greater than 0.05, we can conclude that there is not a
significant difference between the pre- and post-theft sample groups.
5) Renoir - National Museum, Stockholm, Sweden - 2000
Table 14(a) - Descriptive Group Statistics
Group CAR's Mean (%) Std. Deviation
Pre-Theft (1995 - 2000) 25 7.11 11.96
Post-Theft (2000 - 2005) 10 21.09 16.48
This is the only t-test of this section that used CAR's over the five year period prior to and after
this particular theft involving Renoir in 2000. Renoir had 25 repeat sales in the five years prior
to the theft for an average of 7.11%. Following the theft, 10 repeat sales occurred for a higher
average of 21.09%. So far, this result is consistent with the hypothesis and the t-test results
below will tell us if there is a difference between the sample groups.

47
Table 14(b) - Independent Samples Test Results
Levene's Test t-test For Equality of Means
Sig. t df Sig. (2-tailed) Mean Diff.
Equal Var. Assumed 0.20 -2.8 33 0.01 -13.98
The Levene's Test for Equality of Variances shows a similar level of variance in each group, even
though the standard deviation was higher in the post-theft group. The t-statistic of -2.8 is far
enough away from the mean on the normal distribution so that the p-value is 0.01. Therefore,
we can conclude that there is a significant difference between the two groups which is
consistent with the hypothesis. Originally, this theft was meant to be included in Part 2,
however it was moved to Part 3 for two reasons: firstly, Renoir's CAR's only go up to 2008 and
thus the collection of post-theft CAR's would have been shorter than ten years; secondly, the
CAR's from around the early 1990's were extremely low as a result of the art bubble. Because
of these reasons, the results of a test spanning ten years before and after the theft would have
been severely biased. As we can see in the scatter plot below, by 1995 Renoir's CAR's had
somewhat stabilized. The period between 1995 and 2000 saw several negative CAR's for
Renoir's works, while in the five year period after, there were all CAR's were positive. Since the
t-test revealed a significant difference between the groups, there is reason to suggest here that
the theft in question was a causal factor for the higher average CAR's. Below is a scatter plot of
Renoir's compound annual returns (artasanasset.com)

48
Figure 9
3.3.3 Discussion - Part 3
Based on the five cases examined in this section, three (Munch, Dali and Renoir) showed
evidence of a "theft effect" based on the fact that the post-theft auction prices and average
compound annual returns were higher than the pre-theft ones which the t-tests showed to be
significantly different. While the treatment did not seem to impact auction prices of the artists
from the other two thefts, these findings suggest that there might be a short term "theft effect"
of five years whereby CAR's and auction sales are greater relative to CAR's and sales before the
theft.
Table 15 - Summary: Part 3
Theft N (pre-) Mean (pre-) N (post-) Mean (post-) Levene's T-stat P val Hyp.
VG 16 6,871,228.50 29 4,542,081.86 E.V.A 0.67 0.50 Rej.
Mun 45 501,479.04 56 2,386,563.29 E.V.N.A. -2.10 0.04 Acc.
Dali 54 397,421.37 47 1,381,509.47 E.V.N.A. -1.99 0.05 Acc.
Céz 25 5,479,482.52 23 3,353,422.65 E.V.A. 1.22 0.23 Rej.
Ren 25 7.11 (CAR) 10 21.09 (CAR) E.V.A. -2.8 0.01 Acc.

49
In the case of the Munch theft, there are a few interesting characteristics that might help
distinguish a stronger "theft effect" from the other cases. For example, as mentioned before, a
version of Munch's "The Scream" had previously been stolen in 1994. For another version of it
to be taken again and the media attention that followed could reinforce the importance of the
work in the minds of collectors. In advertising, Berlyne (1970) devised a two-part theory
regarding repetition effects (Berlyne, 1970, as cited in Campbell & Keller, 2003, p. 292). The
first part, often referred to as "wearin", involves the habituation of the message to the viewer
whereby they may feel hostile and uncertain to it at first. "Initial levels of message repetition
serve as increases of positive habituation by reducing negative responses to the novel stimulus,
thus increasing effectiveness at lower levels of repetition" (Cox & Cox, 1988, as cited in
Campbell & Keller, 2003, p. 292-293). The second part, referred to as "wearout", occurs when
continued repetition brings tedium and the message begins to lose its effectiveness (Anand &
Sternthal 1990, Blair & Rabuck 1998, Calder & Sternthal 1980, as cited in Campbell & Keller,
2003, p. 293). With regards to art theft, because it is such a random and infrequent occurrence,
it is very unlikely any piece would be stolen frequently enough cause "wearout" on the public's
conscience. However, a repeated theft of an object (in this case, a different version of the same
work) may be enough to trigger a "wearin" effect and demand would increase as a result.
Despite being stolen four separate times, Rembrandt's portrait of Jacob de Gheyn III, still sits in
the Dulwich Picture Gallery in London and since it was never privately bought or sold (nor will it
likely ever be) we can only speculate on its potential monetary fluctuations.
It is unlikely that Berlyne's (1970) theory could explain the significant difference in Dali's
and Renoir's t-tests above. Research did not reveal that any of those works had ever been
stolen prior to their thefts. Since these works belong to a public institution, they are unlikely to
see an auction block in the foreseeable future. On the other hand, Dali ranks in third place on
Art Loss Register's list of artists with the most stolen works with 468 registered items (to see
the list of the 24 artists with the most registered stolen works, please see Appendix A). It is
possible that thefts involving his works prior to the Rio de Janeiro incident had some effect on
prospective collectors. Similarly, Renoir, is number twelve on the ALR's list with registered

50
items. Such a high number could suggest that media exposure from prior thefts made a lasting
impression on collectors. Interestingly, neither Cézanne nor van Gogh are on the list and thus
were likely less frequently targeted and received less relative media exposure.
3.4 - Part 4: Short term effects of art theft (6 months)
3.4.1 Experiment Design
The purpose of the Part 4 is to look for short term effects of a major theft on auction prices for
prints using independent samples t-tests six months prior to and following the theft. Prints by
Picasso are the choice subject of this section since he often sells many at auction in short
periods of time, thus lending themselves well for statistical analysis. Auction prices for prints
were collected from the Blouin Art Sales Index for Christie's and Sotheby's auction houses in
London, England. Prints were the medium of choice because there is more continuous market
activity for them compared to other mediums, like paintings and sculptures. Prints that were
"bought in" at auction were not included in the sample groups. Changes in compound annual
returns on repeat sales of Picasso's prints were not provided by the MMFAI nor were found
elsewhere. The two thefts selected for analysis took place at the Sao Paulo Museum of Art on
December 20, 2007, in Sao Paulo, Brazil, and at the Museum of Modern Art in Paris, France, on
May 20, 2010. In the first theft, Picasso's "Portrait of Suzanne" was stolen along with Candido
Portinari's "O Lavrador de Café", while in the second theft Picasso's "Pigeon aux Petits Pois"
was taken as well as works by Matisse, Braque, Modigliani, and Léger. Both thefts received
substantial amounts of global media attention.
3.4.2 Data Analysis
Below are the results from the independent samples t-tests using Picasso's auction records for
print sales sold at Christie's and Sotheby's auction houses in London, England.

51
1) Sao Paulo Museum of Art, Sao Paulo, Brazil - December 20, 2007
Christie's London
Table 16(a) - Descriptive Group Statistics
Group N Mean (USD) Std. Deviation
Pre-Theft (19/6/07 to 19/12/07) 58 $59,180.72 95,178.13
Post-Theft (20/12/07 to 20/6/08) 32 $56,049.84 74,475.81
In the six months prior to the Sao Paulo theft, 58 Picasso prints were sold at Christie's London
for an average price of $59,180.72. Following the theft, 32 prints were sold for an average
price of $56,049.84. The standard deviation decreased slightly indicating a tighter grouping sale
prices around the median. Immediately we can see that the average price decreased after the
theft which is inconsistent with the hypothesis.
Table 16(b) - Independent Samples Results
Levene's Test t-test For Equality of Means
Sig. t df Sig. (2-tailed) Mean Diff.
Equal Var. Assumed 0.62 0.16 88 0.87 3,130.88
The Levene's Test for Equality of Variances reveals that there is approximately equal variance
between the pre-and post-theft sample groups. The t-statistic of 0.161 and 88 degrees of
freedom gives a p-value of 0.873 which allows us to conclude that there is not a significant
statistical difference for Picasso's print prices before and after the theft. Therefore, the
treatment does not appear to have any effect, at least at Christie's auction house.
Sotheby's London
Table 17(a) - Descriptive Group Statistics

52
Group N Mean (USD) Std. Deviation
Pre-Theft (19/6/07 to 19/12/07) 31 $19,448.58 21,078.71
Post-Theft (20/12/07 to 20/6/08) 23 $18,583.04 15,801.09
Sotheby's auction house in London sold 31 Picasso prints prior to the Sao Paulo theft for an
average price of $19,448.58 and a standard deviation of 21,078.71. Following the theft, 23
prints were sold for an average price of $18,583.04 and a standard deviation of 15,801.09.
Similar to the Christie's auction sales above, the average price for the prints decreased which is
inconsistent with the hypothesis.
Table 17(b) - Independent Samples Results
Levene's Test t-test For Equality of Means
Sig. t df Sig. (2-tailed) Mean Diff.
Equal Var. Assumed 0.68 0.17 52 0.87 865.53
The Levene's Test shows that the variances of the groups are generally equal. The p-value of
0.869 is greater than 0.05 and therefore we can conclude that there is not a statistically
significant difference between the group means for Picasso's print prices before and after this
theft. These findings are also inconsistent with the original hypothesis that a theft would cause
an increase in short term print prices at auction.
2) Museum of Modern Art, Paris, France - May 20, 2010
Christie's London
Table 18(a) - Descriptive Group Statistics
Group N Mean (USD) Std. Deviation
Pre-Theft (19/11/09 to 19/5/10) 22 $23,574.95 18,375.12
Post-Theft (20/5/10 to 20/11/10) 20 $29,157.45 48,100.35
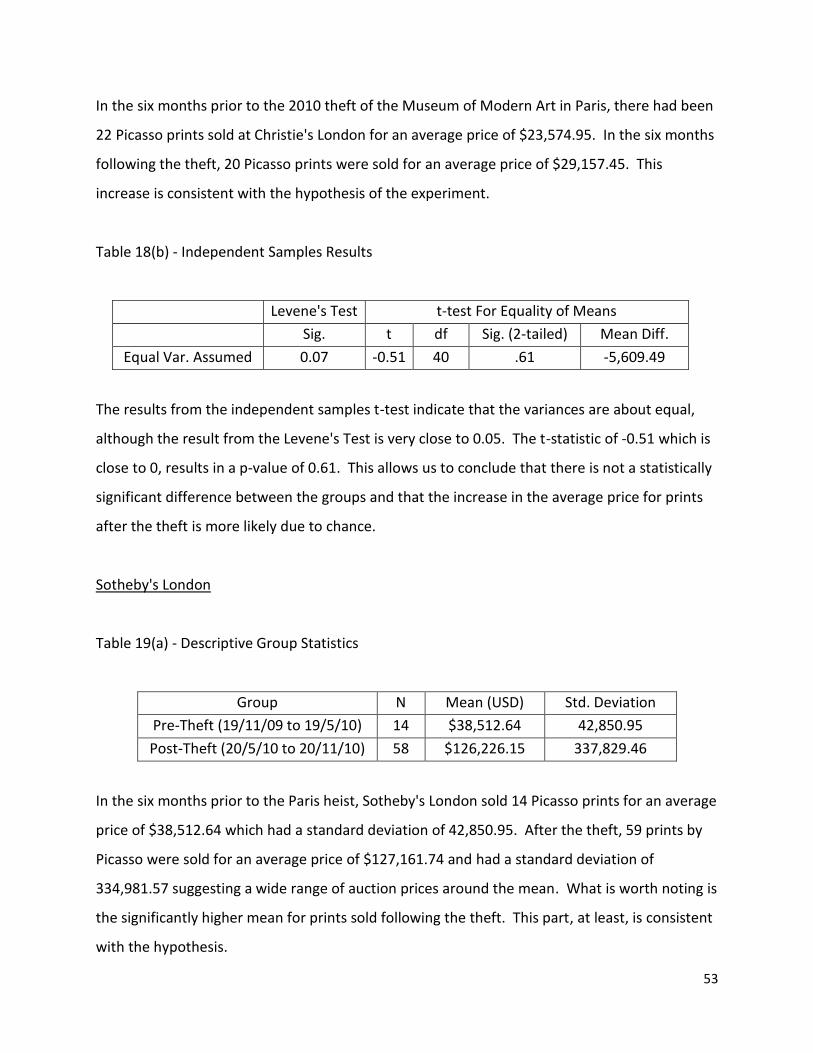
53
In the six months prior to the 2010 theft of the Museum of Modern Art in Paris, there had been
22 Picasso prints sold at Christie's London for an average price of $23,574.95. In the six months
following the theft, 20 Picasso prints were sold for an average price of $29,157.45. This
increase is consistent with the hypothesis of the experiment.
Table 18(b) - Independent Samples Results
Levene's Test t-test For Equality of Means
Sig. t df Sig. (2-tailed) Mean Diff.
Equal Var. Assumed 0.07 -0.51 40 .61 -5,609.49
The results from the independent samples t-test indicate that the variances are about equal,
although the result from the Levene's Test is very close to 0.05. The t-statistic of -0.51 which is
close to 0, results in a p-value of 0.61. This allows us to conclude that there is not a statistically
significant difference between the groups and that the increase in the average price for prints
after the theft is more likely due to chance.
Sotheby's London
Table 19(a) - Descriptive Group Statistics
Group N Mean (USD) Std. Deviation
Pre-Theft (19/11/09 to 19/5/10) 14 $38,512.64 42,850.95
Post-Theft (20/5/10 to 20/11/10) 58 $126,226.15 337,829.46
In the six months prior to the Paris heist, Sotheby's London sold 14 Picasso prints for an average
price of $38,512.64 which had a standard deviation of 42,850.95. After the theft, 59 prints by
Picasso were sold for an average price of $127,161.74 and had a standard deviation of
334,981.57 suggesting a wide range of auction prices around the mean. What is worth noting is
the significantly higher mean for prints sold following the theft. This part, at least, is consistent
with the hypothesis.
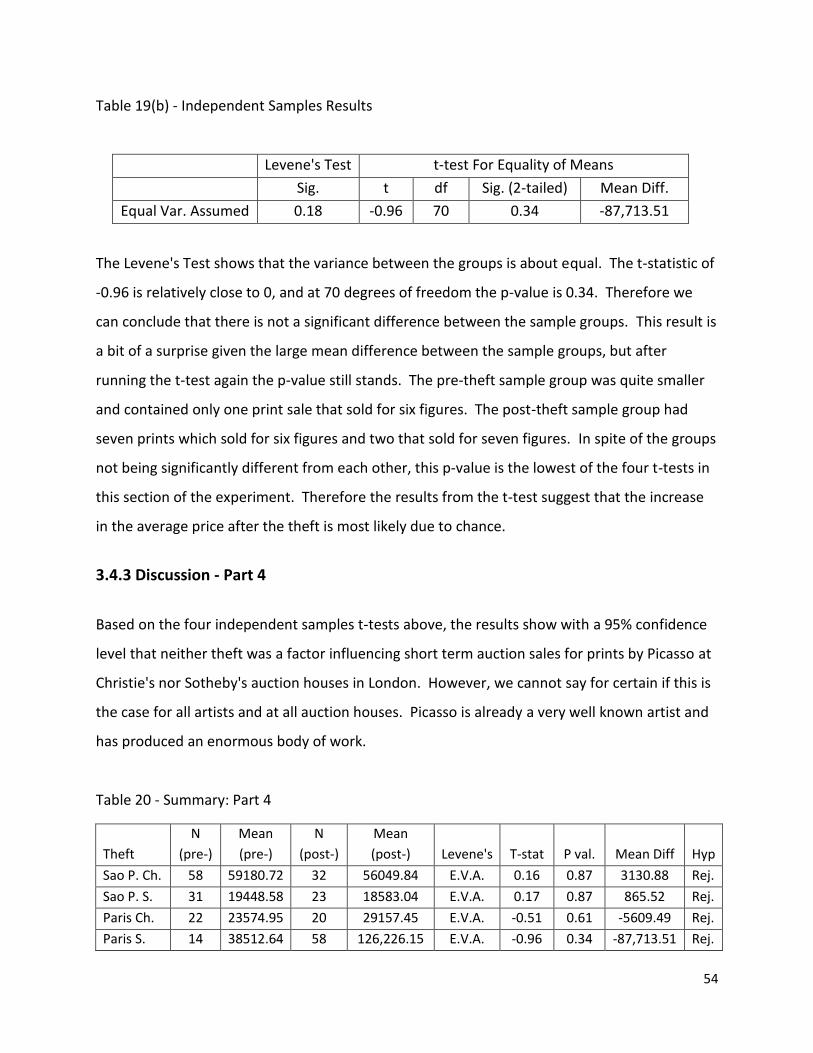
54
Table 19(b) - Independent Samples Results
Levene's Test t-test For Equality of Means
Sig. t df Sig. (2-tailed) Mean Diff.
Equal Var. Assumed 0.18 -0.96 70 0.34 -87,713.51
The Levene's Test shows that the variance between the groups is about equal. The t-statistic of
-0.96 is relatively close to 0, and at 70 degrees of freedom the p-value is 0.34. Therefore we
can conclude that there is not a significant difference between the sample groups. This result is
a bit of a surprise given the large mean difference between the sample groups, but after
running the t-test again the p-value still stands. The pre-theft sample group was quite smaller
and contained only one print sale that sold for six figures. The post-theft sample group had
seven prints which sold for six figures and two that sold for seven figures. In spite of the groups
not being significantly different from each other, this p-value is the lowest of the four t-tests in
this section of the experiment. Therefore the results from the t-test suggest that the increase
in the average price after the theft is most likely due to chance.
3.4.3 Discussion - Part 4
Based on the four independent samples t-tests above, the results show with a 95% confidence
level that neither theft was a factor influencing short term auction sales for prints by Picasso at
Christie's nor Sotheby's auction houses in London. However, we cannot say for certain if this is
the case for all artists and at all auction houses. Picasso is already a very well known artist and
has produced an enormous body of work.
Table 20 - Summary: Part 4
Theft
N
(pre-)
Mean
(pre-)
N
(post-)
Mean
(post-) Levene's T-stat P val. Mean Diff Hyp
Sao P. Ch. 58 59180.72 32 56049.84 E.V.A. 0.16 0.87 3130.88 Rej.
Sao P. S. 31 19448.58 23 18583.04 E.V.A. 0.17 0.87 865.52 Rej.
Paris Ch. 22 23574.95 20 29157.45 E.V.A. -0.51 0.61 -5609.49 Rej.
Paris S. 14 38512.64 58 126,226.15 E.V.A. -0.96 0.34 -87,713.51 Rej.

55
For the purposes of this experiment, using prints may not have been the most
appropriate method for examining short term effects as they were not the same medium as the
type of works stolen. Since the items taken were original works, it would seem logical that the
market would respond more strongly to the same type of medium. However, to try to
quantitatively measure short term changes of artworks would be a different type of challenge
in itself. For this experiment, selecting a theft involving Picasso prints being stolen might have
been a better choice. Generally speaking, however, artists who produce prints tend to do so in
far larger numbers than original works, thus a "theft effect" involving prints would likely have a
proportionately smaller effect on prices and returns. It is also worth mentioning that the p
values (0.87) were identical for Christie's and Sotheby's around the time of the Sao Paulo theft.
This might be a coincidence or perhaps even help to illustrate how little the buyer's at each
auction house were impacted by the Picasso theft in Brazil.
3.5 Conclusions: Experiment 1
Out of the four sections of this experiment, only Part 3, which used periods of five years before
and after a theft demonstrated evidence in support of the hypothesis, that an art theft would
produce higher auction prices and compound annual returns for works by the same artist.
Three of the five artists examined in this section, Munch, Dali and Renoir showed evidence of
this "theft effect". In addition, the "theft effect" appears to be dependent on the absolute
number of the artist's works that are stolen (as is the case with Dali and Renoir according to the
Art loss Register) and the frequency in which a work is stolen (Munch's "The Scream" being
taken twice). The high absolute numbers of registered stolen might also suggest higher
frequency rates of theft, however no information theft frequency was found during the
research. Higher theft frequency would bring more media attention and thus support Berlyne's
(1970) "wearin" theory.
The long term t-tests (ten years and "All CAR's") appear to show that a single incident of
art theft has a limited long term sustainable effect on auction prices and returns on other works

56
by the same artist. Artists who are famous around world, or otherwise considered "superstars"
have their works more frequently targeted by thieves and thefts of their works seem to appear
in the media every few years. Even what widely regarded as the most significant art theft in
history, the Gardner Museum heist in Boston in 1990, did not produce any long term effects on
returns for works by Degas, one of the artists whose works were taken in the raid. Although
around the same time as this incident the art market crashed as a result of an inflated pricing
bubble. Such an historical event and resulting market drop likely overshadowed any "theft
effect".
Based on Berlyne's (1970) two-part advertising theory, we cannot rule out the possibility
that collectors and audiences may suffer from "wearout" as a result of frequent art thefts. For
Picasso, the "wearout" theory may have already taken hold. He is ranked first on the Art Loss
Register's list of artists with the most registered stolen works with 821 (which is 353 more than
Dali). There is a strong possibility that the frequency in which his works are stolen "washes
away" any lingering "theft effect" and that buyer's are to experiencing "wearout".
The most promising avenue for future research based on these case studies would be to
examine more thefts in shorter time spans, namely around three to five year periods, and
search for significant differences between the sample group means. For example, if the periods
examined in Part 2 were shortened to five years instead of ten, then we might have found
similar results involving CAR's like the Renoir theft in 2000. The same might follow for the
thefts in Parts 1 and 4 with regards to original works and prints. There are all sorts of
combinations with regards to periods of time (two, three, four, five years) although these are
beyond the scope of this paper. The next experiment, however, will pursue this idea more and
run a regression analysis on the two thefts from Part 2 with shortened time periods from ten to
five years.

57
IV. Experiment 2: Pre- and Post-Theft Regression Analysis for CAR's
The purpose of this experiment is to determine if any changes occur in the linear regressions of
the pre-theft and post-theft CAR's of the three artists who were targeted in Part 2 of the
previous experiment. In building on the evidence of a five year "theft effect", the thefts from
Part 2 of the previous section will be reexamined using the artists CAR's shortened to five year
periods, pre- and post-theft, instead of ten. CAR's for the selected artists were deemed to be a
more rational unit of analysis in comparison to auction prices because the variance of the
possible rates for CAR's is lower than auction prices which can have an extremely wide range.
The three artists from Part 2 of the previous section, Pissarro (1969), Monet (1969) and Picasso
(1976) each had a substantial enough amount of CAR's to perform a linear regression analysis
and will be the subjects of the analyses below. The regression analysis will also include a line of
best fit for the CAR's as well as provide a linear equation for we which we can use to "predict"
future CAR's. For this experiment what we are most interested in is the difference between the
pre- and post-theft slope of the line of best fit, which might offer some insight into any possible
"theft effect" based on changes in the slope of the line. The equation of the line is y=bx+a. The
components of the equation are:
y= CAR (dependent variable)
b= Slope of line
x= Time (independent variable)
a= Y-intercept
The results from Part 2 of the previous section showed for each of the three thefts analyzed
that there was not a significant difference between the pre- and post-theft CAR's over ten year
periods. Shortening the periods to five years and administering a line of best fit before and
after a theft could contribute more evidence to the "theft effect" theory that art theft does
have an impact on CAR's and auction prices. Similar to the hypothesis of the previous section,
the hypothesis for the following tests is that the slope of the line of best fit, "b", of post-theft

58
linear regression equation will be higher in numerical value than the slope of the pre-theft
regression equation. In other words, a major art theft would have a positive impact on average
compound annual returns in the five years following the theft. Version 21 of SPSS will be used
again for the regression analyses
4.1 Data Analysis
The results from the linear regression analysis are displayed below.
1) Monet - Stephen Hahn Gallery, New York, New York - November 1969
Pre-theft: 1965-1969
Displayed below is a scatter plot of the compound annual returns for repeats sales of work by
Monet five years prior to the Stephen Hahn Gallery theft. Note that the years are numbered
from one to five. This was done as a simple way for SPSS to compute a regression in a five year
period. In this instance, year "1" is actually 1965, year "2" 1966, etc.
Figure 10 - Compound Annual Returns: Monet 1965 - 1969

59
Regression Analysis
Table 21(a) - Model Summary
R R Square Std. Error of Estimate Y intercept Slope Equation
0.57 0.32 5.32 15.17 -2.33 Y= -2.33X + 15.17
The table above contains the results from the linear regression analysis. "R" represents the
correlation coefficient (0.57 in this case). "R Square" is simply the square of "R" (0.57^2) which
is also known as the coefficient of determination and tells us how well the regression equation
fits the data. Essentially it is the proportion of variance in the y-variable as seen through the x-
variable. Numbers that are close to "1" indicate a good fit. In this case, the "R Square" of 0.32
suggests a moderate fit. The Standard Error of the Estimate is similar to standard deviation in
that it is a measure of variability. It indicates how much inaccuracy will result from predictions
using the linear model. Smaller numbers indicate higher accuracy (how2stats.com, 2011). In
this case, the Standard Error of the Estimate is 5.32, which suggests a moderate amount of
variability for predictions. The y-intercept is 15.17 although in the scatter plot above it appears
to be less than 15. This is because it would cross the y-axis at year "0". In any case, we are
more interested in the slope, -2.33, which tells us that, on average, Monet's CAR's were
declining prior to the Stephen Hahn Gallery theft.
Post-theft: 1970 to 1974
Below is the scatter plot and line of best fit for Monet's CAR's in the five years following the
theft. Immediately we can see that the slope of the line is positive and trending upwards, and
is thus consistent with the hypothesis.

60
Figure 11 - Compound Annual Returns: Monet 1970-1974
Regression Analysis
Table 21(b) - Model Summary
R R Square Std. Error of Estimate Y intercept Slope Equation
0.10 0.01 3.88 10.37 0.30 Y= 0.30X + 10.37
The R coefficient of 0.01 provides for a relatively low R Square of 0.01, suggesting a high
amount of variation of CAR's along the y-axis, which is quite apparent in the scatter plot above.
The Standard Error of the Estimate of 3.88 is lower than the pre-theft estimate, suggesting a
more accurate regression despite the lower R Square. The y-intercept is 10.37 and the linear
equation has a positive slope of 0.30. Because the slope is higher (by 2.62) and in fact positive
compared to the pre-theft's negative slope, we can reject the null hypothesis and presume that
compound annual returns for Monet's repeat sales were increasing in five year post-theft
period.

61
2) Pissaro - Stephen Hahn Gallery, New York, New York - November 1969
Pre-theft: 1965-1969
Below is a scatter plot and line of best fit of the CAR's for Pissarro in the five years prior to the
Stephen Hahn Gallery theft. We can immediately see that the slope of the line is negative.
Figure 12 - Compound Annual Returns: Pissarro 1965-1969
Regression Analysis
Table 22(a) - Model Summary
R R Square Std. Error of Estimate Y intercept Slope Equation
0.51 0.26 6.18 16.71 -3.31 Y= -3.31X + 16.71
The R correlation coefficient of 0.51 provides a moderate "R Square" coefficient of 0.26, which
tells us that there is some variance around the line of best fit. The Standard Error of the
Estimate is 6.18 which is higher than either of Monet's suggesting that predictions using the
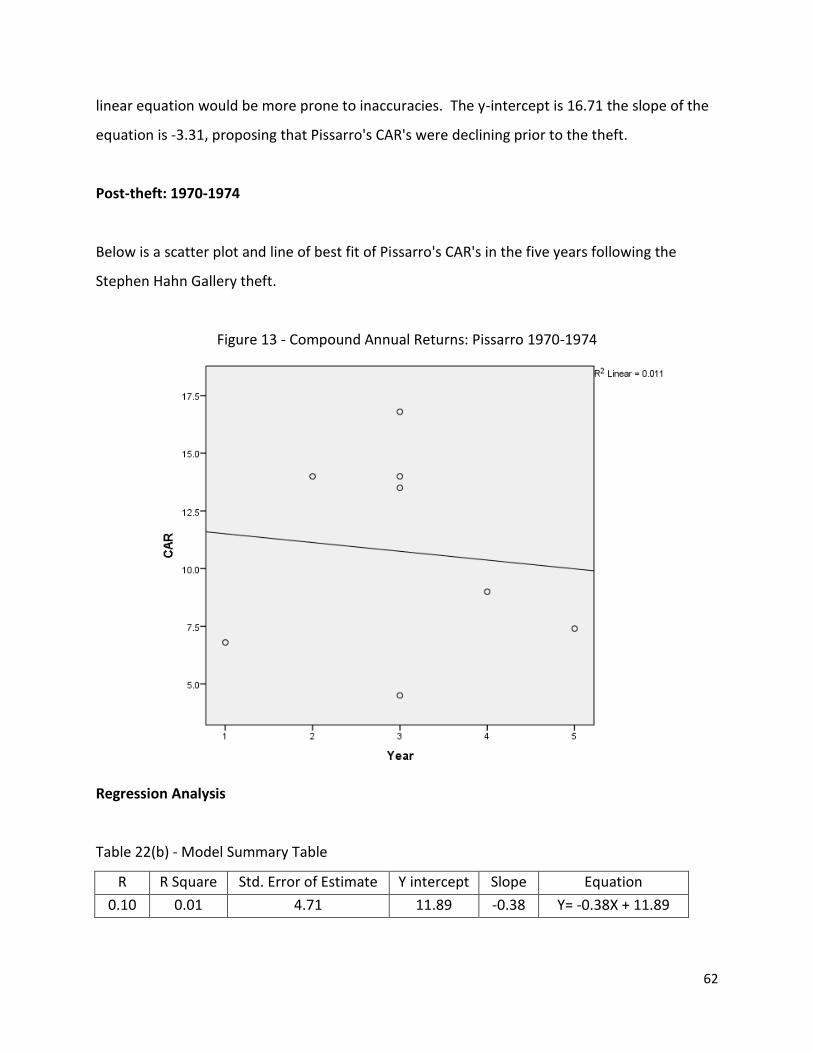
62
linear equation would be more prone to inaccuracies. The y-intercept is 16.71 the slope of the
equation is -3.31, proposing that Pissarro's CAR's were declining prior to the theft.
Post-theft: 1970-1974
Below is a scatter plot and line of best fit of Pissarro's CAR's in the five years following the
Stephen Hahn Gallery theft.
Figure 13 - Compound Annual Returns: Pissarro 1970-1974
Regression Analysis
Table 22(b) - Model Summary Table
R R Square Std. Error of Estimate Y intercept Slope Equation
0.10 0.01 4.71 11.89 -0.38 Y= -0.38X + 11.89

63
The R correlation coefficient of 0.10 provides an R Square coefficient of 0.01 suggesting a high
amount of variation of CAR's along the line of best fit. Despite this, the Standard Error of the
Estimate of 4.71 is lower than the pre-theft estimate alluding to more accurate predictions
from the linear equation. The slope of the equation, -0.38, is higher than the slope of the pre-
theft equation by 2.93 and is therefore technically consistent with the original hypothesis.
What is disconcerting, however, is that the post-theft slope is still negative, meaning that
repeat sale returns were, on average, still declining in the five years following the theft.
Regardless, these results can still provide evidence of a positive "theft effect" in support of the
hypothesis.
2) Palais des Papes, Avignon, France - January 31, 1976
Pre-theft: 1971-1975
Below is a scatter plot and line of best fit for Picasso's CAR's in the five years prior to the Palais
des Papes theft where 118 of his works were stolen.
Figure 14 - Compound Annual Returns: Picasso 1971-1975

64
Regression Analysis
Table 23(a) - Model Summary Table
R R Square Std. Error of Estimate Y intercept Slope Equation
0.02 0.00 4.23 9.46 0.07 Y= 0.07X + 9.46
The R correlation coefficient of 0.02 provides an R Square coefficient of 0.00 meaning that
there is a very high level of variance amongst the CAR's in this five year period. Despite this,
the Standard Error of the Estimate, 4.23, falls within the average range of previous estimates
and suggests that the linear equation would provide at least some accuracy in predicting future
returns. The linear equation has a slope of 0.07 and a y-intercept of 9.46. Part 2 of the
previous experiment discussed the impact that the "death effect" (Czujack 1997) had on
Picasso's auction prices following his death in 1973. It was also mentioned in the literature
review section that Czujack (1997) used hedonic regression in determining this. As we can see
in the scatter plot above, Picasso's highest CAR of 16% was in the year of his death, 1973. He
died in April of that year (picasso.com) and while we do not know the precise date of the repeat
sale, and given that his death was relatively early in the year, the sale likely occurred sometime
after. In any case, the slope of the line of best fit is positive, albeit not by very much, suggesting
that average returns on repeat sales were increasing around the time of his death and up to the
1976 theft.
Post-theft: 1976 - 1980
Below is the scatter plot and line of best for Picasso's CAR's in the five years following the 1976
theft. We can immediately see that the slope of the line is negative and is thus inconsistent
with the hypothesis.

65
Figure 15 - Compound Annual Returns: Picasso 1976 - 1980
Regression Analysis
Table 23(b) - Model Summary Table
R R Square Std. Error of Estimate Y intercept Slope Equation
0.25 0.06 6.94 17.43 -1.06 Y= -1.06X + 17.43
The R correlation coefficient of 0.25 gives an R Square coefficient of determination of 0.06
signifying a high amount of variance from the sampled CAR's along the line of best fit. The
Standard Error of the Estimate, 6.94, is also quite high, suggesting that there would be much
inaccuracy in predicting future returns using the linear model. This can be partially explained
by the range of returns in years one (1976) and five (1980). The line of best fit has a y-intercept
of 17.43 and a slope of -1.06. Since the slope of the line of best fit was lower than the pre-theft
slope, we can conclude that this result is inconsistent with the original hypothesis. Supposing
that this particular theft in fact had no impact on the post-theft CAR's, this result could perhaps
be used to expand Czujack's (1997) findings of a "death effect" in that average returns were

66
decreasing relative to his other works following his death. Czujack (1997) found that the
"death effect" increased auction prices for his works for three years relative to the art market
using hedonic regression. In this regression analysis, we see a similar result using repeat sales.
4.2 Conclusions: Experiment 2
The results from the regression analyses for two of the three artists of interest, Monet and
Pissarro, show evidence of supporting the hypothesis, that an artist's CAR's for their other
works will, on average, increase in the five years following a major theft of his or her works.
After the Stephen Hahn Gallery theft, both Monet and Pissarro had a higher slope in the linear
regression equation for the five post-theft years. This would suggest that demand (and hence
returns from repeat sales) from collectors and the art market grew in the five years following
the theft. Part 2 of Experiment 1 showed that there was not a significant difference at a
confidence level of 95% between the sampled CAR's in the ten years before and after the theft.
Recalling the p-values from those t-tests (0.09 for Monet and 0.1 for Pissarro), at a confidence
level of 90% the sample groups would have been significantly different thus hinting at the
possibility of a "theft effect". By applying a regression analysis for a five year period, pre- and
post-theft, we can see that there was a positive increase in the slope of the line of best fit
following the thefts and therefore adding to the evidence that a short term "theft effect" of five
years does in fact exist.
Table 24 - Summary: Experiment 2
Artist Pre-theft Slope Post-theft slope Difference Hypothesis
Monet b= -2.33 b= 0.30 2.63 Accepted
Pissarro b= -3.31 b= -0.38 2.93 Accepted
Picasso b= 0.07 b= -1.06 -1.13 Rejected
Regarding the case of the 1976 Picasso theft, we have already discussed how the artist's
death is likely a source of bias for finding evidence of a "theft effect". Given the evidence

67
obtained so far of a five year "theft effect", the results from this particular regression analysis
would suggest that a "death effect" is stronger and thus has more influence on CAR's and
auction prices compared to a "theft effect". This would make sense since death is a permanent
one-time event. Thefts can occur anytime and at any frequency. The theft of an artwork is in
itself a type of death since it disappears and the probability of it being recovered is extremely
low. The impact of a theft of one artwork relative to an artist's entire oeuvre is just a fraction of
the impact of the loss of the creator. Both a famous artist's death and a theft of their work(s)
receive a great deal of publicity. Although it is beyond the scope of this paper, a death is
probably more widely reported in the media than a theft and would likely have a more lasting
impact on the audience.

68
V. Does Recovered Art Beat the Market?
The previous two experiments were designed to compare prices and returns of other works by
the same artist before and after a theft. Although examples are extremely scarce, recovered
art does occasionally find its way to auction houses or is purchased through private transactions
following its recovery. Several examples below illustrate the reactions of the art market to
recovered works. While these examples are not repeat sales, their valuations and estimates
prior to and following the thefts were obtained and used to calculate the compound interest
between them.
One case involves two paintings by J.M.W . Turner, "Light and Colour" and "Shade and
Darkness" which were stolen from Schrin Kunsthalle in Frankfurt, Germany, in 1994. At the
time of the theft, the works were valued at £24 million and upon their recovery in 2002 they
were then valued at £36 million (Nairne 2011). The annual compound interest rate over this
eight year period is a nominal rate of 5.2% (mathisfun.com). The average annual rate of
inflation over the same period in the United States was 2.47% (usinflationcalculator.com).
From this information, we can derive the real rate of return for the Turner works to be only
2.73% (real rate of return = nominal rate - inflation).
While no existing auction sale record of Munch's "The Scream" could be found prior to
its theft in 1994, experts estimated its market value to be at least $70 million (USD) at the time
of its theft (Nairne 2011, p. 202). Taking this amount and its record setting auction sale of $120
million (USD) in 2012, the annual compound interest over the 18 year period was a nominal
rate of 3.02% (mathisfun.com). The average annual rate of inflation over the same period in
the United States remained at 2.47%. This provides a low real rate of return of only 0.58%
Given that it is the most expensive painting ever sold at auction, this result is quite surprising.
To provide some perspective on how these two works compare to other studies, Ashenfelter
and Graddy (2002) compiled a list of estimated returns on art investments from various
academic papers.

69
Table 25 - Return on Art Investments (Compiled by Ashenfelter and Graddy, 2002)
Author Sample Method
Nom.
Return
Real
Return
Anderson (1974) 1780-1960: Art Hedonic 3.30% 2.60%
1780-1970: Art Repeat Sales 3.70% 3.00%
Stein (1977) 1946-1968 Random Sampling 10.50%
Baumol (1986) 1652-1961: Art Repeat Sales
0.55%
Frey and Pommerehne
(1989)
1635-1949 Repeat Sales
1.40%
1950-1987 Repeat Sales
1.70%
Buelens and
Ginsburgh (1992) 1700-1961 Hedonic
0.91%
Pesando (1993) 1977-1991: Prints Repeat Sales
1.51%
Goetzmann (1993) 1716-1986: Art Repeat Sales 3.20% 2.00%
Barre, et al. (1996) 1962-1991: Masters Hedonic 12% 5%
Barre, et al. (1996) 1962-1991: Other Hedonic 8% 1%
Chanel, et al. (1996) 1855-1969 Hedonic
4.90%
Chanel, et al. (1996) 1855-1969 Repeat Sales
5%
Mei and Moses (2002) 1875-2000: Art Repeat Sales
4.90%
It is clear that the annual compound interest return rates (nominal and real) of the
Turner paintings and "The Scream" are neither drastically higher or lower than the rates above
but fall amongst these other rates. The real rate of return for "The Scream" (0.58%) is only
slightly higher than the real rate of return found by Baumol (1986) of 0.55%, the lowest of the
real return rates. It is important to note that some of the return rates from the table above
cover long term periods and that the art market can experience swings (high and low). These
rates also encompass many different genres of art as well as masterpieces and inexpensive
works. Mei and Moses (2002) found that masterpieces generally underperform the market.
They estimated that every 10% increase in purchase price results in a decrease of future annual
returns of 0.1% for American artworks (1941-2000), 0.06% for Impressionist pieces (1941-
2000), 0.12% for Old Masters (1900-2000), and 0.1% for all works (1875-2000). Below is a
scatter plot and line of best fit for purchase prices and returns for Old Master artworks (Mei &
Moses, 2002):

70
Figure 16
Based on the recovered Turner painting (which fall under the Old Masters category), we
can see that their expected nominal rate of return of 5.2% is higher than the average expected
return on other Old Master paintings sold for at least $1 million. In fact, the graph above shows
that the average rate of return becomes negative around the $1 million mark. "The Scream" is
considered to be an abstract expressionist artwork and though Mei and Moses (2002) do not
offer any performance measures for this category, based on their other findings we can assume
that masterpieces in this category would also underperform the market. Given its positive
nominal rate of return of 3.02%, it would likely beat other artworks in a similar price range,
albeit since this work set the current auction price record for most expensive work sold at
auction, we do cannot justifiably compare it to any other works in the same pricing category. It
should also be mentioned that "The Scream" exceeded its estimated auction sale price of $80

71
million (US) by 50% when it was put to auction in 2012 (Locker 2012). Similarly, Cézanne's
recovered work "Bouilloire et Fruits" was expected to sell for $14.6 - $19m (USD) upon its
recovery and subsequent auction. It sold for $29.3m, 54% higher than $19m and 100% higher
than $14.6m (Le Goff, no date).
Dr. Raichel Le Goff claims that "a painting always sells when there is a 'story' attached to
it" (Ibid). The "stories" in these examples provide some evidence that returns on recovered art
do perform better than the art market average as well as their auction estimates. However,
when compared to financial markets, the Turner paintings and "The Scream" do not fare as
well. The table below illustrates this comparison.
Table 26 - CAR's for Turner's and "The Scream" Compared to Financial Market Returns
Annual Growth Rates
Turner's Scream DJIA S&P 500 NASDAQ
Jan. 1, 1994 to Dec. 31, 2002 5.20% N.A. 9.28% 7.31% 6.21%
(adjusted for inflation: 2.47%) 2.73% N.A. 6.81% 4.84% 3.74%
Jan. 1, 1994 to Dec. 31, 2012 N.A. 3.02% 6.74% 6.06% 7.59%
(adjusted for inflation: 2.47%) N.A. 0.58% 4.27% 3.59% 5.12%
(Financial market rates were determined from measuringworth.com)
As we can see, neither the Turner's nor "The Scream" would provide higher annual
returns (nominal or real) than the Dow Jones Industrial Average, the S&P 500 or the NASDAQ.
Strictly speaking from an investment perspective, these examples suggest that acquiring a
recovered work would not be a wise investment given the financial market alternatives.
However, what the rate of return on artworks fail to quantitatively measure is the consumption
value and utility that they provide to the owner. Although this discussion is beyond the scope
of this paper, it is very unlikely that the anonymous bidder who purchased "The Scream" did
not do so purely for investment purposes. Rather, he or she purchased an artwork with a
tremendous amount of social and prestige value to it as well as an interesting story.

72
VI. Legal Disputes
Occasionally, when stolen art reappears there is a legal dispute over its ownership. After a
work is stolen, it may pass through several different owners from legitimate transactions
whereby the origins of the work were unknown to the buyer. In a sense this "washes away" the
accountability of the current owner who believed that they acquired the work through good
faith. In common law countries like the U.S. and Great Britain, purchasers cannot acquire good
title from thieves. The Latin term for this is "Nemo dat quod non habet" (no one can give what
they do not have). However in France, Switzerland and Japan, which practice civil law,
purchasers are more favoured than owners (Burnham, as cited in Conklin, 1994, pp. 271).
A recent case in Alexandria, Virginia, U.S., involved a good faith buyer who unknowingly
purchased a stolen Renoir from a flea market for $7. After the purchaser, Marcia Faqua, had
the work authenticated, she opted to sell it at auction only to have the sale postponed when it
was discovered that the work was previously stolen from the Baltimore Museum of Art in 1951.
An insurance claim of $2,500 was paid by an insurance company shortly after its theft.
Currently the museum, the insurance company, and Ms. Faqua are in court proceedings to
determine who rightfully owns the painting. The auction house Ms. Faqua planned to use first
expected the work to fetch around $75,000. However, an appraiser hired by the FBI valued the
work at $22,000 because Renoir's works had recently fallen out of fashion, but more
importantly due to questions regarding its ownership and the possibility that it had been stolen
(Barakat, 2013). It is justifiable that potential legal disputes would lower the demand (and
value) for artworks with controversial origins. No rational person would knowingly purchase
potentially stolen goods or willingly become embroiled in court battles. The examples above
involving the Turner's, "The Scream" and the Cézanne avoided such disputes because they were
returned to their rightful owners. Following their recovery, "The Scream" and the Cézanne
drastically exceeded their pre-auction estimates. With legal controversy a non-issue, these
works were free to perform accordingly with market demand.

73
VII. Conclusions
In this paper we have looked at the economic performance of artworks by famous artists
following major thefts of their works since the middle of the twentieth century. Compound
annual returns on repeat sales and auction records of artworks were employed in statistical
analyses in an effort to determine any noticeable "theft effects" over different periods of time
(six months, five years, ten years, and all known repeat sales). There are rare occasions when
recovered art is sold again and the performance of a few of these cases were compared to
previous art market studies as well as financial markets over the same period of time.
The results from the statistical analyses from the two main experiments show evidence
of a short term five year "theft effect" whereby average auction prices and compound annual
returns for works by the artist rose relative to their sales in the five years prior to the theft. The
results from the long term experiments (ten years and longer) were less convincing and only
one artist, Peter Paul Rubens, had a negative decrease in the average CAR following the 1966
Dulwich theft which was found to be statistically significant.
Several basic economic concepts inspired the hypotheses for both experiments. Firstly,
there is a supply and demand issue regarding art theft. Essentially, theft reduces the supply of
artworks by the artist leaving fewer resources available to the market, it should, in theory,
cause an increase in demand, especially if the artist is well known and whose works are
desirable. This concept would be felt even more prominently in this study since all of the
selected artists had died prior to the thefts of their works. Secondly, the media attention which
normally ensues following a high profile theft would provide free marketing for the artist to
wide audience. This would draw more attention from collectors and the public to the
importance and scarcity of the artist's works and potentially increasing the market value of
their works.

74
In performing the data analysis two statistical techniques were employed using SPSS
(version 21). The first experiment involved independent samples t-tests on compound annual
returns and auction sales of the selected artist before and after a major theft of their works.
This technique was chosen over paired-sample t-tests because the artworks in each sample
group are different. With the date of the theft being the "line" dividing the two sample groups,
significant differences in the means of each could be sought. The second experiment used
regression analysis in a similar way to the independent samples t-tests; an analysis was
performed for the compound annual returns for artists in the five years before and also after a
theft. The differences in the slope of both linear equations provided suggestions of how the
market reacted to the theft of the artist's works. The final section of the paper took a few
notable examples of recovered artworks and compared the compound annual interest to other
studies on art markets as well as financial markets over the same period. This was done to
offer perspective on the possible economic and investment performance of recovered art.
Access to accurate data on compound annual returns was limited as a result of Mei,
Moses, and their customer service department being unresponsive in requests for data.
Because of this, data had to be estimated based on the scatter plot graphs for individual artists
that was provided on their website. The Art Loss Register was also contacted however they
were unable to provide a detailed list of registered stolen items for certain periods of time.
Obtaining detailed data on thefts from law enforcement agencies obviously poses privacy issues
as well. Information on private art sales is extremely difficult to acquire and thus auction data
was used. In general, sales and other types of art market data are less consistent compared to
financial markets where stocks, bonds and other commodities are relatively easy to track and
analyze more comprehensibly.
For future research, the sample of art thefts could be expanded to include more
incidents. Similarly, different combinations of periods of time could also be explored. An
interesting, yet hypothetical, research design would be to match all of the artworks in the
MMFAI with the recovered artworks from the Art Loss Register. From this, a clearer picture on

75
the performance of recovered art could be formed. No data on the frequency of thefts for
specific artists was found during the research. Such information would be a useful variable to
implement in an analysis. Realistically speaking, for the artists that experienced a "theft effect"
as described in this paper, an interesting exercise would be to perform a one-sample t-test on
their pre- and post-theft CAR's to the Mei Moses "All Art" Index during the same time periods
to provide perspective on how the CAR's experiencing "theft effect" perform in comparison to
the art market.

76
Appendix 1
The Art Loss Register's list of 24 artists with the most registered stolen works - March 1, 2013
Name ALR Rank # Works
Picasso, Pablo 1 821
Lawrence, Nick 2 556
Dali, Salvador 3 468
Miro, Joan 4 429
Chagall, Marc 5 328
Levine, David 6 343
Warhol, Andy 7 301
Rijn, Rembrandt van 8 274
Reinicke, Peter 9 252
Nunez del Prado, Marina 10 245
Durer, Albrecht 11 219
Renoir, Pierre Auguste 12 185
Curtis, Edward Sheriff 13 167
Stolnik, Slavko 14 158
Teniers, David II 15 153
Corinth, Lovis 16 145
Rubens, Peter Paul 17 142
Matisse, Henri 18 140
Appel, Karel 19 135
Calder, Alexander 20 131
Barye, Antoine-Louis 21 131
Schiele, Egon 22 127
Daumier, Honore Victorin 23 126
Pesne, Antoine 24 121

77
References
Anand, P. & Sternthal, B. (1990, August). Ease of Message Processing as a Moderator of
Repetition Effects in Advertising. Journal of Marketing Research, 27, p. 345-353.
Anderson, R.C. (1974). Paintings as Investment. Tufts University.
Art Loss Register. (2010, Dec. 31). Case Studies: Cézanne's Bouilloire et Fruits. Retrieved from:
www.artloss.com
Asia News Network. (May 2012). China Daily.
Ashenfelter, O.C., & Graddy, K. (2002, June). Art Auctions: A Survey of Empirical Studies. NBER
Working Paper Series: Working Paper 8997. National Bureau of Economic Research,
Cambridge, Massachusetts.
Barakat, M. (2013, Apr. 3). Who rightly owns the Renoir on a napkin? The Ottawa Citizen. pp.
A12
Barre, M., Docclo, S., & Ginsburgh, V. (1996). Returns on Impressionist, Modern and
Contemporary European Paintings 1962-1911. Annales d'economie et de Statistique, 35,
pp. 143-181.
Baumol, W.J. (1986). Unnatural value: Or Art as a Floating Crap Game. The American Economic
Review, 76, 2. Papers and Proceedings of the Ninety-Eighth Annual Meeting of the
American Economic Association (May, 1986), pp. 10-14
Berlyne, D.E. (1970). Novelty, Complexity, and Hedonic Value. Perception and Psychophysics, 8,
279-286.

78
BBC News. (2000, Dec. 23). Hunt for Stockholm Art Thieves. Retrieved from: news.bbc.co.uk
BBC News. (2007, Feb. 28). Picasso Paintings Stolen in Paris. Retrieved from: news.bbc.co.uk
Blair, M.H. & Rabuck, M.J. (1998, Sept.-Oct.). Advertising Wearin and Wearout: Ten Years Later
- More Empirical Evidence and Successful Practice. Journal of Advertising Research, p. 7-
18.
Blouin Art Sales Index. Retrieved from: artsalesindex.artinfo.com/
Buelens, N. & Ginsburgh, V. (1993). Revisiting Baumol's "Art as a Floating Crap Game".
European Economic Review, 37, pp. 1351-1371.
Calder, B.J. & Sternthal, B. (1980, May). Television Commercial Wearout: An Information
Processing View. Journal of Marketing Research,17, p. 173-186.
Campbell, M.C. & Keller, K.L. (2003). Brand Familiarity and Advertising Repetition Effects.
Journal of Consumer Research, Vol. 30, 2. pp. 292-304.
Campos, N.F. & Barbosa, R.L. (2008). Paintings and numbers: an econometric investigation of
sales rates, prices, and returns in Latin American art auctions. Oxford Economic Papers,
61, 28-51
Chakelian, A. (2012, Apr. 16). Pilfered Paintings: Five Famous Art Heists Through History. Time:
Newsfeed. Retrieved from: newsfeed.time.com
Chanel, O., Gerard-Valet, L. & Ginsburgh, V. (1996). The Relevance of Hedonic Price Indices.
Journal of Cultural Economics, 20, pp. 1-24.

79
Clements, J. (2002, Dec. 8). Thieves Snatch Two Van Goghs from Museum. The Telegraph.
Retrieved from: telegraph.co.uk
Compound Interest Calculator. Retrieved from: mathisfun.com
Conklin, J.E. (1994). Art Crime. Westport, U.S.: Praeger Publishers
Cook, T.D. & Campbell, D.T. (1979). Quasi-exerimentation: Design & Analysis Issues for Field
Settings. Rand-McNally College Publishing Company. Chicago.
Cox, D.S. & Cox, A.D. (1988, June). What Does Familiarity Breed? Complexity as a Moderator of
Repetition Effects in Ad Evaluation. Journal of Consumer Research, 15, pp. 111-116.
Czujack, C. (1997). Picasso Paintings at Auction, 1963-1994. Journal of Cultural Economics, 21.
pp. 229-247.
Ekelund, R.B., Ressler, R.W., & Watson, J.K. (2000). The "Death Effect" in Art Prices: A Demand-
Side Exploration. Journal of Cultural Economics, 24. pp. 283-300.
Esterow, M. (2009, May 1). Inside the Gardner Case. Art News. Retrieved from:
www.artnews.com
Esterow, M. (2011, Aug. 15). How Rembrandt's Were Stolen 81 Times. Art News. Retrieved
from: artnews.com
Frey, B.S. & Pommerehne, W. (1989). Muses and Markets, Explorations in the Economics of the
Arts. Blackwells: Oxford.

80
Ginsburgh, V., Mei, J., & Moses, M. (2006). The Computation of Price Indices (Chapter 27).
Handbook of the Economics of Art and Culture, 1, pp. 947-979.
Goetzmann, W.N. (1993). Accounting for Taste: Art and the Financial Markets Over Three
Centuries. The American Economic Review, 83(5), 1370-1376.
Guerzoni, G. (1994). Testing Reitlinger's Sample Reliability. Paper presented at the 8th
Conference on Cultural Economics, Witten, August.
How2stats. (2011). Linear Regression - SPSS (Part 1). Retrieved from: youtube.com
Lawrence, W., Bachmann, L.M., & Stumm, M.V. (1988). Tracking recent trends in the
international market for art theft. Paper presented at the Fourth International
Conference on Cultural Economics held by A.C.E. in Avignon, France, in May 1986.
Le Goff, R. (no date). Everyone Loves a Happy Ending… Paul Cézanne (Web log message).
Retrieved from The Arts With Raichel Le Goff Blog, http://raichel.org
Locker, M. (2012, May 2). Munch's "The Scream" Could Set Auction Record. Time Newsfeed.
Retrieved from: newsfeed.time.com
Lyall, S. (2004, Aug. 26). Stolen Art Can Reappear in Unexpected Ways. The New York Times.
Retrieved from: nytimes.com
Mei, J., Moses, M. (2002). Art as an Investment and the Underperformance of Masterpieces.
The American Economic Review, 92, 5. pp. 1656-1668.
Mei, J., Moses, M. (2008). Mei Moses Year End 2008 All Art Indexes. Retrieved from:
artasanasset.com

81
Mei, J., Moses, M. (2013, Jan. 14). 2012 World All Art Report: Insights on Art Market Financial
Performance Through 2012 Based on the Mei Moses Family of World Art Indexes.
Beautiful Asset Advisors LLC. Retrieved from: artasanasset.com.
Nairne, S. (2011). Art Theft and the Case of the Stolen Turners. Reaktion Books, London, UK.
Pesando, J.E. (1993). Art as an Investment: The Market for modern Prints. The American
Economic Review. Vol. 85, No. 5. pp. 1075-1089.
Rengers, M. & Velthuis, O. (2002). Determinants of Prices for Contemporary Art in Dutch
Galleries, 1992-1998. Journal of Cultural Economics, 26, 1-28.
Stein, J.P. (1977). The Monetary Appreciation of Paintings. Journal of Political Economy, 85, pp.
1021-1035
Sturcke, J. (2008, Feb. 11). £84m paintings stolen in 'spectacular' Swiss raid. The Guardian.
Retrieved from: http://www.guardian.co.uk/world/2008/feb/11/swiss.art.theft
The Difference Between Arithmetic Mean and Geometric Mean. Retrieved from: algebra.com
The United States Attorney's Office, District of Massachusetts. (2010, Nov. 17). Artwork Stolen
Over Three Decades Ago Returned to Owner. United States Department of Justice.
Retrieved from: justice.gov/usao
Thompson, J. (2006, Feb. 26). Priceless Art Treasures Stolen as Rio Parties. The Independent.
Retrieved from: independent.co.uk

82
Valencia, M. J. (2013, May 9). Man Linked to Gardner Museum Heist Gets Prison Term. The
Boston Globe. Retrieved from: bostonglobe.com
Websites:
www.algebra.com
www.henri-matisse.net/biography.html
www.measuringworth.com
www.picasso.com/life.aspx
www.pierre-auguste-renoir.org/biography.html
www.statistics-help-for-students.com
www.usinflationcalculator.com