Study of the Term Neonatal Brain Injury with combined Diffuse ...
308
Study of the Term Neonatal Brain Injury with combined Diffuse Optical Tomography and Electroencephalography Maria Chalia MD 2018
-
Upload
khangminh22 -
Category
Documents
-
view
1 -
download
0
Transcript of Study of the Term Neonatal Brain Injury with combined Diffuse ...
Study of the Term Neonatal Brain Injury with
combined
Diffuse Optical Tomography and
Electroencephalography
Maria Chalia
MD 2018

Study of the Term Neonatal Brain Injury with
combined
Diffuse Optical Tomography and
Electroencephalography
Maria Chalia Department of Paediatrics
UNIVERSITY OF
CAMBRIDGE
DARWIN COLLEGE
9 February 2018
Supervisors: Professor Topun Austin
Dr Robert Cooper
This thesis is submitted for the degree of Doctor of Medicine (M.D.) at University of
Cambridge.


5
Study of the Term Neonatal Brain Injury with combined Diffuse Optical
Tomography and Electroencephalography
Dr Maria Chalia
This thesis describes the application of combined diffuse optical tomography (DOT) and
electroencephalography (EEG) in the investigation of neonatal term brain injury. With
hypoxic ischaemic encephalopathy (HIE) and perinatal stroke being the most frequent
contributors to brain injury in the term neonatal population, the first part of the thesis
focuses on the description and ongoing requirement for their further investigation. In
continuation to that, the characteristics and unique properties of both DOT and EEG are
described and explored.
The combination of these two modalities was utilised in elucidating the
relationship between neuronal activity and cerebral haemodynamics both in physiological
processes as well as in disease, by the infant’s cot side. This work differs to previous
studies using near-infrared technologies and EEG, as a denser whole head array was used,
offering the potential of 3-dimensional image reconstruction of the cortical
haemodynamic events in relation to electro-cortical activity. These methods were applied
in the study of critically ill infants presenting with seizures in the first few days of life.
The relevant results are presented in three separate chapters of the thesis. Distinct
neurophysiological phenomena such as seizures and burst suppression were detected and
studied in association to underlying HIE. On the grounds of a pre-existing pilot study of
our research group, distinct prolonged de-oxygenated cortical areas were identified
following electrical seizure activity. Further exploration of infants with seizures provided
limited supporting evidence. The investigation of burst suppression in HIE led to the first
ever identification of repeated, waveform, cortical haemodynamic events in response to
bursts of electrical activity with some spatial correlation to regions of brain injury. Further
analysis of the low frequencies within the diffuse optical signal in cases of perinatal
stroke, showed a consistent interhemispheric difference between the healthy and stroke-
affected brain regions.
The limitations, prospects and conclusions are presented in the final chapter. The
use of simultaneous DOT and EEG offers a unique neuro-monitoring and neuro-
investigating tool in the neonatal intensive care environment, which is safe, portable, and
cost-effective, Ongoing research is required for the exploration and development of the
methodology and its potential diagnostic properties.

6

7
The only true wisdom is in knowing you know nothing
Socrates

8
I hereby declare that the work presented in this thesis is the result of my own and includes
nothing which is the outcome of work done in collaboration except as declared in the
Preface and specified in the text.
It is not substantially the same as any that I have submitted, or, is being
concurrently submitted for a degree or diploma or other qualification at the University of
Cambridge or any other University or similar institution except as declared in the Preface
and specified in the text. I further state that no substantial part of my dissertation has
already been submitted, or, is being concurrently submitted for any such degree, diploma
or other qualification at the University of Cambridge or any other University or similar
institution except as declared in the Preface and specified in the text.
In this thesis, I studied preterm and term infants using combined
electroencephalogram and diffuse optical tomography (DOT-EEG) continuing a
programme of work looking at the relationship between cerebral oxygenation and
electrical brain activity (neurovascular coupling). As well as studying infants with
seizures, I conceived the idea of studying burst suppression with the same methodology
and later expanded this to the study of perinatal stroke. After my involvement in the
project, following the initial pilot study, I recruited and studied the infants independently.
I conducted the pre-processing and part of the processing steps in the analysis of the DOT
data. I conducted the image reconstruction where necessary using pre-existing MATLAB
based algorithms developed by the group (primarily by Dr Robert J Cooper).
Dr Andy Michell, consultant neurophysiologist, conducted the clinical
interpretation of the EEGs and I continued with further analysis where warranted (such
as EEG analysis and burst identification in chapter 4). Particularly, for chapter 5 for inter-
observant variability, a PhD student, Dr Chuen Wai Lee also reviewed one third of the
EEG data.
The analysis of the DOT data in chapters 4 and 5 were based on algorithms (in
MATLAB) originally developed by Dr Robert Cooper. Dr Robert Cooper and I initially
developed the analysis of the DOT data in chapter 6. The methodology was further
explored and developed by a PhD student, Laura Dempsey.
The MRI images, used and mentioned in this thesis, were reported by Professor
Mary Rutherford, at Kings College London.

10
This thesis does not exceed the prescribed word limit of 60,000 as specified by
the Degree Committee of the Faculties of Clinical Medicine and Veterinary Medicine.
Maria Chalia

Abstract
This thesis describes the application of combined diffuse optical tomography (DOT) and
electroencephalography (EEG) in the investigation of neonatal term brain injury. With
hypoxic ischaemic encephalopathy (HIE) and perinatal stroke being the most frequent
contributors to brain injury in the term neonatal population, the first part of the thesis
focuses on the description and ongoing requirement for their further investigation. In
continuation to that, the characteristics and unique properties of both DOT and EEG are
described and explored.
The combination of these two modalities was utilised in elucidating the
relationship between neuronal activity and cerebral haemodynamics both in physiological
processes as well as in disease, by the infant’s cot side. This work differs to previous
studies using near-infrared technologies and EEG, as a denser whole head array was used,
offering the potential of 3-dimensional image reconstruction of the cortical
haemodynamic events in relation to electro-cortical activity. These methods were applied
in the study of critically ill infants presenting with seizures in the first few days of life.
The relevant results are presented in three separate chapters of the thesis. Distinct
neurophysiological phenomena such as seizures and burst suppression were detected and
studied in association to underlying HIE. On the grounds of a pre-existing pilot study of
our research group, distinct prolonged de-oxygenated cortical areas were identified
following electrical seizure activity. Further exploration of infants with seizures provided
limited supporting evidence. The investigation of burst suppression in HIE led to the first
ever identification of repeated, waveform, cortical haemodynamic events in response to
bursts of electrical activity with some spatial correlation to regions of brain injury. Further
analysis of the low frequencies within the diffuse optical signal in cases of perinatal
stroke, showed a consistent interhemispheric difference between the healthy and stroke-
affected brain regions.
The limitations, prospects and conclusions are presented in the final chapter. The
use of simultaneous DOT and EEG offers a unique neuro-monitoring and neuro-
investigating tool in the neonatal intensive care environment, which is safe, portable, and
cost-effective, Ongoing research is required for the exploration and development of the
methodology and its potential diagnostic properties.

12
Acknowledgements
The nature of this research requires a strong collaboration between clinicians, physicists,
and engineers. I was fortunate enough to work as part of the neoLAB group, a
collaboration between the Cambridge Centre for Perinatal Neuroscience and the
Biomedical Optics Research Laboratory at University College London (UCL-BORL).
Under the leadership of Professor Topun Austin and Dr Robert Cooper the group has
developed an international reputation in the field of optical imaging of the developing
brain.
I am particularly grateful to the Evelyn Trust, a Cambridge based charitable trust,
for awarding me a 2-year senior clinical research fellowship, which primarily funded my
research work. I am honoured to have been a member of the Department of Paediatrics
of the University of Cambridge. I would also like to thank the Cambridge Perinatal Group
for funding my university tuition fees towards my MD.
Most of all, I would like to thank my supervisors, Professor Topun Austin and Dr
Robert Cooper for their continuous support and guidance. They have both been
inspirational mentors sharing their knowledge and wisdom. They have encouraged me
and supported me along the way towards the completion of my MD.
A special thank you also goes to our research nurse Andrea Edwards and
neurocritical care nurse Kelly Spike for their unconditional support and friendship
throughout this time.
This project could not have taken place without the support of the nurses and
doctors on the neonatal unit at the Rosie Hospital, in Cambridge University Hospitals. I
am also particularly grateful to the parents who consented and allowed me to study their
newborn infants, and some of them had to make such decisions during possibly the most
stressful time of their lives.
Finally, I am forever grateful to my family for their unconditional love and
understanding, Dimitrios and our daughter Lefkianna. This thesis is dedicated to them.

14

Publications resulting from this work
Peer reviewed journal papers
Chalia M, Austin T. Practice guide to neonatal seizures. Paediatrics and Child Health
(2018), https://doi.org/10.1016/j.paed.2018.08.005
Chalia M, Lee C W, Dempsey L A, Edwards A D, Singh H, Michell A W, Everdell N L,
Hill R W, Hebden J C, Austin T, Cooper R J. Hemodynamic response to burst-
suppressed and discontinuous electroencephalography activity in infants with
hypoxic ischemic encephalopathy. Neurophoton. 3(3), 031408 (May 02, 2016).
doi:10.1117/1. NPh.3.3.031408
History: Received December 30, 2015; Accepted March 23, 2016
Conference proceedings
Chalia M, Cooper R J, Lee C W, Dempsey L, Edwards A D, Michell A W, Brigadoi S,
Everdell N L, Hebden J, Austin T. ‘Investigating the cortical haemodynamic response
of burst suppressed or discontinuous electroencephalographic activity in infants
with hypoxic ischaemic encephalopathy’. Neonatal Society Scientific Meeting,
London, United Kingdom, November 2015.
Chalia M, Cooper R J, Lee C W, Dempsey L, Hebden J C, Austin T. ‘Can diffuse optical
tomography provide early detection of perinatal arterial ischaemic stroke?’ Meeting
of the Anglo-French Neonatal Societies, Cambridge, United Kingdom, June 2016.
Conference posters
Chalia M, Cooper R J, Dempsey L, Lee C W, Edwards A D, Michell A W, Brigadoi S,
Everdell N L, Hebden J, Austin T. ‘Investigating the Neurovascular Coupling of Burst
suppression in Infants with Hypoxic Ischaemic Encephalopathy’. 5th Cambridge
Neuroscience Symposium, Imaging the Nervous system, Cambridge, United
Kingdom, September 2015
Chalia M, Cooper R J, Dempsey L, Edwards A D, Lee C W, Michell A W, Brigadoi S,
Everdell N L, Hebden J, Austin T. ‘Prospective Study of the Cerebral Haemodynamic
Correlate of Burst Suppressed or Discontinuous Electroencephalographic Activity
in Hypoxic Ischaemic Encephalopathic Infants’. 1st Congress of joint European
Neonatal Societies, 56th ESPR (European Societies of Paediatric Research) Annual
Meeting, jENS 2015, Budapest, Hungary, September 2015.
Chalia M, Cooper R J, Lee C W, Edwards A D, Michell A W, Dempsey L, Brigadoi S,
Everdell N L, Hebden J, Austin T. ‘Prospective Study of the Cerebral Haemodynamic
Response of Burst Suppressed or Discontinuous Electroencephalographic Activity
in Infants with Hypoxic Ischaemic Encephalopathy’. 9th International Conference
of Brain Monitoring & Neuroprotection in the Newborn (BMN 2015), Cork, Ireland,
October 2015.

16
Chalia M, Cooper R J, Lee C W, Dempsey L, Hebden J, Austin T. ‘Can diffuse optical
tomography provide early detection of perinatal arterial ischaemic stroke (PAIS) at
the cot side?’ Functional Near Infrared Spectroscopy conference (fNIRS 2016), Paris,
France, October 2016.
Dempsey L, Chalia M, Cooper R J, Lee C W, Gibson P, Austin T, Hebden J. ‘Assessing
neonatal stroke lateralisation with time-resolved and continuous-wave DOT’.
European Conferences on Biomedical Optics (ECBO), Messe Munich, Munich,
Germany, June 2017.
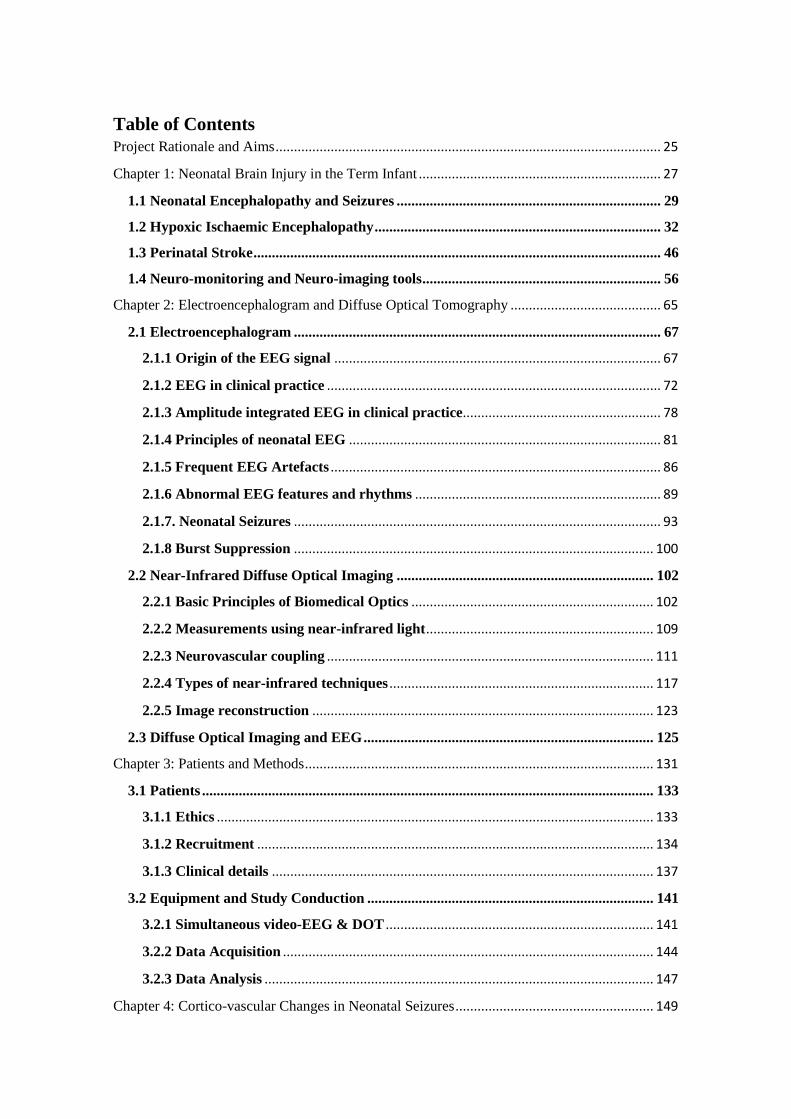
Table of Contents
Project Rationale and Aims ......................................................................................................... 25
Chapter 1: Neonatal Brain Injury in the Term Infant .................................................................. 27
1.1 Neonatal Encephalopathy and Seizures ........................................................................ 29
1.2 Hypoxic Ischaemic Encephalopathy .............................................................................. 32
1.3 Perinatal Stroke ............................................................................................................... 46
1.4 Neuro-monitoring and Neuro-imaging tools ................................................................. 56
Chapter 2: Electroencephalogram and Diffuse Optical Tomography ......................................... 65
2.1 Electroencephalogram .................................................................................................... 67
2.1.1 Origin of the EEG signal ......................................................................................... 67
2.1.2 EEG in clinical practice ........................................................................................... 72
2.1.3 Amplitude integrated EEG in clinical practice...................................................... 78
2.1.4 Principles of neonatal EEG ..................................................................................... 81
2.1.5 Frequent EEG Artefacts .......................................................................................... 86
2.1.6 Abnormal EEG features and rhythms ................................................................... 89
2.1.7. Neonatal Seizures .................................................................................................... 93
2.1.8 Burst Suppression .................................................................................................. 100
2.2 Near-Infrared Diffuse Optical Imaging ...................................................................... 102
2.2.1 Basic Principles of Biomedical Optics .................................................................. 102
2.2.2 Measurements using near-infrared light .............................................................. 109
2.2.3 Neurovascular coupling ......................................................................................... 111
2.2.4 Types of near-infrared techniques ........................................................................ 117
2.2.5 Image reconstruction ............................................................................................. 123
2.3 Diffuse Optical Imaging and EEG ............................................................................... 125
Chapter 3: Patients and Methods ............................................................................................... 131
3.1 Patients ........................................................................................................................... 133
3.1.1 Ethics ....................................................................................................................... 133
3.1.2 Recruitment ............................................................................................................ 134
3.1.3 Clinical details ........................................................................................................ 137
3.2 Equipment and Study Conduction .............................................................................. 141
3.2.1 Simultaneous video-EEG & DOT ......................................................................... 141
3.2.2 Data Acquisition ..................................................................................................... 144
3.2.3 Data Analysis .......................................................................................................... 147
Chapter 4: Cortico-vascular Changes in Neonatal Seizures ...................................................... 149

18
4.1 Optical methods and EEG on neonatal seizures ......................................................... 151
4.2 Patients and Methods .................................................................................................... 155
4.2.1 Patients and Data Acquisition ............................................................................... 155
4.2.2 EEG Data Analysis ................................................................................................. 156
4.2.3 DOT Data Analysis ................................................................................................. 157
4.3 Results ............................................................................................................................ 158
4.3.1 Clinical Details ........................................................................................................ 158
4.3.2 Seizure detection ..................................................................................................... 162
4.3.3 Cortical haemodynamic changes in response to seizure activity ....................... 166
4.4 Discussion and Conclusions .......................................................................................... 174
Chapter 5: Neurovascular Coupling of Burst Suppression ....................................................... 179
5.1 Functional imaging of burst suppression .................................................................... 181
5.2 Patients and Methods .................................................................................................... 183
5.2.1 Patients and Data Acquisition ............................................................................... 183
5.2.2 EEG Data Analysis ................................................................................................. 184
5.2.3 DOT Data Analysis ................................................................................................. 185
5.3 Results ............................................................................................................................ 187
5.3.1 Clinical Details ........................................................................................................ 187
5.3.2 Burst Identification ................................................................................................ 189
5.3.3 Haemodynamic Response to Bursts ...................................................................... 190
5.3.4 Imaging of the Haemodynamic Response to Bursts ............................................ 192
5.4 Discussion and Conclusions .......................................................................................... 196
Chapter 6: Diffuse Optical Tomography in the Early Detection of Perinatal Stroke ................ 201
6.1. Background on functional imaging of perinatal stroke ............................................ 203
6.2 Patients and Methods .................................................................................................... 208
6.2.1 Patients and Data Acquisition ............................................................................... 208
6.2.2 EEG Analysis .......................................................................................................... 209
6.2.3 DOT analysis ........................................................................................................... 211
6.3 Results ............................................................................................................................ 215
6.3.1 Clinical Details ........................................................................................................ 215
6.3.2 EEG Results ............................................................................................................ 220
6.3.3 DOT Results ............................................................................................................ 224
6.4 Discussion and Conclusions .......................................................................................... 227
Chapter 7: Conclusions and Future Directions.......................................................................... 233

19
7.1 Summary of Conclusions .............................................................................................. 235
7.2 Challenges and Methodology Development ................................................................ 237
7.3 Future Directions .......................................................................................................... 243
References ................................................................................................................................. 247
Index of Abbreviations .............................................................................................................. 302

20
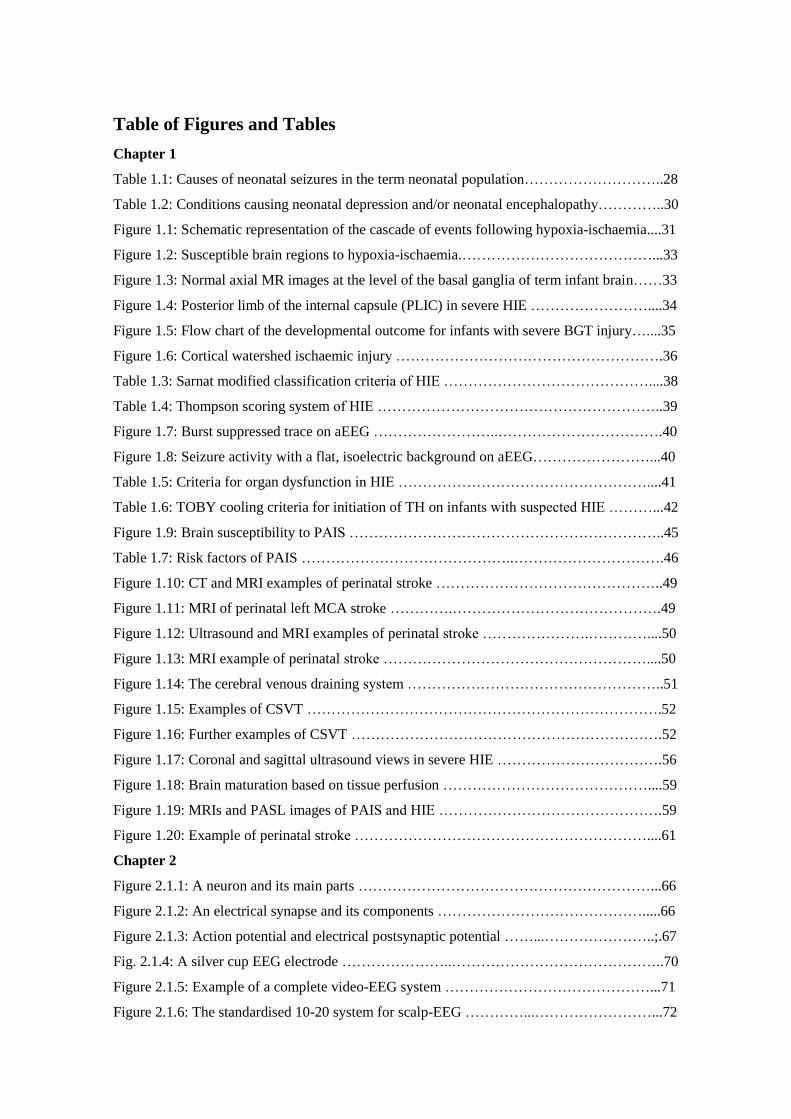
Table of Figures and Tables
Chapter 1
Table 1.1: Causes of neonatal seizures in the term neonatal population………………………..28
Table 1.2: Conditions causing neonatal depression and/or neonatal encephalopathy…………..30
Figure 1.1: Schematic representation of the cascade of events following hypoxia-ischaemia....31
Figure 1.2: Susceptible brain regions to hypoxia-ischaemia.…………………………………...33
Figure 1.3: Normal axial MR images at the level of the basal ganglia of term infant brain……33
Figure 1.4: Posterior limb of the internal capsule (PLIC) in severe HIE ……………………....34
Figure 1.5: Flow chart of the developmental outcome for infants with severe BGT injury…....35
Figure 1.6: Cortical watershed ischaemic injury ……………………………………………….36
Table 1.3: Sarnat modified classification criteria of HIE ……………………………………....38
Table 1.4: Thompson scoring system of HIE …………………………………………………..39
Figure 1.7: Burst suppressed trace on aEEG ……………………..…………………………….40
Figure 1.8: Seizure activity with a flat, isoelectric background on aEEG……………………...40
Table 1.5: Criteria for organ dysfunction in HIE ……………………………………………....41
Table 1.6: TOBY cooling criteria for initiation of TH on infants with suspected HIE ………...42
Figure 1.9: Brain susceptibility to PAIS ………………………………………………………..45
Table 1.7: Risk factors of PAIS ……………………………………..………………………….46
Figure 1.10: CT and MRI examples of perinatal stroke ………………………………………..49
Figure 1.11: MRI of perinatal left MCA stroke ………….…………………………………….49
Figure 1.12: Ultrasound and MRI examples of perinatal stroke ………………….…………....50
Figure 1.13: MRI example of perinatal stroke ………………………………………………....50
Figure 1.14: The cerebral venous draining system ……………………………………………..51
Figure 1.15: Examples of CSVT ……………………………………………………………….52
Figure 1.16: Further examples of CSVT ……………………………………………………….52
Figure 1.17: Coronal and sagittal ultrasound views in severe HIE …………………………….56
Figure 1.18: Brain maturation based on tissue perfusion ……………………………………....59
Figure 1.19: MRIs and PASL images of PAIS and HIE ……………………………………….59
Figure 1.20: Example of perinatal stroke ……………………………………………………....61
Chapter 2
Figure 2.1.1: A neuron and its main parts ……………………………………………………...66
Figure 2.1.2: An electrical synapse and its components …………………………………….....66
Figure 2.1.3: Action potential and electrical postsynaptic potential ……...…………………..;.67
Fig. 2.1.4: A silver cup EEG electrode …………………..……………………………………..70
Figure 2.1.5: Example of a complete video-EEG system ……………………………………...71
Figure 2.1.6: The standardised 10-20 system for scalp-EEG …………...……………………...72

22
Figure 2.1.7: Example of the proposed reduced montage for neonatal EEG …………………..73
Figure 2.1.8: Example of a typical bipolar montage ……………….. ………………………....74
Figure 2.1.9: A comercially available single channel aEEG-CFM system …………………….76
Figure 2.1.10: Single and double-channel aEEG electrode placement ………………………...77
Figure 2.1.11: Example of polysomnographic digitized recording in a 34/40 infant …..……....80
Figure 2.1.12: EEG of a 24/40 weeks infant …………………………………………………...81
Figure 2.1.13: EEG of a 39/40 weeks infant …………………………………………………...81
Figure 2.1.14: EEG of a 40/40 weeks infant …………………………………………………...82
Figure 2.1.15: A simplified schematic representation for neonatal EEG intrepretation ……….83
Figure 2.1.16: Example of the electrode-pop artefact related to the P3 electrode .………...…..84
Figure 2.1.17: Example of an electromyogram (muscle) artefact ……………………………..85
Figure 2.1.18: Example of an eye movement artefact ……………………………………….....86
Figure 2.1.19: Burst-suppressed pattern of a 42/40 weeks post-term infant with HIE ……......88
Figure 2.1.20: EEG showing electrocortical silence ……………………………………..…….89
Figure 2.1.21: Hypsarrhythmic EEG pattern ………………………………...…………………90
Table 2.1: Types of neonatal seizures …………………………..……………………………...93
Figure 2.1.22: EEG trace in epileptic encephalopathy ………………………………..………..96
Figure 2.1.23: Example of rhythmic right delta occipital epileptiform discharge ……..………96
Figure 2.1.24: Example of rhythmic sharp wave activity over the left hemisphere …..……….97
Figure 2.2.1: Representation of the absorption coefficient of water .…………………………. 102
Figure 2.2.2: Representation of the molar extinction coefficients of HbO2 and HHb………….103
Figure 2.2.3: Representation of the absorption spectra for HbO2 and HHb in NIR range ……..104
Figure 2.2.4: The effect of light scattering ………………………….………………………….105
Figure 2.2.5: Representation of the interactions between neuronal and vascular activity ……110
Figure 2.2.6: A typical HRF to cortical activation …………………..………………………..112
Figure 2.2.7: Changes in HbT, HbO2, and HHb concentrations with visual stimulation ……..113
Figure 2.2.8: Example of functional activation ……….………………………………………114
Figure 2.2.9: Time-series plots of the BOLD signal change post somatosensory stimulus …..114
Figure 2.2.10: Demonstration of the three different NIR techniques …………………………115
Figure 2.2.11: Different end-products using CW NIR systems ………………………………116
Figure 2.2.12: Optical topography of the cortical haemodynamic response to sound ……......117
Figure 2.2.13: The banana shaped trajectory of NIR light………………………………….....118
Figure 2.2.14: Example of a time domain NIR image ……………..………………..………..120
Figure 2.3.1: Diffuse optical topography of sensorimotor stimulation of the brain…………..123
Figure 2.3.2: Diffuse optical topographic illustration of visual stimulation in infants ……….125
Figure 2.3.3: Diffuse optical topographic illustration of functional activation …………...…..126
23
Chapter 3
Table 3.1: Consort diagram of patient recruitment………………………………………..134
Table 3.2: Clinical details of recruited patients presenting with seizures ………………..137-138
Table 3.3: Clinical details of the healthy controls recruited in the study ……………………..138
Table 3.4: Clinical details of the preterm infants recruited in the study …………………..….138
Figure 3.2.1: The combination of systems used for the study on a portable trolley ……….....141
Figure 3.2.2: DOT-EEG whole head array and cap ……………..……………………………141
Figure 3.2.3: Images of infants during the study conduction ………..………………………..144
Figure 3.2.4: Graph of the different pre-processing and processing steps …..………………..146
Chapter 4
Figure 4.1.1: Changes in TOI, HbT, HbO2 and HHb in relation to neonatal seizure activity ..150
Figure 4.1.2: Graph showing the average changes relative to the mean changes of HbO2, HHb,
and HbT in relation to seizure activity…………………………………………………...........151
Figure 4.1.3: Series of DOT images of the changes in HbT observed at different phases of a single
neonatal seizure ……………………………………………………………………….............152
Figure 4.3.1: An EEG snapshot of a seizure of patient 20 …………...……………………….161
Figure 4.3.2: An EEG snapshot of a seizure of patient 24…………………………………….162
Table 4.1: Clinical and EEG details for patients 15, 18, 20 and 24 ………………..………. 162
Table 4.2: Timings and duration for each seizure event in seconds for patient 15……………163
Table 4.3: Timings and duration for each seizure event in seconds for patient 18 …………...163
Table 4.4: Timings and duration for each seizure event in seconds for patient 20 …………...163
Table 4.5: Timings and duration for each seizure event in seconds for patient 24 …………...163
Figure 4.3.3: The raw optical signals for patient 15 …………………………………………..164
Figure 4.3.4: Close-up of the optical signal for patient 15 ……………………………………164
Figure 4.3.5: A sample for the power spectra plot for channels 1, 2 and 3 for patient 15 ……165
Figure 4.3.6: Changes of HbO2 in relation to the seizure activity for patient 15 ……………..166
Figure 4.3.7: Changes in HbO2, HHb, and HbT in relation to seizure event 1 on patient 15…167
Figure 4.3.8: The raw optical signal for patient 18 …………………………………………...168
Figure 4.3.9: Changes in HbO2, HHb, and HbT in relation to seizure event 5 on patient 18….168
Figure 4.3.10: The raw optical signal for patient 20 …………………..……………………...169
Figure 4.3.11: Close up of the raw optical signal for patient 20 ……..…………..…………...170
Figure 4.3.12: The raw optical signal for patient 24 ………………………………………….171
Figure 4.3.13: Changes in HbO2, HHb, and HbT in relation to seizure event 3 on patient 24..171
Chapter 5
Table 5.1: Clinical details of the patients with BS ……………………………………………186
Figure 5.3.1: EEG snapshot from patient 19 showing a typical example of burst activity …...187

24
Figure 5.3.2: Burst durations binned as per DOT datasets ……………………………………187
Figure 5.3.3: Representation of the HRFs to bursts lasting from 4 to 6 s in patient 2 ………..188
Figure 5.3.4: The PCA-extracted HRFs to bursts lasting from between 4 to 6 s ……………..189
Figure 5.3.5: The reconstructed image for the increased HbT-HRF in BS for patient 12 ……191
Figure 5.3.6: The reconstructed image for the decreased HbT-HRF in BS for patient 12 ……191
Figure 5.3.7: The reconstructed image for the increased HbT-HRF in BS for patient 19 ……192
Figure 5.3.8: The reconstructed image for the decreased HbT HRF in BS for patient 19 ……192
Figure 5.3.9: Comparison of MRI and DOI for patient 19 ……………………………..……..193
Chapter 6
Figure 6.1.1: Cortical haemodynamic changes in an infant affected by left MCA infarct…….202
Figure 6.1.2: Diffuse optical images of functional connectivity ……………………………...204
Figure 6.2.1: A power spectra plot of an EEG signal …………………………………………208
Figure 6.2.2: The raw optical signal of patient 25 …………………………………………….210
Figure 6.2.3: Flowchart of the MRI processing and mesh manipulation …………………… .212
Table 6.1: Clinical details of the patients diagnosed with PAIS ……………………………...214
Table 6.2: Results of investigations of the patients diagnosed with PAIS ……………………215
Figure 6.3.1: MR images for each of the stroke-affected patients …………………………….216
Figure 6.3.2: MR images for the subjects in the PAIS group …………………………………217
Figure 6.3.3: Power spectra plots with cortical maps in patient 16 .…………………………..219
Figure 6.3.4: Power spectra plots with cortical maps in patient 25 .…………………………..220
Figure 6.3.5: Power spectra plots with cortical maps in patient 29 .…………………………..221
Figure 6.3.6: Processed optical data for patient 25 …………….………………………………222
Table 6.3: Mean correlation values of stroke-affected patients vs CIs of controls …………...224
Project Rationale and Aims
The combination of multi-channel near-infrared diffuse optical tomography (DOT) and
electroencephalography (EEG) offers the ability to study the vascular changes of the
surface of the brain (cortex) and electrical brain activity. This makes it possible to study
the relationship between cortical haemodynamics and electrical activity known as
neurovascular coupling.
A previous pilot study examining the neurovascular coupling of neonatal seizures,
conducted by the group, demonstrated the significance of combining DOT and EEG in
detecting cortico-vascular changes in a newborn infant with hypoxic ischaemic
encephalopathy (HIE). Distinct cortical haemodynamic changes were identified in
relation to recurrent electroencephalographic seizures.
Therefore, this MD project is based on the use of combined DOT and EEG in the
investigation of brain injury in the term neonatal population, with focus on the two,
commonest such clinical entities, hypoxic ischaemic encephalopathy (HIE), and cerebral
infarction.
The principal two aims of this project were to continue to investigate term
newborn infants presenting with seizures and to demonstrate the practicality and readily
available use of combined DOT-EEG at the cot side in the neonatal intensive care unit.
The objectives of the project as presented in chapters 4, 5 and 6 were the
following:
• To investigate and improve the understanding of the potential cortical
haemodynamic changes measured by DOT during neonatal seizures as detected
by EEG.
• To investigate the cortical haemodynamic changes in relation to other
neurophysiological phenomena seen in cases of HIE and neonatal
encephalopathy, such as discontinuous cortico-electrical activity and/or burst
suppression.
• To explore the potential of DOT-EEG in the detection of uni-hemispheric
perinatal stroke.

26
Chapter 1: Neonatal Brain Injury in the
Term Infant

28
1.1 Neonatal Encephalopathy and Seizures
29
1.1 Neonatal Encephalopathy and Seizures
A wide range of pathologies comes under the umbrella of brain injury in the term,
neonatal population. Neonatal encephalopathy is a clinical expression of deranged brain
function in the term infant manifesting in the early postnatal phase. It is characterised by
a decreased level of consciousness and/or seizures and may be associated with respiratory
distress or depression, abnormal tone, and reflexes (1). It may be the consequence of a
hypoxic-ischaemic insult. However, there are other conditions which can be attributed to
an infant being encephalopathic in the neonatal period, such as metabolic conditions,
maternal drug abuse, and cerebral infarction. The conditions associated with neonatal
encephalopathy are also associated with neonatal seizures; however, one needs to make
the distinction that not all infants with encephalopathy present with seizures and not all
infants presenting with seizures are encephalopathic.
Seizures are one of the commonest neurological presentations in the neonatal
period with varied evolution of clinical semiology and symptoms. Therefore, their
aetiology has almost become synonymous to the aetiology of term, neonatal brain injury
(see Table 1.1). In term and near-term infants, the dominant causes are hypoxic ischaemic
encephalopathy (HIE) and cerebral infarction. Their incidence does vary slightly
depending on access to maternal and neonatal services amongst low, middle, and high-
income countries.
The incidence of neonatal seizures has been reported between 0.5 to 5 per 1,000
live births (2-4), predominantly occurring in the first few days of postnatal life. Older
studies were purely based on clinical observation with a mixed population of different
gestational age (GA) and postconceptional age. Other studies were based on prolonged
amplitude-integrated electroencephalography (aEEG) recordings with variation in the GA
of infants and underlying clinical pathologies. Using this methodology, the number
reported is approximately 2 in 1,000 live born infants diagnosed with seizures with this
figure increasing in the instance of prematurity (5, 6). In preterm infants, who were later
found to have developed intraventricular haemorrhage (IVH), aEEG studies have shown
occurrence of subclinical seizures in up to 75% (7, 8).
The principal aetiological factor of neonatal seizures in both preterm and term
infants is HIE, accounting for almost 60% of reported cases (2, 9-11). Cerebral infarction
follows HIE in frequency in term infants. Another main factor is intracranial
1.1 Neonatal Encephalopathy and Seizures
30
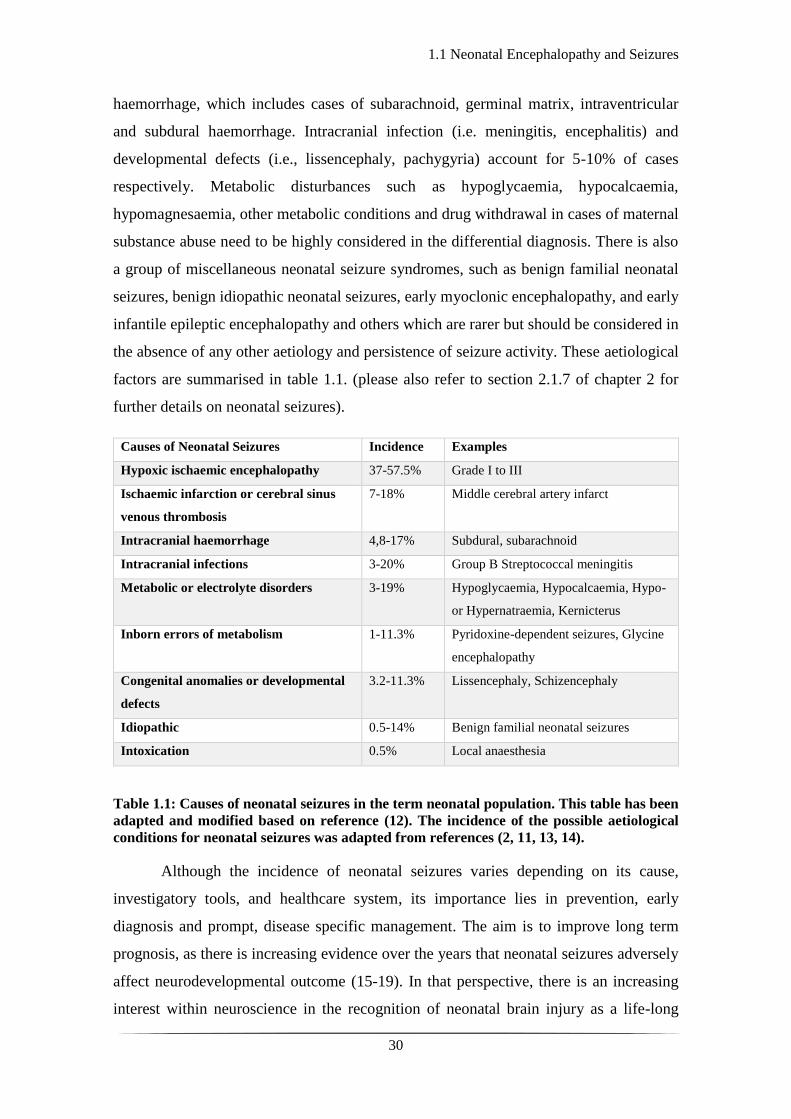
haemorrhage, which includes cases of subarachnoid, germinal matrix, intraventricular
and subdural haemorrhage. Intracranial infection (i.e. meningitis, encephalitis) and
developmental defects (i.e., lissencephaly, pachygyria) account for 5-10% of cases
respectively. Metabolic disturbances such as hypoglycaemia, hypocalcaemia,
hypomagnesaemia, other metabolic conditions and drug withdrawal in cases of maternal
substance abuse need to be highly considered in the differential diagnosis. There is also
a group of miscellaneous neonatal seizure syndromes, such as benign familial neonatal
seizures, benign idiopathic neonatal seizures, early myoclonic encephalopathy, and early
infantile epileptic encephalopathy and others which are rarer but should be considered in
the absence of any other aetiology and persistence of seizure activity. These aetiological
factors are summarised in table 1.1. (please also refer to section 2.1.7 of chapter 2 for
further details on neonatal seizures).
Causes of Neonatal Seizures Incidence Examples
Hypoxic ischaemic encephalopathy 37-57.5% Grade I to III
Ischaemic infarction or cerebral sinus
venous thrombosis
7-18% Middle cerebral artery infarct
Intracranial haemorrhage 4,8-17% Subdural, subarachnoid
Intracranial infections 3-20% Group B Streptococcal meningitis
Metabolic or electrolyte disorders 3-19% Hypoglycaemia, Hypocalcaemia, Hypo-
or Hypernatraemia, Kernicterus
Inborn errors of metabolism 1-11.3% Pyridoxine-dependent seizures, Glycine
encephalopathy
Congenital anomalies or developmental
defects
3.2-11.3% Lissencephaly, Schizencephaly
Idiopathic 0.5-14% Benign familial neonatal seizures
Intoxication 0.5% Local anaesthesia
Table 1.1: Causes of neonatal seizures in the term neonatal population. This table has been
adapted and modified based on reference (12). The incidence of the possible aetiological
conditions for neonatal seizures was adapted from references (2, 11, 13, 14).
Although the incidence of neonatal seizures varies depending on its cause,
investigatory tools, and healthcare system, its importance lies in prevention, early
diagnosis and prompt, disease specific management. The aim is to improve long term
prognosis, as there is increasing evidence over the years that neonatal seizures adversely
affect neurodevelopmental outcome (15-19). In that perspective, there is an increasing
interest within neuroscience in the recognition of neonatal brain injury as a life-long

1.1 Neonatal Encephalopathy and Seizures
31
disease, which can potentially be managed more effectively by understanding its
predisposing factors and mechanisms and by developing tools for early detection, specific
diagnosis, and differentiation of disease severity.
1.2 Hypoxic Ischaemic Encephalopathy
32
1.2 Hypoxic Ischaemic Encephalopathy
Hypoxic ischaemic encephalopathy is the result of decreased or lack of oxygen supply
(hypoxia) and decreased blood perfusion (ischaemia) leading to disruption of cerebral
energy metabolism (20). Hypoxia and ischaemia can occur acutely or chronically and can
be associated with maternal factors (i.e. hypotension), cord factors (obstruction,
prolapse), placental factors (placental insufficiency, abruption) and uterine factors
(rupture) (21). Events in the first 28 days of postnatal life such as respiratory or cardiac
arrest can also lead to HIE. It is interesting to note that HIE is often confused or used
instead of the term neonatal encephalopathy which is a more descriptive term of deranged
neurological status without assumptions on its pathogenetic mechanisms. Neonatal
encephalopathy is called HIE if there is clear evidence of intrapartum asphyxia as the
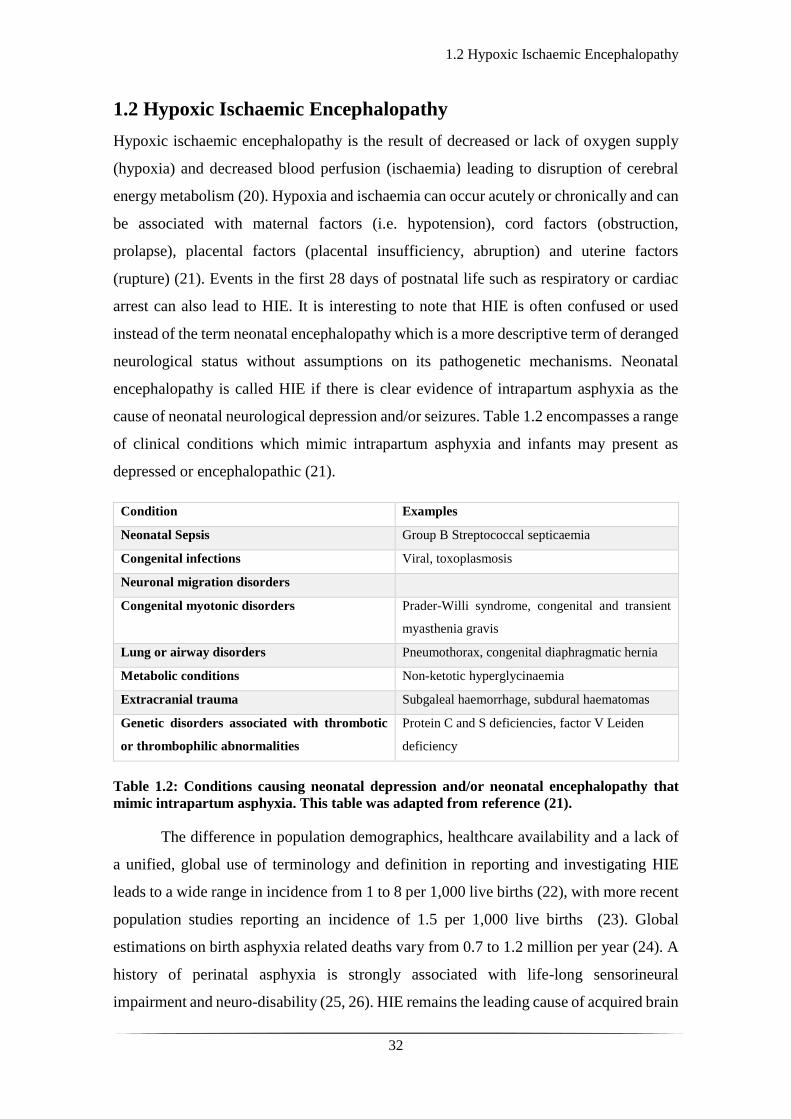
cause of neonatal neurological depression and/or seizures. Table 1.2 encompasses a range
of clinical conditions which mimic intrapartum asphyxia and infants may present as
depressed or encephalopathic (21).
Condition Examples
Neonatal Sepsis Group B Streptococcal septicaemia
Congenital infections Viral, toxoplasmosis
Neuronal migration disorders
Congenital myotonic disorders Prader-Willi syndrome, congenital and transient
myasthenia gravis
Lung or airway disorders Pneumothorax, congenital diaphragmatic hernia
Metabolic conditions Non-ketotic hyperglycinaemia
Extracranial trauma Subgaleal haemorrhage, subdural haematomas
Genetic disorders associated with thrombotic
or thrombophilic abnormalities
Protein C and S deficiencies, factor V Leiden
deficiency
Table 1.2: Conditions causing neonatal depression and/or neonatal encephalopathy that
mimic intrapartum asphyxia. This table was adapted from reference (21).
The difference in population demographics, healthcare availability and a lack of
a unified, global use of terminology and definition in reporting and investigating HIE
leads to a wide range in incidence from 1 to 8 per 1,000 live births (22), with more recent
population studies reporting an incidence of 1.5 per 1,000 live births (23). Global
estimations on birth asphyxia related deaths vary from 0.7 to 1.2 million per year (24). A
history of perinatal asphyxia is strongly associated with life-long sensorineural
impairment and neuro-disability (25, 26). HIE remains the leading cause of acquired brain
1.2 Hypoxic Ischaemic Encephalopathy
33
injury and neuro-disability in the term neonatal population in both the developed and
developing world (27).
An understanding of the pathophysiology of HIE comes from a combination of
clinical observations and animal studies. Based on animal work (28), the initial response
to hypoxia in the foetus results in redistribution of the blood circulation to vital organs
such as the heart and the brain. The heart rate decreases to minimise myocardial work but
at the same time, maintaining circulation in the vital organs. Further hypoxia leads to
metabolic acidosis and finally cessation of circulation to all organs including heart and
brain.
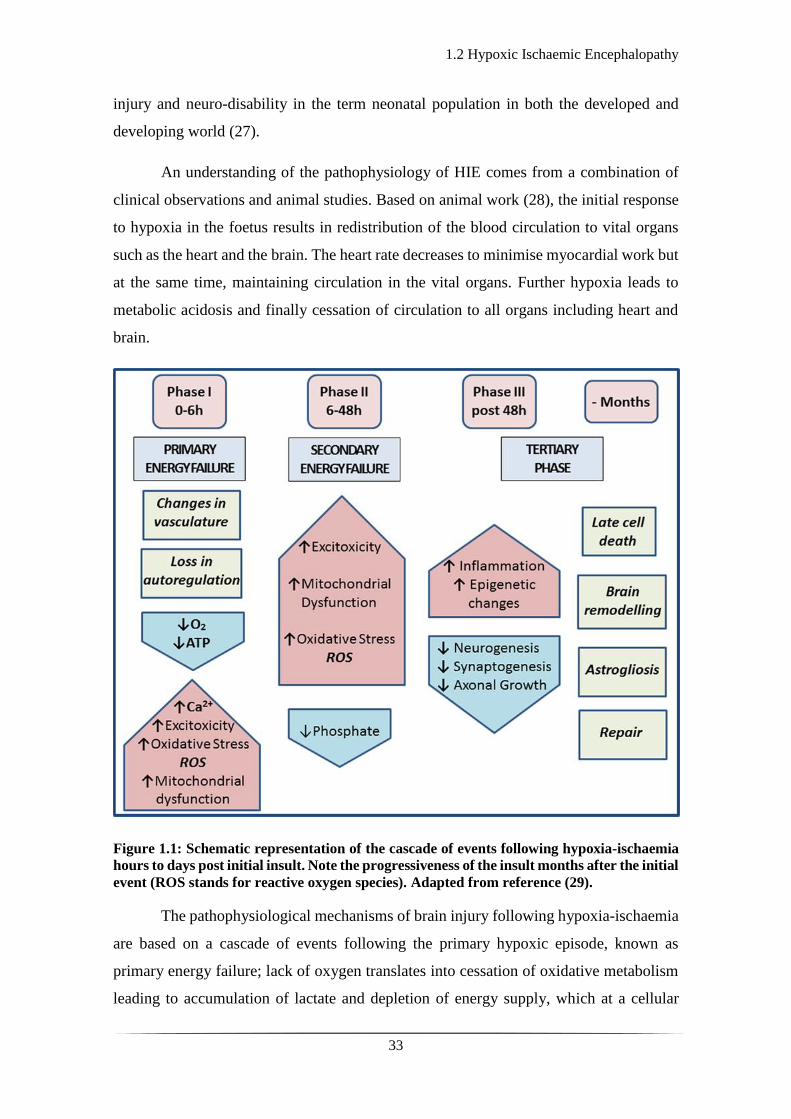
Figure 1.1: Schematic representation of the cascade of events following hypoxia-ischaemia
hours to days post initial insult. Note the progressiveness of the insult months after the initial
event (ROS stands for reactive oxygen species). Adapted from reference (29).
The pathophysiological mechanisms of brain injury following hypoxia-ischaemia
are based on a cascade of events following the primary hypoxic episode, known as
primary energy failure; lack of oxygen translates into cessation of oxidative metabolism
leading to accumulation of lactate and depletion of energy supply, which at a cellular

1.2 Hypoxic Ischaemic Encephalopathy
34
level translates into depletion of adenosine triphosphate (ATP). This leads to failure of
the ATP dependent Na+/K+ pump. In the very severe cases there is influx of Na+ and water
in the cell and subsequent necrosis. In the less severe cases, there is depolarisation of the
membrane with increased extracellular accumulation of excitatory amino acids
(glutamate) and increased intracellular Ca2+ with a subsequent gradual cascade of events
leading to cellular apoptosis (see Fig. 1.1). The initial metabolic acidosis and increase in
lactate results in increase in cerebral blood flow and production of ATP from phosphor-
creatinine (PCr). While acidosis progresses ATP production diminishes and
autoregulation is lost with ultimate neuronal injury and necrosis (20).
Classically there are two main types of brain injury following hypoxia-ischaemia
affecting different brain regions such as the cortex and the deeper nuclear structures, basal
ganglia and thalamus (30) (see Fig.1.2). The basal ganglia and thalamus (BGT) type of
injury pattern is the one most frequently seen following an acute insult (31). These deep
structures are particularly susceptible due to their high metabolic rate and rich
concentration in N-methyl-D-aspartate (NMDA) glutamate receptors (the main excitatory
receptor in neuronal synapses). BGT lesions vary in extent form focal to widespread
abnormal signal intensity seen on MRI. A marker of the severity of the lesions is
associated injury to the posterior limb of the internal capsule, an area which is actively
myelinating at term and is highly susceptible to hypoxia-ischaemia (32). A normal
appearance of the internal capsule is a good prognostic sign for normal motor function
after hypoxic–ischaemic insults (see Fig. 1.3 and 1.4).

1.2 Hypoxic Ischaemic Encephalopathy
35
Figure 1.2: Susceptible brain regions to hypoxia-ischaemia. HIE results in global injury,
affecting neurons of the cortical plate and basal ganglia as well as white matter tracts. Image
adapted by reference (30).
Figure 1.3: Normal axial MR images at the level of the basal ganglia of term infant brain:
(a) a T1-weighted inversion recovery and (b) a T2-weighted sequence. The myelin in the
posterior limb of the internal capsule (long arrows) is visualised as high signal intensity for
about half its length in T1-weighted image (a) but is not as advanced on the T2-weighted
image (b) where it is of low signal intensity. The short black arrows indicate the anterior
limb of the internal capsule. Image adapted from reference (32).
1.2 Hypoxic Ischaemic Encephalopathy
36
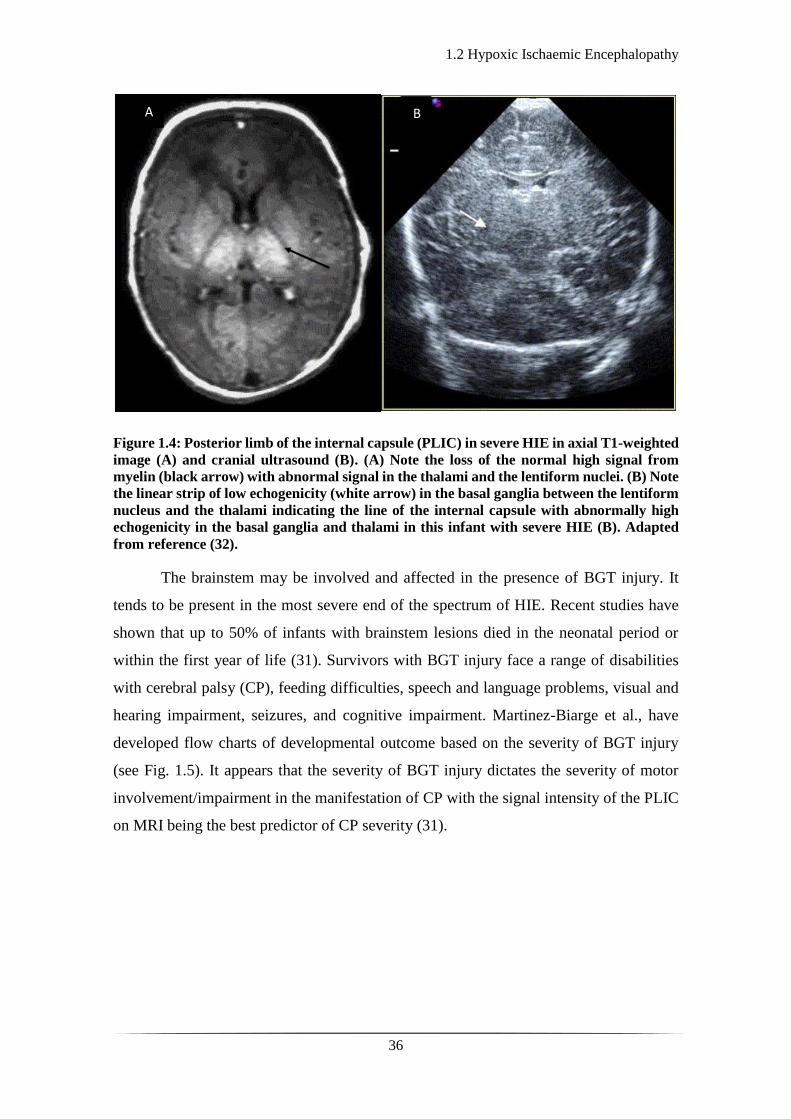
Figure 1.4: Posterior limb of the internal capsule (PLIC) in severe HIE in axial T1-weighted
image (A) and cranial ultrasound (B). (A) Note the loss of the normal high signal from
myelin (black arrow) with abnormal signal in the thalami and the lentiform nuclei. (B) Note
the linear strip of low echogenicity (white arrow) in the basal ganglia between the lentiform
nucleus and the thalami indicating the line of the internal capsule with abnormally high
echogenicity in the basal ganglia and thalami in this infant with severe HIE (B). Adapted
from reference (32).
The brainstem may be involved and affected in the presence of BGT injury. It
tends to be present in the most severe end of the spectrum of HIE. Recent studies have
shown that up to 50% of infants with brainstem lesions died in the neonatal period or
within the first year of life (31). Survivors with BGT injury face a range of disabilities
with cerebral palsy (CP), feeding difficulties, speech and language problems, visual and
hearing impairment, seizures, and cognitive impairment. Martinez-Biarge et al., have
developed flow charts of developmental outcome based on the severity of BGT injury
(see Fig. 1.5). It appears that the severity of BGT injury dictates the severity of motor
involvement/impairment in the manifestation of CP with the signal intensity of the PLIC
on MRI being the best predictor of CP severity (31).
A B

1.2 Hypoxic Ischaemic Encephalopathy
37
Figure 1.5: Flow chart showing the developmental outcome for infants with severe BGT
injury (DQ stands for developmental quotient). Adapted from reference (31).
The cortical watershed pattern of injury tends to be associated with forms of
chronic hypoxia where maternal factors such as hypotension have been shown to be
related. This injury consists of cortical necrosis with involvement of the subjacent white
matter. It tends to affect the parasagittal and supra-medial regions of the convexities
bilaterally with distribution mostly over the parieto-occipital areas than the anterior ones
(see Fig.1.6).

1.2 Hypoxic Ischaemic Encephalopathy
38
Figure 1.6: Cortical watershed ischaemic injury. (A) Axial T1-weighted image showing low
signal intensity bilaterally in the anterior and posterior watershed areas. (B) Axial T2-
weighted image showing increased signal intensity in the same areas, suggesting oedema.
Adapted from reference (33).
Infants with watershed type of injury predominantly have cognitive impairment
with motor development being spared. As the cognitive deficit presents after 12 months
of age and sometimes only when schooling begins, long term follow up is crucial.
There is a global type of injury where both cortical grey and subcortical white
matter are involved. These cases are the most severe ones and often fatal. In surviving
infants, the injury evolves in multi-cystic encephalomalacia with global developmental
delay. It is interesting to note here that infants respond differently to different degrees of
acute and chronic hypoxia ischaemia and that the pattern of injury is not easily
reproducible. Factors such as the primary cause, the degree of hypoxia and ischaemia, the
maturational stage of the brain prior to the insult, regional cerebral blood flow (CBF), and
the general health of the infant collectively play a role in the clinical course and final
neurodevelopmental outcome (21).
Clinically, HIE is categorised into three stages or grades from I to III based on the
Sarnat modified classification (34). However, in all grades there is a common background
of perinatal asphyxia, abnormal neurological status, and varied organ dysfunction. The
grading of HIE is based on a daily clinical assessment of the infant using the Sarnat

1.2 Hypoxic Ischaemic Encephalopathy
39
modified classification (see Table 1.3). Other scoring tools, such as the Thompson score
(also known as the HIE score) have been developed and are based on the Sarnat scale
(35). The Thompson score is a clinical tool assessing a range of signs associated to
neurological dysfunction in infants with evidence of perinatal asphyxia (see Table 1.4).
The score ranges from 0 (normal) to 22 (severe). Infants with a score of 1-10 are
considered to have mild HIE, infants with a score of 11-14 are considered to have
moderate HIE and infants with a score of 15-22 are considered to have severe HIE. It has
been reported that a consistent score of >10 in the first 7 days of life predicts an adverse
outcome with a 100% sensitivity and 61% specificity (35).
Neurologically the infant may appear hyperalert and irritable (mild), lethargic and
hypotonic or utterly comatose with weak or absent respiratory effort and either no
response to stimuli or exhibition of spinal reflex to painful stimuli. Seizures are present
in stage II and III of HIE and commonly present within the first 24 hours of life. In stage
II, there can be an overall reduced electro-encephalographic activity with loss of cyclicity
between sleep and awake states. In stage III the electro-encephalographic activity can be
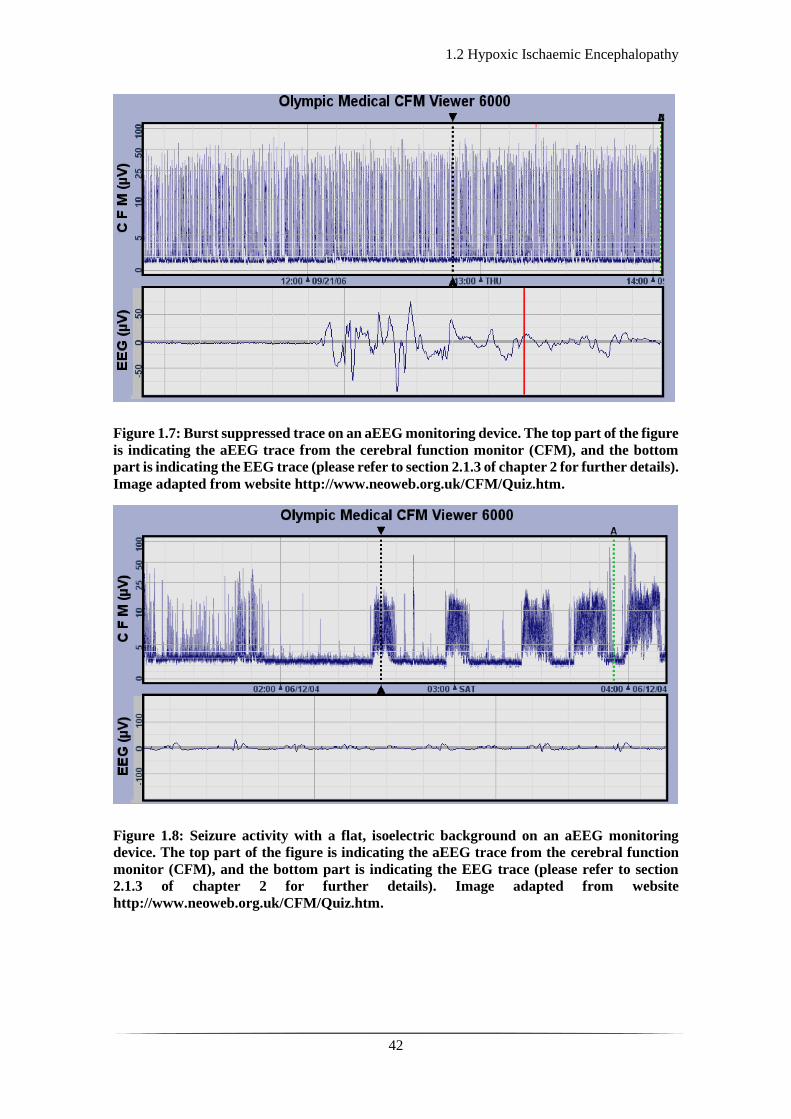
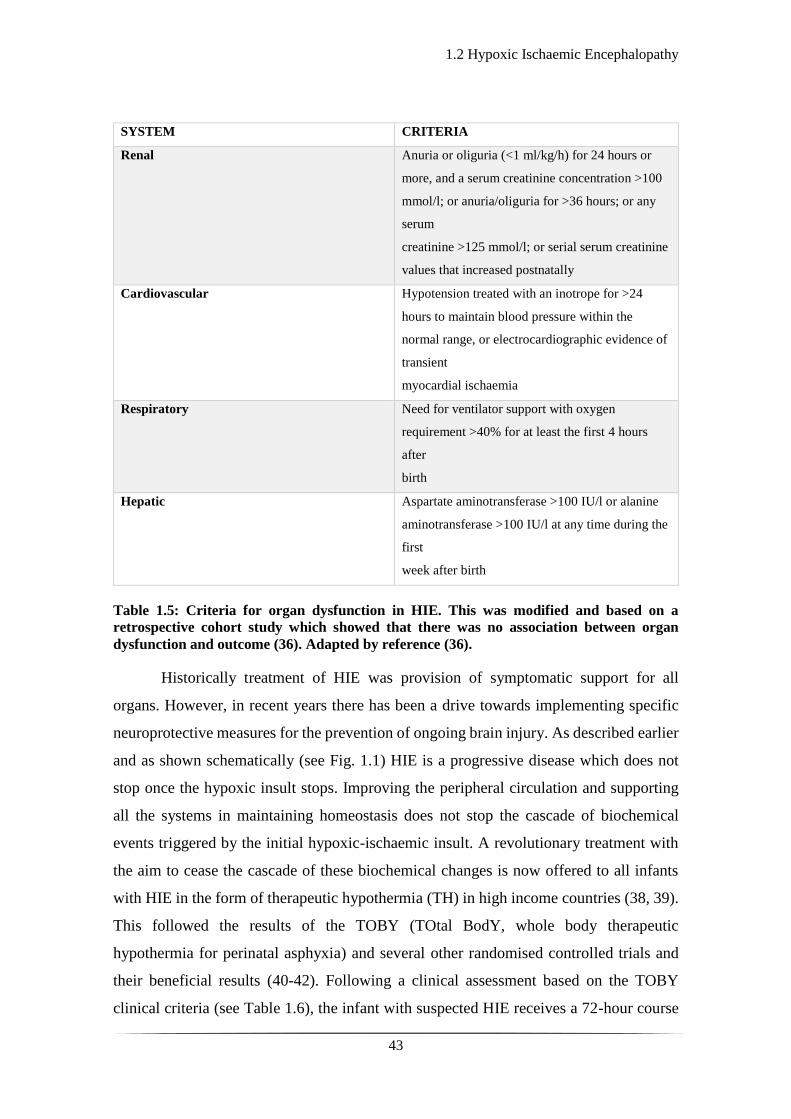
completely flat (see Fig. 1.7) or may have the appearance of burst suppression (see Fig.
1.8) (please refer to chapters 2 and 5). Similarly, seizures may be evident (see Fig. 1.8).

1.2 Hypoxic Ischaemic Encephalopathy
40
Modified Sarnat
STAGE Stage 1 Stage 2 Stage 3
Level of consciousness Hyperalert Lethargic or obtunded Stupor or coma
Activity Normal Decreased Absent
Neuromuscular Control
Muscle Tone Normal Mild Hypotonia Flaccid
Posture Mild distal flexion Strong distal flexion Intermittent decerebration
(extension)
Stretch reflexes Overactive Overactive Decreased or absent
Complex/Primitive
reflexes
Suck Weak Weak or absent Absent
Moro (startle) Strong; low threshold Weak; incomplete; high
threshold
Absent
Tonic Neck Slight Strong Absent
Autonomic function
Pupils Mydriasis Miosis Variable; often unequal;
poor light reflex; fixed;
dilated
Heart rate Tachycardia Bradycardia Variable
Seizures None Common; focal or
multifocal
Uncommon (excluding
decerebration)
Table 1.3: Sarnat modified classification criteria of HIE. Adapted from reference (34).
In terms of other clinical manifestations, there can be a varied involvement or
dysfunction of other organs or systems. Hypoxia-ischaemia activates the diving reflex
which diverts the blood circulation from the skin and the splanchnic area to the most vital
organs; heart, adrenals, and brain. It was thought until recently, that all infants with HIE
would at some point have developed some degree of organ or system dysfunction.

1.2 Hypoxic Ischaemic Encephalopathy
41
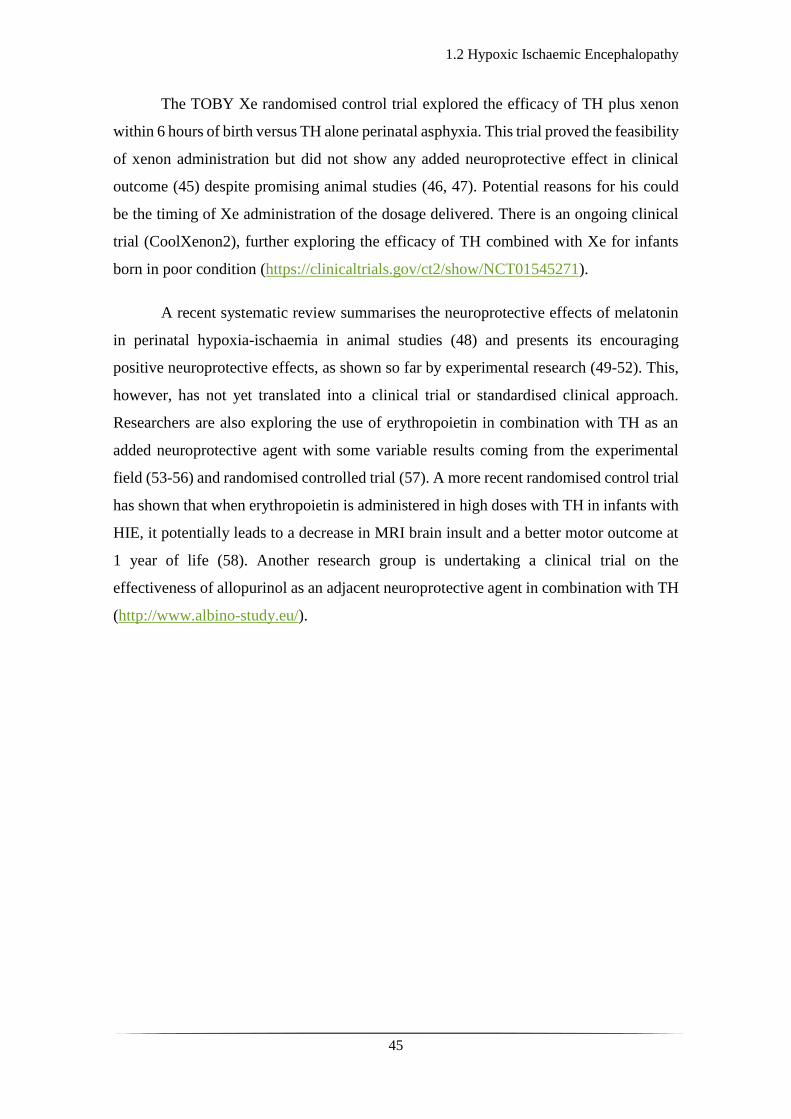
However, a recent study has shown that multiorgan dysfunction is not related to outcome
in HIE cases, with renal, hepatic, cardiovascular, and respiratory involvement in 58-88%
of cases with good outcome and 64-86% of infants with adverse outcome (36). Table 1.5
shows the clinical criteria for single or multiorgan dysfunction.
Sign 0 1 2 3
Tone Normal Hyper Hypo Flaccid
Level of
consciousness
Normal Hyperalert/stare Lethargic Comatose
Fits None < 3 per day >2 per day
Posture Normal Fisting, cycling Strong distal
flexion
Decerebrate
Moro Normal Partial Absent
Grasp Normal Poor Absent
Suck Normal Poor Absent, bites
Respiration Normal Hyperventilation Brief apnoea IPPV (apnoea)
Fontanel Normal Full, not tense Tense
Table 1.4: Thompson scoring system of HIE. This is a modification of the original Sarnat
criteria and is based on 9 clinical signs and gives a score ranging from 0 to 22. Adapted from
reference (37).
1.2 Hypoxic Ischaemic Encephalopathy
42
Figure 1.7: Burst suppressed trace on an aEEG monitoring device. The top part of the figure
is indicating the aEEG trace from the cerebral function monitor (CFM), and the bottom
part is indicating the EEG trace (please refer to section 2.1.3 of chapter 2 for further details).
Image adapted from website http://www.neoweb.org.uk/CFM/Quiz.htm.
Figure 1.8: Seizure activity with a flat, isoelectric background on an aEEG monitoring
device. The top part of the figure is indicating the aEEG trace from the cerebral function
monitor (CFM), and the bottom part is indicating the EEG trace (please refer to section
2.1.3 of chapter 2 for further details). Image adapted from website
http://www.neoweb.org.uk/CFM/Quiz.htm.
1.2 Hypoxic Ischaemic Encephalopathy
43
SYSTEM CRITERIA
Renal Anuria or oliguria (<1 ml/kg/h) for 24 hours or
more, and a serum creatinine concentration >100
mmol/l; or anuria/oliguria for >36 hours; or any
serum
creatinine >125 mmol/l; or serial serum creatinine
values that increased postnatally
Cardiovascular Hypotension treated with an inotrope for >24
hours to maintain blood pressure within the
normal range, or electrocardiographic evidence of
transient
myocardial ischaemia
Respiratory Need for ventilator support with oxygen
requirement >40% for at least the first 4 hours
after
birth
Hepatic Aspartate aminotransferase >100 IU/l or alanine
aminotransferase >100 IU/l at any time during the
first
week after birth
Table 1.5: Criteria for organ dysfunction in HIE. This was modified and based on a
retrospective cohort study which showed that there was no association between organ
dysfunction and outcome (36). Adapted by reference (36).
Historically treatment of HIE was provision of symptomatic support for all
organs. However, in recent years there has been a drive towards implementing specific
neuroprotective measures for the prevention of ongoing brain injury. As described earlier
and as shown schematically (see Fig. 1.1) HIE is a progressive disease which does not
stop once the hypoxic insult stops. Improving the peripheral circulation and supporting
all the systems in maintaining homeostasis does not stop the cascade of biochemical
events triggered by the initial hypoxic-ischaemic insult. A revolutionary treatment with
the aim to cease the cascade of these biochemical changes is now offered to all infants
with HIE in the form of therapeutic hypothermia (TH) in high income countries (38, 39).
This followed the results of the TOBY (TOtal BodY, whole body therapeutic
hypothermia for perinatal asphyxia) and several other randomised controlled trials and
their beneficial results (40-42). Following a clinical assessment based on the TOBY
clinical criteria (see Table 1.6), the infant with suspected HIE receives a 72-hour course

1.2 Hypoxic Ischaemic Encephalopathy
44
of whole-body TH with target core body temperature between 33 to 34 °C, and parallel
continuous aEEG or EEG monitoring (depending on the facilities of the centre delivering
the care). As evident form table 1.6, the treatment is offered to the moderate to severe end
of the HIE clinical spectrum (stage II and III). The studies have shown that the numbers
to treat for one infant to be saved, free of neurodevelopmental sequelae is 8 (43).
Criteria Condition
Criteria A: Infants ≥36 weeks of gestation
admitted to the neonatal unit with at least one of
the following:
Apgar score of ≤5 at 10 minutes after birth
Continued need for resuscitation, including
endotracheal or mask ventilation, at
10 minutes after birth
Acidosis within 60 minutes of birth (defined as any
occurrence of umbilical cord,
arterial or capillary pH <7.00)
Base Deficit ≥ 16 mmol/L in umbilical cord or any
blood sample (arterial, venous
or capillary) within 60 minutes of birth
Criteria B: Infants that meet criteria A should be
assessed whether they meet the following
neurological abnormality entry criteria of
moderate to severe encephalopathy or seizures:
Altered state of consciousness (reduced response
to stimulation or absent response to stimulation)
and
Abnormal tone (focal or general hypotonia, or
flaccid) and
Abnormal primitive reflexes (weak or absent suck
or Moro response)
Table 1.6: TOBY cooling criteria for initiation of TH on infants with suspected HIE. Note
that at least one of criteria A and all of criteria B need to be fulfilled for TH to be considered
as a therapeutic strategy. Adapted by the UK TOBY Cooling Register Clinician’s
Handbook.
Overall, it has been shown that mild to moderate induced hypothermia in HIE
cases reduces the risk of death and disability in infants with less severe EEG
abnormalities, reduces death and moderate to severe disability, and increases the number
of disability-free survivors (40-42, 44). There is ongoing research in the identification of
adjacent neuroprotective measures or agents which could be used in addition to TH for
further improvement of clinical outcome.
1.2 Hypoxic Ischaemic Encephalopathy
45
The TOBY Xe randomised control trial explored the efficacy of TH plus xenon
within 6 hours of birth versus TH alone perinatal asphyxia. This trial proved the feasibility
of xenon administration but did not show any added neuroprotective effect in clinical
outcome (45) despite promising animal studies (46, 47). Potential reasons for his could
be the timing of Xe administration of the dosage delivered. There is an ongoing clinical
trial (CoolXenon2), further exploring the efficacy of TH combined with Xe for infants
born in poor condition (https://clinicaltrials.gov/ct2/show/NCT01545271).
A recent systematic review summarises the neuroprotective effects of melatonin
in perinatal hypoxia-ischaemia in animal studies (48) and presents its encouraging
positive neuroprotective effects, as shown so far by experimental research (49-52). This,
however, has not yet translated into a clinical trial or standardised clinical approach.
Researchers are also exploring the use of erythropoietin in combination with TH as an
added neuroprotective agent with some variable results coming from the experimental
field (53-56) and randomised controlled trial (57). A more recent randomised control trial
has shown that when erythropoietin is administered in high doses with TH in infants with
HIE, it potentially leads to a decrease in MRI brain insult and a better motor outcome at
1 year of life (58). Another research group is undertaking a clinical trial on the
effectiveness of allopurinol as an adjacent neuroprotective agent in combination with TH
(http://www.albino-study.eu/).
1.3 Perinatal Stroke
46
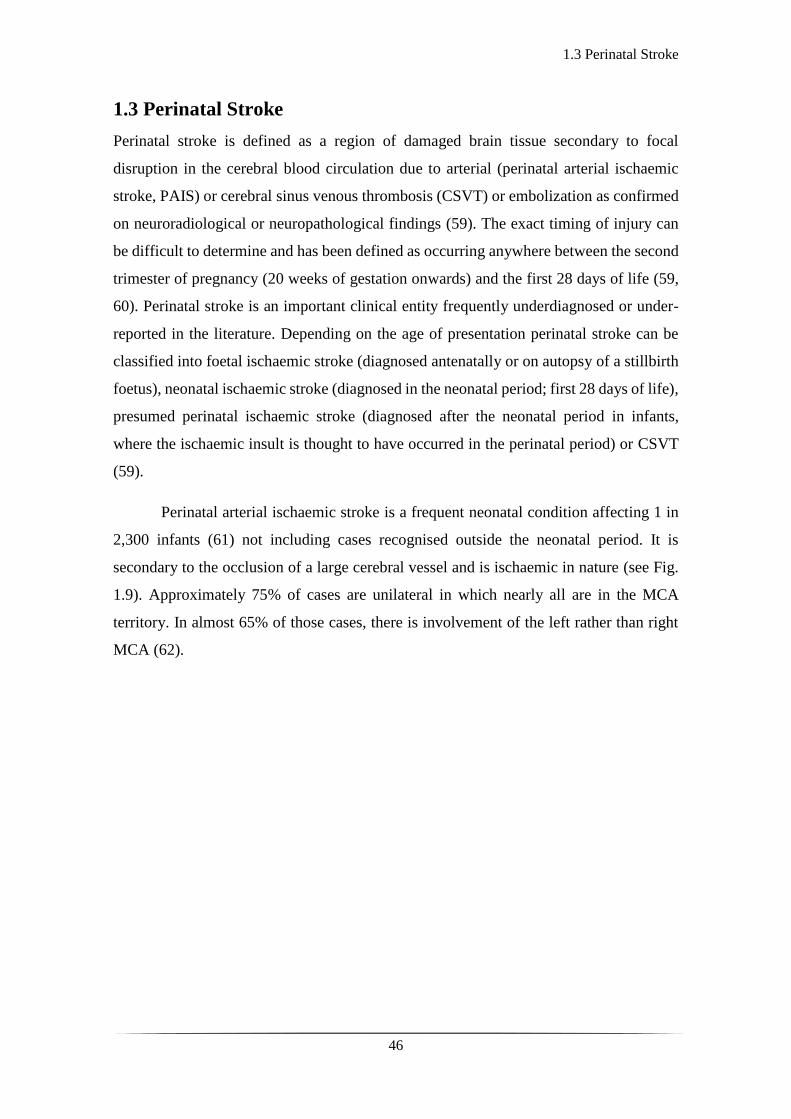
1.3 Perinatal Stroke
Perinatal stroke is defined as a region of damaged brain tissue secondary to focal
disruption in the cerebral blood circulation due to arterial (perinatal arterial ischaemic
stroke, PAIS) or cerebral sinus venous thrombosis (CSVT) or embolization as confirmed
on neuroradiological or neuropathological findings (59). The exact timing of injury can
be difficult to determine and has been defined as occurring anywhere between the second
trimester of pregnancy (20 weeks of gestation onwards) and the first 28 days of life (59,
60). Perinatal stroke is an important clinical entity frequently underdiagnosed or under-
reported in the literature. Depending on the age of presentation perinatal stroke can be
classified into foetal ischaemic stroke (diagnosed antenatally or on autopsy of a stillbirth
foetus), neonatal ischaemic stroke (diagnosed in the neonatal period; first 28 days of life),
presumed perinatal ischaemic stroke (diagnosed after the neonatal period in infants,
where the ischaemic insult is thought to have occurred in the perinatal period) or CSVT
(59).
Perinatal arterial ischaemic stroke is a frequent neonatal condition affecting 1 in
2,300 infants (61) not including cases recognised outside the neonatal period. It is
secondary to the occlusion of a large cerebral vessel and is ischaemic in nature (see Fig.
1.9). Approximately 75% of cases are unilateral in which nearly all are in the MCA
territory. In almost 65% of those cases, there is involvement of the left rather than right
MCA (62).

1.3 Perinatal Stroke
47
Figure 1.9: Brain susceptibility to PAIS. (A) Image showing the brain regions most
susceptible to PAIS. (B) Image showing the supply regions of the large cerebral vessels.
(ACA: Anterior cerebral artery; MCA: Middle cerebral artery; PCA: Posterior cerebral
artery). Image (A) was adapted from reference (30) and image (B) from
neuro4students.wordpress.com.
The aetiology of PAIS is uncertain in most cases. There is a variety of maternal,
intrapartum, and neonatal factors considered to predispose to PAIS (see Table 1.7). The
commonest hypothesis is that of a placental embolus travelling into the foetal circulation,
because of the patency of the foramen ovale and the frequency at which the left MCA is
involved. Other direct aetiological mechanisms have been reported, such as meningitis,
presumably secondary to endothelial injury and inflammation of arteries and veins (63).
It is also associated with congenital heart disease, especially if intravascular
catheters, extracorporeal membrane oxygenation (ECMO) or surgery is required (64).
PAIS has been reported to coexist with NE in up to 5% of cases (65). More recent studies
have shown that although infants with PAIS might have a complicated perinatal history
(66), co-presenting with NE is rare, and the incidence presented in older studies may be
influenced by the misclassification of neonatal seizures under the generic umbrella of NE.
B A
1.3 Perinatal Stroke
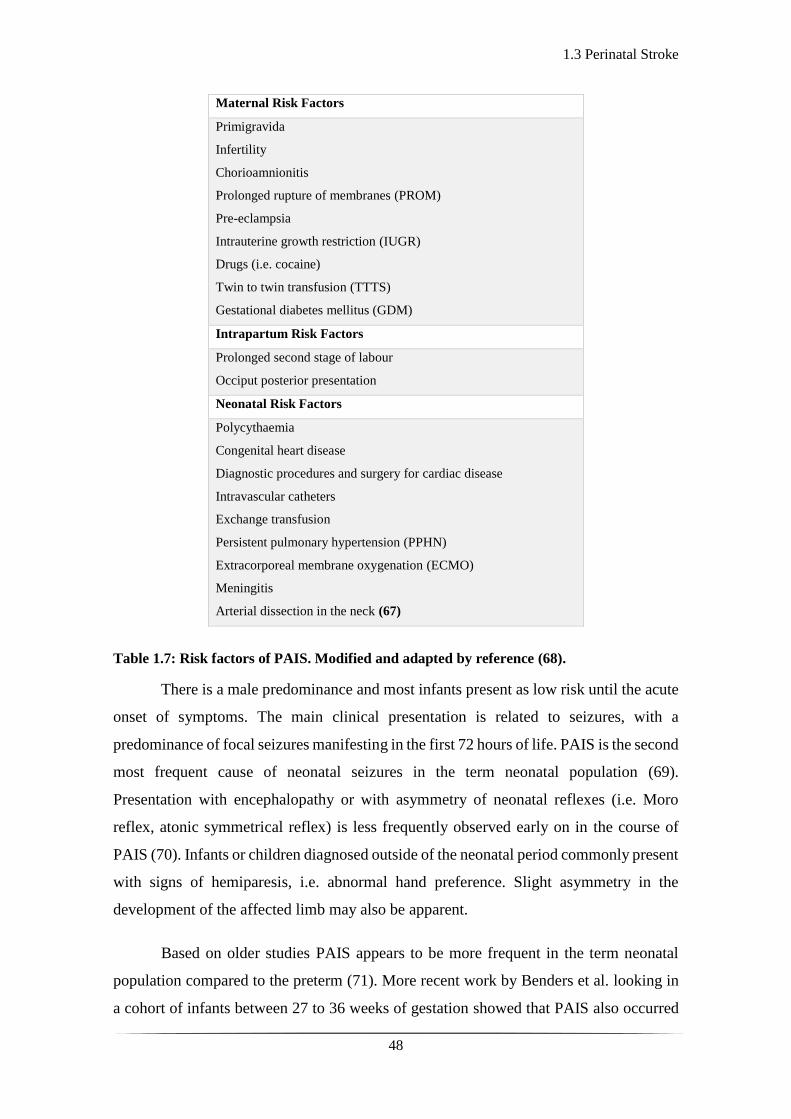
48
Maternal Risk Factors
Primigravida
Infertility
Chorioamnionitis
Prolonged rupture of membranes (PROM)
Pre-eclampsia
Intrauterine growth restriction (IUGR)
Drugs (i.e. cocaine)
Twin to twin transfusion (TTTS)
Gestational diabetes mellitus (GDM)
Intrapartum Risk Factors
Prolonged second stage of labour
Occiput posterior presentation
Neonatal Risk Factors
Polycythaemia
Congenital heart disease
Diagnostic procedures and surgery for cardiac disease
Intravascular catheters
Exchange transfusion
Persistent pulmonary hypertension (PPHN)
Extracorporeal membrane oxygenation (ECMO)
Meningitis
Arterial dissection in the neck (67)
Table 1.7: Risk factors of PAIS. Modified and adapted by reference (68).
There is a male predominance and most infants present as low risk until the acute
onset of symptoms. The main clinical presentation is related to seizures, with a
predominance of focal seizures manifesting in the first 72 hours of life. PAIS is the second
most frequent cause of neonatal seizures in the term neonatal population (69).
Presentation with encephalopathy or with asymmetry of neonatal reflexes (i.e. Moro
reflex, atonic symmetrical reflex) is less frequently observed early on in the course of
PAIS (70). Infants or children diagnosed outside of the neonatal period commonly present
with signs of hemiparesis, i.e. abnormal hand preference. Slight asymmetry in the
development of the affected limb may also be apparent.
Based on older studies PAIS appears to be more frequent in the term neonatal
population compared to the preterm (71). More recent work by Benders et al. looking in
a cohort of infants between 27 to 36 weeks of gestation showed that PAIS also occurred

1.3 Perinatal Stroke
49
in preterm infants and was again more common on the left side and in the MCA territory.
It appeared that infarct of the MCA in gestations of over 32 weeks mainly involved its
main branch (72). The underestimation of its prevalence in the preterm population was
highlighted and the requirement for more frequent neuroimaging was stressed (72, 73).
Several models have been developed to understand the pathophysiological
mechanisms of HIE and focal arterial stroke at term (74). A hypoxic-ischemic insult was
reproduced by unilateral ligation of the common carotid artery (CCA) followed by a
variable duration of exposure to 8% oxygen postnatally in rats (75) and mice. Focal
arterial stroke was reproduced by a transient MCA occlusion model in rats on day 7 (76)
or day 10 of life (77), and mice (78), and a combined permanent MCA occlusion and
transient CCA occlusion in rats (79). It was shown that the hypoxic-ischaemic insult is
associated with increased cerebral blood flow (CBF) during systemic hypoxia, whereas
CBF is disrupted after MCA occlusion. Lack of flow may be evident in the affected artery
for hours post initial infarct (80). Reperfusion occurs either through the affected artery or
via anastomotic arteries and the biochemical cascade in the reperfusion phase is very
much like the one seen in HIE, with macrophages, glial cells, excitotoxic agents (such as
glutamate), and oxidative stress being responsible for the ongoing injury process in the
core of the infarct and its penumbra.
After the first 3 days and up to 6 weeks following the insult, the infarct organises
and this may consist of gliosis, cyst formation, myelin breakdown, and neovascularisation
(81). Eventually, after the second month, an infarct involving a major cerebral artery will
evolve in an area of cortical and subcortical tissue loss, which appears open towards the
subarachnoid space (see Fig. 1.10(B)).
The management of PAIS is supportive and consists of adequate hydration, and
anticonvulsant treatment as clinically indicated. There is not enough evidence to support
thrombolytic measures in the neonatal period and there is concern over the risk of
intracranial haemorrhage with thrombolysis. In the instance of a clearly identified,
ongoing cardio-embolic source the use of low molecular weight heparin (LMWH) may
be justified but proper evidence deriving form randomised controlled trials is lacking
(82).
1.3 Perinatal Stroke
50
Alternative methods of treatment are being explored in the adult population.
Hypothermia preserves cerebral autoregulation (CA) and reduces cytotoxic oedema
around clot formatting in the stroke affected region (83) and could play a role in the
treatment of acute stroke. In a systematic review of animal studies, therapeutic
hypothermia reduced infarct size by 44% (95% confidence interval 40 to 47%) with the
best results being obtained at lower temperatures (≤ 31 °C). A reduction in infarct volume
was also observed by approximately one third with temperature reduction to 35 °C, with
initiation of treatment between 90 and 180 minutes, and in permanent ischemia models
(84). Randomised trials of surface or endovascular hypothermia initiation in the treatment
of acute ischaemic stroke (Cooling for acute ischaemic brain damage - COOL-AID, (85),
Intravascular cooling in the treatment of stroke - ICTus, (86)) have not shown any
significant difference in outcome between the cohort of patients receiving hypothermia
and those who were not. However, the second COOL-AID trial, with a larger number of
patients (10 in the initial, 40 in the second one), showed a trend of decreased lesion growth
on diffusion weighted images (DWI-MR) in the group treated with both thrombolysis and
hypothermia, although the results in clinical outcome were similar between the two
groups (87). In a single-centre study it was shown that out of 15 infants diagnosed with
focal stroke on MRI, 5 of them who also underwent hypothermia did not have any seizure
activity manifestation, thus providing some promise in the neuroprotective role of TH in
perinatal stroke (88).
The outcome of PAIS includes the development of epilepsy later in childhood,
cognitive impairment, and behaviour problems (89). Language delay may be evident in
up to 25% (90). PAIS in the MCA territory may lead to hemiplegia in up to 50% of cases.
In cases where there is additional involvement of the basal ganglia and PLIC, the risk of
developing contralateral hemiplegia is higher regardless of the extent of the infarct (91).
Examples of perinatal stroke and its potential extent in preterm and term infants can be
seen in figures 1.10-13.

1.3 Perinatal Stroke
51
Figure 1.10: CT and MRI examples of perinatal stroke: (A) CT image of 1-day-old infant
with right MCA stroke. (B) Axial T2 weighted MR image of 9-month-old child with evidence
of perinatal stroke, which has led to skull asymmetry and large porencephalic cyst. Adapted
from reference (92).
Figure 1.11: MRI of perinatal left MCA stroke: Axial T2 (top) and diffusion-weighted MRI
(bottom) images of 5-day-old infant with left MCA stroke. Adapted from reference (92).
A B

1.3 Perinatal Stroke
52
Figure 1.12: Ultrasound and MRI examples of stroke: (a) Parasagittal view on ultrasound,
showing a large left MCA infarction in a 27-week infant with history of TTTS. (e)
corresponding MRI, fluid-attenuated inversion recovery sequence of the same child at 18/12
showing gliosis and extensive cavitation adjacent to the left ventricle. (b) Coronal view on
ultrasound, showing right anterior MCA infarction in a 29-week infant (f) corresponding
MRI, at 8 years, showing gliosis adjacent to the right ventricle and cavitation. (c) Coronal
view on ultrasound, showing a left-sided large MCA/ACA watershed infarction in a 30-week
infant, (g) corresponding MRI, at 8 years, showing a gliotic cleft and atrophy of the area
involved. (d) Coronal view on ultrasound, showing a left-sided ACA infarction in a 36-week
infant, (h) corresponding MRI, at 7 years. (TTTS: twin to twin transfusion, ACA: anterior
cerebral artery) Adapted from reference (72).
Figure 1.13: MRI example of perinatal stroke: (A) MRI, T2-weighted showing bilateral
MCA infarct in an infant born at 34/40 weeks of gestation. (B) The corresponding diffusion
weighted image. The MRI was performed on day 4 after birth. Adapted by reference (73).
A B

1.3 Perinatal Stroke
53
Cerebral sinus venous thrombosis (CSVT) is another type of perinatal stroke, less
prevalent compared to PAIS. It occurs in 2.6 in 100,000 live births (93), a rate most likely
underestimated mostly due to under-diagnosis and lack of sophisticated neuroimaging
techniques in many centres. The commonest sinus affected is the superior sagittal, often
with involvement of the straight and transverse sinus (see Fig. 1.14). More than one sinus
is commonly affected (94). The mechanism of injury is thought to be associated to venous
occlusion and haemorrhagic infarction in the brain region drained by the sinus post
CSVT. Venous engorgement, oedema, and increased capillary hydrostatic pressure lead
to brain injury (95), which can vary from venous congestion to ischaemic infarction of
the surrounding cortex, subcortical white matter and deep nuclear structures (see Figures
1.15, 1.16). The natural progression is haemorrhagic transformation of the infarcted brain
tissue.
Cerebral sinus venous thrombosis has also been associated with secondary
intraventricular, intraparenchymal haemorrhage as well as haemorrhage within the basal
ganglia and thalamus due to distal draining veins. A multicentre, retrospective study in
the Netherlands, has shown that amongst the 52 patients identified with CSVT,
approximately 50% had thalamic haemorrhage, 50% had IVH and up to 80% had
intraparenchymal haemorrhage (96).
Figure 1.14: The cerebral venous draining system. CSVT is usually located in the major
dural sinuses; superior sagittal sinus, transverse, straight and sigmoid sinuses. Adapted
from reference (97).

1.3 Perinatal Stroke
54
Figure 1.15: Examples of CSVT: (A) Axial T2-weighted MR image showing left-sided
punctate white matter lesions. (B) Time-of-flight MR venogram image showing absent flow
in the straight sinus. Adapted from reference (96)
Figure 1.16: Further examples of CSVT: (A) Axial T2-weighted MR image showing right
thalamic haemorrhage with a thrombosed vein (arrow) in thalamus. (B) Sagittal T1-
weighted MR image showing high intensity signal in a thrombosed internal cerebral vein
(arrow). Adapted from reference (93).
The risk factors predisposing to CSVT are like the ones of PAIS with
polycythaemia and dehydration being the commonest clinical association. There also
seems to be a consistent male predominance. It can present with seizures but sometimes
the symptoms are subtle, such as hypotonia or apnoea. In the same study, as the one
A B
1.3 Perinatal Stroke
55
mentioned above, the initial symptoms were seizures in almost 80% of the 52 cases
reported (96). It may coexist with HIE, meningitis, or meconium aspiration syndrome.
The management in CSVT is once again supportive, maintaining good hydration,
normocapnia and normoglycaemia with administration of anticonvulsants as required.
Similarly, there is no evidence regarding the use of thrombolysis. The use of LMWH is
variable and awaits formal evaluation.
Overall, PAIS is the commonest cause of unilateral spastic cerebral palsy (98),
and up to 50% of cases with CSVT have been reported to possibly have some motor
deficit from 20 to 80% (99, 100). PAIS is associated with minimal mortality rates with
its occurrence being rare on the same patient or siblings. There is, however, a high chance
of recurrence of seizures later in life up to 50% and especially in children who have
developed unilateral spastic cerebral palsy (101). Seizures are usually easily controlled
with standard antiepileptic agents. There are few cases where development of
hypsarrhythmia is noted with later epilepsy and possible requirement for surgical
resection of the epileptogenic brain region (101). Mortality rates are low in CSVT, up to
2-5% but higher than in cases of PAIS (99, 100). There are some studies that have
reported higher mortality rates of CSVT in up to 19% and 25% possibly due to earlier
diagnosis and different criteria for withdrawal of intensive care (96, 102). Up to 15-40%
of infants with CSVT are reported to develop epilepsy in childhood (94, 99, 103). Infants
with associated thalamic lesions are at higher risk of developing epilepsy which may be
difficult to treat and is related to poor cognitive outcome (104). Mercuri et al., have
described high association of PAIS (105). Berfelo et al., have described uncoordinated
ocular movements in cases of CSVT (96).
The effect of PAIS on cognitive outcome is to yet to be determined, however,
studies with serial follow ups have shown that cognition deteriorates with age and most
likely due to the development of epilepsy (106-108). It also appears that learning
difficulties and behavioural problems are more frequently seen in cases of PAIS who have
developed unilateral spastic cerebral palsy (89). There is a wide range of occurrence of
poor cognitive outcome associated to CSVT from 25% up to 73% amongst different
studies (99, 109, 110).
1.4 Neuro-monitoring and Neuro-imaging tools
56
1.4 Neuro-monitoring and Neuro-imaging tools
The above sections focused on the epidemiology, clinical course, management, and
outcome of the two most frequent causes of encephalopathy and seizures in the term
neonatal population. This section presents the mainstay of tools for neurological
monitoring and neuroimaging in such cases. There are slight variations in practice
amongst different hospitals across the United Kingdom, mainly due to different expertise
in neuroradiology and access to advanced neuroimaging techniques. However, there is a
general approach followed in most tertiary level neonatal intensive care units in
monitoring and imaging infants with suspected HIE or perinatal stroke. In the following
paragraphs, these different tools are described.
In Hypoxic Ischaemic Encephalopathy
In cases of HIE, the commonest neuromonitoring tool is a device best known as the
cerebral function monitor (CFM). This is an aEEG device which provides cot side
baseline monitoring of cerebral electrical activity. It is easily applicable, and both
clinicians and nurses can be trained on its interpretation. It does show changes in the
background electrical activity over time and following various clinical interventions. It
can detect seizures but does have limitations; it is either a single or a two-channel system,
thus limiting the detection of electro-cortical activity to specific scalp areas. Additionally,
it does not detect low frequency activity, which is highly significant as some of the
neonatal seizures can be of low frequency. Numerous studies especially from the
Netherlands have shown that its correct use and knowledge of its limitations can be of
immense value in clinical practice (111-115).
Continuous EEG monitoring with the option of an aEEG display is superior as it
allows multichannel coverage of the brain electrical activity and thus increases the
possibilities of capturing electro-cortical events of clinical interest. Few tertiary centres
have access to the equipment, resources and clinical neurophysiology support required.
Provision of expert neurophysiological interpretation on a 24-hour basis is costly and
unsustainable as in most tertiary hospitals there is only one or two clinical
neurophysiologists with expertise in paediatric and neonatal EEG. (For further details on
EEG please refer to chapter 2).
In terms of neuroimaging, cranial ultrasonography (CrUS) is readily available and
portable to the cot side. It is a convenient tool that allows visualisation of the neonatal
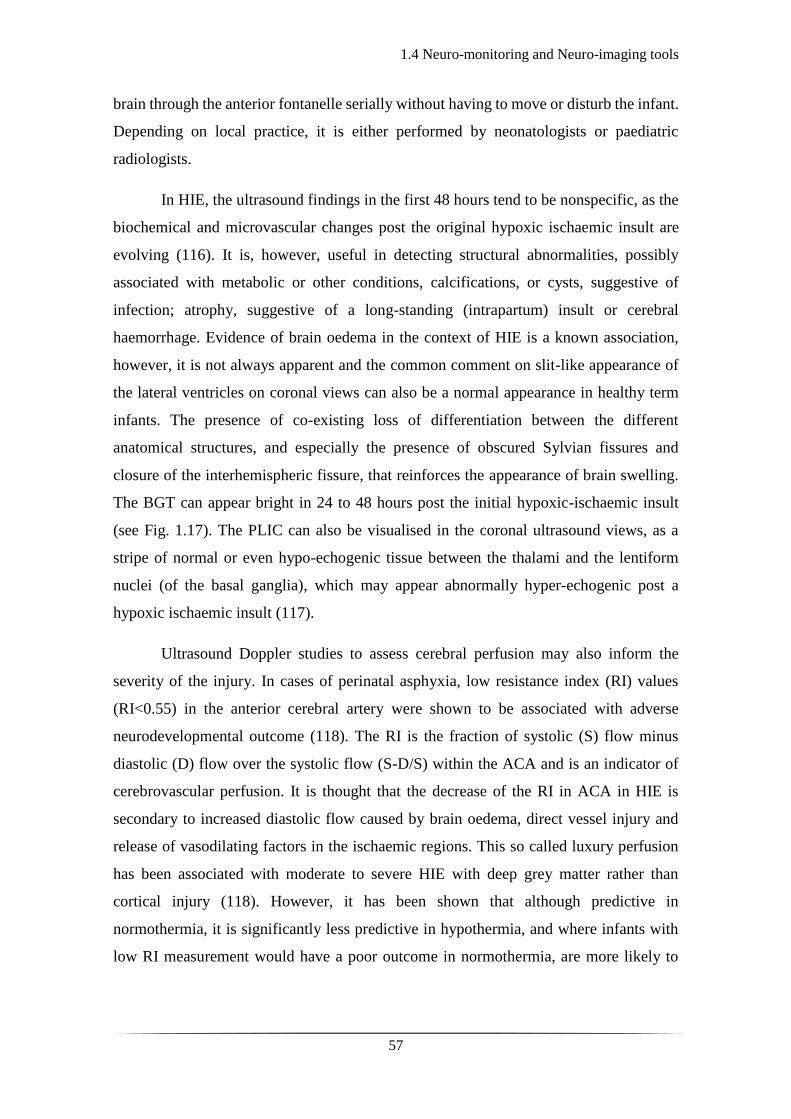
1.4 Neuro-monitoring and Neuro-imaging tools
57
brain through the anterior fontanelle serially without having to move or disturb the infant.
Depending on local practice, it is either performed by neonatologists or paediatric
radiologists.
In HIE, the ultrasound findings in the first 48 hours tend to be nonspecific, as the
biochemical and microvascular changes post the original hypoxic ischaemic insult are
evolving (116). It is, however, useful in detecting structural abnormalities, possibly
associated with metabolic or other conditions, calcifications, or cysts, suggestive of
infection; atrophy, suggestive of a long-standing (intrapartum) insult or cerebral
haemorrhage. Evidence of brain oedema in the context of HIE is a known association,
however, it is not always apparent and the common comment on slit-like appearance of
the lateral ventricles on coronal views can also be a normal appearance in healthy term
infants. The presence of co-existing loss of differentiation between the different
anatomical structures, and especially the presence of obscured Sylvian fissures and
closure of the interhemispheric fissure, that reinforces the appearance of brain swelling.
The BGT can appear bright in 24 to 48 hours post the initial hypoxic-ischaemic insult
(see Fig. 1.17). The PLIC can also be visualised in the coronal ultrasound views, as a
stripe of normal or even hypo-echogenic tissue between the thalami and the lentiform
nuclei (of the basal ganglia), which may appear abnormally hyper-echogenic post a
hypoxic ischaemic insult (117).
Ultrasound Doppler studies to assess cerebral perfusion may also inform the
severity of the injury. In cases of perinatal asphyxia, low resistance index (RI) values
(RI<0.55) in the anterior cerebral artery were shown to be associated with adverse
neurodevelopmental outcome (118). The RI is the fraction of systolic (S) flow minus
diastolic (D) flow over the systolic flow (S-D/S) within the ACA and is an indicator of
cerebrovascular perfusion. It is thought that the decrease of the RI in ACA in HIE is
secondary to increased diastolic flow caused by brain oedema, direct vessel injury and
release of vasodilating factors in the ischaemic regions. This so called luxury perfusion
has been associated with moderate to severe HIE with deep grey matter rather than
cortical injury (118). However, it has been shown that although predictive in
normothermia, it is significantly less predictive in hypothermia, and where infants with
low RI measurement would have a poor outcome in normothermia, are more likely to
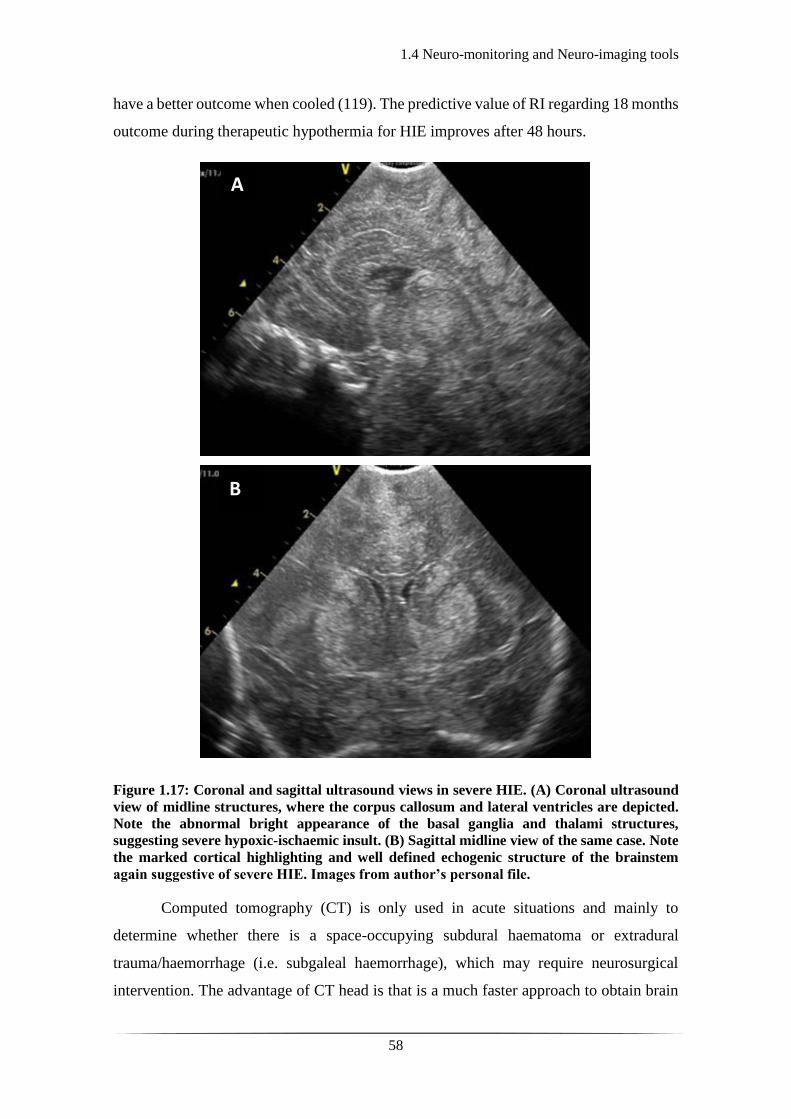
1.4 Neuro-monitoring and Neuro-imaging tools
58
have a better outcome when cooled (119). The predictive value of RI regarding 18 months
outcome during therapeutic hypothermia for HIE improves after 48 hours.
Figure 1.17: Coronal and sagittal ultrasound views in severe HIE. (A) Coronal ultrasound
view of midline structures, where the corpus callosum and lateral ventricles are depicted.
Note the abnormal bright appearance of the basal ganglia and thalami structures,
suggesting severe hypoxic-ischaemic insult. (B) Sagittal midline view of the same case. Note
the marked cortical highlighting and well defined echogenic structure of the brainstem
again suggestive of severe HIE. Images from author’s personal file.
Computed tomography (CT) is only used in acute situations and mainly to
determine whether there is a space-occupying subdural haematoma or extradural
trauma/haemorrhage (i.e. subgaleal haemorrhage), which may require neurosurgical
intervention. The advantage of CT head is that is a much faster approach to obtain brain
A
B

1.4 Neuro-monitoring and Neuro-imaging tools
59
images, the exposure of the infant to ionising radiation though must be considered. In this
respect, CT should only be used in a potential neurosurgical emergency and if further
neuroimaging is required MRI should be recommended.
The gold standard neuro-imaging tool for HIE is MRI (120). It allows early
identification of brain injury secondary to hypoxic-ischaemic insult and assessment of
treatment efficacy (121). The pattern of injury associated to the deeper grey matter
structures (BGT-predominant injury) or the cortex (watershed-predominant injury) or
severe global, may be more evident and specific after the first 4 to 7 days on standardised
conventional MRI, but may be apparent on diffusion-weighted MR imaging (DWI) much
earlier (122). Several studies have shown that MRI aids the prediction of outcome in HIE
(123-126).
It is worth noting here that MRI is also the imaging technique of choice in
diagnosing underlying causes of neonatal seizures (127). One study using clinical
information in combination with CT or MRI identified the cause of neonatal seizures in
almost 80% of a large cohort of infants (11). A more recent study showed an even higher
rate, up to 95%, in identifying the aetiology of neonatal seizures and assisting the
prediction of neurodevelopmental outcome by using MRI (128).
Studies on cerebral oxygen delivery and consumption have provided more
information on the pathophysiology of brain injury in HIE and perinatal stroke. The use
of oxygen-15 positron emission tomography (PET) and xenon-enhanced CT (Xe CT) in
studies assessing brain haemodynamics are invasive and hence not applicable in the
neonatal population. However, more specialised MRI techniques allow the investigation
of different aspects of the brain metabolism; the phase contrast MR angiography (PC-
MRA) and the arterial spin T2-based measurements allow the estimation of oxygen
saturation (SaO2), with oxygen extraction fraction (OEF) and the cerebral metabolic rate
of oxygen (CMRO2), being indirectly calculated from the previously mentioned
parameters (129).
Such techniques have been applied to demonstrate an increase in CBF with
postconceptional age (130-132) and to study HIE and perinatal stroke (see Figures 1.18
and 1.19). For example, De Vis et al., showed significant correlation between increased
perfusion in deep grey matter, as assessed by pulsed arterial spin labelling (PASL), in

1.4 Neuro-monitoring and Neuro-imaging tools
60
infants with poor neurodevelopmental outcome at 9 and 18 months of age following HIE
(133). Shi et al., showed association between higher signal intensity in deep grey matter
structures in infants with HIE, thus indirectly implying association with hyper-perfusion
in the areas of injury (134). However, a study evaluating brain perfusion in the second
week following HIE, showed hyper-perfusion locally and globally but lower perfusion in
the thalami, thus implying a regional low metabolic demand post irreversible injury (135).
This supports a later study which evaluated the progression of brain perfusion in the first
week following HIE, which identified low perfusion on day one followed by hyper-
perfusion in affected regions (136).
Studies based on magnetic resonance spectroscopy (MRS) can also aid
prognostication in cases of HIE (137, 138). Phosphorus MRS studies have shown the
primary and secondary energy failure in hypoxia-ischaemia (as described in section 1.2
of chapter 1) (139, 140). Proton MRS based studies have shown that cerebral lactate
increases in hypoxia-ischaemia, which resolves following effective resuscitation, only to
be followed by a secondary rise 12 to 24 hours post primary insult (141-143) due to
intrinsic production (144). Changes detected by MRS have been shown to provide earlier
indication markers of disease severity in HIE than conventional MRI. Markers such as
lactate to creatinine, lactate to N-acetyl-aspartate (NAA), lactate to choline peak-area
ratios aid prognosis of disease severity and later neurodevelopmental outcome in brain
injury accurately (140, 141, 145-147).
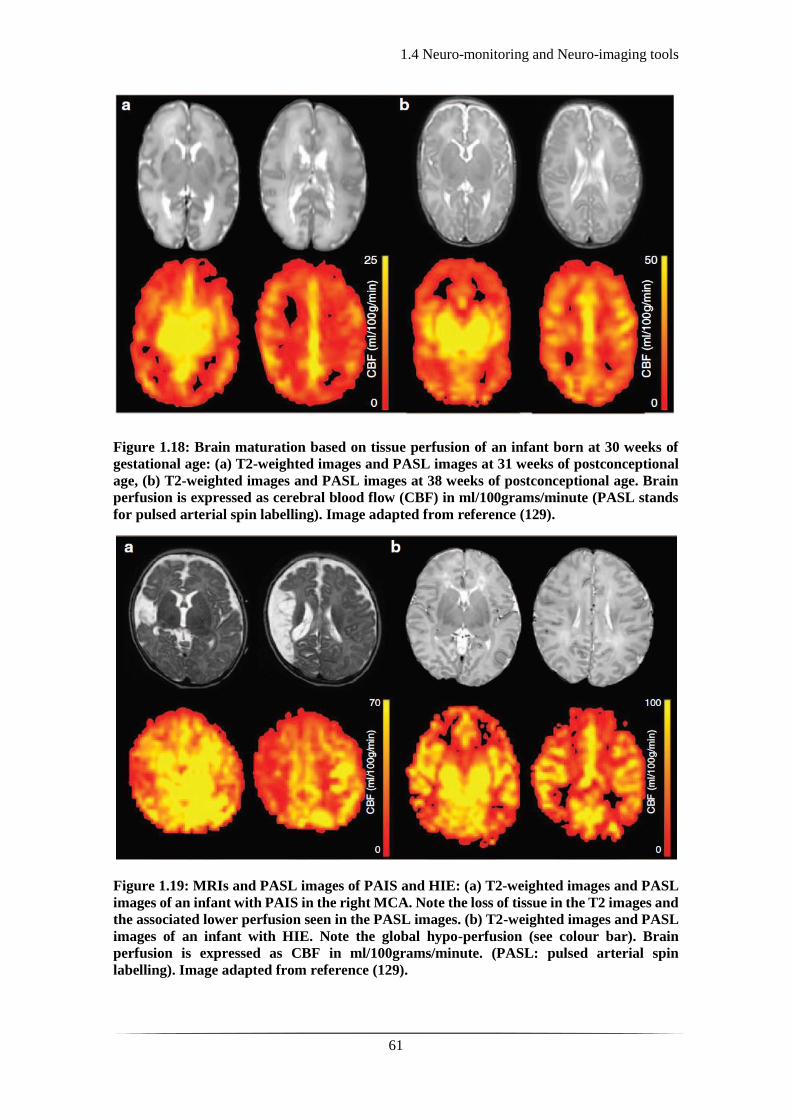
1.4 Neuro-monitoring and Neuro-imaging tools
61
Figure 1.18: Brain maturation based on tissue perfusion of an infant born at 30 weeks of
gestational age: (a) T2-weighted images and PASL images at 31 weeks of postconceptional
age, (b) T2-weighted images and PASL images at 38 weeks of postconceptional age. Brain
perfusion is expressed as cerebral blood flow (CBF) in ml/100grams/minute (PASL stands
for pulsed arterial spin labelling). Image adapted from reference (129).
Figure 1.19: MRIs and PASL images of PAIS and HIE: (a) T2-weighted images and PASL
images of an infant with PAIS in the right MCA. Note the loss of tissue in the T2 images and
the associated lower perfusion seen in the PASL images. (b) T2-weighted images and PASL
images of an infant with HIE. Note the global hypo-perfusion (see colour bar). Brain
perfusion is expressed as CBF in ml/100grams/minute. (PASL: pulsed arterial spin
labelling). Image adapted from reference (129).
1.4 Neuro-monitoring and Neuro-imaging tools
62
In Perinatal Stroke
In cases of perinatal stroke, the current available diagnostic tools by the cot side on an
NICU are CrUS, aEEG and EEG. Both CrUS and aEEG are readily available, while the
access to multichannel EEG is more variable and dependent upon local practice and
expertise.
Studies have shown that aEEG can significantly contribute to the diagnosis of
perinatal stroke (148). It can, however, be less effective in detecting seizures and provides
limited information regarding their origin, location, and nature. Early multichannel EEG
has been shown to aid in the differential diagnosis of between seizures secondary to
perinatal stroke and seizures secondary to HIE based on the background electrographic
activity and the focal nature of seizures in stroke (149). Multichannel continuous EEG
monitoring is a valuable tool in early diagnosis of perinatal stroke in terms of
lateralisation of seizures and certain electroencephalographic features associated with
stroke (150). Asymmetry or attenuation of the background activity tend to depend on the
extent of the infarction (150).
Approximately 70-80% of perinatal stroke cases can be visualised with ultrasound
performed by experienced professionals, except for small cortical infarcts in areas away
from the transducer (i.e. posterior fossa lesions) (151-153) (see Fig. 1.20a). However, the
lesion may take hours to days to organise in the hyperechoic appearance which can be
characterised as stroke; therefore ultrasound is a less sensitive tool in detecting stroke
early (154). Following the infarct there is reperfusion either through the affected or
anastomotic arteries. The macrophages and glial cells that invade the affected region
make the lesion hyperechoic and visible to scanning (81).
Ultrasound Doppler studies can also be utilised in the detection of perinatal stroke.
This is infrequently used, and it is entirely dependent on expertise. The idea is that during
reperfusion of the ischaemic region, high flow velocities may be recorded with low values
of the RI on the affected area compared to the healthy side (155, 156).
The gold standard for detection of perinatal stroke is MRI (157) (see Figures 1.20a
and 1.20b). Among specific MRI techniques, DWI may detect the infarct prior to
standardised conventional T1 and T2 weighted MR images (158). From a
pathophysiological aspect, immediately after the infarct, there is localised oedema which
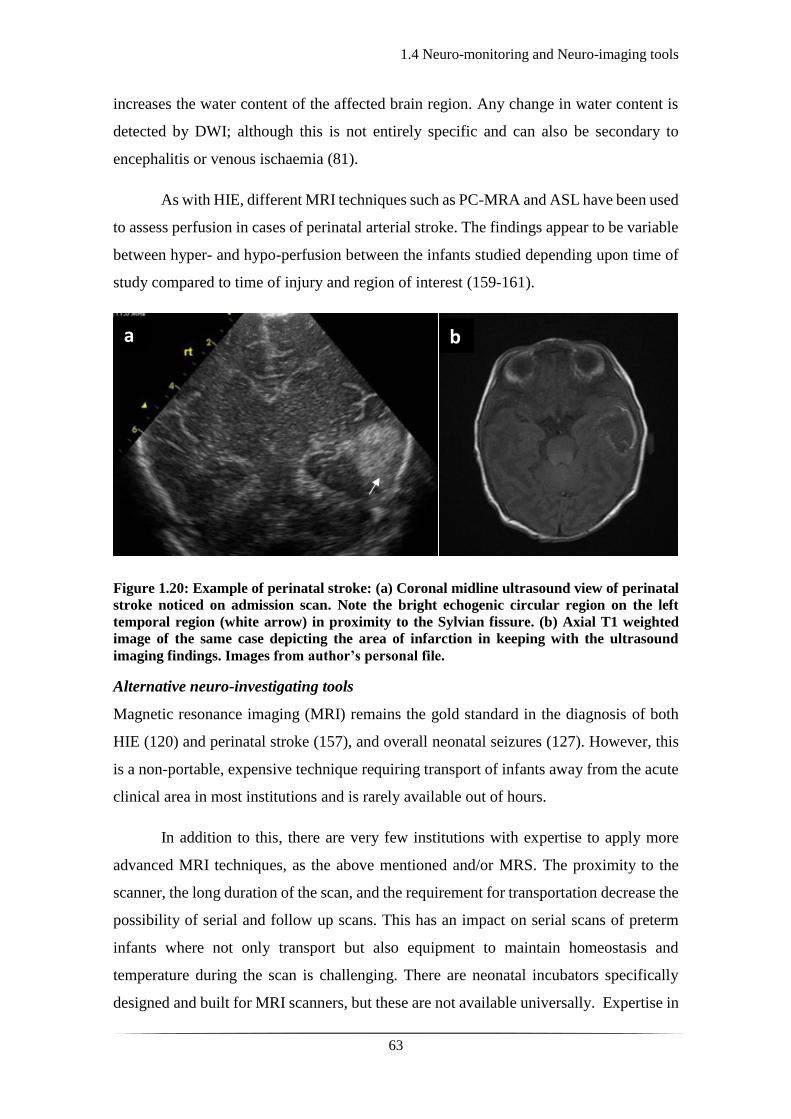
1.4 Neuro-monitoring and Neuro-imaging tools
63
increases the water content of the affected brain region. Any change in water content is
detected by DWI; although this is not entirely specific and can also be secondary to
encephalitis or venous ischaemia (81).
As with HIE, different MRI techniques such as PC-MRA and ASL have been used
to assess perfusion in cases of perinatal arterial stroke. The findings appear to be variable
between hyper- and hypo-perfusion between the infants studied depending upon time of
study compared to time of injury and region of interest (159-161).
Figure 1.20: Example of perinatal stroke: (a) Coronal midline ultrasound view of perinatal
stroke noticed on admission scan. Note the bright echogenic circular region on the left
temporal region (white arrow) in proximity to the Sylvian fissure. (b) Axial T1 weighted
image of the same case depicting the area of infarction in keeping with the ultrasound
imaging findings. Images from author’s personal file.
Alternative neuro-investigating tools
Magnetic resonance imaging (MRI) remains the gold standard in the diagnosis of both
HIE (120) and perinatal stroke (157), and overall neonatal seizures (127). However, this
is a non-portable, expensive technique requiring transport of infants away from the acute
clinical area in most institutions and is rarely available out of hours.
In addition to this, there are very few institutions with expertise to apply more
advanced MRI techniques, as the above mentioned and/or MRS. The proximity to the
scanner, the long duration of the scan, and the requirement for transportation decrease the
possibility of serial and follow up scans. This has an impact on serial scans of preterm
infants where not only transport but also equipment to maintain homeostasis and
temperature during the scan is challenging. There are neonatal incubators specifically
designed and built for MRI scanners, but these are not available universally. Expertise in
a b
1.4 Neuro-monitoring and Neuro-imaging tools
64
neonatal neuroimaging is required for the interpretation of the acquired MR images.
Although most tertiary hospitals have neuroradiology support on site there are few with
specific neonatal neuroradiology experience support, and therefore, external advice is
often sought.
There is an ongoing requirement for the development of cost-effective automated
cot-side brain monitoring and imaging tools which will ultimately improve clinical care
and facilitate application of precision medicine. Near infrared spectroscopy (NIRS) and
different NIR modalities can provide this alternative option as they permit non-invasive
and continuous monitoring of cerebral haemodynamics and oxygenation at the cot side,
by measuring changes in the concentration of oxy- and deoxy-haemoglobin (162-164).
NIRS can augment monitoring of physiological parameters to inform perfusion status in
cases of neonatal brain injury and may be highly valuable in clinical conditions such as
HIE, where there is constant dynamic changes of brain oxygenation and metabolism over
the course of the illness.
Near-infrared techniques have been utilised in the study of infants with HIE and
brain injury since the early eighties and in the next chapter a new approach of NIR
methodology, diffuse optical tomography (DOT) combined with electroencephalography
is presented. By combining DOT and EEG in monitoring and imaging infants with HIE
or stroke, who originally presented with seizures, one may evaluate and begin to
understand the constant dynamic changes in cerebral circulation. The aim of this study is
to prove the feasibility of this imaging modality on a neonatal intensive care environment
and to utilise this in the deeper understanding of the physiology of these morbidities from
a combined neurophysiological and cerebrovascular perspective.
65
Chapter 2: Electroencephalogram and
Diffuse Optical Tomography

66
2.1.1 Origin of the EEG signal
67
2.1 Electroencephalogram
2.1.1 Origin of the EEG signal
The mystery of brain electrical activity has for long been the focus of investigation for
the world of physiology and neuroscience. The foundation of EEG is attributed to an
English physiologist Richard Caton in 1875. He was the first to record the electrical
activity from dog and rabbit brains with a primitive device (165). There follows numerous
studies and descriptions of brain electrical response to electrical stimuli and seizure like
activity in the 1800s and early 1900s (166-168). However, the first to describe the human
EEG was Hans Berger with his report of human EEG recordings dating back to 1929
(169). Since then, EEG has been widely used for the study of behaviour, wakefulness,
and sleep states in research as well as for monitoring and detection of abnormal or
epileptiform activity in clinical practice.
The EEG measures the difference in electrical potential in the scalp. The human
cerebral cortex contains billions of pyramidal neurons (nerve cells), which are electrically
charged, forming complex connections and networks. This continuous neural
electrochemical signalling gives rise to electric fields, which is what is detected via EEG.
This activity, however, has a long distance to travel through different structural layers of
non-neuronal tissue, such as the meninges, cerebrospinal fluid, skull, and skin, to reach
the EEG electrodes. Hence many activated and synchronised neurons are required for the
EEG signal to be produced, transmitted, and measured. For instance, it has been described
that in cases of epileptiform discharges, up to 6 cm2 of neuron surface is required to
exhibit synchronous neural activity in order for it to be detected by scalp EEG (170).
Each neuron consists of axons, dendrites, and cell bodies (soma), (see Fig. 2.1.1).
The nerve cells respond to stimuli and transmit information down the axons. The
dendrites are either connected to axons or dendrites of other cells and are the recipients
or transmitters of impulses between nerve cells. Neural activities in the central nervous
system (CNS) are based on the synaptic currents travelling along these connections
between dendrites and axons, called synapses (see Fig.2.1.2).
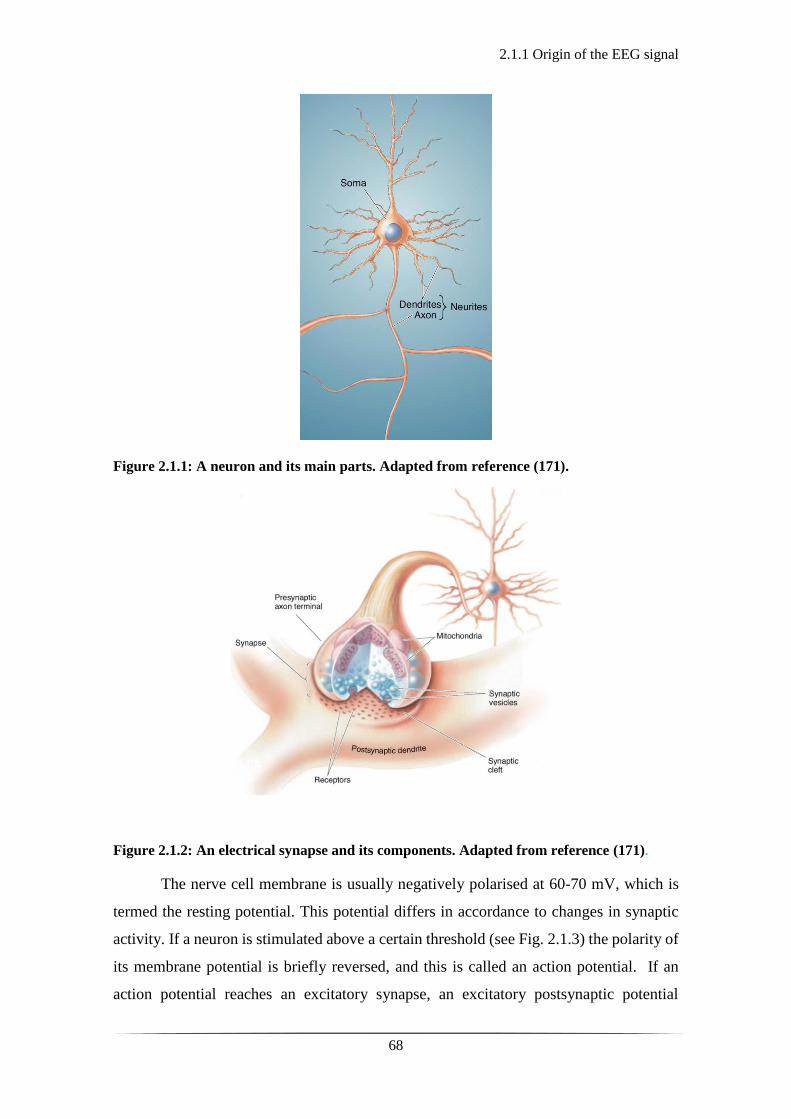
2.1.1 Origin of the EEG signal
68
Figure 2.1.1: A neuron and its main parts. Adapted from reference (171).
Figure 2.1.2: An electrical synapse and its components. Adapted from reference (171).
The nerve cell membrane is usually negatively polarised at 60-70 mV, which is
termed the resting potential. This potential differs in accordance to changes in synaptic
activity. If a neuron is stimulated above a certain threshold (see Fig. 2.1.3) the polarity of
its membrane potential is briefly reversed, and this is called an action potential. If an
action potential reaches an excitatory synapse, an excitatory postsynaptic potential
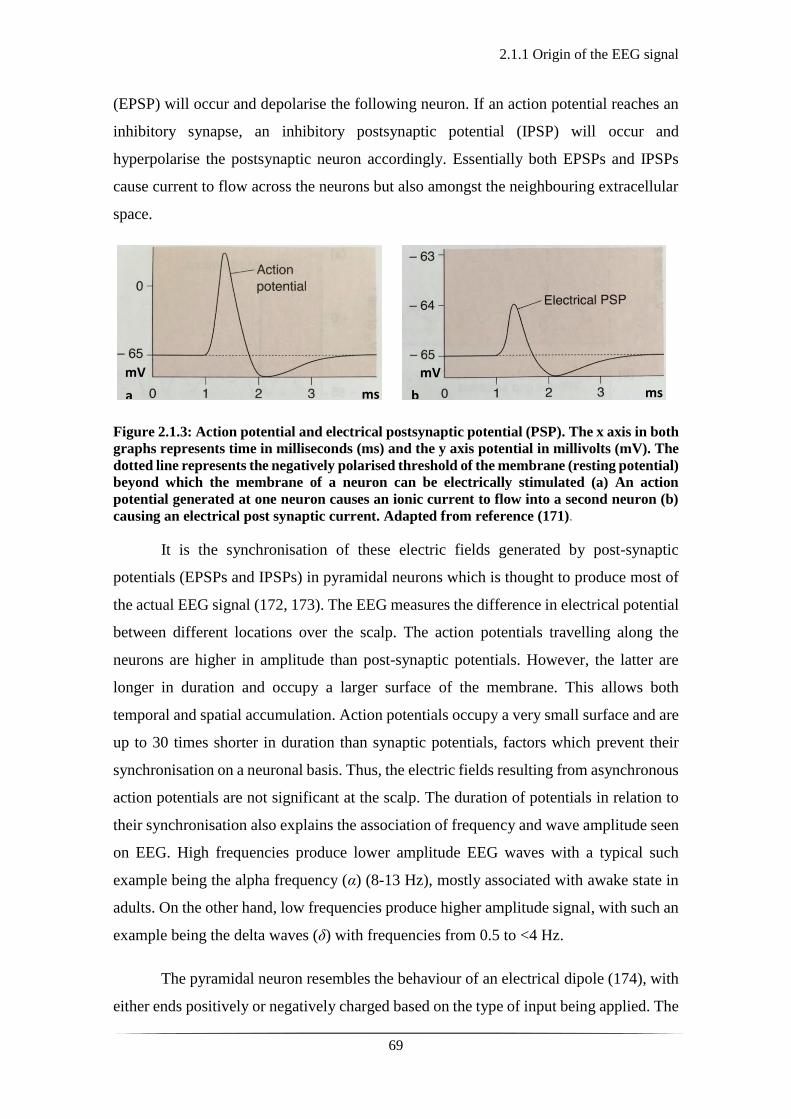
2.1.1 Origin of the EEG signal
69
(EPSP) will occur and depolarise the following neuron. If an action potential reaches an
inhibitory synapse, an inhibitory postsynaptic potential (IPSP) will occur and
hyperpolarise the postsynaptic neuron accordingly. Essentially both EPSPs and IPSPs
cause current to flow across the neurons but also amongst the neighbouring extracellular
space.
Figure 2.1.3: Action potential and electrical postsynaptic potential (PSP). The x axis in both
graphs represents time in milliseconds (ms) and the y axis potential in millivolts (mV). The
dotted line represents the negatively polarised threshold of the membrane (resting potential)
beyond which the membrane of a neuron can be electrically stimulated (a) An action
potential generated at one neuron causes an ionic current to flow into a second neuron (b)
causing an electrical post synaptic current. Adapted from reference (171).
It is the synchronisation of these electric fields generated by post-synaptic
potentials (EPSPs and IPSPs) in pyramidal neurons which is thought to produce most of
the actual EEG signal (172, 173). The EEG measures the difference in electrical potential
between different locations over the scalp. The action potentials travelling along the
neurons are higher in amplitude than post-synaptic potentials. However, the latter are
longer in duration and occupy a larger surface of the membrane. This allows both
temporal and spatial accumulation. Action potentials occupy a very small surface and are
up to 30 times shorter in duration than synaptic potentials, factors which prevent their
synchronisation on a neuronal basis. Thus, the electric fields resulting from asynchronous
action potentials are not significant at the scalp. The duration of potentials in relation to
their synchronisation also explains the association of frequency and wave amplitude seen
on EEG. High frequencies produce lower amplitude EEG waves with a typical such
example being the alpha frequency (α) (8-13 Hz), mostly associated with awake state in
adults. On the other hand, low frequencies produce higher amplitude signal, with such an
example being the delta waves (δ) with frequencies from 0.5 to <4 Hz.
The pyramidal neuron resembles the behaviour of an electrical dipole (174), with
either ends positively or negatively charged based on the type of input being applied. The
a b
mV mV
ms ms

2.1.1 Origin of the EEG signal
70
theory that best describes the conduction of the potential through the extra-cellular spaces
and the association between the recordings and the distance from the source is one of
volume conduction. The best mathematical approach to describing this is the solid angle
theorem of volume conduction (173). The theorem provides a basic understanding of how
the cortical pyramidal dipoles generate the waves seen on EEG, it states that the potential
generated at an electrode (relative to a reference) will be proportional to the solid angle
subtended by the poles of the dipole generator (173).
In terms of size, shape and duration of EEG potentials, there are certain factors
which play a crucial role. These are: (1) the distance of the recoding electrode from the
source of the potential, (2) the duration of post-synaptic potentials (PSPs), (3) the number
of simultaneously activated PSPs and (4) the anatomical orientation of the pyramidal
neurons generating the potential (173). The electrical field produced by the pyramidal
neurons is termed an open field. The potential of an open field decreases inversely to the
distance from each source. The architectural structure of neurons in other regions of the
brain does not resemble the alignment of neuronal dipoles of the cortex. Therefore, the
field potentials generated from the regions of the thalamus and the brain stem are called
closed potentials and are not large enough to be detected on the scalp (173).
It is often presumed that if an electrode is placed deeper than the scalp, more
information will be gained. As briefly mentioned above, the potentials in an open field
decrease in amplitude with the square of the distance from the generator. Due to this,
when an electrode is placed near to one source over the cortex, it will be less sensitive to
more distant regions because of the size of the signal at that location. Whereas if the
electrode is sampling from further away (the scalp) the signal strengths from the close
and distant sources are both smaller, but closer to each other in amplitude and thus more
likely to sample both. Therefore, deeper electrodes detect higher potentials from a small
surface-source and scalp electrodes detect from a large surface-source at a greater
distance (175).
The signal produced at an extracellular level has a certain distance to travel
amongst different anatomical structures to be measured by scalp EEG. This distance (and
the fact that these layers are semi-conductive) decreases the amplitude of the electric field
and leads to loss of spatial information. Therefore, the EEG signal requires amplification

2.1.1 Origin of the EEG signal
71
by a factor of approximately 106 for it to be effectively measured. This makes it vulnerable
to noise interference and artefact.
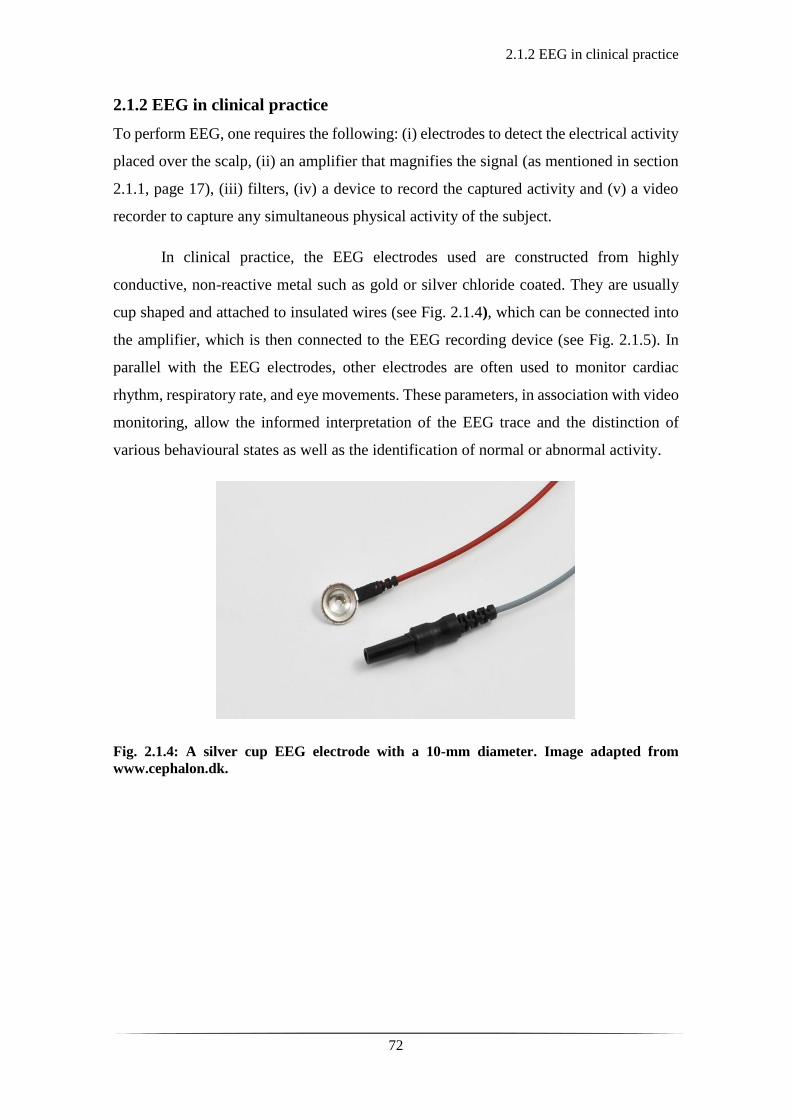
2.1.2 EEG in clinical practice
72
2.1.2 EEG in clinical practice
To perform EEG, one requires the following: (i) electrodes to detect the electrical activity
placed over the scalp, (ii) an amplifier that magnifies the signal (as mentioned in section
2.1.1, page 17), (iii) filters, (iv) a device to record the captured activity and (v) a video
recorder to capture any simultaneous physical activity of the subject.
In clinical practice, the EEG electrodes used are constructed from highly
conductive, non-reactive metal such as gold or silver chloride coated. They are usually
cup shaped and attached to insulated wires (see Fig. 2.1.4), which can be connected into
the amplifier, which is then connected to the EEG recording device (see Fig. 2.1.5). In
parallel with the EEG electrodes, other electrodes are often used to monitor cardiac
rhythm, respiratory rate, and eye movements. These parameters, in association with video
monitoring, allow the informed interpretation of the EEG trace and the distinction of
various behavioural states as well as the identification of normal or abnormal activity.
Fig. 2.1.4: A silver cup EEG electrode with a 10-mm diameter. Image adapted from
www.cephalon.dk.

2.1.2 EEG in clinical practice
73
Figure 2.1.5: Example of a complete video-EEG system. Image adapted from
ww.micromed.eu.
The arrangement of the electrodes over the scalp (array) is standardised according
to the 10-20 international system of electrode placement (176). Each one of the electrodes
is placed 10 or 20 per cent of the total nasion-inion (front–back) or right auricular to left
auricular (right–left) distance of the skull, away from a neighbouring electrode (see Fig.
2.1.6). Each electrode is identifiable by one to two initials and a number which represent
the location on the scalp and the hemisphere they are placed on, respectively; for instance,
F stands for frontal, C for central, T for temporal, P for parietal, O for occipital. The
electrodes over the right hemisphere are represented by even numbers and the ones over
the left with odd numbers.
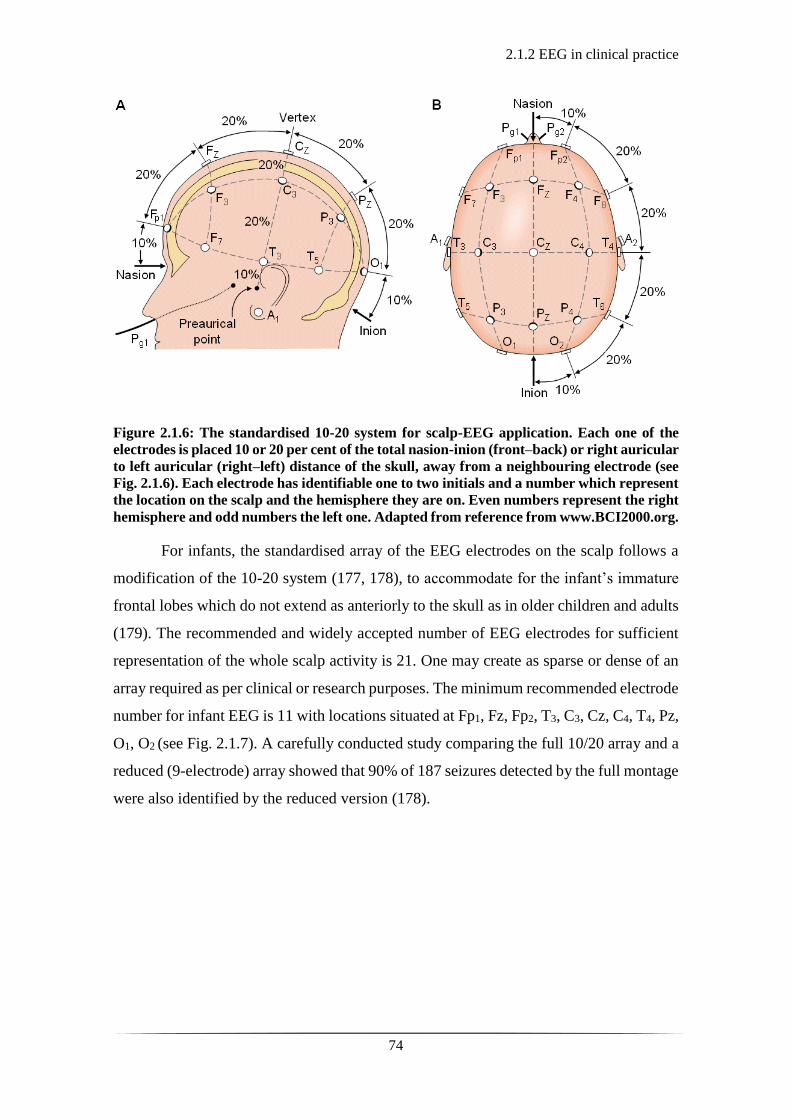
2.1.2 EEG in clinical practice
74
Figure 2.1.6: The standardised 10-20 system for scalp-EEG application. Each one of the
electrodes is placed 10 or 20 per cent of the total nasion-inion (front–back) or right auricular
to left auricular (right–left) distance of the skull, away from a neighbouring electrode (see
Fig. 2.1.6). Each electrode has identifiable one to two initials and a number which represent
the location on the scalp and the hemisphere they are on. Even numbers represent the right
hemisphere and odd numbers the left one. Adapted from reference from www.BCI2000.org.
For infants, the standardised array of the EEG electrodes on the scalp follows a
modification of the 10-20 system (177, 178), to accommodate for the infant’s immature
frontal lobes which do not extend as anteriorly to the skull as in older children and adults
(179). The recommended and widely accepted number of EEG electrodes for sufficient
representation of the whole scalp activity is 21. One may create as sparse or dense of an
array required as per clinical or research purposes. The minimum recommended electrode
number for infant EEG is 11 with locations situated at Fp1, Fz, Fp2, T3, C3, Cz, C4, T4, Pz,
O1, O2 (see Fig. 2.1.7). A carefully conducted study comparing the full 10/20 array and a
reduced (9-electrode) array showed that 90% of 187 seizures detected by the full montage
were also identified by the reduced version (178).

2.1.2 EEG in clinical practice
75
Figure 2.1.7: Example of the proposed reduced montage for neonatal EEG. Image from
author’s personal file.
In addition to the electrodes capturing the cortical electrical activity, the position
of a reference electrode is important as all the variations in electrical potential difference
are recorded relative to it. The reference electrode can be placed on the scalp or away
from the scalp (i.e. shoulder, chest). If the reference is placed too close to a sensing
electrode, the signal recorded across that channel will be reduced as the electrical
potential difference between the two electrodes will tend to zero. However, if the
reference is placed away from the scalp, more noise components will be introduced.
Another important factor during EEG recording is the impedance. This is the
measure of the resistance of a circuit to an alternating current when a certain voltage is
applied. The use of abrasive gel and conductive paste prior to the application of the
sensing electrodes aids the reduction of the impedance. A good contact impedance is
usually defined as one lower than 5 kΩ. However, it is possible to obtain a good signal-
to-noise ratio with contact impedances higher than 5 kΩ and similarly to have a noisy
EEG trace with good contact impedances. Electrical interference in the recording
environment may affect the EEG signal, especially in an acute clinical environment with
electrical infusion pumps or mechanical ventilators.
The amplification of the EEG signal is essential for the recording and visualisation
of the EEG trace. The EEG amplifiers are multi-channel differential devices arranged in
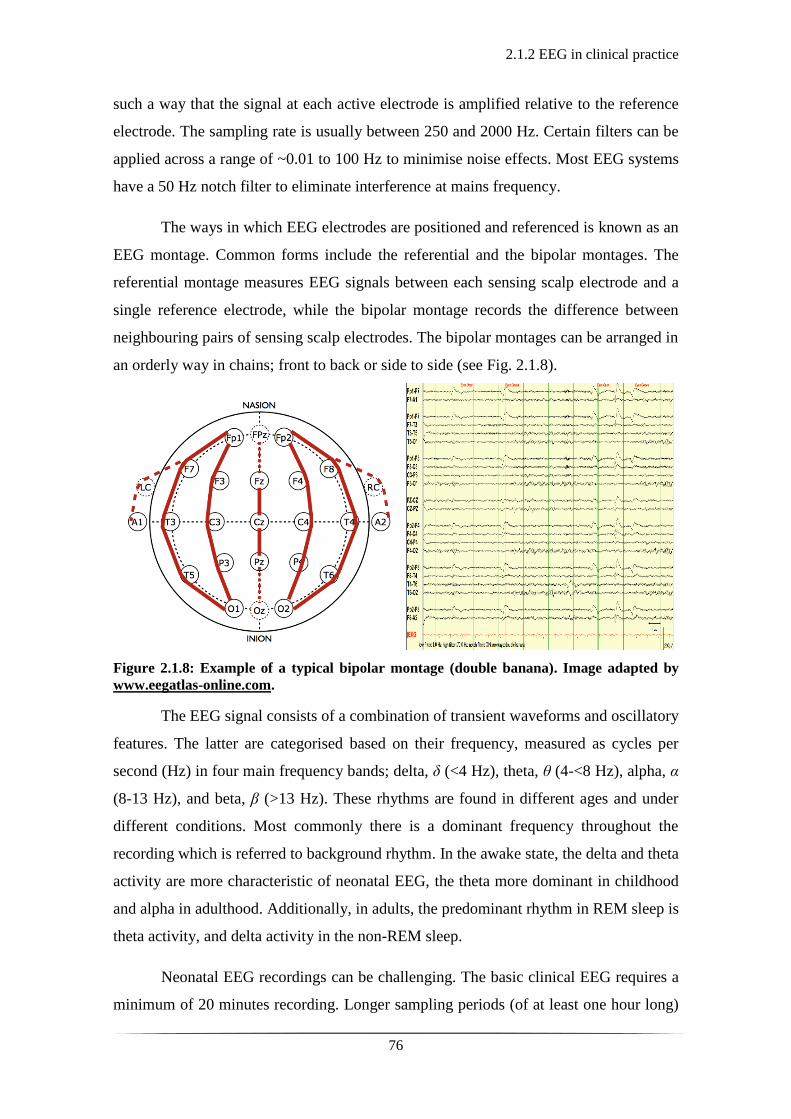
2.1.2 EEG in clinical practice
76
such a way that the signal at each active electrode is amplified relative to the reference
electrode. The sampling rate is usually between 250 and 2000 Hz. Certain filters can be
applied across a range of ~0.01 to 100 Hz to minimise noise effects. Most EEG systems
have a 50 Hz notch filter to eliminate interference at mains frequency.
The ways in which EEG electrodes are positioned and referenced is known as an
EEG montage. Common forms include the referential and the bipolar montages. The
referential montage measures EEG signals between each sensing scalp electrode and a
single reference electrode, while the bipolar montage records the difference between
neighbouring pairs of sensing scalp electrodes. The bipolar montages can be arranged in
an orderly way in chains; front to back or side to side (see Fig. 2.1.8).
Figure 2.1.8: Example of a typical bipolar montage (double banana). Image adapted by
www.eegatlas-online.com.
The EEG signal consists of a combination of transient waveforms and oscillatory
features. The latter are categorised based on their frequency, measured as cycles per
second (Hz) in four main frequency bands; delta, δ (<4 Hz), theta, θ (4-<8 Hz), alpha, α
(8-13 Hz), and beta, β (>13 Hz). These rhythms are found in different ages and under
different conditions. Most commonly there is a dominant frequency throughout the
recording which is referred to background rhythm. In the awake state, the delta and theta
activity are more characteristic of neonatal EEG, the theta more dominant in childhood
and alpha in adulthood. Additionally, in adults, the predominant rhythm in REM sleep is
theta activity, and delta activity in the non-REM sleep.
Neonatal EEG recordings can be challenging. The basic clinical EEG requires a
minimum of 20 minutes recording. Longer sampling periods (of at least one hour long)

2.1.2 EEG in clinical practice
77
can be more informative, in capturing a wide variability of different states which differ
with gestational age and postconceptional age (180). However, in the instance of
abnormal or suspected seizure activity continuous recordings will aid and inform clinical
management (181).
During recordings that take place in the clinical area, and particularly in a neonatal
intensive care unit (NICU), there are certain precautions and considerations to be
considered. The EEG device should be placed as close to the infant possible in a way that
does not interfere with other devices and monitors (i.e. ventilators, intravenous pumps,
other monitors). The electrodes should be placed onto the infant’s scalp appropriately and
not interfering with any clinical care that the infant may be receiving (e.g. hats used to
apply continuous positive airway pressure-CPAP mode of ventilation). The infant should
be positioned ideally supine with head, face, trunk and both upper and lower limbs visible.
Depending on the clinical circumstances and management this might not be possible and
EEG recording should continue and be optimised based on the clinical requirements and
not vice versa.
Simultaneous video monitoring should be performed to capture any abnormal or
seizure-like movement of the infant. The camera should be positioned in a way that
captures the best possible view of the infant. It should capture any interventions (i.e.
suctioning of the ventilated infant), but it should not video the personnel or conversations
around the infant. Its purpose is exclusively to provide information for remote EEG
interpretation. Most modern cameras will have a low light capability to record in ambient
or dim light which is sometimes necessary in the NICU.

2.1.3 Amplitude integrated EEG in clinical practice
78
2.1.3 Amplitude integrated EEG in clinical practice
In a neonatal intensive care environment, amplitude integrated EEG (aEEG) is frequently
used as a simplified continuous monitoring system of the electrical cortical activity. This
method was developed by Maynard in the 1960s for adult intensive care units in response
to a requirement for ongoing neuro-monitoring (182) and evolved further in association
with Prior (183, 184). This method consists of a single or dual channel EEG recording
which is filtered and time compressed (see Fig. 2.1.9) with the aim to monitor trends of
the background electrocortical activity. The monitor is widely known in clinical practice
as a ‘cerebral function monitor’ (CFM).
Figure 2.1.9: A comercially available single channel aEEG-CFM system. The electrodes are
applied onto the infant’s scalp and connected to the aEEG recording system via insulated
wires. The aEEG monitor demonstrates the live continuous single channel EEG trace at the
bottom of the screen and the amplified, time compressed aEEG signal at the top of the screen
(adapted from the natus.com website).
The single or dual-channel aEEG signals are derived from electrodes placed on
the centro-parietal and parietal regions of the scalp. The recommended positions of the
electrodes for the single channel is the bi-parietal placement (P3 and P4, see Fig. 2.1.10a)
and for the dual channel, C3, P3, C4, P4 (see Fig. 2.1.10b) with the neutral electrode
placed along the midline and away from the open anterior fontanelle. The bi-parietal
region is the least likely to be affected by scalp muscle activity and eye movements.
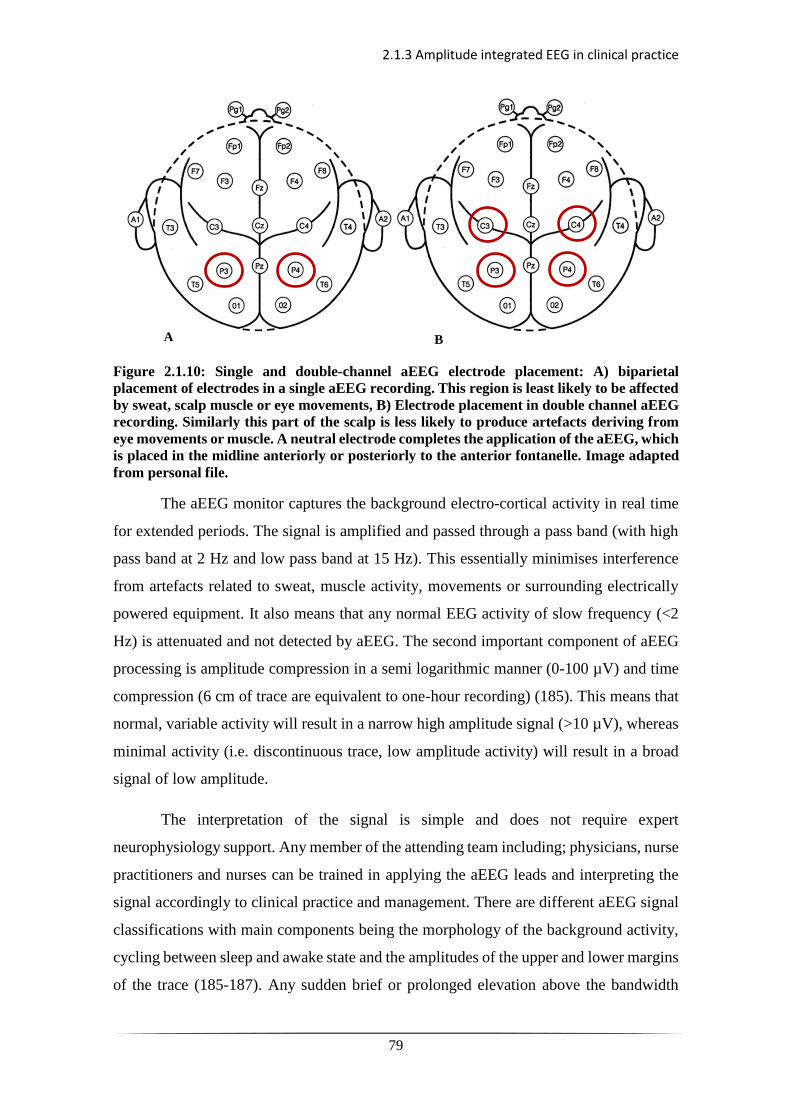
2.1.3 Amplitude integrated EEG in clinical practice
79
Figure 2.1.10: Single and double-channel aEEG electrode placement: A) biparietal
placement of electrodes in a single aEEG recording. This region is least likely to be affected
by sweat, scalp muscle or eye movements, B) Electrode placement in double channel aEEG
recording. Similarly this part of the scalp is less likely to produce artefacts deriving from
eye movements or muscle. A neutral electrode completes the application of the aEEG, which
is placed in the midline anteriorly or posteriorly to the anterior fontanelle. Image adapted
from personal file.
The aEEG monitor captures the background electro-cortical activity in real time
for extended periods. The signal is amplified and passed through a pass band (with high
pass band at 2 Hz and low pass band at 15 Hz). This essentially minimises interference
from artefacts related to sweat, muscle activity, movements or surrounding electrically
powered equipment. It also means that any normal EEG activity of slow frequency (<2
Hz) is attenuated and not detected by aEEG. The second important component of aEEG
processing is amplitude compression in a semi logarithmic manner (0-100 µV) and time
compression (6 cm of trace are equivalent to one-hour recording) (185). This means that
normal, variable activity will result in a narrow high amplitude signal (>10 µV), whereas
minimal activity (i.e. discontinuous trace, low amplitude activity) will result in a broad
signal of low amplitude.
The interpretation of the signal is simple and does not require expert
neurophysiology support. Any member of the attending team including; physicians, nurse
practitioners and nurses can be trained in applying the aEEG leads and interpreting the
signal accordingly to clinical practice and management. There are different aEEG signal
classifications with main components being the morphology of the background activity,
cycling between sleep and awake state and the amplitudes of the upper and lower margins
of the trace (185-187). Any sudden brief or prolonged elevation above the bandwidth
A B
2.1.3 Amplitude integrated EEG in clinical practice
80
should raise clinical suspicion. This should be inspected carefully in association with the
underlying live single or dual channel EEG recording, the overall clinical context and
nursing observations as to whether it is related to artefact or seizure activity.
Overall aEEG is a useful monitoring tool in the NICU. However, low frequency
activity may not be captured. Similarly, low frequency or short-lived seizure activity may
not be detected. The restriction to single or dual channel offers very limited scalp
coverage, which risks not detecting frontal or occipital abnormal activity. The
differentiation between seizures and artefacts may also be difficult to decipher and
requires careful overall monitoring of the infant and information input related to drug
administration or other medical intervention. In any instance of uncertainty or possible
seizure activity, the investigations should be completed by performing a formal EEG,
which remains the gold standard for monitoring of the electrocortical activity.
2.1.4 Principles of neonatal EEG
81
2.1.4 Principles of neonatal EEG
The human EEG goes through certain developmental trajectories, the features, and
characteristics of which are best seen throughout the neonatal period. This makes
interpretation of neonatal EEG dependent on the gestational age (GA) but also post-
conceptional age. Features which may be classified as pathological in older infants or
children may classify as normal, age appropriate EEG features in the preterm and term
infants.
This section attempts to explain some of these features as it is essential for the
understanding of the description and interpretation of pathological traces and EEG states
in the neonatal period. The main EEG aspects covered below, as described by numerous
studies (188-192), are the following: (i) states of sleep and wakefulness, (ii) background
activity, (iii) synchrony, (iv) EEG provoked reactivity, and (v) other special EEG features.
The evaluation of different behavioural states is a multifactorial process and
various physiological and EEG components should be taken into consideration (193). In
the normal term neonate, based on observation (i.e. open eyes, spontaneous movements),
physiological parameters (eye movements, heart rate, respiratory rate) and EEG features,
the following behavioural states can be identified: (i) wakefulness where the infant
appears awake, vigorous with eyes open (active wakefulness, AW) or quiet without
agitation (quiet wakefulness, QW), (ii) active sleep (AS), where the infant appears asleep
with the presence of rapid eye movements (REM-also known as REM sleep) (iii) quiet
sleep (QS) or non-REM sleep, where the infant appears asleep with the absence of REM
(188, 194). A period between two discrete sleep states where the infant appears asleep,
but the rest of the expected parameters are equivocal, is referred to as transitional sleep
state. If this period is not between two distinct sleep states it is simply termed as
indeterminate (195, 196) (see Fig. 2.1.11). The emergence of discrete sleep states occurs
as early as 26-27 weeks of gestation. However, at this stage the EEG may still appear
inconsistent with the infants’ behavioural state. It becomes clearer at gestations 28-29
weeks where one may see distinct AS and QS with the presence of REM (190).
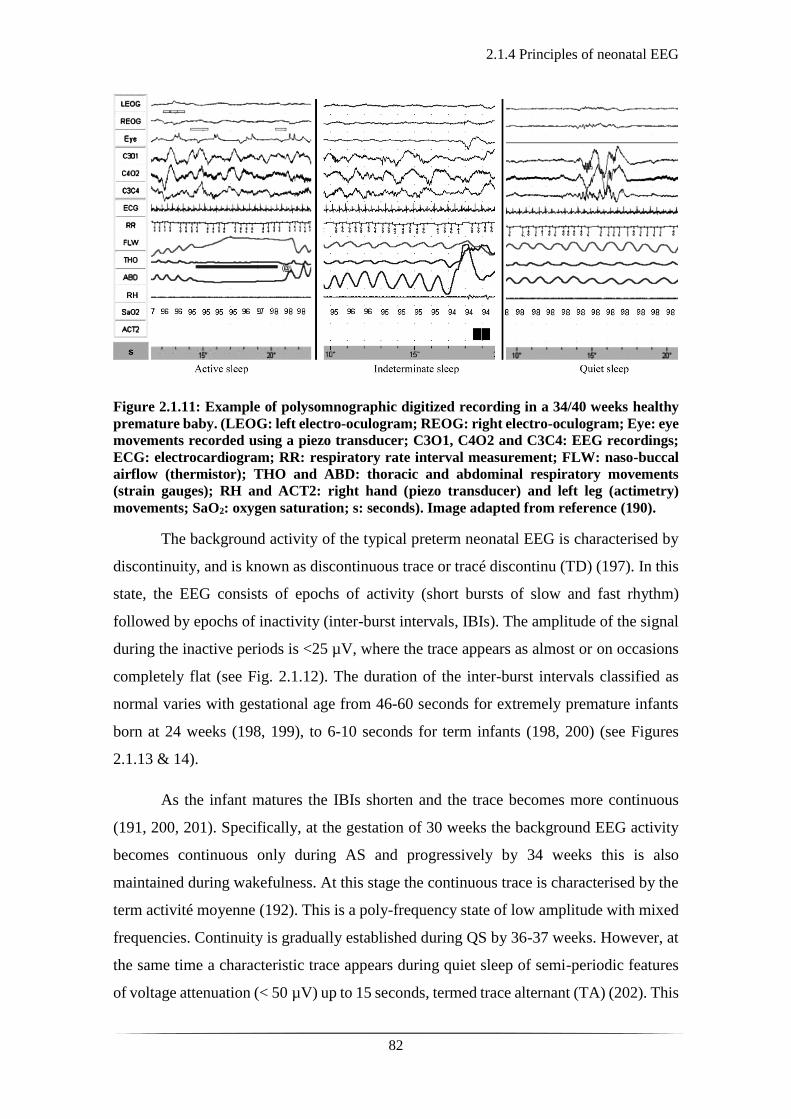
2.1.4 Principles of neonatal EEG
82
Figure 2.1.11: Example of polysomnographic digitized recording in a 34/40 weeks healthy
premature baby. (LEOG: left electro-oculogram; REOG: right electro-oculogram; Eye: eye
movements recorded using a piezo transducer; C3O1, C4O2 and C3C4: EEG recordings;
ECG: electrocardiogram; RR: respiratory rate interval measurement; FLW: naso-buccal
airflow (thermistor); THO and ABD: thoracic and abdominal respiratory movements
(strain gauges); RH and ACT2: right hand (piezo transducer) and left leg (actimetry)
movements; SaO2: oxygen saturation; s: seconds). Image adapted from reference (190).
The background activity of the typical preterm neonatal EEG is characterised by
discontinuity, and is known as discontinuous trace or tracé discontinu (TD) (197). In this
state, the EEG consists of epochs of activity (short bursts of slow and fast rhythm)
followed by epochs of inactivity (inter-burst intervals, IBIs). The amplitude of the signal
during the inactive periods is <25 µV, where the trace appears as almost or on occasions
completely flat (see Fig. 2.1.12). The duration of the inter-burst intervals classified as
normal varies with gestational age from 46-60 seconds for extremely premature infants
born at 24 weeks (198, 199), to 6-10 seconds for term infants (198, 200) (see Figures
2.1.13 & 14).
As the infant matures the IBIs shorten and the trace becomes more continuous
(191, 200, 201). Specifically, at the gestation of 30 weeks the background EEG activity
becomes continuous only during AS and progressively by 34 weeks this is also
maintained during wakefulness. At this stage the continuous trace is characterised by the
term activité moyenne (192). This is a poly-frequency state of low amplitude with mixed
frequencies. Continuity is gradually established during QS by 36-37 weeks. However, at
the same time a characteristic trace appears during quiet sleep of semi-periodic features
of voltage attenuation (< 50 µV) up to 15 seconds, termed trace alternant (TA) (202). This
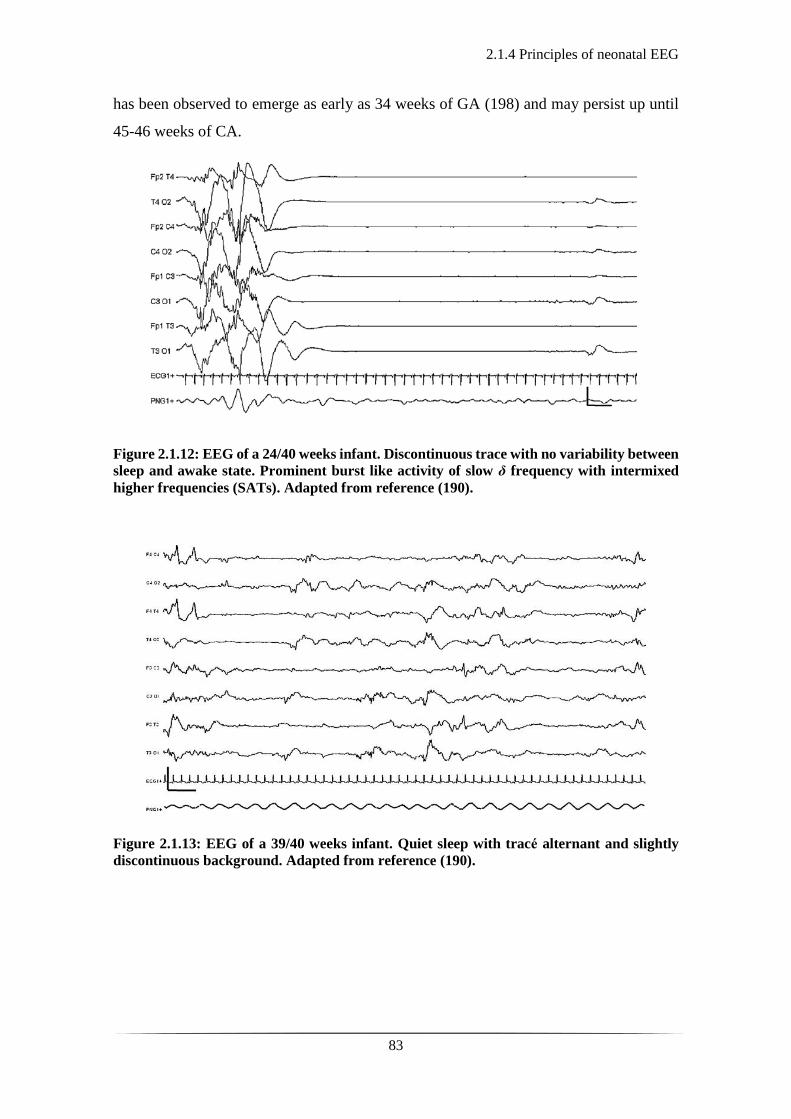
2.1.4 Principles of neonatal EEG
83
has been observed to emerge as early as 34 weeks of GA (198) and may persist up until
45-46 weeks of CA.
Figure 2.1.12: EEG of a 24/40 weeks infant. Discontinuous trace with no variability between
sleep and awake state. Prominent burst like activity of slow δ frequency with intermixed
higher frequencies (SATs). Adapted from reference (190).
Figure 2.1.13: EEG of a 39/40 weeks infant. Quiet sleep with trace alternant and slightly
discontinuous background. Adapted from reference (190).

2.1.4 Principles of neonatal EEG
84
Figure 2.1.14: EEG of a 40/40 weeks infant: a) Quiet wakefulness. Polyfrequency activity
(activite moyennne). b) Active sleep. Continuous activity with mixed frequencies. Low
amplitude. Bilateral anterior dysrhytmia (normal developmental EEG feature). Adapted
from reference (190).
The extremely preterm infant EEG appears, paradoxically hypersynchronous with
an observed absolute synchronisation of the bursts and IBIs. At the stage of 27-28 weeks
of GA the EEG becomes asynchronous with the general rule of thumb that the greater the
distance of the activity from the midline the greater the asynchrony between the two
hemispheres (179). The maturity of the synchrony of the two hemispheres, likewise
continuity of the background activity, first emerges in active sleep and then progresses in
all states coming up to term CA.
Another feature of the EEG examined during neurophysiological studies is the
provoked EEG activity, otherwise known as the EEG reactivity to stimulation. Although
one may observe some reactivity as early as 26-27 weeks (190) this is not always in
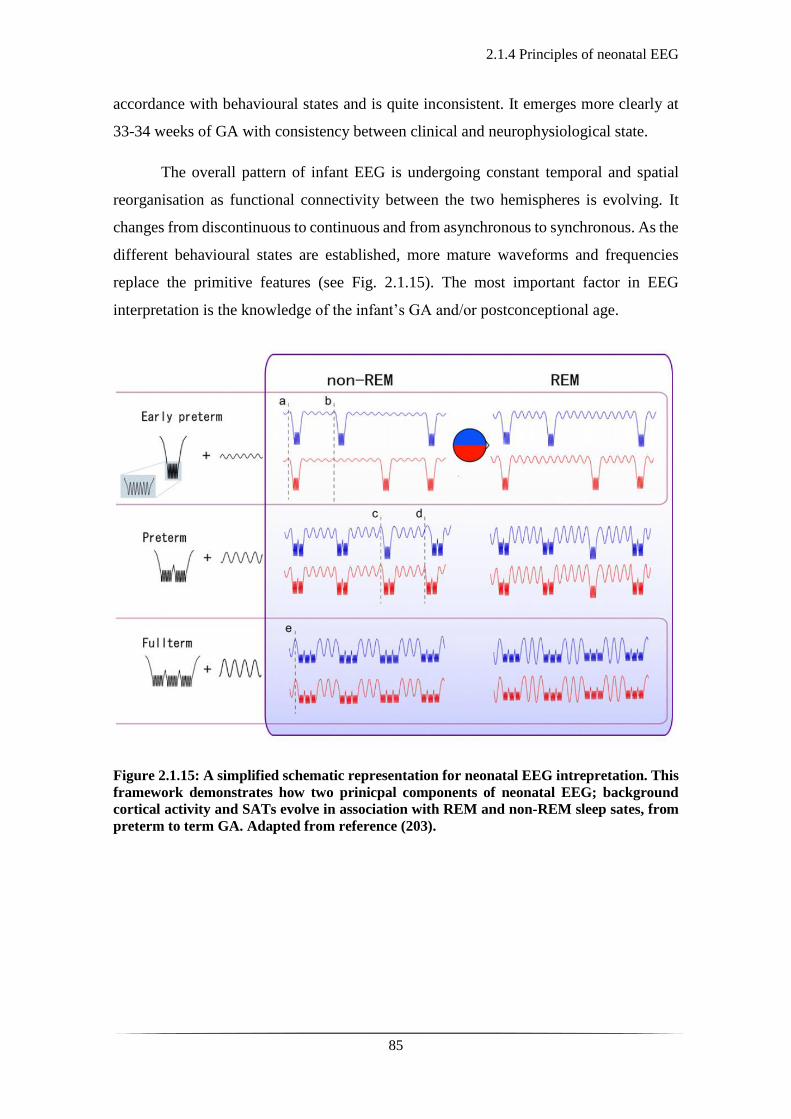
2.1.4 Principles of neonatal EEG
85
accordance with behavioural states and is quite inconsistent. It emerges more clearly at
33-34 weeks of GA with consistency between clinical and neurophysiological state.
The overall pattern of infant EEG is undergoing constant temporal and spatial
reorganisation as functional connectivity between the two hemispheres is evolving. It
changes from discontinuous to continuous and from asynchronous to synchronous. As the
different behavioural states are established, more mature waveforms and frequencies
replace the primitive features (see Fig. 2.1.15). The most important factor in EEG
interpretation is the knowledge of the infant’s GA and/or postconceptional age.
Figure 2.1.15: A simplified schematic representation for neonatal EEG intrepretation. This
framework demonstrates how two prinicpal components of neonatal EEG; background
cortical activity and SATs evolve in association with REM and non-REM sleep sates, from
preterm to term GA. Adapted from reference (203).

2.1.5 Frequent EEG Artefacts
86
2.1.5 Frequent EEG Artefacts
In an intensive care environment, electrical interference from surrounding devices is very
common. However, some of the most frequent artefacts seen in an EEG recording usually
derive from the infant themselves.
One of the most common EEG artefacts is the electrode-pop artefact (see Fig.
2.1.16). This is a result from a sudden decrease in electrode contact (increase in
impedance). It appears as a sharp feature, isolated to one electrode, which in a bipolar
montage will lead to a mirror image across two or more channels. The recognition of this
artefact is significant as it might be mistaken as a spike or epileptic-form activity.
Figure 2.1.16: Example of the electrode-pop artefact related to the P3 electrode. Note that
in the beginning of the trace over the fronto-temporal region there is also EMG artefact.
(adapted by emedicine.medscape.com).
Another frequently seen artefact is the one arising from muscle activity also
known as the electro-myogram (EMG) artefact (see Fig. 2.1.17). Muscle contraction
produces high frequency (20-100 Hz) and high amplitude (up to 100 µV) potentials which
appear as sudden onset of activity with no equivalent to any meaningful cortical
waveform. This can typically derive from muscle contraction from and around the head
with frontalis and temporalis muscles being the principal contributors.
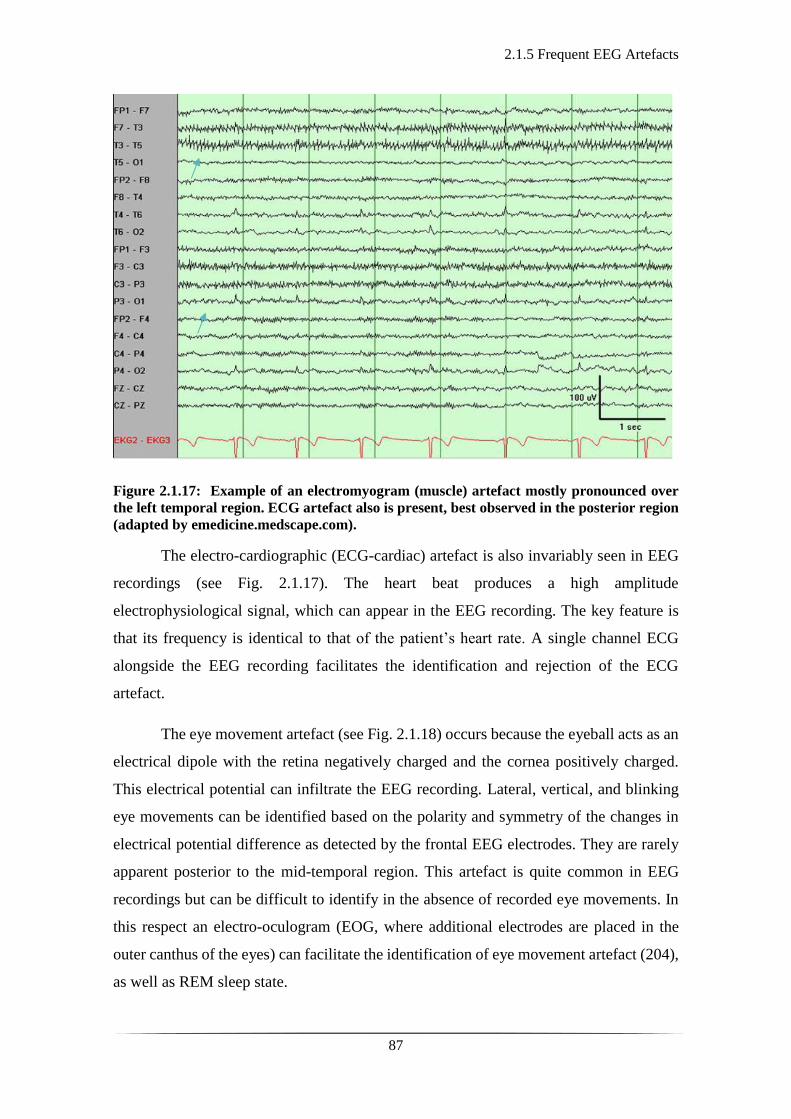
2.1.5 Frequent EEG Artefacts
87
Figure 2.1.17: Example of an electromyogram (muscle) artefact mostly pronounced over
the left temporal region. ECG artefact also is present, best observed in the posterior region
(adapted by emedicine.medscape.com).
The electro-cardiographic (ECG-cardiac) artefact is also invariably seen in EEG
recordings (see Fig. 2.1.17). The heart beat produces a high amplitude
electrophysiological signal, which can appear in the EEG recording. The key feature is
that its frequency is identical to that of the patient’s heart rate. A single channel ECG
alongside the EEG recording facilitates the identification and rejection of the ECG
artefact.
The eye movement artefact (see Fig. 2.1.18) occurs because the eyeball acts as an
electrical dipole with the retina negatively charged and the cornea positively charged.
This electrical potential can infiltrate the EEG recording. Lateral, vertical, and blinking
eye movements can be identified based on the polarity and symmetry of the changes in
electrical potential difference as detected by the frontal EEG electrodes. They are rarely
apparent posterior to the mid-temporal region. This artefact is quite common in EEG
recordings but can be difficult to identify in the absence of recorded eye movements. In
this respect an electro-oculogram (EOG, where additional electrodes are placed in the
outer canthus of the eyes) can facilitate the identification of eye movement artefact (204),
as well as REM sleep state.
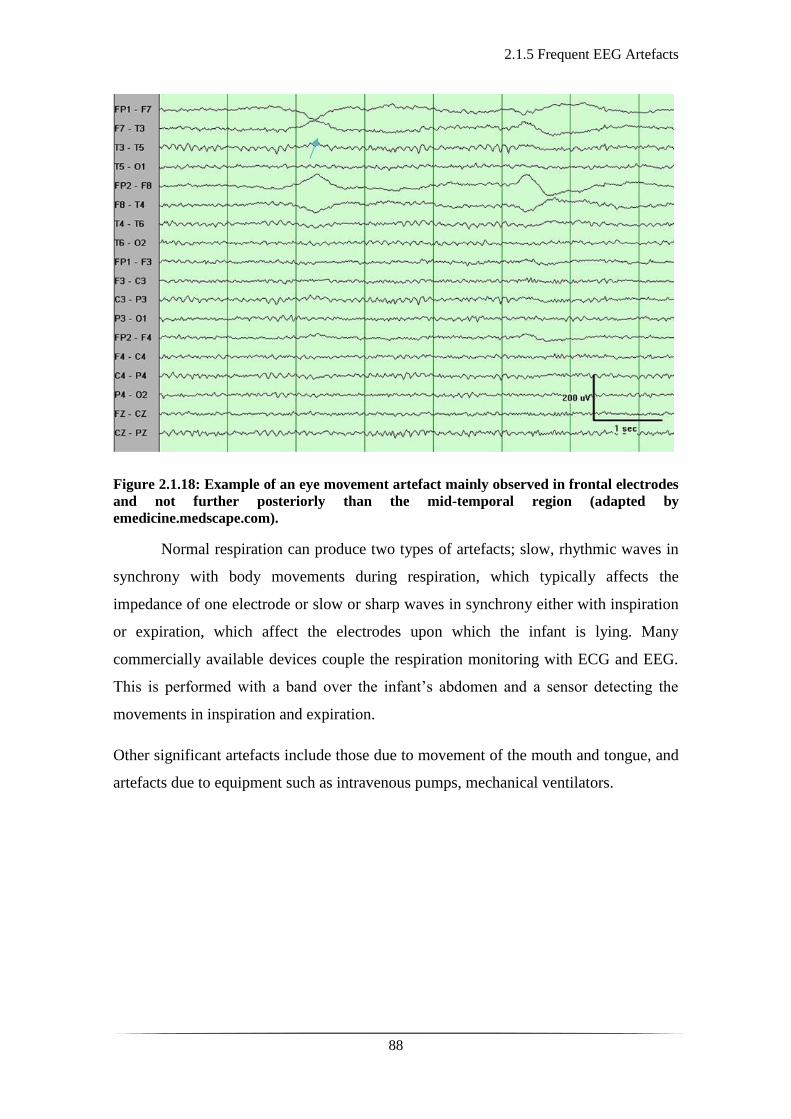
2.1.5 Frequent EEG Artefacts
88
Figure 2.1.18: Example of an eye movement artefact mainly observed in frontal electrodes
and not further posteriorly than the mid-temporal region (adapted by
emedicine.medscape.com).
Normal respiration can produce two types of artefacts; slow, rhythmic waves in
synchrony with body movements during respiration, which typically affects the
impedance of one electrode or slow or sharp waves in synchrony either with inspiration
or expiration, which affect the electrodes upon which the infant is lying. Many
commercially available devices couple the respiration monitoring with ECG and EEG.
This is performed with a band over the infant’s abdomen and a sensor detecting the
movements in inspiration and expiration.
Other significant artefacts include those due to movement of the mouth and tongue, and
artefacts due to equipment such as intravenous pumps, mechanical ventilators.
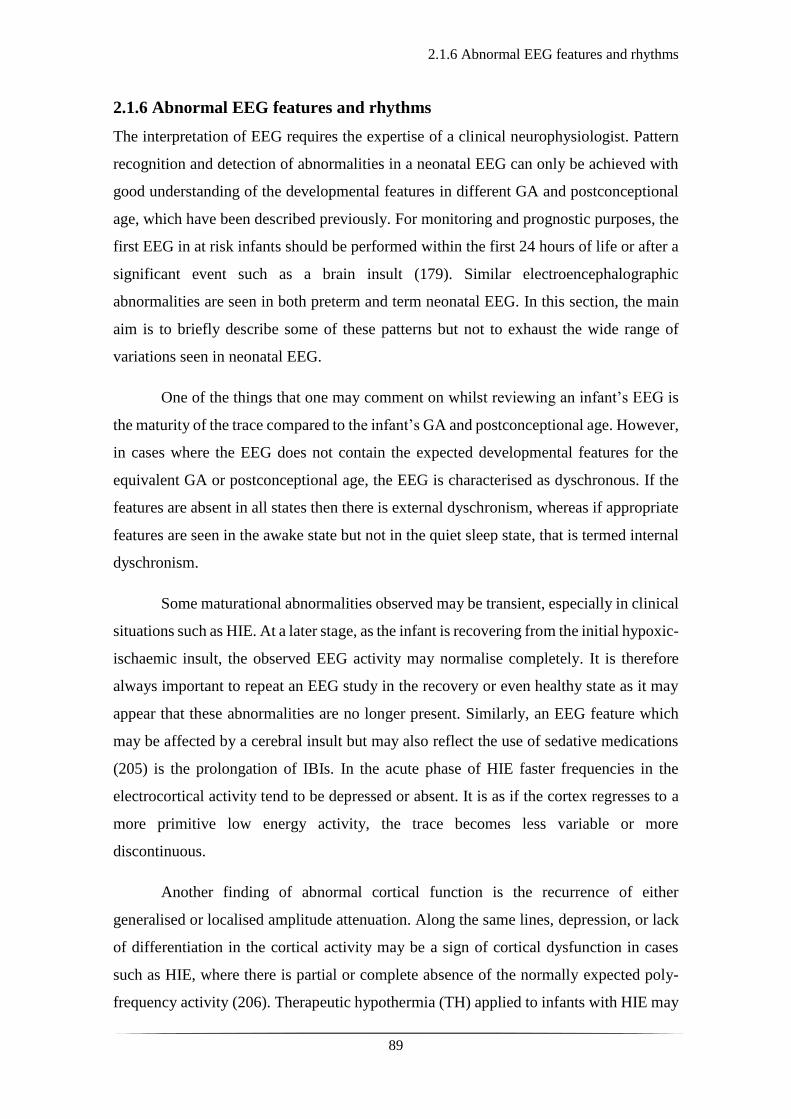
2.1.6 Abnormal EEG features and rhythms
89
2.1.6 Abnormal EEG features and rhythms
The interpretation of EEG requires the expertise of a clinical neurophysiologist. Pattern
recognition and detection of abnormalities in a neonatal EEG can only be achieved with
good understanding of the developmental features in different GA and postconceptional
age, which have been described previously. For monitoring and prognostic purposes, the
first EEG in at risk infants should be performed within the first 24 hours of life or after a
significant event such as a brain insult (179). Similar electroencephalographic
abnormalities are seen in both preterm and term neonatal EEG. In this section, the main
aim is to briefly describe some of these patterns but not to exhaust the wide range of
variations seen in neonatal EEG.
One of the things that one may comment on whilst reviewing an infant’s EEG is
the maturity of the trace compared to the infant’s GA and postconceptional age. However,
in cases where the EEG does not contain the expected developmental features for the
equivalent GA or postconceptional age, the EEG is characterised as dyschronous. If the
features are absent in all states then there is external dyschronism, whereas if appropriate
features are seen in the awake state but not in the quiet sleep state, that is termed internal
dyschronism.
Some maturational abnormalities observed may be transient, especially in clinical
situations such as HIE. At a later stage, as the infant is recovering from the initial hypoxic-
ischaemic insult, the observed EEG activity may normalise completely. It is therefore
always important to repeat an EEG study in the recovery or even healthy state as it may
appear that these abnormalities are no longer present. Similarly, an EEG feature which
may be affected by a cerebral insult but may also reflect the use of sedative medications
(205) is the prolongation of IBIs. In the acute phase of HIE faster frequencies in the
electrocortical activity tend to be depressed or absent. It is as if the cortex regresses to a
more primitive low energy activity, the trace becomes less variable or more
discontinuous.
Another finding of abnormal cortical function is the recurrence of either
generalised or localised amplitude attenuation. Along the same lines, depression, or lack
of differentiation in the cortical activity may be a sign of cortical dysfunction in cases
such as HIE, where there is partial or complete absence of the normally expected poly-
frequency activity (206). Therapeutic hypothermia (TH) applied to infants with HIE may
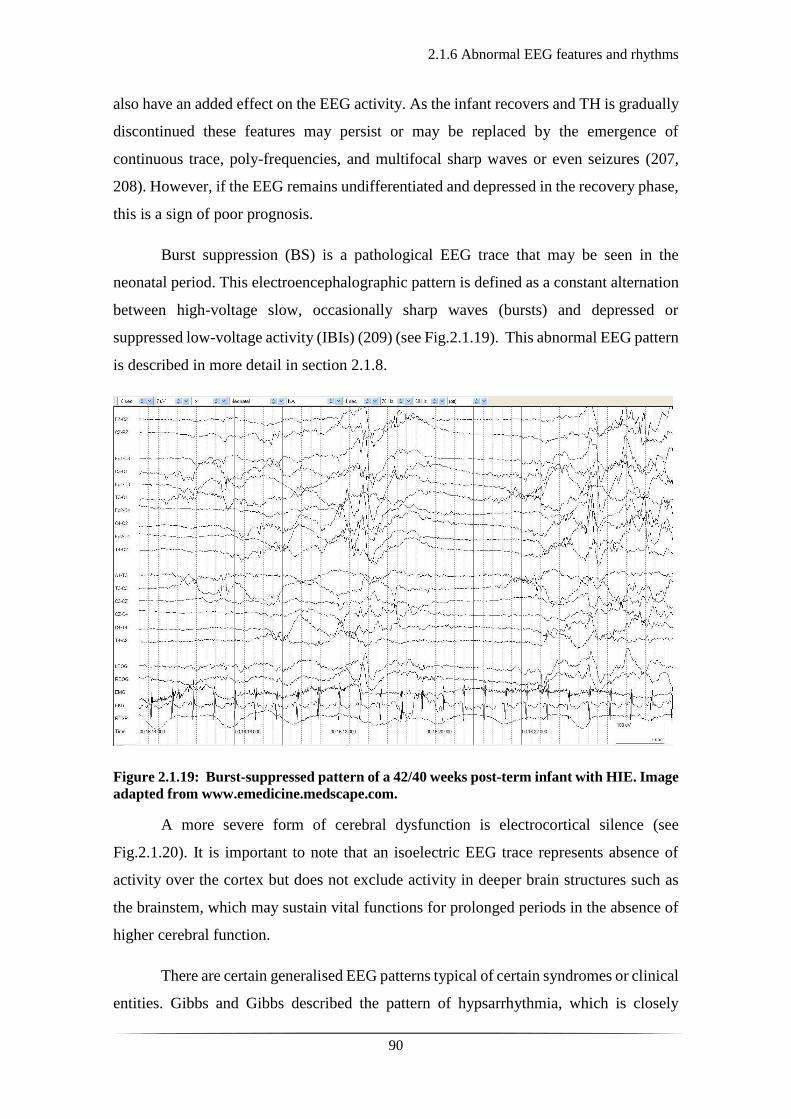
2.1.6 Abnormal EEG features and rhythms
90
also have an added effect on the EEG activity. As the infant recovers and TH is gradually
discontinued these features may persist or may be replaced by the emergence of
continuous trace, poly-frequencies, and multifocal sharp waves or even seizures (207,
208). However, if the EEG remains undifferentiated and depressed in the recovery phase,
this is a sign of poor prognosis.
Burst suppression (BS) is a pathological EEG trace that may be seen in the
neonatal period. This electroencephalographic pattern is defined as a constant alternation
between high-voltage slow, occasionally sharp waves (bursts) and depressed or
suppressed low-voltage activity (IBIs) (209) (see Fig.2.1.19). This abnormal EEG pattern
is described in more detail in section 2.1.8.
Figure 2.1.19: Burst-suppressed pattern of a 42/40 weeks post-term infant with HIE. Image
adapted from www.emedicine.medscape.com.
A more severe form of cerebral dysfunction is electrocortical silence (see
Fig.2.1.20). It is important to note that an isoelectric EEG trace represents absence of
activity over the cortex but does not exclude activity in deeper brain structures such as
the brainstem, which may sustain vital functions for prolonged periods in the absence of
higher cerebral function.
There are certain generalised EEG patterns typical of certain syndromes or clinical
entities. Gibbs and Gibbs described the pattern of hypsarrhythmia, which is closely
2.1.6 Abnormal EEG features and rhythms
91
associated to the condition of infantile spasms and is characterised by high amplitude and
irregular waves and spikes in a background of chaotic and disorganized activity (210)
(see figure 2.1.21). Another example is that of holoprosencephaly, a congenital
developmental defect, where the EEG appearance consists of multiple features occurring
randomly with abrupt changes from one pattern to another, and consist of multifocal spike
and polyspike activity, monorrhytmic activity, asynchrony, iso-electric or low frequency
activity, and overall lack of normal organisation (179, 211).
Figure 2.1.20: EEG showing electrocortical silence. Note the presence of regular
electrocardiographic cardiac rhythm. Image adapted from reference (212).
In other cases of abnormal EEG patterns there can be focal or generalised features.
For instance, there can be sustained rhythmic alpha and theta activity, or sustained
rhythmic delta activity especially in the bifrontal regions, which are all considered
pathological. Other focal abnormalities consist of periodic complexes, which are closely
associated with neonatal herpes simplex encephalopathy (213, 214). The presence of
central positive sharp waves in an infant’s EEG recording has also been associated with
neonatal brain injury. These are not epileptiform discharges, but their natural progress
and physiological process is not well understood. The rate of their occurrence (more than
2 per second) has been proven to be associated with poor outcome (215, 216). Central
positive sharp waves have been linked to severe intraventricular haemorrhage,
periventricular leukomalacia, haemorrhagic parenchymal infarct and periventricular

2.1.6 Abnormal EEG features and rhythms
92
echodensities, and are considered more specific to white matter necrotic lesions than to
intraventricular haemorrhage (217). Temporal sharp waves may also be noted in an
infant’s EEG, and it is often difficult to differentiate whether they are normal or abnormal.
Overall, random sharp waves with infrequent recurrence (less than 2-3 per hour), with
negative polarity of their initial component and arising from any location of the scalp
without specific focality are considered normal with unclear clinical significance.
Focal slow activity that is persistent over a certain brain region is suggestive of a focal
lesion such as infarction, haemorrhage, or even specific congenital anomalies. Similarly,
unilateral attenuation of the background activity can be associated with focal
intraparenchymal lesions such as cerebral infarction. A certain degree of asymmetry of
the background activity between the two hemispheres is expected in the neonatal EEG,
particularly during non-REM sleep.
Figure 2.1.21: Hypsarrhythmic EEG pattern. Note the characteristic high-voltage,
disorganized, chaotic, and asynchronous slow waves with superimposed multifocal spikes
or sharp waves. Periods of generalized electro- decrement are seen throughout the
recording and may be associated with clinical spasms. The above pattern is often more
pronounced during non-REM sleep with the background activity during wakefulness even
being normal. Image adapted from www.acns.com.
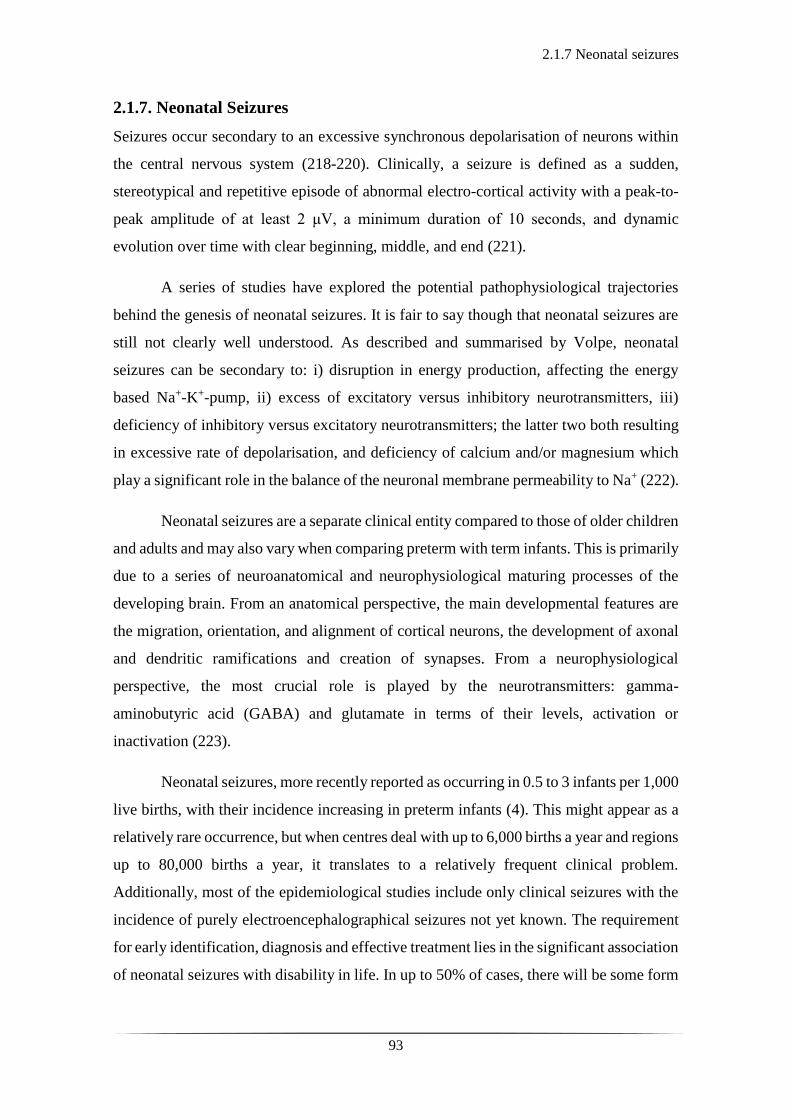
2.1.7 Neonatal seizures
93
2.1.7. Neonatal Seizures
Seizures occur secondary to an excessive synchronous depolarisation of neurons within
the central nervous system (218-220). Clinically, a seizure is defined as a sudden,
stereotypical and repetitive episode of abnormal electro-cortical activity with a peak-to-
peak amplitude of at least 2 μV, a minimum duration of 10 seconds, and dynamic
evolution over time with clear beginning, middle, and end (221).
A series of studies have explored the potential pathophysiological trajectories
behind the genesis of neonatal seizures. It is fair to say though that neonatal seizures are
still not clearly well understood. As described and summarised by Volpe, neonatal
seizures can be secondary to: i) disruption in energy production, affecting the energy
based Na+-K+-pump, ii) excess of excitatory versus inhibitory neurotransmitters, iii)
deficiency of inhibitory versus excitatory neurotransmitters; the latter two both resulting
in excessive rate of depolarisation, and deficiency of calcium and/or magnesium which
play a significant role in the balance of the neuronal membrane permeability to Na+ (222).
Neonatal seizures are a separate clinical entity compared to those of older children
and adults and may also vary when comparing preterm with term infants. This is primarily
due to a series of neuroanatomical and neurophysiological maturing processes of the
developing brain. From an anatomical perspective, the main developmental features are
the migration, orientation, and alignment of cortical neurons, the development of axonal
and dendritic ramifications and creation of synapses. From a neurophysiological
perspective, the most crucial role is played by the neurotransmitters: gamma-
aminobutyric acid (GABA) and glutamate in terms of their levels, activation or
inactivation (223).
Neonatal seizures, more recently reported as occurring in 0.5 to 3 infants per 1,000
live births, with their incidence increasing in preterm infants (4). This might appear as a
relatively rare occurrence, but when centres deal with up to 6,000 births a year and regions
up to 80,000 births a year, it translates to a relatively frequent clinical problem.
Additionally, most of the epidemiological studies include only clinical seizures with the
incidence of purely electroencephalographical seizures not yet known. The requirement
for early identification, diagnosis and effective treatment lies in the significant association
of neonatal seizures with disability in life. In up to 50% of cases, there will be some form

2.1.7 Neonatal seizures
94
of neurological sequelae, such as epilepsy, cerebral palsy, and/or intellectual disability
(224, 225).
Variations in reported incidence of neonatal seizures can be explained by different
diagnostic definitions and methods used. Most neonatal seizures occur on the first day,
and 70% of all cases eventually recognised have been diagnosed by the fourth day.
Humans are more likely to present with a seizure in the neonatal period than any other
point in their lifetime. Subtleties, such as equivocal clinical manifestation, electroclinical
dissociation with ongoing epileptiform electrical activity without any clinical association,
and the lack of equipment and trained staff for 24-hour service in EEG readings, make
the diagnosis of seizures challenging. In a recent study in which members of a clinical
team were shown 20 video recordings of infants with seizure or seizure-like activity, only
50% were correctly identified, with poor inter-observer agreement and no difference
between medical and non-medical staff in the interpretation of the videos (226).
Seizures are clinically subdivided into clonic, tonic and myoclonic. They can also
be focal or generalised. Generalised tonic-clonic seizures are rare in the neonatal period.
They can be very difficult to differentiate from spontaneous normal movements, with
variable EEG correlation and associated autonomic phenomena (226). An additional type
of neonatal seizures, where the described paroxysmal movements and changes in the
behaviour of the infant are neither of the above, nor normal (see Table 2.1). These are
termed as subtle seizures, and are associated with a variety of abnormal movements, such
as eye flickering, staring, chewing, lip smacking, cycling movements of the lower
extremities with autonomic phenomena (most usually referring to increase of systemic
blood pressure) (227). Their correlation to electroencephalographic activity is variable
(227). They are more frequent in premature infants (228), but can also be noted in term
infants with variable EEG correlation (229).
Clonic seizures are most frequently associated with time-synchronised EEG
seizure activity (229, 230). They are rhythmic and rather slow compared to other seizure
types. They can be focal, multifocal, or generalised. Focal clonic seizures are most
frequently associated with cerebral infarction but can also occur in the background of
metabolic encephalopathies. Tonic and myoclonic seizures are less likely associated with
time-synchronised abnormal electrical activity (229). Tonic seizures are usually focal or
generalised and involve sustained posturing of limbs or trunk and neck. Horizontal
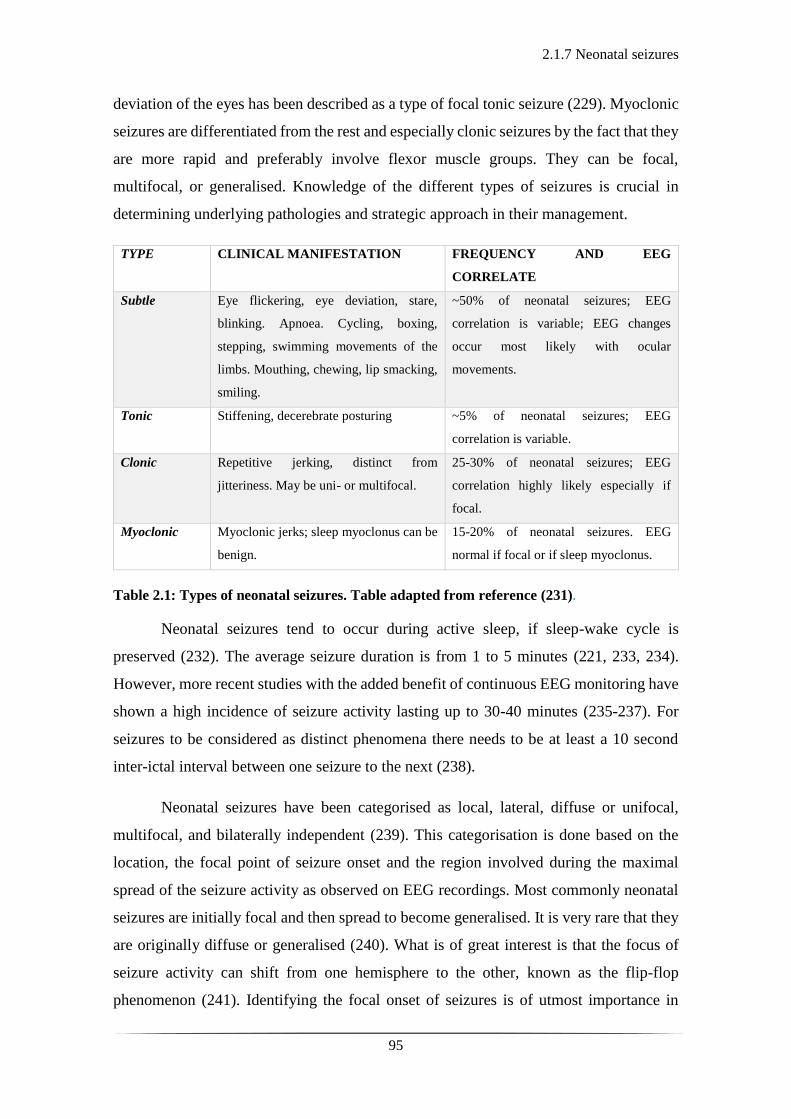
2.1.7 Neonatal seizures
95
deviation of the eyes has been described as a type of focal tonic seizure (229). Myoclonic
seizures are differentiated from the rest and especially clonic seizures by the fact that they
are more rapid and preferably involve flexor muscle groups. They can be focal,
multifocal, or generalised. Knowledge of the different types of seizures is crucial in
determining underlying pathologies and strategic approach in their management.
TYPE CLINICAL MANIFESTATION FREQUENCY AND EEG
CORRELATE
Subtle Eye flickering, eye deviation, stare,
blinking. Apnoea. Cycling, boxing,
stepping, swimming movements of the
limbs. Mouthing, chewing, lip smacking,
smiling.
~50% of neonatal seizures; EEG
correlation is variable; EEG changes
occur most likely with ocular
movements.
Tonic Stiffening, decerebrate posturing ~5% of neonatal seizures; EEG
correlation is variable.
Clonic Repetitive jerking, distinct from
jitteriness. May be uni- or multifocal.
25-30% of neonatal seizures; EEG
correlation highly likely especially if
focal.
Myoclonic Myoclonic jerks; sleep myoclonus can be
benign.
15-20% of neonatal seizures. EEG
normal if focal or if sleep myoclonus.
Table 2.1: Types of neonatal seizures. Table adapted from reference (231).
Neonatal seizures tend to occur during active sleep, if sleep-wake cycle is
preserved (232). The average seizure duration is from 1 to 5 minutes (221, 233, 234).
However, more recent studies with the added benefit of continuous EEG monitoring have
shown a high incidence of seizure activity lasting up to 30-40 minutes (235-237). For
seizures to be considered as distinct phenomena there needs to be at least a 10 second
inter-ictal interval between one seizure to the next (238).
Neonatal seizures have been categorised as local, lateral, diffuse or unifocal,
multifocal, and bilaterally independent (239). This categorisation is done based on the
location, the focal point of seizure onset and the region involved during the maximal
spread of the seizure activity as observed on EEG recordings. Most commonly neonatal
seizures are initially focal and then spread to become generalised. It is very rare that they
are originally diffuse or generalised (240). What is of great interest is that the focus of
seizure activity can shift from one hemisphere to the other, known as the flip-flop
phenomenon (241). Identifying the focal onset of seizures is of utmost importance in
2.1.7 Neonatal seizures
96
aiding clinical diagnosis as focal seizures can be associated with focal injury, while
generalised events are more often associated with widespread injury, such as infection
(242). However, it is important to note that in the neonatal period, generalised injury can
also present as focal seizures (243).
Diagnosis of neonatal seizures is further complicated by the fact that infants may
present with stereotypical, rhythmic movements with no EEG correlate. It is unclear as
to whether these events arise from subcortical structures (i.e., brainstem, hippocampus)
impossible to capture with conventional EEG and as to whether one should treat with
anticonvulsant medications (5). On the other hand, what is frequently seen especially in
immature infants or infants who have already received anticonvulsant treatment, is the
presence of electrographic seizures in the absence of clinical seizure activity. This is
widely known as electroclinical dissociation, a phenomenon well described in the
literature (10, 244-246). One hypothesis supports that the electro-clinical dissociation
could be due to the excitatory as opposed to inhibitory role of the GABA neurotransmitter
in the neonatal period. This is mediated by the efflux of chloride ions (Cl-) (secondary to
expression of two membrane co-transporters of Cl- at the perinatal period), which
eventually depolarises the neuronal membrane causing excitation (247-249). Frequently
used anticonvulsant agents such as benzodiazepines and phenobarbital act as GABA
agonists which may be an explanation for the fact that despite cessation of the clinically
observed seizure there is ongoing electrographic seizure activity.
Another challenge in managing neonatal seizures is the clinical significance of
electrical seizures with no clinical manifestation, termed subclinical seizures. Previous
studies assessing continuous video-EEG monitoring amongst children admitted in
intensive care units have identified subclinical seizures in up to 46% and status epilepticus
in as many as 23% (250-252). Similar results have been shown in studies of critically ill
neonates with subclinical seizures (18, 210). Most of these seizures would go undetected
without the presence of continuous video-EEG recordings. Their effect on ongoing brain
injury has long been debatable (252), with increasing evidence to support an association
between subclinical seizures and poor neurodevelopmental outcome (19, 253).
The question that naturally arises is why is it important to monitor these events if
we do not yet fully comprehend their clinical relevance? Furthermore, should we only
treat clinically obvious seizures and not EEG-only seizures? Such questions have

2.1.7 Neonatal seizures
97
tormented clinical neurophysiologists and neonatologists for years and clear answers are
yet to be established. However, continuous EEG monitoring increasingly reveals that
exclusive clinical judgement on seizure detection is a poor and incomplete approach
which can lead to over or underestimation of the seizure incidence, morphology, and
evolution.
There are extensive animal-based research studies showing the direct effect of
seizures on brain injury. Recurrent seizures in infants may affect their ventilation and lead
to periods of prolonged hypoxia and hypercapnia that precipitate brain injury, especially
in an already insulted cerebral region. However, there are clinical ways to support and
improve ventilation and oxygenation. Studies in paralysed adult animals showed that the
recurrence of seizures results in a point where the increase in energy supply can no longer
maintain the decrease in energy reserves. It was shown that failure in energy supply leads
to further prolongation of the seizures with irreparable injury to the brain tissue (254-
256). Other studies have shown that severe seizures result in excessive secretion of
excitatory amino acids, such as glutamate; a principal excitatory neurotransmitter in the
central nervous system. This appears to occur preferentially in areas involving the
hippocampus and limbic structures leading to neurotransmitter mediated post-synaptic
damage and eventually neuronal death (254-258). Although, most studies suggest that the
neonatal brain is more resilient to seizure mediated neuronal necrosis than that of the
adults (259), it is worthwhile noting that critically-ill infants will most likely present with
EEG-only seizures rather than clinical seizures (243, 260). Therefore, close, continuous
monitoring and a careful clinical approach is required for the neonatal groups most at risk
of seizures and brain injury. Examples of neonatal seizure patterns may be seen in the
following figures (2.1.22-24).
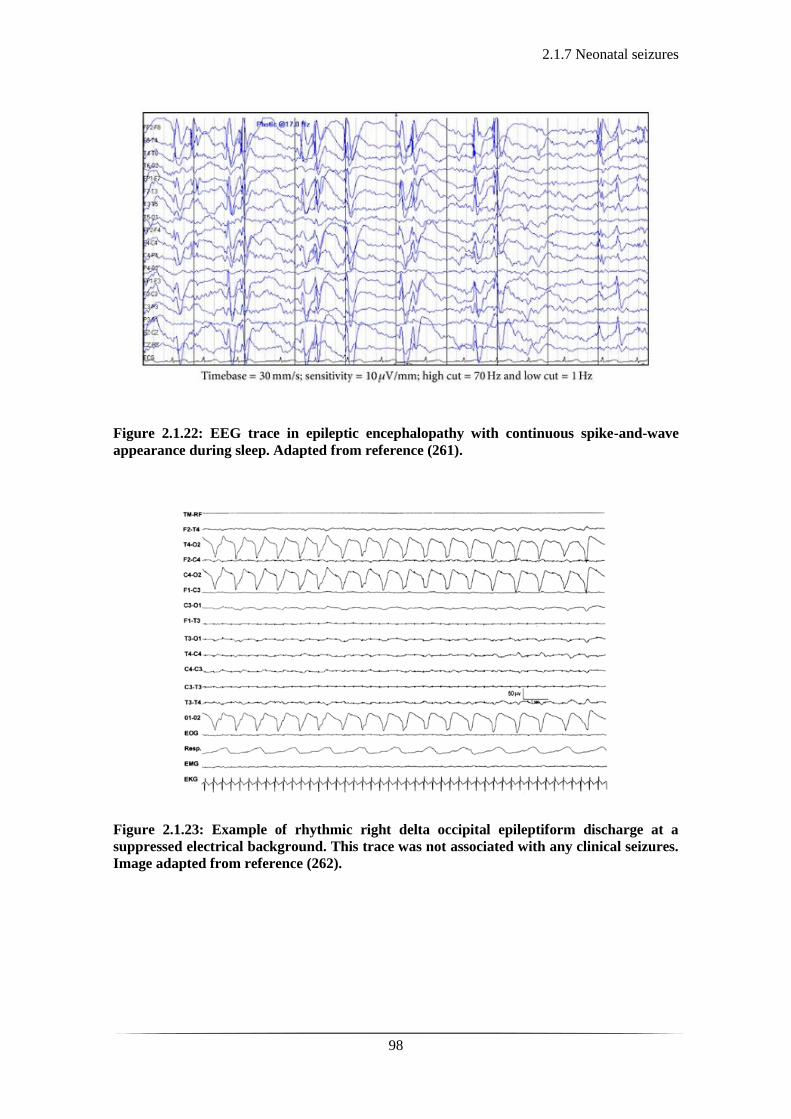
2.1.7 Neonatal seizures
98
Figure 2.1.22: EEG trace in epileptic encephalopathy with continuous spike-and-wave
appearance during sleep. Adapted from reference (261).
Figure 2.1.23: Example of rhythmic right delta occipital epileptiform discharge at a
suppressed electrical background. This trace was not associated with any clinical seizures.
Image adapted from reference (262).

2.1.7 Neonatal seizures
99
Figure 2.1.24: Example of rhythmic sharp wave activity over the left hemisphere. This was
clinically associated with clonic jerking of the right arm and of the leg. Adapted from
reference (262).
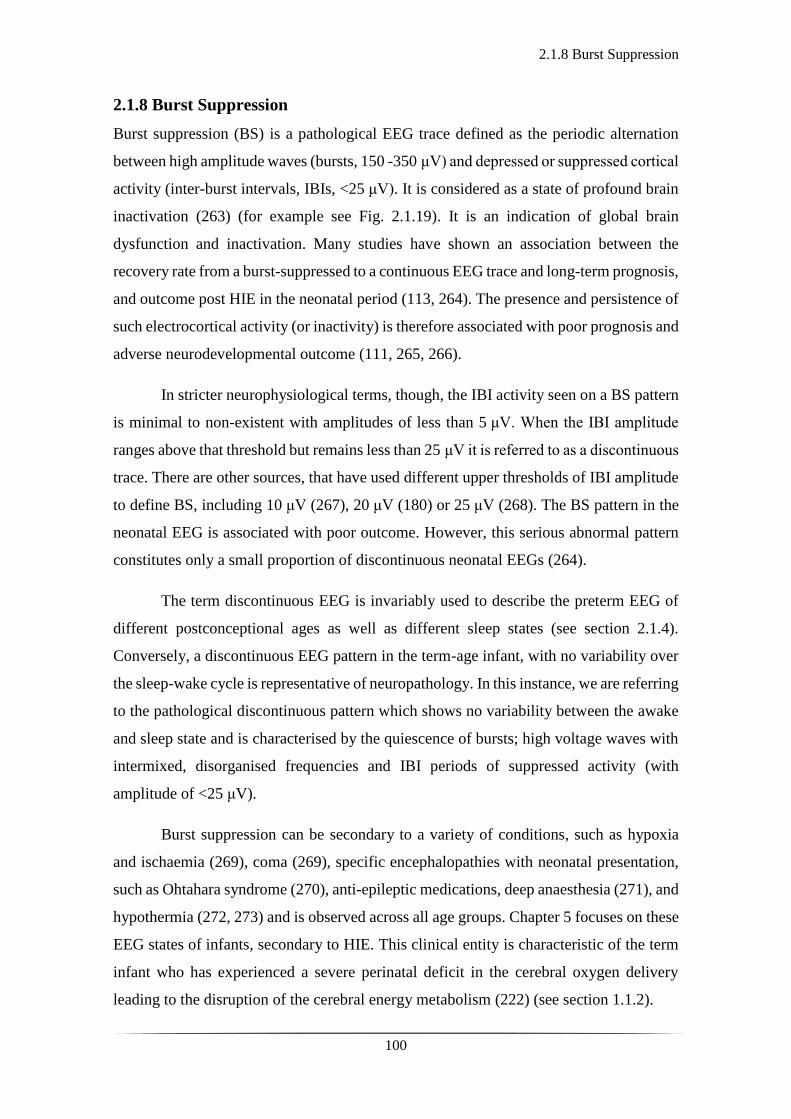
2.1.8 Burst Suppression
100
2.1.8 Burst Suppression
Burst suppression (BS) is a pathological EEG trace defined as the periodic alternation
between high amplitude waves (bursts, 150 -350 μV) and depressed or suppressed cortical
activity (inter-burst intervals, IBIs, <25 μV). It is considered as a state of profound brain
inactivation (263) (for example see Fig. 2.1.19). It is an indication of global brain
dysfunction and inactivation. Many studies have shown an association between the
recovery rate from a burst-suppressed to a continuous EEG trace and long-term prognosis,
and outcome post HIE in the neonatal period (113, 264). The presence and persistence of
such electrocortical activity (or inactivity) is therefore associated with poor prognosis and
adverse neurodevelopmental outcome (111, 265, 266).
In stricter neurophysiological terms, though, the IBI activity seen on a BS pattern
is minimal to non-existent with amplitudes of less than 5 μV. When the IBI amplitude
ranges above that threshold but remains less than 25 μV it is referred to as a discontinuous
trace. There are other sources, that have used different upper thresholds of IBI amplitude
to define BS, including 10 μV (267), 20 μV (180) or 25 μV (268). The BS pattern in the
neonatal EEG is associated with poor outcome. However, this serious abnormal pattern
constitutes only a small proportion of discontinuous neonatal EEGs (264).
The term discontinuous EEG is invariably used to describe the preterm EEG of
different postconceptional ages as well as different sleep states (see section 2.1.4).
Conversely, a discontinuous EEG pattern in the term-age infant, with no variability over
the sleep-wake cycle is representative of neuropathology. In this instance, we are referring
to the pathological discontinuous pattern which shows no variability between the awake
and sleep state and is characterised by the quiescence of bursts; high voltage waves with
intermixed, disorganised frequencies and IBI periods of suppressed activity (with
amplitude of <25 μV).
Burst suppression can be secondary to a variety of conditions, such as hypoxia
and ischaemia (269), coma (269), specific encephalopathies with neonatal presentation,
such as Ohtahara syndrome (270), anti-epileptic medications, deep anaesthesia (271), and
hypothermia (272, 273) and is observed across all age groups. Chapter 5 focuses on these
EEG states of infants, secondary to HIE. This clinical entity is characteristic of the term
infant who has experienced a severe perinatal deficit in the cerebral oxygen delivery
leading to the disruption of the cerebral energy metabolism (222) (see section 1.1.2).
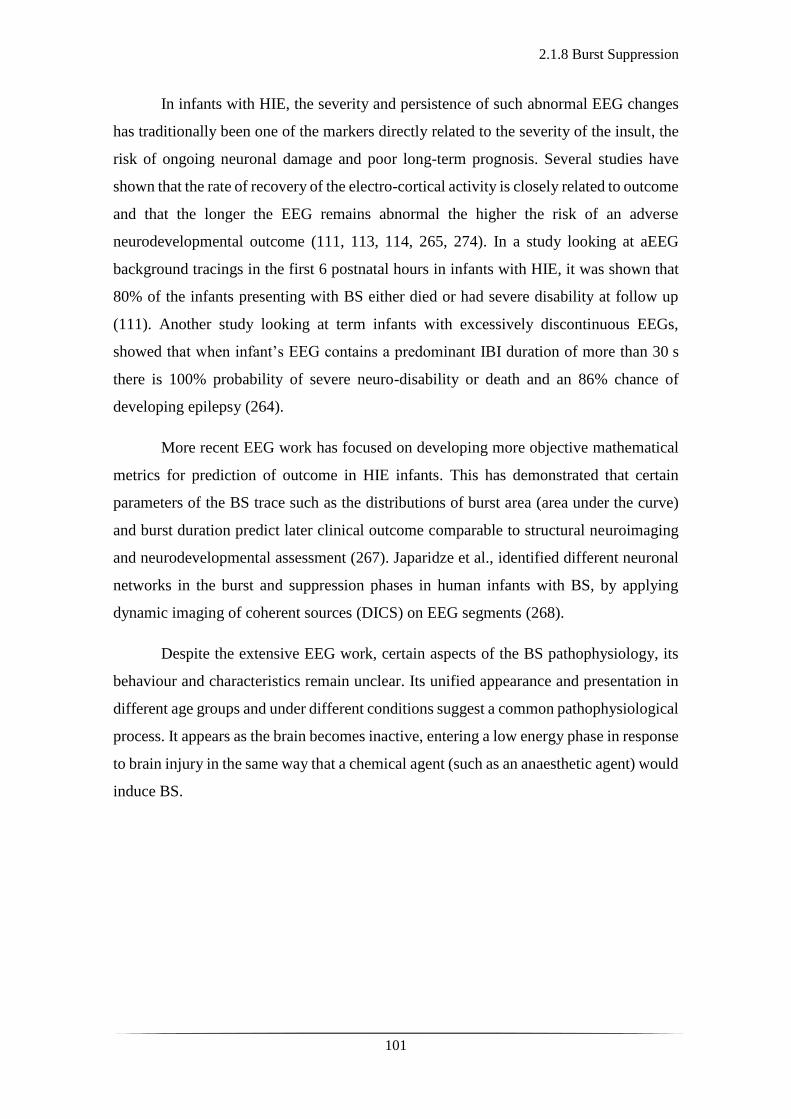
2.1.8 Burst Suppression
101
In infants with HIE, the severity and persistence of such abnormal EEG changes
has traditionally been one of the markers directly related to the severity of the insult, the
risk of ongoing neuronal damage and poor long-term prognosis. Several studies have
shown that the rate of recovery of the electro-cortical activity is closely related to outcome
and that the longer the EEG remains abnormal the higher the risk of an adverse
neurodevelopmental outcome (111, 113, 114, 265, 274). In a study looking at aEEG
background tracings in the first 6 postnatal hours in infants with HIE, it was shown that
80% of the infants presenting with BS either died or had severe disability at follow up
(111). Another study looking at term infants with excessively discontinuous EEGs,
showed that when infant’s EEG contains a predominant IBI duration of more than 30 s
there is 100% probability of severe neuro-disability or death and an 86% chance of
developing epilepsy (264).
More recent EEG work has focused on developing more objective mathematical
metrics for prediction of outcome in HIE infants. This has demonstrated that certain
parameters of the BS trace such as the distributions of burst area (area under the curve)
and burst duration predict later clinical outcome comparable to structural neuroimaging
and neurodevelopmental assessment (267). Japaridze et al., identified different neuronal
networks in the burst and suppression phases in human infants with BS, by applying
dynamic imaging of coherent sources (DICS) on EEG segments (268).
Despite the extensive EEG work, certain aspects of the BS pathophysiology, its
behaviour and characteristics remain unclear. Its unified appearance and presentation in
different age groups and under different conditions suggest a common pathophysiological
process. It appears as the brain becomes inactive, entering a low energy phase in response
to brain injury in the same way that a chemical agent (such as an anaesthetic agent) would
induce BS.
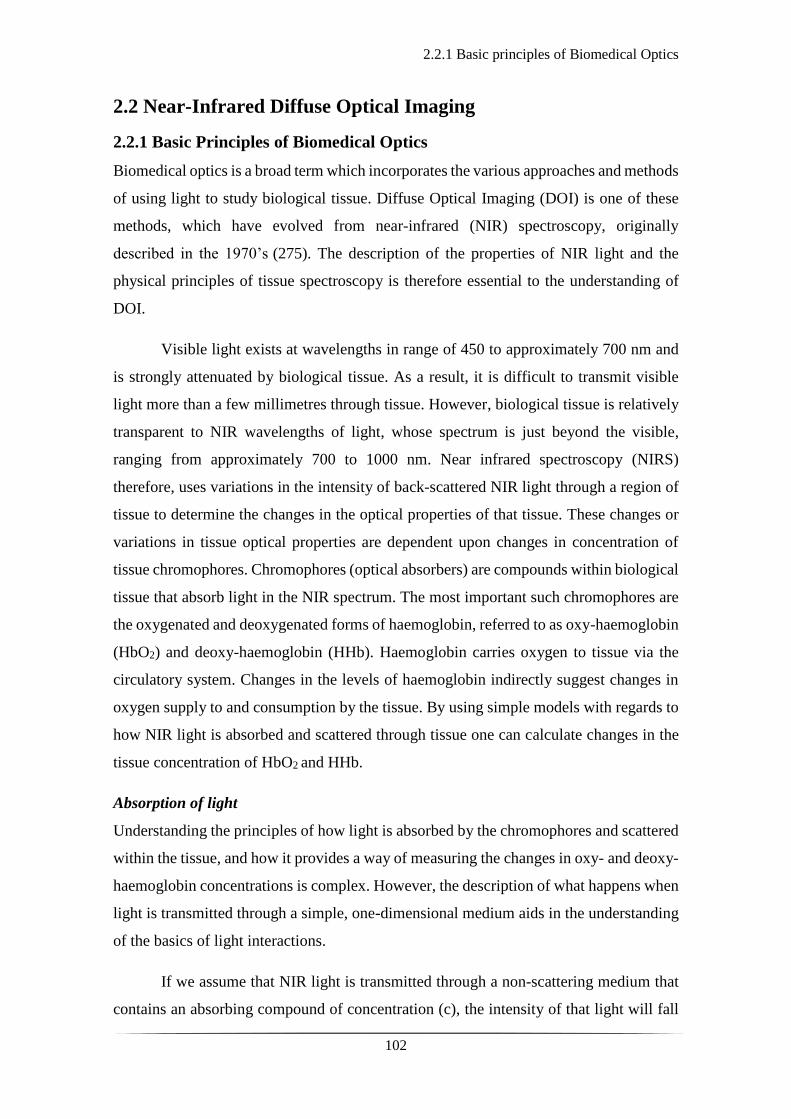
2.2.1 Basic principles of Biomedical Optics
102
2.2 Near-Infrared Diffuse Optical Imaging
2.2.1 Basic Principles of Biomedical Optics
Biomedical optics is a broad term which incorporates the various approaches and methods
of using light to study biological tissue. Diffuse Optical Imaging (DOI) is one of these
methods, which have evolved from near-infrared (NIR) spectroscopy, originally
described in the 1970’s (275). The description of the properties of NIR light and the
physical principles of tissue spectroscopy is therefore essential to the understanding of
DOI.
Visible light exists at wavelengths in range of 450 to approximately 700 nm and
is strongly attenuated by biological tissue. As a result, it is difficult to transmit visible
light more than a few millimetres through tissue. However, biological tissue is relatively
transparent to NIR wavelengths of light, whose spectrum is just beyond the visible,
ranging from approximately 700 to 1000 nm. Near infrared spectroscopy (NIRS)
therefore, uses variations in the intensity of back-scattered NIR light through a region of
tissue to determine the changes in the optical properties of that tissue. These changes or
variations in tissue optical properties are dependent upon changes in concentration of
tissue chromophores. Chromophores (optical absorbers) are compounds within biological
tissue that absorb light in the NIR spectrum. The most important such chromophores are
the oxygenated and deoxygenated forms of haemoglobin, referred to as oxy-haemoglobin
(HbO2) and deoxy-haemoglobin (HHb). Haemoglobin carries oxygen to tissue via the
circulatory system. Changes in the levels of haemoglobin indirectly suggest changes in
oxygen supply to and consumption by the tissue. By using simple models with regards to
how NIR light is absorbed and scattered through tissue one can calculate changes in the
tissue concentration of HbO2 and HHb.
Absorption of light
Understanding the principles of how light is absorbed by the chromophores and scattered
within the tissue, and how it provides a way of measuring the changes in oxy- and deoxy-
haemoglobin concentrations is complex. However, the description of what happens when
light is transmitted through a simple, one-dimensional medium aids in the understanding
of the basics of light interactions.
If we assume that NIR light is transmitted through a non-scattering medium that
contains an absorbing compound of concentration (c), the intensity of that light will fall
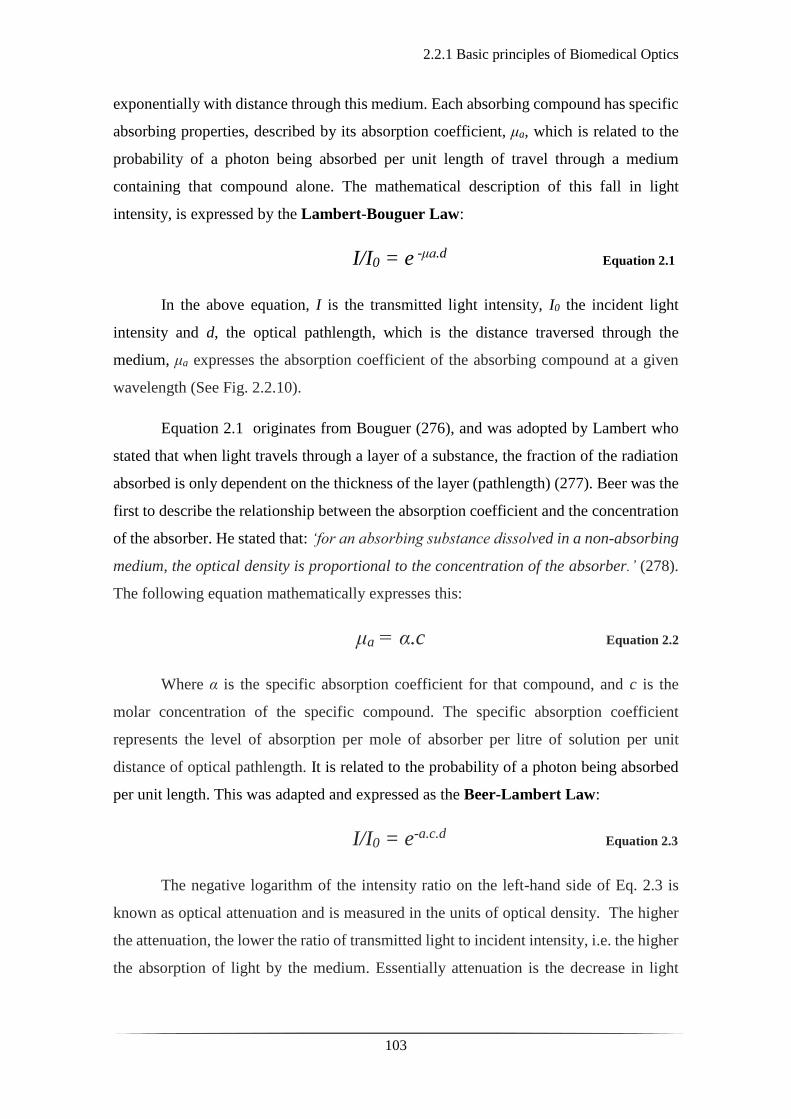
2.2.1 Basic principles of Biomedical Optics
103
exponentially with distance through this medium. Each absorbing compound has specific
absorbing properties, described by its absorption coefficient, μa, which is related to the
probability of a photon being absorbed per unit length of travel through a medium
containing that compound alone. The mathematical description of this fall in light
intensity, is expressed by the Lambert-Bouguer Law:
I/I0 = e -μa.d Equation 2.1
In the above equation, I is the transmitted light intensity, I0 the incident light
intensity and d, the optical pathlength, which is the distance traversed through the
medium, μa expresses the absorption coefficient of the absorbing compound at a given
wavelength (See Fig. 2.2.10).
Equation 2.1 originates from Bouguer (276), and was adopted by Lambert who
stated that when light travels through a layer of a substance, the fraction of the radiation
absorbed is only dependent on the thickness of the layer (pathlength) (277). Beer was the
first to describe the relationship between the absorption coefficient and the concentration
of the absorber. He stated that: ‘for an absorbing substance dissolved in a non-absorbing
medium, the optical density is proportional to the concentration of the absorber.’ (278).
The following equation mathematically expresses this:
μa = α.c Equation 2.2
Where α is the specific absorption coefficient for that compound, and c is the
molar concentration of the specific compound. The specific absorption coefficient
represents the level of absorption per mole of absorber per litre of solution per unit
distance of optical pathlength. It is related to the probability of a photon being absorbed
per unit length. This was adapted and expressed as the Beer-Lambert Law:
I/I0 = e-a.c.d Equation 2.3
The negative logarithm of the intensity ratio on the left-hand side of Eq. 2.3 is
known as optical attenuation and is measured in the units of optical density. The higher
the attenuation, the lower the ratio of transmitted light to incident intensity, i.e. the higher
the absorption of light by the medium. Essentially attenuation is the decrease in light
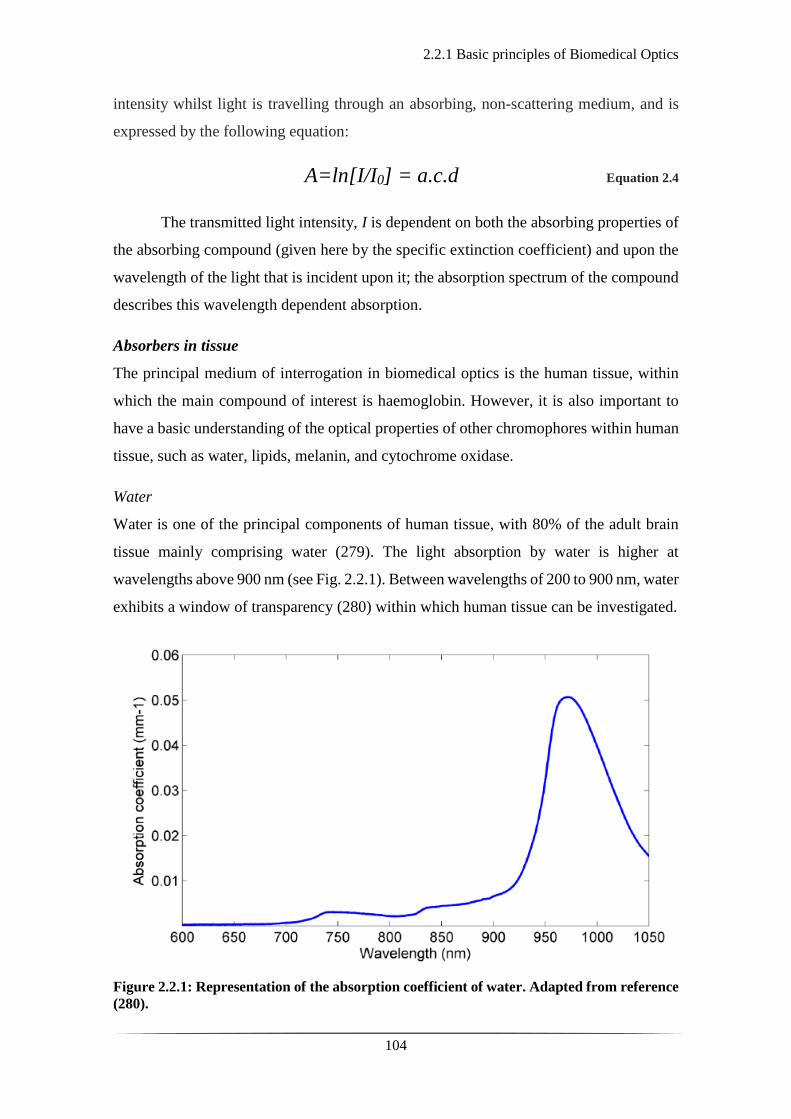
2.2.1 Basic principles of Biomedical Optics
104
intensity whilst light is travelling through an absorbing, non-scattering medium, and is
expressed by the following equation:
A=ln[I/I0] = a.c.d Equation 2.4
The transmitted light intensity, I is dependent on both the absorbing properties of
the absorbing compound (given here by the specific extinction coefficient) and upon the
wavelength of the light that is incident upon it; the absorption spectrum of the compound
describes this wavelength dependent absorption.
Absorbers in tissue
The principal medium of interrogation in biomedical optics is the human tissue, within
which the main compound of interest is haemoglobin. However, it is also important to
have a basic understanding of the optical properties of other chromophores within human
tissue, such as water, lipids, melanin, and cytochrome oxidase.
Water
Water is one of the principal components of human tissue, with 80% of the adult brain
tissue mainly comprising water (279). The light absorption by water is higher at
wavelengths above 900 nm (see Fig. 2.2.1). Between wavelengths of 200 to 900 nm, water
exhibits a window of transparency (280) within which human tissue can be investigated.
Figure 2.2.1: Representation of the absorption coefficient of water. Adapted from reference
(280).

2.2.1 Basic principles of Biomedical Optics
105
Haemoglobin
Within this window of transparency, haemoglobin is the chromophore which is absorbed
in the NIR spectrum, between 600 and 900 nm. It is worth noting that there is a
differentiation in absorption properties between HbO2 and HHb. The difference in the
absorption levels between these two compounds in the visible part of the spectrum
explains the appearance of blood; where oxygenated blood (arterial) appears bright red,
and deoxygenated blood (venous) appears more purple or blue (see Fig. 2.2.2). Similarly,
light at 850nm will be absorbed more by HbO2 and less by HHb; conversely light of
750nm will be absorbed predominantly by HHb (see Fig. 2.2.2 & 2.2.3). An isosbestic
point, where the specific extinction coefficients of both haemoglobin compounds are
equal exists at 800 nm. Before and after this point the absorption of the spectra differs for
HbO2 and HHb. This difference allows spectroscopic separation of the two compounds
by only using a few sample wavelengths. By illuminating tissue with two or more
wavelengths, the changes in the absorption of those two wavelengths of light can be used
to calculate the relative concentration changes of both HbO2 and HHb.
Figure 2.2.2: Representation of the absorption (molar extinction) coefficients of HbO2 (blue
line) and HHb (pink line) for different wavelengths between 400 to 1000 nm. The spectrum
of visible light is overlaid on the x axis. The black square indicates light in the NIR range
with the isosbestic point of HbO2 and HHb. Adapted from reference (281).
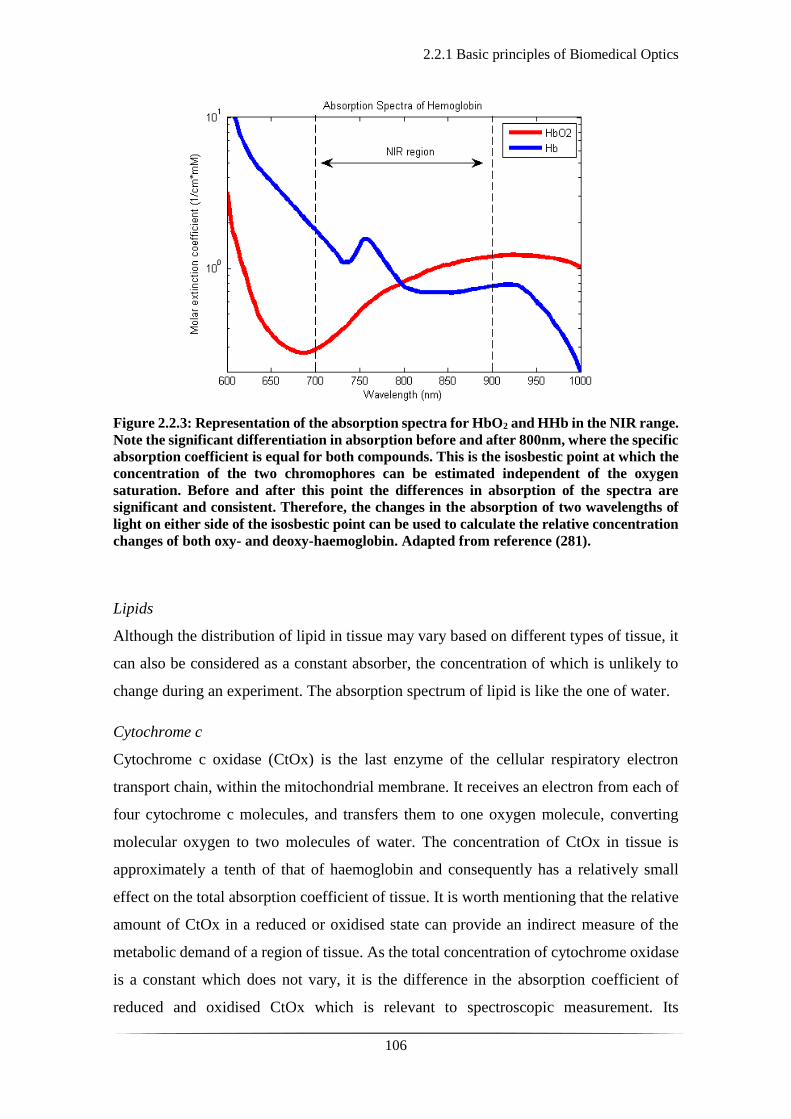
2.2.1 Basic principles of Biomedical Optics
106
Figure 2.2.3: Representation of the absorption spectra for HbO2 and HHb in the NIR range.
Note the significant differentiation in absorption before and after 800nm, where the specific
absorption coefficient is equal for both compounds. This is the isosbestic point at which the
concentration of the two chromophores can be estimated independent of the oxygen
saturation. Before and after this point the differences in absorption of the spectra are
significant and consistent. Therefore, the changes in the absorption of two wavelengths of
light on either side of the isosbestic point can be used to calculate the relative concentration
changes of both oxy- and deoxy-haemoglobin. Adapted from reference (281).
Lipids
Although the distribution of lipid in tissue may vary based on different types of tissue, it
can also be considered as a constant absorber, the concentration of which is unlikely to
change during an experiment. The absorption spectrum of lipid is like the one of water.
Cytochrome c
Cytochrome c oxidase (CtOx) is the last enzyme of the cellular respiratory electron
transport chain, within the mitochondrial membrane. It receives an electron from each of
four cytochrome c molecules, and transfers them to one oxygen molecule, converting
molecular oxygen to two molecules of water. The concentration of CtOx in tissue is
approximately a tenth of that of haemoglobin and consequently has a relatively small
effect on the total absorption coefficient of tissue. It is worth mentioning that the relative
amount of CtOx in a reduced or oxidised state can provide an indirect measure of the
metabolic demand of a region of tissue. As the total concentration of cytochrome oxidase
is a constant which does not vary, it is the difference in the absorption coefficient of
reduced and oxidised CtOx which is relevant to spectroscopic measurement. Its

2.2.1 Basic principles of Biomedical Optics
107
concentration, however, is relatively low compared to haemoglobin and unless using
specific broadband spectrophotometers it is difficult to measure (282).
Scattering of light
Scattering is the other main way in which light interacts with tissue. The term scattering
includes a variety of light-matter interactions which maintain the existence of the
incoming photon but may alter its direction of travel (elastic scattering) or degrade the
photon’s kinetic energy (inelastic scattering). Scattering is the dominant light-matter
interaction in biological tissue at visible and NIR wavelengths. In most cases, when a
photon travels within a scattering medium, the different compounds will change its
direction of travel but not its kinetic energy. Inelastic scattering is generally neglected in
biomedical optics. In the same way that the absorption coefficient (µa) describes the
absorption properties of a certain compound, the scattering coefficient (µs) describes its
scattering properties.
Because of the effect of scattering and unlike the controlled example above, light
does not travel in a straight line through biological tissue. The biological tissue per se is
a scattering medium with its compounds constantly changing the direction of light (see
Fig. 2.2.4), forcing to follow a random path. This is where the term, diffuse, often used
to describe imaging methods (see section 2.2.4), derives from. The direction in which the
scattered photon will travel is dependent on the size of the scattering compound, the light
wavelength, and the refractive indices of the scattering medium.
Figure 2.2.4: The effect of light scattering through a medium containing a scattering
component.
The probability of any given photon being absorbed will no longer be a simple
function of the thickness of the medium as originally described by Bouguer. As a photon
is undergoing a great number of scattering events, it must travel a greater distance to
2.2.1 Basic principles of Biomedical Optics
108
traverse the medium, thus increasing the probability being absorbed. The revision of the
model for the attenuation of light intensity whilst travelling through biological tissue, is
known as the modified Beer Lambert law:
A = log10[I/I0] = a.c.d.B+G Equation 2.5
A stands for attenuation of light intensity, Io for intensity of light incident upon an
absorbing and scattering medium, I intensity of light transmitted through the medium, a
for the specific extinction coefficient of the absorbing compound measured, c for
concentration of the absorbing compound in the solution, d geometrical distance that the
light travels, B for differential pathlength factor (DPF) and G as the additive term to
account for scattering losses (i.e. photons that are scattered away from the detector). The
DPF accounts for the expected increase in average pathlength due to scattering events
(283), and is dependent upon the reduced scattering coefficient, the absorption coefficient
and the geometry of source and detector.
2.2.2 Measurements using near-infrared light
109
2.2.2 Measurements using near-infrared light
The modified Beer-Lambert law is the most important equation in biomedical optics and
it allows us to calculate several physiologically important characteristics. However, in the
same manner the original Beer-Lambert law did not account for the scattering effect, there
are certain limitations within the modified version of the law regarding these
measurements.
The factor which is the most difficult to calculate is the geometrical loss due to
scattering events, G, as this is dependent upon the geometry of the tissue, as well as the
scattering coefficient of the tissue under investigation. Without knowledge of G, the
calculation of the absolute concentration of a compound, c, becomes impossible.
However, if one assumes that the factor G, remains constant and does not change between
two, it then becomes possible to calculate the changes of concentration of a compound
from the measured change in attenuation between the experiments.
Imagine light of intensity Io, illuminating a highly scattering medium that contains
an absorber (chromophore) with a concentration c1. The light attenuation is measured as
A1, but c1 is not possible to determine due to the unknown contribution of scattering
losses, G. Similarly, if we repeat the experiment with the exact same medium and incident
light intensity, Io, but change the concentration of the absorber within the medium to c2,
we will be able to measure the light attenuation, A2.
A1 = c1.a.d.B + G Equation 2.6
A2 = c2.a.d.B + G Equation 2.7
Note that in both equations 2.6 and 2.7, and following certain assumptions, we can
calculate the absolute changes in chromophore concentration based on the absolute
measurements of light attenuation as shown in equation 2.2.8.
ΔA = A2 - A1 = (c2 - c1).a.d.B Equation 2.8
As noted above, factor G is eliminated in Eq. 2.8. Therefore, based on
measurements of the change in attenuation one could determine the changes in absorption
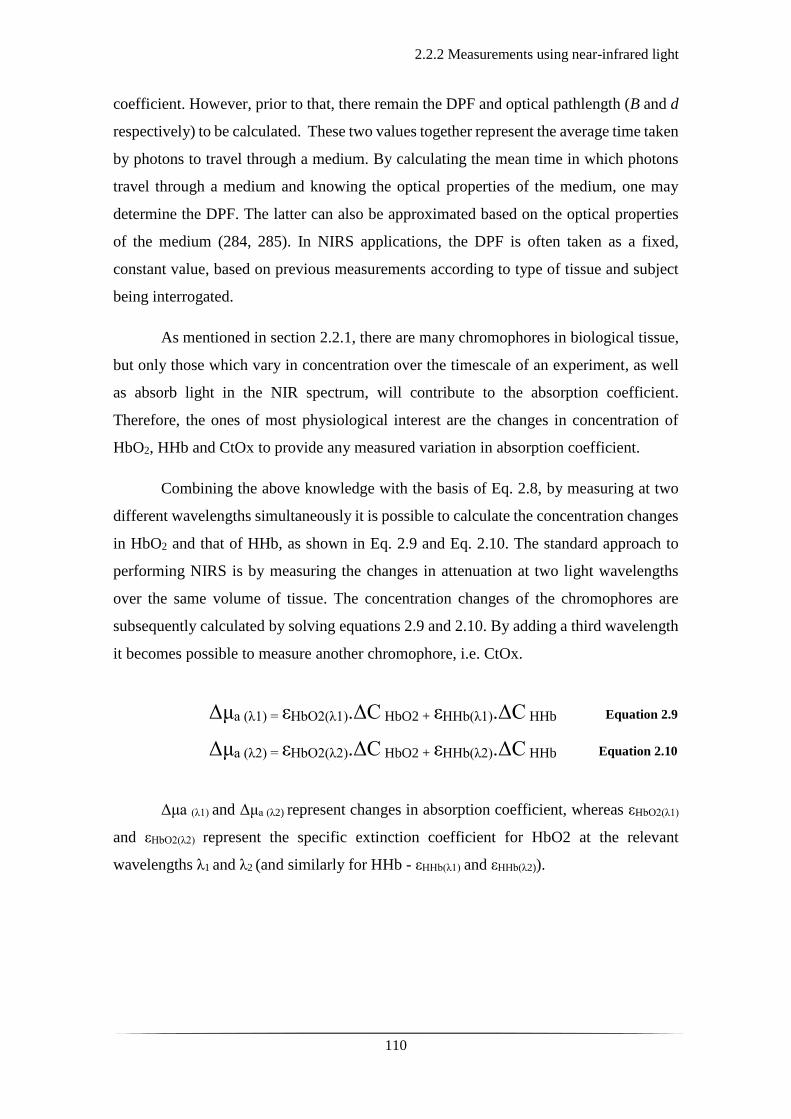
2.2.2 Measurements using near-infrared light
110
coefficient. However, prior to that, there remain the DPF and optical pathlength (B and d
respectively) to be calculated. These two values together represent the average time taken
by photons to travel through a medium. By calculating the mean time in which photons
travel through a medium and knowing the optical properties of the medium, one may
determine the DPF. The latter can also be approximated based on the optical properties
of the medium (284, 285). In NIRS applications, the DPF is often taken as a fixed,
constant value, based on previous measurements according to type of tissue and subject
being interrogated.
As mentioned in section 2.2.1, there are many chromophores in biological tissue,
but only those which vary in concentration over the timescale of an experiment, as well
as absorb light in the NIR spectrum, will contribute to the absorption coefficient.
Therefore, the ones of most physiological interest are the changes in concentration of
HbO2, HHb and CtOx to provide any measured variation in absorption coefficient.
Combining the above knowledge with the basis of Eq. 2.8, by measuring at two
different wavelengths simultaneously it is possible to calculate the concentration changes
in HbO2 and that of HHb, as shown in Eq. 2.9 and Eq. 2.10. The standard approach to
performing NIRS is by measuring the changes in attenuation at two light wavelengths
over the same volume of tissue. The concentration changes of the chromophores are
subsequently calculated by solving equations 2.9 and 2.10. By adding a third wavelength
it becomes possible to measure another chromophore, i.e. CtOx.
Δμa (λ1) = εHbO2(λ1).ΔC HbO2 + εHHb(λ1).ΔC HHb Equation 2.9
Δμa (λ2) = εHbO2(λ2).ΔC HbO2 + εHHb(λ2).ΔC HHb Equation 2.10
Δμa (λ1) and Δμa (λ2) represent changes in absorption coefficient, whereas εHbO2(λ1)
and εHbO2(λ2) represent the specific extinction coefficient for HbO2 at the relevant
wavelengths λ1 and λ2 (and similarly for HHb - εHHb(λ1) and εHHb(λ2)).

2.2.3 Neurovascular coupling
111
2.2.3 Neurovascular coupling
NIRS is an ideal tool for measurements of changes in the chromophore concentration of
a given medium, and it is thus mostly applied to experiments where a stimulus invokes a
change in the chromophore concentration. An ideal such medium is the human cortex,
which is rich in both neuronal and vascular activity.
During a purposeful movement or a cognitive task there is a natural increase in
electro-cortical activity which leads to increased metabolic demands and energy supply
at a cellular level (286, 287). The principal molecule in energy production or consumption
on a cellular level is adenosine tri-phosphatase (ATP), which is the end-product of cellular
respiration. Repeated neuronal activation results in a constant re-polarisation of the
neuronal membrane back to its resting potential state, a highly energy consumptive
process. The ion transporters across the neuronal membrane are fuelled by ATP and their
increased activity leads to high ATP requirements and therefore, increase in cellular
respiration. The latter process is driven by both O2 and glucose supply, which is provided
by the flow of regional vasculature (see Fig. 2.2.5).
Cerebral blood flow (CBF) is vital to the brain, and there is a constant baseline
flow for maintaining all basic functions (288). Within the cerebrovascular system there
are heterogenous mechanisms which maintain cerebral blood flow at a level which meets
the energy requirements and prevents sudden fluctuations due to changes in systemic
arterial blood pressure. The control of blood supply to the brain is tightly regulated at
both a global and regional level. Global cerebral autoregulation, which maintains CBF
over a range of perfusion pressures is regulated by smooth muscle cells in the cerebral
arterioles (289). Local supply of blood to meet metabolic demand of neuronal tissue is
regulated both by smooth muscle cell activation as well as local metabolic factors. In this
way, a constant supply of oxygen and glucose is provided to the neuronal tissues in an
activity-dependent manner.
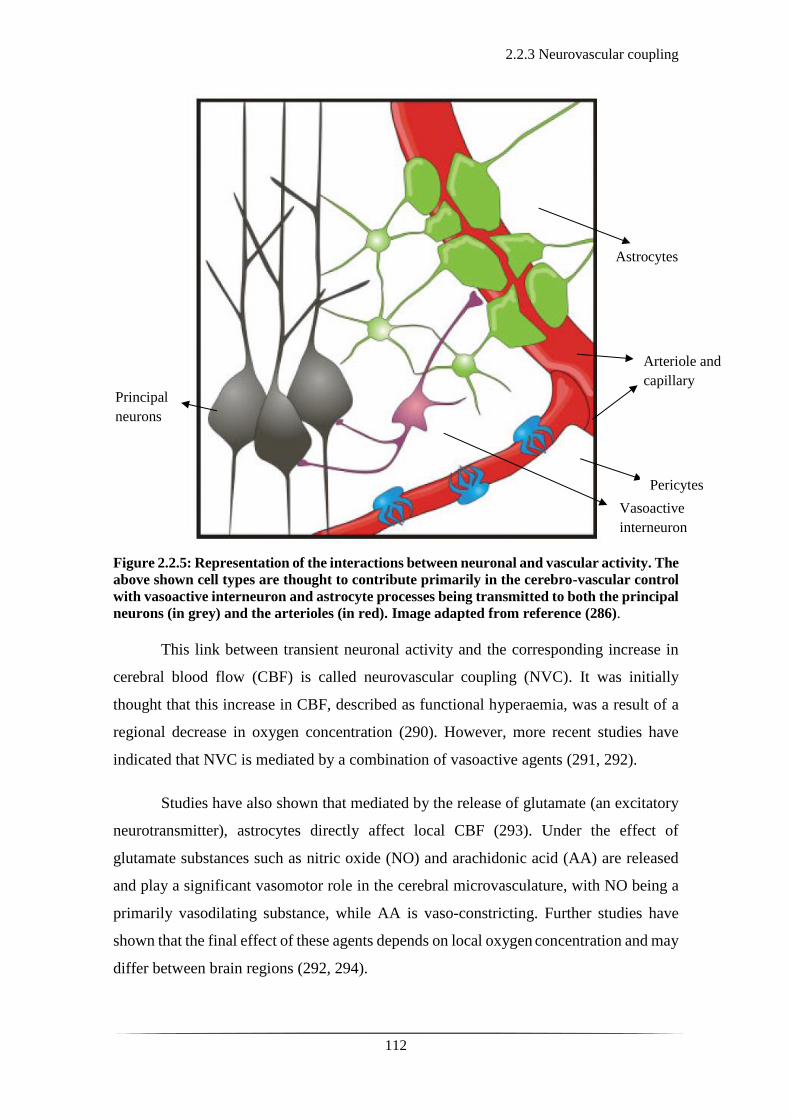
2.2.3 Neurovascular coupling
112
Figure 2.2.5: Representation of the interactions between neuronal and vascular activity. The
above shown cell types are thought to contribute primarily in the cerebro-vascular control
with vasoactive interneuron and astrocyte processes being transmitted to both the principal
neurons (in grey) and the arterioles (in red). Image adapted from reference (286).
This link between transient neuronal activity and the corresponding increase in
cerebral blood flow (CBF) is called neurovascular coupling (NVC). It was initially
thought that this increase in CBF, described as functional hyperaemia, was a result of a
regional decrease in oxygen concentration (290). However, more recent studies have
indicated that NVC is mediated by a combination of vasoactive agents (291, 292).
Studies have also shown that mediated by the release of glutamate (an excitatory
neurotransmitter), astrocytes directly affect local CBF (293). Under the effect of
glutamate substances such as nitric oxide (NO) and arachidonic acid (AA) are released
and play a significant vasomotor role in the cerebral microvasculature, with NO being a
primarily vasodilating substance, while AA is vaso-constricting. Further studies have
shown that the final effect of these agents depends on local oxygen concentration and may
differ between brain regions (292, 294).
Arteriole and
capillary Principal
neurons
Vasoactive
interneuron
Pericytes
Astrocytes

2.2.3 Neurovascular coupling
113
As previously discussed NIRS can measure fluctuations in the concentrations of
HbO2 and HHb. Hence, the NIRS signal reflects the balance between the oxygenated CBF
and the rate at which O2 is consumed (known as the cerebral metabolic rate of oxygen,
CMRO2). Logically, one would anticipate that increased localised neuronal activity
would lead to a localised decrease in HbO2 and increase in HHb secondary to increased
CMRO2. However, the classical anticipated NIRS response is the result of a decrease in
HHb and an increase in HbO2 concentration.
The change in CMRO2 and the corresponding change in CBF are poorly balanced.
With CBF being an indirect measure of oxygen supply, it has been shown that CBF may
increase 6 times more for a given increase in CMRO2 following a somatosensory stimulus
(295). However, although the actual figure remains debatable through the literature,
similar studies have shown that stimulation of changes in the neuronal activity does lead
in CBF over-compensation (296, 297). It is this signal that forms the foundation of
research in the field of investigating the functional cortical activation using NIR optical
techniques and MRI, known as functional NIRS (fNIRS) and blood oxygen level
dependent (BOLD) fMRI.
The classic NIRS functional response in the adult brain is represented by an
increase in HbO2 concentration, accompanied by a decrease in HHb concentration on a
micro-molar scale (see Fig. 2.2.6). This has consistently been demonstrated by adult
NIRS based studies (298-303). As discussed above, it is thought that the decrease in HHb
is secondary to oxygen delivery in excess of oxygen consumption in response to
functional activation of the brain (295). This activity-induced vascular response is known
as the haemodynamic response function (HRF). Normally the HRF to a stimulus is
typically quite slow; it begins at approximately 3 seconds post stimulation and reaches its
crescendo within 20 seconds (304). The shape of the HRF and its time-course will
naturally differ depending upon the type of stimulus (different amplitudes in the signal
have been noted to brief or long-lasting stimuli) (305), the subject, age group, the region
of the brain interrogated and the underlying neuronal activity.
Research studies in adults suggest that the observed haemodynamic response
measured by NIRS is comparable to the BOLD response observed in functional MRI. The
superiority of NIRS is that it is based on the intrinsic blood light absorption and therefore
provides separate measurements of changes in HbO2, HHb, and HbT concentrations.
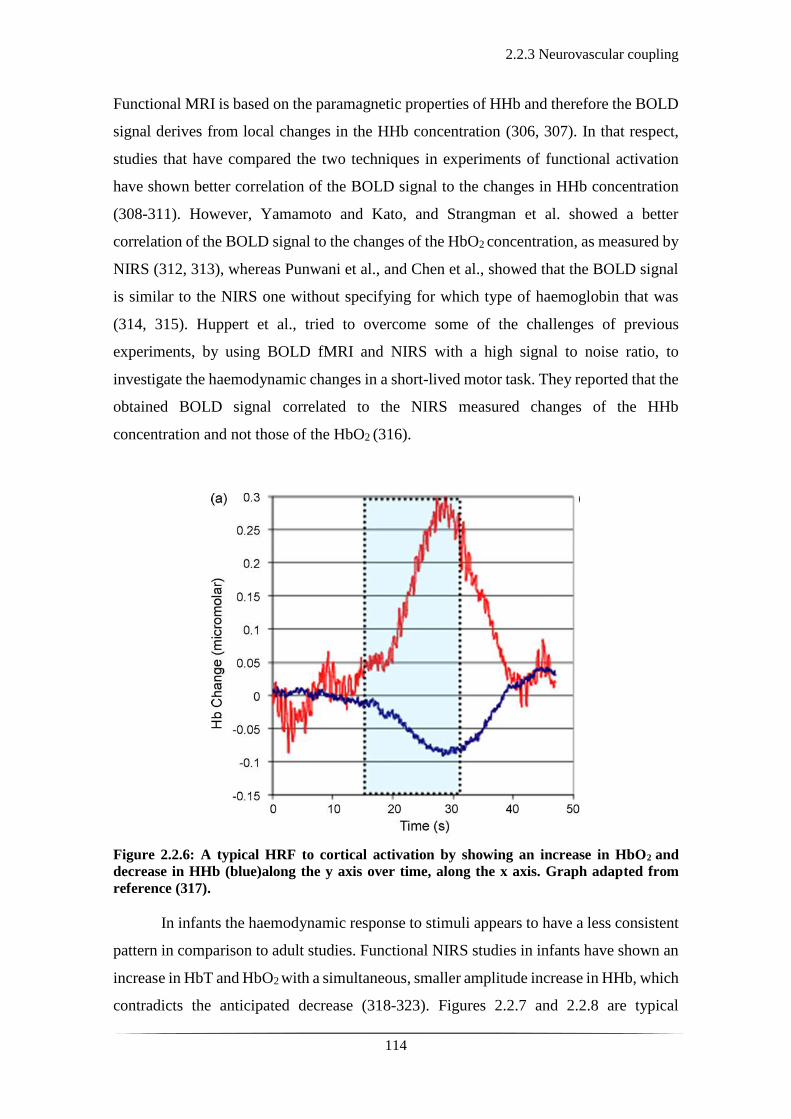
2.2.3 Neurovascular coupling
114
Functional MRI is based on the paramagnetic properties of HHb and therefore the BOLD
signal derives from local changes in the HHb concentration (306, 307). In that respect,
studies that have compared the two techniques in experiments of functional activation
have shown better correlation of the BOLD signal to the changes in HHb concentration
(308-311). However, Yamamoto and Kato, and Strangman et al. showed a better
correlation of the BOLD signal to the changes of the HbO2 concentration, as measured by
NIRS (312, 313), whereas Punwani et al., and Chen et al., showed that the BOLD signal
is similar to the NIRS one without specifying for which type of haemoglobin that was
(314, 315). Huppert et al., tried to overcome some of the challenges of previous
experiments, by using BOLD fMRI and NIRS with a high signal to noise ratio, to
investigate the haemodynamic changes in a short-lived motor task. They reported that the
obtained BOLD signal correlated to the NIRS measured changes of the HHb
concentration and not those of the HbO2 (316).
Figure 2.2.6: A typical HRF to cortical activation by showing an increase in HbO2 and
decrease in HHb (blue)along the y axis over time, along the x axis. Graph adapted from
reference (317).
In infants the haemodynamic response to stimuli appears to have a less consistent
pattern in comparison to adult studies. Functional NIRS studies in infants have shown an
increase in HbT and HbO2 with a simultaneous, smaller amplitude increase in HHb, which
contradicts the anticipated decrease (318-323). Figures 2.2.7 and 2.2.8 are typical
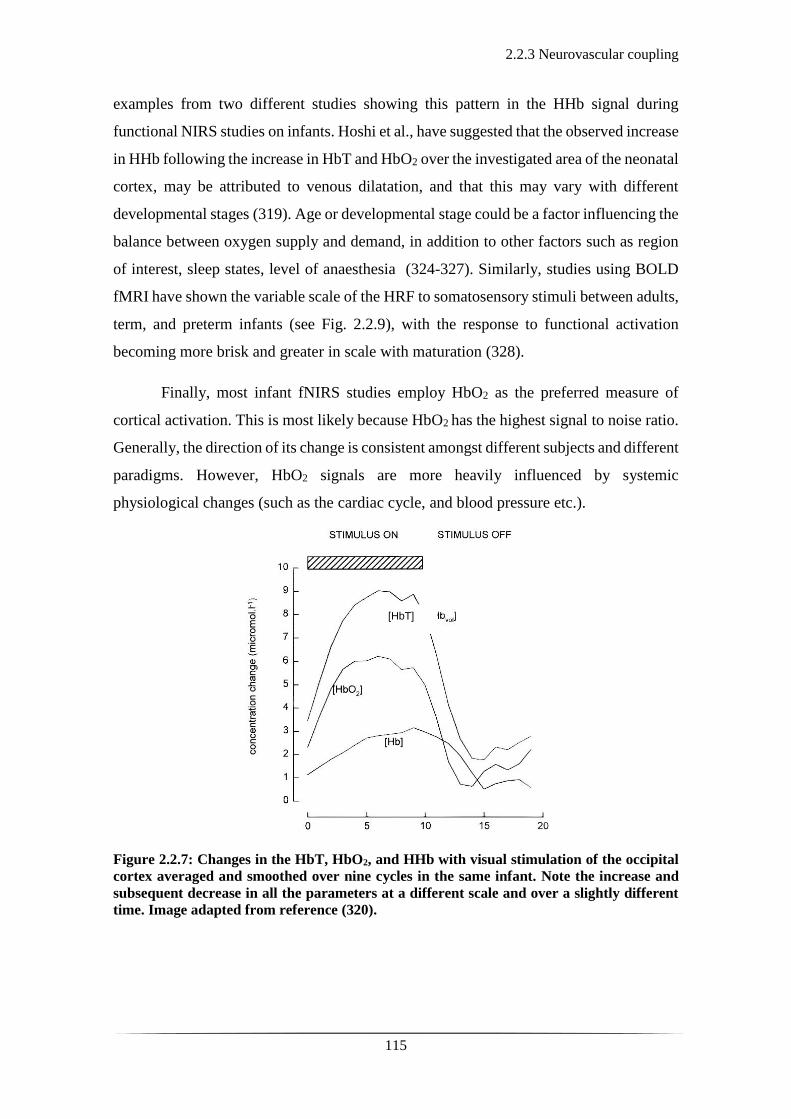
2.2.3 Neurovascular coupling
115
examples from two different studies showing this pattern in the HHb signal during
functional NIRS studies on infants. Hoshi et al., have suggested that the observed increase
in HHb following the increase in HbT and HbO2 over the investigated area of the neonatal
cortex, may be attributed to venous dilatation, and that this may vary with different
developmental stages (319). Age or developmental stage could be a factor influencing the
balance between oxygen supply and demand, in addition to other factors such as region
of interest, sleep states, level of anaesthesia (324-327). Similarly, studies using BOLD
fMRI have shown the variable scale of the HRF to somatosensory stimuli between adults,
term, and preterm infants (see Fig. 2.2.9), with the response to functional activation
becoming more brisk and greater in scale with maturation (328).
Finally, most infant fNIRS studies employ HbO2 as the preferred measure of
cortical activation. This is most likely because HbO2 has the highest signal to noise ratio.
Generally, the direction of its change is consistent amongst different subjects and different
paradigms. However, HbO2 signals are more heavily influenced by systemic
physiological changes (such as the cardiac cycle, and blood pressure etc.).
Figure 2.2.7: Changes in the HbT, HbO2, and HHb with visual stimulation of the occipital
cortex averaged and smoothed over nine cycles in the same infant. Note the increase and
subsequent decrease in all the parameters at a different scale and over a slightly different
time. Image adapted from reference (320).
[HbT]

2.2.3 Neurovascular coupling
116
Figure 2.2.8: Example of functional activation. Changes in oxygenated haemoglobin (oxy-
Hb), deoxygenated haemoglobin (deoxy-Hb), and total haemoglobin (t-Hb) over one channel
in one infant during the (A) first and (B) second stimulation. Note the increase in deoxy-Hb
in Figure A and its decrease in Figure B. Image adapted from reference (319).
Figure 2.2.9: Time-series plots of the BOLD signal change post somatosensory stimulus for
different age groups: the (a) adult; (b) term equivalent infant; (c) preterm infant groups.
(d) Note the decrease in the time to peak of the HRF, and the increase in peak amplitude
with increasing age. Graphs adapted from reference (328).
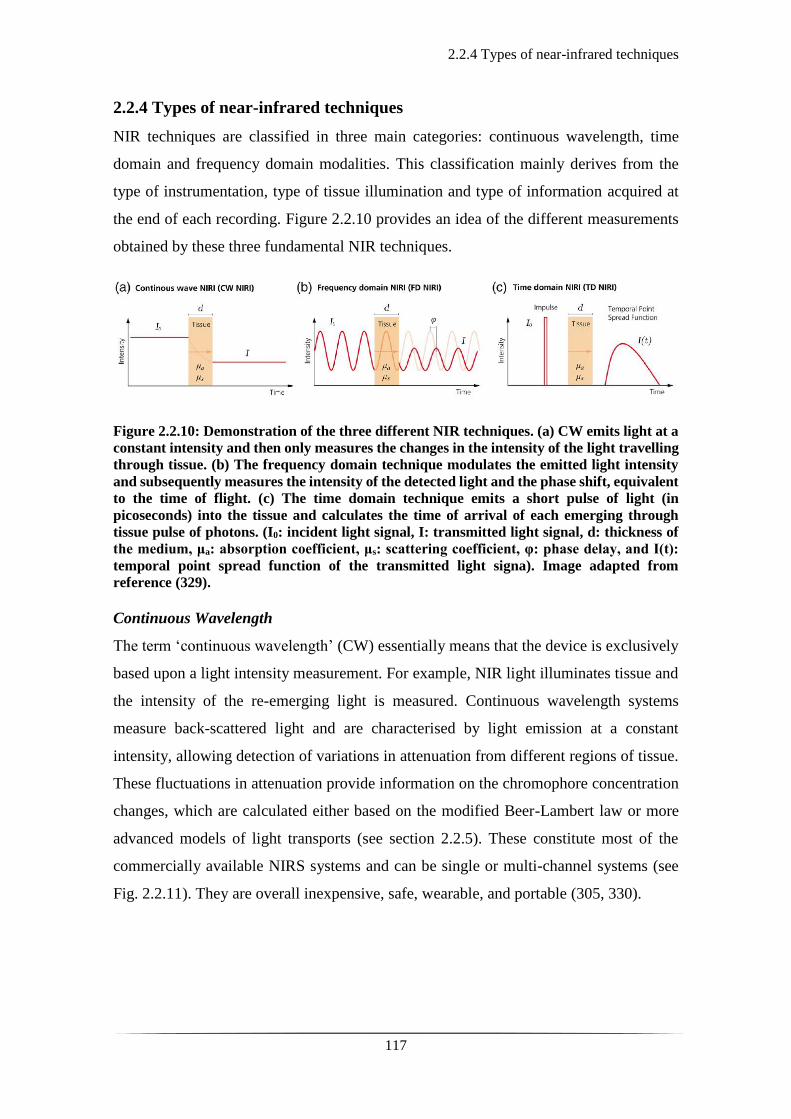
2.2.4 Types of near-infrared techniques
117
2.2.4 Types of near-infrared techniques
NIR techniques are classified in three main categories: continuous wavelength, time
domain and frequency domain modalities. This classification mainly derives from the
type of instrumentation, type of tissue illumination and type of information acquired at
the end of each recording. Figure 2.2.10 provides an idea of the different measurements
obtained by these three fundamental NIR techniques.
Figure 2.2.10: Demonstration of the three different NIR techniques. (a) CW emits light at a
constant intensity and then only measures the changes in the intensity of the light travelling
through tissue. (b) The frequency domain technique modulates the emitted light intensity
and subsequently measures the intensity of the detected light and the phase shift, equivalent
to the time of flight. (c) The time domain technique emits a short pulse of light (in
picoseconds) into the tissue and calculates the time of arrival of each emerging through
tissue pulse of photons. (I0: incident light signal, I: transmitted light signal, d: thickness of
the medium, μa: absorption coefficient, μs: scattering coefficient, φ: phase delay, and I(t):
temporal point spread function of the transmitted light signa). Image adapted from
reference (329).
Continuous Wavelength
The term ‘continuous wavelength’ (CW) essentially means that the device is exclusively
based upon a light intensity measurement. For example, NIR light illuminates tissue and
the intensity of the re-emerging light is measured. Continuous wavelength systems
measure back-scattered light and are characterised by light emission at a constant
intensity, allowing detection of variations in attenuation from different regions of tissue.
These fluctuations in attenuation provide information on the chromophore concentration
changes, which are calculated either based on the modified Beer-Lambert law or more
advanced models of light transports (see section 2.2.5). These constitute most of the
commercially available NIRS systems and can be single or multi-channel systems (see
Fig. 2.2.11). They are overall inexpensive, safe, wearable, and portable (305, 330).

2.2.4 Types of near-infrared techniques
118
Figure 2.2.11: Different end-products using CW NIR systems. This is dependent on the
number of channels and the arrangements of the sources and detectors across the scalp.
Adapted from reference (331).
Continuous wavelength, single channel NIRS systems utilise one source location
and one detector location to investigate a chosen region of tissue. The source and detector
are typically coupled to the body via optical fibres. However, single-channel NIRS
systems can only sample and provide information for a small volume of tissue.
Multi-channel CW NIR systems employ an array of multiple sources and
detectors to investigate the haemodynamics of a broader area of tissue. The use of
multiple sources creates an engineering challenge, because it is critical that the origin of
any detected light is known. There are several methods that allow sources to be
distinguished including time multiplexing (i.e. you turn them on one at a time) and
frequency multiplexing (where each source is modulated at a known frequency) (332).
However, still, simple multi-channel, CW NIRS only provides a series of spectroscopic
measurements across different areas of the tissue investigated.
Continuous wavelength, diffuse optical imaging (DOI) systems have been widely
used in the investigation of the haemodynamic changes of the cortical surface of the brain.
Mainly dependent upon the arrangement of channels used, they offer the possibility of
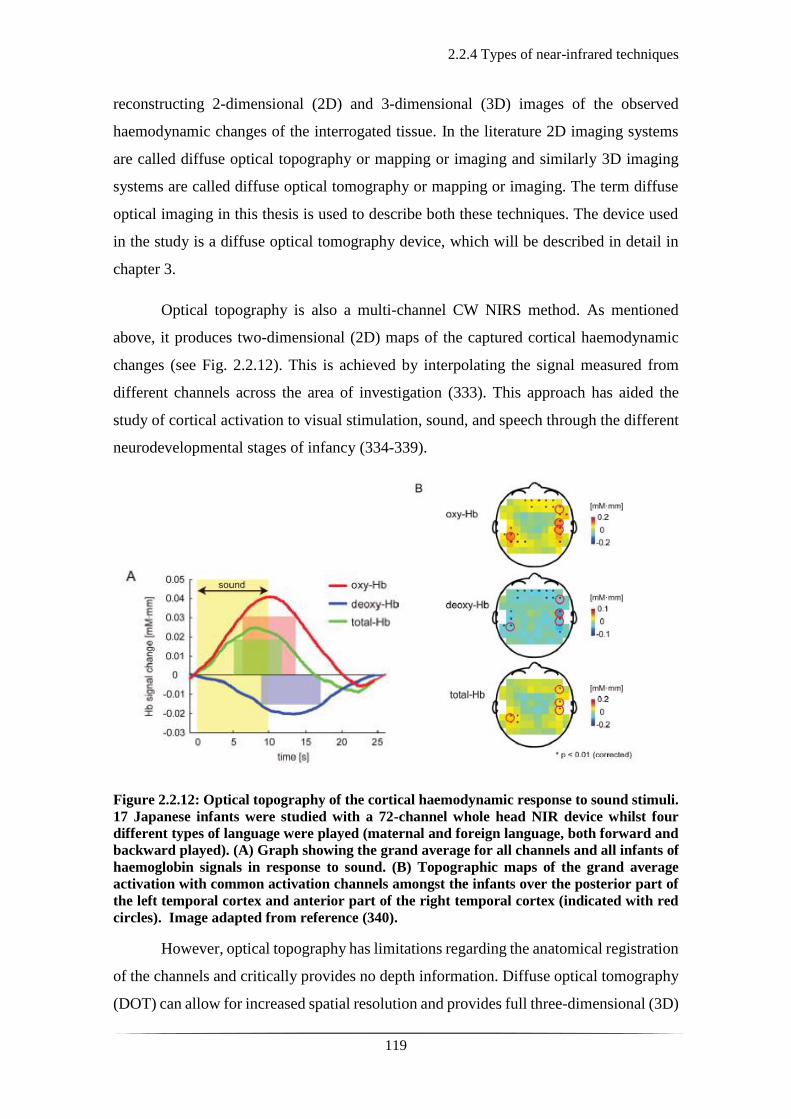
2.2.4 Types of near-infrared techniques
119
reconstructing 2-dimensional (2D) and 3-dimensional (3D) images of the observed
haemodynamic changes of the interrogated tissue. In the literature 2D imaging systems
are called diffuse optical topography or mapping or imaging and similarly 3D imaging
systems are called diffuse optical tomography or mapping or imaging. The term diffuse
optical imaging in this thesis is used to describe both these techniques. The device used
in the study is a diffuse optical tomography device, which will be described in detail in
chapter 3.
Optical topography is also a multi-channel CW NIRS method. As mentioned
above, it produces two-dimensional (2D) maps of the captured cortical haemodynamic
changes (see Fig. 2.2.12). This is achieved by interpolating the signal measured from
different channels across the area of investigation (333). This approach has aided the
study of cortical activation to visual stimulation, sound, and speech through the different
neurodevelopmental stages of infancy (334-339).
Figure 2.2.12: Optical topography of the cortical haemodynamic response to sound stimuli.
17 Japanese infants were studied with a 72-channel whole head NIR device whilst four
different types of language were played (maternal and foreign language, both forward and
backward played). (A) Graph showing the grand average for all channels and all infants of
haemoglobin signals in response to sound. (B) Topographic maps of the grand average
activation with common activation channels amongst the infants over the posterior part of
the left temporal cortex and anterior part of the right temporal cortex (indicated with red
circles). Image adapted from reference (340).
However, optical topography has limitations regarding the anatomical registration
of the channels and critically provides no depth information. Diffuse optical tomography
(DOT) can allow for increased spatial resolution and provides full three-dimensional (3D)

2.2.4 Types of near-infrared techniques
120
images (341). Diffuse optical tomography uses multiple overlapping channels with
multiple source-detector distances (usually ranging from 1.5 to 4 cm) to increase spatial
resolution and improve haemodynamic information deriving from different layers of
depth within the cortex (342, 343) and essentially enables the acquisition of 3D images
(344).
The source-emitted NIR light penetrates tissue in a banana-shaped fashion and the
transmitted light is measured by a neighbouring detector (see Fig.2.2.13). The intensity
of light travelling from a source to a detector through tissue decreases exponentially with
source-detector distance. The source-detector distance is significant as it determines the
sampling depth and the spatial resolution of the final image acquired. A large distance
allows greater sampling depth into the cortex, whereas a short distance provides better
spatial resolution. In infants, a separation of 3 cm typically penetrates 1–1.5 centimetres
into the cortex (281), reported as 0.5 to 2 cm in human adults (345).
Figure 2.2.13: The banana shaped trajectory of NIR light at different source-detector
separations in DOI. The sensitivity distribution of light has a banana shape. The areas
proximal to the source and the detector have the greatest effect on the captured light.
Depending on the depth of the tissue, the spatial sensitivity varies. Hence, by using multi-
distances between sources and detectors, the depth spatial sensitivity increases. Image
adapted from reference (281).
The quality of the images is dependent upon the number of channels, which in
practice is modulated by the weight and number of available optical fibres, as well as the
age of the subject under investigation. Most commercial systems provide 10-20 sources
and 10-20 detectors respectively. Users must choose to cover a wide area sparsely at the
expense of lower resolution, patchy sensitivity, less depth discrimination, or a small area
densely with better resolution and better 3D images, but small field of view (346).

2.2.4 Types of near-infrared techniques
121
Frequency Domain
In contrast to CW NIR systems that only provide intensity measurements, frequency, and
time domain NIR techniques provide additional information about the transmission of
photons through tissue.
The frequency domain system, in addition to light attenuation, also measure the phase
shift by using a sinusoidally modulated input intensity. By comparison of the phase of the
modulated signal going in to the tissue and that coming out, it is possible to measure the
phase shift caused by the tissue. The principal advantage of this method is that from phase
shift, one can calculate the mean optical pathlength. As a result, it is no longer necessary
to estimate the DPF, significantly reducing errors in the measurement of absorption
coefficient. It also allows the effects of absorption and scattering to be studied separately,
something which cannot be achieved by CW NIR systems. Frequency domain systems
have been designed to perform spectroscopic measurements, optical topography, and
optical tomography (333, 347, 348).
Time Domain
The time domain systems are the most sophisticated amongst the NIR techniques as they
measure the time that individual photons take to travel across a volume of tissue. Time
domain systems employ sources that emit very short duration pulses (a few picoseconds),
and extremely sensitive detectors that can pick up the difference between the time of the
pulse, and the arrival time of a photon at the detector. Because of scattering effects, the
input pulse of light is stretched in time: some photons travel in a near straight line to the
detector and thus have a short time of flight, while others experience many scattering
events and take a longer time to reach the detector. The distribution of photon flight times
is called a temporal point spread function (TPSF), which typically has a width of several
nanoseconds. The TPSF represents a histogram of the time of flight of pulses of photons
between source and detector (349). The information within this histogram includes
measurement of the intensity of detected light (like a CW system would). Additionally,
the Fourier transform of the TPSF provides measures of phase shift at every frequency.
Time domain systems provide the same information as both the CW and frequency
domain systems as well as absolute measurements of changes in HbO2 and HHb
concentrations, and the potential to study the separate effects of absorption and scattering.
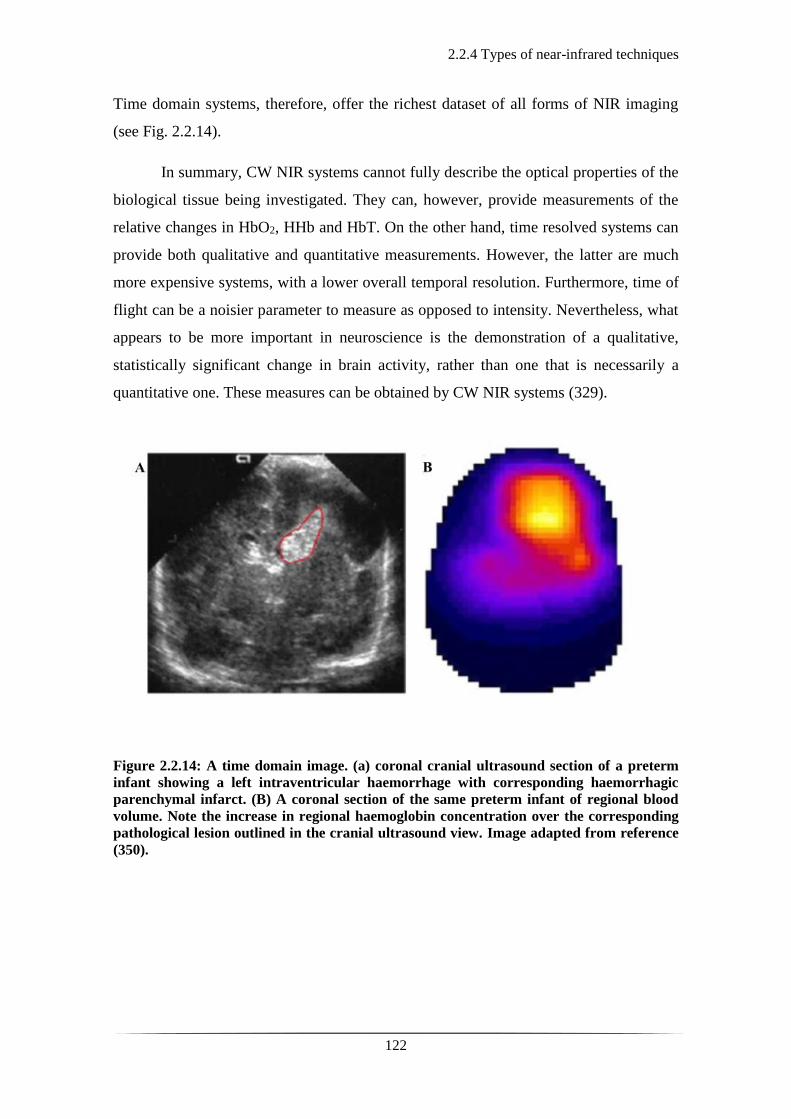
2.2.4 Types of near-infrared techniques
122
Time domain systems, therefore, offer the richest dataset of all forms of NIR imaging
(see Fig. 2.2.14).
In summary, CW NIR systems cannot fully describe the optical properties of the
biological tissue being investigated. They can, however, provide measurements of the
relative changes in HbO2, HHb and HbT. On the other hand, time resolved systems can
provide both qualitative and quantitative measurements. However, the latter are much
more expensive systems, with a lower overall temporal resolution. Furthermore, time of
flight can be a noisier parameter to measure as opposed to intensity. Nevertheless, what
appears to be more important in neuroscience is the demonstration of a qualitative,
statistically significant change in brain activity, rather than one that is necessarily a
quantitative one. These measures can be obtained by CW NIR systems (329).
Figure 2.2.14: A time domain image. (a) coronal cranial ultrasound section of a preterm
infant showing a left intraventricular haemorrhage with corresponding haemorrhagic
parenchymal infarct. (B) A coronal section of the same preterm infant of regional blood
volume. Note the increase in regional haemoglobin concentration over the corresponding
pathological lesion outlined in the cranial ultrasound view. Image adapted from reference
(350).

2.2.5 Image reconstruction
123
2.2.5 Image reconstruction
As mentioned in section 2.2.4 multi-channel CW NIR systems that employ multi-distance
overlapping channels can measure haemodynamic changes in the cortical area monitored,
which can be reconstructed into images. Therefore, this section focuses on the process of
image reconstruction.
Diffuse optical image reconstruction requires three main components; an
anatomical head model, a mathematical model of light transport in tissue and the data
which contain the haemodynamic changes. With these components, it is possible to
produce 4-dimensional (three spatial dimensions plus time) structurally registered images
of changes in HbO2 and HHb concentration.
Near-infrared light is highly scattered in tissue and does not travel in a straight
line (see section 2.2.1, fig. 2.2.4). Therefore, the first stage of image reconstruction is to
provide a mathematical model of light travelling through cerebral tissue. The most widely
used model of light transport in DOI is based on the diffusion equation, which derives
from the radiative transport equation (that models the transport of a variety of particles
through a variety of media). The diffusion equation is used to estimate where light travels
in a head model and thus identify which areas of this head model are sensitive to light.
From this, it is possible to determine the spatial distribution of light that leaves a given
source and reaches a given detector (332), and calculate the sensitivity matrix (J).
The sensitivity matrix is then used to solve the forward problem as seen in Eq. 3.1
below:
Δy = J * Δx Equation 3.1
where:
J = a sensitivity matrix
Δy = changes in measurements of light intensity
Δx = changes in the optical properties of a volume of tissue
The changes in light intensity (Δy) represent the obtained optical signal in a given
volume of tissue with changes in optical properties (Δx) for a given arrangement of
sources and detectors. However, numerical modelling techniques such as the finite
element method (FEM) are needed to model the diffuse transmission of light within
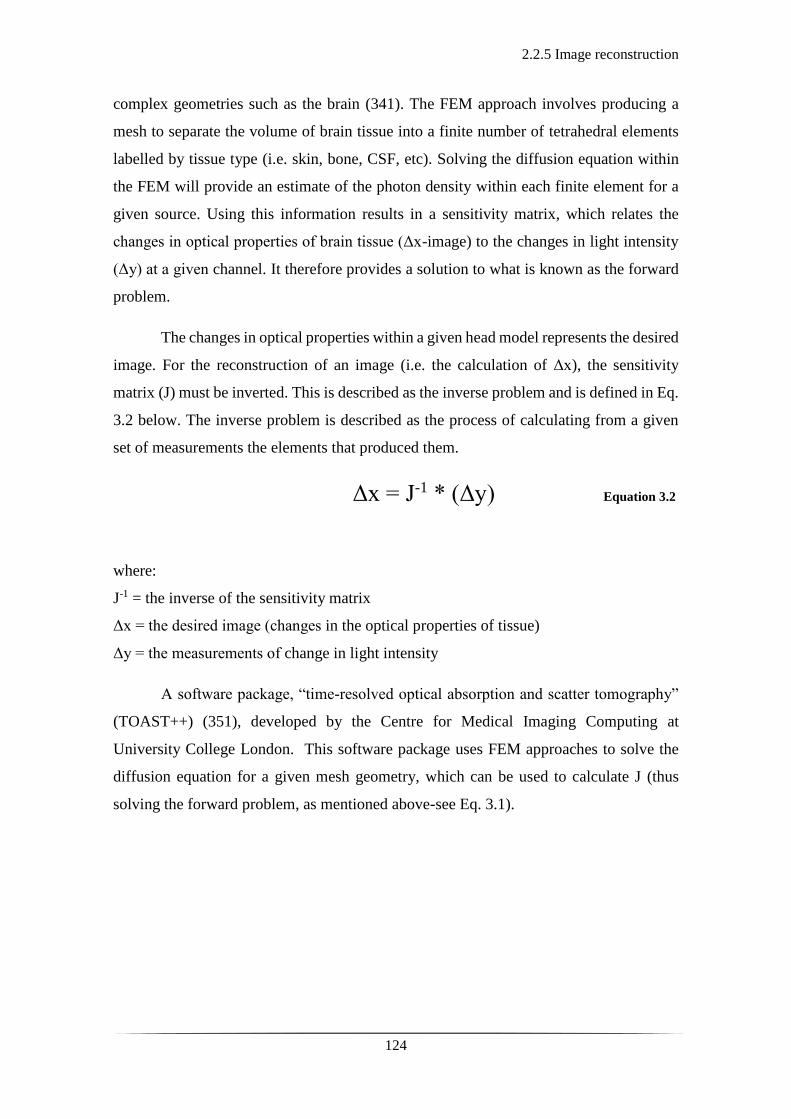
2.2.5 Image reconstruction
124
complex geometries such as the brain (341). The FEM approach involves producing a
mesh to separate the volume of brain tissue into a finite number of tetrahedral elements
labelled by tissue type (i.e. skin, bone, CSF, etc). Solving the diffusion equation within
the FEM will provide an estimate of the photon density within each finite element for a
given source. Using this information results in a sensitivity matrix, which relates the
changes in optical properties of brain tissue (Δx-image) to the changes in light intensity
(Δy) at a given channel. It therefore provides a solution to what is known as the forward
problem.
The changes in optical properties within a given head model represents the desired
image. For the reconstruction of an image (i.e. the calculation of Δx), the sensitivity
matrix (J) must be inverted. This is described as the inverse problem and is defined in Eq.
3.2 below. The inverse problem is described as the process of calculating from a given
set of measurements the elements that produced them.
Δx = J-1 * (Δy) Equation 3.2
where:
J-1 = the inverse of the sensitivity matrix
Δx = the desired image (changes in the optical properties of tissue)
Δy = the measurements of change in light intensity
A software package, “time-resolved optical absorption and scatter tomography”
(TOAST++) (351), developed by the Centre for Medical Imaging Computing at
University College London. This software package uses FEM approaches to solve the
diffusion equation for a given mesh geometry, which can be used to calculate J (thus
solving the forward problem, as mentioned above-see Eq. 3.1).
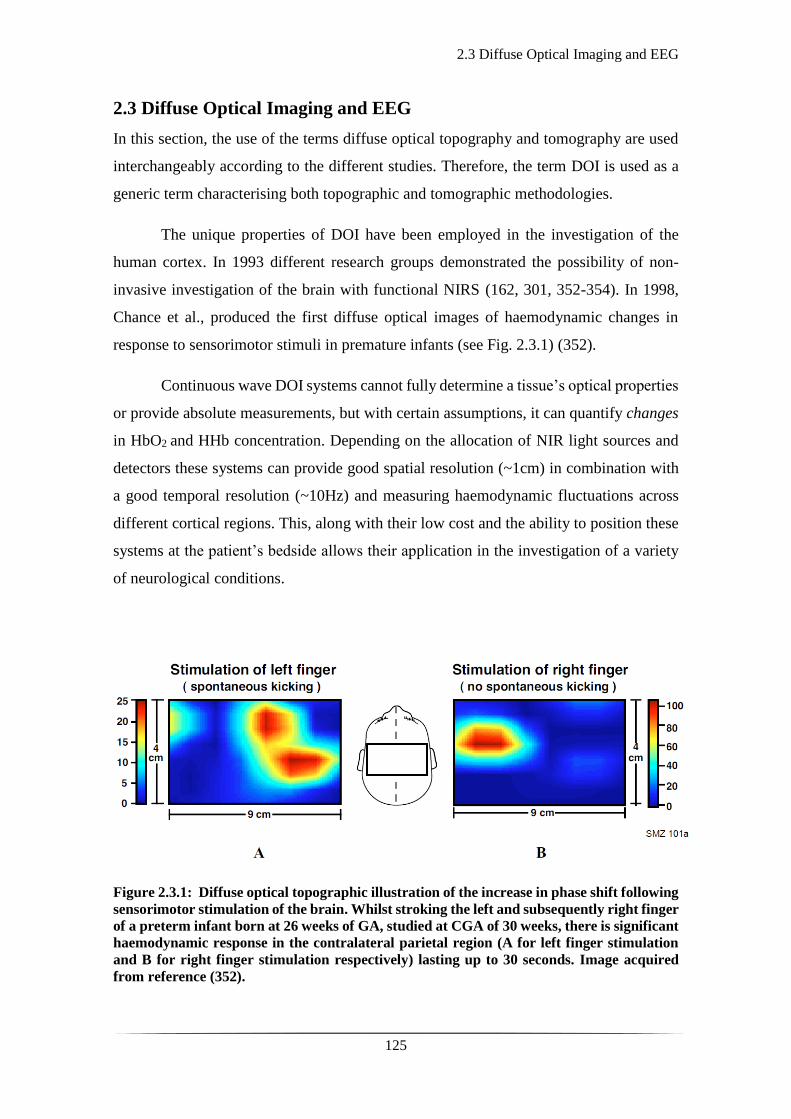
2.3 Diffuse Optical Imaging and EEG
125
2.3 Diffuse Optical Imaging and EEG
In this section, the use of the terms diffuse optical topography and tomography are used
interchangeably according to the different studies. Therefore, the term DOI is used as a
generic term characterising both topographic and tomographic methodologies.
The unique properties of DOI have been employed in the investigation of the
human cortex. In 1993 different research groups demonstrated the possibility of non-
invasive investigation of the brain with functional NIRS (162, 301, 352-354). In 1998,
Chance et al., produced the first diffuse optical images of haemodynamic changes in
response to sensorimotor stimuli in premature infants (see Fig. 2.3.1) (352).
Continuous wave DOI systems cannot fully determine a tissue’s optical properties
or provide absolute measurements, but with certain assumptions, it can quantify changes
in HbO2 and HHb concentration. Depending on the allocation of NIR light sources and
detectors these systems can provide good spatial resolution (~1cm) in combination with
a good temporal resolution (~10Hz) and measuring haemodynamic fluctuations across
different cortical regions. This, along with their low cost and the ability to position these
systems at the patient’s bedside allows their application in the investigation of a variety
of neurological conditions.
Figure 2.3.1: Diffuse optical topographic illustration of the increase in phase shift following
sensorimotor stimulation of the brain. Whilst stroking the left and subsequently right finger
of a preterm infant born at 26 weeks of GA, studied at CGA of 30 weeks, there is significant
haemodynamic response in the contralateral parietal region (A for left finger stimulation
and B for right finger stimulation respectively) lasting up to 30 seconds. Image acquired
from reference (352).
2.3 Diffuse Optical Imaging and EEG
126
Liao et al., employed a continuous wavelength, high-density system to study the
haemodynamic response to visual stimuli of the neonatal occipital cortex (346). Eleven
term newborn infants were studied between day one to two of life, postprandially and
whilst resting or asleep for up to two hours. A screen at 20 cm distance from the infant’s
face would alternate a repetitive 10s visual stimuli, from a checkerboard to a flat pattern
of different luminance. Since the infants had their eyes closed during the study, the visual-
evoked response obtained was secondary to the variation in the luminance. A consistent
distinct increase in the HbO2 concentration, peaking between 10 to 14s post stimuli over
the visual cortex was noted in 7 out of the 11 infants (see Fig.2.3.2) (346). Sato et al.
produced diffuse optical images demonstrating the cortical spatiotemporal
haemodynamic changes in 17 Japanese newborn infants to the sound of their native
language (Japanese) played forward and backwards as opposed to a foreign language
(English) similarly played forward and backwards. A whole-head array was used and
overall 72 channels were representing cortico-vascular changes over the neonatal cortex.
There was significant haemodynamic response to all the sound stimuli over both temporal
and frontal regions with significantly more pronounced response to forward-played
Japanese language as opposed to backwards-played Japanese, forward-played or
backwards-played English (340).
Another group investigating the functional organisation of the brain and its
intrinsic activity by using a highly dense continuous wave DOI technique, produced the
first diffuse optical images of bilateral occipital resting state connectivity in newborn
infants (355). The existence of resting state connectivity networks in adults (356) and in
infants (357-359) has previously been demonstrated with BOLD fMRI.
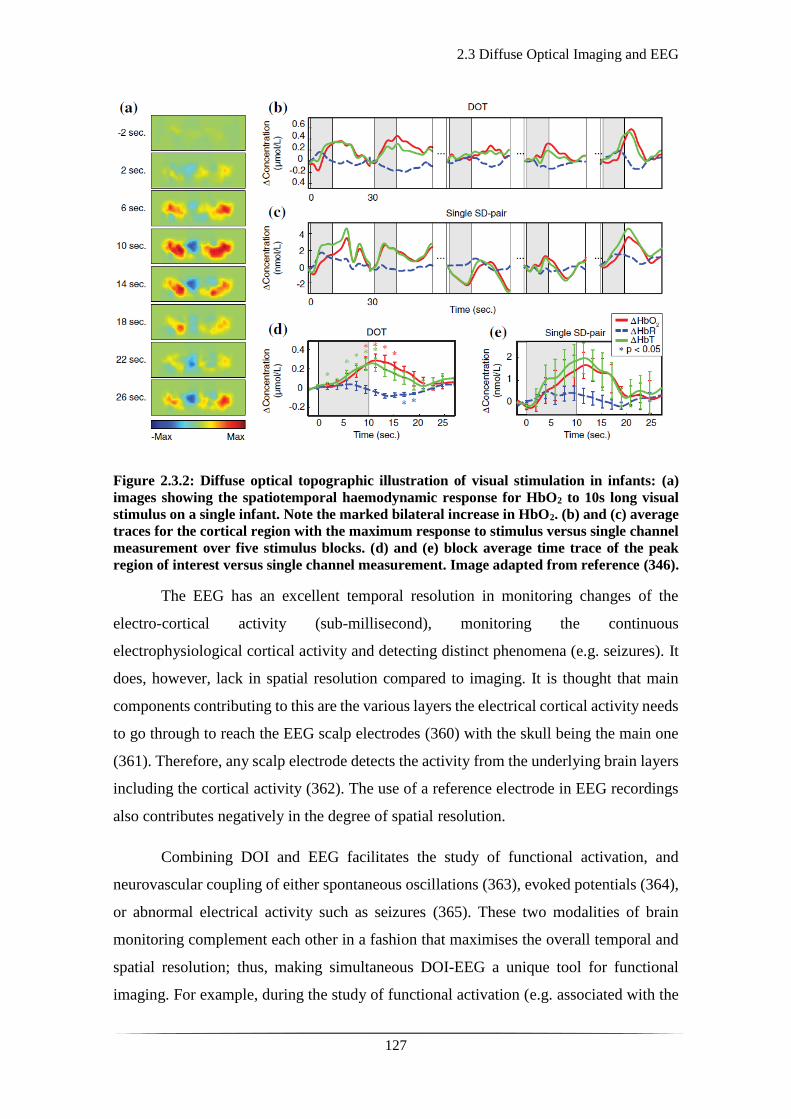
2.3 Diffuse Optical Imaging and EEG
127
Figure 2.3.2: Diffuse optical topographic illustration of visual stimulation in infants: (a)
images showing the spatiotemporal haemodynamic response for HbO2 to 10s long visual
stimulus on a single infant. Note the marked bilateral increase in HbO2. (b) and (c) average
traces for the cortical region with the maximum response to stimulus versus single channel
measurement over five stimulus blocks. (d) and (e) block average time trace of the peak
region of interest versus single channel measurement. Image adapted from reference (346).
The EEG has an excellent temporal resolution in monitoring changes of the
electro-cortical activity (sub-millisecond), monitoring the continuous
electrophysiological cortical activity and detecting distinct phenomena (e.g. seizures). It
does, however, lack in spatial resolution compared to imaging. It is thought that main
components contributing to this are the various layers the electrical cortical activity needs
to go through to reach the EEG scalp electrodes (360) with the skull being the main one
(361). Therefore, any scalp electrode detects the activity from the underlying brain layers
including the cortical activity (362). The use of a reference electrode in EEG recordings
also contributes negatively in the degree of spatial resolution.
Combining DOI and EEG facilitates the study of functional activation, and
neurovascular coupling of either spontaneous oscillations (363), evoked potentials (364),
or abnormal electrical activity such as seizures (365). These two modalities of brain
monitoring complement each other in a fashion that maximises the overall temporal and
spatial resolution; thus, making simultaneous DOI-EEG a unique tool for functional
imaging. For example, during the study of functional activation (e.g. associated with the

2.3 Diffuse Optical Imaging and EEG
128
movement of an arm), one may obtain parallel information via event related potentials
across time (EEG) and the haemodynamic response (DOI) to the event (stimulus). The
signals from the two techniques can provide a map of what the haemodynamic changes
look like in different cortical regions in response to neuronal activation (see Fig. 2.3.3).
Figure 2.3.3: Diffuse optical topographic illustration of functional activation in adults.
Representation of the block average cortical haemodynamic response of HHb 10s after the
onset of left and right hand electrical stimulation on an adult patient. The study showed a
consistent increase in HbO2 and decrease in HHb (as shown in the image above) over the
contralateral cortical side compared to the stimulation. Image adapted from reference
(364).
Diffuse optical imaging can similarly offer information on changes of cortical
haemodynamics in cases of neonatal brain injury. There are however, very few studies
exploring this field. In the study of newborn infants presenting with seizures in the
neonatal period using EEG and DOI, transient haemodynamic events of small increase
followed by profound sustained decrease in HbO2 concentration were identified. This was
consistent amongst the subjects and not seen in the healthy controls, suggesting altered
cortico-vascular activity associated with affected brain tissue (366). For further details of
this work please see section 6.1.
A case study of a term infant with severe HIE and electrophysiological seizures
by Singh et al., using simultaneous EEG and DOI (as described in section 3.2.1), showed
significant changes in HbO2 following seizures (see Fig. 4.1.3 in chapter 4) (365). Seven
2.3 Diffuse Optical Imaging and EEG
129
distinct seizures were detected lasting from 30 to 90s. Although there was a degree of
variability during the separate episodes, the reconstructed diffuse optical images revealed
a consistent increase in HbT and HbO2 concentrations related to the seizure activity. The
diffuse optical images revealed an initial small increase in the HbO2 concentration
followed by its dramatic decrease. The latter persisted for several minutes after the end
of the seizure activity (see Fig. 4.1.3 in chapter 4).
This work by Singh et al., constitutes the initial pilot study that gave rise to this to
this MD research project and lays the ground for the investigation of acquired neonatal
brain injury with video-EEG and DOT. The improved spatial resolution provided by DOT
enhances the information obtained during interesting neurological phenomena as
captured by EEG, in situations of neonatal brain injury. The principal aim of the MD
project presented in my thesis was to understand the physiological haemodynamic
changes of the neonatal brain in response to pathological events (evident in the EEG) in
the context of acquired brain injury.
The main pathological events studied included seizures and burst suppression in
the context of HIE, and perinatal stroke. The results of each topic are presented in chapters
4 to 6. The following chapter broadly describes the study designs, recruitment, data
acquisition, and methodologies. As each condition explored is different, additional
methodological details are provided in each of chapters 4 to 6.

130
131
Chapter 3: Patients and Methods

132

3.1.1 Ethics
133
3.1 Patients
3.1.1 Ethics
The National Research Ethics Service Committee East of England (REC reference
09/H0308/125) approved the conduction of this study and allowed patient recruitment
under the regulations of the Declaration of Helsinki (DoH) as developed by the World
Medical Association (WMA) (367).

3.1.2 Recruitment
134
3.1.2 Recruitment
Following informed parental consent, infants were recruited to the study upon their
admission to the Neonatal Intensive Care Unit (NICU) at the Rosie Hospital of Cambridge
University Hospitals NHS Foundation Trust.
The patients recruited in the study are divided in three categories; the healthy term,
the preterm and the infants presenting with seizures. The data selected during the
conduction of the pilot study, prior to the commencement of my project, have been
included in the analyses of this thesis.
The number of patients recruited during the conduction of the pilot study from
January 2013 until August 2014 was 28:
• Healthy term infants: 9
• Preterm infants: 6
• Infants presenting with seizures: 13 (with data acquired from 12)
During the conduction of the pilot study, the research nurse, Andrea D. Edwards
(ADE) was responsible for patient recruitment. In the beginning of the study she was
supported by Dr Chuen Wai Lee (CWL), clinical research fellow at the time. The data
acquisition was performed by Dr Harsimrat Singh, a post-doctoral research associate in
medical physics with the clinical support of ADE. During that period a total of 51 patients
with presentation of suspected or confirmed seizures were screened. A total of 18 patients
were approached, out of which 13 were consented in the study (see Table 3.1).
My study was completed over a course of two years from September 2014 until
August 2016. Having received training to perform the EEG-DOT scans independently, I
actively started recruiting patients in December 2014. The number of patients recruited
from December 2014 until August 2016 was 34:
• Healthy term infants: 1
• Preterm infants: 17 (data acquired from 14)
• Infants presenting with seizures: 16
During this period, a total number of 34 patients with presentation of suspected or
confirmed seizures were screened. 5 of these patients were deemed inappropriate for
recruitment due to co-existing neurosurgical entities, and one due to redirection of cares
3.1.2 Recruitment
135
being considered and discussed. Eventually 19 patients were approached, out of which
16 were consented and recruited in the study (see Table 3.1). The total number of infants
(both controls and patients) recruited in conjunction with the preliminary pilot study was
62. The clinical details of all 62 infants are presented later in this chapter, in tables 3.2,
3.3 and 3.4.
Healthy term and preterm infants
The eligibility of the healthy term and preterm infants was determined upon clinical
evaluation and discussion with the medical team. The infants had to be either with their
mothers on the postnatal ward or on the NICU receiving minimal clinical input (mainly
requiring help with establishing feeds). Exclusion criteria for the recruitment of healthy
infants were the existence of antenatally diagnosed congenital anomalies or obvious
postnatal dysmorphic features and/or other anomalies. The presence of skull trauma, such
as a cephalohaematoma, caput and/or a skull fracture, and/or abnormal findings on cranial
ultrasound scan (if clinically indicated during their stay) were also considered as
exclusion criteria for the healthy control population. Amongst the preterm population
recruited by me, 7 patients had significant abnormal findings on serial cranial ultrasound
scans. These were recruited and enrolled in the study at a later stage and not in the first
week of life.
Infants presenting with seizures
The infants presenting with seizures and/or HIE were recruited as soon as possible after
their admission to the unit. Most of these patients were transferred in by the neonatal
transport service from other district hospitals, rather than from the Rosie Maternity and
Delivery Unit in Cambridge. This meant that occasionally the parents were still in the
referring hospital. On other occasions, the father would accompany the infant but
depending on their marital status with the mother, consenting the infant was not an option.
This posed significant difficulty in recruiting these patients during their most acute phase,
when they were most likely to seize.
The eligibility for recruitment of seizure/HIE patients was again evaluated based
on the patients’ clinical presentation and the severity of their condition. Following
discussion with the medical team, I would approach the parents for consent and
participating to the study. In situations where consent was granted, but an acute clinical
procedure was required (e.g. insertion of percutaneous long line, transfer to MRI), the
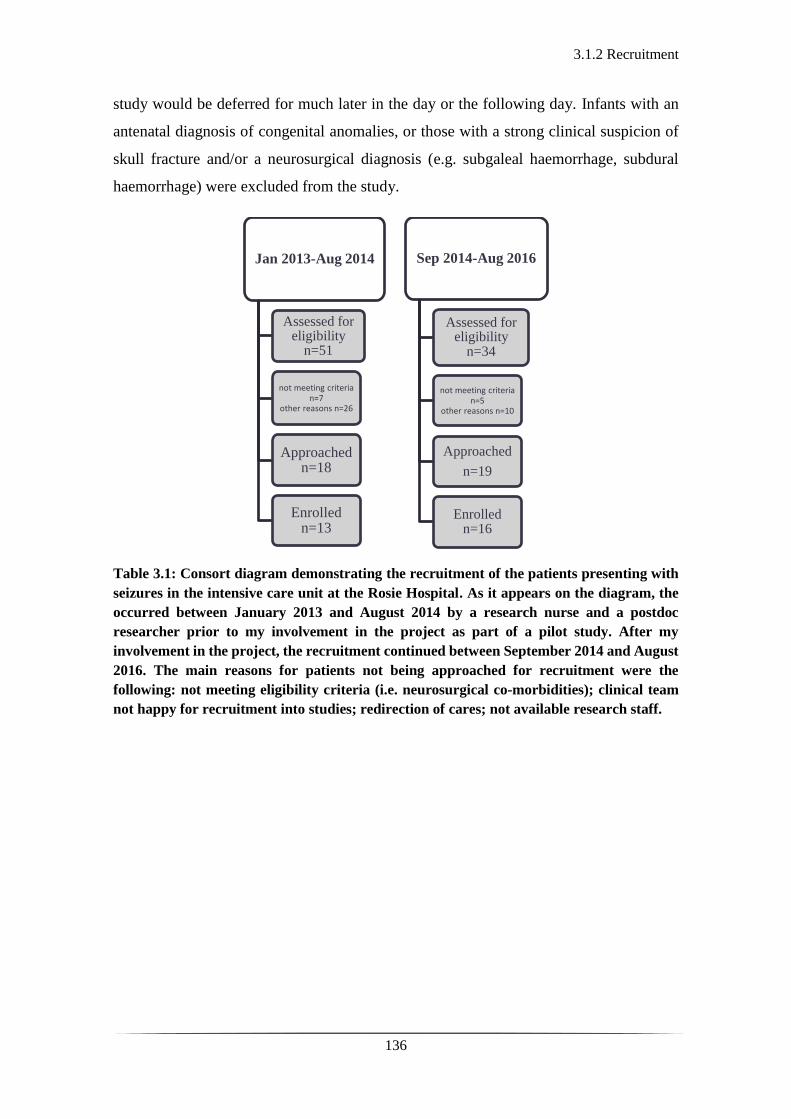
3.1.2 Recruitment
136
study would be deferred for much later in the day or the following day. Infants with an
antenatal diagnosis of congenital anomalies, or those with a strong clinical suspicion of
skull fracture and/or a neurosurgical diagnosis (e.g. subgaleal haemorrhage, subdural
haemorrhage) were excluded from the study.
Table 3.1: Consort diagram demonstrating the recruitment of the patients presenting with
seizures in the intensive care unit at the Rosie Hospital. As it appears on the diagram, the
occurred between January 2013 and August 2014 by a research nurse and a postdoc
researcher prior to my involvement in the project as part of a pilot study. After my
involvement in the project, the recruitment continued between September 2014 and August
2016. The main reasons for patients not being approached for recruitment were the
following: not meeting eligibility criteria (i.e. neurosurgical co-morbidities); clinical team
not happy for recruitment into studies; redirection of cares; not available research staff.
Jan 2013-Aug 2014
Assessed for eligibility
n=51
not meeting criteria n=7
other reasons n=26
Approached n=18
Enrolled n=13
Sep 2014-Aug 2016
Assessed for eligibility
n=34
not meeting criteria n=5
other reasons n=10
Approached
n=19
Enrolled n=16
3.1.3 Clinical details
137
3.1.3 Clinical details
The healthy term infants were recruited in the study in the first few days of postnatal life
and required minimal clinical input. The study was conducted in the postprandial phase
to minimise motion-related artefact.
The preterm infants recruited in the study likewise were receiving low
dependency care. Few of them were receiving non-invasive ventilatory support in the
form of high flow nasal cannula oxygen. The rest of the infants were breathing in air
unaided and were enterally fed. The scans were again performed in the postprandial
phase.
The near term or term infants with seizures were recruited in the acute phase of
their presentation to the unit. This meant that they were receiving intensive neonatal care
in the form of mechanical ventilation, potential inotropic support, multiple intravenous
infusions, intravenous antibiotics, and potentially anticonvulsant treatment. The nature of
these admissions limited the timing of the study. Apart from gaining parental consent, the
fact that most infants were transferred in from another hospital, meant that the infants had
already received one or more anticonvulsant medications in the referring hospital.
Most of the infants presenting with seizures had a suspected primary diagnosis of
HIE, based on their condition at birth, neurological examination, and clinical examination
as described by the Sarnat classification (34). In the instance of strong clinical suspicion
of HIE the infants would be reviewed as to whether they were eligible for total body
therapeutic hypothermia (TH) with target core body temperatures between 33-34 oC. This
clinical evaluation is based upon the TOBY (TOtal BodY, whole body hypothermia for
the treatment of perinatal asphyxial encephalopathy) cooling criteria (43, 368). These
clinical criteria reflect the condition of the infant at birth and their neurological
presentation/examination; if fulfilled, therapeutic hypothermia can be commenced within
the first 6 hours of postnatal life. In the cases of infants delivered elsewhere and
transferred in, passive cooling was commenced from the referring hospital within 6 hours
and active cooling was initiated by the transport services and continued upon arrival to
the NICU at the Rosie Hospital. Most of the patients, 23 out of 29, had a diagnosis of
HIE, 19 of which received a 72-hour course of TH. The other three (patients 1, 12, and
28) presented with seizures at a later stage outside the window of the first 6 hours of life.
Their condition and clinical evaluation at birth and in the first few postnatal hours did not
3.1.3 Clinical details
138
warrant initiation of TH. In one patient (patient 20), TH was discontinued, although
cooling criteria were fulfilled as there was co-existing group B streptococcal meningitis
which was felt to be the main contributing factor in the clinical condition of the infant
and that it would not benefit further from TH.
Within the cohort of patients recruited, however, some presented with seizures in
the first 48 hours of life without any clinical indication or suspicion of a hypoxic-
ischaemic insult in the perinatal period. These patients numbered 5 in total. Patients 16,
25 and 29 had a primary diagnosis of perinatal stroke and presented as previously
asymptomatic, low risk infants with seizures. Patient 23 presented with seizures with
suspected sepsis on the background of maternal varicella infection close to the delivery.
The CSF tested negative for the Varicella-Zoster virus and the MRI showed a mild to
moderate dilatation of the ventricles with a small co-existing intraventricular
haemorrhage (IVH) and mild changes in the cortical appearance of unclear clinical
significance. Patient 27 had poor perinatal adaptation and a seizure at 30 minutes of life,
which was attributed to co-existing hypoglycaemia. The MRI showed small foci of
restricted diffusion in the posterior periventricular white matter and otherwise a normally
formed brain.
All the infants presenting with seizures had an MRI of the head within the first 10
days of life. This was part of their standard clinical care. The local neuro-radiologist
reported the MRI scans. They were also reviewed and reported by Professor Mary
Rutherford, expert in perinatal neuroimaging at Kings College London. All the MRI
reports mentioned in this thesis are the official reports given by Professor Rutherford.
The clinical details of all the infants recruited in the study can be seen in the
following tables 3.2-4. Additional clinical details are also provided in the separate
chapters 4, 5 and 6.
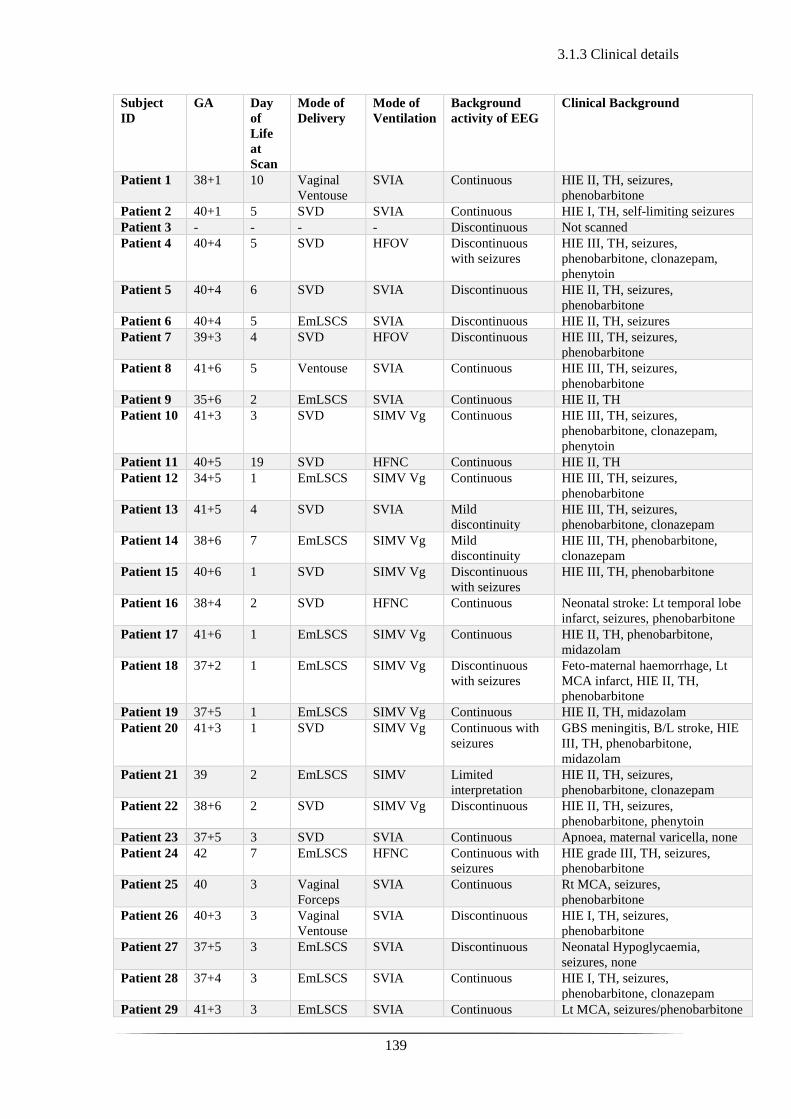
3.1.3 Clinical details
139
Subject
ID
GA Day
of
Life
at
Scan
Mode of
Delivery
Mode of
Ventilation
Background
activity of EEG
Clinical Background
Patient 1 38+1 10 Vaginal
Ventouse
SVIA Continuous HIE II, TH, seizures,
phenobarbitone
Patient 2 40+1 5 SVD SVIA Continuous HIE I, TH, self-limiting seizures
Patient 3 - - - - Discontinuous Not scanned
Patient 4 40+4 5 SVD HFOV Discontinuous
with seizures
HIE III, TH, seizures,
phenobarbitone, clonazepam,
phenytoin
Patient 5 40+4 6 SVD SVIA Discontinuous HIE II, TH, seizures,
phenobarbitone
Patient 6 40+4 5 EmLSCS SVIA Discontinuous HIE II, TH, seizures
Patient 7 39+3 4 SVD HFOV Discontinuous HIE III, TH, seizures,
phenobarbitone
Patient 8 41+6 5 Ventouse SVIA Continuous HIE III, TH, seizures,
phenobarbitone
Patient 9 35+6 2 EmLSCS SVIA Continuous HIE II, TH
Patient 10 41+3 3 SVD SIMV Vg Continuous HIE III, TH, seizures,
phenobarbitone, clonazepam,
phenytoin
Patient 11 40+5 19 SVD HFNC Continuous HIE II, TH
Patient 12 34+5 1 EmLSCS SIMV Vg Continuous HIE III, TH, seizures,
phenobarbitone
Patient 13 41+5 4 SVD SVIA Mild
discontinuity
HIE III, TH, seizures,
phenobarbitone, clonazepam
Patient 14 38+6 7 EmLSCS SIMV Vg Mild
discontinuity
HIE III, TH, phenobarbitone,
clonazepam
Patient 15 40+6 1 SVD SIMV Vg Discontinuous
with seizures
HIE III, TH, phenobarbitone
Patient 16 38+4 2 SVD HFNC Continuous Neonatal stroke: Lt temporal lobe
infarct, seizures, phenobarbitone
Patient 17 41+6 1 EmLSCS SIMV Vg Continuous HIE II, TH, phenobarbitone,
midazolam
Patient 18 37+2 1 EmLSCS SIMV Vg Discontinuous
with seizures
Feto-maternal haemorrhage, Lt
MCA infarct, HIE II, TH,
phenobarbitone
Patient 19 37+5 1 EmLSCS SIMV Vg Continuous HIE II, TH, midazolam
Patient 20 41+3 1 SVD SIMV Vg Continuous with
seizures
GBS meningitis, B/L stroke, HIE
III, TH, phenobarbitone,
midazolam
Patient 21 39 2 EmLSCS SIMV Limited
interpretation
HIE II, TH, seizures,
phenobarbitone, clonazepam
Patient 22 38+6 2 SVD SIMV Vg Discontinuous HIE II, TH, seizures,
phenobarbitone, phenytoin
Patient 23 37+5 3 SVD SVIA Continuous Apnoea, maternal varicella, none
Patient 24 42 7 EmLSCS HFNC Continuous with
seizures
HIE grade III, TH, seizures,
phenobarbitone
Patient 25 40 3 Vaginal
Forceps
SVIA Continuous Rt MCA, seizures,
phenobarbitone
Patient 26 40+3 3 Vaginal
Ventouse
SVIA Discontinuous HIE I, TH, seizures,
phenobarbitone
Patient 27 37+5 3 EmLSCS SVIA Discontinuous Neonatal Hypoglycaemia,
seizures, none
Patient 28 37+4 3 EmLSCS SVIA Continuous HIE I, TH, seizures,
phenobarbitone, clonazepam
Patient 29 41+3 3 EmLSCS SVIA Continuous Lt MCA, seizures/phenobarbitone
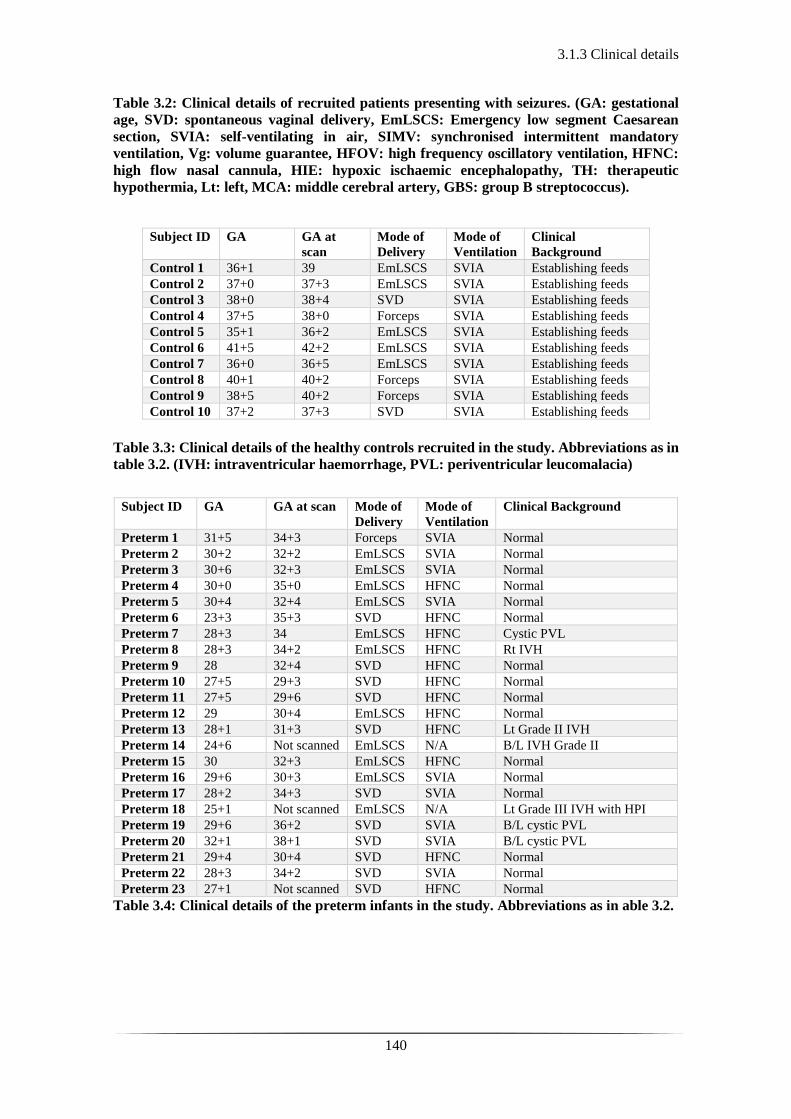
3.1.3 Clinical details
140
Table 3.2: Clinical details of recruited patients presenting with seizures. (GA: gestational
age, SVD: spontaneous vaginal delivery, EmLSCS: Emergency low segment Caesarean
section, SVIA: self-ventilating in air, SIMV: synchronised intermittent mandatory
ventilation, Vg: volume guarantee, HFOV: high frequency oscillatory ventilation, HFNC:
high flow nasal cannula, HIE: hypoxic ischaemic encephalopathy, TH: therapeutic
hypothermia, Lt: left, MCA: middle cerebral artery, GBS: group B streptococcus).
Subject ID GA GA at
scan
Mode of
Delivery
Mode of
Ventilation
Clinical
Background
Control 1 36+1 39 EmLSCS SVIA Establishing feeds
Control 2 37+0 37+3 EmLSCS SVIA Establishing feeds Control 3 38+0 38+4 SVD SVIA Establishing feeds Control 4 37+5 38+0 Forceps SVIA Establishing feeds Control 5 35+1 36+2 EmLSCS SVIA Establishing feeds Control 6 41+5 42+2 EmLSCS SVIA Establishing feeds Control 7 36+0 36+5 EmLSCS SVIA Establishing feeds Control 8 40+1 40+2 Forceps SVIA Establishing feeds Control 9 38+5 40+2 Forceps SVIA Establishing feeds Control 10 37+2 37+3 SVD SVIA Establishing feeds
Table 3.3: Clinical details of the healthy controls recruited in the study. Abbreviations as in
table 3.2. (IVH: intraventricular haemorrhage, PVL: periventricular leucomalacia)
Subject ID GA GA at scan Mode of
Delivery
Mode of
Ventilation
Clinical Background
Preterm 1 31+5 34+3 Forceps SVIA Normal
Preterm 2 30+2 32+2 EmLSCS SVIA Normal
Preterm 3 30+6 32+3 EmLSCS SVIA Normal
Preterm 4 30+0 35+0 EmLSCS HFNC Normal
Preterm 5 30+4 32+4 EmLSCS SVIA Normal Preterm 6 23+3 35+3 SVD HFNC Normal Preterm 7 28+3 34 EmLSCS HFNC Cystic PVL
Preterm 8 28+3 34+2 EmLSCS HFNC Rt IVH
Preterm 9 28 32+4 SVD HFNC Normal Preterm 10 27+5 29+3 SVD HFNC Normal Preterm 11 27+5 29+6 SVD HFNC Normal Preterm 12 29 30+4 EmLSCS HFNC Normal Preterm 13 28+1 31+3 SVD HFNC Lt Grade II IVH
Preterm 14 24+6 Not scanned EmLSCS N/A B/L IVH Grade II
Preterm 15 30 32+3 EmLSCS HFNC Normal Preterm 16 29+6 30+3 EmLSCS SVIA Normal Preterm 17 28+2 34+3 SVD SVIA Normal Preterm 18 25+1 Not scanned EmLSCS N/A Lt Grade III IVH with HPI
Preterm 19 29+6 36+2 SVD SVIA B/L cystic PVL
Preterm 20 32+1 38+1 SVD SVIA B/L cystic PVL
Preterm 21 29+4 30+4 SVD HFNC Normal Preterm 22 28+3 34+2 SVD SVIA Normal Preterm 23 27+1 Not scanned SVD HFNC Normal
Table 3.4: Clinical details of the preterm infants in the study. Abbreviations as in able 3.2.
3.2.1 Simultaneous video-EEG and DOT
141
3.2 Equipment and Study Conduction
3.2.1 Simultaneous video-EEG & DOT
The Cambridge Centre for Perinatal Neuroscience (CCPN) has a long-term collaboration
with the University College London Biomedical Optics Research Lab (UCL BORL),
collectively known as neoLAB. The UCL BORL have developed their own in-house
diffuse optical tomography (DOT) system, the NTS Optical Imaging System (369), which
is also commercially available (see Fig. 3.2.1).
Continuous wave DOT data were acquired using the UCL NTS Optical Imaging
System. This device employs 16 dual-wavelength laser diode sources operating at 780
nm and 850 nm, and 16 avalanche photodiode detectors (APDs). Each source is
modulated at a different frequency between 2-4 kHz. The amount of light which can be
coupled into the scalp is limited for safety reasons, and thus the device maintains an
output intensity below that of the eye safety limit (10 W/m2 for NIR wavelengths in
continuous operation (British Standard EN 60825-1:2007)). The sources are illuminated
simultaneously, and a Fourier transform of the transmitted light recorded at each detector
determines the modulation frequency and thus the origin of the detected light. The
arrangement of source-detector positions on the head determines the spatial resolution of
the final image. The sampling frequency rate of the device is 10 Hz.
Video-EEG data were obtained using a BrainVision V-Amp system (Brain
Products GmbH, Germany). During the conduction of the pilot study, for the first few
patients recruited, the Micromed SystemPlus clinical EEG system (Micromed S.p.A.,
Italy) was used. The sampling frequency of both systems is 250 Hz.
To allow simultaneous DOT-EEG recordings with full scalp coverage, an
integrated infant head-cap was employed. The sources and detectors were coupled to the
infants’ heads using 32 optical fibre bundles (Loptek GmbH & Co. KG) attached to a soft,
flexible head cap (EasyCap, Germany) (see Fig. 3.2.2). Caps of different sizes in
circumference were manufactured by EasyCap to match the age and size of each infant’s
head. The range in head circumference during my study was 28-38cm, in 2cm intervals.
The optical fibres were positioned within the cap at a subset of locations taken from the
10–5 system (370). These locations were chosen to maximize the density of DOT source–
detector pairs (channels) with optimal separations between 20 and 40 mm while also

3.2.1 Simultaneous video-EEG and DOT
142
covering the whole scalp. This distance is large enough to sample brain tissue and small
enough for enough light to be detected. A relative experimental rule-of-thumb, is that a
source-detector pair separated by a distance d will only be sensitive to a depth of
approximately d/2 (371). The array design, which provides a total of 58 dual-wavelength
DOI channels, is shown in figure 3.2.2 and was designed by Laura Dempsey (LAD)
(MPhil student in Cambridge at the time) and Dr Chuen Wai Lee (CWL) (clinical research
fellow at the time) in 2012 prior to the onset of the pilot study.
For the EEG recordings, 13 ring Ag/AgCl EEG electrodes were coupled to the
head cap in the initial studies and following that ring EEG electrodes were coupled to the
head cap (see Fig. 3.2.2). The positions of the EEG electrodes conformed to the standard
neonatal EEG montage (Fp1, Fp2, Fz, T3, T4, C3, Cz, C4, Pz, O1, O2) with reference
and ground electrodes at AFpz and FC1 respectively (see Fig. 3.2.2).
As mentioned before DOT is a safe and non-invasive technique that uses light in
the near-infrared spectrum relying on two principal phenomena, (i) the relative
transparency of biological tissue in this region of the spectrum and (ii) the presence of
compounds in tissue whose absorption of light is oxygen concentration dependent.
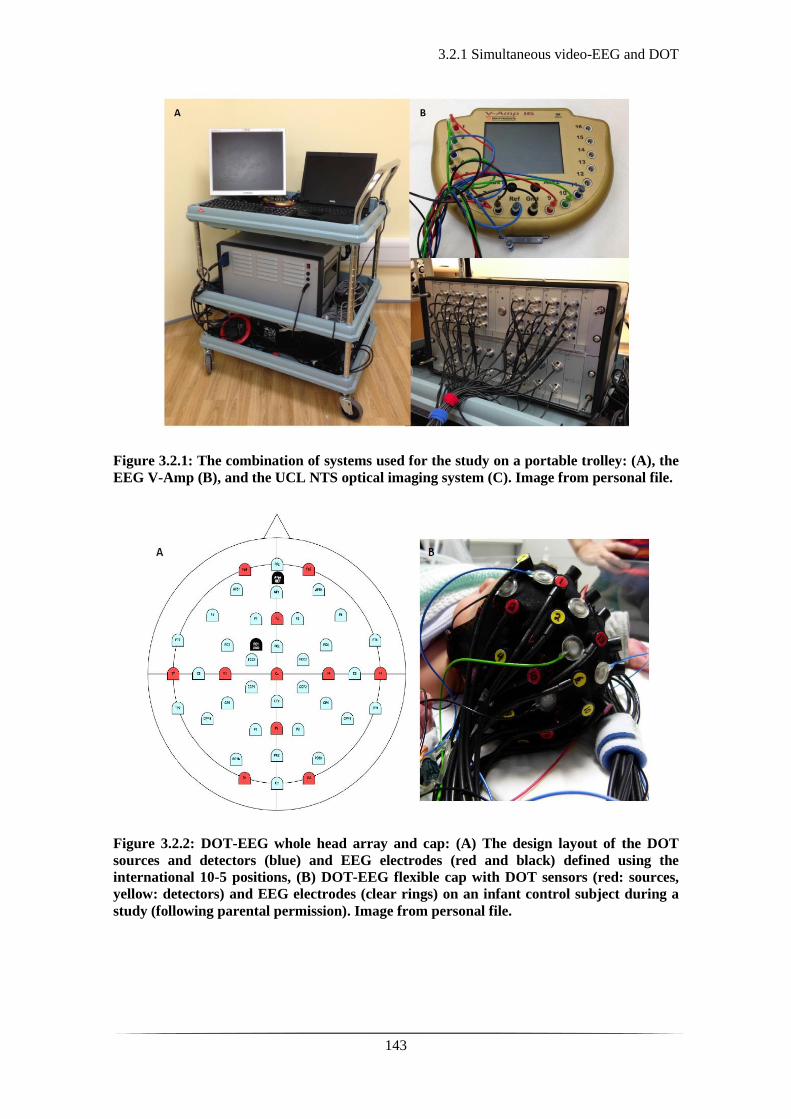
3.2.1 Simultaneous video-EEG and DOT
143
Figure 3.2.1: The combination of systems used for the study on a portable trolley: (A), the
EEG V-Amp (B), and the UCL NTS optical imaging system (C). Image from personal file.
Figure 3.2.2: DOT-EEG whole head array and cap: (A) The design layout of the DOT
sources and detectors (blue) and EEG electrodes (red and black) defined using the
international 10-5 positions, (B) DOT-EEG flexible cap with DOT sensors (red: sources,
yellow: detectors) and EEG electrodes (clear rings) on an infant control subject during a
study (following parental permission). Image from personal file.
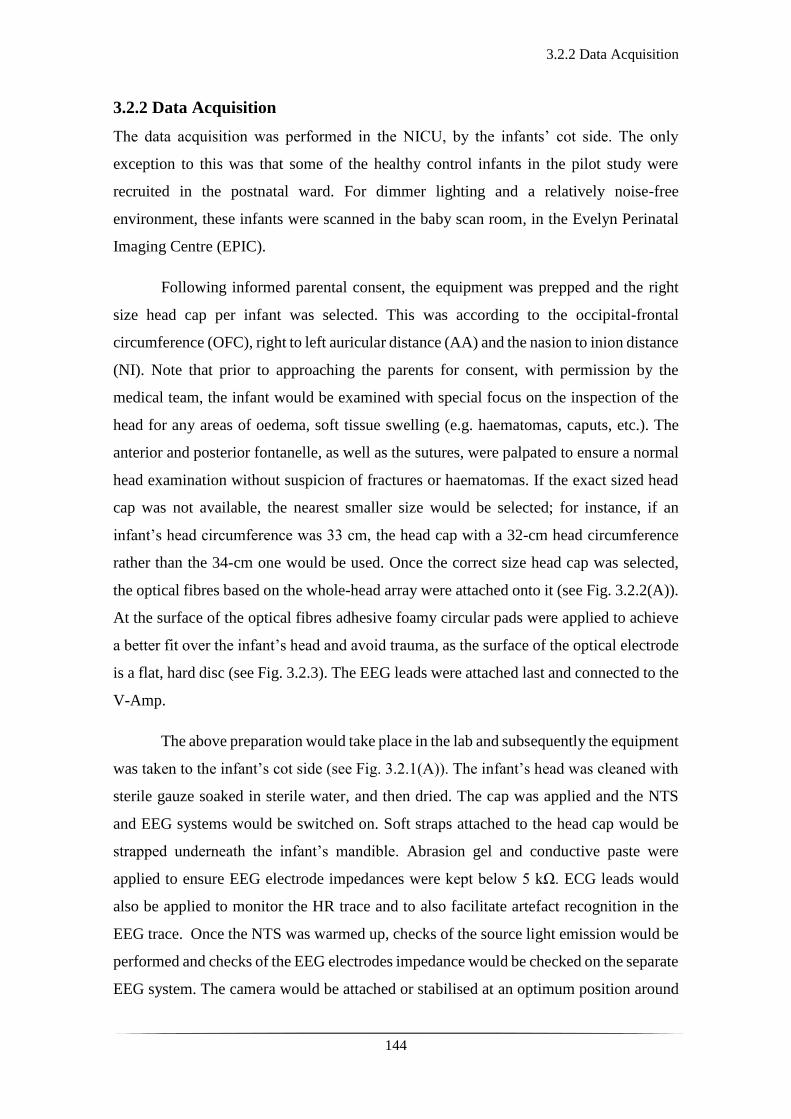
3.2.2 Data Acquisition
144
3.2.2 Data Acquisition
The data acquisition was performed in the NICU, by the infants’ cot side. The only
exception to this was that some of the healthy control infants in the pilot study were
recruited in the postnatal ward. For dimmer lighting and a relatively noise-free
environment, these infants were scanned in the baby scan room, in the Evelyn Perinatal
Imaging Centre (EPIC).
Following informed parental consent, the equipment was prepped and the right
size head cap per infant was selected. This was according to the occipital-frontal
circumference (OFC), right to left auricular distance (AA) and the nasion to inion distance
(NI). Note that prior to approaching the parents for consent, with permission by the
medical team, the infant would be examined with special focus on the inspection of the
head for any areas of oedema, soft tissue swelling (e.g. haematomas, caputs, etc.). The
anterior and posterior fontanelle, as well as the sutures, were palpated to ensure a normal
head examination without suspicion of fractures or haematomas. If the exact sized head
cap was not available, the nearest smaller size would be selected; for instance, if an
infant’s head circumference was 33 cm, the head cap with a 32-cm head circumference
rather than the 34-cm one would be used. Once the correct size head cap was selected,
the optical fibres based on the whole-head array were attached onto it (see Fig. 3.2.2(A)).
At the surface of the optical fibres adhesive foamy circular pads were applied to achieve
a better fit over the infant’s head and avoid trauma, as the surface of the optical electrode
is a flat, hard disc (see Fig. 3.2.3). The EEG leads were attached last and connected to the
V-Amp.
The above preparation would take place in the lab and subsequently the equipment
was taken to the infant’s cot side (see Fig. 3.2.1(A)). The infant’s head was cleaned with
sterile gauze soaked in sterile water, and then dried. The cap was applied and the NTS
and EEG systems would be switched on. Soft straps attached to the head cap would be
strapped underneath the infant’s mandible. Abrasion gel and conductive paste were
applied to ensure EEG electrode impedances were kept below 5 kΩ. ECG leads would
also be applied to monitor the HR trace and to also facilitate artefact recognition in the
EEG trace. Once the NTS was warmed up, checks of the source light emission would be
performed and checks of the EEG electrodes impedance would be checked on the separate
EEG system. The camera would be attached or stabilised at an optimum position around

3.2.2 Data Acquisition
145
or inside the infant’s cot (see Fig. 3.3.3 (A)) and linked to the EEG system. Once all
checks were done, the data acquisition would start with the simultaneous onset of both
systems. The DOT and EEG systems were synchronised using a custom-made external
trigger generator, developed by UCL BORL.
Preparation of the head gear required at least 15 minutes. Application of the head
gear onto the infant’s head and initiation of the study required 10 to 20 minutes. There
was only one occasion where the head gear prepared was not fitting well and a different
size head cap had to be prepared, causing a 20-minute delay. No adverse events were
noted around or during the studies. There was great acceptance of the research study by
the medical and nursing stuff showing support and facilitating its conduction. Parents had
the option of being present throughout the conduction of the study with the only limitation
not to stimulate (i.e. stroke) their infant during the scan. On the contrary, they were
encouraged to pacify their infant in the beginning of the study if they appeared overly
alert or unsettled. Approaching the infants in the postprandial phase, making a
cocoon/nest, and swaddling them aided in acquiring better quality data with fewer
motion-related artefacts. The latter mostly applied to the healthy term or preterm infants,
whereas the patient cohort group were less active.
Throughout the conduction of the scans, clinical care continued undisturbed. The
duration of the recordings varied from 45 to 240 minutes. I was present throughout the
recordings, monitoring the infant, overseeing the quality of the signal, making any
necessary adjustments, and noting any significant events (e.g. seizures, desaturation,
cares being given by the nurse, suction).
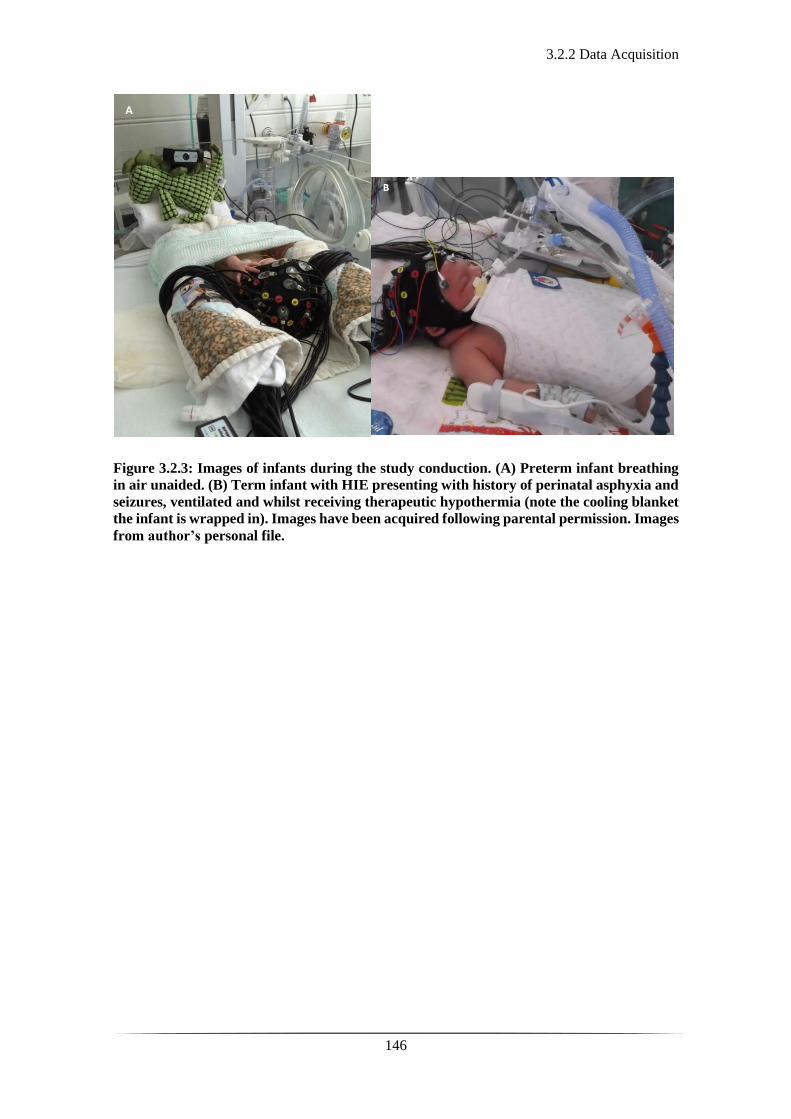
3.2.2 Data Acquisition
146
Figure 3.2.3: Images of infants during the study conduction. (A) Preterm infant breathing
in air unaided. (B) Term infant with HIE presenting with history of perinatal asphyxia and
seizures, ventilated and whilst receiving therapeutic hypothermia (note the cooling blanket
the infant is wrapped in). Images have been acquired following parental permission. Images
from author’s personal file.
A
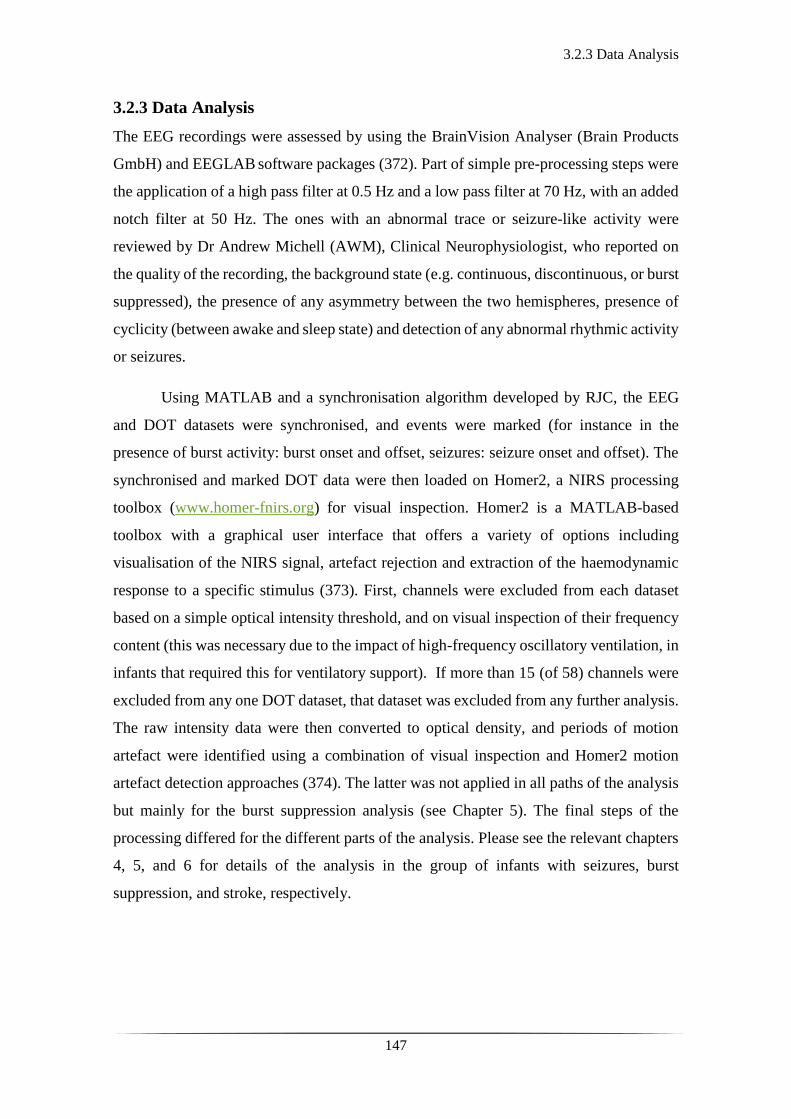
3.2.3 Data Analysis
147
3.2.3 Data Analysis
The EEG recordings were assessed by using the BrainVision Analyser (Brain Products
GmbH) and EEGLAB software packages (372). Part of simple pre-processing steps were
the application of a high pass filter at 0.5 Hz and a low pass filter at 70 Hz, with an added
notch filter at 50 Hz. The ones with an abnormal trace or seizure-like activity were
reviewed by Dr Andrew Michell (AWM), Clinical Neurophysiologist, who reported on
the quality of the recording, the background state (e.g. continuous, discontinuous, or burst
suppressed), the presence of any asymmetry between the two hemispheres, presence of
cyclicity (between awake and sleep state) and detection of any abnormal rhythmic activity
or seizures.
Using MATLAB and a synchronisation algorithm developed by RJC, the EEG
and DOT datasets were synchronised, and events were marked (for instance in the
presence of burst activity: burst onset and offset, seizures: seizure onset and offset). The
synchronised and marked DOT data were then loaded on Homer2, a NIRS processing
toolbox (www.homer-fnirs.org) for visual inspection. Homer2 is a MATLAB-based
toolbox with a graphical user interface that offers a variety of options including
visualisation of the NIRS signal, artefact rejection and extraction of the haemodynamic
response to a specific stimulus (373). First, channels were excluded from each dataset
based on a simple optical intensity threshold, and on visual inspection of their frequency
content (this was necessary due to the impact of high-frequency oscillatory ventilation, in
infants that required this for ventilatory support). If more than 15 (of 58) channels were
excluded from any one DOT dataset, that dataset was excluded from any further analysis.
The raw intensity data were then converted to optical density, and periods of motion
artefact were identified using a combination of visual inspection and Homer2 motion
artefact detection approaches (374). The latter was not applied in all paths of the analysis
but mainly for the burst suppression analysis (see Chapter 5). The final steps of the
processing differed for the different parts of the analysis. Please see the relevant chapters
4, 5, and 6 for details of the analysis in the group of infants with seizures, burst
suppression, and stroke, respectively.

3.2.3 Data Analysis
148
Figure 3.2.4: Graph of the different pre-processing and processing steps.
Pre-processing
Data Quality Check and
Motion Artefact Rejection
Raw DOT Dataset
Spectral Analysis, Band Pass
Filtering and Marking of
events
Synchronized DOT Dataset Synchronized EEG dataset
Raw EEG Dataset
Project-specific Processing
Image Reconstruction

149
Chapter 4: Cortico-vascular Changes in
Neonatal Seizures

150
4.1 Optical methods and EEG on neonatal seizures
151
4.1 Optical methods and EEG on neonatal seizures
Near-infrared spectroscopy (NIRS) has been used in the investigation of seizures to
understand the associated haemodynamic phenomena and develop early detection tools.
As mentioned previously (section 2.2.3 of chapter 2), an increase in neuronal activity
leads to increase in metabolic demand, thus causing local vasodilatation, increased CBF
and oxygenation, via a process known as neurovascular coupling. This mechanism is not
fully understood but it is believed that vasoactive neurotransmitters, released during
neural activity, trigger the contraction or dilatation of the cerebral blood vessels
depending on localised energy demands (375). The combination of EEG and NIR
techniques allows the study of neurovascular coupling, especially in the occurrence of
overt electrical phenomena such as seizures.
Steinhoff et al., demonstrated that coupling NIRS and video-EEG in the pre-
operative assessment of two patients of temporal-originating intractable focal epilepsy,
can aid targeted neurosurgery. They showed marked desaturations in accordance with the
seizures. These were particularly observed in the postictal phase on the ipsilateral region
with inconsistent findings on the contralateral side (376). Sokol et al., showed that data
from combining a single sensor NIRS and EEG could differentiate complex partial
seizures from rapidly evolving secondary generalised seizures. They demonstrated that
there was an increase in cerebral oxygenation during partial seizures with no change of
peripheral oximetry. In contrast they observed a decrease in cerebral oxygenation during
the generalised seizures with a concomitant decrease in peripheral pulse oximetry (377).
This was a study based on a single probe NIRS system (InvosTM system, cerebral/somatic
oximeter, Covidien AG, USA) which provides a single measurement of cerebral
oxygenation from the forehead.
In 2007, Zhao et al., measured intrinsic optical signals from human cortex intra-
operatively during focal seizures. They showed an increase in both cerebral blood volume
(CBV) and HHb concentration preceding and during seizure activity, suggesting an
inadequate supply to meet the metabolic demands (378). The group used optical imaging
in two wavelengths to achieve these measurements but in an alternating pattern rather
than simultaneously, which introduces potential variations between measurements and
artefact, ultimately affecting the calculations of Hb concentrations.

4.1 Optical methods and EEG on neonatal seizures
152
Although there is supporting literature on the neurovascular coupling in
asphyxiated neonates from the early nineties (162, 379), Wallois et al., were the first to
demonstrate evidence of haemodynamic changes in association with seizure-like activity
in the neonatal period combining NIRS and EEG (380). The group used a device with a
limited number of NIRS channels over the parietal areas emitting light simultaneously at
two wavelengths (using a frequency domain spectrophotometer device) for the
measurement of the haemodynamic changes in combination with EEG. They noted a
paradoxical increase in HHb prior to the onset of the event followed by its decline and an
increase in HbO2 and HbT concentration during the seizure-like activity (see Fig. 4.1.1).
This could be explained by a regional increased metabolic rate driving a rapid increase in
CBV, which is insufficient to achieve the expected washout of HHb, as the one noted in
functional activation studies (328). This haemodynamic pattern has also been
demonstrated on the rat neocortex in correlation to inter-ictal activity using multi-
wavelength NIR methodologies (optical recording of intrinsic signals-ORIS) (381).
Figure 4.1.1: Representation of the changes in tissue oxygenation index (TOI), HbT, HbO2
and HHb in response to seizure activity in the neonatal period. This graph shows the
different phases in relation to seizure activity: phase (I) corresponds to no haemodynamic
changes right after the seizure onset, phase (II) to the increase in HbT, HbO2 and HHb, and
decrease in TOI, (III) to a plateau of HbT, HbO2 and HHb, and further decrease in TOI
and (IV) to a plateau and gradual return to the baseline following the seizure offset. Adapted
from reference (380).
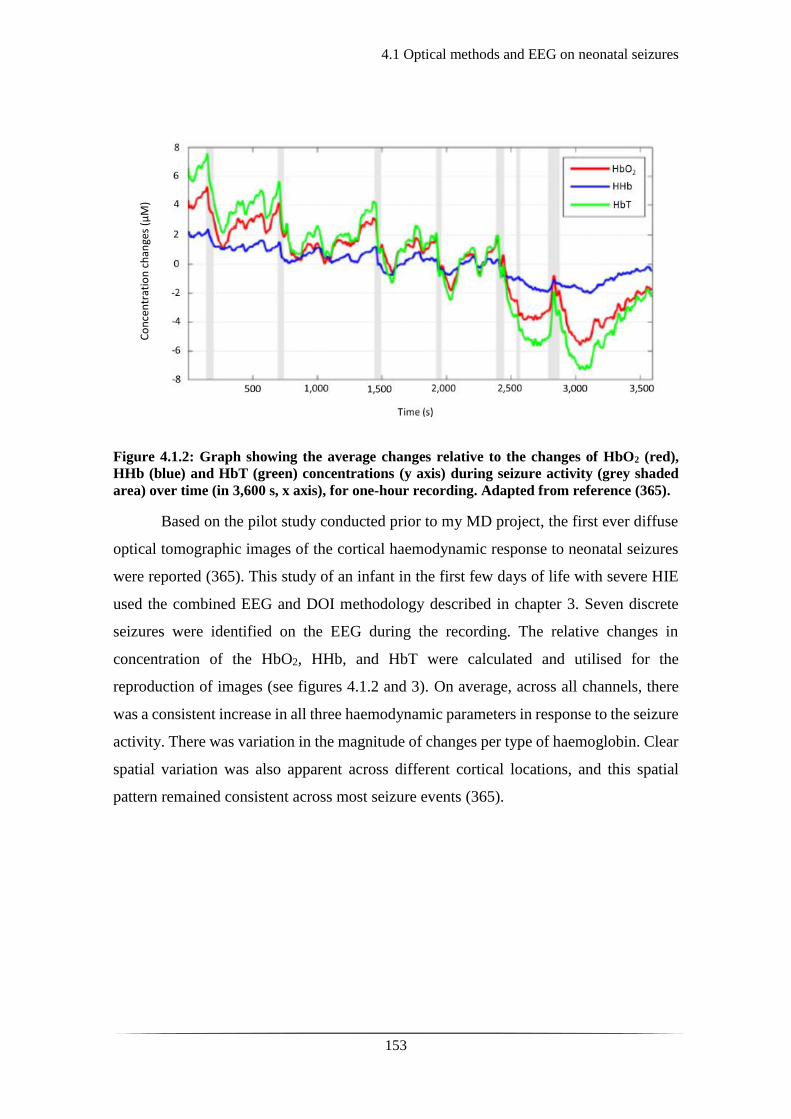
4.1 Optical methods and EEG on neonatal seizures
153
Figure 4.1.2: Graph showing the average changes relative to the changes of HbO2 (red),
HHb (blue) and HbT (green) concentrations (y axis) during seizure activity (grey shaded
area) over time (in 3,600 s, x axis), for one-hour recording. Adapted from reference (365).
Based on the pilot study conducted prior to my MD project, the first ever diffuse
optical tomographic images of the cortical haemodynamic response to neonatal seizures
were reported (365). This study of an infant in the first few days of life with severe HIE
used the combined EEG and DOI methodology described in chapter 3. Seven discrete
seizures were identified on the EEG during the recording. The relative changes in
concentration of the HbO2, HHb, and HbT were calculated and utilised for the
reproduction of images (see figures 4.1.2 and 3). On average, across all channels, there
was a consistent increase in all three haemodynamic parameters in response to the seizure
activity. There was variation in the magnitude of changes per type of haemoglobin. Clear
spatial variation was also apparent across different cortical locations, and this spatial
pattern remained consistent across most seizure events (365).
Co
nce
ntr
atio
n c
han
ges
(µM
)

4.1 Optical methods and EEG on neonatal seizures
154
Figure 4.1.3: A series of DOT images showing the changes in HbT observed at different
phases of a single neonatal seizure 50-seconds long in duration. The top of the image is
showing the changes in concentration of the oxy (red), deoxy (blue) and total (green)
haemoglobin before, during and after the seizure. The lower part of the image demonstrates
the spatial distribution of the changes across the cortex. Note the characteristic rise in all
three parameters 10 s prior to the seizure onset, the peak at 10 s into the seizure and the
beginning of their decrease prior to the offset of the event. A marked decrease in HbT lasts
for several minutes after the offset of the seizure. (Numbers 1 to 7 on the graph and over the
DOT images signify the following: 1-30 s prior to seizure onset; 2-10 s prior to seizure onset;
3-10 s after seizure onset; 4-25 s after seizure onset; 5-25 s after seizure offset; 6-85 s after
seizure offset; 7-175 s after seizure offset). Image adapted from reference (365).
The aim of this part of the project was to explore the cortical haemodynamic
changes observed during electrical seizure activity in the term neonatal population.

4.2.1 Patients and Data Acquisition
155
4.2 Patients and Methods
4.2.1 Patients and Data Acquisition
Newborn infants presenting with seizures in the first 72 hours of life were recruited to the
study following informed parental consent as described in section 3.1.1 of chapter 3. The
video-EEG and DOI device were used in combination to scan the infants whilst receiving
acute neonatal clinical care. The recording period varied from 45 to 240 minutes.
Depending on the day of recruitment and their clinical status, some infants had more than
one scan, performed on consecutive days. No adverse events were recorded during the
study and the scans were well tolerated throughout without interfering with the clinical
management and treatment being delivered.

4.2.2 EEG Data Analysis
156
4.2.2 EEG Data Analysis
During the conduction of the study, there was continuous monitoring of the infant and the
quality of the data being recorded. Simultaneously, the EEG trace was being reviewed
throughout its recording for the detection of any artefact, abnormal rhythm, or seizure-
like activity. A detailed timesheet was kept, reporting all the important events during the
recording from a clinical and data-quality point of view. In the instance of any abnormal
EEG trace detection, the rest of the observations and physiological parameters, such as
peripheral pulse oximetry, mean blood pressure, heart or respiratory rate were noted.
Additionally, any abnormal or unusual infant behaviour, such as unusual breathing
pattern, stereotypical movements (i.e. lip smacking, hiccups, cycling movements of lower
limbs) were noted.
The EEG recordings of the infants with a pathological clinical background were
routinely reviewed and reported by Dr Andrew Michell (AWM), Clinical
Neurophysiologist. The EEG data containing suspected abnormal rhythms (as identified
during data acquisition), were brought to his attention for reporting. In the instance of
identified seizures, the duration, the onset and offset, and the change in frequency during
the seizure activity were noted. The exact timings of the events were then used as markers
on the DOT signal for further processing as described in the following section.
4.2.3 DOT Data Analysis
157
4.2.3 DOT Data Analysis
Using MATLAB, the EEG and DOT datasets were synchronized to the first point in time
of parallel data acquisition and the seizure onset and offset markers were transformed to
the DOI time-base. Using functions from the Homer2 NIRS processing toolbox
(www.homer-fnirs.org) (373) and MATLAB, the DOT data were pre-processed prior to
extracting the haemodynamic response to seizure activity. The seizure onset and offset
timings were marked against the DOT signal. The DOT data were low pass filtered at 1
Hz to eliminate heart rate and high frequency interference, which could be generated by
equipment in the clinical area, such as the ventilator and/or intravenous pumps. The raw
optical intensity data were then converted to optical density for further visual inspection
and artefact rejection processing (374). For channel-wise visual inspection and analysis,
the optical density data were converted into changes in concentration of HbO2, HHb and
HbT using the modified Beer-Lambert law and a pathlength factor of 4.9 (382). The
fluctuations in the haemodynamic signal were then inspected for any obvious deviation
from the baseline in association with the seizure activity.
4.3.1 Clinical Details
158
4.3 Results
4.3.1 Clinical Details
The total number of infants presenting with seizures and recruited into this study was 29.
Amongst these, 5 infants were studied whilst having seizures. These were patient 4, 15,
18, 20 and 24. The clinical details and the results showing the haemodynamic response
to seizures in patient 4 had already been described and published prior to this MD project,
as a pilot study (please see reference (365)).
Patient 15
Patient 15 was a female infant born unexpectedly in a very poor condition, following
induced vaginal delivery at 40+5 weeks of gestation in a local district hospital. Her birth
weight was 3216 grams. This was a low risk pregnancy with no antenatal concerns and
the first baby to this mother. She was born unresponsive with no respiratory effort or heart
rate. The cord was wrapped around her neck. She was given full resuscitation including
intubation, ventilation, cardio-pulmonary resuscitation with three rounds of Adrenaline,
O negative blood and bicarbonate. The APGAR scores were very poor: 0 at 1 minute, 0
at 5 minutes and 2 at 10 minutes. The initial lactate was 20 and pH 6.6. She started seizing
right after being resuscitated and was loaded with intravenous phenobarbitone (20
mg/kg). She was urgently transferred to the Rosie NICU and therapeutic hypothermia
was commenced as a follow up of passive cooling since birth.
On admission, she was ventilated and exhibited abnormal neurology; hypotonia,
posturing, absent gag reflex and fixed, dilated pupils. Her aEEG showed burst suppressed
pattern. On day 2 of life she continued to have seizures associated with profound
desaturations and bradycardias, for which she received a further dose of phenobarbitone.
In view of poor condition at birth, ongoing intractable seizures, no improvement
in neurological status, fixed, dilated, non-responsive pupils, a joint decision with the
family was made for re-direction of care. Following this, she was transferred to a hospice
and intensive care was withdrawn. The MRI showed severe abnormalities within the basal
ganglia, thalami, posterior limb of the internal capsule (PLIC), brainstem and cortex
consistent with a severe acute hypoxic ischaemic insult. These imaging findings were
reported to be in keeping with a likely very severe global neurodevelopmental
impairment.
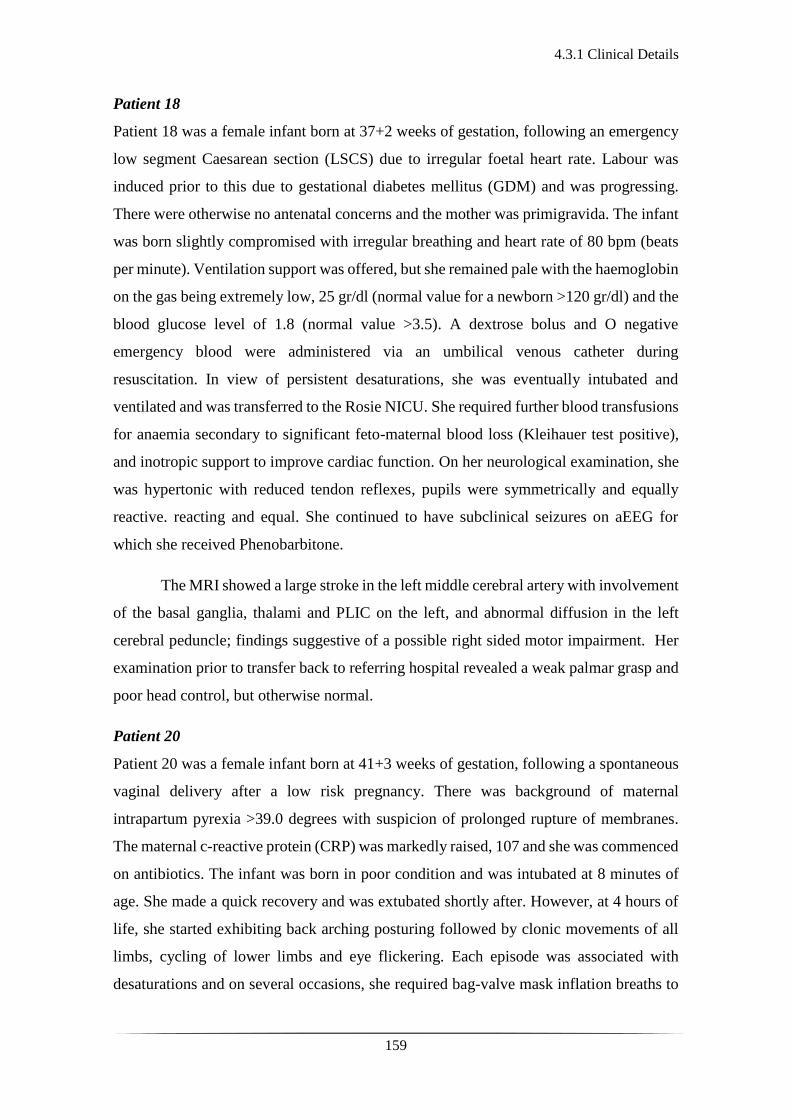
4.3.1 Clinical Details
159
Patient 18
Patient 18 was a female infant born at 37+2 weeks of gestation, following an emergency
low segment Caesarean section (LSCS) due to irregular foetal heart rate. Labour was
induced prior to this due to gestational diabetes mellitus (GDM) and was progressing.
There were otherwise no antenatal concerns and the mother was primigravida. The infant
was born slightly compromised with irregular breathing and heart rate of 80 bpm (beats
per minute). Ventilation support was offered, but she remained pale with the haemoglobin
on the gas being extremely low, 25 gr/dl (normal value for a newborn >120 gr/dl) and the
blood glucose level of 1.8 (normal value >3.5). A dextrose bolus and O negative
emergency blood were administered via an umbilical venous catheter during
resuscitation. In view of persistent desaturations, she was eventually intubated and
ventilated and was transferred to the Rosie NICU. She required further blood transfusions
for anaemia secondary to significant feto-maternal blood loss (Kleihauer test positive),
and inotropic support to improve cardiac function. On her neurological examination, she
was hypertonic with reduced tendon reflexes, pupils were symmetrically and equally
reactive. reacting and equal. She continued to have subclinical seizures on aEEG for
which she received Phenobarbitone.
The MRI showed a large stroke in the left middle cerebral artery with involvement
of the basal ganglia, thalami and PLIC on the left, and abnormal diffusion in the left
cerebral peduncle; findings suggestive of a possible right sided motor impairment. Her
examination prior to transfer back to referring hospital revealed a weak palmar grasp and
poor head control, but otherwise normal.
Patient 20
Patient 20 was a female infant born at 41+3 weeks of gestation, following a spontaneous
vaginal delivery after a low risk pregnancy. There was background of maternal
intrapartum pyrexia >39.0 degrees with suspicion of prolonged rupture of membranes.
The maternal c-reactive protein (CRP) was markedly raised, 107 and she was commenced
on antibiotics. The infant was born in poor condition and was intubated at 8 minutes of
age. She made a quick recovery and was extubated shortly after. However, at 4 hours of
life, she started exhibiting back arching posturing followed by clonic movements of all
limbs, cycling of lower limbs and eye flickering. Each episode was associated with
desaturations and on several occasions, she required bag-valve mask inflation breaths to

4.3.1 Clinical Details
160
recover. Most episodes lasted up to 2 minutes (the longest one lasted 10 minutes) with
less than 10-minute inter-ictal periods. She received Phenobarbitone and was put on a
Midazolam infusion. She was intubated and ventilated for stabilisation. Subsequently, a
decision was made to start passive therapeutic hypothermia and to transfer to the Rosie
NICU for advanced neonatal care. A lumbar puncture performed prior to the infant’s
transport was suggestive of meningitis and the infant was already on appropriate
antibiotic cover. She was intubated and ventilated for transfer. She continued to have
seizures, detected on aEEG monitoring. The Midazolam infusion rate was increased and
a further dose of Phenobarbitone and Phenytoin were administered.
In view of a positive initial blood culture for group B Streptococcus (GBS) and
the positive lumbar puncture result, the principal working diagnosis was GBS sepsis and
meningitis. Therapeutic hypothermia was discontinued. The MRI showed a normally
formed brain with bilateral infarction of both posterior parietal, temporal and occipital
white matter, and cortex. There was some sparing of the left visual cortex but involvement
of both optic radiations. There was additional involvement of the body and posterior
aspects of the corpus callosum and abnormal high signal intensity in the posterior thalami.
The prognosis based on the MRI findings was that the affected tissue would atrophy with
head growth possibly being suboptimal and at increased risk of visual impairment, and
later cognitive and behavioural impairments, potentially within the autistic spectrum
disorders. On discharge, her neurological examination appeared normal and she was
demand breastfeeding.
Patient 24
Patient 24 was a female infant born at 42 weeks of gestation, following an emergency
LSCS due to irregular foetal heart rate. She was born in good condition with APGARS
of 8 at 1 minute and 10 at 5 minutes. At 3 hrs of age, however, she started having multiple
apnoeic episodes with posturing and significant desaturations, highly suggestive of
seizures. She was, therefore, transferred to the Rosie NICU for therapeutic hypothermia.
Seizures were managed with Phenobarbitone, Phenytoin, and Midazolam.
All investigations including a metabolic screen, blood cultures, CSF cultures
(cerebro-spinal fluid), TORCH screen (screen for congenital infections; Toxoplasma,
Rubella, Cytomegalovirus, Herpes Simplex Virus) were negative. In view of ongoing
persistent seizures, she was put on maintenance Phenobarbitone and had a trial of
4.3.1 Clinical Details
161
Pyridoxine. The MRI revealed widespread abnormal signal intensity within the white
matter (involving the PLIC, thalami and corpus callosum) and cortex with an additional
focal haemorrhagic lesion over the left occipital lobe. The prognosis given, based on the
MRI findings, was that the insulted brain tissue would atrophy with subsequent
suboptimal head growth and likely later cognitive and probably some motor impairment.
The findings were consistent with a chronic hypoxic ischaemic injury rather than typical
of isolated acute hypoxic ischaemic injury. Upon discharge, there was truncal hypotonia
and she was still requiring nasogastric tube feeds as unable to complete all bottle feeds.

4.3.2 Seizure detection
162
4.3.2 Seizure detection
Patient 15 was studied on day 2 of life, whilst being ventilated, for approximately one
hour. Discrete electroencephalographic seizures were noted during the recording with
associated desaturations and bradycardias. They were four in total with minimum
duration of 35 seconds and maximum of 76 seconds. The focus of electrographic activity
appeared to be the right anterior quadrant cortical region with the seizures becoming
generalised soon after their onset.
Patient 18 was recruited and studied on the day 2 of life, whilst being ventilated,
for approximately 4,500 seconds. During the study, she was noted to have 5 discrete
episodes of seizures which remained purely electro-graphical with no clinical correlation.
She received Phenobarbitone towards the end of the study due to seizure identification on
the simultaneous aEEG monitoring. The seizure activity during the recording was quite
prolonged with a minimum duration of 60 seconds and a maximum of 639 seconds. In
total, the infant was exhibiting electrical seizure activity for one third of the period during
EEG and DOI data acquisition (1,387 seconds out of 4,500 seconds).
Patient 20 was recruited and studied on day 2 of life for approximately 7,650
seconds. The patient was mechanically ventilated during the scan. During the study, there
were 5 discrete seizures in the space of 2 hours. The minimum seizure duration was 29
seconds and the maximum 1,189 seconds (equivalent to almost 20 minutes). In total, there
was seizure activity (principally subclinical) for one fifth of the period of data acquisition
(1,731 seconds in total out of 7,650 seconds). The ictal activity commenced either from
the right hemisphere or the midline and then became generalised involving all channels
and both hemispheres. All the events were subclinical with no change in any of the
physiological parameters, such as heart rate or peripheral pulse oximetry. She was on a
Midazolam infusion at the time. After the study, the infusion rate of Midazolam was
increased and a further dose of Phenobarbitone and Phenytoin were administered. An
example of the seizure activity detected in patient 20 can be seen in figure 4.3.1.
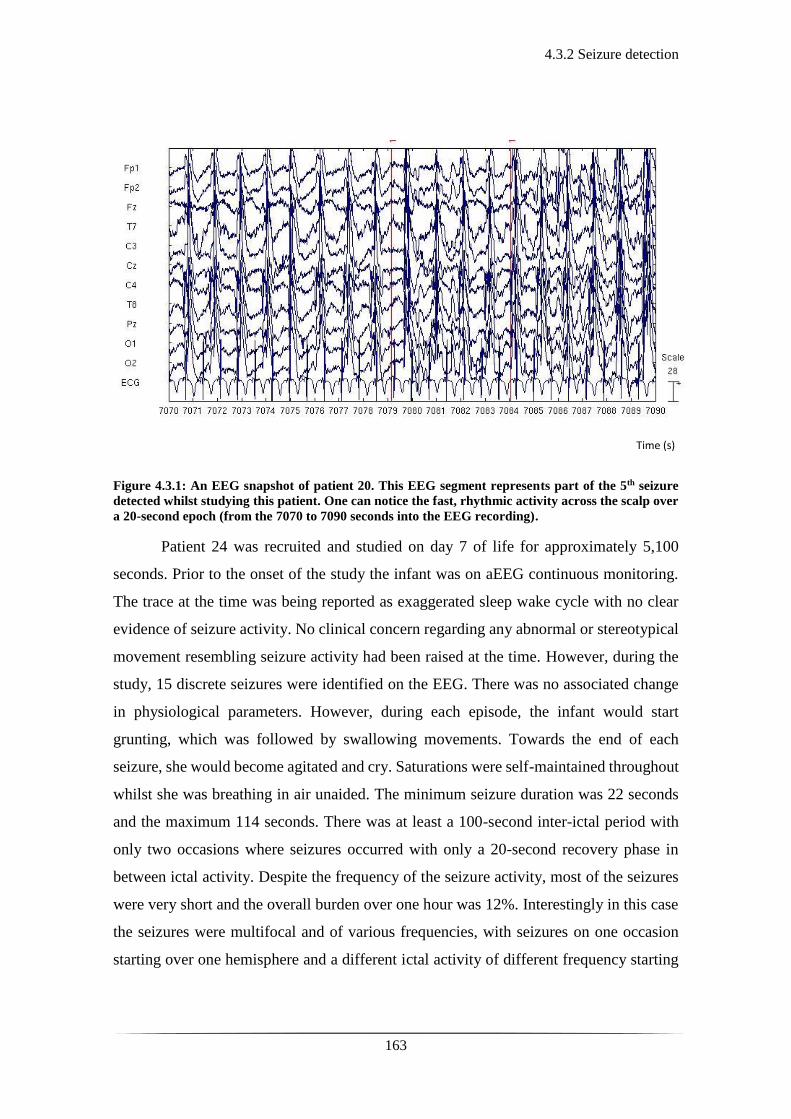
4.3.2 Seizure detection
163
Figure 4.3.1: An EEG snapshot of patient 20. This EEG segment represents part of the 5th seizure
detected whilst studying this patient. One can notice the fast, rhythmic activity across the scalp over
a 20-second epoch (from the 7070 to 7090 seconds into the EEG recording).
Patient 24 was recruited and studied on day 7 of life for approximately 5,100
seconds. Prior to the onset of the study the infant was on aEEG continuous monitoring.
The trace at the time was being reported as exaggerated sleep wake cycle with no clear
evidence of seizure activity. No clinical concern regarding any abnormal or stereotypical
movement resembling seizure activity had been raised at the time. However, during the
study, 15 discrete seizures were identified on the EEG. There was no associated change
in physiological parameters. However, during each episode, the infant would start
grunting, which was followed by swallowing movements. Towards the end of each
seizure, she would become agitated and cry. Saturations were self-maintained throughout
whilst she was breathing in air unaided. The minimum seizure duration was 22 seconds
and the maximum 114 seconds. There was at least a 100-second inter-ictal period with
only two occasions where seizures occurred with only a 20-second recovery phase in
between ictal activity. Despite the frequency of the seizure activity, most of the seizures
were very short and the overall burden over one hour was 12%. Interestingly in this case
the seizures were multifocal and of various frequencies, with seizures on one occasion
starting over one hemisphere and a different ictal activity of different frequency starting
Time (s)

4.3.2 Seizure detection
164
on the other hemisphere shortly after. An example of the seizure activity detected in
patient 24 can be seen in figure 4.3.2.
Figure 4.3.2: An EEG snapshot of patient 24. This EEG segment represents part of the 1st seizure
detected whilst studying this patient. There is on-going rhythmic activity over the right anterior
region, demonstrated in this graph over a 40-second epoch (from 175 to 215 seconds into the EEG
recording).
A summary of some of the clinical details as well as the exact timings of the
seizures for each patient can be seen in the following tables from 4.1 to 4.5.
Subject
ID
Background
EEG activity
No of
Seizures
Focus Medications Underlying Clinical
Condition
Patient 15 Discontinuous 4 Right anterior
quadrant
Phenobarbitone HIE III, TH
Patient 18 Discontinuous 5 Anterior midline Phenobarbitone Feto-maternal haemorrhage,
Neonatal stroke: Lt MCA
infarct, HIE, TH
Patient 20 Continuous 5 Right
hemisphere/midline
Phenobarbitone,
Midazolam
GBS meningitis, B/L stroke,
HIE III, TH
Patient 24 Continuous 15 Multifocal Phenobarbitone HIE grade III, TH
Table 4.1: Clinical and EEG details for patients 15, 18, 20 and 24. Further clinical details
can be seen in table 3.1, chapter 3. (HIE: hypoxic ischaemic encephalopathy, TH:
therapeutic hypothermia, Lt: left, MCA: middle cerebral artery, GBS: group B
streptococcus).
Time (s)
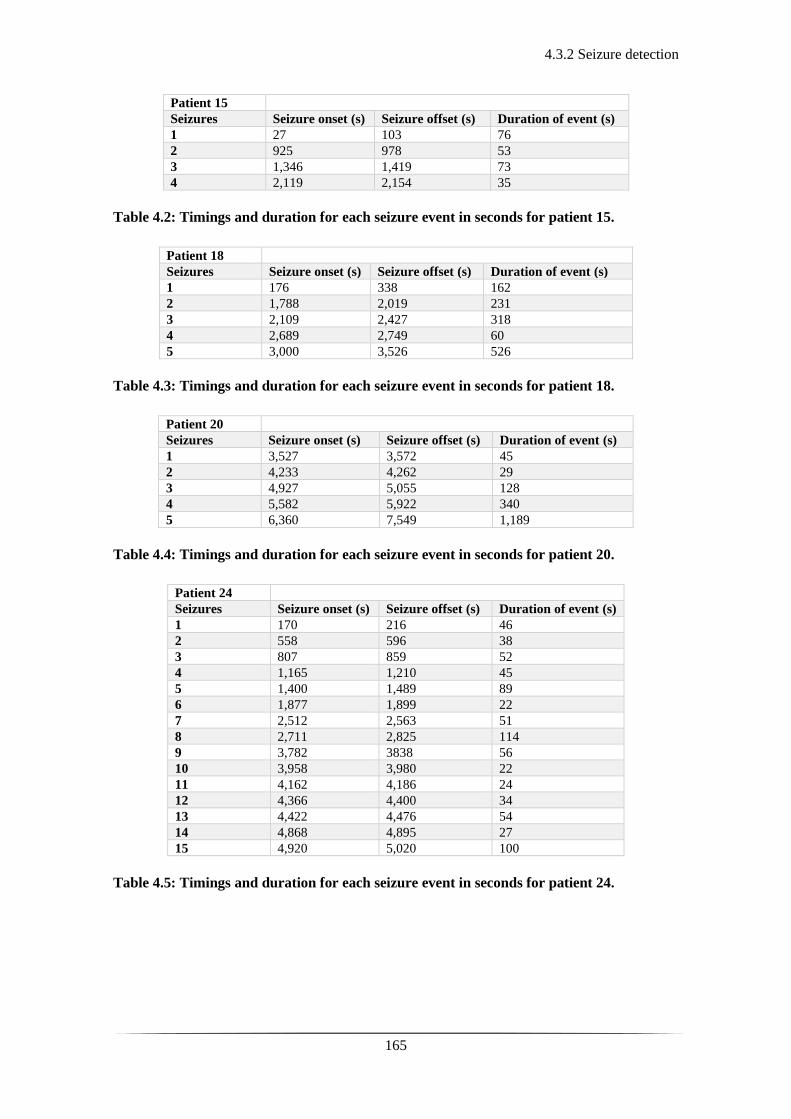
4.3.2 Seizure detection
165
Patient 15
Seizures Seizure onset (s) Seizure offset (s) Duration of event (s)
1 27 103 76
2 925 978 53
3 1,346 1,419 73
4 2,119 2,154 35
Table 4.2: Timings and duration for each seizure event in seconds for patient 15.
Patient 18
Seizures Seizure onset (s) Seizure offset (s) Duration of event (s)
1 176 338 162
2 1,788 2,019 231
3 2,109 2,427 318
4 2,689 2,749 60
5 3,000 3,526 526
Table 4.3: Timings and duration for each seizure event in seconds for patient 18.
Patient 20
Seizures Seizure onset (s) Seizure offset (s) Duration of event (s)
1 3,527 3,572 45
2 4,233 4,262 29
3 4,927 5,055 128
4 5,582 5,922 340
5 6,360 7,549 1,189
Table 4.4: Timings and duration for each seizure event in seconds for patient 20.
Patient 24
Seizures Seizure onset (s) Seizure offset (s) Duration of event (s)
1 170 216 46
2 558 596 38
3 807 859 52
4 1,165 1,210 45
5 1,400 1,489 89
6 1,877 1,899 22
7 2,512 2,563 51
8 2,711 2,825 114
9 3,782 3838 56
10 3,958 3,980 22
11 4,162 4,186 24
12 4,366 4,400 34
13 4,422 4,476 54
14 4,868 4,895 27
15 4,920 5,020 100
Table 4.5: Timings and duration for each seizure event in seconds for patient 24.
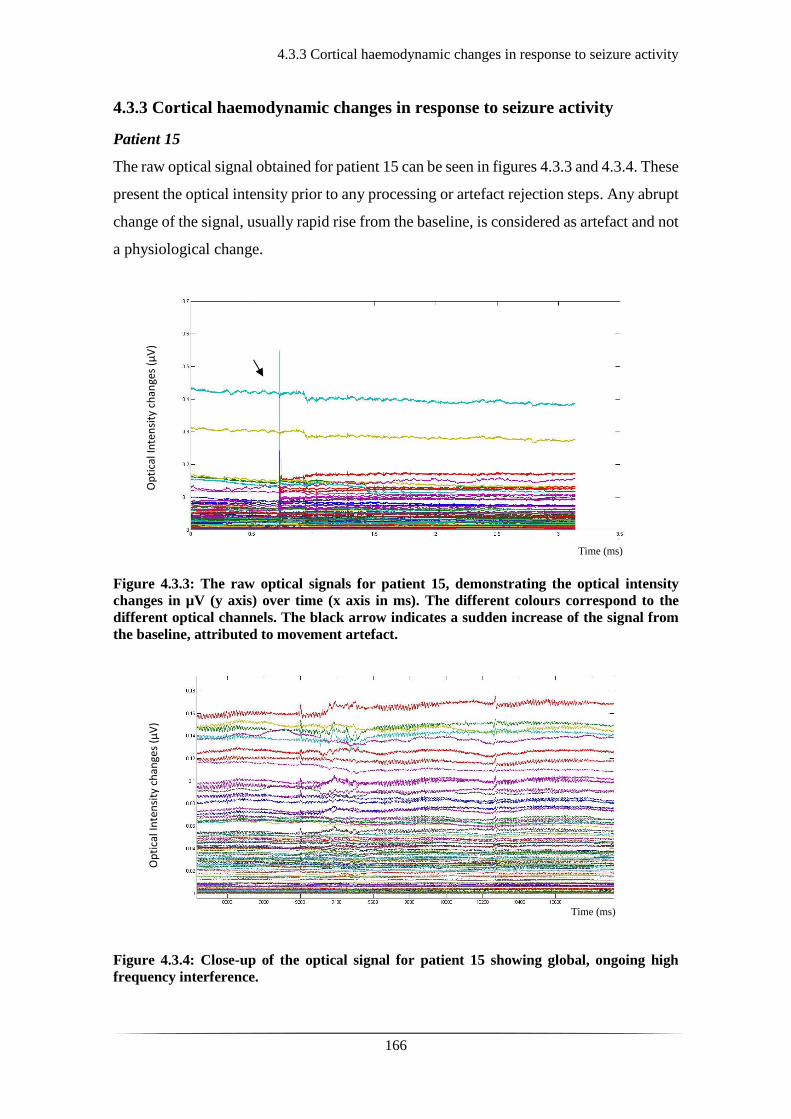
4.3.3 Cortical haemodynamic changes in response to seizure activity
166
4.3.3 Cortical haemodynamic changes in response to seizure activity
Patient 15
The raw optical signal obtained for patient 15 can be seen in figures 4.3.3 and 4.3.4. These
present the optical intensity prior to any processing or artefact rejection steps. Any abrupt
change of the signal, usually rapid rise from the baseline, is considered as artefact and not
a physiological change.
Figure 4.3.3: The raw optical signals for patient 15, demonstrating the optical intensity
changes in µV (y axis) over time (x axis in ms). The different colours correspond to the
different optical channels. The black arrow indicates a sudden increase of the signal from
the baseline, attributed to movement artefact.
Figure 4.3.4: Close-up of the optical signal for patient 15 showing global, ongoing high
frequency interference.
Time (ms)
Op
tica
l In
ten
sity
ch
ange
s (µ
V)
Time (ms)
Op
tica
l In
ten
sity
ch
ange
s (µ
V)
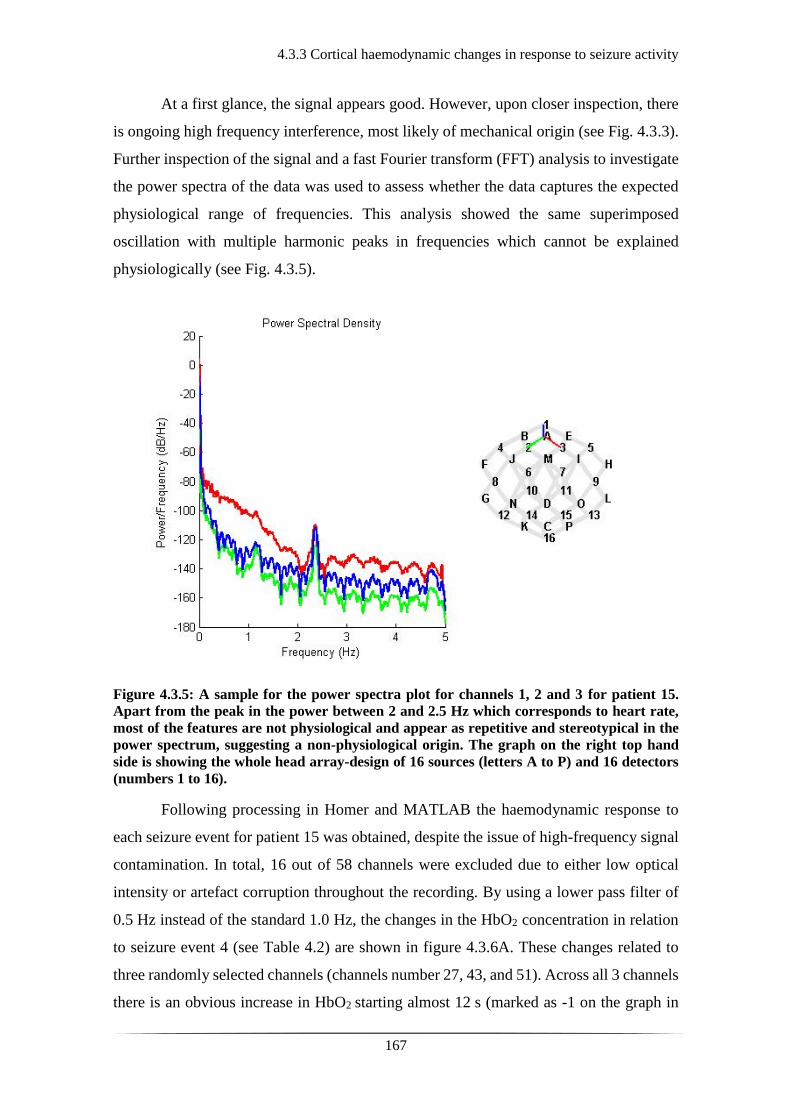
4.3.3 Cortical haemodynamic changes in response to seizure activity
167
At a first glance, the signal appears good. However, upon closer inspection, there
is ongoing high frequency interference, most likely of mechanical origin (see Fig. 4.3.3).
Further inspection of the signal and a fast Fourier transform (FFT) analysis to investigate
the power spectra of the data was used to assess whether the data captures the expected
physiological range of frequencies. This analysis showed the same superimposed
oscillation with multiple harmonic peaks in frequencies which cannot be explained
physiologically (see Fig. 4.3.5).
Figure 4.3.5: A sample for the power spectra plot for channels 1, 2 and 3 for patient 15.
Apart from the peak in the power between 2 and 2.5 Hz which corresponds to heart rate,
most of the features are not physiological and appear as repetitive and stereotypical in the
power spectrum, suggesting a non-physiological origin. The graph on the right top hand
side is showing the whole head array-design of 16 sources (letters A to P) and 16 detectors
(numbers 1 to 16).
Following processing in Homer and MATLAB the haemodynamic response to
each seizure event for patient 15 was obtained, despite the issue of high-frequency signal
contamination. In total, 16 out of 58 channels were excluded due to either low optical
intensity or artefact corruption throughout the recording. By using a lower pass filter of
0.5 Hz instead of the standard 1.0 Hz, the changes in the HbO2 concentration in relation
to seizure event 4 (see Table 4.2) are shown in figure 4.3.6A. These changes related to
three randomly selected channels (channels number 27, 43, and 51). Across all 3 channels
there is an obvious increase in HbO2 starting almost 12 s (marked as -1 on the graph in
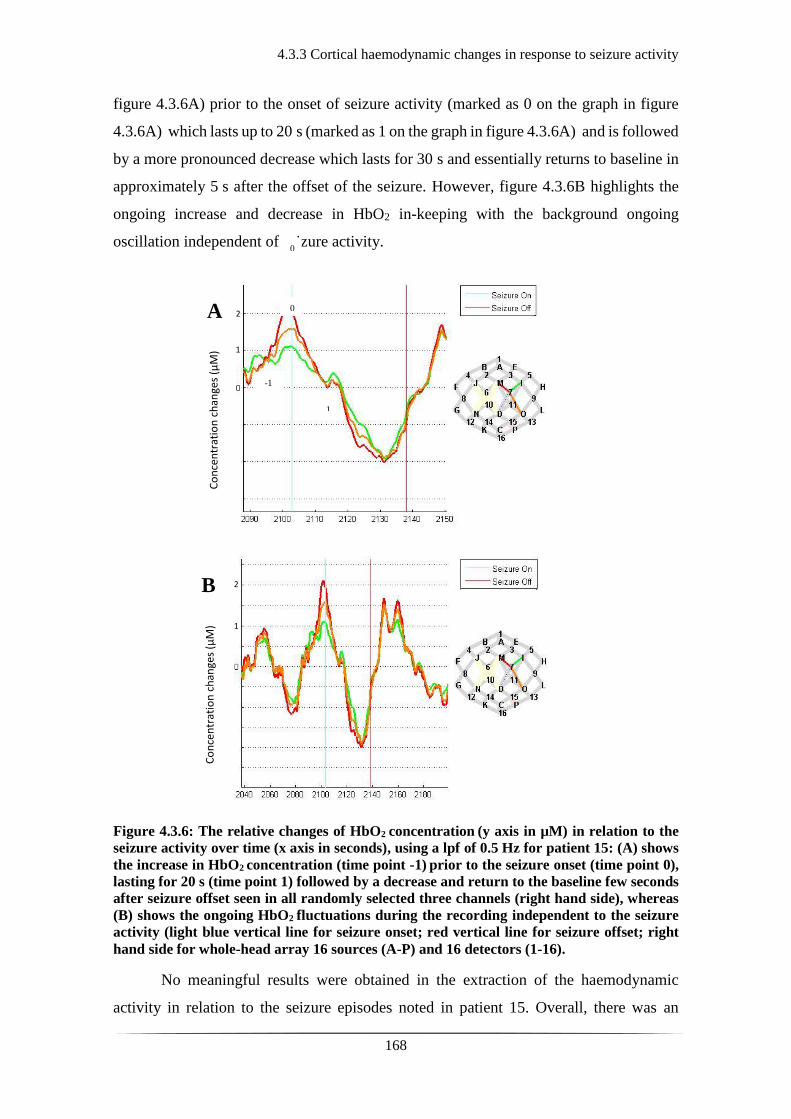
4.3.3 Cortical haemodynamic changes in response to seizure activity
168
figure 4.3.6A) prior to the onset of seizure activity (marked as 0 on the graph in figure
4.3.6A) which lasts up to 20 s (marked as 1 on the graph in figure 4.3.6A) and is followed
by a more pronounced decrease which lasts for 30 s and essentially returns to baseline in
approximately 5 s after the offset of the seizure. However, figure 4.3.6B highlights the
ongoing increase and decrease in HbO2 in-keeping with the background ongoing
oscillation independent of seizure activity.
Figure 4.3.6: The relative changes of HbO2 concentration (y axis in µM) in relation to the
seizure activity over time (x axis in seconds), using a lpf of 0.5 Hz for patient 15: (A) shows
the increase in HbO2 concentration (time point -1) prior to the seizure onset (time point 0),
lasting for 20 s (time point 1) followed by a decrease and return to the baseline few seconds
after seizure offset seen in all randomly selected three channels (right hand side), whereas
(B) shows the ongoing HbO2 fluctuations during the recording independent to the seizure
activity (light blue vertical line for seizure onset; red vertical line for seizure offset; right
hand side for whole-head array 16 sources (A-P) and 16 detectors (1-16).
No meaningful results were obtained in the extraction of the haemodynamic
activity in relation to the seizure episodes noted in patient 15. Overall, there was an
A
B
Co
nce
ntr
atio
n c
han
ges
(µM
)
Co
nce
ntr
atio
n c
han
ges
(µM
)
1
2
1
2
0
-1
1
0
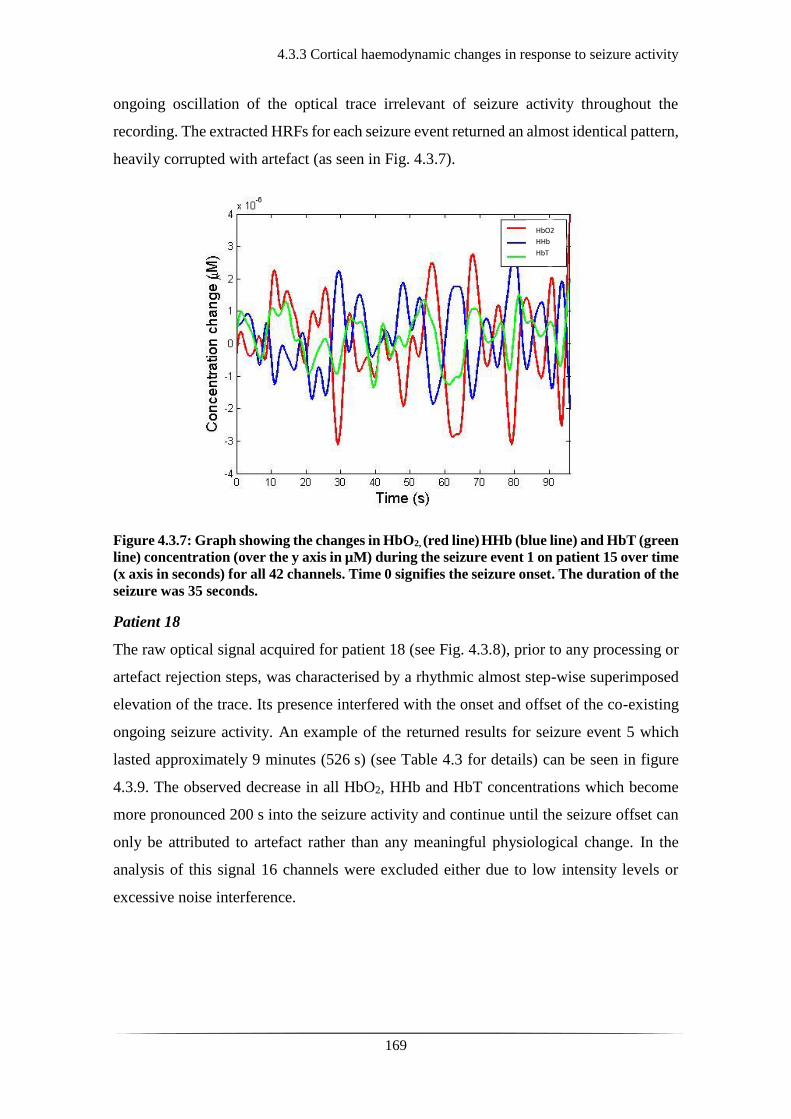
4.3.3 Cortical haemodynamic changes in response to seizure activity
169
ongoing oscillation of the optical trace irrelevant of seizure activity throughout the
recording. The extracted HRFs for each seizure event returned an almost identical pattern,
heavily corrupted with artefact (as seen in Fig. 4.3.7).
Figure 4.3.7: Graph showing the changes in HbO2, (red line) HHb (blue line) and HbT (green
line) concentration (over the y axis in µM) during the seizure event 1 on patient 15 over time
(x axis in seconds) for all 42 channels. Time 0 signifies the seizure onset. The duration of the
seizure was 35 seconds.
Patient 18
The raw optical signal acquired for patient 18 (see Fig. 4.3.8), prior to any processing or
artefact rejection steps, was characterised by a rhythmic almost step-wise superimposed
elevation of the trace. Its presence interfered with the onset and offset of the co-existing
ongoing seizure activity. An example of the returned results for seizure event 5 which
lasted approximately 9 minutes (526 s) (see Table 4.3 for details) can be seen in figure
4.3.9. The observed decrease in all HbO2, HHb and HbT concentrations which become
more pronounced 200 s into the seizure activity and continue until the seizure offset can
only be attributed to artefact rather than any meaningful physiological change. In the
analysis of this signal 16 channels were excluded either due to low intensity levels or
excessive noise interference.
HbO2
HHb
HbT
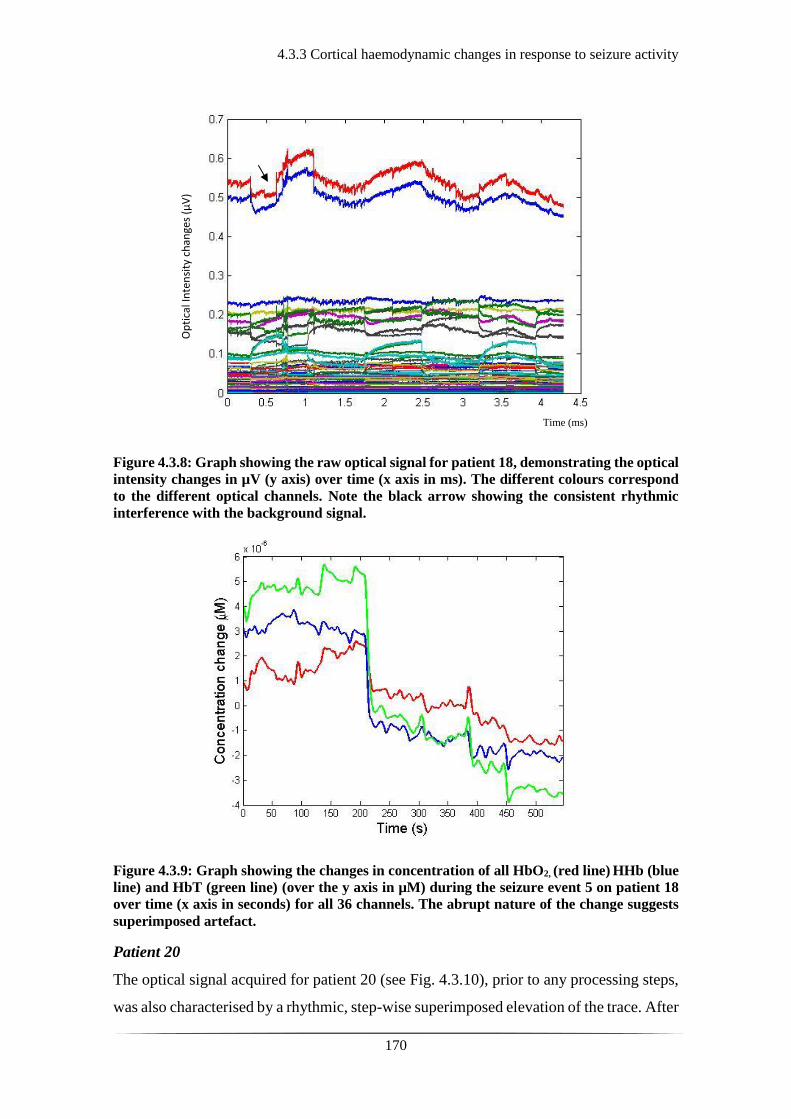
4.3.3 Cortical haemodynamic changes in response to seizure activity
170
Figure 4.3.8: Graph showing the raw optical signal for patient 18, demonstrating the optical
intensity changes in µV (y axis) over time (x axis in ms). The different colours correspond
to the different optical channels. Note the black arrow showing the consistent rhythmic
interference with the background signal.
Figure 4.3.9: Graph showing the changes in concentration of all HbO2, (red line) HHb (blue
line) and HbT (green line) (over the y axis in µM) during the seizure event 5 on patient 18
over time (x axis in seconds) for all 36 channels. The abrupt nature of the change suggests
superimposed artefact.
Patient 20
The optical signal acquired for patient 20 (see Fig. 4.3.10), prior to any processing steps,
was also characterised by a rhythmic, step-wise superimposed elevation of the trace. After
Op
tica
l In
ten
sity
ch
ange
s (µ
V)
Time (ms)

4.3.3 Cortical haemodynamic changes in response to seizure activity
171
further processing, 22 channels were excluded mainly due to motion related artefact.
Similarly, its presence interfered with the onset and offset of the co-existing seizure
activity (see also Fig. 4.3.11), and therefore no meaningful results in terms of the relative
changes in any of the HbO2, HHb and/or HbT concentrations were obtained.
Figure 4.3.10: Graph showing the raw optical signal for patient 20, demonstrating the
optical intensity changes in µV (y axis) over time (x axis in ms). The different colours
correspond to the different optical channels. The black arrows point to the onset of the step-
wise rhythmic elevation of the trace independent to seizure activity.
This elevation in the trace (see Fig.4.3.10, arrows) was persistent throughout the
recording and as mentioned before was also present in the optical signal of patient 18. It
was occurring approximately every 13 minutes and was 8 to 8.5 minutes long in duration.
This was not obvious at the time of data acquisition. The elevation from the baseline is
quite dramatic but one may notice that it is not as abrupt as the standard motion-associated
artefact (see Fig. 4.3.11).
Time (ms)
Op
tica
l In
ten
sity
ch
ange
s (µ
V)
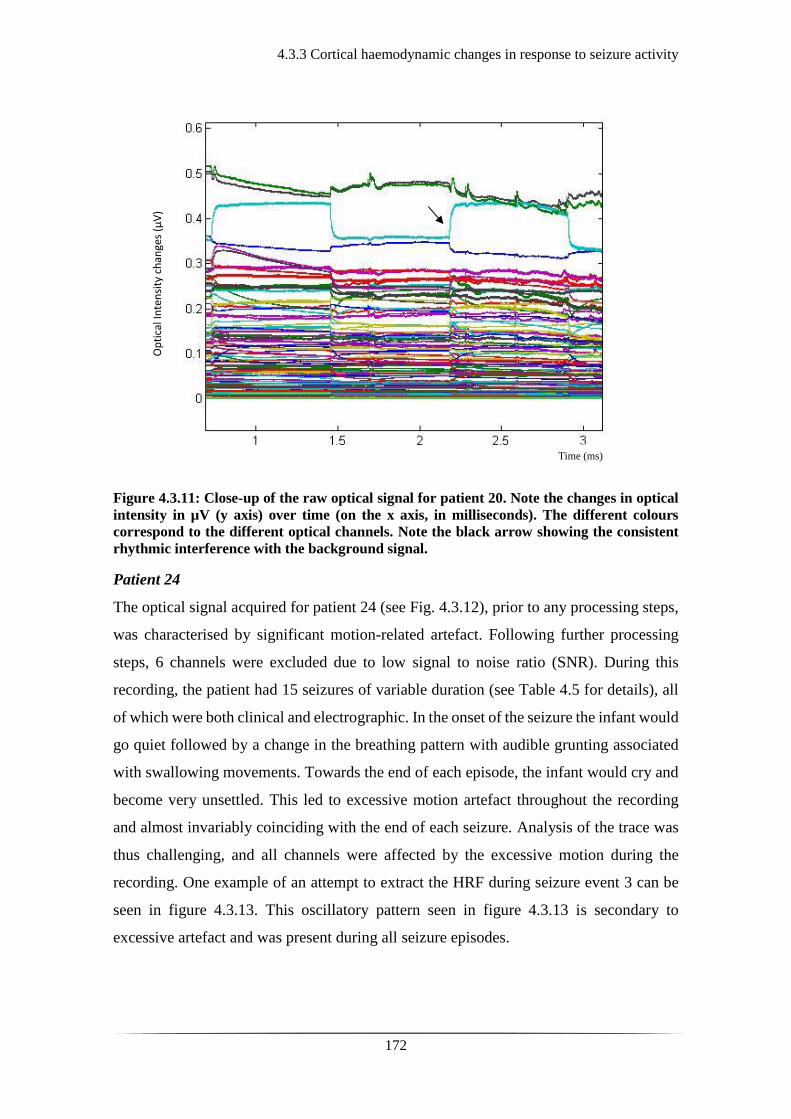
4.3.3 Cortical haemodynamic changes in response to seizure activity
172
Figure 4.3.11: Close-up of the raw optical signal for patient 20. Note the changes in optical
intensity in µV (y axis) over time (on the x axis, in milliseconds). The different colours
correspond to the different optical channels. Note the black arrow showing the consistent
rhythmic interference with the background signal.
Patient 24
The optical signal acquired for patient 24 (see Fig. 4.3.12), prior to any processing steps,
was characterised by significant motion-related artefact. Following further processing
steps, 6 channels were excluded due to low signal to noise ratio (SNR). During this
recording, the patient had 15 seizures of variable duration (see Table 4.5 for details), all
of which were both clinical and electrographic. In the onset of the seizure the infant would
go quiet followed by a change in the breathing pattern with audible grunting associated
with swallowing movements. Towards the end of each episode, the infant would cry and
become very unsettled. This led to excessive motion artefact throughout the recording
and almost invariably coinciding with the end of each seizure. Analysis of the trace was
thus challenging, and all channels were affected by the excessive motion during the
recording. One example of an attempt to extract the HRF during seizure event 3 can be
seen in figure 4.3.13. This oscillatory pattern seen in figure 4.3.13 is secondary to
excessive artefact and was present during all seizure episodes.
Op
tica
l In
ten
sity
ch
ange
s (µ
V)
Time (ms)
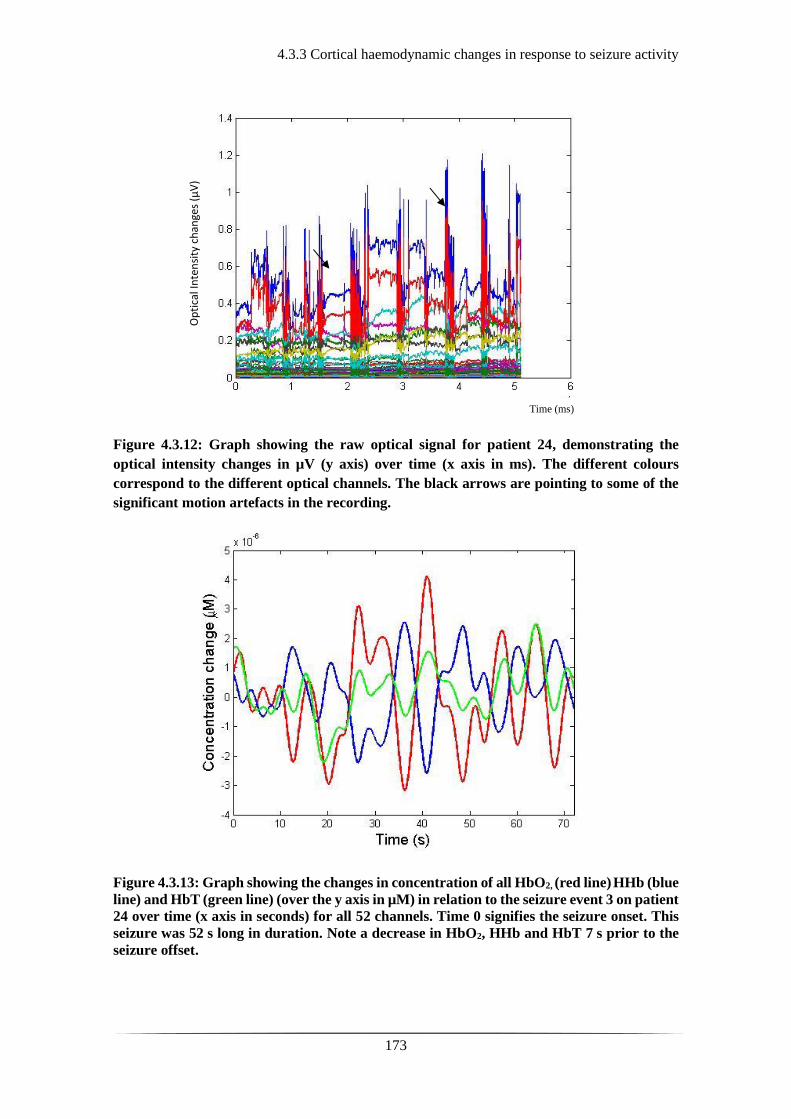
4.3.3 Cortical haemodynamic changes in response to seizure activity
173
Figure 4.3.12: Graph showing the raw optical signal for patient 24, demonstrating the
optical intensity changes in µV (y axis) over time (x axis in ms). The different colours
correspond to the different optical channels. The black arrows are pointing to some of the
significant motion artefacts in the recording.
Figure 4.3.13: Graph showing the changes in concentration of all HbO2, (red line) HHb (blue
line) and HbT (green line) (over the y axis in µM) in relation to the seizure event 3 on patient
24 over time (x axis in seconds) for all 52 channels. Time 0 signifies the seizure onset. This
seizure was 52 s long in duration. Note a decrease in HbO2, HHb and HbT 7 s prior to the
seizure offset.
Time (ms)
Op
tica
l In
ten
sity
ch
ange
s (µ
V)

4.4 Discussion and Conclusions
174
4.4 Discussion and Conclusions
The results for this part of the study are not enough to draw any significant conclusions
regarding the cortico-vascular changes in association to seizure activity. Although for
some of the seizures there was a subsequent increase in the concentration of HbO2 and
HbT, followed by a decrease, this was not consistent across the patients or amongst the
different seizures of the same patient. There were multiple barriers and challenges during
the study which may explain why the results were not as expected or comparable to the
original case study (365).
Most of the patients recruited in the study were transferred to the recruiting unit
rather than being inborn. This meant that most patients already had some definite or
suspected seizure activity with subsequent treatment prior to their admission to the unit
and recruitment to the study. Additionally, patients transported in, often may not have
travelled with the mother or guardian with parental rights, thus delaying the consenting
process. In that respect, most patients were recruited and studied beyond the acute phase
of their seizure activity. Most frequently, when the patients were recruited to the study,
they had already received one or multiple anticonvulsant agents leading to seizure control.
The EEG trace would appear as either burst suppressed, discontinuous, or normalising,
depending on the severity of the initial insult and overall clinical condition.
In study populations of HIE patients receiving TH a wide range of electrographic
seizure onset has been demonstrated. Wusthoff et al., studied 26 infants receiving TH and
showed electrographic seizure onset of 35 hours with more than half of the patients
exhibiting seizure activity in less than 24 hours (383). Glass et al., in a larger cohort across
three centres (n=90) reported a median age of seizure onset at 18 hours with the latest at
62 hours (207). This makes it hard to know exactly when to study the patients in the
absence of continuous multi-channel EEG monitoring. The overall aim was to study the
patients in the acute phase, first 48 to 72 hours. However, the intermittent periods of 1-4
hours of data acquisition rather than continuous (as per granted ethics permission at the
time) limited the detection rate of seizure activity. Furthermore, most of the HIE patients
were receiving TH at the time of data acquisition, which has been reported to contribute
to decreasing seizure burden and altering seizure characteristics (208, 236, 384).
Nevertheless, the patients with seizures during data acquisition, were amongst the
most critically ill infants recruited in this study and approaching the parents was time-
4.4 Discussion and Conclusions
175
critical. It was also challenging as there were situations, where redirection of care was
being considered. The consenting process needed to not interfere with the delivery of the
best clinical care and not pose any added burden to the parents. Regardless of the difficult
circumstances, most families were often happy that their infant’s condition could
contribute to research and potentially help future patients.
On reviewing the optical signal, it becomes apparent to the naked eye as to
whether there are any obvious changes in cortical Hb concentrations in response to seizure
activity. One may also establish by visual inspection whether these changes appear
physiological or artefact related. In the instance of co-existent electrical events on the
EEG trace, multiple artefact correction processes of the optical signal may distort the
presumed neurovascular coupling response. While methods for artefact correction exist
(374), their application was not appropriate for this study. As the interest lies in the
changes of the trace from the baseline any artefact interference leads to multiple
assumptions about the change in trace on removing the artefact. This is a limitation of the
system in collecting meaningful data during a seizure, especially if a patient is exhibiting
physical manifestations during this, as such was the case in patient 24.
It is quite evident from section 4.3 that there were significant issues regarding
artefact in the raw optical signal of all patients (see figures 4.3.3, 4.3.4, 4.3.8, 4.3.10-12).
In patient 15, there was an ongoing oscillatory type of activity superimposed on the signal
throughout the recording (see figures 4.3.3 and 4.3.4). This could be electrical
interference from the equipment around the patient, such as the ventilator. For patient 18
and 20, apart from occasional motion related artefact there was a slow periodic rise and
subsequent fall in the baseline of the optical signal throughout the recording (see figures
4.3.8, 4.3.10, and 4.3.11). This periodic feature appeared to have no temporal correlation
with the seizure events, as it was present at different points during each of the identified
seizures in these infants. Because this feature had a large amplitude, it was impossible to
separate any haemodynamic features related to the seizures themselves.
On reviewing the traces and considering other contributing factors to these
periodic features, the most logical explanation was that the observed repetitive events
could be due to the periodic inflation and deflation of the cooling mattress. The cooling
mattress was wrapped around the patients whilst receiving therapeutic hypothermia
during data acquisition. The mattress used on the unit inflates approximately every 13

4.4 Discussion and Conclusions
176
minutes and the actual inflation lasts up to 10 minutes. During the study, the cooling part
of the mattress around the head was removed and the cap was applied while the rest of
the trunk, upper limbs and lower limbs remained wrapped within the mattress. It is
possible that the inflation of the mattress caused an elevation of the body compared to the
head, which created a head-tilt or slow-motion artefact effect that was apparent in the
DOT trace (see figures 4.3.8, 4.3.10, and 4.3.11).
An interesting observation was that out of 15 patients that were being cooled
during data acquisition, this periodic feature was noted in only 4. One possible
explanation for this phenomenon is that the inflation of the mattress constricts the limbs,
causing an increase in arterial blood pressure. This would not matter in a healthy infant
but in a critically ill infant with altered or absent cerebral autoregulation it may have an
immediate effect on cerebral haemodynamics; increasing the cerebral arterial blood
pressure; increasing the concentrations of HbO2 and HbT in the cortical vasculature;
observed as an elevation of the baseline in the raw optical trace (see figures 4.3.8, 4.3.10,
and 4.3.11). To prove this, however, continuous measurement of the arterial blood
pressure and an accelerometer applied on the head gear (used for scanning the patients)
are required.
In retrospect, the absence of continuous recording of the patients’ physiological
parameters (i.e. heart rate, respiratory rate, mean blood pressure) limits further analysis
of electro-cortical phenomena. As mentioned before, there was continuous observation
of the patients during recording and any change or abnormal activity was noted and
documented, however, subtle trends or changes may well have been missed. For
continuous blood pressure measurement, invasive monitoring (via umbilical arterial or
peripheral arterial catheter in situ) is required. This requirement would limit the
recruitment criteria further and hence it was not pursued.
In view of the excess in noise in the optical signals obtained in patient 15, a lower
lpf was also applied to extract the HRF (see Fig. 4.3.6). The standard approach was to
apply no hpf and to set the lpf at 1.0 Hz. This allowed the exclusion of heart rate (usually
2-3 Hz), and respiratory rate (0.5-1.0 Hz). It also allowed the study of physiological
frequencies associated with resting state (355, 356), smooth muscle cell activity and
cerebral autoregulation (385-387) potentially affected by seizure activity. At a lower lpf
of 0.5 Hz, a naturally smoother HRF was obtained (see Fig. 4.3.6), but that did not alter
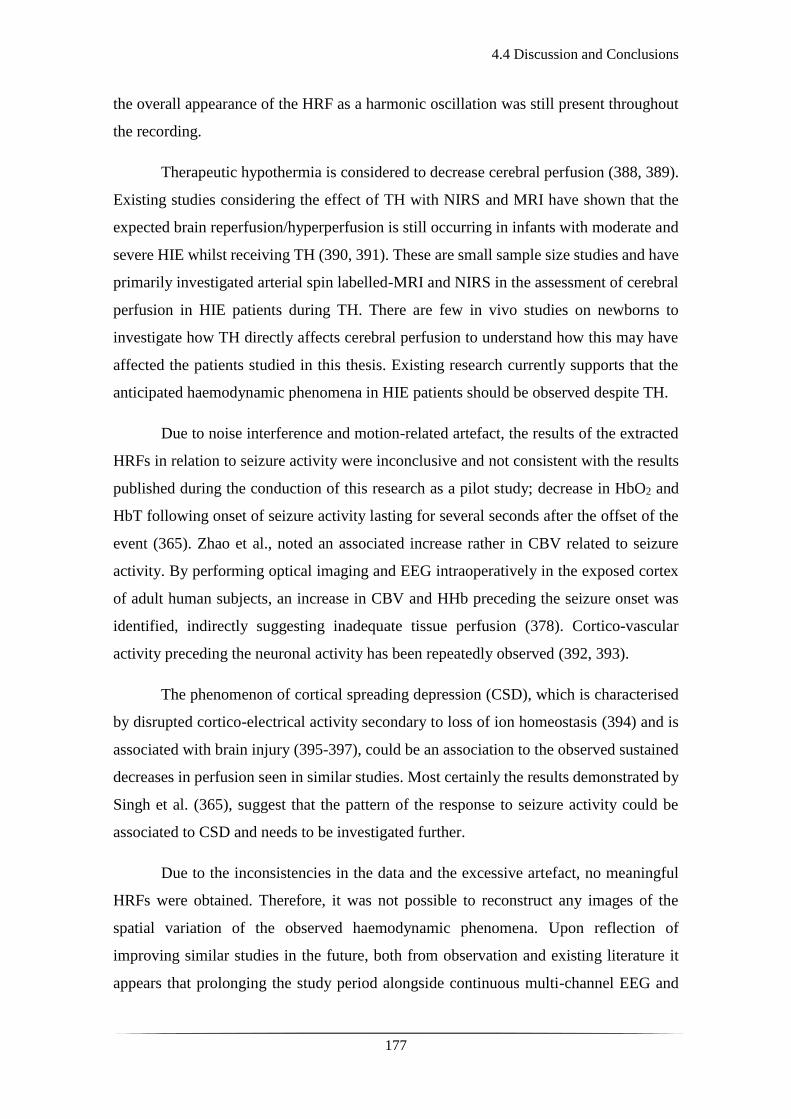
4.4 Discussion and Conclusions
177
the overall appearance of the HRF as a harmonic oscillation was still present throughout
the recording.
Therapeutic hypothermia is considered to decrease cerebral perfusion (388, 389).
Existing studies considering the effect of TH with NIRS and MRI have shown that the
expected brain reperfusion/hyperperfusion is still occurring in infants with moderate and
severe HIE whilst receiving TH (390, 391). These are small sample size studies and have
primarily investigated arterial spin labelled-MRI and NIRS in the assessment of cerebral
perfusion in HIE patients during TH. There are few in vivo studies on newborns to
investigate how TH directly affects cerebral perfusion to understand how this may have
affected the patients studied in this thesis. Existing research currently supports that the
anticipated haemodynamic phenomena in HIE patients should be observed despite TH.
Due to noise interference and motion-related artefact, the results of the extracted
HRFs in relation to seizure activity were inconclusive and not consistent with the results
published during the conduction of this research as a pilot study; decrease in HbO2 and
HbT following onset of seizure activity lasting for several seconds after the offset of the
event (365). Zhao et al., noted an associated increase rather in CBV related to seizure
activity. By performing optical imaging and EEG intraoperatively in the exposed cortex
of adult human subjects, an increase in CBV and HHb preceding the seizure onset was
identified, indirectly suggesting inadequate tissue perfusion (378). Cortico-vascular
activity preceding the neuronal activity has been repeatedly observed (392, 393).
The phenomenon of cortical spreading depression (CSD), which is characterised
by disrupted cortico-electrical activity secondary to loss of ion homeostasis (394) and is
associated with brain injury (395-397), could be an association to the observed sustained
decreases in perfusion seen in similar studies. Most certainly the results demonstrated by
Singh et al. (365), suggest that the pattern of the response to seizure activity could be
associated to CSD and needs to be investigated further.
Due to the inconsistencies in the data and the excessive artefact, no meaningful
HRFs were obtained. Therefore, it was not possible to reconstruct any images of the
spatial variation of the observed haemodynamic phenomena. Upon reflection of
improving similar studies in the future, both from observation and existing literature it
appears that prolonging the study period alongside continuous multi-channel EEG and

4.4 Discussion and Conclusions
178
aiming for early DOT monitoring in the first 48 hours maximises the chances of capturing
seizures. NIRS-based studies have demonstrated that neurovascular coupling in different
conditions is not altered under the effect of different anaesthetic drugs, amongst which
phenobarbitone was also tested (398). The effect of TH on seizure activity should be
encountered more carefully in the sense that the seizure burden may be lower or the
electrographic semiology of the seizures different than the expected; subtle; of slower
frequency; of short duration. The direct effect of TH on cerebral perfusion as assessed by
NIRS methodologies is yet to be defined and should be considered in the analysis of
neurovascular coupling in patients with seizures whilst receiving TH. Finally, further
work is required to refine the technique of data acquisition. In that respect, collection of
continuous physiological parameters, such as invasive arterial mean blood pressure,
saturations, heart rate may aid the interpretation of the data in relation to cortical blood
volume changes. Furthermore, a possible way to improve motion artefact correction in
the future would be to adjust an accelerometer on the recording cap. Thus, by capturing
the movements of the head, motion related artefact can safely be rejected from the optical
signal.
179
Chapter 5: Neurovascular Coupling of Burst
Suppression

180
5.1 Functional imaging of burst suppression
181
5.1 Functional imaging of burst suppression
The actual interaction between abnormal electrical activity and the cortico-vascular
circulation is under-investigated and poorly understood. There is a paucity of studies
investigating cortical haemodynamics in critically ill adults, let alone infants with
pathological EEG tracings. There are some animal studies which combine EEG and
functional neuro-imaging techniques, such as BOLD fMRI. These studies have presented
results on neurovascular coupling in burst suppression and types of epilepsy under the
effect of certain anaesthetic drugs (399-401).
Other animal studies using functional neuroimaging techniques in the form of
BOLD fMRI have shown the existence of spontaneous fluctuations in the BOLD signal
even during BS, in the deepest forms of anaesthesia, suggesting that these may be a
reflection of an inner functional brain organisation (402). One of the first studies to use
EEG and fMRI on a porcine model to investigate changes in functional brain activity at
different levels of thiopental-induced anaesthesia, showed that the intensity of the signal
changes was more prominent in the thalamic as opposed to the cortical regions of interest
(399). In 2011, Liu et al., used simultaneous epidural EEG and double channel laser
Doppler to measure cerebral blood flow (CBF) at different depths of isoflurane-induced
anaesthesia on the rat model. Under the same conditions of neuronal status, they
performed BOLD fMRI independently. They showed strong neurovascular coupling
between the EEG bursts of the BS trace and CBF ‘bumps’ in the Doppler trace, which
varied per level of anaesthesia. These were similarly identified as BOLD ‘bumps’ during
the fMRI, which were also dependent on the degree of anaesthesia (401). In 2014, Sutin
et al., used simultaneous NIRS and EEG to investigate the haemodynamic responses
associated with isoflurane-induced BS in the rat model, similarly showing the existence
of neurovascular coupling between burst activity and the oxy- and deoxy-haemoglobin
fluctuations (403). These studies are the closest to identifying neurovascular coupling in
BS but still refer to animal models. Prior to this investigation there were no in-vivo
functional neuroimaging studies of burst suppression in humans.
Multi-modality neuroimaging approaches (such as DOT-EEG) have the potential
to elucidate the fundamental physiological, neurovascular, and neuro-energetic
characteristics of the BS and discontinuous EEG state. One added advantage is that they
allow the investigation of the spatial characteristics of these states. We conducted this

5.1 Functional imaging of burst suppression
182
part of the study with the principle aim to investigate the haemodynamic events associated
with the BS and discontinuous EEG in critically ill infants with HIE, using DOT and
video-EEG.
The working hypothesis was that there are cortical haemodynamic changes in
response to EEG bursts and therefore to the neuronal activity.

5.2.1 Patients and Data Acquisition
183
5.2 Patients and Methods
5.2.1 Patients and Data Acquisition
Infants selected for the burst-suppression investigation phase of this work presented with
seizures and/or a clinical diagnosis of HIE. They were recruited as mentioned in section
3.1.1 and were scanned during or after having received therapeutic hypothermia. They
were selected in this part of the analysis as they presented with either BS or a
pathologically discontinuous EEG trace during the recording period which ranged from
approximately 60 to 120 minutes. No adverse events were recorded during the study and
the scans were well tolerated throughout without interfering with the clinical input or
management required.
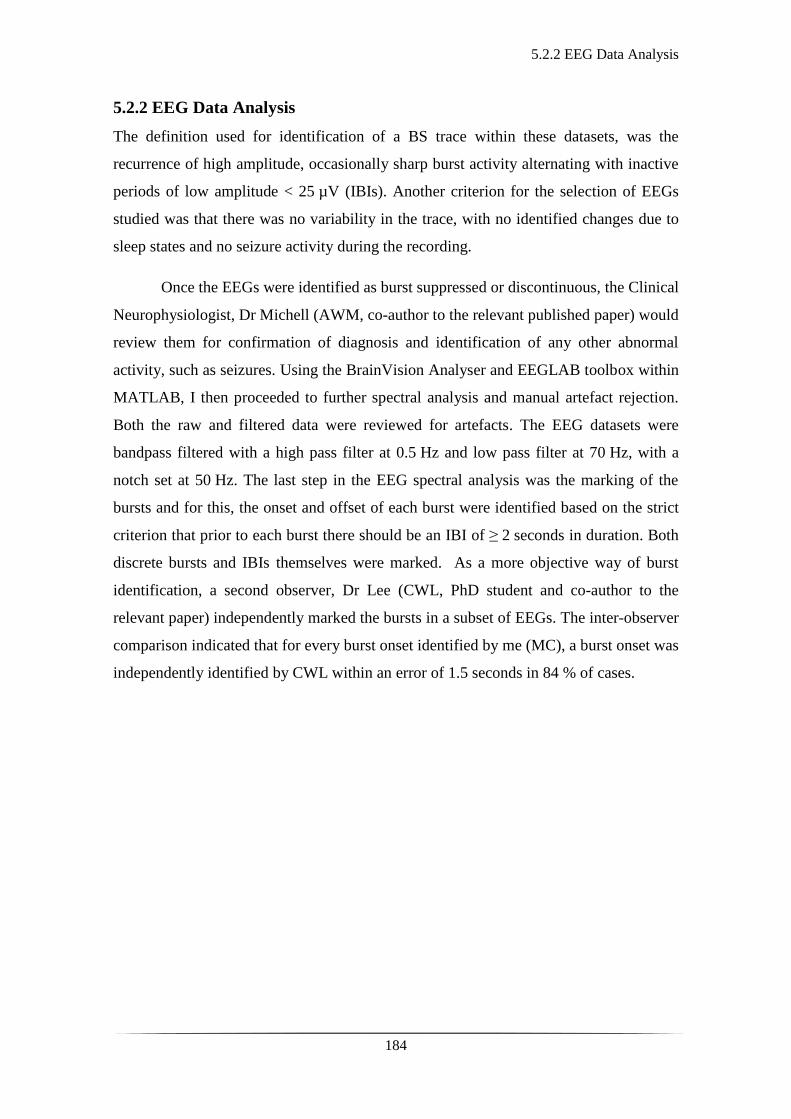
5.2.2 EEG Data Analysis
184
5.2.2 EEG Data Analysis
The definition used for identification of a BS trace within these datasets, was the
recurrence of high amplitude, occasionally sharp burst activity alternating with inactive
periods of low amplitude < 25 µV (IBIs). Another criterion for the selection of EEGs
studied was that there was no variability in the trace, with no identified changes due to
sleep states and no seizure activity during the recording.
Once the EEGs were identified as burst suppressed or discontinuous, the Clinical
Neurophysiologist, Dr Michell (AWM, co-author to the relevant published paper) would
review them for confirmation of diagnosis and identification of any other abnormal
activity, such as seizures. Using the BrainVision Analyser and EEGLAB toolbox within
MATLAB, I then proceeded to further spectral analysis and manual artefact rejection.
Both the raw and filtered data were reviewed for artefacts. The EEG datasets were
bandpass filtered with a high pass filter at 0.5 Hz and low pass filter at 70 Hz, with a
notch set at 50 Hz. The last step in the EEG spectral analysis was the marking of the
bursts and for this, the onset and offset of each burst were identified based on the strict
criterion that prior to each burst there should be an IBI of ≥ 2 seconds in duration. Both
discrete bursts and IBIs themselves were marked. As a more objective way of burst
identification, a second observer, Dr Lee (CWL, PhD student and co-author to the
relevant paper) independently marked the bursts in a subset of EEGs. The inter-observer
comparison indicated that for every burst onset identified by me (MC), a burst onset was
independently identified by CWL within an error of 1.5 seconds in 84 % of cases.

5.2.3 DOT Data Analysis
185
5.2.3 DOT Data Analysis
Using the MATLAB toolbox, the EEG and DOT datasets were synchronised, and the
burst onset and offset markers were transformed to the DOT time-base. Using functions
form the Homer2 NIRS processing toolbox (www.homer-fnirs.org), the DOT data were
first pre-processed using the standard pipeline described in detail in section 3.2.3. Further
project-specific processing consisted of the raw intensity data being converted to optical
density. Periods of motion artefact were identified using a combination of visual
inspection and Homer2 motion artefact detection approaches (374) prior to band-pass
filtering in the range 0.01 to 1 Hz.
To extract the haemodynamic response to the EEG bursts in each dataset, the
bursts were first sub-divided based on their duration into 2-second wide bins over the
range from 0 to 30 s. Bins containing less than 5 bursts were excluded. The burst onset
markers associated with each bin were then treated as separate conditions in an event-
related general linear model of the DOT data (such that the model contained a 0-2 s burst
condition, a 2-4 s burst condition etc.). The general linear model is a generalization of
multiple linear regression model in the instance of more than one dependent variable. The
general linear model was constructed using a series of Gaussian basis functions (with a
standard deviation of 2 s and separated by 1s), to model the haemodynamic response
function (HRF) associated with each burst duration. In this instance, the different
variables are the scale of each basis function used to model the HRF to burst of different
durations. The time range of the modelled HRF was set to -10 to 40 s relative to the burst
onset markers. This approach resulted in an HRF for each accepted DOT channel, burst
duration bin and infant.
To provide an objective representation of the morphology of the spatially-varying
haemodynamic response to bursts in each infant (instead of arbitrarily selecting a channel
to display or taking an average), the principal component analysis (PCA) method was
used. This type of analysis entails finding the linear relationship of a set of variables that
has maximum variance, removing its effect, and repeating this successively. PCA was
performed across the accepted channels in each dataset. An HRF was then produced for
each infant and each burst duration by combining the components required to account for
80 % of the signal variance.
5.2.3 DOT Data Analysis
186
To ensure that any extracted HRF was not an artefact of the data processing
procedure, and was directly temporally correlated with the EEG bursts, additional HRFs
were computed using 10 randomly generated dummy onset vectors in place of the burst
onset markers for each dataset. These dummy vectors contained the same number of
‘events’ as the largest number of bursts in any one bin for each infant. A one-tailed,
Bonferroni-corrected t-test was then performed to identify channels in which the
haemodynamic response to EEG bursts is statistically distinguishable from a vector
produced by concatenating the 10 dummy HRFs.
The algorithms for the synchronization of the DOI-EEG datasets and the HRF
extraction were developed by my co-supervisor and physicist, Dr Cooper (RJC). The
image and video reconstruction of the HRFs were accomplished based on the
methodology described in section 3.2.5.
5.3.1 Clinical Details
187
5.3 Results
5.3.1 Clinical Details
Between March 2013 and September 2015, 9 infants presented with either BS or a
discontinuous EEG trace as defined in section 5.3.2 (patients 2, 4, 7, 10, 12, 14, 18, 19,
21). Three infants were excluded due to excessive noise or artefact within the DOT
datasets (>15 DOT channels were rejected in each dataset), leaving a total of 6 datasets
suitable for analysis. Further clinical information regarding the 6 infants included is
provided in Table 5.1. The median gestational age at birth was 38+6 weeks (range from
34+5 to 40+1 weeks). The median age of the infants at the time of the study was 3.5 days
(with a range from birth to 7 days of life). The length of the DOT-EEG recording ranged
from 47 to 115 minutes with a median period of 59 minutes.
All infants presented with seizures in the first 48 hours of life and received either
one or three types of anticonvulsant treatment prior to (or in one case during), the study
(see Table 5.1). All infants were receiving respiratory support during the study in the form
of conventional mechanical ventilation, apart from patient 7, who was receiving high
frequency oscillatory ventilation and patient 2 who was breathing spontaneously in air.
All infants had stable levels of carbon dioxide partial tension (PCO2) within the normal
range (4.7-6.0 kPa) 34 throughout the study. Two of the infants were receiving inotropic
support during the study to maintain a stable systemic arterial blood pressure (patients 7
and 21). Each infant underwent a structural MRI between 7 to 10 days of life as per the
standard clinical care protocol and all received a final diagnosis of HIE grade III, apart
from patient 2 who received a final diagnosis of HIE grade I (please refer to section 1.1.2
for further details on HIE grading). The MRIs were provisionally reported locally and
were further interpreted by Professor Mary Rutherford as an external expert on neonatal
MRI, as part of the standard clinical care (see Table 5.1). All 6 infants survived and were
either discharged back to the referring hospital or to home.
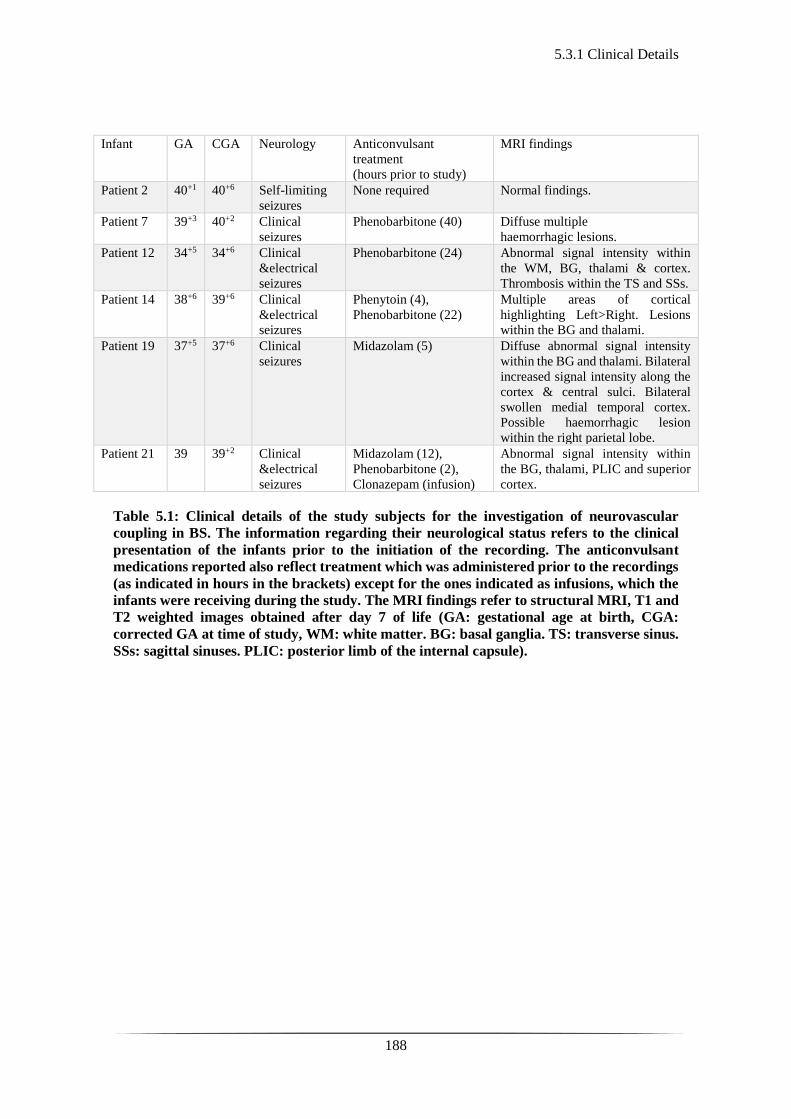
5.3.1 Clinical Details
188
Infant GA
CGA
Neurology Anticonvulsant
treatment
(hours prior to study)
MRI findings
Patient 2 40+1 40+6 Self-limiting
seizures
None required Normal findings.
Patient 7 39+3 40+2 Clinical
seizures
Phenobarbitone (40) Diffuse multiple
haemorrhagic lesions.
Patient 12 34+5 34+6 Clinical
&electrical
seizures
Phenobarbitone (24) Abnormal signal intensity within
the WM, BG, thalami & cortex.
Thrombosis within the TS and SSs.
Patient 14 38+6 39+6 Clinical
&electrical
seizures
Phenytoin (4),
Phenobarbitone (22)
Multiple areas of cortical
highlighting Left>Right. Lesions
within the BG and thalami.
Patient 19 37+5 37+6 Clinical
seizures
Midazolam (5) Diffuse abnormal signal intensity
within the BG and thalami. Bilateral
increased signal intensity along the
cortex & central sulci. Bilateral
swollen medial temporal cortex.
Possible haemorrhagic lesion
within the right parietal lobe.
Patient 21 39 39+2 Clinical
&electrical
seizures
Midazolam (12),
Phenobarbitone (2),
Clonazepam (infusion)
Abnormal signal intensity within
the BG, thalami, PLIC and superior
cortex.
Table 5.1: Clinical details of the study subjects for the investigation of neurovascular
coupling in BS. The information regarding their neurological status refers to the clinical
presentation of the infants prior to the initiation of the recording. The anticonvulsant
medications reported also reflect treatment which was administered prior to the recordings
(as indicated in hours in the brackets) except for the ones indicated as infusions, which the
infants were receiving during the study. The MRI findings refer to structural MRI, T1 and
T2 weighted images obtained after day 7 of life (GA: gestational age at birth, CGA:
corrected GA at time of study, WM: white matter. BG: basal ganglia. TS: transverse sinus.
SSs: sagittal sinuses. PLIC: posterior limb of the internal capsule).
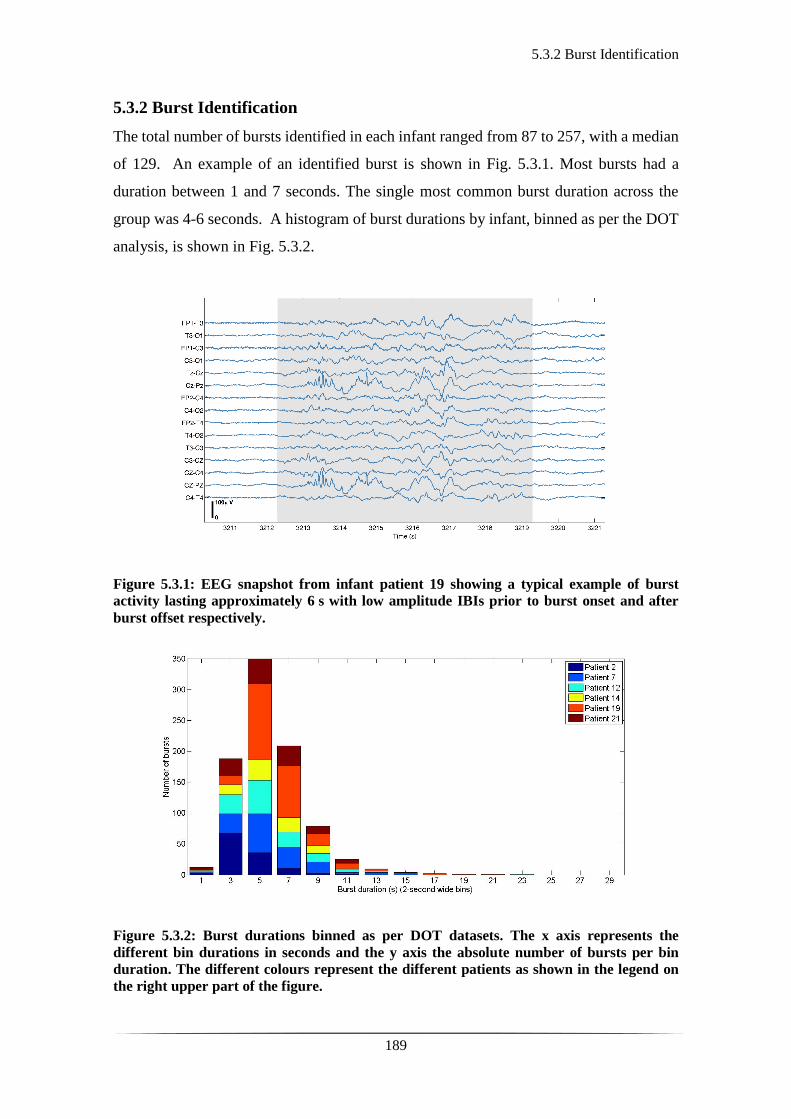
5.3.2 Burst Identification
189
5.3.2 Burst Identification
The total number of bursts identified in each infant ranged from 87 to 257, with a median
of 129. An example of an identified burst is shown in Fig. 5.3.1. Most bursts had a
duration between 1 and 7 seconds. The single most common burst duration across the
group was 4-6 seconds. A histogram of burst durations by infant, binned as per the DOT
analysis, is shown in Fig. 5.3.2.
Figure 5.3.1: EEG snapshot from infant patient 19 showing a typical example of burst
activity lasting approximately 6 s with low amplitude IBIs prior to burst onset and after
burst offset respectively.
Figure 5.3.2: Burst durations binned as per DOT datasets. The x axis represents the
different bin durations in seconds and the y axis the absolute number of bursts per bin
duration. The different colours represent the different patients as shown in the legend on
the right upper part of the figure.
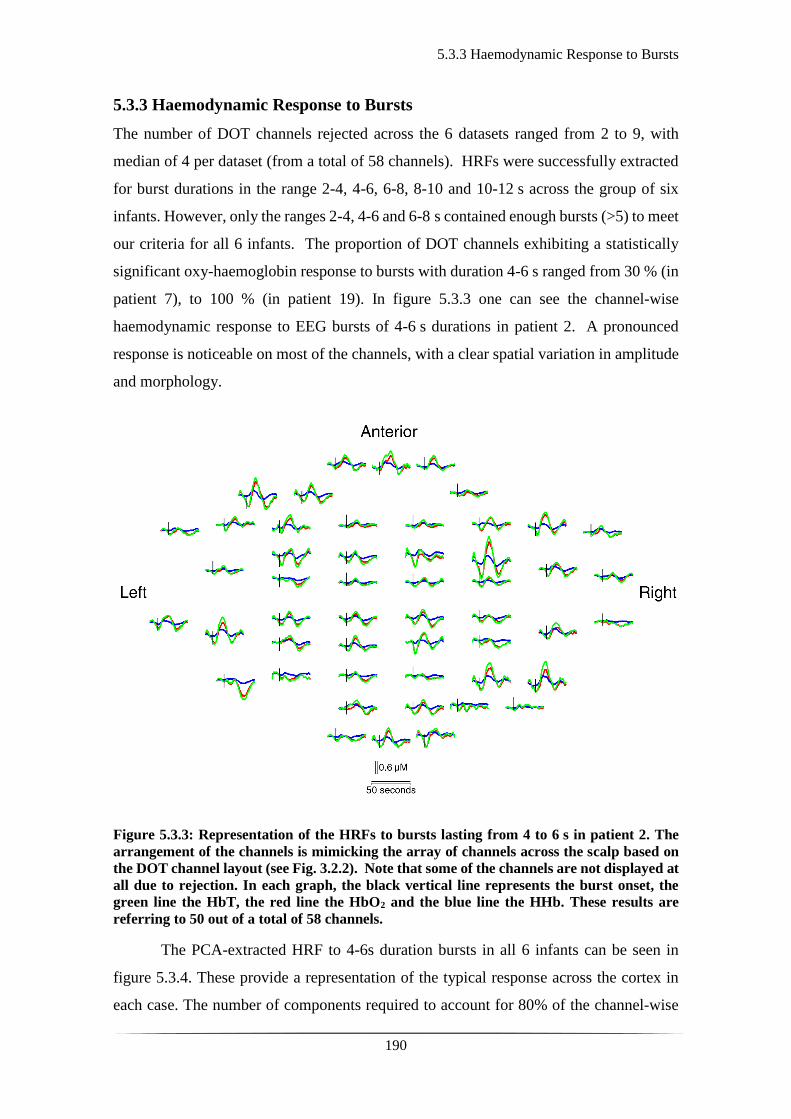
5.3.3 Haemodynamic Response to Bursts
190
5.3.3 Haemodynamic Response to Bursts
The number of DOT channels rejected across the 6 datasets ranged from 2 to 9, with
median of 4 per dataset (from a total of 58 channels). HRFs were successfully extracted
for burst durations in the range 2-4, 4-6, 6-8, 8-10 and 10-12 s across the group of six
infants. However, only the ranges 2-4, 4-6 and 6-8 s contained enough bursts (>5) to meet
our criteria for all 6 infants. The proportion of DOT channels exhibiting a statistically
significant oxy-haemoglobin response to bursts with duration 4-6 s ranged from 30 % (in
patient 7), to 100 % (in patient 19). In figure 5.3.3 one can see the channel-wise
haemodynamic response to EEG bursts of 4-6 s durations in patient 2. A pronounced
response is noticeable on most of the channels, with a clear spatial variation in amplitude
and morphology.
Figure 5.3.3: Representation of the HRFs to bursts lasting from 4 to 6 s in patient 2. The
arrangement of the channels is mimicking the array of channels across the scalp based on
the DOT channel layout (see Fig. 3.2.2). Note that some of the channels are not displayed at
all due to rejection. In each graph, the black vertical line represents the burst onset, the
green line the HbT, the red line the HbO2 and the blue line the HHb. These results are
referring to 50 out of a total of 58 channels.
The PCA-extracted HRF to 4-6s duration bursts in all 6 infants can be seen in
figure 5.3.4. These provide a representation of the typical response across the cortex in
each case. The number of components required to account for 80% of the channel-wise
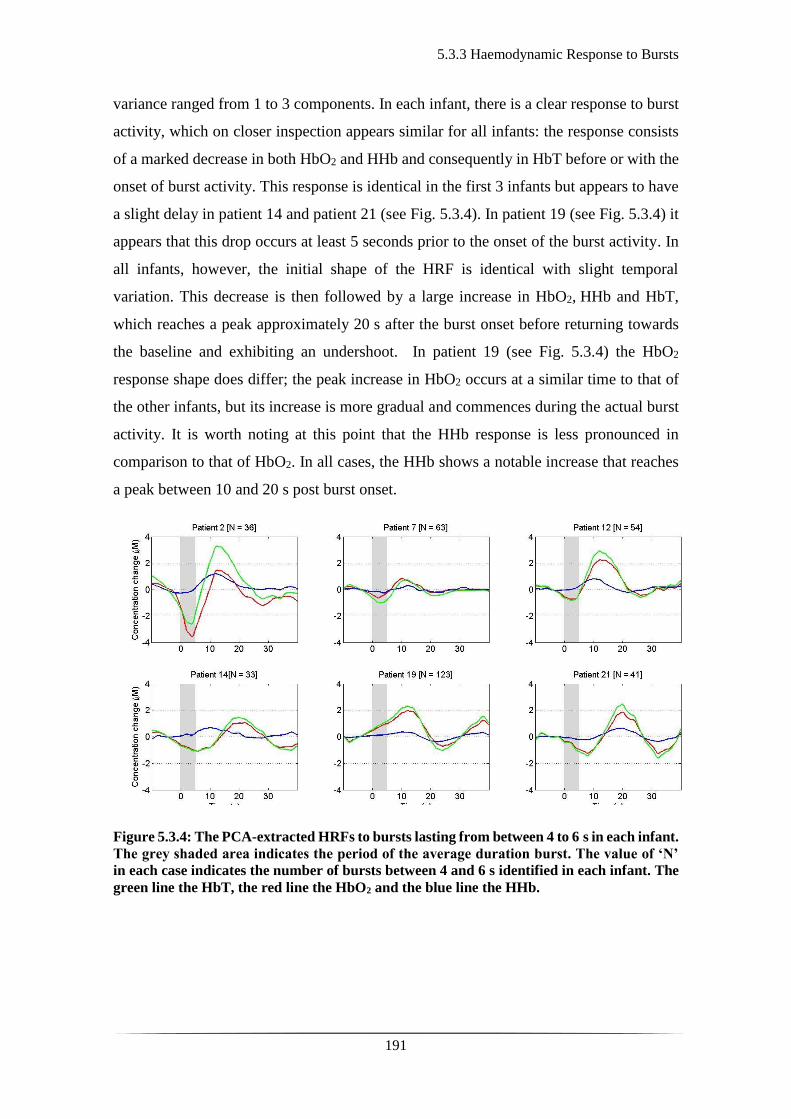
5.3.3 Haemodynamic Response to Bursts
191
variance ranged from 1 to 3 components. In each infant, there is a clear response to burst
activity, which on closer inspection appears similar for all infants: the response consists
of a marked decrease in both HbO2 and HHb and consequently in HbT before or with the
onset of burst activity. This response is identical in the first 3 infants but appears to have
a slight delay in patient 14 and patient 21 (see Fig. 5.3.4). In patient 19 (see Fig. 5.3.4) it
appears that this drop occurs at least 5 seconds prior to the onset of the burst activity. In
all infants, however, the initial shape of the HRF is identical with slight temporal
variation. This decrease is then followed by a large increase in HbO2, HHb and HbT,
which reaches a peak approximately 20 s after the burst onset before returning towards
the baseline and exhibiting an undershoot. In patient 19 (see Fig. 5.3.4) the HbO2
response shape does differ; the peak increase in HbO2 occurs at a similar time to that of
the other infants, but its increase is more gradual and commences during the actual burst
activity. It is worth noting at this point that the HHb response is less pronounced in
comparison to that of HbO2. In all cases, the HHb shows a notable increase that reaches
a peak between 10 and 20 s post burst onset.
Figure 5.3.4: The PCA-extracted HRFs to bursts lasting from between 4 to 6 s in each infant.
The grey shaded area indicates the period of the average duration burst. The value of ‘N’
in each case indicates the number of bursts between 4 and 6 s identified in each infant. The
green line the HbT, the red line the HbO2 and the blue line the HHb.

5.3.4 Imaging of the Haemodynamic Response to Bursts
192
5.3.4 Imaging of the Haemodynamic Response to Bursts
The reconstructed HRFs can be visualised on an image basis across the scalp (see Figures
5.3.5-8). These were reconstructed based on a neonatal head atlas for the correct gestation
per infant (404). Figure 5.3.5 shows three views of the reconstructed cortical image of
changes in HbT for patient 12 at the minimum of its initial decrease (as defined from the
PCA-extracted representative response, see Fig. 5.3.4). This moment in time coincides
with the minimum decrease in both HbO2 and HHb. A small decrease in HbT is apparent
across the cortex, but the changes appear more pronounced in the bilateral temporal and
temporal-parietal regions. Figure 5.3.6 shows data from the same infant at the peak of
the increase in HbT, which occurs at approximately 12 s post burst onset. This moment
in time coincides with the maximum increase in both HbO2 and HHb. The frontal lobes,
right temporal and left parietal regions exhibit the largest increases in HbT, while the
occipital cortex displays a slight decrease. The combination of regions that show a
pronounced increase in HbT during the peak phase (see Fig. 5.3.6) are not completely
consistent with those exhibiting the largest decreases in HbT during the initial dip phase
of the HRF (see Fig. 5.3.5).
Similarly, figure 5.3.7 shows the reconstructed cortical image of HbT at the peak
of the post-burst increase in patient 19, which is also the point of maximum increase in
both HbO2 and HHb. The increase is broadly global, with the largest increases occurring
in both temporal lobes, and an apparent lack of response over the right parietal lobe. The
structural MRI of the same patient (see Fig. 5.3.9) revealed swelling of the bilateral
medial temporal cortices and a possible haemorrhagic lesion over the right parietal lobe.
The last figure 5.3.8, depicts the HbT image associated with the undershoot phase in
patient 19, which shows the largest decreases occurring in the bilateral frontal cortices
and reflects the minimum decrease in both HbO2 and HHb.
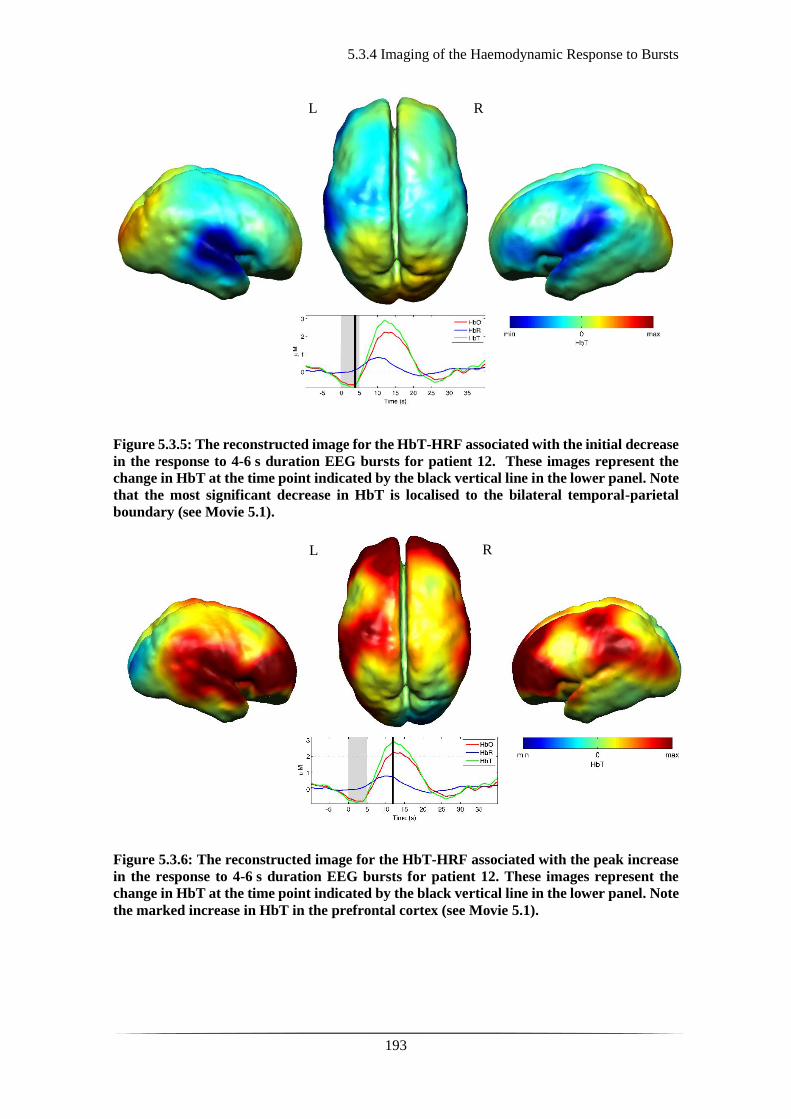
5.3.4 Imaging of the Haemodynamic Response to Bursts
193
Figure 5.3.5: The reconstructed image for the HbT-HRF associated with the initial decrease
in the response to 4-6 s duration EEG bursts for patient 12. These images represent the
change in HbT at the time point indicated by the black vertical line in the lower panel. Note
that the most significant decrease in HbT is localised to the bilateral temporal-parietal
boundary (see Movie 5.1).
Figure 5.3.6: The reconstructed image for the HbT-HRF associated with the peak increase
in the response to 4-6 s duration EEG bursts for patient 12. These images represent the
change in HbT at the time point indicated by the black vertical line in the lower panel. Note
the marked increase in HbT in the prefrontal cortex (see Movie 5.1).
L R
R L
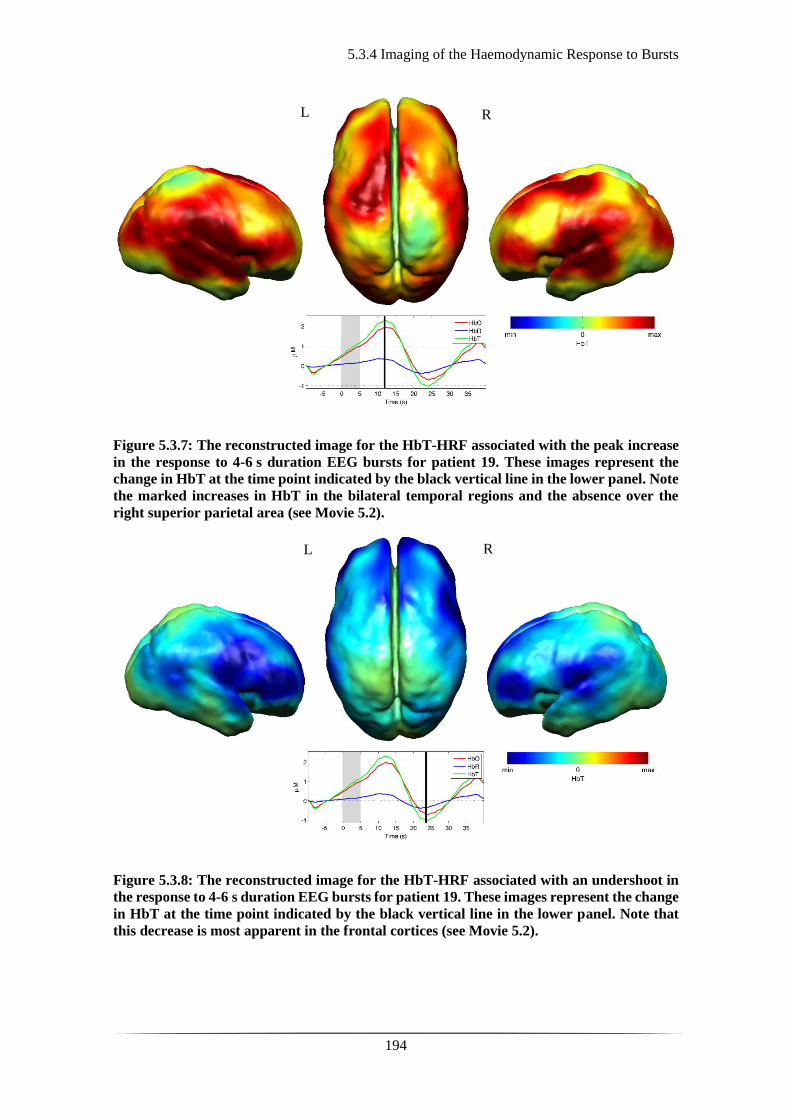
5.3.4 Imaging of the Haemodynamic Response to Bursts
194
Figure 5.3.7: The reconstructed image for the HbT-HRF associated with the peak increase
in the response to 4-6 s duration EEG bursts for patient 19. These images represent the
change in HbT at the time point indicated by the black vertical line in the lower panel. Note
the marked increases in HbT in the bilateral temporal regions and the absence over the
right superior parietal area (see Movie 5.2).
Figure 5.3.8: The reconstructed image for the HbT-HRF associated with an undershoot in
the response to 4-6 s duration EEG bursts for patient 19. These images represent the change
in HbT at the time point indicated by the black vertical line in the lower panel. Note that
this decrease is most apparent in the frontal cortices (see Movie 5.2).
L R
L R
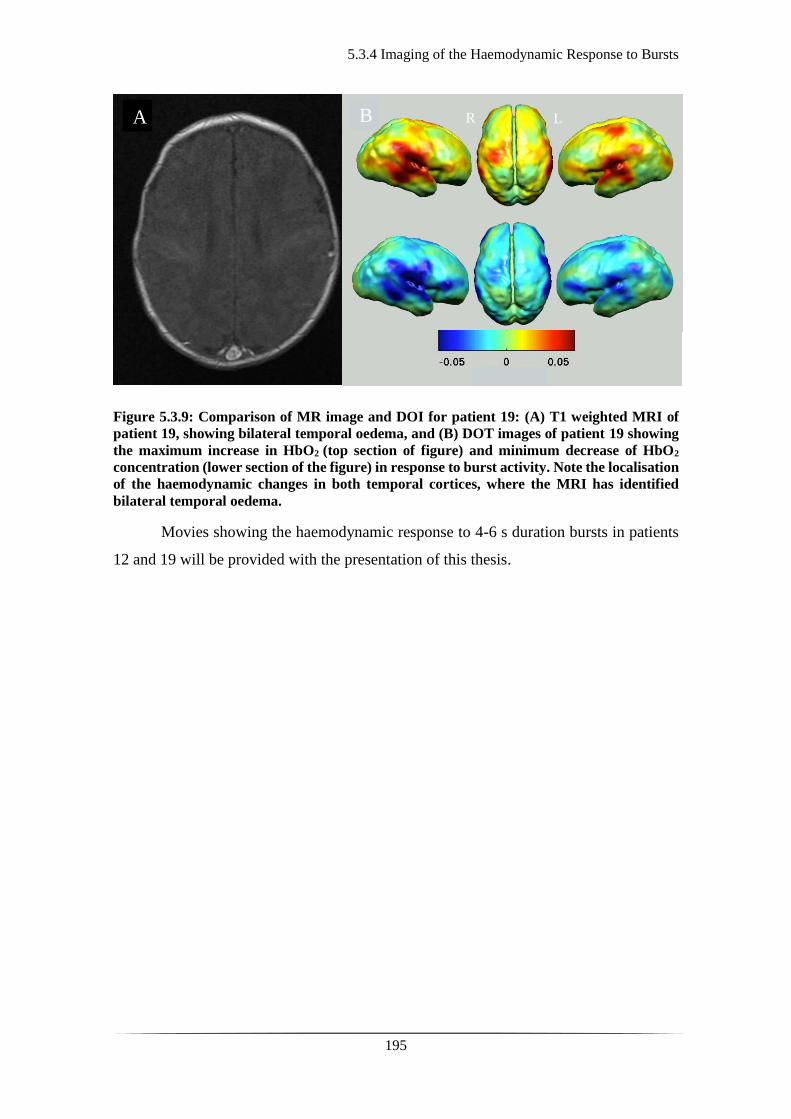
5.3.4 Imaging of the Haemodynamic Response to Bursts
195
Figure 5.3.9: Comparison of MR image and DOI for patient 19: (A) T1 weighted MRI of
patient 19, showing bilateral temporal oedema, and (B) DOT images of patient 19 showing
the maximum increase in HbO2 (top section of figure) and minimum decrease of HbO2
concentration (lower section of the figure) in response to burst activity. Note the localisation
of the haemodynamic changes in both temporal cortices, where the MRI has identified
bilateral temporal oedema.
Movies showing the haemodynamic response to 4-6 s duration bursts in patients
12 and 19 will be provided with the presentation of this thesis.
A
B R L
5.4 Discussion and Conclusions
196
5.4 Discussion and Conclusions
Burst suppression has traditionally been considered as a uniform, global, brain state. It
appears that regardless of the causative mechanism of BS the EEG trace typically seems
consistent and synchronous across the scalp. This has led to the perception that BS reflects
a state of global brain inactivity and thus can be pharmacologically induced in cases of
head injury (405) or status epilepticus (406), as a therapeutic means of minimising or
depressing cortical activity. However, it is still unclear as to whether BS is truly a state
of global suppression of brain function.
There is supporting evidence form the literature that despite the apparent cortical
inactivity in BS, there can be increased activity in subcortical structures, which may
trigger and signal activity in the hyper-excitable cortex. This is a possible hypothesis of
the origin of the observed bursts in BS. This activity has been described as a novel
neurophysiological parameter, known as ‘Nu-complexes’ that originate from the
hippocampus at different depths of coma and therefore in BS (407). Researchers have
attempted to capture more spatial information by performing high density electro-
corticography as opposed to standard scalp EEG on propofol-induced comatose human
adults. They demonstrated that, unlike traditional perception, BS is not a global, unified
phenomenon; it can be localised to specific cortical areas, whilst other regions may
exhibit continuous activity and bursts may occur asynchronously across different brain
locations (263).
These findings have opened new horizons in the way we perceive cortical activity
and have introduced the potentially crucial role of the subcortical structures in the
observed neuronal activity. This gives rise to questions as to how the sub-cortex interacts
with the cortex and as to whether there is a similar interaction between subcortical
neuronal structures and the cortical vasculature, which may contribute to the observed
neurovascular coupling as shown in previous studies (363) and ours (365, 408). They
have also enhanced the importance of using neuroimaging techniques with increased
spatial specificity than scalp EEG to investigate BS and discontinuous EEG phenomena.
Simultaneous DOT-EEG approaches have the advantage of allowing the
investigation of both the temporal and spatial features of the haemodynamic correlate of
BS, which facilitates the investigation of the relationship between discontinuous EEG
states and cerebral function.

5.4 Discussion and Conclusions
197
In this part of the study a significant haemodynamic response to burst activity in
infants with HIE was shown. To date, this appears to be the first study to examine this
phenomenon in this patient group. The haemodynamic component of burst activity in
infants with HIE was best characterised by an initial decrease in HbO2, which reaches a
minimum during or soon after the burst, followed by a pronounced increase (see Fig.
5.3.4) peaking at 10 to 12 s after the burst onset. The changes in HHb are more variable,
but follow the trend of the HbO2 changes and it is quite clear that they are not consistent
with the typical, expected HRF shown in healthy adults (409). There is ongoing debate
regarding the nature of the healthy neonatal HRF. While several studies suggest the
neonatal (and even early pre-term) haemodynamic response is consistent with that
observed in the mature brain (328, 410), a recent study in the rat model suggests that the
haemodynamic response to an external stimulus varies significantly with postnatal age
(411). The latter showed that in the infant rat, the haemodynamic response consists of a
small increase in HbO2, followed by increase in deoxy-haemoglobin, while the response
in the adult rat was consistent with the expected adult human response; an increase in
HbO2 with a parallel decrease in HHb.
A possible interpretation of the observed HRF shape in our data, is that burst
activity induces a regional increase in perfusion and therefore blood volume. The oxygen
extraction is either abnormally low or the oxygen supply exceeds the regional metabolic
demands and hence, the increase in perfusion results in little change in oxygen saturation
with no occurring decrease in HHb. It may, nevertheless, be part of a physiological
process based on most recent literature and a normal variant of haemodynamic response
observed in infancy (411). Another possible explanation to the observed result is
considering the pathophysiological mechanisms of HIE in the following hours post injury,
and specifically the biochemical changes associated with reperfusion injury (412-414).
There are additional confounding factors which may affect the neurovascular
coupling and subsequently the observed HRF, such as therapeutic hypothermia,
anticonvulsant treatment, inotropic support. Anticonvulsant treatment is known to
depress the EEG background activity and its effects are dependent on the type of
medication, the dosage and the timing of administration, and the gestational age of the
infant (415). Standard phenobarbitone loading doses (10-20 mg/kg) only moderately
affect the EEG background activity in full term infants. However, evidence suggests that
5.4 Discussion and Conclusions
198
the more severe the hypoxic ischaemic insult, the more discontinuous and suppressed the
EEG may become post phenobarbitone administration (416). Midazolam is another
medication frequently used in cases of HIE, for its anticonvulsant effects and occasionally
for its sedative effects during mechanical ventilation. It appears that its administration has
limited if none effect on the EEG background appearance (416). The effect of
anticonvulsant treatment on the background electro-cortical activity is decreased over
time as the drugs are metabolised with a median time-to-recovery of 2.5 hours, ranging
from 2 to 15 hours (417). A recent study looking at the effect of anaesthetic drugs on
neurovascular coupling concluded that there is no actual variation across different agents
(398). A recent study on the influence of therapeutic hypothermia on cortico-vascular
activity in infants with HIE, using frequency domain NIRS and diffuse correlation
spectroscopy, showed that compared to the post-hypothermic phase, cerebral oxygen
metabolism and CBF were lower and CBV was higher during hypothermia (418).
While all six infants included in this study were diagnosed with HIE and were
receiving therapeutic hypothermia, the severity of their clinical situation varied. They had
also received a range of anticonvulsants at different times relative to the period of
recording (see Table 5.1). Despite these many confounding factors, the shape of the
principal haemodynamic response to burst events is remarkably consistent across our
cohort (see Fig. 5.3.4).
In 4 out of 6 infants, the peak increase in total haemoglobin occurs between 11
and 12.5 s after the onset of burst activity. A possible explanation for this could be their
common EEG state acts as a control for the many other experimental variables: i.e. the
haemodynamic correlate of BS may be consistent despite the various factors that have led
to that neurological state. However, as is apparent from figures 5.3.5-8, the spatial
distribution of the haemodynamic response to EEG bursts is highly variable across
infants. Furthermore, the dominant features of the representative responses shown in Fig.
5.3.4 are not necessarily at their most pronounced in the same cortical area; while the
initial dip of one infant may be most pronounced at the bilateral temporal-parietal
boundaries (see Fig. 5.3.5), the peak increase in HbT in the same infant can be most
pronounced in the prefrontal cortex (see Fig. 5.3.6).
These results constitute evidence that electro-cortical burst activity in HIE infants
invoke variable haemodynamic responses in different cortical regions. Whether this
5.4 Discussion and Conclusions
199
reflects localized neuronal activity, which otherwise is grossly seen as BS on scalp EEG
must be explored further. So far, there is limited scientific evidence to show that the
phenomenon of BS can be dependent on local dynamics rather than a global state (263).
Future studies on animal models of neonatal asphyxia combining cortical EEG and DOT
measures could elucidate this further.
It is also of striking interest that the MRI of patient 19 (see Fig. 5.3.9) revealed
swelling of the bilateral medial temporal cortices and a possible haemorrhagic lesion over
the right parietal lobe. These findings, to some extent, appear to correlate with the
distribution of the peak HbT changes shown in figure 5.3.7. The largest response is
apparent in the temporal lobes, while a distinct absence of a response can be noted in the
right parietal region.
With this work, the haemodynamic correlate of electro-cortical burst activity in
the burst-suppressed and discontinuous EEG traces of human infants with HIE was
identified. These responses exhibit a consistent morphology but highly variable spatial
distributions across different infants. This observation is consistent with the emerging
picture of BS as a representation of a complex and variable functional brain state, rather
than simply an indication of globally suppressed neuronal activity. DOT-EEG
approaches are likely to play a significant part in future investigations of the
neurophysiological and clinical implications of burst-suppressed and discontinuous EEG
states.

200
201
Chapter 6: Diffuse Optical Tomography in
the Early Detection of Perinatal Stroke

202
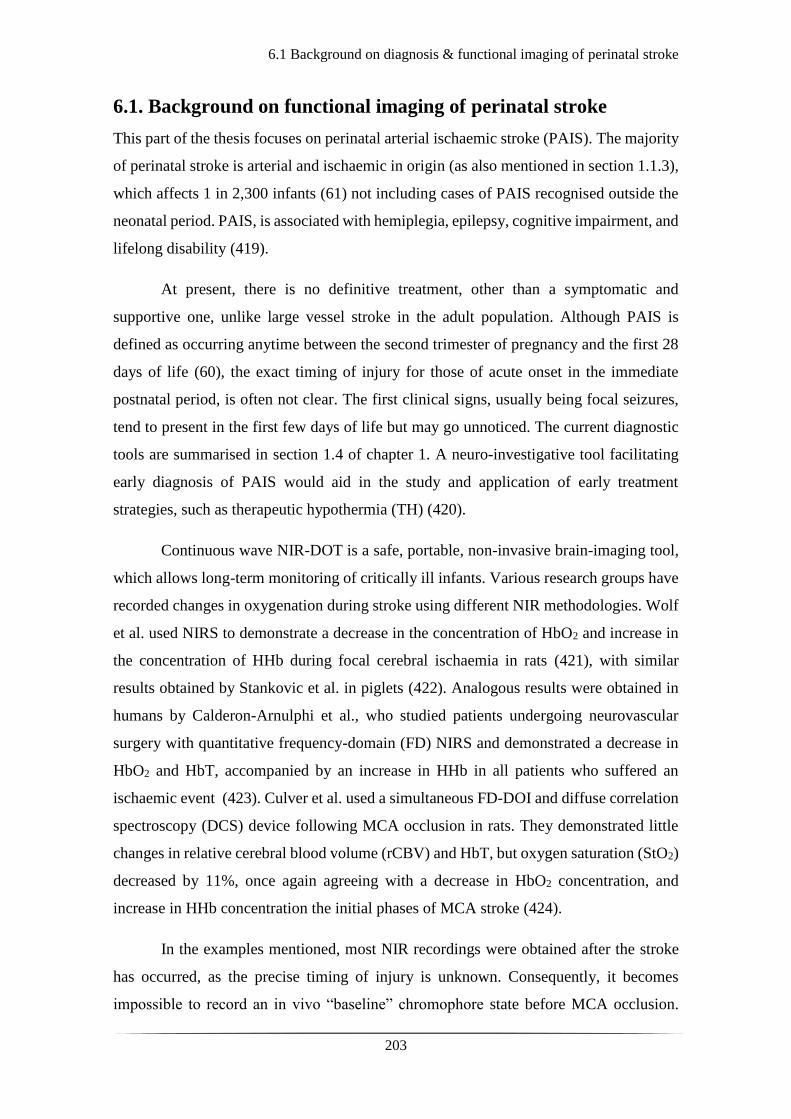
6.1 Background on diagnosis & functional imaging of perinatal stroke
203
6.1. Background on functional imaging of perinatal stroke
This part of the thesis focuses on perinatal arterial ischaemic stroke (PAIS). The majority
of perinatal stroke is arterial and ischaemic in origin (as also mentioned in section 1.1.3),
which affects 1 in 2,300 infants (61) not including cases of PAIS recognised outside the
neonatal period. PAIS, is associated with hemiplegia, epilepsy, cognitive impairment, and
lifelong disability (419).
At present, there is no definitive treatment, other than a symptomatic and
supportive one, unlike large vessel stroke in the adult population. Although PAIS is
defined as occurring anytime between the second trimester of pregnancy and the first 28
days of life (60), the exact timing of injury for those of acute onset in the immediate
postnatal period, is often not clear. The first clinical signs, usually being focal seizures,
tend to present in the first few days of life but may go unnoticed. The current diagnostic
tools are summarised in section 1.4 of chapter 1. A neuro-investigative tool facilitating
early diagnosis of PAIS would aid in the study and application of early treatment
strategies, such as therapeutic hypothermia (TH) (420).
Continuous wave NIR-DOT is a safe, portable, non-invasive brain-imaging tool,
which allows long-term monitoring of critically ill infants. Various research groups have
recorded changes in oxygenation during stroke using different NIR methodologies. Wolf
et al. used NIRS to demonstrate a decrease in the concentration of HbO2 and increase in
the concentration of HHb during focal cerebral ischaemia in rats (421), with similar
results obtained by Stankovic et al. in piglets (422). Analogous results were obtained in
humans by Calderon-Arnulphi et al., who studied patients undergoing neurovascular
surgery with quantitative frequency-domain (FD) NIRS and demonstrated a decrease in
HbO2 and HbT, accompanied by an increase in HHb in all patients who suffered an
ischaemic event (423). Culver et al. used a simultaneous FD-DOI and diffuse correlation
spectroscopy (DCS) device following MCA occlusion in rats. They demonstrated little
changes in relative cerebral blood volume (rCBV) and HbT, but oxygen saturation (StO2)
decreased by 11%, once again agreeing with a decrease in HbO2 concentration, and
increase in HHb concentration the initial phases of MCA stroke (424).
In the examples mentioned, most NIR recordings were obtained after the stroke
has occurred, as the precise timing of injury is unknown. Consequently, it becomes
impossible to record an in vivo “baseline” chromophore state before MCA occlusion.
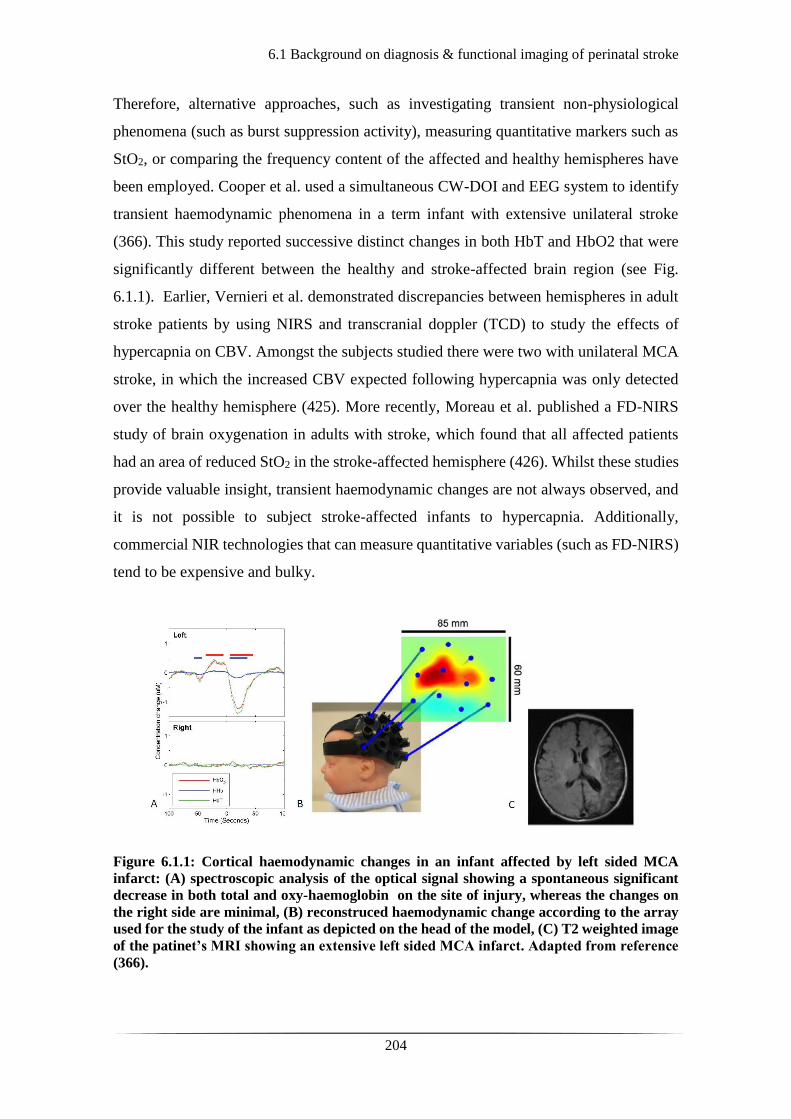
6.1 Background on diagnosis & functional imaging of perinatal stroke
204
Therefore, alternative approaches, such as investigating transient non-physiological
phenomena (such as burst suppression activity), measuring quantitative markers such as
StO2, or comparing the frequency content of the affected and healthy hemispheres have
been employed. Cooper et al. used a simultaneous CW-DOI and EEG system to identify
transient haemodynamic phenomena in a term infant with extensive unilateral stroke
(366). This study reported successive distinct changes in both HbT and HbO2 that were
significantly different between the healthy and stroke-affected brain region (see Fig.
6.1.1). Earlier, Vernieri et al. demonstrated discrepancies between hemispheres in adult
stroke patients by using NIRS and transcranial doppler (TCD) to study the effects of
hypercapnia on CBV. Amongst the subjects studied there were two with unilateral MCA
stroke, in which the increased CBV expected following hypercapnia was only detected
over the healthy hemisphere (425). More recently, Moreau et al. published a FD-NIRS
study of brain oxygenation in adults with stroke, which found that all affected patients
had an area of reduced StO2 in the stroke-affected hemisphere (426). Whilst these studies
provide valuable insight, transient haemodynamic changes are not always observed, and
it is not possible to subject stroke-affected infants to hypercapnia. Additionally,
commercial NIR technologies that can measure quantitative variables (such as FD-NIRS)
tend to be expensive and bulky.
Figure 6.1.1: Cortical haemodynamic changes in an infant affected by left sided MCA
infarct: (A) spectroscopic analysis of the optical signal showing a spontaneous significant
decrease in both total and oxy-haemoglobin on the site of injury, whereas the changes on
the right side are minimal, (B) reconstruced haemodynamic change according to the array
used for the study of the infant as depicted on the head of the model, (C) T2 weighted image
of the patinet’s MRI showing an extensive left sided MCA infarct. Adapted from reference
(366).

6.1 Background on diagnosis & functional imaging of perinatal stroke
205
Another method for detecting stroke is to look at the disturbance of normal brain
physiology. Spontaneous low frequency oscillations (LFOs) of cortical vasculature occur
in the healthy brain, and their clinical significance remains under debate. They are
believed to be associated with myogenic (427), metabolic (428) and neurogenic stimuli
(429), sympathetic tone (430), and cerebral autoregulation (CA) (387, 431). Dynamic
cerebral autoregulation maintains a constant cerebral blood flow (CBF) in the face of
changing cerebral perfusion pressure; this protects the brain from rapid increase or
decrease in CBF during fluctuations of the arterial blood pressure. Numerous studies
support the idea that CA is altered in cases of brain injury, such as ischaemic stroke (432-
436).
The LFO band can be subdivided into very low (VL) frequency oscillations from
0.004 to 0.009 Hz (385, 386), RS frequency oscillations from 0.01 to 0.08 Hz (355, 356),
and Mayer waves from 0.09 to 0.4 Hz (437, 438). Very low frequency oscillations were
originally detected in 1960 as spontaneous fluctuations in the intraventricular pressure of
patients with intracranial disease (439). They have been observed physiologically in
healthy adults by measuring intracranial pressure (440), flow velocity in the MCA (441),
and MR imaging of intraventricular CSF and CBF (442), thus suggesting a link to a
vascular myogenic mechanisms, possibly associated with the smooth muscle cells of the
vessel bed. Resting state oscillations that display a synchronous, symmetrical pattern
across homologous brain regions between hemispheres were initially detected with
BOLD fMRI and are believed to possibly be a precursor to the default mode network
(359). These same RS oscillations have also been observed in neonates using NIR
imaging systems (443-445). More recently, both VL and RS oscillations have been
explored as an indirect marker of CA in adult stroke patients receiving thrombolytic
therapy; showing that stroke severity positively correlated with the degree of altered CA
which was less impaired in the treated group (446). The functional significance of Mayer
waves is a topic of continuing investigation and debate. Mayer waves have been detected
in several species at different inherent frequencies, at 0.1 Hz in humans (458, 459), 0.1
Hz in cats (460, 461), 0.3 Hz in rabbits (462) and 0.4 Hz in rats (463). Some studies have
suggested that Mayer waves are global oscillations in arterial blood pressure correlating
with sympathetic neuronal activity (437), others that they trigger the release of
endothelial-derived nitric oxide during vascular stress (464), or that they are part of
normal vascular baroreflex mechanisms and of no particular function (465).
6.1 Background on diagnosis & functional imaging of perinatal stroke
206
Diffuse optical imaging allows a novel method for the detection and further
investigation of LFOs in PAIS patients. To date, few DOI based studies exist focussing
on the role of LFOs in stroke, and only one of these had a neonatal application. In 2012,
White et al. used CW-DOI to study RS networks in the occipital cortices of healthy term
and preterm infants, demonstrating the absence of inter-hemispheric connectivity in one
neonatal case with mono-hemispheric occipital stroke (see Fig. 6.1.2) (355).
Figure 6.1.2: Diffuse optical images of functional connectivity; using independent
component analysis to demonstrate occipital resting state functional connectivity in
different subsets; (A) healthy term infant, (B) healthy preterm infant with no significant
anatomical brain injury, (C) preterm infant with a complicated clinical course, and (D) a
preterm infant with unilateral occipital stroke. Note the absence of interhemispheric
connectivity in subset D. Adapted from reference (355).
Given the ability of CW diffuse optical systems to quickly obtain cerebral
haemodynamic information early in the life of an infant, and the potential to meaningfully
analyse post-injury data, a further investigation of LFOs of the optical signal in PAIS-
affected infants was warranted. As previously described, spontaneous LFOs potentially
derive from normal neuronal, myogenic, and other brain functions, which are likely
6.1 Background on diagnosis & functional imaging of perinatal stroke
207
affected in cases of brain injury. Therefore, the hypothesis of this part of the study was
that uni-hemispheric stroke would lead to a detectable difference in spontaneous LFOs
between stroke-affected and healthy brain regions. A secondary objective of this study
was to investigate how the results from the DOT data would differ depending on whether
MRI-guided stroke location was encountered in the analysis.

6.2.1 Patients and Data Acquisition
208
6.2 Patients and Methods
6.2.1 Patients and Data Acquisition
Out of the cohort of infants studied in this project, 5 were selected for this part of the
analysis. This was a retrospective investigation and patients were selected based on the
detection of an arterial stroke on the MRI. The MRIs were performed as part of standard
clinical care. Each infant was studied with the DOT-EEG device (as described in chapter
3) for a duration varying from 30 to 120 minutes whilst receiving intensive care on the
NICU.
To support the hypothesis of interhemispheric difference for the LFO bands in
perinatal stroke, the same methodology was applied to control subjects. Out of the cohort
of healthy controls, 4 were selected based on the quality of their continuous DOT data.
The control subjects were healthy newborn infants and most of them were scanned in the
first week of life (except for one, Preterm_1).
Infants presenting with seizures and suspected stroke were scanned within 3 days
from birth. The incidence and location of stroke was later confirmed by MRI between 7
to 10 days of life. Subjects presenting with seizures but no evidence of stroke on MRI as
well as subjects with MRI confirmed bilateral stroke were excluded from the study. All
infants were scanned at the cot-side in the NICU whilst receiving intensive clinical care.
6.2.2 EEG Analysis
209
6.2.2 EEG Analysis
Alongside the DOT recordings there was simultaneous video-EEG monitoring. The
spectral analysis of the EEG traces was performed prior to the known diagnosis and MRI
findings. The EEG traces were also reviewed and reported by the Clinical
Neurophysiologist, Dr Andrew Michell (AWM). The key elements which would lead to
suspicion of stroke would be lateralised signal attenuation of background activity,
unilateral loss of certain frequencies within the electrical activity, detection of seizures
consistently across a specific hemispheric brain region.
A further computational analysis of the raw EEG data was applied using the
EEGLAB toolbox within MATLAB. The aim of this was to plot the channel spectra and
cortical maps to identify whether there were any broad discrepancies between the two
hemispheres for different frequencies of the EEG signal. For the purposes of this, each
dataset was bandpass filtered (hpf 0.5 Hz, lpf 40 Hz) and visually inspected. For each
dataset, artefact-free epochs were used for the calculation of the power spectra for certain
frequencies between 2 and 25 Hz. An example of the power plots can be seen in figure
6.2.1. Using a spherical dipfit model within the EEGLAB toolbox which recognises the
registration of EEG electrodes across the array used in the study, the spectral power for
these frequencies was plotted and presented as cortical spectra maps. This is a simple
approach to establish differences in the spectral power for certain frequencies of the EEG
signal across different parts of the scalp.
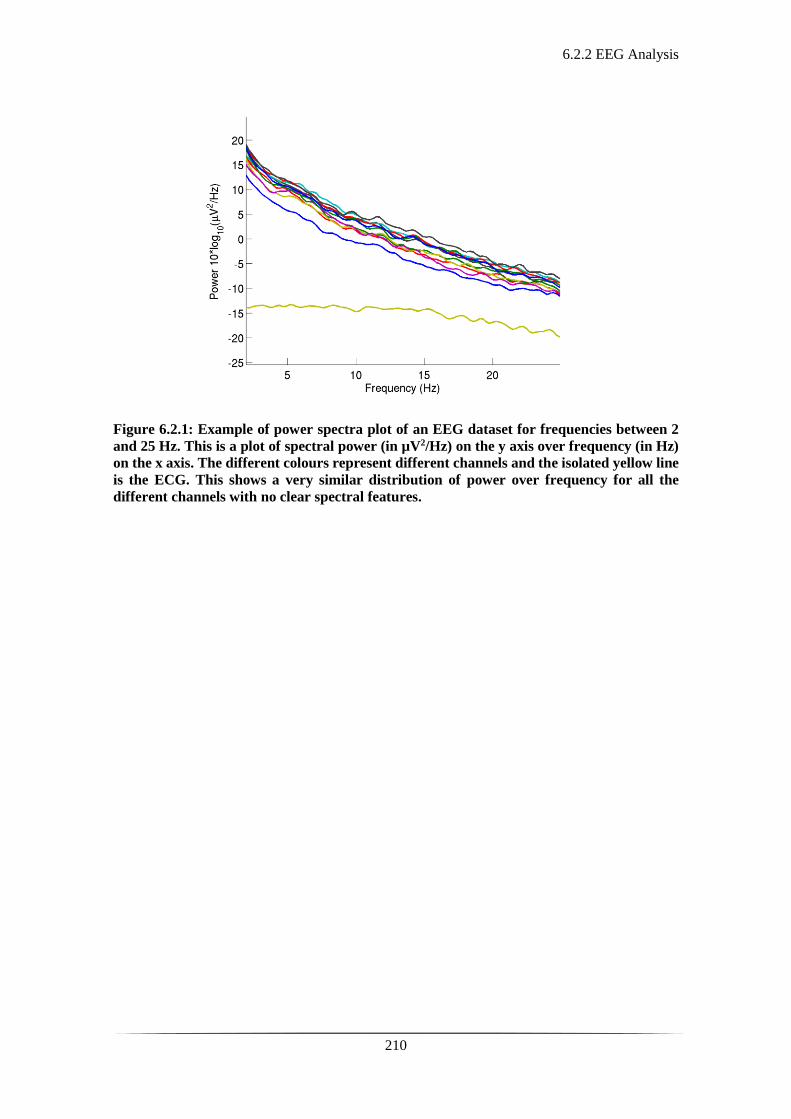
6.2.2 EEG Analysis
210
Figure 6.2.1: Example of power spectra plot of an EEG dataset for frequencies between 2
and 25 Hz. This is a plot of spectral power (in µV2/Hz) on the y axis over frequency (in Hz)
on the x axis. The different colours represent different channels and the isolated yellow line
is the ECG. This shows a very similar distribution of power over frequency for all the
different channels with no clear spectral features.
6.2.3 DOT Analysis
211
6.2.3 DOT analysis
The initial study design and analysis, described in this section, was devised, and
performed by me. It was refined and expanded by RJC and LAD using bespoke scripts
and MATLAB functions.
Pre-processing of the optical data
The initial pre-processing steps were followed as described in section 3.2.3 in chapter 3.
For the selection of ‘healthy channels’, an arbitrary mean threshold of optical intensity
was used (10e-4). If the mean measured optical intensity was found to be below this
threshold the channels were excluded from the analysis. The motion related artefacts were
removed manually (see Fig. 6.2.2). The remaining artefact-free epochs were concatenated
thus producing continuous epochs of a minimum 20-minute duration of optical data per
infant. The concatenation takes the non-motion sections and sandwiches them together.
As part of this process, the mean intensity value of each non-motion segment is adjusted
to match that of the previous segment, thus producing a continuous signal. The set
minimum epochs of continuous DOT data required to capture and detect LFOs was 20
minutes. The length of every optical dataset, used in the analysis, satisfied the Nyquist
criterion for the slowest investigated frequency (0.0055 Hz).
The intensity data were converted to optical density. Based on the modified Beer-
Lambert Law the optical density data were converted to HbO2, HHb, and HbT using a
DPF of 4 for both wavelengths (447). The Hb oscillation data were bandpass filtered into
the following low frequency bands: a) the VL, between 0.0055 and 0.0095 Hz, b) the RS,
between 0.01 and 0.08 Hz, and c) the Mayer wave band, between 0.09 and 0.3 Hz. This
process was guided by review of the literature as mentioned in section 6.1 as well as
careful inspection of the spectral power of the data (for example see Fig. 6.2.6).

6.2.3 DOT Analysis
212
Figure 6.2.2: Raw optical signal of patient 25. This image depicts the raw optical signal;
changes of optical density over time, as acquired by the DOT device. The y axis represents
the changes in optical density and the different colours reflect separate optical channels.
The x axis represents time in milliseconds. Note the sudden change of the trace of the signal
from the baseline between 2.2 and 2.8 x10⁴ milliseconds which reflects motion related
artefact and would be rejected in the pre-processing phase of the analysis.
The main trajectory of the analysis was to compare interhemispheric difference in
a channel-wise manner between the healthy and stroke affected brain regions. The
distribution of the stroke in the MCA territory guided the initial channel selection. These
channels were labelled ‘blind channels’ as their selection was an approximation based on
the array and the MCA territory. Therefore, a more specific approach was attempted
using the MRIs, as described below.
MRI processing, mesh manipulation, and ROI specification
The quality of the patients’ MRIs was adequate to detect anatomical structures and the
stroke affected brain regions. The MRIs were inspected in FSL (FMRIB Software
Library, Oxford: functional MRI of the brain Software Library), which is a library of
methodological tools for functional, structural and diffusion MRI brain data (448, 449)).
The anatomical landmarks of nasion, inion, Ar, Al, and Cz were measured and recorded
in mm, in each patient’s MRI.
The next challenge in the analysis was to certify that the optical data coordinates
were in alignment with each patient’s MRI. This required that the optical atlas mesh was
transformed to match the individual patient’s anatomy. For each patient, an age-matched
Time (ms)
Op
tica
l in
ten
sity
ch
ange
s (µ
V)
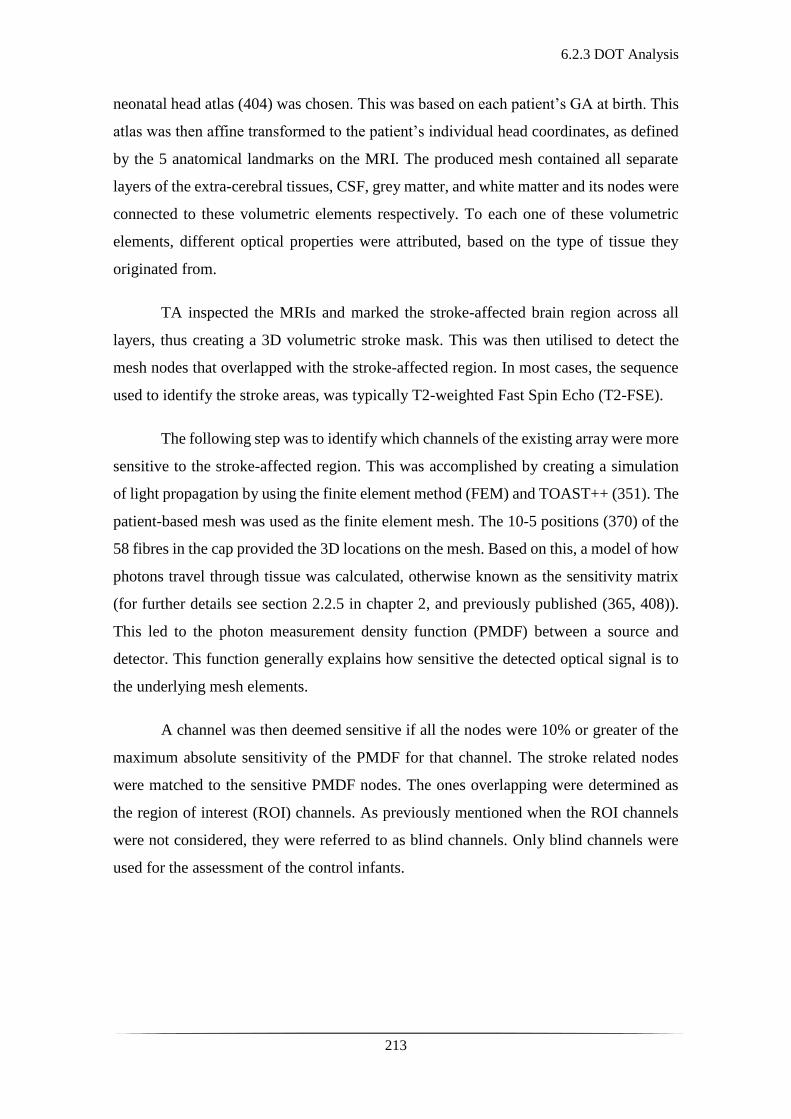
6.2.3 DOT Analysis
213
neonatal head atlas (404) was chosen. This was based on each patient’s GA at birth. This
atlas was then affine transformed to the patient’s individual head coordinates, as defined
by the 5 anatomical landmarks on the MRI. The produced mesh contained all separate
layers of the extra-cerebral tissues, CSF, grey matter, and white matter and its nodes were
connected to these volumetric elements respectively. To each one of these volumetric
elements, different optical properties were attributed, based on the type of tissue they
originated from.
TA inspected the MRIs and marked the stroke-affected brain region across all
layers, thus creating a 3D volumetric stroke mask. This was then utilised to detect the
mesh nodes that overlapped with the stroke-affected region. In most cases, the sequence
used to identify the stroke areas, was typically T2-weighted Fast Spin Echo (T2-FSE).
The following step was to identify which channels of the existing array were more
sensitive to the stroke-affected region. This was accomplished by creating a simulation
of light propagation by using the finite element method (FEM) and TOAST++ (351). The
patient-based mesh was used as the finite element mesh. The 10-5 positions (370) of the
58 fibres in the cap provided the 3D locations on the mesh. Based on this, a model of how
photons travel through tissue was calculated, otherwise known as the sensitivity matrix
(for further details see section 2.2.5 in chapter 2, and previously published (365, 408)).
This led to the photon measurement density function (PMDF) between a source and
detector. This function generally explains how sensitive the detected optical signal is to
the underlying mesh elements.
A channel was then deemed sensitive if all the nodes were 10% or greater of the
maximum absolute sensitivity of the PMDF for that channel. The stroke related nodes
were matched to the sensitive PMDF nodes. The ones overlapping were determined as
the region of interest (ROI) channels. As previously mentioned when the ROI channels
were not considered, they were referred to as blind channels. Only blind channels were
used for the assessment of the control infants.
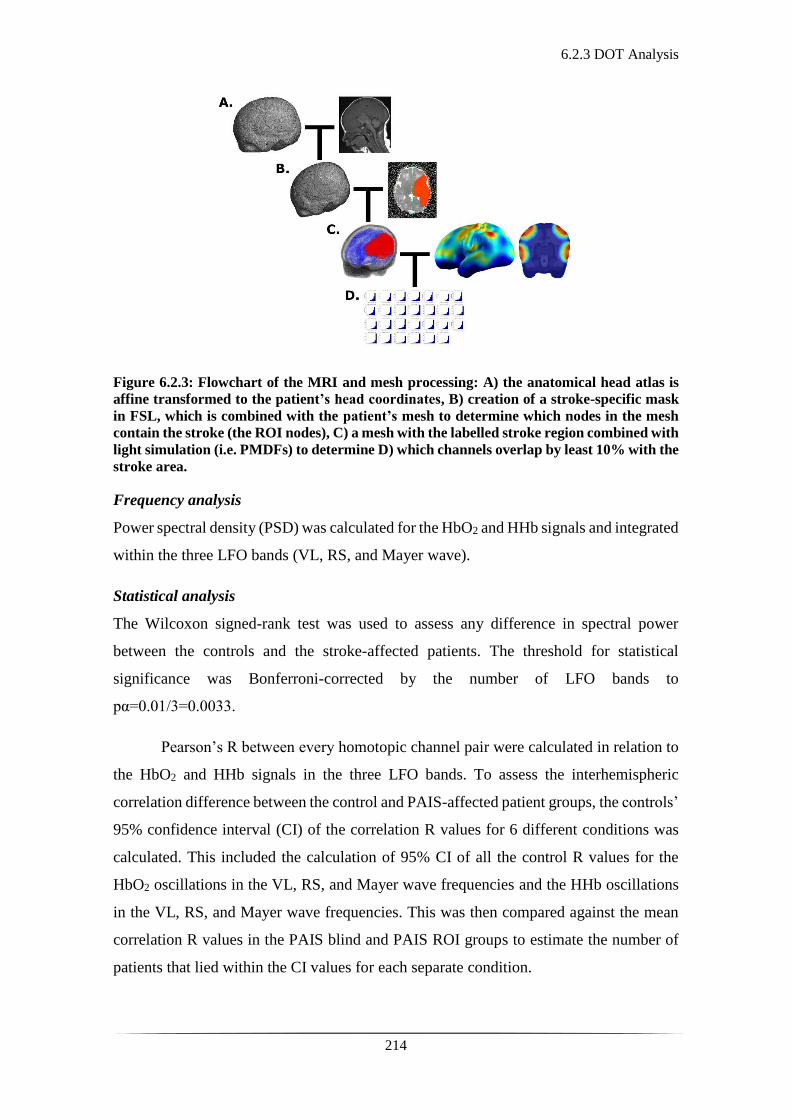
6.2.3 DOT Analysis
214
Figure 6.2.3: Flowchart of the MRI and mesh processing: A) the anatomical head atlas is
affine transformed to the patient’s head coordinates, B) creation of a stroke-specific mask
in FSL, which is combined with the patient’s mesh to determine which nodes in the mesh
contain the stroke (the ROI nodes), C) a mesh with the labelled stroke region combined with
light simulation (i.e. PMDFs) to determine D) which channels overlap by least 10% with the
stroke area.
Frequency analysis
Power spectral density (PSD) was calculated for the HbO2 and HHb signals and integrated
within the three LFO bands (VL, RS, and Mayer wave).
Statistical analysis
The Wilcoxon signed-rank test was used to assess any difference in spectral power
between the controls and the stroke-affected patients. The threshold for statistical
significance was Bonferroni-corrected by the number of LFO bands to
pα=0.01/3=0.0033.
Pearson’s R between every homotopic channel pair were calculated in relation to
the HbO2 and HHb signals in the three LFO bands. To assess the interhemispheric
correlation difference between the control and PAIS-affected patient groups, the controls’
95% confidence interval (CI) of the correlation R values for 6 different conditions was
calculated. This included the calculation of 95% CI of all the control R values for the
HbO2 oscillations in the VL, RS, and Mayer wave frequencies and the HHb oscillations
in the VL, RS, and Mayer wave frequencies. This was then compared against the mean
correlation R values in the PAIS blind and PAIS ROI groups to estimate the number of
patients that lied within the CI values for each separate condition.
6.3.1 Clinical Details
215
6.3 Results
6.3.1 Clinical Details
Within the cohort of infants studied, 5 had a large stroke detected by conventional MRI.
Those were patients 16, 18, 20, 25 and 29. Patients 16, 25 and 29 had an isolated diagnosis
of cerebral infarction, whereas patients 18 and 20 had a diagnosis of both HIE and
cerebral infarction. Patient 20 was excluded from the analysis due to poor data quality.
The clinical details of each patient, including the MRI findings can be seen in tables 6.1
and 6.2.
Within the cohort of infants studied with no identified or reported brain injury,
controls 4, 8, 10, and preterm 1, were included in the stroke analysis. For the clinical
details of the controls please refer to tables 3.2 and 3.3 in section 3.1.3, chapter 3.
Patients 18 and 20 presented with suspected HIE and seizures, fulfilling both
criteria A and B as per TOBY cooling criteria for therapeutic hypothermia (43). However,
in patient 20 therapeutic hypothermia was discontinued within the first 24 hours as it was
determined that her primary diagnosis was not HIE but septicaemia/meningitis. The rest
of the patients were admitted due to initial presentation with clinical seizures or a strong
suspicion of seizures in the first 12 hours of life.
There are several clinical entities associated with the presentation of neonatal
stroke which could possibly play a causative role (see section 1.1.3). The identified
predisposing maternal factors in this cohort were gestational diabetes, prolonged rupture
of membranes, and chorioamnionitis. The identified predisposing neonatal factors were
suspected or confirmed infection/sepsis, HIE, profound anaemia, and persistent
pulmonary hypertension of the newborn (PPHN).
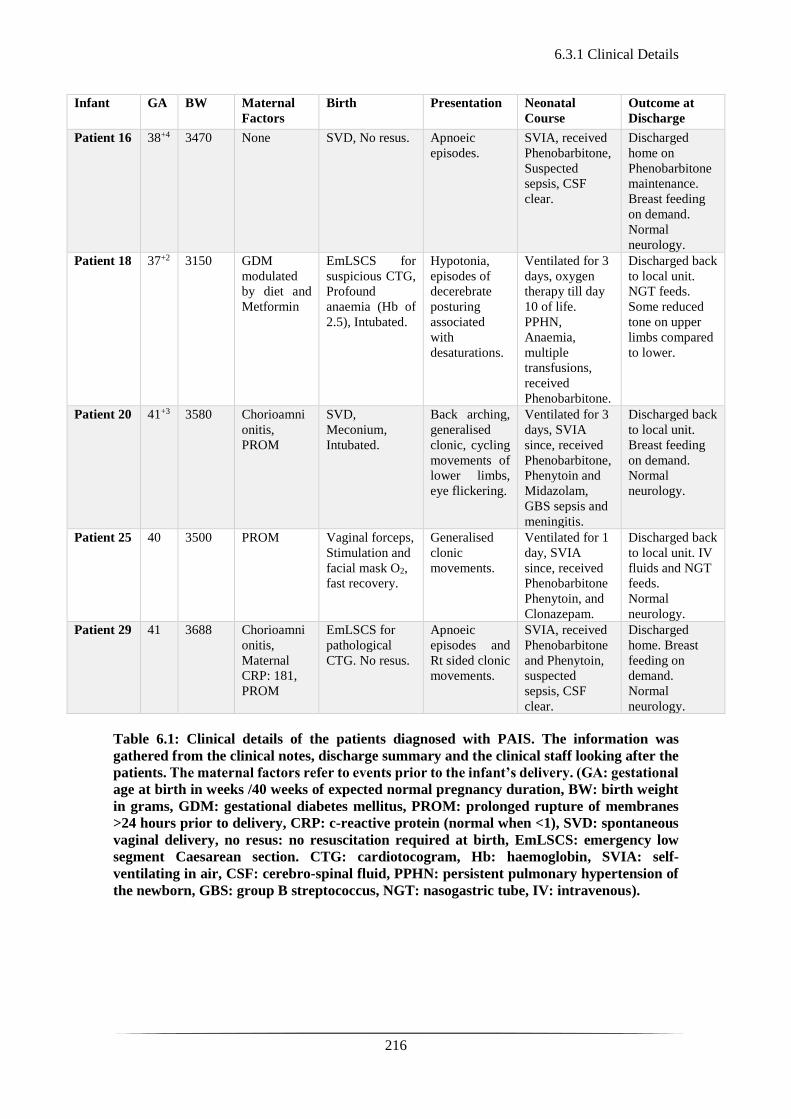
6.3.1 Clinical Details
216
Infant GA
BW Maternal
Factors
Birth Presentation Neonatal
Course
Outcome at
Discharge
Patient 16
38+4 3470 None SVD, No resus. Apnoeic
episodes.
SVIA, received
Phenobarbitone,
Suspected
sepsis, CSF
clear.
Discharged
home on
Phenobarbitone
maintenance.
Breast feeding
on demand.
Normal
neurology.
Patient 18
37+2 3150 GDM
modulated
by diet and
Metformin
EmLSCS for
suspicious CTG,
Profound
anaemia (Hb of
2.5), Intubated.
Hypotonia,
episodes of
decerebrate
posturing
associated
with
desaturations.
Ventilated for 3
days, oxygen
therapy till day
10 of life.
PPHN,
Anaemia,
multiple
transfusions,
received
Phenobarbitone.
Discharged back
to local unit.
NGT feeds.
Some reduced
tone on upper
limbs compared
to lower.
Patient 20 41+3 3580 Chorioamni
onitis,
PROM
SVD,
Meconium,
Intubated.
Back arching,
generalised
clonic, cycling
movements of
lower limbs,
eye flickering.
Ventilated for 3
days, SVIA
since, received
Phenobarbitone,
Phenytoin and
Midazolam,
GBS sepsis and
meningitis.
Discharged back
to local unit.
Breast feeding
on demand.
Normal
neurology.
Patient 25
40 3500 PROM Vaginal forceps,
Stimulation and
facial mask O2,
fast recovery.
Generalised
clonic
movements.
Ventilated for 1
day, SVIA
since, received
Phenobarbitone
Phenytoin, and
Clonazepam.
Discharged back
to local unit. IV
fluids and NGT
feeds.
Normal
neurology.
Patient 29
41 3688 Chorioamni
onitis,
Maternal
CRP: 181,
PROM
EmLSCS for
pathological
CTG. No resus.
Apnoeic
episodes and
Rt sided clonic
movements.
SVIA, received
Phenobarbitone
and Phenytoin,
suspected
sepsis, CSF
clear.
Discharged
home. Breast
feeding on
demand.
Normal
neurology.
Table 6.1: Clinical details of the patients diagnosed with PAIS. The information was
gathered from the clinical notes, discharge summary and the clinical staff looking after the
patients. The maternal factors refer to events prior to the infant’s delivery. (GA: gestational
age at birth in weeks /40 weeks of expected normal pregnancy duration, BW: birth weight
in grams, GDM: gestational diabetes mellitus, PROM: prolonged rupture of membranes
>24 hours prior to delivery, CRP: c-reactive protein (normal when <1), SVD: spontaneous
vaginal delivery, no resus: no resuscitation required at birth, EmLSCS: emergency low
segment Caesarean section. CTG: cardiotocogram, Hb: haemoglobin, SVIA: self-
ventilating in air, CSF: cerebro-spinal fluid, PPHN: persistent pulmonary hypertension of
the newborn, GBS: group B streptococcus, NGT: nasogastric tube, IV: intravenous).
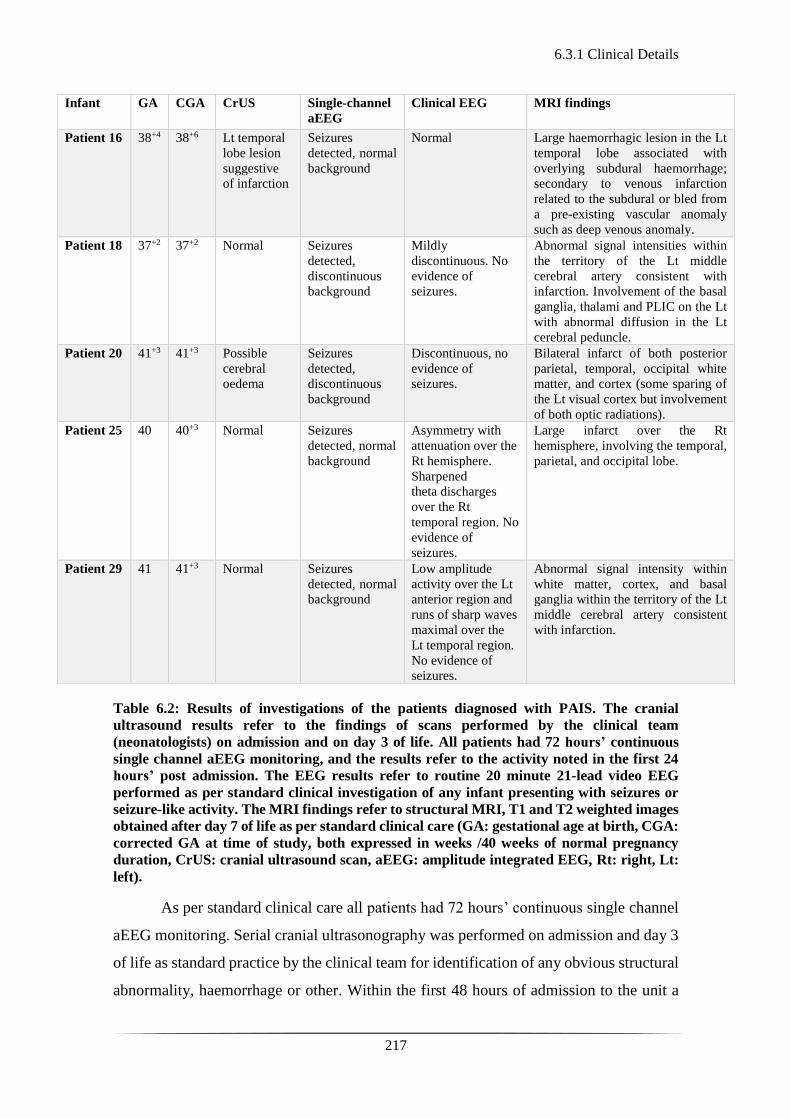
6.3.1 Clinical Details
217
Infant GA
CGA
CrUS Single-channel
aEEG
Clinical EEG MRI findings
Patient 16
38+4 38+6 Lt temporal
lobe lesion
suggestive
of infarction
Seizures
detected, normal
background
Normal Large haemorrhagic lesion in the Lt
temporal lobe associated with
overlying subdural haemorrhage;
secondary to venous infarction
related to the subdural or bled from
a pre-existing vascular anomaly
such as deep venous anomaly.
Patient 18
37+2 37+2 Normal Seizures
detected,
discontinuous
background
Mildly
discontinuous. No
evidence of
seizures.
Abnormal signal intensities within
the territory of the Lt middle
cerebral artery consistent with
infarction. Involvement of the basal
ganglia, thalami and PLIC on the Lt
with abnormal diffusion in the Lt
cerebral peduncle.
Patient 20 41+3 41+3 Possible
cerebral
oedema
Seizures
detected,
discontinuous
background
Discontinuous, no
evidence of
seizures.
Bilateral infarct of both posterior
parietal, temporal, occipital white
matter, and cortex (some sparing of
the Lt visual cortex but involvement
of both optic radiations).
Patient 25
40 40+3 Normal Seizures
detected, normal
background
Asymmetry with
attenuation over the
Rt hemisphere.
Sharpened
theta discharges
over the Rt
temporal region. No
evidence of
seizures.
Large infarct over the Rt
hemisphere, involving the temporal,
parietal, and occipital lobe.
Patient 29
41 41+3 Normal Seizures
detected, normal
background
Low amplitude
activity over the Lt
anterior region and
runs of sharp waves
maximal over the
Lt temporal region.
No evidence of
seizures.
Abnormal signal intensity within
white matter, cortex, and basal
ganglia within the territory of the Lt
middle cerebral artery consistent
with infarction.
Table 6.2: Results of investigations of the patients diagnosed with PAIS. The cranial
ultrasound results refer to the findings of scans performed by the clinical team
(neonatologists) on admission and on day 3 of life. All patients had 72 hours’ continuous
single channel aEEG monitoring, and the results refer to the activity noted in the first 24
hours’ post admission. The EEG results refer to routine 20 minute 21-lead video EEG
performed as per standard clinical investigation of any infant presenting with seizures or
seizure-like activity. The MRI findings refer to structural MRI, T1 and T2 weighted images
obtained after day 7 of life as per standard clinical care (GA: gestational age at birth, CGA:
corrected GA at time of study, both expressed in weeks /40 weeks of normal pregnancy
duration, CrUS: cranial ultrasound scan, aEEG: amplitude integrated EEG, Rt: right, Lt:
left).
As per standard clinical care all patients had 72 hours’ continuous single channel
aEEG monitoring. Serial cranial ultrasonography was performed on admission and day 3
of life as standard practice by the clinical team for identification of any obvious structural
abnormality, haemorrhage or other. Within the first 48 hours of admission to the unit a
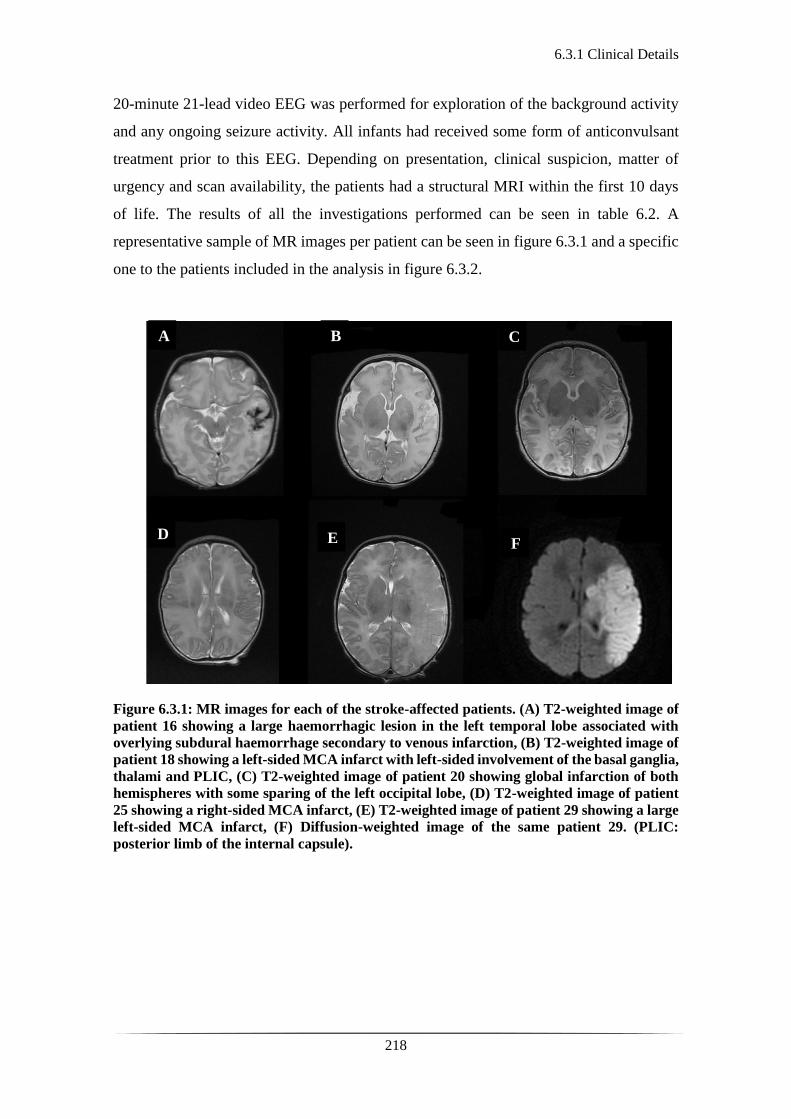
6.3.1 Clinical Details
218
20-minute 21-lead video EEG was performed for exploration of the background activity
and any ongoing seizure activity. All infants had received some form of anticonvulsant
treatment prior to this EEG. Depending on presentation, clinical suspicion, matter of
urgency and scan availability, the patients had a structural MRI within the first 10 days
of life. The results of all the investigations performed can be seen in table 6.2. A
representative sample of MR images per patient can be seen in figure 6.3.1 and a specific
one to the patients included in the analysis in figure 6.3.2.
Figure 6.3.1: MR images for each of the stroke-affected patients. (A) T2-weighted image of
patient 16 showing a large haemorrhagic lesion in the left temporal lobe associated with
overlying subdural haemorrhage secondary to venous infarction, (B) T2-weighted image of
patient 18 showing a left-sided MCA infarct with left-sided involvement of the basal ganglia,
thalami and PLIC, (C) T2-weighted image of patient 20 showing global infarction of both
hemispheres with some sparing of the left occipital lobe, (D) T2-weighted image of patient
25 showing a right-sided MCA infarct, (E) T2-weighted image of patient 29 showing a large
left-sided MCA infarct, (F) Diffusion-weighted image of the same patient 29. (PLIC:
posterior limb of the internal capsule).
A B C
D E F

6.3.1 Clinical Details
219
Figure 6.3.2: Anatomical MR images for the subjects in the PAIS group. A) Sagittal T1-
weighted images of each stroke-affected patient (patient 16, 18, 25 and 29 from left to right
respectively), B) Axial views showing abnormal signal in the stroke location (patient 16, 18,
25 and 29 from left to right respectively). From left to right, the MR sequences depicted here
were T1 SE (Spin Echo), T2 FSE (Fast Spin Echo), T2 FSE, and ADC (Apparent Diffusion
Coefficient). (A: anterior, P: posterior, R: right, L: left).
Patient 16 Patient 18 Patient 25 Patient 29
6.3.2 EEG Results
220
6.3.2 EEG Results
The results of the spectral analysis of the EEG, as reported by AWM were the following:
Patient 16: EEG recording of good quality, with no lateralisation or asymmetry.
Overall background activity of low amplitude with apparent variation between sleep and
wakefulness. No seizure activity detected.
Patient 18: EEG recording of moderate quality, with discontinuous background
trace but not burst suppressed. No asymmetry identified. Seizure activity over the anterior
midline seizure activity between 176 to 338s, 1,788 to 2,019s, 2,109 to 2,427s, 2,689 to
2,749s, 3,000 to 3,526s).
Patient 25: EEG recording of good quality, with no lateralisation or asymmetry.
Overall normal background activity with variation between sleep and wakefulness.
Sharpened theta discharges over the right temporal region No seizure activity detected.
Patient 29: EEG recording of good quality. Continuous background activity with
low amplitude activity over the Lt anterior region and runs of sharp waves maximal over
the Lt temporal region. No seizure activity detected.
Further information was obtained from the extraction of the power spectra of the
EEG signal. The spectral maps are presented in figures 6.3.3-6.3.5.
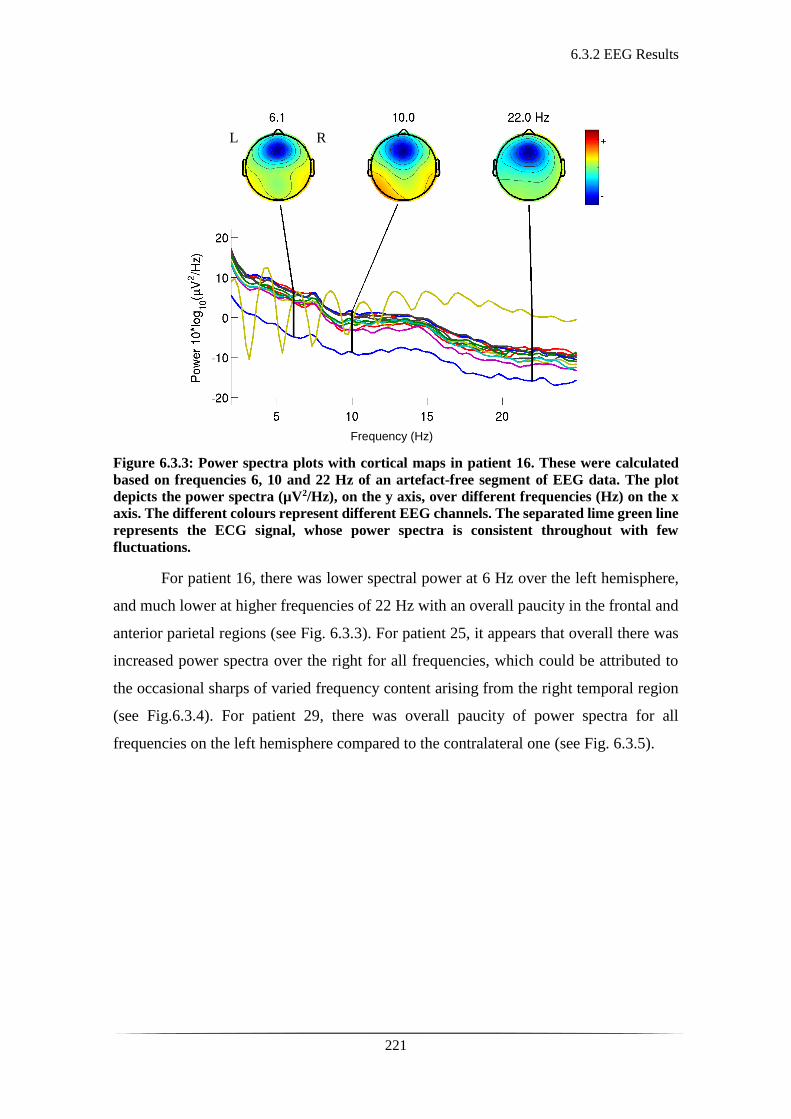
6.3.2 EEG Results
221
Figure 6.3.3: Power spectra plots with cortical maps in patient 16. These were calculated
based on frequencies 6, 10 and 22 Hz of an artefact-free segment of EEG data. The plot
depicts the power spectra (µV2/Hz), on the y axis, over different frequencies (Hz) on the x
axis. The different colours represent different EEG channels. The separated lime green line
represents the ECG signal, whose power spectra is consistent throughout with few
fluctuations.
For patient 16, there was lower spectral power at 6 Hz over the left hemisphere,
and much lower at higher frequencies of 22 Hz with an overall paucity in the frontal and
anterior parietal regions (see Fig. 6.3.3). For patient 25, it appears that overall there was
increased power spectra over the right for all frequencies, which could be attributed to
the occasional sharps of varied frequency content arising from the right temporal region
(see Fig.6.3.4). For patient 29, there was overall paucity of power spectra for all
frequencies on the left hemisphere compared to the contralateral one (see Fig. 6.3.5).
Frequency (Hz)
R L
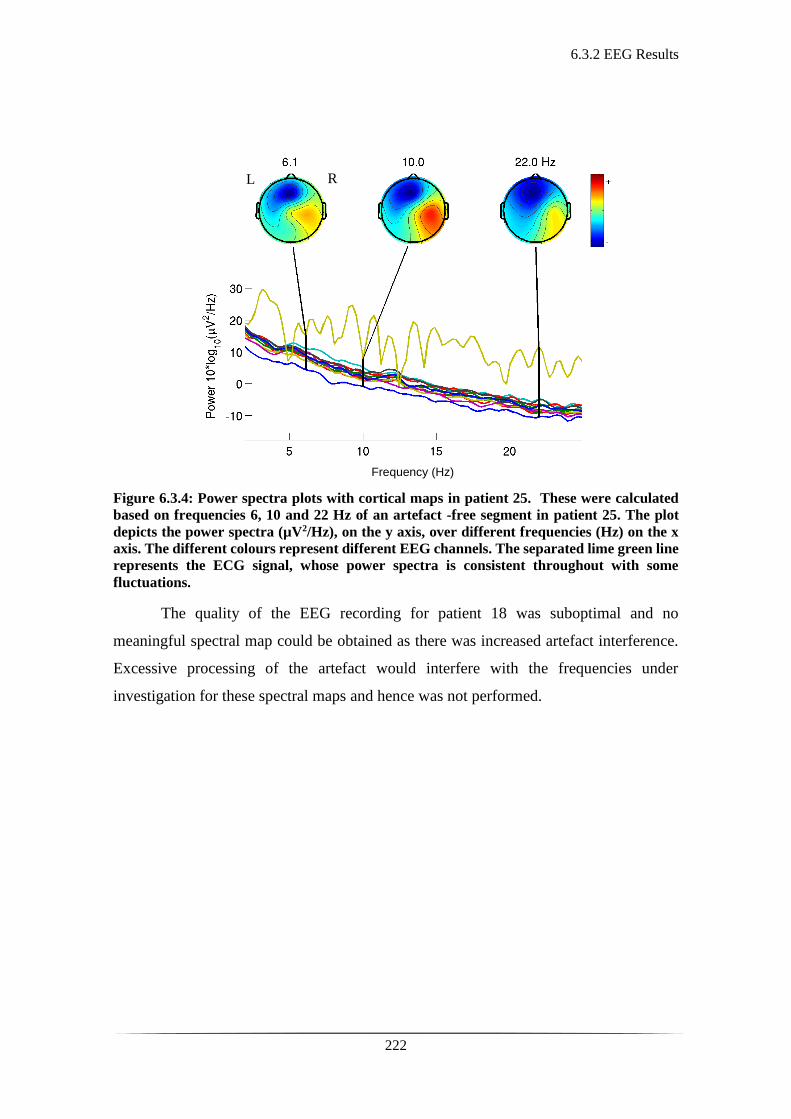
6.3.2 EEG Results
222
Figure 6.3.4: Power spectra plots with cortical maps in patient 25. These were calculated
based on frequencies 6, 10 and 22 Hz of an artefact -free segment in patient 25. The plot
depicts the power spectra (µV2/Hz), on the y axis, over different frequencies (Hz) on the x
axis. The different colours represent different EEG channels. The separated lime green line
represents the ECG signal, whose power spectra is consistent throughout with some
fluctuations.
The quality of the EEG recording for patient 18 was suboptimal and no
meaningful spectral map could be obtained as there was increased artefact interference.
Excessive processing of the artefact would interfere with the frequencies under
investigation for these spectral maps and hence was not performed.
Frequency (Hz)
R L
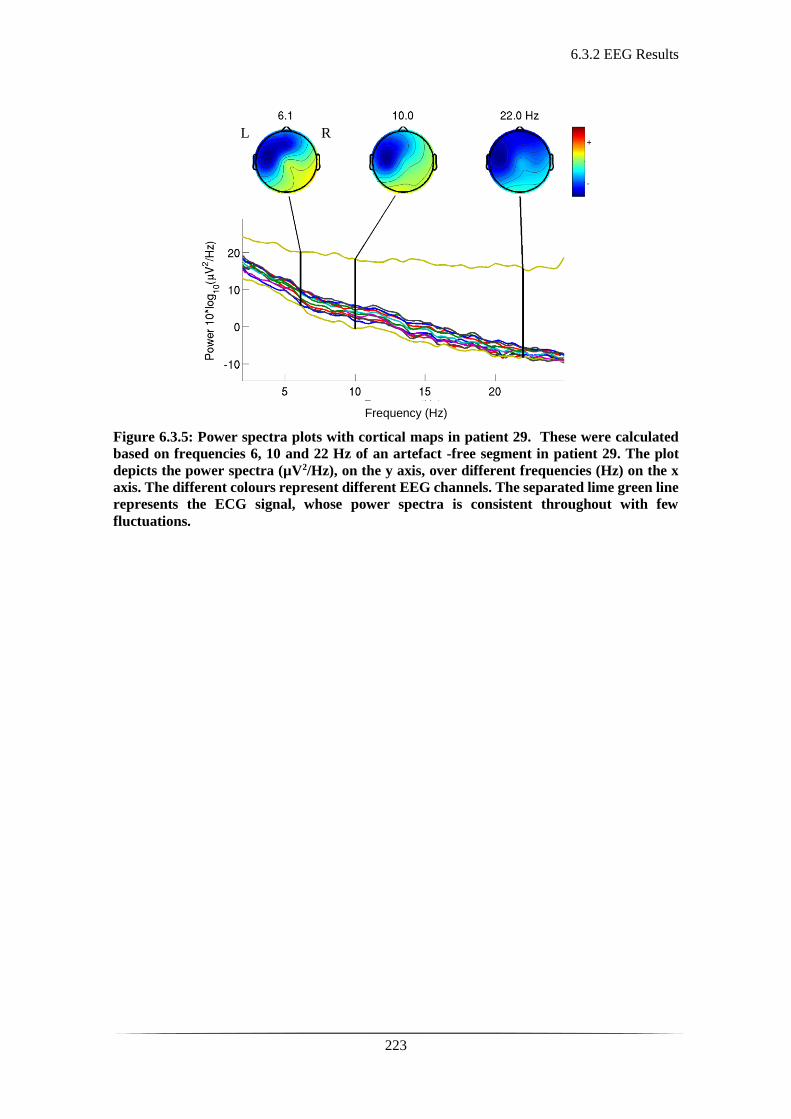
6.3.2 EEG Results
223
Figure 6.3.5: Power spectra plots with cortical maps in patient 29. These were calculated
based on frequencies 6, 10 and 22 Hz of an artefact -free segment in patient 29. The plot
depicts the power spectra (µV2/Hz), on the y axis, over different frequencies (Hz) on the x
axis. The different colours represent different EEG channels. The separated lime green line
represents the ECG signal, whose power spectra is consistent throughout with few
fluctuations.
Frequency (Hz)
R L
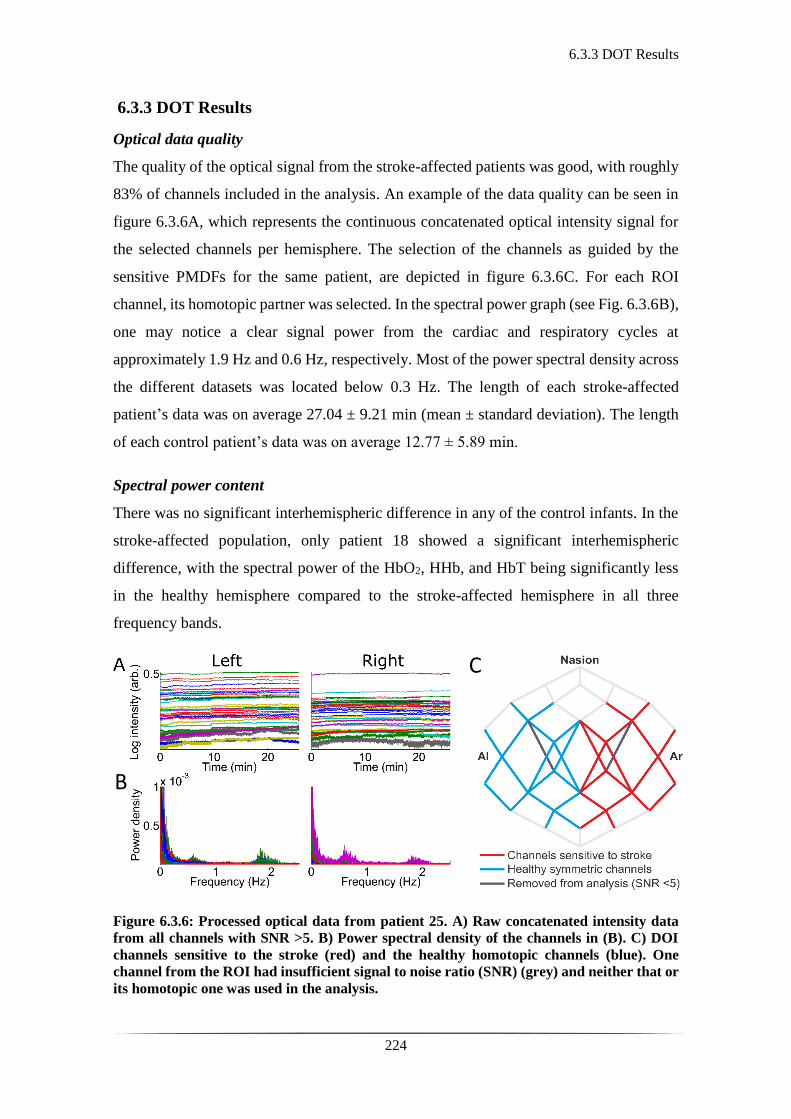
6.3.3 DOT Results
224
6.3.3 DOT Results
Optical data quality
The quality of the optical signal from the stroke-affected patients was good, with roughly
83% of channels included in the analysis. An example of the data quality can be seen in
figure 6.3.6A, which represents the continuous concatenated optical intensity signal for
the selected channels per hemisphere. The selection of the channels as guided by the
sensitive PMDFs for the same patient, are depicted in figure 6.3.6C. For each ROI
channel, its homotopic partner was selected. In the spectral power graph (see Fig. 6.3.6B),
one may notice a clear signal power from the cardiac and respiratory cycles at
approximately 1.9 Hz and 0.6 Hz, respectively. Most of the power spectral density across
the different datasets was located below 0.3 Hz. The length of each stroke-affected
patient’s data was on average 27.04 ± 9.21 min (mean ± standard deviation). The length
of each control patient’s data was on average 12.77 ± 5.89 min.
Spectral power content
There was no significant interhemispheric difference in any of the control infants. In the
stroke-affected population, only patient 18 showed a significant interhemispheric
difference, with the spectral power of the HbO2, HHb, and HbT being significantly less
in the healthy hemisphere compared to the stroke-affected hemisphere in all three
frequency bands.
Figure 6.3.6: Processed optical data from patient 25. A) Raw concatenated intensity data
from all channels with SNR >5. B) Power spectral density of the channels in (B). C) DOI
channels sensitive to the stroke (red) and the healthy homotopic channels (blue). One
channel from the ROI had insufficient signal to noise ratio (SNR) (grey) and neither that or
its homotopic one was used in the analysis.
B
C
6.3.3 DOT Results
225
Correlation results
As mentioned above in the optical data quality section, the optical signal from the stroke-
affected patients was good, with roughly 83% of channels included in the analysis. The
selection of the channels as guided by the sensitive PMDFs (ROI group) was narrowed
based on whether the channels were sampling the area of the stroke. In the ROI group, 2
pairs of channels were deemed to be sampling the area of the stroke for patient 16, 16
pairs for patient 18, 9 pairs for patient 25, and 18 pairs for patient 29.
The mean interhemispheric correlation values for patients 18, 25 and 29 lied
outside the 95% CI of the controls for the HbO2 and HHb oscillations in all three
frequency bands. This was consistently noted in both the blind and ROI group. The mean
interhemispheric correlation values of the ROI channels tested in patient 16 for the HbO2
oscillations in the resting state frequency fell within the 95% CI of the controls, 0.656
(95% CI: 0.635 - 0.713). The rest of the mean interhemispheric correlation values of the
ROI channels tested in patient 16 (as seen below in Table 6.3) lied outside the 95% CI of
the controls. Similarly, the mean interhemispheric correlation values of the blind channels
tested in patient 16 (as seen below in Table 6.3) lied outside the 95% CI of the controls.
The absolute mean values per patient in each condition were either similar or
marginally lower in the ROI group compared to the blind group except for patient 16,
where the mean values of the blind group were the lower ones. The absolute mean values
of patient 16, in both the ROI and blind groups, were much higher compared the ones of
the rest of the patients. This was consistently seen across the different frequency bands.
The mean correlation values of patient 18, 25, and 29 were significantly and consistently
low regardless of MRI-guided channel selection (with values ranging from 0.109 to 0.598
across the ROI and blind groups, see Table 6.3).

6.3.3 DOT Results
226
ROI
P16 P18 P25 P29 95% CI
HbO2 VL 0.823 0.289 0.357 0.510 0.693 - 0.792
RS 0.656 0.348 0.214 0.498 0.635 - 0.713
Mayer 0.736 0.485 0.226 0.319 0.432 - 0.542
HHb VL 0.833 0.235 0.117 0.377 0.581 - 0.724
RS 0.764 0.177 0.205 0.248 0.624 - 0.704
Mayer 0.653 0.281 0.109 0.119 0.341 - 0.441
Blind
P16 P18 P25 P29 95% CI
HbO2 VL 0.639 0.315 0.464 0.598 0.693 - 0.792
RS 0.618 0.352 0.365 0.561 0.639 - 0.712
Mayer 0.621 0.484 0.300 0.379 0.432 - 0.542
HHb VL 0.581 0.197 0.316 0.436 0.582 - 0.724
RS 0.509 0.174 0.333 0.357 0.624 - 0.704
Mayer 0.471 0.266 0.204 0.182 0.339 - 0.441
Table 6.3: Mean interhemispheric correlation values of patients 16, 18, 25, and 29 for HbO2
and HHb oscillations in the VL, RS, and Mayer wave frequency bands compared against
the 95% CI of all the controls in each condition. The table is referring to the two study
groups the ROI group (top half of the table) where channels were selected based on MRI-
guided stroke localisation and the blind group where channels were selected without
imaging-guidance. Note that the given 95% CI values are the same for both the ROI and
blond group. For the controls only one standard channel election was performed, which was
not MRI informed, as there were no neurological concerns or lateralised clinical findings.
6.4 Discussion and Conclusions
227
6.4 Discussion and Conclusions
The results of this part of the thesis are in keeping with some evidence of disrupted
lateralised and inter-hemispheric brain function in stroke-affected subjects. No difference
in the LFO spectral power of either hemisphere was identified in either of the controls or
patients, apart from patient 18. There was a difference in interhemispheric correlation
between controls and PAIS-affected patients in HbO2 and HHb oscillations for all three
frequency bands, with deviation from the relevant 95% CIs of the controls. It was only
the mean interhemispheric correlation value of the ROI channels in HbO2 resting state
oscillations of patient 16, which lied within the 95% CI of the controls in the same
frequency band.
The EEG recordings during the study were similar to the expected results from
other studies (148, 150). In two of the patients, patient 18 and 20, electrographic seizure
activity with focal onset was detected, thus aiding the diagnosis. The EEG can be a
reliable tool for detection of features characteristic or suggestive of stroke. However, if
the lesion is not extensive enough, it does not always appear to cause attenuation or sharp-
like waveform activity (150). In the absence of long, multi-channel recordings it is much
less informative. If no seizures are captured during the EEG recording, it is difficult to
establish the presence of a focal point of their origin or suspect stroke in the first instance.
Administration of medication (such as phenobarbitone) for cessation of seizure activity,
may alter the background activity and mask potential peri-ictal elements suggestive of
perinatal stroke. A pathological EEG does aid the diagnosis but a completely normal one
does not exclude the final diagnosis of perinatal stroke. In the EEG power spectra results
there was some suggestion of lower frequency content over the affected side for patients
16 and 29 (see Figures 6.3.3 and 6.35) and higher frequency content over the right side
for patient 25 where sharp wave activity was ongoing in keeping with lateralisation of
stroke (see Fig. 6.3.4). However, the source analysis performed here was limited by the
small number of EEG electrodes used in the study, thus limiting the use of this tool and
its interpretation.
The MRIs performed, invariably between day 4 to 10 of life, ultimately establish
the diagnosis of perinatal stroke. The cranial ultrasound scans were not diagnostic apart
from patient 16, where the one performed within 24 hours from clinical presentation,

6.4 Discussion and Conclusions
228
accurately detected an echogenic lesion in the left temporal region later confirmed on
MRI.
The optical power spectra content in the different low frequency bands did not
return any significant results for any of the control or PAIS-affected patients, apart from
patient 18. The presumption was that stroke-affected regions would have altered vascular
tone and abnormal circulation patterns which would be represented in the frequency
content of the optical signal. A possible explanation could be that PAIS patients were
scanned with DOT before bulk tissue necrosis had occurred; meaning any change to the
frequency power content of underlying circulation patterns was undetectable. There is
ongoing research to improve the understanding of recovery mechanisms following stroke
not only looking at the infarcted region but also the peri-infarct zone (450-452). In
contrast to our results, Li et al. studied spontaneous cerebral oscillations amongst healthy
adults and patients at risk for atherosclerotic stroke by performing a wavelet transform
analysis on a single left prefrontal NIRS signal in five frequency bands subdivided
between 0.005-2.0 Hz. They found significantly lower oscillation power for HbT and
HbO2 in the group of patients at risk of stroke versus the controls (453). Perhaps the
primarily different origin (haemorrhagic as opposed to ischaemic) and pathophysiological
cascade in adult compared to perinatal stroke may help explain why no interhemispheric
differences in spectral frequency band power were noticed.
The interhemispheric difference in spectral power content was detected only in
patient 18, who had lower spectral power of the HbO2, HHb, and HbT in the healthy
hemisphere compared to the stroke-affected hemisphere in all three frequency bands. This
could be attributed to the ongoing electrographic seizure activity noted on the
simultaneous continuous EEG recording (five discrete episodes of epileptiform activity
were noted, see Table 4.3). This activity was originating from the left hemisphere (stroke-
affected side), spreading across the cortex within seconds of onset. Further studies are
warranted to investigate how the LFO spectral power content of the optical signal could
be used as a method of seizure-detection in the NICU.
The mean interhemispheric correlation values of all patients deviated from the
95% CIs of the controls. This was noted for both HbO2 and HHb oscillations in all three
frequency bands consistently in the blind and ROI groups. The exception was patient 16,
where there was deviation for one of the conditions tested. More specifically, the mean
6.4 Discussion and Conclusions
229
correlation value of the ROI channels for HbO2 resting state oscillations in patient 16 was
the one found to lie within the 95% CI of the controls (0.656, 95% CI: 0.635 - 0.713).
Overall these results (see Table 6.3) demonstrated a significant difference in
interhemispheric correlation in cases of stroke-affected patients. Additionally, the
absolute mean values of patients 18, 25 and 29 were much lower in both the blind and
ROI groups, thus supporting low interhemispheric correlation in stroke-affected patients.
This interhemispheric correlation difference was noted consistently regardless of MRI-
informed channel selection. This potentially supports that having the patient’s MRI is not
necessarily a prerequisite for extracting some early diagnostic information from the
optical data prior to definitive imaging. However, this was only tested on four patients.
The absolute mean values of patient 16 were much higher than the ones of patients
18, 25, and 29. This was a consistent observation regardless of MRI-informed channel
selection, although the values were noted to be lower in the blind-channel assessment.
This would suggest a higher interhemispheric correlation between homotopic channels in
patient 16 as opposed to the rest of the patients. This difference noted could be attributed
to the fact that the lesion in patient 16 was significantly smaller, only occupying a small
region of the left temporal lobe, whereas the lesions in all other patients were significantly
larger (see Figures 6.3.1 and 6.3.2). It was observed that the correlation values for patient
16 were lower in the blind-channel group compared to the ROI-channel assessment. It is
worth noting here that the ROI channels sampling the stroke lesion in patient 16 were
only two homotopic pairs compared to a fair number of channels assessing the stroke
regions in the rest of the patients. The relatively sparse array over the temporal lobe and
small stroke lesion per se would have this effect upon the MRI-guided channel selection
and assessment of interhemispheric correlation. In the blind-channel assessment,
however, the interhemispheric values for patient 16 were lower and still outside the 95%
CI of the controls.
This indirectly could suggest that interhemispheric correlation appears lower in
the event of larger lesions, something which also appears in the EEG literature regarding
perinatal stroke; the larger the lesion, the more pronounced the attenuation of the signal
on the stroke-affected side (150). These results also highlight the importance of using a
dense array over the areas of interest and is explained in further detail later in the
discussion.
6.4 Discussion and Conclusions
230
In a similar fashion, White et al. observed inter-hemispheric Pearson’s R values
of approximately 0.8 for HbO2 and 0.65 HHb in healthy term patients, whereas the patient
with occipital stroke had markedly decreased correlation of approximately 0.2 for HbO2
and -0.15 for HHb (355). White et al., however, demonstrated this only on one patient at
a later stage (at 10 weeks of life) using a high density (HD) DOI device with 106 channels
covering the occipital cortex only. No follow up studies have been presented by the group.
Certain research groups have also explored Hb oscillations in the respiratory and
heart rate frequency bands. Muehlschlegel et al. used bi-hemispheric CW-NIRS to
investigate inter-hemispheric correlation coefficients for the respiratory and cardiac
oscillations amongst nine healthy adults and twelve stroke-affected patients, identifying
that the latter had a lower inter-hemispheric correlation coefficient for both the cardiac
and respiratory frequency bands (454). In this thesis, the respiratory and heart rate
frequencies were not included in the analysis due to the absence of continuous monitoring
of these physiological parameters. There is, however, ongoing work on recording and
integrating this information into the analysis for future studies. Similarly, arterial blood
pressure (ABP) was not recorded, due to no consistently existing continuous invasive
blood pressure monitoring across all the subjects.
Other groups have investigated the interhemispheric phase shift between the ABP
in relation to the flow velocity across the MCA (as measured by transcranial Doppler
(TCD)) and the low frequency HbO2 oscillations using NIRS in both healthy and stroke-
affected adults (446, 455). It was demonstrated that HbO2 inter-hemispheric phase shift
was significantly less in subjects undergoing thrombolytic therapy compared to untreated
stroke adults (446). Han et al. investigated inter-hemispheric phase synchronisation of
HbO2 oscillations in the prefrontal area of stroke-affected elderly patients (21 patients
with cerebral infarction and 21 controls). The group looked at low frequencies (0.021-
0.052 Hz and 0.052-0.145 Hz) and higher frequencies (0.145-0.6 Hz and 0.6-2 Hz),
finding significantly lower phase coherence within the lower frequency bands in
hypertensive patients with cerebral infarction (456). Although this study was a single
channel NIRS experiment on elderly patients, it still demonstrated the disruption of inter-
hemispheric coherence due to stroke primarily within the VL and RS frequency bands. In
healthy adult volunteers, Kuo et al. identified high coherence between the spontaneous
oscillations of the MCA blood flow velocity (as measured by TCD) and ABP only within

6.4 Discussion and Conclusions
231
low frequencies above 0.04 Hz, but not for very low frequencies (0.016 to 0.04 Hz) (431).
Further analysis in their study showed that the phase angle between ABP and the MCA
flow velocity was particularly dependent upon frequencies in the RS band (431). Both
studies add credence to the idea that physical injury to the MCA would most directly
affect VL and RS oscillations, and that these frequency bands should be a primary target
of investigation for stroke detection as presented in this thesis.
The sample of the patients is small, but the consistency of the results suggests an
interhemispheric difference deviating from the expected interhemispheric correlation
seen in controls. Additionally, the results appear to be consistent and independent to MRI-
informed stroke localisation. This supports further research and development of this
technology in early assessment and cortico-vascular monitoring in the first few days of
life until more definitive imaging such as MRI is available or applicable depending on
the patient’s overall clinical condition.
With currently available commercial DOI systems there is insufficient channel
count to densely cover the entire head with sources and detectors; consequently, the only
way to sample the entire cortex was to create a sparse array. As the most likely site of
PAIS injury is the MCA, the richest data generally came from channels sampling the
frontal and parietal cortical regions. A custom-made array to sample the MCA territory
could have been designed. However, the repercussion of this approach is that stroke
located in other brain regions, will be insufficiently sampled. This would decrease the
possibility of providing information on an individual patient basis. There is ongoing
research in the field of high-density DOI systems (see section 7.2 of chapter 7 for further
details).
This part of the thesis is one of very few evaluating PAIS using DOT in the acute
phase of the perinatal stroke, and to current knowledge, it is the first to assess inter-
hemispheric connectivity in stroke-affected infants using a multichannel, whole-head
DOT-EEG system. However, this project is limited by the small number of subjects,
sparse channel arrangement, and lack of access to peripheral physiology data. However,
the inter-hemispheric correlation results, warrant further investigations to develop
definite conclusions regarding the potential for early monitoring and detection of PAIS.
These findings could serve as the basis of a larger study in establishing DOT as an early
6.4 Discussion and Conclusions
232
diagnostic tool of PAIS at the cot-side, one which would complement the existing neuro-
monitoring and neuro-imaging tools to inform clinical management and prognosis.

233
Chapter 7: Conclusions and Future
Directions

234

7.1 Summary of Conclusions
235
7.1 Summary of Conclusions
This thesis has presented certain encouraging results in the field of simultaneous DOT
and EEG investigation of neonatal term brain injury with a focus on HIE and PAIS. The
results have hopefully contributed to a better understanding of these clinical entities and
associated neurophysiological phenomena such as seizures and burst suppression.
This project demonstrated the feasibility of studying critically ill infants in their
first few days of life by the cot side, without interfering with acute clinical care or causing
any adverse reactions. The methodology of combined EEG and multi-channel continuous
wave DOT application proved to be safe, non-invasive, available out of hours, and
portable to the cot side.
As shown, in the case study published by our group (365), DOT and EEG can be
used to capture neonatal seizures and investigate the associated cortico-vascular
fluctuations of HbO2, HHb and HbT. This was an encouraging first step in recognising
some of the haemodynamic changes occurring during a seizure on an infant’s cortex.
However, there was little reproducibility of this data in the later part of this project as
described in my thesis in chapter 4. Although it was incredibly challenging to time and
capture seizure activity in an infant at risk, in 1 to 4-hour recordings, such data were
collected from 4 patients. During these recordings, some changes in the concentration of
mainly HbO2, HbT and less of HHb were noted. Some of the features of these changes
were unlike the typical functional stimulation response seen in infants (457, 458). On the
contrary they were of an amplitude greater than the typically observed in healthy infants
(305, 316). However, the recordings were overall heavily corrupted with artefact, thus
minimising their contribution to substantial analysis and reproducibility of the original
data seen in the case study (365). The artefacts noted were not always patient-related or
seizure related as one would expect (as this was the case for patient 24). In one recording
there was a harmonic oscillation which could be attributed to electrical interference (in
patient 15). In two other recordings, there was a slower superimposing artefact which
seemed to be synchronised with the periodic inflation of the cooling mattress the patient
was wrapped in (patient 18 and 20). These events coincided with either seizure onset or
offset, thus making the extraction of the haemodynamic response challenging.
The first ever images of the cortical haemodynamic changes associated with burst
suppression in the clinical background of neonatal HIE were published during this
7.1 Summary of Conclusions
236
research project (408). A significant increase in the HbO2, HbT, and HHb concentrations
was noted in response to burst activity. This again did not follow the expected functional
stimulation response in infants. The observed changes could potentially be attributed to
either insufficient supply to meet the metabolic demand of the injured tissue or part of the
developmental processes occurring in the neonatal period. The increased spatial
resolution of multichannel DOT, revealed spatiotemporal characteristics of the
haemodynamic changes across the neonatal cortex which in a retrospective analysis,
appeared to be associated with pathological findings in the patient’s own MRI. However,
there is still the requirement for methodological development in establishing image-based
statistical approaches comparable to the ones used in other means of functional neuro-
imaging.
In the investigation of PAIS, there was a consistent deviation of the stroke-
affected patients’ mean interhemispheric correlation from the 95% CI of the
interhemispheric correlation values of all controls in HbO2 and HHb low frequency
oscillations. These results were consistent and somewhat independent to MRI-guided
stroke localisation as the results were similar in both the ROI-channel and blind-channel
selection groups. A variation in the mean interhemispheric correlation values amongst the
patients suggested that the interhemispheric correlation is much lower in cases of large
unilateral lesions. However, one must err on the side of caution as the total number of
patients was only 4 in total. The results indeed originated from a very small number of
patients, principally because of the relative scarcity of PAIS patients. This could still be
an initial step towards further research in the development of a DOT-based methodology
that can complement the existing diagnostic methods in the early detection of perinatal
stroke. The small number of patients in combination with a relatively sparse whole head
array were the main challenging factors in this part of the thesis.
The key issues and challenges identified in this thesis are described in section 7.2
alongside suggestions on how to improve the methodological approach and
reproducibility of this research.
7.2 Challenges and Methodology Development
237
7.2 Challenges and Methodology Development
The key challenges during the conduction of this research and different aspects of this
study were the following: motion artefact, physiological parameters that may affect or
contaminate the optical signal, design and density of the array, lack of image-based
statistical approach to the methodology and number of patients. This section attempts to
address some of these key issues.
One of the most significant issues in acquiring DOT data is the impact of motion
in signal quality. As one may imagine, and as shown in the previous chapters, this is even
more challenging when performing infant studies. Even subtle movement between the
optical fibre and the scalp can cause changes of high amplitude in the optical signal that
only cease as the movement stops. Slight variation in the force applied upon an optical
fibre against the skin affects the intensity measurements significantly, and the same
applies to the presence of hair. As described in the methodology there are ways to
overcome motion artefacts. One way to avoid or minimise the occurrence of motion, is to
make sure the infant is in a comfortable position, ideally in the postprandial phase
(especially in the case of a healthy term infant), asleep or quiet. Prior to the beginning of
the recording, it is also important to arrange the headgear and optical fibres in an optimal
position to avoid their movement during the study. In the pre-processing phase one may
proceed to careful visual inspection and manual rejection of artefact-corrupted periods. A
last option is to apply post-processing methods for filtering artefacts (374). Most DOT-
based studies use all the above-mentioned ways to identify artefact-free epochs whilst
there are ongoing advances in motion artefact rejection (459, 460).
However, there are occasions where movement is inevitable, for instance if the
infant is seizing (as seen in chapter 4). As described previously, clinical seizures in infants
are often subtle, and most frequently detected retrospectively by video-EEG. A possible
way of addressing this would be to include an accelerometer (or other motion sensor) into
the existing DOT headgear. All the above notions could be maintained in minimising
motion with the added advantage of being able to separately capture any movement of
the head whilst acquiring the data. This would allow fully automated detection of motion-
related events and thus aid the artefact filtering processing.
A different type of artefact identified in the group of patients with seizures during
the recordings raised different questions as to what the potential effect on surrounding
7.2 Challenges and Methodology Development
238
factors to data acquisition and the optical signal is. In chapter 4, a re-occurring slow wave
in the optical signal was observed. This was noted in two patients (patient 18 and 20) who
were undergoing hypothermia at the same time. This artefact coincided with the inflation
and deflation of the cooling mattress that the patients had wrapped around them (see
Figures 4.3.8, and 4.3.10-11). The patients’ torso upper and lower limbs were wrapped
within the mattress, whereas the head was exposed as the elastic headgear was applied.
The head part of the cooling mattress was still lying underneath the patients head with the
headgear applied on. There was increase of the optical signal from the baseline with the
inflation of the mattress and decrease relevant to the baseline with the deflation of the
mattress. These changes coincided with either the onset or offset of seizure events making
the extraction of the haemodynamic response to seizure activity challenging. One theory
that could explain this, is that as the mattress was inflating there was slight head
movement. However, the observed morphology of this change in the optical signal was
slower than the one expected to be associated with a motion-related artefact (see Figures
4.3.8, and 4.3.10-11). Another theory that could explain this phenomenon is that the
inflation and deflation of the mattress causes arterial blood pressure changes observed as
cortico-vascular changes in a hypoxic encephalopathic patient with presumed altered
cerebral autoregulation.
To explore the above-mentioned theory there are a lot of questions that remain
unanswered and require further development of the technology for any justifiable
conclusions to be reached. The assessment of any movement of the head could be
addressed with the use of an accelerometer applied onto the headgear as described
previously. The assessment of any peripheral changes such as changes in arterial blood
pressure or heart rate is challenging if there is no simultaneous ongoing monitoring of
these parameters during data acquisition. For future projects, continuous monitoring of
physiological parameters such as heart rate, respiratory rate, SaO2 and arterial blood
pressure should be considered as a requirement. It improves the understanding of cortico-
vascular changes observed and informs the analysis. And finally, is it possible that the
observed changes are not reflective of cortical changes but more superficial tissue
changes?
A frequent issue in DOT data acquisition and analysis is the contamination of the
signal by vascular activity in the layers of extracerebral tissue. Light must penetrate
7.2 Challenges and Methodology Development
239
several layers of tissue before reaching the brain, including the skin and skull.
Physiological changes, such as those due to heart rate, blood pressure or respiration,
occurring within these superficial tissues may contaminate the signal. Recent work shows
that the use of short source-detector NIRS channels (<15 mm), (which are used to
measure haemodynamics of the scalp alone rather than cortical signal) can be used to
improve the brain-specificity of NIRS and DOT measures (see Fig. 2.2.10). Further
analytical methods such as signal regression (346, 461, 462), independent component
analysis (ICA) (463) or principal component analysis (PCA) (464, 465) can be utilised to
calculate and hence eliminate the cortico-vascular changes attributed to superficial layers
of the head. The process of DOT image reconstruction (as mentioned in chapter 2 and 3)
includes the separation of signals arising from the separate superficial structures over the
brain tissue (351). Therefore, the presence of short separation channels onto the head
array during data acquisition would further inform signal analysis and should be
considered in further developing this DOT-EEG technique. Furthermore, in situations like
the presumed “artefact” seen secondary to the cooling mattress, the presence of short
separation channels would clarify whether this could be a response to changes in
superficial vasculature.
The whole-head array used in the project was designed to capture seizure activity
arising from different areas of the cortex. The arrangement of the sources and detectors
was chosen to maximise head coverage and provide good quality signal without the
optical fibres being arranged too sparsely. DOT requires the use of relatively large source-
detector separations to provide sensitivity to deeper regions of the tissue. This sparsity
affects the spatial resolution of the final DOT images. However, denser arrays with
source-detector separations down to <15 mm have been described in the literature (466).
It is anticipated that the limiting trade-off between channel count and cortical coverage
will disappear in the next few years as HD-DOI systems become more widely available.
Indeed, the first diffuse optical images of cortical activation that parallel the spatial
resolution and accuracy of BOLD fMRI have recently been reported (467).
A denser array could have been achieved with the system employed in this thesis.
For instance, if the cortical target is well known, one may increase the density of the
optical fibres by sacrificing a wider field-of-view. In the case of perinatal stroke, a denser
array could be designed, thus addressing the primary areas of interest. As the most
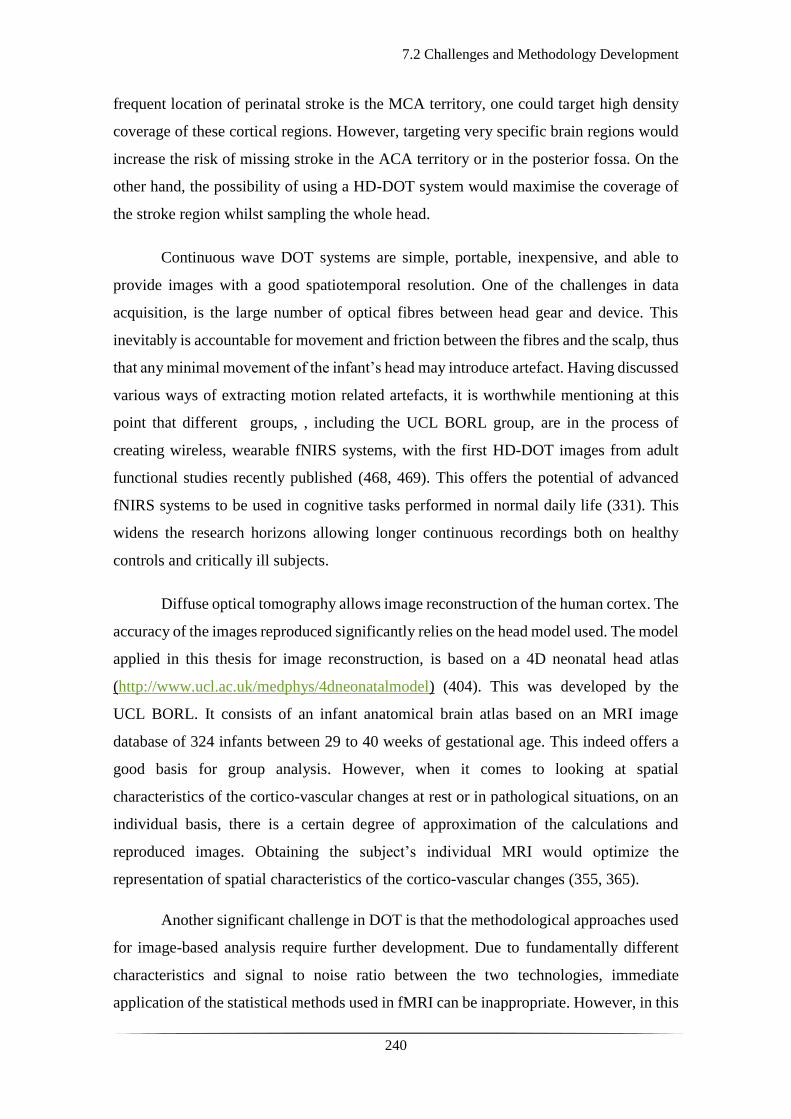
7.2 Challenges and Methodology Development
240
frequent location of perinatal stroke is the MCA territory, one could target high density
coverage of these cortical regions. However, targeting very specific brain regions would
increase the risk of missing stroke in the ACA territory or in the posterior fossa. On the
other hand, the possibility of using a HD-DOT system would maximise the coverage of
the stroke region whilst sampling the whole head.
Continuous wave DOT systems are simple, portable, inexpensive, and able to
provide images with a good spatiotemporal resolution. One of the challenges in data
acquisition, is the large number of optical fibres between head gear and device. This
inevitably is accountable for movement and friction between the fibres and the scalp, thus
that any minimal movement of the infant’s head may introduce artefact. Having discussed
various ways of extracting motion related artefacts, it is worthwhile mentioning at this
point that different groups, , including the UCL BORL group, are in the process of
creating wireless, wearable fNIRS systems, with the first HD-DOT images from adult
functional studies recently published (468, 469). This offers the potential of advanced
fNIRS systems to be used in cognitive tasks performed in normal daily life (331). This
widens the research horizons allowing longer continuous recordings both on healthy
controls and critically ill subjects.
Diffuse optical tomography allows image reconstruction of the human cortex. The
accuracy of the images reproduced significantly relies on the head model used. The model
applied in this thesis for image reconstruction, is based on a 4D neonatal head atlas
(http://www.ucl.ac.uk/medphys/4dneonatalmodel) (404). This was developed by the
UCL BORL. It consists of an infant anatomical brain atlas based on an MRI image
database of 324 infants between 29 to 40 weeks of gestational age. This indeed offers a
good basis for group analysis. However, when it comes to looking at spatial
characteristics of the cortico-vascular changes at rest or in pathological situations, on an
individual basis, there is a certain degree of approximation of the calculations and
reproduced images. Obtaining the subject’s individual MRI would optimize the
representation of spatial characteristics of the cortico-vascular changes (355, 365).
Another significant challenge in DOT is that the methodological approaches used
for image-based analysis require further development. Due to fundamentally different
characteristics and signal to noise ratio between the two technologies, immediate
application of the statistical methods used in fMRI can be inappropriate. However, in this

7.2 Challenges and Methodology Development
241
thesis a general linear model (GLM) approach was used to extract the haemodynamic
response to EEG bursts. As in fMRI statistical analysis, there are statistical parametric
mapping (SPM) tools using a GLM approach to yield statistical maps. These have
similarly been used in fNIRS for image reconstruction (470). However, there is still the
need for ongoing assessment and refinement of these techniques to account for certain
noise characteristics of DOT data prior to their full integration to DOT image
reconstruction (471).
Additionally, to the above-mentioned challenges in DOT data the, there remains
the limitation of absolute quantification of HbO2 and HHb concentrations. Without
additional information regarding the optical properties of the interrogated tissues, CW-
DOT devices can only provide relative measurements of the observed cortico-vascular
changes, rather than absolute measurements of the chromophore concentration. More
advanced optical systems can provide both quantitative measurements and a better
understanding of the optical properties of the investigated tissue such as time domain
fNIRS systems (for details see section 2.2.4 of chapter 2) (350, 472-474). However,
compared to CW-DOT systems, they remain expensive. Although they are portable, they
are often physically large, which makes them less suitable for neuro-imaging in the
neonatal intensive care unit. They are sensitive to movement and stability of their laser
alignment making them less easy to use. With the development of relatively low cost
single photon avalanche detectors (SPADS), the cost and size of time-domain devices
will likely be minimised, allowing these technologies to also become wireless and
wearable in the coming years (475).
Finally, one of the main issues in this study has been the numbers of patients
studied. Given the frequency and nature of some of the conditions investigated, for
instance perinatal stroke, the recruited numbers are expected to be low. However, ways
to improve this in the future is to consider communication of research studies to satellite
referring units to facilitate the consenting process. Another possibility is to consider
seeking ethics approval for consenting over the telephone. This would improve the
recruitment in the acute phase when targeting acute admissions of infants presenting with
seizures. Most of the infants presenting with seizures that were recruited in this study,
were referred from other units and transferred in frequently without their parents being
present in the first hours or days of admission to the unit. This attempt will require careful

7.2 Challenges and Methodology Development
242
consideration, but it would potentially improve the consenting and recruiting process.
Another possibility would be to consider running such studies on a multi-centre basis.
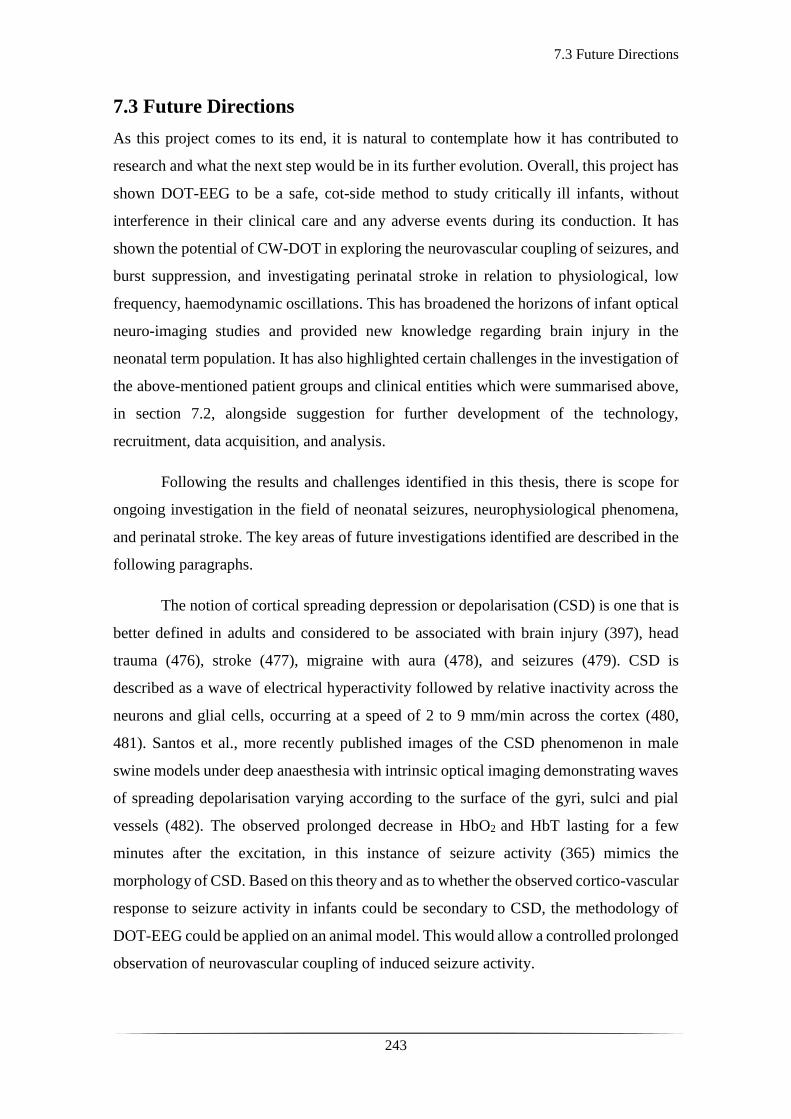
7.3 Future Directions
243
7.3 Future Directions
As this project comes to its end, it is natural to contemplate how it has contributed to
research and what the next step would be in its further evolution. Overall, this project has
shown DOT-EEG to be a safe, cot-side method to study critically ill infants, without
interference in their clinical care and any adverse events during its conduction. It has
shown the potential of CW-DOT in exploring the neurovascular coupling of seizures, and
burst suppression, and investigating perinatal stroke in relation to physiological, low
frequency, haemodynamic oscillations. This has broadened the horizons of infant optical
neuro-imaging studies and provided new knowledge regarding brain injury in the
neonatal term population. It has also highlighted certain challenges in the investigation of
the above-mentioned patient groups and clinical entities which were summarised above,
in section 7.2, alongside suggestion for further development of the technology,
recruitment, data acquisition, and analysis.
Following the results and challenges identified in this thesis, there is scope for
ongoing investigation in the field of neonatal seizures, neurophysiological phenomena,
and perinatal stroke. The key areas of future investigations identified are described in the
following paragraphs.
The notion of cortical spreading depression or depolarisation (CSD) is one that is
better defined in adults and considered to be associated with brain injury (397), head
trauma (476), stroke (477), migraine with aura (478), and seizures (479). CSD is
described as a wave of electrical hyperactivity followed by relative inactivity across the
neurons and glial cells, occurring at a speed of 2 to 9 mm/min across the cortex (480,
481). Santos et al., more recently published images of the CSD phenomenon in male
swine models under deep anaesthesia with intrinsic optical imaging demonstrating waves
of spreading depolarisation varying according to the surface of the gyri, sulci and pial
vessels (482). The observed prolonged decrease in HbO2 and HbT lasting for a few
minutes after the excitation, in this instance of seizure activity (365) mimics the
morphology of CSD. Based on this theory and as to whether the observed cortico-vascular
response to seizure activity in infants could be secondary to CSD, the methodology of
DOT-EEG could be applied on an animal model. This would allow a controlled prolonged
observation of neurovascular coupling of induced seizure activity.

7.3 Future Directions
244
Elevation of the baseline optical signal suggesting increase in HbT, observed in
patients undergoing TH, and coinciding with the periodic inflation of the cooling
mattress, suggested a potential impact of the restraining of limbs to arterial blood pressure
and subsequently cortical vasculature in situations of impaired CA. The fact that this was
observed in very few patients amongst the group undergoing TH further supports the
above-mentioned notion. However, further refinement of the technique is required and
more specifically the addition of short separation channels (as described in section 7.2)
to elucidate potential corruption of the signal from superficial layers. This in combination
with the synchronous acquisition of physiological parameters such as heart and ABP
could facilitate the understanding of the impact of therapeutic hypothermia in the cortical
vasculature.
As described in chapter 6, refinement of the methodological approach and image-
based analysis are the main two areas towards improving the investigation of perinatal
stroke. With HD-DOT systems becoming more widely available in the years to come, a
denser array could be developed for the exploration of stroke in the neonatal period. Such
an evolution of the technology could potentially lead to reproduction of the presented data
in this thesis on a limited number of patients and lead to a multicentre study on perinatal
stroke. At present, TH remains the principal neuroprotective treatment of neonatal brain
injury following HIE with significant reduction in lifelong neuro-disability (43, 44), with
a recent systematic review showing its benefits on patients and reduction of mortality
without increasing the risk of disability (483). Therefore, it has been debated in the
literature as to whether its beneficial effects, such as reduced metabolic demand and
reduced free radical and reactive oxygen species (ROS) formation, can be translated in
other forms of ischaemic injury such as perinatal stroke (85, 86) (for review see reference
(484)). The evolution of DOT and its potential future as a cot-side, neuro-imaging tool in
the NICU, could facilitate clinical trials in perinatal stroke.
The fundamental techniques employed in this project are directly transferable to
the preterm neonatal population. This could form the basis of a study in preterm infants
in the future. There are two main trajectories which could be investigated with
simultaneous DOT-EEG in preterm infants: an investigation of the haemodynamic
correlates of developmental changes in their EEG and an investigation of seizures in the
pre-term neonatal population.

7.3 Future Directions
245
As described in chapter 2 (see section 2.1.4), the neonatal EEG differs between
different gestational ages at birth and similarly matures as the infant reaches term
equivalent age. Studies of neonatal EEGs have provided the research community with
wealth of knowledge regarding the behaviour and phenomenology of neonatal brain
activity (179, 190, 203, 485). One of the main characteristics of preterm neonatal EEG is
its discontinuity, which resembles the appearance of burst suppression with alternating
periods of inactivity and burst like activity. As the infant matures from prematurity to
term, the periods of inactivity shorten, and the EEG progressively becomes continuous.
Most of the emerging features of EEG maturation are noted in active sleep, rather than
quiet sleep, with the latter remaining a period of relative inactivity up to 34-36 weeks of
postconceptional age (trace alternant-for further details see section 2.1.4). Similarly, to
the investigation of burst suppression (see chapter 4), combined DOT-EEG could be
applied in the study of neurovascular coupling of discontinuous neonatal EEG. Coupling
to this burst-like activity of preterm EEG has been shown before using NIRS (363).
However, the methodology described in this thesis could provide further spatiotemporal
information regarding preterm neuronal activity and lead to image reconstruction of the
associated haemodynamic changes. Additionally, longitudinal follow-up with scans of
extreme preterm infants (born below 28 weeks of gestation) could help identify any
maturational process in the cortico-vascular activity in line with the described and well
established evolution of the electrical brain activity (203). Considering distinct occipital
characteristics in the neonatal EEG as well as the excess of motion artefact when studying
well preterm infants, a denser array and ideally wireless technology would facilitate such
as a project. The basis of the technology, and analysis would be similar with the advantage
of a wireless, HD-DOT system.
Finally, simultaneous DOT-EEG could be applied in the study of seizures
amongst preterm infants at risk. There is debate as to the frequency of seizure occurrence
in the preterm population with certain studies showing a low incidence using continuous
EEG monitoring (486) as opposed to a high incidence using aEEG (487). Nevertheless,
there is great variation in such studies based on the population selection, investigating
tools, access to expertise in neonatal neurophysiology and level of neonatal care (regional,
tertiary as opposed to smaller, lower intensity units). Single centre studies have shown an
incidence of up to 48% in low birth weight infants (birth weight of less than 1,500 grams)
(488-490). A recent multicentre study considered the incidence and characteristics of
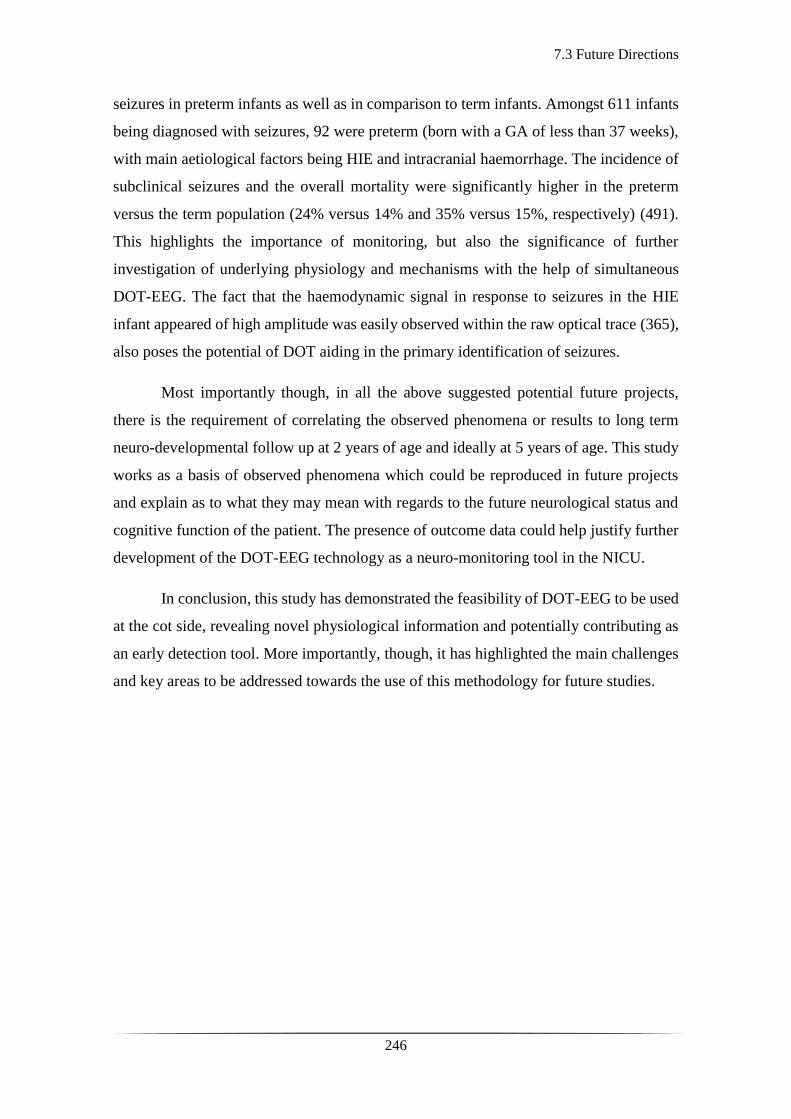
7.3 Future Directions
246
seizures in preterm infants as well as in comparison to term infants. Amongst 611 infants
being diagnosed with seizures, 92 were preterm (born with a GA of less than 37 weeks),
with main aetiological factors being HIE and intracranial haemorrhage. The incidence of
subclinical seizures and the overall mortality were significantly higher in the preterm
versus the term population (24% versus 14% and 35% versus 15%, respectively) (491).
This highlights the importance of monitoring, but also the significance of further
investigation of underlying physiology and mechanisms with the help of simultaneous
DOT-EEG. The fact that the haemodynamic signal in response to seizures in the HIE
infant appeared of high amplitude was easily observed within the raw optical trace (365),
also poses the potential of DOT aiding in the primary identification of seizures.
Most importantly though, in all the above suggested potential future projects,
there is the requirement of correlating the observed phenomena or results to long term
neuro-developmental follow up at 2 years of age and ideally at 5 years of age. This study
works as a basis of observed phenomena which could be reproduced in future projects
and explain as to what they may mean with regards to the future neurological status and
cognitive function of the patient. The presence of outcome data could help justify further
development of the DOT-EEG technology as a neuro-monitoring tool in the NICU.
In conclusion, this study has demonstrated the feasibility of DOT-EEG to be used
at the cot side, revealing novel physiological information and potentially contributing as
an early detection tool. More importantly, though, it has highlighted the main challenges
and key areas to be addressed towards the use of this methodology for future studies.
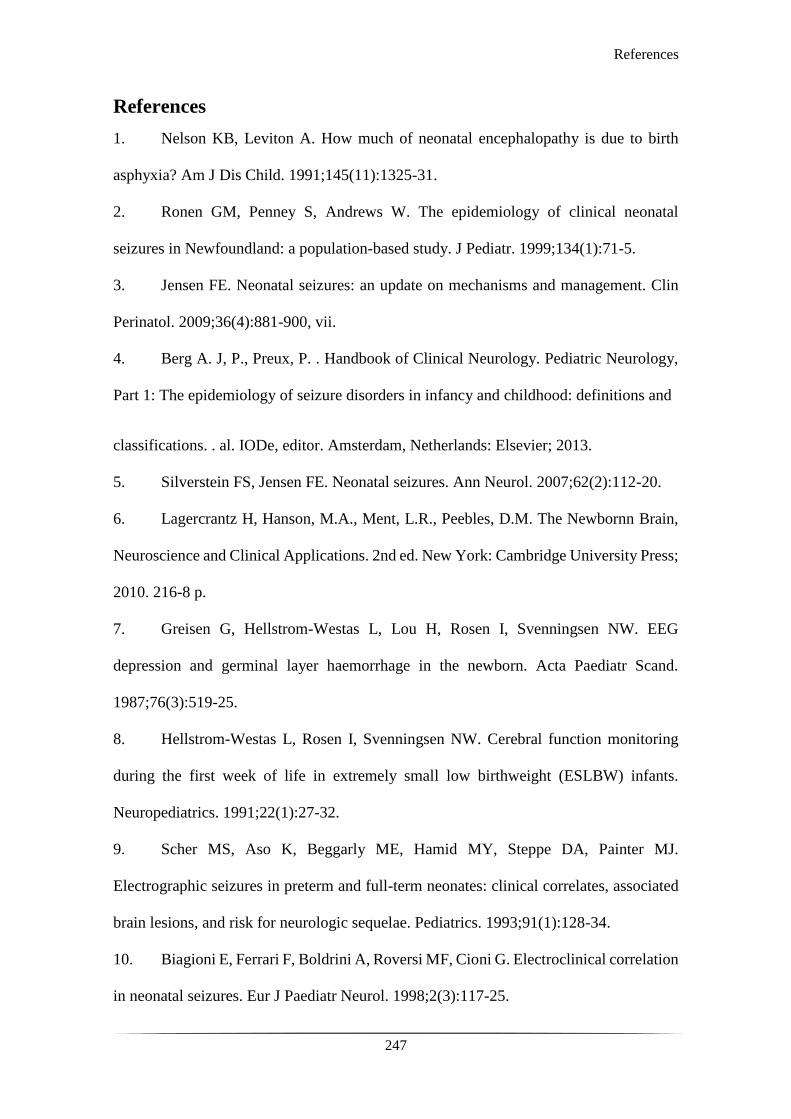
References
247
References
1. Nelson KB, Leviton A. How much of neonatal encephalopathy is due to birth
asphyxia? Am J Dis Child. 1991;145(11):1325-31.
2. Ronen GM, Penney S, Andrews W. The epidemiology of clinical neonatal
seizures in Newfoundland: a population-based study. J Pediatr. 1999;134(1):71-5.
3. Jensen FE. Neonatal seizures: an update on mechanisms and management. Clin
Perinatol. 2009;36(4):881-900, vii.
4. Berg A. J, P., Preux, P. . Handbook of Clinical Neurology. Pediatric Neurology,
Part 1: The epidemiology of seizure disorders in infancy and childhood: definitions and
classifications. . al. IODe, editor. Amsterdam, Netherlands: Elsevier; 2013.
5. Silverstein FS, Jensen FE. Neonatal seizures. Ann Neurol. 2007;62(2):112-20.
6. Lagercrantz H, Hanson, M.A., Ment, L.R., Peebles, D.M. The Newbornn Brain,
Neuroscience and Clinical Applications. 2nd ed. New York: Cambridge University Press;
2010. 216-8 p.
7. Greisen G, Hellstrom-Westas L, Lou H, Rosen I, Svenningsen NW. EEG
depression and germinal layer haemorrhage in the newborn. Acta Paediatr Scand.
1987;76(3):519-25.
8. Hellstrom-Westas L, Rosen I, Svenningsen NW. Cerebral function monitoring
during the first week of life in extremely small low birthweight (ESLBW) infants.
Neuropediatrics. 1991;22(1):27-32.
9. Scher MS, Aso K, Beggarly ME, Hamid MY, Steppe DA, Painter MJ.
Electrographic seizures in preterm and full-term neonates: clinical correlates, associated
brain lesions, and risk for neurologic sequelae. Pediatrics. 1993;91(1):128-34.
10. Biagioni E, Ferrari F, Boldrini A, Roversi MF, Cioni G. Electroclinical correlation
in neonatal seizures. Eur J Paediatr Neurol. 1998;2(3):117-25.
References
248
11. Tekgul H, Gauvreau K, Soul J, Murphy L, Robertson R, Stewart J, et al. The
current etiologic profile and neurodevelopmental outcome of seizures in term newborn
infants. Pediatrics. 2006;117(4):1270-80.
12. Nagarajan L. Neonatal Seizures. Current management and future challenges. 1st
ed. Ohuonu U, editor. London: Man Keith Press; 2016. 114-27 p.
13. Mastrangelo M, Van Lierde A, Bray M, Pastorino G, Marini A, Mosca F. Epileptic
seizures, epilepsy and epileptic syndromes in newborns: a nosological approach to 94
new cases by the 2001 proposed diagnostic scheme for people with epileptic seizures and
with epilepsy. Seizure. 2005;14(5):304-11.
14. Loman AM, ter Horst HJ, Lambrechtsen FA, Lunsing RJ. Neonatal seizures:
aetiology by means of a standardized work-up. Eur J Paediatr Neurol. 2014;18(3):360-7.
15. Levene M. The clinical conundrum of neonatal seizures. Arch Dis Child Fetal
Neonatal Ed. 2002;86(2):F75-7.
16. Holmes GL. The long-term effects of neonatal seizures. Clin Perinatol.
2009;36(4):901-14, vii-viii.
17. Nagarajan L, Palumbo L, Ghosh S. Neurodevelopmental outcomes in neonates
with seizures: a numerical score of background encephalography to help prognosticate. J
Child Neurol. 2010;25(8):961-8.
18. Glass HC, Nash KB, Bonifacio SL, Barkovich AJ, Ferriero DM, Sullivan JE, et
al. Seizures and magnetic resonance imaging-detected brain injury in newborns cooled
for hypoxic-ischemic encephalopathy. J Pediatr. 2011;159(5):731-5 e1.
19. Shah DK, Wusthoff CJ, Clarke P, Wyatt JS, Ramaiah SM, Dias RJ, et al.
Electrographic seizures are associated with brain injury in newborns undergoing
therapeutic hypothermia. Arch Dis Child Fetal Neonatal Ed. 2014;99(3):F219-24.
References
249
20. Volpe JJ. Neurology of the Newborn. ‘Hypoxic-ischaemic encephalopathy:
neuropathology and pathogenesis’. Philadelphia: PA: W. B. Saunders; 2008. 347-99 p.
21. Rennie JM. Rennie & Roberton's Textbook of Neonatology. Neurological
Problems in the Newborn. 5th ed. London: Churchill Livingstone, Elsevier Limited;
2012. 1114-5 p.
22. Badawi N, Kurinczuk JJ, Keogh JM, Alessandri LM, O'Sullivan F, Burton PR, et
al. Intrapartum risk factors for newborn encephalopathy: the Western Australian case-
control study. BMJ. 1998;317(7172):1554-8.
23. Smith J, Wells L, Dodd K. The continuing fall in incidence of hypoxic-ischaemic
encephalopathy in term infants. BJOG. 2000;107(4):461-6.
24. Lawn J, Shibuya K, Stein C. No cry at birth: global estimates of intrapartum
stillbirths and intrapartum-related neonatal deaths. Bull World Health Organ.
2005;83(6):409-17.
25. Marlow N, Rose AS, Rands CE, Draper ES. Neuropsychological and educational
problems at school age associated with neonatal encephalopathy. Arch Dis Child Fetal
Neonatal Ed. 2005;90(5):F380-7.
26. Gonzalez FF, Miller SP. Does perinatal asphyxia impair cognitive function
without cerebral palsy? Arch Dis Child Fetal Neonatal Ed. 2006;91(6):F454-9.
27. Bonifacio SL, Glass HC, Peloquin S, Ferriero DM. A new neurological focus in
neonatal intensive care. Nat Rev Neurol. 2011;7(9):485-94.
28. Peeters LL, Sheldon RE, Jones MD, Jr., Makowski EL, Meschia G. Blood flow
to fetal organs as a function of arterial oxygen content. Am J Obstet Gynecol.
1979;135(5):637-46.
29. Lange S. Peptidylarginine Deiminases as Drug Targets in Neonatal Hypoxic-
Ischemic Encephalopathy. Front Neurol. 2016;7:22.
References
250
30. Silbereis JC, Huang EJ, Back SA, Rowitch DH. Towards improved animal models
of neonatal white matter injury associated with cerebral palsy. Dis Model Mech.
2010;3(11-12):678-88.
31. Martinez-Biarge M, Diez-Sebastian J, Rutherford MA, Cowan FM. Outcomes
after central grey matter injury in term perinatal hypoxic-ischaemic encephalopathy.
Early Hum Dev. 2010;86(11):675-82.
32. Cowan FM, de Vries LS. The internal capsule in neonatal imaging. Semin Fetal
Neonatal Med. 2005;10(5):461-74.
33. Forbes KP, Pipe JG, Bird R. Neonatal hypoxic-ischemic encephalopathy:
detection with diffusion-weighted MR imaging. AJNR Am J Neuroradiol.
2000;21(8):1490-6.
34. Sarnat HB, Sarnat MS. Neonatal encephalopathy following fetal distress. A
clinical and electroencephalographic study. Arch Neurol. 1976;33(10):696-705.
35. Thompson CM, Puterman AS, Linley LL, Hann FM, van der Elst CW, Molteno
CD, et al. The value of a scoring system for hypoxic ischaemic encephalopathy in
predicting neurodevelopmental outcome. Acta Paediatr. 1997;86(7):757-61.
36. Shah P, Riphagen S, Beyene J, Perlman M. Multiorgan dysfunction in infants with
post-asphyxial hypoxic-ischaemic encephalopathy. Arch Dis Child Fetal Neonatal Ed.
2004;89(2):F152-5.
37. Ergenekon E. Therapeutic Hypothermia in neonatal intensive care unit:
Challenges and practical points. Journal of Clinical Neonatology. 2016;5(1):8-17.
38. Azzopardi D, Strohm B, Edwards AD, Halliday H, Juszczak E, Levene M, et al.
Treatment of asphyxiated newborns with moderate hypothermia in routine clinical
practice: how cooling is managed in the UK outside a clinical trial. Arch Dis Child Fetal
Neonatal Ed. 2009;94(4):F260-4.

References
251
39. Kapetanakis A, Azzopardi D, Wyatt J, Robertson NJ. Therapeutic hypothermia
for neonatal encephalopathy: a UK survey of opinion, practice and neuro-investigation at
the end of 2007. Acta Paediatr. 2009;98(4):631-5.
40. Gluckman PD, Wyatt JS, Azzopardi D, Ballard R, Edwards AD, Ferriero DM, et
al. Selective head cooling with mild systemic hypothermia after neonatal encephalopathy:
multicentre randomised trial. Lancet. 2005;365(9460):663-70.
41. Shankaran S, Laptook AR, Ehrenkranz RA, Tyson JE, McDonald SA, Donovan
EF, et al. Whole-body hypothermia for neonates with hypoxic-ischemic encephalopathy.
N Engl J Med. 2005;353(15):1574-84.
42. Simbruner G, Mittal RA, Rohlmann F, Muche R, neo.n EnTP. Systemic
hypothermia after neonatal encephalopathy: outcomes of neo.nEURO.network RCT.
Pediatrics. 2010;126(4):e771-8.
43. Edwards AD, Brocklehurst P, Gunn AJ, Halliday H, Juszczak E, Levene M, et al.
Neurological outcomes at 18 months of age after moderate hypothermia for perinatal
hypoxic ischaemic encephalopathy: synthesis and meta-analysis of trial data. BMJ.
2010;340:c363.
44. Azzopardi DV, Strohm B, Edwards AD, Dyet L, Halliday HL, Juszczak E, et al.
Moderate hypothermia to treat perinatal asphyxial encephalopathy. N Engl J Med.
2009;361(14):1349-58.
45. Azzopardi D, Robertson NJ, Bainbridge A, Cady E, Charles-Edwards G, Deierl
A, et al. Moderate hypothermia within 6 h of birth plus inhaled xenon versus moderate
hypothermia alone after birth asphyxia (TOBY-Xe): a proof-of-concept, open-label,
randomised controlled trial. Lancet Neurol. 2015.
References
252
46. Hobbs C, Thoresen M, Tucker A, Aquilina K, Chakkarapani E, Dingley J. Xenon
and hypothermia combine additively, offering long-term functional and histopathologic
neuroprotection after neonatal hypoxia/ischemia. Stroke. 2008;39(4):1307-13.
47. Chakkarapani E, Dingley J, Liu X, Hoque N, Aquilina K, Porter H, et al. Xenon
enhances hypothermic neuroprotection in asphyxiated newborn pigs. Ann Neurol.
2010;68(3):330-41.
48. Alonso-Alconada D, Alvarez A, Arteaga O, Martinez-Ibarguen A, Hilario E.
Neuroprotective effect of melatonin: a novel therapy against perinatal hypoxia-ischemia.
Int J Mol Sci. 2013;14(5):9379-95.
49. Tutunculer F, Eskiocak S, Basaran UN, Ekuklu G, Ayvaz S, Vatansever U. The
protective role of melatonin in experimental hypoxic brain damage. Pediatr Int.
2005;47(4):434-9.
50. Gitto E, Reiter RJ, Cordaro SP, La Rosa M, Chiurazzi P, Trimarchi G, et al.
Oxidative and inflammatory parameters in respiratory distress syndrome of preterm
newborns: beneficial effects of melatonin. Am J Perinatol. 2004;21(4):209-16.
51. Buonocore G, Groenendaal F. Anti-oxidant strategies. Semin Fetal Neonatal Med.
2007;12(4):287-95.
52. Robertson NJ, Faulkner S, Fleiss B, Bainbridge A, Andorka C, Price D, et al.
Melatonin augments hypothermic neuroprotection in a perinatal asphyxia model. Brain.
2013;136(Pt 1):90-105.
53. Liu R, Suzuki A, Guo Z, Mizuno Y, Urabe T. Intrinsic and extrinsic erythropoietin
enhances neuroprotection against ischemia and reperfusion injury in vitro. J Neurochem.
2006;96(4):1101-10.

References
253
54. Wu YW, Bauer LA, Ballard RA, Ferriero DM, Glidden DV, Mayock DE, et al.
Erythropoietin for neuroprotection in neonatal encephalopathy: safety and
pharmacokinetics. Pediatrics. 2012;130(4):683-91.
55. Fang AY, Gonzalez FF, Sheldon RA, Ferriero DM. Effects of combination
therapy using hypothermia and erythropoietin in a rat model of neonatal hypoxia-
ischemia. Pediatr Res. 2013;73(1):12-7.
56. Fan X, van Bel F, van der Kooij MA, Heijnen CJ, Groenendaal F. Hypothermia
and erythropoietin for neuroprotection after neonatal brain damage. Pediatr Res.
2013;73(1):18-23.
57. Zhu C, Kang W, Xu F, Cheng X, Zhang Z, Jia L, et al. Erythropoietin improved
neurologic outcomes in newborns with hypoxic-ischemic encephalopathy. Pediatrics.
2009;124(2):e218-26.
58. Wu YW, Mathur AM, Chang T, McKinstry RC, Mulkey SB, Mayock DE, et al.
High-Dose Erythropoietin and Hypothermia for Hypoxic-Ischemic Encephalopathy: A
Phase II Trial. Pediatrics. 2016;137(6).
59. Raju TN, Nelson KB, Ferriero D, Lynch JK, Participants N-NPSW. Ischemic
perinatal stroke: summary of a workshop sponsored by the National Institute of Child
Health and Human Development and the National Institute of Neurological Disorders and
Stroke. Pediatrics. 2007;120(3):609-16.
60. Lynch JK, Nelson KB. Epidemiology of perinatal stroke. Curr Opin Pediatr.
2001;13(6):499-505.
61. Wu YW, Lynch JK, Nelson KB. Perinatal arterial stroke: understanding
mechanisms and outcomes. Semin Neurol. 2005;25(4):424-34.

References
254
62. Volpe JJ. Neurology of the Newborn: Hypoxic Ischaemic Encephalopathy:
Neuropathology and Pathogenesis. 5th ed. Philadelphia: Saunders Esevier; 2008. 379-88
p.
63. Fitzgerald KC, Golomb MR. Neonatal arterial ischemic stroke and sinovenous
thrombosis associated with meningitis. J Child Neurol. 2007;22(7):818-22.
64. Chen J, Zimmerman RA, Jarvik GP, Nord AS, Clancy RR, Wernovsky G, et al.
Perioperative stroke in infants undergoing open heart operations for congenital heart
disease. Ann Thorac Surg. 2009;88(3):823-9.
65. Ramaswamy V, Miller SP, Barkovich AJ, Partridge JC, Ferriero DM. Perinatal
stroke in term infants with neonatal encephalopathy. Neurology. 2004;62(11):2088-91.
66. Cheong JL, Cowan FM. Neonatal arterial ischaemic stroke: obstetric issues.
Semin Fetal Neonatal Med. 2009;14(5):267-71.
67. Gupta M, Dinakaran S, Chan TK. Congenital horner syndrome and hemiplegia
secondary to carotid dissection. J Pediatr Ophthalmol Strabismus. 2005;42(2):122-4.
68. Rennie JM. Rennie & Roberton's Textbook of Neonatology. Neurological
Problems in the Newborn. 5th ed. London: Churchill Livingstone, Elsevier Limited;
2012. 1107-13 p.
69. Lee J, Croen LA, Backstrand KH, Yoshida CK, Henning LH, Lindan C, et al.
Maternal and infant characteristics associated with perinatal arterial stroke in the infant.
JAMA. 2005;293(6):723-9.
70. Nelson KB. Perinatal ischemic stroke. Stroke. 2007;38(2 Suppl):742-5.
71. Barmada MA, Moossy J, Shuman RM. Cerebral infarcts with arterial occlusion in
neonates. Ann Neurol. 1979;6(6):495-502.

References
255
72. Benders MJ, Groenendaal F, Uiterwaal CS, Nikkels PG, Bruinse HW, Nievelstein
RA, et al. Maternal and infant characteristics associated with perinatal arterial stroke in
the preterm infant. Stroke. 2007;38(6):1759-65.
73. Benders MJ, Groenendaal F, Uiterwaal CS, de Vries LS. Perinatal arterial stroke
in the preterm infant. Semin Perinatol. 2008;32(5):344-9.
74. Yager JY, Ashwal S. Animal models of perinatal hypoxic-ischemic brain damage.
Pediatr Neurol. 2009;40(3):156-67.
75. Rice JE, 3rd, Vannucci RC, Brierley JB. The influence of immaturity on hypoxic-
ischemic brain damage in the rat. Ann Neurol. 1981;9(2):131-41.
76. Derugin N, Ferriero DM, Vexler ZS. Neonatal reversible focal cerebral ischemia:
a new model. Neurosci Res. 1998;32(4):349-53.
77. Mu D, Jiang X, Sheldon RA, Fox CK, Hamrick SE, Vexler ZS, et al. Regulation
of hypoxia-inducible factor 1alpha and induction of vascular endothelial growth factor in
a rat neonatal stroke model. Neurobiol Dis. 2003;14(3):524-34.
78. Woo MS, Wang X, Faustino JV, Derugin N, Wendland MF, Zhou P, et al. Genetic
deletion of CD36 enhances injury after acute neonatal stroke. Ann Neurol.
2012;72(6):961-70.
79. Renolleau S, Aggoun-Zouaoui D, Ben-Ari Y, Charriaut-Marlangue C. A model
of transient unilateral focal ischemia with reperfusion in the P7 neonatal rat:
morphological changes indicative of apoptosis. Stroke. 1998;29(7):1454-60; discussion
61.
80. d'Orey MC, Melo MJ, Ramos I, Guimaraes H, Alves AR, Silva JS, et al. [Cerebral
ischemic infarction in newborn infants. Diagnosis using pulsed and color Doppler
imaging]. Arch Pediatr. 1999;6(4):457-9.
References
256
81. Govaert P, de Vries, L.S. An Atlas of Neonatal Brain Sonography. 2nd ed.
London: Mac Keith Press; 2010. 295-312 p.
82. Cnossen MH, van Ommen CH, Appel IM. Etiology and treatment of perinatal
stroke; a role for prothrombotic coagulation factors? Semin Fetal Neonatal Med.
2009;14(5):311-7.
83. Kollmar R, Staykov D, Dorfler A, Schellinger PD, Schwab S, Bardutzky J.
Hypothermia reduces perihemorrhagic edema after intracerebral hemorrhage. Stroke.
2010;41(8):1684-9.
84. van der Worp HB, Sena ES, Donnan GA, Howells DW, Macleod MR.
Hypothermia in animal models of acute ischaemic stroke: a systematic review and meta-
analysis. Brain. 2007;130(Pt 12):3063-74.
85. Krieger DW, De Georgia MA, Abou-Chebl A, Andrefsky JC, Sila CA, Katzan IL,
et al. Cooling for acute ischemic brain damage (cool aid): an open pilot study of induced
hypothermia in acute ischemic stroke. Stroke. 2001;32(8):1847-54.
86. Lyden PD, Allgren RL, Ng K, Akins P, Meyer B, Al-Sanani F, et al. Intravascular
Cooling in the Treatment of Stroke (ICTuS): early clinical experience. J Stroke
Cerebrovasc Dis. 2005;14(3):107-14.
87. De Georgia MA, Krieger DW, Abou-Chebl A, Devlin TG, Jauss M, Davis SM, et
al. Cooling for Acute Ischemic Brain Damage (COOL AID): a feasibility trial of
endovascular cooling. Neurology. 2004;63(2):312-7.
88. Harbert MJ, Tam EW, Glass HC, Bonifacio SL, Haeusslein LA, Barkovich AJ, et
al. Hypothermia is correlated with seizure absence in perinatal stroke. J Child Neurol.
2011;26(9):1126-30.
References
257
89. Ricci D, Mercuri E, Barnett A, Rathbone R, Cota F, Haataja L, et al. Cognitive
outcome at early school age in term-born children with perinatally acquired middle
cerebral artery territory infarction. Stroke. 2008;39(2):403-10.
90. Lee J, Croen LA, Lindan C, Nash KB, Yoshida CK, Ferriero DM, et al. Predictors
of outcome in perinatal arterial stroke: a population-based study. Ann Neurol.
2005;58(2):303-8.
91. Boardman JP, Ganesan V, Rutherford MA, Saunders DE, Mercuri E, Cowan F.
Magnetic resonance image correlates of hemiparesis after neonatal and childhood middle
cerebral artery stroke. Pediatrics. 2005;115(2):321-6.
92. Nelson KB, Lynch JK. Stroke in newborn infants. Lancet Neurol. 2004;3(3):150-
8.
93. Ramenghi LA, Govaert P, Fumagalli M, Bassi L, Mosca F. Neonatal cerebral
sinovenous thrombosis. Semin Fetal Neonatal Med. 2009;14(5):278-83.
94. deVeber G, Andrew M, Adams C, Bjornson B, Booth F, Buckley DJ, et al.
Cerebral sinovenous thrombosis in children. N Engl J Med. 2001;345(6):417-23.
95. Dlamini N, Billinghurst L, Kirkham FJ. Cerebral venous sinus (sinovenous)
thrombosis in children. Neurosurg Clin N Am. 2010;21(3):511-27.
96. Berfelo FJ, Kersbergen KJ, van Ommen CH, Govaert P, van Straaten HL, Poll-
The BT, et al. Neonatal cerebral sinovenous thrombosis from symptom to outcome.
Stroke. 2010;41(7):1382-8.
97. Simons B, Nijeholt, G.L., Smithuis, R. Neuroradiology: Cerebral Venous
Thrombosis Netherlands [Educational site of the Radiological Society of the
Netherlands].
98. Kirton A, deVeber G. Cerebral palsy secondary to perinatal ischemic stroke. Clin
Perinatol. 2006;33(2):367-86.

References
258
99. Fitzgerald KC, Williams LS, Garg BP, Carvalho KS, Golomb MR. Cerebral
sinovenous thrombosis in the neonate. Arch Neurol. 2006;63(3):405-9.
100. Moharir MD, Shroff M, Pontigon AM, Askalan R, Yau I, Macgregor D, et al. A
prospective outcome study of neonatal cerebral sinovenous thrombosis. J Child Neurol.
2011;26(9):1137-44.
101. Wanigasinghe J, Reid SM, Mackay MT, Reddihough DS, Harvey AS, Freeman
JL. Epilepsy in hemiplegic cerebral palsy due to perinatal arterial ischaemic stroke. Dev
Med Child Neurol. 2010;52(11):1021-7.
102. Wasay M, Dai AI, Ansari M, Shaikh Z, Roach ES. Cerebral venous sinus
thrombosis in children: a multicenter cohort from the United States. J Child Neurol.
2008;23(1):26-31.
103. Kersbergen KJ, de Vries LS, van Straaten HL, Benders MJ, Nievelstein RA,
Groenendaal F. Anticoagulation therapy and imaging in neonates with a unilateral
thalamic hemorrhage due to cerebral sinovenous thrombosis. Stroke. 2009;40(8):2754-
60.
104. Kersbergen KJ, de Vries LS, Leijten FS, Braun KP, Nievelstein RA, Groenendaal
F, et al. Neonatal thalamic hemorrhage is strongly associated with electrical status
epilepticus in slow wave sleep. Epilepsia. 2013;54(4):733-40.
105. Mercuri E, Anker S, Guzzetta A, Barnett A, Haataja L, Rutherford M, et al.
Neonatal cerebral infarction and visual function at school age. Arch Dis Child Fetal
Neonatal Ed. 2003;88(6):F487-91.
106. Ballantyne AO, Spilkin AM, Hesselink J, Trauner DA. Plasticity in the
developing brain: intellectual, language and academic functions in children with
ischaemic perinatal stroke. Brain. 2008;131(Pt 11):2975-85.
References
259
107. Westmacott R, MacGregor D, Askalan R, deVeber G. Late emergence of
cognitive deficits after unilateral neonatal stroke. Stroke. 2009;40(6):2012-9.
108. van Buuren LM, van der Aa NE, Dekker HC, Vermeulen RJ, van Nieuwenhuizen
O, van Schooneveld MM, et al. Cognitive outcome in childhood after unilateral perinatal
brain injury. Dev Med Child Neurol. 2013;55(10):934-40.
109. Kersbergen KJ, Groenendaal F, Benders MJ, van Straaten HL, Niwa T,
Nievelstein RA, et al. The spectrum of associated brain lesions in cerebral sinovenous
thrombosis: relation to gestational age and outcome. Arch Dis Child Fetal Neonatal Ed.
2011;96(6):F404-9.
110. Grunt S, Wingeier K, Wehrli E, Boltshauser E, Capone A, Fluss J, et al. Cerebral
sinus venous thrombosis in Swiss children. Dev Med Child Neurol. 2010;52(12):1145-
50.
111. Hellstrom-Westas L, Rosen I, Svenningsen NW. Predictive value of early
continuous amplitude integrated EEG recordings on outcome after severe birth asphyxia
in full term infants. Arch Dis Child Fetal Neonatal Ed. 1995;72(1):F34-8.
112. Hellstrom-Westas L, Rosen I. Continuous brain-function monitoring: state of the
art in clinical practice. Semin Fetal Neonatal Med. 2006;11(6):503-11.
113. van Rooij LG, Toet MC, Osredkar D, van Huffelen AC, Groenendaal F, de Vries
LS. Recovery of amplitude integrated electroencephalographic background patterns
within 24 hours of perinatal asphyxia. Arch Dis Child Fetal Neonatal Ed.
2005;90(3):F245-51.
114. Toet MC, Hellstrom-Westas L, Groenendaal F, Eken P, de Vries LS. Amplitude
integrated EEG 3 and 6 hours after birth in full term neonates with hypoxic-ischaemic
encephalopathy. Arch Dis Child Fetal Neonatal Ed. 1999;81(1):F19-23.

References
260
115. Toet MC, van Rooij LG, de Vries LS. The use of amplitude integrated
electroencephalography for assessing neonatal neurologic injury. Clin Perinatol.
2008;35(4):665-78, v.
116. Govaert P, de Vries, L.S. An Atlas of Neontal Brain Sonography. 2nd ed. Hart
HM, editor. London: Mac Keith Press; 2010. 265-92 p.
117. Rutherford MA, Pennock JM, Dubowitz LM. Cranial ultrasound and magnetic
resonance imaging in hypoxic-ischaemic encephalopathy: a comparison with outcome.
Dev Med Child Neurol. 1994;36(9):813-25.
118. Archer LN, Levene MI, Evans DH. Cerebral artery Doppler ultrasonography for
prediction of outcome after perinatal asphyxia. Lancet. 1986;2(8516):1116-8.
119. Elstad M, Whitelaw A, Thoresen M. Cerebral Resistance Index is less predictive
in hypothermic encephalopathic newborns. Acta Paediatr. 2011;100(10):1344-9.
120. Rutherford M, Malamateniou C, McGuinness A, Allsop J, Biarge MM, Counsell
S. Magnetic resonance imaging in hypoxic-ischaemic encephalopathy. Early Hum Dev.
2010;86(6):351-60.
121. Rutherford M, Ramenghi LA, Edwards AD, Brocklehurst P, Halliday H, Levene
M, et al. Assessment of brain tissue injury after moderate hypothermia in neonates with
hypoxic-ischaemic encephalopathy: a nested substudy of a randomised controlled trial.
Lancet Neurol. 2010;9(1):39-45.
122. McKinstry RC, Miller JH, Snyder AZ, Mathur A, Schefft GL, Almli CR, et al. A
prospective, longitudinal diffusion tensor imaging study of brain injury in newborns.
Neurology. 2002;59(6):824-33.
123. Barkovich AJ, Hajnal BL, Vigneron D, Sola A, Partridge JC, Allen F, et al.
Prediction of neuromotor outcome in perinatal asphyxia: evaluation of MR scoring
systems. AJNR Am J Neuroradiol. 1998;19(1):143-9.

References
261
124. Martinez-Biarge M, Diez-Sebastian J, Kapellou O, Gindner D, Allsop JM,
Rutherford MA, et al. Predicting motor outcome and death in term hypoxic-ischemic
encephalopathy. Neurology. 2011;76(24):2055-61.
125. Martinez-Biarge M, Bregant T, Wusthoff CJ, Chew AT, Diez-Sebastian J,
Rutherford MA, et al. White matter and cortical injury in hypoxic-ischemic
encephalopathy: antecedent factors and 2-year outcome. J Pediatr. 2012;161(5):799-807.
126. Goergen SK, Ang H, Wong F, Carse EA, Charlton M, Evans R, et al. Early MRI
in term infants with perinatal hypoxic-ischaemic brain injury: interobserver agreement
and MRI predictors of outcome at 2 years. Clin Radiol. 2014;69(1):72-81.
127. Bonifacio SL, Miller, S.P. Neonatal seizures and brain imaging. Journal of
Pediatric Neurology. 2009;7(1):61-7.
128. Osmond E, Billetop A, Jary S, Likeman M, Thoresen M, Luyt K. Neonatal
seizures: magnetic resonance imaging adds value in the diagnosis and prediction of
neurodisability. Acta Paediatr. 2014;103(8):820-6.
129. De Vis JB, Alderliesten T, Hendrikse J, Petersen ET, Benders MJ. Magnetic
resonance imaging based noninvasive measurements of brain hemodynamics in neonates:
a review. Pediatr Res. 2016;80(5):641-50.
130. Benders MJ, Hendrikse J, De Vries LS, Van Bel F, Groenendaal F. Phase-contrast
magnetic resonance angiography measurements of global cerebral blood flow in the
neonate. Pediatr Res. 2011;69(6):544-7.
131. Varela M, Groves AM, Arichi T, Hajnal JV. Mean cerebral blood flow
measurements using phase contrast MRI in the first year of life. NMR Biomed.
2012;25(9):1063-72.
132. De Vis JB, Petersen ET, de Vries LS, Groenendaal F, Kersbergen KJ, Alderliesten
T, et al. Regional changes in brain perfusion during brain maturation measured non-

References
262
invasively with Arterial Spin Labeling MRI in neonates. Eur J Radiol. 2013;82(3):538-
43.
133. De Vis JB, Hendrikse J, Petersen ET, de Vries LS, van Bel F, Alderliesten T, et
al. Arterial spin-labelling perfusion MRI and outcome in neonates with hypoxic-ischemic
encephalopathy. Eur Radiol. 2015;25(1):113-21.
134. Shi H, Song D, Zhang YX, Qi M, Li HS, Tan ZS, et al. [Analysis of arterial spin
labeling in 33 patients with hypoxic ischemic encephalopathy]. Zhonghua Er Ke Za Zhi.
2012;50(2):131-5.
135. Roth SC, Baudin J, Cady E, Johal K, Townsend JP, Wyatt JS, et al. Relation of
deranged neonatal cerebral oxidative metabolism with neurodevelopmental outcome and
head circumference at 4 years. Dev Med Child Neurol. 1997;39(11):718-25.
136. Wintermark P, Moessinger AC, Gudinchet F, Meuli R. Temporal evolution of MR
perfusion in neonatal hypoxic-ischemic encephalopathy. J Magn Reson Imaging.
2008;27(6):1229-34.
137. Cheong JL, Cady EB, Penrice J, Wyatt JS, Cox IJ, Robertson NJ. Proton MR
spectroscopy in neonates with perinatal cerebral hypoxic-ischemic injury: metabolite
peak-area ratios, relaxation times, and absolute concentrations. AJNR Am J Neuroradiol.
2006;27(7):1546-54.
138. Thayyil S, Chandrasekaran M, Taylor A, Bainbridge A, Cady EB, Chong WK, et
al. Cerebral magnetic resonance biomarkers in neonatal encephalopathy: a meta-analysis.
Pediatrics. 2010;125(2):e382-95.
139. Azzopardi D, Wyatt JS, Cady EB, Delpy DT, Baudin J, Stewart AL, et al.
Prognosis of newborn infants with hypoxic-ischemic brain injury assessed by phosphorus
magnetic resonance spectroscopy. Pediatr Res. 1989;25(5):445-51.

References
263
140. Robertson NJ, Cox IJ, Cowan FM, Counsell SJ, Azzopardi D, Edwards AD.
Cerebral intracellular lactic alkalosis persisting months after neonatal encephalopathy
measured by magnetic resonance spectroscopy. Pediatr Res. 1999;46(3):287-96.
141. Penrice J, Cady EB, Lorek A, Wylezinska M, Amess PN, Aldridge RF, et al.
Proton magnetic resonance spectroscopy of the brain in normal preterm and term infants,
and early changes after perinatal hypoxia-ischemia. Pediatr Res. 1996;40(1):6-14.
142. Penrice J, Lorek A, Cady EB, Amess PN, Wylezinska M, Cooper CE, et al. Proton
magnetic resonance spectroscopy of the brain during acute hypoxia-ischemia and delayed
cerebral energy failure in the newborn piglet. Pediatr Res. 1997;41(6):795-802.
143. Lei H, Peeling J. Effect of temperature on the kinetics of lactate production and
clearance in a rat model of forebrain ischemia. Biochem Cell Biol. 1998;76(2-3):503-9.
144. Rothman DL, Howseman AM, Graham GD, Petroff OA, Lantos G, Fayad PB, et
al. Localized proton NMR observation of [3-13C]lactate in stroke after [1-13C]glucose
infusion. Magn Reson Med. 1991;21(2):302-7.
145. Groenendaal F, Veenhoven RH, van der Grond J, Jansen GH, Witkamp TD, de
Vries LS. Cerebral lactate and N-acetyl-aspartate/choline ratios in asphyxiated full-term
neonates demonstrated in vivo using proton magnetic resonance spectroscopy. Pediatr
Res. 1994;35(2):148-51.
146. Barkovich AJ, Baranski K, Vigneron D, Partridge JC, Hallam DK, Hajnal BL, et
al. Proton MR spectroscopy for the evaluation of brain injury in asphyxiated, term
neonates. AJNR Am J Neuroradiol. 1999;20(8):1399-405.
147. Zarifi MK, Astrakas LG, Poussaint TY, Plessis Ad A, Zurakowski D, Tzika AA.
Prediction of adverse outcome with cerebral lactate level and apparent diffusion
coefficient in infants with perinatal asphyxia. Radiology. 2002;225(3):859-70.
References
264
148. Mercuri E. Early diagnostic and prognostic indicators in full term infants with
neonatal cerebral infarction: an integrated clinical, neuroradiological and EEG approach.
Minerva Pediatr. 2001;53(4):305-11.
149. Rafay MF, Cortez MA, de Veber GA, Tan-Dy C, Al-Futaisi A, Yoon W, et al.
Predictive value of clinical and EEG features in the diagnosis of stroke and hypoxic
ischemic encephalopathy in neonates with seizures. Stroke. 2009;40(7):2402-7.
150. Low E, Mathieson SR, Stevenson NJ, Livingstone V, Ryan CA, Bogue CO, et al.
Early postnatal EEG features of perinatal arterial ischaemic stroke with seizures. PLoS
One. 2014;9(7):e100973.
151. de Vries LS, Groenendaal F, Eken P, van Haastert IC, Rademaker KJ, Meiners
LC. Infarcts in the vascular distribution of the middle cerebral artery in preterm and
fullterm infants. Neuropediatrics. 1997;28(2):88-96.
152. Govaert P, Matthys E, Zecic A, Roelens F, Oostra A, Vanzieleghem B. Perinatal
cortical infarction within middle cerebral artery trunks. Arch Dis Child Fetal Neonatal
Ed. 2000;82(1):F59-63.
153. Cowan F, Mercuri E, Groenendaal F, Bassi L, Ricci D, Rutherford M, et al. Does
cranial ultrasound imaging identify arterial cerebral infarction in term neonates? Arch Dis
Child Fetal Neonatal Ed. 2005;90(3):F252-6.
154. Golomb MR, Dick PT, MacGregor DL, Armstrong DC, DeVeber GA. Cranial
ultrasonography has a low sensitivity for detecting arterial ischemic stroke in term
neonates. J Child Neurol. 2003;18(2):98-103.
155. Donaldson B. Real time ultrasound, arterial pulsation and neonatal cerebral
infarction. Postgrad Med J. 1987;63(738):263-5.
156. Steventon DM, John PR. Power Doppler ultrasound appearances of neonatal
ischaemic brain injury. Pediatr Radiol. 1997;27(2):147-9.
References
265
157. Lequin MH, Dudink J, Tong KA, Obenaus A. Magnetic resonance imaging in
neonatal stroke. Semin Fetal Neonatal Med. 2009;14(5):299-310.
158. Dudink J, Mercuri E, Al-Nakib L, Govaert P, Counsell SJ, Rutherford MA, et al.
Evolution of unilateral perinatal arterial ischemic stroke on conventional and diffusion-
weighted MR imaging. AJNR Am J Neuroradiol. 2009;30(5):998-1004.
159. Wintermark P, Warfield SK. New insights in perinatal arterial ischemic stroke by
assessing brain perfusion. Transl Stroke Res. 2012;3(2):255-62.
160. van der Aa NE, Porsius ED, Hendrikse J, van Kooij BJ, Benders MJ, de Vries LS,
et al. Changes in carotid blood flow after unilateral perinatal arterial ischemic stroke.
Pediatr Res. 2012;72(1):50-6.
161. De Vis JB, Petersen ET, Kersbergen KJ, Alderliesten T, de Vries LS, van Bel F,
et al. Evaluation of perinatal arterial ischemic stroke using noninvasive arterial spin
labeling perfusion MRI. Pediatr Res. 2013;74(3):307-13.
162. Wyatt JS. Near-infrared spectroscopy in asphyxial brain injury. Clin Perinatol.
1993;20(2):369-78.
163. Meek JH, Elwell CE, McCormick DC, Edwards AD, Townsend JP, Stewart AL,
et al. Abnormal cerebral haemodynamics in perinatally asphyxiated neonates related to
outcome. Arch Dis Child Fetal Neonatal Ed. 1999;81(2):F110-5.
164. Marin T, Moore J. Understanding near-infrared spectroscopy. Adv Neonatal Care.
2011;11(6):382-8.
165. Caton R. The electric currents of the brain. British Medical Journal. 1875;2:278.
166. Fritsch G HE. Ueber die elektrishe Erregarkeit des Grosshims. The Cerebral
Cortex Thomas, Springfield. 1870(101):73-96.
167. Beck A CN. Further research on the electrical phenomena of the cerebral cortex
in monkeys and dogs. Rozpr Akad Um Wydz Mat-Przyr Ser. 1891;11(32):369-75.
References
266
168. Cybulski N. Action currents of the cerebral cortex (in Polish). Bull Int Acad
Cracovie. 1914:776.
169. Berger H. Über das Elektrenkephalogramm des Menschen. Archiv für Psychiatrie
und Nervenkrankheiten. 1929;87(1):527-70.
170. Tao JX, Ray A, Hawes-Ebersole S, Ebersole JS. Intracranial EEG substrates of
scalp EEG interictal spikes. Epilepsia. 2005;46(5):669-76.
171. Bear MF, Connors, B.W., Paradiso, M.A. Neuroscience: Exploring the Brain. 4th
Edition ed: Wolters Kluwer; 2016.
172. Niedermeyer E. The electrocerebellogram. Clin EEG Neurosci. 2004;35(2):112-
5.
173. Schaul N. The fundamental neural mechanisms of electroencephalography.
Electroencephalogr Clin Neurophysiol. 1998;106(2):101-7.
174. Gloor P. Neuronal generators and the problem of localization in
electroencephalography: application of volume conductor theory to
electroencephalography. J Clin Neurophysiol. 1985;2(4):327-54.
175. Gloor P, editor Electroencephalography and the role of intracerebral depth
electrode recordings in the selection of patients for surgical treatment of epilepsy.
Advances in Epileptology XVth Epikepsy International Symposium; 1984; New York:
Raven Press.
176. Report of the Committee on Methods of Clinical Examination in
Electroencephalography. Electroencephalogr Clin Neurophysiol. 1958;10:370-75.
177. Kellaway P, Crawley, J.W. A primer of electroencephalography of infants,
sections I & II: methodology and criteria of nomrality. Houston: Baylor University
College of Medicine; 1964. 47 p.

References
267
178. Tekgul H, Bourgeois BF, Gauvreau K, Bergin AM. Electroencephalography in
neonatal seizures: comparison of a reduced and a full 10/20 montage. Pediatr Neurol.
2005;32(3):155-61.
179. Mizrahi EM, Hrachovy, R.A., Kellaway, P. Atlas of Neonatal Encephalography.
3rd ed. Philadelphia: Lippincott Williams & Wilkins; 2004.
180. Pressler RM, Binnie, C.D., Cooper, R., Robinson, R. . Neonatal and Paediatric
Clinical Neurophysiology, 1e. Philadelphia: Churchill Livingstone; 2007. 59-60, 190-1
p.
181. Shellhaas RA, Chang T, Tsuchida T, Scher MS, Riviello JJ, Abend NS, et al. The
American Clinical Neurophysiology Society's Guideline on Continuous
Electroencephalography Monitoring in Neonates. J Clin Neurophysiol. 2011;28(6):611-
7.
182. Maynard DE. EEG analysis using an analogue frequency analyser and a digital
computer. Electroencephalogr Clin Neurophysiol. 1967;23(5):487.
183. Maynard D, Prior PF, Scott DF. Device for continuous monitoring of cerebral
activity in resuscitated patients. Br Med J. 1969;4(5682):545-6.
184. Maynard D, Prior PF, Scott DF. A continuous monitoring device for cerebral
activity. Electroencephalogr Clin Neurophysiol. 1969;27(7):672-3.
185. Hellstrom-Westas L, de Vries, L.S., Rosen, I. Atlas of AMPLITUDE-
INTEGRATED EEGs in the NEWBORN. 2nd ed. London: Informa Healthcare; 2008.
186. Burdjalov VF, Baumgart S, Spitzer AR. Cerebral function monitoring: a new
scoring system for the evaluation of brain maturation in neonates. Pediatrics.
2003;112(4):855-61.
References
268
187. al Naqeeb N, Edwards AD, Cowan FM, Azzopardi D. Assessment of neonatal
encephalopathy by amplitude-integrated electroencephalography. Pediatrics. 1999;103(6
Pt 1):1263-71.
188. Dreyfus-Brisac C. Ontogenesis of brain bioelectrical activity and sleep
organisation in neonates and infants1979.
189. Dreyfus-Brisac C. Neurophysiological studies in human premature and full-term
newborns. Biol Psychiatry. 1975;10(5):485-96.
190. Andre M, Lamblin MD, d'Allest AM, Curzi-Dascalova L, Moussalli-Salefranque
F, T SNT, et al. Electroencephalography in premature and full-term infants.
Developmental features and glossary. Neurophysiol Clin. 2010;40(2):59-124.
191. Torres F, Anderson C. The normal EEG of the human newborn. J Clin
Neurophysiol. 1985;2(2):89-103.
192. Lamblin MD, Andre M, Challamel MJ, Curzi-Dascalova L, d'Allest AM, De
Giovanni E, et al. [Electroencephalography of the premature and term newborn.
Maturational aspects and glossary]. Neurophysiol Clin. 1999;29(2):123-219.
193. Prechtl HF. The behavioural states of the newborn infant (a review). Brain Res.
1974;76(2):185-212.
194. Anders T ER, Parmelee A. . A manual of standardized terminology, techniques
and criteria for scoring of states of sleep and wakefulness in newborn infants: Los
Angeles: UCLA Brain Information Service/BRI Publications Office; 1971.
195. Monod N, Curzi-Dascalova L. [Transitional sleep states in the neonate at term].
Rev Electroencephalogr Neurophysiol Clin. 1973;3(1):87-96.
196. Curzi-Dascalova L, Figueroa JM, Eiselt M, Christova E, Virassamy A, d'Allest
AM, et al. Sleep state organization in premature infants of less than 35 weeks' gestational
age. Pediatr Res. 1993;34(5):624-8.

References
269
197. Dreyfus-Brisac C. The electroencephalogram of the premature infant. World
Neurol. 1962;3:5-15.
198. Laoprasert P. Atlas of Pediatric EEG: Mac Graw Hill Companies, Inc.; 2011.
199. Vecchierini MF, d'Allest AM, Verpillat P. EEG patterns in 10 extreme premature
neonates with normal neurological outcome: qualitative and quantitative data. Brain Dev.
2003;25(5):330-7.
200. Hahn JS, Monyer H, Tharp BR. Interburst interval measurements in the EEGs of
premature infants with normal neurological outcome. Electroencephalogr Clin
Neurophysiol. 1989;73(5):410-8.
201. Selton D, Andre M, Hascoet JM. Normal EEG in very premature infants:
reference criteria. Clin Neurophysiol. 2000;111(12):2116-24.
202. Blanc C, Dreyfus-Brisac C. Electroencephalogramme et maturation cerebrale.
Encephale. 1956;45(3):205-41.
203. Vanhatalo S, Kaila K. Development of neonatal EEG activity: from
phenomenology to physiology. Semin Fetal Neonatal Med. 2006;11(6):471-8.
204. Marmor MF, Holder GE, Seeliger MW, Yamamoto S, International Society for
Clinical Electrophysiology of V. Standard for clinical electroretinography (2004 update).
Doc Ophthalmol. 2004;108(2):107-14.
205. Young GB, da Silva OP. Effects of morphine on the electroencephalograms of
neonates: a prospective, observational study. Clin Neurophysiol. 2000;111(11):1955-60.
206. Selton D, Andre M. Prognosis of hypoxic-ischaemic encephalopathy in full-term
newborns--value of neonatal electroencephalography. Neuropediatrics. 1997;28(5):276-
80.
References
270
207. Glass HC, Wusthoff CJ, Shellhaas RA, Tsuchida TN, Bonifacio SL, Cordeiro M,
et al. Risk factors for EEG seizures in neonates treated with hypothermia: a multicenter
cohort study. Neurology. 2014;82(14):1239-44.
208. Boylan GB, Kharoshankaya L, Wusthoff CJ. Seizures and hypothermia:
importance of electroencephalographic monitoring and considerations for treatment.
Semin Fetal Neonatal Med. 2015;20(2):103-8.
209. Amzica F. What does burst suppression really mean? Epilepsy Behav.
2015;49:234-7.
210. Gibbs FA, Gibbs, E.L. Atlas of electroencephalography. Cambridge: Addison-
Wesley; 1952.
211. Demyer W, White PT. Eeg in Holoprosencephaly (Arhinencephaly). Arch Neurol.
1964;11:507-20.
212. Bokisa AE, Bonachea EM, Jadcherla SR. Death by neurologic criteria in a
neonate: Implications for organ donation. J Neonatal Perinatal Med. 2015;8(3):263-7.
213. Mizrahi EM, Tharp BR. A characteristic EEG pattern in neonatal herpes simplex
encephalitis. Neurology. 1982;32(11):1215-20.
214. Mikati MA, Feraru E, Krishnamoorthy K, Lombroso CT. Neonatal herpes simplex
meningoencephalitis: EEG investigations and clinical correlates. Neurology.
1990;40(9):1433-7.
215. Blume WT, Dreyfus-Brisac C. Positive rolandic sharp waves in neonatal EEG;
types and significance. Electroencephalogr Clin Neurophysiol. 1982;53(3):277-82.
216. Kidokoro H, Okumura A, Hayakawa F, Kato T, Maruyama K, Kubota T, et al.
Chronologic changes in neonatal EEG findings in periventricular leukomalacia.
Pediatrics. 2009;124(3):e468-75.
References
271
217. Novotny EJ, Jr., Tharp BR, Coen RW, Bejar R, Enzmann D, Vaucher YE. Positive
rolandic sharp waves in the EEG of the premature infant. Neurology. 1987;37(9):1481-6.
218. Freeman JM, Lietman PS. A basic approach to the understanding of seizures and
the mechanism of action and metabolism of anticonvulsants. Adv Pediatr.
1973;20(0):291-321.
219. Moshe SL. Epileptogenesis and the immature brain. Epilepsia. 1987;28 Suppl
1:S3-15.
220. Lothman EW. Pathophysiology of seizures and epilepsy in the mature and
immature brain: Cells, synapses and circuits. New York: Demos Publications; 1993.
221. Clancy RR, Legido A. The exact ictal and interictal duration of
electroencephalographic neonatal seizures. Epilepsia. 1987;28(5):537-41.
222. Volpe JJ. Neurology of the Newborn: Neonatal Seizures. 5th ed. Philadelphia:
Saunders Esevier; 2008. 203 p.
223. Volpe JJ. Neurology of the Newborn: Neonatal Seizures. 5th ed. Philadelphia:
Saunders Elsevier; 2008. 203-41 p.
224. Ronen GM, Buckley D, Penney S, Streiner DL. Long-term prognosis in children
with neonatal seizures: a population-based study. Neurology. 2007;69(19):1816-22.
225. Uria-Avellanal C, Marlow N, Rennie JM. Outcome following neonatal seizures.
Semin Fetal Neonatal Med. 2013;18(4):224-32.
226. Malone A, Ryan CA, Fitzgerald A, Burgoyne L, Connolly S, Boylan GB.
Interobserver agreement in neonatal seizure identification. Epilepsia. 2009;50(9):2097-
101.
227. Dreyfus-Brisac C, Monod, N. Electroclinical studies of status epilepticus and
convulsions in the newborn. In Kellaway P, Petterson, S., editor. New York: Grune &
Stratton; 1964.
References
272
228. Radvanyi-Bouvet MF, Vallecalle MH, Morel-Kahn F, Relier JP, Dreyfus-Brisac
C. Seizures and electrical discharges in premature infants. Neuropediatrics.
1985;16(3):143-8.
229. Mizrahi EM, Kellaway P. Characterization and classification of neonatal seizures.
Neurology. 1987;37(12):1837-44.
230. Mizrahi EM, Kellaway, P. Diagnosis and Management of Neonatal Seizures.
Philadelphia: Lippincott-Raven; 1998.
231. Rennie JM. Rennie & Roberton's Textbook of Neonatology. Neurological
Problemss in the Newborn. 5th ed. London: Churchill Livingstone, Elsevier Limited;
2012. 1080-98 p.
232. Pisani F, Cerminara C, Fusco C, Sisti L. Neonatal status epilepticus vs recurrent
neonatal seizures: clinical findings and outcome. Neurology. 2007;69(23):2177-85.
233. Scher MS, Hamid MY, Steppe DA, Beggarly ME, Painter MJ. Ictal and interictal
electrographic seizure durations in preterm and term neonates. Epilepsia. 1993;34(2):284-
8.
234. Shellhaas RA, Clancy RR. Characterization of neonatal seizures by conventional
EEG and single-channel EEG. Clin Neurophysiol. 2007;118(10):2156-61.
235. Lynch NE, Stevenson NJ, Livingstone V, Murphy BP, Rennie JM, Boylan GB.
The temporal evolution of electrographic seizure burden in neonatal hypoxic ischemic
encephalopathy. Epilepsia. 2012;53(3):549-57.
236. Low E, Boylan GB, Mathieson SR, Murray DM, Korotchikova I, Stevenson NJ,
et al. Cooling and seizure burden in term neonates: an observational study. Arch Dis Child
Fetal Neonatal Ed. 2012;97(4):F267-72.
237. McBride MC, Laroia N, Guillet R. Electrographic seizures in neonates correlate
with poor neurodevelopmental outcome. Neurology. 2000;55(4):506-13.

References
273
238. Abend NS, Wusthoff CJ. Neonatal seizures and status epilepticus. J Clin
Neurophysiol. 2012;29(5):441-8.
239. Shah DK, Boylan GB, Rennie JM. Monitoring of seizures in the newborn. Arch
Dis Child Fetal Neonatal Ed. 2012;97(1):F65-9.
240. Clancy RR. The contribution of EEG to the understanding of neonatal seizures.
Epilepsia. 1996;37 Suppl 1:S52-9.
241. Okumura A, Hayakawa F, Kato T, Itomi K, Maruyama K, Kubota T, et al. Ictal
electroencephalographic findings of neonatal seizures in preterm infants. Brain Dev.
2008;30(4):261-8.
242. Wusthoff CJ. Diagnosing neonatal seizures and status epilepticus. J Clin
Neurophysiol. 2013;30(2):115-21.
243. Patrizi S, Holmes GL, Orzalesi M, Allemand F. Neonatal seizures: characteristics
of EEG ictal activity in preterm and fullterm infants. Brain Dev. 2003;25(6):427-37.
244. Scher MS, Painter MJ, Bergman I, Barmada MA, Brunberg J. EEG diagnoses of
neonatal seizures: clinical correlations and outcome. Pediatr Neurol. 1989;5(1):17-24.
245. Lombroso CT. Neonatal seizures: a clinician's overview. Brain Dev.
1996;18(1):1-28.
246. Mizrahi EM. Neonatal seizures: problems in diagnosis and classification.
Epilepsia. 1987;28 Suppl 1:S46-55.
247. Clayton GH, Owens GC, Wolff JS, Smith RL. Ontogeny of cation-Cl-
cotransporter expression in rat neocortex. Brain Res Dev Brain Res. 1998;109(2):281-92.
248. Rivera C, Voipio J, Payne JA, Ruusuvuori E, Lahtinen H, Lamsa K, et al. The
K+/Cl- co-transporter KCC2 renders GABA hyperpolarizing during neuronal maturation.
Nature. 1999;397(6716):251-5.
References
274
249. Yamada J, Okabe A, Toyoda H, Kilb W, Luhmann HJ, Fukuda A. Cl- uptake
promoting depolarizing GABA actions in immature rat neocortical neurones is mediated
by NKCC1. J Physiol. 2004;557(Pt 3):829-41.
250. McCoy B, Sharma R, Ochi A, Go C, Otsubo H, Hutchison JS, et al. Predictors of
nonconvulsive seizures among critically ill children. Epilepsia. 2011;52(11):1973-8.
251. Abend NS, Gutierrez-Colina AM, Topjian AA, Zhao H, Guo R, Donnelly M, et
al. Nonconvulsive seizures are common in critically ill children. Neurology.
2011;76(12):1071-7.
252. Abend NS, Arndt DH, Carpenter JL, Chapman KE, Cornett KM, Gallentine WB,
et al. Electrographic seizures in pediatric ICU patients: cohort study of risk factors and
mortality. Neurology. 2013;81(4):383-91.
253. Kwon JM, Guillet R, Shankaran S, Laptook AR, McDonald SA, Ehrenkranz RA,
et al. Clinical seizures in neonatal hypoxic-ischemic encephalopathy have no independent
impact on neurodevelopmental outcome: secondary analyses of data from the neonatal
research network hypothermia trial. J Child Neurol. 2011;26(3):322-8.
254. Jensen FE, Applegate CD, Holtzman D, Belin TR, Burchfiel JL. Epileptogenic
effect of hypoxia in the immature rodent brain. Ann Neurol. 1991;29(6):629-37.
255. Lowenstein DH, Shimosaka S, So YT, Simon RP. The relationship between
electrographic seizure activity and neuronal injury. Epilepsy Res. 1991;10(1):49-54.
256. Wasterlain CG, Shirasaka Y. Seizures, brain damage and brain development.
Brain Dev. 1994;16(4):279-95.
257. Sanchez RM, Koh S, Rio C, Wang C, Lamperti ED, Sharma D, et al. Decreased
glutamate receptor 2 expression and enhanced epileptogenesis in immature rat
hippocampus after perinatal hypoxia-induced seizures. J Neurosci. 2001;21(20):8154-63.
References
275
258. Meldrum B. Excitotoxicity and epileptic brain damage. Epilepsy Res.
1991;10(1):55-61.
259. Holmes GL. Effects of seizures on brain development: lessons from the
laboratory. Pediatr Neurol. 2005;33(1):1-11.
260. Nagarajan L, Ghosh S, Palumbo L. Ictal electroencephalograms in neonatal
seizures: characteristics and associations. Pediatr Neurol. 2011;45(1):11-6.
261. Jain P, Sharma S, Tripathi M. Diagnosis and management of epileptic
encephalopathies in children. Epilepsy Res Treat. 2013;2013:501981.
262. Pinto LC, Giliberti P. Neonatal seizures: background EEG activity and the
electroclinical correlation in full-term neonates with hypoxic-ischemic encephalopathy.
Analysis by computer-synchronized long-term polygraphic video-EEG monitoring.
Epileptic Disord. 2001;3(3):125-32.
263. Lewis LD, Ching S, Weiner VS, Peterfreund RA, Eskandar EN, Cash SS, et al.
Local cortical dynamics of burst suppression in the anaesthetized brain. Brain.
2013;136(Pt 9):2727-37.
264. Menache CC, Bourgeois BF, Volpe JJ. Prognostic value of neonatal discontinuous
EEG. Pediatr Neurol. 2002;27(2):93-101.
265. Monod N, Pajot, N. and Guidasci, S. The neonatal EEG: statistical studies and
prognostic value in full-term and pre-term babies. Electroencephalogr Clin Neurophysiol.
1972;32(5):529-44.
266. Eken P, Toet MC, Groenendaal F, de Vries LS. Predictive value of early
neuroimaging, pulsed Doppler and neurophysiology in full term infants with hypoxic-
ischaemic encephalopathy. Arch Dis Child Fetal Neonatal Ed. 1995;73(2):F75-80.

References
276
267. Iyer KK, Roberts JA, Metsaranta M, Finnigan S, Breakspear M, Vanhatalo S.
Novel features of early burst suppression predict outcome after birth asphyxia. Ann Clin
Transl Neurol. 2014;1(3):209-14.
268. Japaridze N, Muthuraman M, Reinicke C, Moeller F, Anwar AR, Mideksa KG, et
al. Neuronal Networks during Burst Suppression as Revealed by Source Analysis. PLoS
One. 2015;10(4):e0123807.
269. Young GB. The EEG in coma. J Clin Neurophysiol. 2000;17(5):473-85.
270. Ohtahara S, Yamatogi Y. Epileptic encephalopathies in early infancy with
suppression-burst. J Clin Neurophysiol. 2003;20(6):398-407.
271. Akrawi WP, Drummond JC, Kalkman CJ, Patel PM. A comparison of the
electrophysiologic characteristics of EEG burst-suppression as produced by isoflurane,
thiopental, etomidate, and propofol. J Neurosurg Anesthesiol. 1996;8(1):40-6.
272. Stecker MM, Cheung AT, Pochettino A, Kent GP, Patterson T, Weiss SJ, et al.
Deep hypothermic circulatory arrest: II. Changes in electroencephalogram and evoked
potentials during rewarming. Ann Thorac Surg. 2001;71(1):22-8.
273. Thoresen M, Hellstrom-Westas L, Liu X, de Vries LS. Effect of hypothermia on
amplitude-integrated electroencephalogram in infants with asphyxia. Pediatrics.
2010;126(1):e131-9.
274. Wertheim D, Mercuri E, Faundez JC, Rutherford M, Acolet D, Dubowitz L.
Prognostic value of continuous electroencephalographic recording in full term infants
with hypoxic ischaemic encephalopathy. Arch Dis Child. 1994;71(2):F97-102.
275. Jobsis FF. Non-invasive, infra-red monitoring of cerebral O2 sufficiency,
bloodvolume, HbO2-Hb shifts and bloodflow. Acta Neurol Scand Suppl. 1977;64:452-3.
276. Bouguer P. Essai d'optique sur la gradation de la lumiere Paris, France: Claude
Jombert; 1729. 16-22 p.

References
277
277. Lambert JH. Photometria sive de mensura et gradibus luminis, colorum et
umbrae: Photometry, or On the measure and gradiations of light, colours, and shade.
Germany: Eberhardt Klett; 1760.
278. Beer A. Bestimmung der Absorption des rothen Lichts in fabrigen Flussigkeiten:
Determination of the absorption of red light in coloured liquids. Annalen der Physik und
Chemie. 1852;86:78-88.
279. Woodard HQ, White DR. The composition of body tissues. Br J Radiol.
1986;59(708):1209-18.
280. Matcher SJ, Elwell CE, Cooper CE, Cope M, Delpy DT. Performance comparison
of several published tissue near-infrared spectroscopy algorithms. Anal Biochem.
1995;227(1):54-68.
281. Gervain J, Mehler J, Werker JF, Nelson CA, Csibra G, Lloyd-Fox S, et al. Near-
infrared spectroscopy: a report from the McDonnell infant methodology consortium. Dev
Cogn Neurosci. 2011;1(1):22-46.
282. Tisdall MM, Tachtsidis I, Leung TS, Elwell CE, Smith M. Near-infrared
spectroscopic quantification of changes in the concentration of oxidized cytochrome c
oxidase in the healthy human brain during hypoxemia. J Biomed Opt. 2007;12(2):024002.
283. Delpy DT, Cope M, van der Zee P, Arridge S, Wray S, Wyatt J. Estimation of
optical pathlength through tissue from direct time of flight measurement. Phys Med Biol.
1988;33(12):1433-42.
284. Arridge SR, Cope M, Delpy DT. The theoretical basis for the determination of
optical pathlengths in tissue: temporal and frequency analysis. Phys Med Biol.
1992;37(7):1531-60.
285. van der Zee P, Cope M, Arridge SR, Essenpreis M, Potter LA, Edwards AD, et
al. Experimentally measured optical pathlengths for the adult head, calf and forearm and
References
278
the head of the newborn infant as a function of inter optode spacing. Adv Exp Med Biol.
1992;316:143-53.
286. Gordon GR, Mulligan SJ, MacVicar BA. Astrocyte control of the
cerebrovasculature. Glia. 2007;55(12):1214-21.
287. Buxton RB, Wong EC, Frank LR. Dynamics of blood flow and oxygenation
changes during brain activation: the balloon model. Magn Reson Med. 1998;39(6):855-
64.
288. Iadecola C. Neurovascular regulation in the normal brain and in Alzheimer's
disease. Nat Rev Neurosci. 2004;5(5):347-60.
289. Liao LD, Tsytsarev V, Delgado-Martinez I, Li ML, Erzurumlu R, Vipin A, et al.
Neurovascular coupling: in vivo optical techniques for functional brain imaging. Biomed
Eng Online. 2013;12:38.
290. Magistretti PJ, Pellerin L, Rothman DL, Shulman RG. Energy on demand.
Science. 1999;283(5401):496-7.
291. Iadecola C, Nedergaard M. Glial regulation of the cerebral microvasculature. Nat
Neurosci. 2007;10(11):1369-76.
292. Attwell D, Buchan AM, Charpak S, Lauritzen M, Macvicar BA, Newman EA.
Glial and neuronal control of brain blood flow. Nature. 2010;468(7321):232-43.
293. Orozco-Cabal L, Pollandt S, Liu J, Shinnick-Gallagher P, Gallagher JP.
Regulation of synaptic transmission by CRF receptors. Rev Neurosci. 2006;17(3):279-
307.
294. Rossi DJ. Another BOLD role for astrocytes: coupling blood flow to neural
activity. Nat Neurosci. 2006;9(2):159-61.
References
279
295. Fox PT, Raichle ME. Focal physiological uncoupling of cerebral blood flow and
oxidative metabolism during somatosensory stimulation in human subjects. Proc Natl
Acad Sci U S A. 1986;83(4):1140-4.
296. Boas DA, Strangman G, Culver JP, Hoge RD, Jasdzewski G, Poldrack RA, et al.
Can the cerebral metabolic rate of oxygen be estimated with near-infrared spectroscopy?
Phys Med Biol. 2003;48(15):2405-18.
297. Tak S, Jang J, Lee K, Ye JC. Quantification of CMRO(2) without hypercapnia
using simultaneous near-infrared spectroscopy and fMRI measurements. Phys Med Biol.
2010;55(11):3249-69.
298. Hock C, Muller-Spahn F, Schuh-Hofer S, Hofmann M, Dirnagl U, Villringer A.
Age dependency of changes in cerebral hemoglobin oxygenation during brain activation:
a near-infrared spectroscopy study. J Cereb Blood Flow Metab. 1995;15(6):1103-8.
299. Hock C, Villringer K, Muller-Spahn F, Wenzel R, Heekeren H, Schuh-Hofer S,
et al. Decrease in parietal cerebral hemoglobin oxygenation during performance of a
verbal fluency task in patients with Alzheimer's disease monitored by means of near-
infrared spectroscopy (NIRS)--correlation with simultaneous rCBF-PET measurements.
Brain Res. 1997;755(2):293-303.
300. Hoshi Y, Tamura M. Dynamic multichannel near-infrared optical imaging of
human brain activity. J Appl Physiol (1985). 1993;75(4):1842-6.
301. Hoshi Y, Tamura M. Detection of dynamic changes in cerebral oxygenation
coupled to neuronal function during mental work in man. Neurosci Lett. 1993;150(1):5-
8.
302. Sakatani K, Xie Y, Lichty W, Li S, Zuo H. Language-activated cerebral blood
oxygenation and hemodynamic changes of the left prefrontal cortex in poststroke aphasic
patients: a near-infrared spectroscopy study. Stroke. 1998;29(7):1299-304.
References
280
303. Villringer K, Minoshima S, Hock C, Obrig H, Ziegler S, Dirnagl U, et al.
Assessment of local brain activation. A simultaneous PET and near-infrared spectroscopy
study. Adv Exp Med Biol. 1997;413:149-53.
304. Obrig H, Villringer A. Beyond the visible--imaging the human brain with light. J
Cereb Blood Flow Metab. 2003;23(1):1-18.
305. Lloyd-Fox S, Blasi A, Elwell CE. Illuminating the developing brain: the past,
present and future of functional near infrared spectroscopy. Neurosci Biobehav Rev.
2010;34(3):269-84.
306. Kwong KK, Belliveau JW, Chesler DA, Goldberg IE, Weisskoff RM, Poncelet
BP, et al. Dynamic magnetic resonance imaging of human brain activity during primary
sensory stimulation. Proc Natl Acad Sci U S A. 1992;89(12):5675-9.
307. Ogawa S, Tank DW, Menon R, Ellermann JM, Kim SG, Merkle H, et al. Intrinsic
signal changes accompanying sensory stimulation: functional brain mapping with
magnetic resonance imaging. Proc Natl Acad Sci U S A. 1992;89(13):5951-5.
308. Toronov V, Webb A, Choi JH, Wolf M, Michalos A, Gratton E, et al. Investigation
of human brain hemodynamics by simultaneous near-infrared spectroscopy and
functional magnetic resonance imaging. Med Phys. 2001;28(4):521-7.
309. Toronov V, Walker S, Gupta R, Choi JH, Gratton E, Hueber D, et al. The roles of
changes in deoxyhemoglobin concentration and regional cerebral blood volume in the
fMRI BOLD signal. Neuroimage. 2003;19(4):1521-31.
310. MacIntosh BJ, Klassen LM, Menon RS. Transient hemodynamics during a breath
hold challenge in a two part functional imaging study with simultaneous near-infrared
spectroscopy in adult humans. Neuroimage. 2003;20(2):1246-52.
311. Kleinschmidt A, Obrig H, Requardt M, Merboldt KD, Dirnagl U, Villringer A, et
al. Simultaneous recording of cerebral blood oxygenation changes during human brain
References
281
activation by magnetic resonance imaging and near-infrared spectroscopy. J Cereb Blood
Flow Metab. 1996;16(5):817-26.
312. Yamamoto T, Kato T. Paradoxical correlation between signal in functional
magnetic resonance imaging and deoxygenated haemoglobin content in capillaries: a new
theoretical explanation. Phys Med Biol. 2002;47(7):1121-41.
313. Strangman G, Culver JP, Thompson JH, Boas DA. A quantitative comparison of
simultaneous BOLD fMRI and NIRS recordings during functional brain activation.
Neuroimage. 2002;17(2):719-31.
314. Punwani S, Ordidge RJ, Cooper CE, Amess P, Clemence M. MRI measurements
of cerebral deoxyhaemoglobin concentration [dHb]--correlation with near infrared
spectroscopy (NIRS). NMR Biomed. 1998;11(6):281-9.
315. Chen Y, Tailor DR, Intes X, Chance B. Correlation between near-infrared
spectroscopy and magnetic resonance imaging of rat brain oxygenation modulation. Phys
Med Biol. 2003;48(4):417-27.
316. Huppert TJ, Hoge RD, Diamond SG, Franceschini MA, Boas DA. A temporal
comparison of BOLD, ASL, and NIRS hemodynamic responses to motor stimuli in adult
humans. Neuroimage. 2006;29(2):368-82.
317. Coutts LV, Cooper CE, Elwell CE, Wilkins AJ. Time course of the
haemodynamic response to visual stimulation in migraine, measured using near-infrared
spectroscopy. Cephalalgia. 2012;32(8):621-9.
318. Baird AA, Kagan J, Gaudette T, Walz KA, Hershlag N, Boas DA. Frontal lobe
activation during object permanence: data from near-infrared spectroscopy. Neuroimage.
2002;16(4):1120-5.

References
282
319. Hoshi Y, Kohri S, Matsumoto Y, Cho K, Matsuda T, Okajima S, et al.
Hemodynamic responses to photic stimulation in neonates. Pediatr Neurol.
2000;23(4):323-7.
320. Meek JH, Firbank M, Elwell CE, Atkinson J, Braddick O, Wyatt JS. Regional
hemodynamic responses to visual stimulation in awake infants. Pediatr Res.
1998;43(6):840-3.
321. Sakatani K, Chen S, Lichty W, Zuo H, Wang YP. Cerebral blood oxygenation
changes induced by auditory stimulation in newborn infants measured by near infrared
spectroscopy. Early Hum Dev. 1999;55(3):229-36.
322. Wilcox T, Bortfeld H, Woods R, Wruck E, Boas DA. Using near-infrared
spectroscopy to assess neural activation during object processing in infants. J Biomed
Opt. 2005;10(1):11010.
323. Zaramella P, Freato F, Amigoni A, Salvadori S, Marangoni P, Suppiej A, et al.
Brain auditory activation measured by near-infrared spectroscopy (NIRS) in neonates.
Pediatr Res. 2001;49(2):213-9.
324. Martin E, Joeri P, Loenneker T, Ekatodramis D, Vitacco D, Hennig J, et al. Visual
processing in infants and children studied using functional MRI. Pediatr Res.
1999;46(2):135-40.
325. Marcar VL, Strassle AE, Loenneker T, Schwarz U, Martin E. The influence of
cortical maturation on the BOLD response: an fMRI study of visual cortex in children.
Pediatr Res. 2004;56(6):967-74.
326. Marcar VL, Schwarz U, Martin E, Loenneker T. How depth of anesthesia
influences the blood oxygenation level-dependent signal from the visual cortex of
children. AJNR Am J Neuroradiol. 2006;27(4):799-805.

References
283
327. Wilcox T, Bortfeld H, Woods R, Wruck E, Boas DA. Hemodynamic response to
featural changes in the occipital and inferior temporal cortex in infants: a preliminary
methodological exploration. Dev Sci. 2008;11(3):361-70.
328. Arichi T, Fagiolo G, Varela M, Melendez-Calderon A, Allievi A, Merchant N, et
al. Development of BOLD signal hemodynamic responses in the human brain.
Neuroimage. 2012;63(2):663-73.
329. Scholkmann F, Kleiser S, Metz AJ, Zimmermann R, Mata Pavia J, Wolf U, et al.
A review on continuous wave functional near-infrared spectroscopy and imaging
instrumentation and methodology. Neuroimage. 2014;85 Pt 1:6-27.
330. Irani F, Platek SM, Bunce S, Ruocco AC, Chute D. Functional near infrared
spectroscopy (fNIRS): an emerging neuroimaging technology with important
applications for the study of brain disorders. Clin Neuropsychol. 2007;21(1):9-37.
331. Ferrari M, Quaresima V. A brief review on the history of human functional near-
infrared spectroscopy (fNIRS) development and fields of application. Neuroimage.
2012;63(2):921-35.
332. Gibson AP, Hebden JC, Arridge SR. Recent advances in diffuse optical imaging.
Phys Med Biol. 2005;50(4):R1-43.
333. Franceschini MA, Toronov V, Filiaci M, Gratton E, Fantini S. On-line optical
imaging of the human brain with 160-ms temporal resolution. Opt Express. 2000;6(3):49-
57.
334. Sato H, Takeuchi T, Sakai KL. Temporal cortex activation during speech
recognition: an optical topography study. Cognition. 1999;73(3):B55-66.
335. Taga G, Asakawa K, Maki A, Konishi Y, Koizumi H. Brain imaging in awake
infants by near-infrared optical topography. Proc Natl Acad Sci U S A.
2003;100(19):10722-7.
References
284
336. Gervain J, Macagno F, Cogoi S, Pena M, Mehler J. The neonate brain detects
speech structure. Proc Natl Acad Sci U S A. 2008;105(37):14222-7.
337. Lloyd-Fox S, Blasi A, Volein A, Everdell N, Elwell CE, Johnson MH. Social
perception in infancy: a near infrared spectroscopy study. Child Dev. 2009;80(4):986-99.
338. Lloyd-Fox S, Blasi A, Mercure E, Elwell CE, Johnson MH. The emergence of
cerebral specialization for the human voice over the first months of life. Soc Neurosci.
2012;7(3):317-30.
339. Minagawa-Kawai Y, van der Lely H, Ramus F, Sato Y, Mazuka R, Dupoux E.
Optical brain imaging reveals general auditory and language-specific processing in early
infant development. Cereb Cortex. 2011;21(2):254-61.
340. Sato H, Hirabayashi Y, Tsubokura H, Kanai M, Ashida T, Konishi I, et al.
Cerebral hemodynamics in newborn infants exposed to speech sounds: a whole-head
optical topography study. Hum Brain Mapp. 2012;33(9):2092-103.
341. Arridge SR, Dehghani H, Schweiger M, Okada E. The finite element model for
the propagation of light in scattering media: a direct method for domains with
nonscattering regions. Med Phys. 2000;27(1):252-64.
342. Culver JP, Ntziachristos V, Holboke MJ, Yodh AG. Optimization of optode
arrangements for diffuse optical tomography: A singular-value analysis. Opt Lett.
2001;26(10):701-3.
343. Boas DA, Dale AM, Franceschini MA. Diffuse optical imaging of brain
activation: approaches to optimizing image sensitivity, resolution, and accuracy.
Neuroimage. 2004;23 Suppl 1:S275-88.
344. Joseph DK, Huppert TJ, Franceschini MA, Boas DA. Diffuse optical tomography
system to image brain activation with improved spatial resolution and validation with
functional magnetic resonance imaging. Appl Opt. 2006;45(31):8142-51.
References
285
345. Fukui Y, Ajichi Y, Okada E. Monte Carlo prediction of near-infrared light
propagation in realistic adult and neonatal head models. Appl Opt. 2003;42(16):2881-7.
346. Liao SM, Ferradal SL, White BR, Gregg N, Inder TE, Culver JP. High-density
diffuse optical tomography of term infant visual cortex in the nursery. J Biomed Opt.
2012;17(8):081414.
347. Chance B, Anday E, Nioka S, Zhou S, Hong L, Worden K, et al. A novel method
for fast imaging of brain function, non-invasively, with light. Opt Express.
1998;2(10):411-23.
348. Culver JP, Choe R, Holboke MJ, Zubkov L, Durduran T, Slemp A, et al. Three-
dimensional diffuse optical tomography in the parallel plane transmission geometry:
evaluation of a hybrid frequency domain/continuous wave clinical system for breast
imaging. Med Phys. 2003;30(2):235-47.
349. Hebden JC, Delpy DT. Enhanced time-resolved imaging with a diffusion model
of photon transport. Opt Lett. 1994;19(5):311-3.
350. Austin T, Gibson AP, Branco G, Yusof RM, Arridge SR, Meek JH, et al. Three
dimensional optical imaging of blood volume and oxygenation in the neonatal brain.
Neuroimage. 2006;31(4):1426-33.
351. Schweiger M, Arridge S. The Toast++ software suite for forward and inverse
modeling in optical tomography. J Biomed Opt. 2014;19(4):040801.
352. Chance B, Zhuang Z, UnAh C, Alter C, Lipton L. Cognition-activated low-
frequency modulation of light absorption in human brain. Proc Natl Acad Sci U S A.
1993;90(8):3770-4.
353. Kato T, Kamei A, Takashima S, Ozaki T. Human visual cortical function during
photic stimulation monitoring by means of near-infrared spectroscopy. J Cereb Blood
Flow Metab. 1993;13(3):516-20.

References
286
354. Villringer A, Planck J, Hock C, Schleinkofer L, Dirnagl U. Near infrared
spectroscopy (NIRS): a new tool to study hemodynamic changes during activation of
brain function in human adults. Neurosci Lett. 1993;154(1-2):101-4.
355. White BR, Liao SM, Ferradal SL, Inder TE, Culver JP. Bedside optical imaging
of occipital resting-state functional connectivity in neonates. Neuroimage.
2012;59(3):2529-38.
356. Biswal BB, Van Kylen J, Hyde JS. Simultaneous assessment of flow and BOLD
signals in resting-state functional connectivity maps. NMR Biomed. 1997;10(4-5):165-
70.
357. Fransson P, Skiold B, Engstrom M, Hallberg B, Mosskin M, Aden U, et al.
Spontaneous brain activity in the newborn brain during natural sleep--an fMRI study in
infants born at full term. Pediatr Res. 2009;66(3):301-5.
358. Doria V, Beckmann CF, Arichi T, Merchant N, Groppo M, Turkheimer FE, et al.
Emergence of resting state networks in the preterm human brain. Proc Natl Acad Sci U S
A. 2010;107(46):20015-20.
359. Smyser CD, Inder TE, Shimony JS, Hill JE, Degnan AJ, Snyder AZ, et al.
Longitudinal analysis of neural network development in preterm infants. Cereb Cortex.
2010;20(12):2852-62.
360. Nunez PL, Silberstein RB, Cadusch PJ, Wijesinghe RS, Westdorp AF, Srinivasan
R. A theoretical and experimental study of high resolution EEG based on surface
Laplacians and cortical imaging. Electroencephalogr Clin Neurophysiol. 1994;90(1):40-
57.
361. Srinivasan R, Nunez PL, Tucker DM, Silberstein RB, Cadusch PJ. Spatial
sampling and filtering of EEG with spline laplacians to estimate cortical potentials. Brain
Topogr. 1996;8(4):355-66.
References
287
362. Makeig S, Bell, A., Jung, T.-P., Sejnowski, T. . Independent component analysis
of electroencephalographic data Touretzky D, Mozer, M., Hasselmo, M., editor.
Cambridge1996. 145–51 p.
363. Roche-Labarbe N, Wallois F, Ponchel E, Kongolo G, Grebe R. Coupled
oxygenation oscillation measured by NIRS and intermittent cerebral activation on EEG
in premature infants. Neuroimage. 2007;36(3):718-27.
364. Franceschini MA, Fantini S, Thompson JH, Culver JP, Boas DA. Hemodynamic
evoked response of the sensorimotor cortex measured noninvasively with near-infrared
optical imaging. Psychophysiology. 2003;40(4):548-60.
365. Singh H, Cooper RJ, Wai Lee C, Dempsey L, Edwards A, Brigadoi S, et al.
Mapping cortical haemodynamics during neonatal seizures using diffuse optical
tomography: a case study. Neuroimage Clin. 2014;5:256-65.
366. Cooper RJ, Hebden JC, O'Reilly H, Mitra S, Michell AW, Everdell NL, et al.
Transient haemodynamic events in neurologically compromised infants: a simultaneous
EEG and diffuse optical imaging study. Neuroimage. 2011;55(4):1610-6.
367. World Medical A. World Medical Association Declaration of Helsinki: ethical
principles for medical research involving human subjects. JAMA. 2013;310(20):2191-4.
368. National Institute for Health and Care of Excellence N. Therapeutic hypothermia
with intracorporeal temperature monitoring for hypoxic perinatal brain injury. IPG347.
UK2010.
369. Everdell NL, Gibson, A.P., Tullis, I.D., Vaithianathan, T., Hebden, J.C., Delpy,
D.T. A frequency multiplexed near-infrared topography system for imaging functional
activation in the brain. Review of Scientific Instruments. 2005;76(9).
370. Oostenveld R, Praamstra P. The five percent electrode system for high-resolution
EEG and ERP measurements. Clin Neurophysiol. 2001;112(4):713-9.
References
288
371. Arridge SR. Photon-measurement density functions. Part I: Analytical forms.
Appl Opt. 1995;34(31):7395-409.
372. Brunner C, Delorme A, Makeig S. Eeglab - an Open Source Matlab Toolbox for
Electrophysiological Research. Biomed Tech (Berl). 2013.
373. Huppert TJ, Diamond SG, Franceschini MA, Boas DA. HomER: a review of time-
series analysis methods for near-infrared spectroscopy of the brain. Appl Opt.
2009;48(10):D280-98.
374. Cooper RJ, Selb J, Gagnon L, Phillip D, Schytz HW, Iversen HK, et al. A
systematic comparison of motion artifact correction techniques for functional near-
infrared spectroscopy. Front Neurosci. 2012;6:147.
375. Girouard H, Iadecola C. Neurovascular coupling in the normal brain and in
hypertension, stroke, and Alzheimer disease. J Appl Physiol (1985). 2006;100(1):328-35.
376. Steinhoff BJ, Herrendorf G, Kurth C. Ictal near infrared spectroscopy in temporal
lobe epilepsy: a pilot study. Seizure. 1996;5(2):97-101.
377. Sokol DK, Markand ON, Daly EC, Luerssen TG, Malkoff MD. Near infrared
spectroscopy (NIRS) distinguishes seizure types. Seizure. 2000;9(5):323-7.
378. Zhao M, Suh M, Ma H, Perry C, Geneslaw A, Schwartz TH. Focal increases in
perfusion and decreases in hemoglobin oxygenation precede seizure onset in spontaneous
human epilepsy. Epilepsia. 2007;48(11):2059-67.
379. van Bel F, Dorrepaal CA, Benders MJ, Zeeuwe PE, van de Bor M, Berger HM.
Changes in cerebral hemodynamics and oxygenation in the first 24 hours after birth
asphyxia. Pediatrics. 1993;92(3):365-72.
380. Wallois F, Patil A, Kongolo G, Goudjil S, Grebe R. Haemodynamic changes
during seizure-like activity in a neonate: a simultaneous AC EEG-SPIR and high-
resolution DC EEG recording. Neurophysiol Clin. 2009;39(4-5):217-27.
References
289
381. Suh M, Bahar S, Mehta AD, Schwartz TH. Temporal dependence in uncoupling
of blood volume and oxygenation during interictal epileptiform events in rat neocortex. J
Neurosci. 2005;25(1):68-77.
382. Scholkmann F, Wolf M. General equation for the differential pathlength factor of
the frontal human head depending on wavelength and age. J Biomed Opt.
2013;18(10):105004.
383. Wusthoff CJ, Dlugos DJ, Gutierrez-Colina A, Wang A, Cook N, Donnelly M, et
al. Electrographic seizures during therapeutic hypothermia for neonatal hypoxic-ischemic
encephalopathy. J Child Neurol. 2011;26(6):724-8.
384. Srinivasakumar P, Zempel J, Wallendorf M, Lawrence R, Inder T, Mathur A.
Therapeutic hypothermia in neonatal hypoxic ischemic encephalopathy: electrographic
seizures and magnetic resonance imaging evidence of injury. J Pediatr. 2013;163(2):465-
70.
385. Schroeter ML, Schmiedel O, von Cramon DY. Spontaneous low-frequency
oscillations decline in the aging brain. J Cereb Blood Flow Metab. 2004;24(10):1183-91.
386. Obrig H, Neufang M, Wenzel R, Kohl M, Steinbrink J, Einhäupl K, et al.
Spontaneous Low Frequency Oscillations of Cerebral Hemodynamics and Metabolism in
Human Adults. NeuroImage. 2000;12(6):623-39.
387. Schytz HW, Hansson A, Phillip D, Selb J, Boas DA, Iversen HK, et al.
Spontaneous low-frequency oscillations in cerebral vessels: applications in carotid artery
disease and ischemic stroke. J Stroke Cerebrovasc Dis. 2010;19(6):465-74.
388. Laptook AR, Corbett RJ. The effects of temperature on hypoxic-ischemic brain
injury. Clin Perinatol. 2002;29(4):623-49, vi.
389. Polderman KH. Induced hypothermia and fever control for prevention and
treatment of neurological injuries. Lancet. 2008;371(9628):1955-69.
References
290
390. Wintermark P, Hansen A, Gregas MC, Soul J, Labrecque M, Robertson RL, et al.
Brain perfusion in asphyxiated newborns treated with therapeutic hypothermia. AJNR
Am J Neuroradiol. 2011;32(11):2023-9.
391. Wintermark P, Hansen A, Warfield SK, Dukhovny D, Soul JS. Near-infrared
spectroscopy versus magnetic resonance imaging to study brain perfusion in newborns
with hypoxic-ischemic encephalopathy treated with hypothermia. Neuroimage. 2014;85
Pt 1:287-93.
392. Zhao M, Nguyen J, Ma H, Nishimura N, Schaffer CB, Schwartz TH. Preictal and
ictal neurovascular and metabolic coupling surrounding a seizure focus. J Neurosci.
2011;31(37):13292-300.
393. Ma H, Zhao M, Schwartz TH. Dynamic neurovascular coupling and uncoupling
during ictal onset, propagation, and termination revealed by simultaneous in vivo optical
imaging of neural activity and local blood volume. Cereb Cortex. 2013;23(4):885-99.
394. Kramer DR, Fujii T, Ohiorhenuan I, Liu CY. Interplay between Cortical
Spreading Depolarization and Seizures. Stereotact Funct Neurosurg. 2017;95(1):1-5.
395. Leao AAP. Spreading depression of activity in the cerebral cortex. Journal of
Neurophysiology. 1944;7(6):359-90.
396. Dreier JP. The role of spreading depression, spreading depolarization and
spreading ischemia in neurological disease. Nat Med. 2011;17(4):439-47.
397. Somjen GG. Mechanisms of spreading depression and hypoxic spreading
depression-like depolarization. Physiol Rev. 2001;81(3):1065-96.
398. Franceschini MA, Radhakrishnan H, Thakur K, Wu W, Ruvinskaya S, Carp S, et
al. The effect of different anesthetics on neurovascular coupling. Neuroimage.
2010;51(4):1367-77.

References
291
399. Makiranta MJ, Jauhiainen JP, Oikarinen JT, Suominen K, Tervonen O, Alahuhta
S, et al. Functional magnetic resonance imaging of swine brain during change in
thiopental anesthesia into EEG burst-suppression level--a preliminary study. MAGMA.
2002;15(1-3):27-35.
400. Makiranta M, Ruohonen J, Suominen K, Niinimaki J, Sonkajarvi E, Kiviniemi V,
et al. BOLD signal increase preceeds EEG spike activity--a dynamic penicillin induced
focal epilepsy in deep anesthesia. Neuroimage. 2005;27(4):715-24.
401. Liu X, Zhu XH, Zhang Y, Chen W. Neural origin of spontaneous hemodynamic
fluctuations in rats under burst-suppression anesthesia condition. Cereb Cortex.
2011;21(2):374-84.
402. Vincent JL, Patel GH, Fox MD, Snyder AZ, Baker JT, Van Essen DC, et al.
Intrinsic functional architecture in the anaesthetized monkey brain. Nature.
2007;447(7140):83-6.
403. Sutin JC, C., Boas, D., Brown, E., Franceschini, M.A. , editor Diffuse Optical
Spectroscopy Measurement Of Cerebral Hemodynamics And Oxygen Metabolism
During Anesthesia-Induced Burst Suppression In Rats. Biomedical Optics 2014; USA.
404. Brigadoi S, Aljabar P, Kuklisova-Murgasova M, Arridge SR, Cooper RJ. A 4D
neonatal head model for diffuse optical imaging of pre-term to term infants. Neuroimage.
2014;100:385-94.
405. Hall R, Murdoch J. Brain protection: physiological and pharmacological
considerations. Part II: The pharmacology of brain protection. Can J Anaesth.
1990;37(7):762-77.
406. Claassen J, Hirsch LJ, Emerson RG, Mayer SA. Treatment of refractory status
epilepticus with pentobarbital, propofol, or midazolam: a systematic review. Epilepsia.
2002;43(2):146-53.
References
292
407. Kroeger D, Florea B, Amzica F. Human brain activity patterns beyond the
isoelectric line of extreme deep coma. PLoS One. 2013;8(9):e75257.
408. Chalia M, Lee CW, Dempsey LA, Edwards AD, Singh H, Michell AW, et al.
Hemodynamic response to burst-suppressed and discontinuous electroencephalography
activity in infants with hypoxic ischemic encephalopathy. Neurophotonics.
2016;3(3):031408.
409. Mackert BM, Wubbeler G, Leistner S, Uludag K, Obrig H, Villringer A, et al.
Neurovascular coupling analyzed non-invasively in the human brain. Neuroreport.
2004;15(1):63-6.
410. Roche-Labarbe N, Carp SA, Surova A, Patel M, Boas DA, Grant PE, et al.
Noninvasive optical measures of CBV, StO(2), CBF index, and rCMRO(2) in human
premature neonates' brains in the first six weeks of life. Hum Brain Mapp.
2010;31(3):341-52.
411. Kozberg MG, Chen BR, DeLeo SE, Bouchard MB, Hillman EM. Resolving the
transition from negative to positive blood oxygen level-dependent responses in the
developing brain. Proc Natl Acad Sci U S A. 2013;110(11):4380-5.
412. Hagberg H, Andersson P, Kjellmer I, Thiringer K, Thordstein M. Extracellular
overflow of glutamate, aspartate, GABA and taurine in the cortex and basal ganglia of
fetal lambs during hypoxia-ischemia. Neurosci Lett. 1987;78(3):311-7.
413. Stein DT, Vannucci RC. Calcium accumulation during the evolution of hypoxic-
ischemic brain damage in the immature rat. J Cereb Blood Flow Metab. 1988;8(6):834-
42.
414. Szaflarski J, Burtrum D, Silverstein FS. Cerebral hypoxia-ischemia stimulates
cytokine gene expression in perinatal rats. Stroke. 1995;26(6):1093-100.
References
293
415. Bell AH, Greisen G, Pryds O. Comparison of the effects of phenobarbitone and
morphine administration on EEG activity in preterm babies. Acta Paediatr.
1993;82(1):35-9.
416. Lagercrantz H, Hanson, M.A., Ment, L.R., Peebles, D.M. . The Newborn Brain,
Neuroscience and Clinical Applications. 2nd ed. New York City, USA: Cambridge
University Press; 2010. 220-1 p.
417. Shany E, Benzaquen O, Friger M, Richardson J, Golan A. Influence of
antiepileptic drugs on amplitude-integrated electroencephalography. Pediatr Neurol.
2008;39(6):387-91.
418. Dehaes M, Aggarwal A, Lin PY, Rosa Fortuno C, Fenoglio A, Roche-Labarbe N,
et al. Cerebral oxygen metabolism in neonatal hypoxic ischemic encephalopathy during
and after therapeutic hypothermia. J Cereb Blood Flow Metab. 2014;34(1):87-94.
419. Golomb MR. Outcomes of perinatal arterial ischemic stroke and cerebral
sinovenous thrombosis. Semin Fetal Neonatal Med. 2009;14(5):318-22.
420. Wu TC, Grotta JC. Hypothermia for acute ischaemic stroke. Lancet Neurol.
2013;12(3):275-84.
421. Wolf T, Lindauer U, Reuter U, Back T, Villringer A, Einhaupl K, et al.
Noninvasive near infrared spectroscopy monitoring of regional cerebral blood
oxygenation changes during peri-infarct depolarizations in focal cerebral ischemia in the
rat. J Cereb Blood Flow Metab. 1997;17(9):950-4.
422. Stankovic MR, Maulik D, Rosenfeld W, Stubblefield PG, Kofinas AD, Drexler S,
et al. Real-time optical imaging of experimental brain ischemia and hemorrhage in
neonatal piglets. J Perinat Med. 1999;27(4):279-86.
423. Calderon-Arnulphi M, Alaraj A, Amin-Hanjani S, Mantulin WW, Polzonetti CM,
Gratton E, et al. Detection of cerebral ischemia in neurovascular surgery using

References
294
quantitative frequency-domain near-infrared spectroscopy. J Neurosurg.
2007;106(2):283-90.
424. Culver JP, Durduran T, Furuya D, Cheung C, Greenberg JH, Yodh AG. Diffuse
optical tomography of cerebral blood flow, oxygenation, and metabolism in rat during
focal ischemia. J Cereb Blood Flow Metab. 2003;23(8):911-24.
425. Vernieri F, Rosato N, Pauri F, Tibuzzi F, Passarelli F, Rossini PM. Near infrared
spectroscopy and transcranial Doppler in monohemispheric stroke. Eur Neurol.
1999;41(3):159-62.
426. Moreau F, Yang R, Nambiar V, Demchuk AM, Dunn JF. Near-infrared
measurements of brain oxygenation in stroke. Neurophotonics. 2016;3(3):031403.
427. Auer LM, Gallhofer B. Rhythmic activity of cat pial vessels in vivo. Eur Neurol.
1981;20(6):448-68.
428. Hudetz AG, Smith JJ, Lee JG, Bosnjak ZJ, Kampine JP. Modification of cerebral
laser-Doppler flow oscillations by halothane, PCO2, and nitric oxide synthase blockade.
Am J Physiol. 1995;269(1 Pt 2):H114-20.
429. Mayhew JE, Askew S, Zheng Y, Porrill J, Westby GW, Redgrave P, et al. Cerebral
vasomotion: a 0.1-Hz oscillation in reflected light imaging of neural activity.
Neuroimage. 1996;4(3 Pt 1):183-93.
430. Tachtsidis I, Elwell CE, Leung TS, Lee CW, Smith M, Delpy DT. Investigation
of cerebral haemodynamics by near-infrared spectroscopy in young healthy volunteers
reveals posture-dependent spontaneous oscillations. Physiol Meas. 2004;25(2):437-45.
431. Kuo TB, Chern CM, Sheng WY, Wong WJ, Hu HH. Frequency domain analysis
of cerebral blood flow velocity and its correlation with arterial blood pressure. J Cereb
Blood Flow Metab. 1998;18(3):311-8.
References
295
432. Diehl RR, Linden D, Lucke D, Berlit P. Spontaneous blood pressure oscillations
and cerebral autoregulation. Clin Auton Res. 1998;8(1):7-12.
433. Hu HH, Kuo TB, Wong WJ, Luk YO, Chern CM, Hsu LC, et al. Transfer function
analysis of cerebral hemodynamics in patients with carotid stenosis. J Cereb Blood Flow
Metab. 1999;19(4):460-5.
434. Reinhard M, Roth M, Muller T, Czosnyka M, Timmer J, Hetzel A. Cerebral
autoregulation in carotid artery occlusive disease assessed from spontaneous blood
pressure fluctuations by the correlation coefficient index. Stroke. 2003;34(9):2138-44.
435. Immink RV, van Montfrans GA, Stam J, Karemaker JM, Diamant M, van
Lieshout JJ. Dynamic cerebral autoregulation in acute lacunar and middle cerebral artery
territory ischemic stroke. Stroke. 2005;36(12):2595-600.
436. Dawson SL, Panerai RB, Potter JF. Serial changes in static and dynamic cerebral
autoregulation after acute ischaemic stroke. Cerebrovasc Dis. 2003;16(1):69-75.
437. Julien C. The enigma of Mayer waves: Facts and models. Cardiovasc Res.
2006;70(1):12-21.
438. Bumstead JR, Bauer AQ, Wright PW, Culver JP. Cerebral functional connectivity
and Mayer waves in mice: Phenomena and separability. J Cereb Blood Flow Metab.
2017;37(2):471-84.
439. Lundberg N. Continuous recording and control of ventricular fluid pressure in
neurosurgical practice. Acta Psychiatr Scand Suppl. 1960;36(149):1-193.
440. Newell DW, Aaslid R, Stooss R, Reulen HJ. The relationship of blood flow
velocity fluctuations to intracranial pressure B waves. J Neurosurg. 1992;76(3):415-21.
441. Lang EW, Diehl RR, Timmermann L, Baron R, Deuschl G, Mehdorn HM, et al.
Spontaneous oscillations of arterial blood pressure, cerebral and peripheral blood flow in
healthy and comatose subjects. Neurol Res. 1999;21(7):665-9.
References
296
442. Strik C, Klose U, Kiefer C, Grodd W. Slow rhythmic oscillations in intracranial
CSF and blood flow: registered by MRI. Acta Neurochir Suppl. 2002;81:139-42.
443. White BR, Snyder AZ, Cohen AL, Petersen SE, Raichle ME, Schlaggar BL, et al.
Resting-state functional connectivity in the human brain revealed with diffuse optical
tomography. Neuroimage. 2009;47(1):148-56.
444. Homae F, Watanabe H, Otobe T, Nakano T, Go T, Konishi Y, et al. Development
of global cortical networks in early infancy. J Neurosci. 2010;30(14):4877-82.
445. Lu CM, Zhang YJ, Biswal BB, Zang YF, Peng DL, Zhu CZ. Use of fNIRS to
assess resting state functional connectivity. J Neurosci Methods. 2010;186(2):242-9.
446. Phillip D, Schytz, H.W., Iversen, H.K., Selb, J., Boas, D.A., Ashina, M.
Spontaneous Low Frequency Oscillations in Acute Ischemic Stroke – A Near Infrared
Spectroscopy (NIRS) Study. Journal of Neurology and Neurophysiology.
2014;5(6):1000241.
447. Arri SJ, Muehlemann T, Biallas M, Bucher HU, Wolf M. Precision of cerebral
oxygenation and hemoglobin concentration measurements in neonates measured by near-
infrared spectroscopy. J Biomed Opt. 2011;16(4):047005.
448. Smith SM, Jenkinson M, Woolrich MW, Beckmann CF, Behrens TE, Johansen-
Berg H, et al. Advances in functional and structural MR image analysis and
implementation as FSL. Neuroimage. 2004;23 Suppl 1:S208-19.
449. Jenkinson M, Beckmann CF, Behrens TE, Woolrich MW, Smith SM. Fsl.
Neuroimage. 2012;62(2):782-90.
450. Katsman D, Zheng J, Spinelli K, Carmichael ST. Tissue microenvironments
within functional cortical subdivisions adjacent to focal stroke. J Cereb Blood Flow
Metab. 2003;23(9):997-1009.
References
297
451. Carmichael ST. Rodent models of focal stroke: size, mechanism, and purpose.
NeuroRx. 2005;2(3):396-409.
452. Caine S, Hackett MJ, Hou H, Kumar S, Maley J, Ivanishvili Z, et al. A novel
multi-modal platform to image molecular and elemental alterations in ischemic stroke.
Neurobiol Dis. 2016;91:132-42.
453. Li Z, Zhang M, Xin Q, Chen G, Liu F, Li J. Spectral analysis of near-infrared
spectroscopy signals measured from prefrontal lobe in subjects at risk for stroke. Med
Phys. 2012;39(4):2179-85.
454. Muehlschlegel S, Selb J, Patel M, Diamond SG, Franceschini MA, Sorensen AG,
et al. Feasibility of NIRS in the neurointensive care unit: a pilot study in stroke using
physiological oscillations. Neurocrit Care. 2009;11(2):288-95.
455. Phillip D, Schytz HW, Selb J, Payne S, Iversen HK, Skovgaard LT, et al. Low
frequency oscillations in cephalic vessels assessed by near infrared spectroscopy. Eur J
Clin Invest. 2012;42(11):1180-8.
456. Han Q, Li Z, Gao Y, Li W, Xin Q, Tan Q, et al. Phase synchronization analysis
of prefrontal tissue oxyhemoglobin oscillations in elderly subjects with cerebral
infarction. Med Phys. 2014;41(10):102702.
457. Gibson AP, Austin T, Everdell NL, Schweiger M, Arridge SR, Meek JH, et al.
Three-dimensional whole-head optical tomography of passive motor evoked responses in
the neonate. Neuroimage. 2006;30(2):521-8.
458. Roche-Labarbe N, Fenoglio A, Radhakrishnan H, Kocienski-Filip M, Carp SA,
Dubb J, et al. Somatosensory evoked changes in cerebral oxygen consumption measured
non-invasively in premature neonates. Neuroimage. 2014;85 Pt 1:279-86.
References
298
459. Barker JW, Rosso AL, Sparto PJ, Huppert TJ. Correction of motion artifacts and
serial correlations for real-time functional near-infrared spectroscopy. Neurophotonics.
2016;3(3):031410.
460. Gu Y, Han J, Liang Z, Yan J, Li Z, Li X. Empirical mode decomposition-based
motion artifact correction method for functional near-infrared spectroscopy. J Biomed
Opt. 2016;21(1):15002.
461. Saager R, Berger A. Measurement of layer-like hemodynamic trends in scalp and
cortex: implications for physiological baseline suppression in functional near-infrared
spectroscopy. J Biomed Opt. 2008;13(3):034017.
462. Gregg NM, White BR, Zeff BW, Berger AJ, Culver JP. Brain specificity of diffuse
optical imaging: improvements from superficial signal regression and tomography. Front
Neuroenergetics. 2010;2.
463. Zhang H, Zhang YJ, Lu CM, Ma SY, Zang YF, Zhu CZ. Functional connectivity
as revealed by independent component analysis of resting-state fNIRS measurements.
Neuroimage. 2010;51(3):1150-61.
464. Franceschini MA, Joseph DK, Huppert TJ, Diamond SG, Boas DA. Diffuse
optical imaging of the whole head. J Biomed Opt. 2006;11(5):054007.
465. Zhang Y, Brooks DH, Franceschini MA, Boas DA. Eigenvector-based spatial
filtering for reduction of physiological interference in diffuse optical imaging. J Biomed
Opt. 2005;10(1):11014.
466. Ferradal SL, Liao SM, Eggebrecht AT, Shimony JS, Inder TE, Culver JP, et al.
Functional Imaging of the Developing Brain at the Bedside Using Diffuse Optical
Tomography. Cereb Cortex. 2016;26(4):1558-68.

References
299
467. Eggebrecht AT, Ferradal SL, Robichaux-Viehoever A, Hassanpour MS,
Dehghani H, Snyder AZ, et al. Mapping distributed brain function and networks with
diffuse optical tomography. Nat Photonics. 2014;8(6):448-54.
468. Chitnis D, Airantzis D, Highton D, Williams R, Phan P, Giagka V, et al. Towards
a wearable near infrared spectroscopic probe for monitoring concentrations of multiple
chromophores in biological tissue in vivo. Rev Sci Instrum. 2016;87(6):065112.
469. Chitnis D, Cooper RJ, Dempsey L, Powell S, Quaggia S, Highton D, et al.
Functional imaging of the human brain using a modular, fibre-less, high-density diffuse
optical tomography system. Biomed Opt Express. 2016;7(10):4275-88.
470. Tak S, Ye JC. Statistical analysis of fNIRS data: a comprehensive review.
Neuroimage. 2014;85 Pt 1:72-91.
471. Huppert TJ. Commentary on the statistical properties of noise and its implication
on general linear models in functional near-infrared spectroscopy. Neurophotonics.
2016;3(1):010401.
472. Hintz SR, Benaron DA, van Houten JP, Duckworth JL, Liu FW, Spilman SD, et
al. Stationary headband for clinical time-of-flight optical imaging at the bedside.
Photochem Photobiol. 1998;68(3):361-9.
473. Hebden JC, Gibson A, Yusof RM, Everdell N, Hillman EM, Delpy DT, et al.
Three-dimensional optical tomography of the premature infant brain. Phys Med Biol.
2002;47(23):4155-66.
474. Torricelli A, Contini D, Pifferi A, Caffini M, Re R, Zucchelli L, et al. Time
domain functional NIRS imaging for human brain mapping. Neuroimage. 2014;85 Pt
1:28-50.
475. Lee CW, Cooper RJ, Austin T. Diffuse optical tomography to investigate the
newborn brain. Pediatr Res. 2017.

References
300
476. Hartings JA, Bullock MR, Okonkwo DO, Murray LS, Murray GD, Fabricius M,
et al. Spreading depolarisations and outcome after traumatic brain injury: a prospective
observational study. Lancet Neurol. 2011;10(12):1058-64.
477. Dohmen C, Sakowitz OW, Fabricius M, Bosche B, Reithmeier T, Ernestus RI, et
al. Spreading depolarizations occur in human ischemic stroke with high incidence. Ann
Neurol. 2008;63(6):720-8.
478. Lauritzen M, Dreier JP, Fabricius M, Hartings JA, Graf R, Strong AJ. Clinical
relevance of cortical spreading depression in neurological disorders: migraine, malignant
stroke, subarachnoid and intracranial hemorrhage, and traumatic brain injury. J Cereb
Blood Flow Metab. 2011;31(1):17-35.
479. Fabricius M, Fuhr S, Willumsen L, Dreier JP, Bhatia R, Boutelle MG, et al.
Association of seizures with cortical spreading depression and peri-infarct depolarisations
in the acutely injured human brain. Clin Neurophysiol. 2008;119(9):1973-84.
480. Strong AJ, Anderson PJ, Watts HR, Virley DJ, Lloyd A, Irving EA, et al. Peri-
infarct depolarizations lead to loss of perfusion in ischaemic gyrencephalic cerebral
cortex. Brain. 2007;130(Pt 4):995-1008.
481. Woitzik J, Hecht N, Pinczolits A, Sandow N, Major S, Winkler MK, et al.
Propagation of cortical spreading depolarization in the human cortex after malignant
stroke. Neurology. 2013;80(12):1095-102.
482. Santos E, Scholl M, Sanchez-Porras R, Dahlem MA, Silos H, Unterberg A, et al.
Radial, spiral and reverberating waves of spreading depolarization occur in the
gyrencephalic brain. Neuroimage. 2014;99:244-55.
483. Jacobs SE, Berg M, Hunt R, Tarnow-Mordi WO, Inder TE, Davis PG. Cooling
for newborns with hypoxic ischaemic encephalopathy. Cochrane Database Syst Rev.
2013(1):CD003311.

References
301
484. Titomanlio L, Fernandez-Lopez D, Manganozzi L, Moretti R, Vexler ZS,
Gressens P. Pathophysiology and neuroprotection of global and focal perinatal brain
injury: lessons from animal models. Pediatr Neurol. 2015;52(6):566-84.
485. Vanhatalo S, Palva JM, Andersson S, Rivera C, Voipio J, Kaila K. Slow
endogenous activity transients and developmental expression of K+-Cl- cotransporter 2
in the immature human cortex. Eur J Neurosci. 2005;22(11):2799-804.
486. Lloyd RO, O'Toole JM, Pavlidis E, Filan PM, Boylan GB. Electrographic
Seizures during the Early Postnatal Period in Preterm Infants. J Pediatr. 2017;187:18-25
e2.
487. Evans E, Koh S, Lerner J, Sankar R, Garg M. Accuracy of amplitude integrated
EEG in a neonatal cohort. Arch Dis Child Fetal Neonatal Ed. 2010;95(3):F169-73.
488. Sheth RD, Hobbs GR, Mullett M. Neonatal seizures: incidence, onset, and
etiology by gestational age. J Perinatol. 1999;19(1):40-3.
489. Shah DK, Zempel J, Barton T, Lukas K, Inder TE. Electrographic seizures in
preterm infants during the first week of life are associated with cerebral injury. Pediatr
Res. 2010;67(1):102-6.
490. Vesoulis ZA, Inder TE, Woodward LJ, Buse B, Vavasseur C, Mathur AM. Early
electrographic seizures, brain injury, and neurodevelopmental risk in the very preterm
infant. Pediatr Res. 2014;75(4):564-9.
491. Glass HC, Shellhaas RA, Tsuchida TN, Chang T, Wusthoff CJ, Chu CJ, et al.
Seizures in Preterm Neonates: A Multicenter Observational Cohort Study. Pediatr Neurol.
2017;72:19-24.
Index of Abbreviations
302
Index of Abbreviations
2D: two-dimensional
3D: three-dimensional
AA: arachidonic acid
ACA: anterior cerebral artery
ADC: Apparent Diffusion Coefficient
aEEG: amplitude integrated EEG
AS: active sleep
ASL: arterial spinning labelling
ATP: adenosine triphosphate
AW: active wakefulness
BGT: basal ganglia and thalamus
BOLD fMRI: blood oxygen level dependent functional magnetic resonance imaging
BORL: Biomedical Optics Research Lab
BP: blood pressure
BW: birth weight
Ca++: calcium
CA: cerebral autoregulation
CBF: cerebral blood flow
CBV: cerebral blood volume
CCA: common carotid artery
CFM: cerebral function monitor
CGA: corrected gestational age
CMRO2: cerebral metabolic rate of oxygen

Index of Abbreviations
303
CNS: central nervous system
COOL-AID: cooling for acute ischaemic brain damage
CP: cerebral palsy
CPAP: continuous positive airway pressure
CRP: c-reactive protein (normal when <1)
CrUS: cranial ultrasonography
CSD: cortical spreading depression
CSF: cerebro-spinal fluid
CSVT: cerebral sinus venous thrombosis
CTG: cardiotocogram (foetal heart rate monitoring device)
CT: computed tomography
CtOx: cytochrome c oxidase
CUH: Cambridge University Hospitals
CW: continuous wavelength
DoH: Declaration of Helsinki
DOI: diffuse optical imaging
DOT: diffuse optical tomography
DPF: differential pathlength factor
DQ: developmental quotient
DWI: diffusion weighted imaging
ECG: electro-cardiogram
ECMO: extracorporeal membrane oxygenation
EEG: electro-encephalogram
Index of Abbreviations
304
EMG: electro-myogram
EmLSCS: emergency low segment Caesarean section
EOG: electro-oculogram
EPIC: Evelyn Perinatal Imaging Centre
EPSP: excitatory post-synaptic potential
FEM: finite element method
FFT: fast Fourier transform
fMRI: functional magnetic resonance
fNIRS: functional near-infrared spectroscopy
FSE: Fast Spin Echo
FSL: FMRIB Software Library
GA: gestational age at birth in weeks /40 weeks of expected normal pregnancy duration
GABA: γ-aminobutyric acid
GBS: group B streptococcus (Streptococcus agalactiae)
GDM: gestational diabetes mellitus
GLM: general linear model
Hb: haemoglobin
HbO2: oxy-haemoglobin
HHb: deoxy-haemoglobin
HbT: total haemoglobin
Hbvol: volume haemoglobin
HFNC: high frequency nasal cannula
HFOV: high frequency oscillatory ventilation
Index of Abbreviations
305
HIE: hypoxic ischaemic encephalopathy
hpf: high pass filter
HPI: haemorrhagic parenchymal infarct
HR: heart rate
HRF: haemodynamic response function
IBI: inter-burst interval
ICA: independent component analysis
ICTus: intravascular cooling in the treatment of stroke
iNO: inhaled nitric oxide
IOL: induction of labour
IPSP: inhibitory post-synaptic potential
IQR: interquartile range
IUGR: intrauterine growth restriction
IV: intravenous
IVH: intraventricular haemorrhage
K+: potassium
LEOG: left electro-oculogram
LFOs: low frequency oscillations
LMWH: low molecular weight heparin
lpf: low pass filter
MABP: mean arterial blood pressure
MCA: middle cerebral artery
MRA: magnetic resonance angiography
Index of Abbreviations
306
MRI: magnetic resonance imaging
MRS: magnetic resonance spectroscopy
Na+: sodium
NAA: N-acetyl-asparate
NE: neonatal encephalopathy
NGT: nasogastric tube
NICU: neonatal intensive care unit
NIR: near infrared
NIRS: near infrared spectroscopy
NMDA: N-methyl-D-asparate
NO: nitric oxide
No resus: no resuscitation required at birth
OEF: oxygen extraction fraction
PAIS: perinatal arterial ischaemic stroke
PASL: pulsed arterial spinning labelling
PCA: posterior cerebral artery
PCA: principal component analysis
PCr: phosphor-creatinine
PC-MRA: phase contrast magnetic resonance angiography
PET: positron emission tomography
PLIC: posterior limb of the internal capsule
PMDF: photon measurement density function
PPHN: persistent pulmonary hypertension of the newborn

Index of Abbreviations
307
PROM: prolonged rupture of membranes >24 hours prior to delivery
PSP: post-synaptic potential
PVL: periventricular leukomalacia
QS: quiet sleep
QW: quiet wakefulness
rCBV: regional cerebral blood volume
REM: rapid eye movement
REOG: right electro-oculogram
RI: resistance index
ROI: region of interest
ROS: reactive oxygen species
RR: respiratory rate
RS: resting state
RSFN: resting state function network
rSO2: regional cerebral oxygen saturation
SaO2: oxygen saturation
SAT: spontaneous activity transient
SE: Spin Echo
SIMV: synchronized intermittent mandatory ventilation
SNR: signal to noise ratio
SVD: spontaneous vaginal delivery
SVIA: self-ventilating in air
TA: tracé alternant
Index of Abbreviations
308
TCD: transcranial doppler
TD: trace discontinu
T2-FSE: T2-weighted fast spin echo
TH: therapeutic hypothermia
TOAST++: time-resolved optical absorption and scatter tomography
TOBY: TOtal BodY therapeutic hypothermia for perinatal asphyxia
TOI: tissue oxygenation index
TPSF: temporal point spread function
TTTS: twin to twin transfusion syndrome
UCL: University College London
Vg: volume guarantee
VL: very low
VLFOs: very low frequency oscillations
WMA: world medical association
Xe: xenon