Study of the organisation and the transcriptional activity of ...
192
HAL Id: tel-01206006 https://tel.archives-ouvertes.fr/tel-01206006 Submitted on 28 Sep 2015 HAL is a multi-disciplinary open access archive for the deposit and dissemination of sci- entific research documents, whether they are pub- lished or not. The documents may come from teaching and research institutions in France or abroad, or from public or private research centers. L’archive ouverte pluridisciplinaire HAL, est destinée au dépôt et à la diffusion de documents scientifiques de niveau recherche, publiés ou non, émanant des établissements d’enseignement et de recherche français ou étrangers, des laboratoires publics ou privés. Study of the organisation and the transcriptional activity of mouse major satellites Lorena Kolar-Znika To cite this version: Lorena Kolar-Znika. Study of the organisation and the transcriptional activity of mouse major satellites. Cellular Biology. Université Pierre et Marie Curie - Paris VI, 2015. English. NNT : 2015PA066156. tel-01206006
-
Upload
khangminh22 -
Category
Documents
-
view
1 -
download
0
Transcript of Study of the organisation and the transcriptional activity of ...
HAL Id: tel-01206006https://tel.archives-ouvertes.fr/tel-01206006
Submitted on 28 Sep 2015
HAL is a multi-disciplinary open accessarchive for the deposit and dissemination of sci-entific research documents, whether they are pub-lished or not. The documents may come fromteaching and research institutions in France orabroad, or from public or private research centers.
L’archive ouverte pluridisciplinaire HAL, estdestinée au dépôt et à la diffusion de documentsscientifiques de niveau recherche, publiés ou non,émanant des établissements d’enseignement et derecherche français ou étrangers, des laboratoirespublics ou privés.
Study of the organisation and the transcriptionalactivity of mouse major satellites
Lorena Kolar-Znika
To cite this version:Lorena Kolar-Znika. Study of the organisation and the transcriptional activity of mouse majorsatellites. Cellular Biology. Université Pierre et Marie Curie - Paris VI, 2015. English. �NNT :2015PA066156�. �tel-01206006�
THESE DE DOCTORAT DE L’UNIVERSITE PIERRE ET MARIE CURIE PARIS VI
Ecole Doctorale Sciences de la Nature et de l’Homme
Discipline : Biologie cellulaire et moléculaire
Présentée par
Lorena KOLAR-ZNIKA
Pour obtenir le grade de Docteur de l’Université Pierre et Marie Curie
Study of the organisation and the transcriptional activity of mouse major satellites
Soutenue le 12 mai 2015 devant le jury composé de :
Dr. François Tronche Président
Dr. Nathalie Beaujean Rapporteur
Dr. Pascal Roussel Rapporteur
Dr. Jean-Baptiste Boulé Examinateur
Dr. Christophe Escudé Directeur de thèse
Thèse réalisée au sein du laboratoire Structure et Instabilité des Génomes du Muséum National d’Histoire Naturelle, INSERM U1154, CNRS UMR 7196
Remerciements
Tout d’abord, je remercie les membres du jury d’avoir accepté de juger ce travail. Merci à mes rapporteurs, les docteurs Nathalie Beaujean et Pascal Roussel d’avoir lu et corrigé ce manuscrit, ainsi qu’à mes examinateurs, les docteurs François Tronche et Jean-Baptiste Boulé.
Je remercie le professeur Jean François Riou, le directeur du laboratoire, ainsi que le
docteur Carine Giovannageli, qui était la directrice du laboratoire pendant les deux premières années de ma thèse.
Je remercie également le docteur Christophe Escudé, mon directeur de thèse, de m’avoir accueillie dans son équipe et m’avoir donné la possibilité de faire cette thèse.
Un grand merci à Jean-Baptiste Boulé et Judith Lopes, pour leur soutien et leur
aide précieuse, sans lesquels le courage de continuer aurait été beaucoup plus difficile à trouver. Je remercie JB pour ces longues heures de discussion concernant ma thèse et mes questions pour la suite, de m’avoir écoutée et guidée quand nécessaire. Merci pour tous tes conseils et pour ton travail avec mes manips et mon manuscrit, ce n’était pas dans ton “job description” mais tu l’as fait quand même. Je remercie Judith de m’avoir donné sa confiance pour travailler sur une partie de son projet. Je suis contente d’avoir pu participer à cette étude, même si on l’a commencée la dernière année de ma thèse. J’aurais aimé avoir plus de temps pour continuer de travailler avec toi. Merci aussi pour avoir lu et corrigé une grande partie de mon manuscrit, pour tes conseils et ton implication.
Je remercie tous les membres du laboratoire, plus particulièrement Sasha, Erika, Emmanuelle, Gildas, Patrizia, Jean Baptiste “le grand”, Anthony et Danielle pour leur gentillesse. Un grand merci à Tula pour son écoute et sa gentillesse avec moi.
Je n’oublie pas de remercier Fara et Corinne de s’être occupées avec patience de mes besoins administratifs.
Un petit mot de merci pour tous les doctorants du labo : Karine, Armel, Marine, Marion, Pauline, Lauriane, Astrid, pour leur soutien, bon courage pour la suite!
Merci à Loïc Ponger, pour son humour et sarcasme et pour sa sympathie avec moi ; Loïc Perrouault pour avoir sauvé pas mal de mes gels, merci pour tes conseils et pour tes histoires de voyages lointains dans tous les coins du monde ; Anne pour tous ses conseils et aides avec tout ce qui concerne des manips. On a une grande chance de t’avoir dans le laboratoire, merci de partager tes précieuses connaissances scientifiques avec nous tous. Merci à Julien pour son aide indispensable avec les ordis, les logiciels et les installations avant les séminaires. Ta bonne humeur était toujours la bienvenue, ainsi que ton grand appétit pour tous les bonbons de nous les d’jeuns.
Je tiens à remercier François, pour son aide avec les manips, surtout sur le projet TALE. Merci de m’avoir appris toutes les petites astuces de l’immuno-FISH, d’avoir été toujours prêt à venir m’aider au microscope quand “rien ne marchait” et pour les conversations dans le bureau. C’était un plaisir de maniper avec toi et de rire à la paillasse comme ailleurs. Merci à Charlotte pour tous ses conseils de culture cellulaire, c’était un plaisir de travailler à tes côtés dans le L2, où il y avait toujours une bonne ambiance grâce à ta personnalité chaleureuse et ta joie de vivre. Je garderai en mémoire tous les papotages et les soirées qu’on a fait ensemble.
Mes voisins de bureau, vous avez été nombreux et vous avez contribué à ce que les longues journées se passent dans une bonne ambiance : Hind, Marion, Loïc, Jean, Céline, Lauriane, Astrid, Loélia. Merci à Loélia, c’était un plaisir de partager le bureau avec toi ses quelques derniers mois de ma thèse. Merci à Jean pour ta gentillesse, pour avoir été toujours prêt à discuter avec moi et me soutenir moralement. Astrid, merci pour ta gentillesse, je te souhaite une bonne continuation dans le “noir” de notre bureau ;) Merci à Lauriane pour ta générosité et bonne humeur. Je commençais juste à m’habituer à tes petites particularités comme ton obsession pour les singes, les pates chinoises et les pousses de soja :). Marion, merci pour les petites discussions et papotages dans le bureau, ta salsa attitude et tes chorégraphies sur Cloclo. Prends bien soin de Georgette. Hind, malgré ta naturalisation à la fin, on a pu partager notre “mal du pays” et rigoler autour des petites différences entre nous, les étrangères, et les “autres” :p. Je me souviendrai vivement de tous les moments où tu entrais saoulée dans le bureau, tu étais toujours directe et j’ai beaucoup apprécié ta sincérité. On a bien rigolé dans le labo et hors labo, j’espère te voir bientôt à Oxford, où on va encore rigoler, cette fois en anglais ;). Merci à Céline, qui a squatté notre bureau pendant la période d’écriture de sa thèse. C’est toi qui a fait mes jours les plus joyeux, de notre petit déj tôt le matin, aux pauses café/goûter l’aprèm et parfois les sessions pizzas à 9h du soir au bureau. Je te remercie pour ton support au quotidien, pour toutes mes questions stupides que t’as supporté et aussi pour
tous les doutes que t’as partagé avec moi. Merci pour ton rire et ton amitié au labo et ailleurs, pour toutes les promenades et cafés après et parfois avant “le boulot”.
Merci à mes amies que j’ai rencontré ici en France, certaines d’entre vous apparaissent déjà dans ces remerciements, ainsi que les autres que j’ai eu plaisir à côtoyer après des journées parfois difficiles : Kristina, avec qui j’ai exploré pleins endroits partout autour de Paris ; Anita, ma jumelle thésarde croate, la petite parisienne d’âme qui me manque beaucoup ; Lili, qui sait toujours choisir un bon endroit pour se détendre, qui est là pour écouter quand on a besoin, et en qui j’ai une grande confiance. Merci également à mes amis que j’ai quittés en Croatie, qui pensent toujours à moi et qui seront là qu’importe la distance qui nous sépare : Monika, Jelena, Iva, Valentina et surtout Rados. Merci encore une fois à ma Céline, qui me soutient toujours, sans qui rien ne serait pareil. Je suis ravie de t’avoir rencontrée, merci pour ton aide et ton support, et pour tous les précieux moments passés et à venir, en France et Croatie ! Merci à mes grands-parents pour avoir toujours pris soin de moi, j’attends toujours avec impatience vos appels réguliers des mercredis et dimanches soirs. Merci à ma mère de m’avoir « permis » de partir dans un autre pays, merci pour ton soutien au quotidien, je te dédie cette thèse.
Abbreviations
AGO Argonaut
AUBK Aurora B kinase
BAC Bacterial Artificial Chromosome
CAF-1 Chromatin Assembly Factor 1
Cas9 CRISPR associated protein 9
CATD Cenp-A Targeting Domain
CCAN Constitutively Centromere Associated Network
CDE Centromere DNA Element
CENP Centromeric Protein
CENP-A Centromeric Protein A
CENP-B Centromeric Protein B
ChIP Chromatin Immunoprecipitation
CIP Chemically Induced Proximity
Clr Cryptic Loci Regulator
CPC Chromosomal Passenger Complex
CRISPR Clustered Regularly Interspaced Short Palindromic Repeats
DAPI 4',6-diamidino-2-phenylindole
DMEM Dulbecco's Modified Eagle Medium
DNA FISH DNA Fluorescent In Situ Hybridization
DNMT DNA methyltransferase
dsRNA Double Stranded RNA
2’-O-Me 2’-O-Methyl
ENCODE Encyclopedia Of DNA Elements
FANTOM Functional Annotation Of The Mammalian Genome
FISH Fluorescence In Situ Hybridization
GFP Green Fluorescent Protein
HAC Human Artificial Chromosome
HDAC Histone Deacetylase
HJURP Holliday Junction Recognition Protein
HMT Histone Methyltransferase
HOR Higher-Order Repeat
HOTAIR HOX transcript antisense RNA
HOX Homeobox
HP1 Heterochromatin Protein 1
HSF Heat Shock Factor
IF Immunofluorescence
INCENP Inner Centromere Protein
JMJD2 Jumonji Domain 2
KB Kilobase
LBR Lamin B Receptor
LINE Long Interspersed Element
LNA Locked Nucleic Acid
lncRNA long non-coding RNA
LSD1 Lysine (K)-Specific histone Demethylase 1
LTR Long Terminal Repeat
MeCP2 Methyl CpG Binding Protein 2
mRNA messenger RNA
miRNA micro RNA
ncRNA non-coding RNA
PCR Polymerase Chain Reaction
PCR2 Polycomb Repressive Complex 2
PEV Position Effect Variegation
piRNA piwi RNA
PIWI P-element induced wimpy testis in Drosophila
PNA Peptide Nucleic Acid
PTGS Post-Transcriptional Gene Silencing
RDRC RNA-Dependent RNA Polymerase Complex
RISC RNA-Interference Silencing Complex
RITS RNA-Induced Transcriptional Silencing
RNAse Ribonuclease
RNA FISH RNA Fluorescent In Situ Hybridization
rRNA ribosomal RNA
SINE Short Interspersed Elements
siRNA small interfering RNA
SSC1 Sister Chromatid Cohesion 1
ssRNA single stranded RNA
SUV Suppressor Of Variegation
TALE Transcriptional Activator-Like Effector
TGS Transcriptional Gene Silencing
Tm Melting Temperature
tRNA transfer RNA
TSA Trichostatin A
UTR Untranslated Region
WDHD1 WD repeat and HMG-box DNA binding protein 1
8
Table of contents Abbreviations ............................................................................................................................ 5
Table of contents ....................................................................................................................... 8 Figures ..................................................................................................................................... 12
Tables ....................................................................................................................................... 14 Introduction ............................................................................................................................ 15
CHAPTER I ........................................................................................................................ 16 Structure and function of centromeric regions ............................................................... 16
Usage of the terms ........................................................................................................ 17 I. 1. Determining the centromeric region ......................................................................... 17
1.1. First description of the centromere ........................................................................ 17 1. 2. Organisation of the centromeric region ................................................................ 19 1.3. DNA at the centromeric and pericentromeric region ............................................ 21
1.3.1 Repetitive DNA ............................................................................................... 21 1.3.2. Diverse functions of repetitive DNA ............................................................. 22 1.3.3. Repetitive DNA at the centromeric region ..................................................... 24 1.3.4. Variation of centromeric sequences between species .................................... 24
1.4. Neocentromeres and dicentrics ............................................................................. 26 I. 2. Chromatin organisation at the centromere ............................................................... 28
2.1. Histone modifications and the underlying chromatin state ................................... 28 2.2. The centromere core .............................................................................................. 31
2.2.1. Histone H3 variant CENP-A as the determinant of a functional centromere 31 2.2.2. Centromere associated proteins ...................................................................... 33 2.2.3. Centrochromatin - the chromatin forming at the centromeres ....................... 34
2.3. Pericentromeric region .......................................................................................... 36 2.3.1. Epigenetic signature of pericentromeric heterochromatin ............................. 36 2.3.2. The interaction network which allows the establishment and maintenance of pericentromeric heterochromatin ............................................................................. 38 2.3.3. Heterochromatin assembly in S pombe requires RNA interference ............... 40 2.3.4. Role of pericentromeric heterochromatin ...................................................... 42
2.4. Centromeric and pericentromeric regions in mouse cells ..................................... 44 2.4.1. Organisation of mouse centromeric and pericentromeric region ................... 44 2.4.2. Association of pericentromeric regions .......................................................... 45
CHAPTER II. ..................................................................................................................... 48 Non-coding RNA from centromeric and pericentromeric regions ................................ 48
II.1 Non-coding RNA ....................................................................................................... 49
1.1. The RNA world, old and new ............................................................................... 49 1.1.1. A new perspective on RNA ............................................................................ 49 1.1.2. Non-coding RNA as a key to complexity ...................................................... 50
1.2. Emerging role for ncRNAs ................................................................................... 52 1.2.1. Short ncRNA .................................................................................................. 52 1.2.2. Long ncRNA .................................................................................................. 54
9
II.2. Expression of repetitive sequences ........................................................................... 58
2.1. Evidence for transcription from centromeres and pericentromeres ...................... 58 2.2. Centromeric transcripts as integral components of centromeric chromatin .......... 59
2.2.1. Centromeric RNAs regulate the kinetochore activity .................................... 59 2.2.2. Centromeric transcription stabilise CENP-C binding to the centromeres ...... 60
2.3. Transcription from the pericentromeric region ..................................................... 61 2.3.1. Pericentromeric transcription during stress .................................................... 61 2.3.2. Pericentromeric transcripts participate to heterochromatin reorganisation during development and differentiation ................................................................... 63 2.3.3 Non-coding RNA in heterochromatin formation: lessons from fission yeast . 65 2.3.4. Non-coding RNA as a component of pericentromeric heterochromatin ........ 66
II.3. Regulation of pericentromeric transcription ............................................................. 67
3.1. Chromatin modifications and transcription ........................................................... 67 3.1.1.Histone modifications ..................................................................................... 68 3.1.2. DNA methylation ........................................................................................... 70
3.2. Transcription factors ............................................................................................. 70 3.3. Cell cycle ............................................................................................................... 72
Chapter III .......................................................................................................................... 73 Tools for study of repetitive sequences ............................................................................. 73
I.1. Oligonucleotides for detection of nucleic acids ......................................................... 74
1.1. Hybridization properties of nucleic acids .............................................................. 74 1.2. Oligonucleotides .................................................................................................... 75
1.2.1 A brief history of oligonucleotides .................................................................. 75 1.2.2. Oligos with chemical modifications: 2’-O-Me and LNA .............................. 76
1.3. Locked nucleic acids ............................................................................................. 77 1.3.1 Thermodynamic properties of LNA ................................................................ 77 1.3.2. Use of LNA oligonucleotides ......................................................................... 78
1.4. LNA probes for the study of repetitive sequences ................................................ 81 I. 2. Tools for (epi)genetic engineering ............................................................................ 82
2.1. Tools for targeted genome manipulation .............................................................. 82 2.1.1. Targeting specific DNA loci in living cells ................................................... 82 2.1.2. TALE as a novel DNA binding domain ......................................................... 84 2.2.3. Designer TALEs ............................................................................................. 85
2.2. Epigenetic engineering for studying the functions of chromatin modifications ... 87 2.2.1. Targeting chromatin modifications in living cells ......................................... 87
Objectives ................................................................................................................................ 92 Materials and methods ........................................................................................................... 94
I.1. Methods ...................................................................................................................... 95
1.1. Cell culture ............................................................................................................ 95 1.2. Northern blot ......................................................................................................... 96 1.3. Radioactive labelling ............................................................................................. 97 1.4. RNA extraction ..................................................................................................... 97 1.5. RT PCR ................................................................................................................. 98 1.6. Major satellite DNA probe preparation ................................................................. 98 1.7. In vitro transcription .............................................................................................. 99 1.8. Small RNA separation ........................................................................................... 99
10
1.9. Cell transfection .................................................................................................... 99 1.10. Immunofluorescence ........................................................................................... 99 1.12. Microscopy ........................................................................................................ 100 1.13. TANGO analysis ............................................................................................... 101
I.2. Materials .................................................................................................................. 103
2.1. Oligonucleotides .................................................................................................. 103 2.2. Primers ................................................................................................................ 104
Results ................................................................................................................................... 105 CHAPTER I ...................................................................................................................... 106 Characterization of major satellite transcripts ............................................................. 106
I.I. Characterization of major satellite transcripts using LNA oligonucleotides ............ 107
1.1. Probes for detection of major satellite repeats .................................................... 107 1.2. Characterisation of major satellite transcription by northern blotting of total RNA from mouse cells ........................................................................................................ 109
1.2.1. Transcriptional profile of major satellites in growing mouse cells .............. 109 1.2.2. Detailed characterization of northern hybridization signals ........................ 112 1.2.3. Comparison of transcriptional profile revealed by isosequential LNA and 2’-O-Me oligo ............................................................................................................. 115 1.2.4. High stringency washing .............................................................................. 117 1.2.5. RNA and DNA probes ................................................................................. 118
2.2. Strand specific RT PCR confirms transcription from major satellites ................ 119 I.2. Expression and regulation mechanisms implicated in major satellite transcription 122
2.1. Influence of the inhibitors of chromatin modifiers on major satellite transcription .................................................................................................................................... 122 2.2. Changes in major satellite transcription upon thermal stress .............................. 124 2.3. Influence of different RNA polymerase inhibitors on major satellite transcription .................................................................................................................................... 126
I.3. Sequence characterization ........................................................................................ 128
3.1. Technical details/methods for major satellite sequence characterization ........... 128 I. 4. Conclusion and discussion ...................................................................................... 131
CHAPTER II .................................................................................................................... 137 TALE fused to histone demethylase mJMJD2D for epigenetic engineering at pericentromeric regions of mouse cells .......................................................................... 137
II.1. Targeting mouse major satellites using TALE fused to histone demethylase
mJMJD2D ...................................................................................................................... 138
1.1. Context of the study ............................................................................................ 138 1.2. Visualisation of the specificity of TALE recruitment on major satellites ........... 140 1.3. Loss of H3K9me3 upon transfection with TALE fused to histone demethylase mJMJD2D .................................................................................................................. 141
II.2. Analysis of the effect of histone demethylation upon transfection with TALEs fused
to histone demethylase mJMJD2D ................................................................................. 144
2.1. Tools for Analysis of Nuclear Genome Organisation (TANGO) ....................... 144 2.2. Quantitative analysis of the demethylation of H3K9me3 at the major satellite foci upon transfection with the TALE N212-mJMJD2D .................................................. 145
11
2.3. Effect of the demethylation of H3K9me3 on major satellite foci ....................... 149 II. 3. Conclusion and discussion ..................................................................................... 153
General conclusion and perspectives .................................................................................. 160
Appendix ............................................................................................................................... 163 Bibliography ......................................................................................................................... 165
12
Figures Figure 1. Historical drawings by Walter Flemming (1843-1905) showing cell division. ..................................... 18
Figure 2. Organisation of centromeric and pericentromeric region on a chromosome.. ...................................... 20
Figure 3. Classification of repetitive DNA in the human genome. ........................................................................ 22
Figure 4. Centromeric region in different organisms. ........................................................................................... 26
Figure 5. Dicentric chromosome formation. .......................................................................................................... 28
Figure 6. Histone modifications on different histone tails. .................................................................................... 29
Figure 7. Euchromatin and heterochromatin histone tail modifications. .............................................................. 31
Figure 8. The trilaminar kinetochore structure. .................................................................................................... 34
Figure 9. CENP-A is interspersed with H3 on extended chromatin fibres.. .......................................................... 34
Figure 10. Organisation of centromeric heterochromatin. .................................................................................... 36
Figure 11. HP1 domains and interacting partners. ............................................................................................... 38
Figure 12. Formation of pericentromeric heterochromatin.. ................................................................................ 39
Figure 13. Heterochromatin formation in S. pombe. ............................................................................................. 42
Figure 14. Organisation of mouse centromeric region. ......................................................................................... 45
Figure 15. Association of pericentromeric region in mouse cells. ........................................................................ 46
Figure 16. The percent of non-coding to total genomic DNA per haploid genome across species. ...................... 51
Figure 17. piRNA pathway in D.melanogaster. ..................................................................................................... 53
Figure 18. Functions of long ncRNA. ..................................................................................................................... 55
Figure 19. LncRNA recruit chromatin remodelling complexes to chromatin. ....................................................... 57
Figure 20. Xist lncRNA coats the inactive X chromosome. .................................................................................... 57
Figure 21. Mechanism of transcriptional repression by non-coding RNA. ........................................................... 63
Figure 22. SUMO-ylated HP1 targeting to pericentromeric heterochromatin. .................................................... 67
Figure 23. Chromatin organisation at major and minor satellites requires centromeric RNA. ............................ 68
Figure 24. Transcription factor based mechanism for heterochromatin formation. ............................................. 72
Figure 25. Structure of the locked nucleic acid (LNA) monomer (Kauppinen, Vester, & Wengel, 2005). ............ 77
Figure 26. Schematic representation of the TALE protein. ................................................................................... 84
Figure 27. Designer TALE proteins. ...................................................................................................................... 86
Figure 28. Chromatin in vivo assay system employs chemically induced proximity (CIP) to induce chromatin
modifications in living cells. ................................................................................................................................... 88
Figure 29. Polydactyl zing finger protein fusion. .................................................................................................. 89
Figure 30. Schematic representation of the LITE system. ..................................................................................... 91
Figure 31 Transcriptional profile of major satellite s revealed by LNA modified oligonucleotides. .................. 111
Figure 32. Complex transcriptional profile revealed by LNA probes.. ............................................................... 114
Figure 33. Comparison of the transcriptional profile of MEF cells revealed with isosequential LNA and 2’-O-Me
probe targeting major satellites. .......................................................................................................................... 116
Figure 34. Transcriptional profile revealed by northern blot after different stringency washes. ....................... 117
Figure 35. Transcriptional profile obtained with LNA, DNA and RNA probe targeting major satellite. ........... 118
13
Figure 36. Strand specific RT PCR analysis of total RNA isolated from MEF cells. .......................................... 121
Figure 37. Northern analysis of RNA from cells treated with TSA and chaetocin. ............................................. 123
Figure 38. Northern analysis of RNA from heat shocked MEF cells. .................................................................. 125
Figure 39. Analysis of RNA from cells treated with different RNA polymerase inhibitors. ................................. 127
Figure 40. Comparison between total RNA and recovered short RNA. ............................................................... 129
Figure 41. Northern blot after the ligation of adapters on the short RNA.. ......................................................... 130
Figure 42. 3’ adapter ligation on the U5 RNA. .................................................................................................... 130
Figure 43. Schematic representation of the plasmid pJL156 and different TALE fusion proteins. ..................... 139
Figure 44. Immunofluorescence detection of the TALE N212-GFP binding to major satellites in mouse NIH-3T3
cells. ...................................................................................................................................................................... 140
Figure 45. Immunofluorescence detection of NIH-3T3 cells transfected with different TALE fusion proteins. .. 143
Figure 46. Immuno-FISH detection of NIH-3T3 cells transfected with the TALE N212-mJMJD2D. ................. 145
Figure 47. Segmentation of different structures by TANGO. ............................................................................... 145
Figure 48. Effects of the demethylation with TALE N212-mJMJD2D on H3K9me3 signal in NIH-3T3 cells. ... 147
Figure 49. Quantification of H3K9me3, TALE signal and Hoechst signal in cells transfected with TALE N212-
mJMJD2D and in non-transfected cells. .............................................................................................................. 149
Figure 50. Volume of the major satellite foci upon transfection with the different TALE fusion proteins.. ........ 151
Figure 51. Number of major satellite foci upon transfection with the different TALE fusion proteins. .............. 152
14
Tables
Table 1. Functional classes of short non-coding RNA. ................................................................................................................. 54 Table 2. Cells lines and culture conditions used in this study. ................................................................................................. 95 Table 3. Complete list of oligonucleotides used in this study. ............................................................................................... 103 Table 4. Primers used in the study. ................................................................................................................................................... 104 Table 5. Adapter sequences used for RACE experiments ........................................................................................................ 104 Table 6. List of oligonucleotides used in the study. ................................................................................................................... 108 Table 7. Schematic representation of the results of northern hybridization revealed with the major satellite specific probes. .......................................................................................................................................................................................... 115 Table 8. Lengths of the expected PCR products after RT-‐PCR amplification of major satellite transcripts using the indicated primer pairs. .................................................................................................................................................................. 120 Table 9. Conditions of treatment with trichostatin A and chaetocin. ............................................................................... 122 Table 10. Conditions of treatment with different RNA polymerase inhibitors. ............................................................. 126 Table 11. Three TALE constructs used in the study. ................................................................................................................... 139 Table 12. Different measured values for non-‐transcfected cell and cells transfected with different TALE fusion proteins obtained after TANGO analysis. ....................................................................................................................................... 163 Table 13. Different measured values for non-‐transfected cell and three population of cells transfected with TALE N212-‐mJMJD2D obtained after TANGO analysis ........................................................................................................... 164

15
Introduction
There's real poetry in the real world. Science is the poetry of reality.
Richard Dawkins

16
CHAPTER I
Structure and function of centromeric
regions
17
Usage of the terms
The terms centromere or centromeric region are often used to refer to both the
centromere as the place of kinetochore assembly and the surrounding pericentromeric region.
In this manuscript, I will use the term centromere to refer to the centromere core where the
kinetochore is assembled, while the term pericentromeric will be used for the region
surrounding the central core, comprised of constitutive heterochromatin.
I. 1. Determining the centromeric region
1.1. First description of the centromere
The process of mitosis was first described in the late 19th century by Flemming, who
used the term Chromosomen to name the fibrous, stainable material in the resting nucleus that
eventually become more compact and change into as he calls them, threads, later named
chromosomes. Flemming described the threads slowly rearranging to the centre of the
nucleus where they are separated into two groups to finally reappear in the two daughter
nuclei. He described the filaments from the spindle apparatus, for which he was convinced to
be responsible for the transport of the threads. However, he did not describe the centromere,
and his images show the threads attached to the spindle fibres throughout the chromosome
length (Figure 1). The term centromere was coined by Darlington in 1936 to define the
primary constriction on the mitotic chromosome (Paweletz 2001; Gonçalves Dos Santos Silva
et al. 2008). Indeed, the word centromere comes from Greek words “kentron” meaning
central and “meros” meaning part, referring to its position in the middle of the metaphase
chromosome. Today we know that the centromere, or the primary constriction is not always
found in the centre of the chromosome. With a few exceptions, there exists however, one
defined locus on the chromosome crucial for accurate segregation of the genetic material.
18
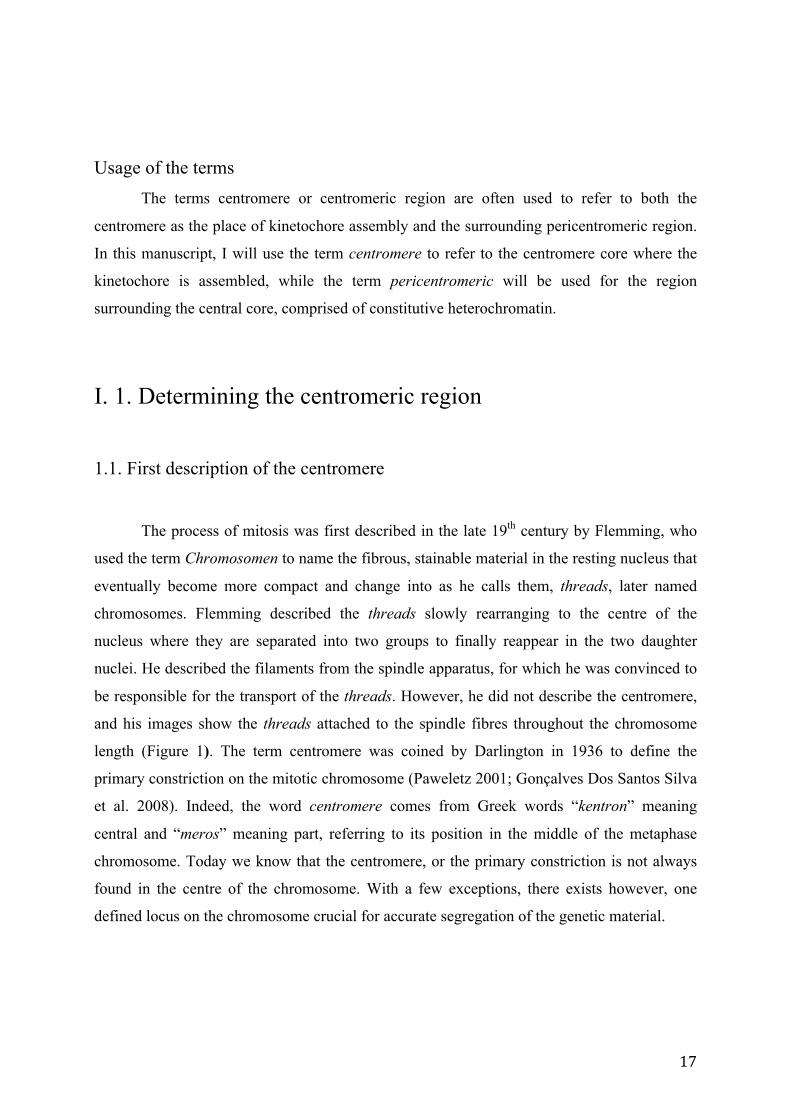
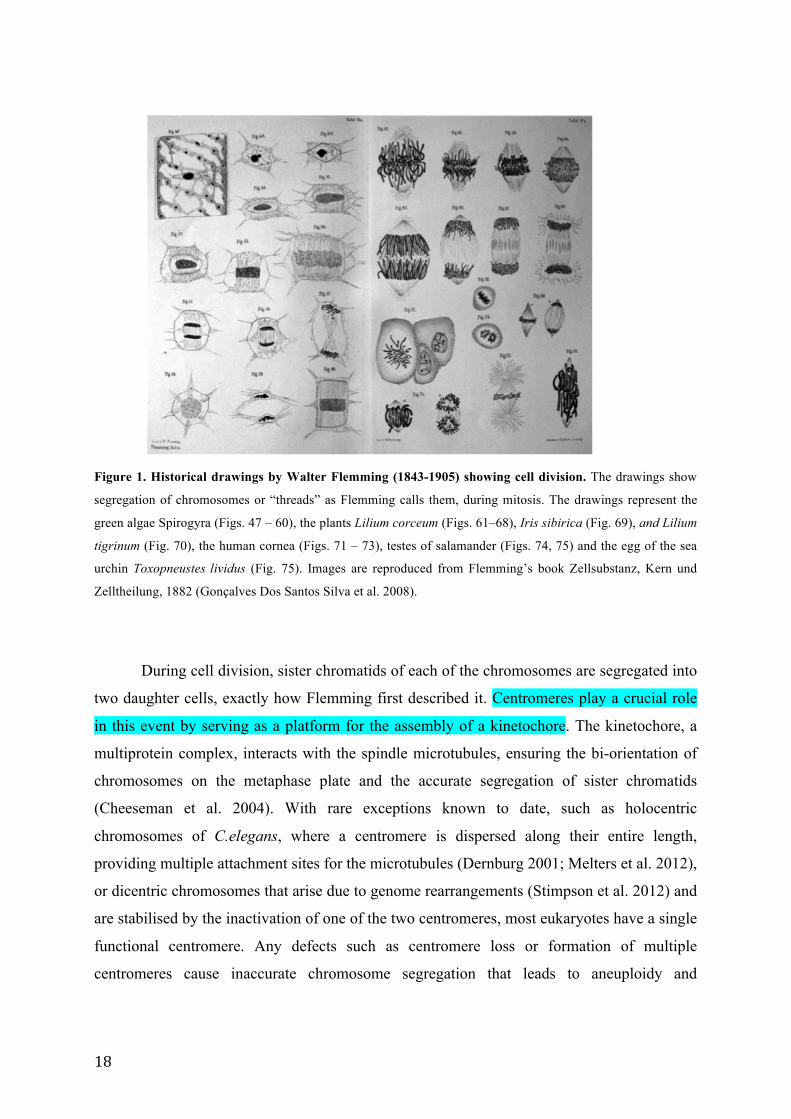
Figure 1. Historical drawings by Walter Flemming (1843-1905) showing cell division. The drawings show
segregation of chromosomes or “threads” as Flemming calls them, during mitosis. The drawings represent the
green algae Spirogyra (Figs. 47 – 60), the plants Lilium corceum (Figs. 61–68), Iris sibirica (Fig. 69), and Lilium
tigrinum (Fig. 70), the human cornea (Figs. 71 – 73), testes of salamander (Figs. 74, 75) and the egg of the sea
urchin Toxopneustes lividus (Fig. 75). Images are reproduced from Flemming’s book Zellsubstanz, Kern und
Zelltheilung, 1882 (Gonçalves Dos Santos Silva et al. 2008).
During cell division, sister chromatids of each of the chromosomes are segregated into
two daughter cells, exactly how Flemming first described it. Centromeres play a crucial role
in this event by serving as a platform for the assembly of a kinetochore. The kinetochore, a
multiprotein complex, interacts with the spindle microtubules, ensuring the bi-orientation of
chromosomes on the metaphase plate and the accurate segregation of sister chromatids
(Cheeseman et al. 2004). With rare exceptions known to date, such as holocentric
chromosomes of C.elegans, where a centromere is dispersed along their entire length,
providing multiple attachment sites for the microtubules (Dernburg 2001; Melters et al. 2012),
or dicentric chromosomes that arise due to genome rearrangements (Stimpson et al. 2012) and
are stabilised by the inactivation of one of the two centromeres, most eukaryotes have a single
functional centromere. Any defects such as centromere loss or formation of multiple
centromeres cause inaccurate chromosome segregation that leads to aneuploidy and
19
chromosome breakage, respectively, thus attesting the necessity of having only one functional
attachment site per chromosome.
Over the years, it had become clear that the centromere is not only a simple scaffold
for the assembly of kinetochore proteins and that it is more complicated in its structure and
organisation than previously thought. While the structure of the kinetochore and its role in
cell division has been extensively studied, the centromere itself remains somewhat elusive.
The centromere role is conserved across the species and most organisms have a single
functional centromere to achieve faithful chromosomal segregation. This chromosomal locus
has a distinct chromatin structure and is surrounded by heterochromatin regions (which will
be described later in this manuscript). Experimental evidences point to the idea that both the
DNA sequence and proteins that modify centromeric chromatin act together to contribute to
the establishment and maintenance of a functional centromere. However, we still poorly
understand the mechanisms by which they do so. An emerging view is that non-coding RNA
synthesised from the surrounding regions play an important role in this processes. They might
act as structural components of the centromeric chromatin or may mediate specific
modifications. It has become clear that the underlying chromatin is not only important for the
function of the kinetochore but also seems to be a self-sustaining region that impacts the
functional organisation of the nucleus, ultimately leading to the control of gene expression.
1. 2. Organisation of the centromeric region
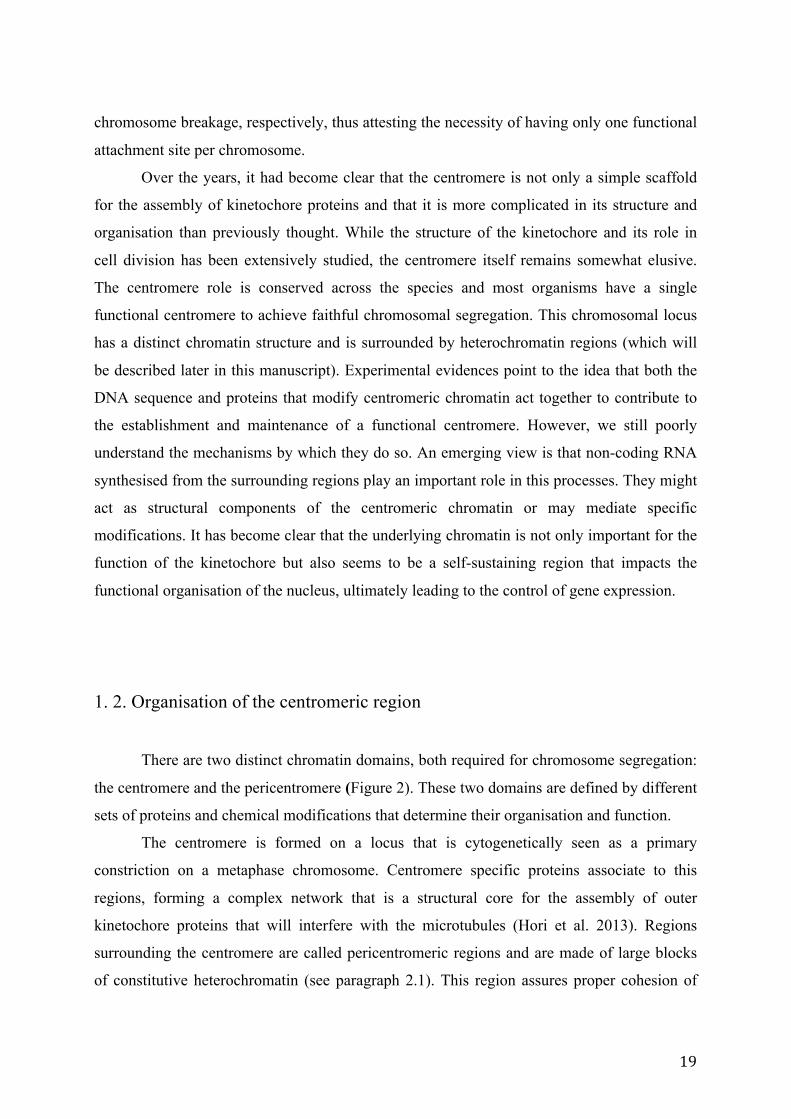
There are two distinct chromatin domains, both required for chromosome segregation:
the centromere and the pericentromere (Figure 2). These two domains are defined by different
sets of proteins and chemical modifications that determine their organisation and function.
The centromere is formed on a locus that is cytogenetically seen as a primary
constriction on a metaphase chromosome. Centromere specific proteins associate to this
regions, forming a complex network that is a structural core for the assembly of outer
kinetochore proteins that will interfere with the microtubules (Hori et al. 2013). Regions
surrounding the centromere are called pericentromeric regions and are made of large blocks
of constitutive heterochromatin (see paragraph 2.1). This region assures proper cohesion of
20
sister chromatids during mitosis and preserves chromosome integrity resisting against the
strong forces generated by the pulling of microtubules (Sullivan 2001).
centromere pericentromere pericentromere
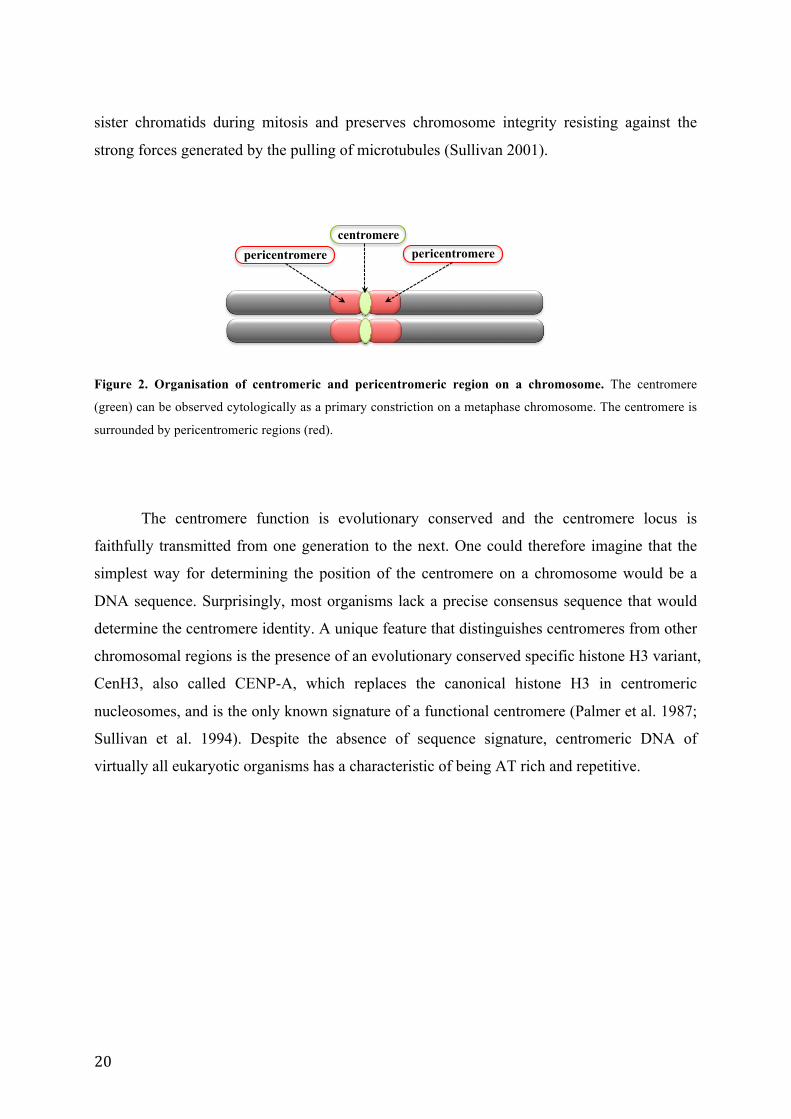
Figure 2. Organisation of centromeric and pericentromeric region on a chromosome. The centromere
(green) can be observed cytologically as a primary constriction on a metaphase chromosome. The centromere is
surrounded by pericentromeric regions (red).
The centromere function is evolutionary conserved and the centromere locus is
faithfully transmitted from one generation to the next. One could therefore imagine that the
simplest way for determining the position of the centromere on a chromosome would be a
DNA sequence. Surprisingly, most organisms lack a precise consensus sequence that would
determine the centromere identity. A unique feature that distinguishes centromeres from other
chromosomal regions is the presence of an evolutionary conserved specific histone H3 variant,
CenH3, also called CENP-A, which replaces the canonical histone H3 in centromeric
nucleosomes, and is the only known signature of a functional centromere (Palmer et al. 1987;
Sullivan et al. 1994). Despite the absence of sequence signature, centromeric DNA of
virtually all eukaryotic organisms has a characteristic of being AT rich and repetitive.
21
1.3. DNA at the centromeric and pericentromeric region
1.3.1 Repetitive DNA
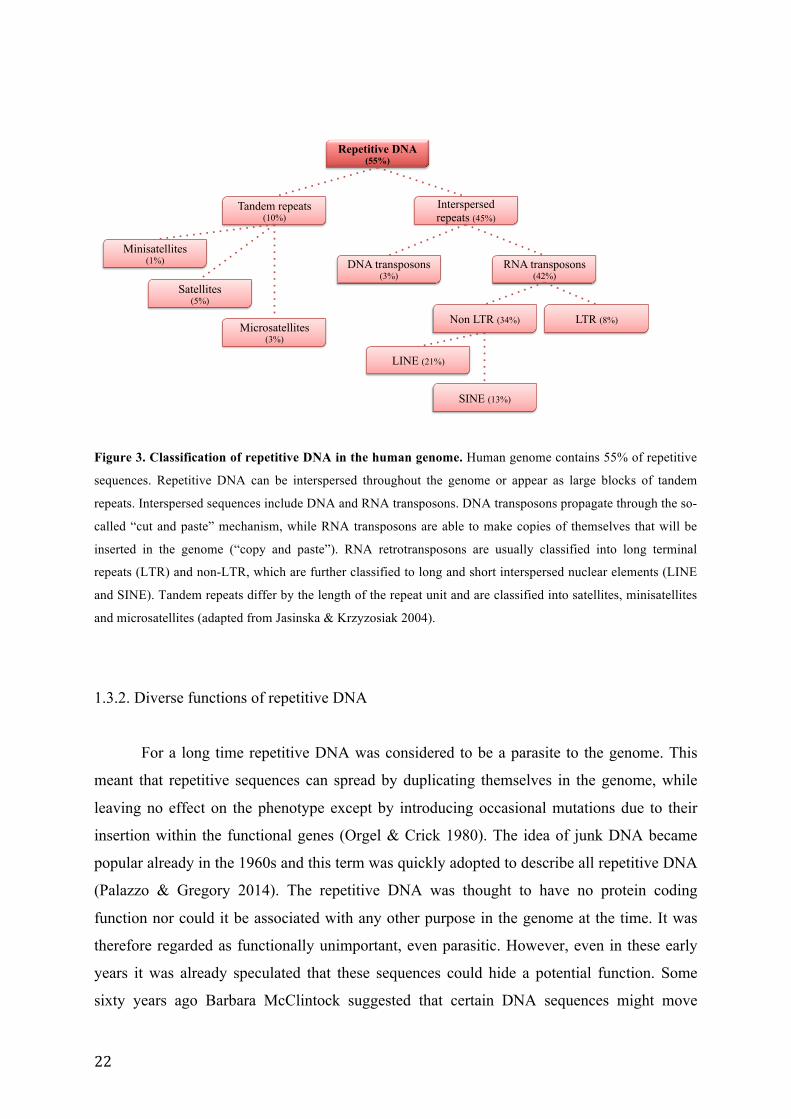
Only around 2% of the human genome codes for proteins. The remaining 98% is made
of non-coding sequences, mostly introns, promoters, and repetitive DNA. Repetitive DNA
occupies around 55% of the human genome and this large amount is a characteristic of all
multicellular organisms (Shapiro & von Sternberg 2005) (Figure 3). It includes both
transposable genetic elements and tandem repeats. Transposable genetic elements are
interspersed throughout the genome and are able to propagate by transposition, moving from
one place in the genome to the other. Four groups of such repeats are known to mammals.
Together, they count for 45% of the human genome. These are the DNA transposons and
RNA transposons, including long interspersed elements (LINE), shorts interspersed elements
(SINE) and long terminal repeats (LTR). Tandemly repeated sequences, also called satellite
sequences occupy around 10% of the human genome. This group of repetitive DNA is
characterized by a monomer unit present in multiple copies that extend in millions of bases in
a head to tail fashion. Depending on the length of the monomer and the size of the block of
the repeated unit, tandem repeats can be classified into satellites, minisatellites and
microsatellites (Figure 3).
22
Repetitive DNA (55%)
Satellites (5%)
Tandem repeats (10%)
Interspersed repeats (45%)
RNA transposons (42%)
DNA transposons (3%)
LTR (8%) Non LTR (34%)
SINE (13%)
LINE (21%)
Minisatellites (1%)
Microsatellites (3%)
Figure 3. Classification of repetitive DNA in the human genome. Human genome contains 55% of repetitive
sequences. Repetitive DNA can be interspersed throughout the genome or appear as large blocks of tandem
repeats. Interspersed sequences include DNA and RNA transposons. DNA transposons propagate through the so-
called “cut and paste” mechanism, while RNA transposons are able to make copies of themselves that will be
inserted in the genome (“copy and paste”). RNA retrotransposons are usually classified into long terminal
repeats (LTR) and non-LTR, which are further classified to long and short interspersed nuclear elements (LINE
and SINE). Tandem repeats differ by the length of the repeat unit and are classified into satellites, minisatellites
and microsatellites (adapted from Jasinska & Krzyzosiak 2004).
1.3.2. Diverse functions of repetitive DNA
For a long time repetitive DNA was considered to be a parasite to the genome. This
meant that repetitive sequences can spread by duplicating themselves in the genome, while
leaving no effect on the phenotype except by introducing occasional mutations due to their
insertion within the functional genes (Orgel & Crick 1980). The idea of junk DNA became
popular already in the 1960s and this term was quickly adopted to describe all repetitive DNA
(Palazzo & Gregory 2014). The repetitive DNA was thought to have no protein coding
function nor could it be associated with any other purpose in the genome at the time. It was
therefore regarded as functionally unimportant, even parasitic. However, even in these early
years it was already speculated that these sequences could hide a potential function. Some
sixty years ago Barbara McClintock suggested that certain DNA sequences might move
23
around the genome and thereby influence the expression of genes. We know these sequences
today as DNA transposons. Somewhere at the same time, Britten and Davidson proposed the
first ideas explaining the mechanisms of gene regulation. They suggested a model where
repetitive DNA is a key for gene regulation in complex organisms. The idea of junk DNA
persisted and even today, repetitive sequences are still regarded as mostly non-functional.
There is, however, an accumulating evidence that somewhat changed the view of non-coding
DNA as functional debris of the genome. Shapiro et al. argue that the repetitive DNA serves
to organise the coding information in the genome (Shapiro & von Sternberg 2005).
Restraining the functionality of the sequence only to the coding portion and ignoring the rest
as an useless parasitic element is not to think about the other aspects of what a functional
sequence really is. Genome requires a precise regulation of expression, replication and repair
and is organised in functional domains. The repetitive DNA could be thus regarded as an
important regulator and organiser of the genome. The simplicity of the information content of
the repetitive sequences and its ability to interact with DNA, RNA and proteins is in
accordance with the proposed function as being organisers of the genetic information and
participating to the control of gene expression (Shapiro & von Sternberg 2005).
Repetitive DNA has been implicated in different aspects of gene expression and
genome organisation. Different classes of repetitive DNA are associated with various
functions in the genome. Transposable elements are found in numerous promoter sequences
and many contain SINE and LINE elements. Human LINE-1 act as positive transcriptional
regulatory element. Human Alu elements as well as mouse B1 and B2 are implicated in
mRNA regulation (Allen et al. 2004). Repetitive DNA has a role in nuclear organisation and
architecture. For example, some human LTR retrotransposons and LINE elements act as
scaffold/matrix associated regions (Rollini 1999), while in Drosophila, gypsy elements
determine intranuclear gene localisation and nuclear pore association (Labrador & Corces
2002). Gypsy also acts as an insulator element that inhibits the propagation of silencing
(Gerasimova et al. 2000). Finally, tandemly repeated DNA act in the structural assembly of
distinct chromatin domains, such as centromeric and pericentromeric regions.
24
1.3.3. Repetitive DNA at the centromeric region
Satellite DNA is localised at the functional centromere and the surrounding
pericentromeric heterochromatin. The name satellite DNA is historical, as these sequences
were originally identified from the cesium chloride density gradient where they appeared as
single, isolated “satellites” due to their higher AT content, in comparison with the rest of the
genome (Corneo et al. 1967). Satellite sequences are organized into several megabases long
units that are formed by the arrangement of monomers into long arrays of tandem repeats.
Satellite sequences are variable between species and can rapidly change in repeat number and
primary sequence. Even today, with the development of the genomic sequencing projects,
satellite sequences stay mostly uncharacterized. The homogeneity of the monomers that are
present in multiple copies makes them difficult to be sequenced and most importantly to be
assembled into large contigs, which is why they are mostly excluded from the genome
assemblies (Rudd & Willard 2004; Plohl et al. 2008).
1.3.4. Variation of centromeric sequences between species
Centromere DNA differs greatly from one species to the next, showing variations in
primary sequence, length and quantity of the repeats. Variations exist even in different
chromosomes of the same organism. The simplest centromere is found in budding yeast S.
cerevisiae, the only organism where a specific DNA sequence determines the centromere
locus. In all chromosomes of S. cerevisiae, three AT-rich DNA sequence elements CDEI,
CDEII and CDEIII (Centromeric DNA element I, II, III) that span a total length of 125 bp,
define a simple point centromere (Figure 4a). CDEIII recruits sequence-specific protein
complex necessary for loading of the yeast CENP-A homolog and the formation of a single
centromeric nucleosome (Hyman et al. 1992; Meraldi et al. 2006). Other eukaryotic
organisms have more complex centromeres, termed regional centromeres, where the
kinetochore assembles at a defined chromosomal domain surrounded by long stretches of
constitutive heterochromatin. In fission yeast S. pombe, the kinetochore assembles at the non-
repetitive AT-rich central domain surrounded by the flanking innermost repeats, while
pericentromeric heterochromatin is formed at the outermost repeats (Takahashi et al. 1992)
(Figure 4b). In Drosophila melanogaster the centromere is assembled on the blocks of simple
25
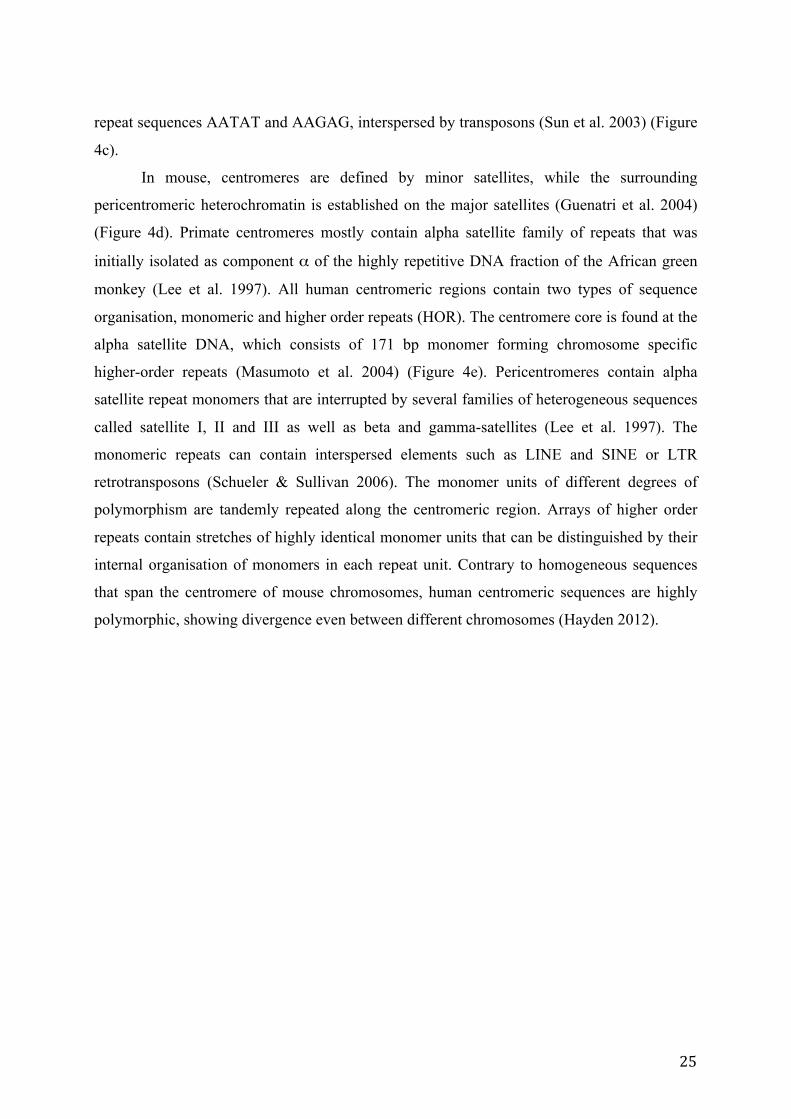
repeat sequences AATAT and AAGAG, interspersed by transposons (Sun et al. 2003) (Figure
4c).
In mouse, centromeres are defined by minor satellites, while the surrounding
pericentromeric heterochromatin is established on the major satellites (Guenatri et al. 2004)
(Figure 4d). Primate centromeres mostly contain alpha satellite family of repeats that was
initially isolated as component α of the highly repetitive DNA fraction of the African green
monkey (Lee et al. 1997). All human centromeric regions contain two types of sequence
organisation, monomeric and higher order repeats (HOR). The centromere core is found at the
alpha satellite DNA, which consists of 171 bp monomer forming chromosome specific
higher-order repeats (Masumoto et al. 2004) (Figure 4e). Pericentromeres contain alpha
satellite repeat monomers that are interrupted by several families of heterogeneous sequences
called satellite I, II and III as well as beta and gamma-satellites (Lee et al. 1997). The
monomeric repeats can contain interspersed elements such as LINE and SINE or LTR
retrotransposons (Schueler & Sullivan 2006). The monomer units of different degrees of
polymorphism are tandemly repeated along the centromeric region. Arrays of higher order
repeats contain stretches of highly identical monomer units that can be distinguished by their
internal organisation of monomers in each repeat unit. Contrary to homogeneous sequences
that span the centromere of mouse chromosomes, human centromeric sequences are highly
polymorphic, showing divergence even between different chromosomes (Hayden 2012).
26
dh dg dg dh imr imr Ctr
a) S. cerevisiae
b) S. pombe
c) D. melanogaster
e) H. sapiens
d) M. musculus
Major satellite Minor satellite
125 bp
CDEIII CDEII CDEI
AATAT AAGAG
200- 500 kb
20-100 kb 20-100 kb
6 Mb 600 kb
HOR 1-3 kb monomer units
0,3-5 Mb
10 kb
Centromeric region
Pericentromeric region
Figure 4. Centromeric and pericentromeric region in different organisms. Centromeric and pericentromeric
regions show differences in the DNA sequence and length between organisms. a) Three DNA elements build the
single point centromere of the S. cerevisiae. The AT-rich, non-repetitive DNA serves as a recognition site for
protein recruitment and formation of a functional centromere. S. cerevisiae lacks the flanking pericentromeric
heterochromatin. b) In S. pombe centromeres, the non-repetitive, AT-rich central core domain (cen) bordered by
repetitive innermost repeats (imr) contains CENP-A homologs. Pericentromeric region is formed at the so-called
outer repeats (otr) that flank the centromere. Outer repeats are composed out of two kinds of tandem repeat
sequences, dg and dh. They are common to three chromosomes of S. pombe, while the central core together with
the inner repeats differ between them. c) Drosophila centromeres are formed on the blocks of simple AATAT
and AAGAG repeats, interrupted by transposons. Pericentromeres are composed out of different complex
satellites with no known consensus sequence. d) In mouse, major and minor satellites distinguish the
pericentromeric from centromeric region, respectively. e) Human α-satellite repeats span the centromeric region
of all chromosomes. The 171 bp motif forms higher order units at the centromere. Flanking pericentromeric
region also contains different alpha satellite families that are interrupted by satellite I, II, III as well as satellites
beta and gamma (adapted from Allshire & Karpen 2009).
1.4. Neocentromeres and dicentrics
The variations in centromere sequence between species or even between chromosomes
of a single organism point to the idea that there are mechanisms that control the processes of
27
centromere formation and inheritance that go beyond a mere determination by the underlying
sequence. Evidence for this come from studies of stable dicentric chromosomes and
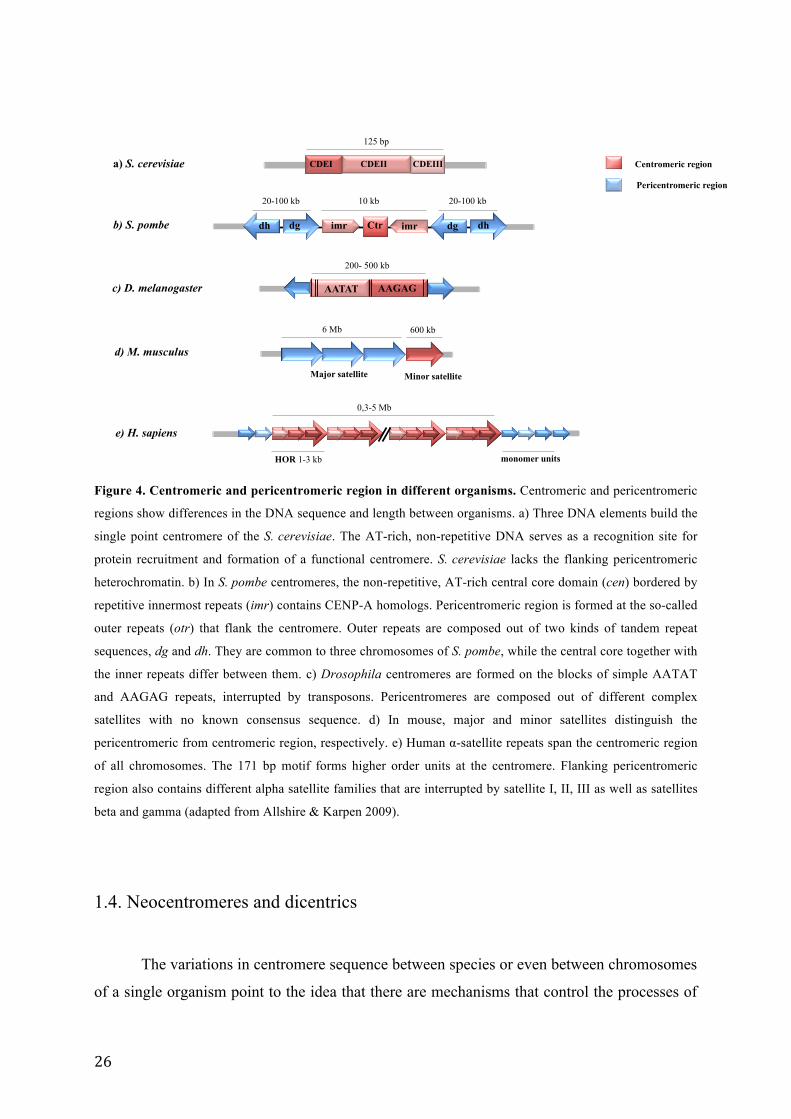
chromosomes that have established functionally new centromere or neocentromere. Dicentric
chromosomes can arise by duplication or other chromosomal rearrangements and can be
stable after inactivation of one of the centromeres (Figure 5). The stabilisation is probably
induced by partial deletion of a part of alpha satellite sequence containing CENP-A. This
abolishes the downstream accumulation of other centromeric proteins and prevents the
formation of a functional kinetochore (Earnshaw et al. 1989; Stimpson et al. 2012).
Neocentromeres mostly form on rearranged or fragmented chromosomes, but can
sometimes appear on non-repetitive, mostly euchromatic loci after the inactivation of the
existing centromere, taking over the role of a functional centromere (Marshall et al. 2008).
After the discovery of neocentromere formation on a human chromosome on a sequence
different from alpha satellite repeat, it became clear the DNA sequence is not sufficient for
the centromere formation (Voullaire et al. 1993). These new functional centromeres are able
to establish a fully functional kinetochore by binding almost all centromeric proteins except
centromeric protein B (CENP-B), which has a binding site in the alpha satellite region.
Formation of neocentromeres on a locus outside of the established repetitive sequence
strongly suggested that divers chemical modifications of chromatin could have a role in
determination of centromere. These chromatin modifications present epigenetic, heritable
changes that do not modify the underlying DNA sequence, but can still influence gene
expression and help to the determination of centromere identity. However, common features
of most centromere sequences such as high AT content and repetitiveness of the primary
sequence testify to the importance of these elements.
28
DICENTRIC CHROMOSOME CHROMOSOME FUSION
CHROMOSOME LOSS
TWO CENTROMERES CHROMOSOME
BREAK
Figure 5. Dicentric chromosome formation. Dicentric chromosomes arise after the fusion of two pieces of
chromosomes that each contain a centromere. The fused chromosome contain two centromeres and is therefore
called dicentric (adapted from the US National Library of Medicine).
The centromere might therefore be determined by the synergy of the DNA sequence
and epigenetic factors, where a special chromatin structure formed by their interactions
determines the centromere identity and activity. The inconsistency between the conservation
of the centromere function and the high divergence of the centromeric sequence is know as
the centromere paradox (Eichler 1999). In order to maintain the centromere function, the
associated proteins are evolving in concert with the rapidly changing repetitive sequences.
These changes in the sequence and adjacent proteins could eventually lead to reproductive
isolation and eventually speciation (Talbert & Henikoff 2006).
I. 2. Chromatin organisation at the centromere
2.1. Histone modifications and the underlying chromatin state
In eukaryotes, DNA is assembled together with histone proteins into chromatin. The
principal unit of chromatin is the nucleosome, an octamer formed by two molecules of four
histones (H2A, H2B, H3 and H4) wrapped with 147 bases of DNA in 1.7 turns (Luger et al.
1997). Histones undergo various chemical modifications that are used to separate and define
different chromatin states connected to their gene expression ability. These post-translational

29
chemical modifications occur on the N-terminal histone tails that extend out of the
nucleosome core. There are eight modifications associated with histones: methylation,
acetylation, phosphorylation, ubiquitinylation, sumoylation, ADP ribosylation, deimination
and proline isomerisation (Figure 6). Due to the large number of histone residues, the number
of possible chemical modifications is vast and grows even more complex when we take into
account that several modifications can appear in different forms, such as for example mono-,
di- or trimethylation (Kouzarides 2007).
H2B
K
KK
G%S%K
Ac
Ac
P Ub
Methylation
Acetylation
Phosporylation
Ubiquitinylation
Ac
Ub
P
H2A
120%14%
12%K%S% G% R% G%P Ac
5%1%
S%P
10%Ac
T%Q%
A% R% K%
R%A%
T%
K%
P Me
Me Me
Ac
3%
8%9%
4%
15%
H4 P S%G%R%G%K
G%G% Me Ac
1%3%
5%
K
H3
Me
Figure 6. Histone modifications on different histone tails. DNA is wrapped around a nucleosome composed
out of an octamere of two molecules of histones H2A, H2B, H3 and H4. Histones contain a flexible N-terminus
know as a histone tail that extends from the nucleosome core. Each histone tail carries a different set of post-
translational modifications such as metylation (Me), acetylation (Ac), phosphorylation (P) and ubiquitinylation
(Ub). These epigenetic modifications dictate the state of the chromatin and influence gene expression.
The combination of histone modifications is known under the name “histone code”
(Jenuwein & Allis 2001). These modifications, together with DNA methylation and chromatin
remodelling are part of epigenetic mechanisms that act together to organise the genome into
distinct functional domains, and contribute to the regulation of the output of genetic
information.
Already at the beginning of the last century, Heitz observed that certain regions of
moss chromosomes show a dense pattern of staining during all phases of the cell cycle when
30
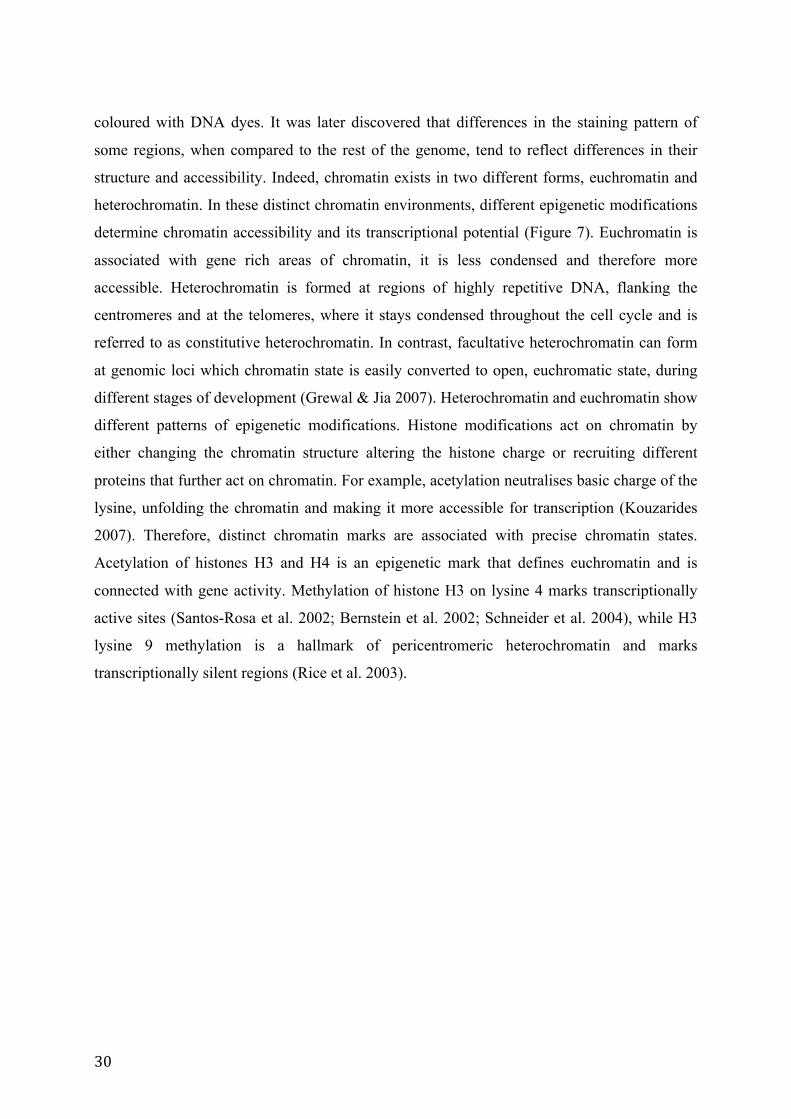
coloured with DNA dyes. It was later discovered that differences in the staining pattern of
some regions, when compared to the rest of the genome, tend to reflect differences in their
structure and accessibility. Indeed, chromatin exists in two different forms, euchromatin and
heterochromatin. In these distinct chromatin environments, different epigenetic modifications
determine chromatin accessibility and its transcriptional potential (Figure 7). Euchromatin is
associated with gene rich areas of chromatin, it is less condensed and therefore more
accessible. Heterochromatin is formed at regions of highly repetitive DNA, flanking the
centromeres and at the telomeres, where it stays condensed throughout the cell cycle and is
referred to as constitutive heterochromatin. In contrast, facultative heterochromatin can form
at genomic loci which chromatin state is easily converted to open, euchromatic state, during
different stages of development (Grewal & Jia 2007). Heterochromatin and euchromatin show
different patterns of epigenetic modifications. Histone modifications act on chromatin by
either changing the chromatin structure altering the histone charge or recruiting different
proteins that further act on chromatin. For example, acetylation neutralises basic charge of the
lysine, unfolding the chromatin and making it more accessible for transcription (Kouzarides
2007). Therefore, distinct chromatin marks are associated with precise chromatin states.
Acetylation of histones H3 and H4 is an epigenetic mark that defines euchromatin and is
connected with gene activity. Methylation of histone H3 on lysine 4 marks transcriptionally
active sites (Santos-Rosa et al. 2002; Bernstein et al. 2002; Schneider et al. 2004), while H3
lysine 9 methylation is a hallmark of pericentromeric heterochromatin and marks
transcriptionally silent regions (Rice et al. 2003).
31
A R T K Q T A R K S T G G K A P R K Q L A T K A A R K S A 9! 27
Me
H3
S G R G K G G K G L G K G G A K R H R K V L R H4 20
Me
A R T K Q T A R K S T G G K A P R K Q L A T K A A R K S A 9!4! 14 27
H3
Heterochromatin
Euchromatin
Ac Ac
Me
S G R G K G G K G L G K G G A K R H R K V L R H4 16
Ac Ac Ac
8 5 12
Ac
Me
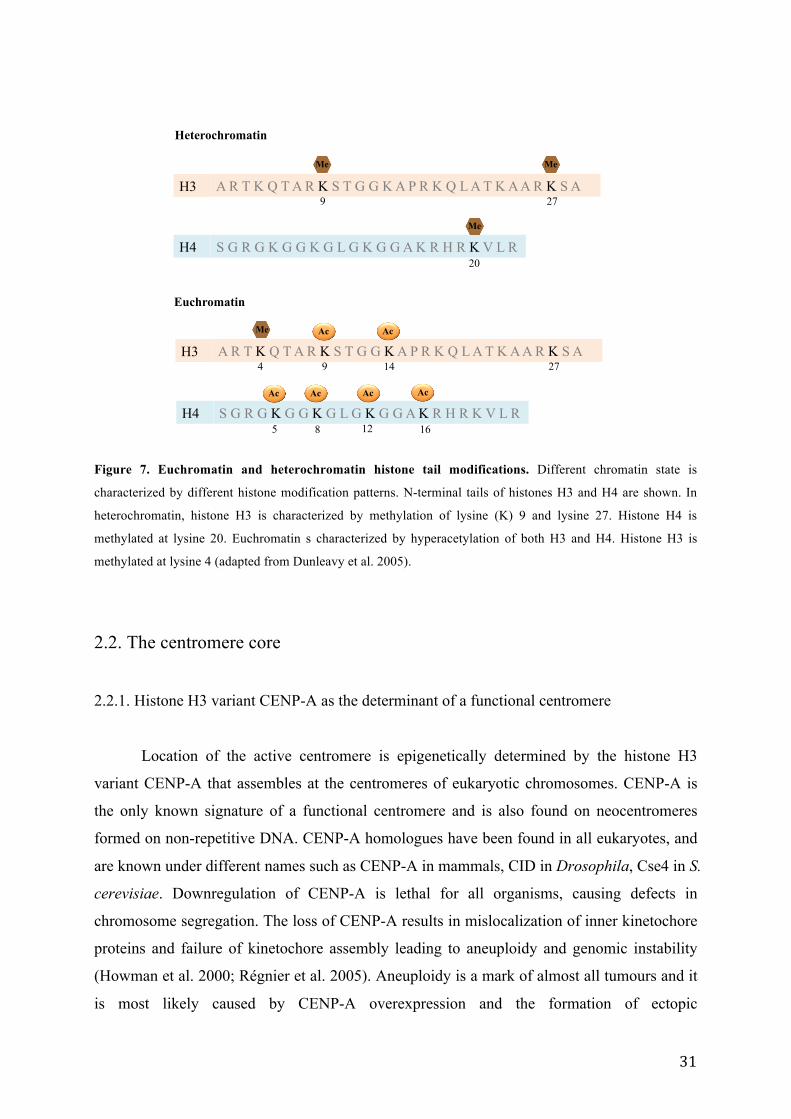
Figure 7. Euchromatin and heterochromatin histone tail modifications. Different chromatin state is
characterized by different histone modification patterns. N-terminal tails of histones H3 and H4 are shown. In
heterochromatin, histone H3 is characterized by methylation of lysine (K) 9 and lysine 27. Histone H4 is
methylated at lysine 20. Euchromatin s characterized by hyperacetylation of both H3 and H4. Histone H3 is
methylated at lysine 4 (adapted from Dunleavy et al. 2005).
2.2. The centromere core
2.2.1. Histone H3 variant CENP-A as the determinant of a functional centromere
Location of the active centromere is epigenetically determined by the histone H3
variant CENP-A that assembles at the centromeres of eukaryotic chromosomes. CENP-A is
the only known signature of a functional centromere and is also found on neocentromeres
formed on non-repetitive DNA. CENP-A homologues have been found in all eukaryotes, and
are known under different names such as CENP-A in mammals, CID in Drosophila, Cse4 in S.
cerevisiae. Downregulation of CENP-A is lethal for all organisms, causing defects in
chromosome segregation. The loss of CENP-A results in mislocalization of inner kinetochore
proteins and failure of kinetochore assembly leading to aneuploidy and genomic instability
(Howman et al. 2000; Régnier et al. 2005). Aneuploidy is a mark of almost all tumours and it
is most likely caused by CENP-A overexpression and the formation of ectopic
32
neocentromeres as observed in human colorectal cancer. CENP-A overexpression in
colorectal cancer cells leads to CENP-A mislocalization to noncentromeric regions of
chromosome or even to a complete loss of CENP-A, suggesting disruption of the kinetochore
(Tomonaga et al. 2003). Indeed, abolishment of CENP-A overexpression decreases
aneuploidy (Amato et al. 2009). If CENP-A overexpression is indeed the main reason for
chromosomal instability in cancer cells, understanding the mechanisms leading to this event
and its consequences might help in developing new approaches in anticancer therapy. How
CENP-A incorporation beyond the centromere boundaries is limited is still not known but it
might be that the formation of pericentromeric heterochromatin prevents further CENP-A
incorporation (Pidoux & Allshire 2005).
CENP-A containing nucleosomes carry structural features that distinguish them from
the canonical H3-containing nucleosomes. Amino acid sequence of the N-terminal tail of
CENP-A differs from histone H3 and is also quite variable between species. However, only
the region localized at the C-terminal histone fold domain called the CENP-A targeting
domain (CATD) is required to target CENP-A to chromosomes (Black et al. 2004). Histone
H3 containing the 22 amino acids that make the CATD domain is able to replace CENP-A at
the functional centromere (Black, Jansen, et al. 2007). Due to the CATD domain, the CENP-
A nucleosomes show a more rigid structure to the interface formed with the histone H4 (ten-
fold more slower hydrogen exchange along the peptide backbone) than the histone H3 (Black,
Brock, et al. 2007).
The canonical histone H3 contains numerous post-translational modifications on its N-
terminal tail, while only some are known for CENP-A (Bailey et al. 2013). CENP-A is
phosphorylated by Aurora B at serine 7 (Ser7), which is similar to Aurora B phosphorylation
of histone H3 at Ser 10 (Zeitlin et al. 2001). Other modifications characteristic only to CENP-
A are trimethylation of glycine 1 (Gly1) and phosphorylation of Ser16 and Ser18. The double
serine phosphorylation motif was shown to form a specific structure that cause intramolecular
associations between the N-terminal tails of CENP-A, changing the conformation of CENP-A
nucleosomes and resulting in a different chromatin structure at the centromere (Bailey et al.
2013).
After each round of replication, centromere site must be re-established at the newly
synthesised sister chromatid. The CENP-A nucleosomes are loaded at the place of the
preexisting CENP-A by the help of a histone chaperone HJURP (Holliday junction
recognition protein) during the early G1 phase (Dunleavy et al. 2005; Foltz et al. 2009).
33
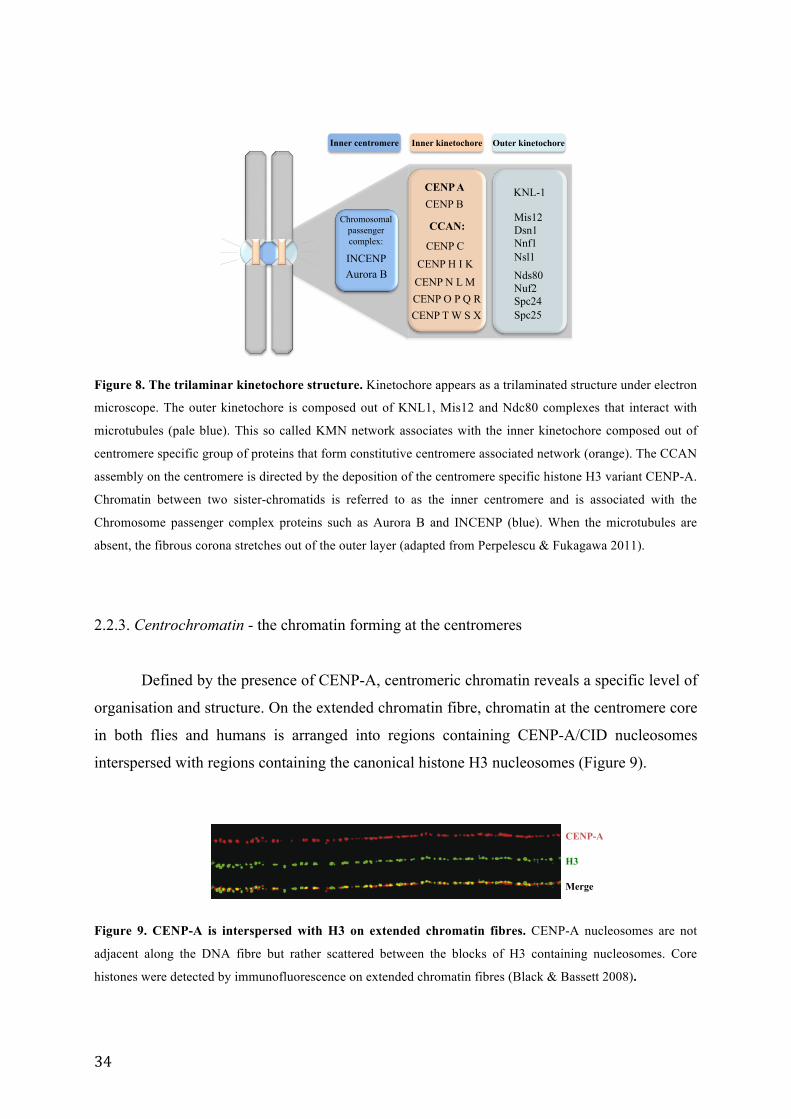
2.2.2. Centromere associated proteins
The kinetochore is seen by electron microscopy as a three-laminar structure at the
primary constriction of chromosomes. It is composed of distinct protein complexes attached
on one side to the microtubules and on the other side to the centromeric chromatin, allowing
the segregation of sister chromatids during cell division (Cheeseman & Desai 2008) (Figure
8). The outer kinetochore layer consists out of several protein complexes. These complexes
together form the KMN network of proteins, named according to the acronym for the protein
components KNL1, Mis12 and Ndc80, that bind to the microtubules (Cheeseman et al. 2004;
Cheeseman et al. 2006). KMN network interacts with proteins of the inner kinetochore
together called the CCAN (constitutively centromere-associated network). The CCAN is
formed by a group of centromere specific proteins termed CENPs (for centromeric proteins).
There are 16 CENPs that permanently associate with the centromere (Foltz et al. 2006; Okada
et al. 2006). The localisation of CCAN occurs downstream to CENP-A deposition suggesting
that CENP-A marks the position for the CCAN assembly. After the initial recruitment to the
centromere, the CCAN acts as a foundation for the assembly of the outer kinetochore proteins
(Hori et al. 2008; Hori et al. 2013). CENP-C localisation to the centromere requires six C-
terminal residues of the CENP-A (Guse et al. 2011). The only centromeric protein that
specifically binds to a centromeric sequence is CENP-B. CENP-B binds to a specific 17 bp
sequence present at the centromeric region of human and mouse, and it seems to be required
for de novo assembly of CENP-A (Masumoto et al. 1989). Chromosomal passenger complex
containing Aurora B kinase, INCENP, Survivin and Borealin transiently mark the centromere
during mitosis (Ruchaud et al. 2007).
34
Inner kinetochore
Outer kinetochore
Mis12 Dsn1 Nnf1 Nsl1
KNL-1
Nds80 Nuf2 Spc24 Spc25
CCAN:
CENP C
CENP T W S X
CENP H I K CENP N L M CENP O P Q R
CENP A
INCENP Aurora B
Outer kinetochore Inner kinetochore Inner centromere
CENP B Chromosomal
passenger complex:
Figure 8. The trilaminar kinetochore structure. Kinetochore appears as a trilaminated structure under electron
microscope. The outer kinetochore is composed out of KNL1, Mis12 and Ndc80 complexes that interact with
microtubules (pale blue). This so called KMN network associates with the inner kinetochore composed out of
centromere specific group of proteins that form constitutive centromere associated network (orange). The CCAN
assembly on the centromere is directed by the deposition of the centromere specific histone H3 variant CENP-A.
Chromatin between two sister-chromatids is referred to as the inner centromere and is associated with the
Chromosome passenger complex proteins such as Aurora B and INCENP (blue). When the microtubules are
absent, the fibrous corona stretches out of the outer layer (adapted from Perpelescu & Fukagawa 2011).
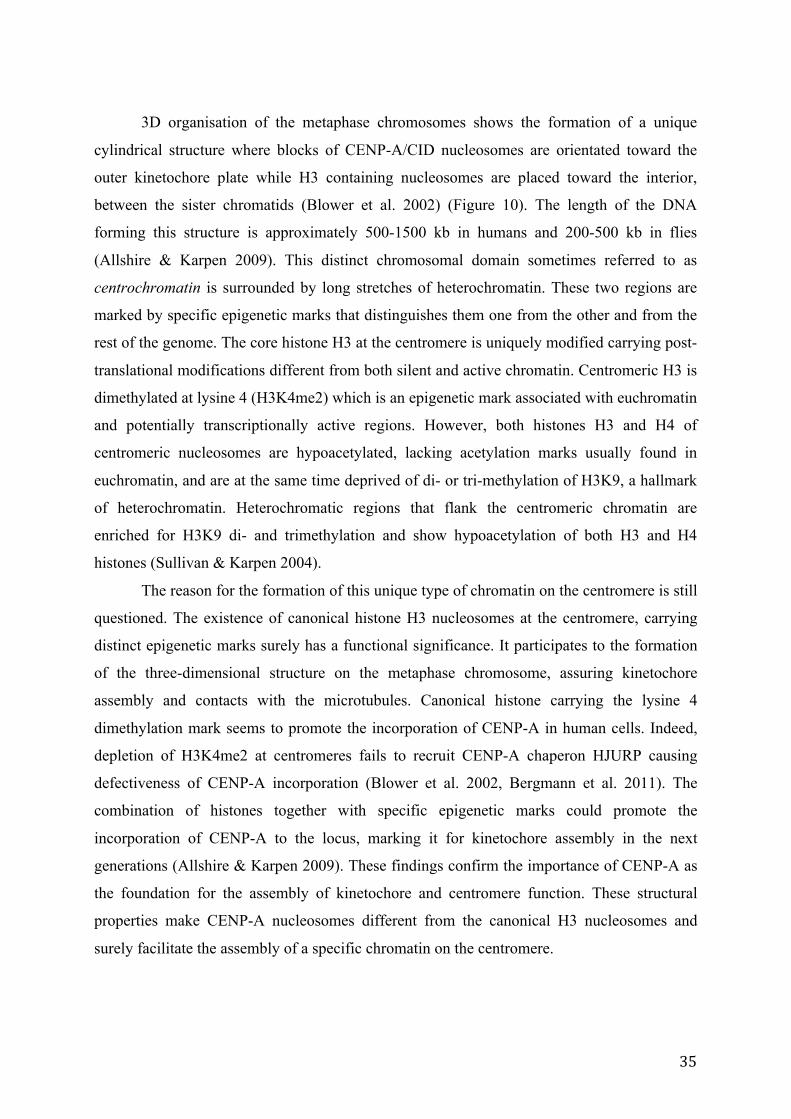
2.2.3. Centrochromatin - the chromatin forming at the centromeres
Defined by the presence of CENP-A, centromeric chromatin reveals a specific level of
organisation and structure. On the extended chromatin fibre, chromatin at the centromere core
in both flies and humans is arranged into regions containing CENP-A/CID nucleosomes
interspersed with regions containing the canonical histone H3 nucleosomes (Figure 9).
H3
CENP-A
Merge
Figure 9. CENP-A is interspersed with H3 on extended chromatin fibres. CENP-A nucleosomes are not
adjacent along the DNA fibre but rather scattered between the blocks of H3 containing nucleosomes. Core
histones were detected by immunofluorescence on extended chromatin fibres (Black & Bassett 2008).
35
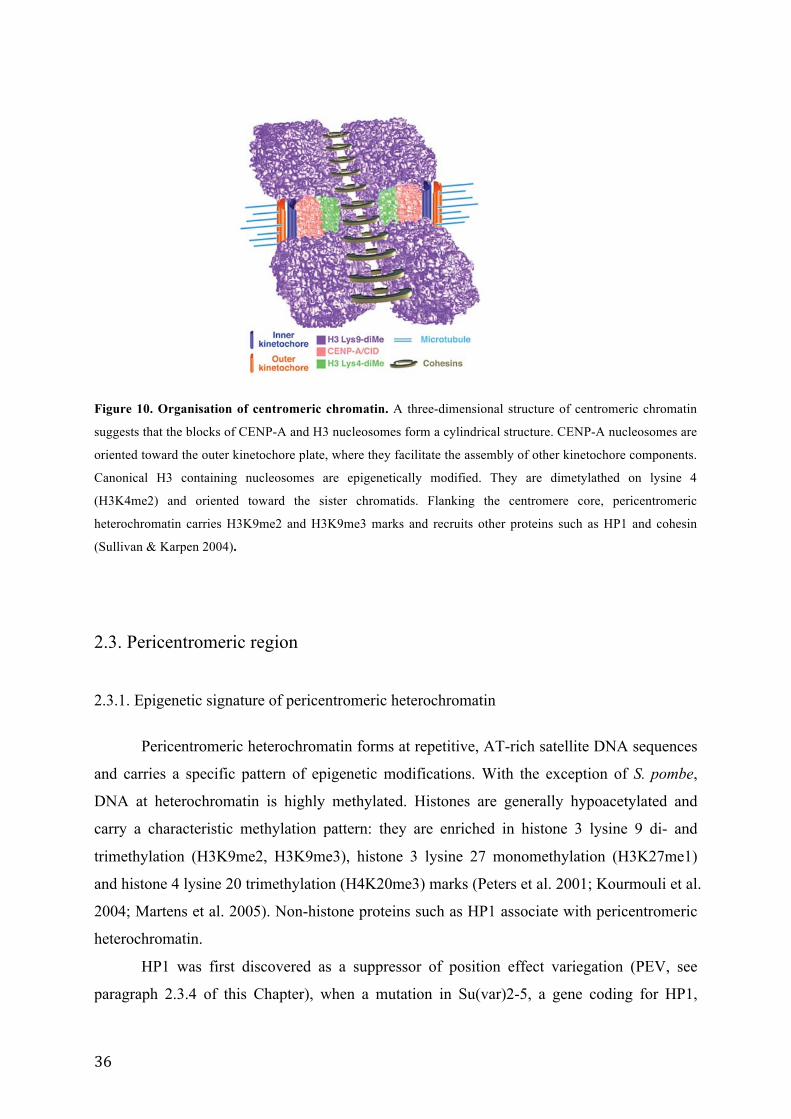
3D organisation of the metaphase chromosomes shows the formation of a unique
cylindrical structure where blocks of CENP-A/CID nucleosomes are orientated toward the
outer kinetochore plate while H3 containing nucleosomes are placed toward the interior,
between the sister chromatids (Blower et al. 2002) (Figure 10). The length of the DNA
forming this structure is approximately 500-1500 kb in humans and 200-500 kb in flies
(Allshire & Karpen 2009). This distinct chromosomal domain sometimes referred to as
centrochromatin is surrounded by long stretches of heterochromatin. These two regions are
marked by specific epigenetic marks that distinguishes them one from the other and from the
rest of the genome. The core histone H3 at the centromere is uniquely modified carrying post-
translational modifications different from both silent and active chromatin. Centromeric H3 is
dimethylated at lysine 4 (H3K4me2) which is an epigenetic mark associated with euchromatin
and potentially transcriptionally active regions. However, both histones H3 and H4 of
centromeric nucleosomes are hypoacetylated, lacking acetylation marks usually found in
euchromatin, and are at the same time deprived of di- or tri-methylation of H3K9, a hallmark
of heterochromatin. Heterochromatic regions that flank the centromeric chromatin are
enriched for H3K9 di- and trimethylation and show hypoacetylation of both H3 and H4
histones (Sullivan & Karpen 2004).
The reason for the formation of this unique type of chromatin on the centromere is still
questioned. The existence of canonical histone H3 nucleosomes at the centromere, carrying
distinct epigenetic marks surely has a functional significance. It participates to the formation
of the three-dimensional structure on the metaphase chromosome, assuring kinetochore
assembly and contacts with the microtubules. Canonical histone carrying the lysine 4
dimethylation mark seems to promote the incorporation of CENP-A in human cells. Indeed,
depletion of H3K4me2 at centromeres fails to recruit CENP-A chaperon HJURP causing
defectiveness of CENP-A incorporation (Blower et al. 2002, Bergmann et al. 2011). The
combination of histones together with specific epigenetic marks could promote the
incorporation of CENP-A to the locus, marking it for kinetochore assembly in the next
generations (Allshire & Karpen 2009). These findings confirm the importance of CENP-A as
the foundation for the assembly of kinetochore and centromere function. These structural
properties make CENP-A nucleosomes different from the canonical H3 nucleosomes and
surely facilitate the assembly of a specific chromatin on the centromere.
36
Figure 10. Organisation of centromeric chromatin. A three-dimensional structure of centromeric chromatin
suggests that the blocks of CENP-A and H3 nucleosomes form a cylindrical structure. CENP-A nucleosomes are
oriented toward the outer kinetochore plate, where they facilitate the assembly of other kinetochore components.
Canonical H3 containing nucleosomes are epigenetically modified. They are dimetylathed on lysine 4
(H3K4me2) and oriented toward the sister chromatids. Flanking the centromere core, pericentromeric
heterochromatin carries H3K9me2 and H3K9me3 marks and recruits other proteins such as HP1 and cohesin
(Sullivan & Karpen 2004).
2.3. Pericentromeric region
2.3.1. Epigenetic signature of pericentromeric heterochromatin
Pericentromeric heterochromatin forms at repetitive, AT-rich satellite DNA sequences
and carries a specific pattern of epigenetic modifications. With the exception of S. pombe,
DNA at heterochromatin is highly methylated. Histones are generally hypoacetylated and
carry a characteristic methylation pattern: they are enriched in histone 3 lysine 9 di- and
trimethylation (H3K9me2, H3K9me3), histone 3 lysine 27 monomethylation (H3K27me1)
and histone 4 lysine 20 trimethylation (H4K20me3) marks (Peters et al. 2001; Kourmouli et al.
2004; Martens et al. 2005). Non-histone proteins such as HP1 associate with pericentromeric
heterochromatin.
HP1 was first discovered as a suppressor of position effect variegation (PEV, see
paragraph 2.3.4 of this Chapter), when a mutation in Su(var)2-5, a gene coding for HP1,
37
resulted in inhibition of PEV (Eissenberg et al. 1990). Three isoforms of HP1 are known in
mammals: HP1α, HP1β and HP1γ. These proteins are evolutionary conserved, and can be
found throughout eukaryotic organisms. HP1 homologs in S. pombe are known under the
names Swi6 and Chp2 (Zeng et al. 2010). Mammalian HP1α and HP1β localize to
heterochromatic regions, while HP1γ can be found in euchromatin, where it is implicated in
transcriptional activation (Minc et al. 2000).
Another non-histone component of pericentromeric heterochromatin is SU(VAR)3-9,
a histone methyltransferase (HMT) conserved from mammals (Suv39h1 and 2) to fission
yeast (Clr4). Suv39h is primarily responsible for trimethylation of H3K9 (Rea et al. 2000;
Rice et al. 2003). Other methyltransferases such as SETDB1 and G9a also modify H3K9 in
mammals, catalysing different levels of methylation (mono- and dimethylation). Suv39h
indirectly controls DNA methylation and methylation of H4K20. Loss of Suv39h activity
causes absence of H3K9 methylation mark and loss of HP1 from heterochromatin (Bannister
et al. 2001; Peters et al. 2001).
HP1 contains three distinct domains that have different binding preferences (Figure
11). HP1 chromodomain present in its N-terminal end tethers HP1 to heterochromatin through
the interaction with Suv39h-trimethylated lysine 9 of histone H3 (Lachner et al. 2001a;
Bannister et al. 2001; Nakayama et al. 2001). This highly specific interaction cannot be seen
in other chromodomain proteins such as Polycomb. Indeed, H3K9me3 binds a conserved
motif present in HP1 chromodomain. However, since H3K9me3 is not specific only to
heterochromatin, but appears throughout the nucleus, this interaction seems not to be
sufficient for HP1 targeting to heterochromatin. Moreover, the central, variable hinge domain
of HP1 is found to strongly bind RNA (Muchardt et al. 2002). HP1 hinge domain is a major
target to sumoylation. It was shown that this post-translational modification promotes
association of HP1 with RNA and its accumulation to pericentromeric heterochromatin
(Maison et al. 2011). H3K9me3 provides binding sites for HP1 that in turn binds Suv39h
enzyme with its chromoshadow domain (Lachner et al. 2001a; Bannister et al. 2001;
Nakayama et al. 2001). HP1 chromoshadow domain can also bind other proteins such as
Suv4-20h2, methyl-CpG-binding proteins, Dnmt3a and Dnmt3b and the large subunit of
chromatin assembly factor CAF, p150, implicated in DNA replication and repair. It also
interacts with HP1α and HP1β, a feature that permits homodimerisation of HP1 proteins.
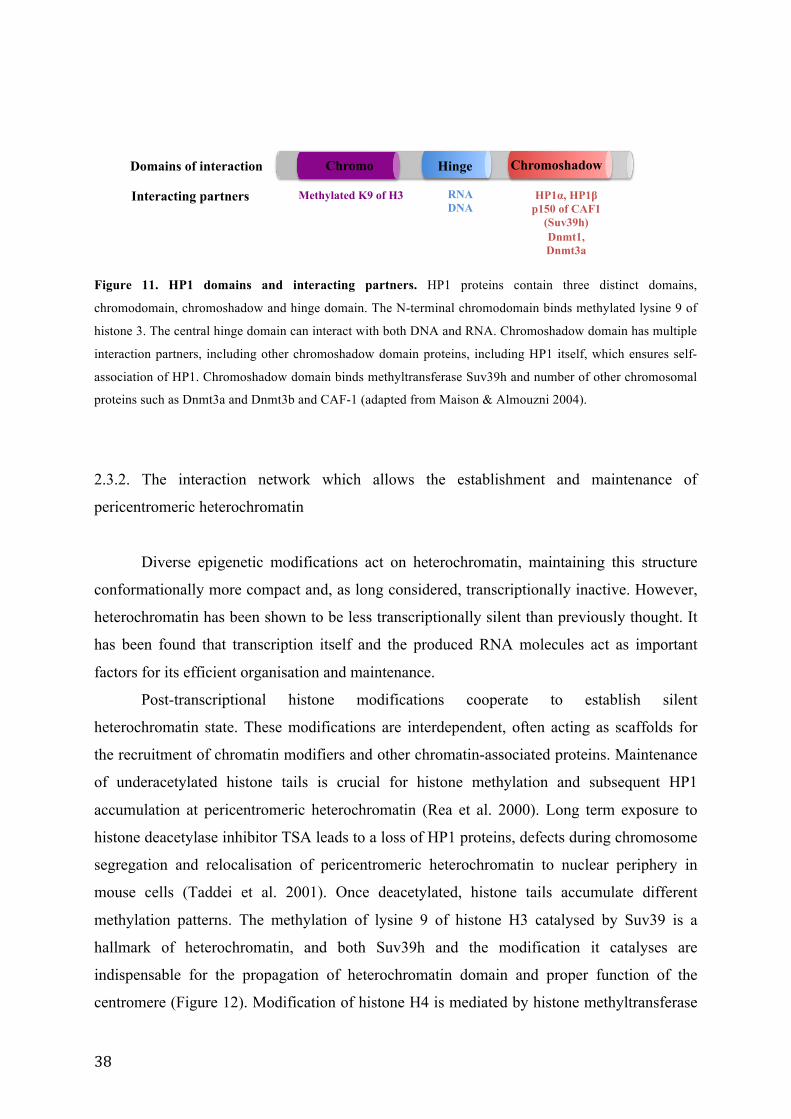
38
Domains of interaction
Methylated K9 of H3
Chromo Hinge Chromoshadow
RNA DNA
HP1α, HP1β p150 of CAF1
(Suv39h) Dnmt1, Dnmt3a
Interacting partners
Figure 11. HP1 domains and interacting partners. HP1 proteins contain three distinct domains,
chromodomain, chromoshadow and hinge domain. The N-terminal chromodomain binds methylated lysine 9 of
histone 3. The central hinge domain can interact with both DNA and RNA. Chromoshadow domain has multiple
interaction partners, including other chromoshadow domain proteins, including HP1 itself, which ensures self-
association of HP1. Chromoshadow domain binds methyltransferase Suv39h and number of other chromosomal
proteins such as Dnmt3a and Dnmt3b and CAF-1 (adapted from Maison & Almouzni 2004).
2.3.2. The interaction network which allows the establishment and maintenance of
pericentromeric heterochromatin
Diverse epigenetic modifications act on heterochromatin, maintaining this structure
conformationally more compact and, as long considered, transcriptionally inactive. However,
heterochromatin has been shown to be less transcriptionally silent than previously thought. It
has been found that transcription itself and the produced RNA molecules act as important
factors for its efficient organisation and maintenance.
Post-transcriptional histone modifications cooperate to establish silent
heterochromatin state. These modifications are interdependent, often acting as scaffolds for
the recruitment of chromatin modifiers and other chromatin-associated proteins. Maintenance
of underacetylated histone tails is crucial for histone methylation and subsequent HP1
accumulation at pericentromeric heterochromatin (Rea et al. 2000). Long term exposure to
histone deacetylase inhibitor TSA leads to a loss of HP1 proteins, defects during chromosome
segregation and relocalisation of pericentromeric heterochromatin to nuclear periphery in
mouse cells (Taddei et al. 2001). Once deacetylated, histone tails accumulate different
methylation patterns. The methylation of lysine 9 of histone H3 catalysed by Suv39 is a
hallmark of heterochromatin, and both Suv39h and the modification it catalyses are
indispensable for the propagation of heterochromatin domain and proper function of the
centromere (Figure 12). Modification of histone H4 is mediated by histone methyltransferase
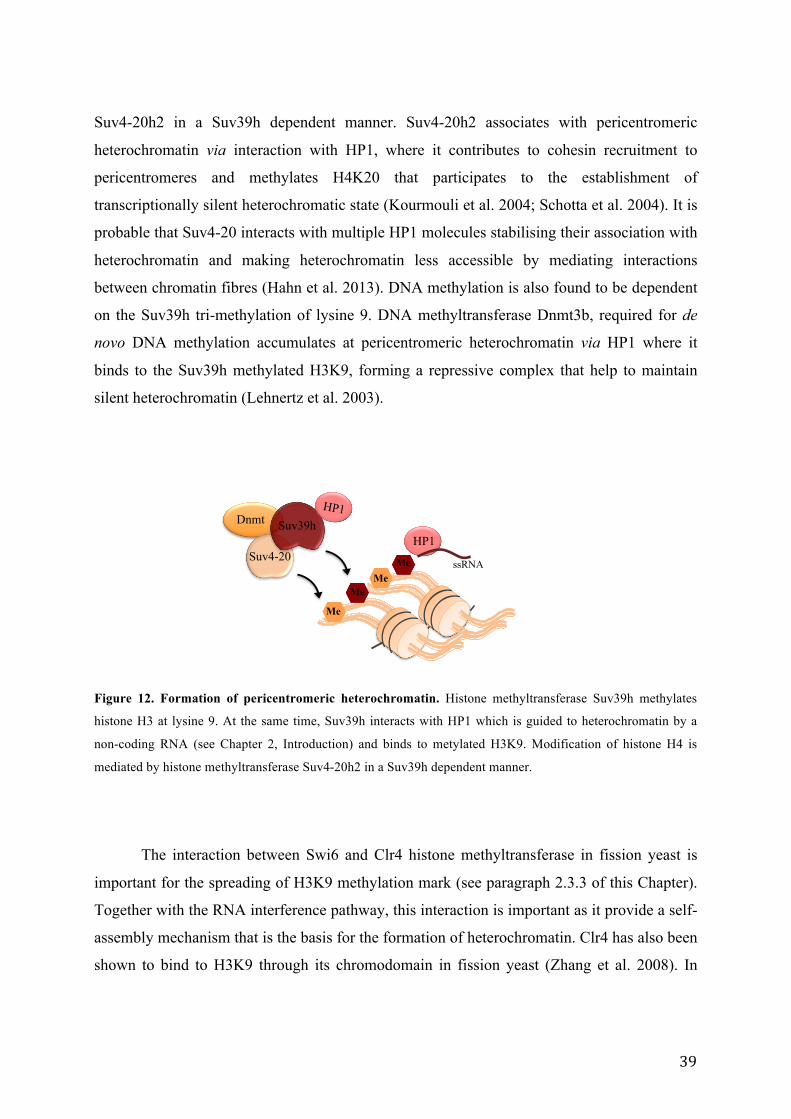
39
Suv4-20h2 in a Suv39h dependent manner. Suv4-20h2 associates with pericentromeric
heterochromatin via interaction with HP1, where it contributes to cohesin recruitment to
pericentromeres and methylates H4K20 that participates to the establishment of
transcriptionally silent heterochromatic state (Kourmouli et al. 2004; Schotta et al. 2004). It is
probable that Suv4-20 interacts with multiple HP1 molecules stabilising their association with
heterochromatin and making heterochromatin less accessible by mediating interactions
between chromatin fibres (Hahn et al. 2013). DNA methylation is also found to be dependent
on the Suv39h tri-methylation of lysine 9. DNA methyltransferase Dnmt3b, required for de
novo DNA methylation accumulates at pericentromeric heterochromatin via HP1 where it
binds to the Suv39h methylated H3K9, forming a repressive complex that help to maintain
silent heterochromatin (Lehnertz et al. 2003).
Dnmt
Suv4-20
Suv39h HP1
HP1
Me
Me Me
Me ssRNA
Figure 12. Formation of pericentromeric heterochromatin. Histone methyltransferase Suv39h methylates
histone H3 at lysine 9. At the same time, Suv39h interacts with HP1 which is guided to heterochromatin by a
non-coding RNA (see Chapter 2, Introduction) and binds to metylated H3K9. Modification of histone H4 is
mediated by histone methyltransferase Suv4-20h2 in a Suv39h dependent manner.
The interaction between Swi6 and Clr4 histone methyltransferase in fission yeast is
important for the spreading of H3K9 methylation mark (see paragraph 2.3.3 of this Chapter).
Together with the RNA interference pathway, this interaction is important as it provide a self-
assembly mechanism that is the basis for the formation of heterochromatin. Clr4 has also been
shown to bind to H3K9 through its chromodomain in fission yeast (Zhang et al. 2008). In
40
mammals it has been proposed that Suv39h interacts with multiple factors that are responsible
for its tethering to pericentric heterochromatin and spreading of the repressive domain.
It was recently shown that in mammals, the HP1 interaction with Suv39h is not as
important as previously thought for spreading of H3K9me3. In Suv39h double null cells, the
H3K9me3 mark was completely recovered over heterochromatin when mouse ES cells were
rescued with the Suv39h mutant unable to bind HP1. Moreover, Suv39h accumulated to
pericentromeric regions and DNA methylation marks were re-established (Muramatsu et al.
2013). It is therefore possible that the Suv39h/Clr4 interaction with methylated H3K9 creates
new binding sites for Suv39h/Clr4 by modification of adjacent H3K9, as well as other
chromatin bound proteins and modification marks, promoting in this way the spreading of
heterochromatin (Müller-Ott et al. 2014). Furthermore, HP1 accumulation also depends on
H3K27me3. Indeed, the accumulation of H3K27me3 at pericentric heterochromatin is
stabilised by its interaction with Polycomb repressive complex 2 that catalyses H3K27me2/3
(Boros et al. 2014).
2.3.3. Heterochromatin assembly in S pombe requires RNA interference
RNA interference is a process by which the expression of a gene is specifically
inhibited by double-stranded RNA (dsRNA). This post-transcriptional silencing process
(PTGS), initially discovered in plants, was described for the first time in C. elegans (Fire et al.
1998). The initial long double-stranded RNA are processed by an endonuclease Dicer to
generate short, 21 bp siRNA. These siRNAs are loaded to a ribonucleoprotein complex RISC
(RNA induced silencing complex), which is guided by the siRNA to the complementary
target RNA. RISC component, protein Argonaut cleaves the target RNA (Kurreck 2009).
Post-transcriptional gene silencing can also be induced by endogenous microRNA, where
they can inhibit translation of the target RNA by the mechanism of steric blocking. RNA
silencing mostly functions at the post-transcriptional level, interfering with the target RNA,
but it can also act directly at the level of chromatin. In this case, the siRNA targets a specific
genomic locus to direct the formation of repressive chromatin domain. The process has first
been described in S. pombe as a transcriptional gene silencing mechanism (Almeida &
Allshire 2005).
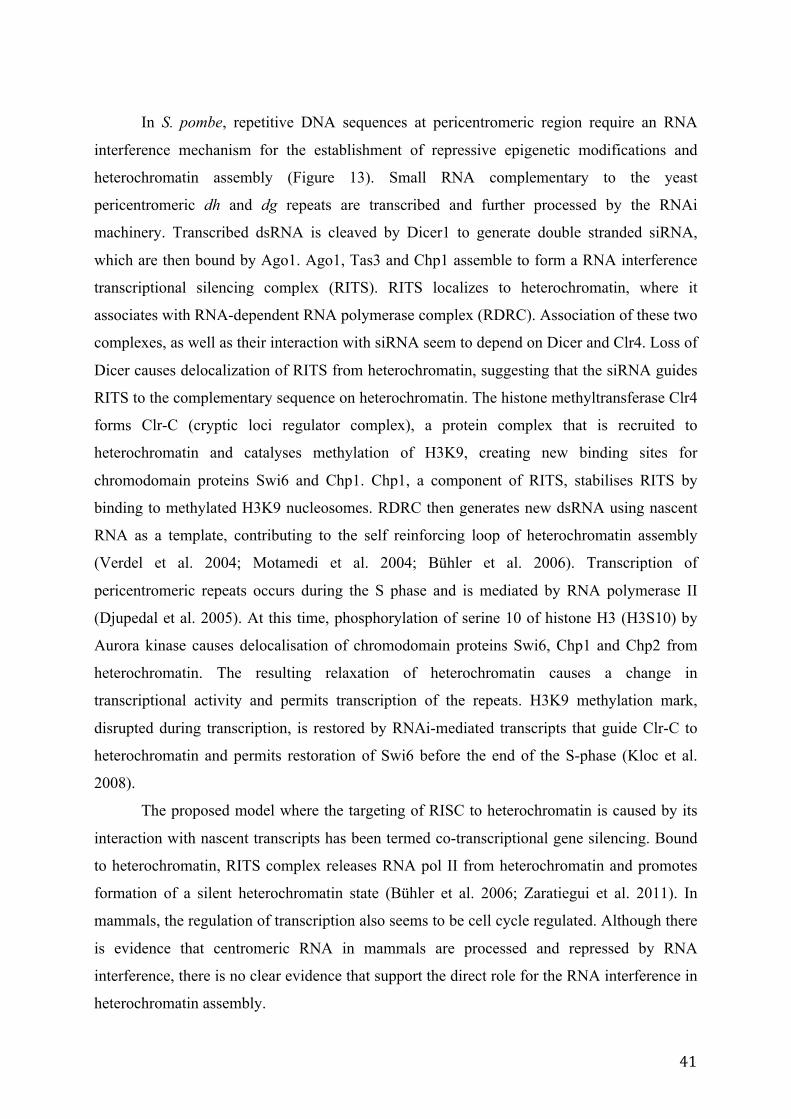
41
In S. pombe, repetitive DNA sequences at pericentromeric region require an RNA
interference mechanism for the establishment of repressive epigenetic modifications and
heterochromatin assembly (Figure 13). Small RNA complementary to the yeast
pericentromeric dh and dg repeats are transcribed and further processed by the RNAi
machinery. Transcribed dsRNA is cleaved by Dicer1 to generate double stranded siRNA,
which are then bound by Ago1. Ago1, Tas3 and Chp1 assemble to form a RNA interference
transcriptional silencing complex (RITS). RITS localizes to heterochromatin, where it
associates with RNA-dependent RNA polymerase complex (RDRC). Association of these two
complexes, as well as their interaction with siRNA seem to depend on Dicer and Clr4. Loss of
Dicer causes delocalization of RITS from heterochromatin, suggesting that the siRNA guides
RITS to the complementary sequence on heterochromatin. The histone methyltransferase Clr4
forms Clr-C (cryptic loci regulator complex), a protein complex that is recruited to
heterochromatin and catalyses methylation of H3K9, creating new binding sites for
chromodomain proteins Swi6 and Chp1. Chp1, a component of RITS, stabilises RITS by
binding to methylated H3K9 nucleosomes. RDRC then generates new dsRNA using nascent
RNA as a template, contributing to the self reinforcing loop of heterochromatin assembly
(Verdel et al. 2004; Motamedi et al. 2004; Bühler et al. 2006). Transcription of
pericentromeric repeats occurs during the S phase and is mediated by RNA polymerase II
(Djupedal et al. 2005). At this time, phosphorylation of serine 10 of histone H3 (H3S10) by
Aurora kinase causes delocalisation of chromodomain proteins Swi6, Chp1 and Chp2 from
heterochromatin. The resulting relaxation of heterochromatin causes a change in
transcriptional activity and permits transcription of the repeats. H3K9 methylation mark,
disrupted during transcription, is restored by RNAi-mediated transcripts that guide Clr-C to
heterochromatin and permits restoration of Swi6 before the end of the S-phase (Kloc et al.
2008).
The proposed model where the targeting of RISC to heterochromatin is caused by its
interaction with nascent transcripts has been termed co-transcriptional gene silencing. Bound
to heterochromatin, RITS complex releases RNA pol II from heterochromatin and promotes
formation of a silent heterochromatin state (Bühler et al. 2006; Zaratiegui et al. 2011). In
mammals, the regulation of transcription also seems to be cell cycle regulated. Although there
is evidence that centromeric RNA in mammals are processed and repressed by RNA
interference, there is no clear evidence that support the direct role for the RNA interference in
heterochromatin assembly.
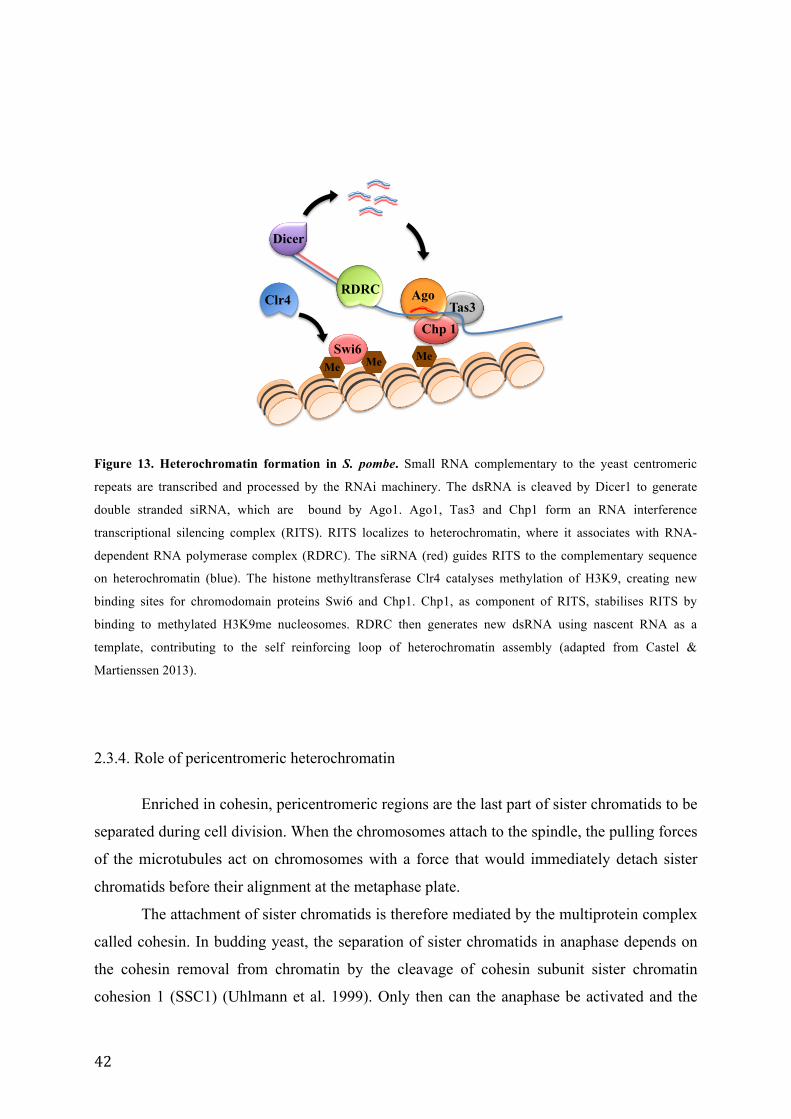
42
Swi6
Clr4
Me Me
Tas3
Chp 1
Ago
Me
RDRC
Dicer
Figure 13. Heterochromatin formation in S. pombe. Small RNA complementary to the yeast centromeric
repeats are transcribed and processed by the RNAi machinery. The dsRNA is cleaved by Dicer1 to generate
double stranded siRNA, which are bound by Ago1. Ago1, Tas3 and Chp1 form an RNA interference
transcriptional silencing complex (RITS). RITS localizes to heterochromatin, where it associates with RNA-
dependent RNA polymerase complex (RDRC). The siRNA (red) guides RITS to the complementary sequence
on heterochromatin (blue). The histone methyltransferase Clr4 catalyses methylation of H3K9, creating new
binding sites for chromodomain proteins Swi6 and Chp1. Chp1, as component of RITS, stabilises RITS by
binding to methylated H3K9me nucleosomes. RDRC then generates new dsRNA using nascent RNA as a
template, contributing to the self reinforcing loop of heterochromatin assembly (adapted from Castel &
Martienssen 2013).
2.3.4. Role of pericentromeric heterochromatin
Enriched in cohesin, pericentromeric regions are the last part of sister chromatids to be
separated during cell division. When the chromosomes attach to the spindle, the pulling forces
of the microtubules act on chromosomes with a force that would immediately detach sister
chromatids before their alignment at the metaphase plate.
The attachment of sister chromatids is therefore mediated by the multiprotein complex
called cohesin. In budding yeast, the separation of sister chromatids in anaphase depends on
the cohesin removal from chromatin by the cleavage of cohesin subunit sister chromatin
cohesion 1 (SSC1) (Uhlmann et al. 1999). Only then can the anaphase be activated and the
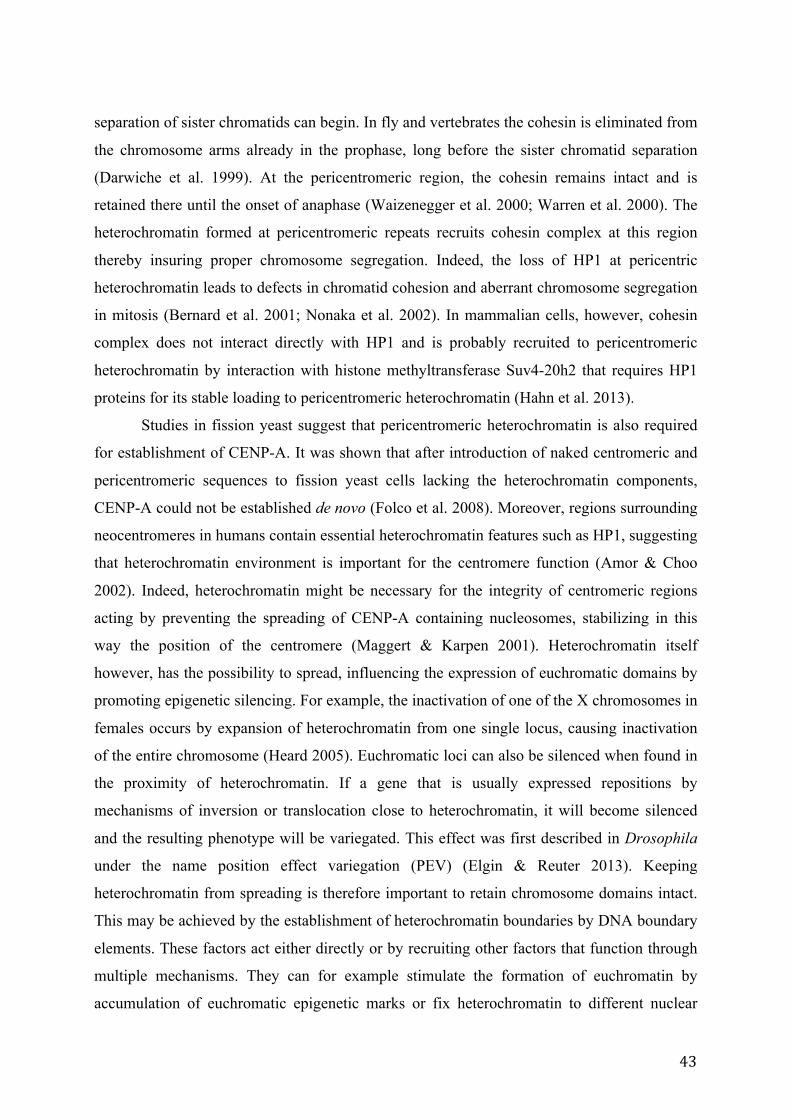
43
separation of sister chromatids can begin. In fly and vertebrates the cohesin is eliminated from
the chromosome arms already in the prophase, long before the sister chromatid separation
(Darwiche et al. 1999). At the pericentromeric region, the cohesin remains intact and is
retained there until the onset of anaphase (Waizenegger et al. 2000; Warren et al. 2000). The
heterochromatin formed at pericentromeric repeats recruits cohesin complex at this region
thereby insuring proper chromosome segregation. Indeed, the loss of HP1 at pericentric
heterochromatin leads to defects in chromatid cohesion and aberrant chromosome segregation
in mitosis (Bernard et al. 2001; Nonaka et al. 2002). In mammalian cells, however, cohesin
complex does not interact directly with HP1 and is probably recruited to pericentromeric
heterochromatin by interaction with histone methyltransferase Suv4-20h2 that requires HP1
proteins for its stable loading to pericentromeric heterochromatin (Hahn et al. 2013).
Studies in fission yeast suggest that pericentromeric heterochromatin is also required
for establishment of CENP-A. It was shown that after introduction of naked centromeric and
pericentromeric sequences to fission yeast cells lacking the heterochromatin components,
CENP-A could not be established de novo (Folco et al. 2008). Moreover, regions surrounding
neocentromeres in humans contain essential heterochromatin features such as HP1, suggesting
that heterochromatin environment is important for the centromere function (Amor & Choo
2002). Indeed, heterochromatin might be necessary for the integrity of centromeric regions
acting by preventing the spreading of CENP-A containing nucleosomes, stabilizing in this
way the position of the centromere (Maggert & Karpen 2001). Heterochromatin itself
however, has the possibility to spread, influencing the expression of euchromatic domains by
promoting epigenetic silencing. For example, the inactivation of one of the X chromosomes in
females occurs by expansion of heterochromatin from one single locus, causing inactivation
of the entire chromosome (Heard 2005). Euchromatic loci can also be silenced when found in
the proximity of heterochromatin. If a gene that is usually expressed repositions by
mechanisms of inversion or translocation close to heterochromatin, it will become silenced
and the resulting phenotype will be variegated. This effect was first described in Drosophila
under the name position effect variegation (PEV) (Elgin & Reuter 2013). Keeping
heterochromatin from spreading is therefore important to retain chromosome domains intact.
This may be achieved by the establishment of heterochromatin boundaries by DNA boundary
elements. These factors act either directly or by recruiting other factors that function through
multiple mechanisms. They can for example stimulate the formation of euchromatin by
accumulation of euchromatic epigenetic marks or fix heterochromatin to different nuclear
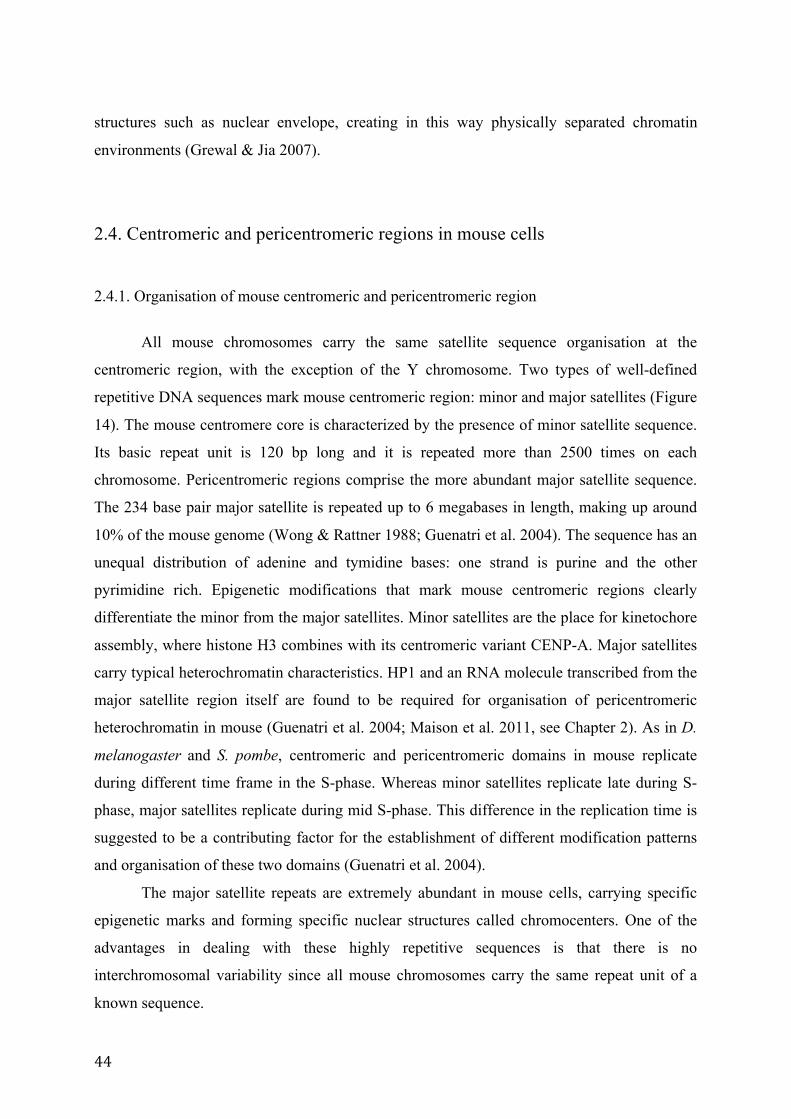
44
structures such as nuclear envelope, creating in this way physically separated chromatin
environments (Grewal & Jia 2007).
2.4. Centromeric and pericentromeric regions in mouse cells
2.4.1. Organisation of mouse centromeric and pericentromeric region
All mouse chromosomes carry the same satellite sequence organisation at the
centromeric region, with the exception of the Y chromosome. Two types of well-defined
repetitive DNA sequences mark mouse centromeric region: minor and major satellites (Figure
14). The mouse centromere core is characterized by the presence of minor satellite sequence.
Its basic repeat unit is 120 bp long and it is repeated more than 2500 times on each
chromosome. Pericentromeric regions comprise the more abundant major satellite sequence.
The 234 base pair major satellite is repeated up to 6 megabases in length, making up around
10% of the mouse genome (Wong & Rattner 1988; Guenatri et al. 2004). The sequence has an
unequal distribution of adenine and tymidine bases: one strand is purine and the other
pyrimidine rich. Epigenetic modifications that mark mouse centromeric regions clearly
differentiate the minor from the major satellites. Minor satellites are the place for kinetochore
assembly, where histone H3 combines with its centromeric variant CENP-A. Major satellites
carry typical heterochromatin characteristics. HP1 and an RNA molecule transcribed from the
major satellite region itself are found to be required for organisation of pericentromeric
heterochromatin in mouse (Guenatri et al. 2004; Maison et al. 2011, see Chapter 2). As in D.
melanogaster and S. pombe, centromeric and pericentromeric domains in mouse replicate
during different time frame in the S-phase. Whereas minor satellites replicate late during S-
phase, major satellites replicate during mid S-phase. This difference in the replication time is
suggested to be a contributing factor for the establishment of different modification patterns
and organisation of these two domains (Guenatri et al. 2004).
The major satellite repeats are extremely abundant in mouse cells, carrying specific
epigenetic marks and forming specific nuclear structures called chromocenters. One of the
advantages in dealing with these highly repetitive sequences is that there is no
interchromosomal variability since all mouse chromosomes carry the same repeat unit of a
known sequence.
45
Figure 14. Organisation of mouse centromeric and pericentromeric region. Mouse telocentric chromosome.
Minor satellite sequences are located on the centromere (green) while the major satellite sequences (pink) are
located around the centromere.
2.4.2. Association of pericentromeric regions
A current assumption is that the organisation of chromatin in the nucleus into the so-
called chromatin domains and their localisation in the nucleus are important for functional
organisation of the nucleus. It has been observed that heterochromatin has a tendency to be
predominantly associated with the nuclear periphery and can be found around the nucleoli
borders, while euchromatin mostly occupies the nuclear interior (Gibcus & Dekker 2013).
The only exception to this nuclear organisation are the rod receptor cells of nocturnal
mammals, where the nuclear localization of heterochromatin and euchromatin in these cells
are inverted. The inversion takes place during rod cell maturation and affects the optical
properties of the retina (Solovei et al. 2009). Heterochromatin is bound to the nuclear
periphery by two different nuclear tethers, the inner nuclear membrane protein lamin B
receptor LBR, and the lamin A/C (Solovei et al. 2013). This conventional nuclear
organisation with the heterochromatin on the inner nuclear membrane seems to facilitate gene
interaction and transcriptional regulation by promoting interaction between chromosomes.
Association of heterochromatin with nuclear envelope seems to affect the correct positioning
of genes in the nucleus and affect transcription (Solovei et al. 2009).
Visible organisation of chromatin into distinct nuclear structures is particularly
remarkable in the nucleus of mouse cells and can be observed as well in several other species
such are some plants and Drosophila (Zhang & Spradling 1995; Fransz et al. 2002).
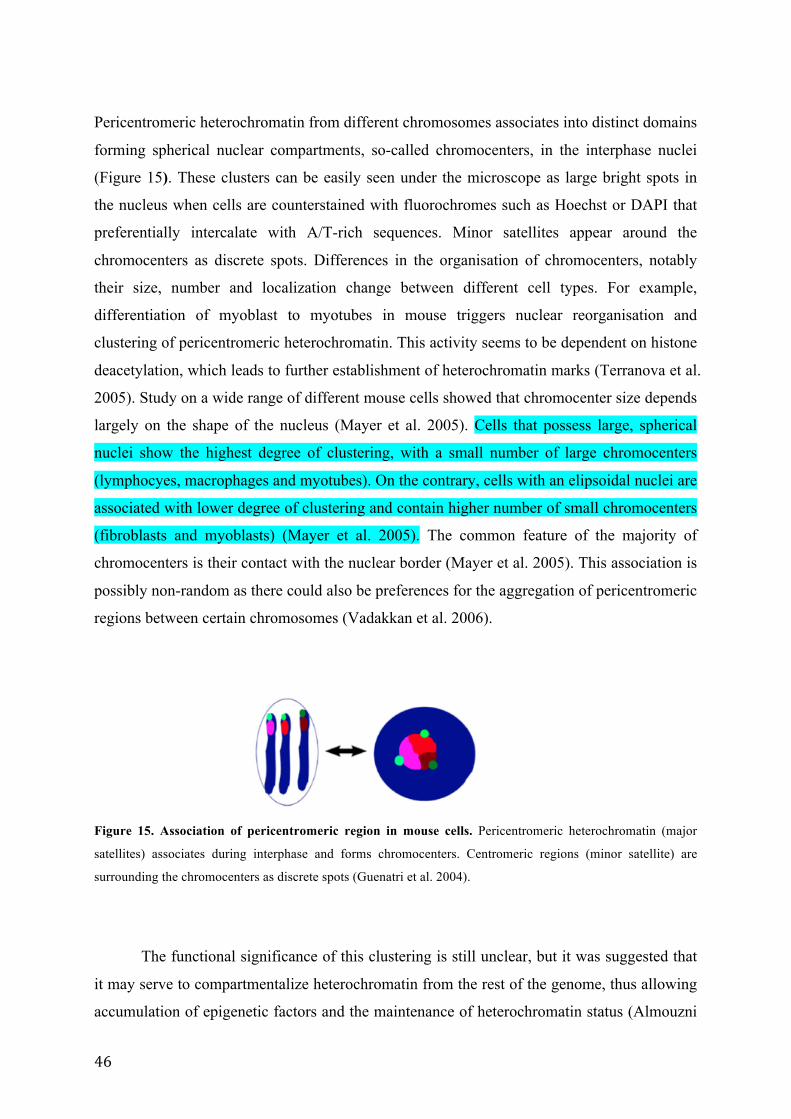
46
Pericentromeric heterochromatin from different chromosomes associates into distinct domains
forming spherical nuclear compartments, so-called chromocenters, in the interphase nuclei
(Figure 15). These clusters can be easily seen under the microscope as large bright spots in
the nucleus when cells are counterstained with fluorochromes such as Hoechst or DAPI that
preferentially intercalate with A/T-rich sequences. Minor satellites appear around the
chromocenters as discrete spots. Differences in the organisation of chromocenters, notably
their size, number and localization change between different cell types. For example,
differentiation of myoblast to myotubes in mouse triggers nuclear reorganisation and
clustering of pericentromeric heterochromatin. This activity seems to be dependent on histone
deacetylation, which leads to further establishment of heterochromatin marks (Terranova et al.
2005). Study on a wide range of different mouse cells showed that chromocenter size depends
largely on the shape of the nucleus (Mayer et al. 2005). Cells that possess large, spherical
nuclei show the highest degree of clustering, with a small number of large chromocenters
(lymphocyes, macrophages and myotubes). On the contrary, cells with an elipsoidal nuclei are
associated with lower degree of clustering and contain higher number of small chromocenters
(fibroblasts and myoblasts) (Mayer et al. 2005). The common feature of the majority of
chromocenters is their contact with the nuclear border (Mayer et al. 2005). This association is
possibly non-random as there could also be preferences for the aggregation of pericentromeric
regions between certain chromosomes (Vadakkan et al. 2006).
Figure 15. Association of pericentromeric region in mouse cells. Pericentromeric heterochromatin (major
satellites) associates during interphase and forms chromocenters. Centromeric regions (minor satellite) are
surrounding the chromocenters as discrete spots (Guenatri et al. 2004).
The functional significance of this clustering is still unclear, but it was suggested that
it may serve to compartmentalize heterochromatin from the rest of the genome, thus allowing
accumulation of epigenetic factors and the maintenance of heterochromatin status (Almouzni
47
& Probst 2011). It has also been observed that association of euchromatic loci with
chromocenters correlates with their silencing, suggesting that chromocenters might participate
to the mechanisms of gene regulation (Brown et al. 1997; Roldán et al. 2005).
48
CHAPTER II.
Non-coding RNA from centromeric and
pericentromeric regions
49
II.1 Non-coding RNA
1.1. The RNA world, old and new
1.1.1. A new perspective on RNA
Postulated by Crick, the central “dogma” of molecular biology had established the
view of RNA molecules as simple intermediaries between the DNA and the protein.
Discovery of mRNA, tRNA and rRNA or even new classes of small nuclear and nucleolar
RNA, all of them dedicated to the production of functional proteins, reinforced the view of
the RNA as a template and a platform for protein synthesis (Morris & Mattick 2014).
Discovery of transcription factors established the idea of proteins as not only enzymes and
structural components but also as molecules capable to directly regulate gene expression
(Morris & Mattick 2014). In the late 1960s, after the discovery of retrotransposon sequences,
it was suggested that the RNA might be involved in the regulatory network of gene
expression in animals (Britten & Davidson 1969; Davidson et al. 1977). Finding that the
coding sequences of higher organisms are interspersed with non-coding regions, both of
which are transcribed together, was however taken with surprise (Berget et al. 1977; Chow et
al. 1977). These non-coding sequences termed introns, were found to be excised from the
primary RNA transcript and were interpreted as remnants of no longer functional genes that
have taken a new role and are now only significant for the mechanism of alternative splicing.
In the early 1980’s two research groups independently discovered that RNA molecules
are capable to catalyse chemical reactions (Kruger et al. 1982; Guerrier-Takada et al. 1983).
Since then, many of these types of RNAs possessing enzymatic properties, termed ribozymes,
have been described. These discoveries supported the now widespread hypothesis of the RNA
World (Gilbert 1986), which postulates that early in the evolution of life, the flow of genetic
information was assured by replicating RNA molecules with catalytic activity (Orgel 2004).
Finally, discoveries of RNA with no protein coding function such as micro RNA and
small interfering RNA put RNA in a new perspective. These were the first evidences for the
existence of new classes of RNA, non-coding RNA that turned out to have important and
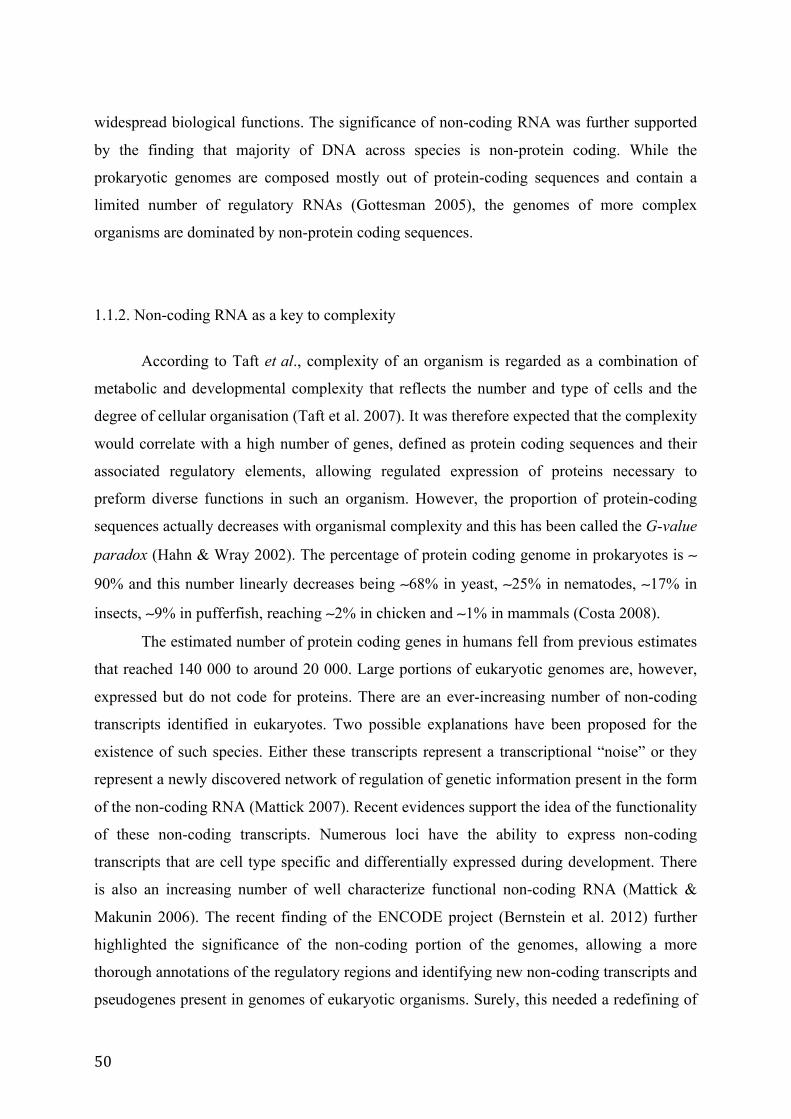
50
widespread biological functions. The significance of non-coding RNA was further supported
by the finding that majority of DNA across species is non-protein coding. While the
prokaryotic genomes are composed mostly out of protein-coding sequences and contain a
limited number of regulatory RNAs (Gottesman 2005), the genomes of more complex
organisms are dominated by non-protein coding sequences.
1.1.2. Non-coding RNA as a key to complexity
According to Taft et al., complexity of an organism is regarded as a combination of
metabolic and developmental complexity that reflects the number and type of cells and the
degree of cellular organisation (Taft et al. 2007). It was therefore expected that the complexity
would correlate with a high number of genes, defined as protein coding sequences and their
associated regulatory elements, allowing regulated expression of proteins necessary to
preform diverse functions in such an organism. However, the proportion of protein-coding
sequences actually decreases with organismal complexity and this has been called the G-value
paradox (Hahn & Wray 2002). The percentage of protein coding genome in prokaryotes is ∼
90% and this number linearly decreases being ∼68% in yeast, ∼25% in nematodes, ∼17% in
insects, ∼9% in pufferfish, reaching ∼2% in chicken and ∼1% in mammals (Costa 2008).
The estimated number of protein coding genes in humans fell from previous estimates
that reached 140 000 to around 20 000. Large portions of eukaryotic genomes are, however,
expressed but do not code for proteins. There are an ever-increasing number of non-coding
transcripts identified in eukaryotes. Two possible explanations have been proposed for the
existence of such species. Either these transcripts represent a transcriptional “noise” or they
represent a newly discovered network of regulation of genetic information present in the form
of the non-coding RNA (Mattick 2007). Recent evidences support the idea of the functionality
of these non-coding transcripts. Numerous loci have the ability to express non-coding
transcripts that are cell type specific and differentially expressed during development. There
is also an increasing number of well characterize functional non-coding RNA (Mattick &
Makunin 2006). The recent finding of the ENCODE project (Bernstein et al. 2012) further
highlighted the significance of the non-coding portion of the genomes, allowing a more
thorough annotations of the regulatory regions and identifying new non-coding transcripts and
pseudogenes present in genomes of eukaryotic organisms. Surely, this needed a redefining of
51
the current definition of a gene. In 2007, a new definition of a gene took into account all the
recent findings of non protein-coding but actively transcribed and potentially functional
transcripts: a gene is a “union of genomic sequences encoding a coherent set of potentially
overlapping functional products” (Gerstein et al. 2007).
According to Mattick, the ncRNA could be the key to complexity of higher organisms
(Figure 16). In other words, the idea is that complex organisms possess an ability to use a
“digital programming system” that is based on non-coding RNAs. These RNAs would have
for main function to be signalling molecules that coordinate a complex molecular network.
The signalling would be performed at two levels, either by sequence specific interactions or
by secondary and tertiary structure through which they are able to target proteins to convey
different actions, one of them being a change in chromatin conformation (Mattick 2004;
Mattick 2007).
Figure 16. The percentage of non-coding to total genomic DNA per haploid genome across species. The
amount of non-coding RNA increases with organismal complexity. Prokaryotes contain less than 25% non-
coding DNA, simple eukaryotes between 25-50%, while this number rises to more than 50% in fungi, plants and
animals, reaching approximately 98,5% in humans. Different colours present prokaryotes (bacteria and archea)
(blue), single cell eukaryotes (black), N.crassa (gray), plants (green), non-chordate invertebrates (nematodes,
insects) (purple), urochordate C.intestinalis (yellow), vertebrates (red) (Mattick 2004).
52
1.2. Emerging role for ncRNAs In 1993, a small, 22 nt RNA was discovered that could inhibit the translation of its
complementary target mRNA (Lee et al. 1993). This was the first evidence for the existence
of non-coding regulatory RNA, a discovery that opened a new field of studies. Today, it is
established that a variety of both short and long non-coding RNA are involved in numerous
biological processes such as transcriptional and post-transcriptional regulation of gene
expression, chromatin structure and nuclear architecture (Mattick et al. 2009) (Table 1). There
is no general unified classification of non-coding transcripts. However, many authors suggest
that the non-coding RNA can be divided into short (>200 nt) and long (>200 nt) transcripts
(Mercer et al. 2009).
1.2.1. Short ncRNA
One of the most studied short RNA are micro RNA (miRNA). These RNA are derived
from hairpin precursor sequences and processed by the Dicer nuclease, which cleaves the
hairpin structure, releasing the mature transcript (Bernstein et al. 2001). Dicer is involved in
the formation of another class of endogenous non-coding RNA, called small interfering RNA
(siRNA). Both siRNA and miRNA recruit a multiprotein complex, called RISC (RNA
induced silencing complex) and are part of the RNA interference process, which presents an
elegant mechanism of post-transcriptional gene regulation (Fire et al. 1998, Chapter I,
Introduction). Unlike siRNA, which require complete sequence complementarity with its
target, miRNA recognize their target RNA by complementarity to a 2-7 nt long seed region in
the 3’UTR (Birmingham et al. 2006). miRNA are one of the most abundant regulators of gene
expression. They have been shown to regulate a myriad of processes including cell
proliferation, cell death or fat metabolism. They constitute around 1% of predicted genes in
humans, worms and flies. As they are differentially expressed during development and
differentiation, it has been suggested that the miRNA profile could be unique to each cell type
(Bartel & Chen 2004).
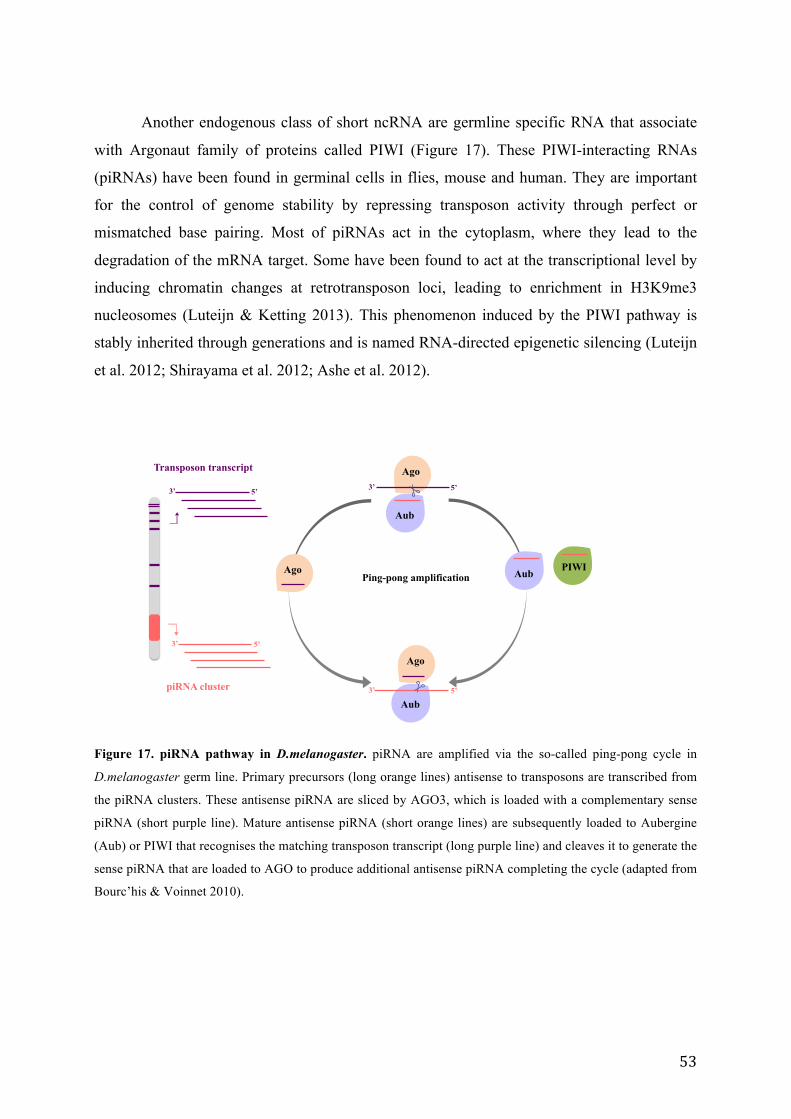
53
Another endogenous class of short ncRNA are germline specific RNA that associate
with Argonaut family of proteins called PIWI (Figure 17). These PIWI-interacting RNAs
(piRNAs) have been found in germinal cells in flies, mouse and human. They are important
for the control of genome stability by repressing transposon activity through perfect or
mismatched base pairing. Most of piRNAs act in the cytoplasm, where they lead to the
degradation of the mRNA target. Some have been found to act at the transcriptional level by
inducing chromatin changes at retrotransposon loci, leading to enrichment in H3K9me3
nucleosomes (Luteijn & Ketting 2013). This phenomenon induced by the PIWI pathway is
stably inherited through generations and is named RNA-directed epigenetic silencing (Luteijn
et al. 2012; Shirayama et al. 2012; Ashe et al. 2012).
Aub
Aub
Aub
Ago
Ago
Ago PIWI Ping-pong amplification
Transposon transcript
piRNA cluster
3’ 5’
3’ 5’
3’ 5’
3’ 5’
Figure 17. piRNA pathway in D.melanogaster. piRNA are amplified via the so-called ping-pong cycle in
D.melanogaster germ line. Primary precursors (long orange lines) antisense to transposons are transcribed from
the piRNA clusters. These antisense piRNA are sliced by AGO3, which is loaded with a complementary sense
piRNA (short purple line). Mature antisense piRNA (short orange lines) are subsequently loaded to Aubergine
(Aub) or PIWI that recognises the matching transposon transcript (long purple line) and cleaves it to generate the
sense piRNA that are loaded to AGO to produce additional antisense piRNA completing the cycle (adapted from
Bourc’his & Voinnet 2010).
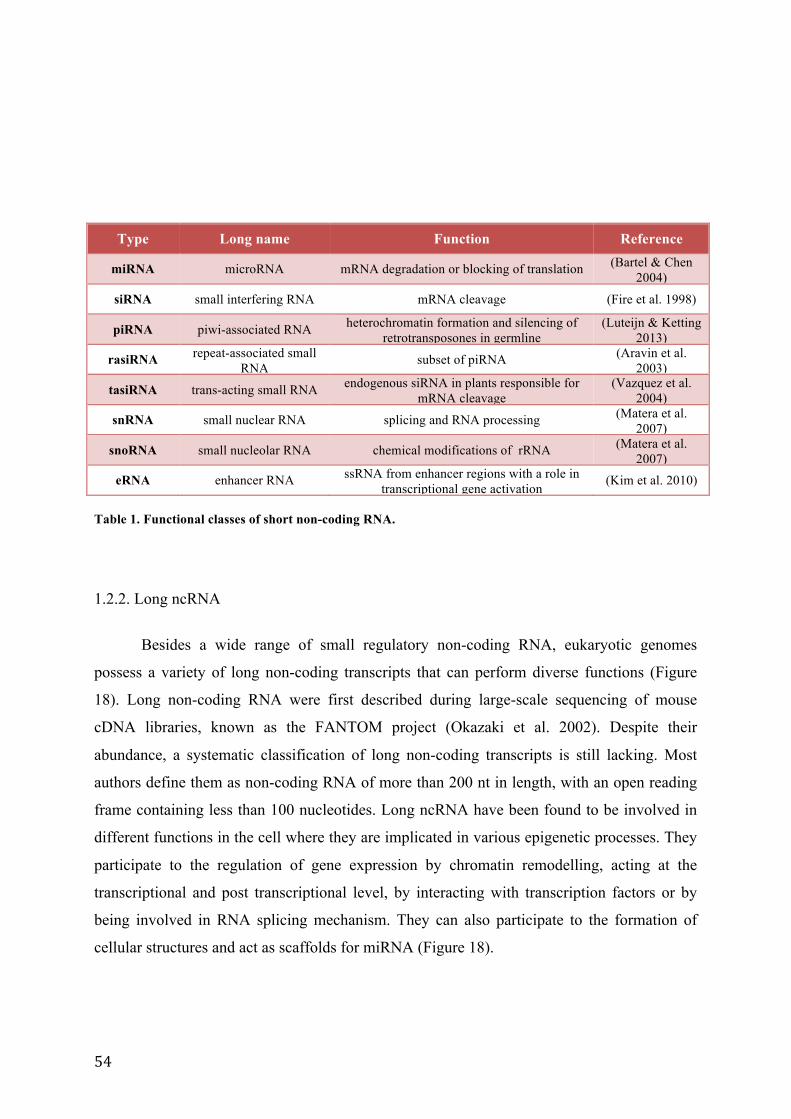
54
Type Long name Function Reference
miRNA microRNA mRNA degradation or blocking of translation (Bartel & Chen 2004)
siRNA small interfering RNA mRNA cleavage (Fire et al. 1998)
piRNA piwi-associated RNA heterochromatin formation and silencing of retrotransposones in germline
(Luteijn & Ketting 2013)
rasiRNA repeat-associated small RNA
subset of piRNA (Aravin et al. 2003)
tasiRNA trans-acting small RNA endogenous siRNA in plants responsible for mRNA cleavage
(Vazquez et al. 2004)
snRNA small nuclear RNA splicing and RNA processing (Matera et al. 2007)
snoRNA small nucleolar RNA chemical modifications of rRNA (Matera et al. 2007)
eRNA enhancer RNA ssRNA from enhancer regions with a role in transcriptional gene activation
(Kim et al. 2010)
Table 1. Functional classes of short non-coding RNA.
1.2.2. Long ncRNA
Besides a wide range of small regulatory non-coding RNA, eukaryotic genomes
possess a variety of long non-coding transcripts that can perform diverse functions (Figure
18). Long non-coding RNA were first described during large-scale sequencing of mouse
cDNA libraries, known as the FANTOM project (Okazaki et al. 2002). Despite their
abundance, a systematic classification of long non-coding transcripts is still lacking. Most
authors define them as non-coding RNA of more than 200 nt in length, with an open reading
frame containing less than 100 nucleotides. Long ncRNA have been found to be involved in
different functions in the cell where they are implicated in various epigenetic processes. They
participate to the regulation of gene expression by chromatin remodelling, acting at the
transcriptional and post transcriptional level, by interacting with transcription factors or by
being involved in RNA splicing mechanism. They can also participate to the formation of
cellular structures and act as scaffolds for miRNA (Figure 18).
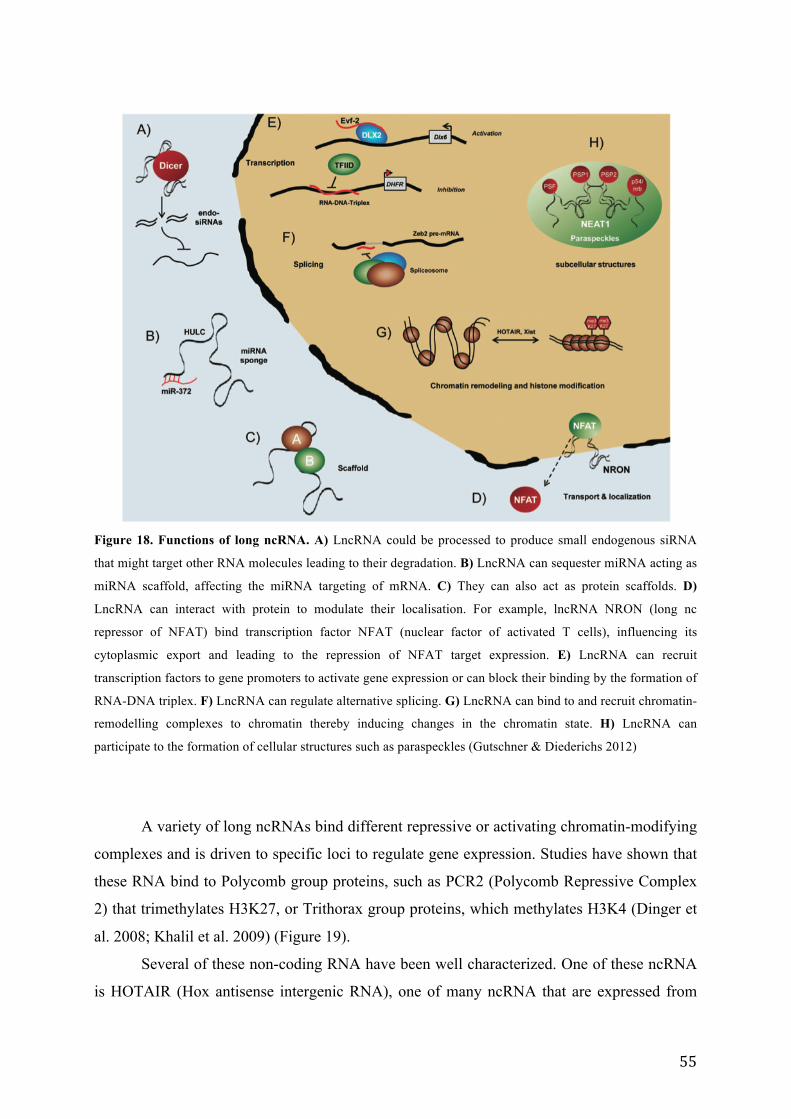
55
Figure 18. Functions of long ncRNA. A) LncRNA could be processed to produce small endogenous siRNA
that might target other RNA molecules leading to their degradation. B) LncRNA can sequester miRNA acting as
miRNA scaffold, affecting the miRNA targeting of mRNA. C) They can also act as protein scaffolds. D)
LncRNA can interact with protein to modulate their localisation. For example, lncRNA NRON (long nc
repressor of NFAT) bind transcription factor NFAT (nuclear factor of activated T cells), influencing its
cytoplasmic export and leading to the repression of NFAT target expression. E) LncRNA can recruit
transcription factors to gene promoters to activate gene expression or can block their binding by the formation of
RNA-DNA triplex. F) LncRNA can regulate alternative splicing. G) LncRNA can bind to and recruit chromatin-
remodelling complexes to chromatin thereby inducing changes in the chromatin state. H) LncRNA can
participate to the formation of cellular structures such as paraspeckles (Gutschner & Diederichs 2012)
A variety of long ncRNAs bind different repressive or activating chromatin-modifying
complexes and is driven to specific loci to regulate gene expression. Studies have shown that
these RNA bind to Polycomb group proteins, such as PCR2 (Polycomb Repressive Complex
2) that trimethylates H3K27, or Trithorax group proteins, which methylates H3K4 (Dinger et
al. 2008; Khalil et al. 2009) (Figure 19).
Several of these non-coding RNA have been well characterized. One of these ncRNA
is HOTAIR (Hox antisense intergenic RNA), one of many ncRNA that are expressed from

56
human homeobox (Hox) loci. HOX loci (HOXA-D) code for transcription factors that control
the early development of the embryo by directing the formation of body structure. As such,
they are considered as the master regulators of embryonic development (Rinn et al. 2007).
These regions are under epigenetic control, and non-coding RNAs play an important role in
the regulation of their expression. HOTAIR, a non-coding RNA expressed from the HOXC
cluster, recruits repressive complexes to silence the HOXD locus in trans. HOTAIR binds
both the Polycomb remodelling complex PRC2, which trimethylates H3K27 and the lysine
specific demethylase LSD1, which demethylates H3K4 (Rinn et al. 2007).
Other long non-coding RNAs have been found to associate with chromatin repressive
complexes to silence imprinted gene clusters. Imprinting is a mechanism where one allele of
an autosomal gene is epigenetically silenced. The long ncRNAs Kcnqlot1 and Air use a
similar mechanism to target repressive epigenetic marks on the silenced allele. Air associates
with the H3K9 methyltransferase G9a on a Slc22a promoter, while Kcnq1ot1 interacts with
both G9a and the PRC2 complex to direct H3K9 and H3K27 methylation to the Kcnq1 locus
from which it is transcribed (Nagano et al. 2008; Pandey et al. 2008).
Inactivation of X chromosome is a mechanism of dosage compensation in mammalian
female genomes, which ensures an equal expression of X-linked genes in both males and
females in all cells (Figure 20). It has been studied most extensively in mouse, where the
inactivation of the X chromosome is a result of an interaction of several non-coding
transcripts. A regulatory region on the X chromosome called X inactivation centre controls
the expression of the long ncRNA Xist. Xist coats the X chromosome from which it is
expressed in cis to induce epigenetic silencing of the entire chromosome. How exactly Xist
induces the inactivation of the entire chromosome is not fully understood. The non-coding
RNA RepA, encoded within Xist and that is required for Xist induction was found to bind the
PCR2 complex and to target it to the X chromosome to initiate silencing (Zhao et al. 2008).
Xist is also able to bind PCR2, and once it covers the inactive X, it can spread the repressive
chromatin marks throughout the chromosome.
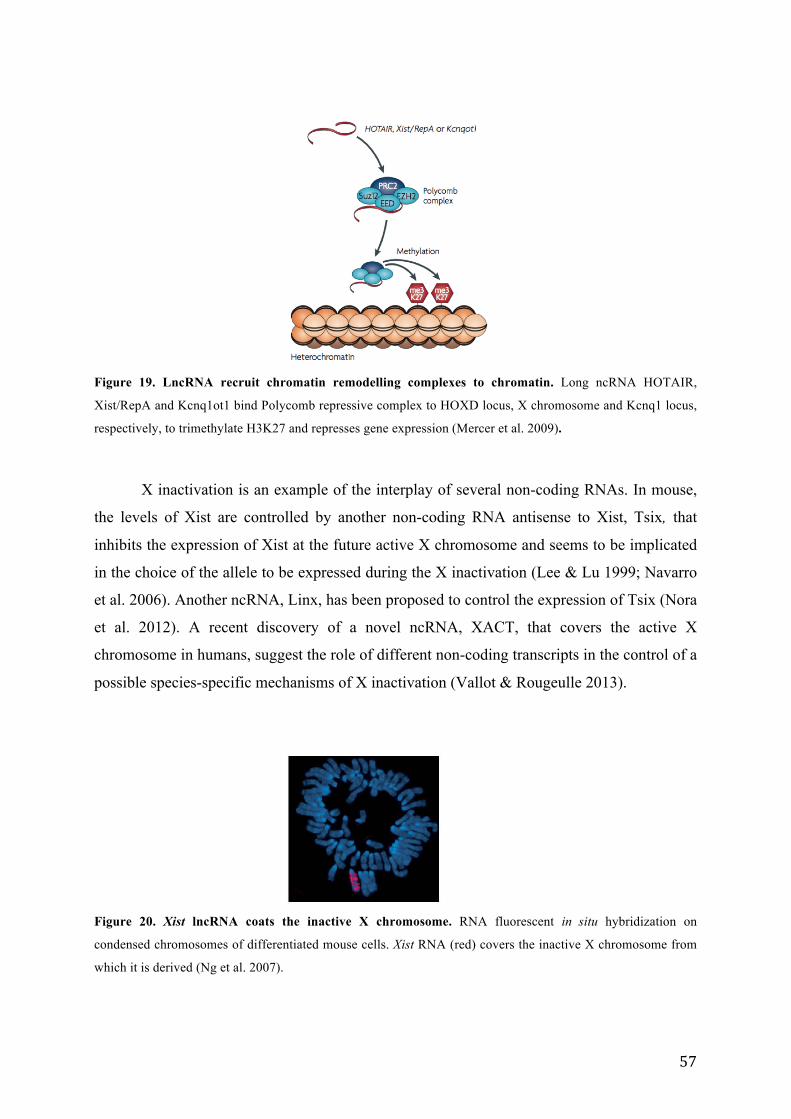
57
Figure 19. LncRNA recruit chromatin remodelling complexes to chromatin. Long ncRNA HOTAIR,
Xist/RepA and Kcnq1ot1 bind Polycomb repressive complex to HOXD locus, X chromosome and Kcnq1 locus,
respectively, to trimethylate H3K27 and represses gene expression (Mercer et al. 2009).
X inactivation is an example of the interplay of several non-coding RNAs. In mouse,
the levels of Xist are controlled by another non-coding RNA antisense to Xist, Tsix, that
inhibits the expression of Xist at the future active X chromosome and seems to be implicated
in the choice of the allele to be expressed during the X inactivation (Lee & Lu 1999; Navarro
et al. 2006). Another ncRNA, Linx, has been proposed to control the expression of Tsix (Nora
et al. 2012). A recent discovery of a novel ncRNA, XACT, that covers the active X
chromosome in humans, suggest the role of different non-coding transcripts in the control of a
possible species-specific mechanisms of X inactivation (Vallot & Rougeulle 2013).
Figure 20. Xist lncRNA coats the inactive X chromosome. RNA fluorescent in situ hybridization on
condensed chromosomes of differentiated mouse cells. Xist RNA (red) covers the inactive X chromosome from
which it is derived (Ng et al. 2007).
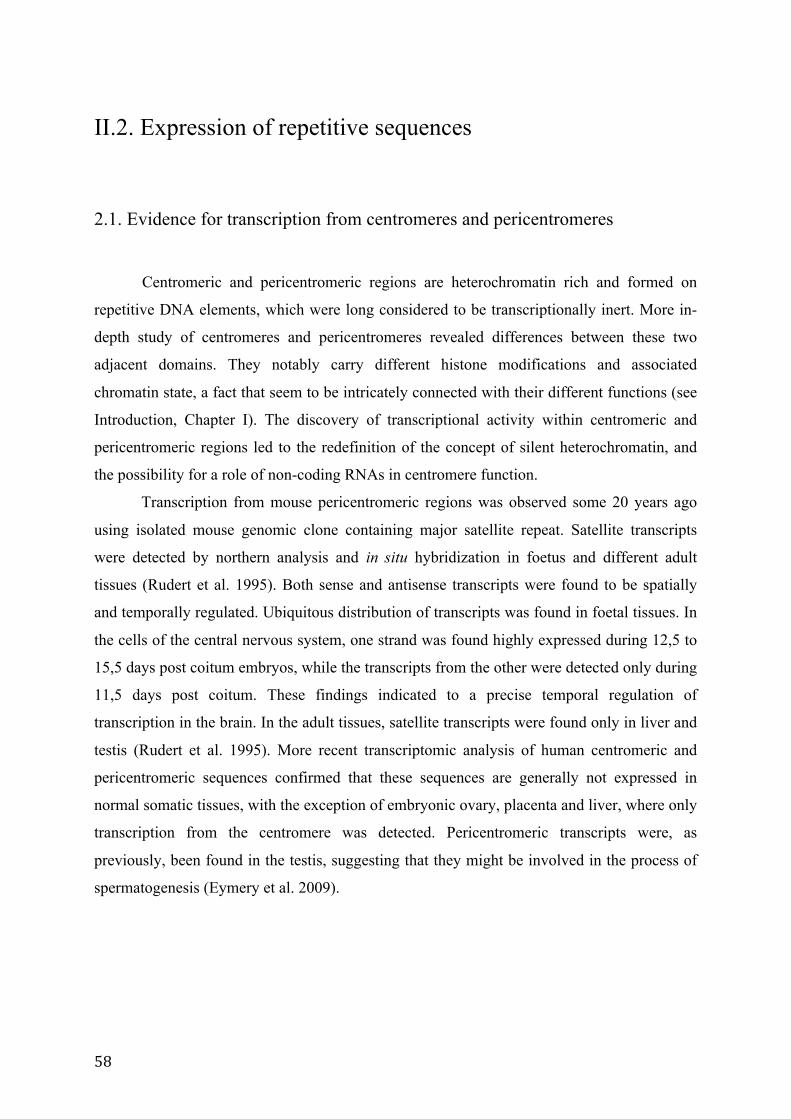
58
II.2. Expression of repetitive sequences
2.1. Evidence for transcription from centromeres and pericentromeres
Centromeric and pericentromeric regions are heterochromatin rich and formed on
repetitive DNA elements, which were long considered to be transcriptionally inert. More in-
depth study of centromeres and pericentromeres revealed differences between these two
adjacent domains. They notably carry different histone modifications and associated
chromatin state, a fact that seem to be intricately connected with their different functions (see
Introduction, Chapter I). The discovery of transcriptional activity within centromeric and
pericentromeric regions led to the redefinition of the concept of silent heterochromatin, and
the possibility for a role of non-coding RNAs in centromere function.
Transcription from mouse pericentromeric regions was observed some 20 years ago
using isolated mouse genomic clone containing major satellite repeat. Satellite transcripts
were detected by northern analysis and in situ hybridization in foetus and different adult
tissues (Rudert et al. 1995). Both sense and antisense transcripts were found to be spatially
and temporally regulated. Ubiquitous distribution of transcripts was found in foetal tissues. In
the cells of the central nervous system, one strand was found highly expressed during 12,5 to
15,5 days post coitum embryos, while the transcripts from the other were detected only during
11,5 days post coitum. These findings indicated to a precise temporal regulation of
transcription in the brain. In the adult tissues, satellite transcripts were found only in liver and
testis (Rudert et al. 1995). More recent transcriptomic analysis of human centromeric and
pericentromeric sequences confirmed that these sequences are generally not expressed in
normal somatic tissues, with the exception of embryonic ovary, placenta and liver, where only
transcription from the centromere was detected. Pericentromeric transcripts were, as
previously, been found in the testis, suggesting that they might be involved in the process of
spermatogenesis (Eymery et al. 2009).
59
2.2. Centromeric transcripts as integral components of centromeric chromatin
Several studies revealed that the transcription of the centromere core domain in yeast
and vertebrate cells can affect centromere integrity and kinetochore function (see further text).
Transcripts emanating from the centromere core domain might be involved in CENP-A
deposition to the centromeres as well as in regulation of the binding of the kinetochore
proteins during mitosis.
2.2.1. Centromeric RNAs regulate the kinetochore activity
There are certain indications that non-coding RNAs are important for the targeting of
the CENP-A to the centromere. A long transcript from the centromeric alpha satellite in
human cells have been found to associate with CENP-A and HJURP. The sequence specific
knockdown of the transcript by the shRNA resulted in the formation of multipolar spindles
and appearance of lagging chromosomes (chromosomes that fails to connect to the mitotic
spindle and are left out of the newly formed daughter cell). This is caused by the abrogation
of HJURP and CENP-A from the chromosomes in the absence of the centromeric transcript,
pointing to the implication of centromeric RNA in targeting these proteins to the centromere
(Quénet & Dalal 2014).
Centromeric transcripts are found to interact with the proteins of the Chromosomal
passenger complex (CPC), Aurora B kinase, INCENP and Survivin. The Aurora B protein
kinase, the principal enzyme of CPC, is involved in spindle formation, regulation of
kinetochore-microtubule attachment and checkpoint and sister chromatid cohesion (Lampson
& Cheeseman 2011). Accumulation of centromeric transcripts results in mislocalization of
Aurora B from the centromeres of the mitotic chromosomes and results in impaired targeting
of Suv39h histone methyltransferase. Metaphase chromosomes are misaligned, showing
altered shape and a defects in sister chromatid cohesion suggesting that the kinase activity of
Aurora B and the interaction of Aurora B with centromeric chromatin could be controlled by
centromeric transcripts (Bouzinba-Segard et al. 2006). Moreover, mouse minor satellite
transcripts accumulate during G2/M phase, coinciding with the association of CPC at the
centromere (Ferri et al. 2009).
60
Accumulation of centromeric transcripts was also reported in mouse and human
during differentiation and stress conditions such as lack of nutrients or heat shock, suggesting
they might be associated with changes in chromatin that occur during this time (Bouzinba-
Segard et al. 2006; Valgardsdottir et al. 2008). Centromeric transcripts accumulate as small
species of around 100-500 nucleotides that could represent multiples of 120 nt minor satellite
units. They might be produced by the cleavage of longer RNA molecules transcribed through
contiguous repeats in exponentially growing, undifferentiated cells. For example, in mouse,
an overexpression of 120-nt centromeric transcripts corresponding to minor satellites leads to
chromosome misalignment and defects in sister chromatin cohesion (Bouzinba-Segard et al.
2006).
2.2.2. Centromeric transcription stabilise CENP-C binding to the centromeres
Studies have shown that centromeric RNA interacts with the kinetochore proteins. In
human cells, INCENP, a component of chromosomal passenger complex and CENP-C were
found to localise to the nucleolus during interphase. This localisation seem to be dependent on
the centromeric RNA as the RNAse treatment results in the loss of both proteins from the
nucleolus. Delocalisation of alpha satellite RNA from the nucleolus seem to be sensitive to
inhibition of RNA polymerase I, since actinomycin treatment in conditions required to inhibit
RNA polymerase I delocalise centromeric transcripts and both CENP-C and INCENP from
the nucleolus (Wong et al. 2007). The significance of RNA pol I involvement is still not clear,
since no reduction in expression level of centromeric transcripts could be detected. Moreover,
specifically degrading single stranded RNA but not double stranded RNAs, results in the
partial delocalisation of CENP-C and complete delocalisation of INCENP and survivin from
the mitotic chromosomes. This suggests that their localisation is primarily dependent on the
single stranded RNA. CENP-C and INCENP are re-established to both nucleolus and
chromosomes after reintroduction of centromeric RNA to the cells.
Nucleolus is an organelle that primarily functions as a production site of rRNA but it
could be engaged in other cellular functions. Both CENP-C and INCENP contain nucleolus
localisation peptides. Localisation of centromere components to the nucleolus could be
explained by the similar mechanisms described for telomeric binding protein, which is
sequestered in the nucleolus until the time for its release during telomere elongation in the late
61
S phase. Similarly, nucleolus might function in sequestration of the centromeric proteins and
RNA, or even act as a place of assembly of nucleoprotein complexes, until the time for
mitosis when they are released to the nucleus and serve to the establishment of a functional
kinetochore (Wong et al. 2007). It has been therefore suggested that RNA might facilitate the
assembly of the nucleoprotein components at the centromere in order to stabilise these
centromere-associated complexes. CENP-C was first characterized as a DNA binding protein.
CENP-C however has a domain similar to HP1 hinge region and is able to bind RNA in both
in vitro and in vivo. In maize, the binding of CENP-C to the DNA is stabilised by its
interaction with centromeric RNA (Du et al. 2010). Inhibition of RNA polymerase II activity
has been shown to deplete centromeric transcription and reduce the CENP-C binding to the
chromosomes, resulting in chromosome missegregation (Chan et al. 2012). Centromeric
transcripts could thus safeguard kinetochore formation by stabilising CENP-C binding at
mitosis (Chan & Wong 2012), while the transcription at pericentromere at this stage of the
cell cycle could help the reestablishment of HP1 and heterochromatin structure at the end of
mitosis (Lu & Gilbert 2007).
2.3. Transcription from the pericentromeric region
2.3.1. Pericentromeric transcription during stress
Upon exposure to thermal stress, vertebrate cells respond by activation of heat shock
transcription factor 1 (HSF1). HSF1 binds to promoters of heat inducible genes to activate
their transcription and the synthesis of specific proteins, called heat shock proteins. These
proteins act as protein chaperones that prevent protein denaturation and aggregation that
might occur in cells upon heat induced stress. In human cells, HSF1 has also been found to
localise to pericentromeric regions of 14 human chromosomes rich in satellite II and III
sequences, with a preferential localisation to the 9q12 region of chromosome 12 (Jolly et al.
2002; Denegri et al. 2002; Eymery et al. 2010). HSF1 is found to activate the transcription of
satellite III sequences. Satellite III transcripts are detected as long RNAs that vary in size
from 2 to several kilobases, synthesised exclusively from the sense, G-rich strand of the
repeat (Jolly et al. 2004; Rizzi et al. 2004). After transcription, they remain associated to their
transcription sites and together with HSF1 form the so-called nuclear stress bodies (Jolly et al.
62
1997). Nuclear stress bodies appear transiently and exclusively in human cells and contain,
besides HSF1 and satellite III transcripts, several splicing factors and RNA binding proteins.
Satellite III transcription can be induced to different extents by other stress inducing agents
such as exposure to UV light and other DNA damaging agents, as well by oxidative stress
(Valgardsdottir et al. 2008). Similar accumulation of satellite transcripts upon stress has been
reported in plants and insects but their function is still not clear (Pecinka et al. 2010; Pezer &
Ugarkovic 2012). Activation of satellite III transcription in these conditions suggest a
conserved role for these transcripts in defence against stress.
It has been argued that these transcripts might serve as an assembly platform for RNA-
binding proteins that can be found in nuclear stress bodies. Transcriptional activation of
satellite III sequences might recruit factors involved in the regulation of gene expression such
as transcription factors and RNA processing factors. Satellite III sequences could thus serve
as regulatory domains that control expression of genes in their proximity in response to stress
(Valgardsdottir et al. 2008). These transcripts might also participate to the reestablishment of
heterochromatin after its disruption by heat shock. Indeed, after induction of stress,
heterochromatin marks such as H3K9 methylation and HP1 become absent from this region,
and there is an increase in the acetylation of histone H3, a characteristic of euchromatin (Rizzi
et al. 2004).
Another example of the transcriptional activation of repetitive sequences upon heat
shock can be found in mouse cells. Even thought there is no evidence for the transcriptional
activation of pericentromeric sequences upon thermal stress, the heat shock induces
upregulation of two transcripts synthesized from short interspersed elements (SINE) called B1
and B2 RNA. B2 RNA has been found to associate with RNA polymerase II and transiently
repress mRNA transcription as a response to stress (Allen et al. 2004) (Figure 21).
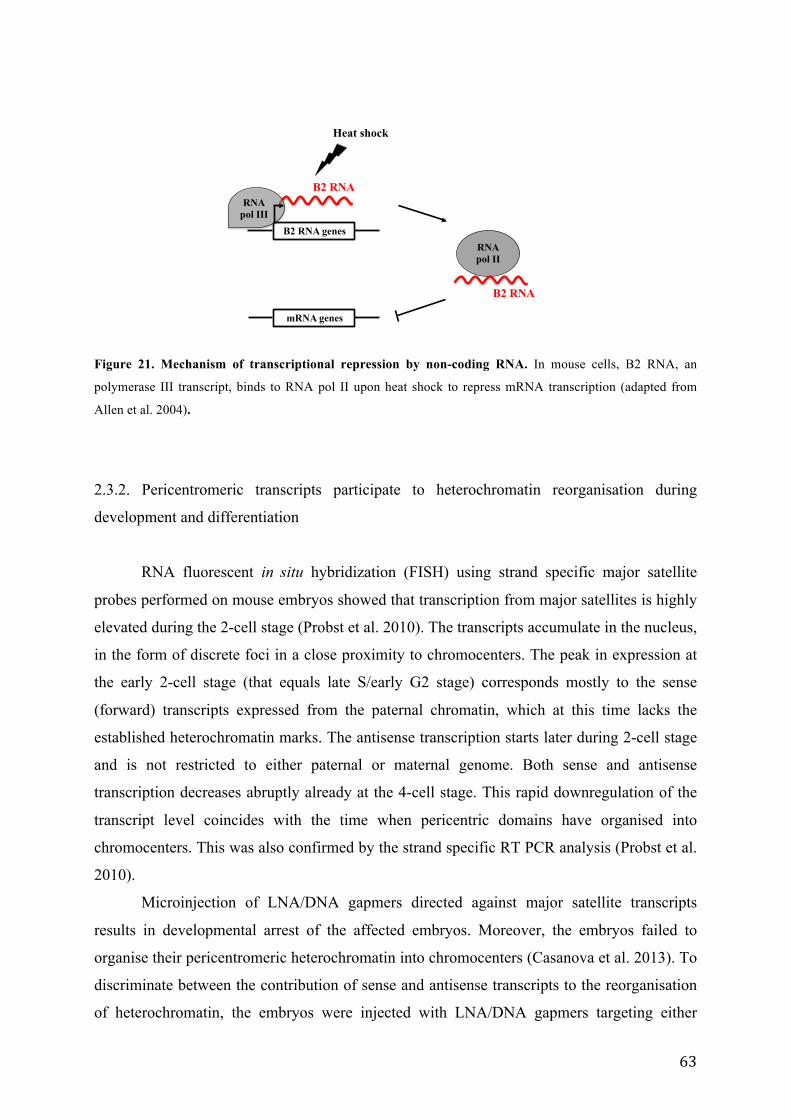
63
B2 RNA genes
RNA pol III
B2 RNA
Heat shock
RNA pol II
B2 RNA
mRNA genes
Figure 21. Mechanism of transcriptional repression by non-coding RNA. In mouse cells, B2 RNA, an
polymerase III transcript, binds to RNA pol II upon heat shock to repress mRNA transcription (adapted from
Allen et al. 2004).
2.3.2. Pericentromeric transcripts participate to heterochromatin reorganisation during
development and differentiation
RNA fluorescent in situ hybridization (FISH) using strand specific major satellite
probes performed on mouse embryos showed that transcription from major satellites is highly
elevated during the 2-cell stage (Probst et al. 2010). The transcripts accumulate in the nucleus,
in the form of discrete foci in a close proximity to chromocenters. The peak in expression at
the early 2-cell stage (that equals late S/early G2 stage) corresponds mostly to the sense
(forward) transcripts expressed from the paternal chromatin, which at this time lacks the
established heterochromatin marks. The antisense transcription starts later during 2-cell stage
and is not restricted to either paternal or maternal genome. Both sense and antisense
transcription decreases abruptly already at the 4-cell stage. This rapid downregulation of the
transcript level coincides with the time when pericentric domains have organised into
chromocenters. This was also confirmed by the strand specific RT PCR analysis (Probst et al.
2010).
Microinjection of LNA/DNA gapmers directed against major satellite transcripts
results in developmental arrest of the affected embryos. Moreover, the embryos failed to
organise their pericentromeric heterochromatin into chromocenters (Casanova et al. 2013). To
discriminate between the contribution of sense and antisense transcripts to the reorganisation
of heterochromatin, the embryos were injected with LNA/DNA gapmers targeting either
64
forward of reverse transcripts. Even though elevated levels of mostly sense transcripts were
observed during the 2-cell stage, interference with these transcripts did not affect
development in comparison to control embryos. On the other hand, interference with
antisense transcripts resulted in developmental arrest and failure of pericentromeric regions to
organise into chromocenters. This demonstrates the importance of the antisense transcripts for
nuclear reorganisation and embryo development (Casanova et al. 2013).
Another study showed that the developmental arrest of the embryos could be rescued
by the injection of double stranded RNA (Santenard et al. 2010). The existence of such
species has not been excluded. It seems so far, however, that the single stranded, antisense
RNA has a dominant role in pericentromeric heterochromatin organisation. A link between
pericentromeric heterochromatin reorganisation and major satellite transcription has been
established in Purkinje cells that are associated to rod receptors in mouse (Solovei et al. 2004;
Solovei et al. 2009). During development, the changes in the appearance of chromocenters
(their number, localisation and size) are accompanied with unusual modifications at the
chromatin level in these cells, where a euchromatic histone mark, H3K4 trimethylation,
becomes enriched at major satellites together with the repressive H3K9 trimethylation. The
acquisition of activating chromatin marks result in an elevated level of satellite transcription
(Kishi et al. 2012).
Normal muscle cell differentiation is accompanied by a global reorganisation of
heterochromatin and transcription from pericentromeric region. This process is characterized
by centromere clustering and followed by an increase in H3K9 and H4K20 methylation at
major satellites, and an accumulation of both major and minor satellite-derived transcripts.
Interestingly, the reorganisation of heterochromatin seems to be dependent on the activity of
histone deacetylases, since the treatment of cells with a HDAC inhibitor prevents this
reorganisation.
Altogether, these studies provide evidence that transcription from major satellites is
involved in the reorganisation of heterochromatin at an early stage in development, when
nuclear reorganisation takes place. This points to the existence of important regulatory
mechanisms that act upon transcription of pericentromeric heterochromatin in a specific time
window in early development (Probst et al. 2010). Only reverse RNA species have been
found to be important for heterochromatin reorganisation, as the interference with the other
strand seem not to affect this process. However, it can not be excluded that the transcripts
from the opposite strand might have other still undefined roles during development (Probst et
65
al. 2010; Casanova et al. 2013). The fact that the differentiation was not affected in cells
which fail to reorganise their heterochromatin into chromocenters might suggest that, in the
absence of the spatial organisation of heterochromatin, the heterochromatin structure is
nevetherless maintained by other factors, allowing differentiation (Terranova et al. 2005).
2.3.3 Non-coding RNA in heterochromatin formation: lessons from fission yeast
The link between the RNAi machinery and pericentromeric transcription is well
established in fission yeast (Volpe et al. 2002). Small RNA transcripts processed by RNAi
machinery participate to the assembly of heterochromatin (see Chapter I, Introduction). It is
still uncertain if RNAi pathway is necessary for the establishment of chromatin structures in
vertebrates or whether centromere-associated transcripts are implicated in these mechanisms.
Numerous examples show evidence for transcription from centromeric and pericentromeric
repeats but there are still unanswered questions concerning the exact function of these RNA.
In vertebrate cells, small RNA species are found to be dependent on Dicer, one of the
key proteins in RNA interference, which cleaves the dsRNA into small interfering RNAs. The
correlation between the accumulation of major satellite transcripts and Dicer downregulation
was described in mouse myoblasts, where cells change the expression of Dicer as they go
through differentiation (Terranova et al. 2005). Moreover, Dicer ablation causes derepression
of both centromeric and pericentromeric transcripts in ES mouse cells (Murchison et al. 2005;
Kanellopoulou et al. 2005). Dicer deficient ES cells showed a reduced level of small RNA
species (25-30 nt) while the longer RNA molecules became specifically enriched in
comparison with cells expressing the protein (Kanellopoulou et al. 2005). The same effect
was observed in Dicer deficient DT40 hybrid chicken-human cell line (Fukagawa et al. 2004).
Dicer inactivation causes delocalisation of HP1 and loss of H3K9 methylation which is
accompanied by mitotic defects such as premature sister chromatid separation. Small
transcripts that correspond to centromeric alpha satellite repeats were strongly reduced in
these cells (Fukagawa et al. 2004). It is however unclear whether loss of Dicer has a similar
effect on pericentromeric heterochromatin in mouse (Kanellopoulou et al. 2005; Murchison et
al. 2005). Other evidence apart of these for the possible role of the RNAi machinery are
scarce.
Long pericentromeric transcripts could be post-transcriptionally processed without the
66
implication of the RNAi machinery. A DNA binding protein WDHD1 has been found to
associate with centromeric chromatin during mid to late S phase in mouse cells (Hsieh et al.
2011). Its downregulation causes loss of HP1 and other heterochromatin associated marks,
and the increase in histone H4 acetylation, leading to mitotic defects. Cells depleted of
WDHD1 show altered sizes of both major and minor satellite-derived transcripts in a fashion
similar to Dicer depletion. The small RNA molecules were significantly reduced in the favour
of enrichment in large RNA species, suggesting that this protein is involved in post-
transcriptional processing of centromeric and pericentromeric RNA (Hsieh et al. 2011).
2.3.4. Non-coding RNA as a component of pericentromeric heterochromatin
Transcription across satellite repeats have been shown to generate both ss- and dsRNA
(Martens et al. 2005; Wong et al. 2007). Elevated levels of dsRNA were reported in Suv39dn,
Dicer or transcription factor Pax3-deficient cells, confirming that it is important to preserve
the correct levels of these transcripts in order to maintain heterochromatin integrity and
proper centromere function (Martens et al. 2005; Fukagawa et al. 2004; Bulut-Karslioglu et al.
2012a). Changes in expression of molecules that reside at or remodel this region, such as HP1
and Suv39h1, have been mostly reported to induce transcription, having as a consequence the
loss of heterochromatin integrity and detrimental effects on normal centromere function.
Indeed, it seems that pericentromeric RNA acts as a structural component of heterochromatin
in mouse (Maison et al. 2011). Reverse, purine rich major satellite transcripts have been
found to associate with SUMO-ylated (Small Ubiquitin-like MOdifier) HP1. The major target
of sumoylation is the hinge domain of HP1, which has an RNA binding activity. While the
localisation of HP1 to the pre-existing HP1 domains at pericentromeric heterochromatin is
possible even without the hinge domain, HP1 lacking the hinge domain is unable to localise to
pericentromeric heterochromatin in Suv39h double null cells. This indicates that the
transcripts from mouse major satellites are required for de novo HP1 alpha localisation at
pericentromeric heterochromatin, probably providing an initial step for its targeting to
pericentromeric heterochromatin (Maison et al. 2011) (Figure 22).
As previously described, a similar interaction between proteins and pericentromeric-
derived RNA could be happening in mouse embryos during first stages of mouse
development (Probst et al. 2010). It is not known if the association of RNA with HP1 is cell
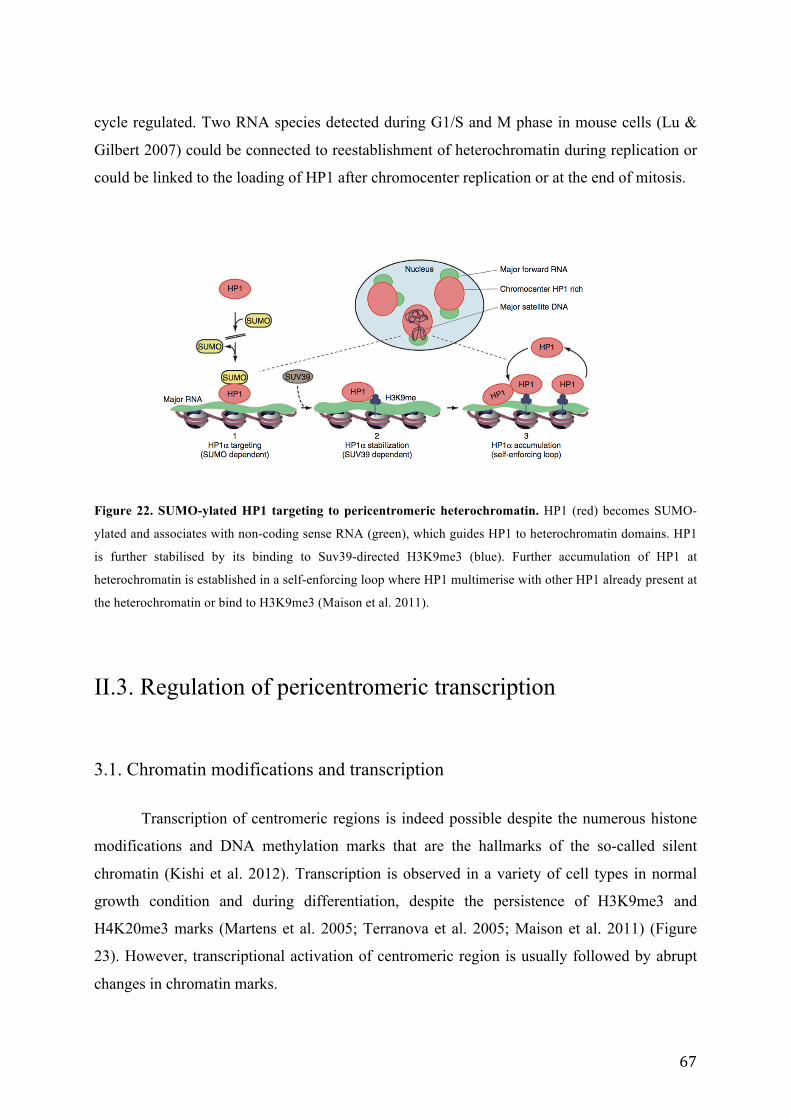
67
cycle regulated. Two RNA species detected during G1/S and M phase in mouse cells (Lu &
Gilbert 2007) could be connected to reestablishment of heterochromatin during replication or
could be linked to the loading of HP1 after chromocenter replication or at the end of mitosis.
Figure 22. SUMO-ylated HP1 targeting to pericentromeric heterochromatin. HP1 (red) becomes SUMO-
ylated and associates with non-coding sense RNA (green), which guides HP1 to heterochromatin domains. HP1
is further stabilised by its binding to Suv39-directed H3K9me3 (blue). Further accumulation of HP1 at
heterochromatin is established in a self-enforcing loop where HP1 multimerise with other HP1 already present at
the heterochromatin or bind to H3K9me3 (Maison et al. 2011).
II.3. Regulation of pericentromeric transcription
3.1. Chromatin modifications and transcription Transcription of centromeric regions is indeed possible despite the numerous histone
modifications and DNA methylation marks that are the hallmarks of the so-called silent
chromatin (Kishi et al. 2012). Transcription is observed in a variety of cell types in normal
growth condition and during differentiation, despite the persistence of H3K9me3 and
H4K20me3 marks (Martens et al. 2005; Terranova et al. 2005; Maison et al. 2011) (Figure
23). However, transcriptional activation of centromeric region is usually followed by abrupt
changes in chromatin marks.
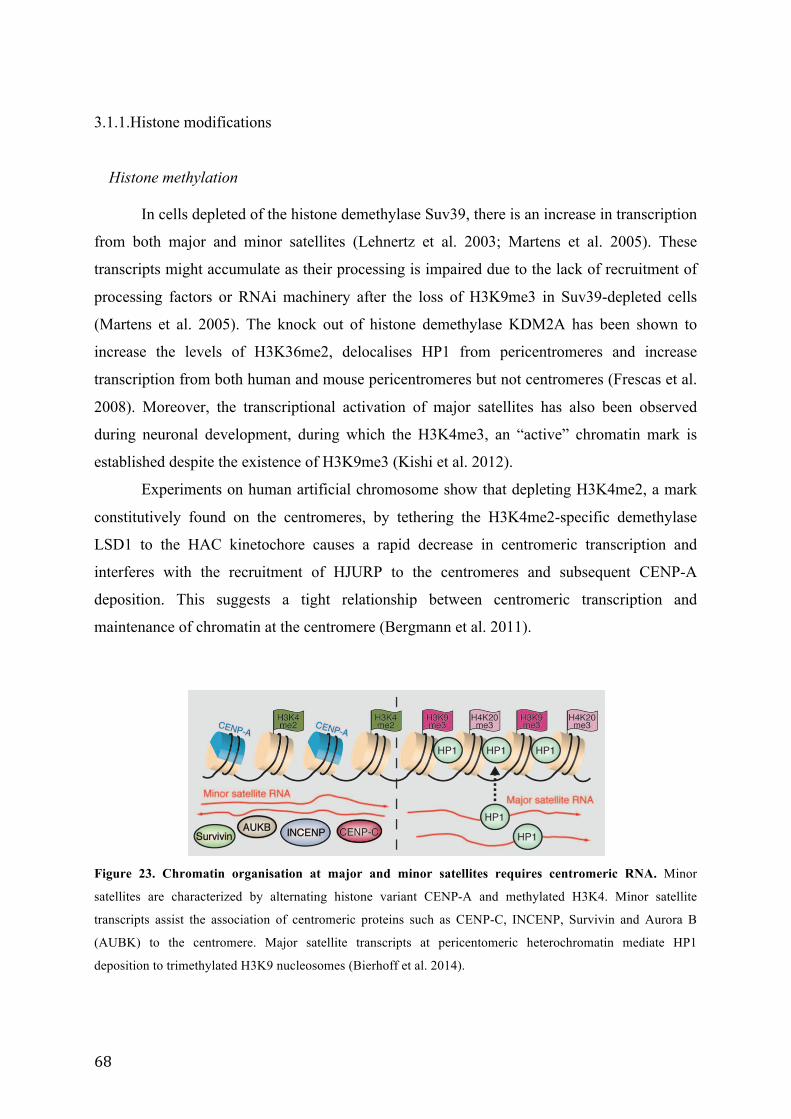
68
3.1.1.Histone modifications
Histone methylation In cells depleted of the histone demethylase Suv39, there is an increase in transcription
from both major and minor satellites (Lehnertz et al. 2003; Martens et al. 2005). These
transcripts might accumulate as their processing is impaired due to the lack of recruitment of
processing factors or RNAi machinery after the loss of H3K9me3 in Suv39-depleted cells
(Martens et al. 2005). The knock out of histone demethylase KDM2A has been shown to
increase the levels of H3K36me2, delocalises HP1 from pericentromeres and increase
transcription from both human and mouse pericentromeres but not centromeres (Frescas et al.
2008). Moreover, the transcriptional activation of major satellites has also been observed
during neuronal development, during which the H3K4me3, an “active” chromatin mark is
established despite the existence of H3K9me3 (Kishi et al. 2012).
Experiments on human artificial chromosome show that depleting H3K4me2, a mark
constitutively found on the centromeres, by tethering the H3K4me2-specific demethylase
LSD1 to the HAC kinetochore causes a rapid decrease in centromeric transcription and
interferes with the recruitment of HJURP to the centromeres and subsequent CENP-A
deposition. This suggests a tight relationship between centromeric transcription and
maintenance of chromatin at the centromere (Bergmann et al. 2011).
Figure 23. Chromatin organisation at major and minor satellites requires centromeric RNA. Minor
satellites are characterized by alternating histone variant CENP-A and methylated H3K4. Minor satellite
transcripts assist the association of centromeric proteins such as CENP-C, INCENP, Survivin and Aurora B
(AUBK) to the centromere. Major satellite transcripts at pericentomeric heterochromatin mediate HP1
deposition to trimethylated H3K9 nucleosomes (Bierhoff et al. 2014).
69
Histone acetylation
Maintaining the hypoacetylated state is required for efficient heterochromatin
organisation and genome integrity as it has been shown that changes in histone acetylation
lead to defects in centromere function (Taddei et al. 2001). Indeed, deacetylation of histone
H3 is required for its subsequent methylation by Suv39h (Rea et al. 2000). Interestingly,
treatment of cells with the histone deacetylase inhibitor TSA does not seem to influence
transcription from either pericentromeric or centromeric regions in mouse cells. However, it
disrupts the organisation of pericentric heterochromatin. HP1 and H3K9me3 are lost from
mouse chromocenters in TSA treated cells, indicating that deacetylase activity is necessary
for the organisation of heterochromatin (Maison et al. 2002).
Maintenance of heterochromatic state is required during S-phase when the replication
disrupts heterochromatin domains. During chromocenter replication in mouse cells, newly
deposited histones are epigenetically modified in order to allow for the re-formation of
heterochromatin. For example, the histone binding protein Np95 recruits histone deacetylase,
which subsequently deacetylates histone H4 following their deposition to newly synthesized
chromatin, allowing the establishment of heterochromatin state after replication. Absence of
Np95 results in the increased transcription of major satellite sequences, as the deacetylation of
H4 at lysines 8 (H4K8) and 16 (H4K16) is necessary for the correct establishment of
heterochromatin following replication (Papait et al. 2007). It is however still not clear whether
the increased transcription is due to the increased transcriptional rate or is the observed RNA
accumulation due to the inhibition of the processing enzymes, such as Dicer.
Upregulation of human centromeric transcripts in response to stress is accompanied by
an increase in acetylated histone H4 acetylation and an accumulation of histone
acetyltransferase CPB at nuclear stress bodies, that are forming at the 9q12 locus. Enrichment
of acetylated H4K8 and H4K16 at nuclear stress bodies and the loss of conventional
chromatin marks such as HP1 and H3K9me3 suggest a different heterochromatin organisation
in nuclear stress bodies that could facilitate the stress induced transcription at this locus (Jolly
et al. 2004; Rizzi et al. 2004).
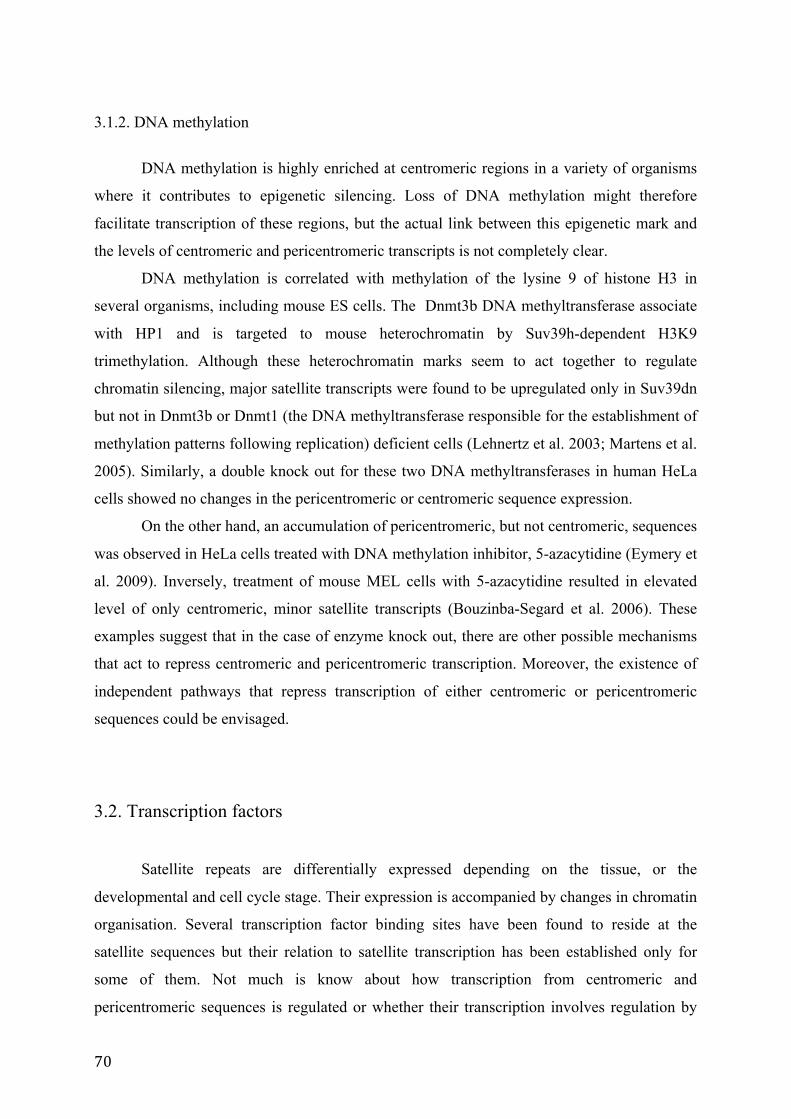
70
3.1.2. DNA methylation
DNA methylation is highly enriched at centromeric regions in a variety of organisms
where it contributes to epigenetic silencing. Loss of DNA methylation might therefore
facilitate transcription of these regions, but the actual link between this epigenetic mark and
the levels of centromeric and pericentromeric transcripts is not completely clear.
DNA methylation is correlated with methylation of the lysine 9 of histone H3 in
several organisms, including mouse ES cells. The Dnmt3b DNA methyltransferase associate
with HP1 and is targeted to mouse heterochromatin by Suv39h-dependent H3K9
trimethylation. Although these heterochromatin marks seem to act together to regulate
chromatin silencing, major satellite transcripts were found to be upregulated only in Suv39dn
but not in Dnmt3b or Dnmt1 (the DNA methyltransferase responsible for the establishment of
methylation patterns following replication) deficient cells (Lehnertz et al. 2003; Martens et al.
2005). Similarly, a double knock out for these two DNA methyltransferases in human HeLa
cells showed no changes in the pericentromeric or centromeric sequence expression.
On the other hand, an accumulation of pericentromeric, but not centromeric, sequences
was observed in HeLa cells treated with DNA methylation inhibitor, 5-azacytidine (Eymery et
al. 2009). Inversely, treatment of mouse MEL cells with 5-azacytidine resulted in elevated
level of only centromeric, minor satellite transcripts (Bouzinba-Segard et al. 2006). These
examples suggest that in the case of enzyme knock out, there are other possible mechanisms
that act to repress centromeric and pericentromeric transcription. Moreover, the existence of
independent pathways that repress transcription of either centromeric or pericentromeric
sequences could be envisaged.
3.2. Transcription factors
Satellite repeats are differentially expressed depending on the tissue, or the
developmental and cell cycle stage. Their expression is accompanied by changes in chromatin
organisation. Several transcription factor binding sites have been found to reside at the
satellite sequences but their relation to satellite transcription has been established only for
some of them. Not much is know about how transcription from centromeric and
pericentromeric sequences is regulated or whether their transcription involves regulation by
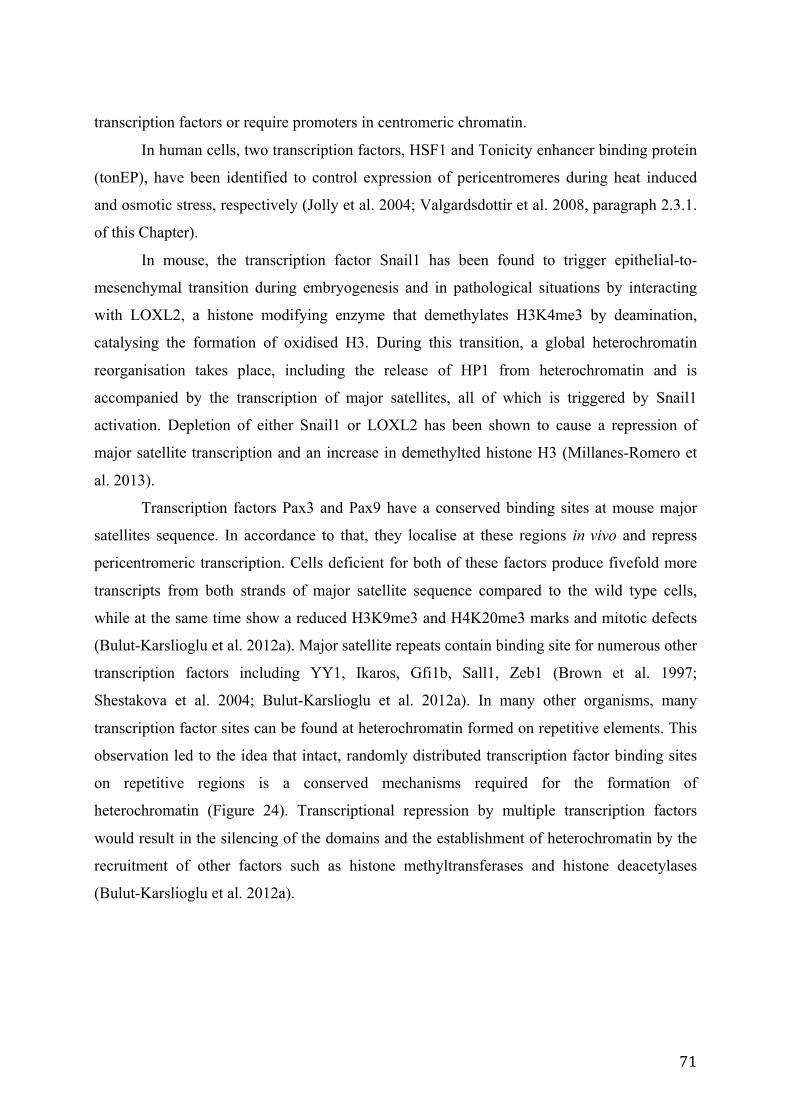
71
transcription factors or require promoters in centromeric chromatin.
In human cells, two transcription factors, HSF1 and Tonicity enhancer binding protein
(tonEP), have been identified to control expression of pericentromeres during heat induced
and osmotic stress, respectively (Jolly et al. 2004; Valgardsdottir et al. 2008, paragraph 2.3.1.
of this Chapter).
In mouse, the transcription factor Snail1 has been found to trigger epithelial-to-
mesenchymal transition during embryogenesis and in pathological situations by interacting
with LOXL2, a histone modifying enzyme that demethylates H3K4me3 by deamination,
catalysing the formation of oxidised H3. During this transition, a global heterochromatin
reorganisation takes place, including the release of HP1 from heterochromatin and is
accompanied by the transcription of major satellites, all of which is triggered by Snail1
activation. Depletion of either Snail1 or LOXL2 has been shown to cause a repression of
major satellite transcription and an increase in demethylted histone H3 (Millanes-Romero et
al. 2013).
Transcription factors Pax3 and Pax9 have a conserved binding sites at mouse major
satellites sequence. In accordance to that, they localise at these regions in vivo and repress
pericentromeric transcription. Cells deficient for both of these factors produce fivefold more
transcripts from both strands of major satellite sequence compared to the wild type cells,
while at the same time show a reduced H3K9me3 and H4K20me3 marks and mitotic defects
(Bulut-Karslioglu et al. 2012a). Major satellite repeats contain binding site for numerous other
transcription factors including YY1, Ikaros, Gfi1b, Sall1, Zeb1 (Brown et al. 1997;
Shestakova et al. 2004; Bulut-Karslioglu et al. 2012a). In many other organisms, many
transcription factor sites can be found at heterochromatin formed on repetitive elements. This
observation led to the idea that intact, randomly distributed transcription factor binding sites
on repetitive regions is a conserved mechanisms required for the formation of
heterochromatin (Figure 24). Transcriptional repression by multiple transcription factors
would result in the silencing of the domains and the establishment of heterochromatin by the
recruitment of other factors such as histone methyltransferases and histone deacetylases
(Bulut-Karslioglu et al. 2012a).
72
Figure 24. Transcription factor based mechanism for heterochromatin formation. Transcription factor
binding sites are non-randomly distributed to regulatory elements such as promoters and enhancers at
euchromatin. Heterochromatin lacks this synergy of regulation and transcription factor sites are more randomly
distributed throughout the heterochromatin, making in this way a distinction between these two chromatin states
(from Bulut-Karslioglu et al. 2012)
3.3. Cell cycle
The possibility that centromeric and pericentromeric transcript levels could be cell-
cycle regulated could explain the inconsistencies in their detection in mammalian cells. In
mouse, major satellite transcripts of different sizes are synthesised during different times of
the cell cycle in proliferating cells (Lu & Gilbert 2007). A heterogeneous set of transcripts
larger than 1kb is detected during G1 phase. These transcripts accumulate until they reach a
peak in G1/S, after which their transcription starts to decrease. This decrease coincides with
the time of chromocenter replication, which starts at the late S phase (Wu et al. 2006).
Another class of smaller RNA species of a size around 150 nt, were detected in mitotic cells,
even though mitosis is considered to be a transcriptionally silent phase, because of the
dissociation of transcription factors from chromatin. Moreover, HP1 delocalises from
heterochromatin during mitosis.
Mitotic transcription has also been observed from centromeric alpha satellite regions
in human cells. Inhibition of RNA polymerase II activity in mitotic cells results in a decrease
in transcription from centromeres and causes chromosome missegregation (Chan et al. 2012).

73
Chapter III
Tools for study of repetitive sequences
74
I.1. Oligonucleotides for detection of nucleic acids
1.1. Hybridization properties of nucleic acids
The discovery of DNA and its structural properties, notably the complementary base
pair binding, soon led to the development of new experimental techniques for the study of
nucleic acids (Noyes & Stark 1975; Southern 1975). These techniques are mostly based on
the process of hybridization between a nucleic acid and its complementary oligonucleotide
sequence. Oligonucleotide is a short chemically synthesized, single stranded piece of nucleic
acid, that can hybridize to a specific part of the target sequence. The ability of hybridization
of the short complementary sequence to any piece of nucleic acid of interest opened the
possibilities for the multiple applications of this principle.
The oligonucleotides can be used for a specific hybridization-based methods for
detection of nucleic acids such as Southern and northern blot. For example, northern blot
technique (especially in combination with polyacrylamide gel electrophoresis) is a widely
used technique for direct detection of RNA molecules that allows to determine both the size
of the RNA of interest and quantify its expression level. They are size fractionated by gel
electrophoresis and then transferred or “blotted” to a membrane and then hybridized with the
labelled oligonucleotide probes. To be detectable after hybridization, the labelling of the
probe can be achieved either by the incorporation of the label into the probe or its direct
attachment to the oligonucleotide.
The principle of hybridization is also used in enzymatic reactions such as reverse
transcription and PCR. These are sensitive methods that allow the detection and amplification
of small amounts of nucleic acid material, which are based on a specific hybridization of
oligonucleotide primers to the template molecule. Random priming is widely used for the
reverse transcription reaction. It is based on the use of short single stranded nucleotide
sequences, usually hexamers that are synthesised in each base combination, giving a mixture
of oligos able to bind to any piece of RNA to produce a large pool of complementary DNA.
On the other hand, oligo dT primers represent mixtures of thymidines of different sizes
designed to bind exclusively to the sequences containing a polyA tail, restricting the use of
75
these primers to polyadenylated RNAs, such as mRNAs, and making them impossible to use
in hybridization to ribosomal and transfer RNA and to non-polyadenylated non-coding RNA.
The use of sequence specific primers are designed according to the known sequence of
interest and they allow for the greatest specificity in the detection of the RNA, especially
when dealing with the low abundant molecules.
Oligonucleotides are also used as antisense molecules. Antisense technology is based
on the sequence complementarity between the oligonucleotide and the RNA to specifically
inhibit mRNA translation or to degrade a target molecule.
Oligonucleotides composed entirely out of DNA or RNA bases are less stable in a
cellular environment, being quickly recognised and degraded by nucleases. They also have a
limiting efficiency of cellular delivery and often show off-target effects. For this reasons,
chemically synthesized nucleic acid analogues have been developed.
1.2. Oligonucleotides
1.2.1 A brief history of oligonucleotides
The history of oligonucleotides synthesis goes back to the beginning of the 20th
century and the studies of the structure of nucleic acids. The first oligonucleotide synthesized
was a dinucleotide, created in 1955, by Michelson and Todd (Michelson & Todd 1955). This
dinucleotide provided the first chemical confirmation of the 3’-5’ phosphodiester linkage
between the nucleotides. For his study on nucleotides, Todd was awarded the Nobel Prize in
Chemistry in 1957. At around the same time, biochemist Har Gobind Khorana brought
revolutionary improvements in the field of oligonucleotide development by introducing new
method of synthesis (Schaller et al. 1963). His oligonucleotides were extended by DNA
polymerase and converted into RNA transcripts. These RNAs were then used for in vitro
protein synthesis and served as a confirmation of the genetic code, for which Khorana was
awarded the Nobel Prize in Physiology and Medicine in 1968 (Yury E. Khudyakov 2002).
Since these early beginnings, new breakthroughs in chemistry made the development of
oligonucleotides a quick and standardised procedure. Today, each oligo is custom made and
used as a tool in a wide range of molecular biology techniques.
76
1.2.2. Oligos with chemical modifications: 2’-O-Me and LNA
The broad use of oligonucleotides led to the development of new forms of
modifications that provide the oligonucleotides with an increased affinity, enhanced thermal
stability and increased nuclease resistance, making them optimal for specific applications.
These new nucleic acid analogues such as 2-O-methyl oligonucleotides, locked nucleic acid
(LNA), peptide nucleic acid (PNA) and morpholinos outperform the standard DNA probes in
nucleic acid detection (Karkare & Bhatnagar 2006).
The main chemical difference between the DNA and RNA lies in the 2’ position of the
sugar moiety. The additional OH group at the 2’ carbon induces a change toward the 3’ endo
conformation of the ribose, leading to the more stable RNA-RNA duplexes. The increase in
the thermal stability of the 3’ endo conformation of the RNA prompted the development of
nucleic acid analogs carrying modifications on the 2’-position of the sugar in order to enhance
the binding properties of oligonucleotides to their target sequences (Prakash 2011).
Furthermore, the proximity of the 2’-sugar modification to the 3’ phosphate group increases
the nuclease resistance of the modified oligonucleotide. One of the limitations of the
modifications at the 2’-position is that their introduction inhibit the RNAse H activity of the
oligonucleotide. This has been successfully overcome by the use of gapmer oligonucleotides,
where the segment of DNA region in the centre of the oligonucleotide is able to induce the
RNAse H cleavage, while allowing the modifications at the flanking nucleotides (Bennett &
Swayze 2010). The introduction of the methyl group was one of the first modifications of the
2’-position of the ribose. This modification improved the thermal stability of the
oligonucleotide bound to the target sequence and improved its nuclease resistance compared
to phosphodiester or phosphothioate oligonucleotides. The 2’-O-methyl modified
oligonucleotides had soon been established as tools for inhibition of miRNA and the study of
miRNA function (Meister et al. 2004; Hutvágner et al. 2004).
To further improve the binding of the modified oligonucleotide to its target sequence,
the preorganisation of the phosphate backbone was achieved by the restriction of the
conformation of the sugar monomer by covalently linking the 2’ and 4’ positions of the ribose.
This 2’-4’ bicyclic nucleic acids such as LNA, have the sugar locked into 3’ endo
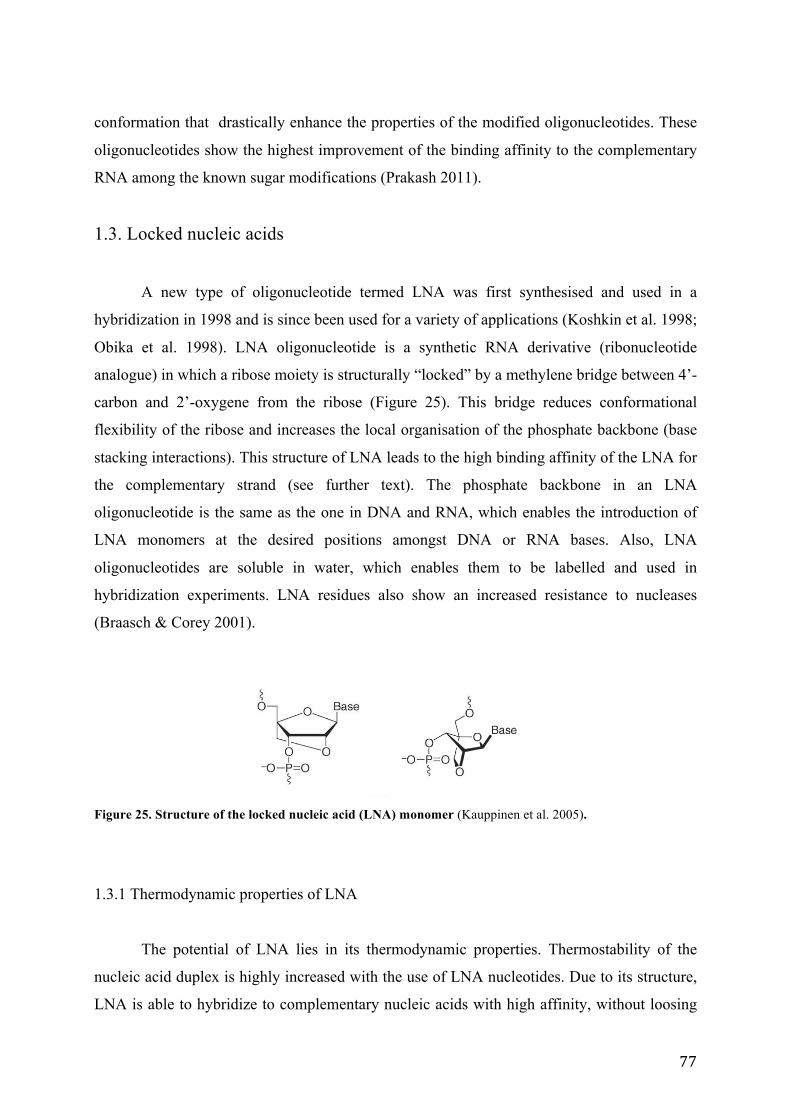
77
conformation that drastically enhance the properties of the modified oligonucleotides. These
oligonucleotides show the highest improvement of the binding affinity to the complementary
RNA among the known sugar modifications (Prakash 2011).
1.3. Locked nucleic acids
A new type of oligonucleotide termed LNA was first synthesised and used in a
hybridization in 1998 and is since been used for a variety of applications (Koshkin et al. 1998;
Obika et al. 1998). LNA oligonucleotide is a synthetic RNA derivative (ribonucleotide
analogue) in which a ribose moiety is structurally “locked” by a methylene bridge between 4’-
carbon and 2’-oxygene from the ribose (Figure 25). This bridge reduces conformational
flexibility of the ribose and increases the local organisation of the phosphate backbone (base
stacking interactions). This structure of LNA leads to the high binding affinity of the LNA for
the complementary strand (see further text). The phosphate backbone in an LNA
oligonucleotide is the same as the one in DNA and RNA, which enables the introduction of
LNA monomers at the desired positions amongst DNA or RNA bases. Also, LNA
oligonucleotides are soluble in water, which enables them to be labelled and used in
hybridization experiments. LNA residues also show an increased resistance to nucleases
(Braasch & Corey 2001).
Figure 25. Structure of the locked nucleic acid (LNA) monomer (Kauppinen et al. 2005).
1.3.1 Thermodynamic properties of LNA
The potential of LNA lies in its thermodynamic properties. Thermostability of the
nucleic acid duplex is highly increased with the use of LNA nucleotides. Due to its structure,
LNA is able to hybridize to complementary nucleic acids with high affinity, without loosing
78
the required sequence specificity. Incorporation of an LNA nucleotide can raise the melting
temperature (Tm) of the duplex for 1-8 °C per LNA against complementary DNA and 2-10 °C
per LNA against complementary RNA, in comparison to the unmodified duplex (Kurreck et
al. 2002). This increase in Tm is the largest increase in thermostability of a nucleic acid
analogue. This characteristic of LNA makes it unparalleled for the use in applications that
require high affinity to the complementary strand. Other modified oligonucleotides do not
show such an effect. For example, while a 2,4-4° C increase per LNA was observed when the
LNA monomer is introduced as an isolated residue into an 18-mer oligonucleotide, 2’-O-
methyl modifications increased the Tm for less than 1°C (Kurreck et al. 2002).
However, this increase in Tm largely depends on the number of modifications and
their position in the oligonucleotide sequence. Moreover, as the number of incorporated LNA
bases is higher, the increase per LNA base seems to decrease. Indeed, the thermostability of
the oligonucleotide per LNA modification is observed to decrease when the substitution with
an LNA nucleotide in the LNA:DNA mixmer reaches 50%. Long non-modified
oligonucleotides that possess higher thermal stability do not seem to remarkably increase their
melting temperature after LNA incorporation. Short modified oligonucleotides with
incorporated LNA bases will, however, have the greatest thermal stability and provide high
affinity for the complementary strand (Braasch & Corey 2001).
1.3.2. Use of LNA oligonucleotides
Different LNA oligonucleotide designs have been used as a tool for diverse biological
applications. LNA oligonucleotides can be used either in the form of a mixmer, where LNA
nucleotides are dispersed between the DNA bases, or as a gapmer, in which two LNA
segments at the two ends of the oligonucleotide are separated by a stretch of 7-8 DNA bases.
Oligonucleotide can also be entirely composed out of LNA nucleotides. These different LNA
designs exert different modes of action. For example, the DNA segment in a gapmer
oligonucleotide is able to recruit RNAse H enzyme when the oligonucleotide is hybridised to
the RNA, leading to a specific cleavage of the DNA: RNA duplex. The LNA mixmers on the
other hand are able to bind to the target RNA and induce steric blockage (Braasch & Corey
2001).
79
a) LNA nucleotides for antisense targeting of cellular RNAs
LNA modified oligonucleotides have a broad application as antisense molecules. The
unmodified DNA oligonucleotide has several disadvantages as an antisense molecule. DNA is
quite unstable in biological media and is quickly degraded by nucleases. Most importantly,
DNA antisense oligonucleotides often non-specifically target RNA or even proteins (Kurreck
et al. 2002). Among different modified oligonucleotides, LNA oligonucleotides are good
candidates for antisense gene targeting due to their thermostability, high specificity and
nuclease resistance, as exemplified in the following text.
Gapmer LNA oligonucleotides have been successfully used to target nuclear
transcripts such as intergenic spacers that separate the rRNA genes (Mayer et al. 2006). LNA
gapmers designed to specifically target both sense and antisense major satellite transcripts in
mouse embryo have shown to have an effect on embryo development (Probst et al. 2010;
Casanova et al. 2013). LNA mixmers have also shown to act as inhibitors of telomerase.
Telomerase is a ribonucleoprotein that contains an RNA, which serves as a template for
maintaining the telomere length. It is expressed in cancer cells where it is thought to help
sustain tumor proliferation. Successful interference with this RNA has been achieved using an
LNA antisense acting as a strong inhibitor of telomerase (Elayadi et al. 2002). Targeting of
Xist lncRNA allows a rapid displacement of the RNA from the X chromosome, without
affecting its stability. LNA mixmers designed to target specific domains of Xist proved that
LNA could be used as a powerful tool for analysis of ncRNAs (Sarma et al. 2010). LNA
oligonucleotides are used as LNA-antagomirs, antisense oligonucleotides designed to silence
specific miRNA that are widely used in loss of function experiments (Naguibneva et al. 2006).
The LNA was one of the first modifications to be used to engineer siRNA. Chemical
modifications of the siRNA have been shown to significantly improve the siRNA properties,
without negatively affecting siRNA activity (Braasch & Corey 2001).
b) LNA antigenes
LNA can also directly target the chromosomal DNA for inhibition of gene expression.
These so-called LNA antigenes designed to bind to gene promoters can bind chromosomal
DNA where they interfere with RNA polymerase and associated transcription factors to
80
reduce RNA expression (Beane et al. 2008). All these cellular studies point to the usefulness
of LNA oligonucleotides to target RNAs with specificity inside the cell.
c) LNA as primers for PCR amplification
Amplification by PCR requires specific hybridization to complementary DNA
sequences. In cases where DNA template is in low quantities or if amplifying a repetitive
region, PCR can be improved by the use of modified oligonucleotides. LNA modifications
have been reported as efficient for use as primers where the amplification requires higher
specificity and sensitivity (Lundin et al. 2013). LNA primers have greater mismatch
sensitivity and they can therefore be used under high annealing temperatures for selective
amplifications against unmodified primers. Since LNA modifications increase the melting
temperature of the duplex, the LNA primers can be made shorter than unmodified
oligonucleotides. This is advantageous for amplification of highly similar sequences, as
shorter oligonucleotides allow correct targeting between sequences that show low levels of
variation. Unmodified primers of the same size would have too low melting temperature for a
correct hybridization under standard conditions. However, caution must be taken when
designing LNA primers as LNA position in a primer is crucial for an improved performance.
Modifications at the 5’end of the primer significantly improve PCR reactions when compared
to modifications at the 3’-end positioning or LNA incorporation throughout the primer (Levin
et al. 2006). LNA primers have proven excellent for detection of single nucleotide
polymorphism in genotyping experiments (Latorra et al. 2003). For example, the LNA
incorporated at the 3’-end of the primer was used to quantify the methylation level of specific
cytosines in a genome (Thomassin et al. 2004).
d) LNA as hybridization probes
Unique properties of LNA oligonucleotides have opened new possibilities for
detection by nucleic acid hybridization. DNA oligonucleotides with several LNA bases
interspersed throughout the probe have been used in northern blot experiments for a specific
detection of miRNA, characterisation of which has been difficult due to their small size and
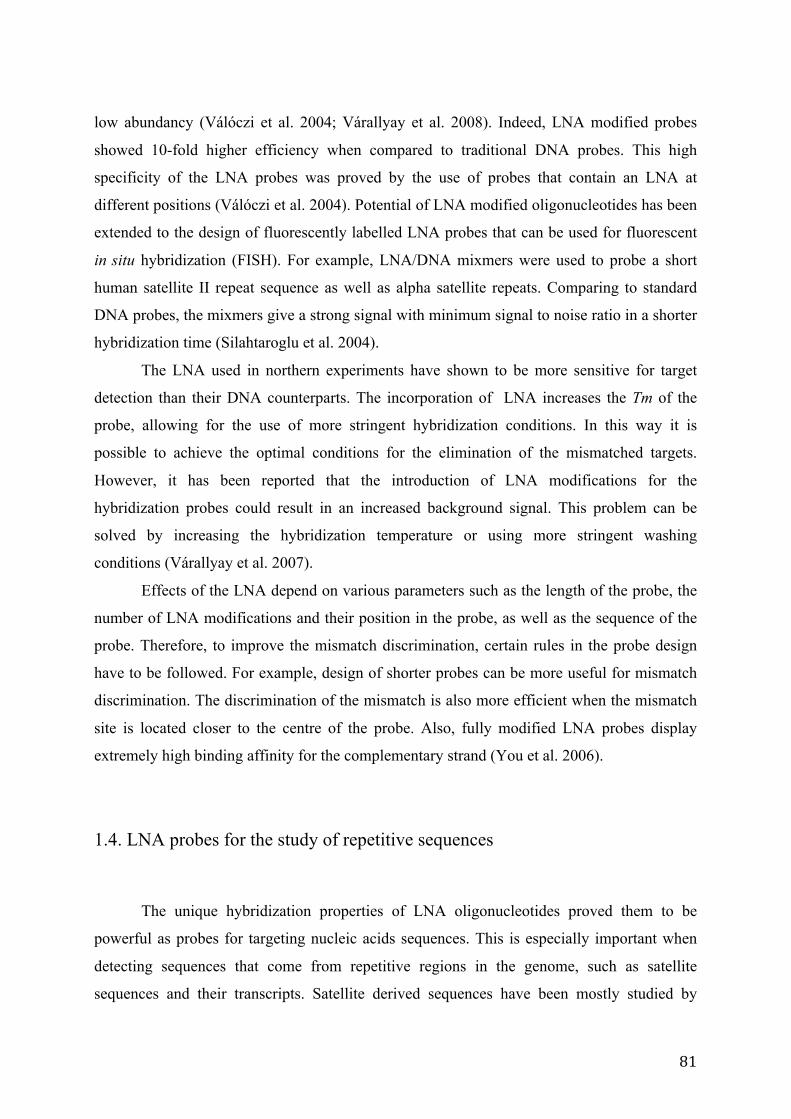
81
low abundancy (Válóczi et al. 2004; Várallyay et al. 2008). Indeed, LNA modified probes
showed 10-fold higher efficiency when compared to traditional DNA probes. This high
specificity of the LNA probes was proved by the use of probes that contain an LNA at
different positions (Válóczi et al. 2004). Potential of LNA modified oligonucleotides has been
extended to the design of fluorescently labelled LNA probes that can be used for fluorescent
in situ hybridization (FISH). For example, LNA/DNA mixmers were used to probe a short
human satellite II repeat sequence as well as alpha satellite repeats. Comparing to standard
DNA probes, the mixmers give a strong signal with minimum signal to noise ratio in a shorter
hybridization time (Silahtaroglu et al. 2004).
The LNA used in northern experiments have shown to be more sensitive for target
detection than their DNA counterparts. The incorporation of LNA increases the Tm of the
probe, allowing for the use of more stringent hybridization conditions. In this way it is
possible to achieve the optimal conditions for the elimination of the mismatched targets.
However, it has been reported that the introduction of LNA modifications for the
hybridization probes could result in an increased background signal. This problem can be
solved by increasing the hybridization temperature or using more stringent washing
conditions (Várallyay et al. 2007).
Effects of the LNA depend on various parameters such as the length of the probe, the
number of LNA modifications and their position in the probe, as well as the sequence of the
probe. Therefore, to improve the mismatch discrimination, certain rules in the probe design
have to be followed. For example, design of shorter probes can be more useful for mismatch
discrimination. The discrimination of the mismatch is also more efficient when the mismatch
site is located closer to the centre of the probe. Also, fully modified LNA probes display
extremely high binding affinity for the complementary strand (You et al. 2006).
1.4. LNA probes for the study of repetitive sequences
The unique hybridization properties of LNA oligonucleotides proved them to be
powerful as probes for targeting nucleic acids sequences. This is especially important when
detecting sequences that come from repetitive regions in the genome, such as satellite
sequences and their transcripts. Satellite derived sequences have been mostly studied by
82
methods such as RT PCR, RNA FISH and northern blot. All of these methods require use of
oligonucleotides for their specific detection. The detection of transcripts by enzymatic
methods such as RT PCR has been mainly based on random priming oligonucleotides.
Reverse transcription performed by random priming increases the cDNA complexity and
lacks the specificity which can be obtained by the use of sequence specific primers. Also, the
strand specific analysis is not possible, which is of great interest when dealing with non-
coding sequences that can be transcribed both as sense and antisense molecules.
As previously discussed, detection by northern blot is a simple method, but it can be
limiting for the detection of low abundant transcripts. The use of chemically modified probes
should increase the sensitivity of the transcript detection. Discriminatory properties of LNA
made them a powerful tool for use in conditions that require high specificity and mismatch
discrimination, which is the case in the detection of repetitive sequences such as major
satellites. Use of these probes in northern blot experiments allow for the discrimination
between the sense and antisense strand. Moreover, the use of LNA probes would allow the
design of short probes comparing to their DNA counterparts, with high specificity for their
target in highly stringent conditions, which is extremely important in studies of repetitive
sequences when trying to distinguish a single transcript between the transcripts that show a
high degree of similarity, where longer probes could not distinguish between the two highly
similar fragments (You et al. 2006; Kaur et al. 2006).
I. 2. Tools for (epi)genetic engineering
2.1. Tools for targeted genome manipulation
2.1.1. Targeting specific DNA loci in living cells
An attractive means to directly modulate the genome function is via the use of fusion
proteins, made out of sequence specific binding domains linked to different effector domains.
Up until now, the most commonly used DNA binding domains were non-mammalian
domains. These include the yeast GAL4-UAS system, the prokaryotic Tet-repressor (TetR)-
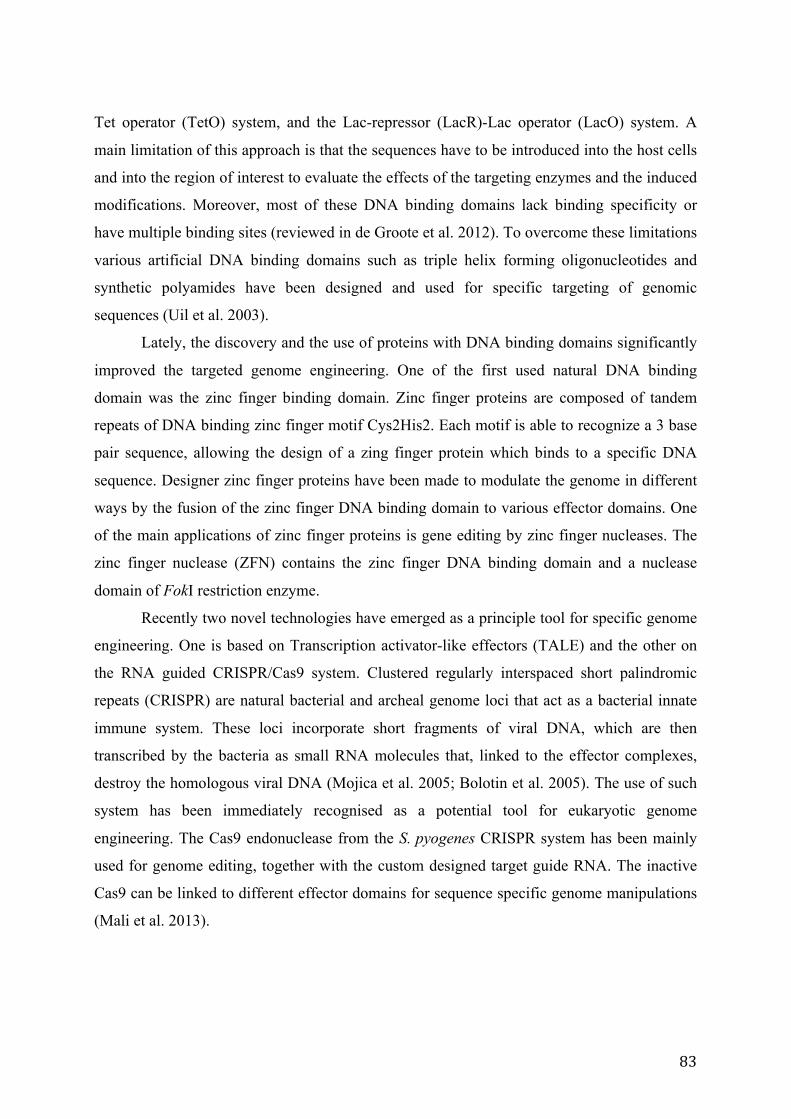
83
Tet operator (TetO) system, and the Lac-repressor (LacR)-Lac operator (LacO) system. A
main limitation of this approach is that the sequences have to be introduced into the host cells
and into the region of interest to evaluate the effects of the targeting enzymes and the induced
modifications. Moreover, most of these DNA binding domains lack binding specificity or
have multiple binding sites (reviewed in de Groote et al. 2012). To overcome these limitations
various artificial DNA binding domains such as triple helix forming oligonucleotides and
synthetic polyamides have been designed and used for specific targeting of genomic
sequences (Uil et al. 2003).
Lately, the discovery and the use of proteins with DNA binding domains significantly
improved the targeted genome engineering. One of the first used natural DNA binding
domain was the zinc finger binding domain. Zinc finger proteins are composed of tandem
repeats of DNA binding zinc finger motif Cys2His2. Each motif is able to recognize a 3 base
pair sequence, allowing the design of a zing finger protein which binds to a specific DNA
sequence. Designer zinc finger proteins have been made to modulate the genome in different
ways by the fusion of the zinc finger DNA binding domain to various effector domains. One
of the main applications of zinc finger proteins is gene editing by zinc finger nucleases. The
zinc finger nuclease (ZFN) contains the zinc finger DNA binding domain and a nuclease
domain of FokI restriction enzyme.
Recently two novel technologies have emerged as a principle tool for specific genome
engineering. One is based on Transcription activator-like effectors (TALE) and the other on
the RNA guided CRISPR/Cas9 system. Clustered regularly interspaced short palindromic
repeats (CRISPR) are natural bacterial and archeal genome loci that act as a bacterial innate
immune system. These loci incorporate short fragments of viral DNA, which are then
transcribed by the bacteria as small RNA molecules that, linked to the effector complexes,
destroy the homologous viral DNA (Mojica et al. 2005; Bolotin et al. 2005). The use of such
system has been immediately recognised as a potential tool for eukaryotic genome
engineering. The Cas9 endonuclease from the S. pyogenes CRISPR system has been mainly
used for genome editing, together with the custom designed target guide RNA. The inactive
Cas9 can be linked to different effector domains for sequence specific genome manipulations
(Mali et al. 2013).
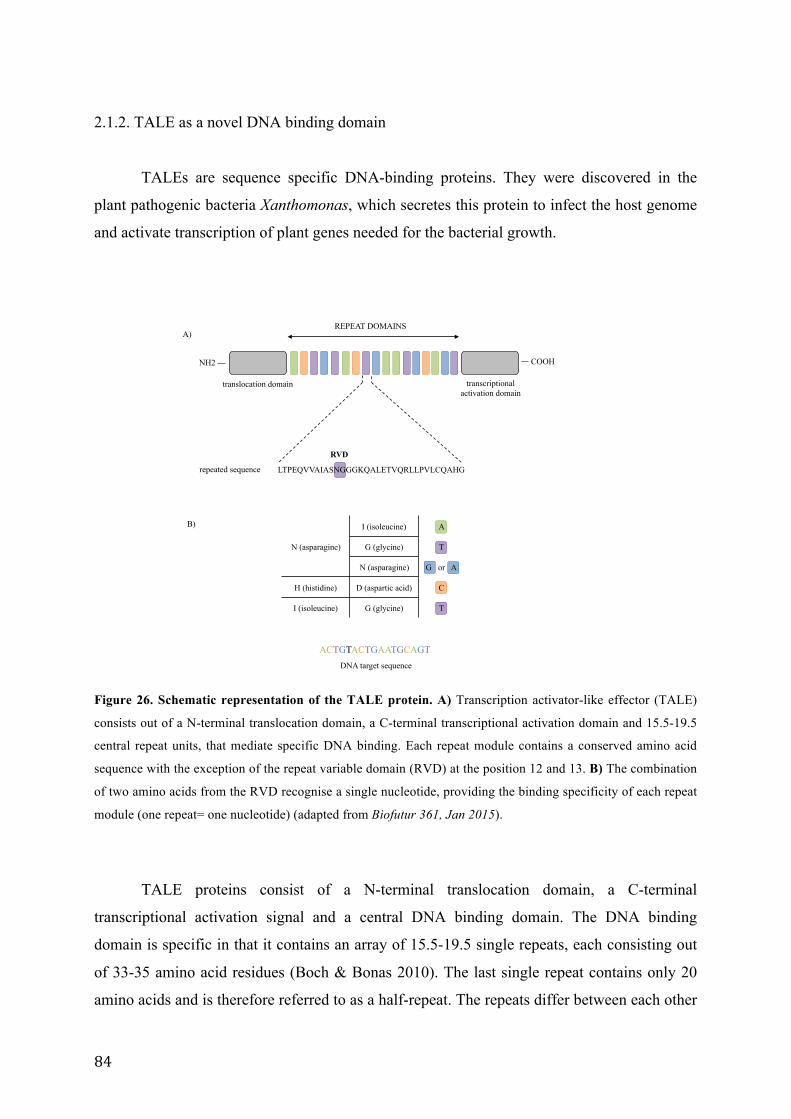
84
2.1.2. TALE as a novel DNA binding domain
TALEs are sequence specific DNA-binding proteins. They were discovered in the
plant pathogenic bacteria Xanthomonas, which secretes this protein to infect the host genome
and activate transcription of plant genes needed for the bacterial growth.
translocation domain
REPEAT DOMAINS
LTPEQVVAIASNGGGKQALETVQRLLPVLCQAHG
N (asparagine)
I (isoleucine) A
G (glycine) T
N (asparagine) G or A
H (histidine) D (aspartic acid) C
I (isoleucine) G (glycine) T
ACTGTACTGAATGCAGT DNA target sequence
transcriptional activation domain
A)
B)
COOH NH2
repeated sequence
RVD
Figure 26. Schematic representation of the TALE protein. A) Transcription activator-like effector (TALE)
consists out of a N-terminal translocation domain, a C-terminal transcriptional activation domain and 15.5-19.5
central repeat units, that mediate specific DNA binding. Each repeat module contains a conserved amino acid
sequence with the exception of the repeat variable domain (RVD) at the position 12 and 13. B) The combination
of two amino acids from the RVD recognise a single nucleotide, providing the binding specificity of each repeat
module (one repeat= one nucleotide) (adapted from Biofutur 361, Jan 2015).
TALE proteins consist of a N-terminal translocation domain, a C-terminal
transcriptional activation signal and a central DNA binding domain. The DNA binding
domain is specific in that it contains an array of 15.5-19.5 single repeats, each consisting out
of 33-35 amino acid residues (Boch & Bonas 2010). The last single repeat contains only 20
amino acids and is therefore referred to as a half-repeat. The repeats differ between each other
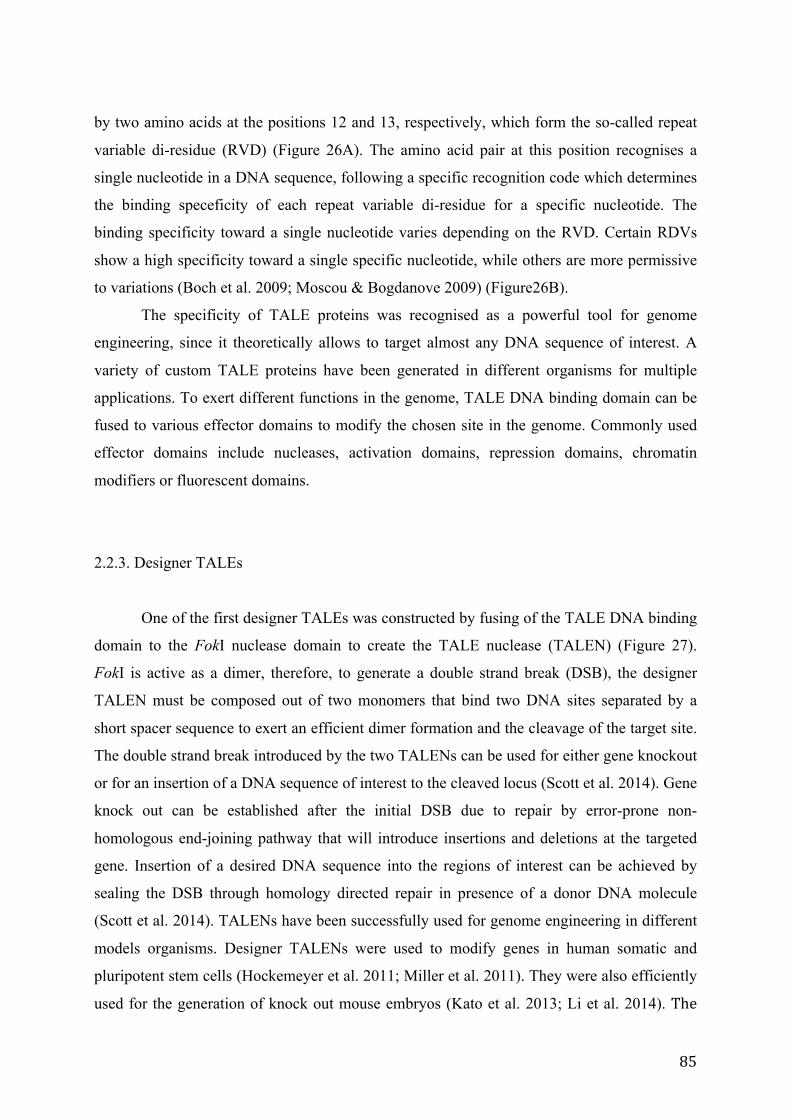
85
by two amino acids at the positions 12 and 13, respectively, which form the so-called repeat
variable di-residue (RVD) (Figure 26A). The amino acid pair at this position recognises a
single nucleotide in a DNA sequence, following a specific recognition code which determines
the binding speceficity of each repeat variable di-residue for a specific nucleotide. The
binding specificity toward a single nucleotide varies depending on the RVD. Certain RDVs
show a high specificity toward a single specific nucleotide, while others are more permissive
to variations (Boch et al. 2009; Moscou & Bogdanove 2009) (Figure26B).
The specificity of TALE proteins was recognised as a powerful tool for genome
engineering, since it theoretically allows to target almost any DNA sequence of interest. A
variety of custom TALE proteins have been generated in different organisms for multiple
applications. To exert different functions in the genome, TALE DNA binding domain can be
fused to various effector domains to modify the chosen site in the genome. Commonly used
effector domains include nucleases, activation domains, repression domains, chromatin
modifiers or fluorescent domains.
2.2.3. Designer TALEs
One of the first designer TALEs was constructed by fusing of the TALE DNA binding
domain to the FokI nuclease domain to create the TALE nuclease (TALEN) (Figure 27).
FokI is active as a dimer, therefore, to generate a double strand break (DSB), the designer
TALEN must be composed out of two monomers that bind two DNA sites separated by a
short spacer sequence to exert an efficient dimer formation and the cleavage of the target site.
The double strand break introduced by the two TALENs can be used for either gene knockout
or for an insertion of a DNA sequence of interest to the cleaved locus (Scott et al. 2014). Gene
knock out can be established after the initial DSB due to repair by error-prone non-
homologous end-joining pathway that will introduce insertions and deletions at the targeted
gene. Insertion of a desired DNA sequence into the regions of interest can be achieved by
sealing the DSB through homology directed repair in presence of a donor DNA molecule
(Scott et al. 2014). TALENs have been successfully used for genome engineering in different
models organisms. Designer TALENs were used to modify genes in human somatic and
pluripotent stem cells (Hockemeyer et al. 2011; Miller et al. 2011). They were also efficiently
used for the generation of knock out mouse embryos (Kato et al. 2013; Li et al. 2014). The
86
ability of TALE proteins to target a specific sequence of interest has been used to
modulate gene expression by fusing a transcriptional activator or repressor to the TALE
DNA binding domain (Figure 27). TALE activators have been shown to regulate gene
expression in a strand and position dependent manner in mammalian cells, suggesting that the
careful selection of the TALE binding site has to be made in order to obtain an optimal
activation or repression of the desired gene (Uhde-Stone et al. 2014).
nuclease domain
transcriptional activation/
repression domain
MT, HAT, HDAC domains
DNA binding domain
DNA binding domain
DNA binding domain
Genome
Transcriptome
Epigenome
Figure 27. Designer TALE proteins. Different effector domains can be fused to the TALE DNA binding
domain to induce modifications at the genome, transcriptome and epigenome. For example, a nuclease domain
can be fused to the TALE domain to create DNA breaks. TALE will guide the transcriptional activator or
repressor domain to the regions of interest to specifically control the transcription of the target gene. Different
chromatin modifiers such are methyltransferases (MT), histone acetyltransferases (HAT) or histone deacetylases
(HDAC) can be fused to TALE DNA binding domain to induce chromatin modifications at the target region
(adapted from Mussolino & Cathomen 2012).
The application of TALEs goes beyond their use in genome editing and gene
regulation. For example, TALE binding domain can be fused to fluorescent proteins to
visualise endogenous genomic sequences. Nuclear dynamics of major and minor satellite
sequences were monitored in living cells by confocal microscopy after transfection with
TALE fused to fluorescent proteins (Miyanari et al. 2013; Miyanari 2014; Thanisch et al.
2014). The use of TALE-fluorescent proteins overcomes in situ hybridization, in which the
87
experiment have to be performed on fixed cells. TALE-fluorescent proteins are mostly
applicable for targeting repetitive genomic regions. However, a single locus detection has yet
to be optimised by using a sufficient number of TALE proteins for efficient visualisation
(Miyanari et al. 2013). Moreover, TALE binding domains have recently been linked with
different chromatin modifiers to target the epigenome and to analyse the effects of chromatin
modifications on specific genomic regions (see further text).
2.2. Epigenetic engineering for studying the functions of chromatin
modifications
2.2.1. Targeting chromatin modifications in living cells
The functional relevance of the complexity of chromatin modifications on the gene
regulation and chromatin dynamics has been recognised. The challenge is still a precise
determination of the roles of specific modifications in a specific genomic loci and in different
physiological contexts. Numerous studies already began to address the question of
functionality of different epigenetic marks and the associated chromatin modifiers. For
example, by performing knock out experiments of different chromatin modifiers it was
possible to obtain information about changes in transcription level of repetitive sequences.
However, as knock out experiments could lead to genome-wide changes, a beter alternative is
to target specific genomic loci (Voigt & Reinberg 2013).
Human artificial chromosome (HAC) containing alpha satellite DNA sequence arrays
have been widely used to study chromatin modifications and CENP-A recruitment at the
kinetochore. HAC contains a synthetic array of alpha satellite repeats containing a CENP-B,
which is proven sufficient to sustain centromere assembly and function. In a construction
where CENP-B containing alpha satellite monomers alternate with Tet operator containing
monomers, the effect of the manipulation of chromatin and the kinetochore by targeting
various TetR fusion proteins has been evaluated. Cells transfected with an expression
construct encoding TetR-EYFP (enhanced yellow fluorescent protein) fused to the lysine
specific demethylase 1 (LSD1) was used to deplete H3K4me2 mark from the HAC
kinetochore. The loss of H3K4me2 was accompanied by a loss of transcription from the HAC
centromeres (Bergmann et al. 2011). The depletion of H3K4me2 correlated with the gradual
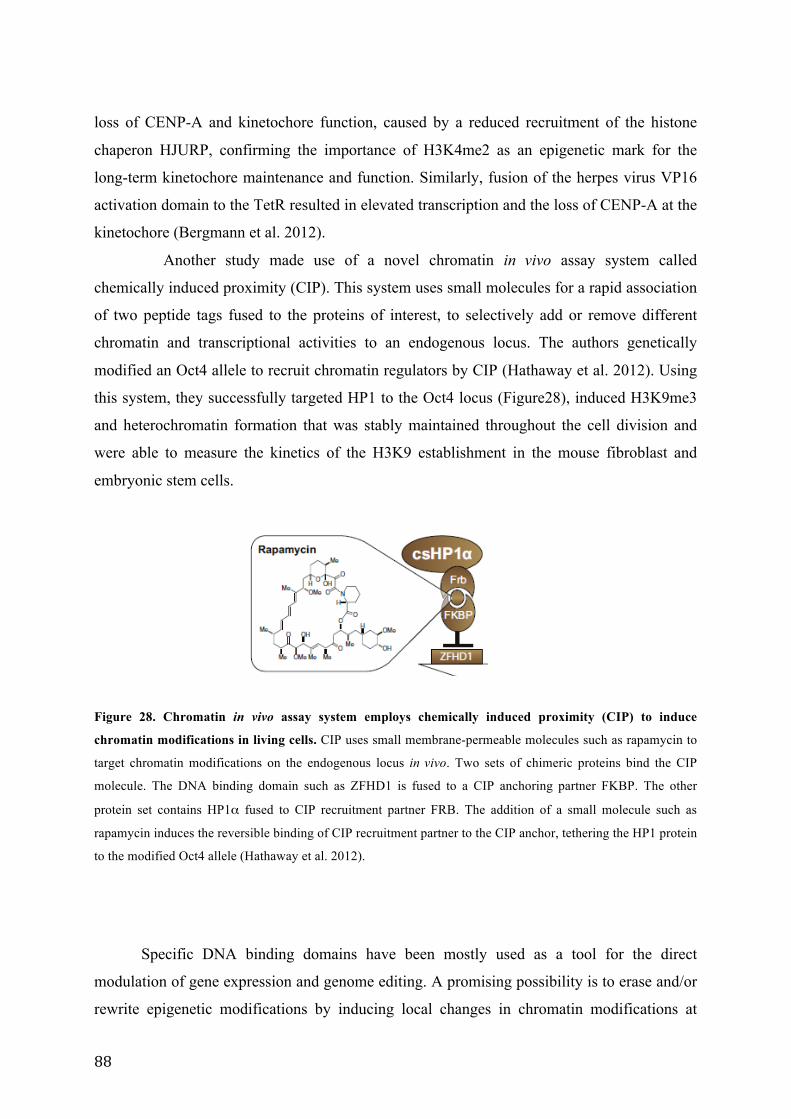
88
loss of CENP-A and kinetochore function, caused by a reduced recruitment of the histone
chaperon HJURP, confirming the importance of H3K4me2 as an epigenetic mark for the
long-term kinetochore maintenance and function. Similarly, fusion of the herpes virus VP16
activation domain to the TetR resulted in elevated transcription and the loss of CENP-A at the
kinetochore (Bergmann et al. 2012).
Another study made use of a novel chromatin in vivo assay system called
chemically induced proximity (CIP). This system uses small molecules for a rapid association
of two peptide tags fused to the proteins of interest, to selectively add or remove different
chromatin and transcriptional activities to an endogenous locus. The authors genetically
modified an Oct4 allele to recruit chromatin regulators by CIP (Hathaway et al. 2012). Using
this system, they successfully targeted HP1 to the Oct4 locus (Figure28), induced H3K9me3
and heterochromatin formation that was stably maintained throughout the cell division and
were able to measure the kinetics of the H3K9 establishment in the mouse fibroblast and
embryonic stem cells.
Figure 28. Chromatin in vivo assay system employs chemically induced proximity (CIP) to induce
chromatin modifications in living cells. CIP uses small membrane-permeable molecules such as rapamycin to
target chromatin modifications on the endogenous locus in vivo. Two sets of chimeric proteins bind the CIP
molecule. The DNA binding domain such as ZFHD1 is fused to a CIP anchoring partner FKBP. The other
protein set contains HP1α fused to CIP recruitment partner FRB. The addition of a small molecule such as
rapamycin induces the reversible binding of CIP recruitment partner to the CIP anchor, tethering the HP1 protein
to the modified Oct4 allele (Hathaway et al. 2012).
Specific DNA binding domains have been mostly used as a tool for the direct
modulation of gene expression and genome editing. A promising possibility is to erase and/or
rewrite epigenetic modifications by inducing local changes in chromatin modifications at

89
endogenous loci. One of the first studies that targeted epigenetic modifications directly at an
endogenous sequence made use of a zing finger that specifically bind major satellites (MaSat).
The experiment performed was the following. Methyl CpG binding protein 2 (MeCP2) is a
member of methyl CpG binding domain family and is involved in the aggregation of
pericentromeric heterochromatin. Mutants of this protein found in the neurological disease
called the Rett syndrom are unable to bind heterochromatin, which results in the impaired
clustering of the pericentromeric repeats in mouse. To force the binding of the mutated
proteins and analyse its functional consequences, the authors artificially recruited different
MeCP2 Rett mutants to pericentromeric regions using a zing finger protein that specifically
binds major satellites. The zing finger was fused to an antibody fragment with a high affinity
for GPF tagged protein, which was therefore able to recruit the GFP labelled MeCP2 mutants
to pericentromeres, allowing the visualisation of chromatin reorganisation dynamics (Casas-
Delucchi et al. 2012) (Figure 29).
Figure 29. Polydactyl zing finger protein fusion. The major satellite binding zing finger protein MaSat fused
to GFP-binding protein (GBP) recruits the GFP-labelled proteins (Protein X-GFP) to major satellite region
(Casas-Delucchi et al. 2012).
2.2.2. TALE for targeting chromatin modifications
The development of custom TALE binding domains that are linked to an effector
domain of interest opened a new possibility for targeted modifications of epigenetic marks at
the endogenous loci.
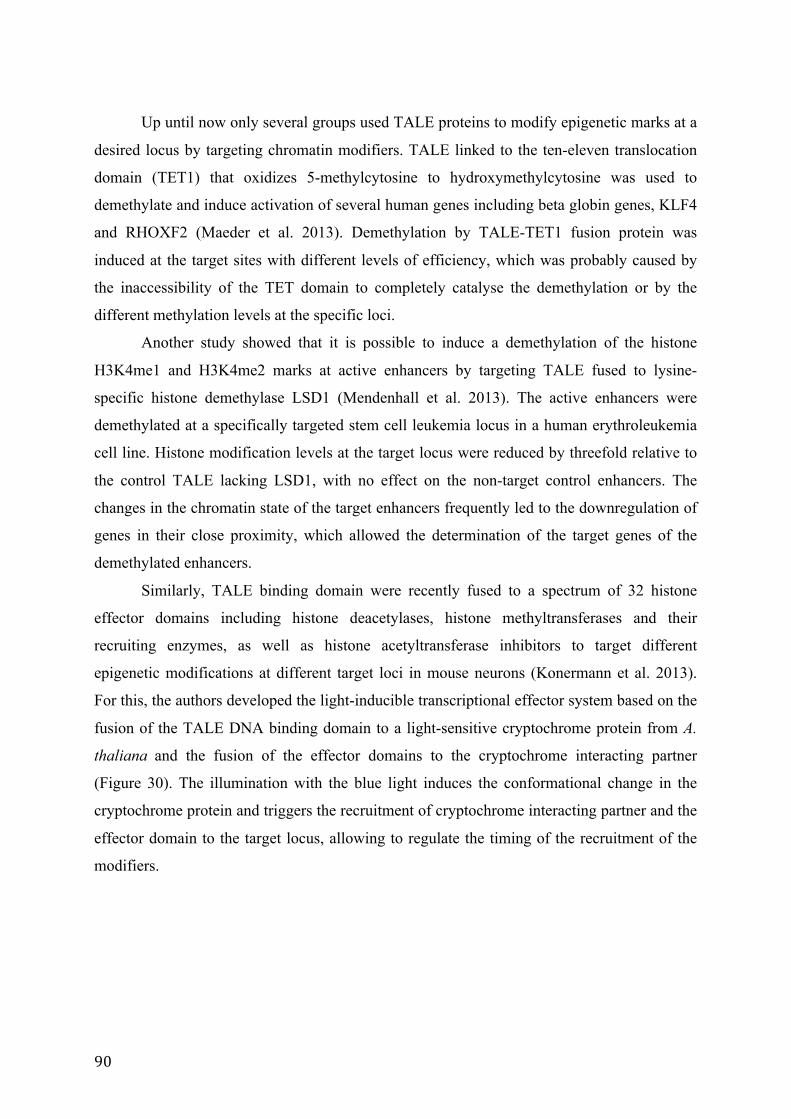
90
Up until now only several groups used TALE proteins to modify epigenetic marks at a
desired locus by targeting chromatin modifiers. TALE linked to the ten-eleven translocation
domain (TET1) that oxidizes 5-methylcytosine to hydroxymethylcytosine was used to
demethylate and induce activation of several human genes including beta globin genes, KLF4
and RHOXF2 (Maeder et al. 2013). Demethylation by TALE-TET1 fusion protein was
induced at the target sites with different levels of efficiency, which was probably caused by
the inaccessibility of the TET domain to completely catalyse the demethylation or by the
different methylation levels at the specific loci.
Another study showed that it is possible to induce a demethylation of the histone
H3K4me1 and H3K4me2 marks at active enhancers by targeting TALE fused to lysine-
specific histone demethylase LSD1 (Mendenhall et al. 2013). The active enhancers were
demethylated at a specifically targeted stem cell leukemia locus in a human erythroleukemia
cell line. Histone modification levels at the target locus were reduced by threefold relative to
the control TALE lacking LSD1, with no effect on the non-target control enhancers. The
changes in the chromatin state of the target enhancers frequently led to the downregulation of
genes in their close proximity, which allowed the determination of the target genes of the
demethylated enhancers.
Similarly, TALE binding domain were recently fused to a spectrum of 32 histone
effector domains including histone deacetylases, histone methyltransferases and their
recruiting enzymes, as well as histone acetyltransferase inhibitors to target different
epigenetic modifications at different target loci in mouse neurons (Konermann et al. 2013).
For this, the authors developed the light-inducible transcriptional effector system based on the
fusion of the TALE DNA binding domain to a light-sensitive cryptochrome protein from A.
thaliana and the fusion of the effector domains to the cryptochrome interacting partner
(Figure 30). The illumination with the blue light induces the conformational change in the
cryptochrome protein and triggers the recruitment of cryptochrome interacting partner and the
effector domain to the target locus, allowing to regulate the timing of the recruitment of the
modifiers.
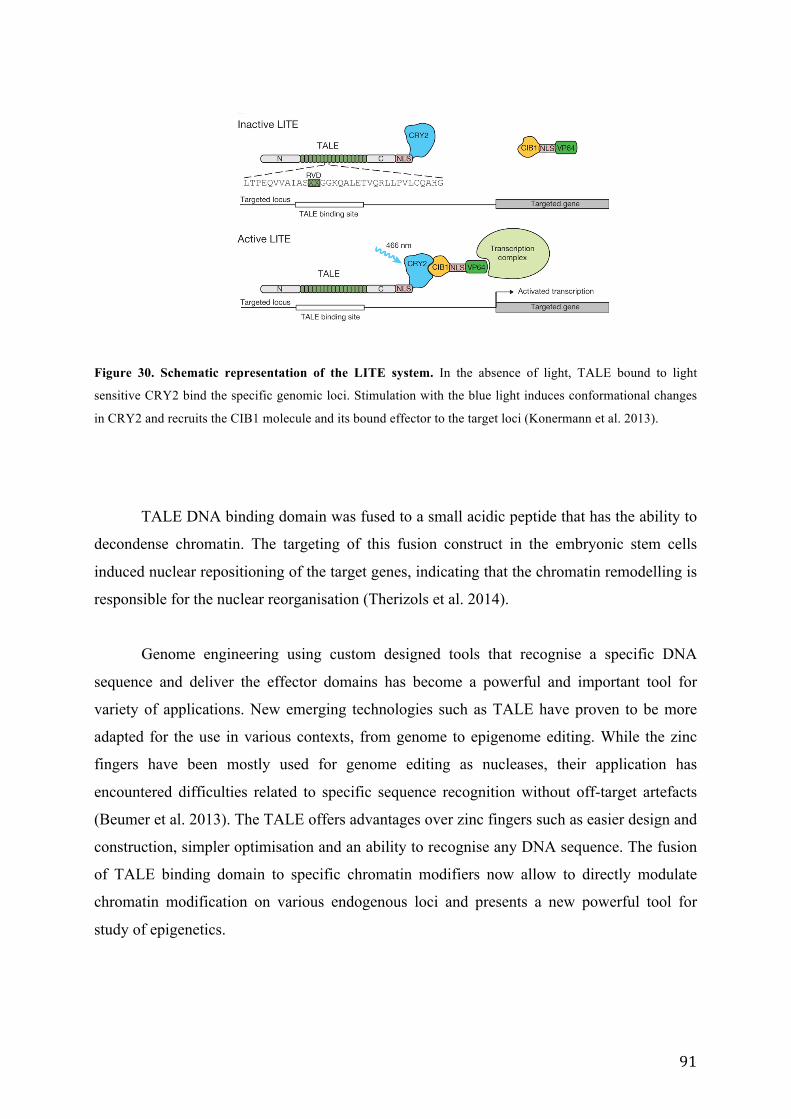
91
Figure 30. Schematic representation of the LITE system. In the absence of light, TALE bound to light
sensitive CRY2 bind the specific genomic loci. Stimulation with the blue light induces conformational changes
in CRY2 and recruits the CIB1 molecule and its bound effector to the target loci (Konermann et al. 2013).
TALE DNA binding domain was fused to a small acidic peptide that has the ability to
decondense chromatin. The targeting of this fusion construct in the embryonic stem cells
induced nuclear repositioning of the target genes, indicating that the chromatin remodelling is
responsible for the nuclear reorganisation (Therizols et al. 2014).
Genome engineering using custom designed tools that recognise a specific DNA
sequence and deliver the effector domains has become a powerful and important tool for
variety of applications. New emerging technologies such as TALE have proven to be more
adapted for the use in various contexts, from genome to epigenome editing. While the zinc
fingers have been mostly used for genome editing as nucleases, their application has
encountered difficulties related to specific sequence recognition without off-target artefacts
(Beumer et al. 2013). The TALE offers advantages over zinc fingers such as easier design and
construction, simpler optimisation and an ability to recognise any DNA sequence. The fusion
of TALE binding domain to specific chromatin modifiers now allow to directly modulate
chromatin modification on various endogenous loci and presents a new powerful tool for
study of epigenetics.
92
Objectives
Centromeric regions have a fundamental role during mitosis and meïosis being a place
for kinetochore formation and sister chromatid cohesion. This function is evolutionary
conserved throughout eukaryotic species, as well as the underlying DNA sequence
organisation, repetitive in almost all eukaryotes. Although long considered as transcriptionally
inactive, these sequences are transcribed as non-coding RNAs in many organisms. Mouse has
a particular organisation at the centromere and presents an interesting model for the study of
centromere biology. Centromeric regions in mouse are organized around two well-defined
types of repetitive sequences. The centromeric constriction is characterized by the presence of
the so-called minor satellite sequences (120 pb, more than 2500 repeats per chromosome),
while the more abundant major satellite sequences (234 bp, about 25 000 repeats per
chromosome) are located next to the centromere toward the chromosome arm, where they
constitute the underlying substrate of what is called pericentromeric heterochromatin.
Pericentromeric heterochromatin, which has been suggested to play a role in genome stability
and gene regulation, is characterized by the presence of specific epigenetic marks, showing
high levels of hypoacetylation, H3K9- and H4K20 trimethylation is organised in particular
nuclear structures called chromocenters. Interestingly, major satellites are differentially
expressed in mouse cells depending on the developmental stage, cell cycle and the
physiological context. These changes in expression level correlate with changes in chromatin
marks and with the changes in the nuclear organisation of pericentromeric heterochromatin. It
is therefore tempting to assume that these transcripts are a part of physiologically relevant
regulatory mechanisms. The experiments in which these transcripts were up- or
downregulated affected the cellular division and differentiation and also affected the nuclear
organisation of the pericentromeric heterochromatin.
Despite the numerous evidence of transcription from major satellites in different
cellular and physiological contexts, the precise characterisation at the molecular level, as well
as the exact mechanisms involved in their expression and processing are still lacking. This is
mostly due to the repetitive nature of the sequence, which impose limitations for their precise
study. Therefore, in the first part of this work we wanted to provide a better characterization
of the transcriptional profile of major satellites and to understand the mechanisms that control
93
their transcription. We made use of short LNA modified oligonucleotides specifically
designed to target both strands of major satellite sequence in northern blot experiments in
order to characterise the transcriptional profile of major satellites in mouse embryonic
fibroblasts grown in normal condition, as well as in a specific physiological context such as
heat shock. To determine the mechanisms of transcript expression and regulation, we wanted
to analyse the transcriptional profile of cells treated with different RNA polymerase inhibitors
and investigate the changes in transcript expression after treatment with inhibitors of different
chromatin modifiers.
In the second part of this work we focused on the study of the chromatin assembled at
the major satellite repeats. To determine the role of the H3K9me3 epigenetic mark on the
organisation of chromocenters, we wanted to use the novel experimental approach based on
the fusion of artificial TALE protein with a specific chromatin modifier to introduce
chromatin changes at the major satellite region. We constructed a TALE protein that is able to
bind an 18 bp sequence of major satellites fused to mouse histone demethylase mJMJD2D to
specifically demethylate H3K9me3. The use of a software that has recently been developed in
the team enables to monitor in 3D imaging experiments and quantify the demethylation of
H3K9 after transfection of cells with a construct expressing the fusion protein.

94
Materials and methods
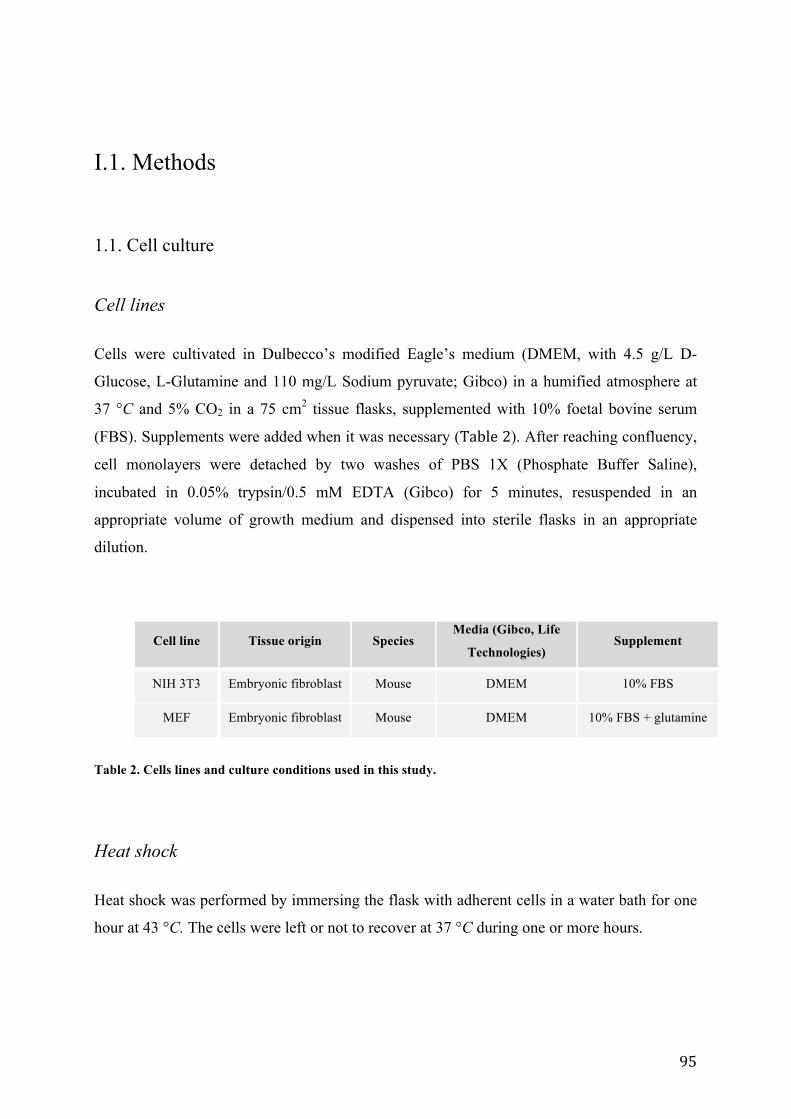
95
I.1. Methods
1.1. Cell culture
Cell lines Cells were cultivated in Dulbecco’s modified Eagle’s medium (DMEM, with 4.5 g/L D-
Glucose, L-Glutamine and 110 mg/L Sodium pyruvate; Gibco) in a humified atmosphere at
37 °C and 5% CO2 in a 75 cm2 tissue flasks, supplemented with 10% foetal bovine serum
(FBS). Supplements were added when it was necessary (Table 2). After reaching confluency,
cell monolayers were detached by two washes of PBS 1X (Phosphate Buffer Saline),
incubated in 0.05% trypsin/0.5 mM EDTA (Gibco) for 5 minutes, resuspended in an
appropriate volume of growth medium and dispensed into sterile flasks in an appropriate
dilution.
Cell line Tissue origin Species Media (Gibco, Life
Technologies) Supplement
NIH 3T3 Embryonic fibroblast Mouse DMEM 10% FBS
MEF Embryonic fibroblast Mouse DMEM 10% FBS + glutamine
Table 2. Cells lines and culture conditions used in this study.
Heat shock
Heat shock was performed by immersing the flask with adherent cells in a water bath for one
hour at 43 °C. The cells were left or not to recover at 37 °C during one or more hours.
96
Drug treatments Trichostatin A
1 µL of 2 mg/mL TSA was diluted in water to obtain a concentration of 60 µM. 25 µL of 60
µM TSA was resuspended in 10 mL cell culture media and added to freshly split cells. Cells
were grown in TSA supplemented media for 24 h at 37 °C.
Chaetocin
Stock solution of chaetocin (1 mg/mL) was diluted in water in 1/1400. 100 µL of intermediate
solution was added to 10 mL cell media. Cells were grown for 48 h at 37 °C.
Actinomycin D
10 µL or 0,25 µL of actinomycine D stock solution (2 mg/mL) was resuspended in 500 µL
cell media. The mixture was added to the cells to a final volume of 10 mL. The cells were
grown in the presence of actinomycin D for 3h.
DRB
25 µL of DRB stock solution (10 mg/mL) were resuspended in 500 µL cell media. The
mixture was added to the cells and cells were left for 3 h at 37 °C.
1.2. Northern blot Sample preparation
Total RNA was extracted using TRIzol® Reagent (Invitrogen). 10 µg RNA were mixed with
an equal volume of 2X formamide loading dye (Ambion) and heated for 10 minutes at 65 °C.
Migration and transfer
Polyacrylamide gel was pre-run for 30 minutes at 40 W in 1X TBE buffer. RNA samples
were loaded into the rinsed wells and migrated for 1h at 20 W. After migration, the gel was
stained with ethidium bromide for 15 minutes. The transfer was done on a nylon membrane
97
(Hybond-N+, GE Healthcare Lifesciences) in a semi dry transfer unit (Amersham
Biosciences) during 1h. Blotted RNAs were crosslinked in a stratalinker at 1200 mJ.
Hybridization
The membrane was hybridized with radiolabeled probes. Prehybridization was performed
with 50% formamide (Bio Basic Canada Inc), 5X SSC (pH 5,6), 5X Denhart solution, 0,5%
SDS and 1 mg of sheared salmon sperm (Sigma Aldrich) during 30 minutes. The
hybridization was performed at 55°C with 50 % formamide (Bio Basic Canada Inc), 5X SSC
(pH 5,6), 5X Denhart solution and 0,5% SDS for 1-3h. For LNA probes, membrane was
washed in 2X SSC and 0,1% SDS buffer once for 5 minutes, and twice for 15 minutes. The
membrane was wrapped in Saran wrap to avoid drying and was exposed to PhosphorImager
during two days.
1.3. Radioactive labelling Oligonucleotides were radioactively labelled on their 3’ end by an incorporation of
radioactive γ-32P. 1 µM of oligonucleotides (Table 3) was incubated in the presence of T4
polynucleotide kinase (New England BioLabs) and ATP γ-32P (Perkin-Elmer) for 1h at 37 °C.
Products were cleaned by passing the samples through a mini spin column in order to
eliminate the unincorporated nucleotides (Micro Bio Spin with Bio-Gel P-6 in Tris-Buffer,
BioRad).
1.4. RNA extraction Cells were washed in PBS 1X, trypsinized and centrifuged for 5 minutes at 200 g. Pellet was
washed twice in PBS 1X. 500 uL of TRIzol® solution (Invitrogen) was added per tube
containing a maximum 2x10⁷ cells. The homogenized mixture was incubated for 5 minutes at
room temperature. Next, 0.2 mL of chloroform was added and the mixture was incubated for
2 min 30 sec at room temperature. Samples were centrifuged for 15 minutes at 4 °C at 11000
g. The aqueous phase was transferred to a new tube, washed with 0.5 mL of isopropanol and
incubated at room temperature for 10 minutes. Samples were centrifuged at 4° C at 11000 g
for 10 minutes. Pellet was washed with 70% ethanol, centrifuged again for 5 minutes and air-
98
dried until the pellet became translucent. The pellet was resuspended in TE buffer (Ambion)
and the samples were heated for 10 minutes at 65 °C. RNA was quantified by
spectrophotometer. The RNA quality was checked on an 1% agarose gel. The RNA were
stored at -80 °C.
1.5. RT PCR 10 µg of RNA were treated in with 2U of Turbo DNase (Ambion) in a total volume of 50 µL
during 30 minutes at 37 °C. Turbo DNase was inactivated in the presence of 15 mM EDTA
by incubation at 75 °C for 10 minutes. For reverse transcription, the RNA was incubated for 5
minutes at 65 °C in the presence of dNTPs (Invitrogen) and major satellite specific primers.
The reverse transcription was realized by addition of 5X First Strand buffer (Invitrogen), 10
mM DDT (Invitrogen), 40 U of RNAseOut (Promega) and 200 U of SuperScript™ III
Reverse Transcriptase (Life Technologies) enzyme by incubation for 50 minutes at 55 °C
followed by termination for 15 minutes at 70 °C.
Obtained cDNA was further amplified by PCR. cDNA was mixed with 200 µM dNTPs
(Invitrogen), 1.5 mM MgCl2, 0,5 µM primers, 10X Taq buffer and 2,5 U of Taq polymerase
(New England BioLabs). PCR conditions were as follows: 3 minutes at 94 °C, 30 seconds at
94 °C, 30 seconds at 57 °C, elongation 1 minute at 72 °C and termination for 5 minutes at
72 °C. Amplification was done in 25 cycles. PCR products were analysed by 1% agarose gel
electrophoresis.
1.6. Major satellite DNA probe preparation Strand specific RT PCR product obtained by the primer pair fw170/rv 220, was purified from
an agarose gel using Micro Elute Gel Extraction Kit (Omega). 4.5 ng of purified product was
cloned using TOPO TA Cloning Kit (Life Technologies). Cloning was verified by sequencing
of selected clones after bacterial transformation. Sequencing was done by GATC Biotech by
using MP13 forward primer. 1 µg of plasmid DNA was digested with EcoRI-HF® (New
England BioLabs). 25 ng of DNA was labeled using Prime-It II Random Priming Labeling
Kit (Agilent Technologies) with 5 µL of dCTP α-32P (Perkin-Elmer). Products were passed

99
through a mini spin column in order to eliminate the unincorporated nucleotides (Micro Bio
Spin with Bio-Gel P-6 in Tris-Buffer, BioRad).
1.7. In vitro transcription In vitro transcription was performed from pCR®4-TOPO, a vector expressing T7 bacterial
promoter, containing a PCR product obtained by RT-PCR using major satellite specific
primers. Plasmid was either linearized on the 3’ end of the sequence to be transcribed or
double digested leaving a linearized product containing the sequence of interest and the T7
priming site. The linearized plasmid was then gel purified (Gel Extraction Kit, Omega).
Transcription was performed using MegaShortScript kit (Ambion) starting with 100 ng of
plasmid DNA in the presence of four ribonucleotides and T7 reaction buffer. The reaction
was incubated for 2 hours at 37° C. Transcripts were further purified by phenol-chloroform
extraction. The quantity of RNA was measured by Nanodrop.
1.8. Small RNA separation 150 µg of RNA was centrifuged in a Nanosep 100K device in a final volume of 50 µL for 5
min at 5000 g. The quantity was measured on Nanodrop.
1.9. Cell transfection
Coverslips were placed at the bottom of the each well of a 6-well plate and 2 mL of warm
media was added to the wells. Cells transfection was performed using Amaxa Nucleofector
(Lonza). 500 000 cells were mixed with the corresponding plasmid, resuspended in 100 µL of
the solution R (Lonza) and subjected to electroporation using the programme U-030. After the
electroporation, the cells were directly seeded to the 6-well plate containing the warm media
and left for 24h at 37°C. After 24 h, the cells were washed in PBS and fixed with 4% PFA
during 10 minutes at room temperature.
1.10. Immunofluorescence
100
Immunofluorescence analysis was performed on cells plated on coverslips (22x22 mm,
0,17+/- 0,01 mm, Menzel-Gläser) using the following antibodies:
Primary antibodies: anti-H3K9me3 (Diagenode) and anti-HA (Abcam)
Secondary antibodies: chicken Alexa488 and rabbit Cy3 (Jackson Immuno Research)
Cells were washed in PBS 1X, fixed with 4% paraformaldehyde during 10 minutes,
then washed 3x 5 minutes in PBS 1X. To facilitate the manipulation, coverslips were glued
using rubber cement on the slides. Cells were permeabilized with PBS 1X-0,1% Triton X-100
during 5 minutes at room temperature. After a brief wash in PBS 1X, aspecific sites were
blocked by incubation in 1,5% blocking solution (Roche Applied Science) during 30 minutes
at 37° C. Cells were subsequently incubated with the primary antibodies diluted in revelation
solution during 1h 30min at RT, in a humid chambre. Excess of antibodies was eliminated by
washing with PBS 1X-0,05% Triton X-100 three times and subsequently incubated with
secondary antibodies diluted in solution for revelation for 30 minutes in a humid chamber at
RT. Cells were washed three times in PBS 1X-0,05% Triton X-100. DNA was stained by
incubating each coverslip in 4 µM Hoechst 33342 (Thermo Scientific) during 30 minutes.
Coverslips were mounted by carefully turning the cover slip at the middle of the slide, right to
the drop of in PPD8 solution (Sigma Aldrich). Coverslips were fixed with nailpolish, left to
dry overnight and then stored at 4 °C for a short period or 20 °C for a long period.
1.12. Microscopy Images were acquired using inversed epifluorescent microscope Zeiss Axio Observer Z1. This
microscope is equipped with an ApoTome illumination system ensuring the high quality
resolution (xy:0,2 µm, z:0,5 µm). Acquisitions were made using the camera OrcaR2
(Hamamatsu) with 63x 1.4 NA immersion oil objective and the following filters:
DAPI (49 shift free) ex. 365 nm/em.445/50
eGFP (38HE shift free) ex. 470/40 nm/em.525/550
DsRed (43 HE shift free) ex.550/25 nm/em.605/70
Cy5 (50 shift free) ex.640/30/em.640/50
The used computer programme was ZEN 2012.
101
1.13. TANGO analysis
The images were taken as a Z-stack, a set of optical slices of the lateral (x,y) axis of
the specimen plane. The images were imported to the TANGO software (Ollion et al. 2013).
The imported images are called channel images. The channels correspond to a stack of images
aquired at a particular wavelenght according to the fluorescent markers, and corresponds to its
an associated biological structure. The defined channels were Hoechst and Cy3 and the
corresponding structures nucleus and major satellite foci. The selection or segmentation of the
defined structures was performed by applying different processing chains to the image
(prefilters: median, Laplacian of Gaussian 3D; postfilters: size and edge filter, morphological
filter). The nuclei were selected from the Hoechst channel and the same ROI selection was
applied to crop all the other fluorescent channels. Following the segmentation of the nucleus,
the previously defined structures within the nucleus were segmented. The segmentation of the
selected structures and the quality of the image processing were verified. The cells carrying a
defect (for example, nucleus cut in the optical axis) and the cells with an imperfect
segmentation of the nuclei (stacking nuclei) were eliminated from the analysis. After the
segmentation of the selected structures, quantitative measurements were carried out for each
of the objects. The following measurements were carried out:
-volume of the nucleus
-integrated total Hoechst signal
-integrated total H3K9me3 signal
-number of Hoechst foci
-number of H3K9me3 foci
-total foci volume
-integrated Hoechst signal inside the foci
-integrated H3K9me3 signal inside the foci
-integrated TALE signal
-elongation
102
From these data, the following calculations were made for both Hoechst and H3K9:
-integrated signal ratio inside the foci (integrated signal inside the foci/integrated total signal)
-integrated signal ratio outside the foci (integrated total signal-signal inside the foci/integrated
total signal)
The statistical analysis was made using the R studio (version 0.97.551). The p-value
was calculated using the Mann-Whitney-Wilcoxon test and corrected with Holm-Bonferroni.
To be able to apply the test, we assured to have a similar distribution of the measured values.
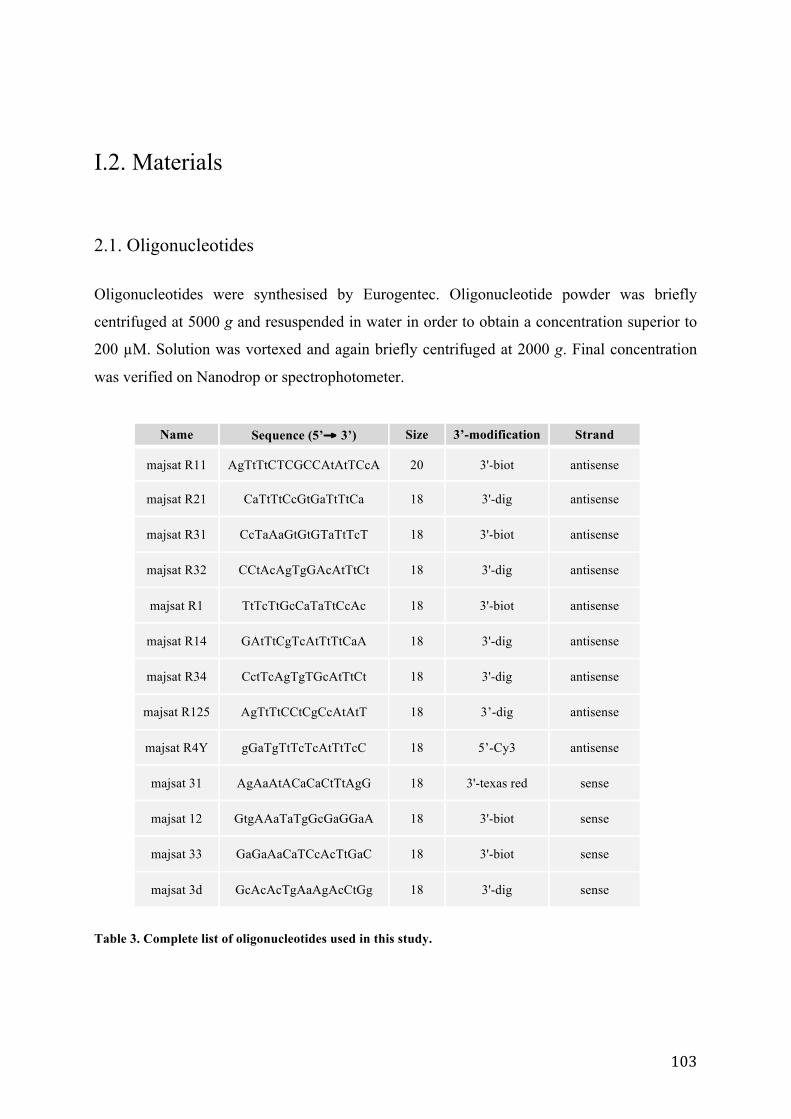
103
I.2. Materials
2.1. Oligonucleotides Oligonucleotides were synthesised by Eurogentec. Oligonucleotide powder was briefly
centrifuged at 5000 g and resuspended in water in order to obtain a concentration superior to
200 µM. Solution was vortexed and again briefly centrifuged at 2000 g. Final concentration
was verified on Nanodrop or spectrophotometer.
Name Sequence (5’→ 3’) Size 3’-modification Strand
majsat R11 AgTtTtCTCGCCAtAtTCcA 20 3'-biot antisense
majsat R21 CaTtTtCcGtGaTtTtCa 18 3'-dig antisense
majsat R31 CcTaAaGtGtGTaTtTcT 18 3'-biot antisense
majsat R32 CCtAcAgTgGAcAtTtCt 18 3'-dig antisense
majsat R1 TtTcTtGcCaTaTtCcAc 18 3'-biot antisense
majsat R14 GAtTtCgTcAtTtTtCaA 18 3'-dig antisense
majsat R34 CctTcAgTgTGcAtTtCt 18 3'-dig antisense
majsat R125 AgTtTtCCtCgCcAtAtT 18 3’-dig antisense
majsat R4Y gGaTgTtTcTcAtTtTcC 18 5’-Cy3 antisense
majsat 31 AgAaAtACaCaCtTtAgG 18 3'-texas red sense
majsat 12 GtgAAaTaTgGcGaGGaA 18 3'-biot sense
majsat 33 GaGaAaCaTCcAcTtGaC 18 3'-biot sense
majsat 3d GcAcAcTgAaAgAcCtGg 18 3'-dig sense
Table 3. Complete list of oligonucleotides used in this study.
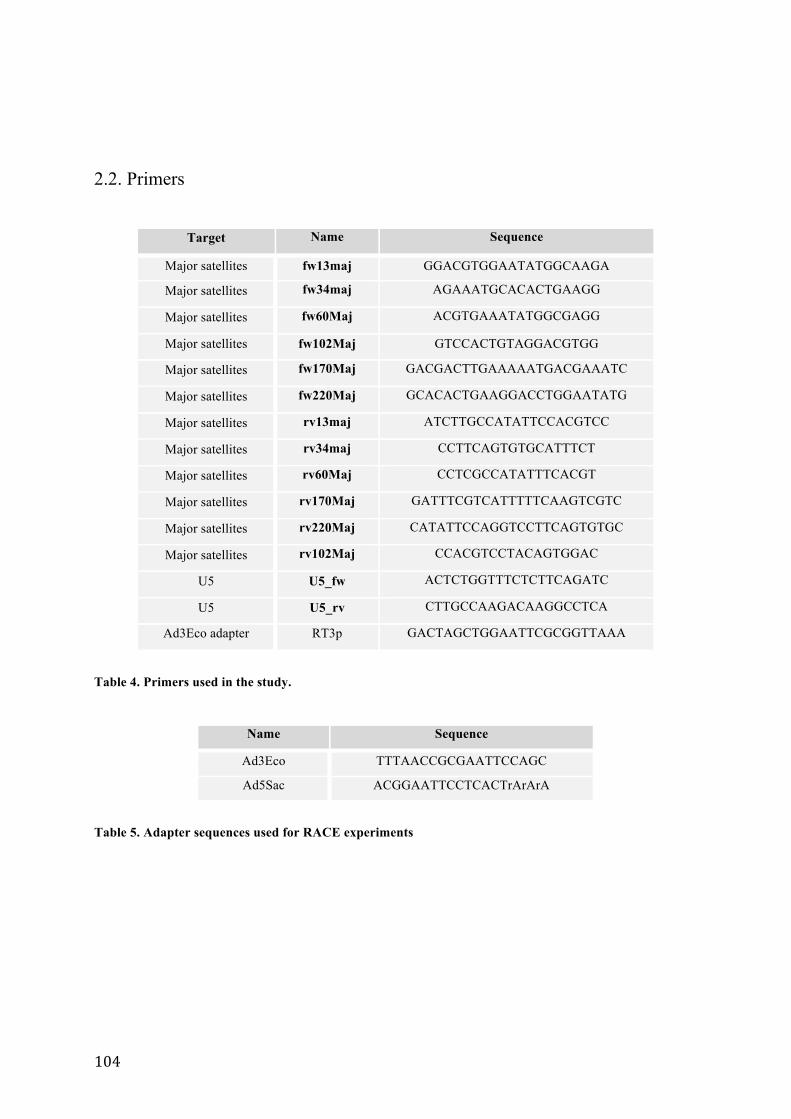
104
2.2. Primers
Target Name Sequence
Major satellites fw13maj GGACGTGGAATATGGCAAGA
Major satellites fw34maj AGAAATGCACACTGAAGG
Major satellites fw60Maj ACGTGAAATATGGCGAGG
Major satellites fw102Maj GTCCACTGTAGGACGTGG
Major satellites fw170Maj GACGACTTGAAAAATGACGAAATC
Major satellites fw220Maj GCACACTGAAGGACCTGGAATATG
Major satellites rv13maj ATCTTGCCATATTCCACGTCC
Major satellites rv34maj CCTTCAGTGTGCATTTCT
Major satellites rv60Maj CCTCGCCATATTTCACGT
Major satellites rv170Maj GATTTCGTCATTTTTCAAGTCGTC
Major satellites rv220Maj CATATTCCAGGTCCTTCAGTGTGC
Major satellites rv102Maj CCACGTCCTACAGTGGAC
U5 U5_fw ACTCTGGTTTCTCTTCAGATC
U5 U5_rv CTTGCCAAGACAAGGCCTCA
Ad3Eco adapter RT3p GACTAGCTGGAATTCGCGGTTAAA
Table 4. Primers used in the study.
Name Sequence
Ad3Eco TTTAACCGCGAATTCCAGC
Ad5Sac ACGGAATTCCTCACTrArArA
Table 5. Adapter sequences used for RACE experiments

105
Results
The world and the universe is an extremely beautiful place, and the more we understand about it the more beautiful does it appear.
Richard Dawkins

106
CHAPTER I
Characterization of major satellite
transcripts
107
I.I. Characterization of major satellite transcripts using LNA
oligonucleotides
1.1. Probes for detection of major satellite repeats
There is evidence for the transcription from the major satellite repeats but the precise
characterization of the RNA remain elusive and has up until now been a challenge because of
the repetitive nature of the sequence. This makes it difficult to determine the exact size of the
transcript or its strand of origin. The problems encountered vis a vis the characterization of
repeated sequences are mostly methodological. Conventional DNA or RNA oligonucleotides
used for hybridization methods or PCR lack the specificity needed in dealing with repetitive
sequences of a high degree of similarity. These limitations could theoretically be overcome by
the use of chemically modified oligonucleotides such as LNA. The modified nucleotides
allow the design of short probes while still retaining high annealing temperatures (and
therefore annealing specificity, see Introduction, Chapter III), facilitating the discrimination
between the highly similar regions of the repetitive sequence.
At the beginning of my thesis, the team has already designed and successfully used
short LNA modified oligonucleotides as probes for specific detection of repeats from
individual chromosomes in human cells by FISH experiments (unpublished data). These
oligonucleotides were able to discriminate between two highly similar target sequences,
where the difference between them was only a couple of nucleotides.
Recognizing their potential, similar oligonucleotides were designed, which target the
sequence of the mouse major satellite repeat. These are short 18-mer probes with a LNA
modification inserted in one out of two oligonucleotides. The probes were designed to target
different parts of both strands of major satellite sequence and distinguish transcripts from
different subunits of the major satellite repeats. The sequences of the oligonucleotides can be
found in Table 6.

108
Name Sequence (5’→ 3’) Size 3’-modification Strand
majsat R11 AgTtTtCTCGCCAtAtTCcA 20 3'-biot antisense
majsat R21 CaTtTtCcGtGaTtTtCa 18 3'-dig antisense
majsat R31 CcTaAaGtGtGTaTtTcT 18 3'-biot antisense
majsat R32 CCtAcAgTgGAcAtTtCt 18 3'-dig antisense
majsat R1 TtTcTtGcCaTaTtCcAc 18 3'-biot antisense
majsat R14 GAtTtCgTcAtTtTtCaA 18 3'-dig antisense
majsat R34 CctTcAgTgTGcAtTtCt 18 3'-dig antisense
majsat 31 AgAaAtACaCaCtTtAgG 18 3'-texas red sense
majsat 12 GtgAAaTaTgGcGaGGaA 18 3'-biot sense
majsat 33 GaGaAaCaTCcAcTtGaC 18 3'-biot sense
majsat 3d GcAcAcTgAaAgAcCtGg 18 3'-dig sense
Table 6. List of oligonucleotides used in the study. In all the nucleotides, the LNA modification is introduced
in one out of two nucleotides. The probe R11 is a gapmer oligonucleotide containing the window of 7 DNA
nucleotides in the middle of the sequence. The LNAs are in indicated in lower letters, while the DNA is in upper
case. The 3’ modifications and the strand of origin are indicated.
The LNA oligonucleotides were designed with a hapten (biotin or digoxigenin) on
their 3’ end, which makes them usable in DNA- or RNA FISH experiments. They can also be
radioactively labelled in 5’ end for use in northern blot experiments. We were interested to
use these oligonucleotides as probes for DNA and RNA FISH and as for probes for northern
blot analysis for a more precise characterisation of major satellite-derived transcripts. At my
arrival in the laboratory, the specificity of binding of the designed probes to the major
satellites had been already verified by DNA FISH experiments, confirming the strong
specificity for the chromocenters on NIH-3T3 cells, which are known to exhibit very
recognisable chromocenters by optical microscopy.
109
1.2. Characterisation of major satellite transcription by northern blotting of total
RNA from mouse cells
1.2.1. Transcriptional profile of major satellites in growing mouse cells
To characterize the transcriptional profile of major satellites we tested LNA modified
oligonucleotides as probes for northern blot experiments. Given the theoretically high
mismatch discrimination provided by these probes and their high specificity for the target
sequence, we hoped to obtain the information about the abundance and size of the RNA
species produced from major satellite loci in mouse cells grown in different conditions. We
first focused on the RNA species produced by exponentially growing MEF cells cultured in
standard medium conditions (see Materials and methods). The total RNA extracted from MEF
cells was separated on 4% (29:1) denaturing polyacrylamide gel, in order to obtain a good
resolution with the transcripts ranging from 50 up to 1000 nucleotides. The RNA were
visualised by ethidium bromide before they were transferred to a nylon membrane and
hybridized with different LNA-modified probes specific for major satellite. For specific
details about conditions used for northern blotting see Materials and methods.
We first assessed the signal given by 12 probes encompassing the major satelite repeat
sequence, covering both strands. Figure 31A shows the position of the hybridization sites of
the used probes we tested. Highly abundant cellular RNA such as tRNA or rRNA (5s and
5.8s), which are strongly labelled by ethidium bromide (Figure 31A) are also lit up by the
LNA probes. We therefore decided to focus only on the bands that do not colocalise with
these abundant RNA molecules. Hybridization pattern vary depending on the probe, but all
probes reveal a complex transcriptional profile, with multiple bands on the blot. The Figure
31B (forward strand) and Figure 31C (reverse strand) show the profile obtained after
hybridization with various probes. Comparing results obtained with different probes,
interestingly, the transcriptional profile is similar for the probes targeting a given strand. This
suggested that the designed probes were indeed targeting the same RNA species, despite their
difference in sequence. The profile obtained with the probes targeting the forward strand
reveals more bands that also show a more prominent signal. This could signify that either the
110
forward transcripts could be more expressed, which is detected with our antisense probes, or
that the antisense probes show the greater affinity for the forward strand than the sense probes
for their respective complementary RNA, therefore introducing a nucleotide bias of the RNA
to be recognised, resulting in less signal coming from the opposite strand.
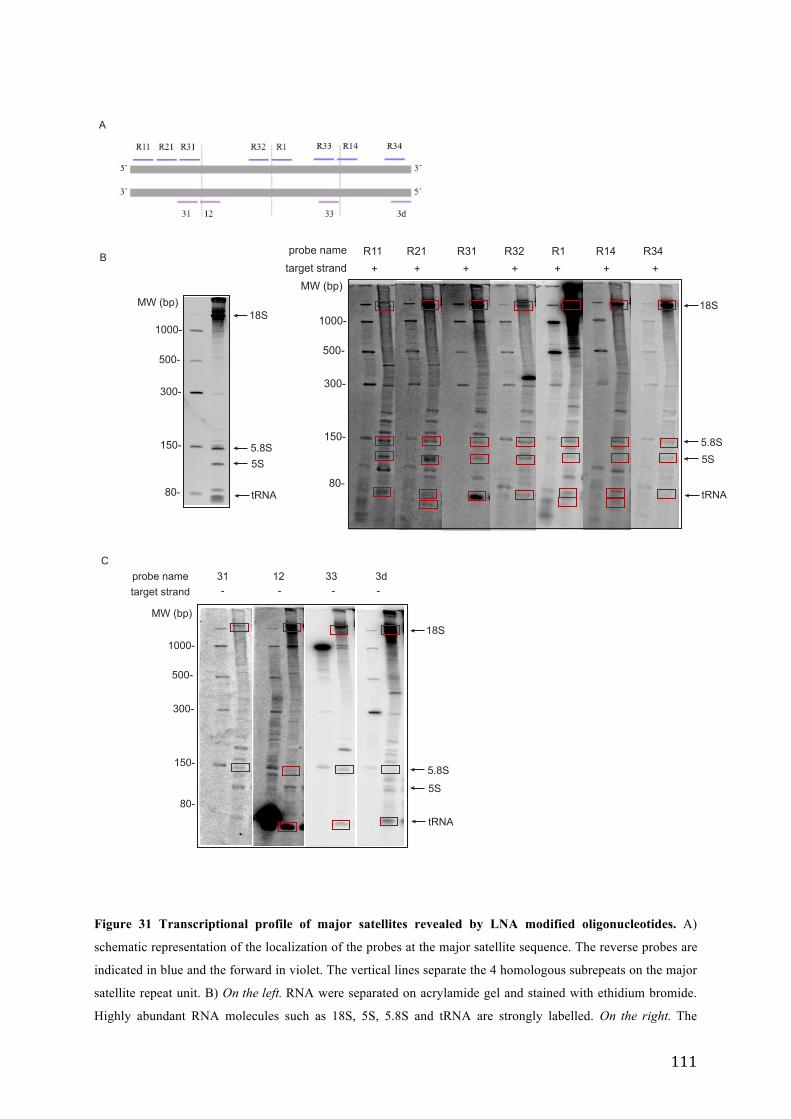
111
Figure 31 Transcriptional profile of major satellites revealed by LNA modified oligonucleotides. A)
schematic representation of the localization of the probes at the major satellite sequence. The reverse probes are
indicated in blue and the forward in violet. The vertical lines separate the 4 homologous subrepeats on the major
satellite repeat unit. B) On the left. RNA were separated on acrylamide gel and stained with ethidium bromide.
Highly abundant RNA molecules such as 18S, 5S, 5.8S and tRNA are strongly labelled. On the right. The
probe nametarget strand
MW (bp)
1000-
500-
300-
150-
80-
R11 R21 R31 R32 R1 R14 R34 + + + + + + +
A
B
probe nametarget strand
MW (bp)
1000-
500-
300-
150-
80-
31 12 33 3d - - - -
MW (bp)
1000-
500-
300-
150-
80-
C
18S
5S5.8S
tRNA
18S
5S5.8S
tRNA
18S
5S
5.8S
tRNA
112
transcriptional profile revealed with the probes targeting the forward strand of major satellites. The highly
abundant molecules stained with ethidium bromide are equally hybridized with the LNA probes and are framed
in red. C) The transcriptional profile revealed by the LNA probes targeting the reverse strand of the major
satellites. The abundant cellular RNA are framed in red. RNA were separated on the 4% polyacrylamide gel and
transferred to a nylon membrane. All hybridizations were performed at 55° C. Washing was performed with
2xSSC.
1.2.2. Detailed characterization of northern hybridization signals
The short LNA probes were designed to target the all four subrepeats of major satellite
sequence (Figure 31 and Chapter II, Introduction). We wanted to use the possibility of
distinguishing between the highly similar subrepeats to get an approximation of the
localisation of each detected transcript on the major satellite sequence.
As already mentioned, the hybridization pattern vary depending on the probe, but a
similar pattern is revealed with all the used probes. The probe R1 differs from the other
probes in that it reveals a strong signal at higher molecular weights. Similar yet somewhat less
pronounced strong hybridization at higher molecular weights is seen for the probe 3d. The
probes R32 and R31 and 12 each strongly reveal one transcript in particular. However, these
transcripts are found to be non-specific, 7SK for R32 and tRNA, for R31 and 12 (Figure 32).
Different probes that target different parts of the repeat reveal the same transcript,
therefore, if the signal observed is specific, it should be possible to reconstitute the position of
the revealed transcripts on the major satellite repeat unit, in the cases where the transcript is
smaller than the length of the major satellite sequence. The satellite transcripts bigger than the
major satellite unit should theoretically be revealed with all the probes.
If we look at the Figure 32, we can see that this is not always the case. Figure 32
displays examples of hybridizations for each probe, with a detailed analysis of the revealed
bands. The size of each of the bands is summarized in Table 7. The bands smaller than 234 nt
are revealed either with almost all the probes, or they are revealed with two or more different
probes that are localised too far away from each other on the major satellite sequence to be
able to reveal the same RNA segment. For example the band at 138 nt is revealed with all the
reverse probes except the probe R34. This band is also revealed with the probes targeting the
opposite strand, 12 and 33. The reverse probes that reveal this transcript encompass together a
113
size bigger than the 138 nucleotides. Another example is the band at 165 nt, revealed with all
the probes except the R14 and 33.
The transcript at 180 nt is revealed with the probes R11, R31 and R34, as well as 3d
which could indicate that this transcript, if it is a major satellite transcript, is transcribed
starting from the end of one repeat, reaching to the beginning of the other. However, it is
surprising that it is not revealed with the probe R21, which localise between the probes R11
and R21, or with the probe 31 (Table 7).
Transcript at 120 nt is revealed with only one probe that targets the sense strand (R21),
and with three probes targeting the opposite strand, 31, 13 and 3d. The revelation with these
three probes is compatible with the size of the revealed transcript, however, the revelation
with only one probe from the opposite strand suggests that there is either a problem of non
specificity or as already mentioned, a problem of affinity toward certain transcripts. The same
problem is found for the transcript at 135 nt, revealed with probes R14 and 3d and 31. The
transcript at 96 and 130 nt are the only ones revealed exclusively with the probes targeting the
forward strand. However, the specificity problem is again encountered with the 96-nt
transcript revealed with the probes that encompass more than 96 bp. The 130 nt transcript is
revealed with the probes R32 and very weakly with the probe R31, suggesting the different
affinity of these probes toward this transcript.
In addition, the bands longer than the major satellite repeat are not always revealed
with all the probes as for example the bands at 235, 275 and 295 or even at 520. If these bands
are indeed major satellite transcripts, this could again suggest that the probes have a different
level of affinity for a specific transcript. The transcript at 390 nt is revealed with all the probes
targeting the forward strand, which could indicate its major satellite origin. This strand is
however revealed only with two probes from the opposite strand, suggesting that the probes
targeting the reverse strand show less affinity for these transcripts.
In summary, these results cast doubt on the fact that all bands revealed by the probes
are specifically major satellite RNA, complicating our analysis of major satellite transcription
by this approach. We tried to circumvent this problem by various approaches, testing different
probe chemistry, as further described.
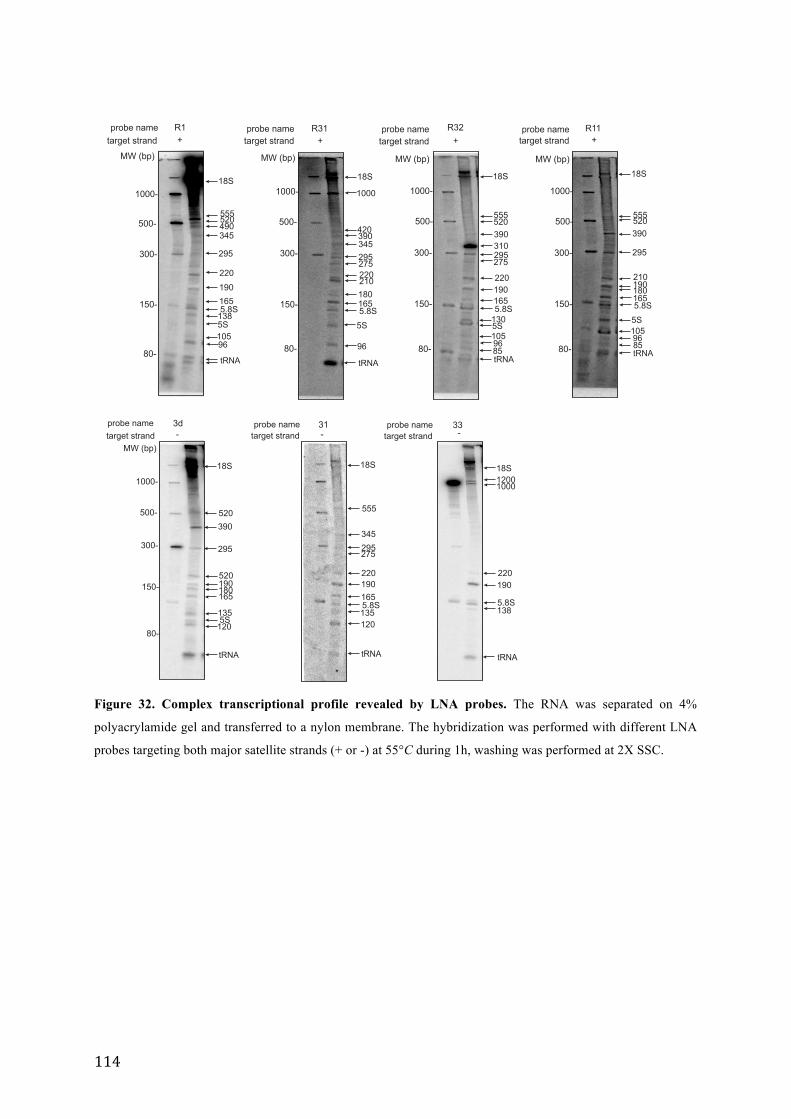
114
probe nametarget strand
MW (bp)
1000-
500-
300-
150-
80-
A
probe nametarget strand
MW (bp)
1000-
500-
300-
150-
80-
probe nametarget strand
96
tRNA
5S
5.8S165
18S
220
105
295
345490
190
555520
probe nametarget strand
MW (bp)
1000-
500-
300-
150-
80-
MW (bp)
1000-
500-
300-
150-
80-96
tRNA
5S
5.8S165
18S
220
295345
180
96
tRNA
5S
5.8S165
18S
220
105
295
390
190
555520
probe nametarget strand
MW (bp)
1000-
500-
300-
150-
80-
138
R1 R31 R32 R11
275
210
1000
275
130
85 tRNA
5S
5.8S165
18S
210
105
295
390
190
555520
8596
+ + + +
3d 33 -
probe nametarget strand
31 - -
probe nametarget strand
tRNA
5S
165
18S
120
295
390
190
520
tRNA
120
5.8S165
18S
295345
190
555
tRNA
5.8S
18S
138
190220220
135
10001200
135
180
520
275
420390
310
180
Figure 32. Complex transcriptional profile revealed by LNA probes. The RNA was separated on 4%
polyacrylamide gel and transferred to a nylon membrane. The hybridization was performed with different LNA
probes targeting both major satellite strands (+ or -) at 55°C during 1h, washing was performed at 2X SSC.
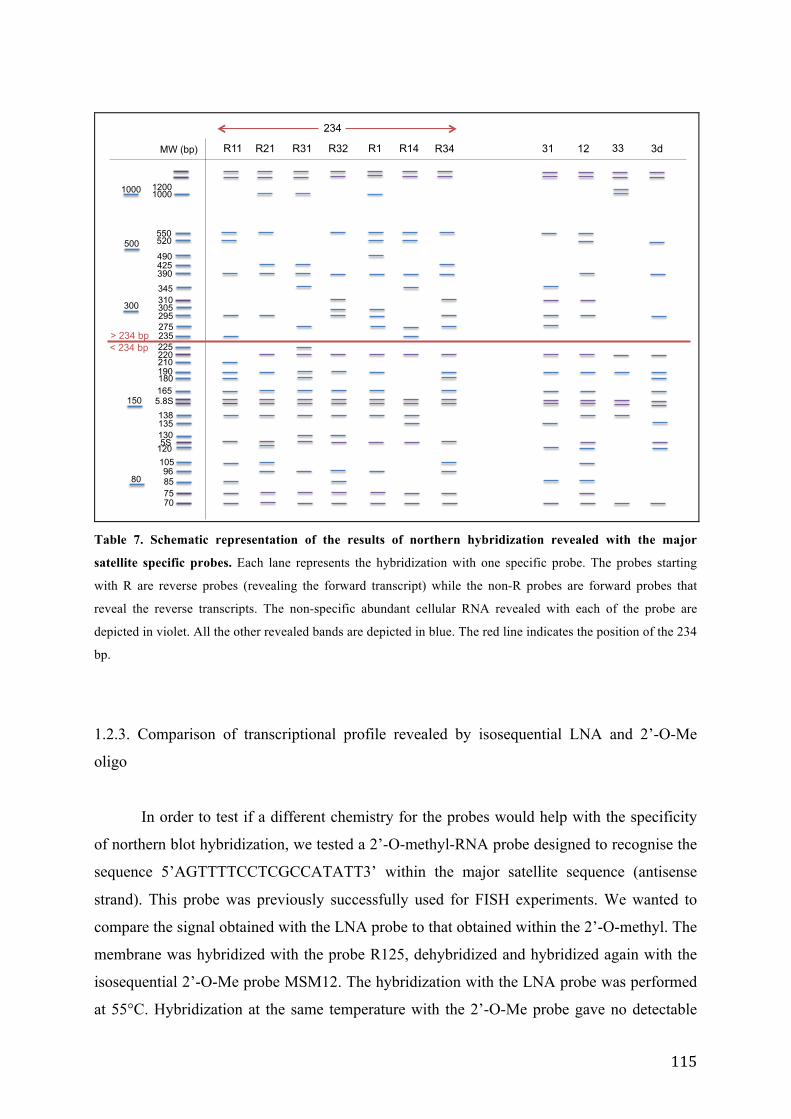
115
80
70 75 85
1000
150
300
500 520
5.8S
310
165 180 190
220
138
105 96
295 275
130 5S
225
390
490
345
550
1000
210
MW (bp) R11 R21 R32 R31 R1 R34 R14
234
> 234 bp < 234 bp
135
120
1200
31 12 33 3d
235
305
425
Table 7. Schematic representation of the results of northern hybridization revealed with the major
satellite specific probes. Each lane represents the hybridization with one specific probe. The probes starting
with R are reverse probes (revealing the forward transcript) while the non-R probes are forward probes that
reveal the reverse transcripts. The non-specific abundant cellular RNA revealed with each of the probe are
depicted in violet. All the other revealed bands are depicted in blue. The red line indicates the position of the 234
bp.
1.2.3. Comparison of transcriptional profile revealed by isosequential LNA and 2’-O-Me
oligo
In order to test if a different chemistry for the probes would help with the specificity
of northern blot hybridization, we tested a 2’-O-methyl-RNA probe designed to recognise the
sequence 5’AGTTTTCCTCGCCATATT3’ within the major satellite sequence (antisense
strand). This probe was previously successfully used for FISH experiments. We wanted to
compare the signal obtained with the LNA probe to that obtained within the 2’-O-methyl. The
membrane was hybridized with the probe R125, dehybridized and hybridized again with the
isosequential 2’-O-Me probe MSM12. The hybridization with the LNA probe was performed
at 55°C. Hybridization at the same temperature with the 2’-O-Me probe gave no detectable
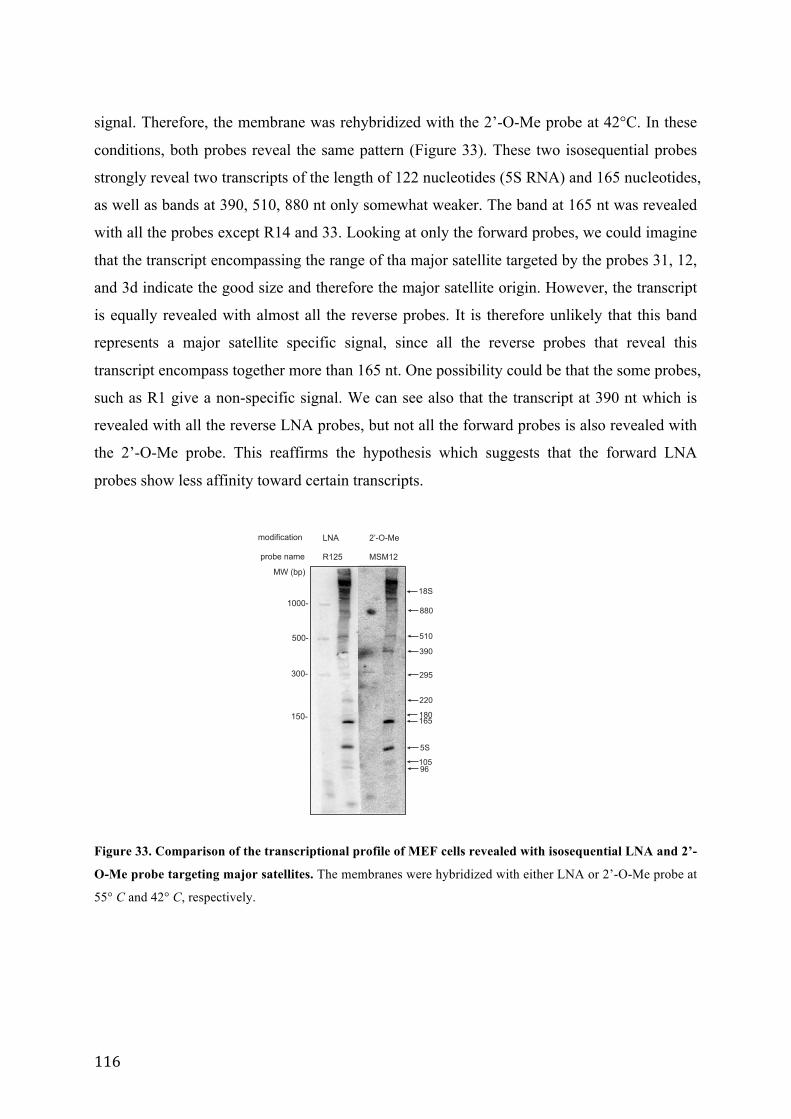
116
signal. Therefore, the membrane was rehybridized with the 2’-O-Me probe at 42°C. In these
conditions, both probes reveal the same pattern (Figure 33). These two isosequential probes
strongly reveal two transcripts of the length of 122 nucleotides (5S RNA) and 165 nucleotides,
as well as bands at 390, 510, 880 nt only somewhat weaker. The band at 165 nt was revealed
with all the probes except R14 and 33. Looking at only the forward probes, we could imagine
that the transcript encompassing the range of tha major satellite targeted by the probes 31, 12,
and 3d indicate the good size and therefore the major satellite origin. However, the transcript
is equally revealed with almost all the reverse probes. It is therefore unlikely that this band
represents a major satellite specific signal, since all the reverse probes that reveal this
transcript encompass together more than 165 nt. One possibility could be that the some probes,
such as R1 give a non-specific signal. We can see also that the transcript at 390 nt which is
revealed with all the reverse LNA probes, but not all the forward probes is also revealed with
the 2’-O-Me probe. This reaffirms the hypothesis which suggests that the forward LNA
probes show less affinity toward certain transcripts.
MW (bp)
1000-
500-
300-
150-
R125 MSM12
LNA 2’-O-Me
probe name
modification
96
5S
165
220
105
180
390
295
510
880
18S
Figure 33. Comparison of the transcriptional profile of MEF cells revealed with isosequential LNA and 2’-
O-Me probe targeting major satellites. The membranes were hybridized with either LNA or 2’-O-Me probe at
55° C and 42° C, respectively.
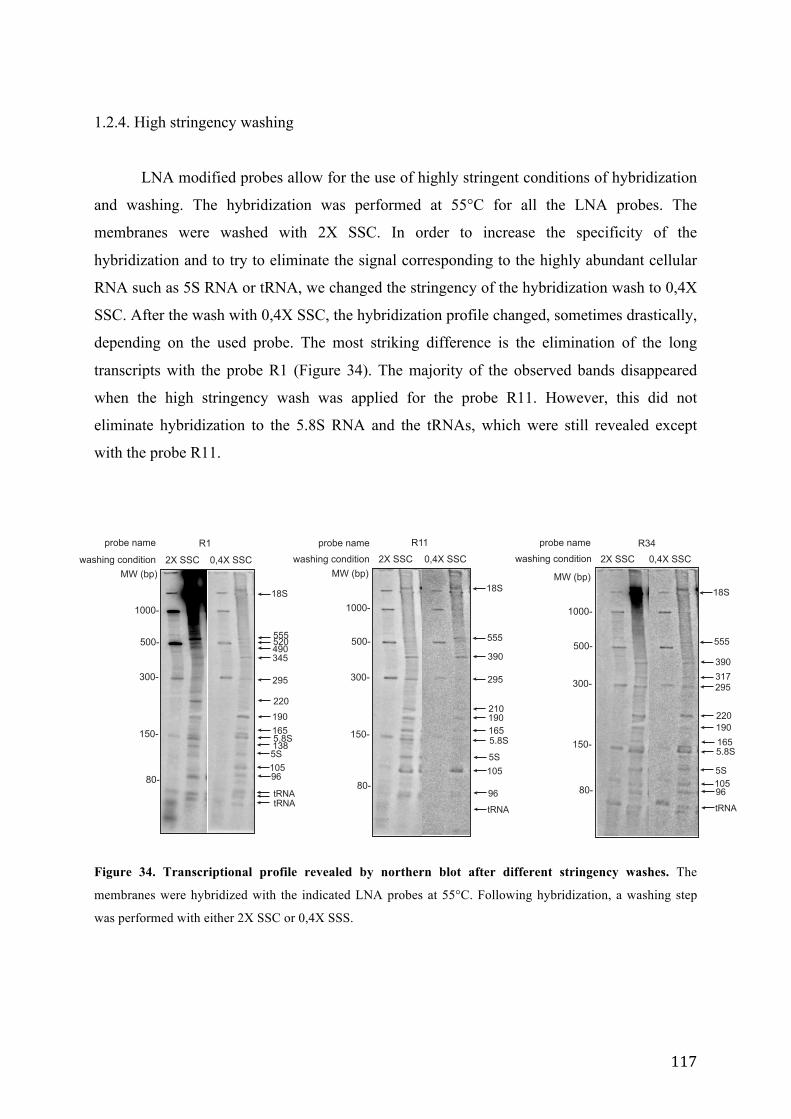
117
1.2.4. High stringency washing
LNA modified probes allow for the use of highly stringent conditions of hybridization
and washing. The hybridization was performed at 55°C for all the LNA probes. The
membranes were washed with 2X SSC. In order to increase the specificity of the
hybridization and to try to eliminate the signal corresponding to the highly abundant cellular
RNA such as 5S RNA or tRNA, we changed the stringency of the hybridization wash to 0,4X
SSC. After the wash with 0,4X SSC, the hybridization profile changed, sometimes drastically,
depending on the used probe. The most striking difference is the elimination of the long
transcripts with the probe R1 (Figure 34). The majority of the observed bands disappeared
when the high stringency wash was applied for the probe R11. However, this did not
eliminate hybridization to the 5.8S RNA and the tRNAs, which were still revealed except
with the probe R11.
MW (bp)
1000-
500-
300-
150-
80-
MW (bp)
1000-
500-
300-
150-
80-
MW (bp)
1000-
500-
300-
150-
80-
R11 R34 R1
2X SSC 2X SSC 2X SSC 0,4X SSC 0,4X SSC 0,4X SSC
probe name
washing condition
probe namewashing condition
probe namewashing condition
96
tRNA
5S
5.8S165
18S
220
105
295
345490
190
555520
tRNA96
tRNA
5S
165
18S
210
105
295
390
190
5.8S
555
96
tRNA
5S
165
18S
220
105
295317
190
555
5.8S
390
138
Figure 34. Transcriptional profile revealed by northern blot after different stringency washes. The
membranes were hybridized with the indicated LNA probes at 55°C. Following hybridization, a washing step
was performed with either 2X SSC or 0,4X SSS.
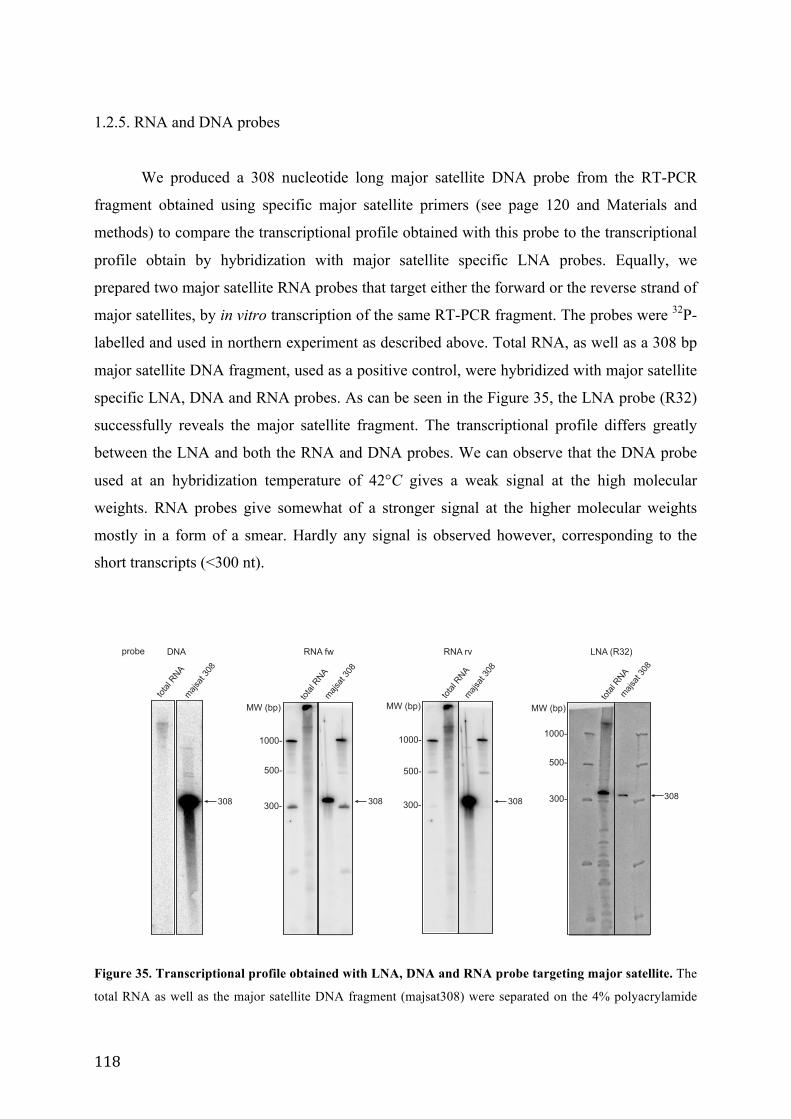
118
1.2.5. RNA and DNA probes
We produced a 308 nucleotide long major satellite DNA probe from the RT-PCR
fragment obtained using specific major satellite primers (see page 120 and Materials and
methods) to compare the transcriptional profile obtained with this probe to the transcriptional
profile obtain by hybridization with major satellite specific LNA probes. Equally, we
prepared two major satellite RNA probes that target either the forward or the reverse strand of
major satellites, by in vitro transcription of the same RT-PCR fragment. The probes were 32P-
labelled and used in northern experiment as described above. Total RNA, as well as a 308 bp
major satellite DNA fragment, used as a positive control, were hybridized with major satellite
specific LNA, DNA and RNA probes. As can be seen in the Figure 35, the LNA probe (R32)
successfully reveals the major satellite fragment. The transcriptional profile differs greatly
between the LNA and both the RNA and DNA probes. We can observe that the DNA probe
used at an hybridization temperature of 42°C gives a weak signal at the high molecular
weights. RNA probes give somewhat of a stronger signal at the higher molecular weights
mostly in a form of a smear. Hardly any signal is observed however, corresponding to the
short transcripts (<300 nt).
total
RNA
total
RNA
total
RNA
total
RNA
majsat
308
majsat
308
majsat
308
majsat
308
MW (bp) MW (bp) MW (bp)
308 308308 308300-
1000-1000-1000-
300-
500-
300-
500-500-
probe DNA RNA fw RNA rv LNA (R32)
Figure 35. Transcriptional profile obtained with LNA, DNA and RNA probe targeting major satellite. The
total RNA as well as the major satellite DNA fragment (majsat308) were separated on the 4% polyacrylamide
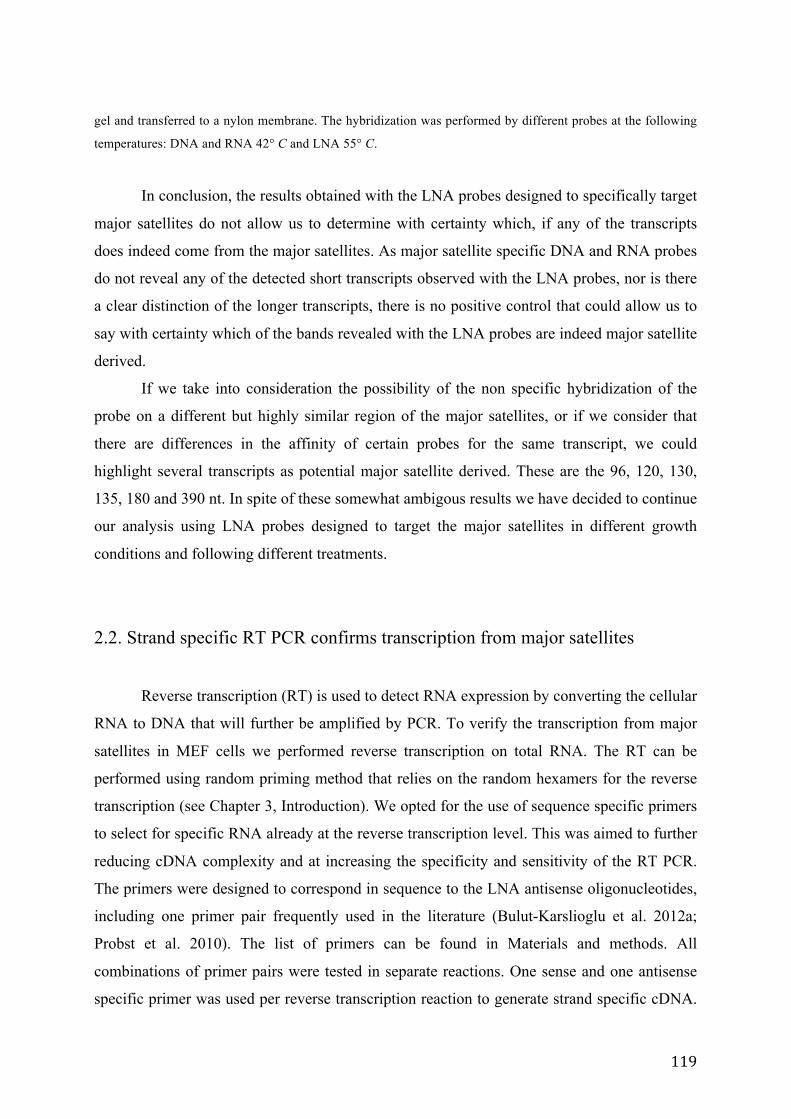
119
gel and transferred to a nylon membrane. The hybridization was performed by different probes at the following
temperatures: DNA and RNA 42° C and LNA 55° C.
In conclusion, the results obtained with the LNA probes designed to specifically target
major satellites do not allow us to determine with certainty which, if any of the transcripts
does indeed come from the major satellites. As major satellite specific DNA and RNA probes
do not reveal any of the detected short transcripts observed with the LNA probes, nor is there
a clear distinction of the longer transcripts, there is no positive control that could allow us to
say with certainty which of the bands revealed with the LNA probes are indeed major satellite
derived.
If we take into consideration the possibility of the non specific hybridization of the
probe on a different but highly similar region of the major satellites, or if we consider that
there are differences in the affinity of certain probes for the same transcript, we could
highlight several transcripts as potential major satellite derived. These are the 96, 120, 130,
135, 180 and 390 nt. In spite of these somewhat ambigous results we have decided to continue
our analysis using LNA probes designed to target the major satellites in different growth
conditions and following different treatments.
2.2. Strand specific RT PCR confirms transcription from major satellites
Reverse transcription (RT) is used to detect RNA expression by converting the cellular
RNA to DNA that will further be amplified by PCR. To verify the transcription from major
satellites in MEF cells we performed reverse transcription on total RNA. The RT can be
performed using random priming method that relies on the random hexamers for the reverse
transcription (see Chapter 3, Introduction). We opted for the use of sequence specific primers
to select for specific RNA already at the reverse transcription level. This was aimed to further
reducing cDNA complexity and at increasing the specificity and sensitivity of the RT PCR.
The primers were designed to correspond in sequence to the LNA antisense oligonucleotides,
including one primer pair frequently used in the literature (Bulut-Karslioglu et al. 2012a;
Probst et al. 2010). The list of primers can be found in Materials and methods. All
combinations of primer pairs were tested in separate reactions. One sense and one antisense
specific primer was used per reverse transcription reaction to generate strand specific cDNA.
120
Following reverse transcription, the cDNA was submitted to a standard PCR amplification
with the same major satellite specific primers.
The major satellite region contains high number of 234 bp monomer units. This
repetitive nature of major satellites makes the PCR amplification products to appear on a gel
in a form of a ladder. The primers hybridize at the same position on multiple repeats of the
major satellite repeat unit, producing fragments of multiple sizes. The distance between the
two fragments on a gel corresponds to the size of major satellite monomer (234 bp).
According to the primer binding site on the sequence it is easy to calculate the size of the
expected PCR product for a specific primer pair. After testing all combinations of primers in
our disposition, two pairs gave the PCR products of the expected length (Figure 36, Table 8).
forward primer reverse primer expected lenghts
fw 170 rv 220 74 308 542
fw 60 rv 170 138 372
! Table 8. Lengths of the expected PCR products after RT-PCR amplification of major satellite transcripts
using the indicated primer pairs.
Figure 36 shows the results of the RT-PCR performed on total RNA from MEF cells.
PCR amplification was performed on the cDNA template obtained by RT performed using
either indicated forward (fw) or reverse (rv) primer. For the primer pair fw60/rv170, a PCR
fragment of the size of 138 bp is obtained for both sense and antisense amplification (Figure
36A). This amplification product corresponds in size to the expected products for this primer
pair (Table 8). The Figure 36B shows the PCR amplification with the second primer pair, fw
170/rv 220. The PCR products obtained using this primer pair after the reverse transcription
performed with fw170 correspond to the expected lengths (Table 8). These are the bands at
74, 308 and 542 bp. The PCR products obtained after the reverse transcription using the
primer rv220 show the same PCR products but in different quantities. The band at 74 bp is
more abundant than the band at 308 nt, while the product at 542 bp is barely detected.
The sequencing of the bands at the position 74 bp and 308 bp, as well as the
sequencing of the band at 138 bp confirmed that these amplified DNA products correspond to
121
major satellite sequence in both orientations. We can therefore conclude that the expected
band at the 542 bp is equally derived from major satellites.
Besides the product of 74, 308 and 542 bp, the amplification of the cDNA obtained
with the primer rv220 gives two bands at 150 and 200 bp. These PCR products most likely
represent hybridization of the primer to the highly similar region of the major satellite
sequence.
The results suggest that both strands of major satellites are transcribed, but probably
not in the same abundance. The existence of both short and long PCR products (74 and 542
bp) suggests that the transcripts exist in various sizes. Since more longer PCR products are
obtained after the amplification of the reverse transcription with the primer fw170, we can
assume that more longer transcripts are produced from the reverse strand of the major
satellites.
308
138
542
74
MW (bp) MW (bp)
200- 200-
300-
500-
50-50-100-
300-
100-
500-
-RT +RT -RT +RT
Fw60 Rv170 Fw170 Rv220
condition condition
primer primer
BA
primer pair fw170/rv220primer pairfw60/rv170
**
Figure 36. Strand specific RT PCR analysis of total RNA isolated from MEF cells. After reverse
transcription with forward or reverse major satellite specific primers, cDNA synthesis was performed in the
presence (+RT) or absence (-RT) of reverse transcriptase as control. A) After strand specific RT-PCR
amplification, a PCR product of the size of 138 bp was obtained with the primer pair fw60/rv170. B) Strand
specific RT-PCR analysis with the pair fw170/rv220 shows an amplification of three specific PCR fragments (74,
308, 542 bp) for the cDNA obtained with either forward or the reverse primer. The bands indicated with an
asterisk represent the non-specific amplification products.
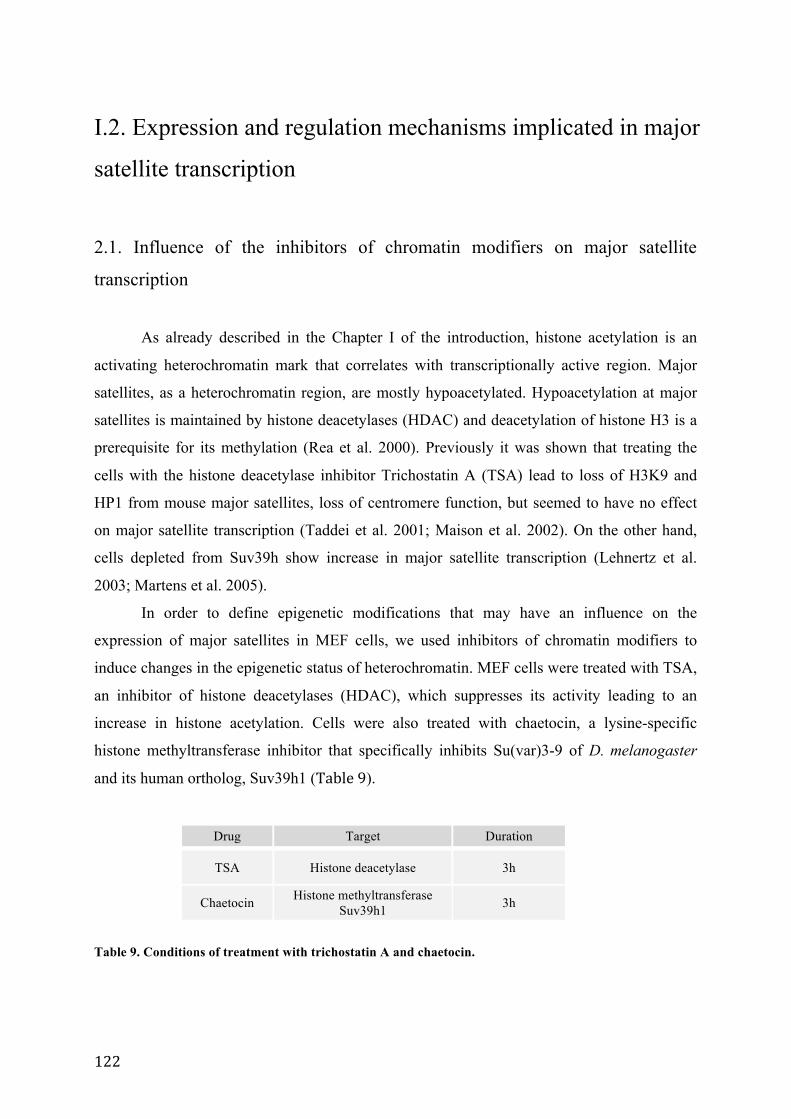
122
I.2. Expression and regulation mechanisms implicated in major
satellite transcription
2.1. Influence of the inhibitors of chromatin modifiers on major satellite
transcription
As already described in the Chapter I of the introduction, histone acetylation is an
activating heterochromatin mark that correlates with transcriptionally active region. Major
satellites, as a heterochromatin region, are mostly hypoacetylated. Hypoacetylation at major
satellites is maintained by histone deacetylases (HDAC) and deacetylation of histone H3 is a
prerequisite for its methylation (Rea et al. 2000). Previously it was shown that treating the
cells with the histone deacetylase inhibitor Trichostatin A (TSA) lead to loss of H3K9 and
HP1 from mouse major satellites, loss of centromere function, but seemed to have no effect
on major satellite transcription (Taddei et al. 2001; Maison et al. 2002). On the other hand,
cells depleted from Suv39h show increase in major satellite transcription (Lehnertz et al.
2003; Martens et al. 2005).
In order to define epigenetic modifications that may have an influence on the
expression of major satellites in MEF cells, we used inhibitors of chromatin modifiers to
induce changes in the epigenetic status of heterochromatin. MEF cells were treated with TSA,
an inhibitor of histone deacetylases (HDAC), which suppresses its activity leading to an
increase in histone acetylation. Cells were also treated with chaetocin, a lysine-specific
histone methyltransferase inhibitor that specifically inhibits Su(var)3-9 of D. melanogaster
and its human ortholog, Suv39h1 (Table 9).
Drug Target Duration
TSA Histone deacetylase 3h
Chaetocin Histone methyltransferase Suv39h1 3h
Table 9. Conditions of treatment with trichostatin A and chaetocin.
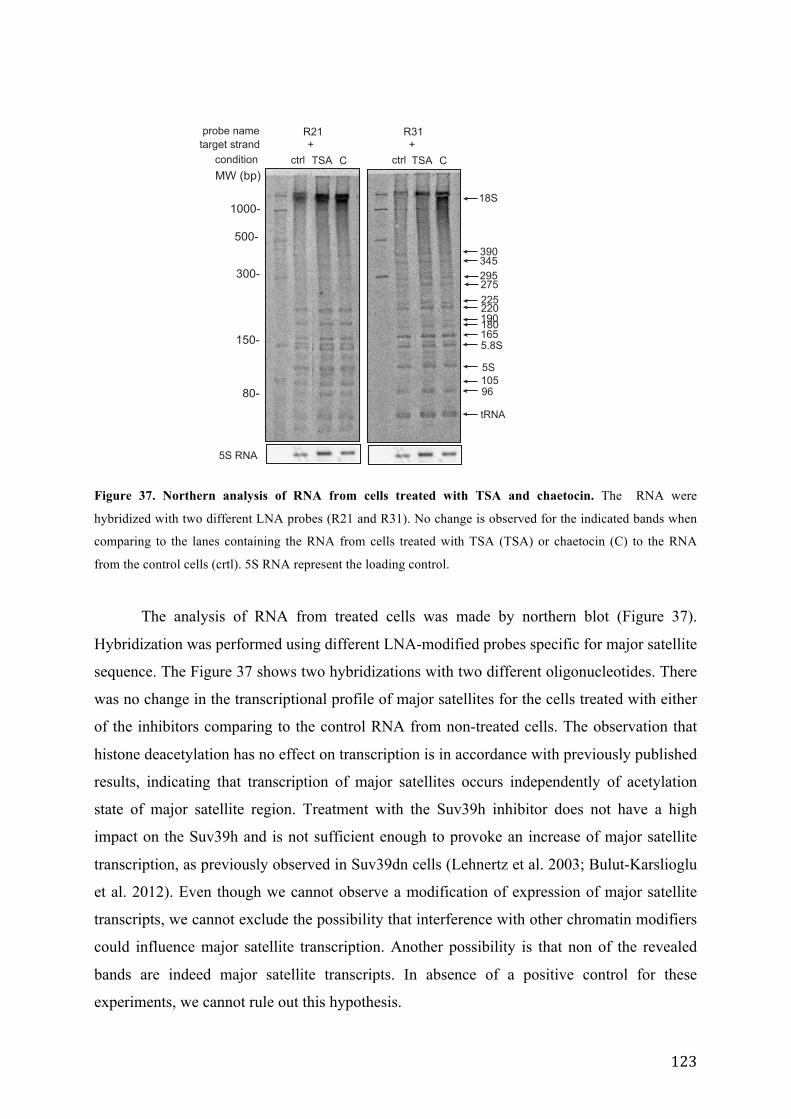
123
probe name
MW (bp)
1000-
500-
300-
150-
80-
target strandR21 R31
+ + CTSActrl CTSActrlcondition
5S RNA
96
tRNA
5S
5.8S165
18S
220180
105
225275295345390
190
Figure 37. Northern analysis of RNA from cells treated with TSA and chaetocin. The RNA were
hybridized with two different LNA probes (R21 and R31). No change is observed for the indicated bands when
comparing to the lanes containing the RNA from cells treated with TSA (TSA) or chaetocin (C) to the RNA
from the control cells (crtl). 5S RNA represent the loading control.
The analysis of RNA from treated cells was made by northern blot (Figure 37).
Hybridization was performed using different LNA-modified probes specific for major satellite
sequence. The Figure 37 shows two hybridizations with two different oligonucleotides. There
was no change in the transcriptional profile of major satellites for the cells treated with either
of the inhibitors comparing to the control RNA from non-treated cells. The observation that
histone deacetylation has no effect on transcription is in accordance with previously published
results, indicating that transcription of major satellites occurs independently of acetylation
state of major satellite region. Treatment with the Suv39h inhibitor does not have a high
impact on the Suv39h and is not sufficient enough to provoke an increase of major satellite
transcription, as previously observed in Suv39dn cells (Lehnertz et al. 2003; Bulut-Karslioglu
et al. 2012). Even though we cannot observe a modification of expression of major satellite
transcripts, we cannot exclude the possibility that interference with other chromatin modifiers
could influence major satellite transcription. Another possibility is that non of the revealed
bands are indeed major satellite transcripts. In absence of a positive control for these
experiments, we cannot rule out this hypothesis.
124
2.2. Changes in major satellite transcription upon thermal stress
In human cells, pericentromeric regions are expressed upon stress conditions such as
heat shock, osmotic shock or exposure to certain chemicals (Valgardsdottir et al. 2008;
Eymery et al. 2010). In mouse, the only RNA to be transcribed from the repetitive sequence is
B2 RNA. This LINE-derived transcript is overexpressed upon heat shock, where it binds
RNA pol II and represses mRNA transcription during heat shock (Allen et al. 2004).
We wanted to investigate if stress conditions would effect the transcription from major
satellites, and is this condition could give information on specific major RNA transcript signal
in our northern blot experiments. For this, a cell culture flask containing growing MEF cells
was immersed in a water bath at 43°C for one hour. Control cells were immersed in a water
bath at 37°C. After the treatment, cells were left to recover for one hour at 37°C. RNAs
extracted from both treated and control cells were analysed by northern blot with strand
specific oligonucleotides. The pattern of expression of one particular transcript of a calculated
length of 96 nucleotides is modified in response to heat shock (Figure 38B). The increase in
expression was detected by four different oligonucleotides targeting different positions of the
forward strand of major satellite. The position of these oligonucleotides can be seen in Figure
38A. The transcript level normalized to the tRNA level shows at least 2,5 fold increase in
expression compared to the non-heat shocked cells, when measured for the probe R1 which
gives the most prominent signal. However, as already described in the part I.1, the revelation
of this transcript is made by five different probes in different intensities, that are located too
far away from each other on the satellite sequence. Therefore, we cannot conclude that this
signal is major satellite specific. There is, however, no doubt that the level of expression of
this RNA is elevated upon heat shock.
We performed a kinetics experiment to monitor the increase in the transcript level at
the different temperatures of the water bath, time of the heat shock duration and time of heat
shock recovery (Figure 38C). The heat shock performed at the 43°C temperature with
different duration and the time of recovery change from 2,5 to 5 fold increase. This increase
falls into the range previously measured for the heat shock performed at 43°C during 1h with
1h recovery (Figure 38C). There is a remarkable difference between the heat shock performed
at 45°C with different duration and recovery time. Heat shock at 45°C during 1h following 1h
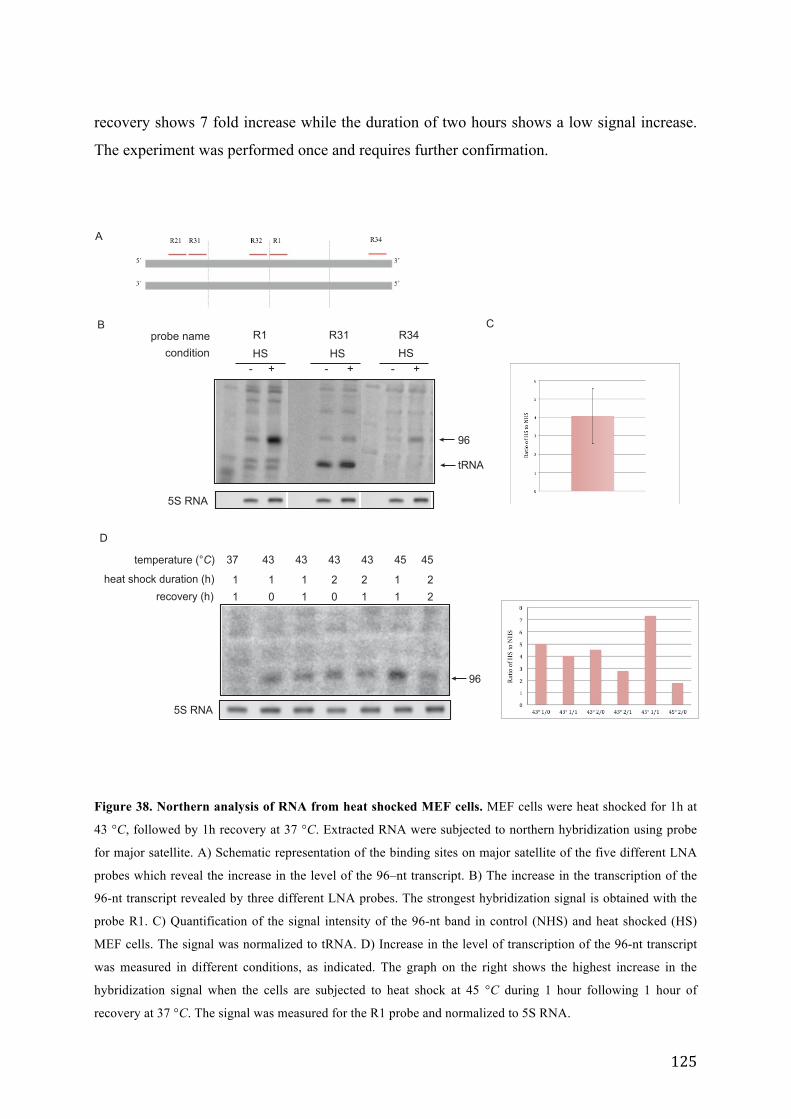
125
recovery shows 7 fold increase while the duration of two hours shows a low signal increase.
The experiment was performed once and requires further confirmation.
temperature (°C)
heat shock duration (h)
recovery (h)
37 43 43 43 43 45 45
1 1 1 2 2 1 2
1 0 1 0 1 1 2
5S RNA
96
5S RNA
probe name R1 R31 R34
condition HS HSHS
- + - + - +
A
96
tRNA
D
B C
Figure 38. Northern analysis of RNA from heat shocked MEF cells. MEF cells were heat shocked for 1h at
43 °C, followed by 1h recovery at 37 °C. Extracted RNA were subjected to northern hybridization using probe
for major satellite. A) Schematic representation of the binding sites on major satellite of the five different LNA
probes which reveal the increase in the level of the 96–nt transcript. B) The increase in the transcription of the
96-nt transcript revealed by three different LNA probes. The strongest hybridization signal is obtained with the
probe R1. C) Quantification of the signal intensity of the 96-nt band in control (NHS) and heat shocked (HS)
MEF cells. The signal was normalized to tRNA. D) Increase in the level of transcription of the 96-nt transcript
was measured in different conditions, as indicated. The graph on the right shows the highest increase in the
hybridization signal when the cells are subjected to heat shock at 45 °C during 1 hour following 1 hour of
recovery at 37 °C. The signal was measured for the R1 probe and normalized to 5S RNA.
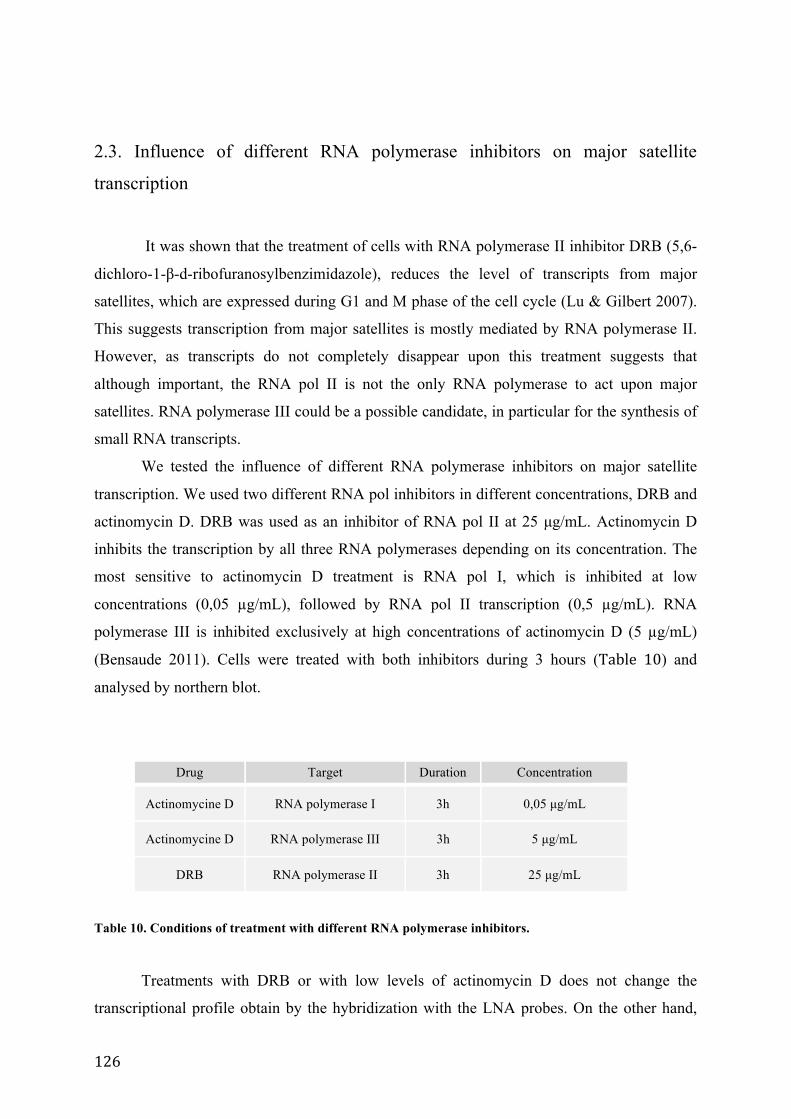
126
2.3. Influence of different RNA polymerase inhibitors on major satellite
transcription
It was shown that the treatment of cells with RNA polymerase II inhibitor DRB (5,6-
dichloro-1-β-d-ribofuranosylbenzimidazole), reduces the level of transcripts from major
satellites, which are expressed during G1 and M phase of the cell cycle (Lu & Gilbert 2007).
This suggests transcription from major satellites is mostly mediated by RNA polymerase II.
However, as transcripts do not completely disappear upon this treatment suggests that
although important, the RNA pol II is not the only RNA polymerase to act upon major
satellites. RNA polymerase III could be a possible candidate, in particular for the synthesis of
small RNA transcripts.
We tested the influence of different RNA polymerase inhibitors on major satellite
transcription. We used two different RNA pol inhibitors in different concentrations, DRB and
actinomycin D. DRB was used as an inhibitor of RNA pol II at 25 µg/mL. Actinomycin D
inhibits the transcription by all three RNA polymerases depending on its concentration. The
most sensitive to actinomycin D treatment is RNA pol I, which is inhibited at low
concentrations (0,05 µg/mL), followed by RNA pol II transcription (0,5 µg/mL). RNA
polymerase III is inhibited exclusively at high concentrations of actinomycin D (5 µg/mL)
(Bensaude 2011). Cells were treated with both inhibitors during 3 hours (Table 10) and
analysed by northern blot.
Drug Target Duration Concentration
Actinomycine D RNA polymerase I 3h 0,05 µg/mL
Actinomycine D RNA polymerase III 3h 5 µg/mL
DRB RNA polymerase II 3h 25 µg/mL
Table 10. Conditions of treatment with different RNA polymerase inhibitors.
Treatments with DRB or with low levels of actinomycin D does not change the
transcriptional profile obtain by the hybridization with the LNA probes. On the other hand,
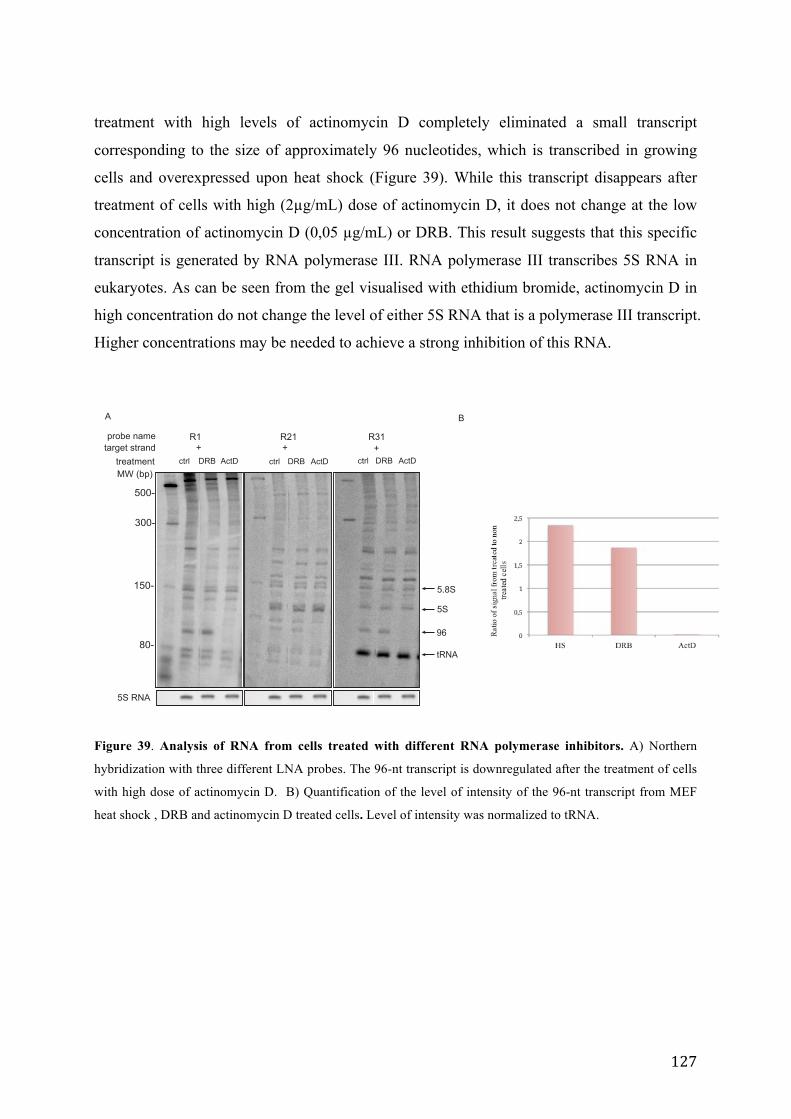
127
treatment with high levels of actinomycin D completely eliminated a small transcript
corresponding to the size of approximately 96 nucleotides, which is transcribed in growing
cells and overexpressed upon heat shock (Figure 39). While this transcript disappears after
treatment of cells with high (2µg/mL) dose of actinomycin D, it does not change at the low
concentration of actinomycin D (0,05 µg/mL) or DRB. This result suggests that this specific
transcript is generated by RNA polymerase III. RNA polymerase III transcribes 5S RNA in
eukaryotes. As can be seen from the gel visualised with ethidium bromide, actinomycin D in
high concentration do not change the level of either 5S RNA that is a polymerase III transcript.
Higher concentrations may be needed to achieve a strong inhibition of this RNA.
5S RNA
probe name
MW (bp)
500-
300-
150-
80-
target strandtreatment ctrl DRB ActD ctrl DRB ActD ctrl DRB ActD
+ + + R1 R21 R31
96
tRNA
5S
5.8S
A B
Figure 39. Analysis of RNA from cells treated with different RNA polymerase inhibitors. A) Northern
hybridization with three different LNA probes. The 96-nt transcript is downregulated after the treatment of cells
with high dose of actinomycin D. B) Quantification of the level of intensity of the 96-nt transcript from MEF
heat shock , DRB and actinomycin D treated cells. Level of intensity was normalized to tRNA.
128
I.3. Sequence characterization
3.1. Technical details/methods for major satellite sequence characterization
Technical difficulties caused by the repetitiveness of the major satellites have so far
limited the precise characterization of the major satellite transcripts. Oligonucleotides allow
the quantification of the abundance of the transcripts and the determination of their strand of
origin. We decided to expand the use of specific primers for the identification of the
sequences of major satellite transcripts. Of our specific interest is the 96 nt transcript, which
is found to be overexpressed in the heat-shocked cells. We decided to combine the ligation of
the known adapter sequences to the short cellular RNA, followed by RT PCR using the
primers that hybridize to the ligated adapter or the use of major satellite specific primers (see
further text).
Small RNA separation
Since northern hybridizations showed non-specific hybridization of our probes to the
long RNA, to minimise the non-specific molecules in our sample and avoid the non-specific
amplification with our primers, we eliminated the long species before adapter ligation. Short
RNA have been separated from the total RNA by ultrafiltration using NanoSep100K device
that acts as a molecular sieve. Using this procedure the molecules are separated on the basis
of their length, theoretically not allowing sequences larger than 450 bp to pass through. Our
experience reveals that there is however a slight recuperation of long molecules. However,
their yield is negligible comparing to the yield of short RNA (Figure 40). The yield of
recuperation of bands of different sizes can be compared on a gel. As can be seen in Figure 40,
the percentage of recuperation varies depending on the length of the transcript. Smaller the
transcript is, higher is its yield of recuperation.
129
shor
t RNA
total
RNA
MW (bp)
150-
80-
300-
5S
5.8S
tRNAtRNA
Figure 40. Comparison between total RNA and recovered short RNA. The RNA was separated on 4%
polyacrylamide gel and stained with ethidium bromide.
Adapter ligation to cellular RNA
It is still unclear whether all non-coding RNA are post-transcriptionally modified, but
majority of them probably do not go through the same maturation steps as mRNA. We have
therefore considered that the major satellite derived transcripts could have a non-
polyadenylated and therefore free 3’ end. With this in mind we wanted to ligate an adapter on
the 3’ end of the RNA. A 5’ adapter could equally be used for the ligation at the 5’ end of the
molecules of interest that contains a 5’ phosphate. Once ligated, the adapters serve for the
fixation of complementary primers and are used to convert a ligated RNA into the
complementary DNA.
The 3’ adapter molecule was designed to obtain optimal ligation efficiency. This 19-
mer oligonucleotide has a dideoxycytidine on its 3’ end to prevent self-circularization and
circularization of ligated RNA molecule. Phosphate at its 5’ ensures the adapter is ligated at
the 3’ end of the RNA molecule. A 5’ adapter is a a 17-mer oligonucleotide with 5’OH and
3’OH group. These two adapters can be ligated on the 3’OH or 5’p of the small RNA,
respectively.
Both adapters was ligated on the totality of small RNA molecules. The ligation was
verified on a polyacrylamide gel (Figure 41). The abundant cellular RNA that ligated the
adapter show a shift in their position on the gel. Transfer RNA, as well as 5S and 5.8S RNA
ligated the 3’ adapter and showed the shift of 19-nt to the higher molecular weights. On the
contrary, no shift was observed after the 5’ adapter ligation on these RNA. The possibility for
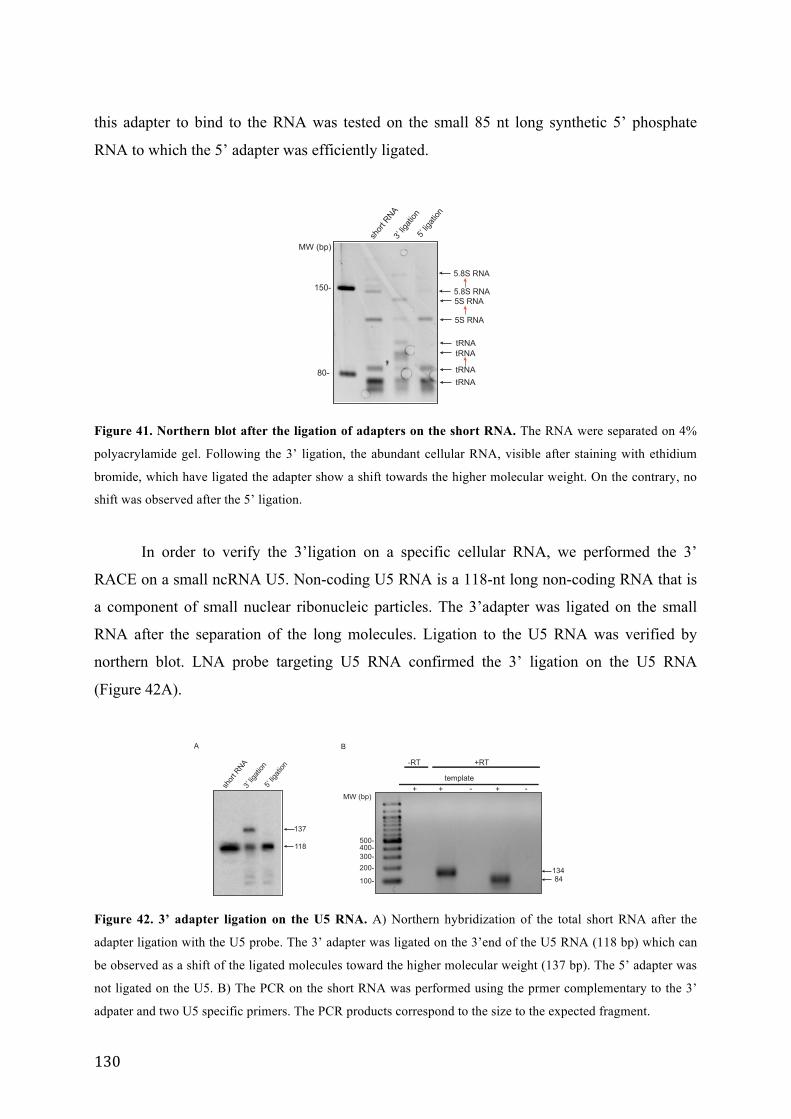
130
this adapter to bind to the RNA was tested on the small 85 nt long synthetic 5’ phosphate
RNA to which the 5’ adapter was efficiently ligated.
5S RNA
tRNAtRNA
tRNAtRNA
5S RNA5.8S RNA
5.8S RNA
MW (bp)
150-
80-sh
ort R
NA 3’
ligati
on5’
ligati
on
Figure 41. Northern blot after the ligation of adapters on the short RNA. The RNA were separated on 4%
polyacrylamide gel. Following the 3’ ligation, the abundant cellular RNA, visible after staining with ethidium
bromide, which have ligated the adapter show a shift towards the higher molecular weight. On the contrary, no
shift was observed after the 5’ ligation.
In order to verify the 3’ligation on a specific cellular RNA, we performed the 3’
RACE on a small ncRNA U5. Non-coding U5 RNA is a 118-nt long non-coding RNA that is
a component of small nuclear ribonucleic particles. The 3’adapter was ligated on the small
RNA after the separation of the long molecules. Ligation to the U5 RNA was verified by
northern blot. LNA probe targeting U5 RNA confirmed the 3’ ligation on the U5 RNA
(Figure 42A).
shor
t RNA
3’ lig
ation
5’ lig
ation
118
137
A B
134 84
MW (bp)
500-
100-
200-
400-300-
template + + + - -
-RT +RT
Figure 42. 3’ adapter ligation on the U5 RNA. A) Northern hybridization of the total short RNA after the
adapter ligation with the U5 probe. The 3’ adapter was ligated on the 3’end of the U5 RNA (118 bp) which can
be observed as a shift of the ligated molecules toward the higher molecular weight (137 bp). The 5’ adapter was
not ligated on the U5. B) The PCR on the short RNA was performed using the prmer complementary to the 3’
adpater and two U5 specific primers. The PCR products correspond to the size to the expected fragment.
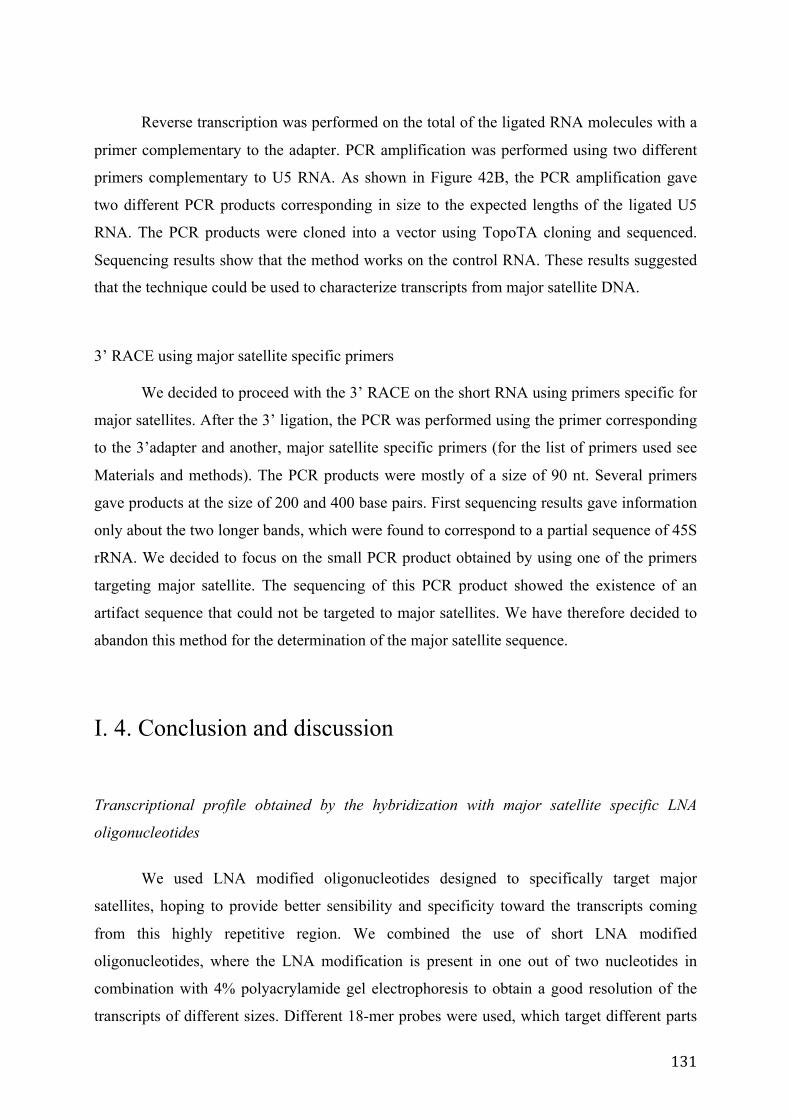
131
Reverse transcription was performed on the total of the ligated RNA molecules with a
primer complementary to the adapter. PCR amplification was performed using two different
primers complementary to U5 RNA. As shown in Figure 42B, the PCR amplification gave
two different PCR products corresponding in size to the expected lengths of the ligated U5
RNA. The PCR products were cloned into a vector using TopoTA cloning and sequenced.
Sequencing results show that the method works on the control RNA. These results suggested
that the technique could be used to characterize transcripts from major satellite DNA.
3’ RACE using major satellite specific primers
We decided to proceed with the 3’ RACE on the short RNA using primers specific for
major satellites. After the 3’ ligation, the PCR was performed using the primer corresponding
to the 3’adapter and another, major satellite specific primers (for the list of primers used see
Materials and methods). The PCR products were mostly of a size of 90 nt. Several primers
gave products at the size of 200 and 400 base pairs. First sequencing results gave information
only about the two longer bands, which were found to correspond to a partial sequence of 45S
rRNA. We decided to focus on the small PCR product obtained by using one of the primers
targeting major satellite. The sequencing of this PCR product showed the existence of an
artifact sequence that could not be targeted to major satellites. We have therefore decided to
abandon this method for the determination of the major satellite sequence.
I. 4. Conclusion and discussion
Transcriptional profile obtained by the hybridization with major satellite specific LNA
oligonucleotides
We used LNA modified oligonucleotides designed to specifically target major
satellites, hoping to provide better sensibility and specificity toward the transcripts coming
from this highly repetitive region. We combined the use of short LNA modified
oligonucleotides, where the LNA modification is present in one out of two nucleotides in
combination with 4% polyacrylamide gel electrophoresis to obtain a good resolution of the
transcripts of different sizes. Different 18-mer probes were used, which target different parts
132
of both strands of the repeat. We have shown that northern hybridization using these probes
reveal a complex transcriptional pattern. Multiple bands are visible after the hybridization
with different probes. Among the different transcripts present on the membrane, we detected
the abundant cellular RNA: tRNA and rRNA (5S, 5.8S and 18S), which were revealed with
almost all of our probes. The revelation of the tRNA and rRNA molecules showed that the
probes designed to specifically target major satellites are able to hybridize to other than their
specific target. Beside these known cellular RNA, other bands are revealed on the membrane,
for which we made an thorough analysis trying to situate each of the transcripts on the major
satellite repeat, depending on its detection with different LNA probes. Even though the
profiles change depending on the probe used, the profiles are somewhat similar for all the
probes targeting a given strand, which suggests that we target the same group of transcripts
with almost all of our probes.
However, certain inconsistencies were observed that complicated the interpretation of
the results. First, the bands with a size bigger than the major satellite repeat (234 bp) were not
revealed with all the probes targeting the same strand. Equally, the bands smaller than the
major satellite repeat are sometimes revealed with all the probes or, the probes revealing a
certain transcript are positioned too far away on the major satellite sequence, covering a size
bigger than the transcript in question. If the transcripts that we detect are indeed derived from
major satellites, the inconsistencies we encounter, such as the revelation of the same
transcripts with different probes that are located to far from each other on the sequence, could
be due to the extremely high similarity sequence within satellite repeats. Indeed, the major
satellite repeat can be separated into four subrepeats that have a high level of similarity. The
LNA probes were designed to target the part of the sequence that show the greatest
polymorphism. In our hands, this strategy was however not discriminating enough for
northern analysis. It is however possible that we did not found the proper hybridization
conditions, or that the LNA modifications were not positioned correctly in a probe for the
achievement of the highest mismatch discrimination.
Complicating the reading of the hybridization signal, the majority of the detected
transcripts are revealed with several probes, however the signal of the given transcript is not
equal for all the probes. One possibility is that a probe complementary to the middle of the
transcript hybridize more strongly than the probe hybridizing to one of the ends of the
transcript. Post-transcriptional modification of the transcripts could also interfere with the
quality of the hybridization signal depending on the probe used.
133
Change of the washing conditions also changed the hybridization profile of the LNA
probes. The short probes with LNA modifications display higher Tm, so it was possible to try
used hybridization temperature and highly stringent conditions. The disappearance of the
smear at the higher molecular weight in these conditions suggest that some non-specific
hybridization is occurring and can be eliminated by changing the stringency of the
experiment. However, the change in conditions did not eliminate the hybridization on the
ribosomal RNA.
LNA probes for northern blot detection of transcripts from a highly repetitive region
Hybridization of the LNA probes on the highly abundant RNA could be explained by
the northern hybridization itself. The hybridization between the probe and the RNA in
northern blot occurs on a membrane, where RNA are localised in a small, restricted space on
the membrane. Hybridization under these conditions could lead to the retention of the probe
by the interactions with these highly abundant RNA in a restricted area of the membrane,
which would not occur if these RNA were present in a solution. This could explain why,
when the probes used in northern experiments are used in DNA FISH, they specifically reveal
the DAPI dense spots in the cells, which represent the clustered major satellites. If we adopt
this explanation, we are able to eliminate the abundant, known RNA which are hybridized
with the LNA probes and are left with the list of transcripts that appear with the hybridization
with more or less all of the probes, as argued in the previous paragraph.
Moreover, the small amounts of the major satellite transcripts could contribute to
difficulties in their detection. This is however not in accordance with previously shown
application of LNA probes, which were successfully used for the detection of the low
abundant miRNA in northern hybridizations (Válóczi et al. 2004). However, the hybridization
with LNA modified probes designed to target the U5, U6 and 7SK RNA revealed correctly
these target RNA, without any non-specific hybridization on other transcripts (not shown).
The repetitive, AT rich sequences of major satellites that LNA probes are expected to detect
could truly be the reason for which it is difficult to obtain a specific hybridization signal.
134
Comparison between the LNA probes with their sequence equivalent DNA and RNA probes in
hybridization experiments
The control hybridizations with DNA and RNA probes did not reveal the same
transcriptional patterns. The hybridization profiles revealed with these two probes were rather
surprising, since only a smear was detected at higher molecular weights. The revelation of
bands at lower molecular weights could have comforted us in the fact that LNA probes were
helping reveal short major satellite transcripts. It is possible that the low abundance of these
transcripts prevents their detection by standard DNA and RNA probes. On the other hand, the
use of the probe carrying another chemical modification, the 2’-O-Me probe revealed the
same transcriptional profile as its isosequential LNA probe. This shows that the non-specific
hybridization is not limited only to the LNA probes. It would be interesting to perform the
hybridization with a negative control containing no specific binding site in the mouse genome
such as the probe targeting human alpha satellites. Ideally, in the absence of the target in the
major satellites, we should expect this probe not to bind to any of the transcripts, which are
detected with the major satellite specific LNA probes.
Although the LNA probes designed to specifically target major satellites showed
specificity problems, we can not exclude the possibility that some of the detected transcripts
are major satellites derived.
Detection of transcripts upregulated upon heat shock
Northern hybridization of the RNA from mouse cells submitted to a heat shock of 1h
at 42°C, using different LNA probes targeting the forward strand of the major satellites
showed that a 96 nt transcript is overexpressed. As the LNA probes designed to target the
major satellite repeats showed non-specific binding, and as we had no positive control
confirming that the revealed transcripts are derived from the major satellite repeat, we can not
certify that the observed overexpressed transcript really is major satellite RNA. This transcript
was revealed with five LNA probes that target different regions of the major satellites. The
signal is found to be most intense with the use of the probe R1, while the hybridization with
other probes showed a less prominent signal, suggesting a variable affinity of different probes
for this transcript. These probes are positioned too far away from each other on the major
135
satellite subrepeat to give any precise indication of its sequence, casting doubt on the origin of
this transcript. Regardless, there is no doubt that the heat shock in mouse cells causes an
overexpression of a short transcript.
Up until now, no increase in the RNA of centromeric or pericentromeric origin upon
stress has been detected in mouse cells. The only two found RNA upregulated upon heat
shock in mouse cells are SINE B1 RNA (136 nt) and B2 RNA (178 nt), that was found to be
involved in the regulation of the RNA pol II transcription during stress (Allen et al. 2004). On
the other hand, it is well established that in human cells, transcripts from pericentromeric
satellite III are upregulated during heat shock (Jolly et al. 2004). These transcripts accumulate
at their site of transcription and together with the heat shock protein 1 form nuclear stress
bodies, of a yet unclear function. Even though this transcript is revealed with several of our
LNA probes, we cannot conclude that it is indeed transcribed from the major satellites.
Nevertheless, upregulation of this transcript upon heat shock and its complete disappearance
after the treatment with RNA polymerase III inhibitor suggests that the B2 RNA is not the
only repeat-associated transcripts that has a possible role in cellular stress. A parallel with the
accumulation of the human satellite III transcripts could be imagined. However, we have tried
to determine the accumulation of the major satellite transcripts with the heat shock protein,
but found no such association in mouse cells (data not shown). This does not completely
exclude the possibility of such an interaction. It would therefore be interesting to identify the
sequence of this transcript. As our initial experiments of major satellite sequence
characterization using adapter ligation failed, we wanted to proceed in the characterization of
this specific transcript starting with gel purification of the small region of a gel where this
transcript migrates. Following adapter ligation on both ends of the purified pool of transcripts
and sequencing of the obtained products, keeping in mind the possible chemical modification
that could interfere with the ligations, we wanted to obtain the sequence of the overexpressed
transcript. Due to a lack of time, these experiments were not completed, therefore the origin
of the short RNA overexpressed upon heat shock in mouse cells still remains unknown. It
would be interesting to see if we can detect the B1 or B2 RNA with the LNA probes designed
to target these transcripts, and to verify if these transcripts are overexpressed as well in our
heat shock conditions.
The 96 transcript was the only transcript that disappeared completely upon the
treatment with the high level of actinomycin D, but not upon the treatment with low levels of
actinomycin or DRB. This suggested that this is an RNA polymerase III transcript.
136
Interestingly, the B1 and B2 RNA, that are equally overexpressed upon heat shock are also
RNA pol III transcripts (Allen et al. 2004). The RNA polymerase III is the least sensible RNA
polymerase, and can be inhibited only with high levels of actinomycin D. We wanted to
confirm our experiment by using directly a selective RNA polymerase III drug, the
tagetitoxin. Unfortunately, production of the drug has stopped. Despite the disappearance of
the 96 nt transcript, we observed no impact of any of the other inhibitors on RNA (for
example 5S RNA should be inhibited by the low levels of actinomycin D). This suggests that
the 3h treatment is not enough to induce a visible effect on these RNA. On the contrary, the
short half life of the 96 transcript proves that it is very sensible to actinomycin D treatment.
Northern hybridization profiles in presence of inhibitors of chromatin modifiers
It has previously been shown that transcription within major satellite is elevated in the
cells that do not have functional Suv39h histone methyltransferase (Lehnertz et al. 2003). We
have therefore treated the cells with the chaetocin, a drug that inhibits the histone
methyltransferase Suv39h, hoping to provoke changes in major satellite transcription. We also
used TSA, an inhibitor of histone deacetylase (HDAC), as a negative control, since TSA
treatment of mouse cells does not interfere with the satellite transcription as observed with RT
PCR (Terranova et al. 2005). Despite the unclear results obtained in the northern blots with
the LNA modified probes, we decided to investigate if we could observe a change for some of
the detected transcripts after the treatment of cells with these two inhibitors of the chromatin
modifiers.
We could not observe any difference in the hybridization experiments of RNA from
non treated cells compared to the RNA from treated cells with both drugs. As we are not sure
to be detecting the major satellite transcripts, we cannot conclude that the absence of the
visible effect on the revealed transcripts is due to the absence of the effect of the treatment
with the inhibitors of chromatin modifiers on major satellites. If we assume that some of our
detected transcripts have a major satellite origin, these results would suggest that the
treatment with the indicated inhibitors has no impact on the major satellites. Our treatment
with chaetocin therefore did not help us to determine RNA from major satellite origin in our
hybridization signals.
137
CHAPTER II
TALE fused to histone demethylase
mJMJD2D for epigenetic engineering at
pericentromeric regions of mouse cells
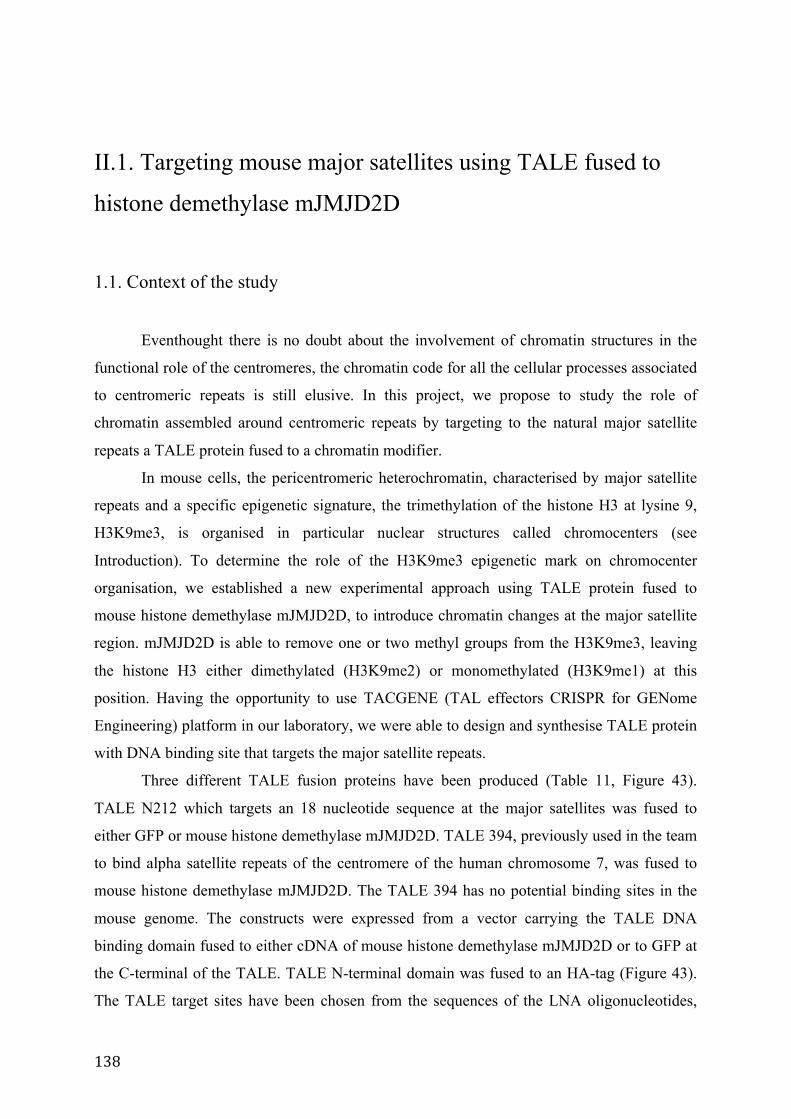
138
II.1. Targeting mouse major satellites using TALE fused to
histone demethylase mJMJD2D
1.1. Context of the study
Eventhought there is no doubt about the involvement of chromatin structures in the
functional role of the centromeres, the chromatin code for all the cellular processes associated
to centromeric repeats is still elusive. In this project, we propose to study the role of
chromatin assembled around centromeric repeats by targeting to the natural major satellite
repeats a TALE protein fused to a chromatin modifier.
In mouse cells, the pericentromeric heterochromatin, characterised by major satellite
repeats and a specific epigenetic signature, the trimethylation of the histone H3 at lysine 9,
H3K9me3, is organised in particular nuclear structures called chromocenters (see
Introduction). To determine the role of the H3K9me3 epigenetic mark on chromocenter
organisation, we established a new experimental approach using TALE protein fused to
mouse histone demethylase mJMJD2D, to introduce chromatin changes at the major satellite
region. mJMJD2D is able to remove one or two methyl groups from the H3K9me3, leaving
the histone H3 either dimethylated (H3K9me2) or monomethylated (H3K9me1) at this
position. Having the opportunity to use TACGENE (TAL effectors CRISPR for GENome
Engineering) platform in our laboratory, we were able to design and synthesise TALE protein
with DNA binding site that targets the major satellite repeats.
Three different TALE fusion proteins have been produced (Table 11, Figure 43).
TALE N212 which targets an 18 nucleotide sequence at the major satellites was fused to
either GFP or mouse histone demethylase mJMJD2D. TALE 394, previously used in the team
to bind alpha satellite repeats of the centromere of the human chromosome 7, was fused to
mouse histone demethylase mJMJD2D. The TALE 394 has no potential binding sites in the
mouse genome. The constructs were expressed from a vector carrying the TALE DNA
binding domain fused to either cDNA of mouse histone demethylase mJMJD2D or to GFP at
the C-terminal of the TALE. TALE N-terminal domain was fused to an HA-tag (Figure 43).
The TALE target sites have been chosen from the sequences of the LNA oligonucleotides,
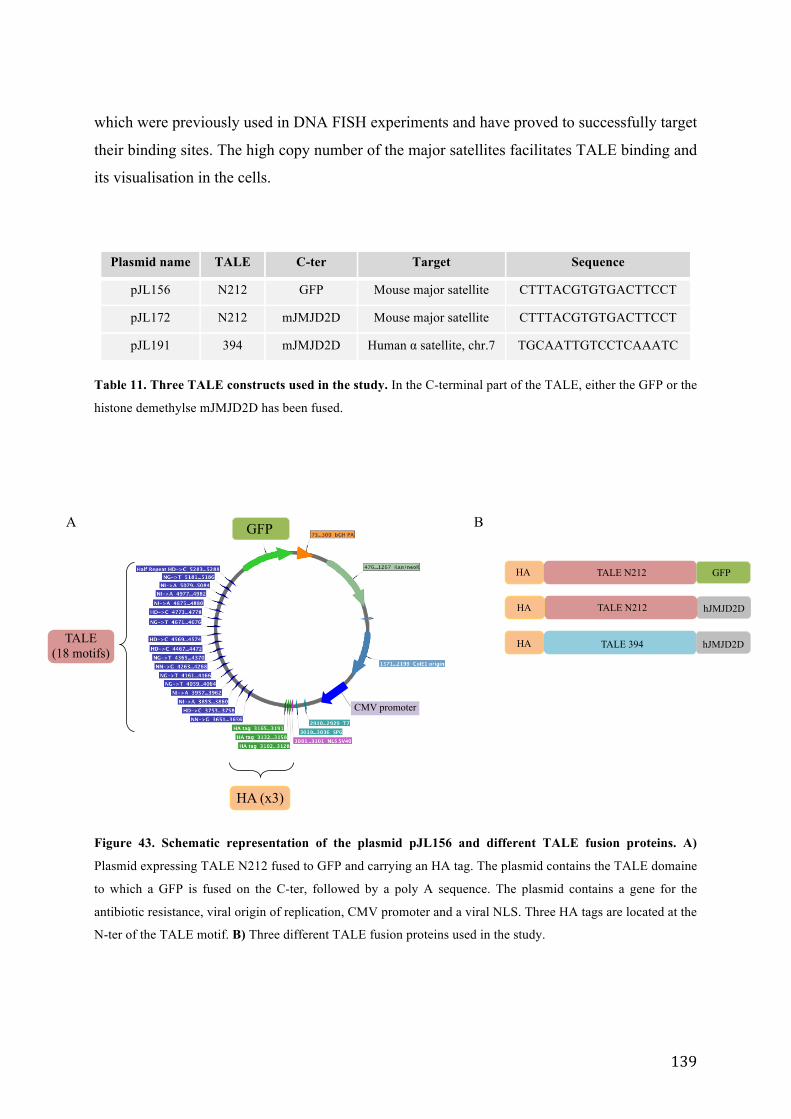
139
which were previously used in DNA FISH experiments and have proved to successfully target
their binding sites. The high copy number of the major satellites facilitates TALE binding and
its visualisation in the cells.
Plasmid name TALE C-ter Target Sequence
pJL156 N212 GFP Mouse major satellite CTTTACGTGTGACTTCCT
pJL172 N212 mJMJD2D Mouse major satellite CTTTACGTGTGACTTCCT
pJL191 394 mJMJD2D Human α satellite, chr.7 TGCAATTGTCCTCAAATC
Table 11. Three TALE constructs used in the study. In the C-terminal part of the TALE, either the GFP or the
histone demethylse mJMJD2D has been fused.
HA (x3)
TALE (18 motifs)
GFP
CMV promoter
A
B
hJMJD2D
hJMJD2D
GFP TALE N212
TALE N212
TALE 394
HA
HA
HA
Figure 43. Schematic representation of the plasmid pJL156 and different TALE fusion proteins. A)
Plasmid expressing TALE N212 fused to GFP and carrying an HA tag. The plasmid contains the TALE domaine
to which a GFP is fused on the C-ter, followed by a poly A sequence. The plasmid contains a gene for the
antibiotic resistance, viral origin of replication, CMV promoter and a viral NLS. Three HA tags are located at the
N-ter of the TALE motif. B) Three different TALE fusion proteins used in the study.
140
1.2. Visualisation of the specificity of TALE recruitment on major satellites
To validate the specificity of TALE N212 and its correct recruitment at the major
satellites, the NIH-3T3 cells (kind gift of C. Francastel) were transiently transfected with the
vector pJL156, which carries TALE N212 fused to GFP. This fibroblast cell line is polyploid
and possesses chromocenters which are easily visualised under the fluorescence microscope.
24 h after transfection, the cells were fixed and an immunofluorescence labelling was
performed to visualise the TALE foci and assess the binding specificity to the region of
interest. The major satellite foci are easily visible after the staining with Hoechst dye,
revealing chromocenter structures (Figure 44). The H3K9me3 labelling reveals
heterochromatin forming large foci. The Hoechst and H3K9me3 staining colocalise as
expected at chromocenters. As can be seen from the Figure 44, the TALE N212-GFP is
expressed in the cells and localises to the major satellite foci. The GFP signal is colocalised
with the H3K9me3 signal at the major satellites.
Hoechst / HA-TALE N212-mJMJD2D Hoechst
HA-TALE N212-mJMJD2D
R4Y / HA-TALE N212-mJMJD2D Hoechst / R4Y R4Y
Figure 44. Immunofluorescence detection of the TALE N212-GFP binding to major satellites in mouse
NIH-3T3 cells. The major satellite foci are easily visible after DNA staining with Hoechst (blue). The H3K9me3
is revealed by anti-H3K9me3 antibody (orange). TALE N212-GFP (green) colocalises with the H3K9me3 signal
and chromocenters.
These results validate that the TALE N212 protein is correctly expressed and recruited
at major satellite repeats in NIH-3T3 transfected cells.
141
1.3. Loss of H3K9me3 upon transfection with TALE fused to histone
demethylase mJMJD2D
Having confirmed the specific binding of TALE N212, we wanted to verify that the
TALE N212 fused to histone demethylase is equally localised to the chromocenters and
whether the histone demethylase is active in our system. The cells were transiently transfected
with the plasmid pJL172 that contains TALE N212 fused to mouse histone demethylase
mJMJD2D. As a control, the plasmid pJL191 expressing the TALE 394 and fused to the same
mouse histone demethylase was also introduced into the cells. The TALE 394 is a negative
control that is not expected to bind the major satellites, therefore leaving the methylation
status of H3K9me3 at the chromocenters intact. The cells were also transfected with TALE
N212-GFP as a control. 24h after transfection, the cells were fixed and an immunofluorescence analysis was
performed. The TALE fusion proteins were revealed with the anti-HA antibody. The major
satellite foci are visualised after Hoechst staining. The histone H3 methylation status was
verified using H3K9me3 specific antibody.
First, we observe that the TALE N212-GPF and TALE N212-mJMJD2D are both
correctly expressed and recruited at the major satellite repeats, as indicated by the
colocalisation of the Hoechst and the HA staining. This result shows that the fusion of the
histone demethylase at the C-terminal part of the TALE does not abolish the correct
recruitment of the TALE protein to its DNA binding sites. The TALE N394-mJMJD2D
shows a punctuate staining all over the nucleus, without a specific localisation to the major
satellites (Figure 45A).
Second, we observe that the transfection with TALE N212-mJMJD2D reveals the
existence of three populations of transfected nuclei (Figure 45A). The first population of cells
has received the TALE fused to the histone demethylase and H3K9me3 signal is still visible
in chromocenters despite the correct recruitment of TALE demethylase. The second
population shows the localisation of the TALE protein at the chromocenters concomitant with
the disappearance of the H3K9me3 from the major satellite foci. In the third population of
cells, the H3K9me3 staining is also lost from the major satellites. Most strikingly, however,
the major satellite foci show an aberrant form. Most of the Hoechst spots lost their round
shape (Figure 45). This suggests that the effect of the TALE demethylase on the H3K9me3 is
variable and this variability has a gradual effect on chromatin organisation.
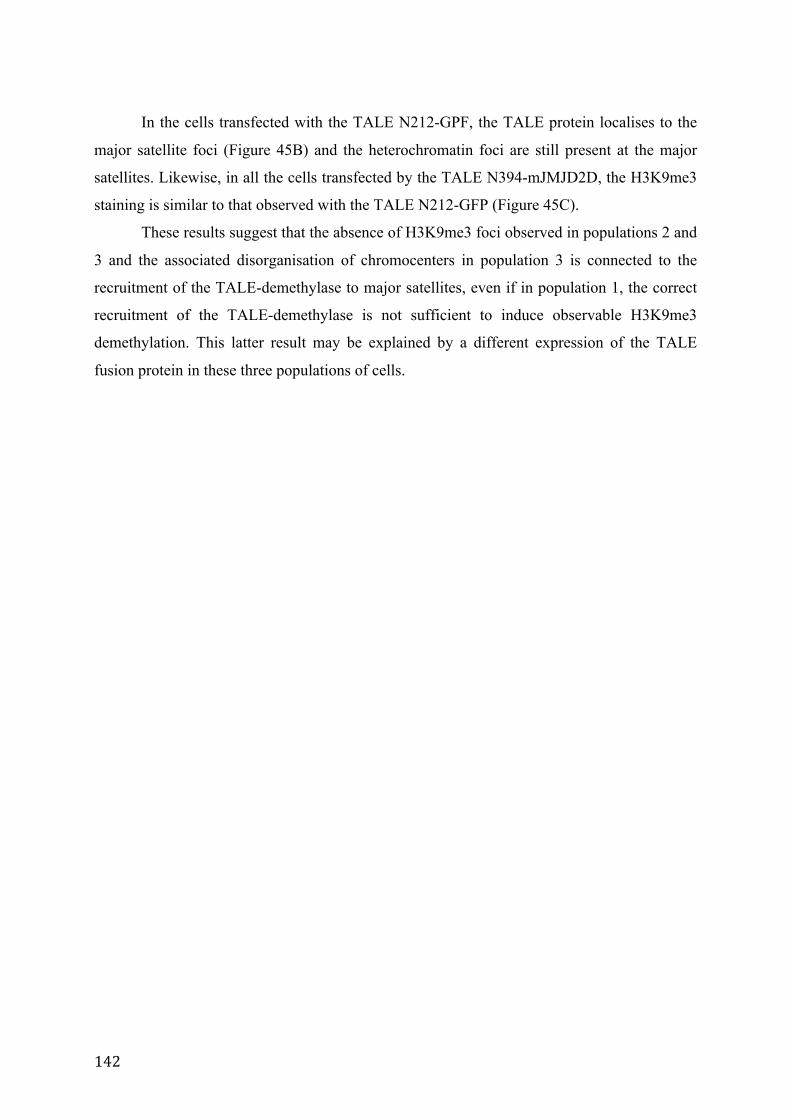
142
In the cells transfected with the TALE N212-GPF, the TALE protein localises to the
major satellite foci (Figure 45B) and the heterochromatin foci are still present at the major
satellites. Likewise, in all the cells transfected by the TALE N394-mJMJD2D, the H3K9me3
staining is similar to that observed with the TALE N212-GFP (Figure 45C).
These results suggest that the absence of H3K9me3 foci observed in populations 2 and
3 and the associated disorganisation of chromocenters in population 3 is connected to the
recruitment of the TALE-demethylase to major satellites, even if in population 1, the correct
recruitment of the TALE-demethylase is not sufficient to induce observable H3K9me3
demethylation. This latter result may be explained by a different expression of the TALE
fusion protein in these three populations of cells.
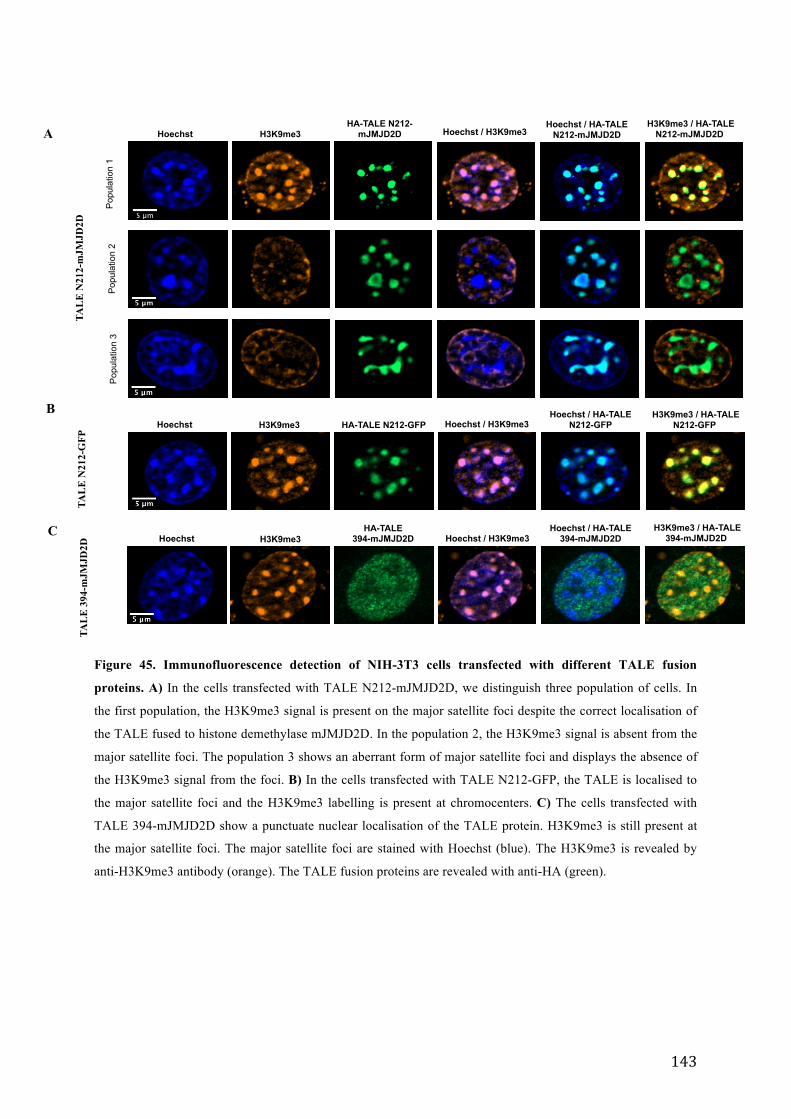
143
Hoechst HA-TALE N212-
mJMJD2D H3K9me3 Hoechst / H3K9me3 Hoechst / HA-TALE
N212-mJMJD2D H3K9me3 / HA-TALE
N212-mJMJD2D
Pop
ulat
ion
1 P
opul
atio
n 2
Pop
ulat
ion
3
Hoechst H3K9me3 HA-TALE
394-mJMJD2D Hoechst / H3K9me3 Hoechst / HA-TALE
394-mJMJD2D H3K9me3 / HA-TALE
394-mJMJD2D
Hoechst H3K9me3 HA-TALE N212-GFP Hoechst / H3K9me3 Hoechst / HA-TALE
N212-GFP H3K9me3 / HA-TALE
N212-GFP
TAL
E N
212-
mJM
JD2D
TA
LE
N21
2-G
FP
TAL
E 3
94-m
JMJD
2D
A
B
C
Figure 45. Immunofluorescence detection of NIH-3T3 cells transfected with different TALE fusion
proteins. A) In the cells transfected with TALE N212-mJMJD2D, we distinguish three population of cells. In
the first population, the H3K9me3 signal is present on the major satellite foci despite the correct localisation of
the TALE fused to histone demethylase mJMJD2D. In the population 2, the H3K9me3 signal is absent from the
major satellite foci. The population 3 shows an aberrant form of major satellite foci and displays the absence of
the H3K9me3 signal from the foci. B) In the cells transfected with TALE N212-GFP, the TALE is localised to
the major satellite foci and the H3K9me3 labelling is present at chromocenters. C) The cells transfected with
TALE 394-mJMJD2D show a punctuate nuclear localisation of the TALE protein. H3K9me3 is still present at
the major satellite foci. The major satellite foci are stained with Hoechst (blue). The H3K9me3 is revealed by
anti-H3K9me3 antibody (orange). The TALE fusion proteins are revealed with anti-HA (green).
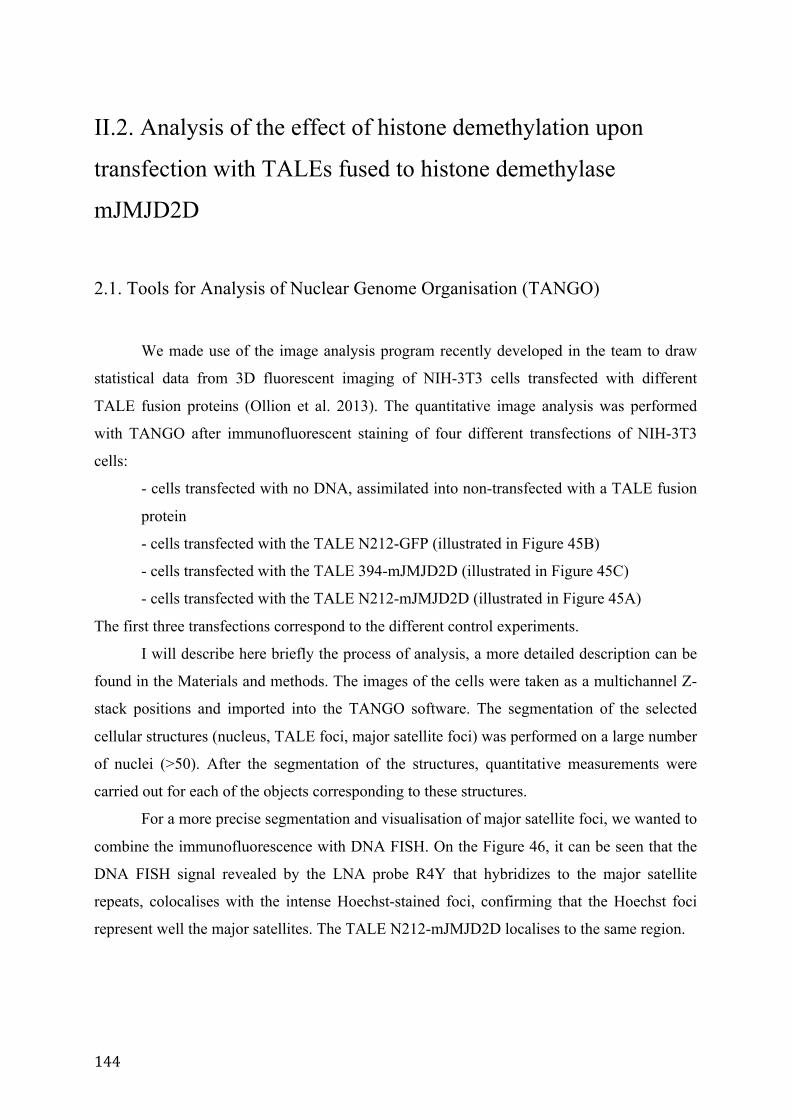
144
II.2. Analysis of the effect of histone demethylation upon
transfection with TALEs fused to histone demethylase
mJMJD2D
2.1. Tools for Analysis of Nuclear Genome Organisation (TANGO)
We made use of the image analysis program recently developed in the team to draw
statistical data from 3D fluorescent imaging of NIH-3T3 cells transfected with different
TALE fusion proteins (Ollion et al. 2013). The quantitative image analysis was performed
with TANGO after immunofluorescent staining of four different transfections of NIH-3T3
cells:
- cells transfected with no DNA, assimilated into non-transfected with a TALE fusion
protein
- cells transfected with the TALE N212-GFP (illustrated in Figure 45B)
- cells transfected with the TALE 394-mJMJD2D (illustrated in Figure 45C)
- cells transfected with the TALE N212-mJMJD2D (illustrated in Figure 45A)
The first three transfections correspond to the different control experiments.
I will describe here briefly the process of analysis, a more detailed description can be
found in the Materials and methods. The images of the cells were taken as a multichannel Z-
stack positions and imported into the TANGO software. The segmentation of the selected
cellular structures (nucleus, TALE foci, major satellite foci) was performed on a large number
of nuclei (>50). After the segmentation of the structures, quantitative measurements were
carried out for each of the objects corresponding to these structures.
For a more precise segmentation and visualisation of major satellite foci, we wanted to
combine the immunofluorescence with DNA FISH. On the Figure 46, it can be seen that the
DNA FISH signal revealed by the LNA probe R4Y that hybridizes to the major satellite
repeats, colocalises with the intense Hoechst-stained foci, confirming that the Hoechst foci
represent well the major satellites. The TALE N212-mJMJD2D localises to the same region.
145
Hoechst / HA-TALE N212-mJMJD2D Hoechst
HA-TALE N212-mJMJD2D
R4Y / HA-TALE N212-mJMJD2D Hoechst / R4Y R4Y
Figure 46. Immuno-FISH detection of NIH-3T3 cells transfected with the TALE N212-mJMJD2D. Major
satellites are revealed with DNA FISH using fluorescent LNA probe R4Y (red). The TALE N212-mJMJD2D is
revealed with the anti-HA antibody (green). The LNA probe targeting major satellites (red) colocalises with the
major satellite foci stained with Hoechst (purple) and the TALE N212-mJMJD2D (yellow).
However, the combination of the DNA FISH treatment with the immunofluorescence
was incompatible with the labelling using anti-H3K9me3 antibody. As the major satellite foci
are strongly stained by the DNA dyes as DAPI or Hoechst, we have therefore relied on
Hoechst signal to achieve the segmentation of the major satellite foci (Figure 47).
A B
Figure 47. Segmentation of different structures by TANGO. A) The major satellite foci are brightly stained
with Hoechst. The major satellites are segmented (yellow lines) after the application of the processing chains to
the image. B) The segmented structures are labelled with a colour that is assigned to each object. The segmented
nucleus is indicated with the yellow line.
2.2. Quantitative analysis of the demethylation of H3K9me3 at the major
satellite foci upon transfection with the TALE N212-mJMJD2D
To assess if the histone demethylase is able to specifically demethylate the H3K9me3
epigenetic mark present at the major satellites, we first investigated the signal of the
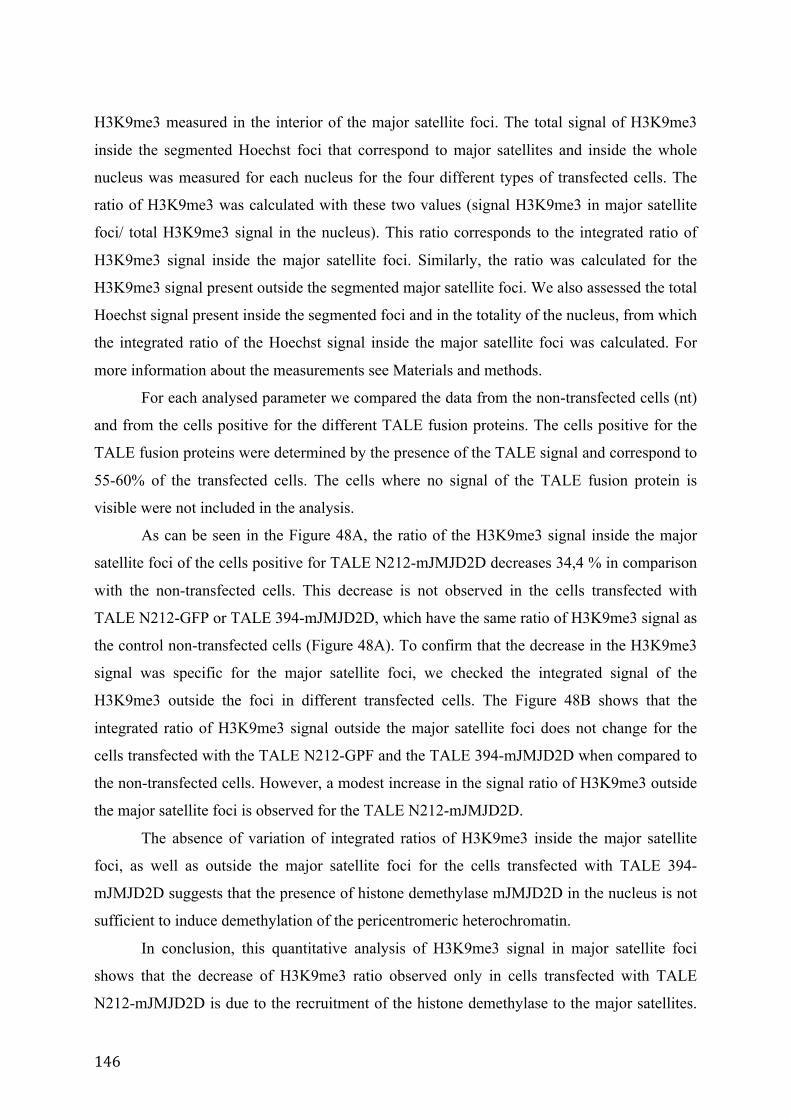
146
H3K9me3 measured in the interior of the major satellite foci. The total signal of H3K9me3
inside the segmented Hoechst foci that correspond to major satellites and inside the whole
nucleus was measured for each nucleus for the four different types of transfected cells. The
ratio of H3K9me3 was calculated with these two values (signal H3K9me3 in major satellite
foci/ total H3K9me3 signal in the nucleus). This ratio corresponds to the integrated ratio of
H3K9me3 signal inside the major satellite foci. Similarly, the ratio was calculated for the
H3K9me3 signal present outside the segmented major satellite foci. We also assessed the total
Hoechst signal present inside the segmented foci and in the totality of the nucleus, from which
the integrated ratio of the Hoechst signal inside the major satellite foci was calculated. For
more information about the measurements see Materials and methods.
For each analysed parameter we compared the data from the non-transfected cells (nt)
and from the cells positive for the different TALE fusion proteins. The cells positive for the
TALE fusion proteins were determined by the presence of the TALE signal and correspond to
55-60% of the transfected cells. The cells where no signal of the TALE fusion protein is
visible were not included in the analysis.
As can be seen in the Figure 48A, the ratio of the H3K9me3 signal inside the major
satellite foci of the cells positive for TALE N212-mJMJD2D decreases 34,4 % in comparison
with the non-transfected cells. This decrease is not observed in the cells transfected with
TALE N212-GFP or TALE 394-mJMJD2D, which have the same ratio of H3K9me3 signal as
the control non-transfected cells (Figure 48A). To confirm that the decrease in the H3K9me3
signal was specific for the major satellite foci, we checked the integrated signal of the
H3K9me3 outside the foci in different transfected cells. The Figure 48B shows that the
integrated ratio of H3K9me3 signal outside the major satellite foci does not change for the
cells transfected with the TALE N212-GPF and the TALE 394-mJMJD2D when compared to
the non-transfected cells. However, a modest increase in the signal ratio of H3K9me3 outside
the major satellite foci is observed for the TALE N212-mJMJD2D.
The absence of variation of integrated ratios of H3K9me3 inside the major satellite
foci, as well as outside the major satellite foci for the cells transfected with TALE 394-
mJMJD2D suggests that the presence of histone demethylase mJMJD2D in the nucleus is not
sufficient to induce demethylation of the pericentromeric heterochromatin.
In conclusion, this quantitative analysis of H3K9me3 signal in major satellite foci
shows that the decrease of H3K9me3 ratio observed only in cells transfected with TALE
N212-mJMJD2D is due to the recruitment of the histone demethylase to the major satellites.
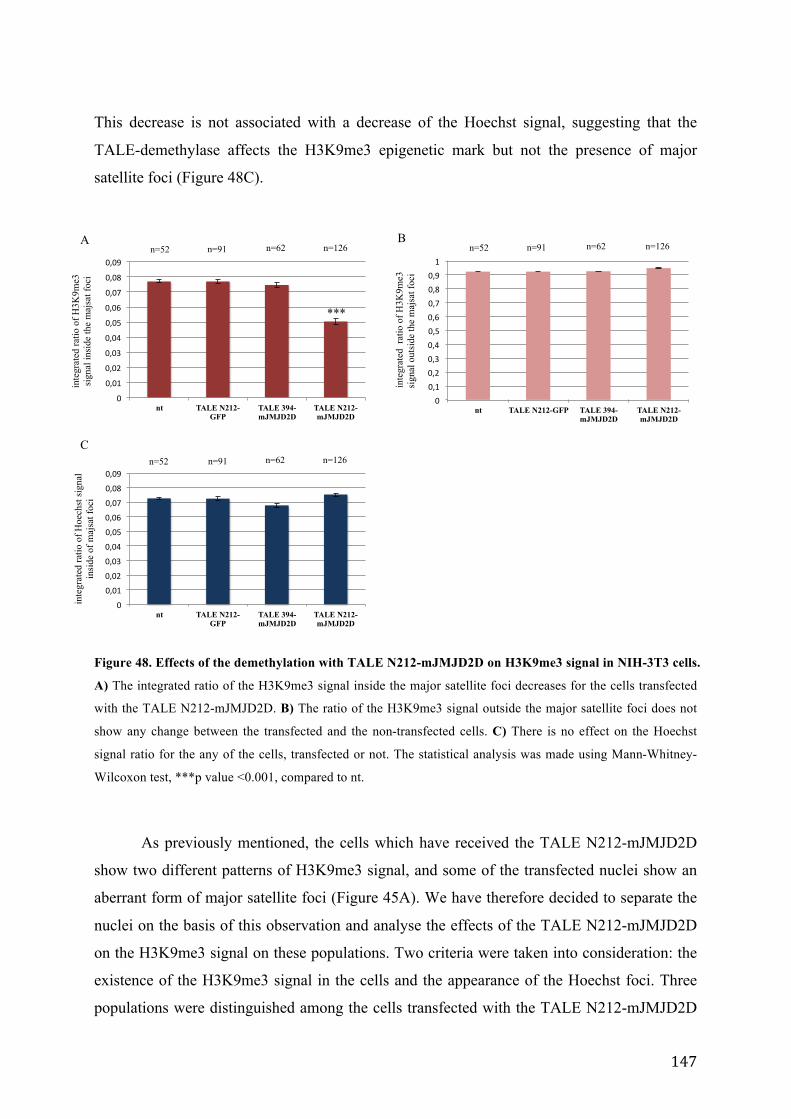
147
This decrease is not associated with a decrease of the Hoechst signal, suggesting that the
TALE-demethylase affects the H3K9me3 epigenetic mark but not the presence of major
satellite foci (Figure 48C).
A B
C
0"
0,01"
0,02"
0,03"
0,04"
0,05"
0,06"
0,07"
0,08"
0,09"
nt TALE N212-GFP
TALE 394-mJMJD2D
TALE N212-mJMJD2D
inte
grat
ed ra
tio o
f Hoe
chst
sign
al
insi
de o
f maj
sat f
oci
0"
0,01"
0,02"
0,03"
0,04"
0,05"
0,06"
0,07"
0,08"
0,09"
nt TALE N212-GFP
TALE 394-mJMJD2D
TALE N212-mJMJD2D
inte
grat
ed ra
tio o
f H3K
9me3
si
gnal
insi
de th
e m
ajsa
t foc
i
0"0,1"0,2"0,3"0,4"0,5"0,6"0,7"0,8"0,9"1"
nt TALE N212-GFP TALE 394-mJMJD2D
TALE N212-mJMJD2D
inte
grat
ed r
atio
of H
3K9m
e3
sign
al o
utsi
de th
e m
ajsa
t foc
i
***
n=52 n=91 n=62 n=126 n=52 n=91 n=62 n=126
n=52 n=91 n=62 n=126
Figure 48. Effects of the demethylation with TALE N212-mJMJD2D on H3K9me3 signal in NIH-3T3 cells.
A) The integrated ratio of the H3K9me3 signal inside the major satellite foci decreases for the cells transfected
with the TALE N212-mJMJD2D. B) The ratio of the H3K9me3 signal outside the major satellite foci does not
show any change between the transfected and the non-transfected cells. C) There is no effect on the Hoechst
signal ratio for the any of the cells, transfected or not. The statistical analysis was made using Mann-Whitney-
Wilcoxon test, ***p value <0.001, compared to nt.
As previously mentioned, the cells which have received the TALE N212-mJMJD2D
show two different patterns of H3K9me3 signal, and some of the transfected nuclei show an
aberrant form of major satellite foci (Figure 45A). We have therefore decided to separate the
nuclei on the basis of this observation and analyse the effects of the TALE N212-mJMJD2D
on the H3K9me3 signal on these populations. Two criteria were taken into consideration: the
existence of the H3K9me3 signal in the cells and the appearance of the Hoechst foci. Three
populations were distinguished among the cells transfected with the TALE N212-mJMJD2D
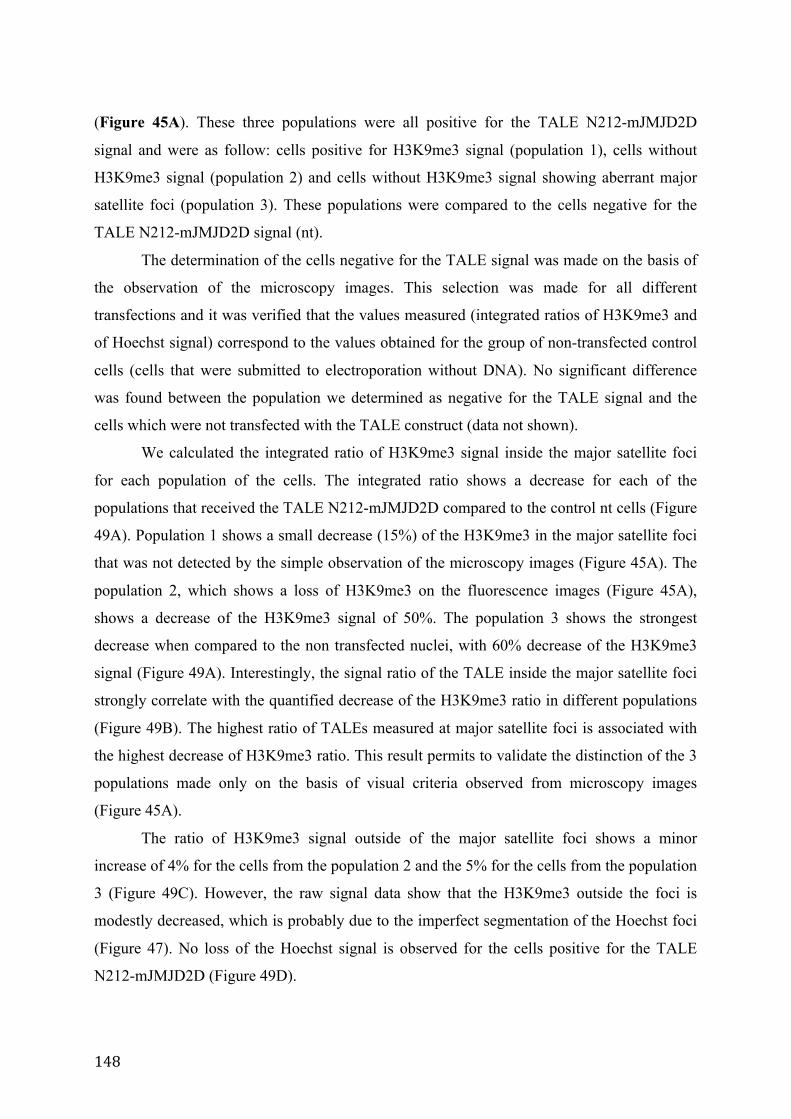
148
(Figure 45A). These three populations were all positive for the TALE N212-mJMJD2D
signal and were as follow: cells positive for H3K9me3 signal (population 1), cells without
H3K9me3 signal (population 2) and cells without H3K9me3 signal showing aberrant major
satellite foci (population 3). These populations were compared to the cells negative for the
TALE N212-mJMJD2D signal (nt).
The determination of the cells negative for the TALE signal was made on the basis of
the observation of the microscopy images. This selection was made for all different
transfections and it was verified that the values measured (integrated ratios of H3K9me3 and
of Hoechst signal) correspond to the values obtained for the group of non-transfected control
cells (cells that were submitted to electroporation without DNA). No significant difference
was found between the population we determined as negative for the TALE signal and the
cells which were not transfected with the TALE construct (data not shown).
We calculated the integrated ratio of H3K9me3 signal inside the major satellite foci
for each population of the cells. The integrated ratio shows a decrease for each of the
populations that received the TALE N212-mJMJD2D compared to the control nt cells (Figure
49A). Population 1 shows a small decrease (15%) of the H3K9me3 in the major satellite foci
that was not detected by the simple observation of the microscopy images (Figure 45A). The
population 2, which shows a loss of H3K9me3 on the fluorescence images (Figure 45A),
shows a decrease of the H3K9me3 signal of 50%. The population 3 shows the strongest
decrease when compared to the non transfected nuclei, with 60% decrease of the H3K9me3
signal (Figure 49A). Interestingly, the signal ratio of the TALE inside the major satellite foci
strongly correlate with the quantified decrease of the H3K9me3 ratio in different populations
(Figure 49B). The highest ratio of TALEs measured at major satellite foci is associated with
the highest decrease of H3K9me3 ratio. This result permits to validate the distinction of the 3
populations made only on the basis of visual criteria observed from microscopy images
(Figure 45A).
The ratio of H3K9me3 signal outside of the major satellite foci shows a minor
increase of 4% for the cells from the population 2 and the 5% for the cells from the population
3 (Figure 49C). However, the raw signal data show that the H3K9me3 outside the foci is
modestly decreased, which is probably due to the imperfect segmentation of the Hoechst foci
(Figure 47). No loss of the Hoechst signal is observed for the cells positive for the TALE
N212-mJMJD2D (Figure 49D).
149
A B
C D
0"
0,01"
0,02"
0,03"
0,04"
0,05"
0,06"
0,07"
0,08"
0,09"
nt pop1 pop2 pop3
inte
grat
ed ra
tio o
f H3K
9me3
sign
al
insi
de th
e m
ajsa
t foc
i
0"
0,2"
0,4"
0,6"
0,8"
1"
1,2"
nt pop1 pop2 pop3
inte
grat
ed ra
tio o
f H3K
9me3
si
gnal
out
side
the
maj
sat f
oci
0"
0,01"
0,02"
0,03"
0,04"
0,05"
0,06"
0,07"
0,08"
0,09"
nt pop1 pop2 pop3
inte
grat
ed ra
tio o
f Hoe
chst
sign
al
insi
de th
e m
ajsa
t foc
i
0"
0,02"
0,04"
0,06"
0,08"
0,1"
0,12"
0,14"
0,16"
0,18"
0,2"
nt pop1 pop2 pop3
inte
grat
ed ra
tio o
f TA
LE N
212-
m
JMJD
2D si
gnal
*** ***
***
n=70 n=53 n=56 n=17 n=70 n=53 n=56 n=17
n=70 n=53 n=56 n=17 n=70 n=53 n=56 n=17
Figure 49. Quantification of H3K9me3, TALE signal and Hoechst signal in cells transfected with TALE
N212-mJMJD2D and in non-transfected cells. A) The integrated ratio of the H3K9me3 signal inside the major
satellite foci is measured for the three populations of the cells transfected with TALE N212-mJMJD2D. B) The
quantification of the TALE signal ratio in the different populations of cells and in non-transfected cells shows a
progressive increase of the TALE signal. C) The ratio of the H3K9me3 signal outside the major satellite foci
does not change for any of the populations in comparison with the cells negative for the TALE signal. D) There
is no significant effect on the Hoechst signal ratio for either population compared to the TALE-negative cells.
The statistical analysis was made using Mann-Whitney-Wilcoxon test, ***p value <0.001, compared to nt.
2.3. Effect of the demethylation of H3K9me3 on major satellite foci
Since the H3K9me3 decrease in the major satellite foci is associated with an abnormal
form of chromocenters in the cells expressing the highest level of TALE N212-mJMJD2D
(population 3, Figure 45A), we wanted to quantify more precisely this morphological changes
of the major satellite foci. For this, we measured the number, volume and the elongation of
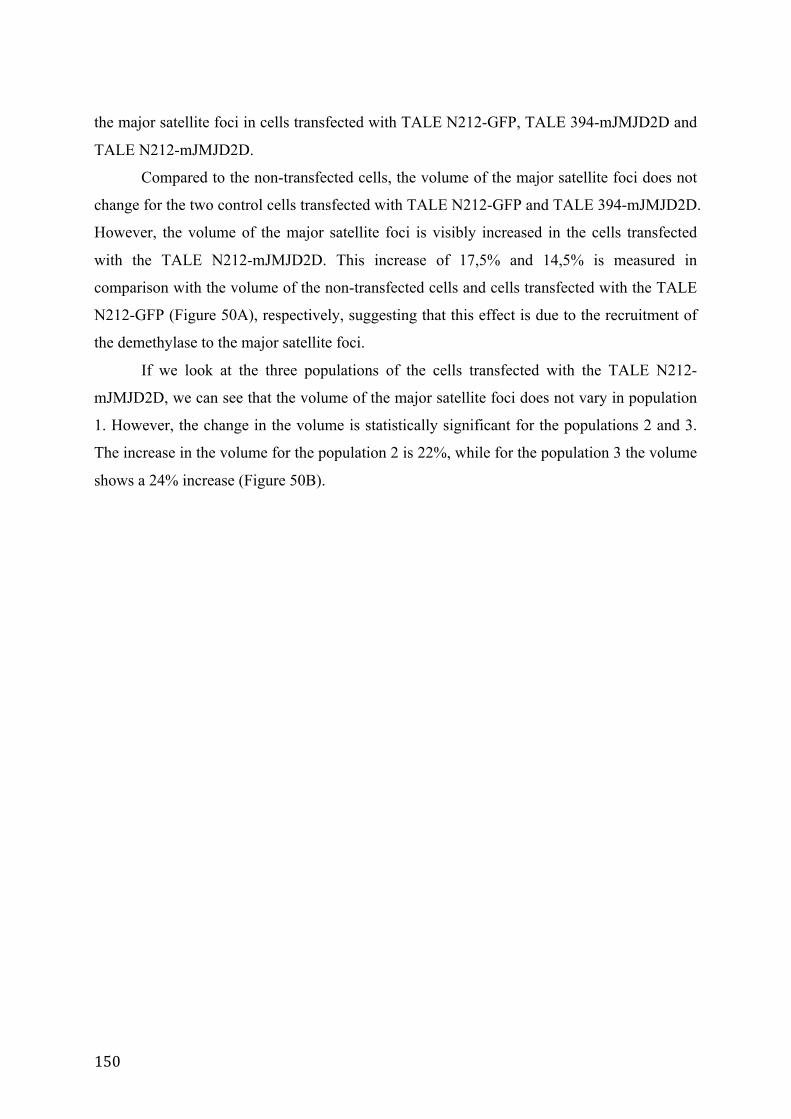
150
the major satellite foci in cells transfected with TALE N212-GFP, TALE 394-mJMJD2D and
TALE N212-mJMJD2D.
Compared to the non-transfected cells, the volume of the major satellite foci does not
change for the two control cells transfected with TALE N212-GFP and TALE 394-mJMJD2D.
However, the volume of the major satellite foci is visibly increased in the cells transfected
with the TALE N212-mJMJD2D. This increase of 17,5% and 14,5% is measured in
comparison with the volume of the non-transfected cells and cells transfected with the TALE
N212-GFP (Figure 50A), respectively, suggesting that this effect is due to the recruitment of
the demethylase to the major satellite foci.
If we look at the three populations of the cells transfected with the TALE N212-
mJMJD2D, we can see that the volume of the major satellite foci does not vary in population
1. However, the change in the volume is statistically significant for the populations 2 and 3.
The increase in the volume for the population 2 is 22%, while for the population 3 the volume
shows a 24% increase (Figure 50B).
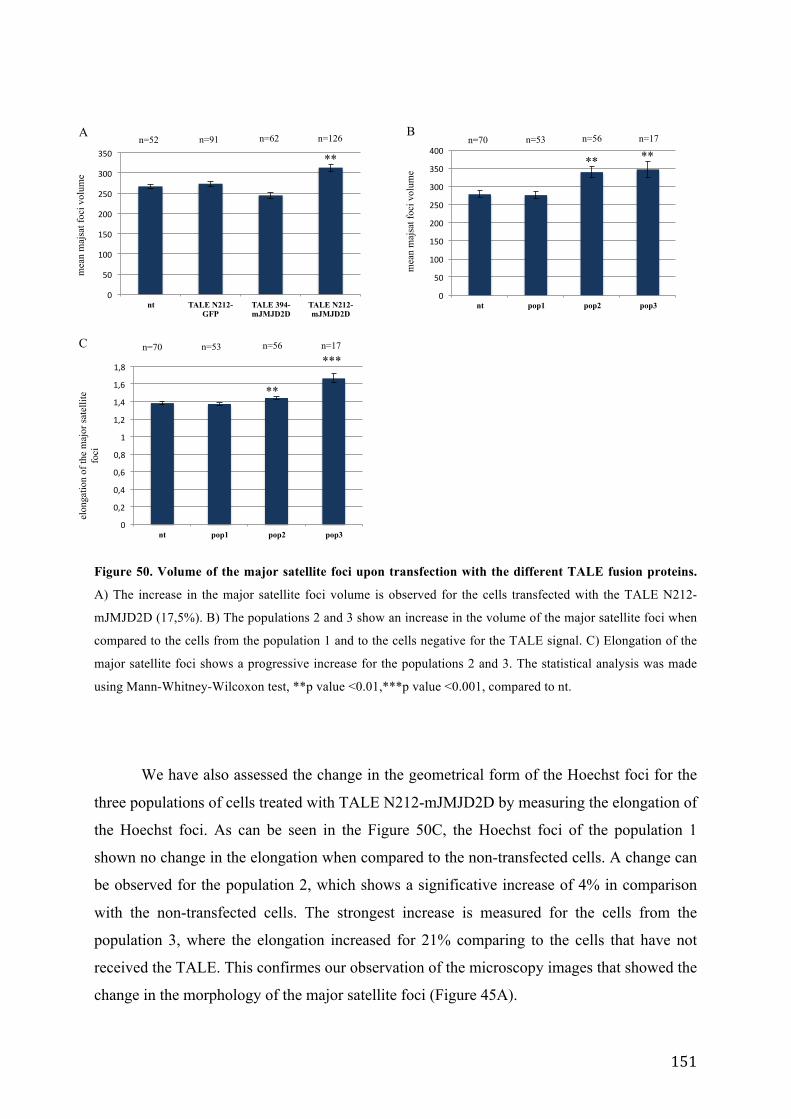
151
A B
0"
50"
100"
150"
200"
250"
300"
350"
nt TALE N212-GFP
TALE 394-mJMJD2D
TALE N212-mJMJD2D
mea
n m
ajsa
t foc
i vol
ume
0"
50"
100"
150"
200"
250"
300"
350"
400"
nt pop1 pop2 pop3
mea
n m
ajsa
t foc
i vol
ume
** ** **
0"
0,2"
0,4"
0,6"
0,8"
1"
1,2"
1,4"
1,6"
1,8"
nt pop1 pop2 pop3
elon
gatio
n of
the
maj
or s
atel
lite
fo
ci
C
**
***
n=52 n=91 n=62 n=126
n=70 n=53 n=56 n=17
n=70 n=53 n=56 n=17
Figure 50. Volume of the major satellite foci upon transfection with the different TALE fusion proteins.
A) The increase in the major satellite foci volume is observed for the cells transfected with the TALE N212-
mJMJD2D (17,5%). B) The populations 2 and 3 show an increase in the volume of the major satellite foci when
compared to the cells from the population 1 and to the cells negative for the TALE signal. C) Elongation of the
major satellite foci shows a progressive increase for the populations 2 and 3. The statistical analysis was made
using Mann-Whitney-Wilcoxon test, **p value <0.01,***p value <0.001, compared to nt.
We have also assessed the change in the geometrical form of the Hoechst foci for the
three populations of cells treated with TALE N212-mJMJD2D by measuring the elongation of
the Hoechst foci. As can be seen in the Figure 50C, the Hoechst foci of the population 1
shown no change in the elongation when compared to the non-transfected cells. A change can
be observed for the population 2, which shows a significative increase of 4% in comparison
with the non-transfected cells. The strongest increase is measured for the cells from the
population 3, where the elongation increased for 21% comparing to the cells that have not
received the TALE. This confirmes our observation of the microscopy images that showed the
change in the morphology of the major satellite foci (Figure 45A).
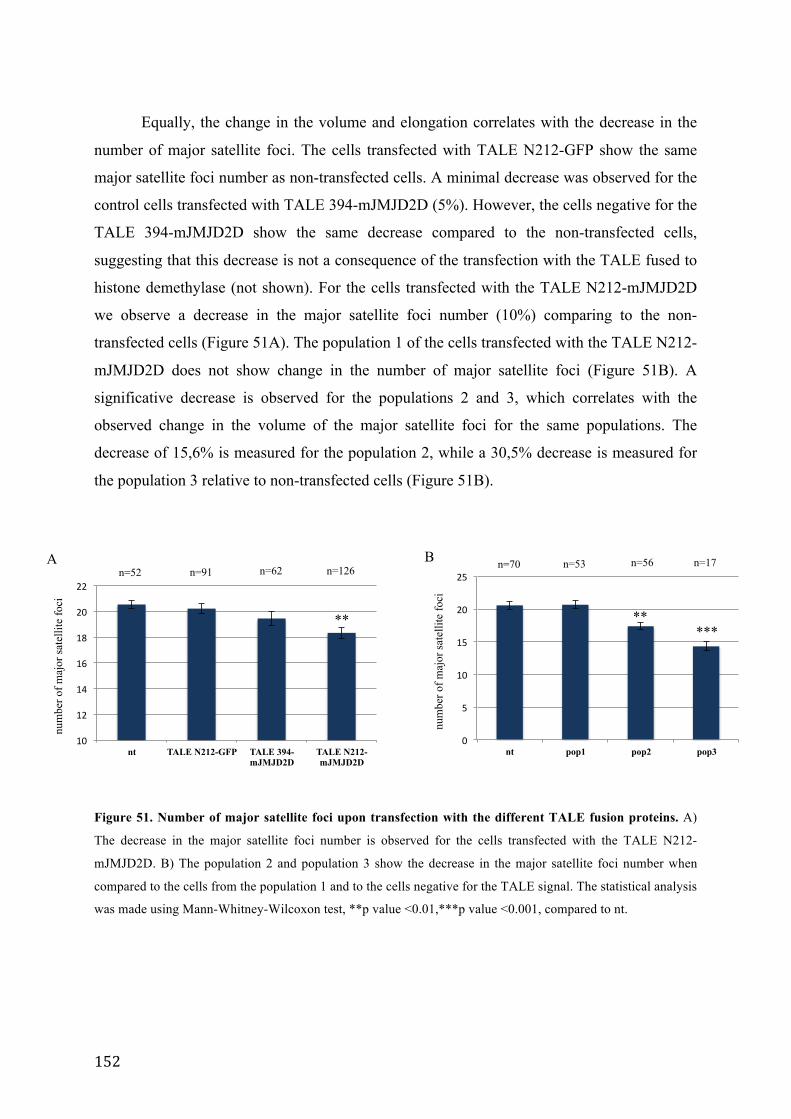
152
Equally, the change in the volume and elongation correlates with the decrease in the
number of major satellite foci. The cells transfected with TALE N212-GFP show the same
major satellite foci number as non-transfected cells. A minimal decrease was observed for the
control cells transfected with TALE 394-mJMJD2D (5%). However, the cells negative for the
TALE 394-mJMJD2D show the same decrease compared to the non-transfected cells,
suggesting that this decrease is not a consequence of the transfection with the TALE fused to
histone demethylase (not shown). For the cells transfected with the TALE N212-mJMJD2D
we observe a decrease in the major satellite foci number (10%) comparing to the non-
transfected cells (Figure 51A). The population 1 of the cells transfected with the TALE N212-
mJMJD2D does not show change in the number of major satellite foci (Figure 51B). A
significative decrease is observed for the populations 2 and 3, which correlates with the
observed change in the volume of the major satellite foci for the same populations. The
decrease of 15,6% is measured for the population 2, while a 30,5% decrease is measured for
the population 3 relative to non-transfected cells (Figure 51B).
10"
12"
14"
16"
18"
20"
22"
nt TALE N212-GFP TALE 394-mJMJD2D
TALE N212-mJMJD2D
num
ber o
f maj
or s
atel
lite
foci
0"
5"
10"
15"
20"
25"
nt pop1 pop2 pop3
num
ber o
f maj
or s
atel
lite
foci
A B
** ** ***
n=52 n=91 n=62 n=126 n=70 n=53 n=56 n=17
Figure 51. Number of major satellite foci upon transfection with the different TALE fusion proteins. A)
The decrease in the major satellite foci number is observed for the cells transfected with the TALE N212-
mJMJD2D. B) The population 2 and population 3 show the decrease in the major satellite foci number when
compared to the cells from the population 1 and to the cells negative for the TALE signal. The statistical analysis
was made using Mann-Whitney-Wilcoxon test, **p value <0.01,***p value <0.001, compared to nt.
153
Concerning the organisation of the major satellite foci, we can conclude that first, the
ratio of Hoechst signal inside the major satellite foci does not vary in non-transfected neither
in cells transfected with the different TALE fusion proteins (Figure 48C and 49D), suggesting
that the total quantity of Hoechst signal inside all major satellite foci is not affected by the
TALE proteins; second, the recruitment of the TALE N212-mJMJD2D on major satellite
repeats induced the increase in the volume and the form of the major satellite foci that is more
accentuate in the populations 2 and 3 and correlated with the quantity of the TALE proteins in
the cells (Figure 50); third, the increased level of TALE N212-mJMJD2D in transfected cells
is associated with a decrease of the number of Hoechst foci (Figure 51).
II. 3. Conclusion and discussion
We have shown that the TALE fusion proteins, TALE N212-GFP and TALE N212-
mJMJD2D, specifically designed to target an 18 bp sequence at the major satellites are
expressed in mouse cells and recruited to their DNA binding site. The transfection with the
TALE N212-mJMJD2D, but not with the TALE N212-GFP or the control TALE 394-
mJMJD2D, specifically abolished the H3K9me3 mark from the major satellite region and
triggered morphological changes of the chromocenters in some of the transfected nuclei.
The use of TALE DNA binding domain for epigenetic engineering at major satellites
In this study we made use of the TALE DNA binding domain, designed to target
major satellite repeats, to introduce targeted chromatin modifications to this region. The
choice for the use of the TALE proteins was made at the time when the TALE technology
was being developed for targeted genome engineering. The use of TALE was justified by the
fact that the use of this technology allow us to target endogenous sequences, without the need
for insertion of foreign sequences into the host cells. Moreover, targeting of the repetitive
sequences allows an efficient visualisation of the TALE protein. Today, the CRISPR/Cas9
system is quickly replacing the use of TALE proteins. We could therefore assume that the use
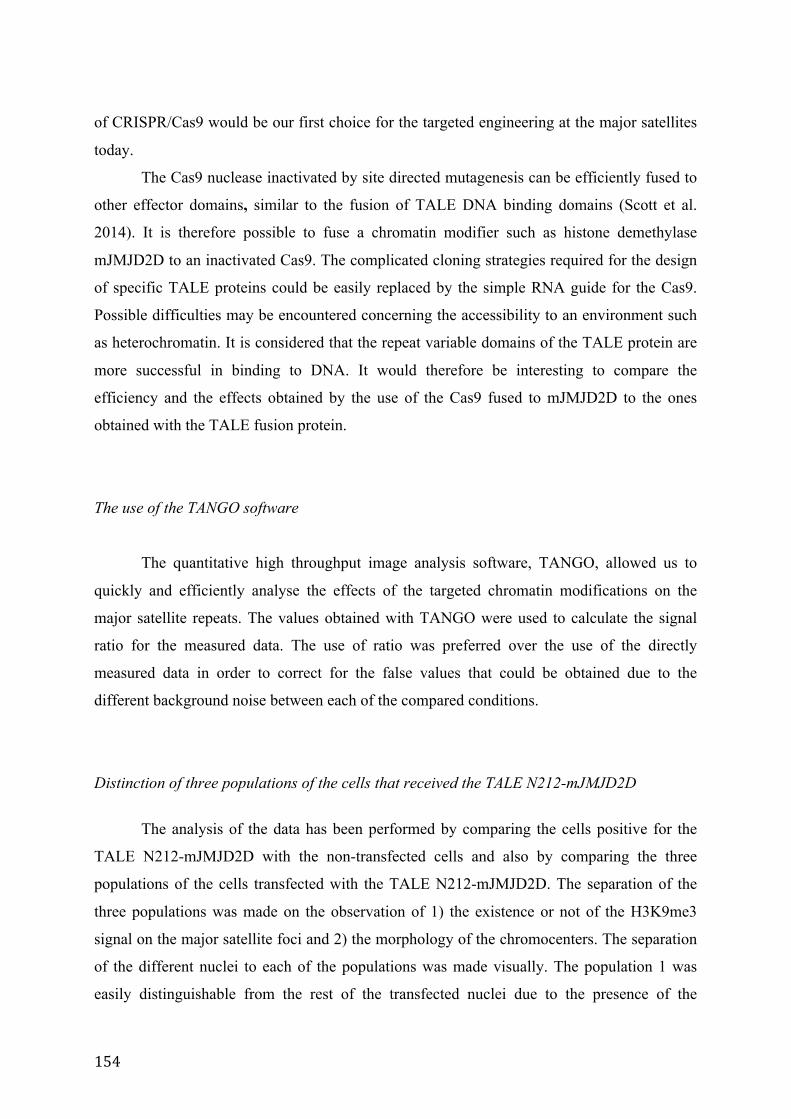
154
of CRISPR/Cas9 would be our first choice for the targeted engineering at the major satellites
today.
The Cas9 nuclease inactivated by site directed mutagenesis can be efficiently fused to
other effector domains, similar to the fusion of TALE DNA binding domains (Scott et al.
2014). It is therefore possible to fuse a chromatin modifier such as histone demethylase
mJMJD2D to an inactivated Cas9. The complicated cloning strategies required for the design
of specific TALE proteins could be easily replaced by the simple RNA guide for the Cas9.
Possible difficulties may be encountered concerning the accessibility to an environment such
as heterochromatin. It is considered that the repeat variable domains of the TALE protein are
more successful in binding to DNA. It would therefore be interesting to compare the
efficiency and the effects obtained by the use of the Cas9 fused to mJMJD2D to the ones
obtained with the TALE fusion protein.
The use of the TANGO software
The quantitative high throughput image analysis software, TANGO, allowed us to
quickly and efficiently analyse the effects of the targeted chromatin modifications on the
major satellite repeats. The values obtained with TANGO were used to calculate the signal
ratio for the measured data. The use of ratio was preferred over the use of the directly
measured data in order to correct for the false values that could be obtained due to the
different background noise between each of the compared conditions.
Distinction of three populations of the cells that received the TALE N212-mJMJD2D
The analysis of the data has been performed by comparing the cells positive for the
TALE N212-mJMJD2D with the non-transfected cells and also by comparing the three
populations of the cells transfected with the TALE N212-mJMJD2D. The separation of the
three populations was made on the observation of 1) the existence or not of the H3K9me3
signal on the major satellite foci and 2) the morphology of the chromocenters. The separation
of the different nuclei to each of the populations was made visually. The population 1 was
easily distinguishable from the rest of the transfected nuclei due to the presence of the
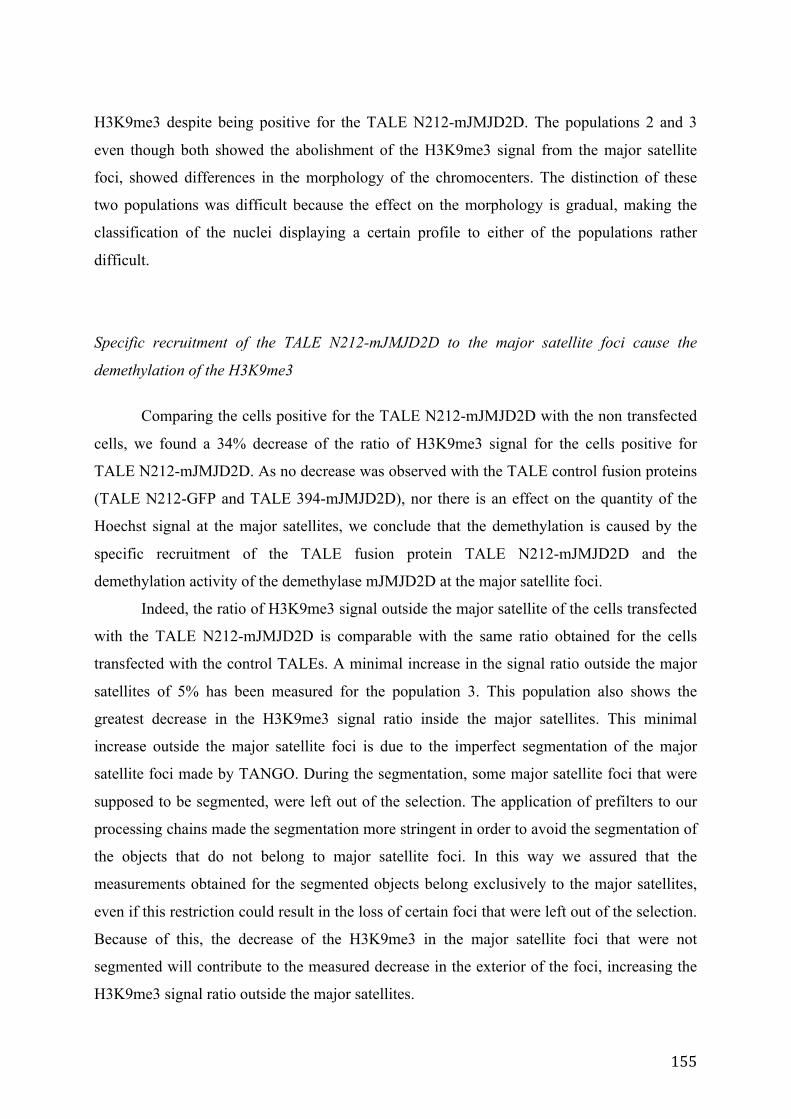
155
H3K9me3 despite being positive for the TALE N212-mJMJD2D. The populations 2 and 3
even though both showed the abolishment of the H3K9me3 signal from the major satellite
foci, showed differences in the morphology of the chromocenters. The distinction of these
two populations was difficult because the effect on the morphology is gradual, making the
classification of the nuclei displaying a certain profile to either of the populations rather
difficult.
Specific recruitment of the TALE N212-mJMJD2D to the major satellite foci cause the
demethylation of the H3K9me3
Comparing the cells positive for the TALE N212-mJMJD2D with the non transfected
cells, we found a 34% decrease of the ratio of H3K9me3 signal for the cells positive for
TALE N212-mJMJD2D. As no decrease was observed with the TALE control fusion proteins
(TALE N212-GFP and TALE 394-mJMJD2D), nor there is an effect on the quantity of the
Hoechst signal at the major satellites, we conclude that the demethylation is caused by the
specific recruitment of the TALE fusion protein TALE N212-mJMJD2D and the
demethylation activity of the demethylase mJMJD2D at the major satellite foci.
Indeed, the ratio of H3K9me3 signal outside the major satellite of the cells transfected
with the TALE N212-mJMJD2D is comparable with the same ratio obtained for the cells
transfected with the control TALEs. A minimal increase in the signal ratio outside the major
satellites of 5% has been measured for the population 3. This population also shows the
greatest decrease in the H3K9me3 signal ratio inside the major satellites. This minimal
increase outside the major satellite foci is due to the imperfect segmentation of the major
satellite foci made by TANGO. During the segmentation, some major satellite foci that were
supposed to be segmented, were left out of the selection. The application of prefilters to our
processing chains made the segmentation more stringent in order to avoid the segmentation of
the objects that do not belong to major satellite foci. In this way we assured that the
measurements obtained for the segmented objects belong exclusively to the major satellites,
even if this restriction could result in the loss of certain foci that were left out of the selection.
Because of this, the decrease of the H3K9me3 in the major satellite foci that were not
segmented will contribute to the measured decrease in the exterior of the foci, increasing the
H3K9me3 signal ratio outside the major satellites.
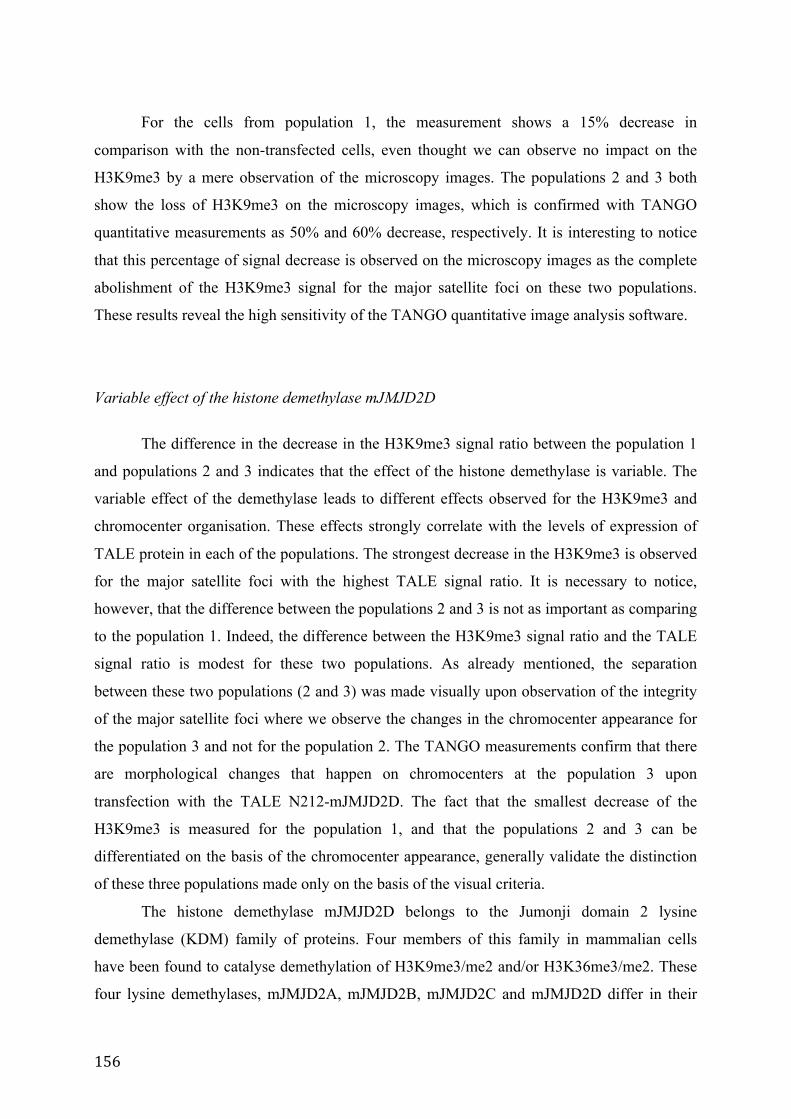
156
For the cells from population 1, the measurement shows a 15% decrease in
comparison with the non-transfected cells, even thought we can observe no impact on the
H3K9me3 by a mere observation of the microscopy images. The populations 2 and 3 both
show the loss of H3K9me3 on the microscopy images, which is confirmed with TANGO
quantitative measurements as 50% and 60% decrease, respectively. It is interesting to notice
that this percentage of signal decrease is observed on the microscopy images as the complete
abolishment of the H3K9me3 signal for the major satellite foci on these two populations.
These results reveal the high sensitivity of the TANGO quantitative image analysis software.
Variable effect of the histone demethylase mJMJD2D
The difference in the decrease in the H3K9me3 signal ratio between the population 1
and populations 2 and 3 indicates that the effect of the histone demethylase is variable. The
variable effect of the demethylase leads to different effects observed for the H3K9me3 and
chromocenter organisation. These effects strongly correlate with the levels of expression of
TALE protein in each of the populations. The strongest decrease in the H3K9me3 is observed
for the major satellite foci with the highest TALE signal ratio. It is necessary to notice,
however, that the difference between the populations 2 and 3 is not as important as comparing
to the population 1. Indeed, the difference between the H3K9me3 signal ratio and the TALE
signal ratio is modest for these two populations. As already mentioned, the separation
between these two populations (2 and 3) was made visually upon observation of the integrity
of the major satellite foci where we observe the changes in the chromocenter appearance for
the population 3 and not for the population 2. The TANGO measurements confirm that there
are morphological changes that happen on chromocenters at the population 3 upon
transfection with the TALE N212-mJMJD2D. The fact that the smallest decrease of the
H3K9me3 is measured for the population 1, and that the populations 2 and 3 can be
differentiated on the basis of the chromocenter appearance, generally validate the distinction
of these three populations made only on the basis of the visual criteria.
The histone demethylase mJMJD2D belongs to the Jumonji domain 2 lysine
demethylase (KDM) family of proteins. Four members of this family in mammalian cells
have been found to catalyse demethylation of H3K9me3/me2 and/or H3K36me3/me2. These
four lysine demethylases, mJMJD2A, mJMJD2B, mJMJD2C and mJMJD2D differ in their
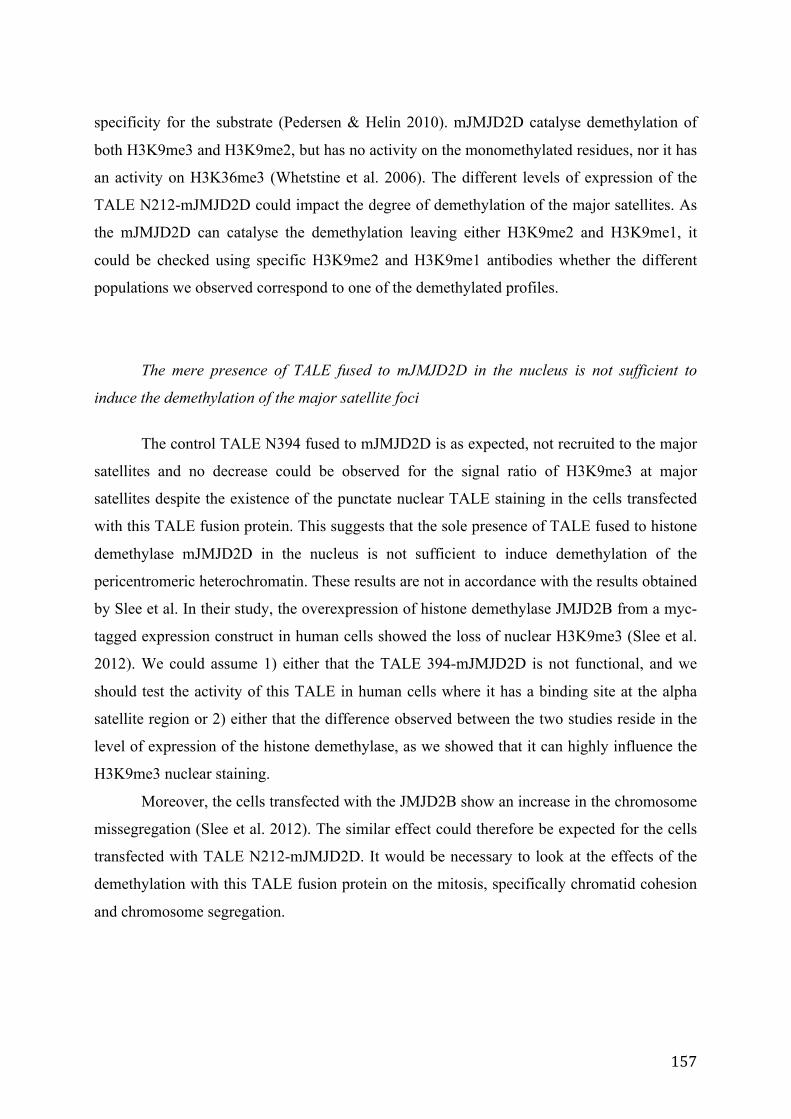
157
specificity for the substrate (Pedersen & Helin 2010). mJMJD2D catalyse demethylation of
both H3K9me3 and H3K9me2, but has no activity on the monomethylated residues, nor it has
an activity on H3K36me3 (Whetstine et al. 2006). The different levels of expression of the
TALE N212-mJMJD2D could impact the degree of demethylation of the major satellites. As
the mJMJD2D can catalyse the demethylation leaving either H3K9me2 and H3K9me1, it
could be checked using specific H3K9me2 and H3K9me1 antibodies whether the different
populations we observed correspond to one of the demethylated profiles.
The mere presence of TALE fused to mJMJD2D in the nucleus is not sufficient to
induce the demethylation of the major satellite foci
The control TALE N394 fused to mJMJD2D is as expected, not recruited to the major
satellites and no decrease could be observed for the signal ratio of H3K9me3 at major
satellites despite the existence of the punctate nuclear TALE staining in the cells transfected
with this TALE fusion protein. This suggests that the sole presence of TALE fused to histone
demethylase mJMJD2D in the nucleus is not sufficient to induce demethylation of the
pericentromeric heterochromatin. These results are not in accordance with the results obtained
by Slee et al. In their study, the overexpression of histone demethylase JMJD2B from a myc-
tagged expression construct in human cells showed the loss of nuclear H3K9me3 (Slee et al.
2012). We could assume 1) either that the TALE 394-mJMJD2D is not functional, and we
should test the activity of this TALE in human cells where it has a binding site at the alpha
satellite region or 2) either that the difference observed between the two studies reside in the
level of expression of the histone demethylase, as we showed that it can highly influence the
H3K9me3 nuclear staining.
Moreover, the cells transfected with the JMJD2B show an increase in the chromosome
missegregation (Slee et al. 2012). The similar effect could therefore be expected for the cells
transfected with TALE N212-mJMJD2D. It would be necessary to look at the effects of the
demethylation with this TALE fusion protein on the mitosis, specifically chromatid cohesion
and chromosome segregation.
158
Effect of the demethylation of H3K9me3 on the organisation of major satellite foci
As already discussed in the previous chapters, the Suv39h histone methyltransferase
converts the H3K9me1 to H3K9me3, inducing the binding of HP1, which is the hallmark of
heterochromatin (Rea et al. 2000; Lachner et al. 2001b). The loss of Suv39h histone
methyltransferase disrupts the H3K9me3 from major satellites, leaving the H3K9 in a
monomethylated state and abolishing the HP1 binding to the major satellites, but still
preserving the organisation of the major satellite foci (Peters et al. 2001).
We showed that the demethylation of the H3K9me3 with the TALE N212-mJMJD2D
triggers morphological changes of the chromocenters. The major satellite foci show an
increase in their volume and the decrease in their number in the cells transfected with the
TALE N212-mJMJD2D comparing to control cells. The measure of the elongation allowed us
to verify the form of the major satellite foci for each of the populations. The 20% change in
the elongation was measured for the the population 3 comparing to non transfected cells,
which further confirmed that the minority of the cells (17/126) display an aberrant form of
chromocenters. These results suggest that the demethylation of the H3K9me3 epigenetic mark
is associated with a disorganisation of major satellite foci, that change their form and become
larger, which may be a result of the merging of several chromocenters.
The monomethylation of H3K9 is catalysed by two histone methyltransferases, Prdm3
and Prdm16. It has been shown that the double knock down of these two methyltransferases
abolishes the H3K9me3 and disintegrates the major satellite foci (Pinheiro et al. 2012). The
effect on the major satellite foci is even more pronounced in cells both double null for Suv39h
and knock down for Prdm3/Prdm16. Moreover, these cells display the unstructured nuclear
lamina that probably results in the breaking of the heterochromatin anchor in the nuclear
lamina. This suggests that the H3K9me1 is important for the subsequent conversion of
H3K9me1 to H3K9me3 by Suv39h and that there is a yet unknown factor required for the
integrity of the chromocenters. The HDAC inhibitor TSA, which also interferes with the
H3K9me3 and H3K9me1 has been shown to partially dissolve the major satellite foci which
relocate toward the nuclear periphery with, however, no effect on the nuclear lamina (Taddei
et al. 2001; Pinheiro et al. 2012).
While the loss of H3K9me3 in Suv39h double null cells alone is not sufficient to
induce changes on chromocenter organisation, the demethylation induced by mJMJD2D
affects the major satellite clustering. The effect of the TALE fused to mJMJD2D shows
159
however only a minor effect on the major satellites. This suggests possible other mechanisms
that conserve the chromocenter organisation in Suv39h double null cells that are affected by
the mJMJD2D induced demethylation of H3K9me3.
The HP1 binding to heterochromatin is dependent on the H3K9me3. It is probable that
the HP1 binding is compromised in the cells transfected with the TALE N212-mJMJD2D.
The HP1 recruitment could be verified by ChIP qPCR in cells treated with TALE N212-
mJMJD2D. The changes introduced to the heterochromatin might also have a strong impact
on the transcription from major satellites. Derepression of major satellite transcripts has been
observed in the cells depleted from Suv39h histone methyltransferase and in Prdm3/Prdm16
double knock down (Lehnertz et al. 2003; Pinheiro et al. 2012). We could therefore expect the
derepression of the major satellites in the cells transfected with TALE N212-mJMJD2D. The
level of transcription of major satellites, but also minor satellites, especially in the cells with
the high expression of TALE proteins could be monitored by strand specific qRT PCR with
the use of sequence specific primers (see Chapter I, Results). The major satellite transcription
could also be investigated by RNA FISH using specific LNA probes that targeting major
satellites. With the use of the TANGO software it would also be interesting to verify if the
affected chromocenters show a change their in position in the nucleus.
160
General conclusion and perspectives
Mouse major satellites are formed of repetitive DNA that surrounds the centromeres.
These sequences display characteristic epigenetic marks and show transcriptional activity.
Also, in the nucleus, major satellites are organised in distinct nuclear structures,
chromocenters, during interphase. There are numerous questions that remain unanswered
concerning this specific chromatin region: i) what is the role of the non-coding transcripts, if
any, in centromere formation and maintenance? ii) what are the mechanisms that drive the
expression of these transcripts? iii) is there an equal contribution of the transcripts from both
strands? iv) what is the contribution of short vs long transcripts? v) are the transcripts post-
transcriptionally processed? vi) how is their transcription modulated in response to
physiological changes? vii) what is the correlation of transcription with epigenetic marks
found on heterochromatin? viii) what is the correlation between chromocenter organisation,
transcription and epigenetic marks? ix) how does the change in epigenetic marks and
transcriptional activity impact genomic stability?
To answer some of this questions, this work was divided in two parts. In the first part,
we used LNA modified oligonucleotides to characterise the transcripts from major satellites in
normal growing conditions and upon stress. In the other part of the work, we use a novel
technique that is based on the fusion of TALE DNA binding domain to induce the
demethylation of H3K9me3 at major satellites specifically, in order to study its effects on the
organisation of chromocenters.
Our use of LNA modified oligonucleotides as probes for northern blot did not allow us
to correctly characterise the transcriptional profile of major satellites. Even thought LNA
modified probes were already used in northern blot experiments for characterization of low
abundant miRNA molecules (Válóczi et al. 2004), they were never used for characterisation
of non-coding transcripts from the repetitive regions such as major satellite. Previous studies
that investigated the transcription from major satellite on northern blot experiments used
mostly DNA or RNA probes, that do not highlight distinct bands but mostly show the
existence of transcriptional activity in the form of a smear (Lu & Gilbert 2007; Hsieh et al.
2011; Bulut-Karslioglu et al. 2012b). These experiences pointed to the existence of major
161
satellite transcripts of various sizes that accumulate during different stages of the cell cycle
(Lu & Gilbert 2007) or show an enrichment of longer species upon down regulation of a
heterochromatin-associated protein WDHD1 (Hsieh et al. 2011), with no indication of the
precise size or strand of origin of the RNA. LNA modified probes were successfully used in
RNA FISH experiments to monitor major satellite transcription in mouse embryos (Probst et
al. 2010). A recent study made use of LNA gapmer oligonucleotides for a specific knock
down of major satellite transcripts (Casanova et al. 2013). We showed that the use of LNA
modified oligonucleotides allows the detection of single transcripts on the blot. However,
because of the hybridization on various known RNA molecules and the lack of strategies for
the elimination of this non-specific signal prevented us from determining which of the
transcripts are indeed of major satellite origin. These experiences question the relevance for
the use of these oligonucleotides for a specific detection of transcripts from repetitive
sequences by northern blotting.
It is known that the variations in major satellite transcription correlate with changes in
the epigenetic status of these sequences. Elevated transcription has been observed for cells
deficient for the Suv39h histone methyltransferase. Some studies point to the correlation
between the major satellite transcription and the organisation of major satellites into
chromocenters. For example, elevated levels of major satellite transcripts correlate with
enhanced H4K20me3 and H3K9me3 marks during muscle cell differentiation (Terranova et al.
2005). The peak of major satellite transcription and their subsequent downregulation coincide
with the time of chromocenter formation during embryo development. Moreover, knock down
of reverse major satellite transcripts has been shown to prevent chromocenter organisation
during embryo development (Casanova et al. 2013). These studies clearly point to the role of
these transcripts in major satellite clustering. Indeed, a single stranded major satellite
transcript associates with HP1 at heterochromatin. This indicates the possible structural role
for major satellite transcripts (Maison et al. 2011).
There have been several studies that used TALE binding domain fused to different
chromatin modifiers to directly interfere with epigenetic marks on different genomic loci
(Konermann et al. 2013; Mendenhall et al. 2013). We have shown that the targeting of the
histone demethylase mJMJD2D fused to a TALE binding domain designed to target major
satellites is an efficient way to specifically modify H3K9me3 epigenetic mark on the major
satellite region. The use of TALE DNA binding domain provides new means to simply and
efficiently target histone modifications. We have shown that by demethylating the H3K9me3
162
we are able to induce morphological changes in the chromocenters in transfected cells, and
that these changes correlate with the level of expression of the TALE fusion protein. This new
approach of targeted genome engineering opens new possibilities to directly study the
implication of epigenetic marks on different aspects of chromatin, such as its structural
organisation and transcription.
TALE DNA binding domains can be fused to other chromatin modifiers to target
different epigenetic marks at major satellites to compare their different effects and
interdependence. Changes in epigenetic marks correlate with chromosomal instability, which
is a hallmark of cancers. The use of TALE DNA binding domains fused to various chromatin
modifiers could be a strategy to regulate the level of chromatin modifications in the cells to
gain insight in their effect on chromosomal instability.
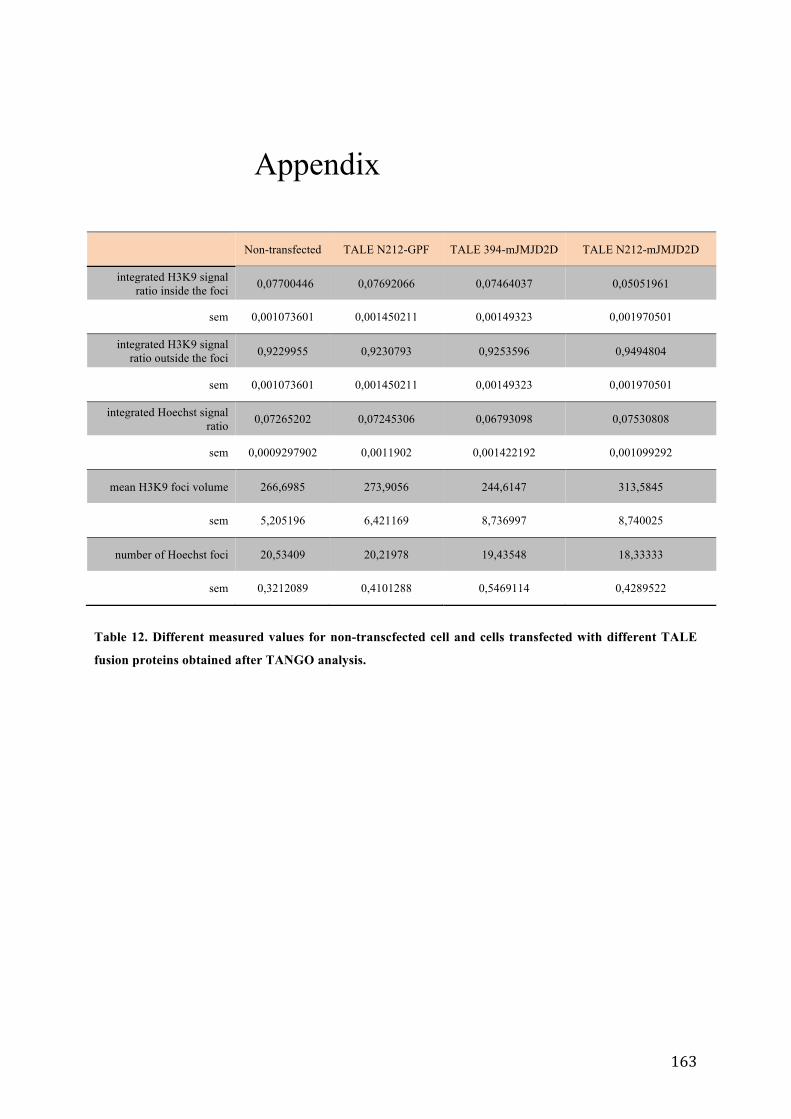
163
Appendix
Non-transfected TALE N212-GPF TALE 394-mJMJD2D TALE N212-mJMJD2D
integrated H3K9 signal ratio inside the foci 0,07700446 0,07692066 0,07464037 0,05051961
sem 0,001073601 0,001450211 0,00149323 0,001970501
integrated H3K9 signal ratio outside the foci 0,9229955 0,9230793 0,9253596 0,9494804
sem 0,001073601 0,001450211 0,00149323 0,001970501
integrated Hoechst signal ratio 0,07265202 0,07245306 0,06793098 0,07530808
sem 0,0009297902 0,0011902 0,001422192 0,001099292
mean H3K9 foci volume 266,6985 273,9056 244,6147 313,5845
sem 5,205196 6,421169 8,736997 8,740025
number of Hoechst foci 20,53409 20,21978 19,43548 18,33333
sem 0,3212089 0,4101288 0,5469114 0,4289522
Table 12. Different measured values for non-transcfected cell and cells transfected with different TALE
fusion proteins obtained after TANGO analysis.
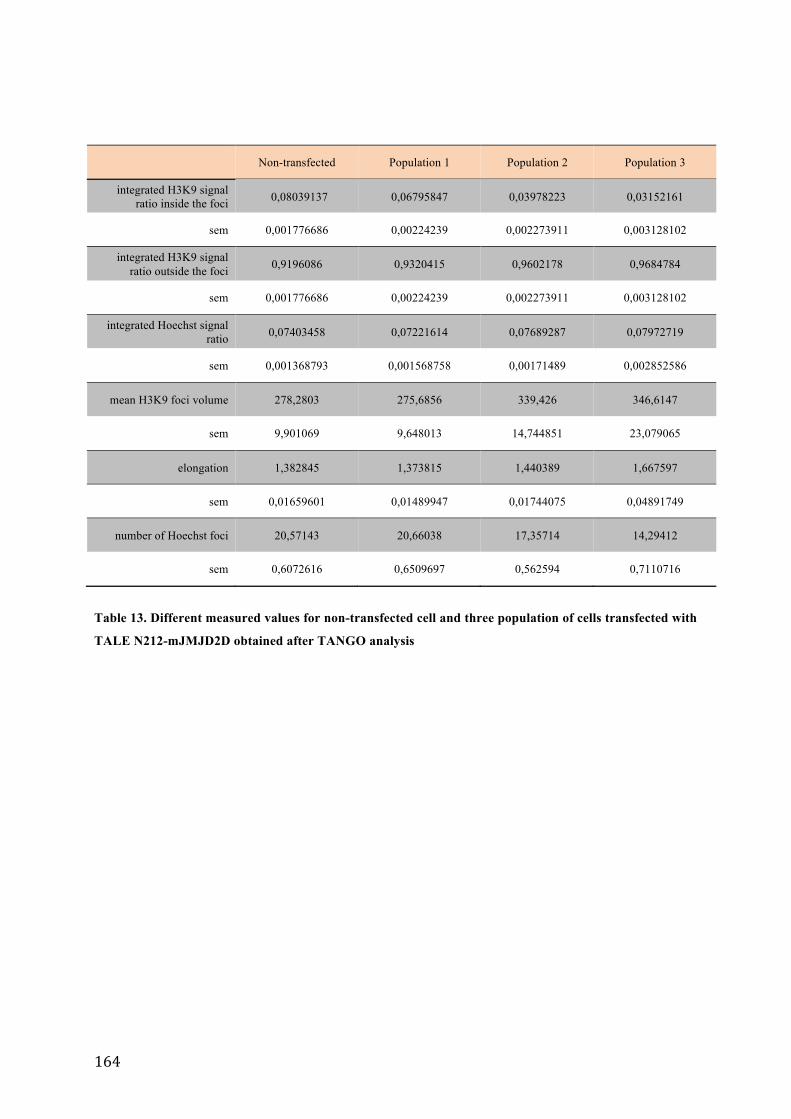
164
Non-transfected Population 1 Population 2 Population 3
integrated H3K9 signal ratio inside the foci 0,08039137 0,06795847 0,03978223 0,03152161
sem 0,001776686 0,00224239 0,002273911 0,003128102
integrated H3K9 signal ratio outside the foci 0,9196086 0,9320415 0,9602178 0,9684784
sem 0,001776686 0,00224239 0,002273911 0,003128102
integrated Hoechst signal ratio 0,07403458 0,07221614 0,07689287 0,07972719
sem 0,001368793 0,001568758 0,00171489 0,002852586
mean H3K9 foci volume 278,2803 275,6856 339,426 346,6147
sem 9,901069 9,648013 14,744851 23,079065
elongation 1,382845 1,373815 1,440389 1,667597
sem 0,01659601 0,01489947 0,01744075 0,04891749
number of Hoechst foci 20,57143 20,66038 17,35714 14,29412
sem 0,6072616 0,6509697 0,562594 0,7110716
Table 13. Different measured values for non-transfected cell and three population of cells transfected with
TALE N212-mJMJD2D obtained after TANGO analysis
165
Bibliography
Allen, T. et al., 2004. The SINE-encoded mouse B2 RNA represses mRNA transcription in response to heat shock. Nature structural & molecular biology, 11(9), pp.816–21. Available at: http://www.ncbi.nlm.nih.gov/pubmed/15300240 [Accessed October 20, 2013].
Allshire, R.C. & Karpen, G.H., 2009. Epigenetic regulation of centromeric chromatin: old dogs, new tricks? Nature reviews. Genetics, 9(12), pp.923–937.
Almeida, R. & Allshire, R.C., 2005. RNA silencing and genome regulation. Trends in cell biology, 15(5), pp.251–8. Available at: http://www.ncbi.nlm.nih.gov/pubmed/15866029 [Accessed August 26, 2014].
Almouzni, G. & Probst, A. V, 2011. Heterochromatin maintenance and establishment: lessons from the mouse pericentromere. Nucleus, 2(5), pp.332–8. Available at: http://www.ncbi.nlm.nih.gov/pubmed/21941119 [Accessed October 9, 2013].
Amato, A. et al., 2009. CENPA overexpression promotes genome instability in pRb-depleted human cells. Molecular cancer, 8, p.119. Available at: http://www.pubmedcentral.nih.gov/articlerender.fcgi?artid=2797498&tool=pmcentrez&rendertype=abstract [Accessed December 10, 2014].
Amor, D.J. & Choo, K.H.A., 2002. Neocentromeres: role in human disease, evolution, and centromere study. American journal of human genetics, 71(4), pp.695–714. Available at: http://www.pubmedcentral.nih.gov/articlerender.fcgi?artid=378529&tool=pmcentrez&rendertype=abstract.
Aravin, A.A. et al., 2003. The small RNA profile during Drosophila melanogaster development. Developmental cell, 5(2), pp.337–50. Available at: http://www.ncbi.nlm.nih.gov/pubmed/12919683 [Accessed November 15, 2014].
Ashe, A. et al., 2012. piRNAs can trigger a multigenerational epigenetic memory in the germline of C. elegans. Cell, 150(1), pp.88–99. Available at: http://www.pubmedcentral.nih.gov/articlerender.fcgi?artid=3464430&tool=pmcentrez&rendertype=abstract [Accessed July 14, 2014].
Bailey, A.O. et al., 2013. Posttranslational modification of CENP-A influences the conformation of centromeric chromatin. Proceedings of the National Academy of Sciences of the United States of America, 110(29), pp.11827–32. Available at: http://www.pubmedcentral.nih.gov/articlerender.fcgi?artid=3718089&tool=pmcentrez&rendertype=abstract [Accessed July 18, 2014].
166
Bannister, A.J. et al., 2001. Selective recognition of methylated lysine 9 on histone H3 by the HP1 chromo domain. Nature, 410(6824), pp.120–4. Available at: http://www.ncbi.nlm.nih.gov/pubmed/11242054.
Barrangou, R. et al., 2007. CRISPR provides acquired resistance against viruses in prokaryotes. Science (New York, N.Y.), 315(5819), pp.1709–12. Available at: http://www.ncbi.nlm.nih.gov/pubmed/17379808 [Accessed July 10, 2014].
Bartel, D.P. & Chen, C.-Z., 2004. Micromanagers of gene expression: the potentially widespread influence of metazoan microRNAs. Nature reviews. Genetics, 5(5), pp.396–400. Available at: http://dx.doi.org/10.1038/nrg1328 [Accessed October 2, 2014].
Beane, R. et al., 2008. Recognition of chromosomal DNA inside cells by locked nucleic acids. Biochemistry, 47(50), pp.13147–9. Available at: http://www.pubmedcentral.nih.gov/articlerender.fcgi?artid=2627484&tool=pmcentrez&rendertype=abstract [Accessed November 6, 2014].
Bennett, C.F. & Swayze, E.E., 2010. RNA targeting therapeutics: molecular mechanisms of antisense oligonucleotides as a therapeutic platform. Annual review of pharmacology and toxicology, 50, pp.259–93. Available at: http://www.ncbi.nlm.nih.gov/pubmed/20055705 [Accessed October 13, 2014].
Berget, S.M., Moore, C. & Sharp, P.A., 1977. Spliced segments at the 5’ terminus of adenovirus 2 late mRNA. Proceedings of the National Academy of Sciences of the United States of America, 74(8), pp.3171–5. Available at: http://www.pubmedcentral.nih.gov/articlerender.fcgi?artid=431482&tool=pmcentrez&rendertype=abstract [Accessed October 1, 2014].
Bergmann, J.H. et al., 2011. Epigenetic engineering shows H3K4me2 is required for HJURP targeting and CENP-A assembly on a synthetic human kinetochore. The EMBO journal, 30(2), pp.328–40. Available at: http://www.pubmedcentral.nih.gov/articlerender.fcgi?artid=3025471&tool=pmcentrez&rendertype=abstract [Accessed July 18, 2014].
Bergmann, J.H. et al., 2012. Epigenetic engineering: histone H3K9 acetylation is compatible with kinetochore structure and function. Journal of cell science, 125(Pt 2), pp.411–21. Available at: http://www.pubmedcentral.nih.gov/articlerender.fcgi?artid=3283876&tool=pmcentrez&rendertype=abstract [Accessed October 13, 2014].
Bernard, P. et al., 2001. Requirement of heterochromatin for cohesion at centromeres. Science (New York, N.Y.), 294(5551), pp.2539–42. Available at: http://www.ncbi.nlm.nih.gov/pubmed/11598266 [Accessed June 4, 2014].
Bernstein, B.E. et al., 2012. An integrated encyclopedia of DNA elements in the human genome. Nature, 489(7414), pp.57–74. Available at: http://www.pubmedcentral.nih.gov/articlerender.fcgi?artid=3439153&tool=pmcentrez&rendertype=abstract [Accessed October 17, 2013].
167
Bernstein, B.E. et al., 2002. Methylation of histone H3 Lys 4 in coding regions of active genes. Proceedings of the National Academy of Sciences of the United States of America, 99(13), pp.8695–700. Available at: http://www.pubmedcentral.nih.gov/articlerender.fcgi?artid=124361&tool=pmcentrez&rendertype=abstract.
Bernstein, E. et al., 2001. Role for a bidentate ribonuclease in the initiation step of RNA interference. Nature, 409(6818), pp.363–6. Available at: http://dx.doi.org/10.1038/35053110 [Accessed July 17, 2014].
Beumer, K.J. et al., 2013. Comparing zinc finger nucleases and transcription activator-like effector nucleases for gene targeting in Drosophila. G3 (Bethesda, Md.), 3(10), pp.1717–25. Available at: http://www.pubmedcentral.nih.gov/articlerender.fcgi?artid=3789796&tool=pmcentrez&rendertype=abstract [Accessed December 9, 2014].
Bierhoff, H., Postepska-Igielska, A. & Grummt, I., 2014. Noisy silence: non-coding RNA and heterochromatin formation at repetitive elements. Epigenetics : official journal of the DNA Methylation Society, 9(1), pp.53–61. Available at: http://www.ncbi.nlm.nih.gov/pubmed/24121539 [Accessed November 18, 2014].
Birmingham, A. et al., 2006. 3’ UTR seed matches, but not overall identity, are associated with RNAi off-targets. Nature methods, 3(3), pp.199–204. Available at: http://dx.doi.org/10.1038/nmeth854 [Accessed November 5, 2014].
Black, B.E., Brock, M.A., et al., 2007. An epigenetic mark generated by the incorporation of CENP-A into centromeric nucleosomes. Proceedings of the National Academy of Sciences of the United States of America, 104(12), pp.5008–13. Available at: http://www.pubmedcentral.nih.gov/articlerender.fcgi?artid=1829255&tool=pmcentrez&rendertype=abstract [Accessed January 5, 2015].
Black, B.E., Jansen, L.E.T., et al., 2007. Centromere identity maintained by nucleosomes assembled with histone H3 containing the CENP-A targeting domain. Molecular cell, 25(2), pp.309–22. Available at: http://www.ncbi.nlm.nih.gov/pubmed/17244537 [Accessed July 10, 2014].
Black, B.E. et al., 2004. Structural determinants for generating centromeric chromatin. Nature, 430(6999), pp.578–582. Available at: http://dx.doi.org/10.1038/nature02766.
Black, B.E. & Bassett, E.A., 2008. The histone variant CENP-A and centromere specification. Current opinion in cell biology, 20(1), pp.91–100. Available at: http://www.ncbi.nlm.nih.gov/pubmed/18226513 [Accessed January 1, 2015].
Blower, M.D., Sullivan, B. a & Karpen, G.H., 2002. Conserved organization of centromeric chromatin in flies and humans. Developmental cell, 2(3), pp.319–30. Available at: http://www.pubmedcentral.nih.gov/articlerender.fcgi?artid=3192492&tool=pmcentrez&rendertype=abstract.
168
Boch, J. et al., 2009. Breaking the code of DNA binding specificity of TAL-type III effectors. Science (New York, N.Y.), 326(5959), pp.1509–12. Available at: http://www.ncbi.nlm.nih.gov/pubmed/19933107 [Accessed July 14, 2014].
Boch, J. & Bonas, U., 2010. Xanthomonas AvrBs3 family-type III effectors: discovery and function. Annual review of phytopathology, 48, pp.419–36. Available at: http://www.ncbi.nlm.nih.gov/pubmed/19400638 [Accessed November 7, 2014].
Bolotin, A. et al., 2005. Clustered regularly interspaced short palindrome repeats (CRISPRs) have spacers of extrachromosomal origin. Microbiology (Reading, England), 151(Pt 8), pp.2551–61. Available at: http://www.ncbi.nlm.nih.gov/pubmed/16079334 [Accessed July 14, 2014].
Boros, J. et al., 2014. Polycomb repressive complex 2 and H3K27me3 cooperate with H3K9 methylation to maintain heterochromatin protein 1α at chromatin. Molecular and cellular biology, 34(19), pp.3662–74. Available at: http://mcb.asm.org/content/34/19/3662.abstract [Accessed March 19, 2015].
Bourc’his, D. & Voinnet, O., 2010. A small-RNA perspective on gametogenesis, fertilization, and early zygotic development. Science (New York, N.Y.), 330(6004), pp.617–22. Available at: http://www.sciencemag.org.gate1.inist.fr/content/330/6004/617.abstract?sid=b4926977-496c-4f7e-ac81-407c791dc358 [Accessed July 30, 2014].
Bouzinba-Segard, H., Guais, A. & Francastel, C., 2006. Accumulation of small murine minor satellite transcripts leads to impaired centromeric architecture and function. Proceedings of the National Academy of Sciences of the United States of America, 103(23), pp.8709–14. Available at: http://www.pubmedcentral.nih.gov/articlerender.fcgi?artid=1482643&tool=pmcentrez&rendertype=abstract.
Braasch, D.A. & Corey, D.R., 2001. Locked nucleic acid (LNA): fine-tuning the recognition of DNA and RNA. Chemistry & Biology, 8(1), pp.1–7. Available at: http://www.sciencedirect.com/science/article/pii/S1074552100000582 [Accessed October 29, 2014].
Britten, R.J. & Davidson, E.H., 1969. Gene regulation for higher cells: a theory. Science (New York, N.Y.), 165(3891), pp.349–57. Available at: http://www.ncbi.nlm.nih.gov/pubmed/5789433.
Brown, K.E. et al., 1997. Association of transcriptionally silent genes with Ikaros complexes at centromeric heterochromatin. Cell, 91(6), pp.845–54. Available at: http://www.ncbi.nlm.nih.gov/pubmed/9413993 [Accessed October 9, 2013].
Bühler, M., Verdel, A. & Moazed, D., 2006. Tethering RITS to a nascent transcript initiates RNAi- and heterochromatin-dependent gene silencing. Cell, 125(5), pp.873–86. Available at: http://www.ncbi.nlm.nih.gov/pubmed/16751098 [Accessed August 15, 2014].
169
Bulut-Karslioglu, A. et al., 2012a. A transcription factor-based mechanism for mouse heterochromatin formation. Nature structural & molecular biology, 19(10), pp.1023–30. Available at: http://www.ncbi.nlm.nih.gov/pubmed/22983563 [Accessed October 20, 2013].
Bulut-Karslioglu, A. et al., 2012b. A transcription factor-based mechanism for mouse heterochromatin formation. Nature structural & molecular biology, 19(10), pp.1023–30. Available at: http://www.ncbi.nlm.nih.gov/pubmed/22983563 [Accessed June 9, 2014].
Casanova, M. et al., 2013. Heterochromatin Reorganization during Early Mouse Development Requires a Single-Stranded Noncoding Transcript. Cell reports, 4(6), pp.1156–67. Available at: http://www.ncbi.nlm.nih.gov/pubmed/24055057 [Accessed September 25, 2013].
Casas-Delucchi, C.S. et al., 2012. Targeted manipulation of heterochromatin rescues MeCP2 Rett mutants and re-establishes higher order chromatin organization. Nucleic acids research, 40(22), p.e176. Available at: http://www.pubmedcentral.nih.gov/articlerender.fcgi?artid=3526307&tool=pmcentrez&rendertype=abstract [Accessed January 26, 2015].
Castel, S.E. & Martienssen, R. a, 2013. RNA interference in the nucleus: roles for small RNAs in transcription, epigenetics and beyond. Nature reviews. Genetics, 14(2), pp.100–12. Available at: http://www.ncbi.nlm.nih.gov/pubmed/23329111 [Accessed October 17, 2013].
Chan, F.L. et al., 2012. Active transcription and essential role of RNA polymerase II at the centromere during mitosis. Proceedings of the National Academy of Sciences of the United States of America, 109(6), pp.1979–84. Available at: http://www.pubmedcentral.nih.gov/articlerender.fcgi?artid=3277563&tool=pmcentrez&rendertype=abstract [Accessed October 27, 2014].
Chan, F.L. & Wong, L.H., 2012. Transcription in the maintenance of centromere chromatin identity. Nucleic acids research, 40(22), pp.11178–88. Available at: http://www.pubmedcentral.nih.gov/articlerender.fcgi?artid=3526279&tool=pmcentrez&rendertype=abstract [Accessed October 20, 2013].
Cheeseman, I.M. et al., 2004. A conserved protein network controls assembly of the outer kinetochore and its ability to sustain tension. Genes & development, 18(18), pp.2255–68. Available at: http://www.pubmedcentral.nih.gov/articlerender.fcgi?artid=517519&tool=pmcentrez&rendertype=abstract [Accessed July 14, 2014].
Cheeseman, I.M. et al., 2006. The conserved KMN network constitutes the core microtubule-binding site of the kinetochore. Cell, 127(5), pp.983–97. Available at: http://www.ncbi.nlm.nih.gov/pubmed/17129783 [Accessed July 16, 2014].
Cheeseman, I.M. & Desai, A., 2008. Molecular architecture of the kinetochore-microtubule interface. Nature reviews. Molecular cell biology, 9(1), pp.33–46. Available at: http://www.ncbi.nlm.nih.gov/pubmed/18097444 [Accessed July 17, 2014].
170
Chow, L.T. et al., 1977. An amazing sequence arrangement at the 5’ ends of adenovirus 2 messenger RNA. Cell, 12(1), pp.1–8. Available at: http://www.ncbi.nlm.nih.gov/pubmed/902310 [Accessed October 1, 2014].
Corneo, G., Ginelli, E. & Polli, E., 1967. A satellite DNA isolated from human tissues. Journal of molecular biology, 23(3), pp.619–22. Available at: http://www.ncbi.nlm.nih.gov/pubmed/6032194.
Costa, F.F., 2008. Non-coding RNAs, epigenetics and complexity. Gene, 410(1), pp.9–17. Available at: http://www.ncbi.nlm.nih.gov/pubmed/18226475 [Accessed October 20, 2013].
Darwiche, N., Freeman, L.A. & Strunnikov, A., 1999. Characterization of the components of the putative mammalian sister chromatid cohesion complex. Gene, 233(1-2), pp.39–47. Available at: http://www.pubmedcentral.nih.gov/articlerender.fcgi?artid=2670183&tool=pmcentrez&rendertype=abstract [Accessed November 18, 2014].
Davidson, E.H., Klein, W.H. & Britten, R.J., 1977. Sequence organization in animal DNA and a speculation on hnRNA as a coordinate regulatory transcript. Developmental biology, 55(1), pp.69–84. Available at: http://www.ncbi.nlm.nih.gov/pubmed/832773 [Accessed October 1, 2014].
Denegri, M. et al., 2002. Human chromosomes 9, 12, and 15 contain the nucleation sites of stress-induced nuclear bodies. Molecular biology of the cell, 13(6), pp.2069–79. Available at: http://www.pubmedcentral.nih.gov/articlerender.fcgi?artid=117625&tool=pmcentrez&rendertype=abstract [Accessed October 20, 2013].
Dernburg, A.F., 2001. Here, there, and everywhere: kinetochore function on holocentric chromosomes. The Journal of cell biology, 153(6), pp.F33–8. Available at: http://www.pubmedcentral.nih.gov/articlerender.fcgi?artid=2192025&tool=pmcentrez&rendertype=abstract [Accessed November 18, 2014].
Dinger, M.E. et al., 2008. Long noncoding RNAs in mouse embryonic stem cell pluripotency and differentiation. Genome research, 18(9), pp.1433–45. Available at: http://www.pubmedcentral.nih.gov/articlerender.fcgi?artid=2527704&tool=pmcentrez&rendertype=abstract [Accessed November 13, 2014].
Djupedal, I., Portoso, M. & Spåhr, H., 2005. RNA Pol II subunit Rpb7 promotes centromeric transcription and RNAi-directed chromatin silencing. Genes & development, 19, pp.2301–2306. Available at: http://genesdev.cshlp.org/content/19/19/2301.short [Accessed August 28, 2014].
Du, Y., Topp, C.N. & Dawe, R.K., 2010. DNA binding of centromere protein C (CENPC) is stabilized by single-stranded RNA. PLoS genetics, 6(2), p.e1000835. Available at: http://www.pubmedcentral.nih.gov/articlerender.fcgi?artid=2816676&tool=pmcentrez&rendertype=abstract [Accessed October 13, 2014].
171
Dunleavy, E., Pidoux, A. & Allshire, R., 2005. Centromeric chromatin makes its mark. Trends in biochemical sciences, 30(4), pp.172–5. Available at: http://www.ncbi.nlm.nih.gov/pubmed/15817392.
Earnshaw, W.C., Ratrie, H. & Stetten, G., 1989. Visualization of centromere proteins CENP-B and CENP-C on a stable dicentric chromosome in cytological spreads. Chromosoma, 98(1), pp.1–12. Available at: http://www.ncbi.nlm.nih.gov/pubmed/2475307.
edited by Yury E. Khudyakov, H.A.F. ed., 2002. Artificial DNA: Methods and Applications, CRC Press. Available at: http://books.google.com/books?id=dexRnDtLlWUC&pgis=1 [Accessed November 4, 2014].
Eichler, E.E., 1999. Repetitive conundrums of centromere structure and function. Human molecular genetics, 8(2), pp.151–5. Available at: http://www.ncbi.nlm.nih.gov/pubmed/9931322.
Eissenberg, J.C. et al., 1990. Mutation in a heterochromatin-specific chromosomal protein is associated with suppression of position-effect variegation in Drosophila melanogaster. Proceedings of the National Academy of Sciences of the United States of America, 87(24), pp.9923–7. Available at: http://www.pubmedcentral.nih.gov/articlerender.fcgi?artid=55286&tool=pmcentrez&rendertype=abstract.
Elayadi, A.N., Braasch, D.A. & Corey, D.R., 2002. Implications of High-Affinity Hybridization by Locked Nucleic Acid Oligomers for Inhibition of Human Telomerase †. Biochemistry, 41(31), pp.9973–9981. Available at: http://europepmc.org/abstract/MED/12146961 [Accessed November 6, 2014].
Elgin, S.C.R. & Reuter, G., 2013. Position-effect variegation, heterochromatin formation, and gene silencing in Drosophila. Cold Spring Harbor perspectives in biology, 5(8), p.a017780. Available at: http://www.ncbi.nlm.nih.gov/pubmed/23906716 [Accessed October 23, 2014].
Eymery, A. et al., 2009. A transcriptomic analysis of human centromeric and pericentric sequences in normal and tumor cells. Nucleic acids research, 37(19), pp.6340–54. Available at: http://www.pubmedcentral.nih.gov/articlerender.fcgi?artid=2770647&tool=pmcentrez&rendertype=abstract [Accessed October 20, 2013].
Eymery, A. et al., 2010. Heat shock factor 1 binds to and transcribes satellite II and III sequences at several pericentromeric regions in heat-shocked cells. Experimental cell research, 316(11), pp.1845–55. Available at: http://www.ncbi.nlm.nih.gov/pubmed/20152833 [Accessed June 10, 2014].
Ferri, F. et al., 2009. Non-coding murine centromeric transcripts associate with and potentiate Aurora B kinase. Nucleic acids research, 37(15), pp.5071–80. Available at: http://www.pubmedcentral.nih.gov/articlerender.fcgi?artid=2731909&tool=pmcentrez&rendertype=abstract [Accessed October 20, 2013].
172
Fire, A. et al., 1998. Potent and specific genetic interference by double-stranded RNA in Caenorhabditis elegans. Nature, 391(6669), pp.806–811. Available at: http://dx.doi.org/10.1038/35888.
Folco, H.D. et al., 2008. Heterochromatin and RNAi are required to establish CENP-A chromatin at centromeres. Science (New York, N.Y.), 319(5859), pp.94–7. Available at: http://www.pubmedcentral.nih.gov/articlerender.fcgi?artid=2586718&tool=pmcentrez&rendertype=abstract [Accessed July 23, 2014].
Foltz, D.R. et al., 2009. Centromere-Specific Assembly of CENP-A Nucleosomes Is Mediated by HJURP. Cell, 137(3), pp.472–484.
Foltz, D.R. et al., 2006. The human CENP-A centromeric nucleosome-associated complex. Nature cell biology, 8(5), pp.458–69. Available at: http://www.ncbi.nlm.nih.gov/pubmed/16622419 [Accessed July 18, 2014].
Fransz, P. et al., 2002. Interphase chromosomes in Arabidopsis are organized as well defined chromocenters from which euchromatin loops emanate. Proceedings of the National Academy of Sciences of the United States of America, 99(22), pp.14584–9. Available at: http://www.pubmedcentral.nih.gov/articlerender.fcgi?artid=137926&tool=pmcentrez&rendertype=abstract [Accessed October 9, 2013].
Frescas, D. et al., 2008. KDM2A represses transcription of centromeric satellite repeats and maintains the heterochromatic state. Cell cycle (Georgetown, Tex.), 7(22), pp.3539–47. Available at: http://www.pubmedcentral.nih.gov/articlerender.fcgi?artid=2636745&tool=pmcentrez&rendertype=abstract [Accessed October 21, 2014].
Fukagawa, T. et al., 2004. Dicer is essential for formation of the heterochromatin structure in vertebrate cells. Nature cell biology, 6(8), pp.784–91. Available at: http://www.ncbi.nlm.nih.gov/pubmed/15247924 [Accessed May 30, 2014].
Gerasimova, T.I., Byrd, K. & Corces, V.G., 2000. A Chromatin Insulator Determines the Nuclear Localization of DNA. Molecular Cell, 6(5), pp.1025–1035. Available at: http://www.sciencedirect.com/science/article/pii/S1097276500001015 [Accessed March 19, 2015].
Gerstein, M.B. et al., 2007. What is a gene, post-ENCODE? History and updated definition. Genome research, 17(6), pp.669–81. Available at: http://genome.cshlp.org/content/17/6/669.full [Accessed July 14, 2014].
Gibcus, J.H. & Dekker, J., 2013. The hierarchy of the 3D genome. Molecular cell, 49(5), pp.773–82. Available at: http://www.pubmedcentral.nih.gov/articlerender.fcgi?artid=3741673&tool=pmcentrez&rendertype=abstract [Accessed July 15, 2014].
Gilbert, W., 1986. Origin of life: The RNA world. Nature, 319(6055), p.618. Available at: http://dx.doi.org/10.1038/319618a0.
173
Gonçalves Dos Santos Silva, A. et al., 2008. Centromeres in cell division, evolution, nuclear organization and disease. Journal of cellular biochemistry, 104(6), pp.2040–58. Available at: http://www.ncbi.nlm.nih.gov/pubmed/18425771 [Accessed September 5, 2014].
Gottesman, S., 2005. Micros for microbes: non-coding regulatory RNAs in bacteria. Trends in genetics : TIG, 21(7), pp.399–404. Available at: http://www.ncbi.nlm.nih.gov/pubmed/15913835 [Accessed July 11, 2014].
Grewal, S.I.S. & Jia, S., 2007. Heterochromatin revisited. Nature reviews. Genetics, 8(1), pp.35–46. Available at: http://www.ncbi.nlm.nih.gov/pubmed/17173056 [Accessed October 20, 2013].
De Groote, M.L., Verschure, P.J. & Rots, M.G., 2012. Epigenetic Editing: targeted rewriting of epigenetic marks to modulate expression of selected target genes. Nucleic acids research, 40(21), pp.10596–613. Available at: http://www.pubmedcentral.nih.gov/articlerender.fcgi?artid=3510492&tool=pmcentrez&rendertype=abstract [Accessed October 17, 2014].
Guenatri, M. et al., 2004. Mouse centric and pericentric satellite repeats form distinct functional heterochromatin. The Journal of cell biology, 166(4), pp.493–505. Available at: http://www.pubmedcentral.nih.gov/articlerender.fcgi?artid=2172221&tool=pmcentrez&rendertype=abstract [Accessed October 20, 2013].
Guerrier-Takada, C. et al., 1983. The RNA moiety of ribonuclease P is the catalytic subunit of the enzyme. Cell, 35(3 Pt 2), pp.849–57. Available at: http://www.ncbi.nlm.nih.gov/pubmed/6197186.
Guse, A. et al., 2011. In vitro centromere and kinetochore assembly on defined chromatin templates. Nature, 477(7364), pp.354–8. Available at: http://www.pubmedcentral.nih.gov/articlerender.fcgi?artid=3175311&tool=pmcentrez&rendertype=abstract [Accessed November 6, 2014].
Gutschner, T. & Diederichs, S., 2012. The hallmarks of cancer: a long non-coding RNA point of view. RNA biology, 9(6), pp.703–19. Available at: http://www.pubmedcentral.nih.gov/articlerender.fcgi?artid=3495743&tool=pmcentrez&rendertype=abstract [Accessed August 29, 2014].
Hahn, M. et al., 2013. Suv4-20h2 mediates chromatin compaction and is important for cohesin recruitment to heterochromatin. Genes & development, 27(8), pp.859–72. Available at: http://www.pubmedcentral.nih.gov/articlerender.fcgi?artid=3650224&tool=pmcentrez&rendertype=abstract [Accessed October 21, 2014].
Hahn, M.W. & Wray, G.A., 2002. The g-value paradox. Evolution & development, 4(2), pp.73–5. Available at: http://www.ncbi.nlm.nih.gov/pubmed/12004964 [Accessed November 18, 2014].
174
Hathaway, N.A. et al., 2012. Dynamics and memory of heterochromatin in living cells. Cell, 149(7), pp.1447–60. Available at: http://www.pubmedcentral.nih.gov/articlerender.fcgi?artid=3422694&tool=pmcentrez&rendertype=abstract [Accessed July 9, 2014].
Hayden, K.E., 2012. Human centromere genomics: now it’s personal. Chromosome research : an international journal on the molecular, supramolecular and evolutionary aspects of chromosome biology, 20(5), pp.621–33. Available at: http://www.ncbi.nlm.nih.gov/pubmed/22801774 [Accessed June 2, 2014].
Heard, E., 2005. Delving into the diversity of facultative heterochromatin: the epigenetics of the inactive X chromosome. Current opinion in genetics & development, 15(5), pp.482–9. Available at: http://www.sciencedirect.com/science/article/pii/S0959437X05001395 [Accessed September 8, 2014].
Hockemeyer, D. et al., 2011. Genetic engineering of human pluripotent cells using TALE nucleases. Nature biotechnology, 29(8), pp.731–4. Available at: http://www.pubmedcentral.nih.gov/articlerender.fcgi?artid=3152587&tool=pmcentrez&rendertype=abstract [Accessed July 11, 2014].
Hori, T. et al., 2008. CCAN makes multiple contacts with centromeric DNA to provide distinct pathways to the outer kinetochore. Cell, 135(6), pp.1039–52. Available at: http://www.ncbi.nlm.nih.gov/pubmed/19070575 [Accessed July 18, 2014].
Hori, T. et al., 2013. The CCAN recruits CENP-A to the centromere and forms the structural core for kinetochore assembly. The Journal of cell biology, 200(1), pp.45–60. Available at: http://www.pubmedcentral.nih.gov/articlerender.fcgi?artid=3542802&tool=pmcentrez&rendertype=abstract [Accessed July 18, 2014].
Howman, E. V. et al., 2000. Early disruption of centromeric chromatin organization in centromere protein A (Cenpa) null mice. Proceedings of the National Academy of Sciences, 97(3), pp.1148–1153. Available at: http://www.pnas.org/content/97/3/1148.long [Accessed January 2, 2015].
Hsieh, C.-L. et al., 2011. WDHD1 modulates the post-transcriptional step of the centromeric silencing pathway. Nucleic acids research, 39(10), pp.4048–62. Available at: http://www.pubmedcentral.nih.gov/articlerender.fcgi?artid=3105424&tool=pmcentrez&rendertype=abstract [Accessed October 20, 2013].
Hutvágner, G. et al., 2004. Sequence-specific inhibition of small RNA function. PLoS biology, 2(4), p.E98. Available at: http://www.pubmedcentral.nih.gov/articlerender.fcgi?artid=350664&tool=pmcentrez&rendertype=abstract [Accessed February 4, 2015].
Hyman, A.A. et al., 1992. Microtubule-motor activity of a yeast centromere-binding protein complex. Nature, 359(6395), pp.533–536. Available at: http://dx.doi.org/10.1038/359533a0.
175
Jasinska, A. & Krzyzosiak, W.J., 2004. Repetitive sequences that shape the human transcriptome. FEBS letters, 567(1), pp.136–41. Available at: http://www.ncbi.nlm.nih.gov/pubmed/15165906 [Accessed December 31, 2014].
Jenuwein, T. & Allis, C.D., 2001. Translating the histone code. Science (New York, N.Y.), 293(5532), pp.1074–80. Available at: http://www.ncbi.nlm.nih.gov/pubmed/11498575 [Accessed July 16, 2014].
Jolly, C. et al., 1997. HSF1 transcription factor concentrates in nuclear foci during heat shock: relationship with transcription sites. Journal of cell science, 110 ( Pt 2, pp.2935–41. Available at: http://www.ncbi.nlm.nih.gov/pubmed/9359877 [Accessed March 19, 2015].
Jolly, C. et al., 2002. In vivo binding of active heat shock transcription factor 1 to human chromosome 9 heterochromatin during stress. The Journal of cell biology, 156(5), pp.775–81. Available at: http://www.pubmedcentral.nih.gov/articlerender.fcgi?artid=2173303&tool=pmcentrez&rendertype=abstract [Accessed October 9, 2013].
Jolly, C. et al., 2004. Stress-induced transcription of satellite III repeats. The Journal of cell biology, 164(1), pp.25–33. Available at: http://www.pubmedcentral.nih.gov/articlerender.fcgi?artid=2171959&tool=pmcentrez&rendertype=abstract [Accessed June 4, 2014].
Kanellopoulou, C. et al., 2005. Dicer-deficient mouse embryonic stem cells are defective in differentiation and centromeric silencing. Genes & development, 19(4), pp.489–501. Available at: http://www.pubmedcentral.nih.gov/articlerender.fcgi?artid=548949&tool=pmcentrez&rendertype=abstract [Accessed May 24, 2014].
Karkare, S. & Bhatnagar, D., 2006. Promising nucleic acid analogs and mimics: characteristic features and applications of PNA, LNA, and morpholino. Applied microbiology and biotechnology, 71(5), pp.575–86. Available at: http://www.ncbi.nlm.nih.gov/pubmed/16683135 [Accessed October 30, 2014].
Kato, T. et al., 2013. Production of Sry knockout mouse using TALEN via oocyte injection. Scientific reports, 3, p.3136. Available at: http://www.pubmedcentral.nih.gov/articlerender.fcgi?artid=3817445&tool=pmcentrez&rendertype=abstract [Accessed January 23, 2015].
Kauppinen, S., Vester, B. & Wengel, J., 2005. Locked nucleic acid (LNA): High affinity targeting of RNA for diagnostics and therapeutics. Drug discovery today. Technologies, 2(3), pp.287–90. Available at: http://www.ncbi.nlm.nih.gov/pubmed/24981949 [Accessed October 22, 2014].
Kaur, H. et al., 2006. Thermodynamic, counterion, and hydration effects for the incorporation of locked nucleic acid nucleotides into DNA duplexes. Biochemistry, 45(23), pp.7347–55. Available at: http://www.ncbi.nlm.nih.gov/pubmed/16752924.
176
Khalil, A.M. et al., 2009. Many human large intergenic noncoding RNAs associate with chromatin-modifying complexes and affect gene expression. Proceedings of the National Academy of Sciences of the United States of America, 106(28), pp.11667–72. Available at: http://www.pubmedcentral.nih.gov/articlerender.fcgi?artid=2704857&tool=pmcentrez&rendertype=abstract [Accessed July 16, 2014].
Kim, T.-K. et al., 2010. Widespread transcription at neuronal activity-regulated enhancers. Nature, 465(7295), pp.182–7. Available at: http://www.pubmedcentral.nih.gov/articlerender.fcgi?artid=3020079&tool=pmcentrez&rendertype=abstract [Accessed July 11, 2014].
Kishi, Y., Kondo, S. & Gotoh, Y., 2012. Transcriptional activation of mouse major satellite regions during neuronal differentiation. Cell structure and function, 37(2), pp.101–10. Available at: http://www.ncbi.nlm.nih.gov/pubmed/22976370 [Accessed October 9, 2013].
Kloc, A. et al., 2008. RNA interference guides histone modification during the S phase of chromosomal replication. Current biology : CB, 18(7), pp.490–5. Available at: http://www.pubmedcentral.nih.gov/articlerender.fcgi?artid=2408823&tool=pmcentrez&rendertype=abstract [Accessed July 22, 2014].
Konermann, S. et al., 2013. Optical control of mammalian endogenous transcription and epigenetic states. Nature, 500(7463), pp.472–6. Available at: http://www.pubmedcentral.nih.gov/articlerender.fcgi?artid=3856241&tool=pmcentrez&rendertype=abstract [Accessed July 11, 2014].
Koshkin, A.A. et al., 1998. LNA (Locked Nucleic Acid): An RNA Mimic Forming Exceedingly Stable LNA:LNA Duplexes. Journal of the American Chemical Society, 120(50), pp.13252–13253. Available at: http://dx.doi.org/10.1021/ja9822862 [Accessed October 29, 2014].
Kourmouli, N. et al., 2004. Heterochromatin and tri-methylated lysine 20 of histone H4 in animals. Journal of cell science, 117(Pt 12), pp.2491–501. Available at: http://www.ncbi.nlm.nih.gov/pubmed/15128874 [Accessed November 18, 2014].
Kouzarides, T., 2007. Chromatin modifications and their function. Cell, 128(4), pp.693–705. Available at: http://www.ncbi.nlm.nih.gov/pubmed/17320507 [Accessed May 23, 2014].
Kruger, K. et al., 1982. Self-splicing RNA: autoexcision and autocyclization of the ribosomal RNA intervening sequence of Tetrahymena. Cell, 31(1), pp.147–57. Available at: http://www.ncbi.nlm.nih.gov/pubmed/6297745.
Kurreck, J. et al., 2002. Design of antisense oligonucleotides stabilized by locked nucleic acids. Nucleic acids research, 30(9), pp.1911–8. Available at: http://www.pubmedcentral.nih.gov/articlerender.fcgi?artid=113840&tool=pmcentrez&rendertype=abstract.
177
Kurreck, J., 2009. RNA interference: from basic research to therapeutic applications. Angewandte Chemie (International ed. in English), 48(8), pp.1378–98. Available at: http://www.ncbi.nlm.nih.gov/pubmed/19153977 [Accessed October 20, 2013].
Labrador, M. & Corces, V.G., 2002. Setting the boundaries of chromatin domains and nuclear organization. Cell, 111(2), pp.151–4. Available at: http://www.ncbi.nlm.nih.gov/pubmed/12408858 [Accessed March 19, 2015].
Lachner, M. et al., 2001a. Methylation of histone H3 lysine 9 creates a binding site for HP1 proteins. Nature, 410(6824), pp.116–20. Available at: http://www.ncbi.nlm.nih.gov/pubmed/11242053.
Lachner, M. et al., 2001b. Methylation of histone H3 lysine 9 creates a binding site for HP1 proteins. Nature, 410(6824), pp.116–20. Available at: http://www.ncbi.nlm.nih.gov/pubmed/11242053 [Accessed September 30, 2013].
Lampson, M.A. & Cheeseman, I.M., 2011. Sensing centromere tension: Aurora B and the regulation of kinetochore function. Trends in cell biology, 21(3), pp.133–40. Available at: http://www.pubmedcentral.nih.gov/articlerender.fcgi?artid=3049846&tool=pmcentrez&rendertype=abstract [Accessed September 10, 2014].
Latorra, D. et al., 2003. Enhanced allele-specific PCR discrimination in SNP genotyping using 3’ locked nucleic acid (LNA) primers. Human mutation, 22(1), pp.79–85. Available at: http://www.ncbi.nlm.nih.gov/pubmed/12815597 [Accessed October 7, 2014].
Lee, C. et al., 1997. Human centromeric DNAs. Human Genetics, 100(3-4), pp.291–304. Available at: http://dx.doi.org/10.1007/s004390050508.
Lee, J.T. & Lu, N., 1999. Targeted mutagenesis of Tsix leads to nonrandom X inactivation. Cell, 99(1), pp.47–57. Available at: http://www.ncbi.nlm.nih.gov/pubmed/10520993 [Accessed October 12, 2014].
Lee, R.C., Feinbaum, R.L. & Ambros, V., 1993. The C. elegans heterochronic gene lin-4 encodes small RNAs with antisense complementarity to lin-14. Cell, 75(5), pp.843–54. Available at: http://www.ncbi.nlm.nih.gov/pubmed/8252621 [Accessed July 20, 2014].
Lehnertz, B. et al., 2003. Suv39h-mediated histone H3 lysine 9 methylation directs DNA methylation to major satellite repeats at pericentric heterochromatin. Current biology : CB, 13(14), pp.1192–200. Available at: http://www.ncbi.nlm.nih.gov/pubmed/12867029 [Accessed October 9, 2013].
Levin, J.D. et al., 2006. Position-dependent effects of locked nucleic acid (LNA) on DNA sequencing and PCR primers. Nucleic acids research, 34(20), p.e142. Available at: http://www.pubmedcentral.nih.gov/articlerender.fcgi?artid=1694044&tool=pmcentrez&rendertype=abstract [Accessed November 7, 2014].
178
Li, C. et al., 2014. Simultaneous gene editing by injection of mRNAs encoding transcription activator-like effector nucleases into mouse zygotes. Molecular and cellular biology, 34(9), pp.1649–58. Available at: http://www.pubmedcentral.nih.gov/articlerender.fcgi?artid=3993595&tool=pmcentrez&rendertype=abstract [Accessed January 12, 2015].
Lu, J. & Gilbert, D.M., 2007. Proliferation-dependent and cell cycle regulated transcription of mouse pericentric heterochromatin. The Journal of cell biology, 179(3), pp.411–21. Available at: http://www.pubmedcentral.nih.gov/articlerender.fcgi?artid=2064789&tool=pmcentrez&rendertype=abstract [Accessed September 26, 2013].
Luger, K. et al., 1997. Crystal structure of the nucleosome core particle at 2.8 A resolution. Nature, 389(6648), pp.251–260.
Lundin, K.E. et al., 2013. Biological activity and biotechnological aspects of locked nucleic acids. Advances in genetics, 82, pp.47–107. Available at: http://www.ncbi.nlm.nih.gov/pubmed/23721720 [Accessed March 19, 2015].
Luteijn, M.J. et al., 2012. Extremely stable Piwi-induced gene silencing in Caenorhabditis elegans. The EMBO journal, 31(16), pp.3422–30. Available at: http://www.pubmedcentral.nih.gov/articlerender.fcgi?artid=3419935&tool=pmcentrez&rendertype=abstract [Accessed September 5, 2014].
Luteijn, M.J. & Ketting, R.F., 2013. PIWI-interacting RNAs: from generation to transgenerational epigenetics. Nature reviews. Genetics, 14(8), pp.523–34. Available at: http://www.ncbi.nlm.nih.gov/pubmed/23797853 [Accessed July 23, 2014].
Maeder, M.L. et al., 2013. Targeted DNA demethylation and activation of endogenous genes using programmable TALE-TET1 fusion proteins. Nature biotechnology, 31(12), pp.1137–42. Available at: http://www.pubmedcentral.nih.gov/articlerender.fcgi?artid=3858462&tool=pmcentrez&rendertype=abstract [Accessed August 30, 2014].
Maggert, K.A. & Karpen, G.H., 2001. The activation of a neocentromere in Drosophila requires proximity to an endogenous centromere. Genetics, 158(4), pp.1615–28. Available at: http://www.pubmedcentral.nih.gov/articlerender.fcgi?artid=1461751&tool=pmcentrez&rendertype=abstract [Accessed November 18, 2014].
Maison, C. et al., 2002. Higher-order structure in pericentric heterochromatin involves a distinct pattern of histone modification and an RNA component. Nature genetics, 30(3), pp.329–34. Available at: http://www.ncbi.nlm.nih.gov/pubmed/11850619 [Accessed October 20, 2013].
Maison, C. et al., 2011. SUMOylation promotes de novo targeting of HP1α to pericentric heterochromatin. Nature genetics, 43(3), pp.220–7. Available at: http://www.ncbi.nlm.nih.gov/pubmed/21317888 [Accessed October 7, 2013].
179
Maison, C. & Almouzni, G., 2004. HP1 and the dynamics of heterochromatin maintenance. Nature reviews. Molecular cell biology, 5(4), pp.296–304. Available at: http://www.ncbi.nlm.nih.gov/pubmed/15071554 [Accessed October 21, 2013].
Mali, P., Esvelt, K.M. & Church, G.M., 2013. Cas9 as a versatile tool for engineering biology. Nature methods, 10(10), pp.957–63. Available at: http://www.pubmedcentral.nih.gov/articlerender.fcgi?artid=4051438&tool=pmcentrez&rendertype=abstract [Accessed July 9, 2014].
Marshall, O.J. et al., 2008. Neocentromeres: new insights into centromere structure, disease development, and karyotype evolution. American journal of human genetics, 82(2), pp.261–82. Available at: http://www.pubmedcentral.nih.gov/articlerender.fcgi?artid=2427194&tool=pmcentrez&rendertype=abstract [Accessed November 18, 2014].
Martens, J.H.A. et al., 2005. The profile of repeat-associated histone lysine methylation states in the mouse epigenome. The EMBO journal, 24(4), pp.800–12. Available at: http://www.pubmedcentral.nih.gov/articlerender.fcgi?artid=549616&tool=pmcentrez&rendertype=abstract [Accessed November 11, 2014].
Masumoto, H. et al., 1989. A human centromere antigen (CENP-B) interacts with a short specific sequence in alphoid DNA, a human centromeric satellite. The Journal of cell biology, 109(5), pp.1963–73. Available at: http://www.pubmedcentral.nih.gov/articlerender.fcgi?artid=2115871&tool=pmcentrez&rendertype=abstract [Accessed November 17, 2014].
Masumoto, H., Nakano, M. & Ohzeki, J.-I., 2004. The role of CENP-B and alpha-satellite DNA: de novo assembly and epigenetic maintenance of human centromeres. Chromosome research : an international journal on the molecular, supramolecular and evolutionary aspects of chromosome biology, 12(6), pp.543–56. Available at: http://www.ncbi.nlm.nih.gov/pubmed/15289662 [Accessed November 18, 2014].
Matera, A.G., Terns, R.M. & Terns, M.P., 2007. Non-coding RNAs: lessons from the small nuclear and small nucleolar RNAs. Nature reviews. Molecular cell biology, 8(3), pp.209–20. Available at: http://www.ncbi.nlm.nih.gov/pubmed/17318225 [Accessed November 4, 2014].
Mattick, J.S., 2007. A new paradigm for developmental biology. The Journal of experimental biology, 210(Pt 9), pp.1526–47. Available at: http://www.ncbi.nlm.nih.gov/pubmed/17449818 [Accessed September 11, 2014].
Mattick, J.S. et al., 2009. RNA regulation of epigenetic processes. BioEssays : news and reviews in molecular, cellular and developmental biology, 31(1), pp.51–9. Available at: http://www.ncbi.nlm.nih.gov/pubmed/19154003 [Accessed July 23, 2014].
Mattick, J.S., 2004. RNA regulation: a new genetics? Nature reviews. Genetics, 5(4), pp.316–23. Available at: http://www.nature.com.gate1.inist.fr/nrg/journal/v5/n4/full/nrg1321.html [Accessed September 30, 2014].
180
Mattick, J.S. & Makunin, I. V, 2006. Non-coding RNA. Human molecular genetics, 15 Spec No, pp.R17–29. Available at: http://www.ncbi.nlm.nih.gov/pubmed/16651366 [Accessed July 11, 2014].
Mayer, C. et al., 2006. Intergenic transcripts regulate the epigenetic state of rRNA genes. Molecular cell, 22(3), pp.351–61. Available at: http://www.ncbi.nlm.nih.gov/pubmed/16678107 [Accessed September 8, 2014].
Mayer, R. et al., 2005. Common themes and cell type specific variations of higher order chromatin arrangements in the mouse. BMC cell biology, 6, p.44. Available at: http://www.pubmedcentral.nih.gov/articlerender.fcgi?artid=1325247&tool=pmcentrez&rendertype=abstract [Accessed October 22, 2013].
Meister, G. et al., 2004. Sequence-specific inhibition of microRNA- and siRNA-induced RNA silencing. RNA (New York, N.Y.), 10(3), pp.544–50. Available at: http://www.pubmedcentral.nih.gov/articlerender.fcgi?artid=1370948&tool=pmcentrez&rendertype=abstract [Accessed February 8, 2015].
Melters, D.P. et al., 2012. Holocentric chromosomes: convergent evolution, meiotic adaptations, and genomic analysis. Chromosome research : an international journal on the molecular, supramolecular and evolutionary aspects of chromosome biology, 20(5), pp.579–93. Available at: http://www.ncbi.nlm.nih.gov/pubmed/22766638 [Accessed May 27, 2014].
Mendenhall, E.M. et al., 2013. Locus-specific editing of histone modifications at endogenous enhancers. Nature biotechnology, 31(12), pp.1133–6. Available at: http://www.pubmedcentral.nih.gov/articlerender.fcgi?artid=3858395&tool=pmcentrez&rendertype=abstract [Accessed December 3, 2014].
Meraldi, P. et al., 2006. Phylogenetic and structural analysis of centromeric DNA and kinetochore proteins. Genome biology, 7(3), p.R23. Available at: http://www.pubmedcentral.nih.gov/articlerender.fcgi?artid=1557759&tool=pmcentrez&rendertype=abstract [Accessed March 19, 2015].
Mercer, T.R., Dinger, M.E. & Mattick, J.S., 2009. Long non-coding RNAs: insights into functions. Nature reviews. Genetics, 10(3), pp.155–9. Available at: http://www.ncbi.nlm.nih.gov/pubmed/19188922 [Accessed July 10, 2014].
Michelson, A.M. & Todd, A.R., 1955. Nucleotides part XXXII. Synthesis of a dithymidine dinucleotide containing a 3?: 5?-internucleotidic linkage. Journal of the Chemical Society, pp.2632–2638. Available at: http://pubs.rsc.org/en/content/articlehtml/1955/jr/jr9550002632 [Accessed March 19, 2015].
Millanes-Romero, A. et al., 2013. Regulation of Heterochromatin Transcription by Snail1/LOXL2 during Epithelial-to-Mesenchymal Transition. Molecular cell, 52(5), pp.746–57. Available at: http://www.ncbi.nlm.nih.gov/pubmed/24239292 [Accessed January 23, 2014].
181
Miller, J.C. et al., 2011. A TALE nuclease architecture for efficient genome editing. Nature biotechnology, 29(2), pp.143–8. Available at: http://www.ncbi.nlm.nih.gov/pubmed/21179091 [Accessed July 10, 2014].
Minc, E., Courvalin, J.-C. & Buendia, B., 2000. HP1γ associates with euchromatin and heterochromatin in mammalian nuclei and chromosomes. Cytogenetic and Genome Research, 90(3-4), pp.279–284. Available at: http://www.karger.com/DOI/10.1159/000056789.
Miyanari, Y., 2014. TAL effector-mediated genome visualization (TGV). Methods (San Diego, Calif.), 69(2), pp.198–204. Available at: http://www.ncbi.nlm.nih.gov/pubmed/24704356 [Accessed January 26, 2015].
Miyanari, Y., Ziegler-Birling, C. & Torres-Padilla, M.-E., 2013. Live visualization of chromatin dynamics with fluorescent TALEs. Nature structural & molecular biology, 20(11), pp.1321–4. Available at: http://www.ncbi.nlm.nih.gov/pubmed/24096363 [Accessed May 28, 2014].
Mojica, F.J.M. et al., 2005. Intervening sequences of regularly spaced prokaryotic repeats derive from foreign genetic elements. Journal of molecular evolution, 60(2), pp.174–82. Available at: http://www.ncbi.nlm.nih.gov/pubmed/15791728 [Accessed August 25, 2014].
Morris, K. V & Mattick, J.S., 2014. The rise of regulatory RNA. Nature reviews. Genetics, 15(6), pp.423–37. Available at: http://www.nature.com/nrg/journal/v15/n6/fig_tab/nrg3722_F1.html [Accessed July 9, 2014].
Moscou, M.J. & Bogdanove, A.J., 2009. A simple cipher governs DNA recognition by TAL effectors. Science (New York, N.Y.), 326(5959), p.1501. Available at: http://www.ncbi.nlm.nih.gov/pubmed/19933106 [Accessed November 12, 2014].
Motamedi, M.R. et al., 2004. Two RNAi complexes, RITS and RDRC, physically interact and localize to noncoding centromeric RNAs. Cell, 119(6), pp.789–802. Available at: http://www.ncbi.nlm.nih.gov/pubmed/15607976.
Muchardt, C. et al., 2002. Coordinated methyl and RNA binding is required for heterochromatin localization of mammalian HP1alpha. EMBO reports, 3(10), pp.975–81. Available at: http://www.pubmedcentral.nih.gov/articlerender.fcgi?artid=1307621&tool=pmcentrez&rendertype=abstract [Accessed November 18, 2014].
Müller-Ott, K. et al., 2014. Specificity, propagation, and memory of pericentric heterochromatin. Molecular systems biology, 10(8), p.746. Available at: http://www.ncbi.nlm.nih.gov/pubmed/25134515.
Muramatsu, D. et al., 2013. Pericentric heterochromatin generated by HP1 protein interaction-defective histone methyltransferase Suv39h1. The Journal of biological chemistry,
182
288(35), pp.25285–96. Available at: http://www.ncbi.nlm.nih.gov/pubmed/23836914 [Accessed November 2, 2013].
Murchison, E.P. et al., 2005. Characterization of Dicer-deficient murine embryonic stem cells. Proceedings of the National Academy of Sciences of the United States of America, 102(34), pp.12135–40. Available at: http://www.pubmedcentral.nih.gov/articlerender.fcgi?artid=1185572&tool=pmcentrez&rendertype=abstract.
Mussolino, C. & Cathomen, T., 2012. TALE nucleases: tailored genome engineering made easy. Current opinion in biotechnology, 23(5), pp.644–50. Available at: http://www.sciencedirect.com/science/article/pii/S0958166912000286 [Accessed July 14, 2014].
Nagano, T. et al., 2008. The Air noncoding RNA epigenetically silences transcription by targeting G9a to chromatin. Science (New York, N.Y.), 322(5908), pp.1717–20. Available at: http://www.ncbi.nlm.nih.gov/pubmed/18988810 [Accessed November 3, 2014].
Naguibneva, I. et al., 2006. An LNA-based loss-of-function assay for micro-RNAs. Biomedicine & pharmacotherapy = Biomédecine & pharmacothérapie, 60(9), pp.633–8. Available at: http://www.ncbi.nlm.nih.gov/pubmed/16962735 [Accessed November 6, 2014].
Nakayama, J. et al., 2001. Role of histone H3 lysine 9 methylation in epigenetic control of heterochromatin assembly. Science (New York, N.Y.), 292(5514), pp.110–3. Available at: http://www.ncbi.nlm.nih.gov/pubmed/11283354 [Accessed July 23, 2014].
Ng, K. et al., 2007. Xist and the order of silencing. EMBO reports, 8(1), pp.34–9. Available at: http://www.pubmedcentral.nih.gov/articlerender.fcgi?artid=1796754&tool=pmcentrez&rendertype=abstract [Accessed September 19, 2014].
Nonaka, N. et al., 2002. Recruitment of cohesin to heterochromatic regions by Swi6/HP1 in fission yeast. Nature cell biology, 4(1), pp.89–93. Available at: http://www.ncbi.nlm.nih.gov/pubmed/11780129 [Accessed July 18, 2014].
Nora, E.P. et al., 2012. Spatial partitioning of the regulatory landscape of the X-inactivation centre. Nature, 485(7398), pp.381–5. Available at: http://www.pubmedcentral.nih.gov/articlerender.fcgi?artid=3555144&tool=pmcentrez&rendertype=abstract [Accessed July 15, 2014].
Noyes, B.E. & Stark, G.R., 1975. Nucleic acid hybridization using DNA covalently coupled to cellulose. Cell, 5(3), pp.301–10. Available at: http://www.ncbi.nlm.nih.gov/pubmed/167982 [Accessed October 30, 2014].
Obika, S. et al., 1998. Stability and structural features of the duplexes containing nucleoside analogues with a fixed N-type conformation, 2′-O,4′-C-methyleneribonucleosides. Tetrahedron Letters, 39(30), pp.5401–5404. Available at:
183
http://www.sciencedirect.com/science/article/pii/S0040403998010843 [Accessed October 29, 2014].
Okada, M. et al., 2006. The CENP-H-I complex is required for the efficient incorporation of newly synthesized CENP-A into centromeres. Nature cell biology, 8(5), pp.446–57. Available at: http://www.ncbi.nlm.nih.gov/pubmed/16622420 [Accessed July 18, 2014].
Okazaki, Y. et al., 2002. Analysis of the mouse transcriptome based on functional annotation of 60,770 full-length cDNAs. Nature, 420(6915), pp.563–73. Available at: http://dx.doi.org/10.1038/nature01266 [Accessed October 3, 2014].
Ollion, J. et al., 2013. TANGO: a generic tool for high-throughput 3D image analysis for studying nuclear organization. Bioinformatics (Oxford, England), 29(14), pp.1840–1. Available at: http://www.pubmedcentral.nih.gov/articlerender.fcgi?artid=3702251&tool=pmcentrez&rendertype=abstract [Accessed November 11, 2013].
Orgel, L.E., 2004. Prebiotic chemistry and the origin of the RNA world. Critical reviews in biochemistry and molecular biology, 39(2), pp.99–123. Available at: http://www.ncbi.nlm.nih.gov/pubmed/15217990 [Accessed July 15, 2014].
Orgel, L.E. & Crick, F.H., 1980. Selfish DNA: the ultimate parasite. Nature, 284(5757), pp.604–7. Available at: http://www.ncbi.nlm.nih.gov/pubmed/7366731 [Accessed March 19, 2015].
Palazzo, A.F. & Gregory, T.R., 2014. The case for junk DNA. J. M. Akey, ed. PLoS genetics, 10(5), p.e1004351. Available at: http://dx.plos.org/10.1371/journal.pgen.1004351 [Accessed July 9, 2014].
Palmer, D.K. et al., 1987. A 17-kD centromere protein (CENP-A) copurifies with nucleosome core particles and with histones. The Journal of cell biology, 104(4), pp.805–15. Available at: http://www.pubmedcentral.nih.gov/articlerender.fcgi?artid=2114441&tool=pmcentrez&rendertype=abstract.
Pandey, R.R. et al., 2008. Kcnq1ot1 antisense noncoding RNA mediates lineage-specific transcriptional silencing through chromatin-level regulation. Molecular cell, 32(2), pp.232–46. Available at: http://www.ncbi.nlm.nih.gov/pubmed/18951091 [Accessed October 1, 2014].
Papait, R. et al., 2007. Np95 is implicated in pericentromeric heterochromatin replication and in major satellite silencing. Molecular biology of the cell, 18(3), pp.1098–106. Available at: http://www.pubmedcentral.nih.gov/articlerender.fcgi?artid=1805105&tool=pmcentrez&rendertype=abstract [Accessed November 18, 2014].
Paweletz, N., 2001. Walther Flemming: pioneer of mitosis research . Nat Rev Mol Cell Biol, 2(1), pp.72–75. Available at: http://dx.doi.org/10.1038/35048077.
184
Pecinka, A. et al., 2010. Epigenetic regulation of repetitive elements is attenuated by prolonged heat stress in Arabidopsis. The Plant cell, 22(9), pp.3118–29. Available at: http://www.pubmedcentral.nih.gov/articlerender.fcgi?artid=2965555&tool=pmcentrez&rendertype=abstract [Accessed September 23, 2014].
Pedersen, M.T. & Helin, K., 2010. Histone demethylases in development and disease. Trends in cell biology, 20(11), pp.662–71. Available at: http://www.ncbi.nlm.nih.gov/pubmed/20863703 [Accessed January 25, 2015].
Perpelescu, M. & Fukagawa, T., 2011. The ABCs of CENPs. Chromosoma, 120(5), pp.425–46. Available at: http://www.ncbi.nlm.nih.gov/pubmed/21751032 [Accessed July 18, 2014].
Peters, a H. et al., 2001. Loss of the Suv39h histone methyltransferases impairs mammalian heterochromatin and genome stability. Cell, 107(3), pp.323–37.
Pezer, Z. & Ugarkovic, D., 2012. Satellite DNA-associated siRNAs as mediators of heat shock response in insects. RNA biology, 9(5), pp.587–95. Available at: http://www.ncbi.nlm.nih.gov/pubmed/22647527 [Accessed October 27, 2014].
Pidoux, A.L. & Allshire, R.C., 2005. The role of heterochromatin in centromere function. Philosophical transactions of the Royal Society of London. Series B, Biological sciences, 360(1455), pp.569–79. Available at: http://www.pubmedcentral.nih.gov/articlerender.fcgi?artid=1569473&tool=pmcentrez&rendertype=abstract [Accessed December 23, 2014].
Pinheiro, I. et al., 2012. Prdm3 and Prdm16 are H3K9me1 methyltransferases required for mammalian heterochromatin integrity. Cell, 150(5), pp.948–60. Available at: http://www.ncbi.nlm.nih.gov/pubmed/22939622.
Plohl, M. et al., 2008. Satellite DNAs between selfishness and functionality: structure, genomics and evolution of tandem repeats in centromeric (hetero)chromatin. Gene, 409(1-2), pp.72–82. Available at: http://www.ncbi.nlm.nih.gov/pubmed/18182173 [Accessed May 29, 2014].
Prakash, T.P., 2011. An overview of sugar-modified oligonucleotides for antisense therapeutics. Chemistry & biodiversity, 8(9), pp.1616–41. Available at: http://www.ncbi.nlm.nih.gov/pubmed/21922654 [Accessed February 6, 2015].
Probst, A. V et al., 2010. A strand-specific burst in transcription of pericentric satellites is required for chromocenter formation and early mouse development. Developmental cell, 19(4), pp.625–38. Available at: http://www.ncbi.nlm.nih.gov/pubmed/20951352 [Accessed October 20, 2013].
Quénet, D. & Dalal, Y., 2014. A long non-coding RNA is required for targeting centromeric protein A to the human centromere. eLife, 3, p.e03254. Available at: http://www.pubmedcentral.nih.gov/articlerender.fcgi?artid=4145801&tool=pmcentrez&rendertype=abstract [Accessed October 17, 2014].
185
Rea, S. et al., 2000. Regulation of chromatin structure by site-specific histone H3 methyltransferases. Nature, 406(6796), pp.593–9. Available at: http://www.ncbi.nlm.nih.gov/pubmed/10949293.
Régnier, V. et al., 2005. CENP-A is required for accurate chromosome segregation and sustained kinetochore association of BubR1. Molecular and cellular biology, 25(10), pp.3967–81. Available at: http://www.pubmedcentral.nih.gov/articlerender.fcgi?artid=1087704&tool=pmcentrez&rendertype=abstract [Accessed November 3, 2014].
Rice, J.C. et al., 2003. Histone Methyltransferases Direct Different Degrees of Methylation to Define Distinct Chromatin Domains. Molecular Cell, 12(6), pp.1591–1598. Available at: http://www.sciencedirect.com/science/article/pii/S1097276503004799 [Accessed November 18, 2014].
Rinn, J.L. et al., 2007. Functional demarcation of active and silent chromatin domains in human HOX loci by noncoding RNAs. Cell, 129(7), pp.1311–23. Available at: http://www.pubmedcentral.nih.gov/articlerender.fcgi?artid=2084369&tool=pmcentrez&rendertype=abstract [Accessed July 16, 2014].
Rizzi, N. et al., 2004. Transcriptional activation of a constitutive heterochromatic domain of the human genome in response to heat shock. Molecular biology of the cell, 15(2), pp.543–51. Available at: http://www.pubmedcentral.nih.gov/articlerender.fcgi?artid=329232&tool=pmcentrez&rendertype=abstract [Accessed October 16, 2014].
Rollini, P., 1999. Identification and characterization of nuclear matrix-attachment regions in the human serpin gene cluster at 14q32.1. Nucleic Acids Research, 27(19), pp.3779–3791. Available at: http://nar.oxfordjournals.org/content/27/19/3779 [Accessed March 19, 2015].
Ruchaud, S., Carmena, M. & Earnshaw, W.C., 2007. Chromosomal passengers: conducting cell division. Nature reviews. Molecular cell biology, 8(10), pp.798–812. Available at: http://www.ncbi.nlm.nih.gov/pubmed/17848966 [Accessed July 23, 2014].
Rudd, M. & Willard, H., 2004. Analysis of the centromeric regions of the human genome assembly. Trends in genetics, 20(11), pp.354–356. Available at: http://www.sciencedirect.com/science/article/pii/S0168952504002422 [Accessed September 12, 2014].
Rudert, F. et al., 1995. Transcripts from opposite strands of gamma satellite DNA are differentially expressed during mouse development. Mammalian genome : official journal of the International Mammalian Genome Society, 6(2), pp.76–83. Available at: http://www.ncbi.nlm.nih.gov/pubmed/7767009 [Accessed October 8, 2013].
Santenard, A. et al., 2010. Heterochromatin formation in the mouse embryo requires critical residues of the histone variant H3.3. Nature cell biology, 12(9), pp.853–62. Available at: http://www.pubmedcentral.nih.gov/articlerender.fcgi?artid=3701880&tool=pmcentrez&rendertype=abstract [Accessed October 20, 2013].
186
Santos-Rosa, H. et al., 2002. Active genes are tri-methylated at K4 of histone H3. Nature, 419(September), pp.407–411. Available at: http://www.nature.com/nature/journal/v419/n6905/abs/nature01080.html [Accessed August 2, 2014].
Sarma, K. et al., 2010. Locked nucleic acids (LNAs) reveal sequence requirements and kinetics of Xist RNA localization to the X chromosome. Proceedings of the National Academy of Sciences of the United States of America, 107(51), pp.22196–201. Available at: http://www.pubmedcentral.nih.gov/articlerender.fcgi?artid=3009817&tool=pmcentrez&rendertype=abstract [Accessed November 6, 2014].
Schaller, H. et al., 1963. Studies on Polynucleotides. XXIV. 1 The Stepwise Synthesis of Specific Deoxyribopolynucleotides (4). 2 Protected Derivatives of Deoxyribonucleosides and New Syntheses of Deoxyribonucleoside-3″ Phosphates 3. Journal of the American Chemical Society, 85(23), pp.3821–3827. Available at: http://dx.doi.org/10.1021/ja00906a021 [Accessed November 4, 2014].
Schneider, R. et al., 2004. Histone H3 lysine 4 methylation patterns in higher eukaryotic genes. Nature cell biology, 6(1), pp.73–7. Available at: http://www.ncbi.nlm.nih.gov/pubmed/14661024 [Accessed July 16, 2014].
Schotta, G. et al., 2004. A silencing pathway to induce H3-K9 and H4-K20 trimethylation at constitutive heterochromatin. Genes & development, 18(11), pp.1251–62. Available at: http://www.pubmedcentral.nih.gov/articlerender.fcgi?artid=420351&tool=pmcentrez&rendertype=abstract [Accessed October 16, 2014].
Schueler, M.G. & Sullivan, B.A., 2006. Structural and functional dynamics of human centromeric chromatin. Annual review of genomics and human genetics, 7, pp.301–13. Available at: http://www.ncbi.nlm.nih.gov/pubmed/16756479 [Accessed November 9, 2014].
Scott, J.N.F., Kupinski, A.P. & Boyes, J., 2014. Targeted genome regulation and modification using transcription activator-like effectors. The FEBS journal, 281(20), pp.4583–97. Available at: http://www.ncbi.nlm.nih.gov/pubmed/25124066 [Accessed December 25, 2014].
Shapiro, J. a & von Sternberg, R., 2005. Why repetitive DNA is essential to genome function. Biological reviews of the Cambridge Philosophical Society, 80(2), pp.227–50. Available at: http://www.ncbi.nlm.nih.gov/pubmed/15921050.
Shestakova, E. a et al., 2004. Transcription factor YY1 associates with pericentromeric gamma-satellite DNA in cycling but not in quiescent (G0) cells. Nucleic acids research, 32(14), pp.4390–9. Available at: http://www.pubmedcentral.nih.gov/articlerender.fcgi?artid=514366&tool=pmcentrez&rendertype=abstract [Accessed May 27, 2014].
Shirayama, M. et al., 2012. piRNAs initiate an epigenetic memory of nonself RNA in the C. elegans germline. Cell, 150(1), pp.65–77. Available at:
187
http://www.pubmedcentral.nih.gov/articlerender.fcgi?artid=3597741&tool=pmcentrez&rendertype=abstract [Accessed July 14, 2014].
Silahtaroglu, A. et al., 2004. LNA-modified oligonucleotides are highly efficient as FISH probes. Cytogenetic and genome research, 107(1-2), pp.32–7. Available at: http://www.ncbi.nlm.nih.gov/pubmed/15305054 [Accessed October 30, 2014].
Slee, R.B. et al., 2012. Cancer-associated alteration of pericentromeric heterochromatin may contribute to chromosome instability. Oncogene, 31(27), pp.3244–53. Available at: http://dx.doi.org/10.1038/onc.2011.502 [Accessed September 29, 2014].
Solovei, I. et al., 2013. LBR and lamin A/C sequentially tether peripheral heterochromatin and inversely regulate differentiation. Cell, 152(3), pp.584–98. Available at: http://www.ncbi.nlm.nih.gov/pubmed/23374351 [Accessed October 20, 2013].
Solovei, I. et al., 2009. Nuclear architecture of rod photoreceptor cells adapts to vision in mammalian evolution. Cell, 137(2), pp.356–68. Available at: http://www.ncbi.nlm.nih.gov/pubmed/19379699 [Accessed September 24, 2013].
Solovei, I. et al., 2004. Positional changes of pericentromeric heterochromatin and nucleoli in postmitotic Purkinje cells during murine cerebellum development. Cytogenetic and Genome Research, 105(2-4), pp.302–310. Available at: http://www.karger.com/doi/10.1159/000078202 [Accessed October 20, 2013].
Southern, E.M., 1975. Detection of specific sequences among DNA fragments separated by gel electrophoresis. Journal of molecular biology, 98(3), pp.503–17. Available at: http://www.ncbi.nlm.nih.gov/pubmed/1195397 [Accessed October 30, 2014].
Stimpson, K.M., Matheny, J.E. & Sullivan, B. a, 2012. Dicentric chromosomes: unique models to study centromere function and inactivation. Chromosome research : an international journal on the molecular, supramolecular and evolutionary aspects of chromosome biology, 20(5), pp.595–605. Available at: http://www.pubmedcentral.nih.gov/articlerender.fcgi?artid=3557915&tool=pmcentrez&rendertype=abstract [Accessed June 4, 2014].
Sullivan, B. a & Karpen, G.H., 2004. Centromeric chromatin exhibits a histone modification pattern that is distinct from both euchromatin and heterochromatin. Nature structural & molecular biology, 11(11), pp.1076–83. Available at: http://www.pubmedcentral.nih.gov/articlerender.fcgi?artid=1283111&tool=pmcentrez&rendertype=abstract [Accessed June 4, 2014].
Sullivan, K.F., 2001. A solid foundation: functional specialization of centromeric chromatin. Current opinion in genetics & development, 11(2), pp.182–8. Available at: http://www.ncbi.nlm.nih.gov/pubmed/11250142 [Accessed November 18, 2014].
Sullivan, K.F., Hechenberger, M. & Masri, K., 1994. Human CENP-A contains a histone H3 related histone fold domain that is required for targeting to the centromere. The Journal of cell biology, 127(3), pp.581–92. Available at:
188
http://www.pubmedcentral.nih.gov/articlerender.fcgi?artid=2120219&tool=pmcentrez&rendertype=abstract.
Sun, X. et al., 2003. Sequence analysis of a functional Drosophila centromere. Genome research, 13(2), pp.182–94. Available at: http://www.pubmedcentral.nih.gov/articlerender.fcgi?artid=420369&tool=pmcentrez&rendertype=abstract [Accessed October 31, 2014].
Taddei, A. et al., 2001. Reversible disruption of pericentric heterochromatin and centromere function by inhibiting deacetylases. Nature cell biology, 3(2), pp.114–20. Available at: http://www.ncbi.nlm.nih.gov/pubmed/11175742 [Accessed October 9, 2013].
Taft, R.J., Pheasant, M. & Mattick, J.S., 2007. The relationship between non-protein-coding DNA and eukaryotic complexity. BioEssays : news and reviews in molecular, cellular and developmental biology, 29(3), pp.288–99. Available at: http://www.ncbi.nlm.nih.gov/pubmed/17295292 [Accessed November 10, 2014].
Takahashi, K. et al., 1992. A low copy number central sequence with strict symmetry and unusual chromatin structure in fission yeast centromere. Molecular biology of the cell, 3(7), pp.819–35. Available at: http://www.pubmedcentral.nih.gov/articlerender.fcgi?artid=275637&tool=pmcentrez&rendertype=abstract.
Talbert, P.B. & Henikoff, S., 2006. Spreading of silent chromatin: inaction at a distance. Nature reviews. Genetics, 7(10), pp.793–803. Available at: http://www.ncbi.nlm.nih.gov/pubmed/16983375 [Accessed July 15, 2014].
Terranova, R. et al., 2005. The reorganisation of constitutive heterochromatin in differentiating muscle requires HDAC activity. Experimental cell research, 310(2), pp.344–56. Available at: http://www.ncbi.nlm.nih.gov/pubmed/16182285 [Accessed September 26, 2013].
Thanisch, K. et al., 2014. Targeting and tracing of specific DNA sequences with dTALEs in living cells. Nucleic acids research, 42(6), p.e38. Available at: http://www.pubmedcentral.nih.gov/articlerender.fcgi?artid=3973286&tool=pmcentrez&rendertype=abstract [Accessed May 23, 2014].
Therizols, P. et al., 2014. Chromatin decondensation is sufficient to alter nuclear organization in embryonic stem cells. Science, 346(6214), pp.1238–1242. Available at: http://www.sciencemag.org/content/346/6214/1238.abstract [Accessed December 5, 2014].
Thomassin, H., Kress, C. & Grange, T., 2004. MethylQuant: a sensitive method for quantifying methylation of specific cytosines within the genome. Nucleic acids research, 32(21), p.e168. Available at: http://www.pubmedcentral.nih.gov/articlerender.fcgi?artid=535695&tool=pmcentrez&rendertype=abstract [Accessed February 5, 2015].
189
Tomonaga, T. et al., 2003. Overexpression and mistargeting of centromere protein-A in human primary colorectal cancer. Cancer research, 63(13), pp.3511–6. Available at: http://www.ncbi.nlm.nih.gov/pubmed/12839935 [Accessed December 10, 2014].
Uhde-Stone, C., Cheung, E. & Lu, B., 2014. TALE activators regulate gene expression in a position- and strand-dependent manner in mammalian cells. Biochemical and biophysical research communications, 443(4), pp.1189–94. Available at: http://www.ncbi.nlm.nih.gov/pubmed/24380858 [Accessed December 29, 2014].
Uhlmann, F., Lottspeich, F. & Nasmyth, K., 1999. Sister-chromatid separation at anaphase onset is promoted by cleavage of the cohesin subunit Scc1. Nature, 400(6739), pp.37–42. Available at: http://www.ncbi.nlm.nih.gov/pubmed/10403247.
Uil, T.G., Haisma, H.J. & Rots, M.G., 2003. Therapeutic modulation of endogenous gene function by agents with designed DNA-sequence specificities. Nucleic acids research, 31(21), pp.6064–78. Available at: http://www.pubmedcentral.nih.gov/articlerender.fcgi?artid=275457&tool=pmcentrez&rendertype=abstract [Accessed January 29, 2015].
Vadakkan, K.I., Li, B. & De Boni, U., 2006. Cell-type specific proximity of centromeric domains of one homologue each of chromosomes 2 and 11 in nuclei of cerebellar Purkinje neurons. Chromosoma, 115(5), pp.395–402. Available at: http://www.ncbi.nlm.nih.gov/pubmed/16741706 [Accessed September 18, 2013].
Valgardsdottir, R. et al., 2008. Transcription of Satellite III non-coding RNAs is a general stress response in human cells. Nucleic acids research, 36(2), pp.423–34. Available at: http://www.pubmedcentral.nih.gov/articlerender.fcgi?artid=2241877&tool=pmcentrez&rendertype=abstract [Accessed October 18, 2013].
Vallot, C. & Rougeulle, C., 2013. Long non-coding RNAs and human X-chromosome regulation: a coat for the active X chromosome. RNA biology, 10(8), pp.1262–5. Available at: http://www.pubmedcentral.nih.gov/articlerender.fcgi?artid=3817146&tool=pmcentrez&rendertype=abstract [Accessed October 13, 2014].
Válóczi, A. et al., 2004. Sensitive and specific detection of microRNAs by northern blot analysis using LNA-modified oligonucleotide probes. Nucleic acids research, 32(22), p.e175. Available at: http://www.pubmedcentral.nih.gov/articlerender.fcgi?artid=545470&tool=pmcentrez&rendertype=abstract [Accessed October 19, 2013].
Várallyay, E., Burgyán, J. & Havelda, Z., 2007. Detection of microRNAs by Northern blot analyses using LNA probes. Methods (San Diego, Calif.), 43(2), pp.140–5. Available at: http://www.ncbi.nlm.nih.gov/pubmed/17889801 [Accessed February 5, 2015].
Várallyay, E., Burgyán, J. & Havelda, Z., 2008. MicroRNA detection by northern blotting using locked nucleic acid probes. Nature protocols, 3(2), pp.190–6. Available at: http://www.ncbi.nlm.nih.gov/pubmed/18274520 [Accessed June 4, 2014].
190
Vazquez, F. et al., 2004. Endogenous trans-acting siRNAs regulate the accumulation of Arabidopsis mRNAs. Molecular cell, 16(1), pp.69–79. Available at: http://www.ncbi.nlm.nih.gov/pubmed/15469823 [Accessed November 8, 2014].
Verdel, A. et al., 2004. RNAi-mediated targeting of heterochromatin by the RITS complex. Science, 303(5658), pp.672–6. Available at: http://www.pubmedcentral.nih.gov/articlerender.fcgi?artid=3244756&tool=pmcentrez&rendertype=abstract [Accessed November 5, 2013].
Voigt, P. & Reinberg, D., 2013. Epigenome editing. Nature biotechnology, 31(12), pp.1097–9. Available at: http://www.nature.com/nbt/journal/v31/n12/fig_tab/nbt.2756_F1.html [Accessed January 30, 2015].
Volpe, T. a et al., 2002. Regulation of heterochromatic silencing and histone H3 lysine-9 methylation by RNAi. Science (New York, N.Y.), 297(5588), pp.1833–7. Available at: http://www.ncbi.nlm.nih.gov/pubmed/12193640 [Accessed May 28, 2014].
Voullaire, L.E. et al., 1993. A functional marker centromere with no detectable alpha-satellite, satellite III, or CENP-B protein: activation of a latent centromere? American journal of human genetics, 52(6), pp.1153–63. Available at: http://www.pubmedcentral.nih.gov/articlerender.fcgi?artid=1682274&tool=pmcentrez&rendertype=abstract [Accessed November 18, 2014].
Waizenegger, I.C. et al., 2000. Two distinct pathways remove mammalian cohesin from chromosome arms in prophase and from centromeres in anaphase. Cell, 103(3), pp.399–410. Available at: http://www.ncbi.nlm.nih.gov/pubmed/11081627.
Warren, W.D. et al., 2000. The Drosophila RAD21 cohesin persists at the centromere region in mitosis. Current biology : CB, 10(22), pp.1463–6. Available at: http://www.ncbi.nlm.nih.gov/pubmed/11102811 [Accessed March 19, 2015].
Whetstine, J.R. et al., 2006. Reversal of histone lysine trimethylation by the JMJD2 family of histone demethylases. Cell, 125(3), pp.467–81. Available at: http://www.ncbi.nlm.nih.gov/pubmed/16603238 [Accessed March 16, 2015].
Wong, A.K. & Rattner, J.B., 1988. Sequence organization and cytological localization of the minor satellite of mouse. Nucleic acids research, 16(24), pp.11645–61. Available at: http://www.pubmedcentral.nih.gov/articlerender.fcgi?artid=339101&tool=pmcentrez&rendertype=abstract [Accessed October 7, 2013].
Wong, L.H. et al., 2007. Centromere RNA is a key component for the assembly of nucleoproteins at the nucleolus and centromere. Genome research, 17(8), pp.1146–60. Available at: http://www.pubmedcentral.nih.gov/articlerender.fcgi?artid=1933521&tool=pmcentrez&rendertype=abstract [Accessed October 13, 2014].
Wu, R., Singh, P.B. & Gilbert, D.M., 2006. Uncoupling global and fine-tuning replication timing determinants for mouse pericentric heterochromatin. The Journal of cell biology, 174(2), pp.185–94. Available at:
191
http://www.pubmedcentral.nih.gov/articlerender.fcgi?artid=2064179&tool=pmcentrez&rendertype=abstract [Accessed October 20, 2013].
You, Y. et al., 2006. Design of LNA probes that improve mismatch discrimination. Nucleic acids research, 34(8), p.e60. Available at: http://www.pubmedcentral.nih.gov/articlerender.fcgi?artid=1456327&tool=pmcentrez&rendertype=abstract [Accessed October 30, 2014].
Zaratiegui, M. et al., 2011. RNAi promotes heterochromatic silencing through replication-coupled release of RNA Pol II. Nature, 479(7371), pp.135–8. Available at: http://www.pubmedcentral.nih.gov/articlerender.fcgi?artid=3391703&tool=pmcentrez&rendertype=abstract [Accessed July 15, 2014].
Zeitlin, S.G., Shelby, R.D. & Sullivan, K.F., 2001. CENP-A is phosphorylated by Aurora B kinase and plays an unexpected role in completion of cytokinesis. The Journal of cell biology, 155(7), pp.1147–57. Available at: http://www.pubmedcentral.nih.gov/articlerender.fcgi?artid=2199334&tool=pmcentrez&rendertype=abstract [Accessed January 2, 2015].
Zeng, W., Ball, A.R. & Yokomori, K., 2010. HP1: Heterochromatin binding proteins working the genome. Epigenetics, 5(4), pp.287–292. Available at: http://www.landesbioscience.com/journals/epigenetics/article/11683/ [Accessed August 22, 2014].
Zhang, K. et al., 2008. Roles of the Clr4 methyltransferase complex in nucleation, spreading and maintenance of heterochromatin. Nature structural & molecular biology, 15(4), pp.381–8. Available at: http://www.ncbi.nlm.nih.gov/pubmed/18345014 [Accessed August 21, 2014].
Zhang, P. & Spradling, A.C., 1995. The Drosophila salivary gland chromocenter contains highly polytenized subdomains of mitotic heterochromatin. Genetics, 139(2), pp.659–70. Available at: http://www.pubmedcentral.nih.gov/articlerender.fcgi?artid=1206372&tool=pmcentrez&rendertype=abstract [Accessed November 5, 2014].
Zhao, J. et al., 2008. Polycomb proteins targeted by a short repeat RNA to the mouse X chromosome. Science (New York, N.Y.), 322(5902), pp.750–6. Available at: http://www.pubmedcentral.nih.gov/articlerender.fcgi?artid=2748911&tool=pmcentrez&rendertype=abstract [Accessed October 30, 2014].