
Study of the evolution of particle size distributions and its effects on the oxidation of pulverized...
13
Combustion and Flame 151 (2007) 482–494 www.elsevier.com/locate/combustflame Study of the evolution of particle size distributions and its effects on the oxidation of pulverized coal Santiago Jiménez a,∗ , Javier Ballester a,b a LITEC-CSIC (Spanish Council for Scientific Research), María de Luna, 10, 50018, Zaragoza, Spain b Fluid Mechanics Group, University of Zaragoza, María de Luna, 3, 50018, Zaragoza, Spain Received 7 August 2006; received in revised form 16 January 2007; accepted 7 August 2007 Available online 12 September 2007 Abstract This paper discusses the factors influencing the evolution of particle size during the combustion of pulverized coal, as well as their consequences for the interpretation of burnout curves. A detailed experimental characteriza- tion of the evolution of the particle size distribution (PSD) of a pulverized coal (anthracite) burned under realistic conditions in an entrained flow reactor is presented and used as the reference data for the subsequent analysis. The data show evidence for particle fragmentation at relatively short times (or, equivalently, high unburnt fractions). The formation of fragments comparable in size to the parent coal/char particles is modeled with a simple fragmen- tation scheme, which results in an improved reproduction of the PSD’s evolution. The effects of fragmentation on the burnout curves are then studied in detail. An enhancement of their curvature is observed, which results in a better fit of the experimental data; in particular, the high conversion range, where the largest discrepancies between predictions and measurements are usually found, is well reproduced with this “extended” model. Simultaneously, the increase of specific surface caused by particle fragmentation causes an increase in the conversion rate, and a smaller total conversion time. To fit the experimental data, new optimal kinetic parameters are calculated. Finally, the potential relevance of fragmentation in the simulation of industrial pf plants is discussed. © 2007 The Combustion Institute. Published by Elsevier Inc. All rights reserved. Keywords: Coal combustion; Fragmentation; Burnout curves; Diameter evolution 1. Introduction Fragmentation of coal particles during combustion has received considerable attention, especially regard- ing its influence on fly ash formation (in the case of pulverized coal combustion) and coal conversion (in fluidized bed boilers). It is generally accepted that this phenomenon does not affect the submicrometer frac- tion of the particulate emissions, for which models for * Corresponding author. Fax: +34 976761882. E-mail address: [email protected] (S. Jiménez). mineral evaporation/condensation reached a separate explanation [1,2]. In the range >1 μm, comparisons between the particle size distribution (PSD) of the original coal with that of the resulting fly ash parti- cles showed the need for a morphological mechanism affecting the burning particles in order to explain the relatively low mean particle size of the ash (compared to the one expected if all the mineral matter in a coal particle coalesced in a single ash corpuscle) [3,4]. The reasonable agreements obtained between simple breakup models (that arbitrarily assigned a number of fragments to each original coal particle) and measure- 0010-2180/$ – see front matter © 2007 The Combustion Institute. Published by Elsevier Inc. All rights reserved. doi:10.1016/j.combustflame.2007.08.001
Transcript of Study of the evolution of particle size distributions and its effects on the oxidation of pulverized...

Combustion and Flame 151 (2007) 482–494www.elsevier.com/locate/combustflame
Study of the evolution of particle size distributions andits effects on the oxidation of pulverized coal
Santiago Jiménez a,∗, Javier Ballester a,b
a LITEC-CSIC (Spanish Council for Scientific Research), María de Luna, 10, 50018, Zaragoza, Spainb Fluid Mechanics Group, University of Zaragoza, María de Luna, 3, 50018, Zaragoza, Spain
Received 7 August 2006; received in revised form 16 January 2007; accepted 7 August 2007
Available online 12 September 2007
Abstract
This paper discusses the factors influencing the evolution of particle size during the combustion of pulverizedcoal, as well as their consequences for the interpretation of burnout curves. A detailed experimental characteriza-tion of the evolution of the particle size distribution (PSD) of a pulverized coal (anthracite) burned under realisticconditions in an entrained flow reactor is presented and used as the reference data for the subsequent analysis. Thedata show evidence for particle fragmentation at relatively short times (or, equivalently, high unburnt fractions).The formation of fragments comparable in size to the parent coal/char particles is modeled with a simple fragmen-tation scheme, which results in an improved reproduction of the PSD’s evolution. The effects of fragmentation onthe burnout curves are then studied in detail. An enhancement of their curvature is observed, which results in abetter fit of the experimental data; in particular, the high conversion range, where the largest discrepancies betweenpredictions and measurements are usually found, is well reproduced with this “extended” model. Simultaneously,the increase of specific surface caused by particle fragmentation causes an increase in the conversion rate, and asmaller total conversion time. To fit the experimental data, new optimal kinetic parameters are calculated. Finally,the potential relevance of fragmentation in the simulation of industrial pf plants is discussed.© 2007 The Combustion Institute. Published by Elsevier Inc. All rights reserved.
Keywords: Coal combustion; Fragmentation; Burnout curves; Diameter evolution
1. Introduction
Fragmentation of coal particles during combustionhas received considerable attention, especially regard-ing its influence on fly ash formation (in the case ofpulverized coal combustion) and coal conversion (influidized bed boilers). It is generally accepted that thisphenomenon does not affect the submicrometer frac-tion of the particulate emissions, for which models for
* Corresponding author. Fax: +34 976761882.E-mail address: [email protected] (S. Jiménez).
0010-2180/$ – see front matter © 2007 The Combustion Institute.doi:10.1016/j.combustflame.2007.08.001
mineral evaporation/condensation reached a separateexplanation [1,2]. In the range >1 µm, comparisonsbetween the particle size distribution (PSD) of theoriginal coal with that of the resulting fly ash parti-cles showed the need for a morphological mechanismaffecting the burning particles in order to explain therelatively low mean particle size of the ash (comparedto the one expected if all the mineral matter in a coalparticle coalesced in a single ash corpuscle) [3,4].The reasonable agreements obtained between simplebreakup models (that arbitrarily assigned a number offragments to each original coal particle) and measure-
Published by Elsevier Inc. All rights reserved.

S. Jiménez, J. Ballester / Combustion and Flame 151 (2007) 482–494 483
ments in laboratory and industrial plants [3,4] sug-gested that fragmentation is a relevant phenomenonin coal combustion.
More complex models were proposed in subse-quent studies, including particle attrition [5], particleshedding by rotation caused by tangential liberationof volatiles [6], and percolative fragmentation [5,7–9]. The latter was first introduced to study the effectof char fragmentation on burnout rate in fluidized bedcombustion (FBC); it was soon adapted to pulver-ized coal combustion (PFC) [10,11], whereas in thiscase the efforts were focused mainly on the process offly ash formation. The first models consisted mostlyof pure Monte Carlo calculations for individual par-ticles, and subsequent modifications were introducedto account for statistical phenomena affecting the coalPSD in the form of probability functions for parti-cle fragmentation rates, or number and properties ofthe fragments produced (e.g., [5] for PFC, [12] forFBC). Also, specific fragmentation models have beenproposed for the different coal combustion modes,ranging from the initial “shrinking core” model(e.g., [9,10]) to calculations specifically designed forhollow char particles (cenospheres) [13–15].
These models, with parameters conveniently adap-ted to each coal, are in reasonable agreement withsome experimental measurements available for pul-verized coal combustion, essentially regarding fly ashproperties. The experimental results reveal notabledifferences in the behavior of different coals and ini-tial coal particle sizes, the number of fragments vary-ing in a typical range of 2–100 (e.g., [3,13]). Morerecently, the existence of a third fine mode (∼1 µm)in ash from coal combustion has been reported and as-cribed also to fragmentation through several possiblemechanisms [16,17].
In contrast, to the authors’ knowledge, little di-rect, detailed information is available on the evolu-tion of the mass-based PSD during the initial com-bustion stages of pulverized coal. Some on-line tech-niques give number-based PSDs [5], more appropri-ate to characterize the relatively fine ash particlesthan to study the effect of char “breakage” into afew fragments comparable in size to the parent charparticle. Liu et al. [14] reported results for a bitumi-nous coal char (initial particle size ∼100 µm), ob-tained in a manner similar to that used in the presentwork, supporting significant particle fragmentationat relatively low burnouts. As an exception, Hurtand Davis [18] did not observe significant particlebreakup events in experiments with individual parti-cles, belonging to several coal types and having sizes50–300 µm, embedded in an inert fiber mat, and theyfound some evidence of spontaneous agglomerationof some fragments produced in late stages of com-bustion.
Although it is generally accepted that char frag-mentation can significantly affect coal conversionrates (see comment 3 and reply in [5] for PFC;[9,12] for FBC), this effect has not been widely incor-porated into the simulations performed for real com-bustion chambers or even for laboratory tests fromwhich the kinetic parameters of coal are derived. Thegeneral aim of the present paper is to gain more in-sight into the occurrence of fragmentation and its roleon the evolution of burning particles and, more gener-ally, the implications for the simulation of pulverizedcoal combustion.
Ballester and Jiménez [19] recently showed theneed to consider the whole PSD (even in the caseof sieved, narrow distributions) in the derivation ofthe kinetic parameters from EFR tests. Following thecommon approach in the field, in that work each par-ticle was assumed to evolve independently (except fortheir contribution to oxygen consumption), its diame-ter (D) varying with the unburnt fraction (U ) accord-ing to the classical expression due to Smith [20,21]D = D0Uα . The parameter α was obtained by adjust-ing the evolution of the PSD mean diameter. The evo-lution of the whole distribution is studied with moredetail in this paper. In the first place, some simpli-fications inherent to the previous approach and theirconsequences on the calculated PSDs are discussed.In the second place, the effects of fragmentation phe-nomena on the burnout curves and on the evolutionof the PSD are analyzed using a modified combustionmodel. A complete set of experimental PSD measure-ments performed with a Spanish anthracite is pre-sented and used as the reference data.
2. Experimental
2.1. Facility and instrumentation
The tests were performed in an entrained flow re-actor (EFR, thereafter). It has been described in moredetail previously [19] and its characteristics will onlybe briefly outlined here. It consists of an externallyheated 1.6-m-long SiC tube, into which fuel particlesare injected pneumatically through an injection gun,whose tip can be located at any point along the up-per half of the tube. Co-flow gases are combustionproducts supplied from a natural gas burner, which si-multaneously preheat gases and serve to control theoxygen concentration in the reactor.
Solid samples are collected by means of an isoki-netic particle-sampling probe, which can be insertedthrough the outlet section to any location along thelower half of the tube. The particles are finally re-tained in a sintered-bronze filter. The distance be-tween injection gun and probe (or, equivalently, the

484 S. Jiménez, J. Ballester / Combustion and Flame 151 (2007) 482–494
residence time of the particles in the combustion at-mosphere) can thus be varied within a wide range(typically 0.2–4 s for oxidation tests, and 0.05–1 s fordevolatilization studies).
The original fuel and the char particles collectedhave been analyzed to obtain their physical-chemicalproperties:
– Ultimate and proximate (ASTM) analyses of thefuel.
– The combustible fraction in every sample was de-termined according to the ash-as-tracer method.The thermogravimetric method developed byMayoral el al. [22] was followed due to the smallamount of sample collected.
– Selected samples were observed in a scanningelectron microscope (SEM) to determine the evo-lution of the particle morphology.
– Particle size distributions have been measured bylaser diffractometry (Malvern Mastersizer S). Inorder to assure a correct size characterization,suspensions were dispersed by ultrasonication ina bath sonicator (40 kHz, 50 W) immediatelybefore wet measurement to break up particle ag-gregates. In prior measurements with pulverizedcoal samples, increasing sonication times weretested; the effect of the ultrasounds was evidentfrom the firsts seconds of application, and rapidlysaturated, so that over 30 s no differences wereobserved and the measurements were repeatable.As a consequence, sonication periods of approx-imately 30 s were used in this study.
2.2. Combustion experiments
The main set of tests refers to experiments per-formed with a Spanish anthracite, whose results con-cerning burnout curves served as a reference for dis-cussion in a previous work [19]. The pulverized coalwas thoroughly sieved in the range 53–63 µm. Fivecombustion conditions were used: four different re-actor (= gas and wall) temperatures (1040, 1175,1300, and 1450 ◦C) with a constant oxygen concen-tration at the reactor’s exit (4% in a molar, dry ba-sis), and an additional series at 1300 ◦C and 8% O2.In all cases, the oxygen concentration at the fuel in-jection point was ∼3% higher, the difference beingconsumed in the combustion of the particles alongthe tube. A highly diluted flow was obtained (par-ticle loading ratios ∼0.02 and ∼ 3 × 10⁻⁶ in massand volume bases, respectively), so that particle-to-particle interactions were negligible. On the otherhand, the calculated critical velocity is a few cen-timeters per second, one order of magnitude smallerthan the gas velocity, thus ensuring entrained flowconditions. These conditions are thought to ensure a
Table 1Proximate and ultimate ASTM analysis of the fuels (as fired,by weight)
Anthracite Coke
Moisture (%) 1.46 0.65Ash (%) 19.17 1.26Volatiles (%) 10.28 11.88Fixed carbon (%) 69.09 86.20C (%) 70.3 87.30H (%) 3.03 3.82N (%) 1.63 2.52S (%) 2.28 4.36HHV (MJ/kg) 27.59 35.6
uniform combustion history of all particles along thereactor.
In addition to these experiments, results from an-other series performed with sieved (53–63 µm) pe-troleum coke at 1300 ◦C and 4% O2 at the reactor’sexit will also be shown. Table 1 presents the proxi-mate and ultimate ASTM analysis of both fuels. In allthe series, seven char samples were collected for eachrun, with distances between injection gun and sam-pling probe from 0.2 to 1.6 m.
The calculated heating rate of the particles injectedinto the EFR is ∼105 K/s, which is representative ofpf systems [23]. The oxygen concentrations were cho-sen in [19] as representative of the longest stage alongthe combustion history of the particles, i.e., char ox-idation after the flame, in order to derive the kineticparameters for char oxidation [19,24]. Important vari-ations in this respect are found among other fragmen-tation studies: the use of similar [13] and somewhathigher concentrations [5] has been reported; in othercases high oxygen concentrations were used (e.g.,from 10% up to 80% O2 in [6]) in order to achievehigher particle temperatures. To the authors’ knowl-edge, there is a lack of detailed data on the evolutionof the PSDs in industrial or laboratory facilities forconcluding likely effects of stoichiometry or particleconcentration on fragmentation.
2.3. Experimental results
Fig. 1 shows the burnout curves obtained for theanthracite in the EFR, in terms of unburnt fraction(U , fraction of the original combustible matter re-maining in the particle) as a function of the distancebetween injection gun and sampling probe (L). Theslightly different slip velocities for the various parti-cle sizes prevent a direct translation of these curves todependences on residence time of the particles in thereactor.
The evolution of the PSD was measured for threeof these series. Figs. 2–4 display the results, comparedin all cases to the PSD of the original sieved coal.

S. Jiménez, J. Ballester / Combustion and Flame 151 (2007) 482–494 485
Fig. 1. Unburnt fraction of the coal along the EFR length for the five combustion conditions tested.
Fig. 2. Measured evolution of the coal/char PSD with the unburnt fraction U . Combustion conditions 1300 ◦C, 4% O2 in fluegases. In these graphs, the Y -axis represents the percentage of volume contained in a narrow interval around diameter Di , withDi+1/Di ≈ 1.16.
The general aspect of these graphs is very similar: be-sides a progressive shift of the peak toward smallerdiameters, the width of the distribution increases withthe degree of burnout (since the distributions are nor-malized, this is more clearly represented by a lower-ing of the mode’s height). With respect to the orig-inal coal distribution, the fraction of particles in therange 20–40 µm displays a fast rise, even for rela-tively high U s. Except for the curves correspondingto very low U levels (<0.07), a clear gradation of thedistributions with the degree of burnout is apparentin Figs. 2–4.
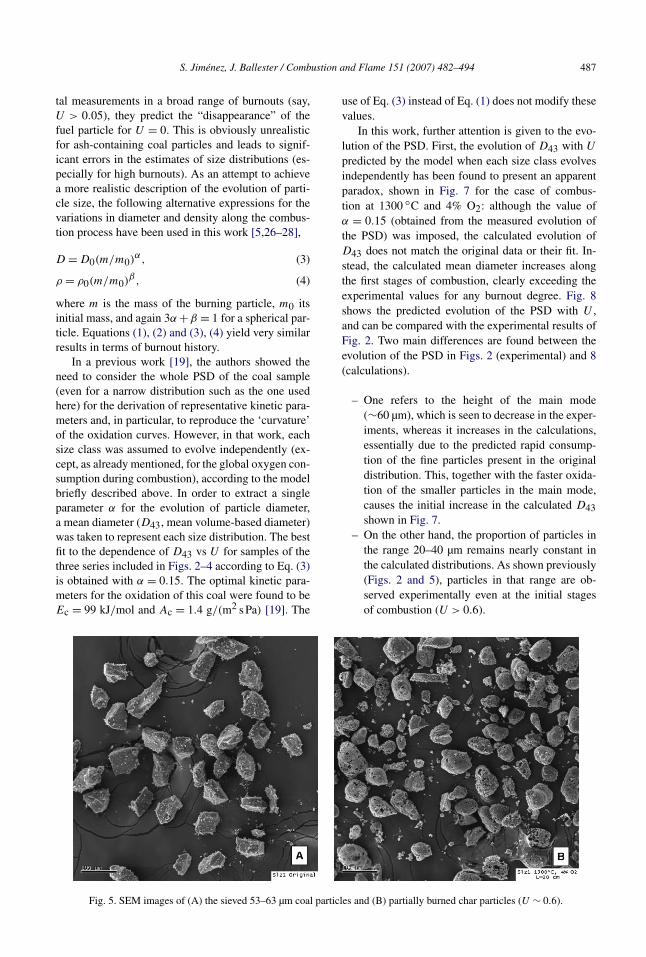
The presence of particles in the range 20–40 µmat high U levels and their absence within the originalsample are apparent also in the SEM pictures shown
in Fig. 5. Incidentally, Fig. 5a also shows the pres-ence of small particles apparently adhering to the sur-face of the large (∼53–63 µm) particles, despite thesample having been sieved repetitively (four times).These small particles were, however, detected in themeasurements performed by diffractometry as a sec-ondary mode <10 µm in Figs. 2–4 and are not relatedto the changes in the intervals ∼20–40 µm.
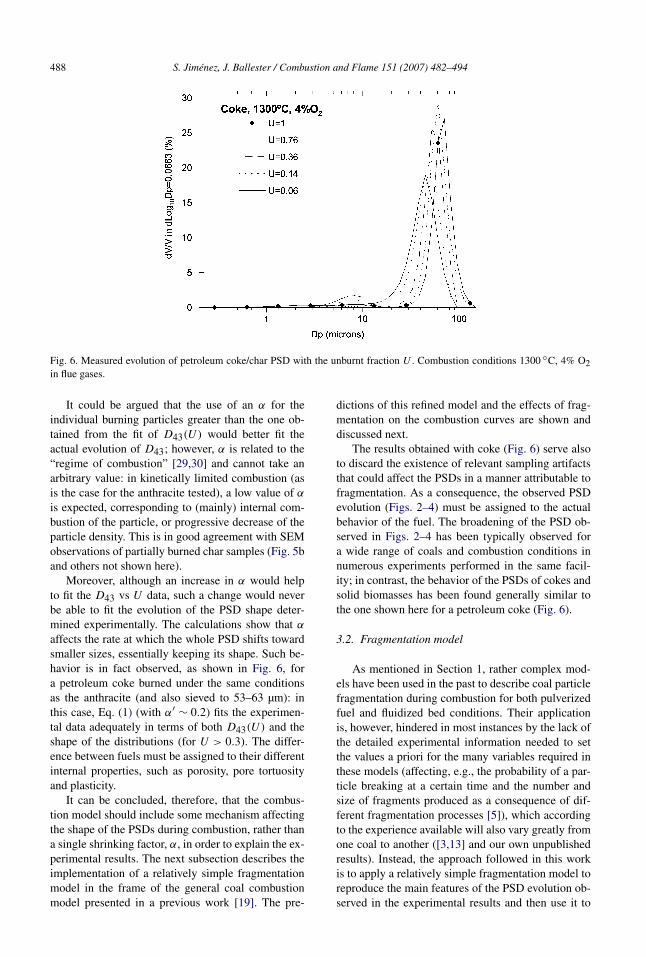
The PSD evolution is markedly different for thecombustion of petroleum coke sieved in the same sizerange (Fig. 6). In this case, the mode “shifts” towardsmaller diameters without significant modification ofits shape for U > 0.3. A progressive increase of themode’s width, together with the appearance of a no-ticeable mode below 10 µm, is observed afterward.

486 S. Jiménez, J. Ballester / Combustion and Flame 151 (2007) 482–494
Fig. 3. Measured evolution of the coal/char PSD with the unburnt fraction U . Combustion conditions 1450 ◦C, 4% O2 in fluegases.
Fig. 4. Measured evolution of the coal/char PSD with the unburnt fraction U . Combustion conditions 1300 ◦C, 8% O2 in fluegases.
3. Evolution of particle size distributions
3.1. An apparent paradox
The experimental data shown in Figs. 1–4 wereused to characterize the reactivity of the anthracite, byderiving the parameters that best describe its oxida-tion behavior. The combustion model is derived fromthe early work of Field et al. [25] and will only besummarized here; a more detailed description can befound in that reference or in [19]. The model consid-ers independently coal devolatilization and char ox-idation; a single-step model is adopted for the firstprocess, whereas char oxidation is modeled by an ap-
parent kinetics based on the outer surface of the charparticles. Two parameters, Ac and Ec, respectivelythe pre-exponential factor (kg/(m2 s Pa) for reactionorder 1) and the activation energy (J/mol), combinedin an Arrhenius-type expression, are used to describethe oxidation rate.
The evolution of coal particle diameter and densityduring combustion was modeled in [19] according tothe expressions, proposed by Smith [20,21],
(1)D = D0Uα′,
(2)ρ = ρ0Uβ ′,
where 3α′ + β ′ = 1 for a spherical particle. AlthoughEqs. (1) and (2) can adequately fit the experimen-
S. Jiménez, J. Ballester / Combustion and Flame 151 (2007) 482–494 487
tal measurements in a broad range of burnouts (say,U > 0.05), they predict the “disappearance” of thefuel particle for U = 0. This is obviously unrealisticfor ash-containing coal particles and leads to signif-icant errors in the estimates of size distributions (es-pecially for high burnouts). As an attempt to achievea more realistic description of the evolution of parti-cle size, the following alternative expressions for thevariations in diameter and density along the combus-tion process have been used in this work [5,26–28],
(3)D = D0(m/m0)α,
(4)ρ = ρ0(m/m0)β ,
where m is the mass of the burning particle, m0 itsinitial mass, and again 3α +β = 1 for a spherical par-ticle. Equations (1), (2) and (3), (4) yield very similarresults in terms of burnout history.
In a previous work [19], the authors showed theneed to consider the whole PSD of the coal sample(even for a narrow distribution such as the one usedhere) for the derivation of representative kinetic para-meters and, in particular, to reproduce the ‘curvature’of the oxidation curves. However, in that work, eachsize class was assumed to evolve independently (ex-cept, as already mentioned, for the global oxygen con-sumption during combustion), according to the modelbriefly described above. In order to extract a singleparameter α for the evolution of particle diameter,a mean diameter (D43, mean volume-based diameter)was taken to represent each size distribution. The bestfit to the dependence of D43 vs U for samples of thethree series included in Figs. 2–4 according to Eq. (3)is obtained with α = 0.15. The optimal kinetic para-meters for the oxidation of this coal were found to beEc = 99 kJ/mol and Ac = 1.4 g/(m2 s Pa) [19]. The
use of Eq. (3) instead of Eq. (1) does not modify thesevalues.
In this work, further attention is given to the evo-lution of the PSD. First, the evolution of D43 with U
predicted by the model when each size class evolvesindependently has been found to present an apparentparadox, shown in Fig. 7 for the case of combus-tion at 1300 ◦C and 4% O2: although the value ofα = 0.15 (obtained from the measured evolution ofthe PSD) was imposed, the calculated evolution ofD43 does not match the original data or their fit. In-stead, the calculated mean diameter increases alongthe first stages of combustion, clearly exceeding theexperimental values for any burnout degree. Fig. 8shows the predicted evolution of the PSD with U ,and can be compared with the experimental results ofFig. 2. Two main differences are found between theevolution of the PSD in Figs. 2 (experimental) and 8(calculations).
– One refers to the height of the main mode(∼60 µm), which is seen to decrease in the exper-iments, whereas it increases in the calculations,essentially due to the predicted rapid consump-tion of the fine particles present in the originaldistribution. This, together with the faster oxida-tion of the smaller particles in the main mode,causes the initial increase in the calculated D43shown in Fig. 7.
– On the other hand, the proportion of particles inthe range 20–40 µm remains nearly constant inthe calculated distributions. As shown previously(Figs. 2 and 5), particles in that range are ob-served experimentally even at the initial stagesof combustion (U > 0.6).
Fig. 5. SEM images of (A) the sieved 53–63 µm coal particles and (B) partially burned char particles (U ∼ 0.6).
488 S. Jiménez, J. Ballester / Combustion and Flame 151 (2007) 482–494
Fig. 6. Measured evolution of petroleum coke/char PSD with the unburnt fraction U . Combustion conditions 1300 ◦C, 4% O2in flue gases.
It could be argued that the use of an α for theindividual burning particles greater than the one ob-tained from the fit of D43(U) would better fit theactual evolution of D43; however, α is related to the“regime of combustion” [29,30] and cannot take anarbitrary value: in kinetically limited combustion (asis the case for the anthracite tested), a low value of α
is expected, corresponding to (mainly) internal com-bustion of the particle, or progressive decrease of theparticle density. This is in good agreement with SEMobservations of partially burned char samples (Fig. 5band others not shown here).
Moreover, although an increase in α would helpto fit the D43 vs U data, such a change would neverbe able to fit the evolution of the PSD shape deter-mined experimentally. The calculations show that α
affects the rate at which the whole PSD shifts towardsmaller sizes, essentially keeping its shape. Such be-havior is in fact observed, as shown in Fig. 6, fora petroleum coke burned under the same conditionsas the anthracite (and also sieved to 53–63 µm): inthis case, Eq. (1) (with α′ ∼ 0.2) fits the experimen-tal data adequately in terms of both D43(U) and theshape of the distributions (for U > 0.3). The differ-ence between fuels must be assigned to their differentinternal properties, such as porosity, pore tortuosityand plasticity.
It can be concluded, therefore, that the combus-tion model should include some mechanism affectingthe shape of the PSDs during combustion, rather thana single shrinking factor, α, in order to explain the ex-perimental results. The next subsection describes theimplementation of a relatively simple fragmentationmodel in the frame of the general coal combustionmodel presented in a previous work [19]. The pre-
dictions of this refined model and the effects of frag-mentation on the combustion curves are shown anddiscussed next.
The results obtained with coke (Fig. 6) serve alsoto discard the existence of relevant sampling artifactsthat could affect the PSDs in a manner attributable tofragmentation. As a consequence, the observed PSDevolution (Figs. 2–4) must be assigned to the actualbehavior of the fuel. The broadening of the PSD ob-served in Figs. 2–4 has been typically observed fora wide range of coals and combustion conditions innumerous experiments performed in the same facil-ity; in contrast, the behavior of the PSDs of cokes andsolid biomasses has been found generally similar tothe one shown here for a petroleum coke (Fig. 6).
3.2. Fragmentation model
As mentioned in Section 1, rather complex mod-els have been used in the past to describe coal particlefragmentation during combustion for both pulverizedfuel and fluidized bed conditions. Their applicationis, however, hindered in most instances by the lack ofthe detailed experimental information needed to setthe values a priori for the many variables required inthese models (affecting, e.g., the probability of a par-ticle breaking at a certain time and the number andsize of fragments produced as a consequence of dif-ferent fragmentation processes [5]), which accordingto the experience available will also vary greatly fromone coal to another ([3,13] and our own unpublishedresults). Instead, the approach followed in this workis to apply a relatively simple fragmentation model toreproduce the main features of the PSD evolution ob-served in the experimental results and then use it to

S. Jiménez, J. Ballester / Combustion and Flame 151 (2007) 482–494 489
explore the effect of fragmentation on the combustioncurves.
The distribution is expressed as the fraction of thetotal mass contained in a narrow interval of sizes.Twenty size classes are used in the calculations,which correspond, for the main mode of the initialdistribution, exactly to the size classes given by theMalvern Mastersizer S software, with Di+1/Di =1.16, where Di is the geometric mean diameter forclass i. The evolution of the particles, in terms ofboth Ui(t) and Di(t) (according to Eq. (3)), is pre-dicted using a coal combustion model [19,25] adaptedto the reactor conditions. After a short time interval(∼0.2 s), the information from the different classes iscombined to recalculate the oxygen partial pressure;fragmentation is implemented as a change in the PSDoccurring at the end of these time intervals.
The production of numerous fine particles by attri-tion or percolative fragmentation, although relevant todetermine the final ash distribution, has a minor effecton the combustion curves, since the mass of the parentcoal/char particle is little affected by these processes,especially in the high U range. The interest is focusedhere on the generation of the ∼20–40 µm particlesobserved from the first stages of combustion, formedby fragmentation of the original 53–63 µm coal par-ticles and comparable in size with them. This is im-plemented in the model by transferring a fraction φ
of the mass in a certain class, i, to the second-nextclass at the left (i − 2), except for the two small-est classes (∼1 µm), for which fragmentation is ne-glected. A similar approach for particle breakage wasused by Mitchell and Akanetuk [5]. For the size in-tervals indicated above, such a shift approximatelycorresponds to a division of a fraction φ of the par-
ticles into two equal fragments. The unburnt fractionof each class is recalculated, and the new distributionused as input for the following time interval.
The fraction φ might take into account influence ofdifferent parameters (U , t , particle temperature (T ),dT/dt , among others) on the fragmentation process.Again, however, the physical or experimental knowl-edge are clearly insufficient to propose more com-plex functions of these magnitudes. Baxter [13] founda trend of increasing percolative fragmentation withparticle size in the pf range, but the narrowness ofthe initial distribution allows neglecting this effect inthe present work. Figs. 2–4 consistently show a pro-gressively smaller change of the PSD with U ; for thisreason, a dependence φ = θ · �U has been consid-ered, being θ a constant, and �U the decrease in U
in the time interval after which fragmentation is calcu-lated. This approach also minimizes the influence ofthe time interval selected on the results. The time in-terval has been chosen so that a division by two of thistime has a negligible effect on the distribution shapefor a particular combustion time.
3.3. Effect of fragmentation on the PSD evolution
Fig. 7 displays the predicted D43(U) evolution fortwo different values of θ (0.8 and 1.7), showing, as ex-pected, a faster reduction of the mean diameter withthe degree of combustion. A reasonable fit of the datais obtained with θ = 1.7. In particular, the initial in-crease of the mean diameter is nearly avoided evenwith θ = 0.8. The evolution of the PSD for this caseis shown in Fig. 9, to be compared with Figs. 2 (ex-perimental) and 8 (calculated without fragmentation).The general aspect of the PSD evolution calculatedwith fragmentation is clearly much more similar to
Fig. 7. Measurements of D43(U) for the run performed at 1300 ◦C, 4% O2 in flue gases. Calculated evolutions in the samecombustion conditions according to different rates of fragmentation (see text): θ = 0, 0.8, and 1.7. The fit of all the experimentaldata to Eq. (3) is also included.

490 S. Jiménez, J. Ballester / Combustion and Flame 151 (2007) 482–494
Fig. 8. Calculated evolution of the PSD without fragmentation (θ = 0). Optimal kinetic parameters: Ec = 99 kJ/mol, Ac =1.4 × 10⁻³ kg/(m2 s Pa).
Fig. 9. Calculated evolution of the PSD with fragmentation (θ = 1.7). Optimal kinetic parameters: Ec = 99 kJ/mol, Ac =1.0 × 10⁻³ kg/(m2 s Pa).
the experimental result than it was when fragmenta-tion was not taken into account. In particular, the risein the fraction of ∼20–40 µm particles in the initialstages of the combustion is well reproduced. Similarresults were obtained for the other combustion condi-tions, not shown here for brevity.
Obviously, subsequent refinements of the frag-mentation model might provide a closer agreementbetween experiments and calculations, but the presentresults serve, in the authors’ opinion, to confirm therole played by particle breakage in the evolution ofthe char PSD during combustion. They also ensurethat the study shown next on the effect of fragmenta-
tion on the combustion curves is made on a realisticbasis.
4. Effect of fragmentation on the combustioncurves
As indicated in the caption of Fig. 9, the ki-netic parameters for oxidation had to be recalculatedwhen fragmentation was introduced into the combus-tion model. Indeed, since the mean diameter evolu-tion is affected by fragmentation, the conversion ratechanges, and new parameters were needed to ade-quately fit the experimental combustion curves shown

S. Jiménez, J. Ballester / Combustion and Flame 151 (2007) 482–494 491
in Fig. 1. In order to enable a direct comparison ofthe different kinetics, the activation energy was keptconstant (99 kJ/mol) while the pre-exponential fac-tor was varied. The best fit for φ = 1.7 · �U wasobtained with Ac = 1.0 g/(m2 s Pa) (to be comparedwith the value found without fragmentation, Ac =1.4 g/(m2 s Pa)).
Fig. 10 compares the experimental results for threecombustion conditions with different predictions re-spectively calculated as follows:
– Without fragmentation, with the correspondingoptimal kinetic parameters [19].
– With fragmentation (φ = 1.7 · �U ) and the newbest {Ac, Ec} pair.
– Finally, with fragmentation, but with the originalkinetic parameters (i.e. corresponding to the fit ofthe data without particle breakage). These curvesare included only for reference and do not actu-ally constitute a fit of the experimental results.
As shown in those graphs, the general depen-dences with temperature and oxygen concentrationare again adequately reproduced when fragmentationis considered. The main difference regarding the qual-ity of the fits caused by the introduction of particlebreakage into the model is related to the curvature ofthe predicted combustion curves, which is enhancedby fragmentation. This might be seen as a furtherstep in the direction started in a previous work [19]:there the real PSD was considered, and this resultedin the appearance of a certain curvature, associatedto the different combustion rates of the size classespresent in the distribution. Here the evolution of par-ticle size as combustion proceeds has been refinedto better fit the measured PSDs (Figs. 2, 8, and 9),which yields a consistent reduction in the discrepan-cies between predicted and experimental results forall the experimental series. Thus, both results indicatethat the simple combustion model for single particlescommonly used is able to reproduce the major and,at least in part, the minor features of the experimentalcombustion curves as long as the actual particle sizedistribution and its evolution are taken into consider-ation.
According to the predictions obtained with thesimple fragmentation schema used here (see Figs. 2and 9), subsequent refinements of this submodelshould point to a faster particle breakage for high U s,followed by a decrease in fragmentation rate, for theconditions explored here (particle size, etc.); as a con-sequence, the curvature of the calculated combustioncurves is expected to be further enhanced, so repro-ducing even better the experimental trends. In anycase, the correct modeling of the actual size of theparticles is found to progressively limit (at least for
the coal and combustion conditions tested) the rel-evance of any possible passivation factor, which indifferent forms were proposed in the past to explainthe shape of the combustion curves with monosizeddistributions [31,32].
The consideration of fragmentation has a directimplication for the specific oxidation rates: the spe-cific surface area increases and, therefore, the rate ofheterogeneous oxidation needs to be lower to matchthe experimental curves. This can be clearly seen inthe pre-exponential factors obtained, for the same ac-tivation energy, without (Ac = 1.4 g/(m2 s Pa)) andwith fragmentation (1.0 g/(m2 s Pa)). This is shownexplicitly in Fig. 10, where the curves calculated withfragmentation and the old parameters are also pre-sented. As a result of the larger area of the frag-ments, the conversion rate is considerably higher andthe length travelled by the particles along the reac-tor (approximately proportional to the residence time)before total combustion is reduced by a factor roughlyequal to the ratio of Acs (10/14).
Similar effects are clearly observed in Fig. 11,where the evolution predicted for a virtually mono-sized distribution of coal particles with D ≈ 60 µm ispresented for the case of combustion along the EFR at1300 ◦C and 4% O2 in flue gases. The kinetic parame-ters corresponding to the anthracite without fragmen-tation and φ = 2 · �U (for the case with breakage)were used in these calculations. In order to make theeffect of fragmentation on the curve more explicit,α = 0 has been selected for this calculation. As shownpreviously (e.g., [19]), if fragmentation is not imple-mented, the model used predicts a nearly linear con-version rate of the coal particle. When fragmentationis considered, the model predicts higher conversionrates in the first stages, and a greater curvature. Sincethere is a relevant remnant of the original 60-µm par-ticles (∼10%), in this case the time for total oxidationis given by those particles, and thus coincides withthe case without fragmentation. Nevertheless, it is rel-evant to note that even a true monosized coal sampleshould exhibit an oxidation rate apparently decreasingwith time (or degree of conversion) as a consequenceof fragmentation phenomena.
4.1. Implications for the modelling of practicalsystems
The final aim of most studies on coal kinetics isto offer an analytical tool to characterize each coal,by means of a limited amount of tests in a labora-tory, so that its properties could be used as input inCFD programs for the simulation of industrial plants.It is obvious that, in order to achieve this, the modelsused to examine the experimental data in the labo-ratory should match those used in the CFD calcula-

492 S. Jiménez, J. Ballester / Combustion and Flame 151 (2007) 482–494
Fig. 10. Experimental U(L) data for three combustion conditions (A—1300 ◦C, 4% O2; B—1450 ◦C, 4% O2; C—1300 ◦C,8% O2). Comparison with calculations assuming no fragmentation and, alternatively, θ = 1.7. In this case, two sets of kineticparameters are used (Ec = 99 kJ/mol, Ac = 1.0 × 10⁻³ and 1.0 × 10⁻⁴ kg/(m2 s Pa); see text).
tions. The latter require, in order to limit the compu-tational costs, relatively simple submodels for eachprocess occurring in the combustion chamber and,in particular, for coal combustion. Essentially two
submodels for char oxidation are used in the liter-ature and the commercial CFD codes (e.g., [33]):one is the approach used here, based on apparent ki-netics/diffusion to the outer particle surface, and the

S. Jiménez, J. Ballester / Combustion and Flame 151 (2007) 482–494 493
Fig. 11. Calculated combustion curves of a monosized PSD (60 µm) with and without fragmentation. α has been set equal tozero. Conditions as in the EFR at 1300 ◦C, 4% O2.
other one intends to describe the actual pore distrib-ution and evolution, keeping the intrinsic carbon re-activity constant (see, e.g., [29]). The latter requires anumber of variables to be determined a priori (poros-ity, tortuosity of the pores, etc.), for which little infor-mation is available in the literature (especially at hightemperatures); however, its main disadvantage residesin the lack of reliable models for the evolution of thepore size and structure. As a consequence, a majorityof the works published make use of the former model.
In spite of some experimental uncertainties, theprevious sections and a previous work [19] haveshown the success of this model in reproducing themain features of the combustion curves experimen-tally determined in an entrained-flow reactor operatedunder realistic combustion conditions. The considera-tion of the actual PSD in the derivation of the kineticparameters, although new for this kind of laboratorystudies is not a difference with respect to the com-mercial codes, as they also consider the real PSD ofthe fuel injected. The evolution of the particle diam-eter, here modeled with the parameter α, and particlefragmentation are, however, usually ignored in com-putational studies and commercial codes.
Fragmentation, as well as the variation of the par-ticle diameter with U , has been shown to contributeto a more adequate fit of the evolution of the fuel PSDand, also, of the combustion curves, especially re-garding oxidation rates at high conversion degrees. Asnoted in [33], this is the range in which the classicalstudies present greater difficulties to correctly repro-duce experiments. Thus, the implementation of suit-able submodels for the evolution of the diameter andfragmentation should improve the accuracy of simula-tions of industrial plants, especially regarding lossesdue to unburnt fuel. A correct treatment of particlesize is important also in the calculation of drag forces
or gas–particle transfer of mass and heat. Due to theway in which the discrete phase is implemented inmost codes, fragmentation should likely be ascribedto each particle as a probabilistic mechanism, ratherthan to the whole distribution (as done here), but thisdoes not seem to be an insurmountable difficulty.
It should be noted that the extension of the modelto include fragmentation (or other) effects requiresthat the coal parameters (Ac, Ec, α) be derived fromexperiments using exactly the same model. As shownin Fig. 10, fragmentation causes an increase in totalsurface area and (at least) the frequency factor needsto be modified to fit the experimental curves. Also,unless a comprehensive fragmentation theory fromfirst principles is available, the parameters used to rep-resent fragmentation rates (here, θ ) have to be derivedfrom specific testing. If new results on the evolutionof PSD are made available for different coal types, itmight be possible to directly assign an approximatevalue for such parameters for specific coals and com-bustion conditions.
5. Conclusions
Different aspects related to the evolution of parti-cle size during pulverized coal combustion have beenaddressed in this paper. In the first place, a detailedcharacterization of the modifications in the PSD ascombustion proceeds has been presented. The studyincludes different tests with an anthracite as well asone complete series for a coke. This type of resultsis considered to be new in this field (in extension anddetail), and might provide a valuable insight into theactual evolution of particle size during combustion. Inparticular, the measurements support the occurrenceof breakage of the particles (∼53–63 µm) into frag-

494 S. Jiménez, J. Ballester / Combustion and Flame 151 (2007) 482–494
ments of comparable size (∼20–40 µm) in the earlystages of combustion.
In the second place, the standard combustionmodel has been extended to include fragmentationeffects in order to evaluate the possibilities to re-produce the observed effects. Besides, the traditionalexpression for particle shrinking has been modifiedto account for the residual size of the mineral matter.The good agreements obtained (and, in particular, thesignificant improvement with respect to the previousmodel) support the adequacy of such modificationsand, specifically, the need for a fragmentation sub-model in order to calculate the evolution of the PSD.
The implications, however, are not restricted tothe specific problem of predicting the PSD evolution.The trends observed when comparing experimentaland calculated results of burnout evolution are alsomodified when fragmentation is taken into account.In particular, the curvature of the calculated combus-tion curves is enhanced, which significantly affects(and improves) the predictions of the model at highburnout degrees, a range in which the largest dis-crepancies between calculations and measurementsare usually found. From the viewpoint of combustionscience, this should be taken into account in orderto assess the adequacy of more sophisticated mod-els of char combustion (e.g., including different typesof passivation phenomena), especially regarding theirpredictions at high burnouts. Finally, this is also a rel-evant aspect for practical applications, where the pre-diction of residual unburnt fractions is in many casesan important objective.
Acknowledgment
Financial support from the Spanish Ministry ofEducation and Science and from the Governmentof Aragón through Grants ENE-2004-08060-C02-02and PM025, respectively, is gratefully acknowledged.
References
[1] R.J. Quann, A.F. Sarofim, Proc. Combust. Inst. 19(1982) 1429–1440.
[2] M. Neville, A.F. Sarofim, Proc. Combust. Inst. 19(1982) 1441–1449.
[3] A.F. Sarofim, J.B. Howard, A. Padia, Combust. Sci.Technol. 16 (1977) 187–204.
[4] R.C. Flagan, S.K. Friedlander, in: D.T. Shaw (Ed.),Recent Developments in Aerosol Science, Wiley, NewYork, 1978, p. 25.
[5] R.E. Mitchell, A.E.J. Akanetuk, Proc. Combust. Inst.26 (1996) 3137–3144.
[6] J.J. Helble, A.F. Sarofim, Combust. Flame 76 (1989)189–196.
[7] A.R. Kerstein, S. Niksa, Prediction and measurementof the critical porosity for fragmentation during charconversion, in: International Conference on Coal Sci-ence, International Energy Agency, Pittsburgh, 1983,pp. 743–746.
[8] A.R. Kerstein, S. Niksa, Proc. Combust. Inst. 20 (1985)941–950.
[9] A.R. Kerstein, B.F. Edwards, Chem. Eng. Sci. 42 (7)(1987) 1629–1634.
[10] S.-G. Kang, J.J. Helble, A.F. Sarofim, J. Beér, Proc.Combust. Inst. 22 (1988) 231–238.
[11] S.-G. Kang, A.R. Kerstein, J.J. Helble, A.F. Sarofim,Aerosol Sci. Technol. 13 (1990) 401–412.
[12] R. Chirone, P. Salatino, L. Massimilla, Combust. Flame77 (1989) 79–90.
[13] L.L. Baxter, Combust. Flame 90 (1992) 174–184.[14] G. Liu, H. Wu, R.P. Gupta, J.A. Lucas, A.G. Tate, T.F.
Wall, Fuel 79 (2000) 627–633.[15] L. Yan, R.P. Gupta, T.F. Wall, Fuel 81 (2002) 337–344.[16] W.P. Linak, C.A. Miller, W.S. Seames, J.O.L. Wendt, T.
Ishinomori, Y. Endo, S. Miyamae, Proc. Combust. Inst.28 (2002) 441–448.
[17] W.S. Seames, Fuel Process. Technol. 81 (2003) 109–125.
[18] R. Hurt, K. Davis, Combust. Flame 116 (1999) 662–670.
[19] J. Ballester, S. Jiménez, Combust. Flame 142 (2005)210–222.
[20] I.W. Smith, Combust. Flame 17 (1971) 303–314.[21] I.W. Smith, Combust. Flame 17 (1971) 421–428.[22] M.C. Mayoral, M.I. Izquierdo, J.M. Andrés, B. Rubio,
Thermochim. Acta 370 (2001) 91–97.[23] A.N. Carpenter, N.M. Skorupska, Coal Combustion—
Analysis and Testing, IEACR/64, IEA Coal Research,London, 1993.
[24] N. Nsakala, R.L. Patel, R.W. Borio, An advancedmethodology for prediction of carbon loss in commer-cial pulverized coal-fired boilers, in: ASME/IEEE JointPower Generation Conference, Portland, OR, October19–23, 1986.
[25] M.A. Field, D.W. Gill, B.B. Morgan, P.G.W. Hawksley,Combustion of Pulverized Coal, The British Coal Uti-lization Research Association, Leatherhead, UK, 1967.
[26] R.E. Mitchell, Proc. Combust. Inst. 22 (1988) 69–78.[27] B. J Waters, R.G. Squires, N.M. Laurendeau, R.E.
Mitchell, Combust. Flame 74 (1988) 91–106.[28] B.J. Waters, R.E. Mitchell, R.G. Squires, N.M. Lauren-
deau, Proc. Combust. Inst. 22 (1988) 17–27.[29] I.W. Smith, Proc. Combust. Inst. 19 (1982) 1045–1065.[30] L.D. Smoot, in: W. Bartok, A. Sarofim (Eds.), Fossil
Fuel Combustion, Wiley, New York, 1991.[31] R. Hurt, J.-K. Sun, M. Lunden, Combust. Flame 113
(1999) 181–197.[32] J. Zelkowski, Energy 26 (2001) 1185–1195.[33] A. Wiliams, R. Backreedy, R. Habib, J.M. Jones,
M. Pourkashanian, Fuel 81 (5) (2002) 627–636.