Study of the effect of prolonged magnetic stirring on the physico-chemical surface properties of...
11
Study of the effect of prolonged magnetic stirring on the physico-chemical surface properties of nanometric transition alumina B. Bonelli • P. Palmero • F. Lomello • M. Armandi • M. Lombardi Received: 15 January 2010 / Accepted: 7 June 2010 / Published online: 17 June 2010 Ó Springer Science+Business Media, LLC 2010 Abstract This article reports the study of a transition nanometric alumina both as such and after prolonged magnetic stirring in bi-distilled water. Stirring was effec- tive in inducing a significant reduction of starting particles agglomeration and modification of the surface properties of the material. The formation of an Al(OH) 3 (gibbsite) phase after magnetic stirring in water was detected by means of XRD on powdered samples. Correspondingly, Infra Red spectrum of magnetically stirred alumina outgassed at 150 °C showed a band at ca. 3300 cm -1 , ascribable to the hydroxide phase, which decomposes at higher temperature. Differential thermal analysis and thermogravimetry also showed a different thermal behaviour between the two materials, in that magnetically stirred alumina presents a broad endothermic peak at about 280 °C accompanied by an abrupt mass loss (ca. 0.5% of the initial weight), due to dehydration of the hydroxide phase. Introduction The term ‘alumina’ refers to different materials: the ther- modynamically stable corundum phase (a-Al 2 O 3 ), of par- amount importance in the field of ceramic applications, is the ultimate product of treatment at T C 1,400 K of all Al oxidic and hydrated systems [1]. In catalysis and surface chemistry, the term alumina is usually referred to the so-called ‘transition aluminas’, which are metastable phases of low crystallinity with high surface area and open porosity [2]. The attention is nowadays focused on nanostructured ceramics, implying the use of ultra-fine powders, which can offer a variety of attractive properties, such as enhanced sinterability as compared to corresponding coarse-grained ones [3]. Nano-sized ceramic powders, however, can often exhibit soft and/or hard agglomeration, the former due to weak van der Waals interactions between particles, the latter referring to primary particles strongly bound together as a result of neck growth. Soft agglomerates can be normally broken by simple mechanical stirring, low-energy agitation or ultra-sonication [4], while for hard agglomerates higher stresses are needed, requiring high-energy milling or high shear mixing processes [4]. The dry forming of hard agglomerated powders leads to green microstructures which are affected by two types of pores: micronic inter-agglom- erates pores, and nanometric inter-crystallites ones, within the agglomerate itself. During sintering, the elimination of inter-agglomerates pores needs high temperatures, thus encouraging grain growth [5]. As a matter of fact, agglom- eration-free particles and narrow size distributions are imperative requirements for nanosized powders to be con- solidated into highly dense, fine microstructures [6]. Although the ceramic industry preferentially employs a-alumina powders to manufacture fired components, the scientific interest is also focused on transition aluminas to produce fully dense alumina and alumina-based composite materials, mostly in view of developing ultra-fine, tailored microstructures [7, 8]. However, the metastability of these powders is a major drawback, since it has a critical B. Bonelli (&) P. Palmero F. Lomello M. Armandi M. Lombardi Dipartimento di Scienza dei Materiali e Ingegneria Chimica, Politecnico di Torino, INSTM Research Unit PoliTO, C.so Duca degli Abruzzi 24, 10129 Torino, Italy e-mail: [email protected] M. Lombardi IIT-Italian Institute of Technology @ POLITO–Centre for Space Human Robotics, C.so Trento 21, 10129 Torino, Italy 123 J Mater Sci (2010) 45:6115–6125 DOI 10.1007/s10853-010-4698-7
-
Upload
independent -
Category
Documents
-
view
0 -
download
0
Transcript of Study of the effect of prolonged magnetic stirring on the physico-chemical surface properties of...

Study of the effect of prolonged magnetic stirringon the physico-chemical surface properties of nanometrictransition alumina
B. Bonelli • P. Palmero • F. Lomello •
M. Armandi • M. Lombardi
Received: 15 January 2010 / Accepted: 7 June 2010 / Published online: 17 June 2010
� Springer Science+Business Media, LLC 2010
Abstract This article reports the study of a transition
nanometric alumina both as such and after prolonged
magnetic stirring in bi-distilled water. Stirring was effec-
tive in inducing a significant reduction of starting particles
agglomeration and modification of the surface properties of
the material. The formation of an Al(OH)3 (gibbsite) phase
after magnetic stirring in water was detected by means of
XRD on powdered samples. Correspondingly, Infra Red
spectrum of magnetically stirred alumina outgassed at
150 �C showed a band at ca. 3300 cm-1, ascribable to the
hydroxide phase, which decomposes at higher temperature.
Differential thermal analysis and thermogravimetry also
showed a different thermal behaviour between the two
materials, in that magnetically stirred alumina presents a
broad endothermic peak at about 280 �C accompanied by
an abrupt mass loss (ca. 0.5% of the initial weight), due to
dehydration of the hydroxide phase.
Introduction
The term ‘alumina’ refers to different materials: the ther-
modynamically stable corundum phase (a-Al2O3), of par-
amount importance in the field of ceramic applications,
is the ultimate product of treatment at T C 1,400 K of all
Al oxidic and hydrated systems [1]. In catalysis and
surface chemistry, the term alumina is usually referred to
the so-called ‘transition aluminas’, which are metastable
phases of low crystallinity with high surface area and
open porosity [2].
The attention is nowadays focused on nanostructured
ceramics, implying the use of ultra-fine powders, which can
offer a variety of attractive properties, such as enhanced
sinterability as compared to corresponding coarse-grained
ones [3]. Nano-sized ceramic powders, however, can often
exhibit soft and/or hard agglomeration, the former due to
weak van der Waals interactions between particles, the latter
referring to primary particles strongly bound together as a
result of neck growth. Soft agglomerates can be normally
broken by simple mechanical stirring, low-energy agitation
or ultra-sonication [4], while for hard agglomerates higher
stresses are needed, requiring high-energy milling or high
shear mixing processes [4]. The dry forming of hard
agglomerated powders leads to green microstructures which
are affected by two types of pores: micronic inter-agglom-
erates pores, and nanometric inter-crystallites ones, within
the agglomerate itself. During sintering, the elimination of
inter-agglomerates pores needs high temperatures, thus
encouraging grain growth [5]. As a matter of fact, agglom-
eration-free particles and narrow size distributions are
imperative requirements for nanosized powders to be con-
solidated into highly dense, fine microstructures [6].
Although the ceramic industry preferentially employs
a-alumina powders to manufacture fired components, the
scientific interest is also focused on transition aluminas to
produce fully dense alumina and alumina-based composite
materials, mostly in view of developing ultra-fine, tailored
microstructures [7, 8]. However, the metastability of these
powders is a major drawback, since it has a critical
B. Bonelli (&) � P. Palmero � F. Lomello � M. Armandi �M. Lombardi
Dipartimento di Scienza dei Materiali e Ingegneria Chimica,
Politecnico di Torino, INSTM Research Unit PoliTO, C.so Duca
degli Abruzzi 24, 10129 Torino, Italy
e-mail: [email protected]
M. Lombardi
IIT-Italian Institute of Technology @ POLITO–Centre for Space
Human Robotics, C.so Trento 21, 10129 Torino, Italy
123
J Mater Sci (2010) 45:6115–6125
DOI 10.1007/s10853-010-4698-7
influence on their sintering behaviour. In fact, transfor-
mation into a-phase is generally accompanied by the for-
mation of a vermicular microstructure, consisting of a
network of large pores [5].
Thus, the final sintering stage requires very high firing
temperatures to consolidate the material up to the theo-
retical density, inducing a significant grain growth. To
overcome the above limitations, various approaches have
been tested. For instance, wet-milling was applied to a
commercial gamma alumina, demonstrating that high
density samples (99%) can be produced after de-agglom-
eration: in fact, homogeneous and close-packed slip-cast
green bodies can be yielded, able to limit the formation of
the vermicular microstructure upon sintering [5]. Our
previous work [9] has shown that it is possible to induce
modifications of nano-crystalline transition alumina parti-
cles by dispersion, thus to lower the h to a-alumina trans-
formation temperature and the related activation energy.
The dispersed powders also showed increased compaction
behaviour under dry forming and sinterability if compared
to the raw, agglomerated material [10].
So far, however, little is known about the role played by
surface properties in these processes: for example, c-Al2O3
when dispersed in water even at neutral pH and in the
absence of other chemical species is not stable to rehy-
dration and should be transformed back into a hydrated
phase [11]. This transformation surely changes the surface
properties of the material, basically the hydroxyls popula-
tion [2, 12]. These microscopic effects of hydration may
influence other relevant macroscopic properties, like for
example the catalytic activity of c-Al2O3 [13], or the
material behaviour during granulation [14].
As far as the rehydration of c-Al2O3 is concerned, two
kinds of behaviour are reported in the literature:
(i) a hydrated layer of hydroxide Al(OH)3 is formed at
the surface of c-Al2O3 particles after suspension in
water, without dissolution of the support, due to the
superficial transformation of alumina surface into
aluminium hydroxide-like layers [15–20];
(ii) alumina is dissolved and then precipitated as well-
shaped large Al(OH)3 particles from supersaturated
aqueous solution at pH C5, with a contact time
between alumina and water exceeding 5 h [21].
Important factors may determine alumina surface rehy-
dration, like contact time; pH of the aqueous solution;
temperature; stirring and also the (nanometric) size of the
parent material. It must be pointed out that it is also dif-
ficult to detect the hydroxide formed, since (i) whether
present in small amounts, it could not be measured by XRD
and (ii) although detected by XRD, its actual location
(outer layer or as a separate phase) may not be unambig-
uously understood.
In this article, de-agglomerated transition alumina pow-
ders were obtained under magnetic stirring; this route was
chosen since it brings about an effective breakage of soft
agglomerates, without inducing any material pollution as
occurs by other dispersion methods: ball-milling or high
shear mixing in rotor–stator systems can induce, in fact,
particles contamination from milling media and even phase
transformation [4, 22–24]. This work reports on the effect
of prolonged magnetic stirring in deionized water (pH
5.8–6.0) on commercial transition nanometric alumina,
with the aims to:
(i) understand the effect of stirring on particles soft
agglomeration;
(ii) study the evolution of surface functionalities as a
function of rehydration and thermal treatment: the
type and abundance of hydroxyls and Lewis acidic
sites is indeed responsible of reactive processes at
powder surface.
Experimental
Materials
A commercial, nano-crystalline transition alumina (Nano-
tek� by Nanophase Technologies Corporation, Darien, IL,
USA), was used as starting material. The powder, hereafter
referred to as A, is characterized by a purity of 99.5%, an
average particle size of 47 nm and specific surface area
(SSA) of 35 m2 g-1, as reported by the supplier (Table 1).
Powder A was dispersed in distilled water (solid content
of 50 wt%) and maintained under magnetic stirring at
about 500 rpm up to 170 h, obtaining the Magnetically
Stirred sample, hereafter referred to as AMagnetically Stirred.
pH was measured on the suspension as a function of time
by a pH-meter; it was 5.1 for the as-dispersed powder and it
stabilized to the value of 5.6 after 24 h of magnetic stirring,
remaining almost stable up to 170 h of stirring. The mea-
sured pH value was in good agreement with literature data
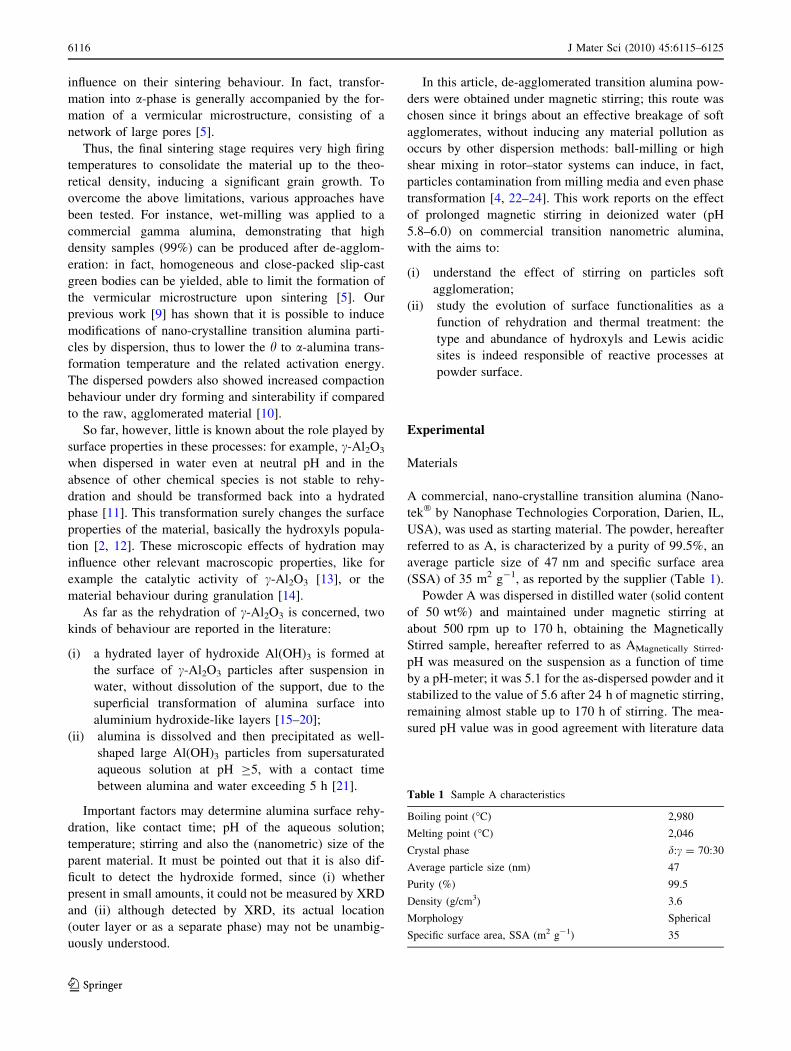
Table 1 Sample A characteristics
Boiling point (�C) 2,980
Melting point (�C) 2,046
Crystal phase d:c = 70:30
Average particle size (nm) 47
Purity (%) 99.5
Density (g/cm3) 3.6
Morphology Spherical
Specific surface area, SSA (m2 g-1) 35
6116 J Mater Sci (2010) 45:6115–6125
123

concerning water suspensions of c-Al2O3, for which a
natural pH in the 4.5–6.0 range was reported [25, 26].
Characterization techniques
The two materials were studied by means of the following
techniques:
• Agglomerate size distributions were determined on
powder suspensions diluted to 7 vol.% by a laser
granulometer (Fritsch Analysette 22 Compact) in the
0.3–300 lm range.
• X-ray diffraction (XRD) patterns were collected on
powdered samples with a Philips PW 1710 diffractom-
eter using Cu Ka radiation (1.541874 A), in the range
5�–70� 2h, with a step size of 0.05� 2h and an
acquisition time per step of 5 s. Diffraction patterns
were indexed by using the Powder Data File database
(P.D.F. 2000, International Centre of Diffraction Data,
Pennsylvania)
• Simultaneous DTA–TG analyses (Netzsch STA 409C)
were performed on powdered samples of about 150 mg,
up to 1,450 �C in static air, at a heating rate of 10 �C/min.
• BET (Brunauer, Emmett, Teller) SSAs of powders,
previously outgassed at 150 �C for 2 h, were measured
by means of N2 adsorption/desorption isotherms at
77 K (Quantachrome Autosorb 1C instrument).
• High resolution transmission electron microscopy
(HRTEM) pictures were collected on a JEOL 3010-UHR
instrument, operated at 300 kV and equipped with a
2k 9 2k pixel Ultrascan 100 camera. Powders were
dispersed into iso-propanol and then let to dry at ambient
conditions.
• For FT-IR (Fourier Transform Infra-Red) measure-
ments, powder samples were pressed into self-support-
ing wafers. Spectra were collected at a resolution of
2 cm-1, on a Bruker FTIR Equinox 55 spectrophotom-
eter equipped with a MCT detector. Outgassing pre-
treatments were carried out using a standard vacuum
frame, in a IR cell equipped with KBr windows. During
outgassing treatments, residual pressure was below
1.00 * 10-3 mbar, as measured by a Pirani vacuum
gauge. To remove water and other atmospheric con-
taminants, wafers were outgassed for 1 h at increasing
temperatures (150, 350 and 500 �C) before adsorption
of CO at nominal 77 K. Due to the weakness of the
interaction with CO, adsorption is studied at low
temperatures: spectra were recorded at the nominal
temperature of liquid nitrogen, by dosing increasing
amounts of CO (in the 0.05–15 mbar equilibrium
pressures range) on samples previously outgassed at
150, 350 or 500 �C, inside a special quartz IR cell,
allowing simultaneously to dose carbon monoxide and
to add liquid N2. After each experiment, an evacuation
step was performed, to study the reversibility of the
interaction.
Results and discussion
Effect of the magnetic stirring on particles soft
agglomeration and crystalline structure
Sample A is characterized by agglomerates sizes, corre-
sponding to 10 (d10), 50 (d50) and 90% (d90) of the
cumulative volume distribution, of 2.6, 8.0 and 16.8 lm,
respectively, as determined by laser granulometry.
A significant reduction of the above soft agglomerates
size was obtained under magnetic stirring of powder A
water suspension. Figure 1 shows the evolution of d50
values as a function of the dispersion time. After 170 h of
magnetic stirring, AMS was obtained, whose d50 value was
about 1 order of magnitude lower than A.
Figure 2 shows the XRD patterns of A and AMS in the
5�–70� 2h range: A is a mixture of transition alumina
phases, precisely d-Al2O3 (ICDD file no. 04-0877) and
c-Al2O3 (ICDD file no. 48-0367), as determined by XRD.
Diffraction patterns of d- and c-phases are seen in both
spectra, the only differences being the peaks at 2h = 18.2�and 2h = 20.3� (arrows) in the AMS spectrum. Inset to
Fig. 2 shows a detail of the 15�–25� 2h range, in which
spectra are superimposed: it is shown that the two peaks
actually appear after magnetic stirring. For the sake of
clarity, only the spectra of the parent material (A) and of
the product obtained after 170 h of magnetic stirring (AMS)
are reported in the figure, but further XRD measurements
on powder stirred for shorter times (namely, for 24, 36, 48
and 72 h) showed that the two peaks appear after 36 h and
then their intensities remained almost constant up to 170 h.
0 20 40 60 80 100 120 140 160 1800
1
2
3
4
5
6
7
8
9
AMS
d 50 (
μm)
stirring time (h)
A
Fig. 1 Evolution of d50 values as a function of the dispersion time
under magnetic stirring
J Mater Sci (2010) 45:6115–6125 6117
123

The two peaks are very close, in both position and relative
intensity, to the (002) and (200) reflections of gibbsite,
respectively (ICDD 76-1782). The two polymorphs of
aluminium hydroxide Al(OH)3, gibbsite and bayerite, can
be, however, discriminated by the diffraction peak at about
18�, occurring at 2h = 18.2� in gibbsite and 18.8� in
bayerite. The formation of a crystalline gibbsite Al(OH)3
phase may thus be inferred, as a consequence of prolonged
magnetic stirring in water.
This result is in agreement with literature data [21, 27],
showing the formation of gibbsite [21] and bayerite [27]
after suspension of c-Al2O3 in water, under continuous
stirring at room temperature. It is interesting to note that
magnetic stirring actually plays a role in the formation of
the hydroxide phase, since a blank sample prepared by
suspending the powder in water for 170 h without stirring
did not show any change in the XRD patterns. XRD
technique, however, does not allow us to assess whether
gibbsite occurs as an outer layer formed on alumina
nanoparticles or as a separate phase. The fact that this
phase is detected by XRD shows, however, that it is large
enough to present a long range order.
The different phase composition among A and AMS gave
rise to different thermal behaviours upon heating, as shown
by DTA curves in Fig. 3a. The dispersed powder presents,
in fact, a broad endothermic peak at about 280 �C, not
detectable with sample A. From TG–DTG curves of AMS in
the 100–600 �C range (Fig. 3b), an abrupt mass loss of
about 0.5% of its initial weight was detected at the same
temperature. According with XRD pattern of this sample
and with literature data [21], the above thermal signal can
be reasonably ascribed to gibbsite dehydration. In addition,
as previously reported [9], gibbsite reflections disappeared
after AMS was calcined at 350 �C, thus confirming that the
endothermic peak in the AMS DTA curve has to be imputed
to thermal decomposition of gibbsite. The amount of alu-
minium hydroxide formed was about 3 wt%, as estimated
in a previous work from the mass-loss of water at about
280 �C in TG curve [9], the corresponding process being
intermediate formation of boehmite (AlOOH) [21], and its
subsequent dehydration, according to the following
reactions:
Al OHð Þ3! AlOOH þ H2O ð1Þ
AlOOH! 1=2 Al2O3 þ 1=2 H2O ð2ÞFrom Fig. 3a, a further difference among A and AMS
thermal behaviours also appears in the high temperature
regime, where exothermal signals can be observed. On the
ground of literature data [28, 29], these DTA peaks can be
attributed to the h to a-Al2O3 phase transformation, since
the other lower-temperature transformations (i.e. from c to
d and from d to h-alumina) do not give rise to calorimetric
signal, because of topotactic transformations. They were
determined at 1,325 and 1,203 �C for A and AMS,
respectively, denoting a significant effect of the dispersion
in reducing the a-phase crystallization temperature.
Fig. 2 XRD patterns of samples A and AMS in the 5�–70� 2h range.
The inset reports a magnification of the 15�–25� 2h range of patterns
of samples A (dashed line) and AMS (solid line); arrows point out
peaks at 2h = 18.2� and 2h = 20.3� observed in the AMS XRD
spectrum
200 400 600 800 1000 1200 1400
endo
A
AMS
1325°C
1203°C
μ
Temperature (°C)
279°C
30
exo
100 200 300 400 500 600
Δm (
%)
Temperature (°C)
0.5
TG
0.1
DTG
DT
G s
igna
l
276°C
(a)
(b)
Fig. 3 DTA curves of A and AMS samples (a); TG–DTG curves of
AMS in the 100–600 �C temperature range (b)
6118 J Mater Sci (2010) 45:6115–6125
123

HRTEM pictures were collected on A and AMS powders,
the latter having been dried after the pre-treatment in water:
Fig. 4 shows, as an example, a selected micrograph of
sample A. Both powders are composed by spherical particles
of heterogeneous diameters, in the 5–100 nm range, forming
agglomerates with variable size, while ‘single particles’
were rarely observed in both materials. The particle size
analysis of the powder before and after dispersion was car-
ried out by determining the size distribution from several
micrographs of each powder sample: an average particle
diameter of 35 nm was determined for both A and AMS.
From HRTEM analysis it was not possible to detect any
gibbsite Al(OH)3 particles, unlike other works [21],
reporting the formation of well-shaped gibbsite crystals
separated from the alumina surface after suspension in
water of nanometric c-Al2O3 at varying pH. Two expla-
nations are possible: in the first instance, HRTEM gives
only a partial view of the material and in this case it was
not possible to select grains in which gibbsite was obser-
vable; alternatively, the gibbsite phase may form a super-
ficial layer, instead of distinct particles, not detectable by
HRTEM observation. In this case, the micrograph taken at
higher magnification (inset to Fig. 4) only shows that
particles are ‘covered’ by a poorly ordered layer of about
2.5-nm thickness, contrasting with their well-crystallized
inner part, in which the crystalline lattice fringes could be
easily observed. Such amorphous layer, most probably
induced by the physical vapour synthesis (PVS) of the
nanostructured powders [30], seems to cover the majority
of particles and will be directly in contact with water
during dispersion under magnetic stirring and therefore
affecting the surface properties of the final material.
In order to measure surface area and possible porosity, N2
adsorption/desorption isotherms at 77 K were performed on
samples previously outgassed at 150 �C, i.e. after removal of
water and other surface contaminants and well before ther-
mal decomposition of gibbsite. Figure 5 shows the corre-
sponding curves: with both samples, Type II isotherms were
obtained typical of either non-porous adsorbents or adsor-
bents with relatively large pores. At low p/p0 values, Type II
isotherms may resemble Type I isotherms, typical of
microporous adsorbent: in this case, microporosity was
evaluated by the as method, which showed that the occur-
rence of microporosity may be excluded with both powders.
Most probably, the isotherm shape in the low p/p0 range is
due to high affinity between adsorbent and adsorbate, i.e.
high C values in the BET equation.
The measured BET SSA values do not differ very much,
in that they are 34.5 and 37.3 m2 g-1 for A and AMS,
respectively: a good agreement is found with the surface area
reported by the supplier. Magnetic stirring is shown to have a
small effect on the SSA. With AMS (squares), however, a
limited hysteresis loop may although indicate a small change
of intra-particles porosity, probably as a consequence of
de-agglomeration upon long-time residence under magnetic
stirring, which should also be responsible for the increase in
surface area. These results show indeed that the presence of
inter-particles porosity may be excluded.
Surface properties as studied by means
of FT-IR spectroscopy
The species at the surface of A and AMS powders were
studied by means of FT-IR spectroscopy: both samples
Fig. 4 Selected HRTEM picture of sample A; the inset reports a
micrograph, taken at a higher magnification, showing the presence of
an outer amorphous layer
0.0 0.2 0.4 0.6 0.8 1.00
5
10
15
20
25
30
35
A A
MS
Ads
orbe
d V
olum
e (c
m3 g
-1 S
TP
)
p/p0
Fig. 5 N2 adsorption/desorption isotherms at 77 K on samples A
(circles) and AMS (squares) out-gassed at 150 �C: black and whitesymbols refer to adsorption and desorption branch, respectively
J Mater Sci (2010) 45:6115–6125 6119
123

were outgassed at increasing temperatures, namely, 150 �C
(before gibbsite decomposition and after removal of
atmospheric contaminants), 350 �C (after decomposition of
gibbsite) and 500 �C (after severe dehydration) since the
presence of surface gibbsite should give rise not only to
peculiar IR bands in the hydroxyls range (3900–
3000 cm-1), but also to different adsorbed species and
different behaviour towards thermal treatments. In order to
allow comparison, all reported spectra were normalised to
unit specific weight.
Figure 6a shows FT-IR spectra of sample A outgassed at
150, 350 and 500 �C: the spectrum of the sample outgassed
at 150 �C shows a broad absorption in the hydroxyls stretch
range (3900–3000 cm-1), typical of a highly hydrated
surface, due to contact with atmospheric moisture. Bands
in the 1650–1200 cm-1 range are related to several car-
bonate-like species, usually observed at the surface of
transition aluminas [2, 31] and definitely removed by
outgassing at 500 �C.
Figure 6b shows a detail of hydroxyls spectra of sample
A outgassed at 350 and 500 �C, showing the presence of
different OH bands. In the past, several accurate models
have been proposed to describe the hydroxyl population of
transition aluminas [2, 12, 32–35]: in this work, reference
will be made to that by Knozinger and Ratnasamy [12],
depicted in Scheme 1.
Bands at 3780 and 3775 cm-1 are therefore assigned to
type Ib and Ia hydroxyls, i.e. free terminal hydroxyls bon-
ded to octahedral (AlVI) and tetrahedral (AlIV) aluminium
ions, respectively; 3725 cm-1 band is assigned to di-
bridged free OH group (type IIa) and 3675 cm-1 band to
free hydroxyls (type III), which are tri-bridged among two
octahedral (AlVI) and one tetrahedral (AlIV) aluminium
ions; band at ^3600 cm-1, with a tail on the lower
wavenumbers side, is assigned H-bonded hydroxyls, which
should be eliminated after outgassing at 500 �C.
Figure 7 shows FT-IR spectra of sample AMS outgassed
at 150, 350 and 500 �C: unlike sample A, carbonate-like
species (1650–1200 cm-1) are stable to thermal treatment
at 500 �C, indicating that, after magnetic stirring, the sur-
face presents stronger basic sites to which atmospheric CO2
may coordinate, probably due to gibbsite.
These differences per se points out the effect of magnetic
stirring on surface properties, but in order to allow a more
detailed analysis of the type and abundance of hydroxyls in
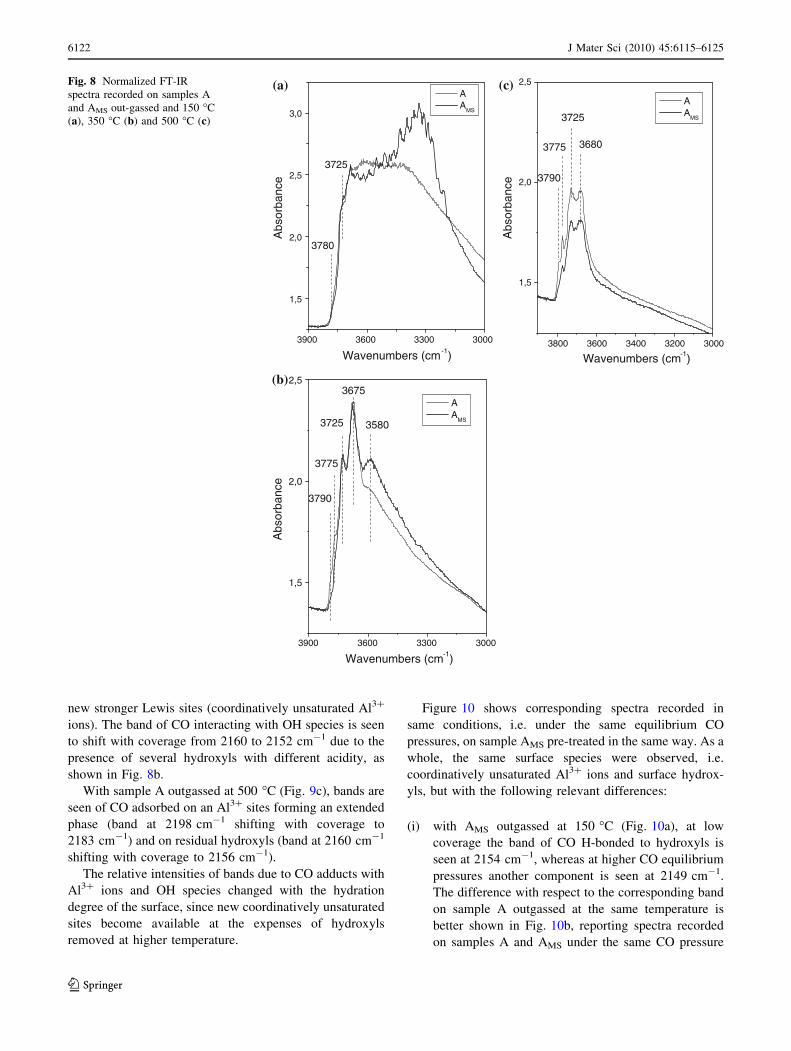
samples A and AMS, Fig. 8 compare hydroxyls spectra
(3900–3000 cm-1 range) of the two samples outgassed at
150 �C (a), 350 �C (b) and 500 �C (c).
Spectra of samples outgassed at 150 �C (Fig. 8a) are
dominated by the signal of H-bonded hydroxyls (broad
absorption below 3600 cm-1); at higher wavenumbers,
bands are seen at 3780 and 3725 cm-1 due to few free
AlVI-OH (Ib) and di-bridged OH (IIa) groups, respectively.
The stirring procedure brings about the appearance of an
intense absorption at about 3330 cm-1 (AMS), not to be
Scheme 1 Models of the different hydroxyls species at the surface of
transition aluminas, after ref. [12]
3600 3200 2800 2400 2000 1600 12000
1
2
3
4
500°C
350°C
150°C
Abs
orba
nce
Wavenumbers (cm-1)
32003800 3600 3400 3000
500°C
350°C3680
3775
3790
36003725
3675
Abs
orba
nce
Wavenumbers (cm-1)
(a)
(b)
Fig. 6 FT-IR spectra recorded on sample A outgassed at 150, 350
and 500 �C (a). Detail of hydroxyls spectra (3900–3000 cm-1 range)
of sample A outgassed at 350 and 500 �C (b)
6120 J Mater Sci (2010) 45:6115–6125
123

ascribed to residual water molecules, removed at room
temperature as shown in Fig. 6a.
Absorption at 3330 cm-1 should therefore be assigned
to OH stretch mode of gibbsite hydroxyls. Gibbsite struc-
tural OH groups have been carefully studied by means of
single-crystal Raman and FT-IR methods [36], which
allowed authors to single out several distinct types of
structural OH groups, basically inter-layer and intra-layer
hydrogen bonded hydroxyls. With single crystals, authors
were able to single out six m(OH) in both IR and Raman
spectra: in the present case, due to the polycrystalline
nature of the material, only a new broad absorption was
observed at 3330 cm-1, indicating the formation of new
OH species. With respect to pure gibbsite (3376 cm-1) the
observed frequency is lower and the band is broad, due to
H-bonded OH species.
The stability of OH species was studied by increasing
the outgassing temperature: as shown in Eqs. 1 and 2,
Al(OH)3 decomposition starts below 300 �C, to give
AlOOH and Al2O3, and at 450 �C the transformation into
c-Al2O3 should be attained: for these reasons samples were
out-gassed at 350 and 500 �C [2].
After outgassing at 350 �C (Fig. 8b), hydroxyls bands
decrease in intensity, due to surface de-hydroxylation: the
main difference between A and AMS is the higher intensity of
the band of H-bonded hydroxyls, which is also downward
shifted, in AMS (3580 cm-1 instead of 3600 cm-1): this is
indication of surface hydroxylation upon magnetic stirring.
According to Eqs. 1 and 2, after outgassing at 500 �C the
typical surface features of de-hydroxylated transition alu-
mina are expected: in Fig. 8c, bands are seen at 3790 cm-1
(type Ib hydroxyls), 3775 cm-1 (type Ia hydroxyls), 3725 cm-1
(type IIa hydroxyls) and 3680 cm-1 (type IIIa hydrox-
yls), whereas 3580 cm-1 band (H-bonded hydroxyls) is
removed.
Absorption intensity decreases with respect to spectra of
samples treated at 150 and 350 �C, in particular as far as
AMS is concerned. Since normalized spectra were reported,
this means that the hydrated phase, i.e. gibbsite formed
upon magnetic stirring, underwent more severe de-
hydroxylation upon outgassing at 500 �C.
As a whole, with the exception of 3330 cm-1 hydroxyls,
the same OH species are present at samples surface, but
with different abundance: to better address this point, CO
adsorption at liquid nitrogen temperature has been studied
by means of FT-IR spectroscopy.
Carbon monoxide is widely used as probe molecule to
study both Lewis and Brønsted acidic sites at the surface of
oxides and zeolites [2, 37–41]. When electrostatic inter-
action takes place between CO and the adsorbing site, like
in the cases above, a hypsochromic shift occurs, with
respect to free CO molecule (2143 cm-1), and character-
istic bands are seen in the C:O stretch region [37]. Being
the interaction very weak, low temperatures are needed and
experiments are performed at the nominal temperature of
liquid nitrogen.
Increasing pressures of CO (in the 0.05–30 mbar range)
were dosed, at the nominal temperature of N2(l), on the two
samples outgassed at 150, 350 and 500 �C: Figs. 9 and 10
show normalized difference spectra, obtained by subtrac-
tion of bare samples spectra shown in Fig. 8.
CO dosage on sample A outgassed at 150 �C (Fig. 9a)
gives rise to the formation of (i) a main band at 2152 cm-1;
(ii) a weaker band in the 2189–2178 cm-1 range and (iii) a
minor absorption at about 2107 cm-1.
The 2152 cm-1 band is due to CO molecules interacting
via H-bonding with AlIV-OH species originally absorbing
at 3725 cm-1 (in Fig. 8b), whereas 3780 cm-1 hydroxyls
are very weak acid and do not interact with CO. The weak
absorption at 2107 cm-1 is probably related to that at
2152 cm-1 and is assigned to CO molecules adsorbed
through the O atom (CO–HO adducts), according to pre-
vious work [42].
The band at 2189 cm-1, shifting to 2178 cm-1 with
coverage, is assigned to CO molecules interacting with
weak Lewis acidic sites, like five-coordinate Al3? or, most
probably, coordinatively unsaturated tetrahedral Al3? of
low index crystal planes [43, 44].
Figure 9b shows difference spectra recorded after CO
dosage on sample A outgassed at 350 �C: two bands are
seen at 2197 cm-1, shifting with coverage to 2183 cm-1
and at 2160 cm-1, shifting to 2152 cm-1. The former is
assigned to CO adsorbed on Al3? sites forming an exten-
ded phase, the latter to CO molecules H-bonded to
hydroxyls with different acidity. With respect to sample A
pre-treated at 150 �C, the band of CO on Al3? sites appears
more intense and shifted to higher wavenumbers: this is
ascribed to surface de-hydroxylation with the formation of
3600 3200 2800 2400 2000 1600 12000
1
2
3
4
500°C
350°C
150°C
Abs
orba
nce
Wavenumbers (cm-1)
Fig. 7 FT-IR spectra recorded on sample AMS outgassed at 150, 350
and 500 �C
J Mater Sci (2010) 45:6115–6125 6121
123
new stronger Lewis sites (coordinatively unsaturated Al3?
ions). The band of CO interacting with OH species is seen
to shift with coverage from 2160 to 2152 cm-1 due to the
presence of several hydroxyls with different acidity, as
shown in Fig. 8b.
With sample A outgassed at 500 �C (Fig. 9c), bands are
seen of CO adsorbed on an Al3? sites forming an extended
phase (band at 2198 cm-1 shifting with coverage to
2183 cm-1) and on residual hydroxyls (band at 2160 cm-1
shifting with coverage to 2156 cm-1).
The relative intensities of bands due to CO adducts with
Al3? ions and OH species changed with the hydration
degree of the surface, since new coordinatively unsaturated
sites become available at the expenses of hydroxyls
removed at higher temperature.
Figure 10 shows corresponding spectra recorded in
same conditions, i.e. under the same equilibrium CO
pressures, on sample AMS pre-treated in the same way. As a
whole, the same surface species were observed, i.e.
coordinatively unsaturated Al3? ions and surface hydrox-
yls, but with the following relevant differences:
(i) with AMS outgassed at 150 �C (Fig. 10a), at low
coverage the band of CO H-bonded to hydroxyls is
seen at 2154 cm-1, whereas at higher CO equilibrium
pressures another component is seen at 2149 cm-1.
The difference with respect to the corresponding band
on sample A outgassed at the same temperature is
better shown in Fig. 10b, reporting spectra recorded
on samples A and AMS under the same CO pressure
3900 3600 3300 3000
1,5
2,0
2,5
3,0
3725
3780
A A
MS
Abs
orba
nce
Wavenumbers (cm-1)
3900 3600 3300 3000
1,5
2,0
2,5
3790
3775
3725 3580
3675 A A
MS
Abs
orba
nce
Wavenumbers (cm-1)
3800 3600 3400 3200 3000
1,5
2,0
2,5
A A
MS
3790
3775
3725
3680
Abs
orba
nce
Wavenumbers (cm-1)
(a) (c)
(b)
Fig. 8 Normalized FT-IR
spectra recorded on samples A
and AMS out-gassed and 150 �C
(a), 350 �C (b) and 500 �C (c)
6122 J Mater Sci (2010) 45:6115–6125
123

(10 mbar). The smaller shift with respect to the free
molecule mode (2143 cm-1) indicates that the com-
ponent at 2149 cm-1 should be related to CO
interacting with weaker acidic hydroxyls, like those
originally absorbing at 3330 cm-1 (Fig. 8a), stem-
ming from the hydroxide phase (gibbsite);
(ii) normalized spectra recorded under the same CO
equilibrium pressures allow us to draw some semi-
quantitative observation: with AMS, intensities of CO
bands are always smaller than with A, indicating a
smaller amount of sites actually accessible at the
surface. The ratio IOH=IAl3þ ; reported for each exper-
iment, between intensities of the bands due to
CO–HO and CO–Al3? adducts, respectively, may
be used to evaluate the relative abundance of Lewis
and Brønsted sites. After treatment at 150 �C,
IOH=IAl3þ is 11.5 and 10.1 for A and AMS, respec-
tively: this can be explained by the fact that
3330 cm-1 hydroxyls belonging to gibbsite, though
abundant, are less acidic and less prone to interact
with CO; after treatment at 350 �C, IOH=IAl3þ is 1.6
and 2.0 for A and AMS, respectively, since AMS
surface is more hydrated, due to prolonged stirring in
water. After outgassing at 500 �C, IOH=IAl3þ is the
same for both materials, due to the formation of the
same c-Al2O3 phase, according to Eq. 2.
0.0
0.5
1.0
1.5
pCO
IOH
/IAl3+
= 11.5OH
Al3+
Abs
orba
nce
Wavenumbers (cm-1)2250 2200 2150 2100 2050
2250 2200 2150 2100 2050
0.0
0.5
1.0
1.5
pCO
IOH
/IAl3+
= 1.1
Abs
orba
nce
Wavenumbers (cm-1)
(a) (b)
(c)
Fig. 9 FT-IR difference
spectra, in the CO stretch region
2250–2050 cm-1 recorded after
dosing CO on sample A
outgassed at 150 �C (a), 350 �C
(b) and 500 �C (c). CO
equilibrium pressures range:
0.5–20 mbar; difference spectra
obtained by subtracting spectra
of bare sample reported in
Fig. 6
J Mater Sci (2010) 45:6115–6125 6123
123

Conclusions
In this work, the study of the effect of magnetic stirring on
nanometric transition alumina was carried out by comple-
mentary techniques in the field of materials science and
surface physical-chemistry. It was therefore possible to
figure out several differences concerning not only powder
de-agglomeration, but also its surface properties, i.e.
parameters that could affect important macroscopic
behaviour, like the sinterability of the material or any
potential catalytic application.
The comparison between A and AMS showed that the
magnetic stirring procedure deeply decreases the starting
agglomerates size, but also affects the physico-chemical
properties of the material. On one hand, the formation of an
Al(OH)3 (gibbsite) phase in AMS was detected by XRD,
indicating that a portion of the material, at least observable
by XRD, was modified under stirring; on the other hand, by
means of FT-IR spectroscopy it was possible to study
surface functionalities. Normalized spectra of powders
outgassed at 500 �C showed that stronger basic sites are
present at the surface of AMS (stable carbonates) and that
changes occurred in the hydroxyls population.
The surface of AMS was indeed more hydrated and less
acidic OH species (band at 3300 cm-1) were observed:
such species were ascribed to the presence of a hydroxide
0.0
0.5
1.0
1.5
pCO
IOH
/IAl3+
= 10.1
Abs
orba
nce
Wavenumbers (cm-1)
0.0
0.5
1.0
1.5
pCO
= 10 mbar
Wavenumbers (cm-1)
Abs
orba
nce
2149
A A
MS
2250 2200 2150 2100 2050
2200 2150 2100 2250 2200 20502150 2100
0.0
0.5
1.0
1.5
pCO
IOH
/IAl3+
= 1.0
Abs
orba
nce
Wavenumbers (cm-1)
(a) (c)
(b) (d)
Fig. 10 FT-IR difference
spectra, in the CO stretch region
2250–2050 cm-1, recorded
after dosing CO (equilibrium
pressures in the 0.5–20 mbar
range) on sample AMS out-
gassed at 150 �C (a), 350 �C (c)
and 500 �C (d). Difference
spectra obtained by subtracting
spectra of bare sample reported
in Fig. 7. b Comparison of
difference spectra recorded at
the same CO equilibrium
pressure (10 mbar) on samples
A and AMS outgassed at 150 �C
6124 J Mater Sci (2010) 45:6115–6125
123

phase, which decomposed by increasing the temperature, in
fair agreement with DTA–TG curves. Interestingly, such
hydroxide phase did not form on a blank sample suspended
in water without stirring, so pointing out the crucial role of
magnetic stirring in the modification of the surface prop-
erties of the material.
References
1. Lippens BC, Steggerda JJ (1970) In: Linsen BG (ed) Physical and
chemical aspects of adsorbents and catalysts. Academic Press,
New York, p 171
2. Morterra C, Magnacca G (1996) Catal Today 27:497 (and ref-
erences therein)
3. Mayo MJ (1996) Int Mater Rev 41:85
4. Teleki A, Wengeler R, Wengeler L, Nirschl H, Pratsinin SE
(2008) Powder Technol 181:292
5. Bowen P, Carry C (2002) Powder Technol 128:248
6. Ma J, Lim LC (2002) J Eur Ceram Soc 22:2197
7. Bowen P, Carry C, Luxembourg D, Hofmann H (2005) Powder
Technol 157:100
8. Bloch B, Ravi BG, Chaim R (2000) Mater Lett 42:61
9. Palmero P, Bonelli B, Lomello F, Garrone E, Montanaro L (2009)
J Therm Anal Calorim 97:223
10. Palmero P, Lombardi M, Montanaro L, Azar M, Chevalier J,
Garnier V (2009) Int J Appl Ceram Technol 6:420
11. Lefevre G, Duc M, Lepeut P, Caplain R, Fedoroff M (2002)
Langmuir 18:7530
12. Knozinger H, Ratnasamy P (1978) Catal Rev Sci Eng 17:31
13. Euzen P, Raybaud P, Krokidis X, Toulhoat H, Le Loarer JL,
Jolivet JP, Froidefond C (2002) In: Schuth F, Sing KSW,
Weitkamp J (eds) Handbook of porous solids, vol 3. Wiley-VCH,
Weinheim, p 1591
14. Huang CC, Kono HO (1989) Ind Eng Chem Res 28:910
15. Mieth JA, Huang YJ, Schwarz JA (1988) J Colloid Interface Sci
123:366
16. Santacesaria E, Carra S, Adami I (1977) Ind Eng Chem Prod Res
Dev 16(1):41
17. Digne M, Sautet P, Raybaud P, Euzen P, Toulhoat H (2004) J
Catal 226:54
18. Chen Y, Hyldtoft J, Jacobsen CJH, Nielsen OF (1995) Spectro-
chim Acta A 51:2161
19. Dyer C, Hendra PJ, Forsling W, Ranheimer M (1993) Spectro-
chim Acta A 49:691
20. Laiti E, Persson P, Ohman LO (1998) Langmuir 14:825
21. Carrier X, Marceau E, Lambert J-F, Che M (2007) J Colloid
Interface Sci 308:429
22. Reid CB, Forrester JS, Goodshaw HJ, Kisi EH, Suaning GJ
(2008) Ceram Int 34:1551
23. Xie Z-P, Lu J-W, Huang Y, Cheng Y-B (2003) Mater Lett 57:
2501
24. Sen S, Ram ML, Roy S, Sarkar BK (1999) J Mater Res 14:841
25. Gaydardzhiev S, Ay P (2006) J Mater Sci 41:5257. doi:10.1007/
s10853-006-0354-7
26. Zhao W, Yang D, Song J, Yang Z, Liang C, Xu M, Xu T (2004) J
Wuhan Univ Technol 19:4
27. Roelofs F, Vogelsberger W (2006) J Colloid Interface Sci 303:
450
28. Kao H-C, Wei W-C (2000) J Am Ceram Soc 83:362
29. Azar M, Palmero P, Lombardi M, Garnier V, Montanaro L,
Fantozzi G, Chevalier J (2008) J Eur Ceram Soc 28:1121
30. Hofmeister H, Kodderitzsch P, Dutta J (1998) J Non-Crystal
Solids 232:182
31. Iordan A, Zaki MI, Kappenstein C (2004) Phys Chem Chem Phys
6:2502
32. Tsyganenko AA, Filimonov VN (1972) Spectrosc Lett 5:477
33. Tsyganenko AA, Filimonov VN (1973) J Mol Struct 19:579
34. Peri JB (1965) J Phys Chem 69:231
35. Busca G, Lonrenzelli V, Sanchez Escribano V, Guidetti R (1991)
J Catal 131:167
36. Wang S-L, Johnston CT (2000) Am Mineral 85:739
37. Zecchina A, Arean CO (1996) Chem Rev 25(3):187 (and refer-
ences therein)
38. Bonelli B, Onida B, Chen JD, Galarneau A, Di Renzo F, Fajula F,
Garrone E (2004) Micropor Mesopor Mater 67:95
39. Lercher JA, Grundling C, Eder-Mirth G (1996) Catal Today
27:353
40. Cairon O, Chevreau T, Lavalley J-C (1998) J Chem Soc Faraday
Trans 94:3039
41. Hadjiivanov KI, Vayssilov GN (2007) Adv Catal 47:307
42. Arean CO, Manoilova OV, Tsiganenko AA, Palomino GT,
Mentruit MP, Geobaldo F, Garrone E (2001) Eur J Inorg Chem
7:1739
43. Morterra C, Bolis V, Magnacca G (1994) Langmuir 10:1812
44. Bolis V, Cerrato G, Magnacca G, Morterra C (1998) Thermochim
Acta 321:63
J Mater Sci (2010) 45:6115–6125 6125
123