Study of the application of pulsed electric fields (PEF) on ...
241
HAL Id: tel-01540436 https://tel.archives-ouvertes.fr/tel-01540436 Submitted on 16 Jun 2017 HAL is a multi-disciplinary open access archive for the deposit and dissemination of sci- entific research documents, whether they are pub- lished or not. The documents may come from teaching and research institutions in France or abroad, or from public or private research centers. L’archive ouverte pluridisciplinaire HAL, est destinée au dépôt et à la diffusion de documents scientifiques de niveau recherche, publiés ou non, émanant des établissements d’enseignement et de recherche français ou étrangers, des laboratoires publics ou privés. Study of the application of pulsed electric fields (PEF) on microalgae for the extraction of neutral lipids. Pierre Bodenes To cite this version: Pierre Bodenes. Study of the application of pulsed electric fields (PEF) on microalgae for the extraction of neutral lipids.. Physics [physics]. Université Paris Saclay (COmUE), 2017. English. NNT : 2017SACLN017. tel-01540436
-
Upload
khangminh22 -
Category
Documents
-
view
1 -
download
0
Transcript of Study of the application of pulsed electric fields (PEF) on ...

HAL Id: tel-01540436https://tel.archives-ouvertes.fr/tel-01540436
Submitted on 16 Jun 2017
HAL is a multi-disciplinary open accessarchive for the deposit and dissemination of sci-entific research documents, whether they are pub-lished or not. The documents may come fromteaching and research institutions in France orabroad, or from public or private research centers.
L’archive ouverte pluridisciplinaire HAL, estdestinée au dépôt et à la diffusion de documentsscientifiques de niveau recherche, publiés ou non,émanant des établissements d’enseignement et derecherche français ou étrangers, des laboratoirespublics ou privés.
Study of the application of pulsed electric fields (PEF)on microalgae for the extraction of neutral lipids.
Pierre Bodenes
To cite this version:Pierre Bodenes. Study of the application of pulsed electric fields (PEF) on microalgae for the extractionof neutral lipids.. Physics [physics]. Université Paris Saclay (COmUE), 2017. English. �NNT :2017SACLN017�. �tel-01540436�

2017SACLN017
THESE DE DOCTORAT DE
L’UNIVERSITE PARIS-SACLAY PREPAREE À
L’ECOLE NORMALE SUPERIEURE DE CACHAN (ECOLE NORMALE SUPERIEURE PARIS-SACLAY)
ECOLE DOCTORALE N° (575) ELECTRICAL, OPTICAL, BIO-PHYSICS AND ENGINEERING
Spécialité de doctorat : Physique
Par
Mr Pierre Bodénès
Etude de l’application de champs électriques pulsés sur des microalgues en vue de l’extraction de lipides neutres
Thèse présentée et soutenue à Cachan, le mercredi 10 Mai 2017 :
Composition du Jury :
Mme Marie-Pierre Rols Directeur de recherche, IPBS, Toulouse Rapporteur Mr Luc Marchal Maître de conférences, GEPEA, Université de Nantes Rapporteur Mme Elisabeth Dufour-Gergam Professeur des Universités, C2N, Université Paris Sud Présidente du Jury Mme Filipa Lopes Maître de conférences, LGPM, CentraleSupelec Encadrante Mr Olivier Français Professeur, ESIEE Paris Encadrant Mr Bruno Le Pioufle Professeur des Universités, SATIE, ENS Paris Saclay Directeur de thèse Mme Dominique Pareau Professeur émérite, LGPM, CentraleSupelec Co-directrice (invitée)

Université Paris-Saclay
Espace Technologique / Immeuble Discovery
Route de l’Orme aux Merisiers RD 128 / 91190 Saint-Aubin, France

3
Sommaire général – Summary
Preface Remerciements – Acknowledgments ............................................................................................. 7
Résumé du travail de thèse .......................................................................................................... 12
Introduction ....................................................................................................................................... 12
Matériel et méthodes ........................................................................................................................ 13
Résultats et perspectives ................................................................................................................... 15
Thesis outline (objectif et plan) .................................................................................................... 22
Chapter 1: The future of algae-derived biodiesel
I. Global outlook on energy supply and demand ............................................................................ 28
II. Review on crude oil production and future alternative ............................................................... 29
III. Current biofuel production and future technologies ................................................................. 32
IV. From algae culture to oil harvesting. Review of existing technologies and constraints ................ 37
V. Key points for future viability of algae-derived biodiesel ............................................................ 53
Chapter 1 conclusion ................................................................................................................... 60
Chapter 1 references ................................................................................................................... 62
Chapter 2: Inducing lipid accumulation in green
microalgae and developing characterization methods
Chapter 2: Introduction ............................................................................................................... 75
I. Morphology, composition and metabolism of green micro-algae ................................................ 76
I.1) Cell structure ............................................................................................................................... 76
I.2) Respiration activity ...................................................................................................................... 80
I.3) Photosynthetic activity ................................................................................................................ 81
II. Lipid biosynthesis and composition .......................................................................................... 85
II.1) Lipid synthesis in microalgae: from light to TAGs ..................................................................... 85
II.2) Lipid classes ............................................................................................................................... 87

4
II.3) Culture conditions and cell composition ................................................................................... 90
III. Review of analytical methods .................................................................................................. 95
III.1) Biomass growth ........................................................................................................................ 95
III.2) Lipid content ............................................................................................................................. 99
III.3) Cell size ................................................................................................................................... 107
IV. Procedure to induce lipid accumulation developed in this work .............................................. 108
V. Development and validation of the methods .......................................................................... 111
VI. Results ................................................................................................................................. 118
VI.1) Biomass growth ...................................................................................................................... 119
VI.2) Chlorophyll content ................................................................................................................ 121
VI.3) Dry weight (stress condition) ................................................................................................. 123
VI.4) Lipid content .......................................................................................................................... 125
VI.5) Monitoring cell size ................................................................................................................ 135
Chapter 2: conclusion ................................................................................................................ 137
Chapter 2: references ................................................................................................................ 139
Chapter 3: The use of Pulsed Electric Fields for the
extraction of lipids from Chlamydomonas reinhardtii:
study in microdevice and electroporation cuvettes
Chapter 3: Introduction ............................................................................................................. 165
I. State of the art ....................................................................................................................... 166
I.1) Principle and interests of Pulsed Electric Field (PEF) ................................................................ 166
I.2) Use of PEF in biotechnology ...................................................................................................... 175
I.3) Use of bio-micro-devices to monitor algae cells in situ ............................................................ 178
II. Material and methods ........................................................................................................... 181
II.1) Micro-device for studying the in situ permeabilization and characterization of Chlamydomonas
reinhardtii ........................................................................................................................................ 181
II.2) Electroporation in cuvettes ...................................................................................................... 183
II.3) Viability/permeability measurements...................................................................................... 184
II.4) Measurement of lipid extraction with/without PEF ................................................................ 196
III. Results .................................................................................................................................. 200

5
III.1) Electroporation in the micro-device ....................................................................................... 200
III.2) Electroporation in cuvettes ..................................................................................................... 209
III.2) Association of PEF to solvent for lipid extraction ................................................................... 216
Chapter 3: conclusions .............................................................................................................. 224
Chapter 3: references ......................................................................................................................... 226
Discussion
Discussion ................................................................................................................................. 235
Abstract / Résumé

6

7
Remerciements – Acknowledgments
Je tiens tout d’abord à remercier les structures d’accueil qui ont permis à cette thèse
pluridisciplinaire de se réaliser dans des conditions remarquables. Je remercie donc Pascal
Larzabal, directeur du laboratoire SATIE (Systèmes et Applications des Technologies de
l’Information et de l’Energie) pour ces entrevues toujours très chaleureuses et son accueil
dans ce laboratoire de l’ENS Cachan. Je remercie également Patrick Perré pour m’avoir permis
de réaliser une grande partie de mon travail au sein du laboratoire LGPM (Laboratoire de
Génie des Procédés et Matériaux) de l’école CentraleSupelec. Enfin, je remercie également
Eric Deprez, directeur de l’institut d’Alembert, l’entité pluridisciplinaire de l’ENS Cachan où de
multiples équipes de recherche variées se côtoient et profitent de l’équipement mis à
disposition par l’institut. Je ne peux que remercier l’ENS Cachan pour l’attribution de cette
bourse de thèse en 2013. Les bourses IDA ont été un gros coup de pouce également pour
acheter l’équipement nécessaire lors de cette thèse. Enfin les bourses Labex LaSIPS ont
également été d’une grande aide, en effet les recherches expérimentales sont très couteuses
en matériel et consommables ! Enfin, un contrat CNRS m’a donné quelques mois de plus pour
prolonger légèrement mon contrat doctoral et réaliser des expériences supplémentaires
présentées dans le chapitre 3 de ce manuscrit. Trois ans c’est malheureusement extrêmement
court lorsque le projet nécessite la mise en place du matériel et des méthodes expérimentales
et analytiques.
Je ne peux que remercier le personnel administratif des structures citées précédemment :
Sophie Abriet, Aurore Gracia, Béatrice Bacquet, Gaelle Callouard, Marjolaine Vernier, Brigitte
Dudon, Véronique Mathet, Catherine Kruch et Sandra Julien-Anchier. Je sais que les
doctorants qui sont sur plusieurs sites donnent beaucoup de fil à retordre d’un point de vue
administratif… et ce n’est pas encore fini pour moi. Je remercie également le personnel
administratif qui m’a suivi au cours de ce cursus universitaire, à l’école doctoral administrative
(EDSP ENS Cachan) ou scientifique (ED EOBE Université Paris Saclay) : Christine Rose, Sophie
Garus, Laurence Stephen, et finalement Eric Cassan, le directeur de mon école doctorale.
Je n’aurais jamais eu ce goût prononcé pour la biotechnologie des microalgues sans les
enseignements sur cette thématique à Saint Nazaire, je pense notamment à Jeremy Pruvost
et son cours sur les photo-bioréacteurs, qui mine de rien a lancé plusieurs vocations (les
personnes visées se reconnaitront) ! Mes deux stages de 6 mois ont fortement contribué à
accroitre ma curiosité scientifique et à donner du sens à toutes ces années d’études. Je
remercie donc grandement le docteur Stéphane Le Floch, et Matthieu Dussauze pour la
transmission de leur expertise dans le domaine de l’écotoxicologie marine. Que de bons
moments à pécher des crevettes pour nos expériences ! Finally, I have earned an infinite
quantity of knowledge in the bioprocess group of Wageningen University being supervised by
Dirk Martens, Packo Lamers and Kim Mulders: so much things to learn from you whether in

8
your management or in the way you conduct your researchs. The quantity of interactions with
this first generation of young algaeners have not fallen on deaf ears. I continue to read your
publications with a big pleasure. Also I did my best to continue to improve my English and
share my work to you by writing this manuscript in English.
Merci au personnel technique pour leur aide lors de la fabrication de pièces, la réparation
d’éléments électriques, ou l’enregistrement d’images en microscopie : Etienne Henry, Thierry
Martin, Cyril Breton, Joel Casalinho, Jean Trubuil, Patrice Vallade, Gerard Chaplier, Jeff
Audibert et les toutes les autres personnes qui ont apporté leur pierre à l’édifice.
J’ai beaucoup apprécié les discussions que j’ai pu avoir avec tous les permanents, je pense
notamment à Hervé Duval, avec qui nous avons pu partager nos gouts musicaux, Bertrand
David, toujours là pour me donner des conseils, Moncef Stambouli, toujours très sympathique
et Touhami Smaoui pour nos discussions variées. Sans oublier Jean-Pierre Lefevre qui a eu la
malchance de se sentir petit trop régulièrement, mais avec qui j’ai appris beaucoup de choses
sur des sujets variés. Je remercie également tout le personnel de SATIE et du LGPM qui ont
enrichi mon savoir et adouci certaines journées difficiles.
Merci aux membres du jury de m’avoir fait l’honneur d’examiner et d’évaluer mon travail.
C’est une chance d’avoir la possibilité d’avoir un retour sur ce travail complexe par des acteurs
majeurs des disciplines approchées au cours de ce doctorat en Physique : Elisabeth Dufour-
Gergam pour l’aspect micro-technologies, Marie-Pierre Rols pour son expérience sur l’étude
de l’électroporation in situ, et Luc Marchal sur la thématique extraction de composés
d’intérêts de microalgues.
J’exprime tous mes remerciements à Dominique Pareau, qui a eu le courage et la motivation
d’encadrer officiellement une énième et peut-être sa dernière thèse après une longue et riche
carrière scientifique. Je la remercie vivement pour son expérience et sa tempérance (l’arcane
14 du tarot de Marseille donne tout le sens que Dominique a pu apporter), et malgré tout elle
a su garder une grande curiosité et un enthousiasme de jeunesse lorsque des résultats
prometteurs se sont dévoilés.
Filipa Lopes a été d’une grande sagesse et s’est souvent fait l’avocat du diable pour canaliser
ma curiosité et la diriger vers un travail rigoureux et le plus irréprochable possible. Nous avons
pu avancer très vite dans l’exploration de méthodologies nouvelles et adaptés à nos
conditions expérimentales. Je te remercie pour ton encadrement mais aussi tes efforts à faire
vivre l’équipe bioprocédés en étant toujours à la recherche de financements : on y croit à cette
ANR !
Je crois que je ne peux que faire un remerciement groupé à Olivier Français et Bruno Le Pioufle
tant votre « duo » parait inséparable. Comme l’a déjà évoqué Olivier, notre première

9
rencontre dans la cafeteria de l’institut pour me présenter le sujet a été un moment de
révélation, j’ai immédiatement eu envie de travailler avec vous et de découvrir vos recherches,
et de vous partager mes connaissances et mon enthousiasme pour la biotechnologie des micro
algues. A cette époque, Claudia Tranito et Feriel Hamdi étaient encore en thèse et j’ai pu être
formé aux Bio-MEMS grâce à votre travail conjoint. C’était toujours un moment de bonheur
d’aller au restaurant japonais tous ensemble et de commander les traditionnels oeils de
poulets, algues et même saké pour les grandes occasions. Enfin c’était un plaisir d’observer
avec vous tout ce que l’on a fait subir à ces pauvres cellules pour leur faire cracher ces
maudites gouttelettes !
I would like to thank Maria Antonia Correira and Madhumidha MURUGAN for their very harsh
work during their respective 6 month internships. Your work was precious to help me at the
intensive moments of my PhD, when I was struggling to develop the methodology using
fluorescent dyes such as Bodipy and Nile Red. I hope that you have learnt the capacity to face
the numerous difficulties of the experimental research, and I wish you the best in your future
careers.
Après avoir parlé de Biomis et des étudiants en stage qui m’ont aidé, mes remerciements se
tournent naturellement vers Sakina Bensalem, tu as eu la chance de prolonger ton aventure
de stage vers la thèse pour le meilleur et pour le pire ! C’est un immense plaisir de partager
ces nombreux moments avec toi que ce soit pour ton dynamisme, ta joie de vivre, et ta
générosité. A deux on a parfois pu rendre les expérience bien plus joyeuses et efficaces… mais
dans certains cas la joie l’a emporté sur l’efficacité ! Et je te souhaite le meilleur pour continuer
cette recherche, sur des terrains de plus en plus innovants mais délicats à maitriser.
Je remercie tous les doctorants et post-doctorants que j’ai croisé au sein des différentes
structures… Je n’ai pas toujours eu le temps de bien tous vous connaitre. Je voudrais saluer
les nombreuses personnes qui ont partagé mon bureau : Hela, Vanessa, Claudia, Feriel, Li,
Abdellatif, Yu-Sheng, Jean, Tieying, Timothée. Je voudrais saluer également Marine qui a aussi
débuté sa thèse dans des conditions similaires au miennes, c’est-à-dire à cheval entre le
laboratoire LGPM et l’institut d’Alembert, avec qui j’ai partagé cette aventure parfois difficile.
Un merci à Cedric pour ses conseils avisés et son expérience pour les montages expérimentaux
et l’utilisation de marqueurs fluorescents. Salutations également à Armelle, toujours de bonne
humeur et bienveillante. J’adresse enfin ma gratitude envers Jordan, aka Dr No ou El Principe,
pour les nombreux moments où nous avons confronté nos visions de la vie.
J’adresse finalement mes remerciements à mes amis qui me voient évoluer et grandir depuis
plusieurs années. Comme vous pouvez le voir je peux me montrer un peu plus bavard à l’écrit
qu’à l’oral comme l’atteste les nombreuses pages de ce manuscrit. Je remercie donc mes potes
de Pen Bellec : Romain, Fred, Thomas. Je suis bien heureux que Plougastel démarre la
production de microalgues. Je remercie mes amis d’IUT de Pontivy, Pierro, Coco, Val, Tutur,

10
les bledar du Galsen. Mes profs et amis de Saint Nazaire, notamment les surics que je revois
régulièrement : Maruiiie, Chatuss, Rombouv, DamsD, Denis&Quentin, et tous les autres qui
me connaissent principalement sous le nom de GrandPierre. Un grand merci à Kenzui qui nous
accueille toujours les bras ouverts à Saint Nazaire, et à Arnaud Artu pour toutes les aventures
que nous continuons à partager tous ensemble.
J’adresse mes remerciements à ma famille. La famille de Traouidan : Philippe, Françoise, Gaël,
Rozenn et Antoine. Toute la famille du Finistère Nord, du côté de ma mère. Un gros bisou à
ma grande sœur Lucille qui a eu le courage de démarrer une carrière fantasque dans le milieu
de la mode après un doctorat en chimie. Je ne peux que terminer ces remerciements en
remerciant ma mère, Monique Bodénès, pour la force qu’elle au travers de son parcours de
vie semé d’embuches, et pour sa générosité infinie envers ses proches.
Je voudrais enfin adresser un dernier au revoir à tous ceux qui nous ont quitté
récemment : Jean Yves Kervella, qui pour moi fait partie de mon enfance avec qui nous avons
visité les iles bretonnes sur le Salsa. Ma Grand-Mère, pleine de fantaisie et d’originalité,
toujours très généreuse envers ses 5 petits-enfants. Et bien sûr mon père Jaques Bodénès qui
a toujours clamé haut et fort sa malice, sa liberté, et qui a transmis à moi et ma sœur un
certain goût pour la prise de risques et la volonté de sortir des sentiers battus. Je suis heureux
qu’il puisse être fier du parcours de ses deux enfants.

11

12
Résumé du travail de thèse
Introduction
Les microalgues, tout comme les plantes supérieures, ont la capacité de fixer l’énergie lumineuse sous
la forme de chaines carbonées (sucre/huile) qui peuvent être ensuite converties par
fermentation/transestérification en bioéthanol/biodiesel. Ces molécules bio-sourcées renouvelables
ont le potentiel de se substituer aux molécules issues du pétrole, de plus en plus rares et onéreuses à
extraire. La faisabilité technologique du procédé de culture de microalgues en bioréacteur solaire et
d’extraction des lipides pour une valorisation en biodiesel a été démontrée ; cependant ses importants
coûts (notamment énergétiques) l’empêchent pour l’instant d’être viable d’un point de vue
économique, mais surtout d’un point de vue énergétique. L’utilisation industrielle des microalgues est
donc aujourd’hui restreinte à la production de molécules à haute valeur ajoutée pour des applications
nutraceutiques, cosmétiques, biomédicales.
Ce travail de thèse s’inscrit donc dans la problématique de réduction des coûts énergétiques d’un tel
procédé, et en particulier de l’étape d’extraction des lipides des microalgues (plus particulièrement
des lipides neutres, ciblés pour la production de biodiesel) ; le but est en effet de développer à terme
un procédé industriel de production de biocarburant à rendement énergétique positif (énergie
produite/énergie dépensée). Dans le cadre de cette thèse nous avons choisi d’étudier en particulier
l’extraction de ces lipides piégés au sein du cytoplasme, par l’utilisation de champs électriques pulsés.
Pour la plupart des microalgues vertes (« chlorophytes »), les conditions de croissance en conditions
phototrophes diffèrent des conditions entrainant une haute teneur en lipides intracellulaires. Ces
dernières conditions sont généralement appelées « stress » puisqu’elles entrainent une réponse
métabolique non optimale du point de vue de la croissance. En effet, en photo-autotrophie (régime
de croissance associé à l’apport de lumière et de CO2), l’apport de lumière devra être contrôlé de façon
à éviter la photo-inhibition (excès de lumière) ou la photo-limitation (manque de lumière) ; de plus
l’apport de nutriments (majoritairement N, P, K) permet une croissance très rapide. Lors du stress
induisant l’accumulation de lipides, l’azote est absent du milieu de culture et la lumière est apportée
en excès de façon à entrainer un déséquilibre énergétique au sein de la cellule : sans azote la cellule
ne peut plus se diviser et le flux d’électrons vers cette voie métabolique est donc bloqué. Ce
déséquilibre énergétique est dangereux pour la cellule et sa solution pour se maintenir en vie est de
stocker en énergie carbonée sous forme de sucres ou de lipides non fonctionnels.
Les champs électriques pulsés (PEF, Pulsed Electric Fields en anglais) agissent par l’application répétée
d’une différence de potentiel entre deux électrodes et entrainent un gradient ionique au sein du
cytoplasme de la cellule ainsi que dans le milieu externe. Ce gradient augmente artificiellement le
potentiel transmembranaire au niveau de la membrane cytoplasmique faisant face aux électrodes et
se traduit par l’apparition de pores dans la bicouche lipidique de celle-ci. Selon les paramètres de
traitement (principalement la durée des impulsions et l’amplitude du champ électrique appliqué),
l’apparition de pores sous l’effet du champ électrique (électroporation) peut être irréversible
(conduisant à la mort cellulaire) ou réversible (fermeture des pores après arrêt du champ électrique,
permettant, en principe, le maintien de la viabilité). Les applications de ce traitement sont

13
nombreuses, notamment dans le domaine biomédical (traitement du cancer par lyse non thermique,
insertion de molécules anti-cancéreuses) ou agroalimentaire (extraction de jus de fruit, stérilisation,
etc…). C’est donc tout naturellement que ce procédé est envisagé ?? dans le cas des microalgues où
l’étape d’extraction des composés d’intérêt est souvent réalisée par des procédés très énergivores et
peu respectueux de l’environnement (centrifugation, broyage mécanique, utilisation de solvants
toxiques...) ; il est donc important de trouver des alternatives et le procédé PEF semble très
prometteur en ce sens.
Le projet s’inscrit dans le cadre d’une collaboration entre l’équipe BIOMIS (Bio-micro-systèmes) du
Laboratoire des Systèmes et Applications des Technologies de l’Information et de l’Energie (SATIE ;
UMR CNRS 8029) de l’ENS Paris Saclay et l’ équipe Bioprocédés du Laboratoire Génie des Procédés et
Matériaux (LGPM,EA 4038) de CentraleSupélec. Ce travail de thèse étant un projet nouveau pour les
deux équipes (culture d’algues pour la production lipidique au sein du LGPM, étude de micro-algues
en micro-systèmes au sein de SATIE), une partie importante du projet a été consacrée au
développement de méthodes ainsi qu’à la mise en place d’outils de caractérisation des microalgues.
Matériel et méthodes
Un certain nombre de d’espèces de microalgues ont été étudiées afin de sélectionner la souche modèle
pour ce travail. Dans le cas du procédé PEF, il est primordial d’utiliser une espèce d’eau douce afin de
pouvoir traiter les cellules dans un milieu faiblement conducteur et ainsi réduire l’effet Joule.
L’utilisation de Chlorella vulgaris, étudiée en premier lieu, a conduit à diverses difficultés
expérimentales. Nous nous sommes ensuite tournés vers des espèces de taille plus importante qui
sont plus sensibles à l’application d’un champ électrique (sensibilité proportionnelle au rayon selon
l’équation de Schwan) et plus faciles à observer/caractériser à l’aide de la microscopie. Parmi plusieurs
souches étudiées, Chlamydomonas reinhardtii wild type a finalement été retenue pour la majorité
des essais ; sa souche mutante déficiente en paroi (cw15) a permis par comparaison d’évaluer l’effet
de la paroi sur le niveau d’électroporation.
Il était ensuite important de pouvoir caractériser les cellules avant et après traitement PEF : leur
nombre et leur état (taille, contenu en lipides, morphologie des gouttelettes de lipides,
perméabilisation de la membrane, viabilité etc). Des techniques de caractérisation ont été ainsi
développées et optimisées.
Une grande partie du suivi de la concentration cellulaire et de la caractérisation des cellules a été
réalisée à l’aide de la cytomètrie en flux permettant, notamment, des mesures plus rapides que le
comptage cellulaire par cellule de Malassez; nous avons corrélé les résultats obtenus par les deux
méthodes en phases de croissance et de stress des cellules.
Différents marqueurs fluorescents ont été également utilisés pour caractériser la viabilité cellulaire et
permettre de visualiser les gouttelettes lipidiques et la paroi cellulaire : Bodipy marqueur spécifique
aux lipides neutres, Concanavaline marqueur de la paroi, Propidium Iodide (PI) et Sytox Green
marqueurs de perméabilisation de la membrane, Fluorescein diacetate (FDA) marqueur d’activité
enzymatique. Les conditions de marquage (quantité de marqueur vs biomasse, temps d’incubation…)
ont été optimisées dans chaque cas. Des mesures d’autofluorescence ont permis de suivre les
pigments photosynthétiques de la cellule (chlorophylle a/chlorophylle b).

14
Les cellules marquées ont été également observées à l’aide de la microscopie à épifluorescence
(équipé d’une caméra à haute sensibilité photonique) ou de la microscopie confocale (Confocal Laser
Scanning Microscopy). Les paramètres d’acquisition des images ont été optimisés.
L’imagerie confocale permet notamment de réaliser un scan en 3 dimensions d’une cellule et d’estimer
la taille des gouttelettes de lipides, leur nombre par cellule ainsi que leur volume après une
reconstruction 3D (avec déconvolution permettant de corriger les déformations de l’image).
Le marquage conjoint de la cellule par la Concanavaline et le Bodipy permet d’observer en microscopie
confocale les gouttelettes de lipides et la paroi cellulaire. Les pigments sont également visualisés par
autofluorescence. Cependant cette observation se fait à l’échelle de la cellule ; le résultat n’est pas
extrapolable à l’ensemble de la population cellulaire, la morphologie cellulaire et le contenu lipidique
étant très disparates chez des cellules en stress.
L’intensité moyenne de fluorescence par cellule marquée au Bodipy peut par contre être mesurée en
cytométrie en flux. L’appareil mesure l’intensité émise par chaque cellule et estime ensuite la moyenne
de l’échantillon analysé (1000 - 5000 cellules). Etant donné la qualité des images acquises qui montrent
une affinité très spécifique du Bodipy avec les lipides neutres, l’idée de faire de cette technique une
méthode d’analyse quantitative des lipides a été testée (voir ci-dessous).
Pour évaluer la viabilité et la perméabilité de la membrane, les cellules sont marquées et leur
fluorescence mesurée : vert pour la FDA (indicateur d’activité enzymatique, donc de viabilité) et jaune
pour le sytox green (indicateur de perméabilité). Au dessus d’un certain seuil de fluorescence la cellule
est comptée comme marquée et l’appareil calcule la proportion de cellules marquées, donnant pour
la FDA le taux de viabilité et pour le SG ou le PI le pourcentage de cellules perméabilisées.
En ce qui concerne la taille des cellules, nous avons testé deux méthodes permettant de déterminer
leur diamètre : une estimation directe par microscopie et une mesure par granulométrie laser. La
mesure par granulométrie laser est extrêmement sensible aux paramètres optiques des particules
analysées, ce qui complique l’interprétation des résultats et les rend sujets à caution, à moins d’une
étude exhaustive très longue de mise au point que nous n’avons pas réalisée. Nous avons donc préféré
les mesures directes par microscopie qui sont fiables.
L’analyse des lipides a été bien sûr un point important de notre travail.
Les méthodes classiques de mesure des lipides sont la méthode gravimétrique (extraction des lipides
totaux par chloroforme/méthanol, puis pesée du résidu après évaporation) et ? la chromatographie
gazeuse ; cependant elles nécessitent une quantité assez importante de biomasse (plusieurs
milligrammes d’algues sèches par analyse) et sont incompatibles avec l’échelle de nos essais. Nous
avons donc testé deux autres méthodes ne nécessitant que des quantités faibles de biomasse
(quelques millions de cellule dans 100 μL).
Dans un premier temps nous avons réalisé des essais afin de vérifier si la méthode de marquage au
Bodipy (et mesure de la fluorescence par cytomètrie à flux) pouvait être utilisée pour quantifier les
lipides neutres. Nous avons en particulier étudié l’influence de la quantité de Bodipy (rapport
bodipy/cellule) utilisée et de la présence ou non d’un lavage à la suite du marquage ; les résultats en
terme d’intensité moyenne de fluorescence sont extrêmement sensibles au rapport lipides/Bodipy et

15
au lavage. Mais le plus préjudiciable est que, malgré une optimisation du protocole, la perméabilité de
la membrane, étant fortement modifiée suite à un traitement PEF, influence le marquage, toutes
choses égales par ailleurs ; en effet à quantités de lipides égales, un traitement des cellules par PEF
peut augmenter d’un facteur deux l’intensité de fluorescence des cellules par rapport aux cellules non
traitées. Cette technique n’est pas donc utilisable pour quantifier précisément les lipides neutres dans
nos conditions de travail. Des résultats montrent de plus qu’il n’est pas possible de corréler de manière
fiable l’intensité moyenne de fluorescence associée au Bodipy avec la quantité de lipides neutres
intracellulaires, mesurée par chromatographie gazeuse (mesure faite par un laboratoire externe). Il
n’en reste pas moins que cette méthode peut être un outil intéressant et rapide d’estimation
qualitative des lipides.
Nous avons finalement employé une méthode colorimétrique dite SPV (Sulpho-Phospho-Vanillin)). Les
réactifs chimiques employés réagissent avec les acides gras insaturés des lipides neutres, mais aussi
polaires (lipides membranaires). Cette méthode doit donc être utilisée avec précaution pour quantifier
les lipides neutres ; elle nécessite en effet d’effectuer des corrélations préalables entre l’absorbance
obtenue et les quantités de lipides neutres et polaires, mesurées par ailleurs par chromatographie
gazeuse. Elle semble également pouvoir être employée directement sur des phases solvant contenant
des lipides extraits, ce qui est un autre avantage. Même si elle est imparfaite en absolu, elle a été
utilisée pour comparer les teneurs en lipides des microalgues avant et après traitements (PEF et/ou
solvant). Les résultats sont présentés en équivalents trioléine, le lipide témoin employé dans cette
étude, et il a été vérifié que ces résultats étaient du même ordre de grandeur que ceux obtenus par
chromatographie gazeuse.
Après la mise au point des diverses méthodes d’analyse et caractérisation, nous avons étudié et
optimisé le procédé de culture des cellules en deux phases : une phase de croissance et une phase
d’accumulation des lipides.
Dans un premier temps les microalgues ont été cultivées dans des conditions propices à leur croissance
afin d’obtenir une biomasse relativement concentrée. Ensuite les conditions ont été changées lors de
la deuxième phase afin que les cellules accumulent des lipides. La mise en place de ces deux phases a
nécessité une optimisation des conditions : principalement l’apport de lumière, la durée des phases et
la concentration cellulaire au sein des cultures au cours des deux phases. Pour ce faire nous avons suivi
la concentration cellulaire et caractérisé les cellules en termes de teneur en lipides des cellules,
viabilité et perméabilité de la membrane et taille des cellules.
Résultats et perspectives
Nous avons pu mesurer une très forte réduction de l’autofluorescence associée à des pigments
cellulaires (chlorophylle) chez Chlamydomonas reinhardtii en période de stress par rapport à la phase
de croissance. Il s’agit d’une réaction de la cellule en réponse au stress azoté.
La durée de la deuxième phase (stress) à la fin de laquelle le traitement d’extraction de lipides doit
être effectuée a été choisie ensuite de façon à maximiser la productivité en lipides.

16
Les résultats ont montré que le contenu lipidique des cellules atteint un maximum après 4 à 7 jours de
stress ; nous avons donc choisi une durée de 7 jours pour la durée du stress azoté. A l’issue de cette
phase, les teneurs en lipides ont été estimées ; nous avons trouvé 39 pg/cellule en équivalent triolein
(SPV, acides gras insaturés) et 27 pg/cellule en lipides neutres (chromatographie). La teneur en lipides
neutres des cellules peut cependant varier selon les cultures ; les cellules de certaines d’entre elles
continuent à croître en début de stress et accumulent donc moins de lipides, ceci associé à une dilution
des photons compte tenu d’un phénomène de photo-ombrage lié à une forte densité cellulaire.
Par ailleurs, à 7 jours de stress azoté, le taux de perméabilité membranaire est inférieur à 5 % et le
taux de viabilité est de l’ordre de 90 à 95% : les cellules sont donc en excellent état à ce moment. Par
contre, leur viabilité se dégrade significativement si la période de stress est prolongée au delà de 7
jours.
Enfin les cellules grossissent en période de stress par suite de l’accumulation de lipides ; elles restent
ovoïdales, mais leur dimension maximale moyenne passe de 7 µm en phase de croissance à 10 µm en
phase de stress. Cette différence de taille indiquerait que les cellules seraient légèrement plus
sensibles au traitement électrique en phase de stress.
Le système de traitement PEF a ensuite été développé. Les impulsions électriques ont tout d’abord
été produites avec un générateur électrique de paillasse couplé à un amplificateur ; les cellules étaient
observées au microscope optique. L’emploi d’un marqueur fluorescent de perméabilisation
membranaire tel que PI ou SG a ensuite permis d’évaluer l’effet des champs électriques sur les cellules
avec le microscope à épifluorescence.
Un générateur d’impulsions bipolaires a été acquis au cours du projet afin de pouvoir réaliser une
étude des paramètres sur une large gamme de temps d’impulsions (temps de pulse minimal théorique,
1 µs) et de champs électriques (impulsions bipolaires de – 1 000 V à + 1 000 V). Un microsystème
comportant un grand nombre de chambres parallèles permettant de piéger des cellules de microalgues
(environ 30 - 150 cellules par chambre) dans un réseau d’électrodes en or, couplé à la microscopie a
été conçu et réalisé en salle blanche ; il permet de plus de caractériser les effets des PEF sur des
populations d’algues relativement importantes afin d’en déduire des comportements globaux. La
distance réduite entre les électrodes a permis de pouvoir appliquer un champ électrique très élevé,
jusqu’à 50 kV/cm.
Ce dispositif optimisé a permis ensuite de réaliser une première étude sur la consommation d’énergie
du traitement PEF mettant en lumière le lien crucial entre la durée des impulsions et l’intensité du
champ électrique. Cette relation est connue dans le domaine de l’électroporation, mais de manière
empirique ; en effet aucune équation théorique ne permet de faire le lien entre le temps d’impulsion
et le champ électrique. Nos résultats ont montré que pour un même taux de perméabilisation des
cellules, la dépense énergétique du traitement est réduite lors de l’utilisation d’impulsions courtes
couplées à un champ électrique élevé. En effet, par exemple pour perméabiliser 50 % des cellules de
Chlamydomonas reinhardtii wt en phase d’accumulation de lipides, un traitement avec des impulsions
de 5 µs et un champ électrique de 3,56 kV/cm résulte en une dépense énergétique 10 fois plus faible
que celle d’un traitement avec des impulsions de 500 µs et un champ électrique de 1,12 kV/cm. Par
ailleurs, l’utilisation d’impulsions très courtes, de quelques micro-secondes, permet également de
limiter l’échauffement thermique réduisant ainsi la dégradation des molécules lipidiques ;

17
l’échauffement est même négligeable dans nos essais car la température dans la chambre
d’électroporation retombe à son niveau initial entre chaque impulsion (durée entre chaque impulsion :
100 ms) grâce à la diffusion thermique vers l’extérieur de la chambre.
En parallèle de ces aspects purement énergétiques, nous avons étudié l’effet des PEF sur les cellules.
Plusieurs effets ont pu être observés in situ et en temps réel grâce à l’utilisation de la microscopie
d’épifluorescence couplée à une caméra permettant d’enregistrer des effets dynamiques avec une
haute résolution.
En premier lieu la pénétration du marqueur fluorescent PI dans des cellules a été observée in situ.
Les résultats ont montré que le traitement par champ électriques pulsés seul ne permet pas
d’extraire l’huile des cellules quelles que soient les conditions utilisées, même les plus énergétiques.
Ce résultat important prouve que la membrane n’est pas la seule barrière à l’extraction de l’huile, la
paroi jouant également un rôle majeur dans le maintien de la structure cellulaire, sur laquelle le
traitement PEF à effet thermique réduit a peu d’effets. De plus le caractère hydrophobe des lipides
neutres peut freiner leur transfert vers l’extérieur hydrophile de la cellule. Le procédé par champs
électriques pulsés peut donc être utilisé comme pré-traitement de la biomasse algale, associé par
exemple à l’extraction par solvant. Un autre résultat très intéressant démontre une coalescence des
gouttelettes de lipides à l’intérieur de la cellule (traitement électrique appliqué de 5 µs, 6 kV/cm).
Les PEF ont donc des effets intracellulaires, en plus de la perméabilisation membranaire. Ces
observations de coalescence en direct des gouttelettes de lipides sont totalement inédites dans la
communauté de l’électroporation.
Troisièmement des essais avec la souche mutante Chlamydomonas reinhardtii cw15 qui a une paroi
beaucoup plus fine ont montré une lyse des cellules après traitement, résultant en un déversement du
contenu intracellulaire dans le milieu. La résistance mécanique de la paroi de la souche mutante ne
permet donc pas de maintenir l’intégrité cellulaire, au contraire de la souche non mutée (wild type).
Ces résultats montrent bien l’effet important de la paroi et ont donné lieu à un premier article publié
dans le journal Algal Research (Juin 2016).
Après les deux premières phases décrites précédemment que sont le développement des techniques
de culture et de caractérisation des algues et le développement du microsystème PEF dédié, des essais
d’électroporation à une échelle supérieure à celle du microsystème (en microcuvettes) ont été
réalisés de façon à mieux comprendre les mécanismes d’électroporation et à quantifier l’impact des
PEF sur l’extraction des lipides.
Les conditions de champ entrainant les deux types de perméabilisation (réversible ou irréversible) ont
été déterminées grâce à un marquage conjoint FDA et SG pour des durées d’impulsions de 5, 50 et 500
µs. On retrouve les limites correspondant à la perméabilisation réversible que nous avions
déterminées au préalable dans le microsystème. Il a été nécessaire d’ajouter le marqueur à différents
moments pour atteindre les deux types de perméabilisation. Le marqueur est ajouté pendant le
traitement d’électroporation et les cellules marquées correspondent alors aux deux types de
perméabilisation. Si le marqueur est mis en contact avec les cellules 1h après traitement, il ne peut
pénétrer que dans les cellules perméabilisées de façon irréversible. Les champs nécessaires pour
obtenir une perméabilisation irréversible sont légèrement plus élevés que les conditions réversibles.

18
Les résultats montrent qu’il est possible d’obtenir jusqu’à 80 % de cellules en phase de stress
perméabilisées de façon réversible. Dans le cas des impulsions de 5 µs, le champ électrique doit être
égal à 4.5 kV/cm pour obtenir ce résultat. Des expériences supplémentaires (mise en contact des
cellules avec le marqueur de perméabilité quelques secondes après perméabilisation) ont permis de
déterminer la dynamique de fermeture des pores et de montrer que les pores réversibles ont une
durée de vie extrêmement courte, de l’ordre de quelques secondes. La viabilité des cellules reste
élevée, supérieure à 80 %.
Il semble donc possible d’utiliser les impulsions électriques dans une perspective de « milking »,
c’est-à-dire l’extraction de composés d’intérêt des microalgues par l’ouverture de pores réversibles
tout en maintenant la viabilité cellulaire. Cette pratique serait donc envisageable pour l’extraction de
petites molécules hydrosolubles, la taille des pores réversibles étant de l’ordre du nano-mètre.
En ce qui concerne l’extraction des lipides neutres hydrophobes, les résultats ont montré qu’il est
nécessaire d’associer le traitement électrique à une autre méthode d’extraction pour obtenir une
extraction significative.
Nous avons donc associé le traitement électrique à l’extraction par solvant. Le choix du solvant est
délicat ; il doit être « doux » vis-à-vis des microalgues, c’est à dire ne pas entrainer de lyse cellulaire ou
affecter la viabilité, et il doit être le plus spécifique possible des lipides neutres (peu d’interactions avec
les lipides polaires).
Le coefficient de partage du solvant entre l’octanol et l’eau, noté LogP, a été le critère principal de
choix. Les solvants à LogP faible sont les plus hydrophiles tandis que ceux à logP élevés sont fortement
hydrophobes et ont donc une forte affinité avec les lipides neutres ; il est cependant difficile de réaliser
un bon contact entre eux et les algues qui évoluent dans un environnement aqueux. Les solvants à
LogP élevé (supérieur à 5,5) sont généralement considérés comme biocompatibles, notamment car ils
sont peu en contact direct avec les cellules ; ils ont en effet du mal à franchir les têtes polaires des
bicouches lipidiques de la membrane cytoplasmique.
Nous avons commencé donc par évaluer l’impact sur la lyse cellulaire de trois solvants de diverses
hydrophobicités : l’acétate d’éthyle (LogP = 0,73), l’hexane (LogP = 4,00), et le dodécane (LogP = 6,6).
Mis en contact avec les cellules, l’acétate d’éthyle relativement hydrophile a provoqué une lyse
cellulaire. Les deux autres solvants n’ont pas montré d’effet significatif sur la lyse, même après 2 heures
de mise en contact avec les cellules.
Après contact de cellules non traitées par PEF avec le solvant, les observations au microscope confocal
ont montré la libération des lipides du cytoplasme par l’acétate d’éthyle, alors que le dodécane a une
très faible capacité d’extraction. Le solvant intermédiaire, l’hexane, montre une certaine capacité à
extraire les lipides neutres. Nous avons donc décidé de l’utiliser.
En mettant en contact 100 µL de solution d’algues (7 jours d’accumulation, 2∙107 cellules/mL) et 200 µL
d’hexane sous une agitation modérée (effectué à l’aide d’un arbre mécanique), l’extraction des lipides
est totale en deux heures. On obtient un système pluri-phasique après centrifugation : le culot
d’algues épuisées en lipides neutres, le milieu aqueux, une couche jaune interfaciale contenant les
lipides et la phase supérieure (hexane pur). Ceci pourrait être dû à l’insolubilité des lipides dans
19
l’hexane, ce qui est étonnant car la trioléine est elle-même très soluble dans ce dernier. L’explication
pourrait plutôt être liée à la co-extraction de phospholipides de la membrane qui entoure les
gouttelettes lipidiques et libérés en même temps que les lipides neutres ; ces phospholipides
joueraient le rôle de surfactants et interagiraient avec les lipides, créant une barrière entre ceux-ci et
l’hexane. L’ajout d’un solvant polaire tel que l’isopropanol l’éthanol permet de faire migrer les lipides
extraits dans la phase supérieure en détruisant cette barrière, les lipides polaires pouvant
certainement être re-solubilisés dans la phase aqueuse à l’aide du solvant polaire. Cet effet devra être
confirmé par l’analyse des diverses phases en chromatographie gazeuse ; la méthode SPV permettrait
quant à elle d’évaluer le contenu en lipides insaturés de réserve (neutres) et membranaires (polaires)
des deux phases séparées.
Afin de comparer l’impact des différents traitements (solvant seul, PEF seul ou combinaison des deux)
sur l’extraction de lipides, nous avons simplement dosé la phase aqueuse contenant les microalgues
avant et après traitement, ce qui permet d’évaluer par différence le taux d’extraction des lipides.
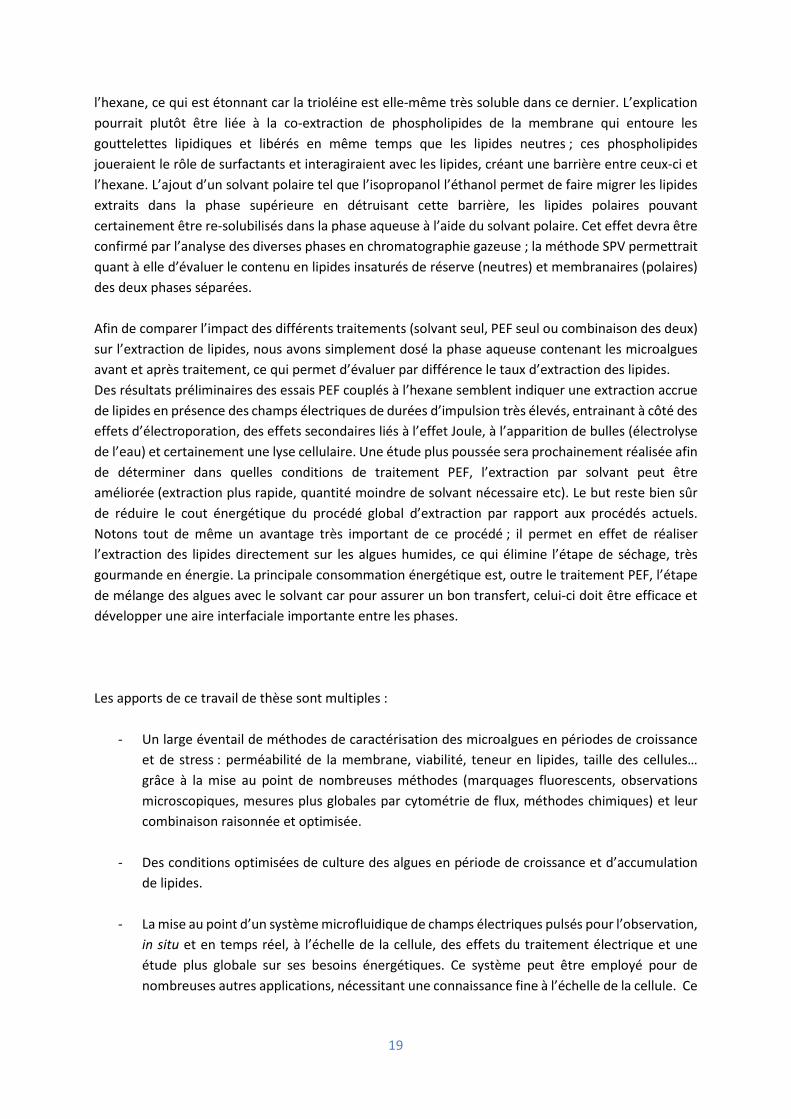
Des résultats préliminaires des essais PEF couplés à l’hexane semblent indiquer une extraction accrue
de lipides en présence des champs électriques de durées d’impulsion très élevés, entrainant à côté des
effets d’électroporation, des effets secondaires liés à l’effet Joule, à l’apparition de bulles (électrolyse
de l’eau) et certainement une lyse cellulaire. Une étude plus poussée sera prochainement réalisée afin
de déterminer dans quelles conditions de traitement PEF, l’extraction par solvant peut être
améliorée (extraction plus rapide, quantité moindre de solvant nécessaire etc). Le but reste bien sûr
de réduire le cout énergétique du procédé global d’extraction par rapport aux procédés actuels.
Notons tout de même un avantage très important de ce procédé ; il permet en effet de réaliser
l’extraction des lipides directement sur les algues humides, ce qui élimine l’étape de séchage, très
gourmande en énergie. La principale consommation énergétique est, outre le traitement PEF, l’étape
de mélange des algues avec le solvant car pour assurer un bon transfert, celui-ci doit être efficace et
développer une aire interfaciale importante entre les phases.
Les apports de ce travail de thèse sont multiples :
- Un large éventail de méthodes de caractérisation des microalgues en périodes de croissance
et de stress : perméabilité de la membrane, viabilité, teneur en lipides, taille des cellules…
grâce à la mise au point de nombreuses méthodes (marquages fluorescents, observations
microscopiques, mesures plus globales par cytométrie de flux, méthodes chimiques) et leur
combinaison raisonnée et optimisée.
- Des conditions optimisées de culture des algues en période de croissance et d’accumulation
de lipides.
- La mise au point d’un système microfluidique de champs électriques pulsés pour l’observation,
in situ et en temps réel, à l’échelle de la cellule, des effets du traitement électrique et une
étude plus globale sur ses besoins énergétiques. Ce système peut être employé pour de
nombreuses autres applications, nécessitant une connaissance fine à l’échelle de la cellule. Ce

20
travail a donné lieu à la publication d’un article dans une revue internationale.
- L’étude à plus grande échelle, avec des combinaisons pertinentes de marqueurs, de
l’électroporation réversible et irréversible. Ce travail réalisé en microcuvettes
d’électroporation a permis de mesurer les taux de perméabilité réversible et irréversible à
différents champs électriques pour différentes durées d’impulsions ; il a également conduit à
une estimation du temps de fermeture des pores, un couplage électroporation/extraction par
solvant et une caractérisation cellulaire après extraction par solvant.
- Le couplage de l’électroporation à l’extraction par solvant et la caractérisation cellulaire fine
après la combinaison des traitements (perméabilité membranaire, activité enzymatique,
reprise de croissance, lyse cellulaire, imagerie) ; les premiers résultats sont prometteurs pour
pouvoir envisager la mise au point d’un procédé couplant ces deux traitements, applicable
directement sur les algues humides et moins gourmand en énergie que les procédés actuels
d’extraction. Des nouveaux essais sont prévus pour aller plus loin et quantifier l’impact du pré-
traitement PEF sur l’extraction des lipides de Chlamydomonas reinhardtii.
Ce travail bien sûr soulève encore de nombreuses questions et ouvre donc la voie à quelques
perspectives très intéressantes :
- L’évaluation du contenu lipidique marqué au Bodipy par reconstitution 3D avec les images
acquises au microscope confocal est une méthode peu exploitée dans la littérature et qu’il
serait intéressant de développer. Accompagner cette reconstitution 3D des gouttelettes de
lipides, de la visualisation de la chlorophylle par autofluorescenve et de la reconstitution des
différentes couches de la paroi marquée par la concanavalin permettrait de mieux caractériser
les cellules, notamment à la suite des traitements multiples (PEF, PEF avec solvant, etc). La
fixation des cellules à un substrat pour un scan 3D pourrait se révéler nécessaire.
- La mise au point et l’optimisation d’un procédé couplant PEF à l’extraction par solvant
devraient être étudiées plus en détail à la suite des résultats obtenus. Par ailleurs, ce procédé
pourrait être inséré dans un contexte de fractionnement de la biomasse algale de façon à
récupérer différents produits d’intérêt des microalgues, dont les lipides en intégrant une étape
de recyclage du solvant.
- Une autre voie explorée à la suite de cette thèse est d’associer au traitement PEF, un système
permettant de soumettre les algues à des sollicitations mécaniques (notamment par ondes
acoustiques), en couplage ou non à l’extraction par solvant et d’évaluer l’intérêt du couplage
de procédés pour l’extraction de molécules des microalgues.
- Un autre cas intéressant serait d’évaluer l’intérêt du procédé PEF pour l’extraction de
molécules à haute valeur ajouté, comme par exemple, des caroténoïdes.

21

22
Thesis outline
Among the 21th century challenges that the humanity has to face, the energetic transition towards
sustainable and environmentally-friendly productions and the increasing nutritional demand due to a
rise in the worldwide population, open the gate towards innovative bio-based processes.
Microalgae, with their high growth rate and diversity, have a great potential to produce a variety of
chemicals in multiple environments. However, this industry is still very young and the current high
production costs limit the use of microalgae to very specific markets and high valued products.
The biofuel production using microalgae, highly needed due to the declining reserves of fossil fuels,
requires a reduction of the energy consumption at the different steps of this process. Indeed, one of
the main issues which jeopardize the economic and energetic viability of algae-derived biodiesel is the
high energetic cost involved in the extraction of oils produced by algae cells.
As a consequence, the objective of this work is to propose an innovative extraction technique which
may replace the current mechanical or chemical processes used to extract lipids trapped in algae
cytoplasm. Pulsed Electric Field (PEF), an electrical treatment used to permeate cells or tissues in
various applications, can be a good candidate. Indeed, it destabilizes the cell membrane and thus, by
creating pores, foster insertion of exogenous molecules into the cell or extraction of endogenous ones
from it. PEF actions on lipid accumulated cells will then be investigated in the context of this thesis.
The developed approach aims at studying the PEF process at the scale of a single algae cell using a
miniaturized electroporation device and to monitor, in situ, the effect of PEF on the potential lipid
extraction from microalgae. Afterwards, the goal is to optimize the parameters of electroporation to
reduce energy consumption while permeabilizing the cell membrane. Preliminary solvent extraction
experiments are thereafter carried out in order to evaluate how PEF could be used in a lipid extraction
process.
The work is a first collaboration between two laboratories (SATIE of ENS Cachan and LGPM of
CentraleSupélec) having different expertise and this to tackle the subject with a multidisciplinary
approach. In the particular field of process engineering, algae are mainly considered, at macroscopic
scale, as biomass. However, when one wants to develop innovative processes, studies at microscopic
scale must be carried out. This kind of study is performed in this thesis. In addition, understanding
interactions between microalgae and electric fields requires a deep knowledge in both biology and
electrical engineering, which is only possible through collaboration between specialists of these
domains. Finally, many equipment and expertise were needed in various fields such as chemistry,
microscopy, and microtechnology to develop the tools and methods required for this multidisciplinary
approach.
The work is presented in three distinct chapters. In chapter 1, the state of the art is presented in order
to introduce the context of algae biofuel. The Chapter 2 is devoted to the cultivation of oleaginous
algae and their characterization. The Chapter 3 is focused on the study of PEF effects on oleaginous
algae and on lipid recovery.
The Chapter 1 aims to offer a global view of the complexity of algae-derived biodiesel. The first part
presents the current state of global energy uses with a particular emphasis on the future of crude oil
supply and the alternative fuel sources. Afterwards, the current and future biofuels are briefly
reviewed with a comparison of first and second generations of biodiesel with the potential third
generation: microalgae. Microalgae require specific cultivation technologies and downstream

23
processes whose advantages and disadvantages are presented. Finally, the principle keys for a future
feasibility of algae-derived biodiesel are introduced.
The Chapter 2 details more specifically the biological aspects, such as the different classes of lipids of
the cell and the metabolism of lipid accumulation. Then a literature review of different methods to
produce algae with a high oil content and to characterize the biomass is presented. As algae cultures
and PEF treatments are performed in very low volumes, several specific cultivation and analytical
methods are developed and described. A suitable algae strain was identified for this study:
Chlamydomonas reinhardtii.
The Chapter 3 is focused on the application of PEF on Chlamydomonas reinhardtii towards the
extraction of lipids. The first part presents the theory and applications of PEF in general and in algal
technologies. Afterwards, the micro-system designed and built in a clean room to study, in situ, the
electroporation of microalgae is presented. Complementary analyses are performed with another
electroporation system (electroporation cuvette) in order to study PEF association with solvent
extraction. The development and optimization of methods to estimate cell viability and permeability
at micro and macroscales is then presented. The outputs of the study are the following: 1) analysis of
PEF energy consumption under several electrical field conditions, 2) characterization of PEF effects on
lipid bodies, the cell membrane and the cell wall. Finally, a method was also developed to evaluate the
effect of PEF as a pre-treatment for lipid extraction with a solvent.

24

Chapter 1: The future of algae-derived biodiesel
25
Chapter 1
The future of algae-derived biodiesel

Chapter 1: The future of algae-derived biodiesel
26
List of abbreviations: ............................................................................................................................. 27
I. Global outlook on energy supply and demand ....................................................................... 28
II. Review on crude oil production and future alternatives .............................................................. 29
II1) Crude oil production and consumption ................................................................................ 29
II2) Hydrocarbon production ....................................................................................................... 30
III. Current biofuel production and future technologies .............................................................. 32
III1) Current production ................................................................................................................ 32
III2) Future technologies ............................................................................................................... 34
IV. From algae culture to oil harvesting. Review of existing technologies and constraints ... 37
IV1) Birth of algae biotechnology and discovery of the biodiversity ............................................ 37
IV2) Culture contraints .................................................................................................................. 38
IV2a) Light supply .................................................................................................................... 38
IV2b) Temperature and pH ..................................................................................................... 40
IV2c) Nutrients ........................................................................................................................ 41
IV2d) Mixing ............................................................................................................................ 42
IV3) Culture systems ..................................................................................................................... 42
IV3a) Open illuminated systems ............................................................................................. 42
IV3b) Closed photobioreactors ............................................................................................... 44
IV3c) Heterotrophic and mixotrophic cultures ....................................................................... 47
IV3d) Biofilm cultures .............................................................................................................. 48
IV4) Harvesting/Extraction methods in suspension cultures ....................................................... 48
IV4a) Harvesting ...................................................................................................................... 48
IV4b) Physical processes of extraction .................................................................................... 50
IV4c) Chemical processes of extraction .................................................................................. 52
V. Key points for future viability of algae-derived biodiesel ............................................................. 53
V1) Current economic review ...................................................................................................... 53
V2) Biorefinery concept ............................................................................................................... 57
V3) Bioengineering algae ............................................................................................................. 59
Chapter 1 conclusion ............................................................................................................................ 60
Chapter 1 references ............................................................................................................................ 62
I1. Appendix I.1: Additional information about oil production .................................................. 66

Chapter 1: The future of algae-derived biodiesel
27
List of abbreviations:
• toe: tons of oil equivalent (11.63 MWh)
• OECD: Organization for Economic Co-operation and Development countries
• NGLs Natural Gas liquids
• CTLs Coal-to-liquids
• GTLs Gas-to-liquids
• IEA International Energy Agency (https://www.iea.org/)
• US$/bbl US dollar per barrel of crude oil
• mb Million barrels of crude oil
• NOx Nitrogen oxides
• BtL Biomass to liquids
• FT Fischer-Tropsch process
• Syngas Synthetic gas
• DME Dimethylether
• Bio-SG Bio-synthetic gas
• HVO Hydrotreated vegetable oil
• HMV Hydroxymethyl furfural
• ASP Aquatic Species Program
• ATP Adenosine Triphosphate
• NADPH Nicotinamide adenine dinucleotide phosphate
• hv Photon energy flow (Planck constant multiplied by frequency)
• Gc Critical irradiance (µmol/m²/s)
• Gz Irradiance at a certain depth z of a photobioreactor (µmol/m²/s)
• NPQ Non-Photochemical Quenching
• DIC Dissolved Inorganic Carbon
• FAMEs Fatty Acids Methyl Esters
• I Light irradiance supplied (µmol/m²/s)
• NER Net Energy Ratio (Energy input/Energy output)
• RP Raceway Ponds
• OP Open Ponds
• PBR Photobioreactors
• PEF Pulsed Electric Fields
• MSN Mesoporous Silica Nanoparticles
• FFAs Free Fatty Acids
• PLE Pressurized Liquid Extraction
• UAE Ultrasound Assisted Extraction
• ASE Accelerated Solvent Extraction
• BaU Business as Usual
• HRJ Hydrotreated Renewable Jet fuel
• TAGs Triacylglyceride
• HVP High Value Compounds
• FCCS Flow Cytometry and Cell Sorting

Chapter 1: The future of algae-derived biodiesel
28
I. Global outlook on energy supply and demand
The world global energy consumption (Figure 1.a) was estimated at 8,978 million tons of oil equivalent
(toe) in 2012 (1 toe represents 11.63 MWh). About 40% of this energy is used by OECD (Organisation
for Economic Co-operation and Development) countries. The energy demand of these countries tends
to stabilize after a strong increase due to industrial development (+11% from 2012 to 2050). However
the energy demand of other regions will keep increasing strongly [1]. By 2050, the final energy demand
may rise by 74% in China, 120% in Asia, 160% in Africa and 90% in South America. Therefore, according
to these estimations, the energy consumption may increase up to 14,000 Mtoe in 2050.
Before being used to produce heat, electricity or other products primary energy must be transformed.
All the energies resulting from human-made transformations are called secondary energies. These
transformations are indeed necessary to make energy available for trade and use. The main primary
energy sources (Figure 1.b) are oil, coal and gas, representing 81.7% of the total supply. The renewable
sources, biofuels and biogas, earth (geothermal energy), wind, sun and water (hydroelectricity)
represent only 13.5% of the total primary energy supply. Nuclear energy only counts for 4.8%.
Figure 1: a) 2012 World final energy consumption by region adapted from [2,3]. 1 Asia excludes China.
2 Includes international aviation and international marine bunkers. b) World primary energy supply in 2012 adapted from
[2,3].1 Includes geothermal, solar, wind, heat, etc. 2 peat and oil shale are aggregated with coal.
Energy consumption is globally divided into three sectors: industry, transport and services*
(*agriculture, residential, commercial and public services etc...) as illustrated in Figure 2. But the source
used can depend on the sector type; for example, the transport sector is highly dependent on crude
oil and industry on coal.

Chapter 1: The future of algae-derived biodiesel
29
Figure 2: World energy consumption by sector, adapted from [3]. *Other includes agriculture, commercial and public
services, residential and non-specified... Renewable energy sources not presented in this Figure.
II. Review on crude oil production and future alternatives
II1) Crude oil production and consumption
Crude oil, or petroleum or petrol, which was used as a source of energy at a rate of 85 millions of
barrels per day in 2013 [4] (one barrel is equivalent to 158 L, i.e. 0.12 to 0.16 toe) is a natural and
renewable resource at a geological time scale. Crude oil is a fossil fuel which origins started 20 to 350
million years ago. The natural production of petrol has started millions years ago with the
sedimentation of non-assimilated organic material in the sedimentary basin of oceans, lakes and
deltas. Carbon is incorporated into sedimentary sludges with mineral matter (sand, clay). During a
dozen millions of years, the matter will migrate to a deeper level of the terrestrial crust and beyond
1,000 meters be converted into an insoluble mixture of extremely large organic molecules called
'kerogen', trapped in the source rock. Generation of liquid oil starts at around 60 to 70°C (1,500 to
2,000 meters) and continues until 120 to 160°C through a phenomenon called pyrolysis [5]. Crude oil
and gas, under high pressure constraints, can be expelled through permeable rocks toward upper
layers. Expelled oil can leak to the surface and emerge as a 'seep'. Most of the oil is trapped under non
permeable sub-surface rocks in storage spaces named 'reservoir rocks' and forms a pool. The oil
remaining in the source rocks or in impermeable rocks is named 'tight oil'. The rate of current oil
generation has been estimated to be no more than few million barrels per year [4].
The well-known natural origins of crude oil were however rapidly forgotten behind the economic
constraints which make this rare and precious resource a predominant tool to human development.
The main world producers are Saudi Arabia, Russia and United States which represent more than 35%
of the total world production [3]. A map of the world oil production is presented in appendix 1, Figure
1. The world demands, of some 30 billion barrels per year, increase constantly by a rate of 1 to 2 % per

Chapter 1: The future of algae-derived biodiesel
30
year. It is clear that at an entropic time scale, natural petrol reserves can be considered as finite and
then petrol is a rapidly depleting fossil resource.
II2) Hydrocarbon production
Crude oil extracted from reservoir pools out of the ground is a complex mixture of hydrocarbons that
remains in liquid phase when extracted to the surface. The nature and relative abundance of the
components, described in Figure 3, vary with the petroleum source. Petroleum is converted to refined
products in three steps: distillation, cracking and reforming. Petroleum is first heated to approximately
400°C, temperature at which it is a mixture of liquid and vapor. This mixture, called the feedstock, is
introduced into the refining tower. The most volatile components are recovered at the top of the
column where temperature is lower while the less volatile condense at its bottom. The composition of
the fraction obtained at each level of the column, called petroleum fraction, varies; each fraction is
indeed a mixture of compounds of nearby volatilities (i.e. with a similar number of carbon atoms) and
presents various final uses [6].
Figure 3: Petroleum fractions condense at different temperatures, depending on the number of carbons atoms in the
molecules, and are drawn of the column. The most volatile components (those with the lowest boiling points) condense
at the top of the column, and the least volatile (those with the highest boiling points) condense at the bottom [6].
In addition to crude oil and condensates, many liquid hydrocarbons can be extracted or produced, and
are a substantial complement in the liquid fuel supply (Figure 4).
While crude oil and condensates represent 68.5 million barrels per year in 2011 [4], natural gas liquids
(NGLs) count for 12.1 million barrels. Crude oil and NGLs are named 'conventional petrol resources'.
'Non-conventional hydrocarbon resources’ include oil sands, biofuels, tight oil, extra-heavy oil, Gas-to-
Liquids (GTLs) and Coal-to-Liquids (CTLs).

Chapter 1: The future of algae-derived biodiesel
31
Figure 4: global hydrocarbons liquids production in 2011 (million barrels per year) [4].
Natural Gas liquids (NGLs) are the liquid fractions of natural gas, mostly ethane and pentane. Oil sands are extremely
viscous forms of petroleum referred to as bitumen. Biofuels are transport fuels derived from biological sources. Tight oil is
crude oil contained in shale or carbonate rocks that can be obtained using horizontal wells with multi-stage hydraulic
fracturing (fracking). Extra-heavy oil is very dense crude oil with a viscosity higher than 10,000 centipoises. Gas-to-liquids
(GTLs) and Coal-to-liquids (CTLs) are obtained using Fischer-Tropsch process to convert gas or coals to synthetic fuels
(synfuels).
The major part of liquid hydrocarbons production is crude oil and NGLs, referred as conventional
hydrocarbons feedstocks. The non-conventional feedstocks represent a minor part of this production
(6 % in 2011). The global production (crude oil, condensats, and NGLs) will need to increase by 1 to 2 %
every year to meet the future demand. The future evolution in the energy supply and demand is
influenced by 5 main factors: (i) world population (+1.5 % per year), (ii) globalization which rapidly
increases the energy needed per inhabitant in the developing countries (+1.5 % per year), (iii) energy
price fluctuations, (iv) improvements in the energy uses (-1 % per year) and (v) willingness to reduce
gas emissions by 2025-2030 in order to mitigate global warming [7]. Tremendous amounts of
greenhouse gases are indeed released from fossil fuel consumption; consequently the atmospheric
CO2 concentration was increased from a pre-industrial level of 280 ppm to 401 ppm in september 2016
[8,9]. The aim is to reduce CO2 emissions by 40 to 70 % by 2050 in order to limit its atmospheric
concentration to 450-500 ppm and then the temperature increase to a maximum of 2°C above pre-
industrial temperatures. If no effort is made, the atmospheric CO2 concentration may increase to 750
to 1300 ppm leading to a temperature increase up to 3.7 to 4.8°C at the end of the century [10].
Crude oil price is extremely unstable. The barrel price has varied from 30 to 150 US$/bbl (US$ price of
one barrel) during the last decade (for more details, see Figure 2, appendix 1). A sharp decrease of the
demand (due to financial crisis which reduced global activity in 2009), or, on the contrary, an excess of
production (due to the strong development of fracking sources and an excess of production in Saoudi
Arabia and Iran in 2015) lead to a collapsing oil price, below 40 US$/bbl.
In parallel to the offer/demand rule, the different crude oil feedstocks possess inherent extraction
costs (illustrated Figure 3 of appendix 1) which vary between 20 and 180 US$/bbl. A depletion of the

Chapter 1: The future of algae-derived biodiesel
32
low cost feedstocks and a need to meet the increasing world demand by extracting more and more
expensive sources lead to a slow and irremediable crude oil price increase. The barrel price is expected
to increase chaotically within the range of 120 to 200 US$/bbl by 2035 [11].
A future increase of the demand, in parallel with the reduction in the production capacities of the
current sources, must be supported by expending the diversity of supply sources : crude oil including
tight oil, NGLs and unconventional oils including sands gas, coal to liquids and biofuels [4] as illustrated
in Figure 5.
Figure 5: Projection of global all-liquids production to 2035 [4]
III. Current biofuel production and future technologies
III1) Current production
Biofuels are predominantly produced from a variety of bio-feedstocks. Bio-feedstocks or biomass refer
to all vegetable matters that can be obtained by photosynthesis. Biomass is currently the only
renewable feedstock to produce liquid fuel.
Biofuels have a massive potential to represent a significant part of future sustainable energy. IEA
(International Energy Agency) indeed estimates that biofuels will provide 27 % of the transport
consumption by 2050 [2]. Globally, the annual biodiesel production increased from 15 thousand
barrels per day in 2000 to 289 in 2008 [12], but this is still very low in comparison with the 85 millions
of barells consumed.
The biomass feedstock for biofuels production should fullfill two main requirements: low production
costs and large production volume to be able to compete with crude oil supplies. On the other hand,
this feedstock is strongly dependent on climate conditions, geographical location, local soil nature and
agricultural practices.

Chapter 1: The future of algae-derived biodiesel
33
The main advantage of biofuels over crude oil, besides their sustainablility, is their very low carbon
footprint. Indeed, despite carbon dioxyde is released during fuel combustion, it is roughly
counterbalanced by the CO2 absorption by plants during their culture. But the impact analysis of
biofuels must also take into account the footprint of farming operations and transports [13]. This
results in a negative carbon balance, rising skepticism among scientists about the industrial scale up of
biofuel production. Biofuels combustion nevertheless releases less sulfur dioxide and particules
(87.7 % reduction) than diesel fuel [14]. When considering nitrogen oxides (NOx), the emission may
however be increased up to 70 % [15] when using current engine technologies. A modification of the
combustion process (injection, ignition temperature) is then necessary for biodiesel engines [16], as
conventional engines were optimized over a century to work with petroleum carbon fuels.
The biofuel worldwide production is illustrated in Figure 6.
Figure 6: 2000-2010 liquid biofuels production [17].
In 2012, the USA were responsible of 45.5 % of the global production with 27.4 Mtep thanks to the
programm 'Renewable Fuel Standard', with two main axes developed : increase of ethanol production
and expanding development of second generation biofuels technologies. Brazil started a programm in
1970 called 'Proalcool' and positions itself as the historical leader of biofuel production. In 2012 Brazil
represented 22.5 % of the worldwide production while Europe contributed only to 16.6 % with
Germany and France as the dominant actors.
The development of biofuels during the last decades was mainly focused on three axes : conversion of
sugar to ethanol, production of biodiesel, production of biogas (not illustrated in Figure 6).
In the classic sugar-to-ethanol process, sucrose is obtained from sugar crops. The main industrial steps
of the process include press milling, liquefaction, saccharification, fermentation, distillation, drying and
denaturing [9]. The conversion of starch crops to ethanol requires a pre-transformation step: the
hydrolysis of starch into glucose, which requires more energy than the sugar-to-ethanol route. The
cost of production from sugar and starch is very sensitive to the highly volatile feedstock prices.
Commercial bioethanol is currently produced from starch and sugar-based crops including sugar cane,
wheat, sugar beet, sweet sorghum, corn, barley, potato, yam and cassava [9]. In 2012, 42 % of the U.S.
corn grains were used to produce 49 billion liters of bioethanol replacing then 10 % of gasoline fuel
used in the whole country [9]. Sugar cane is the predominant feedstock to produce bioethanol in Brazil.

Chapter 1: The future of algae-derived biodiesel
34
Biodiesel is a mixture of mono-alkyl esters of long chain fatty acids derived from raw edible or non-
edible vegetable oils, animal fats and used cooking oil [12][17]. These oils and fats are converted to
biodiesel thanks to a trans-esterification process by addition of alcohol (mostly methanol or ethanol).
Currently, more than 95 % of the worldwide biodiesel is produced from edible oils coming from
rapeseed (84 %), sunflower (13 %), palm (1 %), soybean and others (2 %).
Biogas is produced through anaerobic digestion of feedstocks such as animal manure, organic waste
(compost), sewage sludge or dedicated green energy crops. Biogas is often used to generate heat and
electricity. It can be also upgraded to biomethane CH4 by removing CO2 and hydrogen sulfide (H2S).
Biodiesel and biofuels produced from food crops are generally referred as 'first-generation biofuels'.
Their use raises some concerns, in particular the competition with food and feed crop exploitation...
Indeed, by 2050 the expected worldwide population of 9 billion inhabitants will result in a huge food
supply demand. Consequently, this will increase the price of vegetable oils which indirectly will affect
the economical viability of the first generation biodiesel industry.
III2) Future technologies
Because of the constraints of current biofuels, many studies are performed on advanced biofuel
technologies; several are already deployed at early commercial scale, as illustrated in Figure 7.
Figure 7: Biofuel commercialization stage [17]. Conventional biofuel technologies include well-established processes that
are already producing biofuels on a commercial scale, commonly referred to as first-generation. Advanced biofuel
technologies are conversion processes which are still in research and development, pilot or demonstration phase, they
are commonly referred to as a second- or third- generation.
In comparison with the first generation of oil feedstocks, non-edible oil resources are gaining increased
attention because they can be cultivated on wastelands, not suitable for food crops, and are more
economical than edible oils. Non edible oils as well as animal fats and waste oils are considered as the
second generation of biodiesel feedstocks.
This so-called second generation of biodiesel is the future of biodiesel supply for the next decades.

Chapter 1: The future of algae-derived biodiesel
35
Yet, the second generation feedstocks may not fulfill the global oil demand increase because of the
surface productivity limitations. Moreover, in the case of many types of animal fats, the
transesterification process is difficult due to the high amount of saturated fatty acids.
Many other advanced biofuels are on development stage and represent the future of energy supply at
longer term. They are listed below.
Hydrotreated vegetable oil (HVO) is produced by hydrogenation of vegetable oils or animal fats
instead of their transesterification [18]. This reaction consists in the catalytic reduction of unsaturated
fatty acids with a hydrogen source.
Biomass-to-liquid (BtL) diesel, similarly to coal to liquid (CtL), is produced by a two-step process; first
the biomass is converted into syngas (synthetic gas) rich in hydrogen and carbon monoxide; then, the
syngas is catalytically converted through Fisher-Tropsch synthesis into various hydrocarbon liquids,
including synthetic diesel and bio-kerosene.
Bio-synthetic gas (Bio-SG) corresponds to biomethane derived from biomass via thermal processes.
Bio-methanol can be produced from a wide range of biomass feedstocks via a thermochemical route
which is similar to Biomass-to-liquid (BtL). It can be blended with petrol at 10 to 20 %.
Biobutanol is traditionally produced by ABE fermentation - the anaerobic conversion of carbohydrates
by strains of Clostridium into Acetone, Butanol and Ethanol. 85 % Butanol/gasoline blends can be used
in unmodified petrol engines [19]. Biobutanol can be used as a transport fuel.
Furanics are “furan-based organic liquids” with biofuel potential. Furans are heterocyclic organic
compounds containing rings of one oxygen and four carbon atoms. 5-Hydroxymethylfurfural (HMF), a
main building-block of Furanics, can be produced by the acid catalyzed dehydration of hexoses, such
as glucose and fructose from biological feedstocks [20–22].
Biohydrogen for use as a transport fuel can be produced from fossil fuels as well as renewable sources:
biogas reforming, fermentation of renewable materials, cell-free enzymatic process, production from
microbial fuel cells and from algae [19].
Microalgae are considered as the third generation of biodiesel feedstock. Microalgae are
photosynthetic microorganisms that convert sunlight, water and CO2 to algal biomass, more efficiently
than conventional crop plants. They are a very promising feedstock because of their high capacity to
produce biomass containing high oil contents, with higher growth rate and productivity than edible
and non-edible feedstocks (Table 1) [12,23].
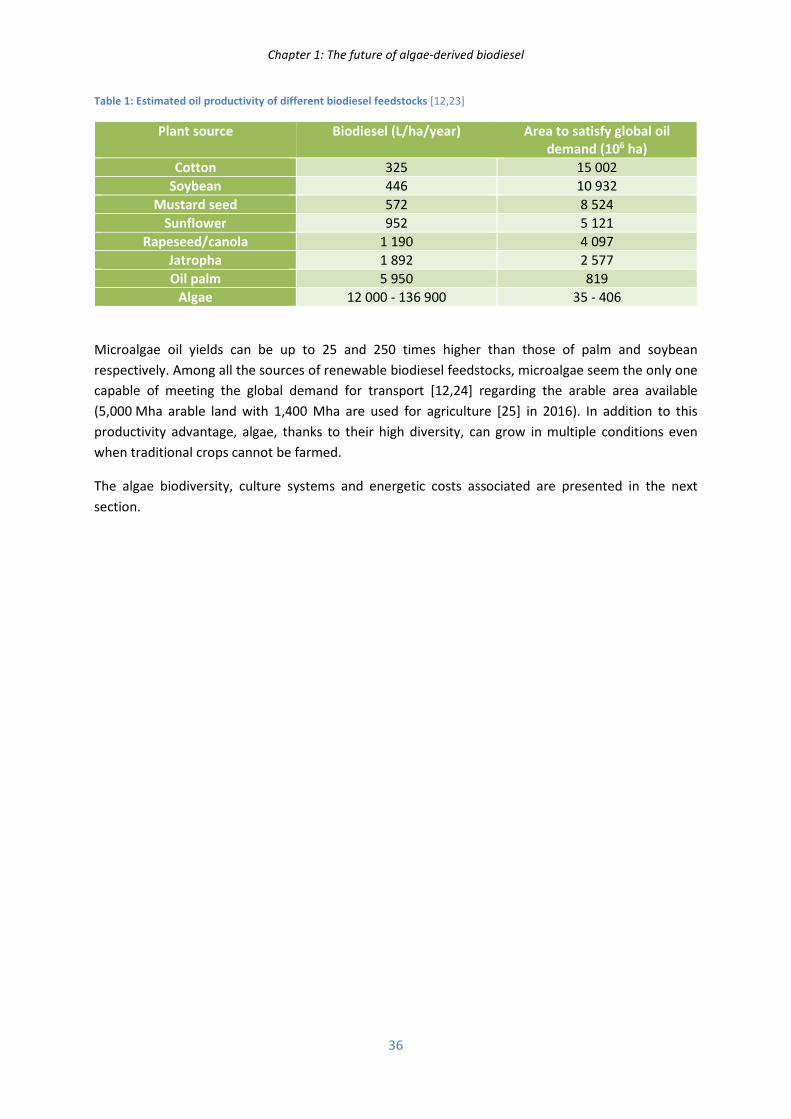
Chapter 1: The future of algae-derived biodiesel
36
Table 1: Estimated oil productivity of different biodiesel feedstocks [12,23]
Plant source Biodiesel (L/ha/year) Area to satisfy global oil
demand (106 ha)
Cotton 325 15 002
Soybean 446 10 932
Mustard seed 572 8 524
Sunflower 952 5 121
Rapeseed/canola 1 190 4 097
Jatropha 1 892 2 577
Oil palm 5 950 819
Algae 12 000 - 136 900 35 - 406
Microalgae oil yields can be up to 25 and 250 times higher than those of palm and soybean
respectively. Among all the sources of renewable biodiesel feedstocks, microalgae seem the only one
capable of meeting the global demand for transport [12,24] regarding the arable area available
(5,000 Mha arable land with 1,400 Mha are used for agriculture [25] in 2016). In addition to this
productivity advantage, algae, thanks to their high diversity, can grow in multiple conditions even
when traditional crops cannot be farmed.
The algae biodiversity, culture systems and energetic costs associated are presented in the next
section.

Chapter 1: The future of algae-derived biodiesel
37
IV. From algae culture to oil harvesting. Review of existing
technologies and constraints
IV1) Birth of algae biotechnology and discovery of the biodiversity
The idea of using algae to produce lipids emerged in 1942 with Richard Harder and Hans von Witsch’s
works [26]; in the following decades, many biologists underlined the high capacity of algae to convert
efficiently solar energy into lipids [27,28]. Specific culture and engineering systems were developed
then to cultivate this new biological feedstock at larger scales. In 1970s, the United States started a
program named Aquatic Species Program (ASP) which aim was to produce biodiesel from microalgae.
During more than 30 years, 3,000 algal strains were collected and screened for properties such as high
growth rate, high lipid content and resistance to the environmental conditions. Japan started a
program in 1990 focused on 'biological CO2 fixation and utilization’ which underlined the capability of
algae to grow on flue gas as a CO2 source. These first programs were successful - promising lipid
production strains were obtained, new photobioreactors for algae culture were designed, processes
at large scale were studied. The increasing interest of microalgae biotechnology was also driven by
their potential to produce feed and food.
Research on algae for the mass-production of oil is mainly focused on so-called 'microalgae'; they are
microorganisms capable of photosynthesis with diameters lower than 0.4 mm and including diatoms
and cyanobacteria, as opposed to macroalgae such as seaweed. In April 2016, the algae base contained
4,516 prokaryotic and 42,582 eukaryotic species [29].
The tree of life presented in Figure 8 illustrates the 9 domains of life in bold (e.g. Bacteria) divided in
kingdoms (e.g. Cyanobacteria). The kingdoms of photosynthetic algae (in white characters in the tree)
are located in 6 of the 9 existing life domains. According to the phylogenetic evolution, primates
(kingdom Metazoa) are surprisingly closer to sponges (same kingdom) than two different microalgae
between themselves, for example Chlamydomonas (kingdom Viridi plantae) and Nannochloropsis
(kingdom Heterokontophytes). The symbiosis represented with a blue-green arrow is at the origin of
the chloroplasts of red algae, blue algae, green algae and plants which evolved from an endosymbiotic
cyanobacteria living in an eukaryotic host cell [30] (mitochondria may also come from an
endosymbiosis, illustrated with a blue arrow). Photosynthetic cells have spread to other domains of
life with various symbiosis represented with green, yellow or red arrows. Some of the organisms are
known to be toxic and are indicated with a red star.

Chapter 1: The future of algae-derived biodiesel
38
Figure 8 : Photosynthetic species in the tree of life represented in white Characters [31].
This amazing diversity is very hard to perceive and to estimate; we are still in the infancy in the field of
microalgae phylogeny. But this high diversity is promising for the microalgae biotechnology. However,
each strain has its own specificities and the technology associated must be adapted to the strain used.
IV2) Culture contraints
In algae and plants, carbon assimilation into cells is performed by photosynthesis. This complex process
enables the conversion of light energy (photons) to chemical energy (ATP and NADPH), further used
by the cell to synthesize organic carbon from inorganic carbon (CO2). CO2 and light supplies are thus
paramount during the autotrophic growth of algae. The reactions involved in photosynthesis are
further explained in Chapter 2.
IV2a) Light supply
Microalgae growth strongly depends on light supply; one of the main concerns is that the light
distribution in the culture is not homogeneous, light is indeed self-attenuated by the biomass.
Therefore the light collected during a given period by a cell depends on many parameters: light
irradiance at the surface of the reactor (µmol/m²/s), culture density (number of cell/mL), cell optical
parameters [32] (optical section, refraction/absorption index, etc...), cell position in the reactor,
degree of mixing, as illustrated in Figure 9. The critical irradiance Gc is the value under which the light
supply is insufficient for prokaryotic cells to grow [33]; respiration then exceeds photosynthesis,
leading to a reduction of the organic content of the medium (if any) and of the cells.

Chapter 1: The future of algae-derived biodiesel
39
Figure 9: Irradiance distribution in a reactor [33]
Individual algae cells develop large antenna pigment complexes to absorb a maximum of photons [34–
36], as illustrated in Figure 10. Consequently, most of the available light is absorbed by the cells close
to the illuminated surface that can then easily absorb energy beyond their photochemical capacity.
This phenomenon leads to three problems (i) an excess of excitation in the superficial cells leading to
oxidative damage and photo-inhibition (mortality, growth rate reduction, degradation of sensitive
compounds), (ii) a photoprotective mechanism, Non-Photochemical Quenching (NPQ), in these cells,
resulting in energy dissipation into heat (up to 80 %) [37,38] and (iii) a shading effect to the cells far
away from the light source, photo-limitation.
Figure 10: Antenna size influence on light transfer, and problem associated [36]
As a result of light distribution in the volume, the culture can be divided into different zones according
to the light regime of the cells: light inhibition, light saturation (maximum growth rate), light limitation
and no cell growth (Figure 11).

Chapter 1: The future of algae-derived biodiesel
40
Figure 11: Effect of light intensity on photoautotrophic growth of photosynthetic cells [39]
During a batch culture, a dark zone appears at a certain distance z to the illuminated surface when the
cell concentration is too high (Figure 9); in this zone the irradiance is lower than its critical value Gz <
Gc. This leads to a reduction in the biomass productivity in the reactor and thus requires a periodic
harvest of the cells to maintain a reasonable biomass concentration and then a high productivity. For
a continuous culture, a good solution is to harvest continuously the biomass produced when the light
regime is optimal (no dark zone and low light inhibition), to maintain an optimal cell concentration in
the bioreactor.
In addition to this difficulty concerning the crucial relation between light regime and biomass
productivity, daily and seasonal irradiance variations in natural conditions must be considered. These
unavoidable variations increase the difficulty to manage both photo-inhibition and photo-limitation
efficiently in order to optimize the biomass productivity.
IV2b) Temperature and pH
As mentioned previously, the light saturation regime leads to a significant dissipation of energy in the
culture; in addition, water strongly absorbs infrared waves [40], also leading to heat dissipation.
Temperature can then highly increase leading to undesirable effects; it is thus important to control
and maintain this parameter at the optimal value of the cultivated strain (Figure 12). In the case of
natural conditions, the strain must therefore be carefully selected according to the geographical
position of the cultivation system in order to limit energy consumptions (cooling down or heating the
culture). Most of algae strains are mesophiles, i.e. growing at temperatures within the range of 15 to
50°C. Psychrophiles optimally grow below 15°C; some snow and ice algae even grow at 1°C, for
example Chlamydomonas nivalis in Figure 13. As for thermophiles the culture temperature must be
higher than 50°C and for hyperthermophiles above 80°C. Microalgae may live in very high or low pHs
media (Figure 14), in fresh and salty waters, even in high saline conditions as Dunaliella salina (up to 3
M NaCl) (Figure 15) [41].

Chapter 1: The future of algae-derived biodiesel
41
Figure 12: Optimal growth temperatures for representative
microalgae. Red algae are indicated in red, green algae in
green, cyanobacteria in blue, and diatoms in brown. (The
number inside parenthesis indicates the reference number
from the original article [41]).
Figure 13: Chlamydomonas nivalis, a green algae that can
grow in ice and snow. When subjected to high light, the algae
produces high contents of carotenoids (astaxanthin)[42]. Also
commonly referred as 'watermelon snow' or 'blood snow'.
Figure 14: Example of known pH limits for representative
acidophilic, mesophilic and alkalophilic algae and
cyanobacteria [41].
Figure 15: Algae bloom of a halophilic, alkaline green algae:
Dunaliella salina [43]
A strain already adapted to the specific environmental conditions, temperature, pH and salinity, can
be cultivated in open conditions. In addition, using extremophilic strains prevents contaminations as
few species are able to grow in these conditions.
IV2c) Nutrients
Dissolved inorganic carbon (DIC) must be present in the medium for microalgae growth. The
production of 1 kg of dry algal biomass requires 1.83 kg CO2, which can readily be obtained from
industrial flue gases via bio-fixation [44]. Carbon is indeed the main element of the biomass,

Chapter 1: The future of algae-derived biodiesel
42
representing approximately 50 % of the dry weight. In autotrophic cultures, it can be provided as
soluble inorganic salts (HCO3- or CO3
2-) or as gaseous CO2.
In an open culture, the liquid culture is generally in equilibrium with the atmospheric air containing
approximately 400 ppm CO2 [8]. The nature of the soluble carbon species depends on pH: mostly CO2
between pH 0 and 6, HCO3- between pH 6 and 10 and CO3
2- above pH 10. If the culture is fed with
inorganic carbon, a desorption of CO2 from the medium to the atmosphere could occur depending on
pH; covering the culture system and/or maintaining a high pH can limit this phenomenon.
The second most important nutrient is nitrogen representing from 1 to 10% of the dry weight and
particularly needed for the biosynthesis of proteins and photosynthetic pigments. It is mostly provided
as mineral salts: ammonium, nitrate or nitrite ions, which are easily assimilated by a majority of algae
strains. Some cyanobacteria are also able to use gaseous N2 as nitrogen source.
Moreover, many other macronutrients must also be supplied to the culture medium: Na, K, Ca, P, S,
Mg, Cl as well as micronutrients: Fe, Si, Zn, Mn, Br, B, Mo, V, Sr, Al, Rb, Li, Cu, Co; I, Se and vitamins.
As mentioned previously, each strain has its own optimal pH. But photosynthesis leads to an increase
in pH due to CO2 consumption; gaseous CO2 can be added to the culture to maintain its pH at the
optimal value.
IV2d) Mixing
An efficient mixing of the culture is generally paramount to meet the requirements mentioned above
(easy transfer of micro and macronutrients, homogeneity in pH…) and limit the negative phenomena
(thermal stratification, dark zones for some microalgae...). But mixing generally requires high energy
amounts and the shear stress induced by agitation can affect the cells viability [45].
For choosing the mixing system (mechanical agitation, gas spraying, pumping system), different
parameters must be taken into account: (1) the shear stress sensitivity of the strain, (2) the mixing
efficiency (residence time, dead zones) and (3) the energy cost.
IV3) Culture systems
IV3a) Open illuminated systems
The largest (considering the surface) culture systems nowadays are extensive open systems (also
referred as open ponds). Temperature is regulated by natural evaporation; CO2 is supplied by
atmospheric air and there is no agitation (Figure 16). The investment costs are then minimal and the
energy cost negligible. They generally can only be used for extremophilic algae strains, able to grow in
harsh conditions (e.g. Dunaliella Salina which can grow in high salinity cultures).

Chapter 1: The future of algae-derived biodiesel
43
Figure 16 Hutt Lagoon in Australia is a natural salty lake, with 250 ha of artificial ponds used to farm Dunaliella Salina, a
carotenoid producing algae.
Many other open artificial bioreactors for algae culture are available but the most commonly used is
the "raceway reactor" also called "raceway pound”, in which agitation is generally ensured by a
paddlewheel. Examples of raceways are illustrated in Figure 17 and Figure 18. Aside from open ponds
this technology is the easiest and cheapest to cultivate algae cells. The reactor is either excavated in
the ground, the bottom being covered by an impermeable material, or built in plastic or cement above
the ground. The most common values for the pond depth are between 0.1 and 0.5 m [46]. Mixing is
performed by a mechanical rotating device, usually a paddlewheel, giving a liquid velocity between
0.15 and 0.25 m∙s-1, which prevents cells sedimentation. To optimize gas-liquid transfer and satisfy the
CO2 requirements, the raceway is generally equipped with submerged aerators.
Raceways
Figure 17: Dunaliella salina and Spirulina platensis cultivated in
raceways, Cyanotech Hawai[47]
Figure 18 Partially covered raceways for microalgae
cultivation at Ourofino Agronegocio, Brazil [48]
However open cultivation technologies lead to serious problems, such as lower volumetric
productivities compared to closed systems (0.1 compared to 1.5 kg.m-3.day-1), water evaporation
through the open surface and contaminations [49]. Many studies were performed to model and/or to
follow the productivity of an algae during a given season [50–52] and to optimize the pond design in
terms of hydrodynamics [53–56], thermal behavior, solubilization of CO2, nutrient supply, etc... As

Chapter 1: The future of algae-derived biodiesel
44
shown in Figure 18, raceway reactors may be partially covered with a transparent plastic material to
limit evaporation and contaminations.
IV3b) Closed photobioreactors
Multiple reactor designs were developed to face the drawbacks of the raceways: low productivity, high
contamination risks, high evaporation. The diversity of design is so large that it cannot be listed
exhaustively in this report, but for a large scale production, two main designs are encountered: flat
panels reactors and tubular reactors (vertical or horizontal).
Panel photobioreactors are flat, transparent vessels made of glass, plexiglass, plastic or other
transparent materials. The mixing of the culture is carried out directly by air bubbling; air is introduced
via a perforated tube at the bottom of the reactor [49]. Flat panels are never thicker than 5-6 cm,
otherwise the light entering the panel would not penetrate into the heart of the culture. Vertical
reactors result in the dilution of direct sunlight and a reduced illumination via shading effects, as
illustrated in Figure 19.
Figure 19 Shading effect of vertical panels[27]
Tubular reactors, as flat panels, are made of transparent material with a limited diameter in order to
reduce light gradients. Agitation is provided by an air pump.
The main advantage of these closed systems, compared to raceways ponds, is the large surface to
volume ratio which enables a better control of the light intensity supplied to the culture.
Contaminations are also minimized and the cultivation conditions (pH, temperature, CO2
concentration, mixing intensity and nutrient level) can be more easily controlled to suit the optimal
growing conditions of microalgae strains, in contrast with open systems.
An example of a vertical tubular reactor is illustrated in Figure 20; the shading effect between the
vertical structures can be seen. A large production facility of caroteinoid pigments in horizontal tubular
reactors is presented in Figure 21. In this case, the high ilumination from direct sunlight is aimed to
induce accumulation of carotenoid pigments in Haematococcus pluvialis cells in response to a light
stress. The energy required for the agitation in this system is high because of the great length and small
radius of the tubes. In addition, cooling is performed by spraying demineralized water on the tubes.
The important cost of the process is however counterbalanced by the high value of the pigments
extracted from the algae.

Chapter 1: The future of algae-derived biodiesel
45
Among the various possibilities, some examples of flat pannels are presented in Figure 22 and Figure
23. Like a photovoltaic pannel, the reactor of example 22 can be inclined to face the sun all along the
day or in some cases be positioned at particular angles to get an optimal irradiance. The Figure 23
presents a system of vertical flat pannels surrounded by water in a plastic bag. This original solution
enables to control the algae culture temperature night and day.
Tubular reactors
Figure 20 Vertical photobioreactors for microalgae cultivation
[57]
Figure 21 Haematococcus pluvialis cultivation via horizontal
tubular reactors in Israel [58] for astaxantin production (red
pigment)
Flat panels
Figure 22 Flat panel reactor on the roof of a building in Saint
Nazaire, France [59]
Figure 23 Flat panels immerged in water in Algae parc,
Wageningen University, Netherlands. [60]
For the production of large market scale and low cost products such as oil for biofuel, the choice of the
bioreactor type must be focused on a single criterion: the balance between the energy consumption
for production and the potential energy production associated with biomass. This criterion is generally
estimated via the NER indicator: Net Energy Ratio, defined as the ratio of total energy input and output,
where a ratio lower than 1 denotes a positive energy balance and vice versa [48] (in some articles the
Energy Efficiency Ratio is defined as the inverse: total energy output vs total energy input).

Chapter 1: The future of algae-derived biodiesel
46
It is interesting to compare NERs for oil produced by crops and by microalgae. For oil bearing crops,
despite their low surface productivity, NER is always significantly lower than 1 (between 0.7 and 0.2)
for the whole process: feedstock cultivation, harvesting, seeds drying, oil extraction (mechanical
pressing/enzymatic extraction/solvent extraction) and generally transesterification to obtain Fatty
Acids Methyl Esters (FAMEs) and glycerol [12]. For algae production however, NER is hardly below 1
(Figure 24). On current knowledge, raceway pounds are more energy efficient than closed systems
[61]. Even if closed systems exhibit lipid surface productivities 10 to 20 times higher than raceways
[62], the energy consumption for agitation in closed systems drastically increases the NER indicator.
Indeed, decreasing the light path of photobioreactors while increasing mixing (turbulence) in high cell
density cultures requires a high energy input; this bioreactor type is therefore not recommended for
large-scale production of biofuels from microalgae [44,48].
Figure 24: Net energy ratio for micro-algae biomass production (The NER is defined as the sum of the energy used for
cultivation, harvesting and drying, divided by the energy content of the dry biomass) [61]
But when the biomass lipid content increases, along with its energetic value, the NER indicator is
decreased [63]. Finally an additional valorization of biomass wastes after lipid extraction by other
energetic processes (e.g. anaerobic digestion of microalgae residue) may drastically reduce the NER
value [64]. But thanks to many active researches, future technological progresses in managing energy
consumptions in closed photo-bioreactors will without any doubt improve the energy efficiency of
these systems.
As illustrated in Figure 24, for raceway systems, algae harvesting and dewatering/drying steps
represent the major part of the process energetic cost; this is due to the generally low biomass
concentrations of the cultures (less than 1 g/L), leading to the elimination of huge water amounts. On
the contrary, for very intensive PBR systems in which the biomass concentration can reach up to 10 to

Chapter 1: The future of algae-derived biodiesel
47
20 g/L (thanks to a high illuminated surface to volume ratio, an optimized cooling system, a good
mixing, a satisfactory CO2 supply etc...), the dewatering step represents a minor part of the high
production cost.
Two alternative algae growth systems must also be covered in this report: (i) heterotrophic cultures
and (ii) biofilms cultures.
IV3c) Heterotrophic and mixotrophic cultures
In heterotrophic systems, algae grow in the absence of light, using their respiration metabolism (Figure
25). The fixation of gaseous CO2 in the case of autotrophic cultures is replaced by external organic
carbon sources (e.g. glucose, acetate, glycerol, fructose, sucrose, lactose, galactose, mannose) [65].
Figure 25 Photosynthesis and cellular respiration [66]
Even in autotrophic cultures (no organic carbon supplied to the culture), respiration occurs during night
and even in day light for highly concentrated cultures. Mitochondria enable the cell to create ATP
energy from the degradation of organic carbon stored in the cytoplasm (carbohydrates or lipids) [67].
The reactions involved in respiration and photosynthesis are further detailed in Chapter 2.
Mixotrophy is a combination of autotrophic and heterotrophic cultures, in which CO2 and external
organic carbon are simultaneously assimilated. This provides two important advantages: (i) it leads to
much higher biomass concentrations compared to autotrophic cultures (ii) existing technologies
(fermenters and centrifuges) can be used [65].
These hetero or mixotrophic culture systems however exhibit many major drawbacks: (i) increasing
costs with the use of organic carbon as nutrient, (ii) high risk of contamination and competition with
other organisms, (iii) limitation to specific algae strains, (iv) inability to produce light-induced
metabolites [65] and (v) production of CO2.

Chapter 1: The future of algae-derived biodiesel
48
IV3d) Biofilm cultures
Biofilm cultures are alternatives to suspension-based culture systems; they are characterized by an
accumulation of biomass on a solid surface. This mode of cultivation has a strong advantage in
comparison with suspended cultures, as the harvesting step is greatly facilitated; the biofilm attached
to the surface has indeed a high solid content of 10 to 20 % and can be easily harvested by scraping
[68,69]. An example of biofilm culture is illustrated in Figure 26.
Figure 26 Biofilm growth on a rotating disk. Disks are partially submerged in a medium [69,70]
In addition, in this type of culture, the amount of water required is strongly reduced. But there is still
a significant lack of understanding of CO2 transfer and light penetration across the biofilm [68].
However, a few recent projects showed promising results of this process as an alternative to classic
suspended cultures. Further researches however need to be carried out to test different attachment
materials and strains, and to estimate the economic feasibility of this process at large scale [68].
IV4) Harvesting/Extraction methods in suspension cultures
IV4a) Harvesting
Harvesting, also referred as dewatering or drying, is the separation of the biomass from the culture
medium. The cost is significant because microalgae grown in open cultivation systems are relatively
diluted (ca. 0.1 to 3 g.L-1) [71]. In addition, unicellular microalgal cells are very small, with a diameter
usually lower than 20 µm, sometimes even under 5 µm.
The different harvesting methods are summarized in table 2.

Chapter 1: The future of algae-derived biodiesel
49
Table 2: Algal biomass harvesting methods (modified from [48]).
Harvesting Method
Process description Advantages Disadvantages
Centrifugation [72] Governed by Stokes'Law:
Sedimentation of suspended solids
is determined by density and radius
of algal cells. Concentrated algal
biomass can be obtained.
Centrifugation force: 5,000 - 10,
000 g with 95% removal efficiency.
Rapid and efficient Energy intensive and high
maintenance cost
Flocculation [73–79] To aggregate the algal biomass to a
larger size and hence ease
sedimentation. Coagulants used:
ferric chloride (FeCl3), aluminium
sulfate (Al2(SO4)3, alun) and ferric
sulfate (Fe2(SO4)3). Normally used as
a pretreatment step to
centrifugation, gravity
sedimentation,or filtration.
Cost effective The algal biomass cannot be
used for some downstream
applications such as animal
feed or anaerobic digestion
because of flocculants
toxicity. Some bio-based
flocculants/coagulants may
be used as an alternative but
are more expensive.
Dissolved air
Flotation [80]
Trapping algal biomass by
dispersing micro air bubbles. The
fine bubbles (less than 10 µm)
adhere to the biomass (after
flocculation process) and lift them
to the surface.
Applicable to large volumes
of biomass
Toxicity of flocculants may
reduce algal biomass value.
Flocculation is indeed
necessary to apply this
method. Some bio-based
flocculants/coagulants may
be used as an alternative but
are more expensive.
Filtration [81–86] Press and membrane filters are
operated under pressured or
vacuum conditions.
Filter press: Effective in
recovering algae of
relatively large size (e.g.,
Spirulina platensis)
Micro/ultrafiltration
(membrane filters) :
Effective in recovering both
large and small algae.
Filter press: Ineffective to
recover small algae (e.g.,
Scenedesmus and Chlorella)
Micro/ultrafiltration: High
cost due to membrane
replacement (membrane
clogging),and maintenance.
Gravity
sedimentation
Governed by Stokes'law:
Sedimentation of suspended solids
is determined by density and radius
of algal cells. Algae are left to settle
naturally by means of gravity.
The cell density evolves with its
content: a high lipid content
reduces cells density.
Low cost because no
additional chemicals or
physical treatment needed,
no energy consumption.
Requires relatively high
settling times
Not effective for small algae
Drying (solar drying,
roller drying (Figure
27), spray drying,
freeze drying) [87]
Thermal process to induce water
evaporation facilitated by an
increased surface to volume ratio.
Low moisture content in the
final product
Denaturation of organic
compounds for high
temperature conditons.

Chapter 1: The future of algae-derived biodiesel
50
Electrophoresis
techniques [88]
Form aggregates induced by an
electric field generated by two or
more electrodes. The negatively
charged microalgal cells are
attracted to positive electrodes
where upon contact, they are
neutralized and form aggregates
(electrolytic flocculation). This
phenomenon can be used as
"Electrolytic coagulation" with
reactive electrodes that releases
coagulants (iron or aluminium
hydroxide). Electrolytic flotation
performed via cathodes of inactive
metal that generate hydrogen
bubbles from water electrolysis.
Low energy and no release
of contaminating
flocculants [89] in the case
of electrolytic flocculation.
Electrodes need to be
replaced periodically.
High energy (in the case of
electrolytic flotation)
Centrifugation is broadly used, it is the most rapid and reliable method of harvesting suspended algae.
However, as stated by the U.S. Department of Energy, at the current state of the centrifugation
technology, this method is cost-prohibitive for large scale uses [90].
Lower energy consuming processes (0.1 to 1 kWh/t of water evaporated) are generally used to make
a first concentration to 1 to 5 % w/w; a seond concentration step (centrifugation, filtration or drying)
allows to obtain an algal paste/powder of above 15 % w/w by [71].
Some systems are especially developped to face the problematic of algae dewatering. An exemple
among the solutions is presented in Figure 27, referred as "roller drying". At the entrance of the
system, algae are pre-concentrated before being spread on a large surface and rolled to dry them to a
powder with a reduced energy consumption.
Figure 27: Solid liquid Separation pilot model dewatering microalgae from Algaeventure systems (roller drying)
After harvesting the biomass, a disruption step is generally needed to separate the intracellular
valuable compounds (lipids, pigments, proteins) from the cell wall. Many methods are used and are
usually classified between physical and bio-chemical processes.
IV4b) Physical processes of extraction
The physical processes aim to break the wall of the cells and/or permeabilize their membrane:
different types of technology are described below:

Chapter 1: The future of algae-derived biodiesel
51
Expeller pressing is a classical method used to extract oil from raw materials, which are squeezed under
high pressure. In the case of algae, it is highly recommended to dry the cells before this type of process.
Bead milling (or mixer milling) [91,92] uses a homogenizer containing beads, originally designed for
size reduction of paint or lacquer particles [92]. It was proved to be a powerful technique for the mild
disintegration of microbial cells and microalgae by frequent collisions or frictions with the beads. The
dispersion system consists of a milling chamber and a mechanical agitator; the milling chamber is filled
with grinding beads (glass, zircon oxide, steel…) and the product to be fractionated. This method
requires an expensive cooling system to prevent the thermal degradation of the target products [93],
increasing the global cost.
High pressure homogenization also known as French pressing is a cell disruption process in which a
flow is sprayed at a high hydrostatic pressure (at least 100 MPa) into a restriction tube. At this high
pressure, shear stress, cavitation, turbulence, impingement and temperature increases are observed
[94] leading to a very high disruption efficiency.
Microwaves: A dielectric or polar material placed in a rapidly oscillating electric field, such as that
produced by microwaves (approximately 2450 MHz [95]), generates heat because of the frictional
forces arising from molecular movements [96]. Intracellular heating results in the formation of water
vapor, leading to permeabilization of the membranes and micro-cracks in the cell walls. The drawbacks
of microwave processes are the degradation of thermo-sensitive chemicals and the high energy cost.
Ultrasonication: when ultrasounds radiate in a liquid medium, two main mechanisms lead to the
impairment of the cells or other structures: cavitation and acoustic streaming [97]. Cavitation is the
production of microbubbles due to the applied ultrasounds. As the microbubbles continue to expand,
they eventually become unstable and implode violently. Bubbles explosion is sending shock waves that
disrupt surrounding materials such as cells. Cavitation effects are more intense at low frequencies (18
to 40 kHz) than at high (400 to 800 kHz). Ultrasonic cavitation is affected by the liquid viscosity and its
temperature. Because temperature rapidly increases with heat dissipation, the medium must be
cooled down continuously for a maximal efficiency. In addition, the release of free radicals from the
breakdown of water molecules may degrade the oil quality. Ultrasound can also be used in the
presence of an organic solvent, the process is named ultrasound-assisted extraction (UAE) [98–100];
ultrasounds enhance the solvent transfer through the cell wall thanks to the collapses produced by
cavitation.
Pulsed electric fields (PEF), also referred as electroporation or permeabilization, is a process using short
or high voltage pulses generated by two electrodes placed in the medium. The generated electric field
leads to a displacement of charges in and outside the cells. This phenomenon indirectly increases the
charge gradient across the cell membrane (trans-membrane potential) which leads to the spontaneous
formation of aqueous pores in the membrane lipid bilayer [101]. According to the treatment
parameters, the pores can either reseal in several milliseconds or be irreversible. The process can
generate heat in the medium depending on its parameters. The effects on cell wall is still very few
studied but works suggest that it may be weakly affected by non-thermal electroporation [102]
(treatment leading to a low temperature increase).
Mesoporous Silica Nanoparticles (MSN) is a novel technology using mesoporous nanoparticles to
selectively extract and sequester target fuel-relevant and high value compounds within the algae

Chapter 1: The future of algae-derived biodiesel
52
mixture. These 10 nm particles present pores with various surface functional groups and are used for
example for sequestration of FFAs [103,104].
IV4c) Chemical processes of extraction
The chemical processes aim to dissolve the microalgae cell wall and/or permeabilize the cell membrane
by addition of chemicals, to separate polar and non-polar contents by hydrophilic/hydrophobic
affinities.
Osmotic shock or osmotic stress: leads to cell disruption through a sudden increase or decrease in the
salt concentration of the liquid medium, which disturbs the balance of osmotic pressures between the
interior and the exterior of the cell [93]. This effect causes the creation of numerous pores and a rapid
change in the movement of water across the cell membrane leading to a permanent cell disruption.
Most of the studies are performed with hyper-osmotic shocks by increasing salt concentration in the
medium. When coupled with solvent extraction, it allows increased extraction yields, especially for
wall deficient strains [105].
Enzymatic treatment: consists in using various enzymes to digest and thus weaken the microalgae cell
wall. As the algae wall is composed of a complex polysaccharide and glycoprotein matrix [106], specific
enzymes able to degrade its components are available, without damaging the sensitive chemicals
inside the cytoplasm. The critical drawback of this method is the high cost of these enzymes [93].
Solvent extraction: extraction of algal oil by organic chemicals. Benzene and ether have been widely
used, along with hexane which is relatively cheap. In a Soxhlet extractor, the algal sample is
continuously in contact with fresh solvent, but the solvent amount is still limited thanks to recycling
(successive evaporation and condensation); the extraction of lipids can be then highly efficient [93].
However, this process is energy consuming and its scale up is difficult. And the principal downside of
solvents is the potential hazard related to their use: the majority of them are indeed highly flammable,
harmful and dangerous for environment.
Pressurized liquid extraction (PLE), also known as accelerated solvent extraction (ASE), is a method
that enhances extraction by using compressed supercritical solvents at high temperature: lipid
recovery increased from 37.6 % to 69.6 % when heating a mixture of limonene and ethanol (1:1, v/v)
from 50°C to 200°C at 20.7 MPa [107]. In comparison with the Soxhlet method, PLE exhibits a higher
yield, a higher extraction rate and a lower solvent consumption [93]. Carbon dioxide (CO2) is the most
common solvent used to extract bioactive compounds from natural sources; it indeed has interesting
properties for bioactive extraction: (i) cost efficiency, (ii) critical conditions easily attainable, (iii)
environmentally friendly solvent [108].
Conclusion: Determining the most efficient and cost effective extraction method is paramount to
maximize the ratio “lipids recovered per spent energy”. The high elasticity of cell walls and membranes
reduces the efficiency of pure mechanical methods. Besides, even when free water is removed, the
wet biomass retains interstitial water which hinders lipid extraction by organic solvents and, acting as
a lubricant, decreases the effectiveness of mechanical methods. It seems then to be interesting to
couple different methods to favor lipid extraction.

Chapter 1: The future of algae-derived biodiesel
53
V. Key points for future viability of algae-derived biodiesel
The current autotrophic production of algae for biofuel is still clearly at pilot - early demonstration
scale. Companies are not yet able to commercialize algae derived biofuel because of high costs
associated with culture, harvesting and extraction steps and with the variability of productivities due
to weather variations [109,110] and contamination issues. Several steps of the process must be
improved before large scale production of algal oil: algae culture, mixing and thermal regulation (to
reduce energy demands), gas supply, harvesting and extraction.
V1) Current economic review
Several universities are developping in the frame of public-private partnerships research plateforms to
compare and optimize different processes at pilot scale. We can mention as an example the R&D
Algosolis plateform in Saint-Nazaire, France (Figure 28), Algae park in Wageningen University,
Netherlands (Figure 29), or the plateform of Arizona State University (Figure 30). In addition
sustainability and economic feasibility of algae-derived biodiesel production using current
technologies are evaluated by numerous research programs.
Figure 28 Algosolis platform, Saint-Nazaire, France [111]

Chapter 1: The future of algae-derived biodiesel
54
Figure 29 Algae park facility, Wageningen, Netherlands [112]
Figure 30 Arizona Center for Algae Technology, Arizona state, USA [113]
The production of such facilities remains negligible in term of volume and the processes are not yet
economical for biofuel production. The current state of productivities, costs and large scale
requirements of water and nutrients is detailed below.
In a photosynthetic system, 8 photons of photosynthethically active radiation (ca. 48% of the incident
solar flux) are required to fix one molecule of CO2 into carbohydrate form - thus resulting in a maximum
photosynthetic efficiency of 12 % (fraction of light converted to chemical energy). However, under real
and essentially favorable conditions (i.e. low to moderate light levels), the photosynthetic efficiency
reported actually ranges of 4.5 to 7 % in ponds and close photobioreactors, respectively; in the
former case, this corresponds to a yield of 30-40 gdry biomass m-2 d-1 [44].

Chapter 1: The future of algae-derived biodiesel
55
Finally, the annual yield of algal crops generally ranges from 50 to 150 tons of dry biomass per hectare
[63]. However, because a high lipid content and a high growth rare correspond to significantly different
culture conditions (see Chapter 2), the inverse relationship between the lipid content and the cell
growth rate reduces the total amount of oil produced annually. The sensitivity of the biodiesel
production cost to key input parameters decreases in the following order: algae oil content > algae
annual productivity per unit area > plant production capacity > carbon price increase rate [63]. Despite
the higher surface productivities of algae in comparison with food crops, the cost of oil production
from algae (in the range of 2.4 to 6 US$/L [114], illustrated in Figure 31) greatly exceeds the price of
biodiesel, which was below 1 US$/L beginning 2015.
Figure 31: Estimation of the minimum biodiesel derived from microalgae selling price from [114]. OP is open pounds,
PBRs refers to Photobioreactors, Hybrid is a mix of OP+PBRs.
Also, using current algae productivities, 9.25 million ha (almost the surface area of Portugal) would be
required to supply the European market, assuming a productivity of 40,000 liters per ha per year [44].
This surface seems unrealistic, but this is still much lower than the surface required if conventional
land crops were used to supply the European market of fuel (Oil palm: 5,950 liters per ha per year, see
Table 1). This productivity is based on a 3 % solar energy conversion to biomass and a biomass oil
content of 50 %, under the solar conditions of Portugal.
In addition, a total of 1.8 tons of CO2 is needed to produce 1 ton of algal biomass, which means that
1.3 billion tons of CO2 would be required for the production of 0.4 billion m3 biodiesel to supply the
European transportation market [27]. Many studies are performed to use flue gas as a CO2 source but
the biggest difficulty is the purification of the fumes, as they should be free of growth inhibitors and
toxic chemicals. Bio-mitigation of CO2 emissions provides a complementary function that may be
exploited to reduce costs and enable a sustained utilization of microalgae as a biofuel resource [115].
As the algae biomass contains 7 % nitrogen and 1 % phosphorus [44], 25 million tons of nitrogen and
4 million tons of phosphorous would be needed, which is about twice the amount of fertilizers
produced in Europe. For sustainable production of biodiesel from microalgae, it will be important to

Chapter 1: The future of algae-derived biodiesel
56
use residual nutrient sources (about 8 million tons of nitrogen in Europe) and to recycle nutrients as
much as possible. Besides Barbosa and Wijffels [116] estimate there is a need of roughly 3,000 L of
water for 1 L of biofuel (in comparison of 10,000 L for food crops). These high demands of substrate
and water can be met by using algae for bioremediation, i.e for CO2 sequestering [117] and wastewater
treatment [118,119].
In a recent report, Takeshita [120] concluded that the future viability of algae derived biofuel is
strongly dependent on CO2 stabilization constraints which could probably be implemented to limit
global warming according to two scenarios: Business as usual (BaU) with a limitation to 500 ppmv in
the atmosphere or a limitation to 400 ppmv. The cost of algae production would increase in the same
time as the CO2 prices along with the stiffening of its stabilization constraints. Indeed, to supply
biodiesel from algae at a very large scale, the feed might be pure CO2 captured from stationary sources
[121]. In the case of a stabilization to 400 ppmv by 2100, biodiesel and hydrotreated renewable jet
(HRJ) fuel from microalgae would take a very small place in the global energy mix (Figure 32). With the
current legislation (no CO2 limitation), the model projects the start of large scale productions by 2050.
Figure 32: Part of Algae-derived microalgal biodiesel and HRJ (hydrotreated Renewable jet fuel) from algae in the case of
Business as usual (BaU), or in the case of a limitation to 400 ppmv in the final energy consumption [120]. DME is a synthetic
fuel: Dimethyl Ether. FT products are the Fischer-Tropsch synthetic fuels.
Nowadays, the current prices of algal technologies are too high to commercialize obulk chemicals for
large markets. Worldwide microalgal manufacturing infrastructures (producing the equivalent of
~5000 tons of dry algal biomass) are limited to the production of high-value products such as
carotenoids and omega 3 fatty acids used as food and feed ingredients [44][27].

Chapter 1: The future of algae-derived biodiesel
57
V2) Biorefinery concept
The value of the biomass for biofuel production is generally evaluated by its lipid content that can be
converted to biodiesel via trans-esterification. The valuable lipids are generally triglycerides (TAGs) and
fatty acids accumulated in the cytoplasm as lipid droplets (see Chapter 2). Trans-esterification is a
reaction, in which the glycerol backbone of the TAGs is replaced by methanol which esterifies fatty
acids, the side chains of TAGs, into methyl esters (biodiesel). The general equation for
transesterification is shown in Figure 33 [115].
Figure 33: Base catalyzed transesterification reaction [115]
As mentioned previously, the energetic and economic value of the created biodiesel from algae may
not be sufficient regarding all the costs involved during the whole cycle (see Figures 24 and 31).
A recent report evaluated that the co-production and extraction of a high value product (HVP; e.g., β-
carotene at 0.1 % of biomass, 600 US$/kg) may represent the dominant revenue streams of the
biomass [122]. Even if algae produce 100 times more oil than HVP on a per tonnage basis, the revenue
from HVPs is about 10 times greater due to their difference in value. However, it must be noticed that
HVP markets are small and easily saturable. Nevertheless, this co-production is necessary in the short
term for an economic viability of algae-derived diesel. In these conditions, a scale up of existing
production plants associated with reasonable advancements in technologies, will lead to a price
below 50 US$/bbl [122], equivalent to 0.30 US$/L, which is quite acceptable. The list of high value
products is very large: bioactive compounds such as fatty acids, carotenoids, fluorescent pigments,
isotope biochemicals, drug screening molecules, etc... Some examples with corresponding applications
and prices are listed in Table 3.
Table 3: High Value Products from microalgae [115]
High Value Products Applications Price (US$)
β-Carotene Nutritional, therapeutic,
Cosmetics, Colorants,
Aquaculture
300 to 3.000/kg
Astaxanthin Colorants, Aquaculture,
Nutritional, therapeutic,
Cosmetics
2.500/kg
Secondary carotenoids (lutein,
zeaxanthin, lycopene, bixin)
Nutritional, therapeutic,
Cosmetics
Gamma Linoleic acid (GLA) Nutritional

Chapter 1: The future of algae-derived biodiesel
58
Arachidonic acid (AA) Nutritional
Eicosapentaenoic acid (EPA) Nutritional
Docosahexaenoic acid (DHA) Nutritional
R-phycoerythrin (PE) Fluorescent tags, Colorants,
Cosmetics, Nutritional
3.25 to 14/mg
R-phycoerythrin (PE) Goat Anti-mouse IgC, 145/mg
Allophycocyanin (APC) Fluorescent tags, Colorants,
Cosmetics, Nutritional
6 to 17/mg
β-phycoerythrin (PE) Fluorescent tags, Colorants,
Cosmetics, Nutritional
145/mg
Sensilight PBXL1 Anti-GST 1500/mg
Mixed fatty acids Isotopes 60/g 13C-mixed free fatty acids Isotopes 200/g
13C-DHA (95%) Isotopes 38,000/g 15N-alanine Isotopes 260/g
2H7, 13C, 15N4-arginine Isotopes 5,900/g
dATP-CN Isotopes 26,000/g
Antioxidants
Vitamins
All the HVPs listed above are however produced with specific strains, in controlled conditions and using
expensive extraction-purification processes. It may not be possible to extract and separate oil and
HVPs with a high energy efficiency and without degrading sensitive high value products. The process
of extracting and separating a maximum of valuable compounds from microalgae is generally
referred as the biorefinery. In addition, the algae biorefinery requires a mild pre-treatment of the cells
for an efficient extraction and fractionation of the chemicals. To be valuable the produced components
must be functional at the end of the process cycle [116].
Residual algal biomass (algal biomass after extraction of valuable products and oil) can be further
processed to obtain valuable inputs in the global life cycle, thus contributing to the economic feasibility
of the process.
The various valorizations of residual biomass are listed below.
(1) Use as fertilizer thanks to its high N and P content (2) Direct combustion for energy production:
biomass is burnt and releases carbon dioxide, water and heat which is stored as hot gases or converted
into mechanical energy using turbines. (3) Gasification for syngas (synthetic gas) production [115]:
the gasification step involves the reaction of biomass with air oxygen or steam to produce a gaseous
mixture of CO, CO2, H2, CH4 and N2; syngas can be produced by catalytic or non-catalytic reactions. (4)
Thermochemical liquefaction for liquid biofuel production: the high water activity of the biomass
allows in sub-critical conditions to decompose biomass materials down to smaller molecules with a
high energy density (liquid biofuel). (5) Pyrolysis (conventional, fast or flash): the thermal degradation
of biomass by heat in the absence of oxygen results in the production of charcoal, bio-oil and fuel
gaseous products. (6) Anaerobic digestion for the production of biogas (CH4, CO2, H2S and others). (7)
alcoholic fermentation for bioethanol production: it is the conversion of biomass material which
contains sugar, starch and cellulose, into ethanol, using yeasts such as Saccharomycess cerevisiae. (8)
Direct methanolysis (also referred as "direct transesterification" or "wet transesterification").

Chapter 1: The future of algae-derived biodiesel
59
Alternatively with the classic lysis-extraction-transesterification steps, wet biomass is directly in
contact with alcohol acting as an extraction solvent and a transesterification reagent [95].
V3) Bioengineering algae
Improving algae culture and downstream processes in order to reduce energy inputs, maximize the
biomass value (by using its remediation capacities, producing high value compounds and valorizing
"waste biomass") associated with a scaling up at industry scale will progressively improve the economic
sustainability of algae-derived biodiesel in the near future.
A solution that must be carefully evaluated is the engineering of the biomass itself. As food crops were
slowly and progressively improved from the very beginning of agricultural activities by homo-sapiens
about 10,000 years ago, the improvement of algae strains has recently been investigated. The strain
Chlamydomonas reinhardtii was the first algae with a fully sequenced genome [123]. Today, several
dozens of microalgae strains including green (Chlrorophyta), red (Rhodophyta) a brown (Phaeophyta)
algae have been successively modified [124].
Improvement strategies on wild type microalgae are as numerous as the constraints and goals
associated with their engineering: (1) minimize energetic losses through cell division and metabolism,
(2) increase the net photosynthetic productivity [36] (3) increase nutrient assimilation capacity, (3)
modify bulk energy and carbon flows, (4) enhance the algae capacity to remain dominant in
contaminated cultures (e.g. resistance to predators, pathogens), (5) enhance the harvestability and
processability of the algae biomass (for instance biology of flocculation), (6) increase the content in
valuable chemicals [125], (7) develop "triggering technologies" for biotechnology (to stop and start
growth, trigger programmed cell death or dissemble the cell wall upon demand) [126]. An example of
optimized algae strain is illustrated in Figure 34 from [27].
Figure 34 Ideal microalgae for oil production [27]

Chapter 1: The future of algae-derived biodiesel
60
As an example, hyper-producing mutants generated by random insertional mutagenesis can be
selected by quantitative flow cytometry and cell sorting (FCCS) [127]. The cells are analysed on the
fluorescence of desired products (natural fluorescence, or molecular probes associated) and hyper-
producing cells can be isolated.
Algae bio-engineering obviously raises ethical problems. Modified algae may rapidly proliferate in
environment and outcompete wild type species. Is it possible to modify artificially algae in a few
decades as food crops were naturally modified over 10,000 years after a long crop selection ?. Is it
possible to take the risk of affecting biodiversity while trying to solve a global energy issue ? These
questions must be very carefully considered.
Chapter 1 conclusion
A rapid development of biomass-derived fuels is urgently required in this 21st century due to the future
depletion of crude oil sources. Although successive oil price cracks in the early years of the century
have limited the development of biofuels such as bioethanol (sugar-derived fuels), biodiesel (oil-
derived fuel) and biogas, these 1st and 2nd generations of biofuels have already demonstrated their
economic viability to take part in the global energy production of the near future. However, the surfacic
productivities of traditional crops will not be able to meet the world demand of energy. Due to their
rapid growth rate, their high lipid contents in certain conditions and their ability to grow on non
cultivable areas, microalgae have the potential to produce biofuel on a very large scale. However, the
complex technologies of culture and downstream processes are still immature making this algae-
derived biofuel not yet economical (estimated between 2.4 and 6 US$/L) and not favorable in term of
energy input/energy output ratio (hardly below 1). There is a multiplicity of culture systems; however,
raceway pounds, the most simple technology, remain the reference; for them dewatering and lipid
extraction represent the major energy demanding steps. It is the reason why novel technologies must
be therefore developed for these steps as alternatives to current expensive and energy intensive
processes such as centrifugation, drying, and cell lysis.
Globally, uncertainties of the world energy future are linked to geopolitical choices such as the decision
to limit CO2 in the atmosphere. The diversity of potential strains, culture systems, harvesting processes,
lysis/extraction processes, biomass to energy processes, valorization of high value products,
bioremediation and algae bioengineering offers a huge potential of improving the feasibillity and
sustainibility of algae-derived biodiesel.
At the moment, the production of biodiesel from algae is a prospect, and only major improvements in
technologies used for algae culture and lipid extraction may lead to an efficient Net Energy Ratio.
Among the various processes presented in this chapter and likely to reduce the final cost of algae
derived biodiesel, Pulsed Electric Fields is a very promising technology which may improve the
extraction of intracellular compounds of algae as it may permeabilize cell membranes with a low
energetic cost.

Chapter 1: The future of algae-derived biodiesel
61
In this project, the use of Pulsed Electric Field (PEF) in algae downstream processing is considered in
order to reduce the overall energy consumption for the extraction of lipids toward the production
of biodiesel from microalgae. Algae are today mostly used to produce unsaturated fatty acids (e.g.
omega 3) for neutraceutical purposes and proteins or pigments for food/feed; PEF may also be
introduced in these already economic processes to reduce their production cost.
We will now focus in the chapter 2 on the metabolism of a lipid accumulating algae strain,
Chlamydomonas reinhardtii which will be used to produce biofuel. A large part of chapter 2 is
dedicated to the specific caracterization methods that we developed in the framework of this PhD
thesis to monitor the lipid content in algae cells.
The chapter 3 will be devoted to the use of Pulsed Electric Fields (PEF) towards the extraction of lipids
from Chlamydomonas reinhardtii. Indeed, the main output of my PhD thesis is an energetic
optimization of the PEF treatment thanks to the use of multiple fluorescent dyes. Chapter 3 also
describes the first results of coupling PEF with organic solvent extraction, in order to determine if an
optimized PEF treatment may improve lipid extraction.

Chapter 1: The future of algae-derived biodiesel
62
Chapter 1 references
[1] EIA, Global energy demand, Energy Tomorrow. (2014). http://energytomorrow.org/energy-101/global-energy-demand.
[2] http://www.connaissancedesenergies.org/.
[3] International Energy Agency, Key World Energy Statistics 2015, (2015) 81. doi:10.1787/9789264039537-en.
[4] R.G. Miller, S.R. Sorrell, The future of oil supply., Philos. Trans. A. Math. Phys. Eng. Sci. 372 (2014) 20130179.
doi:10.1098/rsta.2013.0179.
[5] K. McCarthy, K. Rojas, M. Niemann, D. Palmowski, K. Peters, A. Stankiewicz, Basic Petroleum Geochemistry for Source Rock
Evaluation, Oilf. Rev. 23 (2011) 32–43.
http://www.slb.com/~/media/Files/resources/oilfield_review/ors11/sum11/basic_petroleum.pdf.
[6] O. After, 3 . 8 Gasoline : A Deeper Look 3 . 8 Gasoline : A Deeper Look, (n.d.) 1–4.
[7] http://www.cop21.gouv.fr/.
[8] https://www.co2.earth/.
[9] M. Guo, W. Song, J. Buhain, Bioenergy and biofuels: History, status, and perspective, Renew. Sustain. Energy Rev. 42 (2015) 712–
725. doi:10.1016/j.rser.2014.10.013.
[10] http://www.actu-environnement.com/ae/news/rapport-giec-2c-emissions-ges-temperatures-hausse-21395.php4.
[11] World oil outlook, 2015. doi:10.1190/1.1439163.
[12] a. E. Atabani, a. S. Silitonga, I.A. Badruddin, T.M.I. Mahlia, H.H. Masjuki, S. Mekhilef, A comprehensive review on biodiesel as an
alternative energy resource and its characteristics, Renew. Sustain. Energy Rev. 16 (2012) 2070–2093.
doi:10.1016/j.rser.2012.01.003.
[13] C. Ryan, Cultivating Clean Energy, the Promise of Algae Biofuels, Nat. Resour. Def. Counc. (2009) 81.
http://scholar.google.co.jp/scholar?hl=en&q=cultivating+clean+energy+the+promise+of+algae+biofuels&btnG=&as_sdt=1,5&as_
sdtp=#0.
[14] X. Ji, X. Long, A review of the ecological and socioeconomic effects of biofuel and energy policy recommendations, Renew. Sustain.
Energy Rev. 61 (2016) 41–52. doi:10.1016/j.rser.2016.03.026.
[15] J.M. Bergthorson, M.J. Thomson, A review of the combustion and emissions properties of advanced transportation biofuels and
their impact on existing and future engines, Renew. Sustain. Energy Rev. 42 (2015) 1393–1417. doi:10.1016/j.rser.2014.10.034.
[16] S.K. Hoekman, C. Robbins, Review of the effects of biodiesel on NOx emissions, Fuel Process. Technol. 96 (2012) 237–249.
doi:10.1016/j.fuproc.2011.12.036.
[17] A. Jagger, Biofuels for transport in 2050, Biofuels, Bioprod. Biorefining. 5 (2011) 481–485. doi:10.1002/bbb.330.
[18] S.Y. No, Application of hydrotreated vegetable oil from triglyceride based biomass to CI engines - A review, Fuel. 115 (2014) 88–96.
doi:10.1016/j.fuel.2013.07.001.
[19] http://www.biofuelstp.eu/index.html.
[20] G. Gruter, E. De Jong, Furanics : novel fuel opt¡ons from carbohydrates, Biofuels Technol. (2009) 11–17.
[21] http://www.isaaa.org/kc/cropbiotechupdate/article/default.asp?ID=2991.
[22] P. Imhof, A.S. Dias, G.J.G. de Jong, Furanics: Versatile Molecules for Biofuels and Bulk Chemicals Applications, Nam.Confex.Com.
1446 (2008) 2008–2008. http://nam.confex.com/data/abstract/nam/2009/Paper_2970_abstract_1281_0.pdf.
[23] M. Al-Qasmi, N. Raut, S. Talebi, S. Al-Rajhi, T. Al-Barwani, A Review of Effect of Light on Microalgae Growth, Proc. World Congr.
Eng. I (2012) 8–10.
[24] Y. Chisti, Biodiesel from microalgae., Biotechnol. Adv. 25 (2007) 294–306. doi:10.1016/j.biotechadv.2007.02.001.
[25] https://en.wikipedia.org/wiki/Arable_land.
[26] https://en.wikipedia.org/wiki/Algae_fuel#cite_note-18.
[27] R.H. Wijffels, M.J. Barbosa, An outlook on microalgal biofuels., Science. 329 (2010) 796–799. doi:10.1126/science.1189003.
[28] D.M. Karl, Solar energy capture and transformation in the sea, Elem. Sci. Anthr. 2 (2014) 21.
doi:10.12952/journal.elementa.000021.
[29] http://www.algaebase.org/browse/taxonomy/.
[30] O. de Clerck, K.A. Bogaert, F. Leliaert, Diversity and Evolution of Algae BT - (null), 2012.
http://linkinghub.elsevier.com/retrieve/pii/B9780123914996000025%5Cnfile:///Users/jbro886/Dropbox/Papers
3/Library.papers3/Files/F2/F29389F1-3B40-4E58-A753-5A676A7B4CDA.pdf%5Cnpapers3://publication/doi/10.1016/B978-0-12-
391499-6.00002-5.
[31] http://shigen.nig.ac.jp/algae_tree/TreeE.html.
[32] L. Pottier, J. Pruvost, J. Deremetz, J.F. Cornet, J. Legrand, C.G. Dussap, A fully predictive model for one-dimensional light attenuation
by Chlamydomonas reinhardtii in a torus photobioreactor, Biotechnol. Bioeng. 91 (2005) 569–582. doi:10.1002/bit.20475.
[33] H. Takache, J. Pruvost, J.-F. Cornet, Kinetic modeling of the photosynthetic growth of Chlamydomonas reinhardtii in a
photobioreactor., Biotechnol. Prog. 28 (2012) 681–92. doi:10.1002/btpr.1545.
[34] K.J.M. Mulders, P.P. Lamers, D.E. Martens, R.H. Wijffels, Phototrophic pigment production with microalgae: Biological constraints
and opportunities, J. Phycol. 50 (2014) 229–242. doi:10.1111/jpy.12173.
[35] T. De Mooij, M. Janssen, O. Cerezo-Chinarro, J.H. Mussgnug, O. Kruse, M. Ballottari, R. Bassi, S. Bujaldon, F.A. Wollman, R.H. Wijffels,
Antenna size reduction as a strategy to increase biomass productivity: a great potential not yet realized, J. Appl. Phycol. (2014)
1063–1077. doi:10.1007/s10811-014-0427-y.
[36] Z. Perrine, S. Negi, R.T. Sayre, Optimization of photosynthetic light energy utilization by microalgae, Algal Res. 1 (2012) 134–142.
doi:10.1016/j.algal.2012.07.002.
[37] G. Perin, A. Bellan, A. Segalla, A. Meneghesso, A. Alboresi, T. Morosinotto, Generation of random mutants to improve light-use
efficiency of Nannochloropsis gaditana cultures for biofuel production., Biotechnol. Biofuels. 8 (2015) 161. doi:10.1186/s13068-
015-0337-5.
[38] J.U. Grobbelaar, Mass Production of Microalgae at Optimal Photosynthetic Rates, Photosynthesis. (2013) 357–371.
doi:10.5772/55193.
[39] J.C. Ogbonna, H. Tanaka, Light requirement and photosynthetic cell cultivation – Development of processes for efficient light
utilization in photobioreactors, J. Appl. Phycol. 12 (2000) 207–218. doi:10.1023/A:1008194627239.
[40] http://www1.lsbu.ac.uk/water/water_vibrational_spectrum.html.
Chapter 1: The future of algae-derived biodiesel
63
[41] P. Varshney, P. Mikulic, A. Vonshak, J. Beardall, P.P. Wangikar, Extremophilic micro-algae and their potential contribution in
biotechnology, Bioresour. Technol. 184 (2015) 363–372. doi:10.1016/j.biortech.2014.11.040.
[42] https://unfamiliarstars.wordpress.com/2013/08/25/dont-eat-the-pink-snow/.
[43] http://algix.com/tag/dunaliella-salina/.
[44] H.M. Amaro, A.C. Guedes, F.X. Malcata, Advances and perspectives in using microalgae to produce biodiesel, Appl. Energy. 88
(2011) 3402–3410. doi:10.1016/j.apenergy.2010.12.014.
[45] M.J. Barbosa, Hadiyanto, R.H. Wijffels, Overcoming Shear Stress of Microalgae Cultures in Sparged Photobioreactors, Biotechnol.
Bioeng. 85 (2004) 78–85. doi:10.1002/bit.10862.
[46] T.E. Murphy, B.J. Kapili, A.M. Detweiler, B.M. Bebout, L.E. Prufert-Bebout, Vertical distribution of algal productivity in open pond
raceways, Algal Res. 11 (2015) 334–342. doi:10.1016/j.algal.2015.07.003.
[47] http://the.honoluluadvertiser.com/dailypix/2010/Feb/12/hawaii2120351AR_b.jpg.
[48] M.K. Lam, K.T. Lee, Biofuels from Algae, 2014. doi:10.1016/B978-0-444-59558-4.00012-7.
[49] M. Marsullo, A. Mian, A.V. Ensinas, G. Manente, A. Lazzaretto, F. Marechal, Dynamic Modeling of the Microalgae Cultivation Phase
for Energy Production in Open Raceway Ponds and Flat Panel Photobioreactors, Front. Energy Res. 3 (2015) 1–18.
doi:10.3389/fenrg.2015.00041.
[50] G. De Bhowmick, G. Subramanian, S. Mishra, R. Sen, Raceway pond cultivation of a marine microalga of Indian origin for biomass
and lipid production: A case study, Algal Res. 6 (2014) 201–209. doi:10.1016/j.algal.2014.07.005.
[51] K.C. Tran, J.L. Mendoza Martin, S. Heaven, C.J. Banks, F.G. Acien Fernandez, E. Molina Grima, Cultivation and anaerobic digestion
of Scenedesmus spp. grown in a pilot-scale open raceway, Algal Res. 5 (2014) 95–102. doi:10.1016/j.algal.2014.06.001.
[52] P.M. Slegers, M.B. Lösing, R.H. Wijffels, G. van Straten, A.J.B. van Boxtel, Scenario evaluation of open pond microalgae production,
Algal Res. 2 (2013) 358–368. doi:10.1016/j.algal.2013.05.001.
[53] I. Fernández, F.G. Acién, J.L. Guzmán, M. Berenguel, J.L. Mendoza, Dynamic model of an industrial raceway reactor for microalgae
production, Algal Res. 17 (2016) 67–78. doi:10.1016/j.algal.2016.04.021.
[54] J. Huang, X. Qu, M. Wan, J. Ying, Y. Li, F. Zhu, J. Wang, G. Shen, J. Chen, W. Li, Investigation on the performance of raceway ponds
with internal structures by the means of CFD simulations and experiments, Algal Res. 10 (2015) 64–71.
doi:10.1016/j.algal.2015.04.012.
[55] R. Hreiz, B. Sialve, J. Morchain, R. Escudié, J.-P. Steyer, P. Guiraud, Experimental and numerical investigation of hydrodynamics in
raceway reactors used for algaculture, Chem. Eng. J. 250 (2014) 230–239. doi:10.1016/j.cej.2014.03.027.
[56] P.E. Gharagozloo, J.L. Drewry, A.M. Collins, T.A. Dempster, C.Y. Choi, S.C. James, Analysis and modeling of Nannochloropsis growth
in lab, greenhouse, and raceway experiments, J. Appl. Phycol. (2014) 1–12. doi:10.1007/s10811-014-0257-y.
[57] http://www.nanovoltaics.com/content/algae-photobioreactors.
[58] http://www.israel21c.org/top-12-agri-tech-companies-from-israel-2/.
[59] http://www.20minutes.fr/nantes/1711883-20151018-lunettes-carburant-bitume-nantes-transforme-algues-moins-polluer.
[60] http://www.wageningenur.nl/en/newsarticle/Costeffective-algae-production-within-reach.htm.
[61] R. Slade, A. Bauen, Micro-algae cultivation for biofuels: Cost, energy balance, environmental impacts and future prospects, Biomass
and Bioenergy. 53 (2013) 29–38. doi:10.1016/j.biombioe.2012.12.019.
[62] O. Jorquera, A. Kiperstok, E.A. Sales, M. Embiruçu, M.L. Ghirardi, Comparative energy life-cycle analyses of microalgal biomass
production in open ponds and photobioreactors, Bioresour. Technol. 101 (2010) 1406–1413. doi:10.1016/j.biortech.2009.09.038.
[63] G. Brownbridge, P. Azadi, A. Smallbone, A. Bhave, B. Taylor, M. Kraft, The future viability of algae-derived biodiesel under economic
and technical uncertainties, Bioresour. Technol. 151 (2014) 166–173. doi:10.1016/j.biortech.2013.10.062.
[64] J.C. Quinn, T.G. Smith, C.M. Downes, C. Quinn, Microalgae to biofuels lifecycle assessment - Multiple pathway evaluation, Algal
Res. 4 (2014) 116–122. doi:10.1016/j.algal.2013.11.002.
[65] O. Perez-Garcia, F.M.E. Escalante, L.E. de-Bashan, Y. Bashan, Heterotrophic cultures of microalgae: Metabolism and potential
products, Water Res. 45 (2011) 11–36. doi:10.1016/j.watres.2010.08.037.
[66] http://www.ck12.org/life-science/Connecting-Cellular-Respiration-and-Photosynthesis-in-Life-Science/lesson/Connecting-
Cellular-Respiration-and-Photosynthesis-MS-LS/.
[67] P.R. Mooij, G.R. Stouten, J. Tamis, M.C.M. van Loosdrecht, R. Kleerebezem, Survival of the fattest, Energy Environ. Sci. 6 (2013)
3404. doi:10.1039/c3ee42912a.
[68] M. Gross, D. Jarboe, Z. Wen, Biofilm-based algal cultivation systems, Appl. Microbiol. Biotechnol. 99 (2015) 5781–5789.
doi:10.1007/s00253-015-6736-5.
[69] A. Salimbeni, W. Blanken, M. Janssen, ALGADISK -NOVEL ALGAE-BASED SOLUTION FOR CO2 CAPTURE AND BIOMASS, (2014).
[70] W. Blanken, A. Magalh??es, P. Sebesty??n, A. Rinzema, R.H. Wijffels, M. Janssen, Microalgal biofilm growth under day-night cycles,
Algal Res. 21 (2017) 16–26. doi:10.1016/j.algal.2016.11.006.
[71] R. Bosma, M.H. Vermuë, J. Tramper, R.H. Wijffels, Towards increased microalgal productivity in photobioreactors, Int. Sugar J. Vol.
112 (2010) 74–85.
[72] A.J. Dassey, C.S. Theegala, Harvesting economics and strategies using centrifugation for cost effective separation of microalgae
cells for biodiesel applications, Bioresour. Technol. 128 (2013) 241–245. doi:10.1016/j.biortech.2012.10.061.
[73] Y. Liu, T. Jin, Y. Yu, C. Wu, H. Mou, Characterization of fl occulating and antimicrobial activity of salmine, Algal. 16 (2016) 46–53.
doi:10.1016/j.algal.2016.03.003.
[74] T. Chatsungnoen, Y. Chisti, Harvesting microalgae by flocculation–sedimentation, Algal Res. 13 (2016) 271–283.
doi:10.1016/j.algal.2015.12.009.
[75] K.L. Morrissey, M.I. Keirn, Y. Inaba, A.J. Denham, G.J. Henry, B.W. Vogler, M.C. Posewitz, M.P. Stoykovich, Recyclable polyampholyte
flocculants for the cost-effective dewatering of microalgae and cyanobacteria, Algal Res. 11 (2015) 304–312.
doi:10.1016/j.algal.2015.07.009.
[76] L. Pezzolesi, C. Samorì, R. Pistocchi, Flocculation induced by homogeneous and heterogeneous acid treatments in Desmodesmus
communis, Algal Res. 10 (2015) 145–151. doi:10.1016/j.algal.2015.04.024.
[77] R. Gutiérrez, F. Passos, I. Ferrer, E. Uggetti, J. García, Harvesting microalgae from wastewater treatment systems with natural
flocculants: Effect on biomass settling and biogas production, Algal Res. 9 (2015) 204–211. doi:10.1016/j.algal.2015.03.010.
[78] T. Ndikubwimana, X. Zeng, Y. Liu, J.S. Chang, Y. Lu, Harvesting of microalgae Desmodesmus sp. F51 by bioflocculation with bacterial
bioflocculant, Algal Res. 6 (2014) 186–193. doi:10.1016/j.algal.2014.09.004.
[79] J.A. Gerde, L. Yao, J. Lio, Z. Wen, T. Wang, Microalgae flocculation: Impact of flocculant type, algae species and cell concentration,

Chapter 1: The future of algae-derived biodiesel
64
Algal Res. 3 (2014) 30–35. doi:10.1016/j.algal.2013.11.015.
[80] W. Zhou, L. Gao, W. Cheng, L. Chen, J. Wang, H. Wang, W. Zhang, T. Liu, Electro-flotation of Chlorella sp. assisted with flocculation
by chitosan, Algal Res. 18 (2016) 7–14. doi:10.1016/j.algal.2016.05.029.
[81] M. Larronde-Larretche, X. Jin, Microalgae (Scenedesmus obliquus) dewatering using forward osmosis membrane: Influence of draw
solution chemistry, Algal Res. 15 (2016) 1–8. doi:10.1016/j.algal.2016.01.014.
[82] H. Chu, F. Zhao, X. Tan, L. Yang, X. Zhou, J. Zhao, Y. Zhang, The impact of temperature on membrane fouling in algae harvesting,
Algal Res. 16 (2016) 458–464. doi:10.1016/j.algal.2016.04.012.
[83] W. Mo, L. Soh, J.R. Werber, M. Elimelech, J.B. Zimmerman, Application of membrane dewatering for algal biofuel, Algal Res. 11
(2015) 1–12. doi:10.1016/j.algal.2015.05.018.
[84] J. Pavez, F. Cabrera, L. Azócar, A. Torres, D. Jeison, Ultrafiltration of non-axenic microalgae cultures: Energetic requirements and
filtration performance, Algal Res. 10 (2015) 121–127. doi:10.1016/j.algal.2015.04.022.
[85] V. Discart, M.R. Bilad, R. Moorkens, H. Arafat, I.F.J. Vankelecom, Decreasing membrane fouling during Chlorella vulgaris broth
filtration via membrane development and coagulant assisted filtration, Algal Res. 9 (2015) 55–64. doi:10.1016/j.algal.2015.02.029.
[86] D.Y. Kim, T. Hwang, Y.K. Oh, J.I. Han, Harvesting Chlorella sp. KR-1 using cross-flow electro-filtration, Algal Res. 6 (2014) 170–174.
doi:10.1016/j.algal.2014.10.004.
[87] J.J. Milledge, S. Heaven, A review of the harvesting of micro-algae for biofuel production, Rev. Environ. Sci. Biotechnol. 12 (2013)
165–178. doi:10.1007/s11157-012-9301-z.
[88] N. Uduman, Y. Qi, M.K. Danquah, G.M. Forde, A. Hoadley, Dewatering of microalgal cultures: A major bottleneck to algae-based
fuels, J. Renew. Sustain. Energy. 2 (2010) 12701. doi:10.1063/1.3294480.
[89] E. Poelman, N. De Pauw, B. Jeurissen, Potential of electrolytic flocculation for recovery of micro-algae, Resour. Conserv. Recycl. 19
(1997) 1–10. doi:10.1016/S0921-3449(96)01156-1.
[90] L. Christenson, R. Sims, Production and harvesting of microalgae for wastewater treatment, biofuels, and bioproducts., Biotechnol.
Adv. 29 (2011) 686–702. doi:10.1016/j.biotechadv.2011.05.015.
[91] B. Serive, R. Kaas, J.-B. Bérard, V. Pasquet, L. Picot, J.-P. Cadoret, Selection and optimisation of a method for efficient metabolites
extraction from microalgae., Bioresour. Technol. 124 (2012) 311–20. doi:10.1016/j.biortech.2012.07.105.
[92] P.R. Postma, T.L. Miron, G. Olivieri, M.J. Barbosa, R.H. Wijffels, M.H.M. Eppink, Mild disintegration of the green microalgae Chlorella
vulgaris using bead milling, Bioresour. Technol. 184 (2015) 297–304. doi:10.1016/j.biortech.2014.09.033.
[93] J. Kim, G. Yoo, H. Lee, J. Lim, K. Kim, C.W. Kim, M.S. Park, J.-W. Yang, Methods of downstream processing for the production of
biodiesel from microalgae., Biotechnol. Adv. 31 (2013) 862–76. doi:10.1016/j.biotechadv.2013.04.006.
[94] . http://web.utk.edu/~fede/high pressure homogenization.html.
[95] J. Kim, G. Yoo, H. Lee, J. Lim, K. Kim, C.W. Kim, M.S. Park, J.-W. Yang, Methods of downstream processing for the production of
biodiesel from microalgae., Biotechnol. Adv. 31 (2013) 862–76. doi:10.1016/j.biotechadv.2013.04.006.
[96] R. Ranjith Kumar, P. Hanumantha Rao, M. Arumugam, Lipid Extraction Methods from Microalgae: A Comprehensive Review, Front.
Energy Res. 2 (2015) 1–9. doi:10.3389/fenrg.2014.00061.
[97] J.A. Gerde, M. Montalbo-Lomboy, L. Yao, D. Grewell, T. Wang, Evaluation of microalgae cell disruption by ultrasonic treatment,
Bioresour. Technol. 125 (2012) 175–181. doi:10.1016/j.biortech.2012.08.110.
[98] A.F. Ferreira, A.P.S. Dias, C.M. Silva, M. Costa, Effect of low frequency ultrasound on microalgae solvent extraction: Analysis of
products, energy consumption and emissions, Algal Res. 14 (2016) 9–16. doi:10.1016/j.algal.2015.12.015.
[99] M.D. Macías-Sánchez, C. Mantell, M. Rodríguez, E. Martínez de la Ossa, L.M. Lubián, O. Montero, Comparison of supercritical fluid
and ultrasound-assisted extraction of carotenoids and chlorophyll a from Dunaliella salina., Talanta. 77 (2009) 948–52.
doi:10.1016/j.talanta.2008.07.032.
[100] Y.-H. Kim, S. Park, M.H. Kim, Y.-K. Choi, Y.-H. Yang, H.J. Kim, H. Kim, H.-S. Kim, K.-G. Song, S.H. Lee, Ultrasound-assisted extraction
of lipids from Chlorella vulgaris using [Bmim][MeSO4], Biomass and Bioenergy. 56 (2013) 99–103.
doi:10.1016/j.biombioe.2013.04.022.
[101] T. Kotnik, P. Kramar, G. Pucihar, D. Miklavcic, M. Tarek, Cell membrane electroporation- Part 1: The phenomenon, IEEE Electr. Insul.
Mag. 28 (2012) 14–23. doi:10.1109/MEI.2012.6268438.
[102] P. Bodénès, F. Lopes, D. Pareau, O. Français, B. Le Pioufle, Microdevice for studying the in situ permeabilization and characterization
of Chlamydomonas reinhardtii in lipid accumulation phase, Algal Res. 16 (2016) 357–367. doi:10.1016/j.algal.2016.03.023.
[103] B. Grant, C. Mark, F. Field, Functional Mesoporous Silica Nanoparticles for the Selective Sequestration of Fatty Acids point charges,
(2012) 20.
[104] I.T. Program, Nanoparticle Technology for Biorefinery of Non – Food Source Feedstocks, (n.d.).
[105] G. Yoo, W.-K. Park, C.W. Kim, Y.-E. Choi, J.-W. Yang, Direct lipid extraction from wet Chlamydomonas reinhardtii biomass using
osmotic shock., Bioresour. Technol. 123 (2012) 717–22. doi:10.1016/j.biortech.2012.07.102.
[106] H.G. Gerken, B. Donohoe, E.P. Knoshaug, Enzymatic cell wall degradation of Chlorella vulgaris and other microalgae for biofuels
production., Planta. 237 (2013) 239–53. doi:10.1007/s00425-012-1765-0.
[107] M.T. Golmakani, J.A. Mendiola, K. Rezaei, E. Ib????ez, Pressurized limonene as an alternative bio-solvent for the extraction of lipids
from marine microorganisms, J. Supercrit. Fluids. 92 (2014) 1–7. doi:10.1016/j.supflu.2014.05.001.
[108] Feb 2015, (2015) 3194.
[109] J. Yarnold, I.L. Ross, B. Hankamer, Photoacclimation and productivity of Chlamydomonas reinhardtii grown in fluctuating light
regimes which simulate outdoor algal culture conditions, Algal Res. 13 (2015) 1–13. doi:10.1016/j.algal.2015.11.001.
[110] M. Huesemann, B. Crowe, P. Waller, A. Chavis, S. Hobbs, S. Edmundson, M. Wigmosta, A validated model to predict microalgae
growth in outdoor pond cultures subjected to fluctuating light intensities and water temperatures, Algal Res. 13 (2016) 195–206.
doi:10.1016/j.algal.2015.11.008.
[111] http://algosolis.com/wp-content/uploads/2016/04/photo31.jpg.
[112] http://www.wageningenur.nl/en/Expertise-Services/Facilities/AlgaePARC.htm.
[113] https://asunow.asu.edu/content/asu-lead-first-ever-national-algae-testbed-awarded-15m-grant-department-energy.
[114] C.P. Bravo-Fritz, C.A. Sáez-Navarrete, L.A. Herrera-Zeppelin, F. Varas-Concha, Multi-scenario energy-economic evaluation for a
biorefinery based on microalgae biomass with application of anaerobic digestion, Algal Res. 16 (2016) 292–307.
doi:10.1016/j.algal.2016.03.028.
[115] T. Suganya, M. Varman, H.H. Masjuki, S. Renganathan, Macroalgae and microalgae as a potential source for commercial
applications along with biofuels production: A biorefinery approach, Renew. Sustain. Energy Rev. 55 (2016) 909–941.

Chapter 1: The future of algae-derived biodiesel
65
doi:10.1016/j.rser.2015.11.026.
[116] M. Vanthoor-Koopmans, R.H. Wijffels, M.J. Barbosa, M.H.M. Eppink, Biorefinery of microalgae for food and fuel., Bioresour.
Technol. 135 (2013) 142–9. doi:10.1016/j.biortech.2012.10.135.
[117] C. Shene, Y. Chisti, M. Bustamante, M. Rubilar, Effect of CO2 in the aeration gas on cultivation of the microalga Nannochloropsis
oculata: Experimental study and mathematical modeling of CO2 assimilation, Algal Res. 13 (2016) 16–29.
doi:10.1016/j.algal.2015.11.005.
[118] N. Neveux, M. Magnusson, L. Mata, A. Whelan, R. de Nys, N.A. Paul, The treatment of municipal wastewater by the macroalga
Oedogonium sp. and its potential for the production of biocrude, Algal Res. 13 (2016) 284–292. doi:10.1016/j.algal.2015.12.010.
[119] M. Stockenreiter, F. Haupt, J. Seppälä, T. Tamminen, K. Spilling, Nutrient uptake and lipid yield in diverse microalgal communities
grown in wastewater, Algal Res. 15 (2016) 77–82. doi:10.1016/j.algal.2016.02.013.
[120] T. Takeshita, Competitiveness, role, and impact of microalgal biodiesel in the global energy future, Appl. Energy. 88 (2011) 3481–
3491. doi:10.1016/j.apenergy.2011.02.009.
[121] V. Kovacevic, J. Wesseler, Cost-effectiveness analysis of algae energy production in the EU, Energy Policy. 38 (2010) 5749–5757.
doi:10.1016/j.enpol.2010.05.025.
[122] E. Stephens, I.L. Ross, Z. King, J.H. Mussgnug, O. Kruse, C. Posten, M. a Borowitzka, B. Hankamer, An economic and technical
evaluation of microalgal biofuels., Nat. Biotechnol. 28 (2010) 126–128. doi:10.1038/nbt0210-126.
[123] S.S. Merchant, S.E. Prochnik, O. Vallon, E.H. Harris, J. Karpowicz, G.B. Witman, A. Terry, A. Salamov, L.K. Fritz-laylin, L. Maréchal-
drouard, W.F. Marshall, L. Qu, D.R. Nelson, a Sanderfoot, M.H. Spalding, V. V Kapitonov, Q. Ren, P. Cardol, H. Cerutti, G. Chanfreau,
P. Ferris, H. Fukuzawa, D. González-ballester, B. Mueller-roeber, S. Rajamani, R.T. Sayre, I. Dubchak, D. Goodstein, L. Hornick, Y.W.
Huang, Y. Luo, D. Martínez, W. Chi, A. Ngau, B. Otillar, A. Porter, L. Szajkowski, G. Werner, K. Zhou, V. Igor, D.S. Rokhsar, A.R.
Grossman, The Chlamydomonas Genome Reveals the Evolution of Key Animal and Plant Functions, Science (80-. ). 318 (2010) 245–
250. doi:10.1126/science.1143609.The.
[124] R. Radakovits, R.E. Jinkerson, A. Darzins, M.C. Posewitz, Genetic engineering of algae for enhanced biofuel production, Eukaryot.
Cell. 9 (2010) 486–501. doi:10.1128/EC.00364-09.
[125] V.H. Work, R. Radakovits, R.E. Jinkerson, J.E. Meuser, L.G. Elliott, D.J. Vinyard, L.M.L. Laurens, G.C. Dismukes, M.C. Posewitz,
Increased Lipid Accumulation in the Chlamydomonas reinhardtii sta7-10 Starchless Isoamylase Mutant and Increased Carbohydrate
Synthesis in Complemented Strains, Eukaryot. Cell. 9 (2010) 1251–1261. doi:10.1128/EC.00075-10.
[126] E. Eroglu, S.M. Smith, C.L. Raston, Biomass and Biofuels from Microalgae, 2015. doi:10.1007/978-3-319-16640-7.
[127] C. Cagnon, B. Mirabella, H.M. Nguyen, A. Beyly-Adriano, S. Bouvet, S. Cuiné, F. Beisson, G. Peltier, Y. Li-Beisson, Development of a
forward genetic screen to isolate oil mutants in the green microalga Chlamydomonas reinhardtii., Biotechnol. Biofuels. 6 (2013)
178. doi:10.1186/1754-6834-6-178.
[128] https://yearbook.enerdata.net/crude-oil-production.html.

Chapter 1: The future of algae-derived biodiesel
66
I1. Appendix I.1: Additional information about oil
production
Figure 1 2014 world crude oil production, in Mt. [128]
Figure 2: 2005-2015 Crude oil price variations
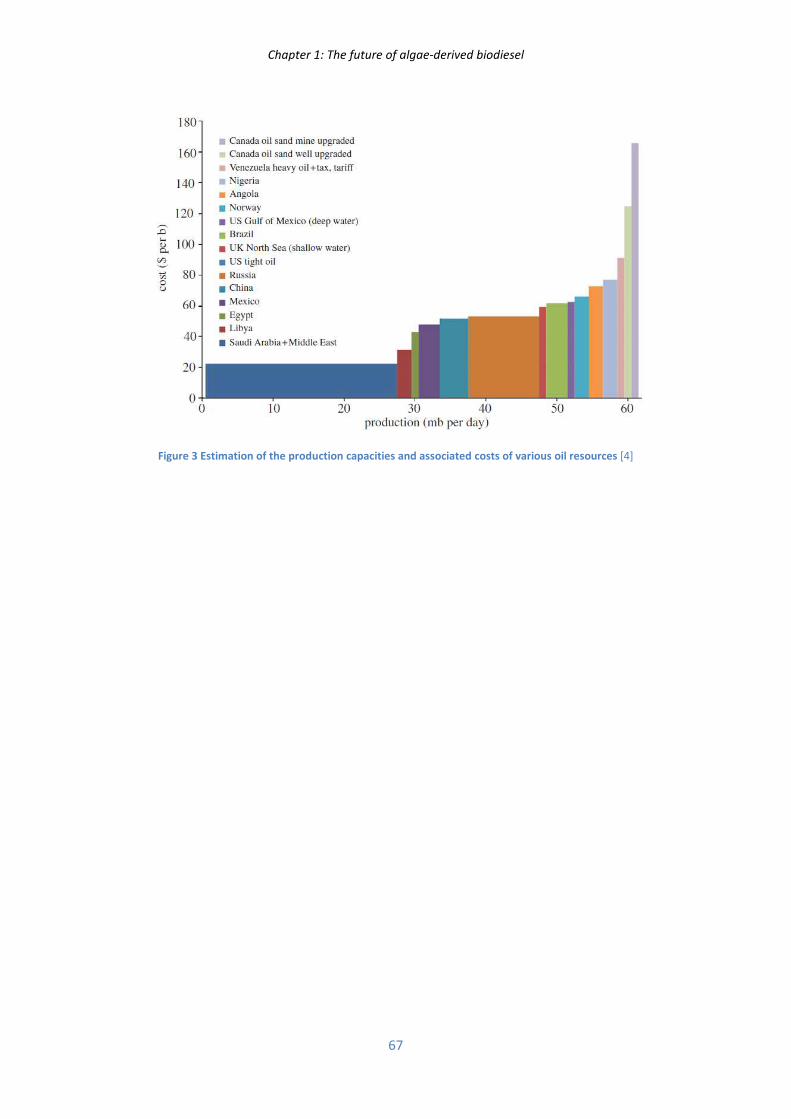
Chapter 1: The future of algae-derived biodiesel
67
Figure 3 Estimation of the production capacities and associated costs of various oil resources [4]

Chapter 1: The future of algae-derived biodiesel
68

Chapter 2: Inducing lipid accumulation in green microalgae and developing characterization methods
69
Chapter 2
Inducing lipid accumulation in green microalgae
and developing characterization methods

Chapter 2: Inducing lipid accumulation in green microalgae and developing characterization methods
70
List of abbreviations: ............................................................................................................................ 73
Chapter 2: introduction ........................................................................................................................ 75
I. Morphology, composition and metabolism of green micro-algae ............................................. 76
I1) Cell structure ......................................................................................................................... 76
I1a) Plasma membrane ............................................................................................................ 76
I1b) Cell wall ............................................................................................................................. 77
I1c) Chlamydomonas reinhardtii specificities ......................................................................... 77
I2) Respiration activity ............................................................................................................... 80
I3) Photosynthetic activity ......................................................................................................... 81
I3a) Chloroplasts ...................................................................................................................... 81
I3b) Light conversion to electrons ........................................................................................... 82
I3c) Electron transport chain ................................................................................................... 83
I3d) Dark reactions (Calvin cycle) ............................................................................................ 84
II. Lipid biosynthesis and composition ............................................................................................. 85
II1) Lipid synthesis in microalgae: From light to TAGs ............................................................... 85
II2) Lipid classes ........................................................................................................................... 87
II2a) Polar and neutral lipids ..................................................................................................... 87
II2b) Fatty acids ......................................................................................................................... 89
II3) Culture conditions and cell composition ............................................................................. 90
II3a) Cell composition during growth ....................................................................................... 90
II3b) Stress induction: from functional to storage lipids ......................................................... 91
II3c) Strategies to conciliate algae production and lipid content ........................................... 93
II3d) Conditions found in literature .......................................................................................... 93
III. Review of analytical methods .................................................................................................. 95
III1) Biomass growth .................................................................................................................... 95
III1a) Absorbance or Optical density (OD)............................................................................. 95
III1b) Cell number ................................................................................................................... 95
III1c) Dry weight (DW) ............................................................................................................... 98
III1d) Comparison of the different methods ......................................................................... 99
III2) Lipid content ......................................................................................................................... 99
III2a) Gravimetric methods (solvent extraction) ................................................................... 99

Chapter 2: Inducing lipid accumulation in green microalgae and developing characterization methods
71
III2b) Transesterifiaction and Gas Chromatography analyses ............................................ 101
III2c) Lipophilic dyes (Nile red and Bodipy) ............................................................................. 101
III2d) Colorimetric method (Sulfophosphovanillin) ............................................................ 105
III2e) Conclusion about lipid quantification ........................................................................ 107
III3) Cell size ................................................................................................................................ 107
IV. Procedure to induce lipid accumulation developed in this work ......................................... 108
IV1) 1st step “growth step”: ...................................................................................................... 109
IV2) 2nd step "stress conditions”: ............................................................................................. 109
IV3) Discussion of the conditions chosen .................................................................................. 110
V. Development and validation of the methods ............................................................................ 111
V1) Determination of cell concentration by flow cytometry ................................................... 111
V2) Calibration curve of SPV method using Triolein ................................................................ 111
V3) Development of Bodipy staining on Chlamydomonas reinardtii ...................................... 111
V3a) Effect of the ratio Bodipy/cell and the presence of a washing step on Chlamydomonas
reinhardtii ................................................................................................................................... 112
V3b) Observation on Chlamydomonas reinhardtii cells in 7 days of stress using a Confocal
Laser Scanning Microscopy (CLSM). ........................................................................................... 115
V3c) Conclusion on Bodipy staining protocol ........................................................................ 116
V4) Development of a CLSM method to observe Chlamydomonas reinhardtii (pigments,
lipids, cell wall). .............................................................................................................................. 116
VI. Results ..................................................................................................................................... 118
VI1) Biomass growth .................................................................................................................. 119
VI1a) First step: Growth phase ............................................................................................ 119
VI1b) Second step: Stress phase .......................................................................................... 119
VI1c) Illustration of the two steps ....................................................................................... 120
VI2) Chlorophyll content ............................................................................................................ 121
VI2a) First step: Growth phase ............................................................................................ 121
VI2b) Second step: stress conditions ................................................................................... 122
VI3) Dry weight (stress condition) ............................................................................................. 123
VI4) Lipid content ....................................................................................................................... 125
VI4a) Identification and quantification of Fatty acids (polar + neutral FA) during stress,
measured by gas chromatography (GC-FID). ............................................................................. 125
VI4b) Analysis of FA composition for biodiesel purpose and analytical methods ............. 127
VI4c) Colorimetric method: SulphoPhosphoVanillin (SPV). ............................................... 128
VI4d) Monitoring Chlamydomonas reinhardtii cell with CLSM imaging ............................ 130

Chapter 2: Inducing lipid accumulation in green microalgae and developing characterization methods
72
VI4e) Monitoring of neutral lipid content with Bodipy staining and flow cytometry ....... 133
VI5) Monitoring cell size ............................................................................................................. 135
Chapter 2 conclusion .......................................................................................................................... 137
Chapter 2 references ........................................................................................................................... 139
II1. Appendix II.1: Lipid production strategies in literature ...................................................... 143
II2. Appendix II.2: Quantification of unsaturated fatty acids using the colorimetric
Sulphophosphovanillin (SPV) method ............................................................................................. 145
II3. Appendix II.3: Additional lipid estimation methods ............................................................ 148
II4. Appendix II.4: Principle of laser granulometry .................................................................... 150
II5. Appendix II5: Medium preparation ..................................................................................... 152
II6. Appendix II.6: Correlation cyto/malassez in growth and stress phase ............................... 156
II7. Appendix II.7: Confocal microcopy vs fluorescence microscopy ........................................ 157
II8. Appendix II.8: CLSM optical configuration to monitor Chlamydomonas reinhardtii cells
stained with Bodipy and Concanavalin TRITC (track 1: Bodipy, track 2: Chlorophyll, and track 3:
concanavalin, track 4: merged channels) ........................................................................................ 158

Chapter 2: Inducing lipid accumulation in green microalgae and developing characterization methods
73
List of abbreviations:
• ATP Adenosine Triphosphate
• NADPH Nicotinamide adenine dinucleotide phosphate
• PEF Pulsed Electric Fields
• TAGs Triacylglycerides
• CLSM Confocal Laser Scanning Microscopy
• TRITC Tetramethylrhodamine
• Bodipy BODIPY® 505/515
(4,4-Difluoro-1,3,5,7-Tetramethyl-4-Bora-3a,4a-Diaza-s-Indacene)
• FA Fatty Acids
• SPV Sulfo-Phospho-Vanillin
• GC-FID Gas Chromatography coupled with a Flame Ionization Detector
• DW Dry weight
• TO Triolein
• CFPP Cold Filter Plugging Point
• PerCP-c y5.5 Peridinin-Chlorophyll-Protein coupled with cyanin 5.5, a far-red emitting dye
• TAP Tris-Acetate-Phosphate, medium for Chlamydomonas reinhardtii
• TAP N- TAP medium depleted in nitrogen, used for stress phase
• W Stands for a washing step performed after staining cells with a dye
• CMOS Complementary Metal Oxide Semiconductor (photodetector)
• NR Nile red (lipophilic dye)
• DMSO Dimethylsulphoxid
• EDTA Ethylenediaminetetraacetic acid
• FAMEs Fatty Acids Methyl Esters
• SPE Solid Phase Extraction
• OD Optical Density
• PMT Photomultiplier tubes
• FSC Forward scatter signal (flow cytometry)
• SSC Side scatter signal (flow cytometry)
• a.u. Arbitrary units
• LED Light emitting diodes
• ROS Reactive Oxygen Species
• ER Endoplasmic Reticulum
• rPh Photon flow rate
• PtdIns Phosphatidylinositol
• PtdEtn Phosphatidylethanolamine
• DGTS Diacylglyceryltrimethylhomo-Ser
• SQDG Sulfoquinovosyl diacylglycerols
• PtdGro Phosphatidylglycerol
• DGDG Digalactosyldiacylglycerol
• MGDG Monogalactosyldiacylglycerol

Chapter 2: Inducing lipid accumulation in green microalgae and developing characterization methods
74
• PUFA Poly Unsaturated Fatty Acids
• PUVLCFA Poly Unsaturated Very Long Chain Fatty Acids
• EPA Eicosapentaenoic acid
• DHA Docosahexaenoic acid
• PG Phosphatidylglycerol
• PC Phosphatidylcholine
• PE Phosphatidylethanolamine
• PS Phosphatidylserine
• PI Phosphatidylinositol
• PA Phosphatidic acid
• DGTA Diacylglycerol-O-(hydrox ymethyl)-(N,N,N-trimethyl)-β-alanine
• DGCC Diacylglycerol-O-carboxyl-(hydroxymethyl)choline
• G3P Glycerol 3-phosphate
• Lyso-PA Lysophosphatidic Acid
• PA Phosphatidic acid
• DAG Diacylglycerol
• NADH Nicotinamide adenine dinucleotide
• RuBP Ribulose-1,5-bisphosphate
• CBB Calvin-Benson-Bassham cycle
• PSI (P700) Photosystem I, finale molecule: P700
• PSI (P680) Photosystem II, finale molecule: P680
• ETS Electron Transport Chain
• PAR Photo Active Radiation
• DNA Deoxyribonucleic acid
• acetyl-CoA Acetyl coenzyme A
• TCA Tricarboxylic acid cycle
• TEM Transmission electron microscopy
• Cw15 Chlamydomonas reinhardti mutant (cell wall deficient derived from wild
type)
• CRwt Chlamydomonas reinhardti wild type.

Chapter 2: Inducing lipid accumulation in green microalgae and developing characterization methods
75
Chapter 2: introduction
Microalgae, with their high division frequency leading to a high growth rate, outcompete conventional
crops for the production of biomass feedstocks for biofuels (ethanol, biodiesel or biogas) [1–3]. The
accumulation of intracellular carbohydrates for ethanol production or of triacylglycerols (TAGs) for
biodiesel production requires culture conditions that generally differ from those of optimal growth [4–
6].
This chapter presents (1) the main differences between growth and lipid accumulation metabolism in
oleaginous microalgae, (2) the strategies to trigger lipid accumulation metabolism and (3) how to
conciliate significant biomass growth and lipid accumulation in the cells.
A two-step strategy used to cultivate Chlamydomonas reinhardtii wild type and trigger lipid
accumulation in them is thereafter presented. In this context, optimization of the culture conditions
to induce growth and lipid accumulation is required. Among the parameters that affect both growth
and lipid storage, duration of the growth and accumulation stages, biomass content at the different
stages, light supplied to the culture, pH of the medium, temperature etc can be cited. First, these
parameters were carefully chosen taking into account results from the literature.
Finally, the different methods to monitor the biomass properties during lipid accumulation are
presented. Lipid contents of microalgae were detected and estimated by three different analytical
methods (flow cytometry associated with the use of lipophilic dye, colorimetry, microscopy) and the
results are compared. The cell size during the lipid accumulation phase was also estimated by
granulometry and microscopy.

Chapter 2: Inducing lipid accumulation in green microalgae and developing characterization methods
76
I. Morphology, composition and metabolism of green micro-algae
I1) Cell structure
Chlorophyceae are one of the classes of green unicellular microalgae, including most of the strains
studied in this work: Chlamydomonas reinhardtii, Chlorella vulgaris, Parachlorella kessleri,
Scenedesmus obliquus. These strains may differ in size and shape but they possess similar organelles
with specific functions in the cellular metabolism and enclosed in the polar lipid membrane. A plasma
membrane separates the interior of the cell from the external environment. Like terrestrial plants,
most of algae also possess a cell wall which provides a good mechanical resistance to the cell. A typical
cell structure is presented in Figure 1.
Figure 1: Green microalgae cell structure [7]. The nucleus is a membrane-enclosed organelle found in eukaryotic cells which contains most of the cell genetic material organized as chromosomes. The cytoplasm comprises the cytosol and organelles, the internal sub-structures. Cytosol represents up about 70% of the cell volume and is a complex mixture of cytoskeleton filaments (e.g. actin filaments and microtubules), dissolved molecules, and water. Vacuoles allow the cell to control turgor pressure [8], associated with the gradient of osmotic pressure between the interior and exterior of the cell. The Golgi body (also referred as Golgi apparatus) has a major role in protein glycosylation and sorting, but is also a major biosynthetic organelle that synthesizes large quantities of cell wall polysaccharides [9]. The lipid droplets are made up of neutral lipids (mainly triacylglycerols, TAGs) stored in the cytoplasm as energy sinks for future use.
I1a) Plasma membrane
The plasma membrane (also known as cell membrane or cytoplasmic membrane) is common to all
eukaryotic cells and separates the cytoplasm containing organites from the extracellular fluid (Figure
2). It consists in a phospholipid bilayer with embedded proteins. The cell membrane is selectively

Chapter 2: Inducing lipid accumulation in green microalgae and developing characterization methods
77
permeable and able to regulate the entering and exiting of molar fluxes across itself, by transfer thanks
to gradients of e.g ions, dissolved CO2 and O2 and other compounds.
Figure 2: Diagram of the cell membrane
In addition, the transmembrane proteins enable the transport of nutrients such as sugars and amino
acids into the cell and the excretion of metabolites by active pumping. The cytoskeleton underlying
the cell membrane is a complex network of filaments and tubules that extends through the cytoplasm
to the nucleus. It provides an internal mechanical resistance to the cell and helps to maintain its shape.
The cell membrane also contains various proteins (around 50% of membrane volume) and
carbohydrates.
I1b) Cell wall
The cell wall is a particularity of plants, algae, fungi and prokaryotic cells and it is not present in
mammalian cells. The composition and structure of algae cell walls greatly vary with strains. In most
cells, the cell wall is flexible but has a considerable tensile strength. Many Chlorophyceae possess
microfibrillar cellulose, homogalacturonans and rhamnogalactutonan-I, extensin and arabinogalactan
constituents [10].
I1c) Chlamydomonas reinhardtii specificities
In Chlamydomonas, the cell wall does not contain cellulose but is made of crystalline glycoproteins,
specifically based upon aggregates of hydroxyproline-rich glycoproteins (HFGPs) and glycine-rich
glycoproteins. The Chlamydomonas reinhardtii’s cell wall is structured in 7 layers (Figure 3). The inner
layer, W1 is made of anastomosing fibers in a non-dense trabecular network of 30 to 200 nm width.
Layers W2 and W6 are made of glycoproteins surrounding a granular layer W4. Layers W3 and W5 are
electron-transparent regions that are probably non-dense spaces rather than true wall components.
The W7 layer (outer layer) contains non-structural glycoproteins in a transitional stage prior to their
release into the culture medium [11]. Chlamydomonas reinhardii has been muted in several strains

Chapter 2: Inducing lipid accumulation in green microalgae and developing characterization methods
78
with altered cell walls. The Cw15 mutant fails to assemble the central triplet W2-W6 layers and only
has fibers resembling the outer layer of the wild-type wall.
Figure 3: Diagram of the cell wall of C. reinhardtii [11]. WI, W3 and W7 are non-dense layers.
Chlamydomonas reinhardtii has a structure similar to the general one of a green microalga presented
in Figure 1. The only specificities are (1) a U-shaped chloroplast, (2) a pair of flagella of 12 µm length
and less than 0.5 µm width [12] and (3) an eyespot (Figure 4). The eyespot consists of two layers of
regularly arranged electron dense granules of 80-130 nm diameter; it reflects incident light back to a
rhodopsin photoreceptor situated in the plasma membrane which enables the cell to orient its
movement towards light. The flagella enable the cell to swim in the direction of light, detected by the
eyespot; the average forward swimming speed is about 100 - 200 µm/sec.
Figure 4: Chlamydomonas reinhardtii structure [13]

Chapter 2: Inducing lipid accumulation in green microalgae and developing characterization methods
79
Images of Chlamydomonas reinhardtii recorded with Transmission Electronic Microscopy (TEM) are
presented in Figure 5. The cell structure and relative composition evolve with the culture conditions;
here a nitrogen depletion in the medium increases starch (grey granules) and neutral lipid content
(dark spots) on the cell [14].
Figure 5: Ultrastructure of Chlamydomonas reinhardtii during N limitation [14] after 0; 1; 2; and 3 days of stress. Scale bars
represents 2 µm. E, Eyespot; LD, lipid droplets; N, nucleus; P, pyranoids; S, starch granules; T, thylakoid membranes; V,
vacuoles.
Under optimal growth conditions, the cell undergoes two or three rounds of mitosis before the
daughter cells are released from the old cell wall into the medium. Thus, a single growth step may
result in 2 to 16 daughter cells per mother cell. In bright light at 25°C, the exponential phase cells
typically divide three times to produce eight daughters, but at lower temperatures or lower light
(below 100 µmol∙m-2∙s-1) intensities, two divisions are more usual. The number of division is generally
proportional to the growth rate [15]. The use of light and dark cycles synchronizes the circadian cycles
and division behavior in the cell populatio. Cell division can be separated into two phases: interdivision
and division phases (Figure 6, [16]). The mother cell increases in size during a step referred as
commitment sizer (G step). During this step, organelles (chloroplast, pyrenoid, golgi apparatus) and
nucleus increase in size and separate in the future daughter cells. The ratio of the cell volume at the
beginning of the division phase to the initial cell volume determines the number of daughter cells. S/M
cycle is referred to as synthesis of DNA and mitosis steps that generate daughter cells of uniform size
enclosed within a single mother cell wall. During the S/M step, the cells lose their flagella and recover
it after being released individually in the medium.

Chapter 2: Inducing lipid accumulation in green microalgae and developing characterization methods
80
Figure 6: Commitment sizer (G) and synthesis/mitosis (S/M) cycles [16]. The number of division n may vary from 1 to 5
leading from 2 to 32 daughter cells.
I2) Respiration activity
A mitochondrion is a double membrane organelle found in all eukaryotic algae cells, which produces
energy as Adenosine Tri-Phosphate (ATP) through respiration (Figure 7). A mitochondrion contains
outer and inner membranes composed of phospholipid bilayers and proteins. The central set of
reactions of mitochondrion producing ATP is the Krebs cycle, also known as tricarboxylic acid (TCA)
cycle.
Figure 7: Mitochondrion structure [17]
The TCA cycle generates energy through the oxidation of acetyl-CoA derived from carbohydrates, fats
and proteins, into CO2 and ATP. The involved reactions are carried out by 8 enzymes with complete
oxidation of acetate, in the form of acetyl-CoA, into two molecules of CO2 and water.

Chapter 2: Inducing lipid accumulation in green microalgae and developing characterization methods
81
I3) Photosynthetic activity
I3a) Chloroplasts
The chloroplast is the organelle responsible for photosynthesis. Briefly, it contains the photosynthetic
pigments which capture light and are involved in a set of light reactions that produce the energy
required to fix CO2 and convert it into organic carbon (during Calvin cycle). The ellipsoid-shaped
chloroplast is enclosed in a double membrane, composed of two layers separated by the
intermembrane space (Figure 8). The outer layer is a semi-porous membrane which features a number
of embedded membrane transport proteins. The inner chloroplast membrane borders the stroma and
regulates passage of materials in both directions. Also, fatty acids, lipids and carotenoids are
synthesized in the inner membrane. Enclosed by the chloroplast membrane is the stroma, a protein-
rich, alkaline, semi-gel-like material that contains dissolved enzymes and in which the thylakoid system
floats. The Calvin cycle, which fixes CO2 into organic carbon takes place in the stroma.
Figure 8: Cell chloroplast structure [18]
Like mitochondria, chloroplasts possess their own genomes (DNA) and ribosomes, they are used to
synthesize chloroplasts proteins, e.g. Rubisco (Ribulose-1,5-biphosphate-carboxylase-oxygenase), the
enzyme that fixes CO2 into sugar molecules. Rubisco self-assembles into pyrenoids, which is the center
of carbon concentration mechanisms in microalgae. Starch granules are synthesized from fixed CO2
or dissolved inorganic carbon (DIC) and are accumulated around pyrenoids.
Thylakoids are small interconnected sacks which contain the membranes where the light reaction of
photosynthesis takes place. There are two types of thylakoids: granal thylakoids and stromal
thylakoids. The flat tops and bottoms of granal thylakoids contain the photosystem II protein complex
(detailed below). Photosystem I and ATP synthase are large protein complexes found in the stromal
thylakoid membrane. The number of thylakoids and the total thylakoid area of a chloroplast are
influenced by light exposure. A low amount of light leads to increased surface area in order to improve
light capture. Photosystems I and II contain light-harvesting complexes with chlorophyll and
carotenoids that absorb light energy and use it to energize electrons.

Chapter 2: Inducing lipid accumulation in green microalgae and developing characterization methods
82
Photosynthesis provides the energy to drive the process of carbon fixation and the reducing power
(NADPH) to convert carbon dioxide into a carbohydrate via a reduction reaction. The general equation
of photosynthesis is written below:
carbon dioxide + water + light energy → carbohydrate + oxygen + water
Photosynthesis occurs in two separated steps (1) light-dependent reactions and (2) light independent reactions.
During light-dependent reactions, the energy of light is captured and converted to energy storage molecules ATP and NADPH.
The overall equation for the light-dependent series of reactions is:
2 H2O + 2 NADP+ + 3 ADP + 3 Pi + light → 2 NADPH + 2 H+ + 3 ATP + O2
where Pi stands for inorganic phosphate.
I3b) Light conversion to electrons
Light is generally referred as the visible region of the electromagnetic radiation spectrum (in the range
400 - 740 nm) as illustrated in Figure 9.
Figure 9: The electromagnetic spectrum. Light is a form of electromagnetic energy conveniently represented as a wave.
The shorter the wavelength of light, the greater its energy. Visible light represents only a small part of the electromagnetic
spectrum between 400 and 740 nm [19].
Light is a charge-less bundle of energy (quanta or photons) diffused as a wave or particles depending
on the conditions, and thus can be described as a quantic particle like electrons. At the molecular scale
of the light reaction complex, a quantum of visible light collides with photosynthetic pigments that are
able to react with photons at a certain level of energy, i.e. at a certain wavelength.
Antenna complexes containing several pigments able to absorb photons in the range of 400 to 680 nm
(known as Photosynthetic Active Radiations, PAR, and illustrated in Figure 10.a) are situated in
thylakoid membranes ,

Chapter 2: Inducing lipid accumulation in green microalgae and developing characterization methods
83
Figure 10: a) Photosynthetic pigments and corresponding capture wavelengths. b) Transmission of energy in photosystems.
The Pigments composition varies with algae species and light conditions. ETS stands for Electron transport chain, detailed
below.
The reaction centers of photosynthetic systems are organized as a cluster of various pigments which
can absorb the visible light and transmit the energy to the reaction center constituted by a pair of
Chlorophyll a molecules capturing light at the optimal wavelength of 680 (P680, Figure 10.b). In green
microalgae (Chlorophyta), these pigments are chlorophyll a, b and carotenoids such as lutein,
zeaxanthin, β-carotene, α-carotene, antheraxanthin, violaxanthin, astaxanthin, cantaxanthin and
neoxanthin [20].
Many side pigments may also act as photoprotective pigments by converting an excess of energy into
heat or act as an antioxidant to avoid the formation of triplet excited chlorophyll a. The dissipation of
energy in the photosystem leads to a reduction of the photosynthetic yield.
The photosynthetic yield expressed as the fraction of light energy converted into chemical energy
varies within the range of 5 – 7 % while the theoretical maximal yield is approximately 15 – 20 % of the
visible light [21] (theoretical yield of 7.5 - 8.5 % when UV and Infrared are considered). The conversion
yield depends on factors such as the light flow density and the pigments composition of the
photosystems. The presence of characteristic pigments (carotenoids, phycobiliproteins) depends on
algae species. The relative pigment composition in a cell culture may also greatly vary during time,
depending on the light supplied, shading effects, nutrient depletion etc... to maximize the
photosynthetic yield with limited heat and oxidative damages. In other worlds, in reduced light
conditions, the algae will deploy a large antenna, while during a light inhibition the antenna is reduced.
In the case of photo-inhibition, the algae may synthetize more pigments around the antenna to act as
chemical quenchers that will protect chlorophyll [22].
The absorption of energy by P680 frees an electron by a process called photoinduced charge
separation illustrated on the right in Figure 10.b. That free electron is transferred to the primary
electron-acceptor molecule, Pheophytin a (Pheophytin a is a chlorophyll a molecule with the
magnesium atom replaced by two protons).
I3c) Electron transport chain

Chapter 2: Inducing lipid accumulation in green microalgae and developing characterization methods
84
Briefly, electrons are continuously lost from photosystem II to photosystem I through a non-cyclic
electron transport chain (generally referred as Z-scheme, illustrated in Figure 11), and recovered in
PSII by water-splitting. Then, the electrons are excited a second time in photosystem I to a second
electron transport chain to finally reduce NADP into NADPH. The first electron transport chain from
PSII to PSI leads to an accumulation of protons in the stroma. This electro-chemical potential serves to
generate ATP thanks to ATP synthase.
Figure 11: Light reactions of photosynthesis, modified from [19]. The electrons provided by PSII are transmitted to PSI, a photosystem with a pair of central Chlorophyll a that absorb light at 700 nm (P700). There, it is further excited by the light absorbed by P700 after a transmission of the photon through the pigments antenna. The electron is then passed along a chain of electron acceptors to which it transfers some of its energy. The energy delivered to the final electron acceptors, ferrodoxin, is used to move hydrogen ions across the thylakoid membrane from the stroma to the lumen in the b6-f complex. The protons accumulated in the stroma must pass through the channels provided by ATP synthase. As protons pass through ATP synthase, ADP is phosphorylated to ATP and released into the stroma. Since the excited electron does not return to PSII, this mechanism for making ATP is called noncyclic photophosphorylation. The electron is eventually used to reduce the co-enzyme NADP with a H+ to NADPH (which has functions in the light-independent reaction); at that point, the path of that electron ends. Because PSII is the electron donor of the electron transport chain, a source of electron must reduce the oxidized chlorophyll a molecule of PSII. This source of electron is water which is split into diatomic oxygen and protons thanks to a dedicated enzyme. The electrons yielded are transferred to a redox-active tyrosine residue that then reduces the oxidized chlorophyll a center P680. Oxygen is the waste product of light reactions.
I3d) Dark reactions (Calvin cycle)
The Calvin cycle, Calvin-Benson-Bassham (CBB) cycle, also known as the dark reactions, is a series of
biochemical redox reactions that take place in the stroma. This cycle fixes CO2 into 3-
phosphoglyceraldehyde (also referred as Glyceraldehyde 3-phosphate G3P) molecules and uses the
energy and electrons delivered from ATP and NADPH produced in the light reactions.
The cycle can be described by the following global reaction:
3 CO2 +6 NADPH +5 H2O + 9 ATP → G3P + 2 H+ + 6 NADP+ + 9 ADP + 8 Pi
(Pi = inorganic phosphate)

Chapter 2: Inducing lipid accumulation in green microalgae and developing characterization methods
85
The Calvin cycle can be divided into 3 simple stages as illustrated in Figure 12:
(1) The cycle starts with the enzyme Rubisco which fixes CO2 into a five-carbon Ribulose bisphosphate
(RuBP) molecule. This results in an unstable molecule with 6 carbon atoms.
(2) The molecule created rapidly breaks down into molecules containing 3 carbon atoms and called 3-
phosphoglyceric acid (3-PGA). ATP and NADPH provided by the light reactions are used to convert 3-
PGA into G3P, glyceraldehyde-3-phosphate.
(3) The next stage in the Calvin cycle is the regeneration of RuBP (Rubisco bi phosphate). Five G3P
molecules produce three RuBP molecules, using three molecules of ATP.
Figure 12: Dark reactions of photosynthesis
II. Lipid biosynthesis and composition
II1) Lipid synthesis in microalgae: From light to TAGs
Lipids are essential constituents of living organisms and are defined as compounds readily soluble in
non-polar organic solvents, but insoluble in water [23].
Fatty acids are the building blocks of these lipids. In algae and plants, the de novo synthesis of fatty
acids uses as substrates the photosynthetically fixed carbon molecules of the Calvin cycle (e.g., G3P)
(Figure 13).

Chapter 2: Inducing lipid accumulation in green microalgae and developing characterization methods
86
Figure 13: Microalgal metabolic pathways. ER: Endoplasmic Reticulum [24].
The fixed sugars are further processed to produce acetyl-coA (coenzyme A), a precursor for fatty acid
synthesis in the chloroplast. This synthesis requires stoichiometric amounts of ATP, acetyl CoA and
NADPH for each two carbon atoms added to the growing acyl chain (acyl groups are derived from
hydrolyzed fatty acids). Photosynthetic reactions are thus essential in providing a carbon source and
generating reducing power (NADH and NADPH) and energy (ATP) for fatty acid synthesis [25].
The first step in fatty acid synthesis is the conversion of acetyl-CoA to malonyl CoA, catalyzed by acetyl-
Coa carboxylase (ACCase) [23]. Subsequently, malonyl Coa is converted to a long chain fatty acids
through a complex pathway which requires successive enzymatic reactions (e.g. conversion of CoA to
ACP catalyzed by malonyl Coa:ACP transferase).
Afterwards, the FAs synthesized in the chloroplast are transferred to the endoplasmic reticulum (ER)
membranes for synthesis of membrane polar lipids and cytosolic storage neutral lipids (mainly
triacylglycerols). Triacylglycerols (TAGs) are formed by the sequential acylation of glycerol-3-
phosphate backbone (G3P) with three acyl-CoAs catalyzed by a group of enzymes named
acyltransferases (Figure 14).

Chapter 2: Inducing lipid accumulation in green microalgae and developing characterization methods
87
Figure 14: TAGs pathway in ER [26]. (1) Cytosolic glycerol-3-phosphate acyl transferase, (2) lyso-phosphatidic acid acyl
transferase, (3) phosphatidic acid phosphatase, and (4) diacylglyerol acyl transferase.
At first, TAGs are sequestered and accumulated, due to their hydrophobicity, between the two layers
of the ER membrane (Figure 15) [27]. During ongoing synthesis of TAGs, an oil droplet is formed. After
reaching a certain size, this droplet is released into the cytosol as an independent oil body.
Figure 15: Oil body biosynthesis in the ER. Accumulation of TAGs between the two layers of ER (left part) and release of
an independent oil body into the cytoplasm (right part).
In parallel with lipid synthesis, algae can also synthesize and store carbohydrates as starch. Many algae
use starch as the primary storage of organic compounds in priority to neutral lipids. The regulation of
starch and lipid syntheses and the possible interaction between both pathways is still poorly
understood; but some studies are performed to inactivate the starch synthesis pathway and then
increase lipid accumulation [23,28].
II2) Lipid classes
Lipids are hydrophobic molecules containing hydrocarbons. There are four types of lipids in
microalgae: phospholipids, glycolipids, betaine lipids and triacylglycerols (TAGs).
II2a) Polar and neutral lipids
Because of their polar heads, the majority of the lipids presented here are classified as polar lipids.
Only TAGs, consisting in three fatty acids bound to a glycerol backbone, are classified as neutral lipids.

Chapter 2: Inducing lipid accumulation in green microalgae and developing characterization methods
88
TAGs as well as polar lipids contain acyl groups (represented by R in Figure 16) [27]. A minor part of
the neutral lipids can also be in the form of diacylglycerol, monoacylglycerols or even free FAs.
Figure 16: Lipid molecules generally found in algae modified from [29]
Polar glycolipids are predominantly located in photosynthetic membranes with MGDG
(Monogalactosyldiacylglycerol, see Figure 16) and SQDG strictly restricted to the thylakoid membranes
of the chloroplast while DGDG is also found in the extraplastidial membranes [29]. PG is the only
phospholipid present in thylakoid membranes of the chloroplasts [25]. DGTS is a betaine glycerolipid
that can also be found in the organelles of many lower plants and algae [30]. The plasma membrane
of algae is mostly composed of phospholipids: PE, PC and/or PI. The composition in phospholipids
varies with the photosynthetic species. For example, PC is the major phospholipid in land plants but is
not present in Chlamydomonas reinhardtii.

Chapter 2: Inducing lipid accumulation in green microalgae and developing characterization methods
89
Figure 17: Major polar lipid classes in Chlamydomonas reinhardtii [25]
II2b) Fatty acids
Fatty acids in Chlamydomonas usually have similar acyl chain lengths to those present in most land
species [31]: 16 and 18 carbon atoms (C16-C18). The fatty acids are saturated (with no double bound
C-C) (noted C16:0 and C18:0), mono-unsaturated with one double bound (C16:1 and C18:1) or poly-
unsaturated with at least two double bonds (PUFA); the last class is not generally present in
Chlamydomonas.
In other algae strains, the chain length can vary from 14 up to 22 carbon atoms with up to 6 double
bounds [6]. Poly unsaturated very long-chain fatty acids (PUVLCFAs) are elongated fatty acids
synthesized in specific algae groups such as euglenophytes, diatoms and haptophytes which possess
desaturases/elongases enzymes able to produce PUVLCFAs from C18 and derivatives [27]; examples
of PUVLCFAs are Arachidonic acid 20:4(ω-6), Eicosapentaenoic (EPA) C20:5 (ω-3) and Docosahexaenoic
acid DHA C22:6 (ω-3). ω3 EPA and DHA are high value compounds for nutrition and medicine.
Complementary omega 3 fatty acids are used to increase the ω3/ω6 balance to 1/1, the optimal
balance for health [32] because it has a direct influence on blood fluidity. Additionally, ω3 DHA is very
important for fetus development, pregnancy outcomes, cognitive development and maintenance,
learning and memory, visual function, immune system, and more.
In a prospect of producing biodiesel by transesterification of TAGs to fatty acid methyl esters (FAME),
the nature and proportion of fatty acids are critical for biodiesel quality. Critical parameters like cetane
number (combustion speed and compression needed for ignition), iodine value (oxidation stability)
and cold filter plugging point (CFPP, fluidity and density) are correlated with the methyl ester
composition. An optimal diesel production requires a high amount of mono-unsaturated fatty acids
with low levels of saturated and poly-unsaturated FAs [33] as illustrated in Figure 18 (maximum of 20 %
of saturated FA, between 50 to 100 % of mono-unsaturated FA and a maximum of 30 % of PUFA).

Chapter 2: Inducing lipid accumulation in green microalgae and developing characterization methods
90
Figure 18: Finetti diagram of the biodiesel qualities according to their monounsaturated, polyunsaturated and saturated
methyl esters mass fractions. Yellow: good cetane number and iodine value, blue: good CFPP, green: biodiesel that satisfies
the European Standard UNE-EN 14214 [33]. The analysis of the fatty acid composition of TAGs is required to situate the oil
quality produced by the algae.
II3) Culture conditions and cell composition
II3a) Cell composition during growth
The cell content in neutral lipids (TAGs) is low in growth conditions in the majority of microalgae. For
Chlamydomonas reinhardtii in growth phase, the total lipid content (polar+neutral) is less than 20% of
the dry weight and the TAG proportion in these lipids is only 1 % (Figure 19).
Figure 19: Cell composition in terms of carbohydrate, protein, chlorophyll and glycerolipids in Chlamydomonas reinhardtii
(growth condition). PtdGro (PG), TtdEnt (PE), and PtdIns (PI) [34].

Chapter 2: Inducing lipid accumulation in green microalgae and developing characterization methods
91
II3b) Stress induction: from functional to storage lipids
Fatty acids produced in plastids of the chloroplast and modified in the ER are retained as structural
components of cellular membranes [27] and serve as functional biomass together with synthesized
proteins as illustrated previously.
Under certain culture conditions, carbohydrates (starch) and neutral lipids may be accumulated to
store the energy supplied from the chloroplast. These storage compounds may be easily catabolized
[35] and serve as a source of organic compounds in the Krebs cycle when there is no energy available
from photosynthetic activity, for example when the cell is in the dark zone of a photobioreactor or
during the night period.
The composition of algal biomass is strongly dependent on culture conditions [36]. A lack of nutrient
in the culture medium, changes in CO2 level, light or pH conditions may lead to a radical change in cell
metabolism. In the so called "adverse growth conditions", also referred as "stress conditions", the
energy available from the light reactions is not used to produce functional biomass in priority (Figure
20), many algae alter their lipid biosynthetic pathways toward the synthesis and accumulation of
neutral lipids as cytoplasmic lipid bodies. In contrast, in favorable growth conditions, they synthesize
fatty acids as substrates for esterification into glycerol based polar lipids [4].
Figure 20: Schematic representation of the chemical energy distributed from the photosystem. Photons (rph) are absorbed
and used to drive electrons from water, ending up in functional biomass (rx), TAG (rT) and starch (rs). rL represents the light
energy dissipated in the thylakoids on one hand and used in catabolism on the other hand [36].
When the flow of photons is increased and the ability of the cell to produce functional biomass is
decreased (nutrient depletion), the cell needs to trigger the energy storage pathways in order to
reduce the excess of energy released in dissipation (heat) /catabolism (formation or harmful reactive
oxygen species ROS). When ROS accumulate and cause irreversible damages, algae experience
photoinhibition and oxidative stress [37]. In these conditions, the cell increases the pathways of starch
and TAG metabolism and modify the photosynthetic apparatus as described previously.

Chapter 2: Inducing lipid accumulation in green microalgae and developing characterization methods
92
The carbon distribution between starch and neutral lipid as energy storage compounds is highly
dependent on the algal strain and on the stress duration [38]. Most green algae (Chlorophyta), as
Chlamydomonas reinhardtii [36], produce and accumulate carbohydrates (starch) as a primary energy
and carbon reserve, whereas TAGs serve as a secondary storage under growth conditions [7]. Starch
storage is the immediate available energy that can be used by algae for important metabolic processes.
Some algae accumulate only starch during a stress period, some others both starch and TAGs; several
strains transiently accumulate starch before forming lipids. As illustrated in figure 20, a reduced
amount of nutrient (medium diluted 10 fold) leads to an accumulation of starch in the first days of
stress followed by an accumulation of storage lipids for Parachlorella kessleri [4] After placing cells in
a nutrient rich medium (medium 1), a sharp decline in the levels of lipid and starch is observed.
Figure 21: Change in relative starch, total lipid and storage (neutral) lipid content (% DW) in cultures of Parachlorella
kessleri. Cultures were firstly grown in a 10 fold diluted medium to induce a stress (medium 0.1) and then transferred into
a complete mineral medium (medium 1) [39].
Nutrients limitations invariably cause a steadily declining cell division rate and modify carbon
partition from functional biomass to storage compounds (neutral lipids/starch) [35]. Nitrogen is the
most critical nutrient affecting lipid metabolism in algae. Under nitrogen limitation the capacity for
protein synthesis is reduced [40]. Sulfur and phosphorous deprivation also affect lipid biosynthesis
[35].
In Chlorella vulgaris, nitrogen deprivation allows a good lipid productivity of 53.96 ± 0.63 mg.L-1.d-1
while all other stresses (deprivation of potassium-phosphate, of iron and of nitrogen- potassium-
phosphate and iron ) resulted in lower lipid productivities [41].
Most of the time nitrogen depletion is associated with high light intensity to trigger the accumulation
of neutral lipid and/or starch. In these conditions, a strong reduction of the growth rate is observed.
Storage lipids can thus be considered as secondary metabolites, i.e. metabolites not associated with
biomass growth. However, when taking into account the neutral lipids productivity, biomass growth
rate and lipid content must also be considered. Thus, a lipid production strategy must conciliate the

Chapter 2: Inducing lipid accumulation in green microalgae and developing characterization methods
93
opposite conditions of growth (complete medium, optimal light supplied) and lipid accumulation
(nitrogen depletion, excess of light).
II3c) Strategies to conciliate algae production and lipid content
The strategies to cultivate the cells in order to obtain a high lipid content are:
(1) Two step batch method:
The cells are cultivated in a nutrient complete medium to maximize their production, they are
afterwards re-suspended in a nutrient depleted medium to stop biomass production and increase the
lipid storage [4,6,38,41–43]. This method is easy to set at laboratory scale with centrifugation of the
cells between both steps, but technically more difficult at large scale.
(2) One step batch method
The cells are grown in a diluted medium where nitrogen and/or other nutrients are in insufficient
quantities. The cells firstly grow and completely consume the nutrients; they afterwards start to
accumulate lipids and/or starch [44–46]. This method is more suitable for large scale cultures.
(3) Turbidostat continuous culture:
The biomass content is maintained constant in a continuous bioreactor working at steady state ; the
nutrients are adjusted to a low value [36,44]. This method aims to continuously produce new biomass
while increasing its TAG content, but is rather complex. It is necessary to find a compromise between
biomass growth and lipid accumulation as TGAs are secondary metabolites.
II3d) Conditions found in literature
Together with the nutrients supplied, both light irradiance and CO2 are important growth parameters.
In most studies, the light is supplied artificially with fluorescent tubes or light emitting diodes (LED)
panels. The emission spectrum of the light supplied generally differs from a raw white light as algae
pigments do not absorb the green light (~ 500 to 600 nm) [47]. Thus, artificial lights generally supply a
mix of blue and red lights in order to avoid a loss of energy (and heat). LED systems are generally more
expensive than fluorescent tubes but consume less energy and produce less heat.
Several culture conditions described in the literature are presented hereafter:
• Breuer et. al [6] used a two-step batch system to cultivate several algae strains in 250 mL
Erlenmeyer filled with 100 mL liquid, supplied by an average light intensity of 150 µmol.m-2.s-
1 with fluorescent tubes and by air enriched with 5% CO2, both during growth and
accumulation steps. Lipid accumulation is started after centrifugation/re-suspension with an
initial biomass concentration of 1 - 1.5 g/L with a medium depleted in nitrogen (KNO3 replaced
by equimolar KCl) during 14 days. The average and maximum biomass and fatty acid
productivities of several strains in complete medium (N+) and nitrogen depleted medium (N-)
are presented in Table 5 Appendix 1. The average TAG productivity is also presented. Nitrogen
depletion (N-) decreases biomass productivities of the nine strains tested compared with the

Chapter 2: Inducing lipid accumulation in green microalgae and developing characterization methods
94
complete medium (N+) but increases TAG productivity. The best TAG productivity was 323
mg∙L-1∙d-1 for Scenedesmus obliquus. For this strain, the volumetric biomass productivity was
high both in nitrogen depleted (average of 719 mg∙L-1∙d-1) and nitrogen sufficient conditions
(average of 767 mg∙L-1∙d-1). In most of the other strains tested, the biomass production is highly
reduced in nitrogen depletion conditions. The following conditions: 1.0 mM KNO3, 1.0 % CO2
and 60 µmol photons.m-2.s-1 at 25°C yielded the highest TAG productivity of 40 mg.L-1.d-1 [48].
• Takeshita et al. [49] have also used a two-step batch system to induce lipid and starch
accumulation in several Chlorella strains, but with a sulfur stress. The pre-culture was
performed in a complete medium under a 12:12 h LD cycle (light/dark cycles) at 50 µmol
photons∙m-2∙s-1. After reaching a certain biomass content, the cells were re-suspended in a
sulfur deprived medium at a concentration of 1∙106 cells/mL in 93 mL test tubes containing 80
mL media, supplied with 600 µmol photons∙m-2∙s-1 and air enriched with 2-3% CO2. The
biomass, lipid and starch productivitiesare detailed Table 6 Appendix 1.
• Praveenkumar et al. [41] used a white light at 300 µE∙m-2∙s-1 12:12-h LD cycle for Chlorella sp.
BUM11008 during 16 days in complete medium and re-suspended the strains in nitrogen free
medium, potassium-phosphate free medium, iron free medium or nitrogen, potassium-
phosphate and nitrogen free medium.
• Mutjaba et al. [43] have cultivated the strain Chlorella vulgaris in 250 mL flasks containing 100
mL medium and supplied 80 - 100 µmol∙m-2∙s-1 of continuous fluorescence illumination. Cells
werethen transferred into a bubble-column photobioreactor to be inoculated at less than 0.1
g∙L-1 of dry weight in a complete medium (stage 1). Enriched 4% CO2 air is supplied at a rate of
0.15 vvm and white fluorescent light at 200 µmol∙m-2∙s-1. When the culture reached a cell
density of 1.5 - 2 g∙L-1, the cells were centrifuged and resuspended in a nitrogen deficient
medium to accumulate lipids (stage 2). The maximum lipid content was reached after 12 - 24h
of stage 2 (stress). The results of biomass and lipid productivities obtained are presented in
Table 7 Appendix 1.
• Ördög et al. [44] inoculated Chlorella minutissima at a very low biomass concentration (Dry
weight 10 mg∙L-1) in media at different concentrations of nitrogen, supplied with 130 µE∙m-2∙s-
1 with 14:10 h L/D cycle. Cultures were aerated with air enriched with 1.5% CO2.
• Griffiths et al. [45] used white fluorescent tubes of 18W to supply light to Chlorella vulgaris
grown in airlift photobioreactors aerated with air enriched with 0.29% CO2. The bioreactors
were inoculated with 50 mg∙L-1 at starting nitrate concentrations ranging from 0 to 2 g∙L-1. The
results obtained are presented in Table 8 appendix 1.

Chapter 2: Inducing lipid accumulation in green microalgae and developing characterization methods
95
The culture conditions for cell growth and lipid accumulation chosen in this project were selected from
this literature review. They are presented in the section IV of the chapter.
A review of the microalgae characterization methods was also performed to develop fast and reliable
techniques to monitor various features of the biomass. They are described hereafter.
III. Review of analytical methods
III1) Biomass growth
During a cell culture, biomass growth is usually monitored according to three measures: (1) absorbance
or optical density, (2) cell number, and (3) dry weight. The principles and means to measure these
parameters are detailed below.
III1a) Absorbance or Optical density (OD)
Measuring the absorbance of a culture at a given wavelength is a simple mean to obtain the biomass
concentration. The absorbance is generally measured in the range of 650 – 700 nm, corresponding to
the maximal absorption of chlorophyll pigments at 680nm. This method is then indirect, as it measures
the biomass chlorophyll content and not the biomass concentration itself. To be reliable, it might be
used only on algae with a constant pigment content; this is the case for cells maintained in optimal
growth conditions. But this measurement is not appropriate in lipid accumulation phase as the
chlorophyll content would constantly change. This method was thus not used in this work.
III1b) Cell number
One reliable and easy way to estimate cell number is using a hemocytometer. The main
hemocytometers are Mallassez cells and Thoma cells. The principle of a hemocytometer is a glass slide
with an incorporated "counting chamber" which possess a specific geometry. This chamber possesses
a calibrated grid composed of squares of different surface areas (Figure 22 and Figure 23).

Chapter 2: Inducing lipid accumulation in green microalgae and developing characterization methods
96
Figure 22: Square surfaces of a Malassez/Thoma
hemocytometer [50]
Figure 23: Cells on the grid of a hemocytometer[51]
The counting chamber is filled with a cell solution (10 - 20 µL). The solution can be diluted with the
culture medium in order to avoid an excess of cells on the grid. Cell concentration is then calculated
by counting with the help of a microscope a certain number of cells (100 - 250 cells) on the grid (square
surfaces multiplied by the depth: 0.2 mm for Malassez cells and 0.1 mm for Thoma cells).
The cell concentration can also be estimated by automatic devices able to count the cells selectively
towards cell debris and dust particles present in the culture. The two main methods to discard the cells
from the other objects are impedance detection (coulter counter) and optical detection (flow
cytometer).
In this project, additionally with hemocytometers, a flow cytometer Merck Guava “easycyte 5 single
sample flow” (Millipore Corporation 25801 Industrial Blvd Hayward, CA 94545) was used. The
instrument features are presented in Figure 24.
Figure 24: Flow cytometer and features. a) Guava easyCyte Single Sample Flow cytometer;. 1. Up to 12 simultaneous
detection parameters; 2. Microcapillary flow cell; 3. Wash vial; 4. Waste vial; 6. Single sample loader. b) scheme of the
microcapillary. c) optical configuration. 50 mW blue laser (488 nm), 3 fluorescence detector channels (525 nm, 583 nm and
680 nm). The yellow line represents the micro capillary were the cells are flowed in front of the laser.

Chapter 2: Inducing lipid accumulation in green microalgae and developing characterization methods
97
A laser beam excites the particles flowing through a micro-capillary and the intensity of light scattered
is measured by two photo-multipliers (PMT): Forward scatter (FSC) and Side Scatter (SSC) (Figure 25),
enabling to distinguish large algae cells from other "dust particles" which emit a lower SSC and FSC
signal. The forward-scattered light is proportional to the cell-surface area or size [52]; it is a
measurement of mostly diffracted light detected on the axis of the incident laser beam [53]. SSC is
proportional to particle granularity, internal complexity and a minor part is proportional to cell area.
Figure 25: Light scattered by a particle to the photo-multipliers (PMT). Side (SSC) and Forward (FSC) light Scattered.
During analysis, “events” are counted, corresponding to the particles detected by the PMT FSC for
which the signal is higher than a threshold; all particles giving a lower signal are considered as
background noise.
In this method, the minimal FSC signal required is 1∙102 a.u. displayed on the right of the vertical dashed
red line in the plot of Figure 26.a. All particles detected with a FSC inferior to 1∙102 a.u. are considered
as a background noise and their data are not treated. Each particle detected is plotted on the graph as
a dot according to its FSC/SSC coordinates. All the algae cells having similar sizes will display similar
FSC/SSC values and are thus plotted as a dense cloud of points on the top right corner of the plot as
they are the largest particles detected. A gate is created (red line) to select the population of algae and
discard the other particles (e.g. cell debris, dust).
The analysis method used in the project was developed on the software Incyte with the following
parameters:
• total count: 1000 - 2000 Events
• flow rate: 0.59 µL/s
• Gains: FSC 8.00, SSC 8.00, 5 decade acquisitions
• threshold fixed at FSC 200 a.u.
• algae gate fixed at FSC between 1∙103 and 1∙105 a.u. and SSC between 2∙102 and 1∙105 a.u.
The algae concentration is calculated by dividing the number of particles counted inside the gate by
the volume of the sample. The concentration measured is displayed on the top left corner of the plot
along with the percentage of events detected inside the gate.

Chapter 2: Inducing lipid accumulation in green microalgae and developing characterization methods
98
Figure 26: Measurement of cell concentration with the software Incyte. a) adjustment of FSC threshold (vertical red line)
and algae gate. Cell concentration displayed on the top left corner. b) verification of algae fluorescence, minimal
fluorescence threshold set at 0.5 a.u.. (horizontal red line).
The optimal algae concentration range of this method is 2∙105 - 3∙105 cells/mL. Each measure takes
between 15 and 40 seconds.
Emission detected in the red spectrum (PMT 680 nm) is associated with chlorophyll a and b
autofluorescence. A verification step was used in the project and was performed on the algae gate to
ensure that algae detected by the granularity signals (FSC and SSC) emit in the red channel and indeed
possess even a low amount of chlorophyll (Figure 26.b). A second threshold is set on the red
fluorescence at a value of 0.1 au. Most of the time, this threshold discards less than 1% of the particles
detected as algae in the FSC/SSC gate as most of the cells possess a red fluorescence within the range
of 1∙103 to 2∙104.
The methods developed for Chlorella vulgaris and Chlamydomonas reinhardtii were validated with the
help of an hemocytometer (section V1)). Indeed, concentrations given by cytometry were compared
with those obtained by microscopy.
III1c) Dry weight (DW)
The dry weight is a paramount value for precise quantitative estimation of the biomass produced. It
corresponds to the biomass weight contained in a known volume of culture after filtration and drying.
It is generally expressed in g/L or mg/mL.
In the protocol used, the amount of biomass DW in the sample must be in the range 3 to 5 mg.. The
first step is the biomass filtration through a glass fiber filter GF/C 47 mm 1.2 µm. The glass fiber has
been previously pre-filtered with distilled water, pre-dried at 105°C and weighted after being cooled
in a desiccator. After sample filtration, the set of filters are dried in an oven at 105°C during 24h, cooled
in a desiccator and weighed.
The dry weight is calculated by the following equation:

Chapter 2: Inducing lipid accumulation in green microalgae and developing characterization methods
99
�� =���� ���� ������ ����� ���� ���� ����
����� ������� ���� �2.1)
Because the dry weight evaluation requires a high biomass quantity (3 to 5 mg), this method is not
suitable for daily analyses in this project.
III1d) Comparison of the different methods
The different methods to evaluate biomass concentration are summarized in Table 1:
Table 1: Methods to quantify biomass
Method Unit Volume required per
sample
Biomass required per
analyze
Optical density Absorbance (a.u.) < 1 000 µL OD680 > 0.05 a.u.
Hemocytometry Cells/mL < 100 µL 100 cells on the grid
Flow cytometry Cells/mL 50 - 1000 µL 1 000 cells
Dry weight g/L Minimum 3 000 µL (for DW> 1 g/L )
3 mg
In this work, for daily analyses, the cell concentration was systematically evaluated by flow cytometry
as this method is fast and reproducible. Dry weight measurements were performed only when needed,
generally at the end of the experiments. The optical density method was not used.
III2) Lipid content
Because the cell lipid content greatly evolves with the culture conditions, it is necessary to be able to
evaluate it at any time; and the same for the lipid contents before and after extraction, as one of the
main purposes of this PhD thesis is to evaluate the extraction efficiency of different methods. Several
methods for this type of analysis will be described below.
III2a) Gravimetric methods (solvent extraction)
Gravimetric methods consist in the extraction of total lipids (neutral + polar) with a harsh solvent
mixture (the constraints are different in lipid extraction for commercial valorization where hazardous
solvent are avoided). The gravimetric methods are generally adapted from the well-known Blight and
Dyer [54] or Folch methods [55]; the total lipids are extracted into an organic solvent which is
afterwards evaporated; weighing is then performed on the residue. These methods were proposed
more than 50 years ago and are not adapted to the extraction of lipids from microalgae, due to the
high amount of biomass needed for analysis.
These two techniques use a mixture of a polar solvent (methanol) and a non-polar one (chloroform)
to extract lipids out of the cell. The mechanism for lipid extraction is explained in Figure 27.

Chapter 2: Inducing lipid accumulation in green microalgae and developing characterization methods
100
Figure 27: Schematic diagram of the proposed organic solvent extraction mechanisms. yellow circle: lipids, white circle:
non-polar organic solvent, white diamonds: polar organic solvent. [56].
The non-polar organic solvents, such as hexane or chloroform, are able to cross the cell membrane,
enter the cytoplasm and interact with neutral lipids using van der Waals forces to form organic solvent-
lipid complexes; these complexes are then transferred across the cell membrane. It should be
highlighted that a part of the fatty acids is forming polar lipid complexes with some of the organelles.
Only non-polar:polar solvent mixtures (represented by white circles and white diamonds) are able to
extract theses membrane-based lipid-proteins associations. The polar solvents form hydrogen bonds
with the polar part of the lipids [57]. The created hydrogen bonds are strong enough to displace the
lipid-protein associations binding the lipid complex to the cell membrane. Addition of polar solvents
facilitate therefore the extraction of membrane-associated neutral lipid complexes, and inevitably
leads to the co-extraction of polar lipids.
Folch method and Blight & Dyer methods were proposed more than 50 years ago and are not specific
to the extraction of lipids from microalgae. The method Folch was originally made to extract lipid from
animal tissues, the method Blight and Dyer was optimized for the extraction of lipids from fish muscle
[58].
Some recent methods were adapted to the constraints of algae cultures. Unlike animal tissues, algae
cells possess a high interstitial water content (even after centrifugation) and a cell wall which may alter
solvent penetration. The use of drying and cell wall breaking steps is then often necessary to estimate
the lipid content accurately.

Chapter 2: Inducing lipid accumulation in green microalgae and developing characterization methods
101
Axelsson and Gentili [59] proposed a single step method which requires less steps than the two classic
methods proposed above and allows at least five times higher sample throughput (less solvent used):
30 mg of DW biomass could be extracted with 10 mL solvent mixture. The procedure was proposed to
reduce time and biomass sample use in comparison with the classic methods though allowing fast
qualitative-quantitative analyses of total fatty acids.
The solvent mixture must be adapted to the polarities of the lipids extracted. Several pure solvents or
mixtures are possible: chloroform:methanol 1:1, chloroform:methanol 2:1, dichloromethane:ethanol
1:1, hexane-isopropanol 3:2, acetone, diethyl ether, methyl-tert-butyl ether-methanol 10:3. Because
of the large variety of lipids present in microalgae, highly varying in polarity, the extracted lipid quantity
and composition vary with the solvents used [60].
Ryckebosch et al. [58] showed that chloroform:methanol 1:1 is the best solvent mixture for extraction
of total lipids from microalgae. The use of mechanical (e.g. bead milling, pressing, autoclaving,
lyophilization, microwaving, high pressure homogenization, ultrasonication) or chemical (acid,
enzyme, osmotic shock) processes together with solvent extraction may drastically improve the total
lipid extraction yield in comparison with a simple mixing of intact biomass with solvents [56,61–64].
In the case of lipid analysis, the use of one or several disruptive pre-treatments is very common, despite
the high energy consumption. The non-fatty acid containing lipids, like pigments and steroids, are
however also estimated [60], giving interferences. But the main drawback is the high amount of
biomass needed for analysis.
III2b) Transesterifiaction and Gas Chromatography analyses
Another method, able to determine lipids is FA transesterification into fatty acid methyl esters (FAMEs)
followed by their quantification and identification using gas chromatography with a flame ionization
detector (GC-FID). This method enables to greatly reduce the amount of biomass required (5 mg of
DW instead of several g) and provides the composition of fatty acids present in microalgal biomass.
Lipids in TAGs and membranes can be detected. A separation step can be added using solid phase
extraction (SPE) columns [60].
III2c) Lipophilic dyes (Nile red and Bodipy)
Lipophilic dyes (also referred as fluorescent probes or fluorophores), able to bond to intracellular
neutral lipids, can be used to estimate TAGs contents in microalgae.
Nile Red (NR, 9-diethylamino-5Hbenzo[α]phenoxazine-5-one) was discovered in the early 20th century
[65], but its interest in measuring neutral lipids in microalgae has rapidly increased since 2000. A more
recent dye, BODIPY 505/515 (4,4-difluoro-1,3,5,7-tetramethyl-4-bora-3a,4adiaza-s-indacene) appears
to be also convenient.
The principle of fluorescence can be explained as follows: when a photon is absorbed by an electron
of a fluorescent particle, this particle is raised to an excited state (Figure 28). A part of this energy is
dissipated as a photon to relax to the ground state [66]; but another part of the energy is lost, the
emitted photon then carries less energy and thus has a higher wavelength. This shift in wavelength is
called the Stokes shift and illustrated in Figure 29. Excitation/emission is cyclical until the fluorescent
molecule is irreversibly damaged (photobleached).

Chapter 2: Inducing lipid accumulation in green microalgae and developing characterization methods
102
Nile red (NR) and Bodipy have different excitation/emission spectra, as illustrated in Table 2 (n.b. NR
spectra also vary with environmental conditions [67]).
Table 2: Characteristics of the lipophilic fluorochromes Nile Red and Bodipy 505/515 and advised staining protocols
Molecule
Nile red Bodipy 505/515
Structure
[65]
[68]
Formula
C20H18N2O2 [69] C13H15BF2N2 [69]
Molecular
weight (g/mol)
248.08 [69] 318.37 [69]
Target
TAGs [69] Lipid droplets[69]
Spectra
[70]
*spectrum of Bodipy ex 500/ em 510
Stain carrier DMSO (5% v/v - 25% v/v) DMSO [69]
Figure 28: Jablonski energy diagram of
fluorescence [66]
Figure 29: The Stokes shift of the excitation and emission spectra
of a fluorophore

Chapter 2: Inducing lipid accumulation in green microalgae and developing characterization methods
103
Glycerol (0.1-0.125 mg/mL) EDTA (3.0-3.8 mg/mL) [65]
Glycerol
Dye and cell
Concentrations
0.25-2.0 µg/mL [65] 5∙104 to 1∙106 cells/mL [69]
0.04-2.6 µg/mL 5∙104 to 1∙106 cells/mL [69]
Incubation time 5-40 min [65] 5-15 min [69]
5-15 min [69]
Temperature 30-40 °C [65]
DMSO: Dimethyl sulfoxide; EDTA: Ethylenediaminetetraacetic.
According to the solvent used, the light absorption of NR varies in wavelength and intensity, a property
known as solvatochromism [65] and illustrated in Figure 30. Its absorption and emission bands vary in
spectral position, shape and intensity with the nature of the solvent [67].
The magnitude of fluorescence is proportional to the amount of dye in the cell and the size of the
neutral-lipid droplet. Because of the solvatochromism property of NR, excitation/emission
wavelengths of the dye vary with the lipid bound. Thus, different excitation/emission wavelengths
have been reported for various microalgae species or even for the same strain in different conditions.
In addition the metachromatic properties of NR induced by the environment polarity can be exploited
to estimate the polarity distribution of the lipids [71,72]; a low wavelength (575 nm) corresponds to
neutral lipids while a higher wavelength (625 nm) indicates polar lipids. The use of NR is then very
complex, however most of the studies are performed with this dye as it is well known.
BODIPY may show a better cell penetration [73], a more stable fluorescence [74], and an easier
differentiation from pigments auto-fluorescence [69,75]. But it gives a very strong green auto-
fluorescence in the medium when using a too high concentration [73] (Figure 31); in this example
0.067 µg/mL Bodipy was used for 1∙106 cells/mL instead of 0.05 µg/mL, the optimal concentration
found for C. vulgaris.
Figure 30: Nile red under visible and ultraviolet (366 nm) light un
different solvents. From left to right: 1. water, 2. methanol, 3.
ethanol, 4. acetonitrile, 5. dimethylformamide, 6. acetone, 7. ethyl
acetate, 8. dichloromethane, 9. n-hexane, 10. methyl-tert-
butylether, 11. cyclohexane, 12. toluene.
Figure 31: Bodipy auto-fluorescence in the
medium, resulting from an excess of dye
(0.067 µg/mL of Bodipy for 1·106 cells/mL of
C. vulgaris)
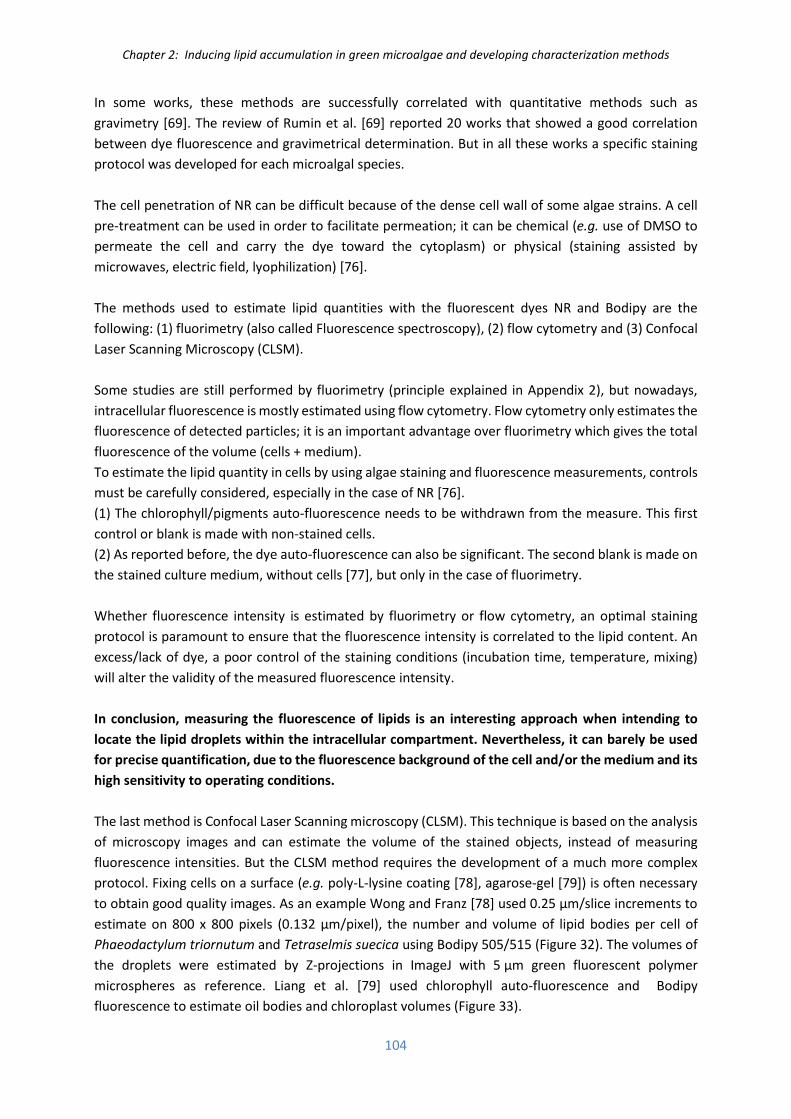
Chapter 2: Inducing lipid accumulation in green microalgae and developing characterization methods
104
In some works, these methods are successfully correlated with quantitative methods such as
gravimetry [69]. The review of Rumin et al. [69] reported 20 works that showed a good correlation
between dye fluorescence and gravimetrical determination. But in all these works a specific staining
protocol was developed for each microalgal species.
The cell penetration of NR can be difficult because of the dense cell wall of some algae strains. A cell
pre-treatment can be used in order to facilitate permeation; it can be chemical (e.g. use of DMSO to
permeate the cell and carry the dye toward the cytoplasm) or physical (staining assisted by
microwaves, electric field, lyophilization) [76].
The methods used to estimate lipid quantities with the fluorescent dyes NR and Bodipy are the
following: (1) fluorimetry (also called Fluorescence spectroscopy), (2) flow cytometry and (3) Confocal
Laser Scanning Microscopy (CLSM).
Some studies are still performed by fluorimetry (principle explained in Appendix 2), but nowadays,
intracellular fluorescence is mostly estimated using flow cytometry. Flow cytometry only estimates the
fluorescence of detected particles; it is an important advantage over fluorimetry which gives the total
fluorescence of the volume (cells + medium).
To estimate the lipid quantity in cells by using algae staining and fluorescence measurements, controls
must be carefully considered, especially in the case of NR [76].
(1) The chlorophyll/pigments auto-fluorescence needs to be withdrawn from the measure. This first
control or blank is made with non-stained cells.
(2) As reported before, the dye auto-fluorescence can also be significant. The second blank is made on
the stained culture medium, without cells [77], but only in the case of fluorimetry.
Whether fluorescence intensity is estimated by fluorimetry or flow cytometry, an optimal staining
protocol is paramount to ensure that the fluorescence intensity is correlated to the lipid content. An
excess/lack of dye, a poor control of the staining conditions (incubation time, temperature, mixing)
will alter the validity of the measured fluorescence intensity.
In conclusion, measuring the fluorescence of lipids is an interesting approach when intending to
locate the lipid droplets within the intracellular compartment. Nevertheless, it can barely be used
for precise quantification, due to the fluorescence background of the cell and/or the medium and its
high sensitivity to operating conditions.
The last method is Confocal Laser Scanning microscopy (CLSM). This technique is based on the analysis
of microscopy images and can estimate the volume of the stained objects, instead of measuring
fluorescence intensities. But the CLSM method requires the development of a much more complex
protocol. Fixing cells on a surface (e.g. poly-L-lysine coating [78], agarose-gel [79]) is often necessary
to obtain good quality images. As an example Wong and Franz [78] used 0.25 µm/slice increments to
estimate on 800 x 800 pixels (0.132 µm/pixel), the number and volume of lipid bodies per cell of
Phaeodactylum triornutum and Tetraselmis suecica using Bodipy 505/515 (Figure 32). The volumes of
the droplets were estimated by Z-projections in ImageJ with 5 µm green fluorescent polymer
microspheres as reference. Liang et al. [79] used chlorophyll auto-fluorescence and Bodipy
fluorescence to estimate oil bodies and chloroplast volumes (Figure 33).

Chapter 2: Inducing lipid accumulation in green microalgae and developing characterization methods
105
Figure 32: Volume of lipid bodies per cell in T. suecica (Normal
and Nitrogen deficient conditions) [78]
Figure 33: Volumetric changes of oil bodies and chloroplasts in
F. solaris in response to nutrient limitation [79].
A similar method was used for Tetraselmis subcordiformis by Xu et. al [80].
III2d) Colorimetric method (Sulfophosphovanillin)
Finally, colorimetric methods are alternatives to measure lipid content of the cells. The most widely
used is the Sulfophosphovanillin (SPV) method, especially in medical applications, such as lipid analysis
in human serum [81,82] and in algal production [83,84].
The method is illustrated below in Figure 34. The complete protocol is detailed in Appendix 3.
Figure 34: Illustration of the SPV method [84].
The SPV reaction is performed is three steps (Figure 35) [82]. First the chromogen formation is based
on the electrophilic addition of sulfuric acid to an alkene by acid-aldehyde reactions (a). In the second
step, a vanillin phosphate ester is formed which then reacts with chromogen (b). Finally, after an
incubation period, a purple-red chromophore, detected by its absorbance at 530 nm, is formed (c).

Chapter 2: Inducing lipid accumulation in green microalgae and developing characterization methods
106
The absorbance is proportional to the amount of unsaturated fatty acids contained in the sample, in a
given range of concentrations.
Figure 35: Proposed reactions for the SPV method, modified from Knight et al. [85]. a) Chromogen formation, sulfuric acid
reacts with unsaturated carbon atoms of fatty acids. b) Vanillin reacts with phosphoric acid to form a phosphovanillin
complex. c) the phosphovanillin complex binds with sulfur which the chromogen to form sulfophosphovanillin
chromophores.
The advantage of this technique, in comparison with gravimetrical methods, is the limited amount of
biomass required. According to Mishra et al. [84], the absorbance must be higher than 0.05, several
hundred of microliters of alga suspension are generally sufficient.
Furthermore, SPV detects unsaturated FA only, but both polar (FA in the membrane) and neutral FA
(FA as TAGs). But the result also depends on the structure of the molecule: oleic acid (C18:1) gives a
higher response than linoleic acid (C18:2) and linolenic acid (C18:3) [85], with a difference of about 5-
10 % as illustrated in Figure 36.

Chapter 2: Inducing lipid accumulation in green microalgae and developing characterization methods
107
Figure 36: SPV response for oleic acid (C18:1), linoleic acid (C18:2) and linolonic acid (C18:3) [85]
The major difficulty when using SPV on algae, is the necessity to have a suitable reference lipid and its
choice is generally complicated. Indeed, the reference must have a FA composition (especially the ratio
of saturated/unsaturated FA) as close as possible to the composition of the algae analyzed. This
problematic requires to know a priori the FA composition of the algae (e.g. using gas chromatography)
and to find a reference oil with the same composition.
Finally, the interference of other carbon-carbon double bounds presents in algae (pigments, vitamins)
is quite unstudied in literature. To conclude, SPV method is a simple, straightforward method to
estimate lipid content but is certainly not as precise as a chromatography method.
III2e) Conclusion about lipid quantification
To conclude about lipid quantification, several techniques were investigated during this project, our
principal constraint was the possibility of using low amounts of biomass, due to the specificity of our
experiments (microsystems, electroporation cuvettes). Bodipy-associated methods were coupled with
flow cytometry for qualitative images and semi-quantitative measurements (fluorescence associated
values). In addition we used the SPV method using the protocol proposed by Mishra et al. [84]. Finally,
gas chromatography was performed with the help of an external laboratory to obtain the exact
composition of FA in Chlamydomonas reinhardtii at different stages of lipid accumulation.
Additional lipid estimation techniques, not studied in this project, are presented in Appendix 4.
III3) Cell size
On one hand cell size measurements were required in order to estimate their behavior during lipid
accumulation. A precise estimation of the size is also necessary when selecting electroporation
parameters as the applied electric potential must be proportional to the cell diameter (see Chapter 3).

Chapter 2: Inducing lipid accumulation in green microalgae and developing characterization methods
108
Two methods were studied: laser granulometry and microscopic measurements.
The laser granulomer used in this work was a Malvern Mastersizer 3000. The principles of the method
are described in appendix 5.
In addition with laser granulometry, microscopic measurements were performed using an inverted
microscope Nikon Eclipse Ti-S equipped with x40 magnification objective LWD 40x/0.55 Ph1 ADL and
a CMOS colored camera Nikon DS-Ri2 (captor size 4908 x 3264 pixels) with an additional magnification
lens. The diameter estimation was performed by measuring the longer membrane to membrane length
on a minimum of 200 cells with the software NIS Elements D as illustrated in Figure 37.
Figure 37: Estimation of diameter distribution of a cell population with the software NIS Elements D. Image recorded
with Chlamydomonas reinhardtii after 4 days of stress.
IV. Procedure to induce lipid accumulation developed in this work
In the early stage of the project, several algae strains were cultivated in order to test their ability to
produce high intracellular lipid contents.
Afterwards, the culture was restricted to the most suitable strain, to study PEF: Chlamydomonas
reinhardii which is large (~ 7 to 10 µm diameter), can accumulate high amount of lipids, and is a
freshwater strain. Cell size and medium conductivity are indeed paramount features in a PEF treatment
(see chapter 3).
Algae strains were obtained from the Culture Collection of Algae at the University of Goettingen
(EPSAG, Nikolausberger Goettingen, Germany). Chlamydomonas reinhardtii SAG 34.89 (wild type), and
Chlamydomonas reinhardtii SAG 83.81 (Cell wall deficient muted strain from the wild type 34.98, also
known as cw15) were cultivated in TAP Medium [86]. Other strains, Acutodesmus Obliquus SAG 13.80

Chapter 2: Inducing lipid accumulation in green microalgae and developing characterization methods
109
(also known as Scenedesmus Obliquus) and Parachlorella kessleri SAG 13.80 were cultivated in B3N
medium. The media are detailed in Appendix 6.
All the cultures were axenic and prepared with media and vessels autoclaved at 121°C. The lipid
accumulation was performed in two steps as described previously: cell growth in optimal conditions
and re-suspension in a nitrogen depleted medium.
IV1) 1st step “growth step”:
Algae strains were maintained in optimal growth conditions in an incubator Minitron Infors HT (Figure
38).
The conditions are:
• Inoculation at a low cell concentration (inferior to 5∙104 cells∙mL-1)
• Re-inoculation at low concentration as soon as the mother culture reaches a limit
concentration (1∙107 cells∙mL-1) in order to avoid light limitation
• Continuous light supply: 20 - 40 µmol∙m-2∙s-1
• Low volume to surface ratio because of the low light supply. Maximum 50 mL of medium in
250 Erlenmeyer flasks (Fischerbrand) as shown in Figure 39.
• Ambient air enriched at 1.5 % CO2. Erlenmeyer flasks equipped with air-permeable silicone
plugs (S-type).
• Temperature maintained at 24 ± 1°C.
• Mixing at 100 rpm.
After reaching a certain quantity of biomass, the cells are centrifuged at 6000 g during 5 minutes and
re-suspended in a depleted medium, as explained below.
IV2) 2nd step "stress conditions”:
Lipid accumulation is performed using nitrogen deprivation associated with high light conditions. The
centrifuged cells were re-suspended in 40-60 mL of a nitrogen depleted medium in 250 mL Erlenmeyer
Figure 38: Minitron HT incubator used to grow algae Figure 39: Maximum 50 mL of medium in 250 mL Erlenmeyer
flasks. Culture at 24 ± 1 °C, 20-40 µmol·m-2.s-1, 1.5 % CO2.

Chapter 2: Inducing lipid accumulation in green microalgae and developing characterization methods
110
flasks (Fisherbrand) with a silicon plug S-type and placed in a home-made lipid accumulation system
(Figure 40), where the supplied light intensity supplied is higher than in the growth conditions. The
preparation of the depleted medium is detailed in Appendix 6.
The conditions are:
• Nitrogen depleted medium: TAP N- in the case of Chlamydomonas reinhardtii, Bristol N- in the
case of other strains.
• Inoculation with centrifuged cells at a concentration of 3∙106 cells∙mL-1.
• Continuous light supply with blue/red lamps (Arcadia FMH24T5, 24W) to provide an average
light intensity of 100 -150 µmol∙m-2∙s-1.
• Mixing at 100 rpm.
• Temperature maintained at 24 ± 1°C (system in a temperature controlled room + ventilators).
• Ambient air (0.04 % CO2).
Figure 40: Lipid accumulation system. 40-60 mL of medium in 250 mL Erlenmeyer flasks. Culture at 24±1°C, 100-
150 µmol·m-2·s-1, 1.5% CO2. Media depleted in nitrogen.
IV3) Discussion of the conditions chosen
The conditions of culture were optimized to obtain, as possible, reproducible algae suspensions for the
following electroporation and extraction experiments.
The conditions presented above in “growth conditions”, that lead to a high growth rate (µ), without
light stress or limitation, are applied. During experiments, the cell concentration was monitored over
time to verify that cultures were in the exponential growth phase and to ensure reproducibility.
Attention was paid on avoiding light limitation due to an excess of biomass in the culture. This is the
reason why algae cells were generally re-inoculated after 3-4 days of growth in a new fresh medium at
a reduced concentration. Particular attention was paid on the pigment content (autofluorescence per
cell) during growth, to verify that it remained rather constant. In our conditions, light was constantly
provided, with no light/dark cycles. Without light/dark cycles which mimic a natural sun cycle,
interdivision and division phases are not synchronized in the culture. The very low light intensity

Chapter 2: Inducing lipid accumulation in green microalgae and developing characterization methods
111
supplied to the culture during growth constraints the cell to develop their antenna size in order to
maximize light absorption. This sur-development of antenna size during growth leads to a maximum
light stress when the cells are incubated in lipid accumulation conditions with no nitrogen and high
light supplied as an excess of photon will reach the center of photosystem II [87,88].
During the second phase aiming at accumulating neutral lipids, a sufficient quantity of biomass was
necessary for the further experiments and analyzes, but it was also required to use a reduced cell
concentration to trigger a high light stress. In the case of Chlamydomonas reinhardtii, the
concentration used at the beginning of stress conditions was generally 3∙106 cells/mL in 40 - 60 mL. In
some experiments, multiple parallel cultures were prepared under stress conditions to satisfy the
demand of particular measurements (e.g. lipids measured by GC-FID and biomass quantity
characterized by dry weight). The lipid accumulation system was specifically set-up for this project.
Improvements of the set-up would be possible such as an increase in the carbon dioxide concentration
and a higher light irradiance but after setting up the protocol, changes in culture conditions were
avoided.
The limited volume of cultures, of several dozens of milliliters, were chosen in order to avoid light
limitation.
V. Development and validation of the methods
V1) Determination of cell concentration by flow cytometry
The cell concentration of Chlamydomonas reinhardtii wild type was monitored by flow cytometry. A
method was developed for cells in stress and exponential growth phase conditions. As previously
reported, data obtained using flow cytometry were compared with those obtained by microscopy
(Malassez method) in order to validate the former method; a very good correlation was obtained for
Chlamydomonas reinhardtii wild type both in growth phase (Figure 73) and after 14 days of stress
(Figure 74). The average difference between flow cytometry and Malassez cells was 11 % and 18 % for
respectively growth phase and stress conditions. In addition, when using flow cytometry at
concentrations about 3∙105 cells/mL, the difference between flow cytometry and hemocytometry is
only 8 % and 9 % in growth and stress phases, respectively.
V2) Calibration curve of SPV method using Triolein
The SPV method was calibrated with triolein dissolved in chloroform (2 mg/mL) and evaporated in
different quantities (from 12.5 to 125 µL) as described in Appendix II2. Triolein is composed of three
molecules of oleic acid 18:1 and a molecule of glycerol. As discussed in the results, triolein is the main
unsaturated FA present in our algae. When estimating lipid quantities on algae solutions, the
absorbance response can be converted into a triolein equivalent (TOeq in µg). The correlations obtained
are presented in the appendix 3 of the chapter 3.
V3) Development of Bodipy staining on Chlamydomonas reinardtii

Chapter 2: Inducing lipid accumulation in green microalgae and developing characterization methods
112
The main difficulty of Bodipy staining is to optimize the amount of dye, which depends on (1) the
number of lipid containing cells and (2) the neutral lipid content per cell. The latter varies with the
microalgae strain, the culture conditions and in our case, with the stress duration. Questions such as:
Should the amount of dye vary with the stress duration? What would happen if there is an excess or a
lack of dye? are raised.
To optimize the dye dosage, experiments using different quantities of it, with or without a washing
step (centrifugation + resuspension in an unstained medium), were conducted. We thought to use an
excess of due to entirely stain the lipid droplets and wash the cells to remove the excess of dye not
binded to neutral lipids. According to Govender et. al, [73], Bodipy specifically bonds to lipid droplets.
No dye is thus expected to stay unbound in the cytoplasm of the cell. In addition, if conditions are
conveniently optimized, no excess of the dye should be observed in microscopy. In order to confirm
these facts, tests were carried out using confocal scanning imaging and flow cytometry; a washing step
was first added to the staining protocol (see hereafter) in order to eliminate dye excess.
Two methods were used in our work to optimize lipid staining: (i) microscopic observations (epi-
fluorescence or confocal microscopy), and (ii) quantitative measurements using e.g. flow cytometry;
this consists of measuring the mean green fluorescence per cell (at 530 nm).
These two options have major drawbacks: (i) the observations may greatly vary with the acquisition
parameters: lamp intensity, attenuation filters, objective, exposure duration and gain. Moreover,
Bodipy bleaching (fluorescence degradation due to lamp exposure) occurs. (ii) quantitative results can
be obtained through flow cytometry but the interpreation of data can be difficult. This point will be
further discussed.
In the following sections, the detailed procedure to optimize Bodipy staining is described and
discussed.
V3a) Effect of the ratio Bodipy/cell and the presence of a washing step on
Chlamydomonas reinhardtii
Conditions from Govender et al. [73] were first considered to establish our staining protocol. To verify
the effect of a washing step on Bodipy fluorescence, the quantity of Bodipy was higher than the one
suggested by Govender et al. [73] which recommend 0.067 µg of Bodipy for 1 million of Chlorella
vulgaris cells. The amount of Bodipy used was adjusted according to the bio-volume of
Chlamydomonas reinhardtii cells in comparison with Chlorella vulgaris ones: the ratio of cell radius
equal to 3.5 (Chlamydomonas reinhardii and Chlorella vulgaris radii estimated to respectively 3.5 and
1 µm) leads to a ratio of biovolume of 43. Thus, a Bodipy quantity ranging from 0.5 to 2 µg for 1 million
of Chlamydomonas reinhardtii cells in lipid accumulation phase (13 days of stress) was tested. The
mean green fluorescence (530 nm) per cell was measured for a Bodipy ratio of 0.5, 1, 1.5 and 2 µg for
1∙106 cells, with and without an additional washing step (noted W). Results are presented in Figure 41.
Cells were incubated with Bodipy during 7 minutes and then diluted to be measured by flow cytometry
(concentration of 2.5∙105 cells/mL, 2 000 cells measured). In the case of the washing step, cells were
centrifuged at 6 000 g during 5 minutes and resuspended in fresh medium (TAP N-).

Chapter 2: Inducing lipid accumulation in green microalgae and developing characterization methods
113
Figure 41: Bodipy fluorescence measured by flow cytometry for Chlamydomonas reinahrdtii in lipid accumulation phase
(13 days of stress) for various Bodipy and cell ratios (quantity in micrograms of Bodipy for 1 million of cells) with and
without a washing step (centrifugation + resuspension in fresh medium after staining).
From Figure 41, it is clear that the ratio of 0.5 µg of Bodipy for 1∙106 cells is not enough to stain neutral
lipids accumulated in Chlamydomonas reinhardtii after 13 days of stress. Indeed, increasing the ratio
to 1 µg, resulted in a great increase in fluorescence. But for higher ratios (1.5 µg and 2 µg) there is no
further increase. This shows that the ratio 1 µg for 1∙106 cells seems to be optimal for Chlamydomonas
reinhardtii at 13 days of lipid accumulation stress.
The effect of the washing step on fluorescence intensity is difficult to understand. As flow cytometry
does not take into account the medium fluorescence washing slightly reduces the amount of
intracellular Bodipy (for ratio of 1 and more) even if this is not very significant. However, for the lowest
Bodipy concentration (0.5 µg for 106 cell) for which neutral lipids are only partially stained, the decrease
related to washing is very high.
This observation raises the question about the lability of Bodipy bound to neutral lipids, which is a
strong drawback for this method. Another question must be answered: does Bodipy keep in the
cytoplasm and stain molecules other than lipid droplets?
Chlamydomonas reinhardtii cells at 6 days of stress stained with Bodipy (1 µg + washing step, 1 µg and
1.5 µg for 1 million of cells) are shown in Figure 42. The fluorescence seems to be well related to lipid
droplets but it is hard to distinguish direct fluorescence from fluorescence coming from nearby objects:
i.e. a small fluorescence is observed in the cytoplasm between droplets, but this could be due to the
fluorescence diffracted from surrounding droplets. More precision could be obtained with confocal
microscopy, as the field observed is illuminated and recorded pixel by pixel to avoid the light emitted
out of the focus.
In conclusion, from the images, no clear difference could be observed between cells stained with 1
µg of Bodipy for 1 million cells with or without a washing step. No fluorescence seems to be observed
out of the cells, in the background of the image, suggesting that Bodipy is not in excess. This was
previously observed by Govender et al. [73].

Chapter 2: Inducing lipid accumulation in green microalgae and developing characterization methods
114
Finally, the cells stained with 1.5 µg of Bodipy for 1 million of cells show a very slight fluorescence in
the background of the image. We can therefore hypothesize that the optimal Bodipy to stain 1 million
of Chlamydomonas reinhardtii cells at 6 days of stress would be comprised between 1 and 1.5 µg.
Figure 42: Bodipy staining step. Chlamydomonas reinhardtii cells at 6 days of stress observed with an epi-fluorescence
microscope (1 µg + washing step, 1 µg and 1.5 µg for 1 million of cells)
Furthermore, Chlamydomonas reinhardtii cells in growth phase were stained under the same
conditions, i.e. 1 µg of Bodipy for 1∙106 cells and observed by epifluorescence microscopy (Figure 45).
Figure 43: Bodipy staining (1 µg for 1·106 cells) on Chlamydomonas reinhardtii in growth conditions observed with an epi-
fluorescence microscope. a) Washing step, b) no washing step. Chlorophyll autofluorescence (red) and Bodipy fluorescence
(green).
In Figure 43, we observe a clear difference with (a) and without (b) a washing step suggesting that
there was a clear excess of dye (1 µg for 1∙106 cells) in contrast to the Figure 42 where no effect was
observed with or without washing. This may indicate that the amount of dye used should vary with
stress duration as the amount of lipid droplets increases during stress. In the case of an excess of dye
used (Figure 43.b), Bodipy fluorescence is observed (1) in lipid droplets, (2) on plasma membranes, (3)
in the cytoplasm, and (4) in the medium out of the cells.
The washing step seems therefore to affect Bodipy fluorescence in the medium and also in the cells:
cytoplasm and membranes when using an excess of dye. In Figure 42, for stress conditions, no clear
difference could be observed on cells with or without a washing step: the fluorescence is indeed so
strong due to a high lipid content that it is very hard to identify its origin. In conclusion, fluorescence

Chapter 2: Inducing lipid accumulation in green microalgae and developing characterization methods
115
microscopy seems to be not suitable for optimizing the staining protocol and select if a washing step
in necessary or not.
V3b) Observation on Chlamydomonas reinhardtii cells in 7 days of stress using a
Confocal Laser Scanning Microscopy (CLSM).
The confocal laser scanning microscopy (CLSM) allows a more efficient observation of the fluorescence
emitted by Bodipy stained cells. In comparison with epi-fluorescence microscopy, CLSM increases
optical resolution by adding a spatial pinhole which eliminates out-of-focus light [89]. With the help
of laser (instead of lamps in the case of epi-fluorescence microscopy), the sample is scanned point by
point to avoid the excitation of the surrounding sample. This technique gains in resolution in space,
but loses in rate of acquisition compared with the epi-fluorescence microscope equipped with a color
camera presented previously. To better understand the difference with wide field fluorescence, see
Appendix 7.
Because of the low rate of image acquisition (several seconds per image), the algae sample must keep
stable during image acquisition in confocal microscopy. When the algae cells are immobilized, it is
possible to acquire a high resolution image of Chlamydomonas reinhardtii stained with Bodipy (1 µg
for 1∙106 cells at 7 days of stress) as presented in Figure 44. In this image, acquisition is performed on
X/Y and also in Z plans. This figure presents the acquisition on 15 Z plans, each distanced by 0.35 µm.
Figure 44: 15 Z stacks of a Chlamydomonas reinhardtii cell stained with Bodipy (1 µg for 1·106 cells at 7 days of stress, no
washing step), 0.35 µm between each Z slice. Bodipy is detected in the green channel, Chlorophyll autofluorescence is
detected in the red channel. Diameter of the cell: 11 µm. Recording Is performed from the bottom to the top.
The use of CLSM enables to visualize precisely the numerous lipid droplets which are inside the
cytoplasm. On the example of Figure 44, about 30 to 40 lipid droplets of a diameter ranging from 0.1
to 1 µm were counted in the cytoplasm. The first slices (top left on the figure 46) seem well illuminated
by the laser, but the 5 last slices (bottom right of Figure 44) are shadowed, probably because the laser

Chapter 2: Inducing lipid accumulation in green microalgae and developing characterization methods
116
could not penetrate the whole cell. Despite the absence of washing step, Bodipy seems to stain only
lipid droplets, and not the lipids associated with the membranes. The use of a washing step is
therefore not justified, provided the observation is made with CSLM.
V3c) Conclusion on Bodipy staining protocol
When studying Chlamydomonas reinhardtii cells with a high lipid content (after 13 days of stress),
we found that 0.5 µg Bodipy/million cell is not a sufficient ratio to stain correctly the lipids, whereas
1 µg/million cell is enough; higher ratios do not result in different staining. As for the growth
conditions (where the cells contain few lipids), 1 µg Bodipy/million cell seems to be excessive, as a
green fluorescence is observed in the medium out of the cells and in other parts of the cells (Figure
43.b). As expected, we confirm that the optimal quantity of Bodipy strongly depends on the lipid
content of the cells.
When using an excess of Bodipy for staining, the medium fluorescence can be eliminated by a washing
step (removal of the medium after staining and resuspension in fresh medium). But unfortunately the
washing step also removes a part of the intra-fluorescence; flow-cytometry indeed confirmed a
decrease in the mean fluorescence per cell after washing due to a loss of Bodipy of the cells.
Finally, CLSM imaging on cells in stress conditions (7 days) performed without a washing step and
with an adequate ratio of Bodipy, showed an efficient staining of the lipid droplets; no Bodipy is
observed in the cytoplasm or in the membrane.
Bodipy agglomeration in membranes or in the cytoplasm then seems to be related to an excess of
Bodipy
V4) Development of a CLSM method to observe Chlamydomonas reinhardtii (pigments,
lipids, cell wall).
The use of multiple fluorescence probes to specifically detect algae compounds, as presented in the
previous section, must take into account the excitation/emission of the dyes (see Figure 28 and Figure
29 for further information on excitation/emission) to avoid overlapping of each dye with chlorophyll
auto-fluorescence and with the other ones.
An additional dye was also used to stain the cell wall of Chlamydomonas reinhardtii in order to help
characterizing the global shape of the alga.
This section aims to explain how the cell wall dye was used taking into account the fluorescence
properties of Chlorophyll and Bodipy, and then, how the optical configuration was chosen to record
CLSM images (excitation/emission used in the different channels). These issues were also considered
for all fluorescent molecules used in this work, including viability/permeability probes presented in
Chapter 3.
A fluorescence configuration can be analyzed with a tool called “spectra viewer, or spectra analyzer”,
which illustrates the excitation/emission spectrum for all the fluorescent molecules considered. The
tool can be found on internet.
Chlorophyll a autofluorescence can be mimicked in the tool by selecting the fluorophore PerCP-cy5.5
which refers to the Peridinin chlorophyll protein (PerCP). As it can be observed in Figure 45.a,
Chlorophyll a excitation has a large band from 350 to 720 nm with two maximum peaks at 490 and 670
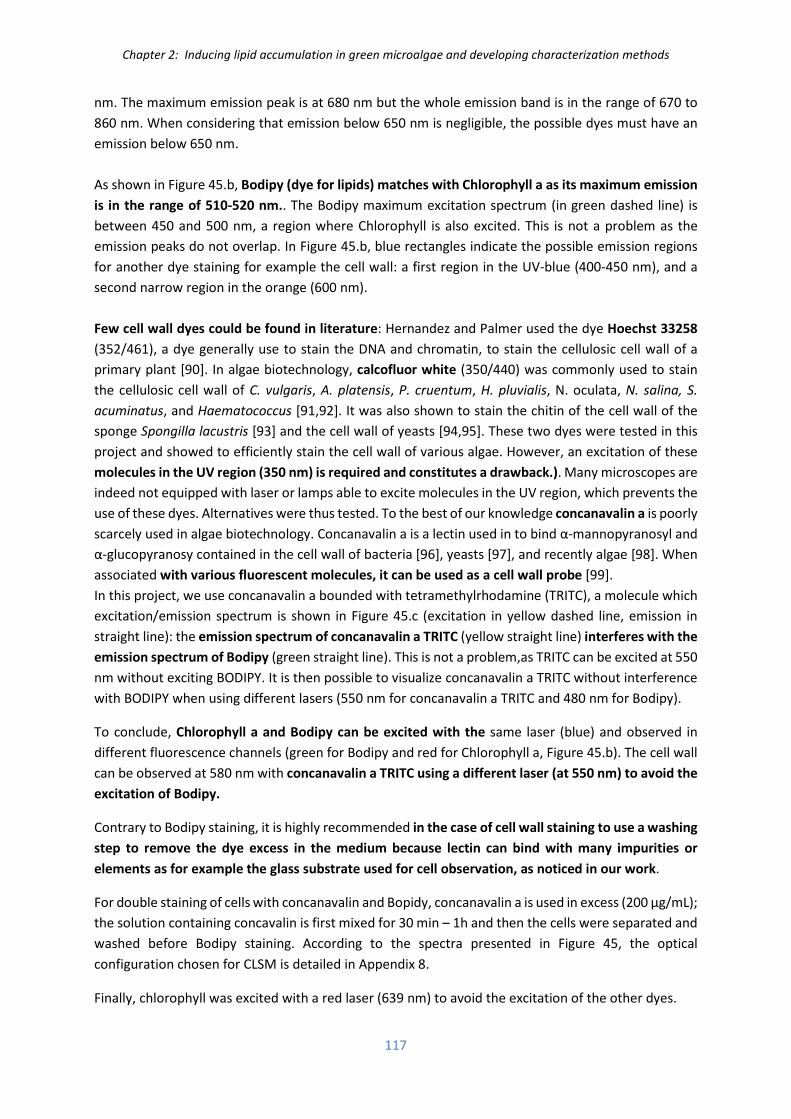
Chapter 2: Inducing lipid accumulation in green microalgae and developing characterization methods
117
nm. The maximum emission peak is at 680 nm but the whole emission band is in the range of 670 to
860 nm. When considering that emission below 650 nm is negligible, the possible dyes must have an
emission below 650 nm.
As shown in Figure 45.b, Bodipy (dye for lipids) matches with Chlorophyll a as its maximum emission
is in the range of 510-520 nm.. The Bodipy maximum excitation spectrum (in green dashed line) is
between 450 and 500 nm, a region where Chlorophyll is also excited. This is not a problem as the
emission peaks do not overlap. In Figure 45.b, blue rectangles indicate the possible emission regions
for another dye staining for example the cell wall: a first region in the UV-blue (400-450 nm), and a
second narrow region in the orange (600 nm).
Few cell wall dyes could be found in literature: Hernandez and Palmer used the dye Hoechst 33258
(352/461), a dye generally use to stain the DNA and chromatin, to stain the cellulosic cell wall of a
primary plant [90]. In algae biotechnology, calcofluor white (350/440) was commonly used to stain
the cellulosic cell wall of C. vulgaris, A. platensis, P. cruentum, H. pluvialis, N. oculata, N. salina, S.
acuminatus, and Haematococcus [91,92]. It was also shown to stain the chitin of the cell wall of the
sponge Spongilla lacustris [93] and the cell wall of yeasts [94,95]. These two dyes were tested in this
project and showed to efficiently stain the cell wall of various algae. However, an excitation of these
molecules in the UV region (350 nm) is required and constitutes a drawback.). Many microscopes are
indeed not equipped with laser or lamps able to excite molecules in the UV region, which prevents the
use of these dyes. Alternatives were thus tested. To the best of our knowledge concanavalin a is poorly
scarcely used in algae biotechnology. Concanavalin a is a lectin used in to bind α-mannopyranosyl and
α-glucopyranosy contained in the cell wall of bacteria [96], yeasts [97], and recently algae [98]. When
associated with various fluorescent molecules, it can be used as a cell wall probe [99].
In this project, we use concanavalin a bounded with tetramethylrhodamine (TRITC), a molecule which
excitation/emission spectrum is shown in Figure 45.c (excitation in yellow dashed line, emission in
straight line): the emission spectrum of concanavalin a TRITC (yellow straight line) interferes with the
emission spectrum of Bodipy (green straight line). This is not a problem,as TRITC can be excited at 550
nm without exciting BODIPY. It is then possible to visualize concanavalin a TRITC without interference
with BODIPY when using different lasers (550 nm for concanavalin a TRITC and 480 nm for Bodipy).
To conclude, Chlorophyll a and Bodipy can be excited with the same laser (blue) and observed in
different fluorescence channels (green for Bodipy and red for Chlorophyll a, Figure 45.b). The cell wall
can be observed at 580 nm with concanavalin a TRITC using a different laser (at 550 nm) to avoid the
excitation of Bodipy.
Contrary to Bodipy staining, it is highly recommended in the case of cell wall staining to use a washing
step to remove the dye excess in the medium because lectin can bind with many impurities or
elements as for example the glass substrate used for cell observation, as noticed in our work.
For double staining of cells with concanavalin and Bopidy, concanavalin a is used in excess (200 µg/mL);
the solution containing concavalin is first mixed for 30 min – 1h and then the cells were separated and
washed before Bodipy staining. According to the spectra presented in Figure 45, the optical
configuration chosen for CLSM is detailed in Appendix 8.
Finally, chlorophyll was excited with a red laser (639 nm) to avoid the excitation of the other dyes.

Chapter 2: Inducing lipid accumulation in green microalgae and developing characterization methods
118
Figure 45: Spectra viewer of Chlorophyll a mimicked by Peridinin chlorophyll protein (PerCP), Bodipy, and Concanavalin
Tetramethylrhodamine (TRITC). Dashed and full lines correspond to excitation and emission spectra respectively.
VI. Results

Chapter 2: Inducing lipid accumulation in green microalgae and developing characterization methods
119
VI1) Biomass growth
The specific growth rate, µ, was estimated on the exponential growth phase according to equation 3.
μ = ��� ���! ��
����� (Equation 2.2 [46])
Where ti and tf are the initial and final culture times and Ni and Nf (cells/mL) correspond to cell
concentrations at ti and tf respectively
VI1a) First step: Growth phase
The growth patterns and the specific growth rates determined for cultures developed in the growth
(Figure 38) are compared in Figure 46. The concentration was measured by flow cytometry as
described in Figure 26.
Figure 46: Cell concentration measured over time for Chlamydomonas reinhardtii wild type. Cells are grown in 250 mL
Erlenmeyer flasks. Growth incubator: low light intensity (20 – 40 µmol·m-2·s-1) and enriched CO2 atmosphere (1.5). All
cultures were inoculated in TAP N+.
The growth rate was quite similar in the three cultures performed in the growth incubator, the mean
growth rate measured was 1.43 ± 0.03 d-1. The growth rate in the light incubator was a little higher
1.71 ± 0.03 d-1. According to this result, light seems to be more limiting than CO2, as an increase in light
and a decrease in CO2 leads to a slight increase in the growth rate.
VI1b) Second step: Stress phase
During the stress phase (figure 50), the cell concentration increases from (3.26 ± 0.36)∙106 cells/mL,
generally during the first 4 days of stress, and stagnate after at a maximal concentration. The culture

Chapter 2: Inducing lipid accumulation in green microalgae and developing characterization methods
120
2 exhibits a particular behavior, with no significant variation of cell concentration, which cannot be
explained. After 7 days of stress, the cell concentration reached varies from 4∙106 cells/mL to 1∙107
cells/mL.
It must be noted that the cells growth behavior may greatly vary among cell cultures This could be
related to the pre-culture conditions, e.g. cell concentration of the culture before centrifugation/re-
suspension.
Figure 47: Cell concentration over time for 5 cultures of Chlamydomonas reinhardtii WT in stress conditions
VI1c) Illustration of the two steps
The evolution of cell concentration during growth step and stress is presented in Figure 48. The
measurements on the two steps presented here were performed on two different cell cultures but the
figure illustrates the reduction of growth rate always observed during stress in comparison with the
exponential growth during the growth phase.

Chapter 2: Inducing lipid accumulation in green microalgae and developing characterization methods
121
Figure 48: Illustration of the two steps: exponential growth and stress conditions, with a resuspension and dilution from
growth phase to stress phase.
VI2) Chlorophyll content
Chlorophyll concentration together with cell concentration were determined by cytometry. The former
was detected by measuring red autofluorescence at 680 nm (gain set for red fluorescence: 8).
VI2a) First step: Growth phase
The evolution of red fluorescence per cell over time for several cultures in growth phase is illustrated
in Figure 49. The average mean red fluorescence measured for over 30 algae samples in exponential
growth at different times was equal to 1.05∙104 ± 0.32∙104 au.

Chapter 2: Inducing lipid accumulation in green microalgae and developing characterization methods
122
Figure 49: Mean red fluorescence (associated with chlorophyll autofluorescence) measured over time for 4
Chlamydomonas reinhardtii WT cultures in optimal growth conditions. Mean red fluorescence and standard deviation is
shown in a green bar.
Red fluorescence varies around the mean value of approximately 1∙104 au. This variation could be due
to cell cycles in which the pigment content per cell would increase before division into daughter cells.
In addition, the pigment content could adapt to light distribution inside the culture. But in exponential
phase red autofluorescence does not exhibit any global tendency to decrease or increase with time.
VI2b) Second step: stress conditions
The evolution of mean red autofluorescence of four cultures in stress conditions (high light intensity
of 100 -150 µmol∙m-2∙s-1, nitrogen depletion) is shown in Figure 50 (mean red fluorescence per cell in
log scale).

Chapter 2: Inducing lipid accumulation in green microalgae and developing characterization methods
123
Figure 50: Mean red fluorescence per cell over time for two cultures of Chlamydomonas reinhardtii WT in stress
conditions.
In contrast with growth conditions, red fluorescence drastically falls for both cultures from about 1∙104
a.u. to less than 4∙102 a.u. in 8 days. The decrease is exponential in the first 8 days of stress with an
average decrease of -0.408 ± 0.047 d-1 when plotting the logarithm of the mean red. The decrease of
pigment content can be easily explained by the absence of nitrogen in the medium which prevents cell
division (see Figure 49 and Figure 50). The inability of the cell to divide and an increase of light supplied
to the culture results in an high excess of energy at the outlet of the photosystem (see Figure 20). The
first strategy of the cell to reduce this harmful energy is to decrease the quantity of photons absorbed
by degrading a part of the pigments. The nitrogen contained in chlorophyll molecules could also be
used a source of nitrogen source.
It would be interesting to correlate the red fluorescence per cell measured with flow cytometry with
the determination of chlorophyll content per cell with a quantitative method (e.g. chromatography
analysis).
VI3) Dry weight (stress condition)
The evolution of dry weight of 3 cultures during stress (cultures 1, 2 and 3, Figure 47) is presented in
Figure 51. The dry weight protocol requires a high quantity of culture volume and was thus only
perform on 3 cultures. Interestingly, while the 3 cultures showed different cell concentration pattern
(Figure 47, the highest cell concentration was determined for culture 3 after 7 days of stress and the
lowest one was measured for culture 2), the total dry weight of biomass per unit of volume increased
similarly in the 3 cultures from 0.3 - 0.4 g∙L-1 to approximately 1 g∙L-1 after 8 days of stress (Figure 51).
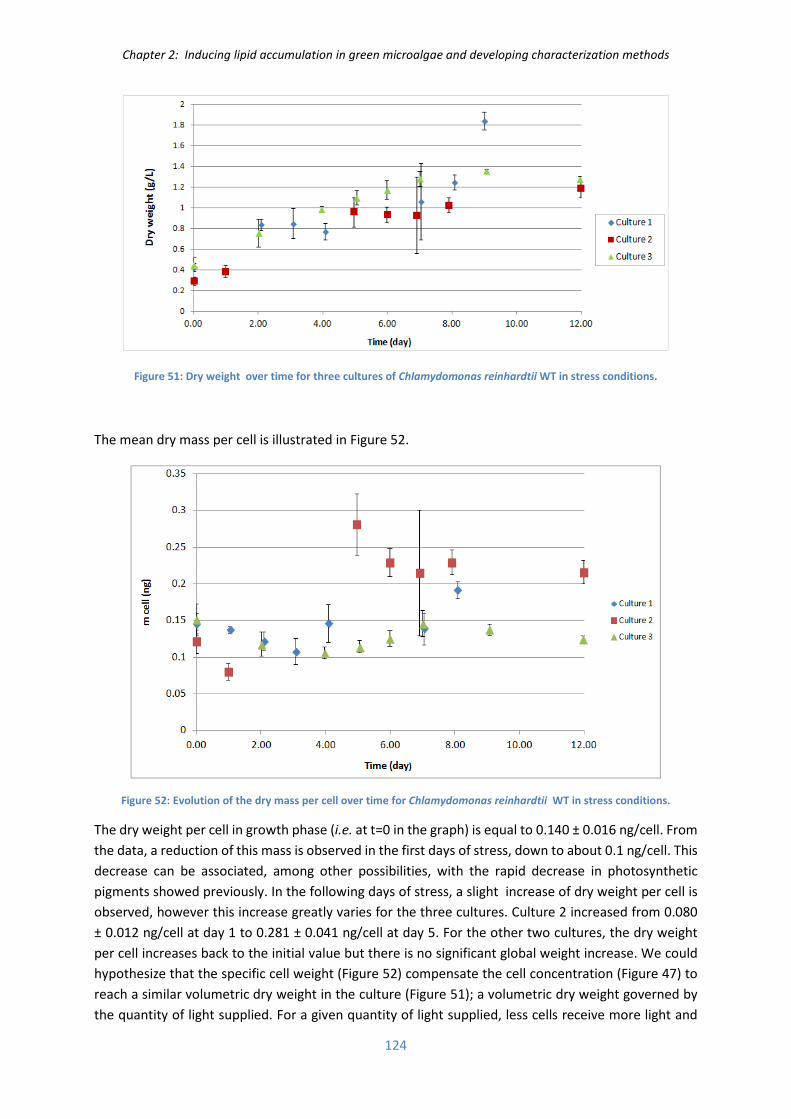
Chapter 2: Inducing lipid accumulation in green microalgae and developing characterization methods
124
Figure 51: Dry weight over time for three cultures of Chlamydomonas reinhardtii WT in stress conditions.
The mean dry mass per cell is illustrated in Figure 52.
Figure 52: Evolution of the dry mass per cell over time for Chlamydomonas reinhardtii WT in stress conditions.
The dry weight per cell in growth phase (i.e. at t=0 in the graph) is equal to 0.140 ± 0.016 ng/cell. From
the data, a reduction of this mass is observed in the first days of stress, down to about 0.1 ng/cell. This
decrease can be associated, among other possibilities, with the rapid decrease in photosynthetic
pigments showed previously. In the following days of stress, a slight increase of dry weight per cell is
observed, however this increase greatly varies for the three cultures. Culture 2 increased from 0.080
± 0.012 ng/cell at day 1 to 0.281 ± 0.041 ng/cell at day 5. For the other two cultures, the dry weight
per cell increases back to the initial value but there is no significant global weight increase. We could
hypothesize that the specific cell weight (Figure 52) compensate the cell concentration (Figure 47) to
reach a similar volumetric dry weight in the culture (Figure 51); a volumetric dry weight governed by
the quantity of light supplied. For a given quantity of light supplied, less cells receive more light and

Chapter 2: Inducing lipid accumulation in green microalgae and developing characterization methods
125
thus can accumulate more secondary metabolites (such as starch and TAGs in the case of
Chlamydomonas reinhardtii). But overall, if considering that the photosynthetic yield (conversion of
light into algae mass) is similar in the different cultures, the volumetric mass is similar (g/L). It is
possible that the cultures who divided more has spent more resources in the production of biomass
than the production of secondary metabolites.
Mulders and colleagues [100] described this phenomenon of increased specific cell production in
reduced cell concentration in Figure 53.
Figure 53: Illustration of the effect of biomass concentration on cellular productivity and volumetric productivity [100]
VI4) Lipid content
VI4a) Identification and quantification of Fatty acids (polar + neutral FA) during
stress, measured by gas chromatography (GC-FID).
The FA analyzes for Chlamydomonas reinhardtii wild type were performed one single time by an
external laboratory (Bioprocess Engineering group, Wageningen University and Research Center,
Netherlands). The analytical method [60] was described in the section “Gas Chromatography analyses”
of this chapter.
Total lipids are completely extracted and then separated by Solid Phase Extraction (SPE) into a polar
FA (Fatty Acids) pool (membrane associated FA) and a neutral FA pool (FA accumulated as TAGs in the
cytoplasm).
The results in terms of total FA composition are presented in Figure 54: 8 samples from culture 3 (in
Figure 47, Figure 51 and Figure 52), corresponding to different stress durations were analyzed in
triplicate. FA compositions in the polar pool (A) and in the neutral pool (B) are presented in Figure 55.

Chapter 2: Inducing lipid accumulation in green microalgae and developing characterization methods
126
Figure 54: Evolution of total fatty acids and their composition (neutral FA + polar FA) in Chlamydomonas reinhardtii over
time (12 days of stress). *FA only detected in the polar FA pool, ** FA only detected in the neutral FA pool.
Figure 55: Evolution of total fatty acids and their composition Chlamydomonas reinhardtii over time (12 days of stress) A
polar FA, B neutral FA. *FA only detected in the polar FA pool, ** FA only detected in the neutral FA pool.
The mass fraction of polar FAs (dry mass of polar FAs per dry mass of cells) is roughly constant during
the whole stress period till 7 days, at approximately 14.55 ± 2.40 % (Figure 55.A). A slight increase in
this mass fraction, up to 18.25 ± 2.75 %, is observed afterwards. But their composition greatly varies:
the proportion in C16:0 and C18:1 increases to the detriment of C16:4 and C18:3 FA. This corresponds
to a hydrogenation of some unsaturated FA which reduce their degree of saturation (from C16:4 to
C16:0 and from C18:3 to C18:1).

Chapter 2: Inducing lipid accumulation in green microalgae and developing characterization methods
127
On the contrary, the mass fraction of neutral FAs increases during stress from 4.86 ± 0.21 % DW at
the beginning of experiment to 17.79 ± 2.75% DW after 2 days of stress and 23.11 ± 2.06% DW after 7
days of stress (Figure 55.B). At the beginning of stress, the main FA in neutral FA pool is C19:0 (1.69 ±
0.09 % of total DW). The two other main FA are C16:0 and C18:1 which represent respectively 0.95 ±
0.03 and 0.91 ± 0.05 % of DW). After 7 days of stress, the 6 main FA are: C18:1, C16:0, C18:2, C19:0,
C18:3 and C16:1 respectively at 6.22 ± 0.17, 4.68 ± 0.15, 3.02 ± 0.23, 2.39 ± 0.02, 1.59 ± 0.20 and 1.52
± 0.10 %. Long chained FA are more present in the neutral FA pool that in the polar FA pool. C19:0 is
not found in membrane associated FA (i.e. polar FA). On the contrary C15:0 is found in the polar pool
but not in the neutral pool.
Finally, when neutral and polar FA are considered together as a total FA present in the biomass, the
lipid content increases from 19 % up to 36 – 37 % (Figure 54). After 7 days of stress, C18:1 represents
9.58 % DW and C16:0 9.28 % of DW. After these two main FA, the most represented FA are C18:2
(3.82 %), C15:0 (3.03 %), C19:0 (2.39 %), and C18:3 (2.00 %). Work et al. [101] also measured C18:1
and C16:0 as the two main FA accumulated by Chlamydomonas reinhardtii wt during stress but the
others main FA found were C16:1, C16:2, C16:3 and C18:0. In the work of Breuer et al. [60] where 9
the FA composition of 9 oleaginous strains was analyzed, C18:1 and C16:0 were also found to be the
main FA with C18:1 mostly found in the neutral FA pool. Whether in Work et al. [101] or Breuer et al.
[60], the FA 19:0 is not found. In another study, Breuer et al. [42] has showed that the FA composition
in a culture varies with temperature and pH.
VI4b) Analysis of FA composition for biodiesel purpose and analytical methods
In addition, with polar and neutral pool relative compositions, it is interesting to distinguish saturated
FA (Cn:0) from mono-unsaturated FA (Cn:1) and poly-unsaturated FA (Cn:2,3,4,). This consideration
is important for biofuel production (see section II2), Figure 18) and for SPV method (see section III2),
Figure 35).
When considering FA identified in the non-polar pool (TAGs) analyzed (Figure 58B) which could be
transesterified to biodiesel, about 1/3 are saturated and 2/3 are unsaturated (about 45% mono-
unsaturated and 20% poly-unsaturated). When comparing with data from Figure 18, FA from our
samples can be transesterified to biodiesel (neutral FA); the representative point on figure 17 would
be in the yellow region with good cetane number and iodine value, but the cold filter plugging point
(CFPP) is not sufficient as it requires a minimum of 80% of mono-unsaturated FA.
Our results are also important when considering the SPV (SulfoPhosphoVanillin) method that will be
used to quantify total lipids as previously reported (section III2d), Appendix II2 and hereafter). It should
be reminded that only unsaturated FA, both polar and non-polar FA (membranes associated FA and
TAGs, respectively) are detected with this method. To correlate chromatography analysis with SPV
method (see hereafter), saturated FA (C15:0, C16:0, C18:0, C20:0) are discarded from data presented
in Figure 54.
The evolution of the mass of unsaturated FA per cell of Chlamydomonas reinhardtii during stress
conditions is therefore presented in Figure 56 ( the relative composition of FA in % of total dry weight

Chapter 2: Inducing lipid accumulation in green microalgae and developing characterization methods
128
can be converted to a relative composition of FA in nano-grams per cell (10-9 grams) by using the cell
concentration and cell dry weight of the culture (data from culture 3, Figure 47 and Figure 52).
Figure 56: Mass of unsaturated FA per cell over time measured for Chlamydomonas reinhardtii in stress conditions.
In Figure 56, it can be observed that the mass of unsaturated FA increased during stress from
approximately 0.015 ng per cell to 0.027 ng. This increase is mostly due to the increase content of oleic
acid C18:1 and linoleic acid C18:2. Between day 7 and day 9 of stress, the mass of unsaturated FA per
cell decreases back to the less than 0.020 ng. During stress, after a period of neutral lipid accumulation
due to an energetic imbalance at the outlet of photosystems of cells Figure 20, the cells may degrade
their carbon stored in the cytoplasm to use it as a source of organic energy.
When comparing the evolution of biomass (Figure 47) and lipid accumulation presented above, it is
interesting to observe that until day 4 the cell concentration (in cell number per volume) increases in
the same time as the neutral FA content (from 5 to 23% of DW). After day 4, the cell concentration and
the FA content (in % DW) tend to stabilize. However, an increase in dry weight per cell is observed in
the culture 3 from day 4 to day 7(Figure 52), indicating that the FA fraction may evolve between day
0 and day 4 of stress (Figure 54) and then the cell continues to accumulate FA until day 7 (Figure 56)
and other energy storage compounds (e.g. starch) without modifying the relative FA content per cell.
When comparing the other cultures, it would have been interesting to analyze culture 2 which has a
higher cell weight to verify if this culture has accumulated very high amount of neutral FA compared
to the culture 1.
VI4c) Colorimetric method: SulphoPhosphoVanillin (SPV).

Chapter 2: Inducing lipid accumulation in green microalgae and developing characterization methods
129
The SPV method described by Mishra and colleagues [84] was used to rapidly estimate the lipid
quantity in algae cultures (see section III2), Figure 34, Figure 35). Algae in stress conditions (7 days of
stress) at different concentrations were used to verify the linearity of the response with cell number.
Thus algae were concentrated at different factors from 0.5 (dilution) to 8, corresponding to a cell
concentration ranging from 5∙106 to 4∙107 cells/mL and thus 5∙106 to 4∙107 cells (100 µL of aqueous
phase added). Algae in growth phase were also tested with the SPV reaction. The results are gathered
in table 3.
First absorbances were plotted towards concentration factors; a good straight line (r2= 0.994) is
obtained confirming the feasibility of the method for analyzing algae.
Its equation is Abs = 0.117 (Concentration Factor). The triolein equivalent mass (TOeq) was calculated
by converting the absorbance into TOeq (µg) by using the correlation found in appendix III.3 (Abs =
0.003 TOeq). C18:1 in the main unsaturated FA found in our algae (Figure 56).
Table 3: Estimation of the Triolein equivalent per cell: Chlamydomonas reinhardtii in stress (7 days) and in growth phase
Color development for the various concentrations tested is illustrated in Figure 57.
Figure 57: SPV colorations obtained for algae in 7 days of stress concentrated by a factor from 0.5 to 8 (from the left to
the right).
7 days of stress Growth
phase
Concentration
factor
0 0.5 1 2 4 4
Cell number (cells) 0 4.97E5 9.94E5 1.99E6 3.98E6 4.56E6
Mean abs 530 nm 0 0.055 ± 0.014
0.130 ± 0.016
0.250 ± 0.016
0.455 ± 0.015
0.323 ± 0.064
Toeq (µg) 0 17.74 41.94 80.65 146.77 104.19
Toeq per cell (ng) 0 0.036
± 0.009 0.042
± 0.005 0.041
± 0.001 0.037
± 0.001 0.023
± 0.004
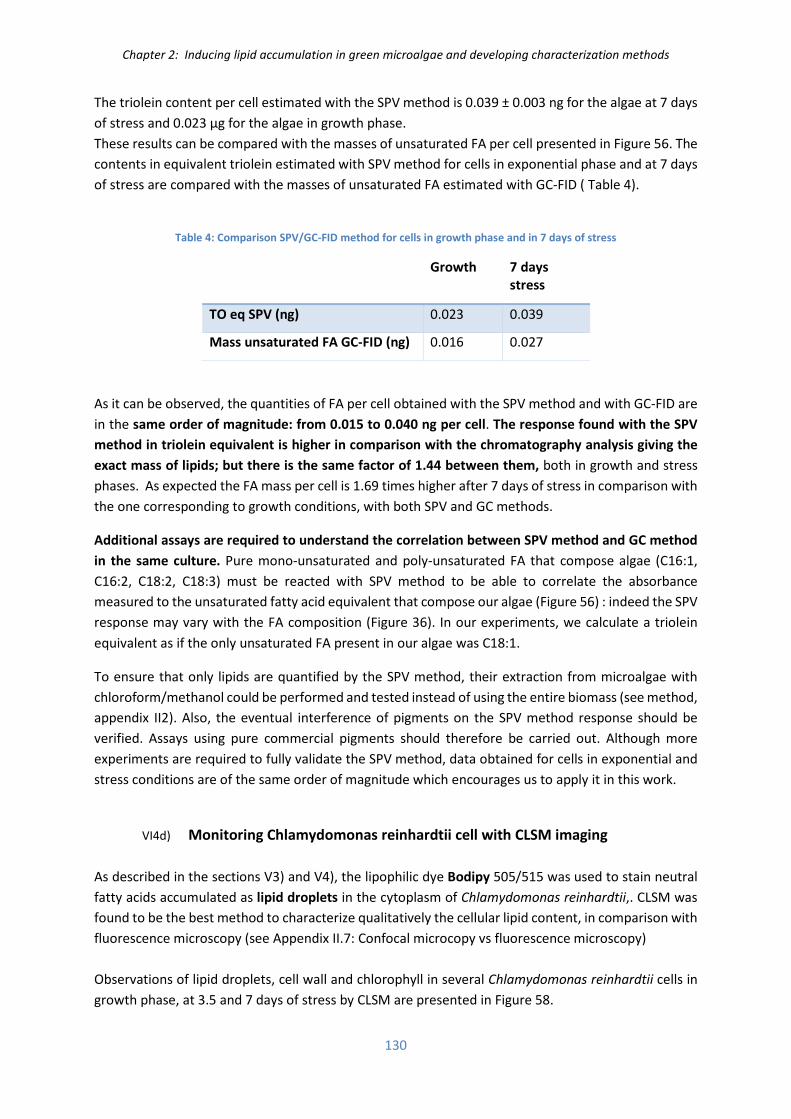
Chapter 2: Inducing lipid accumulation in green microalgae and developing characterization methods
130
The triolein content per cell estimated with the SPV method is 0.039 ± 0.003 ng for the algae at 7 days
of stress and 0.023 µg for the algae in growth phase.
These results can be compared with the masses of unsaturated FA per cell presented in Figure 56. The
contents in equivalent triolein estimated with SPV method for cells in exponential phase and at 7 days
of stress are compared with the masses of unsaturated FA estimated with GC-FID ( Table 4).
Table 4: Comparison SPV/GC-FID method for cells in growth phase and in 7 days of stress
Growth 7 days
stress
TO eq SPV (ng) 0.023 0.039
Mass unsaturated FA GC-FID (ng) 0.016 0.027
As it can be observed, the quantities of FA per cell obtained with the SPV method and with GC-FID are
in the same order of magnitude: from 0.015 to 0.040 ng per cell. The response found with the SPV
method in triolein equivalent is higher in comparison with the chromatography analysis giving the
exact mass of lipids; but there is the same factor of 1.44 between them, both in growth and stress
phases. As expected the FA mass per cell is 1.69 times higher after 7 days of stress in comparison with
the one corresponding to growth conditions, with both SPV and GC methods.
Additional assays are required to understand the correlation between SPV method and GC method
in the same culture. Pure mono-unsaturated and poly-unsaturated FA that compose algae (C16:1,
C16:2, C18:2, C18:3) must be reacted with SPV method to be able to correlate the absorbance
measured to the unsaturated fatty acid equivalent that compose our algae (Figure 56) : indeed the SPV
response may vary with the FA composition (Figure 36). In our experiments, we calculate a triolein
equivalent as if the only unsaturated FA present in our algae was C18:1.
To ensure that only lipids are quantified by the SPV method, their extraction from microalgae with
chloroform/methanol could be performed and tested instead of using the entire biomass (see method,
appendix II2). Also, the eventual interference of pigments on the SPV method response should be
verified. Assays using pure commercial pigments should therefore be carried out. Although more
experiments are required to fully validate the SPV method, data obtained for cells in exponential and
stress conditions are of the same order of magnitude which encourages us to apply it in this work.
VI4d) Monitoring Chlamydomonas reinhardtii cell with CLSM imaging
As described in the sections V3) and V4), the lipophilic dye Bodipy 505/515 was used to stain neutral
fatty acids accumulated as lipid droplets in the cytoplasm of Chlamydomonas reinhardtii,. CLSM was
found to be the best method to characterize qualitatively the cellular lipid content, in comparison with
fluorescence microscopy (see Appendix II.7: Confocal microcopy vs fluorescence microscopy)
Observations of lipid droplets, cell wall and chlorophyll in several Chlamydomonas reinhardtii cells in
growth phase, at 3.5 and 7 days of stress by CLSM are presented in Figure 58.

Chapter 2: Inducing lipid accumulation in green microalgae and developing characterization methods
131
Figure 58: CLSM imaging of Chlamydomons reinhardtii cells at different phases of stress (A: growth phase, B: 3.5 days of
stress and C: 7 days of stress). Lipid droplets stained by Bodipy 505/515 in green, cell wall stained by concanavalin TRITC
in yellow, chlorophyll autofluorescence in red.

Chapter 2: Inducing lipid accumulation in green microalgae and developing characterization methods
132
Concerning auto-fluorescent pigments (mainly chlorophyll a and b), the observations are in
accordance with the results in Figure 50, which showed a decrease in the chlorophyll fluorescence per
cell. Indeed, the chlorophyll content decreased by a factor 9 in the first 4 days of stress and then by a
factor 4 between day 4 and day 7. The observation of chlorophyll in the cells in growth phase are in
accordance with the structure represented in Figure 4, where the thylakoid membranes cover
approximately 70 to 80 % of the cytoplasmic surface. Interestingly, though a large space is occupied
(Figure 61), chlorophyll represents a lower percentage of the dry weight of vegetative cells, 2%
according to Figure 19. It should however be highlighted that the chlorophyll content is strongly
affected by the culture conditions, such as light and nutrients concentrations. In our conditions, a
chlorophyll content higher than 2 % is certainly expected.
Concerning lipids, a very high increase of lipid droplet volume per cell is observed between day 0
(growth phase) and 7 days of stress. Interestingly, the increase in volume appears more important
between day 3.5 and 7 than at the beginning of the stress phase. In addition, the size of the lipid
droplets varies between 0.1 µm to several µm, from a few droplets to several dozens per cell.
These observations can be compared with the neutral FA content per cell presented in Figure 59.
Figure 59: Mass of neutral FA (TAGs) per cell during stress, estimated from GC measurements Data of the culture 3: cell
concentration and cell dry weight (Figure 47 and Figure 52) and the neutral FA lipids (Figure 55.b)
The mass of neutral FA per cell increases from 0.007 ng to 0.035 ng per cell (increase by a factor 5).
This increase calculated from GC measures seems lower than the one suggested by CLSM
observations where the increase in lipid droplet volume per cell seems much more important as
almost no lipid droplet is observed in Figure 58.A (exponential growth) and a very high bio-volume of
lipid droplets is observed in Figure 58.C (7 days of stress). The difference could be explained by 2 main
hypotheses: (1) the variability between the cultures. The neutral lipid content per cell measured in
culture 3 (Figure 59) could be lower than that of many other cultures. This could be related to the high
cell concentrations of this culture compared to other cultures (Figure 47), which strongly affects light
penetration and therefore lipid accumulation. As illustrated in Figure 53, it is possible that the
accumulation of energy per cell is minimized by an increased cell concentration and (2), it is possible

Chapter 2: Inducing lipid accumulation in green microalgae and developing characterization methods
133
that some neutral FA were measured by GC-FID but not stained by Bodipy, e.g., neutral FA associated
to the endoplasmic reticulum membrane (see Figure 15).
Concerning the cell wall observations, Chlamydomonas reinhardtii cells in growth phase are packaged
as 1,2 or 4 cells during their division in small cell wall orbs and contained in a larger cell wall which
encompasses the daughter cells (see Figure 58Erreur ! Source du renvoi introuvable.). The cell wall is
about a hundred nanometer thick. During stress, the cell wall enlarges into multiple layers of various
thicknesses and densities as previously illustrated (Figure 3), up to a total thickness of several
micrometers (Figure 60).
Figure 60: CLSM image of Chlamydomonas reinhardtii wild type cell which possesses a thick cell wall (stained by
concanavalin a TRITC in yellow).
VI4e) Monitoring of neutral lipid content with Bodipy staining and flow cytometry
Bodipy fluorescence per cell was monitored by flow cytometry after an optimization of the staining
protocol (section V3)). The mean fluorescence per cell, measured on over 2,000 cells in triplicate for 4
cultures of Chlamydomonas reinhardtii in different days of stress is presented in Figure 61. The
following conditions were applied: 1.5 µg or 1 µg of Bodipy was used to stain 1∙106 cells for cultures 1,
2 and 3 (1.5 µg) and culture 4 (1 µg ) respectively, with 10 minutes of incubation, No washing step
(removal of the excess of Bodipy from the medium) was performed.
At the beginning of the assay, (day 0), the Bodipy mean fluorescence varies from 120 a.u. per cell
(culture 4) to 314 a.u. (cultures 1 and 2). After 7 days of stress, the mean Bodipy fluorescence per cell
varies from 751 a.u. (culture 3) up to 6,718 a.u. (order of magnitude between the two cultures: 9). The
ratio of mean Bodipy fluorescences at day 7 over day 0 varies from 4.75 to 25 in the 4 cultures (Figure
61).

Chapter 2: Inducing lipid accumulation in green microalgae and developing characterization methods
134
Figure 61: Mean green fluorescence per cell (associated with Bodipy fluorescence) measured by flow cytometry measured
on 4 cultures of Chlamydomonas reinhardii in stress conditions. Bodipy added: 1.5 µg of Bodipy for 1·106 cells/mL, no
washing step, 10 min of staining (for culture 4, the quantity added is 1.5 µg of Bodipy for 1·106 cells/mL).
These results confirm the accumulation of lipid droplets in the cells as the mean fluorescence increases
during time. However, the mean fluorescence value measured in the 4 cultures at day 7 of stress is
much higher than the other cultures. Questions are therefore raised: is this variation due to a
difference of cell behavior for the four cultures? We hypothesized that less lipid content had been
accumulated per cell in culture 3 because of the higher biomass concentration of this culture (Figure
47). This could explain the lower fluorescence values of culture 3 in comparison with the other cultures
e.g. culture 1. But the differences of fluorescence could also be due to a variation of the Bodipy
penetration in the cells. Many side experiments have been carried and results showed that Bodipy
fluorescence per cell varies greatly with conditions such as those related to cell permeability [76] and
lipid droplets structure. For instance, the presence of several small lipid droplets or few large affects
strongly the mean fluorescence measured though similar lipid contents in the cell.
To validate or invalidate the Bodipy staining protocol, additional assays must be performed where
correlations between Bodipy fluorescence and neutral lipid content per cell measured by gas
chromatography analysis would be determined [76]. In the view of the results obtained in this project,
the correlation could not be validated yet although, the mean Bodipy fluorescence increased by a ratio
of 4.75 (Figure 61) and the mass of neutral FA per cell increased by a ratio of 4.66 for the culture 3
(culture both measured on chromatography and Bodipy) (Figure 59).
An additional correlation between SPV and Bodipy fluorescence responses could be also performed.
However, these two methods do not measure the same parameter: one is supposed to measure
neutral lipids (Bodipy staining associated to flow cytometry) and the other one to quantify total
unsaturated fatty acids in algae solutions (neutral plus polar lipids). These two methods are really fast
and easy to perform, but are much less precise and reliable than the costly and time consuming GC
analysis. They were however the main methods used to evaluate lipid extraction from microalgae in

Chapter 2: Inducing lipid accumulation in green microalgae and developing characterization methods
135
this work as they are the most adapted taking into account the biomass volume used during PEF (Pulse
Electric Field) experiments in microsystems and electroporation cuvettes (see Chapter 3).
VI5) Monitoring cell size
The mean cell diameter of Chlamydomonas reinhardtii wild type was in the range of 6 to 10.5 µm
depending on stress durations.
Two methods were used, (1) laser granulometry and (2) manual optical measurements (see section
III3)) More precisely, mean cell diameters of 6.54 ± 0.03, 6.61 ± 0.04 and 7.38 ± 0.03 for 0, 7 and 14
days of stress, respectively, were determined by Laser granulometry (Figure 62) whereas 6.79 ± 0.08,
9.95 ± 0.14, and 10.02 ± 0.04 were measured for 0, 7 and 15 days of stress, respectively, by microscopy
(Figure 63).
Figure 62: Distribution of number density (%) per size classes estimated from Chlamydomonas reinhardtii wt at
different lipid accumulation stages by laser granulometry
Figure 63: Distribution of number density (%) per size classes estimated from Chlamydomonas reinhardtii wt at
different lipid accumulation stages by laser granulometry
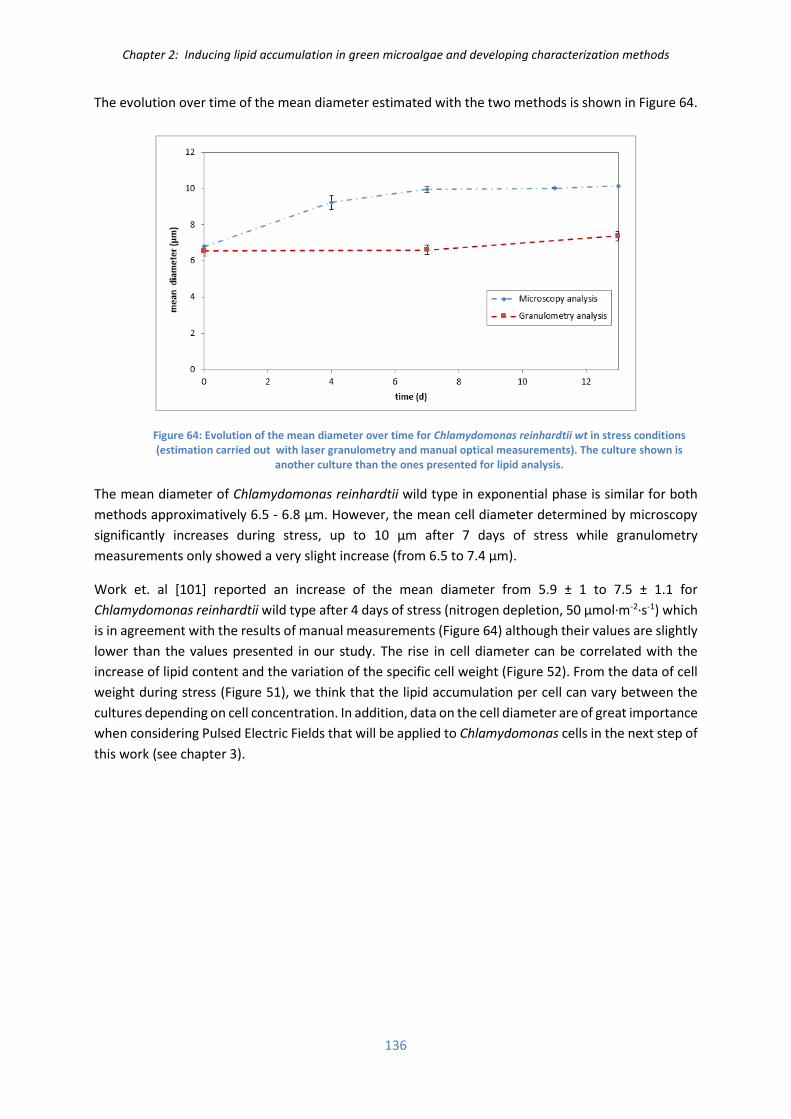
Chapter 2: Inducing lipid accumulation in green microalgae and developing characterization methods
136
The evolution over time of the mean diameter estimated with the two methods is shown in Figure 64.
Figure 64: Evolution of the mean diameter over time for Chlamydomonas reinhardtii wt in stress conditions
(estimation carried out with laser granulometry and manual optical measurements). The culture shown is
another culture than the ones presented for lipid analysis.
The mean diameter of Chlamydomonas reinhardtii wild type in exponential phase is similar for both
methods approximatively 6.5 - 6.8 µm. However, the mean cell diameter determined by microscopy
significantly increases during stress, up to 10 µm after 7 days of stress while granulometry
measurements only showed a very slight increase (from 6.5 to 7.4 µm).
Work et. al [101] reported an increase of the mean diameter from 5.9 ± 1 to 7.5 ± 1.1 for
Chlamydomonas reinhardtii wild type after 4 days of stress (nitrogen depletion, 50 µmol∙m-2∙s-1) which
is in agreement with the results of manual measurements (Figure 64) although their values are slightly
lower than the values presented in our study. The rise in cell diameter can be correlated with the
increase of lipid content and the variation of the specific cell weight (Figure 52). From the data of cell
weight during stress (Figure 51), we think that the lipid accumulation per cell can vary between the
cultures depending on cell concentration. In addition, data on the cell diameter are of great importance
when considering Pulsed Electric Fields that will be applied to Chlamydomonas cells in the next step of
this work (see chapter 3).

Chapter 2: Inducing lipid accumulation in green microalgae and developing characterization methods
137
Chapter 2 conclusion
In the first section of this chapter, the mechanisms of accumulation of neutral lipids in algae cells are
presented. The conversion of inorganic carbon into organic compounds through photosynthesis is
regulated by culture conditions. In the so called “optimal growth conditions”, i.e. optimal light
irradiance and nutrient concentration, algae will mainly synthetize molecules to produce functional
biomass and will divide at high rate.
A depletion of nitrogen in the medium combined with an increase of the photon flow rate will lead to
a rapid decrease in the photosynthetic activity and cell division and a rapid increase in neutral lipid
and/or starch contents in the majority of green microalgae strains. These carbon chains stored in the
cytoplasm consist of an energy sink to be converted back into functional biomass as soon as the
optimal conditions are reestablished.
In this context, a two steps strategy to induce neutral lipids accumulation in Chlamydomonas
reinhardtii was used and seems to be efficient to obtain biomass rich in lipids.
A reduction of microalgae specific growth rate from 1.4 d-1 in growth conditions to a complete stop of
cell division after approximately 4 days of stress.
Moreover, cell chlorophyll content, given by the auto-fluorescence intensity (flow cytometry),
decreased by a factor of 50 to 100 during stress conditions compared with growth phase. The cell
concentration rapidly reaches a maximum value within the range of 5∙106 - 1∙107 cells/mL after
approximately 7 days of stress from a starting concentration of 3∙106 cells/mL at the beginning of
stress. Furthermore, an increase in cell diameter, estimated at 6 µm at the beginning of stress
conditions up to 10 µm after 7 days was observed.
The volumetric dry weight increases from 0.3 to 1 g/L after 6-7 days of stress. The evolution of dry
weight per cell followed a pattern inverse from the one of cell concentration. This result tends to
indicate that a high photon rate per cell (a reduced cell concentration for a similar light irradiance of
100 – 150 µmol∙m2∙s-1 results in a higher specific photon flow rate) increases cellular weight rise during
stress because of an increased energy received per cell. In other ways, a reduced cell concentration
may result in a higher neutral lipid content (and/or starch content) per cell. Anyway this behavior
would have few impact on volumetric lipid productivity.
The evolution of the FA composition measured by GC-FID analysis as shown that the lipid content
increases from 18 % to 35 % of the dry weight after 4 days of stress. The mass of polar lipids (membrane
associated FA) tends to be stable at 14 % DW. However, the relative mass of neutral fatty acids (TAGs)
increased from 5 to above 20 % DW after 4 days of stress, and then stabilizes. For polar FA, the relative
abundance of poly-unsaturated FA (e.g. C16:4 and C18:3) decreases during stress for an increase
abundance of C16:0 and C18:1 in the membranes. In neutral TAGs, the main FA found after 4 days of
stress are C18:1, C16:0, C18:2 and C19:0.
From the results presented in this chapter, Chlamydomonas reinhardtii wt cells at maximum stress
duration of 7 days should be used for lipid extraction as no increase in neutral lipid content is observed
after this time.

Chapter 2: Inducing lipid accumulation in green microalgae and developing characterization methods
138
In this chapter, the development and optimization of methods to quantify cell lipid content were also
described. The choice of using fluorescent dyes detected by flow cytometry and a colorimetric method
was justified by the fact of dealing with very low biomass volumes when performing electroporation
assays in micro-systems or in electroporation cuvettes (few micro-litters to a maximum of one milliliter
of algae solution) (see Chapter 3).
First, cell lipid contents in triolein equivalent determined by the SPV method (colorimetry) are in the
same order of magnitude as those measured by the classical and commonly used GC-FID
chromatography. Moreover, results confirm that lipid droplets accumulation in the cell can be
detected by measuring the mean Bodipy fluorescence by flow cytometry. SPV and Bodipy staining
methods are indeed fast and adapted to reduced biomass amounts and daily monitoring but more
work is required to further correlate their data to those of GC-FID chromatography.
Bodipy can also be used for microscopic observations, performed here to detect lipid droplets in micro-
systems. On the other hand, SVP method is correlated with unsaturated total FA content (neutral FA
accumulated as TAGs + polar membrane associated FA) and thus is less adapted for total neutral lipid
quantification. Still, results obtained with the SPV method seemed more reproducible than a method
based on Bodipy fluorescence which can be influenced with many parameters.

Chapter 2: Inducing lipid accumulation in green microalgae and developing characterization methods
139
Chapter 2 references
[1] M.K. Lam, K.T. Lee, Biofuels from Algae, 2014. doi:10.1016/B978-0-444-59558-4.00012-7. [2] A. Darzins, P. Pienkos, L. Edye, Current status and potential for algal biofuels production., Natl. Renew. Energy Lab. NREL A Rep. to
Bioenergy Task 39. Report T39 (2010) 146. http://www.globalbioenergy.org/uploads/media/1008_IEA_Bioenergy_-_Current_status_and_potential_for_algal_biofuels_production.pdf.
[3] a. E. Atabani, a. S. Silitonga, I.A. Badruddin, T.M.I. Mahlia, H.H. Masjuki, S. Mekhilef, A comprehensive review on biodiesel as an alternative energy resource and its characteristics, Renew. Sustain. Energy Rev. 16 (2012) 2070–2093. doi:10.1016/j.rser.2012.01.003.
[4] X. Li, P. Přibyl, K. Bišová, S. Kawano, V. Cepák, V. Zachleder, M. Čížková, I. Brányiková, M. Vítová, The microalga Parachlorella kessleri--a novel highly efficient lipid producer., Biotechnol. Bioeng. 110 (2013) 97–107. doi:10.1002/bit.24595.
[5] A. Klok, Optimization of lipid production in microalgae, n.d. [6] G. Breuer, P.P. Lamers, D.E. Martens, R.B. Draaisma, R.H. Wijffels, The impact of nitrogen starvation on the dynamics of
triacylglycerol accumulation in nine microalgae strains., Bioresour. Technol. 124 (2012) 217–26. doi:10.1016/j.biortech.2012.08.003.
[7] C. Safi, B. Zebib, O. Merah, P.-Y. Pontalier, C. Vaca-Garcia, Morphology, composition, production, processing and applications of Chlorella vulgaris: A review, Renew. Sustain. Energy Rev. 35 (2014) 265–278. doi:10.1016/j.rser.2014.04.007.
[8] B. Becker, Function and Evolution of the Vacuolar Compartment in Green Algae and Land Plants (Viridiplantae), Int. Rev. Cytol. 264 (2007) 1–24. doi:10.1016/S0074-7696(07)64001-7.
[9] P. Dupree, D.J. Sherrier, The plant Golgi apparatus, Biochim. Biophys. Acta - Mol. Cell Res. 1404 (1998) 259–270. doi:10.1016/S0167-4889(98)00061-5.
[10] D.S. Domozych, M. Ciancia, J.U. Fangel, M.D. Mikkelsen, P. Ulvskov, W.G.T. Willats, The Cell Walls of Green Algae: A Journey through Evolution and Diversity., Front. Plant Sci. 3 (2012) 82. doi:10.3389/fpls.2012.00082.
[11] E.H. Harris, The Chlamydomonas Sourcebook. Volume 1, second edition., 2009. [12] C.D. Silflow, P. a Lefebvre, Assembly and motility of eukaryotic cilia and flagella. Lessons from Chlamydomonas reinhardtii., Plant
Physiol. 127 (2001) 1500–1507. doi:10.1104/pp.010807. [13] http://www.athenapub.com/17Records-06.htm. [14] E.R. Moellering, C. Benning, RNA interference silencing of a major lipid droplet protein affects lipid droplet size in Chlamydomonas
reinhardtii, Eukaryot. Cell. 9 (2010) 97–106. doi:10.1128/EC.00203-09. [15] M. Vítová, K. Bišová, M. Hlavová, S. Kawano, V. Zachleder, M. Cížková, Chlamydomonas reinhardtii: duration of its cell cycle and
phases at growth rates affected by temperature., Planta. 234 (2011) 599–608. doi:10.1007/s00425-011-1427-7. [16] F.R. Cross, J.G. Umen, The Chlamydomonas cell cycle, Plant J. 82 (2015) 370–392. doi:10.1111/tpj.12795. [17] https://en.wikipedia.org/wiki/Mitochondrion. [18] https://en.wikipedia.org/wiki/Chloroplast. [19] Raven, Photosynthesis, Biol. Plants. (2013) 183–204. [20] K.J.M. Mulders, P.P. Lamers, D.E. Martens, R.H. Wijffels, Phototrophic pigment production with microalgae: Biological constraints
and opportunities, J. Phycol. 50 (2014) 229–242. doi:10.1111/jpy.12173. [21] J.F. Cornet, Calculation of optimal design and ideal productivities of volumetrically lightened photobioreactors using the constructal
approach, Chem. Eng. Sci. 65 (2010) 985–998. doi:10.1016/j.ces.2009.09.052. [22] F. Ramel, S. Birtic, S. Cuiné, C. Triantaphylidès, J.-L. Ravanat, M. Havaux, Chemical quenching of singlet oxygen by carotenoids in
plants., Plant Physiol. 158 (2012) 1267–78. doi:10.1104/pp.111.182394. [23] Y. Li, D. Han, G. Hu, M. Sommerfeld, Q. Hu, Inhibition of starch synthesis results in overproduction of lipids in Chlamydomonas
reinhardtii, Biotechnol. Bioeng. 107 (2010) 258–268. doi:10.1002/bit.22807. [24] R. Radakovits, R.E. Jinkerson, A. Darzins, M.C. Posewitz, Genetic engineering of algae for enhanced biofuel production, Eukaryot.
Cell. 9 (2010) 486–501. doi:10.1128/EC.00364-09. [25] http://lipidlibrary.aocs.org/Biochemistry/content.cfm?ItemNumber=40313. [26] Q. Hu, M. Sommerfeld, E. Jarvis, M. Ghirardi, M. Posewitz, M. Seibert, A. Darzins, Microalgal triacylglycerols as feedstocks for biofuel
production: perspectives and advances., Plant J. 54 (2008) 621–39. doi:10.1111/j.1365-313X.2008.03492.x. [27] A. Cagliari, R. Margis, F. dos S. Maraschin, A.C. Turchetto-Zolet, G. Loss, M. Margis-Pinheiro, Biosynthesis of Triacylglycerols (TAGs)
in plants and algae, Int. J. Plant Biol. 2 (2011) e10. doi:10.4081/pb.2011.e10. [28] V.H. Work, R. Radakovits, R.E. Jinkerson, J.E. Meuser, L.G. Elliott, D.J. Vinyard, L.M.L. Laurens, G.C. Dismukes, M.C. Posewitz,
Increased lipid accumulation in the Chlamydomonas reinhardtii sta7-10 starchless isoamylase mutant and increased carbohydrate synthesis in complemented strains., Eukaryot. Cell. 9 (2010) 1251–61. doi:10.1128/EC.00075-10.
[29] M. Kumar, C.R.K. Reddy, C. Salt, M. Che, <Functional ingredients from algae for foods and nutraceuticals-Woodhead Publishing- Book 2013.pdf>, 2013. doi:10.1533/9780857098689.
[30] V.M. Dembitsky, O. a Rozentsvet, Distribution of polar lipids in some marine, brackish and freshwater green macrophytes, Phytochemistry. 41 (1996) 483–488. doi:10.1016/0031-9422(95)00570-6.
[31] M. Siaut, S. Cuiné, C. Cagnon, B. Fessler, M. Nguyen, P. Carrier, A. Beyly, F. Beisson, C. Triantaphylidès, Y. Li-Beisson, G. Peltier, Oil accumulation in the model green alga Chlamydomonas reinhardtii: characterization, variability between common laboratory strains and relationship with starch reserves., BMC Biotechnol. 11 (2011) 7. doi:10.1186/1472-6750-11-7.
[32] S.D. Doughman, S. Krupanidhi, C.B. Sanjeevi, Omega-3 fatty acids for nutrition and medicine: considering microalgae oil as a vegetarian source of EPA and DHA., Curr. Diabetes Rev. 3 (2007) 198–203. doi:10.2174/157339907781368968.
[33] M.J. Ramos, C.M. Fern??ndez, A. Casas, L. Rodr??guez, ??ngel P??rez, Influence of fatty acid composition of raw materials on biodiesel properties, Bioresour. Technol. 100 (2009) 261–268. doi:10.1016/j.biortech.2008.06.039.
[34] Y. Li-Beisson, F. Beisson, W. Riekhof, Metabolism of acyl-lipids in Chlamydomonas reinhardtii, Plant J. 82 (2015) 504–522. doi:10.1111/tpj.12787.
[35] K.K. Sharma, H. Schuhmann, P.M. Schenk, High Lipid Induction in Microalgae for Biodiesel Production, Energies. 5 (2012) 1532–1553. doi:10.3390/en5051532.

Chapter 2: Inducing lipid accumulation in green microalgae and developing characterization methods
140
[36] A.J. Klok, J. a Verbaanderd, P.P. Lamers, D.E. Martens, A. Rinzema, R.H. Wijffels, A model for customising biomass composition in continuous microalgae production., Bioresour. Technol. 146 (2013) 89–100. doi:10.1016/j.biortech.2013.07.039.
[37] A. Packer, Y. Li, T. Andersen, Q. Hu, Y. Kuang, M. Sommerfeld, Growth and neutral lipid synthesis in green microalgae: A mathematical model, Bioresour. Technol. 102 (2011) 111–117. doi:10.1016/j.biortech.2010.06.029.
[38] T. Takeshita, S. Ota, T. Yamazaki, A. Hirata, V. Zachleder, S. Kawano, Starch and lipid accumulation in eight strains of six Chlorella species under comparatively high light intensity and aeration culture conditions, Bioresour. Technol. 158 (2014) 127–134. doi:10.1016/j.biortech.2014.01.135.
[39] B. Fernandes, J. Teixeira, G. Dragone, A. a Vicente, S. Kawano, K. Bišová, P. Přibyl, V. Zachleder, M. Vítová, Relationship between starch and lipid accumulation induced by nutrient depletion and replenishment in the microalga Parachlorella kessleri., Bioresour. Technol. 144 (2013) 268–74. doi:10.1016/j.biortech.2013.06.096.
[40] Z. Kolber, J. Zehr, P. Falkowski, Effects of Growth Irradiance and Nitrogen Limitation on Photosynthetic Energy Conversion in Photosystem II., Plant Physiol. 88 (1988) 923–929. doi:10.1104/pp.88.3.923.
[41] R. Praveenkumar, K. Shameera, G. Mahalakshmi, M.A. Akbarsha, N. Thajuddin, Influence of nutrient deprivations on lipid accumulation in a dominant indigenous microalga Chlorella sp., BUM11008: Evaluation for biodiesel production, Biomass and Bioenergy. 37 (2012) 60–66. doi:10.1016/j.biombioe.2011.12.035.
[42] G. Breuer, P.P. Lamers, D.E. Martens, R.B. Draaisma, R.H. Wijffels, Effect of light intensity, pH, and temperature on triacylglycerol (TAG) accumulation induced by nitrogen starvation in Scenedesmus obliquus., Bioresour. Technol. 143 (2013) 1–9. doi:10.1016/j.biortech.2013.05.105.
[43] G. Mujtaba, W. Choi, C.-G. Lee, K. Lee, Lipid production by Chlorella vulgaris after a shift from nutrient-rich to nitrogen starvation conditions., Bioresour. Technol. 123 (2012) 279–83. doi:10.1016/j.biortech.2012.07.057.
[44] V. Ördög, W. a. Stirk, P. Bálint, J. Staden, C. Lovász, Changes in lipid, protein and pigment concentrations in nitrogen-stressed Chlorella minutissima cultures, J. Appl. Phycol. 24 (2011) 907–914. doi:10.1007/s10811-011-9711-2.
[45] M.J. Griffiths, R.P. van Hille, S.T.L. Harrison, The effect of nitrogen limitation on lipid productivity and cell composition in Chlorella vulgaris., Appl. Microbiol. Biotechnol. 98 (2014) 2345–56. doi:10.1007/s00253-013-5442-4.
[46] P. Zhao, X. Yu, J. Li, X. Tang, Z. Huang, Enhancing lipid productivity by co-cultivation of Chlorella sp. U4341 and Monoraphidium sp. FXY-10., J. Biosci. Bioeng. xx (2014) 10–15. doi:10.1016/j.jbiosc.2013.12.014.
[47] P.S.C. Schulze, L.A. Barreira, H.G.C. Pereira, J.A. Perales, J.C.S. Varela, Light emitting diodes (LEDs) applied to microalgal production, Trends Biotechnol. 32 (2014) 422–430. doi:10.1016/j.tibtech.2014.06.001.
[48] J.-M. Lv, L.-H. Cheng, X.-H. Xu, L. Zhang, H.-L. Chen, Enhanced lipid production of Chlorella vulgaris by adjustment of cultivation conditions., Bioresour. Technol. 101 (2010) 6797–804. doi:10.1016/j.biortech.2010.03.120.
[49] T. Takeshita, Competitiveness, role, and impact of microalgal biodiesel in the global energy future, Appl. Energy. 88 (2011) 3481–3491. doi:10.1016/j.apenergy.2011.02.009.
[50] http://www.hemocytometer.org/2013/04/11/hemocytometer-square-size/. [51] http://bitesizebio.com/13687/cell-counting-with-a-hemocytometer-easy-as-1-2-3/. [52] C.E. Seed, I. Larma, J.L. Tomkins, Cell size selection in Chlamydomonas reinhardtii gametes using fluorescence activated cell sorting,
Algal Res. 16 (2016) 93–101. doi:10.1016/j.algal.2016.03.004. [53] No Title, (n.d.). http://nikitavsurpatne.yolasite.com/optics.php. [54] E.G. BLIGH, W.J. DVER, Canadian Journal of Biochemistry and Physiology, 37 (1959). [55] J. Folch, M. Lees, G.. Sloane Stanley, a Simple, 55 (1987) 999–1033. [56] R. Halim, M.K. Danquah, P. a Webley, Extraction of oil from microalgae for biodiesel production: A review., Biotechnol. Adv. 30
(2012) 709–32. doi:10.1016/j.biotechadv.2012.01.001. [57] A.R. Medina, E.M. Grima, A.G. Gimenez, M.J.I. Gonzalez, Downstream processing of algal polyunsaturated fatty acids, Biotechnol.
Adv. 16 (1998) 517–580. doi:10.1016/S0734-9750(97)00083-9. [58] E. Ryckebosch, K. Muylaert, I. Foubert, Optimization of an Analytical Procedure for Extraction of Lipids from Microalgae, J. Am. Oil
Chem. Soc. 89 (2011) 189–198. doi:10.1007/s11746-011-1903-z. [59] M. Axelsson, F. Gentili, A single-step method for rapid extraction of total lipids from green microalgae., PLoS One. 9 (2014) e89643.
doi:10.1371/journal.pone.0089643. [60] G. Breuer, W.A.C. Evers, J.H. de Vree, D.M.M. Kleinegris, D.E. Martens, R.H. Wijffels, P.P. Lamers, Analysis of Fatty Acid Content and
Composition in Microalgae, J. Vis. Exp. 80 (2013) e50628. doi:10.3791/50628. [61] B.H.J. Yap, S. a. Crawford, G.J. Dumsday, P.J. Scales, G.J.O. Martin, A mechanistic study of algal cell disruption and its effect on lipid
recovery by solvent extraction, Algal Res. 5 (2014) 112–120. doi:10.1016/j.algal.2014.07.001. [62] J.Y. Lee, C. Yoo, S.Y. Jun, C.Y. Ahn, H.M. Oh, Comparison of several methods for effective lipid extraction from microalgae, Bioresour.
Technol. 101 (2010) S75-7. doi:10.1016/j.biortech.2009.03.058. [63] P. Mercer, R.E. Armenta, Developments in oil extraction from microalgae, Eur. J. Lipid Sci. Technol. 113 (2011) 539–547.
doi:10.1002/ejlt.201000455. [64] B. Serive, R. Kaas, J.-B. Bérard, V. Pasquet, L. Picot, J.-P. Cadoret, Selection and optimisation of a method for efficient metabolites
extraction from microalgae., Bioresour. Technol. 124 (2012) 311–20. doi:10.1016/j.biortech.2012.07.105. [65] G.S. Alemán-Nava, S.P. Cuellar-Bermudez, M. Cuaresma, R. Bosma, K. Muylaert, B.E. Ritmann, R. Parra, How to us Nile Red, a
selective fluorescent stain for microalgal neutral lipids, J. Microbiol. Methods. 128 (2016) 74–79. doi:10.1016/j.mimet.2016.07.011. [66] No Title, (n.d.). https://www.thermofisher.com/fr/fr/home/life-science/protein-biology/protein-biology-learning-center/protein-
biology-resource-library/pierce-protein-methods/fluorescent-probes.html. [67] P. Greenspan, S.D. Fowler, Spectrofluorometric studies of the lipid probe, nile red., J. Lipid Res. 26 (1985) 781–789. [68] http://www.google.com.na/patents/WO2003090604A2?cl=en. [69] J. Rumin, H. Bonnefond, B. Saint-Jean, C. Rouxel, A. Sciandra, O. Bernard, J.-P. Cadoret, G. Bougaran, The use of fluorescent Nile
red and BODIPY for lipid measurement in microalgae, Biotechnol. Biofuels. 8 (2015) 42. doi:10.1186/s13068-015-0220-4. [70] https://www.thermofisher.com/order/catalog/product/N1142. [71] A. De la Jara, A. Martel, C. Molina, L. Nordströn, V. De la Rosa, R. Díaz, Flow cytometric determination of lipid content in a marine
dinoflagellate, J. Appl. Phycol. (2003) 433–438. [72] H. Mendoza Guzmán, A. de la Jara Valido, K. Freijanes Presmanes, L. Carmona Duarte, Quick estimation of intraspecific variation of
fatty acid composition in Dunaliella salina using flow cytometry and Nile Red, J. Appl. Phycol. 24 (2012) 1237–1243. doi:10.1007/s10811-011-9768-y.

Chapter 2: Inducing lipid accumulation in green microalgae and developing characterization methods
141
[73] T. Govender, L. Ramanna, I. Rawat, F. Bux, BODIPY staining, an alternative to the Nile Red fluorescence method for the evaluation of intracellular lipids in microalgae., Bioresour. Technol. 114 (2012) 507–11. doi:10.1016/j.biortech.2012.03.024.
[74] N. Velmurugan, M. Sung, S.S. Yim, M.S. Park, J.W. Yang, K.J. Jeong, Evaluation of intracellular lipid bodies in Chlamydomonas reinhardtii strains by flow cytometry., Bioresour. Technol. 138 (2013) 30–7. doi:10.1016/j.biortech.2013.03.078.
[75] P. Hyka, S. Lickova, P. Přibyl, K. Melzoch, K. Kovar, Flow cytometry for the development of biotechnological processes with microalgae., Biotechnol. Adv. 31 (2012) 2–16. doi:10.1016/j.biotechadv.2012.04.007.
[76] J. Rumin, H. Bonnefond, B. Saint-Jean, C. Rouxel, A. Sciandra, O. Bernard, J.-P. Cadoret, G. Bougaran, The use of fluorescent Nile red and BODIPY for lipid measurement in microalgae., Biotechnol. Biofuels. 8 (2015) 42. doi:10.1186/s13068-015-0220-4.
[77] G.D. Feng, F. Zhang, L.H. Cheng, X.H. Xu, L. Zhang, H.L. Chen, Evaluation of FT-IR and Nile Red methods for microalgal lipid characterization and biomass composition determination, Bioresour. Technol. 128 (2013) 107–112. doi:10.1016/j.biortech.2012.09.123.
[78] D.M. Wong, A.K. Franz, A comparison of lipid storage in Phaeodactylum tricornutum and Tetraselmis suecica using laser scanning confocal microscopy., J. Microbiol. Methods. 95 (2013) 122–8. doi:10.1016/j.mimet.2013.07.026.
[79] Y. Liang, K. Osada, Y. Sunaga, T. Yoshino, C. Bowler, T. Tanaka, Dynamic oil body generation in the marine oleaginous diatom Fistulifera solaris in response to nutrient limitation as revealed by morphological and lipidomic analysis, Algal Res. 12 (2015) 359–367. doi:10.1016/j.algal.2015.09.017.
[80] D. Xu, Z. Gao, F. Li, X. Fan, X. Zhang, N. Ye, S. Mou, C. Liang, D. Li, Detection and quantitation of lipid in the microalga Tetraselmis subcordiformis (Wille) Butcher with BODIPY 505/515 staining., Bioresour. Technol. 127 (2013) 386–90. doi:10.1016/j.biortech.2012.09.068.
[81] G.T. Vatassery, M.A. Sheridan, A.M. Krezowski, A.S. Divine, H.L. Bach, Use of the sulfo-phospo-vanillin reaction in a routine method for determining total lipids in human cerebrospinal fluid, Clin. Biochem. 14 (1981) 21–24. doi:10.1016/0009-9120(81)90120-X.
[82] K.R. Johnson, G. Ellis, C. Toothill, The sulfophosphovanillin reaction for serum lipids: a reappraisal, Clin. Chem. 23 (1977) 1669–1678.
[83] Y.S. Cheng, Y. Zheng, J.S. VanderGheynst, Rapid quantitative analysis of lipids using a colorimetric method in a microplate format, Lipids. 46 (2011) 95–103. doi:10.1007/s11745-010-3494-0.
[84] S.K. Mishra, W.I. Suh, W. Farooq, M. Moon, A. Shrivastav, M.S. Park, J.W. Yang, Rapid quantification of microalgal lipids in aqueous medium by a simple colorimetric method, Bioresour. Technol. 155 (2014) 330–333. doi:10.1016/j.biortech.2013.12.077.
[85] J.A. Knight, S. Anderson, J.M. Rawle, Chemical basis of the sulfo-phospho-vanillin reaction for estimating total serum lipids, Clin Chem. 18 (1972) 199–202. http://www.ncbi.nlm.nih.gov/entrez/query.fcgi?cmd=Retrieve&db=PubMed&dopt=Citation&list_uids=5020813.
[86] TAP Medium, http://www.chlamy.org/TAP.html. (n.d.). [87] T. De Mooij, M. Janssen, O. Cerezo-Chinarro, J.H. Mussgnug, O. Kruse, M. Ballottari, R. Bassi, S. Bujaldon, F.A. Wollman, R.H. Wijffels,
Antenna size reduction as a strategy to increase biomass productivity: a great potential not yet realized, J. Appl. Phycol. (2014) 1063–1077. doi:10.1007/s10811-014-0427-y.
[88] Z. Perrine, S. Negi, R.T. Sayre, Optimization of photosynthetic light energy utilization by microalgae, Algal Res. 1 (2012) 134–142. doi:10.1016/j.algal.2012.07.002.
[89] H.C. Ishikawa-Ankerhold, R. Ankerhold, G.P.C. Drummen, Advanced fluorescence microscopy techniques-FRAP, FLIP, FLAP, FRET and FLIM, Molecules. 17 (2012) 4047–4132. doi:10.3390/molecules17044047.
[90] L.F. Hernandez and J.H. Palmer, Fluorescence staining of primary plant cell wall using Bizbenzimide (33258 Hoechst) Fluorochrome, (1988).
[91] C. Safi, A.V. Ursu, C. Laroche, B. Zebib, O. Merah, P.-Y. Pontalier, C. Vaca-Garcia, Aqueous extraction of proteins from microalgae: Effect of different cell disruption methods, Algal Res. 3 (2014) 61–65. doi:10.1016/j.algal.2013.12.004.
[92] I. Pouneva, EVALUATION OF ALGAL CULTURE VIABILITY AND PHYSIOLOGICAL STATE BY FLUORESCENT MICROSCOPIC METHODS, 23 (1997) 67–76.
[93] H. Ehrlich, O. V Kaluzhnaya, E. Brunner, M. V Tsurkan, A. Ereskovsky, M. Ilan, K.R. Tabachnick, V. V Bazhenov, S. Paasch, M. Kammer, R. Born, A. Stelling, R. Galli, S. Belikov, O. V Petrova, V. V Sivkov, D. Vyalikh, S. Hunoldt, G. Wörheide, Identification and first insights into the structure and biosynthesis of chitin from the freshwater sponge Spongilla lacustris., J. Struct. Biol. 183 (2013) 474–83. doi:10.1016/j.jsb.2013.06.015.
[94] M.N. Stagoj, R. Komel, A. Comino, Microtiter plate assay of yeast cell number using the fluorescent dye calcofluor white M2R., Biotechniques. 36 (2004) 380–2. http://www.ncbi.nlm.nih.gov/pubmed/15038150.
[95] K. a Henderson, A.L. Hughes, D.E. Gottschling, Mother-daughter asymmetry of pH underlies aging and rejuvenation in yeast., Elife. (2014) e03504. doi:10.7554/eLife.03504.
[96] R.J. Doyle, D.C. Birdsell, Interaction of concanavalin A with the cell wall of Bacillus subtilis., J. Bacteriol. 109 (1972) 652–658. [97] J.S. Tkacz, E.B. Cybulska, J.O. Lampen, Specific staining of wall mannan in yeast cells with fluorescein-conjugated concanavalin A.,
J. Bacteriol. 105 (1971) 1–5. [98] B. Fontaniella, A.M. Millanes, C. Vicente, M.E. Legaz, Concanavalin A binds to a mannose-containing ligand in the cell wall of some
lichen phycobionts, Plant Physiol. Biochem. 42 (2004) 773–779. doi:10.1016/j.plaphy.2004.09.003. [99] L. Ex, Concanavalin A Conjugates | 2 Before You Begin, Biochem. Proc Nat Acad Sci. 32 (1993) 1–3. [100] K.J.M. Mulders, J.H. Janssen, D.E. Martens, R.H. Wijffels, P.P. Lamers, Effect of biomass concentration on secondary carotenoids
and triacylglycerol (TAG) accumulation in nitrogen-depleted Chlorella zofingiensis, Algal Res. 6 (2014) 8–16. doi:10.1016/j.algal.2014.08.006.
[101] V.H. Work, R. Radakovits, R.E. Jinkerson, J.E. Meuser, L.G. Elliott, D.J. Vinyard, L.M.L. Laurens, G.C. Dismukes, M.C. Posewitz, Increased lipid accumulation in the Chlamydomonas reinhardtii sta7-10 starchless isoamylase mutant and increased carbohydrate synthesis in complemented strains., Eukaryot. Cell. 9 (2010) 1251–61. doi:10.1128/EC.00075-10.
[102] T.H. Lee, J.S. Chang, H.Y. Wang, Current developments in high-throughput analysis for microalgae cellular contents, Biotechnol. J. 8 (2013) 1301–1314. doi:10.1002/biot.201200391.
[103] O. Samek, Z. Pilát, J. Ježek, M. Šerý, S. Bernatová, P. Zemánek, L. Nedbal, M. Trtílek, Raman microspectroscopy monitoring of lipids in algal cells, 8651 (2011) 8651. doi:10.1364/FIO.2011.FTuA6.
[104] G.O. James, C.H. Hocart, W. Hillier, H. Chen, F. Kordbacheh, G.D. Price, M.A. Djordjevic, Fatty acid profiling of Chlamydomonas reinhardtii under nitrogen deprivation, Bioresour. Technol. 102 (2011) 3343–3351. doi:10.1016/j.biortech.2010.11.051.
[105] A.P. Dean, D.C. Sigee, B. Estrada, J.K. Pittman, Using FTIR spectroscopy for rapid determination of lipid accumulation in response
Chapter 2: Inducing lipid accumulation in green microalgae and developing characterization methods
142
to nitrogen limitation in freshwater microalgae, Bioresour. Technol. 101 (2010) 4499–4507. doi:10.1016/j.biortech.2010.01.065. [106] B. Fuchs, R. S????, K. Teuber, M. Eibisch, J. Schiller, Lipid analysis by thin-layer chromatography-A review of the current state, J.
Chromatogr. A. 1218 (2011) 2754–2774. doi:10.1016/j.chroma.2010.11.066. [107] K.J. Choi, Z. Nakhost, E. Barzana, M. Karel, Lipid content and fatty acid composition of green algae Scenedesmus obliquus grown in
a constant cell density apparatus., Food Biotechnol. 1 (1987) 117–128. doi:10.1080/08905438709549660. [108] E. Lee, R.L. Heng, L. Pilon, Spectral optical properties of selected photosynthetic microalgae producing biofuels, J. Quant. Spectrosc.
Radiat. Transf. 114 (2013) 122–135. doi:10.1016/j.jqsrt.2012.08.012.

Chapter 2: Inducing lipid accumulation in green microalgae and developing characterization methods
143
II1. Appendix II.1: Lipid production strategies in
literature
Table 5: Average productivities and the highest observed productivities between two consecutive time points of biomass,
total fatty acids, as well as the average TAG productivity for nitrogen-sufficient (N+) and deficient (N-) cultures [6].
Species Volumetric biomass
productivity (mg.l-1.day-1)
Volumetric fatty acid
productivity (mg.l-1.day-1)
Average volumetric TAG
productivity (mg.l-1.day-1)
Average Max Average Max
C. vulgaris N- 217 489 130 173 134
C. vulgaris N+ 668 771 77 91 1
C. zofingiensis N- 508 674 251 301 242
C. zofingiensis N+ 792 973 80 97 3
D. tertiolecta N- 341 680 38 46 22
D. tertiolecta N+ 487 503 56 61 0
I. galbana N- 149 276 65 76 26
I. galbana N+ 401 620 56 67 1
N. oleabundans N- 426 799 202 265 216
N. oleabundans N+ 451 776 62 122 15
Nannochloris sp N+ 264 340 36 40 15
Nannochloris sp N+ 524 776 46 56 2
P. cruentum N- 308 679 38 58 8
P. cruentum N+ 679 710 35 37 21
P. tricomutum N- 122 413 51 109 45
P. tricomutum N+ 486 530 64 73 11
S. obliquus N- 719 822 360 498 323
S. obliquus N+ 767 883 68 73 6
Table 6: Biomass, lipid and starch productivity in eight strains of six Chlorella species. Biomass and lipid productivity were
measured after 5 days of sulfur deprivation, maximum starch productivities indicated were measured after 4 or 5 days
[38].
Strain Biomass Lipid Starch
Final g/L g/L/day Final g/L g/L/day Final g/L g/L/day
C. viscosa 2.9 0.57 0.42 0.081 0.170 0.034
C. vulgaris 2.8 0.55 1.50 0.290 0.277 0.069
C. sorokiniana 2.9 0.57 0.21 0.039 0.471 0.094
C. emersonii 5.4 1.00 1.30 0.230 0.699 0.180
P. beijerinckii 4.6 0.87 1.00 0.190 0.326 0.065
P. kessleri CCALA 255 3.4 0.61 1.10 0.200 0.405 0.100
P. kessleri NIES-2159 5.6 1.00 1.20 0.210 0.662 0.170
P. kessleri NIES-2152 4.9 0.93 1.70 0.330 0.875 0.220

Chapter 2: Inducing lipid accumulation in green microalgae and developing characterization methods
144
Table 7: Comparisons of biomass and lipid productivities between growth-associated lipid production and two-stage
production [43]
Table 8: Time of nitrogen exhaustion in the medium, maximum specific growth rate (µmax), maximum biomass
productivity, and maximum instantaneous lipid productivity of C. vulgaris batch cultures at different starting nitrate
concentrations [45]
Initial nitrate
concentration
(mg·L-1)
N exhaustion (days
from inoculation)
µmax (day-1) Maximum biomass
productivity
(g·L-1·day-1)
Maximum lipid
productivity
(mg·L-1·day-1)
0 0 0.4 0.016 3
40 1.2 1.5 0.149 30
70 1.7 1.5 0.200 48
100 2.0 1.5 0.265 53
170 2.2 1.4 0.326 57
420 4.9 1.4 0.335 55
570 8.6 1.4 0.352 48
1,200 19.7 1.3 0.366 29
2,000 - 1.1 0.373 31

Chapter 2: Inducing lipid accumulation in green microalgae and developing characterization methods
145
II2. Appendix II.2: Quantification of unsaturated
fatty acids using the colorimetric
Sulphophosphovanillin (SPV) method
Principle
Figure 65: Principle of the method [84]
Material
Vanilin 99% (ref: 10387020) 0.6 g
Absolute ethanol 10 ml
Deionized water (-) ml
Distilled water (-) ml
Orthophosphoric acid 85% (ref: 10102060) 400 mL
Glycerine trioleate 99% (ref: 10190612) 20 mg
Chlorophorm 10 ml
Sulfuric Acid (98%) 2 ml (per sample)
100 °C Heater x1
37°C, 200 Rpm incubator x1
Glass cuvettes for spectro x1
glass tubes + caps (15 mL min) x9
Ice (-)
Vanilin solution 5 ml (per sample)
-20 °C freezer X1
37°C, 200 rpm incubator X1

Chapter 2: Inducing lipid accumulation in green microalgae and developing characterization methods
146
Preparation of SPV Solution
• Dissolve 0.6 g of vanilin in 10 ml absolute ethanol
• add 90 ml of deionized water
• add 400 ml of concentrated phosphoric acid
• store the 500 mL bottle in the dark before use
• Fresh SPV solution needs to be prepare before use
Calibration curve (Triolein in chlorophorm)
• Dissolve 20 mg of triolein in 10 mL of chloroform (2 mg/ml)
• store at -20°C before use
• Add different quantities of triolein in glass tubes:
• Evaporate the chloroform at 60°C during 10 minutes
• In each tube, add 100 µl of distilled water
• In each tube, add 2 mL of concentrated sulfuric acid (98%)
• Heat at 100°C during 10 min
• Cool the tubes in ice during 5 min
• add 5 mL of SPV solution (caution, solution becomes very hot after mixing)
• incubate the tubes at 37°C, 200 rpm during 15 min
• transfer the content in glass absorbance cuvettes
• read the absorbance at 530 nm. Dilute if needed with the blank solution (0 µg lipid).
Figure 66: Tube heater (WTW CR3200) and ice cooling
Figure 67: Mixing device (ELMI Inteli-Mixer, Mode 60, 99 Rpm) in a
oven at 37°.
Lip qty (µg) 0 10 20 30 40 50 60 70
Triolein sol (µl) 0 5 10 15 20 25 30 35
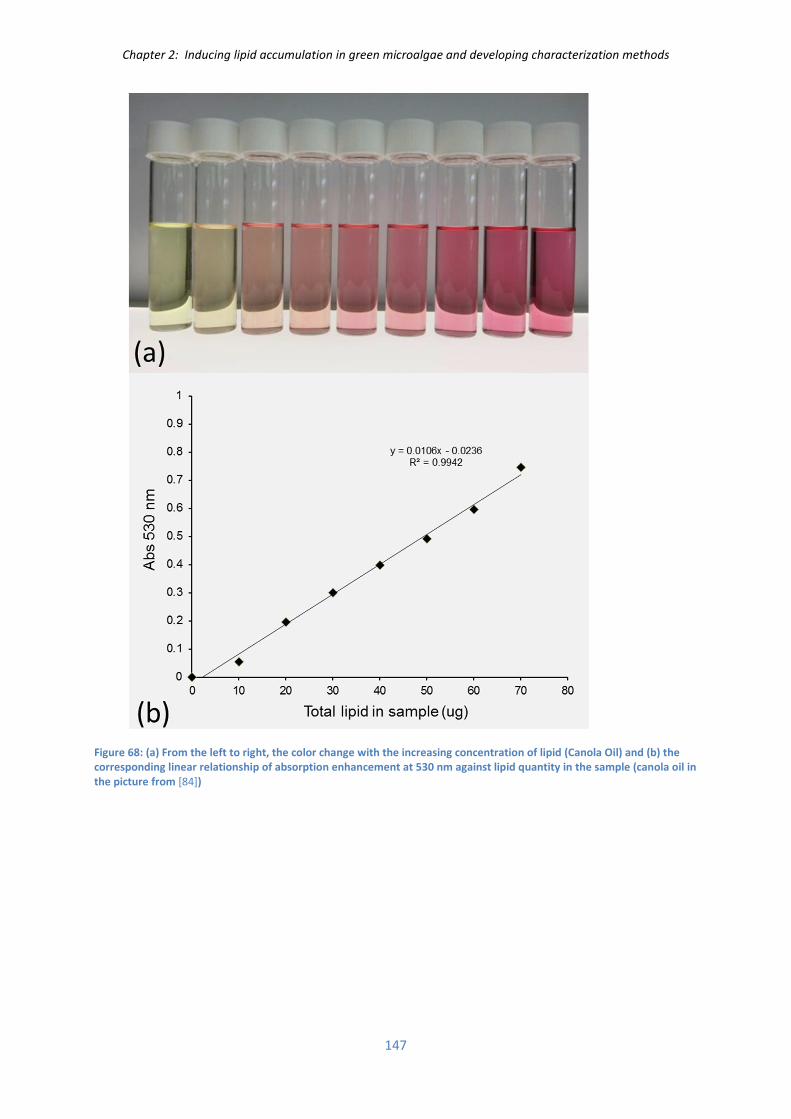
Chapter 2: Inducing lipid accumulation in green microalgae and developing characterization methods
147
Figure 68: (a) From the left to right, the color change with the increasing concentration of lipid (Canola Oil) and (b) the
corresponding linear relationship of absorption enhancement at 530 nm against lipid quantity in the sample (canola oil in
the picture from [84])

Chapter 2: Inducing lipid accumulation in green microalgae and developing characterization methods
148
II3. Appendix II.3: Additional lipid estimation
methods
Raman spectroscopy for analyzing microalgae content is a recent option in development which could
have been used in this project. Raman spectroscopy is based on the Raman effect in which a photon
emitted at a very specific wavelength of the visible light interacts with a molecule at a ground excited
state. Light can be scattered in two ways: elastically (Rayleigh scattering) or inelastically (Raman
scattering). Only one in a million of photons will be Raman scattered. A photon excites the molecule
and result in a rovibronic state that is a different rotational or vibrational state than the one in which
the molecule was originally. The energy of the inelastically scattered photons can either be shifted
slightly higher or slightly lower than that of the incident photon. This induce a shift in the wavelength
of the photon. This shift of a reduced frequency is designated as a Stokes shift (or anti Stokes shift
when the energy is increased). Raman spectrometry detects the emitted lights from light excited
molecules and assimilate each distinct mode of vibration with a specific molecular structure [102].
Exposition of a 785 nm laser beam to an isolated cell can enable to detect the volume of a lipid body
thanks to the excitation of the β-carotene contained in lipid bodies [103].
Fourier transform infrared spectroscopy (FTIR) is an absorption spectroscopy technique where mid-
infrared light is passed through the sample. The difference with Raman is there is no peaks
corresponding with molecules oscillated but dips, showing the resonant absorption at various
wavelengths and take into account Rayleigh scattering (change in dipole moment). FITR spectroscopy
was efficiently used to estimate lipid accumulation in Chlamydomonas reinhardtii during nitrogen
deprivation [104,105].
Thin-layer chromatography (TLC) for the quantification of lipids from algae is also possible [106]. Choi
et al. used thin layer chromatography to analyze the lipids of Scenedesmus obliquus [107] on plates
pre-coated with 0.25 or 0.5 mm layer of silica gel. They used a solvent system of petroleum ether-ethyl
ether-acetic acid (80:20:1, v/v) for the neutral lipid fraction. Chloroform-methanol-acetic acid-water
(70:30:20:7, v/v) was used for glycolipid and phospholipid fractions. Lipids were identified by
comparing Rf values with literature, pure standards of by using specific spray reagents. Thin layer
chromatogram of neutral lipids is presented Figure 69.

Chapter 2: Inducing lipid accumulation in green microalgae and developing characterization methods
149
Figure 69: Thin layer chromatogram of neutral lipids of Scenedesmus obliquus. The spots of neutral lipid fraction were as
follow: HC: Hydrocarbons, SE: Sterol esters, TG: Triglycerides, FFA: Free fatty acids, DG: Diglycerides, FS: Free sterols, MG:
Monoglycerides, Un1-Un5: Unidentified components.

Chapter 2: Inducing lipid accumulation in green microalgae and developing characterization methods
150
II4. Appendix II.4: Principle of laser granulometry
Laser granulometry is based on dynamic light scattering where two lasers (blue: 470 nm and red: 633
nm) are used to illuminate a sample (particles flowed in the laser beam) illustrated figure 51. The two
laser beams are scattered in multiple directions and multiple angles. This repartition of diffracted light
is measured with several detectors situated as several angles. From the analyzes of light diffraction of
the multiple detectors, size repartition of the particles can be estimated using an optical model of light
diffraction. The theory mostly used with this device, in the case of algae, is the Mie theory, which
supposes a particle size superior to the wavelength of the lasers (>1 µm). The other optical diffusion
models, Rayleigh/Fraunhofer, Raman, Brillouin are adapted for molecular diffusion for particles
smaller than wavelength.
Figure 70: Malvern Mastersizer 3000 and measurement devices.
From left to right: Liquid sample (manual), Dry sample, Liquid
sample (automatic
Figure 71: Optical h of the laser granulometer Malvern
Mastersizer 3000
An optical model must be created choosing the optical model used, dispersant refractive index (RI),
size distribution of the particles analyzed, if the particles are spherical or non spherical, and the
refraction/absorption index of the particles at 470 and 633 nm. The model is validated when the fit of
the model corresponds with the data obtained with the detectors. Also, residual and weighted residual
must be as low as possible (lower than 1) and be similar.
Analyses where performed with the Hydro MV module using following parameters: Non-spherical
particle mode; dispersant: water (RI=1.330); additional blue light measurements; 3 measurements;
stirrer speed: 3000 rpm; no ultrasound; analysis model: general purpose; number distribution; result
range: 1-150 µm.
The optical properties of Chlamydomonas reinhardtii cells were determined using the tool “Optical
Properties Optimizer) of the device after entering values found in literature and illustrated on figure
52 [108]. Two optical models were created for the measurements: one is specific for growth phase
conditions, the other model for lipid accumulation conditions. Optimal parameters found are detailed
in table 9.

Chapter 2: Inducing lipid accumulation in green microalgae and developing characterization methods
151
Figure 72: Refraction (a) and Absorption (b) Index measured for four Chlamydomonas reinhardtii strains CC125, tla1, tlaX
and tla1-CW+ measured on the visible spectrum [108].
Table 9: Refraction and absorption index found for Chlamydomonas reinhardtii SAG 34.89 (wild type) for blue laser (470
nm) and red laser (633 nm) with the tool "Optical properties optimizer" of the laser granulometer. Different optimal
values were found for at different lipid accumulation periods: growth phase, 7 days of stress and 14 days of stress.
Optical model RI 633nm AI633nm RI470nm AI470nm
Cr growth phase 1.527 0.0030 1.527 0.0030
Cr lipid 7d 1.560 0.0001 1.560 0.0001
Cr lipid 14d 1.560 0.0001 1.6800 0.00065

Chapter 2: Inducing lipid accumulation in green microalgae and developing characterization methods
152
II5. Appendix II5: Medium preparation

Chapter 2: Inducing lipid accumulation in green microalgae and developing characterization methods
153

Chapter 2: Inducing lipid accumulation in green microalgae and developing characterization methods
154

Chapter 2: Inducing lipid accumulation in green microalgae and developing characterization methods
155

Chapter 2: Inducing lipid accumulation in green microalgae and developing characterization methods
156
II6. Appendix II.6: Correlation cyto/malassez in
growth and stress phase
Figure 73: Correlation between cell concentration determined by cytometry and microscopy using Malassez chamber for
Chlamydomonas reinhardtii wild type (growth phase); correlation in blue; first bisector in black. .
Figure 74: Correlation between cell concentration determined by cytometry and microscopy using Malassez chamber for
for Chlamydomonas reinhardtii wild type (stress phase). correlation in blue; first bisector in black

Chapter 2: Inducing lipid accumulation in green microalgae and developing characterization methods
157
II7. Appendix II.7: Confocal microcopy vs
fluorescence microscopy
Figure 75: In confocal microscopy (B) the detection beam emitted from the illuminated sample path a pinhole aperture
(red rectangle) in front of the detectors. This enable to reduce the light emitted above and below the focal plane. The
reconstitution of the specimen illuminated has a higher resolution in comparison with wide field fluorescence (A) [89].

Chapter 2: Inducing lipid accumulation in green microalgae and developing characterization methods
158
II8. Appendix II.8: CLSM optical configuration to
monitor Chlamydomonas reinhardtii cells stained
with Bodipy and Concanavalin TRITC (track 1:
Bodipy, track 2: Chlorophyll, and track 3:
concanavalin, track 4: merged channels)
Figure 76: LCSM Track 1 configuration (Bodipy)
Figure 77: LCSM Track 2 configuration (Chlorophyll)

Chapter 2: Inducing lipid accumulation in green microalgae and developing characterization methods
159
Figure 78: LCSM Track 3 configuration (Concanavalin)
Figure 79: CLSM imaging of Chlamydomonas reinhardii in stress phase. Track 1, lipid droplets stained with Bodipy, Track 2:
chlorophyll autofluorescence, Track 3: concanavalin fluorescence, Track 4: merged channels.

Chapter 2: Inducing lipid accumulation in green microalgae and developing characterization methods
160

Chapter 3: The use of Pulsed Electric Fields for the extraction of lipids from Chlamydomonas reinhardtii:
study in microdevice and electroporation cuvettes
161
Chapter 3
The use of Pulsed Electric Fields for the extraction of lipids
from Chlamydomonas reinhardtii:
study in microdevice and electroporation cuvettes

Chapter 3: The use of Pulsed Electric Fields for the extraction of lipids from Chlamydomonas reinhardtii:
study in microdevice and electroporation cuvettes
162
Summary List of abbreviations: .......................................................................................................................... 164
Chapter 3: introduction ....................................................................................................................... 165
I. State of the art ............................................................................................................................ 166
I1) Principle and interests of Pulsed Electric Field (PEF) ......................................................... 166
I1a) Principle ........................................................................................................................... 166
I1b) Theory .............................................................................................................................. 168
I1c) Side effects ...................................................................................................................... 170
I1d) Treatment parameters .................................................................................................... 172
I1e) Applications ..................................................................................................................... 174
I2) Use of PEF in algae biotechnology ..................................................................................... 175
I3) Use of bio-micro-devices to monitor algae cells in situ ..................................................... 178
I3a) Cell culture monitoring on a chip .................................................................................... 178
I3b) Investigation of dielectric properties .............................................................................. 178
I3c) Investigation cell lysis in situ via DEP forces .................................................................... 180
II. Material and methods ................................................................................................................ 181
II1) Micro-device for studying the in situ permeabilization and characterization of
Chlamydomonas reinhardtii ........................................................................................................... 181
II2) Electroporation in cuvettes ................................................................................................ 183
II3) Viability/permeability measurements ............................................................................... 184
II3a) Choice of the dyes ........................................................................................................... 185
II3b) Determination of the optimal staining conditions .......................................................... 187
II3c) Validation of the PI and FDA optimal conditions ............................................................ 189
II3d) Development and validation of the staining methods by flow cytometry ..................... 191
II3e) Measure of the permeabilization level in the micro-device ........................................... 193
II3f) Measure of permeability (irreversible permeabilization (IP) and reversible
permeabilization (RP)) and viability in the electroporation cuvettes ......................................... 195
II4) Measurement of lipid extraction with/without PEF ......................................................... 196
II4a) Characteristics of the solvent .......................................................................................... 196
II4b) Mixing protocol ............................................................................................................... 198
II4c) SPV analysis after extraction ........................................................................................... 199
III. Results ..................................................................................................................................... 200
III1) Electroporation in the micro-device .................................................................................. 200
III1a) Calculation of the theoretical critical electrical field and charging time..................... 201

Chapter 3: The use of Pulsed Electric Fields for the extraction of lipids from Chlamydomonas reinhardtii:
study in microdevice and electroporation cuvettes
163
III1b) Determination of the critical electric field for Chlamydomonas reinhardtii (membrane
fully charged) ............................................................................................................................... 201
III1c) Experiments ..................................................................................................................... 202
III1d) Relation between energy consumption and permeabilization ................................... 205
III1e) Sensitivity of Chlamydomonas reinhardii to PEF at various stages of lipid accumulation
206
III1f) Qualitative observations by optical and epifluorescence microscopy ............................ 207
III2) Electroporation in cuvettes ................................................................................................ 209
III2a) Measurement of viability and irreversible permeability after PEF treatment ............ 209
III2b) Reversible and irreversible permeabilization for different pulse durations ............... 210
III2c) Reversible/irreversible permeabilization parameters, energy and temperature increase
212
III2d) Life cycle of reversible pores ....................................................................................... 214
III2e) Transport of various molecules through the pores ..................................................... 215
III2f) Observations of the cell structure and lipid droplets by CLSM ....................................... 215
III3) Association of PEF to solvent for lipid extraction .............................................................. 216
III3a) Cell lysis ....................................................................................................................... 216
III3b) CLSM imaging of cells after solvent extraction ........................................................... 218
III3c) Lipid extraction ................................................................................................................ 220
III3d) Conclusion on lipid extraction ..................................................................................... 223
Chapter 3 conclusion .......................................................................................................................... 224
Chapter 3 references .......................................................................................................................... 226
III1. Appendix III.1: Lipid production strategies in literature. List of viability related dyes, from
[62]. Dyes can be classified according to their application: (1) permeability dyes, (2) membrane
potential dyes, and (3) cellular enzyme activity dyes [62]. ............................................................. 229
III2. Appendix III.2: Temperature profiles in the microdevice simulated in COMSOL ............... 230
III3. Appendix III.3: Calibration curves of triolein dissolved in hexane ...................................... 232

Chapter 3: The use of Pulsed Electric Fields for the extraction of lipids from Chlamydomonas reinhardtii:
study in microdevice and electroporation cuvettes
164
List of abbreviations:
• PEF Pulsed Electric Field
• ΔΨi Induced membrane potential (V)
• E Electric field (kV/cm)
• Vm Membrane resting potential (V)
• ΔΨcrit Critical membrane potential (V)
• ∆tpu Pulse duration (s)
• τm Membrane charging time (s): time duration to reach 63% of the full charge
• rs Rising time (s): time duration to reach the full charge
• rd Resting duration between two pulses (V=0)
• ∆Tpu Joule heating due to one pule (°K or °C)
• ∆ttreat Total pulse duration (s)
• ∆Ttreat Total joule heating of the treatment (°K or °C)
• Wpu Energy delivered from on pulse (W)
• Wtreat Energy delivered from the treatment (W)
• F Pulse frequency (Hz)
• ���∗ Clausius-Mossoti factor
• ��∗ Complex permittivity (F/m)
• �� Polydimethylsiloxane
• S1805 Positive photoresist
• SU8 Negative photoresist
• CMOS Complementary Metal Oxide Semiconductor
• SG Sytox Green (permeability dye)
• PI Propidium Iodide (permeability dye)
• FDA Fluorescein Diacetate (viability dye)
• FITC Fluorescein isothiocyanate
• PerCP-Cy5.5 Peridinin-Chlorophyll-Protein coupled with cyanin 5.5, a far-red emitting dye
• PMT Photomultiplier
• TAP Tris-Acetate-Phosphate, medium for Chlamydomonas reinhardtii
• LogP partition-coefficient which corresponds the logarithmic ratio of concentration
between octanol and water
• FA Fatty acids
• SPV Sulpho-phospho-Vanillin
• Ecrit Critical electric field of permeabilization (kV/cm)
• Dye staining Percentage of dye in cell population measured (%)
• Dye uptake Percentage of dye in cell population offset by the value before treatment (%)
• NP Naturally permeabilized cells (before PEF treatment)
• RP Reversibly permeabilized cells
• IP Irreversibly permeabilized cells
• SA Cells stained by a dye 1 h after PEF treatment (only stains NP+IP)
• SB Cells in contact with the dye before PEF treatment (NP+RP+IP)

Chapter 3: The use of Pulsed Electric Fields for the extraction of lipids from Chlamydomonas reinhardtii:
study in microdevice and electroporation cuvettes
165
Chapter 3: introduction
As discussed in the Chapter 1, downstream processes in microalgae production are strongly dependent
on the strains and culture conditions used, and most of all on the target compound and market aimed.
For massive markets with a final low cost product, such as biodiesel, the energy involved in the
downstream processes has a high impact on the cost of the product [1]. For biodiesel production from
microalgae, the average final cost is estimated at 3.7 US$/L [2], which must be reduced to 1 US$/L in
order to be competitive with the expected price of fossil fuels by 2030 - 2050. One or several
technological breakthroughs must be accomplished in order to make algae derived biofuels
competitive in the future.
The standard downstream processes used in feed and food industries are hardly used in microalgae
production. This is first related to the immaturity of microalgae biotechnology and second to the
difficulty to treat with common downstream processes the suspensions containing small cells, some
of those with thick cell walls.
Thus, despite the huge and wide potential of microalgae, their cultures are mainly carried out to
produce high value compounds because of the high energy costs associated to culture, harvesting and
extraction steps. In this context, the development of innovative processes for molecules extraction
from microalgae is of primary importance. Pulsed Electric Field (PEF), a technology discovered about
fifty years ago, which starts to demonstrate plenty of applications in various fields, may be a candidate
to facilitate the extraction of intracellular compounds at a low energetic cost.
The aim of the work presented in this Chapter is to study the impact of PEF on Chlamydomonas
reinhardtii membrane permeability and on lipid extraction.
After setting-up of the culture system and optimization of characterization methods (Chapter 2), a
dedicated micro-device, miniaturized to the scale of algae cells, is built to study in situ the effect of
PEF on cells The goal is to develop a microscopic method to evaluate cell permeabilization in situ for
several treatment conditions. The purpose is to determine the set of parameters that permeabilize
algae cells while limiting the energy spent. Besides, the effects of PEF on lipids and cell wall are
visualized using microscopic tools (optic/fluorescence and confocal laser scanning microscopes).
Afterwards, additional experiments are performed at an upper scale to characterize the
reversibility/irreversibility of the pores created. Finally, PEF pre-treatment is associated with solvent
extraction to assess the interest of electroporating algae cells to improve lipid extraction.

Chapter 3: The use of Pulsed Electric Fields for the extraction of lipids from Chlamydomonas reinhardtii:
study in microdevice and electroporation cuvettes
166
I. State of the art
I1) Principle and interests of Pulsed Electric Field (PEF)
I1a) Principle
The principle of Pulsed Electric Field (PEF) consists of applying on cells or tissues repeated short
pulses of an electric field E (expressed in V/cm) created between two electrodes. The application of
repeated electric fields leads to cell membrane poration [3]. This phenomenon is explained by a
phospholipid bilayer destabilization when the induced trans-membrane voltage (ΔΨi) reaches a
critical value (ΔΨc) [4] as illustrated in Figure 1. This destabilization often results in the apparition of
pores, initiated by the penetration of polar molecules (represented by red and grey spheres in the
Figure 1) between the polar heads of the bilayer (represented with green spheres). Pore creation
proceeds with the migration of the phospholipid head groups in the inner part of the membrane which
then stabilizes into a pore. Pore annihilation begins at the end of the electric field application. At this
step, the pore size starts to decrease, the polar head groups migrate back to their initial position and
reseal the membrane. Finally, the remaining polar molecules, such as water, trapped in the membrane,
are moved out to restore the initial membrane structure.
Figure 1: Molecular dynamic simulation of an electropore in a lipid bilayer [5]. Water is represented by red and grey spheres
while phosphorus atoms of the polar fatty acids are seen as large green spheres (apolar tails of phospholipids not
represented). “Pore creation in an electric field begins with the introduction water defect into the bilayer, followed by the
reorganization of the phospholipid head groups in each leaflet around the defect (pore construction). Migration of
additional water and head groups into the pore continues until an arbitrarily defined mature pore structure is formed
(pore maturation). Pore annihilation begins with the removal of the porating electric field. The pore structure is quasi-
stable at this time (pore destabilization), but soon there is a decrease in pore size as head groups and water begin to
migrate out of the membrane interior (pore degradation). The head groups separate again into two groups (pore
deconstruction). Water quickly follows (pore dissolution) and the intact structure of the bilayer is restored.”
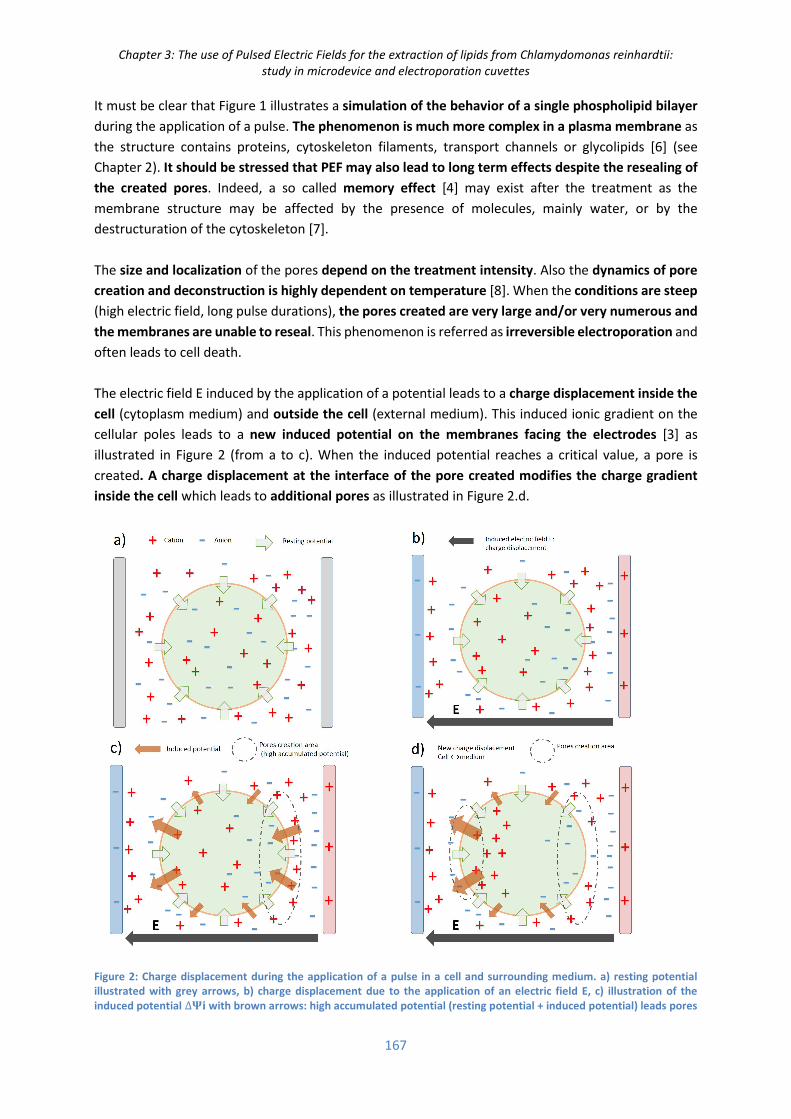
Chapter 3: The use of Pulsed Electric Fields for the extraction of lipids from Chlamydomonas reinhardtii:
study in microdevice and electroporation cuvettes
167
It must be clear that Figure 1 illustrates a simulation of the behavior of a single phospholipid bilayer
during the application of a pulse. The phenomenon is much more complex in a plasma membrane as
the structure contains proteins, cytoskeleton filaments, transport channels or glycolipids [6] (see
Chapter 2). It should be stressed that PEF may also lead to long term effects despite the resealing of
the created pores. Indeed, a so called memory effect [4] may exist after the treatment as the
membrane structure may be affected by the presence of molecules, mainly water, or by the
destructuration of the cytoskeleton [7].
The size and localization of the pores depend on the treatment intensity. Also the dynamics of pore
creation and deconstruction is highly dependent on temperature [8]. When the conditions are steep
(high electric field, long pulse durations), the pores created are very large and/or very numerous and
the membranes are unable to reseal. This phenomenon is referred as irreversible electroporation and
often leads to cell death.
The electric field E induced by the application of a potential leads to a charge displacement inside the
cell (cytoplasm medium) and outside the cell (external medium). This induced ionic gradient on the
cellular poles leads to a new induced potential on the membranes facing the electrodes [3] as
illustrated in Figure 2 (from a to c). When the induced potential reaches a critical value, a pore is
created. A charge displacement at the interface of the pore created modifies the charge gradient
inside the cell which leads to additional pores as illustrated in Figure 2.d.
Figure 2: Charge displacement during the application of a pulse in a cell and surrounding medium. a) resting potential
illustrated with grey arrows, b) charge displacement due to the application of an electric field E, c) illustration of the
induced potential ∆� with brown arrows: high accumulated potential (resting potential + induced potential) leads pores

Chapter 3: The use of Pulsed Electric Fields for the extraction of lipids from Chlamydomonas reinhardtii:
study in microdevice and electroporation cuvettes
168
creation on the membrane area facing the cathode, d) pores creation leads to a new charge displacement and a
redistribution of transmembrane potential: new pores may appear on the membrane facing the anode.
I1b) Theory
The resting potential Vm, illustrated in Figure 2 with a grey arrow, can be determined from the
Goldman equation [9]:
�� = ��� ln (∑ ���������� !"∑ �#$%&'$%(�)
�$*�∑ ����������)"∑ �#$%&'$%(� !
�$*�) (3.1)
Pion is the permeability for the considered ion (m·s-1), [ion]in/[ion]out the ratio of the concentrations of
each ion in the cytoplasm and external medium. R the ideal gas constant equal to 8.314 JK-1·mol-1, T
the temperature (K), F the Faraday constant equal to 96.485 C·mol-1.
The resting potential is most of the time negative, in the range of -50 mV to -100 mV for mammalian
cells and measured at -100 mV for Nitella Expensa, a superior plant [10].
The critical potential ΔΨcrit required to trigger membrane permeabilization is known to be in the range
of 0.2 - 1.5 V for mammalian cells [11].
The induced trans-membrane potential ∆,- on a spherical cell at time t is given by the Schwan
equation (equation 3.2) [12].
∆./(0) = − 23 · 5 · 6 · cos (:) · ;1 − => !
?@A (3.2)
with ΔΨi (V) the induced potential applied on the membrane, r(m) the cell radius, E (V/m) the electric
field applied, θ (rad) the angle between ∆.B and the applied electric field, τm (s) the membrane
charging time constant.
It should be noted that the strength and direction of ∆.B vary with the position on the cell surface, as
they depend on the angle θ of ∆.B with the applied field direction. This may restrain the effect of PEF
on a small region of the membrane [13]. As illustrated in Figure 2, the induced field is added to the
resting potential.
Schwan equation (equation 3.2, [12,14]) underlines the importance of cell size. A cell with a large
diameter will undergo a stronger induced potential. Besides the induced electric field is always
proportional to the electric field applied E (potential V applied divided by the distance between the
electrodes, expressed in V/m).
Conventional electroporation uses pulses which duration tpu is longer than plasma membrane
charging time (τm). This parameter is calculated according to equations 3.3 and 3.4 depending on the
model used: in the double shell model the cell wall is taken into account in contrast with the single
shell model [15]. Single shell model is the common model for mammalian cells. However, for vegetal
cells, which possess a cell wall, the double shell model is more relevant [16].

Chapter 3: The use of Pulsed Electric Fields for the extraction of lipids from Chlamydomonas reinhardtii:
study in microdevice and electroporation cuvettes
169
Membrane lipid bilayer can be considered as a capacitor Cm, as the membrane charging requires the
displacement of positive and negative charges in the cytoplasm and in the surrounding medium,
(Figure 2.b). Charging duration is inversely proportional to cytoplasm and medium conductivities σ.
τD = r· EF ( GHIJK + G
3 H�MN) single shell model [15] (3.3)
O�= r· EF ( GHIJK + H�MN"HIP
3 H�MN HIP) double shell model [16] (3.4)
with Cm the membrane capacitance, estimated at 0.01 F·m-2 [17]; σcyt, σmed, and σcw cytoplasm,
medium and cell wall conductivities, respectively (S·m-1). The charging time is in the range 0.4 to 1 µs
for mammalian cells [18].
It should be noted that the determination of the membrane charging time constant τm (time duration
to charge 63% of the maximal voltage) illustrated Figure 3, is important especially when using short
pulses to compensate the inability to reach the full charge with a higher electric field applied (see
equation 3.2 the relation between t and τm): the application of an electric field of 1 KV/cm during a
pulse of 1 µs would result in an electric field of 0.63 kV/cm (63 % of the full charge of the membrane)
illustrated in Figure 3. To counterbalance the charging effect, an application of an electric field of 1.59
kV/cm would result in an electric field of 1 kV/cm on the membrane after 1 µs.
Figure 3 : Illustration of the membrane charging dynamic, modeled by a RC charging circuit curve [19]
The full charge of the membrane, corresponding to a pulse duration higher or equal to the charging
time of the membrane, requires a duration of the electric field application longer than several times
the charging time τm (∆tpu > 5 τm to reach 95% of the final charge, when considering equation 3.2).

Chapter 3: The use of Pulsed Electric Fields for the extraction of lipids from Chlamydomonas reinhardtii:
study in microdevice and electroporation cuvettes
170
I1c) Side effects
Undesirable side effects may come up when applying an electric field to a liquid medium: joule heating
and water electrolysis. Joule effect is a volume effect due to the propagation of the electric field in
the medium. Water electrolysis is a surface effect on the interface electrode (electronic conduction)
/ medium (ionic conduction).
Considering there is no external heat exchange (diffusion, convection), the temperature increase due
to Joule effect ΔTpu for one single pulse can be estimated with equation 3.5 [11]. The temperature
increase (in °K or °C) directly depends on field strength E (V.m-1), pulse duration Δtpu (s), medium
conductivity σmed (S.m-1), medium heat capacity Cp (J.K-1) and medium volumetric mass density ρ
(kg/m3).
ΔTST = U��·V (3.5)
Where W is the spent energy
W = |6|3 · ∆0�Y · Z�MN (3.6)
Consequently, the total temperature increase due to the treatment ΔTtreat max (considering no cooling)
can be upper hounded thanks to equation 3.7:
[\K]M^K �^_ < [\�Y ∙ b�Y (3.7)
with Npu, the number of pulses used during the treatment.
While the heat capacity Cp can be considered as constant in the aqueous medium, medium
conductivity can increase because of the release of ionic substances [20] (e.g calcium from the
endoplasmic reticulum [21]). To prevent heating, some PEF treatments on microalgae are performed
in a low conductivity buffer [22,23], or heat is eliminated using a cooling system [24,25]. Without any
of these precautions, temperature may increase by several dozens of degrees depending on treatment
parameters, thus affecting cells viability and metabolites stability.
Increasing temperature by several dozens of degrees may result in a phase transition (melting) of the
membrane [26] (Figure 4) from a gel (solid ordered phase) to a fluid (disorganized phase). Heating from
20 °C to 35-40 °C destabilizes the membrane to give a ripple phase (intermediate phase) and above
40°C a fluid phase. A transition phase corresponds to an increase of per volume lipid (Å3/lipid) in the
membrane as showed in the Y axis of the Figure 4. This increased volume in fluid phase is due to an
increased head-head distance in the bilayer as the membrane thickness is reduced in this state.

Chapter 3: The use of Pulsed Electric Fields for the extraction of lipids from Chlamydomonas reinhardtii:
study in microdevice and electroporation cuvettes
171
Figure 4: Phase transition in a membrane bilayer depending on temperature [26].
Cell membrane permeabilization can be associated with the phase transition, electroporation is
associated to the induced electric field.
Water electrolysis may also occur on both electrodes. This phenomenon leads to the formation of gas
bubbles at the cathode (hydrogen) and the anode (oxygen). The electrolysis potential with current in
function for various electrode materials is showed in Figure 5. As shown, gold and platinum are the
best materiel to avoid water electrolysis.
Figure 5 : Electrolysis potential with current in aqueous medium for various electrode materials. The graphs are shifted
vertically for comparison. Au, gold; Pt, platinum; B:PCD are two polycrystalline films boron-doped diamond; B:SCD is a
single crystalline boron-doped diamond; and SCD is a single-crystal-line undoped diamond [27].
Both mechanisms (temperature increase and water electrolysis) may have many consequences during
PEF application: interferences on electric field distribution, generation of reactive oxygen species and
mechanical stresses on cells due to bubbles. Moreover, both temperature [28] and reactive oxygen

Chapter 3: The use of Pulsed Electric Fields for the extraction of lipids from Chlamydomonas reinhardtii:
study in microdevice and electroporation cuvettes
172
species [29] can affect the permeabilization threshold (critical potential to induce permeabilization
ΔΨc).
I1d) Treatment parameters
PEF treatment can be characterized by many parameters. As mentioned previously the pulse duration
Δtpu and the electric field applied E have a paramount importance on cell permeabilization. Also,
pulses can be defined by their shapes and frequencies.
Frequency (Hz) is equal to the number of cycles per second:
c( de) = G� (f) (3.8)
with P the duration between two positive pulses (Figure 6).
Figure 6 : Square shaped pulses: (a) monopolar pulses, and (b) bipolar pulses.
PEF can also be performed with so called “bipolar pulses” where the two electrodes alternate between
the cathode state and the anode state. In such case, the charges will move in different directions with
each polarity change.
The evolution with time of the applied potential between electrodes (i.e electric field) may also have
a sinusoidal shape, corresponding to a cyclic bipolar signal where the potential applied is always rising
or decreasing. Figure 6 illustrates square shaped pulses. Pulses may also have a trapezoidal,
exponential or bell shape.
The rising time, rs, is generally used to indicate the duration required to reach the maximum pulse
potential, starting from 0. In the case of a square shaped pulse, the rising time is neglected in
comparison with the pulse duration.
The resting duration, rd, is the duration where the electric field is equal to 0, leading to a redistribution
of charges within the medium and cytoplasm.

Chapter 3: The use of Pulsed Electric Fields for the extraction of lipids from Chlamydomonas reinhardtii:
study in microdevice and electroporation cuvettes
173
In the majority of PEF treatments, the resting duration is very long in comparison to the pulse duration.
Indeed, the application of a sufficient electric field in a very short duration leads to membrane
breakdown with negligible energy spending and associated side effects.
A large range of PEF (pulse duration/electric field strength) conditions are found in the literature. The
pulse duration may range from 1 ns to 1 s and the strength of the applied field from 0.1 kV/cm to
100 kV/cm for several kinds of cells [11].
It is well established that the treatment effect is highly correlated to the couple pulse duration/electric
field strength [30], i.e. shorter pulses require higher fields to obtain the same effect on the cell
membrane. Figure 7 represents the close relation between pulse duration and electric field strength
and their associated effects on mammalians cells. These latter are the common models used to study
PEF effects on living organisms.
Figure 7: Electroporation and thermal effects caused by exposure of mammalian cells to electric fields. Reversible
electroporation, irreversible electroporation and thermal damage as functions of electric field strength and duration [30]. Exposure duration stands for one single pulse duration.
Very short pulses (Δtpu < 1 µs), referred as nanopulses, may lead to cell apoptosis by affecting internal
organelles, while the membrane charge does not reach the permeabilization level [31]. As shown in
Figure 7, the electric fields associated with nanopulses are much higher than those generally used in
conventional electroporation (several tens of kV/cm). On the opposite, long pulse durations (long
pulses, low electric field) can lead to increased pore radius and resealing time [32,33] (time needed
for the membrane to recover, if the permeabilization is reversible). Moreover, applying an electric field
during a long duration (Δtpu > 1 ms) also leads to electrophoresis. Electrophoresis is the transport of
charged species toward the opposite charged electrode. This effect contributes to the diffusion of
small charged species across the membrane [34]. In some medical applications, pulses of different
durations (nano-micro and millisecond) are combined, first short pulses of high intensity to
permeabilize the membrane and then long pulses with low intensity to enhance gene or drug transport
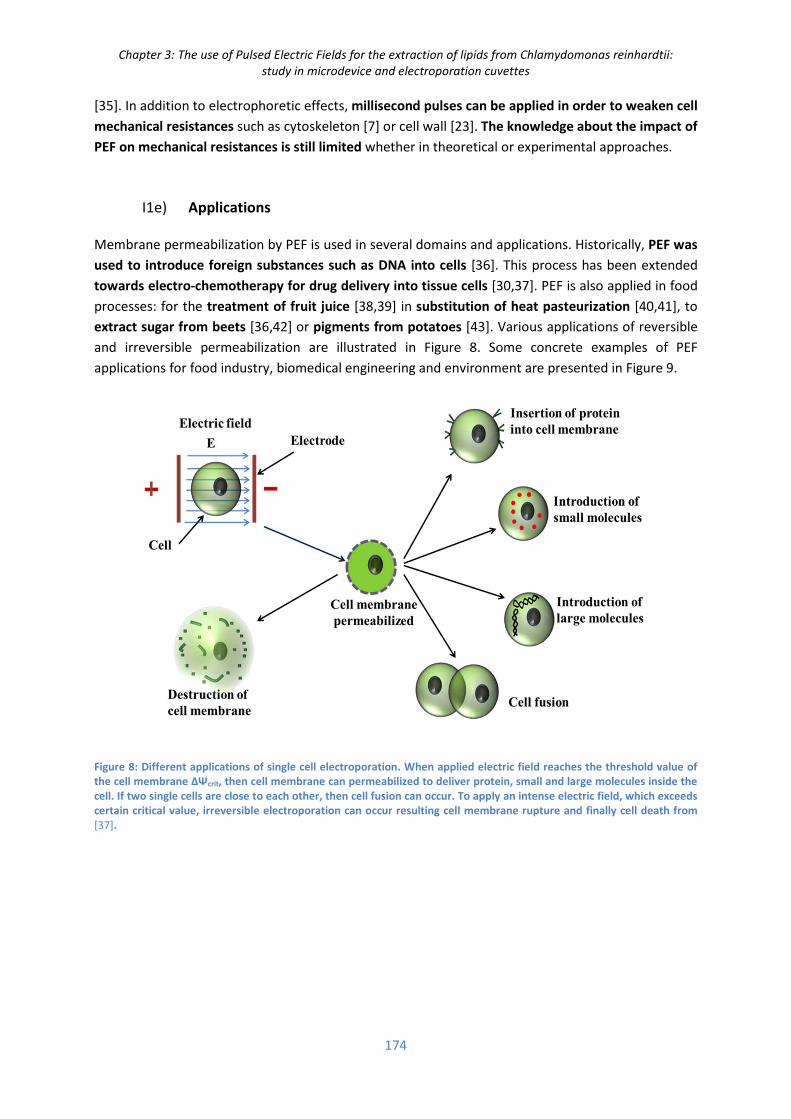
Chapter 3: The use of Pulsed Electric Fields for the extraction of lipids from Chlamydomonas reinhardtii:
study in microdevice and electroporation cuvettes
174
[35]. In addition to electrophoretic effects, millisecond pulses can be applied in order to weaken cell
mechanical resistances such as cytoskeleton [7] or cell wall [23]. The knowledge about the impact of
PEF on mechanical resistances is still limited whether in theoretical or experimental approaches.
I1e) Applications
Membrane permeabilization by PEF is used in several domains and applications. Historically, PEF was
used to introduce foreign substances such as DNA into cells [36]. This process has been extended
towards electro-chemotherapy for drug delivery into tissue cells [30,37]. PEF is also applied in food
processes: for the treatment of fruit juice [38,39] in substitution of heat pasteurization [40,41], to
extract sugar from beets [36,42] or pigments from potatoes [43]. Various applications of reversible
and irreversible permeabilization are illustrated in Figure 8. Some concrete examples of PEF
applications for food industry, biomedical engineering and environment are presented in Figure 9.
Figure 8: Different applications of single cell electroporation. When applied electric field reaches the threshold value of
the cell membrane ΔΨcrit, then cell membrane can permeabilized to deliver protein, small and large molecules inside the
cell. If two single cells are close to each other, then cell fusion can occur. To apply an intense electric field, which exceeds
certain critical value, irreversible electroporation can occur resulting cell membrane rupture and finally cell death from
[37].

Chapter 3: The use of Pulsed Electric Fields for the extraction of lipids from Chlamydomonas reinhardtii:
study in microdevice and electroporation cuvettes
175
Figure 9: a) PEF treated/untreated sugar beets and corresponding yield of juice obtained by cold pressing with 32 bar
pressure for 15 minutes [44]. b) Nanoknife technology: treatment of cancer tissues by irreversible electroporation [45]. c)
Bacteria before and after PEF treatment observed by scanning electrons micrographs (7.5 kV/cm, 4 ms pulses, scale bar:
2 µm) [46].
I2) Use of PEF in algae biotechnology
Despite the high potential of microalgae applications, several technological and economical
bottlenecks must be overcome before large-scale production of biodiesel from microalgae takes
place. It is now clearly recognized that the downstream processes (harvesting/dewatering and lipids
extraction steps) have a high environmental footprint and impact negatively the cost efficiency of the
whole process. The development of innovative and environmentally friendly downstream processes is
thus of utmost importance (see Chapter 1).
As for superior plants, PEF may be a breakthrough technology which can change dramatically the
downstream processes used for the fractionation of valuable compounds from microalgae. There
are indeed three main challenges in the current used downstream technologies: (1) reducing the
energy associated with algae dewatering and extraction of the target compounds, (2) reducing the
environmental impact of the whole process and (3) avoiding the degradation of the valuable
compounds and recovering them separately.
The use of PEF for algae fractionation in various valuable compounds has a high potential and is
illustrated in Figure 10 [46].

Chapter 3: The use of Pulsed Electric Fields for the extraction of lipids from Chlamydomonas reinhardtii:
study in microdevice and electroporation cuvettes
176
Figure 10: PEF treatment of microalgae biomass [46]. After treatment, the aqueous fraction is released into the
extracellular medium, whereas lipids may require further solvent extraction. The biomass residues may then be used in
thermochemical conversion and for methane production. New processing route combinations for complete microalgae
biomass valorization are then possible.
Various studies have recently emerged to evaluate the use of PEF to improve the extraction of valuable
compounds from microalgae, mostly hydro-soluble proteins and lipids. The treatment conditions may
greatly vary depending on the target compound and strain. The impact of treatment parameters such
as pulse duration and amplitude, pulse number and shape, frequency on extraction remains unclear
as PEF is a very young process in plant/microalgae technology [44]. Some studies are performed on
diluted culture media (wet extraction) and in low conductivity buffers; others deal with algae pastes
obtained after pre-concentration or water extraction. Several studies describing the application of PEF
on eukaryotic algae cells to recover target compounds are briefly presented hereafter and summarized
in table 1.
Table 1: PEF conditions for the extraction of valuable compounds
• Zbinden et. al [25] (study 1) obtained a significant enhancement in the rate of lipid recovery
with ethyl acetate when using PEF compared with the control (without PEF and in the presence
of the solvent). This result was certainly linked to the high cell lysis (90%) observed. The total
energy input was estimated at 42 J/mL (11 kWh/m3) for 1.9 g/L of algae.
• Goettel et. al [20] (study 2) observed an increase in conductivity of the treated suspension
(from 0.6 mS/cm to 3 mS/cm 2 hours after PEF treatment), revealing the release of ionic
Study Pulse duration
(µs)
Electric Field (kV·cm-1)
Pulse shape Pulse number Strain Cell diameter (µm)
Target compound
1 [25] 0.36 45 Exponential decay
7 200 Ankistrodesmus
falcatus
2.5 large 36-65 long
Lipid
2 [20] 1 23 - 43 Square 20 - 110 Auxenochlorella
protothecoides
5 - 8 Proteins Carbohydrates
3 [22] 6 - 150 10 -25 Square 50 Chlorella
vulgaris
2 - 4 Carotenoids
4 [47] 10 20 Exponential decay
1 - 600 Nannochloropsis 2 - 3 Proteins
5 [48] 100 2.7 Square 21 Chlorella
vulgaris
2 - 4 Lipid
6 [23] 2 000 3-6 Square bipolar
30 Chlorella
vulgaris
Nannochloropsis
2 - 4
2 - 3
Proteins

Chapter 3: The use of Pulsed Electric Fields for the extraction of lipids from Chlamydomonas reinhardtii:
study in microdevice and electroporation cuvettes
177
substances from the cells. In addition, carbohydrates and proteins were drained out of the
cell. The temperature increase was of 15.5°C for an energy input of 100 kJ/kgsus (36-167 g dry
weight per kg suspension). Lipids were not excreted at all despite their high amount in the
cells.
• Luengo et. al [22] (study 3) studied PEF coupled to ethanol extraction to recover pigments
from C. vulgaris [49]. The best extraction yields of carotenoids, chlorophyll a and chlorophyll
b were obtained 1h after PEF (20 kV·cm-1, 75 µs pulses). The extraction of carotenoids,
chlorophyll a and chlorophyll b increased by a factor of 1.2, 1.6 and 2.1, respectively, compared
to the control, as a result of an irreversible electroporation. Reversible permeabilization was
obtained when using less drastic conditions: 50 pulses of 3 µs with an electric field of 10 kV·cm-
1.
• Parniakov et. al [47] (study 4) observed that a PEF pre-treatment could be efficient to extract
ionic components and water soluble proteins. PEF was however less efficient than sonication
for pigment extraction, but with a lower energy consumption.
• Flisar et. al [48] (study 5) compared PEF with solvent extraction (chloroform/methanol) for
lipids recovery (0.43 g lipid/g dry biomass). The cells treated by PEF in a flow chamber were
left in a refrigerator for 1 week; oil was then recovered at the surface of the medium. The
application of 10, 20 or 40 pulses (corresponding to 7.2, 14.4 and 28.8 kJ/L) gave a yield of
respectively 23, 31 and 32 %, compared with solvent extraction alone (100 % extraction).
• Coustets et. al [23] (study 6) demonstrated that protein extraction from species of
Nannochloropsis and Chlorella was more efficient with PEF compared with the control, by a
factor 5 -10. The tests were performed in pure water to reduce heating effects (100 µS/cm for
Nannochloropsis, 200 µS/cm for Chlorella) and the electric field strength was adapted to each
strain (6 kV/cm for Nannochloropsis, and 3 kV/cm for Chlorella). The use of a high-ionic
strength buffer was shown to improve protein extraction from Chlorella vulgaris compared to
pure water. Moreover, according to the authors, improvements in extraction were obtained
when re-suspending Chlorella samples in glycerol and dithiothreitol in order to increase wall
porosity.
The previous data clearly demonstrate that conditions to permeabilize algae cells using PEF are highly
dependent on microalgae strains properties (species, size, …) and medium conditions (cell
concentration, medium properties, …). Besides, PEF showed positive effects in extracting various
compounds from microalgae, such as lipids, proteins, pigments and carbohydrates. Improvements in
extraction yields were obtained when using media containing compounds that strongly increase cell
wall porosity.
In the specific case of lipids, they seem to be highly restrained by the cell wall. An enhancement in
lipid extraction was observed when using an organic solvent coupled to PEF [25] or PEF alone [48] as
hydrophobic lipids coagulate and float on the surface after cell lysis.
Additionally, the temperature increase during the PEF treatment may have a major role both on
solvent transport and cell wall structure. In some works, the cells are re-suspended in low

Chapter 3: The use of Pulsed Electric Fields for the extraction of lipids from Chlamydomonas reinhardtii:
study in microdevice and electroporation cuvettes
178
conductivity media in order to reduce the thermal effects [23,47] but this requires an additional step
in the process which is not recommended in higher scale systems.
I3) Use of bio-micro-devices to monitor algae cells in situ
The use of micro-devices for algal biotechnology was greatly increased in the recent years to help
understanding complex phenomena at the cell scale. Some research works describing the application
of such tools for the study of microalgae are presented hereafter.
I3a) Cell culture monitoring on a chip
Matsumura et. al [50] monitored cell division of Chlamydomonas reinhardtii over time using a single-
cell cultivation system with several micro-cultivation chambers . Nutrients were continuously supplied
in order to mimic an optimal growth environment.
Min et. al [51] used a PDMS microfluidic device to apply a compressive stress on Chlamydomonas
reinhardtii cells in 2 - 2.5 µm high micro-channels (Figure 14.a). This mechanical stress induced a
physiological response, increasing the lipid content of the cells and modifying cell growth patterns.
In another study, Kwak et. al [52] designed a complex microfluidic system made of multiple layers of
PDMS where the culture medium was supplied by a central inlet, to cultivate various strains of
oleaginous algae in growth or stress conditions and to perform lipid extraction in situ (Figure 14.b).
Figure 11 Examples of microfluidic systems to study Chlamydomas reinhardtii. a) Study of the impact of membrane
distortion on the physiology of Chlamydomonas reinhardtii [51] and b) [52] a multiplex microfluidic for the screening of
oleaginous strains - with integrated harvesting and purification (solvent injection) steps.
I3b) Investigation of dielectric properties
The dielectric characteristics of cells can be determined using bio-impedance measurements [53] in
situ. In this context, the micro-devices are used to trap cells near electrodes.
The characterization is performed by measuring the electromechanical behavior of the cells subjected
to alternative electric fields as the cell will undergoe dielectrophoresis forces (DEP). DEP are
dependent on a key parameter, named Clausius Mossotti factor ���∗ .

Chapter 3: The use of Pulsed Electric Fields for the extraction of lipids from Chlamydomonas reinhardtii:
study in microdevice and electroporation cuvettes
179
���∗ = gh∗ >gi∗gh∗ "3gi∗ (3.9)
The Claussius Mossotti complex factor depends on the complex permittivities difference between the
medium ��∗ and the particle ��∗ . The latter can be expressed as follows:
��∗ = ��M�j ∗ k ll%mno"3p qrs! ∗ %qitiu ∗
qrs! ∗ %vqitiu ∗ w
k ll%mno>p qrs! ∗ %qitiu ∗
qrs! ∗ %vqitiu ∗ w (3.10)
with r cell radius, d membrane thickness, �IJK ∗ the complex permittivity of the cytoplasm and ��M�j ∗ the
complex permittivity of the membrane.
Monitoring algae cells submitted to different electric field frequencies in media of various
conductivities enables to evaluate the cytoplasm conductivity. Indeed, when the real part of the
Clausius Mossoti factor is positive, the cells are attracted by high electric fields, i.e. near the
electrodes. When the real part of the Clausius Mossoti factor is negative, cells are rejected to low
electric fields, i.e. far from the electrodes. Data from one experiment performed at the lab
demonstrates this statement (Figure 12).
Figure 12 : Chlorella vulgaris cells in negative DEP at 50 kHz (a) and positive DEP at 100 kHz (b). Distance between the
electrodes: 25 µm. (c) device used for the experiments. Electrodes in platinum, square chip in silicon (size: 2.5 x 2.5 µm)
The study of DEP forces can be an innovative tool to detect cells with high lipid content or even to
separate [54] them from the other cells as the cytoplasm conductivity is reduced when the cell
accumulates neutral lipids [15,55]. Another innovative single cell spectroscopic method, named electro-rotation, based on the effect of the dielectrophoretic torque generated by rotating electric fields (Figure 13), links the rotational
behavior (rotation speed, sense of rotation) with the dielectric properties of the cell.

Chapter 3: The use of Pulsed Electric Fields for the extraction of lipids from Chlamydomonas reinhardtii:
study in microdevice and electroporation cuvettes
180
Figure 13: a) Scheme describing the electrorotation technique [56]. Four electrodes, processed by photo-lithography, are
radially arranged and driven with four 90°-phase-shifted signals producing a rotating field. Angular velocity of the cell is
measured via a microscope. b) Rotation spectra of algae at field strength of 20 kV/m on zygotes of Chlamydomonas
nivalis measured at 4°C.
Measuring the rotational spectra of a single algae cell and its protoplast (wall-free cell), in dedicated
microdevices, enables one to determine conductivity, permittivity and thickness of cell wall,
membrane and cytoplasm [56]. Such measurements can also be used to characterize the cell
properties before/after permeabilization [57].
I3c) Investigation cell lysis in situ via DEP forces
Other devices are used to study cell permeabilization coupled to DEP inducing conditions. In the study
of Bahi et. al, a microdevice was used to visualize in-situ permeabilization of the toxic marine
microalgae Karenia brevis [58]. Permeabilization was performed with an alternative electric field of
30 kV/cm at a frequency of 600 kHz which also attract the cells to the electrodes with a DEP force.
Figure 14: Left: Image of the microchip next to a UK pound coin for size reference. Right a) Karenia brevis cells trapped on
the electrodes (white circle) with positive DEP with 1 V field at 200 kHz for 20 s. Electroporation of 60 V (30 kV/cm) field
at 600 kHz for 5 s (b), 10 s (c) and 15 s (d) [58]. Electrodes are made with a 200 nm platinum layer on a glass substrate.
Electrode distance: 20 µm.
Figure 14 shows the destructuration of the cell membrane and cytoplasm leakage in a wall deficient
strain.

Chapter 3: The use of Pulsed Electric Fields for the extraction of lipids from Chlamydomonas reinhardtii:
study in microdevice and electroporation cuvettes
181
II. Material and methods
II1) Micro-device for studying the in situ permeabilization and
characterization of Chlamydomonas reinhardtii
To better understand the impact of PEF on Chlamydomonas reinhardtii, a dedicated micro-device was
built. Effects on a single cell or on a small population of algae cells were monitored.
The bio-device was designed to trap microalgae in visualization chambers. The cells were monitored
by microscopy, in bright or fluorescence fields, before, during and after application of PEF.
The chambers were made of a thick photoresist as detailed hereafter and were placed above a parallel
electrode network.
The biochip, illustrated in Figure 15, consisted of two layers: an electric layer to deliver pulsed electric
fields and a fluidic layer to trap the cells. It was fabricated using a conventional micro-fabrication
process in a clean room [59].
For the electrodes, a 20 nm chromium adhesion layer, covered by a 150 nm gold layer, was sputtered
on a quartz substrate. A first photolithography step was employed to pattern the electric layer. This
process includes the deposition of S1805 Shipley photoresist by spin coating (t = 30 s, v = 1000 rpm),
followed by a prebaking (115 °C, 1 min) and UV exposure (365 nm, intensity = 120 mJ·cm-2) (Figure
15.a). A developing step was then performed (developer 351, 1min) (Figure 15.b), followed by gold
etching with KI (4 g KI, 1 g I2, 40 mL H2O, 7 s) and chromium etching (ChromeEtch18 micro resist
technology, 45 s) (Figure 15.c). Photoresist removal was done using acetone and isopropanol (IPA).
The microfluidic level was patterned with a second photolithography step: the 25 µm high microfluidic
chamber was defined by negative thick photoresist (SU8 2025, Microchem©) spin coated in two steps:
5 s at 500 rpm and 30 s at 2700 rpm. A soft-baking (3 min at 65 °C and 15 min at 95 °C), followed by
UV exposure (365 nm, intensity = 240 mJ·cm-2) (Figure 15.d) gave the pattern for the micro-device
design (Figure 15.e). A post exposure baking was then performed (3 min at 65 °C and 15 min at 95 °C)
before development (MicroChem © SU8 developer, 6 min) associated to a hard-baking step (175 °C,
30 min, slope 5 °C·min-1) to fix the thick resist level (3h).

Chapter 3: The use of Pulsed Electric Fields for the extraction of lipids from Chlamydomonas reinhardtii:
study in microdevice and electroporation cuvettes
182
Figure 15: Microfabrication process of the biodevice. The electrode layer is patterned on a glass substrate in 3
steps: photoresist patterning by UV light exposure (a), photoresist development (b), and Au/Cr wet etching
and photoresist removing (c). A fluidic layer is patterned above the electrode layer by a second UV light
exposure (d) to obtain several multiple electroporation chambers shown on the scheme (e) and picture (f).
The electrode gap was small enough to achieve high electric fields [60], up to 30 kV·cm-1 and
60 kV·cm-1, with gaps of respectively 300 µm and 150 µm using an accessible voltage generator (up
to 1 kV). Large chambers have an internal dimension of 720 µm x 480 µm, designed to be observed
with a 20 x objective. Small chambers possess an internal dimension of 360 µm x 150 µm designed for
observation with a 40 x objective (Figure 16). The device was designed to be observed with a CMOS
(Complementary Metal Oxide Semi-conducor) camera sensor 36.0 x 23.9 mm with a resolution 4908 x
3264 pixels (16.25 megapixel) equipped with a mount F type with 2.5 x magnification T2-T2 SLR.
Figure 16 : Small chamber (x length: 325 µm, z length: 147 µm) observed with the 20 x objective.
The generator used was a Betatech Electrocell B10 HVLV. The generator characteristics are the
following: U = −1000 to +1000 V (bipolar pulses), Δtpu = 5 - 50,000 μs (pulse duration), Ti = 5–50,000 μs
(duration between positive and negative pulses), P (period of one pulse cycle) ranging 80 µs to 10 sec,
burst of pulses: 1 - 10,000 pulses.

Chapter 3: The use of Pulsed Electric Fields for the extraction of lipids from Chlamydomonas reinhardtii:
study in microdevice and electroporation cuvettes
183
The microfluidic layer (white layer in Figure 17.a) was designed as a set of 6 lines of 15 chambers for
a total of 90 numerated closed chambers. There were 3 lines of 45 large chambers (gap of 300 µm) or
3 lines of 45 smaller chambers (gap of 150 µm) as illustrated in the figure. The electric layer (orange
layer in Figure 17.a) connects the various chambers with parallel electrodes. The electroporation
micro-device was connected to the pulse generator by a homemade supporting base fastened above
the microscope objectives and designed to support up to 2 kV DC voltage (Figure 17.b).
Figure 17 a. Scheme of the overall design of the electroporation micro-device. Orange: electric level, white: fluidic level.
(*) 45 large chambers (internal dimensions: 720 µm x 480 µm, electrode gap: 300 µm) designed to be observed with a 20
x objective, (**) 45 small chambers (internal dimensions: 360 µm x 150 µm, electrode gap: 150 µm) designed to be
observed with a 40 x objective. b. Picture of the chip connected to the generator, placed above a microscope objective.
II2) Electroporation in cuvettes
The use of dedicated micro-devices coupled with direct cell observation by microscopy gives a first
insight into the electroporation phenomena. However, in order to further quantify PEF effects on cells
(e.g. viability) and molecules extraction, additional analyses must be performed on cells recovered
after electroporation. Another electroporation device was then used.

Chapter 3: The use of Pulsed Electric Fields for the extraction of lipids from Chlamydomonas reinhardtii:
study in microdevice and electroporation cuvettes
184
Electroporation cuvettes are plastic squared cuvettes made in transparent plastic which possess
aluminum electrodes with a gap of 4, 2 or 1 mm (Figure 18). With this higher electrode distance
compared with micro-devices (several millimeters instead of hundreds micrometers), the electric field
which could be applied in such systems is limited to 5 kV/cm (2 mm) and 10 kV/cm (1 mm) (for the
micro-device: 30 kV/cm with an electrode gap of 300 µm). In the 2 mm and 1 mm cuvettes, 500 and
120 µL of cell suspension can be treated, respectively
Electroporation cuvettes were used to perform multiple complementary experiments to those
carried out with the micro-device.
Figure 18 : Electroporation cuvettes.
Electrode distance: 1 mm, 120 µL (brown cap); 2 mm, 500 µL (green cap); 4 mm, 2 000 µL (blue cap).
II3) Viability/permeability measurements
Cell viability and membrane permeability are among the parameters that were measured to assess
the impact of PEF on microalgae cells.
In this context, chlorophyll autofluorescence is usually correlated with photosynthetic activity.
According to the study of Sato et. al [61], the fluorescence intensity can be therefore used to sort
viable from non-viable cells as non-viable cells greatly lose their fluorescence intensity as shown in
Figure 19. Accordingly, viable cells are seen in red, from chlorophyll autofluorescence, and non-viable
are detected in green from staining with a so called "viability dye”: Sytox green (SG).

Chapter 3: The use of Pulsed Electric Fields for the extraction of lipids from Chlamydomonas reinhardtii:
study in microdevice and electroporation cuvettes
185
The use of chlorophyll auto-fluorescence to detect viability is not suitable when the cells are in lipid
inducing stress conditions which greatly affect cell chlorophyll content. Several dyes can be used to
sort viable and non-viable cells.
II3a) Choice of the dyes
Several fluorescent dyes can be used to monitor cell viability and membrane permeability. Hyka et al.
[62] published a review of the dyes used in algae biotechnology with different targets: permeability
(staining of nucleic acid in permeabilized cells), membrane potential (potentiometric probes) and
cellular enzyme activity; all these methods can be associated with cell viability. The list of dyes is
presented in appendix II.1 (Chapter 2).
Four probes were tested in this project using microscopy and flow cytometry methods: two
permeability dyes, Propidium iodide (PI) and Sytox green (SG), and two enzyme activity dyes, Calcein-
AM and Fluorescein Diacetate (FDA) were used.
Propidium Iodide and Sytox Green are molecular probes that bind to DNA in the cells. However,
because of their high molecular weight (PI, 668; SG, 600 Da [63]), they cannot pass through intact
membranes to stain the cell DNA. They are then mostly used to sort non permeable cells, generally
associated with viable cells, and permeable or non-viable cells. In the case of electroporation, cells
can however be permeabilized for a very short time without affecting viability.
The use of PI (ex. 536 nm/em. 636 nm) to evaluate cell permeability through flow cytometry was not
appropriate in our work. In fact, the optimal excitation wavelength for PI is 536 nm and the blue laser
of the flow cytometer used for this study emits light at 488 nm. Moreover, PI fluorescence may
overlay with chlorophyll auto fluorescence excited at 488 nm [62]. This problem may be overcome
when using adapted laser or filters to excite PI in the orange spectrum which increases the selectivity
of PI over chlorophyll.
Figure 19: Images of cells showing SG fluorescence (non-viable, green) and pigments autofluorescence (viable, red)
[61]. Sample contains 50% viable cells. Left: Synechocystis sp. (scale bar: 10 µm), right: Oscillatoria agardhii (scale bar
50 µm).

Chapter 3: The use of Pulsed Electric Fields for the extraction of lipids from Chlamydomonas reinhardtii:
study in microdevice and electroporation cuvettes
186
The non-fluorescent dyes FDA and Calcein AM passively diffuse into the cells and are hydrolyzed by
cellular enzymes to form polar fluorescent molecules; these molecules remain in the cells if their
cytoplasmic membrane is intact [62]. Therefore, these dyes indicate at the same time enzymatic
activity and membrane permeability.
On the other hand, when using flow cytometry to evaluate permeabilization in cuvettes, SG was
preferred as previously discussed (excitation at 488 nm). FDA was used to evaluate enzymatic activity.
When choosing dyes, it is important to verify their compatibility with the equipment (laser, lamps,
photomultiplier). If a multiple staining is planned, the compatibility of the dyes between themselves
and with pigments auto-fluorescence must be evaluated to avoid an overlapping of the fluorescence
spectra in the detection channels.
It is highly recommended to use a spectra viewer tool to verify that the dyes are correctly excited, as
close as possible to their maximum excitation peak and to use a detector band in the optimal emission
spectrum, as previously reported (Chapter 2).
The optical configuration of our Merck flow cytometer is illustrated in Figure 20 with the blue laser at
488 nm and the green, orange and red detectors. It can be clearly seen that a green dye, such as FDA,
is adapted to our device. Indeed, the laser matches with the green dashed excitation spectrum, and
the green detector perfectly corresponds to the emission spectrum. PI is excited with the blue laser
but not at its optimal excitation wavelength (shown in orange dashed line). This will result in a low
emission (orange line) which is poorly adapted to our detectors. Emission in the red region will overlap
with chlorophyll autofluorescence at 680 nm and the emission at yellow fluorescence is very low. Thus,
this kind of orange dye such as PI (or Nile red in the case of lipid detection), is not adapted for a flow
cytometer which possesses this optical configuration.
Figure 20: Excitation (dashed lines)/Emission (straight lines) spectra for two dyes: FDA (green) and PI (orange) for the
optical configuration of the flow cytometer Easycyte 5. Optical configuration: 50 mW blue laser (488 nm), 3 fluorescence
detector channels (525 nm, 583 nm and 680 nm).
Chlorophyll autofluorescence can be mimicked with the Peridinin-Chlorophyll-Protein (PerCP-Cy5.5)
with the spectra viewer as shown in the Chapter 2. When comparing Figure 20 and chlorophyll
emission peaks, PI must clearly be detected before 650 nm, when the emission of the chlorophyll a is
low. Light harvesting complex of Chlamydomonas reinhardtii also contains chlorophyll b [64] which
may however be more problematic than chlorophyll a (chlorophyll a/b ratio of approximately 2.3 in

Chapter 3: The use of Pulsed Electric Fields for the extraction of lipids from Chlamydomonas reinhardtii:
study in microdevice and electroporation cuvettes
187
Chlamydomonas reinhardtii [65]). Carotenoids fluorescence may also interfere (chlorophyll/
carotenoids ratio ranging from 4 in low light to 2 in high light conditions [65]).
Although flow cytometry is unsuitable to PI measurements, cell permeabilization by PEF in the micro-
device coupled to microscopy was evaluated by PI fluorescence. The choice was based on the fact that
PI is the most widely used dye to assess permeability. Moreover, in our study, special attention was
paid to avoid the overlap of fluorescence of cell pigments and PI, i.e. by using an adapted fluorescence
filter.
The orange dye (PI) can be detected with the optical configuration of the epi-fluorescence
microscope: the light source is a Xenon lamp and the fluorescence filters are FITC (485/530), CY3
(545/610), CY5 (620/700), and B2A (470/490+) (in Figure 21). The xenon lamp gives a light on the
whole visible spectrum from 350 to 870 nm.
Fluorescence filters enable to select a particular excitation band, discard the others and also detect
the emitted fluorescence in a narrow band. The excitation spectrum of the CY3 filter (530 - 560 nm)
very well matches with the excitation peak of PI; the resulting fluorescence is then high and adapted
with the emission range of the CY3 filter (573 - 648). If a double staining FDA (fluorescein)/PI is
performed, FDA (FITC fluorescence) and PI fluorescence overlap at 600 nm because FDA is also excited
with the CY3 filter, though not at its optimal wavelength.
Figure 21: Excitation (dashed lines)/Emission (straight lines) spectra for two dyes: FDA (green) and PI (orange) for the
optical configuration of the epi-fluorescence microscope used. Xenon lamp, fluorescence filters: Nikon FITC and Cy3.
This verification of the fluorescence bands was performed for all the dyes used for
viability/permeability, lipid content and cell wall staining (see Chapter 2).
In conclusion, viability (enzymatic activity) was measured with Fluorescein Diacetate (FDA) while
membrane permeability was determined with either Propidium Iodide (PI) (microscopy) or Sytox
Green (SG) (flow cytometry measurements).
II3b) Determination of the optimal staining conditions

Chapter 3: The use of Pulsed Electric Fields for the extraction of lipids from Chlamydomonas reinhardtii:
study in microdevice and electroporation cuvettes
188
The staining protocols were optimized regarding the amount of dye per cell and the incubation time
along with optical parameters, i.e. fluorescence filter, lamp intensity, exposure duration and gain for
microscopy, photomultiplier (PMT) gain and fluorescence threshold in the case of flow cytometry.
The optimization of PI and FDA protocols is described hereafter.
PI staining conditions
The PI stock solution was prepared by diluting the molecule at a concentration of 1 g/L (1.5 mM) in
distilled water. PI concentrations within the range of 5 to 500 µM were tested on preheated
Chlamydomonas reinhardtii at concentrations from 3·106 to 1·107 cells/mL.
From microscopic observations, the optimal conditions were found: PI concentration 100 µM and
incubation time 5 minutes. Although PI stained DNA of permeabilized cells was efficiently observed at
lower concentrations of PI, the visualization was better at 100 µM. At higher PI concentrations, a
significant fluorescence of the medium was observed, with no improvement in the DNA staining.
Confocal Laser Scanning Microscopy (CLSM) images showing PI stained DNA of a permeabilized
Chlamydomonas reinhardtii cell are presented in Figure 22.
Figure 22 Depth stacks (from bottom to top) of a single permeabilized Chlamydomonas reinhardtii cell in growth phase
stained with Propidium Iodide. Stained nucleus is shown in green, chlorophyll auto-fluorescence in red.
FDA staining conditions
FDA protocol optimization was performed using flow cytometry.
FDA was diluted in acetone at a concentration of 11 mM, as found in literature [66]. The FDA staining
protocol was optimized on Chlamydomonas reinhardtii cells both in growth phase (Figure 23 a and b)
and after seven days of lipid accumulation (Figure 23 c and d). The mean green fluorescence per cell
was measured by flow cytometry for several incubation times and FDA concentrations.

Chapter 3: The use of Pulsed Electric Fields for the extraction of lipids from Chlamydomonas reinhardtii:
study in microdevice and electroporation cuvettes
189
Figure 23 Optimization of the FDA staining protocol using flow cytometry regarding the green fluorescence per cell.
Measurements were performed on Chlamydomonas reinhardtii cells in growth phase and stress conditions (7 days of
nitrogen stress). Optimal conditions are indicated with the green rectangles. Growth phase a) incubation time: 5-6 minutes,
b) FDA concentration: 5.5·10-3 µmol·mL-1 for a concentration of 1.5·105 cells·mL-1. 7 days of stress c) incubation time: 5-6
minutes, d) FDA concentration: 5.5·10-3 µmol·mL-1 for a concentration of 1.5·105 cells·mL-1
A decrease in the green fluorescence per cell is observed for FDA concentrations higher than 5.5 µM
for both conditions. A significant decrease in cell concentration after staining with FDA concentration
higher than 55 µM was observed suggesting cell lysis. Furthermore, cell disruption was confirmed to
be due to FDA and not to acetone (FDA is indeed diluted in acetone).
Figure 23 also shows the impact of incubation time with a dye penetration in the first 5 minutes after
staining and a slow release of the dye in the medium after this time [67]. The optimal measurement
time is thus 5 minutes after staining.
In summary, the optimal incubation time was found within the range of 5 - 6 minutes and the optimal concentration is 5.5 µM for a cell concentration of 1.5·105 cells/mL.
II3c) Validation of the PI and FDA optimal conditions
In order to validate the staining methods, samples treated with the optimized FDA and PI protocols
were first observed by epi-fluorescence microscopy. Some cells were permeabilized and enzymes
inactivated by heating the cells at 80°C during 10 minutes and a mixture of non-treated and treated
cells (equal proportion) was prepared. Cells were successively stained with FDA and PI as previously
described. Bright field, green fluorescence (FDA) and red fluorescence (PI) images observed with an
objective 40x are presented in Figure 24. Viable cells detected with a green fluorescence are circled in
green while the dead cells detected with a red fluorescence appear in red (detection with separated
filters).

Chapter 3: The use of Pulsed Electric Fields for the extraction of lipids from Chlamydomonas reinhardtii:
study in microdevice and electroporation cuvettes
190
Figure 24: 50/50 mixture of Chlamydomonas reinhardtii dead /alive (cells in growth phase) stained with FDA and PI. a)
Bright field, b) esterase enzymatic activity detected with the green fluorescence filter (FITC), c) Nucleus of permeabilized
cells detected with the orange-red fluorescence filter (CY3). 13 living cells are detected for 8 dead.
As is can be seen in the bright field image (Figure 24.a), some cells (circled in red) appear less green
and less structured than the others. Heat treated cells have indeed their photosynthetic apparatus and
their cytoplasm membrane degraded, inducing a loss of structure, as it appears when they are stained
with PI (Figure 24.c). The cells with a regular circular shape and bright green in the bright field image,
circled in green, appear efficiently stained with FDA (Figure 24.b).
An observation of non-treated cells was also performed with an objective 20x on Chlamydomonas
reinhardtii cells at 5 days of stress (Figure 25). In this sample, 19 cells are stained by PI and 120 with
FDA, which indicates 86.33 % of viability.

Chapter 3: The use of Pulsed Electric Fields for the extraction of lipids from Chlamydomonas reinhardtii:
study in microdevice and electroporation cuvettes
191
Figure 25: Chlamydomonas reinhardtii cells at 5 days of stress, stained with FDA and PI. a) bright field, green fluorescence
and red fluorescence acquisitions merged in one image, b) green fluorescence and red fluorescence acquisitions merged
in one image.
A manual counting of PI stained cells was used to estimate the permeabilization ratio of hundreds
of PEF treated cells in micro-devices as reported later on. However, for rapid quantitative results on
over thousands of cells, the flow cytometry method was preferred.
II3d) Development and validation of the staining methods by flow cytometry
As explained before, for FDA, in flow cytometry, the optimal incubation time was found within the
range of 5 - 6 minutes and the optimal concentration is 5.5 µM for a cell concentration of 1.5·105
cells/mL. The Sytox Green protocol was also optimized using flow cytometry. The commercial solution (5 mM
in DMSO) is diluted in TAP medium to a concentration of 200 µM to prepare the stock solution. Finally,
the optimal concentration of SG was determined 0.5 µM for 2.5·105 cells/mL for an incubation time
of 5 min.

Chapter 3: The use of Pulsed Electric Fields for the extraction of lipids from Chlamydomonas reinhardtii:
study in microdevice and electroporation cuvettes
192
For the development of the methods in flow cytometry, both viability and permeabilization
fluorescence thresholds (R4 Figure 27 for Sytox Green, R3 Figure 28 for FDA) were determined by
mixing heat treated cells and non-treated cells at different ratios.
Unlike SG and PI which can be stained simultaneously on the same cell population (Figure 24), SG and
FDA staining methods were performed separately in flow cytometry because both FDA and SG exhibit
a fluorescence emission in the green and yellow fluorescence channels.
Figure 26: Mean yellow fluorescence (SG) of samples with different ratios of treated/non treated Chlamydomonas
reinhardtii cells (7 days of stress) stained with SG. Permeabilized cells are stained by SG and their fluorescence is within
the range of 8·102 to 1·104 a.u. while non stained cells have a fluorescence within the range of 1·101 to 1·102 a.u. A threshold
R4 is fixed at 2·102 a.u. to discard non permeabilized cells on the bottom and permeabilized cells on the top of Plot 05.
Theoretical permeability measured: 20 %, 30 %, 80 %.
Figure 27: Mean green fluorescence (FDA) of samples with different ratios of treated/non treated Chlamydomonas
reinhardtii cells (7 days of stress) stained with FDA. Cells with esterase enzyme activity and non permeable are stained by
FDA, and their fluorescence increases within the range of 2·103 to 4·104 a.u. while non stained cells appear to have a
fluorescence within the range of 5·100 to 1·102 a.u. A threshold R3 is fixed at 1·103 a.u. to discard non viable cells on the
bottom from viable cells on the top of the Plot 02. Theoretical viability measured: 20 %, 50 %, 80 %.
It must be underlined that all these arbitrary fluorescence intensities and corresponding thresholds
are highly dependent of the gains and sensitive optical settings that can vary over time: laser to
detectors X/Y alignments, voltage of the 5 PMT detectors. Whether for FDA, SG or Bodipy staining, it
is highly recommended to verify the fluorescence in the different channels with calibrated beads
(Merck easy-check kit in the case of our device, even if beads of the size of algae would have been
preferred) and adjust the optical settings if necessary.
The calibration curves correlating the measured and theoretical viability/permeability of samples at
different ratios of heat-treated and non-treated cells are presented in Figure 28.

Chapter 3: The use of Pulsed Electric Fields for the extraction of lipids from Chlamydomonas reinhardtii:
study in microdevice and electroporation cuvettes
193
Accordingly, the viability and permeability measured with FDA and SG, respectively, fully correlate
with the theoretical values.
All measurements were performed in triplicate. The average standard deviation for the triplicate is
approximately 1% of viability/permeability.
Figure 28 : Correlation curves permeability (a) and viability (b) measured/theory to validate flow cytometry methods for
Sytox Green (SG) and Fluorescein Diacetate (FDA). Tested on Chlamydomonas reinhardtii wild type in 7 days of stress.
In conclusion, viability (enzymatic activity) was measured with Fluorescein Diacetate (FDA) while membrane permeability was determined with either Propidium Iodide (PI) (microscopy) or Sytox
Green (SG) (flow cytometry measurements).
II3e) Measure of the permeabilization level in the micro-device
The effect of PEF on cell permeabilization was evaluated in the micro-device and was characterized
using propidium iodide (PI) diluted in the sample of microalgae cells to a final concentration of
100 µM.
All experiments were performed in TAP medium, which conductivity is 0.213 S·m-1 at 20 °C.
15 µL of the microalgae solution, with a cell concentration in the range of. 2·106 - 1·107 cells/mL and
containing PI were placed on the surface of the device. A glass cover-slide (24 x 30 mm, d = 1 mm)
covered the algae solution in order to spread it and fill the multiple electroporation chambers with the
sample. We assume that a variation of algae concentration would have no impact on the obtained
results as algae cells represent less than 0.2 % v/v (i.e. less than 2 g/L) in the chamber. The electrical
shielding of the cells can thus be considered negligible in our case. The use of a more concentrated
sample may however affect the electrical treatment.
For microscopic observations, we used an inverted microscope Nikon eclipse Ti-U equipped with a 20x
objective (Nikon Plan fluor x20 DIC N2 NA = 0.6) and a 40x objective (Nikon Achromat LWD x40 Ph1
ADL NA = 0.5).
In order to get quantitative data of cell PI uptake, each experiment was performed in three
independent chambers and in duplicate.

Chapter 3: The use of Pulsed Electric Fields for the extraction of lipids from Chlamydomonas reinhardtii:
study in microdevice and electroporation cuvettes
194
First, the cells in the chambers were observed with the x20 objective and the images were recorded
in bright field (Figure 29.a) (no fluorescence filter, exposure time of 10 ms and gain x1) and afterwards
with the CY3 filter (Figure 29.b) (exposure time of 700 ms, and gain x4). The number of stained cells
nPI0 and the total number of cells ntot0 within each chamber were calculated, giving the natural
permeabilization rate (before PEF).
The PEF treatment was then applied. It was observed that PI penetrated permeabilized cells within a
few seconds after treatment. Afterwards, new bright field and fluorescence images (Figure 29.c and
d) were recorded in the three chambers, more than 30 s after the treatment, to let the cells settle
down within the focus of the objective.
In the calculation of the PI uptake (equation 3.12), for each measurement, the total number of cells
stained with PI before treatment (nPI0 consisting of naturally permeabilized cells) was subtracted from
the stained cell number after treatment (nPI1) and from the total cell number measured after
treatment ntot1 (ntot1 and ntot0, the cell number in the chamber after and before treatment, were
always very close).
PI uptake (%) =xyzG>xyz{x|}|G>xyz{ × 100 (3.11)
The average number of cells per chamber was approximately 60. Algae permeabilization experiments
are illustrated in Figure 29.
Figure 29: View in one of the large electroporation chamber (720 µm x 480 µm, electrode gap: 300 µm) with the x20
objective. Images recorded before and after PEF treatment (10 pulse of 5µs, frequency 10 Hz, 180V corresponding to E=6
kV·cm-1). Bright field images (a) before and (c) after PEF; and fluorescence images (b) before and (d) after treatment. Scale
bar: 100 µm.
A picture of the experimental set-up is presented in Figure 30.

Chapter 3: The use of Pulsed Electric Fields for the extraction of lipids from Chlamydomonas reinhardtii:
study in microdevice and electroporation cuvettes
195
Figure 30: Experimental set-up to measure in-situ permeabilization with the micro-device.
1: Beta-tech generator electrocell B10 HVlV. 2: Fluorescence lamp (Xenon). 3: Electroporation device on the support
plugged to the generator. 4: Camera color CMOS NIKON DS-RI2 5: Inverted microscope Nikon eclipse Ti-U equipped with
several fluorescence filters and objectives 6: Cell permeabilization monitoring.
II3f) Measure of permeability (irreversible permeabilization (IP) and reversible
permeabilization (RP)) and viability in the electroporation cuvettes
In the micro-device, the cells are in contact with PI during permeabilization. This means that the dye
stains both irreversible and reversible permeabilized cells together with natural permeabilized cells
(cells before treatment). It should be stressed that if staining is carried out 1h after PEF, the dye would
stain only irreversibly and natural permeabilized cells as the literature reported that reversible pores
may reseal a few seconds after treatment. Vernes et. al [68] mentioned 10 min as the time necessary
for membrane recovery after PEF treatment.
To distinguish natural permeabilization (NP), reversible permeabilization (RP) and irreversible
permeabilization (IP), three measurements must be performed: levels of permeabilization of non-
treated cells (standing for NP), of cells stained before PEF application (SB includes NP+IP+RP) and of
cells PEF-treated and stained 1h after PEF application (SA includes NP+IP).
These assays were carried out in the electroporation cuvettes illustrated in Figure 18 (see section II2).
The permeability levels were measured with Sytox Green (SG) by cytometry as presented previously in
Figure 26. The SG uptake by the cell is determined according to the protocols described in Figure 31.

Chapter 3: The use of Pulsed Electric Fields for the extraction of lipids from Chlamydomonas reinhardtii:
study in microdevice and electroporation cuvettes
196
Figure 31: Sytox green staining protocols. Natural permeabilization (NP), Staining after (SA) measures NP+ irreversible
permeabilization (IP), Staining before (SB) measures NP+IP+RP.
Additionally, viability tests were performed with fluorescein diacetate (FDA) 1h after the PEF
treatment. The staining protocol was the one optimized before: 5.5 µM FDA for 1.5·105 cells/mL, 5-6
min incubation time.
II4) Measurement of lipid extraction with/without PEF
To measure the impact of PEF pre-treatment on lipid extraction from Chlamydomonas reinhardtii, cells
were either treated or not by a PEF treatment, and then mixed with a solvent. At first, the contact of
algae with solvent during PEF treatment was tested in our electroporation system. However, the
biphasic system (algae/water + organic solvent) requires a very efficient mixing in order to improve
the transfer of lipids between both phases. Aqueous phase (water + algae) and/or solvent phase were
then separated before being analyzed with the SPV method (Chapter 2). On the difference with the
solvents used for lipid analysis, generally chloroform/methanol, the solvents used for lipid extraction
must be safe, eco-friendly and cheap to be scaled-up.
II4a) Characteristics of the solvent
To choose the solvent, several characteristics were taken into account.
The solubility of solvent in water (in mg/L) or hydrophobicity which is generally expressed by
Log(Poct/wat), Poct/wat being the partition coefficient of the solvent between 1-octanol and water. A high
LogP denotes a high hydrophobicity.

Chapter 3: The use of Pulsed Electric Fields for the extraction of lipids from Chlamydomonas reinhardtii:
study in microdevice and electroporation cuvettes
197
A high hydrophobicity of the solvent generally results in a strong affinity with neutral lipids. A low
extraction yield is however expected because of the poor contact of the solvent with the cytoplasmic
lipids in this biphasic system; the solvent is indeed scarcely soluble in the water phase and does not
penetrate easily into the cell through the polar heads of the phospholipids of the membrane; besides
the lipid droplets are protected in the cell by a hydrophilic layer. As a consequence, in these conditions,
algae viability is usually slightly affected by hydrophobic solvents. Zheng et. al. [69] identified the
solvents with LogP < 5.5 as “toxic” and the solvents with LogP > 5.5 as “biocompatible”. It was also
observed by Mojaat et. al [70], which has plotted the photosynthetic activity in function of the log P
and observed an effect on the activity below Log(P) = 5. They have also showed a linear correlation
between the critical aqueous solvent concentration and the LogP value of the solvent: “the amount
of solvent dissolved in water and in the cellular membrane decreases with increasing solvent
hydrophobicity (logPoct)”. The molecular weight has, together with the LogP, a major impact on cell
viability [69,70]. A molecular weight over 150 g·mol-1 has shown to be biocompatible whereas below,
the solvent is toxic.
In the lipids extraction process, apolar biocompatible solvents may be blended with polar chemicals
which can penetrate into the cell and break the hydrogen bounds of neutral fatty acids with polar
molecules of the cytoplasm [71]. Moreover, the extraction yield can be improved without negative
effect on cell viability if the concentration of the toxic solvent in the aqueous phase is lower than the
aqueous critical solvent concentration [70,72] (solvent concentration in the water which result in
membrane denaturation). Accordingly, Marchal et. al, [73] added 5 % v/v of dichloromethane to the
biocompatible solvent decane to increase β-carotene solubility in the solvent without strongly
affecting cell viability of Dunaliella salina (from 80 to 70 % of viable cells, solubility increased from 300
to 500 mg·mL-1).
A low boiling point was also preferred for facilities of evaporation.
The Sulpho-phospho-vanillin colorimetric method (SPV, see Chapter 2) was then used to quantify lipid
extraction after solvent evaporation. Triolein (three 18:1 FA linked to glycerol molecule) was used as
standard. The calibration curve obtained at different triolein concentrations dissolved in the chosen
solvent was used for the calculations (see Appendix III3).
In the choice of the solvents tested, we took into account the ability to extract neutral lipids with a
limited impact on glycolipids and phospholipids (polar lipids), and a low toxicity on the cells. The impact
on the toxicity is evaluated in the prospect of re-use of the cells after extraction [74–76] (bio-milking),
coupled with reversible electroporation (electroporation with an impact on the membrane but no
impact on cell viability). If the extraction of intracellular lipids seems incompatible with the extraction
of lipid droplets, we aimed to use a solvent which has no lysis effect in prospect of algae fractionation
(separation of valuable compounds).
The solvents hexane and ethyl-acetate showed to have the ability to extract neutral lipids with limited
effects on polar lipids in comparison with chloroform, methanol, and ethanol [77]. The lipid extraction
is generally known to be more efficient when using a solvent mixture. In the article of Wu et. al [77],
the extraction duration needed is of 2 hours, and it was shown that the temperature has a paramount
impact on the extraction, especially over 60 °C. Chen et. al, [78], used a mix of hexane:ethanol 3:1 in
subcritical state (1.4 MPa, 90°C). This ratio was also used by Li et. al, [79]. Dodecane is shown to be the

Chapter 3: The use of Pulsed Electric Fields for the extraction of lipids from Chlamydomonas reinhardtii:
study in microdevice and electroporation cuvettes
198
more bio-compatible solvent by Zhang et.al [69] but the extraction could be very low because of the
low affinity with the polar phase.
The protocol used to extract lipids from Chlamydomonas reinhardtii is presented hereafter.
II4b) Mixing protocol
Before being mixed with the solvent, the algae solution (Chlamydomonas reinhardtii wt at 7 days of
stress) was first centrifuged to concentrate it in order to obtain a significant response of the SPV
method. A volume of 100 µL of 1 - 5·107 cells/mL (Figure 32) was placed in a 1 mm electroporation
cuvette, subjected to PEF or not and transferred back in Eppendorf tubes.
Figure 32 : Concentration and electroporation steps before mixing with solvent.
The solvent was added in a ratio 2:1 (2 volumes of solvent for 1 volume of algae solution). Samples
were mixed with a mixing device:“intelli-Mixer RM-2l elmi”, the program used is the F6 (alternation of
rotation and oscillation) at 90 rpm (Figure 33). The time of mixing varies from 10 to 120 minutes
depending on the experiment.
Figure 33 : Picture of the mixing device: intelli-Mixer RM-2l elmi.
Afterwards, the two phases are separated by a centrifugation step (Figure 34).
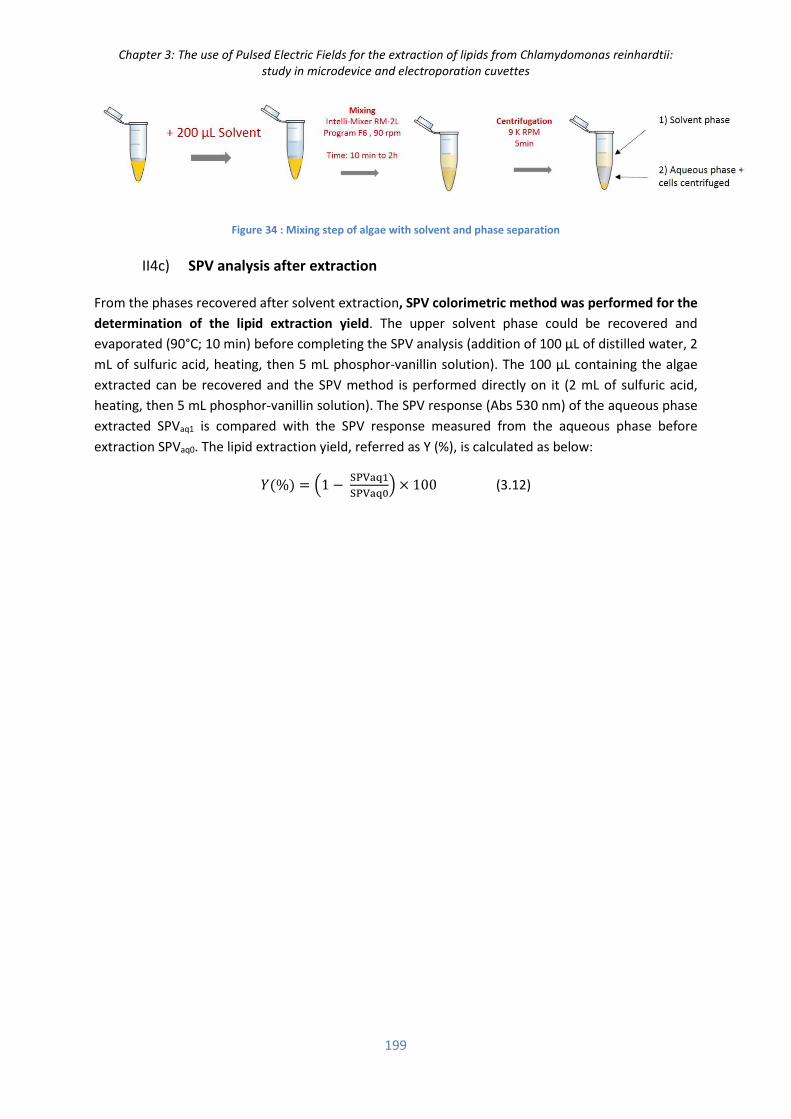
Chapter 3: The use of Pulsed Electric Fields for the extraction of lipids from Chlamydomonas reinhardtii:
study in microdevice and electroporation cuvettes
199
Figure 34 : Mixing step of algae with solvent and phase separation
II4c) SPV analysis after extraction
From the phases recovered after solvent extraction, SPV colorimetric method was performed for the
determination of the lipid extraction yield. The upper solvent phase could be recovered and
evaporated (90°C; 10 min) before completing the SPV analysis (addition of 100 µL of distilled water, 2
mL of sulfuric acid, heating, then 5 mL phosphor-vanillin solution). The 100 µL containing the algae
extracted can be recovered and the SPV method is performed directly on it (2 mL of sulfuric acid,
heating, then 5 mL phosphor-vanillin solution). The SPV response (Abs 530 nm) of the aqueous phase
extracted SPVaq1 is compared with the SPV response measured from the aqueous phase before
extraction SPVaq0. The lipid extraction yield, referred as Y (%), is calculated as below:
�(%) = k1 − �y���G�y���{n × 100 (3.12)

Chapter 3: The use of Pulsed Electric Fields for the extraction of lipids from Chlamydomonas reinhardtii:
study in microdevice and electroporation cuvettes
200
III. Results
First, the results on the effect of PEF on cell permeability in the micro-device and electroporation
cuvettes set-ups are presented. Afterwards, data of lipid extraction with or without PEF pre-treatment
is discussed. Results are presented as following:
Micro-device experiments:
- We first investigated the relation between the PEF energy consumption, for a given set of
electrical conditions, and the efficiency of the treatment measured by the propidium iodide
uptake by algae at 7 days of stress (high lipid content).
- Afterwards, the impact of the stress duration on the sensitivity of Chlamydomonas
reinhardtii to permeabilization was investigated.
- The effects of PEF on lipids and cell wall behavior during the PEF treatment were observed
in-situ.
Electroporation cuvettes assays:
- Conditions tested in the micro-device were further used in an up-scaled system
(electroporation cuvettes). Cell permeabilization was further characterized: the distinction
between reversible/irreversible permeability was assessed. Finally, cells were harvested
after PEF treatment to be observed with CLSM imaging to characterize the effects on lipid
droplets and cell wall.
First lipid extraction results:
- Three solvents (ethyl-acetate, hexane, dodecane) of various toxicities were tested regarding
their effect on cell lysis
- Thereafter the effect of two solvents (ethyl-acetate, dodecane) on the cells (lipids and cell
wall stained) were qualitatively observed (CLSM)
- Finally, lipid extraction performed by hexane with or without PEF pre-treatment was
evaluated.
III1) Electroporation in the micro-device
The goal was to determine the optimal conditions of electroporation while minimizing the energy
demand of the process.
In this context, the membrane charging time τm (time constant to lead 63 % of the maximal charge, see
Figure 3), and the critical electrical field (Ecrit), the electric field applied to trigger membrane
permeabilization, were first calculated before performing the electroporation assays.

Chapter 3: The use of Pulsed Electric Fields for the extraction of lipids from Chlamydomonas reinhardtii:
study in microdevice and electroporation cuvettes
201
III1a) Calculation of the theoretical critical electrical field and charging time
The minimum and maximum charging times can be estimated with equations 3.3 (single shell model)
and 3.4 (double shell model) presented in section I1b) of this chapter, using the minimal and maximal
values of the radius r and the cytoplasm conductivity σcyt, as shown in equations 3.14 and 3.15. The
equation taking into account the cell wall (double shell model) tends to increase the value of the
membrane charging time.
τD D�x = 5�B� · EF ( GHIJKi�� + G
3 H�MN) single shell model [15] (3.13)
O� �^_= r�^_ · EF ( GHIJKi�) + H�MN"HIP
3 H�MN HIP) double shell model [16] (3.14)
with Cm equal to 0.01 F·m-2
The values presented in Table 2 were used to evaluate the charging time. Most of the values presented
below come from the study of Bono et. al [15], or were determined in our work (cytoplasm radius =
cell diameter/2 when considering the cell wall and membrane thicknesses negligible in comparison
with the cytoplasm).
Table 2: Electric parameters for calculating the charging time of Chlamydomonas reinhardtii. Data collected from [15]. Bold: data measured.
Conductivity (mS/m) Relative permittivity Radius/Thickness
cytoplasm 1200 (low lipid content) to 200 (high lipid content)
60
3.5 µm (low lipid
content)
5 µm (high lipid
content)
plasma
membrane
0.01 2.3 4.5 nm
cell wall 50 60 165 nm medium 213 (TAP N-) 80 (pure water) (-)
From the two models presented above and the dielectric properties of Chlamydomonas reinhardtii ,
the charging time was determined in the range of 0.12 – 0.88 µs, i.e. below one micro-second. The
increase in cell radius (from 3.5 µm up to 5 µm) and the reduction of the cytoplasm conductivity (from
1.2 to 0.2 S/m) during stress due to lipid accumulation increase the charging time: from 0.12 to 0.38
µs in the single shell model, and from 0.47 to 0.88 µs in the double shell model.
In this chapter, the minimal pulse duration used is therefore 5 µs. We can thus consider that in any
case, the full charge of the membrane is reached.
III1b) Determination of the critical electric field for Chlamydomonas reinhardtii
(membrane fully charged)
The critical electric field required to permeabilize the membrane Ecrit can be calculated using the
Schwan equation (equation 3.2), considering the full charge of the membrane and using the
theoretical critical value required to induce membrane destabilization ΔΨcrit (0.2 to 1.5 V for
mammalian cells).
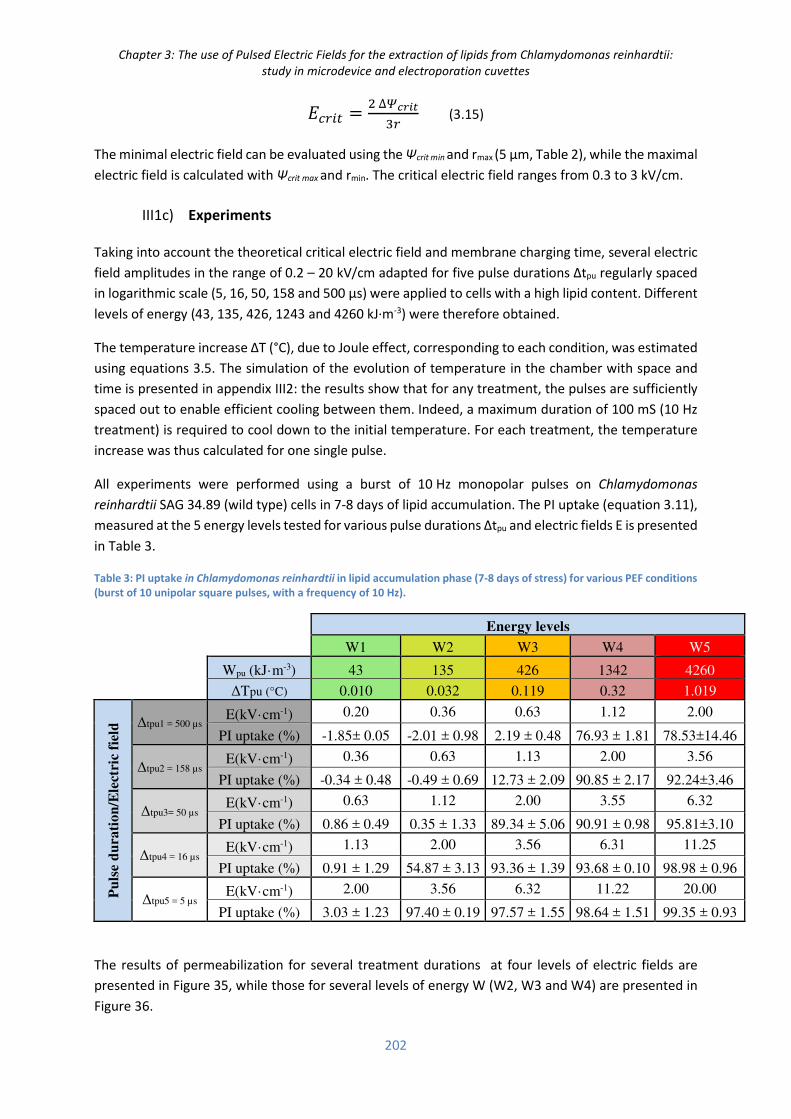
Chapter 3: The use of Pulsed Electric Fields for the extraction of lipids from Chlamydomonas reinhardtii:
study in microdevice and electroporation cuvettes
202
6I]BK = 3 ∆�rl�!2] (3.15)
The minimal electric field can be evaluated using the Ψcrit min and rmax (5 µm, Table 2), while the maximal
electric field is calculated with Ψcrit max and rmin. The critical electric field ranges from 0.3 to 3 kV/cm.
III1c) Experiments
Taking into account the theoretical critical electric field and membrane charging time, several electric
field amplitudes in the range of 0.2 – 20 kV/cm adapted for five pulse durations Δtpu regularly spaced
in logarithmic scale (5, 16, 50, 158 and 500 µs) were applied to cells with a high lipid content. Different
levels of energy (43, 135, 426, 1243 and 4260 kJ·m-3) were therefore obtained.
The temperature increase ΔT (°C), due to Joule effect, corresponding to each condition, was estimated
using equations 3.5. The simulation of the evolution of temperature in the chamber with space and
time is presented in appendix III2: the results show that for any treatment, the pulses are sufficiently
spaced out to enable efficient cooling between them. Indeed, a maximum duration of 100 mS (10 Hz
treatment) is required to cool down to the initial temperature. For each treatment, the temperature
increase was thus calculated for one single pulse.
All experiments were performed using a burst of 10 Hz monopolar pulses on Chlamydomonas
reinhardtii SAG 34.89 (wild type) cells in 7-8 days of lipid accumulation. The PI uptake (equation 3.11),
measured at the 5 energy levels tested for various pulse durations Δtpu and electric fields E is presented
in Table 3.
Table 3: PI uptake in Chlamydomonas reinhardtii in lipid accumulation phase (7-8 days of stress) for various PEF conditions
(burst of 10 unipolar square pulses, with a frequency of 10 Hz).
Energy levels
W1 W2 W3 W4 W5
Wpu (kJ·m-3) 43 135 426 1342 4260
ΔTpu (°C) 0.010 0.032 0.119 0.32 1.019
Pu
lse
du
rati
on
/Ele
ctri
c fi
eld
Δtpu1 = 500 µs E(kV·cm-1) 0.20 0.36 0.63 1.12 2.00
PI uptake (%) -1.85± 0.05 -2.01 ± 0.98 2.19 ± 0.48 76.93 ± 1.81 78.53±14.46
Δtpu2 = 158 µs E(kV·cm-1) 0.36 0.63 1.13 2.00 3.56
PI uptake (%) -0.34 ± 0.48 -0.49 ± 0.69 12.73 ± 2.09 90.85 ± 2.17 92.24±3.46
Δtpu3= 50 µs E(kV·cm-1) 0.63 1.12 2.00 3.55 6.32
PI uptake (%) 0.86 ± 0.49 0.35 ± 1.33 89.34 ± 5.06 90.91 ± 0.98 95.81±3.10
Δtpu4 = 16 µs E(kV·cm-1) 1.13 2.00 3.56 6.31 11.25
PI uptake (%) 0.91 ± 1.29 54.87 ± 3.13 93.36 ± 1.39 93.68 ± 0.10 98.98 ± 0.96
Δtpu5 = 5 µs E(kV·cm-1) 2.00 3.56 6.32 11.22 20.00
PI uptake (%) 3.03 ± 1.23 97.40 ± 0.19 97.57 ± 1.55 98.64 ± 1.51 99.35 ± 0.93
The results of permeabilization for several treatment durations at four levels of electric fields are
presented in Figure 35, while those for several levels of energy W (W2, W3 and W4) are presented in
Figure 36.

Chapter 3: The use of Pulsed Electric Fields for the extraction of lipids from Chlamydomonas reinhardtii:
study in microdevice and electroporation cuvettes
203
The Schwan equation (equation 3.2), neglects the impact of pulse duration as soon as the membrane
is fully charged (after 5 µs).
However, results show that for a given electric field, pulse duration has a paramount impact on
permeability. An electric field of 3.56 kV/cm leads to cell permeabilization whatever the pulse duration
tested (from 5 to 158 µs). On the other hand, an electric field of 2 kV/cm does not permeabilize cells
when associated with 5 µs pulses, leads to 55 % of PI uptake when associated with 16 µs pulses and
above 90 % of PI uptake for longer pulses. The lower electric field 1.13 kV/cm leads to cell
permeabilization only with 500 µs pulses.
Regarding the energy spent, conditions leading to 1342 kJ·m-3 per pulse (W4) permeabilize cells for any
pulse duration (low pulse durations have a high electric field associated, long pulse durations have a
lower electric field associated). On the other hand, at lower levels of energy, cells are permeabilized
only when using short pulses (coupled with high electric field): 426 kJ·m-3 per pulse (W3) requires a
maximum pulse duration of 50 µs and 135 kJ·m-3 per pulse (W2) required a maximum pulse duration
of 5 µs.
Moreover, data demonstrate that, for similar cell permeabilization, short pulse durations are more
energy efficient than long pulses (e.g, lower energy is spent when using 5 µs compared to 158 µs at
3.56 kV/cm while attaining cell permeability higher than 91%).
Figure 35: PI uptake (%) resulting from several treatments with different electric fields E (0.63, 1.13, 2 and 3.56 kV·cm-1)
and pulse durations Δtpu (5, 16, 50, 158 and 500 µs). Experiments performed with Chlamydomonas reinhardtii cells at 7-8
days of lipid accumulation
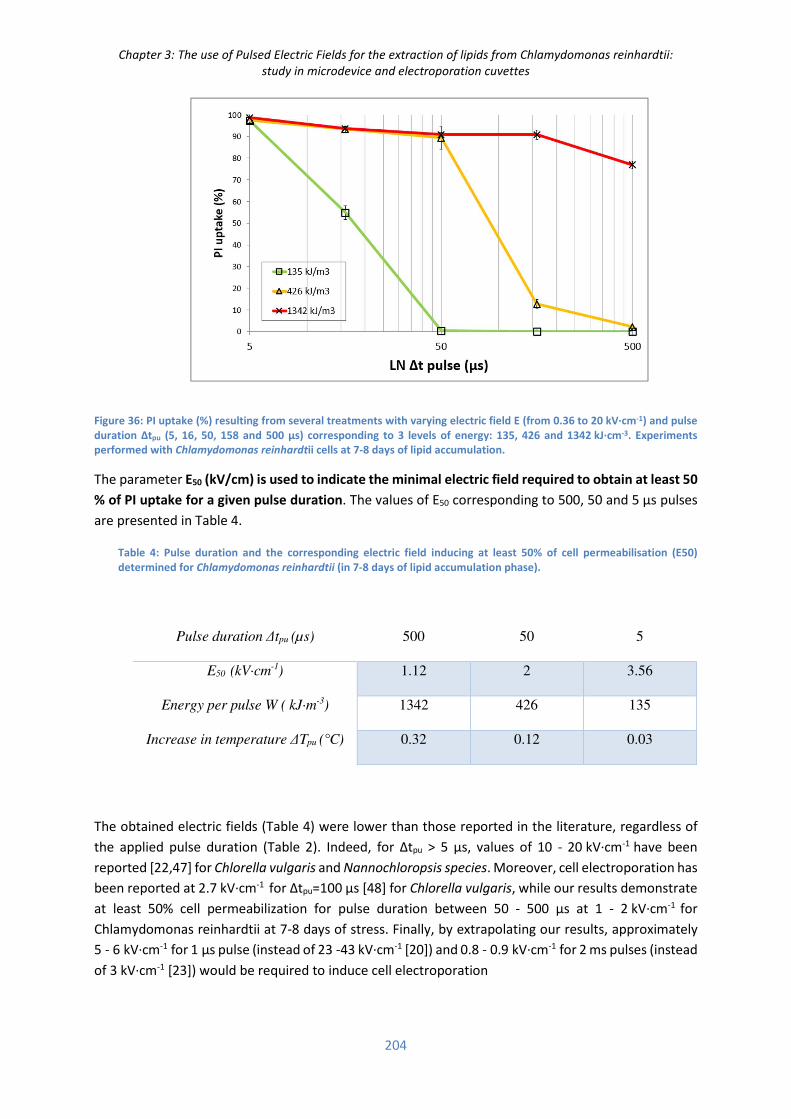
Chapter 3: The use of Pulsed Electric Fields for the extraction of lipids from Chlamydomonas reinhardtii:
study in microdevice and electroporation cuvettes
204
Figure 36: PI uptake (%) resulting from several treatments with varying electric field E (from 0.36 to 20 kV·cm-1) and pulse
duration Δtpu (5, 16, 50, 158 and 500 µs) corresponding to 3 levels of energy: 135, 426 and 1342 kJ·cm-3. Experiments
performed with Chlamydomonas reinhardtii cells at 7-8 days of lipid accumulation.
The parameter E50 (kV/cm) is used to indicate the minimal electric field required to obtain at least 50
% of PI uptake for a given pulse duration. The values of E50 corresponding to 500, 50 and 5 µs pulses
are presented in Table 4.
Table 4: Pulse duration and the corresponding electric field inducing at least 50% of cell permeabilisation (E50)
determined for Chlamydomonas reinhardtii (in 7-8 days of lipid accumulation phase).
The obtained electric fields (Table 4) were lower than those reported in the literature, regardless of
the applied pulse duration (Table 2). Indeed, for Δtpu > 5 µs, values of 10 - 20 kV·cm-1 have been
reported [22,47] for Chlorella vulgaris and Nannochloropsis species. Moreover, cell electroporation has
been reported at 2.7 kV·cm-1 for Δtpu=100 µs [48] for Chlorella vulgaris, while our results demonstrate
at least 50% cell permeabilization for pulse duration between 50 - 500 µs at 1 - 2 kV·cm-1 for
Chlamydomonas reinhardtii at 7-8 days of stress. Finally, by extrapolating our results, approximately
5 - 6 kV·cm-1 for 1 µs pulse (instead of 23 -43 kV·cm-1 [20]) and 0.8 - 0.9 kV·cm-1 for 2 ms pulses (instead
of 3 kV·cm-1 [23]) would be required to induce cell electroporation
Pulse duration Δtpu (µs) 500 50 5
E50 (kV·cm-1) 1.12 2 3.56
Energy per pulse W ( kJ·m-3) 1342 426 135
Increase in temperature ΔTpu (°C) 0.32 0.12 0.03

Chapter 3: The use of Pulsed Electric Fields for the extraction of lipids from Chlamydomonas reinhardtii:
study in microdevice and electroporation cuvettes
205
We can easily explain those differences by at least two reasons: (i) Chlamydomonas reinhardtii cells
are 3 to 4 fold larger than Chlorella vulgaris and Nannochloropsis. This increase in cell diameter
contributes to the reduction of the critical electric field (Ecrit) by a factor of 3 - 4 according to the Schwan
equation (eq. 3.2, section I1b)) and (ii), in most cases, including references [20] and [23], the intensity
of the field actually applied for algae electroporation is set much higher (2 - 3 times) than the critical
value, ensuring the permeabilization of 100 % of the cells.
III1d) Relation between energy consumption and permeabilization
As mentioned before, the use of short pulses associated with optimal electric fields is more energy
efficient than that with long pulses. When considering the E50 (Table 4), reducing the pulse duration
by 10 times requires an increase of the electric field by a factor slightly less than two. Under this
condition, the corresponding energy is drastically reduced by a factor of 3.15 (Table 4). Moreover,
since the temperature increase is proportional to energy (equation 3.5), less heat is generated when
using shorter pulses (Table 4).
Additional simulations which take into account the heat transfer within the chamber and throughout
the electrodes and the glass of the system showed that the temperature cools down to its initial level
between two pulses in any condition tested (Appendix III2). This is linked to the natural cooling that
occurs between pulses under our frequency conditions and large surface to volume ratio [60] (Small
volume of the electroporation chamber in comparison to the surfaces of cooling).
Nevertheless, the approximation obtained when using equation 3.5 should be reconsidered when
using frequencies higher than 10 Hz, higher energies than those presented in Table 3, higher medium
conductivity, or using a larger chamber possessing a reduced surface to volume ratio. Moreover, the
conductivity of the medium may increase during PEF treatment because of the leakage of ions from
the biomass, further impacting the calculation [80].
Moreover, it should be noted that for conditions associated to high energy delivered per pulse (W ≥
1342 kJ·m-3), gas appeared at the vicinity of electrodes, probably due to water electrolysis. These
mechanisms can impact negatively the distribution of the electric field or change the medium
conductivity as previously stated. Reducing the energy used during the PEF treatment is thus a way
to avoid such effects. In some conditions, algae can precipitate at the vicinity of the electrodes,
probably because of electrophoretic forces [81]. In accordance with our results, Straessner et. al.
showed that short pulses reduce these effects [81].
Under our conditions, the best result in terms of PI uptake to energy delivered was found when using
a burst of 10 unipolar pulses at 10 Hz with 5 µs of pulse duration and a field amplitude of 3.5 kV·cm-
1 .
It must be noted that the energy consumption should not be the only criterion to select pulse width
and electric field intensity. It was indeed shown in the literature that the pulse width impacts the size
of the pores created by the treatment; short pulses result in a multiplicity of small pores while long
pulses result in a few large pores [32]. Moreover, the use of micro-pulses, with a duration lower than
100 µs, remains quite unexplored and may have unexpected intracellular effects impacting probably
cells viability [11].

Chapter 3: The use of Pulsed Electric Fields for the extraction of lipids from Chlamydomonas reinhardtii:
study in microdevice and electroporation cuvettes
206
III1e) Sensitivity of Chlamydomonas reinhardii to PEF at various stages of lipid
accumulation
Chlamydomonas reinhardii at different stages of lipid accumulation (after 4, 7 and 14 days of
nitrogen stress conditions) and in exponential growth phase has been subjected to PEF treatment
(burst of 10 unipolar pulses of 5 µs with a frequency of 10 Hz, amplitude ranging from 0 to 5 kV·cm-1).
The results showed that Chlamydomonas reinhardtii cell permeabilization occurred at electric field
intensities ranging from 2 to 5 kV·cm-1 (Figure 37).
Figure 37 Permeabilization efficiency of Chlamydomonas reinhardtii cells (wild type) over electrical field intensity (PEF
treatment conditions: 10 unipolar pulses, 5 µs long, 10 Hz). The efficiency is expressed as the total number of stained cells
by PI after treatment (this includes the PI stained cells prior to PEF) over the total number of cells in the sample. The colors
correspond to different conditions: exponential growth phase (green square), 4 days of stress (yellow triangle), 7 days of
stress (orange diamond) and 14 days of stress (red circle).
Without PEF treatment (0 kV/cm), the percentage of cells stained by PI is below 5 % for the cells at
exponential growth and after 4 days of stress. Permeability achieves values in the range of 10 to 20 %
after 7 days of stress and dramatically increases above 50 % after 14 days of stress. These results
show that the duration of the starvation stress affects Chlamydomonas reinhardtii cell permeability.
Besides, lipid accumulation does not seem to affect the permeabilization behavior. Indeed, whether
after 4, 7 or 14 days of stress, cell permeabilization is observed in the range of 2 to 4 kV/cm.
We found that the cells in exponential growth seem to be slightly less sensitive to the treatment.
This result may be explained by the smaller diameter of the Chlamydomonas reinhardtii cells in division
in comparison with the one of the cells in stress (see Chapter 2: during stress, the mean diameter
increases from 7 to 10 µm). In addition, cells in growth phase have a particular ovoid shape for which,
according to the orientation of the cells with the electric field, a higher electric field may be required
to ensure permeabilization. The measurement was repeated several times (two populations of cells

Chapter 3: The use of Pulsed Electric Fields for the extraction of lipids from Chlamydomonas reinhardtii:
study in microdevice and electroporation cuvettes
207
measured in duplicate for each cell condition). Moreover, two permeabilization patterns seem to be
observed, one between 2 and 3 kV/cm, and a second between 3 and 4 kV/cm (certainly due to the
orientation of the ovoidal shape with the field which has an impact in the Schwan equation, eq. 3.2).
III1f) Qualitative observations by optical and epifluorescence microscopy
In order to get a better insight into PEF effects on cell structure/morphology, in particular lipid
droplets, cells were observed by optical/epifluorescence microscopy during PEF treatment. PEF
experiments were carried out at 6 kV·cm-1, burst of 5 µs and 10 Hz unipolar pulses. A significant
membrane permeabilization of Chlamydomonas reinhardtii cells is detected with PI penetration
(Figure 38.b). However, the cell structure was maintained as suggested by the bright field observation
(Figure 38.a). In addition, Bodipy fluorescence showed that the lipid droplets remain in the cytoplasm
(Figure 38.c). The cell wall may prevent both lipid release from the cytoplasm and cell disintegration,
even after electrical treatment.
Figure 38: Chlamydomonas reinhardtii (wild type) permeabilized by a PEF treatment of 6 kV·cm-1, 5 µs pulses and 10 HZ
(a) bright field, (b) PI detected using CY3 fluorescence filter, (c) lipid droplets stained with bodipy 505/515 using B2A
fluorescence filter. Observation at the beginning of the treatment (d), 1s after (e) and 2s after (f). Displacement and
appearance of large droplets are observed (red circles).
However, a rearrangement of lipid droplets in the cytoplasm was observed a few seconds after the
PEF treatment (Figure 38, 0s, 1s, 2s after treatment corresponding to d, e and f images, respectively);
some droplets were merged 2s after treatment (red circles). Lipid displacement and coalescence of
lipid droplets within the cytoplasm can be observed in real time during the PEF treatment in a video
provided in supplementary data in Bodénes et. al. (2016) [82].
On the whole, from observations performed at repeated times in bright and fluorescence fields, the
data show that very short pulses (5 µs) permeabilize the cytoplasm membrane (shown by PI
penetration) with limited effects on the cell wall (Figure 38.a), but with clear additional effects on the
intracellular lipids.

Chapter 3: The use of Pulsed Electric Fields for the extraction of lipids from Chlamydomonas reinhardtii:
study in microdevice and electroporation cuvettes
208
Additional observations of PEF treated Chlamydomonas reinhardtii cells at 7 days of stress (6 kV/cm,
5 µs, burst of 10 pulses, few minutes after treatment) is illustrated in Figure 40. In this figure, the
observation is performed with bright field and fluorescence. The fluorescence filter (Nikon B2A)
enables to excite and observe the simultaneous fluorescence of the lipid droplets stained with Bodipy
(in green) and the autofluorescence of the chlorophyll (in red). As it can be seen, all the lipid droplets
and chlorophyll remain in the cytoplasm of the PEF treated cells.
Figure 39 : Chlamydomonas reinhardtii wild type (7 days of stress) cells few minutes after PEF treatment (6 kV/cm, 5 µs,
burst of 10 pulses). a) Bright field, b) B2A fluorescence filter which shows lipid droplets stained by bodipy (green) and
chlorophyll autofluorescence (red). Scale bar: 10 µm.
In addition, the effects of PEF were also tested on the Chlamydomonas reinhardtii cell wall deficient
strain cw15 (SAG 34.98) (Figure 40).
Figure 40: Chlamydomonas reinhardtii cell wall deficient mutant in exponential growth conditions (a) before and (b) 2
minutes after 6 KV·cm-1, 5 µs, 10 Hz treatment.
A strong effect on cell integrity was observed in the mutant compared with the wild type strain. This
experiment underlines the fact that when a wild type cell is permeabilized, the cell wall maintains
the cell integrity (Figure 39), while a cell wall deficient strain, as Chlamydomonas reinhardtii cw15,
is destructured, as expected, in such fields (6 kV/cm, 5 µs) [83]. The Figure 41 shows the
destabilization of the membrane of the cell wall deficient strain cw15 (in growth phase) observed a
few seconds after PEF.
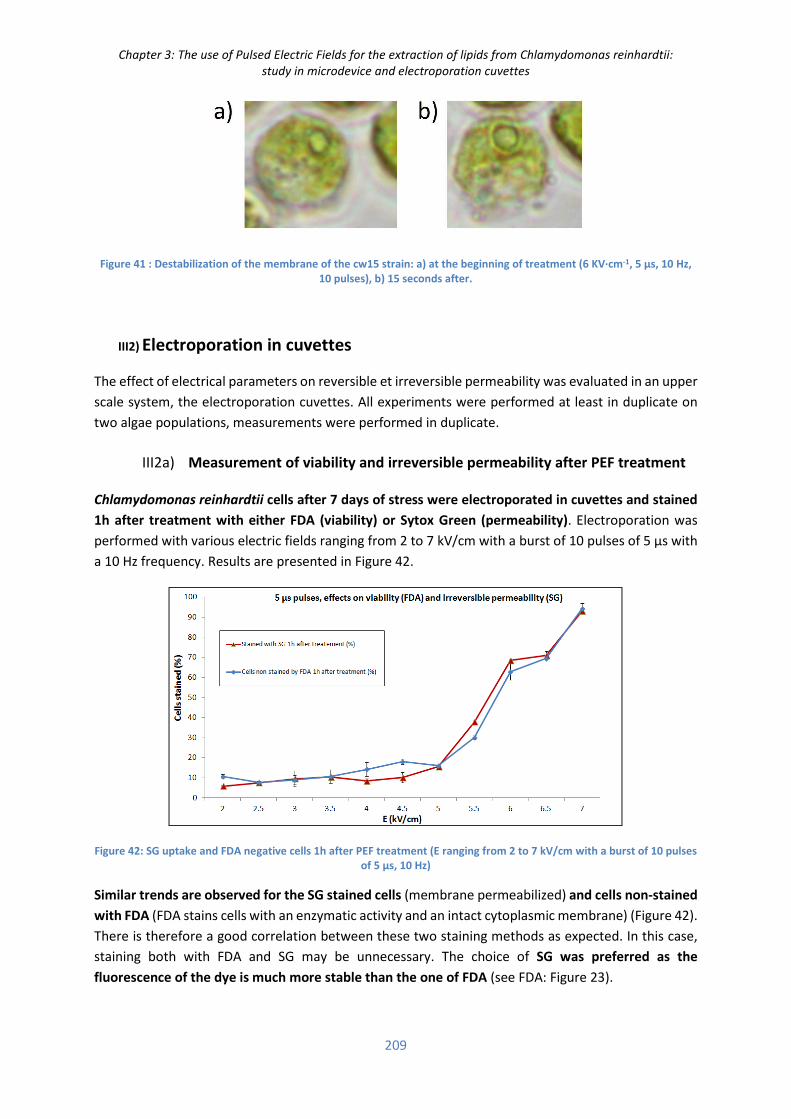
Chapter 3: The use of Pulsed Electric Fields for the extraction of lipids from Chlamydomonas reinhardtii:
study in microdevice and electroporation cuvettes
209
Figure 41 : Destabilization of the membrane of the cw15 strain: a) at the beginning of treatment (6 KV·cm-1, 5 µs, 10 Hz,
10 pulses), b) 15 seconds after.
III2) Electroporation in cuvettes
The effect of electrical parameters on reversible et irreversible permeability was evaluated in an upper
scale system, the electroporation cuvettes. All experiments were performed at least in duplicate on
two algae populations, measurements were performed in duplicate.
III2a) Measurement of viability and irreversible permeability after PEF treatment
Chlamydomonas reinhardtii cells after 7 days of stress were electroporated in cuvettes and stained
1h after treatment with either FDA (viability) or Sytox Green (permeability). Electroporation was
performed with various electric fields ranging from 2 to 7 kV/cm with a burst of 10 pulses of 5 µs with
a 10 Hz frequency. Results are presented in Figure 42.
Figure 42: SG uptake and FDA negative cells 1h after PEF treatment (E ranging from 2 to 7 kV/cm with a burst of 10 pulses
of 5 µs, 10 Hz)
Similar trends are observed for the SG stained cells (membrane permeabilized) and cells non-stained
with FDA (FDA stains cells with an enzymatic activity and an intact cytoplasmic membrane) (Figure 42).
There is therefore a good correlation between these two staining methods as expected. In this case,
staining both with FDA and SG may be unnecessary. The choice of SG was preferred as the
fluorescence of the dye is much more stable than the one of FDA (see FDA: Figure 23).

Chapter 3: The use of Pulsed Electric Fields for the extraction of lipids from Chlamydomonas reinhardtii:
study in microdevice and electroporation cuvettes
210
III2b) Reversible and irreversible permeabilization for different pulse durations
The distribution of reversibly, irreversibly, naturally and non permeabilized cells for various PEF
treatments is presented in Figure 43 (5 µs pulses), Figure 44 (50 µs pulses) and Figure 45 (500 µs
pulses). Data were estimated by staining the cells with SG before PEF (naturally permeabilized cells),
immediately (naturally together with reversible and irreversible permeabilized cells) and 1h (naturally
together with irreversible permeabilized cells) after PEF treatment as described in Figure 31.
Chlamydomonas reinhardtii in 7 -8 days of stress showed an average natural permeabilization of 5.7 ±
0.6 %.
Figure 43: Non permeabilized, reversibly permeabilized (Rev), irreversibly permeabilized and naturally permeabilized
Chlamydomonas reinhardtii cells (7-8 d of stress) measured by staining with SG before and after PEF treatment and
expressed as a percentage of SG uptake in the cells, measured by flow cytometry. PEF treatment: E ranging from 2 to 7
kV/cm with a burst of 10 pulses of 5 µs, 10 Hz.

Chapter 3: The use of Pulsed Electric Fields for the extraction of lipids from Chlamydomonas reinhardtii:
study in microdevice and electroporation cuvettes
211
Figure 44: Non permeabilized, reversibly permeabilized (Rev), irreversibly permeabilized and naturally permeabilized
Chlamydomonas reinhardtii cells (7-8 d of stress) measured by staining with SG before and after PEF treatment and
expressed as a percentage of SG uptake in the cells, measured by flow cytometry. PEF treatment: E ranging from 2 to 7
kV/cm with a burst of 10 pulses of 5 µs, 10 Hz.
Figure 45: Non permeabilized, reversibly permeabilized (Rev), irreversibly permeabilized and naturally permeabilized
Chlamydomonas reinhardtii cells (7-8 d of stress) measured by staining with SG before and after PEF treatment and
expressed as a percentage of SG uptake in the cells, measured by flow cytometry. PEF treatment: E ranging from 2 to 7
kV/cm with a burst of 10 pulses of 500 µs, 10 Hz.
The figures show two permeabilization patterns: first the reversible permeabilization (in green) and
the irreversible permeabilization (in red): reversible permeabilization concerns cells that are stained

Chapter 3: The use of Pulsed Electric Fields for the extraction of lipids from Chlamydomonas reinhardtii:
study in microdevice and electroporation cuvettes
212
by SG during treatment but not stained after treatment because the membrane has resealed. These
results are in agreement with those obtained in the micro-device, presented in Table 4. In the latter
case, total permeabilization (reversible + irreversible + natural permeabilization) was evaluated by PI
staining before PEF treatment (the dye is in the medium during PEF treatment).
III2c) Reversible/irreversible permeabilization parameters, energy and
temperature increase
The maximum ratio of reversibly permeabilized cells is observed at an electric field of 4.5 kV/cm,
2.2 kV/cm and 1.7 kV/cm for 5, 50 and 500 µs pulses, respectively (Figure 46 and Figure 47). Note
that for the 50 µs pulses, the ratio of reversibly permeabilized cells is surprisingly lower than that of 5
µs and 500 µs but this difference is certainly due to experimental errors.
Irreversible permeabilization (minimum of 90% of SG uptake 1h after treatment) is obtained for an
electric field of 7 kV/cm, 4.5 kV/cm and 3.2 kV/cm for 5, 50 and 500 µs pulses, respectively (Figure
46).
Figure 46: Reversible permeabilization (reversibly permeabililzed cells over total cells) for 5, 50 and 500 µs pulses (burst
of 10 pulses, 10 Hz) on Chlamydomonas reinhardtii cells in 7-8d of stress.
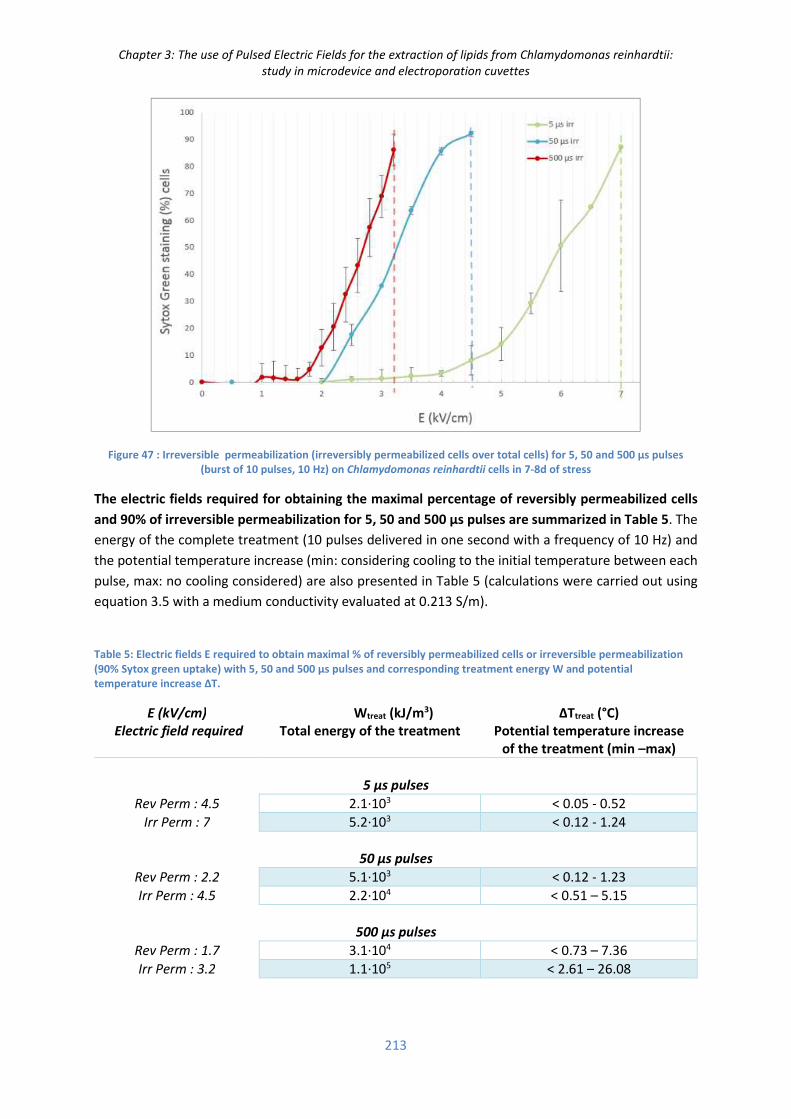
Chapter 3: The use of Pulsed Electric Fields for the extraction of lipids from Chlamydomonas reinhardtii:
study in microdevice and electroporation cuvettes
213
Figure 47 : Irreversible permeabilization (irreversibly permeabilized cells over total cells) for 5, 50 and 500 µs pulses
(burst of 10 pulses, 10 Hz) on Chlamydomonas reinhardtii cells in 7-8d of stress
The electric fields required for obtaining the maximal percentage of reversibly permeabilized cells
and 90% of irreversible permeabilization for 5, 50 and 500 µs pulses are summarized in Table 5. The
energy of the complete treatment (10 pulses delivered in one second with a frequency of 10 Hz) and
the potential temperature increase (min: considering cooling to the initial temperature between each
pulse, max: no cooling considered) are also presented in Table 5 (calculations were carried out using
equation 3.5 with a medium conductivity evaluated at 0.213 S/m).
Table 5: Electric fields E required to obtain maximal % of reversibly permeabilized cells or irreversible permeabilization
(90% Sytox green uptake) with 5, 50 and 500 µs pulses and corresponding treatment energy W and potential
temperature increase ΔT.
E (kV/cm)
Electric field required
Wtreat (kJ/m3)
Total energy of the treatment
ΔTtreat (°C)
Potential temperature increase
of the treatment (min –max)
5 µs pulses
Rev Perm : 4.5 2.1·103 < 0.05 - 0.52 Irr Perm : 7 5.2·103 < 0.12 - 1.24
50 µs pulses
Rev Perm : 2.2 5.1·103 < 0.12 - 1.23 Irr Perm : 4.5 2.2·104 < 0.51 – 5.15
500 µs pulses
Rev Perm : 1.7 3.1·104 < 0.73 – 7.36 Irr Perm : 3.2 1.1·105 < 2.61 – 26.08

Chapter 3: The use of Pulsed Electric Fields for the extraction of lipids from Chlamydomonas reinhardtii:
study in microdevice and electroporation cuvettes
214
As shown in Table 5, the potential temperature increase is moderate for all the conditions proposed,
except for the case of irreversible permeabilization with 500 µs pulses which may lead to a high
temperature increase (+26°C). But the actual value may however be lower because of the heat
dissipation into the environment. Our experiments suggest that permeabilization is not linked to
temperature increase as low pulse durations permeabilize the cells with a moderated temperature
increase.
In our optimized pulse duration (5 µs), the energy consumption is in the range of 2 - 5 kJ/L (or kW/L
as the treatment duration is one second) for 80 % of reversibly and 90% of irreversibly permeabilized
cells, respectively. According to complementary experiments, it could also be possible to reduce the
number of pulses of the treatment to less than 5 without significant change in permeabilization. To
compare with the energy levels found in the literature: 7 - 28 kJ/L [48], 42 kJ/L [25], 100 kJ/L [20], we
obtain lower energy consumptions thanks to our optimized conditions of electric field/pulse duration.
As mentioned before, the higher values of energy found in literature may be related to parameters
other than ours such as (1) cell size, (2) cell density (high cell density may require an increased electric
field because of cell shielding), and also (3) size of the pores aimed: the extraction of large molecules
may require a stronger treatment (discussed thereafter).
Additional experiments should however be performed with more concentrated cell cultures to see the
impact of the biomass concentration on the treatment efficiency. In our conditions the biomass
concentration was approximately 1 g/L (0.1 % volumetric), far from the conditions used by Goettel et.
al [20] (36-167 g dry weight per kg suspension, 3-15 % volumetric). The cell suspension may indeed
interfere with the propagation of the electric field within the electroporation chamber.
III2d) Life cycle of reversible pores
To estimate the life duration of reversible pores obtained with pulses of 5, 50 and 500 µs ,
electroporated cells under reversible conditions were recovered and immediately stained with SG at
20 s, 40 s, 1 min, 2 min, 3 min, 4 min, 5 min or 6 min after treatment (Figure 48).
Figure 48: Dynamics of pore releasing of Chlamydomonas reinhardtii after reversible PEF treatments at 21.5°C Reversible
PEF conditions were those presented in Table 5. SG staining was performed after reversible PEF conditions treatment
(t=0) or 20s, 40s, 1 min, 2 min, 3 min, 4 min, 5 min and 6 min after treatment. Because the pores were stable after 3 min,
the figure is focused between 0 and 3 min.

Chapter 3: The use of Pulsed Electric Fields for the extraction of lipids from Chlamydomonas reinhardtii:
study in microdevice and electroporation cuvettes
215
Interestingly, the results show that at room temperature, the reversible pores last for a maximum of
one minute and the majority reseals in the first 20 s after the PEF treatment. Experiments could not
be performed with shorter durations, from 0 to 20 s.
The PEF treated cells showed 60 to 80% of reversible permeabilization (reversible permeabilization
obtained with 50 µs pulses was higher in the experiment of the Figure 48 than the experiment of the
Figure 44). Various pore resealing durations, ranging from a hundred of milliseconds to several hours,
are reported in the literature. Saulis et. al. [84] reported various stages in the membrane recovery: a
rapid decrease of pore size (in less than one second), then a slow decrease (a few minutes), and a
complete pore closing (in dozens of minutes). The memory effect of an increased membrane
viscoelasticity and mechanical effects on cytoskeletal networks [6] are also reported. The dynamics of
pore resealing is also highly dependent on temperature. Working at temperatures around 0°C might
greatly increase the resealing duration of reversible pores.
III2e) Transport of various molecules through the pores
Permeabilization effects were monitored both with Propidium Iodide (micro-device) and Sytox Green
(cuvettes) which have similar molecular weights of 668 and 600 Da, respectively and are able to enter
into the cells. The uptake of molecules of other sizes was obtained at other electric fields as reported
by Saulis and Saulé [32]. Small particles/ions (K+: r = 0.16 - 0.22 nm, Mannitol 182 Da: r = 0.36 - 0. 42
nm, Sucrose 342 Da: r = 0.44 - 0.52 nm) penetrate at lower electric field strength and short pulse
durations (micro-second pulses), while large molecules (Bleomycin 1500 Da: r = 0.8 nm) require higher
electric field strength and pulse durations (millisecond pulses). However, in these conditions, large
pores are created and cell lysis occurs as pores are not able to reseal, as observed with mammalian
cells in the case of the penetration of large molecules such as bleomycin.
The molecular weight of TAG molecules is less than 900 Da. Indeed, the molecular weight of a
triacylglycerol molecule is equal to the weight of the central glycerol backbone (38 Da) and three times
the weight of the FA chain. For example, in the case of three 18:1 oleic acid (282 Da), one of the main
neutral FA present at 7 days of stress (see chapter 2), the molecular weight is 884 Da. This means that
the TAG molecule radius is probably similar to that of SG and PI and thus a single TAG molecule is,
regarding the size, probably able to be transported across the created pores.
From the experiments performed, it is shown that a molecule such as PI or SG can penetrate through
reversible pores, created on very specific electrical conditions. However, these pores reseal themselves
very fast, within a minute, and the molecules could not penetrate any longer.
III2f) Observations of the cell structure and lipid droplets by CLSM
From previous data, it was observed in situ that the cell wall of Chlamydomonas reinhardtii was
poorly or not affected at all during the PEF treatment in our conditions in the microdevice
(optical/epifluorescence microscopy). Further experiments were carried out in which confocal
observations of PEF treated cells, stained with bodipy (neutral lipids) and with Concanavalin a (cell wall
carbohydrate-binding protein) were performed.
The observation of the cells before and after PEF treatment (irreversible conditions of 7 kV/cm, 5 µs,
burst of 10 pulses with a frequency of 10 Hz were applied) suggest that the cell wall (in yellow) is not
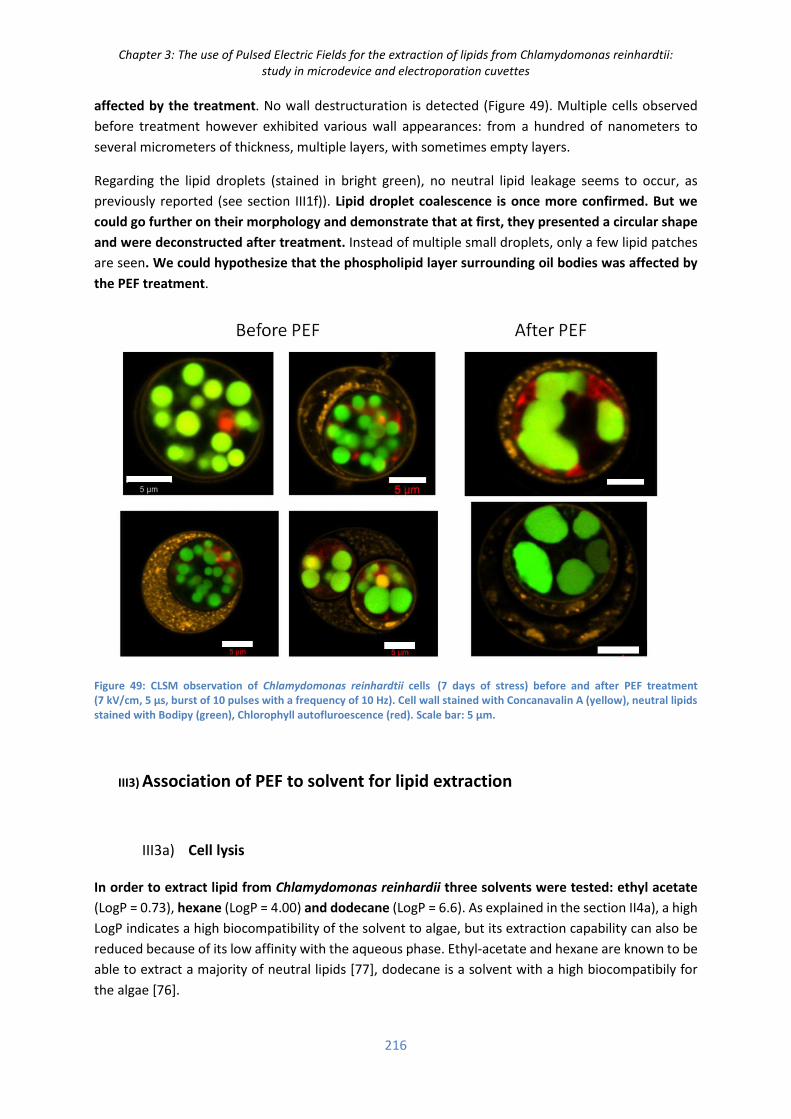
Chapter 3: The use of Pulsed Electric Fields for the extraction of lipids from Chlamydomonas reinhardtii:
study in microdevice and electroporation cuvettes
216
affected by the treatment. No wall destructuration is detected (Figure 49). Multiple cells observed
before treatment however exhibited various wall appearances: from a hundred of nanometers to
several micrometers of thickness, multiple layers, with sometimes empty layers.
Regarding the lipid droplets (stained in bright green), no neutral lipid leakage seems to occur, as
previously reported (see section III1f)). Lipid droplet coalescence is once more confirmed. But we
could go further on their morphology and demonstrate that at first, they presented a circular shape
and were deconstructed after treatment. Instead of multiple small droplets, only a few lipid patches
are seen. We could hypothesize that the phospholipid layer surrounding oil bodies was affected by
the PEF treatment.
Figure 49: CLSM observation of Chlamydomonas reinhardtii cells (7 days of stress) before and after PEF treatment
(7 kV/cm, 5 µs, burst of 10 pulses with a frequency of 10 Hz). Cell wall stained with Concanavalin A (yellow), neutral lipids
stained with Bodipy (green), Chlorophyll autofluroescence (red). Scale bar: 5 µm.
III3) Association of PEF to solvent for lipid extraction
III3a) Cell lysis
In order to extract lipid from Chlamydomonas reinhardii three solvents were tested: ethyl acetate
(LogP = 0.73), hexane (LogP = 4.00) and dodecane (LogP = 6.6). As explained in the section II4a), a high
LogP indicates a high biocompatibility of the solvent to algae, but its extraction capability can also be
reduced because of its low affinity with the aqueous phase. Ethyl-acetate and hexane are known to be
able to extract a majority of neutral lipids [77], dodecane is a solvent with a high biocompatibily for
the algae [76].

Chapter 3: The use of Pulsed Electric Fields for the extraction of lipids from Chlamydomonas reinhardtii:
study in microdevice and electroporation cuvettes
217
First, the impact of those solvents on cell lysis was evaluated.
The mixing step was performed as described in Figure 34, except that the ratio of solvent to aqueous
phase was different: ethyl acetate (Figure 50) was added at low volumes (7.5 µL, 10 µL and 20 µL for
100 µL of algae solution), hexane (Figure 51) was added at a ratio of 2:1, and dodecane (Figure 52) at
a ratio 1:1 (experiments were performed at various stages of the project).
Figure 50 : Cell concentration* (%) over mixing time when mixing Chlamydomonas reinhardtii wt (7d of stress) with ethyl
acetate. *Cell concentration relative to the cell concentration before mixing.
Figure 51: Cell concentration* (%) over time when mixing Chlamydomonas reinhardtii wt (7d of stress) with hexane. *Cell
concentration relative to the cell concentration before mixing.

Chapter 3: The use of Pulsed Electric Fields for the extraction of lipids from Chlamydomonas reinhardtii:
study in microdevice and electroporation cuvettes
218
Figure 52 : Cell concentration* over time when mixing Chlamydomonas reinhardtii wt (7d of stress) with dodecane. *Cell
concentration relative to the cell concentration before mixing.
As it can be observed in Figure 50, ethyl-acetate has a very strong impact on cell lysis as a high
reduction of the cell number is measured after a few seconds of contact when using a solvent ratio
of 0.1:1 (20 µL or solvent of 200 µL of algae). When using a lower volume of solvent, cell lysis is reduced.
This is in accordance with the aqueous critical solvent concentration mentioned previously in the
report [70], where solvent with a low LogP can have major impact on the cells. For the other solvents,
hexane and dodecane, the impact on cell lysis is negligible, even when using a high volume of solvent
and longer mixing times (up to 2 hours). From the previous data, ethyl acetate was no further studied.
III3b) CLSM imaging of cells after solvent extraction
Chlamydomonas reinhardtii wt cells (7 days of stress) treated with ethyl acetate (10 µL in 100 µL of
algae, mixing duration: 10 minutes) were observed by CLSM (Figure 53). Lipids are stained by Bodipy
(in green) and the cell wall is stained with concanavalin TRITC (in yellow). As it can be observed, cells
are still intact after contact with ethyl acetate. Moreover, bodipy staining is found in the cytoplasm
and in between the cell wall layers, suggesting that part of the lipids is trapped in the cell wall and
that others left the cytoplasm under solvent action.

Chapter 3: The use of Pulsed Electric Fields for the extraction of lipids from Chlamydomonas reinhardtii:
study in microdevice and electroporation cuvettes
219
Figure 53 : CLSM imaging of Chlamydomonas reinhardtii wt cells after 10 min mixing with ethyl acetate (7.5 µL of ethyl
acetate added to 100 µL of algal solution). Lipid droplets stained by bodipy (green), cell wall stained by concanavalin
TRITC (yellow). Scale bar: 10 µm.
The effect of dodecane on Chlamydomonas reinhardtii wt cells (7 days of stress) is shown in Figure 54
(2 h mixing time solvent/algae ratio of 1:1). Observations confirmed that a part of the cells was totally
unaffected by the solvent. Indeed, due to the high hydrophobicity of the solvent, the contact between
cells and dodecane was quite reduced despite the used mixing conditions. In Figure 54, only cells
affected by the solvent are shown. The lipid droplets are destructured in the cytoplasm, but most of
them seem to remain in the cytoplasm. Also, Bodipy fluorescence seems to be bleached by the
solvent.
Figure 54 : CLSM imaging of Chlamydomonas reinhardtii wt cells after 2 h mixing with dodecane (ratio 1:1). Lipid droplets
stained by bodipy (green), cell wall stained by concanavalin TRITC (yellow). Scale bar: 10 µm.

Chapter 3: The use of Pulsed Electric Fields for the extraction of lipids from Chlamydomonas reinhardtii:
study in microdevice and electroporation cuvettes
220
III3c) Lipid extraction
After evaluating cell lysis and solvent effect on lipid droplets behavior by CLSM imaging, lipid extraction
is quantified.
Because of Bodipy bleaching when cells are in contact with solvents and loss of lipid droplets structure
under these conditions (see Figure 54), Bodipy was not used for quantitative analyzes of lipid
extraction. Indeed, he measurement of the mean bodipy fluorescence per cell before and after solvent
extraction is not a suitable method in these conditions.
SPV colorimetric method was therefore used to evaluate lipid extraction from the cells. Lipid
amounts in the solvent and aqueous phases before and after extraction were measured (section
II4c))
For further experiments, hexane was chosen as the model solvent because of its very low impact on
cell lysis (Figure 51), and its LogP of 4 (intermediate between dodecane and ethyl acetate) is expected
to allow a rather good contact of the solvent with the cells and then a significant lipid extraction. In
addition, its boiling point is low (68°C) which enables an easy solvent evaporation required for the
SPV method.
First, similar calibration curves of triolein dissolved in hexane and chloroform, the solvent commonly
used in the SPV method, were obtained (Figure 59). The former (see appendix III3) was used for the
calculations.
After mixing the algal solution and hexane and centrifugation of the mixture, the system split into
three phases with a yellowish layer between hexane (upper layer) and the aqueous phase (bottom
layer) as illustrated below (Figure 55):
Figure 55 : Lipid extraction perfomed with 200 µL of hexane on 100 µL of aqueous phase containing algae. Oleosome
(neutral lipids as Triacylglycerides surrounded by a mono-layer of phospho-lipids and proteins) are contained in the
cytoplasm of algae in the aqueous phase (0). Lipids extracted remains as an interphase (2) between the aqueous phase (1)
and the hexane phase (3). Modified from [85].

Chapter 3: The use of Pulsed Electric Fields for the extraction of lipids from Chlamydomonas reinhardtii:
study in microdevice and electroporation cuvettes
221
The yellowish layer probably consists of neutral and/or polar lipids extracted, but not dissolved in the
hexane upper phase; this yellow layer indeed entirely dissolves into hexane after addition of a low
quantity of Isopropanol (IPA), resulting in only two phases (aqueous and organic containing hexane,
IPA and lipids). The mixture of high polar IPA and low polar hexane could thus be used to dissolve the
fatty acids in the upper phase.
However, further experiments showed that IPA is not suitable for SPV analyzes. Indeed, after its
addition, the absorbance measured in the aqueous and solvent phases was much higher (absorbance
above 10) than determined in the algal solution before extraction (in the range of 0.4). Consequently,
experiments were further performed without IPA, and the yellowish interface was considered as an
independent phase.
The extraction rate in the aqueous phase is presented in Figure 56.
Figure 56 : SPV signal measured in the aqueous phase after mixing with hexane. The value is expressed as a percentage,
relative to the initial value before extraction.
The figure presenting the evolution of SPV signal of the aqueous phase with time shows that most of
the lipids are extracted during the first hour of extraction. After two hours of extraction, about 10 %
of the signal remain in the aqueous phase, 90 % is in the interface, no signal is measured in the hexane
phase.
In the following experiment, algae solutions were mixed with hexane during 10 minutes with or
without PEF pre-treatment. PEF conditions used were those leading to irreversible permeabilization
of Chlamydomonas reinhardtii wt cells while minimizing energy consumption, i.e. 7 kV/cm, 5 µs and
a burst of 10 pulse (10 Hz).
SPV data of the different phases under the tested conditions are presented in Figure 57. Results (in
absorbance) are converted into triolein equivalent with the equation of the calibration curve
presented before. The medium and upper phases are analyzed together.

Chapter 3: The use of Pulsed Electric Fields for the extraction of lipids from Chlamydomonas reinhardtii:
study in microdevice and electroporation cuvettes
222
Figure 57 : Lipid extraction after 10 minutes of mixing with hexane with or without PEF pre-treatment (5 µs, 7 kV/cm)..
Analyzes of the phases by the SPV method. Measurements are given in triolein equivalent.
The results show that part of the lipids is efficiently extracted after 10 minutes of mixing of the algae
solution with hexane (which is not in accordance with the extraction rate presented Figure 56). The
mass balances of triolein equivalents are not satisfied due to the difficulty of volume precise measures.
As a consequence, assuming that the aqueous response would be more precise, the extracted lipid
mass, expressed in triolein equivalent, (in both medium and upper phases), was calculated by
difference between the initial lipid mass and the aqueous remaining value.
Nevertheless, up to this point with our experiment, we couldn’t distinguish the extraction obtained
with or without PEF pre-treatment (66-68%). We could not demonstrate the improvement brought
by the PEF treatment to the lipid extraction.
In addition, the majority of the SPV response of both medium and upper phases is obtained in the
medium phase and not in hexane, due to the poor solubility of lipids in pure hexane. Moreover, no cell
lysis was detected under these conditions.
Finally, stronger PEF conditions were used in order to check if lipid extraction could be improved
with PEF pre-treatment (50 and 500 µs pulses with an electric field of 7 kV/cm). The lipid content of
the aqueous phase was measured and the extraction yield was calculated by difference as before.
Figure 58 : Lipid extraction after 1h of mixing with hexane with or without PEF pre-treatment (50 µs, 7 kV/cm and 500 µs
7 kV/cm). Analyzes of the phases by SPV method. Calculation: equation 3.13.

Chapter 3: The use of Pulsed Electric Fields for the extraction of lipids from Chlamydomonas reinhardtii:
study in microdevice and electroporation cuvettes
223
An improvement of lipid extraction after treating the cells with these stronger conditions of PEF is
clearly observed. However, this positive result must be carefully evaluated: (1) the energy spent in this
PEF pre-treatment is huge in comparison with the optimal conditions determined before. This leads
to a high temperature increase in the cuvette which can melt the cell wall leading to cell lysis and
foster the release of lipids. In comparison with 5 µs pulses and 7 kV/cm, the energy spent for 50 µs
and 500 pulses with an electric field of 7 kV/cm is 10 and 100 times higher, respectively. (2) the lipid
extraction obtained here without PEF (reference), of 4.5 ± 3.1 %, is much lower than the extraction of
66% obtained after 1 hour in the experiment performed with 5 µs pulses (Figure 57) and than the
extraction rate presented in Figure 56. Results must be carefully evaluated. A question still remains
on the non reproductibility of lipid extraction with solvent; this must be further examined.
III3d) Conclusion on lipid extraction
A good compromise must be found when choosing the PEF pre-treatment conditions in order to
obtain an improvement of lipid extraction with a limited energy use. In our tested conditions
(7KV/cm, 5 µs), the opening of irreversible pores on the cell membrane does not improve clearly lipid
extraction with solvent. Two hypothesis can be drawn from this observation (1) either the size of the
pores opened is not sufficient for a rapid lipid transfer across the membrane or (2) lipid diffusion
across the membrane is improved with PEF but the cell wall hinders further lipid extraction.
We could verify that an irreversible permeabilization followed by several hours of incubation (to let
irreversible pores expand) allows efficient lipid extraction.
If it is verified that the cell wall is the limiting interface which prevents lipids extraction, the use of PEF
as a pre-treatment must be accompanied by other complementary treatments (mechanical
compression) to improve lipid extraction. This strategy is evaluated in the laboratory (with promising
preliminary results). Anyway, the use of PEF for the extraction of soluble compounds such as
proteins and pigments remains reasonable. More studied on the use of the cell wall deficient algae
Chlamydomonas reinhardtii cw15 could be performed to trigger the release of the cytoplasm content
by non-thermal electroporation.

Chapter 3: The use of Pulsed Electric Fields for the extraction of lipids from Chlamydomonas reinhardtii:
study in microdevice and electroporation cuvettes
224
Chapter 3 conclusion
The use of pulsed electric fields has an increasing interest in various fields: biomedical, food,
environment. PEF is also a candidate as a novel downstream process in algal biotechnology as it can
be used as a low-energy demanding pre-treatment process to facilitate the extraction of intracellular
compounds from algae. Because of the multiplicity of (1) PEF parameters (pulse duration, electric field
intensity, pulse frequency and shape), (2) algae strain and cultures features (cell size, cell wall
thickness, medium conductivity etc...) and (3) the various applications (cell lysis, extraction of soluble
compounds as well as lipids), it is difficult to have a clear overview of the effects of such a process in
algae and therefore its application as an innovative downstream process. Studies aiming at
understanding the impact of PEF on microalgae membrane and cell wall must therefore be
undertaken. Moreover, in contrast to biomedical applications, the energy demand is a paramount
criterion for the economic viability and environmental footprint of this innovative process at
industrial scale.
The study was performed on Chlamydomonas reinhardtii wild type. PEF main parameters, electric field
and pulse durations, were optimized (considering the energy consumption, the permeabilization of
cells as well as their viability after permeabilization) and a burst of 10 monopolar square pulses
delivered with a frequency of 10 Hz was set constant. Membrane permeability, measured with two
dyes: Propidium Iodide and Sytox Green, was determined at different electric fields (0.2 to 20 kV/cm)
and various pulse durations within the range of 5 µs to 500 µs.
We designed and built a dedicated micro-device to study the impact of PEF on algae cells in situ.
With this new approach, cell structure and, in particular, the behavior of special features (lipids,
membrane, cell wall) could be observed in situ and, in some cases, in real time when applying a PEF
treatment. PEF conditions allowing high permeability were optimized while minimizing the process
energy demand. In this context, an experimental method based on the penetration of Propidium Iodide
in permeabilized cells was developed. The results obtained by a visual counting in the micro-device
were then verified in an up-scaled system (micro-cuvettes) by automatic counting using a flow
cytometry method.
Electric fields required to trigger reversible and irreversible electroporation of Chlamydomonas
reinhardtii cells in accumulating lipids conditions, were, respectively, for 5 µs pulses, 4.5 kV/cm and
7 kV/cm. Electric fields required for 50 and 500 µs pulses are lower, but the overall energy spent is
higher. The energy consumptions to perform electroporation are though lower than those reported
by other authors. It is thus very interesting to use short pulses with high electric field from an
economic point of view. However, it is not so trivial to scale up the process to large volumes, due to
the high voltage required to achieve the desired electric field.
The effects of sub-microsecond pulses were not investigated because our generator was not able to
deliver nano-pulses. Nanopulses, which consist in the application of very high electric field (tens –
hundreds of kV/cm during few nano-seconds) may lead to very different results, such as internal effects
without affecting the cytoplasmic membrane. In term of energy spent per pulse, these pulses may

Chapter 3: The use of Pulsed Electric Fields for the extraction of lipids from Chlamydomonas reinhardtii:
study in microdevice and electroporation cuvettes
225
result in a very economical treatment. However, the effects on membrane permeability, cell viability,
cell wall effects are totally unknown.
The optimal parameters determined in this study could be used, as a starting point, for another algae
strain by a simple adaptation of the electric field to the algae size (see the importance of cell radius in
Schwan equation, eq. 3.2). Although, PEF inducing permeability does not seem to be related to Joule
effect, in our optimized conditions. However, temperature increases, which highly depend on electric
field and pulse duration, and on the medium conductivity, must be carefully evaluated to distinguish
electroporation effects with other side effects when using long pulses.
The resealing of reversible pores using short (5 µs) or long pulses (500 µs) was shown to be very fast:
within one minute.
In situ qualitative observations using lipid droplets staining demonstrated lipids displacement and
coalescence during the application of pulses in bright field and fluorescence. Moreover, our treatment
conditions, leading to membrane permeabilization with low thermal effects, showed no impact on the
thick wall of Chlamydomonas reinhardtii wild type. Despite an effect of PEF on lipid droplets, the low
affinity of lipids with the external medium and the presence of the unaffected cell wall may prevent
natural lipid leakage. Consequently, and as expected, in the case of a strain with a resistant cell wall,
PEF must be associated with a secondary treatment, e.g. the use of organic solvents.
Additional experiments performed with solvents have shown that the polar affinity of the solvent is a
paramount parameter to consider in order to find the compromise between biocompatibility with
algae and lipid extraction. Based on the effect of the solvents on cell lysis and qualitative
observations, pure hexane was finally chosen for lipid extraction in a purpose of algae fractionation
in an aqueous extraction (valorization of the remaining biomass, reduction of the energy spent during
water separation). The goal was to check if PEF pre-treatment could improve lipid extraction with
hexane. Our preliminary results showed that irreversible electroporation can increase the lipid
extraction with solvents. In the case of reversible electroporation, complementary treatment must
be applied prior to the solvent assisted lipid extraction. Promising preliminary experiments are
currently held in the laboratory.

Chapter 3: The use of Pulsed Electric Fields for the extraction of lipids from Chlamydomonas reinhardtii:
study in microdevice and electroporation cuvettes
226
Chapter 3 references
[1] R. Slade, A. Bauen, Micro-algae cultivation for biofuels: Cost, energy balance, environmental impacts and future prospects, Biomass and Bioenergy. 53 (2013) 29–38. doi:10.1016/j.biombioe.2012.12.019.
[2] C.P. Bravo-Fritz, C.A. Sáez-Navarrete, L.A. Herrera-Zeppelin, F. Varas-Concha, Multi-scenario energy-economic evaluation for a biorefinery based on microalgae biomass with application of anaerobic digestion, Algal Res. 16 (2016) 292–307. doi:10.1016/j.algal.2016.03.028.
[3] T. Kotnik, P. Kramar, G. Pucihar, D. Miklavcic, M. Tarek, Cell membrane electroporation- Part 1: The phenomenon, IEEE Electr. Insul. Mag. 28 (2012) 14–23. doi:10.1109/MEI.2012.6268438.
[4] J. Teissie, M. Golzio, M.P. Rols, Mechanisms of cell membrane electropermeabilization: a minireview of our present (lack of ?) knowledge., Biochim. Biophys. Acta. 1724 (2005) 270–80. doi:10.1016/j.bbagen.2005.05.006.
[5] E.C. Neyts, M. Yusupov, C.C. Verlackt, A. Bogaerts, Computer Simulations of Plasma-Biomolecule and Plasma- Tissue Interactions for a Better Insight in Plasma Medicine, J. Phys. D. Appl. Phys. XX (2014) 29. doi:10.1088/0022-3727/47/29/293001.
[6] W. Sung, P.J. Park, Dynamics of pore growth in membranes and membrane stability., Biophys. J. 73 (1997) 1797–804. doi:10.1016/S0006-3495(97)78210-9.
[7] L. Chopinet, C. Roduit, M.-P. Rols, E. Dague, Destabilization induced by electropermeabilization analyzed by atomic force microscopy., Biochim. Biophys. Acta. 1828 (2013) 2223–9. doi:10.1016/j.bbamem.2013.05.035.
[8] M. Kanduser, M. Sentjurc, D. Miklavcic, The temperature effect during pulse application on cell membrane fluidity and permeabilization., Bioelectrochemistry. 74 (2008) 52–7. doi:10.1016/j.bioelechem.2008.04.012.
[9] L. Barr, Membrane Potential Profiles and- the Goldman Equation, (1965) 351–356. [10] S. Abe, J. Takeda, M. Senda, Resting membrane potential and action potential of Nitella expansa protoplasts, 21 (1980) 537–546. [11] J.C. Weaver, K.C. Smith, A.T. Esser, R.S. Son, T.R. Gowrishankar, A brief overview of electroporation pulse strength-duration space:
a region where additional intracellular effects are expected., Bioelectrochemistry. 87 (2012) 236–43. doi:10.1016/j.bioelechem.2012.02.007.
[12] P. Marszalek, Schwan equation and transmembrane potential induced by, 58 (1990) 1053–1058. [13] C.M. Electropermeabilization, An Experimental Evaluation of the Critical Potential Difference, 65 (1993) 409–413. [14] D. Grund, D. Zellmembranen, B. Anlegen, D. Zellinnere, D. Auf, D. Ladungsverteilung, Uber die Im pedanz einer Suspension vo n
kugelförmigen Teilchen mit einer Schale, (1959) 125–131. [15] M.S. Bono, B. a Ahner, B.J. Kirby, Detection of algal lipid accumulation due to nitrogen limitation via dielectric spectroscopy of
Chlamydomonas reinhardtii suspensions in a coaxial transmission line sample cell., Bioresour. Technol. 143 (2013) 623–31. doi:10.1016/j.biortech.2013.06.040.
[16] Y. Polevaya, I. Ermolina, M. Schlesinger, B.Z. Ginzburg, Y. Feldman, Time domain dielectric spectroscopy study of human cells. II. Normal and malignant white blood cells., Biochim. Biophys. Acta. 1419 (1999) 257–271. doi:10.1007/BF00188038.
[17] W.M. Arnold, U. Zimmermann, Rotating-field-induced rotation and measurement of the membrane capacitance of single mesophyll cells of avena sativa, Zeitschrift Fur Naturforsch. - Sect. C J. Biosci. 37 (1982) 908–915. doi:10.1515/znc-1982-1010.
[18] B.G. Frank S. Barnes, Biological and Medical Aspects of Electromagnetic Fields (Handbook of Biological Effects of Electromagnetic Fields) 3Ed, 2006.
[19] http://www.electronics-tutorials.ws/rc/rc_1.html. [20] M. Goettel, C. Eing, C. Gusbeth, R. Straessner, W. Frey, Pulsed electric field assisted extraction of intracellular valuables from
microalgae, Algal Res. 2 (2013) 401–408. doi:10.1016/j.algal.2013.07.004. [21] C. Dalmay, M. a De Menorval, O. Français, L.M. Mir, B. Le Pioufle, A microfluidic device with removable packaging for the real time
visualisation of intracellular effects of nanosecond electrical pulses on adherent cells., Lab Chip. 12 (2012) 4709–15. doi:10.1039/c2lc40857k.
[22] E. Luengo, S. Condón-Abanto, I. Alvarez, J. Raso, Effect of Pulsed Electric Field Treatments on Permeabilization and Extraction of Pigments from Chlorella vulgaris., J. Membr. Biol. 247 (2014) 1269–77. doi:10.1007/s00232-014-9688-2.
[23] M. Coustets, N. Al-Karablieh, C. Thomsen, J. Teissié, Flow process for electroextraction of total proteins from microalgae., J. Membr. Biol. 246 (2013) 751–60. doi:10.1007/s00232-013-9542-y.
[24] J. Sheng, R. Vannela, B.E. Rittmann, Evaluation of cell-disruption effects of pulsed-electric-field treatment of Synechocystis PCC 6803., Environ. Sci. Technol. 45 (2011) 3795–802. doi:10.1021/es103339x.
[25] M.D.A. Zbinden, B.S.M. Sturm, R.D. Nord, W.J. Carey, D. Moore, H. Shinogle, S.M. Stagg-Williams, Pulsed electric field (PEF) as an intensification pretreatment for greener solvent lipid extraction from microalgae., Biotechnol. Bioeng. 110 (2013) 1605–15. doi:10.1002/bit.24829.
[26] S. Tristram-Nagle, J.F. Nagle, Lipid bilayers: Thermodynamics, structure, fluctuations, and interactions, Chem. Phys. Lipids. 127 (2004) 3–14. doi:10.1016/j.chemphyslip.2003.09.002.
[27] C.E. Nebel, D. Shin, B. Rezek, N. Tokuda, Diamond and biology, (2007) 439–461. doi:10.1098/rsif.2006.0196. [28] M. Kanduser, M. Sentjurc, D. Miklavcic, The temperature effect during pulse application on cell membrane fluidity and
permeabilization., Bioelectrochemistry. 74 (2008) 52–7. doi:10.1016/j.bioelechem.2008.04.012. [29] P.T. Vernier, Z. a Levine, Y.-H. Wu, V. Joubert, M.J. Ziegler, L.M. Mir, D.P. Tieleman, Electroporating fields target oxidatively damaged
areas in the cell membrane., PLoS One. 4 (2009) e7966. doi:10.1371/journal.pone.0007966. [30] M.L. Yarmush, A. Golberg, G. Serša, T. Kotnik, D. Miklavčič, Electroporation-based technologies for medicine: principles,
applications, and challenges., Annu. Rev. Biomed. Eng. 16 (2014) 295–320. doi:10.1146/annurev-bioeng-071813-104622. [31] S.J. Beebe, N.M. Sain, W. Ren, Induction of Cell Death Mechanisms and Apoptosis by Nanosecond Pulsed Electric Fields (nsPEFs).,
Cells. 2 (2013) 136–62. doi:10.3390/cells2010136. [32] G. Saulis, R. Saulė, Size of the pores created by an electric pulse: microsecond vs millisecond pulses., Biochim. Biophys. Acta. 1818
(2012) 3032–9. doi:10.1016/j.bbamem.2012.06.018. [33] M.G. Moisescu, M. Radu, E. Kovacs, L.M. Mir, T. Savopol, Changes of cell electrical parameters induced by electroporation. A

Chapter 3: The use of Pulsed Electric Fields for the extraction of lipids from Chlamydomonas reinhardtii:
study in microdevice and electroporation cuvettes
227
dielectrophoresis study., Biochim. Biophys. Acta. 1828 (2013) 365–72. doi:10.1016/j.bbamem.2012.08.030. [34] M.M. Sadik, J. Li, J.W. Shan, D.I. Shreiber, H. Lin, Quantification of propidium iodide delivery using millisecond electric pulses:
experiments., Biochim. Biophys. Acta. 1828 (2013) 1322–8. doi:10.1016/j.bbamem.2013.01.002. [35] S. Guo, D.L. Jackson, N.I. Burcus, Y.-J. Chen, S. Xiao, R. Heller, Gene electrotransfer enhanced by nanosecond pulsed electric fields,
Mol. Ther. — Methods Clin. Dev. 1 (2014) 14043. doi:10.1038/mtm.2014.43. [36] S. Haberl, D. Miklavcic, G. Sersa, W. Frey, B. Rubinsky, Cell membrane electroporation-Part 2: the applications, IEEE Electr. Insul.
Mag. 29 (2013) 29–37. doi:10.1109/MEI.2013.6410537. [37] T.S. Santra, P. Wang, Electroporation Based Drug Delivery and Its Applications, (2013). [38] R. Buckow, S. Ng, S. Toepfl, Pulsed Electric Field Processing of Orange Juice: A Review on Microbial, Enzymatic, Nutritional, and
Sensory Quality and Stability, Compr. Rev. Food Sci. Food Saf. 12 (2013) 455–467. doi:10.1111/1541-4337.12026. [39] M.F. Turk, C. Billaud, E. Vorobiev, A. Baron, Continuous pulsed electric field treatment of French cider apple and juice expression
on the pilot scale belt press, Innov. Food Sci. Emerg. Technol. 14 (2012) 61–69. doi:10.1016/j.ifset.2012.02.001. [40] L. Schrive, G. Lumia, F. Pujol, N. Boussetta, Liquid food pasteurization by pulsed electric fields: dimensionless analysis via Sherwood
number for a comprehensive understanding, Eur. Food Res. Technol. 239 (2014) 707–718. doi:10.1007/s00217-014-2268-y. [41] G. Saldaña, I. Álvarez, S. Condón, J. Raso, Microbiological aspects related to the feasibility of PEF technology for food pasteurization.,
Crit. Rev. Food Sci. Nutr. 54 (2014) 1415–26. doi:10.1080/10408398.2011.638995. [42] K. Loginova, M. Loginov, E. Vorobiev, N.I. Lebovka, Better lime purification of sugar beet juice obtained by low temperature aqueous
extraction assisted by pulsed electric field, LWT - Food Sci. Technol. 46 (2012) 371–374. doi:10.1016/j.lwt.2011.10.005. [43] E. Puértolas, O. Cregenzán, E. Luengo, I. Alvarez, J. Raso, Pulsed-electric-field-assisted extraction of anthocyanins from purple-
fleshed potato., Food Chem. 136 (2013) 1330–6. doi:10.1016/j.foodchem.2012.09.080. [44] D. Miklavˇ, Electrotechnologies for Extraction from Food Plants and Biomaterials, Springer New York, New York, NY, 2009.
doi:10.1007/978-0-387-79374-0. [45] http://hpbandgisurgery.com/irreversible-electroporation/. [46] T. Kotnik, W. Frey, M. Sack, S. Haberl Meglič, M. Peterka, D. Miklavčič, Electroporation-based applications in biotechnology, Trends
Biotechnol. 33 (2015) 480–488. doi:10.1016/j.tibtech.2015.06.002. [47] O. Parniakov, F.J. Barba, N. Grimi, L. Marchal, S. Jubeau, N. Lebovka, E. Vorobiev, Pulsed electric field and pH assisted selective
extraction of intracellular components from microalgae Nannochloropsis, Algal Res. 8 (2015) 128–134. doi:10.1016/j.algal.2015.01.014.
[48] K. Flisar, S.H. Meglic, J. Morelj, J. Golob, D. Miklavcic, Testing a prototype pulse generator for a continuous flow system and its use for E. coli inactivation and microalgae lipid extraction., Bioelectrochemistry. 100 (2014) 44–51. doi:10.1016/j.bioelechem.2014.03.008.
[49] M.U. Khan, K. Mitchell, Chlorophylls Carotenoids, Methods. 148 (1987) 350–382. [50] K. Matsumura, T. Yagi, A. Hattori, M. Soloviev, K. Yasuda, Using single cell cultivation system for on-chip monitoring of the
interdivision timer in Chlamydomonas reinhardtii cell cycle., J. Nanobiotechnology. 8 (2010) 23. doi:10.1186/1477-3155-8-23. [51] S.K. Min, G.H. Yoon, J.H. Joo, S.J. Sim, H.S. Shin, Mechanosensitive physiology of Chlamydomonas reinhardtii under direct
membrane distortion., Sci. Rep. 4 (2014) 4675. doi:10.1038/srep04675. [52] H.S. Kwak, J.Y.H. Kim, S.C. Na, N.L. Jeon, S.J. Sim, Multiplex microfluidic system integrating sequential operations of microalgal lipid
production, Analyst. 141 (2016) 1218–1225. doi:10.1039/C5AN02409A. [53] Olivier Français and Bruno Le Pioufle, Single Cell Electrical Characterization Techniques, 2016. doi:10.1007/978-3-319-26779-1_15-
1. [54] Y.-L. Deng, J.-S. Chang, Y.-J. Juang, Separation of microalgae with different lipid contents by dielectrophoresis., Bioresour. Technol.
135 (2013) 137–41. doi:10.1016/j.biortech.2012.11.046. [55] K. a. Michael, S.R. Hiibel, E.J. Geiger, Dependence of the dielectrophoretic upper crossover frequency on the lipid content of
microalgal cells, Algal Res. 6 (2014) 17–21. doi:10.1016/j.algal.2014.08.004. [56] T. Mu, Dielectric single cell spectra in snow algae, (1998) 303–310. [57] C.I. Trainito, E. Bayart, F. Subra, O. Français, B. Le Pioufle, The Electrorotation as a Tool to Monitor the Dielectric Properties of
Spheroid During the Permeabilization, J. Membr. Biol. (2016). doi:10.1007/s00232-016-9880-7. [58] M.M. Bahi, M.-N. Tsaloglou, M. Mowlem, H. Morgan, Electroporation and lysis of marine microalga Karenia brevis for RNA
extraction and amplification., J. R. Soc. Interface. 8 (2011) 601–8. doi:10.1098/rsif.2010.0445. [59] C.I. Trainito, O. Français, B. Le Pioufle, E.N. Supérieure, L. Satie, C.I. Trainito, E.N. Supérieure, L. Satie, Monitoring the
permeabilization of a single cell in a microfluidic device , through the estimation of its dielectric properties based on combined dielectrophoresis and electrorotation in-situ experiments . Abbreviation : PEF : Pulsed Electric Field , ROT , (n.d.) 1–18. doi:10.1002/elps.201400482.This.
[60] M.B. Fox, D.C. Esveld, a Valero, R. Luttge, H.C. Mastwijk, P. V Bartels, a van den Berg, R.M. Boom, Electroporation of cells in microfluidic devices: a review., Anal. Bioanal. Chem. 385 (2006) 474–85. doi:10.1007/s00216-006-0327-3.
[61] M. Sato, Y. Murata, M. Mizusawa, A Simple and Rapid Dual fluorescence Viability Assay, 20 (2004). [62] P. Hyka, S. Lickova, P. Přibyl, K. Melzoch, K. Kovar, Flow cytometry for the development of biotechnological processes with
microalgae., Biotechnol. Adv. 31 (2012) 2–16. doi:10.1016/j.biotechadv.2012.04.007. [63] F.C. Mortimer, D.J. Mason, V. a Gant, Flow Cytometric Monitoring of Antibiotic-Induced Injury in < i >Escherichia coli < / i > Using
Cell-Impermeant Fluorescent Probes Flow Cytometric Monitoring of Antibiotic-Induced Injury in Escherichia coli Using Cell-Impermeant Fluorescent Probes, 44 (2000) 676–681. doi:10.1128/AAC.44.3.676-681.2000.Updated.
[64] K.-S. Kan, J.P. Thornber, The light-harvesting chlorophyll a/b-protein complex of Chlamydomonas reinhardii, Plant Physiol. 57 (1976) 47–52. doi:10.1104/pp.57.1.47.
[65] G. Bonente, S. Pippa, S. Castellano, R. Bassi, M. Ballottari, Acclimation of Chlamydomonas reinhardtii to different growth irradiances, J. Biol. Chem. 287 (2012) 5833–5847. doi:10.1074/jbc.M111.304279.
[66] M.H.A. Michels, A.J. Van Der Goot, N.H. Norsker, R.H. Wijffels, Effects of shear stress on the microalgae Chaetoceros muelleri, Bioprocess Biosyst. Eng. 33 (2010) 921–927. doi:10.1007/s00449-010-0415-9.
[67] P. Hyka, S. Lickova, P. Přibyl, K. Melzoch, K. Kovar, Flow cytometry for the development of biotechnological processes with microalgae., Biotechnol. Adv. 31 (2012) 2–16. doi:10.1016/j.biotechadv.2012.04.007.
[68] M.C. Vernhes, P. a. Cabanes, J. Teissie, Chinese hamster ovary cells sensitivity to localized electrical stresses, Bioelectrochemistry Bioenerg. 48 (1999) 17–25. doi:10.1016/S0302-4598(98)00239-6.
Chapter 3: The use of Pulsed Electric Fields for the extraction of lipids from Chlamydomonas reinhardtii:
study in microdevice and electroporation cuvettes
228
[69] F. Zhang, L.-H. Cheng, X.-H. Xu, L. Zhang, H.-L. Chen, Screening of biocompatible organic solvents for enhancement of lipid milking from Nannochloropsis sp., Process Biochem. 46 (2011) 1934–1941. doi:10.1016/j.procbio.2011.06.024.
[70] M. Mojaat, A. Foucault, J. Pruvost, J. Legrand, Optimal selection of organic solvents for biocompatible extraction of ??-carotene from Dunaliella salina, J. Biotechnol. 133 (2008) 433–441. doi:10.1016/j.jbiotec.2007.11.003.
[71] R. Halim, M.K. Danquah, P. a Webley, Extraction of oil from microalgae for biodiesel production: A review., Biotechnol. Adv. 30 (2012) 709–32. doi:10.1016/j.biotechadv.2012.01.001.
[72] M. Vermu??, J. Sikkema, A. Verheul, R. Bakker, J. Tramper, Toxicity of homologous series of organic solvents for the gram???positive bacteria Arthrobacter and Nocardia Sp. and the gram???negative bacteria Acinetobacter and Pseudomonas Sp., Biotechnol. Bioeng. 42 (1993) 747–758. doi:10.1002/bit.260420610.
[73] L. Marchal, M. Mojaat-Guemir, A. Foucault, J. Pruvost, Centrifugal partition extraction of β-carotene from Dunaliella salina for efficient and biocompatible recovery of metabolites., Bioresour. Technol. 134 (2013) 396–400. doi:10.1016/j.biortech.2013.02.019.
[74] M.A. Hejazi, R.H. Wijffels, Milking of microalgae., Trends Biotechnol. 22 (2004) 189–94. doi:10.1016/j.tibtech.2004.02.009. [75] D.M.M. Kleinegris, M.A. van Es, M. Janssen, W.A. Brandenburg, R.H. Wijffels, Phase toxicity of dodecane on the microalga Dunaliella
salina, J. Appl. Phycol. 23 (2011) 949–958. doi:10.1007/s10811-010-9615-6. [76] F. Zhang, L.-H. Cheng, X.-H. Xu, L. Zhang, H.-L. Chen, Application of memberane dispersion for enhanced lipid milking from
Botryococcus braunii FACHB 357., J. Biotechnol. 165 (2013) 22–9. doi:10.1016/j.jbiotec.2013.02.010. [77] J. Wu, M.A. Alam, Y. Pan, D. Huang, Z. Wang, T. Wang, Enhanced extraction of lipids from microalgae with eco-friendly mixture of
methanol and ethyl acetate for biodiesel production, J. Taiwan Inst. Chem. Eng. 71 (2017) 323–329. doi:10.1016/j.jtice.2016.12.039. [78] M. Chen, T. Liu, X. Chen, L. Chen, W. Zhang, J. Wang, L. Gao, Y. Chen, X. Peng, Subcritical co-solvents extraction of lipid from wet
microalgae pastes of Nannochloropsis sp., Eur. J. Lipid Sci. Technol. 114 (2012) 205–212. doi:10.1002/ejlt.201100120. [79] Y. Li, F. Ghasemi Naghdi, S. Garg, T.C. Adarme-Vega, K.J. Thurecht, W.A. Ghafor, S. Tannock, P.M. Schenk, A comparative study: the
impact of different lipid extraction methods on current microalgal lipid research., Microb. Cell Fact. 13 (2014) 14. doi:10.1186/1475-2859-13-14.
[80] M. Goettel, C. Eing, C. Gusbeth, R. Straessner, W. Frey, Pulsed electric field assisted extraction of intracellular valuables from microalgae, Algal Res. 2 (2013) 401–408. doi:10.1016/j.algal.2013.07.004.
[81] R. Straessner, A. Silve, C. Eing, S. Rocke, R. Wuestner, K. Leber, G. Mueller, W. Frey, Microalgae precipitation in treatment chambers during pulsed electric field (PEF) processing, Innov. Food Sci. Emerg. Technol. (2016). doi:10.1016/j.ifset.2016.07.008.
[82] P. Bodénès, F. Lopes, D. Pareau, O. Français, B. Le Pioufle, Microdevice for studying the in situ permeabilization and characterization of Chlamydomonas reinhardtii in lipid accumulation phase, Algal Res. 16 (2016) 357–367. doi:10.1016/j.algal.2016.03.023.
[83] R.J. Thompson, J.P. Davies, G. Mosig, â€TM Dark-Lethality â€TM of Certain Chlamydomonas reinhardtii Strains Is Prevented by Dim Blue Light ’, (1985) 903–907.
[84] G. Saulis, M.S. Venslauskas, J. Naktinis, Kinetics of pore resealing in cell-membranes after electroporation, Bioelectrochemistry Bioenerg. 26 (1991) 1–13.
[85] http://www.int.laborundmore.com/archive/936206/From-fat-droplets-in-plant-cells-to-novel-foods.html.

Chapter 3: The use of Pulsed Electric Fields for the extraction of lipids from Chlamydomonas reinhardtii:
study in microdevice and electroporation cuvettes
229
III1. Appendix III.1: Lipid production strategies in
literature. List of viability related dyes, from [62]. Dyes can be classified according to their application:
(1) permeability dyes, (2) membrane potential dyes,
and (3) cellular enzyme activity dyes [62].
Permeability
Dye Target Fluorescence Excitation (nm)
Emission (nm)
DAPI DNA 358 (UV) 461 Hoeschst 33342 DNA 536 617 PI (Propidium Iodide) Nucleic acid content 536 617
PicoGreen DNA 480 520 SYBR Green I Nucleic acid content 497 520 SYTO 9 Nucleic acid content 483 503 SYTO 13 Nucleic acid content 488 509 SYTO RNAselect RNA 490 530 SYTOX Green I (SG) Nucleic acid content 504 523
SYTOX Green II Nucleic acid content 504 523
Membrane potential
CTC Electron transport 450 630 DHR ROS (Reactive Oxygen species) 505 534 DiOC6 Membrane potential,
respiration rate 484 501
TMRM Membrane potential and integrity
555 580
Cellular enzyme activity
Calcein-AM Non-specific esterase activity,
membrane integrity
494 517
Carboxy-H2 DFFDA ROS 478 519 CFDA-SE Non-specific esterase activity 492 517 CMFDA Non-specific esterase activity 485 538 ELF 97 - phosphate Alkaline phosphatase activity 345 530 FDA
(fluorescein diacetate)
Non-specific esterase activity 492 519
H2DCFDA ROS, respiration activity 505 535 HE (hydroethidine, dihydroethidium)
Perroxidase activity 510 595
Rhodamine 123 Mitochondrial membrane potential
507 529

Chapter 3: The use of Pulsed Electric Fields for the extraction of lipids from Chlamydomonas reinhardtii:
study in microdevice and electroporation cuvettes
230
III2. Appendix III.2: Temperature profiles in the
microdevice simulated in COMSOL
Pulse of 5 µs, 620V (20 kV/cm)
A single 5 µs pulse of 620V leads to a temperature elevation of 2°C on the edge of the electrode, dissipated in 100 ms.
Figure 1: Evolution of the temperature (y, in °K) with time (x, in second) after a single pulse near the electrode (green) and at the center of the electroporation chamber (blue) LOG Scale.
Figure 2: Mapping of the temperature distribution among the chamber (x, distance from the center of the chamber in m) after pulse application (5 µs, 620 V). Temperature elevation of 2 °C near the electrodes)
Figure 3: Temperature profile from the center of the chamber (x=0) to the electrode (x=-1.5·10-4)
for t = 5µs , t=10µs, t=1ms, t=10ms, t=0.1s. E = 20 kV/cm
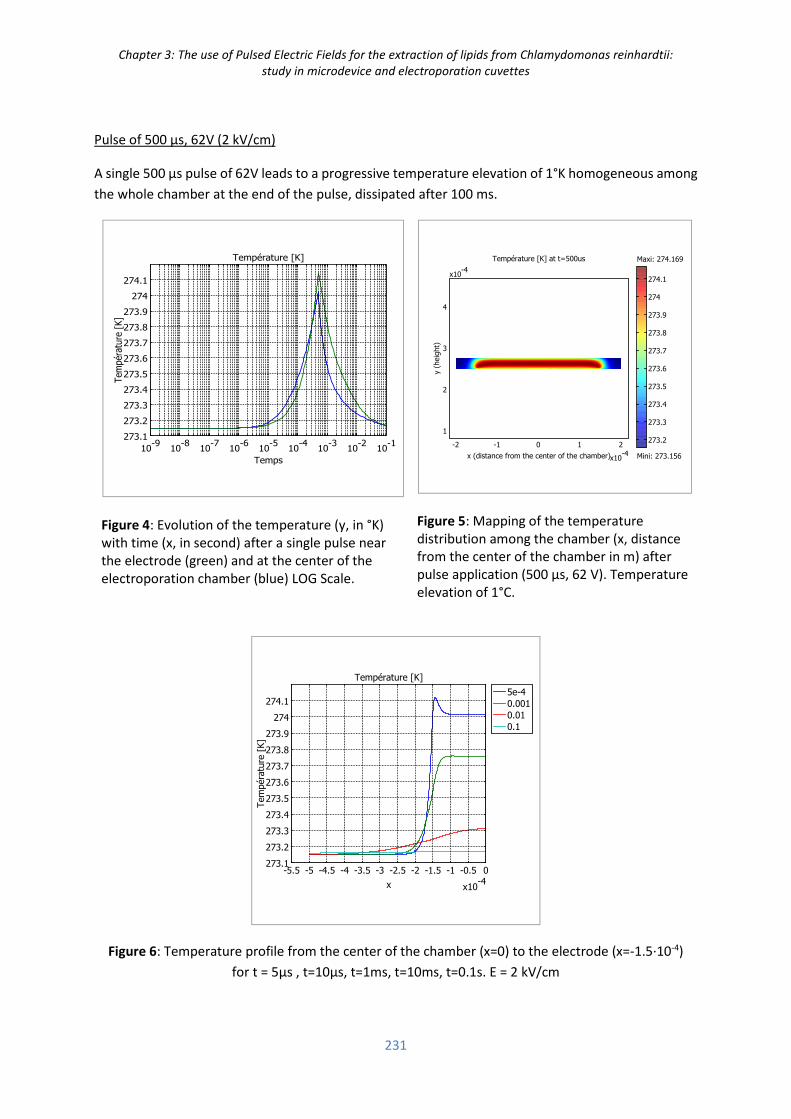
Chapter 3: The use of Pulsed Electric Fields for the extraction of lipids from Chlamydomonas reinhardtii:
study in microdevice and electroporation cuvettes
231
Pulse of 500 µs, 62V (2 kV/cm)
A single 500 µs pulse of 62V leads to a progressive temperature elevation of 1°K homogeneous among
the whole chamber at the end of the pulse, dissipated after 100 ms.
Figure 4: Evolution of the temperature (y, in °K) with time (x, in second) after a single pulse near the electrode (green) and at the center of the electroporation chamber (blue) LOG Scale.
Figure 5: Mapping of the temperature distribution among the chamber (x, distance from the center of the chamber in m) after pulse application (500 µs, 62 V). Temperature elevation of 1°C.
Figure 6: Temperature profile from the center of the chamber (x=0) to the electrode (x=-1.5·10-4)
for t = 5µs , t=10µs, t=1ms, t=10ms, t=0.1s. E = 2 kV/cm
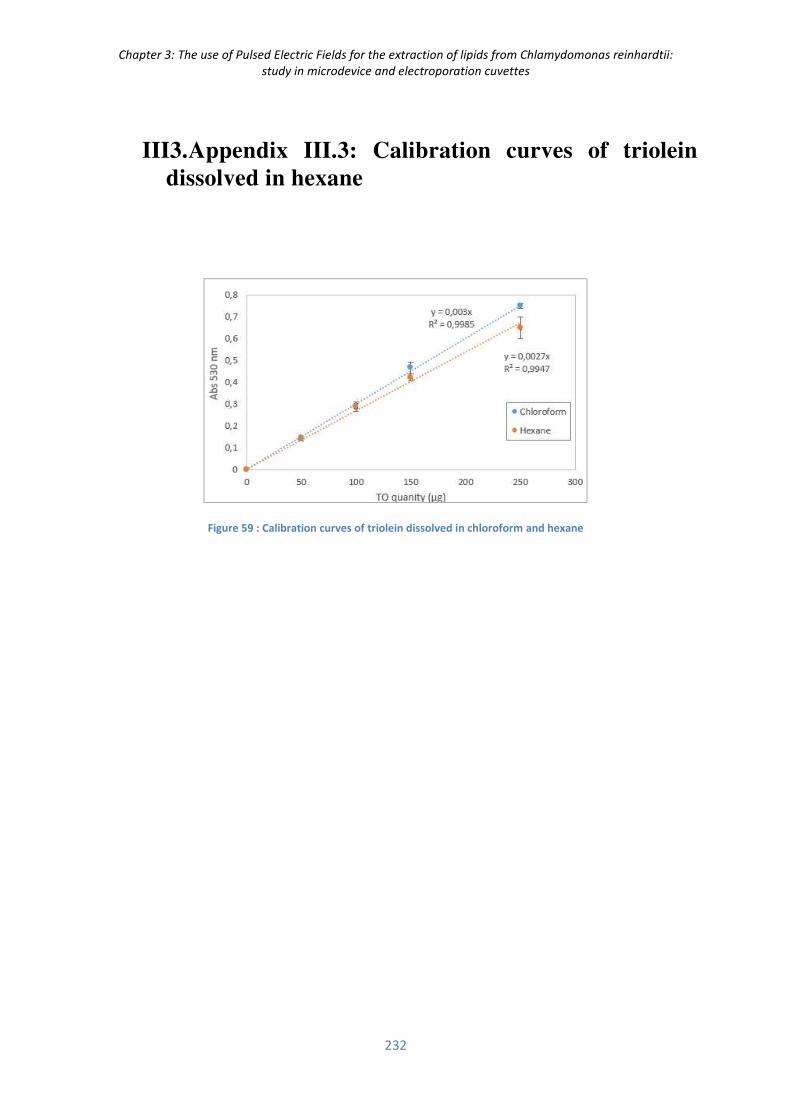
Chapter 3: The use of Pulsed Electric Fields for the extraction of lipids from Chlamydomonas reinhardtii:
study in microdevice and electroporation cuvettes
232
III3. Appendix III.3: Calibration curves of triolein
dissolved in hexane
Figure 59 : Calibration curves of triolein dissolved in chloroform and hexane

Chapter 3: The use of Pulsed Electric Fields for the extraction of lipids from Chlamydomonas reinhardtii:
study in microdevice and electroporation cuvettes
233

Chapter 3: The use of Pulsed Electric Fields for the extraction of lipids from Chlamydomonas reinhardtii:
study in microdevice and electroporation cuvettes
234

Discussion
235
Discussion
This work takes part in the research of innovative solutions which can be implemented to overcome
the challenge of producing biofuels with microalgae at a favorable energy efficiency. Here, the effect
of Pulsed Electric Fields (PEF), which are already of primary interest in various domains such as
oncology, biotechnology, food processes, on microalgae cells and on lipid extraction from these
organisms is evaluated. Studies are first performed in a micro-system. This is required before upscaling
the PEF process.
First, we chose a microalgae specie as a model to our study. Among various strains cultivated for this
project, such as Dunaliella Salina, Parachlorella Kessleri and Acutodesmus obliquus, Chlamydomonas
reinahrdtii wild type and its cell wall deficient mutant were finally chosen as the final candidates for
the following reasons: (i) the high number of data already existing in literature about this strain, (ii)
Chlamydomonas reinhardtii is known to accumulate a high lipid content during stress, (iii) the cell has
a larger diameter in comparison with Chlorella vulgaris (preliminary assays were performed with this
specie). This increases its sensitivity to the electric field applied according to Schwan equation, (iv) its
relative circular shape which leads to a homogeneous effect of the electric field on the cell and (v)
this freshwater strain is cultivated in a relative low conductivity medium which limits the Joule effect
of the PEF treatment. The only strong disadvantage of Chlamydomonas reinhardtii is its motility
conferred by two flagella, which does not facilitate the observation of the cells during the treatment;
motility is however highly reduced when the cells are in lipid accumulation conditions.
Concerning the cell culture, the system was kept as simple as possible. The batch cultures required
to rapidly fix a certain stress duration to obtain reproducible lipid content in the cells subjected to PEF
treatment. After visual observations and first analyses of lipid content with Bodipy by flow cytometry,
the stress duration of seven days was finally chosen.
Concerning cell characterization, the evaluation of lipid content was however challenging in our
conditions (very low amount of biomass) as the conventional methods of gravimetric quantification
together with gas chromatography require a high sample volume. We developed then a simple
analytical method that uses low biomass amounts.
The Bodipy staining of cells permits to localize the lipid droplet within the cytoplasm but is not
adequate to quantify precisely. There are many interferences indeed; the application of PEF on algae
cells before Bodipy staining increases the bodipy fluorescence intensity and the contact of algae with
organic solvents also affects the results. Finally, the colorimetric SPV method was implemented
showing a high robustness and a fast and simple protocol of analysis; in addition, this method can be
applied on both raw algae solutions and solvent extracts. The SPV response is however not specific to
neutral lipids and GC analysis is then required to determine the exact composition of lipids
accumulated. But the SPV method can be a precious tool for estimating the evolution of the cell
lipid content. Additional correlations between SPV responses and fatty acid contents (determined
by GC analysis) might be performed.
Innovative, fast and accurate methods of lipid quantification are required. In this context, the
determination of lipid content by 3D reconstruction of bodipy stained lipid droplets recorded by LCSM
could be further studied. But a high quality software of deconvolution must be used and an automatic
image processing method must be developed, as well as a cell fixation method.
Lipid and cell wall staining with bodipy and concanavalin respectively was used to record cell images
before and after PEF or solvent treatments.

Discussion
236
Cell viability/permeability were evaluated by microscopy and flow cytometry. These methods were
first optimized. Manual counting of stained permeable cells in electroporation chambers, used in the
first part of the project, is a very long process in comparison with analysis with flow cytometry. But the
counted could be automated with image analysis software. In our case, flow cytometry was chosen to
evaluate cell viability/permeability.
The interest of using an electroporation micro-device from the very beginning of the project was to
visualize in situ the phenomena at the cell scale. This approach enabled to observe, for the first time,
the coalescence of lipid droplets during PEF treatment. We also measured, in direct, the rapid
penetration of the propidium iodide into permeabilized cells during/after PEF treatment. Reversibly
permeabilized cells showed to be stained with PI, but still able to swim with their flagella. We also
observed no effect on the cell wall due to PEF treatment, thought, the cell walls deficient mutant of
Chlamydomonas reinhardtii showed to be strongly affected by the PEF treatment: a complete
destructuration of the cell is observed. Also, we observed in dedicated fluidic system the mixing of
algae with solvent, showing the necessity of an efficient mixing system during lipid extraction.
Following a single cell during PEF treatment was tested but rapidly replaced by the monitoring of
several cells for two important reasons: (1) a very high disparity of the cells was observed: it seemed
then be more relevant to observe a sample of several different cells which present variable sizes, lipid
contents, cell wall sizes, etc… These differences are not important when considering the scale of the
process but they are critical at the scale of cell engineering. (2) Secondly, the cell motility and mobility
(due to hydrodynamics) strongly reduced the possibility to follow a single cell during the treatment
with a high magnification objective. Most of the single cell monitoring studies found in literature are
realized on adherent mammal cells.
The mobility of the cells is then a problem for their observation. A specific method was tested to fix
the cells on glass coverslips for their observation during PEF; Poly-L-lysine was used but the adhesion
obtained on Chlorella vulgaris (preliminary assays performed in this thesis) was inconclusive. The
attachment of an algae cell may indeed greatly vary with the composition of the cell wall of the stain
tested; the coating of a glass substrate with a thin layer of a gel containing proteins and sucrose could
be tested in order to improve adhesion. Cell immobilization may also be necessary when using LCSM
imaging to quantify the cell lipid content, as previously reported.
The contact of algae with solvent during PEF treatment was first tested in the electroporation system.
However, the biphasic system (algae/water + organic solvent) requires a very efficient mixing in order
to improve the transfer of lipids between both phases. The process of associating electroporation and
solvent mixing extraction may could also be miniaturized and is under consideration in our group.
The work was performed with the goal of recycling algae cells after lipid extraction. The optimal
conditions to perform a reversible electroporation treatment were found in our study. However, in
our first experiments, cells electroporated with low PEF energy (5 µs, 7 kV/cm) did not exhibit a
higher lipid extraction in comparison with non electroporated cells. This may be due to the absence
of effect on the cell wall though the membrane is permeabilized. But more results must be obtained
to confirm the hypothesis.
In contrast, very energetic treatments leading to an important thermal effect in the electroporation
chamber showed to improve lipid extraction by solvent, but the cell wall may be highly affected by
temperature.
Anyway, we worked to combine other effects (like mechanical solicitations) with moderate PEF
conditions to enhance solvent assisted extraction of lipids.

Discussion
237
Assays performed with lower solvent volume (lower solvent to algae ratio) should be performed in
cells subjected or not to PEF treatment. PEF may improve lipid extraction while reducing the solvent
volume required for the extraction. Moreover, the process developed is also interesting regarding the
energy consumption as extraction is performed on wet algae: water removal is not necessary, leading
to high energy savings. The influence of other PEF parameters should be also have been investigated:
pulse number, bipolar pulses, lower frequency, temperature in the electroporation cuvette
(electroporation in ice…).
PEF treatment can be an interesting pre-treatment process before solvent extraction compared to
other highly energy demanding processes that disrupt the cells and thus unease further
downstream/purification processes. But, more experiments are required to confirm this statement.
PEF should be also used to extract high-valuable compounds from microalgae. The extraction of
carotenoids such as astaxanthin in a pigment accumulating freshwater strain could also be tested:
the measure of pigment content could be very easy using the flow cytometry, thanks to the pigment
auto-fluorescence. Also, the market of natural pigments is very promising because of their high price
(see Chapter 1).
Finally, this project had an important part of experimental work: set-up of the lipid accumulation
device, optimization of several methods for cell characterization by flow cytometer and microscopy,
set-up of a new Pulsed Electric Field generator, design and mounting of the electroporation set-up
(reception of a new color camera, fabrication of connections…), choice of dye, development of staining
protocols, development of SPV method, development of solvent extraction method, etc... The major
part of this work was then devoted to design, install, optimize experimental devices and to develop
characterization and analytical methods; without this preliminary but important work, no experiment
could have been performed. Very interesting results were already obtained and many questions are
raised. From now with these optimized tools it will be rather easy for future students and researchers
to perform the necessary experiments to answer the questions raised by this study: can we show that
PEF improves solvent extraction at low energy expense? Additional experiments are required. What
is the state of the algae after the extraction (membrane, enzymatic activity, cell wall, valorization of
other compounds)? Additional analyzes such as electronic microscopy, use of fluorescent dyes, and
analysis of chemicals are required.

Discussion
238


Université Paris-Saclay
Espace Technologique / Immeuble Discovery
Route de l’Orme aux Merisiers RD 128 / 91190 Saint-Aubin, France
Titre : Etude de l’application de champs électriques pulsés sur des microalgues en vue de l’extraction de lipides neutres. Mots clés : microalgues, biodiesel, champs électriques pulsés, microsystèmes
Résumé : Les microalgues, de par leur diversité, peuvent offrir une multiplicité de molécules bio-sourcées pour des applications variées (alimentation, énergie, santé etc…). Cependant, la production de biodiesel à partir de microalgues, désignée comme la 3e génération de biocarburant, nécessite encore une optimisation lors de l’étape de culture de la biomasse ou lors de l’extraction de l’huile pour que le procédé soit énergétiquement viable. Parmi les voies d’amélioration, l’application de champs électriques pulsés (PEF) en prétraitement à la biomasse pourrait améliorer la rentabilité énergétique du procédé d’extraction de lipides. Ce procédé appliqué aux microalgues est étudié dans le contexte d’une collaboration entre le laboratoire SATIE de l’ENS Cachan Paris Saclay et le laboratoire LGPM de Paris Saclay.
Un microsystème d’électroporation a été conçu afin d’étudier in situ l’impact des champs électriques pulsés sur les cellules de microalgue, Chlamydomonas reinhardtii chargées en lipides. Parmi les principaux résultats du projet, l’étude énergétique du procédé a montré que les impulsions de très courte durée (5 µs) sont les moins énergivores. Associées à un champ électrique de 4.5 kV/cm, ces impulsions entrainent une perméabilisation réversible (80 % de cellules atteinted) de quelques secondes tandis qu’un champ de 7 kV/cm entraine un effet irréversible. Après ce prétraitement, les algues sont ensuite mélangées à de l’hexane afin d’évaluer si les lipides sont extraits plus facilement de la cellule.
Title: Study of the application of pulsed electric fields (PEF) on microalgae for the extraction of neutral lipids. Keywords: microalgae, biodiesel, PEF, micro-systems
Abstract: Microalgae offer a multiplicity of applications for the production of bio-sourced compounds such as proteins, pigments, sugar and oils. However, the energy spent for algae culture and lipid extraction hinder the energetic viability of the process for the production of biofuel derived from algae oils. Among possible improvements, pulsed electric fields (PEF) may be used as a pre-treatment to extract valuable compounds from microalgae and making the process less energy demanding. This project started with a collaboration between the team of bio-micro-systems Biomis, laboratory SATIE, with the team of bio-process engineering laboratory LGPM to study in situ the effects of PEF on microalgae. First, a energetic study is performed in a
micro-system specially built for this project to characterize in situ, the effect of various treatment parameters (pulse duration / electric field) on Chlamydomonas reinhardtii cells with high lipid content. Among the outputs of this study, an enegetic optimization of PEF conditions shows that a high level of permeability and low energy consumption are obtained when using short pulses of 5 µs. Associated with an electric field of 4.5 kV/cm, the pores are reversible (80 % of the cells reached) during few seconds, and with a field of 7 kV/cm or higher, the permeabilization is irreversible. Afterwards, the tre-treatment is associated with solvent mixing (hexane) to evaluated if the lipid extraction is improved.