
penerapan lean manufacturing untuk mereduksi waste ... - Neliti
Upload
khangminh22Category
view
0download
0
Study of Select Issues in Lean Manufacturing
Basant Chaurasia**IIMT Institute of Engineering & Technology,
Meerut- 250001, Uttar Pradesh, India
Prof. (Dr.) Dixit GargDepartment of Mechanical Engineering,
NIT, Kurukshetra, Haryana-136119, India
Dr. Ashish AgarwalDepartment of Mechanical Engineering,
IGNOU, New Delhi, India
Dr. K.K. Garg, LLDIMS, New Delhi
ABSTRACT
In the existing global competitive market, offering high quality product with competitive cost is a challenging task for companies. In present paper a paradigm of lean production system focusing on its benefits has been presented. A conceptual framework of lean manufacturing showing benefits has been discussed. Lean manufacturing identifies and eliminates non value adding activities in design, production , supply chain management, order processing. This paper also analyzes ways to achieve leanness in manufacturing. It also investigates the overall impact of the benefits from lean manufacturing. The finding in the paper provides learning insights to readers about lean manufacturing.
Keywords: Lean manufacturing; benefits; Impact; Issues
INTRODUCTION
The term ‘lean’ is first introduced in last two decade by Womack et.al. 1990 in their book “The machine that change the word”. Lean Manufacturing is an endeavor on doing right task, at right time, in right quantity to achieve relentless perfect work flow while eliminating waste with the flexibility and ability to change. Birth of lean was in Japanese company Toyota Corporation Taiichi Ohno started 1940s Toyota production system.
Figure 1: The Lean House
HIGH QUALITY, LOWEST COST,
SHORTEST DELIVERY TIME
JUST INTIME
PEOPLE-MACHINE
SEPARATION
STANDARDWORK
TAKT TIME
PULL FLOW
JIDOKA(VisualizeProblem)
ONE-PIECE FLOW 5SKAIZEN
OPERATIONAL STABILITY (heijunka) STANDARD WORK

2 tLingaya's Lalita Devi Journal of Professional Studies Study of Select Issues in Lean Manufacturing t3
Toyota Company got popularity in 1980’s for effective continuous flow process and focus to strive on added value to customer that was opposite to Henry Ford mass production system based on material resource planning (MRP) that was high volume production of standardized product with minimum product changeovers.
The Lean “house” Diagram demonstrates how the Lean manufacturing can be foundation for improvement of Quality, Standardization of work & Satisfaction of customer. In past two decades Toyota production System has been studied by many of researchers namely Adler, 1993; Womack and Jones, 1994; Liker, 1998; Sobek et al. 1998; Spear and Bowen, 1999; Mike Rother, 2009. Brox and Fader, 2002 defined just-in-time (JIT) production system as a manufacturing pioneer that identifies and eliminates all forms of waste from the system and strive for continual improvement. The follow on book, Lean Thinking: Banish Waste and Create Wealth in your Organization (Womack and Jones, 1996), tolds key steps of lean thinking Value, Value stream, flow, pull and perfection.
2. BENEFITS FROM LEAN MANUFACTURING
Lean manufacturing accelerate overall business performance this system configured of maximum flexibility and quick response resulting low inventory, reduction in lead time and high customer satisfaction.
Figure 2: Benefits of lean manufacturing
2.1 Reduction in Lead Time
Lead time is the amount of time that elapses between when a process starts and when it is completed. Lead time is examined in Process industry, manufacturing sector, supply chain management and project management, where as companies want to reduce the amount of time it takes to deliver products into the market. In business process, lead time minimization is normally preferred. With the application of lean concept non value activities gets minimize which further results in reduction in lead time.
2.2 Reduction in Work in Process Inventory
In lean manufacturing attempt is made to reduce the wastage. Raw material is introduced in the production process but is not yet a finished product. Work in progress (WIP) therefore refers to all those materials and partly finished goods that are at different stages of the production process. WIP exhibits inventory of raw materials at the starting of the production line cycle and finished products inventory at the end of the production line cycle. Cost of work in process inventory causes increases the cost of product, cost of labour, cost of electricity etc.
2.3 Productivity Improvement
In the simplest form, productivity is broadly defined as the relation between output produced and one or more associated inputs that are used in production process (National Research council, 1979). Concept of productivity depends of objective of measurement, data availability and researcher preference. Ratio is also measurement of efficiency so it can be also called productive efficiency.
2.4 Improved Profitability
It is the ratio of sales to cost that is equivalent to productivity multiply by Price recovery factor.
This concept given by the American productivity centre. As the productivity increases profitability also increases.
2.5 Effective Communication System
Communication is defined as an interpersonal connection across tasks, with a limited time frame, for the purpose to define, conduct and control the transfer of information generated in one task to another .Communication is interaction between two parties .Either in form of e-mail, meeting, paper, phone, mobile, fax, social networking sites, internet, intranet or any form. It must be clear and straight.
2.6 High Level of Customers Satisfaction
Customer satisfaction is the measure of how product and services provide by the companies meet the customer expectation. Satisfaction is the customer fulfillment response, it is judgment of product or services feature or both itself provide pleasured level of fulfillment either partial or full (Oliver, 1997)
3. THRUST OF LEAN MANUFACTURING
3.1 Leadership
The leadership within a manufacturing company plays an important role in sustaining the progress of lean concepts. The experts having relevant experience guide the less experience employee working for achieving leanness (Abdulmalek et.al., 2007).
3.2 Working Culture Environment
The working culture of any manufacturing company determines the success of lean. The biggest problem in lean implementation is has been observed that no effort is done to priorities the importance of building a culture of prevention.
3.3 5S Implementation
Implementing 5S in workplace, 5S stands short, set in order, shine, standardize and sustain. When companies introduced 5S as lean thinking, they ensure all unnecessary work tool and suppliers are removed (short), all necessary tools gets their specified place (set in order), work place is clean where work is performs (shine), cleaning methods are applies consistently (Standardize), continuously improve the practice of 5S. Causes to increase productivity is balanced flow, minimize waiting, walking and unnecessary material handling activity, standardize task, visual control, team work, mistake proofing & zero error.
3.4 Continuous Improvement Process
To thrive and survive in highly competitive market scenario it is vital to increase and protect current profitability. Profitability of company increases due to measures and method of aspect related to product development, chain of supply, shop floor management and after sales service integration (Warneck et.al., 1995). Cost time investment (CTI) helps company how much money tied up in process & how long for before recovered through sales with help of cost-time-profile (Revera et.al., 2007). Lean profitability related to responsible autonomy in situation where people involved in developing procedure, adopt responsibility and decision making authority transfers from higher to lower in order to reduce inventory, short cycle time, process flow based layout (Treville et.al, 2006)
3.5 Streamlining Communication System
Communication is a key variable that affects the success rate in lean manufacturing implementation. Communication in any organization is important to share the information related to production, quality and suppliers. In the absence of communication there may be a problem related to workers, quality and production (Worley and doolen, 2006.)
3.6 Improving Customer Satisfaction Level
Lean manufacturing strive to be relentless in the elimination of all variability and waste and to ensure continuous improvement towards goal of customer satisfaction. Lean strategy was developing with customers, ownership group, Suppliers and employees. Lean paramount is concern with safety of product through continuous improvement efforts, adoption of new quality process and system that fulfill customer need and expectation. Lean enterprises continuously strive to achieve delivery time through elimination of waste, reduced lead time and lowering work in process.
4. OBJECTIVES OF LEAN MANUFACTURING
4.1 Smoothened Production Process
In lean paradigm notion that take time precisely matches with production demand it improve dismal delivery performance of production process. Lean creates culture of continuous improvement, when process cycle of lead time decreases production
ReducedWork inProcess
Inventory
HighlySatisfied
Customer
ReducedCustomer &Productionlead time
Benefits
IncreaseProductivity
IncreaseProfitability
StreamlineCommunication

4 tLingaya's Lalita Devi Journal of Professional Studies Study of Select Issues in Lean Manufacturing t5
process tremendously smoothened it is able to make quickly and respond faster Customer demand, supplier demand, and stakeholder demand.
4.2 Improved Process Flexibility
Lean manufacturing has ability to reconfigure or alter production process rapidly as per customer need and changing competitive market scenario to sustain in global economy. Increased production process, reduces work in process inventory in certain class of flexible manufacturing system (Kumar et.al.). Also flexible manufacturing system is minimized by maintaining balanced load on machine.
4.3 Continuous Improvement Process
Lean manufacturing reduces root causes of bottleneck or constraints in production process. Changes from traditional schedule to 5S drive which is led to detailed problem solving & significant care improvement in health & service sector. It improving reliability, efficiency of machine and equipment. It improves flow of production to keep inputs and outputs to be consistent in production and services span.
4.4 Enhanced Business Process Value
The system endeavor continuously meets demand efficiently and avoids wasting resources. Tangible benefits discussed by Kaplan (1986) include inventory reduction, floor space reduction, quality improvement, increased flexibility& improved scheduling.
4.5 Better Communication Reliability
Communication influence can be processional, environmental and individual. Poor communication could increase the defects. Therefore appropriate and clear communication is important.
4.6 Increased Company Brand Value
Because of lean eliminate uncertainty of performance; improve quality and robustness of product that tends towards customer satisfaction. Customer delivery time, service quality has been improved. Good service quality in context of how quick correcting problems, reliability of information driven, and politeness, ecofriendly, and responsiveness gives pleasure to customer.
5. TRENDS IN LEAN MANUFACTURING
Lean manufacturing started from Japanese automotive company Toyota in production process. Now this concept is being used in worldwide known as Toyota production System. The term lean was introduced by very first by Womack et.al in 1990s. Now concept of lean has been implemented in areas like hospitals, call centers, fast moving consumable goods plants, defense, automobile industries, food processing units etc to achieve their goals, in less cost get quality product and highly satisfied customer, stakeholders. Lean benefits are being achieved by minimizing production lead time, reducing work in process inventory, and eliminating excess raw material. Excess semi finished product and unwanted finished product need to be reduced in order to achieve accelerated productivity and high rate of profitability. Inter and Intra personal communication system enhanced in better way through lean thinking.
To achieve lean benefits paradigm should implement lean tools such as 5S, kanban, pull system, JIT, TPM etc. These tools help in reducing lead time and work in process. Mistake proofing, team leadership, revealing unnecessary and unwanted process, material helps to increase profitability and productivity. DSM helps to improve communication system other than phones, walky- talky, fax, Wi-Fi connection, visual inspection. Lean manufacturing satisfied to their customer, stakeholder, supplier, employee, owner because of continual improvement cost of product decreases, in lean environment chances of error is less, time to produce finished product is least and quality of product is good.
Impact of lean benefits in lean environment is disseminated in lead time, customer lead time those who want quality product in minimum cost to their expected time. Industries those implementing lean manufacturing with help of lean tools enhance their productivity, reduces production cost, increases flexibility, communication system and lastly delivered improved product quality.
6. CONCLUSION
In the paper the concept of lean manufacturing has been discussed. From the literature review it has been found that lean manufacturing leads to minimization of production lead time, reduction in work in process inventory, enhancement in productivity improvement in profitability, effective communication system and high customer satisfaction level. The concept of lean in manufacturing can be achieved by proper management of production process and by minimizing the waste. The objectives of lean manufacturing are to improve process flexibility, to enhance business process value and to have better company brand value. It has
been observed from the literature review that there are very few empirical study which have analyses the objective of lean manufacturing and benefits of lean manufacturing .The authors of the paper intended to extent the current work to an empirical study, the empirical study will investigate the level of leanness in manufacturing in Indian companies.
REFERENCES
[1] Agarwal A., Shankar R, and Tiwari M.K. (2006), ‘Modeling the metrics of lean, agile and leagile supply chain: An ANP-based approach’, European Journal of Operational Research, (173), pp.211–225.
[2] Brett W. Braiden, Kenneth R. Morrion. (1996) ‘Lean Manufacturing optimization of automotive motor compartment system’, Computer integrated Engineering, Vol.31 No.1/2, pp.99-102
[3] Danny J. Johnson. (2003) ‘A Framework for Reducing Manufacturing Throughput Time’, Journal of Manufacturing Systems, Vol. 22 No. 4
[4] Fawaz A. Abdulmalek and Jayant Rajgopal. (2007) ‘Analyzing the benefits of lean manufacturing and value stream mapping via simulation: A process sector case study’, International Journal of Production Economics, (107) pp.223–236
[5] Gabriel E.(1996) ‘The lean approach to project management’, International Journal of Project Management, Vol. 15 No. 4, pp. 205-209
[6] Gautam N., and Singh N., (2008) ‘Lean product development: Maximizing the customer perceived value through design change (redesign)’, International Journal of Production Economics, Vol.114, pp. 313– 332
[7] J. Womack, D. Jones and D. Roos. (1991) The Machine That Changed the World: The Story of Lean Production, New York: Harper Perennial
[8] K. Kosonen and P. Buhanist (1995) ‘Customer Focused lean production development’ International Journal of Production Economics, Vol.41, pp.211-216.
[9] Kaplan R S. Must (1986) ‘CIM be justified by faith alone?’ Harvard Business Review, pp. 87–95
[10] Lluis Cuatrecasas Arbos.(2002) ‘Design of a rapid response and high efficiency service by lean production principles: Methodology and evaluation of variability of performance’. International Journal of Production Economics, Vol 80, pp.169–183
[11] Panizzolo R.(1998) ‘Applying the lessons learned from 27 lean manufacturers. The relevance of relationships management’, International Journal of Production Economics, Vol.55 pp. 223-240
[12] Peter Bruun and Robert N. Efford. (2004) ‘Lean production and the Internet’. International Journal of Production Economics, Vol.89, 247–260.
[13] P. Hines and Nick Rich. (1997) ‘The seven value stream mapping tools’, International Journal of Operations & Production Management, Vol. 17 No. 1, pp. 46-64.
[14] Rachna Shah and Peter T. Ward. (2003) ‘Lean manufacturing: context, practice bundles, and performance’, Journal of Operations Management vol.21, pp129–149
[15] Toni L. Doolen and Maria E. Hacker. (2005), ‘A Review of Lean Assessment in Organizations: An Exploratory Study of Lean Practices by Electronics Manufacturers’, Journal of Manufacturing Systems, Vol. 24 No. 1.2
[16] William G. Sullivan, Thomas N. McDonald and Eileen M. Van Aken. (2002), ‘Equipment replacement decisions and lean manufacturing’. Robotics and Computer Integrated Manufacturing vol.18, pp. 255–265
[17] Worley and Doolen. (2006) ‘The role of communication and management support in a lean manufacturing implementation, management decision vol.44, No.2, pp.228-245
Mr. Basant Chaurasia is working as Assistant Professor in the Department of Mechanical Engineering at IIMT Meerut. He did his B.E. (Mechanical) from Rohilkhand University, M.Tech. from UPTU, Lucknow and Pursuing Ph.D. From NIT, Kurukshetra. He has 10 year experience in Teaching & research work.
Dr. Dixit Garg is working as Professor in the Department of Mechanical Engineering at NIT Kurukshetra. Published more than 70 research papers in various reputed Journals and conferences at National and International Level. Acted as editor/reviewer in International Journals/ Conferences and Short Term Training Programmed. Delivered many expert lecturers and participated in panel discussions. Performed a number of academic duties such as Member Senate, BOS, DRC. Presently acting as Member, Board of Governors of many institutes. Expert Member for various committees of AICTE New Delhi, UPSC New Delhi, Technical Education Department of Haryana Government, Kurukshetra University, Awarded ‘Eminent Engineering Personality Award’, selected for ‘Shiksha Ratan Puruskar’ and ‘Best Citizens of India award’. Life member of ISTE New Delhi and ISME New Delhi.
Dr. Ashish Agarwal has been working as Associate Professor, Mechanical Engineering at Indira Gandhi National Open University New Delhi India. He earned his Ph.D from IIT Delhi in the area of Supply Chain Management. He has published several papers in International Journals like European Journal of Operations Research, Supply Chain Management: An International Journal, Industrial Marketing Management, Work Study etc.,. His areas of interest are Supply Chain Management, Total Quality Management, Operations Management, Knowledge Management, System Dynamics, Multi Criteria Decision Making etc. He has supervised two Ph.D students.

6 tLingaya's Lalita Devi Journal of Professional Studies Application of Asset Management to Railway Fleet t7
Application of Asset Management to Railway Fleet
1Aniket Dwivedi
2Kumar Vaibhav Bhatnagar3Mukul Saini
1,2,3M.Tech 3rd sem School of ICTGautam Buddha University,Greater Noida-201301, UP
1Email: [email protected], Ph: 9650206854
ABSTRACT
There has been much written about the application of asset management to national critical infrastructure – highways, water and power utilities, railway infrastructure etc. However, the application to fleet is somewhat less documented.
Fleet assets are generally characterised as being complex systems of mechanical and electrical components. Mechanical failures are typically a mix of fatigue and age/usage related. Electrical and electronic components are more prone to random failures. The most appropriate maintenance regime should be designed around a Reliability Centred Maintenance approach. RCM focuses on the fitness for purpose of the asset and makes use of failure and performance information to support intervention decisions.
The paper considers current best practice approaches to demand analysis, strategic planning, reliability analysis and operational management. The use of information systems to support business processes is also considered.
A framework for asset management is proposed that draws on this best practice, and considers both the requirements of ISO:55001, as well as the guidance of EN50126 for Railway RAMS. The framework provides the scope for a fleet asset management system.
The paper ultimately concludes by considering what can be learnt from Fleet Operators and how this would be transferred to infrastructure managers to improve the economic and efficient delivery of critical infrastructure.
Keywords: Fleet, Management, Reliability, critical, infrastructure.
INTRODUCTION
The rise in oil prices and a continuing poor economic outlook has seen ridership on public transport increasing globally. In the USA, a nation not associated with high public transport use, some agencies have reported a 50% increase in ridership. But therein lies the problem. With government budget deficits putting transport subsidies at risk, and operating costs (including fuel costs) increasing, many agencies are now considering the most efficient and effective way to continue to deliver the services which are increasingly sought.
Over the last five years, GHD has worked with transit providers around the globe to improve the management of transit fleet assets. Working with organisations in the United Kingdom, Europe, Australia and the United States, GHD has established good practice asset management for fleet assets.
This paper introduces the reader to examples of good practice asset management and considers how these concepts and approaches may be applied to improve the economic and efficient management of fixed, infrastructure assets.
2 CHARACTERISTICS OF FLEET ASSETS
Fleet assets are generally characterised as being complex systems of mechanical and electrical components. Mechanical failures are typically a mix of fatigue and age/usage related. Electrical and electronic components are more prone to random failures.
A key characteristic of fleet assets is the ability to take the asset out of service in order to carry out intervention activities (inspection, maintenance, overhaul etc). While this may be stating the obvious, it heavily influences the management regime adopted for these types of assets. Similarly, it also tends to lead asset owners/ operators to hold a fleet size with spare operational capacity. This clearly allows intervention activities to be conducted with minimised impact on service delivery which is a benefit most critical infrastructure operators do not have.
That said transit fleets are being increasingly operated at high capacity, with minimal ‘float’ for failures etc. This is driven by an increase in service requirements (for examples increased service frequencies or increased train length) and operators unwilling or unable to invest in holding spare capacity.
It also enables effective management of issues and risks, by isolating a fault or failure at the MMI level and addressing the cause across multiple assets
3 FLEET ASSET MANAGEMENT
The concept of Asset Management as defined by documents such as the International Infrastructure Management Manual and BSI PAS-55:2008 are being considered and adopted by fleet managers as a means of reducing operational expenditure and increasing service reliability. This is no different from their infrastructure counterparts. However, from GHD’s experience we suggest the starting point is somewhat more mature.
Our research, through working with agencies across the globe suggests that Fleet Managers have a better grasp of the service delivery requirement and understand more so the relationship between service delivery, asset reliability and cost. This in turn provides a higher degree of focus for both strategic and Operational management of the asset that is not always found with Infrastructure Managers. We have identified five key characteristics for good practice fleet asset management, as follows:
1. Defining the asset2. Maintenance policies3. Roles and responsibilities4. Managing operational assets5. Management system approach
These will be discussed further in the following five sections.
3.1 Defining the Asset
Almost all organisations we have worked with have at some point questioned what should be considered an ‘asset’. There is often confusion within an organisation between the financial definition and the asset management definition.
For the purposes of asset management, current thinking is that the asset should be defined at the ‘Maintenance Managed Item’ level. Where the ‘the Maintenance Managed Item’ (MMI) establishes the lowest level of asset that should be recognised and maintained individually. An example of good practice fleet asset management, is the development of an asset hierarchy data model (see figure 1) that demonstrate the relationship between asset, asset sub-system and the maintainable asset (MMI). This supports maintenance design, monitoring and establishing Key Performance Indicators (KPI’s) that drive business direction.
3.2 Maintenance Policies
Maintenance on fleet assets is generally driven by the manufacturer’s guidelines. In some instances particularly with new fleet, this is a requirement as part of the purchase and to avoid voiding warranties. It is fairly typical that fleet assets are designed and manufactured with a designed service life and a maintenance regime designed to deliver this.
It is noted however that regimes are usually fairly standard while the operating conditions can vary considerably. For example a city ‘hopper’ type bus service will require a different maintenance regime than a long distance service.
As a consequence many fleet operators are now designing more appropriate maintenance regimes around a Reliability Centred Maintenance (RCM) approach. RCM focuses on the fitness for purpose of the asset and makes use of failure and performance information to support intervention decisions. The ability to identify both the asset and the relationships between asset sub-systems (using for example the hierarchy model in 3.1) are essential for both steering the effort in introducing RCM, but also in providing the supporting information to design the consequent maintenance regime.

8 tLingaya's Lalita Devi Journal of Professional Studies Application of Asset Management to Railway Fleet t9
3.3 Roles and Responsibilities
One of the hardest elements of establishing an effective and efficient asset management system is the breaking down of organisation departmental silos and conflicting functional contributions. Yet this is also one of the most important features, yielding some of the biggest organisational performance benefits.
A clearly defined asset management system should provide the means of collaboration across such functional divides. It ensures accountability for all stages of the asset life both within operational tolerances (e.g. operations, maintenance, overhauls) and outside of operational tolerances (e.g. fault rectifications).
There are many different structures that are adopted, all of which from experience have their strengths and weaknesses. However common characteristics of good practice asset management organisations include:
• Leadership and accountability: The organisation is led by a powerful champion for asset management who is part of the Senior Management Team.
• Ownership and responsibility: A function within the organisation is tasked with developing and implementing asset management.
• The ‘think tank’: A ‘think tank’ is in place to provide performance monitoring, support maintenance decision making and guide maintenance practices.
• Collaboration: Monthly review meetings are held between to review intervention activities, performance and cost.
While many of the agencies we have worked with have demonstrated some but not all of the above, we find that following a realisation of the opportunity it is a combination of the above (through introduction) that has led to successful asset management.
A key characteristic of best practice organisations is the establishment of an asset management function to support both the development and implementation of asset management across the organisation.
Being separate from operations, maintenance or capital programmes the asset management group is able to balance stakeholder demands to ensure cost, risk and performance is optimised and contributions are harnessed and controlled towards a common purpose.
In Europe the introduction of the European Union Directives for Interoperability and Safety places certain requirements on maintaining records of the roles and responsibilities related to railway fleet management and operation. A National Vehicle Register (NVR) records the owner, keeper and Entity in Charge of Maintenance (ECM) for each fleet. These roles are defined as follows:
• Owner: Legal owner of the vehicle
• Keeper: The person or entity that exploits the vehicle as a means of transport.
• Entity in Charge of Maintenance: The person or entity responsible for ensuring that vehicles are in a safe state of running by means of a system for maintenance. This entity shall carry out the maintenance itself or make use of contracted maintenance workshops.
• Sets asset Management Policy and Strategy that effectively becomes the Service Level Agreements between the Owner/ Keeper and the Asset Management Division
Establishes Asset Management Plans with both the Maintenance Division and the Capital procurement function, which effectively become the Service Level Agreements between the Asset Management Division and the Asset Delivery teams.
Figure 1: Asset Manager – an Essential Cog in the Relationship between Asset Owner and Asset Maintainer.
It is noted that the legislation provides no guidance on how a railway undertaking should structure itself, but rather places a requirement to ensure that there is known responsibility and accountability for both commercial aspects (the keeper) and safety/ operational aspects (the ECM) for all vehicles.
In the context of asset management, we would suggest that the ECM role could be considered as the Asset Manager in the above figure, with fleet maintenance being undertaken by a separate function either within the organisation or outsourced to a third party.
In this way, the ECM or Asset Manager considers both the safe operation of the vehicle, but is better positioned to consider lifecycle costs, performance and risk issues. It will also ensure that there is a balanced approach taken to commercial, safety, operational and other stakeholder needs.
3.4 Managing Operational Assets
As highlighted earlier a key characteristic of fleet assets is the ability to take the asset out of service in order to carry out intervention activities (inspection, maintenance, overhaul etc). That said, our research suggests that the largest proportion of asset related service disruption comes from in-service faults and failures. This is as opposed to faults and failures identified when the vehicle is out of service and can generally be attended to (in addition to the point made earlier that agencies tend to operate fleets with spare operational capacity).
As a consequence, many fleet operators have introduced “Front-Line Response Teams” to support rapid issue resolution for in-service vehicles. Many organisations use these types of approaches to not only attend to faults, but also to monitor fleet assets and undertake more advanced maintenance scheduling. This “Enhanced Roadside Assistance” style approach is something which has enabled improved maintenance control and from our experience has resulted in improved reliability and performance.
A key enabler for this type of capability is knowledge and information. Train Operators need to be informed about what to do in the event of an in-service fault. This can include a help-desk approach or an Operator handbook to help with small interventions (system resets for example). Knowledge must be accessible to both Operator and the Maintenance Technicians. Similarly information needs to be communicated in such a way to support intervention decisions.
The introduction of a suitable failure reporting and corrective action system (FRACAS) can support the necessary flow of information. Alignment with an asset hierarchy provides consistency across the asset management approach.
As a consequence, a key characteristic of good practice has been the introduction of a management system. This sits at the heart of such an approach and ensures that all concerned understand how to ‘pass the baton’ when an asset develops a fault.
3.5 Management System Approach.
The concept of a Management System for Railway Fleet Operators (particularly so in the UK and Europe) is not foreign. This has been driven through legislation by the need for a Railway Safety Case stating how the Fleet Operator would meet all the safety requirements. The Safety Case demonstrated, through a body of evidence, that an operator had the systems in place to manage operations (including maintenance) safely and meet required safety standards.
Many train operators have as a consequence implemented ISO: 9001 management systems to demonstrate how the organisation meets all safety requirements.
This evidence based requirement differs significantly from non-railway infrastructure industries where safety is more commonly enforced through prescriptive approaches, which typically follow the assumption that following a ‘good’ process will result in a ‘good’ product. Further, the concept of an Asset Management Management System is something that fleet operators both understand the value of and are able to more quickly introduce due to the foundations being laid.
However, from our experience many fleet operators have understandably focused there management system development on safe operation, and there is therefore an opportunity to further define an Asset Management Framework to support more effective and efficient management of fleet assets.
This is reinforced somewhat through the European Union Directives for Interoperability and Safety which requires that where the Entity in Charge of Maintenance is also the railway undertaking, then there is a further requirement to establish a Maintenance Management System through the Safety Management System.
4 A FRAMEWORK FOR ASSET MANAGEMENT
The asset management framework (or business model) is the collection of products and processes that must be undertaken in order to deliver services in the most efficient, effective and economical way.
It sets out the relationships between operations, maintenance capital planning and both steward and owner of the fleet. It defines the scope of the asset management information systems and information requirements to support asset management
FleetMaintenance
AssetManager
Owner
Keeper

10 tLingaya's Lalita Devi Journal of Professional Studies Application of Asset Management to Railway Fleet t11
The ability to measure success of the approach should not be underestimated. Most organisations measure to an extent, the condition and performance of their assets, few measure the outcome of the management approach.
These measures include such things as:
• Life cycle costs (target lifecycle costs are now being built into train production contracts)
• Availability – target to reduce lost customer hours
• Ambience (cleanliness)
• Reliability (Mean Time Between Failures are also specified as part of train production contracts)
• Capability – measure of number of units available for service
• Fault rectification – as a measure of maintenance efficiency
6 CONCLUSIONS
In conclusion, while evidence suggests that both fleet and infrastructure managers are progressing with the implementation of asset management management systems, our research has identified several areas where fleet managers are more mature than their infrastructure counterparts. There is therefore the opportunity to transfer knowledge and experience from fleet systems to infrastructure systems to support more efficient and effective asset management. Key areas include the roles and responsibilities for assets, management systems and operational management of assets. All of these have a direct impact on the successful management of both fleet and infrastructure assets.
REFERENCES
[1] CENELEC Railway Applications. The Specification and Demonstration of Reliability, Availability, Maintainability and Safety (RAMS)-prEN 50126. CENELEC, August 2002.
[2] Matthew J.Morley. Safety-level communication in railway interlocking. Science of Computer Programming , 29(1997) 147-170.
[3] YANG Nifei, DUAN Wu, LU Peiling. Safety related communication standards and secure protocol studies. Chinese Railways. 2008.06. 48-51. (in Chinese)
[4] CENELEC. Railway applications. Communication, signaling and processing systems – Part 1: Safety related communication in closed transmission systems - EN 50159-1. CENELEC. March 2001.
[5] CENELEC. Railway applications. Communication, signaling and processing systems – Part 2: Safety related communication in open transmission systems - EN 50159-2. CENELEC. March 2001.
decision making. It demonstrates the importance of the ‘line of sight’ concept by linking the organisational strategic goals through to its asset management policy, asset management strategy and objectives and asset management plans. Asset Management is an inherently integrated approach and cannot be successfully implemented by managing individual assets or different life cycle stages (such as maintenance) in isolation. Therefore it is important that an organisation develops an overall business model for all of its fleet assets and ensure this covers all life cycle stages and organisational functions.
GHD have over several years established a best practice framework (See figure 3) for asset management which it uses to assess businesses against. The framework draws on our experience working with fleet and infrastructure operators in the transport and utilities sectors across the globe.
Figure 2: Best Practice Asset Management Framework.
The asset management framework recognises that for success three things need to be in place:
1. Asset Management Decision Making (Line of Sight): There are four key stages to decision-making that drives the organisation to address its strategic objectives and ultimately ensure that the service needs are delivered in the most efficient, effective and economical manner. These include:
a) Setting Direction: The objective of the first stage is to set out the overall framework that enables the organisation to determine the direction and corresponding asset management actions that best serve the aims it is obliged to fulfil. In other words the outputs address the “The What, Why and the How” of asset management. Typically this would be presented as an asset management policy and asset management strategy and objectives.
b) Programming: In stage two the asset capability is analysed and the necessary work programmes developed. The output from this level is often in the form of a set of Asset Strategies – setting out what needs to done to the each of the fleet types to achieve the long-term desired state of the fleet. Preparation: In stage three the Preparation of projects and works packages is undertaken translating the work programmes into tangible works activities. The key outputs from this level are the
Asset Management Plans which describe the implementation of the organisations Asset Management Strategy and Asset Strategies in terms of “The What, When and Where”. They present the work programs for maintenance and renewal along with the cost tables. This provides ownership, responsibility and accountability across the fleet and across the organisation.
c) Implementation: In stage four the focus is on the implementation of works plans to achieve the desired state of the fleet within budget and operational constraints. This is a capability to schedule and deliver the projects and works packages (including maintenance) within the operational environment. The outcome is not the works plans, but the ability to implement them to achieve the required output.
2. Monitoring and Review: Monitoring provides the feedback loop between the asset intervention and the condition and performance it delivers. A distinction should be made between monitoring the performance of the assets (Asset Monitoring) and the performance of the systems used to manage the assets (Management Review). Both of which are critical to assuring the successful outcome of the asset management decision making process.
3. Enablers: The effectiveness of the asset management decision making process is dependent on the capability of the organisation (its people), and the support mechanisms provided by asset information and technology tools to support business processes.
Monitor. Review. Enablers.Line of Sight.
60
0 M
an
agem
en
t Sys
tem
Revi
ew
100Setting Direction
200Programming
300Preparation
400Implementation
700 People &Organisation
800 Data &Information
900 Technology
50
0 A
sset
Mo
nit
ori
ng

12 tLingaya's Lalita Devi Journal of Professional Studies Comparison of EVA and Traditional Performance Measures—A Case Study t13
Comparison of EVA and Traditional Performance Measures—A Case Study
Anshu JainAssistant Professor
Department of Commerce, Shaheed Bhagat Singh (E) College,
Delhi UniversityE-mail: [email protected]
ABSTRACT
This study aims to demonstrate the comparison between EVA and other traditional measures of corporate performance, taking a real-life case study of Hindustan Unilever Limited (HUL), a FMCG major in the Indian Corporate sector. It concludes that EVA is superior to traditional measures of corporate performance in terms of shareholders’ value creation. It also reveals that there is a significant and positive correlation between EVA and share prices of the company.
INTRODUCTION
Potential investors measure overall performance of a firm as a whole to decide whether to invest in the firm or not. Existing investors measure the performance to decide whether to continue with the firm or to exit from it. Metrics of performance play a vital role not only in evaluating the current performance of the firm but also in achieving high performance and growth in the future.
Because of the different approaches to measure performance, it is very important for the company to identify and choose a metric which measures the firm’s value as much as possible without being biased towards any of the stakeholders. The selection of an appropriate measurement is critical for the success of the firm. Most of the currently used performance measures like RONW, ROCE and EPS etc. are based on the current net income, total assets, and net sales or similar inputs or outputs of the business unit. These traditional metrics measure various aspects of the firm’s performance but have certain limitations. All these accounting based performance measures fail to assess the true or economic return of the firm as they are based on the historical asset values, which in turn are distorted by inflation and other factors like risk level and the time value of money. Though these measures are easy to calculate, but they do not include the cost of capital. This led to the immense popularity of value based performance measures.
Value based management (VBM) offers another approach to performance measurement and metrics. It is a consistent framework that aligns management action and strategic objectives with shareholders’ value creation. It instills a mindset where everyone in the organization learns to prioritize decisions based on their understanding of how these decisions contribute to corporate world, to create a corporate mindset in which management decision making and execution are focused on the creation of shareholder value keeping into mind the fundamental drivers of shareholders’ value i.e. returns and growth.
Value creation is the wealth created for a company's shareholders through price appreciation and dividends. In this study, value stands for economic value added i.e., how much value has been added to the wealth of the shareholders? or whether the company has created/destructed the value.
By incorporating the value based management, a company’s ability, to effectively manage the value, could become a source of competitive advantage in and of itself. Value managed companies focus on value-oriented decision making in the four key management processes of planning, budgeting, compensation and management reporting. When taken together, the results of value management can help the company build and maintain the competitive advantage. It is evident that the value based management is a powerful tool.
Modern performance measures are closely linked to the shareholders’ value. They reflect future trends, the expectation of the investors and the market, the impact of inflation, the level of risk and the value of money over the time. These measures create the connection between the value creation and incentive compensation system that makes managers responsible for their decisions. The modern metrics remove the influence of accrual accounting and provide the investors an idea of the ability of the company to improve shareholders’ value from one period to another.
Economic Value Added (EVA) is the most recent corporate performance measurement tool. In this direction, a number of studies have been made for the corporate sector of the developed countries. But in respect of the Indian corporate sector enough research work has not been done. Thus, a need has been felt to investigate some vital issues regarding EVA. Through this study, an attempt has been made to explain how effectively the Indian corporate sector has been at creating the shareholders’ value.
Objective of the study
The study is framed to achieve the following objectives:
• To assess the superiority of EVA over traditional performance measures of corporate financial performance.
• To examine the relationship of share prices with EVA, RONW, ROCE and EPS. Taking a case study of HUL, a FMCG major for a period from 2007 to 2012.
Source of data
The secondary data has been collected from the published annual reports of Hindustan Unilever Limited. Also, the database Prowess has been used to collect financial data of the company. Other relevant information has been retrieved from other published sources. The coefficient of correlation has been used to analyze the data.
Concept of EVA
EVA, patented by New York based consulting firm, Stern Stewart & Co., has emerged as a critical tool to measure and monitor corporate performance. Today, the EVA concept has got wider acceptance as a key indicator of performance since industry is shifting from the product centric to a value centric world. EVA can be used as a measure of both internal and external performance. Stewart (1994) cites in-house research which indicates that EVA is almost 50% better than accounting based measures in explaining changes in the shareholders’ wealth.
EVA is based on the principle that the company must pay for the use of equity capital employed by it to earn profits. As per the view of Peter Drucker, a management consultant (1998), “Until a business returns a profit that is greater than its cost of capital, it operates at a loss... The enterprise still returns less to the economy than it devours in resources…Until then it does not create wealth; it destroys it”.
EVA is the surplus (deficit) that remains after levying a charge against after-tax operating profit for the opportunity cost of equity capital as well as debt capital used to generate those profits.
EVA= NOPAT – (WACC x CE)
where NOPAT stand for Net operating profit after tax, WACC for Weighted average cost of capital and CE for Capital employed.
This formula will produce either a positive or negative EVA. A positive EVA reflects that the company is increasing its value to its shareholders’, whereas a negative EVA reflects that it is diminishing its value to its shareholders’.
Traditional Performance Measures
Some of the traditional performance measures are as follows:
Return on Net Worth (RONW)
RONW is a relatively narrow measure of shareholder value creation. It is profit before interest and taxes divided by net worth.
where Net Worth = Equity Capital + Free Reserves and Surplus
Worth Net
Tax and Interest before ProfitRONW =

14 tLingaya's Lalita Devi Journal of Professional Studies Comparison of EVA and Traditional Performance Measures—A Case Study t15
Return on Capital Employed (ROCE)
It is another measure of shareholder wealth which is based on the narrow criterion of absolute profits only. ROCE is profits before interest and taxes divided by the capital employed.
Earnings per share (EPS)
EPS represents that portion of a company's profit which has been allocated to each outstanding equity share.
Literature Review
Milunovich and Tsuei (1996) reviewed the correlation between MVA (Market Value Added) and several financial performance measures, including EVA in the computer industry. They found EVA to correlate somewhat better with MVA than the other measures.
Chen and Dodd (1997) reported that EVA measure provides relatively more information than the traditional measures of accounting profits. They also found that EVA and RI (Residual Income) variables are highly correlated and identical in terms of association with stock returns.
Kramer, Jonathan K & Pushner George (1997) in their study found no clear evidence to support the contention that EVA is the best internal measure of corporate success in adding value to the shareholders investments. On the contrary the market seems to be more focused on the "profit" than EVA. NOPAT explained more of total variation in MVA than does EVA.
Turvey et al. (2000) studied the relationship between EVA and stock market returns for a sample of 17 publicly traded food companies in Canada. The key finding was that no correlation existed between the two.
Case study of Hindustan Unilever Limited
In HUL, the goal of sustainable long term value creation for the shareholders is well understood by all the business groups, Measures to evaluate business performance and to set targets take into account the EVA concept of value creation.
Table 1: EVA trends of HUL: 2007-2012
(Rs in Crores)
Particulars 2007-08 2008-09 2009-10 2010-11 2011-12
1 Average Debt 382 342 119 2 –
2 Average Equity 2402 1928 2497 3118 3462
3 Average Capital Employed 2784 2270 2616 3120 3462
4 Cost of Debt, post-tax % 6.24 3.91 3.95 5.36 6.2
5 Cost of Equity % 17.59 14.47 12.51 12.93 10.1
6 WACC % 16.03 12.88 12.12 12.92 10.1
7 COCE (3x6) 446 365 317 403 350
8 PAT 1743 2501 2103 2153 2599
9 Add: Interest, after taxes 17 17 5 0 1
10 NOPAT 1760 2518 2108 2153 2600
11 EVA (10-7) 1314 2154 1791 1750 2250
12 EVACE: (EVA/CE) (%) 47.2 94.89 68.46 56.09 64.99
Source: HUL Annual report 2012
From the table1, it can be inferred that the company has been adding value to the shareholders during the study period of 2007-2012. The calculation of EVA depends on the calculation of the components of the EVA. The major components of EVA are NOPAT and COCE. The EVA of the company has increased from Rs. 1,314 Crores for the year 2007-08 to Rs.2,250 Crores for the year 2011-12, indicating the good economic earning capacity of the company. However, there is a fall of Rs. 363 Crores in EVA in the year 2009-10 as compared to 2008-09 due to fall in NOPAT. Again during 2010-11, there is a slight decrease in EVA because of the increase in cost of debt (post-tax) from 3.95% during 2009-10 to 5.36% during 2010-11. Thereafter, the company’s EVA rose to Rs.2,250 crores during the year 2011-12.
Employed Capital
Taxes and Interest before ProfitROCE =
Shares gOutstandin of Number
rsshareholde to available Profit NetEPS =
Table 2: Value of various performance metrics: 2007-2012
Year EVA(Rs) (%) (%) (Rs) (Rs) (%)
2007-08 1314 164.07 154.54 9.26 234.11 47.2
2008-09 2154 153.84 127.69 9.59 239.17 94.89
2009-10 1791 113.38 113.38 9.62 238.96 68.46
2010-11 1750 111.37 111.37 11.91 283.07 56.09
2011-12 2250 99.59 99.59 11.9 409.71 64.99
Source: computed & compiled
From the table 2, it is observed that HUL depicts a rosy picture in terms of Return on Capital Employed, Return on Net worth and EPS during 2007-2012. During 2007-08, RONW is 164.07 i.e., for every Rs 100 invested the return is Rs 164.07, whereas EVA as a percentage of Capital Employed is only 47.2 i.e., for every Rs 100 invested, the company has added value of Rs 47.2. Similarly, ROCE is 154.54 i.e. for every Rs. 100 invested, the return is Rs. 154.54. Also, during 2011-12, values of Return on net worth as well as Return on capital employed show that for every investment of Rs. 100, a return of Rs. 99.59 has been earned. But as per EVACE, only Rs. 64.99 return is earned on every Rs. 100 invested. Thus the comparison shows that divergence exists between the performance results given by traditional methods and EVA. The traditional measures do not reflect the real value addition to shareholders’ wealth.
The relationship of share prices with EVA, RONW, ROCE and EPS is examined by using coefficient of correlation in Table 3.
Table 3: Correlation between various performance measures and share prices
Correlation of share prices with Value of r
EVA 0.60
RONW – 0.69
ROCE – 0.68
EPS 0.80
Source: Computed
The result indicates that correlation between EPS and share prices is positive and the value of correlation coefficient is highest amongst all the performance measures. EPS is found to be most significant variable affecting the share prices of a company. EVA is also positively correlated with share prices but the value of correlation coefficient is less than the same obtained in case of EPS. However, share prices are found to be negatively correlated to RONW and ROCE. This indicates that increase in EPS as well as EVA will have a positive impact on share prices while an increase in RONW and ROCE may not positively affect the share prices of the company.
CONCLUSION
This study describes and compares EVA with traditional performance measures- RONW, ROCE and EPS. The relationship of share prices with these performance measures has also been analyzed. It is observed that EVA, when compared with traditional measures, gives better figures related to shareholders’ value added at the end of the accounting year since EVA takes care of the cost of capital invested in the business. Traditional performance measures do not consider cost of capital in the calculation of NOPAT.
The correlation results between share prices and various performance measures show that EPS and EVA are significantly positively correlated with share prices. However, an increase in RONW and ROCE may not positively affect the share prices of the company. Thus, it is concluded that EVA is superior to RONW and ROCE in terms of shareholders’ value creation. Also, there exists a significant positive correlation between EVA and share prices.
REFERENCES
1. Asish K Bhattacharya & B.V.Phani, “Economic Value Added- A General Perspective”, 2000.
2. Banarjee, Ashok, “Linkage between Economic Value Added and Market Value Added: An Analysis, Vikalpa, Vol. 25, No. 3, July-September 2000, pp. 23-36.
3. Bhaskaranarayana, P., “Benchmarks for Profitability: RONA vs EVA”, The Chartered Secretary, Vol. No. XXX, No. 7, July 2000.
4. Chen, S. and J.L. Dodd, “Economic Value Added: An Empirical Examination of a New Corporate Performance Measure,” Journal of Managerial Issues, 9(3), 1997, pp. 318-333.
RONW ROCE EPS Share Price EVACE

16 tLingaya's Lalita Devi Journal of Professional Studies The Effect of Advertising Attitudes on Social Film Makers—Review t17
5. Dr. Anil K. Sharma & Satish Kumar, “Economic Value Added – Literature Review and Relevant Issues”, International Journal of Economics and Finance, Vol.2 (2), May 2010.
6. Kramer, Jonathan K. and G. Pushner., “An empirical analysis of economic value added as a proxy for market value added”, Financial Practice and Education, 7(1), 1997, pp. 41–49.
7. Lehn, K., & Makhija, A. K., “EVA and MVA: As Performance Measures and Signals for Strategic Change Strategy and Leadership”, 1996, pp. 34 - 38.
8. Milunovich, S. and A. Tsuei, “EVA in the Computer Industry,” Journal of Applied Corporate Finance, 9(2), 1996, pp. 104-115.
9. Ramana, D.V., “Economic value added and other accounting performance indicators: An empirical analysis from Indian companies”, The ICFAI Journal of Accounting Research, 6(2), 2007, pp. 7–20.
10. Rappaport, A., “Creating Shareholder Value: The New Standard for Business Performance”, New York. The Free Press: A Division of Macmillan Publishers, 1986.
11. Stewart, G. B., “The Quest for Value: A Guide for Senior Managers”, Harper Business, New York, 1991.
12. Stern, J, “The EVA Challenges“, New York: John Willey & Sons, 1993, pp. 25-35.
13. Telaranta, T., (1997). “On Residual Income Variables and Shareholder Wealth Creation”, Master’s Thesis, Helsinki School of Economics and Business Administration, 1997.
14. Turvey, C.L., Van Duren, E. & Sparling, D., “The relationship between economic value added and the stock market performance of agribusiness firms”, Agribusiness, 16(4), 2000, pp. 399-416.
15. Uyemura, D. G., Kantor, C. C., & Pettit, J. M., “EVA® for banks: Value creation, risk management, and profitability measurement”, Journal of Applied Corporate Finance, 9(2), 1996, pp. 94 - 113.
The Effect of Advertising Attitudes on Social Film Makers—Review
*Katta Ashok Kumar**J. Madan Mohan
***Dr. Ch. Bala Nageswara Rao
ABSTRACT
Ashok Kumar is thinker, researcher preferred to live away from media civilization and show with actor humble personality and opponent attitudes, struggled against of constructing situations. The first purpose of this research was to investigate the impact of advertising appeals compare the effectiveness of the influences advertising appeals.
Keywords: Advertising, advertising appeals, advertising attitude, social film.
INTRODUCTION
Kotler (1997) pointed out in his study that advertising appeal is the theme of an advertisement. To make the audience receive a necessary message, advertisers have to put some driving power into the message. This driving power is appeal. Every advertising appeal represents an attraction, which arouses consumers’ desires. What kind of advertising appeal design can attract consumers more easily and effectively? To highlight a commodity image, many companies invite famous stars to be their product spokespersons. It is easier for consumers to identify with celebrities. Expert spokespersons help present product differences more effectively by combining their rich professional knowledge with reasonably persuasive appeals. The right choice of advertising spokesman is a critical element in successful advertising. Does an advertising spokesperson influence consumers’ attitudes or enhance purchase intentions? This is what this paper will explore. Advertising attitudes reflect persuasive psychological effects and act as important indices for measuring advertising effects. Thus, advertising attitudes create a certain influential power on purchase intentions, which is yet another management issue we want to explore in this paper. Advertising has become one of the most important commercial activities in the modern competitive environment. Companies spend a large part of their budget to produce and run advertisements for promotions to communicate information about their company and products. Companies hope that consumers will purchase their products due to the advertisements, which deliver messages about a certain brand and its products. Thorson and Leavitt (1992) stated that the best prophet for purchase is advertising. Technologies progress rapidly day by day, contributing to the constant renewal of and changes in broadcasting forms. Among those forms, advertising media is widely used. Advertisements are useful for the representation of a commodity’s image. They also act as announcements for the corporate image and product positioning. Advertisements are a kind of persuasive communication that offers product information to every consumer via institutions in charge of production or supply. In a complete study of marketing and promotional activities, advertising usually plays the most important role. Therefore, the advertising effect has become a key issue.
Moster et al. (2002) explains that films offer product exposure to millions of customers, making product placements a rapidly growing marketing communication medium. By cleverly weaving a product into a scene, marketers hope audiences will connect their brand with the stars or story they see on the screen. Product placements have received renewed attention within the

18 tLingaya's Lalita Devi Journal of Professional Studies The Effect of Advertising Attitudes on Social Film Makers—Review t19
developing context in Africa, (Van der Waldt, 2005; DuToit and Redelinghuys, 2004; Du Preez and Williams, 2004; Nunes and Stroebel, 2004). In order to counter television commercials zipping and zapping, audience fragmentation due to the rise in the number of cable channels, commercial clutter driven by increasing time allocated to advertisements and a simultaneous decrease in commercial length. Several factors caused marketers to develop innovative placement techniques (Gupta and Lord, 1998). These changes have led manufacturers and marketers to seek product placement as an alternative means to reach the consumer. Due to the proliferation of advertisements and the consequent difficulty in getting commercial messages to reach and influence potential customers, product placement appears to be an interesting alternative to traditional marketing communication tools (D’Astrous and Chartier, 2000). Product placement is considered an important marketing vehicle; it should be used to complement the other vehicles of advertising and marketing. The goal that marketers hope to achieve when using product placements is to establish a brand name or to reinforce it. Product placements can be subdivided into real placements and virtual placements. Real placements are those created as an integral part of film production, often requiring the participation of film actors or actresses. Virtual placements are those that are inserted via digital technology using a process independent from the production of the audiovisual segment (Balasubramanian, 1994). According to Berglund and Spets (2003) placing products and brands on both the screen and in the conversation, increases the probability that the viewer recognizes the product or brand. It is therefore anticipated that potential customers absorb information about products and brands from many sources. Although product placements have grown into a popular form of advertising, deficiencies in the research of product placements commonly exist. As a result, a number of important issues remain unexplored and in need of further validation (Gupta et al., 2000). This study identified realism and brand recognition as variables that are less explored.
Advertising Attitude, Appeal
Advertising attitude is defined in this study as the degree of a consumer’s preference formed by subjective perception towards a commercial. As to the measurement of advertising attitudes. Belch and Belch (1998) and Schiffman and Kanuk (2007), this paper defines advertising appeal as the degree of drawing consumers’ attention and enhancing their desire to increase their product purchase intention. Advertising appeal is categorized into rational appeal and emotional appeal (Belch and Belch, 1998; Chu, 1996). In this paper, rational appeal is defined as the degree of rational appeal focusing on rational purchase. The appeal delivers consumers’ interests by giving reasons. It emphasizes that a product or service is able to achieve a function or interest which a consumer desires. In this paper, emotional appeal is defined as the degree of stimulating consumers’ purchase intention by arousing their positive or negative emotions.
Film Maker View
Film-maker Guy Debord One of the founders and most influential representatives of situations movement which affected the entire world from late 1980s to early 1990s. Throughout his life, he preferred to live away from media civilization and “show”; with his humble personality and opponent attitudes, he struggled against the society of wealth, which was in the rise, and tried to strengthen the “theory of constructing situations “ with a number of thinkers who thought and lived like he did (Matthews et al., 2008: 20). The fight of creating individuals with a potential to undertake the control of their own space and time against the universe of metas and shows of the capitalist society that kills passion for living has ended with the organization of a radical mass student and worker movement that could turn into an effective cooperation in late 1960s. Throughout this entire process, the basic arguments that situationists took as their basis were constructed on revitalizing through revolutionization again of their situations in global society which is devoid of wealth and freedoms. For this purpose, the framework of situations movement which was shaped in 1957, gained an international character with participation of some political and artistic organizations; it also conducted several activities with political content which could revitalize artistic praxis. This movement was organized based on the effective synergy of these organizations (“International Movement for an Imaginative Bauhaus”, “The Lettrist International”, “The London Psychologeographic Society”), and tried to destroy the raw living spaces which lack emotions, passion, and freedom, which was purposefully constructed by capitalist way of thinking and restructure them on aesthetic and philosophical foundations; on the other hand, it declared war against the reality of capitalist world, particularly exhibition of wealth and richness at show level, since its early beginning. In this sense, as expressed by Matthews, Debord et al. “seriously criticized the capitalist world surrounding them, which was developing, and felt huge discontent with the promotion of consumer materials and “high living standards” promised by these products” (2008: 34). Capitalist wealth society is a society which positions all individuals as “customers”, regardless of their qualifications and roots, and makes the invisible exploitation of their bodies and minds under the disguise of “show” in leisure and entertainment industry, which is a part of a bureaucratized functioning; it is clear that an internationally-organized struggle would be fought against this society. Nevertheless, according to Debord, this movement which was fed by the previously accumulated political culture in its core, had to fight a non-bureaucratic war, as “situationist international was born from a political culture which came from a long anarchist resistance tradition, which was against both private and bureaucratic struggle” (Debord, 2008: 30). The anarchist resistance tradition mentioned by Debord is a rooted tradition represented by rich historical experiences of European anarchists. This tradition opens the political struggle in daily life to a collective opposition spirit as well as
the direction of individual passions, which thus does not underestimate the individual demands for freedom and happiness. In the anarchist war fought against capitalist society, the theoretical films made so much so that he did not see any harm in filming the infamous Show Society in addition to his several intellectual products and conferences given by Debord, most of which were recorded to a recorder with the concern that possibly a communicative and conditioner environment could exist which could make the audience and speaker dependent on each other and the writings, books and declarations written by him, all gave examples of the fact that individual freedom could not be replaced by anything under any condition. In this context, Debord first produced the concept of “Show Society” which replaced the daily life show which dominated relations between people and made our society one of its customers” (Matthews et al., 2008: 34). Show, as defined by Debord, is just another name for the meta-fetishism of capitalist society. The impact of show in this sense is the effect of personality, ethics and daily living practices established through metas owned which alienate individuals to the realities of daily life and events. Show society is the society of restricting, reducing and in time eliminating the intervention of existence felt in mind and heart to life in exchange for material and physical satisfaction just as in this declaration made by Situationist International in 1959 which presents a general critique of capitalism defined as “a society without culture”: “as production equals disaster in the dominant ethical schema, real life must be found in consumption, consuming products properly (...) the world of consumption is in fact the world where everyone is perfected in a common manner, where everyone is detached, alienated, not involved (in worldly events and problems) (Debord, 2008: 48). This detachment and alienation inevitably leads to individual carelessness and insensitivity, which has turned into a show experienced as a dominant form that exerts absolute control on each space and time in which people communicated with each other. According to Debord, except the images of capitalist show that accompanies mass consumption activities, one of the most concrete and widespread examples that it manifests itself in daily life are modern mass tourism. Debord says “modern mass tourism presents cities and landscapes, but not with the purpose of satisfying such passions as living in humane and geographical environments; it presents them as pure, serial and shallow shows (which earn respect to the people who tell memories about them) (Debord, 2008: 50). In this sense, the show presents perspectives which differentiate the passion for living from instant ambiances of life, and destroys the effort for living with a meaning and opportunities for freely initiated experiences. The inferiority of consumption is made invisible under the artificial light of show which penetrated to the entire geographical environment, whereas the conscious or unconscious arrangements of geography open to show creates a new psychology that puts its stamp on individual emotions and behaviours in an effective manner. This reality briefly labelled as “psycho-geography” by situationists tells the story of the function of an excessively visualised and mediatised physical environment conditioning and organizing conscious and behaviours of people in the direction of consumption. There are some notions that international situationists (IS) is offered in order to create a mass resistance for breaking this and similar conditioning effects. The first of these notions is “evasion”. This phenomenon is briefly defined by situationist as follows: “Attributing images and opinions to one’s self and changing their original meaning in a way that they can challenge dominant culture. One good example popularized by situatonists is the caricatures in which the phrases of characters were replaced by revolutionist slogans and ideas” (Matthews, 2008: 63).” The concepts of “derivation” and “détournement”, which symbolize the two tools of a life independent from show, are attached vital attention by situationist movement. The concept of “derivation” represents the free outings of situationits in different districts of the city. However, these outings must not be confused with flaneurs (roaming about) of Benjamin. Flâneur in its simplest form means the “wanderer-thinker” which is seen in Baudelaire and Kerouac and is mostly attributed to travelling, seeing, listening and interpreting, and from time to time wandering lazily and using the right to laziness; in this sense, it is different from the derivation of situationists. Situationist outing represents breathing outside the modern show city or a derivation from the physical environment imposed on individuals. Such an outing which aims at minimizing psycho-geographic determination is, in Debord’s terms, “one of the fundamental situationist practices.” “Derivations, which are fast passage techniques between different environments, involve a playful-constructive attitude and the awareness of psycho-geographic impacts; thus, it is rather different from classical concepts of travel or wandering” (Debord, 2008: 42). “Déroulement”, which is another concept, envisaged by situationist movement for overcoming the situations constructed by the society of detachment and alienation between individuals, namely the show society, is the name given to earning a new content or changing its meaningful orientation of the meanings given by the indicators and symbols of show society in its essence. By reversing the advertisement slogans, this trend which represents the revolutionist tendency of the attempt to pass from a show society to a situationism society, which is its structural opposite, also represents an anarchist struggle against the alienating forces which were made acute by the labour and consumption ethic of capitalist society. The same struggle is also one way of reckoning with a series of specialization activity fields which is turned into a spectacular and attractive show by capitalism from human labour and time. As stated by Metthews, “capitalism creates a series of experts (psychologists, professors, scientists etc.) who work for its sustainability. We usually do not prefer being dependent on experts, but this system is established. Whether people want it or not, the reign of experts called “politicians” who represent the people is a good example of this phenomenon” (Debord, 2008: 66). Expertise involves individual leaving the control of his/her life to the ideological devices of information society. It is the price paid to have good parents, a good spouse, and a good appearance. Diet-fashion experts, marriage counsellors, “incentives” in working life, psychiatrists etc. are the ideological supervision and monitoring devices in this sense; these devices only secure the survival of individual rather than “leading a real life”. Then, survival is another important concept in the struggle fought by situationist movement against capitalist show society. In show society, “life is the

20 tLingaya's Lalita Devi Journal of Professional Studies The Effect of Advertising Attitudes on Social Film Makers—Review t21
approval of passions and creative skills of individual, whereas survival is working, consuming, watching television etc.” (Matthews, 2008: 68). Therefore, as can be understood from this explanation, show is stepping outside the values which are products of life-related activity and consuming the ready-made values presented by the world of images / metas. In one sense, show is the holistic circulation of commodified values, therefore it sends to the system of societal relations established by individuals through metas and images. In this system of relations, one can speak of materialised ethic that conforms to the logic of capital accumulation rather than a certain ethical attitude between individuals. As stated by Matthews, “according to Marx, the money which transcends a certain threshold becomes capital. Debord believes, on the other hand, capital which transcends a certain threshold turns into images. Thus, Debord applied the idea of materialization to all fields of social life and updated and extended Marx’s theory of commodity fetishism” (2008: 75). Nevertheless, what underlies the commodity fetishism valid in show society and in general the loyalty to the image of metas is the same dependency to consumption. As Knabb states, in such a society “show represents the secret agent who tells at what degree a sake should be served and presents the exotic methods of living to polished tastes to masses, which were before confined to the upper classes. Show (...) entertainments proliferate and the number of attendants can increase, but meta foundations are inevitably kept under pressure in the template of consumption” (Debord, 2008: 106). Then, the world of show is the world of met as and it is almost impossible to prove that in this word of met as a life is being led with a reasonable image. For this reason, Debord et al. and other situationists conceptualise the show in the form of visual exhibition of the meta before anything else. In this context, as stated by Debord, “the world, visualised by the show, which both exist and not exists, is the world of meta(s) that dominate on everything experienced” (2006: 50). The dialectical relation established by Debord between accumulation of information based on images and actual societal activities displays the deep intellectual cleavage between understanding the reality and “thinking about reality”. Debord says “the show which reverses reality is produced de facto. The reality, which is also being lived concurrently, is materially invaded by viewing the show and adopts the show and adds the show order in its structure. There is objective reality in both sides (...). The reality appears within the show instantly, the show is real. This mutual alienation is the essence and foundation of the existing society” (2006: 38). The show witnesses the historical instant of a society which alienated to its own reality, or, in other words, it is nothing more than the temporal utilization of reality. The opinions presented by Debord on the show society is full of the testimony of this historical instance which includes the experienced moments with all their “vitality”. If the reality of the image claims that it can reveal all other parts of the reality that is worth appearing, then “everything which is seen is good, and everything which is good is seen” (Debord, 2006: 39). This optimism is the only one that alienated mediatic society can adopt. This inference naturally ends with aggrandizement of the visible reality of the moment instead of the holism of life that blends both the good and the bad. As a matter of fact, in the final instance, “the foundation of show rests upon the loss of the unity of world” (Debord, 2006: 46). To sum up, the books that we attempted to review in detail in this paper, is strongly recommended to everyone who feel that controlling the time and space of their own lives is a virtue in the midst of a global consumption society where the dark shadow of “show” loomed over like a nightmare on our lives.
Realism in Films
Film producers argue that the use of a brand name product in a film enhances the realism, due to the fact that it lends a natural “everyday” touch to its settings. To depict a film character entering a restaurant, a store or petrol station with no names attached to them would be meaningless (Gupta et al., 2000). According to Junction (2003), product placements strengthen a film’s link to real life. Product placements therefore add realism and authenticity to scenes in films. It is further argued that the use of products that consumers are already familiar with, increases the credibility and power of the film as something the audience can identify with (Xroads, 2004). It is argued that real life products placed in films have a higher credibility than that of paid advertisements due to their perceived realism. Placing a brand name product within a film gives products an intensified sense of realism (Junction, 2003). The use of generic products in a film can draw attention away from the film’s message. It makes sense for films to use branded items. Due to the fact that the audience eats, drinks, wears and drives brand name products, the use of these items can assist the film by invoking a certain time period or creating the feel of a specific location (Moster et al., 2002). Another reason product placements are useful is that they often reinforce a film character’s personality or history. Unlike traditional advertising messages, product placement also provides a venue where products can be realistically portrayed, and possibly demonstrated in the context of a film scene (Morton and Friedman, 2000). According to Dodd and Johnstone (2000) product recognition can be seen as a person’s ability to identify a product name in a film. In order for a product to be effectively recognised in a film, it should have a reasonable length of exposure time as well as having a well-integrated placement such as audio, visual or audio-visual. Product recognition depends significantly on the objective and subjective nature of product placements in media such as film as identified by D’Astous and Chartier (2000). Berglund and Spets (2003) state that research has established product placements as an effective marketing communication tool that has the ability to enhance brand recognition by consumers. Recognition is an advertising effectiveness test that involves showing a respondent an advertisement to determine if he or she has seen it. Recognition tests measure consumer recognition of an individual advertisement. Lamb et al. (2004) explain that recognition tests are typically used to measure the effectiveness of the advertisement. If an advertisement is considered to have high recognition, it is assumed that the advertisement is effective. Previous research by Gupta and Lord (1998) has shown that recognition will be higher when a product placement includes both an audio and a visual compared to that of only a subtle visual usage. A prominent visual product placement is where a
product is easily identified by its position and size and when it is included in a major scene within a film. A subtle visual product placement has a limited time of exposure and is often used as a background prop without audio reinforcement.

22 tLingaya's Lalita Devi Journal of Professional Studies Emergency Management in India t23
Emergency Management in India
S. Ayswarya
ABSTRACT
EMERGENCY MANAGEMENT in INDIA
Emergency management (or Disaster management) is the discipline of dealing with and avoiding both natural and manmade disasters. It involves preparedness, response and recovery in order to lessen the impact of disasters. All aspects of disaster management deal with the processes used to protect populations or organizations from the consequences of disasters, wars and acts of terrorism. Emergency management seeks to promote safer, less vulnerable communities with the capacity to cope with hazards and disasters. Emergency management protects communities by coordinating and integrating all activities necessary to build, sustain, and improve the capability to mitigate against, prepare for, respond to, and recover from threatened or actual natural disasters, acts of terrorism, or other man-made disasters.
After independence India began a process of rapid industrialization. It inevitably lacked some framework conditions, such as an understanding of the risks of chemical hazards. Creating or raising public awareness of possible hazards within a community, stimulating development of co-operative plans to respond to any emergency that might occur and encouraging accident prevention were the main goals during that period. Implementation in this vast country followed a two-track approach of development of awareness at the national level, and in-depth implementation in selected high-risk industrial areas. Emergency prevention and preparedness is a complex issue, and industrializing countries need to address the matter as an integral part of a larger sustainable development agenda. Experience in countries such as India can do much to streamline the process elsewhere, with growing pressures to better address disaster issues.
Nations should incorporate them in their development plans and ensure sufficient follow up measures at the community, sub-regional, regional, national and international levels Disaster response alone is not sufficient as it yields only temporary results at a very high cost. Prevention and mitigation contribute to lasting improvement in safety and are essential to integrated disaster management.
keywords: disaster management, measures, development programs, mitigation, prevention
INTRODUCTION
Emergency management (or Disaster management) is the discipline of dealing with and avoiding both natural and manmade disasters. It involves preparedness, response and recovery in order to lessen the impact of disasters. All aspects of disaster management deal with the processes used to protect populations or organizations from the consequences of disasters, wars and acts of terrorism.
Definition
Emergency management is the managerial function charged with creating the framework within which communities reduce vulnerability to hazards and cope with disasters.
Vision
Emergency management seeks to promote safer, less vulnerable communities with the capacity to cope with hazards and disasters.

24 tLingaya's Lalita Devi Journal of Professional Studies Emergency Management in India t25
Mission
Emergency management protects communities by coordinating and integrating all activities necessary to build, sustain, and improve the capability to mitigate against, prepare for, respond to, and recover from threatened or actual natural disasters, acts of terrorism, or other man-made disasters.
Principles
Emergency management must be:
Comprehensive – emergency managers consider and take into account all hazards, all phases, all stakeholders and all impacts relevant to disasters.
Progressive – emergency managers anticipate future disasters and take preventive and prepara-tory measures to build disaster-resistant and disaster-resilient communities.
Risk-driven – emergency managers use sound risk management principles (hazard identifica-tion, risk analysis, and impact analysis) in assigning priorities and resources.
Integrated – emergency managers ensure unity of effort among all levels of government and all elements of a community.
Collaborative – emergency managers create and sustain broad and sincere relationships among individuals and organizations to encourage trust, advocate a team atmosphere, build consensus, and facilitate communication.
Coordinated – emergency managers synchronize the activities of all relevant stakeholders to achieve a common purpose.
Flexible – emergency managers use creative and innovative approaches in solving disaster challenges.
Professional – emergency managers value a science and knowledge-based approach based on education, training, experience, ethical practice, public stewardship and continuous improvement.
PHASES OF EMERGENCY MANAGEMENT
Mitigation
Activities providing a critical foundation in the effort to reduce the loss of life and property from natural and/or manmade disasters by avoiding or lessening the impact of a disaster and providing value to the public by creating safer communities. Mitigation seeks to fix the cycle of disaster damage, reconstruction, and repeated damage. These activities or actions, in most cases, will have a long-term sustained effect.
Preparedness
A continuous cycle of planning, organizing, training, equipping, exercising, evaluating, and taking corrective action in an effort to ensure effective coordination during incident response. Within the National Incident Management System, preparedness focuses on the following elements: planning; procedures and protocols; training and exercises; personnel qualification and certification; and equipment certification.
Response
Activities that address the short-term, direct effects of an incident. Response includes immediate actions to save lives, protect property, and meet basic human needs. Response also includes the execution of emergency operations plans and of mitigation activities designed to limit the loss of life, personal injury, property damage, and other unfavorable outcomes. As indicated by the situation, response activities include applying intelligence and other information to lessen the effects or consequences of an incident; increased security operations; continuing investigations into nature and source of the threat; ongoing public health and agricultural surveillance and testing processes; immunizations, isolation, or quarantine; and specific law enforcement operations aimed at preempting, interdicting, or disrupting illegal activity, and apprehending actual perpetrators and bringing them to justice.
Recovery
The development, coordination, and execution of service- and site-restoration plans; the reconstitution of government operations and services; individual, private-sector, nongovernmental, and public assistance programs to provide housing and to promote restoration; long-term care and treatment of affected persons; additional measures for social, political, environmental, and economic restoration; evaluation of the incident to identify lessons learned; post incident reporting; and development of initiatives to mitigate the effects of future incidents.
VULNERABILITIES IN INDIA
Vulnerability is the susceptibility of being harmed. A disaster occurs when hazard interacts with vulnerability. Vulnerability could be due to the human related factors or natural features. The human related factors that increase vulnerability of India include apathy, poverty, corruption, illiteracy, land use pattern, technological misuse, and terrorism. Poor land use planning and inconsistent emergency management systems leads to vulnerability to floods, drought, cyclones, earthquake, heat and cold waves, and landslides.
India has a highly diversified range of natural features. Its unique geo-climatic conditions make the country among the most vulnerable to natural disasters in the world. About 60% of the total area of the country is vulnerable to seismic damage of buildings in varying degrees. With urbanization and concentration of population in metropolitan cities, more and more people are becoming vulnerable to locational disasters
The percentage of the population below the official poverty line was 28% in 2004-2005. The absolute number of poor people was 302 million in 2004-2005. Forty six percent of the children in the age group zero to three years suffered from malnutrition in 2005-2006. The literacy rate has steadily gone up to 64.8% in 2001, the number of illiterate persons still exceeds 304 million, making India the country with the highest number of illiterate persons in the world. Some parts of India still do not have even electricity and/or telephone connectivity. All of these factors – from illiteracy and poverty to infrastructure inadequacy and apathy, indicate that India is highly vulnerable to disasters.
EVOLUTION OF DISASTER MANAGEMENT LEGISLATION IN INDIA
Historically, measures to address problems of famine and to some extent floods have been the focus of disaster management in India. Some form of legal framework was introduced during the late 1870s when the first Famine Commission suggested the formulation of Famine Codes. It also suggested the establishment of agriculture departments in provinces with a view to improving agricultural production and taking preparedness measures for meeting situations of failure of rains. Even after Independence, disaster management efforts were limited to fighting natural calamities. In the 1970s, a comprehensive drought management programme focusing on mitigation was taken up through the Drought Prone Areas Programme (DPAP).
After Independence, a Scarcity Relief Division was set up in the Ministry of Agriculture, GoI, to deal with the problem of food scarcity. In 1995, the National Centre for Disaster Management (NCDM) was established within the Indian Institute of Public Administration (IIPA). The NDM Division and the NCDM were expected human resources development, research, training, building a data base and the coordination of various programmes undertaken by different organizations.
The 1990s were a time of important developments at the international level with the declaration of the IDNDR by the UN followed by the Yokohama declaration. National governments were expected to focus on prevention and mitigation aspects, demonstrating a holistic approach to disaster management. The GoI constituted a High Powered Committee (HPC) on disaster management under the chairmanship of Shri J.C. Pant in August 1999. The HPC’s mandate was to review existing arrangements for preparedness and mitigation of natural disasters and recommend measures for strengthening the organizational structure. The HPC was also asked to formulate a comprehensive model plan for natural disaster management at the national, state and district levels. Subsequently, man-made disasters were also brought within its scope. The final report of the HPC displayed a vision to work towards a disaster–free India by adhering to a culture of preparedness, quick response, strategic thinking and prevention. The HPC was converted into a Working Group of the National Committee.
The GoI set up the Second Administrative Reforms Commission (ARC) under the chairmanship of Shri Veerappa Moily in August 2005 to prepare a detailed blueprint for revamping the public administration system.
Roles, Responsibilities and Functions of Ministries of the Government of India
• Coordination of actions of the Ministries or Departments of the Government of India, State Governments, National Authority, State Authorities, governmental and non-governmental organizations in relation to disaster management.
• Ensure the integration of measures for prevention of disasters and mitigation by Ministries or Departments of the Government of India into their development plans and projects.
• Ensure appropriate allocation of funds for prevention of disaster, mitigation, capacity- building and preparedness by the Ministries or Departments of the Government of India.
• Ensure that Ministries or Departments of the Government of India take necessary measures for preparedness to promptly and effectively respond to any threatening disaster situation or disaster.
• Cooperation and assistance to State Governments, as requested by them or otherwise deemed appropriate by it.
• Deployment of naval, military and air forces, other armed forces of the Union or any other civilian personnel as may be required for the purpose of this Act.

26 tLingaya's Lalita Devi Journal of Professional Studies Emergency Management in India t27
• Coordination with the United Nations agencies, international organizations and governments of foreign countries for the purposes of this Act.
• Establish institutions for research, training and developmental programmes in the field of disaster management.
NDMA has prepared a disaster management policy framework. The themes underpinning this policy:
• Community-based disaster management, including integration of the policy, plans and execution at the grass root level.
• Capacity development in all related areas.
• Consolidation of past initiatives and best practices.
• Cooperation with agencies at national, regional and international levels.
• Compliance and coordination to generate a multi-sectoral synergy.
The objectives guiding the policy formulation have evolved to include:
• Promoting a culture of prevention and preparedness – by centre-staging disaster management (DM) as an overriding priority at all levels and at all times.
• Encouraging mitigation measures based on state-of-the-art technology and environmental sustainability.
• Mainstreaming DM concerns into the development planning process.
• Putting in place a streamlined institutional techno-legal framework in order to create and preserve the integrity of an enabling regulatory environment and a compliance regime.
• Developing contemporary forecasting and early warning systems backed by responsive and fail-safe communications and Information Technology (IT) support.
• Promoting a productive partnership with the Media, NGOs and the Corporate Sector in the areas of awareness generation and capacity development.
• Ensuring efficient response and relief with a caring humane approach towards the vulnerable sections of the society.
• Making reconstruction an opportunity to build back better and construct disaster-resilient structures and habitats (NDMA 2009).
INSTITUTIONAL AND POLICY FRAMEWORK
The institutional and policy mechanisms for carrying out response, relief and rehabilitation have been well-established since Independence. These mechanisms have proved to be robust and effective insofar as response, relief and rehabilitation are concerned.
At the national level, the Ministry of Home Affairs is the nodal Ministry for all matters concerning disaster management. The Central Relief Commissioner (CRC) in the Ministry of Home Affairs is the nodal officer to coordinate relief operations for natural disasters. The CRC receives information relating to forecasting/warning of a natural calamity from India Meteorological Department (IMD) or from Central Water Commission of Ministry of Water Resources on a continuing basis. The Ministries/Departments/Organizations concerned with the primary and secondary functions relating to the management of disasters include: India Meteorological Department, Central Water Commission, Ministry of Home Affairs, Ministry of Defense, Ministry of Finance, Ministry of Rural Development, Ministry of Urban Development, Department of Communications, Ministry of Health, Ministry of Water Resources, Ministry of Petroleum, Department of Agriculture & Cooperation. Ministry of Power, Department of Civil Supplies, Ministry of Railways, Ministry of Information and Broadcasting, Planning Commission, Cabinet Secretariat, Department of Surface Transport, Ministry of Social Justice, Department of Women and Child Development, Ministry of Environment and Forest, Department of Food. Each Ministry/Department/Organization nominate their nodal officer to the Crisis Management Group chaired by Central Relief Commissioner. The nodal officer is responsible for preparing sectoral Action Plan/Emergency Support Function Plan for managing disasters.
National Crisis Management Committee (NCMC)
Cabinet Secretary, who is the highest executive officer, heads the NCMC. Secretaries of all the concerned Ministries /Departments as well as organizations are the members of the Committee. The NCMC gives direction to the Crisis Management Group as deemed necessary. The Secretary, Ministry of Home Affairs is responsible for ensuring that all developments are brought to the notice of the NCMC promptly. The NCMC can give directions to any Ministry/Department/Organization for specific action needed for meeting the crisis situation.
Crisis Management Group
The Central Relief Commissioner in the Ministry of Home Affairs is the Chairman of the CMG, consisting of senior officers (called nodal officers) from various concerned Ministries. The CMG’s functions are to review every year contingency plans formulated by
various Ministries/Departments/Organizations in their respective sectors, measures required for dealing with a natural disasters, coordinate the activities of the Central Ministries and the State Governments in relation to disaster preparedness and relief and to obtain information from the nodal officers on measures relating to above. The CMG, in the event of a natural disaster, meets frequently to review the relief operations and extend all possible assistance required by the affected States to overcome the situation effectively. The Resident Commissioner of the affected State is also associated with such meetings.
Control Room (Emergency Operation Room)
An Emergency Operations Center (Control Room) exists in the nodal Ministry of Home Affairs, which functions round the clock, to assist the Central Relief Commissioner in the discharge of his duties. The activities of the Control Room include collection and responsible for preparing sectoral Action Plan/Emergency Support Function Plan for managing disasters, transmission of information concerning natural calamity and relief, keeping close contact with governments of the affected States, interaction with other Central Ministries/Departments/Organizations in connection with relief, maintaining records containing all relevant information relating to action points and contact points in Central Ministries etc., keeping up-to-date details of all concerned officers at the Central and State levels.
Contingency Action Plan
A National Contingency Action Plan (CAP) for dealing with contingencies arising in the wake of natural disasters has been formulated by the Government of India and it had been periodically updated. It facilitates the launching of relief operations without delay. The CAP identifies the initiatives required to be taken by various Central Ministries/Departments in the wake of natural calamities, sets down the procedure and determines the focal points in the administrative machinery.
State Relief Manuals
Each State Government has relief manuals/codes which identify that role of each officer in the State for managing the natural disasters. These are reviewed and updated periodically based on the experience of managing the disasters and the need of the State.
CONCLUSION
Emergency management programs are developed and implemented through the analysis of information. Emergency management programs are planned, implemented, and modified based on volume of business or reaction to emergencies as they occur. GIS allows emergency management needs to be identified prior to an incident. Disaster events, such as wildfires, tsunami, floods, earthquakes, hurricanes, epidemics, chemical cloud dispersion, and oil spills, can be modeled and displayed in GIS.

28 tLingaya's Lalita Devi Journal of Professional Studies Investors Perception Towards Depository Services Provided by Depository Participants t29
Investors Perception Towards Depository Services Provided by Depository Participants
*B. Venu Gopal, MBA, (Ph.D)**Dr. Ch. Rama Prasada Rao, MBA., (Ph.D)
ABSTRACT
One of the biggest problems faced by Indian Capital market has been manual and paper work settlement system. Under this system, the clearing and settlement of transactions take place only with the use of paper work. The system of Physical delivery of scrip’s poses many problems for purchaser as well as the seller in the form of delayed settlements. Thus to eliminate paper work, facilitate scrip less trading and electronic book entry of the transfer of securities, it was found necessary to replace the old system of transfer and settlement with the new and modern system of depositories. In this research paper an attempt has been made to achieve the objective (i) Make a comparative analysis of DP services being administered by depository participants. (ii) To determine investors perception towards DP services. A consensus survey of DP services provided by offered by Indiainfoline Ltd, Net Worth Ltd, Karvays Ltd, PCS Securities Ltd. including cross questioning and discussion with the Depository Participants investors as per convenience. The data analyzed by frequency tables and cumulative percentages, discriptives result 1.7234, one way sample sd.1.1677 and Anova 317.247. Depository Participant have been adopting better services to investors.
Key words: Capital Market, Depository Participants, Services, Investors, Attributes
INTRODUCTION
One of the biggest problems faced by Indian Capital market has been manual and paper work settlement system. Under this system, the clearing and settlement of transactions take place only with the use of paper work. The system of Physical delivery of scrip’s poses many problems for purchaser as well as the seller in the form of delayed settlements. Thus to eliminate paper work, facilitate scrip less trading and electronic book entry of the transfer of securities, it was found necessary to replace the old system of transfer and settlement with the new and modern system of depositories. Accordingly the Government of India enacted the Depositories Act in 1996 for the orderly growth and development of Indian capital market. The governing body of SEBI approved the draft of SEBI (Depositories and participant) regulation Act 1996. The Government of India on July 10, 1997 introduced the depository bill to usher scrip less trading, National securities depository Ltd Promoted by Industrial Development Bank of India, UTI and NSE emerged as the first depository to be registered in India.
DEPOSITORY PARTICIPANTS
A DP is acting as Investor representative in the depository system. It is also an agent of depository. Its functions are like a link between the depository and beneficial owners/investors. DP maintains the ownership records of every beneficial owner in book entry form. The main services provided by DP’s are as follows:
• Dematerialization i.e. converting Physical Securities into electronic form
• To maintain record of holdings in the electronic form.
• Settlement of all-market trades.
• Providing electronic credit in respect of securities allotted by Issuers under IPO.
• Pledging of dematerialized securities.
• Facilitating securities lending and borrowing if the DP is registered as an approved intermediary for the purpose.
REVIEW OF LITERATURE
Schmiedel et. al (2006) analyzed the existence and extent of economies of scale in depository and settlement systems. The study indicated the existence of significant economies of scale but degree of such economies differs by settlement, institution and region. Kanan (2008) highlighted that dematerialization has certainly brought about lot of improvement in the investment habits in our country and is bane for the companies and has created havoc in maintaining the members register and in conducting the members meeting. Sultan Sing (2011) tried to study the factors affecting the decision making of the investors in depository system. Most of the investors are of the view that shorter settlement period, safety of securities with the depositories, attitude of the staff available with the DPs, timely services provided by the DPs to the investors, reduction in transaction cost, repatriation of sales proceeds of shares/debentures by NRIs are some of the factors which affects the decision making of the investors in depository system.
METHODOLOGY OF THE STUDY
Statement of the Problem
All Depository Participants in the country are providing a variety of financial products/ Financial Services which depict creativity and constant innovation of financial products as per the needs of their customer base. The main reason for selecting this topic is to compare and highlight the DP services being administered by various depository participants and to give suggestions to these DP’s to enhance creativity in their offerings.
OBJECTIVES OF THE STUDY
The main objective of this paper is to:
1. Make a comparative analysis of DP services being administered by depository participants.
2. To determine investors perception towards DP services.
Research Approach
A consensus survey of DP services provided by offered by Indiainfoline ltd, Net worth ltd, Karvays ltd, PCS Securities ltd. including cross questioning and discussion with the Depository Participants investors as per convenience.
Sample Size: 100 investors
Sources of Data
1. Depository Participant information Brochures
2. Journals and Magazines
3. Depository Accounts, record of delivery instructions.
4. Discussion and counter questioning interview with the investors who have opened the Demat account with These DP’s.
Limitations of the Study
1. It was sometimes difficult to obtain data and sometimes wrong information was provided by source, which has to be crosschecked and verified.
2. Data collected may be subjective due to personal perception of different interviewed.
3. The dynamic Environment Prevalent in the Depository Participants’ t may render the findings to be untrue and obsolete over a period of time.
4. Gathering information from various DPs was not an easy task.
* B.VENU GOPAL MBA. Research Scholar in Srikrishnadevaraya Institute of Management, Srikrishnadevaraya University, Anantapuram-515 003, Cell: 9959803981, Email Id:[email protected]
** Dr. Ch. RAMA PRASADA RAO MBA, Ph.D., Professor (Retired) in Srikrishnadevaraya Institute of Management, SrikrishnadevarayaUniversity, Anantapuram-515 003, Cell: 9885285179, Email Id: [email protected]
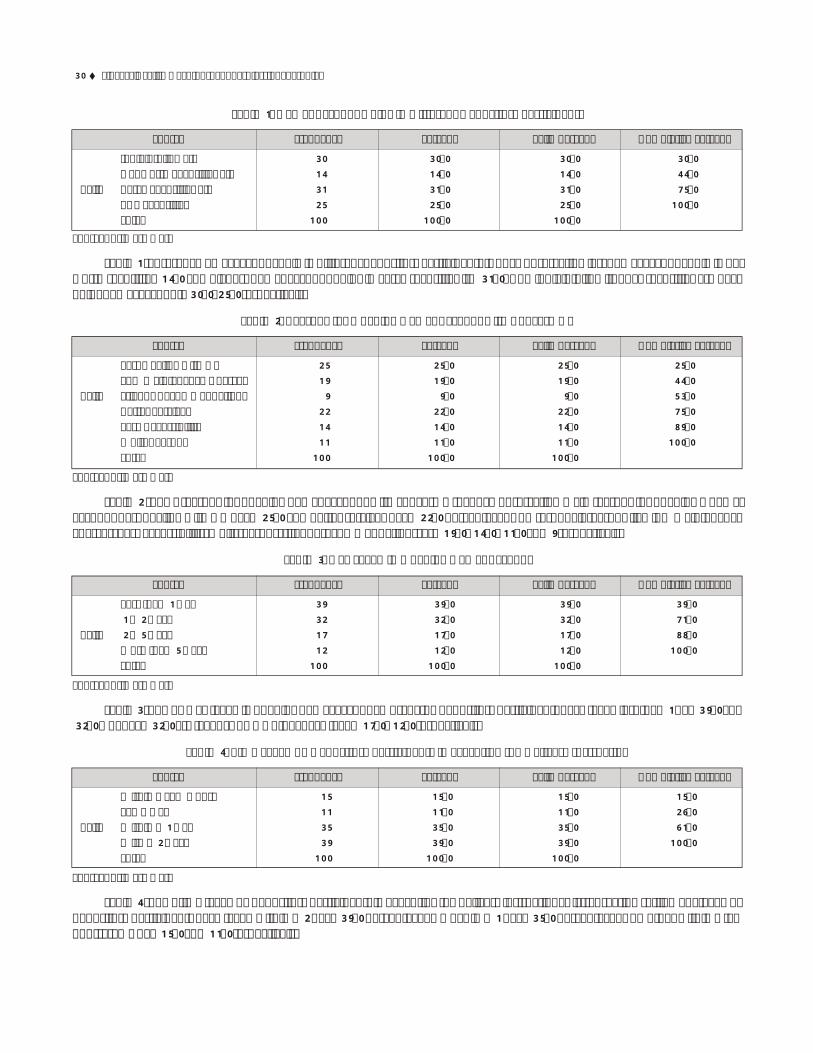
30 tLingaya's Lalita Devi Journal of Professional Studies Investors Perception Towards Depository Services Provided by Depository Participants t31
Table 1: Demat Account Holds in Different Depository Participants
Source Frequency Percent Valid percent Cumulative Percent
Indiainfoline Ltd 30 30.0 30.0 30.0
Net worth Securities Ltd 14 14.0 14.0 44.0
Valid Karvy Securities Ltd 31 31.0 31.0 75.0
PCS Securities 25 25.0 25.0 100.0
Total 100 100.0 100.0
Source: Primary Data
Table 1 represent Demat account hold in different depository Participants .Above observation lest demat account hold in net worth secutiries 14.0 and highest demat account holds in karvy securities ltd 31.0. And indiainfoline ltd, pcs securities are have holds demat accounts 30.0,25.0 respectively.
Table 2: Reasons for Opening Demat Account with Concern DP
Source Frequency Percent Valid percent Cumulative Percent
Past Dealing with DP 25 25.0 25.0 25.0
Low Maintenance Charges 19 19.0 19.0 44.0
Valid Friends Recommendations 9 9.0 9.0 53.0
Better Services 22 22.0 22.0 75.0
Easy Accessibility 14 14.0 14.0 89.0
Multi Reasons 11 11.0 11.0 100.0
Total 100 100.0 100.0
Source: Primary Data
Table 2 shows reasons for opening demat account with concern DP. above observation main reasons for opening a demat account past dealing with DP have 25.0 and better services have 22.0 percentage. And rest of all reasons like low maintenance charges, easy accessibility, multi reasons, friends recommendations, are 19.0, 14.0, 11.0 and 9 respectively.
Table 3: Day Taken in Opening Demat Account
Source Frequency Percent Valid percent Cumulative Percent
Less than 1 Day 39 39.0 39.0 39.0
1 – 2 Days 32 32.0 32.0 71.0
Valid 2 – 5 Days 17 17.0 17.0 88.0
More than 5 Days 12 12.0 12.0 100.0
Total 100 100.0 100.0
Source: Primary Data
Table 3 shows a Day taken in opening demat account most of the depository participants have taken less than 1 day 39.0 and 32.0 DPs have 32.0 are taken. And DP other have taken 17.0, 12.0 respectively.
Table 4: Time Taken by Depository Participants in Executing the Delivery Instruction
Source Frequency Percent Valid percent Cumulative Percent
Within a Few Hours 15 15.0 15.0 15.0
Same Day 11 11.0 11.0 26.0
Valid Within a 1 Day 35 35.0 35.0 61.0
With a 2 Days 39 39.0 39.0 100.0
Total 100 100.0 100.0
Source: Primary Data
Table 4 shows time taken by depository participants in executing the delivery instruction. All transaction settlement taken by depository participants have taken within a 2 days 39.0 percentage. DP has in a 1 days 35.0 percentage. And other within a few hours, same day 15.0 and 11.0 respectively.
Table 5: Attributes for Preferring Depository Participants
Source Frequency Percent Valid percent Cumulative Percent
SafetyAccessibility 19 19.0 19.0 40.0Image 7 7.0 7.0 47.0
Valid Cost Structure 20 20.0 20.0 67.0Quick Settlement 18 18.0 18.0 85.0Personalized Attention 15 15.0 15.0 100.0Total 100 100.0 100.0
Source: Primary Data
Table 5 shows Attributes for preferring depository participants .Investors have to influenced by this attributes tor preferring depository participants. Main attributes influenced by investor safety attribute responded 21.0 percentages and cost structure 20.0, accessibility 19.0, quick settlement 18.0, personalized attention 15.0 and Image of DP influenced by investors 7.0 lest preference have taken.
Table 6: Opinion about Services Provided by Depository Participants
Source Frequency Percent Valid percent Cumulative Percent
Satisfactory 65 65.0 65.0 65.0Somewhat satisfactory 26 26.0 26.0 91.0
Valid Not Satisfactory 9 9.0 9.0 100.0Total 100 100.0 100.0
Source: Primary data
Table 6 shows opinion about services provided by depository participants .Investors majority opinion have satisfactory of services provided by Depository Participants 65.0 percentage. Somewhat satisfactory 26.0 percentage and 9.0 percentages investors have not satisfied services provided by Depository Participants.
Table 7: Statistics
Source Demat Account Reasons for Days Taken in Time Taken by Attributes Opinon Aboutholds in Different Opening Opening a Depository preferring Services Provided
Depository Demat Account Demat Account Participants in Depository by DepositoryParticipants with Concern DP Executing the Participants Participants
Delivery Instruction
Valid100 100 100 100 100 100N
Missing 0 0 0 0 0 0Mean 2.5100 3.1400 2.0200 2.9800 3.4000 1.4400Std. Deviation 1.16771 1.72340 1.02474 1.05390 1.78093 .65628
Source: SPSS
Table 7 shows statistics of investor perception towards services provided by depository participants. Above observation statistics applied mean and std. deviation attributes preferring depository participants mean 3.400 and std. deviation 1.7809 and lest of above observation opinon about services provided by depository participants mean 1.440 and std. deviation 0.6562.
Table 8: Ratio Statistics for Demat Account holds in Different Depository Participants / Reasons for Opening Demat Account with Concern DP
Group Mean Weighted Mean Std. Deviation Price Related Coefficient of Coefficient of Differential Dispersion Variation
Median Centered
Safety 1.000 1.000 0.000 1.000 0.000 0.0%Accessibility .868 .853 .226 1.018 .132 26.4%Image 1.143 1.176 .178 .971 .143 23.6%Cost Structure 1.100 1.081 .157 1.018 .100 18.7%Quick Settlement .694 .683 .132 1.017 .157 27.3%personalized Attention .527 .523 .046 1.007 .053 10.7%Overall .879 .799 .249 1.100 .181 27.7%
Source: SPSS
21 21.0 21.0 21.0

32 tLingaya's Lalita Devi Journal of Professional Studies Investors Perception Towards Depository Services Provided by Depository Participants t33
Table 8 shows statistics for demat account holds in different depository participants reasons for opening demat account with concern depository participants .Above observation coefficient of dispersion very high .181 and low 0.00 and median 27.7 of quick settlement of investors have to opening demat account with concern depository participants.
Table 9 : Descriptives
95% ConfidenceInterval for Mean
N Mean Std. Std. Lower UpperDeviation Error Bound Bound Minimum Maximum
Reasons forOpening NetworthDemat Securities Ltd 14 2.0000 0.00000 0.00000 2.0000 2.0000 2.00 2.00Account with Karvy Securities Ltd 31 5.1613 .73470 .13196 4.8918 5.4308 4.00 6.00Concern DP PCS Securities 25 3.6400 .48990 .09798 3.4378 3.8422 3.00 4.00
Total 100 3.1400 1.72340 .17234 2.7980 3.4820 1.00 6.00
Days Taken Indiainfoline Ltd 30 1.0000 0.00000 0.00000 1.0000 1.0000 1.00 1.00in Opening Networth Securities Demat Ltd 14 1.3571 .49725 .13289 1.0700 1.6442 1.00 2.00Account Karvy Securities Ltd 31 3.3226 .59928 .10763 3.1028 3.5424 2.00 4.00
PCS Securities 25 2.0000 0.00000 0.00000 2.0000 2.0000 2.00 2.00
Total 100 2.0200 1.02474 .10247 1.8167 2.2233 1.00 4.00
Time Taken Indiainfoline Ltd 30 1.6333 .71840 .13116 1.3651 1.9016 1.00 3.00by Depository Networth Participants in Securities Ltd 14 3.0000 0.00000 0.00000 3.0000 3.0000 3.00 3.00Executing the Karvy Securities Ltd 31 4.0000 0.00000 0.00000 4.0000 4.0000 4.00 4.00Delivery PCS Securities 25 3.3200 .47610 .09522 3.1235 3.5165 3.00 4.00Instruction Total 100 2.9800 1.05390 .10539 2.7709 3.1891 1.00 4.00
Attributes for Indiainfoline Ltd 30 1.3000 .46609 .08510 1.1260 1.4740 1.00 2.00Prefering Networth Depository Securities Ltd 14 2.2857 .46881 .12529 2.0150 2.5564 2.00 3.00Participants Karvy Securities Ltd 31 5.4839 .50800 .09124 5.2975 5.6702 5.00 6.00
PCS Securities 25 3.9600 .45461 .09092 3.7723 4.1477 3.00 5.00
Total 100 3.4000 1.78093 .17809 3.0466 3.7534 1.00 6.00
Opinion Indiainfoline Ltd 30 1.3333 .75810 .13841 1.0503 1.6164 1.00 3.00About Services Networth Provided by Securities Ltd 14 2.2857 .46881 .12529 2.0150 2.5564 2.00 3.00 Depository Karvy Securities Ltd 31 1.0000 0.00000 0.00000 1.0000 1.0000 1.00 1.00Participants PCS Securities 25 1.6400 .48990 .09798 1.4378 1.8422 1.00 2.00
Total 100 1.4400 .65628 .06563 1.3098 1.5702 1.00 3.00
Source : SPSS
Table 9 shows descriptive analysis of different depository participants with investor perception towards services provided by different depository participants. Above observation mean and std.deviation and coeffience of different dp have shown reason of all this observation we categories minimum and maximum.
RECOMMENDATIONS AND SUGGESTIONS
• Depositary services should be more transparent, systematic and fast, due to this investors can easily understand the depository system and they can easily avail them.
• SEBI should also set up more working groups. Comprising NSDL for the progress in dematerialized trading.
• The most important reason of non popularity of this system is lack of awareness on the part of investors steps should be taken to create public confidence in such electronic trading by adopting mode of media, publication of studies, periodical review functioning of depositories.
• A proper network of DP’s should be designed in such a way that it should cover not only major locations but small cities also.
• Option to have securities in physical term should be abolished and it should made mandatory to have securities in Demat form.
• There should be no or less custody or annual maintenance charges charged by DP’s from individual investors.
Indiainfoline Ltd 30 1.1667 .37905 .06920 1.0251 1.3082 1.00 2.00
BIBLIOGRAPHY
1. Bal Kishan & Nartass, Securities market in India, Krishna Press, New Delhi, 1998.
2. Krishan, S.S. Narta, Security Market in India, Kanishka Publishers Distributors, 1998.
3. Punithavathy Pandian, Security Analysis and Portfolio Management, Vikas Publications, Sixth Edition, 2005.
4. S.C. Gupta, Fundamental of Statistics, Himalaya Publishing House, 2002.
Websites :www.sebi.gov.in www.hdfcbank.comwww.idbi.com www.icici.comwww.axisbank.com www.kotak.com

34 tLingaya's Lalita Devi Journal of Professional Studies A Study on Personal Growth Initiative (PGI) in Multicultural Students t35
A Study on Personal Growth Initiative (PGI) in Multicultural Students
Tahere Pilevar Hessari *, Delaram Chehelmard Elahabadi,
A. Santosh Kumari
ABSTRACT
This paper is an attempt to evaluate the personal growth initiative among select students of JNTU_H University. It focuses on Identifying differences in personal growth initiative in college students with respect to gender, and age, academic year, family annual income, and nationality.
The Personal Growth Initiative scale (PGI), has been administered on 279 international and Indian students. To measure Personal Growth Initiative, “Personal Growth Initiative Scale” is used. The responses for questionnaire are taken on 6-point Likert-scale for Personal Growth Initiative. In addition, the reliability of the scale was investigated by using Cronbach’s alpha coefficient which was alpha=.799 and it has acceptable internal consistencies. The outcome of the research showed that student’s PGI is generally high (M=42.85. on the 6-point scale) compared to the highest possible mean of 54.
Key words: Personal Growth Initiative (PGI), Intentional change, Application of knowledge.
INTRODUCTION
Personal growth may be defined as a change in individuals feelings, believes, attitudes and behavior resulting from understanding their shortcomings (Robitschek, 1999; Wright, et al., 2006). An important aspect of personal growth is the individual’s continuous development in spite of any challenges he/she may encounter (Levine, et al., 2005). Continued personal growth over a persons’ lifespan is important for a healthy and well balanced life. According to Robitschek (1998, 1999) personal growth can occur as a result of intentional and unintentional processes. However personal growth initiative is only concerned with intentional change.
REVIEW OF LITRATURE
Personal growth initiative is a metacognitive construct defined as the active and intentional engagement in changing and developing as a person (Robitschek, 1998). It is a global trait-like construct that may reflect the pursuit of a variety of affective, behavioral, or cognitive self-changes. Intentionality is of key importance in that those with high Personal Growth Initiative (PGI) tend to select personal growth as a goal and intentionally seek out personal growth experiences. Furthermore, PGI is theoretically assumed to contain both individual cognitive and behavioral components comprised of general goals relating to personal change and plans to attain those goals (Robitschek, 2003). The literature on PGI is still in its infancy; therefore, the construct is currently in need of further validation. However, initial evidence supports PGI as a unique construct that is associated with a variety of relevant cognitive constructs
RESEARCH METHODOLOGY
Primary Objectives
• To study the level of Personal growth initiative of select students in Jawaharlal Nehru Technological University in Hyderabad.
• To measure the internal consistency of the scale of PGI between select students in Jawaharlal Nehru Technological University in Hyderabad.
Secondary Objective
• To study the differences in personal growth initiative with respect to demographic characteristics.
Selection of Sample
The research sample was selected randomly by the researcher and consisted of 279 students from Jawaharlal Nehru Technological University in Hyderabad. The respondents were students from different colleges.
Tools Used In the Study
This research utilized the “survey” method and the data was gathered using the Personal Growth Initiative, “Personal Growth Initiative Scale” (by Robitschek, C., 1998)”, is used. The responses for questionnaire will be taken on 6-point Likert-scale for Personal Growth Initiative.
RESULT DISCUTION
Demographic Variables
Among the sample group of 279 students, 170 respondents were male and 109 were female. In addition, majorities of 77% of the respondents were from the age group 18 to 23 years, and just 23% were above 23 years of age. In terms of students ‘course of study, 50.9% of the respondents were studying B.Tech followed by M.Tech at 21.1%. Around half of the participating students had a percentage between70 to 80 and a significant portion of students (32%) had a percentage less than 70. Moreover, more than 80 % of the students are from families with annual income less than 5, 00,000. The negligible portion of 6.5 % of the students is from families with annual income greater than 10, 00,000. Finally, 88% of the respondents were students with Indian nationality and 12% non-Indian
Descriptive statistics of PGI
Descriptive statistics were computed, including the PGI minimum, maximum, and mean score, standard error, standard deviation, and variance (shown next) for the PGI scores.
The mean of total is 42.85 which is a high mean compared to the highest possible mean of 54.
The mean of foreigner and Indian are 43.2 and 42.8, respectively. It shows that the mean of PGI for foreigner and Indian are nearly same, but, the minimum for foreigner is 31 and for Indian is 11.
Table 1: Descriptive Statistic of PGI Nationality
N Minimum Maximum Mean Std. Deviation
Indian 245 11 54 42.80 6.680
Foreigner 34 31 51 43.21 4.935
Total 279 11 54 42.85 6.486
Valid N 279
Source: Compiled on SPSS

“Analysis of The Coeval Workplace Strategiesfor a Successful Corporate Mantra”
— An insight into the contemporary managerial approach towards the changing workplace dynamics in India
Dhruv Priyadarshi Nijhawan (M.I.M.A)Stuti Priyadarshni Nijhawan
ABSTRACT
Since the beginning of the industrial revolution management practitioners, researchers and policy makers have tried to define and evaluate particular workplace practices and systems that can spur productivity growth at the organizational level. The spectrum of organizational workplace issues has widened tremendously over the past several decades. From a mere business philosophy, the concept of workplace management has grown to a full-fledged corporate discipline. The contemporary strategic solution to managing workplace lies in the successful implementation of its recruiting and retaining functions.
However, during the last few years, the cases for employee dissatisfaction have witnessed a surge at multinationals in India. Never before has the workplace changed as rapidly or as dramatically as it is changing today. Managers are faced with issues they couldn’t have predicted ten years ago. This has lead to a change in corporate, personal and association life. A number of trends have impacted the relationship between employees and their workplaces such as
• A more complex legal environment and changes to laws influencing employee rights and employer legal compliance
• Economic uncertainty and volatility
• The impact of information and communications technologies
• Greater demand for work/life balance
• Growing demographic shifts leading to a shortage of high-skilled workers
Successful managers are those who have mastered the skills of managing change and have the abilities to keep pace with these emerging business trends.
The purpose of this research paper is to explore the issues that have lead to a change at the contemporary corporate workplace in India and strategies developed to resolve them at the managerial level. For the purpose of this study, the technique of primary research has been used with a structured questionnaire and survey method. A sample set of 50 respondents from different leadership levels and diversified industries is used to understand the relative importance of workplace mechanics. The questionnaire is designed keeping in mind various parameters of study such as workplace etiquettes, conflict management and resolution, workplace diversity, legal and ethical issues, stress management, flexi time work approach, sexual harassment and workplace violence.
Key words: Manager, Conflict, Workplace
36 tLingaya's Lalita Devi Journal of Professional Studies Analysis of The Coeval Workplace Strategies for a Successful Corporate Mantra t37
INTRODUCTION
Workplace management is a process intended to create and maintain a positive work environment where the similarities and differences of individuals are valued. The literature on workplace management has mostly emphasized on organisation culture; its impact on diversity; conflict management; workplace violence; stress management; human resource management practices and institutional environment. The current study examines the potential barriers to healthy workplace management and suggests strategies to enhance workplace inclusiveness. This study concludes that successfully managing workplace can lead to more committed, better satisfied, better performing employees and potentially better financial performance for an organisation. A sound managerial approach to handle various workplace related issues has become a necessary trait for contemporary senior executives. Nowadays, as a manager, people have to face difficult conversations with employees that tend to make them defensive and angry. In the midst of workplace management crisis, a leader needs to effectively coach his team to enhance productivity. He needs the skill and art of helping someone improve their performance and reach their full potential. There needs to be a transition from a directive approach such as teaching, advising, giving feedback, offering suggestions, to a more non-directive approach like asking questions and listening so that the employee can solve his or her problems. When employees can come up with their own solutions, they are more committed, the strategies are more likely to be implemented and these individuals are more likely to solve similar problems next time on their own.
KEY WORKPLACE MANAGEMENT ISSUES
1. Workforce Diversity
A business that embraces changing demographics can reap the economic benefits of a diverse and inclusive workforce. The businesses that recruit from a diverse workforce are better able to find the best and the brightest talent needed to compete nationwide and globally. By including people from different backgrounds, skills, and experiences, businesses are relatively better placed to breed the type of innovative and creative environment needed to succeed in an increasingly competitive economy. Employee diversity also helps to optimize workforce productivity and job performance. Moreover, diverse workforce drives economic growth, as more women, racial and ethnic minorities enter the workforce. The major benefits of a diverse employee base are:
• Pool of talent: Organisations employing professionals from diverse backgrounds, talent and experience band have the advantage of flexibility in adapting to fluctuating markets and customer demand with greater variety of solutions to problems in service, sourcing, and allocation of resources.
• Global Workforce: A diverse workforce with different languages and cultural understanding allows a company to provide service to customers on a global basis.
Managing diversity is an art of planning and implementing practices, policies and systems to deal with people such that the potential advantages of diversity are optimized and its potential disadvantages are reduced with an aim to improve organizational productivity. Managing diversity well provides a distinct advantage in an era when flexibility and creativity are keys to competitiveness. According to a 2011 study from Forbes Insights, "diversity is no longer simply a matter of creating a heterogeneous workforce, but using that workforce to innovate and give it a competitive advantage in the marketplace." However, the key challenges in managing workforce diversity faced by managers in India are:
• Barrier to communication in the chain of command: Communication barriers lead to problems in a company attempting to create a diverse workplace. When an Indian company hires employees of different regional culture, employees and managers may experience difficulties communicating with one another. This can lead to misunderstandings and a decrease in productivity. For example, if a superior gives instructions about completing a certain task to an employee who fails to fully understand the instructions, the employee may make mistakes if he tries to complete the task without receiving further clarity.
• Need to improve gender diversity: A big part of the problem in India is the nature of the discussion around gender workplace diversity. Highly generalized studies appear from time to time suggesting that companies with women CEOs are better performers or are more ethical or are better places to work than those headed by men. If corporations do not create opportunities for competent women, they will be depriving themselves of a wider talent pool.
• Reluctance to change among senior executives: Although workplace diversity is beneficial to an organisation, some senior employees and managers may not react positively to changes made. Those who oppose workforce diversity usually reject new ideas, innovative thinking and make work environments more rigid. To deal with opposition, proponents of the concept should explain the reasons for diversity and what benefits changes in diversity bring to management and employees.
2. Conflict Management
Workplaces are often an unavoidable source of conflict. People come from widely different backgrounds and value systems, and

38 tLingaya's Lalita Devi Journal of Professional Studies Analysis of The Coeval Workplace Strategies for a Successful Corporate Mantra t39
have different methods of approaching workplace behavior. While conflict may be inevitable, it is not always bad for the workplace, if handled properly. One of the most prominent reasons for conflict is the nature of the group which may result in goal variances and differences in perceptions. Any given group embodies various qualities, values, or unique traits that are created, followed and even defended. Relationships between groups often reflect the opinions they hold of each other's characteristics. When groups share some interests and their directions seem parallel, each group may view the other positively; however, if the activities and goals of groups differ, they may view each other in a negative manner. Some major reasons for contemporary conflicts in organisations are:
• Difference of perception among team members regarding work pressure and stretch hours
• Team members blaming each other for past mistakes
• Rebellious jealousy due to perceived belief among team members for “playing favorites”
• Dissatisfaction due to nature of work assigned
• Personality clash. For example, a systematic vs. unorganized approach to the job, or a sensitive person vs. insensitive person
• Disagreements based on ideas, goals, process discrepancies, etc.
• Personal hygiene factors of individual employees
3. Stress Management
Employees stress is a growing concern for organisations today. Stress is a situation in which people face constraints and opportunity loss of something they desire. The consequences of such a condition are unpredictable and crucial. Stress is the response of people to the excessive pressure or demands placed on them. Stress is not always negative. It may induce an individual to discover innovative and smarter way of doing things. This positive dimension of stress is called enstress. But usually, the term stress has a negative connotation and this negative aspect of stress is termed as distress. We can say that “Stress causes some people to break, and other to break records. According to Madhusudan Thaku, Regional vice president (South Asia) of Regus (workspace provider company), the corporate sector has a major role to play in avoiding employee stress at their end. He states “There is no doubt that stressed-out workers are unhappy and unhealthy. So businesses that want to help their staff lead more rewarding lives must analyse and tackle levels of stress within their organisation”
Workplace stress has many causes, which includes long hours of work, heavy workload, job insecurity, threat of job loss, conflicts with other workers etc. Moreover, frequent disputes and dissatisfaction within the group, increase in the number of complaints, difficulty in keeping up with the quantity of work, poor performance, and handling customer dissatisfaction often lowers employee morale and ultimately leads to stress
4. Workplace Violence and Harassment
The ILO has a much broader description of workplace violence that could be physical or psychological, anything at place of work that may fall under homicide, molestation, kicking, biting, punching, harassment, including sexual, and racial abuse, bullying, mobbing, victimising, leaving offensive messages, name-calling or deliberate silence. Greater levels of awareness are required in organisations, both amongst managers and workers.
Unlike India, sexual harassment laws are gender neutral in most parts of the world. Moreover, the laws on this controversial issue vary from country to country and company to company. However, at several places companies tend to take a lenient view of relationship between two sexes if the employees are peers but are strict when it comes to a subordinate and senior employee relationship, as happened in the recent case of Phaneesh Murthy (former CEO of iGATE Corp). Murthy was sacked after a company sexual harassment investigation revealed that he had not disclosed a relationship with a subordinate.
Workplace violence and harassment issues should be tackled with immediacy and toughness. There two major hurdles in the organizational process are “reporting mismanagement” and “absence of a strong legislation”. Many incidents of workplace violence go unreported or are reported very late (after the damage has been done) primarily due to fear of repercussion and lack of awareness. We definitely need more teeth both in terms of legislation and reporting.
RESEARCH OBJECTIVES
1. To study key factors for workplace management in corporates.
2. To identify the most important challenging factor as identified by employees in managing workplace.
3. To recommend / suggest ways for improving workplace by managing the issues of the corporate.
RESEARCH METHODOLOGY
The study is descriptive in nature and seeks to identify the key factors of workplace management which are important for the employees working in corporates. The main purpose of the study is to identify the most important challenging factors for the employees for workplace management.
SCOPE OF THE RESEARCH
The scope of this research is the limited to employees working in corporates.
SAMPLE SIZE
The sample size was 84 respondents working in different corporates in India.
COLLECTION OF DATA
This study is based on survey method with primary data collection on the five dimensions of workplace management namely: Workforce Diversity, Conflict Management, Stress Management, Workplace Violence And Harassment and Legal And Ethical Issues
The survey was conducted to study the relative importance of factors of in workplace management in order at corporations in India. The purpose of this survey the respondents were asked to provide a rank of 1 to 5 for factors mentioned below; such that the factor which they believe is the biggest challenge for corporate in contemporary workplace management should be ranked “1”.
Data Collected On Questionnaire Basis From The Different People Working at Different Designations in Corporate
1– 2– 3– 4– 5– Total– Average Ranking
CONFLICT 25% 28.57% 35.71% 10.71% 0%MANAGEMENT 21 24 30 9 0 84 3.68and RESOLUTION
WORKPLACE DIVERSITY 3.57% 14.29% 21.43% 35.71% 25%
3 12 18 30 21 84 2.36
WORKPLACE 17.86% 21.43% 7.14% 14.29% 39.29%VIOLENCE and 15 18 6 12 33 84 2.64HARASSMENT
STRESS MANAGEMENT 39.29% 14.29% 14.29% 21.43% 10.71%
33 12 12 18 9 84 3.50
LEGAL and ETHICAL ISSUES 14.29% 21.43% 21.43% 17.86% 25%(such as changing employee 12 18 18 15 21 84 2.82benefit regulations, demand for flexi time approach, etc)
Findings of survey:
The following analysis has been made from the above collected responses of the respondents:
1. The most important challenge at workplace according to the respondents of this research is Stress Management. So this is the opinion of people working at corporates that to cope up with the stress is the biggest challenge in front of them.
2. The second most challenging factor ranked is Conflict Management and Resolution which according to the respondents is difficult to deal with at workplace.
3. This is followed by Workplace Diversity and Workplace Violence and Harassment, so the respondents find these factors less challenging in comparison to stress management and conflict management and resolution, the reason could be the rarity of these factors which also point out the healthy climate of corporates.
4. The least challenging factor is LEGAL and ETHICAL ISSUES (such as changing employee benefit regulations, demand for flexi time approach, etc.); the reason could be that still these policies are not implemented strongly.
RECOMMENDATIONS AND CONCLUSION
1. STRESS MANAGEMENT: The most important challenge as identified by the respondents at their workplace management is stress management so here we offer some recommendation to cope up with workplace management. The key to reducing stress is to prevent it. Some of the ways in which businesses could try to alleviate stress on their employees one way is individual intervention by monitoring the stressors in the individual and next is attacking that stressor and trying to figure out ways to alleviate them in any way. Developing social support, changing behavioral patterns, Employee Assistance Programs etc. could be other programs which can help the employees and businesses to manage stress in employees. As also certain counseling sessions could be done by corporates for their employees.

40 tLingaya's Lalita Devi Journal of Professional Studies A Critical Review of CSR Towards Consumers Through ISO 26000 Window t41
2. Conflict Management and Resolution is the second most important challenge and we are here providing certain recommendations to deal with it at workplace first is to manage stress while remaining alert and calm. By staying calm, you can accurately read and interpret verbal and nonverbal communication. Control your emotions and behavior. Pay attention to the feelings being expressed as well as the spoken words of others. By avoiding disrespectful words and actions corporates can manage conflict and also by maintaining strong HR department resolution of conflicts can be done timely and fairly.
3. Workplace diversity can be managed by being aware of and respectful of differences of culture, background and gender. So corporates should try to involve all employees at workplace so that there is proper co-ordination and co-operation.
4. Workplace Violence and harassment can be managed by having rules and guidelines at the workplace and which are strictly made to follow by all. As well as all complains should be dealt at fast pace and strict punishment should be levied on the guilty.
5. Legal and ethical issues also play a very important role in maintaining proper workplace environment so some recommendations to handle such issues is first to develop a workplace policy based on company’s philosophy, mission statement and code of conduct. Incorporate the policy into your performance management program to hold employees accountable for their actions and alert them to their responsibilities to uphold professional standards throughout their job performance and interaction with peers and supervisors. Also providing workplace ethics training to employees is also a helpful step to handle ethical issues.
REFERENCES
1. Watson, N. (2001). The private workplace and the proposed "notice of electronic monitoring act": is "notice" enough? Federal Communications Law Journal, 54(1), 79-104.
2. Crampton, S., & Mishra, J. (1998). Employee monitoring: privacy in the workplace? Advanced Management Journal, 63, 17 - 21.
3. Work, finances biggest cause of stress for Indian employees Friday, Sep 7, 2012, 8:00 IST | Place: Mumbai | Agency: DNA
4. Betancourt, H., & Lopez, S.R. (1993). The study of culture, ethnicity and race in American psychology. American Psychologist, 28,629–637
5. Cox, T., Jr. (1993). Cultural diversity in organizations. San Francisco, CA: Berrett-Koehle
6. http://www.mindtools.com/pages/article/eight-causes-conflict.htm
7. http://www.mediate.com/articles/belak1.cfm
8. http://www.forbes.com/sites/mikemyatt/2012/02/22/5-keys-to-dealing-with-workplace-conflict/
A Critical Review of CSR Towards Consumers Through ISO 26000 Window
—A Case Study of DLF
Geeta DeviAssistant Professor
(SBSE, University of Delhi)
ABSTRACT
Business organizations are more pertain about their impact on consumers to sell their products and services. The aim of profit maximization is not enough, therefore businesses need is to do more for betterment of society and consumers in long run. This paper explains corporate social responsibility towards consumer in accordance to the clause 6.7 “Consumer Issue” of ISO 26000 Guidelines. This clause highlights seven consumers’ issues and it supposed to be that a business organization has fulfilled relevant consumer issues according to their nature of business. A study on DLF Ltd., a real estate company, critically examines their behaviour towards their consumers.
INTRODUCTION
Business organizations are taking CSR as core activities of their business which leads to sustainability growth as well as making good positioning in the mind of the consumers and helps to please potential consumers.
Corporate Social Responsibility (CSR) means that a corporate should go beyond their boundaries of balance sheet to contribute in development of society, environment and economy. It is considered that the corporate should be giving something
1back to their society. According to Michael Hopkins Corporate social responsibility is concerned with treating the stakeholders of the firm ethically or in a responsible manner. Ethically or responsible means treating stakeholders in a manner deemed acceptable in civilized societies. Social includes economic responsibility as well. Stakeholders exist both within a firm and outside; the natural environment is a stakeholder as an example. The wider aim of social responsibility is to create higher and higher standards of living, while preserving the profitability of the corporation, for peoples (both within and outside the corporation). CSR is also associated with good corporate citizenship, corporate governance, corporate sustainability, sustainable development etc. but all have the same meaning. Companies are expected to be engaged in earning profit while being involved in social development.
The purpose of this paper is to analyze social behaviour of DLF Ltd. in accordance of clause 6.7 of ISO 26000. Delhi Land and Finance (DLF) Ltd., largest commercial real estate developer in India, was formed in 1946. Its primary business is development of residential, commercial and retail properties. It developed first residential colonies Krishna Nagar in Delhi which was completed in 1949. Since then it also developed many other urban colonies like Kailash Colony, Model Town and Greater Kailash in Delhi.
1. Michael Hopkins, “Corporate social responsibility: an issues paper” (Working Paper No.27, 2004)

42 tLingaya's Lalita Devi Journal of Professional Studies A Critical Review of CSR Towards Consumers Through ISO 26000 Window t43
In mid 1970, it started developing DLF city project at Gurgaon which include infrastructure, hospitals, hotels, shopping malls and recreational spaces. It has made its presence across the country as well as outside the country.
As per clause 6.7 of ISO 26000, it is responsible to satisfy their consumer through providing essential information and engage in fair contractual practices relating to product and service. First we need to understand the ISO 26000 guidelines on Consumer issues which are as follows.
ISO (International Organization for Standardization) 26000 provides guidance on criteria for social responsibilities of an organization. ISO is the largest developer of standards in the world which are useful for all types of organizations. The clause 6.7 of ISO 26000 Guideline is related to consumer issues that an organization is expected to fulfill all of the responsibility towards their consumers. Consumer is one of key stakeholder of organization who uses or consumes product and services for personal purposes. Organization is responsible for providing good, healthy, environment friendly product or energy efficient product, essential information relating to safely use of product, promote sustainable consumption, addressing and resolving complaints etc.
ISO 26000 highlights consumer issues as:
I. Fair marketing, factual and unbiased information and fair contractual practices (Clause 6.7.3)
II. Protecting consumers’ health and safety (Clause 6.7.4)
III. Sustainable consumption (Clause 6.7.5)
IV. Consumer service, Complaints and dispute resolution (Clause 6.7.6)
V. Consumer data protection and privacy (Clause 6.7.7)
VI. Access to essential services (Clause 6.7.8)
VII. Consumer Education and Awareness (Clause 6.7.9)
In this paper, we analyzed the DLF Ltd according to nature of their business and their behaviour towards consumers as per clause I & VII mentioned above.
A. Fair marketing, factual and unbiased information and fair contractual practices (Clause 6.7.3)
The information about product and services provided should be fair, factual and unbiased as the language could be understood by consumers. This helps consumers to make decisions about consumption and purchases, and to compare different product and services. Fair contractual means to protect the legitimate interests of both the parties’ i.e. suppliers and consumers by mitigating the imbalance in managing power between them. While marketing and advertising product and services, business organizations should provide information in transparent manner and not engage in any practices that is deceptive, fraudulent, unfair, unclear or ambiguous etc. Organizations should use common language for providing information that should be complete, accurate and understandable by consumer and also gives details about its location (local address), contact including email etc.
B. Consumer Education and Awareness (Clause 6.7.9)
Education and awareness initiative helps consumer to be well-informed about their rights and responsibilities and also make their purchasing decisions or consumption choices responsible to contribute sustainable development. Provide appropriate information for proper disposal of waste products and efficient use of materials, energy and water.
This clause is related to consumer issues and provides guidance on how to serve consumer in better way. A socially responsible organization towards its customer has to fulfill all of its responsibility as mentioned above. And this is a challenging task for companies - how to meet the need and expectations of consumers? As needs of consumers are changing continuously. Companies are trying to do their best for their consumers through innovations in their respective products and providing superiority in services. They are continuously investing in R&D to achieve consumer loyalty and maximize the satisfaction level of their consumers. However, not all companies can achieve the target of satisfying consumer and enhancing consumer loyalty.
Methodology
This paper is theoretical in nature. Information collected form secondary source such as printed articles, website of the company and other public bodies.
Literature Review
Every company wants to fulfill the needs and expectation of consumers by its respective product and services and provide them higher satisfaction. The objective of company is not to please its consumer but also attract potential consumers. Therefore, they are trying to meets the needs of consumers now and in future to maximize its profit and contribute to sustainable development.
However, DLF Ltd. does not behave like consumer friendly company as it has abused its dominant position and engaging in unfair contractual practice in real estate industry. A case in point is case no. 19 of 2010 filed with Competition Commission of India
(CCI), “Belaire Owners’’ Association against three respondents DLF limited, HUDA and the Department of Town and Country Planning (DTCP), Where the Competition Commission of India has held that DLF limited was engaged in unfair contractual practice and imposed unreasonable conditions on the allotment of apartment of housing which has adverse effects on the rights of the allottees. HUDA and DTCP has approved and permitted DLF Limited‘s illegal act. Further, DLF limited had used its dominant position in dictating the terms which puts allottees in a disadvantageous condition.
The project of DLF limited was each of five multi-storied buildings to be built consist 19 floors and 368 apartments had to be constructed within a period of 36 months but actually there are 29 floors constructed and 544 apartments instead of 368.
DG (Director General) submitted its report that while booking the apartments, it did not tell allottees that there will be a revision in number of floors. The number of floors has increased while the area of land remains same. It was against the interest of allottees and they have raised issues for clarification. But DLF reminded consumers of the agreement with allottees and asking to pay the installments amount and those failing to do so resulting in cancellation of their allotments. Once again, DLF has gained when cancellation was made because amount paid by allottees were forfeited. This act of DLF was unjustified which affected consumers’ at greater extent.
The Commission has analyzed the entire Apartment Buyer Agreement very carefully and held that several clauses of the agreements were unfair and amounted to abuse of dominance.
The clauses of the agreement which had been held to be unfair by Competition Commission of India (CCI) are:
a) Clause E: DLF reserve itself the exclusive sole and discretion not only change number of zones but also their earmarked uses residential to commercial.
b) Clause 9.1: DLF had reserved its right to alter/modify/delete building plan and disallow its allottees not to arrogating.
¦This shows that DLF limited failed to provide fair, factual information and do not follow fair contractual practice with its customers.
¦It advertised the building plan but failed to fulfill the promise made.
¦It didn’t provide clear term and condition of the agreement and duration about the completion of apartment.
c) Clause J and K: The allottee of apartment was not allowed carrying out any investigation and any objection to DLF.
¦DLF reserves its right to change the entire plan without informing to allottees.
¦This agreement should be consider as fraud as after entering into agreement alteration is not allowed.
d) Clause 3 and 4: DLF will retain 10% sale price as earnest money for entire duration and hold so that allottees were followed the term of the agreement.
¦It imposes arbitrary conditions on allottees which is not fair contractual practice.
e) Clause 35: There were arbitrary mismatch between buyer and seller that in case allottee fail to pay installment in due time, interest should be charged at the rate of 15% for first 90 days and after 90 days @ 18%. On the other hand DLF pay only Rs.5/- per sq. ft. to the allottees for per month delay i.e. 1% per annum.
As per the latest judgment on 3rd January, 2013 CCI has asked to modify the buyer agreement of DLF's Belaire project which were earlier favouring DLF dominant position in the Real Estate and subsequently protecting the rights of consumers.
There are another two cases filed against DLF in Competition Commission of India.
1. The case no. 43 of 2011, Mr. Haravtar Singh Arora and his wife Gurjit Kaur Arora against DLF Limited filed in Competition Commission of India. The husband and wife booked two units in Belaire project at Gurgaon and made a down payment of Rs. 20,00,000 for said apartments’ units.
According to them, DLF issued a notice for payment of further installments but subsequently DLF had sent letter of cancellation to the allottees that the apartment booked by them have been cancelled and amount paid have been forfeited. This shows that how DLF limited has imposed arbitrary, unfair and unreasonable conditions on the apartment allottees and abused its dominance position in the market. As per DG investigation, DLF limited had cancelled the booking, forfeited amounts of the class or groups of buyers of the apartment and rebooked apartments for others. Competition Commission of India found that this case is similar to aforesaid case and it covers facts and issues of this case as well.
2. The case no. 55/2010 of M/s. Mili Marketing Private Limited Vs DLF Limited, HUDA and DTCP alleged that DLF limited has abused its dominance position and imposed unreasonable and unfair condition on the apartment allottees. It has not taken prior necessary permission and approvals to the concerned government and other parties have also violated the provisions of various government agencies. DTCP has sanctioned and approved its project to change building plans. This case was also clubbed by Competition Commission of India with the Belaire owner Association case.

44 tLingaya's Lalita Devi Journal of Professional Studies
CONCLUSION
Business organizations are taking CSR as core activities of their business which leads to sustainability growth as well as making good positioning in the mind of the consumers and helps to please potential consumers.
Today, CSR seems to be utmost important activity of business organization for betterment and achieving goals in short term as well as long term.
After examining the behaviour of DLF Ltd., the study finds that despite the company having good image but it is not necessary that company is socially responsible and respect their consumers’ right and interest.
DLF a market leader in real estate industry claims that it provides better and innovative services to their customer and contributes the development of society. But as per the case of “Belaire Owners” Association construe it had abusing its dominant position in the market and puts unfair clauses in the agreement which violated interest of consumers.
It depends upon the nature of business which relevant consumer issues have to fulfill. According to Clause 6.7 of ISO 26000 Guidelines, it is expected from DLF Limited to be fair in contractual practice but it failed to comply with consumers issues:
1. Clause 6.7.3: Fair marketing, factual and unbiased information and fair contractual practices: DLF Limited is considered as highly qualified and experienced in the relevant industry. But it does not respect their consumers and their rights. It did not give full and fair information relating to their project to the consumers and modify the project only to its convenience.
2. Clause 6.7.9: Consumer Education and Awareness: DLF Limited did not educate their consumers and didn’t enhance awareness but only exploited them by one sided agreement.
The cases decided by the Competition Commission of India have imposed penalty on DLF Ltd. amounting Rs. 630 Crores that demonstrated DLF does not respect its customer’s rights and interests. Hence, based on the above facts DLF cannot be said to a socially responsible company.
Limitation and Further Research
This study includes only one issue and one Company i.e. Consumer & DLF Ltd. Further research can extended by using primary data from consumer including more companies.
REFERENCES
A. Article:
1. Hopkins, Michael (2004), “Corporate social responsibility: An issues paper”, Working Paper No. 27
B. Report\Guidelines:-
1. International Standard ISO 26000 Guidance on “Social responsibility” issued by ISO on 2010(E).
C. Internet Resources:-
1. http://www.cci.gov.in/May2011/OrderOfCommission/DLFMainOrder110811.pdf accessedon March 29, 2012 (Belaire Owner's Association vs DLF Limited and HUDA)
2. http://www.dlf.in/dlf/wcm/connect/corporate/DLF_SITE/HOME/TOP+LINK/About+US/Overview accessed on July 6, 2012 (Referred Overview of DLF Ltd.)
3. http://articles.economictimes.indiatimes.com/2013-01-14/news/36331741_1_belaire-project-dlf-s-park-place-unfair-conditions accessed on January 25,2013 (Belaire Owner's Association vs DLF Limited and HUDA).
4. http://www.cci.gov.in/May2011/OrderOfCommission/CaseNo43and44of2011.pdf accessed on 4th April, 2012. (Haravtar Singh Arora and his wife Gurjit Kaur Arora vs DLF Ltd)
5. http://www.cci.gov.in/May2011/OrderOfCommission/MiliMktgMainOrder14Nov2011.pdf (M/s Mili Marketing Private Limited. vs M/s DLF Limited. & Ors.)
Teleconferencing Overview and Its Impact on Education, Business & Society
Mr. Ravi Ayyagari
INTRODUCATION
Teleconferencing means meeting through a telecommunications medium. It is a generic term for linking people between two or more locations by electronics. There are at least six types of teleconferencing: audio, audio graphic, computer, video, business television (BTV), and distance education. The methods used differ in the technology, but common factors contribute to the shared definition of teleconferencing:
• Use a telecommunications channel
• Link people at multiple locations
• Interactive to provide two-way communications
• Dynamic to require users' active participation
Interactive Technologies
The new systems have varying degrees of interactivity - the capability to talk back to the user. They are enabling and satellites, computers, teletext, view data, cassettes, cable, and videodiscs all fit the same emerging pattern. They provide ways for individuals to step out of the mass audiences and take an active role in the process by which information is transmitted. The new technologies are de-massified so that a special message can be exchanged with each individual in a large audience. They are the opposite o mass media and shift control to the user.
Many are asynchronous and can send or receive a message at a time convenient for individuals without being in communication at the same time. This overcomes time as a variable affecting communication. A video, data and voice delivery system reduces travel costs. When the material is retrieved and saved to a video tape or disc, the material can be used at anytime or anyplace.
As more interactive technologies emerge, the value of being an independent learner will increase. Research shows that learning from new technologies is as effective as traditional methods. Large groups are cost-effective and everyone gets the same information.
...teleconferencing can only facilitate the linking of people-it does not alter the complexity of group communication. Although it may be easier for us to communicate with teleconferencing, it may also be easier for us to miscommunicate.
Three essential features of teleconferencing are:
• Resource persons
• Participants present at particular time and in dispersed Places
• Interactions between Participants and resource person.
Research Scholar IGNOU
Teleconferencing Overview and Its Impact on Education, Business & Society t45

The communication in teleconferencing is both vertical and horizontal, and the emphasis is on interaction at all levels. Meaningful interaction in real time is the strength of teleconferencing, and this sets it apart from other technologies used in education. The one-way limitation of educational broadcasting is overcome through the technology configuration.
Stimulating responses to visuals, situations, dialogue, discussion, sharing, active experimentation, project work, etc. encourage interactivity, resulting in different transactional processes such as:
Conceptualization
Concretization of experience
Reflective observation
Application
Types of Teleconferences
Audio Teleconference
Audiographics Teleconference
Computer Teleconference
Video Teleconference
HISTORY: It all started just a mere 47 years ago in the 1960's as a vision from American Telephone and Telegraph (AT & T) through its Picture phone device – the birth of teleconferencing. At that time, travel was cheap and many people simply didn't understand that the Picture phone would be a workplace changing technology. Its taken 47 years and hundreds of millions of dollars spent on fuel consumption for the idea that grew out of Picture phone to become a real-world every day application embraced by millions worldwide.
Uses of Teleconferencing
Education
Teleconferencing is used in both formal and non-formal learning contexts to facilitate teacher-learner and learner-learner discussions, as well as to access experts and other resource persons remotely. In open and distance learning, teleconferencing is a useful tool for providing direct instruction and learner support, minimizing learner isolation. For instance, an audiographic teleconferencing network between Tianjin Medical University in China and four outlying Tianjin municipalities was piloted in 1999 as part of a multi-year collaboration between Tianjin Medical University and the University of Ottawa, School of Nursing funded by the Canadian International Development Agency. The audiographic teleconferencing network aims to provide continuing education and academic upgrading to nurses in parts of Tianjin municipality where access to nursing education has been extremely limited. Other higher education institutions using teleconferencing in their online learning programs include the Open University of the United Kingdom, UniTAR (University Tun Abdul Ruzak) in Malaysia, Open University of Hong Kong, and Indira Gandhi National Open University, India.
In the academic area, teleconferencing is useful for the following activities:
Delivery of full courses, lessons, tutoring, project work and training can be provided to the students through teleconferencing,
Delivery of certificate level courses for professional development. These courses can be modular and multi-media in nature comprising print, contact programs, and audio-video conferencing.
Partial support to courses through counseling, etc.
Introduction of short/new courses in skill development, vocational training, professional development, and to address problems related to introduction of new curriculum, and lack of teachers and facilities.
•
•
•
•
These and other transactional processes of this nature accelerate communication skills. Teleconferencing could have different technical configurations and applications. It includes use of telephone for audio conferencing, graphics in addition to audio for audio-graphic conferencing, television and/or computer for video conferencing. The video conferencing could be one-way video two-way audio or two-way video. The configuration can be simple or complex. The presentation can be just talk/discussion or it can be highly structured using sophisticated visual support. In today's terminology video conferencing and teleconferencing are similar as they function on the same pattern.
Teleconferencing is essentially a means for communication and training. It can be used for information dissemination, guidance in response to policy, consultations with experts, focused group discussions, interviews, etc. As a technology, it has broad applications in education, training and development, Business/corporate communication, governance and professional and medical courses/services.
•
•
•
•
•
•
•
•
•
•
Tutoring in difficult areas of the curriculum.
Remedial learning and off-hours teaching can be provided.
Enrichment, updating, guidance to additional learning resources, extension of existing courses.
Interaction by students with scientists, experts, decision and policy makers, etc. to obtain multiple perspectives on an issue.
Apart from academic activities, teleconferencing is used for administrative matters such as:
Problems solving and counseling on admissions, examination, status of' course ware materials distribution,
Guidance and advice on course content, expectations, assignments, grading, credits, etc.
Training and Development
Teleconferencing is used to provide training and staff development for capacity building in agriculture, health, nutrition, family welfare, etc. in remote rural areas.
It reaches out to a large number of groups such as community workers, farmers, functionaries, etc. for extension activities, sharing of experiences, rising of issues, introducing government schemes, projects, mobilizing for activities and conducting campaigns.
Teleconferencing has been effectively used for empowerment of women and local self-government bodies and training of grass root workers spread over large geographical areas.
Business/Corporate Communication
In the business and corporate sector, teleconferencing has been used for a variety of purposes such as organizing conferences, interviews for recruitment, project supervision, problem solving, consultations, information dissemination and training of the personnel. Education, training, instruction, information and counseling are merged resulting in an overall improvement in staff performance.
Governance
Using teleconferencing facilities, planners, administrators and executives can directly and simultaneously interact with people at all levels for speedy dissemination of policy, execution and monitoring the implementation of projects, problem solving, and providing expert consultations.
Professional and Medicinal Courses and Services
Medicine is an area in which teleconferencing is being increasingly used. Hospitals can provide medical services to remote areas with expert diagnosis and medical advice. Similarly, many professional training institutes are using the teleconferencing mode to provide quality teaching support to widely dispersed student community
KEY FEATURES
1. Operator assistance: Allows the moderator to enter into a private conversation with the conferencing operator.
2. Moderator dial out: Allows participants to leave their teleconference temporarily and bring in additional participants.
3. Recording: A valuable tool for creating a permanent record of the conversation which can be used later for training, monitoring and marketing purposes.
4. Lecture mode and individual line mute: A useful function when there is significant background noise or when information only needs to be conveyed to certain participants.
5. Security: Be sure to choose a teleconferencing company that offers this function, as it will ensure that no additional persons, including the operator, may enter the conference.
6. Automated roll call and participant count: Allows the moderator to hear the number of participants currently on the line and also to listen to a recording of each participant's name.
7. Add reference number/billing code: Associate a reference code which corresponds with expenditure.
8. Automatic disconnects: A function which immediately disconnects everyone currently on the teleconference. This ensures that no-one can remain online after the conference ends.
Combining with Web and Video
In a world saturated with visual communication, many of us are familiar and at ease with the desktop video and web conferencing technologies. There has been a significant shift in the way in which we interact with computers and mobile devices and this means
46 tLingaya's Lalita Devi Journal of Professional Studies Teleconferencing Overview and Its Impact on Education, Business & Society t47

that business is no longer solely responsible for leading the adoption of technology among its employees - rather it must keep up with and integrate such technologies across its own organizational cultures.
Over the last decade, desktop video and web conferencing have been through a number of developmental cycles to address issues such as software downloads, firewalls, bandwidth and support for Windows versus Macs.
Thankfully, virtual conferencing companies are now able to offer integrated and fully functioning services across the web, video and telephone platforms. The obvious advantage of integrating telephony with video and web is that participants can see, share and update information and documents without having to employ or learn complicated technologies
IMPACT OF EMERGING TECHNOLOGIES LIKE TELECONFERENCING
In the past few decades there has been a revolution in computing and communications, and all indications are that technological progress and use of information technology will continue at a rapid pace. Accompanying and supporting the dramatic increases in the power and use of new information technologies has been the declining cost of communications as a result of both technological improvements and increased competition. According to Moore's law the processing power of microchips is doubling every 18 months. These advances present many significant opportunities but also pose major challenges. Today, innovations in information technology are having wide ranging effects across numerous domains of society, and policy makers are acting on issues involving economic productivity, intellectual property rights, privacy protection, and affordability of and access to information. Choices made now will have long- lasting consequences, and attention must be paid to their social and economic impacts.
BUSINESS MODELS, COMMERECE AND MARKET STRUCTURE
One important way in which information technology is affecting work is by reducing the importance of distance. In many industries, the geographic distribution of work is changing significantly. For instance, some software firms have found that they can overcome the tight lo- cal market for software engineers by sending projects to India or other nations where the wages are much lower. Furthermore, such arrangements can take advantage of the time differences so that critical projects can be worked on nearly around the clock. Firms can outsource their manufacturing to other nations and rely on telecommunications to keep marketing, R&D, and distribution teams in close contact with the manufacturing groups.
WORK PLACE AND LABOUR MARKET
Computers and communication technologies allow individuals to communicate with one another in ways complementary to traditional face to face, telephonic, and written modes. They enable collaborative work involving distributed communities of actors who seldom, if ever, meet physically. These technologies utilize communication infrastructures that are both global and always up, thus enabling 24-hour activity and asynchronous as well as synchronous interactions among individuals, groups, and organizations. Social interaction in organizations will be affected by use of computers and communication technologies.
PRIVATE LIFE AND SOCIETY
The latest technological advances are not limited to just business. Emerging technology has affected the way we live in many ways, including Medical technology, Safeguarding the life, Social Development: Education, Lifestyle & Living Standard and many More. The rapid increase in computing and communications power has raised considerable concern about privacy both in the public and private sector. Technological progress inevitably creates dependence on technology. Indeed the creation of vital infrastructure ensures dependence on that infrastructure. As surely as the world is now dependent on its transport, telephone, and other infrastructures, it will be dependent on the emerging information infrastructure. Dependence on technology can bring risks. Failures in the technological infrastructure can cause the collapse of economic and social functionality. Black-outs of long distance telephone service, credit data systems, electronic funds transfer systems, and other such vital communications and information processing services would undoubtedly cause widespread economic disruption. The ongoing computing and communications revolution has numerous economic and social impacts on modern society and requires serious social science investigation in order to manage its risks and dangers. Such work would be valuable for both social policy and technology design. Decisions have to be taken carefully. Many choices being made now will be costly or difficult to modify in the future.
Limitations of Teleconferencing
Teleconferencing has its limitations, but these can be overcome to a great extent by corrective measures and using appropriate content, planning, organization and management.
For example, for effective interaction, there is a limit to the number of learning centers. If the number of centers is increased, time for interactivity for each center is correspondingly reduced. However, this can be overcome to a great extent by using fax and
48 tLingaya's Lalita Devi Journal of Professional Studies Teleconferencing Overview and Its Impact on Education, Business & Society t49
e-mail technologies along with telephone lines. Another way is to rotate the question-answer sessions among different groups of centers. This strategy would take care of language differences as well.
Since teleconferencing demands real time interaction, the learners are required to be present at particular times and places. It may be difficult for them to do so because of logistics problems and other reasons, resulting in poor attendance at the sessions. However, the proceedings can be recorded and sent to such learners as cannot attend at the learning centers. Experience shows that learners benefit a great deal even from recorded versions. For those who have participated, repeatability provides new insights.
FUTURE TRENDS IN TELECONFERENCING
In looking at the status of today’s technologies and applications, teleconferencing is poised for tremendous growth. A number of factors are contributing to this readiness posture. They include advances in technology and a maturing of the industry that are meshing with organizational concerns about productivity, communications, operating costs, and competition. Teleconferencing has also proved its effectiveness in many situations, and has demonstrated its ability to meet diverse needs.
There are, however, warning signs. Most involve human factors and those “soft” areas that relate to users and applications. Emerging as primary issues are the design of user-oriented systems, implementation strategies, training, appropriate applications, and support structures that promote successful applications and the integration of teleconferencing into an organization. There has been a tendency for people to put technology first, rather than focusing on applications and end users. The growth of teleconferencing depends on the recognition of human factors as well.
In the 80s, we saw dramatic changes in teleconferencing systems. We are currently witnessing the movement toward digital communications and information processing on many fronts. This trend not only promises to continue but will accelerate. In the teleconferencing industry, we are now seeing the forerunners of future products and services that will be more sophisticated and more widely available.
A relatively recent entrant into the market, for example, is multimedia software for personal computer workstations. These technologies include various combinations of laser scanning, video pictures, light-pens, electronic tablets, mouse digital telephones, touch-sensitive screens, and voice recognition. They are directed to individual desktop teleconferencing as well as group teleconference rooms. In the continuing merger of teleconferencing with computers, multimedia will become an important tool in communicating information and data.
With digital voice will come more new audio teleconferencing products, from station equipment to advanced Bridges. New digital bridges have already been introduced that not only integrate voice and graphics but also improve transmission quality and system control.
The impact of compressed video codec’s and digital video processing will also increase as new products emerge. New compression techniques will also find their way into other products, like freeze frame video and audio graphics systems, to reduce transmission time.
Products for digital voice, graphics, and video will be linked via terrestrial loops and satellite skyways. Promoting the concept of inter-networking will be gateways joining local facilities to long-distance channels as we move toward integrated service digital networks.
Communications technologies are indeed advancing rapidly, promising – or threatening – to link us in local, national, and worldwide networks. With a dazzling array of new products and services on the horizon, it may be even more difficult to remember that the ultimate goal of any technology is to expand human potential. In the final analysis, the value of teleconferencing rests on how well it serves people, and its worth is measured by its users.
Following facts can be the Base of Emerging Trends in Teleconferencing
Trend One: Lifelike Experiences
Trend Two: Widespread Use of Technology
Trend Three: Industry-specific Applications
REFERENCES
Effective Teleconferencing & Webinars
From Paul Charles & Associates
TELECONFERENCING CUTS COSTS
By Dr. S. Ann Earon, Chairperson, IMCCA.

50 tLingaya's Lalita Devi Journal of Professional Studies Office Noise and Productivity—Study of Offices at Chandigarh t51
Office Noise and Productivity— Study of Offices at Chandigarh
Gurkirpal [email protected]
ABSTRACT
Major spending of organisations is on staff salaries. In order to be efficient and competitive in the profession, the staff should be productive. Staff will be productive when they are comfortable with regard to Office Environment. In this paper effect of Office Noise on productivity of occupants is highlighted. A research to this regard was conducted in Offices of capital city of Chandigarh (India). Various Offices were sampled and Questionnaire survey of productivity was conducted to get first hand information from Office Occupants.
Key words: productivity, office design, Noise
INTRODUCTION
Introduction People spend most of their time indoors -- be it office or home. The success of any organization is dependent on the productivity of the employees. The productivity of the employees is dependent on comfort levels at their office. World over research has been done to study the effect on office noise/environment on productivity but not in India. So the study is conducted to identify the effects of office noise in offices at Chandigarh (India).
Aim is to study the effect of noise on productivity of office employees.
Literature review Various literature pertain to the study of multiple offices and office buildings indicated that the factors such as dissatisfaction, cluttered workplaces and the physical environment are playing a major role in the loss of employees’ productivity (Carnevale 1992, Clements-Croome 1997).
How workspace is designed and occupied affects not only how people feel, but also their work performance, their commitment to their employer, and the creation of new knowledge (human capital) in the organization. These are the cornerstones of the domain known as the environmental psychology of workspace (Vischer, 2008). Moreover, measures of user perceptions of environmental conditions can be used to diagnose building performance and the effectiveness of building systems (Vischer& Fischer, 2005). A large number of work environment studies have tested users’ satisfaction in reference to specific workspace features (Becker, 1981; Brennan, Chugh & Kline, 2002; Hedge, 1991; Humphries, 2005; Veitch, Charles, Newsham, Marquardt & Geerts, 2004). These studies show that people’s preferences are affected by, among other things, Noise.
METHODOLOGY
Sample
A total of 660 employees from various offices of Chandigarh were recruited as sample. The age range of the sample was between 25-60 years. The minimum educational qualification was graduation. For inclusion in the study the employee must be working in that particular organization since last three years. Primary data was collected through a structured questionnaire. The
President, Telemanagement Resources International Inc.
Higher Education at a Distance with Teleconferencing: Teachers’ Perceptions
Ms. Poonam Bhushna
Indira Gandhi National Open University, New Delhi, India
Real World Teleconferencing
Mark Billinghurst, Adrian Cheok, Hirokazu Kato, Simon Prince
HIT Lab New Zealand
National University of Singapore
Hiroshima City University

52 tLingaya's Lalita Devi Journal of Professional Studies Office Noise and Productivity—Study of Offices at Chandigarh t53
questionnaire was developed on the basis of the research literature review. The questionnaire consisted of 5 questions on noise variable to be rated on a five point Likert scale.
Data Analysis
For result findings and in-depth analysis of the different components of office environment on the performance level of the employees, statistical techniques of correlation has been used. SPSS software as research tool for data analysis is used for this research.
RESULTS
Table 1: Descriptive Statistic of Various Factors/Elements of Office Design
Factors Respondents (N) Mean Std. Deviation
Noise 660 2.9723 .57606
Table 2: Correlation between Elements of Office Design and Employee Productivity
Office Design Element Pearson Correlation (r) Significance
Noise .350** .00
** Correlation is significant at the 0.01 level (2-tailed)
Result analysis
This relationship between office design and productivity was determined by using the Pearson’s Correlation. This shows that when the Noise of the office is not comfortable and according to the needs of the employees their productivity is affected. The positive relationship between Noise and productivity(r=.350) at 0.00 shows that employees’ productivity correlates to the Noise conditions in the offices. (Table 2).
Discussion Analysis of the collected data revealed that office design has a substantial impact on the employees’ productivity. The overall impact of different elements showed that Noise affects the productivity of most employees. The results are similar to previous research viz; Amjad & Hamid (2009), Amir & Shahibzada (2009); Haapakangas et al (2008), Kari (2010), Miller et al (2010); Vischer, (2005), Wyon (2004).
Present study found correlation between employee’s productivity and Noise. Tapping Noise as a resource reduces energy use and improves productivity.
Limitations the study is limited to Noise only and is not exhaustive .
Following are a few limitations of the study• The sample size was not diverse enough to give the image of all organizations functioning in India.
Future Research Scope
Future research can be done on the public sector or semi government organizations and can be compared with the findings of this research. In addition a good study can be conducted for comparison among services and manufacturing sector as well.
CONCLUSION
On the basis of our research we can conclude that the Noise component of office environment have impact on the performance level of the office employees, can affect the out put of the employees. If Noise factor is favorable for office employees then they can perform much better. This will contribute towards enhanced output and exceptional performance
REFERENCES
1. Huges, J. (2007, July). Office design is pivotal to employee productivity. Sandiego source the daily transcript.
2. The Gensler Design + Performance Index, The U.S. Workplace Survey (2006), www.gensler.com
3. Clements-Croome, D., Kaluarachchi, Y. (2000) An Assessment of the Influence of the In-door Environment on the Productivity of Occupants in Offices Design, Construction and Operation of Healthy Buildings, pp.67–81
4. Roelofsen, P. (2002). The impact of office environments on employee performance: The design of the workplace as a strategy for productivity enhancement. Journal of Facilities Management, 1(3), 247–264.
5. Haynes, B. P. (2007). Office productivity: A shift from cost reduction to human contribution. Facilities, 25(11/12), 452–462.
6. Hameed, A., & Amjad, S. (2009). „Impact of office design on employees? productivity: A case study of banking organizations of Abbottabad, Pakistan. Journal of Public Affairs, Administration and Management, 3(1), 1–13.
7. Perceived acoustic environment, work performance and well-being -survey results from Finnish offices—AnnuHaapakangas, Riikka Helenius, Esko Keskinen, ValtteriHongisto
8. Measuring the impact of office environment on performance level of employees in the private sector of Pakistan—Faiza Amir & Dr. Shamim A Sahibzada; Shaheed Zulfiqar Ali Bhutto Institute of Science and Technology Islamabad Pakistan. Faculty of Management Sciences
9. Journal of public affairs, administration and management Volume 3, Issue 1, 2009; Impact of Office Design on Employees’ Productivity: A Case study of Banking, Organizations of Abbottabad, Pakistan ; Amina Hameed, Shehla Amjad,
10. Faculty of Business and Economics The English Language Ph.D Programme The impact of the indoor environment on the productivity of Call Center Employees By Uri Domàn Submitted for the Degree of Doctor of Philosophy
11. Green Buildings and Productivity Draft: August 19, 2009 Forthcoming in the Journal of Sustainable Real Estate Vol. 1, No. 1, Fall 2009
12. By Norm G. Miller, PhD, University of San Diego, Burnham-Moores Center for Real Estate[[email protected]] and Dave Pogue, LEED AP and National Director of Sustainability, CBRE [[email protected]]
13. Quiana D. Gough, University of Baltimore, degree expected May of 2010 in Business,[email protected] and Susan M. Davis, Bachelor of Commerce, University of British Columbia,[email protected]
14. Vischer, J.C. (2005). Measuring the Impact of Moving on Building Users. EcoLibrium. September, 22-27.
15. Carnevale, D.G., (1992), Physical Settings of Work. Public Productivity and Management Review, 15, 4,sd423-436.
16. Clements-Croome, D.J., (1997). Specifying Indoor Climate, in book Naturally Ventilated Buildings, (Spon)
17. Sehgal S. (2012) Relationship between Work Environment And Productivity” International Journal of Engineering Research and Applications. Vol. 2, (4),1992-1995.

54 tLingaya's Lalita Devi Journal of Professional Studies Efficiency of Financial Markets t55
Efficiency of Financial Markets
Mr. Jadhav Sachin K. Assistant Professor
THE CONCEPT OF MARKET EFFICIENCY
In the 1970s Eugene Fama defined an efficient financial market as "one in which prices always fully reflect available information”. The most common type of efficiency referred to in financial markets is the allocative efficiency, or the efficiency of allocating resources. This includes producing the right goods for the right people at the right price. A trait of allocatively efficient financial market is that it channels funds from the ultimate lenders to the ultimate borrowers in a way that the funds are used in the most socially useful manner.
With a better understanding of price formation in competitive markets, the random walk model came to be seen as a set of observations that can be consistent with the efficient markets hypothesis. The switch of emphasis began with observations such as that of Samuelson (1965), who’s “Proof That Properly Anticipated Prices Fluctuate Randomly” began with the observation that "in competitive markets there is a buyer for every seller. If one could be sure that a price would rise, it would have already risen." Samuelson asserted that "arguments like this are used to deduce that competitive prices must display price changes that perform a random walk with no predictable bias." Samuelson explains that "we would expect people in the market place, in pursuit of avid and intelligent self-interest, to take account of those elements of future events that in a probability sense may be discerned to be casting their shadows before them." By presenting his proof in a general form, Samuelson added rigour to our notion of a well-functioning market.
Methodology
The study was conducted using secondary data.
Secondary data
It was collected from various books, articles, journals and blogs on financial market efficiency.
Necessary conditions for market efficiency
Markets do not become efficient automatically. It is the actions of investors, sensing bargains and putting into effect schemes to beat the market, that make markets efficient. The necessary conditions for a market inefficiency to be eliminated are as follows -
(1) The market inefficiency should provide the basis for a scheme to beat the market and earn excess returns. For this to hold true
(a) The asset (or assets) which are the source of the inefficiency has to be traded.
(b) The transactions costs of executing the scheme have to be smaller than the expected profits from the scheme.
(2) There should be profit maximizing investors who
(a) Recognize the 'potential for excess return'
(b) Can replicate the beat the market scheme that earns the excess return
(c) Have the resources to trade on the stock until the inefficiency disappears
Efficient Markets and Profit-seeking investors: The Internal Contradiction
1. There is an internal contradiction in claiming that there is no possibility of beating the market in an efficient market and then requiring profit-maximizing investors to constantly seek out ways of beating the market and thus making it efficient.
2. If markets were, in fact, efficient, investors would stop looking for inefficiencies, which would lead to markets becoming inefficient again.
3. It makes sense to think about an efficient market as a self-correcting mechanism, where inefficiencies appear at regular intervals but disappear almost instantaneously as investors find them and trade on them.
Market Efficiency Levels
Eugene Fama identified three levels of market efficiency:
1. Weak-form efficiency
Prices of the securities instantly and fully reflect all information of the past prices. This means future price movements cannot be predicted by using past prices. It is simply to say that, past data on stock prices are of no use in predicting future stock price changes. Everything is random. In this kind of market, should simply use a "buy-and-hold" strategy.
2. Semi-strong efficiency
Asset prices fully reflect all of the publicly available information. Therefore, only investors with additional inside information could have advantage on the market. Any price anomalies are quickly found out and the stock market adjusts.
3. Strong-form efficiency
Asset prices fully reflect all of the public and inside information available. Therefore, no one can have advantage on the market in predicting prices since there is no data that would provide any additional value to the investors.
Market Efficiency Types
James Tobin identified four efficiency types that could be present in a financial market:
1. Information arbitrage efficiency
Asset prices fully reflect all of the privately available information (the least demanding requirement for efficient market, since arbitrage includes realizable, risk free transactions)
Arbitrage involves taking advantage of price similarities of financial instruments between 2 or more markets by trading to generate losses. It involves only risk-free transactions and the information used for trading is obtained at no cost. Therefore, the profit opportunities are not fully exploited, and it can be said that arbitrage is a result of market inefficiency. This reflects the weak-information efficiency model.
2. Fundamental valuation efficiency
Asset prices reflect the expected past flows of payments associated with holding the assets (profit forecasts are correct, they attract investors) Fundamental valuation involves lower risks and less profit opportunities. It refers to the accuracy of the predicted return on the investment. Financial markets are characterized by predictability and inconsistent misalignments that force the prices to always deviate from their fundamental valuations. This reflects the semi-strong information efficiency model.
3. Full insurance efficiency
It ensures the continuous delivery of goods and services in all contingencies.
4. Functional/Operational efficiency
The products and services available at the financial markets are provided for the least cost and are directly useful to the participants. Every financial market will contain a unique mixture of the identified efficiency types.
Financial Efficiency versus Macroeconomic Stability: Is There a Conflict?
A first question is whether the growing role of nonbank intermediaries and money markets as sources of business finance reducing the special role once played by commercial banks, the institutions subject to the most direct control by the Fed is likely to imply a reduced ability of the Fed to control the pace of spending in the economy and hence ultimately to achieve its inflation-stabilization objectives. The presumption that monetary policy’s effectiveness depends on some special role of banks is based on an old-fashioned idea that monetary policy acts by rationing the flow of credit that would otherwise occur; the Fed acts by controlling the flow of oxygen to the economy, and must maintain a sort of choke-hold to do it. If one takes that view, one might well be worried

that the increasing efficiency of the financial system, giving private parties opportunities to substitute away from the particular channels that the Fed is best able to obstruct, should reduce the effectiveness of monetary policy. But the exploitation of distortions in the efficient allocation of credit by the market system is neither essential nor, in my view, a particularly desirable aspect of monetary control under present circumstances, whatever its importance may have been at certain times in the past. The main way that monetary policy now works in the United States and throughout the industrialized world is by affecting the level of interest rates, rather than through quantitative controls over credit flows. And not only does this seem to be a sufficient channel for central banks to achieve their stabilization goals fairly well for central banks worldwide have done better at stabilizing both inflation and real variables over the past decade, despite having largely forsworn efforts to intervene directly in markets but it is the one that is most consistent with an important argument for the use of monetary policy as our main tool of stabilization policy. This is the idea that monetary policy has an advantage of acting relatively uniformly on spending decisions throughout the economy, allowing policymakers to stabilize inflationary pressures without creating undue allocative distortions across sectors of the economy. Some might argue that it should not be possible to control interest rates without controlling the supply of credit, so that the difference in the two approaches is more superficial than fundamental; and that while it might be preferable to restrict the supply of credit uniformly rather than solely through particular channels, some choke-hold will be needed, and regulations will likely be necessary to ensure that the part of the credit supply that the Fed can restrict will continue to matter for aggregate credit flow. But this represents an error in economic analysis, though not one that one can explain in detail on this occasion.
The important point is that there is nota particular level of interest rates that would be determined by the forces of supply and demand if the Fed were not able to interfere with them, for example, by preventing private institutions from offering credit on the terms with which they would otherwise be content. A typical partial equilibrium analysis of “the market for credit” might make it seem that there should be. But an inter temporal, general equilibrium analysis reveals that there is not. Specifically, general equilibrium analysis in a model where, for the sake of simplicity, we suppose that all wages and prices are perfectly flexible reveals that while relative prices have well-defined equilibrium values in the absence of distortions due to taxation or other government intervention, market forces cannot similarly determine the absolute prices of goods and services in terms of a fiat unit of account. The meaning of a “dollar” the unit of account by which the prices of real goods and services happen to be quoted would have to be determined by the policies of the Fed, even in a world where markets were completely efficient and completely unconstrained by government interference, for a dollar refers to nothing other than a type of Fed liability. And the central bank’s role in defining the meaning of a fiat unit of account need not involve any interference with the freedom of contract, any more than the establishment of a standard meaning of a unit of measure such as the “yard” represents interference with the freedom of contract in markets where goods such as cloth may be sold by the yard. It should furthermore be noted that not only is the meaning of a “dollar” something that can be determined by an arbitrary decision of the Fed, without any defiance of market forces being required, but there is a separate arbitrary decision of this kind to be made at each point in time. Just as market forces do not determine the value of a dollar on any given day, they do not require that its value be the same from day to day. This means that the nominal interest rate that should be available between any two dates is not determined by market “fundamentals,” but is instead up to the arbitrary decision of the central bank, insofar as the nominal yield in question is defined in units of the liabilities of that central bank. This is important because in practice central banks find it more convenient to pursue their policy aims through control of short-term nominal interest rates rather than by directly seeking to fix the exchange value of their liabilities in terms of any real goods and services. At this point, one might object to my only providing an argument for the indeterminacy of the nominal interest rate in a world without government interference in markets; there would still be a well-defined, market determined real rate of return over any time period, whereas central banks actually need to control real rates if they are to affect real expenditure. It may furthermore be argued that the apparent ability of a central bank to control nominal interest rates as it wishes depends upon the assumption that prices in terms of dollars can be freely adjusted without any consequence for relative prices, while there are important nominal rigidities in practice. It might then seem that even central bank control of nominal interest rates should be ineffective in practice, unless it is possible to obstruct credit flows. But a more careful analysis would reveal that the existence of nominal rigidities undermines the argument that real interest rates should be determined by economic “fundamentals” in the absence of distortions resulting from government policy. Economic fundamentals should determine an equilibrium real rate of interest consistent with market clearing the real rate of interest required to induce people to demand at each point in time exactly the amount that the economy is able to produce. But if wages and/or prices do not immediately adjust in order to clear goods markets and labor markets, then the real interest rate need not be at this level, even in the absence of any interference with the behavior of private parties; a different real interest rate is simply associated with a different inter temporal pattern of imbalances between supply and demand. The possibility of central bank control over nominal interest rates indeed, the necessity for the central bank to signal to the private sector how nominal variables should evolve, if there is to be any determinate level of nominal interest rates remains; but in such a world, central bank control over nominal interest rates also implies an ability to shift real interest rates, at least temporarily.
Thus, there is no reason to seek to slow down improvements in financial efficiency on the grounds that this should allow better control by the Fed over macroeconomic conditions.
CONCLUSION
Financial market efficiency is an important topic in the world of Finance. While most financiers believe the markets are neither 100% efficient, nor 100% inefficient, many disagree where on the efficiency line the world's markets fall. It can be concluded that in reality a financial market can’t be considered to be extremely efficient, or completely inefficient. The financial markets are a mixture of both, sometimes the market will provide fair returns on the investment for everyone, while at other times certain investors will generate above average returns on their investment.
REFERENCES
1. http://en.wikipedia.org/wiki/Financial_market_efficiency
2. http://pages.stern.nyu.edu/~%20adamodar/New_Home_Page/invemgmt/effdefn.htm
3. Published in European Financial Management, Volume 4, Number 1, March 1998, pp 91-193 A brief history of market efficiency Elroy Dimson and Massoud Mussavian
4. London Business School, Sussex Place, Regents Park, London NW1 4SA, UK. E-mail: [email protected] and
6. Financial Market Efficiency and the Effectiveness of Monetary Policy by Michael Woodford
56 tLingaya's Lalita Devi Journal of Professional Studies Efficiency of Financial Markets t57

58 tLingaya's Lalita Devi Journal of Professional Studies Labour Unions’ Backfire on Organizational Change t59
Labour Unions’ Backfire on Organizational Change
Kavita Malhotra
ABSTRACT
People don't resist change. They resist being changed. Organizational change brings that change in which people have to change themselves. But as a human tendency they resist changes and backfire on the organizational change. Organizational Change implies the creation of imbalances in the existing pattern of the situation. When an organization operates and functions for a long time, an adjustment between the technical, human and structural set up is established. It tends to approximate equilibrium in relation to its environment. In other words, organizational members evolve a tentative set of relations with the environment. They have an adjustment with their job, working conditions, friends and colleagues etc. Change requires individuals to make new adjustments. Hence the fears of adjustments give rise to the problem of change and resistance to change. Individuals comes in to danger and groups resist change where their existence is in danger or a total change in overall work environment is contemplated. This research paper is concerned with the resistance to change that shows how labour unions resist those organizational changes which are not in favour of their interests and cause loss to the organization. An organizational change was introduced in Maruti Manesar Plant by demanding the Good Conduct bond from the workers that resulted into labour unrest and caused a huge loss to the Company. The good conduct bond required the workers to declare they would "not resort to go slow, intermittent stoppage of work, stay-in-strike, work-to-rule, sabotage or otherwise indulge in any activity, which would hamper normal production in the factory".
Keywords: Organizational Changes, resistance to change, backfire, Labour Unrest, Mental Revolution
INTRODUCTION
Organizational Change refers to any alteration which occurs in the overall work environment of an organization .Organizational change is about reviewing and modifying management structures and business processes. Organization is composed of a number of subsystems, which are also in a dynamic relationship of interaction and interdependence with one another. Any change in a sub system creates a chain of changes throughout the entire system. Though “Change is the law of nature”, it is also the fact that people have a natural instinct to resist the changes. Resistance to change is understood to be a natural phenomenon. Sources of resistance to change may be rational or emotional. Rational Resistance occurs when people do not have proper knowledge or information to evaluate the change. Emotional Resistance involves the psychological problems of fear, anxiety, suspicion, insecurity and the like. These feelings are evoked because of the people’s perception of how the change will affect them. These causes of resistance to change sometimes results in hostility or aggression as an immediate reaction. At group level additional signs of resistance are exhibited. Slow downs and strikes are the usual symptoms of group resistances. Another strategy adopted by labour unions to resist change is restriction of output. Labour unrest as a result of resistance to change has to be managed in a very planned and effective manner as this may cause a huge loss to the organization. Last year, labour unrest resulted in a loss of over Rs 2,500 crore for the Maruti Company.
Objectives & Importance of study:
1. To analyze the organizational change and its impact on organization and labour unions
2. To find out the reasons and causes of resistance to organizational change.
3. To analyze the adverse effects of the organizational changes and to find out the ways to implement organizational change in an effective and unopposed manner.
4. To show the importance of cordial labour management relationship in an organization and role of mental revolution in improving labour management relationship.
LITERATURE REVIEW
There have not been much written on Labour union reactions on the organizational change and how they backfire on it. But there has been a lot of research on organizational change, its impacts, employees’ attitudes towards organizational change and how to introduce change in a planned and effective manner.
According to Gateway Information Services, a New York consulting firm, 70% of all change programs fail due to employee resistance. Given the poor success record of various interventions strategies, it is reasonable to seriously question their validity as it relates to understanding the dynamics of organizational change. If intervention strategies are suspect, it is also reasonable to question the organizational change theory which supports these interventions. Lewin’s model of organizational change consists of two basic concepts. The first that an organization’s natural state is static or unchanging. Lewin describes this state as being “frozen”. When the organization is in a state of change it is malleable or it “thaws” then reverts to a static or “frozen” state. The second is an organization can be successfully divided into two groups. One that seeks change and one that opposes change. I have grave doubts that either concept has much basis in actual organizations.
Based on work done by Roseabeth Kanter, it seems that no maters were a person is in the organization they feel, at least to some degree, that they are powerless to change the organization. This, of course, is a matter of perspective. The people at the bottom certainly don't see the people at the top as being powerless. Yet the people at the top acknowledge all the trappings associated with power but don't experience the power to substantially influence the organization. The people who are in the middle share the view of power from both the top and the bottom simultaneously. I feel it is reasonable to conclude that a realistic understanding of organizational change recognize all of these viewpoints as an aspect of reality.
Against a background of rapid technological development, a growing knowledge workforce and the shifting of accepted work practices, change is becoming an ever-present feature of organizational life (Burnes, 2004). However, whilst many organizations appreciate the need for change, as many as 70% of the change programmes do not achieve their intended outcomes (Balogun and Hope Hailey, 2004).
Within the literature, one of the most influential perspectives within what are known as ‘planned approaches’ to change is that of Lewin (1952, in Elrod II and Tippett, 2002) who argued that change involves a three stage process: firstly, unfreezing current behaviour; secondly, moving to the new behaviour; and, finally, refreezing the new behaviour. The three-step model was adopted for many years as the dominant framework for understanding the process of organizational change (Todnem, 2005). Since its formulation, the theory has been reviewed and modified, with stages being divided to make more specific steps. For example, Bullock and Batten (1985) developed a four stage model consisting of exploration, planning, action and integration.
Change is unavoidable in order to remain competitive in today’s fast-paced market environment. Management guru, Tom Peters puts it that ‘change or die’ has been the bottom line for countless firms (Jick & Peiperl, 2011). Change can be large or small, evolutionary or revolutionary, sought after or resisted (Hayes, 2010) and is a general feature of organizational life, both at an operational and strategic level (Todnem, 2005). Burnes (1992) expressed that ‘change management is not a distinct discipline but rather, the theory and practice of change management draws on a number of social science disciplines and traditions’ (Kitchen & Daly, 2002). It is also defined as ‘the process of continually renewing an organization’s direction, structure, and capabilities to serve the ever-changing needs of external and internal customers’ (Moran & Brightman, 2000).
Once we have introduced the concept of organizational change and have presented a typology, we will analyze the term ‘resistance to change’. On one hand, resistance is a phenomenon that affects the change process, delaying or slowing down its beginning, obstructing or hindering its implementation, and increasing its costs (Ansoff, 1990). On the other hand, resistance is any conduct that tries to keep the status quo, that is to say, resistance is equivalent to inertia, as the persistence to avoid change (Maurer, 1996; Rumelt, 1995; Zaltman and Duncan, 1977). So, inertia and thus resistance are not negative concepts in general, since change is not inherently beneficial for organizations. Even more, resistance could show change managers certain aspects that are not properly considered in the change process (Waddell and Sohal, 1998).
RESEARCH METHODOLOGY AND DATA COLLECTION
The present study made an attempt to analyze backfire and intolerance of labour unions against the organizational change. In our present research Paper we use Secondary Data. The secondary data that has been used in this research paper has been collected

60 tLingaya's Lalita Devi Journal of Professional Studies Labour Unions’ Backfire on Organizational Change t61
from the various books on Organizational Behviour, websites and newspapers like Economic Times, Hindustan Times and The Times of India.
Data Findings and Interpretation
Last year, labour unrest resulted in a loss of over Rs 2,500 crore for the company. So, what's causing Maruti such big problems at Manesar? As per the information, facts and data collected, four major organizational changes have resulted in the simmering tension between the management and workers at Maruti Suzuki.
The Missing India connect
Since 2007, two important changes have happened at Maruti. One, Shinzo Nakanishi, the current MD of Maruti Suzuki, took over the reins from Jagdish Khattar. RC Bhargava, who was a director, was made chairman. Two, Maruti and the India market are also becoming increasingly important for Suzuki Motors. Till recently, Maruti contributed more than half of the parent's profits. As Maruti's contribution to Suzuki has increased, the latter's tendency to control India operations has increased. Agreed, it has an Indian chairman but Bhargava is 78 years old. It does have many senior Indian executives who have been 'lifers' at Maruti. But insiders who will speak on the condition of anonymity say the Japanese voice counts and often tend to dominate crucial decisions. Culturally, Indians and Japanese are far apart. Their sense of discipline, punctuality, employee connect too are very different. Some loss of connect with Indians is expected.
Leaner, Meaner Pressures
The challenges of running manufacturing outfits have surged. Costs and wages have increased and sales are poor & volatile. Doing business is difficult. Doing profitable business is even more difficult. Every company is figuring out ways to bring down costs and improve productivity. Most have contract labour to bring in flexibility and reduce costs. At Maruti's Manesar factory, 40% workers are on contract and their salary could be half of the regular workers. Maruti is among the better pay masters. Amid all this, competitive intensity in the marketplace for Maruti has never been as severe. Being a volume player, the only way for it to survive and flourish is to churn out more and more cars. All this has translated into relentless pressure to improve productivity and margins at all levels. For Maruti, this pressure is particularly high. Not surprisingly, the Manesar plant, that churns out two top-selling models in the Maruti stable — Swift and Dzire — is at the heart of all the strife.
Young & Restless Workers
In Haryana, young blue-collar workers have seen dramatic changes around them. Land prices have surged as Gurgaon has become a commercial hub. Overnight, people have become rich and their lives have transformed simply because they made a killing selling their land. Such changes have re-calibrated worker expectation that have seen their sleepy little hamlet transform into a city of high rises and malls in a decade.
They are less tolerant and fairly aggressive in their expectations and how they want to achieve it. Poor wage hikes and raging inflation have queered the pitch further, resulting in an impatient, militant workforce, which believes in aggressive posturing. Sonu Gujjar, the leader of the labour unrest at Maruti plant last year, represents that generation. In his 20s, Gujjar organised a concall with analysts to put forth the workers' point of view and made headlines.
Return of the Red Flag
From its peak in the 1980s, trade unions have been on a decline in India. Trade union bodies across the board — from Citu to AITUC — have been seeing a steady decline over the years. It does not help that a large percentage of workers in Indian factories are foot-loose contract workers. Over 90% of the Indians are employed in the unorganized sector where the trade unions have been finding it difficult to make inroads. They have made many efforts to spread their network among white collar workers like BPO employees, but with little success. Expectedly, they are tapping into every possible opportunity they can get to grow their base. Their involvement in Maruti's labour unrest signals that.
But the major cause for the labour unrest was Good Conduct Bond. The good conduct bond required the workers to declare they would "not resort to go slow, intermittent stoppage of work, stay-in-strike, work-to-rule, sabotage or otherwise indulge in any activity, which would hamper normal production in the factory".
Even the government also criticized it. Government said demanding good conduct bond from workers by Maruti Suzuki India (MSI) management during the recent labour unrest at its Manesar plant was an "arbitrary act" and amounted to "unfair labour practice". "Demanding of good conduct bonds from workers as per conditions before allowing them to resume work is an arbitrary act and it also amounts to unfair labour practice as given in the Industrial Disputes Act, 1947," Labour and Employment Minister Mallikarjun Kharge said.
Though Haryana Government had reported that management of Manesar plant had imposed a condition of submitting good conduct bond by workers for entering the unit as there was reported widespread indiscipline by workers and acts of sabotage and production of defective vehicles."
RESULTS & DISCUSSION
Many a times Organizational change can result into violence as it happened at Maruti Suzuki's Manesar factory, which killed one senior employee and injured close to 100 others. Since 2007, two important changes have happened at Maruti. One, Shinzo Nakanishi, the current MD of Maruti Suzuki, took over the reins from Jagdish Khattar. RC Bhargava, who was a director, was made chairman. Two, Maruti and the India market are also becoming increasingly important for Suzuki Moto. As Maruti's contribution to Suzuki has increased, the latter's tendency to control India operations has increased. But insiders say the Japanese voice counts and often tends to dominate crucial decisions. Culturally, Indians and Japanese are far apart. Their sense of discipline, punctuality, employee connect too are very different. Some loss of connect with Indians is expected.
From its peak in the 1980s, trade unions have been on a decline in India. Trade union bodies across the board — from Citu to AITUC — have been seeing a steady decline over the years. It does not help that a large percentage of workers in Indian factories are foot-loose contract workers. Over 90% of the Indians are employed in the unorganized sector where the trade unions have been finding it difficult to make inroads. Their involvement in Maruti's labour unrest signals that.
CONCLUSION
Cordial Labour management relations are very important for the smooth functioning of an organization. For this it is essential to implement and manage the organizational change in a proper manner. Moreover to deal with the organizational change concept of Mental Revolution given by F.W. Taylor should be introduced in the organization. Management and workers should have a positive attitude towards each other. This will result in close cooperation between them and organizational changes will get implemented in a smooth and effective manner.
REFERENCES
1. Griffin, Ricky W.: Organisational Behaviour, Houghton Miffin Co., Boston.
2. Koontz, Harold, Cyril O Donnell, and Heinz Weihrich: Essentials of Management, Tata McGraw Hill, New Delhi.
3. Luthans, Fred: Organizational Behaviour, McGraw Hill, New York.
4. Newstrom, John W. and Keith Davis: Organisational Behaviour: Human Behaviour at Work, Tata McGraw Hill, New Delhi.
5. Robbins, Stephen P.: Organizational Behaviour, Prentice Hall, New Delhi.
6. Sukla, Madhukar: Understanding Organizations: Organisation Theory and Practice in India.
7. Singh, Hawa: Organisational Behaviour, V.K. Global Publications Private Ltd., New Delhi.
www.indianexpress.com
articles.economictimes.indiatimes.com
timesofindia.indiatimes.com

62 tLingaya's Lalita Devi Journal of Professional Studies VAT Roads to GST: Possible Impacts, Implications and Policies t63
VAT Roads to GST: Possible Impacts, Implications and Policies
KomalResearch Scholar,
MDU Rohtak
Prof. Sanjiv KumarDept. of Commerce,
MDU Rohtak
ABSTRACT
One of the most widely debated issues in Indian Public Finances in current times is undoubtedly the proposed Goods and Services Tax (GST). Perceived as the ‘biggest tax overhaul since independence’ GST promises to fuel overall economic growth and increase tax revenue of the government to a great extent by removing all the impediments that the financial system had been hitherto subject to. According to the Report of the Task Force on Goods and Services Tax (2009), the present system of indirect taxation results in misallocation of resources and lowers productivity and economic growth. Therefore, it is claimed that there is an urgent need of replacing the existing tax system by a new regime of taxation of goods and services The most important issue regarding the structure of proposed GST is whether conventional GST is at all feasible is federal country like India where both the Centre and State has concurrent powers to tax domestic trade in goods and services. This paper puts an attempt to explore the present system of VAT which has been in effect since 2005 and then goes to explore certain critical issues related to GST, its prospects and problems and how it can usher in a new era of government finances of the country.
Key words: Value Added Tax, Goods and Service Tax
INTRODUCTION
In the sales tax structure, before a commodity was produced, inputs were first taxed, and then after the commodity was produced with input tax load, output was taxed again. This caused an unfair double taxation with cascading effects. In the VAT, a set-off is given for input tax as well as tax paid on previous purchases. Also, there were a multiplicity of taxes in several states, and such taxes include turnover tax, surcharge on sales tax, additional surcharge, etc. With the introduction of VAT these other taxes abolished to a greater extent. CST is also going to be abolished in a phased manner. The trading community in India had exploited the Governments by misutilising the sales tax system in adopting loopholes in the system administered by the Centre or State. If a well administered system comes in, it will close avenues for traders and businessmen to evade paying. With these objectives in mind, The Government of India set up an Empowered Committee of State Finance Ministers (referred as Empowered Committee) in 1999 to formulate the basic design of VAT through consensus. Deliberations over six years bore fruit in a White Paper in January 2005. While laying down the basic design, the White Paper provided space for “federal flexibility” by permitting State Governments to adopt appropriate variations.
Methodology of VAT
VAT rate assumed to be 10%
With now VAT being in place in all states across the country, the system of taxation has not only become more transparent, tax compliance has also increased to a great deal. Increase in Central Tax Revenue also was substantially with implantation of VAT. However, implantation of VAT in States was a difficult task in a federal structure like India where States enjoy a considerable autonomy over taxation—in levying and deciding rates of sales taxes etc. State VAT implementation required a harmonious rate at which all states would agree hence ending the rate war. Steps were taken to prevent unhealthy competition among states and at the same time preventing the states from losing their autonomy. As a consequence, States started implementing VAT from 2005. Responses of Industry and Trade to Central and State VAT have been very encouraging ever since the full-fledged implementation of VAT. The rate of growth of Tax Revenue has nearly doubled from the average annual rate of growth the pre-VAT five year period after the introduction of VAT.
‘FRACTURED’ VAT?
Despite VAT’s success in mobilizing greater tax revenue, the first discussion paper of Empowered Committee of State Finance Ministers point out that there are there are certain shortcomings of the Central as well as State VAT. In context of CENVAT, it has been pointed out that CENVAT has not been extended to include chain of value addition in the distributive trade below the stage of production. Moreover, CENVAT also does not include many Central Taxes like Additional Excise Duty, Additional Customs Duty, Surcharges, etc. The non-inclusion of these taxes keeps the benefits of comprehensive input tax and service tax set-off out of reach for manufacturers and dealers. Like CENVAT, several aspects of incompleteness of State VAT have also been pointed out by the Empowered Committee. There are, for instance, even now, several taxes which are in the nature of indirect tax on goods and services, such as luxury tax, entertainment tax, etc., and yet not subsumed in the VAT. Moreover, in the present State-level VAT scheme, CENVAT load on the goods remains included in the value of goods to be taxed under State VAT, and contributing to that extent a cascading effect on account of CENVAT element. This CENVAT load needs to be removed. Furthermore, any commodity, in general, is produced on the basis of physical inputs as well as services, and there should be integration of VAT on goods with tax on services at the State level as well, and at the same time there should also be removal of cascading effect of service tax. Such integration is missing in case of State VAT. Thus, contrary to expectations, VAT although could solve some problems of the existing system of taxes and increase tax buoyancy by a certain extent, it could not be regarded as a panacea of all ills associated with indirect taxation.
WAY ROAD TO GST
Perceived as the ‘biggest tax overhaul since independence’, introduction of GST at the Central level is expected not only to include comprehensively more indirect Central taxes and integrate goods and service taxes for the purpose of set-off relief, but also lead to revenue gain for the Centre through widening of the dealer base by capturing value addition in the distributive trade and increased compliance. Apart from this, in the GST, both the cascading effects of CENVAT and service tax are removed with set-off, and a
CustomerGross value of purchase Rs. 900Add: VAT@10% Rs. 90Total purchase price Rs. 990
Primary producer: FarmerSale of wheat to miller Rs.100VAT Payable@10% Rs. 10
Secondary producer: MillerInput Rs. 100Value Added Rs. 200Sale to Baker Rs.300VAT@10% Rs. 30Less: Input tax credit Rs. 10VAT payable Rs. 20
Secondary producer: BakerInput Rs. 300Value Added Rs. 600Sale to Customer Rs. 900VAT@10% Rs. 90Less: Input tax credit Rs. 30VAT payable Rs. 60
GovernmentVAT collection =
Rs. (10 + 20 + 60) = Rs. 90(Actually borne by the
customer)

64 tLingaya's Lalita Devi Journal of Professional Studies VAT Roads to GST: Possible Impacts, Implications and Policies t65
continuous chain of set-off from the original producer’s point and service provider’s point up to the retailer’s level is established which reduces the burden of all cascading effects (First Discussion Paper on GST, 2009). This is the essence of GST, and this is why GST is not simply VAT plus service tax but an improvement over the previous system of VAT. GST at the State-level is also expected to improve the overall revenue scenario as it gives additional power of levy of taxation of services for the States, encourage a system of comprehensive set-off relief, including set-off for cascading burden of CENVAT and service taxes and also remove the burden of Central Sales Tax. Because of the removal of cascading effect, the burden of tax under GST on goods will, in general, fall (see CII-KPMG survey 2010, Report of the Task Force on GST 2009 etc.).
According to the Report of the Task Force on Goods and Services Tax (2009), the present system of indirect taxation results in misallocation of resources and lowers productivity and economic growth. Therefore, it is claimed that there is an urgent need of replacing the existing tax system by a new regime of taxation of goods and services which would foster the achievement of the following objectives:
1. The incidence of tax falls only on domestic consumption2. The efficiency and equity of the system is optimized3. There should be no export of taxes across taxing jurisdiction4. The Indian market should be integrated into a single common market5. It enhances the cause of cooperative federalism (Report of the Task Force on Goods and Services Tax, 2009: 4)
These are the primary objectives which are to be achieved by moving from \the present system of VAT to a better orchestrated GST regime. Kelkar (2009) succinctly summarizes the expected benefits of GST: “It will bring about a phase change on the tax firmament by redistributing the burden of taxation equitably between manufacturing and services. It will lower the tax rate by broadening the tax base and minimizing expectations. It will reduce distortions and foster a common market across the country and reduce compliance cost. It will promote exports.
CRITICAL ISSUES
Dual GST
The most important issue regarding the structure of proposed GST is whether conventional GST is at all feasible is federal country like India where both the Centre and State has concurrent powers to tax domestic trade in goods and services. By conventional GST we mean GST which is levied and collected by the Central Government. However, such centralized system of GST implementation would imply states’ to lose their fiscal autonomy in levying and collection of taxes. In fact, this was one of the main reasons behind the States’ initial vehement opposition against the introduction of GST. Therefore, the Task Force has recommended that the GST to be implemented in India would be ‘dual’ in nature. It would be a dual levy independently imposed concurrently by the Centre and the States. It would consist of two components: one levied by the Centre (CGST) and another levied by the States and Union Territories (SGST). However, the base of tax levy would be identical. International experience shows that such models of dual value added taxes have been successful.
Consumption type GST
According to the Task Force Report, the Centre and State should adopt a consumption type GST i.e. there should be no distinction between raw materials and capital goods in allowing GST credit. Using consumption as the tax base, it is argued, will be favourable both from perspectives of economic neutrality and ease of administration. The report also mentions that tax base of both CGST and SGST should cover all goods and services until it reaches the final consumer. As such, no distinction needs to be made between goods and services. A registered dealer will be required to collect taxes on every invoice irrespective of whether the supply is for goods or services. The Task Force also recommends since CGST and SGST will be levied on all goods and services, all present taxes levied by the Centre and the State must be subsumed in these taxes. Table 1 lists the taxes which are subsumed in GST.
Table 1: Taxes to be subsumed in GST
Central taxes subsumed in CGST
1. Central Excise Duty (including Additional Excise Duties)2. Service Tax 2. Entertainment Tax3. Additional Customs Duty 3. Entry tax not in lieu of Octroi4. Surcharges and all cess 4. Other Taxes and Duties (Luxury Tax, Taxes on lottery, etc.)
Taxes levied by the States on goods and services to be subsumed in GST1. Stamp duty2. Taxes on Vehicles3. Taxes on Goods and Passengers4. Taxes and duties on electricity
Source: Report of Task Force on Goods and Services Tax in India (2009)
State Level taxes to be subsumed in SGST
1. VAT/Sales Tax
GST on ‘Destination Principle’
Considerable debate has taken on the issue of whether GST should be implemented under the origin principle or destination principle because GST in India is aimed to improve competitiveness; the Report proposes that GST should be structured on the destination principle. Consequently, tax base will shift to consumption from production activities whereby imports will be taxed and exports will not be taxed. As such, the state in which consumption takes place will earn the tax revenue. In case of international trade, exports should be zero rated, it is proposed and imports should be subjected to CGST and SGST.
Taxing ‘Inter-State sales’
Another issue that requires careful examination before full-fledged GST implementation takes place is taxation of inter-state sales. According to Kelkar (2009), it would be necessary to guard against tax arbitrage where local sales which will be taxed could be shown as interstate sales which will not. Kelkar also points out that there could also be serious problem in taxing services supplied from one state, consumed in another and paid for in the third state. The discussion paper of the Empowered Committee addresses such concerns by proposing a model of Integrated GST (IGST). The IGST model would work as follows. The Centre would levy IGST (CGST plus SGST) on all inter-state transactions of taxable goods and services. The inter-state seller will pay IGST on value addition after adjusting available credit if IGST, CGST and SGST on his input purchases. The Exporting State will transfer to the Centre the credit of SGST used in the payment of IGST. The importing dealer can claim credit of IGST while discharging his output tax liability in his own state. The Centre will transfer to the importing state the credit of IGST used in the payment of SGST. This is the essence of proposed IGST model. This model would ensure that the SGST amount will be transferred to the destination state.
GST Exemption
Ideally there should not be any exemption from CGST and SGST since exemption increases the amount of tax finally paid on intermediate goods. As such exemption will result in undesired results. However, if at all the government needs to provide exemptions, the Task Force report recommends that they should be restricted to only items listed in Table 2.
Table 2: List of items exempted from GST
1. All public services of Government (excluding Railways, Post and Telegraph, public sector enterprises, banks and insurance, health and education services).
2. Any service transactions between the employer and employee either as a service provider, recipient or vice-versa
3. Any unprocessed food article covered under PDS
4. Education services provided by non-Government schools and colleges
5. Health services provided by non-Governmental agencies
Source: Report of Task Force on Goods and Services Tax in India (2009)
ROAD AHEAD
The GST at the Central and at the State level when introduced – is clear from the discussion above – will thus give more relief to producers and consumers through a more comprehensive and wider coverage of input tax set-off and service tax setoff, subsuming of several taxes in the GST. With the GST being properly formulated, it is expected that there will be revenue/ resource gain for both the Centre and the States, primarily through widening of tax base and possibility of a significant improvement in tax-compliance. However, as the KPMG-CII (2010) survey mentions proper implementation of GST requires concerted efforts on parts of all stakeholders, namely, Central Government, State Governments and trade and industry. Of course, it is the Central Government which needs to take the initial step. Tax payer education or public awareness campaigns needs to be provisioned. Public workshops, seminars and training on GST also must be conducted in all states. States must also work out their revenue neutral rates, revenue implications as well as compensation packages. These issues must be resolved at the earliest so as to ensure smooth transition from the existing system of VAT to the new GST regime.
REFERENCES
[1] Report on Reform of Domestic Trade Taxes in India, National Institute of Public Finance and Policy, New Delhi, 1994
[2] Budget Speech by Union Finance Minister, Government of India, 2012
[3] Bird, Richard M. and Pierre-Pascal Gendron (2007): The VAT in Developing and Transition Countries, Cambridge University Press, Cambridge.
[4] Brumbaugh (2006): “Taxes and International Competitiveness”, CRS Report for Congress, Order Code RS22445.
[5] Desai, Mihir A. and James R. Hines (2002): “Value-Added Taxes and International Trade: The Evidence”.
[6] Empowered Committee of State Finance Ministers (2005): “A White Paper on State Level Value Added Tax”, Ministry of Finance, Government of India, New Delhi.

66 tLingaya's Lalita Devi Journal of Professional Studies Revitalizing Organisational Change Through Webinar: An Analytical Study t67
[7] KPMG-CII (2010): “Report on Goods and Services Tax Survey: Industry expectations and perceptions”.
[8] Ministry of Finance (2008-09): “Indian Public Finance Statistics”, Department of Economic Affairs, Economic Division, GOI.
[9] Poddar, Satya and Ehtisham Ahmad (2009): “GST Reforms and Intergovernmental Considerations in India”, Ministry of Finance, Government of India.
[10] Rao, M. Govinda and R. Kavita Rao (2006): “Trends and Issues in Tax Policy and Reform in India”, India Policy Forum – 2005-06, NCAER-Brookings Institution.
[11] Shankar (2005): “Thirty Years of Tax Reform in India”, Economic and Political Weekly.
[12] The Empowered Committee of State Finance Ministers (2009): “First Discussion Paper on Goods and Services Tax in India”, Government of India, New Delhi.
Revitalizing Organisational Change Through Webinar: An Analytical Study
Mrs. Manisha Navale
Businesses grow by communicating more effectively with their customers and prospects. With powerful new technologies that enable businesses to engage each customer individually, using whatever channel works best: web, mail, text or email; marketers improve customer loyalty and grow revenues for businesses with consumer brands.
Companies are working toward creating a more inclusive work environment. This means ‘equitable messaging’ for all employees, regardless of how and where they work, said Susan Johnson, Vice President, Executive Succession and Diversity Strategies, Pitney Bowes Inc. Further adding she said, “Effective diversity strategies now address regional, generational and even technological differences found throughout the workforce.”
It’s just impossible to stand out these days in the globalized market with messages streaming in from all over the world and ‘how to grab the attention of prospects and customers without breaking the bank?’
As more and more companies include interactive and digital strategies in their campaigns, Forrester Research predicted, back in 2009, that social media would see the highest rate of growth among all digital media through 2014.
The service allows real-time point-to-point communications as well as multicast communications from one sender to many receivers. It offers information of text-based messages, voice and video chat to be shared simultaneously, across geographically dispersed locations. Applications for web conferencing include meetings, training events, lectures, or short presentations from any computer.
Direct mail, e-mail, mobile messaging, Facebook, YouTube, Twitter, Flickr, MySpace, Yelp, FourSquare, blogging, microblogging, podcasts—today there are a lot of different communications channels available for interacting with customers.
For some businesses, keeping marketing strategies relevant and effective in the digital age can seem overwhelming. But for a savvy marketing professional, having all these channels available represents an unprecedented opportunity for: complete multi-channel marketing integration, ongoing brand building, highly targeted messaging, higher response rates, more loyal customers and, most importantly, increased revenues.
Susan Johnson adds: “As companies master customer communications management, they should also apply this strategy with their own employees. Sending the right message in the right channel to each generation in this challenging economic environment may lead to increased productivity and morale.”
WEBINAR: INSPIRING INNOVATION IN BUSINESS CONTINUITY
It seems that technology is evolving every day. There's always a new product or service that can streamline an organizations function, how company operate, and how to do business. As an IT professional one is often at the forefront of implementing groundbreaking technology. But with requests coming from everywhere, it can be hard to see through the noise and find the real value. But what's next in IT management? And what way it can be ensured that webinar is ahead of the game?
To compete with other medias of communication a new technique revolutionized the world with its many features and is used to optimize returns from an organization’s direct marketing and that is Webinar (First known use: 1998).

In short, it can be described as Web-based seminar, a presentation, lecture, workshop or seminar that is transmitted over the Web or in brief it is an interactive seminar conducted over the World Wide Web.
It also improves the profitability and effectiveness of direct marketing spend.
Breakthroughs in B-to-B marketing automation and digital body language and this drive can lead through the sales funnel.
A key feature of a Webinar is its interactive elements—the ability to give, receive and discuss information in contrast with Webcast, in which the data transmission is one way and does not allow interaction between the presenter and the audience.
It is actually substituting face to face conversation with online platforms to exchange information and knowledge with experts and individuals in any field of one’s interest. In many ways it has been proved that discussion groups are more effective means of communication and webinar has proved the same.
Webinars are one of the most popular ways to get the message out to target audiences without travel costs, scheduling conflicts and the time drain — making it an incredibly powerful tool for businesses to expand their reach even with limited budgets and dispersed audiences.
It has audio and visual components where the visual component of a webinar is shared through a web conferencing tool or internet browser. The audio portion of a webinar is usually broadcast through the audiences’ computers or through the telephone.
A webinar also allows the hosting organization or a company to interact with an audience. The audience can ask the speaker or moderator’s questions on the spot through an instant messaging tool or e-mail.
Organizations happily part with their information because webinars are of high-value, hands-on training, which they can experience from the comfort of their own offices in their own countries. It’s really a win-win situation as the employers get leads, while the employees get the required training.
According to the research study on ‘What tactics did surveyed marketers think were most effective?’ conducted by Joe Pulizzi, a content marketing strategist of the Content Marketing Institute in partnership with Marketing Profs, which surveyed around 2,400 marketers in North America, Europe and the U.K., and Australia made the following conclusions:
Among the top 11 were:
1. Videos
2. Webinars
3. Email newsletters
4. Blogs
5. Articles on own websites
6. Research reports
7. eBooks
8. White papers
9. Social media (not blogs)
WEBINAR: EXTENDING THE VALUE OF CURRENT INFRASTRUCTURE
Every coin has its two sides. Webinars has proved itself as one of the effective means of communication in the business organization in the present era due to its vulnerable features, as
• It offers lively interviews and panel discussions with opportunities to brainstorm, ask questions and connect with other professionals around important topics such as building online influence, effective content curation, best ethical practices in corporate blogging and much more
• Unleashing of people's creative energies, innovative spirits, professional skills and leader presence for corporate growth
• Very time effective, can be sent and received within seconds and at any time
• Provide business professionals with fresh perspective, new skills and encourage accelerated growth
• Cost effective—no paper, no stamps, no costs
• Allows for direct access to others
• Messages can be saved and stored
• Convenient for communicating with people in different places and different time zones
• Easier to communicate with people who understand written English but don’t speak it well
• Excellent mechanism for follow-up or action items after a meeting
• The main advantage of social media and other digital channels is the ability to send unobtrusive outgoing communications to
massive relevant audiences, in real time, with minimal cost and effort. Failing to integrate social media channels into the marketing mix would be a mistake and a missed marketing opportunity for any business today.
With pros, comes the cons though comparatibly meager and can be solved with little effort within an organization.
• with etiquette—no standards—people make up own styles, can be very confusing
• often used to distribute inappropriate material
• often used to avoid confrontation and can be easily misinterpreted
• often casual and informal—this can create a potential hazard
• not everyone has an email account or access to internet at all times.
• its not confidential–threat to the organizers, can be easily accessible through personal computers though it has been deleted from central network.
WEBINAR: SEVEN SURE FIRE TIPS FOR EFFECTIVE ORGANISATIONAL DEVELOPMENT
If these seven sure-fire tips can be followed for the webinar—it will lead to more exposure, more leads more engagement.
1. Research the best date and time. Depending on the audience, their internet usage times will vary. What will be the best time to host the session? Starting with a survey of the user group through social channels and through some testing it can be figured out which time is the most effective and run with that one.
2. Email invites through social media... Why not try promoting it socially as well? With social media, the message can be posted, tweeted, liked and shared by the employees and target audience — reaching prospects others never thought to target. It can encourage employees to maximize the message, especially if they have established trust with the target attendees. It can create incentives to encourage employees to pick up the phone and lock-in prospects the old-school way.
3. To choose the speakers wisely. The target presenter may have all the credibility, knowledge and clout in world. The speaker can hold the room and help them write a gripping script with information from the company’s subject matter experts.
4. To keep the front door unlocked. The organization should make it easy for people to register and attend the event by keeping the registration fields to a minimum— name, email and company — using a one-click “submit” button. The less barriers to entry, the more guests the organizers will have.
5. To wind up in 30 minutes or less. A simple 30-minutes-or-less rule will keep the audience engaged, and will up the chances they return for a future webinar.. There’s a reason most TED talks last less than 20 minutes—and those folks are some of the most dynamic speakers in the world.
6. Multimedia not optional. The Webinar can be six times more effective with audio and visual elements. Speakers should turn on their webcam to capture the guests’ attention and include multimedia elements in their presentations, such as polling, videos and chat.
7. To Follow-up with the replay. With recording functionality built into many web meeting tools, a single webinar can be maximized over and over. To follow-up with the attendees, send them the link to the replay file so they can share the information with their colleagues. Organizations can easily keep an accessible online library of past webinars for the prospects to view at any time. And with the power of social media, it can expand the impact of the webinar even more by socializing the replay to drive visibility — and hopefully more sales.
WEBINAR: MOVE FORWARD TO COLLABORATE WITH OTHERS
Responses reflected that webinars are targeted at many different industries, with good representation in education, technology, financial business, and services. They also included webinars used for training and education (included in 71% of responses), marketing and lead gen (included in 37% of responses), and customer communications (included in 29% of responses). Respondents could pick more than one use of webinars, and they also mentioned sales, employee communications, and industry communications in roughly equal numbers
It was concluded that… Do the benefits of webinars outweigh costs? This seems to the authors, the only generic question that makes sense on a bottom line basis and should apply to any business decision. The results were overwhelmingly positive. It’s worth mentioning some of the comments associated with this question:
• Compared to face-to-face meetings, yes.
• Compared to the costs of travel for in-person training, etc… WAY Cheaper!
• The benefits outweigh the costs—but only over a long period of time. “Benefits” tend to be defined as “sales leads” and while it is found that webinars definitely produce these, they are typically longer tail leads which require additional nurturing over time.
68 tLingaya's Lalita Devi Journal of Professional Studies Revitalizing Organisational Change Through Webinar: An Analytical Study t69

• Webinars are provided as a member service. They are highly rated, in high demand, and have very low incremental cost.
• The general comments that people provided after survey, not associated with a particular question are:
¦It saves tens of thousands every month, it is the best form of formal communication, it’s easy to use, and it’s cheap.
¦It’s used for student orientations and seminars. It’s also used for Faculty Development and everyone loves it.
¦Webinars are effective for generating sales/leads and image of a company.
¦It's often hard to measure the ROI (Return on Investment) or effectiveness of a single webinar. But, when integrated into a comprehensive marketing plan that includes email marketing, print marketing and other communications, webinars are a vital component to the overall success of any campaign.
¦The organizations can run 5 webinars per week on an average, webinars are effective and profitable. .
WEBINAR: THE POWER OF ENGAGING THE RIGHT MESSAGE TO THE RIGHT PERSON AT THE RIGHT TIME
‘Delivering the message’, this might be the most important piece of relevant communications after crafting the message itself. The recipient list is equally as crucial as the message being sent. It’s fair to say that all can think of a few examples of the wrong messages being delivered to the wrong people and panic breaking out. Communication plans and their recipients should be driven by checklists, which drive the content, recipients and attachments for the communications. With these checklists you can also use other situational information such as location, work schedules, presence and availability, skills, and job function to ensure that the distribution lists for emergency notifications are accurate and only the people who need to know are notified and this can be only possible through Webinar.
Webinar as an effective communication is logical, rational and persuasive; especially it is useful in industrial relations, organizational change and relocation. It adopts participative approach which is aimed at improving the competitiveness, effectiveness and flexibility of the entire organization.
BIBLIOGRAPHY
1. Peter M. Sandman, Four Kinds of Risk Communication, Peter M. Sandman
2. 6 Weeks to a great webinar: Generate Leads and Tell your story to the world, W. Wayne Turmel
3. Business Ethics Concepts and Cases, Velasquez
4. The Theory and Practice of Managerial Ethics, Sadri, Dastoor, Jayashree
5. http://en.wikipedia.org/wiki/Web_conferencing#Features
70 tLingaya's Lalita Devi Journal of Professional Studies Relevance of Humanistic and Scientific Management Theories of Organization in Current Scenario: An Exploration t71
Relevance of Humanistic and Scientific Management Theories of Organization in Current Scenario:
An Exploration
Dr. Ragini SahaiAssociate Professor & Incharge (Social Sciences)Department of Applied Science & Humanities
Galgotia College of Engineering & Technology (UPTU)Greater NOIDA - 9910702440
Management is the process of designing and maintaining an environment in which individuals working together in groups efficiently accomplish the goals. It is a process of utilization of resources in an effective and efficient manner. It is an executive function which is primarily concerned with the broad policies laid down by administration. It includes direction, control of various resources to attain long term business objectives. In short management is that agency which provides leadership, guidance and control for the achievement of the objectives at different level set by administration
Objective
Various management theories have been propounded by sociologist, psychologist and management experts. To name a few - Scientific management proposed by F.W. Taylor, Fayol principles of administration, Webers Bureaucracy and Elton Mayo Hawthorne studies. The principles outlined in these theories have relevance in present organization scenario to some extent and also been modified according the suitability and needs of the organization. The paper would explore the relevance of two foundational theories in management viz Taylor & Hawthorne with respect to organizational productivity in the present scenario.
Explanation of Theories
Scientific management principles of Taylor emphasized heavily on economic rationality, efficiency and standardization of procedures. It applies the application of science to management. It means conducting business activities according to standardized tools, methods and trained personnel in order to increase the output, improve quality and reduce costs and wastes. The principles are :
• Every job should be broken into elements and a scientific method to perform each element should be established. Working by rule of thumb or simple habit and common sense should be replaced by scientific method of study.
• Workers should be scientifically selected with right attitude for jobs and to be trained to perform work, Management should be cooperative with the workers to ensure that all work is done accordance to scientific principles
• There should be scientific distribution of work and responsibility between workers and management. The management should design the work,set up and supervise the task and workforce.
Scientific management helped in laying the foundation for job specialization and mass production and resulted in following applications:
• Maximum utility of efforts thus eliminating waste
• Greater specialization of activities with proper design of jobs, specification of methods and set time and motion standards.

72 tLingaya's Lalita Devi Journal of Professional Studies Relevance of Humanistic and Scientific Management Theories of Organization in Current Scenario: An Exploration t73
• Emphasis on fitting workers to particular tasks and training them further to best utilize their abilities.
• Establishment of standards of performance as average output and maximum output per capita.
• Role of compensation and other incentive for increase in productivity.
The scientific management primarily emphasized on economic rationality, efficiency, standardization and ignored the roles of individuals and groups in an organization and their basic social needs of human beings. The fundamental assumption of scientific management that most people are motivated by economic rewards is too mechanical and physiological. It promotes individualism rather than team spirit. Specialization makes the worker unfit for other jobs and also the work is more repetitive and monotonous. It also discourages participation of worker with management.
Humanistic or Behavioural approach to management also known as human relations approach is based upon the premise of increase in productivity and managerial efficiency through an understanding of the people. The humanistic approach gave rise the concept of social man whose interactions with other would determine the quality and quantity of work productivity. In addition to job itself the other aspects affecting the workplace are informal social groups, management employee relationship and interrelatedness of many facets of work environment.
The Hawthorne studies represented a major step in systematically studying human behavior and understanding of the individual worker with emphasis on motivation, needs, interpersonal relationships and group dynamics. The series of experiments carried out at Western Electrical Plant by Elton Mayo has suggested that workplace has a social environment in which employees interact with each other.
These studies showed that better physical environment or increased economic benefits were not the sufficient motivators to enhance productivity. Scientists working under this approach argued that interpersonal relations, informal groupings, cooperation of people are key factors in achieving organizational objectives as well giving human satisfaction. The theories concluded that any organization or the workplace is a social system and human beings are the most important factor in organization. Workers are not merely rational beings who are simply motivated by money and incentives but they are the socio psychological beings who respond to the total work situation. Workers are also influenced highly by the informal groupings, its beliefs and norms. Also the socio psychological factors exercise a direct influence on employee behavior and performance than physical conditions of work. On the whole employees in any organization respond to the total work situation. Their behaviour and performance are highly conditioned by factors inside and outside the work place. These studies represented a major step forward in systematically studying worker behavior with emphasis on motivation, needs, interpersonal relations and group dynamics
Research Findings and Current Scenario
The research has been undertaken in the private college employees of greater NOIDA area. 250 respondents consisting of male and female teachers were the key respondents and the datawas collected through a questionnaire. Indicators’ relating to factors of job satisfaction and motivational aspects of work was reviewed. Apart from the questionnaire the author has also undertaken indepth discussions with the respondents and probed on certain qualitative issues. Scientific observation and systematic analysis of work place systems has also been done in order to understand the whole perspective of work environment . The data was systematically scrutinized and following important observations were noted :
92 % of workers feel that in the professional life the most motivating factor is the money. The respondents revealed that due to high competitive forces in the market, rise of capitalism, growing consumerism and increased demand of the coming workforce pressurizes people to take decision very materialistically. The profession of any kind is being calculated in terms of its commercial value. It is also found that respondents are keen to learn better thing to develop their own skill and talent in order to achieve in the competitive world. Amongst the indicators of job satisfaction at least three fourth respondents analysed that their personal satisfaction is closely linked to the factors like amount of money being earned,incentives, rewards etc. Other factors coming in the lower hierarchy are physical facilities, environment, skill development, group engagement etc.
More than a quarter of respondents feel that though physical conditions, facilities for work are also the key instruments in making ones job lucrative however these factors may not be the essential factors for sustainability in the job. Being a part of informal group do give satisfaction to employees in terms of achieving social and interpersonal needs but this may not stop them from opting out to other jobs when it comes to be higher in incentives and upgradation of salaries.
Productivity and concept of economic man is being appreciated by the respondents and need for materialism is justified looking into the growing demands of lifestyles. The respondents discussed that if given the chance to improve their productivity through any kind of training programme ,they would prioritize it. By upgrading their skills in profession was found to be closely linked in the high productivity and making chances for promotional growth and hike in salaries. It was also seen that for achieving higher salaries the employees were ready to switch over for jobsby sidelining all other factors related to environment and facilities provided by the organization otherwise.
Looking into the differences in perception of male and female it was found that more than three quarter of women prefer to be stable and less competitive than males. Though money reain one of the most motivating factor in both the sexes however the view of women with respect to work differs in terms of attaining professional growth alonwith fulfilling their domestic roles. Distance of workplace and other conditions viz interpersonal relations with the colleagues, safety and security keeps a prominence place in terms of their job continuity and growth.
While on quarer of women do show the characteristics of finding upward mobility in profession by opting towards salary hikes. Sense of independence by working as a professional is one of the most satisfying factor for a majority of women.
Current Scenario: In the current economic scenario when the pressures of globalization coupled with urbanization and modernization is fastly effecting the societal growth the inter linkage between the business environment scenario and the individual job has become important. Globalization which has brought huge technological changes, new products and economic opportunities has also brought changes in organizational styles and works. It has brought rapid integration of countries, trade and foreign investments and opened the organization into a competitive market. The demands of cut throat competition alongwith the availability of highly educated and skilled people in the workforce as well as high ambition to reach the top ladder has put the organizations into pressure to manage the human behavior at workplaces. Talent management is yet another emerging area. With the changing work culture across the globe the organizational life styles and demands from the workforce is highly changing. On the other hand the workforce of the present generation has also fastly changed the outlooks and perception of their jobs and commercialization of their education.
The principles of Taylor has high relevance in terms of understanding current job requirements, job skills ,job specialization, involvement, economic cut down etc in the current scenario. It also looks into the economizing the organization by looking into maximum utility of efforts, compensation role and incentives for maximum productivity. Specialization determine the number of activities with proper design of jobs, specification of methods, time management which are some of the crucial principles of scientific management and are highly applicable too .In the present context the organizations on the one hand organization are demanding their workforce to be highly competitive whereas people also themselves have been changing fast in terms of achieving professional growth. The concept of marketing their own experiences and background has actually been growing.
The human relations approach which highlights the role of informal groups, environment are key factors for productivity and may not be linked to enhancement of incentives and salary of human beings. However in the present scenarion it has been found by the author that enhancement of productivity is highly linked to compensation and incentives provided by the organization rather than linkages with the group and informal associations. Human beings in the workplaces are more concerned with the economic packages vis a vis their adaptability to job requirements. In the current scenario the attachment towards group, team work etc may or may not be closely linked to productivity. It has minimal effect in their productivity as people are more attracted towards achievement to materialistic life and comforts. Human relations become secondary when it comes to compensation, advancement of career and incentives. The difference is also found in context of gender e.g. women look more for groups, associations, stability and continue to work if circumstances are favouring them with their domestic roles too. However men look more for specialization, enhancement, incentives, movement, changing of job due to change in compensation etc .The current economic scenario is pressurizing people to move from informal groupism to more professionalism and creating a culture of individualism.

74 tLingaya's Lalita Devi Journal of Professional Studies Role of Banking Sectors in Financial Inclusion t75
Role of Banking Sectors in Financial Inclusion—A Case Study Of Bihar
Barun Kumar JhaResearch Scholar
Department of Applied Economics & CommercePatna University, Patna
ABSTRACT
Financial inclusion denotes delivery of financial services at an affordable cost to the vast sections of the disadvantaged and low-income groups. The various financial services include credit, savings, insurance and payments and remittance facilities. Financial inclusion and access to finance are different issues. Financial inclusion is defined here as the proportion of individuals and firms that use financial services. The lack of use does not necessarily mean a lack of access. Some people may have access to financial services at affordable prices, but choose not to use certain financial services, while many others may lack access in the sense that the costs of these services are prohibitively high or that the services are simply unavailable because of regulatory barriers, legal hurdles, or an assortment of market and cultural phenomena. The key issue is the degree to which the lack of inclusion derives from a lack of demand for financial services or from barriers that impede individuals and firms from accessing the services. This paper is an attempt to discuss the role of commercial banks in achieving the financial inclusion drive in the state of Bihar.
Key words: Financial Inclusion, Financial Services, Commercial Bank.
INTRODUCTION
Financial Inclusion is delivery of basic banking services at an affordable cost to the vast sections of disadvantaged and low income groups. It includes access to formal financial system such as financial institutions, markets and instruments, like savings, loans, remittances and insurance services, at affordable prices. The importance of financial inclusion stems from various factors. First, an inability to access financial services could lead financially excluded entities to deal mostly in cash, with its attendant problems of safe-keeping. Second, the lack of access to safe and formal saving avenues could reduce their incentives to save. When saving occurs, safety and interest rate benefits may not be to the extent available in the formal system. Inadequate savings could lead households to depend on external sources of funds, in times of need. Often these sources are unregulated and carry high interest rates. High interest rates increase the risk of default by borrowers. Third, the lack of credit products means inability to make investments and significantly improve their livelihoods. As a result, small entrepreneurs often lack an enabling financial environment to grow. Fourth, the lack of remittance products leads to money transfers being cumbersome and high risk. Fifth, the lack of insurance products means lack of opportunities for risk management and wealth smoothening.
Access to an organized financial system implies availability of standardized financial products from regulated institutions. Savings products, small value remittances, insurance products and purchases on credit make financial planning easier. Savings products enable consumption smoothing over time. Remittance products are safer than cash payments, not only to prevent theft, but also to document proof of payment. More importantly, credit histories are built, which enable borrowing at more favorable terms in the future. With increasing automation, financial service providers rely on existing databases rather than personal
interaction in order to make offers to customers. This puts financially excluded individuals at a distinct disadvantage as they are unlikely to feature in such databases. It is commonly argued that the economy as a whole benefits through financial inclusion. First, it could be an important tool to reduce income inequality in the economy. Low income individuals are often those not accessing financial services. Once access is provided, these individuals have greater potential to improve their income levels. Second, more financial resources become available for efficient intermediation and allocation. Third, greater financial stability may be expected if financial activity moves from unregulated to regulated institutions. Fourth, access to finance promotes more start-up enterprises, who often contribute to risk taking, employment and processes of creative destruction.
OBJECTIVE OF THE STUDY
The main objective of study is to assess the performance of banks of Bihar towards financial inclusion.
Financial Inclusion in India
In India, the concept of financial inclusion was first incorporated in 2005, when it was introduced by K.C. Chakraborthy, the chairman of Indian Bank. Mangalam Village turn out to be the first village in India where all households were provided banking facilities. Norms were relaxed for those people who were planning to open accounts with annual deposits of less than Rs. 50,000. General credit cards (GCCs) were issued to the poor and the underprivileged with a outlook to help them access easy credit. In January 2006, the Reserve Bank allowed commercial banks to make use of the services of nongovernmental organizations (NGOs/SHGs), micro-finance institutions, and other civil society organizations as intermediaries for providing financial and banking services. These intermediaries could be used as business facilitators or business correspondents by commercial banks. The bank asked the commercial banks in different regions to start a 100% financial inclusion campaign on a pilot basis. As an outcome of the campaign states or U.T.s like Pondicherry, Himachal Pradesh and Kerela declared 100% financial inclusion in all their districts. Reserve Bank of India’s visualization for 2020 is to open nearly 600 million new customers? accounts and service them through a diversity of channels by leveraging on IT. However, illiteracy and the low income savings and lack of bank branches in rural areas remain to be an obstruction to financial inclusion in many states and there is inadequate legal and financial structure.
Role of Banking Sector
A bank is a financial institution that serves as a financial intermediary. A commercial bank accepts deposits and pools those funds to provide credit, either directly by lending, or indirectly by investing these funds through the capital market. Capital Market is defined as a market in which money is provided for period longer than a year. The main functions of the commercial bank include transfer of funds, acceptance of deposits and offering those deposits as loans for the establishment of industries, purchase of houses, equipments, capital investment purposes, tax collection and refunds, payment of pensions etc.
In India, the focus of financial inclusion is confined to ensure a bare minimum access of saving bank account without frills, but it should be viewed in a much wider perspective. The financial inclusion efforts should offer access to a range of financial services including savings, the short and long-term credit, insurance, pension, money transfer etc. and all this at a reasonable cost.
The number of commercial Banks in a country provides an opportunity for the people of that country to participate in the formal financial system and to utilize financial services of formal financial system. Larger the number of commercial banks, larger the scope for bringing people in to formal financial system provided if banks provide suitable financial products and services.
The financial sector in India has always been dominated by the Scheduled Commercial Banks (SCBs), accounting for major chunk of the total financial flows in the economy. These banks also play a major role in financial inclusion, and this is especially important for the rural sector. In the near absence of a capital market, the financial sector in a state like Bihar is almost entirely driven by the SCBs. Any adverse development in the international and national banking scenario, therefore, is likely to impact the financial sector in Bihar as well.
Table 1 : Distribution of Commercial Bank Branch Offices in Bihar
Years
(End March) Growth Rate Rural Semi- urban Urban All
2008 3792 2.16 61.6 21.0 17.4 100.0
2009 3942 3.96 59.7 21.7 18.6 100.0
2010 4180 5.43 57.4 22.8 19.8 100.0
2011 4388 4.98 56.2 23.6 20.2 100.0
2012 4701 7.13 54.8 24.4 20.8 100.0
2013 5008 6.53 54.0 25.2 20.8 100.0
Source : Statistical Tables Relating to Banks in India, 2012-13, RBI
Total Percentage Percentage distribution of branches by location

76 tLingaya's Lalita Devi Journal of Professional Studies Role of Banking Sectors in Financial Inclusion t77
increased by Rs 948 crore (6.3 percent), and credits increased by Rs 823 crore (11.7 percent). In 2011-12, the deposits and credits grew at much higher rates of 9.8 percent and 11.8 percent respectively. Further, the growth rates in both deposits and credits in Bihar were among the lowest in the country. The growth of deposits and credits in 2012-13 was also much less than the peak achieved in 2008-09, when deposits had increased by Rs 3200 crore and credits by Rs 1600 crore. It is to be noted that less than 50 percent of what the rural economy of Bihar deposits with the RRBs flows back to it in the form of credit. After 2008-09, the growth in deposits of RRBs has slowed down steeply; from a high growth of about 23 percent in 2008-09, it had fallen to 6.3 percent in 2012-13.
Table 4 : Distribution of Employees of SCBs
Officers Clerks Sub-ordinates Total
Number % Share Number % Share Number % Share
Female 1377 44.3 1368 44 363 11.7 3108
Male 14418 42.4 12239 36 7326 21.6 33983
Total 15795 42.6 13607 36.7 7689 20.7 37091
Source : Basic Statistical Returns of Scheduled Commercial Banks in India, RBI
From Table 4, it can be seen that there were 37,091 bank employees in Bihar in March 2012 (36,362 in March 2011) and 42.6 percent of them belonged to the category of officers, up from 41.4 percent in the previous year. Bihar accounted for only 3.2 percent of all the employees of scheduled commercial banks in India in March, 2012. From Table 4, it is seen that the total number of female employees of scheduled commercial banks in Bihar in 2012 was 3108, an improvement over 2011 when it was 2443 only. Female employees of scheduled commercial banks in Bihar account for a share of only 1.4 percent of all female employment in the scheduled commercial banks in the country.
Table 5 : CD Ratio of All Banks in Bihar
Year Deposit Credit CD Ratio(Rs. crore) (Rs. crore)
2001-02 30482 6946 22.79
2002-03 33815 8089 23.92
2003-04 35824 9604 26.81
2004-05 40295 12031 29.86
2005-06 46134 14808 32.10
2006-07 56342 19048 33.81
2007-08 68244 22077 32.35
2008-09 83048 24051 28.96
2009-10 98588 31679 32.13
2010-11 113909 38723 33.99
2011-12 138163 50704 36.70
2012-13 161036 65364 40.59
Source: State Level Bankers' Committee
The Credit-Deposit (CD) ratios in Bihar since 2001-02, according to data released by the State Level Banker’s Committee (SLBC) chaired by the State Bank of India, are presented in Table 5. As per this data, in March 2013, the CD ratio of Bihar was 40.59 percent, higher than 36.70 percent prevailing in March 2012. In September, 2013, it was marginally lower at 40.52 percent. Even though there has been some improvement in CDR in recent years, its low level continues to plague the banking scenario in Bihar.
CONCLUSIONS
The financial sector in India has always been dominated by the Scheduled Commercial Banks (SCBs), accounting for major chunk of the total financial flows in the economy. These banks also play a major role in financial inclusion, and this is especially important for the rural sector. At the end of March 2013, 54.0 percent of the total 5008 branches of commercial banks in Bihar were located in rural areas, compared to 61.6 percent in 2008. Bihar accounted for only 4.6 percent of all the bank branches in the country in March 2013, though its share in country's population was 8.6 percent. Bihar’s share in the total bank branches in the country has also practically remained the same over the past few years. Bihar accounted for only 3.2 percent of all the employees of scheduled commercial banks in India in March, 2012. Female employees of scheduled commercial banks in Bihar account for a share of only 1.4 percent of all female employment in the scheduled commercial banks in the country. Bihar, a slow starter, is gradually catching
Table 1 shows the distribution of commercial bank branches in Bihar from 2008 to 2013 and their growth. At the end of March 2013, 54.0 percent of the total 5008 branches of commercial banks in Bihar were located in rural areas, compared to 61.6 percent in 2008. The decline in the share of rural branches has been continuing unabated since 2008. In 2012-13, 307 new branches were added compared to 313 in the previous year, and the growth rate of 6.53 per cent in bank expansion in that year was marginally lower than the highest rate (7.13 percent), achieved in 2011-12. However, out of 307 new branches opened in 2012-13, all but 128 branches were opened in either urban (64 branches) or semi-urban areas (115 branches). As of 2013, the private non-nationalised banks have 155 urban and semi-urban and only 12 rural branches. The banks obviously wanted to take advantage of the demand-driven growth and increase in purchasing power in urban and semi-urban areas, but the purpose of financial inclusion would not be achieved if the rural areas are ignored. Bihar accounted for only 4.6 percent of all the bank branches in the country in March 2013, though its share in country's population was 8.6 percent. Bihar’s share in the total bank branches in the country has also practically remained the same over the past few years.
Figure 1: % Distribution of branches by location
Table 2: Number of Branches of State and District Central Cooperative Banks
India Bihar Percentage
State Co-operative Banks 999 16 1.6
District Central Co-operative Banks 13302 279 2.09
Total 14301 295 2.06
Source : Statistical Tables Relating to Banks in India, 2012-13, RBI
The data for the State and District Central Cooperative Banks are shown in Table 2. It emerges from the table that the total number of State and District Central Cooperative Banks and District Central Co-operative Banks in the country is 999 and 13302 respectively. However, in Bihar, this number is only 16 and 279 respectively.
Table 3 : Number of RRBs Branches in Bihar
Rural Semi- Urban Urban Total
Madhya Bihar Gramin Bank 407 42 25 474
Bihar Kshetriya Gramin Bank 178 59 6 243
Uttar Bihar Gramin Bank 860 94 47 1001
Total 1445 195 78 1718
Source : Statistical Tables Relating to Banks in India, 2012-13, RBI
With the promulgation of Regional Rural Banks (RRB) Act of 1976, the regional rural banks came into existence to channel resources towards agricultural and rural credit. With equity holdings by the central government, the concerned state governments and the sponsoring banks in the proportion of 50:15:35 respectively, the RRBs provide a multi-agency approach for agricultural and rural credit in India.
The data for RRBs is shown in Tables 3. At the end of March, 2012, Bihar had 1594 RRB branches; by September, 2013, the number had increased to 1718. Uttar Bihar Gramin Bank alone accounted for 58 percent of the total RRB branches in the state. While the total number of branches of RRBs had increased by 7.8 percent over the previous year, the deposits of RRBs in Bihar
70
60
50
40
30
20
10
0
2008 2009 2010 2011 2012 2013
Rural
Semi-urban
Urban

78 tLingaya's Lalita Devi Journal of Professional Studies Is Job Satisfaction An Illusion or Reality t79
up with other states in both formations of SHGs and ensuring their bank linkages. As of March, 2013, SHG coverage in rural Bihar was 35.22 lakh households, roughly 48 percent of total rural households.
REFERENCES
1. Chakravarty, Satya and Rupayan Pal, 2010, “Measuring Financial Inclusion: An Axiomatic Approach,” Indira Gandhi Institute of Development Research, Working Paper No. WP 2010/003.
2. Economic Survey 2013-14, February 2014, Finance Department, Govt. Of Bihar.
3. Financial Inclusion – RBI Initiatives A Presentation by Dr. K.C. Chakrabarty Deputy Governor, RBI At ‘National Seminar on Launching a National Initiative’ for Financial Inclusion’ organised by DFS, GOI at New Delhi on September 18, 2009.
4. Jiaqin Y, Whitefield M, and Bhanot R, (2005). “E-Banking in Rural Area - Recent Trend and Development: A Case Study”, Communications of the IIMA, Volume 5 Issue 4.
5. Rakesh Mohan,(2009), Financial Inclusion in India: Is the Glass Half Empty or Three Quarters Full? Working Paper No. 409, Stanford Center for International Development.
6. Rangarajan Committee (2008), Report of the Committee on Financial Inclusion, Government of India.
7. Reserve Bank of India (2006a), “Financial Inclusion and Millennium Development Goals”, Address by Usha Thorat, Deputy Governor of the Reserve Bank of India, January 16.
8. Reserve bank of India (2013), Report of Trend and Progress of Banking in India 2009-10, Mumbai.
9. Sarma, Mandira, 2012, “Index of Financial Inclusion – A measure of financial sector inclusiveness,” Berlin Working Papers on Money, Finance, Trade and Development, Working Paper No. 07/2012.
10. Sharma, A. (2009), “Challenges: For Building Financial Inclusive India”. ICFAI Reader, pp.14-20, May 2009.
11. Sharma, P. (2009), “Financial Inclusion by Channelizing Existing Resources in India”. The India Economy Review, pp. 76-82, 2009.
12. Thorat, Usha (2007), Taking Banking Services to the Common Man – Financial Inclusion.
Is Job Satisfaction An Illusion or Reality(SWOT Analysis on SSPIL Group)
Ms. Kirti SharmaCompany Executive (LPS Bossard)
Mob. No. [email protected]
ABSTRACT
JOB SATISFACTION—AN ILLUSION OR REALITY ?
A recent Chandler Hill Partners poll asking job seekers to comment on the level of satisfaction with their current job (held in America) indicated that only 27 percent of respondents considered their jobs to be satisfying.
A 27 percent satisfaction rate is an alarmingly low number considering that job satisfaction impacts productivity levels, quality of interaction in the corporate culture and society in general as workers return to their private lives with the stress and frustrations accumulated during the workday.
The financial impact brought about by a less than empowered workforce may be so large and so obscure it defies calculation. Additionally, it may account in part for some of the major issues currently effecting our economic growth, such as outsourcing or the hiring of undocumented workers.
Based on these findings and the trickle-down nature of its impact, job satisfaction may very well be one of the most serious issues facing our nation today.
What does it take to be satisfied in one’s job?
Money, yes certainly, as a society we are still validated somewhat by the salaries we command individually, but another poll taken by Chandler Hill Partners indicates that money isn’t the only ingredient in job satisfaction.
Recognition and reward are the goals when human resource departments sit down to design Employee Motivation Programs, but our clients tell us other things play even larger roles; issues such as personal challenge, personal reputation, the company’s image in the community and its impact to humanitarian and environmental concerns.
This survey prompts me to study that “Is job satisfaction an illusion” even in countries like India.
Key Words: Illusion, Job Satisfaction, Respondents, Stress and Frustration.
INTRODUCTION
Job Satisfaction: Defined
Job satisfaction can be defined as a positive feeling about one’s job resulting from an evaluation of its characteristics.
Importance of Job Satisfaction
Job satisfaction can have an effect on several different aspects of your business. In 2007, a worldwide survey of six industrialized nations including the United States showed that 80 percent of American workers are satisfied with their jobs, according to the Harris Interactive website. Understanding the importance of job satisfaction will motivate you to make sure that your employees are among the 8 out of 10 satisfied American workers.

1. Turnover
In order to understand the importance of job satisfaction, you need to attach economic factors to it. The cost of losing and replacing one single employee can be as high as $75,000, according to William G. Bliss, writing on the Small Business Advisor website. Some of the costs involved in replacing an employee include advertising for a replacement, the drop in productivity that occurs when you lose an experienced employee and the drop in productivity that occurs when you are bringing a new employee up to speed. Creating job satisfaction lowers employee turnover and reduces these costs to the company.
2. Morale
A disgruntled employee who is unhappy with his job can cause a drop in overall productivity. But as that employee starts to spread his dissatisfaction through the rest of the staff, it can cause a drop in employee morale. The dissatisfaction with the company can grow if not addressed, and a universal drop in productivity occurs. Employees who are satisfied with their jobs do not create problems with staff morale.
3. Training
An employee who is satisfied with her job will want to retain that job for as long as possible. When the company offers training to enhance employee knowledge regarding their job duties, that training is accepted by satisfied employees. Ongoing training helps to make your staff more competitive within your industry by keeping them up to date on new developments in sales processes, equipment and changes with the competition. Satisfied employees are more eager to apply new knowledge to their job performance and help to improve the company's competitive advantage.
4. Recruitment
Satisfied employees will attempt to recruit people they know who have the background necessary to assist the company. Recruiting new talent for your company becomes easier when the existing staff is satisfied and speaks highly of your organization. When your current staff is satisfied, they will act as recruiters for your organization and bring talented candidates to your company's attention that may have otherwise not applied for a position.
(SSIPL position in 2009-2011)
• Conversion of Company from private limited company (SSIPL Retail Private Limited) to a public limited (SSIPL Retail Limited.)
• Largest manufacturer of footwear for Reebok in India
• The 100th Nike store became operational under the SSIPL network in India across 41 cities
• Commissioning of fourth footwear manufacturing unit at Selaqui.
• Added “skechers” to the product portfolio for footwear manufacturing.
OBJECTIVES OF STUDY
The objective of the case study carried out at “SSIPL Retail Ltd.” is to know that employees of company are really satisfied or not from polices and benefits provided to them by the company or it is just an illusion.
The objective is to know the prevailing Employee welfare & social security system of the organization is efficient and effective or not and to know, are the employees satisfied with the system and if not what changes they would like to prefer.
In order to get the best out of a employees in the matter of production, working conditions require to be improved to a large extent. The employees should at least have the means and facilities to keep them in a state of health and efficiency.
SIGNIFICANCE OF STUDY
Every research carried out has its significance .There is always a motive behind it. After the research work is completed, we can found some results, some recommendation and some conclusion, which are very helpful for the company as well as for individual.
The significance of choosing this project is to understand that employees are really satisfied in companies or it is just an illusion that they are satisfied. Through this case study we also came to know that what benefits and facilities company is providing to the employees. And identify what conditions or requirements based on age, sex, religion, caste and ethnicity employees thinks should be their. This helps company to know that why attrition rate is high. How they can minimize it in the future?
By this we come to know whether the primary source of data collection is better or the secondary source.
RESEARCH METHODOLOGY
My study is based on descriptive research. I have collected the material through secondary sources. Data collected from various online Journals and publications. A SWOT analysis is done.
SWOT ANALYSIS
Strength
Strength describes the positive attributes, tangible and intangible, and internal to the company.
• Corporate Image.
• Co-operation between different departments.
• Good relations with dealers and customers.
• Superior quality of product produced.
• Employees get response very quickly, as there is no Red Tapism.
• A flat, networked organization therefore, speed and flexibility in decision-making.
• The organization grooms the spirit of freedom and every employee is encouraged to take his own decision that encapsulates the Win-Win formula.
• It also provides individuals with a platform for personal growth in a challenging environment with a clear vision, goals and shared management principles.
Weaknessess
• Week performance appraisal system.
• Limited flexibility.
• Attrition rate is high.
• Absenteeism rate is high in labor.
• Hire a large number of employees from other states than Haryana because of which attrition rate is high.
• No facility provided to commute.
• Long time period for wage settlement.
• Concept of Job Enrichment is not there.
Opportunities
Opportunities assess the external attractive factors that affect the topic. These opportunities exist in our surroundings.
• Expand business.
• More tie up with other world class organizations.
• New and advanced technology.
• May become globally best.
• Quick response to customer needs.
Threats
The threats are also external factors and influenced any object externally. The threats which company facing are :
• Employees nowadays are very intelligent and ambitious, and they want more & more, hence to satisfy them, well-defined and regulated facilities should be needed.
• High employee attrition rate.
• More marketing by competitors.
CONCLUSION OF THE STUDY
In developing countries or under developed countries employees are more satisfied. Here job satisfaction is not illusion as in developed countries like America and Britain. Because here rate of unemployment and poverty is high and employees therefore feel satisfied from the financial gains they receive.
At SSIPL workers are satisfied and contended from work. It is a boon for the organization because satisfaction is a personal thing and an organization can’t satisfy its worker only by giving more.
Although there are some issues like-problem of conveyance and proper performance appraisal on which there is some amount of dissatisfaction among employees, but company management is sure that they would be able to tackle them very soon.
In the end we can conclude that workers are happy with the physical working conditions inside the company. Workers are also happy with the safety parameters provided by the management, facilities of health and recreation, facilities provided by the ESI, medical benefits provided by the company & by the loan facility provided by the company.
80 tLingaya's Lalita Devi Journal of Professional Studies Is Job Satisfaction An Illusion or Reality t81

SSIPL is successful in maintaining good relationship with the workers. The success of the organization is largely due to its workers as it is an Employee intensive organization.
SUGGESTIONS & RECOMMENDATIONS
• It’s a manufacturing unit here production dept and quality dept enjoying more importance but according to me other departments also need more attention.
• Suggestion box should be there in every department should be open once by CEO or MD once a week.
• More interpersonal rapport (interaction) through meetings and parties should be there.
• Employee motivation through gifts for target achievement.
• Prizes like gift (food) vouchers should be given for new ideas.
• Ratio of female staff must be increased.
• Retention bonus should be given to employees working in company more than 2 years.
• Collectivist Approach should be emphasized.
• Employees’ Personality Enrichment Projects should be given more importance.
• A Psychologist should be appointed to understand the employee problems more precisely and giving counseling in problem areas.
• Employee participation must be emphasized in the organization.
BIBLIOGRAPHY
Books and Journals
• MARKETING MANAGEMENT PHILIP KOTLER ,Tata McGraw Hill Publication, 12th EDITION
• Human Resource Management in a Business Context by Alan Price, 3rd edition (April 2007)
• Empowering Employees by Kenneth L. Murrell, Mimi Meredith
• Human Resource Management by Robert L. Mathis, John H. Jackson, 11th edition
• Rose, M., ‘Good deal, bad deal? Job satisfaction in occupations’, Work Employment and Society , Vol. 17, No. 3, 2003, pp. 503-530.
• Organizational Behavior by Stephen P. Robbins
• Research Methodology by C.R. Kothari
Magazines and Papers
• BUSINESS INDIA April, 2010
• Employee Power MAGAZINE. JAN 2012
Clark, A.E., Measures of job satisfaction - What makes a good job? Labour Market and Social Policy - Occasional Paper No. 34, OECD, Paris, 1998
WEBSITES
• www.citehr.com
• www.hrforum.com
• www.coolavenues.com
• www.wikipedia.org
• www.ssiplretail.com
• www.google.com
• Syptak, J.M., Marsland, D.W. and Ulmer, D., Job satisfaction: Putting theory into practice, American Academy of Family Physicians, 1999, available at: http://www.aafp.org/fpm/991000fm/26.html
• Williams, J.R., Job satisfaction and organizational commitment, a Sloan Work and Family Encyclopedia entry, 2004, available at: http://wfnetwork.bc.edu/encyclopedia_entry.php?id=244
82 tLingaya's Lalita Devi Journal of Professional Studies Work to Family Conflict Among Male and Female Professionals—An Important Issue to be Addressed t83
Work to Family Conflict Among Male and Female Professionals—An Important Issue to be Addressed
Kavita Dahiya, Shweta HoodaAssistant Professor, SRM University,
Associate Professor [email protected]
ABSTRACT
Work and family issues and challenges have substantial changed during the past few decades. One major issue reported is related to rise in work family conflict. The purpose of this paper is to explore the concept of work-family conflict and to understand the level of work to family conflict among the male and female professionals. This paper also discusses work and family issues and challenges and then suggests some of the strategies to overcome work-family conflict.
Key words: work-family conflict, strategies
INTRODUCTION
More than one decade’s research has suggested a significant difference between predictors of work family conflict for male and female employees. Many educational researchers like (Frye and Breaugh, 2004) have great urge to investigate the relationships between the professional and family lives of female teachers. Work can conflict with one’s home and family life. However, workaholism can lead to adverse effects on one’s relationship with his or her partner. Workaholism is “an individual difference characteristic referring to self-imposed demands, compulsive overworking, an inability to regulate work habits, and an over indulgence in work to the exclusion of most other life activities (Robinson, 1997).” Workaholism can affect a person’s private life since it includes exclusion of other activities including spending time with spouses which is significant to any healthy, happy relationship.
This paper is an attempt to understand work family conflict among male and female professionals and its level on the basis of work being done by different researchers.
CONCEPT
Most researchers make the distinction between what is termed work-family conflict, and what is termed family–work conflict. Work-to-family conflict occurs when experiences at work interfere with family life, like extensive, irregular, or inflexible work hours, work overload and other forms of job stress, interpersonal conflict at work, extensive travel, career transitions, unsupportive supervisor or organization. For example, an unexpected meeting late in the day may prevent a parent from picking up his or her child from school.
Family-to-work conflict occurs when experiences in the family interfere with work life like presence of young children, primary responsibility for children, elder care responsibilities, interpersonal conflict within the family unit, unsupportive family

84 tLingaya's Lalita Devi Journal of Professional Studies Work to Family Conflict Among Male and Female Professionals—An Important Issue to be Addressed t85
members. For example, a parent may take time off from work in order to take care of a sick child. Although these two forms of conflict–work interference with family (WIF) and family interference with work (FIW) are strongly correlated with each other, more attention has been directed at WIF more than FIW.
Family conflict is “a form of inter role conflict in which the role pressures from the work and family domains are mutually incompatible in some respect. That is participation in the work (family) role is made more difficult by virtue of participation in the family (work) role” (Greenhaus & Beutell, 1985, p. 77).
Types of Work-Family Conflict
Three types of work-family conflict have been identified: time based, strain based, and behavior based.
1. Time-based - competing time requirements across work and family roles
2. Strain-based - pressures in one role impair performance in the second role
3. Behaviour-based - incompatibility of behaviours necessary for the two roles
REVIEW OF LITERATURE
Conflict is a normal part of life. Experiencing conflict or strain between various roles is a typical result of being subject to demand of multiple roles (Edward and Rothbard, 2000). In fact, having multiple roles has actually been linked with certain positive outcomes (e.g., self-esteem, life satisfaction, fulfilment of goals, pride). Understanding the positive and negative linkages between work conflicts, family conflicts, and the interface, is not only important for HR, but also for organisations, families, and society.
Some of the work-family conflict research has focused on construct measurement, including the measurement of the direction and process of interaction between work roles and family roles (Kossek & Ozeki, 1998).
Most researchers make the distinction between what is termed work-family conflict, and what is termed family–work conflict. Although these two forms of conflict–work interference with family (WIF) and family interference with work (FIW) are strongly correlated with each other, more attention has been directed at WIF more than FIW.
Earlier studies defined and assessed work-family conflict as a global, bi-directional, unidimensional construct in which work roles interfere with family roles and vice- versa (Cooke & Rousseau, 1984; Googins & Burden, 1987; Rice et al., 1992; Staines et al., 1986).
Kinnumen and Mauno (1998) studied employees in Finland and found that there were no gender differences in the overall levels of conflict. Aryee and Luk(1996) studied WFC in Hong Kong and found that there were no significant gender differences related to overall. In their study Staines et al. (1986) found that husbands whose wives were employed report significantly lower levels of job and life satisfaction than husbands of housewives. They examined possible reasons for the negative relationship between wives’ employment and husbands’ life satisfaction. career satisfaction and more specifically to certain determinants.
Perrewe et al. (1999) point out that although there has been research evidence that indicates that there is a negative relationship between work-family conflict and life satisfaction, there has been very little research that has examined why work-family conflict is related to life satisfaction.
RESEARCH METHODOLOGY
Descriptive research design: The research design is descriptive because it a study to understand the level of work family conflict male and females professionals.
Objectives of the study
1. To understand the level of work family conflict in male and female professionals.
2. To suggest ways to overcome the conflict.
Inference
On the basis of the various studies conducted it is found that the level of work family conflict among the male and female professionals is almost same and there is no significant difference. For this some suggestions can be made on considering different approaches of different researchers.
Issues and Challenges
There are chances of arise of issues related to home and work place both for the working male as well as female professionals. Work and family conflict affect one another. The two largest aspects of a person's life are home life and what they do for work. If there is conflict at home, the individual is more prone to experience conflict in the workplace, according to the Centre for American
Progress. Identifying the source of the conflict and resolving it will help to rebuild a healthy growing environment at home and at work.
Sources of Conflict
a) At home: Conflict arises when there is a difference in opinion, belief or perspective. Two or more people are unable to resolve the differences between this gap, leading to conflict. Sources of conflict at home are primarily relational, such as unmet expectations, hurtful words or difference in perspective between parents and children. Size of the family, support from family members, and concern for children etc. are the main determinants related to family problems.
b) At Work place: Sources of conflict at work can be relationships with management or co-workers, lack of direction, or ineffective tools provided to complete expected tasks. Child care arrangements, supervisor support, skill utilisation and organisation based self esteem are some of the major determinants at work place.
Response to conflicting situations
People handle work and home conflict differently. The most common reactions to conflict are avoidance, anger, blaming and manipulation. Avoidance is the approach where a person either uses denial or stays away from the subject causing the conflict. People respond in anger because they feel threatened or fearful of the conflict which can lead to blaming. Blaming is used to pass the burden of the conflict on to the other person. Manipulation is used by authority figures, such as the parent or leadership at work, to not engage in the conflict.
Resolution Approaches
Resolving conflict at home and work begins with addressing the issue at hand in a non-confrontational manner. If the conflict is between a mother and son, the father may assume the role of the mediator so that both people can have assistance in being understood. At work, the leadership can handle the conflict and guide both parties through the process of identifying the source of the conflict and coming to a mutual agreement.
Prevention
Prevention begins with communication. Interpersonal communication in home provides clear expectations, directives and needs. At work, conflict is prevented through effective organizational development, leadership skills and corporate policy. Addressing the conflict while it is in its beginning stages can prevent the disagreement from growing and causing more harm.
Consideration
• Conflict is a part of life that will not go away, according to winstonbrill.com. Learning to identify and deal with conflict is an essential skill to promote a healthy family life and working environment. Minimizing conflict at home will reduce conflict at work and vice-versa.
Strategies for Coping with Work-Family Conflict
How are Work- Family Conflicts being addressed is the main task of concern for the organisation as well as home so as to maintain peace at both places.
The demands of a busy work schedule can make it difficult to find the time to spend with family members. According to a University of Haifa study, the growing number of dual-income families and single-parent households may create conflict for those who need to work as well as raise a family. Work-family conflict coping strategies can include making a point to find family time or reducing the number of hours spent on the job.
• Take advantage of Technology
With advances in technology, individuals who work outside of the home and have intense schedules are finding a way to keep in touch with their families when they can not physically be with them. Cell phones, Wireless internet and gadgets make it so that family members and loved ones are at the finger tips of working individuals. "Technology has provided a bit of an upper hand, allowing them unprecedented control and creativity in maneuvering the tenuous balance between work and family" (Temple 2009).
• Arrange for home safety system
When a family member is the care giver of their elderly parent or relative conflicts can occur at work, in the home and lead to depression. Having a medical alert and home safety system in place can offer peace of mind, relieve stress and maintain the elder person's independence.

86 tLingaya's Lalita Devi Journal of Professional Studies Work to Family Conflict Among Male and Female Professionals—An Important Issue to be Addressed t87
• Set Boundaries
Make a point of trying to keep your work and family lives separate. Don't spend a lot of time talking about your family activities at work, and don't try to resolve minor family-related issues by talking to your spouse or children on the phone from the workplace. Do not rehash your work day at the dinner table or when spending time with family members.
• Spare the Time
If you have a demanding job that requires long hours or extended travel, it can be difficult to find the time for family activities. To ensure you're not neglecting your family, incorporate family time into your schedule when planning your week. If you're traveling, schedule time to talk to family members by phone when you won't be interrupted.
Figure 2: Work-family conflict coping strategies
• Change Work Hours
Look for opportunities to change your work hours so you can spend more time with family. For example, if you work in the evening, talk to your employer about switching to the day shift so you can be home with the family at night. You may even need to consider looking for a new job if that is the only way to change your schedule.
• Delegate the authority
If you operate your own business, look for ways to delegate work tasks so that you free up more time to spend with family. For example, consider hiring a manager to oversee parts of your operation. You could also outsource tasks you've been performing yourself like bookkeeping, marketing, managing payroll or making deliveries.
• Reduce Work Hours
If it's financially feasible, consider reducing the number of hours you work. In a situation where both spouses work full time, explore the possibility of you or your spouse switching to part-time work. This will likely require some financial belt-tightening, but you'll create a situation where at least one spouse can spend more time with your children.
CONCLUSION
The research article concludes that there is no significant difference in the variance of level of conflict between the male and female professions. The conflicts are related to family affects the work at organisation and vice-versa. So, the issues related to work family conflict should be given due importance and must be handled tactfully so as to have better results in personal and professional life.
REFERENCES
1. A. Tatman, Role stresstors, interrole conflict, and well-being: The moderating influence of spousal support and coping and coping behaviors among employed parents. (Master’s thesis, University of Wisconsin, 2001).
Ways toaddress
work familyconflicts
Take advantage
of Technology Arrange
for homesafetysystem
Take Authority
2. B. Taylor, R. Delcampo, and D. Blancero. Work–family conflict /facilitation and the role of workplace supports for U.S. Hispanic professionals. Journal of Organizational Behavior, 2009, 30, 643–664.
3. C. Lambert, S. Kass, C. Priotrowski, and S. Vodanovich. Impact factors on work-family balance: Initial support for border theory. Organization Development Journal, 2006, 24(3), 64-72.
4. J. Greenhaus, and N. Beutell. Sources of Conflict between work and family roles. Academy of Management Review, 1985, 10(1), 76-88.
5. M. Warner and P. Hausdorf. The positive interaction of work and family roles using need theory to further understand the work-family interface. Journal of Managerial Psychology, 2009, 24(40), 372-385.
6. S. Boyar, G. Maertz, A. Pearson, and S. Keough. Work-family conflict: A model of linkage between work and family domain variables and turnover intention. Journal of Managerial Issue, 2003, 40(2), 175-190.
7. http://en.wikipedia.org/wiki/Work%E2%80%93family_conflict
88 tLingaya's Lalita Devi Journal of Professional Studies A Review based Analysis on “Cyber Crime” t89
A Review based Analysis on “Cyber Crime”
Vidhi [email protected]
ABSTRACT
This document provides a basic guidelines for securing the PC, network and thus an organization from various kinds of cyber crimes. Various problems and crimes caused that prevails in the society are discussed in this document. Basic need for an organization are given so that care should be taken to protect instead of curing it later. As the types of cyber are increasing but acts regarding these crimes are still not clear which is one of the major cause of the increase.
Keywords: Cyber Stalking, Obscenity, Logic bombs, Trojan attacks, Web jacking, key loggers, Root Kits, voyeurism.
INTRODUCTION
More broadly, this paper is designed to:
• sound an alarm regarding new cyber security priorities
• describe the form and magnitude of the threats posed by cyber crime
• suggest useful responses to mitigate these threats
The up gradation of the computer technology has changed the society tremendously. Everyone now is aware of use of computer and online communication. Now the craze has shifted from television to computer. It is not only for professionals but is touching every age group. The use of social networking sites, online chatting, money transfer etc. fascinates every individual. But the rise of technology and online communication has produced a dramatic increase in the incidence of criminal activity, it has also resulted in the emergence of what appear to be some new varieties of criminal activity. Both the increase in the incidence of criminal activity and the possible emergence of new varieties of criminal activity pose challenges for legal systems, as well as for law enforcement.
Cyber crime cases include internet banking frauds, cheating on-line, illegal funds transfer through credit card frauds, debit card frauds, On-line harassment, Cyber Stalking, Obscenity, Cyber Terrorism, damaging critical information etc.
The Oxford Reference Online defines 'cyber crime' as crime committed over the Internet.
The Encyclopedia Britannica defines 'cyber crime' as any crime that is committed by means of special knowledge or expert use of computer technology. Crime/frauds are relating to:
• Phishing: The act of acquiring private or sensitive data from personal computers for use in fraudulent activities. Phishing is usually done by sending emails that seem to appear to come from credible sources (however, they are in no way affiliated with the actual source/company), which require users to put in personal data such as a credit card number or social security number. This information is then transmitted to the hacker and utilized to commit acts of fraud. Some of the criminals behind phishing scams have even gone so far as to create websites that appear to be operated by government agencies. Many virus programs and email providers have developed software in attempt to combat the problem.
• Credit cards/debit cards cloning: Credit or debit card can be skimmed. A skimmer is a device that can read encoded information surreptitiously on a credit or debit card's magnetic strip
• RTGS transactions (Real Time Gross Settlement): Real time gross settlement systems (RTGS) are funds transfer systems where transfer of money or securities takes place from one bank to another on a "real time" and on "gross" basis. Settlement in "real time" means payment transaction is not subjected to any waiting period. The transactions are settled as soon as they are processed. "Gross settlement" means the transaction is settled on one to one basis without bunching or netting with any other transaction. Once processed, payments are final and irrevocable.
• Conjured/Fictitious fund transfer: There has been a spate of fictitious offers of cheap funds in recent times from fraudsters in form of Lotteries, Money Circulation schemes etc., These offers come through letters, e-mails, mobile phones, SMS, etc.
• Weird offers: These offers are lucrative but cause harm by gaining access to private information.
• SMS forging: Call Forging is the trick by which you can spoof the identity of the caller and misguide the caller. That means one can call FROM any number.
• Denial of service (DoS): This is an act by the criminal, who floods the bandwidth of the victim’s network or fills his e-mail box with spam mail.
• Virus / worm attacks: Viruses are programs that attach themselves to a computer or a file and then circulate themselves to other files and to other computers on a network. They usually affect the data on a computer, either by altering or deleting it. Worms, unlike viruses do not need the host to attach themselves to. They merely make functional copies of themselves and do this repeatedly till they eat up all the available space on a computer's memory.
• Logic bombs: These are event dependent programs. This implies that these programs are created to do something only when a certain event (known as a trigger event) occurs. E.g. even some viruses may be termed logic bombs because they lie dormant all through the year and become active only on a particular date
• Trojan attacks: This term has its origin in the word ‘Trojan horse’. In software field this means an unauthorized programme, which passively gains control over another’s system by representing itself as an authorised programme. The most common form of installing a Trojan is through e-mail.
• Web jacking: This term is derived from the term hi jacking. In these kinds of offences the hacker gains access and control over the web site of another. He may even mutilate or change the information on the site. This may be done for fulfilling political objectives or for money.
VALIDATING A CRIME
To probe the real cause of cyber crimes is a complex job. The validation part of these crimes are intangible. To collect all the relevant evidences becomes challenge to the investigator not only technically but also legally.
Using the Internet, it is possible for a person sitting at one end of the world steal a computer resource of the person sitting at the another end. Cyber crime being technology driven evolves continuously and ingeniously making it difficult for investigators to cope up with changes. Criminals are always one step ahead in the sense that they create technology or come up with technique to perpetrate a particular crime and the law enforcers then counter such techniques or technologies.
CASES ENCOUNTERED
Case registered on 12 Dec 2012, 22:49 IST source TOI (Times of India) : A team from the Samta Nagar police station has gone to Delhi to trace the cyber criminals involved in emptying Chinmay Dash's bank account of Rs 1.75 lakh and deactivating his phone Sim.
• 20 Jul 2012, 20:05 IST source TOI (Times of India): The Bargarh police on Friday said the five Africans it arrested recently from New Delhi had overstayed in the country months after the expiry of their tourist visa and were regularly engaged in crimes like fleecing unsuspecting people of lakhs of rupees through fake cyber lottery messages. The five, now in judicial custody, include four from Nigeria and one resident of Uganda
• 28 Feb 2012, 18:12 IST IST source TOI (Times of India): The city's Cyber Crime Investigation Unit (CCIU), constituted in May last year, has registered as many as 22 ATM/Debit card fraud cases from different police stations of the state capital in the past one year, involving a sum of around Rs 12 lakh. Seven cases were registered at Secretariat PS, five at Kotwali PS, four at Gandhi Maidan PS and one each at Pirbahore PS, Kadam Kuan PS, Jakkanpur PS, Dhanarua, Shastri Nagar and Airport PS
List is huge and survey depicts that these crimes are rapidly increasing
Cyber Crimes are a new class of crimes rapidly increasing due to extensive use of Internet and IT enabled services. The Information Technology(IT) Act, 2000, specifies the acts which are punishable. Since the primary objective of this Act is to create an

enabling environment for commercial use of I.T., certain specific omissions and commissions of criminals while using computers have not been included. Several offences having bearing on cyber arena are also registered under the appropriate sections of the IPC with the legal recognition of Electronic Records and the amendments made in several sections of the IPC vide IT Act, 2000. The statistics on Cyber Crimes are collected under the following heads:
i) Offences registered under the Information Technology Act 2000.
ii) Offences under the IPC (with use of Computers)
CRIME CASES IN 2008, 2009, 2010, 2011
2008 2009 2010 2011
1 Tampering computer source documents 26 21 64 94
2 Hacking with Computer System
(i) Loss/damage to computer resource/utility 56 115 346 826
(ii) Hacking 82 118 164 157
3. Fraud Digital Signature Certificate 3 4 3 12
4. Breach of Confidentiality or privacy. 8 10 15 26
5. Publishing false Digital Signature Certificate 0 1 2 3
AWARENESS DRIVES
Cyber Crime Cell Rajasthan envisaged by Mukesh Choudhary, a young entrepreneur and Cyber Crime Expert with his dedicated team through website have created a platform to provide solution to the same, helping and zeroing the threats with the aim to create to “Safe Cyber Society- Safe India"
As more and more students are falling victims to cyber crime Jharkhand police woken up to the need of cyber security. Jharkhand police's Cyber Defense and Research Centre (CDRC) has finally decided to make young netizens alert to the hidden threat. The primary aim is to make the netizens safe.
CURE TO CYBER CRIME
Personnel Training
Training the personnel for handling such situations and effectively ensuring the “need to know basis” may be a viable solution. Making them aware of the lucrative schemes, lotteries, surprise gifts that might put them in trouble.
Introduction of New Laws
Though there are number of acts for preventing cyber crimes such as blocking website, introducing electronic signatures etc and other proactive measures to provide solution instead of curing. But ,still there is a big debate towards it as the number of crimes are increasing with the users exposure to the technology and rapid increase in the use of Internet has led to a spate in crime like child pornography, cyber terrorism, publishing sexually explicit content in electronic form and video voyeurism.
All cyber crimes do not come under the IT Act. Many cyber crimes come under the Indian Penal Code such as sending threatening message by email Section 506 IPC, sending defamatory message by email Section 499 IPC, sending a mail outraging the modesty Section 509 IPC, forgery of electronic records Section 465 IPC etc. There is a need for amendments or passing new laws to reduce computer security incidents.
E-SECURITY: Avoid getting into huge arguments online during chat or discussions with other users.
PASSWORD SECURITY: Password is a key, which is used to protect your information from the bad guys in the Cyber World
SECURITY PROGRAMME: Not using a security program may send information back to the site eg. Information stored in cookies might prove fatal.
SECURE THE SYSTEM: Securing your Computer, Network with a strong password and regularly scan computers for backdoors, key loggers , Root Kits etc.,
SECURE ORGANISATION: Cybercrime and identify theft are among the fastest growing crimes, yet employers cannot find people who have the right mix of skills to work in the area.
In an organization, following things should be kept under vigilant:
• Forensic analysis of the computers used in an organization.
• Understand legal issues in keeping information secure when conducting investigations.
• Understand the role and the use of digital evidence in litigation.
• Prepare investigation reports and court testimony.
• Analyze user activity.
• Use crime scene search techniques, handle evidence and interview witnesses.
• Prepare investigative reports and court testimony .
• Perform investigations into misuse of IT in a corporate environment.
• Investigate crime against computer systems including malware.
• Deploy information security mechanisms
• Conduct independent.
Organization such as IT companies, Banks and financial institutions, Industrial companies should keep experts to handle various cyber crimes. People who can be helping hand in Digital Investigation & Forensic Computing:
1. Project and program managers
2. Systems / network managers
3. Developers
4. Information security specialists
5. Computer forensics and security analysts
6. Test, audit and engineering and technical specialists
7. Experts in risk management and fraud prevention.
SECURE SITES: Always use secure sites especially if there is a personal information transfer involves.
BACKUP OF DATA: Always keep backup of the data so that you can retrieve it if there is a data loss.
KEEP WATCH ON CHILDREN: Always keep a watch on the sites that your children are accessing to prevent any kind of harassment or depravation in children.
FIREWALLS: Use firewall to analyze incoming and outgoing network traffic by analyzing the data packets and determining whether they should be allowed through or not, based on a rule set. It is a software or hardware-based network security system that controls the A network's firewall builds a bridge between the internal network or computer it protects, upon securing that the other network is secure and trusted, usually an external (inter) network, such as the Internet, that is not assumed to be secure and trusted.[
IDS: An intrusion detection system (IDS) is a type of security software designed to automatically alert administrators when someone or something is trying to compromise information system through malicious activities or through security policy violations or in other words, An IDS works by monitoring system activity through examining vulnerabilities in the system, the integrity of files and conducting an analysis of patterns based on already known attacks. It also automatically monitors the Internet to search for any of the latest threats which could result in a future attack.
WHAT-IF YOU ARE A VICTIM OF ANY OF THE CYBER CRIME
Cyber Crime Complaint Center - Supporting Lawyers and Authorities in the angst of cyber criminals, and gathering electronic evidence for a successful litigation. In criminal law where the quantum of evidence required is proof beyond reasonable doubt, your case is as good as your evidence. Taking any of the criminal activity leniently can increase the limit of crime, therefore experts in Cyber Crime Tracking and Documentation should be called immediately. If you are a victim of internet fraud, scam, or anything that relates to Information Technology and Communication (IT&C), Internet Fraud, Internet Impersonation, or if you are wrongfully accused of committing a cyber crime, then one must take it to Cyber Crime Complaint Center.
INTERNET REPUTATION PROTECTION SERVICES TO SPICK AND SPAN THE WEB
Companies offering free blog services provide only the means to create such sites. Unfortunately, they cannot monitor their sites all the time. So when a blog-writer impersonates somebody else, or writes defamatory remarks against another, these companies are not in a position to arbitrate disputes. Even if a blog site contains unappealing or distasteful contents or presents unpopular viewpoints, these companies still allow their users to create such sites because they do not make any claims about its contents. All in the name of freedom of expression, to the detriment of the hapless victims and their loved ones. Though they provide means to which such victims may report such abuses, the damage has been done. Relief is not as quick as it should come. Most often than not, the perpetrator remains unpunished.
Is there any way out from libelous, negative and/or "unfriendly" articles made it on top of the search engines page results or can we "erase" them from the search engines' pages results or Can we totally remove them from the Internet and with the help of
90 tLingaya's Lalita Devi Journal of Professional Studies A Review based Analysis on “Cyber Crime” t91

various portals available, we can even trace the culprits, gather electronic evidence and assist your lawyers and the proper authorities to bring them to the court of law!
Internet Protection Service is used to Remove Malicious Blog Sites and Libelous Social Networking Sites not only from the Search Engines Page Results but from the Internet as well. Coordinate with the authorities to track and trace the identity of the "author" and perform cyber crime forensics to help you lawyers gather electronic evidence for a successful conviction in the courts of law.
CONCLUSION
It is not easy to curb the cyber crime but we can avoid by following netiquettes, by getting aware of the prevailing scenario. We should not getting into lucrative advertisements which might get our personal information in dormant state and then become a cause for some major crime. We do not suggest that cyber security professionals consider a change in focus and additional duties lightly. However, we do suggest that organizations consider their exposures to cyber crime and their current detection, prevention, and mitigation capabilities. Given the profits and current conditions, cyber crime may well be coming to your neighborhood—if it has not already moved in.
More importantly, how would you know?
We do not suggest that cyber security professionals consider a change in focus and additional duties lightly. However, we do suggest that organizations consider their exposures to cyber crime and their current detection, prevention, and mitigation capabilities. Given the profits and current conditions, cyber crime may well be coming to your neighborhood—if it has not already moved in.
More importantly, how would you know?
REFERENCES
1. http://www.deloitte.com/assets/Dcom-UnitedStates/Local%20Assets/Documents/AERS/us_aers_Deloitte%20Cyber%20Crime% 20POV%20Jan252010.pdf
2. Manovich, Lev. 2008. Software Takes Command. Unpublished. http://lab.softwarestudies.com/2008/11/softbook.html. Accessed May 10, 2011.
3. Marx, Gary. 1984. “Routinizing the Discovery of Secrets: Computers as Informants.” American Behavioral Scientist. 27(4): 423-52.
4. ----. 1988. Undercover: Police Surveillance in America. Berkeley: University of California Press.
5. Millan, Luis. 2011. “Insurers and Social Media: Insurers’ use of social networks impinges on privacy rights.” The Lawyers Weekly. March 25. http://www.lawyersweekly.ca/index.php?section=article&volume=30&number=43&article=2. Accessed May 10, 2011.
6. Natapoff, Alexandra. 2009. Snitching: Criminal Informants and the Erosion of American Justice. New York: New York University Press.
7. Nye, David. 2006. Technology Matters: Questions to Live With. Cambridge, MA: The MIT Press.
8. O’Connor, Mary Quinn. 2011. “Social-Networking Tools Help Find Missing Children.” FoxNews.com. March 30. http://www.foxnews.com/scitech/2011/03/30/social-networking-tools-help-missing-children/. Accessed May 10, 2011.
9. Pearlman, Leah. 2007. “Facebook Ads.” The Facebook Blog. November 6. http://blog.facebook.com/blog.php?post=6972252130. Accessed May 10, 2011.
10. Popken, Ben. 2011. “Facebook is Number One Tool for Divorce Lawyers.” The Consumerist. May 18. http://consumerist.com/2011/05/ facebook-is-number-one-tool-for-divorce-lawyers.html. Accessed May 28th, 2011.
92 tLingaya's Lalita Devi Journal of Professional Studies Investigating The Dependence between Employee Empowerment... t93
Investigating The Dependence between Employee Empowerment and Job Satisfaction Among Employees
Working in Hotel Industry (Categorized Hotels) in Faridabad
Dr. Vijit ChaturvediAssociate Professor
Lingaya’s UniversityC/o Mr. Anurag Chaturvedi
Metal DealsS.C.F. No. 1, IInd Floor, Sector-17,
Faridabad (Haryana) - 121002Contact : 98106 50829,
E-mail: [email protected]
ABSTRACT
Job satisfaction and employee empowerment are two such factors that have a deep bearing impact on organization performance. Empowering refers to making the employee accountable and committed and probably the organization expects it should result in to high level of job satisfaction or improved job attitude. Empowerment being an art needs careful attention, defined purpose and establishing interlink age between what and how this may result into a positive and a constructive attitude towards job and immediate task. The present paper aims at determining the role of employee empowerment on job satisfaction or whether empowered employee feels satisfied or holds a positive attitude towards his job or not. It is also attempted to find whether male and female employees hold same or different level of jobs satisfaction towards their task or not.
Service industry being an attraction for everyone seem to be very alluring and definitely is as well but there are many limiting factors that may act as constraint or pull performance of employees .After analysis and interpretation it was found that females were less satisfied in comparison to males and employee empowerment was found to be significantly related with job satisfaction of employees. It can be inferred that merely making and expecting people should be accountable and feel empowered does not work, it is the exemplary behaviour set by leaders, vision and long term objectives of the top management and the interlink age between the individual and organizational objectives that work largely. It is important to focus on participation, involvement matched with rewarding and compensating or appreciating efforts of employees both as individual and in teams for whatever contribution they are adding to the organization.
For female employees it is quite obvious they being exhibiting dual roles as homemaker and professional needs some work friendly practices and support that can help in retaining this significant percentage of female work force followed by preserving their intellectual capital.
The findings support the fact that employees need to feel empowered and confident not by pressure or any force but by an intrinsic motivation which will help in creating a sustained feeling of pride and contentment. Thus, aligned efforts, employee driven policies, flexible work culture and a collaborative work culture will help in driving and excelling performance largely.
Key words: Job satisfaction, Employee empowerment, Organization effectiveness

94 tLingaya's Lalita Devi Journal of Professional Studies Investigating The Dependence between Employee Empowerment... t95
INTRODUCTION
Empowerment means encouraging the people to make decisions with least intervention from Higher management (Handy, 1993). Employee empowerment is defined as giving the power to employees to make decisions. It is a form of freedom in which employee takes decisions to ensure maximum satisfaction to customers. Empowerment is the initial, fundamental and an extraordinary aspect for achievement of success and growth for any business and enhances the productivity. Employees and customer satisfaction is, therefore, effected by empowerment using it as a tool through which businesses goals could be obtained. Employees are the assets of an organization (Davidson, 2004) and can make or break the organization; highly motivated employees give the unexpected output while an employees with low motivation level can drag the company growth downwards (Deal, 2005).
Job satisfaction is been defined popularly s the attitude and the perception that an individual holds towards his or her job. It is the feeling and predisposition that an individual holds and gradually reinforces in the mind of employees as they remain connected with the organization. It is a highly independent variable that gets affected by many intrinsic and extrinsic variables but largely and majorly effect the opinion and feeling that an individual holds towards the organization .It is the contentment and the satisfaction feeling towards the job that makes employees to decide whether they are going to stay in the organization or not. It is this feeling that even guides their action, output, performance and attitude and thus shaping organization future.
Empowering employees become important because in today’s stiff competition it is not only the performance or the put come of an employee or the earlier created brand image that is important tbut working on building a sustainable image and development is the need. Service industry is one which requires employees with high presentable, communication and sound reasoning with promptness and expertise since handling customers with expected outcomes that too for future is a challenge. Thus making employees feel accountable by training them, enhancing their participation, creating a congenial work environment, a supportive work culture and sound 2-way communication across the level is important Thus, understanding how employees can be empowered so that it results in high level of job satisfaction leading to development of talent capital and maintaining the talent workforce will become easier and feasible.
REVIEW OF PREVIOUS STUDIES
Lawler & Mohr am (1989) defined the employee involvement as it a proper procedure to compete the capability of worker for enhancing their commitment and achievement of growth and success of organization. Handling the employees is the one of the difficult tasks for the managers. A problem appears when an organization on parallel lines start work on imparting employees empowerment as well as implementing various techniques to improve performance. In this phenomenon, effort is to maintain a required level of performance from employees while having trust on them by giving empowerment for betterment of the organization. This display of trust through empowerment for achievement of performance is, therefore, an important factor in service industry. Lack of commitment on part of employees and frequent changes in duties by employer without willingness are obstacles to employee empowerment.
Studies have shown that age, gender, race, and education have important effects on job satisfaction. Using 370 employees, (e.g., faculty, administrators, staff), from a large south-eastern university, Emery and associates found that role conflict and ambiguity. Low levels of control, poor management, and low levels of participation in decision making were all determinants of job dissatisfaction in the Bog and Cooper study (1994).
Judge et al. (2001) cited that there are other studies by Locke (1970), Schwab & Cummings (1970), and Vroom (1964) that have shown that there is at least some relationship between those variables. Iaffaldano and Muchinsky (1985) did an extensive analysis on the relationship between job performance and job satisfaction. Across their many studies, they found a mean correlation of .17 (Iaffaldano & Muchinsky, 1985). There are also stronger relationships depending on specific circumstances such as mood and employee level within the company (Morrison, 1997).
Leadership and leadership styles that emphasize work related characteristics are: challenging work, fair and adequate rewards for work performance, a safe and clean work environment with supportive superiors, and an atmosphere where peers and subordinates can have an impact on the job satisfaction of subordinates. Schneider et al. (1992) indicate that challenging work does correlate with positive job satisfaction.
Bruce and Blackburn (1992) report that fair and equitable pay, promotions, and financial rewards for workers performance are linked to positive job satisfaction. Bruce and Blackburn also report that a clean and safe work place with supportive colleagues can influence job satisfaction. Low levels of control, poor management, and low levels of participation in decision making were all determinants of job dissatisfaction in the Bogg and Cooper study (1994).
Organizational culture is products of people who may at first share some beliefs and then who build and encourage a more fully developed ethos that defines that group's relationship and purpose. The social nature of organizational culture indicates that each culture is unique; although there will be commonalities among organizations but no two organizations will be exactly identical (Budd, 1996). According to researchers like Trice and Beyer culture is a result of ideologies. These ideologies are
sometimes not understood by the members of an organization and they are even not shared by all members but they are still encouraged to engage in some behaviour while staying away from others (Haas & Hwang, 2007).
Choi and Scott (2008) found that team winning percentage was associated with culture type and strength in American Triple-A baseball organizations. In a study of state sporting organizations in Australia Colyer (2000) found differences in the perceptions of organizational culture between the paid work force and volunteers, and suggested the potential impact of those differences would affect the management of the workforce. MacIntosh and Doherty (2005) found that perceived organizational culture in one company was inversely associated with fitness club staff intention to leave their organization and drew implications for the management of fitness organizations.
Research Methodology
Objectives of study: Based on the literature review and the purpose of determining the relationship between the two variables the following objectives were framed.
1) To identify if there is a difference in job satisfaction with respect to the gender of employees
2) To determine if employee empowerment affects their satisfaction level towards their job or job attitude
Research Hypothesis
H1: There will be no significant difference in the job satisfaction level of employee’s based on their gender
H2: Employee empowerment will significantly have a positive impact on the job satisfaction of employees or Employee empowerment will lead to higher job satisfaction among employees
For the present study employee empowerment is considered as independent variable and job satisfaction is been treated as dependent variable. A structured questionnaire consisting of two different parts was framed for employee empowerment to assess the role of employee empowerment in making people feel satisfied towards the task..Part-A consisted of demographic details like age, gender, education qualifications, years of experience etc. 24 items including factors like participation, decision making, job autonomy, training, behaviour of seniors, job autonomy, task structure, type of supervision, quality expectations, conflict resolution were considered to design the questionnaire.
Job satisfaction as assessed using the job attitude scale developed by Dr. H.C Ganguli which has a proven reliability and validity. This scale consists of 26 items consisting of different variables mthat can affect job satisfaction both intrinsically and extrinsically categorized in six different categories. The scale used for measuring employee empowerment was pre-tested on 25 employees working in 3 different hotels in Faridabad comprising of both male and female employees. The Cronbach Alpha for the items was 0.76 which states that the scale is suitable for measuring employee empowerment. Both the instruments are thus reliable and possess content validity to be used as a tool for measuring the level of the stated variables for the study.
For the present study 150 questionnaires were distributed based on convenience sampling to employees working at middle level and at front desk, back end operations in 7 different categorized hotels in Faridabad .Out of the distributed questionnaire 98 filled questionnaires in all respects could be received for the purpose of study.
Research tools used: Independent sample t-test and simple regression analysis was used to interpret the data and test the hypothesis.
Data analysis and Interpretation
Based on the above stated objectives and the data analysis the following observations can be made:
In order to test the first hypothesis if there is any significant difference in job satisfaction level of employees based on gender t-test (independent sample) was used..From table -1 it is clear that the job satisfaction score of male employees was higher than the female employees. . Also from the p value (p>0.05) it is clear that there is a significant difference between the satisfaction level of male and female employees .this may be because of the fact that females have dual responsibilities both at home and at workplaces which makes it a little difficult to focus completely and thus making the employee dissatisfied because of not spending complete time on any one of them. This makes the satisfaction level low as well as creates negativity in the workplace as well. Thus, the framed hypothesis that employees will show significant difference in their job satisfaction based on gender stands accepted.
Table-1 showing Mean, S.D and p-value to determine significant difference between job satisfactions based on gender
Group Mean Std Dev p-value
MALE 4.2545 0.55450.003
FEMALE 3.2124 0.4821

96 tLingaya's Lalita Devi Journal of Professional Studies Investigating The Dependence between Employee Empowerment... t97
The second objective was framed to determine relationship that exists between employee empowerment and job satisfaction in order to determine the same simple regression analysis was used .from table-2 it is clear that the model is significant and employee empowerment predict the level of jobs satisfaction that employee holds(p<0.05). From the results it can be seen that the value of R-square is 0.642 which indicates that 64% of the variance in the model is explained by predictor variable employee empowerment. The value of F-statistics is 13.2578 it reflects that there is a significant positive relationship between the two variables. The regression coefficient value is 0.428 which explains that employee empowerment contributes 42% of change in the level of job satisfaction is contributed by the feeling of employee empowerment. Thus, the framed hypothesis that employee empowerment will lead to higher job satisfaction stands accepted.
Table 2: Showing Regression coefficient, t-value, standard error, F-statistic
Constant Employee Empowerment R-square F-statistics
2.4214 0.485
(0.178) (0.428) 0.642
[12.256] [3.2145]
0.000 0.000 0.000
Findings of Study
From the above interpretation and analysis the following findings can be made:
1. Employee empowerment and job satisfaction both are highly required for keeping the talent capital productive and motivated and helping organization to grow.
2. There is a difference in the level of job satisfaction based on gender among employees working in hotels, the reason behind this being females engaged and occupied for household responsibilities right from nurturing children to taking care of household work and other related expectations and pressures along with similar such expectations at workplace makes the situation more pressurizing and stressful for them. As a result they expect that organization should design policies and task in such a way that will help them in reducing the stress level and making it easier for them to accomplish their goals
3. After analysis it was found that there exists a significant positive relationship between employee empowerment and jobs satisfaction and employee empowerment to a large extent explains change in the level of job satisfaction.
4. Males are comparatively found to display higher jobs satisfaction because in contrast to female counterparts they are less pressurized as dual role and accountability to a extent is limited not fully exempted because with up rise in nuclear families and both partners working it is wrong to say that male employees are able to put their 100% in job without any accountability at personal front.
5. It is important that policy makers and owners of such organization entities should take special care of the women workforce and try to provide the best of support whether it is in context to training, timing, safety, crèches, day care facilities, child care or any other. It will help in preserving this segment of workforce and will also help in establishing a strong employer brand for the organization.
CONCLUSION
Thus with the objectives with which this study was conducted few perspective with an individual and organization perspective are clear. It can be concluded on the basis of above discussion and statistical findings that employees cannot be pressurized or no coercion can work to derive the best out of employees. It is the empowerment and resulting accountability that an employee’s feels that results into high commitment, satisfaction, positive attitude and a collaborative work culture. The techniques of empowering the employee may vary but till an employee feels the ownership and involvement right from decision making to work autonomy it will be very difficult to align individual goals with organization goals. Further, today when organization is in the journey of creating employee centric environment and culture sufficient care should be taken to provide a organization friendly work environment where manageable stress exists and it becomes feasible for employees to perform.
Thus, the study has implications for various other service industries because it is the creativity, innovativeness and the belongingness of an employee which helps an employee to put his best effort in strategically aligning his or her intellect and commitment to an organization thus even developing citizenship behaviour.
13.2578
REFERENCES
1. Argyris and Chris, (1998). Empowerment: The emperor s new clothes, Harvard Bus. Rev, 76, 98-108.
2. Best of the Best. (1999). Saluting the global award recipients of Arthur Andersen's best practices awards, Fortune. Vol.139, No. 4, S1-7.
3. Davidson, I. (2004). Employees: Business asset or legal liability? Internet Works, Autumn 2004, Vol 86.\
4. Halvorsen, D. L. (2005). An Investigation of Employee Satisfaction and Employee Empowerment Specific to on-Site Supervisors in The Residential Construction Industry, A thesis for master degree submitted to the faculty of Brigham Young University, (December, 2005)
5. Ripley, R.E. and Ripley, M.J. (1992). Empowerment, the cornerstone of quality: Empowering management in innovative organizations in the 1990 s. Management Decision, 30, 20-43.
6. Spatz, D. (2000). Team building in construction. Practice Periodical on Structural Design and Construction, Vol 5, 93-105.
7. Spice, M, and Gilbert, A. (1991), Leadership for empowerment. The Public Manager, 21(3), 27-31.
8. Tony, C. (1999). Cultivation council. Sell. Power, 19: 100-102.

98 tLingaya's Lalita Devi Journal of Professional Studies Turnaround of Steel Authority of India Limited : A Case-Study t99
Turnaround of Steel Authority of India Limited: A Case-Study
Malay MandalResearch Scholar
Department Of Applied Economics and CommercePatna University, Patna – 800005
Ph: 09304032880E-mail: [email protected]: Flat No. 302, Block-A
Radhika Madan Apartment, Kurji, Dist. – Patna, Bihar – 800010
INTRODUCTION
Till the late 1980s, the Steel Authority of India Limited (SAIL), one of the largest steel manufacturing corporations anywhere in the world, had been operating in a largely sellers’ market. But since July 1991, there had been the following changes in its business environment:-
1. Removal of the licensing conditions that were required for the creation of fresh capacity,
2. The lowering of tariff rates to allow consumers to use the import option,
3. The removal of the pricing and distribution controls that were mandatory for the Integrated Steel Plants, and,
4. The industry had gone through a process of major deregulation with the removal of levies like the Steel Development Fund and the Freight Equalisation Fund.
An immediate impact of the above mentioned decontrol process had been the creation of substantial capacity in the steel sector. According to the investment plans in 1995, it was expected that by the turn of the century there would be a near doubling of the crude steel capacity of the Indian Steel industry.
SAIL’s plants were set up at a time, when maximisation of production volume was the primary goal. And, being a PSU, SAIL’s operations were not solely dictated by commercial considerations, as its role was also to fulfill the larger objective of national development through generating employment, developing social infrastructure and rehabilitation of sick units. With the process of liberalisation of Indian economy initiated in the early 1990s, SAIL saw a fundamental shift in its business environment: SAIL for the first time was exposed to forces of serious competition, both domestic and international.
Handicapped by the huge workforce and outdated technology, SAIL had to compete with the new domestic players which enjoyed locational and technological advantages. At the same time, to make matters worse, SAIL had to take on the responsibility of reviving sick steel units.
Hence, recognising the need for bridging the technological gap, SAIL undertook massive capital expenditure programmes for its Durgapur, Bokaro and Rourkela steel plants to reduce costs, upgrade technologies, increase product quality, increase production capacity and, most importantly, to improve production efficiencies. The massive capex coincided with the recession in the domestic user industry, and the South-east Asian financial melt down that affected the global economy.
The Financial Year 1998-99 was the beginning of a difficult period for SAIL. Since 1995-96, SAIL had started experiencing a sharp decline in its profitability. In 1997-98, it barely managed to remain in the profit zone. An internal estimate by the company revealed that the main factors behind the decline in profitability from over Rs. 1,300 crore in 1995-96 around to Rs.1,200 crore in 1998-99 was primarily due to falling prices and the rise in input costs.
Thus, with the tightly squeezed margins, SAIL was finding it difficult to meet its cash requirements through operations. This was forcing SAIL to raise more debt, increasing its interest burden each year. Starting at around Rs 1,800 crore in 1998-99, interest cost threatened to spiral to over Rs.3,000 crore by 2002-03. The debt-equity ratio was becoming quite adverse and it was expected at that time to exceed 7.5 by 2002-03. And, with the erosion of more than Rs.4,000 crore of equity, SAIL was in real danger of becoming a deemed BIFR company which could have been a blow to its image as the premier steel company of India.
Therefore, it was imperative that the various factors affecting its business operations are addressed in a holistic way by the management and workers of SAIL. It required actions at macro as well as micro levels to bring the overall turnaround and restructuring efforts from the drawing boards to ground reality.
The company identified the following areas (popularly known as the 5 R’s) and proposed to focus its efforts on these:
1. Restoring the Financial Foundation
2. Restructuring the Organisation
3. Reinforcing Marketing Initiatives
4. Regaining Cost Leadership
5. Redefining Business Performance
The first ‘R’ pertained to financial restructuring, while the other four ‘R’s pertained to business restructuring.
The fruits of sustained efforts throughout the organisation were realised by SAIL when it showed spectacular results in the fiscal 2003-04, which was a landmark year. It has been very aptly termed as the biggest turnaround in the corporate sector. With its fundamentals significantly strengthened as a result of an internal campaign – on improving operational efficiencies using available resources – undertaken during the recession period, the company was fully prepared to take advantage of the market upsurge with significantly higher gains.
The all-round sustained efforts resulted into cost reduction to the tune of Rs. 450-500 crores every year progressively from previous year. Thus, SAIL succeeded beyond all expectations by rewriting its own record books.
There is no denying that SAIL’s turnaround was supported by gradual improvement in the market conditions. The consumption of steel in India had grown at an average rate of 6-7% over the last few years. The global market for steel had also witnessed a significantly high growth contributed mainly by a demand boom in China.
However, turnarounds are never permanent. Therefore, constant vigilance is required to remain competitive. Several companies managed highly successful turnarounds, experienced high rates of profitability, and enjoyed renewed market presence for several years only to experience a new predicament 15, 20, or 30 years later. Hence, notwithstanding the spectacular turnaround, SAIL needs to sustain its continual growth in order to ensure its profitable existence.
And, therefore, the study attempts to analyze the past mistakes and build upon the present growth to succeed in the futuristic world by formulating a comprehensive strategy - one for today, one for tomorrow; as, “tomorrow never happens by chance: success has to be planned”. Although, due care has been taken to compile the case study on the basis of critical plant-wise data as well as information available in the Annual Reports of SAIL; however, owing to the paucity of time, in-depth interviews of key personnel involved in the restructuring and turnaround process could not be carried out.
OBJECTIVE OF THE STUDY
The objective of this case study is to make a critical examination of the factors that led to the downtrend in the profitability of ‘Navratna’ manufacturing powerhouse of independent India. And, based on the examination, an attempt is made to diagnose the internal elements as well as the external factors that led to steady decline of SAIL’s bottom-line. Inferences are also drawn on the basis of a comparative study of the major players in the backdrop of the emerging global industry structure, and recommendations are made for the profitable existence of SAIL.
METHODOLOGY
The case study is based on the information (secondary data) available in the websites of SAIL, other relevant websites, and business magazines as well as the Annual Reports of SAIL. Plant-wise data have also been examined in order to analyze the basic reasons – technological, financial and HRM-related - for the decline in profits.

100 tLingaya's Lalita Devi Journal of Professional Studies Turnaround of Steel Authority of India Limited : A Case-Study t101
Limitations
The lack of primary data, by way of personal interviews with personnel at all levels across the cross-section of the organisational hierarchy, might have skewed the analysis of the case study - and the resulting inferences - in favour of what the top management (and the Government of India) wants to portray in order to eulogize the Pyrrhic turnaround of SAIL through the restructuring and re-engineering processes. Hence, a detailed plant-wise study may have given a more practical basis for formulation of the strategies for future growth of the enterprise as a whole.
INTRODUCTION TO THE STEEL INDUSTRY IN INDIA
The foundation of the Indian steel industry was conceived and nurtured by visionaries like Jamshedji Tata and M. Visvesvaraya during the pre-independence era. In the post independence era, Pandit Jawaharlal Nehru laid great stress on industrialisation for economic resurgence and chose to make the steel industry one of the corner stones of such resurgence. And, for modern India’s iron and steel industry, August 27, 1907, was a red-letter day when the Tata Iron and Steel Company (TISCO) was formed as a Swadeshi venture to produce 1,20,000 tonnes of pig iron. The TISCO plant at Sakchi (renamed Jamshedpur) in Bihar, started pig iron production in December 1908 and rolled out its first steel the following year. TISCO had expanded its production capacity to one million tonnes ingot by the time the country achieved freedom.
Prime Minister Nehru firmly believed that "no country can be politically and economically independent unless it is highly industrialized and has developed its resources to the utmost". Nehru’s ideas about India’s development were broadly incorporated in free India’s first Industrial Policy Resolution adopted by the Constituent Assembly in 1948. The resolution officially accepted the principle of mixed economy. Industries were divided into four categories. In the first category were strategic industries which were made the monopoly of the Government. In the second category were six industries which included, among others, coal, iron and steel.
LIBERALISATION OF THE STEEL INDUSTRY
The liberalization of industrial policies since 1991 have resolved many of the problems, mainly by allowing the entry of private sector investments into the large scale steel manufacturing by allowing access to financing from India and abroad, and also by allowing the free import of technology.
After the liberalisation of the economy, new players came into the steel industry. These entrepreneurs were dynamic and innovative in planning, project concept and choice of technology route, determining plant capacity, product mix and manning, and also in evolving marketing concepts based on customer oriented production.
Swot Analysis of the Indian Steel Industry
The strengths, weaknesses, opportunities and threats for the Indian steel industry have been tabulated below:
Strengths
1. Availability of iron ore and coal
2. Low labour wage rates 2. Low productivity
3. Abundance of quality manpower 3. Coking coal import dependence
4. Mature production base 4. Low R&D investments
5. High cost of debt
6. Inadequate infrastructure
Opportunities Threats
1. Unexplored rural market 1. China becoming net exporter
2. Growing domestic demand 2. Protectionism in the West
3. Exports 3. Dumping by competitors
4. Consolidation
The steel consumption in the world is expected to grow at 3% per annum as compared to 2% per annum in the past fifteen years, with China dominating the world steel demand. As the Indian growth rate of steel production over the past fifteen years has been 7% per annum, the projected growth rate of 7.3 % per annum compares well with the projected national income growth rate of 7-8 % per annum, given an income elasticity of steel consumption of around 1.
Therefore, at this stage, the long-term strategic goal of India should, be to have a modern and efficient steel industry of world standards, catering to diversified steel demand. The focus should be to achieve global competitiveness not only in terms of cost, quality and product-mix but also in terms of global benchmarks of efficiency and productivity. This would require indigenous
Weaknesses
1. Unscientific mining
production of over 100 million tonnes (mT) per annum by 2019-20 from the 2004-05 level of 38 mT, which implies a compounded annual growth of 7.3 % per annum.
The downtrend in the profitability of SAIL
SAIL’s plants were set up at a time when maximisation of production volume was the primary goal. And, being a PSU, SAIL’s operations were not solely dictated by commercial considerations, as its role was also to fulfill the larger objective of national development through generating employment, developing social infrastructure and rehabilitation of sick units. With the process of liberalisation of Indian economy initiated in the early 1990s, SAIL saw a fundamental shift in its business environment: SAIL for the first time was exposed to forces of serious competition, both domestic and international.
Handicapped by the huge workforce and outdated technology, SAIL had to compete with new domestic players which enjoyed locational and technological advantages. At the same time, to make matters worse, SAIL had to take on the responsibility of reviving sick steel units.
Hence, recognising the need for bridging the technological gap, SAIL undertook massive capital expenditure programmes for its Durgapur, Bokaro and Rourkela steel plants to reduce costs, upgrade technologies, increase product quality, increase production capacity and, most importantly, to improve production efficiencies. The massive capex coincided with the recession in domestic user industry and South-east Asian melt down that affected the global economy.
The Financial Year 1998-99 was the beginning of a difficult period for SAIL. Since 1995-96, SAIL had started experiencing a sharp decline in its profitability. In 1997-98, it barely managed to remain in the profit zone. An internal estimate by the company revealed that the main factors behind the decline in profitability from over Rs. 1,300 crore in 1995-96 around to Rs.1,200 crore in 1998-99 was primarily due to the falling prices and the rise in input costs.
Thus, with the tightly squeezed margins, SAIL was finding it difficult to meet its cash requirements through operations. This was forcing SAIL to raise more debt, increasing its interest burden each year. Starting at around Rs 1,800 crore in 1998-99, interest cost threatened to spiral to over Rs.3,000 crore by 2002-03. The debt-equity ratio was becoming quite adverse and it was expected at that time to exceed 7.5 by 2002-03. And, with the erosion of more than Rs.4,000 crore of equity, SAIL was in real danger of becoming a deemed BIFR company which could have been a blow to its image as the premier steel company of India.
SAIL’s multi-pronged strategy
After identifying the reasons for the decline of its performance with the help of consultants like McKinsey, BCG and IDBI, SAIL had developed a massive turnaround and transformation plan for bringing back the company to profit and growth path. And, despite of the stagnant market, the Steel Authority of India (SAIL) had registered a profit, before tax, of Rs.149 crores for the fiscal 1997-98. Higher sales, increase in price realisation, significant saving from cost cutting measures and an increase in market share enabled the company to register a higher operating profit of Rs.2,497 crores. In fact, in a market characterized by demand crunch, aggressive marketing strategies saw SAIL recording a 3.6% increase in sales turnover to Rs.14,624 crores along with a higher market share of 27%.
With a view to overcoming the continued stagnancy of the domestic market, SAIL had embarked on an extensive plan that concentrated on increasing sales, reduction of the cost of production, focusing on value added items and improving the techno-economic parameters. The cost reduction drive during 1997-98 had instilled enough confidence in undertaking a more intensified programme and identification of newer areas of operations for gaining cost leadership in the industry.
Similarly, marketing was re-oriented to enhance the market share through increased sales of value-added items and an improved product mix. These initiatives helped raise the total sales realisation in 1998-99. Also, the benefits of modernization started flowing in from the Durgapur and Rourkela plants in the form of higher production, better productivity and improved finished products.
The successful hot trial of the continuous caster at Bokaro had led to further improvement in techno-economic parameters. The facility of agglomeration was strengthened along with new facilities for raw material bedding and blending. The above steps had enabled SAIL’s integrated plants to use more fines to cut down the cost of usable iron ore and improve the consistency in composition of raw material used. It had also helped reduce the coal to hot metal, facilitating subsequent steel making.
Marketing Strategies
SAIL had also adopted aggressive marketing strategies in the competitive environment where domestic demand continued to be weak. There was increased focus on direct dispatch of materials to customers’ doorsteps, in the manner and time in which they wanted.
Some of the salient features of SAIL’s market-oriented marketing strategy include:
1. Adopting market-driven pricing strategies;

102 tLingaya's Lalita Devi Journal of Professional Studies Turnaround of Steel Authority of India Limited : A Case-Study t103
2. Orienting product mix to suit market requirements and adjusting production in tune with the changes in market demand;
3. Extensive customer contact;
4. Booking of orders through participation in tenders and negotiations invited by various purchasers including government departments, railways, PSU projects and the like;
5. Constantly improving after-sales services such as refunds settlement against quality complaints and the like; and,
6. Boosting exports to relieve pressure on domestic market.
SAIL’s drive to be more market-oriented had resulted in a significant change in its product mix, development and manufacture of new products and focused research and development in areas where the company perceived latent or emergent demand. And, in order to meet the changing requirements of customers, the product mix was oriented to the specific needs of different market segments. Besides this, the interface between marketing and the production plants was strengthened for ensuring supply of customized products within a shorter lead time.
New opportunities for export
In spite of the domestic demand for steel saturating in 1997-98, SAIL managed to increase its share significantly by exporting over one million tones of iron and steel products, and this success further strengthened SAIL’s intention to be a long-term player in the international trade for iron and steel. Apart from the plans to turn SAIL into an international trading house by initially concentrating on steel and steel-related products, it had also planned to export 15% of its production by the turn of the century. As a step towards this venture, SAIL had set up a consignment base in Dubai from where the requirements of customers for a variety of steel grades in small quantities could be cost-effectively met.
Human resources development was paid attention to, as quality improvement is not a one-time effort but an on-going process. Besides, the technical support services for the user industries in the selection and application of refractories, and other value-added services such as design, manufacture and installation required consistent HRD.
LEARNING FROM THE TURNAROUND AND RESTRUCTURING PROCESS
The planning and implementation of the process for turnaround and restructuring were vital to realise the intended results for SAIL. The need for turnaround and restructuring was realised much earlier and the concerns were expressed to all stakeholders. Although conscious thinking had begun in 1997-98 to initiate the process of assessing magnanimity of the problem and subsequently for charting out path to turnaround and transformation for achieving global competitiveness by 1999, the outcomes were very much dependent on the effectiveness of the restructuring process and its effective implementation. The entire process can be broadly enumerated as follows:
1. Analysis of business environment
2. Evaluation of the performance of the organisation
3. Development of roadmap to turnaround and restructuring
4. Deciding organisational priorities and planning action steps
5. Scanning and responding to the market changes
6. Effective coordination with the external agencies
7. Proper design of interventions at Organisational and Plant/Unit Levels
8. Ensuring the involvement of people in the restructuring process
9. Scientific monitoring of results at macro as well as micro levels
The above mentioned learnings from the turnaround process of the organization resulted in the strengthening of sustained efforts at macro as well as micro levels during the process of restructuring which ultimately resulted in turnaround of the organization, as well after it.
Suggestions for framing Future Strategies
SAIL today is one of the largest industrial entities in India. Its strength has been the diversified range of quality steel products catering to the domestic, as well as the export markets and a large pool of technical and professional expertise. The company has the distinction of being India’s largest producer of iron ore and of having the country’s second largest mines network. The accent in SAIL is to continuously adapt to the competitive business environment and excel as a business organisation, both within and outside India.
SAIL is on the threshold of a major transition phase where it is facing a plethora of opportunities as well as risks, and is fully geared to translate and every opportunity by taking strategic business risks for moving in an upward trajectory of rapid growth.
With the most of its units being situated in western India, SAIL’s production units situated in eastern India faced an indirect cost disadvantage in terms of higher freight charges. This implied a potential loss of large markets for SAIL. Most of the emerging
capacities were planned in the flat products (largely hot-rolled coils) sector, where the returns were substantially higher. Thus, it is likely that the excess capacity emerging in the hot-rolled market, would make the competition intensive.
SAIL’s objective should be to get to the top quadrant of the product portfolio matrix signifying both high market attractiveness and high strategic strength. If the above mentioned objective is achieved, it shall significantly improve the bottom-line of the company. And, therefore, it is recommended that SAIL should opt for value-added products to maintain its dominant position in the market.
Prerogatives for the Government
The current excise duty at 15 % on all iron and steel items is quite high. In view of the vast potential for increase in steel consumption and inherent advantages like the availability of raw materials and skilled labour, the Government should initiate the following steps in different areas to increase the production as well as consumption of steel:
1. Easy availability of finance at lower interest.
2. Development of infrastructure. This will call for investments both by Govt. and private sector as also induction of foreign capital.
3. More incentives for exports, so that better realization can be obtained through exports. Without this, it will be almost impossible to achieve the export target of six million tones fixed by the Govt. for 2001-02.
4. Putting in place an anti-dumping mechanism so that cheap import are discouraged.
5. Rationalisation of duty structure – both customs and excise. In some cases, the customs duties are even lower than those recommended by the Chellaiah Committee and in other cases, the customs duties on raw materials and finished product are the same. The excise duty needs to be reduced to 5% on all products of iron and to 10% on steel.
6. Development of the agricultural sector through improved irrigation mechanization of agricultural operations and the like and
7. Taking up housing projects in both urban and rural areas.
The medium and long term prospects of steel have been encouraging. The problem had been in the short run, with increasing supplies facing a stagnant market. The development of proper infrastructure facilities like power, roads, railways and facilities at ports is essential if the steel industry is to grow consistently. And, with the increase in the Government expenditure on infrastructure development, the demand for steel shall also grow.
On the demand side, the strategy should be to create incremental demand through promotional efforts, creation of awareness and strengthening of the delivery chain, particularly in the rural areas. And, on the supply side, the strategy should be to create additional capacity, remove procedural bottlenecks in respect of inputs such as iron ore and coal, and, increase the investments in R&D and HRD. At the same time, it should take care to adopt technologies which:
• Have synergy with the natural resource endowments of the country.
• Are conducive to production of high-end and special steel required for sophisticated industrial and scientific applications.
• Minimize damage to the environment at various stages of steel making and mining.
• Optimize resource utilization.
• Facilitate modernization of the steel industry so as to achieve global standards of productivity and efficiency.
• Development of front-end and strategic steel based materials.
According to the Indian Bureau of Mines, the country has net reserves of over 24 billion tonnes of iron ore. Given the rule that one tonne of steel requires 1.6 tonnes of iron ore, the annual need for ore, even if the production of steel hits the target by 2020, would be 176 million tonnes, against the meager reserves of 24 billion tonnes. Hence, the utmost priority of the Indian Government should take proactive steps towards the sourcing of iron ores over and above the projected requirements as per the planned additions to the existing production capacities. At the same time, advanced technology should be used in mining and processing of the available ores.
At this juncture, the Government should also contemplate the constitution of an independent entity on the lines of the ‘ONGC Videsh Ltd.’, to initiate the prospecting and sourcing of ore from multiple locations transcending the national borders.
To sum up, the steel industry in India today is facing new challenges and tough competition from both within and outside the country. The work culture, which had developed over a period of time under a protected regime, is undergoing a change. For its proper and desirable growth, cost reduction and improvement in quality of products together with advanced technology and skill is called for, so as to meet the international competitiveness.
A Chinese proverb states, “if you are planning for a year, sow rice; if planning for 20 years, grow trees; and, if for centuries, invest in men and culture”. SAIL’s planning process in the steel sector should take the seasonal hazards in its stride, for it is not in the business of sowing rice, and invest in the education of its personnel so that they are at par with the global standards and encourage a

healthy and vibrant work culture which can nurture people’s creativity to generate in-house innovations for the ultimate enhancement of all productivity parameters.
And, SAIL would do well to remember Peter Drucker’s advice that, ‘The modern Corporation is a political institution; its purpose is the creation of legitimate power in the industrial sphere’, and strive towards the objective of ensuring that, ‘there is a little bit of SAIL’s steel in everybody’s life’ – all across the globe.
BIBLIOGRAPHY
1. Annual Reports of SAIL, 2003-04, 2004-05, 2005-06, and 2006-07
2. Anthony, Robert N. & Vijay Govindarajan. Management Control Systems: Dedication & Distinction, (ISBN O-07-058756-6 )
3. Iron & Steel 1999-2000, JPC Publication
4. Nilakant, V. and Ramnarayan, S., Managing Organisational Change, [ISBN 81-7036-702-6]
5. Operational Statistics 2003-04, Bhilai Steel Plant, SAIL News, Vol.29, No.2, March-April 2001
Web References:
• Website of SAIL : www.sail.co.in
• Website of the Ministry of Steel, Govt. of India : http://steel.nic.in
• Website of the Indian Bureau of Mines : http://ibm.gov.in
• www.worldsteeldynamics.com
• www.steelonthenet.com
• www.indianindustry.com
• www.tatasteel.com
• www.jindalsteel.com
104 tLingaya's Lalita Devi Journal of Professional Studies Future Prospects of Green Marketing t105
Future Prospects of Green Marketing
Dr. Deepak Singh*-Lilesh Gautam**
Anil Parihar ***
ABSTRACT
Green marketing is a concept of imbalance in the eco system. Green, environmental and eco-marketing are part of the new marketing approaches which do not just refocus, adjust or enhance existing marketing thinking and practice, but seek to challenge those approaches and provide a substantially different perspective. Green marketing incorporates a broad range of activities, including product modification, changes to the production process, packaging changes, as well as modifying advertising. This concept has enabled for the re-marketing and packaging of existing products which already adhere to such guidelines. Additionally, the development of green marketing has opened the door of opportunity for companies to co-brand their products into separate line, lauding the green-friendliness of some while ignoring that of others. Such marketing techniques will be explained as a direct result of movement in the minds of the consumer market. As a result of this businesses have increased their rate of targeting consumers who are concerned about the environment. The popularity of such marketing approach and its effectiveness is hotly debated. Supporters claim that environmental appeals are actually growing in number–the energy star label. This paper discusses how businesses have increased their rate of targeting green consumers, those who are concerned about the environment and allow it to affect their purchasing decisions. The paper identifies the three particular segments of green consumers and explains out its effectiveness challenges and opportunities businesses have with green marketing. The paper also examines the present trends of green marketing in India and gives a brief look at the future of green marketing and concludes that green marketing is something that is still continuously growing in both practice and demand.
INTRODUCTION
The green marketing was first introduced in the late 1970s when the American Marketing Association (AMA) organized the first ever workshop on ecological marketing in 1975 which resulted in the first book on the subject, entitled ‘Ecological Marketing’ by Henion and Kinnear in 1976. The first definition of green marketing was according to Henion as follows:
“The implementation of marketing programmes directed at the environmentally conscious market segment” (Banerjee 1999).Henion’s definition of green marketing has evolving and many more definitions of green marketing have arisen throughout the years. Fuller (1999) defined the green marketing as follows: “The process of planning, implementing, and controlling the development, pricing, promotion and distribution of products in a manner that satisfies the following three criteria: (1) Customer needs are met, (2) Organizational goods are attained and (3) The process is compatible with ecosystems”. According to Ottman (1999) green marketing serves two key objectives as follows:
• To develop the products that incorporate consumers’ needs for convenience, affordable pricing and performance while having a minimal impact on the environment.
* Faculty of Marketing, Institute of Commerce & Management, J.U., Gwalior
** Research Scholar, Institute of Commerce & Management, J.U., Gwalior
*** Research Scholar, Institute of Commerce & Management, J.U., Gwalior

106 tLingaya's Lalita Devi Journal of Professional Studies Future Prospects of Green Marketing t107
• To project an image of high quality, including environmental aspects, both in regards to product attributes and in regards to product attributes and manufactures tracks record of environment fulfillment.
It is worth noting that green marketing is actually related to another topic which is gaining visibility in corporate circles and corporate social responsibility (CSR). A company can provide fewer napkins, using less ink and paper, encouraging customers to use online billing for offices which are all green initiatives that can quickly reduce costs of the company. Green marketing is very important item for a company because it offers business bottom line incentives and top line growth possibilities. Companies can develop new and improved products and services with environmental impacts which help access to new markets, substantially increase profits and enjoy competitive advantages. The term Green marketing refers to the planning, development and promotion of products or services that satisfy the needs of consumers for quality, output, needs of consumers for quality, output, however a negative effect on the environment, with regard to the use of raw material, the consumption of energy etc (Peattie and Crane 2005, Grant 2008, Pride and Ferrell) In the USA the green market counts about $250 billion, while 63 million of consumers are directed towards product that either protect the environment contrary to the conventional ones, or have been produced with processes that respect the society and the environment. The same consumers are prone to spend an additional 7-20% in order to buy pure green products and reject the non-viable alternatives, offered to them by the conventional market (Reitman’s 1992, According to a recent research, at a world level, the positive fame of a company about its environmental responsibility is determined by the 53% of consumers (about 1 billion) as a decisive reason that makes them buy and use its products (Spanos 2008, Papadopoulos et al. 2012).
OBJECTIVES OF STUDY
(1) To define the future prospects of green marketing in India
(2) To describe the importance of green product marketing.
IMPORTANCE OF GREEN MARKETING
Economy of the world faces serious difficulties due to global warming, greenhouse gas (GHG) (Mohajan 2011). Green marketing is in due to the pressure that comes from inclined environmental awareness in the global climate change. Therefore, the marketers need to include a green approach in framing the marketing programmes. There are several suggested reasons for firms increased use of green marketing and some of them are as follows (Singh 2008):
• Organizations perceive environmental marketing to be an opportunity which can be used to achieve its objectives,
• Organizations believe that they have a moral obligation to be more socially responsible,
• Cost factors associated with waste disposal or reductions in material usage forces firms to modify their behavior
• Competitors’ environmental activities pressure firms to change their environmental marketing activities, pressure firms to change their environmental marketing activities, and
• Governmental bodies are forcing firms to become more responsible.
In the 21st century consumers become more conscious about their safer and healthy environment.
Obviously the customers always want to buy eco-friendly and environment harmless commodities for their daily lives. In 2007 green marketing came in main stream of global business and it has captured the public consciousness. The best example of green marketing issues that helping to make environment safe and eco-friendly is from printing machines industries which are trying to be greener by reducing emissions of Volatile Organic Compounds(VOCs), handling of contaminated water and toxic waste as well as tracking of inks, solvents and other chemicals(Chaudhary et al. 2011). The McDonald’s company replaced its clam shell packaging with waxed paper because of increased consumer concern relating to polystyrene production and ozone depletion (Singh 2008). The government of a country can stress to product green marketing commodities to reduce production of harmful goods or by-products, to modify consumer consumption of harmful goods. These governmental regulations are designed to control the amount of hazardous wastes produced by firms. Government can impose a tax on production or use of non-green marketing products. For example, in Australia there is a higher gas tax associated with leaded petrol. A company can produce green marketing product to teach other companies the importance and demand of it.
GREEN MARKETING PRODUCTS
The customers always prefer environmental household products which must benefit them such as, safe to use around children, no toxic ingredients, no chemical residues, and no strong fumes commodities. At present most of the daily newspapers are in online and seminars, conferences and publications as well as on-going webinars on how to become a green company or community. School kids have environmentally related projects at schools or eco-friendly programs that they are implementing at home or in their communities (Chaudhary et al. 2011). Most of the companies practicing green marketing in their products and some of them are as follows:
• Coca-Cola Company of the USA pumped syrup directly from tank instead of plastic which saved 68 million pound/year.
• Xerox introduced a high quality recycled photocopier paper in an attempt to satisfy the demands of firms for less environmentally harmful products.
• In 1994, Philips launched the Earthlight, a super energy-efficient compact fluorescent light (CFL) bulb designed to be an environmentally preferable substitute for the traditional energy-intensive incandescent bulb (Ottman et al. 2006).
• In India, Badarpur Thermal Power station of NTPC in Delhi is devising ways to utilize coal-ash that has been a major source of air and water pollution.
• In India, Barauni refinery of IOC is taken steps for restricting air and water pollutants
CONSTRAINTS TO IMPLEMENT GREEN MARKETING
Implementation of green marketing in the industrial and manufacturing sectors is not an easy job. The firm has to face many problems while treading the way of green marketing. In any country to product materials for green marketing the manufacturers have to face various challenges. Some of these challenges are being as follows (Welling and Chavan 2010): Hardhan Kumar Mohajan, Int. J. Eco. Res., 2012, v3i3, 1-11 ISSN: 2229-6158 IJER | MAY - JUNE 2012 Available [email protected]
• To supply green marketing products first the manufacturers need to create public consciousness about the usefulness of the use of these types of products. The consumers must know that green marketing encourages the manufacturers to product green products, to use green technology and green energy which are environmentally less harmful.
• It need a lot of money has to be spent on R& D (research and development) programmes, so that initially it will be a costly matter.
• Initially the profits of the company will be very low because renewable and recyclable products and green technologies are more expensive but in the long run it will be profitable since consumers will want to spend extra amount for green products.
• At the starting many customers may not be willing to pay a higher price for green products which may affect the sales of the company. Initially the environment conscious people will be the buyers of green product
THE FUTURE OF GREEN MARKETING
There are many lessons to be learned to be learned to avoid green marketing myopia, the short version of all this is that effective green marketing requires applying good marketing principles to make green products desirable for consumers. The question that remains, however, is, what is green Marketing’s future? Business scholars have viewed it as a “fringe” topic, given that environmentalism's acceptance of limits and conservation does not mesh well with marketing's traditional axioms of “give customer what they want” and “sell as much as you can”. Evidence indicates that successful green products have avoided green marketing myopia by following three important principles:
Consumer Value Positioning
1) Design environmental products to perform as well as (or Better than) alternatives.
2) Promote and deliver the consumer desired value of Environmental products and target relevant consumer Market segments.
3) Broaden mainstream appeal by bundling consumer Desired value into environmental products.
Calibration of Consumer Knowledge
1) Educate consumers with marketing messages that connect environmental attributes with desired consumer Value.
2) Frame environmental product attributes as “solutions” For consumer needs.
3) Create engaging and educational internet sites about Environmental products desired consumer value.
Credibility of Product Claim
1) Employ environmental product and consumer benefit claims that are specific and meaningful.
2) Procure product endorsements or eco-certifications from trustworthy third parties and educate consumers about the meaning behind those endorsements and ecocertifications.
3) Encourage consumer evangelism via consumers social and internet communication network with compelling, i n t e r e s t i n g and entertaining information about environmental products.
CONCLUDING REMARKS
In this paper we have studied that Green marketing is a very good concept in today’s world. Due to increase of global warming the firms have to product green marketing commodities. Adoption of green marketing in the society may not be easy in the short run,

108 tLingaya's Lalita Devi Journal of Professional Studies Micro Finance: A Conceptual Analysis t109
but in the long run surely it will be profitable. Government and various social organizations may compel all the organizations to practice green marketing for sustainable development. We have tried to give a guideline to encourage the Indian manufacturers to product harmless green marketing products. To initiate green marketing products all the supports of the government must be needed. Also the consumers will be conscious to buy green marketing products, although these products are comparatively costly but less harmful and very useful for future generation .In future green marketing will be a wider concept and it is helpful in various prospect to our society and people more research study is needed to be done in the field of green marketing.
REFERENCES
1. Amatruda J. (2010), Evaluating and Selecting Green Products. Whole Building Design Guide Website, National Institute of Building Sciences, Washington, DC. Web: www.wbdg.org/resources/green products.php
2. Anderson, A (2009), Green Marketing, The Federal Trade Commission, Arrow, K.J.; Dasgupta, P.; Goulder, L.H.; Mumford, K.J. and Oleson, K. (2010), Sustainability and the Measurement of Wealth: NIESR Discussion Paper No. 369.
3. Chaudhary, B.; Tripathi, S. and Monga, N. (2011), Green Marketing and CSR, International Journal of Research in Finance & Marketing, 1(6)
4. Coddington, W. (1993), Environmental Marketing, New York, McGraw- Hill. Dasgupta, P. (2007), Measuring Sustainable Development: Theory and Application: Asian Development Review, 24(1): 1-10
5. Holt, E. (1996), Green Pricing Experience and Lessons Learned. Proceedings: 1996 ACEEE Summer Study on Energy Efficiency in Buildings. Pacific Grove, California. 25-31 August.
6. Iron Mountain Fulfillment Services, Inc. (2008), Making ‘Green’ Marketing More Fulfilling, White Paper No. 120808.
7. Ottman, J. 1998. Green Marketing: Opportunity for Innovation. Chicago, Ill.: NTC Business Books.
8. Fritzsche, D.J. and Duehr, R. (1982). The effects of ecological concern on product attribute utility. American Marketing Association Proceedings, Chicago, IL, 364-369.
9. Henion, E.K. (1972). The effect of ecologically relevant information on detergent sales”, Journal of Marketing Research, 9, 10-14.
10. P. Pinstrup-:\ndersen, "Incorporating Nutritional Goals into the Design of International Agricultural Research," in "International Agricultural Research and Human
WEBSITES
www.goggle.comwww.emerald.comwww.green resources.comwww.google scholar.comwww.rediffmail.com
Micro Finance: A Conceptual Analysis
Ms. Soniya SinghAssistant Professor
LDC Institute of Technical StudiesSoraon, Allahabad (Uttar Pradesh), India
Email: [email protected]: 9565522675
BIOGRAPHICAL NOTES
Soniya Singh is an Assistant Professor in LDC Institute of Technical Studies, soroan, Allahabad, India. She had qualified twice UGC NET (Management) DEC 2011, JUNE 2012. She received her MBA in Human Resource and Finance from IILM Academy of higher learning, Lucknow, affiliated to GBTU. Her area of interest is Finance and Human Resource including Consumer Behavior, human resource management.
ABSTRACT
More than 150 million poor people have access to collateral-free loans .However; there are still large sections of the world population that are excluded from the financial services market. In India half of the poor are financially excluded from the country’s main stream of the banking sector. Still in India 22 percent of the people are living below the poverty line. Their monthly income is less than $1 per day and they are living in most un-liveable conditions. In India, growth with equity has been the central objective right from the inception of the planning process. The eleventh Five year plan (2007-12) re-emphasized the need for a more inclusive growth in order to ensure that the per capita income growth is broad- based. More and more Indian companies are trying to enter in the list of fortune 500 and one of our Indian entrepreneurs appears in the list of the top five richest persons of the world. The paper discuss about tackling this disparity between people by ways of financial inclusion through micro finance models and it also analyses how that leads to the economic development of a country.
The major factor account for high incidence of rural poverty is the low asset base. According to Reserve bank of India, about 51% of people house possess only 10% of the total asset of India .this has resulted low production capacity both in agriculture (which contribute around 22-25% of GDP) and Manufacturing sector. Rural people have very low access to institutionalized credit (from commercial bank).
The paper looks at the growth and transformation of microfinance organizations (MFO) in India.
We first, define microfinance and identify its “value attributes”. Having chosen only those MFOs
That have microfinance as the core, we look at the transformation experiences.
Key words: Micro finance, Financial Inclusion, SHGs, MFOs, Poverty Alleviation, Economic Development.

110 tLingaya's Lalita Devi Journal of Professional Studies Micro Finance: A Conceptual Analysis t111
INTRODUCTION
Microfinance is usually understood to entail the provision of financial services to micro-entrepreneurs and small businesses, which lack access to banking and related services due to the high transaction costs associated with serving these client categories. The two main mechanisms for the delivery of financial services to such clients are (1) relationship-based banking for individual entrepreneurs and small businesses; and (2) group-based models, where several entrepreneurs come together to apply for loans and other services as a group.
In some regions, for example Southern Africa, microfinance is used to describe the supply of financial services to low-income employees, which however is closer to the retail finance model prevalent in mainstream banking. For some, microfinance is a movement whose object is "a world in which as many poor and near-poor households as possible have permanent access to an appropriate range of high quality financial services, including not just credit but also savings, insurance, and fund transfers." Many of those who promote microfinance generally believe that such access will help poor people out of poverty. For others, microfinance is a way to promote economic development, employment and growth through the support of micro-entrepreneurs and small businesses.
Microfinance is a broad category of services, which includes microcredit. Microcredit is provision of credit services to poor clients. Although microcredit is one of the aspects of microfinance, conflation of the two terms is endemic in public discourse. Critics often attack microcredit while referring to it indiscriminately as either 'microcredit' or 'microfinance'. Due to the broad range of microfinance services, it is difficult to assess impact, and very few studies have tried to assess its full impact.
Micro-finance economically disadvantaged segments of society, for enabling them to raise their income levels largest in term of population after China. India's GDP ranks among the top 15 economies of the world. However, around 300 million people or about 80 million households are living below the poverty line, i.e. less than $2 per day according to the World Bank and the poorest are which earns $1 per day. It is further estimated that of these households, only about 20% have access to credit from the formal sector. Out of these 80 million house hold, 80% takes credit from the informal sources i.e. local Zamidars, Chit Funds etc. With about 80 million households below MFIs include non- governmental organizations (NGOs), credit unions, non-bank financial intermediaries, and even a few commercial banks.
Need of the Study
• The need of microfinance arises because the rural India requires sources of finance for poverty alleviation, procurement of agricultural and farms input.
• Micro finance is a programme to support the poor rural people to pay its debt and maintain social and economic status in the villages.
• As we know that India is agriculture based economy so microfinance may be a tools to empower the farmers and rural peoples to make agriculture profitable.
• So the researchers are interested to find out the scopes of microfinance in rural India. This research paper is highlighting a picture rural India as a profitable segment for microfinance institutions.
Financial Needs of Poor People
Financial needs and financial services.
In developing economies and particularly in the rural areas, many activities that would be classified in the developed world as financial are not monetized: that is, money is not used to carry them out. Almost by definition, poor people have very little money. But circumstances often arise in their lives in which they need money or the things money can buy.
In Stuart Rutherford’s recent book The Poor and Their Money, he cites several types of needs:[9]
• Lifecycle Needs: such as weddings, funerals, childbirth, education, homebuilding, widowhood, old age.
• Personal Emergencies: such as sickness, injury, unemployment, theft, harassment or death.
• Disasters: such as fires, floods, cyclones and man-made events like war or bulldozing of dwellings.
• Investment Opportunities: expanding a business, buying land or equipment, improving housing, securing a job (which often requires paying a large bribe), etc.
Poor people find creative and often collaborative ways to meet these needs, primarily through creating and exchanging different forms of non-cash value. Common substitutes for cash vary from country to country but typically include livestock, grains, jewelry, and precious metals.
As Marguerite Robinson describes in The Microfinance Revolution, the 1980s demonstrated that "microfinance could provide large-scale outreach profitably," and in the 1990s, "microfinance began to develop as an industry" (2001, p. 54). In the
2000s, the microfinance industry's objective is to satisfy the unmet demand on a much larger scale, and to play a role in reducing poverty. While much progress has been made in developing a viable, commercial microfinance sector in the last few decades, several issues remain that need to be addressed before the industry will be able to satisfy massive worldwide demand.
LITERATURE REVIEW
Over the past centuries practical visionaries, from the Franciscan monks who founded the community-oriented pawnshops of the 15th century, to the founders of the European credit union movement in the 19th century (such as Friedrich Wilhelm Raiffeisen) and the founders of the microcredit movement in the 1970s (such as Muhammad Yunus) have tested practices and built institutions designed to bring the kinds of opportunities and risk-management tools that financial services can provide to the doorsteps of poor people. While the success of the Grameen Bank (which now serves over 7 million poor Bangladeshi women) has inspired the world, it has proved difficult to replicate this success. In nations with lower population densities, meeting the operating costs of a retail branch by serving nearby customers has proven considerably more challenging. Hans Dieter Seibel, board member of the European Microfinance Platform, is in favor of the group model. This particular model (used by many Microfinance institutions) makes financial sense, he says, because it reduces transaction costs. Microfinance programmes also need to be based on local funds. The history of micro financing can be traced back as long to the middle of the 1800s when the theorist Lysander Spooner was writing over the benefits from small credits to entrepreneurs and farmers as a way getting the people out of poverty. Independently to Spooner, Friedrich Wilhelm Raiffeisen founded the first cooperative lending banks to support farmers in rural Germany.
The modern use of the expression "micro financing" has roots in the 1970s when organizations, such as Grameen Bank of Bangladesh with the microfinance pioneer Muhammad Yunus, were starting and shaping the modern industry of micro financing. Another pioneer in this sector is Akhtar Hameed Khan.
PRINCIPLES OF MICRO FINANCE
Some principles that summarize a century and a half of development practice were encapsulated in 2004 by Consultative Group to Assist the Poor (CGAP) and endorsed by the Group of Eight leaders at the G8 Summit on June 10, 2004:
1. Poor people need not just loans but also savings, insurance and money transfer services.
2. Microfinance must be useful to poor households: helping them raise income, build up assets and/or cushion themselves against external shocks.
3. "Microfinance can pay for itself." Subsidies from donors and government are scarce and uncertain, and so to reach large numbers of poor people, microfinance must pay for itself.
4. Microfinance means building permanent local institutions.
5. Microfinance also means integrating the financial needs of poor people into a country's mainstream financial system.
6. "The job of government is to enable financial services, not to provide them."
7. "Donor funds should complement private capital, not compete with it."
8. "The key bottleneck is the shortage of strong institutions and managers." Donors should focus on capacity building.
9. Interest rate ceilings hurt poor people by preventing microfinance institutions from covering their costs, which chokes off the supply of credit.
10. Microfinance institutions should measure and disclose their performance – both financially and socially.
OBJECTIVES OF THE STUDY
• To review the present status of the micro finance in India in particular and the world general.
• To highlight the measures taken by the Government of India and RBI for promoting micro finance
• To highlight how the micro finance models are useful to increase Financial Inclusion.
• To understands the marketing of microfinance products in rural market.
• Finding out the role of Self Help Groups (SHGs) in micro finance.
• To study the importance and role of microfinance in poverty alleviation and Profitable agriculture activities
Research Methodology
This is a descriptive research paper based on secondary data. Secondary research was conducted to review the present status of Micro Finance in India. Data has been collected from the websites of the Reserve Bank of India, NABARD, MFIs, various publication of Economic survey and also taken from various committee reports submitted to Government of India on micro finance, research paper, journals, books and magazines.

112 tLingaya's Lalita Devi Journal of Professional Studies Micro Finance: A Conceptual Analysis t113
Limitations of Micro Finance
The obstacles or challenges to building a sound commercial microfinance industry include:
• Inappropriate donor subsidies
• Poor regulation and supervision of deposit-taking MFIs
• Few MFIs that meet the needs for savings, remittances or insurance
• Limited management capacity in MFIs
• Institutional inefficiencies
• Need for more dissemination and adoption of rural, agricultural microfinance methodologies
Factors Affecting Access To Financial Services
• Gender Issues : Access to credit is often limited for women who do not have, or cannot hold title to assets such as land and property or must seek male guarantees to borrow.
• Age Factor : Financial service providers usually target the middle of the economically active population, often overlooking the design of appropriate products for older or younger potential customers.
• Legal Identity : Lack of legal identities like identity cards, birth certificates or written records often exclude women, ethnic minorities, economic and political refugees and migrant workers from accessing financial services
• Limited literacy : Limited literacy, particularly financial literacy, i.e., basic mathematics, business finance skills as well as lack of understanding often constraints demand for financial services.
• Place of living : Although effective distance is as much about transportation infrastructure as physical distance, factors like density of population, rural and remote areas, mobility of the population (i.e., highly mobile people with no fixed or formal address), insurgency in a location, etc., also affect access to financial services.
• Psychological and cultural barriers : The feeling that banks are not interested to look into their cause has led to self-exclusion for many of the low income groups. However, cultural and religious barriers to banking have also been observed in some of the countries Social security payments
• Bank charges : In most of the countries, transaction is free as long as the account has sufficient funds to cover the cost of transactions made. However, there are a range of other charges that have a disproportionate effect on people with low income.
• Terms and Conditions : Terms and conditions attached to products such as minimum balance requirements and conditions relating to the use of accounts often dissuade people from using such products/services.
• Level of Income : Financial status of people is always important in gaining access to financial services. Extremely poor people find it difficult to access financial services even when the services are tailored for them. Perception barriers and income discrimination among potential members in group-lending programmes may exclude the poorer members of the community.
• Type of occupation : Many banks have not developed the capacity to evaluate loan applications of small borrowers and unorganized enterprises and hence tend to deny such loan requests.
• Attractiveness of the product: Both the financial services/products (savings accounts, credit products, payment services and insurance) and how their availability is marketed are crucial in financial inclusion.
According to Report on Currency and Finance 2006-08 the critical dimensions of Financial exclusion include access exclusion, condition exclusion (conditions attached to financial products), price exclusion and self exclusion because of the fear of refusal to access by the service providers. The financial exclusion process becomes self-reinforcing and can often be an important factor in social exclusion, especially for communities with limited access to financial products, particularly in rural areas.
One of the successes in the last few years is supposed to have been the Mahatma Gandhi National Rural employment Guarantee Scheme. It has increased financial inclusion because it is mandated into the scheme that payments are made through the job cards, through bank accounts. Prior to this scheme of ‘No frills accounts’, as directed by the RBI, paved the way for Financial Inclusion. It is mandatory for state agencies to make the payments under various social security schemes through bank account
FINANCIAL INCLUSION: AN OVERVIEW
More recently, the term financial inclusion has gained argument among professionals. “Financial Inclusion” focuses attention on the need to bring previously excluded people under the umbrella of financial institutions. There is no universally accepted definition of financial inclusion. Financial Inclusion is generally defined in terms of exclusion from the financial system. The working or operational definitions of financial exclusion generally focus on ownership or access to particular financial products and services. Furthermore, the definitions have witnessed as shift in emphasis from the earlier ones, which defined financial inclusion
and exclusion largely in terms of physical access, to a wider definition covering access to and use and understanding of products and services.
Rangarajan's committee on financial inclusion defines it as:
“Financial inclusion may be defined as the process of access to financial services and timely and adequate credit where needed by vulnerable groups such as weaker sections and low income groups at an affordable cost.”
The financial services include the entire gamut - savings, loans, insurance, credit, payments etc. The financial system has to provide its function of transferring resources from surplus to deficit units but both deficit and surplus units are those with low incomes, poor background etc. By providing these services, the aim is to help them come out of poverty. So far, the focus has only been on delivering credit (it is called as microfinance but is microcredit) and has been quite successful.
The access to finance could be divided into four segments:
1. The proportion of the population that uses a bank or bank like institution
2. Population which uses services from non-bank “other formal” financial institutions, but does not use bank services
3. The population which only uses services from information financial service providers
4. Percentage of population transacting regularly through formal financial instruments and,
5. The population which uses no financial services.
Since measuring inclusion is perceived to be difficult, financial inclusion has generally been defined in terms of exclusion from the financial system. It focuses on ownership or access to particular financial products and services. Specific indicators such as number of bank accounts, number of bank branches that are generally used as measures of financial inclusion can provide only partial information on the level of financial inclusion in an economy.
In India, the financially excluded sections comprise largely marginal farmers, landless labourers, oral lessees, self employed and unorganized sectors enterprises, urban slum dwellers, migrants, ethnic minorities and socially excluded groups, senior citizens and women. Some of the important causes of relatively low extension of institutional credit in the rural areas are risk perception, cost of its assessment and management, lack of rural infrastructure, and vast geographical spread of the rural areas with more than half a million villages, some sparsely populated.
RATIONALE FOR FINANCIAL INCLUSION
Finance has come a long way since the time when it wasn't recognized as a factor for growth and development. It is now attributed as the brain of an economic system and most economies strive to make their financial systems more efficient. It also keeps policymakers on their toes as any problem in this sector could freeze the entire economy and even lead to a contagion.
The first question that comes to mind is why can't financial inclusion happen on its own? Why do we need to make a policy to increase the same? Like any other product or service, why can't it find a market of its own? The reasons are:
1. FINANCIAL EXCLUSION: It has been found that financial services are used only by a section of the population. There is demand for these services but it has not been provided. The excluded regions are rural, poor regions and also those living in harsh climatic conditions where it is difficult to provide these financial services. The excluded population then hasto relies on informal sector (moneylenders etc) for availing finance that is usually at exorbitant rates. These leads to a vicious cycle. First, high cost of finance implies that first poor person has to earn much more than someone who has access to lower cost finance. Second, the major portion of the earnings is paid to the moneylender and the person can never come out of the poverty.
2. HIGH COST: It has also been seen that poor living in urban areas don't utilize the financial services as they find financial services are costly and thus are unaffordable. Hence, even if financial services are available, the high costs deter the poor from accessing them. For example, to open a checking account in Cameroon, the minimum deposit requirement is over 700 dollars, an amount higher than the average GDP per capita of that country, while no minimum amounts are required in South Africa or Swaziland. Annual fees to maintain a checking account exceed 25 percent of GDP per capita in Sierra Leone, while there are no such fees in the Philippines. In Bangladesh, Pakistan, Philippines, to get a small business loan processed requires more than a month, while the wait is only a day in Denmark. The fees for transferring 250 dollars internationally are 50 dollars in the Dominican Republic, but only 30 cents in Belgium.
3. NON-PRICE BARRIERS: Access to formal financial services also requires documents of proof regarding a persons' identity, income etc. The poor people do not have these documents and thus are excluded from these services. They may also subscribe to the services initially but may not use them as actively as others because of high distance between the bank and residence, poor infrastructure etc.
4. BEHAVIORAL ASPECTS: Research in behavioral economics has shown that many people are not comfortable using formal financial services. The reasons are difficulty in understanding language, various documents and conditions that come with financial services etc.

114 tLingaya's Lalita Devi Journal of Professional Studies Micro Finance: A Conceptual Analysis t115
There are a number of positive externalities of financial inclusion. One of the important effects is one is able to reap the advantages of network externality of financial inclusion as the value of the entire national financial system increases. Yet another reason why financial inclusion is a quasi public good is that the consequent fuller participation by all in the financial system makes monetary policy more effective and thus enhances the prospects of noninflationary growth.
WHO ARE THE EXCLUDED AND WHY?
Many people across the globe are excluded from mainstream banking. These range from people with low income to people with low information and accessibility to people with no social security or insurance cover. The main reasons behind exclusion are:
1. LACK OF INFORMATION: Lack of information about the role and function of banks, banking services and products, interest rates, etc. stop people from including themselves in mainstream banking.
2. INSUFFICIENT DOCUMENTATION: Many people (even in metropolis and urban areas) are unable to show their self identification documents during the opening of a bank account or during taking a loan.
3. LACK OF AWARENESS: Many people are unaware of the banking terms and conditions laid down from time to time.
4. HIGH TRANSACTION CHARGES: Various commercial banks across the globe levy transaction charges on credit or debit transactions, on over usage of banking services, on cheque book issuance etc
5. LACK OF ACCESS: Accessibility is a problem from all those people who live in geopolitically isolated regions. Moreover, as most of the commercial banks are located in the vicinity of cities, people in rural areas (mainly in developing countries) have a geographical barrier in accessing banks.
6. ILLITERACY: Because of illiteracy, a substantial number of people are unable to take recourse to banking services.
Figure 1 : An overview of Financial Inclusion Services
SELF HELP GROUP
A self-help group (SHG) is a village-based financial intermediary usually composed of 10–20 local women. Most self-help groups are located in India, though SHGs can also be found in other countries, especially in South Asia and Southeast Asia.
Members make small regular savings contributions over a few months until there is enough capital in the group to begin lending. Funds may then be lent back to the members or to others in the village for any purpose. In India, many SHGs are 'linked' to banks for the delivery of microcredit.
STRUCTURE
SHGs are member-based micro finance (having its origin in Bangladesh) intermediaries inspired by external technical support that lie between informal financial market actors like moneylenders, collectors, and ROSCAs on one hand, and formal actors like micro finance institutions and banks on the other. Other organizations in this transitional zone in financial market development include CVECAs and accumulating savings & credit association ASCAs.
Self-Help Group may be registered or unregistered. It typically comprises a group of micro entrepreneurs having homogenous social and economic backgrounds; all voluntarily coming together to save regular small sums of money, mutually agreeing to contribute to a common fund and to meet their emergency needs on the basis of mutual help. They pool their resources to become financially stable, taking loans from the money collected by that group and by making everybody in that group self-employed. The group members use collective wisdom and peer pressure to ensure proper end-use of credit and timely repayment.
This system eliminates the need for collateral and is closely related to that of solidarity lending, widely used by micro finance institutions. To make the book-keeping simple enough to be handled by the members, flat interest rates are used for most loan calculations.
Goals
Self-help groups are started by non-profit organizations (NGOs) that generally have broad anti-poverty agendas. Self-help groups are seen as instruments for a variety of goals including empowering women, developing leadership abilities among poor people, increasing school enrolments, and improving nutrition and the use of birth control. Financial intermediation is generally seen more as an entry point to these other goals, rather than as a primary objective. This can hinder their development as sources of village capital, as well as their efforts to aggregate locally controlled pools of capital through federation, as was historically accomplished by credit unions.
Advantages of financing through SHGs
An economically poor individual gains strength as part of a group. Besides, financing through SHGs reduces transaction costs for both lenders and borrowers. While lenders have to handle only a single SHG account instead of a large number of small-sized individual accounts, borrowers as part of an SHG cut down expenses on travel (to & from the branch and other places) for completing paper work and on the loss of workdays in canvassing for loans.
POVERTY ALLIEVATION
Poverty occurs in both developing countries and developed countries. While poverty is much more widespread in developing countries, both types of countries undertake poverty reduction measures. Poverty has historically been accepted as inevitable as non-industrialized economies produced very little while populations grew almost as fast making wealth scarce. Geoffrey Parker wrote that "In Antwerp and Lyon, two of the largest cities in western Europe, by 1600 three-quarters of the total population were too poor to pay taxes, and therefore likely to need relief in times of crisis." Poverty reduction, or poverty alleviation, has been largely as a result of overall economic growth. Food shortages were common before modern agricultural technology and in places that lack them today, such as nitrogen fertilizers, pesticides and irrigation methods. The dawn of industrial revolution led to high economic growth, eliminating mass poverty in what is now considered the developed world. World GDP per person quintupled during the 20th century. In 1820, 75% of humanity lived on less than a dollar a day, while in 2001, only about 20% do.
Today, continued economic development is constrained by the lack of economic freedoms. Economic liberalization requires extending property rights to the poor, especially to land. Financial services, notably savings, can be made accessible to the poor through technology, such as mobile banking. Inefficient institutions, corruption and political instability can also discourage investment. Aid and government support in health, education and infrastructure helps growth by increasing human and physical capital.
ECONOMIC DEVELOPMENT
Economic development generally refers to the sustained, concerted actions of policymakers and communities that promote the standard of living and economic health of a specific area. Economic development can also be referred to as the quantitative and qualitative changes in the economy. Such actions can involve multiple areas including development of human capital, critical infrastructure, regional competitiveness, environmental sustainability, social inclusion, health, safety, literacy, and other initiatives. Economic development differs from economic growth. Whereas economic development is a policy intervention endeavor with aims of economic and social well-being of people, economic growth is a phenomenon of market productivity and rise in GDP. Consequently, as economist Amartya Sen points out: “economic growth is one aspect of the process of economic development.”
The University of Iowa’s Center for International Finance and Development states that:
'Economic development' is a term that economists, politicians, and others have used frequently in the 20th century. The concept, however, has been in existence in the West for centuries. Modernization, Westernization, and especially Industrialization are other terms people have used when discussing economic development. Although no one is sure when the concept originated, most people agree that development is closely bound up with the evolution of capitalism and the demise of feudalism.
Findings
• Considerable gap between demand and supply for all financial services.
• Majority of poor are excluded from financial services. This is due to, inter alia, the following reasons:
• Bankers feel that it is risky to finance poor people’s because of their creditworthiness.
• High transaction costs.
BANKACCOUNTS
FINANCIALINCLUSION
SAVINGS
TRANSFEROF FUNDS
FINANCIALADVICE
CHEAPERCREDIT
INSURANCE

116 tLingaya's Lalita Devi Journal of Professional Studies Analysing Scope of Extensive Carbon Markets in India t117
CONCLUSION
With a view to evolving supplementary credit strategies for reaching the unreached rural poor in the rural areas micro finance innovations are yielding results and giving hope to the millions of poor through providing credit. In other words, micro finance is a programme for the poor and by the poor to mobilize the savings and use them to meet their financing needs. Thus, micro financing is a new method to meet the credit requirement in rural areas. In other words, there is need to evolve an informal credit system with assistance from financial institutions. Though the size of credit is very small for the target users, like micro entrepreneurs and low income households to utilize the fund for income generation and enterprise development and is also for community use, with the nominal terms and conditions and easy to understand with the help of SHGs and banks. There is now mounting hope that micro finance can be a large scale poverty alleviation tool. Banks too are shedding their old reluctance to lend to the poor and are looking to tap the expertise of micro credit groups to create a new market.
REFERENCES
1. Aminur Rahaman. 1999. Women and micro credit in rural Bangladesh; Anthropological study of the Rhetoric and Realities of Grameen Bank Lending, West View Press.
2. Acharya, R.N., Kagan, A. and Lingam, S.R. (2008) ‘Online banking applications and community bank performance’, The International Journal of Bank Marketing, Vol. 26, No. 6, pp.418–439.
3. B. Jaya Raman 2001. Micro finance: retrospect and prospects, Occasional Paper- 20 NABARD.
4. Bardhan, Pranab and T. N. Srinivasan .1974. poverty and income distribution in india, Calcutta. Statistical publishing society
5. Banerjee, Abhijit, and Thomas Piketty. 2004. Are the rich growing richer: evidence from the Indian tax data, world bank Economic Review, forthcoming.
6. Datey, V.S. Economic Laws; Taxman, new delhi p. 453.
7. Development Research Group Study, No. 22, Department of Economic Analysis and Policy, Reserve Bank of India, Mumbai September 20, 2000.
8. Gilson, John, and Lang 1990; Hoshi, Kashyap, and Scharfstein 1990, Stigliz and Weiss 1981.
9. Levine 1996; Walter and Gray 1983; Gelb and sagari 1990.
10. Himanshu and Abhijit Sen 2004. Poverty and inequality in India: getting closer to the truth, Economic and Political Weekly.
11. Pandey, I.M. Financial Management, Vikas Publishing. House Pvt. Ltd. 2002, pp. 633.
12. Karim Rezaul and Mitsue Osada. 1998. Dropping out: an emerging factor in the success of micro credit- based poverty Alleviation Programmes, The Developing Economies, XXXVI(3) September: 257-58.
13. Lal, Deepak, Rakesh Mohan, and I.Natarajan, 2001. Economic reform and poverty alleviation; a tale of two surveys. Economic and Political Weekly, March 24, pp. 1017-28.
14. Maheshwari & Maheshwari, Banking Law and Practices, Himalaya Publishing Pvt Ltd, Allahabad, pp.152.
15. Meenakshi, J.V. and Brida Vishwanthan. 2003. Calorie deprivation in rural India, 1983-1999/2000. Economic and Political Weekly, 37(4) Jan 25: 369-375.
16. Sundaram, K and Suresh Tendulkar. 2003a. poverty has declined in the 1990s; a resolution of the comparability problems in NSS consumer expenditure data. Economic and Political Weekly, Jan 25, pp. 327-337.
17. Sundaram, K. and Suresh Tendulkar. 2003b. NAS-NSS estimates of private consumption for poverty estimation: a further comparative examination. Economic and Poverty weekly, Jan 25, pp 376-384.
18. Sundaram, K. and Suresh Tendulkar. 2003c. Poverty in India in the 1990s: an analysis of changes in 15 major states,” Economic and political Weekly, Apr.5, pp. 1385-1393.
19. Sundaram, K. and Suresh Tendulkar. 2003d. Poverty in India in the 1990s. revised results for All –India and 15 major states for 1993-94. Economic and Political Weekly. Nov 15, pp. 4865-4872.
20. Tenth Five Year Plan Vol.II, Planning Commission, Govt. of India. New Delhi.
Analysing Scope of Extensive Carbon Markets in India: Case Study on Kota Thermal Power Plant and European Carbon Markets
Hema NagpalAssistant Professor
Department of EconomicsShaheed Bhagat Singh College (Eve.)
University of Delhi
ABSTRACT
India, being one of the leading generators of CERs through CDM, has a large scope in emissions trading. Its 2008 National Action Plan on Climate Change (NAPCC) specifies eight national missions for 2017 that centre on improving: energy efficiency, solar technology, sustainable habitats, water, Himalayan ecosystems, “green India”, agriculture, and strategic knowledge. The paper studies European Union Emission Trading Scheme and Kota Thermal Power Station to show the possibility of a beneficial trade arrangement and to provide for a strong case in favour a well established Indian carbon market structure.
1. INTRODUCTION OF CARBON MARKET
In 1988 the World Meteorological Organization (WMO) and the United Nations Environment Programme (UNEP) organized the Intergovernmental Panel on Climate Change (IPCC), to study the scientific, political and economic information surrounding the risks of climate change due to anthropogenic influences. With the United Nations Framework Convention on Climate Change (UNFCCC), negotiated at the Rio Earth Summit in 1992, the need to address the problem of climate change with a political response was formally acknowledged. The convention called on countries to reduce dangerous greenhouse gas emissions with an acceptance of “common but differentiated responsibilities and respective capabilities.” This idea of ‘common but differentiated responsibilities’ appeared to acknowledge a greater responsibility for rich countries to take action for their unequal consumption of the world’s resources.
Whilst the convention encouraged these actions, it was not until the development of the Kyoto Protocol in 1997 that signatories were obliged to take action to reduce their emissions by 5.2% from 1990 levels for the commitment period of 2008-12. At this time, many of the goals of the UNFCCC also became more market-based and flexible. The Kyoto Protocol allows for countries that are unable to meet their targets through national measures, to use ‘flexible’ market mechanisms to gain more leverage in how they attain their reduced emission goals. These flexible mechanisms enable countries to meet their targets in the most ‘cost effective’ manner, and include ‘Emissions Trading,’ ‘Joint Implementation,’ and the ‘Clean Development Mechanism.’
Emissions Trading began to be discussed within the context of international climate change negotiations with the UN Conference on Trade and Development (UNCTAD) and the establishment of an International Emissions Trading Association (IETA). However, it was not until the mid-90s that discussions surrounding formalizing emissions trading into practice really began to occur.
1.1. Carbon Trading
In COP and Carbon Trading by Mary Thibodeau, it was highlighted that the popular approach to the problem of global warming became the “project of building a single, liquid global carbon market worth many trillions of dollars – backed by the UN, national

governments, economists, environmentalists and many in the business sector.” With the Kyoto Protocol in 1997, polluter countries that have agreed to emission targets are given emission credits, which are equivalent to their reduction commitments from 1990 levels. Credit quotas are then distributed nationally through ‘grandfather’ clauses, which allow the biggest polluters to receive the largest allocation of credits. If the polluter does not use the entire pollution credit quota, they can either ‘bank’ the credits for the future or sell the credits on the open market to be purchased by another polluter. In contrast, if they use up all their credits, they must purchase more from a polluting country that has not used up its full allocation, or invest in projects in other countries through either Joint Implementation (JI) or the Clean Development Mechanism (CDM).
Emission trading entails the creation of a carbon market which allows countries with emission credits to spare to sell them to countries unable to meet their targets. Credit is transferred for emission reductions accumulated through projects to form units which are equivalent to one tonne of Carbon-di-oxide.
1.2 Sequence of Events and The Present
Table 2: Sequence of Events
1979 The first World Climate Conference (WCC) takes place.
1988 Inter-governmental Panel on Climate Change is set up
1990 IPCC’s first assessment report released
1991 First meeting of the inter-governmental negotiating committee (INC) takes place
1992 The INC adopts UNFCCC text. At the Earth Summit in Rio, the UNFCCC is opened for signature along with its sister Rio Conventions, UNCBD
1994 UNFCCC enters into force
1995 The first Conference of the Parties (COP 1) takes place in Berlin
1996 The UNFCCC secretariat is set up to support action under the Convention
1997 Kyoto Protocol formally adopted in December at COP3
2001 Release of IPCC’s Third Assessment Report. Bonn Agreements adopted, based on the Buenos Aires Plan of Action of 1998
2005 Kyoto Protocol enforced. The first meeting of the parties to the Kyoto Protocol (MOP 1) takes place in Montreal
2007 IPCC’s Fourth Assessment Report released. Climate science enters popular consciousness. At COP13, parties agreed on the Bali roadmap, which charted the way towards a post-2012 outcome
2009 Copenhagen Accord drafted at COP15 in...Copenhagen. Countries later submitted emission reduction pledges or mitigation action pledges, all non-binding
2010 Cancun Agreements drafted and largely accepted at the COP16
2011 On the road to COP17 in Durban
Source: Author’s compilation
1.3. Carbon markets and Asia Pacific Region
Asia Pacific region includes the region in or near Western Pacific Ocean. The region varies in size depending on context, but it typically includes at least much of East Asia, Southeast Asia, and Oceania.
As per Carbon Forum Asia’s report, under Sustainable Development Mechanisms Programme, United Nations Framework Convention on Climate Change, presented in Bangkok, on 24 September 2013, the Director John Kilani highlighted that the CDM ( Clean Development Mechanism) is the world’s only international carbon credit and accounting mechanism with more than 7,200 projects. Approximately 85 percent of these projects are in the Asia Pacific. This includes projects in 33 countries, and represents more than 790 million tons of avoided CO2 emissions per year. In addition to the international carbon market, countries are exploring national markets to meet emission reduction targets.
This year, the first markets in China came online, with more in development. In the Asia Pacific region, market work is underway in South Korea, Vietnam, Thailand, India, Indonesia and Kazakhstan, just to name a few.
1.4 Carbon Markets and India
From the above mentioned analysis of the Carbon forum Asia’s Report, India per se doesn’t have a broad and a well established carbon market (MCX, India).
However, a Case Study on India : Guide to Emissions Trading conducted by Environmental Defense Front, under International Emission Trading Scheme (IETS), mentions that in order to encourage its own sustainable development, in 2011 India committed to a voluntary Copenhagen Accord target of 20-25% emissions intensity reduction relative to 2005 levels by 2020. India’s current domestic climate policies are expected to decrease emissions by 0.6 GtCO2 by 2020. These policies include:
• 20 GW of installed PV and solar-thermal capacity and 2 GW of off-grid power by 2020 (40 MtCO2 reduction);
• Increase renewable energy usage by 30 GW (60 MtCO2 reduction)
• Increase nuclear power usage by 40 GW (175 MtCO2 reduction)
• Additional energy efficiency measures (124 MtCO2 reduction);
• Aforestation of degraded lands and an increase in forest plantation area (55-191 MtCO2 reduction); and
• A 50% target for additional efficient supercritical coal plants (40 MtCO2 emissions reduction by 2020);
In addition, since July 2010 there has been a nationwide carbon tax on coal for 50 rupees/ton of coal produced in and imported to India. The base of India’s climate policy framework is its 2008 National Action Plan on Climate Change (NAPCC), which specifies eight national missions for 2017 that centre on improving: energy efficiency, solar technology, sustainable habitats, water, Himalayan ecosystems, “green India”, agriculture, and strategic knowledge.
Therefore, India, being one of the leading generators of CERs through CDM, has a large scope in emissions trading. Analysts forecast that its trading in carbon credits would touch US$ 100 billion by 2010. The number of expected annual CERs in India is hovering around 28 million and considering that each of these CERs is sold for around 15 euros, on an average, the expected value is going to be around Rs 2,500 crore.
The next section provides an understanding of the European Union Emission Trading Scheme and studies the emission levels at the Kota Thermal Power Station. The two studies are then combined so as to show that beneficial trade practises can be conducted between the power station and the European carbon markets, highlighting that an establishment of a strong Indian Carbon market can financially as well as environmentally be beneficial for India as well the world.
2. UNDERSTANDING SCOPE OF CARBON MARKETS IN INDIA THROUGH A CASE STUDY :LINKING KOTA THERMAL POWER PLANT AND EUROPEAN CARBON MARKETS
2.1. European Union Emission Trading Scheme
In order to meet Kyoto Protocol obligations, the European Union set up the EU ETS (European Union Emission Trading Scheme), a domestic cap and trade system for about 15,000 installations inside the EU that were constrained in their CO2 emissions, and which could also use some KP units, Certified Emission Reduction schemes (CERs) and Emission Reduction Units (ERUs) under certain conditions, to meet their obligations.
To elaborate, the EU ETS factsheet explains its working on the basis of their ‘cap and trade’ principle. As per the October 2013 factsheet, the overall volume of greenhouse gases that can be emitted each year by the power plants, factories and other companies covered by the system is subject to a cap set at EU level. Within this Europe-wide cap, companies receive or buy emission allowances which they can trade if they wish. That is, the companies have to emit within the prescribed limits. In any situation, if in a year, they emit more than the limit, they have to pay a fine according to € 100 per tonne of CO2 emitted or they can purchase the extra emissions from anywhere across the globe, from the power plant units or companies emitting less than the prescribed units of emissions, as per norms established by EU. However, if in case there is a surplus of allowances of emissions available, then the companies or power plants can either trade these extra units of allowances with other establishments that are in need of such units against monetary benefits or they can carry forward the surplus to next year production or forfeit the same, as per guidelines provided in the EU ETS norms. Hence, emission allowances are the ‘currency’ of the EU ETS, and the limit on the total number available gives them a value. Each allowance gives the holder the right to emit one tonne of CO2, the main greenhouse gas, or the equivalent amount of two more powerful greenhouse gases, nitrous oxide (N2O) and perfluorocarbons (PFCs).
Furthermore, the next stage of EU ETS established that from 2013 onwards, the cap on emissions from power stations and other fixed installations is reduced by 1.74% every year, so as to reduce the emissions below the 2005 levels. This means that in 2020, greenhouse gas emissions from these sectors will be 21% lower than in 2005.
These caps and norms aim at the fact that the need to purchase or draw on their reserves of allowances and credits creates a permanent incentive for companies to reduce their emissions. But companies can also sell allowances and credits, for instance if they judge they have more than they are going to need. These flexibilities in the system allow companies to choose the most cost-effective options to address their emissions. The main options that can be considered are:
• Investment in more efficient technology and/or a shift to less carbon-intensive energy sources in order to reduce emissions;
• Purchase of extra allowances or credits on the market;
• A combination of the above.
Overall the EU ETS spans around 45% of total greenhouse gas emissions from the 28 EU countries. Earlier the vast majority of emission allowances was previously given away for free by the governments. However, from 2013 auctioning is the main method of allocating allowances. This means that business houses, power plant stations etc. have to buy an increasing proportion of their allowances at auction. As per the EU ETS factsheet, auctioning is the most transparent method of allocating allowances and puts into practice the principle that the polluter should pay for the damages caused to the resources. This process is expected to push up
118 tLingaya's Lalita Devi Journal of Professional Studies Analysing Scope of Extensive Carbon Markets in India t119

the demand for the allowances in the global carbon market scenario, have a positive impact on the prices of the allowances and motivate the business houses to tap the positive effects by increasing the supply and reducing their own emissions.
The above analysis highlights that the norms established by EU ETS extend to beyond 2020 and aims at long term execution of plans for CDMs and CERs. This strengthens the base of an expanding global carbon markets in terms of the size of the units of emissions traded. Post Durban analysis of carbon markets by Andrei Marcu also show similar analysis. It states that the activities of the EU and Japan in the carbon market and their use of Kyoto Protocol-recognised units were driven by their obligations stemming from the basic Kyoto Protocol. Thus, trade in Certified Emission Reduction schemes ( CERs) and Emission Reduction Units ( ERUs), representing the vast bulk of GHG market activity, was largely confined to the EU, Japan and the developing countries.
Hence, a trade consideration with either of the two regions was a profitable option, due to well established carbon market structure for long term.
2.2 About Kota Thermal Power Plant
According to the Central Electricity Authority of India, as of March 31, 1998, 83 steam plants were in operation in India. These plants generated almost 80% of total generated power for the nation. Coal consumption by various plants in the country during the year 1997-98 was almost 203 million metric tons. As of May 2010, the total generation from coal and lignite power plants was 461 billion kWh (at bus-bar) leading to carbon-di-oxide emissions of 508 million tons during 2008 – 09.
The main emissions from coal combustion at thermal power plants are carbon dioxide (CO2), nitrogen oxides (NO), sulphur oxides (SO), chlorofluorocarbons (CFCs), and air- borne inorganic particles such as fly ash, soot, and other trace gas species.
Rajasthan uses three major sources of energy – firewood/dung cakes in rural area, electricity and petroleum products. Increasing demand for energy & limited alternative sources impose a huge pressure on this sector. In light of this, coal based thermal power is the only viable source of energy available.
One of the Thermal Power Plants in India, Kota Thermal Power Station (KTPS) is located on the left bank of river Chambal in Rajasthan’s principal industrial city, Kota. It meets majority of the electricity needs of the state of Rajasthan. Currently there are 2 units of 110 MW, 3 units of 210 MW and 2 units of 195 MW each. (Comprehensive Environmental Impact Assessment of Kota Thermal Power Station, Rajasthan State Electricity Board). The highest consumption of energy is by the industrial sector followed by the agriculture and commercial sector. The requirement of energy has been growing steadily over the years thereby increasing the pressure on fossil fuels like coal on one hand and rising pollution levels to meet the mounting energy needs on the other.
The current total carbon-di-oxide emissions of KTPS are 5,462,720 tons per annum. (Rajasthan Rajya Vidyut Utpadan Nigam Limited Feasibility Report, Kota Thermal Power Station).
2.3 Hypothesis
The analysis would be conducted to determine whether it is profitable for India to have a well established carbon market structure. Furthermore, statistical analysis would be used to evaluate the profitability of the market in different time frames, price levels and at different rates of discounts.
2.4 Area Of Research And Proposed Data Set
Kota thermal powers station and European Carbon markets will be used for analysis. The carbon credit market and carbon price factor would play an important role in the assessment of the success and profitability of the technology.
Kota Thermal Power Plant provides the details for the cost analysis and the units of carbon-di-oxide available for the purpose of trade, as per the norms of the European carbon markets. The carbon markets would facilitate with the data on the carbon-di-oxide price levels, generating the benefit segment of the project. The two data sets, costs and benefits would then be used along with different rates of discounts, to test for the profitability levels that can be reaped in the future.
2.5 Key Features of the Analysis
The following are the key points that should be kept in mind while conducting research and analysis:
1. The time period considered for the purpose of analysis is from January 2012 to December 2020.
2. The analysis is carried out on monthly basis, thereby, listing out an array of 108 months time frame under study.
3. The word carbon used in the analysis is equivalent to carbon-di-oxide. NO other variant of carbon is dealt with, under this study.
The original cost structure was obtained in US Dollars. The Prices obtained from the European Carbon Market were mentioned in terms of Euros. Hence, in order to create uniformity through out and for the sake of analysis, standard unit of Indian Rupee will be followed. The exchange rate followed is at the rate of Rs. 50/- for per unit of dollar and Rs. 65 for per unit of Euro, for the purpose of conversion.
2.6 Methodology and Data Analysis
Economic and econometric tools have been used extensively in order to determine the cost, the benefits and the NPV of the net benefits to establish the profitability from trade.
Units of Carbon available: The units available for trade will be determined on the basis of comparison between the sanctioned allowances under the EU ETS and the emissions by the KTPS.
Cost Structure: All the categories of costs that are incurred in the establishment and effective functioning of KTPS have been determined. (Data on the fixed costs and salary figures, office expenses and other miscellaneous expenses are calculated on the basis of Rajasthan Rajya Vidyut Utpadan Nigam Ltd., Kota Thermal Power Station and on consultation with Mr. Mathur, Senior Chemist, KTPS).
Benefit Structure: This deals with forecasting the average annual prices for the time period January 2012 to December 2020 by using time series analysis, on the basis of data available for the time period May 2004 to January 2012 for the European Carbon Markets. ( Data on prices collected from The Point Carbon, A Thomas and Reuters Company). Also, in order to include the volatility factor in the carbon markets, the following different levels of prices are considered.
Price Level 1: Forecasted prices – 2% of the forecasted price level
Price Level 2: Forecasted prices – 1% of the forecasted price level
Price Level 3: Forecasted prices
Price Level 4: Forecasted prices + 1% of the forecasted price level
Price Level 5: Forecasted prices + 2% of the forecasted price level
Finally, the benefits are obtained by the product of units available for the purpose of trade and the forecasted prices.
Net Benefit: Difference between the benefits and costs for each time period is taken to establish the Net Benefit.
Rate of Discount and Net Present Value : Annual compounded rate of discount calculated from the annual rate of interest (three levels of annual rate of interest: 3%, 5% and 10%). Annual compounded rates of discount are used to find the NPV corresponding to different price levels and rate of discounts. ( Refer appendix for explanation on rate of discount and NPV)
In order to check the comment on the profitability factor, we need to check whether the NPV obtained from the methodology above, is greater than or equal to or less than zero. Results and Conclusion follow.
2.7 Results
The price levels mentioned in the table below are as follows:
Price Level 1: Forecasted prices - 2% of the forecasted price level
Price Level 2: Forecasted prices - 1% of the forecasted price level
Price Level 3: Forecasted prices
Price Level 4: Forecasted prices + 1% of the forecasted price level
Price Level 5: Forecasted prices + 2% of the forecasted price level
Table 1: NPV At Various Forecasted Price Levels And Discount Rates
NPV
(In Billion Rs.) Price Level 1 Price Level 2 Price Level 3 Price Level 4 Price Level 5
Rates of Discounts
3% annual rate of discount 7.493/= 7.584/= 7.676/= 7.767/= 7.859/=
5% annual rate of discount 6.788/= 6.872/= 6.956/= 7.040/= 7.124/=
10% annual rate of discount 5.378/= 5.448/= 5.517/= 5.586/= 5.655/=
Source: Author’s Compilation
The logic behind using these different variations of forecasted price levels is the key feature of Carbon Markets, its high volatility. The market experiences huge fluctuation. In order, to account for these fluctuations and high degree of volatility, an entire range around forecasted price values is considered. The different ranges of values provide a different NPV level, that help to generate a range in which the future benefits can lie.
Prices For Net Benefit at For Net Benefit at For Net Benefit at For Net Benefit at For Net Benefit at
120 tLingaya's Lalita Devi Journal of Professional Studies Analysing Scope of Extensive Carbon Markets in India t121

The analysis shows that price variation has little impact on the values of NPV generated i.e. NPV is not very sensitive to the price levels. The volatility factor would, hence, have little impact on the NPV of the future benefits. Therefore, even if the prices do fall down to a very low level, there still exists scope of benefit and profit geberation.
3. CONCLUSION
The results of the case study show that at different price levels, it is beneficial for KTPS to trade the surplus allowances with the European carbon markets. More so, the possibility to tap such profits is financially large enough in terms of value.
Hence, it supports the fact that if such a market exists in India, business houses, power plants and such establishments can reap monetary benefits by participating and trading in the market. At the same time, it can also act as a strong incentive for these establishments to undertake investments and establish technologies that can further reduce emissions to increase the surplus levels available for trade in the market on a global front. This will have an positive impact on the environment of the region and reduce emissions globally as well.
REFERENCES
1. ADB (1997). Guidlines for the economic analysis of projects. Economics and resource centre. Available online at http://www.adb.org/documents/guidelines/eco_analysis/default.asp, Accessed on 12 February, 2012.
2. Bettelheim, E.C. and Gilonne d'Origny (2006). Carbon Sinks and Emissions Trading under the Kyoto Protocol: A Legal Analysis. Philosophical Transactions: Mathematical, Physical and Engineering Sciences, 360(1797):1827-1851.
3. Box, G.E.P., G.M. Jenkins and G.C. Reinsel (1994). Time Series Analysis: Forecasting and Control. Pearson Education, Delhi.
4. Carbon Finance for sustainable development, 61111. Annual report 2009, World Bank.
5. Clean Development Mechanism in India. Available online at http://cdmindia.nic.in/cdm_india.htm, Accessed on 21 December, 2011.
6. Comprehensive Environmental Impact Assessment Of Kota Thermal Power Station Unit-6 stage-IV (210Mw). Sponsor-Rajasthan State Electricity Board National Environmental Engineering Research Institute, Nagpur.
7. D, Esther, Michael Greenstone, Rohini Pande and Nicholas Ryan (2010). Towards an Emissions Trading Scheme for Air Pollutants in India. MIT Centre for Energy and Environmental Policy Research.
8. Dasgupta, A.K. and D.W. Pearce (1972). Cost-Benefit Analysis: Theory and Practice. Macmillan, London.
9. Derze, J. and N.H. Stern (1985). The theory of Cost-Benefit Analysis. Department of Economics, University of Warwick, UK.
10. Evans, D.J. (2006). Social discount rates for the European Union. Business School Oxford Brookes University, Wheatley Campus, Oxford.
11. Ihaka, R. (2005). Time Series Analysis, Lecture notes for 475.726. Statistics Department, University of Auckland, New Zealand.
12. Kollmuss, A., Helge Zink and Clifford Polycarp (2008). Making Sense of the Voluntary Carbon Market A Comparison of Carbon Offset Standards. WWF, Germany.
13. Kyoto Protocol to the United Nations Framework Convention on Climate Change (1998), United Nations.
14. Layard and Glaister (1994). Cost-Beneft Analysis. Cambridge University press, Cambridge, UK.
15. Low Carbon strategies for growth, Interim Report (2011), Planning Commission, Government of India.
16. Marcue, A. (2011). Post Durban Analysis, December 22, 2011. Centre for European Policy Studies, Brussels.
17. MCX, India. Available online at http://www.mcxindia.com/SitePages/ContractSpecification.aspx?ProductCode=Carbon_(CER), Accessed on 17 February, 2012.
18. Murty, M.N., K.K. Dhavala, M. Ghosh and R. Singh (2006). Social Cost Benefit Analysis of Delhi Metro Available online at http://mpra.ub.unimuenchen.de/1658/1/MPRA_paper_1685.pdf, Accessed on 18 January, 2012.
19. Prest, A.R. and R. Turvey (1965). Cost-Benefit Analysis: A survey. The Economic Journal, 75(300):683-735.
20. Rajasthan Rajya Vidyut Utpadan Nigam Ltd., Kota Thermal Power Station, Visit of Hon'ble Members of Public Undertaking Committee Dated 26th Oct 2002.
21. Rajasthan State Environment Policy (2004). Department of Environment, Government of Rajasthan, Jaipur.
22. Rambaud, S.C. and Maria J.M. Torrecillas (2006). Social Discount Rate: A Revision. Anales De Estudios Economicos y Empresariales, 16:75-98.
23. Richards, K.R. (1997). The time value of carbon in bottom-up studies. Critical Reviews in Environmental Science and Technology, 27 (special):279–292.
24. Schmidt, C.W. (2009). Carbon Offsets: Growing Pains in a Growing Market. Environmental Health Perspectives, 117(2):62-68.
25. Schulze, E.D., Valentini, R. and Sanz, M.J. (2002). The long way from Kyoto to Marrakech: Implications of the Kyoto Protocol negotiations for global ecology. Global Change Biology, 8(6):505–518.
26. Seaz, C.A. and J.C. Requena (2007). Reconciling Sustainability and Discounting in Cost-Benefit analysis: A methodological proposal. Ecological Economics, 60:712-725.
27. Sen, A. (2000). The Discipline of Cost-Benefit Analysis. The Journal of Legal Studies, 29(S2):931-952.
28. Singh, J.K. (2001). Clean Development Mechanism (CDM) And Carbon Trading In India. Clean Development Project Opportunities in India, TERI, New Delhi.
29. Swinehart, S.C. (1996) Afforestation as a method of carbon sequestration: A cost benefit analysis. Ph.D. thesis, Stanford University.
30. Taiyab N. (2006). Exploring the market for voluntary carbon offsets. International Institute for Environment and Development, London.
31. The Kyoto Protocol. Available online at http://unfccc.int/kyoto_protocol/items/2830.php., Accessed on 29 January, 2012.
32. Thermal Power Plants Environmental Regulation (1996). Pollution Control Implementation Division II, Central Pollution Control Board.
33. Turvey, R. (1963). Present value versus internal Rate of return- An essay in the Theory of the Third Best. The Economic Journal, 73(289):93-98.
34. UNFCC, 2001a. Review of Implementation of Commitments of other Provisions of the Convention. Preparations for the first session of the Conference of Parties as the Meeting of the Parties to the Kyoto Protocol. FCC/CP/2001/L.7, 24 July, 2001.
35. UNFCCC, 2001b. The Marrakesh Accords & the Marrakesh Declaration. Available at http://www.unfccc.de/, accessed on 17 January, 2012.
36. United Nations Framework Convention on Climate Change (1997). United Nations General Assembly, A/AC.237/18, New York.
37. U. Sankar ( 2010 ) Social Rate of Discount, Intergenerational Equity and Cliamte Change, Centre of Excellence in Environmental economics, Madras School of Economics.
38. Veldt, K. Van‘t and A.J. Plantinga (2005). Carbon sequestration or abatement? The effect of rising carbon prices on the optimal portfolio of greenhouse gas abatement strategies. Journal of Environmental Economics and Management, 50(1):59–81.
39. Werksman, J. (1998). The Clean Development Mechanism: unwrapping the Kyoto Surprise. Review of European Community and International Environmental Law, 7:147-158.
40. Workshop on Econometric packages at Indian Council for Research on International Economic Relations (2008). Eviews Training by Ganesh Manjhi, Ph.D, JNU, New Delhi.
APPENDIX
A1. Social Rate of Discount
It is important to convert future flows of costs and benefits from an investment project into the same units as current values from a social perspective. That is, the flows of benefits and costs which accrue to some future time period, must be brought to their present value, for the sake of analysis. This is done with the help of Social Rate of Discount, calculated by summation of marginal elasticity of utility and per capita growth rate of consumption. This rate is generally applied to public sector investment projects. In a without uncertainty world, when projects are independent and there are no externalities, using a given SDR, the net present value of benefit of each project can be calculated and the projects can be ranked on the basis of their net present values. The decision problem becomes choice of a project which yields the highest net present value of benefit.
The results of a cost-benefit analysis are very sensitive to the choice of social discount rate. Setting the discount rate too high could prevent potentially desirable projects from being undertaken, whereas selecting a discount rate that is too low could result in making investments that are economically inefficient.
Hence, in order to generate analysis that reflects the true picture, we consider three rates of discounts, 3%, 5% and 10%. The choice is made so that effective representation of domain of both social and private rate of discounts is made.
A little review for the same brought out the following conclusions:
1. Private rates of discount is more than social rate of discount, as, the latter is associated with public projects that consider benefit for a larger section of people and hence, involve large time frames, high initial investments and delay in the expected returns. Private rate of discounts or Corporate rates of discounts would prefer considering projects that do not require continuous high levels of investments and delay in the expected rate of returns. This is also the reason behind worry, when it comes to project related reduction in environmental degradation, as they require high and continuous investment levels for initial time periods and returns are generated only after a certain lag period. (Maria et al. ).
2. On distinction between world and Indian social Rate of Discount: Since our concern here is India and Europe, speaking about these two, the average SRD in European Union earlier was around 8% to 10%, however, it is now reduced to around 4%. (Social Discount rates for European Union, Evans, Oxford Brookers University). However, in case of India, it stands close to 8%. This substantiates to the evidence that developing countries have a lower SRD in contrast to their developing counterparts. Going by the logic of a low SRD, this is one major contrasting feature and also a cause of major debate amongst various economists.
3. There are many conceptual and measurement problems in applying the SDR analysis for climate change mitigation projects (Sankar, 2010) . These issues arise because of many reasons, such as :
122 tLingaya's Lalita Devi Journal of Professional Studies Analysing Scope of Extensive Carbon Markets in India t123

Michael Foucault: What is An Author?
Aishwarya Kalia
The statement posed by Foucault (What is an author?) gives us a sense of how he is going to perceive an author in this essay. The title of the essay what is an author prepares a reader to actually think critically and differently. Instead of ‘Who is an author’ he used ‘What is an author’ which is suggestive of his viewing of an author in terms of a concept and not as a person who writes a text.
Like Barthes, he is not denying the existence of a person who writes. In his opinion, whenever one writes, he puts on the ‘author-function’ (Foucault 125). What I mean to say is that he is concerned with function of an author and meaning of the text is generated by this function only. ‘Therefore, a text is shaped by this function of an author and not by the person himself’ (Foucault 125). Author-function’ is central to his thought in his essay.
Foucault examines author as a function of discourse and how does it functions in discourses to differentiate one from another. For this, he has listed the characteristics of a discourse ‘that support this use’ (Foucault 124).
Firstly, when the copyright rules came into the prominence, ‘the trangressive properties’ (Foucault 124) of an author’s writing was given more importance. Thus, in a way, author was considered as a regulator of culture.
Secondly, he tried to locate the anonymity of a text without intervening in author’s identity. For this, he goes back to the ancient civilization where this was actually used to happen:
‘Even within our civilization, the same types of texts have not always required authors; there was a time when those texts which we now call “literary” (stories, folk tales, epics and tragedies) were accepted, circulated, and valorised without any question about the identity of the author’ (Foucault 125).
So, here, I think he goes back to the Anglo-Saxon era. We find traces of all the characteristics in Anglo-Saxon literature which Foucault is talking about. As we know that, their literature was unwritten. This unwritten literature was mostly in poetry and songs form which had been transmitted from one generation to another. So we don’t know who was actually the originator of this literature .We can now critically analyse an Anglo-Saxon poem like ‘The Wanderer ‘without considering its author ,besides we don’t have a choice as it doesn’t have an author. Now it permits us to move a step further. Sometimes it is not so much about knowing or not knowing who the author is; rather about the way one reads the text in the “presence” or absence of such knowledge. Therefore, the anonymity of the text is established. The scientific texts of the seventeenth and eighteenth centuries also accepted in the similar ways.
On the other hand, he says we always require an author’s identity in literary discourses. If there was no author, we always wrestle with the text to extract the identity of an author from it. In a way, he is questioning this notion where we always confine ourselves to locate the identity of an author in relation to text. And he argued to break away from these stereotypical convictions in order to bring a change in the perspectives.
Moving to third author-function, he says that an ‘author-not easy to be located. An author is ‘rational entity’ (Foucault127) and is needs to be constructed through certain set of operations. For this, he says that there are ‘transhistorical constants in the rules that govern the construction of an author’ (Foucault127). He distinguished the traditional method of literary criticism with Modern criticism for the construction of an author. Saint Jerome gives four criteria to construct the figure of an author. But what if any author does not falls on these grounds? For instance, his third trait says that ‘those written in a different style and containing words and phrases not ordinarily found in other works (the author is seen as a stylistic uniformity)’ (Foucault 128).
Michael Foucault: What is An Author? t125124 tLingaya's Lalita Devi Journal of Professional Studies
(a) The projects costs are incurred now but the benefits occur after long time and when they do occur the benefits may be available for very long period, say one hundred years more. The current generation incurs the mitigation costs and the benefits would accrue to future generations. In conventional social cost benefit analysis of investment projects, the assumed life of project is often less than 50 years.
(b) There are both structural uncertainties and inertia in the climate system. The cascading effects of uncertainties from emissions to concentration of greenhouse gases in the atmosphere, from the concentrations to increases in the global temperature, from the increase in the temperature to the impacts on the economic system, and the extent and speed of government’s policy responses result in probability distributions for per capita consumption growth etc. Incorporation of non- substitutability between natural capital and man-made capital, irreversibility of some investment decisions and possibility of learning over time, and intra-generational equity considerations pose great challenges in development of an appropriate framework for analysing climate change mitigation policies.
A.2 NET PRESENT VALUE
The sum of all discounted costs and benefits from the project is called the Net Present Value (NPV). The sum reflects how much the project will earn. If the NPV is negative, clearly the costs outweigh the benefits and the project is not economically feasible. If the NPV is positive, however, it indicates economic feasibility of the project and shows that the project is desirable because the present value of its benefits exceeds the present value of its costs (This also corresponds to equating marginal cost and marginal benefit). If the NPV is positive, the project should be undertaken. When choosing among a range of project choices, all of which yield a positive NPV, allocative efficiency dictates that the project with the highest NPV be chosen. In other words, the project with the maximum difference between present value of benefits and present value of costs is chosen.
A.3 STEPS INVOLVED CALCULATING NET PRESENT VALUE USING SOCIAL RATE OFDISCOUNT
In order to capture the large variation and determine the band in which the Net Benefit will fluctuate, we consider THREE SOCIAL RATES OF DISCOUNTS. These rates enable us to obtain analysis with rate of discounts close to both Social Rate as well as Private rate of Discounts:
• 3% Annual SRD
• 5% Annual SRD
• 10% Annual SRD
The formula used for the calculation of NPV is:
Here t is the time period (years);
x is the annual social rate of discount
Net benefit: Benefit – Cost
NPV)}100/x(1{
Benefit Nett
=+∑

126 tLingaya's Lalita Devi Journal of Professional Studies t127
Now, I think the poet like Fernando Pessoa (1888-1935) deserves a mention here. Pessoa is responsible for the modernist invention of heteronym. He was technically an author living in various selves. This means that he creates different personalities and not just names. Every personality is different from the other-writing styles are different, relations etc. It is in this sense that he wrote poems about a fictional character by a fictional poet .In a way, he denied the fixity in the idea of a poet. In contrast with Jerome’s idea, there is no uniformity in his style of writing.
Moving away from Jerome’s idea ,he says that ‘modern criticism does not appear to have these same suspicions concerning authentication’ (Foucault 128). What he is trying to say that an author shows his presence in the text when he has to connect his scattered or incoherent links and conclude with giving the unity to the structure as whole.
For instance, the detective fiction of Agatha Christie is an appropriate example. In her novels, first few chapters are devoted to the source of information. The suspicions are scattered to be picked up by the reader. Gaps in the sentences, red hairings aimed for the reader’s attention to be diverted are thrown quite casually that they sometimes become incompatible for one another. Then, all these are combined at the end of the novel revealing us the person who is guilty. For this, she has to appear herself in the end to tie up all the loose links in order to prove the crime.
Then, he argued that function of an author in a discourse. He believed that the author-function lies in between ‘the actual writer and the fictional narrator’ (Foucault 129). He has to keep a balance between the two.
At last, he says that author –function has to be dynamic in nature because it has to function differently in different discourses.
There are various changes which Foucault wishes to see in our ways of approaching literature and other ways of approaching literature and other cultural discourses. In this essay, his work seemed to return to this notion to transgress orthodox limits; viewing literary and cultural discourses in a different light rather than how it’s being usually perceived.
The first change (as I have already mentioned in this paper) is that where he tried to establish the anonymity of the text without the identity of the author (refer to second author-function from this paper).
As I said in the beginning that it is not the author’s name that is important but how it functions. Foucault tried to shift our perspectives in that sense. He addresses the arousal of problems when we associate the name of an author with the text. How we can be sure of the works associated with an author. For this, he took the example of Shakespeare. If we get to know that Shakespeare had not written his sonnets or wrote the works associated with the names of his contemporaries. It obviously brings a change in our perspective.
So, when Pessoa wrote a poem about a fictional character creating a fictional self of an author, we actually not sure of whether he is writing or it is written by Ricardo Reis (a heteronym).
To conclude, Foucault’s point is that in other texts as well, when it seems as though there are contradictions etc in a given set of works by the same writer, we attempt to “resolve” the contradictions by referring to the identity of the author. We assume that everything must make sense as the thinking of “one” mind. That is what he wants us to move away from. Foucault wishes to have a culture ‘where discourse would circulate without any need for an author’ (Foucault 138), therefore, he tried to change a our mindset in this concern.
Guidelines for Contributors
l
l
l
l
l
l
l
l
l
l
Chief Editor
Lingaya’s Lalita Devi Journal of Professional Studies
Lingaya’s Lalita Devi Institute of Management & SciencesMandi, New Delhi - 110047
Ph : (011)-26651112 / 3E-mail: [email protected], [email protected]
Website: www.lldims.org.in/
Subscription amount should be paid by Demand Draft drawn in favour of 'Lingaya's Lalita Devi Institute of Management & Sciences’
Manuscripts should be sent along with the undertaking/authorization letter for the originality and copyright issue in favour of the Chief Editor.
The cover page should contain the title of the paper, author's name, designation, official address, contact phone and email address. The page should contain an abstract of not more than 150 words along with key words (a maximum of 8 key words).
Maximum length of the manuscript should be between 3000-4000 words.
The main page should not contain the authors name or affiliation. The face sheet should contain a declaration by the author stating that the article/research paper has not been published or not been submitted or accepted for publication by any other journal, magazine or book publishing house.
The text should be single spaced and should be typed in Times New Roman style with a font size of 12 pts and 1 inch margin all around.
Footnotes should appear at the bottom of the page on which they are cited/referenced.
Tables and figures should be numbered in Roman Numerals and can appear either in the body of the manuscript or at the end of the manuscript. Sources of data used in both tables and figures should be duly acknowledged as a footnote to the same.
At the end of the manuscript, all references cited in the body text should be complete in all respects and arranged in alphabetical order. Authors should carefully check the list of references for the completeness, accuracy and consistency.
All the Research papers and review paper will be peer reviewed or double blind refereed. The decision of the editorial committee and Chief Editor will be final.
Manuscripts and all the correspondence regarding subscription of 'Lingaya's Lalita Devi Journal of Professional Studies' should be addressed to:
Subscription
Academic Institution : Rs. 350 Per Issue
Corporate : Rs. 550 Per Issue
Overseas : US $20 Per Issue
Old Text
Copyright © 2022 FDOKUMEN