Study of high radio frequency plasma discharge effects on carbon fiber using Raman spectroscopy
11
This article appeared in a journal published by Elsevier. The attached copy is furnished to the author for internal non-commercial research and education use, including for instruction at the authors institution and sharing with colleagues. Other uses, including reproduction and distribution, or selling or licensing copies, or posting to personal, institutional or third party websites are prohibited. In most cases authors are permitted to post their version of the article (e.g. in Word or Tex form) to their personal website or institutional repository. Authors requiring further information regarding Elsevier’s archiving and manuscript policies are encouraged to visit: http://www.elsevier.com/authorsrights
Transcript of Study of high radio frequency plasma discharge effects on carbon fiber using Raman spectroscopy
This article appeared in a journal published by Elsevier. The attachedcopy is furnished to the author for internal non-commercial researchand education use, including for instruction at the authors institution
and sharing with colleagues.
Other uses, including reproduction and distribution, or selling orlicensing copies, or posting to personal, institutional or third party
websites are prohibited.
In most cases authors are permitted to post their version of thearticle (e.g. in Word or Tex form) to their personal website orinstitutional repository. Authors requiring further information
regarding Elsevier’s archiving and manuscript policies areencouraged to visit:
http://www.elsevier.com/authorsrights

Author's personal copy
Study of high radio frequency plasma discharge effects on carbon fiberusing Raman spectroscopy
D. Akbar a,⁎, Ümmugül E. Güngör b
a Hacettepe University Technopolis, Advance Technology Research Center, Beytepe Campus, 06800 Beytepe, Ankara, Turkeyb Middle East Technical University, Department of Physics, 06800 Ankara, Turkey
a b s t r a c ta r t i c l e i n f o
Article history:Received 13 May 2013Accepted in revised form 16 December 2013Available online 25 December 2013
Keywords:High frequency RF-PECVDCarbon fiberSingle and dual RF-CCP dischargeOrder and disorder of carbon fiberRaman and FT-IR spectroscopy
The goal of this research is to evaluate the potential of single and dual high RF reactors for the treatment of carbonfiber by Raman and FT-IR spectroscopies. Unsized poly-acrylonitrile (PAN) carbon fiber was treated with singlehigh frequency (40.68 MHz) and double radio frequency capacitively coupled plasma (RF-CCP) discharge reactor(40.68/2.1 MHz) using pure nitrogen gas. The changes in the structure of the carbon fiber surfaces due to thevariations of the D and G band intensity ratio (ID/IG), crystallite size (La) and Full-Width-at-Half-Maximumwith plasma power, gas pressure, and treatment-time were described. It was found that the disorder of carbonfiber increases (the ID/IG ratio increased) with increasing high RF power and the process time. In contrast, thedegree of the order (La) increases with increasing the gas pressure. It was also observed that the degree ofgraphitization accrued due to the shift of the D and G bands to the lower wave number. And, from FT-IR result,it was found that the C_C bond disappeared, and only carbon to nitrogen double and triple bonds are availableby increasing pressure and RF power. In dual RF reactor, at high pressure and long process time, the disordervalues (ID/IG) decrease with the increase of low frequency power. Furthermore, this mode has faster effects onthe surface of carbon fiber than single RF mode.
© 2013 Elsevier B.V. All rights reserved.
1. Introduction
Carbon fibers (CF) play an important role for the reinforcementof the composite materials due to its excellent mechanical propertiessuch as strength, fatigue-tolerance and light weight [1–3]. ThereforeCF applications continue to grow in the aerospace, biomedical, sportinggoods, and automotive industries. The surface chemistry and roughnessof CF strongly influence the adhesive properties of the interface, whichultimately affect the overall properties of the composites. An importantamount of scientific and technological work has been carried out toimprove the mechanical properties of CF and CF composites [4,5].Because of the graphitic nature of CF and that they are relatively inert,surface treatments are necessary to enhance the surface energy, andthus to increase the ability to establish strong interactions betweenfibers and the matrix.
Electrochemical oxidation is a conventional surface modificationmethod for CF. However, due to the environmental pollution problems,its application in industrial field is limited. Thus, it was very importantto develop alternative environmentally friendly methods. One of thesenew techniques for surface modification of CF with maintaining ofthe bulk properties of the fiber is the plasma discharge [6–9]. Plasma
treatments are very effective methods for introducing different chemi-cal structures on the CF surfaces [10–12]. In addition, by choosing suit-able gas plasmas, the properties of the fiber surface can be controlled.
To obtain more detailed information on CF structure, plasmadischarge experiments were prepared. Some research groups havestudied the effect of plasma on reinforcing fibers to introduce aminegroups onto their surfaces using ammonia plasmas [13,14]. And it wasfound that the high frequency discharge plasma displays much bettereffects on the surface modification on all materials as compared tothe direct current discharge plasma [15]. In fact, nitrogen plasmatreatments have not introduced new nitrogen functionality ontosurfaces; but instead, have cleaned fiber surfaces of contaminants andsuccessfully introducing C/N functionality into fiber surfaces [16]. Thefunctionalization occurs within the radio frequency (RF) plasma dis-charge by breaking the bonds of the fiber, and by creating reactivesites on the fiber chainwhich they are ready to react with active plasmaspecies. The rapid integration of nitrogen to the surface causes forma-tion of groups like C_N, N\C\N, and amine groups in plasma [17].There are many advantages of the plasma surface treatments likeincreasing the wettability by combining polar groups on the surface,removing the surface contamination and; forming functional groupsof the treated surfaces [18,19].
In this work, we report the results of our study on the use of singlehigh radio frequency (SRF) (40.68 MHz) and dual radio frequency(DRF) (40.68/2.1 MHz) capacitively coupled discharge systems to
Surface & Coatings Technology 240 (2014) 233–242
⁎ Corresponding author. Tel./fax: +90 546 216 5421.E-mail address: [email protected] (D. Akbar).
0257-8972/$ – see front matter © 2013 Elsevier B.V. All rights reserved.http://dx.doi.org/10.1016/j.surfcoat.2013.12.032
Contents lists available at ScienceDirect
Surface & Coatings Technology
j ourna l homepage: www.e lsev ie r .com/ locate /sur fcoat

Author's personal copy
generate low pressure N2 radicals as one of the newest surface mod-ification technique. We have determined the optimum treatmentconditions for both reactors to improve the physical, electrical, andmechanical properties of the unsized poly-acrylonitrile (PAN)-basedCF. One advantage of this configuration (DRF discharge) is that the ionenergy and ionflux impinging on the substrate surface can be separatelycontrolled [20–22]. In the literature, it is generally believed that the ionflux is supposed to be controlled by the high frequency (HF) generator(40.68 MHz), while the ion energy is mainly determined by the lowfrequency generator (LF) (2.1 MHz).
The degree of crystallization of CF was examined by Raman spec-troscopy. This technique has been recognized as one of the most sen-sitive, non-destructive, non-contacting, and quick measurement toolsfor studying the structural properties of carbonaceous materials.Raman spectra provide information on the crystalline perfection ofgraphite-basedmaterials [23,24]. Raman spectroscopy is a lasermethod
which uses inelastic scattering of light from the sample surface toinvestigate vibrational, rotational, and other low-frequency modes ofinteraction between molecules at room temperature and at ambient
Fig. 1. Schematic diagram of the high frequency dual RF-PECVD system.
Fig. 2.Raman spectra of the carbonfiber samples for single RFplasma discharge reactors at100 W and 30 min.
a
b
Fig. 3. Relative intensity ratio (ID/IG) ratio (a) and crystallite size (La) (b) for SRF as afunction of HF powers at constant time for each pressure value.
234 D. Akbar, Ü.E. Güngör / Surface & Coatings Technology 240 (2014) 233–242

Author's personal copy
pressure. Raman bands are sharp peaks in the spectra that can beassociated with the vibration modes at the molecular level.
Early studies on graphite materials revealed that a Raman bandat ~1585 cm−1 can be related to C\C vibrations in graphite and ispresent in all carbon fibers. Another band in poly-crystalline graphitewas found at ~1330 cm−1 and can be related to the boundaries of thegraphite crystals. Thus it can be related to particle size and structuraldisorder effects [25]. It is well-known that the position of D-band (Dfor disorder) in the Raman spectrum appears at different wave numberschanging the excitation wavelength. The change in the peak position ofthe D-band with excitation wavelength can be explained in terms ofresonance of the electronic and vibrational density of states. To increasethe spectral separation of theD andG bands, it is common to use a greenlaser as the excitation wavelength.
Raman spectroscopy has been extensively used to identify thedisorder in the sp2 network of different carbon structures [26–31]. Theevolution of the disorder is usually quantified using the well-knownTuinstra–Koenig relation ID/IG = C(λ) / La [25], where ID/IG is therelative intensity ratio (relative peak area) between the disorder-induced D band (~1350 cm−1) and the Raman-allowed first-orderG band (~1580 cm−1). It was concluded that the intensity ratio (ID/IG)is inversely proportional to the in-plane crystalline sizes La. The pro-portionality constant C(λ) depends on the excitation laser wavelength.The most commonly used value for C(λ) is 4.4 nm for λ = 488 nm[25,32]. From the previous work [33], the value of the C factor canbe estimated to be 4.95 nm for the excitation wavelength 532 nm(2.33 eV).
It is well known that the line width and the ID/IG intensity ratio bothdepend on the structure of the carbon. Furthermore, the ID/IG ratio isgenerally considered as a quality parameter because the first-order
Raman scattering (G-band) process is not affected by the defects. Incontrast, the D-band is a second-order Raman scattering processwhich is enhanced by the presence of defects, and it is more commonin low modulus/low heat treatment fibers [34,35].
2. Experimental setup
A schematic diagram of the discharge reactor is shown in Fig. 1.The system consists of a stainless steel cylindrical chamber withdimension 500 × 400 mm2. The electrodes were made of isolatedaluminum with a diameter of 200 mm, and the distance betweentwo electrodes is 40 mm. The discharge was sustained by SRF powersource (40.68 MHz, 600 W) and DRF plasma sources (40.68/2.1 MHz).For the SRF case, the bottom electrode was grounded, and the HFpower is connected to the top electrode. In the DRF case, the LF(2.1 MHz, 600 W) was connected to the bottom electrode and com-monly grounded with the HF generator. The RF generators werecoupled to the top and bottom electrodes by using automatic matchingnetworks and high frequency band-pass-filter on the HF generatorside, as shown in Fig. 1. Thefiberswere placed on top of a glass substrateand all together placed on the bottom electrode of the plasma reactor.The treatments were made using both SRF and DRF plasma dischargeswith different powers, pressures, and treatment times. Nitrogen gaswith purity 99.999% was applied as the activation gas.
WITEC alpha300S Scanning Near-Field Optical Microscopy (SNOM)is used to characterize the surface structure of the CF. The excitationof the surface samples was made by 532 nm He–Ne laser with power~100 mW to obtain Raman spectra. A Nikon objective (100×) lenswas installed to focus the laser beam on the individual fiber surface.The RF power sources were changed from 50 to 200 W. The flow rate
a b
c d
Fig. 4. Relative intensity ratio (ID/IG) ratio (a, c) and crystallite size (La) (b, d) for SRF as a function of different HF powers at constant pressure for each process time at 30 and 90 min.
235D. Akbar, Ü.E. Güngör / Surface & Coatings Technology 240 (2014) 233–242

Author's personal copy
of the nitrogen gas kept constant during the treatment process.The exposure time and gas pressure were changed in the ranges 0.1 to0.9 Torr and 15 to 90 min, respectively. A band of unsized PAN-basedCF of length about 2–3 cm was placed over a glass between twoelectrodes so that it was entirely immersed in the center of thedischarge plasma.
3. Results and discussion
Fig. 2 shows the Raman spectra of the CF samples. The spectrumrange is scanned from 500 to 4000 cm−1. Each spectrum has thedistinct graphitic band (G-band) at 1580 cm−1 which corresponds toin-plane vibrations of graphite lattice (E2g vibrational mode). Anotherband at 1350 cm−1 (A1g mode) is linked to the degree of structuralorganization (disorder finite-sized microcrystalline) of the CF [36–38].A comparison of these spectra reveals that the untreated referencesample has a well-defined peak, which increases with the graphiticorder (E2g band) as compared to the (A1g mode). However, at highpressure values, the latter is more intense than E2g for treated fiber,which indicates larger structural disorder of the CF.
Our results show that there is a frequency shift for the peaks of the Dand G bands of the PAN-based CF. Due to the variance in data pointsnear the peaks, the peak shift measurements are carried usingsmoothed forms of the spectra. Then, to analyze and filter out defecteddata from the CF spectra, a Lorentzian PeakFit part of the commercialsoftware program (OriginLab) was used. As a result, the time andpower dependence trend of the D and G band intensity ratio, bandpositions, and the Full-Width-at-Half-Maximum (FWHM) could bederived from the evolution of the corresponding band profiles.
Figs. 1–9 show that the reference sample values possess differentID/IG ratios depending on the applied RF power and the process time.It is well known that the relative intensity ratio of the D-band to theG-band depends on both the degree of graphitization and the alignmentof the graphitic planes. The relative intensity of the CF increases withincreasing RF power of SRF and DRF modes at low pressure, as inFigs. 1, 2, and 7, representing the transformation of graphitic carboninto the disordered carbon. In other words, the increase in the D bandpeak height relative to the G bandpeak can be explained by the increasein the ordering of carbon structure and growth in the size of the graphit-ic clusters (growth of nanographite structures) [27,39,40].
Knight and White [32] formula has been used to calculate the rela-tionship between the relative intensity and the crystallite domainsize La of graphite as La = 44 / R (in our case La = 49.5 / R). The surfacecrystallite size increased from 2.5 to 4.14 nmby changing the treatmentconditions (RF power, gas pressure, and process time). This shows ahigher degree of ordering of the graphitic structures [41,42], as wewill discuss in detail in the following sections.
3.1. Effects of SRF discharge
From Figs. 3 and 4(a and b), it was observed that the effect of theplasma discharge on the CF is very effective when the pressure isabout 0.3 Torr at constant process time. As the process time and thepressure increase the ratio ID/IG (La) decreases (increases).
In contrast, the ID/IG ratio (La) increases (decreases) as the HF powerincreases and there is a maximum value (ID/IG = 5) when the processtime is 30 min. This is because the electron density and the electrontemperature have the minimum values at 0.3 Torr. This is because theplasma heating transitions from collisionless to collisional (heating
a b
c d
Fig. 5. Relative intensity ratio (ID/IG) ratio (a, c) and crystallite size (La) (b, d) for SRF as a function of pressure at constant process time for each HF power.
236 D. Akbar, Ü.E. Güngör / Surface & Coatings Technology 240 (2014) 233–242

Author's personal copy
effect) occur under this operational conditions [43]. On the other hand,the electron temperature decreases (electron density increases) withincreasing HF power at constant pressure. Decreasing the distancebetween defects may cause the evolution of the ID/IG with increasingRF power (increasing ion energy) [44]. Thus, the maximum valueof the La appears at 100 W and 30 minute process time, as shownin Table 1.
It is very important to clarify that the D and G band positions haveno linear trends in relation with the process time and applied power.Indeed, the oscillatory trend in the D and G band positions of CF is espe-cially evident. At the same time, SRF and DRF plasma discharges causethe oscillatory trend in FWHM band values, as will be discussed in thelast section.
Fig. 4(a and b) shows that the disorder value decreases to its mini-mum value (crystallite increases, La = 4.144 nm) when the HF poweris 100 W and gas pressure is 1.0 Torr, at process time 30 min. It isvery important to note here that the actual graphitic materials arepoly-crystalline, and the La can be controlled by the heating treatmentand the process time. As a result, we can conclude that the La increasesonly with increasing plasma heating temperature, without further needfor high temperature treatment by furnace [31]. At 100 W of HF powerand low process time (30 min), as in Figs. 5(a and b) and 6(a and b)respectively, the ID/IG ratio (La) decreases (increases) with the increas-ing pressure. For high HF power (200 W) and gas pressures higherthan 0.3 Torr, the variations in the La and the (ID/IG) appearmore clearlywith the increasing pressure and process time, as in Fig. 5(c and d).
For longer process time (90 min), as in Fig. 6(c and d), it was foundthat the ID/IG ratio (La) increases (decreases) as the pressure increasesuntil 0.5 Torr; then it starts decreasing, but always staying at higher
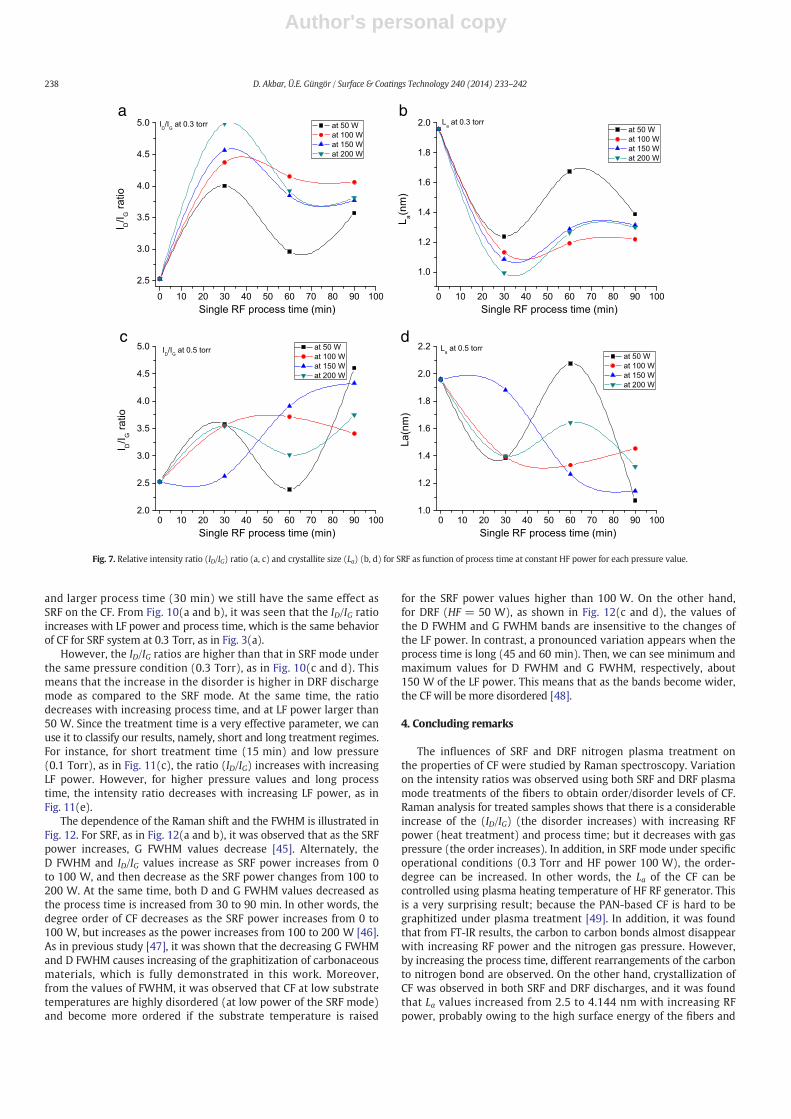
values than those for the untreated sample. We see from Fig. 7 that,as the process time increases, the ID/IG ratio increases and there is apeak value at 30 min. Furthermore, one sees that as the HF powerincreases, the ratio increases at low pressure, but decreases when thepressure is increased.
Furthermore, from the FT-IR analysis of the untreated and treatedsamples at high RF power, pressure and long time treatment (0.75 Torr,200 W and 60 min), it was found that carbon to carbon bonds arecompletely disappeared and only carbon to nitrogen bonds can bedominated, as in Fig. 8(a and b). Therefore it is possible to have orderedfiber structure with sp2 bonds under these conditions. In addition, somepeaks showing stretching vibrations between H and N or C (N\H orC\H), which observed in the range of 2500–4000 cm−1. Table 2 cansummarize FT-IR results of the untreated and treated carbon fibersamples with high frequency RF plasma discharge at differentprocess conditions. The table shows that the C_C bonds disappearedand only carbon to nitrogen double and triple bonds are available byincreasing the pressure and RF power. This is because high number ofenergetic particles and nitrogen enrichment can produce due to thetransition point of the plasma from alpha mode (collisionless electronheating) to gamma mode (collisional electron heating). Meanwhiledifferent molecular rearrangements were observed in carbon fiberstructures by increasing the processing time.
3.2. Effects of dual CCP discharge
Fig. 9(a and b) shows that the ID/IG ratio and the La remain almostconstant with increasing pressure at low process times (15 and30 min). For high power of the low frequency generator (LF = 100 W)
a b
c d
Fig. 6. Relative intensity ratio (ID/IG) ratio (a, c) and crystallite size (La) (b, d) for SRF as a function of pressure at constant HF powers for each process time.
237D. Akbar, Ü.E. Güngör / Surface & Coatings Technology 240 (2014) 233–242
Author's personal copy
and larger process time (30 min) we still have the same effect asSRF on the CF. From Fig. 10(a and b), it was seen that the ID/IG ratioincreases with LF power and process time, which is the same behaviorof CF for SRF system at 0.3 Torr, as in Fig. 3(a).
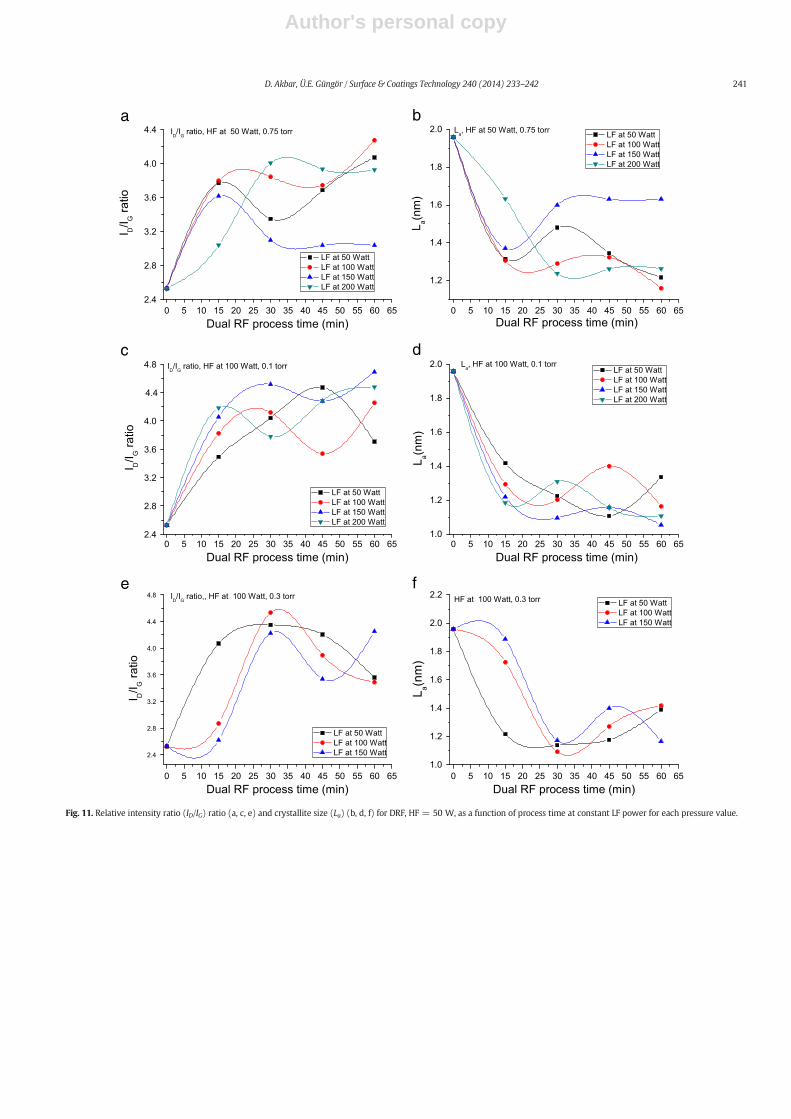
However, the ID/IG ratios are higher than that in SRF mode underthe same pressure condition (0.3 Torr), as in Fig. 10(c and d). Thismeans that the increase in the disorder is higher in DRF dischargemode as compared to the SRF mode. At the same time, the ratiodecreases with increasing process time, and at LF power larger than50 W. Since the treatment time is a very effective parameter, we canuse it to classify our results, namely, short and long treatment regimes.For instance, for short treatment time (15 min) and low pressure(0.1 Torr), as in Fig. 11(c), the ratio (ID/IG) increases with increasingLF power. However, for higher pressure values and long processtime, the intensity ratio decreases with increasing LF power, as inFig. 11(e).
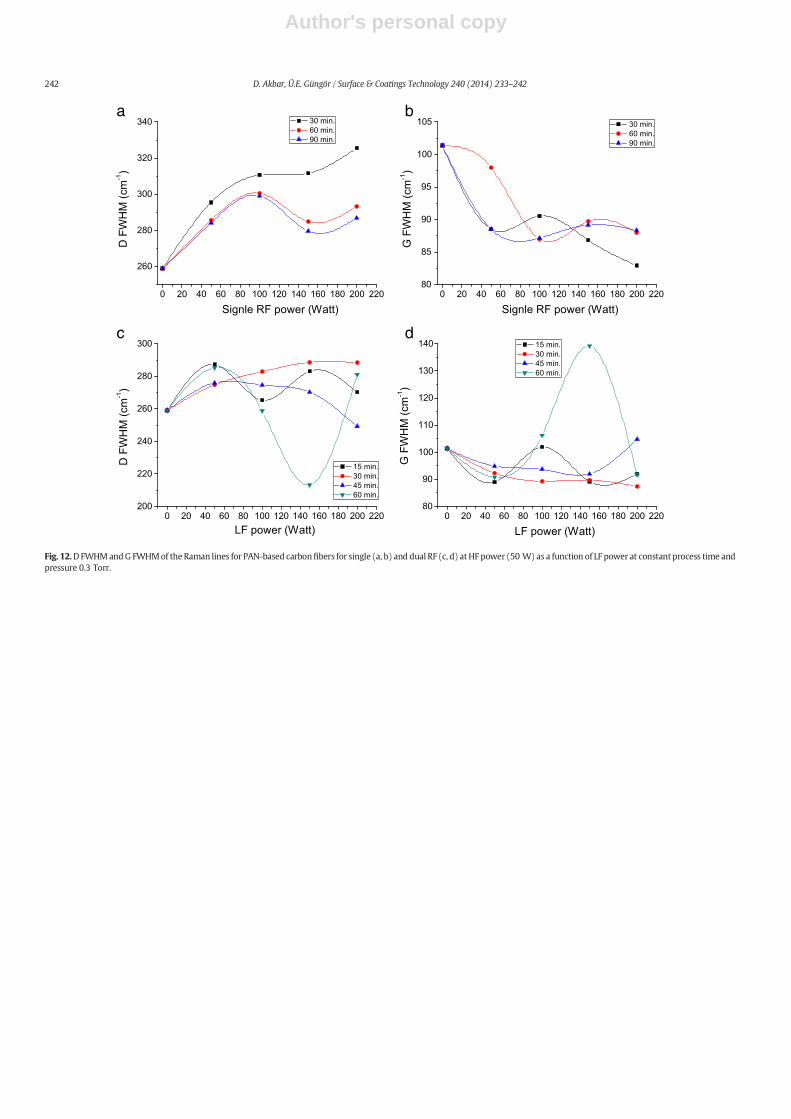
The dependence of the Raman shift and the FWHM is illustrated inFig. 12. For SRF, as in Fig. 12(a and b), it was observed that as the SRFpower increases, G FWHM values decrease [45]. Alternately, theD FWHM and ID/IG values increase as SRF power increases from 0to 100 W, and then decrease as the SRF power changes from 100 to200 W. At the same time, both D and G FWHM values decreased asthe process time is increased from 30 to 90 min. In other words, thedegree order of CF decreases as the SRF power increases from 0 to100 W, but increases as the power increases from 100 to 200 W [46].As in previous study [47], it was shown that the decreasing G FWHMand D FWHM causes increasing of the graphitization of carbonaceousmaterials, which is fully demonstrated in this work. Moreover,from the values of FWHM, it was observed that CF at low substratetemperatures are highly disordered (at low power of the SRF mode)and become more ordered if the substrate temperature is raised
for the SRF power values higher than 100 W. On the other hand,for DRF (HF = 50 W), as shown in Fig. 12(c and d), the values ofthe D FWHM and G FWHM bands are insensitive to the changes ofthe LF power. In contrast, a pronounced variation appears when theprocess time is long (45 and 60 min). Then, we can see minimum andmaximum values for D FWHM and G FWHM, respectively, about150 W of the LF power. This means that as the bands become wider,the CF will be more disordered [48].
4. Concluding remarks
The influences of SRF and DRF nitrogen plasma treatment onthe properties of CF were studied by Raman spectroscopy. Variationon the intensity ratios was observed using both SRF and DRF plasmamode treatments of the fibers to obtain order/disorder levels of CF.Raman analysis for treated samples shows that there is a considerableincrease of the (ID/IG) (the disorder increases) with increasing RFpower (heat treatment) and process time; but it decreases with gaspressure (the order increases). In addition, in SRF mode under specificoperational conditions (0.3 Torr and HF power 100 W), the order-degree can be increased. In other words, the La of the CF can becontrolled using plasma heating temperature of HF RF generator. Thisis a very surprising result; because the PAN-based CF is hard to begraphitized under plasma treatment [49]. In addition, it was foundthat from FT-IR results, the carbon to carbon bonds almost disappearwith increasing RF power and the nitrogen gas pressure. However,by increasing the process time, different rearrangements of the carbonto nitrogen bond are observed. On the other hand, crystallization ofCF was observed in both SRF and DRF discharges, and it was foundthat La values increased from 2.5 to 4.144 nm with increasing RFpower, probably owing to the high surface energy of the fibers and
a b
c d
Fig. 7. Relative intensity ratio (ID/IG) ratio (a, c) and crystallite size (La) (b, d) for SRF as function of process time at constant HF power for each pressure value.
238 D. Akbar, Ü.E. Güngör / Surface & Coatings Technology 240 (2014) 233–242

Author's personal copy
growth of the nanographite structures. Furthermore, D and G bandsmove towards lower wave number (increasing the degree of graphiti-zation) [50]. Therefore, we can say that the plasma treatments affectthe position and width of the main Raman bands, which has neverbeen seen before in previous studies.
One of the most important differences between SRF and DRFplasma discharge treatment is that the time dependence of ID/IG trendsshows maximum values around 30 min; this happens around 15 minfor DRF plasma discharge at low pressure (0.1 Torr). This means thatDRF mode can be used to get faster and more effective results. At thesame time, the disorder of the CF can be decreased with increasingLF power at high pressure and longer time treatment.
Acknowledgments
We would like to thank Dr. Ural Akbulut and Dr. Erdal Bayramli fortheir support in this work and also Bilkent National NanotechnologyResearch Center (UNAM) for allowing the use their confocal Ramanmicroscopy device.
References
[1] A. Shindo, in: S.L. Phoenix, I.J. Beyerlein (Eds.), Comprehensive Composite Materials,vol. 1, Elsevier Science, Amsterdam, 2000, pp. 1–33.
[2] L.M. Manocha, Encyclopaedia ofMaterials: Science and Technology, Elsevier Science,Amsterdam, 2001, pp. 906–916, (Part1).
a
b
Fig. 8. FT-IR analysis for untreated (a) and for treated high-ordered carbon fiber (b) underprocess condition 0.75 Torr–200 W–60 min.
a
b
Fig. 9. Relative intensity ratio (ID/IG) ratio (a) and crystallite size (La) (b) for DRF power(50–100 W) as a function of pressures at constant process time.
Table 1Shows the maximum values of La (untreated sample La = 2.5 nm) under differenttreatment conditions.
Pressure (Torr) Process time (min) HF power (Watts) ID/IG La (nm)
1.0 30 100 1.1957 4.151.0 60 50 and 100 1.5627 3.171.0 60 200 1.5627 3.17
Table 2FT-IR results of untreated and some treated carbon fibers under different treatment condi-tions.
Samples Wavenumber (cm−1) Functional group
Untreated 1539.20 C_C1653.00 C_N2355.09 C`N2500–4000 (N\H, C\H or others)
0.3 Torr, 100 W, 60 min 1540.16 C_C1653.00 C_N2355.09 C`N2500–4000 (N-H, C-H or others)
0.3 Torr, 200 W, 30 min 2355.09 C`N0.3 Torr, 200 W, 60 min 1653.96 C_N
2355.0 C`N0.5 Torr, 50 W, 30 min 1539.20 C_C
2357.20 C`N2500–4000 (N\H, C\H or others)
0.5 Torr, 50 W, 60 min 1653.00 C_N2355.09 C`N2500–4000 (N\H, C\H or others)
0.75 Torr, 200 W, 60 min 1653.96 C_N2354.13 C`N2500–4000 (N\H, C\H or others)
239D. Akbar, Ü.E. Güngör / Surface & Coatings Technology 240 (2014) 233–242

Author's personal copy
[3] S. Chand, J. Mater. Sci. 35 (2000) 1303–1313.[4] L.H. Peebles, Carbon Fibers: Formation, Structure and Properties, CRC Press, Boca
Raton, FL, 1995.[5] M.A. Montes-Morán, R.J. Young, Carbon 40 (2002) 857–875.[6] R. Li, L. Ye, Y.W. Mai, Compos. Part A 28 (1997) 73–86.[7] C.-M. Chan, T.-M. Ko, H. Hiraoka, Surf. Sci. Rep. 24 (1996) 1–24.[8] E.M. Liston, in: G. Akovali (Ed.), The Interfacial Interactions in Polymeric Composites,
NATO ASI Series, Series E, Applied Science, 230, Kluwer, Dordrecht, 1993,pp. 223–268.
[9] E.M. Liston, J. Adhes. 30 (1989) 199–218.[10] Y. Xie, P.M.A. Sherwood, Appl. Spectrosc. 43 (1989) 1153–1158.[11] T.H. Yoon, J.E. McGrath, High Perform. Polym. 4 (1992) 203–214.[12] I.H. Loh, R.E. Cohen, R.F. Baddour, J. Mater. Sci. 22 (1987) 2937–2947.[13] J.B. Donnet, M. Brendle, T.L. Dhami, O.P. Bahl, Carbon 24 (1986) 757–770.[14] Hu. Sun Mujin, Wu. Baorong, T. Yisheng, H. Ying, Compos. Sci. Technol. 34 (1989)
353–364.[15] Rongzhi Li, Lin Ye, Yiu-Wing Mai, Compos. A: Appl. Sci. Manuf. 28A (1997) 73–86.[16] R.J. Smiley, W.N. Delgass, MRS Proc. 318 (1993) 361, http://dx.doi.org/10.1557/
PROC-318-361.[17] G.A. Wade, W.J. Cantwell, J. Mater. Sci. Lett. 19 (2000) 1829–1832.[18] L.B. Nohara, G.P. Filho, E.L. Nohara, M.U. Kleinke, M.C. Rezende, Mater. Res. 8 (2005)
281–286.[19] N. Dilsiz, J. Adhes. Sci. Technol. 14 (2000) 975–987.[20] H.H. Goto, H.D. Lowe, T. Ohmi, J. Vac. Sci. Technol. A 10 (1992) 3048–3055.[21] J. Schuleze, Z.Z. Donkó, B.G. Heil, D. Luggenhölscher, T. Mussenbrock, R.P.
Brinkmann, et al., J. Phys. D. Appl. Phys. 41 (2008) 105214–105229.[22] H.C. Kim, J.K. Lee, Phys. Rev. Lett. 93 (2004) 085003–085007.[23] Al Jishi, G. Dresselhaus, Phys. Rev. B 26 (1982) 4514–4522.[24] M. Endo, C. Kim, T. Karaki, M.J. Matthews, S.D.M. Brown, M.S. Dresselhaus, et al.,
Carbon 36 (1998) 1633–1641.[25] F. Tuinstra, J.L. Koenig, J. Chem. Phys. 53 (1970) 1126–1130.[26] R.O. Dillon, J.A. Woollam, V. Katkanant, Phys. Rev. B 29 (1984) 3482–3489.[27] A.C. Ferrari, J. Robertson, Phys. Rev. B 61 (2000) 14095–14107.
[28] L.G. Cancçado, K. Takai, T. Enoki, M. Endo, Y.A. Kim, H. Mizusaki, Appl. Phys. Lett. 88(2006) 163106–163109.
[29] D. Teweldebrhan, A.A. Baladin, Appl. Phys. Lett. 94 (2009) 013101–013104.[30] J.H. Chen, W.G. Cullen, C. Jang, M.S. Fuhrer, E.D.Williams, Phys. Rev. Lett. 102 (2009)
236805–236809.[31] M.A. Pimenta, G. Dresselhaus, M.S. Dresselhaus, L.G. Cancçado, A. Jorio, R. Saito, Phys.
Chem. Chem. Phys. 9 (2007) 1276–1291.[32] D.S. Knight, W.B. White, J. Mater. Res. 4 (1989) 385–393.[33] M.J. Matthews,M.A. Pimenta, G. Dresselhaus, M.S. Dresselhaus, M. Endo, Phys. Rev. B
59 (1999) R6585–R6588.[34] V.M. Irurzun, M.P. Ruiz, D.E. Resasco, Carbon 48 (2010) 2873–2881.[35] N. Melanitis, P.L. Tetlow, C. Galiotis, J. Mater. Sci. 31 (1996) 851–860.[36] D. Leveque, M.H. Auvray, Compos. Sci. Technol. 56 (1996) 749–754.[37] G.A. Zickler, B. Smarsly, N. Gierlinger, H. Peterlik, O. Paris, Carbon 44 (2006)
3239–3246.[38] N. Meyer, G. Marx, K.W. Brzezinka, Fresenius J. Anal. Chem. 349 (1994) 167–168.[39] Ruslan Sergiienko, Etsuro Shibata, Sunghoon Kim, Takuya Kinota, Takashi
Nakamura, Carbon 47 (2009) 1056–1065.[40] E.A. Smorgonskaya, V.I. Ivanov-Omski, Semiconductors 39 (2005) 934–940.[41] K. Angoni, J. Mater. Sci. 33 (1998) 3693–3698.[42] L.A. Pesin, J. Mater. Sci. 37 (2002) 1–28.[43] V.A. Godyak, R.B. Piejak, B.M. Alexadrovich, Phys. Rev. Lett. 68 (1992) 40–43.[44] M.M. Lucchese, F. Stavale, E.H. Martins Ferreira, C. Vilani, M.V.O. Moutinho, R.B.
Capaz, et al., Carbon 48 (2010) 1592–1597.[45] Chan Kim, Sang-Hee Park, Jang-Ik Cho, Do-Young Lee, Tae-Jin Park, Wan-Jin Lee,
et al., J. Raman Spectrosc. 35 (2004) 928–933.[46] Liang-Hsun Lai, Sham-Tsong Shiue, Hung-Yi Lin, Vacuum 87 (2013) 141–144.[47] A. Sadezky, A.H. Muckenhuber, H. Grothe, R. Niessner, U. Pöschl, Carbon 43 (2005)
1731–1742.[48] H.J. Scheibe, D. Drescher, P. Alers, Fresenius J. Anal. Chem. 353 (1995) 695–697.[49] Zhen-hua Huang, Hai-hui Zhou, Qi-ling Peng, Jin-hua Chen, Ya-fei Kuang, Trans.
Nonferrous Met. Soc. China 20 (2010) 1418–1423.[50] T. Gruber, T. Waldeck-Zerda, M. Gerspacher, Carbon 32 (1994) 1377–1382.
a b
c d
Fig. 10. Relative intensity ratio (ID/IG) ratio (a, c) and crystallite size (La) (b, d) for DRF power (50–100 W) as a function of LF power at constant process time.
240 D. Akbar, Ü.E. Güngör / Surface & Coatings Technology 240 (2014) 233–242
Author's personal copy
a b
c d
e f
Fig. 11. Relative intensity ratio (ID/IG) ratio (a, c, e) and crystallite size (La) (b, d, f) for DRF, HF = 50 W, as a function of process time at constant LF power for each pressure value.
241D. Akbar, Ü.E. Güngör / Surface & Coatings Technology 240 (2014) 233–242
Author's personal copy
a b
c d
Fig. 12.D FWHMandG FWHMof the Raman lines for PAN-based carbonfibers for single (a, b) and dual RF (c, d) at HF power (50 W) as a function of LF power at constant process time andpressure 0.3 Torr.
242 D. Akbar, Ü.E. Güngör / Surface & Coatings Technology 240 (2014) 233–242