Study of a Neurofeedback methodology for treatment of ...
110
Study of a Neurofeedback methodology for treatment of chronic pain in clinical context Joana Correia Vaz Sousa Thesis to obtain the Master of Science Degree in Biomedical Engineering Supervisor(s): Professor Agostinho Cláudio da Rosa Professor Fernando Manuel Fernandes Melício Examination Committee Chairperson: Professora Ana Luísa Nobre Fred Supervisor: Professor Agostinho Cláudio da Rosa Member of the Committee: Professor Doutor Lucindo Palminha do Couto Ormonde June 2019
-
Upload
khangminh22 -
Category
Documents
-
view
4 -
download
0
Transcript of Study of a Neurofeedback methodology for treatment of ...

Study of a Neurofeedback methodology for treatment ofchronic pain in clinical context
Joana Correia Vaz Sousa
Thesis to obtain the Master of Science Degree in
Biomedical Engineering
Supervisor(s): Professor Agostinho Cláudio da RosaProfessor Fernando Manuel Fernandes Melício
Examination Committee
Chairperson: Professora Ana Luísa Nobre FredSupervisor: Professor Agostinho Cláudio da Rosa
Member of the Committee: Professor Doutor Lucindo Palminha do Couto Ormonde
June 2019

ii

Preface
The work presented in this thesis was performed at the Evolutionary Systems and Biomedical Engineer-
ing Lab of Institute for Systems and Robotics at Instituto Superior Tecnico (Lisbon, Portugal), during the
period September 2018-June 2019, under the supervision of Prof. Agostinho Rosa and Prof. Fernando
Melıcio.
iii

iv

Para a Vo Mira.
v

vi

Acknowledgments
Em primeiro lugar, gostaria de agradecer ao Professor Agostinho Rosa e ao Professor Fernando Melıcio
a oportunidade de poder desenvolver este projeto que foi, sem duvida, um dos maiores e melhores
desafios durante o meu percurso academico. Deixo tambem a minha palavra de agradecimento ao Dr.
Lucindo Ormonde, a Dra. Teresa Fontinhas e ao Dr. Joao Silva pela disponibilidade e colaboracao neste
projeto. Aos meus voluntarios quero agradecer por terem confiado em mim e se terem disponibilizado,
tanto fısica como emocionalmente, durante estes meses.
Apesar de nao ser facil de descrever fielmente o que me vai na alma, quero agradecer a minha
querida Ines pelo imenso apoio, paciencia e carinho que demonstrou ao longo destes meses. Foram
muitos os almocos, as sessoes e as viagens de metro partilhadas que proporcionaram o inıcio de
uma linda amizade. A Joana quero deixar tambem uma palavra querida por toda a ajuda e constante
companhia, tornando os meus dias de trabalho mais leves e divertidos. Nao poderia deixar de agradecer
aos restantes colegas do LaSEEB com quem partilhei frustracoes e gargalhadas, especialmente ao
Tiago, a Marta, ao Francisco, a Ana, ao Timoteo, e a Raquel.
Quero deixar aqui a minha palavra de amor aos amigos da minha vida. A amiga Marta que, em
6 anos de amizade, nunca me deixou morrer a fome nem dormir na rua. A Pipa e ao Kiko por me
terem adoptado e me levarem com eles para todo o lado. A Doina por ter partilhado uma das minhas
maiores aventuras pela Europa. Ao meu amigo Tomas que torna sempre os dias chuvosos em glitter.
A Margarida, ao Pipo, ao Rafa e ao Ricardo por se terem tornado mais do que simples colegas de
carteira. E a tantos outros que, apesar de nao ter mencionado, partilharam comigo os melhores anos
da minha vida.
A minha tia Mena por me ter acolhido no conforto da sua casa, pelo carinho e momentos de cumpli-
cidade nestes ultimos tres anos.
E porque sem eles eu nao me tornaria o que sou hoje, aos meus pais e aos meus irmaos pelo amor
incondicional, por serem o meu porto seguro, e por sempre acreditarem em mim.
vii

viii

Resumo
A dor cronica e um problema de saude mundial caracterizado por debilitacao fısica e normalmente
acompanhado por ansiedade, depressao e diminuicao das funcoes cognitivas. Estudos anteriores sug-
erem que o Neurofeedback (NF), um tipo de biofeedback em que os indivıduos sao treinados para auto-
regular a sua atividade cerebral, tem demonstrado o seu potencial como uma abordagem terapeutica
complementar/alternativa em indivıduos com dor cronica.
Nesta tese, foi desenhado e implementado um protocolo de EEG-NF em 7 doentes com dor cronica
na coluna, com o objetivo de diminuir o seu nıvel de dor. O treino compreendeu 16 sessoes, nas quais
foi aplicado um protocolo alfa/teta para aumentar a atividade alfa e simultaneamente inibir a atividade de
teta. Uma vez que apenas ainda 4 de 7 participantes completaram o tratamento, a analise foi realizada
da primeira a setima sessao. Todos os sujeitos aumentaram significativamente o racio alfa/teta dentro
das sessoes, mas nao ao longo destas. Considerando apenas learners, observou-se uma melhoria
significativa do racio alfa/teta dentro e ao longo das sessoes. O nıvel de dor pos-treino tende a ser
menor do que na fase pre-treino. Os pacientes melhoraram a sua cognicao e mantiveram seu estado
geral de saude.
Embora se tenham verificado melhorias nas primeiras 7 sessoes, e importante avaliar os resultados
apos todo o tratamento. Espera-se obter conclusoes mais robustas aumentando o tamanho da amostra
e adicionando o grupo de controlo. Contudo, este estudo fornece suporte preliminar para a potencial
eficacia do NF no tratamento da dor cronica na coluna, sugerindo futura investigacao.
Palavras-chave: Dor cronica, Neurofeedback, EEG, Racio alfa/teta
ix

x
Abstract
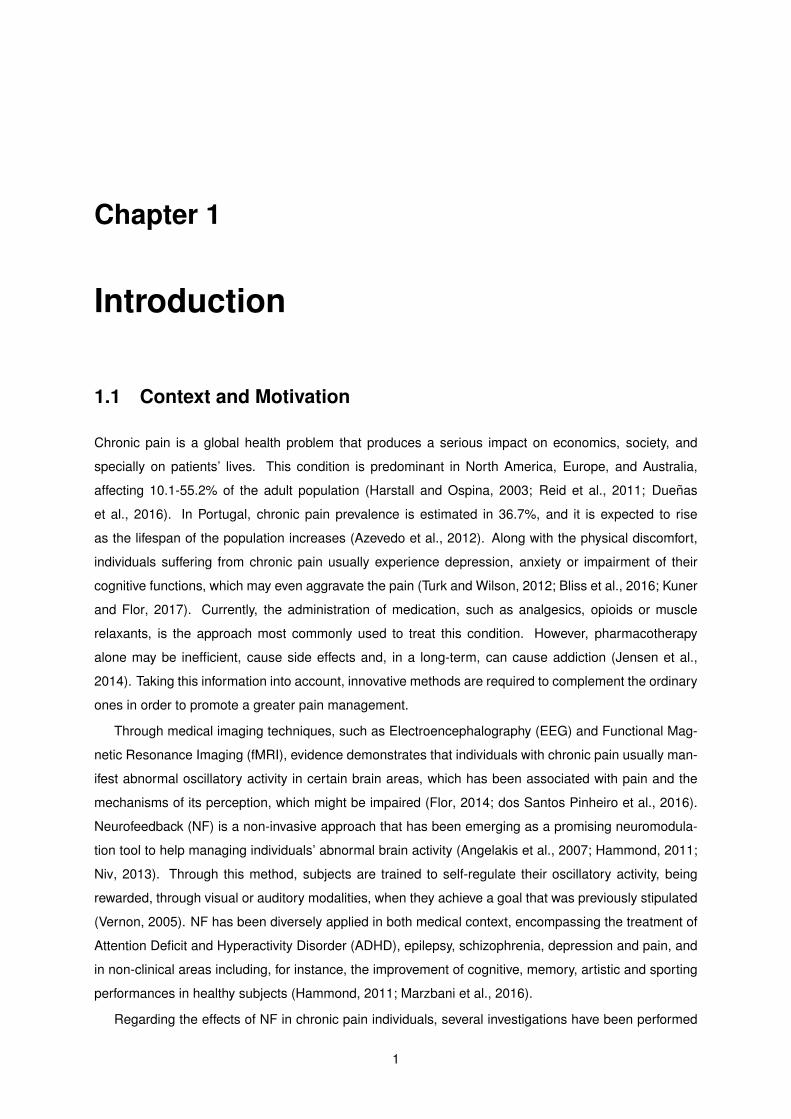
Chronic pain is a worldwide health problem characterized by physical debilitation and often accompa-
nied by anxiety, depression, and cognitive impairment. Previous research suggests that Neurofeed-
back (NF), a type of biofeedback in which individuals are trained to self-regulate their brain activity, has
demonstrated its potential as a complementary/alternative approach to help chronic pain patients.
In this thesis, an EEG-NF training protocol was designed and implemented in 7 chronic back pain
patients, aiming to decrease their pain level. The training comprised 16 sessions, in which an alpha/theta
protocol was applied at Cz to enhance alpha activity and simultaneously inhibit theta. Since only 4 out
of 7 participants have already completed the treatment, the analysis was performed from the first to the
seventh session. Considering all participants, a significant raise of the alpha/theta ratio was observed
within sessions, as well as a significant decrease of the theta relative amplitude. Across sessions, a
significant increase was observed for the alpha band. Pain level in post-NF state tend to be lower than
in pre-NF state in each session. Patients improved cognition and maintained their general health state.
Although improvements were seen in patients’ training performance over the first seven sessions,
it is important to further evaluate the outcomes for the whole treatment. By increasing sample size
and adding a control group it is expected that stronger conclusions can be drawn. Nonetheless, these
findings provide preliminary support for the NF potential efficacy in the treatment of chronic back pain,
suggesting further investigation is needed.
Keywords: Chronic Pain, Neurofeedback, EEG, Alpha/theta ratio
xi

xii

Contents
Preface . . . . . . . . . . . . . . . . . . . . . . . . . . . . . . . . . . . . . . . . . . . . . . . . . iii
Acknowledgments . . . . . . . . . . . . . . . . . . . . . . . . . . . . . . . . . . . . . . . . . . . vii
Resumo . . . . . . . . . . . . . . . . . . . . . . . . . . . . . . . . . . . . . . . . . . . . . . . . . ix
Abstract . . . . . . . . . . . . . . . . . . . . . . . . . . . . . . . . . . . . . . . . . . . . . . . . . xi
List of Tables . . . . . . . . . . . . . . . . . . . . . . . . . . . . . . . . . . . . . . . . . . . . . . xvii
List of Figures . . . . . . . . . . . . . . . . . . . . . . . . . . . . . . . . . . . . . . . . . . . . . xix
List of Abbreviations xxi
1 Introduction 1
1.1 Context and Motivation . . . . . . . . . . . . . . . . . . . . . . . . . . . . . . . . . . . . . . 1
1.2 Objectives . . . . . . . . . . . . . . . . . . . . . . . . . . . . . . . . . . . . . . . . . . . . . 2
1.3 Thesis Outline . . . . . . . . . . . . . . . . . . . . . . . . . . . . . . . . . . . . . . . . . . 2
2 Background 5
2.1 Electroencephalography . . . . . . . . . . . . . . . . . . . . . . . . . . . . . . . . . . . . . 5
2.1.1 Context . . . . . . . . . . . . . . . . . . . . . . . . . . . . . . . . . . . . . . . . . . 5
2.1.2 Electrode placement and the 10-20 International System . . . . . . . . . . . . . . 6
2.1.3 EEG electrical activity . . . . . . . . . . . . . . . . . . . . . . . . . . . . . . . . . . 7
2.1.4 Neural oscillations . . . . . . . . . . . . . . . . . . . . . . . . . . . . . . . . . . . . 7
2.1.5 Artifacts . . . . . . . . . . . . . . . . . . . . . . . . . . . . . . . . . . . . . . . . . . 9
2.2 Chronic Pain . . . . . . . . . . . . . . . . . . . . . . . . . . . . . . . . . . . . . . . . . . . 10
2.2.1 Context . . . . . . . . . . . . . . . . . . . . . . . . . . . . . . . . . . . . . . . . . . 10
2.2.2 Physiologic mechanisms of pain . . . . . . . . . . . . . . . . . . . . . . . . . . . . 11
2.2.3 Cortical reorganization and EEG patterns . . . . . . . . . . . . . . . . . . . . . . . 12
2.2.4 Chronic Back Pain . . . . . . . . . . . . . . . . . . . . . . . . . . . . . . . . . . . . 14
2.3 Neurofeedback . . . . . . . . . . . . . . . . . . . . . . . . . . . . . . . . . . . . . . . . . . 14
2.3.1 Context . . . . . . . . . . . . . . . . . . . . . . . . . . . . . . . . . . . . . . . . . . 14
2.3.2 Neurofeedback underlying mechanisms . . . . . . . . . . . . . . . . . . . . . . . . 15
2.3.3 Neurofeedback techniques . . . . . . . . . . . . . . . . . . . . . . . . . . . . . . . 15
2.3.4 Neurofeedback Protocols . . . . . . . . . . . . . . . . . . . . . . . . . . . . . . . . 17
xiii

3 Literature Review 19
3.1 Current Treatments for Chronic Pain . . . . . . . . . . . . . . . . . . . . . . . . . . . . . . 19
3.2 Clinical Applications of Neurofeedback . . . . . . . . . . . . . . . . . . . . . . . . . . . . . 20
3.2.1 Chronic pain . . . . . . . . . . . . . . . . . . . . . . . . . . . . . . . . . . . . . . . 20
3.2.2 Other clinical applications . . . . . . . . . . . . . . . . . . . . . . . . . . . . . . . . 26
3.3 Artistic, Sporting, Cognitive and Memory Neurofeedback Applications . . . . . . . . . . . 29
4 Methods 31
4.1 Participants . . . . . . . . . . . . . . . . . . . . . . . . . . . . . . . . . . . . . . . . . . . . 31
4.2 Acquisition Equipment . . . . . . . . . . . . . . . . . . . . . . . . . . . . . . . . . . . . . . 32
4.3 Experiment Design and Protocol . . . . . . . . . . . . . . . . . . . . . . . . . . . . . . . . 32
4.3.1 Protocol features . . . . . . . . . . . . . . . . . . . . . . . . . . . . . . . . . . . . . 34
4.3.2 Individual Alpha Band and Individual Theta Band . . . . . . . . . . . . . . . . . . . 34
4.3.3 Neurofeedback training . . . . . . . . . . . . . . . . . . . . . . . . . . . . . . . . . 35
4.3.4 Active baseline . . . . . . . . . . . . . . . . . . . . . . . . . . . . . . . . . . . . . . 37
4.4 Measures . . . . . . . . . . . . . . . . . . . . . . . . . . . . . . . . . . . . . . . . . . . . . 37
4.4.1 Psychological tests . . . . . . . . . . . . . . . . . . . . . . . . . . . . . . . . . . . . 37
4.4.2 Cognitive tests . . . . . . . . . . . . . . . . . . . . . . . . . . . . . . . . . . . . . . 39
4.4.3 Wong-Baker Faces Pain Rating Scale R© and Mental State Questionnaire . . . . . . 41
4.5 Data Analysis . . . . . . . . . . . . . . . . . . . . . . . . . . . . . . . . . . . . . . . . . . . 42
4.5.1 Data pre-processing and extraction . . . . . . . . . . . . . . . . . . . . . . . . . . . 42
4.5.2 Data treatment . . . . . . . . . . . . . . . . . . . . . . . . . . . . . . . . . . . . . . 43
5 Results 47
5.1 Training evaluation . . . . . . . . . . . . . . . . . . . . . . . . . . . . . . . . . . . . . . . . 47
5.1.1 Neurofeedback training . . . . . . . . . . . . . . . . . . . . . . . . . . . . . . . . . 47
5.1.2 Resting and Active Baselines . . . . . . . . . . . . . . . . . . . . . . . . . . . . . . 53
5.2 Measures’ evaluation . . . . . . . . . . . . . . . . . . . . . . . . . . . . . . . . . . . . . . . 54
5.2.1 Psychological tests . . . . . . . . . . . . . . . . . . . . . . . . . . . . . . . . . . . . 54
5.2.2 Cognitive tests . . . . . . . . . . . . . . . . . . . . . . . . . . . . . . . . . . . . . . 57
5.2.3 Wong-Baker Faces Pain Rating Scale and Mental State Questionnaire . . . . . . . 58
5.2.4 Mental strategies . . . . . . . . . . . . . . . . . . . . . . . . . . . . . . . . . . . . . 60
6 Discussion 61
6.1 Training assessment . . . . . . . . . . . . . . . . . . . . . . . . . . . . . . . . . . . . . . . 61
6.1.1 Training effects on IAB/ITB ratio, IAB and ITB . . . . . . . . . . . . . . . . . . . . . 61
6.1.2 Training effects on other frequency bands . . . . . . . . . . . . . . . . . . . . . . . 63
6.1.3 Training effects on resting and active baselines . . . . . . . . . . . . . . . . . . . . 64
6.2 Psychological and cognitive assessments . . . . . . . . . . . . . . . . . . . . . . . . . . . 64
6.2.1 Psychological evaluation . . . . . . . . . . . . . . . . . . . . . . . . . . . . . . . . 65
xiv

6.2.2 Cognitive performance . . . . . . . . . . . . . . . . . . . . . . . . . . . . . . . . . . 65
6.2.3 Pain and Mental State evaluation . . . . . . . . . . . . . . . . . . . . . . . . . . . . 66
6.2.4 Mental strategies . . . . . . . . . . . . . . . . . . . . . . . . . . . . . . . . . . . . . 66
6.3 Limitations . . . . . . . . . . . . . . . . . . . . . . . . . . . . . . . . . . . . . . . . . . . . 66
7 Conclusions 69
7.1 Summary and Contributions . . . . . . . . . . . . . . . . . . . . . . . . . . . . . . . . . . . 69
7.2 Future Work . . . . . . . . . . . . . . . . . . . . . . . . . . . . . . . . . . . . . . . . . . . . 70
Bibliography 71
A Psychological evaluation - Tables 83
B Mental State Questionnaire 85
xv

xvi

List of Tables
3.1 State of the art: NF experiments in chronic pain. . . . . . . . . . . . . . . . . . . . . . . . 24
4.1 Demographic data of CBP patients. . . . . . . . . . . . . . . . . . . . . . . . . . . . . . . . 32
5.1 Wilcoxon Signed Rank test: across sessions’ learning indexes considering all patients. . . 49
5.2 Wilcoxon Signed Rank test: within session’s learning indexes considering all patients. . . 50
5.3 Wilcoxon Signed Rank test: across sessions’ learning indexes considering learners. . . . 52
5.4 Wilcoxon Signed Rank test: within session’s learning indexes considering learners. . . . . 52
5.5 Cognitive tests results: W statistic (W) and respective p-value (p) resulting from Wilcoxon
Signed Rank test. . . . . . . . . . . . . . . . . . . . . . . . . . . . . . . . . . . . . . . . . 58
5.6 Wong-Baker Faces Pain Rating Scale (pre- to post-NF training pain rates’ differences): W
statistic (W) and respective p-value (p) resulting from Wilcoxon Signed Rank test. . . . . . 59
5.7 Mental strategies . . . . . . . . . . . . . . . . . . . . . . . . . . . . . . . . . . . . . . . . . 60
A.1 WHY-MPI results: W statistic (W) and respective p-value (p) resulting from Wilcoxon
Signed Rank test. . . . . . . . . . . . . . . . . . . . . . . . . . . . . . . . . . . . . . . . . 83
A.2 PCS results: W statistic (W) and respective p-value (p) resulting from Wilcoxon Signed
Rank test. . . . . . . . . . . . . . . . . . . . . . . . . . . . . . . . . . . . . . . . . . . . . . 83
A.3 SF-36 results: W statistic (W) and respective p-value (p) resulting from Wilcoxon Signed
Rank test. . . . . . . . . . . . . . . . . . . . . . . . . . . . . . . . . . . . . . . . . . . . . . 83
A.4 SCL-90 results: W statistic (W) and respective p-value (p) resulting from Wilcoxon Signed
Rank test. . . . . . . . . . . . . . . . . . . . . . . . . . . . . . . . . . . . . . . . . . . . . . 84
A.5 STAI and BDI results: W statistic (W) and respective p-value (p) resulting from Wilcoxon
Signed Rank test. . . . . . . . . . . . . . . . . . . . . . . . . . . . . . . . . . . . . . . . . 84
xvii

xviii

List of Figures
2.1 10-20 International System for electrode placement. . . . . . . . . . . . . . . . . . . . . . 6
2.2 Example of normal brainwaves. . . . . . . . . . . . . . . . . . . . . . . . . . . . . . . . . . 9
2.3 Example of artifacts. . . . . . . . . . . . . . . . . . . . . . . . . . . . . . . . . . . . . . . . 10
2.4 Nociceptive pathways from periphery to the brain. . . . . . . . . . . . . . . . . . . . . . . 13
4.1 NF treatment diagram. . . . . . . . . . . . . . . . . . . . . . . . . . . . . . . . . . . . . . . 33
4.2 Training session diagram. . . . . . . . . . . . . . . . . . . . . . . . . . . . . . . . . . . . . 33
4.3 Example of the amplitude spectrum used to calculate IAB. . . . . . . . . . . . . . . . . . . 34
4.4 Feedback display. . . . . . . . . . . . . . . . . . . . . . . . . . . . . . . . . . . . . . . . . 36
4.5 Active baseline display. . . . . . . . . . . . . . . . . . . . . . . . . . . . . . . . . . . . . . 37
4.6 Digit span test. . . . . . . . . . . . . . . . . . . . . . . . . . . . . . . . . . . . . . . . . . . 39
4.7 N-back test. . . . . . . . . . . . . . . . . . . . . . . . . . . . . . . . . . . . . . . . . . . . . 40
4.8 OddBall test. . . . . . . . . . . . . . . . . . . . . . . . . . . . . . . . . . . . . . . . . . . . 40
4.9 Rotation test. . . . . . . . . . . . . . . . . . . . . . . . . . . . . . . . . . . . . . . . . . . . 41
4.10 Wong-Baker Faces Pain Rating Scale (Portuguese version). . . . . . . . . . . . . . . . . . 41
5.1 Evolution across sessions during NF at Cz: (a) Median relative amplitude of all frequency
bands; (b) IAB/ITB relative amplitude. . . . . . . . . . . . . . . . . . . . . . . . . . . . . . 48
5.2 Distribution of the across sessions’ learning measures (A1, A2) across all participants, at
Cz and for all bands. . . . . . . . . . . . . . . . . . . . . . . . . . . . . . . . . . . . . . . . 48
5.3 Evolution within session during NF at Cz: (a) Median relative amplitude of all frequency
bands; (b) IAB/ITB relative amplitude. . . . . . . . . . . . . . . . . . . . . . . . . . . . . . 49
5.4 Distribution of the within session’s learning measures (W1, W2) across all participants, at
Cz and for all frequency bands. . . . . . . . . . . . . . . . . . . . . . . . . . . . . . . . . . 50
5.5 Distribution of the training performance measures for Learners and Non-learners for IAB/ITB
ratio. . . . . . . . . . . . . . . . . . . . . . . . . . . . . . . . . . . . . . . . . . . . . . . . . 51
5.6 Distribution of IAB/ITB relative amplitudes of pre-NF and post-NF baseline during EO, EC
and AB, at Cz. . . . . . . . . . . . . . . . . . . . . . . . . . . . . . . . . . . . . . . . . . . 53
5.7 Comparison of IAB/ITB relative amplitudes during pre-NF baseline, post-NF baseline, with
EO, EC and AB, and NF at Cz. . . . . . . . . . . . . . . . . . . . . . . . . . . . . . . . . . 54
5.8 WHY-MPI: scores obtained at t0 and t1. . . . . . . . . . . . . . . . . . . . . . . . . . . . . 55
xix

5.9 PCS: scores obtained at t0 and t1. . . . . . . . . . . . . . . . . . . . . . . . . . . . . . . . 55
5.10 SF-36: scores obtained at t0 and t1. . . . . . . . . . . . . . . . . . . . . . . . . . . . . . . 56
5.11 SCL-90: scores obtained at t0 and t1. . . . . . . . . . . . . . . . . . . . . . . . . . . . . . 56
5.12 STAI and BDI: scores obtained at t0 and t1. . . . . . . . . . . . . . . . . . . . . . . . . . . 57
5.13 Digit Span test: score and span obtained at t0 and t1. . . . . . . . . . . . . . . . . . . . . 57
5.14 N-Back, OddBall and Rotation Tests: % of Successes obtained at t0 and t1. . . . . . . . . 58
5.15 Wong-Baker Faces Pain Rating Scale: distribution of the results obtained at pre- and
post-NF training in each session. . . . . . . . . . . . . . . . . . . . . . . . . . . . . . . . . 59
5.16 Mental scores across sessions . . . . . . . . . . . . . . . . . . . . . . . . . . . . . . . . . 60
B.1 Mental State Questionnaire. . . . . . . . . . . . . . . . . . . . . . . . . . . . . . . . . . . . 85
xx

List of Abbreviations
AB Active Baseline
ACC Anterior Cingulate Cortex
ADHD Attention Deficit and Hyperactivity Disorder
BDI Beck Depression Inventory
BOLD Blood Oxygen-Level-Dependent
CHLN Centro Hospitalar Lisboa Norte
CIPN Chemotherapy-induced peripheral neuropathy
CNS Central Nervous System
CNV Contingent Negative Variation
CRPS Complex Regional Pain Syndrome
EC Eyes closed
EEG Electroencephalography
EMG Electromyography
EO Eyes open
EPSP Excitatory Post-Synaptic Potential
ERP Event-Related Potentials
fMRI Functional Magnetic Resonance Imaging
HEG Hemoencephalographic
HRV Heart Rate Variability
HTF Higher Transition Frequency
xxi

IAB Individual Alpha Band
IAF Individual Alpha Frequency
IPSP Inhibitory Post-Synaptic Potential
ISR Institute for Systems and Robotics
IST Instituto Superior Tecnico
ITB Individual Theta Band
LA Lower Alpha Band
LaSEEB Evolutionary Systems and Biomedical Engineering Lab
LENS Low Energy Neurofeedback System
LORETA Low-resolution electromagnetic resolution
LTF Lower Transition Frequency
NF Neurofeedback
NIRS Near Infrared Spectroscopy
PCC Posterior Cingulate Cortex
PCS Pain Catastrophizing Scale
PFC Prefrontal Cortex
pIR HEG Passive Infrared Hemoencephalographic
PNS Peripheral Nervous System
PTSD Post-Traumatic Stress Disorder
qEEG Quantitative Electroencephalography
rtfMRI Real-time Functional Magnetic Resonance Imaging
SCI Spinal Cord Injury
SCL-90 Symptom Checklist 90
SCP Slow Cortical Potential
SF-36 36-Item Short Form Survey
SMR Sensory Motor Rhythm
xxii

STAI State-Trait Anxiety Inventory
TENS Transcutaneous Electrical Nerve Stimulation
UA Upper Alpha Band
UMD Unidade Multidisciplinar da Dor
WHY-MPI West Haven-Yale Multidimensional Pain Inventory
xxiii

xxiv
Chapter 1
Introduction
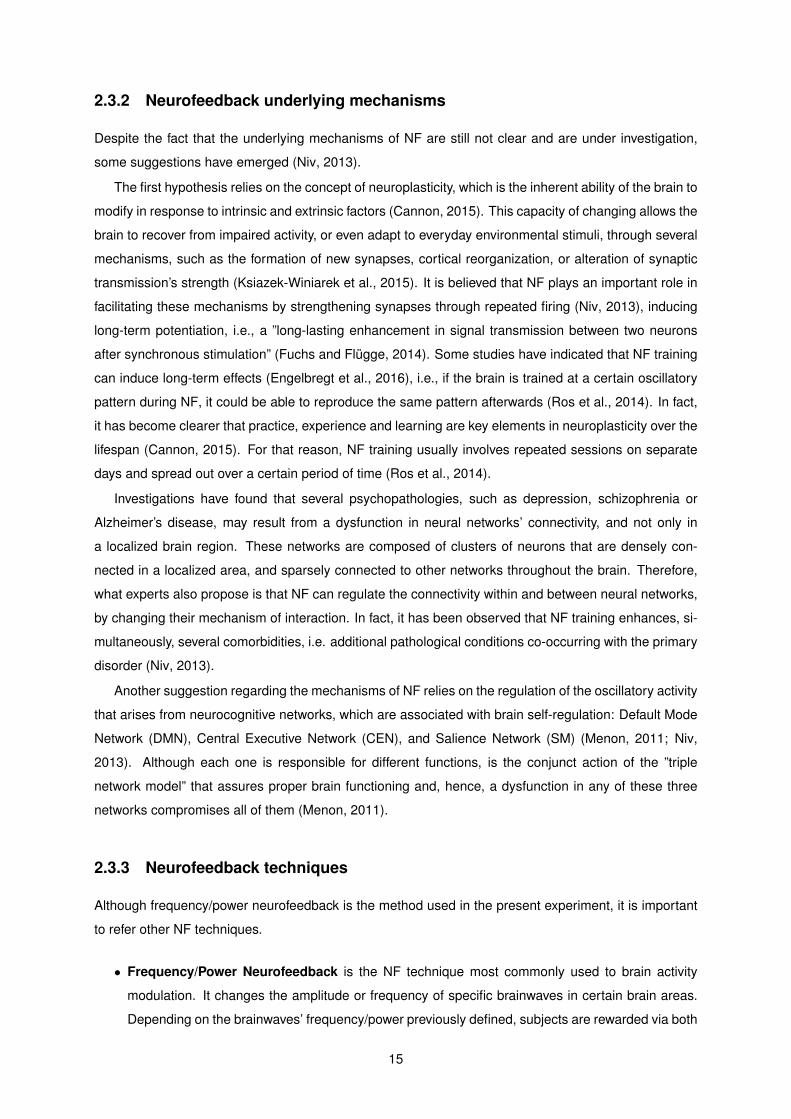
1.1 Context and Motivation
Chronic pain is a global health problem that produces a serious impact on economics, society, and
specially on patients’ lives. This condition is predominant in North America, Europe, and Australia,
affecting 10.1-55.2% of the adult population (Harstall and Ospina, 2003; Reid et al., 2011; Duenas
et al., 2016). In Portugal, chronic pain prevalence is estimated in 36.7%, and it is expected to rise
as the lifespan of the population increases (Azevedo et al., 2012). Along with the physical discomfort,
individuals suffering from chronic pain usually experience depression, anxiety or impairment of their
cognitive functions, which may even aggravate the pain (Turk and Wilson, 2012; Bliss et al., 2016; Kuner
and Flor, 2017). Currently, the administration of medication, such as analgesics, opioids or muscle
relaxants, is the approach most commonly used to treat this condition. However, pharmacotherapy
alone may be inefficient, cause side effects and, in a long-term, can cause addiction (Jensen et al.,
2014). Taking this information into account, innovative methods are required to complement the ordinary
ones in order to promote a greater pain management.
Through medical imaging techniques, such as Electroencephalography (EEG) and Functional Mag-
netic Resonance Imaging (fMRI), evidence demonstrates that individuals with chronic pain usually man-
ifest abnormal oscillatory activity in certain brain areas, which has been associated with pain and the
mechanisms of its perception, which might be impaired (Flor, 2014; dos Santos Pinheiro et al., 2016).
Neurofeedback (NF) is a non-invasive approach that has been emerging as a promising neuromodula-
tion tool to help managing individuals’ abnormal brain activity (Angelakis et al., 2007; Hammond, 2011;
Niv, 2013). Through this method, subjects are trained to self-regulate their oscillatory activity, being
rewarded, through visual or auditory modalities, when they achieve a goal that was previously stipulated
(Vernon, 2005). NF has been diversely applied in both medical context, encompassing the treatment of
Attention Deficit and Hyperactivity Disorder (ADHD), epilepsy, schizophrenia, depression and pain, and
in non-clinical areas including, for instance, the improvement of cognitive, memory, artistic and sporting
performances in healthy subjects (Hammond, 2011; Marzbani et al., 2016).
Regarding the effects of NF in chronic pain individuals, several investigations have been performed
1

throughout the years having a common main goal: to decrease the frequency and the severity of pain. Al-
though no large-scale clinical trial has been completed to date, a number of case series and preliminary
studies have been published, providing a better insight of the NF potential benefits (Jensen et al., 2014).
These include experiments in patients suffering from migraines (Siniatchkin et al., 2000; Stokes and
Lappin, 2010), fibromyalgia (Kayıran et al., 2010; Caro and Winter, 2011; Nelson et al., 2010), Complex
Regional Pain Syndrome (CRPS) (Jensen et al., 2007), Spinal Cord Injury (SCI) (Jensen et al., 2013),
and Chemotherapy-induced peripheral neuropathy (CIPN) (Prinsloo et al., 2017). The benefits reported
by these investigations appear to be ”moderate at best”, and some of them lack of deeper understand-
ing of NF long-term effects. However, there is evidence that NF can actually alter brain activity and
might thus be used as a complementary approach to treat chronic pain and other conditions (Jensen
et al., 2014). In fact, one of the hypothesis that has emerged is that NF training might improve several
pathological conditions simultaneously besides the primary disorder (Niv, 2013).
Due to the fact that no investigation has been carried out to date regarding NF in chronic back pain,
a preliminary research aiming to investigate the existence of NF potential benefits in patients suffering
from this condition would be a valuable contribution to the field. With this project, treatment parameters,
including sessions’ duration, reinforced/inhibited bandwidths, training electrode, among others, can be
assessed regarding their efficacy and be further refined, in order to design a protocol that could be
applied in a clinical context.
1.2 Objectives
The present thesis aims to investigate the potential benefits of applying a NF training protocol, specifi-
cally the enhancement of the Individual Alpha Band (IAB)/Individual Theta Band (ITB) relative amplitude,
in patients suffering from chronic back pain.
The specific objectives of this project were the:
1. Development and implementation of an EEG-NF protocol targeting IAB/ITB ratio for attenuating
the experience of pain;
2. Assessment of possible alterations of the EEG signal throughout the treatment;
3. Evaluation of NF efficacy and applicability in chronic back patients by assessing their well-being
and pain level in a pre- and post-treatment state;
4. Analysis of the NF training’s impact on patients’ cognitive performance.
1.3 Thesis Outline
This thesis is composed of seven chapters. The present chapter encompasses the context, the motiva-
tion and the objectives of this project. In the second chapter, concepts concerning EEG, chronic pain,
and NF are described. The third chapter includes research from the current literature on chronic pain
2

and NF fields. In chapter four, the methods employed in this project are detailed. The results obtained
from this experiment are described in chapter five, and then discussed in chapter six. The last chapter
comprises the main conclusions extracted from this project, as well as pertinent topics that could be
included in future work.
3

4

Chapter 2
Background
2.1 Electroencephalography
2.1.1 Context
EEG is a medical imaging technique that represents cerebral cortex electrical activity plotted over time.
It records the spontaneous brain activity by measuring the potential difference between two different
electrodes located on the scalp (Teplan et al., 2002; Olejniczak, 2006).
Richard Caton (1842-1926), a British physician with a particular interest in the electrophysiologic
phenomena, performed his experiments in animals, with the use of a galvanometer, aiming to explore
the electrical activity of their exposed brain hemispheres. Throughout his studies, Caton also pointed out
the relationship between the measured electric currents and the underlying brain structures (Schomer
and Da Silva, 2012). Some years later, the German neuropsychiatrist Hans Berger (1873–1941), con-
sidered by the scientific community as the pioneer of the EEG, began his studies in humans in the year
of 1924 (Millett, 2001; Schomer and Da Silva, 2012). He recruited patients injured from the First World
War that presented large skull bone defects. However, since he realized that these defects were not ad-
vantageous for recording brain electrical activity, Berger decided to carry out his experiments in subjects
with an intact skull and scalp. The first human EEG recording was obtained from his son in 1925. In
1929, Berger was the first to report the existence of the alpha rhythm and the alpha-blocking response.
Reports on the effect of hypoxia on the brain and the first recording of spindles during sleep were also
remarkable findings in Berger’s work (Schomer and Da Silva, 2012).
Although it has a good temporal resolution, EEG does not provide information on the anatomic
structures of the brain. This lack of high-spatial-resolution can be overcome by combining EEG with
advanced imaging techniques such as magnetic resonance imaging (MRI) and computed tomography
(CT). On the other hand, high-density EEG is a recent method that can also counteract this spatial
issue, since it has up to 256 electrodes covering the scalp, allowing a real-time precise identification of
the cortical signal’s source (Murphy et al. (2011)). Nonetheless, as a non-invasive, portable and low-
cost technique, traditional EEG has been a valuable brain-imaging method for not only diverse research
areas, such as neuroscience, psychophysiology, psychology, and cognitive science but also in a clinical
5

context. For instance, EEG has shown to be helpful in the diagnosis and characterization of several
brain conditions like Alzheimer’s disease, schizophrenia, epilepsy, and sleep disorders by monitoring
abnormal electrical activity (Mannan et al., 2018).
2.1.2 Electrode placement and the 10-20 International System
The 10-20 International System represents a method of electrodes placement on the scalp for neu-
rophysiological recordings, being based on the correlation between the location of an electrode and
the underlying cerebral cortex area. This system standardizes skull areas for further data comparison
(Homan et al., 1987; Steinmetz et al., 1989).
The numbers ‘10’ and ‘20’ represent the distance between adjacent electrodes that are 10% or 20%
of the total anterior-posterior or left-right distances of the cranium. A letter and a number are used to
identify the electrodes location concerning the brain area and the hemispheres, respectively. For the
brain areas, the following terminology is used: Fp for fronto polar; F for frontal; C for central; T for
temporal; P for parietal; and O for occipital. Regarding the hemispheres, odd numbers - 1,3,5 and 7 -
correspond to electrodes positioned on the left hemisphere, whereas even numbers - 2,4,6 and 8 - refer
to electrodes placed on the right hemisphere. Also, the ‘zero’ (‘z’) denotes the electrodes positioned on
the mid line that separates both hemispheres. Of 21 electrodes, 19 are used for recording cortical areas
and 2 other electrodes are used as reference electrodes (Klem et al., 1999; Marzbani et al., 2016).
To position the electrodes properly, specific measurements are needed and four anatomical land-
marks are considered: the nasion point, the inion point, and both preauricular points. The measure-
ments include (1) the anterior-posterior plane, from the nasion to the inion; (2) the central coronal plane,
from the left preauricular point through the C vertex mark to the right preauricular point; (3) the circumfer-
ential measurement taken over the temporal lobes from the midline Fp position to the midline O position;
and (4) the antero-posterior measurement taken from the left and right Fp position through the lateral C
position to the left and right O position (Klem et al., 1999).
Nasion
Inion
T3M1 M2
T4C3 C4Cz
Pz
Fz
Fp1 Fp2
F3 F4 F8F7
T5 T6P3 P4
O1 O2
Left
preauricular
point
Right
preauricular
point
Figure 2.1: 10-20 International System for electrode placement (adapted from Klem et al., 1999).
6

2.1.3 EEG electrical activity
The human brain is continuously in activity due to the large number of electrochemical signals that are
constantly transmitted between neurons from all brain structures. Due to the presence of ions, neurons
are electrically charged and, up to the arrival of a stimulus, these cells remain with a resting potential
associated. When the stimulus arrives and with enough strength, membrane’s depolarization occurs,
propelling an action potential. In the brain, synapses occur when a pre-synaptic cell releases, through
the axon terminal, neurotransmitters to the following neuron’s dendrites, causing an electrical polarity
change inside of the post-synaptic cell (Olejniczak, 2006). There are two types of post-synaptic poten-
tial: the Excitatory Post-Synaptic Potential (EPSP), and the Inhibitory Post-Synaptic Potential (IPSP),
depending whether the action potential’s effect is excitatory or inhibitory, respectively (Niedermeyer and
da Silva, 2005). Generally, a single EPSP might not be sufficient to depolarize the cell membrane and
generate an action potential. For that reason, the action potential depends on the algebraic summation
of several EPSP, together with the IPSP. Therefore, the synaptic activity recorded as EEG is the contri-
bution of both EPSP and IPSP, mostly from cortical pyramidal cells (Niedermeyer and da Silva, 2005;
Olejniczak, 2006).
2.1.4 Neural oscillations
EEG experiments are commonly used to measure neural oscillations (also known as brainwaves) asso-
ciated with specific brain states, such as ”wakefulness, sleep, and attentiveness” (Jensen et al., 2015),
and are usually regarded as synchronized or desynchronized activities. Synchronization indicates high-
amplitude brainwaves occurrence with relatively slow frequencies, whereas desynchronization implies
the decrease or suppression of a certain band power, that replaces the synchronized rhythms (Steriade
et al., 1990; Klimesch, 1996).
EEG oscillations are defined by the peak frequency, bandwidth and power (or amplitude) and their
frequencies are conventionally clustered into fixed frequency bands (illustrated in Figure 2.2): Delta [0.5-
4 Hz], Theta [4-8 Hz], Alpha [8-13 Hz], Sensory Motor Rhythm (SMR) [12-14 Hz], Beta [14-30 Hz], and
Gamma [30-70 Hz] (Doppelmayr et al., 1998; da Silva, 2013). The activity of these EEG rhythms might
be associated with physiological events in both normal and pathological conditions, as described below
(Steriade et al., 1990).
• Delta waves are the slowest, high-amplitude brainwaves, which can be originated in the thalamus
or in the cortex. They prevail during the 3rd and 4th states of sleep and anesthesia, being also
associated with increased comfort and reduced pain (Michel et al., 2017). The presence of delta
activity during awake state may indicate learning disabilities (Marzbani et al., 2016).
• Theta brainwaves are originated in the hippocampus. At very slow levels, theta activity represents
the borderline between waking and sleep (Hammond, 2011). On the other hand, Vernon (2005)
affirms that recognition memory processes are correlated with these oscillations recorded from the
scalp. During working memory tasks, theta activity is conspicuous in anterior midline and cingu-
7

late regions (Michel et al., 2017). In addition, theta activity is related to hypnosis and meditation
(Jensen et al., 2015).
• Alpha is the dominant frequency recorded by scalp EEG in adults, detected mainly over the
parieto-occipital cortex during relaxed wakefulness, especially at eye closure (da Silva, 1991).
Moreover, studies report its enhancement by attention tasks (Michel et al., 2017). Alpha waves
can be recorded from the synchronous electrical activity of the thalamus, and also from the visual
cortex. In the latter, alpha rhythms are generated and spread in different directions by cortical
neurons’ interaction from localized small areas called epicenters (da Silva, 1991). Based on the
hypothesis that alpha activity oscillates within different frequencies under certain conditions, sev-
eral authors suggest a subdivision of the alpha into two components: (1) Lower Alpha Band (LA),
which in turn is divided into two sub-bands (lower-1 and lower-2), and (2) Upper Alpha Band (UA)
(Klimesch, 1999; da Silva, 2013). From previous experiments, the lower alpha band was found to
reflect attentional processes, whereas semantic long-term memory processes are associated with
upper alpha oscillations (Klimesch, 1996). LA and UA were established as being 4 Hz below and 2
Hz above the Individual Alpha Frequency (IAF), which corresponds to the frequency of maximum
power in the subjects’ alpha band, respectively (Klimesch, 1999). Since alpha frequency varies
as a function of age and differs among subjects, investigators recommend the definition of an IAB
for each person instead of using fixed frequency bands. IAB is delimited by a Lower Transition
Frequency (LTF) that separates the theta band from LA, and a Higher Transition Frequency (HTF)
that marks the boundary between UA and the beta band (Klimesch, 1999).
• SMR is defined as the low beta band and appears over the sensorimotor cortex. SMR emerges
from interactions that result from bursting activity of neurons from the ventro-basal nuclei of the
thalamus, which concern the conduction of afferent somatosensory information (Sterman and Eg-
ner, 2006). From studies performed in animals, SMR activity appears to be associated with relaxed
attentiveness (Hammond, 2011).
• Beta activity is characterized by relatively fast waves that appear during epochs of increased alert-
ness. They are related with mental performance, intellectual activity, and strong focus. Mental and
physical disorders, such as insomnia, depression, and ADHD, can be an indicator of inappropriate
beta activity (Steriade et al., 1990; Hammond, 2011).
• Gamma waves are the fastest rhythms of brain activity originated predominantly in the hippocam-
pus, which is the brain area responsible to convert short-term to long-term memory. Thus, this
waves’ activity is intimately related with intensely focused attention, cognitive processing and mem-
ory (Hammond, 2011; Marzbani et al., 2016).
8

Delta
Theta
Alpha
Beta
Gamma
1 2 3 4
35 μV
Figure 2.2: Example of normal brainwaves (from low to high frequency): delta, theta, alpha, beta and
gamma rhythms (extracted from Uriguen and Garcia-Zapirain, 2015).
2.1.5 Artifacts
Artifacts are electric potentials recorded by EEG that emerge from sources other than brain activity
and can lead to misinterpretation. Therefore, steps regarding the identification and elimination of these
artifacts are essential to have an accurate interpretation of the EEG recording. Artifacts are classified
depending on their source. When electrical activity is produced by other body parts than the brain,
artifacts are classified as physiologic, whereas if they are originated by external sources, artifacts are
considered as non-physiologic (Tatum et al., 2011; Tandle and Jog, 2015):
• Physiologic artifacts
– Eye movements: As other tissues of the human body, the eye works as an electrical dipole,
i.e., the cornea is electropositive whereas the retina is electronegative, generating a direct
current potential difference that is measured by the EEG. Therefore, eye rolling causes a
change of potential in the electrodes that are near the eye, and the eye blink produces signals
with very large amplitude when compared with brain signals.
– Tongue movements: Similarly to the eye, the tongue behaves as a bioelectrical dipole and
its movements produce a potential that covers predominantly the frontal and temporal areas.
Intermittent or repetitive slow waves in the delta range are detected by the EEG as the tongue
moves involuntarily, either for swallowing or speaking.
– Myogenic activity: Muscle artifacts are mainly produced by the temporalis and frontalis mus-
cles activity, such as masseter muscles’ contraction or jaw clenching. By their duration and
rate of firing, the myogenic artifacts can be easily detected given their short duration potentials
and presence of intermittent ‘polyspikes’.
9

– Cardiac activity: The heart produces mechanical electrical artifacts that may appear as an
electrocardiogram waveform (QRS complex) in the temporal area of the left hemisphere dur-
ing EEG recording. Another artifact produced by cardiac muscle contraction is the pulse,
which appears as slow waves after the QRS complex. The pulse artifact may also be origi-
nated by an electrode that is positioned over an artery, producing periodic oscillations.
– Other body movements: Respiration and head movements produce artifacts that appear as
slow waves in the EEG recording.
– Skin: The sweat produced in the scalp may interfere with the metal of the electrodes and
compromise the signal acquisition.
EOG
ECG
EMG
70 μV
1 2 3 4 5 6
\
Figure 2.3: Example of artifacts: eye movement (EOG), muscular activity (EMG), and cardiac activity
(ECG) (extracted from Uriguen and Garcia-Zapirain, 2015).
• Non-physiologic artifacts
– Patient-electrodes interface: Patients’ sudden movements or the electrode setting itself may
lead to electrode pop, causing a momentary variation in the impedance of a certain electrode,
which can be observed as sharp waves in the EEG recording.
– Interference: A 50 or 60 Hz artifact may be originated by poor grounding of the EEG elec-
trodes, depending on the power system’s frequency being used.
2.2 Chronic Pain
2.2.1 Context
Pain is considered chronic when it persists beyond the estimated period of recovery from an injury,
which could last for several weeks or longer. Besides the discomfort and unpleasantness, chronic pain
10

is associated with fear, anxiety, depression, sleep deprivation, and cognitive impairment. Unlike acute
pain, chronic pain does not promote any beneficial function and it significantly compromises individuals’
quality of life (Turk and Wilson, 2012; Bliss et al., 2016; Kuner and Flor, 2017).
Indeed, chronic pain is a public health care problem worldwide, producing a significant negative
impact on economics and society. Although it has been difficult to determine its prevalence in the
general population due to data and criteria variability, surveys estimate that chronic pain predominates
in North America, Europe, and Australia, affecting 10.1-55.2% of the adult population (Harstall and
Ospina, 2003; Reid et al., 2011; Duenas et al., 2016). In Portugal, an epidemiological study performed
by Azevedo et al. (2012) estimated that the prevalence of chronic pain was 36.7%, and due to lifespan
increase and aging population, these numbers will tend to rise.
Chronic pain can be branched into two types: (1) the inflammatory ou muscular pain, that derives
from a continuous stream of nociceptive stimuli, and (2) the neuropathic pain, which in turn results
from nerve damage. The latter can also be subdivided into two types: peripheral neuropathic pain
and central neuropathic pain, whether it is originated by a lesion/dysfunction of the Peripheral Nervous
System (PNS) or of the Central Nervous System (CNS), respectively (Kuner and Flor, 2017). Also, some
chronic pain disorders might result from the combination of both nociceptive and neuropathic pain.
2.2.2 Physiologic mechanisms of pain
Before the publication of Melzack et al. (1965) about the gate control theory of pain, it was thought that
there was a single channel through which nociception was directly transmitted from the injured tissue’s
nerves towards a ”pain center” in the brain (Jensen et al., 2009). However, this theory postulates that,
before reaching the brain, cells from the dorsal horn of the spinal cord influence the nociceptive input
carried by nerve fibers from the injury site. This process acts as a ”gate mechanism” that modulates
the nociceptive signal’s transmission, by inhibiting or facilitating it. For instance, it is suggested that a
non-noxious input ”closes the gate”, i.e. it blocks the painful stimulus, avoiding its perception by the CNS
as pain, whereas the activity of fibers carrying a noxious input tends to promote its transmission, i.e.
”opens the gate” (Turk and Wilson, 2012).
Nociception, which refers to the processing of a noxious stimulus resulting in the perception of pain
by the brain, includes four steps (Kandel et al., 2000; Kuner and Flor, 2017):
1. Transduction - It is the process by which a noxious stimulus (mechanical, chemical or thermal) is
converted into electrical energy by a peripheral nociceptor. An action potential is thus triggered by
the activation of the nociceptor (Turk and Wilson, 2012).
2. Transmission - After transduction, the action potential propagates through afferent nerve fibers,
from the damaged site to the spinal cord nociceptors. The afferent nerve fibers involved in this
process present different functions: (1) fast, myelinated Aδ fibers, which are responsible for trans-
mitting sharp and intense pain; (2) slow, unmyelinated C fibers that transmit longer-term and throb-
bing pain; and (3) large-diameter myelinated Aβ fibers which are responsible for transmitting non-
noxious stimuli (tactile stimuli). To facilitate the nociception process, neurotransmitters are then
11

released, such as the P substance, carrying the information from the spinal cord to the thalamus
and cerebral cortex (H Vranken, 2012).
3. Modulation - It occurs when an afferent neuron is influenced by spinal dorsal horn cells. This is,
the nociceptive signal can be amplified or diminished by these cells through the release of exci-
tatory or inhibitory neurotransmitters, respectively. In addition, endogenous analgesics from the
human organism, such as serotonin, noradrenaline or opioids, can modulate the pain by avoiding
excitatory neurotransmitters liberation. Besides, the pain information is controlled by the CNS by
ascending and descending pathways (illustrated in Figure 2.4) (Turk and Wilson, 2012):
• Ascending pathways - The pain information is carried from the spinal cord to several brain
structures through three major tracts: the spinothalamic (most prominent ascending nocicep-
tive pathway in the spinal cord), the spinoreticular, and the spinomesencephalic.
• Descending pathways - It includes fibers coming from several nuclei of the brainstem that
suppress the noxious stimulus at the spinal cord nociceptors level.
4. Perception - The last step is when the information is sent from the thalamus to the somatosensory
cortex where it is perceived as pain (Turk and Wilson, 2012).
2.2.3 Cortical reorganization and EEG patterns
Investigations in the neuroscience field came to the conclusion that the adult human brain is capable of
adapting and changing at functional and structural levels (Flor, 2003; Turk and Wilson, 2012). Indeed,
chronic pain should be regarded as a consequence of plasticity within the CNS and not only as an
altered functional state. There is clear evidence that when pain is prolonged or it reaches intense states,
a hypersensitization of spinal cord cells occurs, as well as a reorganization of multiple pain-related brain
areas, such as the thalamus and cortex. This may lead to pain experience perpetuation even though the
original damage has already been repaired (May, 2008; Turk and Wilson, 2012). In chronic pain patients,
both pain thresholds and tolerance levels are diminished by this increased sensitization, and tend to be
lower with chronicity, leading to an abnormal reactivity to either noxious or simple tactile stimuli (Flor,
2003).
Studies concerning spontaneous brain activity assessment have identified specific frequencies of
neural oscillations’ activity that might be associated with pain and its perception (dos Santos Pinheiro
et al., 2016). Through brain imaging techniques, it has been possible to also determine multiple cortical
areas involved in pain processing. Authors refer to this series of structures as the pain matrix, which in-
cludes the Anterior Cingulate Cortex (ACC), Posterior Cingulate Cortex (PCC), Prefrontal Cortex (PFC),
primary (S1) and secondary (S2) somatosensory cortex, insula, thalamus, amygdala, and brainstem
(Stern et al., 2006; Nishigami et al., 2014). It was suggested that these areas exhibit distinct pain infor-
mation encoding. For instance, ACC and insula play a relevant role in the processing of emotional and
motivational features of pain, whereas for encoding information about sensory aspects, such as pain
duration or location, both S1 and S2 reveal a greater contribution (Peng et al., 2015).
12

Figure 2.4: Nociceptive pathways from periphery to the brain. DRG = dorsal root ganglia; ACC = anteriorcingulate cortex; BG = basal ganglia; HT = hypothalamus; M1 = primary motor cortex; PAG = periaque-ductal grey; PB = parabrachial nucleus; PCC = posterior cingulate cortex; PFC = prefrontal cortex; S1= primary somatosensory cortex; S2 = secondary somatosensory cortex; SMA = supplementary motorarea. Figure extracted from Kuner and Flor (2017).
Regarding brainwaves’ activity, Jensen et al. (2009) affirm that both the experience of pain in healthy
subjects and individuals suffering from chronic pain are associated with a lower alpha activity. More-
over, lower amplitudes of alpha are suggested to be related with increased pain perception, since its
decreased activity facilitates information transfer through thalamocortical and cortico-cortical pathways
(Jacobs and Jensen, 2015; Peng et al., 2015). Furthermore, studies comparing the power spectra in
chronic pain patients and healthy controls reported the presence of overactivations within the theta and
beta frequency ranges, specifically in structures of the pain matrix, in patients (Stern et al., 2006; Jensen
et al., 2009; Flor, 2014). The peak frequency has been another EEG parameter used to assess differ-
ences between chronic patients and controls. In chronic subjects, experiments have found a shifting of
the dominant peak (computed from the average power spectra) towards lower frequencies, which was
correlated with an ”increase in psychopathology or a reduction in life satisfaction” (Schmidt et al., 2012;
dos Santos Pinheiro et al., 2016).
13

2.2.4 Chronic Back Pain
Chronic Back Pain (CBP) is the pain located in the back that persists after the expected healing period.
Although its etiology still remains unclear, it is known that CBP can have inflammatory or neuropathic
components, or even both (Kuner and Flor (2017)). Regarding morphological alterations, several exper-
iments performed in patients suffering from CBP have shown atrophy (specifically, a decrease in gray
matter) in the brain structures known to play a crucial role in the physiologic mechanisms of pain, (May,
2008; Baliki et al., 2012).
Based on the impaired segment of the spine, CBP comprises upper back pain, mid back pain, low
back pain, and coccydynia, affecting the cervical, the thorax, the lumbar, and the sacral areas, re-
spectively (Leboeuf-Yde et al., 2009; Nathan et al., 2010). CBP patients are characterized by motor
weakness, sensory deficits, and pain usually described as dull and throbbing. This pain can also radi-
ate into the limbs, causing paresthesia, an abnormal dermal sensation such as numbness, burning or
cooling sensation, tingling, itching or pricking (Freynhagen and Baron, 2009).
During Von Korff et al. (2005) investigation, it was concluded that CBP pain is highly comorbid with
other (1) chronic pain conditions, such as arthritis or severe headaches, (2) chronic physical diseases,
like respiratory or digestive conditions, and (3) mental disorders. The latter includes anxiety disorders,
such as phobias or Post-Traumatic Stress Disorder (PTSD), and mood disorders, as major depression
or bipolar disorder (Von Korff et al., 2005).
2.3 Neurofeedback
2.3.1 Context
NF is a type of biofeedback in which individuals are trained, through operant-conditioning, to self-regulate
their brain activity. This can be achieved, for instance, by rewarding the increase or inhibition of the
magnitude of oscillations in specific bandwidths (Angelakis et al., 2007; Jacobs and Jensen, 2015).
During this procedure, the information of the EEG that is being recorded is extracted and given to the
subject by a real-time feedback loop in a visual and/or audio format. It is through these feedbacks that
the subject becomes aware of the variations that occur during the training, giving him/her the ability to
analyze and voluntarily modulate their progress in order to improve their performance (Vernon et al.,
2004).
NF is a non-invasive approach of brain activity regulation that does not imply the administration of
pharmacological compounds into the brain, or the introduction of magnetic or electrical activity, avoiding
brain dependency on external factors for better functioning (Niv, 2013). As it will be described in sec-
tions 3.2 and 3.3, NF has been a valuable technique not only in a clinical context for treating neurological
and psychiatric disorders, but also to enhance cognitive performance in healthy individuals (Angelakis
et al., 2007).
14
2.3.2 Neurofeedback underlying mechanisms
Despite the fact that the underlying mechanisms of NF are still not clear and are under investigation,
some suggestions have emerged (Niv, 2013).
The first hypothesis relies on the concept of neuroplasticity, which is the inherent ability of the brain to
modify in response to intrinsic and extrinsic factors (Cannon, 2015). This capacity of changing allows the
brain to recover from impaired activity, or even adapt to everyday environmental stimuli, through several
mechanisms, such as the formation of new synapses, cortical reorganization, or alteration of synaptic
transmission’s strength (Ksiazek-Winiarek et al., 2015). It is believed that NF plays an important role in
facilitating these mechanisms by strengthening synapses through repeated firing (Niv, 2013), inducing
long-term potentiation, i.e., a ”long-lasting enhancement in signal transmission between two neurons
after synchronous stimulation” (Fuchs and Flugge, 2014). Some studies have indicated that NF training
can induce long-term effects (Engelbregt et al., 2016), i.e., if the brain is trained at a certain oscillatory
pattern during NF, it could be able to reproduce the same pattern afterwards (Ros et al., 2014). In fact,
it has become clearer that practice, experience and learning are key elements in neuroplasticity over the
lifespan (Cannon, 2015). For that reason, NF training usually involves repeated sessions on separate
days and spread out over a certain period of time (Ros et al., 2014).
Investigations have found that several psychopathologies, such as depression, schizophrenia or
Alzheimer’s disease, may result from a dysfunction in neural networks’ connectivity, and not only in
a localized brain region. These networks are composed of clusters of neurons that are densely con-
nected in a localized area, and sparsely connected to other networks throughout the brain. Therefore,
what experts also propose is that NF can regulate the connectivity within and between neural networks,
by changing their mechanism of interaction. In fact, it has been observed that NF training enhances, si-
multaneously, several comorbidities, i.e. additional pathological conditions co-occurring with the primary
disorder (Niv, 2013).
Another suggestion regarding the mechanisms of NF relies on the regulation of the oscillatory activity
that arises from neurocognitive networks, which are associated with brain self-regulation: Default Mode
Network (DMN), Central Executive Network (CEN), and Salience Network (SM) (Menon, 2011; Niv,
2013). Although each one is responsible for different functions, is the conjunct action of the ”triple
network model” that assures proper brain functioning and, hence, a dysfunction in any of these three
networks compromises all of them (Menon, 2011).
2.3.3 Neurofeedback techniques
Although frequency/power neurofeedback is the method used in the present experiment, it is important
to refer other NF techniques.
• Frequency/Power Neurofeedback is the NF technique most commonly used to brain activity
modulation. It changes the amplitude or frequency of specific brainwaves in certain brain areas.
Depending on the brainwaves’ frequency/power previously defined, subjects are rewarded via both
15

visual or auditory approaches. It is typically denominated as ”surface neurofeedback” since it
includes 2-4 surface electrodes (Jensen et al., 2014; Marzbani et al., 2016).
• Slow Cortical Potential (SCP) Neurofeedback is a method of brainwave activity self-regulation
typically used in pathological conditions where excitation thresholds are impaired. Unlike brain-
waves’ oscillatory activity, Event-Related Potentials (ERP) such as SCPs are time-locked, thus do
not arise spontaneously, and their duration varies from 300 ms to several seconds (Siniatchkin
et al., 2000; Strehl, 2009). SCPs result from the depolarization of the cortical pyramidal cells’ api-
cal dendrites, which in turn is caused by synchronous firing from thalamocortical paths. Through
training, subjects can voluntarily regulate these slow potentials by producing either negative or
positive shifts, to increase or reduce excitability of local cortical networks, respectively (Birbaumer,
1999; Strehl, 2009).
• Low Energy Neurofeedback System (LENS) is a passive EEG biofeedback system that applies
a weak electromagnetic signal as a carrier wave for the feedback that will reorganize patient’s brain
physiology while they are motionless with their eyes closed. This is guided by a topographic EEG
map, and the stimuli is administered at all electrode sites, being delivered for only one second at
each of the chosen sites throughout sessions. The stimulation frequency is constantly updated
based on the dominant EEG frequency (Ochs, 2006; Hammond, 2011).
• Hemoencephalographic (HEG) is a system that allows the subject to voluntarily control his/her
cerebral blood flow by increasing blood oxygen levels in defined brain areas (Dias et al., 2012).
For this purpose, this technique implements Near Infrared Spectroscopy (NIRS), which makes use
of light in red and near infrared wavelengths. Also, Passive Infrared Hemoencephalographic (pIR
HEG) aims to modulate cerebral blood flow but through brain thermal activity alterations (Budzynski
et al., 2009).
• Live Z-score is a NF technique in which the feedback is given based on a continuous statistical
comparison between a normative database and certain variables of subject’s brain activity. The
database used should be for the patient’s approximate age group. In this approach, the patient is,
for example, observing a picture that becomes clearer as his/her brain activity behaves similarly
to the norms previously established; if not, the picture flickers and turns blurred (Hammond, 2011;
Marzbani et al., 2016).
• Low-resolution electromagnetic resolution (LORETA) is a recent approach capable of measur-
ing and localizing the brain’s electrical activity through the EEG signals recorded from the scalp.
By estimating current densities throughout brain volume, this method produces, in real-time, a
low-resolution tomography of the electrical activity. When comparing to other techniques, one of
the advantages of LORETA is indeed the ability to study and analyze deeper brain structures that
generate subjects’ EEG activity within a frequency band (Pascual-Marqui et al., 1994; Budzynski
et al., 2009).
16

• Real-time Functional Magnetic Resonance Imaging (rtfMRI) Neurofeedback is a technique
that combines rtfMRI and NF. The rtfMRI enables the mapping of human brain activity through
the Blood Oxygen-Level-Dependent (BOLD) signal and, in turn, NF allows a subject to watch and
regulate this signal by using certain cognitive strategies during the MRI scanning (Cox et al., 1995;
Guan et al., 2015). For example, in the Guan et al. (2015) experiment, the feedback was given to
the patients as a scrolling line graph representing the BOLD signal, which they had to up or down
regulate within the respective training block. When compared with EEG-NF, rtfMRI has higher
spatial resolution, thus allowing a greater control over a specific brain region depending on the
physiological target to be trained (Sulzer et al., 2013; Guan et al., 2015). On the other hand, as
BOLD signal arises as a consequence of local neuronal activity through neurovascular coupling
mechanisms, it is natural that the observable response occurs with some delay. Therefore, the
temporal relation between the feedback and the event that triggered may be inaccurate due to this
phenomenon (Aguirre et al., 1998).
2.3.4 Neurofeedback Protocols
Protocol selection is still a relevant subject to discussion when applying NF training, since its effective-
ness may differ among subjects. Depending on the purpose for which NF is performed, it is possible to
inhibit and/or enhance the activity of certain frequency bands. The following protocols are considered
by Marzbani et al. (2016) the most commonly used:
• Single band
– Delta: Delta waves are generally associated with sleep, reduced pain and increased comfort.
Thus, delta training is normally applied to alleviate headaches, traumatic brain injury or even
learning disorders (Marzbani et al., 2016).
– Theta: Theta treatment reduces anxiety, depression and other emotional disorders (Marzbani
et al., 2016).
– Alpha: Although there are several frequency bandwidths for the alpha training, the most com-
mon is the 7-10 Hz frequency range, which is generally used for reducing stress and anxiety
(Marzbani et al., 2016). Depending on the frequency range, alpha treatment can be applied
for pain relief, cognitive and memory performance improvement, or brain injuries treatment
(Angelakis et al., 2007; Marzbani et al., 2016).
– SMR: SMR NF has shown a beneficial outcome on sustained attention when applied to indi-
viduals with ADHD, as well as on attentional processing capability of individuals with learning
difficulties (Vernon et al., 2003).
– Beta: Besides improving focus, attention and cognitive processing, beta training also reduces
insomnia, addictive problems, such as alcoholism, and obsessive disorders (Marzbani et al.,
2016).
17

– Gamma: As gamma activity is associated with cognitive processing and memory, its train-
ing is used for endorsing mental acuity and problem-solving tasks, improving the speed of
information processing (Marzbani et al., 2016).
• Ratio
– Alpha/Theta: Generally, this training involves increasing individual’s theta activity over alpha
amplitude, with eyes closed, and through a pleasant auditory feedback (Vernon, 2005; Gruze-
lier, 2014b). It has been used to increase creativity and musical performance (Vernon et al.,
2003; Gruzelier, 2014b), to reduce stress (Marzbani et al., 2016), and to treat individuals with
PTSD (Peniston and Kulkosky, 1991; Vernon et al., 2003).
– Theta/Beta/SMR: By suppressing theta while increasing low beta activity, typically combined
with upregulation of SMR, this protocol aims to increase and enhance attention, and it has
been tested in children with ADHD for further improvements in cognition and behavior (Vernon
et al., 2004; Leins et al., 2007; Niv, 2013).
• Assymetry: Since depression may be linked with an activation difference between the right and
left prefrontal cortex, alpha asymmetry protocols have been used as a treatment to address this
problem (Baehr et al., 2001; Hammond, 2005; Niv, 2013). The objective is to reduce left alpha
activity, which represents neural hypoactivity, and increase right frontal alpha activity, in order to
reduce susceptibility toward negative emotions (Baehr et al., 2001; Niv, 2013).
18

Chapter 3
Literature Review
In this chapter, current treatments in chronic pain are described, as well as NF applications in different
areas, namely in clinical and non-clinical contexts. Due to the wide range of investigations that have
been developed in the NF field, only the more relevant studies are reported in this chapter.
3.1 Current Treatments for Chronic Pain
Pharmacotherapy is the most common treatment to manage chronic pain, including: (1) first-line medi-
cation, such as antidepressants, calcium channel α2 − δ ligands (i.e. gabapentin and pregabalin), and
topical lidocaine; (2) second-line medication, consisting of opioid analgesics, tapentadol, and tramadol;
and (3) third-line medication, like anticonvulsant medication (to reduce neuronal hyperexcitability), and
NMDA receptor antagonists (to inhibit the excitatory activity of glutamate) (H Vranken, 2012). However,
the pharmacological approach alone may not be sufficiently effective in most chronic pain patients, and
can cause, for instance, addiction and side effects (Jensen et al., 2014).
The growing understanding that pain results from the brain’s response to the sensory input, rather
than from the input itself, suggests that neuromodulatory approaches may play an important role in
pain management (Jensen et al., 2014; Prinsloo et al., 2017). Neuromodulation actuates, electrically or
chemically, in the activity of the peripheral or central nervous systems by inhibition, stimulation, modifi-
cation, or regulation of the neurophysiological processes that underlie the experience and perception of
pain (Krames et al., 2009).
Hypnosis has been the more popular technique regarding neuromodulation. It is defined as a ”social
interaction” between the patient and the hypnotist, in which the latter conducts the session by offering
suggestions that target changes in the presenting problem (Kihlstrom, 1985). The hypnotic induction
consists of giving to the patient direct suggestions for comfort and relaxation, or indirect suggestions for
treatment benefits in order to alleviate their pain. Moreover, ”post-hypnotic” suggestions may also be
provided aiming for the patient to perform self-hypnosis and thus maintain the benefits experienced dur-
ing sessions (Jensen et al., 2014). Although meditation may exist in different forms, mindfulness-based
meditation has also been studied has a neuromodulatory intervention for chronic pain management
19
(Jensen et al., 2014). The main objective of this technique is to improve bodily function and attenuate
the experience of pain by ”modulating expectations, the nature and orientation of attention toward the
experience, and the corresponding emotional response” (Rosenzweig et al., 2010; Zeidan et al., 2012).
Moreover, evidence from studies using EEG and fMRI in long-term meditators have shown significant
correlation between mindfulness meditation and cortical brain structures that are known to be associated
with pain perception (Zeidan et al., 2012; Jensen et al., 2014).
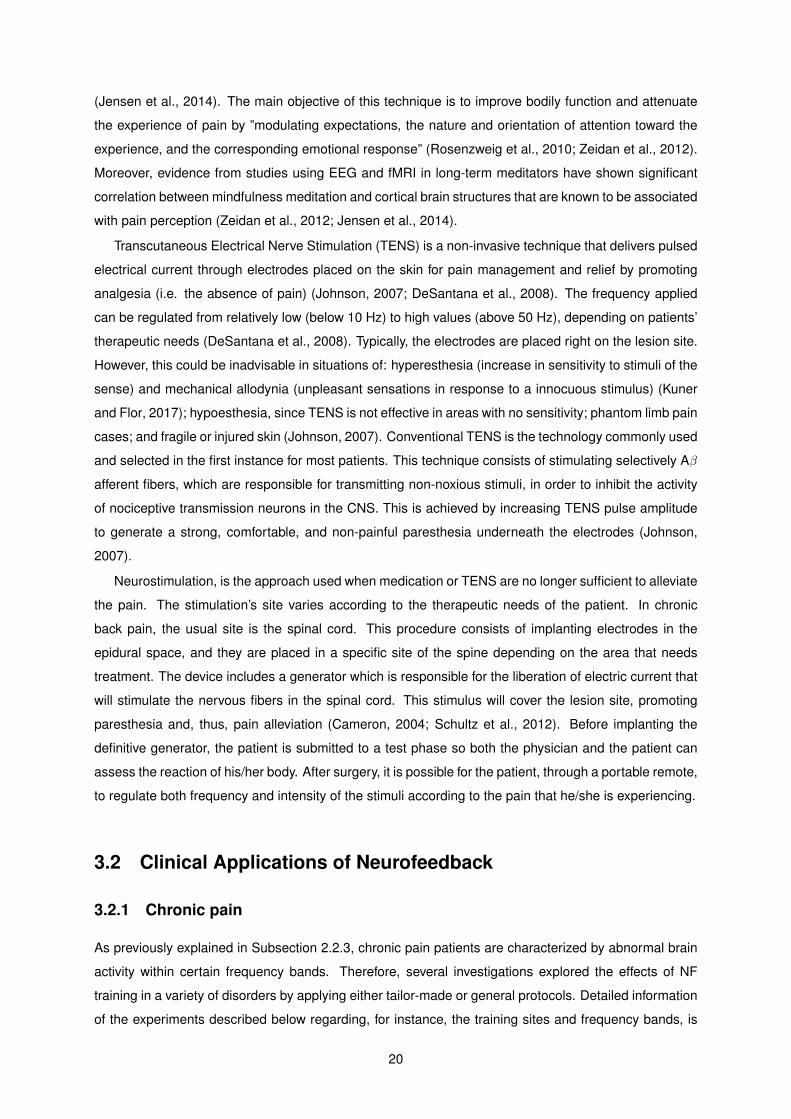
Transcutaneous Electrical Nerve Stimulation (TENS) is a non-invasive technique that delivers pulsed
electrical current through electrodes placed on the skin for pain management and relief by promoting
analgesia (i.e. the absence of pain) (Johnson, 2007; DeSantana et al., 2008). The frequency applied
can be regulated from relatively low (below 10 Hz) to high values (above 50 Hz), depending on patients’
therapeutic needs (DeSantana et al., 2008). Typically, the electrodes are placed right on the lesion site.
However, this could be inadvisable in situations of: hyperesthesia (increase in sensitivity to stimuli of the
sense) and mechanical allodynia (unpleasant sensations in response to a innocuous stimulus) (Kuner
and Flor, 2017); hypoesthesia, since TENS is not effective in areas with no sensitivity; phantom limb pain
cases; and fragile or injured skin (Johnson, 2007). Conventional TENS is the technology commonly used
and selected in the first instance for most patients. This technique consists of stimulating selectively Aβ
afferent fibers, which are responsible for transmitting non-noxious stimuli, in order to inhibit the activity
of nociceptive transmission neurons in the CNS. This is achieved by increasing TENS pulse amplitude
to generate a strong, comfortable, and non-painful paresthesia underneath the electrodes (Johnson,
2007).
Neurostimulation, is the approach used when medication or TENS are no longer sufficient to alleviate
the pain. The stimulation’s site varies according to the therapeutic needs of the patient. In chronic
back pain, the usual site is the spinal cord. This procedure consists of implanting electrodes in the
epidural space, and they are placed in a specific site of the spine depending on the area that needs
treatment. The device includes a generator which is responsible for the liberation of electric current that
will stimulate the nervous fibers in the spinal cord. This stimulus will cover the lesion site, promoting
paresthesia and, thus, pain alleviation (Cameron, 2004; Schultz et al., 2012). Before implanting the
definitive generator, the patient is submitted to a test phase so both the physician and the patient can
assess the reaction of his/her body. After surgery, it is possible for the patient, through a portable remote,
to regulate both frequency and intensity of the stimuli according to the pain that he/she is experiencing.
3.2 Clinical Applications of Neurofeedback
3.2.1 Chronic pain
As previously explained in Subsection 2.2.3, chronic pain patients are characterized by abnormal brain
activity within certain frequency bands. Therefore, several investigations explored the effects of NF
training in a variety of disorders by applying either tailor-made or general protocols. Detailed information
of the experiments described below regarding, for instance, the training sites and frequency bands, is
20

presented in Table 3.1.
Contrary to healthy subjects, migraneurs are characterized my SCPs increased amplitudes, and thus
conspicuous cortical excitability. With this in mind, Siniatchkin et al. (2000) conducted an exploratory
experiment consisting of SCPs self-regulation in children suffering from migraines to further assess its
clinical efficacy and investigate to which extent participants were able to control their brain activity. In
the first 2 sessions, when compared to healthy controls, migraneurs showed limited capacity to control
cortical negativity, in both feedback and transfer (used to evaluate response control without feedback)
trials. Over 10 sessions, a significant learning effect was found within the migraneurs, specially during
the feedback trials. One month after the treatment, half of the migraneurs presented a reduction in pain
frequency of 50% or more (Siniatchkin et al., 2000). Also Stokes and Lappin (2010) performed a study in
37 migraneurs to whom an average of 40 NF sessions was administered, combined with pIR HEG and
handwarming biofeedback, over a period of 6 months. The NF protocol was designed based on indi-
vidual’s neurophysiological evaluation, and each set of training sites had associated specific reward and
inhibit frequency bands that were maintained for each patient during the treatment. The results showed
that 70% of the patients had a reduction of at least 50% or greater in the migraines frequency post-
treatment. Already during the follow-up period, a ”major or total improvement” of migraine headaches,
anxiety, focus, other headaches, depression, and sleep were observed in 62%, 32%, 38%, 50%, 41%,
and 32% of the patients, respectively (Stokes and Lappin, 2010).
In 2010, Kayıran et al. (2010) conducted a clinical experiment to evaluate the efficacy of NF in alle-
viating the symptoms and signs of patients with fibromyalgia. Participants were randomly allocated in
the NF group, which was provided with 20 sessions of SMR-theta training (enhance and decrease SMR
and theta activities, respectively), or the control group that was taking escitalopram (an antidepressant
that actuates on the serotonergic system) for 8 weeks. Regarding the results, there were no statistically
significant differences in mean amplitudes of EEG rhythms. Although, when compared to baseline, a
significant decrease of theta/SMR ratio was found at the 4th week in the NF group. The levels of pain,
fatigue, anxiety and depression of both groups decreased significantly and continued to be lower com-
pared to the baseline in every session of follow-up. However, the NF group exhibited lower pain and
fatigue scores than those of control group during the follow-up period (Kayıran et al., 2010). Based on
evidence indicating that NF has been a useful tool to treat cognitive deficits, Caro and Winter (2011)
applied EEG-Biofeedback in a group of patients suffering from fibromyalgia with attention problems that
have failed conventional treatment. Investigators were hoping not only to improve participants’ attention
capacity, but also ameliorate the somatic symptoms of this syndrome. The attention task comprised
visual or auditory stimulus. Outcomes were then compared to a control group that also presented fi-
bromyalgia but that was only receiving standard medical care. Except for the auditory attention, patients
exhibited a significant improvement in visual attention and in fibromyalgia-related symptoms, such as
fatigue, pain and tenderness. There were no significant changes in control’s somatic symptoms (Caro
and Winter, 2011). Concerning other techniques, Nelson et al. (2010) designed a double-blind and
placebo-controlled trial to assess the effects of LENS in patients with fibromyalgia. Participants were
then randomly allocated in the active group and the sham group. Although sessions were identical for
21

both groups, the electromagnetic stimulation was not administered in the placebo condition. Investiga-
tors observed that there were no significant changes between the active and sham groups, since both
improved shortly after sessions, but not at follow-up. Improvements in symptoms, such as fatigue, pain
and cognitive clouding, were seen during sessions within the active group, though these effects have
not prevailed. These results led to the authors speculation about the positive influence of the placebo in
these patients during treatment versus follow-up (Nelson et al., 2010).
Jensen et al. (2007) performed a study in which a single NF session was applied to a group of patients
suffering from Complex Regional Pain Syndrome (CRPS), a post-traumatic pain condition related to local
neurogenic inflammation and severe pain in the subcutaneous tissues, joints and skin. The purpose of
this study was to assess the average decrease in pain and document other possible benefits of the NF
training. Regarding pain intensity, a significant decrease of the pain level was observed from pre- to
post-training at the primary pain site that was applied. In addition, 50% of the patients reported clinically
meaningful changes in pain intensity, i.e. changes that represented a reduction of 30% or more from
the pre-session levels (Jensen et al., 2007). Since NF has shown to be a promising approach to treat
people with chronic pain, another investigation was developed by Jensen et al. (2013) in a group of
participants suffering from Spinal Cord Injury (SCI) that were in constant pain. From studies’ evidence
concerning brain activity patterns in chronic pain, investigators designed three different protocols and
applied them in 4 sessions each: (A) alpha reinforcement and beta suppression at T4 and T3; (B) 10-15
Hz reinforcement, and beta and theta suppression at C3-A1 and C4-A2; and (C) 10-15 Hz reinforcement,
and beta and theta suppression at P3-A1 and P4-A2. The findings from this study reveal that there was
a ”small but statistically significant effect” both on pain unpleasantness and worst pain intensity, which
prevailed during the follow-up period. Regarding brain activity, the protocols applied appear to have
pre- to post-treatment effects on both theta and alpha frequency ranges, but not beta activity. For future
research and clinical practice, such observations have important implications for selecting the NF training
protocols, specifically in cases of SCI-related pain (Jensen et al., 2013).
Chemotherapy-Induced Peripheral Neuropathy (CIPN) is a common side effect in patients that un-
derwent cytotoxic cancer therapy, causing significant debilitation and pain, which in turn leads to the
impairment of patients’ quality of life. In 2017, Prinsloo et al. conducted a randomized controlled trial
with cancer survivors in order to investigate the efficacy of EEG-NF on CIPN symptoms’ improvement,
with the primary outcome being pain. Participants were thus allocated in the NFB or the wait list-control
(WLC) groups, depending on whether they were receiving the treatment or not, respectively. The NFB
group was provided with 20 sessions of 45 minutes in which participants were required to maintain the
amplitude of their EEG reward band (which was, in this case, the alpha band (8-12 Hz)) above the de-
fined threshold, while decreasing the amplitude of the inhibiting band(s). Calculations of the theta/beta
and alpha/beta ratios were performed. For EEG neuroimaging, LORETA was the applied method ”to
evaluate neural correlates of the placebo response” to NF. Regarding pain measures, the Brief Pain
Inventory was used to assess the severity of pain and its impact on patients’ daily life. Additionally,
investigators applied the Pain Quality Assessment Scale to analyze other CIPN-related symptoms. The
results revealed that, by the end of the treatment, the NFB group showed a significant decrease in the
22
primary outcome (”worst pain”) than the WLC group, with an effect size of 0.83. In addition, they ob-
served significant improvements in all domains of secondary outcomes, such as numbness and tingling.
Regarding alterations in brain activity, they found statistically significant changes over time and between
groups within the alpha and beta frequency ranges. Curiously, when correlating frequency band’s ac-
tivity and CIPN symptoms, they found that the pain reduction was correlated with the decrease of beta
activity, but not with increases of alpha activity or alpha/beta ratio, which was not expected by previ-
ous findings in EEG and pain literature suggesting that ”alpha frequencies are key to a reduction in the
severity of symptoms” (Prinsloo et al., 2017).
23

Table 3.1: Detailed information of the NF experiments in chronic pain.
Author
(Date)
Type of pain;
NNF type
Sessions’ no.
and duration
Electrode
placement
Bandwidth(s)
reinforced
Bandwidth(s)
inhibited
Siniatchkin et al.
(2000)
Migraines; N = 10 migraneurs
children + 10 healthy children
on waiting-list
EEG NF – SCPs
self-regulation
One introductory session
+ 10 sessions (for 8 weeks);
Duration of approx. 1h
Cz-Fz; mastoids
as referenceNot applicable. Not applicable.
Jensen et al.
(2007)
CRPS; N= 18;
Obs.: patients were also
participating in a
multidisciplinary 20-day
CRPS treatment program
EEG NF – Frequency/
Power
4-6h each day of the
20-day program;
Duration of 30min
Depending on the
subject, 1-4 sites were
trained; P3-P4 was the
combination most
used (15 patients)
Reinforced frequencies
vary according to
patient and electrodes
None
Kayiran et al.
(2010)
Fibromyalgia; N=18/20
patients + 18/20 control
(with 10mg/day of
escitalopram treatment)
EEG NF - Frequency/
Power
20 sessions (for 4 weeks);
Approx. 30min
C4; reference lobe
on the left side and
ground on the right
side
SMR (12-15 Hz) Theta (4-7 Hz)
Nelson et al.
(2010)
Fibromyalgia; N= 34:
17 active + 17 sham
treatment
LENS
22 sessions; Sessions’ duration
depends on the number of sites
being stimulated (3 different
sites maximum), and on the
stimulation time (1-3 sec)
EEG measured in
19 electrodesNot applicable. Not applicable.
24

Table 3.1 continued from previous page
Author
(Date)
Type of pain;
NNF type
Sessions’ no.
and duration
Electrode
placement
Bandwidth(s)
reinforced
Bandwidth(s)
inhibited
Stokes and Lappin
(2010)
Migraines; N= 37; Obs.: All
patients were on at least one
type of medication for
migraine (preventive,
abortive or rescue)
EEG NF combined with
pIR HEG and hand-
warming biofeedback
Average of 40 sessions;
Duration of 30min
T3-T4, C3-C4, F3-F4,
Fp1-Fp2 and P3-P4
Variable - each set of sites had their own set
of frequencies to be reinforced and inhibited
and this stayed the same for each pair of
sites for each individual patient
Caro et al.
(2011)
Fibromyalgia;
N= 15 patients + 63 controlEEG NF
40 or more sessions;
Average duration: 21.6min
without interruption or rest
Cz; reference and
ground electrodes
on the earlobes
SMR (12-15 Hz)Theta (4-7/8 Hz) and
high beta (22-30 Hz)
Jensen et al.
(2013)
SCI; N=13, but only 10
individuals completed
the treatment
EEG NF - Frequency/
Power
12 sessions with 3 different
protocols (A, B and C);
Duration not mentioned
A) T3 and T4
B) C3-A1 and C4-A2
C) P3-A1 and P4-A2
A) Alpha
B) 10-15 Hz
C) 10-15 Hz
A) Beta
B) Beta and theta
C) Beta and theta
Prinsloo et al.
(2017)
CIPN; N= 62: 30 NFB group
+ 32 wait-list control group)
EEG NF and LORETA;
Visual and auditory
rewards
20 sessions (for 10 weeks)
for the NFB group;
Duration of 45min
qEEG measured
in 19 electrodesAlpha (8-12 Hz) None.
25
3.2.2 Other clinical applications
Chronic conditions
Other interesting experiments were developed in the NF field applied to chronic conditions that are
characterized by abnormal brain activity. For instance, Dohrmann et al. (2007) conducted a study in 21
individuals with chronic tinnitus, which refers to the sensation of ringing or buzzing sounds without any
external acoustic signal. The NF training program comprised a set of three protocols with 10 sessions
each: tau-to-delta power ratio (TDR) enhancement; tau power (8-12 Hz, which is the auditory alpha
rhythm) reinforcement, without delta power feedback; and delta power (1-4 Hz) inhibition, without tau
power feedback. Comparing pre- to post-treatment, the TDR alteration was strongly related to tinnitus
intensity reduction. In fact, tinnitus sensation disappeared in participants who successfully modified their
oscillatory pattern. Moreover, no significant differences between the reductions of the three protocol
groups were observed (Dohrmann et al., 2007).
A case study carried by Monjezi and Lyle (2007) aimed to investigate the effects of NF treatment in
two female subjects with Type I Diabetes Mellitus. Specifically, they intended to assess how NF would
actuate on patients’ perception of their life quality, as well as on their glucose blood levels. Subjects were
then provided with 20 sessions in which three different protocols were applied. These encompassed a
single reward band of either 15-18 Hz at C3, 12-14 Hz at C4, or 11-14 Hz at C3-C4 (for interhemispheric
training), and simultaneous inhibition of delta (4-7 Hz) and high beta (22-36 Hz). Regarding the results
obtained, participants reported improvements in diabetes-related symptoms, and showed lower fluctua-
tions of their blood glucose levels and dosages of the insulin taken on a daily basis. Moreover, subjects
were feeling more calm, energetic and tolerant after the experiment (Monjezi and Lyle, 2007).
Attention-Deficit/Hyperactivity Disorder
ADHD is a common diagnosis worldwide characterized by inattentiveness, with or without impulsivity,
and excessive activity, which in turn lead to functional impairment, affective disorders, and learning
problems (Furman, 2005). The observable symptoms start to emerge during childhood, and although
they can change in quantity and quality over time, most individuals still experience some of the symptoms
in adulthood (Mercugliano, 1999).
ADHD-related symptoms are associated with reduced cortical excitability, which in turn is reflected
by an increased theta activity and lower ERP’s amplitudes, namely the Contingent Negative Variation
(CNV) that belongs to the SCPs’ family (Mayer et al., 2016). Hence, several investigations have been
conducted to assess the outcomes of applying two different NF protocols in ADHD patients: theta/beta
training (Gevensleben et al., 2009; Meisel et al., 2014; Duric et al., 2017; Gelade et al., 2018), which
aims to produce a focused and alert but relaxed state that addresses tonic aspects of cortical arousal,
and SCPs training (Heinrich et al., 2004; Gevensleben et al., 2009; Christiansen et al., 2014; Strehl et al.,
2017), that targets the regulation of cortical excitability (Van Doren et al., 2019). Furthermore, Leins et al.
(2007) conducted a study with children with ADHD to compare these two training protocols regarding
their cognitive and behavioral effects. Therefore, the theta/beta participants were trained to inhibit theta,
26

while increasing beta, and the SCP participants were trained to produce positive and negative SCP-
shifts. Both groups were able to regulate their cortical activity and significant improvement in cognition
and behavior was reported, with no significant differences between groups (Leins et al., 2007).
Other protocols and NF methods have been used in this disorder. Marx et al. (2015) conducted a
pilot study aiming to reduce the symptoms of children with ADHD by using NIRS-NF, and compared
its outcomes with other feedback techniques (EEG and Electromyography (EMG)). Findings reported a
significant reduction of ADHD-related symptoms in all experimental groups, with no significant difference
among them. Regarding other frequency bands, Kaiser and Othmer (2000) evaluated the efficacy of
SMR-beta NF training in a large sample of children and adults with attention problems. Significant
improvement in attentiveness and impulsivity were reported after the treatment.
Schizophrenia
Schizophrenia is a mental illness that has a substantial negative impact on patients’ well-being and
health, compromising their daily life. Antipsychotic medication is the current treatment for this disorder;
however, when used at long-term, can cause side effects and may not be always effective (Surmeli
et al., 2012). Due to the heterogeneity of this disorder, evidence from EEG and Quantitative Elec-
troencephalography (qEEG) literature reveal that schizophrenics present different patterns of abnormal
oscillatory activity in certain brain regions: decreased alpha and beta with increased theta in anterior
regions; increased theta and alpha with decreased beta; excessive beta in anteriotemporal regions; in-
creased alpha with a decrease in all other frequency bands, especially delta; and excessive theta and
delta in posterior areas (John et al., 1994). Since NF has been a powerful tool in neuromodulation,
studies in this area aim to improve not only schizophrenia-related negative symptoms, but also several
cognitive impairments that are frequently associated with this disorder (Surmeli et al., 2012).
A study performed by Gruzelier et al. (1999) aimed to train self-regulation of interhemispheric asym-
metry in subjects with schizophrenia. The results obtained showed that all patients were able to learn to
control interhemispheric negativity, despite their attentional and motivational problems. However, inves-
tigators found that learning performance tend to be lower in the end of the session due to a decrease
in patients’ concentration, suggesting thus the implementation of shorter sessions or stronger reinforce-
ments to facilitate the training. In fact, Nan et al. (2017) explored in a single schizophrenic subject the
potential advantages of employing a ”short but intensive” NF training. This consisted of increasing al-
pha while decreasing beta2 (20-30 Hz), at P4, in four consecutive days, which corresponded to a total
training duration of 13.5 hours. Investigators observed an increase of alpha/beta2 ratio over sessions,
as well as improvements regarding short-term memory, mood, and speech pattern.
Epilepsy
Epilepsy is a chronic neurological disease characterized by epileptic seizures that occur due to ”abnor-
mal excessive or synchronous neuronal activity in the brain” (Moshe et al., 2015). Studies developed
in the NF field have reported a reduction of seizures when training the patients to enhance frequencies
27

in the 9-18 Hz range and decrease slow frequencies in the 3-8 Hz range, although total elimination is
uncommon (Walker and Kozlowski, 2005). After the pioneer investigation carried by Sterman and Friar
(1972), in which an epileptic subject was submitted to a SMR biofeedback training aiming to suppress
seizures’ occurrence, subsequent studies were performed in order to explore the feasibility of using
SMR training as a clinical application for treating epilepsy (Lubar and Bahler, 1976; Lantz and Sterman,
1988; Frey, 2016). Indeed, the review performed by Sterman and Egner (2006) states that this protocol
can significantly diminish seizures’ incidence. Moreover, Strehl et al. (2014) focused on the training of
SCPs for treating subjects with intractable epilepsy, assessing whether the effects of the NF-SCP were
maintained 10 years after the end of the treatment. Besides patients’ ability to self-regulate their SCPs,
investigators also reported a significant decrease in seizure frequency after the end of the treatment.
Regarding other NF techniques, Koberda and Frey (2015) conducted an experiment using LORETA Z-
score as a tool for seizures’ control. Regardless of the epilepsy type, all 10 patients presented significant
improvements, encompassing clinical remissions and reduction of seizure occurrence.
Depression
As a non-invasive technique, NF may be an alternative to other treatments, such as medication or
intense levels of transcranial magnetic stimulation, for treating depression (Hammond, 2005). According
to Davidson (1998), depression is characterized by an imbalance of activation between the right and
left prefrontal cortex, being the former more involved with negative emotions, and the latter with positive
affect and memories. This imbalance is reflected by the increased alpha activity in the left frontal cortex,
which in turn is reflected by an hypoactivation of the left area (Davidson, 1998). Based on this evidence,
NF protocols have been derived to treat depression.
In 1997, Baehr et al. conducted a case study in which alpha asymmetry training protocol was given,
in more than 34 sessions, to two women who were depressed, in order to assess their ability to learn to
enhance left hemisphere activation and/or to decrease the activation of the right hemisphere, and if this
treatment could diminish the signs of depression. Both patients were currently receiving psychotherapy
and medication for treating depression; however, neither of them showed significant improvement until
they were provided with the alpha asymmetry training, suggesting that this NF protocol is an effective
tool to combine with other conventional treatments. Also Wang et al. (2016) performed an experiment to
explore the benefits of this training but with a short-term six-session protocol. Findings reported that pa-
tients who increased their asymmetry score had decreased symptoms of anxiety and depression, while
the score of the control group decreased from pre- to post-interventions. However, not all patients re-
ceiving the treatment showed significant improvements in symptoms, suggesting that a higher number of
sessions would be required. Regarding other frequency bands, Dias and van Deusen (2011) introduced
a new protocol that consisted of increasing the beta/theta ratio while combining it with alpha asymmetry
training in the left prefrontal cortex. Although this experiment was performed only with one subject, it
was reported a 43% reduction in the average intensity of depressive symptoms after ten sessions, sug-
gesting that this protocol could be integrated in other therapeutic approaches, such as medication and
psychotherapy.
28
3.3 Artistic, Sporting, Cognitive and Memory Neurofeedback Ap-
plications
Based on the evidence that both alpha and theta activities are involved in the human creative process,
Egner and Gruzelier (2003) performed a pilot study in a group of professional musicians with the aim
of investigating the benefits and influence of certain NF protocols in participants’ musical performance.
Hence, a sample of 22 students was trained on three NF protocols: SMR (12-15 Hz) and beta1 (15-18
Hz), both for attention improvement, and alpha/theta, i.e. the enhancement of theta (5-8 Hz) over al-
pha (8-11 Hz) during an eyes-closed resting state to promote deep relaxation. When compared with a
non-training control group, the results showed that the musical improvements levels were significantly
correlated with the increase of theta over alpha amplitudes, whereas the beta1 and SMR protocols were
unrelated to performance changes. Notwithstanding, Gruzelier et al. (2014a) conducted an experiment
to assess the effects of alpha/theta and SMR training protocols on advance playing and novice singing
ability, believing that the first protocol would, as observed before, enhance music performance at both
novice and advanced levels, whereas SMR protocol would have the potential of improving novice perfor-
mance. Although no improvements were reported in the creativity domain, novice participants benefited
from the SMR training regarding music performance in the terms of technique.
Regarding the art of dancing, two controlled studies were conducted in order to assess how al-
pha/theta training and Heart Rate Variability (HRV) biofeedback would influence dancers’ performance
(Gruzelier, 2014b). In the first investigation, Raymond et al. (2005a) randomly allocated a group of
dancers into the alpha/theta and HRV training groups, and into a control group that did not receive any
intervention. It was possible to observe that both training groups exhibited higher improvement in overall
execution than the control group. Within the evaluated categories, the alpha/theta protocol enhanced
”Timing”, while HRV improved ”Technique”. In the second study, Gruzelier et al. (2014b) divided a sam-
ple of 45 participants into four different groups for further comparison: alpha/theta NF, HRV, ”Choreol-
ogy Studies” (a group receiving choreology instructions), and no-intervention control. The results did
not reveal an improvement in dance performance from these interventions, although it was detected a
reduction in anxiety followed by HRV training.
Concerning sports, a study conducted by Landers et al. (1991) aimed to assess to what extent
SCPs training would influence pre-elite archers’ performance. Participants were randomly allocated in:
a ”training” group that received the correct feedback; a ”non-training” group, which received an ”incor-
rect” feedback; and a control group, that did not received any feedback. The former reported significant
improvements in performance, whereas the training given to the second group worsened their perfor-
mance. No significant changes were observed regarding performance in the control group. Moreover,
Arns et al. (2008) investigated the existence of differential EEG profiles for successful and unsuccessful
golf putts for each participant. This individual approach was examined in six golfers in whom EEG was
recorded, at FPz, immediately before golf putting. They were provided with three daily-training sessions,
and the target frequency bands were determined according to each participant personalized event-
locked EEG profile performed in the assessment session. Regarding the results, investigators showed
29
that, overall, participants actually can learn to improve their putting performance when they are trained
on their personalized brain profiles associated with successful putts. Notwithstanding, when assessing
the three sessions individually, benefits from the training were not observed in the last session.
NF has also been used for cognition and memory enhancement in healthy subjects (Hammond,
2011; Gruzelier, 2014a). In 2005, Hanslmayr et al. conducted a study with 18 healthy students to
explore whether NF training could improve cognitive performance by increasing UA power or decreasing
theta power, using a mental rotation task before and after the training to assess their performance. The
participants considered as responders, i.e., the ones who were able to increase their UA, reported better
performance on the task after the training, and a positive correlation was found between the cognitive
performance improvement and training success (Hanslmayr et al., 2005).
Also Zoefel et al. (2011) examined the impact of training UA band on subjects’ cognitive functions.
Participants were separated in two groups: 14 in the NF training group, and 10 in the control group
that did not received feedback. Significant training success was observed in 11 of the 14 subjects, and
individually UA was increased independently of other frequency bands. When comparing both groups,
cognitive performance, which was also assessed through a mental rotation task, was significantly higher
for the NF group than for the control, suggesting, as Hanslmayr et al. (2005), a positive association be-
tween increased UA amplitude and cognitive function enhancement (Zoefel et al., 2011). To complement
this experiment, Escolano et al. (2011) evaluated not only the hypothesis that UA increase is related to
an improvement of the working memory performance, but also the effect of training the subjects during a
passive open-eyes resting state. Results showed an increase of UA band during both active and passive
tasks, but independence was not obtained in LA band during the passive state. When comparing to the
control group, it was obtained a significant improvement in working memory (Escolano et al., 2011).
Effects of individual alpha NF training in short-term memory were examined by Nan et al. (2012) in a
group of 16 students, comparing the outcomes with a control group. EEG results revealed participants’
learning ability to increase the relative amplitude in IAB during NF training. Additionally, they found
a positive correlation between increased individual UA band during training and short-term memory
improvement (Nan et al., 2012). Several studies have also been performed intending to preserve and
ameliorate cognitive functions in the healthy elderly by applying alpha (Angelakis et al., 2004; Lecomte
and Juhel, 2011), theta (Becerra et al., 2012; Wang and Hsieh, 2013) or gamma (Staufenbiel et al., 2014)
training protocols. Promising findings regarding improvements in visual, verbal and working memory
(Angelakis et al., 2004), and lower levels of stress and anxiety (Lecomte and Juhel, 2011) were reported
specially when increasing alpha power.
30

Chapter 4
Methods
4.1 Participants
Eleven subjects with CBP were recruited from the Unidade Multidisciplinar da Dor (UMD), at Centro
Hospitalar Lisboa Norte (CHLN), for a period of 3 months. Three out of this sample of participants quit
after the pre-treatment evaluation (psychological tests) due to personal issues. From the remaining 8
subjects, at this point of the experiment, 4 participants completed all 16 training sessions, 1 completed
9 sessions, 2 reached the intermediate evaluation (until the 7th session), and 1 person performed 3
sessions.
Inclusion criteria for participation included patients over 18 years old with the ability to read and write
in Portuguese, and who had incurred CBP at least 3 months prior to the study. Regarding exclusion
criteria, patients enrolled in this study should not have other severe health problems (e.g. epilepsy,
heart-related pathologies, psychological or psychiatric disorders) than CBP, neither comorbidities that
could interfere with the evaluation of pain levels. Patients with abnormal brain activity unrelated to pain,
significant cerebral/cranial damages, or currently under psychoactive substances that could substantially
affect their brain activity were not engaged in the experiment.
An informative leaflet describing the experiment and a consent form were provided to the participants
at the beginning of the study. Afterwards, demographic data of each patient (summarized in Table 4.1)
was collected: (1) age, (2) gender, (3) marital status, (4) schooling, and (5) work activity. In addition, the
patients were asked for how long they were in pain; which medication were they currently taking; and
if they had the following sensations: burning, painful cold, electric shocks, tingling, pricking, numbness,
and itching. For pain management, the medication comprises analgesics, anti-inflammatory drugs, neu-
ropathic pain regulators and muscle relaxants. Additionally, some patients were also prescribed with
antidepressants and anxiolytics. Some participants were also taking anticoagulants, hormone regula-
tors, stomach protectors, medication for cholesterol, blood pressure, or anemia. They were advised not
to drastically change their current medication during the experiment period so the NF treatment could
be the only variable.
This project was revised and approved by the Ethics Committee of the Centro Academico de Medic-
31

ina de Lisboa and CHLN. Before signing the consent form, it was assured that patients were aware of the
experiment conditions and informed that the collected data could be published keeping the anonymity.
Participants were all volunteers, and no monetary award was given for their cooperation in this study.
Table 4.1: Demographic data of CBP patients.
Age (years; mean±SD) 45.57 ± 13.09 (26-62)
Sex (N) Female: 6; Male: 1
Dominant hand (N) Left: 0; Right: 7
4.2 Acquisition Equipment
Depending on participants’ availability, the acquisitions were carried out in a room provided by the UMD
at CHLN, or in a room of the Evolutionary Systems and Biomedical Engineering Lab (LaSEEB), a re-
search lab of Institute for Systems and Robotics (ISR), at Instituto Superior Tecnico (IST) facilities.
For signals acquisition, an EEG cap with 20 electrodes (including the ground electrode) was placed
on subjects’ head according to the International 10-20 System, using the left and right mastoids as
references (M1 and M2, respectively) for common mode rejection. The signal was recorded by Somnium
software platform, with a sampling frequency of 250 Hz, from the following electrodes: Cz, Fp1, F7, F3,
T3, C3, T5, P3, O1, Fz, Pz, Fp2, F8, F4, T4, C4, T6, P4 and O2. For signal amplification,EEG amplifier
Vertex 723 Q was used (produced by Meditron Electromedicina Ltda, Sao Paulo, Brazil), with an analog
band-pass filter between 0.1 and 70 Hz, directly connected to the cap. To reduce skin impedance, an
abrasive conductive gel was applied, with a cotton pad, on the forehead and skin behind the earlobes.
The reference electrodes were then placed using a conductive sticky paste that allowed fixation. The
contact between the remaining electrodes and the scalp was made using an electro-gel (Electro-Cap
International Inc., Ohio, U.S.A.) injected through the electro-cap holes using a blunt tipped syringe to
help remove hair and lightly abrade the skin. During this process, an impedance below 10 kΩ was
maintained for all electrodes.
In both rooms, patients were seated on a comfortable armchair in front of a computer screen and told
to be relaxed. It was tried to maintain the training environment as quiet as possible during the period
of acquisitions. In order to avoid distracting or stressing the subjects, the researcher was sitting in a
different desk during the NF training time, continuously monitoring the EEG signal in a second screen.
4.3 Experiment Design and Protocol
Despite the fact that not all participants completed the planned sessions within the stipulated period, the
following information describes the whole experiment design and the creation of the protocol that was
applied.
32

Eight CBP patients were provided with 1-2 sessions per week, for a 3-month period, completing a
total of 16 sessions of NF-alpha/theta treatment. Each session had a duration of approximately 1h30,
except the first, seventh and last sessions, which lasted around 2h30, and in which cognitive tests
(described in subsection 4.4.2) were conducted. On recruitment day, all subjects performed a set of six
psychological tests (described in subsection 4.4.1) before starting the NF treatment (PT1). This set was
again applied between the seventh and eighth sessions (PT2), and also after the end of the treatment
(PT3). A schematic timeline of the experiment is represented in Fig. 4.1
S1 S7 S8 S16
PT1 CT1 CT2 PT2 CT3 PT3
Figure 4.1: NF treatment diagram. CT = Cognitive tests; PT = Psychological tests. Regarding thenumbers: 1, 2, and 3 = pre-treatment, intermedium, and post-treatment evaluations, respectively); S =Session (from the 1st to the 16th session).
Regarding NF sessions’ workflow, the participants answered to the Wong-Baker Faces Pain Rating
Scale R© (described in subsection 4.4.3), in the beginning of the session and right after the NF training.
Resting baselines were preceded by a 2-minute relaxed state and assessed for both Eyes open (EO)
and Eyes closed (EC), recorded twice, alternately, for 1 minute each, at the beginning and at the end of
each session. The active baseline (described in subsection 4.3.4) was also measured after each resting
baseline. Cognitive tests were performed before the NF training in the first session, and after the second
active baseline in the seventh and final evaluation. The NF training consisted of 5 blocks, and each one
was composed by 10 trials of 30 seconds, with a 5-seconds interval between them. Total NF time in
each session was around 30 minutes. To conclude the session, participants answered the Mental State
Questionnaire (described in subsection 4.4.3).M
en
tal S
tate
Qu
estio
nn
air
e
Faces P
ain
Rating S
cale
Co
gn
itiv
e T
ests
*
5min
B1
T1 T5…
30s
T2
5s B5
T1 T5……
25min
NF Training
Fa
ce
s P
ain
Ra
tin
g S
ca
le
Re
stin
g p
ha
se
2min
Re
stin
g p
ha
se
2min
Resting
Baseline
EO EC
1min 1min
4min (2x2 min)
Active
Ba
se
line
1min
Active
Ba
se
line
1min
Resting
Baseline
EO EC
1min 1min
4min (2x2 min)
Figure 4.2: Training session diagram. Cognitive tests* - performed before NF training in the 1st session;in the 7th and 14th sessions, they are performed only before the Mental State Questionnaire.
A transfer training (described later in subsection 4.3.3) was performed from session 12 to 16, during
which no feedback was provided. For that purpose, a 1-min block (the transfer block ) composed of 2
transfer trials of 30 seconds each was added after the 5 NF-training blocks.
33

4.3.1 Protocol features
Based on the review of previous studies regarding chronic pain and NF, the training protocol aims to
enhance IAB and decrease ITB band at Cz.
Although other electrode training sites have been used, such as T3 and T4 which are located near the
sensory cortices, it is possible to obtain global effects on brain activity and avoid abnormal imbalances
in left/right hemispheres by using a central site (Jensen et al., 2014). Regarding the training frequency
ranges applied in this protocol, the goal was (1) to increase activity hypothesized to be correlated with
reduced pain information processing, and (2) to decrease brain activity thought to be associated with
the processing of nociceptive information (Jensen et al., 2014, Flor, 2014, Jacobs and Jensen, 2015).
Therefore, since lower alpha activity has been associated with increased pain perception, and patients
with chronic pain exhibit overactivations within theta frequency range, the training consisted of increasing
the IAB/ITB ratio.
4.3.2 Individual Alpha Band and Individual Theta Band
The first resting baseline was measured to define the IAB of each subject. For that purpose, the signal
was recorded for EO and EC and properly labeled after artifact removal, in order to generate an ampli-
tude spectrum (illustrated in Fig. 4.3). To compute the spectrum and obtain LTF, IAF, and HTF values,
the labeled events were chosen through the Somnium IAF interface for the CZ channel. Nonetheless,
when the IAF peak was not easily identifiable, the O1 or O2 channels were used to better observe the
spectrum and thus extract an adequate IAF value, since alpha activity is more easily detected in the
posterior-occipital area. Then, the peak was manually selected in the Cz channel, as well as the IAB
boundaries (Rodrigues et al., 2010).
Figure 4.3: Example of the amplitude spectrum used to calculate IAB. Green curve = signal spectrumwith eyes closed; grey curve = signal spectrum with eyes open. LTF and HTF (marked in red) correspondto the left and right intersections, respectively, between the curves.
Although LTF, IAF, and HTF values are automatically generated by the software, the researcher
was allowed to adjust them manually. In fact, to obtain an IAB as accurate as possible, taking into
account subjects’ characteristics, a specific metric was created. Since alpha peak varies as a function
34
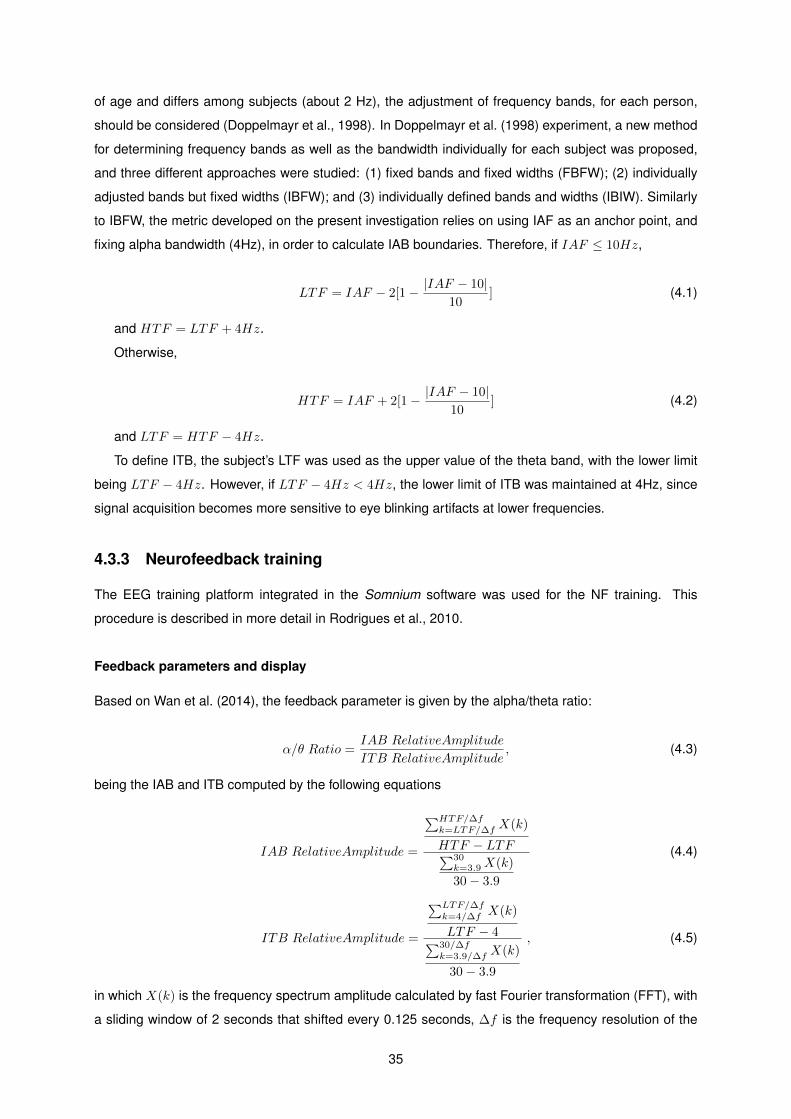
of age and differs among subjects (about 2 Hz), the adjustment of frequency bands, for each person,
should be considered (Doppelmayr et al., 1998). In Doppelmayr et al. (1998) experiment, a new method
for determining frequency bands as well as the bandwidth individually for each subject was proposed,
and three different approaches were studied: (1) fixed bands and fixed widths (FBFW); (2) individually
adjusted bands but fixed widths (IBFW); and (3) individually defined bands and widths (IBIW). Similarly
to IBFW, the metric developed on the present investigation relies on using IAF as an anchor point, and
fixing alpha bandwidth (4Hz), in order to calculate IAB boundaries. Therefore, if IAF ≤ 10Hz,
LTF = IAF − 2[1− |IAF − 10|10
] (4.1)
and HTF = LTF + 4Hz.
Otherwise,
HTF = IAF + 2[1− |IAF − 10|10
] (4.2)
and LTF = HTF − 4Hz.
To define ITB, the subject’s LTF was used as the upper value of the theta band, with the lower limit
being LTF − 4Hz. However, if LTF − 4Hz < 4Hz, the lower limit of ITB was maintained at 4Hz, since
signal acquisition becomes more sensitive to eye blinking artifacts at lower frequencies.
4.3.3 Neurofeedback training
The EEG training platform integrated in the Somnium software was used for the NF training. This
procedure is described in more detail in Rodrigues et al., 2010.
Feedback parameters and display
Based on Wan et al. (2014), the feedback parameter is given by the alpha/theta ratio:
α/θ Ratio =IAB RelativeAmplitude
ITB RelativeAmplitude, (4.3)
being the IAB and ITB computed by the following equations
IAB RelativeAmplitude =
∑HTF/∆fk=LTF/∆f X(k)
HTF − LTF∑30k=3.9X(k)
30− 3.9
(4.4)
ITB RelativeAmplitude =
∑LTF/∆fk=4/∆f X(k)
LTF − 4∑30/∆fk=3.9/∆f X(k)
30− 3.9
, (4.5)
in which X(k) is the frequency spectrum amplitude calculated by fast Fourier transformation (FFT), with
a sliding window of 2 seconds that shifted every 0.125 seconds, ∆f is the frequency resolution of the
35

FFT, and k is the spectrum index. (Wan et al., 2016).
Two three-dimensional objects (a sphere and a cube in a gray background) are used to reflect the
feedback parameters in real time according to the protocol settings previously established. Thus, the
feedback received by the participant depends on the achievement of two goals.
Goal 1 relies on the relation between the EEG signal that is being measured and a threshold value
previously defined. In this case, Goal 1 is achieved when alpha/theta ratio value is above the threshold.
Goal 1 is reflected when the sphere increases its size and goes from white to purple. Before reaching
Goal 1, the sphere is composed of a minimum of 4 sides, and after that this number keeps increasing,
smoothing its shape. If alpha/theta ratio goes below the threshold, the number of sides starts decreasing
until the sphere ends up with only 4 sides again.
On the other hand, Goal 2 is accomplished when Goal 1 is continuously achieved for more than a
pre-defined time period (a period of 2 seconds was established). When Goal 2 is attained, the cube
raises up until Goal 1 is no longer maintained. Then, the cube starts falling slowly until it reaches the
bottom or Goal 2 is achieved again.
Regarding the threshold, its value was set to 1 in the first session. However, it could be adjusted
according to the percentage of time that the alpha/theta ratio was above the threshold in each session.
If the percentage of time was higher than 60% or lower than 20%, threshold was increased or decreased
by 0.1, respectively, in order to hinder or facilitate the NF training level.
(a) No goal achieved. (b) Goal 1. (c) Goal 2.
Figure 4.4: Feedback display.
Training
Before starting the training, it was explained to the participants that they should first concentrate on
turning the sphere purple and increase its size as much as possible. For that purpose, subjects were
encouraged to use several mental strategies during the training and were advised to use a single one
per block. In this way, it was possible to analyze which mental strategies produced better results in order
to repeat them afterwards. Between blocks, subjects could rest for a short period, while the researcher
was writing down the strategies applied and other observations, and the feedback parameters were
redefined.
The NF training aims not only to promote brain activity modulation towards a specific EEG pattern
programmed to be rewarded but also to give subjects the ability to reproduce, without visual feedback,
the same mental strategies that they have been applying during the NF training. In other words, a transfer
training was performed so participants could transfer the skills acquired in the NF protocol to daily life
(Siniatchkin et al., 2000; Moriyama et al., 2012). Therefore, during the transfer training, participants
36

faced a static screen, focusing on a certain point to avoid muscle artifacts during EEG signal acquisition.
To promote a relaxed and concentrated state, a simple and nature related desktop background was
chosen.
4.3.4 Active baseline
Based on the works of Zoefel et al. (2011) and Escolano et al. (2011), an assessment of 1-min recording
in an open-eyes active state was performed succeeding each resting baseline. The active task was cre-
ated based on the NF training display to assure comparability regarding the degree of visual stimulation
(Fig. 4.5). It consisted of a slideshow with purple and white circles that appeared randomly, in which the
subject was asked to count the number of white circles. In each session, all the patients performed the
same set of two distinct active tasks (pre- and post-NF), and this set was different throughout sessions.
(a) Purple circle. (b) White circle.
Figure 4.5: Active baseline display.
4.4 Measures
4.4.1 Psychological tests
A set of six psychological tests (applied in Portuguese) was filled out by the patients for a pre-treatment,
intermedium, and post-treatment evaluation of their well-being and pain condition. These tests are
validated for the Portuguese population and the translated versions were provided by Cristina Caldeira
and Pedro Ferreira, two psychologists from CHLN.
1. West Haven-Yale Multidimensional Pain Inventory (WHY-MPI) is one of the most used ques-
tionnaires in clinical evaluation and in the area of chronic pain. It is a self-administered ques-
tionnaire consisting of 52 items distributed in three different sections: (1) Part I is divided in five
subscales that evaluate the individual perception of pain severity (PS), the functional pain inter-
ference (INT), the patient’s perception of self-control (LC) over his own life, affective distress
(AD) associated with pain, and perception of existing family support (SUP); (2) Part II assesses
patient’s perception of the behavior and response of his/her ”significant person” (the person to
whom the patient feels closest to emotionally, regardless of the regularity of the relationship) when
faced with patient’s pain-related complaints, being organized in three subscales that evaluate so-
licitous responses (SR), distracting responses (DR), and negative responses (NR) of the
”significant person”; (3) Part III evaluates how often patients carry out a set of daily activities, and it
37

is organized into household chores (HC), outdoor work (OW), outdoor activities (OA), social
activities (SA), and general activity (GA) subscales (Kerns et al., 1985).
2. Pain Catastrophizing Scale (PCS) is a self-response questionnaire including 13 items in which
subjects are asked to indicate how frequently they have a set of thoughts, perceptions, or feelings
associated with pain, using a numerical scale of classification of five points (from 0 - ”never” to
4 - ”always”). The concept of catastrophizing associated with pain encompasses three distinct
dimensions: (1) a pain-related rumination or obsession component (e.g. ”I can’t stop thinking
about how much it hurts”); (2) a magnification or exaggeration component in the assessment of
the threat it represents (e.g. ”I’m afraid that something serious might happen”); (3) and a devaluing
component (defined as helplessness) of the capacity and resources of control and management
of the pain experience (e.g. ”There is nothing I can do to reduce the intensity of my pain”) (Sullivan
et al., 2001).
3. 36-Item Short Form Survey (SF-36) is a generic instrument for measuring health-related quality
of life. This test comprises eight dimensions, represented by eight corresponding multi-item scales:
(1) Physical Functioning - PF, (2) role limitations due to physical problems (Role Physical – RP),
(3) pain (Bodily Pain – BP), (4) general health status (General Health – GH), (5) Vitality – VT, (6)
Social Functioning – SF, (7) role limitations due to emotional issues (Role Emotional – RE), and
(8) emotional well-being (Mental Health – MH). Each scale results from a weighted aggregation of
between two and ten items and is rated on a scale of 0 to 100 percentage points, in which the value
0 corresponds to a severe disability or pain and 100 to the absence of disability or pain (Ware Jr
and Sherbourne, 1992).
4. Symptom Checklist 90 (SCL-90) is a 90-item self-report inventory that measures, in a scale of 0
(”Never”) to 4 (”Extremely”), psychological symptoms and distress through nine primary symptom
dimensions and three global indices. The first encompasses Somatization (SOM), Obsessive-
Compulsive (OC), Interpersonal Sensitivity (INT), Depression (DEP), Anxiety (ANX), Hostility
(HOS), Phobic Anxiety (PHOB), Paranoid Ideation (PAR), and Psychoticism (PSY). There is
also an additional scale (AS) that refers to food or sleep disturbs, and guilty feellings or suicide
thoughts (Maruish, 2017). This list of symptoms may not be directly related with the pain experi-
enced.
5. State-Trait Anxiety Inventory (STAI) is a reliable and sensitive measure of anxiety and frequently
applied in psychology research. This test consists of two 20-items questionnaires: (1) the first one
measures state anxiety (how the person feels at the moment), (2) and the other, trait anxiety
(how the person generally feels).
6. Beck Depression Inventory (BDI) is a 21-question multiple-choice self-report questionnaire that
measures the severity of depression, being each answer scored on a scale value of 0 to 3. It
comprises items relating to symptoms of (1) depression such as hopelessness and irritability, (2)
38

cognitions such as guilt or feelings of being punished, as well as (3) physical symptoms such as
fatigue, weight loss, and lack of sexual interest (Beck et al., 1961).
4.4.2 Cognitive tests
In order to evaluate the effects of the NF training in participants’ mental performance, five cognitive tests
(already in Somnium) were carried out in the first, seventh, and last sessions:
1. Digit Span (Forward and Reverse) - By definition, digit span is the maximum number of digits
in a sequence that a person can recall in the correct order, being a useful tool to assess one’s
short term memory performance (Nan et al., 2012). It consists of a series of trials showing random
digits, where the person is asked to repeat them in the same (Forward) or reverse (Reverse) order
(Fig. 4.6). In this study, ten trials were performed for both approaches. It began with a 3-digit
sequence and, as the test proceeded, the number of digits increased until a 13-digit sequence.
(a) Interface. (b) Workflow.
Figure 4.6: Digit span: the correct answer is ’15009’ or ’90051’ whether the participant is performing the
Forward or Reverse approach, respectively.
2. N-Back - In cognitive neuroscience, this test has become a standard measure to evaluate people’s
working memory. The N-back task is a ”continuous-recognition measure” that presents stimulus
sequences such as numbers, letters, or pictures. For each sequence’s item, the participant has to
decide whether it matches the one showed N items ago (Kane et al., 2007). In this study, it was
performed a 3-Back task with random numbers, in which the participant had to decide, by clicking
Yes or No, if the current item was the same appearing three positions before (Fig. 4.7). A 23-digit
sequence was chosen, which results in 20 trials, and each item was shown for a maximum of 3
seconds, during which the participant could answer. An interval of 2 seconds between digits was
also defined.
39

(a) Interface. (b) Workflow.
Figure 4.7: N-back: 3-Back example.
3. OddBall - The OddBall test evaluates participants’ attention by randomly displaying a series of
geometrical shapes - a circle, a square and an octagon - with an interval of 0.5 seconds between
them (Fig. 4.8). The participant was asked to click on the image’s centre only when a circle
appeared. It consisted of 100 trials during 0.5 seconds each, and the decay rate was adjusted to
60%.
(a) Ball. (b) Square. (c) Octagon.
Figure 4.8: OddBall geometrical shapes.
4. Rotation Test - This test evaluates participant’s mental rotation skill by displaying, side by side,
two three-dimensional figures (Fig. 4.9). The figure placed on the right side can be the same image
of the reference one (on the left side) but rotated in a certain angle, or it can be a similar rotated
image, although they are not equal. Therefore, the participant has to observe both figures and
decide if they are equivalent or not (Hanslmayr et al., 2005). In this case, 20 trials were presented,
with an interval of 7 seconds between them. Each trial was displayed for 7 seconds, during which
the person could answer.
40

Figure 4.9: Rotation test: trial example.
4.4.3 Wong-Baker Faces Pain Rating Scale R© and Mental State Questionnaire
The Wong-Baker Faces Pain Rating Scale R© is a tool used worldwide in people aged 3 and older to help
them communicate about their pain, improving assessment so that its management can be addressed.
This scale consists of six distinct cartoon faces, being each one of them associated with a certain state
of pain, and also a numeric scale rated from 0 to 10 (illustrated in Fig. 4.10) (Wong and Baker, 1988). In
this study, the scale was first explained to the subjects so they could be able to choose the face that best
depicted the pain that they were experiencing. The scale was presented to patients before each set of
passive baselines, in order to evaluate whether the NF training had immediate effects on their pain state
or not.
Figure 4.10: Portuguese version of the Wong-Baker Faces Pain Rating Scale R© (adapted from Wong andBaker, 1988). Sem dor = No hurt; Dor ligeira = Hurts Little Bit; Dor moderada = Hurts Little More/ HurtsEven More; Dor intensa = Hurts Whole Lot; Dor insuportavel = Hurts Worst.
In addition, to assess patients’ mental conditions during training, a simple questionnaire - the Mental
State Questionnaire (Figure B.1) - was given at the end of each session. Since patients’ mood and
daily life may vary from one session to another, it seemed plausible to evaluate how factors such as
concentration, motivation, sleepiness, and stress could interfere in participants’ training performance. A
rating scale was used to analyse the frequency of these four mentioned states/sensations: 1 - never, 2
- rarely, 3 - sometimes, 4 - frequently, 5 - always. In the same questionnaire, patients were asked about
which block they felt more easiness or difficulty in achieving the NF goal.
41

4.5 Data Analysis
Since not all the recruited participants reached to the post-treatment evaluation yet, the data analysis
was performed on the period between the pre and intermedium evaluation (t0 and t1, respectively).
4.5.1 Data pre-processing and extraction
The pre-processing and extraction of information from the raw EEG was performed using Somnium
tools.
Artifact removal
As previously explained in subsection 2.1.5, the EEG signal may present artifacts, i.e. activity that
was recorded and whose source is other than the brain. Thus, to avoid analysis’ misinterpretation, it
was necessary to remove them. Artifacts emerged mostly due to electrode popping, body movements,
sweat, and eye blinking. Except for the latter, it was relatively easy to minimize these artifacts by telling
the patient to seat and relax at a comfortable position, cleaning the scalp when possible, and by trying
to maintain an adequate room temperature. Occasionally, baseline periods were extended, in order to
record a signal with the minimum of high amplitude and sharped artifacts. Manual removal of every
single occurrence was not feasible due to the recurrent presence of eye blinking, and thus, only artifacts
caused by repetitive eye movements were eliminated. Additionally, in order to avoid the presence of low
frequency artifacts, the signal was normalized from 3.99 Hz to 30 Hz.
EEG events and reports
Regarding the EEG events, a primary registration of the baselines was performed manually over the
sessions. In a pre-processing stage, the periods of Eyes Open, Eyes Closed and Active Baseline
were manually marked on the signal to remove the artifacts, whereas the periods of “Session”, that
correspond to the NF training itself, were automatically registered. After pre-processing the raw EEG
signal of each patient, amplitude reports were individually generated for the four different states (EO,
EC, Active Baseline (AB), and NF) and for each electrode. To generate the reports, individual amplitudes
were introduced, i.e. the LTF, IAF and HTF values of each subject, as well as the normalization range
(3.99-30 Hz). These individual reports comprised the date, the time, and the amplitude measurements of
several frequency bands that were registered during the whole treatment. For the states EO, EC and AB,
amplitude information was registered according to the previously marked events, while for the Session
state the amplitude values were separated by the training blocks. Individual reports were then copied to
spreadsheets and extracted with MATLAB2016b for further analysis. Based on the NF protocols most
frequently found in the literature, one ratio and eight frequency bands were chosen as the more relevant
ones for data assessment:
Alpha/theta ratio: IAB/ITB
Individual Theta Band: from 4 Hz to LTF
42
Individual Alpha Band: from LTF to HTF
Individual Lower Alpha Band 1: from LTF to LTF+(IAF-LTF)/2
Individual Lower Alpha Band 2: from LTF+(IAF-LTF)/2 to IAF
Individual Upper Alpha Band: from IAF to HTF
SMR: from 12 Hz to 15 Hz
Beta Band 1: from 16 to 20 Hz
Beta Band 2: from 20 to 28 Hz
4.5.2 Data treatment
Data treatment was conducted using the MATLAB software (version R2016b). The visualization of plots
and the statistical analyses were performed using both MATLAB and R Studio software.
Pre- and post-training baseline differentiation
Since both resting and active baseline measures were performed before and after the NF training in
each session, it was necessary to cluster them in two different groups. Based on the date and hour
registered in the amplitude reports it was used the clustering algorithm k-means adapted from the work
of Esteves (2017) to separate the baseline periods into pre-training and post-training clusters.
Evaluation of training performance
Based on methods previously employed in studies concerning learning (Wan et al., 2014; Esteves,
2017; Bucho, 2018), a set of learning indexes was defined to evaluate training performance regarding
the variation of alpha/theta ratio, within and across sessions.
Within sessions
• W1: it computes, for each session (i), the difference between the last and first blocks, relative to
the first block, and then averaged across all training sessions:
W1 =
#sessions∑i=1
(block5 − block1
block1
)i
#sessions(4.6)
• W2: it computes, for each session, the slope of the linear regression that fits the evolution of the
relative amplitude of a certain frequency band along blocks, and then averaged across sessions.
Being yi = mixi + bi considered the trendline for the i− th session, one has:
W2 =
#sessions∑i=1
mi
#sessions, (4.7)
43

in which yi corresponds to the relative amplitude, mi stands as the slope, xi is the block number,
and bi is the y-intercept, which will depend mostly on each subject’s characteristics.
Across sessions
• A1: it computes the difference between the mean of the last two sessions and the mean of the first
two, relative to the latter:
A1 =Mean(S6, S7)−Mean(S1, S2)
Mean(S1, S2)(4.8)
• A2: it computes the slope (m) of the linear regression that fits the evolution of a certain frequency
band along sessions. Considering the trendline as y = mx+ b, one has:
A2 = m, (4.9)
where y corresponds to the relative amplitude of a certain frequency range, x represents the
session number, and b the y-intercept, which will depend on subjects’ intrinsic characteristics.
Evaluation of psychological effects
The assessment of possible psychological effects due to the NF training was performed through scores’
changes of the psychological tests applied. The WHY-MPI was evaluated on its 13 domains; the PCS on
its 3 domains; the SF-36 on its 8 domains; the SCL-90 on its 10 domains; the STAI on its 2 domains; and
BDI on its single domain (see Subsection 4.4.1). The results obtained at the pre-treatment evaluation
(t0) were compared to those obtained at the intermedium evaluation (t1).
Evaluation of cognitive effects
The cognitive tests described in Subsection 4.4.2 were used to assess whether the NF training protocol
had any kind of effects in participants’ cognition regarding memory, attention and mental rotation skill.
For the Digit Span test evaluation (for both Forward and Reverse), two indicators were chosen: ”Span”,
the maximum number of digits in a sequence that the participant recalled in the correct order; and
”Score”, which is calculated according to the digit span and to the ratio between the number of digits
remembered in the correct order and the total digits showed (Rodrigues et al. (2010)). For the N-Back,
OddBall and Rotation tests, the ”% of Sucesses” (number of correct answers/total number of trials) was
the indicator used to evaluate participants’ performance. The results obtained in the 1st session (t0)
were compared to those obtained in the 7th session (t1). The response time was not taken into account
on any of the tests.
Wong-Baker Faces Pain Rating Scale and mental state evaluation
Regarding the pain scale used in this experiment, the ratings of each patient obtained before the training
(preNF ) were compared to those obtained after the training (postNF ), for each session, in order to
44

evaluate whether there was an immediate decrease in pain after applying the NF. It was analyzed, for
each patient, if there was a negative correlation between their IAB/ITB relative amplitude and the pain
score change (∆ pain = postNF rating− preNF rating) in each session. Moreover, the averaged pain
score change (∆ pain) was computed for each patient to assess the correlation between the decrease
in pain and the training performance within sessions, by using the W1 and W2 learning measures.
To investigate to which extent the sensations of the Mental State Questionnaire (concentration, mo-
tivation, sleepiness, and stress) influenced the training performance, or vice-versa, the averaged scores
of these four factors, of each subject, were compared with the learning measures A1 and A2. Addition-
ally, it was examined, for each patient, whether there was a correlation between sensations’ scores and
IAB/ITB relative amplitude along sessions.
Mental strategies
Subjects’ mental strategies were collected after each 5-min block of every session. For each session, the
mental strategy corresponding to the training block with the highest IAB/ITB amplitude value at Cz was
considered as the best one. Although a variety of different strategies was collected among subjects, it
was possible to cluster them into six categories, in order to facilitate results interpretation and to analyze
to what extent a certain type of strategy had benefited patients’ performance. Based on the work of
Esteves (2017), these categories are: (1) feedback, which consisted of subject’s concentration on the
feedback display (the sphere and/or the cube); (2) imagination, that included personal wishes or unreal
events; (3) memories, comprising internal (e.g. family, friends, special events, living with no pain) and
external moments (such as books, movies or series); (4) motor, doing physical exercise or other activities
that require body movement, like cooking or shopping; (5) relaxation, referring to breathing or alternative
techniques; and (6) other, which includes, for instance, random thoughts.
Statistical analysis
Firstly, in order to choose the adequate statistical test to apply, more specifically, either parametric or
non-parametric tests, some conditions had to be verified. The main premises of a parametric test are
normality, linearity, homoscedasticity, and independence, which have to be validated by the Shapiro-
Wilk test for further employment (Shapiro and Wilk, 1965). Regarding this experiment, when applying
the Shapiro-Wilk test, the normality premise was not verified since sample’s size is considered small
(N = 7). Therefore, non-parametric tests and medians (instead of means) were applied.
Boxplots were used as the non-parametric method to graphically depict the data, consisting of a
box that contains the median at the center, and the 25th and 75th percentiles at its bottom and top,
respectively. The spaces between the different parts of the box indicates the degree of skewness and
dispersion in the data. The variability outside the upper and lower quartiles is indicated by whiskers, i.e.
the lines that extend vertically from the box to the maximum and minimum points, respectively, excluding
outliers (observations situated at an abnormal distance from other values), which in turn are represented
by individual points (Frigge et al., 1989).
45
To analyze the observations’ differences between t0 and t1 regarding the psychological and cognitive
tests, the non-parametric test applied was the Wilcoxon Signed-Rank test, which can be used as an
alternative to the parametric paired Student’s t-test. It is based on the differences’ breadth between each
pair of observations from the same sample, as well as on differences’ rank order (Corder and Foreman,
2011). The differences between each sample pair were computed and ranked according to their absolute
values. Then, according to their sign, observations are split in two, and the sum of the ranks for the
positive values is computed and compared with a critical value established (Chernick and Friis, 2003).
The W statistic value corresponds to the sum of the ranks of the positive differences. The null hypothesis,
H0, affirms that the median is equal to zero, which means that there is no significant difference between
samples, or, alternatively, it states that the median is different from zero (two-sided), the median is lower
than zero (left-sided), or the median is larger than zero (right-sided). In this experiment, it was defined
a statistical significance for a p-value below 0.05 (confidence interval of 95%), i.e. if p− value < 0.05, it
means that H0 can be rejected .
To assess a possible association between variables, it was applied the Spearman’s rank correlation,
which is a non-parametric statistic that measures the strength of the relationship between variables, and
evaluates their monotonic association, which might not be linear (Altman, 1990).
46

Chapter 5
Results
5.1 Training evaluation
In this section, the NF training analysis was performed regarding the alterations that occurred both
across and within sessions. To assess trainability, the evolution of the IAB/ITB relative amplitude was
examined, whereas the variation of the other frequency bands was observed in order to study at what
extent they are influenced by the training. Both resting (for EO and EC) and active baselines were also
examined in order to evaluate if changes occurred from pre- to post-NF training.
5.1.1 Neurofeedback training
Across sessions
In Figure 5.1b, it is possible to observe an increase of the median IAB/ITB relative amplitude from the 1st
to the 4th session and again from the 6th to the 7th session. Assessing bands individually (Figure 5.1a),
the median ITB relative amplitude did not decrease continuously over sessions, but only from the 2nd
to the 3rd, and from the 5th to the 7th session. Regarding the IAB band, it is possible to detect a
small increase across sessions, although it is not monotonic. With the exception of the LA band (which
includes LA1 and LA2), the median values of the other frequency bands oscillate around the initial value
throughout the sessions.
47
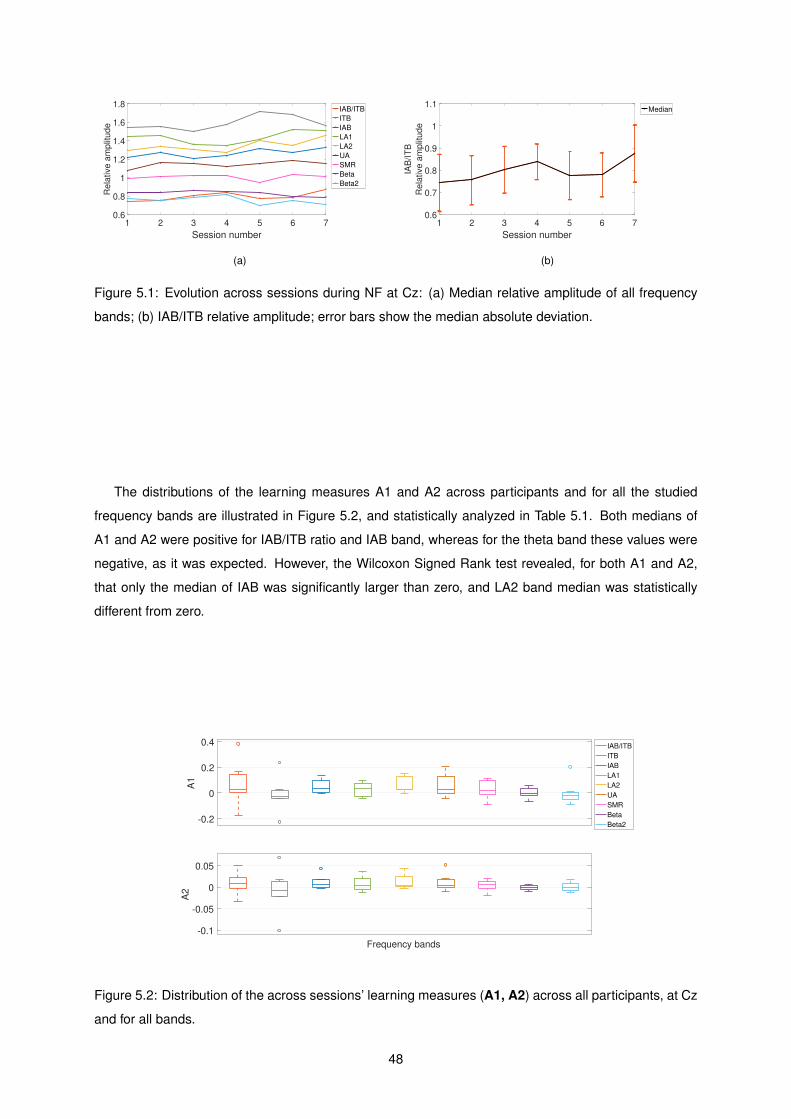
1 2 3 4 5 6 7
Session number
0.6
0.8
1
1.2
1.4
1.6
1.8R
ela
tive
am
plit
ud
eIAB/ITB
ITB
IAB
LA1
LA2
UA
SMR
Beta
Beta2
(a)
1 2 3 4 5 6 7
Session number
0.6
0.7
0.8
0.9
1
1.1
IAB
/IT
B
Re
lative
am
plit
ud
e
Median
(b)
Figure 5.1: Evolution across sessions during NF at Cz: (a) Median relative amplitude of all frequency
bands; (b) IAB/ITB relative amplitude; error bars show the median absolute deviation.
The distributions of the learning measures A1 and A2 across participants and for all the studied
frequency bands are illustrated in Figure 5.2, and statistically analyzed in Table 5.1. Both medians of
A1 and A2 were positive for IAB/ITB ratio and IAB band, whereas for the theta band these values were
negative, as it was expected. However, the Wilcoxon Signed Rank test revealed, for both A1 and A2,
that only the median of IAB was significantly larger than zero, and LA2 band median was statistically
different from zero.
-0.2
0
0.2
0.4
A1
Frequency bands
-0.1
-0.05
0
0.05
A2
IAB/ITB
ITB
IAB
LA1
LA2
UA
SMR
Beta
Beta2
Figure 5.2: Distribution of the across sessions’ learning measures (A1, A2) across all participants, at Cz
and for all bands.
48

Table 5.1: Median (Mdn), W statistic (W) and p-values (p) resulting from the Wilcoxon Signed Rank
test (right-sided for IAB/ITB and IAB; left-sided for ITB; two-sided for the other bands) for all participants
across sessions. Significant p-values (<0.05) are in bold; medians with absolute value below 0.001 are
shown as zero.
Frequency
bands
A1 A2
Mdn W p Mdn W p
IAB/ITB 0.029 21 0.148 0.008 20 0.188
ITB -0.027 9 0.234 -0.008 10 0.289
IAB 0.035 25 0.039 0.006 25 0.039
LA1 0.036 21 0.297 0.005 20 0.375
LA2 0.028 27 0.031 0.004 26 0.047
UA 0.026 21 0.297 0.004 23 0.156
SMR 0.019 21 0.297 0.005 18 0.578
Beta -0.001 14 1 0 11.5 0.735
Beta2 -0.019 8 0.375 -0.002 13.5 1
Within session
The evaluation within session was performed similarly to the analysis across sessions. In Figure 5.3a,
it is represented the relative amplitudes’ evolution of all studied frequency bands within session, being
these amplitude values averaged across sessions. From this graphic, it is possible to observe a slight
increase of the IAB/ITB ratio along the 5 blocks. However, there is not an apparent variation regarding
the IAB or the ITB bands. Figure 5.3b illustrates the behavior of IAB/ITB relative amplitude within each
session (represented by the dashed curves), being the black curve a representation of the median
amplitude values of all sessions. Clearly, there is an increasing trend of the IAB/ITB relative amplitude
across blocks.
1 2 3 4 5
Block number
0.6
0.8
1
1.2
1.4
1.6
Re
lative
am
plit
ud
e
IAB/ITB
ITB
IAB
LA1
LA2
UA
SMR
Beta
Beta2
(a)
1 2 3 4 5
Block Number
0.7
0.75
0.8
0.85
0.9
0.95
IAB
/IT
B
Re
lative
am
plit
ud
e
S1
S2
S3
S4
S5
S6
S7
Median
(b)
Figure 5.3: Evolution within session during NF at Cz: (a) Median relative amplitude of all frequency
bands; (b) IAB/ITB relative amplitude; the dashed lines correspond to the median for all participants for
a given session; error bars show the median absolute deviation.
49

The distributions of the learning measures W1 and W2 across participants and for all the studied fre-
quency bands are illustrated in Figure 5.4, and statistically assessed in Table 5.2. As one could expect,
both W1 and W2 medians were positive for the IAB/ITB ratio, and negative for the ITB. Nonetheless,
it would be expected that both learning measures’ medians were positive for the IAB, which is not ob-
served. In fact, the results from the Wilcoxon Signed Rank test reveal that the medians for both IAB/ITB
and ITB were significantly larger and smaller than zero, respectively, whereas no p-value under 0.05
was obtained for IAB or any of its components. Regarding the other frequency bands, the median of A1
for Beta2 was significantly different from zero.
-0.1
0
0.1
W1
Frequency bands
-0.06
-0.04
-0.02
0
0.02
W2
IAB/ITB
ITB
IAB
LA1
LA2
UA
SMR
Beta
Beta2
Figure 5.4: Distribution of the within session’s learning measures (W1, W2) across all participants, at Cz
and for all frequency bands.
Table 5.2: Median (Mdn), W statistic (W) and p-values (p) resulting from the Wilcoxon Signed Rank
test (right-sided for IAB/ITB and IAB; left-sided for ITB; two-sided for the other bands) for all participants
within session. Significant p-values (<0.05) are in bold; medians with absolute value below 0.001 are
shown as zero.
Frequency
bands
W1 W2
Mdn W p Mdn W p
IAB/ITB 0.049 27 0.016 0.008 27 0.016
ITB -0.081 3 0.039 -0.022 1 0.016
IAB -0.015 8 0.852 -0.003 9 0.812
LA1 -0.028 10 0.578 -0.006 5 0.156
LA2 -0.004 11 0.688 -0.004 14 1
UA -0.008 11 0.688 -0.002 11 0.688
SMR 0.014 18 0.578 0.005 21 0.297
Beta 0.017 24 0.109 0.005 20 0.375
Beta2 0.049 26 0.047 0.012 25 0.075
50

Learners
Although NF has reported benefits in several areas, not all individuals are able to learn to self-regulate
their brain activity even after repeated training sessions, being defined as non-learners (Wan et al., 2014;
Alkoby et al., 2018). To date, there is not a unique metric that differentiates learners from non-learners
and the assessment of learning ability varies among studies (Alkoby et al., 2018).
In this experiment, participants were considered as non-learners when at least one of their learning
measures describing the progression of the IAB/ITB ratio across sessions presented a negative value
(i.e. A1 < 0 or A2 < 0 for IAB/ITB), meaning that these participants were not capable of increasing
IAB/ITB along time. Five out of seven participants were classified as learners.
The distribution of the four learning measures’ values for the IAB/ITB ratio and for both learners and
non-learners is depicted in Figure 5.5. Considering the learners, the medians of all learning measures
were always larger comparatively to non-learners, being learners’ A1 more skewed to higher values than
the others.
A1 A1 A2 A2 W1 W1 W2 W2
-0.3
-0.2
-0.1
0
0.1
0.2
0.3
0.4Learners
Non-Learners
Figure 5.5: Distribution of the training performance measures for Learners and Non-learners for IAB/ITB
ratio.
Regarding the statistical analysis considering only the learners, the results across and within ses-
sions obtained from the Wilcoxon Signed Rank test are presented in Tables 5.3 and 5.4, respectively.
The medians of both A1 and A2 were significantly larger than zero for the IAB/ITB ratio, as it was ex-
pected, and significantly smaller than zero concerning the ITB only for A1. Within session, the medians
of both learning measures were significantly greater than zero for IAB/ITB, and lower than zero for the
ITB. No statistically significant effects were observed regarding the IAB or its components.
51

Table 5.3: Median (Mdn), W statistic (W) and p-values (p) resulting from the Wilcoxon Signed Rank test
(right-sided for IAB/ITB and IAB; left-sided for ITB; two-sided for the other bands) for LEARNERS across
sessions. Significant p-values (<0.05) are in bold; medians with absolute value below 0.001 are shown
as zero.
Frequency
bands
A1 A2
Mdn W p Mdn W p
IAB/ITB 0.085 15 0.031 0.010 15 0.031
ITB -0.045 0 0.031 -0.020 1 0.062
IAB 0.044 14 0.062 0.016 14 0.062
LA1 0.036 11 0.438 0.005 10 0.625
LA2 0.053 15 0.062 0.020 15 0.062
UA 0.078 12 0.312 0.015 14 0.125
SMR 0.082 15 0.062 0.013 15 0.062
Beta -0.001 8 1 0 7.5 1
Beta2 -0.018 6 0.812 0.004 10 0.625
Table 5.4: Median (Mdn), W statistic (W) and p-values (p) resulting from the Wilcoxon Signed Rank test
(right-sided for IAB/ITB and IAB; left-sided for ITB; two-sided for the other bands) for LEARNERS within
session. Significant p-values (<0.05) are in bold; medians with absolute value below 0.001 are shown
as zero.
Frequency
bands
W1 W2
Mdn W p Mdn W p
IAB/ITB 0.062 15 0.031 0.008 15 0.031
ITB -0.090 0 0.031 -0.047 0 0.031
IAB -0.015 2 0.938 -0.007 2 0.9381
LA1 -0.028 4 0.438 -0.014 1 0.125
LA2 -0.004 5 0.625 -0.008 6 0.812
UA -0.011 4 0.438 -0.004 4 0.438
SMR 0.024 15 0.062 0.006 15 0.062
Beta 0.041 14 0.125 0.006 12 0.312
Beta2 0.082 15 0.062 0.015 15 0.062
52

5.1.2 Resting and Active Baselines
In Figure 5.6, there are depicted the distributions of the median of IAB/ITB relative amplitudes, at Cz,
during pre- and post-NF baseline of EO, EC, and AB over sessions. During EO (upper plot), the median
of the post-NF baseline was always higher than for the pre-NF baseline, except in the 4th and 6th
session. Similarly, during the AB, the post-NF baseline median was always higher than for the pre-NF
baseline, except in the 3rd session. Regarding the median of pre- and post-NF baseline during EC
period, there is no clear tendency.
1 2 3 4 5 6 70.6
0.8
1
1.2
EO Baseline
1 2 3 4 5 6 7
0.51
1.52
2.5
IAB
/IT
B R
ela
tive A
mplit
ude
EC Baseline
1 2 3 4 5 6 7
Session number
0.5
1
Active Baseline
Pre-NF
Post-NF
Figure 5.6: Distribution of IAB/ITB relative amplitudes of pre-NF and post-NF baseline during EO, EC
and AB, at Cz.
When comparing the evolution of the IAB/ITB relative amplitudes during the NF training and the pre-
NF and post-NF baselines for EO (upper plot of Figure 5.7), it is possible to observe that NF amplitudes
were always lower, except in the 3rd session for the pre-NF baseline. Regarding the EC period (middle
plot of Figure 5.7), NF amplitude values were regularly inferior than the pre-NF and post-NF baseline.
For the AB (lower plot of Figure 5.7), NF amplitude values were higher than pre-NF baseline except in
the 3rd session.
53

1 2 3 4 5 6 7
0.8
1EO Baseline
NF
Pre-NF
Pos-NF
1 2 3 4 5 6 70.60.8
11.21.41.6
IAB
/IT
B R
ela
tive a
mplit
ude
EC Baseline
1 2 3 4 5 6 7
Session number
0.7
0.8
0.9
Active Baseline
Figure 5.7: Comparison of IAB/ITB relative amplitudes during pre-NF baseline, post-NF baseline, with
EO, EC and AB, and NF at Cz.
To analyze if significant differences occurred between pre- to post-NF training, the Wilcoxon Signed
Rank test was performed, for EO, EC and AB, to compare IAB/ITB amplitude values of the pre-NF
baseline from the 1st session with the values obtained in the post-NF baseline from the 7th session. No
statistically significant changes were observed regarding the EC baseline and AB, whereas a p-value
under 0.05 was obtained for the EO baseline (p = 0.047).
5.2 Measures’ evaluation
The measures used in this experiment were analyzed in order to assess if alterations in participants’ well-
being, pain and cognition occurred between the first and seventh sessions. In addition, the variation of
the mental states’ scores along sessions was assessed, as well as the frequency of the mental strategies
that had a better effect during the NF training.
5.2.1 Psychological tests
Figure 5.8 represents the distribution of the scores obtained from the WHY-MPI in each one of its do-
mains. In Part I (upper plot), it is possible to observe, from t0 to t1, an increase of the median in the
pain severity domain, and a decrease in the life-control median. Regarding the other domains, there
were no strong variations in medians from t0 to t1. However, the results from the Wilcoxon Signed Rank
test (presented in Table A.1) revealed that there were no significant differences in the scores obtained
between these two time points .
54

Interference Support Pain Severity Life-Control Affective Distress
2
4
6
Score
Part I
Negative Responses Solicitous Responses Distracting Responses
0
2
4
6
Score
Part II
Household Chores Outdoor Work Outdoor Activities Social Activities General Activity
0
2
4
6
Score
Part III
t0
t1
Figure 5.8: WHY-MPI: scores obtained at t0 and t1.
Scores’ distributions that resulted from the PCS can be observed in Figure 5.9. Whereas in the
magnification domain it is possible to observe an improvement from t0 to t1, the results show a worsening
in the rumination and helplessness domains. Notwithstanding, the results obtained from the Wilcoxon
Signed Rank test (presented in Table A.2) show that there were no significant changes from t0 to t1 in
any domain.
0
2
4
6
8
10
12
14
16
Score
Rumination
0
2
4
6
8
10
Score
Magnification
0
5
10
15
20
Score
Helplessness
t0
t1
Figure 5.9: PCS: scores obtained at t0 and t1.
The distribution of scores that resulted from the SF-36 at t0 and t1 are depicted in Figure 5.10.
Although the results obtained from the Wilcoxon Signed Rank test (presented in Table A.3) show that
there were no significant changes from t0 to t1 in any domains, it is noteworthy the increase of the
55

median score in both social functioning and role emotional dimensions.
Physical Functioning Role Physical Bodily Pain General Health0
50
100S
core
Vitality Social Functioning Role Emotional Mental Health0
50
100
Score
t0
t1
Figure 5.10: SF-36: scores obtained at t0 and t1.
Regarding the distribution scores that resulted from the SCL-90 (shown in Figure 5.11), there are no
apparent critical variations in any of the domains, since the median of scores was either maintained or
slightly decreased from t0 to t1. The results obtained from the Wilcoxon Signed Rank test demonstrate
that there were no statistically significant differences between the scores at t0 and t1 (see Table A.4).
Somatization Interpersonal Sensitivity Depression Anxiety
0
1
2
3
Score
Hostility Phobic Anxiety Paranoid Ideation Psychoticism Additional Scale
0
1
2
3
Score
t0
t1
Figure 5.11: SCL-90: scores obtained at t0 and t1.
Finally, in Figure 5.12 it is possible to assess whether there were alterations from t0 to t1 regarding
STAI and BDI. Although the results obtained from the Wilcoxon Signed Rank test (presented in Table A.5)
show that there were no significant changes from t0 to t1 in the scores of both domains of STAI, neither
56

in the BDI scores, it is noteworthy the increase of the median score in the trait anxiety domain.
2.2
2.25
2.3
2.35
2.4
2.45
2.5
2.55
2.6S
core
State Anxiety
1.9
2
2.1
2.2
2.3
2.4
2.5
2.6
2.7
Score
Trait Anxiety
0
5
10
15
20
25
30
Score
BDI
t0
t1
Figure 5.12: STAI (includes state anxiety and trait anxiety ) and BDI: scores obtained at t0 and t1.
5.2.2 Cognitive tests
In Figure 5.13, it is observed an increase in both span and score medians of the Digit Span-Forward
from t0 to t1. Regarding the Digit Span-Reverse test, the score median increased along time points, but
the span median was maintained. Usually, subjects get higher span in the Forward test comparatively
Reserve one.
4
6
8
Span
DS Forward
0.3
0.4
0.5
0.6
0.7
Score
4
6
8
Span
DS Reverse
0.3
0.4
0.5
0.6
Score
t0
t1
Figure 5.13: Digit Span test (Forward on the left; Reverse on the right): score and span obtained at t0
and t1.
57

Regarding the results of the N-back test, no changes were observed in the median of successes’
percentage, whereas an improve in both OddBall and Rotation tests was verified (Figure 5.14).
0.1
0.2
0.3
0.4
0.5
0.6
0.7
0.8
% o
f S
uccesses
N-back
0.75
0.8
0.85
0.9
0.95
1
OddBall
0.3
0.4
0.5
0.6
0.7
Rotation test
t0
t1
Figure 5.14: N-Back, OddBall and Rotation Tests (from the left to the right): % of Successes obtained at
t0 and t1.
The results obtained from the Wilcoxon Signed Rank test (presented in Table 5.5) show that there
were significant changes from t0 to t1 in both Digit Span scores (DS Forward: p = 0.036; DS Reverse:
p = 0.031), and also in the Rotation test score (p = 0.016).
Table 5.5: Cognitive tests results: W statistic (W) and respective p-value (p) resulting from Wilcoxon
Signed Rank test.
DS-Forward DS-Reverse N-Back OddBall Rotation test
Span Score Span Score
p 0.667 0.036 0.850 0.031 0.528 0.553 0.016
W 11 0 6 1 7 10 0
To evaluate whether the NF training performance had influenced participants’ performance in cogni-
tive tests, the Spearman’s correlation was computed between the scores of each cognitive test and the
learning measures across sessions (A1 and A2). It was found a significant negative correlation between
the score change in Rotation test and both A1 and A2 (rs = −0.815, p = 0.025).
5.2.3 Wong-Baker Faces Pain Rating Scale and Mental State Questionnaire
Figure 5.15 presents the distribution of the pain scale ratings of all participants, at pre- and post-NF
training in each session. It is possible to observe that the post-NF pain scores are less dispersed
58

than the pre-NF scores. Regarding the medians’ changes from pre- to post-NF, a decrease in pain is
observed in the first and the seventh sessions.
However, the results obtained from the Wilcoxon Signed Rank test (presented in Table 5.6) show that
there were no significant changes in pain from pre- to post-NF training in any session. Even the pain
scale is subjective and not precise, it shows, nevertheless, a mild reduction trend.
S1 S2 S3 S4 S5 S6 S70
2
4
6
8
10
Sco
re
pre-NF post-NF
Figure 5.15: Wong-Baker Faces Pain Rating Scale: distribution of the results obtained at pre- and post-
NF training in each session.
Table 5.6: Wong-Baker Faces Pain Rating Scale (pre- to post-NF training pain rates’ differences): W
statistic (W) and respective p-value (p) resulting from Wilcoxon Signed Rank test.
S1 S2 S3 S4 S5 S6 S7
p 0.089 0.766 1 NA 1 0.149 0.346
W 10 9 1 0 1.5 6 3
The Spearman’s correlation of the ∆ pain with the IAB/ITB relative amplitude obtained in each ses-
sion was computed for each patient, but no p-values under 0.05 were obtained. Also, when computing
the same correlation between ∆ pain and W1 and W2, no significant results were observed.
Regarding the Mental State Questionnaire, Figure 5.16 depicts the scores’ distribution of each state
(concentration, motivation, sleepiness and stress) of all participants and averaged across sessions.
Overall, it is noticeable that all participants reported higher scores of concentration and motivation than
of sleepiness and stress.
59

Concentration Motivation Sleepiness Stress0
1
2
3
4
5
Sco
re
Figure 5.16: Mental scores across sessions: scores obtained for each of the four mental states for each
participant and averaged across sessions.
After computing the Spearman’s correlation of the four states’ scores with the IAB/ITB relative am-
plitude of each session for each patient, only one significant result was obtained for sleepiness (rs =
−0.896 and p = 0.0063), meaning that increased IAB/ITB relative amplitude along sessions is negatively
correlated with higher scores of sleepiness, but only in one of the subjects. The correlation between
each of the four averaged scores and each of the learning measures along sessions, i.e., A1 and A2,
was also performed, but no significant results were obtained.
5.2.4 Mental strategies
Twenty-one different strategies were found as the most successful ones employed during NF training.
These were grouped in six distinct categories: feedback, motor, memories, imagination, relaxation, and
other, and the frequency with which any strategy of all categories was chosen is presented in Table 5.7.
Strategies included in the memories and imagination groups were the most popular among participants,
accounting for 40.82% and 24.49% of the all strategies, respectively.
Table 5.7: Frequency table of the best strategies employed during the NF training.
Feedback Motor Memories Imagination Relaxation Other
Counts 1 9 20 12 6 1
Percent 2.04% 18.37% 40.82% 24.49% 12.24% 2.04%
60

Chapter 6
Discussion
This chapter is divided into three sections: (1) training assessment, including the effects of NF training
on IAB/ITB ratio and both bands individually, the effects on the other studied bands, and on the resting
and active baselines; (2) psychological and cognitive assessments, also comprising pain level, mental
state, and mental strategies evaluation; and (3) the main limitations found in this experiment.
6.1 Training assessment
Based on the concepts of Zoefel et al. (2011) work, we aimed to study trainability, i.e. the existence
of effects resulting from the training in the target frequency, which is, in this case, the IAB/ITB ratio.
Moreover, independence was also assessed in order to see if these potential effects had intervene or
not in the other frequency bands’ behavior. Both trainability and independence were analyzed based only
on the training measures (A1, A2, W1 and W2), not taking into consideration the effects in baselines.
6.1.1 Training effects on IAB/ITB ratio, IAB and ITB
In the present experiment, the NF training consisted of enhancing alpha activity over theta, i.e. the ob-
jective relied on increasing the IAB/ITB ratio throughout the treatment. Therefore, the EEG assessment
was performed regarding the evolution of the IAB/ITB ratio, as well as of the theta and alpha bands
individually, both across sessions and within each session.
Across sessions
According to the results obtained for all participants and the whole training, significant variations regard-
ing the IAB were observed. Both A1 and A2 medians were significantly larger than zero for the IAB,
meaning that participants were able to learn to increase their alpha band. Regarding IAB components,
this enhancement is mostly reflected by the LA2, since both learning measures’ medians were signifi-
cantly different from zero for this band. Although it seems that IAB/ITB ratio is slightly increasing over
sessions (Figure 5.1b), none of the learning measures’ medians (A1 and A2) was significantly larger
61

than zero for the ratio, and thus, trainability was not verified, presumably because participants were not
able of significantly decrease their theta band throughout sessions.
When considering only the learners, evidence showed that participants were capable of significantly
enhancing their alpha/theta ratio, not by increasing IAB, but by significantly decreasing their theta band.
Statistical significance was obtained in both A1 and A2 for IAB/ITB ratio, and the median of A1 for ITB
was significantly smaller than zero, but the same did not happen regarding A2. This could be explained
by the fact that A1 reflects the learning progression taking into account the first and the last two training
sessions, while A2, which corresponds to the slope of the linear regression along sessions, takes into
consideration the seven sessions. Therefore, a slight variation of the ITB amplitude in the 3rd, 4th or 5th
session may have influenced A2 computation, which in turn was reflected on the statistical analysis.
Within session
From Figure 5.3b, one may actually observe that the median IAB/ITB relative amplitude is gradually
rising across blocks. Indeed, regarding the results from the statistical analysis, trainability was verified
for the IAB/ITB ratio, since both W1 and W2 medians were significantly larger than zero. Participants
were able to successfully decrease their theta band, but failed on enhancing their alpha band.
In the same figure, it is also possible to visualize the behavior of the alpha/theta ratio along blocks in
each session. In the first two sessions, the variations of IAB/ITB relative amplitude are less pronounced
than in the following sessions. This may reflect participants’ ability to alter their brainwaves’ activity,
which becomes easier as they keep training; in other words, in a period of 5 minutes (that corresponds
to one block), subjects can increase or decrease more rapidly their amplitudes as the number of sessions
progresses. Nonetheless, from the 3rd session, these variations of amplitude become more pronounced
from the 2nd block. Although participants already know sessions’ procedure, this may happen because,
in the first 5-min block, they are still trying to concentrate and disconnect from the external environment.
So, the first block may be defined as an ”adaptation period” within each session. Despite the fact that
the highest amplitude value was observed in the 4th block of the 7th session, an overall decrease is
seen throughout blocks in this session when comparing to the others. A possible explanation may
be the existence of cognitive tests at the end of this session, which, in general, might have provoked
higher stress and reduced motivation in the participants. A potential solution to overcome this issue is to
perform the cognitive tests at the beginning of the 7th or 8th session, in order to reduce the probability
of compromising participants’ performance during the NF training.
When assessing trainability among only the learners, the statistical analysis revealed that both medi-
ans of W1 and W2 were significantly larger than zero for the IAB/ITB ratio, and significantly smaller than
zero for ITB. Nonetheless, learners were not able to considerably enhance their alpha band.
In summary: (1) All participants showed significant changes within session, but not across sessions
regarding the learning progression of IAB/ITB ratio; (2) Considering only learners, subjects revealed
62

significant alterations in IAB/ITB both across blocks and over sessions. Taking into account the former
observations, the disparity between across and within session learning was discussed by Cho et al.
(2008), who trained healthy individuals for enhancing alpha band (8-12 Hz). They suggested that the
effects of operant conditioning are evident along time rather than over each session. However, the results
obtained from their investigation are the opposite to what was observed in the present experiment.
Similarly to what was done in the current study, Egner et al. (2002) conducted an experiment with
healthy subjects aiming to promote deep relaxation by training them to raise theta activity over alpha’s.
Authors found a significant linear increase in theta/alpha ratio within session, but no significant linear
or other polynomial trend across sessions was obtained. Based on these findings, they suggest that
several variables, such as the emotional state or the amount of sleep during the night before the session,
may interfere in the assessment of ”between-session effects” and are hardly controllable. Moreover,
authors hypothesize that a larger number of sessions (more than 5) would provide more grounded
results regarding ”across-session learning effects”. In a similar study, Raymond et al. (2005b) provided
9 sessions to 12 subjects with a NF training protocol consisting of theta/alpha ratio enhance. Again,
significant effects were found within session, but not across. Extrapolating to this work, since sessions’
appointments were constrained by subjects’ availability, the time of the day for the training was not
held constant across sessions for all participants, which may have precluded the detection of significant
effects along sessions.
When analyzing IAB and ITB independently, one may observe that in the circumstances where
IAB/ITB ratio had significantly improved, no significant alterations were seen for the alpha band pro-
gression, but only for the theta band. According to Klimesch (1999), alpha and theta are related to each
other but in opposite ways. Hence, it would be expected that, when enhancing IAB, ITB would decrease.
However, considering all participants and the training across sessions, IAB significantly increases while
ITB decreases but not substantially, which may mean that, although these bands evolve in opposite
directions over time, their progression is not proportional. When separating non-learners from learners,
a similar situation happened: ITB decreased significantly, and IAB was enhanced but not considerably.
From this, we can speculate that non-learners learned how to increase IAB but not ITB over time. On the
other hand, in the within session assessment, all patients successfully decreased ITB, but the medians
of W1 and W2 were negative for IAB, meaning that trainability was not verified for the alpha band across
blocks. The same happened when considering only learners.
Taking this information into account, it is known that alpha and theta activities are physiologically re-
lated and diverge in opposite ways albeit not extensively along time, making it harder to obtain statistical
significance when training them simultaneously. Perhaps, a protocol consisting in training both bands
but in different sessions would provide a better understanding about their behavior.
6.1.2 Training effects on other frequency bands
The behavior of the relative amplitudes of other frequency bands (SMR, beta and beta2) was also
assessed within and across sessions and only during the NF training, so independence could be studied.
63
According to the statistical results presented in Table 5.2, although trainability was verified for the
IAB/ITB ratio, independence was not present, since significant alterations were observed only in the
beta2 band concerning the W1 learning measure. High-frequency neural activity has been associated
to muscle activity (Muthukumaraswamy, 2013), which leads us to think that this significant alteration of
the beta2 band may be due to facial movements during the NF training. Across sessions, no statistically
significant changes were found for the SMR, beta and beta2 bands, thus independence was verified.
Considering only learners, independence was assured both within and across sessions.
6.1.3 Training effects on resting and active baselines
From Figure 5.7, one may observe that IAB/ITB relative amplitudes for the EO pre-baseline were gener-
ally higher than the values registered for AB pre-baseline and NF throughout sessions. The explanation
could rely on the fact that alpha activity is suppressed with visual stimulation. Since during EO resting
baseline patients were asked to fix a point, visual stimuli is reduced comparatively to AB period. In other
words, when performing the active task (counting several circles for one minute) there is higher visual
stimulation than over the EO resting baseline, which is reflected by lower values of alpha activity and,
thus, lower amplitude values of the alpha/theta ratio. The same can be speculated when comparing EO
pre-baseline and NF relative amplitudes. Concerning the AB pre-baseline and NF, IAB/ITB amplitude
values are higher in the latter. Although both AB and NF require visual attention, the NF regulates the
oscillatory activity towards the alpha enhancement and, thus, the increase of alpha/theta ratio.
For the IAB/ITB ratio, no significant training effects were observed neither in the EC baseline nor in
the active baseline for all subjects. However, when comparing IAB/ITB amplitude values of the pre-NF
baseline measured in the 1st session with the values obtained in the post-NF baseline in the 7th session,
significant changes were observed for the EO baseline.
The measurement of resting baselines may be influenced by a variety of uncontrollable factors, such
as subjects’ intrinsic characteristics, the time of day of EEG acquisition, subjects’ emotional state, among
others (Thatcher et al., 2003). Therefore, it is difficult to clearly know whether baseline’s variations are
due to NF training or external factors. One possible solution for this problem would be the comparison
of chronic back patients’ brain activity data at rest with a normative EEG database. Although there are
several normative resting EEG databases available, their utility depends on the information provided.
Specifically, there should be full disclosure regarding the number of subjects per age group, sample’s
demographics and geographic location, gender, acquisition and technical procedures, among others
(Thatcher, 2001). Thus, using a database comprising a sample of healthy subjects that match patients’
characteristics would enable a group comparison between patients and controls.
6.2 Psychological and cognitive assessments
During the experiment, subjects performed a set of psychological and cognitive tests for further evalua-
tion regarding potential effects on their well-being and cognition. Furthermore, a pain rating scale was
64

used to assess the possibility of immediate effects from the NF training, and a mental state questionnaire
was applied to investigate a possible correlation between the four states and the training performance.
Finally, the mental strategies most frequently used by the subjects are discussed further ahead.
6.2.1 Psychological evaluation
Participants performed a set of psychological tests before the 1st session, t0, and after the 7th session,
t1, aiming to assess whether the NF had improved other symptoms besides pain, such as anxiety,
or physical conditions that generally compromise subjects’ daily activities. Between these two time
points, no statistically significant differences were found in any of the domains of all the tests performed.
Notwithstanding, some patients reported that they were experiencing more calmness and serenity from
the moment the experiment started. As Nelson et al. (2010) referred in their investigation, patients may
feel better just by the simple fact of coming to treatment appointments. Indeed, subjects used to talk
about their personal issues or their daily life moments, which sometimes allowed them to distract from
the pain they were feeling at the moment.
Situations unrelated to the NF treatment and its effects could interfere in patients’ responses when
filling out the tests. Such external circumstances (e.g. personal problems, work issues or other health
conditions) are not easy to control or avoid, even if the experimenter tries to promote the best environ-
ment for the patient.
6.2.2 Cognitive performance
All participants performed five cognitive tests in the 1st session prior to the NF training, t0, and in the 7th
session after the post-NF baseline measurements, t1. Statistically significant results were obtained for
both scores of Digit Span test (Forward and Reverse), but not for the spans. This means that, although
the maximum number of digits in a sequence recalled by the participant in the correct order did not
change from t0 to t1, the percentage of correct digits recalled in a sequence increased. Nonetheless,
these results were not correlated with subjects’ training performance regarding their alpha/theta ratio.
Also in the Rotation test, statistical differences from t0 to t1 were obtained. However, when computing
the correlation between test’s scores and training performance across sessions, a negative correlation
was found (with both A1 and A2). This means that participants with poor performance obtained better
results in the Rotation test, which was not expected. No clear explanation was found, possibly indicating
that subjects improved their mental rotation skills due to factors that transcend NF training.
Since these tests required special attention and memory skills, some patients reported frustration
and difficulties in performing the tasks, leading to lack of motivation and nervousness. On the other
hand, if the pain level was higher than usual in that day, patients had to try harder to stay focused during
the tasks. From the experimenter point of view, the N-Back test was the one in which patients had more
struggle, suggesting the use of different parameters in future experiments.
65

6.2.3 Pain and Mental State evaluation
From the pain rating scale results, no significant decrease in pain was observed from pre- to post-NF
training in any session for all patients, nor when analyzing each subject individually. Assessing pain
is usually challenging, since the scales that are frequently used lack sensitivity, and the one used in
this experiment is no exception. Moreover, it is necessary to have in mind that rating pain depends on
patients’ pain perception, i.e. some of them may have higher tolerance comparatively to others, and thus,
subjectivity may be present. On the other hand, medication is another factor to consider, since stronger
analgesics can be camouflaging aggressive symptoms that patients usually feel when not taking them,
which may influence their response.
Regarding the responses from the Mental State Questionnaire, patients’ maintained, in general, a
high motivation throughout the experiment, even in those days when they felt more uncomfortable due
to their pain condition. Nonetheless, no significant correlations were found between the four states (con-
centration, motivation, sleepiness, and stress) and the training performance measures across sessions
(A1 and A2). When analyzing subjects individually, a significant negative correlation between sleepiness
and IAB/ITB relative amplitude was found for only one subject. One of the problems in this analysis relies
on the fact that a numerical scale of five points was used for classifying each state, being participants’
response based on their personal opinion and experience, and thus subjective. A possible solution to
try to overcome this issue is to use measures capable of objectively quantifying these states. Although
it may seem difficult to accomplish for the concentration, motivation and stress states, sleepiness may
be characterized by, for example, the number of hours slept in the night before the session in relation to
the average number of hours that the participant usually sleeps.
6.2.4 Mental strategies
Among the six categories of strategies, memories was the most frequently used by participants. After
trying several strategies in order to explore which one had a better effect during the training, subjects
reported that emotional and positive thoughts were the best approach to achieve the goals. Interestingly,
most individuals from the Zoefel et al. (2011) experiment also claimed ”evoking emotions as the best
strategy”, although the target frequency band was the UA. Furthermore, Wan et al. (2014) reported that,
one average, the most successful mental strategies included positive thoughts related to friends, love
and family. Nonetheless, the patients from the present study noticed that a certain strategy did no longer
work after using it repeatedly.
6.3 Limitations
It is important to have in mind that assessing pain is challenging and it has been a very discussed and
sensitive issue. It is difficult to determine pain intensity with precision, since the instruments usually
used to evaluate pain are qualitative and rely on patients’ personal experience and, thus, subjectivity
is inherent. Therefore, the existence an objective neuronal marker that could predict individual pain
66

sensitivity from brain activity recorded through EEG could provide valuable information about patients’
pain perception and reduce interindividual variability (Schulz et al., 2011).
Regarding the protocol design, it is believed that, due to their physical condition, subjects would
benefit more from a NF training comprising less time-consuming but intensive sessions. Therefore, a
rearrangement of the protocol design is suggested, including the addition of a follow-up period to assess
NF long-term effects.
The protocol features chosen in this experiment were based on general EEG patterns for chronic
pain due to the lack of information regarding typical EEG patterns of brain activity in chronic back pain
patients, which could be useful to draw a more specific protocol. As a suggestion, an individual EEG
recording before starting the treatment would possibly provide information regarding each patient’s brain
activity, and, perhaps, a more personalized protocol could be designed.
Moreover, even if all participants engaged in this project completed the 16 sessions, the sample size
would still be reduced, which can limit the statistical analysis. Although a control group was not included
at this point of the experiment due to the small number of recruited participants, this study aims to further
incorporate a group of 10/15 patients receiving a sham treatment to explore, for instance, the possibility
of placebo effects.
67

68

Chapter 7
Conclusions
7.1 Summary and Contributions
In this thesis, the main objective was to investigate the potential benefits of applying NF in patients
suffering from chronic back pain. For this purpose, an EEG-NF protocol targeting the increase of IAB/ITB
ratio, at Cz, was developed and implemented aiming to alleviate patients’ pain experience.
Regarding trainability, results revealed that, across sessions, only patients considered as learners
were able to significantly increase their alpha/theta ratio. Within session, all patients were able to suc-
cessfully enhance IAB/ITB. Concerning the training effects on other frequency bands, independence
was verified within session, but not across, for all participants. Considering only learners, the training
of the target frequency did not significantly interfere in the activity of the SMR, beta, and beta2 bands
when performing the EEG assessment throughout the treatment and along each session. From the psy-
chological analysis, the NF training did not have effects in patients’ well-being and general health, since
no significant differences were obtained between the beginning of the treatment and after the seventh
session. Regarding cognition, although participants revealed significant improvements in certain tests,
no correlation was found with training performance. Although some patients reported that they were ex-
periencing tranquility as the treatment was proceeding, statistical analysis did not reveal differences in
subjects’ pain level. Therefore, it was considered that the protocol used may not be sufficiently specific
for chronic back pain and thus further studies should be performed in order to refine it.
Although improvements were seen in patients’ training performance over the first half of the proce-
dure, it is important to further evaluate the outcomes for the whole treatment that was designed in first
place. By increasing sample size and adding a control group, it is expected that stronger conclusions
can be drawn. Nonetheless, these preliminary findings provide additional evidence for the NF potential
efficacy in the treatment of chronic back pain, suggesting further investigation for a deeper understand-
ing.
In conclusion, several studies have demonstrated that NF can alter brain activity and might be used
as a complementary approach to treat chronic pain and other clinical conditions. Given the importance
of the problem of chronic pain, that affects people’s daily life worldwide, research into any treatment that
69

could potentially attenuate pain would be conspicuous.
7.2 Future Work
During the next months, it is expected that all participants finish the 16 sessions for further assessment,
which will include the transfer training analysis. A topographical study would also be important, since in
this experiment only Cz was analyzed. Moreover, it is necessary to continue the recruitment of subjects
to increase not only the sample size receiving the NF treatment, but also to add to the experiment a
control group that will receive a sham treatment, allowing a comparison between groups.
70

Bibliography
Aguirre, G. K., Zarahn, E., and D’esposito, M. (1998). The variability of human, BOLD hemodynamic
responses. Neuroimage, 8(4):360–369.
Alkoby, O., Abu-Rmileh, A., Shriki, O., and Todder, D. (2018). Can we predict who will respond to
neurofeedback? A review of the inefficacy problem and existing predictors for successful EEG neuro-
feedback learning. Neuroscience, 378:155–164.
Altman, D. G. (1990). Practical statistics for medical research. CRC press.
Angelakis, E., Lubar, J. F., and Stathopoulou, S. (2004). Electroencephalographic peak alpha frequency
correlates of cognitive traits. Neuroscience Letters, 371(1):60–63.
Angelakis, E., Stathopoulou, S., Frymiare, J. L., Green, D. L., Lubar, J. F., and Kounios, J. (2007).
EEG neurofeedback: a brief overview and an example of peak alpha frequency training for cognitive
enhancement in the elderly. The clinical neuropsychologist, 21(1):110–129.
Arns, M., Kleinnijenhuis, M., Fallahpour, K., and Breteler, R. (2008). Golf performance enhancement
and real-life neurofeedback training using personalized event-locked EEG profiles. Journal of Neu-
rotherapy, 11(4):11–18.
Azevedo, L. F., Costa-Pereira, A., Mendonca, L., Dias, C. C., and Castro-Lopes, J. M. (2012). Epi-
demiology of chronic pain: a population-based nationwide study on its prevalence, characteristics and
associated disability in Portugal. The journal of pain, 13(8):773–783.
Baehr, E., Rosenfeld, J. P., and Baehr, R. (1997). The clinical use of an alpha asymmetry protocol in the
neurofeedback treatment of depression: Two case studies. Journal of neurotherapy, 2(3):10–23.
Baehr, E., Rosenfeld, J. P., and Baehr, R. (2001). Clinical use of an alpha asymmetry neurofeedback
protocol in the treatment of mood disorders: Follow-up study one to five years post therapy. Journal
of neurotherapy, 4(4):11–18.
Baliki, M. N., Petre, B., Torbey, S., Herrmann, K. M., Huang, L., Schnitzer, T. J., Fields, H. L., and
Apkarian, A. V. (2012). Corticostriatal functional connectivity predicts transition to chronic back pain.
Nature neuroscience, 15(8):1117.
71

Becerra, J., Fernandez, T., Roca-Stappung, M., Diaz-Comas, L., Galan, L., Bosch, J., Espino, M.,
Moreno, A. J., and Harmony, T. (2012). Neurofeedback in healthy elderly human subjects with elec-
troencephalographic risk for cognitive disorder. Journal of Alzheimer’s Disease, 28(2):357–367.
Beck, A. T., Ward, C. H., Mendelson, M., Mock, J., and Erbaugh, J. (1961). An inventory for measuring
depression. Archives of general psychiatry, 4(6):561–571.
Birbaumer, N. (1999). Slow cortical potentials: plasticity, operant control, and behavioral effects. The
Neuroscientist, 5(2):74–78.
Bliss, T. V., Collingridge, G. L., Kaang, B.-K., and Zhuo, M. (2016). Synaptic plasticity in the anterior
cingulate cortex in acute and chronic pain. Nature Reviews Neuroscience, 17(8):485.
Bucho, T. (2018). Comparison of auditory and visual modalities for EEG-neurofeedback. Master’s thesis,
Instituto Superior Tecnico, Lisbon, Portugal.
Budzynski, T. H., Budzynski, H. K., Evans, J. R., and Abarbanel, A. (2009). Introduction to quantitative
EEG and neurofeedback: Advanced theory and applications. Academic Press.
Cameron, T. (2004). Safety and efficacy of spinal cord stimulation for the treatment of chronic pain: a
20-year literature review. Journal of Neurosurgery: Spine, 100(3):254–267.
Cannon, R. L. (2015). Editorial perspective: Defining neurofeedback and its functional processes. Neu-
roRegulation, 2(2):60–60.
Caro, X. J. and Winter, E. F. (2011). EEG biofeedback treatment improves certain attention and somatic
symptoms in fibromyalgia: a pilot study. Applied psychophysiology and biofeedback, 36(3):193–200.
Chernick, M. R. and Friis, R. H. (2003). Introductory biostatistics for the health sciences: modern
applications including bootstrap. John Wiley & Sons.
Cho, M. K., Jang, H. S., Jeong, S.-H., Jang, I.-S., Choi, B.-J., and Lee, M.-G. T. (2008). Alpha neuro-
feedback improves the maintaining ability of alpha activity. Neuroreport, 19(3):315–317.
Christiansen, H., Reh, V., Schmidt, M. H., and Rief, W. (2014). Slow cortical potential neurofeedback
and self-management training in outpatient care for children with ADHD: study protocol and first pre-
liminary results of a randomized controlled trial. Frontiers in human neuroscience, 8:943.
Corder, G. W. and Foreman, D. I. (2011). Nonparametric statistics for non-statisticians.
Cox, R. W., Jesmanowicz, A., and Hyde, J. S. (1995). Real-time functional magnetic resonance imaging.
Magnetic resonance in medicine, 33(2):230–236.
da Silva, F. L. (1991). Neural mechanisms underlying brain waves: from neural membranes to networks.
Electroencephalography and clinical neurophysiology, 79(2):81–93.
da Silva, F. L. (2013). EEG and MEG: relevance to neuroscience. Neuron, 80(5):1112–1128.
72

Davidson, R. J. (1998). Affective style and affective disorders: Perspectives from affective neuroscience.
Cognition & Emotion, 12(3):307–330.
DeSantana, J. M., Walsh, D. M., Vance, C., Rakel, B. A., and Sluka, K. A. (2008). Effectiveness of tran-
scutaneous electrical nerve stimulation for treatment of hyperalgesia and pain. Current rheumatology
reports, 10(6):492.
Dias, A. M. and van Deusen, A. (2011). A new neurofeedback protocol for depression. The Spanish
journal of psychology, 14(1):374–384.
Dias, A. M., Van Deusen, A. M., Oda, E., and Bonfim, M. R. (2012). Clinical Efficacy of a New Automated
Hemoencefalographic Neurofeedback Protocol. The Spanish journal of psychology, 15(3):930–941.
Dohrmann, K., Weisz, N., Schlee, W., Hartmann, T., and Elbert, T. (2007). Neurofeedback for treating
tinnitus. Progress in brain research, 166:473–554.
Doppelmayr, M., Klimesch, W., Pachinger, T., and Ripper, B. (1998). Individual differences in brain dy-
namics: important implications for the calculation of event-related band power. Biological cybernetics,
79(1):49–57.
dos Santos Pinheiro, E. S., de Queiros, F. C., Montoya, P., Santos, C. L., do Nascimento, M. A., Ito, C. H.,
Silva, M., Santos, D. B. N., Benevides, S., Miranda, J. G. V., et al. (2016). Electroencephalographic
patterns in chronic pain: a systematic review of the literature. PLoS One, 11(2):e0149085.
Duenas, M., Ojeda, B., Salazar, A., Mico, J. A., and Failde, I. (2016). A review of chronic pain impact on
patients, their social environment and the health care system. Journal of pain research, 9:457.
Duric, N. S., Assmus, J., Gundersen, D., Duric Golos, A., and Elgen, I. B. (2017). Multimodal treatment
in children and adolescents with attention-deficit/hyperactivity disorder: a 6-month follow-up. Nordic
journal of psychiatry, 71(5):386–394.
Egner, T. and Gruzelier, J. H. (2003). Ecological validity of neurofeedback: Modulation of slow wave
EEG enhances musical performance. Neuroreport, 14(9):1221–1224.
Egner, T., Strawson, E., and Gruzelier, J. H. (2002). EEG signature and phenomenology of alpha/theta
neurofeedback training versus mock feedback. Applied psychophysiology and biofeedback, 27(4):261.
Engelbregt, H. J., Keeser, D., Van Eijk, L., Suiker, E., Eichhorn, D., Karch, S., Deijen, J., and Pogarell,
O. (2016). Short and long-term effects of sham-controlled prefrontal EEG-neurofeedback training in
healthy subjects. Clinical Neurophysiology, 127(4):1931–1937.
Escolano, C., Aguilar, M., and Minguez, J. (2011). EEG-based upper alpha neurofeedback training
improves working memory performance. In 2011 Annual International Conference of the IEEE Engi-
neering in Medicine and Biology Society, pages 2327–2330. IEEE.
Esteves, I. (2017). Neurofeedback training intensity: implications on EEG-self regulation. Master’s
thesis, Instituto Superior Tecnico, Lisbon, Portugal.
73

Flor, H. (2003). Cortical reorganisation and chronic pain: implications for rehabilitation. Journal of
Rehabilitation Medicine-Supplements, 41(41):66–72.
Flor, H. (2014). Psychological pain interventions and neurophysiology: Implications for a mechanism-
based approach. American Psychologist, 69(2):188.
Frey, L. (2016). Impact of sensorimotor rhythm neurofeedback on quality of life in patients with medically-
refractory seizures. NeuroRegulation, 3(1):3–3.
Freynhagen, R. and Baron, R. (2009). The evaluation of neuropathic components in low back pain.
Current pain and headache reports, 13(3):185–190.
Frigge, M., Hoaglin, D. C., and Iglewicz, B. (1989). Some implementations of the boxplot. The American
Statistician, 43(1):50–54.
Fuchs, E. and Flugge, G. (2014). Adult neuroplasticity: more than 40 years of research. Neural plasticity,
2014.
Furman, L. (2005). What is attention-deficit hyperactivity disorder (ADHD)? Journal of child neurology,
20(12):994–1002.
Gelade, K., Janssen, T. W., Bink, M., Twisk, J. W., van Mourik, R., Maras, A., and Oosterlaan, J. (2018).
A 6-month follow-up of an RCT on behavioral and neurocognitive effects of neurofeedback in children
with ADHD. European child & adolescent psychiatry, 27(5):581–593.
Gevensleben, H., Holl, B., Albrecht, B., Vogel, C., Schlamp, D., Kratz, O., Studer, P., Rothenberger,
A., Moll, G. H., and Heinrich, H. (2009). Is neurofeedback an efficacious treatment for ADHD? A
randomised controlled clinical trial. Journal of Child Psychology and Psychiatry, 50(7):780–789.
Gruzelier, J., Hardman, E., Wild, J., and Zaman, R. (1999). Learned control of slow potential interhemi-
spheric asymmetry in schizophrenia. International Journal of Psychophysiology, 34(3):341–348.
Gruzelier, J. H. (2014a). EEG-neurofeedback for optimising performance. I: a review of cognitive and
affective outcome in healthy participants. Neuroscience & Biobehavioral Reviews, 44:124–141.
Gruzelier, J. H. (2014b). EEG-neurofeedback for optimising performance. II: creativity, the performing
arts and ecological validity. Neuroscience & Biobehavioral Reviews, 44:142–158.
Gruzelier, J. H., Holmes, P., Hirst, L., Bulpin, K., Rahman, S., Van Run, C., and Leach, J. (2014a). Repli-
cation of elite music performance enhancement following alpha/theta neurofeedback and application
to novice performance and improvisation with SMR benefits. Biological psychology, 95:96–107.
Gruzelier, J. H., Thompson, T., Redding, E., Brandt, R., and Steffert, T. (2014b). Application of al-
pha/theta neurofeedback and heart rate variability training to young contemporary dancers: State
anxiety and creativity. International Journal of Psychophysiology, 93(1):105–111.
74

Guan, M., Ma, L., Li, L., Yan, B., Zhao, L., Tong, L., Dou, S., Xia, L., Wang, M., and Shi, D. (2015). Self-
regulation of brain activity in patients with postherpetic neuralgia: a double-blind randomized study
using real-time FMRI neurofeedback. PLoS One, 10(4):e0123675.
H Vranken, J. (2012). Elucidation of pathophysiology and treatment of neuropathic pain. Central Ner-
vous System Agents in Medicinal Chemistry (Formerly Current Medicinal Chemistry-Central Nervous
System Agents), 12(4):304–314.
Hammond, D. C. (2005). Neurofeedback treatment of depression and anxiety. Journal of Adult Devel-
opment, 12(2-3):131–137.
Hammond, D. C. (2011). What is neurofeedback: An update. Journal of Neurotherapy, 15(4):305–336.
Hanslmayr, S., Sauseng, P., Doppelmayr, M., Schabus, M., and Klimesch, W. (2005). Increasing individ-
ual upper alpha power by neurofeedback improves cognitive performance in human subjects. Applied
psychophysiology and biofeedback, 30(1):1–10.
Harstall, C. and Ospina, M. (2003). How prevalent is chronic pain? Pain: Clinical Updates, 11:1–4.
Heinrich, H., Gevensleben, H., Freisleder, F. J., Moll, G. H., and Rothenberger, A. (2004). Training of
slow cortical potentials in attention-deficit/hyperactivity disorder: evidence for positive behavioral and
neurophysiological effects. Biological psychiatry, 55(7):772–775.
Homan, R. W., Herman, J., and Purdy, P. (1987). Cerebral location of international 10–20 system
electrode placement. Electroencephalography and clinical neurophysiology, 66(4):376–382.
Jacobs, E. H. and Jensen, M. P. (2015). EEG Neurofeedback in the Treatment of Chronic Pain: A Case
Series. NeuroRegulation, 2(2):86.
Jensen, M. P., Adachi, T., and Hakimian, S. (2015). Brain oscillations, hypnosis, and hypnotizability.
American Journal of Clinical Hypnosis, 57(3):230–253.
Jensen, M. P., Day, M. A., and Miro, J. (2014). Neuromodulatory treatments for chronic pain: efficacy
and mechanisms. Nature Reviews Neurology, 10(3):167.
Jensen, M. P., Gertz, K. J., Kupper, A. E., Braden, A. L., Howe, J. D., Hakimian, S., and Sherlin, L. H.
(2013). Steps toward developing an EEG biofeedback treatment for chronic pain. Applied psychophys-
iology and biofeedback, 38(2):101–108.
Jensen, M. P., Grierson, C., Tracy-Smith, V., Bacigalupi, S. C., and Othmer, S. (2007). Neurofeedback
treatment for pain associated with complex regional pain syndrome type I. Journal of Neurotherapy,
11(1):45–53.
Jensen, M. P., Sherlin, L. H., Hakimian, S., and Fregni, F. (2009). Neuromodulatory approaches for
chronic pain management: Research findings and clinical implications. Journal of Neurotherapy,
13(4):196–213.
75

John, E. R., Prichep, L. S., Alper, K. R., Mas, F. G., Cancro, R., Easton, P., and Sverdlov, L. (1994).
Quantitative electrophysiological characteristics and subtyping of schizophrenia. Biological psychiatry,
36(12):801–826.
Johnson, M. (2007). Transcutaneous electrical nerve stimulation: mechanisms, clinical application and
evidence. Reviews in pain, 1(1):7–11.
Kaiser, D. A. and Othmer, S. (2000). Effect of neurofeedback on variables of attention in a large multi-
center trial. Journal of Neurotherapy, 4(1):5–15.
Kandel, E. R., Schwartz, J. H., Jessell, T. M., of Biochemistry, D., Jessell, M. B. T., Siegelbaum, S., and
Hudspeth, A. (2000). Principles of neural science, volume 4. McGraw-hill New York.
Kane, M. J., Conway, A. R., Miura, T. K., and Colflesh, G. J. (2007). Working memory, attention control,
and the N-back task: a question of construct validity. Journal of Experimental Psychology: Learning,
Memory, and Cognition, 33(3):615.
Kayıran, S., Dursun, E., Dursun, N., Ermutlu, N., and Karamursel, S. (2010). Neurofeedback intervention
in fibromyalgia syndrome; a randomized, controlled, rater blind clinical trial. Applied psychophysiology
and biofeedback, 35(4):293–302.
Kerns, R. D., Turk, D. C., and Rudy, T. E. (1985). The west haven-yale multidimensional pain inventory
(WHYMPI). Pain, 23(4):345–356.
Kihlstrom, J. F. (1985). Hypnosis. Annual review of psychology, 36(1):385–418.
Klem, G. H., Luders, H. O., Jasper, H., Elger, C., et al. (1999). The ten-twenty electrode system of the
International Federation. Electroencephalogr Clin Neurophysiol, 52(3):3–6.
Klimesch, W. (1996). Memory processes, brain oscillations and EEG synchronization. International
journal of psychophysiology, 24(1-2):61–100.
Klimesch, W. (1999). EEG alpha and theta oscillations reflect cognitive and memory performance: a
review and analysis. Brain research reviews, 29(2-3):169–195.
Koberda, J. and Frey, L. (2015). Z-score LORETA neurofeedback as a potential therapy for patients with
seizures and refractory epilepsy. Neurol Neurobiol, Volume1, 1.
Krames, E. S., Peckham, P. H., Rezai, A., and Aboelsaad, F. (2009). What is neuromodulation? In
Neuromodulation, pages 3–8. Elsevier.
Ksiazek-Winiarek, D. J., Szpakowski, P., and Glabinski, A. (2015). Neural plasticity in multiple sclerosis:
the functional and molecular background. Neural plasticity, 2015.
Kuner, R. and Flor, H. (2017). Structural plasticity and reorganisation in chronic pain. Nature Reviews
Neuroscience, 18(1):20.
76

Landers, D. M., Petruzzello, S. J., Salazar, W., Crews, D. J., Kubitz, K. A., Gannon, T. L., and Han, M.
(1991). The influence of electrocortical biofeedback on performance in pre-elite archers. Medicine &
Science in Sports & Exercise.
Lantz, D. and Sterman, M. B. (1988). Neuropsychological assessment of subjects with uncontrolled
epilepsy: effects of EEG feedback training. Epilepsia, 29(2):163–171.
Leboeuf-Yde, C., Nielsen, J., Kyvik, K. O., Fejer, R., and Hartvigsen, J. (2009). Pain in the lumbar,
thoracic or cervical regions: do age and gender matter? A population-based study of 34,902 Danish
twins 20–71 years of age. BMC musculoskeletal disorders, 10(1):39.
Lecomte, G. and Juhel, J. (2011). The effects of neurofeedback training on memory performance in
elderly subjects. Psychology, 2(08):846.
Leins, U., Goth, G., Hinterberger, T., Klinger, C., Rumpf, N., and Strehl, U. (2007). Neurofeedback for
children with ADHD: a comparison of SCP and Theta/Beta protocols. Applied psychophysiology and
biofeedback, 32(2):73–88.
Lubar, J. F. and Bahler, W. (1976). Behavioral management of epileptic seizures following EEG biofeed-
back training of the sensorimotor rhythm. Biofeedback and Self-regulation, 1(1):77–104.
Mannan, M. M. N., Kamran, M. A., and Jeong, M. Y. (2018). Identification and removal of physiological
artifacts from electroencephalogram signals: A review. IEEE Access, 6:30630–30652.
Maruish, M. E. (2017). Handbook of psychological assessment in primary care settings. Taylor & Francis.
Marx, A.-M., Ehlis, A.-C., Furdea, A., Holtmann, M., Banaschewski, T., Brandeis, D., Rothenberger, A.,
Gevensleben, H., Freitag, C. M., Fuchsenberger, Y., et al. (2015). Near-infrared spectroscopy (NIRS)
neurofeedback as a treatment for children with attention deficit hyperactivity disorder (ADHD)—a pilot
study. Frontiers in human neuroscience, 8:1038.
Marzbani, H., Marateb, H. R., and Mansourian, M. (2016). Neurofeedback: a comprehensive review on
system design, methodology and clinical applications. Basic and clinical neuroscience, 7(2):143.
May, A. (2008). Chronic pain may change the structure of the brain. PAIN R©, 137(1):7–15.
Mayer, K., Blume, F., Wyckoff, S. N., Brokmeier, L. L., and Strehl, U. (2016). Neurofeedback of slow
cortical potentials as a treatment for adults with Attention Deficit-/Hyperactivity Disorder. Clinical
Neurophysiology, 127(2):1374–1386.
Meisel, V., Servera, M., Garcia-Banda, G., Cardo, E., and Moreno, I. (2014). Reprint of “Neurofeedback
and standard pharmacological intervention in ADHD: a randomized controlled trial with six-month
follow-up”. Biological psychology, 95:116–125.
Melzack, R., Wall, P. D., et al. (1965). Pain mechanisms: a new theory. Science, 150(3699):971–979.
Menon, V. (2011). Large-scale brain networks and psychopathology: a unifying triple network model.
Trends in cognitive sciences, 15(10):483–506.
77

Mercugliano, M. (1999). What is attention-deficit/hyperactivity disorder? Pediatric Clinics of North
America, 46(5):831–843.
Michel, C. M., Koening, T., Brandels, D., and Gianotti, L. R. (2017). Electrical Neuroimaging. Cambridge
University Press.
Millett, D. (2001). Hans Berger: From psychic energy to the EEG. Perspectives in biology and medicine,
44(4):522–542.
Monjezi, S. and Lyle, R. R. (2007). Neurofeedback treatment of type I diabetes mellitus: Perceptions
of quality of life and stabilization of insulin treatment–two case studies. Journal of Neurotherapy,
10(4):17–23.
Moriyama, T. S., Polanczyk, G., Caye, A., Banaschewski, T., Brandeis, D., and Rohde, L. A. (2012).
Evidence-based information on the clinical use of neurofeedback for ADHD. Neurotherapeutics,
9(3):588–598.
Moshe, S. L., Perucca, E., Ryvlin, P., and Tomson, T. (2015). Epilepsy: new advances. The Lancet,
385(9971):884–898.
Murphy, M., Bruno, M.-A., Riedner, B. A., Boveroux, P., Noirhomme, Q., Landsness, E. C., Brichant, J.-F.,
Phillips, C., Massimini, M., Laureys, S., et al. (2011). Propofol anesthesia and sleep: a high-density
EEG study. Sleep, 34(3):283–291.
Muthukumaraswamy, S. (2013). High-frequency brain activity and muscle artifacts in MEG/EEG: a re-
view and recommendations. Frontiers in human neuroscience, 7:138.
Nan, W., Rodrigues, J. P., Ma, J., Qu, X., Wan, F., Mak, P.-I., Mak, P. U., Vai, M. I., and Rosa, A.
(2012). Individual alpha neurofeedback training effect on short term memory. International journal of
psychophysiology, 86(1):83–87.
Nan, W., Wan, F., Chang, L., Pun, S. H., Vai, M. I., and Rosa, A. (2017). An exploratory study of intensive
neurofeedback training for schizophrenia. Behavioural neurology, 2017.
Nathan, S., Fisher, B., and Roberts, C. (2010). Coccydynia: a review of pathoanatomy, aetiology,
treatment and outcome. The Journal of bone and joint surgery. British volume, 92(12):1622–1627.
Nelson, D. V., Bennett, R. M., Barkhuizen, A., Sexton, G. J., Jones, K. D., Esty, M. L., Ochs, L., and
Donaldson, C. S. (2010). Neurotherapy of fibromyalgia? Pain Medicine, 11(6):912–919.
Niedermeyer, E. and da Silva, F. L. (2005). Electroencephalography: basic principles, clinical applica-
tions, and related fields. Lippincott Williams & Wilkins.
Nishigami, T., Nakano, H., Osumi, M., Tsujishita, M., Mibu, A., and Ushida, T. (2014). Central neural
mechanisms of interindividual difference in discomfort during sensorimotor incongruence in healthy
volunteers: an experimental study. Rheumatology, 53(7):1194–1199.
78

Niv, S. (2013). Clinical efficacy and potential mechanisms of neurofeedback. Personality and Individual
Differences, 54(6):676–686.
Ochs, L. (2006). The low energy neurofeedback system (LENS): Theory, background, and introduction.
Journal of Neurotherapy, 10(2-3):5–39.
Olejniczak, P. (2006). Neurophysiologic basis of EEG. Journal of clinical neurophysiology, 23(3):186–
189.
Pascual-Marqui, R. D., Michel, C. M., and Lehmann, D. (1994). Low resolution electromagnetic tomog-
raphy: a new method for localizing electrical activity in the brain. International Journal of psychophys-
iology, 18(1):49–65.
Peng, W., Babiloni, C., Mao, Y., and Hu, Y. (2015). Subjective pain perception mediated by alpha
rhythms. Biological psychology, 109:141–150.
Peniston, E. G. and Kulkosky, P. J. (1991). Alpha-theta brainwave neurofeedback for Vietnam veterans
with combat-related post-traumatic stress disorder. Medical Psychotherapy, 4(1):47–60.
Prinsloo, S., Novy, D., Driver, L., Lyle, R., Ramondetta, L., Eng, C., McQuade, J., Lopez, G., and
Cohen, L. (2017). Randomized controlled trial of neurofeedback on chemotherapy-induced peripheral
neuropathy: A pilot study. Cancer, 123(11):1989–1997.
Raymond, J., Sajid, I., Parkinson, L. A., and Gruzelier, J. H. (2005a). Biofeedback and dance perfor-
mance: A preliminary investigation. Applied Psychophysiology and Biofeedback, 30(1):65–73.
Raymond, J., Varney, C., Parkinson, L. A., and Gruzelier, J. H. (2005b). The effects of alpha/theta
neurofeedback on personality and mood. Cognitive brain research, 23(2-3):287–292.
Reid, K. J., Harker, J., Bala, M. M., Truyers, C., Kellen, E., Bekkering, G. E., and Kleijnen, J. (2011).
Epidemiology of chronic non-cancer pain in Europe: narrative review of prevalence, pain treatments
and pain impact. Current medical research and opinion, 27(2):449–462.
Rodrigues, J. P., Migotina, D. G., and da Rosa, A. C. (2010). EEG training platform: Improving Brain-
Computer Interaction and cognitive skills. In Human System Interactions (HSI), 2010 3rd Conference
on, pages 425–429. IEEE.
Ros, T., J Baars, B., Lanius, R. A., and Vuilleumier, P. (2014). Tuning pathological brain oscillations with
neurofeedback: a systems neuroscience framework. Frontiers in human neuroscience, 8:1008.
Rosenzweig, S., Greeson, J. M., Reibel, D. K., Green, J. S., Jasser, S. A., and Beasley, D. (2010).
Mindfulness-based stress reduction for chronic pain conditions: variation in treatment outcomes and
role of home meditation practice. Journal of psychosomatic research, 68(1):29–36.
Schmidt, S., Naranjo, J. R., Brenneisen, C., Gundlach, J., Schultz, C., Kaube, H., Hinterberger, T., and
Jeanmonod, D. (2012). Pain ratings, psychological functioning and quantitative EEG in a controlled
study of chronic back pain patients. PLoS One, 7(3):e31138.
79

Schomer, D. L. and Da Silva, F. L. (2012). Niedermeyer’s electroencephalography: basic principles,
clinical applications, and related fields. Lippincott Williams & Wilkins.
Schultz, D. M., Webster, L., Kosek, P., Dar, U., Tan, Y., and Sun, M. (2012). Sensor-driven position-
adaptive spinal cord stimulation for chronic pain. Pain Physician, 15(1):1–12.
Schulz, E., Zherdin, A., Tiemann, L., Plant, C., and Ploner, M. (2011). Decoding an individual’s sensitivity
to pain from the multivariate analysis of EEG data. Cerebral cortex, 22(5):1118–1123.
Shapiro, S. S. and Wilk, M. B. (1965). An analysis of variance test for normality (complete samples).
Biometrika, 52(3/4):591–611.
Siniatchkin, M., Hierundar, A., Kropp, P., Kuhnert, R., Gerber, W.-D., and Stephani, U. (2000). Self-
regulation of slow cortical potentials in children with migraine: an exploratory study. Applied psy-
chophysiology and biofeedback, 25(1):13–32.
Staufenbiel, S., Brouwer, A.-M., Keizer, A., and Van Wouwe, N. (2014). Effect of beta and gamma
neurofeedback on memory and intelligence in the elderly. Biological psychology, 95:74–85.
Steinmetz, H., Furst, G., and Meyer, B.-U. (1989). Craniocerebral topography within the international
10–20 system. Electroencephalography and clinical neurophysiology, 72(6):499–506.
Steriade, M., Gloor, P., Llinas, R. R., Da Silva, F. L., and Mesulam, M.-M. (1990). Basic mechanisms of
cerebral rhythmic activities. Electroencephalography and clinical neurophysiology, 76(6):481–508.
Sterman, M. and Friar, L. (1972). Suppression of seizures in an epileptic following sensorimotor EEG
feedback training. Electroencephalography and clinical neurophysiology, 33(1):89–95.
Sterman, M. B. and Egner, T. (2006). Foundation and practice of neurofeedback for the treatment of
epilepsy. Applied psychophysiology and biofeedback, 31(1):21.
Stern, J., Jeanmonod, D., and Sarnthein, J. (2006). Persistent EEG overactivation in the cortical pain
matrix of neurogenic pain patients. Neuroimage, 31(2):721–731.
Stokes, D. A. and Lappin, M. S. (2010). Neurofeedback and biofeedback with 37 migraineurs: a clinical
outcome study. Behavioral and Brain Functions, 6(1):9.
Strehl, U. (2009). Slow cortical potentials neurofeedback. Journal of Neurotherapy, 13(2):117–126.
Strehl, U., Aggensteiner, P., Wachtlin, D., Brandeis, D., Albrecht, B., Arana, M., Bach, C., Banaschewski,
T., Bogen, T., Flaig-Rohr, A., et al. (2017). Neurofeedback of slow cortical potentials in children with
attention-deficit/hyperactivity disorder: a multicenter randomized trial controlling for unspecific effects.
Frontiers in human neuroscience, 11:135.
Strehl, U., Birkle, S. M., Worz, S., and Kotchoubey, B. (2014). Sustained reduction of seizures in pa-
tients with intractable epilepsy after self-regulation training of slow cortical potentials–10 years after.
Frontiers in human neuroscience, 8:604.
80
Sullivan, M. J., Thorn, B., Haythornthwaite, J. A., Keefe, F., Martin, M., Bradley, L. A., and Lefebvre,
J. C. (2001). Theoretical perspectives on the relation between catastrophizing and pain. The Clinical
journal of pain, 17(1):52–64.
Sulzer, J., Haller, S., Scharnowski, F., Weiskopf, N., Birbaumer, N., Blefari, M. L., Bruehl, A. B., Cohen,
L. G., Gassert, R., Goebel, R., et al. (2013). Real-time fMRI neurofeedback: progress and challenges.
Neuroimage, 76:386–399.
Surmeli, T., Ertem, A., Eralp, E., and Kos, I. H. (2012). Schizophrenia and the efficacy of qEEG-guided
neurofeedback treatment: a clinical case series. Clinical EEG and Neuroscience, 43(2):133–144.
Tandle, A. and Jog, N. (2015). Classification of Artefacts in EEG Signal Recordings and Overview of
Removing Techniques. In International Conference on Computer Technology, pages 46–50. Citeseer.
Tatum, W. O., Dworetzky, B. A., and Schomer, D. L. (2011). Artifact and recording concepts in EEG.
Journal of clinical neurophysiology, 28(3):252–263.
Teplan, M. et al. (2002). Fundamentals of EEG measurement. Measurement science review, 2(2):1–11.
Thatcher, R. W. (2001). Normative EEG databases and EEG biofeedback. J Neurother, 3(2-4):1–29.
Thatcher, R. W., Walker, R. A., Biver, C. J., North, D. N., and Curtin, R. (2003). Quantitative EEG
normative databases: Validation and clinical correlation. Journal of Neurotherapy, 7(3-4):87–121.
Turk, D. C. and Wilson, H. D. (2012). Chronic pain. Handbook of Psychology, Second Edition, 9.
Uriguen, J. A. and Garcia-Zapirain, B. (2015). EEG artifact removal—state-of-the-art and guidelines.
Journal of neural engineering, 12(3):031001.
Van Doren, J., Arns, M., Heinrich, H., Vollebregt, M. A., Strehl, U., and Loo, S. K. (2019). Sustained ef-
fects of neurofeedback in ADHD: a systematic review and meta-analysis. European child & adolescent
psychiatry, 28(3):293–305.
Vernon, D., Egner, T., Cooper, N., Compton, T., Neilands, C., Sheri, A., and Gruzelier, J. (2003). The
effect of training distinct neurofeedback protocols on aspects of cognitive performance. International
journal of psychophysiology, 47(1):75–85.
Vernon, D., Frick, A., and Gruzelier, J. (2004). Neurofeedback as a treatment for ADHD: A methodologi-
cal review with implications for future research. Journal of Neurotherapy, 8(2):53–82.
Vernon, D. J. (2005). Can neurofeedback training enhance performance? An evaluation of the evidence
with implications for future research. Applied psychophysiology and biofeedback, 30(4):347.
Von Korff, M., Crane, P., Lane, M., Miglioretti, D. L., Simon, G., Saunders, K., Stang, P., Brandenburg,
N., and Kessler, R. (2005). Chronic spinal pain and physical–mental comorbidity in the United States:
results from the national comorbidity survey replication. Pain, 113(3):331–339.
81

Walker, J. E. and Kozlowski, G. P. (2005). Neurofeedback treatment of epilepsy. Child and Adolescent
Psychiatric Clinics, 14(1):163–176.
Wan, F., Da Cruz, J. N., Nan, W., Wong, C. M., Vai, M. I., and Rosa, A. (2016). Alpha neurofeedback
training improves SSVEP-based BCI performance. Journal of neural engineering, 13(3):036019.
Wan, F., Nan, W., Vai, M. I., and Rosa, A. (2014). Resting alpha activity predicts learning ability in alpha
neurofeedback. Frontiers in human neuroscience, 8:500.
Wang, J.-R. and Hsieh, S. (2013). Neurofeedback training improves attention and working memory
performance. Clinical Neurophysiology, 124(12):2406–2420.
Wang, S.-Y., Lin, I.-M., Peper, E., Chen, Y.-T., Tang, T.-C., Yeh, Y.-C., Tsai, Y.-C., and Chu, C.-C. (2016).
The efficacy of neurofeedback among patients with major depressive disorder: Preliminary study.
NeuroRegulation, 3(3):127–127.
Ware Jr, J. E. and Sherbourne, C. D. (1992). The MOS 36-item short-form health survey (SF-36): I.
Conceptual framework and item selection. Medical care, pages 473–483.
Wong, D. L. and Baker, C. M. (1988). Pain in children: comparison of assessment scales. Pediatr Nurs,
14(1):9–17.
Zeidan, F., Grant, J., Brown, C., McHaffie, J., and Coghill, R. (2012). Mindfulness meditation-related
pain relief: evidence for unique brain mechanisms in the regulation of pain. Neuroscience letters,
520(2):165–173.
Zoefel, B., Huster, R. J., and Herrmann, C. S. (2011). Neurofeedback training of the upper alpha fre-
quency band in EEG improves cognitive performance. Neuroimage, 54(2):1427–1431.
82
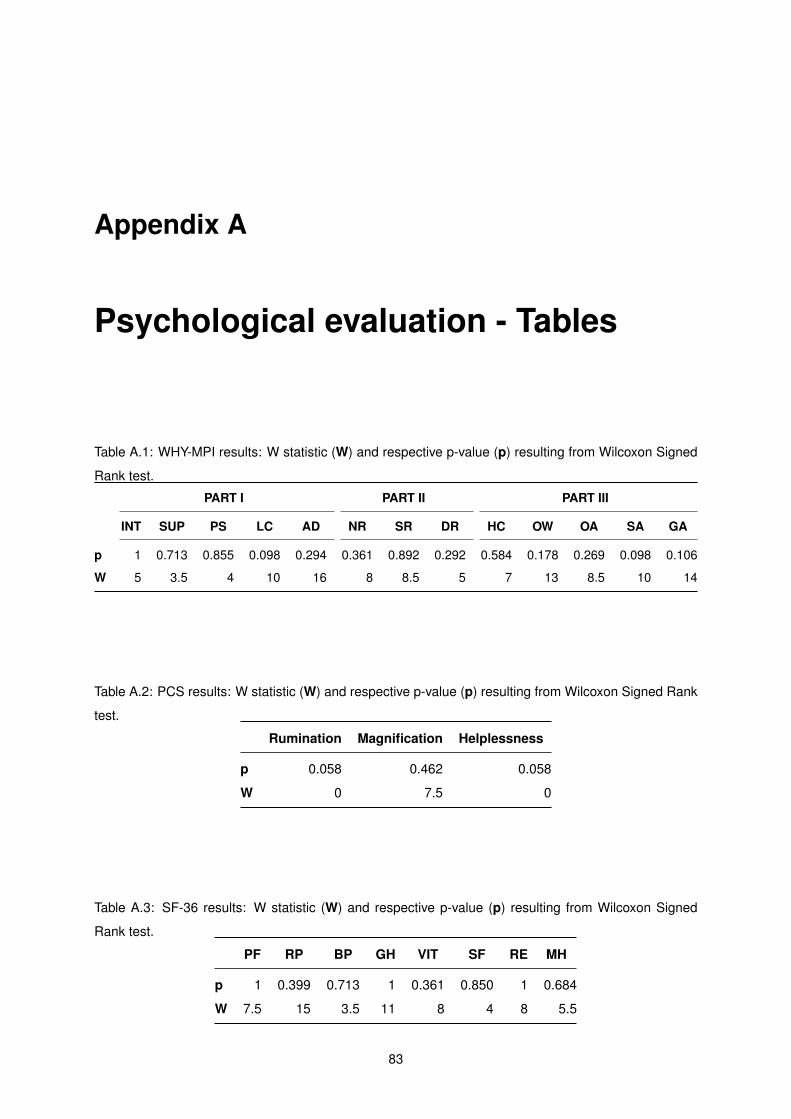
Appendix A
Psychological evaluation - Tables
Table A.1: WHY-MPI results: W statistic (W) and respective p-value (p) resulting from Wilcoxon Signed
Rank test.
PART I PART II PART III
INT SUP PS LC AD NR SR DR HC OW OA SA GA
p 1 0.713 0.855 0.098 0.294 0.361 0.892 0.292 0.584 0.178 0.269 0.098 0.106
W 5 3.5 4 10 16 8 8.5 5 7 13 8.5 10 14
Table A.2: PCS results: W statistic (W) and respective p-value (p) resulting from Wilcoxon Signed Rank
test.
Rumination Magnification Helplessness
p 0.058 0.462 0.058
W 0 7.5 0
Table A.3: SF-36 results: W statistic (W) and respective p-value (p) resulting from Wilcoxon Signed
Rank test.
PF RP BP GH VIT SF RE MH
p 1 0.399 0.713 1 0.361 0.850 1 0.684
W 7.5 15 3.5 11 8 4 8 5.5
83

Table A.4: SCL-90 results: W statistic (W) and respective p-value (p) resulting from Wilcoxon Signed
Rank test.
SOM OC IS DEP ANX HOS PHOB PAR PSY AS
p 0.248 1 1 0.399 0.916 0.104 0.278 0.892 0.341 0.462
W 16.5 8 5.5 6 9.5 14 3 6.5 11.5 14.5
Table A.5: STAI and BDI results: W statistic (W) and respective p-value (p) resulting from Wilcoxon
Signed Rank test.
STAI BDI
State Anxiety Trait Anxiety
p 0.343 1 0.598
W 3.5 7.5 7.5
84

Appendix B
Mental State Questionnaire
QUESTIONÁRIO
Data:_________________ Sujeito:_______________________ Sessão:______________
A. Por favor, assinale com uma X o bloco em que sentiu mais facilidade em atingir o objectivo:
Bloco 1 Bloco 2 Bloco 3 Bloco 4 Bloco 5
B. Por favor, assinale com uma X o bloco em que sentiu mais dificuldade em atingir o objectivo:
Bloco 1 Bloco 2 Bloco 3 Bloco 4 Bloco 5
C. Por favor, coloque uma X na descrição que mais se adequa à frequência com que
sentiu cada um dos seguintes estados/sensações: (correspondência: 1 – nunca, 2 - pouco, 3 - ocasionalmente, 4- frequentemente, 5 - durante todo o tempo)
Sonolência:
1 - 2 - 3 - 4 - 5 -
Motivação:
1 - 2 - 3 - 4 - 5 -
Concentração:
1 - 2 - 3 - 4 - 5 -
Stress:
1 - 2 - 3 - 4 - 5 -
Figure B.1: Mental State Questionnaire (provided by Esteves (2017)).
85

86