On the Implementation of HealthAgents: Agent-Based Brain Tumour Diagnosis
Upload
khangminh22Category
view
1download
0
Studies on the Immunogenicity of Tumour Associated
Antigens in Leukaemia
A thesis submitted to the Newcastle University for the degree of Doctor of
Philosophy in the Faculty of Medical Sciences Institute of Cellular Medicine
June 2010
Ghofran Al-Qudaihi
Institute of Cellular Medicine, Haematological Sciences, Newcastle University,
United Kingdom
2
Abstract
There is an urgent need for the development of leukaemia-targeted
immunotherapeutic approaches. Wilms’ tumour antigen (WT1), M-phase
phosphoprotein 11 (MPP11) and proteinase-3 (PR-3) proteins are overexpressed in
leukemic cells and represent attractive immunotherapeutic candidates. The first part
of this study explored the feasibility of using an approach to develop a novel
leukaemia vaccine by modifying the sequence of low avidity HLA-A*0201-
restricted peptide epitopes derived from WT1 protein (WT1-126126-134 and WT1-
187187-195). The modified WT1-Db126 showed enhanced binding ability to the
HLA-A*0201 molecule, increased the frequency of IFN-γ producing cytotoxic T
lymphocyte (CTL), and boosted the lytic activity of the generated CTL against
HLA-matched leukaemia cells. Interestingly, the CTL line generated with the
modified epitope was able to recognize the wild-type peptide presented by target
cells. The second part of this study identified a novel epitope derived from WT1
antigen (WT1-60237-251). This epitope was recognized by a CD4+ T cells in an
HLA-DRB1*04-restricted manner and secreted Th2 cytokines (IL-5 and IL-4). The
third part of the study aimed to identify potential CD8+ CTL epitopes in the
sequence of MPP11 and PR-3 that may bind to HLA-A*0201 molecule and provoke
specific CTL responses. A potential HLA-A*0201 binding epitope named MPP-437-
45 derived from the MPP11 protein was identified which was used to generate a CTL
line. This CTL line specifically recognized peptide-loaded target cells in both
ELISPOT and cytotoxic assays. Importantly, this CTL line exerted a cytotoxic effect
towards the CML leukemic cell line K562-A2.1. The study also demonstrated that
PR-3-derived peptides PR-129129-137 and PR-99-17 were not immunogenic since they
were incapable of inducing specific CD8+ T cell responses.
In conclusion, modification of the WT1-Db126 epitope resulted in enhancement of
its immunogenicity without altering its antigenic specificity. The WT1-60 and MPP-
4 peptides have been identified as novel CD4 and CD8 T-cell epitopes, respectively.

3
Table of Contents
Title Page…………………………………………………………………… 1
Abstract …………………………………………………………………….. 2
Table of Contents …………………………………………………………... 3
List of Figures ……………………………………………………………… 7
List of Tables …………………………………………………………......... 13
List of Abbreviations …………………………………………………......... 14
Acknowledgements……………………………………………………......... 17
1. INTRODUCTION………………………………………………………..18
1.1. Leukaemia ............................................................................................. 19
1.1.1. General characteristics and classification ............................................... 19
1.1.2. Incidence and mortality.......................................................................... 25
1.1.3. Prognosis ............................................................................................... 25
1.1.3.1. Acute myelogenous leukaemia............................................................... 25
1.1.3.2. Chronic myelogenous leukaemia............................................................ 27
1.1.3.3. Acute lymphoblastic leukaemia ............................................................. 27
1.1.3.4. Chronic lymphoblastic leukaemia .......................................................... 28
1.1.4. Treatment .............................................................................................. 28
1.2. Tumour Immunology............................................................................. 29
1.2.1. Tumour immune surveillance theory...................................................... 29
1.2.2. Cancer immunoediting theory ................................................................ 33
1.2.3. Immune recognition of tumour cells....................................................... 34
1.2.3.1. Natural killer cells.................................................................................. 35
1.2.3.2. T lymphocytes or T cells........................................................................ 36
1.2.4. Mechanisms of tumour escape ............................................................... 39
1.3. Immunotherapy for Leukaemia .............................................................. 40
1.3.1. Allogeneic hematopoietic stem cell transplantation ................................ 40
1.3.2. Potential target antigens of the GvL effect ............................................. 41
1.4. Candidate antigens for leukaemia immunotherapy ................................. 45
1.4.1. Wilms’ tumor 1 (WT1) .......................................................................... 45
1.4.2. M-Phase Phosphoprotein 11 (MPP11).................................................... 45
1.4.3. Proteinase-3 (PR-3)................................................................................ 46

4
1.4.4. Approaches for the identification of tumour antigens ............................. 48
1.4.5. Modalities of T-cell-mediated immunotherapy....................................... 52
1.4.5.1. Peptide-based vaccines .......................................................................... 52
1.4.5.2. Full-length tumour antigen vaccines....................................................... 53
1.4.5.3. Whole-tumour cell vaccines................................................................... 53
1.4.5.4. Dendritic cell-based vaccines................................................................. 54
1.5. Aims of this Study ................................................................................. 55
2. MATERIALS AND METHODS………………………………………...57
2.1. Patients and Donors ............................................................................... 58
2.2. Preparation of Peripheral Blood Mononuclear Cells............................... 58
2.3. T lymphocyte Epitope Prediction and Peptide Synthesis ........................ 58
2.3.1. WT1-pepmix ......................................................................................... 58
2.3.2. WT1 peptides ........................................................................................ 59
2.3.3. MPP11 and PR-3 peptides ..................................................................... 59
2.4. T2 Binding Assay .................................................................................. 60
2.5. Culture and Generation of Target Antigen Presenting Cells (APCs) ....... 63
2.5.1. Cell lines................................................................................................ 63
2.5.2. Generation of B-lymphoblastoid cell lines ............................................. 63
2.5.3. Generation of PHA blast ........................................................................ 63
2.5.4. Generation of mature dendritic cells from autologous monocytes........... 64
2.5.4.1. Isolation of monocytes for subsequent dendritic cell generation ............. 64
2.5.4.2. Generation of mature conventional dendritic cells.................................. 65
2.5.4.3. Generation of mature fast dendritic cells ................................................ 65
2.6. Generation of T lymphocyte lines .......................................................... 65
2.6.1. Isolation of CD8+ T lymphocytes ........................................................... 65
2.6.2. Generation of anti-peptide specific CD8+ T lymphocytes ....................... 66
2.6.3. Generation of anti-peptide specific CD4+ T lymphocytes ....................... 67
2.7. Generation of T Lymphocyte Clones...................................................... 67
2.7.1. Cloning of WT1 T cell line .................................................................... 67
2.7.1.1. T cell cloning by limiting dilution assay................................................. 67
2.7.1.2. T cell cloning using dynabeads .............................................................. 68
2.7.2. Cloning of MPP11 T cell line................................................................. 68
2.8. Flow Cytometry Analysis ...................................................................... 69
2.9. Cytotoxicity Assay (Chromium Release Assay) ..................................... 69

5
2.10. T Cell Proliferation Assay..................................................................... 70
2.11. Enzyme-Linked Immunospot Assay (ELISPOT).................................... 70
2.12. Enzyme-Linked Immunosorbent Assay (ELISA) ................................... 71
2.13. RNA Preparation ................................................................................... 71
2.14. Reverse Transcription (RT).................................................................... 72
2.15. Conventional Reverse Transcription- Polymerase Chain Reaction (RT-
PCR)……………………………………………………………………..................72
2.16. Quantitative Real Time RT-PCR for WT1 Expression in Patients’
Leukemic Cells .................................................................................................... 74
2.17. Statistical Analysis................................................................................. 74
3. WT1 PEPTIDE ANALOGOUE WT1-126Y ENHANCES LEUKEMIA
LYSIS………………………………………………………………………………75
3.1. Introduction ........................................................................................... 76
3.2. Aim ....................................................................................................... 76
3.3. Results ................................................................................................... 77
3.3.1. WT1 antigen screening in leukaemia patients and normal donors........... 77
3.3.2. Identification of peptides predicted to highly bind to the HLA-A0201
molecule……………………………………………………………………………81
3.3.3. Generation of WT1 peptide-specific cytotoxic T cell lines ..................... 93
3.3.4. Enhanced cytotoxicity of CTL generated against WT1-126Y................. 98
3.3.5. WT1-126Y peptide increased the frequency of IFN-γ producing T cells104
3.3.6. Evaluation of WT1 expression and lytic activity of anti-WT1 T cell lines
against HLA-A0201-matched leukemic cells...................................................... 107
3.4. Discussion ........................................................................................... 110
4. IDENTIFICATION OF A NOVEL WT1-DERIVED EPITOPE
RECOGNIZED BY HUMAN CD4+ T CELLS………………………………......114
4.1. Introduction ......................................................................................... 115
4.2. Aim ..................................................................................................... 116
4.3. Results ................................................................................................. 116
4.3.1. Generation of T-cell lines against the WT1-Pepmix and analysis of their
HLA restriction .................................................................................................. 116
4.3.2. Generation of specific responses against WT1-Pepmix using dynabeads125
4.3.3. Identification of a novel WT1-60 peptide recognized by TCL-57 T
cells………………………………………………………………………………..127

6
4.3.4. Generation of TCL-57 derived T cell clones using the WT1-60 peptide and
analysis of their HLA-restriction ........................................................................ 131
4.3.5. Evaluation of the cytokine profile of the TCL-57 T cell line and its
derivative clones ................................................................................................ 134
4.3.6. Proliferative activity of TCC-15 clone against HLA-DR-matched leukemic
cells……………………………………………………………………………….134
4.4. Discussion ........................................................................................... 140
5. IMMUNOGENICITY OF M-PHASE PHOSPHOPROTEIN 11 AND
PROTEINASE-3 IN LEUKAEMIAS…………………………………………….143
5.1. Introduction ......................................................................................... 144
5.2. Aim ..................................................................................................... 144
5.3. Results ................................................................................................. 145
5.3.1. MPP11 antigen screening in leukaemia patients and normal donors ..... 145
5.3.2. Selection of potential CTL epitopes derived from MPP11 and PR3
proteins…………………………………………………………………………....149
5.3.3. Generation of MPP11 specific T lymphocyte lines by T2 cells............. 157
5.3.4. Generation of MPP11 specific T lymphocyte lines by DC2d................ 168
5.3.5. CD8+ T cell responses to MPP11- derived peptides.............................. 168
5.3.5.1. MPP-4 CTL s produced specific IFN-γ ................................................ 168
5.3.5.2. MPP-4 CTLs specifically lysed MPP-4-pulsed target cells................... 178
5.3.5.3. Cloning of MPP-4 CTLs ...................................................................... 179
5.3.6. Generation of PR3 specific T lymphocyte lines.................................... 188
5.3.7. CD8+ T cell responses to PR3-derived peptides.................................... 188
5.3.7.1. IFN-γ and granzyme B production by PR3 T cell lines......................... 188
5.3.7.2. Cytotoxic activity of anti-PR3 CTLs .................................................... 198
5.4. Discussion ........................................................................................... 204
6. GENERAL DISCUSSION……………………………………………...209
7. REFERENCES………………………………………………………….216
8. APPENDIX……………………………………………………………...277

7
List of Figures
Figure 1.1. The process of hematopoiesis………………………………………… 21
Figure 1.2. Development of leukaemia from HSCs………………………………. 22
Figure 1.3. Major histocompatibility complex class I presentation pathway………38
Figure 1.4.The basic steps of reverse immunology approach for the identification of
immunogenic epitopes……………………………………………………………...50
Figure 2.1. Principles of T2 binding assay…………………………………………62
Figure 3.1.RT-PCR analysis of WT1 gene expression in PBMCs from AML, ALL
patients and normal donors…………………………………………………………79
Figure 3.2. Wild-type (WT1-126N, WT1-187N) and the modified (WT1-126Y,
WT1-187Y) peptides binding affinities to HLA-A*0201 molecule as predicted by
the computer-based epitope prediction program BIMAS…………………………..83
Figure 3.3. Flow cytometric analysis of HLA-A2 molecules expressed by T2 cells
cultured overnight in the absence or in the presence of 50, 30, 15, 7 and 1µM of the
WT1-126N peptide…………………………………………………………………84
Figure 3.4. Flow cytometric analysis of HLA-A2 molecules expressed by T2 cells
cultured overnight in the absence or in the presence of 50, 30, 15, 7 and 1µM of the
WT1-126Y peptide…………………………………………………………………85
Figure 3.5. Flow cytometric analysis of HLA-A2 molecules expressed by T2 cells
cultured overnight in the absence or in the presence of 50, 30, 15, 7 and 1µM of the
WT1-187N peptide…………………………………………………………………86
Figure 3.6. Flow cytometric analysis of HLA-A2 molecules expressed by T2 cells
cultured overnight in the absence or in the presence of 50, 30, 15, 7 and 1µM of the
WT1-187Y peptide…………………………………………………………………87
Figure 3.7. Flow cytometric analysis of HLA-A2 molecules expressed by T2 cells
cultured overnight in the absence or in the presence of 70, 7 and 0.7µM of the WT1-
126N peptide……………………………………………………………………..... 88
Figure 3.8. Flow cytometric analysis of HLA-A2 molecules expressed by T2 cells
cultured overnight in the absence or in the presence of 70, 7 and 0.7µM of the WT1-
126Y peptide………………………………………………………………………. 89
Figure 3.9. Flow cytometric analysis of HLA-A2 molecules expressed by T2 cells
cultured overnight in the absence or in the presence of 70, 7 and 0.7µM of the WT1-
187N peptide………………………………………………………………………. 90

8
Figure 3.10.Flow cytometric analysis of HLA-A2 molecules expressed by T2 cells
cultured overnight in the absence or in the presence of 70, 7 and 0.7µM of the WT1-
187Y peptide………………………………………………………………………. 91
Figure 3.11.The binding ability of WT1-derived peptides to HLA-A*0201 molecule
as measured by a standard T2 stabilization assay…………………………………. 92
Figure 3.12. Method used to generate CTLs specific for 126N and its analogue
(126Y) peptides……………………………………………………………………. 95
Figure 3.13. Efficiency of magnetic bead cell separation…………………………. 96
Figure 3.14.Flow cytometry analysis of CD1a and CD83 expression in the mature-
monocytes derived DC-32………………………………………………………... 97
Figure 3.15. Cytotoxicity assay with T cells generated against WT1-126N and WT1-
126Y peptides from a healthy HLA-A*0201 donor………………………………100
Figure 3.16. Inhibition of lytic activity of BC-32 T cell lines generated against WT1-
126N and WT1-126Y peptides after blocking with an anti-ABC antibody showing
the restriction response to the HLA-A*0201 molecule…………………………...101
Figure 3.17. Non-specific lysis by BC-21 T cell lines generated against WT1-126N
and WT1-126Y peptides as tested using a standard chromium release assay…….102
Figure 3.18. Non-specific lysis by BC-37 T cell lines generated against WT1-126N
and WT1-126Y peptides as tested using a standard chromium release assay…….103
Figure 3.19.Specific production of IFN- by the two T cell lines generated against
the wild type 126N and its analogue 126Y peptides as measured by an ELISPOT
assay……………………………………………………………………………… 105
Figure 3.20. Non-specific IFN- release by BC-21 CTLs generated against the WT1-
126N and WT1-126Y peptides using an IFN-γ- ELISPOT assay………………...106
Figure 3.21. Non-specific IFN- release by BC-37 CTLs generated against the WT1-
126N and WT1-126Y peptides using an IFN-γ- ELISPOT assay………………...106
Figure 3.22.Cytotoxicity assay showing the lytic activity of the 126N and 126Y T
cell lines against HLA-A*0201-matched (AML-28) and non-matched AML-27
cells………………………………………………………………………………..109
Figure 4.1. Flow cytometry analysis of CD1a and CD83 expression in the mature-
monocytes derived DCs…………………………………………………………...119
Figure 4.2. Sequence list of the 110 single WT1-derived micro-scale peptides…..120

9
Figure 4.3. Proliferative activity of T-cell lines generated against the WT1-
Pepmix…………………………………………………………………………….121
Figure 4.4. Proliferative activity of the T-cell line 57 generated against the WT1-
Pepmix…………………………………………………………………………….122
Figure 4.5. Effect of blocking antibodies on the proliferative responses of TCL-
57…………………………………………………………………………………..123
Figure 4.6. Flow cytometry analysis of CD8, CD4, CD25 and FOXP3 expression in
the TCL-57………………………………………………………………………...124
Figure 4.7. The efficiency of the dynabead T cell expander in activating exhausted T
cells………………………………………………………………………………..126
Figure 4.8. Screening of TCL-57 specificity using a microscale WT1 peptide set.129
Figure 4.9. Proliferative activity of TCL-57 against the peptides WT1-60, WT1-61,
WT1-79, WT1-80 and WT1-96 only……………………………………………...130
Figure 4.10. Proliferative activity of T cell clones generated from TCL-57……...132
Figure 4.11. Proliferative activity of TCC-15 and TCC-19 T cell clones………...133
Figure 4.12. Cytokine productions by the TCL-57 T-cell line……………………136
Figure 4.13. Cytokine production by the T cell clones TCC-15 and TCC-19…….137
Figure 4.14. Evaluation of proliferation of TCC-15 against different HLA-matched
leukemias………………………………………………………………………….139
Figure 5.1.RT-PCR analysis of MPP11 gene expression in PBMCs from AML, ALL
patients and normal donors……………………………………………………….. 147
Figure 5.2. MPP11 Protein sequence…………………………………………….. 151
Figure 5.3. PR-3 protein sequence……………………………………………….. 151
Figure 5.4. Flow cytometric analysis of HLA-A2 molecules expressed by T2 cells
cultured overnight in the absence or in the presence of 30 µM of WT1-187N or each
MPP11-derived peptide…………………………………………………………...153
Figure 5.5.Flow cytometric analysis of HLA-A2 molecules expressed by T2 cells
cultured overnight in the absence or in the presence of 30 µM of each PR-3-derived
peptide……………………………………………………………………………..154
Figure 5.6.The binding ability of MPP11-derived peptides to the HLA-A*0201
molecule as measured by the T2 peptide-binding assay…………………………..155
Figure 5.7.The binding ability of PR-3 derived peptides to the HLA-A*0201
molecules as measured by the T2 binding assay………………………………….156

10
Figure 5.8.Non-specific IFN- release of BC-21 CTLs generated by T2 cells against
the MPP-3, MPP-4 and WT1-126N peptides using an IFN-γ- ELISPOT assay….159
Figure 5.9.Non-specific IFN- release of BC-32 CTLs generated by T2 cells against
the MPP-3, MPP-4 and WT1-126N peptides using an IFN-γ- ELISPOT assay….161
Figure 5.10.Non-specific lysis by BC-21 CTLs generated by T2 cells against MPP-3
peptide as tested using a standard chromium release assay……………………….162
Figure 5.11.Non-specific lysis by BC-21 CTLs generated by T2 cells against MPP-4
peptide as tested using a standard chromium release assay……………………….163
Figure 5.12.Non-specific lysis by BC-21 CTLs generated by T2 cells against WT1-
126N peptide as tested using a standard chromium release assay………………...164
Figure 5.13.Non-specific lysis by BC-32 CTLs generated by T2 cells against MPP-3
peptide as tested using a standard chromium release assay……………………….165
Figure 5.14.Non-specific lysis by BC-32 CTLs generated by T2 cells against MPP-4
peptide as tested using a standard chromium release assay……………………….166
Figure 5.15.Non-specific lysis by BC-32 CTLs generated by T2 cells against WT1-
126N peptide as tested using a standard chromium release assay………………...167
Figure 5.16.Specificity of BC-21 CTLs generated by DC2d against the MPP-3 and
MPP-4 peptides using an IFN-γ- ELISPOT assay………………………………...170
Figure 5.17. Non-specific IFN- release of BC-32 CTLs generated by DC2d cells
against the MPP-4 and the MPP-3 peptides using an IFN-γ- ELISPOT assay……171
Figure 5.18.Non-specific IFN- release of BC-37 CTLs generated by DC2d cells
against the MPP-4 and the MPP-3 peptides using an IFN-γ- ELISPOT assay……172
Figure 5.19.Non-specific IFN- release of BC-41 CTLs generated by DC2d cells
against the MPP-4 and the MPP-3 peptides using an IFN-γ- ELISPOT assay……173
Figure 5.20.Specificity of BC-21 CTLs generated by DC2d against the MPP-4
peptides using granzyme B and perforin ELISPOT assay………………………...174
Figure 5.21.Non-specific granzyme B and perforin release by BC-32 CTLs
generated by DC2d cells against the MPP-4 peptides using an ELISPOT assay…175
Figure 5.22.Non-specific granzyme B and perforin release of BC-37 CTLs generated
by DC2d cells against the MPP-4 peptides using an ELISPOT assay…………….176
Figure 5.23.Non-specific granzyme B and perforin release of BC-41 CTLs generated
by DC2d cells against the MPP-4 peptides using an ELISPOT assay…………….177

11
Figure 5.24. Recognition of HLA-A0201+ target cells by BC-21 T cell line generated
by DC2d against MPP-4 peptide as tested using a standard chromium release
assay……………………………………………………………………………… 180
Figure 5.25.Non-specific lysis by BC-32 T cell line generated by DC2d against
MPP-4 peptide as tested using a standard chromium release assay……………….181
Figure 5.26.Non-specific lysis by BC-37 T cell line generated by DC2d against
MPP-4 peptide as tested using a standard chromium release assay……………….182
Figure 5.27.Non-specific lysis by BC-41 T cell line generated by DC2d against
MPP-4 peptide as tested using a standard chromium release assay……………….183
Figure 5.28.Non-specific lysis by BC-21 T cell line generated by DC2d against
MPP-3 peptide as tested using a standard chromium release assay……………….184
Figure 5.29. Non-specific lysis by BC-32 T cell line generated by DC2d against
MPP-3 peptide as tested using a standard chromium release assay……………….185
Figure 5.30. Non-specific lysis by BC-37 T cell line generated by DC2d against
MPP-3 peptide as tested using a standard chromium release assay……………….186
Figure 5.31. Non-specific lysis by BC-41 T cell line generated by DC2d against
MPP-3 peptide as tested using a standard chromium release assay……………….187
Figure 5.32.ELISPOT assay for IFN- production by BC-32 T cell lines generated
by DC2d cells against peptides derived from the PR-3 antigen…………………..190
Figure 5.33. ELISPOT assay for IFN- production by BC-37 T cell lines generated
by DC2d cells against peptides derived from the PR-3 antigen…………………..192
Figure 5.34. ELISPOT assay for IFN- production by BC-41 T cell lines generated
by DC2d cells against peptides derived from the PR-3 antigen…………………..193
Figure 5.35. ELISPOT assay for granzyme B production by BC-37 T cell lines
generated by DC2d cells against the peptides derived from PR-3 antigen………..194
Figure 5.36. ELISPOT assay for granzyme B production by BC-32 T cell lines
generated by DC2d cells against the peptides derived from PR-3 antigen………..195
Figure 5.37. ELISPOT assay for granzyme B production by BC-41 T cell lines
generated by DC2d cells against the peptides derived from PR-3
antigen……………………………………………………………………………..196
Figure 5.38. Non-specific lysis by BC-32 T cell line generated by DC2d against PR-
129 peptide as tested using a standard chromium release
assay……………………………………………………………………………….199

12
Figure 5.39.Non-specific lysis by BC-32 T cell line generated by DC2d against PR-9
peptide as tested using a standard chromium release assay……………………….200
Figure 5.40. Recognition of peptide pulse target cells by BC-32 T cell line generated
by DC2d against PR-169 peptide as tested using a standard chromium release
assay……………………………………………………………………………….201
Figure 5.41.Non-specific lysis by BC-37 T cell lines generated by DC2d against the
PR-3 peptides as tested using a standard chromium release assay………………..202
13
List of Tables
Table 1.1. The French-American-British (FAB) classification of acute leukaemia.23
Table 1.2. World health organization (WHO) classification of acute leukaemia….24
Table 1.3. Tumour antigens expressed in leukaemias …………………………......44
Table 1.4. Internet-based prediction algorithms…………………………………...51
Table 2.1. Primer sequences……………………………………………………….73
Table 2.2. PCR conditions………………………………………………………...73
Table 3.1. Clinical features of leukaemia patients with WT1 gene expression……80
Table 3.2. Clinical characteristics of patients and donors used in the study……..108
Table 4.1. HLA typing of normal donors used to generate anti-WT1 T cell lines.118
Table 4.2. Results of the attempts to clone the TCL-57………………………….132
Table 4.3. Patients information…………………………………………………...138
Table 5.1. Clinical features of leukaemia patients with MPP11 gene expression..148
Table 5.2. Peptide Sequences derived from MPP11 and their binding prediction to
HLA- A*0201 molecule…………………………………………………………..152
Table 5.3. Peptide Sequences derived from PR3 and their binding prediction to
HLA- A*0201 molecule…………………………………………………………152

14
List of Abbreviations
ABL Abelson ALL acute lymphocytic leukaemia ALP alkaline phosphatase AML acute myelogenous leukaemia APC antigen presenting cell APL acute promyelocytic leukaemia ATCC American Type Culture Collection ATRA all-trans retinoic acid BCG bacillus Calmette-Guérin BCL2 B-cell CLL/lymphoma 2 BCR breakpoint cluster region BIMAS bioinformatics and molecular analysis section BSA bovine serum albumin CD cluster of differentiation CLL chronic lymphocytic leukaemia CM complete medium CML chronic myelogenous leukaemia CR complete remission CTLA-4 cytotoxic T-lymphocyte antigen 4 CTLs cytotoxic T Lymphocytes DC dendritic cells DLI donor lymphocyte infusions DMSO dimethyl sulfoxide DNA deoxyribonucleic acid DNTP deoxyribonucleoside triphosphate DTT dithiothreitol E.coli Escherichia coli E:T ratio effector:target ratio EBV Epstine barr virus EDTA ethylenediaminetetra-acetic acid ELISPOT enzyme-linked immunospot assay FAB French-American-British FACS fluorescence- activated cell sorter FCS fetal calf serum FI fluorescence index FITC fluorescein isothiocyanate FLT3 fms-like tyrosine kinase 3 FOXP3 forkhead box protein P3 GM-CSF granulocyte-macrophage colony stimulating factor GvHD graft-versus-host disease GvL graft-versus-leukaemia HLA human leukocyte antigen

15
HPLC high performance liquid chromatography HRP horseradish peroxidase HSCs hematopoietic stem cells HSCT hematopoietic stem cell transplantation IFN-γ interferon-gamma IFN-α interferon-alpha IgG immunoglobulin G IgVH immunoglobulin heavy chain IL-10 interleukein-10 IL-12 interleukein-12 IL-2 interleukein-2 IL-4 interleukein-4 IL-6 interleukein-6 Il-7 interleukein-7 KIR killer cell immunoglobulin-like receptors LAAs leukaemia-associated antigens LCL lymphoblastoid cell lines LPS lipopolysaccaride mAbs monoclonal antibodies MCA methylchlanthrene MDS myelodysplastic syndrome mHAs minor histocompatibilty antigens MHC major histocompatibility complex MICA MHC-class I-related chain A MICB MHC-class I-related chain B MPN myeloproliferative neoplasm MPP11 M-Phase Phosphoprotein 11 mRNA messenger RNA NE neutrophil elastase NK natural killer NKT natural killer T NPM1 nucleophosmin N-terminus amino-terminal PBMCs peripheral blood mononuclear cells PBS phosphate buffered saline pfp pore-forming protein Ph Philadelphia PHA phytohaemagglutinin PML-RARα promyelocytic leukemia-retinoic acid receptor α PR-3 Proteinase-3 PRAME preferentially expressed antigen of melanoma RAG recombination-activating gene RHAMM receptor for hyaluronic-acid-mediated motility RT-PCR reverse transcriptase-polymerase chain reaction

16
SCID severe-combined immunodeficiency SEREX serological analysis of recombinant cDNA expression
libraries STAT1 signal transducer and activator of transcription 1 TAP transporter associated with associated with antigen
processing TCL T cell line TCR T-cell receptor TGF-β1 transforming growth factor-beta 1 Th T helper TILs tumour-infiltrating lymphocytes TMB tetramethylbenzidine
TNF-α tumour necrosis factor-alpha Tregs regulatory T cells ULBPs unique long16-binding proteins VEGF vascular endothelial growth factor WBC white blood cells WHO World Health Organization WT1 Wilms’ tumour 1 Y tyrosine ZAP-70 zeta-associated protein of 70 kD γδ T cells gamma delta T cells

17
Acknowledgments
In the first place I would like to record my gratitude to my supervisor, Dr. Said
Dermime for his invaluable assistance, continuous guidance, encouragement and
support throughout the course of the thesis. I also wish to express my gratitude to
my supervisor, Prof. Anne Dickinson for her supervision, guidance and help.
I would like to convey special thanks to King Khlaid Foundation for financing my
PhD study. I also would like to acknowledge the Research Centre in King Faisal
Specialist Hospital for allowing me to use their lab facilities.
I am heartily thankful to Cynthia Lehe for her invaluable help, technical assistances
and for reading this thesis. Collective and individual acknowledgments are also
owed to my colleagues at the Tumor Immunology and Immunogenetics Units.
I would like to thank Dr. Ayodele Alaiya for his assistance on editing my thesis
writing, Eammon for his generous blood donation, the Training and Education
committee for their continuous support and library staff for their assistance during
the time of writing up my thesis. Deepest gratitude is also due to Dr. Iman Al-Saleh
and Dr. Mai Al-Mohana who were always willing to listen to me and provide
advice.
My family and my friends deserve special mention for their indispensable support.
My sincere thanks and appreciation go to my husband Ramzi Alshammasi for his
patience, moral support and understanding through the duration of my study. Lastly,
I offer my regards to all of those who supported me in any respect during the
completion of the project.

18
1. INTRODUCTION
19
1.1. Leukaemia
1.1.1. General characteristics and classification
Leukaemia is a term which refers to several types of cancers that affect the blood-
forming cells in the bone marrow. Formation of blood cells takes place within the
bone marrow in a process called hematopoiesis where hematopoietic stem cells
(HSCs) give rise to all mature blood cell types (Figure 1.1.) In leukaemia, abnormal
cells grow and multiply without control and hence accumulate in the bone marrow
and peripheral blood leading to a decrease in normal blood cell production. These
leukaemia cells are generally white blood cells (WBC) that are unable to carry out
the functions of the normal cells. Current evidence indicates that HSCs are the target
for the genetic and epigenetic events that lead to the emergence of leukemic clone
(Figure 1.2; reviewed in Passegue et al., 2003). On the other hand, studies performed
on mouse models of certain types of human leukemias showed that restricted
progenitors or even differentiated cells may also become malignantly transformed
(reviewed in Passegue et al., 2003) .
Patients with leukaemia share similar symptoms such as fatigue, shortness of breath,
headaches, swollen spleen, ecchymoses, epistaxis and increased risk of infections
(Resto, Caballero et al. 2000; Bozzone 2009). These symptoms are due to anaemia,
neutropenia and thrombocytopenia or from infiltration of malignant cells into tissues
(Devine and Larson, 1994). The exact cause of leukaemia is not known but it
commonly arises as result of chromosomal rearrangements. These rearrangements
consist of translocations, inversions, or deletions in genes that regulate blood cell
development or homeostasis (Mitelman, 2000). However, several risk factors have
been identified. These include smoking (Kane et al., 1999), exposure to ionizing
radiation or to certain chemicals such as benzene (Travis et al., 1994), radiation
therapy and some types of chemotherapy used to treat other cancers (Smith et al.,
2003). The blood disorder myelodysplastic syndrome and myeloproliferative
disorder as well as some genetic diseases such as Down's syndrome are also linked
to an increased risk of leukaemia. Additionally, infection with some viruses such as
human thymus derived T-cell leukaemia virus (HTLV-1) and Epstein-Barr virus
(EBV) causes some forms of leukaemia (Mahieux and Gessain, 2003, Lombardi et
al., 1987).

20
Leukaemia is classified into four major categories depending on the particular cell
type affected (myeloid or lymphoid) as well as the rate of cell growth (acute or
chronic). The four major types are: acute lymphoblastic leukaemia (ALL), chronic
lymphoblastic leukaemia (CLL), acute myelogenous leukaemia (AML) and chronic
myelogenous leukaemia (CML). Acute leukaemias are characterized by abnormal
proliferation and expansion of malignantly transformed hematopoietic stem cells
that accumulate in the marrow and blood and may spread to other organs of the body
such as lymph nodes, spleen, liver and central nervous system (Devine and Larson,
1994). Chronic leukaemias, on the other hand, develop more slowly and involve
more mature white blood cells.
Acute leukaemias are further classified into distinct subtypes using different
classification schemes. The most frequently used are the French-American-British
(FAB) classification and the newer World Health Organization (WHO)
classification. The FAB system classified acute leukaemias according to the
morphology of the predominant leukemic cell type along with some cytochemical
findings (Bennett et al., 1985, Bennett et al., 1976). This system has categorized
ALL into three subtypes (L1-L3) and AML into eight subtypes (M0-M7; Table 1.1).
The WHO classification scheme contains more prognostic information as it
integrates not only morphological but also immunological, cytogenetic, molecular
genetic and clinical features in constructing its classification system (Vardiman et
al., 2009). Entities of acute leukaemias recognized by WHO classification are shown
in Table 1.2.

21
CLP
ST-HSC
LT-HSC
GMP
Erythrocytes Megakaryocytes Granulocytes Monocyte/ Macrophages
Dendritic cells
NK cells T cells B cells
Self-renewal
CMP
MEP
Plur
ipot
ent
Stem
cel
lsM
ultip
oten
t pro
geni
tors
Com
mitt
edpr
ecur
sors
Mat
ure
cells
Figure 1.1. The process of hematopoiesis.
Hematopoietic stem cells (HSCs) can be divided into long-term hematopoietic stem cells (LT-HSCs)
and short-term hematopoietic stem cells (ST-HSCs). The LT-HSCs are highly self-renewing cells that
reconstitute the host for its entire life span whereas the ST-HSCs reconstitute the host for a limited
period. The ST-HSCs give rise to two multipotent progenitors: common myeloid progenitors (CMPs)
and common lymphoid progenitors (CLPs). The CMPs give rise to granulocyte/macrophage
progenitors (GMP), which then differentiate into monocytes/macrophages and granulocytes, and to
megakaryocyte/erythroid progenitors (MEP), which produce megakaryocytes/platelets and
erythrocytes. The CLPs give rise to T lymphocytes, B lymphocytes and natural killer cells. Both
CMPs and CLPs give rise to dendritic cells. Figure adapted with modification from (Passegue et al.,
2003).

22
Impaired differentiation (e.g., BCR-ABL, PML-RARα translocation)Increased cell survival (e.g., BCL-2, FAS-receptor signaling pathway)Increased proliferation (e.g., BCR-ABL, Cyclin D1)Deregulated self-renewal (e.g., WNT pathway)Genomic instability Emergence of leukemic clone
Accu
mul
atio
n of
gen
etic
and
epig
enet
ic e
vent
s
Self-renewal regulated
Emergence of leukemic clone
Accu
mul
atio
n of
gen
etic
and
epig
enet
ic e
vent
s
Self-renewal regulated
Accu
mul
atio
n of
gen
etic
and
epig
enet
ic e
vent
s
Self-renewal regulated
Accu
mul
atio
n of
gen
etic
and
epig
enet
ic e
vent
s
Self-renewal regulated
Figure 1.2. Development of leukaemia from HSCs.
Accumulation of the genetic and epigenetic events in HSC compartment eventually lead to the
emergence of leukemic clone due to impaired differentiation, increased cell survival, increased
proliferation capacity, increased self renewal and genomic instability. Figure adapted with
modifications from (Rossi et al., 2008, Passegue et al., 2003).

23
Table 1.1. The French-American-British (FAB) classification of acute leukaemia,
adapted with modification from (Devine and Larson, 1994).
Morphologic Features Frequency ALL Subtypes
L1 small homogenous cells 70% in children 30% in adults
L2 large heterogeneous cells 27% in children 65% in adults
L3 large homogenous cells
3-5% in both children and
adults
AML Subtypes
M0 large granular myeloblasts 2-3%
M1 large poorly differentiated myeloblasts 20%
M2 myeloblasts with maturation 25-30%
M3 hypergranular promyelocytes 8-15%
M4 myelomonoblasts 20-25%
M4Eo myelomonoblasts with abnormal eosinophils 5%
M5 monoblasts, promonocytes or moncytes 10%
M6 erythroblasts 5%
M7 large and small megakaryoblasts 1-2%

24
Table 1.2. World health organization (WHO) classification of acute leukaemia,
adapted with modification from (Vardiman et al., 2009). Acute Myeloid Leukaemia acute myeloid leukaemia with recurrent genetic abnormalities such as AML with
t(8;21), AML with inv(16) or t(16;16), AML with t(9;11), AML with t(6;9), and acute promyelocytic leukaemia (APL) with t(15;17).
acute myeloid leukaemia with multilineage dysplasia: AML developed following myelodysplastic syndrome (MDS) or myelodysplastic/myeloproliferative neoplasm (MDS/MPN).
therapy-related AML: AML developed as a complication after cytotoxic and/or radiation therapy.
acute myeloid leukaemia not otherwise specified: AML subtypes that do not fall into one of the above groups.
myeloid leukaemia associated with Down's syndrome
Acute leukaemias of ambiguous lineage acute undifferentiated leukaemia
mixed phenotype acute leukaemia with t(9;22), or with t(v;11q23) mixed phenotype acute leukaemia, B/myeloid mixed phenotype acute leukaemia, T/myeloid provisional entity natural killer (NK) cell lymphoblastic leukaemia/lymphoma
B lymphoblastic leukaemia/lymphoma B lymphoblastic leukaemia/lymphoma, NOS
B lymphoblastic leukaemia/lymphoma with recurrent genetic abnormalities such as
t(9;22), t(v;11q23) and t(12;21).
T lymphoblastic leukemia/lymphoma

25
1.1.2. Incidence and mortality
Leukaemia is among the ten most commonly occurring cancers in the whole world
(Ferlay et al., 2010). In Saudi Arabia, around 5.8% of all cancer cases analyzed
during the year 2005 were leukemias, making it the fifth most common cancer in
this country (Al-Eid and Arteh, 2009). The overall incidence of leukaemia
worldwide in year 2008 was 5.1 cases per 100.000 population and the mortality rate
was 3.6 cases per 100.000 population (Ferlay et al., 2010). Furthermore, it is the
most frequent type of cancer found in children accounting for more than 30% of all
childhood cancers (Al-Eid and Arteh, 2009, Bozzone, 2009). The survival rate for
children with leukaemia is greater than 80%, whereas only 30-40% of adult
leukaemia patients survive the disease for five years after diagnosis (Faderl et al.,
2003, Jabbour et al., 2005).
The incidence rate of leukaemia varies with race, age, and gender. Caucasians were
found to have higher incidence rates of leukaemia (12.8 per 100.000) than that found
in American Indians/Alaskan Natives (7.0 per 100.000) and Asian Americans (7.3
per 100.000;Bozzone, 2009). Adult Hispanics had lower incidence rates of
leukaemia whereas Hispanic children had the greatest incidence when compared to
other non-Hispanic White and Black individuals (Matasar et al., 2006). The reasons
for the variation in different populations are not currently understood. Leukaemia
incidence is higher in males than in females. Approximately 56% of all cases are
seen in males while females account for only 44% of the cases (Bozzone, 2009).
Incidence rate by age differs for each type of leukaemia. In general, children up to
four years old and adults over 70 years have the highest incidence (Faderl et al.,
2003, Hoelzer and Gokbuget, 2000). The most common types of leukaemia found in
adults are AML and CLL while ALL is the most common form of leukaemia in
children (Bozzone, 2009, Robak and Wierzbowska, 2009).
1.1.3. Prognosis
1.1.3.1. Acute myelogenous leukaemia
Prognostic factors which predict the outcome in AML patients can be divided into
two categories. The first category contains factors that predict the treatment-related
death. These factors are related to patient characteristics such as age and general

26
health condition (Dohner et al., 2010). Infants, elderly and patients with hepatic or
renal dysfunction, and central nervous system involvement have poor outcome
(Appelbaum et al., 2006, Juliusson et al., 2009, Merck). The other category contains
factors related to characteristics of the AML clone and predicts resistance to
treatment (Dohner et al., 2010). The most important factors among this category are
cytogenetic analysis and molecular genetic findings performed at diagnosis
(Grimwade, 2001, Grimwade et al., 1998, Byrd et al., 2002). It has been reported
that 55-78% of adults with AML have cytogenetic abnormalities at diagnosis
(Marosi et al., 1992, Fischer et al., 1996, Tien et al., 1995, Stasi et al., 1993). Based
on these cytogenetic findings, AML patients have been categorized into three risk
groups: favourable, intermediate, or adverse. The prognostic group with favourable
cytogenetic is defined by the presence of chromosomal translocation between
chromosome 8 and 21, translocation within chromosome 16 or chromosome 16
inversion. The intermediate prognostic group includes patients with normal
karyotypes as well as patients with cytogenetic abnormalities not classified as
favourable or adverse. Patients with chromosomal abnormalities such as deletion or
loss of chromosome 5 or 7, chromosome 3 inversion and translocation between
chromosome 6 and 9 fall into an adverse risk group (Slovak et al., 2000, Byrd et al.,
2002, Grimwade et al., 1998, Dohner et al., 2010). The molecular genetic changes in
AML blasts that have prognostic significance include mutations in or overexpression
of specific genes. Mutations in FLT3 gene (Fms-like tyrosine kinase 3), a gene
encoding for a receptor tyrosine kinase, are one of the most frequent genetic
alterations occurring in AML. Patients harboring such mutations have a poorer
outcome (Whitman et al., 2001, Kottaridis et al., 2001). The Wilms’ tumor 1 (WT1)
is a transcription factor that is overexpressed in most AML patients. Mutations in
the gene encoding WT1 represent an adverse prognostic factor (King-Underwood
and Pritchard-Jones, 1998, Virappane et al., 2008, Renneville et al., 2009). On the
contrary, some studies have reported a favourable outcome associated with
mutations in the nucleophosmin gene (NPM1) (Schnittger et al., 2005, Dohner et al.,
2005). Other factors predicting resistance to treatment in AML are the presence of
transmembrane transporter proteins that actively extrudes certain chemotherapeutic
compounds from leukemic cells (Musto et al., 1991, Wood et al., 1994), high WBC
count at time of diagnosis (Dohner et al., 2010) and having secondary AML

27
(therapy-related AML or AML with a previous history of MDS or MDS/MPN)
compared with de novo AML (Estey et al., 1997, Estey and Dohner, 2006).
1.1.3.2. Chronic myelogenous leukaemia
The main prognostic factors for CML patients are the disease phase and presence or
absence of the Philadelphia (Ph) chromosome. Philadelphia chromosome is a short
chromosome 22 that results from the reciprocal translocation between chromosome
9 and 22 and leads to the generation of an abnormally active BCR-ABL1 tyrosine
kinase (Nowell and Hungerford, 1960, Rowley, 1973). Patients diagnosed in the
advanced phase and patients who don’t have the Ph chromosome have worse
outcomes (Hernandez-Boluda and Cervantes, 2009, Ezdinli et al., 1970,
Theologides, 1972, Gomez et al., 1981). Further prognostic factors that are
associated with poor prognosis among Ph chromosome-positive patients in the
chronic phase of the disease include older age, spleen enlargement, very high or
very low platelet counts, increased blood percentage of blasts and increased number
of eosinophils (Jacquillat et al., 1978, Sokal et al., 1984, Tura et al., 1981).
1.1.3.3. Acute lymphoblastic leukaemia
Acute lymphoblastic leukaemia prognostic factors include age, initial WBC count,
number of chromosomes and associated structural abnormalities (Mandrell, 2009).
Survival decreases with increasing age (Chessells et al., 1998). It also decreases with
high initial WBC count (Hoelzer and Gokbuget, 2000). The cytogenetic-molecular
abnormalities occur in about 80% of children and 60-70% of adults (Faderl et al.,
1998). In childhood ALL, hyperdiploid karyotype, which refers to leukemic blasts
with chromosome number ranging from 51-68, is associated with a better clinical
outcome; whereas having a normal number of chromosomes (diploid) or normal
chromosome number with abnormal morphology (pseudodiploid) is associated with
an intermediate outcome. A poor prognosis is associated with hypodiploid ALL
where chromosomes number is less than 45 (Mandrell, 2009). Adult patients with
either hyperdiploid (>50, 47-50, with 6q-) or diploid karyotypes have a better
prognosis (Bloomfield et al., 1989). The translocation t(12;21) is the most frequent
translocation occurring in childhood ALL cases and it indicates a favourable

28
prognosis (Mandrell, 2009), whereas the t(9;22) translocation is most frequently
found in adult patients and has been linked with poor prognosis (Faderl et al., 1998).
1.1.3.4. Chronic lymphoblastic leukaemia
Prognostic factors associated with a shorter survival time in patients with CLL
include rapid lymphocyte doubling time, expression of B-cell CLL/lymphoma 2
(BCL2), elevated serum thymidine kinase, CD38 positivity, absence of mutations in
genes encoding immunoglobulin heavy chain (IgVH), and expression of the
intracellular signaling molecule zeta-associated protein of 70 kD (ZAP-70) (Crespo
et al., 2003, Faderl et al., 2002, Hallek et al., 1999, Hamblin et al., 1999, Jelinek et
al., 2001, Montserrat et al., 1986). The cytogenetic abnormality associated with
favourable prognosis is deletion of 13q. An intermediate risk is associated with 11q
deletions, 12q trisomy and normal karyotypes whereas the worst prognosis is
associated with 17p deletions (Dohner et al., 2000).
1.1.4. Treatment
Current treatment modalities for leukaemia include chemotherapy, radiation therapy
and immunotherapy. The choice of treatment depends on the leukaemia subtype,
patients’ risk factors, age and general health. Immediate treatment is required in case
of acute leukemias due to rapid progression of malignant cells which can be fatal
within weeks or months (Devine and Larson, 1994). Usually treatment of acute
forms consists of two phases: remission-induction and post-remission therapy. The
induction therapy is usually a chemotherapy that aims to reduce the number of
leukemic cells to achieve a complete remission (CR), a condition where patients
have normal peripheral blood counts and less than 5% of leukemic cells in their
bone marrow (Devine and Larson, 1994). The goal of post-remission therapy is to
prolong the remission period as long as possible by destroying the remaining
undetectable leukemic cells which could contribute to relapse. Strategies for post-
induction therapy include treatment with intensive high-dose chemotherapy (termed
consolidation therapy), or low-dose chemotherapy (termed maintenance therapy) or
chemoradiotherapy with either allogeneic or autologous stem cell transplantation
(see section 1.3.1) (Devine and Larson, 1994, Tallman et al., 2005).

29
The outcome of patients with particular leukemic subtypes has been greatly
improved with the use of specific targeted therapies such as all-trans retinoic acid
(ATRA), tyrosine kinase inhibitors and monoclonal antibodies. The efficacy of these
targeted therapies was superior when used in combination with chemotherapy. All-
trans-retinoic acid is used to treat APL patients with the translocation t(15;17) which
occurs in more than 95% of the APL patients. The t(15;17) translocation results in a
fusion transcript that gives rise to the promyelocytic leukaemia-retinoic acid
receptor α (PML-RARα). Treatment with ATRA brings on complete remissions in
most APL patients by forcing APL-blasts to differentiate into mature granulocytes
(Huang et al., 1988, Tallman et al., 1997). Selective tyrosine kinase inhibitors that
block the activity of the deregulated BCR-ABL1 tyrosine kinase are used to treat
patients with Ph chromosome. Approximately 95% of CML patients and 15-30% of
adults with ALL have the Ph chromosome (Bernstein, 1988, Faderl et al., 1998).
Imatinib, the first tyrosine kinase inhibitor used, has become the standard therapy for
CML patients as it induces high rates of complete responses and improves survival
(O'Brien et al., 2003, Druker et al., 2001b). Philadelphia-positive ALL patients used
to have the worst prognosis; however, promising results have been achieved with the
use of imatinib (de Labarthe et al., 2007, Yanada et al., 2006, Druker et al., 2001a).
The monoclonal antibodies rituximab (anti-CD20) and alemtuzumab (anti-CD52)
have been shown to be effective in patients with ALL, B cell-CLL and refractory
CLL (Byrd et al., 2003, Stilgenbauer and Dohner, 2002, Thomas et al., 2006). A
number of monoclonal antibodies have been used to treat AML patients. Among
these, gemtuzumab ozogamicin which consists of an anti-CD33 antibody linked to
an immunotoxin is being evaluated in randomized trials (Robak and Wierzbowska,
2009). Preliminary results indicate that the addition of gemtuzumab ozogamicin to
standard chemotherapy has improved outcomes in AML patients (Chevallier et al.,
2008).
1.2. Tumour Immunology
1.2.1. Tumour immune surveillance theory
The ability of the immune system to survey the body and destroy any transformed
cells before they appear clinically was first suggested by Paul Ehrlich in the early
20th century (Ehrlich, 1909). In 1949, Sir Macfarlane Burnet published his theory of

30
acquired immunological tolerance which states that self-reactive lymphocytes are
deleted in prenatal life during the development of the immune system (Burnet,
1949). Burnet’s theory was experimentally verified by Medawar and colleagues
(Billingham et al., 1953) and led to the abandonment of the concept proposed by
Ehrlich. However, tumour transplantation experiments performed during the 1950s
in genetically identical mice strongly suggested the existence of antigens associated
with tumour cells enabling them to be recognized and eliminated by the immune
system (Baldwin, 1955, Foley, 1953, Prehn and Main, 1957). In these experiments,
mice could reject transplanted autologous tumour when challenged with a second
injection of the same tumour cells. Consequently, Burnet and Lewis Thomas
adopted Ehrlich’s early idea and proposed that major function of the immune system
is to protect from neoplastic disease (Burnet, 1970, Burnet, 1957, Thomas, 1959).
The term immunological surveillance was coined by Burnet who assumed that
lymphocytes play the key role in identifying and eliminating malignant cells
(Burnet, 1967, Burnet, 1970, Burnet, 1964).
The validity of the theory was tested for the first time when the nude strain of mice
became available to researchers. These mice lack a functional thymus making them
severely immunocompromised. According to the immune surveillance theory,
immunocompromised individuals will be more susceptible to develop tumours than
those with a competent immune system. Nevertheless, early experiments, carried out
in 1970s, showed that there was no increase in the incidence of either spontaneously
arising or chemically induced tumours among the athymic nude mice compared with
their normal wild-type counterparts (Rygaard and Povlsen, 1974, Stutman, 1974,
Burstein and Law, 1971). In contrast, several studies confirmed that the immune
surveillance mechanisms were able to eliminate the growth of tumour cells induced
by oncogenic viruses in mice (Fefer et al., 1968, Fefer et al., 1967, Klein, 1976).
These findings suggested that the immune surveillance in mice targeted
transforming viruses but not tumours themselves. Shortly afterwards, the hypothesis
was retrieved when it became clear that nude mice were not completely
immunocompromised, since detectable populations of functional αβ T cells were
found in this strain of mice (Ikehara et al., 1984, Maleckar and Sherman, 1987). In
addition to αβ T cells, other components of the immune system, able to develop
totally outside the thymus, have been discovered and found to be present in large

31
numbers in nude mice such as natural killer (NK) cells and gamma delta (γδ) T cells
(Hayday, 2000). Repetition of the experiments carried out by Stutman (1974) using
mice with different genetic backgrounds revealed that athymic nude mice did form
more tumours than the immunocompetent controls after treatment with different
doses of the chemical carcinogen, methylcholanthrene (MCA; (Engel et al., 1996).
Moreover, it has been found that tumour formation induced by MCA was greater in
immunodeficient severe-combined immunodeficiency (SCID) mice than in their
normal counterparts (Engel et al., 1997).
Stronger evidence for the existence of immune surveillance was gathered using
genetically altered strains of mice and monoclonal antibodies (mAbs) specific for
various components of the immune system. Interferon-gamma (IFN-γ) is a
pleiotropic cytokine secreted by activated NK cells and activated thymus-derived
(T) cells (Boehm et al., 1997). Several studies have shown that this cytokine plays a
critical role in protecting the host against the growth of transplanted tumours, as well
as the formation of chemically induced and spontaneously arising tumours (Dighe et
al., 1994, Kaplan et al., 1998, Shankaran et al., 2001). One of these studies showed
that transplanted murine immunogenic fibrosarcoma cell line (Meth A) grew faster
in mice treated with anti-IFN-γ than their control counterparts (Dighe et al., 1994).
These tumour cells were made insensitive to IFN-γ by the insertion of a genetically
engineered truncated IFN-γ receptor -subunit. The insensitive tumour cells
displayed enhanced tumorgenicity and were resistant to LPS induced tumour
rejection, as compared with control tumours when transplanted into naïve syngeneic
hosts (Dighe et al., 1994). Another study showed that IFN-γ-deficient mice
developed more spontaneous lymphomas and lung tumours compared with
genetically matched wild type controls (Street et al., 2002). Mice lacking either IFN-
γ receptor chain or signal transducer and activator of transcription 1 (STAT1), the
transcription factor necessary for mediating interferon receptor signaling, were
found to be more susceptible to MCA-induced tumours than their wild-type controls
(Kaplan et al., 1998). Additionally, IFN-γ-insensitive mice lacking the genes
encoding for the tumor-suppressor protein p53 developed tumours more rapidly than
wild-type mice (Kaplan et al., 1998). These mice also developed a wider spectrum
of tumours compared with mice lacking only p53 (Kaplan et al., 1998). In vivo
depletion studies showed that adoptively transferred lymphocytes were not able to
32
induce regression of established tumours in mice depleted of IFN-γ (Barth et al.,
1991, Tuttle et al., 1993).
Perforin is another key component that has been shown to play an important role in
tumour surveillance. It is a pore-forming protein (pfp) stored in cytoplasmic
granules of cytotoxic lymphocytes (CD8+ T cells and NK cells). It mediates the
main effector mechanism used by cytotoxic lymphocytes to induce apoptosis in
target cells (Russell and Ley, 2002). Compared with perforin-competent controls,
mice lacking perforin were more susceptible to tumour formation induced by MCA
(Smyth et al., 2000a, van den Broek et al., 1996, Street et al., 2001). Perforin-
deficient mice also had an increased incidence of spontaneously disseminated
lymphomas (Smyth et al., 2000b, Street et al., 2002, Street et al., 2004). When
syngeneic tumour cell lines were injected into perforin-deficient mice and their
normal counterparts, tumour cells were eliminated 10-100-fold more efficiently by
perforin-sufficient mice (van den Broek et al., 1996).
A study carried out using mice lacking recombination activating gene 1 and 2
proteins (RAG1 and RAG2) strongly supported the concept of lymphocytes
protecting the host against tumour growth (Shankaran et al., 2001). RAG1 and
RAG2 proteins are responsible for the rearrangement of VDJ DNA segments that
leads to the formation of antibody molecules as well as T-cell receptors. Mice
deficient in either of these genes fail to rearrange lymphocyte antigen receptors and
thus completely lack natural killer T (NKT), T and B lymphocytes (Shinkai et al.,
1992). Mice lacking the gene RAG-2 had a higher incidence of spontaneous and
chemically induced tumours than matched wild-type controls. Interestingly, mice
lacking both RAG2 and STAT1 genes developed spontaneous breast tumours that
were not observed in wild type or RAG2-deficint mice (Shankaran et al., 2001). The
role of NK cells in protecting against tumour formation and metastasis was
highlighted in several studies. These studies showed that NK cell-deficient mice
have an increased incidence of spontaneous tumours and cancer metastasis (Haliotis
et al., 1985, Gorelik et al., 1982, Talmadge et al., 1980, Smyth et al., 2000a). In
addition, mice that were depleted of both NK and NKT cells by the anti-NK1.1
monoclonal antibody were two to three times more susceptible to MCA-induced
tumour formation than control mice (Smyth et al., 2001).

33
In humans, the concept of tumour immune surveillance has gained more supporting
evidence through several clinical observations. One of the observations was the
increased risk of developing malignancies in immunosuppressed transplant
recipients. Some follow-up studies of these patients have shown a higher incidence
of virally induced tumours compared with the normal population whereas the
incidence of non-virally induced tumours was not increased (Penn, 1988, Sheil et al.,
1997). Nevertheless, other studies have also shown that the incidence of developing
a variety of non-virally induced cancers is higher in immunosuppressed patients than
in the general population (Birkeland et al., 1995, Pham et al., 1995, Sheil, 1986,
Penn, 1996, Vajdic et al., 2006). Another observation was the existence of a
significant relationship between the presence, location, and activation state of
lymphocytes in a tumour (tumour-infiltrating lymphocytes; TILs) and improved
prognosis. Such a relationship was first observed in melanoma patients in whom the
presence of TILs in the vertical growth phase of primary cutaneous melanomas was
correlated with survival (Clemente et al., 1996, Clark et al., 1989, Mihm et al.,
1996). The presence TILs was also correlated with improved outcome in patients
with broad range of cancers including ovarian, breast, colorectal, gastric,
oesophageal and squamous cell lung carcinoma (Naito et al., 1998, Schumacher et
al., 2001, Yoshimoto et al., 1993, Zhang et al., 2003, Ishigami et al., 2000, Villegas
et al., 2002). Finally, spontaneous regression of cancers has been occasionally seen
in patients with melanoma, neuroblastoma and renal cancer indicating that the
immune system may develop efficient anti-tumour immune responses (Bodurtha et
al., 1976, Menzies and McCarthy, 1997, Everson and Cole, 1966).
1.2.2. Cancer immunoediting theory
Despite the evidence in support of immunosurveillance, cancers continue to occur in
immunocompetent hosts, which suggests failure of the immune system to prevent
tumour growth and metastasis even in immunocompetent environments (Dunn et al.,
2002). As a result, an updated immunosurveillance hypothesis called cancer
immunoediting has been proposed by Schreiber and his colleagues (Dunn et al.,
2002). This hypothesis proposes that the immune system not only controls the
growth of tumour cells but also indirectly shapes the neoplastic disease. According
to the hypothesis, the process of immunoediting consists of three stages: elimination,

34
equilibrium and escape. The first stage represents the original concept of the
immunosurveillance theory. It starts when tissues surrounding the growing
transformed cells induce inflammatory signals that lead to recruitment of innate
immune cells including NKT, NK, γδ T cells, macrophages and dendritic cells
(DCs). The infiltrating lymphocytes (NKT, NK and γδ T cells) recognize the
transformed cells and release IFN-γ which induces tumour cell death. Chemokines,
released from tumour cells themselves as well as from surrounding tissues, also
promote death of the tumour cell by preventing angiogenesis. Immature DCs ingest
tumour cell debris and home to draining lymph nodes where they activate tumour-
specific naïve T cells. The activated tumour-specific T cells migrate to the tumor site
and destroy antigen-bearing tumour cells. In the equilibrium stage, lymphocytes and
IFN-γ exert a selective pressure on tumour cell variants that have survived the
elimination process leading to selection of tumour cells with reduced
immunogenicity. This process is perhaps the longest of the three stages and may
occur over a period of many years in humans. Tumour cell variants that have
acquired insensitivity to immunological detection enter the escape phase, where they
expand in an uncontrolled manner resulting in clinically detectable malignant
disease (Dunn et al., 2002).
1.2.3. Immune recognition of tumour cells
The immune system is a network of organs and tissues as well as humoral factors
that work together to eradicate any invading pathogens and malignant cells. It has
the ability to discriminate between self and non-self. It is composed of two main
arms, innate and adaptive arms. Innate immunity is the first line of defence, whereas
adaptive immunity is involved in the late phase of host defence. Innate immunity
includes physical barriers such as skin, soluble factors such as complement and
cellular components. The cellular components of innate immunity are neutrophils,
monocytes, macrophages, NK, NKT, and γδ T cells. Receptors for these cells are
fixed in the genome, requiring no rearrangements and recognize conserved
molecular patterns that are specific to pathogens. Adaptive immunity mediates
highly specific immune responses and displays immunologic memory, therefore
subsequent exposure to the same antigen leads to faster and more vigorous
responses. It includes B and T lymphocytes. These cells have receptors with great

35
variation, able to recognize an unlimited number of highly specific pathogens
through rearrangements of receptor gene segments (Melief, 1992). Both arms of the
immune system play an essential role in the elimination of cancer cells. The major
effector cells of innate immunity are NK cells and of adaptive immunity are T cells
(Caligiuri et al., 2004).
1.2.3.1. Natural killer cells
Natural killer cells are characterized by their potent cytolytic activity against tumor
and virally infected cells. Unlike T lymphocytes, NK cells do not possess clonally
distributed antigen receptors. However, they share certain functions with T cells
such as cytolytic effector mechanisms and cytokine production. In this, NK cells use
perforin and granzymes to achieve the cytolytic activity against target cells and
secrete cytokines such as IFN-γ, tumour necrosis factor–alpha (TNF-α) and
granulocyte macrophage-colony stimulating factor (GM-CSF) that mediate
inflammatory responses (Biron et al., 1999, Moretta, 2005).
NK cells recognize their targets through an array of surface receptors that have
either inhibitory or activating function (Moretta et al., 1996, Long and Wagtmann,
1997, Lanier, 1998, Moretta et al., 2000). The engagement of NK inhibitory
receptors to their ligands on target cells generates a signal that inhibits NK cell lysis-
a mechanism known as missing self recognition, whereas engagement of activating
NK receptors to their ligands delivers a signal that lead to target lysis-a mechanism
known as induced self recognition. The ligands for the inhibitory receptors are major
histocompatibilty complex (MHC) class I molecules and these are of two main
types; the killer cell immunoglobulin-like receptors (KIR) which specifically
recognize human leukocyte antigen (HLA)-A, -B, and –C alleles, and
CD94/NKG2A which identifies the polymorphic HLA-E molecules (Braud et al.,
1998, Moretta et al., 1996, Vilches and Parham, 2002). Loss or down regulation of
MHC class I molecules is frequently seen in tumours (Marincola et al., 2000).
Ligands that have been identified to be recognized by activating receptors are stress-
inducible molecules such as MHC-class I-related chain A/B (MICA/B), and the
unique long 16-binding proteins (ULBPs). These molecules are highly expressed by
cells suffering from stress resulting from either viral infections or neoplastic
transformation and are recognized by the activating receptor, NKG2D (Bauer et al.,

36
1999, Cosman et al., 2001). Therefore, tumour cells that have lost or express low
levels of class I MHC molecules and tumour cells that have up regulated ligands for
activating receptors, even in the presence of normal levels of MHC class I
molecules, will be targeted by NK cells. Besides their potent anti-tumour cytolytic
activity, activated NK cells facilitate adaptive anti-tumour immune responses by
stimulating the maturation of DCs (Degli-Esposti and Smyth, 2005).
1.2.3.2. T lymphocytes or T cells
T lymphocytes are considered to be the most efficient cells in mediating anti-tumour
immune responses. They are characterized by the presence of a unique receptor on
their cell surface called T-cell receptor (TCR) which is a heterodimer consisting of
either αβ or γδ chains. The majority of T cells express αβ TCR chains and either
CD4 or CD8 molecules. CD4+ T lymphocytes generally function as cytokine-
secreting T helper cells (Th), while CD8+ T lymphocytes generally function as
cytotoxic T cells (CTLs) (Delves and Roitt, 2000). Besides helper T cells, there are
also CD4+ regulatory T cells (Tregs) which are able to control effector responses
(Thornton and Shevach, 1998, Takahashi et al., 1998).
Unlike B cells which recognize free antigens, the TCR recognizes peptide antigens
that are displayed on the cell surface in combination with MHC molecules. MHC
molecules are highly polymorphic cell surface glycoproteins encoded by genes
within the major histocompatibility complex. Class I molecules are made up of a
heavy α chain and a non-covalently associated light chain, β2-microglobulin. Class
II molecules are made up of α and β chains. The presentation of protein antigens to
T cells in the context of MHC molecules involves two distinct intracellular
processing pathways. The endogenous pathway generally presents peptides derived
from cytoplasmic proteins in the context of class I MHC molecules to CD8+ T cells,
whereas the exogenous pathway mainly presents peptides derived from processing
of engulfed extracellular proteins in the context of class II MHC molecules to CD4+
T cells (Doyle and Strominger, 1987, Norment et al., 1988). Antigen processing and
presentation by the MHC class I pathway involves three major steps: processing of
endogenous proteins by the proteasome, transporting the generated peptides by
transporter associated with antigen processing (TAP) and peptide binding to nascent
MHC molecules (Figure 1.3). All nucleated cells express MHC class I molecules on

37
their surfaces. Therefore, malignantly transformed cells presenting epitopes derived
from tumour antigens could be recognized and eliminated by effector CD8+ T cells.
In contrast class II molecules are only expressed by professional antigen presenting
cells i.e. DCs, B cells and macrophages. For optimal activation of CD8+ T cells, the
signal generated by the interaction between the peptide-MHC complex and the T-
cell receptor is not sufficient. A second signal designated as co-stimulation is
required. It is provided by the interaction between CD28 on the T cell surface and
members of the B7 family (CD80/B7-1, CD86/B7-2) located on the surface of
antigen presenting cells (Lenschow et al., 1996). If a naïve T cell - i.e., a cell that
has not yet encountered a specific antigen - recognizes an antigen in the presence of
adequate costimulatory signals, cells will be primed and activated. Activated T cells
proliferate by clonal expansion and differentiate into both effector and memory cells
(van Stipdonk et al., 2001). On the other hand, if T cell stimulation occurs in the
absence of appropriate costimulatory signals, this will lead to T cell
unresponsiveness (anergy) or apoptosis and death -a mechanism which gives rise to
the induction of peripheral T cell tolerance (Lenschow et al., 1996). Additionally, T
cells express inhibitory receptors, such as cytotoxic T lymphocyte-4 (CTLA-
4/CD152) and programmed death-1 (PD-1) that negatively regulate T cell function
(Walunas et al., 1994, Carreno and Collins, 2002).
CD8+ T cells induce cytolysis of their target cells through at least two different
mechanisms: the granule exocytosis pathway which is mediated by perforin and
granzymes or Fas-mediated pathway by upregulation of membrane-bound Fas
ligand (FasL/CD95L) which interacts with the Fas receptor (CD95) on target cells.
CD8+ T cells also produce a number of cytokines including TNF-α and IFN-γ
(Delves and Roitt, 2000).

38
cytoplasm
Cell surface
Endogenous protein
proteasome
TAP
MHC I MHC I-peptide
Golgi
presentation
peptides
MHC I-peptide
cytoplasm
Cell surface
Endogenous protein
proteasome
TAP
MHC I MHC I-peptide
Golgi
presentation
peptides
MHC I-peptide
Cell surface
Endogenous protein
proteasome
TAP
MHC I MHC I-peptide
Golgi
presentation
peptides
MHC I-peptide
Figure 1.3. Major histocompatibility complex class I presentation pathway.
Three major steps contribute to this pathway. The first step is the degradation of endogenous proteins
into smaller fragments by the proteasome which is a large multienzyme complex in the cytosol. The
resulting peptides are translocated into the lumen of endoplasmic reticulum by TAP where they bind
to nascent MHC class I molecules and transported through Golgi apparatus to the cell surface. Figure
adapted with modifications from (Heath et al., 2004)
39
1.2.4. Mechanisms of tumour escape
Surviving tumours developed different mechanisms to escape recognition by the
host immune system. Some of these mechanisms involve alterations in the
expression of effector molecules crucial for T cell recognition. These mechanisms
include: alterations in the expression of HLA class I and class II molecules,
mutations of β2-microglobulin, downregulation of TAP, loss of tumour antigens,
decreasing the expression of the co-stimulatory molecules such as B7 molecules,
and enhancing the expression of co-inhibitory molecules such as B7-H1 molecule
(Dorfman et al., 1997, Marsman et al., 2005, Jager et al., 2001, Marincola et al.,
2000, Dong et al., 2002, Dermime et al., 1997, Bicknell et al., 1996, Vitale et al.,
1998, Ghebeh et al., 2008). Impaired binding of perforin to the tumour cell
membrane is a mechanism used by tumour cells to resist killing by cytolytic cells
(Lehmann et al., 2000). Down regulation of Fas and mutations in Fas as well as in
TNF-related apoptosis-inducing ligand receptors have also been reported in some
tumours (Real et al., 2001, Shin et al., 2001). Tumours can kill infiltrating immune
cells by expressing FasL without damaging themselves (Whiteside, 2002). In
addition, tumors and a subset of DCs constitutively express the enzyme indoleamine
2,3-dioxygenase which induces tryptophan deficiency in the tumour
microenvironment and sensitizes activated T cells to apoptosis (Uyttenhove et al.,
2003, Munn et al., 2004).
Tumours can also evade immune recognition by secreting a number of
immunosuppressive mediators such as IL-6, IL-10, macrophage-colony stimulating
factor (M-CSF) vascular endothelial growth factor (VEGF), transforming growth
factor beta (TGF-β), soluble FasL and soluble MICA. These suppressive mediators
promote tumour growth by inhibiting anti-tumour immune responses and/or
recruiting immune cells with regulatory functions favourable for the tumour. IL-10,
TGF-β and VEGF suppress DCs differentiation and maturation (Gabrilovich et al.,
1998, Kim et al., 2006). Immature DCs in turn induce either T-cell unresponsiveness
or Tregs, a suppressor subset of CD4+ T cells that have been shown to inhibit anti-
tumour specific T cells (Almand et al., 2001, Jonuleit et al., 2000, Dhodapkar et al.,
2001, Hawiger et al., 2001, Zou, 2005, Lehe et al., 2008). IL-6 and M-CSF secreted
by tumour cells and tumour environmental macrophages switch DC differentiation
towards macrophage differentiation (Menetrier-Caux et al., 1998). Soluble FasL and

40
soluble MICA inhibit anti-tumour activity of both cytotoxic T cells and NK cells
(Doubrovina et al., 2003, Webb et al., 2002). Besides the induction of immature
DCs and Tregs, tumour mediators promote the recruitment of myeloid suppressor
cells which inhibit priming of naïve T cells (Bronte et al., 2001).
1.3. Immunotherapy for Leukaemia
1.3.1. Allogeneic hematopoietic stem cell transplantation
Allogeneic hematopoietic stem cells transplantation (HSCT) is an efficient therapy
for a variety of haematological malignancies, including leukemias. It was developed
with the aim of restoring the hematopoietic stem cell compartment in patients
following a myeloablative conditioning regimen i.e. high dose chemotherapy and/or
total body irradiation. It is now known that donor immune cells transplanted with the
stem cell allograft, or arising from it, recognize and eliminate residual leukaemia
cells in the recipient - an immunological effect known as graft-versus-leukaemia
(GvL). The donor immune cells may also attack normal host tissues such as skin,
gastrointestinal tract and liver giving rise to a graft-versus-host disease (GvHD)
complication. Another possible consequence of the HSCT is graft rejection,
occurring when recipient immune cells attack and destroy the transplanted graft,
leading to a host-versus-graft (HvG) reaction (Appelbaum, 2001).
The existence of a GvL effect has been supported by studies showing that relapse
rates following allogeneic transplantation were lower in patients who developed
GvHD compared with those who did not (Weiden et al., 1979, Weiden et al., 1981).
The relapse rates were also lower in patients who received allogeneic transplants
compared with those who received syngeneic transplants i.e. from their identical
twin (Gale et al., 1994, Fefer et al., 1987). However, the most important evidence
for the existence of the GvL effect came form the astonishing success of donor
lymphocyte infusions (DLI). In DLI, patients relapsing following allogeneic HSCT
are treated with infusions of lymphocytes obtained from the peripheral blood of the
original stem cell donor. Using this immunotherapeutic approach, complete
remissions could be re-induced in most relapsed CML and some AML patients
(Kolb et al., 1995, Kolb et al., 1990). The reactions occurring during the GvL effect
are mainly mediated by donor CD4+ and CD8+ T lymphocytes. Evidence for this

41
came from increased relapsed rates in patients who received T cell-depleted grafts in
an attempt to prevent GvHD activity (Apperley et al., 1986, Hale et al., 1988).
Besides T cells, NK cells have also been shown to contribute to the GvL response in
cases of mismatched hematopoietic transplants (Ruggeri et al., 2002, Giebel et al.,
2003). The GvL effect could be separated form GvHD in some patients because
relapsed rates were reduced in a subset of patients who received allogeneic HSCT
but did not develop GvHD and remissions could be achieved after DLI without
developing GvHD (Giralt and Kolb, 1996, Kolb and Holler, 1997, Horowitz et al.,
1990, Collins et al., 1997). These findings led to efforts to develop T-cell based
therapy for leukaemia patients that aim to augment the GvL effect without causing
GvHD.
1.3.2. Potential target antigens of the GvL effect
Targets recognized by alloreactive donor T cells during a GvL response include
antigenic peptides that are either derived from polymorphic minor histocompatibility
antigens (mHAgs) or derived from antigens that are associated with the malignant
phenotype, known as leukaemia antigens (Appelbaum, 2001). The mHAgs are
immunogenic peptides derived from intracellular proteins that differ between the
donor and the recipient as a result of genomic polymorphisms. These antigens have
been shown to be targets of alloreactive T cells in both GvL and GvHD reactions
(Warren et al., 1998, Goulmy et al., 1983, Goulmy et al., 1996). Some of the
identified mHAgs, including HA-1 and HA-2, are derived from proteins expressed
only in hematopoietic cells, whereas other mHAgs are broadly expressed in all or
most tissues (den Haan et al., 1998, den Haan et al., 1995, de Bueger et al., 1992).
Several studies have demonstrated that T cells specific for the hematopoietic
restricted mHAgs, but not the broadly expressed antigens represent ideal
immunotherapeutic targets that would enhance the GvL activity with minimal
GvHD (Akatsuka et al., 2003, Mutis et al., 1999a, Bonnet et al., 1999, Mutis et al.,
1999b, Dickinson et al., 2002, Stumpf et al., 2009, Ofran et al., 2010).
Leukaemia antigens fall into two major categories: leukaemia-specific antigens and
leukaemia-associated antigens (LAAs). Examples for each category are presented in
Table 1.3 (Borrello and Sotomayor, 2002). The specific antigens are those resulting

42
from mutations or chromosomal translocations as well as antigens that are derived
from viral proteins. Examples of this group include BCR-ABL found in CML and
PML-RARα found in APL patients. The BCR-ABL is a chimeric protein that results
from a t(9;22) translocation found in 95% of CML patients. Chromosomal
translocation is a common finding in leukaemia that results in the generation of
fusion genes coding for chimeric proteins. The joining region of the chimeric
proteins generates unique epitopes that are tumour specific and therefore represent
attractive targets for immunotherapy. Several CTL epitopes derived from the joining
region of the BCR-ABL have been identified. These epitopes were found to bind to
several HLA alleles, including HLA-A2, -A3, A11 and -B8 molecules and to elicit
specific CTL responses in vitro (Yotnda et al., 1998, Clark et al., 2001, Bocchia et
al., 1996, Osman et al., 1999a). The associated antigens are normal proteins that are
aberrantly expressed or over-expressed in leukemic cells compared with normal
cells. This category can be subdivided into two groups according to their expression
patterns in normal and malignant tissues. These groups are overexpressed antigens
and cancer-germ line antigens. Overexpressed antigens are normal proteins that are
expressed in normal tissues at low levels and expressed constitutively in tumour
cells. Since these proteins are self normal proteins, immunological tolerance may
exist and prevent their recognition by T cells. However, the overexpression of these
normal proteins can break the immunological tolerance towards these antigens
(Dermime et al., 2002). The WT1 and proteinase-3 (PR-3) are examples of
overexpressed leukaemia antigens that have been shown to be recognized by
autologous CTLs. M-Phase Phosphoprotein 11 (MPP11) and the receptor for
hyaluronic-acid-mediated motility (RHAMM/CD168) are overexpressed antigens
that were identified as potential LAAs by serological screening of myeloid
leukaemia patients (Greiner et al., 2003, Greiner et al., 2002). In addition, an HLA-
A0201-restricted CTL epitope derived from RHAMM has been also identified
(Greiner et al., 2005). Cancer-germ line antigens result from reactivation of genes
which are normally silent in normal cells and become activated in different tumours.
Their expression in normal tissues is restricted to placental trophoblasts and
testicular germ cells. They represent attractive targets for specific immunotherapy
since germ line cells lack MHC class I and class II molecules, epitopes of these
antigens will not be expressed by these tissues (Borrello and Sotomayor, 2002).
Preferentially expressed antigen of melanoma (PRAME) is a cancer-testis antigen

43
that has been shown to elicit humoral immune response in 47% of AML patients
(Greiner et al., 2000).

44
Table 1.3. Tumour antigens expressed in leukaemias, adapted with modification
from (Borrello and Sotomayor, 2002). Category of Antigen Leukaemia type
Specific-leukaemia antigens
Fusion gene products
-BCR-ABL Chronic myelogenous leukaemia
-DEK-CAN Acute myelogenous leukaemia
-AML/ETO Acute myelogenous leukaemia
-PML-RARα Acute Promyelocytic leukaemia
Viral-Associated Antigens
- HTLV-1 Adult T-cell leukaemia
Associated-leukaemia antigens
Cancer-germ line antigens
-PRAME Acute myelogenous leukaemia
Overexpressed Antigens
- Proteinase-3 Acute myelogenous leukaemia and Chronic myelogenous leukaemia
- WT-1 Acute myelogenous leukaemia, Chronic myelogenous leukaemia and Acute lymphoblastic leukaemia
-MPP11 Acute myelogenous leukaemia and Chronic myelogenous leukaemia
-RHAMM Acute myelogenous leukaemia and Chronic myelogenous leukaemia

45
1.4. Candidate antigens for leukaemia immunotherapy
1.4.1. Wilms’ tumor 1 (WT1)
The WT1 gene encodes a zinc finger transcription factor that is normally expressed
in tissues of mesodermal origin during embryogensis, including the kidney, gonads,
heart, mesothelium and spleen. It has been shown to be responsible for childhood
renal cancer (Call et al., 1990). It is overexpressed in acute myelogenous and
lymphoblastic leukaemia, chronic myelogenous leukaemia and also in various types
of solid tumours including lung and breast cancer (Oji et al., 1999, Bergmann et al.,
1997, Menssen et al., 1995, Loeb et al., 2001, Oji et al., 2002). The higher
expression levels of WT1 in leukaemia patients have been found to be associated
with poor prognosis (Bergmann et al., 1997, Inoue et al., 1997, Boublikova et al.,
2006). Therefore, WT1 is important as a prognostic marker as well as in the
detection and monitoring of minimal residual disease in leukaemia and
myelodysplastic syndrome (Inoue et al., 1994). WT1-derived HLA class I peptide
epitopes with various HLA restrictions including HLA-A201, -A24, -A206 and -
A01 have been identified (Azuma et al., 2002, Bellantuono et al., 2002, Oka et al.,
2000, Li et al., 2008, Asemissen et al., 2006). Class II epitopes derived from WT1
have also been identified (Kobayashi et al., 2006, Fujiki et al., 2007, Knights et al.,
2002, May et al., 2007). Furthermore, natural specific humoral immune responses to
the WT1 antigen have been reported in patients with haematological malignancies
(Elisseeva et al., 2002, Wu et al., 2005). For these reasons, WT1 has been
considered as an attractive target for cancer immunotherapy.
1.4.2. M-Phase Phosphoprotein 11 (MPP11)
MPP11 was discovered by Matsumoto-Taniura et al (1996) using MPM2
monoclonal antibody, which recognizes several important mitosis phosphoproteins
found to be present during mitosis (Davis et al., 1983). Recently, it has been
reported that MPP11 function as a ribosome-associated molecular chaperon
(Hundley et al., 2005, Otto et al., 2005). MPP11 maps to the critical region of
chromosome 7q22-31.1, which is a critical common position in human cancer
(Resto et al., 2000, Zenklusen and Conti, 1996). MPP11 has been detected by
serological analysis of cDNA expression libraries (SEREX) in solid tumours and

46
haematological malignancies including melanoma, breast, renal cell carcinoma,
small cell lung cancer and leukaemia (Gure et al., 2000, Greiner et al., 2003). The
humoral immune responses to MPP11 have been detected in patients with AML and
CML, but not in healthy donors or patient with autoimmune diseases (Greiner et al.,
2003). Moreover, this protein has been found to be expressed extensively in AML,
and CML patients as compared to normal controls (Schmitt et al., 2006, Greiner et
al., 2003, Greiner et al., 2004). Immuno-histochemical staining of primary tumour
sections and Western blot analysis of head and neck squamus cell cancer (HNSC
cell lines revealed tumour-specific overexpression of MPP11 protein (Resto et al.,
2000). Additionally, fluorescence in situ hybridization analysis carried out on
HNSCC cell lines showed an increase in the copy number of MPP11 along with
chromosome 7 suggesting an oncogenic role for MPP11 (Resto et al., 2000). The
specific overexpression of MPP11 by tumour tissues (with the exception of very low
expression in testis, kidney, and lung) makes it an attractive target for cancer
immunotherapy (Greiner et al., 2004).
1.4.3. Proteinase-3 (PR-3)
PR-3 is a serine protease enzyme that is induced at the promylocytic stage of
differentiation and stored in azurophilic granules of promyelocytes (van der Woude
et al., 1985). PR-3 is known to be a target of anti-neutrophil cytoplasmic antibody
(Hernandez-Caballero et al.) in patients who have the autoimmune disease
Wegener's granulomatosis (Williams et al., 1994). Furthermore, proliferative T cell
responses against purified PR-3 protein has been documented in these patients
(Ballieux et al., 1995). PR-3 belongs to the group of primary granule proteins, which
are aberrantly expressed in myeloid leukaemias. It is highly overexpressed by cells
from CML patients and differentially expressed by some AML cells (Muller-Berat
et al., 1994, Yong et al., 2008). Importantly, it may be involved in the process of
leukemogenesis because antisense oligodeoxynucleotides against PR-3 were able to
inhibit cell proliferation and induce differentiation in an HL-60 promyelocytic
leukaemia cell line (Bories et al., 1989). Therefore, PR-3 is of great interest as a
source of leukaemia antigens for immunotherapy (Barrett and Rezvani, 2006,
Fujiwara et al., 2005).

47
An antigenic HLA-A*0201-restricted epitope, named PR1 (VLQELNVTV), derived
from the PR-3 antigen has been identified (Molldrem et al., 1996) and is being used
in clinical trials for leukaemia patients (Heslop et al., 2003, Clinical Trials.gov,
2006, Clinical Trials.gov, 2009, Qazilbash et al., 2004). This epitope was identified
by Molldrem et al. (1996) who used BIMAS algorithm software program to identify
PR-3-derived peptides with high binding affinities to the most frequent HLA-A
allele, HLA-A*0201. The predicted peptides were used to elicit peptide-specific
CTLs in vitro from healthy HLA-A*0201 donor lymphocytes which specifically
lysed HLA-A*0201 positive myeloid leukemias overexpressing proteinase-3
(Molldrem et al., 1996). In a subsequent study, Molldrem and his colleagues showed
that the same CTLs were able to inhibit the colony formation in vitro by leukemic
but not normal CD34+ cells (Molldrem et al., 1997). Furthermore, both cell lysis and
inhibition of progenitor formation correlated with the amount of intra-cytoplasmic
PR-3 expression by the leukaemia target cells (Molldrem et al., 1996, Molldrem et
al., 1997). The PR-1 T cell epitope was then thoroughly investigated. Only T cells
with high avidity exerted an anti-leukemic effect following isolation of high and low
avidity anti-PR-1 T cells from normal individuals (Molldrem et al., 2003). In
accordance with previous results that showed the presence of PR-1-specific T cells
in healthy individuals at low frequencies (Molldrem et al., 1999), Molldrem et al.
reported high frequencies of cytotoxic T cells specific to the PR-1 epitope in CML
patients responding to interferon-α {} and also in a group of patients responding to
allogeneic bone marrow transplantation (BMT) treatment. This suggests that the PR-
1-specific CTLs expand in responding patients and contribute to remission
(Molldrem et al., 2000). The existence of natural immune response to PR1 that can
be amplified in the presence of leukemic cells was demonstrated by the Barrett
group {Rezvani, 2003 #119} who found that PR-1-specific memory T-cell
frequencies of around 1/100 000 exist in healthy donors, while blood taken from
patients in remission showed one and two log increases over the normal baseline.
PR-1 peptide sequence is also expressed by neutrophil elastase (NE) which is
another granular serine protease found to be highly expressed in CML progenitors
(Fujiwara et al., 2004, Yong et al., 2008). Interestingly, it has been reported that a
high expression levels of both PR-3 and NE in CD34+ progenitors were associated
with longer survival in patients with CML suggesting T-cell mediated responses
against these overexpressed antigens (Yong et al., 2007, Yong et al., 2006).

48
1.4.4. Approaches for the identification of tumour antigens
Different approaches have been used to identify tumour antigens that induce
immune responses in humans. The first approach used is based on the identification
of targets that were recognized by patients' tumour-specific CTLs clones. To identify
such antigens, genomic DNA libraries or cDNA libraries prepared from tumour cells
were transfected into cells expressing the appropriate MHC molecule. The tumour-
specific T cells were then tested for their ability to recognize the antigen by
releasing cytokines or lysing specific target cells (van der Bruggen et al., 1991,
Kawakami et al., 1994). The majority of genes encoding tumour antigens in solid
malignancies have been identified using this approach (Wang and Rosenberg, 1996).
Another approach based on a biochemical purification method is also used. This
method involves acid-elution of peptides from MHC molecules purified from
tumour cells and separation of the eluted peptides by high performance liquid
chromatography. Peptide fractions are then loaded onto MHC-matched APCs to test
their ability to elicit T-cell responses. The reactive peptides are further analyzed
using tandem mass spectrometry which allows the isolation and sequencing of
individual peptides. Once the amino acid sequence is identified, database searches
can be used to determine the source of the antigen (Hunt et al., 1992, Cox et al.,
1994, Skipper et al., 1999, van Bergen et al., 2007, den Haan et al., 1995).
SEREX (serological analysis of recombinant cDNA expression libraries) as well as
proteomics are used for identification of tumour antigens based on detection of
proteins that elicit spontaneous humoral immune responses in cancer patients. In the
SEREX method, a cDNA library is constructed from a fresh tumour specimen,
packaged into a lambda-phage vector and expressed in Escherichia coli (E.coli). The
recombinant proteins are transferred onto nitrocellulose membranes and screened for
recognition by high-titer IgG antibodies present in the patient’s serum (Sahin et al.,
1995, Chen et al., 1997). Some T cell defined antigens could be also detected using
SEREX analysis, indicating that this approach is useful in identifying tumour
antigens that are recognized by antibodies (Sahin et al., 1995). More importantly, at
least two of the newly SEREX-identified antigens were subsequently shown to elicit
specific T-cell responses (Chen et al., 1997, Greiner et al., 2005). The other method,
proteomics, analyzes cellular extracts as well as serum proteins from normal and

49
cancer patients to compare and identify differentially expressed tumour antigens. It
uses two-dimensional western blotting experiments to separate proteins followed by
incubation with sera from cancer patients. Mass spectrometry and database search
are then used to identify reactive target proteins (Le Naour, 2007, Chen et al., 2002,
Cui et al., 2005).
Analyzing gene expression profiles in cancer cells and comparing them with those in
normal counterparts is used to identify any abnormal genes (mutated or virally-
derived) or normal but overexpressed genes that are aberrantly expressed in tumour
cells. The techniques used to analyze the expression of genes include gene
microarrays, serial analysis of gene expression (SAGE) and cDNA subtraction
(Velculescu et al., 1995, Wang et al., 2000).
Candidate tumour antigens that have been identified by approaches such as SEREX
or gene expression analyses can be searched for their epitopes using computer based
prediction algorithms available on the worldwide web. This approach is known as
reverse immunology or epitope deduction. It has been used to identify CTL epitopes
not only from tumour antigens but also from viral antigens, microbial antigens and
autoantigens (Satoh et al., 2005, Capo et al., 2005, Hassainya et al., 2005). It is
based on the identification of peptides that are predicted to bind to a given MHC
class I allele. Subsequently the immunogenicity of the identified peptides is studied
by challenging CD8+ T cells with APCs-loaded peptides. The basic steps of this
method are shown in Figure 1.4. Nowadays other steps involved in the antigen
processing and presentation by MHC class I pathway i.e. proteasome processing and
TAP translocation, can be also predicted. Table 1.4 list algorithms that have been
established for prediction of either one step of the presentation pathway or a
combination of these steps. Among these the bioinformatics and molecular analysis
section (BIMAS) and the SYFPEITHI database are the most commonly used
algorithms (Kessler and Melief, 2007).

50
Candidate antigen
MHC binding prediction(using algorithms such as BIMAS and
SYFPEITHI)
Candidate peptides
Testing MHC binding experimentally(T2 binding assay)
Generation of anti-peptide specific CTLs
Testing CTLs specificity (cytotoxic assay, cytokine analysis,
tetramer analysis)
In vitro analysis in HLA-transgenicmice
Phase I clinical trial
Figure 1.4. The basic steps of reverse immunology approach for the identification of
immunogenic epitopes.
A candidate antigen is selected and screened for peptides that bind well to a particular class I allele
using computer programs. The predicted peptide sequences are synthesized and their binding
affinities are measured using assays such as the T2 binding assay (see Materials and Methods, section
2.4). Peptides with high binding affinities are pulsed onto APCs and peptide-specific CTLs are
generated in vitro. The generated CTLs are tested for their specificity and subsequently for their
recognition of tumour cells expressing the antigen of interest. The next step is to test the
immunogenicity of the epitope in HLA-transgenic mice. If the epitope gives positive results,
candidate antigens can be classified as tumour antigen and tested in clinical phase I trials. Figure
adapted with modifications from (Schultze and Vonderheide, 2001).

51
Table 1.4. Internet-based prediction algorithms, adapted with modification from
(Kessler and Melief, 2007).
Program Prediction of
URL MHC
class I Proteasome
cleavage TAP
BIMAS
+
http://bimas.dcrt.nih.gov/molbio/hla_bind
HLA-A2 (no name) + http://zlab.bu.edu/SMM/
IEDB (HLA class 1) + http://tools.immuneepitope.org/analyze/html/
MAPPP (combined) + http://www.mpiib-berlin.mpg.de/MAPPP/expertquery.html
MAPPP (Fragpredict) + http://www.mpiib-berlin.mpg.de/MAPPP/cleavage.html
MHC II (no name) + http://bioinfo.weizmann.ac.il/mhc2motifs/
MHC-BPS + http://bidd.cz3.nus.edu.sg/mhc/
MHCPred + http://www.jenner.ac.uk/MHCPred
Multipred + http://research.i2r.a-star.edu.sg/multipred/
NetChop + http://www.cbs.dtu.dk/services/NetChop
NetMHC + http://www.cbs.dtu.dk/services/NetMHC
nHLAPred + http://www.imtech.res.in/raghava/propred1/index.html
PAProC + http://paproc.de
Pcleavage + http://www.imtech.res.in/raghava/pcleavage/
PREDEP + http://margalit.huji.ac.il/
PREDTAP + http://antigen.i2r.a-star.edu.sg/predTAP/
ProPred-I + + http://www.imtech.res.in/raghava/propred1/index.html
RANKPEP + + http://bio.dfci.harvard.edu/Tools/rankpep.html
SVMHC + http://www-bs.informatik.uni-tuebingen.de/SVMHC/
SVRMHC + http://svrmhc.umn.edu/SVRMHCdb/
SYFPEITHI + http://www.syfpeithi.de
TAPPred + http://imtech.res.in/raghava/tappred/

52
1.4.5. Modalities of T-cell-mediated immunotherapy
The identification of several leukaemia antigens that can be specifically recognized
by antigen-specific T cells, has led to the development of immunotherapeutic
regimens using T cells. There are two types of T-cell-mediated immunotherapy: the
passive adoptive T-cell transfer and active immunostimulatory vaccination (Kessler
and Melief, 2007). The widely used form of adoptive transfer of T cells is the
infusion of unmanipulated donor lymphocytes to treat leukemic patients who have
relapsed after allogeneic HSCT. This therapy is curative in a significant percentage
of patients (Kolb et al., 1995). The other form of adoptive therapy utilizes the
identification and expansion of autologous or allogeneic antigen-specific cells that
specifically target leukemic cells, followed by administration to cancer patients
(Rosenberg et al., 2008). T cells specific for leukaemia antigens can be isolated from
the leukaemia patient or can be generated in vitro using leukaemia antigen-loaded
APCs (Amrolia et al., 2003). Another method is the transfer of a TCR gene specific
for leukaemia antigen, such as WT1 via lymphocyte transfection (Stauss et al.,
2008). Active vaccination based on the use of either defined or undefined tumour
antigens, include the following strategies:
1.4.5.1. Peptide-based vaccines
Peptide-based vaccines deliver a peptide or multiple synthetic peptides of tumour
antigens that can be recognized by the patient immune system in an MHC-restricted
manner. Several phase I and II clinical vaccine trials that investigate the clinical
significance of MHC class I-restricted peptides derived from BCR-ABL, WT1, PR-3
as well as RHAMM have been performed in leukaemia patients and have showed
some encouraging results (Cathcart et al., 2004, Qazilbash et al., 2004, Oka et al.,
2004, Mailander et al., 2004, Schmitt et al., 2008, Pinilla-Ibarz et al., 2000). A
number of strategies have been established to improve this type of vaccination.
These strategies include injection of a peptide vaccine together with an adjuvant
such as montanide or peptide loaded onto DCs (Osman et al., 1999b, Qazilbash et
al., 2004, Pinilla-Ibarz et al., 2000). It is well known that a CD4+ T-helper response
is required for robust and persistent CD8+ T-cell responses (Janssen et al., 2003,
Kumaraguru et al., 2004). Therefore, a tumour-specific Th1 epitope can be
incorporated along with the CTL epitope to enhance the CTL-mediated tumour

53
destruction (Smits et al., 2009). Another strategy known as epitope enhancement has
also been used. Epitope enhancement strategies rely on the use of heteroclitic
(modified) peptides. These peptides are synthetic variants of the natural peptide
sequence with the same HLA-binding specificity and avidity, but with enhanced
affinity to class I MHC molecules or to TCR (Smits et al., 2009). This strategy has
been used to enhance the immunogenicity of peptides derived from leukaemia
antigens such as BCR-ABL, CD33 and WT1 as well as peptides derived from
melanoma associated antigens such as MART-1/Melan-A and gp100 (Tsuboi et al.,
2002, Pinilla-Ibarz et al., 2005, Valmori et al., 1998, Parkhurst et al., 1996, Bae et
al., 2004a).
1.4.5.2. Full-length tumour antigen vaccines
Recombinant viral vectors or naked DNA plasmids that encode defined full-length
tumour antigens are used to deliver full-length tumour antigen vaccines (Kessler and
Melief, 2007). Viral vectors have the ability to initiate immune responses with
inflammatory reactions occurring as a result of the viral infection. According to the
danger theory (Matzinger, 1994), viral infection should attract professional APCs
necessary for antigen presentation (Dermime et al., 2002). In a mouse model,
vaccination with adenovirus encoding the WT1 antigen was shown to elicit potent
anti-WT1 responses, protect mice from leukemic cell challenge and retarded tumour
growth (Osada et al., 2009). A DNA-based vaccine targeting the leukaemia antigen
PML-RARα in a mouse model induced protective immune responses against
leukaemia progression when combined with the conventional ATRA therapy (Padua
et al., 2003).
1.4.5.3. Whole-tumour cell vaccines
Whole-tumour cell vaccines are among the earliest forms of cellular therapy that has
been used to vaccinate cancer patients. It usually consisted of autologous irradiated
tumour cells or tumour-derived lysates. In order to induce the required immune
response in tumour-bearing patients, tumour-cell vaccines were mixed with bacterial
adjuvants such as Bacillus Calmette-Guerin (BCG) or cytokines such as IL-2 and
GM-CSF (Powles et al., 1975, Powles et al., 1977, Zhang et al., 2005). Nowadays,
tumour cells can be genetically modified to express high levels of co-stimulatory
molecules, such as CD80 and /or cytokines, such as IL-2 and GM-CSF (Chan et al.,

54
2005, Stripecke et al., 2000). When using this kind of vaccination, all antigens that
could serve as targets for the immune system will be included in the vaccine without
the need for their prior identification. However, the main limitation for this approach
is the need for a personalized vaccine. This problem has been solved by the use of
allogeneic tumour-cell vaccination in which cell lines derived from the tumour type
which is the therapeutic target can be established in vitro, genetically modified, and
used as a single reagent (Dermime et al., 2002).
1.4.5.4. Dendritic cell-based vaccines
Dendritic cells represent the most powerful APCs capable of priming effective T cell
responses (Banchereau and Steinman, 1998). Immature DCs constitutively express
high levels of MHC molecules, costimulatory and adhesion molecules and possess
an extraordinary capacity to capture and process antigens. Upon maturation, DCs are
able to stimulate CD4+ T cells via HLA class II and CD8+ T cells via interaction of
HLA class I-a process known as cross-priming. DCs also stimulate NK cells and B
cells (Banchereau and Palucka, 2005). Besides these properties, the possibility to
generate large numbers of functional human DCs ex vivo has opened the way to use
these cells in vaccination trials. Two general strategies have been used to obtain
human DCs for vaccine therapy: immature DC precursors can be purified from
peripheral blood or DCs can be derived in vitro from peripheral blood CD14+
monocytes or CD34+ hematopoietic stem cells using GM-CSF and IL-4 (Borrello
and Sotomayor, 2002). Different approaches for the development of DC-based
vaccines have been used in leukaemia patients and many of which were effective in
inducing anti-leukaemia immune responses. DCs were loaded with peptides derived
from the leukaemia antigens PML-RARα, or transfected with mRNA encoding WT1
antigen (Osman et al., 1999b, Smits et al., 2009). DCs were also loaded with
undefined leukaemia antigens derived from apoptotic or necrotic leukaemia cells,
leukaemia cell lysates or acid eluted peptides (Delluc et al., 2007, Weigel et al.,
2006, Jarnjak-Jankovic et al., 2005, Lee et al., 2004, Spisek et al., 2002). Leukaemia
cells induced to express DCs properties by differentiation, fusion or genetic transfer
have been also used (Klammer et al., 2005, Roddie et al., 2000, Roddie et al., 2006).
Importantly, these leukemic cells maintain expression of leukemic antigens but also
have some immuno-stimulatory features of DCs.

55
1.5. Aims of this Study
In order to improve the T-cell-based immunotherapeutic approaches for leukaemia
patients, this study aimed to enhance the immunogenicity of previously identified
epitopes derived from WT1 antigen as well as to identify novel potential epitopes
derived from other leukaemia-associated antigens such as MPP11 and PR-3.
The Db126126-134 (126N=RMFPNAPYL) and WH187187-195 (187N=SLGEQQYSV)
are HLA-A*0201-resticted epitopes derived from the WT1 antigen. These epitopes
have been shown to elicit specific CTL responses. The aim of the first part of the
study was to improve the immunogenicity of these epitopes using an epitope
enhancement approach consisting of replacing the first amino acid of the epitope
sequence with a tyrosine. The modified peptides may then display stronger binding
affinities to the HLA-A*0201 molecule and enable a more efficient trigger of
peptide-specific CTLs, recognizing the naturally occurring epitope. The CTL lines
will be generated by in vitro stimulation of CD8+ T cells, purified from normal
human HLA-A*0201donor, using autologous-mature DCs loaded with the WT1-
derived peptides. The immunogenicity of the CTLs generated against each analogue
peptide will be compared with that of the native sequence using cytotoxicity and
ELISPOT assays against WT1-loaded autologous LCLs and T2 cells and HLA-
matched leukaemia cells. Importantly, the CTLs specific for the analogue peptides
will be tested for their ability to recognize the native sequences.
Our group has successfully generated Treg clones specific for a peptide derived
from WT1 antigen, WT1-84-333-347 (RYFKLSHLQMHSRKH), in an HLA-DR04
restricted manner and showed the existence of this population in leukaemia patients.
The aim of the second part of the study was to investigate whether Tregs specific for
WT1-84 peptide could also be generated from other HLA-DR04-matched donors.
The T cell lines will be generated by in vitro stimulation of PBMCs obtained from
three normal HLA-DR04+ donors using autologous-mature DCs loaded with the
WT1-Pepmix. The proliferative activity of the generated T cell lines will be tested
for their ability to recognize WT1-84 peptide using proliferation assay against WT1-
Pepmix/ WT1-84 peptide loaded autologous APCs.

56
The third part of the study aimed to identify novel CD8+ CTL epitopes in the gene
sequence of MPP11 and PR-3 which may bind to the HLA-A*0201 molecule and
provoke specific CTL responses. Identification of such novel CTL epitopes derived
from these leukaemia-associated antigens is a crucial step for the development of
leukaemia-specific therapies. These epitopes will be used as targets for the
generation of antigen specific T-cells which subsequently could be utilized in
adoptive therapy or the development of vaccines efficient in eradicating minimal
residual leukemic cells in leukaemia patients expressing elevated levels of MPP11
and/or PR3. The identification of the novel CTL epitopes will be carried out by
screening the amino acid sequence of MPP11 and PR-3 antigens for potential HLA-
A*0201 binding peptides using epitope prediction programs. CTL lines will be
generated against candidate peptides by in vitro stimulations of CD8+ T cells,
purified from normal human HLA-A*0201donors, using APCs-loaded peptides. The
generated CTL lines will be tested for the ability to generate anti-peptide specific
responses using cytotoxicity and ELISPOT assays against peptide-loaded target cells
and HLA-matched leukaemia cells.

57
2. MATERIALS AND METHODS

58
2.1. Patients and Donors
All samples were obtained with informed consent at King Faisal Specialist Hospital
and Research Centre (KFSH&RC), Saudi Arabia. Blood samples were obtained
from patients with AML and ALL patients. Information such as the percentage of
the blast cells in the patients’ blood samples as well as the patients’ status were
obtained from the clinic. Leukocyte-rich Buffy coats not older than eight hours were
obtained from healthy volunteers from the Blood Bank.
2.2. Preparation of Peripheral Blood Mononuclear Cells
Peripheral blood mononuclear cells (PBMCs from leukaemia patients and healthy
donors were isolated from heparinized blood by density gradient centrifugation over
Ficoll–Paque PLUS (Amersham Biosciences) according to the manufacturers’
instructions. Briefly, blood samples were diluted with 2-4 volumes of phosphate-
buffered saline containing 0.5% fetal calf serum (PBS/FCS).Each sample was then
carefully layered over a Ficoll-Paque Plus layer in sterile centrifuge tubes. The
samples were centrifuged at 2000 rpm. The interface cells (PBMCS i.e. lymphocytes
and monocytes) were aspirated and placed in a sterile centrifuge tube and washed in
cold PBS/FCS. The cells were further washed twice and cryopreserved by
resuspending in 90% FCS + 10% DMSO, and aliquoted into freezing containers
(Nalgene cryogenic vials) for 2h at –80˚C and then in liquid nitrogen at -192°C until
further processing. The HLA typing of these samples was carried out at the routine
Immunopathology Laboratory.
2.3. T lymphocyte Epitope Prediction and Peptide Synthesis
2.3.1. WT1-pepmix
A pool of 110 peptides spanning the entire length of the WT1 protein designated as
WT1-Pepmix and a micro-scale WT1 peptide set containing each peptide in a single
well were obtained from JPT Peptide Technologies (Jerini AG, GmbH) with a purity
of more than 70% by HPLC. The peptides were 15 amino acids long with an overlap
of 11 amino acids.

59
2.3.2. WT1 peptides
A tyrosine (amino acid substitution in the sequence of the following 9-mer WT1
peptide) was carried out at the N-terminus in: Peptide Db126 for arginine (wild type
126N126-134 = RMFPNAPYL, analogue 126Y = YMFPNAPYL), and in peptide
WH187187-195 for Serine (wild type 187N = SLGEQQYSV, analogue 187Y =
YLGEQQYSV). We compared the predictive binding ability of the wild-type (126N
and 187N peptides with their corresponding analogues (126Y and 187Y) to the
HLA-A*0201 molecule using a computer-based epitope prediction program,
BIMAS. The score predicted by BIMAS algorithm is based on the calculation of the
theoretical half-time of the peptide dissociation to HLA class I molecules (Parker et
al., 1994).
Individual 15-mer WT1 peptides used were WT1-60 237-251
(TMNQMNLGATLKGVA), WT1-61241-255 (MNLGATLKGVAAGSS), WT1-79313-
327 (SASETSEKRPFMCAY), WT1-80317-331 (TSEKRPFMCAYPGCN), WT1-84333-
347 (RYFKLSHLQMHSRKH), and WT1-96381-395 (KPFQCKTCQRKFSRS). In
addition to peptides derived from the WT1 sequence, hTert672-686
(RPGLLGASVLGLDDI) HLA-DR*07–restricted peptide derived from the human
telomerase reverse transcriptase (hTRT) (Schroers et al., 2002), was obtained and
used as a positive control.
2.3.3. MPP11 and PR-3 peptides
MPP11 peptide sequences predicted to bind to HLA-A*0201 molecule were
obtained using the SYFPEITHI prediction program. For PR-3, peptide sequences
predicted to bind to HLA- A*0201 molecule were obtained using three computer-
based epitope prediction programs (BIMAS, SYFPEITHI and RANKPEP).The
SYFPEITHI prediction algorithm is a database comprising more than 4500 peptide
sequences known to bind class I and class II MHC molecules. The scoring system
of the SYFPEITHI program is based on the presence of certain amino acids in
certain positions along the MHC-binding groove (Rammensee et al., 1999).
RANKPEP server prediction is based on the similarity of an entered protein
sequence to a set of peptides known to bind to a given MHC molecule. The degree
of similarity is scored using a Position Specific Scoring Matrixes (PSSM) derived

60
from the aligned peptides that are known to bind to a particular MHC molecule
(Reche et al., 2002).
The amino acid sequences of MPP11 and PR-3 were entered into the specified
programs and candidate epitopes were selected based on their predicted ability to
bind to the HLA- A*0201 molecule. Four 9-mer peptides derived from MPP11 and
two 9-mer peptides derived from PR-3 were selected as potential epitopes for the
generation of CTL responses. The four MPP11-derived peptides were: MPP-1N421-
429 (QLLIKAVNL), MPP-2419-427 (DLQLLIKAV), MPP-313-21 (AIMLLLPSA) and
MPP-437-45 (STLCQVEPV). The PR-3-derived peptides were: PR-129129-137
(NLSASVATV) and PR-99-17 (ALASVLLAL). In addition to the predicted peptides,
we modified the sequence of the first predicted peptide derived from MPP11 by
introducing a Y at its N-terminus (wild type MPP-1N= QLLIKAVNL, analog MPP-
1Y= YMFPNAPYL). Furthermore, PR-169169-177 (VLQELNVTV), a previously
described HLA-A*0201 epitope derived from PR-3 antigen, was used as a positive
control (Molldrem et al., 1996). The amino acid sequences of the nonameric
peptides with a purity of 90% were synthesized and purified by Alta Bioscience
(Birmingham University, UK).
2.4. T2 Binding Assay
Peptide binding capacity to the HLA-A*0201 molecule was measured using the
TAP-deficient, HLA-A*0201-positive cells as described previously (Molldrem et
al., 1996). T2 cells are a hybrid human cell line produced by fusion of a B
lymphoblast line 174 with a T lymphoblast line CEM. The cell line has a
homozygous deletion of the MHC class II region on chromosome 6 including the
known transporter proteins for antigenic peptide TAP1 and TAP2 genes and
proteasome genes. They contain the gene HLA-A*0201, but express very low levels
of cell-surface HLA-A*0201 and are unable to present endogenous antigens
(Zweerink et al., 1993). Stable HLA-A*0201 expression in T2 cells is observed only
when peptides that are capable of binding to and stabilizing the cell surface
expression of the HLA-A*0201 molecule are added exogenously. The principle of
the assay is as illustrated in Figure 2.1. Briefly, T2 cells were washed three times,
suspended at 106 cells/mL and incubated for 18 hours in serum-free medium

61
containing different concentrations of peptides and 1 g/mL 2-microglobulin
(Sigma). Cells were then washed twice with cold FACS buffer (PBS containing 2%
FCS). Purified rabbit IgG (Sigma) was added to the cell suspension and incubated
for 15 minutes on ice in order to block the FC receptors. FITC-conjugated mouse
anti-HLA-A2 antibody (clone: BB7.2; AbD Serotec) was added to the cell
suspension (1μg/106 cells) and incubated for 30 minutes at 4°C in the dark. The cells
were washed twice with cold FACS buffer and fixed with PBS/4%
paraformaldehyde. The level of HLA-A2 expression was analyzed using
fluorescence-activated cell sorter (FACS) Scan (Becton & Dickinson,
Immunocytometry Systems, CA, USA). HLA-A2 expression was quantified as
fluorescence index (FI) according to the following formula: fluorescence index =
(median fluorescence intensity with peptide - median fluorescence intensity without
peptide)/ median fluorescence intensity without peptide. All T2 binding assays were
carried out in duplicate.

62
Figure 2.1. Principles of T2 binding assay.
T2 cells are incapable of presenting endogenously synthesized antigens due to a deletion in genes that
encode the transporter associated with antigen processing (TAP1 and TAP2). Therefore, the HLA-A2
molecules expressed by these cells are unstable and disassociate in the absence of peptides. The
stability of HLA-A2 molecules at the cell surfaces can be achieved by adding exogenous peptides
with high affinity for HLA-A2. The amount of stable HLA-A2 can be followed using an anti-HLA-
A2 monoclonal antibody and quantified by flow cytometry.
Peptide/MHC Class I complex
+ HLA-A*0201 Peptide
MHC Class I molecule
T2 T2

63
2.5. Culture and Generation of Target Antigen Presenting Cells (APCs)
2.5.1. Cell lines
The mutant TAP-deficient cell line T2 (ATCC number CRL-1992) and the HLA-
class I and II negative human CML cell line K-562 (ATCC number CCL-243) were
purchased from American Type Culture Collection (ATCC, Manassas, VA, USA).
K-562 cells transfected with HLA-A*0201 gene were kindly provided by Dr.
Wolfgang Herr (University of Mainz, Germany). The T2 and K562 cells were
maintained in complete medium (CM) consisting of RPMI 1640 medium (Sigma,
MO, USA) supplemented with 10% Fetal Calf Serum (FCS) (Cambrex Bio Science,
MD, USA), 2 mM L-glutamine, 100 IU/ml penicillin and 100 mg/mL streptomycin
(Sigma). K562/A*0201 were cultured in CM containing 0.5 mg/mL geneticin
(G418, Sigma).
2.5.2. Generation of B-lymphoblastoid cell lines
B-lymphoblastoid cell lines (LCLs) were established from normal donors by
transformation of B cells using Epstein-Barr virus (EBV) according to a standard
technique (Neitzel, 1986). The EBV virus stock was produced by the B95.8 cell line
and was kindly provided by the Derartment of Genetics (Research Centre,
KFSH&RC). Briefly, PBMCs (107 cells) were incubated with the virus (500 µL) for
an hour at 37ºC. Then cells were cultured in CM containing 1µg/mL PHA (PHA-P,
Sigma) and 0.1 ug/mL cyclosporin A and maintained by twice-weekly refreshing of
CM. Established LCLs were used after 3-4 weeks of culture.
2.5.3. Generation of PHA blast
PHA blasts were prepared as described previously (Atanackovic et al., 2003).
PBMCs were seeded onto 24-well plates (BD Biosciences, USA) at a density of 1-2
x 106 cells /well into a 24-well culture plate in T cell culture medium. The T cell
culture medium consisted of X-vivo 15 medium (BioWhittaker, MD), supplemented
with 10% heat-inactivated human AB serum (Sigma). A concentration of 10 μg/mL
phytohemagglutinin (PHA) was added to the culture on day 0. Half of the medium
was replaced with a complete medium containing 20 IU/mL recombinant human
interleukin-2 (rhIL-2; eBioscience) and 40 ng/mL rhIL-7 on day 3, and this step was
64
subsequently repeated every 3 days. The activated T cell-APCs (T-APCs) were
checked for class II, CD80, and CD86 expression and then used as target cells
around day 20 of the culture.
2.5.4. Generation of mature dendritic cells from autologous monocytes
2.5.4.1. Isolation of monocytes for subsequent dendritic cell generation
Monocytes (CD14+ cells) were isolated from PBMCs of healthy HLA-A*0201
positive donors either by negative selection using a MACS human Monocyte
Isolation kit II (Miltenyi Biotec, Bergisch Gladbach, Germany) or by plastic
adherence. Monocyte magnetic isolation was done according to the manufacturer’s
instructions. Briefly, 107 PBMCS were suspended in 30 µL of ice-cold MACS
buffer (PBS supplemented with 0.5% bovine serum albumin (BSA) and 2 mM
EDTA) and 10 µL of FcR blocking reagent (human Ig). Non-CD14+ T cells were
indirectly magnetically labelled by incubating the cells with 10 µL of biotin-
conjugated antibodies cocktail against CD3, CD7, CD16, CD19, CD56, CD123, and
Glycophorin A. After 10 minutes of incubation at 4–8°C, 20 µL of anti-biotin micro
beads (clone: Bio3-18E7.2; mouse IgG1) and buffer were added. Following an
additional 15 minutes of incubation at the same temperature as above, cells were
washed and resuspended in 500 µL of buffer. The MS column (Miltenyi Biotec)
were prepared by placing it in the magnetic field of a MACS separator and rinsing
with 500 µL of MACS buffer. The cell suspension was applied onto columns and
allowed to pass through and effluent was collected (unlabeled cells), representing
the enriched monocyte fraction.
For monocyte isolation by plastic adherence, PBMCs were cultured at 5 x 10⁶
cells/mL/well of a 6-well plate (Sigma) in X-vivo 15 medium supplemented with 2
mM L-glutamine (DC-medium), and allowed to adhere in a 5% CO2 incubator at
37°C for 90-minutes. Non-adherent cells and media were removed and fresh DC-
medium was added to the cells. After a second incubation period, non-adherent cells
and media were removed and the adherent cells were washed carefully with pre-
warmed medium. The isolated monocytes were resuspended in fresh DC-medium.

65
2.5.4.2. Generation of mature conventional dendritic cells
The isolated monocytes were cultured in six-well plates in DC-medium in the
presence of 50 ng/mL rhIL-4 and 100 ng/mL recombinant human granulocyte
macrophage colony-stimulating factor (rhGM-CSF; R&D Systems, MN). Immature
dendritic cells (DC) were stimulated into maturity by adding 20 ng/mL recombinant
human tumour necrosis factor- α (rhTNF-α; R&D Systems), 10 ng/mL rhIL-1β
(eBioscience, CA) and 25 mg/mL polyinosinic acid:poly-CMP (Poly I:C; Sigma) on
day 6 and mature dendritic cells (DCs) were harvested on day 7.
2.5.4.3. Generation of mature fast dendritic cells
Fast dendritic cells (DC2d) were generated according to previously published
protocols (Dauer et al., 2003, Ho et al., 2006) with minor modifications. Briefly,
DC-medium supplemented with 100 ng/mL rhGM-CSF and 50 ng/mL rhIL-4 was
added to monocytes cultured in 6-well plates. Maturation cytokines, 10 ng/mL
rhTNF, 10 ng/mL rhIL-1, 10 ng/mL rhIL-6 (R&D Systems) and 1 M PGE2
(Sigma), were added to the cultures on the next day. Cultures were incubated for an
additional day before mature DC2d were harvested.
2.6. Generation of T lymphocyte lines
Different approaches have been used to generate CD8+ T lymphocyte lines. These
approaches include the use of mature conventional DCs or mature fast DCs to prime
naïve CD8+ T cells. Two rounds of T cell-stimulation were sufficient to prime the T
cells. Following priming, DCs or monocytes were used to expand the generated T
cell lines. Another approach employed the use of T2 cells to prime and to expand
naïve CD8+ T cells. A single approach was used to generate CD4+ T lymphocyte
lines. In this approach, mature conventional DCs were used to prime naïve CD4+ T
cells and monocytes or T-APCS were used to expand the generated T cell lines.
2.6.1. Isolation of CD8+ T lymphocytes
CD8+ T lymphocytes were negatively separated from PBMCS obtained from healthy
HLA-A0201 positive donors using MACS CD8+ T Cell Isolation Kit II (Miltenyi
Biotec). Following the manufacturer’s protocols, 107 PBMCS were suspended in 40

66
µL of ice-cold MACS buffer. Non-CD8+ T lymphocytes were indirectly
magnetically labelled by incubating the cells with 10 µL of a cocktail of biotin-
conjugated antibodies against CD4, CD14, CD16 CD19, CD36, CD56, CD123, TCR
γ/δ and Glycophorin A. After 10 minutes of incubation at 4–8°C, 20 µL of anti-
biotin microbeads (clone: Bio3-18E7.2; mouse IgG1) and buffer were added. After
an additional 15 minutes of incubation at the same temperature, cells were washed,
resuspended in 500 µL of buffer, and applied to the prepared MS columns (Miltenyi
Biotec). The effluent (unlabeled cells) was collected, representing the enriched
CD8+ T cell fraction.
2.6.2. Generation of anti-peptide specific CD8+ T lymphocytes
Some of the CD8+ T cell lines were generated using protocol adapted from previous
studies (Molldrem et al., 1996, Houbiers et al., 1993). Briefly, T2 cells were washed
three times in serum-free medium and incubated with each peptide at concentrations
of 50 μM/mL and 1 μg/mL β2-microglobulin at 37 C, 5% CO2 for 2 hours. The
peptide-pulsed T2 cells were then irradiated with 7500 rad, washed once and added
to freshly purified CD8+ in T lymphocyte culture medium (X-vivo 15 medium
supplemented with 2 mM L-glutamine and 10% human serum) at a T lymphocyte:
T2 ratio of 5:1. After 7-10 days of T cell stimulation, the second stimulation was
performed and on the following day, 20 IU/mL of rhIL-2 was added. The cultured T
lymphocytes were maintained by restimulations with peptide-pulsed T2 cells. After
the third in vitro stimulation, peptide-stimulated cells were tested for their
cytotoxicity using chromium release assays. DC-loaded peptides were used to in
vitro prime some of the purified CD8+ T lymphocytes. Briefly, the mature DCs
growing in DC medium were harvested, washed once with the same medium and
incubated with the peptides at concentration of 50 μM/mL and 5 μg/mL β2-
microglobulin for 2 hours at 37 C, 5% CO2. The peptide loaded DCs were then X
irradiated (2500 rads), washed once and added to the CD8+ T lymphocytes at 20:1 to
5:1 T lymphocytes: DCs ratio. rhIL-7 (20 ng/mL) and rhIL-12 (100 pg/mL) were
added to each culture. The cells were incubated in 2 mL T cell culture medium in
24-well plates. After 7-10 days, T lymphocyte were harvested, washed and re-
stimulated with peptide loaded DC2d as previously described and rhIL-2 (20
IU/mL) was added the following day. The cultured T lymphocytes were maintained

67
by re-stimulation with autologous peptide-loaded antigen presenting cells (DCs or
freshly prepared adherent monocytes) and fed with rhIL-2 the next day. T
lymphocyte lines against the different peptides were generated. Responder T
lymphocytes were tested for their specificity and cytotoxic activity using Enzyme-
Linked Immunospot Assay (ELISPOT) Assay and Chromium Release Assay against
different targets.
2.6.3. Generation of anti-peptide specific CD4+ T lymphocytes
Irradiated DCs (2500 rads) were pulsed with 10 μg/mL WT1-Pepmix in DC medium
and incubated for 4 h at 37C, 5% CO2. DCs were co cultured with autologous
PBMCs at a 10:1 T-cell to DC ratio. T cell culture medium containing 10 ng/mL
rhIL-7, and 20 pg/mL rhIL-12 (R&D Systems) was used. After 7-10 days of co-
culture, a similar second stimulation was performed and 260 IU/mL rhIL-2 was
added 2 days after re-stimulation. T cells were re-stimulated with autologous
peptide-loaded cells (freshly prepared adherent monocytes or T-APC) and 260
IU/mL rhIL-2 was added 2 days after each re-stimulation.
After several rounds of antigen-specific re-stimulation, dynabeads CD3/CD28 T cell
expander (Invitrogen Dynal, USA) was used to activate T cells according to the
manufacturers’ protocol. The beads are superparamagnetic polystyrene beads
coated with monoclonal antibodies against the CD3 and CD28 cell surface
molecules of T cells. For T cell stimulation, 1 bead/5-10 T cells was added to T cells
cultured in T cell culture medium containing 260 IU/mL rhIL-2. Cells were
expanded for up to 2 weeks before antigen-specific re-stimulation was repeated.
2.7. Generation of T Lymphocyte Clones
2.7.1. Cloning of WT1 T cell line
2.7.1.1. T cell cloning by limiting dilution assay
WT1-TCL57 was cloned using a limiting dilution method as mentioned above
except that HLA-matched allogeneic LCLs were used to stimulate the T cell line.
The T cells were seeded at 1, 2 and 5 cells/well/200 μL in T cell culture medium in
96-well U-bottomed plates. Allogeneic PBMCs were irradiated with 2500 rad and

68
used as a feeder layer (25 x 103 cells/well). LCLs were incubated separately in X-
Vivo 15 with 50 μM/mL of WT1-peptides for 2 hr at 37C. LCLs were then
irradiated with 7500 rad, washed once and used for T cell stimulation (50 x 103
cells/well) in the presence of 130 IU/mL of rhIL-2.
2.7.1.2. T cell cloning using dynabeads
The T cells were seeded at 5 cells/well/200 μL T cell culture medium containing
dynabeads CD3/CD28 T cell expander (1 bead/5-10 T cells) and rhIL-2 (130
IU/mL) in 96-well V-bottomed plates. The cultures were fed with fresh medium
containing rhIL-2 (130 IU/mL) every 3-4 days and kept for 2-4 weeks. Growing
clones were transferred to 96-U-bottomed plates and re-stimulated with irradiated
peptide-pulsed T-APC. Clones were tested for their specificity against target APC-
pulsed with or without WT1-peptides (WT1-60, WT1-61, and WT1-80) using the
proliferation assay.
2.7.2. Cloning of MPP11 T cell line
T lymphocytes lines were cloned by limiting dilution as described before (Dermime
et al., 1996, Ho et al., 2006) with minor modifications. T lymphocytes were seeded
at 1, 2 and 5 cells/well/200 μL T cell culture medium in 96-well U-bottomed plates.
Allogeneic PBMCs were X-irradiated (2500 rads) and used as a feeder layer (25 x
103 cells/well). T2 cells were incubated separately in X-Vivo 15 (5 X 10⁶ cells/mL)
with 5 μg/mL β2-microglobulin and 50 μM/mL of MPP-4 peptide for 2 hours at
37C. T2 cells were then irradiated (7500 rads), washed once and used for T cell
stimulation (50 x 103 cells/well) in the presence of 130 IU/mL of rhIL-2. 5ng/mL
rhIL15 (R&D Systems) and 30ng/mL OKT3 were also added to the wells. The
plates were incubated for 2-4 weeks. Cultures were re-fed with fresh medium
containing rhIL-2 (130 IU/mL) every 3-4 days. Wells with positive signs of growth
were selected for expansion. Growing clones were transferred to 96-well flat-
bottomed plates, and each clone was stimulated with irradiated peptide- pulsed T2
cells. The activation cycle was repeated after 7-10 days of culture at lymphocyte: T2
ratios of 20:1 to 5:1. Clones were screened for their lytic activity against T2-pulsed
with or without peptide using a Chromium Release Assay.

69
2.8. Flow Cytometry Analysis
Cells were collected into FACS tubes (Falcon) and washed with cold FACS buffer.
Purified rabbit IgG (Sigma) was added to the cell suspension and incubated for 15
minutes on ice in order to block the FC receptors. Fluorochrome-conjugated mouse
anti-human antibody was added to the cell suspension (1 μg/106 cells), with a
control sample labelled with isotype-matched monoclonal antibody. The cells were
incubated on ice for 30-60 minutes in the dark, washed twice with cold FACS
buffer, fixed with 300 μl of PBS/4% paraformaldehyde and analyzed using FACS
Scan. The following antibodies were purchased from AbD Serotec, NC, anti-CD14-
FITC (clone: TuK4). Antibodies purchased from Dakocytomation, CA, were anti-
CD8-FITC (clone: DK25), anti-CD3-APC (clone: UCHT1) and anti-CD4-FITC
(clone: MT310). Anti-CD1a-FITC (clone: HI149) and anti-CD83-PE (clone:
HB15e) were obtained from BD Biosciences, USA. In addition, Tregs were
phenotyped using a kit obtained from eBioscience and used according to the
manufacturer’s instructions. Briefly, the T cells were stained with a cocktail of anti-
CD4-FITC and anti-CD25-PE, fixed, permeabilized using the Foxp3 staining buffers
and subsequently stained with anti-Foxp3-APC. Analyses were performed using
FACS Scan (Becton & Dickinson, Immunocytometry Systems, CA, USA).
2.9. Cytotoxicity Assay (Chromium Release Assay)
Cytotoxicity assays were performed 5 days after the in vitro stimulation. Target
cells were removed from culture, washed in RPMI1640 serum-free medium, re-
suspended in a minimal volume (± 50 μL) of RPMI1640 and incubated with Cr51
(100 μCi) per target for 90 minutes. Target cells labeled with peptide were
concurrently incubated with the appropriate peptide at 50 μM/mL. The cells were
then washed and placed in 96 V bottomed wells at 103 cells/100 μL/well. The
effector T lymphocytes were washed, and added in triplicate at varying quantities to
the target cells, to give varying effector to target (E:T) ratios in a final volume of
200 μL/well. The plates were spun for 5 minutes (300g) and incubated for 4 hours at
37 ˚C and 5% CO2 before 100 μL supernatants were removed and transferred to
1450 Microbeta Plus Wallac plates (Wallac, Turku, Finland). 150 μL scintillation

70
fluid, Optiphase HiSafe 2 (Wallac), was added to each well and the plates were heat-
sealed using a Microsealer system (Wallac).
Chromium release was assessed by a liquid scintillation counter (Wallac). Target
cells were also incubated with 0.2% Tween 20 or medium alone to assess the
maximum and minimum (spontaneous) release of the chromium respectively.
Spontaneous release was maintained and never exceeded 20% of the maximum
release. The percentage of specific lysis was calculated as: % Specific lysis =
(experimental release - spontaneous release)/(maximal release - spontaneous release)
x100. In some of the experiments, 10 µg/mL anti-class I ABC blocking antibody
(clone: W6/32, AbD Serotec) was added to target cells before T lymphocytes
addition.
2.10. T Cell Proliferation Assay
T-cell proliferation was assessed by tritiated thymidine ([3H]-thymidine)
incorporation. T cells were seeded in duplicate or triplicate wells of a 96-well U-
bottomed plate. T cells were cultured with different stimulators at T cells: APCs
ratio of 1:2 in a final volume of 200 μl of T cell culture medium for 3 d.
[3H]thymidine (1 µCi per well; Amersham) was added 18 hours before harvest and
cells were subsequently harvested onto glass fiber filters (Wallac); [3H]thymidine
incorporation was measured using a 1450 Micro Beta PLUS liquid scintillation
counter (Wallac). In some of the experiments, 60 µg/mL of the following purified
and azide-free blocking antibodies were used: anti–HLA-DR (clone: G46-6, BD
Biosciences), anti–HLA-DP, and anti–HLA-DQ (clones: 1a3 and B7/21
respectively, Leinco Technologies). The anti-ABC antibody (AbD Serotec) was
used at 10 µg/mL and mouse isotypes were used as controls.
2.11. Enzyme-Linked Immunospot Assay (ELISPOT)
ELISPOT assay was performed using IFN-γ, granzyme B and perforin kits
(Mabtech, Mariemont, OH) according to the manufacturer’s protocol. 5x10³ to
5x10⁴ T lymphocytes/well and 2 x10⁴ to 105 cells/well of different stimulators were
seeded in Multiscreen 96-well plates (Millipore, MA) pre-coated overnight (4˚C)
with catching-antibody. The plates were then blocked with T lymphocyte culture

71
medium. After 40 hours incubation (37˚C, 5% CO2), cells were removed and after
washing, biotinylated monoclonal antibodies specific for IFN-γ, granzyme B, and
perforin were added and incubated for 3 hours at room temperature (RT). After
washing, Streptavidin-alkaline phosphatase (ALP) or Streptavidin-horseradish
peroxidase (HRP) was added to each well and incubated at RT for 2 hours. After
washing, the appropriate substrate (BCIP/NBT in the case of ALP and AEC in the
case of HRP) was added to each well and incubated at RT until colour developed
according to the manufacturer’s instructions. Spots were counted using an
automated ELISPOT reader (AID, Strasberg, Germany). Antigen-specific T cell
frequencies were considered to be significantly higher if they were at least two-fold
higher than in the control wells.
2.12. Enzyme-Linked Immunosorbent Assay (ELISA)
Supernatants from 48-h T cell cultures were harvested and stored in aliquots at -
80˚C until used. ELISA for human IFN-γ, IL-4, IL-5, IL-10, GM-CSF ELISA kits
(Mabtech) and transforming growth factor (TGF)-β1 matched antibody pairs (R&D
Systems) was performed according to the manufacturer’s instructions. Briefly, Nunc
Maxisorp 96-well plates (eBioscience) were coated with the appropriate capture
antibodies overnight. To start the assay, plates were washed and blocked with
blocking buffers for 1 hr at room temperature. Diluted samples and standards were
added and incubated for 2 hr. The plates were washed, incubated with biotin–
conjugated detection antibodies, washed again and then incubated with Streptavidin-
HRP and washed. Tetramethylbenzidine (TMB) substrate was added for colour
development. After suitable time, colour development was stopped by adding 2M
sulphuric acid. Optical density was measured in an ELISA reader (Anthosn Lucy 3)
at 450 nm.
2.13. RNA Preparation
Total RNA was isolated from PBMCSs using Trizol method. According to the
manufacturer’s instructions, cells were lysed with 1 ml Tri reagent (Sigma). After
mixing the lysed cells with chloroform, total RNA content was collected,
precipitated with isopropanol, washed once with 75% ethanol, dissolved in

72
diethylpyrocarbonate (DEPC)-treated water and stored at -80˚C. The concentration
and purity of the extracted RNA was determined by measuring the absorbance at
260 and 280 nm with a spectrophotometer.
2.14. Reverse Transcription (RT)
RNA from each sample was treated with DNase1 (Invitrogen, CA) and then reverse-
transcribed in a 25-μL reaction volume. 1 μg RNA in DEPC-treated water was
incubated at 65˚C for 5 minutes and then mixed with Reaction mix. Reaction mix
included RT buffer (50 mM Tris-HCl, PH 8.5; 30 mM KCl; 8 mM MgCl2), 1 mM
dithiothreitol (DTT), 100 M of dNTP mix, 200 ng of Oligo-d(T) primers, 80 U of
RNAse inhibitor, and 600 U of Moloney murine leukemia virus reverse transcriptase
(Invitrogen). The reaction mixture was then incubated at 37˚C for 2 h, boiled for 5
minutes, placed quickly on ice and stored at -80˚C until use.
2.15. Conventional Reverse Transcription- Polymerase Chain Reaction (RT-
PCR)
The WT1 and MPP11 mRNA expression was quantified in PBMCs obtained from
normal donors and leukaemia patients using conventional RT-PCR. 0.1 μg mRNA
equivalent of cDNA was used. Sequences of the WT-1 and MPP11 primers used
were based on previous studies (Greiner et al., 2003, Greiner et al., 2004). The
amplification product of the house keeping gene β-actin served as control of cDNA
quality. β-actin primers were designed using Oligo 6 software. Table 2.1and Table
2.2 display the sequences of the primers and PCR conditions, respectively. mRNA
isolated from the K562 cell line served as a positive control for WT1 and MPP11
genes. Distilled water served as a negative control. The PCR products were
electrophoresed on a 1% agarose gel. Expected band size was 1243 bp, 790 bp for
MPP11 and WT1, respectively.

73
Table 2.1. Primer sequences
Antigen
Forward primer
Reverse primer
Mpp11
5’AAGATCATTATGCAGTTCTTGGAC 3’
5’CCAATAACATCTTTGGCAGTTCT3’
WT1 5’ATGAGGATCCCATGGGCCAGC 3’ 5’CCTGGGACACTGAACGGTCCCCGA3’
β-actin 5’CCCAGCACAATGAAGATCAAGATCAT 3’ 5’ATCTGCTGGAAGGTGGACAGCGA 3’
Table 2.2. PCR conditions
Antigen
Denaturation
Annealing
Elongation
Cycles
MgCl2
MPP11
94˚C (1 min)
60˚C (1min)
72 ˚C (1 min)
28
1.5mM
WT1 94˚C (1 min) 64˚C (1 min) 72 ˚C (1 min) 30 1.5mM
β-actin 94˚C (1 min) 60˚C (1 min) 72 ˚C (1 min) 28 1.5mM
74
2.16. Quantitative Real Time RT-PCR for WT1 Expression in Patients’
Leukemic Cells
The WT1 mRNA expression was quantified using Light Cycler FastStart DNA
master SYBR Green 1kit (Roche, Mannheim, Germany) in a Light Cycler (Roche).
PBGD was used as house-keeping gene. 2 μL cDNA from the K562 cells was used
to generate standard curves (Greiner et al., 2004) in 5-log steps for WT1 and PBGD.
Amplification was conducted in a total volume of 20 μL for 40 cycles/10 sec at
95˚C, 4 sec/64˚C and 35 sec/72˚C. Samples were run in triplicates and their relative
expression was determined by normalizing the expression of each target to PBGD
and then comparing this to the normalized expression in a reference sample (K562)
to calculate a fold change-value. Primers were designed using Oligo 6 software. The
WT1 forward primer: TTCATCAAACAGGAGCCGAGC and reverse primer:
GGTGCGAGGGCGTGTGA were used. The PBGD forward primer:
CATGTCTGGTAACGGCAATG and reverse primer:
TCTTCTCCAGGGCATGTTCAA were used. All primers were obtained from
Aragene Laboratory (KFSH&RC).
2.17. Statistical Analysis
The statistical methods used were the mean, the median, the standard deviation and
the Student t test. The mean is the average of a set of data. The standard deviation
is used to measure the spread or dispersion of data around the mean. The mean and
the standard deviation were calculated using Excel. The median is defined as the
numeric value separating the higher half of a sample, a population, or a probability
distribution, from the lower half. It was calculated using CellQuest software. The
Student t test was used for comparative analysis as it is the most commonly used
method to evaluate the differences in means between two groups. A P value less
than or equal to 0.05 was deemed to be significant in all experiments.

75
3. WT1 PEPTIDE ANALOGOUE WT1-126Y
ENHANCES LEUKEMIA LYSIS

76
3.1. Introduction
The Wilms tumour antigen 1 (WT1) has been shown to be expressed at low levels in
some normal cells such as CD34+ stem cells (Ellisen et al., 2001, Menssen et al.,
1997, Inoue et al., 1997). Therefore, many of the potential CTL epitopes against this
antigen may be absent or suboptimal. This is mainly due to clonal deletion of high-
avidity CTLs during maturation of the immune system (Wood et al., 1987). To this
end, different groups introduced modifications in the sequence of the anchor
positions of these ‘sub-optimal’ peptides to improve their binding to HLA class I
molecules and to increase their immunogenicity (Parkhurst et al., 1996, Chen et al.,
2000, Valmori et al., 1998, Bakker et al., 1997). Besides modification of anchor
positions, substitution of amino acid residues pointing to the T cell receptor has been
shown to enhance epitope immunogenicity (Hoffmann et al., 2002, Tangri et al.,
2001, Zaremba et al., 1997). It has been shown that modified peptides used to
immunized transgenic mice were able to induce potent peptide-specific CTLs that
induced tumour regression (Dyall et al., 1998, El-Shami et al., 2000, Mullins et al.,
2001, Overwijk et al., 2003). Some of these modified peptides have been effectively
used to vaccinate cancer patients (Rosenberg et al., 1998), to improve the detection
of anti-tumour immunity (Chen et al., 2000), or to reverse the unresponsiveness of T
lymphocytes to wild-type tumour antigens (Hoffmann et al., 2002). Indeed, it has
been reported that vaccination of cancer patients with WT1-modified peptides
induced WT1-specific CTLs and resulted in tumour regression (Oka et al., 2004).
3.2. Aim
The aim of the study was to explore the feasibility of using an approach that
enhances the immunogenicity of low-avidity restricted peptides without altering
their antigenic specificity (Tourdot et al., 2000). This approach consists of replacing
the first amino acid of the epitope by a tyrosine (P1Y). The advantage of this
strategy is that the P1Y variants are able to efficiently trigger in vivo wild-type
peptide-specific CTLs which also recognized the naturally occurring epitope
(Tourdot et al., 2000).
Given that WT1 specific CTLs isolated from leukaemia patients exert a low-avidity
response (Rezvani et al., 2003, Scheibenbogen et al., 2002), experiments were

77
carried out where a Y amino acid substitution in the sequence of the Db126 and
WH187 WT1-derived peptides was introduced with the aim of improving their
binding affinities to MHC I and enhancing the immunogenicity of the peptides. Two
peptides were selected as they have been reported to be presented by the most
common Caucasians HLA allele (HLA-A*0201 present in approximately 50% of the
population) and exert specific lysis against WT1-expressing leukaemia cells (Oka et
al., 2000). In order to identify leukaemia AML and ALL samples which were
positive for WT1 for subsequent use in cytotoxicity assays, forty samples were
analysed for WT-1 expression
3.3. Results
3.3.1. WT1 antigen screening in leukaemia patients and normal donors
The mRNA expression pattern of the WT1 antigen was evaluated in PBMCs of
AML (n=20), ALL (n=20) and in PBMCs of healthy volunteers (n=28) using
conventional RT-PCR. This screening was performed for two purposes. The first
purpose was to compare the WT1 gene expression level in acute leukaemia patients
and in normal donors. The second purpose was to be able to select the HLA-
A*0201+ leukaemia donors expressing the WT1 gene to be used (if needed) as
targets for T cells generated against the WT1 peptides.
Total RNA was extracted from the PBMCs of patients and healthy donors and
reverse transcriptized into cDNA using Moloney murine leukaemia virus. The
extraction and reverse transcription methods are described in Chapter 2 section 2.13
and 2.14, respectively. The conventional RT-PCR was performed as described in
Chapter 2 section 2.15. The amplification product of the house keeping gene β-actin
served as control of cDNA quality. RNA isolated from K562 cell line, which
expresses WT1, served as a positive control. Distilled water served as a negative
control. The expression of the WT1 gene was classified into one of the following
categories: - , no detectable mRNA expression; +, low expression; ++, moderate
expression; +++, high expression. The intensity of the positive bands determined the
level of antigen expression.

78
The results show that 16/20 (80%) of AML patients and 9/20 (45%) of ALL patients
express the WT1 gene. In total, WT1 expression was detected in 25/40 (62.5%) of
acute leukaemia patients. However, WT1 expression was not detected in any of the
27 normal donors tested. Results are shown in Figure 3.1 and Table 3.1. As shown
in Table 3.1, there was no clear relation between WT1 expression levels and the
blast number (the percentage of blasts varies between 1% and 99%).

79
16/20 (80%) AML patients express the WT1 gene
WT1
-actin
9/20 (45%) ALL patients express the WT1 gene
WT1
-actin
Normal donors
WT1
-actin
Figure 3.1. RT-PCR analysis of WT1 gene expression in PBMCs from AML, ALL patients
and normal donors.
80% of AML patients and 45% of ALL patients expressed the WT1 antigen, whereas none of the
normal donors expressed the WT1 antigen.

80
Table 3.1. Clinical features of leukaemia patients with WT1 gene expression.
Patients #
Subtypes
Status
% Blast
WT1 expression
M0
AML 3
New
84
++ M1 AML 1 New 61 + M2 AML 5 New 1 -
AML 7 New 61 + AML 8 New 20 +++ AML 19 New 23 + AML 29 Rel Post chemo 81 -
M4E0 AML 13 2nd Rel post allo BMT 10 + AML 36 New 12 ++
M4 AML 25 New 52 +++ AML 27 New 81 +++ AML 28 New 61 +
M5a AML 2 New NR - AML 12 New 79 -
M5 AML 11 New 80 ++ AML 16 New 4 ++ AML 24 New 50 +++ AML 31 New 13 ++ AML 34 Rel Post allo BMT 80 +++
M6 AML 20 New 65 ++
Pre T-cell ALL 26 New 99 ++ T-cell ALL 1 Rel 6 -
ALL 2 Rel Post-BMT 87 - ALL 3 Rel 87 - ALL 13 New 75 +++ ALL 16 New NR ++ ALL 18 New 94 - ALL 22 New 47 ++ ALL 23 New 84 +++
Pre B-cell ALL 4 New 55 + ALL 5 New 56 +++ ALL 20 New 5 + ALL 21 New 83 + ALL 27 New 59 - ALL 28 New 88 - ALL 29 New 2 - ALL 36 Rel on chemo NR -
B-cell ALL 10 New 59 - BP / Biclonal ALL 7 New 89 -
ALL 24 NR Rel 61 -
New, newly diagnosed; Rel, relapsed; - , no detectable mRNA expression; +, low expression; ++,
moderate expression; +++, high expression

81
3.3.2. Identification of peptides predicted to highly bind to the HLA-A0201
molecule
Two WT1 peptides known to be HLA-A*0201 restricted peptides (Oka et al., 2000),
were modified by substituting the amino acid at position 1 with tyrosine (Y). The
binding of the wild-type peptides (126N and 187N) with their corresponding
analogues (126Y and 187Y) to the HLA-A*0201 molecule was compared using a
computer-based epitope prediction program
(http://bimas.dcrt.nih.gov/molbio/hla_bind/). The amino acid sequences of each
peptide (wild-types and analogues) were entered into the BIMAS program and the
HLA-A*0201 molecule was selected. After entering the amino acid sequence and
selecting the MHC type, the predicted binding score for each peptide was obtained.
The data indicated that this tyrosine modification resulted in a 4.6-fold increase in
the estimated half-time of disassociation of the modified peptides to HLA-A*0201
compared with their native counterparts as shown in Figure 3.2 .
The computer-based epitope prediction program has been suggested to have only
60–80% predictive accuracy (Pinilla-Ibarz et al., 2006). Therefore, the strength of
the interaction between these peptides and the HLA-A*0201 molecules was directly
measured using the T2 binding assay. The assay was performed twice; however,
different concentrations of the WT1-derived peptides were used. T2 cells were
pulsed with either 50, 30, 15, 7 and 1μM or with 70, 7 and 0.7 μM of each peptide
overnight at 37˚C in a serum-free medium. Cells were washed, stained with FITC-
conjugated anti-HLA-A2 monoclonal antibody and analyzed by flow cytometry. The
HLA-A*0201 expression by the T2 cells was quantified as fluorescence index
according to the following formula: fluorescence index = (median fluorescence
intensity with peptide - median fluorescence intensity without peptide)/ median
fluorescence intensity without peptide. Figures 3.3, 3.4, 3.5 and 3.6 show the flow
cytometric analyses of T2 cells incubated overnight with different concentrations
(50, 30, 15, 7 and 1μM) of either native or modified 126 and 187 peptides. Figures
3.7, 3.8, 3.9 and 3.10 show the flow cytometric analyses of T2 cells incubated
overnight with different concentrations (70, 7 and 0.7μM) of either native or
modified 126 and 187 peptides.

82
Using different concentrations of the 9-mer peptides, an enhanced binding of the
126Y analogue peptide was observed compared to the wild-type 126N peptide at all
doses tested (Figure 3.11A). A concentration of 50 µM of the 126N peptide was
needed to achieve a 2.5 fluorescence index, while only 15 µM of the 126Y peptide
was sufficient to reach the 2.5 fluorescence index. However, modification of the 187
peptide (187Y) did not enhance its binding ability and stabilization of the HLA-
A*0201 molecules (Figure 3.11 B). The same pattern of peptide binding affinity was
observed when the binding assay was repeated with different peptide concentrations
(70, 7 and 0.7 μM) (Figure 3.11A and B).
These data show a selective enhancement of peptide binding to HLA-A*0201 after
modification, and thus demonstrated a good model to test the effect of this process
on the function of the generated T cells.

83
0
200
400
600
800
1000
1200
1400
1600
WT1-126N WT1-126Y WT1-187N WT1-187Y
Peptides
Estim
ate
of 1
/2 ti
me
of d
isas
soci
atio
n of
a
mol
ecul
e
Figure 3.2. Wild-type (WT1-126N, WT1-187N) and the modified (WT1-126Y, WT1-187Y)
peptides binding affinities to HLA-A*0201 molecule as predicted by the computer-based epitope
prediction program BIMAS.
Using this program, we have shown that substitution of the tyrosine (Y) at position 1 resulted in 4.6-
fold increase in the estimated half time of disassociation of the modified peptides compared to their
native counterparts.
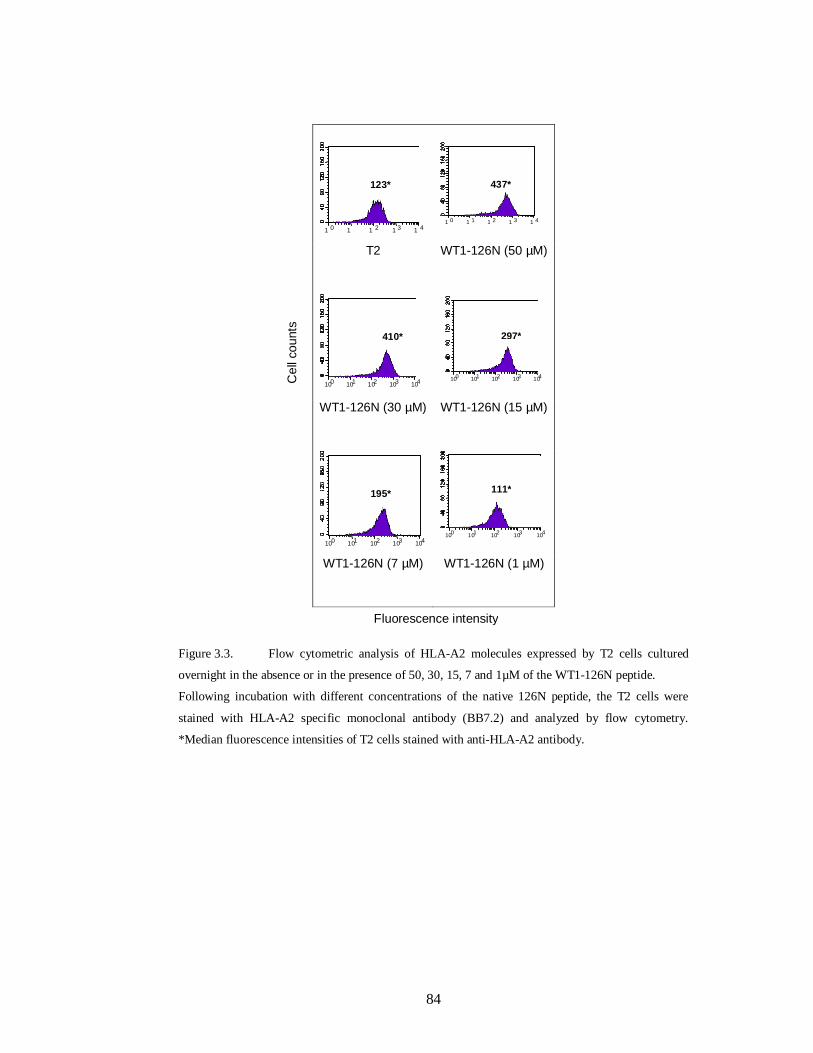
84
T2 WT1-126N (50 µM)
WT1-126N (30 µM) WT1-126N (15 µM)
WT1-126N (7 µM) WT1-126N (1 µM)
Figure 3.3. Flow cytometric analysis of HLA-A2 molecules expressed by T2 cells cultured
overnight in the absence or in the presence of 50, 30, 15, 7 and 1µM of the WT1-126N peptide.
Following incubation with different concentrations of the native 126N peptide, the T2 cells were
stained with HLA-A2 specific monoclonal antibody (BB7.2) and analyzed by flow cytometry.
*Median fluorescence intensities of T2 cells stained with anti-HLA-A2 antibody.
10 0 1
0 10 2 1
0 3 10 4
123*
10 0 1
0 1 10 2 1
0 3 10 4
437*
10 0 10 1 10 2 10 3 10 4
410*
100 10 1 10 2 10 3 104
297*
10 0 10 1 10 2 10 3 10 4
195*
100 10 1 10 2 10 3 10 4
111*
Cel
l cou
nts
Fluorescence intensity

85
T2 WT1-126Y (50 µM)
WT1-126Y (30 µM) WT1-126Y (15 µM)
WT1-126Y (7 µM) WT1-126Y (1 µM)
Figure 3.4. Flow cytometric analysis of HLA-A2 molecules expressed by T2 cells cultured
overnight in the absence or in the presence of 50, 30, 15, 7 and 1µM of the WT1-126Y peptide.
Following incubation with different concentrations of the analogue 126Y peptide, the T2 cells were
stained with HLA-A2 specific monoclonal antibody (BB7.2) and analyzed by flow cytometry.
*Median fluorescence intensities of T2 cells stained with anti-HLA-A2 antibody.
10 0 1
0 1 10 2 1
0 3 10 4
129*
4 10 0 10 1 10 2 10 3 10
10 0 10 1 10 2 10 3 10 4
661*
10 0 1
0 1 10 2 1
0 3 10 4
429*
1 0 1 1 1 2 1 3 1 4
343*
1 0 1 1 1 2 1 3 1 4
168*
Fluorescence intensity
547*
Cel
l cou
nts

86
T2 WT1-187N (50 µM)
WT1-187N (30 µM) WT1-187N (15 µM)
WT1-187N (7 µM) WT1-187N (1 µM)
Figure 3.5. Flow cytometric analysis of HLA-A2 molecules expressed by T2 cells cultured
overnight in the absence or in the presence of 50, 30, 15, 7 and 1µM of the WT1-187N peptide.
Following incubation with different concentrations of the analogue 187N peptide, the T2 cells were
stained with HLA-A2 specific monoclonal antibody (BB7.2) and analyzed by flow cytometry.
*Median fluorescence intensities of T2 cells stained with anti-HLA-A2 antibody.
10 0 1
0 1 10 2 1
0 3 10 4
10 0 10 1 10 2 10 3 10 4
843*
1 0 1
1 1 2 1
3 1 4
820*
1 0 1
1 1 2 1
3 1 4
750*
10 0 1
0 1 10 2 1
0 3 10 4
M1
453*
10 0 10 1 10 2 10 3 10 4
145*
Cel
l cou
nts
Fluorescence intensity
835*

87
T2 WT1-187Y (50 µM)
WT1-187Y (30 µM) WT1-187Y (15 µM)
WT1-187Y (7 µM) WT1-187Y (1 µM)
Figure 3.6. Flow cytometric analysis of HLA-A2 molecules expressed by T2 cells cultured
overnight in the absence or in the presence of 50, 30, 15, 7 and 1µM of the WT1-187Y peptide.
Following incubation with different concentrations of the analogue 187Y peptide, the T2 cells were
stained with HLA-A2 specific monoclonal antibody (BB7.2) and analyzed by flow cytometry.
*Median fluorescence intensities of T2 cells stained with anti-HLA-A2 antibody.
10 0 10 1 10 2 10 3 10 4
168*
10 0 10 1 10 2 10 3 10 4
1 0 1
1 1 2 1
3 1 4
820*
1 0 1
1 1 2 1
3 1 4
730*
10 0 10 1 10 2 10 3 10 4
791*
1 0 1 1 1 2 1 3 1 4
Cel
l cou
nts
Fluorescence intensity
798*
514*
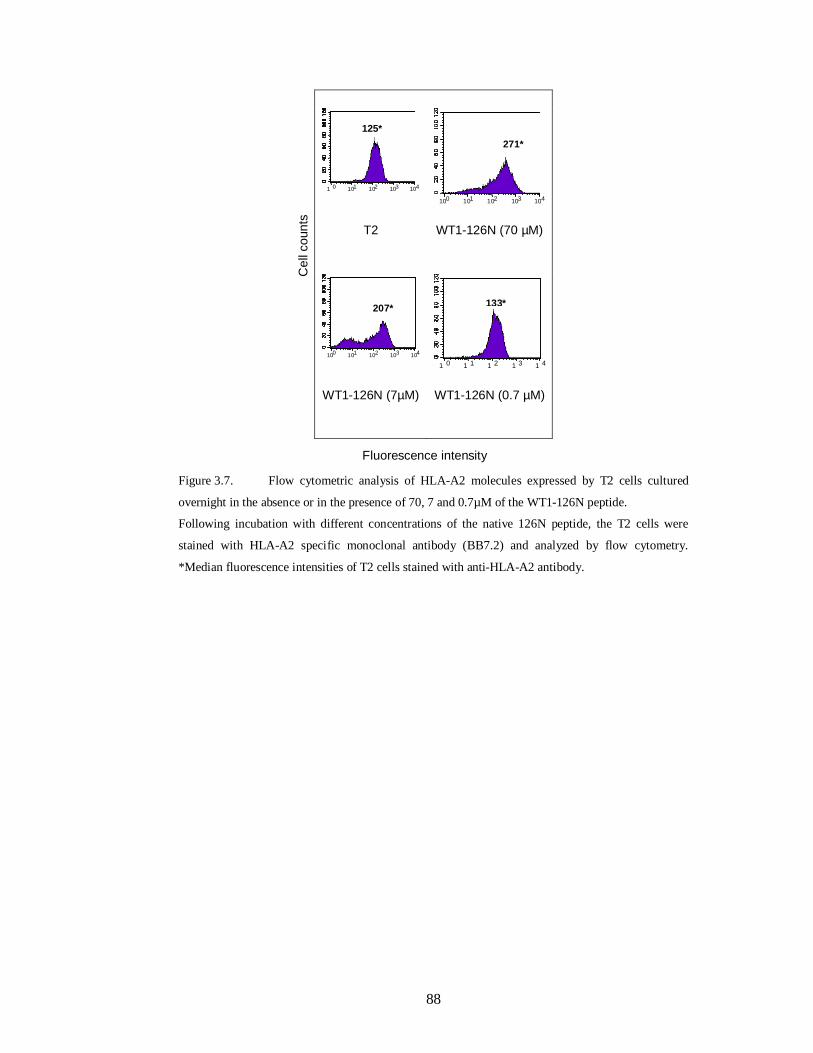
88
T2 WT1-126N (70 µM)
WT1-126N (7µM) WT1-126N (0.7 µM)
Figure 3.7. Flow cytometric analysis of HLA-A2 molecules expressed by T2 cells cultured
overnight in the absence or in the presence of 70, 7 and 0.7µM of the WT1-126N peptide.
Following incubation with different concentrations of the native 126N peptide, the T2 cells were
stained with HLA-A2 specific monoclonal antibody (BB7.2) and analyzed by flow cytometry.
*Median fluorescence intensities of T2 cells stained with anti-HLA-A2 antibody.
10 0 10 1 10 2 10 3 10 4
125*
10 0 10 1 10 2 10 3 10 4
271*
10 0 10 1 10 2 10 3 10 4
207*
10 0 1
0 1 10 2 1
0 3 10 4
133* C
ell c
ount
s
Fluorescence intensity

89
T2 WT1-126Y (70 µM)
WT1-126Y (7µM) WT1-126Y (0.7 µM)
Figure 3.8. Flow cytometric analysis of HLA-A2 molecules expressed by T2 cells cultured
overnight in the absence or in the presence of 70, 7 and 0.7µM of the WT1-126Y peptide.
Following incubation with different concentrations of the analogue 126Y peptide, the T2 cells were
stained with HLA-A2 specific monoclonal antibody (BB7.2) and analyzed by flow cytometry.
*Median fluorescence intensities of T2 cells stained with anti-HLA-A2 antibody.
10 0 10 1 10 2 10 3 10 4
410*
10 0 1
0 1 10 2 1
0 3 10 4
311*
100 10 1 10 2 10 3 104
141*
10 0 10 1 10 2 10 3 1
0 4
Cel
l cou
nts
125*
Fluorescence intensity

90
T2 WT1-187N (70 µM)
WT1-187N (7µM) WT1-187N (0.7 µM)
Figure 3.9. Flow cytometric analysis of HLA-A2 molecules expressed by T2 cells cultured
overnight in the absence or in the presence of 70, 7 and 0.7µM of the WT1-187N peptide.
Following incubation with different concentrations of the native 187N peptide, the T2 cells were
stained with HLA-A2 specific monoclonal antibody (BB7.2) and analyzed by flow cytometry.
*Median fluorescence intensities of T2 cells stained with anti-HLA-A2 antibody.
10 0 10 1 10 2 10 3 10 4
496*
10 0 10 1 102 10 3 10 4
190*
10 0 1
0 1 10 2 1
0 3 10 4
231*
10 0 101 10 2 10 3 104
Fluorescence intensity
Cel
l cou
nts
125*
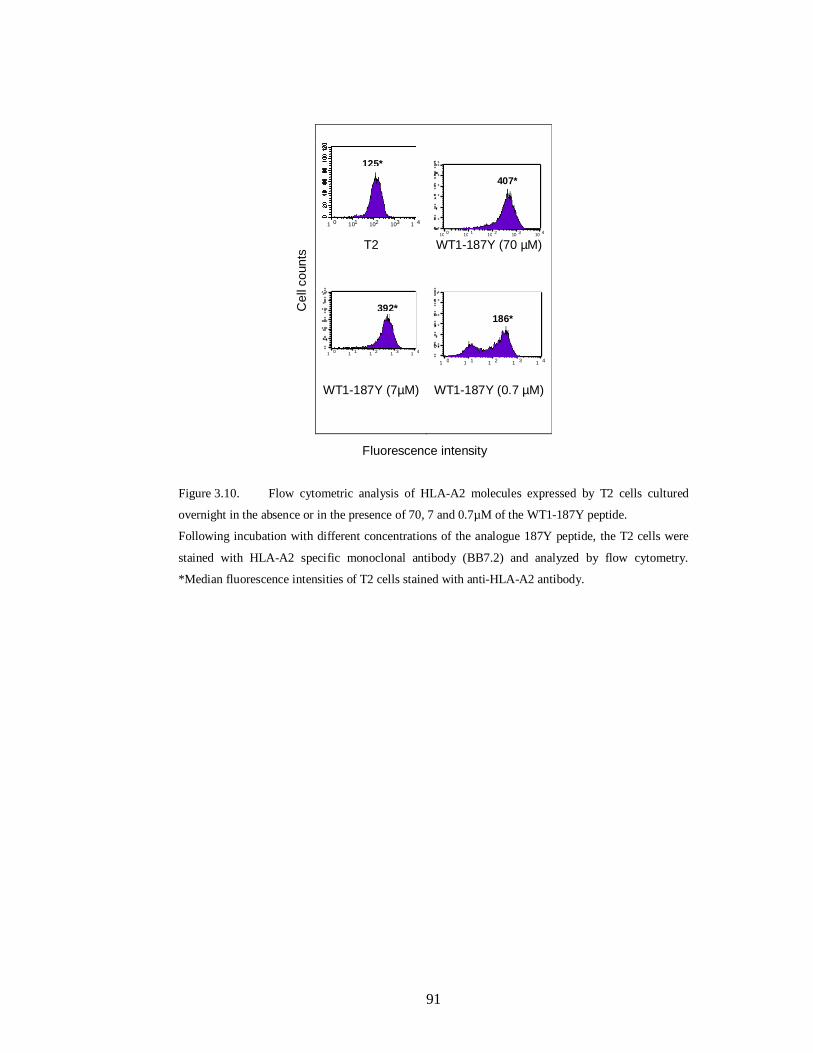
91
T2 WT1-187Y (70 µM)
WT1-187Y (7µM) WT1-187Y (0.7 µM)
Figure 3.10. Flow cytometric analysis of HLA-A2 molecules expressed by T2 cells cultured
overnight in the absence or in the presence of 70, 7 and 0.7µM of the WT1-187Y peptide.
Following incubation with different concentrations of the analogue 187Y peptide, the T2 cells were
stained with HLA-A2 specific monoclonal antibody (BB7.2) and analyzed by flow cytometry.
*Median fluorescence intensities of T2 cells stained with anti-HLA-A2 antibody.
10 0 10 1 10 2 10 3 10 4
M1
10 0 1
0 1 10 2 1
0 3 10 4
M
1 0 1 1 1 2 1 3 1 4
10 0 10 1 10 2 103 1
0 4
125*
Cel
l cou
nts
Fluorescence intensity
186*
407*
392*

92
A
012345
50 30 15 7 1
Peptide concentration (uM)
Fluo
resc
ence
In
dex WT1-126N
WT1-126Y
B
012345
50 30 15 7 1
Peptide concentration (uM)
Fluo
resc
ence
In
dex WT1-187N
WT1-187Y
0
1
2
3
4
70 7 0.7
Peptide concentration (uM)
Fluo
resc
ence
Inde
x
WT1-126N
WT1-126Y
0
1
2
3
4
70 7 0.7
Peptide concentration (uM)
Fluo
resc
ence
Inde
x
WT1-187N
WT1-187Y
Figure 3.11. The binding ability of WT1-derived peptides to HLA-A*0201 molecule as
measured by a standard T2 stabilization assay.
The experiment was performed at either 50, 30, 15, 7 and 1μM or at 70, 7 and 07 μM of each peptide.
X axis represents different concentrations per well of the peptide tested. Fluorescence index is shown
on the Y axis. (A): HLA-A*0201 epitope enhancement of the WT1-126N wild-type peptide by an
amino acid substitution (Y) at position 1 (126Y) analogue peptide. (B) No enhancement in the case of
peptide 187Y.

93
3.3.3. Generation of WT1 peptide-specific cytotoxic T cell lines
The effect of a tyrosine modification of the WT1-126 peptide on its ability to induce
specific CTL compared with its wild-type peptide, was tested because only the 126Y
analogue peptide but not the 187Y peptide showed a high binding affinity to the
HLA-A*0201 molecule compared to their other peptide counterparts. An optimized
T-cell activation protocol, with CD14+ monocytes-derived DC as antigen presenting
cells, and purified CD8+ T cells as responders was used in order to generate and
expand T cell lines specific to the native (126N) and the modified (126Y) peptides.
The method for the generation of the T cell lines is as illustrated in Figure 3.12. The
PBMCs were obtained from three normal healthy HLA-A*0201 donors designated
as BC-21, BC-32 and BC-37, and used as a source of APCs and responder cells.
Monocytes and CD8+ T cells were isolated from BC-32 by negative selection using
magnetic beads. Cells were stained with FITC-conjugated anti-CD14 antibody and
analyzed by flow cytometry in order to determine the degree of purity achieved
during monocyte separation. Ninety-five percent of the purified cells were CD14+ as
shown in Figure 3.13A, and were used to generate conventional DCs as described in
Materials and Methods section 2.5.4.2. For CD8+ T cells, aliquots of cells before and
after the separation were collected and stained with FITC-conjugated anti-CD8
antibody. The percentage of CD8+ T cells among PBMC-32 was 22% (Figure
3.13B) and the purity of the CD8+ T cells fraction was 82% (Figure 3.13C) as
verified by flow cytometry. DCs were used to prime CD8+ T cells since DCs are the
most potent stimulators of naïve T lymphocytes. The expression level of CD1a, and
CD83 on the cell surface of the mature DCs were analysed by flow cytometry.
Preliminary experiments that used PBMCs obtained from other normal donors were
carried out to compare the expression levels of the DC-related markers by immature
as well as mature DCs. These experiments showed that the mature DCs down
regulated the expression level of CD1a whereas the expression level of the
activation marker CD83 was up regulated. As shown in Figure 3.14A and B, only
0.5% of the mature DCs expressed the CD1a marker while 85% of them expressed
CD83 marker.
To compare the immunogenicity of the native and the modified WT1-126 peptides
as well as to investigate whether the generated line against the analogue peptide

94
could enhance stronger CTLs response and more importantly whether it cross-
reacted with its naturally occurring counter-part, the CTLs were tested after 3 to 8
rounds of stimulations against different HLA-A*0201+ targets in the presence or
absence of autologous peptide using a Chromium Release Assay and an ELISPOT
assay.

95
7 -10days
Test T cells Specificity
Purified CD8+ T cells
Mature DC 126N or 126Y Peptides
+
Peptide-loaded
DC
+
+
+ IL-7 and IL-12
Re-stimulation
+ IL-23-5 rounds of stimulations
CD8+ T Cell
CD8+ T Cell
7 -10days
Test T cells Specificity
Purified CD8+ T cells
Mature DC 126N or 126Y Peptides
+
Peptide-loaded
DC
+
+
+ IL-7 and IL-12
Re-stimulation
+ IL-23-5 rounds of stimulations
CD8+ T CellCD8+ T CellCD8+ T Cell
CD8+ T CellCD8+ T CellCD8+ T Cell
Figure 3.12. Method used to generate CTLs specific for 126N and its analogue (126Y) peptides.
Peptide-pulsed autologous DCs were used to prime and re-stimulate CD8+T cells. IL-7 and IL-12
were added at the initiation of the cultures. IL-2 was added one day after each subsequent stimulation.
The immunogenicity of the generated CTL lines were tested and compared after 3-8 rounds of
stimulation.

96
A
Anti-CD14 (FITC)
95%
Eve
nts
Anti- IgG1 (FITC)
1.2%Eve
nts
Anti-CD14 (FITC)
95%
Eve
nts
Anti-CD14 (FITC)
95%
Eve
nts
Anti- IgG1 (FITC)
1.2%Eve
nts
Anti- IgG1 (FITC)
1.2%Eve
nts
B
Ant
i-CD
3 (A
PC
)Anti-CD8 (FITC)
33% 22%
1.9%
Anti-IgG1( FITC)
Anti-
IgG
1 (A
PC
)
0.3%
4%
0.8%
Ant
i-CD
3 (A
PC
)Anti-CD8 (FITC)
33% 22%
1.9%Ant
i-CD
3 (A
PC
)Anti-CD8 (FITC)
33% 22%
1.9%
33% 22%
1.9%
Anti-IgG1( FITC)
Anti-
IgG
1 (A
PC
)
0.3%
4%
0.8%
Anti-IgG1( FITC)
Anti-
IgG
1 (A
PC
)
0.3%
4%
0.8%
C
Ant
i-CD
3 (A
PC
)
Anti-CD8 (FITC)
7% 82%
0.1%
0.6% 2%
8%
Anti-IgG1( FITC)
Anti-
IgG
1 (A
PC
)
Ant
i-CD
3 (A
PC
)
Anti-CD8 (FITC)
7% 82%
0.1%
Ant
i-CD
3 (A
PC
)
Anti-CD8 (FITC)
7% 82%
0.1%
0.6% 2%
8%
Anti-IgG1( FITC)
Anti-
IgG
1 (A
PC
)
0.6% 2%
8%
Anti-IgG1( FITC)
Anti-
IgG
1 (A
PC
)
Figure 3.13. Efficiency of magnetic bead cell separation.
(A) Flow cytometry analysis of CD14+ cells isolated from PBMC-32 by negative selection (B) Flow
cytometry analysis of CD8+ in PBMC-32 before separation (C) and after separation.

97
A
B
Figure 3.14. Flow cytometry analysis of CD1a and CD83 expression in the mature-monocytes
derived DC-32.
(A) Histograms show that 0.5% of DC-32 expresses CD1a marker. (B) Histograms show that 85% of
DC-32 expresses the activation marker CD83.
10 0 10 1 10 2 10 3 10 4 Mouse IgG1 (FITC)
M1 10 0 10 1 10 2 10 3 10 4
Anti-CD1a (FITC) M1
0.3 % 0.5 % Ev
ents
Even
ts
10 0 10 1 10 2 10 3 10 4 Mouse IgG1 (PE)
M1 10 0 10 1 10 2 1 3 10 4
Anti-CD80 (PE)
M1 85 % 0.25 %
Even
ts
Even
ts

98
3.3.4. Enhanced cytotoxicity of CTL generated against WT1-126Y
We tested the effect of tyrosine modification of the WT-126 peptide on its ability to
induce specific CTL compared with its wild-type peptide. After three to eight rounds
of stimulations, the generated T cell lines were tested against the autologous LCLs
or T2 cells in the presence or absence of autologous peptide using a Chromium
Release Assay. At the early stages of T cell stimulation, most of the T cells’
responses were not specific. Therefore, the T cell lines were subjected to weekly
stimulation and the cytotoxic assay was performed five days after each antigen-
specific stimulation. Cross-reactivity between the two peptides was also tested to
determine if the analogue peptide 126Y is able to induce an immune response to the
native peptide (126N). The lytic activity of the T cell lines generated from BC-32
against 126N and 126Y after four and seven rounds of stimulations are presented in
Figure 3.15A and B, respectively. Figure 3.15A shows that the CTL raised against
the native (WT1-126N) and the modified (WT1-126Y) peptides were not able to
specifically lyse the peptide-loaded LCLs. The assay was done after only four
rounds of T cell stimulation. Figure 3.15B shows that following the seventh antigen-
specific re-stimulation, specific lysis was recorded against the T2 cells for both BC-
32 T cell lines raised against the 126N peptide and its 126Y analogue, because there
was no T cell response against the T2 cells in the absence of the peptides. However,
a significantly (P=0.0006) higher lytic activity was recorded when the T cell line
raised against the 126Y modified peptide was used (Figure 3.15B). Interestingly, we
found cross reactivity of each T cell line with the opposite peptide. In this, the T cell
line generated against the wild-type 126N peptide was able to equally lyse the T2
cells loaded with the 126N or the 126Y. Similar results were obtained for the T cell
line generated against the analogue 126N peptide. The generated T cell lines were
tested against different APCs loaded with the corresponding peptide such as
autologous LCLs and T2 cells. Usually when the T cells showed a specific killing
response against one of the peptide-loaded target cells, they will show killing
responses against other peptide-loaded targets. The 126N and 126Y CTLs failed to
recognize peptide-loaded LCLs because the test was done after four rounds of T cell
stimulation. CD8+ T cells needed more rounds of antigen-stimulation before a
specific response is seen.

99
To confirm that the T cells response generated against both the wild-type 126N and
the 126Y peptides is restricted to the HLA-A*0201 molecule, an HLA blocking
assay was performed. Blocking of the HLA-ABC resulted in a strong inhibition of
the cytotoxic activity of both T cell lines against peptide-loaded T2 cells (Figure
3.16). However, the isotype control did not inhibit the cytotoxic activity of this T
cell lines. These data show that the tyrosine modification of the WT1-126 peptide,
which enhanced their binding to HLA-A*0201, can increase its lytic activity not
only to the 126Y epitope, but also to the wild-type 126N counterpart.
The lytic activity of the T cell lines generated against the native peptide 126N and its
analogue 126Y from BC-21 and BC-37 was also tested and compared. However,
none of these T cell lines elicit any peptide-specific cytotoxic responses. These T
cell lines were challenged with T2 cells pulsed with no peptide or with each peptide
at different E:T ratio starting from 100:1. Figure 3.17A and B shows the failure of
the 126N and 126Y T cell lines generated from BC-21 to recognize T2 cells loaded
with either the native or with the analogue peptide. Similar findings have been
reported for the T cell lines generated from BC-37. As shown in Figure 3.18A and
B, BC-37 T cell lines did not exert any specific cytotoxicity towards T2 cells loaded
with either the native or with the analogue peptide

100
B
0
5
10
1520
2530
3540
45
40:1 20:1 10:1 5:1E:T ratio
% L
ysis
T2T2+126NT2+126Y
T2T2+126NT2+126Y
A
0
2
4
6
8
10
12
14
16
18
50:1 25:1 12.5:1 6.25:1
E:T ratio
% L
ysis
LCL32
LCL32+126N
LCL32+126Y
LCL32
LCL32+126N
LCL32+126Y
P=0.
0006
B
0
5
10
1520
2530
3540
45
40:1 20:1 10:1 5:1E:T ratio
% L
ysis
T2T2+126NT2+126Y
T2T2+126NT2+126Y
B
0
5
10
1520
2530
3540
45
40:1 20:1 10:1 5:1E:T ratio
% L
ysis
T2T2+126NT2+126Y
T2T2+126NT2+126Y
A
0
2
4
6
8
10
12
14
16
18
50:1 25:1 12.5:1 6.25:1
E:T ratio
% L
ysis
LCL32
LCL32+126N
LCL32+126Y
LCL32
LCL32+126N
LCL32+126Y
P=0.
0006
A
0
2
4
6
8
10
12
14
16
18
50:1 25:1 12.5:1 6.25:1
E:T ratio
% L
ysis
LCL32
LCL32+126N
LCL32+126Y
LCL32
LCL32+126N
LCL32+126Y
P=0.
0006
Figure 3.15. Cytotoxicity assay with T cells generated against WT1-126N and WT1-126Y
peptides from a healthy HLA-A*0201 donor.
Cytotoxicity of the T cell line generated against the native 126N peptide is shown with the closed
symbols. Cytotoxicity of the T cell line generated against the analogue 126Y peptide is shown with
the opened symbols. (A): Non-specific lysis by CTLs generated against 126N and 126Y peptides
after the fourth round of in vitro antigen-stimulation. Target cells were autologous LCLs pulsed with
either no peptide (♦,◊), 126N peptide (■,□) or with 126Y peptide (▲,∆). (B): Specific lysis by CTLs
generated against 126N and 126Y peptides after the seventh round of in vitro antigen-stimulation.
Target cells were T2 cells pulsed with either no peptide (♦,◊), 126N peptide (■,□) or with 126Y
peptide (▲,∆). The data are presented as the percentage specific lysis at the indicated E:T ratios.
Error bars (±SD) represent triplicate wells from one experiment. P value between A and B=0.0006.

101
0 10 20 30 40 50
126N T cellline
126Y T cellline
T ce
ll lin
es
% Lysis at E:T ratio (40:1)
T2 + PEPTIDE [Isotype]
T2 + PEPTIDE [anti-ABC]
T2 + PEPTIDE
Figure 3.16. Inhibition of lytic activity of BC-32 T cell lines generated against WT1-126N and
WT1-126Y peptides after blocking with an anti-ABC antibody showing the restriction response to the
HLA-A*0201 molecule.
The assay was performed after the seventh round of in vitro antigen-stimulation. Ab was added to the
wells containing T2 cells 20 min before the addition of T cells. The data are presented as the
percentage specific lysis at E:T ratio of 40:1. Error bars (±SD) represent triplicate wells from one
experiment.

102
0112233
100:1 50:1 25:1 12.5:1
% L
ysis
E:t ratio
A
T2
T2+126N
T2+126Y
0123456789
100:1 50:1 25:1 12.5:1
% L
ysis
E:T ratio
B
T2
T2+126N
T2+126Y
0112233
100:1 50:1 25:1 12.5:1
% L
ysis
E:t ratio
A
T2
T2+126N
T2+126Y
0123456789
100:1 50:1 25:1 12.5:1
% L
ysis
E:T ratio
B
T2
T2+126N
T2+126Y
Figure 3.17. Non-specific lysis by BC-21 T cell lines generated against WT1-126N and WT1-
126Y peptides as tested using a standard chromium release assay.
The T cell line generated from a normal HLA-A0201+ donor, BC-21, were used as effector cells.
Target cells were T2 cells pulsed with either no peptide (♦), with 126N peptide (■) or with 126Y
peptide (▲). (A) Shows the cytotoxicity of the T cell line generated against the native 126N peptide.
(B) Shows the cytotoxicity of the T cell line generated against the analogue 126Y peptide. The data
are presented as the percentage specific lysis at the indicated E:T ratios and represents the average of
two experiments and error bars indicate the SD.
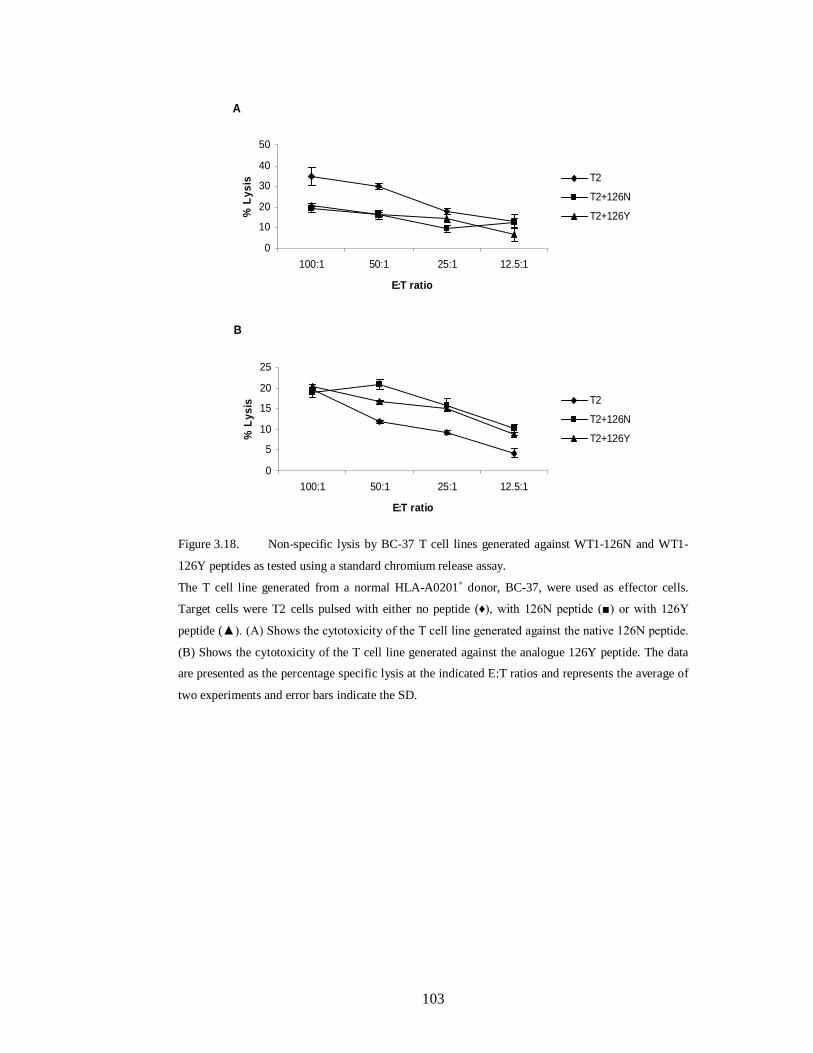
103
A
0
10
20
30
40
50
100:1 50:1 25:1 12.5:1
E:T ratio
% L
ysis T2
T2+126N
T2+126Y
B
0
5
10
15
20
25
100:1 50:1 25:1 12.5:1
E:T ratio
% L
ysis T2
T2+126N
T2+126Y
A
0
10
20
30
40
50
100:1 50:1 25:1 12.5:1
E:T ratio
% L
ysis T2
T2+126N
T2+126Y
B
0
5
10
15
20
25
100:1 50:1 25:1 12.5:1
E:T ratio
% L
ysis T2
T2+126N
T2+126Y
Figure 3.18. Non-specific lysis by BC-37 T cell lines generated against WT1-126N and WT1-
126Y peptides as tested using a standard chromium release assay.
The T cell line generated from a normal HLA-A0201+ donor, BC-37, were used as effector cells.
Target cells were T2 cells pulsed with either no peptide (♦), with 126N peptide (■) or with 126Y
peptide (▲). (A) Shows the cytotoxicity of the T cell line generated against the native 126N peptide.
(B) Shows the cytotoxicity of the T cell line generated against the analogue 126Y peptide. The data
are presented as the percentage specific lysis at the indicated E:T ratios and represents the average of
two experiments and error bars indicate the SD.

104
3.3.5. WT1-126Y peptide increased the frequency of IFN-γ producing T cells
We have tested the 126N and the 126Y T cell lines for the frequency of IFN-γ
producing T cells after three rounds of in vitro stimulation using an ELISPOT assay.
Results obtained from two experiments are shown in Figure 3.19A. Both T cell lines
generated from BC-32 produced specific IFN-γ in response to stimulation with
autologous LCL loaded with their corresponding peptide (Figure 3.19A). However,
the T cell line generated with the analogue 126Y peptide exerted a significantly
higher number (P=0.0003) of IFN-γ producing T cells compared with that generated
against the 126N wild-type peptide (Figure 3.19A). The 126N and 126Y T cell lines
were challenged with the PHA to explore whether the two T cell lines did not differ
in the proportion of T cells capable of IFN-production. As shown in Figure 3.19B,
the two lines did not differ in the proportion of T cells capable of IFN- production.
These data demonstrate that modification of the WT1-126 peptide can increase the
frequency of IFN-γ producing T cells and thus making them better effector cells.
The 126N and the 126Y T cell lines generated from BC-21 and BC-37 were also
tested for the frequency of IFN-γ producing T cells. Consistent with the cytotoxic
findings, these T cell lines did not produce specific IFN- when stimulated with
autologous LCL loaded with their corresponding peptide (Figure 3.20 and Figure
3.21).

105
B
020406080
100120140
126N T cellline
126Y T cellline
IFN
- g sp
ots/
20.0
00 C
D8+ T
ce
lls
T cells + PHA
A
0
5
10
15
20
25
30
126N T cell line 126Y T cell lineIFN
- g s
pots
/20.
000
CD
8+ T c
ells
T cells only
T cells + LCL
T cells + LCL + PEPTIDE
B
020406080
100120140
126N T cellline
126Y T cellline
IFN
- g sp
ots/
20.0
00 C
D8+ T
ce
lls
T cells + PHA
A
0
5
10
15
20
25
30
126N T cell line 126Y T cell lineIFN
- g s
pots
/20.
000
CD
8+ T c
ells
T cells only
T cells + LCL
T cells + LCL + PEPTIDE
Figure 3.19. Specific production of IFN- by the two T cell lines generated against the wild type
126N and its analogue 126Y peptides as measured by an ELISPOT assay.
The T cell lines were established from BC-32, an HLA-A0201+ donor, and tested following three to
eight rounds of in vitro T cell stimulations. The background observed when T cells alone were used is
shown. (A) T cells were stimulated with autologous LCL± peptide for 40 h in anti-IFN- pre-coated
wells before development of the spots. T cells incubated without stimulators (T cell only) served as a
baseline. (B) T cells stimulated with PHA did not differ in the proportion of T cells capable of IFN-
production. Results are expressed as IFN- γ positive cells per 20.000 CD8+ T cells and are the mean
of duplicate assays (±SD).

106
0
5
10
15
20
25
30
126N T Cell line 126Y T Cell line
IFN
- g s
pots
/20.
000
CD
8+ T c
ells
T Cells only
T cells + LCL-21
T cells + LCL-21+ PEPTIDE
Figure 3.20. Non-specific IFN- release by BC-21 CTLs generated against the WT1-126N and
WT1-126Y peptides using an IFN-γ- ELISPOT assay.
The T cell lines were established from BC-21, an HLA-A0201+ donor, and tested following three to
eight rounds of in vitro T cell stimulations. Targets were autologous LCLs pulsed with either no
peptide or with peptide. The background observed when T cells alone were used is shown. Results
are expressed as IFN- γ positive cells per 20.000 CD8+ T cells and are the mean of triplicate assays
(±SD).
0
5
10
15
20
25
30
126N T Cell line 126Y T Cell line
IFN
- g s
pots
/20.
000
CD
8+ T c
ells
T Cells only
T cells + LCL-37
T cells + LCL-37+ PEPTIDE
Figure 3.21. Non-specific IFN- release by BC-37 CTLs generated against the WT1-126N and
WT1-126Y peptides using an IFN-γ- ELISPOT assay.
The T cell lines were established from BC-37, an HLA-A0201+ donor, and tested following three to
eight rounds of in vitro T cell stimulations. Targets were autologous LCLs pulsed with either no
peptide or with peptide. The background observed when T cells alone were used is shown. Results
are expressed as IFN- γ positive cells per 20.000 CD8+ T cells and are the mean of triplicate assays
(±SD).

107
3.3.6. Evaluation of WT1 expression and lytic activity of anti-WT1 T cell lines
against HLA-A0201-matched leukemic cells
Given the above, the feasibility of using this modification approach of the WT1-126
peptide to generate CTLs that effectively kill HLA-A*0201-matched leukemic cells
was tested. The expression of the WT1 mRNA in fresh AML cells (AML-27 and
AML-28) was examined using Q-RT-PCR. K562 cells, known to express high levels
of WT1 (Greiner et al., 2004) were used as a positive control. PBMC-32 derived
from a normal donor was used as a negative control. Higher levels of WT1
expression were observed in AML samples (Table 3.2). The lytic activity of the two
T cell lines generated against the 126N and 126Y peptides were then measured
against PBMCs from HLA-A*0201-matched (AML-28) and non-HLA-A0201
matched (AML-27) AML patients. Specific lytic activity was recorded for both T
cell lines against the AML-28 cells expressing the HLA-A*0201 molecule (Figure
3.22). However, both T cell lines failed to recognise non-HLA-A*0201 AML-27
even though they expressed high levels of WT1 (Figure 3.22). Interestingly, the T
cell line generated with the analogue 126Y peptide exerted a significantly higher
lytic activity (P=0.0014) compared with that generated against the 126N wild-type
peptide (Figure 3.22). Altogether, our data indicated that the modified WT1-126Y
enhanced its binding to HLA-A*0201, increased the frequency of IFN-γ producing
T cells, and boosted the lytic activity against HLA-matched leukaemia cells.
Therefore, modification of the WT1-126 peptide provides a potential approach for
the development of leukaemia vaccine.

108
Table 3.2. Clinical characteristics of patients and donors used in the study
Donor/Patient Samples
HLA-A Type
% Blasts1
QRT-PCR2
RT-PCR3
Status4
FAB-Type5
PBMC-32
A0201, 29
NA
60
-
NA
NA
AML-27
25,29 81 7950 +++ new
M4
AML-28 A0201, 26 61 1800 +
new M4
1 % blasts were determined routinely by the hematopathology laboratory 2 Quantitative real-time PCR data for the expression level of WT1 which normalized from K562
set on 1000 3 Conventional RT-PCR data for the expression of WT1 4 New indicates that samples were taken at first diagnosis 5 French-American-British classification NA=not applicable
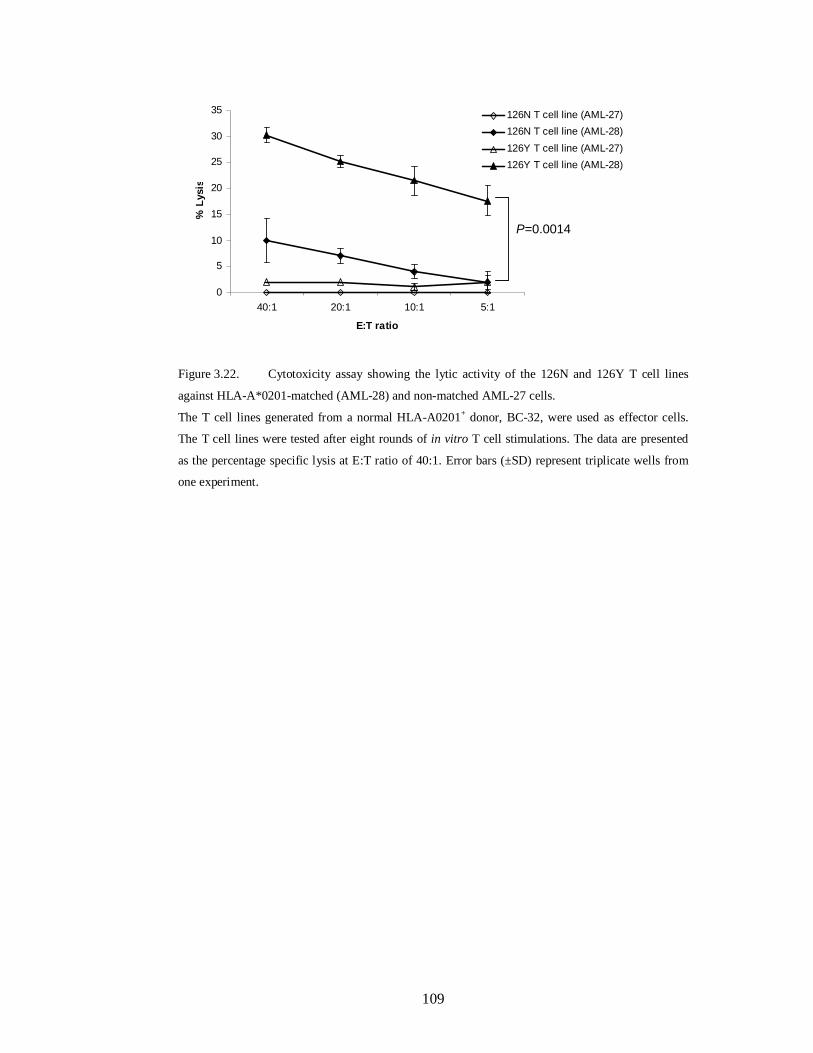
109
0
5
10
15
20
25
30
35
40:1 20:1 10:1 5:1
E:T ratio
% L
ysis
126N T cell line (AML-27)126N T cell line (AML-28)126Y T cell line (AML-27)126Y T cell line (AML-28)
P=0.0014
0
5
10
15
20
25
30
35
40:1 20:1 10:1 5:1
E:T ratio
% L
ysis
126N T cell line (AML-27)126N T cell line (AML-28)126Y T cell line (AML-27)126Y T cell line (AML-28)
P=0.0014
Figure 3.22. Cytotoxicity assay showing the lytic activity of the 126N and 126Y T cell lines
against HLA-A*0201-matched (AML-28) and non-matched AML-27 cells.
The T cell lines generated from a normal HLA-A0201+ donor, BC-32, were used as effector cells.
The T cell lines were tested after eight rounds of in vitro T cell stimulations. The data are presented
as the percentage specific lysis at E:T ratio of 40:1. Error bars (±SD) represent triplicate wells from
one experiment.

110
3.4. Discussion
Majority of tumour-associated antigens, which have been identified so far, are
derived from self-antigens. Immunological tolerance can prevent the development of
immune responses against such self-antigens. Therefore, most self/tumour antigens
used in clinical trials so far showed poor immunogenicity. To circumvent the
problem of tolerance, Stauss et al. (Bellantuono et al., 2002, Gao et al., 2000)
developed an allo-restricted CTL against leukaemia. In this approach, T cells from
HLA-A*0201 donors were stimulated with peptide loaded HLA-A*0201-matched
APCs. This allowed the generation of high-avidity allo-restricted CTLs against an
HLAA0201 WT1-derived epitope. Interestingly, the generated CTLs specifically
lysed WT1 , HLA-A*0201-matched leukaemia cells. More importantly, only the
high-avidity CTLs were able to eliminate the progenitors of CFU-GM and BFU-GM
from CD34 CML samples, whereas normal CD34 progenitors/stem cells were
spared (Bellantuono et al., 2002, Gao et al., 2000). However, as allogeneic APCs
usually provoke dominant CTL responses against allogeneic epitopes, the isolation
of HLA-A0201-WT1 peptide-specific allogeneic CTLs was unsuccessful in many
cases. Another drawback of this strategy is the difficultly in applying such an
approach in clinical settings. A more promising approach has been recently
developed by the same group, which rely on introducing the WT1-specific TCR into
autologous T cells for possible future clinical applications (Xue et al., 2005).
Because the WT1 is a self-protein expressed at low levels in some normal cells
(Ellisen et al., 2001, Menssen et al., 1997), many of the potential CTL epitopes from
this antigen may be absent or ‘sub-optimal’. This is due to clonal deletion of high-
avidity CTLs during maturation of the immune system. Therefore, the induction of
antitumor immune responses frequently needs to be addressed against those ‘sub-
optimal’ CTL epitopes to enhance their immunogenicity, frequency and hence their
therapeutic potential. In addition, naturally arising CD25+ CD4+ regulatory T cells
(Tregs), play an important role in the maintenance of immunologic self-tolerance
(Sakaguchi et al., 2006). Although this T cell population plays a key role in
regulating the immune response to self antigen, it has been shown recently that
Tregs can directly suppress the anti-tumour immune responses in cancer patients
(Beyer and Schultze, 2006, Clarke et al., 2006, Khazaie and von Boehmer, 2006,
Orentas et al., 2006). Indeed, another group demonstrated that the depletion of this T

111
cell population resulted in an enhancement of vaccine-mediated anti-tumour
immunity in cancer patients (Dannull et al., 2005). Furthermore, a recent study
showed that such response can be largely affected by the presence of CD4 +CD25+
Tregs and depletion of this T cell population was necessary for the generation of an
effective WT1- specific cytotoxic response (Asemissen et al., 2006).
It is known that the immunogenicity of antigenic peptides is dependent on their
binding affinity to MHC class I molecules; stability of the peptide-MHC complexes;
and the avidity of the TCR binding to the peptide complex (Yu et al., 2004). It has
been demonstrated that the poor immunogenicity of some self/tumour antigens is
due to the instability of the peptide-MHC complex rather than low affinity of T cell
receptors to peptide-MHC complexes (Yu et al., 2004). Therefore, many studies
have focused on introduction of a peptide modification to improve the binding of
self antigenic peptides to their corresponding MHC class I molecules and
consequently enhance the immunogenicity of these peptides (Bakker et al., 1997,
Chen et al., 2000, Hoffmann et al., 2002, Parkhurst et al., 1996, Rosenberg et al.,
1998, Tangri et al., 2001, Valmori et al., 1998). In the present study, we have
applied a previously described strategy to enhance the immunogenicity of low-
avidity HLA-A0201-restricted peptides without altering their antigenic specificity
(Tourdot et al., 2000). Briefly, this consists of substituting the first amino acid of the
epitope with a tyrosine (Y). The importance of this approach is that the resulting
peptide analogues are able to efficiently trigger in vivo wild-type peptide-specific
CTLs which also recognised the naturally occurring epitope (Tourdot et al., 2000).
We have carried out the Y amino acid substitution in the sequence of the two known
HLA-A*0201- restricted Db126 and WH187 WT1-derived peptides (Oka et al.,
2000). Using a computer-based epitope prediction program, the 126Y and 187Y
analogue peptides were predicted to bind 4.6-fold more to the HLA-A0201 molecule
compared to their native 126N and 187N counterparts. However, a significant
enhancement of the actual binding ability was recorded for the 126Y peptide
analogue when we used the T2 binding assay. Therefore, we generated CTLs lines
against the wild-type 126N and its 126Y peptide analogue. Although both peptides
were able to induce specific cytotoxic immune responses against autologous
peptide-loaded T2 cells, the CTL line generated with the 126Y peptide showed a
higher and significant lytic activity compared with the CTL line generated with the

112
126N wild-type peptide. Interestingly, CTL generated against the 126Y analogue
peptide was able to lyse the T2 target cells when loaded with the wild-type peptide.
Therefore, modification of the 126 peptide resulted in enhancement of its
immunogenicity without altering its antigenic specificity. Another important finding
was the significant high lytic activity observed for the 126Y CTL line against HLA-
A*0201-matched leukemic cells expressing the WT1 antigen. These data imply that
the generated 126N and 126Y T cell lines were different. In addition, these data
confirm that T cells generated against the 126Y analogue peptide cross-react also
with the naturally processed 126N native peptide. These results suggest that
stimulation with the 126Y peptide analogue induced CTLs with a high TCR avidity.
Finally, the high lytic activity provoked by the 126Y CTL may also be attributed to
the significantly high number of anti-126 T cells in this T cell line as demonstrated
by γ-IFN production.
During the course of this study, Pinilla-Ibarz et al. (Pinilla-Ibarz et al., 2006)
reported on a similar study based on the same strategy to modify several HLA-
A0201 WT1-derived peptides including the 126N, 187N and their analogues as
described in the present work. Although, this group did not find any difference in the
binding affinity between the 2 126N and 126Y peptides, they reported that
stimulation with the 126Y peptide analogue was able to generate an earlier and
stronger specific CTL than that generated with the 126N wild-type peptide.
Consistent with our findings the 126Y CTL line was able to recognise the 126N
wild-type peptide on the target cells and specifically lyse HLA-A0201-matched
leukaemia cells expressing the WT1 antigen. Another group has introduced a
tyrosine modification in position two of a 9-mer WT1-derived peptide which is
known to bind to the HLA-A*2402 molecule and showed a better binding affinity
and elicitation of higher lytic activity (Tsuboi et al., 2002). Moreover, the modified
peptide has been used to vaccinate cancer patients where a clear correlation was
observed between an increase in the frequencies of WT1-specific CTL after
vaccination and clinical responses (Oka et al., 2004).
In conclusion, this study is consistent with previously reported findings (Oka et al.,
2004, Pinilla-Ibarz et al., 2006, Tsuboi et al., 2002) and has shed more light on the
importance of peptide modification as a new approach in elucidating a better

113
immune response, needed to combat cancer. On the basis of these findings,
leukaemia patients could be clinically tried for vaccination with the current WT1-
126Y peptide analogue or adoptively treated with ex vivo anti-WT1-126Y T cells to
specifically enhance the graft-versus-leukaemia effect and anti-WT1 CTL
frequency, which are known to be very low in these patients.

114
4. IDENTIFICATION OF A NOVEL WT1-DERIVED
EPITOPE RECOGNIZED BY HUMAN CD4+ T
CELLS

115
4.1. Introduction
Compelling evidence indicates a key role for regulatory T cells (Tregs) in the host
response to cancer. In both mice and humans, Treg populations were shown to
directly suppress anti-tumour immunity and to contribute to tumour growth and
progression (Beyer and Schultze, 2006, Ghebeh et al., 2008, Shen et al., 2009, Ke et
al., 2008, Sakaguchi, 2004, Lizee et al., 2006). Depletion or reduction of this T-cell
population restored the anti-tumour immunity and resulted in an enhancement of
vaccine efficacy in cancer patients (Dannull et al., 2005, Ruter et al., 2009,
Nishikawa et al., 2005, Mahnke et al., 2007). Furthermore, patients with solid
tumours as well as haematological malignancies have been shown to have increased
prevalence of Tregs (Sasada et al., 2003, Ichihara et al., 2003, Strauss et al., 2007,
Miller et al., 2006, Wang et al., 2005b, Beyer et al., 2006) . The presence of
increased number of Tregs in cancer patients has been shown to be inversely related
to the outcome of several malignancies (Salama et al., 2009, Heimberger et al.,
2008). Tregs may directly modulate the CD8+ T-cell response or alternatively
promote tolerization of CD8+ T cells by preventing the licensing of antigen-
presenting cells (APC) by CD4+ T helper cells (Alpan et al., 2004, Bourgeois et al.,
2002). It has became clear that CD8+ T cells generated in the absence of CD4+ T
cells help may have a normal primary response; however, their cytotoxic memory
response is severely weakened (Janssen et al., 2003).
In our lab, we generated a T cell line and clones that specifically recognized a WT1-
333-347 (RYFKLSHLQMHSRKH) peptide designated as WT1-84 in an HLA-
DRB1*0402–restricted manner. These T-cell clones produced GM-CSF, IL-4 and
IL-5 in response to WT1-84 peptide exerting a T helper 2 cytokine profile.
Importantly, they recognized HLA-DRB1*04 matched fresh leukemic cells
expressing the WT1 antigen. These clones had a CD4+CD25+Foxp3+GITR+CD127–
Tregs phenotype and significantly inhibited the proliferative activity of allogeneic T
cells Importantly, anti–WT1-84 interleukin-5+/granzyme B+/Foxp3+ CD4+ Tregs
have been detected in five of eight HLA-DR4+ acute myeloid leukaemia patients
(Lehe et al., 2008).

116
4.2. Aim
Specific anti-WT1 immune responses have been described in which CD8+ cytotoxic
T cells have been generated in vitro (Asemissen et al., 2006, Oka et al., 2000,
Azuma et al., 2002, Bellantuono et al., 2002, Li et al., 2008). However, a recent
study showed that such response can be largely affected by the presence of
CD4+CD25+ Tregs in which depletion of this T-cell population was necessary for
the generation of an effective WT1-specific cytotoxic response (Asemissen et al.,
2006). In our lab, we generated a Treg clones specific for the WT1-84 antigen in an
HLA-DRB1*0402–restricted manner. We also showed the existence of this T cell
population in leukaemia patients. The aim of this part of the study was to investigate
whether this T cell type could also be generated from other HLA-DR04+ donors. In
this chapter, specific T cell lines and clones were generated against a mixture of
peptides derived from the WT1 antigen (WT1-Pepmix) and tested for their peptide
specificity by proliferation assay against different APCs loaded with WT1 peptides
and also against WT1-expressing leukemic cells.
4.3. Results
4.3.1. Generation of T-cell lines against the WT1-Pepmix and analysis of their
HLA restriction
In order to confirm our previous findings in more HLA-DRB1*04 positive donors,
T-cell lines from three healthy individuals designated as BC-52, BC-57 and BC-62
were generated. Two of the donors, BC-52 and BC-62, share the same HLA-DR
alleles i.e. 0402,1601 and matched with the donor used to generate the WT1-84
reactive T cell lines in one of the DR alleles i.e., *0402, whereas the BC-57 donor
has HLA-DR-*0406, 0701 alleles (Table 4.1). PBMCs from the three donors (BC-
52, BC-57 and BC-62) were stimulated for two rounds with autologous-
conventional DCs generated from blood monocytes as described in Materials and
Methods section 2.5.4.2. The phenotype of the generated DCs from the three donors
was verified by FACS analysis (Figure 4.1A, B and C). After two rounds of
stimulation, the cells were re-stimulated with different autologous APCs i.e.
monocytes and activated T cells (T-APCs). The T-APCs were prepared from a
single donor (BC-57) as described in Materials and Methods section 2.5.3. Mature

117
DCs were pulsed with WT1-Pepmix, a mixture of 110 synthetic 15-mer peptides that
overlaps by 11 amino acids and spans the entire WT1 sequence. Figure 4.2 shows
the sequence of the 110 peptides of the WT1-Pepmix. Corresponding T-cell lines
designated TCL-52, TCL-57, and TCL-62 were generated and their proliferative
activity was assessed in a thymidine uptake [3H]-proliferation assay. All T cell lines
were tested after the fourth and the fifth round of stimulation and showed specific
proliferative activity against autologous PBMCs pulsed with WT1-Pepmix (Figure
4.3 A and B). Both TCL-52 and TCL-62 lines showed high proliferative activity
against PBMCs pulsed with WT1-84 peptide. Additionally, the HLA restriction of
the lines was determined in which anti–HLA-DR mAb was found to significantly
inhibit their proliferation (Figure 4.3A & B). These data indicate that the two cell
lines (TCL-52 and TCL-62) recognized WT1-84 peptide in an HLA-DR restricted
manner and thereby confirming the previous findings. The TCL-52 and TCL-62
were extensively studied by my colleague Cynthia Lehe who published her findings
in the 2008 August 1 issue of the Cancer Research Journal (Lehe et al., 2008).
The proliferation of TCL-57 against PBMCs and LCLs pulsed with the WT1-84
peptide was not very strong indicating that the T cells were not recognizing the
WT1-84 peptide (Figure 4.4). However, the TCL-57 showed strong proliferative
activity against autologous PBMCs and LCLs pulsed with the WT1-Pepmix as
shown in Figure 4.4. The mean proliferation of TCL-57 to the Pepmix was 3.5 and
1.8 times higher than the proliferation to autologous PBMCs and LCLs pulsed with
the WT1-84 peptide, respectively (Figure 4.4). To analyze the HLA restriction of the
TCL-57, an antibody-blocking assay was performed using monoclonal antibodies
specific to class I and class II molecules. As shown in Figure 4.5, the proliferation of
TCL-57 was inhibited to some extent by the use of anti-HLA-ABC, anti-HLA-DP
and anti-HLA-DQ mAb but it was significantly inhibited by using anti-HLA-DR
mAb. These data indicate that the TCL-57 recognized a peptide within the 110
WT1-Pepmix peptides in an HLA-DR-restricted manner. The phenotype analysis of
the generated TCL-57 using the flow cytometry revealed that that 95% of the
generated T cells were CD4+ T cells (Figure 4.6A). These cells were also analyzed
for the expression of two important Tregs markers CD25 and Foxp3 in CD4+ T cells.
As shown in Figure 4.6B, 16.8% of the CD4+ T cells co-express CD25 and Foxp3.
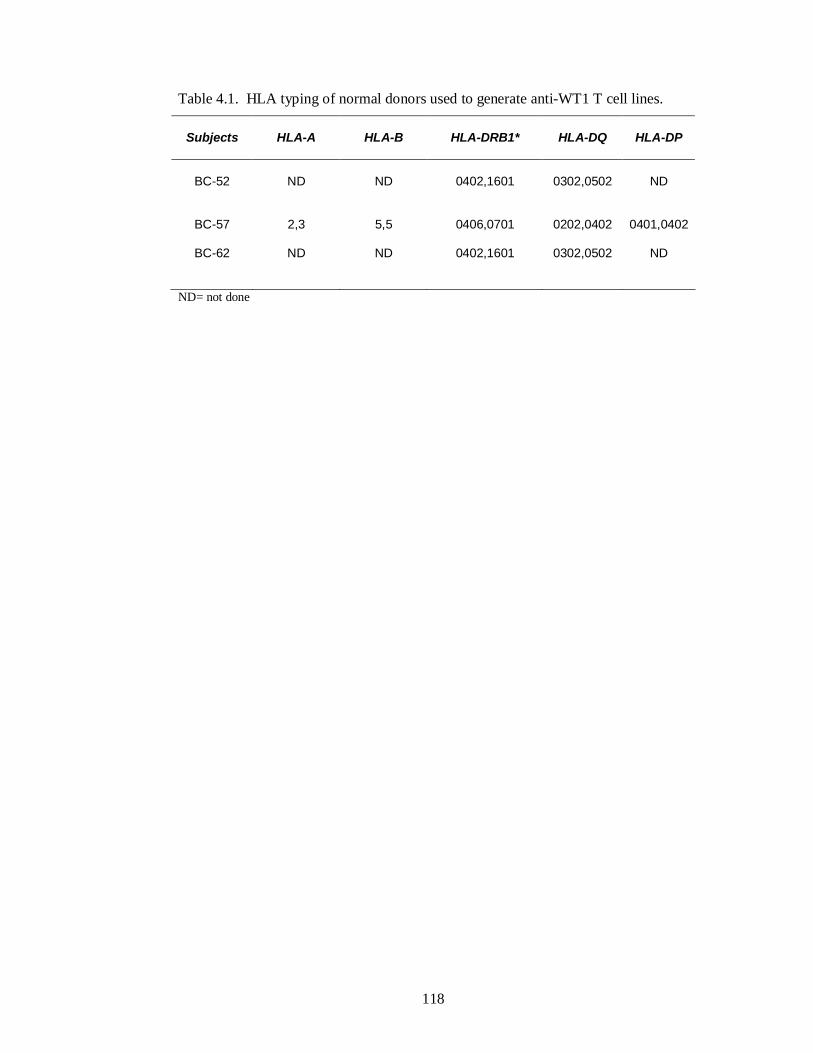
118
Table 4.1. HLA typing of normal donors used to generate anti-WT1 T cell lines.
Subjects
HLA-A
HLA-B
HLA-DRB1*
HLA-DQ
HLA-DP
BC-52
ND
ND
0402,1601
0302,0502
ND
BC-57
2,3
5,5
0406,0701
0202,0402
0401,0402
BC-62 ND ND 0402,1601 0302,0502
ND
ND= not done

119
A
10 0 10 1 10 2 10 3 10 4Anti-IgG1 (PE)
0.44%
0%
2.90%
Ant
i-IgG
1 (A
PC)
10 0 10 1 10 2 10 3 10 4Anti-IgG1 (PE)
0.44%
0%
2.90%
Ant
i-IgG
1 (A
PC)
10 0 10 1 10 2 10 3 10 4Anti-CD83 (PE)
0.04% 0.51%
68.41%
Anti-
CD
1a (A
PC)
10 0 10 1 10 2 10 3 10 4Anti-CD83 (PE)
0.04% 0.51%
68.41%
Anti-
CD
1a (A
PC)
B
10 0 10 1 10 2 10 3 10 4
2.13%
0.06%0.42%
Anti-IgG1 (PE)
Ant
i-IgG
1 (A
PC)
10 0 10 1 10 2 10 3 10 4
2.13%
0.06%0.42%
Anti-IgG1 (PE)
Ant
i-IgG
1 (A
PC)
10 0 10 1 10 2 10 3 10 4
0.11% 0.38%
56.44%
Ant
i-CD
1a (A
PC)
Anti-CD83 (PE)
10 0 10 1 10 2 10 3 10 4
0.11% 0.38%
56.44%
Ant
i-CD
1a (A
PC)
Anti-CD83 (PE) C
100 101 102 103 104
0.95% 0%
0.62%
Anti-IgG1 (PE)
Ant
i-IgG
1 (A
PC)
100 101 102 103 104
0.95% 0%
0.62%
Anti-IgG1 (PE)
Ant
i-IgG
1 (A
PC)
Sample ID: DC 62
100 101 102 103 104
0.31% 0.29%
48.92%Ant
i-CD1a
(APC)
Anti-CD83 (PE)
Sample ID: DC 62
100 101 102 103 104
0.31% 0.29%
48.92%Ant
i-CD1a
(APC)
Anti-CD83 (PE)
Figure 4.1. Flow cytometry analysis of CD1a and CD83 expression in the mature-monocytes
derived DCs.
(A) (B) and (C) show the expression level of CD1a marker and the activation marker CD83 in DC-
52, DC-57 and DC-62, respectively.

120
Figure 4.2. Sequence list of the 110 single WT1-derived micro-scale peptides

121
B
0 500 1000 1500 2000 2500 3000 3500
none
PBMCs
PBMCs (Pepmix)
PBMCs (WT1-84)
PBMCs (WT184)+Anti-HLA DR
Stim
ulat
ors
[3H]thymidine uptake (cpm)
A
0 5000 10000 15000 20000 25000
none
PBMCs
PBMCs (Pepmix)
PBMCs (WT1- 84)
PBMCs (WT1-84)+Anti-HLA DR
Stim
ulat
ors
[3H]thymidine uptake (cpm)
B
0 500 1000 1500 2000 2500 3000 3500
none
PBMCs
PBMCs (Pepmix)
PBMCs (WT1-84)
PBMCs (WT184)+Anti-HLA DR
Stim
ulat
ors
[3H]thymidine uptake (cpm)
A
0 5000 10000 15000 20000 25000
none
PBMCs
PBMCs (Pepmix)
PBMCs (WT1- 84)
PBMCs (WT1-84)+Anti-HLA DR
Stim
ulat
ors
[3H]thymidine uptake (cpm)
Figure 4.3. Proliferative activity of T-cell lines generated against the WT1-Pepmix.
T cells (25x104 per well) from two T-cell lines (TCL-52 and TCL-62) were challenged for 72 h with
irradiated (2500 rads, XR) autologous PBMCs (105 per well) in the absence or presence of either
WT1-Pepmix or WT1-84. Cells were pulsed with [3H] thymidine for an additional 18 h and then
harvested. T cells only (none) were used as a negative control. HLA-DR mAbs were added to the
wells containing PBMCs 20 min before the addition of T cells to confirm that the response was
restricted to the HLA-DR molecule. (A): the proliferative activity of TCL-52 mixed with irradiated
autologous PBMCs pulsed with the WT1-Pepmix or WT1-84 peptide. (B): the proliferative activity
of TCL-62 mixed with irradiated autologous PBMCs pulsed with the WT1-Pepmix or WT1-84. Data
represent the mean of two different experiments performed in duplicate. Error bars indicate the SD.

122
0 5000 10000 15000 20000 25000 30000
none
PBMCs
PBMCs (Pepmix)
PBMCs (WT1-84)
LCL 57
LCL 57(Pepmix)
LCL 57(WT1-84)
Stim
ulat
ors
3[H]thymidine uptake (cpm)
Figure 4.4. Proliferative activity of the T-cell line 57 generated against the WT1-Pepmix.
T cells (25x104 per well) from a healthy donor were challenged for 72 h with irradiated (2500 rads,
XR) autologous PBMCs (105 per well) in the absence or presence of either WT1-Pepmix or WT1-84.
Cells were pulsed with [3H] thymidine for an additional 18 h and then harvested. T cells only (none)
were used as a negative control. Data represent the average of two different experiments performed in
duplicate. Error bars indicate the SD.

123
0 5000 10000 15000 20000 25000 30000
none
PBMCs
PBMCs+Pepmix
PBMCs+Pepmix+anti-ABC
PBMCs+Pepmix+anti-DR
PBMCs+Pepmix+anti-DQ
PBMCs+Pepmix+anti-DP
Stim
ulat
ors
3[H] Thymidine Uptake (cpm)
Figure 4.5. Effect of blocking antibodies on the proliferative responses of TCL-57.
T cells (25x104 per well) from a healthy donor were challenged for 72 h with irradiated (2500 rads,
XR) autologous PBMCs (105 per well) in the absence or presence of WT1-Pepmix. In order to assess
T cell restriction, HLA-ABC, HLA-DR, HLA-DQ and HLA-DP azide-free mAbs were added to the
corresponding wells containing PBMCs 20 min before the addition of T cells. T cells only (none)
were used as a negative control. Cells were pulsed with [3H] thymidine for an additional 18 h and
then harvested. Data represent the average of two experiments performed in duplicate. Error bars
indicate the SD.

124
A
100 101 102 103 104CD4 FITC
100 101 102 103 104CD4 FITC 100 101 102 103 104
Anti-CD4 (FITC)
3.62% 0.85%
94.92%
Anti-
CD8
(PE-
CY5
)
100 101 102 103 104Anti-CD4 (FITC)
3.62% 0.85%
94.92%
Anti-
CD8
(PE-
CY5
)
B
Anti-CD4 (FITC)
R1
SSC
H
Anti-CD4 (FITC)
R1
SSC
H
FL2-H
2.76%
0.44%3.26%
Ant
i-Ig
G1
(APC
)
FL2-H
2.76%
0.44%3.26%
Ant
i-Ig
G1
(APC
)
Anti-CD25 (PE)
19.05%
16.76%16.89%
Anti-
FOX
P3 (A
PC)
Anti-CD25 (PE)
19.05%
16.76%16.89%
Anti-
FOX
P3 (A
PC)
Figure 4.6. Flow cytometry analysis of CD8, CD4, CD25 and FOXP3 expression in the TCL-
57.
(A): 95% T cells are CD4+ T cells. (B): 16.8% of CD4+ T cells co-express CD25 and FOXP3
molecules.

125
4.3.2. Generation of specific responses against WT1-Pepmix using dynabeads
The dynabeads T cell expander was used to activate the TCL-57 after several rounds
of antigen-specific re-stimulations with autologous-APCs (DCs or monocytes)
pulsed with the Pepmix. The dynabeads are polystyrene beads coated with
monoclonal antibodies against the CD3 and CD28 cell surface molecules. The beads
were used because the T cells were poorly proliferating which may have been due to
the age of the T-cell cultures.
After the 9th stimulation, the T cells were divided into two fractions. One of these
fractions was re-stimulated with autologous monocytes loaded with the WT1-
Pepmix and the other fraction was re-stimulated with the dynabeads. After two more
rounds of stimulation, the cells were tested in a proliferation assay to evaluate the
efficiency of bead-stimulation. Although the T cells stimulated with monocytes
showed a specific proliferative response against WT1 pepmix, a very high
proliferative capacity (7.5 fold) was recorded for T cells stimulated with the
dynabeads when challenged with PBMCs pulsed with the Pepmix (Figure 4.7). The
result demonstrated that the dynabeads T cell expander was very efficient in
activating the exhausted T cells after several rounds of antigen-specific re-
stimulation.

126
0 5000 10000 15000 20000 25000
none
PBMC
PBMC (Pepmix)
Stim
ulat
ors
[3H]Thymidine uptake
TC-BTC-M
Figure 4.7. The efficiency of the dynabead T cell expander in activating exhausted T cells.
T cells (25x104 per well), either re-stimulated with monocytes pulsed with WT1-Pepmix (TC-M) or
with dynabeads (TC-B), were challenged for 72 h with irradiated (2500 rads, XR) autologous PBMCs
(105 per well) in the absence or presence of WT1-Pepmix. T cells only (none) were used as a negative
control. Cells were pulsed with [3H] thymidine for an additional 18 h and then harvested. Error bars
(±SD) represent duplicate wells from one experiment.

127
4.3.3. Identification of a novel WT1-60 peptide recognized by TCL-57 T cells
The specificity of TCL-57 was further investigated as this T cell line showed no
response towards the WT1-84 peptide. The TCL-57 (activated with dynabeads) was
screened by proliferation assay against individual 110 WT1-Pepmix peptides using a
microscale WT1 peptide set, a 96-well plate that contains a single WT1 peptide of
the 110-Pepmix peptides in each well (Figure 4.8A). In this proliferation assay, five
peptides designated WT1-60237-251, WT1-61241-255, WT1-79313-327, WT1-80317-331 and
WT1-96381-395 induced strong proliferative activity (ranging from 4.7 to 8.3 fold) of
the TCL-57 cells (Figure 4.8B). The rest of the peptides did not induce any
significant proliferative activity. These five peptides were ordered and specificity of
the TCL-57 was again tested by challenging T cells against each one of the
individual-test peptides in a proliferation assay. As shown in Figure 4.9, the peptide
WT1-60237-251 (TMNQMNLGATLKGVA) induced the strongest T cell proliferative
response. WT1-60 peptide induced a 10 fold increase in proliferative activity of
TCL-57. In addition, the proliferative response of T cells to WT1-60 was 3.3 times
higher than that against the Pepmix.

128
A
1N1N
2N2N
3N3N
4N4N
5N5N
6N6N
7N7N
8N8N
9N9N
10N10N
11N11N
12N12N
13N13N
14N14N
15N15N
16N16N
17N17N
18N18N
19N19N
20N20N
21N21N
22N22N
23N23N
24N24N
25N25N
26N26N
27N27N
28N28N
29N29N
30N30N
31N31N
32N32N
33N33N
34N34N
35N35N
36N36N
37N37N
38N38N
39N39N
40N40N
41N41N
42N42N
43N43N
44N44N
45N45N
46N46N
47N47N
48N48N
49N49N
50N50N
51N51N
52N52N
53N53N
54N54N
55N55N
56N56N
57N57N
58N58N
59N59N
60p
60p
61p
61p
62N62N
63N63N
64N64N
65N65N
66N66N
67N67N
68N68N
69N69N
70N70N
71N71N
72N72N
73N73N
74N74N
75N75N
76N76N
77N77N
78N78N
79p
79p
80p
80p
81N81N
82N82N
83N83N
84N84N
85N85N
86N86N
87N87N
88N88N
89N89N
90N90N
91N91N
92N92N
93N93N
94N94N
95N95N
96p
96p
97N
98N
99N
100N
101N
102N
103N
104N
105N
106N
107N
108N
109N
110N
97N
98N
99N
100N
101N
102N
103N
104N
105N
106N
107N
108N
109N
110N

129
B
0 2000 4000 6000 8000 10000 12000
none
PBMCs
PBMCs+Pepmix
PBMCs+WT1-60
PBMCs+WT1-61
PBMCs+WT1-79
PBMCs+WT1-80
PBMCs+WT1-96St
imul
ator
s
[3H] Thymidine Uptake (cpm)
Figure 4.8. Screening of TCL-57 specificity using a microscale WT1 peptide set.
The proliferative activity of TCL-57 against PBMCs loaded with WT1-Pepmix or with individual
peptide was tested to determine which single peptides induced responses to the WT1-Pepmix. T cells
(15.000 cells/well) were challenged for 72 h with irradiated (2500 rads, XR) autologous PBMCs
(500.000 cells/well) in a microscale plate. Cells were pulsed with [3H] thymidine for an additional
18h and then harvested. (A) Shows the location of the WT1-Pepmix peptides in the 96-well plates.
Each well of the plates contains a single peptide of the 110-peptide set. N, the peptide did not induce
any proliferative activity of the TCL-57; P, the peptide induced a significant proliferative activity of
the TCL-57. (B) Shows the proliferation of the TCL-57 from the same screening experiment against
PBMCs loaded with WT1-Pepmix or with individual peptide that induced responses to the peptide
pools. T cells only (none) were used as negative control. Error bars (±SD) represent duplicate wells
from one experiment.

130
0 5000 10000 15000 20000 25000 30000
none
PBMCs
PBMCs+Pepmix
PBMCs+WT1-60
PBMCs+WT1-61
PBMCs+WT1-79
PBMCs+WT1-80
PBMCs+WT1-96
Stim
ulat
ors
[3H]thymidine uptake (cpm)
Figure 4.9. Proliferative activity of TCL-57 against the peptides WT1-60, WT1-61, WT1-79,
WT1-80 and WT1-96 only.
This figure demonstrates that among the five peptides only one peptide (WT1-60) induced the highest
proliferative activity of TCL 57. T cells (25x104 cells/well) were challenged for 72 h with
irradiated (2500 rads, XR) autologous PBMCs (105 per well cells/well). Cells were
pulsed with [3H] thymidine for an additional 18 h and then harvested. T cells only
(none) were used as negative control. Error bars (±SD) represent duplicate wells
from two experiments.

131
4.3.4. Generation of TCL-57 derived T cell clones using the WT1-60 peptide
and analysis of their HLA-restriction
Three attempts were performed to clone the TCL-57 T cells using a standard
limiting dilution assay. T cells were seeded at 1, 2 and 5 cells/well against HLA-
matched allogeneic LCLs loaded with the WT1-60 peptide in the presence of IL-2
and a pool of allogeneic PBMCs which was used as a feeder. Despite these three
attempts to clone the T cells, no clones were obtained using this method. Therefore,
another method was utilized to generate clones specific to the WT1-60 peptide.
Because the dynabead CD3/CD28 T cell expander efficiently activated the poorly
proliferating T cells, the beads were used to clone the T cells. The T cells were
seeded at 5 cells/well in 96-well V-bottomed plates in the presence of the dynabeads
and IL-2. The V-bottomed plates were used since no feeder cells were added. Using
this method, 6 clones were obtained and were tested for their specificity using a
proliferation assay against autologous PBMCs pulsed with or without the WT1-
derived peptide. The attempts performed to clone the TCL-57 are summarized in
Table 4.2. Figure 4.10 demonstrates that two clones, TCC-15 and TCC-19, were
specific to WT1-60 peptide.
To define more precisely the HLA-DR restriction, HLA-DR–matched allogeneic
LCLs sharing the DR-04 (LCL-11) or DRB1*0701 (LCL-18) with the TCC clones
were used. Moreover, an HLA-DR*07–restricted epitope, hTRT672-686
(RPGLLGASVLGLDDI), derived from human telomerase reverse transcriptase
(Schroers et al., 2002) sequence was included as a negative control. Both clones,
TCC-19 and TCC-15, did not show any proliferative response to LCL-18 loaded
with WT1-60 peptide, ruling out the involvement of the DRB1*0701 in this
presentation. However, LCL-11 sharing different HLA-DRB1*04 suballele
(DRB1*0401) with the clones, induced a specific proliferative activity against the
WT1-60 peptide, showing the requirement for DRB1*04 restriction in this process
(Figure 4.11A and B). In addition, HLA-DR mAb blocked the T cell response
showing the requirement for HLA-DR molecule in the presentation of WT1-60
peptide to both T cell clones (Figure 4.11A and B).

132
Table 4.2. Results of the attempts to clone the TCL-57.
Stimulators
attempts
feeders
IL-2
(IU/mL)
Plates
Seeding density
(cells/well)
1
2
5
HLA-matched allogeneic
LCLs
3
allogeneic
PBMCs
130
U-
bottomed
N
N
N
Dynabead CD3/CD28 T cell expander
1
Without feeders
130
V-
bottomed
ND
ND
Y
N No clones were obtained
ND Not done
Y Clones were obtained
0 1000 2000 3000 4000 5000 6000 7000 8000
TCC-1
TCC-3
TCC-10
TCC-15
TCC-16
TCC-19
T ce
ll cl
ones
[3H]Thymidine uptake (cpm)
TCC-1
PBMCs+WT1-96
PBMCs+WT1-80
PBMCs+WT1-79
PBMCs+WT1-61
PBMCs+WT1-60
PBMCs
none
Figure 4.10. Proliferative activity of T cell clones generated from TCL-57.
The TCL-57 was cloned using the dynabead CD3/CD28 T cell expander. 6 clones were obtained and
tested for their specificity against autologous PBMCs pulsed with (blue colour) or without WT1
derived peptide (green colour) in a proliferation assay.

133
B
0 1000 2000 3000 4000 5000 6000
none
T-APCs
T-APCs+WT1-Pepmix
T-APCs+WT1-60
T-APCs+WT1-60+Anti-DR
T-APCs+WT1-60+Anti-DQ
T-APCs+WT1-60+Anti-DP
T-APCs+WT1-60+Anti-class I
T-APCs+hTert
LCL-18 (DR-0701)
LCL-18+WT1-60
LCL-11(DR-0401,03)
LCL-11+WT1-60
Stim
ulat
ors
[3H]Thymidine uptake
A
0 5000 10000 15000 20000 25000 30000 35000
none
T-APCs
T-APCs+WT1-Pepmix
T-APCs+WT1-60
T-APCs+WT1-60+Anti-DR
T-APCs+WT1-60+Anti-DQ
T-APCs+WT1-60+Anti-DP
T-APCs+WT1-60+Anti-class I
T-APCs+hTert
LCL-18 (DR-0701)
LCL-18+WT1-60
LCL-11(DR-0401,03)
LCL-11+WT1-60
Stim
ulat
ors
[3H]Thymidine uptake
Figure 4.11. Proliferative activity of TCC-15 and TCC-19 T cell clones.
TCC-15 (A) or TCC-19 (B) T cells (25x104 per well) from a healthy donor were challenged for 72 h
with irradiated (2500 rads, XR) autologous T-APCs (105 per well) or allogeneic LCLs in the absence
or presence of either WT1-Pepmix or WT1-60. T-APCs pulsed with or without hTert peptide (HLA-
DR7-restricted epitope) was included as a positive control. To assess for T cell restriction, HLA-
ABC, HLA-DR, HLA-DQ and HLA-DP mAbs were added to the corresponding wells containing T-
APCs 20 min before the addition of T cells. Cells were pulsed with [3H] thymidine for an additional
18 h and then harvested. T cells only (none) were used as a negative control. Data represent the
average of two different experiments performed in duplicate. Error bars indicate the SD.

134
4.3.5. Evaluation of the cytokine profile of the TCL-57 T cell line and its
derivative clones
Cytokines generated during an immune response dictate the outcome of this
response. Hence, the cytokine profile generated by the TCL-57 cell line and clones
was evaluated by enzyme-linked immunosorbent assays (ELISAs). The released
cytokines were determined from cell culture supernatants of T cell cultured for 48
hours with irradiated autologous PBMCs or T-APCs pulsed with WT1-Pepmix or
WT1-60 peptide. Autologous PBMCs were used to test the cytokine released by the
T cell line. Because no more autologous PBMCs were left, the T-APCs were used to
test the cytokine released by the T cell clone. Before using the T-APCs in this assay,
these cells were tested and compared with the PBMCs in a proliferation assay which
showed that the T-APCs were highly effeicint in activating T cells.
A similar cytokine production pattern was found between the line and the two
clones. However, the cytokines produced by the clones should identify the type of
the immune response if a different pattern was seen. The T cell line secreted IL-4,
IL-5 and GM-CSF specifically to WT1-60 and WT1-pepmix, and small amounts of
TGF-β1, IL-10 and IFN-γ. This clearly indicates a T helper 2 (Th2) polarized
immune response. For the clones, a similar cytokine production pattern was found
although an increase in IFN-γ production was found upon stimulation with pepmix
or WT1-60 which was more prominent in TCC-15. Figure 4.12 and Figure 4.13
show the cytokine profile of the T cell line and clones, respectively.
4.3.6. Proliferative activity of TCC-15 clone against HLA-DR-matched
leukemic cells
The proliferative activity of the clone TCC-15 only was tested against PBMCs
obtained from WT1-expressing AML and ALL patients because the TCC-19 cell
number was too low. The expression of WT1 mRNA in leukaemia samples was
examined using conventional and quantitative RT-PCR (Table 4.3). Because the
HLA-DR was the restriction element for the clones, its expression was evaluated by
FACS analysis. All the examined leukemic samples expressed HLA-DR, although at
different levels (Table 4.3). In addition, Table 4.3 shows the percentage of leukemic
blasts in the sample used. PBMCs from DR0701-1302 matched for DR0701 AML

135
(AML-28), DR0701-0406 fully matched ALL (ALL-21) and HLA-DR0301-0405
allelic positive ALL (ALL- 16) were used. The DR non-matched 1104-1605, but
WT1-expressing AML (AML-27) was used as a negative control. As shown in
Figure 4.14, the TCC-15 clone did not recognize any of the leukemic cells used.
The data indicates that WT1-60 peptide might be either not naturally processed by
the leukemic cells or only very low levels of this peptide is presented but it is
insufficient to be recognized by anti-WT1 specific T cells.

136
0
500
1000
1500
none APCs APCs (pepmix) APCs (WT1-60)
Stimulators
Cyt
okin
e pr
oduc
tion
(pg/
ml)
GM-CSF
TGF-β1
IL-5
IL-10
IFN-γ
IL-4
Figure 4.12. Cytokine productions by the TCL-57 T-cell line.
The cytokines were quantified by ELISAs using cytokine-specific capture antibodies. The released
cytokines were determined from cell culture supernatants of T cell cultured for 48 hours with
irradiated autologous PBMCs pulsed with WT1-Pepmix or WT1-60 peptide. The cytokines level was
determined twice. Values represent the mean of the two experiments performed in duplicate. Error
bars indicate the SD.

137
A
0
500
1000
1500
2000
none APCs APCs(pepmix)
APCs (WT1-60)
Stimulators
Cyt
okin
e pr
oduc
tion
(pg/
ml)
GM-CSF
TGF-B1
IL-5
IL-10
IFN-γ
IL-4
B
0
500
1000
1500
2000
none APCs APCs(pepmix)
APCs (WT1-60)
Stimulators
Cyt
okin
e pr
oduc
tion
(pg/
ml)
GM-CSF
TGF-β1
IL-5
IL-10
IFN-γ
IL-4
A
0
500
1000
1500
2000
none APCs APCs(pepmix)
APCs (WT1-60)
Stimulators
Cyt
okin
e pr
oduc
tion
(pg/
ml)
GM-CSF
TGF-B1
IL-5
IL-10
IFN-γ
IL-4
B
0
500
1000
1500
2000
none APCs APCs(pepmix)
APCs (WT1-60)
Stimulators
Cyt
okin
e pr
oduc
tion
(pg/
ml)
GM-CSF
TGF-β1
IL-5
IL-10
IFN-γ
IL-4
Figure 4.13. Cytokine production by the T cell clones TCC-15 and TCC-19.
The cytokines were quantified by ELISAs using cytokine-specific capture antibodies. The released
cytokines were determined from cell culture supernatants of T cell cultured for 48 hours with
irradiated autologous T-APCs pulsed with WT1-Pepmix or WT1-60 peptide. (A) Cytokine
production by the T cell clone TCC-15. The cytokine levels were determined twice for TCC-15. Data
represent the mean of two different experiments performed in duplicate. Error bars indicate the SD.
(B) Cytokine production by the T cell clone TCC-19. The cytokine levels were determined only once
for TCC-19. Data represent the mean of duplicate wells from one experiment. Error bars indicate the
SD.

138
Table 4.3. Patients information.
Patients %
Blasts1
HLA-DRB1*
QRT-PCR2
RT-PCR3
% HLA-DR/MFI4
Status5
Subtypes
AML-27 81 1104,1605 7950 +++ 60/200 new M4
AML-28 61 0701,1302 1800 + ND new M4
ALL-16 NA 0301,0405 8780 ++ 20/211 new T-cell
ALL-21 83 0701,0406 333 + 72/667 new Pre B-cell
1 % blasts were determined routinely by the hematopathology laboratory
2 Quantitative real-time PCR data for the expression level of WT1 which normalized from
K562 on 1000 3 Conventional RT-PCR data for the expression of WT1 4 % positive for HLA-DR molecule/mean of fluorescence intensity (MFA) as determined by
FACS analysis
5 New indicates that samples were taken at first diagnosis.
NA=not available
ND= not done

139
0 100 200 300 400 500 600 700
TCC 15
TCC 15+T-APCs
TCC15+T-APCs+WT1-60
ALL-21
TCC 15+ALL-21
ALL16
TCC15+ALL16
AML-28
TCC 15+AML-28
AML-27
TCC 15+AML-27
Targ
ets
[3H]Thymidine uptake
Figure 4.14. Evaluation of proliferation of TCC-15 against different HLA-matched leukemias.
Proliferative activity of TCC-15 against PBMCs from DR0701 matched AML (AML-28), non-
matched (AML-27), DR0701-0406 matched (ALL-21) and HLA-DR04 allelic positive (ALL- 16)
patients. T cells (25x104 per well) were challenged for 72 h with irradiated (2500 rads, XR) PBMCs
(105 per well) from AML and ALL patients. Cells were pulsed with [3H] thymidine for an additional
18 h and then harvested. T cells only and T cells challenged with irradiated autologous T-APCs in the
absence or presence of the WT1-60 peptide served as negative and positive controls, respectively. Data represent the mean of two different experiments performed in duplicate. Error bars indicate the
SD.

140
4.4. Discussion
We have previously identified novel human anti-WT1 Tregs cell line and clones
using a pool of overlapping peptides spanning the entire WT1 sequence. The T-cell
line and clones specifically recognized a WT1-333-347 (RYFKLSHLQMHSRKH)
peptide designated as WT1-84 in an HLA-DRB1*0402–restricted-manner (Lehe et
al., 2008). In this study, the same methodology was used to generate antigen-specific
CD4+ T cells with specific proliferative responses to the previously identified
peptide in 2 out of 3 donors. In this, TCL-52 and TCL-62 generated T cell lines from
two donors who share the same HLA-DR-allele (HLA-DR-*0402) with the donor
used in the previous study recognized the WT1-84 epitope. However, the TCL-57 T
cell line generated from a donor with an HLA-DR-*0406 allele failed to recognize
the previously identified epitope but rather recognized another peptide WT1-60237-
251(TMNQMNLGATLKGVA) designated (WT1-60).
The WT1-60 peptide was able to induce a specific proliferative response in the
generated T cell line and clones against peptide-pulsed autologous APCs. However,
no significant proliferation of the T -cell clone was recorded against leukemic cell
samples of three patients expressing the WT1 antigen as well as the HLA-DR
molecule. Furthermore, the WT1-60 peptide was able to induce a specific
proliferative cross-reactivity in the T cell clones after challenging with LCL-11
sharing the HLA-DR04 allele with the clones. No proliferative response of the T cell
clones was recorded against LCL-18 (HLA-DR0701 homozygous donor). Therefore,
the WT1-60 peptide seems to be presented through the HLA-DR04 molecule.
Because AML-28 donor shares the HLA-DR*0701 with the clones, no proliferative
response of the T cell clone was recorded against this leukemic cells. The failure of
the T cell clone to recognize ALL-16, although expressing high levels of WT1
antigen and shares the HLA-DR04 allele with the clones might be due to the
differences in the sub-allelic level or to low HLA-DR expression. However, the
fully-matched HLA-DR ALL sample (ALL-21) did not induce any proliferative
response in the T cell clone. In this, 72% of the ALL-21 cells express the HLA-DR
molecule, however leukemic cells from this patient did not express high levels of the
WT1 antigen and this may account for the T cell unresponsiveness. Another,
explanation for non-recognition of this epitope by the leukemic cells is that the

141
peptide may not be naturally processed or may be below the threshold required to
trigger T-cell recognition and effector function in addition to the inhibitory effect of
the leukemic cells (Dermime et al., 2002).
The generated T cell line and clones exerted a Th2 cytokine profile (IL-5, IL-4) in
response to the WT1-60 peptide. It has been shown that the affinity of the antigen
for TCR and the antigen dose can influence the differentiation of Th1 and Th2 cells
(Constant and Bottomly, 1997). Th2 cells are generated only in the presence of a
low dose of an antigen, and a weak TCR signal is needed for their generation (Tao et
al., 1997). In this study, only 10 µg/mL of the 110 Pepmix including the WT1237-251
peptide were used to prime the T cells. Therefore, the antigen dose and peptide
competition in the case of the WT1-Pepmix may contribute to the generation of a
Th2 helper cell type. In addition, high concentration of IL-2 (260 IU/mL) was used
for the T-cell generation. High dose of IL-2 has been shown to increase the
frequency of Tregs in cancer patients (Ahmadzadeh and Rosenberg, 2006). It is
possible that the presence of high dose of IL-2 in the T-cell cultures played a role in
the polarization of T cells to Th2 phenotype as it has been described in other systems
(Cote-Sierra et al., 2004).
A recent study by Durinovic-Bello and colleagues (Durinovic-Bello et al., 2006)
showed that human Th2 cells that exert a down-regulatory Treg phenotype also
express the Foxp3 molecule. However, Foxp3 has also been shown to be expressed
transiently in activated non-Tregs, whereas it is stably expressed in Tregs (Wang et
al., 2007). In the present study, 16.8% of the generated TCL-57 T cell line expressed
Foxp3 and exerted a CD4+CD25+Foxp3+ Treg phenotype. This percentage is higher
than the percentage of native Treg isolated from peripheral blood, which is usually
does not exceed 5% of CD4+ T cells in normal adult individuals. A preliminary
result showed that the T cell clones expressed higher Foxp3 molecule than the TCL-
57 T cell line. However, the expression of Foxp3 and other Treg-related markers
such as GITR, CTLA-4 and CD127 in the T cell clone (TCC-15) should be further
examined to confirm the Treg phenotype. It is well known that Tregs suppress
effector T cells by inhibiting activation, proliferation, differentiation, and effector
function (Sakaguchi et al., 2009, Askenasy et al., 2008, Spadafora-Ferreira et al.,
2007). Therefore, the generated clone should be tested for its ability to inhibit

142
immune responses in functional assays to confirm the suppressive effect of these T
cells. The use of anti-CD3 and anti-CD28 monoclonal antibodies to expand and clone
antigen-specific T cells has been previously reported (Riddell and Greenberg, 1990,
Trickett and Kwan, 2003). This method has also been described to rapidly expand
antigen-specific T cells for potential clinical applications (Thompson et al., 2003,
Garlie et al., 1999, Laport et al., 2003) . In the present work this methodology was
used to activate and expand the exhausted T cell line (TCL-57) using beads coated
with anti-CD3/anti-CD28 monoclonal antibodies. This method was very efficient
not only in activating the T cells but also in enhancing the process of T cell cloning.
In this, the T cell line and clones retained their specificity to both Pepmix and WT1-
60 peptide following two rounds of re-stimulations with the beads. Therefore, this
method allowed the activation and expansion of CD4+ T cells without altering their
antigenic specificity. In addition, this method dramatically reduces the number of
antigen presenting cells required for re-stimulation.
In conclusion, antigen-specific CD4+ T cells were detected using a pool of
overlapping peptides spanning the entire sequence of the WT1 antigen. These cells
showed very high and specific proliferation response to the WT1-60237-251 peptide
and exerted a Th2 cytokines (IL-5, IL-4) profile. Therefore, the generated CD4+ T
cells can be considered as a WT1-60-specific Th2 T cell type. Further investigations
are needed to examine whether these cells are of theTh2 like-Treg type. If these cells
were confirmed to be Tregs, leukemic PBMCs should be tested to verify whether
this population exists in leukaemia patients as they may then contribute to the
inhibition of specific T cell anti-WT1 responses in such patients similar to that
described in our previous study (Lehe et al., 2008).

143
5. IMMUNOGENICITY OF M-PHASE
PHOSPHOPROTEIN 11 AND PROTEINASE-3 IN
LEUKAEMIAS

144
5.1. Introduction
Despite major advances in molecular biology and targeted therapy of leukaemia,
current treatment strategies induce adverse side effects and fail to achieve and
maintain remission in many patients. In acute myeloid leukaemia (AML), the most
deadly form of leukaemia (Bozzone, 2009), the majority of adult patients younger
than 60 years achieve a complete remission following consolidation therapy.
However, only approximately 30 to 40% maintain durable remission (Tallman et al.,
2005). Furthermore, the complete remission rate and duration attained by older
AML patients is less, with an overall survival rate of 20 to 40% (Tallman et al.,
2005). Therefore, there is an urgent need for the development of leukaemia-targeted
immunotherapy designed to eliminate residual leukemic cells thus enhancing the
graft-versus-leukaemia (GVL) effect observed after allogeneic hematopoietic stem
cell transplantation (HSCT) and/or prolonging a complete remission achieved by
chemotherapy (Guglielmelli et al., 2007, Boon and Old, 1997).
The WT1 antigen represents a crucial target for tumour immunotherapy. However,
cancer cells frequently escape T-cell recognition by losing or down-regulating the
expression of the targeted-tumour antigen (Begley and Ribas, 2008). Therefore,
immunotherapeutic approaches based on targeting epitopes derived from more than
one antigen may be more effective in inducing anti-tumour immune responses.
5.2. Aim
There is an urgent need for the development of leukaemia-targeted
immunotherapeutic approaches using defined leukaemia-associated antigens (LAA)
that are preferentially expressed by most leukaemia subtypes and absent or
minimally expressed in vital tissues. Although various antigenic epitopes derived
from leukaemia antigens have been identified, progress in targeting specific
immunotherapeutic approaches depends in the recognition of a wider range of
leukaemia antigens. The aim of the study was to identify potential CD8+ cytotoxic T
lymphocyte (CTL) epitopes in the leukaemia-associated antigens PR-3 and MPP11
that bind to the most common class I molecule, HLA-A*0201 molecule, and
provoke specific cytotoxic T lymphocyte responses. This would allow the use of

145
these peptides in leukaemia immunotherapy by either expanding ex vivo tumour-
reactive specific CTLs for adoptive T-cell immunotherapy or actively inducing
leukaemia antigen-specific T–cell immunity in vivo by vaccinating patients with
well defined leukaemia-associated antigens. Forty samples from AML and ALL
patients were also screened for MPP11 positivity.
5.3. Results
5.3.1. MPP11 antigen screening in leukaemia patients and normal donors
The mRNA expression pattern of the MPP11 antigen was evaluated in PBMCs of
patients with AML (n=20), ALL (n=20) and in PBMCs of healthy volunteers (n=28)
using conventional RT-PCR. This screening was performed for two purposes. The
first purpose was to compare the MPP11 gene expression level in acute leukaemia
patients and in normal donors. The second purpose was to be able to select the HLA-
A*0201+ leukaemia donors expressing the MPP11 gene to be used (if needed) as
targets for T cells generated against the MPP11 peptides.
Total RNA was extracted from the PBMCs of patients and healthy donors and
reverse transcriptized into cDNA using Moloney murine leukaemia virus. The
extraction and reverse transcription methods are described in Chapter 2 section 2.13
and 2.14, respectively. The conventional RT-PCR was performed as described in
Chapter 2 section 2.15. The amplification product of the house keeping gene β-actin
served as control of cDNA quality. RNA isolated from K562 cell line, which
expresses MPP11, served as a positive control. Distilled water served as a negative
control. The expression of the MPP11 gene was classified into one of the following
categories: - , no detectable mRNA expression; +, low expression; ++, moderate
expression; +++, high expression. The intensity of the positive bands determined the
level of antigen expression.
The results show that 16/20 (80%) of AML patients and 17/20 (85%) of ALL
patients expressed the MPP11 gene. In total, the MPP11 was expressed in 33 out of
40 (82.5%) acute leukaemia patients and in 9/28 (32%) normal donors. The level of
the expression of the MPP11 antigen was generally higher in acute leukaemia
patients compared to low levels of expression in normal donors. Results are shown

146
in Figure 5.1 and Table 5.1. As shown in Table 5.1, there was no clear relation
between MPP11 expression levels and the blast number (the percentage of blast
varies between 1 and 99%).

147
16/20 (80%) AML patients express the MPP11 gene
MPP11
-actin
17/20 (85%) ALL patient express the MPP11 gene
MPP11
-actin
9/28 (32%) normal donors express the MPP11
MPP11
-actin
Figure 5.1. RT-PCR analysis of MPP11 gene expression in PBMCs from AML, ALL patients
and normal donors.
80% of AML patients and 85% of ALL patients expressed the MPP11 antigen, whereas only 32% of
the normal donors expressed the MPP11 antigen.

148
Table 5.1. Clinical features of leukaemia patients with MPP11 gene expression
Subtypes1
Patients #
Status2
% Blast3
MPP11 expression
M0
AML 3
New
84
++ M1 AML 1 New 61 - M2 AML 5 New 1 +
AML 7 New 61 + AML 8 New 20 ++ AML 19 New 23 +++ AML 29 Rel Post chemo 81 ++
M4 E0 AML 13 2nd Rel post allo BMT 10 ++ AML 36 New 12 +
M4 AML 25 New 52 + AML 27 New 81 + AML 28 New 61 ++
M5a AML 2 New NR - AML 12 New 79 -
M5 AML 11 New 80 + AML 16 New 4 +++ AML 24 New 50 ++ AML 31 New 13 - AML 34 Rel Post allo BMT 80 +++
M6 AML 20 New 65 +++
Pre T-cell ALL 26 New 99 ++ T-cell ALL 1 Rel 6 +
ALL 2 Rel Post-BMT 87 + ALL 3 Rel 87 + ALL 13 New 75 + ALL 16 New NR +++ ALL 18 New 94 ++ ALL 22 New 47 - ALL 23 New 84 ++
Pre B-cell ALL 4 New 55 ++ ALL 5 New 56 ++ ALL 20 New 5 - ALL 21 New 83 ++ ALL 27 New 59 ++ ALL 28 New 88 ++ ALL 29 New 2 ++ ALL 36 Rel on chemo NR ++
B-cell ALL 10 New 59 - BP / Biclonal ALL 7 New 89 +
NR ALL 24 Rel 61 +++
New, newly diagnosed; Rel, relapsed; - , no detectable mRNA expression; +, low expression; ++,
moderate expression; +++, high expression
149
5.3.2. Selection of potential CTL epitopes derived from MPP11 and PR3
proteins
The candidate epitopes derived from MPP11 and PR-3 were obtained using internet-
based prediction programs. The selected peptides were synthesized and tested for
their capacity to bind to the HLA-A*0201 molecule and/or generate cytotoxic T
lymphocyte responses. Potential CTL epitopes derived from MPP11 antigen were
predicted using the SYFPEITHI and BIMAS epitope prediction programs available
at www.syfpeithi.de and www-bimas.cit.nih.gov, respectively. In each of the
programs website, the amino acid sequences of the MPP11 (Figure 5.2) were
entered. The HLA-A*0201 was selected for the MHC type and 9-mer was selected
for the length of the peptides. Subsequently, the results from the database displayed
numerous 9-mer peptides along with their positions and their predicted binding
scores. Peptides qualified as positive if the score ranked ≥22 using the SYFPEITHI
software or ≥100 using the BIMAS software. Four native peptides derived from
MPP11 protein were selected. Although these peptides recorded a theoretically low
binding affinity to the HLA-A*0201 molecule using the BIMAS software, they
showed high binding affinity to the same molecule by the SYFPEITHI software.
Peptides binding scores were ranging from 22 to 25 according to SYFPEITHI and
from 79 to 4 according to BIMAS. In addition to the predicted peptides, tyrosine
amino acid substitution in the P1 position of the first predicted epitope MPPN-1
(QLLIKAVNL) was also carried out. The binding score of the modified epitope,
MPPY-1 (YLLIKAVNL), was enhanced from 25 to 27 as assessed by the
SYFPEITHI server and from 79 to 364 as evaluated by the BIMAS server. The
sequences of the peptides as well as their binding scores are presented in Table 5.2.
Potential PR3-derived candidate sequences predicted to bind to the HLA-A*0201
molecule were obtained using three different epitope prediction programs
(SYFPEITHI, BIMAS and RANKPEP). The amino acid sequences of PR-3 (Figure
5.3) were entered into the computer programs, the MHC type and the length of the
peptides were selected and potential candidate epitopes were displayed on the
database. Two 9-mer peptides (PR-9 and PR-129) were selected as potential
epitopes for the generation of cytotoxic T lymphocyte responses. The PR-9 peptide
was selected as having the highest probability of binding based on the proposed
SYFPEITHI algorithm. On the other hand, PR-129 had the highest score using

150
BIMAS and RANKPEP algorithms. In addition to the two selected peptides, PR-169
peptide-the previously described PR-1 epitope (Molldrem et al., 1996) was selected
to serve as a positive control. The predicted binding scores by different computer
programs for the 3 different PR3 peptides are listed in Table 5.3.
The standard T2 binding assay, illustrated in Figure 2.1 was used to evaluate the
ability of MPP11 and PR-3 candidate peptides to bind and stabilize HLA-A*0201
molecule using the well-characterized A2-binding peptides WT1-187 and PR-169 as
positive controls. The human processing-defective T2 cell line express empty HLA
class I molecules. The binding assay is based on the stabilization of HLA class I
molecules on the cell surface by the addition of peptides exogenously. The T2 cells
are incubated with peptides overnight and if the peptide binds to the HLA-A*0201,
the surface expression will be stabilized and there will be an upregulation of this
molecule. Changes in its expression were assessed by staining HLA-A*0201 and
quantifying the fluorescence intensity by flow cytometry analysis. The peptides are
assumed to bind if their fluorescence ratio is greater than 1. All T2 binding assays
were done in duplicate. Figure 5.4 and Figure 5.5 show the flow cytometric analyses
of T2 cells following overnight incubation with 30 µM of either MPP-11 or PR-3
derived peptides, respectively.
As shown in Figure 5.6, MPP-3 and MPP-4 peptides (Fluorescence Index [FI] =1.1
and 2.5, respectively) stably bind to the HLA*A-0201molecule. The affinity of
MPP-4 peptide to the molecule was comparable with that observed for the positive
control WT1-187 epitope (FI =2.6). 187N is a WT1 derivative peptide known to
highly bind to the HLA-A*0201 molecule (Oka et al., 2000). Because of their high
binding affinities, MPP-3 and MPP-4 peptides were selected for the generation of
peptide-specific T lymphocyte lines. On the other hand, the peptides MPP-1N,
MPP1-Y, and MPP-2 were excluded from testing for immunogenicity since they did
not show any binding or only very weak binding to the HLA-A*0201 molecule.
Regarding PR3 peptides, the PR-129 peptide up-regulated the HLA-A*0201
molecule and showed high affinity to this molecule (FI=1.9) compared to the
positive control PR-169 peptide (FI=2.5). However, the PR-9 peptide had a low
binding affinity to the HLA-A*0201 molecule (FI=0.6). The results of the T2
binding assay for the PR3 peptides are shown in Figure 5.7.
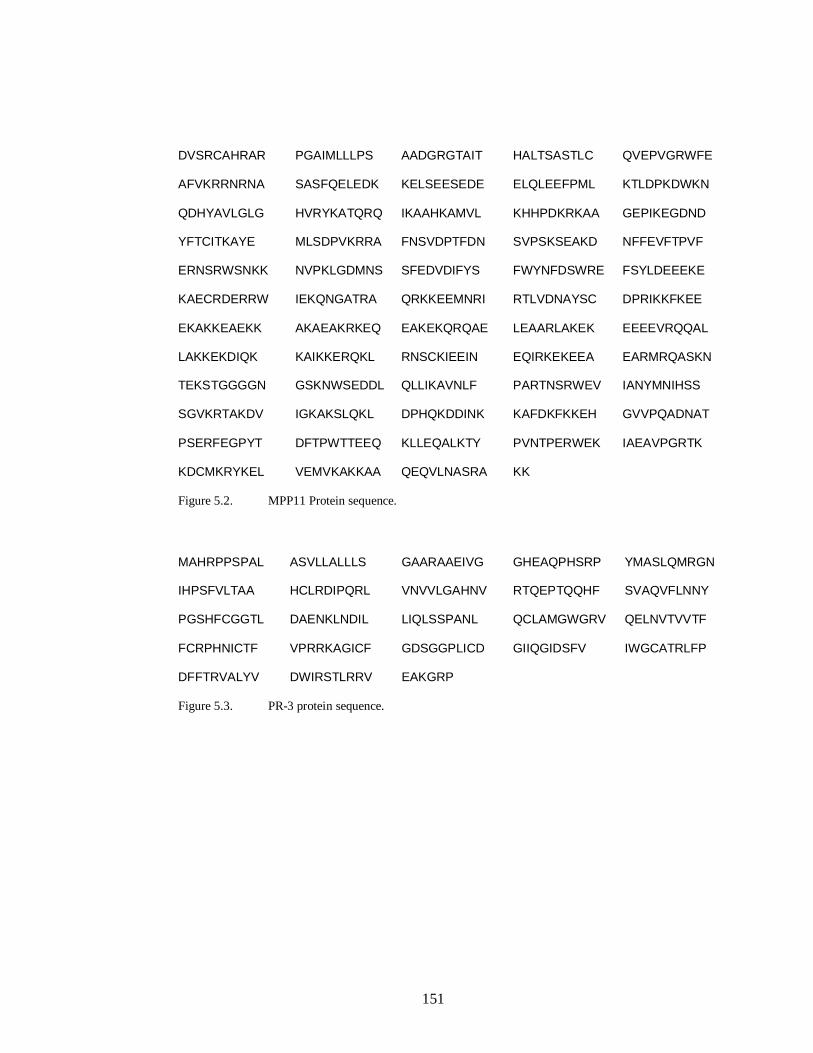
151
DVSRCAHRAR PGAIMLLLPS AADGRGTAIT HALTSASTLC QVEPVGRWFE
AFVKRRNRNA SASFQELEDK KELSEESEDE ELQLEEFPML KTLDPKDWKN
QDHYAVLGLG HVRYKATQRQ IKAAHKAMVL KHHPDKRKAA GEPIKEGDND
YFTCITKAYE MLSDPVKRRA FNSVDPTFDN SVPSKSEAKD NFFEVFTPVF
ERNSRWSNKK NVPKLGDMNS SFEDVDIFYS FWYNFDSWRE FSYLDEEEKE
KAECRDERRW IEKQNGATRA QRKKEEMNRI RTLVDNAYSC DPRIKKFKEE
EKAKKEAEKK AKAEAKRKEQ EAKEKQRQAE LEAARLAKEK EEEEVRQQAL
LAKKEKDIQK KAIKKERQKL RNSCKIEEIN EQIRKEKEEA EARMRQASKN
TEKSTGGGGN GSKNWSEDDL QLLIKAVNLF PARTNSRWEV IANYMNIHSS
SGVKRTAKDV IGKAKSLQKL DPHQKDDINK KAFDKFKKEH GVVPQADNAT
PSERFEGPYT DFTPWTTEEQ KLLEQALKTY PVNTPERWEK IAEAVPGRTK
KDCMKRYKEL VEMVKAKKAA QEQVLNASRA KK
Figure 5.2. MPP11 Protein sequence.
MAHRPPSPAL ASVLLALLLS GAARAAEIVG GHEAQPHSRP YMASLQMRGN
IHPSFVLTAA HCLRDIPQRL VNVVLGAHNV RTQEPTQQHF SVAQVFLNNY
PGSHFCGGTL DAENKLNDIL LIQLSSPANL QCLAMGWGRV QELNVTVVTF
FCRPHNICTF VPRRKAGICF GDSGGPLICD GIIQGIDSFV IWGCATRLFP
DFFTRVALYV DWIRSTLRRV EAKGRP
Figure 5.3. PR-3 protein sequence.

152
Table 5.2. Peptide Sequences derived from MPP11 and their binding prediction to
HLA- A*0201 molecule
Given name
Start
position
Sequence
BIMAS* Score
SYFPEITHI**
Score
MPP-1N
421
QLLIKAVNL
79
25
MPP-1Y Y-422 YLLIKAVNL 364 27
MPP-2 419 DLQLLIKAV 12 24
MPP-3 13 AIMLLLPSA 6
23
MPP-4 37 STLCQVEPV 4 22
Table 5.3. Peptide Sequences derived from PR3 and their binding prediction to
HLA- A*0201 molecule
Given name
start position
Sequence
BIMAS* Score
SYFPEITHI**
Score
RANKPEP***
Score
PR-169
169
VLQELNVTV
484.7
28
72.8%
PR-129 129 NLSASVATV 159.9 28 90.35%
PR-9 9 ALASVLLAL 49.1 30 86.84%
* The BIMAS scoring system is based on the calculation of the theoretical half-life of the
MHC class I/peptide complex, which is a measure peptide-binding affinity. Peptides qualified as
positive if the score was ≥100.
** The SYFPEITHI scoring system is based on the presence of certain amino acids in certain
position along the MHC-binding groove. Optimal anchor residues are valued at 10 points, unusual
anchors are given 6-8 points and preferred residues are worth 1-4 points. Amino acids with negative
effect on the bining affinity score between -1 and -3. The maximum score for HLA-A*0201 is 36.
Peptides qualified as positive if the score ranked ≥22.
*** The RANKPEP scoring system includes information on the score of the peptide and the %
optimum score of the predicted peptide relative to that of a sequence that yields the maximum score
with selected profile. Peptides qualified as positive if the % optimum was ≥50%.

153
T2 WT1-187N
MPP-1N MPP-1Y
MPP-2 MPP-3
MPP-4
Figure 5.4. Flow cytometric analysis of HLA-A2 molecules expressed by T2 cells cultured
overnight in the absence or in the presence of 30 µM of WT1-187N or each MPP11-derived peptide.
The WT1-187N peptide was used as a positive control. Following incubation with the peptides, the
T2 cells were stained with HLA-A2 specific monoclonal antibody (BB7.2) and analyzed by flow
cytometry. *Average of median fluorescence intensities of duplicate experiments of T2 binding
assay.
373* 1
375*
80*
151*
104*
Cel
l cou
nts
Fluorescence intensity

154
T2 PR-169
PR-129 PR-9
Figure 5.5. Flow cytometric analysis of HLA-A2 molecules expressed by T2 cells cultured
overnight in the absence or in the presence of 30 µM of each PR-3-derived peptide.
The PR-169 peptide was used as a positive control. Following incubation with the peptides, the T2
cells were stained with HLA-A2 specific monoclonal antibody (BB7.2) and analyzed by flow
cytometry. *Average of median fluorescence intensities of duplicate experiments of T2 binding
assay.
10 0 1
0 1 10 2 1
0 3 10 4
134*
10 0 10 1 10 2 10 3 10 4
10 0 1
0 1 10 2 1
0 3 10 4
208*
10 0 10 1 10 2 103 10 4
407*
Fluorescence intensity
Cel
l cou
nts
522*

155
0.0
0.5
1.0
1.5
2.0
2.5
3.0
3.5
WT1-187N MPP-1N MPP-1Y MPP-2 MPP-3 MPP-4
Peptides
Fluo
resc
ence
Inde
x
Figure 5.6. The binding ability of MPP11-derived peptides to the HLA-A*0201 molecule as
measured by the T2 peptide-binding assay.
WT1-187N, a well-characterized A2-binding peptide, served as a positive control. MPP-3 and MPP-4
peptides stably bind to the HLA-A*0201 as demonstrated by stabilization of surface HLA-A2. The
peptides MPP-1N, MPP-2 and the modified peptide MPP-1Y showed no binding to HLA-A*0201
and thereby were not used to generate CTLs. Each value represents the average of duplicate assays
and error bars indicate the SD.

156
011223344
PR-169 PR-129 PR-9
PR-3 Peptides
Fluo
resc
ence
Inde
x
Figure 5.7. The binding ability of PR-3 derived peptides to the HLA-A*0201 molecules as
measured by the T2 binding assay.
PR-169 is a well-characterized A2-binding peptide that is used as a positive control. PR-129 peptide
has a high binding affinity whereas PR-9 has a very low binding affinity to the HLA-A*0201
molecule. Each value represents the average of duplicate assays and error bars indicate the SD.

157
5.3.3. Generation of MPP11 specific T lymphocyte lines by T2 cells
The ability of the MPP11-derived peptides to induce specific cytotoxic T
lymphocytes (CTLs) was tested. PBMCs obtained from two HLA-A*0201 positive
healthy volunteers designated as BC-21 and BC-32 were utilized to generate CTLs
specific to the selected peptides. The responder cells were CD8+ T cells purified by
MACS negative selection as described in Materials and Methods section 2.6.1. The
purified CD8+ T cells were then stimulated in vitro with T2 cells. The choice of T2
cells as APCs was made to reduce the number of PBMCs used and was based on
previous studies (Houbiers et al., 1993, Molldrem et al., 1996, Oka et al., 2000). The
T2 cells were pulsed with MPP-4, MPP-3 or WT1-126N peptide and used to prime
and activate the purified CD8+ T cells every 7-10 days. The T cell line generated
against the WT1-126N peptide was used as a control. The generated T cell lines
were tested against different HLA-A*0201+ targets in the presence or absence of
autologous peptide using a Chromium Release Assay and an ELISPOT assay after 3
to 8 rounds of stimulations.
The specificity of in vitro primed CTLs was first tested for specific IFN-γ release to
stimulation with the corresponding peptides using an ELISPOT assay. The T cell
lines (MPP-3, MPP-4 and WT1-126N) generated from both donors (BC-21 and BC-
32) did not produce antigen specific IFN-γ spots when stimulated with T2-loaded
peptide (Figure 5.8 and Figure 5.9). In addition, autologous PBMCs un-pulsed or
peptide-pulsed, K562 and K562-A2.1 were used to test the specificity of the T cell
lines generated from BC-21 donor. K562 is a leukaemia cell line expressing MPP11
antigen and K562-A2.1 is the same cell line but transfected with the HLA-A*0201
molecule. As shown in Figure 5.8, no antigen specific IFN-γ spots were formed
when the three BC-21-T cell lines were challenged with targets other than T2 cells.
The next step in monitoring CD8+ T cell responses to MPP11-derived peptides was
to test the cytotoxic activity of the generated T cell lines in a standard Cr51-release
assay. Consistent with the results obtained with the ELISPOT assay; the T cell lines
generated from the two different donors (BC-21 and BC-32) did not elicit any
peptide-specific cytotoxic responses. The T cell lines generated from BC-21 donor
were challenged with T2 cells or LCL-21 pulsed with no peptide or with each

158
peptide at different E:T ratio starting from 50:1. As shown in Figure 5.10, Figure
5.11 and Figure 5.12, the MPP-3, the MPP-4 and the WT1-126N T cell lines did not
recognize peptide-pulsed T2 or LCL-21 targets cells. The T cell lines generated from
the other donor (BC-32) were challenged with T2 cells or LCL-32 pulsed with no
peptide or with each peptide at different E:T ratio starting from 100:1. In these
cytotoxic experiments, K562 and K562-A2.1 were used as targets too. The three
tested T cell lines did not show any peptide-specific cytotoxic responses toward
peptide-pulsed T2, LCL-32 as well as K562-A2.1 targets cells (Figure 5.13, Figure
5.14 and Figure 5.15).

159
C
0 2 4 6 8 10 12 14 16 18 20
none
PBM Cs
PBM Cs (126N)
T2
T2 (126N)
K562
K562-A2.1
Targ
ets
IFN-g spots/ 20 000 CD8+ T cells
A
0 2 4 6 8 10 12 14 16 18 20
none
PBMCs
PBMCs (MPP-3)
T2
T2 (MPP-3)
K562
K562-A2.1
Targ
ets
IFN-g spots/20 000 CD8+ T cells
B
0 2 4 6 8 10 12 14 16 18 20
none
PBMCs
PBMCs (MPP-4)
T2
T2 (MPP-4)
K562
K562-A2.1
Targ
ets
IFN-g spots/20 000 CD8+ T cells
Figure 5.8. Non-specific IFN- release of BC-21 CTLs generated by T2 cells against the MPP-
3, MPP-4 and WT1-126N peptides using an IFN-γ- ELISPOT assay.
The T cell lines were established from BC-21, an HLA-A0201+ donor, and tested following three to
eight rounds of in vitro T cell stimulations. Targets were autologous PBMCs T2 cells, K562 and
K562-A2.1. The PBMCs and T2 cells were pulsed with either no peptide or with peptide.

160
Figure 5.8. Continued
The background observed when T cells alone were used is shown. Non-specific IFN- release is
shown for T cell line generated against the MPP-3 peptide (A). Non-specific IFN- release is shown
for T cell line generated against the MPP-4 peptide (B). Non-specific IFN- release is shown for T
cell line generated against the WT1-126N peptide (C). Results are expressed as IFN- γ positive cells
per 20.000 CD8+ T cells and are the mean of triplicate assays (±SD).

161
A
0 5 10 15 20 25 30 35 40
none
T2
T2 (MPP-3)
Targ
ets
IIFN-g spots/20 000 CD8+ T cells
B
0 5 10 15 20 25 30 35 40
none
T2
T2 (MPP-4)
Targ
ets
IIFN-g spots/20 000 CD8+ T cells
C
0 5 10 15 20 25 30 35 40
none
T2
T2 (126N)
Targ
ets
IFN-g spots/20 000 CD8+ T cells
A
0 5 10 15 20 25 30 35 40
none
T2
T2 (MPP-3)
Targ
ets
IIFN-g spots/20 000 CD8+ T cells
B
0 5 10 15 20 25 30 35 40
none
T2
T2 (MPP-4)
Targ
ets
IIFN-g spots/20 000 CD8+ T cells
C
0 5 10 15 20 25 30 35 40
none
T2
T2 (126N)
Targ
ets
IFN-g spots/20 000 CD8+ T cells
Figure 5.9. Non-specific IFN- release of BC-32 CTLs generated by T2 cells against the MPP-
3, MPP-4 and WT1-126N peptides using an IFN-γ- ELISPOT assay.
The T cell lines were established from BC-32, an HLA-A0201+ donor, and tested following three to
eight rounds of in vitro T cell stimulations. Targets were T2 cells pulsed with either no peptide or
with peptide. The background observed when T cells alone were used is shown. Non-specific IFN-
release is shown for T cell line generated against the MPP-3 peptide (A). Non-specific IFN- release
is shown for T cell line generated against the MPP-4 peptide (B). Non-specific IFN- release is
shown for T cell line generated against the WT1-126N peptide (C). Results are expressed as IFN- γ
positive cells per 20.000 CD8+ T cells and are the mean of triplicate assays (±SD).

162
05
10152025303540
50:1 25:1 12.5:1 6.25:1
% L
ysis
E:T ratio
B
LCL21
LCL21+MPP-3
0123456789
50:1 25:1 12.5:1 6.25:1
% L
ysis
E:T ratio
A
T2
T2+MPP-3
05
10152025303540
50:1 25:1 12.5:1 6.25:1
% L
ysis
E:T ratio
B
LCL21
LCL21+MPP-3
0123456789
50:1 25:1 12.5:1 6.25:1
% L
ysis
E:T ratio
A
T2
T2+MPP-3
Figure 5.10. Non-specific lysis by BC-21 CTLs generated by T2 cells against MPP-3 peptide as
tested using a standard chromium release assay.
The effector cells were MPP-3 T cell line generated from an HLA-A0201+ donor, BC-21, by T2 cells.
The T cell line was tested following three to eight rounds of in vitro T cell stimulations. Target cells
were pulsed with either no peptide (dark blue symbol) or with MPP-3 peptide (pink symbol). The
MPP-3 T cell line was stimulated with T2 cells (A), and with autologous LCL-21 (B). The data are
presented as the percentage specific lysis at the indicated E:T ratios and represents the average of
three experiments. Error bars indicate the SD.

163
B
05
101520253035
50:1 25:1 12.5:1 6.25:1
E:T ratio
% L
ysis LCL21
LCL21+MPP-4
A
02468
1012
50:1 25:1 12.5:1 6.25:1
E:T ratio
% L
ysis T2
T2+MPP-4
B
05
101520253035
50:1 25:1 12.5:1 6.25:1
E:T ratio
% L
ysis LCL21
LCL21+MPP-4
A
02468
1012
50:1 25:1 12.5:1 6.25:1
E:T ratio
% L
ysis T2
T2+MPP-4
Figure 5.11. Non-specific lysis by BC-21 CTLs generated by T2 cells against MPP-4 peptide as
tested using a standard chromium release assay.
The effector cells were MPP-4 T cell line generated from an HLA-A0201+ donor, BC-21, by T2 cells.
The T cell line was tested following three to eight rounds of in vitro T cell stimulations. Target cells
were pulsed with either no peptide (dark blue symbol) or with MPP-4 peptide (pink symbol). The
MPP-4 T cell line was stimulated with T2 cells (A), and with autologous LCL-21 (B). The data are
presented as the percentage specific lysis at the indicated E:T ratios and represents the average of
three experiments. Error bars indicate the SD.

164
B
0
5
10
15
20
50:1 25:1 12.5:1 6.25:1
E:T raio
% L
ysis LCL21
LCL21+126N
A
0123456
50:1 25:1 12.5:1 6.25:1
E:T ratio
% ly
sis T2
T2+126N
B
0
5
10
15
20
50:1 25:1 12.5:1 6.25:1
E:T raio
% L
ysis LCL21
LCL21+126N
A
0123456
50:1 25:1 12.5:1 6.25:1
E:T ratio
% ly
sis T2
T2+126N
Figure 5.12. Non-specific lysis by BC-21 CTLs generated by T2 cells against WT1-126N
peptide as tested using a standard chromium release assay.
The effector cells were WT1-126N T cell line generated from an HLA-A0201+ donor, BC-21, by T2
cells. The T cell line was tested following three to eight rounds of in vitro T cell stimulations. Target
cells were pulsed with either no peptide (dark blue symbol) or with WT1-126N peptide (pink
symbol). The WT1-126N T cell line was stimulated with T2 cells (A), and with autologous LCL-21
(B). The data are presented as the percentage specific lysis at the indicated E:T ratios and represents
the average of three experiments. Error bars indicate the SD.

165
A
010203040506070
100:1 50:1 25:1 12.5:1
E:T ratio
% L
ysis T2
T2+MPP-3
B
02468
101214
100:1 50:1 25:1 12.5:1
E:T ratio
% L
ysis LCL32
LCL32+MPP-3
C
0
2
4
6
8
10
100:1 50:1 25:1 12.5:1
E:T ratio
% L
ysis K562
K562-A2.1
A
010203040506070
100:1 50:1 25:1 12.5:1
E:T ratio
% L
ysis T2
T2+MPP-3
B
02468
101214
100:1 50:1 25:1 12.5:1
E:T ratio
% L
ysis LCL32
LCL32+MPP-3
C
0
2
4
6
8
10
100:1 50:1 25:1 12.5:1
E:T ratio
% L
ysis K562
K562-A2.1
Figure 5.13. Non-specific lysis by BC-32 CTLs generated by T2 cells against MPP-3 peptide as
tested using a standard chromium release assay.
The effector cells were MPP-3 T cell line generated from an HLA-A0201+ donor, BC-32, by T2 cells.
The T cell line was tested following three to eight rounds of in vitro T cell stimulations. Target cells
were pulsed with either no peptide (dark blue symbol) or with MPP-3 peptide (pink symbol). The
MPP-3 T cell line was stimulated with T2 cells (A), with autologous LCL-32 (B) and with K562-
A2.1. (C). The data are presented as the percentage specific lysis at the indicated E:T ratios and
represents the average of three experiments. Error bars indicate the SD.

166
B
-5
0
5
10
15
20
100:1 50:1 25:1 12.5:1
E:T ratio
% L
ysis LCL32
LCL32+MPP-4
A
0102030405060
100:1 50:1 25:1 12.5:1
E:T ratio
% L
ysis
T2
T2+MPP-4
C
0
2
4
6
8
10
100:1 50:1 25:1 12.5:1
E:T ratio
% L
ysis K562
K562-A2.1
B
-5
0
5
10
15
20
100:1 50:1 25:1 12.5:1
E:T ratio
% L
ysis LCL32
LCL32+MPP-4
A
0102030405060
100:1 50:1 25:1 12.5:1
E:T ratio
% L
ysis
T2
T2+MPP-4
C
0
2
4
6
8
10
100:1 50:1 25:1 12.5:1
E:T ratio
% L
ysis K562
K562-A2.1
Figure 5.14. Non-specific lysis by BC-32 CTLs generated by T2 cells against MPP-4 peptide as
tested using a standard chromium release assay.
The effector cells were MPP-4 T cell line generated from an HLA-A0201+ donor, BC-32, by T2 cells.
The T cell line was tested following three to eight rounds of in vitro T cell stimulations. Target cells
were pulsed with either no peptide (dark blue symbol) or with MPP-4 peptide (pink symbol). The
MPP-4 T cell line was stimulated with T2 cells (A), with autologous LCL-32 (B) and with K562-
A2.1. (C). The data are presented as the percentage specific lysis at the indicated E:T ratios and
represents the average of three experiments. Error bars indicate the SD.

167
A
0102030405060
100:1 50:1 25:1 12.5:1
E:T ratio
% L
ysis T2
T2+126N
B
-202468
1012
100:1 50:1 25:1 12.5:1
E:T ratio
% L
ysis LCL32
LCL32+126N
C
0
2
4
6
8
10
100:1 50:1 25:1 12.5:1
E:T ratio
% L
ysis K562
K562-A2.1
A
0102030405060
100:1 50:1 25:1 12.5:1
E:T ratio
% L
ysis T2
T2+126N
B
-202468
1012
100:1 50:1 25:1 12.5:1
E:T ratio
% L
ysis LCL32
LCL32+126N
C
0
2
4
6
8
10
100:1 50:1 25:1 12.5:1
E:T ratio
% L
ysis K562
K562-A2.1
Figure 5.15. Non-specific lysis by BC-32 CTLs generated by T2 cells against WT1-126N
peptide as tested using a standard chromium release assay.
The effector cells were WT1-126N T cell line generated from an HLA-A0201+ donor, BC-32, by T2
cells. The T cell line was tested following three to eight rounds of in vitro T cell stimulations. Target
cells were pulsed with either no peptide (dark blue symbol) or with WT1-126N peptide (pink
symbol). The WT1-126N T cell line was stimulated with T2 cells (A), with autologous LCL-32 (B)
and with K562-A2.1. (C). The data are presented as the percentage specific lysis at the indicated E:T
ratios and represents the average of three experiments. Error bars indicate the SD.
.

168
5.3.4. Generation of MPP11 specific T lymphocyte lines by DC2d
The T cell lines generated form the two different donors (BC-21 and BC-32) by T2
cells showed no specific CD8+ T cell responses to any of the peptides tested
including the positive control peptide WT1-126N. Therefore, a second protocol for
the generation of CD8+ T cell lines was then used where peptide-pulsed DC2d (fast
DC) were used to prime the purified CD8+ T cells and peptide-pulsed monocytes
were used for subsequent T cell stimulations. The DC2d were generated as described
in Materials and Methods section 2.5.4.3. PBMCs obtained from four different
HLA-A*0201 positive healthy volunteers were utilized to generate CTLs specific to
the selected peptides. The four donors were designated as BC-21, BC-32, BC-37
and BC-41. The PBMCs from each donor were used as the source of the responder
cells and antigen presenting cells. The responder cells were CD8+ T cells purified by
MACS negative selection and stimulated in vitro with antigen presenting cells-
loaded peptide for 7-10 days.
To investigate whether the MPP11 synthetic peptides could stimulate peptide-
specific CTLs, the generated T cell lines were tested against different HLA-
A*0201+ targets in the presence or absence of autologous peptide using a Chromium
Release Assay and an ELISPOT assay after 3 to 8 rounds of stimulations.
5.3.5. CD8+ T cell responses to MPP11- derived peptides
5.3.5.1. MPP-4 CTL s produced specific IFN-γ
After the third round of stimulation, the specificity of in vitro primed CTLs was first
tested for specific IFN-γ release to stimulation with the corresponding peptides using
an ELISPOT assay. The BC-21 CTLs generated against the MPP-4 peptide
produced specific IFN-γ spots when stimulated with T2-loaded peptide whereas
non-specific production was seen in case of CTLs generated from the same donor
against MPP-3 as shown in Figure 5.16A and B. The anti-MPP-3 and anti-MPP-4 T
cell lines generated from the three other donors (BC-32, BC-37 and BC-41) were
also tested. However, these T cell lines did not produce any specific IFN-γ spots
when challenged with either MPP-3 or MPP-4 peptides (Figure 5.17, Figure 5.18
and Figure 5.19). The specificity of BC-32 and BC-37 T cell lines was tested by
challenging the T cells from each donor with T2 cells and autologous LCLs

169
unpulsed or pulsed with their corresponding peptide (Figure 5.17A and B and Figure
5.18A and B). The specificity of BC-41 T cell lines was tested using unloaded or
peptide-loaded T2 cells Figure 5.19A and B.
Because CD8+ T cells are known to utilize cytotoxic factors such as granzyme B
and/or perforin to induce killing of their target cells, the BC-21 MPP-4-CTL was
therefore tested for the release of granzyme B and/or perforin. The test was
performed after 5 rounds of stimulation. MPP-4 pulsed T2 and autologous LCLs
were used as stimulators. No specific production of granzyme B and/or perforin to
the peptide MPP-4 was observed due to very high background responses seen when
BC-21 T cells alone were used in the assay (Figure 5.20 A and B). Although
specific IFN- release was seen with the MPP-4 T cell line generated from BC-21
donor only, the MPP-4 T cell lines generated from BC-32, BC-37 and BC-41 were
also tested for the release of granzyme B and/or perforin. MPP-4 pulsed T2 or K562-
A2.1 cells were used as stimulators. As shown in Figure 5.21, Figure 5.22 and
Figure 5.23, the three T cell lines did not produce any specific granzyme B or
perforin spots when challenging with APCs loaded with MPP-4 peptide.

170
A
0 5 10 15 20 25 30 35 40
none
T2
T2 (MPP-4)
Targ
ets
IFN-g spots/20 000 CD8+ T cells
B
0 5 10 15 20 25 30 35 40
none
T2
T2 (MPP-3)
Targ
ets
IFN-g spots/20 000 CD8+ T cells
A
0 5 10 15 20 25 30 35 40
none
T2
T2 (MPP-4)
Targ
ets
IFN-g spots/20 000 CD8+ T cells
B
0 5 10 15 20 25 30 35 40
none
T2
T2 (MPP-3)
Targ
ets
IFN-g spots/20 000 CD8+ T cells
Figure 5.16. Specificity of BC-21 CTLs generated by DC2d against the MPP-3 and MPP-4
peptides using an IFN-γ- ELISPOT assay.
The T cell lines were established from BC-21, an HLA-A0201+ donor, and tested following three to
eight rounds of in vitro T cell stimulations. Targets were T2 cells pulsed with either no peptide or
with peptide. The background observed when T cells alone were used is shown. Results are expressed
as IFN- γ positive cells per 20.000 CD8+ T cells and are the mean of triplicate assays (±SD). MPP-4-
CTLs released IFN- upon re-stimulation with T2 cells pulsed with MPP-4 peptide (A). T cell line
generated against the MPP-3 peptide released more IFN- upon re-stimulation with T2 cells alone
(B).

171
A
0 20 40 60 80 100 120
none
T2
T2 (MPP-4)
LCL-32
LCL-32 (MPP-4)
Targ
ets
IFN-g spots/20 000 CD8+ T cells
B
0 20 40 60 80 100
none
T2
T2 (MPP-3)
LCL-32
LCL-32 (MPP-3)
Targ
ets
IIFN-g spots/20 000 CD8+ T cells
A
0 20 40 60 80 100 120
none
T2
T2 (MPP-4)
LCL-32
LCL-32 (MPP-4)
Targ
ets
IFN-g spots/20 000 CD8+ T cells
B
0 20 40 60 80 100
none
T2
T2 (MPP-3)
LCL-32
LCL-32 (MPP-3)
Targ
ets
IIFN-g spots/20 000 CD8+ T cells
Figure 5.17. Non-specific IFN- release of BC-32 CTLs generated by DC2d cells against the
MPP-4 and the MPP-3 peptides using an IFN-γ- ELISPOT assay.
The T cell lines were established from BC-32, an HLA-A0201+ donor, and tested following three to
eight rounds of in vitro T cell stimulations. Targets were T2 cells and LCL-32 pulsed with either no
peptide or with peptide. The background observed when T cells alone were used is shown. Non-
specific IFN- release is shown for T cell line generated against the MPP-4 peptide (A). Non-specific
IFN- release is shown for T cell line generated against the MPP-3 peptide (B). Results are expressed
as IFN- γ positive cells per 20.000 CD8+ T cells and are the mean of triplicate assays (±SD).

172
A
0 50 100 150 200 250
none
T2
T2 (MPP-4)
LCL-37
LCL-37 (MPP-4)
Targ
ets
IFN-g spots/20.000 CD8+ T cells
B
0 50 100 150 200 250
none
T2
T2 (MPP-3)
LCL-37
LCL-37 (MPP-3)
Targ
ets
IFN-g spots/20.000 CD8+ T cells
A
0 50 100 150 200 250
none
T2
T2 (MPP-4)
LCL-37
LCL-37 (MPP-4)
Targ
ets
IFN-g spots/20.000 CD8+ T cells
B
0 50 100 150 200 250
none
T2
T2 (MPP-3)
LCL-37
LCL-37 (MPP-3)
Targ
ets
IFN-g spots/20.000 CD8+ T cells
Figure 5.18. Non-specific IFN- release of BC-37 CTLs generated by DC2d cells against the
MPP-4 and the MPP-3 peptides using an IFN-γ- ELISPOT assay.
The T cell lines were established from BC-37, an HLA-A0201+ donor, and tested following three to
eight rounds of in vitro T cell stimulations. Targets were T2 cells and LCL-37 pulsed with either no
peptide or with peptide. The background observed when T cells alone were used is shown. Non-
specific IFN- release is shown for T cell line generated against the MPP-4 peptide (A). Non-specific
IFN- release is shown for T cell line generated against the MPP-3 peptide (B). Results are expressed
as IFN- γ positive cells per 20.000 CD8+ T cells and are the mean of triplicate assays (±SD).

173
A
0 10 20 30 40 50
none
T2
T2 (MPP-4)
Targ
ets
IFN-g spots/10 000 CD8+ T cells
B
0 10 20 30 40 50
none
T2
T2 (MPP-3)
Targ
ets
IFN-g spots/10 000 CD8+ T cells
Figure 5.19. Non-specific IFN- release of BC-41 CTLs generated by DC2d cells against the
MPP-4 and the MPP-3 peptides using an IFN-γ- ELISPOT assay.
The T cell lines were established from BC-41, an HLA-A0201+ donor, and tested following three to
eight rounds of in vitro T cell stimulations. Targets were T2 cells pulsed with either no peptide or
with peptide. The background observed when T cells alone were used is shown. Non-specific IFN-
release is shown for T cell line generated against the MPP-4 peptide (A). Non-specific IFN- release
is shown for T cell line generated against the MPP-3 peptide (B). Results are expressed as IFN- γ
positive cells per 20.000 CD8+ T cells and are the mean of duplicate assays (±SD).

174
A
0 20 40 60 80 100 120 140 160
none
T2
T2(MPP-4)
LCL
LCL (MPP-4)
Targ
ets
Granzyme B spots/10 000 CD8+ T cells
B
0 20 40 60 80 100 120
none
T2
T2(MPP-4)
LCL
LCL (MPP-4)
Targ
ets
Perforin spots/10 000 CD8+ T cells
A
0 20 40 60 80 100 120 140 160
none
T2
T2(MPP-4)
LCL
LCL (MPP-4)
Targ
ets
Granzyme B spots/10 000 CD8+ T cells
B
0 20 40 60 80 100 120
none
T2
T2(MPP-4)
LCL
LCL (MPP-4)
Targ
ets
Perforin spots/10 000 CD8+ T cells
Figure 5.20. Specificity of BC-21 CTLs generated by DC2d against the MPP-4 peptides using
granzyme B and perforin ELISPOT assay.
The T cell lines were established from BC-21, an HLA-A0201+ donor, and tested following five to
eight rounds of in vitro T cell stimulations. Targets were T2 cells and autologous LCL-21 cells pulsed
with either no peptide or with MPP-4 peptide. Results are expressed as granzyme B (A) or perforin
(B) positive cells per 10.000 CD8+ T cells and are the mean of duplicate assays (±SD). T cell line
MPP-4 released high granzyme B and perforin when T cells alone were used and when no peptide
was used.

175
A
0 2 4 6 8 10
None
K562-A2.1
K562-A2.1 (MPP-4)
Targ
ets
Granzyme B spots/10 000 CD8+ T cells
B
0 1 2 3 4 5 6
None
K562-A2.1
K562-A2.1 (MPP-4)
Targ
ets
Perforinspots/10 000 CD8+ T cells
A
0 2 4 6 8 10
None
K562-A2.1
K562-A2.1 (MPP-4)
Targ
ets
Granzyme B spots/10 000 CD8+ T cells
B
0 1 2 3 4 5 6
None
K562-A2.1
K562-A2.1 (MPP-4)
Targ
ets
Perforinspots/10 000 CD8+ T cells
Figure 5.21. Non-specific granzyme B and perforin release by BC-32 CTLs generated by DC2d
cells against the MPP-4 peptides using an ELISPOT assay.
The anti-MPP-4 T cell line was established from BC-32, an HLA-A0201+ donor, and tested following
five to eight rounds of in vitro T cell stimulations. Targets were K562-A2.1 cells pulsed with either
no MPP-4 peptide or with the peptide. The background observed when T cells alone were used is
shown. (A) Shows non-specific granzyme B release for BC-32 MPP-4 T cell line. (B) Shows non-
specific perforin release for BC-32 MPP-4 T cell line. Results are expressed as granzyme B or
perforin positive cells per 10.000 CD8+ T cells and are the mean of duplicate assays (±SD).

176
A
0 5 10 15 20
none
T2
T2 (MPP-4)
Targ
ets
Granzyme B spots/20 000 CD8+ T cells
B
0 5 10 15 20
none
T2
T2 (MPP-4)
Targ
ets
perforin spots/20 000 CD8+ T cells
A
0 5 10 15 20
none
T2
T2 (MPP-4)
Targ
ets
Granzyme B spots/20 000 CD8+ T cells
B
0 5 10 15 20
none
T2
T2 (MPP-4)
Targ
ets
perforin spots/20 000 CD8+ T cells
Figure 5.22. Non-specific granzyme B and perforin release of BC-37 CTLs generated by DC2d
cells against the MPP-4 peptides using an ELISPOT assay.
The anti-MPP-4 T cell line was established from BC-37, an HLA-A0201+ donor, and tested following
five to eight rounds of in vitro T cell stimulations. Targets were T2 cells pulsed with either no MPP-4
peptide or with the peptide. The background observed when T cells alone were used is shown. (A)
Shows non-specific granzyme B release for BC-37 MPP-4 T cell line. (B) Shows non-specific
perforin release for BC-37 MPP-4 T cell line. Results are expressed as granzyme B or perforin
positive cells per 20.000 CD8+ T cells and are the mean of duplicate assays (±SD).

177
A
0 5 10 15 20 25 30
none
K562-A2.1
K562-A2.1 (MPP-4)
Targ
ets
Granzyme B spots/10 000 CD8+ T cells
B
0 5 10 15 20 25 30
none
K562-A2.1
K562-A2.1 (MPP-4)
Targ
ets
Perforin spots/10 000 CD8+ T cells
A
0 5 10 15 20 25 30
none
K562-A2.1
K562-A2.1 (MPP-4)
Targ
ets
Granzyme B spots/10 000 CD8+ T cells
B
0 5 10 15 20 25 30
none
K562-A2.1
K562-A2.1 (MPP-4)
Targ
ets
Perforin spots/10 000 CD8+ T cells
Figure 5.23. Non-specific granzyme B and perforin release of BC-41 CTLs generated by DC2d
cells against the MPP-4 peptides using an ELISPOT assay.
The anti-MPP-4 T cell line was established from BC-41, an HLA-A0201+ donor, and tested following
five to eight rounds of in vitro T cell stimulations. Targets were K562-A2.1 cells pulsed with either
no MPP-4 peptide or with the peptide. The background observed when T cells alone were used is
shown. (A) Shows non-specific granzyme B release for BC-41 MPP-4 T cell line. (B) Shows non-
specific perforin release for BC-41 MPP-4 T cell line. Results are expressed as granzyme B or
perforin positive cells per 10.000 CD8+ T cells and are the mean of duplicate assays (±SD).

178
5.3.5.2. MPP-4 CTLs specifically lysed MPP-4-pulsed target cells
The expanded anti-MPP-3 and anti-MPP-4 T cell lines generated from the four
HLA-A*0201 donors were tested for their specificity against T2 cells and
autologous LCL using a chromium release assay. Specific lysis of 16.4% against the
T2 cells loaded with MPP-4 peptide compared to 0.25% in the absence of the
peptide was recorded for TCL-21 MPP-4 at an effector to target ratio (E:T) of 50:1
(Figure 5.24A). 34.3% specific lysis for the same T cell line was recorded against
autologous LCL (LCL-21) loaded with the MPP-4 peptide compared to 6.5% against
autologous LCL in the absence of the peptide at E: T ratio of 50:1 (Figure 5.24B).
The cytotoxic activity of MPP-4 T cell line against K562-A2.1 was also measured.
K562-A2.1 is a leukaemia cell line expressing MPP11 and transfected with the
HLA-A*0201 molecule. At an E:T ratio of 50:1, MPP-4 CTLs exerted a lytic
activity of 13% against this leukaemia cell line. Whereas only 3.65% lysis towards
the wild type K-562 (lacking the HLA-A2 expression) was recorded at the same E:
T ratio (Figure 5.24C).
In accordance with the ELISPOT results, only the MPP-4 T cell line generated from
BC-21 showed peptide specificity while T cell lines generated from the other three
donors (BC-32, BC-37 and BC-41) could not lyse different HLA-A2.1+ target cells
loaded with the MPP-4 peptide (Figure 5.25, Figure 5.26 and Figure 5.27). Non-
specific lysis was recorded for the TCL-32 MPP-4 challenged with unpulsed or
peptide pulsed T2 cells (Figure 5.25A) and LCL-32 (Figure 5.25B). Non-specific
lysis was recoreded by the same T cell line against K-562 and K562-A2.1 (Figure
5.25C). Very low level of lysis (2.8% only) by TCL-37 MPP-4 of peptide-loaded
LCL-37 was recorded (Figure 5.26). The TCL-41 MPP-4 failed to recognize
peptide-loaded LCL-41 (Figure 5.27A) as well as K562-A2.1 (Figure 5.27B).
Once more the results of the ELISPOT are consistent with the cytotoxic findings.
Herein, all of the four T cell lines generated against the MPP-3 peptide did not show
any specific cytotoxic activity (Figure 5.28, Figure 5.29, Figure 5.30 and Figure
5.31). The TCL-21 MPP-3 failed to recognize peptide-loaded T2 cells (Figure
5.28A) as well as peptide-loaded autologous LCL (Figure 5.28B). The TCL-32

179
MPP-3 failed to recognize the peptide-loaded T2 cells (Figure 5.29A) and showed
no lytic activity against unpulsed or peptide-pulsed autologous LCL (Figure 5.29B).
The same thing was recorded for the TCL-37 MPP-3 when challenged with
autologous LCL (Figure 5.30). The TCL-41 MPP-3 did not recognize peptide-
pulsed LCL-41 (Figure 5.31A) as well as K562-A2.1 (Figure 5.31B).
5.3.5.3. Cloning of MPP-4 CTLs
The TCL-21 MPP-4 that showed specificity to the MPP-4 peptide was cloned at 1, 2
and 5 cells/well against the T2 loaded peptide and a pool of allogeneic PBMCs in
the presence of IL-2 and IL-15 using a standard limiting dilution assay. In order to
obtain an optimal expansion, anti-CD3 antibody (OKT3) was added. 200 T cell
clones were generated. These clones were screened for their specificity against the
MPP-4 peptide using the cytotoxic chromium release assay. The T2 cells were either
unpulsed or pulsed with MPP-4 peptide. Unfortunately, none of the clones showed
specific lytic activity for the MPP-4 peptide. Therefore, another attempt was done to
clone the T cell line in the presence of IL-2 only (without the addition of either IL-
15 or OKT3), however, the generated T cell clones (9 clones) died at an early stage.
Moreover, the specific cytotoxicity of the generated MPP-4 T cell lines was only
seen with the line generated from the BC-21 donor. We were not successful in
generating specific T cell lines against the MPP-4 peptide using a further three
HLA-A*0201 positive donors.

180
A
0
5
10
15
20
50:1 25:1 12.5:1 6.25:1
E:T ratio
% L
ysis
T2T2+MPP-4
C
0
5
10
15
20
50:1 25:1 12.5:1 6.25:1
E:T ratio
% L
ysis K562
K562-A2.1
B
0
10
20
30
40
50:1 25:1 12.5:1 6.25:1
E:T ratio
% L
ysis LCL21
LCL21+MPP-4
A
0
5
10
15
20
50:1 25:1 12.5:1 6.25:1
E:T ratio
% L
ysis
T2T2+MPP-4
C
0
5
10
15
20
50:1 25:1 12.5:1 6.25:1
E:T ratio
% L
ysis K562
K562-A2.1
B
0
10
20
30
40
50:1 25:1 12.5:1 6.25:1
E:T ratio
% L
ysis LCL21
LCL21+MPP-4
Figure 5.24. Recognition of HLA-A0201+ target cells by BC-21 T cell line generated by DC2d
against MPP-4 peptide as tested using a standard chromium release assay.
The MPP-4 T cell line generated from normal HLA-A0201+ donor, BC-21, was used as effector cells.
(A) Target cells were T2 cells pulsed with either no peptide (dark blue symbol) or with MPP-4
peptide (pink symbol). (B) Target cells were autologous LCL-21 pulsed with either no peptide (dark
blue symbol) or with MPP-4 peptide (pink symbol). (C) Target cells were K562 (dark blue symbol)
and K562-A2.1 (pink symbol). The data are presented as the percentage specific lysis at the indicated
E:T ratios and represents the average of the two experiment and error bars indicate the SD.

181
B
0
5
10
15
50:1 25:1 12.5:1 6.25:1
E:T ratio
% L
ysis LCL32
LCL32+MPP-4
A
0
5
10
15
20
25
50:1 25:1 12.5:1 6.25:1
E:T ratio
% L
ysis T2
T2+MPP-4
C
0
2
4
6
8
100:1 50:1 25:1 12.5:1
E:T ratio
% L
ysis K562
K562-A2.1
B
0
5
10
15
50:1 25:1 12.5:1 6.25:1
E:T ratio
% L
ysis LCL32
LCL32+MPP-4
A
0
5
10
15
20
25
50:1 25:1 12.5:1 6.25:1
E:T ratio
% L
ysis T2
T2+MPP-4
C
0
2
4
6
8
100:1 50:1 25:1 12.5:1
E:T ratio
% L
ysis K562
K562-A2.1
Figure 5.25. Non-specific lysis by BC-32 T cell line generated by DC2d against MPP-4 peptide
as tested using a standard chromium release assay.
The MPP-4 T cell line generated from normal HLA-A0201+ donor, BC-32, were used as effector
cells. (A) Target cells were T2 cells pulsed with either no peptide (dark blue symbol) or with MPP-4
peptide (pink symbol). (B) Target cells were autologous LCL-32 pulsed with either no peptide (dark
blue symbol) or with MPP-4 peptide (pink symbol). (C) Target cells were K562 (dark blue symbol)
and K562-A2.1 (pink symbol). The data are presented as the percentage specific lysis at the indicated
E:T ratios and represents the average of the two experiment and error bars indicate the SD.

182
0
0.5
1
1.5
2
2.5
3
3.5
24:1 12:01 6:01 3:01
E:T ratio
% L
ysis LCL37
LCL37+MPP-4
Figure 5.26. Non-specific lysis by BC-37 T cell line generated by DC2d against MPP-4 peptide
as tested using a standard chromium release assay.
The MPP-4 T cell line generated from normal HLA-A0201+ donor, BC-37, were used as effector
cells. Target cells were autologous LCL-37 pulsed with either no peptide (dark blue symbol) or with
MPP-4 peptide (pink symbol). The data are presented as the percentage specific lysis at the indicated
E:T ratios and represents the average of the two experiment and error bars indicate the SD.
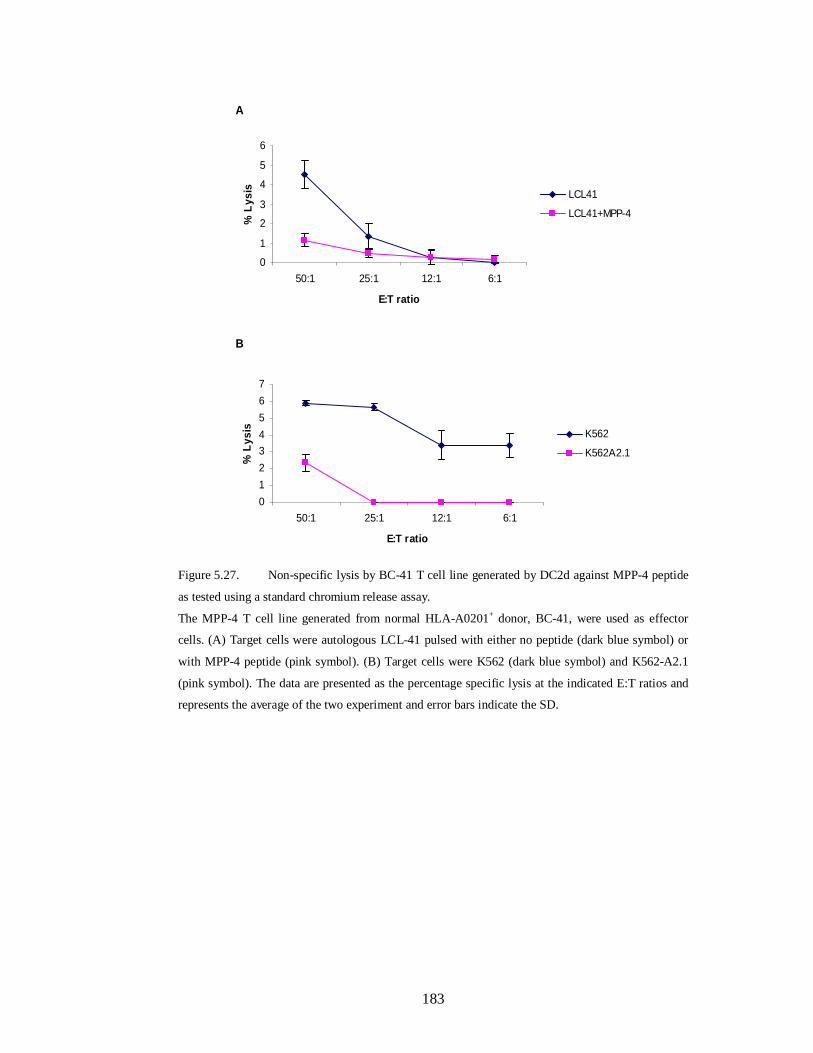
183
A
0
1
2
3
4
5
6
50:1 25:1 12:1 6:1
E:T ratio
% L
ysis LCL41
LCL41+MPP-4
B
01234567
50:1 25:1 12:1 6:1
E:T ratio
% L
ysis K562
K562A2.1
A
0
1
2
3
4
5
6
50:1 25:1 12:1 6:1
E:T ratio
% L
ysis LCL41
LCL41+MPP-4
B
01234567
50:1 25:1 12:1 6:1
E:T ratio
% L
ysis K562
K562A2.1
Figure 5.27. Non-specific lysis by BC-41 T cell line generated by DC2d against MPP-4 peptide
as tested using a standard chromium release assay.
The MPP-4 T cell line generated from normal HLA-A0201+ donor, BC-41, were used as effector
cells. (A) Target cells were autologous LCL-41 pulsed with either no peptide (dark blue symbol) or
with MPP-4 peptide (pink symbol). (B) Target cells were K562 (dark blue symbol) and K562-A2.1
(pink symbol). The data are presented as the percentage specific lysis at the indicated E:T ratios and
represents the average of the two experiment and error bars indicate the SD.

184
A
02468
1012
100:1 50:1 25:1 12.5:1
E:T ratio
% L
ysis T2
T2+MPP-3
B
05
1015202530
50:1 25:1 12.5:1 6.25:1
E:T ratio
% L
ysis LCL21
LCL21+MPP-3
A
02468
1012
100:1 50:1 25:1 12.5:1
E:T ratio
% L
ysis T2
T2+MPP-3
B
05
1015202530
50:1 25:1 12.5:1 6.25:1
E:T ratio
% L
ysis LCL21
LCL21+MPP-3
Figure 5.28. Non-specific lysis by BC-21 T cell line generated by DC2d against MPP-3 peptide
as tested using a standard chromium release assay.
The MPP-3 T cell line generated from a normal HLA-A0201+ donor, BC-21, were used as effector
cells. (A) Target cells were T2 cells pulsed with either no peptide (dark blue symbol) or with MPP-4
peptide (pink symbol). (B) Target cells were autologous LCL-21 pulsed with either no peptide (dark
blue symbol) or with MPP-4 peptide (pink symbol). The data are presented as the percentage specific
lysis at the indicated E:T ratios and represents the average of the two experiments and error bars
indicate the SD.

185
A
0
5
10
15
20
50:1 25:1 12.5:1 6.25:1
E:T ratio
% L
ysis T2
T2+MPP-3
B
0
0.2
0.4
0.6
0.8
1
100:1 50:1 25:1 12.5:1
E:T ratio
% L
ysis LCL32
LCL32+MPP-3
A
0
5
10
15
20
50:1 25:1 12.5:1 6.25:1
E:T ratio
% L
ysis T2
T2+MPP-3
B
0
0.2
0.4
0.6
0.8
1
100:1 50:1 25:1 12.5:1
E:T ratio
% L
ysis LCL32
LCL32+MPP-3
Figure 5.29. Non-specific lysis by BC-32 T cell line generated by DC2d against MPP-3 peptide
as tested using a standard chromium release assay.
The MPP-3 T cell line generated from a normal HLA-A0201+ donor, BC-32 was used as effector
cells. The T cells were stimulated with T2 cells (A) and with autologous LCL-32 (B). Target cells
pulsed with no peptide are represented by dark blue symbol, whereas target cells pulsed with MPP-3
peptide are represented by pink symbol. The data are presented as the percentage specific lysis at the
indicated E:T ratios and represents the average of the two experiments and error bars indicate the SD.

186
0
0.2
0.4
0.6
0.8
1
24:1 12:01 6:01 3:01
E:T ratio
% L
ysis LCL37
LCL37+MPP-3
Figure 5.30. Non-specific lysis by BC-37 T cell line generated by DC2d against MPP-3 peptide
as tested using a standard chromium release assay.
The MPP-3 T cell line generated from a normal HLA-A0201+ donor was used as effector cells. The T
cells were stimulated with autologous LCL-37. LCL-37 pulsed with no peptide are represented by
dark blue symbol, whereas LCL-37 pulsed with MPP-3 peptide are represented by pink symbol. The
data are presented as the percentage specific lysis at the indicated E:T ratios and represents the
average of the two experiments and error bars indicate the SD.

187
A
0
1
2
3
4
5
50:1 25:1 12.5:1 6.25:1
E:T ratio
% L
ysis LCL41
LCL41-MPP-3
B
0
0.5
1
1.5
2
2.5
50:1 25:1 12.5:1 6.25:1
E:T ratio
% L
ysis K562
K562-A2.1
A
0
1
2
3
4
5
50:1 25:1 12.5:1 6.25:1
E:T ratio
% L
ysis LCL41
LCL41-MPP-3
B
0
0.5
1
1.5
2
2.5
50:1 25:1 12.5:1 6.25:1
E:T ratio
% L
ysis K562
K562-A2.1
Figure 5.31. Non-specific lysis by BC-41 T cell line generated by DC2d against MPP-3 peptide
as tested using a standard chromium release assay.
The MPP-3 T cell line generated from a normal HLA-A0201+ donor, BC-41, was used as effector
cells. (A) Target cells were T2 cells pulsed with either no peptide (dark blue symbol) or with MPP-3
peptide (pink symbol). (B) Target cells were K562 (dark blue symbol) and K562-A2.1 (pink symbol).
The data are presented as the percentage specific lysis at the indicated E:T ratios and represents the
average of the two experiments and error bars indicate the SD.

188
5.3.6. Generation of PR3 specific T lymphocyte lines
The ability of the PR3-derived peptides to induce specific cytotoxic T lymphocytes
(CTLs) was tested. PBMCs obtained from three different HLA-A*0201 positive
healthy volunteers were utilized to generate CTLs specific to the selected peptides.
The three donors were designated as BC-32, BC-37 and BC-41. The PBMCs from
each donor were used as the source of the responder cells and antigen presenting
cells. The responder cells were CD8+ T cells purified by MACS negative selection
and stimulated in vitro with antigen presenting cells-loaded peptide for 7-10 days.
The protocol used for the generation of CD8+ T cell lines utilized peptide-pulsed
DC2d (fast DC) to prime the purified CD8+ T cells and peptide-pulsed monocytes
for subsequent T cell stimulations. The DC2d were generated as described in
Materials and Methods section 2.5.4.3.
To investigate whether the PR3 synthetic peptides could stimulate peptide-specific
CTLs, the generated T cell lines were tested against different HLA-A*0201+ targets
in the presence or absence of autologous peptide using a Chromium Release Assay
and an ELISPOT assay after 3 to 8 rounds of stimulations.
5.3.7. CD8+ T cell responses to PR3-derived peptides
5.3.7.1. IFN-γ and granzyme B production by PR3 T cell lines
After the fourth round of stimulation, the specificity of the in vitro primed CTLs was
tested first for IFN-γ release to stimulation with the corresponding peptides using an
ELISPOT assay. All the generated BC-32-CTL lines were able to produce IFN-γ
against autologous targets regardless of the presence or absence of the corresponding
peptide. No specific IFN-γ production was recorded for the two CTLs generated
against the PR-129 and PR-9 test peptides (Figure 5.32A and B). However, the CTL
line generated with the PR-169 positive control peptide produced IFN-γ after
stimulation with autologous LCLs loaded with the PR-169 peptide (Figure 5.32C).
Interestingly, when monocytes were used as stimulators, IFN- γ specific production
by the anti-PR169 CTL were observed in the presence of peptide and only when IL-
2 (10 ng/ml) was added (Figure 5.32C).

189
The specificity of the T cell lines generated from the two other donors, BC-37 and
BC-41, was also tested in IFN-ELISPOT assays. Targets used to test BC-37 T
cell lines were T2 cells and autologous LCL pulsed with either no peptide or with
corresponding PR-3-peptide. K562-A2.1 cells, loaded with either no peptide or with
corresponding PR-3-peptide, were used to test BC-41 T cell lines. As shown in
Figure 5.33 and Figure 5.34, none of the generated PR-3-T cell lines produced
specific IFN-γ spots when challenged with peptide-loaded target cells including the
positive control PR-169.
The next ELISPOT assay was to test whether the generated PR3-T cell lines produce
specific granzyme B. K562-A2.1 and T2 cells loaded with each peptide were used as
stimulators in this ELISPOT assay. No granzyme B production was recorded for the
BC-37-CTLs, BC-32-CTLs as well as BC-41-CTLs generated against the PR-9 and
PR-129 test peptides (Figure 5.35A and B), (Figure 5.36A and B) and (Figure 5.37A
and B). However, the control peptide PR-169-CTL generated from BC-37, BC-32
and BC-41 produced granzyme B after stimulation with T2 or K562-A2.1 loaded
with the PR-169 peptide (Figure 5.35C, Figure 5.36C and Figure 5.37C ).

190
C
0 20 40 60 80 100 120 140
none
LCL-32
LCL-32 (PR-169)
Mo
Mo+IL-2
Mo (PR-169)
Mo (PR-169)+IL-2
Targ
ets
IFN-g spots/50.000 CD8+ T Cells
A
0 20 40 60 80 100 120 140
none
LCL-32
LCL-32 (PR-129)
Mo
Mo+IL-2
Mo (PR-129)
Mo (PR-129)+IL-2
Targ
ets
IFN-g spots /50.000 CD8+ T Cells
B
0 20 40 60 80 100 120 140
none
LCL-32
LCL-32 (PR-9)
Mo
Mo+IL-2
Mo (PR-9)
Mo (PR-9)+IL-2
Targ
ets
IFN-g spots/50.000 CD8+ T Cells
Figure 5.32. ELISPOT assay for IFN- production by BC-32 T cell lines generated by DC2d
cells against peptides derived from the PR-3 antigen.

191
Figure 5.32. Continued
The T cell lines were established from a healthy HLA-A*0201+ donor, BC-32, and tested following
four to eight rounds of in vitro T cell stimulations. T cell line generated against PR-169 peptide was
included as a positive control. Targets were LCL-32 and autologous monocytes pulsed with either no
peptide or with peptide. Monocytes were pulsed with each peptide in the presence or absence of IL-2.
T cell lines generated against PR-129 (A) and PR-9 (B) did not produce more spots of IFN- when
stimulated with target cells pulsed with the corresponding peptide. The positive control PR-169
produces more IFN- spots when stimulated with LCL-pulsed peptide and monocyte-pulsed peptide
in the presence of IL-2 (C). The background observed when T cells alone were used is shown.
Results are expressed as IFN- γ positive cells per 50.000 CD8+ T cells and are the mean of duplicate
assays (±SD). Mo= Monocytes.

192
C
0 50 100 150 200 250 300
none
T2
T2 (PR-169)
LCL37
LCL (PR-169)
Targ
ets
IFN-g spots/50 000 CD8+ T cells
A
0 50 100 150 200 250 300
none
T2
T2 (PR-129)
LCL37
LCL (PR-129)
Targ
ets
IFN-g spots/50 000 CD8+ T cells
B
0 50 100 150 200 250 300
none
T2
T2 (PR-9)
LCL37
LCL37 (PR-9)
Targ
ets
IFN-g spots/50 000 CD8+ T cells
Figure 5.33. ELISPOT assay for IFN- production by BC-37 T cell lines generated by DC2d
cells against peptides derived from the PR-3 antigen.
The T cell lines were established from a healthy HLA-A*0201+ donor, BC-37, and tested following
four to eight rounds of in vitro T cell stimulations. T cell line generated against PR-169 peptide was
included as a positive control. Targets were T2 cells and LCL-37 pulsed with either no peptide or
with peptide. The T cell lines generated against PR-129 (A), PR-9 (B) and PR-169 (C) did not
produce more spots of IFN- when stimulated with target cells pulsed with the corresponding peptide.
The background observed when T cells alone were used is shown. Results are expressed as IFN- γ
positive cells per 50.000 CD8+ T cells and are the mean of duplicate assays (±SD).

193
A
0 20 40 60 80 100 120
none
K562-A2.1
K562-A2.1 (PR-129)
Targ
ets
IFN-g spots/10 000 CD8+ T cells
B
0 20 40 60 80 100 120
none
K562-A2.1
K562-A2.1 (PR-9)
Targ
ets
IFN-g spots/10 000 CD8+ T cells
C
0 20 40 60 80 100 120
none
K562-A2.1
K562-A2.1 (PR-169)
Targ
ets
IFN-g spots/10 000 CD8+ T cells
A
0 20 40 60 80 100 120
none
K562-A2.1
K562-A2.1 (PR-129)
Targ
ets
IFN-g spots/10 000 CD8+ T cells
B
0 20 40 60 80 100 120
none
K562-A2.1
K562-A2.1 (PR-9)
Targ
ets
IFN-g spots/10 000 CD8+ T cells
C
0 20 40 60 80 100 120
none
K562-A2.1
K562-A2.1 (PR-169)
Targ
ets
IFN-g spots/10 000 CD8+ T cells
Figure 5.34. ELISPOT assay for IFN- production by BC-41 T cell lines generated by DC2d
cells against peptides derived from the PR-3 antigen.
The T cell lines were established from a healthy HLA-A*0201+ donor, BC-41, and tested following
four to eight rounds of in vitro T cell stimulations. T cell line generated against PR-169 peptide was
included as a positive control. Targets were T2 cells and LCL-37 pulsed with either no peptide or
with peptide. The T cell lines generated against PR-129 (A), PR-9 (B) and PR-169 (C) did not
produce more spots of IFN- when stimulated with target cells pulsed with the corresponding peptide.
The background observed when T cells alone were used is shown. Results are expressed as IFN- γ
positive cells per 10.000 CD8+ T cells and are the mean of duplicate assays (±SD).

194
C
0 10 20 30 40 50 60
none
T2
T2 (PR-169)
Targ
ets
Granzyme B spots/20.000 CD8+ T cells
A
0 10 20 30 40 50 60
none
T2
T2 (PR-129)
Targ
ets
Granzyme B spots/20.000 CD8+ T cells
B
0 10 20 30 40 50 60
none
T2
T2 (PR-9)
Targ
ets
Granzyme B spots/20.000 CD8+ T cells
C
0 10 20 30 40 50 60
none
T2
T2 (PR-169)
Targ
ets
Granzyme B spots/20.000 CD8+ T cells
A
0 10 20 30 40 50 60
none
T2
T2 (PR-129)
Targ
ets
Granzyme B spots/20.000 CD8+ T cells
B
0 10 20 30 40 50 60
none
T2
T2 (PR-9)
Targ
ets
Granzyme B spots/20.000 CD8+ T cells
Figure 5.35. ELISPOT assay for granzyme B production by BC-37 T cell lines generated by
DC2d cells against the peptides derived from PR-3 antigen.
The T cell lines were established from a healthy HLA-A*0201+ donor, BC-37, and tested following
three to eight rounds of in vitro T cell stimulations. T cell line generated against PR-169 peptide was
included as a positive control. Targets were T2 pulsed with either no peptide or with peptide. T cell
lines generated against PR-129 (A) and PR-9 (B) did not produce more spots of granzyme B when
stimulated with T2 cells pulsed with the corresponding peptide. The positive control PR-169
produces more granzyme B spots when stimulated with T2-pulsed peptide (C). The background
observed when T cells alone were used is shown. Results are expressed as granzyme B positive cells
per 20.000 CD8+ T cells and are the mean of duplicate assays (±SD).

195
C
0 5 10 15 20
none
K562-A2.1
K562-A2.1 (PR-169)
Targ
ets
Granzyme B spots/10.000 CD8 + T cells
A
0 5 10 15 20
none
K562-A2.1
K562-A2.1 (PR-129)
Targ
ets
Granzyme B spots/10.000 CD8+ T cells
B
0 5 10 15 20
none
K562-A2.1
K562-A2.1 (PR-9)
Targ
ets
Granzyme B spots/10.000 CD8+ T cells
C
0 5 10 15 20
none
K562-A2.1
K562-A2.1 (PR-169)
Targ
ets
Granzyme B spots/10.000 CD8 + T cells
A
0 5 10 15 20
none
K562-A2.1
K562-A2.1 (PR-129)
Targ
ets
Granzyme B spots/10.000 CD8+ T cells
B
0 5 10 15 20
none
K562-A2.1
K562-A2.1 (PR-9)
Targ
ets
Granzyme B spots/10.000 CD8+ T cells
Figure 5.36. ELISPOT assay for granzyme B production by BC-32 T cell lines generated by
DC2d cells against the peptides derived from PR-3 antigen.
The T cell lines were established from a healthy HLA-A*0201+ donor, BC-32, and tested following
three to eight rounds of in vitro T cell stimulations. T cell line generated against PR-169 peptide was
included as a positive control. Targets were K562-A2.1 cells pulsed with either no peptide or with
peptide. T cell lines generated against PR-129 (A) and PR-9 (B) did not produce more spots of
granzyme B when stimulated with K562-A2.1 cells pulsed with the corresponding peptide. The
positive control PR-169 produces more granzyme B spots when stimulated with K562-A2.1-pulsed
peptide (C). The background observed when T cells alone were used is shown. Results are expressed
as granzyme B positive cells per 10.000 CD8+ T cells and are the mean of duplicate assays (±SD).

196
A
0 5 10 15 20 25 30 35
none
K562-A2.1
K562-A2.1 (PR-129)
Targ
ets
Granzyme B spots/10 000 CD8+ T cells
B
0 5 10 15 20 25 30 35
none
K562-A2.1
K562-A2.1 (PR-9)
Targ
ets
Granzyme B spots/10 000 CD8+ T cells
C
0 5 10 15 20 25 30 35
none
K562-A2.1
K562-A2.1 (PR-169)
Targ
ets
Granzyme B spots/10 000 CD8+ T cells
Figure 5.37. ELISPOT assay for granzyme B production by BC-41 T cell lines generated by
DC2d cells against the peptides derived from PR-3 antigen.
The T cell lines were established from a healthy HLA-A*0201+ donor, BC-41, and tested following
three to eight rounds of in vitro T cell stimulations. T cell line generated against PR-169 peptide was
included as a positive control. Targets were K562-A2.1 cells pulsed with either no peptide or with
peptide. T cell lines generated against PR-129 (A) and PR-9 (B) did not produce more spots of
granzyme B when stimulated with K562-A2.1 cells pulsed with the corresponding peptide.

197
Figure 5.37. Continued
The positive control PR-169 produces more granzyme B spots when stimulated with K562-A2.1-
pulsed peptide (C). The background observed when T cells alone were used is shown. Results are
expressed as granzyme B positive cells per 10.000 CD8+ T cells and are the mean of duplicate assays
(±SD).

198
5.3.7.2. Cytotoxic activity of anti-PR3 CTLs
The next step in monitoring CD8+ T cell responses to PR3-derived peptides was to
test the cytotoxic activity of the generated T cell lines in a standard Cr51-release
assay. T2 cells or autologous LCLs were pulsed with no peptide or with each peptide
and used as targets at different E:T ratio. Among the three HLA-A*0201 donors
used to generate anti-PR-3 CTLs, peptide-specific cytotoxic responses were only
demonstrated with a T cell line generated from one donor i.e. BC-32. Consistent
with the results obtained with the ELISPOT assay; the T cell line generated against
the previously identified epitope PR-169 showed peptide-specific cytotoxic
responses, whereas the T cell lines generated from the same donor against the PR-9
and PR-129 test peptides did not elicit any peptide-specific cytotoxic responses. The
PR-129-T cell line peptide did not recognize peptide-pulsed T2 and LCL-32 targets
cells (Figure 5.17A and B). Similarly, the PR-9-T cell line peptide tested against T2
cells and LCL-32 did not recognize peptide-pulsed target cells (Figure 5.39A and
B). The PR-169-CTL line recorded a specific lysis of 51% against T2 cells loaded
with PR-169 peptide compared to 6% in the absence of the peptide at E:T ratio 25:1
(Figure 5.40A). In addition, 10% specific lysis was demonstrated for the same CTL
line against LCL-32 pulsed-peptide and only 4% lysis against LCL-32 in the
absence of the peptide (Figure 5.40 A &B).
The specificity of the T cell lines generated from BC-37 donor was also examined
using cytotoxicity assays. However, none of the generated CTL lines showed a
specific activity against peptide-loaded LCL-37 including the positive control PR-
169 peptide (Figure 5.41A, B and C). The cytotoxic activity of the T cell lines
generated from BC-41 could not be tested due to low cell number.

199
A
010203040506070
25:1 12:1 6:1 3:1
E:T ratio
% L
ysis T2
T2+PR-129
B
02468
101214
25:1 12:1 6:1 3:1
E:T ratio
% L
ysis LCL32
LCL32+PR-129
A
010203040506070
25:1 12:1 6:1 3:1
E:T ratio
% L
ysis T2
T2+PR-129
B
02468
101214
25:1 12:1 6:1 3:1
E:T ratio
% L
ysis LCL32
LCL32+PR-129
Figure 5.38. Non-specific lysis by BC-32 T cell line generated by DC2d against PR-129 peptide
as tested using a standard chromium release assay.
The PR-129 T cell line generated from normal HLA-A0201+ donor, BC-32, was used as effector
cells. Target cells were T2 cells and LCL-32 pulsed with either no peptide (dark blue symbol) or with
PR-129 peptide (pink symbol). The PR-129 T cell line was stimulated with T2 cells (A) and with
LCL-32 (B). The data are presented as the percentage specific lysis at the indicated E:T ratios and
represents the average of the two experiments and error bars indicate the SD.

200
A
0102030405060
16:1 8:1 4:1 2:1
E:T ratio
% L
ysis T2
T2+PR-9
B
0
2
4
6
8
16:1 8:1 4:1 2:1
E:T ratio
% L
ysis LCL32
LCL32+PR-9
A
0102030405060
16:1 8:1 4:1 2:1
E:T ratio
% L
ysis T2
T2+PR-9
B
0
2
4
6
8
16:1 8:1 4:1 2:1
E:T ratio
% L
ysis LCL32
LCL32+PR-9
Figure 5.39. Non-specific lysis by BC-32 T cell line generated by DC2d against PR-9 peptide as
tested using a standard chromium release assay.
The PR-9 T cell line generated from normal HLA-A0201+ donor, BC-32, was used as effector cells.
Target cells were T2 cells and LCL-32 pulsed with either no peptide (dark blue symbol) or with PR-9
peptide (pink symbol). The PR-9 T cell line was stimulated with T2 cells (A) and with LCL-32 (B).
The data are presented as the percentage specific lysis at the indicated E:T ratios and represents the
average of the two experiments and error bars indicate the SD.

201
A
010203040506070
25:1 12:1 6:1 3:1
E:T ratio
% L
ysis T2
T2+PR-169
B
0
5
10
15
20
25
25:1 12:1 6:1 3:1
E:T ratio
% L
ysis LCL32
LCL32+PR-169
A
010203040506070
25:1 12:1 6:1 3:1
E:T ratio
% L
ysis T2
T2+PR-169
B
0
5
10
15
20
25
25:1 12:1 6:1 3:1
E:T ratio
% L
ysis LCL32
LCL32+PR-169
Figure 5.40. Recognition of peptide pulse target cells by BC-32 T cell line generated by DC2d
against PR-169 peptide as tested using a standard chromium release assay.
The PR-169 T cell line generated from normal HLA-A0201+ donor, BC-32, was used as effector
cells. Target cells were autologous T2 cells and LCL-32 pulsed with either no peptide (dark blue
symbol) or with PR-169 peptide (pink symbol). (A) Shows the cytotoxic activity of PR-169 cell line
against peptide-pulsed T2. (B) Shows the cytotoxic activity of PR-169 cell line against peptide-pulsed
LCL-32. The data are presented as the percentage specific lysis at the indicated E:T ratios and
represents the average of the two experiments and error bars indicate the SD.

202
C
0
1
2
3
4
5
24:1 12:01 6:01 3:1
E:T ratio
% L
ysis LCL37
LCL37+PR-169
A
-0.50
0.51
1.52
2.53
3.5
24:1 12:01 6:01 3:1
E:T ratio
% L
ysis LCL37
LCL37+PR-129
B
0
0.2
0.4
0.6
0.8
1
24:1 12:01 6:01 3:1
E:T ratio
% L
ysis
LCL37
LCL37+PR-9
C
0
1
2
3
4
5
24:1 12:01 6:01 3:1
E:T ratio
% L
ysis LCL37
LCL37+PR-169
A
-0.50
0.51
1.52
2.53
3.5
24:1 12:01 6:01 3:1
E:T ratio
% L
ysis LCL37
LCL37+PR-129
B
0
0.2
0.4
0.6
0.8
1
24:1 12:01 6:01 3:1
E:T ratio
% L
ysis
LCL37
LCL37+PR-9
Figure 5.41. Non-specific lysis by BC-37 T cell lines generated by DC2d against the PR-3
peptides as tested using a standard chromium release assay.
The three T cell lines, PR-129, PR-9 and PR-169, were generated from a normal HLA-A0201+ donor,
BC-37. The PR-169 T cell line was included as a positive control. The T cells were used as effector
cells. Target cells were LCL-37 pulsed with either no peptide (dark blue symbol) or with
corresponding peptide (pink symbol). (A) Shows non-specific lysis of the T cell line generated
against the PR-129 peptide. (B) Shows non-specific lysis of the T cell line generated against the PR-9
peptide. (C) Shows non-specific lysis of the T cell line generated against the PR-169 peptide.

203
Figure 5.41. Continued
The data are presented as the percentage specific lysis at the indicated E:T ratios and represents the
average of the two experiments and error bars indicate the SD.

204
5.4. Discussion
CD8+ cytotoxic T lymphocytes (CTLs) recognize endogenously processed peptides
consisting of 8-11 amino acids, most commonly 9 amino acids long, presented on
the cell surface of target cells in the context of major histocompatibility complex
(MHC) class I molecules. These cells are believed to play an important role in
identifying and eliminating tumour cells (Melief and Kast, 1995). To date, several
CD8+ T cell epitopes derived from leukaemia antigens have been identified, some of
them have been investigated in clinical trials (Heslop et al., 2003, Qazilbash et al.,
2004, Schmitt et al., 2008). Importantly, the graft versus leukaemia (GVL) effect
often seen after allogeneic HSCT has been found to be mediated mostly by donor-
derived CD8+ T cells recognizing peptides derived from leukaemia antigens and/or
minor histocompatibility antigens (mHAs) presented on recipient cells (Schetelig et
al., 2005, Wu and Ritz, 2006, Appelbaum, 2001). Overexpressed antigens such as
WT1, PR-3 and MUC1 represent possible targets of specific GVL reactions (Kapp et
al., 2009, Molldrem et al., 2000, Rezvani et al., 2003).
This study investigated the potential of CD8+ T cell epitopes derived from the
leukaemia associated antigens MPP11 and PR-3 using a reverse immunological
approach. Previous studies have reported the existence of a humoral response
against MPP11 protein as well as the overexpression of this protein in patients with
myeloid leukaemias (Greiner et al., 2003, Greiner et al., 2004, Schmitt et al., 2006).
However, the identification of CD8+ T-cell epitopes derived from the MPP11
protein is a crucial contribution to the field of leukaemia immunotherapy. Although
the antigenic epitope PR-1 has already been identified (Molldrem et al., 1996); PR-3
seems to be a rich source of peptide epitopes that can elicit a specific CTL response.
Therefore, additional A*0201-restricted epitopes capable of inducing CTL responses
were searched for within known databases, and tested.
The reverse immunological approach permitted the identification of class I as well
as class II candidate epitopes derived from known tumour antigens on the basis of
HLA-binding motifs (Stevanovic, 2002, Paschen et al., 2004). Using this approach,
numerous epitopes could be identified in leukaemia (Molldrem et al., 1996, Oka et
al., 2000, Greiner et al., 2005, Asemissen et al., 2006) as well as in solid tumours
(Alves et al., 2003, Ayyoub et al., 2002, Fujie et al., 1999, Kawashima et al., 1998,

205
Kessler et al., 2001, Neumann et al., 2005). The amino acid sequences derived from
MPP11 and PR-3 proteins were examined for the presence of peptides containing
binding motifs for one of the most frequent class I alleles, A*0201 allele using
computer-based epitope prediction programs. Four MPP11-derived peptides were
identified which were predicted to bind with high affinity to HLA-A*0201
molecule. The peptides were named MPP-1N, MPP-2, MPP-3 and MPP-4. The
actual binding capacity of the selected peptides was tested using T2 binding assay.
The MPP11- derived peptides MPP-3 and MPP-4 recorded binding scores lower
than MPP-1N, and MPP2 scores as determined by the SYFPEITHI software.
However, in the actual T2 binding assay, MPP-3 and MPP-4 were found to have
higher binding affinities compared to the two other peptides. This was probably due
to a very poor dissolution of the MPP-1N and MPP-2 peptides since more
hydrophobic amino acids are contained within their sequence. In addition to the four
predicted peptides, the amino acid sequence of the highest scoring peptide i.e., MPP-
1N (QLLIKAVNL) was modified. Studies (Tourdot et al., 2000, Valmori et al.,
1998, Al Qudaihi et al., 2009) have shown that introducing a tyrosine amino acid
residue at the first position (P1Y) of a peptide enhances epitope immunogenicity.
Therefore, a tyrosine amino acid residue was introduced in P1 of the MPP-1N
peptide in order to boost its binding affinity and /or immunogenicity. The
modification of the MPP-1N peptide enhanced the binding affinity of the modified
MPP-1Y peptide using the algorithm prediction but in the actual binding assay, the
analogue peptide could not stabilize the HLA-A*0201 molecule which again may be
due to its poor dissolution.
Inconsistent with other groups (Molldrem et al., 1996, Oka et al., 2000, Houbiers et
al., 1993) who have succeeded in identifying CD8+ T-cell epitopes using a simple
method that employs T2 cells as antigen-presenting cells, specific immune responses
could not be generated using this method to both MPP11-derived peptides as well as
the WT1-126N peptide which was included as a positive control. Since MPP11 and
WT1 are self-proteins, the majority of high avidity CD8+ T cells might have been
deleted during thymic maturation (Starr et al., 2003). Thus it is more difficult to
generate cytotoxic T cell responses from the remaining low avidity-naïve precursors
because their activation required more stringent costimulatory requirements
(Janeway and Bottomly, 1994, Swain et al., 1996). DCs as antigen-presenting cells

206
were therefore used for the generation of anti-MPP11 CTL immune responses. DCs
are known as the professional antigen presenting cells because of their unique ability
to stimulate naïve T-cell responses (Banchereau and Steinman, 1998). However,
following priming of naïve T cells (usually two rounds of T cell stimulation) other
good APCs such as monocytes and T-APCs could be used for T cell expaniosn. The
conventional protocol for generating monocyte-derived DCs include 7-9 days of
culture, however, Dauer et al., (2003) described a rapid protocol for the generation
of mature DCs from monocytes within only two days of in vitro culture. Such cells,
termed as FastDC or DC2d, were found to be capable of inducing tumour-specific
CD8+ T cell responses as effectively as DCs generated according to the conventional
7-day method (Dauer et al., 2005, Ho et al., 2006). Moreover, CTL lines primed
with DC2d expanded more effectively and showed greater lytic activity than lines
stimulated with DC7d (Dauer et al., 2005, Ho et al., 2006). Using DC2d as antigen
presenting cells to prime T cell responses, antigen-specific responses by CTL-21
generated against MPP-4 peptide were detected via cytokine production and
cytotoxic assays. MPP-4-CTLs selectively recognized peptide-loaded T2 cells and
responded by releasing IFN- in an ELISPOT assay (Fig. 5.3A). These T cells
specifically killed T2 cells and autologous LCLs when loaded with the MPP-4
peptide suggesting recognition was selective to the MPP-4 peptide (Fig. 5.4 A&B).
Moreover, they were capable of recognizing the leukaemia cell lines K562-A2.1
expressing MPP11 protein (Fig. 5.4 C). Even though, T2 cells were not efficient at
priming and generating specific-CD8+ T cell immunity, however these cells were
very useful as targets when conducting functional assays such as cytotoxicity and
ELISPOT.
Four healthy HLA-A*0201 positive individuals were used to generate MPP-4-
specific CTLs; however, specific responses could only be observed in one CTL line
established from one donor, i.e., BC 21. The failure to obtain specific CTL
responses to tumour antigens in all four donors tested has been observed previously
and it has been suggested to be due to the low frequency of peptide-specific CD8+ T
cell precursors in healthy individuals (Ohminami et al., 2000). The MPP-4 CTL line
was cloned before testing its capability of recognizing fresh A*0201-positive
leukemic cells that overexpressed MPP11 protein. Unfortunately, no MPP-4-specific
clones could be generated. Although leukaemia samples were screened for the

207
MPP11 gene expression, the results were not used as no specific clones against
MPP-4 were generated. Standard techniques for cloning T cells employ stimulation
with antigen loaded-APCs in the presence of IL-2 and allogeneic feeder cells in
limiting dilution cultures followed by repeated re-stimulations to maintain growth
and specificity. In the first attempt, the MPP-4 T cell line was cloned by stimulation
with peptide pulsed-T2 cells in the presence of allogeneic feeder cells, IL-2, IL-15
and anti-CD3 monoclonal antibody (OKT3). Interleukin-2 is the cytokine frequently
used to promote the survival and expansion of cultured T cells (Smith, 1988). IL-2
and IL-15 share the β-chain and the common γ chain receptor (IL-2/IL-15 Rβγc), but
each cytokine has its unique α-chain receptor (Carson et al., 1994, Grabstein et al.,
1994). IL-15 was initially identified by its capability to promote the development of
NK cells and the survival of CD8+ memory T cells in vivo (Colucci et al., 2003,
Zhang et al., 1998). However, it has been reported that anti-tumour-CTLs expanded
and survived for relatively long time periods in vitro in the presence of IL-15
whereas CTLs maintained in IL-2 died at earlier stages (Lu et al., 2002).
Furthermore, IL-15-maintained CTLs retained their effector function as cytotoxic
cells and did not switch into memory cells (Lu et al., 2002). For TCR triggering,
OKT3 was used as reported previously (Ho et al., 2006). Because all of the
generated clones were not specific, another attempt to clone the line was conducted
but without the addition of either IL-15 or anti-CD3 monoclonal antibody. This time
the generated clones were few and died at an early stage perhaps because of old T
cell culture.
Two PR-3 peptides (PR-129 and PR-9) that contained anchor motifs required for the
binding to the class I-A*0201 molecule were identified. However, both peptides
were incapable of inducing specific CD8+ T cell responses. Although the PR-129
peptide displayed high binding affinity to the HLA-A*0201 molecule, there were no
precursor T cells with appropriate T cell receptors (TCRs) reactive to these peptides.
This result implied again that peptide binding capacity to the HLA molecule was not
the only factor that determines its immunogenicity. The positive control PR-169
peptide was effective in inducing specific responses as measured by the ELISPOT as
well as in cytotoxicity assays in two (BC 32 and BC 37) out of four HLA-A*0201
positive donors. The demonstration that the positive control PR-169 peptide was
effective in inducing specific cytotoxic activity and specific cytokine production

208
indicated that the stimulation system used in the present study was optimum for
generation of cytotoxic T cells. Previous studies have reported the overexpression of
PR-3 protein in patients with myeloid leukaemias (Muller-Berat et al., 1994, Yong et
al., 2008). In this study, the leukaemic samples were not screened for the PR-3
expression. There was no need to select leukaemia samples that express PR-3
antigen since no specific T cell responses were recorded against PR-9 and PR-129
peptides.
In summary, the data suggested that CD8+ T cells reactive with the MPP-4 peptide
could be generated from the T cell repertoire of HLA-A0201+ healthy individuals.
More importantly, these CTLs were able to specifically lyse the K562-A2.1
leukemic cells naturally expressing the MPP11 antigen. The study also demonstrated
that both PR-129 and PR-9 peptides were non-immunogenic.

209
6. GENERAL DISCUSSION

210
A major obstacle facing cancer vaccines is tolerance to self-tumour antigens which
can prevent the development of effective anti-tumour CTL responses. Different
approaches have been tested to circumvent this problem (Bellantuono et al., 2002,
Gao et al., 2000, Xue et al., 2005). Among these, modified peptide ligands known as
heteroclitic peptides have been used to improve the reactivity of T cells specific for
tumour antigens by enhancing their affinity to HLA molecules or TCR. These
peptide ligands are analogues of native tumour antigens generated by single or
double amino acid substitutions at certain MHC anchor positions. A number of
peptide analogues derived from melanoma associated antigens and leukaemia
antigens capable of recognizing native epitopes with enhanced immunogenicity have
been described (Tsuboi et al., 2002, Pinilla-Ibarz et al., 2005, Valmori et al., 1998,
Bae et al., 2004a, Bae et al., 2004b, Parkhurst et al., 1996). Tsuboi et al (2002)
reported that a modified HLA-A*2402-restricted WT1 peptide exhibited a higher
binding affinity and elicited WT1-specific CTLs more effectively than the natural
WT1 peptide. Bae et al (2004a, , 2004b) identified a novel HLA-A*0201-restricted
epitope derived from CD33 and showed that analogues to the native sequence
displayed enhanced affinity and immunogenicity. Indeed, the modification approach
has been used to enhance immunogenicity of epitopes not only derived from self
antigens but also derived from the leukaemia-specific antigen BCR-ABL. In this,
HLA-A*0201-restricted epitopes derived from BCR-ABL junctional region have
been improved in terms of their binding capacity and immunogenicity by modifying
their sequences (Pinilla-Ibarz et al., 2005). Based on these findings, analogues
derived from WT1 and BCR-ABL have been tested in vaccination trials in which
clinical responses to the vaccines have been reported (Maslak et al., 2008, Oka et al.,
2004).
In this study, an analogue to a previously identified epitope, Db126
(RMFPNAPYL), derived from the WT1 antigen has been identified. The analogue
126Y (YMFPNAPYL) was designed using a single amino acid substitution strategy
initially described by Tourdot et al (Tourdot et al., 2000). This strategy consists of
replacing the amino acid at position 1 of HLA-A*0201-associated peptides with a
tyrosine residue (Y). Although vaccination trials using the native Db126 peptide
have demonstrated some immunological effect (Rezvani et al., 2008, Mailander et
al., 2004, Keilholz et al., 2006), the use of an analogue peptide might enhance the

211
vaccine potency as it may induce biological responses superior to that induced by
the native sequence. Therefore, the purpose of developing this analogue was to test
whether it would elicit potent CD8+ CTL responses more efficiently than the native
peptide and whether it would be capable of recognizing its native sequence. Data
presented in chapter 3 showed that modification in the sequence of the wild type
epitope improved its binding to the HLA-A*0201 molecule and enhanced its
immunogenicity. Importantly, CTLs generated with the modified 126Y peptide
lysed HLA-matched WT1+ AML cells more efficiently than CTLs generated with
the native epitope. Similar results supporting our findings have been reported by the
Scheinberg group (Pinilla-Ibarz et al., 2006). They showed that the WT1A1
analogue (the same as 126Y analogue) generated more potent CD8 CTL responses
and was able to recognize and lyse WT1+ CML cell lines. In a subsequent study, the
same group identified an HLA-DR-restricted epitope (WT1-122A1,
SGQAYMFPNAPYLPSCLES) spanning the WT1 amino acids 122-140 and showed
that inclusion of the heteroclitic peptide WT1A1/126Y within the sequence of the
helper peptide induces a robust CD4 and CD8 T cell response (May et al., 2007). In
addition, the modified WT1-122A1 epitope was more potent in inducing cytotoxic
CD8+ CTL responses than the native sequence, WT1-122A (May et al., 2007).
These results along with results presented in this thesis demonstrate that the
analogue 126Y epitope is able to cross-react with its native sequence and it is more
efficient than the native epitope in inducing anti-WT1 responses. All together these
data should open the door for a potential immunotherapeutic approach utilizing
WT1-126Y peptide analogue to target malignant tumour cells in HLA-matched
leukaemia and possibly in other WT1-expressing tumours.
The ability of the 126Y peptide analogue to induce reliable immune responses in
vivo has been tested by the Scheinberg group via a recently conducted pilot study
using multivalent-WT1 peptides to vaccinate patients with AML, mesothelioma and
non-small cell lung cancer (Maslak et al., 2010, Krug et al., 2010). The vaccine
consisted of the analogue peptide WT1A1/126Y and three class II peptides including
the modified WT1-122A1. A total of ten AML patients in complete remission (CR)
following chemotherapy who had measurable WT1 transcript were enrolled. Patients
received the four WT1 peptides plus the immune adjuvant montanide and GM-CSF.
In this trial, robust CD4 and CD8 T-cell immune responses were observed to the

212
WT1 peptides in high proportion of patients with minimal toxicity. Importantly, the
WT1-122A1 heteroclitic peptide was more efficient in inducing anti-126N immune
responses than its native sequences (Maslak et al., 2010). Data from this trial
suggested that it is possible to induce effector cells capable of recognizing WT1-
expressing malignant cells in vitro. However, further clinical trials that evaluate the
clinical effectiveness of this vaccine as a post-remission therapy for leukaemia
patients are needed.
Despite the promise of using heteroclitic peptides as a strategy to break tolerance to
the WT1 antigen, the mono-therapy vaccine alone will not be able to achieve robust
and persistent anti-tumour responses that will prevent relapse. For the best clinical
benefit it will probably be necessary to combine multiple therapeutic interventions
which include blockade of host-negative immunoregulatory mechanisms
(checkpoints) such as CTLA-4, PD-1 and most importantly regulatory T cells
(Tregs). Tregs have been shown to play an important role in modulating both natural
and adoptive immune responses in cancer patients. It has been demonstrated that
Tregs directly suppress the anti-tumour immune responses in cancer patients (Beyer
and Schultze, 2006, Ghebeh et al., 2008), and depletion of this T-cell population
resulted in an enhancement of vaccine-mediated anti-tumour immunity in cancer
patients (Dannull et al., 2005, Mahnke et al., 2007). Furthermore, Tregs have been
shown to be inversely related to the outcome of several human malignancies
(Salama et al., 2009, Heimberger et al., 2008). Importantly, fully functional Tregs
specific for LAGE1 and ARTC1 were demonstrated in melanoma patients (Wang et
al., 2004, Wang et al., 2005a). Greiner et al (2006) investigated the influence of the
expression levels of several LAAs on the clinical outcome of patients with AML.
High expression of three LAAs was found to be associated with favourable clinical
outcome, inducing strong CD8+ CTL responses. However, there was no correlation
with the clinical outcome nor induction of natural anti-WT1 CD8+ CTL response in
these patients (Greiner et al., 2006). In line with this, Nishikawa et al (2005) has
shown the existence of tumour-specific Tregs, which actively suppress antigen-
specific anti-tumour immunity in cancer patients. Another study by Nadal and
colleagues suggested that Tregs exert an inhibitory effect on graft versus leukaemia
and this was associated with relapse after allogeneic stem cell transplantation (Nadal
et al., 2007). Importantly, it has been shown that anti-WT1 responses can be largely

213
affected by the presence of CD4+CD25+ Tregs in which depletion of this T-cell
population was necessary for the generation of an effective WT1-specific CTL
responses (Asemissen et al., 2006). Moreover, our group has identified a human
HLA-DRB1*0402–restricted CD4+CD25+FOXP3+ Tregs population specific for the
WT1 antigen and showed that this antigen is a novel target for leukaemia-specific
CD4+ Tregs (Lehe et al., 2008). In this study, we have generated Tregs cell lines and
clones using a pool of 110 15-mer overlapping peptides across the entire WT1
protein. These T-cell lines and clones specifically recognized a WT1333-347-derived
peptide (RYFKLSHLQMHSRKH) designated WT1-84 in an HLA-DRB1*0402–
restricted manner. The Treg clones were able to recognize HLA-DRB1*04–matched
fresh leukemic cells expressing the WT1 antigen and were able to significantly
inhibit the proliferative activity of allogeneic T cells. We also detected anti–WT1-84
Tregs in HLA-DR4+ AML patients. Furthermore, we have shown that the presence
of Tregs strongly inhibited the induction of anti–WT1-126 CD8+ CTL responses
(Lehe et al., 2008). Therefore, the existence of such tumour-specific Tregs can
actively suppress the WT1-specific anti-tumour immunity in cancer patients as
shown in other systems (Nishikawa et al., 2005). In addition to our previous
findings, a novel MHC class II epitope derived from WT1 antigen and presented by
DRB1*04 (WT1-60237-251, TMNQMNLGATLKGVA) was identified in this
presented study. This peptide was recognized by CD4+ T cells obtained from a
healthy HLA-DRB1*0406,0701 donor. The anti-WT1-60- peptide T-cell line was
generated using the same methodology and conditions used to generate the anti-
WT1-84 Tregs. Moreover, the cytokines secreted by these cells was of a Th2
cytokine profile similar to that of generated Tregs. WT1-60 may thus represent
another target for Tregs. However, these T cells should be further examined for the
presence of Treg markers, to confirm the Treg-phenotype, and for their suppressor
effect, to confirm Treg function.
Current interests in cancer immunotherapy should be focused on determining the
therapeutic implications of Treg cells ‘‘regulating the regulators.’’ Interestingly,
elimination of Tregs by IL-2 conjugated to diphtheria toxin (ONTAK) enhanced
vaccine-mediated anti-tumour immunity in cancer patients (Dannull et al., 2005,
Mahnke et al., 2007). However, targeting the CD25 molecule may eliminate Tregs,
leading to an increase in the susceptibility to autoimmunity, and it can also deplete

214
activated CD25+ effector cells, which may be important for clearance of cancer and
infection (Curtin et al., 2008). Therefore, studies should be tailored toward
developing selective depletion strategies directed against Treg-related markers.
Alternatively, triggering of TLR8 or OX40, and potentially blocking adenosine,
might improve the chances of neutralizing Tregs immunosuppression in cancer
patients (Colombo and Piconese, 2007).
Although the WT1 antigen represents an ultimate target for tumour immunotherapy,
targeting a single tumour antigen may result in tumour immune escape by losing or
down-regulating the expression of the parent protein. Therefore, immunotherapeutic
approaches targeting more than one antigen may be more effective in inducing anti-
tumour immune responses. In this respect, Rezvani et al (2008) showed that a
combined peptide vaccine consisting of PR-1 (VLQELNVTV) and WT1-126
(RMFPNAPYL) peptides was safe and could elicit immunologic responses
associated with a reduction in WT1 mRNA expression in patients with myeloid
leukaemia. In line with this strategy, the work presented in chapter 5 focused on the
identification of novel potential multi-antigenic epitopes, derived from two potential
antigens (MPP11 and PR-3), that are presented in the context of HLA-A*0201
molecule and recognized by T cells. The data showed that CTLs directed against the
MPP-4 (STLCQVEPV) peptide derived from the MPP11 antigen could be generated
form peripheral blood mononuclear cells of an HLA-A*0201 normal donor. These
findings strongly suggest that MPP-4-specific T cells should be further investigated
as they may be used for the development of an efficient T-cell based leukaemia
immunotherapy. MPP-4 specific T cells could be expanded ex vivo for adoptive
transfer to leukaemia patients or MPP-4 peptide may be utilized in vaccination trials
as a single agent or in combination with epitopes derived from other antigens such
as WT1.
Collectively, data presented in this thesis expanded our knowledge of improving T-
cell based immunotherapeutic approaches against leukaemia by demonstrating the
concept of introducing a modified epitope within a self tumour antigen and by
identifying a novel epitope derived from the MPP11 antigen. Indeed the
commentary by Justin Kline on our study of the WT1-126 peptide modification
“altering tumour antigens may be the next logical step to take on the road to

215
improving cancer immunotherapy” supports such strategy (Kline, 2009). Epitope-
modification represents a promising approach for improving current strategies in
immunotherapy for cancer patients. However, tumour immunotherapy should focus
on the development of strategies that will further increase the immunogenicity of
self-epitopes and decrease tolerance. In addition, such approaches should be
incorporated into strategies that specifically deplete or inhibit Tregs in cancer
patients as the existence of this T cell population may contribute to the impairment
of anti-tumour responses and to the limited success of cancer immunotherapy in
humans.
In order to develop immunotherapeutic strategies for a broad range of cancer bearing
patients, future studies will investigate whether WT1, MPP11 and PR-3 antigens
containing potential epitopes presented by common HLA alleles other than HLA-
A*0201. Modifications in the sequence of PR-169 and/or MPP-4 epitopes using the
same approach used to promote WT1 peptides and generation of T cell responses
using the wild type PR-169 and MPP-4 peptides and their analogues should be also
investigated.

216
7. REFERENCES

217
AHMADZADEH, M. & ROSENBERG, S. A. (2006) IL-2 administration increases
CD4+ CD25(hi) Foxp3+ regulatory T cells in cancer patients. Blood, 107,
2409-14.
AKATSUKA, Y., WARREN, E. H., GOOLEY, T. A., BRICKNER, A. G., LIN, M.
T., HANSEN, J. A., MARTIN, P. J., MADTES, D. K., ENGELHARD, V.
H., TAKAHASHI, T. & RIDDELL, S. R. (2003) Disparity for a newly
identified minor histocompatibility antigen, HA-8, correlates with acute
graft-versus-host disease after haematopoietic stem cell transplantation from
an HLA-identical sibling. Br J Haematol, 123, 671-5.
AL-EID, H. & ARTEH, S. (2009) Cancer Incidence Report Saudi Arabia 2005.
Riyadh, Ministry of Health.
AL QUDAIHI, G., LEHE, C., NEGASH, M., AL-ALWAN, M., GHEBEH, H.,
MOHAMED, S. Y., SALEH, A. J., AL-HUMAIDAN, H., TBAKHI, A.,
DICKINSON, A., ALJURF, M. & DERMIME, S. (2009) Enhancement of
lytic activity of leukemic cells by CD8+ cytotoxic T lymphocytes generated
against a WT1 peptide analogue. Leuk Lymphoma, 50, 260-9.
ALMAND, B., CLARK, J. I., NIKITINA, E., VAN BEYNEN, J., ENGLISH, N. R.,
KNIGHT, S. C., CARBONE, D. P. & GABRILOVICH, D. I. (2001)
Increased production of immature myeloid cells in cancer patients: a
mechanism of immunosuppression in cancer. J Immunol, 166, 678-89.
ALPAN, O., BACHELDER, E., ISIL, E., ARNHEITER, H. & MATZINGER, P.
(2004) 'Educated' dendritic cells act as messengers from memory to naive T
helper cells. Nat Immunol, 5, 615-22.
ALVES, P. M., FAURE, O., GRAFF-DUBOIS, S., GROSS, D. A., CORNET, S.,
CHOUAIB, S., MICONNET, I., LEMONNIER, F. A. &
KOSMATOPOULOS, K. (2003) EphA2 as target of anticancer
immunotherapy: identification of HLA-A*0201-restricted epitopes. Cancer
Res, 63, 8476-80.

218
AMROLIA, P. J., REID, S. D., GAO, L., SCHULTHEIS, B., DOTTI, G.,
BRENNER, M. K., MELO, J. V., GOLDMAN, J. M. & STAUSS, H. J.
(2003) Allorestricted cytotoxic T cells specific for human CD45 show potent
antileukemic activity. Blood, 101, 1007-14.
APPELBAUM, F. R. (2001) Haematopoietic cell transplantation as immunotherapy.
Nature, 411, 385-9.
APPELBAUM, F. R., GUNDACKER, H., HEAD, D. R., SLOVAK, M. L.,
WILLMAN, C. L., GODWIN, J. E., ANDERSON, J. E. & PETERSDORF,
S. H. (2006) Age and acute myeloid leukemia. Blood, 107, 3481-5.
APPERLEY, J. F., JONES, L., HALE, G., WALDMANN, H., HOWS, J.,
ROMBOS, Y., TSATALAS, C., MARCUS, R. E., GOOLDEN, A. W.,
GORDON-SMITH, E. C. & ET AL. (1986) Bone marrow transplantation for
patients with chronic myeloid leukaemia: T-cell depletion with Campath-1
reduces the incidence of graft-versus-host disease but may increase the risk
of leukaemic relapse. Bone Marrow Transplant, 1, 53-66.
ASEMISSEN, A. M., KEILHOLZ, U., TENZER, S., MULLER, M., WALTER, S.,
STEVANOVIC, S., SCHILD, H., LETSCH, A., THIEL, E., RAMMENSEE,
H. G. & SCHEIBENBOGEN, C. (2006) Identification of a highly
immunogenic HLA-A*01-binding T cell epitope of WT1. Clin Cancer Res,
12, 7476-82.
ASKENASY, N., KAMINITZ, A. & YARKONI, S. (2008) Mechanisms of T
regulatory cell function. Autoimmun Rev, 7, 370-5.
ATANACKOVIC, D., MATSUO, M., RITTER, E., MAZZARA, G., RITTER, G.,
JAGER, E., KNUTH, A., OLD, L. J. & GNJATIC, S. (2003) Monitoring
CD4+ T cell responses against viral and tumor antigens using T cells as
novel target APC. J Immunol Methods, 278, 57-66.
AYYOUB, M., STEVANOVIC, S., SAHIN, U., GUILLAUME, P., SERVIS, C.,
RIMOLDI, D., VALMORI, D., ROMERO, P., CEROTTINI, J. C.,
RAMMENSEE, H. G., PFREUNDSCHUH, M., SPEISER, D. & LEVY, F.

219
(2002) Proteasome-assisted identification of a SSX-2-derived epitope
recognized by tumor-reactive CTL infiltrating metastatic melanoma. J
Immunol, 168, 1717-22.
AZUMA, T., MAKITA, M., NINOMIYA, K., FUJITA, S., HARADA, M. &
YASUKAWA, M. (2002) Identification of a novel WT1-derived peptide
which induces human leucocyte antigen-A24-restricted anti-leukaemia
cytotoxic T lymphocytes. Br J Haematol, 116, 601-3.
BAE, J., MARTINSON, J. A. & KLINGEMANN, H. G. (2004a) Heteroclitic CD33
peptide with enhanced anti-acute myeloid leukemic immunogenicity. Clin
Cancer Res, 10, 7043-52.
BAE, J., MARTINSON, J. A. & KLINGEMANN, H. G. (2004b) Identification of
novel CD33 antigen-specific peptides for the generation of cytotoxic T
lymphocytes against acute myeloid leukemia. Cell Immunol, 227, 38-50.
BAKKER, A. B., VAN DER BURG, S. H., HUIJBENS, R. J., DRIJFHOUT, J. W.,
MELIEF, C. J., ADEMA, G. J. & FIGDOR, C. G. (1997) Analogues of CTL
epitopes with improved MHC class-I binding capacity elicit anti-melanoma
CTL recognizing the wild-type epitope. Int J Cancer, 70, 302-9.
BALDWIN, R. W. (1955) Immunity to methylcholanthrene-induced tumours in
inbred rats following atrophy and regression of the implanted tumours. Br J
Cancer, 9, 652-7.
BALLIEUX, B. E., VAN DER BURG, S. H., HAGEN, E. C., VAN DER WOUDE,
F. J., MELIEF, C. J. & DAHA, M. R. (1995) Cell-mediated autoimmunity in
patients with Wegener's granulomatosis (WG). Clin Exp Immunol, 100, 186-
93.
BANCHEREAU, J. & PALUCKA, A. K. (2005) Dendritic cells as therapeutic
vaccines against cancer. Nat Rev Immunol, 5, 296-306.
BANCHEREAU, J. & STEINMAN, R. M. (1998) Dendritic cells and the control of
immunity. Nature, 392, 245-52.

220
BARRETT, J. & REZVANI, K. (2006) Neutrophil granule proteins as targets of
leukemia-specific immune responses. Curr Opin Hematol, 13, 15-20.
BARTH, R. J., JR., MULE, J. J., SPIESS, P. J. & ROSENBERG, S. A. (1991)
Interferon gamma and tumor necrosis factor have a role in tumor regressions
mediated by murine CD8+ tumor-infiltrating lymphocytes. J Exp Med, 173,
647-58.
BAUER, S., GROH, V., WU, J., STEINLE, A., PHILLIPS, J. H., LANIER, L. L. &
SPIES, T. (1999) Activation of NK cells and T cells by NKG2D, a receptor
for stress-inducible MICA. Science, 285, 727-9.
BEGLEY, J. & RIBAS, A. (2008) Targeted therapies to improve tumor
immunotherapy. Clin Cancer Res, 14, 4385-91.
BELLANTUONO, I., GAO, L., PARRY, S., MARLEY, S., DAZZI, F.,
APPERLEY, J., GOLDMAN, J. M. & STAUSS, H. J. (2002) Two distinct
HLA-A0201-presented epitopes of the Wilms tumor antigen 1 can function
as targets for leukemia-reactive CTL. Blood, 100, 3835-7.
BENNETT, J. M., CATOVSKY, D., DANIEL, M. T., FLANDRIN, G., GALTON,
D. A., GRALNICK, H. R. & SULTAN, C. (1976) Proposals for the
classification of the acute leukaemias. French-American-British (FAB) co-
operative group. Br J Haematol, 33, 451-8.
BENNETT, J. M., CATOVSKY, D., DANIEL, M. T., FLANDRIN, G., GALTON,
D. A., GRALNICK, H. R. & SULTAN, C. (1985) Proposed revised criteria
for the classification of acute myeloid leukemia. A report of the French-
American-British Cooperative Group. Ann Intern Med, 103, 620-5.
BERGMANN, L., MIETHING, C., MAURER, U., BRIEGER, J., KARAKAS, T.,
WEIDMANN, E. & HOELZER, D. (1997) High levels of Wilms' tumor
gene (wt1) mRNA in acute myeloid leukemias are associated with a worse
long-term outcome. Blood, 90, 1217-25.
BERNSTEIN, R. (1988) Cytogenetics of chronic myelogenous leukemia. Semin
Hematol, 25, 20-34.

221
BEYER, M., KOCHANEK, M., GIESE, T., ENDL, E., WEIHRAUCH, M. R.,
KNOLLE, P. A., CLASSEN, S. & SCHULTZE, J. L. (2006) In vivo
peripheral expansion of naive CD4+CD25high FoxP3+ regulatory T cells in
patients with multiple myeloma. Blood, 107, 3940-9.
BEYER, M. & SCHULTZE, J. L. (2006) Regulatory T cells in cancer. Blood, 108,
804-11.
BICKNELL, D. C., KAKLAMANIS, L., HAMPSON, R., BODMER, W. F. &
KARRAN, P. (1996) Selection for beta 2-microglobulin mutation in
mismatch repair-defective colorectal carcinomas. Curr Biol, 6, 1695-7.
BILLINGHAM, R. E., BRENT, L. & MEDAWAR, P. B. (1953) Actively acquired
tolerance of foreign cells. Nature, 172, 603-6.
BIRKELAND, S. A., STORM, H. H., LAMM, L. U., BARLOW, L., BLOHME, I.,
FORSBERG, B., EKLUND, B., FJELDBORG, O., FRIEDBERG, M.,
FRODIN, L. & ET AL. (1995) Cancer risk after renal transplantation in the
Nordic countries, 1964-1986. Int J Cancer, 60, 183-9.
BIRON, C. A., NGUYEN, K. B., PIEN, G. C., COUSENS, L. P. & SALAZAR-
MATHER, T. P. (1999) Natural killer cells in antiviral defense: function and
regulation by innate cytokines. Annu Rev Immunol, 17, 189-220.
BLOOMFIELD, C. D., SECKER-WALKER, L. M., GOLDMAN, A. I., VAN DEN
BERGHE, H., DE LA CHAPELLE, A., RUUTU, T., ALIMENA, G.,
GARSON, O. M., GOLOMB, H. M., ROWLEY, J. D. & ET AL. (1989) Six-
year follow-up of the clinical significance of karyotype in acute
lymphoblastic leukemia. Cancer Genet Cytogenet, 40, 171-85.
BOCCHIA, M., KORONTSVIT, T., XU, Q., MACKINNON, S., YANG, S. Y.,
SETTE, A. & SCHEINBERG, D. A. (1996) Specific human cellular
immunity to bcr-abl oncogene-derived peptides. Blood, 87, 3587-92.
BODURTHA, A. J., BERKELHAMMER, J., KIM, Y. H., LAUCIUS, J. F. &
MASTRANGELO, M. J. (1976) A clinical histologic, and immunologic

222
study of a case of metastatic malignant melanoma undergoing spontaneous
remission. Cancer, 37, 735-42.
BOEHM, U., KLAMP, T., GROOT, M. & HOWARD, J. C. (1997) Cellular
responses to interferon-gamma. Annu Rev Immunol, 15, 749-95.
BONNET, D., WARREN, E. H., GREENBERG, P. D., DICK, J. E. & RIDDELL,
S. R. (1999) CD8(+) minor histocompatibility antigen-specific cytotoxic T
lymphocyte clones eliminate human acute myeloid leukemia stem cells. Proc
Natl Acad Sci U S A, 96, 8639-44.
BOON, T. & OLD, L. J. (1997) Cancer Tumor antigens. Curr Opin Immunol, 9,
681-3.
BORIES, D., RAYNAL, M. C., SOLOMON, D. H., DARZYNKIEWICZ, Z. &
CAYRE, Y. E. (1989) Down-regulation of a serine protease, myeloblastin,
causes growth arrest and differentiation of promyelocytic leukemia cells.
Cell, 59, 959-68.
BORRELLO, I. M. & SOTOMAYOR, E. M. (2002) Cancer vaccines for
hematologic malignancies. Cancer Control, 9, 138-51.
BOUBLIKOVA, L., KALINOVA, M., RYAN, J., QUINN, F., O'MARCAIGH, A.,
SMITH, O., BROWNE, P., STARY, J., MCCANN, S. R., TRKA, J. &
LAWLER, M. (2006) Wilms' tumor gene 1 (WT1) expression in childhood
acute lymphoblastic leukemia: a wide range of WT1 expression levels, its
impact on prognosis and minimal residual disease monitoring. Leukemia, 20,
254-63.
BOURGEOIS, C., ROCHA, B. & TANCHOT, C. (2002) A role for CD40
expression on CD8+ T cells in the generation of CD8+ T cell memory.
Science, 297, 2060-3.
BOZZONE, D. M. (2009) Leukemia, Chelsea House, New York.
BRAUD, V. M., ALLAN, D. S., O'CALLAGHAN, C. A., SODERSTROM, K.,
D'ANDREA, A., OGG, G. S., LAZETIC, S., YOUNG, N. T., BELL, J. I.,

223
PHILLIPS, J. H., LANIER, L. L. & MCMICHAEL, A. J. (1998) HLA-E
binds to natural killer cell receptors CD94/NKG2A, B and C. Nature, 391,
795-9.
BRONTE, V., SERAFINI, P., APOLLONI, E. & ZANOVELLO, P. (2001) Tumor-
induced immune dysfunctions caused by myeloid suppressor cells. J
Immunother, 24, 431-46.
BURNET, F. M. (1967) Immunological aspects of malignant disease. Lancet, 1,
1171-4.
BURNET, F. M. (1970) The concept of immunological surveillance. Prog Exp
Tumor Res, 13, 1-27.
BURNET FM, F. F. (1949) The production of antibodies., Macmillan, Melbourne.
BURNET, F. M. F., F. (1949) The production of antibodies., Macmillan,
Melbourne.
BURNET, M. (1957) Cancer: a biological approach. III. Viruses associated with
neoplastic conditions. IV. Practical applications. Br Med J, 1, 841-7.
BURNET, M. (1964) Immunological Factors in the Process of Carcinogenesis. Br
Med Bull, 20, 154-8.
BURSTEIN, N. A. & LAW, L. W. (1971) Neonatal thymectomy and non-viral
mammary tumours in mice. Nature, 231, 450-2.
BYRD, J. C., MROZEK, K., DODGE, R. K., CARROLL, A. J., EDWARDS, C. G.,
ARTHUR, D. C., PETTENATI, M. J., PATIL, S. R., RAO, K. W.,
WATSON, M. S., KODURU, P. R., MOORE, J. O., STONE, R. M.,
MAYER, R. J., FELDMAN, E. J., DAVEY, F. R., SCHIFFER, C. A.,
LARSON, R. A. & BLOOMFIELD, C. D. (2002) Pretreatment cytogenetic
abnormalities are predictive of induction success, cumulative incidence of
relapse, and overall survival in adult patients with de novo acute myeloid
leukemia: results from Cancer and Leukemia Group B (CALGB 8461).
Blood, 100, 4325-36.

224
BYRD, J. C., PETERSON, B. L., MORRISON, V. A., PARK, K., JACOBSON, R.,
HOKE, E., VARDIMAN, J. W., RAI, K., SCHIFFER, C. A. & LARSON, R.
A. (2003) Randomized phase 2 study of fludarabine with concurrent versus
sequential treatment with rituximab in symptomatic, untreated patients with
B-cell chronic lymphocytic leukemia: results from Cancer and Leukemia
Group B 9712 (CALGB 9712). Blood, 101, 6-14.
CALIGIURI, M. A., VELARDI, A., SCHEINBERG, D. A. & BORRELLO, I. M.
(2004) Immunotherapeutic approaches for hematologic malignancies.
Hematology (Am Soc Hematol Educ Program), 337-53.
CALL, K. M., GLASER, T., ITO, C. Y., BUCKLER, A. J., PELLETIER, J.,
HABER, D. A., ROSE, E. A., KRAL, A., YEGER, H., LEWIS, W. H. & ET
AL. (1990) Isolation and characterization of a zinc finger polypeptide gene at
the human chromosome 11 Wilms' tumor locus. Cell, 60, 509-20.
CAPO, S., NUTI, S., SCARSELLI, M., TAVARINI, S., MONTIGIANI, S., MORI,
E., FINCO, O., ABRIGNANI, S., GRANDI, G. & BENSI, G. (2005)
Chlamydia pneumoniae genome sequence analysis and identification of
HLA-A2-restricted CD8+ T cell epitopes recognized by infection-primed T
cells. Vaccine, 23, 5028-37.
CARRENO, B. M. & COLLINS, M. (2002) The B7 family of ligands and its
receptors: new pathways for costimulation and inhibition of immune
responses. Annu Rev Immunol, 20, 29-53.
CARSON, W. E., GIRI, J. G., LINDEMANN, M. J., LINETT, M. L., AHDIEH, M.,
PAXTON, R., ANDERSON, D., EISENMANN, J., GRABSTEIN, K. &
CALIGIURI, M. A. (1994) Interleukin (IL) 15 is a novel cytokine that
activates human natural killer cells via components of the IL-2 receptor. J
Exp Med, 180, 1395-403.
CATHCART, K., PINILLA-IBARZ, J., KORONTSVIT, T., SCHWARTZ, J.,
ZAKHALEVA, V., PAPADOPOULOS, E. B. & SCHEINBERG, D. A.
(2004) A multivalent bcr-abl fusion peptide vaccination trial in patients with
chronic myeloid leukemia. Blood, 103, 1037-42.

225
CHAN, L., HARDWICK, N., DARLING, D., GALEA-LAURI, J., GAKEN, J.,
DEVEREUX, S., KEMENY, M., MUFTI, G. & FARZANEH, F. (2005) IL-
2/B7.1 (CD80) fusagene transduction of AML blasts by a self-inactivating
lentiviral vector stimulates T cell responses in vitro: a strategy to generate
whole cell vaccines for AML. Mol Ther, 11, 120-31.
CHEN, G., GHARIB, T. G., HUANG, C. C., THOMAS, D. G., SHEDDEN, K. A.,
TAYLOR, J. M., KARDIA, S. L., MISEK, D. E., GIORDANO, T. J.,
IANNETTONI, M. D., ORRINGER, M. B., HANASH, S. M. & BEER, D.
G. (2002) Proteomic analysis of lung adenocarcinoma: identification of a
highly expressed set of proteins in tumors. Clin Cancer Res, 8, 2298-305.
CHEN, J. L., DUNBAR, P. R., GILEADI, U., JAGER, E., GNJATIC, S.,
NAGATA, Y., STOCKERT, E., PANICALI, D. L., CHEN, Y. T., KNUTH,
A., OLD, L. J. & CERUNDOLO, V. (2000) Identification of NY-ESO-1
peptide analogues capable of improved stimulation of tumor-reactive CTL. J
Immunol, 165, 948-55.
CHEN, Y. T., SCANLAN, M. J., SAHIN, U., TURECI, O., GURE, A. O., TSANG,
S., WILLIAMSON, B., STOCKERT, E., PFREUNDSCHUH, M. & OLD, L.
J. (1997) A testicular antigen aberrantly expressed in human cancers detected
by autologous antibody screening. Proc Natl Acad Sci U S A, 94, 1914-8.
CHESSELLS, J. M., HALL, E., PRENTICE, H. G., DURRANT, J., BAILEY, C. C.
& RICHARDS, S. M. (1998) The impact of age on outcome in
lymphoblastic leukaemia; MRC UKALL X and XA compared: a report from
the MRC Paediatric and Adult Working Parties. Leukemia, 12, 463-73.
CHEVALLIER, P., DELAUNAY, J., TURLURE, P., PIGNEUX, A., HUNAULT,
M., GARAND, R., GUILLAUME, T., AVET-LOISEAU, H., DMYTRUK,
N., GIRAULT, S., MILPIED, N., IFRAH, N., MOHTY, M. &
HAROUSSEAU, J. L. (2008) Long-term disease-free survival after
gemtuzumab, intermediate-dose cytarabine, and mitoxantrone in patients
with CD33(+) primary resistant or relapsed acute myeloid leukemia. J Clin
Oncol, 26, 5192-7.

226
CLARK, R. E., DODI, I. A., HILL, S. C., LILL, J. R., AUBERT, G.,
MACINTYRE, A. R., ROJAS, J., BOURDON, A., BONNER, P. L.,
WANG, L., CHRISTMAS, S. E., TRAVERS, P. J., CREASER, C. S.,
REES, R. C. & MADRIGAL, J. A. (2001) Direct evidence that leukemic
cells present HLA-associated immunogenic peptides derived from the BCR-
ABL b3a2 fusion protein. Blood, 98, 2887-93.
CLARK, W. H., JR., ELDER, D. E., GUERRY, D. T., BRAITMAN, L. E.,
TROCK, B. J., SCHULTZ, D., SYNNESTVEDT, M. & HALPERN, A. C.
(1989) Model predicting survival in stage I melanoma based on tumor
progression. J Natl Cancer Inst, 81, 1893-904.
CLARKE, S. L., BETTS, G. J., PLANT, A., WRIGHT, K. L., EL-SHANAWANY,
T. M., HARROP, R., TORKINGTON, J., REES, B. I., WILLIAMS, G. T.,
GALLIMORE, A. M. & GODKIN, A. J. (2006) CD4+CD25+FOXP3+
regulatory T cells suppress anti-tumor immune responses in patients with
colorectal cancer. PLoS ONE, 1, e129.
CLEMENTE, C. G., MIHM, M. C., JR., BUFALINO, R., ZURRIDA, S., COLLINI,
P. & CASCINELLI, N. (1996) Prognostic value of tumor infiltrating
lymphocytes in the vertical growth phase of primary cutaneous melanoma.
Cancer, 77, 1303-10.
CLINICAL TRIALS.GOV (2006) Proteinase 3 PR1 Peptide Mixed With Montanide
ISA-51 VG Adjuvant and Administered With GM-CSF and PEG-
INTRON(R).
CLINICAL TRIALS.GOV (2009) PR1-Specific Cytotoxic T-Lymphocyte Infusion
With Recurrent Chronic Myelogenous Leukemia (CML) After Allogeneic
Hematopoietic Transplantation.
COLLINS, R. H., JR., SHPILBERG, O., DROBYSKI, W. R., PORTER, D. L.,
GIRALT, S., CHAMPLIN, R., GOODMAN, S. A., WOLFF, S. N., HU, W.,
VERFAILLIE, C., LIST, A., DALTON, W., OGNOSKIE, N., CHETRIT,
A., ANTIN, J. H. & NEMUNAITIS, J. (1997) Donor leukocyte infusions in

227
140 patients with relapsed malignancy after allogeneic bone marrow
transplantation. J Clin Oncol, 15, 433-44.
COLOMBO, M. P. & PICONESE, S. (2007) Regulatory-T-cell inhibition versus
depletion: the right choice in cancer immunotherapy. Nat Rev Cancer, 7,
880-7.
COLUCCI, F., CALIGIURI, M. A. & DI SANTO, J. P. (2003) What does it take to
make a natural killer? Nat Rev Immunol, 3, 413-25.
CONSTANT, S. L. & BOTTOMLY, K. (1997) Induction of Th1 and Th2 CD4+ T
cell responses: the alternative approaches. Annu Rev Immunol, 15, 297-322.
COSMAN, D., MULLBERG, J., SUTHERLAND, C. L., CHIN, W., ARMITAGE,
R., FANSLOW, W., KUBIN, M. & CHALUPNY, N. J. (2001) ULBPs,
novel MHC class I-related molecules, bind to CMV glycoprotein UL16 and
stimulate NK cytotoxicity through the NKG2D receptor. Immunity, 14, 123-
33.
COTE-SIERRA, J., FOUCRAS, G., GUO, L., CHIODETTI, L., YOUNG, H. A.,
HU-LI, J., ZHU, J. & PAUL, W. E. (2004) Interleukin 2 plays a central role
in Th2 differentiation. Proc Natl Acad Sci U S A, 101, 3880-5.
COX, A. L., SKIPPER, J., CHEN, Y., HENDERSON, R. A., DARROW, T. L.,
SHABANOWITZ, J., ENGELHARD, V. H., HUNT, D. F. & SLINGLUFF,
C. L., JR. (1994) Identification of a peptide recognized by five melanoma-
specific human cytotoxic T cell lines. Science, 264, 716-9.
CRESPO, M., BOSCH, F., VILLAMOR, N., BELLOSILLO, B., COLOMER, D.,
ROZMAN, M., MARCE, S., LOPEZ-GUILLERMO, A., CAMPO, E. &
MONTSERRAT, E. (2003) ZAP-70 expression as a surrogate for
immunoglobulin-variable-region mutations in chronic lymphocytic leukemia.
N Engl J Med, 348, 1764-75.
CUI, J. W., LI, W. H., WANG, J., LI, A. L., LI, H. Y., WANG, H. X., HE, K., LI,
W., KANG, L. H., YU, M., SHEN, B. F., WANG, G. J. & ZHANG, X. M.

228
(2005) Proteomics-based identification of human acute leukemia antigens
that induce humoral immune response. Mol Cell Proteomics, 4, 1718-24.
CURTIN, J. F., CANDOLFI, M., FAKHOURI, T. M., LIU, C., ALDEN, A.,
EDWARDS, M., LOWENSTEIN, P. R. & CASTRO, M. G. (2008) Treg
depletion inhibits efficacy of cancer immunotherapy: implications for
clinical trials. PLoS ONE, 3, e1983.
DANNULL, J., SU, Z., RIZZIERI, D., YANG, B. K., COLEMAN, D., YANCEY,
D., ZHANG, A., DAHM, P., CHAO, N., GILBOA, E. & VIEWEG, J.
(2005) Enhancement of vaccine-mediated antitumor immunity in cancer
patients after depletion of regulatory T cells. J Clin Invest, 115, 3623-33.
DAUER, M., OBERMAIER, B., HERTEN, J., HAERLE, C., POHL, K.,
ROTHENFUSSER, S., SCHNURR, M., ENDRES, S. & EIGLER, A. (2003)
Mature dendritic cells derived from human monocytes within 48 hours: a
novel strategy for dendritic cell differentiation from blood precursors. J
Immunol, 170, 4069-76.
DAUER, M., SCHAD, K., HERTEN, J., JUNKMANN, J., BAUER, C., KIEFL, R.,
ENDRES, S. & EIGLER, A. (2005) FastDC derived from human monocytes
within 48 h effectively prime tumor antigen-specific cytotoxic T cells. J
Immunol Methods, 302, 145-55.
DAVIS, F. M., TSAO, T. Y., FOWLER, S. K. & RAO, P. N. (1983) Monoclonal
antibodies to mitotic cells. Proc Natl Acad Sci U S A, 80, 2926-30.
DE BUEGER, M., BAKKER, A., VAN ROOD, J. J., VAN DER WOUDE, F. &
GOULMY, E. (1992) Tissue distribution of human minor histocompatibility
antigens. Ubiquitous versus restricted tissue distribution indicates
heterogeneity among human cytotoxic T lymphocyte-defined non-MHC
antigens. J Immunol, 149, 1788-94.
DE LABARTHE, A., ROUSSELOT, P., HUGUET-RIGAL, F., DELABESSE, E.,
WITZ, F., MAURY, S., REA, D., CAYUELA, J. M., VEKEMANS, M. C.,
REMAN, O., BUZYN, A., PIGNEUX, A., ESCOFFRE, M.,

229
CHALANDON, Y., MACINTYRE, E., LHERITIER, V., VERNANT, J. P.,
THOMAS, X., IFRAH, N. & DOMBRET, H. (2007) Imatinib combined
with induction or consolidation chemotherapy in patients with de novo
Philadelphia chromosome-positive acute lymphoblastic leukemia: results of
the GRAAPH-2003 study. Blood, 109, 1408-13.
DEGLI-ESPOSTI, M. A. & SMYTH, M. J. (2005) Close encounters of different
kinds: dendritic cells and NK cells take centre stage. Nat Rev Immunol, 5,
112-24.
DELLUC, S., TOURNEUR, L., FRADELIZI, D., RUBIO, M. T., MARCHIOL-
FOURNIGAULT, C., CHIOCCHIA, G. & BUZYN, A. (2007) DC-based
vaccine loaded with acid-eluted peptides in acute myeloid leukemia: the
importance of choosing the best elution method. Cancer Immunol
Immunother, 56, 1-12.
DELVES, P. J. & ROITT, I. M. (2000) The immune system. Second of two parts. N
Engl J Med, 343, 108-17.
DEN HAAN, J. M., MEADOWS, L. M., WANG, W., POOL, J., BLOKLAND, E.,
BISHOP, T. L., REINHARDUS, C., SHABANOWITZ, J., OFFRINGA, R.,
HUNT, D. F., ENGELHARD, V. H. & GOULMY, E. (1998) The minor
histocompatibility antigen HA-1: a diallelic gene with a single amino acid
polymorphism. Science, 279, 1054-7.
DEN HAAN, J. M., SHERMAN, N. E., BLOKLAND, E., HUCZKO, E., KONING,
F., DRIJFHOUT, J. W., SKIPPER, J., SHABANOWITZ, J., HUNT, D. F.,
ENGELHARD, V. H. & ET AL. (1995) Identification of a graft versus host
disease-associated human minor histocompatibility antigen. Science, 268,
1476-80.
DENGLER, R., MUNSTERMANN, U., AL-BATRAN, S., HAUSNER, I.,
FADERL, S., NERL, C. & EMMERICH, B. (1995) Immunocytochemical
and flow cytometric detection of proteinase 3 (myeloblastin) in normal and
leukaemic myeloid cells. Br J Haematol, 89, 250-7.

230
DERMIME, S., ARMSTRONG, A., HAWKINS, R. E. & STERN, P. L. (2002)
Cancer vaccines and immunotherapy. Br Med Bull, 62, 149-62.
DERMIME, S., BERTAZZOLI, C., MARCHESI, E., RAVAGNANI, F., BLASER,
K., CORNEO, G. M., POGLIANI, E., PARMIANI, G. & GAMBACORTI-
PASSERINI, C. (1996) Lack of T-cell-mediated recognition of the fusion
region of the pml/RAR-alpha hybrid protein by lymphocytes of acute
promyelocytic leukemia patients. Clin Cancer Res, 2, 593-600.
DERMIME, S., MAVROUDIS, D., JIANG, Y. Z., HENSEL, N., MOLLDREM, J.
& BARRETT, A. J. (1997) Immune escape from a graft-versus-leukemia
effect may play a role in the relapse of myeloid leukemias following
allogeneic bone marrow transplantation. Bone Marrow Transplant, 19, 989-
99.
DEVINE, S. M. & LARSON, R. A. (1994) Acute leukemia in adults: recent
developments in diagnosis and treatment. CA Cancer J Clin, 44, 326-52.
DHODAPKAR, M. V., STEINMAN, R. M., KRASOVSKY, J., MUNZ, C. &
BHARDWAJ, N. (2001) Antigen-specific inhibition of effector T cell
function in humans after injection of immature dendritic cells. J Exp Med,
193, 233-8.
DICKINSON, A. M., WANG, X. N., SVILAND, L., VYTH-DREESE, F. A.,
JACKSON, G. H., SCHUMACHER, T. N., HAANEN, J. B., MUTIS, T. &
GOULMY, E. (2002) In situ dissection of the graft-versus-host activities of
cytotoxic T cells specific for minor histocompatibility antigens. Nat Med, 8,
410-4.
DIGHE, A. S., RICHARDS, E., OLD, L. J. & SCHREIBER, R. D. (1994) Enhanced
in vivo growth and resistance to rejection of tumor cells expressing dominant
negative IFN gamma receptors. Immunity, 1, 447-56.
DOHNER, H., ESTEY, E. H., AMADORI, S., APPELBAUM, F. R., BUCHNER,
T., BURNETT, A. K., DOMBRET, H., FENAUX, P., GRIMWADE, D.,
LARSON, R. A., LO-COCO, F., NAOE, T., NIEDERWIESER, D.,

231
OSSENKOPPELE, G. J., SANZ, M. A., SIERRA, J., TALLMAN, M. S.,
LOWENBERG, B. & BLOOMFIELD, C. D. (2010) Diagnosis and
management of acute myeloid leukemia in adults: recommendations from an
international expert panel, on behalf of the European LeukemiaNet. Blood,
115, 453-74.
DOHNER, H., STILGENBAUER, S., BENNER, A., LEUPOLT, E., KROBER, A.,
BULLINGER, L., DOHNER, K., BENTZ, M. & LICHTER, P. (2000)
Genomic aberrations and survival in chronic lymphocytic leukemia. N Engl J
Med, 343, 1910-6.
DOHNER, K., SCHLENK, R. F., HABDANK, M., SCHOLL, C., RUCKER, F. G.,
CORBACIOGLU, A., BULLINGER, L., FROHLING, S. & DOHNER, H.
(2005) Mutant nucleophosmin (NPM1) predicts favorable prognosis in
younger adults with acute myeloid leukemia and normal cytogenetics:
interaction with other gene mutations. Blood, 106, 3740-6.
DONG, H., STROME, S. E., SALOMAO, D. R., TAMURA, H., HIRANO, F.,
FLIES, D. B., ROCHE, P. C., LU, J., ZHU, G., TAMADA, K., LENNON,
V. A., CELIS, E. & CHEN, L. (2002) Tumor-associated B7-H1 promotes T-
cell apoptosis: a potential mechanism of immune evasion. Nat Med, 8, 793-
800.
DORFMAN, D. M., SCHULTZE, J. L., SHAHSAFAEI, A., MICHALAK, S.,
GRIBBEN, J. G., FREEMAN, G. J., PINKUS, G. S. & NADLER, L. M.
(1997) In vivo expression of B7-1 and B7-2 by follicular lymphoma cells can
prevent induction of T-cell anergy but is insufficient to induce significant T-
cell proliferation. Blood, 90, 4297-306.
DOUBROVINA, E. S., DOUBROVIN, M. M., VIDER, E., SISSON, R. B.,
O'REILLY, R. J., DUPONT, B. & VYAS, Y. M. (2003) Evasion from NK
cell immunity by MHC class I chain-related molecules expressing colon
adenocarcinoma. J Immunol, 171, 6891-9.
DOYLE, C. & STROMINGER, J. L. (1987) Interaction between CD4 and class II
MHC molecules mediates cell adhesion. Nature, 330, 256-9.

232
DRUKER, B. J., SAWYERS, C. L., KANTARJIAN, H., RESTA, D. J., REESE, S.
F., FORD, J. M., CAPDEVILLE, R. & TALPAZ, M. (2001a) Activity of a
specific inhibitor of the BCR-ABL tyrosine kinase in the blast crisis of
chronic myeloid leukemia and acute lymphoblastic leukemia with the
Philadelphia chromosome. N Engl J Med, 344, 1038-42.
DRUKER, B. J., TALPAZ, M., RESTA, D. J., PENG, B., BUCHDUNGER, E.,
FORD, J. M., LYDON, N. B., KANTARJIAN, H., CAPDEVILLE, R.,
OHNO-JONES, S. & SAWYERS, C. L. (2001b) Efficacy and safety of a
specific inhibitor of the BCR-ABL tyrosine kinase in chronic myeloid
leukemia. N Engl J Med, 344, 1031-7.
DUNN, G. P., BRUCE, A. T., IKEDA, H., OLD, L. J. & SCHREIBER, R. D.
(2002) Cancer immunoediting: from immunosurveillance to tumor escape.
Nat Immunol, 3, 991-8.
DURINOVIC-BELLO, I., ROSINGER, S., OLSON, J. A., CONGIA, M., AHMAD,
R. C., RICKERT, M., HAMPL, J., KALBACHER, H., DRIJFHOUT, J. W.,
MELLINS, E. D., AL DAHOUK, S., KAMRADT, T., MAEURER, M. J.,
NHAN, C., ROEP, B. O., BOEHM, B. O., POLYCHRONAKOS, C.,
NEPOM, G. T., KARGES, W., MCDEVITT, H. O. & SONDERSTRUP, G.
(2006) DRB1*0401-restricted human T cell clone specific for the major
proinsulin73-90 epitope expresses a down-regulatory T helper 2 phenotype.
Proc Natl Acad Sci U S A, 103, 11683-8.
DYALL, R., BOWNE, W. B., WEBER, L. W., LEMAOULT, J., SZABO, P.,
MOROI, Y., PISKUN, G., LEWIS, J. J., HOUGHTON, A. N. & NIKOLIC-
ZUGIC, J. (1998) Heteroclitic immunization induces tumor immunity. J Exp
Med, 188, 1553-61.
EHRLICH, P. (1909) Uber den jetzigen Stand der Karzinomforschung. Ned Tijdscr
Gneneesk., 53, 273-90.
EL-SHAMI, K. M., TIROSH, B., POPOVIC, D., CARMON, L., TZEHOVAL, E.,
VADAI, E., FELDMAN, M. & EISENBACH, L. (2000) Induction of

233
antitumor immunity by proteasome-inhibited syngeneic fibroblasts pulsed
with a modified TAA peptide. Int J Cancer, 85, 236-42.
ELISSEEVA, O. A., OKA, Y., TSUBOI, A., OGATA, K., WU, F., KIM, E. H.,
SOMA, T., TAMAKI, H., KAWAKAMI, M., OJI, Y., HOSEN, N.,
KUBOTA, T., NAKAGAWA, M., YAMAGAMI, T., HIRAOKA, A.,
TSUKAGUCHI, M., UDAKA, K., OGAWA, H., KISHIMOTO, T.,
NOMURA, T. & SUGIYAMA, H. (2002) Humoral immune responses
against Wilms tumor gene WT1 product in patients with hematopoietic
malignancies. Blood, 99, 3272-9.
ELLISEN, L. W., CARLESSO, N., CHENG, T., SCADDEN, D. T. & HABER, D.
A. (2001) The Wilms tumor suppressor WT1 directs stage-specific
quiescence and differentiation of human hematopoietic progenitor cells.
Embo J, 20, 1897-909.
ENGEL, A. M., SVANE, I. M., MOURITSEN, S., RYGAARD, J., CLAUSEN, J. &
WERDELIN, O. (1996) Methylcholanthrene-induced sarcomas in nude mice
have short induction times and relatively low levels of surface MHC class I
expression. Apmis, 104, 629-39.
ENGEL, A. M., SVANE, I. M., RYGAARD, J. & WERDELIN, O. (1997) MCA
sarcomas induced in scid mice are more immunogenic than MCA sarcomas
induced in congenic, immunocompetent mice. Scand J Immunol, 45, 463-70.
ESTEY, E. & DOHNER, H. (2006) Acute myeloid leukaemia. Lancet, 368, 1894-
907.
ESTEY, E., THALL, P., BERAN, M., KANTARJIAN, H., PIERCE, S. &
KEATING, M. (1997) Effect of diagnosis (refractory anemia with excess
blasts, refractory anemia with excess blasts in transformation, or acute
myeloid leukemia [AML]) on outcome of AML-type chemotherapy. Blood,
90, 2969-77.
EVERSON, T. & COLE, W. (1966) Spontaneous regression of cancer.,
Philadelphia, W.B. Saunders.

234
EZDINLI, E. Z., SOKAL, J. E., CROSSWHITE, L. & SANDBERG, A. A. (1970)
Philadelphia-chromosome-positive and -negative chronic myelocytic
leukemia. Ann Intern Med, 72, 175-82.
FADERL, S., JEHA, S. & KANTARJIAN, H. M. (2003) The biology and therapy of
adult acute lymphoblastic leukemia. Cancer, 98, 1337-54.
FADERL, S., KANTARJIAN, H. M., TALPAZ, M. & ESTROV, Z. (1998) Clinical
significance of cytogenetic abnormalities in adult acute lymphoblastic
leukemia. Blood, 91, 3995-4019.
FADERL, S., KEATING, M. J., DO, K. A., LIANG, S. Y., KANTARJIAN, H. M.,
O'BRIEN, S., GARCIA-MANERO, G., MANSHOURI, T. & ALBITAR, M.
(2002) Expression profile of 11 proteins and their prognostic significance in
patients with chronic lymphocytic leukemia (CLL). Leukemia, 16, 1045-52.
FEFER, A., MCCOY, J. L. & GLYNN, J. P. (1967) Induction and regression of
primary moloney sarcoma virus-induced tumors in mice. Cancer Res, 27,
1626-31.
FEFER, A., MCCOY, J. L., PERK, K. & GLYNN, J. P. (1968) Immunologic,
virologic, and pathologic studies of regression of autochthonous Moloney
sarcoma virus-induced tumors in mice. Cancer Res, 28, 1577-85.
FEFER, A., SULLIVAN, K. M., WEIDEN, P., BUCKNER, C. D., SCHOCH, G.,
STORB, R. & THOMAS, E. D. (1987) Graft versus leukemia effect in man:
the relapse rate of acute leukemia is lower after allogeneic than after
syngeneic marrow transplantation. Prog Clin Biol Res, 244, 401-8.
FERLAY, J., SHIN, H. R., BRAY, F., FORMAN, D., MATHERS, C. & PARKIN,
D. M. (2010) Estimates of worldwide burden of cancer in 2008:
GLOBOCAN 2008. Int J Cancer.
FISCHER, K., SCHOLL, C., SALAT, J., FROHLING, S., SCHLENK, R., BENTZ,
M., STILGENBAUER, S., LICHTER, P. & DOHNER, H. (1996) Design
and validation of DNA probe sets for a comprehensive interphase
cytogenetic analysis of acute myeloid leukemia. Blood, 88, 3962-71.

235
FOLEY, E. J. (1953) Antigenic properties of methylcholanthrene-induced tumors in
mice of the strain of origin. Cancer Res, 13, 835-7.
FUJIE, T., TAHARA, K., TANAKA, F., MORI, M., TAKESAKO, K. &
AKIYOSHI, T. (1999) A MAGE-1-encoded HLA-A24-binding synthetic
peptide induces specific anti-tumor cytotoxic T lymphocytes. Int J Cancer,
80, 169-72.
FUJIKI, F., OKA, Y., TSUBOI, A., KAWAKAMI, M., KAWAKATSU, M.,
NAKAJIMA, H., ELISSEEVA, O. A., HARADA, Y., ITO, K., LI, Z.,
TATSUMI, N., SAKAGUCHI, N., FUJIOKA, T., MASUDA, T.,
YASUKAWA, M., UDAKA, K., KAWASE, I., OJI, Y. & SUGIYAMA, H.
(2007) Identification and characterization of a WT1 (Wilms Tumor Gene)
protein-derived HLA-DRB1*0405-restricted 16-mer helper peptide that
promotes the induction and activation of WT1-specific cytotoxic T
lymphocytes. J Immunother, 30, 282-93.
FUJIWARA, H., EL OURIAGHLI, F., GRUBE, M., PRICE, D. A., REZVANI, K.,
GOSTICK, E., SCONOCCHIA, G., MELENHORST, J., HENSEL, N.,
DOUEK, D. C. & BARRETT, A. J. (2004) Identification and in vitro
expansion of CD4+ and CD8+ T cells specific for human neutrophil elastase.
Blood, 103, 3076-83.
FUJIWARA, H., MELENHORST, J. J., EL OURIAGHLI, F., KAJIGAYA, S.,
GRUBE, M., SCONOCCHIA, G., REZVANI, K., PRICE, D. A., HENSEL,
N. F., DOUEK, D. C. & BARRETT, A. J. (2005) In vitro induction of
myeloid leukemia-specific CD4 and CD8 T cells by CD40 ligand-activated
B cells gene modified to express primary granule proteins. Clin Cancer Res,
11, 4495-503.
GABRILOVICH, D., ISHIDA, T., OYAMA, T., RAN, S., KRAVTSOV, V.,
NADAF, S. & CARBONE, D. P. (1998) Vascular endothelial growth factor
inhibits the development of dendritic cells and dramatically affects the
differentiation of multiple hematopoietic lineages in vivo. Blood, 92, 4150-
66.

236
GALE, R. P., HOROWITZ, M. M., ASH, R. C., CHAMPLIN, R. E., GOLDMAN,
J. M., RIMM, A. A., RINGDEN, O., STONE, J. A. & BORTIN, M. M.
(1994) Identical-twin bone marrow transplants for leukemia. Ann Intern
Med, 120, 646-52.
GAO, L., BELLANTUONO, I., ELSASSER, A., MARLEY, S. B., GORDON, M.
Y., GOLDMAN, J. M. & STAUSS, H. J. (2000) Selective elimination of
leukemic CD34(+) progenitor cells by cytotoxic T lymphocytes specific for
WT1. Blood, 95, 2198-203.
GARLIE, N. K., LEFEVER, A. V., SIEBENLIST, R. E., LEVINE, B. L., JUNE, C.
H. & LUM, L. G. (1999) T cells coactivated with immobilized anti-CD3 and
anti-CD28 as potential immunotherapy for cancer. J Immunother, 22, 336-
45.
GHEBEH, H., BARHOUSH, E., TULBAH, A., ELKUM, N., AL-TWEIGERI, T. &
DERMIME, S. (2008) FOXP3+ Tregs and B7-H1+/PD-1+ T lymphocytes
co-infiltrate the tumor tissues of high-risk breast cancer patients: Implication
for immunotherapy. BMC Cancer, 8, 57.
GIEBEL, S., LOCATELLI, F., LAMPARELLI, T., VELARDI, A., DAVIES, S.,
FRUMENTO, G., MACCARIO, R., BONETTI, F., WOJNAR, J.,
MARTINETTI, M., FRASSONI, F., GIORGIANI, G., BACIGALUPO, A.
& HOLOWIECKI, J. (2003) Survival advantage with KIR ligand
incompatibility in hematopoietic stem cell transplantation from unrelated
donors. Blood, 102, 814-9.
GIRALT, S. A. & KOLB, H. J. (1996) Donor lymphocyte infusions. Curr Opin
Oncol, 8, 96-102.
GOMEZ, G. A., SOKAL, J. E. & WALSH, D. (1981) Prognostic features at
diagnosis of chronic myelocytic leukemia. Cancer, 47, 2470-7.
GORELIK, E., WILTROUT, R. H., OKUMURA, K., HABU, S. & HERBERMAN,
R. B. (1982) Role of NK cells in the control of metastatic spread and growth
of tumor cells in mice. Int J Cancer, 30, 107-12.

237
GOULMY, E., GRATAMA, J. W., BLOKLAND, E., ZWAAN, F. E. & VAN
ROOD, J. J. (1983) A minor transplantation antigen detected by MHC-
restricted cytotoxic T lymphocytes during graft-versus-host disease. Nature,
302, 159-61.
GOULMY, E., SCHIPPER, R., POOL, J., BLOKLAND, E., FALKENBURG, J. H.,
VOSSEN, J., GRATWOHL, A., VOGELSANG, G. B., VAN
HOUWELINGEN, H. C. & VAN ROOD, J. J. (1996) Mismatches of minor
histocompatibility antigens between HLA-identical donors and recipients and
the development of graft-versus-host disease after bone marrow
transplantation. N Engl J Med, 334, 281-5.
GRABSTEIN, K. H., EISENMAN, J., SHANEBECK, K., RAUCH, C.,
SRINIVASAN, S., FUNG, V., BEERS, C., RICHARDSON, J.,
SCHOENBORN, M. A., AHDIEH, M. & ET AL. (1994) Cloning of a T cell
growth factor that interacts with the beta chain of the interleukin-2 receptor.
Science, 264, 965-8.
GREINER, J., LI, L., RINGHOFFER, M., BARTH, T. F., GIANNOPOULOS, K.,
GUILLAUME, P., RITTER, G., WIESNETH, M., DOHNER, H. &
SCHMITT, M. (2005) Identification and characterization of epitopes of the
receptor for hyaluronic acid-mediated motility (RHAMM/CD168)
recognized by CD8+ T cells of HLA-A2-positive patients with acute myeloid
leukemia. Blood, 106, 938-45.
GREINER, J., RINGHOFFER, M., SIMIKOPINKO, O., SZMARAGOWSKA, A.,
HUEBSCH, S., MAURER, U., BERGMANN, L. & SCHMITT, M. (2000)
Simultaneous expression of different immunogenic antigens in acute myeloid
leukemia. Exp Hematol, 28, 1413-22.
GREINER, J., RINGHOFFER, M., TANIGUCHI, M., HAUSER, T., SCHMITT,
A., DOHNER, H. & SCHMITT, M. (2003) Characterization of several
leukemia-associated antigens inducing humoral immune responses in acute
and chronic myeloid leukemia. Int J Cancer, 106, 224-31.

238
GREINER, J., RINGHOFFER, M., TANIGUCHI, M., LI, L., SCHMITT, A.,
SHIKU, H., DOHNER, H. & SCHMITT, M. (2004) mRNA expression of
leukemia-associated antigens in patients with acute myeloid leukemia for the
development of specific immunotherapies. Int J Cancer, 108, 704-11.
GREINER, J., RINGHOFFER, M., TANIGUCHI, M., SCHMITT, A., KIRCHNER,
D., KRAHN, G., HEILMANN, V., GSCHWEND, J., BERGMANN, L.,
DOHNER, H. & SCHMITT, M. (2002) Receptor for hyaluronan acid-
mediated motility (RHAMM) is a new immunogenic leukemia-associated
antigen in acute and chronic myeloid leukemia. Exp Hematol, 30, 1029-35.
GREINER, J., SCHMITT, M., LI, L., GIANNOPOULOS, K., BOSCH, K.,
SCHMITT, A., DOHNER, K., SCHLENK, R. F., POLLACK, J. R.,
DOHNER, H. & BULLINGER, L. (2006) Expression of tumor-associated
antigens in acute myeloid leukemia: Implications for specific
immunotherapeutic approaches. Blood, 108, 4109-17.
GRIMWADE, D. (2001) The clinical significance of cytogenetic abnormalities in
acute myeloid leukaemia. Best Pract Res Clin Haematol, 14, 497-529.
GRIMWADE, D., WALKER, H., OLIVER, F., WHEATLEY, K., HARRISON, C.,
HARRISON, G., REES, J., HANN, I., STEVENS, R., BURNETT, A. &
GOLDSTONE, A. (1998) The importance of diagnostic cytogenetics on
outcome in AML: analysis of 1,612 patients entered into the MRC AML 10
trial. The Medical Research Council Adult and Children's Leukaemia
Working Parties. Blood, 92, 2322-33.
GUGLIELMELLI, P., ZINI, R., BOGANI, C., SALATI, S., PANCRAZZI, A.,
BIANCHI, E., MANNELLI, F., FERRARI, S., LE BOUSSE-KERDILES,
M. C., BOSI, A., BAROSI, G., MIGLIACCIO, A. R., MANFREDINI, R. &
VANNUCCHI, A. M. (2007) Molecular profiling of CD34+ cells in
idiopathic myelofibrosis identifies a set of disease-associated genes and
reveals the clinical significance of Wilms' tumor gene 1 (WT1). Stem Cells,
25, 165-73.

239
GURE, A. O., STOCKERT, E., SCANLAN, M. J., KERESZTES, R. S., JAGER,
D., ALTORKI, N. K., OLD, L. J. & CHEN, Y. T. (2000) Serological
identification of embryonic neural proteins as highly immunogenic tumor
antigens in small cell lung cancer. Proc Natl Acad Sci U S A, 97, 4198-203.
HALE, G., COBBOLD, S. & WALDMANN, H. (1988) T cell depletion with
CAMPATH-1 in allogeneic bone marrow transplantation. Transplantation,
45, 753-9.
HALIOTIS, T., BALL, J. K., DEXTER, D. & RODER, J. C. (1985) Spontaneous
and induced primary oncogenesis in natural killer (NK)-cell-deficient beige
mutant mice. Int J Cancer, 35, 505-13.
HALLEK, M., LANGENMAYER, I., NERL, C., KNAUF, W.,
DIETZFELBINGER, H., ADORF, D., OSTWALD, M., BUSCH, R.,
KUHN-HALLEK, I., THIEL, E. & EMMERICH, B. (1999) Elevated serum
thymidine kinase levels identify a subgroup at high risk of disease
progression in early, nonsmoldering chronic lymphocytic leukemia. Blood,
93, 1732-7.
HAMBLIN, T. J., DAVIS, Z., GARDINER, A., OSCIER, D. G. & STEVENSON,
F. K. (1999) Unmutated Ig V(H) genes are associated with a more aggressive
form of chronic lymphocytic leukemia. Blood, 94, 1848-54.
HASSAINYA, Y., GARCIA-PONS, F., KRATZER, R., LINDO, V., GREER, F.,
LEMONNIER, F. A., NIEDERMANN, G. & VAN ENDERT, P. M. (2005)
Identification of naturally processed HLA-A2--restricted proinsulin epitopes
by reverse immunology. Diabetes, 54, 2053-9.
HAWIGER, D., INABA, K., DORSETT, Y., GUO, M., MAHNKE, K., RIVERA,
M., RAVETCH, J. V., STEINMAN, R. M. & NUSSENZWEIG, M. C.
(2001) Dendritic cells induce peripheral T cell unresponsiveness under
steady state conditions in vivo. J Exp Med, 194, 769-79.
HAYDAY, A. C. (2000) [gamma][delta] cells: a right time and a right place for a
conserved third way of protection. Annu Rev Immunol, 18, 975-1026.

240
HEATH, W. R., BELZ, G. T., BEHRENS, G. M., SMITH, C. M., FOREHAN, S. P.,
PARISH, I. A., DAVEY, G. M., WILSON, N. S., CARBONE, F. R. &
VILLADANGOS, J. A. (2004) Cross-presentation, dendritic cell subsets,
and the generation of immunity to cellular antigens. Immunol Rev, 199, 9-26.
HEIMBERGER, A. B., ABOU-GHAZAL, M., REINA-ORTIZ, C., YANG, D. S.,
SUN, W., QIAO, W., HIRAOKA, N. & FULLER, G. N. (2008) Incidence
and prognostic impact of FoxP3+ regulatory T cells in human gliomas. Clin
Cancer Res, 14, 5166-72.
HERNANDEZ-BOLUDA, J. C. & CERVANTES, F. (2009) Prognostic factors in
chronic myeloid leukaemia. Best Pract Res Clin Haematol, 22, 343-53.
HERNANDEZ-CABALLERO, E., MAYANI, H., MONTESINOS, J. J., ARENAS,
D., SALAMANCA, F. & PENALOZA, R. (2007) In vitro leukemic cell
differentiation and WT1 gene expression. Leuk Res, 31, 395-7.
HESLOP, H. E., STEVENSON, F. K. & MOLLDREM, J. J. (2003) Immunotherapy
of hematologic malignancy. Hematology Am Soc Hematol Educ Program,
331-49.
HO, W. Y., NGUYEN, H. N., WOLFL, M., KUBALL, J. & GREENBERG, P. D.
(2006) In vitro methods for generating CD8+ T-cell clones for
immunotherapy from the naive repertoire. J Immunol Methods, 310, 40-52.
HOELZER, D. & GOKBUGET, N. (2000) Recent approaches in acute
lymphoblastic leukemia in adults. Crit Rev Oncol Hematol, 36, 49-58.
HOFFMANN, T. K., LOFTUS, D. J., NAKANO, K., MAEURER, M. J.,
CHIKAMATSU, K., APPELLA, E., WHITESIDE, T. L. & DELEO, A. B.
(2002) The ability of variant peptides to reverse the nonresponsiveness of T
lymphocytes to the wild-type sequence p53(264-272) epitope. J Immunol,
168, 1338-47.
HOROWITZ, M. M., GALE, R. P., SONDEL, P. M., GOLDMAN, J. M., KERSEY,
J., KOLB, H. J., RIMM, A. A., RINGDEN, O., ROZMAN, C., SPECK, B. &

241
ET AL. (1990) Graft-versus-leukemia reactions after bone marrow
transplantation. Blood, 75, 555-62.
HOUBIERS, J. G., NIJMAN, H. W., VAN DER BURG, S. H., DRIJFHOUT, J. W.,
KENEMANS, P., VAN DE VELDE, C. J., BRAND, A., MOMBURG, F.,
KAST, W. M. & MELIEF, C. J. (1993) In vitro induction of human
cytotoxic T lymphocyte responses against peptides of mutant and wild-type
p53. Eur J Immunol, 23, 2072-7.
HUANG, M. E., YE, Y. C., CHEN, S. R., CHAI, J. R., LU, J. X., ZHOA, L., GU, L.
J. & WANG, Z. Y. (1988) Use of all-trans retinoic acid in the treatment of
acute promyelocytic leukemia. Blood, 72, 567-72.
HUNDLEY, H. A., WALTER, W., BAIRSTOW, S. & CRAIG, E. A. (2005) Human
Mpp11 J protein: ribosome-tethered molecular chaperones are ubiquitous.
Science, 308, 1032-4.
HUNT, D. F., HENDERSON, R. A., SHABANOWITZ, J., SAKAGUCHI, K.,
MICHEL, H., SEVILIR, N., COX, A. L., APPELLA, E. & ENGELHARD,
V. H. (1992) Characterization of peptides bound to the class I MHC
molecule HLA-A2.1 by mass spectrometry. Science, 255, 1261-3.
ICHIHARA, F., KONO, K., TAKAHASHI, A., KAWAIDA, H., SUGAI, H. &
FUJII, H. (2003) Increased populations of regulatory T cells in peripheral
blood and tumor-infiltrating lymphocytes in patients with gastric and
esophageal cancers. Clin Cancer Res, 9, 4404-8.
IKEDA, H., LETHE, B., LEHMANN, F., VAN BAREN, N., BAURAIN, J. F., DE
SMET, C., CHAMBOST, H., VITALE, M., MORETTA, A., BOON, T. &
COULIE, P. G. (1997) Characterization of an antigen that is recognized on a
melanoma showing partial HLA loss by CTL expressing an NK inhibitory
receptor. Immunity, 6, 199-208.
IKEHARA, S., PAHWA, R. N., FERNANDES, G., HANSEN, C. T. & GOOD, R.
A. (1984) Functional T cells in athymic nude mice. Proc Natl Acad Sci U S
A, 81, 886-8.

242
INOUE, K., OGAWA, H., SONODA, Y., KIMURA, T., SAKABE, H., OKA, Y.,
MIYAKE, S., TAMAKI, H., OJI, Y., YAMAGAMI, T., TATEKAWA, T.,
SOMA, T., KISHIMOTO, T. & SUGIYAMA, H. (1997) Aberrant
overexpression of the Wilms tumor gene (WT1) in human leukemia. Blood,
89, 1405-12.
INOUE, K., SUGIYAMA, H., OGAWA, H., NAKAGAWA, M., YAMAGAMI, T.,
MIWA, H., KITA, K., HIRAOKA, A., MASAOKA, T., NASU, K. & ET
AL. (1994) WT1 as a new prognostic factor and a new marker for the
detection of minimal residual disease in acute leukemia. Blood, 84, 3071-9.
ISHIGAMI, S., NATSUGOE, S., TOKUDA, K., NAKAJO, A., CHE, X.,
IWASHIGE, H., ARIDOME, K., HOKITA, S. & AIKOU, T. (2000)
Prognostic value of intratumoral natural killer cells in gastric carcinoma.
Cancer, 88, 577-83.
JABBOUR, E. J., FADERL, S. & KANTARJIAN, H. M. (2005) Adult acute
lymphoblastic leukemia. Mayo Clin Proc, 80, 1517-27.
JACQUILLAT, C., CHASTANG, C., TANZER, J., BRIERE, J., WEIL, M.,
PEREIRA-NETO, M., GEMON-AUCLERC, M. F., SCHAISON, G.,
DOMINGO, A., BOIRON, M. & BERNARD, J. (1978) Prognostic factors in
chronic granulocytic leukemia. A study of 798 cases. Boll Ist Sieroter Milan,
57, 237-46.
JAGER, D., JAGER, E. & KNUTH, A. (2001) Immune responses to tumour
antigens: implications for antigen specific immunotherapy of cancer. J Clin
Pathol, 54, 669-74.
JANEWAY, C. A., JR. & BOTTOMLY, K. (1994) Signals and signs for
lymphocyte responses. Cell, 76, 275-85.
JANSSEN, E. M., LEMMENS, E. E., WOLFE, T., CHRISTEN, U., VON
HERRATH, M. G. & SCHOENBERGER, S. P. (2003) CD4+ T cells are
required for secondary expansion and memory in CD8+ T lymphocytes.
Nature, 421, 852-6.

243
JARNJAK-JANKOVIC, S., PETTERSEN, R. D., SAEBOE-LARSSEN, S.,
WESENBERG, F. & GAUDERNACK, G. (2005) Evaluation of dendritic
cells loaded with apoptotic cancer cells or expressing tumour mRNA as
potential cancer vaccines against leukemia. BMC Cancer, 5, 20.
JELINEK, D. F., TSCHUMPER, R. C., GEYER, S. M., BONE, N. D., DEWALD,
G. W., HANSON, C. A., STENSON, M. J., WITZIG, T. E., TEFFERI, A. &
KAY, N. E. (2001) Analysis of clonal B-cell CD38 and immunoglobulin
variable region sequence status in relation to clinical outcome for B-chronic
lymphocytic leukaemia. Br J Haematol, 115, 854-61.
JONULEIT, H., SCHMITT, E., SCHULER, G., KNOP, J. & ENK, A. H. (2000)
Induction of interleukin 10-producing, nonproliferating CD4(+) T cells with
regulatory properties by repetitive stimulation with allogeneic immature
human dendritic cells. J Exp Med, 192, 1213-22.
JULIUSSON, G., ANTUNOVIC, P., DEROLF, A., LEHMANN, S., MOLLGARD,
L., STOCKELBERG, D., TIDEFELT, U., WAHLIN, A. & HOGLUND, M.
(2009) Age and acute myeloid leukemia: real world data on decision to treat
and outcomes from the Swedish Acute Leukemia Registry. Blood, 113,
4179-87.
KANE, E. V., ROMAN, E., CARTWRIGHT, R., PARKER, J. & MORGAN, G.
(1999) Tobacco and the risk of acute leukaemia in adults. Br J Cancer, 81,
1228-33.
KAPLAN, D. H., SHANKARAN, V., DIGHE, A. S., STOCKERT, E., AGUET, M.,
OLD, L. J. & SCHREIBER, R. D. (1998) Demonstration of an interferon
gamma-dependent tumor surveillance system in immunocompetent mice.
Proc Natl Acad Sci U S A, 95, 7556-61.
KAPP, M., STEVANOVIC, S., FICK, K., TAN, S. M., LOEFFLER, J., OPITZ, A.,
TONN, T., STUHLER, G., EINSELE, H. & GRIGOLEIT, G. U. (2009)
CD8+ T-cell responses to tumor-associated antigens correlate with superior
relapse-free survival after allo-SCT. Bone Marrow Transplant, 43, 399-410.

244
KAWAKAMI, Y., ELIYAHU, S., DELGADO, C. H., ROBBINS, P. F.,
RIVOLTINI, L., TOPALIAN, S. L., MIKI, T. & ROSENBERG, S. A.
(1994) Cloning of the gene coding for a shared human melanoma antigen
recognized by autologous T cells infiltrating into tumor. Proc Natl Acad Sci
U S A, 91, 3515-9.
KAWASHIMA, I., HUDSON, S. J., TSAI, V., SOUTHWOOD, S., TAKESAKO,
K., APPELLA, E., SETTE, A. & CELIS, E. (1998) The multi-epitope
approach for immunotherapy for cancer: identification of several CTL
epitopes from various tumor-associated antigens expressed on solid epithelial
tumors. Hum Immunol, 59, 1-14.
KE, X., WANG, J., LI, L., CHEN, I. H., WANG, H. & YANG, X. F. (2008) Roles
of CD4+CD25(high) FOXP3+ Tregs in lymphomas and tumors are complex.
Front Biosci, 13, 3986-4001.
KEILHOLZ, U., LETSCH, A., BUSSE, A., ASEMISSEN, A. M., SCHMITTEL, A.,
HOFMANN, W. K., UHAREK, L., BLAU, I. W., THIEL, E. &
SCHEIBENBOGEN, C. (2006) Clinical and Immunological Activity of
WT1 Peptide Vaccination in Patients with Acute Myeloid Leukemia and
Myelodysplasia: Results of a Phase II Trial. ASH Annual Meeting Abstracts,
108, 567-.
KESSLER, J. H., BEEKMAN, N. J., BRES-VLOEMANS, S. A., VERDIJK, P.,
VAN VEELEN, P. A., KLOOSTERMAN-JOOSTEN, A. M., VISSERS, D.
C., TEN BOSCH, G. J., KESTER, M. G., SIJTS, A., WOUTER
DRIJFHOUT, J., OSSENDORP, F., OFFRINGA, R. & MELIEF, C. J.
(2001) Efficient identification of novel HLA-A(*)0201-presented cytotoxic
T lymphocyte epitopes in the widely expressed tumor antigen PRAME by
proteasome-mediated digestion analysis. J Exp Med, 193, 73-88.
KESSLER, J. H. & MELIEF, C. J. (2007) Identification of T-cell epitopes for cancer
immunotherapy. Leukemia, 21, 1859-74.

245
KHAZAIE, K. & VON BOEHMER, H. (2006) The impact of CD4+CD25+ Treg on
tumor specific CD8+ T cell cytotoxicity and cancer. Semin Cancer Biol, 16,
124-36.
KIM, R., EMI, M., TANABE, K. & ARIHIRO, K. (2006) Tumor-driven evolution
of immunosuppressive networks during malignant progression. Cancer Res,
66, 5527-36.
KING-UNDERWOOD, L. & PRITCHARD-JONES, K. (1998) Wilms' tumor
(WT1) gene mutations occur mainly in acute myeloid leukemia and may
confer drug resistance. Blood, 91, 2961-8.
KLAMMER, M., WATERFALL, M., SAMUEL, K., TURNER, M. L. & RODDIE,
P. H. (2005) Fusion hybrids of dendritic cells and autologous myeloid blasts
as a potential cellular vaccine for acute myeloid leukaemia. Br J Haematol,
129, 340-9.
KLEIN, G. (1976) Immune surveillance--a powerful mechanism with a limited
range. Natl Cancer Inst Monogr, 44, 109-13.
KLINE, J. (2009) Will changing the face of WT1 make it more attractive to T cells?
Leuk Lymphoma, 50, 156-7.
KNIGHTS, A. J., ZANIOU, A., REES, R. C., PAWELEC, G. & MULLER, L.
(2002) Prediction of an HLA-DR-binding peptide derived from Wilms'
tumour 1 protein and demonstration of in vitro immunogenicity of WT1(124-
138)-pulsed dendritic cells generated according to an optimised protocol.
Cancer Immunol Immunother, 51, 271-81.
KOBAYASHI, H., NAGATO, T., AOKI, N., SATO, K., KIMURA, S., TATENO,
M. & CELIS, E. (2006) Defining MHC class II T helper epitopes for WT1
tumor antigen. Cancer Immunol Immunother, 55, 850-60.
KOLB, H. J. & HOLLER, E. (1997) Adoptive immunotherapy with donor
lymphocyte transfusions. Curr Opin Oncol, 9, 139-45.
246
KOLB, H. J., MITTERMULLER, J., CLEMM, C., HOLLER, E., LEDDEROSE, G.,
BREHM, G., HEIM, M. & WILMANNS, W. (1990) Donor leukocyte
transfusions for treatment of recurrent chronic myelogenous leukemia in
marrow transplant patients. Blood, 76, 2462-5.
KOLB, H. J., SCHATTENBERG, A., GOLDMAN, J. M., HERTENSTEIN, B.,
JACOBSEN, N., ARCESE, W., LJUNGMAN, P., FERRANT, A.,
VERDONCK, L., NIEDERWIESER, D., VAN RHEE, F.,
MITTERMUELLER, J., DE WITTE, T., HOLLER, E. & ANSARI, H.
(1995) Graft-versus-leukemia effect of donor lymphocyte transfusions in
marrow grafted patients. Blood, 86, 2041-50.
KOTTARIDIS, P. D., GALE, R. E., FREW, M. E., HARRISON, G.,
LANGABEER, S. E., BELTON, A. A., WALKER, H., WHEATLEY, K.,
BOWEN, D. T., BURNETT, A. K., GOLDSTONE, A. H. & LINCH, D. C.
(2001) The presence of a FLT3 internal tandem duplication in patients with
acute myeloid leukemia (AML) adds important prognostic information to
cytogenetic risk group and response to the first cycle of chemotherapy:
analysis of 854 patients from the United Kingdom Medical Research Council
AML 10 and 12 trials. Blood, 98, 1752-9.
KRUG, L. M., DAO, T., BROWN, A. B., MASLAK, P., TRAVIS, W., BEKELE,
S., KORONTSVIT, T., ZAKHALEVA, V., WOLCHOK, J., YUAN, J., LI,
H., TYSON, L. & SCHEINBERG, D. A. (2010) WT1 peptide vaccinations
induce CD4 and CD8 T cell immune responses in patients with
mesothelioma and non-small cell lung cancer. Cancer Immunol Immunother.
KUMARAGURU, U., SUVAS, S., BISWAS, P. S., AZKUR, A. K. & ROUSE, B.
T. (2004) Concomitant helper response rescues otherwise low avidity CD8+
memory CTLs to become efficient effectors in vivo. J Immunol, 172, 3719-
24.
LANIER, L. L. (1998) NK cell receptors. Annu Rev Immunol, 16, 359-93.
LAPORT, G. G., LEVINE, B. L., STADTMAUER, E. A., SCHUSTER, S. J.,
LUGER, S. M., GRUPP, S., BUNIN, N., STROBL, F. J., COTTE, J.,

247
ZHENG, Z., GREGSON, B., RIVERS, P., VONDERHEIDE, R. H.,
LIEBOWITZ, D. N., PORTER, D. L. & JUNE, C. H. (2003) Adoptive
transfer of costimulated T cells induces lymphocytosis in patients with
relapsed/refractory non-Hodgkin lymphoma following CD34+-selected
hematopoietic cell transplantation. Blood, 102, 2004-13.
LE NAOUR, F. (2007) Identification of tumor antigens by using proteomics.
Methods Mol Biol, 360, 327-34.
LEE, J. J., KOOK, H., PARK, M. S., NAM, J. H., CHOI, B. H., SONG, W. H.,
PARK, K. S., LEE, I. K., CHUNG, I. J., HWANG, T. J. & KIM, H. J. (2004)
Immunotherapy using autologous monocyte-derived dendritic cells pulsed
with leukemic cell lysates for acute myeloid leukemia relapse after
autologous peripheral blood stem cell transplantation. J Clin Apher, 19, 66-
70.
LEHE, C., GHEBEH, H., AL-SULAIMAN, A., AL QUDAIHI, G., AL-HUSSEIN,
K., ALMOHAREB, F., CHAUDHRI, N., ALSHARIF, F., AL-ZAHRANI,
H., TBAKHI, A., ALJURF, M. & DERMIME, S. (2008) The Wilms' tumor
antigen is a novel target for human CD4+ regulatory T cells: implications for
immunotherapy. Cancer Res, 68, 6350-9.
LEHMANN, C., ZEIS, M., SCHMITZ, N. & UHAREK, L. (2000) Impaired binding
of perforin on the surface of tumor cells is a cause of target cell resistance
against cytotoxic effector cells. Blood, 96, 594-600.
LENSCHOW, D. J., WALUNAS, T. L. & BLUESTONE, J. A. (1996) CD28/B7
system of T cell costimulation. Annu Rev Immunol, 14, 233-58.
LI, Z., OKA, Y., TSUBOI, A., FUJIKI, F., HARADA, Y., NAKAJIMA, H.,
MASUDA, T., FUKUDA, Y., KAWAKATSU, M., MORIMOTO, S.,
KATAGIRI, T., TATSUMI, N., HOSEN, N., SHIRAKATA, T., NISHIDA,
S., KAWAKAMI, Y., UDAKA, K., KAWASE, I., OJI, Y. & SUGIYAMA,
H. (2008) Identification of a WT1 protein-derived peptide, WT1, as a HLA-
A 0206-restricted, WT1-specific CTL epitope. Microbiol Immunol, 52, 551-
8.

248
LIZEE, G., RADVANYI, L. G., OVERWIJK, W. W. & HWU, P. (2006) Improving
antitumor immune responses by circumventing immunoregulatory cells and
mechanisms. Clin Cancer Res, 12, 4794-803.
LOEB, D. M., EVRON, E., PATEL, C. B., SHARMA, P. M., NIRANJAN, B.,
BULUWELA, L., WEITZMAN, S. A., KORZ, D. & SUKUMAR, S. (2001)
Wilms' tumor suppressor gene (WT1) is expressed in primary breast tumors
despite tumor-specific promoter methylation. Cancer Res, 61, 921-5.
LOMBARDI, L., NEWCOMB, E. W. & DALLA-FAVERA, R. (1987)
Pathogenesis of Burkitt lymphoma: expression of an activated c-myc
oncogene causes the tumorigenic conversion of EBV-infected human B
lymphoblasts. Cell, 49, 161-70.
LONG, E. O. & WAGTMANN, N. (1997) Natural killer cell receptors. Curr Opin
Immunol, 9, 344-50.
LU, J., GIUNTOLI, R. L., 2ND, OMIYA, R., KOBAYASHI, H., KENNEDY, R. &
CELIS, E. (2002) Interleukin 15 promotes antigen-independent in vitro
expansion and long-term survival of antitumor cytotoxic T lymphocytes.
Clin Cancer Res, 8, 3877-84.
MAHIEUX, R. & GESSAIN, A. (2003) HTLV-1 and associated adult T-cell
leukemia/lymphoma. Rev Clin Exp Hematol, 7, 336-61.
MAHNKE, K., SCHONFELD, K., FONDEL, S., RING, S., KARAKHANOVA, S.,
WIEDEMEYER, K., BEDKE, T., JOHNSON, T. S., STORN, V.,
SCHALLENBERG, S. & ENK, A. H. (2007) Depletion of CD4+CD25+
human regulatory T cells in vivo: kinetics of Treg depletion and alterations
in immune functions in vivo and in vitro. Int J Cancer, 120, 2723-33.
MAILANDER, V., SCHEIBENBOGEN, C., THIEL, E., LETSCH, A., BLAU, I. W.
& KEILHOLZ, U. (2004) Complete remission in a patient with recurrent
acute myeloid leukemia induced by vaccination with WT1 peptide in the
absence of hematological or renal toxicity. Leukemia, 18, 165-6.
249
MALECKAR, J. R. & SHERMAN, L. A. (1987) The composition of the T cell
receptor repertoire in nude mice. J Immunol, 138, 3873-6.
MANDRELL, B. N. (2009) The genetic profile and monitoring of acute
lymphoblastic leukemia in children and adolescents. J Pediatr Nurs, 24, 173-
8.
MARINCOLA, F. M., JAFFEE, E. M., HICKLIN, D. J. & FERRONE, S. (2000)
Escape of human solid tumors from T-cell recognition: molecular
mechanisms and functional significance. Adv Immunol, 74, 181-273.
MAROSI, C., KOLLER, U., KOLLER-WEBER, E., SCHWARZINGER, I.,
SCHNEIDER, B., JAGER, U., VAHLS, P., NOWOTNY, H., PIRC-
DANOEWINATA, H., STEGER, G. & ET AL. (1992) Prognostic impact of
karyotype and immunologic phenotype in 125 adult patients with de novo
AML. Cancer Genet Cytogenet, 61, 14-25.
MARSMAN, M., JORDENS, I., GRIEKSPOOR, A. & NEEFJES, J. (2005)
Chaperoning antigen presentation by MHC class II molecules and their role
in oncogenesis. Adv Cancer Res, 93, 129-58.
MASLAK, P. G., DAO, T., GOMEZ, M., CHANEL, S., PACKIN, J.,
KORONTSVIT, T., ZAKHALEVA, V., PINILLA-IBARZ, J., BERMAN, E.
& SCHEINBERG, D. A. (2008) A pilot vaccination trial of synthetic analog
peptides derived from the BCR-ABL breakpoints in CML patients with
minimal disease. Leukemia, 22, 1613-6.
MASLAK, P. G., DAO, T., KRUG, L. M., CHANEL, S., KORONTSVIT, T.,
ZAKHALEVA, V., ZHANG, R., WOLCHOK, J. D., YUAN, J., PINILLA-
IBARZ, J., BERMAN, E., WEISS, M., JURCIC, J., FRATTINI, M. G. &
SCHEINBERG, D. A. (2010) Vaccination with synthetic analog peptides
derived from WT1 oncoprotein induces T cell responses in patients with
complete remission from acute myeloid leukemia (AML). Blood.

250
MATASAR, M. J., RITCHIE, E. K., CONSEDINE, N., MAGAI, C. & NEUGUT,
A. I. (2006) Incidence rates of the major leukemia subtypes among US
Hispanics, Blacks, and non-Hispanic Whites. Leuk Lymphoma, 47, 2365-70.
MATSUMOTO-TANIURA, N., PIROLLET, F., MONROE, R., GERACE, L. &
WESTENDORF, J. M. (1996) Identification of novel M phase
phosphoproteins by expression cloning. Mol Biol Cell, 7, 1455-69.
MATZINGER, P. (1994) Tolerance, danger, and the extended family. Annu Rev
Immunol, 12, 991-1045.
MAY, R. J., DAO, T., PINILLA-IBARZ, J., KORONTSVIT, T., ZAKHALEVA,
V., ZHANG, R. H., MASLAK, P. & SCHEINBERG, D. A. (2007) Peptide
epitopes from the Wilms' tumor 1 oncoprotein stimulate CD4+ and CD8+ T
cells that recognize and kill human malignant mesothelioma tumor cells. Clin
Cancer Res, 13, 4547-55.
MELIEF, C. J. (1992) Tumor eradication by adoptive transfer of cytotoxic T
lymphocytes. Adv Cancer Res, 58, 143-75.
MELIEF, C. J. & KAST, W. M. (1995) T-cell immunotherapy of tumors by
adoptive transfer of cytotoxic T lymphocytes and by vaccination with
minimal essential epitopes. Immunol Rev, 145, 167-77.
MENETRIER-CAUX, C., MONTMAIN, G., DIEU, M. C., BAIN, C., FAVROT,
M. C., CAUX, C. & BLAY, J. Y. (1998) Inhibition of the differentiation of
dendritic cells from CD34(+) progenitors by tumor cells: role of interleukin-
6 and macrophage colony-stimulating factor. Blood, 92, 4778-91.
MENSSEN, H. D., RENKL, H. J., ENTEZAMI, M. & THIEL, E. (1997) Wilms'
tumor gene expression in human CD34+ hematopoietic progenitors during
fetal development and early clonogenic growth. Blood, 89, 3486-7.
MENSSEN, H. D., RENKL, H. J., RODECK, U., MAURER, J., NOTTER, M.,
SCHWARTZ, S., REINHARDT, R. & THIEL, E. (1995) Presence of Wilms'
tumor gene (wt1) transcripts and the WT1 nuclear protein in the majority of
human acute leukemias. Leukemia, 9, 1060-7.

251
MENZIES, S. W. & MCCARTHY, W. H. (1997) Complete regression of primary
cutaneous malignant melanoma. Arch Surg, 132, 553-6.
MERCK Acute Leukemia.
MIHM, M. C., JR., CLEMENTE, C. G. & CASCINELLI, N. (1996) Tumor
infiltrating lymphocytes in lymph node melanoma metastases: a
histopathologic prognostic indicator and an expression of local immune
response. Lab Invest, 74, 43-7.
MILLER, A. M., LUNDBERG, K., OZENCI, V., BANHAM, A. H.,
HELLSTROM, M., EGEVAD, L. & PISA, P. (2006) CD4+CD25high T
cells are enriched in the tumor and peripheral blood of prostate cancer
patients. J Immunol, 177, 7398-405.
MITELMAN, F. (2000) Recurrent chromosome aberrations in cancer. Mutat Res,
462, 247-53.
MOLLDREM, J., DERMIME, S., PARKER, K., JIANG, Y. Z., MAVROUDIS, D.,
HENSEL, N., FUKUSHIMA, P. & BARRETT, A. J. (1996) Targeted T-cell
therapy for human leukemia: cytotoxic T lymphocytes specific for a peptide
derived from proteinase 3 preferentially lyse human myeloid leukemia cells.
Blood, 88, 2450-7.
MOLLDREM, J. J., CLAVE, E., JIANG, Y. Z., MAVROUDIS, D., RAPTIS, A.,
HENSEL, N., AGARWALA, V. & BARRETT, A. J. (1997) Cytotoxic T
lymphocytes specific for a nonpolymorphic proteinase 3 peptide
preferentially inhibit chronic myeloid leukemia colony-forming units. Blood,
90, 2529-34.
MOLLDREM, J. J., LEE, P. P., KANT, S., WIEDER, E., JIANG, W., LU, S.,
WANG, C. & DAVIS, M. M. (2003) Chronic myelogenous leukemia shapes
host immunity by selective deletion of high-avidity leukemia-specific T
cells. J Clin Invest, 111, 639-47.
MOLLDREM, J. J., LEE, P. P., WANG, C., CHAMPLIN, R. E. & DAVIS, M. M.
(1999) A PR1-human leukocyte antigen-A2 tetramer can be used to isolate

252
low-frequency cytotoxic T lymphocytes from healthy donors that selectively
lyse chronic myelogenous leukemia. Cancer Res, 59, 2675-81.
MOLLDREM, J. J., LEE, P. P., WANG, C., FELIO, K., KANTARJIAN, H. M.,
CHAMPLIN, R. E. & DAVIS, M. M. (2000) Evidence that specific T
lymphocytes may participate in the elimination of chronic myelogenous
leukemia. Nat Med, 6, 1018-23.
MONTSERRAT, E., SANCHEZ-BISONO, J., VINOLAS, N. & ROZMAN, C.
(1986) Lymphocyte doubling time in chronic lymphocytic leukaemia:
analysis of its prognostic significance. Br J Haematol, 62, 567-75.
MORETTA, A. (2005) The dialogue between human natural killer cells and
dendritic cells. Curr Opin Immunol, 17, 306-11.
MORETTA, A., BIASSONI, R., BOTTINO, C., MINGARI, M. C. & MORETTA,
L. (2000) Natural cytotoxicity receptors that trigger human NK-cell-
mediated cytolysis. Immunol Today, 21, 228-34.
MORETTA, A., BOTTINO, C., VITALE, M., PENDE, D., BIASSONI, R.,
MINGARI, M. C. & MORETTA, L. (1996) Receptors for HLA class-I
molecules in human natural killer cells. Annu Rev Immunol, 14, 619-48.
MULLER-BERAT, N., MINOWADA, J., TSUJI-TAKAYAMA, K., DREXLER,
H., LANOTTE, M., WIESLANDER, J. & WIIK, A. (1994) The phylogeny
of proteinase 3/myeloblastin, the autoantigen in Wegener's granulomatosis,
and myeloperoxidase as shown by immunohistochemical studies on human
leukemic cell lines. Clin Immunol Immunopathol, 70, 51-9.
MULLINS, D. W., BULLOCK, T. N., COLELLA, T. A., ROBILA, V. V. &
ENGELHARD, V. H. (2001) Immune responses to the HLA-A*0201-
restricted epitopes of tyrosinase and glycoprotein 100 enable control of
melanoma outgrowth in HLA-A*0201-transgenic mice. J Immunol, 167,
4853-60.
MUNN, D. H., SHARMA, M. D., HOU, D., BABAN, B., LEE, J. R., ANTONIA, S.
J., MESSINA, J. L., CHANDLER, P., KONI, P. A. & MELLOR, A. L.

253
(2004) Expression of indoleamine 2,3-dioxygenase by plasmacytoid
dendritic cells in tumor-draining lymph nodes. J Clin Invest, 114, 280-90.
MUSTO, P., MELILLO, L., LOMBARDI, G., MATERA, R., DI GIORGIO, G. &
CAROTENUTO, M. (1991) High risk of early resistant relapse for
leukaemic patients with presence of multidrug resistance associated P-
glycoprotein positive cells in complete remission. Br J Haematol, 77, 50-3.
MUTIS, T., GILLESPIE, G., SCHRAMA, E., FALKENBURG, J. H., MOSS, P. &
GOULMY, E. (1999a) Tetrameric HLA class I-minor histocompatibility
antigen peptide complexes demonstrate minor histocompatibility antigen-
specific cytotoxic T lymphocytes in patients with graft-versus-host disease.
Nat Med, 5, 839-42.
MUTIS, T., VERDIJK, R., SCHRAMA, E., ESENDAM, B., BRAND, A. &
GOULMY, E. (1999b) Feasibility of immunotherapy of relapsed leukemia
with ex vivo-generated cytotoxic T lymphocytes specific for hematopoietic
system-restricted minor histocompatibility antigens. Blood, 93, 2336-41.
NADAL, E., GARIN, M., KAEDA, J., APPERLEY, J., LECHLER, R. & DAZZI, F.
(2007) Increased frequencies of CD4(+)CD25(high) T(regs) correlate with
disease relapse after allogeneic stem cell transplantation for chronic myeloid
leukemia. Leukemia, 21, 472-9.
NAITO, Y., SAITO, K., SHIIBA, K., OHUCHI, A., SAIGENJI, K., NAGURA, H.
& OHTANI, H. (1998) CD8+ T cells infiltrated within cancer cell nests as a
prognostic factor in human colorectal cancer. Cancer Res, 58, 3491-4.
NEITZEL, H. (1986) A routine method for the establishment of permanent growing
lymphoblastoid cell lines. Hum Genet, 73, 320-6.
NEUMANN, F., WAGNER, C., PREUSS, K. D., KUBUSCHOK, B.,
SCHORMANN, C., STEVANOVIC, S. & PFREUNDSCHUH, M. (2005)
Identification of an epitope derived from the cancer testis antigen HOM-
TES-14/SCP1 and presented by dendritic cells to circulating CD4+ T cells.
Blood, 106, 3105-13.

254
NISHIKAWA, H., JAGER, E., RITTER, G., OLD, L. J. & GNJATIC, S. (2005)
CD4+ CD25+ regulatory T cells control the induction of antigen-specific
CD4+ helper T cell responses in cancer patients. Blood, 106, 1008-11.
NORMENT, A. M., SALTER, R. D., PARHAM, P., ENGELHARD, V. H. &
LITTMAN, D. R. (1988) Cell-cell adhesion mediated by CD8 and MHC
class I molecules. Nature, 336, 79-81.
NOWELL, P. C. & HUNGERFORD, D. A. (1960) Chromosome studies on normal
and leukemic human leukocytes. J Natl Cancer Inst, 25, 85-109.
O'BRIEN, S. G., GUILHOT, F., LARSON, R. A., GATHMANN, I., BACCARANI,
M., CERVANTES, F., CORNELISSEN, J. J., FISCHER, T., HOCHHAUS,
A., HUGHES, T., LECHNER, K., NIELSEN, J. L., ROUSSELOT, P.,
REIFFERS, J., SAGLIO, G., SHEPHERD, J., SIMONSSON, B.,
GRATWOHL, A., GOLDMAN, J. M., KANTARJIAN, H., TAYLOR, K.,
VERHOEF, G., BOLTON, A. E., CAPDEVILLE, R. & DRUKER, B. J.
(2003) Imatinib compared with interferon and low-dose cytarabine for newly
diagnosed chronic-phase chronic myeloid leukemia. N Engl J Med, 348, 994-
1004.
OFRAN, Y., KIM, H. T., BRUSIC, V., BLAKE, L., MANDRELL, M., WU, C. J.,
SARANTOPOULOS, S., BELLUCCI, R., KESKIN, D. B., SOIFFER, R. J.,
ANTIN, J. H. & RITZ, J. (2010) Diverse patterns of T-cell response against
multiple newly identified human Y chromosome-encoded minor
histocompatibility epitopes. Clin Cancer Res, 16, 1642-51.
OHMINAMI, H., YASUKAWA, M. & FUJITA, S. (2000) HLA class I-restricted
lysis of leukemia cells by a CD8(+) cytotoxic T-lymphocyte clone specific
for WT1 peptide. Blood, 95, 286-93.
OJI, Y., MIYOSHI, S., MAEDA, H., HAYASHI, S., TAMAKI, H., NAKATSUKA,
S., YAO, M., TAKAHASHI, E., NAKANO, Y., HIRABAYASHI, H.,
SHINTANI, Y., OKA, Y., TSUBOI, A., HOSEN, N., ASADA, M.,
FUJIOKA, T., MURAKAMI, M., KANATO, K., MOTOMURA, M., KIM,
E. H., KAWAKAMI, M., IKEGAME, K., OGAWA, H., AOZASA, K.,

255
KAWASE, I. & SUGIYAMA, H. (2002) Overexpression of the Wilms'
tumor gene WT1 in de novo lung cancers. Int J Cancer, 100, 297-303.
OJI, Y., OGAWA, H., TAMAKI, H., OKA, Y., TSUBOI, A., KIM, E. H., SOMA,
T., TATEKAWA, T., KAWAKAMI, M., ASADA, M., KISHIMOTO, T. &
SUGIYAMA, H. (1999) Expression of the Wilms' tumor gene WT1 in solid
tumors and its involvement in tumor cell growth. Jpn J Cancer Res, 90, 194-
204.
OKA, Y., ELISSEEVA, O. A., TSUBOI, A., OGAWA, H., TAMAKI, H., LI, H.,
OJI, Y., KIM, E. H., SOMA, T., ASADA, M., UEDA, K., MARUYA, E.,
SAJI, H., KISHIMOTO, T., UDAKA, K. & SUGIYAMA, H. (2000) Human
cytotoxic T-lymphocyte responses specific for peptides of the wild-type
Wilms' tumor gene (WT1 ) product. Immunogenetics, 51, 99-107.
OKA, Y., TSUBOI, A., TAGUCHI, T., OSAKI, T., KYO, T., NAKAJIMA, H.,
ELISSEEVA, O. A., OJI, Y., KAWAKAMI, M., IKEGAME, K., HOSEN,
N., YOSHIHARA, S., WU, F., FUJIKI, F., MURAKAMI, M., MASUDA,
T., NISHIDA, S., SHIRAKATA, T., NAKATSUKA, S., SASAKI, A.,
UDAKA, K., DOHY, H., AOZASA, K., NOGUCHI, S., KAWASE, I. &
SUGIYAMA, H. (2004) Induction of WT1 (Wilms' tumor gene)-specific
cytotoxic T lymphocytes by WT1 peptide vaccine and the resultant cancer
regression. Proc Natl Acad Sci U S A, 101, 13885-90.
ORENTAS, R. J., KOHLER, M. E. & JOHNSON, B. D. (2006) Suppression of anti-
cancer immunity by regulatory T cells: back to the future. Semin Cancer
Biol, 16, 137-49.
OSADA, T., WOO, C. Y., MCKINNEY, M., YANG, X. Y., LEI, G., LABRECHE,
H. G., HARTMAN, Z. C., NIEDZWIECKI, D., CHAO, N.,
AMALFITANO, A., MORSE, M. A., LYERLY, H. K. & CLAY, T. M.
(2009) Induction of Wilms' tumor protein (WT1)-specific antitumor
immunity using a truncated WT1-expressing adenovirus vaccine. Clin
Cancer Res, 15, 2789-96.

256
OSMAN, Y., TAKAHASHI, M., ZHENG, Z., KOIKE, T., TOBA, K., LIU, A.,
FURUKAWA, T., AOKI, S. & AIZAWA, Y. (1999a) Generation of bcr-abl
specific cytotoxic T-lymphocytes by using dendritic cells pulsed with bcr-abl
(b3a2) peptide: its applicability for donor leukocyte transfusions in marrow
grafted CML patients. Leukemia, 13, 166-74.
OSMAN, Y., TAKAHASHI, M., ZHENG, Z., TOBA, K., LIU, A., FURUKAWA,
T., NARITA, M., AIZAWA, Y., KOIKE, T. & SHIBATA, A. (1999b)
Dendritic cells stimulate the expansion of PML-RAR alpha specific
cytotoxic T-lymphocytes: its applicability for antileukemia immunotherapy.
J Exp Clin Cancer Res, 18, 485-92.
OTTO, H., CONZ, C., MAIER, P., WOLFLE, T., SUZUKI, C. K., JENO, P.,
RUCKNAGEL, P., STAHL, J. & ROSPERT, S. (2005) The chaperones
MPP11 and Hsp70L1 form the mammalian ribosome-associated complex.
Proc Natl Acad Sci U S A, 102, 10064-9.
OVERWIJK, W. W., THEORET, M. R., FINKELSTEIN, S. E., SURMAN, D. R.,
DE JONG, L. A., VYTH-DREESE, F. A., DELLEMIJN, T. A., ANTONY,
P. A., SPIESS, P. J., PALMER, D. C., HEIMANN, D. M., KLEBANOFF, C.
A., YU, Z., HWANG, L. N., FEIGENBAUM, L., KRUISBEEK, A. M.,
ROSENBERG, S. A. & RESTIFO, N. P. (2003) Tumor regression and
autoimmunity after reversal of a functionally tolerant state of self-reactive
CD8+ T cells. J Exp Med, 198, 569-80.
PADUA, R. A., LARGHERO, J., ROBIN, M., LE POGAM, C., SCHLAGETER,
M. H., MUSZLAK, S., FRIC, J., WEST, R., ROUSSELOT, P., PHAN, T.
H., MUDDE, L., TEISSERENC, H., CARPENTIER, A. F., KOGAN, S.,
DEGOS, L., PLA, M., BISHOP, J. M., STEVENSON, F., CHARRON, D. &
CHOMIENNE, C. (2003) PML-RARA-targeted DNA vaccine induces
protective immunity in a mouse model of leukemia. Nat Med, 9, 1413-7.
PARKER, K. C., BEDNAREK, M. A. & COLIGAN, J. E. (1994) Scheme for
ranking potential HLA-A2 binding peptides based on independent binding of
individual peptide side-chains. J Immunol, 152, 163-75.

257
PARKHURST, M. R., SALGALLER, M. L., SOUTHWOOD, S., ROBBINS, P. F.,
SETTE, A., ROSENBERG, S. A. & KAWAKAMI, Y. (1996) Improved
induction of melanoma-reactive CTL with peptides from the melanoma
antigen gp100 modified at HLA-A*0201-binding residues. J Immunol, 157,
2539-48.
PASCHEN, A., EICHMULLER, S. & SCHADENDORF, D. (2004) Identification
of tumor antigens and T-cell epitopes, and its clinical application. Cancer
Immunol Immunother, 53, 196-203.
PASSEGUE, E., JAMIESON, C. H., AILLES, L. E. & WEISSMAN, I. L. (2003)
Normal and leukemic hematopoiesis: are leukemias a stem cell disorder or a
reacquisition of stem cell characteristics? Proc Natl Acad Sci U S A, 100
Suppl 1, 11842-9.
PENN, I. (1988) Tumors of the immunocompromised patient. Annu Rev Med, 39,
63-73.
PENN, I. (1996) Malignant melanoma in organ allograft recipients. Transplantation,
61, 274-8.
PHAM, S. M., KORMOS, R. L., LANDRENEAU, R. J., KAWAI, A.,
GONZALEZ-CANCEL, I., HARDESTY, R. L., HATTLER, B. G. &
GRIFFITH, B. P. (1995) Solid tumors after heart transplantation: lethality of
lung cancer. Ann Thorac Surg, 60, 1623-6.
PINILLA-IBARZ, J., CATHCART, K., KORONTSVIT, T., SOIGNET, S.,
BOCCHIA, M., CAGGIANO, J., LAI, L., JIMENEZ, J., KOLITZ, J. &
SCHEINBERG, D. A. (2000) Vaccination of patients with chronic
myelogenous leukemia with bcr-abl oncogene breakpoint fusion peptides
generates specific immune responses. Blood, 95, 1781-7.
PINILLA-IBARZ, J., KORONTSVIT, T., ZAKHALEVA, V., ROBERTS, W. &
SCHEINBERG, D. A. (2005) Synthetic peptide analogs derived from bcr/abl
fusion proteins and the induction of heteroclitic human T-cell responses.
Haematologica, 90, 1324-32.

258
PINILLA-IBARZ, J., MAY, R. J., KORONTSVIT, T., GOMEZ, M., KAPPEL, B.,
ZAKHALEVA, V., ZHANG, R. H. & SCHEINBERG, D. A. (2006)
Improved human T-cell responses against synthetic HLA-0201 analog
peptides derived from the WT1 oncoprotein. Leukemia, 20, 2025-33.
POWLES, R. L., LISTER, T. A., CROWTHER, D., MCELWAIN, T.,
ALEXANDER, P. & FAIRLEY, G. H. (1975) Immunotherapy for acute
myelogenous leukemia. Bibl Haematol, 737-49.
POWLES, R. L., RUSSELL, J., LISTER, T. A., OLIVER, T., WHITEHOUSE, J.
M., MALPAS, J., CHAPUIS, B., CROWTHER, D. & ALEXANDER, P.
(1977) Immunotherapy for acute myelogenous leukaemia: a controlled
clinical study 2 1/2 years after entry of the last patient. Br J Cancer, 35, 265-
72.
PREHN, R. T. & MAIN, J. M. (1957) Immunity to methylcholanthrene-induced
sarcomas. J Natl Cancer Inst, 18, 769-78.
QAZILBASH, M. H., WIEDER, E., RIOS, R., LU, S., KANT, S., GIRALT, S.,
ESTEY, E. H., THALL, P., DE LIMA, M., COURIEL, D., CHAMPLIN, R.
E., KOMANDURI, K. & MOLLDREM, J. J. (2004) Vaccination with the
PR1 Leukemia-Associated Antigen Can Induce Complete Remission in
Patients with Myeloid Leukemia. ASH Annual Meeting Abstracts, 104, 259-.
RAMMENSEE, H., BACHMANN, J., EMMERICH, N. P., BACHOR, O. A. &
STEVANOVIC, S. (1999) SYFPEITHI: database for MHC ligands and
peptide motifs. Immunogenetics, 50, 213-9.
REAL, L. M., JIMENEZ, P., KIRKIN, A., SERRANO, A., GARCIA, A.,
CANTON, J., ZEUTHEN, J., GARRIDO, F. & RUIZ-CABELLO, F. (2001)
Multiple mechanisms of immune evasion can coexist in melanoma tumor
cell lines derived from the same patient. Cancer Immunol Immunother, 49,
621-8.
RECHE, P. A., GLUTTING, J. P. & REINHERZ, E. L. (2002) Prediction of MHC
class I binding peptides using profile motifs. Hum Immunol, 63, 701-9.

259
RENNEVILLE, A., BOISSEL, N., ZURAWSKI, V., LLOPIS, L., BIGGIO, V.,
NIBOUREL, O., PHILIPPE, N., THOMAS, X., DOMBRET, H. &
PREUDHOMME, C. (2009) Wilms tumor 1 gene mutations are associated
with a higher risk of recurrence in young adults with acute myeloid
leukemia: a study from the Acute Leukemia French Association. Cancer,
115, 3719-27.
RESTO, V. A., CABALLERO, O. L., BUTA, M. R., WESTRA, W. H., WU, L.,
WESTENDORF, J. M., JEN, J., HIETER, P. & SIDRANSKY, D. (2000) A
putative oncogenic role for MPP11 in head and neck squamous cell cancer.
Cancer Res, 60, 5529-35.
REZVANI, K., GRUBE, M., BRENCHLEY, J. M., SCONOCCHIA, G.,
FUJIWARA, H., PRICE, D. A., GOSTICK, E., YAMADA, K.,
MELENHORST, J., CHILDS, R., HENSEL, N., DOUEK, D. C. &
BARRETT, A. J. (2003) Functional leukemia-associated antigen-specific
memory CD8+ T cells exist in healthy individuals and in patients with
chronic myelogenous leukemia before and after stem cell transplantation.
Blood, 102, 2892-900.
REZVANI, K., YONG, A. S., MIELKE, S., SAVANI, B. N., MUSSE, L.,
SUPERATA, J., JAFARPOUR, B., BOSS, C. & BARRETT, A. J. (2008)
Leukemia-associated antigen-specific T-cell responses following combined
PR1 and WT1 peptide vaccination in patients with myeloid malignancies.
Blood, 111, 236-42.
RIDDELL, S. R. & GREENBERG, P. D. (1990) The use of anti-CD3 and anti-
CD28 monoclonal antibodies to clone and expand human antigen-specific T
cells. J Immunol Methods, 128, 189-201.
ROBAK, T. & WIERZBOWSKA, A. (2009) Current and emerging therapies for
acute myeloid leukemia. Clin Ther, 31 Pt 2, 2349-70.
RODDIE, H., KLAMMER, M., THOMAS, C., THOMSON, R., ATKINSON, A.,
SPROUL, A., WATERFALL, M., SAMUEL, K., YIN, J., JOHNSON, P. &
TURNER, M. (2006) Phase I/II study of vaccination with dendritic-like
260
leukaemia cells for the immunotherapy of acute myeloid leukaemia. Br J
Haematol, 133, 152-7.
RODDIE, P. H., PATERSON, T. & TURNER, M. L. (2000) Gene transfer to
primary acute myeloid leukaemia blasts and myeloid leukaemia cell lines.
Cytokines Cell Mol Ther, 6, 127-34.
ROSENBERG, S. A., RESTIFO, N. P., YANG, J. C., MORGAN, R. A. &
DUDLEY, M. E. (2008) Adoptive cell transfer: a clinical path to effective
cancer immunotherapy. Nat Rev Cancer, 8, 299-308.
ROSENBERG, S. A., YANG, J. C., SCHWARTZENTRUBER, D. J., HWU, P.,
MARINCOLA, F. M., TOPALIAN, S. L., RESTIFO, N. P., DUDLEY, M.
E., SCHWARZ, S. L., SPIESS, P. J., WUNDERLICH, J. R., PARKHURST,
M. R., KAWAKAMI, Y., SEIPP, C. A., EINHORN, J. H. & WHITE, D. E.
(1998) Immunologic and therapeutic evaluation of a synthetic peptide
vaccine for the treatment of patients with metastatic melanoma. Nat Med, 4,
321-7.
ROSSI, D. J., JAMIESON, C. H. & WEISSMAN, I. L. (2008) Stems cells and the
pathways to aging and cancer. Cell, 132, 681-96.
ROWLEY, J. D. (1973) Letter: A new consistent chromosomal abnormality in
chronic myelogenous leukaemia identified by quinacrine fluorescence and
Giemsa staining. Nature, 243, 290-3.
RUGGERI, L., CAPANNI, M., URBANI, E., PERRUCCIO, K., SHLOMCHIK, W.
D., TOSTI, A., POSATI, S., ROGAIA, D., FRASSONI, F., AVERSA, F.,
MARTELLI, M. F. & VELARDI, A. (2002) Effectiveness of donor natural
killer cell alloreactivity in mismatched hematopoietic transplants. Science,
295, 2097-100.
RUSSELL, J. H. & LEY, T. J. (2002) Lymphocyte-mediated cytotoxicity. Annu Rev
Immunol, 20, 323-70.
RUTER, J., BARNETT, B. G., KRYCZEK, I., BRUMLIK, M. J., DANIEL, B. J.,
COUKOS, G., ZOU, W. & CURIEL, T. J. (2009) Altering regulatory T cell

261
function in cancer immunotherapy: a novel means to boost the efficacy of
cancer vaccines. Front Biosci, 14, 1761-70.
RYGAARD, J. & POVLSEN, C. O. (1974) The mouse mutant nude does not
develop spontaneous tumours. An argument against immunological
surveillance. Acta Pathol Microbiol Scand B Microbiol Immunol, 82, 99-
106.
SAHIN, U., TURECI, O., SCHMITT, H., COCHLOVIUS, B., JOHANNES, T.,
SCHMITS, R., STENNER, F., LUO, G., SCHOBERT, I. &
PFREUNDSCHUH, M. (1995) Human neoplasms elicit multiple specific
immune responses in the autologous host. Proc Natl Acad Sci U S A, 92,
11810-3.
SAKAGUCHI, S. (2004) Naturally arising CD4+ regulatory t cells for immunologic
self-tolerance and negative control of immune responses. Annu Rev Immunol,
22, 531-62.
SAKAGUCHI, S., ONO, M., SETOGUCHI, R., YAGI, H., HORI, S.,
FEHERVARI, Z., SHIMIZU, J., TAKAHASHI, T. & NOMURA, T. (2006)
Foxp3+ CD25+ CD4+ natural regulatory T cells in dominant self-tolerance
and autoimmune disease. Immunol Rev, 212, 8-27.
SAKAGUCHI, S., WING, K., ONISHI, Y., PRIETO-MARTIN, P. &
YAMAGUCHI, T. (2009) Regulatory T cells: how do they suppress immune
responses? Int Immunol, 21, 1105-11.
SALAMA, P., PHILLIPS, M., GRIEU, F., MORRIS, M., ZEPS, N., JOSEPH, D.,
PLATELL, C. & IACOPETTA, B. (2009) Tumor-infiltrating FOXP3+ T
regulatory cells show strong prognostic significance in colorectal cancer. J
Clin Oncol, 27, 186-92.
SASADA, T., KIMURA, M., YOSHIDA, Y., KANAI, M. & TAKABAYASHI, A.
(2003) CD4+CD25+ regulatory T cells in patients with gastrointestinal
malignancies: possible involvement of regulatory T cells in disease
progression. Cancer, 98, 1089-99.

262
SATOH, M., TAKAMIYA, Y., OKA, S., TOKUNAGA, K. & TAKIGUCHI, M.
(2005) Identification and characterization of HIV-1-specific CD8+ T cell
epitopes presented by HLA-A*2601. Vaccine, 23, 3783-90.
SCHEIBENBOGEN, C., LETSCH, A., THIEL, E., SCHMITTEL, A.,
MAILAENDER, V., BAERWOLF, S., NAGORSEN, D. & KEILHOLZ, U.
(2002) CD8 T-cell responses to Wilms tumor gene product WT1 and
proteinase 3 in patients with acute myeloid leukemia. Blood, 100, 2132-7.
SCHETELIG, J., KIANI, A., SCHMITZ, M., EHNINGER, G. & BORNHAUSER,
M. (2005) T cell-mediated graft-versus-leukemia reactions after allogeneic
stem cell transplantation. Cancer Immunol Immunother, 54, 1043-58.
SCHLUNS, K. S. & LEFRANCOIS, L. (2003) Cytokine control of memory T-cell
development and survival. Nat Rev Immunol, 3, 269-79.
SCHMITT, M., LI, L., GIANNOPOULOS, K., CHEN, J., BRUNNER, C., BARTH,
T., SCHMITT, A., WIESNETH, M., DِHNER, K., DِHNER, H. &
GREINER, J. (2006) Chronic myeloid leukemia cells express tumor-
associated antigens eliciting specific CD8+ T-cell responses and are lacking
costimulatory molecules. Experimental Hematology, 34, 1709-1719.
SCHMITT, M., SCHMITT, A., ROJEWSKI, M. T., CHEN, J., GIANNOPOULOS,
K., FEI, F., YU, Y., GOTZ, M., HEYDUK, M., RITTER, G., SPEISER, D.
E., GNJATIC, S., GUILLAUME, P., RINGHOFFER, M., SCHLENK, R. F.,
LIEBISCH, P., BUNJES, D., SHIKU, H., DOHNER, H. & GREINER, J.
(2008) RHAMM-R3 peptide vaccination in patients with acute myeloid
leukemia, myelodysplastic syndrome, and multiple myeloma elicits
immunologic and clinical responses. Blood, 111, 1357-65.
SCHNITTGER, S., SCHOCH, C., KERN, W., MECUCCI, C., TSCHULIK, C.,
MARTELLI, M. F., HAFERLACH, T., HIDDEMANN, W. & FALINI, B.
(2005) Nucleophosmin gene mutations are predictors of favorable prognosis
in acute myelogenous leukemia with a normal karyotype. Blood, 106, 3733-
9.

263
SCHROERS, R., HUANG, X. F., HAMMER, J., ZHANG, J. & CHEN, S. Y. (2002)
Identification of HLA DR7-restricted epitopes from human telomerase
reverse transcriptase recognized by CD4+ T-helper cells. Cancer Res, 62,
2600-5.
SCHULTZE, J. L. & VONDERHEIDE, R. H. (2001) From cancer genomics to
cancer immunotherapy: toward second-generation tumor antigens. Trends
Immunol, 22, 516-23.
SCHUMACHER, K., HAENSCH, W., ROEFZAAD, C. & SCHLAG, P. M. (2001)
Prognostic significance of activated CD8(+) T cell infiltrations within
esophageal carcinomas. Cancer Res, 61, 3932-6.
SHANKARAN, V., IKEDA, H., BRUCE, A. T., WHITE, J. M., SWANSON, P. E.,
OLD, L. J. & SCHREIBER, R. D. (2001) IFNgamma and lymphocytes
prevent primary tumour development and shape tumour immunogenicity.
Nature, 410, 1107-11.
SHEIL, A. G. (1986) Cancer after transplantation. World J Surg, 10, 389-96.
SHEIL, A. G., DISNEY, A. P., MATHEW, T. H., LIVINGSTON, B. E. & KEOGH,
A. M. (1997) Lymphoma incidence, cyclosporine, and the evolution and
major impact of malignancy following organ transplantation. Transplant
Proc, 29, 825-7.
SHEN, L. S., WANG, J., SHEN, D. F., YUAN, X. L., DONG, P., LI, M. X., XUE,
J., ZHANG, F. M., GE, H. L. & XU, D. (2009)
CD4(+)CD25(+)CD127(low/-) regulatory T cells express Foxp3 and
suppress effector T cell proliferation and contribute to gastric cancers
progression. Clin Immunol, 131, 109-18.
SHIN, M. S., KIM, H. S., LEE, S. H., PARK, W. S., KIM, S. Y., PARK, J. Y., LEE,
J. H., LEE, S. K., LEE, S. N., JUNG, S. S., HAN, J. Y., KIM, H., LEE, J. Y.
& YOO, N. J. (2001) Mutations of tumor necrosis factor-related apoptosis-
inducing ligand receptor 1 (TRAIL-R1) and receptor 2 (TRAIL-R2) genes in
metastatic breast cancers. Cancer Res, 61, 4942-6.

264
SHINKAI, Y., RATHBUN, G., LAM, K. P., OLTZ, E. M., STEWART, V.,
MENDELSOHN, M., CHARRON, J., DATTA, M., YOUNG, F., STALL,
A. M. & ET AL. (1992) RAG-2-deficient mice lack mature lymphocytes
owing to inability to initiate V(D)J rearrangement. Cell, 68, 855-67.
SKIPPER, J. C., GULDEN, P. H., HENDRICKSON, R. C., HARTHUN, N.,
CALDWELL, J. A., SHABANOWITZ, J., ENGELHARD, V. H., HUNT, D.
F. & SLINGLUFF, C. L., JR. (1999) Mass-spectrometric evaluation of HLA-
A*0201-associated peptides identifies dominant naturally processed forms of
CTL epitopes from MART-1 and gp100. Int J Cancer, 82, 669-77.
SLOVAK, M. L., KOPECKY, K. J., CASSILETH, P. A., HARRINGTON, D. H.,
THEIL, K. S., MOHAMED, A., PAIETTA, E., WILLMAN, C. L., HEAD,
D. R., ROWE, J. M., FORMAN, S. J. & APPELBAUM, F. R. (2000)
Karyotypic analysis predicts outcome of preremission and postremission
therapy in adult acute myeloid leukemia: a Southwest Oncology
Group/Eastern Cooperative Oncology Group Study. Blood, 96, 4075-83.
SMITH, K. A. (1988) Interleukin-2: inception, impact, and implications. Science,
240, 1169-76.
SMITH, S. M., LE BEAU, M. M., HUO, D., KARRISON, T., SOBECKS, R. M.,
ANASTASI, J., VARDIMAN, J. W., ROWLEY, J. D. & LARSON, R. A.
(2003) Clinical-cytogenetic associations in 306 patients with therapy-related
myelodysplasia and myeloid leukemia: the University of Chicago series.
Blood, 102, 43-52.
SMITS, E. L., BERNEMAN, Z. N. & VAN TENDELOO, V. F. (2009)
Immunotherapy of acute myeloid leukemia: current approaches. Oncologist,
14, 240-52.
SMYTH, M. J., CROWE, N. Y. & GODFREY, D. I. (2001) NK cells and NKT cells
collaborate in host protection from methylcholanthrene-induced
fibrosarcoma. Int Immunol, 13, 459-63.

265
SMYTH, M. J., THIA, K. Y., STREET, S. E., CRETNEY, E., TRAPANI, J. A.,
TANIGUCHI, M., KAWANO, T., PELIKAN, S. B., CROWE, N. Y. &
GODFREY, D. I. (2000a) Differential tumor surveillance by natural killer
(NK) and NKT cells. J Exp Med, 191, 661-8.
SMYTH, M. J., THIA, K. Y., STREET, S. E., MACGREGOR, D., GODFREY, D.
I. & TRAPANI, J. A. (2000b) Perforin-mediated cytotoxicity is critical for
surveillance of spontaneous lymphoma. J Exp Med, 192, 755-60.
SOKAL, J. E., COX, E. B., BACCARANI, M., TURA, S., GOMEZ, G. A.,
ROBERTSON, J. E., TSO, C. Y., BRAUN, T. J., CLARKSON, B. D.,
CERVANTES, F. & ET AL. (1984) Prognostic discrimination in "good-risk"
chronic granulocytic leukemia. Blood, 63, 789-99.
SPADAFORA-FERREIRA, M., CALDAS, C., FAE, K. C., MARRERO, I.,
MONTEIRO, S. M., LIN-WANG, H. T., SOCORRO-SILVA, A.,
FONSECA, S. G., FONSECA, J. A., KALIL, J. & COELHO, V. (2007)
CD4+CD25+Foxp3+ indirect alloreactive T cells from renal transplant
patients suppress both the direct and indirect pathways of allorecognition.
Scand J Immunol, 66, 352-61.
SPISEK, R., CHEVALLIER, P., MORINEAU, N., MILPIED, N., AVET-
LOISEAU, H., HAROUSSEAU, J. L., MEFLAH, K. & GREGOIRE, M.
(2002) Induction of leukemia-specific cytotoxic response by cross-
presentation of late-apoptotic leukemic blasts by autologous dendritic cells of
nonleukemic origin. Cancer Res, 62, 2861-8.
STARR, T. K., JAMESON, S. C. & HOGQUIST, K. A. (2003) Positive and
negative selection of T cells. Annu Rev Immunol, 21, 139-76.
STASI, R., DEL POETA, G., MASI, M., TRIBALTO, M., VENDITTI, A., PAPA,
G., NICOLETTI, B., VERNOLE, P., TEDESCHI, B., DELAROCHE, I. &
ET AL. (1993) Incidence of chromosome abnormalities and clinical
significance of karyotype in de novo acute myeloid leukemia. Cancer Genet
Cytogenet, 67, 28-34.

266
STAUSS, H. J., THOMAS, S., CESCO-GASPERE, M., HART, D. P., XUE, S. A.,
HOLLER, A., KING, J., WRIGHT, G., PERRO, M., POSPORI, C. &
MORRIS, E. (2008) WT1-specific T cell receptor gene therapy: improving
TCR function in transduced T cells. Blood Cells Mol Dis, 40, 113-6.
STEVANOVIC, S. (2002) Identification of tumour-associated T-cell epitopes for
vaccine development. Nat Rev Cancer, 2, 514-20.
STILGENBAUER, S. & DOHNER, H. (2002) Campath-1H-induced complete
remission of chronic lymphocytic leukemia despite p53 gene mutation and
resistance to chemotherapy. N Engl J Med, 347, 452-3.
STRAUSS, L., BERGMANN, C., GOODING, W., JOHNSON, J. T. &
WHITESIDE, T. L. (2007) The frequency and suppressor function of
CD4+CD25highFoxp3+ T cells in the circulation of patients with squamous
cell carcinoma of the head and neck. Clin Cancer Res, 13, 6301-11.
STREET, S. E., CRETNEY, E. & SMYTH, M. J. (2001) Perforin and interferon-
gamma activities independently control tumor initiation, growth, and
metastasis. Blood, 97, 192-7.
STREET, S. E., HAYAKAWA, Y., ZHAN, Y., LEW, A. M., MACGREGOR, D.,
JAMIESON, A. M., DIEFENBACH, A., YAGITA, H., GODFREY, D. I. &
SMYTH, M. J. (2004) Innate immune surveillance of spontaneous B cell
lymphomas by natural killer cells and gammadelta T cells. J Exp Med, 199,
879-84.
STREET, S. E., TRAPANI, J. A., MACGREGOR, D. & SMYTH, M. J. (2002)
Suppression of lymphoma and epithelial malignancies effected by interferon
gamma. J Exp Med, 196, 129-34.
STRIPECKE, R., CARDOSO, A. A., PEPPER, K. A., SKELTON, D. C., YU, X. J.,
MASCARENHAS, L., WEINBERG, K. I., NADLER, L. M. & KOHN, D.
B. (2000) Lentiviral vectors for efficient delivery of CD80 and granulocyte-
macrophage- colony-stimulating factor in human acute lymphoblastic

267
leukemia and acute myeloid leukemia cells to induce antileukemic immune
responses. Blood, 96, 1317-26.
STUMPF, A. N., VAN DER MEIJDEN, E. D., VAN BERGEN, C. A.,
WILLEMZE, R., FALKENBURG, J. H. & GRIFFIOEN, M. (2009)
Identification of 4 new HLA-DR-restricted minor histocompatibility antigens
as hematopoietic targets in antitumor immunity. Blood, 114, 3684-92.
STUTMAN, O. (1974) Tumor development after 3-methylcholanthrene in
immunologically deficient athymic-nude mice. Science, 183, 534-6.
SWAIN, S. L., CROFT, M., DUBEY, C., HAYNES, L., ROGERS, P., ZHANG, X.
& BRADLEY, L. M. (1996) From naive to memory T cells. Immunol Rev,
150, 143-67.
TAKAHASHI, T., KUNIYASU, Y., TODA, M., SAKAGUCHI, N., ITOH, M.,
IWATA, M., SHIMIZU, J. & SAKAGUCHI, S. (1998) Immunologic self-
tolerance maintained by CD25+CD4+ naturally anergic and suppressive T
cells: induction of autoimmune disease by breaking their anergic/suppressive
state. Int Immunol, 10, 1969-80.
TALLMAN, M. S. (2005) New strategies for the treatment of acute myeloid
leukemia including antibodies and other novel agents. Hematology Am Soc
Hematol Educ Program, 143-50.
TALLMAN, M. S., ANDERSEN, J. W., SCHIFFER, C. A., APPELBAUM, F. R.,
FEUSNER, J. H., OGDEN, A., SHEPHERD, L., WILLMAN, C.,
BLOOMFIELD, C. D., ROWE, J. M. & WIERNIK, P. H. (1997) All-trans-
retinoic acid in acute promyelocytic leukemia. N Engl J Med, 337, 1021-8.
TALLMAN, M. S., GILLILAND, D. G. & ROWE, J. M. (2005) Drug therapy for
acute myeloid leukemia. Blood, 106, 1154-63.
TALMADGE, J. E., MEYERS, K. M., PRIEUR, D. J. & STARKEY, J. R. (1980)
Role of NK cells in tumour growth and metastasis in beige mice. Nature,
284, 622-4.

268
TANGRI, S., ISHIOKA, G. Y., HUANG, X., SIDNEY, J., SOUTHWOOD, S.,
FIKES, J. & SETTE, A. (2001) Structural features of peptide analogs of
human histocompatibility leukocyte antigen class I epitopes that are more
potent and immunogenic than wild-type peptide. J Exp Med, 194, 833-46.
TAO, X., CONSTANT, S., JORRITSMA, P. & BOTTOMLY, K. (1997) Strength of
TCR signal determines the costimulatory requirements for Th1 and Th2
CD4+ T cell differentiation. J Immunol, 159, 5956-63.
THEOLOGIDES, A. (1972) Unfavorable signs in patients with chronic myelocytic
leukemia. Ann Intern Med, 76, 95-9.
THOMAS, D. A., FADERL, S., O'BRIEN, S., BUESO-RAMOS, C., CORTES, J.,
GARCIA-MANERO, G., GILES, F. J., VERSTOVSEK, S., WIERDA, W.
G., PIERCE, S. A., SHAN, J., BRANDT, M., HAGEMEISTER, F. B.,
KEATING, M. J., CABANILLAS, F. & KANTARJIAN, H. (2006)
Chemoimmunotherapy with hyper-CVAD plus rituximab for the treatment of
adult Burkitt and Burkitt-type lymphoma or acute lymphoblastic leukemia.
Cancer, 106, 1569-80.
THOMAS, L. (1959) Discussion of cellular and humoral aspects of the
hypersensitivity states. . In: Lawrence HS, ed. Cellular and Humoral Aspects
of Hypersensitivity. New York, Hoeber-Harper.
THOMPSON, J. A., FIGLIN, R. A., SIFRI-STEELE, C., BERENSON, R. J. &
FROHLICH, M. W. (2003) A phase I trial of CD3/CD28-activated T cells
(Xcellerated T cells) and interleukin-2 in patients with metastatic renal cell
carcinoma. Clin Cancer Res, 9, 3562-70.
THORNTON, A. M. & SHEVACH, E. M. (1998) CD4+CD25+ immunoregulatory
T cells suppress polyclonal T cell activation in vitro by inhibiting interleukin
2 production. J Exp Med, 188, 287-96.
TIEN, H. F., WANG, C. H., LIN, M. T., LEE, F. Y., LIU, M. C., CHUANG, S. M.,
CHEN, Y. C., SHEN, M. C., LIN, K. H. & LIN, D. T. (1995) Correlation of
cytogenetic results with immunophenotype, genotype, clinical features, and

269
ras mutation in acute myeloid leukemia. A study of 235 Chinese patients in
Taiwan. Cancer Genet Cytogenet, 84, 60-8.
TOURDOT, S., SCARDINO, A., SALOUSTROU, E., GROSS, D. A., PASCOLO,
S., CORDOPATIS, P., LEMONNIER, F. A. & KOSMATOPOULOS, K.
(2000) A general strategy to enhance immunogenicity of low-affinity HLA-
A2. 1-associated peptides: implication in the identification of cryptic tumor
epitopes. Eur J Immunol, 30, 3411-21.
TRAVIS, L. B., LI, C. Y., ZHANG, Z. N., LI, D. G., YIN, S. N., CHOW, W. H., LI,
G. L., DOSEMECI, M., BLOT, W., FRAUMENI, J. F., JR. & ET AL.
(1994) Hematopoietic malignancies and related disorders among benzene-
exposed workers in China. Leuk Lymphoma, 14, 91-102.
TRICKETT, A. & KWAN, Y. L. (2003) T cell stimulation and expansion using anti-
CD3/CD28 beads. J Immunol Methods, 275, 251-5.
TSUBOI, A., OKA, Y., UDAKA, K., MURAKAMI, M., MASUDA, T., NAKANO,
A., NAKAJIMA, H., YASUKAWA, M., HIRAKI, A., OJI, Y.,
KAWAKAMI, M., HOSEN, N., FUJIOKA, T., WU, F., TANIGUCHI, Y.,
NISHIDA, S., ASADA, M., OGAWA, H., KAWASE, I. & SUGIYAMA, H.
(2002) Enhanced induction of human WT1-specific cytotoxic T lymphocytes
with a 9-mer WT1 peptide modified at HLA-A*2402-binding residues.
Cancer Immunol Immunother, 51, 614-20.
TURA, S., BACCARANI, M. & CORBELLI, G. (1981) Staging of chronic myeloid
leukaemia. Br J Haematol, 47, 105-19.
TUTTLE, T. M., MCCRADY, C. W., INGE, T. H., SALOUR, M. & BEAR, H. D.
(1993) gamma-Interferon plays a key role in T-cell-induced tumor
regression. Cancer Res, 53, 833-9.
UYTTENHOVE, C., PILOTTE, L., THEATE, I., STROOBANT, V., COLAU, D.,
PARMENTIER, N., BOON, T. & VAN DEN EYNDE, B. J. (2003)
Evidence for a tumoral immune resistance mechanism based on tryptophan
degradation by indoleamine 2,3-dioxygenase. Nat Med, 9, 1269-74.

270
VAJDIC, C. M., MCDONALD, S. P., MCCREDIE, M. R., VAN LEEUWEN, M.
T., STEWART, J. H., LAW, M., CHAPMAN, J. R., WEBSTER, A. C.,
KALDOR, J. M. & GRULICH, A. E. (2006) Cancer incidence before and
after kidney transplantation. JAMA, 296, 2823-31.
VALMORI, D., FONTENEAU, J. F., LIZANA, C. M., GERVOIS, N., LIENARD,
D., RIMOLDI, D., JONGENEEL, V., JOTEREAU, F., CEROTTINI, J. C. &
ROMERO, P. (1998) Enhanced generation of specific tumor-reactive CTL in
vitro by selected Melan-A/MART-1 immunodominant peptide analogues. J
Immunol, 160, 1750-8.
VAN BERGEN, C. A., KESTER, M. G., JEDEMA, I., HEEMSKERK, M. H., VAN
LUXEMBURG-HEIJS, S. A., KLOOSTERBOER, F. M., MARIJT, W. A.,
DE RU, A. H., SCHAAFSMA, M. R., WILLEMZE, R., VAN VEELEN, P.
A. & FALKENBURG, J. H. (2007) Multiple myeloma-reactive T cells
recognize an activation-induced minor histocompatibility antigen encoded by
the ATP-dependent interferon-responsive (ADIR) gene. Blood, 109, 4089-
96.
VAN DEN BROEK, M. E., KAGI, D., OSSENDORP, F., TOES, R., VAMVAKAS,
S., LUTZ, W. K., MELIEF, C. J., ZINKERNAGEL, R. M. &
HENGARTNER, H. (1996) Decreased tumor surveillance in perforin-
deficient mice. J Exp Med, 184, 1781-90.
VAN DER BRUGGEN, P., TRAVERSARI, C., CHOMEZ, P., LURQUIN, C., DE
PLAEN, E., VAN DEN EYNDE, B., KNUTH, A. & BOON, T. (1991) A
gene encoding an antigen recognized by cytolytic T lymphocytes on a human
melanoma. Science, 254, 1643-7.
VAN DER GELD, Y. M., LIMBURG, P. C. & KALLENBERG, C. G. (2001)
Proteinase 3, Wegener's autoantigen: from gene to antigen. J Leukoc Biol,
69, 177-90.
VAN DER WOUDE, F. J., RASMUSSEN, N., LOBATTO, S., WIIK, A., PERMIN,
H., VAN ES, L. A., VAN DER GIESSEN, M., VAN DER HEM, G. K. &
THE, T. H. (1985) Autoantibodies against neutrophils and monocytes: tool

271
for diagnosis and marker of disease activity in Wegener's granulomatosis.
Lancet, 1, 425-9.
VAN STIPDONK, M. J., LEMMENS, E. E. & SCHOENBERGER, S. P. (2001)
Naive CTLs require a single brief period of antigenic stimulation for clonal
expansion and differentiation. Nat Immunol, 2, 423-9.
VARDIMAN, J. W., THIELE, J., ARBER, D. A., BRUNNING, R. D.,
BOROWITZ, M. J., PORWIT, A., HARRIS, N. L., LE BEAU, M. M.,
HELLSTROM-LINDBERG, E., TEFFERI, A. & BLOOMFIELD, C. D.
(2009) The 2008 revision of the World Health Organization (WHO)
classification of myeloid neoplasms and acute leukemia: rationale and
important changes. Blood, 114, 937-51.
VELCULESCU, V. E., ZHANG, L., VOGELSTEIN, B. & KINZLER, K. W. (1995)
Serial analysis of gene expression. Science, 270, 484-7.
VILCHES, C. & PARHAM, P. (2002) KIR: diverse, rapidly evolving receptors of
innate and adaptive immunity. Annu Rev Immunol, 20, 217-51.
VILLEGAS, F. R., COCA, S., VILLARRUBIA, V. G., JIMENEZ, R., CHILLON,
M. J., JARENO, J., ZUIL, M. & CALLOL, L. (2002) Prognostic
significance of tumor infiltrating natural killer cells subset CD57 in patients
with squamous cell lung cancer. Lung Cancer, 35, 23-8.
VIRAPPANE, P., GALE, R., HILLS, R., KAKKAS, I., SUMMERS, K., STEVENS,
J., ALLEN, C., GREEN, C., QUENTMEIER, H., DREXLER, H.,
BURNETT, A., LINCH, D., BONNET, D., LISTER, T. A. &
FITZGIBBON, J. (2008) Mutation of the Wilms' tumor 1 gene is a poor
prognostic factor associated with chemotherapy resistance in normal
karyotype acute myeloid leukemia: the United Kingdom Medical Research
Council Adult Leukaemia Working Party. J Clin Oncol, 26, 5429-35.
VITALE, M., REZZANI, R., RODELLA, L., ZAULI, G., GRIGOLATO, P.,
CADEI, M., HICKLIN, D. J. & FERRONE, S. (1998) HLA class I antigen
and transporter associated with antigen processing (TAP1 and TAP2) down-

272
regulation in high-grade primary breast carcinoma lesions. Cancer Res, 58,
737-42.
WALUNAS, T. L., LENSCHOW, D. J., BAKKER, C. Y., LINSLEY, P. S.,
FREEMAN, G. J., GREEN, J. M., THOMPSON, C. B. & BLUESTONE, J.
A. (1994) CTLA-4 can function as a negative regulator of T cell activation.
Immunity, 1, 405-13.
WANG, H. Y., LEE, D. A., PENG, G., GUO, Z., LI, Y., KINIWA, Y., SHEVACH,
E. M. & WANG, R. F. (2004) Tumor-specific human CD4+ regulatory T
cells and their ligands: implications for immunotherapy. Immunity, 20, 107-
18.
WANG, H. Y., PENG, G., GUO, Z., SHEVACH, E. M. & WANG, R. F. (2005a)
Recognition of a new ARTC1 peptide ligand uniquely expressed in tumor
cells by antigen-specific CD4+ regulatory T cells. J Immunol, 174, 2661-70.
WANG, J., IOAN-FACSINAY, A., VAN DER VOORT, E. I., HUIZINGA, T. W.
& TOES, R. E. (2007) Transient expression of FOXP3 in human activated
nonregulatory CD4+ T cells. Eur J Immunol, 37, 129-38.
WANG, R. F. & ROSENBERG, S. A. (1996) Human tumor antigens recognized by
T lymphocytes: implications for cancer therapy. J Leukoc Biol, 60, 296-309.
WANG, T., HOPKINS, D., SCHMIDT, C., SILVA, S., HOUGHTON, R., TAKITA,
H., REPASKY, E. & REED, S. G. (2000) Identification of genes
differentially over-expressed in lung squamous cell carcinoma using
combination of cDNA subtraction and microarray analysis. Oncogene, 19,
1519-28.
WANG, X., ZHENG, J., LIU, J., YAO, J., HE, Y., LI, X., YU, J., YANG, J., LIU,
Z. & HUANG, S. (2005b) Increased population of CD4(+)CD25(high),
regulatory T cells with their higher apoptotic and proliferating status in
peripheral blood of acute myeloid leukemia patients. Eur J Haematol, 75,
468-76.

273
WARREN, E. H., GREENBERG, P. D. & RIDDELL, S. R. (1998) Cytotoxic T-
lymphocyte-defined human minor histocompatibility antigens with a
restricted tissue distribution. Blood, 91, 2197-207.
WEBB, S. D., SHERRATT, J. A. & FISH, R. G. (2002) Cells behaving badly: a
theoretical model for the Fas/FasL system in tumour immunology. Math
Biosci, 179, 113-29.
WEIDEN, P. L., FLOURNOY, N., THOMAS, E. D., PRENTICE, R., FEFER, A.,
BUCKNER, C. D. & STORB, R. (1979) Antileukemic effect of graft-versus-
host disease in human recipients of allogeneic-marrow grafts. N Engl J Med,
300, 1068-73.
WEIDEN, P. L., SULLIVAN, K. M., FLOURNOY, N., STORB, R. & THOMAS,
E. D. (1981) Antileukemic effect of chronic graft-versus-host disease:
contribution to improved survival after allogeneic marrow transplantation. N
Engl J Med, 304, 1529-33.
WEIGEL, B. J., PANOSKALTSIS-MORTARI, A., DIERS, M., GARCIA, M.,
LEES, C., KRIEG, A. M., CHEN, W. & BLAZAR, B. R. (2006) Dendritic
cells pulsed or fused with AML cellular antigen provide comparable in vivo
antitumor protective responses. Exp Hematol, 34, 1403-12.
WHITESIDE, T. L. (2002) Tumor-induced death of immune cells: its mechanisms
and consequences. Semin Cancer Biol, 12, 43-50.
WHITMAN, S. P., ARCHER, K. J., FENG, L., BALDUS, C., BECKNELL, B.,
CARLSON, B. D., CARROLL, A. J., MROZEK, K., VARDIMAN, J. W.,
GEORGE, S. L., KOLITZ, J. E., LARSON, R. A., BLOOMFIELD, C. D. &
CALIGIURI, M. A. (2001) Absence of the wild-type allele predicts poor
prognosis in adult de novo acute myeloid leukemia with normal cytogenetics
and the internal tandem duplication of FLT3: a cancer and leukemia group B
study. Cancer Res, 61, 7233-9.
WILLIAMS, R. C., JR., STAUD, R., MALONE, C. C., PAYABYAB, J., BYRES,
L. & UNDERWOOD, D. (1994) Epitopes on proteinase-3 recognized by

274
antibodies from patients with Wegener's granulomatosis. J Immunol, 152,
4722-37.
WOOD, P., BURGESS, R., MACGREGOR, A. & YIN, J. A. (1994) P-glycoprotein
expression on acute myeloid leukaemia blast cells at diagnosis predicts
response to chemotherapy and survival. Br J Haematol, 87, 509-14.
WOOD, P. J., SOCARRAS, S. & STREILEIN, J. W. (1987) Modification of the
cytotoxic T cell repertoire in neonatal tolerance. Evidence for preferential
survival of cells with low avidity for tolerogen. J Immunol, 139, 3236-44.
WU, C. J. & RITZ, J. (2006) Induction of tumor immunity following allogeneic
stem cell transplantation. Adv Immunol, 90, 133-73.
WU, F., OKA, Y., TSUBOI, A., ELISSEEVA, O. A., OGATA, K., NAKAJIMA,
H., FUJIKI, F., MASUDA, T., MURAKAMI, M., YOSHIHARA, S.,
IKEGAME, K., HOSEN, N., KAWAKAMI, M., NAKAGAWA, M.,
KUBOTA, T., SOMA, T., YAMAGAMI, T., TSUKAGUCHI, M.,
OGAWA, H., OJI, Y., HAMAOKA, T., KAWASE, I. & SUGIYAMA, H.
(2005) Th1-biased humoral immune responses against Wilms tumor gene
WT1 product in the patients with hematopoietic malignancies. Leukemia, 19,
268-74.
XUE, S. A., GAO, L., HART, D., GILLMORE, R., QASIM, W., THRASHER, A.,
APPERLEY, J., ENGELS, B., UCKERT, W., MORRIS, E. & STAUSS, H.
(2005) Elimination of human leukemia cells in NOD/SCID mice by WT1-
TCR gene-transduced human T cells. Blood, 106, 3062-7.
YANADA, M., TAKEUCHI, J., SUGIURA, I., AKIYAMA, H., USUI, N.,
YAGASAKI, F., KOBAYASHI, T., UEDA, Y., TAKEUCHI, M.,
MIYAWAKI, S., MARUTA, A., EMI, N., MIYAZAKI, Y., OHTAKE, S.,
JINNAI, I., MATSUO, K., NAOE, T. & OHNO, R. (2006) High complete
remission rate and promising outcome by combination of imatinib and
chemotherapy for newly diagnosed BCR-ABL-positive acute lymphoblastic
leukemia: a phase II study by the Japan Adult Leukemia Study Group. J Clin
Oncol, 24, 460-6.

275
YONG, A. S., KEYVANFAR, K., ENIAFE, R., SAVANI, B. N., REZVANI, K.,
SLOAND, E. M., GOLDMAN, J. M. & BARRETT, A. J. (2008)
Hematopoietic stem cells and progenitors of chronic myeloid leukemia
express leukemia-associated antigens: implications for the graft-versus-
leukemia effect and peptide vaccine-based immunotherapy. Leukemia, 22,
1721-7.
YONG, A. S., REZVANI, K., SAVANI, B. N., ENIAFE, R., MIELKE, S.,
GOLDMAN, J. M. & BARRETT, A. J. (2007) High PR3 or ELA2
expression by CD34+ cells in advanced-phase chronic myeloid leukemia is
associated with improved outcome following allogeneic stem cell
transplantation and may improve PR1 peptide-driven graft-versus-leukemia
effects. Blood, 110, 770-5.
YONG, A. S., SZYDLO, R. M., GOLDMAN, J. M., APPERLEY, J. F. & MELO, J.
V. (2006) Molecular profiling of CD34+ cells identifies low expression of
CD7, along with high expression of proteinase 3 or elastase, as predictors of
longer survival in patients with CML. Blood, 107, 205-12.
YOSHIMOTO, M., SAKAMOTO, G. & OHASHI, Y. (1993) Time dependency of
the influence of prognostic factors on relapse in breast cancer. Cancer, 72,
2993-3001.
YOTNDA, P., FIRAT, H., GARCIA-PONS, F., GARCIA, Z., GOURRU, G.,
VERNANT, J. P., LEMONNIER, F. A., LEBLOND, V. & LANGLADE-
DEMOYEN, P. (1998) Cytotoxic T cell response against the chimeric p210
BCR-ABL protein in patients with chronic myelogenous leukemia. J Clin
Invest, 101, 2290-6.
YU, Z., THEORET, M. R., TOULOUKIAN, C. E., SURMAN, D. R., GARMAN, S.
C., FEIGENBAUM, L., BAXTER, T. K., BAKER, B. M. & RESTIFO, N. P.
(2004) Poor immunogenicity of a self/tumor antigen derives from peptide-
MHC-I instability and is independent of tolerance. J Clin Invest, 114, 551-9.
ZAREMBA, S., BARZAGA, E., ZHU, M., SOARES, N., TSANG, K. Y. &
SCHLOM, J. (1997) Identification of an enhancer agonist cytotoxic T

276
lymphocyte peptide from human carcinoembryonic antigen. Cancer Res, 57,
4570-7.
ZENKLUSEN, J. C. & CONTI, C. J. (1996) Cytogenetic, molecular and functional
evidence for novel tumor suppressor genes on the long arm of human
chromosome 7. Mol Carcinog, 15, 167-75.
ZHANG, L., CONEJO-GARCIA, J. R., KATSAROS, D., GIMOTTY, P. A.,
MASSOBRIO, M., REGNANI, G., MAKRIGIANNAKIS, A., GRAY, H.,
SCHLIENGER, K., LIEBMAN, M. N., RUBIN, S. C. & COUKOS, G.
(2003) Intratumoral T cells, recurrence, and survival in epithelial ovarian
cancer. N Engl J Med, 348, 203-13.
ZHANG, W. G., LIU, S. H., CAO, X. M., CHENG, Y. X., MA, X. R., YANG, Y. &
WANG, Y. L. (2005) A phase-I clinical trial of active immunotherapy for
acute leukemia using inactivated autologous leukemia cells mixed with IL-2,
GM-CSF, and IL-6. Leuk Res, 29, 3-9.
ZHANG, X., SUN, S., HWANG, I., TOUGH, D. F. & SPRENT, J. (1998) Potent
and selective stimulation of memory-phenotype CD8+ T cells in vivo by IL-
15. Immunity, 8, 591-9.
ZOU, W. (2005) Immunosuppressive networks in the tumour environment and their
therapeutic relevance. Nat Rev Cancer, 5, 263-74.
ZWEERINK, H. J., GAMMON, M. C., UTZ, U., SAUMA, S. Y., HARRER, T.,
HAWKINS, J. C., JOHNSON, R. P., SIROTINA, A., HERMES, J. D.,
WALKER, B. D. & ET AL. (1993) Presentation of endogenous peptides to
MHC class I-restricted cytotoxic T lymphocytes in transport deletion mutant
T2 cells. J Immunol, 150, 1763-71.

277
8. APPENDIX

278
Contents
Papers
Paper I: Enhancement of lytic activity of leukemic cells by CD8+ cytotoxic T
lymphocytes generated against a WT1 peptide analogue.
Paper II: The Wilms’ tumor antigen is a novel target for human CD4+regulatory T
cells: implications for immunotherapy.
Paper III: Identification of a novel peptide derived from the M-phase
phosphoprotein 11 (MPP11) leukemic antigen recognized by human CD8+
cytotoxic T lymphocytes.
Posters
Poster I: Investigation of M-Phase Phosphoprotein (MPP11) as a Novel Target for
Leukemia T Cell Immunotherapy. Presented at the British Society of Immunology
Congress, Harrogate, UK, 6-9 December 2005. Published in the Immunology, 2005,
116, Suppl 1, p 89.
Poster II: CD8+ cytotoxic T lymphocytes generated against a WT1 peptide analog
enhance the lytic activity of leukemic cells. Presented at the 20th Meeting of the
European Association for cancer research Conference Lyon, France, 5-8 June 2008.
Published in European Journal of Cancer Supplements, 2008, 6, P 168.
Output of HLA Peptide-Binding Prediction Programs
Ethics Approval Letters

ORIGINAL ARTICLE: RESEARCH
Enhancement of lytic activity of leukemic cells by CD8þ cytotoxic Tlymphocytes generated against a WT1 peptide analogue
GHOFRAN AL QUDAIHI1,2, CYNTHIA LEHE1, MUNA NEGASH1,
MONTHER AL-ALWAN1, HAZEM GHEBEH1, SAID YOUSUF MOHAMED3,
ABU-JAFAR MOHAMMED SALEH3, HIND AL-HUMAIDAN4, ABDELGHANI TBAKHI5,
ANNE DICKINSON2, MAHMOUD ALJURF3, & SAID DERMIME1
1Tumor Immunology Section, King Faisal Specialist Hospital and Research Centre, Riyadh, Saudi Arabia, 2Department of
Haematological Sciences, School of Clinical and Laboratory Sciences, Medical School University of Newcastle Upon Tyne, UK,3Department of Adult Hematology/Oncology, 4Blood Bank, and 5Department of Immunopathology, King Faisal Specialist
Hospital and Research Centre, Riyadh, Saudi Arabia
(Received 19 July 2008; revised 20 September 2008; accepted 22 October 2008)
AbstractThe Wilms tumor antigen 1 (WT1) antigen is over-expressed in human leukemias, making it an attractive target forimmunotherapy. Most WT1-specific Cytotoxic T Lymphocytes (CTLs) described so far displayed low avidity, limiting itsfunction. To improve the immunogenicity of CTL epitopes, we replaced the first-amino-acid of two known immunogenicWT1-peptides (126 and 187) with a tyrosine. This modification enhances 126Y analogue-binding ability, triggers significantnumber of IFN-g-producing T cells (P¼ 0.0003), induces CTL that cross-react with the wild-type peptide, exerts asignificant lytic activity against peptide-loaded-targets (P¼ 0.0006) and HLA-A0201-matched-leukemic cells (P¼ 0.0014).These data support peptide modification as a feasible approach for the development of a leukemia-vaccine.
Keywords: WT1 Db126 analogue, CD8þ CTL, AML, peptide modification, dendritic cells, immunotherapy
Introduction
Cytotoxic T Lymphocytes (CTLs) recognise tumor
antigens in the form of short peptides (CTL
epitopes) presented by MHC class I molecules on
the cell surface of an antigen presenting cell [1]. In
the last few years, a large number of tumor antigens
and their corresponding CTL epitopes have been
identified in several hematological malignancies and
solid tumors [1,2]. The Wilms tumor antigen 1
(WT1), a gene that has been shown to be responsible
for the childhood renal cancer [3], performs an
oncogenic function in various types of leukemia [4]
and solid tumors [5]. This antigen has been shown to
serve as marker for disease burden [6–9]. It is
overexpressed in acute myelocytic and lymphocytic
leukemia, chronic myelocytic leukemia and also in
various types of solid tumors including lung and
breast cancer [10–12]. For this reason, it has been
considered as an attractive target for immunother-
apy. Because WT1 has been shown to be expressed
at low levels in some normal cells such as CD34þ
stem cells [13,14], many of the potential CTL
epitopes against this antigen may be absent or sub-
optimal. This is mainly due to clonal deletion of
high-avidity CTLs during maturation of the im-
mune system [15]. To this end, different groups
introduced modifications in the sequence of these
‘sub-optimal’ peptides to improve their binding to
HLA class I molecules and to increase their
immunogenicity [16–19]. For example, substitution
of amino acid residues pointing to the T cell
Correspondence: Said Dermime, Tumor Immunology Section, King Faisal Specialist Hospital & Research Centre, MBC 03, PO Box 3354, Riyadh 11211,
Saudi Arabia. Tel: þ966-1-442-4552. Fax: þ966-1-442-7858. E-mail: [email protected] or [email protected]
Leukemia & Lymphoma, February 2009; 50(2): 260–269
ISSN 1042-8194 print/ISSN 1029-2403 online � 2009 Informa Healthcare USA, Inc.
DOI: 10.1080/10428190802578478
Leu
k L
ymph
oma
Dow
nloa
ded
from
info
rmah
ealth
care
.com
by
Uni
vers
ity o
f N
ewca
stle
Upo
n T
yne
on 0
7/29
/10
For
pers
onal
use
onl
y.

receptor has been shown to enhance epitope
immunogenicity [20,21]. Some of these modified
peptides have been effectively used to vaccinate
cancer patients [22], to improve the detection
of anti-tumor immunity [19], or to reverse the
irresponsiveness of T lymphocytes to wild-type
tumor antigens [21]. Indeed, vaccination of cancer
patients with WT1-modified peptides induced
WT1-specific CTLs and resulted in tumor
regression [23].
It has been demonstrated that WT1 specific CTLs
isolated from leukemia patients exert a low-avidity
response [24,25]. In the present study, we explored
the feasibility of using an approach that enhances
the immunogenicity of these low-avidity restricted-
peptides without altering their antigenic specificity
[26]. This approach consists of replacing the first
amino acid of the epitope by a tyrosine (P1Y).
The advantage of this approach is that the P1Y
variants are able to efficiently trigger in vivo wild-type
peptide-specific CTLs which also recognised the
naturally occurring epitope [26]. We have carried out
the Y amino acid substitution in the sequence of the
126 and 187 WT1-derived peptides. We have
selected these two peptides as they were reported to
be presented by the most common HLA allele
(HLA-A0201 present in 50% of the population)
and exert specific lysis against WT1-expressing
leukemia cells [27].
Our study demonstrated that the replacement of
the first amino acid of WT1–126 with tyrosine
(126Y) enhanced its binding to HLA-A0201 mole-
cule and increased the CTL lytic activity not only to
the 126Y epitope but also to the wild-type 126N
counterpart. This modification also enhanced the
frequency of the IFN-g producing T cells and
increased the CTL lytic activity against HLA-
A0201-matched leukemic cells. Interestingly, we
found that the primed T cells generated against this
modified peptide can cross-react with the wild-type
peptide.
Materials and methods
Cell lines
The T2 and K562 cell lines were purchased from
ATCC (Manassas, VA). B-lymphoblastoid cell Lines
(LCL) were established by transformation of B cells
using Epstein–Barr virus using standard techniques
[28]. The T2, LCL and K562 cells were maintained
in complete medium (CM) consisting of RPMI 1640
medium (Sigma, MO) supplemented with 10% FCS
(Cambrex Bio Science, MD), 2 mM L-glutamine,
100 IU/mL penicillin and 100 mg/mL streptomycin
(Sigma).
Peptides
A Y amino acid substitution in the sequence of the
following WT1 peptides was carried out: Peptide 126
(wild type 126N¼RMFPNAPYL, analogue
126Y¼YMFPNAPYL), and peptide 187 (wild type
187N¼SLGEQQYSV, analogue 187Y¼YLGE
QQYSV). The peptides were synthesised and
HPLC-purified to �90% purity by Alta Bioscience,
Birmingham, UK.
Prediction of peptide-binding to the HLA-A*0201
molecule and in vitro binding ability of the peptides using
the T2 binding assay
We first compared the predictive binding ability of
the wild-type (126N and 187N) peptides with their
corresponding analogues (126Y and 187Y) to the
HLA-A*0201 molecule using a computer-based
epitope prediction program (http://bimas.dcrt.nih.
gov/molbio/hla_bind). Peptide binding capacity to
the HLA-A*0201 molecule was then measured using
the T2 binding assay described previously [29]. T2
cells are a hybrid human cell line which lacks most of
the MHC class I region including the known
transporter proteins for antigenic peptide (TAP)
and proteasome genes. They contain the gene
HLA-A*0201, but express very low levels of cell-
surface HLA-A*0201 and are unable to present
endogenous antigens [30]. Stable HLA-A2.1 expres-
sion in T2 cells is observed only when peptides that
are capable of binding to and stabilising the cell
surface expression of the HLA-A2.1 molecule are
added exogenously. T2 cells were washed three times
in serum-free CM and suspended at 106 cells/mL.
Cells (106 cells/well) were incubated for 18 h in
serum-free CM containing different concentrations
of peptides and 1 mg/mL b2-microglobulin (Sigma).
The cells were washed twice with cold PBS contain-
ing 2% FCS and incubated for 30 min at 48C with
anti-HLA-A2.1 BB7.2 monoclonal antibody conju-
gated to FITC ((AbD Serotec, NC). The cells were
washed three times and fixed with 4% paraformalde-
hyde. The level of HLA-A2 expression was analysed
using FACS Scan (Becton & Dickinson, Immuno-
cytometry Systems, CA). HLA-A2 expression was
quantified as fluorescence index according to the
following formula: fluorescence index¼ (mean fluor-
escence intensity with peptide (mean fluorescence
intensity without peptide)/mean fluorescence
intensity without peptide.
Isolation of peripheral blood mononuclear cells
Peripheral blood mononuclear cells (PBMCs) from
patients with leukemia and healthy donors were
Peptide analogue enhances leukemia lysis 261
Leu
k L
ymph
oma
Dow
nloa
ded
from
info
rmah
ealth
care
.com
by
Uni
vers
ity o
f N
ewca
stle
Upo
n T
yne
on 0
7/29
/10
For
pers
onal
use
onl
y.

isolated from blood samples by density gradient
centrifugation over Ficoll–Paque PLUS (Amersham
Biosciences AB, Uppsala, Sweden). Written in-
formed consent was obtained from patients and
donors prior to sample collection. The cells were
aliquoted and cryopreserved in 90% FCS þ 10%
DMSO according to pre-established procedures.
The HLA typing of these samples were carried out
at the Immunopathology Laboratory (King Faisal
Specialist Hospital and Research Centre) and HLA-
A*0201þ subjects were selected. The patients and
donor information are presented in Table I.
Generation of autologous monocytes derived dendritic cells
Monocytes (CD14þ cells) were isolated from
PBMCs of a healthy donor, designated as BC-32,
using MACS human Monocytes Isolation kit II
(Miltenyi Biotec, Bergisch Gladbach, Germany)
according to the manufacturer’s instructions. The
CD14þ cells were adhered and cultured in 24-well
plates in X-vivo 15 medium (BioWhittaker, MD)
supplemented with 2 mM L-glutamine (DC-med-
ium) in the presence of 50 ng/mL rhIL-4 and
100 ng/mL rhGM-CSF (R&D Systems, MN).
20 ng/mL rhTNF-a, (R&D Systems), 10 ng/mL
rhIL-1b (eBioscience, CA) and 25 mg/mL Poly I:C
(Sigma) were added on day 6 and mature dendritic
cells (DCs) were harvested on day 8.
Generation of anti-WT1 126N and 126Y peptide
specific CTLs
CD8þ T lymphocytes were separated from PBMCs
obtained from healthy HLA-A2-positive donors
using MACS Cell Isolation Kits according to
manufacturer’s protocols. CD8þ T lymphocytes
were stimulated in vitro with the 126N or 126Y
peptides loaded on DCs. Briefly, the DCs growing in
X-vivo 15 medium were washed once in the same
medium and incubated with the peptides at concen-
tration of 50 mM/mL and 5 mg/mL b2-microglobulin
for 2 h at 378C. The peptide loaded DCs were then
X irradiated (2500 rads), washed once and added to
the CD8þ T lymphocytes at 5:1 T lymphocytes:
DCs ratio. IL-7 (20 ng/mL) and IL-12 (100 pg/mL)
were added to each culture. The cells were incubated
in 2 mL DC-medium þ 10% heat inactivated human
AB serum (Sigma) in 24-well plates. After 7 days of
co-culture, a similar second stimulation was per-
formed, and on the following day, IL-2 (20 IU/mL)
was added (the cultured cells were maintained by
weekly stimulation with peptide-loaded DCs and
feeding with IL-2 the next day). Two T cell lines
against the two different peptides were generated.
Responder T lymphocytes were tested for cytotoxic
activity (Chromium Release Assay) and IFN-gproduction (ELISPOT Assay) against different tar-
gets. Cross-reactivity between the peptides was also
tested to determine if the analogue peptide 126Y is
able to induce immune response against the native
126N peptide.
Quantitative real time RT-PCR for WT1 expression in
patients’ leukemic cells
Total RNA was isolated from PBMC-32, AML-27
and AML-28 samples (see Table I) and treated with
DNase1 (Invitrogen, CA). For cDNA synthesis, 1 mg
RNA using oligo-dT-primers and M-MLV RT
(Invitrogen) were used in a total volume of 25 mL.
The WT1 mRNA expression was quantified using
Light Cycler FastStart DNA master SYBR Green 1
kit (Roche, Mannheim, Germany) in a Light Cycler
(Roche). PBGD was used as house-keeping gene.
2 mL cDNA from the K562 cells was used to
generate standard curves [31] in 5-log steps for
WT1 and PBGD. Amplification was conducted in a
total volume of 20 mL for 40 cycles/10 sec at 958C, 4
sec/648C and 35 sec/728C. Samples were run in
triplicates and their relative expression was deter-
mined by normalising the expression of each target to
PBGD and then comparing this to the normalised
expression in a reference sample (K562) to calculate
a fold-change-value. Forward primer: TTCATC
AAACAGGAGCCGAGC and reverse primer:
Table I. Information for patients and donors used in the study.
Donor/patient samples HLA-A type % Blasts* QRT-PCR WT 1 mRNA{ Status{ FAB-typex
PBMCC-32 A0201, 29 NA 60 NA NA
AML-27 25, 29 81 7950 New M4
AML-28 A0201, 26 61 1800 New M4
*% blasts were determined routinely by the hematopathology laboratory.{Quantative real-time PCR data for the expression level of WTl which normalised from K562 set on 1000.{New indicates that samples were taken at first diagnosis.xFrench–American–British classification.
Na, not applicable.
262 G. Al Qudaihi et al.
Leu
k L
ymph
oma
Dow
nloa
ded
from
info
rmah
ealth
care
.com
by
Uni
vers
ity o
f N
ewca
stle
Upo
n T
yne
on 0
7/29
/10
For
pers
onal
use
onl
y.

GGTGCGAGGGCGTGTGA were used for WT1.
For PBGD, forward primer: CATGTCTGG
TAACGGCAATG and reverse primer: TCTTCT
CCAGGGCATGTTCAA were used.
Chromium release assay
Target cells were removed from culture, washed in
RPMI1640 serum-free medium, re-suspended in a
minimal volume of RPMI1640 and incubated with51Cr (100 mCi) per target for 90 min. Target cells
labelled with peptide were concurrently incubated
with the appropriate peptide at 50 mM/mL. The
target cells were then washed and placed in 96 V-
bottomed wells at 103 cells/100 mL/well. The effector
T cells were washed, and added in triplicate at
varying quantities to the target cells, to give varying
effector to target ratios (E:T ratios) in a final volume
of 200 mL/well. The plates were spun for 5 min
(300g) and incubated for 4 h at 378C before 100 mL
supernatants were removed and transferred to 1450
Microbeta Plus Wallac plates (Wallac, Turku, Fin-
land). 150 mL scintillation fluid, Optiphase HiSafe 2
(Wallac) was added to each well and the plates were
heat-sealed using a Microsealer system (Wallac).
Chromium release was assessed by a liquid scintilla-
tion counter (Wallac). Target cells were also in-
cubated with 0.2% Tween 20 or medium alone to
assess the maximum and minimal (spontaneous)
release of the chromium respectively. Spontaneous
release was never exceeding 20% of the maxi-
mum release. Percent specific lysis was calculated as:
% Specific lysis ¼ðexperimental release
� spontaneous releaseÞ=ðmaximal release
� spontaneous releaseÞ � 100:
In some experiments blocking antibody
(10 mg/mL) anti-class I ABC (AbD Serotec, NC)
was added to target cells before adding T cells.
ELISPOT assay
An ELISPOT assay for IFN-g production by the
generated T cell lines was performed using an IFN-gkit (Mabtech, OH) according to the manufacturer’s
protocol. 20 000 T cells/well and 2000 cells/well of
different stimulators were seeded in Multiscreen 96-
well plates (Millipore, MA) pre-coated overnight
(48C) with catching-antibody (1-D1K). After 40 h
incubation (378C, 5% CO2), cells were removed and
after washing, Biotinylated-IFN-g antibody was
added for 3 h at room temperature (RT). After
washing, Streptavidin ALP was added to each
well and incubated at RT for 2 h. After washing,
100 mL/well of BCIP/NBT substrate (Sigma) was
added to each well and incubated at RT until colour
developed according to the manufacturer’s instruc-
tions. Spots were counted using an automated
ELISPOT reader (AID, Strasberg, Germany). Anti-
gen-specific T cell frequencies were considered to be
increased when they were at least two-fold higher
than in the control wells.
Statistical analysis
Comparative analysis was performed by the Student t
test. A P value less than or equal to 0.05 was deemed
to be significant in all experiments.
Results
Identification of peptides predicted to highly bind to
the HLA-A0201 molecule
HLA-A0201 is one of the most common allele in the
whole population. Thus, we aimed to identify
peptides with enhanced binding to HLA-A0201
that can be recognised by the T cell receptors. This
approach may afford peptides that would induce
CTL recognising modified peptides with stronger
affinity compared with CTL induced with unmodi-
fied peptides. To this end, we modified the two WT1
peptides, which are known to be HLA-A0201
restricted peptides [27], by substituting the amino
acid at position 1 with tyrosine (Y). The binding of
the wild-type peptides (126N and 187N) was
compared with their corresponding analogues
(126Y and 187Y) to the HLA-A0201 molecule using
a computer-based epitope prediction program
(http://bimas.dcrt.nih.gov/molbio/hla_bind/). Our
data (Figure 1) demonstrated that this tyrosine
Figure 1. Prediction of the wild-type (WT1-126N, WT1-187N)
and the modified (WT1-126Y, WT1-187Y) peptides and their
binding affinities to the HLA-A02 01 molecule as predicted by the
computer-based epitope prediction program (http://bimas.dcrt.
nih.gov/molbio/hla_bind/).
Peptide analogue enhances leukemia lysis 263
Leu
k L
ymph
oma
Dow
nloa
ded
from
info
rmah
ealth
care
.com
by
Uni
vers
ity o
f N
ewca
stle
Upo
n T
yne
on 0
7/29
/10
For
pers
onal
use
onl
y.

modification resulted in 4.6-fold increase in the
estimated half-time of disassociation of the modified
peptides to HLA-A0201 compared with their native
counterparts.
The computer-based epitope prediction program
has only 60–80% predictive accuracy. Therefore, we
directly measured the strength of the interaction
between these peptides and the HLA-A0201 mole-
cules using the T2 binding assay described above.
We observed enhanced binding of the 126Y analogue
peptide compared to the wild-type 126N peptide at
all doses tested (Figure 2A). Although 50 mM of the
126N peptide is needed to achieve a 2.5 fluorescence
index, only 15 mM of the 126Y peptide was able to
reach the 2.5 fluorescence index. However, modifi-
cation of the 187 peptide (187Y) did not enhance its
binding ability and stabilisation of the HLA-A0201
molecules (Figure 2B). These data show a selective
enhancement of peptide binding to HLA-A0201
after modification, thus give us a good model to test
the effect of this process on the function of T cell
generated.
Enhanced cytotoxicity of CTL generated against
WT1-126Y
Because only the 126Y analogue peptide but not
the 187Y peptide showed a high binding affinity to
the HLA-A0201 molecule compared to their
peptides counterparts, we tested the effect of
tyrosine modification of the WT-126 peptide on
its ability to induce specific CTL compared with its
wild-type peptide. We used an optimised T-cell
activation protocol, with CD14þ monocytes-derived
DC as antigen presenting cells, and purified CD8þ
T cells to investigate whether the new synthetic
WT1 (126Y) analogue could stimulate peptide-
specific CTLs. After three to five rounds of
stimulations, the generated T cell lines were tested
against the T2 cells in the presence or absence of
autologous peptide using a Chromium Release
Assay and an IFN-g ELISPOT assay. Cross-
reactivity between the two peptides was also tested
to determine if the analogue peptide 126Y is able
to induce immune response to the native peptide
(126N).
The lysis activity of the T cell lines generated
against 126N and 126Y are presented in Figure 3(A)
and (B), respectively. Specific lysis was recorded
against the T2 cells for both T cell lines raised against
the 126N peptide and its 126Y analogue, because
there was no T cell response against the T2 cells in
the absence of the peptides. However, a significantly
(P¼ 0.0006) higher lytic activity was recorded when
the T cell line raised against the 126Y modified
peptide was used (Figure 3A versus Figure 3B).
Interestingly, we found cross reactivity of each T cell
line with the opposite peptide. In this, the T cell line
generated against the wild-type 126N peptide was
able to equally lyse the T2 cells loaded with the 126N
or the 126Y. Similar results were obtained for the T
cell line generated against the analogue 126N
peptide. To confirm that the T cells response
generated against both the wild-type 126N and the
126Y peptides is restricted to the HLA-A0201
molecule, an HLA blocking assay was performed.
Blocking of the HLA-ABC resulted in a strong
inhibition of the cytotoxic activity of both T cell lines
against peptide-loaded T2 cells [Figure 3(C)].
However, the isotype control did not inhibit the
cytotoxic activity of this T cell lines. These data show
that the tyrosine modification of the WT1-126
peptide, which enhanced their binding to HLA-
A0201, can increase its lytic activity not only to the
126Y epitope, but also to the wild-type 126N
counterpart.
Figure 2. HLA-A0201 epitope enhancement of the WT1-126N wild-type peptide by an amino acid substitution (Y) at position 1 (126Y)
analogue peptide (A) and no enhancement in the case of peptide 187Y (B) as measured by the T2 stabilisation. The assay was conducted as
described in Materials and methods section. The HLA-A0201 expression by the T2 cells was quantified as fluorescence index according to
the following formula: fluorescence index¼ (mean fluorescence intensity with peptide – mean fluorescence intensity without peptide)/mean
fluorescence intensity without peptide.
264 G. Al Qudaihi et al.
Leu
k L
ymph
oma
Dow
nloa
ded
from
info
rmah
ealth
care
.com
by
Uni
vers
ity o
f N
ewca
stle
Upo
n T
yne
on 0
7/29
/10
For
pers
onal
use
onl
y.

WT1-126Y peptide increased the frequency of IFN-gproducing T cells
The 126N and the 126Y T cell lines were tested for
the frequency of IFN-g producing T cells after three
rounds of in vitro stimulation using an ELISPOT
assay. Both T cell lines produced specific IFN-g in
response to stimulation with autologous LCL loaded
with their corresponding peptide (Figure 4). How-
ever, the T cell line generated with the analogue
126Y peptide exerted a significantly higher number
(P¼ 0.0003) of IFN-g producing T cells compared
with that generated against the 126N wild-type
peptide (Figure 4). These data demonstrate that
modification of the WT1-126 peptide can increase
the frequency of IFN-g producing T cells and thus
making them better effector cells.
Evaluation of WT1 expression and lytic activity of
anti-WT1 T cell lines against HLA-A0201-matched
leukemic cells
Given the above, we tested the feasibility of using this
modification approach of the WT1-126 peptide to
generate CTLs that effectively kill HLA-A0201-
matched leukemic cells. We first examined the expres-
sion of the WT1 mRNA in fresh AML cells (AML-27
and AML-28) using Q-RT-PCR. K562 cells, known to
express high levels of WT1 [31] were used as a positive-
control. PBMC-32 from a normal donor served as a
negative control. Higher levels of WT1 expression
were observed in AML samples (Table I). The lytic
activity of the two T cell lines generated against the
126N and 126Y peptides were then measured against
PBMCs from HLA-A0201-matched (AML-28) and
Figure 3. Cytotoxicity assay with T cells from a healthy HLA-A0201 donor after multiple stimulations in vitro. T cells were stimulated in vitro
following the protocol described in Material and methods section with the peptides. (A) Specific lysis of the 126N T cell line and its cross-
reactivity with the analogue 126Y peptide. (B) Specific lysis of the 126Y T cell line and its cross-reactivity with the wild-type 126N peptide.
(C) Inhibition of lytic activity after blocking with anti-ABC antibody showing the restriction response to the HLA-A0201 molecule. Ab was
added to the wells containing T2 cells 20 min before the addition of T cells. P value between A and B¼0.0006.
Peptide analogue enhances leukemia lysis 265
Leu
k L
ymph
oma
Dow
nloa
ded
from
info
rmah
ealth
care
.com
by
Uni
vers
ity o
f N
ewca
stle
Upo
n T
yne
on 0
7/29
/10
For
pers
onal
use
onl
y.

non-HLA-A0201 matched (AML-27) AML patients.
Specific lytic activity was recorded for both T cell
lines against the AML-28 cells expressing the
HLA-A0201 molecule (Figure 5). However, both
T cell lines failed to recognise non-HLA-A0201
AML-27 although they express high levels of WT1
(Figure 5). Interestingly, the T cell line generated
with the analogue 126Y peptide exerted a signifi-
cantly higher lytic activity (P¼ 0.0014) compared
with that generated against the 126N wild-type
peptide (Figure 5). Altogether, the modified WT1-
126Y enhanced its binding to HLA-A0201, in-
creased the frequency of IFN-g producing T cells,
and boosted the lytic activity against HLA-matched
leukemia cells. Thus, modification of the WT1-126
peptide provides a potential approach for the devel-
opment of leukemia vaccine.
Discussion
Most tumor associated antigens which have been
identified so far are derived from self-antigens.
Immunological tolerance can prevent the develop-
ment of immune responses against such self-anti-
gens. Therefore, most self/tumor antigens used in
clinical trials so far showed poor immunogenicity. To
circumvent the problem of tolerance, Stauss
et al. [32,33] developed an allo-restricted CTL
against leukemia. In this approach, T cells from
HLA-A0201þ donors were stimulated with peptide-
loaded HLA-A0201-matched APCs. This allows the
generation of high-avidity allo-restricted CTLs
against an HLAA0201 WT1-derived epitope. Inter-
estingly, the generated CTLs specifically lysed
WT1þ, HLA-A0201-matched leukemia cells. More
importantly, only the high-avidity CTLs were able to
eliminate the progenitors of CFU-GM and BFU-
GM from CD34þ CML samples, whereas normal
CD34þ progenitors/stem cells were spared [32,33].
However, as allogeneic APCs usually provoke domi-
nant CTL responses against allogeneic epitopes, the
isolation of HLA-A0201-WT1 peptide-specific allo-
geneic CTLs was unsuccessful in many cases.
Another drawback of this strategy is the difficultly
in applying such an approach in the clinical settings.
A more promising approach has been recently
developed by the same group, which rely on
introducing the WT1-specific TCR into autologous
T cells for possible future clinical applications [34].
Because the WT1 is a self-protein expressed at low
levels in some normal cells [35,36], many of the
potential CTL epitopes from this antigen may be
absent or ‘sub-optimal’. This is due to clonal deletion
of high-avidity CTLs during maturation of the
immune system. Therefore, the induction of anti-
tumor immune responses frequently needs to be
addressed against those ‘sub-optimal’ CTL epitopes
to enhance their immunogenicity, frequency and
hence their therapeutic potential. In addition, natu-
rally arising CD25þCD4þ regulatory T cells (Tregs),
play an important role in the maintenance of
immunologic self-tolerance [37]. Although this T
cell population plays a key role in regulating the
immune response to self antigen, it has been shown
recently that Tregs can directly suppress the anti-
tumor immune responses in cancer patients [38–41].
Indeed, another group demonstrated that the
depletion of this T cell population resulted in
an enhancement of vaccine-mediated anti-tumor
Figure 4. Specific production of IFN-g by the two T cell lines
generated against the wild type 126N and its analogue 126Y
peptides as measured by an ELISPOT assay. T cells (26 104 cell/
well) were stimulated with 26103 cell/well autologous
LCL+peptide for 40 h in anti-IFN-g pre-coated wells before
development of the spots. T cells incubated without stimulators
(T cell only) served as a baseline.
Figure 5. Cytotoxicity assay showing the lytic activity of the 126N
and 126Y T cell lines against HLA-A0201-matched (AML-28)
and non-matched AML-27 cells. T cells were used after three
rounds of stimulations.
266 G. Al Qudaihi et al.
Leu
k L
ymph
oma
Dow
nloa
ded
from
info
rmah
ealth
care
.com
by
Uni
vers
ity o
f N
ewca
stle
Upo
n T
yne
on 0
7/29
/10
For
pers
onal
use
onl
y.
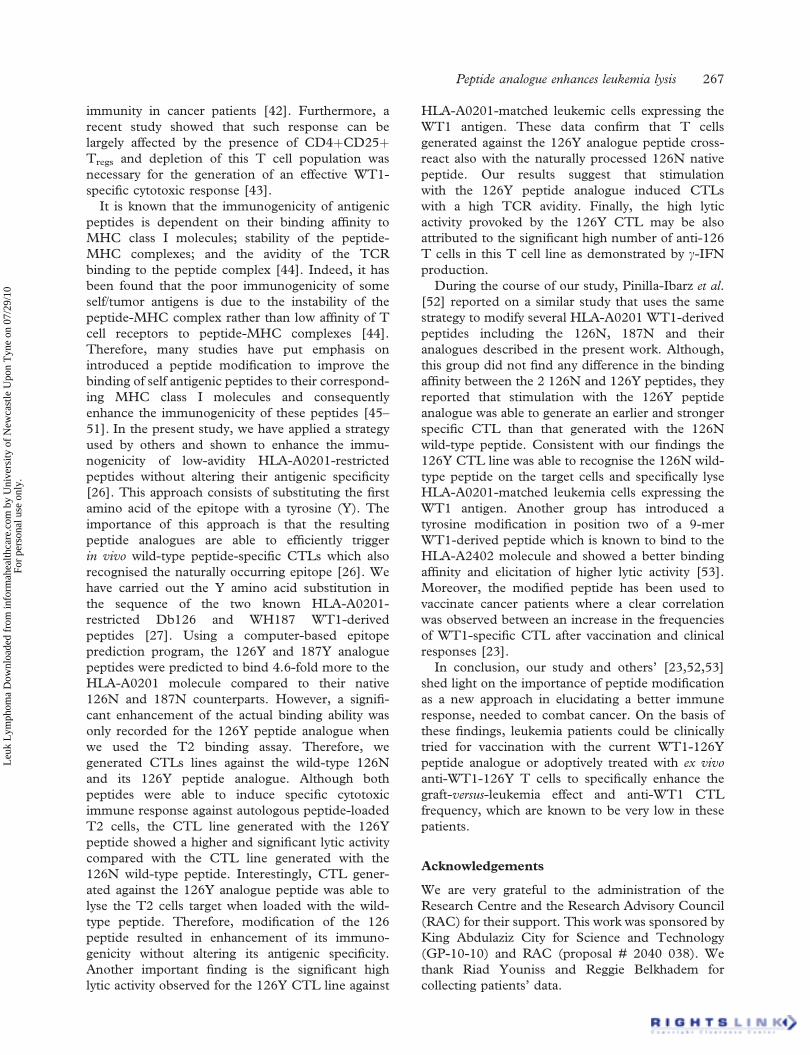
immunity in cancer patients [42]. Furthermore, a
recent study showed that such response can be
largely affected by the presence of CD4þCD25þTregs and depletion of this T cell population was
necessary for the generation of an effective WT1-
specific cytotoxic response [43].
It is known that the immunogenicity of antigenic
peptides is dependent on their binding affinity to
MHC class I molecules; stability of the peptide-
MHC complexes; and the avidity of the TCR
binding to the peptide complex [44]. Indeed, it has
been found that the poor immunogenicity of some
self/tumor antigens is due to the instability of the
peptide-MHC complex rather than low affinity of T
cell receptors to peptide-MHC complexes [44].
Therefore, many studies have put emphasis on
introduced a peptide modification to improve the
binding of self antigenic peptides to their correspond-
ing MHC class I molecules and consequently
enhance the immunogenicity of these peptides [45–
51]. In the present study, we have applied a strategy
used by others and shown to enhance the immu-
nogenicity of low-avidity HLA-A0201-restricted
peptides without altering their antigenic specificity
[26]. This approach consists of substituting the first
amino acid of the epitope with a tyrosine (Y). The
importance of this approach is that the resulting
peptide analogues are able to efficiently trigger
in vivo wild-type peptide-specific CTLs which also
recognised the naturally occurring epitope [26]. We
have carried out the Y amino acid substitution in
the sequence of the two known HLA-A0201-
restricted Db126 and WH187 WT1-derived
peptides [27]. Using a computer-based epitope
prediction program, the 126Y and 187Y analogue
peptides were predicted to bind 4.6-fold more to the
HLA-A0201 molecule compared to their native
126N and 187N counterparts. However, a signifi-
cant enhancement of the actual binding ability was
only recorded for the 126Y peptide analogue when
we used the T2 binding assay. Therefore, we
generated CTLs lines against the wild-type 126N
and its 126Y peptide analogue. Although both
peptides were able to induce specific cytotoxic
immune response against autologous peptide-loaded
T2 cells, the CTL line generated with the 126Y
peptide showed a higher and significant lytic activity
compared with the CTL line generated with the
126N wild-type peptide. Interestingly, CTL gener-
ated against the 126Y analogue peptide was able to
lyse the T2 cells target when loaded with the wild-
type peptide. Therefore, modification of the 126
peptide resulted in enhancement of its immuno-
genicity without altering its antigenic specificity.
Another important finding is the significant high
lytic activity observed for the 126Y CTL line against
HLA-A0201-matched leukemic cells expressing the
WT1 antigen. These data confirm that T cells
generated against the 126Y analogue peptide cross-
react also with the naturally processed 126N native
peptide. Our results suggest that stimulation
with the 126Y peptide analogue induced CTLs
with a high TCR avidity. Finally, the high lytic
activity provoked by the 126Y CTL may be also
attributed to the significant high number of anti-126
T cells in this T cell line as demonstrated by g-IFN
production.
During the course of our study, Pinilla-Ibarz et al.
[52] reported on a similar study that uses the same
strategy to modify several HLA-A0201 WT1-derived
peptides including the 126N, 187N and their
analogues described in the present work. Although,
this group did not find any difference in the binding
affinity between the 2 126N and 126Y peptides, they
reported that stimulation with the 126Y peptide
analogue was able to generate an earlier and stronger
specific CTL than that generated with the 126N
wild-type peptide. Consistent with our findings the
126Y CTL line was able to recognise the 126N wild-
type peptide on the target cells and specifically lyse
HLA-A0201-matched leukemia cells expressing the
WT1 antigen. Another group has introduced a
tyrosine modification in position two of a 9-mer
WT1-derived peptide which is known to bind to the
HLA-A2402 molecule and showed a better binding
affinity and elicitation of higher lytic activity [53].
Moreover, the modified peptide has been used to
vaccinate cancer patients where a clear correlation
was observed between an increase in the frequencies
of WT1-specific CTL after vaccination and clinical
responses [23].
In conclusion, our study and others’ [23,52,53]
shed light on the importance of peptide modification
as a new approach in elucidating a better immune
response, needed to combat cancer. On the basis of
these findings, leukemia patients could be clinically
tried for vaccination with the current WT1-126Y
peptide analogue or adoptively treated with ex vivo
anti-WT1-126Y T cells to specifically enhance the
graft-versus-leukemia effect and anti-WT1 CTL
frequency, which are known to be very low in these
patients.
Acknowledgements
We are very grateful to the administration of the
Research Centre and the Research Advisory Council
(RAC) for their support. This work was sponsored by
King Abdulaziz City for Science and Technology
(GP-10-10) and RAC (proposal # 2040 038). We
thank Riad Youniss and Reggie Belkhadem for
collecting patients’ data.
Peptide analogue enhances leukemia lysis 267
Leu
k L
ymph
oma
Dow
nloa
ded
from
info
rmah
ealth
care
.com
by
Uni
vers
ity o
f N
ewca
stle
Upo
n T
yne
on 0
7/29
/10
For
pers
onal
use
onl
y.

References
1. Dermime S, Armstrong A, Hawkins RE, Stern PL. Cancer
vaccines and immunotherapy. Br Med Bull 2002;62:149–162.
2. Dermime S, Gilham DE, Shaw DM, Davidson EJ, Meziane el
K, Armstrong A, et al. Vaccine and antibody-directed T cell
tumour immunotherapy. Biochim Biophys Acta 2004;1704:
11–35.
3. Call KM, Glaser T, Ito CY, Buckler AJ, Pelletier J, Haber DA,
et al. Isolation and characterization of a zinc finger polypeptide
gene at the human chromosome 11 Wilms’ tumor locus. Cell
1990;60:509–520.
4. Inoue K, Ogawa H, Sonoda Y, Kimura T, Sakabe H, Oka Y,
et al. Aberrant overexpression of the Wilms tumor gene
(WT1) in human leukemia. Blood 1997;89:1405–1412.
5. Oji Y, Ogawa H, Tamaki H, Oka Y, Tsuboi A, Kim EH, et al.
Expression of the Wilms’ tumor gene WT1 in solid tumors
and its involvement in tumor cell growth. Jpn J Cancer Res
1999;90:194–204.
6. Tamaki H, Ogawa H. Monitoring of minimal residual disease
using WT1 assay for patients with chronic myeloid leukemia
who undergo allogeneic stem cell transplantation. Bone
Marrow Transplant 2004;19:19.
7. Ogawa H, Ikegame K, Kawakami M, Tamaki H. WT1
gene transcript assay for relapse in acute leukemia after
transplantation. Leuk Lymphoma 2004;45:1747–1753.
8. Cilloni D, Saglio G. WT1 as a universal marker for minimal
residual disease detection and quantification in myeloid
leukemias and in myelodysplastic syndrome. Acta Haematol
2004;112:79–84.
9. Bader P, Niemeyer C, Weber G, Coliva T, Rossi V,
Kreyenberg H, et al. WT1 gene expression: useful marker
for minimal residual disease in childhood myelodysplastic
syndromes and juvenile myelo-monocytic leukemia? Eur J
Haematol 2004;73:25–28.
10. Oka Y, Tsuboi A, Elisseeva OA, Udaka K, Sugiyama H. WT1
as a novel target antigen for cancer immunotherapy. Curr
Cancer Drug Targets 2002;2:45–54.
11. Oji Y, Miyoshi S, Maeda H, Hayashi S, Tamaki H, Nakatsuka
S, et al. Overexpression of the Wilms’ tumor gene WT1 in
de novo lung cancers. Int J Cancer 2002;100:297–303.
12. Loeb DM, Evron E, Patel CB, Sharma PM, Niranjan B,
Buluwela L, et al. Wilms’ tumor suppressor gene (WT1) is
expressed in primary breast tumors despite tumor-specific
promoter methylation. Cancer Res 2001;61:921–925.
13. Menssen HD, Renkl HJ, Entezami M, Thiel E. Wilms’ tumor
gene expression in human CD34þ hematopoietic progenitors
during fetal development and early clonogenic growth. Blood
1997;89:3486–3487.
14. Ellisen LW, Carlesso N, Cheng T, Scadden DT, Haber DA.
The Wilms tumor suppressor WT1 directs stage-specific
quiescence and differentiation of human hematopoietic
progenitor cells. EMBO J 2001;20:1897–1909.
15. Wood PJ, Socarras S, Streilein JW. Modification of the
cytotoxic T cell repertoire in neonatal tolerance. Evidence for
preferential survival of cells with low avidity for tolerogen. J
Immunol 1987;139:3236–3244.
16. Parkhurst MR, Salgaller ML, Southwood S, Robbins PF,
Sette A, Rosenberg SA, et al. Improved induction of
melanoma-reactive CTL with peptides from the melanoma
antigen gp100 modified at HLA-A*0201-binding residues. J
Immunol 1996;157:2539–2548.
17. Bakker AB, van der Burg SH, Huijbens RJ, Drijfhout JW,
Melief CJ, Adema GJ, et al. Analogues of CTL epitopes with
improved MHC class-I binding capacity elicit anti-melanoma
CTL recognizing the wild-type epitope. Int J Cancer
1997;70:302–309.
18. Valmori D, Fonteneau JF, Lizana CM, Gervois N, Lienard D,
Rimoldi D, et al. Enhanced generation of specific
tumor-reactive CTL in vitro by selected Melan-A/MART-1
immunodominant peptide analogues. J Immunol 1998;160:
1750–1758.
19. Chen JL, Dunbar PR, Gileadi U, Jager E, Gnjatic S, Nagata Y,
et al. Identification of NY-ESO-1 peptide analogues capable
of improved stimulation of tumor-reactive CTL. J Immunol
2000;165:948–955.
20. Tangri S, Ishioka GY, Huang X, Sidney J, Southwood S,
Fikes J, et al. Structural features of peptide analogs of human
histocompatibility leukocyte antigen class I epitopes that are
more potent and immunogenic than wild-type peptide. J Exp
Med 2001;194:833–846.
21. Hoffmann TK, Loftus DJ, Nakano K, Maeurer MJ,
Chikamatsu K, Appella E, et al. The ability of variant peptides
to reverse the nonresponsiveness of T lymphocytes to the
wild-type sequence p53(264–272) epitope. J Immunol 2002;
168:1338–1347.
22. Rosenberg SA, Yang JC, Schwartzentruber DJ, Hwu P,
Marincola FM, Topalian SL, et al. Immunologic and
therapeutic evaluation of a synthetic peptide vaccine for the
treatment of patients with metastatic melanoma. Nat Med
1998;4:321–327.
23. Oka Y, Tsuboi A, Taguchi T, Osaki T, Kyo T, Nakajima H,
et al. Induction of WT1 (Wilms’ tumor gene)-specific
cytotoxic T lymphocytes by WT1 peptide vaccine and the
resultant cancer regression. Proc Natl Acad Sci USA 2004;
101:13885–13890.
24. Rezvani K, Grube M, Brenchley JM, Sconocchia G, Fujiwara
H, Price DA, et al. Functional leukemia-associated antigen-
specific memory CD8þ T cells exist in healthy individuals and
in patients with chronic myelogenous leukemia before and
after stem cell transplantation. Blood 2003;102:2892–2900.
25. Scheibenbogen C, Letsch A, Thiel E, Schmittel A, Mailaender
V, Baerwolf S, et al. CD8 T-cell responses to Wilms tumor
gene product WT1 and proteinase 3 in patients with acute
myeloid leukemia. Blood 2002;100:2132–2137.
26. Tourdot S, Scardino A, Saloustrou E, Gross DA, Pascolo S,
Cordopatis P, et al. A general strategy to enhance immuno-
genicity of low-affinity HLA-A2. 1-associated peptides:
implication in the identification of cryptic tumor epitopes.
Eur J Immunol 2000;30:3411–3421.
27. Oka Y, Elisseeva OA, Tsuboi A, Ogawa H, Tamaki H, Li H,
et al. Human cytotoxic T-lymphocyte responses specific for
peptides of the wild-type Wilms’ tumor gene (WT1) product.
Immunogenetics 2000;51:99–107.
28. Sugden B, Mark W. Clonal transformation of adult human
leukocytes by Epstein-Barr virus. J Virol 1977;23:503–508.
29. Molldrem J, Dermime S, Parker K, Jiang YZ, Mavroudis D,
Hensel N, et al. Targeted T-cell therapy for human leukemia:
cytotoxic T lymphocytes specific for a peptide derived from
proteinase 3 preferentially lyse human myeloid leukemia cells.
Blood 1996;88:2450–2457.
30. Zweerink HJ, Gammon MC, Utz U, Sauma SY, Harrer T,
Hawkins JC, et al. Presentation of endogenous peptides to
MHC class I-restricted cytotoxic T lymphocytes in transport
deletion mutant T2 cells. J Immunol 1993;150:1763–1771.
31. Greiner J, Ringhoffer M, Taniguchi M, Li L, Schmitt A,
Shiku H, et al. mRNA expression of leukemia-associated
antigens in patients with acute myeloid leukemia for the
development of specific immunotherapies. Int J Cancer
2004;108:704–711.
32. Bellantuono I, Gao L, Parry S, Marley S, Dazzi F, Apperley J,
et al. Two distinct HLA-A0201-presented epitopes of
the Wilms tumor antigen 1 can function as targets for
leukemia-reactive CTL. Blood 2002;100:3835–3837.
268 G. Al Qudaihi et al.
Leu
k L
ymph
oma
Dow
nloa
ded
from
info
rmah
ealth
care
.com
by
Uni
vers
ity o
f N
ewca
stle
Upo
n T
yne
on 0
7/29
/10
For
pers
onal
use
onl
y.

33. Gao L, Bellantuono I, Elsasser A, Marley SB, Gordon MY,
Goldman JM, et al. Selective elimination of leukemic
CD34(þ) progenitor cells by cytotoxic T lymphocytes specific
for WT1. Blood 2000;95:2198–2203.
34. Xue SA, Gao L, Hart D, Gillmore R, Qasim W, Thrasher A,
et al. Elimination of human leukemia cells in NOD/SCID
mice by WT1-TCR gene-transduced human T cells. Blood
2005;106:3062–3067.
35. Ellisen LW, Carlesso N, Cheng T, Scadden DT, Haber DA.
The Wilms tumor suppressor WT1 directs stage-specific
quiescence and differentiation of human hematopoietic
progenitor cells. Embo J 2001;20:1897–1909.
36. Menssen HD, Renkl HJ, Entezami M, Thiel E. Wilms’ tumor
gene expression in human CD34þ hematopoietic progenitors
during fetal development and early clonogenic growth. Blood
1997;89:3486–3487.
37. Sakaguchi S, Ono M, Setoguchi R, Yagi H, Hori S, Fehervari
Z, et al. Foxp3þ CD25þ CD4þ natural regulatory T cells in
dominant self-tolerance and autoimmune disease. Immunol
Rev 2006;212:8–27.
38. Beyer M, Schultze JL. Regulatory T cells in cancer. Blood
2006;108:804–811.
39. Clarke SL, Betts GJ, Plant A, Wright KL, El-Shanawany TM,
Harrop R, et al. CD4CD25FOXP3 Regulatory T cells
suppress anti-tumor immune responses in patients with
colorectal cancer. PLoS ONE 2006;1:e129.
40. Khazaie K, von Boehmer H. The impact of CD4þCD25þTreg on tumor specific CD8þ T cell cytotoxicity and cancer.
Semin Cancer Biol 2006;16:124–136.
41. Orentas RJ, Kohler ME, Johnson BD. Suppression of anti-
cancer immunity by regulatory T cells: back to the future.
Semin Cancer Biol 2006;16:137–149.
42. Dannull J, Su Z, Rizzieri D, Yang BK, Coleman D, Yancey D,
et al. Enhancement of vaccine-mediated antitumor immunity
in cancer patients after depletion of regulatory T cells. J Clin
Invest 2005;115:3623–3633.
43. Asemissen AM, Keilholz U, Tenzer S, Muller M, Walter S,
Stevanovic S, et al. Identification of a highly immunogenic
HLA-A*01-binding T cell epitope of WT1. Clin Cancer Res
2006;12:7476–7482.
44. Yu Z, Theoret MR, Touloukian CE, Surman DR, Garman
SC, Feigenbaum L, et al. Poor immunogenicity of a self/tumor
antigen derives from peptide-MHC-I instability and is
independent of tolerance. J Clin Invest 2004;114:551–559.
45. Bakker AB, van der Burg SH, Huijbens RJ, Drijfhout JW,
Melief CJ, Adema GJ, et al. Analogues of CTL epitopes with
improved MHC class-I binding capacity elicit anti-melanoma
CTL recognizing the wild-type epitope. Int J Cancer
1997;70:302–309.
46. Chen J-L, Dunbar PR, Gileadi U, Jager E, Gnjatic S, Nagata
Y, et al. Identification of NY-ESO-1 peptide analogues
capable of improved stimulation of tumor-reactive CTL. J
Immunol 2000;165:948–955.
47. Hoffmann TK, Loftus DJ, Nakano K, Maeurer MJ,
Chikamatsu K, Appella E, et al. The ability of variant peptides
to reverse the nonresponsiveness of T Lymphocytes to the
wild-type sequence p53264-272 epitope. J Immunol
2002;168:1338–1347.
48. Parkhurst MR, Salgaller ML, Southwood S, Robbins PF,
Sette A, Rosenberg SA, et al. Improved induction of
melanoma-reactive CTL with peptides from the melanoma
antigen gp100 modified at HLA-A*0201-binding residues.
J Immunol 1996;157:2539–2548.
49. Rosenberg SA, Yang JC, Schwartzentruber DJ, Hwu P,
Marincola FM, Topalian SL, et al. Immunologic and
therapeutic evaluation of a synthetic peptide vaccine for the
treatment of patients with metastatic melanoma. Nat Med
1998;4:321–327.
50. Tangri S, Ishioka GY, Huang X, Sidney J, Southwood S,
Fikes J, et al. Structural features of peptide analogs of human
histocompatibility leukocyte antigen class I epitopes that are
more potent and immunogenic than wild-type peptide. J Exp
Med 2001;194:833–846.
51. Valmori D, Fonteneau J-F, Lizana CM, Gervois N, Lienard
D, Rimoldi D, et al. Enhanced generation of specific
tumor-reactive CTL in vitro by selected melan-A/MART-1
immunodominant peptide analogues. J Immunol 1998;160:
1750–1758.
52. Pinilla-Ibarz J, May RJ, Korontsvit T, Gomez M,
Kappel B, Zakhaleva V, et al. Improved human
T-cell responses against synthetic HLA-0201 analog peptides
derived from the WT1 oncoprotein. Leukemia 2006;20:2025–
2033.
53. Tsuboi A, Oka Y, Udaka K, Murakami M, Masuda T,
Nakano A, et al. Enhanced induction of human WT1-specific
cytotoxic T lymphocytes with a 9-mer WT1 peptide
modified at HLA-A*2402-binding residues. Cancer Immunol
Immunother 2002;51:614–620.
Peptide analogue enhances leukemia lysis 269
Leu
k L
ymph
oma
Dow
nloa
ded
from
info
rmah
ealth
care
.com
by
Uni
vers
ity o
f N
ewca
stle
Upo
n T
yne
on 0
7/29
/10
For
pers
onal
use
onl
y.

The Wilms’ Tumor Antigen Is a Novel Target for Human CD4+
Regulatory T Cells: Implications for Immunotherapy
Cynthia Lehe,1Hazem Ghebeh,
1Abdullah Al-Sulaiman,
2Ghofran Al Qudaihi,
1
Khaled Al-Hussein,2Fahad Almohareb,
3Naeem Chaudhri,
3Fahad Alsharif,
3
Hazza Al-Zahrani,3Abdelghani Tbakhi,
4Mahmoud Aljurf,
3and Said Dermime
1
1Tumor Immunology Section, 2Histocompatibility and Immunogenetics Section, 3Adult Hematology/Oncology, and4Immunopathology, King Faisal Specialist Hospital and Research Centre, Riyadh, Saudi Arabia
Abstract
Compelling evidences indicate a key role for regulatory T cells(Treg) on the host response to cancer. The Wilms’ tumorantigen (WT1) is overexpressed in several human leukemiasand thus considered as promising target for development ofleukemia vaccine. However, recent studies indicated that thegeneration of effective WT1-specific cytotoxic T cells can belargely affected by the presence of Tregs. We have generatedT-cell lines and clones that specifically recognized a WT1-84(RYFKLSHLQMHSRKH) peptide in an HLA-DRB1*0402–restricted manner. Importantly, they recognized HLA-DRB1*04–matched fresh leukemic cells expressing the WT1antigen. These clones exerted a T helper 2 cytokine profile,had a CD4+CD25+Foxp3+GITR+CD127� Treg phenotype, andsignificantly inhibited the proliferative activity of allogeneic Tcells independently of cell contact. Priming of alloreactive Tcells in the presence of Tregs strongly inhibited the expansionof natural killer (NK), NK T, and CD8+ T cells and had aninhibitory effect on NK/NK T cytotoxic activity but not onCD8+ T cells. Furthermore, priming of T cells with the WT1-126HLA-A0201–restricted peptide in the presence of Tregs stronglyinhibited the induction of anti–WT1-126 CD8+ CTL responsesas evidenced by both very low cytotoxic activity and IFN-;production. Moreover, these Treg clones specifically producedgranzyme B and selectively induced apoptosis in WT1-84–pulsed autologous antigen-presenting cells but not in apopto-tic-resistant DR4-matched leukemic cells. Importantly, wehave also detected anti–WT1-84 interleukin-5+/granzyme B+/Foxp3+ CD4+ Tregs in five of eight HLA-DR4+ acute myeloidleukemia patients. Collectively, our in vitro and in vivofindings strongly suggest important implications for theclinical manipulation of Tregs in cancer patients. [Cancer Res2008;68(15):6350–9]
Introduction
The Wilms’ tumor (WT1) gene exerts an oncogenic function invarious types of leukemias (1). It is also overexpressed in severalsolid tumors (2), and therefore, it has been considered as anattractive target for cancer immunotherapy. Specific anti-WT1
immune responses have been described in which CD8+ cytotoxic Tcells (3, 4) have been generated in vitro . However, a recent studyshowed that such response can be largely affected by the presenceof CD4+CD25+ regulatory T cells (Treg) in which depletion of thisT-cell population was necessary for the generation of an effectiveWT1-specific cytotoxic response (3).It has been shown recently that Tregs directly suppress the
antitumor immune responses in cancer patients (5, 6), anddepletion of this T-cell population resulted in an enhancement ofvaccine-mediated antitumor immunity in cancer patients (7). Thishighlights the role of Tregs in modulating both natural and adoptiveimmune responses in cancer patients. Tregs may directly modulatethe CD8+ T-cell response (8) or alternatively promote tolerization ofCD8+ T cells by preventing the licensing of antigen-presenting cells(APC) by CD4+ T helper cells (9). It has became clear that CD8+ Tcells generated in the absence of CD4+ T cells help may have anormal primary response; however, their cytotoxic memoryresponse is severely weakened (10). A recent study by Greinerand colleagues (11) investigated the influence of the expressionlevels of several leukemia-associated antigens (LAA) on the clinicaloutcome of patients with acute myeloid leukemia (AML). Highexpression of three LAAs, which was found to be associated withfavorable clinical outcome, induced strong CD8+ T-cell responses.However, there was no correlation with the clinical outcome norinduction of natural detectable anti-WT1 CD8+ T-cell response inthese patients (11). In line with this, a recent study has shown theexistence of tumor-specific Tregs, which actively suppress antigen-specific antitumor immunity in cancer patients (12). Furthermore,fully functional Tregs specific for LAGE1 (13) and ARTC1 (14) wereshown in melanoma patients. Another study by Nadal andcolleagues (15) suggested that Tregs exert an inhibitory effect ongraft versus leukemia and this was associated with relapse afterallogeneic stem cell transplantation.To this end, we asked whether an anti-WT1 Treg population exist
in leukemia patients, which may contribute to the impairment ofanti-WT1 responses. We have identified a human HLA-DRB1*0402–restricted CD4+ Treg population and showed that the WT1 is anovel target for leukemia-specific CD4+ Tregs.
Materials and Methods
Patients and donors. Peripheral blood mononuclear cells (PBMC) from
leukemia patients and healthy donors were isolated by density gradientcentrifugation. This study was conducted in accordance with Helsinki
Declaration and all patients and donors signed a consent form approved by
the Research Ethics Committee of King Faisal Specialist Hospital andResearch Center (KFSH&RC). The study was approved by the KFSH&RC
Research Advisory Council (RAC#2030006). Patient and donor information
is listed in Supplementary Data 1.
Note: Supplementary data for this article are available at Cancer Research Online(http://cancerres.aacrjournals.org/).
Requests for reprints: Said Dermime, Tumor Immunology Section, King FaisalSpecialist Hospital and Research Centre, MBC 03, P. O. Box 3354, Riyadh 11211, SaudiArabia. Phone: 966-1-442-4552; Fax: 966-1-442-7858; E-mail: [email protected] [email protected].
I2008 American Association for Cancer Research.doi:10.1158/0008-5472.CAN-08-0050
Cancer Res 2008; 68: (15). August 1, 2008 6350 www.aacrjournals.org
Research Article

Peptides. A pool of 110 peptides derived from the WT1 protein desig-nated as WT1-Pepmix and a microscale WT1 peptide set containing each
peptide in a single well were obtained from JPT Peptide Technologies (Jerini
AG, GmbH; Supplementary Data 2). The WT1333-347 (RYFKLSHLQMHSRKH),
WT1-84, HPV3373-87 (ASDLRTIQQLLMGTV) HLA-DR*0402–restricted pep-tide (16), and the WT1-db126 (RMFPNAPYL) HLA-A0201–restricted peptide
(4) were synthesized and high-performance liquid chromatography purified
to z90% purity by Alta Bioscience.
Cell lines. B-lymphoblastoid cell lines (LCL) were established bytransformation of B cells using EBV using standard techniques (17). K562
and T2 cell lines were purchased from the American Type Culture
Collection. All cell lines were maintained in RPMI 1640 (Sigma)
supplemented with 10% FCS (Cambrex Bio Science), 2 mmol/L L-glutamine,100 IU/mL penicillin, and 100 mg/mL streptomycin (Sigma).
Generation of autologous monocyte-derived dendritic cells. CD14+
cells were isolated from PBMCs of three healthy donors, designated as BC-
29, BC-52, and BC-62, using MACS Monocytes Isolation kit (Miltenyi Biotec)
according to the manufacturer’s instructions. CD14+ cells were adhered and
cultured in 24-well plates in X-VIVO 15 medium supplemented with
2 mmol/L L-glutamine [dendritic cell (DC) medium] in the presence of
50 ng/mL recombinant human interleukin (rhIL)-4 and 100 ng/mL
recombinant human granulocyte macrophage colony-stimulating factor
(GM-CSF; R&D Systems). Recombinant human tumor necrosis factor-a(20 ng/mL; R&D Systems), 10 ng/mL rhIL-1h (eBioscience), and 25 Ag/mL
polyinosinic acid:poly-CMP (Sigma) were added on day 6 and mature DCs
were harvested on day 8.Generation of anti–WT1-specific Tregs and clones. Irradiated DCs
(3,000 rads) were pulsed with 10 Ag/mL WT1-Pepmix in DC medium and
incubated for 4 h at 37jC, 5% CO2. DCs were cocultured with autologous
PBMCs at a 10:1 T-cell to DC ratio. DC medium containing 10 ng/mL rhIL-7,20 pg/mL rhIL-12 (R&D Systems), and 10% heat-inactivated human
serum (Sigma) was used. T cells were restimulated at weekly intervals
and 260 IU/mL rhIL-2 was added 2 d after each restimulation. Three of
three anti–WT1-Pepmix-specific T-cell lines were obtained after the fourthrestimulation. Anti–WT1-Pepmix T-cell clones were generated as described
before (18). T cells were screened for their peptide specificity against the
microscale WT1 peptide set.Proliferation and 51Cr cytotoxicity assay. T-cell proliferation was
assessed by [3H]thymidine incorporation as described before (18). Briefly,
T cells were cocultured with X-irradiated PBMCs, LCLs (Fantigens), or
leukemic cells at different ratios in DC medium containing 10% humanserum for 3 d. [3H]thymidine (1 ACi/well; Amersham) was added for the last
18 h. [3H]thymidine uptake was measured using a 1450 Micro Beta PLUS
liquid scintillation counter (Wallac). In some experiments, the following
blocking antibodies (50–100 Ag/mL) were used: anti-ABC (AbD Serotec),anti–HLA-DR (BD Biosciences), anti–HLA-DP, and anti–HLA-DQ (Leinco
Technologies). Mouse isotypes were used as controls. Cytotoxic activity was
measured by a standard 51Cr release assay as described before (18).ELISA. Supernatants from 48-h T-cell cultures were harvested, and ELISA
for the human IFN-g, IL-4, IL-5, IL-10, and GM-CSF ELISA kits (Mabtech)
and transforming growth factor (TGF)-h1 and TGF-h2 matched antibody
pairs (R&D Systems) was performed according to the manufacturer’sinstructions.
Flow cytometry. T cells were phenotypically analyzed using the human
Treg staining kit (eBioscience) according to the manufacturer’s instructions
and also stained with CTLA-4-PE (Dako Corp.), CD127-RPE, and GITR-APC
(eBioscience). The T-cell receptor (TCR) Vh profile was determined using
the IOTest Beta Mark, TCR Vh Repertoire kit (Beckman Coulter). Cells were
analyzed using FACScan (Becton Dickinson).
Immunostaining. Immunostaining on cytospins was carried out as
described previously (19). Anti-Foxp3 antibody (eBioscience), anti-CD3antibody (Dako), and anti-WT1 antibody (Dako) were used. Isotype-
matched controls for all antibodies were used. The staining was evaluated
by two independent scientists.
Reverse transcription-PCR for Foxp3 expression. Total RNA wasisolated using RNeasy Micro kit (Qiagen). The forward primer CAGCTGCC-
CACACTGCCCCTAG and the reverse primer CAGTGCCATTTTCCCAGC-
CAG were used for Foxp3. The PCR conditions were 95jC/3 min, 35 cyclesof 95jC/1 min, 67jC/40 s, and 72jC/1 min. The h-actin forward primer
ATCTGGCACCACACCTTCTACAATGAGCTGCG and the reverse primer
CGTCATACTCCTGCTTGCTGATCCACATCTGC were used as a control.
PCR products were separated by electrophoresis on a 1% agarose gel(Sigma).
Quantitative real-time reverse transcription-PCR for WT1 expres-sion. Total RNA was isolated as above and treated with DNase1
(Invitrogen). For cDNA synthesis, 1 Ag RNA using oligo(dT) primers andMoloney murine leukemia virus reverse transcriptase (Invitrogen) was used
in a total volume of 25 AL. The WT1 mRNA expression was quantified using
LightCycler FastStart DNA Master SYBR Green 1 kit (Roche) in a
LightCycler (Roche). Porphobilinogen deaminase (PBGD) was used ashousekeeping gene. cDNA (2 AL) from K562 was used to generate standard
curves (20). Amplification was conducted in a total volume of 20 AL for
40 cycles/10 s at 95jC, 4 s/64jC, and 35 s/72jC. The forward primerTTCATCAAACAGGAGCCGAGC and the reverse primer GTGCGAGGG-
CGTGTGA were used for WT1. For PBGD, the forward primer CATGTC-
TGGTAACGGCAATG and the reverse primer TCTTCTCCAGGGCATGTTCAA
were used.Treg suppression assays and Transwell experiments. To examine the
suppressive effect of the Treg clones on the induction of T helper
alloresponses, a standard mixed lymphocyte reaction (MLR) was carried
out as described before (21). Briefly, fresh BC-29 PBMCs (105 per well,
responders) were cultured in DC medium containing 10% human serum for
5 d with XR, 3,000 rads allogeneic PBMCs (105 per well, stimulators) with
different concentrations of Tregs + autologous LCL FWT1-84 peptide. The
proliferative activity was determined as before. For some experiments,
neutralizing antibodies against TGF-h1/h2, IL-4, IL-5 (R&D Systems), IL-10
(Biosource), and GM-CSF (Biolegend) were added in the assay at an
optimum final concentration of 5 Ag/mL. The effect of Treg inhibition on
nonirradiated autologous LCL was also examined. Transwell experiments
were performed in 24-well plates with pore size of 0.4 Am (Corning Costar).
BC-29 PBMCs (0.75 � 106 per well, responders) were cultured in the outer
wells of 24-well plates in DC medium containing 10% human serum and
XR, 3,000 rads allogeneic (BC-8) PBMCs (1.5 � 106 per well, stimulators).
Treg clones (0.15 � 106 cells per well) were added into the inner wells of
autologous LCL F WT1-84 peptide. After 4 d in culture, the cells in the
outer wells were harvested and transferred to 96-well plates and the
proliferative activity was determined as before.
The suppressive effect of Tregs on the induction of alloreactive and anti–WT1-specific cytotoxic responses was examined. For alloreactive CTLs, BC-
29 PBMCs (2 � 106 per well, responders) were cultured in DC medium
containing 10% human serum for 7 d with XR, 7,500 rads allogeneic LCL
(0.5 � 106 cells per well, stimulators) in 24-well plates F 0.5 � 106 cells perwell TCC 29.B.42 Treg clone + WT1-84 peptide. This procedure was used for
the generation of anti-WT1 CTLs, except that autologous DC pulsed with
the WT1-126 (RMFPNAPYL) HLA-A0201–restricted peptide (4) was used.
IL-2 (25 units/mL) was added on day 4 and a similar stimulation wasrepeated after 7 d. Several stimulations were carried out without addition of
the Tregs every 7 d. Flow cytometry analysis was used to determine the CD8,
CD56, and CD8/CD56 cell population in the culture. CD8 T cells werepurified using MACS human CD8-negative selection kit (Miltenyi Biotec).
Cytotoxic and IFN-g production activity were determined by 51Cr release
and enzyme-linked immunospot (ELISPOT) assays, respectively.
ELISPOT assay. ELISPOT assay was performed using IFN-g, granzyme B,and perforin kits (Mabtech). Autologous LCLs or AML cells were used as
stimulators. Tregs (103 cells per well) and stimulators (2 � 104 cells per well)
were seeded in Multiscreen 96-well plates (Millipore) precoated with
catching antibody. After 40 h of incubation, cells were removed and plateswere processed according to the manufacturer’s instructions. Spots were
counted using an automated ELISPOT reader (AID). Antigen-specific T-cell
frequencies were considered to be increased when they were at least 2-foldhigher than in the control wells.
Apoptosis assay. An apoptosis assay was carried out using Vybrant
Apoptosis Assay Kit #2 (Invitrogen). Tregs (2 � 104) and target cells (2 � 104)
were incubated in DC medium + 10% human serum for 24 h. Targets were
WT1 as a New Target for Leukemia-Specific CD4+ Tregs
www.aacrjournals.org 6351 Cancer Res 2008; 68: (15). August 1, 2008

gated after staining with monoclonal antibodies (mAb) to CD19-PE, CD40-PE, and CD33-PE (BD Biosciences) for LCL, DCs, and AML, respectively.
Apoptosis was measured by flow cytometry assessment of phosphatidylser-
ine externalization cells stained with Alexa Fluor 488 Annexin V in
combination with propidium iodide.Intracellular cytokine staining and determination of anti–WT1-84/
Foxp3+ Treg frequencies in AML patients. PBMCs (2 � 106/mL) were
cultured in DC medium + 10% human serum + 125 units IL-2 for 48 h FWT1-84 peptide. Brefeldin A (eBioscience) was added at 5 Ag/mL in the last12 h of culture. Cells were surface stained with anti-CD4 antibody (BD
Biosciences) followed by fixation/permeabilization using eBioscience buffer.
Cells were intracellularly stained with anti–granzyme B, anti–IL-5 anti-
bodies (BD Biosciences), and anti-Foxp3 antibody (eBioscience) andanalyzed using FACScan as above.
Results
Generation of T-cell lines and clones against the WT1-Pepmix and analysis of their HLA restriction. PBMCs from threehealthy individuals, BC-29, BC-52, and BC-62 (Supplementary
Data 1), sharing the HLA-DRB1*0402 molecule, were stimulatedrepeatedly with autologous DCs pulsed with WT1-Pepmix.Corresponding T-cell lines designated TCL 29, TCL 52, and TCL62 with specific proliferative activity against autologous WT1-Pepmix–pulsed LCLs were generated (Fig. 1A). The TCL 29 line,which gave high proliferative activity, was cloned by limitingdilution, and 48 clones were obtained and screened by proliferationassay against autologous LCL FWT1-Pepmix. Eight clones showedspecific proliferative activity against the WT1-pepmix. Four clones(TCC 29.B.9, TCC 29.B.16, TCC 29.B.19, and TCC 29.B.42), whichshowed the highest and most stable proliferative activity (Fig. 1A),were selected and expanded for further analysis. TCL 29 was thenscreened by proliferation assay against the individual 110 WT1-Pepmix peptides. A peptide designated WT1-84 with the WT1333-347RYFKLSHLQMHSRKH sequence induced the strongest specificproliferative activity of TCL 29 (Fig. 1B). Interestingly, both TCL 52and TCL 62 lines also showed specific proliferative activity againstthe WT1-84 peptide (data not shown). The rest of the peptidesdid not induce significant proliferative activity, indicating the
Figure 1. Proliferative activity of T-cell lines and clones generated against the WT1-Pepmix. A, T cells (5 � 104 per well) from three T-cell lines (TCL 29, TCL 52, TCL62) and four expanded T-cell clones (TCC 29.B.9, TCC 29.B.16, TCC 29.B.19, and TCC 29.B.42) were challenged for 72 h with irradiated (8,000 rads, XR) autologousLCL (105 per well) in the absence (gray columns ) or presence (black columns) of WT1-Pepmix. Cells were pulsed with [3H]thymidine for additional 18 h and thenharvested. T cells only (TC ; white columns ) were used as negative control. B, the TCL 29 cells (2.5 � 104 per well) were mixed with irradiated autologous PBMCs(5 � 104 per well) pulsed with the different 110 single WT1 peptides. The culture conditions were the same as described in A. C, representative T-cell clone (TCC29.B.42) showing the restriction response to the HLA-DR molecule. Experimental conditions were the same as described in A . mAbs were added to the wells containingLCLs 20 min before the addition of T cells. D, proliferative activity of a representative T-cell clone (TCC 29.B.42) against the HLA-DR0402–matched LCL-19 andthe HLA-DR0701–matched LCL-18 in the absence (gray columns ) or presence (black columns ) of the WT1-84 peptide. Experimental conditions for D were the same asdescribed in A with the exception that 104 T cells per well were challenged for 72 h with 2 � 104 per well irradiated LCLs.
Cancer Research
Cancer Res 2008; 68: (15). August 1, 2008 6352 www.aacrjournals.org

immunodominance of this epitope. All clones had specificproliferative activity to the WT1-84 peptide and a dose-dependentresponse was shown in all clones with the optimal concentration at40 Amol/L (data not shown). The HLA restriction of the clones wasdetermined in which anti–HLA-DR mAb was found to significantlyinhibit their proliferative activity, whereas their correspondingisotypes had no inhibition effect (Fig. 1C). To define more preciselythe HLA-DR restriction, two HLA-DR–matched allogeneic LCLssharing the DRB1*0402 (LCL-19) or DRB1*0701 (LCL-18) with theTCC 29.B.42 clone were used. LCL-18 failed to present the WT1-84peptide, ruling out the involvement of the DRB1*0701 in thispresentation. However, LCL-19 sharing the DRB1*0402 with theclone induced a specific proliferative activity against the WT1-84peptide, showing the requirement of DRB1*0402 restriction in thisprocess (Fig. 1D). No proliferative response was recorded when LCLpulsed with a negative control HPV3373-87 HLA-DR*0402–restrictedpeptide was used (data not shown). All clones were CD4+ (data notshown). Because CD4+ T cells can exert a cytotoxic effect (22),we used 51Cr release assay to examine cytotoxic effect againstautologous LCL FWT1-84. No lytic activity was detected (data notshown), ruling out this possibility.
Evaluation of the cytokine profile of the T-cell clones.Cytokines generated during an immune response dictate the
outcome of this response. Hence, we evaluated the cytokineprofile generated by the anti–WT1-84 clones. Various cytokines
released were determined from cell culture supernatants of T cells
cultured for 48 h with irradiated autologous PBMCs or LCL FWT1-84 or FWT1-Pepmix. All clones secreted very high amountsof IL-5 and GM-CSF, and high IL-4, specifically to WT1-84 and
WT1-Pepmix, but little or no IL-10, TGF-h1/h2, or IFN-g(Supplementary Data 3). This clearly shows a T helper 2 (Th2)-polarized immune response.
Characterization of the phenotypic profile and TCR usage ofthe T-cell clones. The cytokine profile of the clones suggested thatthey represent a Th2 phenotype. It has been recently shown (23)that human Th2 cells exert a Treg phenotype in which a generatedTh2 clone also expressed Foxp3, a specific marker for Treg lineages(24, 25). Foxp3 is also expressed transiently in activated non-Tregs(26). Therefore, we tested whether TCL 29 and clones expressFoxp3 after long-term culture. Figure 2A shows the presence ofFoxp3 mRNA in TCL 29 and two other clones. Because Tregs areelevated during pregnancy (27), we used PBMCs from a pregnant
Figure 2. Phenotypic analysis of the TCL 29 T-cell line and the expanded T-cell clones generated against the WT1-Pepmix. A, RNA expression of Foxp3 in theT-cell line (TCL 29) and clones (TCC 29.B.9 and TCC 29.B.42). PBMCs from a 7-mo pregnant women (PBMC-PR) and LCL-29 were used as a positive and a negativecontrol. PBMC-29 from which the TCL 29 was generated was used as a baseline. b-Actin acts as a housekeeping gene. Total RNA was isolated from different individualcell types and analyzed by RT-PCR. B, cytospin immunocytochemical double staining of a representative T-cell clone (TCC 29.B.9) after more than 1 mo inculture showing (right ) the nuclear expression of the Foxp3 protein (brown) and the membranous expression of the CD3 T-cell marker (blue ). Left, anti–CD3-stainedcells with an isotype Foxp3-matched negative control. Magnification, �520. C and D, FACS analysis of a representative T-cell clone (TCC 29.B.9) showing a Tregphenotype after more than 1 mo in culture.
WT1 as a New Target for Leukemia-Specific CD4+ Tregs
www.aacrjournals.org 6353 Cancer Res 2008; 68: (15). August 1, 2008
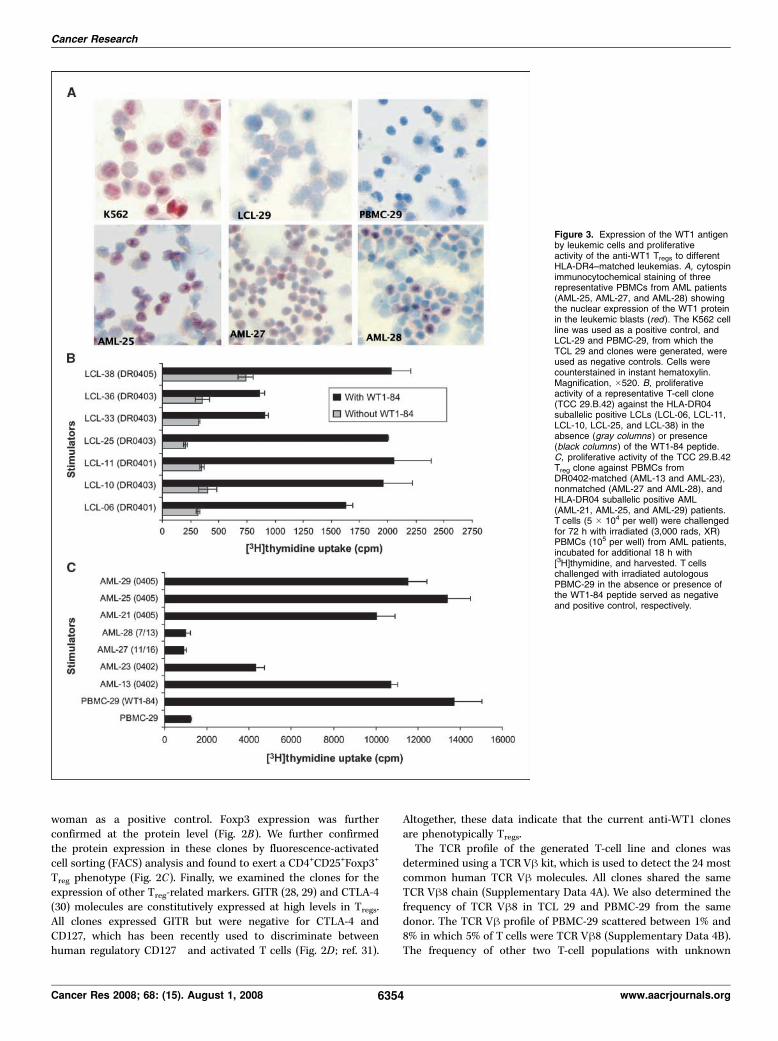
woman as a positive control. Foxp3 expression was furtherconfirmed at the protein level (Fig. 2B). We further confirmedthe protein expression in these clones by fluorescence-activatedcell sorting (FACS) analysis and found to exert a CD4+CD25+Foxp3+
Treg phenotype (Fig. 2C). Finally, we examined the clones for theexpression of other Treg-related markers. GITR (28, 29) and CTLA-4(30) molecules are constitutively expressed at high levels in Tregs.All clones expressed GITR but were negative for CTLA-4 andCD127, which has been recently used to discriminate betweenhuman regulatory CD127� and activated T cells (Fig. 2D ; ref. 31).
Altogether, these data indicate that the current anti-WT1 clonesare phenotypically Tregs.The TCR profile of the generated T-cell line and clones was
determined using a TCR Vh kit, which is used to detect the 24 mostcommon human TCR Vh molecules. All clones shared the sameTCR Vh8 chain (Supplementary Data 4A). We also determined thefrequency of TCR Vh8 in TCL 29 and PBMC-29 from the samedonor. The TCR Vh profile of PBMC-29 scattered between 1% and8% in which 5% of T cells were TCR Vh8 (Supplementary Data 4B).The frequency of other two T-cell populations with unknown
Figure 3. Expression of the WT1 antigenby leukemic cells and proliferativeactivity of the anti-WT1 Tregs to differentHLA-DR4–matched leukemias. A, cytospinimmunocytochemical staining of threerepresentative PBMCs from AML patients(AML-25, AML-27, and AML-28) showingthe nuclear expression of the WT1 proteinin the leukemic blasts (red). The K562 cellline was used as a positive control, andLCL-29 and PBMC-29, from which theTCL 29 and clones were generated, wereused as negative controls. Cells werecounterstained in instant hematoxylin.Magnification, �520. B, proliferativeactivity of a representative T-cell clone(TCC 29.B.42) against the HLA-DR04suballelic positive LCLs (LCL-06, LCL-11,LCL-10, LCL-25, and LCL-38) in theabsence (gray columns ) or presence(black columns ) of the WT1-84 peptide.C, proliferative activity of the TCC 29.B.42Treg clone against PBMCs fromDR0402-matched (AML-13 and AML-23),nonmatched (AML-27 and AML-28), andHLA-DR04 suballelic positive AML(AML-21, AML-25, and AML-29) patients.T cells (5 � 104 per well) were challengedfor 72 h with irradiated (3,000 rads, XR)PBMCs (105 per well) from AML patients,incubated for additional 18 h with[3H]thymidine, and harvested. T cellschallenged with irradiated autologousPBMC-29 in the absence or presence ofthe WT1-84 peptide served as negativeand positive control, respectively.
Cancer Research
Cancer Res 2008; 68: (15). August 1, 2008 6354 www.aacrjournals.org

specificities was increased (Vh2, 8–21%; Vh3, 7–12%) after sevenrounds of stimulation (Supplementary Data 4C). Interestingly, theTCR Vh8+ T-cell frequency was enriched to 40% in TCL 29 afterseven rounds of stimulation, indicating the immunodominance ofanti–WT1-84 TCR Vh8+ T-cell population in TCL 29.
Evaluation of WT1 expression and proliferative activity ofanti-WT1 Tregs against DR4-matched healthy and leukemiccells. We examined the expression of the WT1 mRNA in fresh AMLcells using quantitative reverse transcription-PCR (RT-PCR). WT1protein expression was also evaluated by immunostaining andscored by two independent scientists. K562 cells, known to expresshigh levels of WT1 (20), were used as a positive control. PBMCsand LCLs from normal donors served as negative controls. Higherlevels of WT1 expression were recorded in AML samples(Supplementary Data 5). Figure 3A shows immunostaining of
PBMCs from three AML patients indicating different levels of WT1expression.Because HLA-DR was the restriction element for the clones
(Fig. 1C), it was important to evaluate its expression in the AMLsamples. All AML samples expressed HLA-DR, although atdifferent levels (Supplementary Data 5). The proliferative activityof a selective clone was then measured against PBMCs from twoDR0402-matched (AML-13 and AML-23) and two non-DR0402(AML-27 and AML-28) AML patients. Specific proliferative activitywas recorded for the clone against AML-13 and AML-23 cellsexpressing the DR0402 molecule (Fig. 3B). However, this clonefailed to recognize non-DR0402 AML-27 and AML-28 cells,although they express high levels of WT1 (Fig. 3C). Percentagesof leukemic blasts used in this study are shown in SupplementaryData 4, column 2. T cells challenged with PBMC-29 F WT1-84
Figure 4. Suppressive function of the TCC 29.B.42 Treg clone. A, top, the proliferative activity of allo-MLR was strongly suppressed by a representative clone TCC29.B.42 at different clone to allo-PBMCs ratios in which specific activation of the clones with WT1-84 peptide was required for such suppressive activity; middle,Transwell experiments showing that Tregs cultured in inner wells were able to significantly suppress the proliferative activity of the allo-MLR cells cultured in the outerwells (ratio was at 1:5); bottom, blocking antibodies to TGF-h1/h2, IL-4, IL-5, IL-10, or GM-CSF did not restore the allo-MLR (ratio was at 1:20). B, top, the suppressiveeffect of the TCC 29.B.42 Treg clone on the expansion of alloreactive cytotoxic lymphocytes (inhibition effect of the Tregs on the expansion of NK (CD56), NK T(CD8/CD56), and CD8 cells after second and fifth stimulation; middle, the cytotoxic activity of purified CD8+ alloreactive T lymphocytes generated in the presenceor absence of Tregs and tested against allogeneic LCL-5 and K562 cells; bottom, the cytotoxic activity of mixed alloreactive T lymphocytes generated in the presence orabsence of Tregs and tested against allogeneic LCL-5 and K562 cells. C, top, the suppressive effect of the TCC 29.B.42 Treg clone on the induction of anti–WT1-126CTLs; bottom, the suppressive effect of the TCC 29.B.42 Treg clone on the induction of anti–WT1-126 IFN-g–producing T lymphocytes. CTLs were challengedwith irradiated T2 cells in the absence (TC[T2] ) or presence (TC[T2+126 peptide] ) of peptide. T cells only (TC ) were used as negative control.
WT1 as a New Target for Leukemia-Specific CD4+ Tregs
www.aacrjournals.org 6355 Cancer Res 2008; 68: (15). August 1, 2008

served as negative and positive controls. We have also showedthat the WT1-84 peptide was able to induce a specificproliferative cross-reactivity in the T-cell clones after challengingwith LCLs sharing different HLA-DR04 suballeles: DR-0401 (LCL-06 and LCL-11), DR-0403 (LCL-10, LCL-25, LCL-33, and LCL-36),and DR-0405 (LCL-38; Fig. 3B). Therefore, we tested theproliferative activity of the clones against WT1-expressing PBMCsfrom different HLA-DR04 suballelic positive AML patients (AML-21, AML-25, and AML-29). The clones recognized all AML cellsused (Fig. 3C). We conclude that leukemic cells express relativelyhigh levels of the WT1 antigen and able to process it to theWT1-84 peptide, which then presented to Tregs through the HLA-DR04 molecule.
Evaluation of the inhibition effect of the Treg clones onalloreactive T helper/cytotoxic lymphocytes and induction ofanti-WT1 CTL responses. To evaluate whether the Treg clonesexert a suppressor function on alloreactive T helper lymphocytes,
we used an allo-MLR (32) as a functional readout. All clonessignificantly suppressed the proliferative activity of the allo-MLRand showed a strong inhibition effect even at 1:100 T-cell to allo-PBMC ratio (Fig. 4A, top). Specific activation of the clones withWT1-84 peptide was required for such suppressive activity, asstimulation with LCL alone did not have a significant effect. Totest whether cell-cell contact was required for such inhibition, wecarried out experiments in Transwell plates. All clones cultured ininner wells were able to significantly suppress the proliferativeactivity of the allo-MLR cells cultured in the outer wells (Fig. 4A,middle), showing that cell-cell contact was not required for suchinhibition. This inhibition effect was not mediated with TGF-h1/h2, IL-4, IL-5, IL-10, or GM-CSF, as mAbs to these cytokines didnot restore the allo-MLR (Fig. 4A, bottom). The clones inhibitedalso the proliferation of autologous LCL (data not shown),suggesting the involvement of other soluble factors in suchinhibition.We next examined the suppressive effect of TCC 29.B.42 Treg
clone on the expansion and function of alloreactive cytotoxiclymphocytes. The presence of Tregs had a strong inhibition effect onthe expansion of both natural killer (NK; CD56) and NK T (CD8/CD56) cells in early cultures, whereas a strong inhibition effect onthe expansion of CD8 was recorded in late cultures (Fig. 4B, top).However, the cytotoxic activity of alloreactive CD8+ CTLs generatedin the presence of Tregs was comparable with that generated in theabsence of Tregs when allogeneic LCL-5 cells were used as a target(Fig. 4B, middle). Interestingly, NK activity against K562 wasrecorded only in mixed alloreactive cells generated in the absenceof Tregs (Fig. 4B, bottom).Finally, we examined the suppressive effect of TCC 29.B.42 Treg
clone on the induction of anti-WT1 CTL responses. The presence ofTregs had a strong inhibition effect on the induction of anti–WT1-126 CD8+ CTL responses as evidenced by both very low cytotoxicactivity (Fig. 4C, top) and IFN-g production (Fig. 4C, bottom)recorded for the CTL-126 Tregs after challenge with the HLA-A0201
+
T2 cell line as a target.Production of granzyme B and induction of apoptosis by
the Treg clones. We next sought to determine what other solublefactors are involved in such inhibition. Granzyme B is producedby Tregs and induces apoptosis in target cells in a perforin-independent (33) and perforin-dependent (34) manners. There-fore, we examined our Treg clones for granzyme B and perforinproduction using ELISPOT and intracellular staining assays.Granzyme B was specifically produced in response to autologousLCL in the presence of the WT1-84 peptide and also tostimulation with DR4-matched AML-25 cells but not to non–DR4-matched AML-27 cells (Fig. 5A). Perforin was not detectedby either assays (data not shown). We further examined theapoptotic effect of these clones. A specific apoptosis was inducedin autologous DCs and LCL pulsed with WT1-84 peptide but noapoptotic effect was detected for either DR4-matched AML-25 ornon–DR4-matched AML-27 cells (Fig. 5B). These data show thecapability of Tregs to selectively induce apoptosis in APCs and notin AML cells.
Determination of anti–WT1-84 Treg frequencies in AMLpatients. Our generated Treg clones exerted a CD4+Foxp3+
phenotype and specifically produced IL-5 and granzyme B inresponse to the WT1-84 peptide. Therefore, we have used
intracellular cytokine staining to test for specific granzyme B and
IL-5 production and Foxp3 expression by CD4+ T cells in AML
patients. Of eight HLA-DR-4+ patients (Supplementary Data 1)
Figure 5. Specific production of granzyme B by anti-WT1 Treg clones andinduction of apoptosis in target cells. A, ELISPOT assay for granzyme Bproduction by three Treg clones. Tregs (10
3 per well) were stimulated withautologous LCL FWT1-84, HLA-matched AML-25, or nonmatched AML-27cells (2 � 104 per well) for 40 h in anti–granzyme B precoated wells beforedevelopment of the spots. T cells incubated without stimulators (TC) served asa baseline. B, proportion of apoptosis induction by TCC 29.B.42 Treg clone after24 h of incubation with target cells. Apoptosis was determined by FACS usingAnnexin V in combination with propidium iodide on CD19 (LCL), CD40 (DCs),and CD33 (AML) gated cells.
Cancer Research
Cancer Res 2008; 68: (15). August 1, 2008 6356 www.aacrjournals.org

tested, five patients showed significant increase in granzyme
B/Foxp3 expression and IL-5 production in the presence of the
WT1-84 peptide (Fig. 6). Non–HLA-DR-4 (AML-27 and AML-28)
and HLA-DR-4+ donors (BC-29 and BC-62; Supplementary Data 1)
were negative (data not shown). These findings support our in vitro
data and show the amplification of tumor-specific anti–WT1-84
Tregs in AML patients in HLA-DR4–restricted manner.
Discussion
In this study, we identified novel human anti-WT1 Treg andclones using a pool of 110 15-mer overlapping peptides across theentire WT1 protein. These T-cell lines and clones specificallyrecognized a WT1333-347 (RYFKLSHLQMHSRKH) peptide designat-ed WT1-84 in an HLA-DRB1*0402–restricted manner. The T-cellclones produced GM-CSF, IL-4, and IL-5 in response to the WT1-84peptide exerting a Th2 cytokine profile. During the course of ourstudy, Fujiki and colleagues (35) described an anti-WT1 T helper 1(Th1) T-cell clone restricted to HLA-DRB1*0405 and specific toa 16-mer WT1332-347 peptide that has an additional amino acidcompared with the 15-mer WT1333-347 epitope described in ourstudy. It has been shown that the affinity of the antigen for TCR
and the antigen dose can influence the differentiation of Th1 andTh2 cells (36). Th2 cells are generated only in the presence of a lowdose of an antigen, and a weak TCR signal is needed for theirgeneration (37). Fujiki and colleagues used high dose (50 Ag/mL)of the WT1332-347 as a single peptide to prime T cells, whereas only10 Ag/mL of the 110 Pepmix including the WT1333-347 peptide wereused in the current study. Therefore, the antigen dose and peptidecompetition in the case of the WT1-Pepmix may contribute tothe generation of two different T helper cell types. Finally, we usedhigh concentration of IL-2 (260 IU/mL) for the T-cell generation,whereas Fujiki and colleagues used only 20 IU/mL in their study.High dose of IL-2 has been shown to increase the frequency ofTregs in cancer patients (38) and selectively up-regulate the in vitroexpression of Foxp3 in Tregs. It is possible that the presence of highdose of IL-2 in our T-cell cultures played a role in the polarizationof T cells to Th2 phenotype as it has been described in othersystems (39) and up-regulated the expression of Foxp3 in this T-cellpopulation.A recent study by Durinovic-Bello and colleagues (23) showed
that human Th2 cells that exert a down-regulatory Tregphenotype also express Foxp3. However, Foxp3 has also beenshown to be expressed transiently in activated non-Tregs, whereas
Figure 6. Intracellular staining and determination ofanti–WT1-84 Foxp3+ Treg frequencies in AML patients.PBMCs (2 � 106/mL) were cultured in DC medium asdescribed in Materials and Methods + 125 units of IL-2 for48 h FWT1-84 peptide. Brefeldin A was added at 5 Ag/mLin the last 12 h of culture. Granzyme B-FITC/Foxp3-APCdouble-positive cells were analyzed on gated CD4-PE+
cells. IL-5-PE+ cells were analyzed on gated CD4�APC+
cells. AML-3, AML-24, AML-25, AML-29, and AML-37showed significant increase in granzyme B/Foxp3expression and IL-5 production in response to the WT1-84peptide. Inserted numbers indicate the percentage ofpositive cells within the quadrant or the gate.
WT1 as a New Target for Leukemia-Specific CD4+ Tregs
www.aacrjournals.org 6357 Cancer Res 2008; 68: (15). August 1, 2008

it is stably expressed in Tregs (26). We have shown that thegenerated T-cell clones were stably expressing Foxp3 and exerteda CD4+CD25+Foxp3+ Treg phenotype. Furthermore, the T-cellclones were examined for the expression of other Treg-relatedmarkers (GITR, CTLA-4, and CD127) and confirmed to beCD4+CD25+Foxp3+GITR+CD127� antigen-specific Tregs. The lackof CD127 expression rules out the activation-induced Foxp3expression. These clones recognize the WT1-84 epitope throughtheir TCR Vh8 chain. The immunodominance of the anti–WT1-84/TCR Vh8+ T-cell population in the generated T-cell line mayhave had a down-regulatory effect on the generation of Th1 Tcells against other epitopes in the WT1-Pepmix. Importantly,these Treg clones recognized HLA-DR4–matched leukemic cellsexpressing the WT1 antigen, showing the natural processing andpresentation of the WT1-84 epitope. The WT1-84 peptidedescribed in this study seems to be a promiscuous HLA classII–restricted T-cell epitope as it has been reported to berecognized by both HLA-DP5–restricted cytotoxic (22) and HLA-DR0405–restricted T helper (35) CD4+ T cells.Demonstration of functional Tregs will reside eventually on their
ability to inhibit immune responses in functional assays (40).Several molecular and cellular events have been attributed to thesuppressive effect of Tregs (41). The Treg clones described in thepresent study were able to significantly inhibit the proliferativeactivity of allogeneic T cells independently of cell contact.Moreover, priming in the presence of anti–WT1-84 Tregs had astrong inhibition effect on the expansion and cytotoxic activity ofNK and NK T-cell populations. This agrees with the recent studyshowing a direct inhibitory effect of Tregs on the generation andfunction of NK cells (42). However, the presence of anti–WT1-84Tregs had a strong inhibition effect on the expansion of alloreactiveCD8 T cells but no effect on their cytotoxic activity. The animalmodel study by Edinger and colleagues (43) showing that Tregssuppress alloantigen-driven expansion of CD8 T cells withoutinhibition of their cytotoxic effect supports our observation. Moreimportantly, we have shown that the presence of Tregs stronglyinhibited the induction of anti–WT1-126 CD8+ CTL responses. Theexistence of such tumor-specific Tregs can actively suppress theWT1-specific antitumor immunity in cancer patients as it has beenshown in other systems (12).Furthermore, the present Tregs inhibited the proliferation of
LCL, which does not depend on cytokines in their proliferation,suggesting the involvement of other soluble factors. It has beenshown that production of granzyme B by Tregs results in theinduction of apoptosis in T and B cells in a perforin-independentfashion (33). The current Tregs specifically produced granzyme B,but not perforin, in response to the WT1-84 peptide and inducedapoptosis in LCL and DCs, suggesting a direct effect of granzyme
B on the suppressive activity of these Tregs. However, they failedto induce apoptosis in HLA-matched AML cells, althoughgranzyme B was produced in response to these cells. It is knownthat leukemic cells use several antiapoptotic signals to escapekilling (44). Apoptosis in response to granzyme B involvesactivation of caspase-dependent cell death pathways (45).Blockade in caspase activation pathways is a common featurein leukemia (46), and this may explain the current resistance ofAML cells to apoptosis. Our findings raise the possibility thatleukemic cells may function as APC to preferentially induce anti–WT1-specific Tregs and hence down-regulate the patients’ immuneresponse through induction of apoptosis in APCs, such as DCsand B cells (34), and/or inhibition of specific and nonspecificanti-leukemia immune responses. Another important finding isthe detection of anti–WT1-84 IL-5+/granzyme B+/Foxp3+ CD4+
Tregs in five of eight HLA-DR4+ AML patients. The recent demon-stration by Zhou and colleagues (47) that tumor-specific Tregs areamplified in vivo following cancer vaccination supports our data.Current interests in cancer immunotherapy should be focused
on determining the therapeutic implications of Tregs ‘‘regulating theregulators.’’ Interestingly, elimination of Tregs by IL-2 conjugated todiphtheria toxin (ONTAK) enhanced vaccine-mediated antitumorimmunity in cancer patients (7). However, targeting the CD25molecule may eliminate Tregs, leading to an increase in thesusceptibility to autoimmunity, and it can also deplete activatedCD25+ effector cells, which may be important for clearance ofcancer and infection (48). Therefore, studies should be tailoredtoward developing selective depletion strategies directed againstTreg-related markers. Alternatively, triggering of TLR8 or OX40, andpotentially blocking adenosine, might improve the chances ofneutralizing Treg immunosuppression in cancer patients (49). Inconclusion, our findings should open opportunity for the clinicalmanipulation of anti-WT1 Tregs for the treatment of leukemiapatients.
Disclosure of Potential Conflicts of Interest
All authors read and approved the final manuscript. The authors declare that theyhave no financial competing interests.
Acknowledgments
Received 1/8/2008; revised 5/20/2008; accepted 5/22/2008.Grant support: Research Centre and Research Advisory Council proposal grant
2030 006.The costs of publication of this article were defrayed in part by the payment of page
charges. This article must therefore be hereby marked advertisement in accordancewith 18 U.S.C. Section 1734 solely to indicate this fact.
We thank Drs. Ayodele Alaiya and Monther Al-Alwan for critical review, ManogaranPulicat for analyzing the FACS data, and Riad Youniss and Reggie Belkhadem forcollecting patients’ data.
References
1. Inoue K, Ogawa H, Sonoda Y, et al. Aberrantoverexpression of the Wilms tumor gene (WT1) inhuman leukemia. Blood 1997;89:1405–12.
2. Nakatsuka S, Oji Y, Horiuchi T, et al. Immunohisto-chemical detection of WT1 protein in a variety of cancercells. Mod Pathol 2006;19:804–14.
3. Asemissen AM, Keilholz U, Tenzer S, et al. Identifica-tion of a highly immunogenic HLA-A*01-binding T cellepitope of WT1. Clin Cancer Res 2006;12:7476–82.
4. Oka Y, Elisseeva OA, Tsuboi A, et al. Human cytotoxicT-lymphocyte responses specific for peptides of the
wild-type Wilms’ tumor gene (WT1) product. Immuno-genetics 2000;51:99–107.
5. Beyer M, Schultze JL. Regulatory T cells in cancer.Blood 2006;108:804–11.
6. Ghebeh H, Barhoush E, Tulbah A, Elkum N, Al-Tweigeri T, Dermime S. FOXP3+ Tregs and B7-H1+/PD-1+ T lymphocytes co-infiltrate the tumor tissues ofhigh-risk breast cancer patients: implication forimmunotherapy. BMC Cancer 2008;8:57.
7. Dannull J, Su Z, Rizzieri D, et al. Enhancement ofvaccine-mediated antitumor immunity in cancerpatients after depletion of regulatory T cells. J ClinInvest 2005;115:3623–33.
8. Bourgeois C, Rocha B, Tanchot C. A role for CD40expression on CD8+ T cells in the generation of CD8+ Tcell memory. Science 2002;297:2060–3.
9. Alpan O, Bachelder E, Isil E, Arnheiter H, Matzinger P.‘Educated’ dendritic cells act as messengers frommemory to naive T helper cells. Nat Immunol 2004;5:615–22.
10. Janssen EM, Lemmens EE, Wolfe T, Christen U, vonHerrath MG, Schoenberger SP. CD4+ T cells are requiredfor secondary expansion and memory in CD8+ Tlymphocytes. Nature 2003;421:852–6.
11. Greiner J, Schmitt M, Li L, et al. Expression oftumor-associated antigens in acute myeloid leukemia:
Cancer Research
Cancer Res 2008; 68: (15). August 1, 2008 6358 www.aacrjournals.org

implications for specific immunotherapeutic approaches.Blood 2006;108:4109–17.
12. Nishikawa H, Jager E, Ritter G, Old LJ, Gnjatic S. CD4+
CD25+ regulatory T cells control the induction ofantigen-specific CD4+ helper T cell responses in cancerpatients. Blood 2005;106:1008–11.
13. Wang HY, Lee DA, Peng G, et al. Tumor-specifichuman CD4+ regulatory T cells and their ligands:implications for immunotherapy. Immunity 2004;20:107–18.
14. Wang HY, Peng G, Guo Z, Shevach EM, Wang RF.Recognition of a new ARTC1 peptide ligand uniquelyexpressed in tumor cells by antigen-specific CD4+
regulatory T cells. J Immunol 2005;174:2661–70.15. Nadal E, Garin M, Kaeda J, Apperley J, Lechler R,Dazzi F. Increased frequencies of CD4(+)CD25(high)T(regs) correlate with disease relapse after allogeneicstem cell transplantation for chronic myeloid leukemia.Leukemia 2007;21:472–9.
16. Hohn H, Pilch H, Gunzel S, et al. Human papilloma-virus type 33 E7 peptides presented by HLA-DR*0402 totumor-infiltrating T cells in cervical cancer. J Virol 2000;74:6632–6.
17. Sugden B, Mark W. Clonal transformation of adulthuman leukocytes by Epstein-Barr virus. J Virol 1977;23:503–8.
18. Dermime S, Bertazzoli C, Marchesi E, et al. Lack of T-cell-mediated recognition of the fusion region of thepml/RAR-a hybrid protein by lymphocytes of acutepromyelocytic leukemia patients. Clin Cancer Res 1996;2:593–600.
19. Ghebeh H, Tulbah A, Mohammed S, et al. Expressionof B7-H1 in breast cancer patients is strongly associatedwith high proliferative Ki-67-expressing tumor cells. Int JCancer 2007;121:751–8.
20. Greiner J, Ringhoffer M, Taniguchi M, et al. mRNAexpression of leukemia-associated antigens in patientswith acute myeloid leukemia for the development ofspecific immunotherapies. Int J Cancer 2004;108:704–11.
21. Dermime S, Mavroudis D, Jiang YZ, Hensel N,Molldrem J, Barrett AJ. Immune escape from a graft-versus-leukemia effect may play a role in the relapseof myeloid leukemias following allogeneic bonemarrow transplantation. Bone Marrow Transplant1997;19:989–99.
22. Guo Y, Niiya H, Azuma T, et al. Direct recognitionand lysis of leukemia cells by WT1-specific CD4+ Tlymphocytes in an HLA class II-restricted manner.Blood 2005;106:1415–8.
23. Durinovic-Bello I, Rosinger S, Olson JA, et al.DRB1*0401-restricted human T cell clone specific for
the major proinsulin73-90 epitope expresses a down-regulatory T helper 2 phenotype. Proc Natl Acad SciU S A 2006;103:11683–8.
24. Fontenot JD, Gavin MA, Rudensky AY. Foxp3programs the development and function of CD4+CD25+
regulatory T cells. Nat Immunol 2003;4:330–6.25. Hori S, Sakaguchi S. Foxp3: a critical regulator of thedevelopment and function of regulatory T cells.Microbes Infect 2004;6:745–51.
26. Wang J, Ioan-Facsinay A, van der Voort EI, HuizingaTW, Toes RE. Transient expression of FOXP3 in humanactivated nonregulatory CD4+ T cells. Eur J Immunol2007;37:129–38.
27. Somerset DA, Zheng Y, Kilby MD, Sansom DM,Drayson MT. Normal human pregnancy is associatedwith an elevation in the immune suppressive CD25+
CD4+ regulatory T-cell subset. Immunology 2004;112:38–43.
28. McHugh RS, Whitters MJ, Piccirillo CA, et al.CD4(+)CD25(+) immunoregulatory T cells: gene expres-sion analysis reveals a functional role for the glucocor-ticoid-induced TNF receptor. Immunity 2002;16:311–23.
29. Shimizu J, Yamazaki S, Takahashi T, Ishida Y,Sakaguchi S. Stimulation of CD25(+)CD4(+) regulatoryT cells through GITR breaks immunological self-tolerance. Nat Immunol 2002;3:135–42.
30. Sakaguchi S. Naturally arising CD4+ regulatory t cellsfor immunologic self-tolerance and negative control ofimmune responses. Annu Rev Immunol 2004;22:531–62.
31. Seddiki N, Santner-Nanan B, Martinson J, et al.Expression of interleukin (IL)-2 and IL-7 receptorsdiscriminates between human regulatory and activatedT cells. J Exp Med 2006;203:1693–700.
32. Godfrey WR, Ge YG, Spoden DJ, et al. In vitro -expanded human CD4(+)CD25(+) T-regulatory cells canmarkedly inhibit allogeneic dendritic cell-stimulatedMLR cultures. Blood 2004;104:453–61.
33. Gondek DC, Lu L-F, Quezada SA, Sakaguchi S, NoelleRJ. Cutting edge: contact-mediated suppression byCD4+CD25+ regulatory cells involves a granzyme B-dependent, perforin-independent mechanism. J Immu-nol 2005;174:1783–6.
34. Zhao D-M, Thornton AM, DiPaolo RJ, Shevach EM.Activated CD4+CD25+ T cells selectively kill B lympho-cytes. Blood 2006;107:3925–32.
35. Fujiki F, Oka Y, Tsuboi A, et al. Identification andcharacterization of a WT1 (Wilms tumor gene)protein-derived HLA-DRB1*0405-restricted 16-merhelper peptide that promotes the induction andactivation of WT1-specific cytotoxic T lymphocytes. JImmunother 2007;30:282–93.
36. Constant SL, Bottomly K. Induction of Th1 and Th2CD4+ T cell responses: the alternative approaches. AnnuRev Immunol 1997;15:297–322.
37. Tao X, Constant S, Jorritsma P, Bottomly K. Strengthof TCR signal determines the costimulatory require-ments for Th1 and Th2 CD4+ T cell differentiation. JImmunol 1997;159:5956–63.
38. Ahmadzadeh M, Rosenberg SA. IL-2 administrationincreases CD4+CD25hi Foxp3+ regulatory T cells incancer patients. Blood 2006;107:2409–14.
39. Cote-Sierra J, Foucras G, Guo L, et al. Interleukin 2plays a central role in Th2 differentiation. Proc NatlAcad Sci U S A 2004;101:3880–5.
40. Spadafora-Ferreira M, Caldas C, Fae KC, et al.CD4(+)CD25(+)Foxp3(+) indirect alloreactive T cellsfrom renal transplant patients suppress both the directand indirect pathways of allorecognition. Scand JImmunol 2007;66:352–61.
41. Miyara M, Sakaguchi S. Natural regulatory T cells:mechanisms of suppression. Trends Mol Med 2007;13:108–16.
42. Giroux M, Yurchenko E, St.-Pierre J, Piccirillo CA,Perreault C. T Regulatory cells control numbers of NKcells and CD8a+ immature dendritic cells in the lymphnode paracortex. J Immunol 2007;179:4492–502.
43. Edinger M, Hoffmann P, Ermann J, et al. CD4+CD25+
regulatory T cells preserve graft-versus-tumor activitywhile inhibiting graft-versus-host disease after bonemarrow transplantation [see comment]. Nat Med 2003;9:1144–50.
44. Smith BD, Bambach BJ, Vala MS, et al. Inhibitedapoptosis and drug resistance in acute myeloidleukaemia. Br J Haematol 1998;102:1042–9.
45. Sutton VR, Wowk ME, Cancilla M, Trapani JA.Caspase activation by granzyme B is indirect, andcaspase autoprocessing requires the release of pro-apoptotic mitochondrial factors. Immunity 2003;18:319–29.
46. Schimmer AD, Pedersen IM, Kitada S, et al.Functional blocks in caspase activation pathways arecommon in leukemia and predict patient response toinduction chemotherapy. Cancer Res 2003;63:1242–8.
47. Zhou G, Drake CG, Levitsky HI. Amplification oftumor-specific regulatory T cells following therapeuticcancer vaccines. Blood 2006;107:628–36.
48. Curtin JF, Candolfi M, Fakhouri TM, et al. Tregdepletion inhibits efficacy of cancer immunotherapy:implications for clinical trials. PLoS ONE 2008;3:e1983.
49. Colombo MP, Piconese S. Regulatory-T-cell inhibitionversus depletion: the right choice in cancer immuno-therapy. Nat Rev Cancer 2007;7:880–7.
WT1 as a New Target for Leukemia-Specific CD4+ Tregs
www.aacrjournals.org 6359 Cancer Res 2008; 68: (15). August 1, 2008

original research report
Hematol Oncol Stem Cell Ther 3(1) First Quarter 2010 hemoncstem.edmgr.com24
Despite major advances in molecular biolooogy and targeted therapy of leukemia, curoorent treatment strategies induce adverse side
effects and fail to achieve and maintain remission in many patients. In acute myeloid leukemia (AML), the most deadly form of leukemia,1,2 the majority of adult patients younger than 60 years achieve a complete reoomission following consolidation therapy. However, only approximately 30% to 40% maintain durable remission.3 Furthermore, the complete remission rate and duration
Identification of a novel peptide derived from the M-phase phosphoprotein 11 (MPP11) leukemic antigen recognized by human CD8+ cytotoxic T lymphocytesGhofran Al Qudaihi,a,b Cynthia Lehe,a Anne Dickinson,c Khaled Eltayeb,c Walid Rasheed,c Naeem Chaudhri,c Mahmoud Aljurf,c Said Dermimea
From the aTumor Immunology Section, King Faisal Specialist Hospital & Research Centre, Riyadh, Saudi Arabia, bHaematological Sciences, Institute of Cellular Medicine, Medical School Newcastle University, United Kingdom and cAdult Hematology/Oncology, King Faisal Specialist Hospital & Research Centre, Riyadh, Saudi Arabia
Correspondence: Said Dermime, MSc, PhD · Chairman of Department of Biomedical Research and Head of Immunology & Innovative Cell Therapy, Dasman Institute for Research, Education & Prevention of Diabetes & Other Chronic Conditions PO Box 1180, Dasman 15462, Kuwait · T: +965-2-224-2999 ext. 4555 / +965-9-909-4619 F: +965-2-249-2406 · [email protected] · Accepted for publication February 2010
Hematol Oncol Stem Cell Ther 3(1): 24-33
BACKGROUND AND OBJECTIVES: There is an urgent need for the development of leukemia-targeted im--munotherapeutic approaches using defined leukemia-associated antigens that are preferentially expressed by most leukemia subtypes and absent or minimally expressed in vital tissues. M-phase phosphoprotein 11 protein (MPP11) is extensively overexpressed in leukemic cells and therefore is considered an attractive target for leu--kemia T cell therapy. We sought to identify potential CD8+ cytotoxic T lymphocytes that specifically recognised peptides derived from the MPP11 antigen. MATERIALS AND METHODS: A computer-based epitope prediction program SYFPEITHI, was used to predict peptides from the MPP11 protein that bind to the most common HLA- A*0201 molecule. Peptide binding ca--pacity to the HLA-A*0201 molecule was measured using the T2 TAP-deficient, HLA-A*0201-positive cell line. Dendritic cells were pulsed with peptides and then used to generate CD8+ cytotoxic T lymphocytes (CTL). The CML leukemic cell line K562-A2.1 naturally expressing the MPP11 antigen and engineered to express the HLA-A*0201 molecule was used as the target cell. RESULTS: We have identified a potential HLA-A*0201 binding epitope (STLCQVEPV) named MPP-4 derived from the MPP11 protein which was used to generate a CTL line. Interestingly, this CTL line specifically rec--ognized peptide-loaded target cells in both ELISPOT and cytotoxic assays. Importantly, this CTL line exerted a cytotoxic effect towards the CML leukemic cell line K562-A2.1. CONCLUSION: This is the first study to describe a novel epitope derived from the MPP11 antigen that has been recognized by human CD8+ CTL.
attained by older AML patients is less, with an overall survival rate of 20% to 40%.3 Therefore, there is an uroogent need for the development of leukemiaotargeted imoomunotherapy designed to eliminate residual leukemic cells thus enhancing the graftoversusoleukemia (GVL) effect observed after allogeneic hematopoietic stem cell transplantation (HSCT) and/or prolonging a complete remission achieved by chemotherapy.4,5
Leukemia cells express unique antigens or overexoopress normal cellular antigens.6,7 The overexpressed

original research reportnOvel pepTide reCOgnized by Cd8+ CTl
Hematol Oncol Stem Cell Ther 3(1) First Quarter 2010 hemoncstem.edmgr.com 25
normal antigens constitute attractive targets for the development of leukemia immunotherapy.6 Among this group of antigens are the Mophase phosphoproootein 11 (MPP11) proteins. MPP11 was discovered by MatsumotooTaniura et al8,9 using an MPM2 monoooclonal antibody, which recognizes several important mitosis phosphoproteins found to be present during mitosis.8o10 Recently, it has been reported that MPP11 functions as a ribosomeoassociated molecular chaperooone.11,12 MPP11 maps to the region of chromosome 7q22o31.1, which is a critical common position in huooman cancer.10,13 MPP11 has been detected by serologioocal analysis of cDNA expression libraries (SEREX) in solid tumours and hematological malignancies including melanoma, breast, renal cell carcinoma, small cell lung cancer and leukemia.14,15 The humoral immune responses to MPP11 have been detected in patients with acute (AML) and chronic myeloid leuookemia (CML), but not in healthy donors or patients with autoimmune diseases.15 Moreover, this protein has been found to be expressed extensively in AML and CML patients as compared to normal controls.15o
18 Immunohistochemical staining of primary tumor sections and Western blot analysis of head and neck squamous cell cancer (HNSCC) cell lines revealed tumorospecific overexpression of MPP11 protein.13,15
Additionally, fluorescence in situ hybridization analyoosis carried out on HNSCC cell lines showed an inoocrease in the copy number of MPP11 along with chrooomosome 7 suggesting an oncogenic role for MPP11.13 The specific overexpression of MPP11 by tumor tisoosues (with the exception of very low expression in tesootis, kidney, and lung) makes it an attractive target for cancer immunotherapies.15,17
We sought to identify potential CD8+ cytotoxic T lymphocyte (CTL) epitopes in the leukemiaoassociooated MPP11 antigen that bind to the most common HLAoA*0201 molecule and provoke specific CTL reoosponses. Although various antigenic epitopes derived from leukemia antigens have been identified, progress in targeting specific immunotherapeutic approaches depends on the recognition of a wider range of leukeoomia antigens. This would allow the use of these pepootides in leukemia immunotherapy by either expanding ex vivo tumororeactive specific CTLs for adoptive T cell therapy or actively inducing leukemia antigenospeoocific Tocell immunity in vivo by vaccinating patients with wellodefined leukemiaoassociated antigens.
MATERIALS AND METHODS Leukocyteorich buffy coats not older than eight hours were obtained from healthy volunteers from the blood
bank. All samples were obtained with informed conoosent at King Faisal Specialist Hospital and Research Centre (KFSHRC). Peripheral blood mononuclear cells (PBMCs) from healthy donors were isolated from heparinized blood by density gradient centrifugation over FicolloPaque PLUS (Amersham Biosciences) acoocording to the manufacturers’ instructions. PBMCs were suspended in 90% Fetal Calf Serum (FCS) + 10% dimethyl sulfoxide (DMSO), aliquoted and cryooopreserved in liquid nitrogen until further processing. The HLA typing of these samples was carried out at the routine immunopathology laboratory.
T lymphocyte epitope prediction and peptide synttthesis The SYFPEITHI prediction algorithm is a dataoobase comprising more than 4500 peptide sequences known to bind class I and class II MHC molecules. The scoring system of the SYFPEITHI program is based on the presence of certain amino acids in certain positions along the MHCobinding groove.19 Peptides qualified as positive if the score ranked ≥22. The amino acid sequences of MPP11 were entered into the specified program and candidate epitopes were seoolected based on their predicted ability to bind to the HLAo A*0201 molecule. Four 9omer peptides derived from MPP11 were selected as potential epitopes for the generation of CTL responses. The four peptides were: MPPo1N=MMP11o421o429 (QLLIKAVNL), MPPo2=MP11o419o427 (DLQLLIKAV), MPPo3=MPP11o313o321 (AIMLLLPSA), and MPPo4=MPP11o437o445 (STLCQVEPV). In addition to the predicted peptides, we modified the sequence of the first predicted peptide derived from MPP11 by introducing a Y at its Noterminus (wild type MPPo1N= QLLIKAVNL, analog MPPo1Y=MPP11o1Y(YLLIKAVNL) according to our recent study.20 This approach enhanced both the binding and the immunogenicity of the modified peptide. The amino acid sequences of the nonameric peptides with a puoority of ≥90% were synthesized and purified by Alta Bioscience, Birmingham, UK.
T2 binding assay Peptide binding capacity to the HLAoA*0201 molooecule was measured using the TAPodeficient, HLAoA*0201opositive cells as described previously.21 Briefly, T2 cells were washed three times, suspended at 106 cells/mL and incubated for 18 hours at 37ºC in serumofree medium containing 30 µM of each pepootide and 1 mg/mL b2omicroglobulin (Sigma). Cells were then washed twice with cold FACS buffer (phosoo

original research report nOvel pepTide reCOgnized by Cd8+ CTl
Hematol Oncol Stem Cell Ther 3(1) First Quarter 2010 hemoncstem.edmgr.com26
phate buffered saline containing 2% FCS). Purified rabbit IgG (Sigma) was added to the cell suspension and incubated for 15 minutes on ice in order to block the FC receptors. FITCoconjugated mouse antioHLAoA2 antibody was added to the cell suspension (1 µg/106 cells), with a control sample labelled with isotypeomatched monoclonal antibody and incubated for 30 min at 4ºC in the dark. The cells were washed twice with cold FACS buffer, and fixed with 300 µL of PBS/4% paraformaldehyde. The level of HLAoA2 expression was analyzed using fluorescenceoactioovated cell sorter (FACS) scan (Becton & Dickinson, Immunocytometry Systems, CA, USA). HLAoA2 expression was quantified as fluorescence index (FI) according to the following formula: fluorescence index = (mean fluorescence intensity with peptideomean fluorescence intensity without peptide)/mean fluoresoocence intensity without peptide. All T2 binding assays were carried out in duplicate.
Cell lines The mutant TAPodeficient cell line T2 (ATCC numoober CRLo1992) and the HLAoclass I and II negative human CML cell line Ko562 (ATCC number CCLo243) were purchased from American Type Culture Collection (ATCC, Manassas, VA, USA). Ko562 cells transfected with the HLAoA*0201 gene22 were kindly provided by Dr. Wolfgang Herr (University of Mainz, Germany). The T2 and K562 cells were maintained in complete medium (CM) consisting of RPMI 1640 medium (Sigma, MO, USA) suppleoomented with 10% FCS (Cambrex Bio Science, MD, USA), 2 mM Loglutamine, 100 IU/mL penicillin and 100 mg/mL streptomycin (Sigma). K562/ A*0201 were cultured in CM containing 0.5 mg/mL geneticin (G418, Sigma). Bolymphoblastoid cell lines (LCLs) were established from normal donors by transformaootion of B cells using EpsteinoBarr virus (EBV) accordooing to a standard technique.23 Briefly, PBMCs (107 cells) were incubated with the virus (EBV virus stock, B95.8) for an hour at 37ºC. The cells were cultured in CM containing 1µg/mL PHA (PHAoP, Sigma) and 0.1 ug/mL cyclosporin A, and established LCLs lines were used after 3o4 weeks of culture.
Generation of DC2d dendritic cells (FasttDC) Monocytes (CD14+ cells) were isolated from PBMCs of healthy HLAoA*0201 positive donors by plastic adherence. PBMCs were cultured at 5×10⁶ cells/mL/well of a 6owell plate (Sigma) in Xovivo 15 medium (DComedium), and allowed to adhere in a 5% CO2 incubator at 37ºC for 90omin. Nonoadherent cells
and media were removed and fresh DComedium was added to the cells. After a second incubation period, nonoadherent cells and media were removed and the adherent cells were washed carefully with preowarmed medium. The DC2d were generated according to preooviously published protocols24,25 with minor modificaootions. Briefly, DComedium supplemented with 100 ng/mL rhGMoCSF and 50 ng/mL rhILo4 (R&D Systems) was added to monocytes cultured in 6owell plates. Maturation cytokines, 10 ng/mL rhTNFa, 10 ng/mL rhILo1b, 10 ng/mL rhILo6 (R&D Systems) and 1 mM PGE2 (Sigma), were added to the cultures on the next day. Cultures were incubated for an addiootional day before mature DC2d were harvested.
Generation of antitpeptide specific CD8+ T lymphottcytes CD8+ T lymphocytes were negatively separated from PBMCS obtained from healthy HLAoA*0201 posiootive donors using MACS CD8+ T Cell Isolation Kit II (Miltenyi Biotec) according to the manufacturer’s protocols. Some of the CD8+ T lymphocytes lines were generated using a protocol adapted from previooous studies.21,26 Briefly, T2 cells were washed three times in serumofree medium and incubated with each peptide at concentrations of 50 µM/mL and 1 µg/mL b2omicroglobulin at 37 °C, 5% CO2 for 2 hours. The peptideopulsed T2 cells were then Xoirradiated (7500 rads), washed and added to freshly purified CD8+ T lymphocytes (T lymphocytes:T2 ratio of 5:1). After 7o10 days of stimulation, the second stimulation was performed and on the following day, 20 IU/mL of rhILo2 (R&D Systems) was added. The cultured T lymphocytes were maintained by reostimulations with peptideopulsed T2 cells. After the third in viootro stimulation, the generated T lymphocytes were tested for their specificity and cytotoxic activity using enzymeolinked immunospot assay (ELISPOT) and chromium release assays. DC2doloaded peptides were also used to in vitro prime some of the purified CD8+ T lymphocytes. Briefly, mature DC2d cells were haroovested, washed in serumofree medium and incubated with the peptides at concentration of 50 µM/mL and 5 µg/mL b2omicroglobulin for 2 hours at 37°C, 5% CO2. The peptide loaded DCs were then Xoirradiated (2500 rads), washed once and added to the CD8+ T lymphocytes at 20:1 to 5:1 T lymphocytes: DCs ratio. rhILo7 (20 ng/mL) and rhILo12 (100 pg/mL) (R&D Systems) were added to each culture. The cells were incubated in 2 mL T lymphocyte culture medium in 24owell plates. After 7o10 days, T lymphocytes were harvested, washed and reostimulated with peptide

original research reportnOvel pepTide reCOgnized by Cd8+ CTl
Hematol Oncol Stem Cell Ther 3(1) First Quarter 2010 hemoncstem.edmgr.com 27
loaded DC2d as previously described and rhILo2 (20 IU/mL) was added the following day. The cultured T lymphocytes were maintained by reostimulation with autologous peptideoloaded adherent monocytes and feeding with rhILo2 the next day. T lymphocytes lines against the different peptides were generated. Responder T lymphocytes were tested for their pepootide specificity and cytotoxic activity using enzymeolinked immunospot assay (ELISPOT) and chromium release assay against different targets.
Generation of T lymphocyte clones T lymphocytes lines were cloned by limiting dilution as described before25,27 with minor modifications. T lymphocytes were seeded at 1, 2 and 5 cells/well/200 µL T lymphocytes culture medium in 96owell Uobottomed plates. Allogeneic PBMCs were Xoirradiated (2500 rads) and used as a feeder layer (25×103 cells/well). T2 cells were incubated separately in XoVivo 15 medium (5×10⁶ cells/mL) with 5 µg/mL b2omicroglobulin and 50 µM/mL of MPP11 peptides for 2 hours at 37ºC. T2 cells were then irradiated (7500 rads), washed once and used for T lymphocytes stimulation (50×103 cells/well) in the presence of 130 IU/mL of rhILo2.5ng/mL rhIL15 (R&D Systems), and 30ng/mL OKT3 (R&D Systems), were also added to the wells. The plates were incubated for 2o4 weeks. Cultures were reofed with fresh medium containing rhILo2 (130 IU/mL) every 3o4 days. Wells with positive signs of growth were seoolected for expansion. Growing clones were transferred to 96owell flatobottomed plates, and each clone was stimulated with Xoirradiated peptideopulsed T2 cells. The activation cycle was repeated after 7o10 days of culooture at T lymphocyte: T2 ratios of 20:1 to 5:1. Clones were screened for their lytic activity against T2opulsed with or without peptide using chromium release assay.
Cytotoxicity assay (chromium release assay) Cytotoxicity assays were performed 5 days post in viootro stimulation. Target cells were removed from culture, washed in RPMI1640 serumofree medium, reosusoopended in a minimal volume (± 50 µL) of RPMI1640 and incubated with 51Cr (100 µCi) per target for 90 min. Target cells labelled with peptide were concuroorently incubated with the appropriate peptide at 50 µM/mL. The cells were then washed and placed in 96 Vobottomed wells at 103 cells/100 µL/well. The efoofector T cells were washed, and added in triplicate at varying quantities to the target cells, to give varying efoofector to target ratios (E:T ratios) in a final volume of 200 µL/well. The plates were spun for 5 min (300 g) and incubated for 4 hours at 37ºC and 5% CO2 before
100 µL supernatants were removed and transferred to 1450 Microbeta Plus Wallac plates (Wallac, Turku, Finland). 150 µL scintillation fluids, Optiphase HiSafe 2 (Wallac), were added to each well and the plates were heatosealed using a Microsealer system (Wallac).
Chromium release was assessed by a liquid scintillaootion counter (Wallac). Target cells were also incubated with 0.2% Tween 20 or medium alone to assess the maximum and minimum (spontaneous) release of the chromium respectively. Spontaneous release was never exceeded 20% of the maximum release. The percentage of specific lysis was calculated as: % specific lysis = (exooperimental release–spontaneous release)/(maximal reoolease–spontaneous release)×100. In some of the experooiments 10 µg/mL antioclass I ABC blocking antibody (clone: W6/32, AbD Serotec) was added to target cells before T lymphocytes addition.
Enzymetlinked immunospot assay (ELISPOT) ELISPOT assay was performed using IFNog, granzyme B, and perforin kits (Mabtech, Mariemont, OH) acoocording to the manufacturer’s protocols. 5×10³ to 5×10⁴ T lymphocytes/well and 2×10⁴ to 105 cells/well of difooferent stimulators were seeded in Multiscreen 96owell plates (Millipore, MA) preocoated overnight (4ºC) with catchingoantibody. The plates were then blocked with T lymphocytes culture medium. After 40 hours incubation (37ºC, 5% CO2), cells were removed and after washing, biotinylated monoclonal antibodies specific for IFNog, granzyme B, or perforin were added and incubated for 3 hours at room temperature (RT). After washing, Streptavidinoalkaline phosphatase28 or Streptavidinohorseradish peroxidase (HRP) were added to each well and incubated at RT for 2 hours. After washing, the appropriate substrate (BCIP/NBT in case of ALP and AEC in case of HRP) was added to each well and incubated at RT until color developed according to the manufacturer’s instructions. Spots were counted usooing an automated ELISPOT reader (AID, Strasberg, Germany). Antigenospecific T lymphocytes frequencies were considered to be significantly higher if they were at least twoofold higher than in the control wells.
RESULTS
Selection of potential CTL epitopes derived from the MPP11 protein The amino acid sequences of MPP11 were entered into the computer program and potential candidate epitopes were selected, synthesized and tested for their capacity to bind to the HLAoA*0201 molecule and/or generate cytotoxic T lymphocytes responses. We selected four

original research report nOvel pepTide reCOgnized by Cd8+ CTl
Hematol Oncol Stem Cell Ther 3(1) First Quarter 2010 hemoncstem.edmgr.com28
native peptides derived from MPP11 protein using the Syfpeithi server available at www.syfpeithi.de. These peptides showed high theoretical binding affinity to the HLAoA*0201 molecule with binding scores ranging from 22 to 25. In addition to the predicted peptides, we have carried out tyrosine amino acid substitution in the P1 position of the first predicted epitope MPPo1Y (QLLIKAVNL). The binding score of the modified epitope, MPPo1Y (YLLIKAVNL), was enhanced from 25 to 27 as assessed by the Syfpeithi program. The seooquences of the peptides as well as their binding scores are presented in Table 1.
We used the standard T2 binding assay to evaluate the ability of MPP11 candidate peptides to bind and stabilize the HLAoA*0201 molecule using the wellocharacterized A2obinding peptides WT1o187 as a posiootive control (WT1 derived peptide known to effectively
bind to the HLAoA*0201 molecule.20,29 The human processingodefective T2 cell line express empty HLA class I molecules. The binding assay is based on the staoobilization of HLA class I molecules on the cell surface by the addition of peptides exogenously. The T2 cells are incubated with peptides overnight and if the pepootide binds to the HLAoA*0201, the surface expression will be stabilized and there will be an upregulation of this molecule. Changes in its expression were assessed by staining HLAoA*0201 and quantifying the fluoresoocence intensity by flow cytometry analysis. The peptides are assumed to bind if their fluorescence ratio is greater than 1. All T2 binding assays were done in duplicate. As shown in Figure 1, the MPPo3 and MPPo4 peptides (Fluorescence Index [FI] =1.1 and 2.5 respectively) stably bind to the HLA*Ao0201 molecule. The affinity of the MPPo4 peptide to the molecule was comparable with that observed for the positive control WT1o187 epitope (FI=2.6). Because of their high binding affiniooties, we selected MPPo3 and MPPo4 peptides for the generation of peptideospecific T lymphocytes lines. On the other hand, the peptides MPPo1N, MPP1oY, and MPPo2 were excluded from testing for immunogenicity since they did not show any binding or only very weak binding to the HLAoA*0201 molecule.
Generation of MPP11tspecific T lymphocytes lines We tested the ability of the MPP11oderived peptides to induce specific cytotoxic T lymphocytes (CTLs). We used PBMCs obtained from four different HLAoA*0201 positive healthy volunteers to generate CTLs specific to the selected peptides. The four donors were designated as BCo21, BCo32, BCo37 and BCo41. PBMCs from each donor were used as the source of the responder cells and antigen presenting cells. The responder cells were CD8+ T cells purified by MACS negative selection and stimulated in vitro with antigen presenting cells loaded with peptide for 7o10 days. Initially, we used T2 cells pulsed with peptides to prime and activate T lymphocytes raised against MPP11odeoorived peptides. However, we did not observe any specific CD8+ T lymphocyte responses to any of the peptides tested including the WT1o126N positive control pepootide. Therefore, we used another protocol for the genooeration of CD8+ T lymphocyte lines where peptideopulsed DC2d were used to prime the CD8+ T lymoophocytes and peptideopulsed monocytes were used for subsequent T lymphocyte stimulations. To investigate whether the MPP11 synthetic peptides could stimulate peptideospecific CTLs, the generated T cell lines were tested against different HLAoA*0201+ targets in the presence or absence of autologous peptide using a chrooo
Figure 1. The binding ability of Mpp11-derived peptides to the HlA-A*0201 molecule as measured by the T2 peptide-binding assay. The WT1-187n peptide served as a positive control. Mpp-3 and Mpp-4 peptides stably bind to the HlA-A*0201. The peptides Mpp-1n, Mpp-2 and the modified peptide Mpp-1y showed no binding to HlA-A*0201 and thereby were not used to generate CTls. each value represents the average of duplicate assays and error bars indicate the Sd.
Table 1. peptide Sequences derived from the Mpp11 protein and their binding prediction to the HlA- A*0201 molecule.
Given name Start position Sequence SYFPEITHI Score
Mpp-1n 421 QlliKAvnl 25
Mpp-1y y-422 ylliKAvnl 27
Mpp-2 419 dlQlliKAv 24
Mpp-3 13 AiMlllpSA 23
Mpp-4 37 STlCQvepv 22

original research reportnOvel pepTide reCOgnized by Cd8+ CTl
Hematol Oncol Stem Cell Ther 3(1) First Quarter 2010 hemoncstem.edmgr.com 29
mium release assay and an ELISPOT assay after 3 to 8 rounds of stimulations.
Cytotoxic T cell lines generated against MPPt4 (STLCQVEPV) peptide produced specific IFNtgAfter the third round of stimulation, the specificity of in vitro primed CTLs was first tested for specific IFNog release by stimulation with the corresponding peptides using an ELISPOT assay. The CTLs generated against the MPPo4 (STLCQVEPV) peptide produced specific IFNog spots when stimulated with T2oloaded peptide whereas nonospecific production was seen in case of CTLs generated against the MPPo3 (AIMLLLPSA) peptide as shown in Figure 2A and B.
Because CD8+ T lymphocytes are known to use cytotoxic factors such as granzyme B and/or perforin to induce killing of their target cells, so we tested the MPPo4o CTL for the release of granzyme B and/or perforin after 5 rounds of stimulation. MPPo4 pulsed T2 or autologous LCLs were used as stimulators. There was no specific production of granzyme B and/or perforin to the peptide MPPo4 due to very high background responses seen when T lymphocytes were used alone in the assay (Figures 2c and 2d).
T lymphocytes generated against the MPPt4 peptide specifically lyse MPPt4tpulsed target cells and leukettmic cells The expanded MPP11 T lymphocyte lines generooated against the MPPo4 and MPPo3 peptides were tested for their specific cytotoxicity against T2 cells and autologous LCLs using a chromium release assay. Specific lysis of 17.8% against the T2 cells loaded with the MPPo4 peptide compared to 0% in the absence of peptide was recorded for TCL21 MPPo4 at effector to target ratio (E:T) of 50:1 (Figure 3A). In addition, 35% specific lysis for the same T lymphocytes line was recorded against autologous LCL loaded with the MPPo4 peptide compared to 6% against autologous LCL in the absence of the peptide at E: T ratio of 50:1 (Figure 3b).
The cytotoxic activity of the MPPo4 T lymphooocytes line against the leukemic K562oA2.1 cell line was also measured (K562oA2.1 cells which naturally express the MPP11 antigen was transfected with the HLAoA*0201 molecule). Interestingly, the MPPo4 CTLs exerted a lytic activity of 14% against this leuookemia cell line at an E:T ratio of 50:1, whereas only 7% lysis towards the wild type Ko562 (lacking the
Figure 2. Specificity of CTls generated against the Mpp-3 and Mpp-4 peptides using an eliSpOT assay. The CTl lines were established from bC-21, an HlA-A0201+ donor, following three to five rounds of in vitro T lymphocyte stimulations. Mpp-4-CTls releases specific iFn-g upon re-stimulation with T2 cells pulsed with Mpp-4 peptide (A). CTls generated against the Mpp-3 peptide did not release specific iFn-g (b). High and non-specific granzyme b (C) and perforin secretion by CTl-Mpp-4 (d). All assays were performed in triplicate and error bars indicate the Sd.

original research report nOvel pepTide reCOgnized by Cd8+ CTl
Hematol Oncol Stem Cell Ther 3(1) First Quarter 2010 hemoncstem.edmgr.com30
HLAoA2 expression) was recorded at the same E:T ratio (Figure 3c). Similar to the ELISPOT results, the T lymphocytes line generated against the MPPo3 peptide did not show any specific cytotoxic activity (Figure 3d).
DISCUSSION CD8+ CTLs recognize endogenously processed peptides3,30 consisting of 8o11 amino acids, most commonly 9 amino acids long, presented on the cell surface of target cells in the context of major MHC class I molecules. These cells are believed to play an important role in identifying and eliminating tumor cells.31 To date, several CD8+ CTL epitopes derived from leukemia antigens have been identified, and some of them have been investigated in clinical trials.32o34 Importantly, the graftoversusoleukemia (GVL) effect often seen after allogeneic hematopoietic stem cell transplantation (AHSCT) has been found to be meoodiated mostly by donoroderived CD8+ T lymphocytes
recognizing peptides derived from leukemia antigens and/or minor histocompatibilty antigens (mHAs) presented on recipient cells.35o37 Overexpressed antioogens such as WT1, PRo3 and MUC1 represent posoosible targets of specific GVL reactions.38o40
Previous studies have reported the existence of a humoral response against the MPP11 protein as well as the overexpression of this protein in patients with myeloid leukemias.15o17 However, the identification of CD8+ CTL epitopes derived from this protein is a crucial contribution to the field of leukemia immunoootherapy. In this study, we investigated potential CD8+ CTL epitopes derived from the MPP11 antigen usooing a reverse immunology approach.41 The reverse imoomunology approach permits the identification of class I as well as class II candidate epitopes derived from known tumor antigens on the basis of HLAobindooing motifs.42,43 Using this approach, numerous epitooopes were identified in leukemia21,29,44,45 as well as in solid tumours.46o51 We first examined the amino acid
Figure 3. Cytotoxic activity of Mpp11 CTl lines generated from the bC-21 donor as tested using a standard chromium release assay. Mpp11-CTl lines were challenged with different HlA-A0201+ target cells at different e: T ratios. T2 and autologous lCls were pulsed with each peptide before challenge. Mpp-4 specific cytotoxic T cells specifically lysed peptide loaded T2 cells (A) and autologous lCl pulsed peptide (b). The same CTl lines lysed the leukemic cell line K-562-A2.1 and K-562 by TCl21 Mpp-4 (C). non-specific lysis of CTl line generated against Mpp-3 (d).

original research reportnOvel pepTide reCOgnized by Cd8+ CTl
Hematol Oncol Stem Cell Ther 3(1) First Quarter 2010 hemoncstem.edmgr.com 31
sequences derived from the MPP11 protein for the presence of peptides containing binding motifs for one of the most frequent A*0201 class I alleles,52 usooing a computerobased epitope prediction program. We identified four MPP11oderived peptides predicted to bind with high affinity to the HLAoA*0201 molecule. The peptides were named MPPo1N, MPPo2, MPPo3 and MPPo4. Using the T2 binding assay, we tested the actual binding capacity of the selected peptides. The MPP11oderived peptides MPPo3 and MPPo4 recordooed binding scores lower than MPPo1N, and MPP2 scores as determined by the SYFPEITHI software. However, in the actual T2 binding assay, MPPo3 and MPPo4 were found to have higher binding affinities compared to the two other peptides. This is probably due to a very poor dissolution of the MPPo1N and MPPo2 peptides since more hydrophobic amino acids are contained within their sequence. In addition to the four predicted peptides, we modified the amino acid sequence of the highest scoring peptide i.e., MPPo1N (QLLIKAVNL). We20 and others53,54 have shown that introducing a tyrosine amino acid residue at the first position (P1Y) of a peptide enhances epitope immuoonogenicity. Therefore, a tyrosine amino acid residue was introduced in P1 of the MPPo1N peptide to boost its binding affinity and/or immunogenicity. The modificaootion of MPPo1N peptide enhanced the binding affinity of the modified MPPo1Y peptide using the algorithm prediction but in the actual binding assay, the analogue peptide could not stabilize the HLAoA*0201 molecule which is again may be due to its poor dissolution.
Consistent with other groups21,26,29 who have sucooceeded in identifying CD8+ CTL epitopes using a simple method that employs T2 cells as antigenopreoosenting cells, we could not generate specific immune responses using this method to both MPP11oderived peptides as well as WT1o126N peptide which was inoocluded as a positive control. Since MPP11 and WT1 are self proteins, the majority of high avidity CD8+ T lymphocytes may have been deleted during thymic maturation.55 Thus it is more difficult to generate CTL responses from the remaining low avidityonaïve precuroosors because their activation requires more stringent cooostimulatory requirements.56,57 Therefore, we used DCs as antigenopresenting cells for the generation of antioMPP11 CTL responses. DCs are known as the profesoosional antigen presenting cells because of their unique ability to stimulate naïve T lymphocyte responses. The conventional protocol for generating monocyteoderived DCs included 7o9 days of culture, however, Dauer et al,24 described a rapid protocol for the generation of mature DCs from monocytes within only two days of
in vitro culture. Such cells, termed fast DC or DC2d, were found to be capable of inducing tumorospecific CD8+ CTL responses as effectively as DCs generooated according to the conventional 7oday protocol.25,58 Moreover, CTL lines primed with the DC2d cells exoopanded more effectively and showed greater lytic activooity than lines stimulated with the DC7d cells.25,58 Using the DC2d protocol, we were able to detect antigenospeoocific responses by the CTLo21 line generated against the MPPo4 peptide. MPPo4oCTLs selectively recognized peptideoloaded T2 cells and specifically responded to the targets by releasing IFNog in an ELISPOT assay. Importantly, these T lymphocytes specifically killed T2 cells and autologous LCLs when loaded with the MPPo4 peptide. Moreover, they were capable of recooognizing the leukemia cell line K562oA2.1 expressing the MPP11 protein. Even though T2 cells were not efooficient at priming and generating specificoCD8+ CTL immunity, these cells were very useful as targets when conducting functional assays such as cytotoxicity and ELISPOT assays.
We have attempted to generate MPPo4ospecific CTLs from four healthy HLAoA*0201 positive indiooviduals; however, specific responses could only be obooserved in one CTL line established from one donor (BCo21). The failure to obtain specific CTL responses to tumor antigens in all donors tested was observed in a previous study was thought to be due to the low frequency of peptideospecific CD8+ T lymphocyte precursors in healthy individuals.59 We aimed to clone the MPPo4 CTL line before testing its capability of recognizing fresh A*0201opositive leukemic cells that overexpress the MPP11 protein. Unfortunately, regardooless of our attempts to generate MPPo4ospecific clones, we could not generate any specific clones. Standard techniques for cloning T cells employ stimulation with antigen loadedoAPCs in the presence of ILo2 and allooogeneic feeder cells in limiting dilution cultures followed by repeated reostimulations to maintain growth and specificity. In the first attempt, the MPPo4 CTL line was cloned by stimulation with peptide pulsedoT2 cells in the presence of allogeneic feeder cells in the presooence of ILo2, ILo15 and OKT3. ILo2 is the cytokine frequently used to promote the survival and expansion of cultured T cells.60 ILo2 and ILo15 share the bochain and the common gochain receptor (ILo2/ILo15 Rbgc), but each cytokine has its unique αochain receptor.61,62 ILo15 was initially identified by its capability to prooomote the development of NK cells and the survival of CD8+ memory T lymphocytes in vivo.63o65 However, it has been reported that antitumoroCTLs expanded and survived for relatively long time periods in vitro in the

original research report nOvel pepTide reCOgnized by Cd8+ CTl
Hematol Oncol Stem Cell Ther 3(1) First Quarter 2010 hemoncstem.edmgr.com32
presence of ILo15 whereas CTLs maintained in ILo2 died at earlier stages.66 Furthermore, ILo15omaintained CTLs retained their effector function as CTLs and did not switch into memory cells.66 For TCR triggering, we used OKT3 as reported previously.25 Because all of the generated clones were not specific, we conducted anothooer attempt to clone the line but without the addition of either ILo15 or OKT3 antibody. The generated T lymoophocytes clones were very few and died at early stage perhaps as a result of an old T lymphocyte culture.
In summary, our data suggests that CD8+ CTL reacootive to the MPPo4 peptide could be generated from the
T lymphocytes repertoire of HLAoA*0201+ healthy individuals. More importantly, these CTLs were able to specifically lyse the K562oA2.1 leukemic cells naturally expressing the MPP11 antigen.
AcknowledgmentsWe are very grateful to the administration of the Research Centre and the Research Advisory Council (RAC) for their support. This work was sponsored by RAC (proposal # 2040010). We would like to thank Dr. Wolfgang Herr (University of Mainz, Germany) for providing the K-562 cells transfected with the HLA-A*0201 gene.
1. bozzone dM. leukemia. 1st ed: Chelsea House, new york. 2009. 2. leukemia Facts and Statistics. leukemia and lymphoma Society, 2009. 3. Tallman MS, gilliland dg, rowe JM. drug therapy for acute myeloid leukemia. blood. 2005;106:1154-1163. 4. guglielmelli p, zini r, bogani C, et al. Molecular profiling of Cd34+ cells in idiopathic myelofibrosis identifies a set of disease-associated genes and reveals the clinical significance of Wilms’ tumor gene 1 (WT1). Stem Cells. 2007;25:165-173. 5. boon T, Old lJ. Cancer Tumor antigens. Curr Opin immunol. 1997;9:681-683. 6. dermime S, Armstrong A, Hawkins re, Stern pl. Cancer vaccines and immunotherapy. br Med bull 2002;62:149-162. 7. dermime S, gilham de, Shaw dM, et al. vaccine and antibody-directed T cell tumour immunothera--py. biochim biophys Acta. 2004;1704:11-35. 8. Matsumoto-Taniura n, pirollet F, Monroe r, gerace l, Westendorf JM. identification of novel M phase phosphoproteins by expression cloning. Mol biol Cell. 1996;7:1455-1469. 9. davis FM, Tsao Ty, Fowler SK, rao pn. Mono--clonal antibodies to mitotic cells. proc natl Acad Sci USA. 1983;80:2926-2930. 10. zenklusen JC, Conti CJ. Cytogenetic, molecular and functional evidence for novel tumor suppres--sor genes on the long arm of human chromosome 7. Mol Carcinog. 1996;15:167-175. 11. Hundley HA, Walter W, bairstow S, Craig eA. Human Mpp11 J protein: ribosome-tethered molecular chaperones are ubiquitous. Science. 2005;308:1032-1034. 12. Otto H, Conz C, Maier p, et al. The chaperones Mpp11 and Hsp70l1 form the mammalian ribo--some-associated complex. proc natl Acad Sci USA. 2005;102:10064-10069. 13. resto vA, Caballero Ol, buta Mr, et al. A puta--tive oncogenic role for Mpp11 in head and neck squamous cell cancer. Cancer res. 2000;60:5529-5535. 14. gure AO, Stockert e, Scanlan MJ, et al. Se--rological identification of embryonic neural pro--teins as highly immunogenic tumor antigens in small cell lung cancer. proc natl Acad Sci USA. 2000;97:4198-4203. 15. greiner J, ringhoffer M, Taniguchi M, et al. Characterization of several leukemia-associated antigens inducing humoral immune responses in acute and chronic myeloid leukemia. int J Cancer. 2003;106:224-231. 16. Schmitt M, li l, giannopoulos K, et al. Chronic
myeloid leukemia cells express tumor-associated antigens eliciting specific Cd8+ T-cell responses and are lacking costimulatory molecules. exp He--matol. 2006;34:1709-1719. 17. greiner J, ringhoffer M, Taniguchi M, et al. mrnA expression of leukemia-associated anti--gens in patients with acute myeloid leukemia for the development of specific immunotherapies. int J Cancer. 2004;108:704-711. 18. van der geld yM, limburg pC, Kallenberg Cg. proteinase 3, Wegener’s autoantigen: from gene to antigen. J leukoc biol 2001;69:177-190. 19. rammensee H, bachmann J, emmerich np, bachor OA, Stevanovic S. SyFpeiTHi: database for MHC ligands and peptide motifs. immunogen--et. 1999;50:213-219. 20. Al Qudaihi g, lehe C, negash M, et al. en--hancement of lytic activity of leukemic cells by Cd8+ cytotoxic T lymphocytes generated against a WT1 peptide analogue. leuk lymphoma. 2009;50:260-269. 21. Molldrem J, dermime S, parker K, et al. Tar--geted T-cell therapy for human leukemia: cytotoxic T lymphocytes specific for a peptide derived from proteinase 3 preferentially lyse human myeloid leukemia cells. blood. 1996;88:2450-2457. 22. britten CM, Meyer rg, Kreer T, drexler i, Wol--fel T, Herr W. The use of HlA-A*0201-transfected K562 as standard antigen-presenting cells for Cd8(+) T lymphocytes in iFn-gamma eliSpOT as--says. J immunol Methods. 2002;259:95-110. 23. neitzel H. A routine method for the establish--ment of permanent growing lymphoblastoid cell lines. Hum genet. 1986;73:320-326. 24. dauer M, Obermaier b, Herten J, et al. Mature dendritic cells derived from human monocytes within 48 hours: a novel strategy for dendritic cell differentiation from blood precursors. J immunol. 2003;170:4069-4076. 25. Ho Wy, nguyen Hn, Wolfl M, Kuball J, green--berg pd. in vitro methods for generating Cd8+ T-cell clones for immunotherapy from the naive repertoire. J immunol Methods. 2006;310:40-52. 26. Houbiers Jg, nijman HW, van der burg SH, et al. in vitro induction of human cytotoxic T lympho--cyte responses against peptides of mutant and wild-type p53. eur J immunol. 1993;23:2072-2077. 27. dermime S, bertazzoli C, Marchesi e, et al. lack of T-cell-mediated recognition of the fusion region of the pml/rAr-alpha hybrid protein by lymphocytes of acute promyelocytic leukemia pa--tients. Clin Cancer res. 1996;2:593-600. 28. Clark WH, Jr., elder de, guerry dt, et al. Model predicting survival in stage i melanoma
based on tumor progression. J natl Cancer inst. 1989;81:1893-1904. 29. Oka y, elisseeva OA, Tsuboi A, et al. Human cytotoxic T-lymphocyte responses specific for peptides of the wild-type Wilms’ tumor gene (WT1 ) product. immunogenet. 2000;51:99-107. 30. Tallman MS. new strategies for the treatment of acute myeloid leukemia including antibodies and other novel agents. Hematology Am Soc He--matol educ program. 2005:143-150. 31. Melief CJ, Kast WM. T-cell immunotherapy of tumors by adoptive transfer of cytotoxic T lympho--cytes and by vaccination with minimal essential epitopes. immunol rev. 1995;145:167-177. 32. Heslop He, Stevenson FK, Molldrem JJ. immu--notherapy of hematologic malignancy. Hematol--ogy Am Soc Hematol educ program. 2003:331-349. 33. Qazilbash MH, Wieder e, rios r, et al. vacci--nation with the pr1 leukemia-Associated Antigen Can induce Complete remission in patients with Myeloid leukemia. ASH Annual Meeting Ab--stracts 2004;104:259. 34. Schmitt M, Schmitt A, rojewski MT, et al. rHAMM-r3 peptide vaccination in patients with acute myeloid leukemia, myelodysplastic syn--drome, and multiple myeloma elicits immunologic and clinical responses. blood. 2008;111:1357-1365. 35. Schetelig J, Kiani A, Schmitz M, ehninger g, bornhauser M. T cell-mediated graft-versus-leukemia reactions after allogeneic stem cell transplantation. Cancer immunol immunother. 2005;54:1043-1058. 36. Wu CJ, ritz J. induction of tumor immunity fol--lowing allogeneic stem cell transplantation. Adv immunol. 2006;90:133-173. 37. Appelbaum Fr. Haematopoietic cell transplan--tation as immunotherapy. nature. 2001;411:385-389. 38. Kapp M, Stevanovic S, Fick K, et al. Cd8+ T-cell responses to tumor-associated antigens correlate with superior relapse-free survival after allo-SCT. bone Marrow Transpl. 2009;43:399-410. 39. Molldrem JJ, lee pp, Wang C, et al. evidence that specific T lymphocytes may participate in the elimination of chronic myelogenous leukemia. nat Med. 2000;6:1018-1023. 40. rezvani K, grube M, brenchley JM, et al. Functional leukemia-associated antigen-specific memory Cd8+ T cells exist in healthy individuals and in patients with chronic myelogenous leuke--mia before and after stem cell transplantation. blood. 2003;102:2892-2900. 41. viatte S, Alves pM, romero p. reverse im--munology approach for the identification of Cd8
REFERENCES

original research reportnOvel pepTide reCOgnized by Cd8+ CTl
Hematol Oncol Stem Cell Ther 3(1) First Quarter 2010 hemoncstem.edmgr.com 33
T-cell-defined antigens: advantages and hurdles. immunol Cell biol. 2006;84:318-330. 42. Stevanovic S. identification of tumour-associ--ated T-cell epitopes for vaccine development. nat rev Cancer. 2002;2:514-520. 43. paschen A, eichmuller S, Schadendorf d. iden--tification of tumor antigens and T-cell epitopes, and its clinical application. Cancer immunol im--munother. 2004;53:196-203. 44. greiner J, li l, ringhoffer M, et al. identification and characterization of epitopes of the receptor for hyaluronic acid-mediated motility (rHAMM/Cd168) recognized by Cd8+ T cells of HlA-A2-pos--itive patients with acute myeloid leukemia. blood. 2005;106:938-945. 45. Asemissen AM, Keilholz U, Tenzer S, et al. identification of a highly immunogenic HlA-A*01-binding T cell epitope of WT1. Clin Cancer res. 2006;12:7476-7482. 46. Alves pM, Faure O, graff-dubois S, et al. ephA2 as target of anticancer immunotherapy: identifica--tion of HlA-A*0201-restricted epitopes. Cancer res. 2003;63:8476-8480. 47. Ayyoub M, Stevanovic S, Sahin U, et al. pro--teasome-assisted identification of a SSX-2-de--rived epitope recognized by tumor-reactive CTl infiltrating metastatic melanoma. J immunol. 2002;168:1717-1722. 48. Fujie T, Tahara K, Tanaka F, Mori M, Takesako K, Akiyoshi T. A MAge-1-encoded HlA-A24-binding synthetic peptide induces specific anti-tumor cyto--toxic T lymphocytes. int J Cancer. 1999;80:169-172. 49. Kawashima i, Hudson SJ, Tsai v, et al. The multi-epitope approach for immunotherapy for cancer: identification of several CTl epitopes from various
tumor-associated antigens expressed on solid epi--thelial tumors. Hum immunol. 1998;59:1-14. 50. Kessler JH, beekman nJ, bres-vloemans SA, et al. efficient identification of novel HlA-A(*)0201-presented cytotoxic T lymphocyte epitopes in the widely expressed tumor antigen prAMe by pro--teasome-mediated digestion analysis. J exp Med. 2001;193:73-88. 51. neumann F, Wagner C, preuss Kd, et al. identi--fication of an epitope derived from the cancer tes--tis antigen HOM-TeS-14/SCp1 and presented by dendritic cells to circulating Cd4+ T cells. blood. 2005;106:3105-3113. 52. player MA, barracchini KC, Simonis Tb, et al. differences in frequency distribution of HlA-A2 subtypes between north American and italian white melanoma patients: relevance for epitope specific vaccination protocols. J immunother em--phasis Tumor immunol. 1996;19:357-363. 53. Tourdot S, Scardino A, Saloustrou e, et al. A general strategy to enhance immunogenicity of low-affinity HlA-A2. 1-associated peptides: impli--cation in the identification of cryptic tumor epit--opes. eur J immunol. 2000;30:3411-3421. 54. valmori d, Fonteneau JF, lizana CM, et al. enhanced generation of specific tumor-reactive CTl in vitro by selected Melan-A/MArT-1 im--munodominant peptide analogues. J immunol. 1998;160:1750-1758. 55. Starr TK, Jameson SC, Hogquist KA. positive and negative selection of T cells. Annu rev im--munol. 2003;21:139-176. 56. Janeway CA, Jr., bottomly K. Signals and signs for lymphocyte responses. Cell 1994;76:275-285. 57. Swain Sl, Croft M, dubey C, et al. From naive
to memory T cells. immunol rev. 1996;150:143-167. 58. dauer M, Schad K, Herten J, et al. FastdC derived from human monocytes within 48 h ef--fectively prime tumor antigen-specific cytotoxic T cells. J immunol Methods. 2005;302:145-155. 59. Ohminami H, yasukawa M, Fujita S. HlA class i-restricted lysis of leukemia cells by a Cd8(+) cytotoxic T-lymphocyte clone specific for WT1 peptide. blood. 2000;95:286-293. 60. Smith KA. interleukin-2: inception, impact, and implications. Science 1988;240:1169-1176. 61. Carson We, giri Jg, lindemann MJ, et al. in--terleukin (il) 15 is a novel cytokine that activates human natural killer cells via components of the il-2 receptor. J exp Med. 1994;180:1395-1403. 62. grabstein KH, eisenman J, Shanebeck K, et al. Cloning of a T cell growth factor that interacts with the beta chain of the interleukin-2 receptor. Science. 1994;264:965-968. 63. Colucci F, Caligiuri MA, di Santo Jp. What does it take to make a natural killer? nat rev im--munol. 2003;3:413-425. 64. zhang X, Sun S, Hwang i, Tough dF, Sprent J. potent and selective stimulation of memory-phenotype Cd8+ T cells in vivo by il-15. immun. 1998;8:591-599. 65. Schluns KS, lefrancois l. Cytokine control of memory T-cell development and survival. nat rev immunol. 2003;3:269-279. 66. lu J, giuntoli rl, 2nd, Omiya r, Kobayashi H, Kennedy r, Celis e. interleukin 15 promotes anti--gen-independent in vitro expansion and long-term survival of antitumor cytotoxic T lymphocytes. Clin Cancer res. 2002;8:3877-3884.


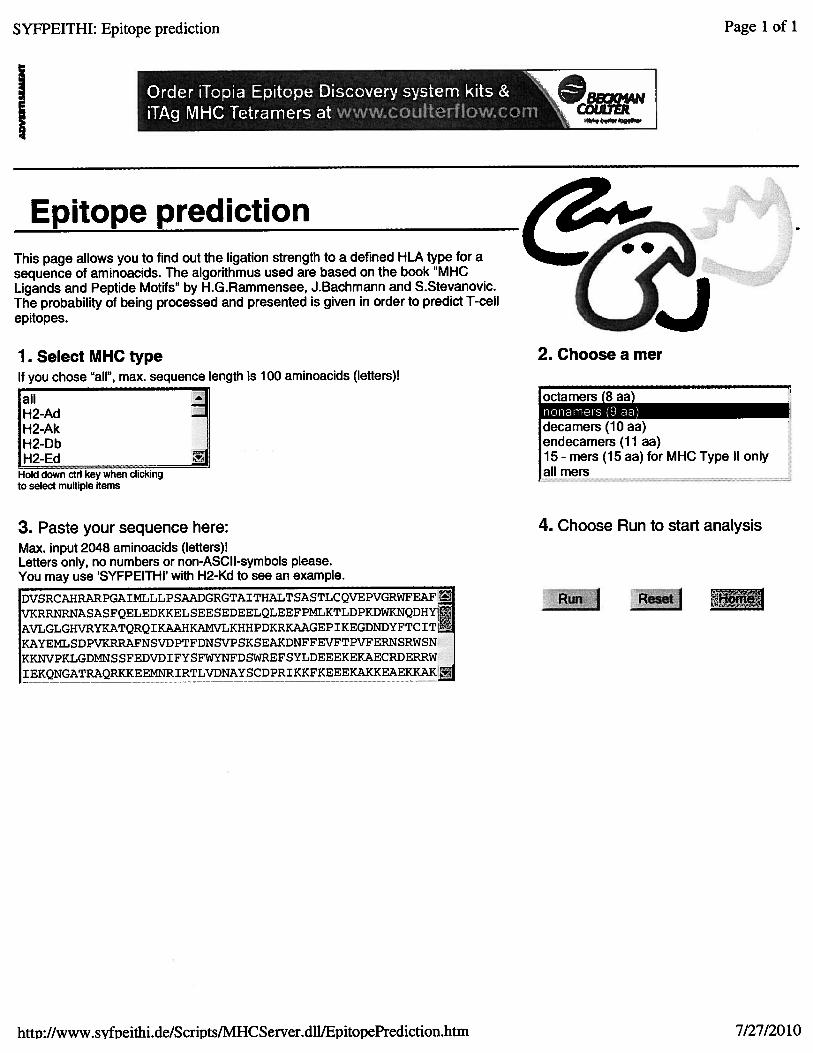


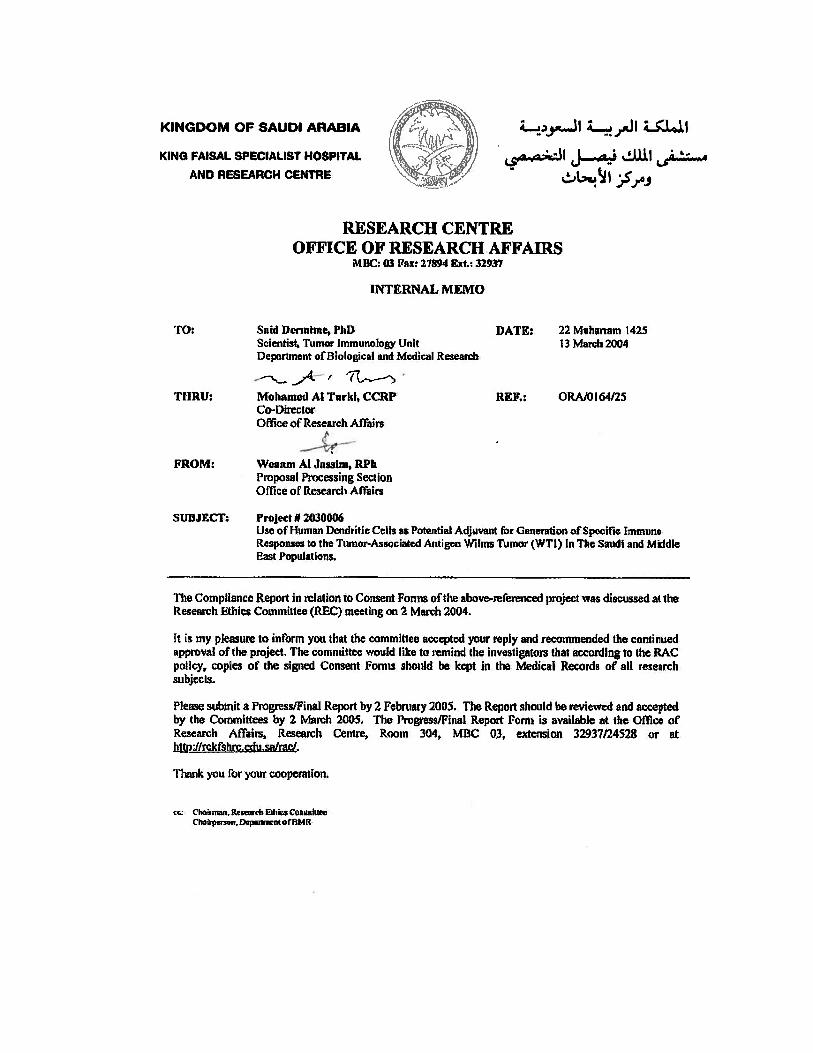
Copyright © 2022 FDOKUMEN