studies of interaction of small molecules with water condensed
329
STUDIES OF INTERACTION OF SMALL MOLECULES WITH WATER CONDENSED MEDIA by Sergey Mitlin A thesis presented to the University of Waterloo in fulfillment of the thesis requirement for the degree of Doctor of Philosophy in Chemistry Waterloo, Ontario, Canada, 2006 © Sergey Mitlin 2006
-
Upload
khangminh22 -
Category
Documents
-
view
2 -
download
0
Transcript of studies of interaction of small molecules with water condensed

STUDIES OF INTERACTION OF SMALL MOLECULES WITH WATER CONDENSED
MEDIA
by
Sergey Mitlin
A thesis
presented to the University of Waterloo
in fulfillment of the
thesis requirement for the degree of
Doctor of Philosophy
in
Chemistry
Waterloo, Ontario, Canada, 2006
© Sergey Mitlin 2006

ii
I hereby declare that I am the sole author of this thesis. This is a true copy of the thesis,
including any required final revisions, as accepted by my examiners.
I understand that my thesis may be made electronically available to the public.

iii
ABSTRACT
STUDIES OF INTERACTION OF SMALL MOLECULES WITH WATER CONDENSED
MEDIA
The present work reports experimental and theoretical studies of the intermolecular
interactions in condensed water media. The chemical objects comprise pristine ice and polar
organic substances: acetone, acetaldehyde, methanol and chloroform and bi-component water-
organic deposits. The experimental part of the studies includes the Fourier Transform Infrared
Reflection Absorption spectral (FTIR RAS) examination of the processes of film growth by
vapor deposition on cold metal substrate and subsequent annealing. The theoretical studies
include ab initio (MP2) and semi-empirical (B3LYP) calculations on the small water and
water-organic clusters and classical molecular dynamics simulations of the adsorption of inert
guests (Xe/Rn) on the ice surface. The FTIR RA spectral studies reveal that depending on the
deposition conditions condensed water media exist in two principal structural forms:
noncrystalline and polycrystalline. The former is characterized by porous structure while the
latter exists as a non-porous medium with smooth external interface. On annealing,
characteristic spectral changes indicate on a rapid crystallization occurring at a certain
temperature range. The initial adsorption of organic molecules is accompanied by the
hydrogen-bonded coordination between the functional group of organic species and non-
coordinated hydroxyl group of the ice surface, the topology of which depends on the electronic
properties of the functional group. The computational studies of small water-organic clusters
reveal, in particular, two major coordination minima for carbonyl group: a single hydrogen-
bonded in-plane complex and a double hydrogen-bonded in-plane complex. The classical
molecular dynamics of Xe/Rn species on the ice interface is consistent with two distinctly
different surface adsorption sites: one that delocalized over the entire surface and one that
confined to small opening in the top ice layer, disrupted by the thermal molecular motion. The
penetration barrier is associated with van der Walls repulsion of guest species from the ordered
water hexagonal arrangement. A thermo-disruption of latter leads to a rapid diffusion of guest
species inside ice medium.

iv
ACKNOWLEGMENTS
At the top of the list let me express my sincere thanks to the members of advisory
committee Professors Tong Leung, James Sloan, Bruce Torrie and Dan Thomas for many
helpful comments and suggestions during the long period of my studies. I am indebted to
Professor Tong Leung who has supervised these studies for providing a rare opportunity to
explore different scientific aspects of the water studies. Special thanks go to Professor Bruce
Torrie for many hours of insightful discussions and advices.
I am grateful to Professors Peter Bernath, Marcel Nooijen, John Goddard, Tom Woo,
Paul Rowntree and Dr. Nick Taylor for useful discussions and consultations. Contribution of
Professor Victoria Buch to the computational part of this work is noted with special thanks.
I would like especially aknowlege that present studies are fundamentally based on the
pioneer, thorough studies of Professor Paul Devlin on water media. Without his studies the
present work would not be possible. I am also grateful to Professor Devlin, whose opinion I
highly value, for reading and commenting on the present manuscript.
My sincere thanks go to Professor Robert Le Roy and members of his group, Douglas
Weir and Yiye Huang, for providing access to the computation facilities and for constant help
along the course of computational studies.
My appreciation is also extended to Sean McLeod, a member of Professor Peter
Bernath's team, for sharing knowledge and kind help in conducting computational studies.
I would like also to thank all stuff members and secretariat of the Department of
Chemistry and, especially, Catherine Van Esch and Scott Nicoll for their kind cooperation
along my staying in the Department.
A unique UHV chamber used in the present studies has been manufactured by a rare
craftsman and great man Richard Forgett, with whom I have a real pleasure to work on this
project and with whom we became friends. Without his dedication and personal support this
project would be impossible. I wish to express to Rick my deepest appreciation for his
immerse help during the period of my studies.
My sincere thanks also go to the entire staff of the Science Electronic and Machine
Shops at the University of Waterloo and, in particular, to Dave Reader, Krunomir Dvorski,
Jacek Szubra, Mike Lang, Andy Colclough, Reg Graf, and Harmen Vander Heide. Their
outstanding skills and workmanship are well known far beyond the University of Waterloo.

v
Many thanks should go to Drs. Tony Eng, Tim Rider and Tim Johnson from Bruker
Canada, with whom I have a pleasure to collaborate on the experimental part of this project.
They have provided us with exceptionally well-tuned FTIR instrument, certainly one of the
best instruments of this class in the world, and have supported us in difficult moments by
outstanding service going well beyond their direct duties. It is impossible to imagine
successful spectral studies on Bruker machines without support of these people. I am grateful
to share a merit for observing those unique surface features, which are reported in the present
experimental studies, with the team of Bruker Canada.
I am sincerely grateful to Dr. Sasha Lemak and Dr. Galina Orlova for discussions of
the practical aspects of molecular dynamic and quantum mechanical calculations. Their
instructive help has been very useful for the theoretical part of the present studies. I wish also
to thank Dr. A. M. Mebel for providing the data on optimized geometries of selected acetone-
water clusters.
I would like to extent my thanks to the entire staff of the Library at the University of
Waterloo, which provides us with exceptionally well-established bibliographic and information
serves.
Specials thanks should go to my lab mates Dr. Qiang Li and Dr. Zhenua He, with
whom I have shared the fascination and difficulty of the studies. I wish to especially thank Dr.
Nina Heinig for proof reading of the thesis. Technical assistance of Qiang Gao in conducting
certain experimental runs is appreciated.
Finally, I would like to acknowledge with my sincere thanks a personal support of the
present studies by Professor Ranjana Bird, Dean of Graduate Studies Office, and senior
advisor Mrs. Elaine Garner. Their help was of the vital importance for the present studies.

vi
TABLE OF CONTENTS
ABSTRACT ............................................................................................................................... iii
ACKNOWLEGMENTS............................................................................................................. iv
LIST OF TABLES ..................................................................................................................... ix
LIST OF FIGURES..................................................................................................................... x
CHAPTER 1................................................................................................................................ 1
Introduction ................................................................................................................................. 1
1.1 General Introduction........................................................................................................ 1
1.2 Research Objectives ........................................................................................................ 8
1.3 Thesis Organization....................................................................................................... 11
CHAPTER 2.............................................................................................................................. 16
Bibliographical Review and Modeling of the Non-Crystalline Water Media........................... 16
2.1 Solid and Liquid Water: Structures and Models ........................................................... 17
2.2 Crystalline and Non-Crystalline Solid Phases: General Description ............................ 21
2.3 Structures of Selected Solid Ice Phases......................................................................... 26
2.3.1 Structure and Properties of Hexagonal Ice, Ih, and its Proton Ordered Structural
Analog Ice XI....................................................................................................................... 27
2.4 Structure and Properties of Non-Crystalline Water....................................................... 35
2.4.1 3-Dimensional Structural Units for the Non-Crystalline Water Hydrogen-Bonded
Network ............................................................................................................................... 37
2.4.2 Icosahedral 280-mer Model of Non-Crystalline Water......................................... 39
2.4.2.1 Expanded Cluster....................................................................................... 39
2.4.2.2 Construction of the 280-mer Molecule Expanded Cluster from the
Structural Units........................................................................................................... 45
2.4.2.3 Collapsed Cluster....................................................................................... 48
2.5 Ice Adsorbate Interactions: IR Spectroscopy and Computer Simulations .................... 50
CHAPTER 3.............................................................................................................................. 67
Experimental.............................................................................................................................. 67
3.1 Experimental Objectives................................................................................................ 67
3.2 UHV/FTIR RAS Chamber: Design and Construction .................................................. 69
3.3 Samples and Accessories Preparation and Manipulation..............................................73
vii
3.4 FTIR RA Spectral Acquisition ...................................................................................... 73
3.5 Fresnel Method for Simulating the FTIR RA Spectra of Polycrystalline and
Noncrystalline Ice Films............................................................................................................ 74
CHAPTER 4.............................................................................................................................. 85
Theoretical Analysis and Computer Simulations of the Interaction of Small Polar Molecules
with Water Media ...................................................................................................................... 85
4.1 Quantum Mechanical Analysis of the Hydrogen Bonding in Water Media.................. 85
4.2 Theoretical Background of the Ab Initio and Density Functional Theory Calculations ...
..................................................................................................................................... 127
4.2.1 Computational Methods and Supermolecular Approach to the Multimolecular
Complexes ......................................................................................................................... 127
4.2.1.1 Counterpoise Procedure for the Basis Set Superposition Error............... 141
4.2.2 Cooperativity Effects in the Water Media........................................................... 145
4.3 Ab Initio and Semi-Empirical Analysis of the Hydrogen Bonding in the Small Water
Clusters (H2O)n, n=2-6. ........................................................................................................... 151
4.3.1 Water Dimer: Ab Initio and Semi-Empirical Results.......................................... 158
4.3.1.1 Cross-section of the Potential Energy Surface of Water Dimer along the
O−O Coordinate ....................................................................................................... 165
4.3.2 Water Tetramers .................................................................................................. 175
4.3.3 Comparative Analysis of Small Water Clusters.................................................. 180
4.4 Acetone-Water Clusters: MP2 and B3LYP Studies..................................................... 185
CHAPTER 5............................................................................................................................ 212
Experimental Results and Interpretations................................................................................ 212
5.1 The IR spectral Examination of the Ice Films Vapor Deposition at 125-185 K: Ice
Spectral Bands and Dangling Bonds ....................................................................................... 212
5.1.1 Polycrystalline Ice at 155-185 K ......................................................................... 212
5.1.2 Noncrystalline Ice at 128-145 K.......................................................................... 224
5.1.3 OH Dangling Bonds ............................................................................................ 233
5.1.4 Summary.............................................................................................................. 238
5.2 Crystallization of Noncrystalline Ice Films at 160-165 K: IR Spectral Picture .......... 239
5.3 The FTIR RA Spectral Analysis of Pristine Films of Organic Substances on Metal

viii
Surface at Cryogenic Temperatures ........................................................................................ 247
5.3.1 Solid Chloroform on the Cu Substrate at 125-165 K .......................................... 247
5.3.2 Solid Acetone on the Cu Substrate at 125-165 K................................................ 256
5.4 The Interaction of Chloroform with Noncrystalline Ice.............................................. 275
5.5 Interaction of Organic Substances with Oxygen-containing Functional Groups with
Noncrystalline and Polycrystalline Ices .................................................................................. 279
5.5.1 The Interaction of Acetone with OH Dangling Bonds on Ice Films................... 279
5.5.2 Concluding Remarks ........................................................................................... 288
CHAPTER 6............................................................................................................................ 293
Surface Adsorption and Trapping of Inert Gases on Hexagonal Ice by Molecular Dynamics
Simulations .............................................................................................................................. 293
6.1 Introduction ................................................................................................................. 293
6.2 Methods and Computational Details ........................................................................... 296
6.3 Results and Discussion ................................................................................................ 298
6.3.1 Potential of Mean Force of Xe on Ice.................................................................. 298
6.3.2 Order-disorder of the Xe-Ice Surface .................................................................. 301
6.3.3 Surface Dynamics of Xe...................................................................................... 306
6.4 The Diffusive Transport in Systems comprising of the Gas and Liquid phases ......... 308
CHAPTER 7............................................................................................................................ 311
General Conclusions................................................................................................................ 311

ix
LIST OF TABLES
Table 2.2.1. Structures of the crystalline phases of water. ....................................................... 24
Table 4.1.1. IR frequencies of single water molecule, dimer and water in condense state. ... 120
Table 4.2.1. Properties of H2O, H, O, and OH radicals at different levels of theory. ............ 139
Table 4.2.2. Binding energies of the water dimer W2 (Cs) and cyclic hexamer W6 (S6). ...... 149
Table 4.2.3. Optimized geometry and dimerization energy for the linear water dimer for the
selected classical potentials [59]. ............................................................................................ 149
Table 4.2.4. Multi-body decomposition of the binding energy for the water dimer W2 (Cs) and
the water cyclic hexamer W6 (S6) at the MP2(fc)/aug-cc-pvtz level. SCF, E2 and EMP2
designate the HF energy, second order MP correction and the total MP2 energy. ................. 150
Table 4.2.5. Multi-body decomposition of the binding energy for the water dimer W2 (Cs) and
the water cyclic hexamer W6 (S6) at the B3LYP level with 6-311++g(3df, 3pd) basis set. .... 151
Table 4.3.1. The comparative table for the ab initio and B3LYP data for water monomer and
dimer........................................................................................................................................ 161
Table 4.3.2. Local minima and transition states in the HB systems with 4 water molecules. 177
Table 4.4.1. Geometrical, bond (Wiberg, W.B., and Mayer-Mulliken, M.M.) and population
parameters for the acetone molecule model at the MP2/aug-cc-pvtz and the B3LYP/LBS. .... 186
Table 4.4.2. MP2(fc) comparative analysis of the Ac-W and Ac-W2 complexes. ................. 198
Table 4.4.3. B3LYP comparative analysis of the the Ac-W, Ac-W2 and Ac-W3 complexes. 199
Table 4.4.4. Experimental and computed frequencies for the Ac-Wn HB complexes. .......... 200
Table 5.3.1. The correlation diagram for crystalline chloroform phase, space group Pnma,
factor group D2h. ...................................................................................................................... 251
Table 5.3.2. The IR spectral data on the C−H stretching and bending modes of chloroform.253
Table 5.3.3. The correlation diagram for the Cmcm acetone phase. ...................................... 263
Table 5.3.4. The correlation diagram for the Pbca acetone phase. ........................................ 264
Table 5.3.5. The frequencies of fundamental vibrations of the acetone in solid crystalline state.
................................................................................................................................................. 267
x
LIST OF FIGURES
Figure 2.2.1. Schematic partial phase diagram of water [12]................................................... 23
Figure 2.3.1. Crystallographic structure of the proton-disordered hexagonal ice, Ih [26]. ...... 27
Figure 2.3.2. Crystallographic models of (a) the proton-ordered ice XI and (b) the hexagonal
ice, Ih. ........................................................................................................................................ 29
Figure 2.3.3. Fragment of the crystalline cubic structure......................................................... 30
Figure 2.3.4. Crystallographic structure of proton ordered ice II............................................. 31
Figure 2.3.5. The oxygen subnetwork arrangement in ice II .................................................... 33
Figure 2.3.6. The structure of ices III and IX. .......................................................................... 34
Figure 2.4.1. The structure of bicyclo-octamer unit. ................................................................ 37
Figure 2.4.2. Structure and connectivity graph of the tricycle-decamer unit (10 H2O). .......... 38
Figure 2.4.3. The structure and connectivity of tetradecimal structural unit (14 H2O)............ 39
Figure 2.4.4. The spacefill 3-dimensional structure of expanded 280-molecule water cluster of
icosahedral symmetry. ............................................................................................................... 40
Figure 2.4.5. The representation of the expanded cluster in the spherical coordinates............. 41
Figure 2.4.6. The pentagon-dodecahedron first shell (512): 20 water molecules, a key structural
element of expanded cluster and the Chaplin's model of liquid water. ..................................... 42
Figure 2.4.7. Second Shell: 80 water molecules....................................................................... 43
Figure 2.4.8. Third shell: 180 water molecules. ....................................................................... 44
Figure 2.4.9. Construction of the 280-mer expanded cluster from the 22 bicyclo-octamer units.
................................................................................................................................................... 45
Figure 2.4.10. Construction of the expanded cluster from the primitive strucutral units......... 46
Figure 2.4.11. The radial O···O distribution functions for water molecules in the expanded
cluster shown separately for the first, the second, and the third shells...................................... 47
Figure 2.4.12. The inner cavity of the collapsed cluster of cubic symmetry............................ 48
Figure 2.4.13. The inner cubic cavity with additional 8 H2O molecules from the second shell.
................................................................................................................................................... 49
Figure 2.4.14. The radial O···O distribution function for the molecules in the collapsed cluster
for different central cavities: cubic, tetrahedral, and octahedral. .............................................. 50
Figure 3.2.1. Schematic layout of the UHV chamber.............................................................. 70
Figure 3.2.2. Schematic layout of the optical arrangement. ..................................................... 72

xi
Figure 3.5.1. The geometry of IR beam passage through the ice media. .................................76
Figure 3.5.2. The He-Ne laser interference patterns for the growing pristine ice film. ........... 77
Figure 3.5.3. Fresnel spectra of the 1-nm pc-ice film at different incident angles...................80
Figure 3.5.4. Fresnel spectra of pc-ice films as function of film thickness.............................. 82
Figure 4.1.1. The configuration of bifurcated hydrogen bond in the tetrahedral water network.
Reproduced from Giguere [9].................................................................................................... 87
Figure 4.1.2. Structure of 26-mer water cluster optimized at the HF/6-31g(d,p) level............ 89
Figure 4.1.3. Molecular neighborhood of the water molecule that acts as a triple acceptor in
the 26-mer cluster optimized at HF/6-31g(d,p) level. ............................................................... 90
Figure 4.1.4. Radial distribution functions for the low-density and high-density amorphous
solids at 80 K. Reproduced from Finney et al. [12]. ................................................................ 92
Figure 4.1.5. Distribution functions of the 26-mer cluster at the HF/6-31g(d,p) level. ........... 94
Figure 4.1.6. Distribution functions of the 26-mer cluster at HF, B3LYP and TIP4P levels. 100
Figure 4.1.7. Calculated IR spectra for the 26-mer cluster at (a) B3LYP and (b) HF levels.. 103
Figure 4.1.8. The experimental IR depletion spectra of size-selected water clusters with 7, 8,
9, 10 molecules and mixture of 10-20-mer clusters. Reproduced from Buck and Huisken [17].
................................................................................................................................................. 104
Figure 4.1.9. The histogram of nearest neighbor O···O distances between pairs of hydrogen
bonded molecules in the 6-10-mer clusters at MP2 level. Reproduced from Sadlej et al. [18].
................................................................................................................................................. 105
Figure 4.1.10. The histogram of nearest neighbour O···O distances between pairs of hydrogen
bonded molecules in the 26-mer and 6-mer water clusters at HF, B3LYP and TIP4P levels. 106
Figure 4.1.11. The structure of protonated O center in the 26-mer cation at B3LYP level. ... 109
Figure 4.1.12. Calculated IR spectra of the 26-mer H53O26+ cation (blue curve) and neutral 26-
mer H52O26 (red curve) clusters optimized at B3LYP/6-31g(d,p) level. .................................. 110
Figure 4.1.13. Computed and experimental (reproduced from Kim et al. [20]) differential IR
spectra between protonated 26-mer H53O26+ and pristine, H52O26, water clusters. ................. 113
Figure 4.1.14. The histograms of nearest neighbour O···O distances between pairs of hydrogen
bonded water molecules for 26-mer neutral and protonated cluster at B3LYP/6-31g(d,p). .... 114
Figure 4.1.15. FTIR-RAS spectra of the HCl-ice films in comparison with that of pristine ice.
................................................................................................................................................. 115

xii
Figure 4.1.16. Differential IR spectra of H/DCL on ice. Reproduced from Devlin et al. [21].
................................................................................................................................................. 117
Figure 4.1.17. Potential energy profiles along the O−H coordinate for H2O, (H2O)2 and H5O2+.
................................................................................................................................................. 118
Figure 4.1.18. Comparison of the harmonic frequencies of water monomer and dimer with that
of (a) H3O+ and (b) H5O2
+ cations at the MP2/aug-cc-pvtz level. ........................................... 119
Figure 4.1.19. Double minimum proton potential and wave functions Ψ0+ and Ψ0− of the two
lowest states of Zundel ion. Reproduced from Janoshek et al. [19 a].................................... 123
Figure 4.1.20. Experimental [24] and computed IR spectra of H5O2+. .................................. 125
Figure 4.3.1. The geometry of the water dimer at Cs minimum. ............................................ 158
Figure 4.3.2. Potential energy profile for the water dimer along the O−O coordinate. ......... 167
Figure 4.3.3. Profile of the BSSE corrected binding and interaction energies of water dimer
along the O···O coordinate at the MP2/aug-cc-pvtz level of theory. (a) Wide and (b) narrow
range of the variation of O−O distance. .................................................................................. 169
Figure 4.3.4. Profiles of the BSSE counterpoise correction for the water dimer along the O−O
coordinate at the MP2/aug-cc-pvtz level. ................................................................................ 171
Figure 4.3.5. Profiles of the deformation energies of two water monomers in the dimer along
the O···O coordinate at MP2/6-311++g(3df, 3pd).................................................................. 172
Figure 4.3.6. The dependence of the (O−H)d distance, the O···H−O HB angle, and the acceptor
bending angle in the water dimer on the intermolecular O···O distance. ................................ 174
Figure 4.3.7. Binding energies and thermodynamic functions for the water tetramer clusters.
................................................................................................................................................. 176
Figure 4.3.8. Properties of cyclic regular tetramer, pentamer and hexamer water structures.182
Figure 4.3.9. Compact water clusters:prism and cage for hexamer and tri-leaf for pentamer.
................................................................................................................................................. 183
Figure 4.4.1. Atomic labelling and molecular structure of the acetone molecule.................. 187
Figure 4.4.2. Acetone (Ac)·H2O / 1HB complex is a parent structure for the β-class............ 194
Figure 4.4.3. Acetone (Ac)·2H2O sequential / 1HB complex from the β-class...................... 195
Figure 4.4.4. Acetone (Ac)·2H2O (C2)/2HB complex is a parent structure for the α-class.... 196
Figure 4.4.5. Resonance Lewis forms for Ac, Ac-W, and Ac-W2 complexes were obtained by
NBO program on the bases of the SCF density matrix for the optimal geometries. ............... 197

xiii
Figure 4.4.6. Different coordination of acetone on the water cyclic hexamer. ...................... 203
Figure 4.4.7. The interaction energy parameters for acetone-water clusters from the β- and the
α-classes at the B3LYP/6-311++g(3df, 3pd) level. ................................................................. 204
Figure 4.4.8. The frequencies of the carbonyl and the carbon-carbon stretching vibrations for
selected acetone-water clusters at the B3LYP/6-311++g(3df, 3pd) level. .............................. 205
Figure 5.1.1. Comparison of experimental IR-RA spectra of the OH stretch region at 160 K
for the early stage of formation of a polycrystalline ice (pc-ice) film with Fresnel simulations.
................................................................................................................................................. 214
Figure 5.1.2. Comparison of the OH stretching band of the experimental FTIR-RA spectra of
polycrystalline (pc) ice deposits with simulated Fresnel and Berreman profiles. ................... 217
Figure 5.1.3. Comparison of experimental IR-RA spectra of thick polycrystalline films with
the corresponding Fresnel spectra for non-polarized light and their σ- and π- components. .. 220
Figure 5.1.4. Comparison of the present experimental IR-RA spectra obtained at 83º of
incident with the corresponding RA spectra reported by Jenniskens et al. at 75º incidence [17].
................................................................................................................................................. 224
Figure 5.1.5. Comparison of experimental IR-RA spectra (at 2 cm-1 resolution) for non-
crystalline ice (nc-ice) films deposited at 131 K and 1×10⁻⁶ Torr for (A) 40, (B) 65, and (C) 90
seconds with the corresponding Fresnel spectra for film thicknesses of 6, 18, and 35 nm,
respectively.............................................................................................................................. 226
Figure 5.1.6. Comparison of experimental IR-RA spectra and the corresponding Fresnel
spectra in the OH stretch region for non-crystalline ice (nc-ice) and polycrystalline ice (pc-ice)
deposited at 1×10⁻⁶ Torr and 131 K and 160 K, respectively.................................................. 227
Figure 5.1.7. Comparison of experimental IR-RA spectra and the corresponding Fresnel
spectra in the OH bending and combination band region for non-crystalline ice (nc-ice) and
polycrystalline ice (pc-ice) deposited at 1×10⁻⁶ Torr and 131 K and 160 K, respectively...... 229
Figure 5.1.8. Comparison of experimental IR-RA spectra of noncrystalline ice (nc-ice) films
obtained (at 0.5 cm-1 resolution) by vapour deposition at 131 K. ........................................... 230
Figure 5.1.9. Integrated absorbance intensity of the OH dangling bond signal as a function of
the film thickness for (a) polycrystalline ice (pc-ice) deposited at 160 K and 1×10⁻⁶ Torr, and
(b) non-crystalline ice (nc-ice) deposited at 131 K and 5×10⁻⁶ Torr. ...................................... 235
Figure 5.2.1. Typical evolution of the OH stretching mode of the nc-ice film upon annealing.

xiv
................................................................................................................................................. 240
Figure 5.2.2. Comparison of the OH stretching band of the experimental FTIR-RA spectra of
an early-stage noncrystalline (nc) H2O ice deposit with those of annealed samples. ............. 242
Figure 5.2.3. Evolution of (a) the OD stretching band (for D2O) and (b) the OH stretching
band (for HDO) in the experimental FTIR-RA spectra upon annealing of nc-ice film. ......... 245
Figure 5.3.1. The crystallographic structure of chloroform. The structure belongs to the
Pnma, D2h16, space group with the 4 molecules per crystallographic unit cell [37]................ 250
Figure 5.3.2. (I) π- and (II) σ- polarized spectral regions for (a) ν1 (C−H) stretching and (b) ν4
(C−H) deformation bands of growing CHCl3 films at deposition temperature of 125 K. ...... 255
Figure 5.3.3. The π-spectrum of CHCl3 film vapour deposited at P = 1×10⁻⁶ Torr and 125 K.
................................................................................................................................................. 255
Figure 5.3.4. Molecular arrangement of the acetone molecules in a crystal of the metastable C-
centered orthorhombic acetone phase Cmcm. a = 6.514, b = 5.4159, c = 10.756 Å, Z = 4 [47].
................................................................................................................................................. 257
Figure 5.3.5. Structure of the Cmcm layer of acetone molecules in the Cmcm phase [47].... 258
Figure 5.3.6. The molecular arrangement in the crystal of stable orthorhombic acetone phase
(Pbca), T = 150 K, a = 8.873, b = 8.000, c = 22.027 Å, Z = 16 [47], dimensions 2a x 2b x 1c.
................................................................................................................................................. 259
Figure 5.3.7. The pgg-layer in the Pbca stable acetone phase [47]......................................... 261
Figure 5.3.8. The pg-layer in the Pbca stable acetone phase [47].......................................... 262
Figure 5.3.9. The (a) σ- and (b) π-polarized spectra of acetone films during fast condensation
at 130 K and PAc=5×10⁻⁵ Torr and PAc=1×10⁻⁶ Torr, respectively. Spectra A through D on
panel (a) correspond to the deposition time of 60 sec; 140 sec; 220 sec; 360 sec, respectively;
the spectrum on panel (b) corresponds to the deposition time of 600 sec...............................266
Figure 5.3.10. The RA spectra of the carbonyl group region of solid acetone....................... 273
Figure 5.3.11. Experimental RA spectra of acetone at 130 K with non-polarized beam. The
LO/TO splitting is evident for the CH3 deformation and C−C asymmetric stretch modes. .... 274
Figure 5.4.1. Differential RA spectra of chloroform adsorbed on noncrystalline ice at 125 K.
................................................................................................................................................. 277
Figure 5.4.2. The spectral region of C−H deformational band for chloroform on ice at 125 K.
................................................................................................................................................. 278

xv
Figure 5.5.1. Experimental RA difference spectra of acetone obtained under different
conditions on a polycrystalline ice (pc-ice) film deposited at 160 K and 5×10⁻⁷ Torr. .......... 280
Figure 5.5.2. MDS snapshot of the acetone-ice surface at the molar ratio Ac/H2O = 6.25×10⁻².
................................................................................................................................................. 283
Figure 5.5.3. MDS snapshot of the acetone-ice surface at the molar ratio Ac/H2O = 0.25.... 284
Figure 5.5.4. The FTIR-RA spectra of acetone species from the α-, the β- and the γ- classes on
the thin nc- and pc-ice media, and on the bare Cu. ................................................................. 285
Figure 5.5.5. Integrated absorbance of OH dangling bond (solid circle) and C=O stretch (open
circle) features in the RA difference spectra as a function of acetone exposure at (a) 160 K and
1×10⁻⁶ Torr on a polycrystalline ice (pc-ice) film 1200 nm thick, and (b) 131 K and 5×10⁻⁷ Torr
on a non-crystalline ice (nc-ice) film 1200 nm thick............................................................... 287
Figure 6.3.1. (a) Order-parameters and (b) Potential of mean force, W(z), as a function of the
z-coordinate (the direction perpendicular to the ice surface) for the Xe-ice system at 180 K.299
Figure 6.3.2. Translational order parameter ST of (a) the top and (b) bottom layers of the
outermost bilayer as a function of simulation time for two MD trajectories. ......................... 302
Figure 6.3.3. Snapshot of the positions of oxygen atoms in the outermost bilayer (open
circles) for t = 3 ns on a typical trajectory of (a) the pristine ice, and (b) the Xe-ice system. 304
Figure 6.3.4. Typical trajectory of the Xe atom on the ice surface (a) in the (x, y) plane and (b)
along the corresponding z-coordinate of the Xe atom............................................................. 307

1
CHAPTER 1
Introduction
1.1 General Introduction
The present studies concern the fundamental physico-chemical processes in condensed
water media using infrared spectroscopy and computational techniques. Infrared spectroscopy
is among the most powerful tools for investigating the hydrogen bonded structures of low-
density noncrystalline water and crystalline ices. The present work utilizes the infrared
spectral method and computational techniques for studying the properties of water media and
the guest-water interaction at cryogenic temperatures. Comprising adsorption, penetration of
the medium surface, occlusion or enclathration, and chemical surface reactions, the physico-
chemical processes in the condensed water media are part of the global matter circulation on
Earth. In all spheres - biosphere, geosphere and atmosphere - the physico-chemical processes
associated water media contribute significantly to and, in many cases, control the global
chemical balance. The abundance of water media and their unique properties form ultimate
foundation for all scientific studies on water in chemistry, geochemistry, atmospheric studies
and ecology.
The mechanisms of adsorption, absorption, inside-host transport and interactions of the
chemically different species with the ice micro-phases over the entire range of relevant
temperatures remains the subject of intense investigations and debates primarily due to the
important role that ice as the adsorbent and/or absorbent plays in atmospheric and stratospheric
[1], biospheric [2, 3], cometary and interstellar chemistry [4, 5]. The important issue of the
heterogeneous chemistry and physics on the surfaces of water objects is associated with those
physico-chemical processes in the polar stratospheric clouds, which convert two most
abundant inert reservoirs of chlorine, HCl and ClONO2 into Cl2. The latter species could be
readily photo-decomposed to yield active chlorine, the known catalytic destroyer of ozone [6].
The penetration of surfaces confining a water medium is often a critical step in the inter-phase
transport. Numerous experiments have shown that the chemical species belonging to the
diametrically opposite classes, exemplified by the van der Waals particles on one side and
Lewis acids and bases on the opposite, penetrate the ice and convert it to the corresponding

2
crystalline or noncrystalline hydrates [7, 8, 9, 10, 11, 12].
One of the ultimate goals in the spectral and structural studies of water media and the
physico-chemical processes in condensed water resides in the explanation of the macroscopic
properties of water and aqueous solutions, including IR and Raman spectra, in terms of the
intermolecular forces. The understanding of these properties is mutually related to the concept
of the hydrogen bond (HB, for short) between the molecular species in the system. Taking into
account the conceptual importance of HB for the present studies, the hydrogen bonding
between water molecules (specifically, HB in small water clusters) and that in the complexes
of water with small oxygen-containing organic molecules is analyzed in Chapter 4. This
analysis is based primarily on the quantum mechanical calculations performed in the present
studies.
The present work explores both the experimental method of infrared spectroscopy and
the computational techniques in an attempt to correlate the spectral and structural information.
There is a double purpose associated with the present studies of bi-component (polar organic-
water) systems: (i) to investigate the state of water media using a guest molecule as a probe,
and (ii) to extract the structural information of the local hydrogen bond coordination between
the organic and water molecules. For instance, the coordination of water molecules around
carbonyl compounds remains to be a subject of intense studies [13, 14]. The present work
provides a detailed quantum mechanical analysis of this problem in Chapter 4. The spectral
information on the acetone-water and chloroform-water systems at cryogenic temperature is
discussed in Chapter 5. In particular, the analysis of spectral data on acetone-water cryogenic
deposits with parallel quantum-mechanical and molecular dynamic studies leads to
establishing a fairly complete spectrum-structure correlation scheme. This scheme can most
certainly be extrapolated on the liquid acetone-water solutions.
A very peculiar feature of the nucleation and crystallization processes taking place in
the atmosphere is the appearance of metastable liquid water or liquid phases of the water
solutions at temperatures below their freezing points. The filed observations and the
laboratory experiments [15] on the formation of clouds indicate that the water droplets remain
in the liquid state at temperatures far below 0 ºC. In this case metastable water is referred to as
being in a supercooled liquid state. In situ measurements in the deep convective clouds reveal
that the supercooled water droplets exist in liquid state at temperatures as low as −37.5ºC [16].
3
The nucleation processes in such supercooled liquid have found yet neither theoretical
explanations nor a complete qualitative description. According to recent and somewhat
"intuitive" thermodynamical arguments, the crystalline ice nuclei are expected to appear
preferentially on the air-supercooled-liquid interface, which indicates the significance of
interfacial properties for the kinetics of glaciation [17]. The underlying reasons for this
remarkable property of forming supercooled liquid state and respective delay in the
crystallization could be associated with the mismatch between a short range order anticipated
in the supercooled state and the long range order of the hexagonal, Ih, or cubic ice, Ic. In other
words, the supercooled state appears to be arrested within a certain area of the configurational
space, corresponding to the aperiodic structures. A transition from this configurational
subspace to the configurational area of crystalline packings is associated with the free energy
barrier of the entropic nature. In aperiodic systems, there is a large number of different
configurations (and conformations) of the water hydrogen bond network within a narrow
energy range. The energy difference between these numerous aperiodic configurations and
between the aperiodic configurations and the crystalline structures is typically very small. A
high density of configurations on the energy scale is associated with the relaxed potential of
water-water interaction as discussed in Chapter 4. The entropy of the aperiodic water state is
apparently larger than that of the crystalline minima. Therefore, ordering of an aperiodic
structure into a crystalline form most likely involves overcoming a free energy entropic barrier.
In the present studies, the crystallization of aperiodic ice media at a low temperature boundary
(see Chapter 2 for the partial phase diagram of water and the localization of boundaries of
aperiodic amorph) has been investigated using infrared spectroscopy as discussed in Chapter 5.
The structures and models of crystalline and noncrystalline media are discussed in detail in
Chapter 2.
A fundamental structural problem in studying the noncrystalline water media resides in
establishing the possibility of microscopic geometric description of an aperiodic system in
question. If such a description is possible then the subsequent problem will be to find an
algorithm for generating theses representative microscopic structures. These microscopic
molecular ensembles form an inherent structure of the aperiodic medium. Pivotal for the
concept of the inherent structure of noncrystalline media, the correlation between the topology
of a multidimensional potential energy surface and the structural and dynamic characteristics
4
of an aperiodic system can be explored using a mapping procedure, which connects any
available instant configuration to a parent local potential minimum that represents a stable
arrangement. Such mapping, described in details by Stillinger and Weber [18], allows
separating the vibrational motion within geometric boundaries of a potential minimum (the
interior of the potential minimum is called a basin) and the transition (barrier hopping)
between different neighboring potential minima. These two kinds of motion, i.e. the
vibrational oscillations within a basin and the inter-basin hoppings, often display very different
time characteristics as discussed by Eisenberg and Kauzmann in their fundamental book on the
water structure and properties [19]. In the present work, quantum mechanical and classical
potential energy minimization of small water clusters are performed in order to generate an
ensemble of local minima that are part of the inherent structure. The physico-chemical
properties of these minimized structures, including the IR spectra, can be readily calculated,
which makes possible structure-property correlations. Furthermore, the computed properties
(for very limited number of clusters in the present work), such as radial distribution functions
and IR spectra, are found to be in reasonable accord with the experimental data. An account of
these attempts is given in Chapter 4.
The configurations at distinct minima are temperature independent and, therefore,
could be used for identifying an inherent structure of the molecular systems (even when these
systems are in an aperiodic state). The topology of the potential energy surface (PES) is a
complex function of the following parameters: (i) intermolecular forces; (ii) geometric forms
attained by the water molecules under given external conditions; and (iii) the molecular
density. In determining the topological features (critical and saddle points) of the PES, all the
above-listed factors are practically independent of the temperature. This property of a
molecular arrangement at a local minimum being temperature independence justifies the
concept of inherent structure in the application to aperiodic systems. The PES features of a
multi-molecule water system are closely related to the potential surface of the water dimer.
However, the pairwise water-water potential is strongly affected by the presence of other water
molecules surrounding a water dimer. This multi-body contribution in the hydrogen bond
network is typically referred to as a cooperativity effect, which will be investigated in detail in
Chapter 4. It should be noted at the very beginning that the cooperativity effect is responsible
for specific IR spectral features in the acetone-water system.

5
Populated by the water system at temperatures above the melting point, a set of distinct
local minima corresponds to the numerous homogeneous noncrystalline packings. These
packings are thought to be characterized by a narrow distribution and relatively high values of
the average potential energy per molecule. Furthermore, it could be assumed that the inherent
structure of a water vapor deposition on metal substrates at cryogenic temperatures will be
similar to that of liquid water. The difference between liquid and noncrystalline solid media
resides in the rate of inter-basin hopping: in the case of liquid, the structural transitions are fast,
whereas in the case of solid, structural changes are infinitely slow, i.e. the molecular mobility
is insufficient for overcoming the free energy barriers. In contrast, a much smaller set of
crystalline packings is associated with the deepest minima observed globally on the topological
PES terrains. Peculiarly, in the case of water crystalline polymorphs, the energies of phase
transitions are small in spite of significant conformational and configurational differences in
their crystalline structures. However, the crystalline structures of ice maintain in their
majority a coordination number 4, which is characteristic to the water HB network. For
example, the values of ∆U (hexagonal ice, Ih → ice two, II ) = 19×10−3 kcal·mole−1 and ∆U (Ih
→ ice three, III ) = 0.256 kcal·mole−1 [19] are indeed small in comparison with the maximum
value of HB energy in Ih at ~5.1 kcal·mole−1 [19]. The small values of the enthalpy of phase
transitions indicate the configurational flexibility of the crystalline packings in the 4-
coordinated HB networks. The flexibility of the HB contacts between water molecules self
manifests, in particular, in the relaxed (smooth) shape of the energy profiles with respect to the
geometric variables of the water dimer. This aspect of the HB between water molecules is
discussed in detail in Chapter 4. In other words, the flexibility of HB networks is associated
with relatively small variations of the potential energy with large changes in the geometrical
parameters. In general, the flexibility of HB contacts is responsible for both the
configurational and conformational packings and the dynamic properties of the water media,
including the IR-spectral features.
An important question about the local structure of aperiodic water media is whether
there is a geometric reproducibility (the common patterns) in the first or higher order
coordination spheres at those local PES minima, which are part of a homogeneous set of the
water replicas. Each water replica or, i.e. the configuration of a local PES minimum, can be
characterized by distribution functions (for instance, the pairwise distribution functions for the

6
O···O, O···H and H···H pairs). If such a configuration is generated to represent a single water
replica comprising of a large number of molecules, the computed distribution functions can be
compared with the experimental data. In the present work, the generation of water replicas is
demonstrated using examples of very small water clusters (4-26 molecule) as discussed in
Chapter 4. In spite of this small size and the limited data on configurational and
conformational space available for the clusters of a particular size, the computational results
brings interesting information on the inherent structures of low- and high-density amorphs. It
is established in the present studies that these small-size replicas can be used for obtaining both
the average structural parameters and unique features.
The spatial 3-dimensional homogeneity of aperiodic water systems allows partitioning
the system on molecular cells, each of which can be used as a representative model of the
whole aperiodic system. This cellular structure of aperiodic media is different from a
crystalline packing, where the whole structure is formed by the repetition of the exactly the
same crystallographic cell. Of course, the spatial homogeneity in aperiodic (i.e. lacking
crystalline long-range symmetry) system is fundamentally different from the lattice periodicity
in crystalline packings, which is a source of the spatial heterogeneity in a crystal. In particular,
if a local arrangement (molecular cell) exhibits symmetry incompatible with the Bravais
symmetry, the repetition of these local patterns in the 3D-space will lead either to the
crystalline samples containing dislocation defects, or to the open-network (crystalline)
packings, such as those taking place in clathrate-hydrates or zeolites. In this context, two
experimental observations appear to be especially relevant. Firstly, the crystallization of
noncrystalline water at 150 K proceeds to the microcrystalline cubic ice, Ic, and only at much
higher temperatures (~210 K) to the hexagonal ice, which is the most stable crystalline phase
at low temperature-low pressure section of phase diagram [20]. Secondly, the noncrystalline
water at low temperatures exhibits two (or even more!) distinct polyamorphous forms
classified according to their densities. The principal noncrystalline forms are low-density
aperiodic and high-density aperiodic states [32]. The former observation appears to suggest
frustration (mismatch between the local symmetry and the global symmetry of crystal) as the
reason for the formation of the highly polycrystalline and metastable Ic (instead of Ih) on the
crystallization of low-density noncrystalline water. Therefore, there are grounds to attribute
the inherent structure of low-density noncrystalline species to that of Ic. Furthermore, the

7
presence of distinct amorphous water species allows consideration of distinct inherent
aperiodic structures with different densities. In the light of the proposed relation between the
inherent structures of aperiodic system and certain crystalline packings, one should attempt to
establish such a correlation in the case of aperiodic and crystalline packings of the water. In
particular, if a low-density aperiodic state is in the structural relation with the open-network
ices Ic and/or Ih, a high-density aperiodic state was found to be in the structural relation with
the high pressure ices such as ice VII and ice VIII [21], which are characterized by cubic
symmetry lattice with a coordination number 8 in a dramatic contrast with the coordination
number 4 in the Ic/Ih open-network systems. However, among these 8 nearest neighbors only
4 of them are hydrogen-bonded so the coordination number for hydrogen-bonded molecules
still remains at 4. It should also be noted that the crystallization of the high-density aperiodic
structure proceeds at 77 K with the formation of the orientationally proton-disordered ice VII
whereas at more elevated temperatures near 160 K the formation of proton-ordered ice VIII
was observed [21], which is similar to the crystallization events taking place with the low-
density aperiodic water system [20 and references therein].
On a structural level, the departure of a spatial arrangement of the structural units from
periodicity occuring in a noncrystalline liquid and glass phase, creates a possibility for the
formation of the finite-size clusters of a non-crystallographic symmetry with a deep potential-
energy minimum such as the tridecan (12+1) icosahedron with one of the molecules located in
the center of the regular pentagonal dodecahedron proposed by Frank [22]. By studying the
local motifs with icosahedral and fivefold symmetry, Baker and Hoare [23] have found a
considerable variety of the locally symmetric structures, which suggests the existence of the
non-periodic networks characterized by self-limiting growth patterns. The present studies
attempt to follow Hoare's proposal to generate plausible geometrical structures on an a priori
basis followed by the testing of their properties. The icosahedral symmetry group operations
on the "elementary" structural units of water such as bicyclo-octamer (tied by the directional
hydrogen bonds) leads to the 280-molecular complex as one possible candidate for the
structural unit of aperiodic water (see Chapter 2). Use of an icosahedral symmetry for the
generation and classification of finite-size molecular assemblies appears to be successful.
Indeed, such experts in the field of water structure as Pauling [24], Bernal [25, 26], Frank [27],
Franks [28], Angell [15], Stillinger [29, 30] and many others [22, 31, 32 and references

8
therein] have strongly asserted the geometric or topological representations of the water
medium as a powerful, if not unique, tool for the interpreting and predicting of the water
properties. The illustration of a geometrical aspect of the studies on the water can be readily
achieved by referring to a fundamental concept of the tetrahedral form, which single water
molecule can attain in a condensed state. It should be again clarified that the tetrahedral form
of the neighborhood of a water molecule in the multi-particle medium is not a rigid
arrangement completely predefined by the properties of the individual water molecule, but
rather a result of the cooperative interactions within the medium. An assembly of these
molecular tetrahedrons creates a network, in which a number of nearest neighbors around a
structural unit approaches a value of four. In the structural studies on water, Bernal [26], in
particular, had widely employed a geometric analogy between the structures of solid water
phases and that of crystalline silicate phases. While in his and Fowler's [25] original model,
liquid water had been described as a dynamic "mixture" of the tridymite-like ice (ordinary Ih
hexagonal ice) and the quartz-like ice, Bernal associated in his later model the structure of
liquid water with the disordered keatite packing (structurally unique crystalline polymorph of
SiO2 containing pentagonal rings of silicon-oxygen tetrahedrons). Extending this comparative
structural analysis by including the structures of clathrate-hydrates and those of carcass
alumosilicates (zeolites) could be useful in designing those finite-size clusters, which would be
generally common to tetrahedral networks regardless of the particularities of chemical bonding
in the latter.
1.2 Research Objectives
The major goals of the present experimental and theoretical studies include: (i) design,
construction and testing of the ultra-high-vacuum (UHV) chamber coupled optically with the
Fourier Transform Infrared spectrometer for performing infrared reflection-adsorption spectral
experiments ( abbreviated by FTIR RAS or RAS through the rest of the thesis) on thin films of
ice and/or volatile organic substances at cryogenic temperatures; (ii) FTIR RAS investigation
of the adsorption and absorption complexes formed by small molecules of environmental
significance on the ice micro phases; (iii) spectral investigation of the phase composition
and/or phase transitions in the vapor deposited and thermo-annealed pristine water and organic
films; and finally (iv) computer simulations and theoretical studies of the model systems in

9
order to provide a description of the fundamental surface processes on ice and an adequate
interpretation for the spectral data.
The FTIR RAS is known to be a useful tool for the examination of the chemical and
physical processes on the surfaces of metals and on dielectric thin films deposited on metals.
Therefore, the choice of technique for the experimental studies was to a large degree
predetermined by such attractive feature of the FTIR RAS method as sensitivity down to the
sub-monolayer coverage of the film surfaces. However, as it usually happens, the advantages
in one area bring disadvantages and complications in other areas. Among the latter, the most
serious are (i) the inapplicability of the Beers-Lambert law directly to the analysis of RA
spectra, and (ii) the significant distortion of the spectral RA features in comparison with the
transmittance spectra, which makes impossible a direct comparison of the RA spectra with
analogous transmittance spectra. An alternative experimental method for the spectral studies
of the surface processes on the ice nano-particles has been established by Devlin [33] and is
based on the transmittance spectroscopy of a 3-D ensemble of ice particles collected in a
collisional-cooling cylindrical double-wall FTIR cell. The IR transmittance spectra obtained
from the ensemble of nanoparticles also will vary substantially from that of the corresponding
thin film, particularly for the vibrational modes of large transition dipole moment. Therefore,
both the RA spectra of thin ice films and the transmittance spectra of nanoparticles impose
serious difficulties for their interpretations. For example, during the experimental studies of
pristine ice films [34] the present author has discovered that the spectra of polycrystalline ice
obtained in the RA mode and those in the transmittance mode are incompatible (although the
properties of polycrystalline ice medium studied in different labs are very likely to be
identical). Moreover, an attempt of direct comparison will inevitably lead to wrong
conclusions regarding the structure of ice films because the information encoded in these
spectra is fundamentally different, particularly with respect to the strongest vibrational bands
such as the OH stretching mode. In the ideal case of infinitely thin and optically perfect film,
the transmittance IR band is given by the imaginary part of dielectric function, Im(ε) =
ε''=2·n·k, where a dielectric function, ε, is defined as ε'−i·ε'', and ε = (n−i·k)2 =n2−k2−2i·n·k,
and n and k are refractive and absorption indexes of the medium, respectively. The same band
in the reflection-absorption spectra is given by an energy loss function or a Berreman's profile
[35] defined as Im(−ε−1) = ε''/(ε'2+ε''2)=2·n·k /(n2+k2)2. From an analysis of the simple

10
dispersion curve for a damped harmonic oscillator, it follows that at the resonance frequency ω
= ω0, the absorption index k reaches its maximum while n and ε' become equal 1, which
typically corresponds to the case when the absorbance maximum of transmittance mode, i.e.
2·n·k reaches its maximum. On the other hand, in the case of reflection-absorption spectra,
Im(−ε−1) reaches maximum at a frequency given by the following expression: ω = ω0·(ε0 /ε∞)½
[35], where ε0 is the dielectric constant and ε∞ is a value of the dielectric function at high
frequency. Therefore, in the transmittance spectra the maximum of absorption band is located
at the frequency of the transverse optical (TO) mode, whereas in the RAS the same
fundamental transition appears at the frequency of the longitudinal optical (LO) mode. The
stronger the oscillator strength of the fundamental vibration, the stronger is the LO/TO split
and consequently the larger difference between the observed transmittance and RA spectra. In
the present experiment, the strong LO/TO splits were found for the OH stretch mode in the
pristine ice films and for the carbonyl stretching mode in the pristine acetone film. Moreover,
the RA character of the light-matter interaction in the thin films leads to the appearance of
interference optical features, the frequency positions and intensities of which are dependent on
the film thickness. Similar effects of the light interference could be observed also in the
transmittance experiment performed in a thin optical cell. In addition to these optical
interference patterns, the RA spectra of the ice films with rough surface could show additional
spectral features originated from light scattering from the surface or bulk irregularities, which
further complicates the interpretation of the spectra. The necessity of the spectral simulations
on the basis of simple optical model becomes evident. A choice has been given to a Fresnel
optical model for the three-layer stratified media: vacuum-dielectric film- metal substrate. A
similar optical model has been previously employed in the studies of ice films by RAS
technique and appears to provide an acceptable agreement between simulated and
experimental spectra [36]. A detailed description of the Fresnel model is given in Chapter 3.
In contrast to the strong vibrational fundamental modes that are subject to dielectric effects
described above, there are surface-localized vibrations such as vibrations of OH dangling
bonds in the water media, which are much less affected by the dielectric optical effect. For
these spectral features, the comparison between transmittance and RA modes is valid.
An independent proof of the validity of the present experimental procedures and
spectral data treatment comes from the FTIR RAS studies of Mate et al. [37], who performed

11
detailed RAS studies of pristine ice films and corroborate with the present RAS results.
The computer simulations were performed using UNIX on 64- multiprocessor and 32-
bit single processor computers. The Gaussian [38] set of programs has been used for quantum
mechanical ab initio and semi-empirical B3LYP computations whereas the CHARMM [39] set
of programs has been employed for classical molecular dynamic simulations. The ab initio
results obtained in the present work for single water molecule have been compared with those
published previously [40] and there was good numerical agreement between the results of
different laboratories. The comparison of the computed and experimental IR spectra allows
one to predict the structures of distinctly different hydrogen-bonded and non-coordinated
complexes that carbonyl compounds such as acetone and acetaldehyde form on the surface and
in the bulk of ice films. The structure of distinct complexes for acetone and chloroform
species in the ice can also be inferred on the basis of the present studies. The classical MD
simulations of the Xe/Rn-ice (the results of Rn/ice simulations are not presented because they
are qualitatively similar to those of the Xe-ice system) systems reveal two distinct adsorption
complexes on the ice surface, one of which is mobile and localized atop the surface water layer
whereas another is confined within the first water layer. The latter localized complex appears
to be a precursor to the further penetration inside the water media. The penetration process of
the guest species appears to be associated with the mobility of the water molecules in the
media and in the present case leads to the partial loss of water crystallinity.
Apart from their necessity for extracting structural information from the RAS data, the
computer experiments were also found to be useful in providing a molecular-level
representation of the structural and dynamical features of the systems under investigation.
1.3 Thesis Organization
The present thesis comprises 7 Chapters. An introduction to the subject and general
problematics of the water studies are discussed in the present first Chapter. The second
Chapter provides a bibliographic review on the major results in understanding the structural
and spectral properties of the water media with an emphasis on the water phase diagram as the
main reference tool. The water phases, their structures and models are the main topics
reviewed in Chapter 2. Chapter 3 describes in detail the content of the present experimental
work and a method of the treatment of spectral data. Chapter 4 deals with the theoretical

12
analysis of the hydrogen-bonded systems with an emphasis on the water and acetone-water
complexes, and outlines the major results of quantum mechanical simulations undertaken in
order to extract relevant structural information from the spectral data. Furthermore, Chapter 4
provides a necessary theoretical background on the vibrational spectroscopy for the following
Chapter 5, which deals with analysis of the RA spectral information of pristine water and
organic films and the bi-component organic-water systems. Theoretical analysis of the
penetration of guest molecules in the water media is represented in Chapter 6, where particular
attention is given to the computational studies of a model Xe/ice systems. Finally, Chapter 7
summarizes the main results of the present work.

13
References:
1. B. J. Finlayson-Pitts, J. H. Pitts, "Chemistry of upper and lower atmosphere." 2000,
Academic press, and references therein.
2. A. L. Sumner, P. B. Shepson, Nature 398 (1999) 230.
3. T. L. Couch, A. L. Sumner, T. M. Dassau, P. B. Shepson, R. E. Honrath, Geophys.
Res. Letters 27 (2000) 2241.
4. G. Notesco, A. Bar-Nun, Icarus 148 (2000) 456.
5. M. P. Bernstein, S. A. Sandford, L. J. Allamandola, J. S. Gillette, S. J. Clement,
R. N. Zare, Science 283 (1999) 1135.
6. M. J. Molina, "The Probable Role of Stratospheric Ice Clouds: Heterrogeneous
Chemistry of the Ozone Hole" in "The Chemistry of t he Atmosphere: Its Impact on
Global Change", ed. J. G. Calvert (1994) Blackwell Scientific Publications.
7. R. M. Barrer, A. V. J. Edge, Proc. Roy. Soc. London A300 (1967) 1.
8. A. W. Adamson, B. R. Jones, J. Colloid Interface Sci. 37 (1971) 831.
9. J. Ocampo, J. Klinger, J. Colloid Interface Sci. 2 (1982) 377.
10. M. J. Molina, T-L. Tso, L. T. Molina, F. C.-Y. Wang, Science 238 (1987) 1253.
11. L. Delzeit, K. Powell, N. Uras, J. P. Devlin, J. Phys. Chem. A 101 (1997) 2327.
12. K. L. Foster, M. A. Tolbert, S. M. George, J. Phys. Chem. A 101 (1997) 4979.
13. A. K. Soper, E. W. Castner, A. Luzar, Biophys. Chem. 105 (2003) 649.
14. J.-J. Max, C. Chapados, J. Chem. Phys. 120 (2004) 6625.
15. A. Angell, in "Water: A Comprehensive Treatise" 7 (1972), 1, ed. F. Franks, Plenum
Press, New York.
16. D. Rosenfeld, W. L. Woodley, Nature 405 (2000) 440.
17. A. Tabazadeh, Y. S. Djikaev, H. Reiss, Proc. Nat. Acad. Sci. 99 (2002) 15873.
18. F. H. Stillinger, T. A. Weber, Phys. Rev. A 25 (1982) 978.
19. D. Eisenberg, W. Kauzmann, "The Structure and Properties of Water" (1969),
Clarendon Press, Oxford.
20. P. V. Hobbs, "Ice Physics", (1974) Clarendon Press, Oxford.
21. R. J. Hemley, L. C. Chen, H. K. Mao, Nature 338 (1989) 638.
22. M. R. Hoare, J. Non-Cryst. Sol. 31 (1978) 157.

14
23. M. R. Hoare, Ann. N. Y. Acad. Sci. 279 (1976) 186.
24. L. Pauling, "Hydrogen Bonding" (1959) 1, ed. D. Hadzi, Pergamon Press, New York.
25. J. D. Bernal, R. H. Fowler, J. Chem. Phys. 1 (1933) 515.
26. J. D. Bernal, "The Geometry of the Structure of Liquid" (1963) 25, in "Liquids:
Structures, Properties, Solid Interactions", (1965), ed. T. J. Hughel, Elsevier Publishing
Company, New York.
27. H. S. Frank, Science 169 (1970) 635.
28. F. Franks, ed. "Water: A Comprehensive Treatise" 1-7 (1982) Plenum Press, New
York.
29. F. H. Stillinger, Science 209 (1980) 451.
30. F. H. Stillinger, T. A. Weber, J. Phys. Chem. 87 (1983) 2833.
31. A. H. Narten, H. A. Levy, Science 165 (1969) 447.
32. O. Mishima, H. E. Stanley, Nature 396 (1998) 329.
33. J. P. Devlin, V. Buch, "Ice Nanoparticles and Ice Adsorbate Interactions: FTIR
Spectroscopy and Computer Simulations", in " Water in Confined Geometries", ed. V.
Buch and J. P. Devlin, (2003) Springer, Berlin.
34. S. Mitlin, K. T. Leung, J. Phys. Chem. B 106 (2002) 6234.
35. D. W. Berreman, Phys. Rev. 130 (1963) 2193.
36. M. A. Zondlo, T. B. Onasch, M. S. Warshawsky, M. A. Tolbert, G. Mallick, P. Arentz,
M. S. Robinson, J. Phys. Chem. B 101 (1997) 10887.
37. B. Mate, A. Medialdea, M. A. Moreno, R. Escribano, V. J. Herrero, J. Phys. Chem. B
107 (2003) 11098.
38. Gaussian 03, Revision C.02, M. J. Frisch, G. W. Trucks, H. B. Schlegel, G. E.
Scuseria, M. A. Robb, J. R. Cheeseman, J. A. Montgomery, Jr., T. Vreven, K. N.
Kudin, J. C. Burant, J. M. Millam, S. S. Iyengar, J. Tomasi, V. Barone, B. Mennucci,
M. Cossi, G. Scalmani, N. Rega, G. A. Petersson, H. Nakatsuji, M. Hada, M. Ehara, K.
Toyota, R. Fukuda, J. Hasegawa, M. Ishida, T. Nakajima, Y. Honda, O. Kitao, H.
Nakai, M. Klene, X. Li, J. E. Knox, H. P. Hratchian, J. B. Cross, V. Bakken, C.
Adamo, J. Jaramillo, R. Gomperts, R. E. Stratmann, O. Yazyev, A. J. Austin, R.
Cammi, C. Pomelli, J. W. Ochterski, P. Y. Ayala, K. Morokuma, G. A. Voth, P.

15
Salvador, J. J. Dannenberg, V. G. Zakrzewski, S. Dapprich, A. D. Daniels, M. C.
Strain, O. Farkas, D. K. Malick, A. D. Rabuck, K. Raghavachari, J. B. Foresman, J. V.
Ortiz, Q. Cui, A. G. Baboul, S. Clifford, J. Cioslowski, B. B. Stefanov, G. Liu, A.
Liashenko, P. Piskorz, I. Komaromi, R. L. Martin, D. J. Fox, T. Keith, M. A. Al-
Laham, C. Y. Peng, A. Nanayakkara, M. Challacombe, P. M. W. Gill, B. Johnson, W.
Chen, M. W. Wong, C. Gonzalez, and J. A. Pople, Gaussian, Inc., Wallingford CT,
2004.
39. B. P. Brooks, P. E. Bruccoleri, B. D. Olafson, D. J. States, S. Swaminathan, M.
Karplus, J. Comput. Chem. 4 (1983) 187.
40. D. Feller, J. Chem. Phys. 96 (1992) 6104.

16
CHAPTER 2
Bibliographical Review and Modeling of the Non-Crystalline Water Media
The main purpose of the present review is to outline the current status in the
understanding of the relationship between the structures of solid water micro-phases and those
physico-chemical processes of environmental significance that occur on the surface or in the
bulk of these micro-phases. The present author has found that a literature review of this
subject does not provide the opportunity to represent the structural data on the crystalline and
non-crystalline water media. Therefore, for analytical purposes the present author has
constructed and analyzed 3-dimensional computer models of selected crystalline and non-
crystalline structures using the literature data. The main difficulties reside, of course, in
finding an algorithm for designing non-crystalline water models. The first four sections deal
with the subjects of solid water phases, their structures and morphologies. The subsequent
section will give the necessary technical details and outline the recent results in the application
of infrared spectroscopy and computer simulations to the investigation of physico-chemical
processes on the ice surfaces. The last section of the present Chapter reviews the
bibliographical data on the interaction of the adsorbates of different chemical properties with
ice media.
A search for the inherent structure of aperiodic water media leads to a set of relatively
small, compact water polyhedra, which can be used as structural units for constructing large-
scale water clusters of the icosahedral symmetry. Following Chaplin's approach [1], the
present author shows the model structures that are suitable for further computer studies on the
large water systems. These models provide a convenient starting point for the theoretical and
computational studies of liquid and noncrystalline water systems including aqueous solutions
and clathrate-hydrates. The present classical molecular dynamics simulations on Xe-ice
systems (reported in Chapter 6) demonstrate that the pentagon-dodecahedron unit with 20
water molecules corresponds to the "natural" coordination sphere for small molecules. The
large water clusters can be constructed on the basis of the pentagon-dodecahedron unit acting
as the first inner shell.
17
2.1 Solid and Liquid Water: Structures and Models
A general review of the ice phases is necessary for further discussions on both
crystalline and non-crystalline water structures and their bulk and surface properties. Among
the latter, the disorder in the proton and oxygen sub-networks should be noted as a very
interesting example specific to the water HB network, which manifests itself, in particular, in
the corresponding IR spectra of the corresponding media. Moreover, the theories of
noncrystalline (nc for short) water media at ambient and sub-zero temperatures are mutually
related to the crystallographic structures observed in the solid crystalline phases such as the
low-density open-work hexagonal (Ih) ice, and the cubic (Ic) ice, and the high-density ices
(including the ice II or III /IX phases). For example, the mixed model of the liquid water
developed by Robinson and coworkers [2, 3] is based fundamentally on the two-state outer-
neighbor bonding configurations, which correspond to two distinct non-nearest-neighbor (i.e.
non hydrogen bonded) O···O distances observed in the Ih and the ice-II phases. A key element
of Robinson's approach resides in the modeling of the non-crystalline water structure as a
special ensemble of hexagonal rings. Liquid water is explicitly considered as a dynamic
mixture of two types of the hexagonal packing: the Ih- and ice-II packings, which transform
into each other on a picosecond timescale such that the relative statistical weight of each
packing depends on the pressure and temperature. If the temperature rises, the structural
composition shifts dynamically from the low-density and more rigid Ih-type configuration
characterized by a 1···3 (non-hydrogen-bonded next neighbor) intermolecular distance of ~ 4.5
Å (see Figure 2.3.1) to the high-density and more fragile ice-II configuration with the outer-
neighbor 1···3 intermolecular distances of 3.4 Å (see Figure 2.3.4 and Figure 2.3.5). The
authors of this theory have also suggested that the aforementioned polymorphic transformation
proceeds through bending of the inner-neighbor hydrogen bonds (within HB chain of 1–2–3
molecules) without significant alteration of the equilibrium O–O nearest-neighbor distances at
~ 2.8 Å and the equilibrium coordination number of water molecules, 4. This approach is
based on the early ideas of Kamb, who suggested that the density and X-ray structure of the
liquid water near 0 °C could be understood and represented within the framework of the
dynamic mixing between the normal ice Ih structure and that of ice II - and/or ice III -type [4].
It should be also noted with this respect that, in attempt to augment the original Bernal-Fowler
[5] theory of the liquid water, Bernal has also proposed a model that associates the inherent

18
structure of the liquid water with the keatite structure of silica belonging to the tetragonal
symmetry group P41212. The keatite structure bears close resemblance to the ice III structure
(shown on Figure 2.3.6), which also belongs to a space group of the tetragonal symmetry,
P43212 [6]. In the original 1933 version of the Bernal-Fowler theory, there were postulated
three different intermolecular arrangements, which could take place in the liquid water: (i)
tetrahedrally-coordinated, open-work tridymite packing below 4 °C; (ii) tetrahedrally-
coordinated, quartz packing of high density between 4-200 °C; (iii) random close-packing (the
coordination number above 4) at higher temperatures. These structural forms are "not distinct"
[5] (i.e. other structural packings (unspecified) are not excluded from the picture) and exist in
an instant transformation into each other. In the modified theory, Bernal has conceived the
liquid water as a totally disordered pseudo-keatite structure, therefore associating the
crystalline packing in keatite with the inherent structure of liquid water. A key structural
element of the keatite and ice III structures is a puckered pentagonal ring of silicon-oxygen
tetrahedrons or water molecules, respectively, which contrasts with the hexagonal ring pattern
observed in the low-density ices Ih and the Ic or in the high-density ice II . Related essentially
to the Bernal's keatite model of water (the keatite model has been subsequently discarded
according to Finney's correspondence to Walrafen [7]) a different model of liquid water been
developed by Walrafen and coworkers [7] and employed for the interpretation of the Raman
spectra of water media at different temperatures including the subzero range. The key element
of Walrafen's model [7] is the coexistence of hexagonal as well as pentagonal rings. Both
models consider a pentagonal five-member ring of water molecules as an essential structural
element of the liquid water, in order to prevent the system from attaining a long range order
[6]. Walrafen [7] has also argued that this group of water models conform most closely to the
liquid water at supercooled state at subzero temperatures. Regrettably, Walrafen et al. [7] has
provided only a verbal description of their model that does not allow to construct an
appropriate water structure by computer or other means and use this model effectively. The
present author has therefore undertaken the task of building, whenever possible, the computer
models of the water structures to facilitate a discussion about these issues. The presence of
both pentagonal and hexagonal rings in the noncrystalline water is consistent with co-
equilibrium between the liquid water, the Ih, and ices II and III at a triple point ~ −20 °C and ~
2 kbar (see Figure 2.2.1 below for the phase diagram). Within the framework of these models,

19
the structure of noncrystalline water could be conceived as a dynamic composition of
hexagonal and pentagonal rings that are puckered in different degrees and interconnected in
different ways.
Undoubtedly, the assumption of the flexibility of hydrogen bond network in water is an
essential element of this class of theoretical models. An open space provided by the interior of
pentagonal and hexagonal rings is significantly different, which should influence the
diffusional parameters of the water media with respect to the foreign probe particles. The
puckering of the individual rings includes primarily an angular distortion of the HB network
whereas the coordination number in the first coordination sphere, 4, remains unchanged, which
holds true for a majority of the crystalline and perhaps noncrystalline phases at low and
moderate pressures (< 2 GPa). The small energy changes for the high-pressure ice transitions
indicates that the tetrahedral coordination of the water molecules appears to be not very
sensitive to the angular distortion as large as 30° from the optimal 109.47° tetrahedral angle.
Subcritical water therefore is not a closely packed system in which a coordination number in
the first coordination sphere should be either 12 for a closely packed crystalline structure or
close to 8 for a random closely packed structure [6]. This fundamental deviation of the water
structure from the close packing arrangement is most definitely due to the contribution of the
hydrogen bonds to the local molecular arrangement. Using the X-ray diffraction
measurements, Narten and Levy [8] found that the average number of the nearest neighbors is
~ 4.4 at 4-200 °C confirming the average tetrahedral geometry of the water molecule. Similar
experimental techniques give very different numbers of nearest neighbors for simple liquids:
for neon and argons, for example, 8.6 and 10.5 nearest neighbors were found, respectively [9].
Another interesting idea regarding the properties of the HB network resides in the attributing a
high flexibility to this network. This property is in agreement with a large distribution of the
O–O–O angles observed for the crystalline ice phases (see Table 2.2.1 below). In other words,
upon external thermodynamic force a HB network undergoes a reconstruction in order to
preserve the time-averaged continuity of the hydrogen bonds, which is achieved by the
conformational transitions of a deformational type. This idea will be demonstrated below in
using the example of the expanded-to-collapsed cluster transition. The flexibility of the water
HB network helps to explain the density variations of the liquid water induced by external
forces in general and, in particular, consolidates the ideas on relationship between the open

20
work clathrate-hydrate structures and higher-density structures of ambient and supercooled
liquid water.
Concerning the life-time of a particular instantaneous or time-averaged configuration
relevant to a certain macroscopic property in the solid or liquid water, it is possible to establish
three distinct levels according to fast molecular oscillations and slow molecular rotations and
translations: (i) instantaneous configuration or snapshot; (ii) vibrational τV time scale and the
corresponding averaged configuration (V-configuration); (iii) translational τD (rotational) time
scale and the corresponding diffusionally-averaged D-configuration [9]. In particular, τV can
be estimated as the average period of a molecular vibrational mode, which is in the case of Ih
is the hindered translational mode at ω = 200 cm−1. Accordingly, the characteristic vibrational
time τV ~ 1/(ω·c) of water molecule in Ih is ~ 0.2 ps (1ps = 1×10⁻¹² sec), (c designates the
speed of light in vacuum). Therefore, a structure observed at a time scale smaller than τV
should be considered as an instantaneous configuration, whereas the structure observed at time
scale τV < t < τD is a vibrationally averaged V-configuration. The frequency dependence of the
dielectric function provides the estimation for the period of rotational rearrangement of the
water molecules in Ih, which is ~10 µsec (i.e. 1×10⁻⁵ sec). Therefore, the structure observed
over a period larger than τD (Ih) ~10 µsec is considered as a D-configuration. In liquid water,
WL, the molecular motions could be still divided between the fast oscillations within the same
molecular cage and relatively slow rotational and translational rearrangements towards a new
local environment. Indeed, spectroscopic studies revealed that the hindered translation band in
liquid water is at 193 cm−1 [9], which is very close to 200 cm−1 of Ih, giving essentially similar
value of τV (WL) at 0.2 ps. In sharp contrast to the coincidence in the frequency of the
molecular vibrational modes for the liquid and solid water, the dielectric relaxation time for
liquid water at 0 °C is of the order of 10 ps that also sets the value of τD (WL) to ~10 ps. which
is by six orders of magnitude smaller than that for solid Ih but still significantly larger than the
corresponding period of a molecular vibration. In accord with the aforementioned data, the
thermal motion of water molecules in the solid and liquid phases can be regarded as being of
two types: the rapid oscillations about a temporary position within the molecular cage and the
slow inter-minima hoppings, which are of course much faster in the case of normal liquid state
in comparison with that in the solid or supercooled liquid states. There are peculiar data with
reference to the nearly identical values of the relaxation time and the activation energy for

21
different response processes in the water media such as self-diffusion (τDiff (Ih) ~1.7 µsec at −2
°C and 0.63 eV=14.482 kcal·mole−1), dielectric relaxation (τDebay ~ 2.2 µsec at −2°C and 0.58
eV=13.333 kcal·mole−1 ) and the average time-of-stay of a molecule at a given orientation of
proton-proton vector (τH−H ~ 0.6 µsec and 0.61 eV=14.023 kcal·mole−1 ) [10 and References
therein] ). The mechanism of molecular reorientation in hexagonal ice is primarily associated
with valence faults and molecular vacancies. In particular, migration of non-deal vacancies is
found to be equally effective in all relaxation processes in the ice lattice such as molecular
diffusion, dielectric and elastic relaxations and spin-lattice relaxation [10].
The IR and Raman spectroscopy and inelastic neutron scattering provide information
about the V-configuration for the liquid and solid states. In particular, it means that if there are
different molecular complexes of the guest molecule embedded in the water matrix (assuming
the presence of the activation barrier between nearest local minima) the corresponding
vibrational bands will be fundamentally resolvable by the IR spectroscopy even though a guest
molecule can change its vibrational status by walking from one distinct cage to the different
arrangement. The lifetime of V-structure depends strongly on the temperature and phase state
of the water medium. Considering a noncrystalline state of water, it should be noted that τD
ascends significantly as the temperature decreases below 0 °C.
2.2 Crystalline and Non-Crystalline Solid Phases: General Description
Water demonstrates a fascinating range of crystalline phases, in which molecular packing
varies from an open-work 4-coordinated hexagonal architecture in Ih/XI/Ic system to high-
density 8-coordinated cubic packing of the two interpenetrating HB sub-networks in VII and
VIII ice system. Traditionally, the ice phases are labeled with the Roman numerals I-XII in the
order in which they were synthesized experimentally. This latter circumstance leads
unfortunately to an absence of a relationship between a numerical identifier and an ice
structure. Each of the crystalline phases, except ices IV, IX, XII, and Ic, is stable over a certain
range of the (T, P) parameters, but it is a fundamental feature of the water HB network that
many ice phases protrude inside a region of stability of another neighboring phase.
Furthermore, some phases such as ice Ic or ice XII [11] are considered to be metastable over
the entire thermodynamic (T, P) space. The partial phase diagram of water in the low pressure
range is given below on Figure 2.2.1.
22
The structural properties of crystalline and non-crystalline ice phases have been
investigated by a variety of techniques, including X-ray diffraction [12, 13], electron
diffraction and microscopy [14, 15], neutron diffraction and inelastic scattering [16, 17],
helium diffraction [18], calorimetry [19], and IR and Raman spectroscopies [20, 21, 22, 23,
24]. These studies have shown in particular that condensation of water vapor on a cold
substrate at low pressure may lead to, depending upon the deposition conditions, the formation
of different non-crystalline structures below 130 K and of polycrystalline ice (pc-ice for short)
polymorphs, Ic, and Ih at a more elevated temperature. The metastability of cubic ice is
especially important for the present studies because it is shown that the low-density nc-ice,
formed initially by water vapor deposition at temperatures below ~135 K, crystallizes upon
annealing firstly into the polycrystalline cubic ice, Ic, at 150-160 K. The transformation of the
latter metastable phase into thermodynamically stable hexagonal ice, Ih, occurs only at much
higher temperatures near 230 K [13]. It could be suggested that these kinetic properties of
"extended" metastability and coexistence of different phases indicate the presence of a network
of flexible intermolecular hydrogen bonds. These bonds are responsible for the peculiar
properties of water phases.
As just mentioned, apart from the thirteen crystalline phases, solid water can exist at
low temperatures in a supercooled state and in a number of noncrystalline solid forms, the
existence of which and the peculiarity of their properties pose some interesting questions in
condensed matter physics. Among them, the following issues should be highlighted: the
nature of the sharp increase in isothermal compressibility, the isobaric heat capacity, and the
magnitude of the thermal expansion coefficient upon supercooling; the nature of non-
crystalline forms of solid water and the transitions between them; the relationship between
liquid, supercooled, and solid water below and above glass-liquid transition temperature, Tg.
To date, there are known to be, at least, three amorphous solid phases, which are distinctly
different by the density, low-density amorph (LDA)(ρ ~ 0.94 g·cm-3 at P = 1 bar [11]), high-
density amorph (HDA)( ρ ~ 1.17 g·cm-3 at P = 1 bar [11]), and very high-density amorph
(VHDA)( ρ ~ 1.25 g·cm-3 at P = 1 bar [25]). The LDA is of special interest for the present
studies because it is formed by the vapor water deposition on a cooled metal surface. The
other polyamorphous high-density non-crystalline modifications are less relevant because they
only exist at a high pressure range.
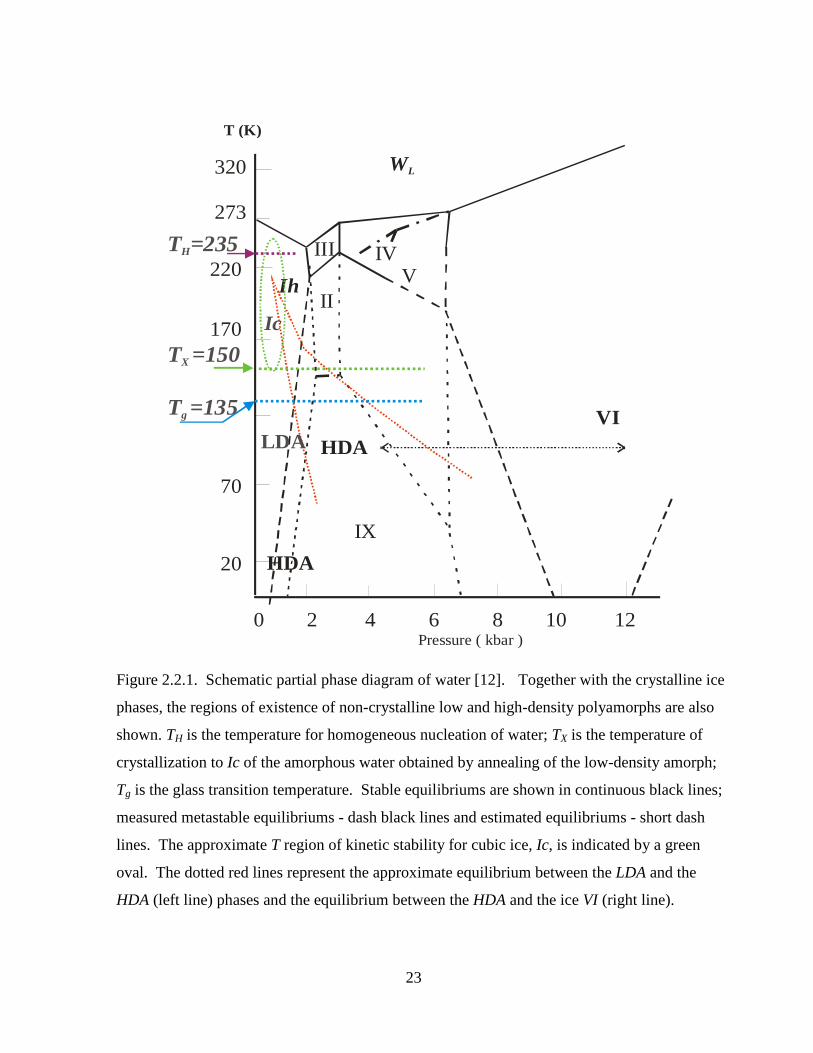
23
0 2 4 6 8 10 12 Pressure ( kbar )
320
273
170
70
20
220T =235
T =150
H
X
T =135g
T (K)
WL
VI
IX
Ih
IV V
II
III
LDA
Ic
HDA
HDA
Figure 2.2.1. Schematic partial phase diagram of water [12]. Together with the crystalline ice
phases, the regions of existence of non-crystalline low and high-density polyamorphs are also
shown. TH is the temperature for homogeneous nucleation of water; TX is the temperature of
crystallization to Ic of the amorphous water obtained by annealing of the low-density amorph;
Tg is the glass transition temperature. Stable equilibriums are shown in continuous black lines;
measured metastable equilibriums - dash black lines and estimated equilibriums - short dash
lines. The approximate T region of kinetic stability for cubic ice, Ic, is indicated by a green
oval. The dotted red lines represent the approximate equilibrium between the LDA and the
HDA (left line) phases and the equilibrium between the HDA and the ice VI (right line).

24
Table 2.2.1. Structures of the crystalline phases of water. Parameters are given at the
temperature T and the pressure P stated.
Ice Crystal System
Space Group
Molec. per cell /H.Ord.
T (K)
P (GPa)
Density (g·cm−3) /Mol.V.
(Å3)
Coord. N. /NN Dist.
(Å)
O–O–O Angles (Deg)/ Str. El.
Cell Par. (Å), (Deg)
References
Ih Hex. P63/mmc 4 N
250 0 0.920 32.52
4 2.74
109°±0.2
Hex. a = 4.518, c = 7.356
Kuhs and Lehmann [26]
Ic Cubic mF 34_
8 N
78 0 0.931 32.13
4 2.75148
109°
Hex. a = 6.358 Kuhs et al.
[27]
II Rhomb. _3R 12
Y 123 0 1.170
25.57 4
2.75-2.84 80-128° a = 7.78,
α = 113.1° Kamb [28]
III Tetrag. P41212 12 N
250 0.28 1.165 25.68
4 2.76-2.80
87-141°
Pent. a = 6.666 c = 6.936
Londono et al.[29]
IV Rhomb. cR_3 16
N 110
0 1.272
23.52 a = 7.60
α = 70.1° Engelhard and Kamb [30]
V Mon. A2/a 28 N
98
223
0
0.53
1.231 24.30 1.283 23.32
4 2.76-2.87
84-128° a = 9.22 b = 7.54 c = 10.35 β = 109.2°
Kamb et al. [31]
VI Tetrag. P42/nmc 10 N
225 1.1 1.373 21.79
4 2.80-2.82
76-128° a = 6.181 c = 5.698
Kuhs et al. [32]
VII Cubic Pn3m 2/N 295 2.4 1.599 18.71
8 2.95
109.5° a = 3.344 Kuhs et al. [32]
VIII Tetrag. I41/amd 8 Y
10 2.4 1.628 18.38
8 2.96(HB); 2.80; 3.15
109.5° a = 4.656 c = 6.775
Kuhs et al. [32]
IX
III Tetrag. P41212 12
Y 165 0.28 1.194
25.06 4
2.76-2.80 87-141°
Pent. a = 6.692 c = 6.715
Londono et al. [29]
X Cubic Pn3m 2 300 62 2.79 10.72
a = 2.78 Hemley et al. [33]
XI Ih
Ortho. Cmc21 8 Y
5 0 0.934 32.03
109°±0.2
Hex. a = 4.465 c = 7.858 a = 7.292
Line and Whitworth [34]
XII IV
Tetrag. dI 24_
12 N
260 0.50 1.292 23.15
a = 8.304 c = 4.024
Lobban et al. [35]
There is an apparent similarity between the processes of crystallization of metastable
supercooled media above Tg=135 K and below TX =235 K. The former process is much slower
than the latter because takes place at lower temperatures, which allows experimental
observation of the crystallization in the time domain. In the present studies the FTIR RAS

25
investigation of the crystallization of the vapor deposited LDA has been undertaken and
reported in Chapter 5. There are premises for assuming that these results could be useful also
for studying the nucleation mechanism at upper limit of the liquid stability.
Among the twelve known crystalline phases of water today, the hexagonal ice Ih (space
group P63/mmc) is the normal form of ice obtained by freezing water at atmospheric pressure
or by direct condensation of vapor above ~170 K. At temperatures below 273 K and at
pressures equal to or lower than 1 atm, Ih is assumed to be the thermodynamically most stable
phase of solid water. Its metastable polymorph of a locally similar structure, the ice of cubic
symmetry, Ic, with space group mF 34_
can be formed, in particular, by the heating of either
vitrified states of water [12 and references therein,13], any of the high-pressure ices (II to IX)
[36], or the pressure-amorphized cubic and the hexagonal ices [37]. The direct transition from
the liquid water to cubic ice WL → Ic was observed in the experiments on the hyperquenching
of the micrometer water droplets down to 170-220 K [11], and on the evaporative cooling of
the water clusters of 4-6×10³ molecules down to 200 K [38]. These observations are thought
to be in accord with the Ostwald cascade rule [38, 39], which could be formulated in the
following statement: if several different crystalline phases exist, a metastable non-crystalline
material will transform through a number of intermediate metastable forms to a crystalline
state of the next-lowest free energy, which is the least stable one. In other words, under certain
thermodynamical conditions, the formation of the cubic ice nuclei appears to be more
favorable kinetically than that of the hexagonal polymorph. Therefore, the cubic ice will be
formed first, instead of the hexagonal ice, if the crystallization process is governed by the
kinetics, which requires a certain level of supersaturation. This possibility is of a special
significance for the atmospheric physics and the chemistry because the cubic ice phase could
be involved in the formation of icy particles in the clouds and of snowflakes [40, 41, 42]. The
recent observation and computer modeling of the atmospheric halo over Northern Chile in the
vicinity of the persistently steaming Lascar volcano provide further support for the possibility
of the presence of the cubic ice together with Ih in the atmosphere in the form of spatially
oriented octahedral Ic crystals in the cirrus clouds at temperature as low as 187 K [43]. The
rareness of such observations could be interpreted in such a way that only in some rare and
unique cases the crystallization of water droplets occurs under such supersaturation that would
be high enough to cause the crystallization of cubic ice. The formation of Ic could be

26
considered, therefore, as an indicator of the crystallization that occurs in a deeply supercooled
media. In the particular case [43], there are grounds for further speculation that the hot stream
rising up from the volcano becomes highly supersaturated with respect to the liquid and solid
water or H2O/H2SO4/NH3 systems after deep adiabatic cooling and especially after sharp and
deep cooling by the very cold air masses at high elevations. Other atmospheric features, such
as the noctilucent clouds, could also contain ice crystals in the cubic form [44].
2.3 Structures of Selected Solid Ice Phases
The structures of crystalline water phases play a fundamental role for understanding the
structural and dynamical properties of the bulk and the surface of non-crystalline water
microphases. Any model of non-crystalline water is constructed either on the basis of the
known crystalline structure of one or a few coexisting phases or by applying symmetry
operations incompatible with the continuous crystalline lattice.

27
2.3.1 Structure and Properties of Hexagonal Ice, Ih, and its Proton Ordered Structural
Analog Ice XI
a. a view along
−−011
b. a view along
−100
Figure 2.3.1. Crystallographic structure of the proton-disordered hexagonal ice, Ih [26].
Oxygen subnetwork belongs to the hexagonal space group P63/mmc.
c/2
glide plane
Oxygen atoms
Hydrogen atoms
(1/2 occupancy)
mirror planes
glide planes
mirror planes

28
There are 4 water molecules in the P63/mmc hexagonal unit cell with the following
lattice parameters: a = 4.4969 Å and c = 7.3211 Å at 10 K and 4.519 Å / 7.357 Å, respectively,
at 253 K [11]. The ordered oxygen subnetwork displays a hexagonal-ring packing
characterized by the 63 screw axis passing through the center of hexagons (i.e. the origin of the
unit cell, Figure 2.3.1, b) and a set of three mirror and three c/2 glide planes passing through
the screw axis. Two adjacent layers of the puckered but otherwise close to ideal hexagons are
related by the mirror plane (Figure 2.3.1, a). The fundamental features of the oxygen packing
in the hexagonal ice, Ih, reside in the close-to-ideal tetrahedral configuration of the first
coordination sphere, which assumes the presence of four nearest neighbors around an oxygen
atom and the closeness of the O–O–O angles to the tetrahedral value of 109.5°. Unlike the
crystalline closest packing, which assumes 12 nearest neighbors and is driven primarily by the
dispersion forces, the present tetragonal arrangement exists as a network of the hydrogen
bonded water molecules, in which the dispersion contribution to the lattice energy could be
even negative. At 253 K, the mean value of the O–O HB distance is 2.764 Å, which is much
shorter than 2.980 Å [45] for a water dimer in the gas phase, indicating a very strong
contraction and, certainly, an energy gain in the HB contact between neighboring water
molecules due to condensation. Unlike the ordered oxygen subnetwork, the hydrogen atoms
appear to be in a disordered state, the average arrangement of which is shown in Figure 2.3.1.
As a result of the proton disorder in the Ih, the hydrogen atoms are randomly distributed over
the crystal. The most significant structural feature of the Ih structure is the nearly ideal
tetrahedral first coordination sphere for a water molecule. The tetrahedrality of the first
coordination sphere is a main topological element in the hydrogen bonding of water molecules.

29
Figure 2.3.2. Crystallographic models of (a) the proton-ordered ice XI and (b) the hexagonal
ice, Ih.
(a) Fragment of the proton ordered ice XI
structure at a orthorhombic space group
Cmc21.
(b) Fragment of the proton disordered Ih
structure with the O-subnetwork at
a hexagonal space group P63/mmc.
(001)
[100]
prism planes
basal planes (0001)
−)1010(
−)2011(
a-plane
[010]
(010)

30
Figure 2.3.3. Fragment of the crystalline cubic structure. Cubic ice Ic mF 34−
, a = 6.37 Å,
(fragment of the structure). A vertical line is parallel to the [111] direction.
Similarly to the structure of Ih, the crystal structure of proton ordered ice II shown on
Figure 2.3.4 can be constructed from the water hexagons, which are less puckered in this case.
Kamb [28] described the crystallographic relationship between these two phases in a following
way: hexagonal columns of Ih are detached from one another and shifted relatively up and
down in the [111] direction in order to give a rhombohedral stacking pattern, and then rotated
by ~ 30° around their axis ([111]) such that a more closely packed system can be generated by
reconnecting those hexagons. The hexagonal rings within each column are twisted by 15°
relative to one another as it is shown below on Figure 2.3.5. The HB connectivity of the
hexagonal rings and the arrangement of the columns is shown on panels a and b of Figure
2.3.5, where the length of HB's (shown in wire lines) binding the nearest neighbors within the
rings is 2.78 Å (light spheres, panel a) and 2.80 Å (dark spheres, panel a). The HB's between
rings within the columns and between the columns are at 2.77 Å and 2.84 Å, which is shorter
and longer than that in the rings, respectively. The overall length of the HB contacts in the ice
II structure appears to be slightly larger than that in the Ih and Ic structures, which finds
corresponding manifestation in the IR spectra: νOH (HDO in D2O) appears at 3277 cm−1 in Ih
and at 3373 cm−1, 3357 cm−1, and 3323 cm−1 in ice II [46].
[111]

31
a b
c
Figure 2.3.4. Crystallographic structure of proton ordered ice II. Rhombohedral lattice, space
group, after Kamb et al.[28]. Oxygen and hydrogen atoms are represented by dark (larger) and
light (smaller) spheres, respectively. The picture contains 27 unit cells.
The internal energy of ice II of −3R space group is larger than that of hexagonal ice
only by 19×10−3 kcal·mole−1 , which indicates minor weakening of the HB network due to the
distortion of the "perfect" hexagonal packing in Ih [9]. However, in contrast to the proton
disorder Ih, hydrogen atoms in the ice II are ordered in a way that facilitates a cooperativity
32
effect, which in turn strengthens the bonding in HB systems. With respect to the distances
between third-neighbors (1···4) O···O, there is a remarkable difference between Ih/Ic and ice II .
This structural difference resides in the appearance of the non-HB molecular pairs at distances
between 3.24 Å to 4.76 Å (see panel c on Figure 2.3.5 for the ice II ), whereas in the Ih/Ic
structures the 1···3 neighbors are separated by ~ 4.5 Å. The hexagonal rings within columns
are flatter in comparison with the Ih/Ic packing, which leads in particular to considerable
shortening of the 1···4 between-ring distance from 4.6 Å in Ih to 3.7 Å in ice II . These
circumstances are reckoned for the density of ice II , 1.18 g·cm−3, which is higher than density
of Ih/Ic, 0.93 g·cm−3 [11]. This structural feature of ice II arises from the high pressure force
on the HB network causing such deformation of the latter, which allows decreasing of the
molecular volume without disruption of the hydrogen-bonded network.

33
Figure 2.3.5. The oxygen subnetwork arrangement in ice II . (a) a side view (perpendicular to
the [111]); (b) a top view (parallel to [111]) on the oxygen subnetwork of the ice II structure; (c)
complete connectivity of the oxygen subnetwork in ice II . Two non-equivalent hexagonal rings
are represented in dark and light grey color.
(c)
(b) (a)
3.24
3.42

34
The ice III phase exhibits a proton disorder while ice IX phase is a crystallographically
analogous proton-ordered phase. Unlike Ih, in which water molecules are arranged in
hexagons, ices III and IX contain water molecules arranged in pentagons. As has been
mentioned in the section 2.1, the Bernal and Walrafen models of non-crystalline water are
based on the combination of hexagonal and pentagonal rings. Ice III/IX shown on Figure 2.3.6
is that crystalline phase, which provides support for such models.
a
b
c
Figure 2.3.6. The structure of ices III and IX. Positions of the oxygen atoms (dark)
in the crystallographic structure common for both ice phases are shown.
35
2.4 Structure and Properties of Non-Crystalline Water
Low-temperature micro-phases of ice have attracted intense interest over the past
decade primarily due to their important role as a common medium for organic and inorganic
chemical processes at different temperature regimes in the biosphere (220-273 K) [47],
atmosphere (190-220 K) [48, 49], and interstellar space (10 K) [50]. The interaction of
polymorph phases with the impinging molecules could lead to adsorption, clusterization and
chemical modification, and diffusion in the original or modified forms into the bulk of the ice
phase. The mechanisms of the interaction between the adsorbates and ice are therefore
expected to depend on the bulk structure, and the surface properties and dynamics of the
specific complexes of the micro-phases that exist under different temperature and other
conditions.
Despite many sometimes controversial observations, there is a general consensus
among the early studies [12, 51, 52, 53, 54] that condensation of water vapor on a cold
substrate at low pressure under the appropriate deposition conditions can lead to the formation
of different non-crystalline structures below 130 K and of polycrystalline polymorphs Ic and Ih
at a higher temperature. In the case of nc-ice, the low-density amorphous ice is commonly
described as a highly porous open network with nanoscale pores and therefore a significant
concentration of non-compensated surface OH groups [23, 55]. For the more compact high-
density amorphous ice, its structure has been proposed to be similar to the low-density
amorphous ice, particularly in terms of the oxygen-oxygen radial distribution function but with
additional water molecules occupying interstitial sites [53]. Non-crystalline structures are
metastable with respect to crystalline phases Ic and Ih and consequently their formation and
existence are kinetically controlled. Upon annealing to a higher temperature, nc-ice transforms
irreversibly to Ic over 140-160 K [56], which in turn undergoes a further irreversible phase
transition to Ih over 160-240 K. The wide transition temperature range of the Ic-to-Ih
transition is thought to be the result of dependence of the crystallization temperature on the
size of cubic ice crystals [56]. This series of crystallization processes, which begin at a
temperature just above the glass-to-liquid transition, is found to be incomplete in the sense that
fragments of non-crystalline micro-phases can coexist metastably with Ic over 140-210 K and
with both Ic and Ih above 160 K. The nature of these non-crystalline micro-phases remains a
subject of intense debate [13, 53, 54, 56]. These observations suggest that the ice phase

36
between 135 K (the onset of the glass-to-liquid transition) and 240 K (the completion of the Ic-
to-Ih transformation) consists of non-crystalline and crystalline micro-phases in dynamic
equilibrium, with increasing proportion of the latter phase with increasing temperature. The
structural evolution of these ice micro-phases with temperature involves morphological and
interfacial processes in which rearrangement of hydrogen bonds at multiple internal and
external interfaces plays a key role. The reconstruction processes that accompany the phase
transformations are believed to be responsible for the kinetically controlled nature of the phase
transformations [56]. Clearly, the nature and composition of the ice micro-phases (the
substrate) at a particular temperature induce a noticeable effect on the types of adsorbates and
their interactions with the ice structure itself. On the other hand, molecules adsorbed on the
surface or trapped into the bulk of such a complex, could in turn, affect the dynamics of the
phase transformation and especially the progress of reconstruction. Indeed, very little is
known about the surface complexes of the ice micro-phases over the temperature range 140-
210 K.
The surface area of ice micro-phases may vary greatly from 240-500 m2/g for vapor-
deposited low-density amorphous ice (due to the abundance of nanoscale pores in a highly
open network) [57] to 5-12 m2/g corresponding to film structures without pores [58]. By
comparing the amounts of surface areas of nc-ice and pc-ice deposited at 22-145 K by effusive
beam dosing at different incident angles and by ambient dosing, Stevenson et al. showed that
the surface area of the nc-ice deposits increases with a larger incident angle (from the normal
direction) in qualitative accord with the predictions of the ballistic deposition model [59]. This
model takes into general account of the interplay between roughening caused by randomness
of deposition, smoothing by surface diffusion, and non-local effects generated by shadowing
[60]. The unusually large values of surface area obtained by ambient dosing at 22 K (2700
m2/g) and 77 K (640 m2/g) along with the linear increase of the surface area with deposition
time led Stevenson et al. to propose that the internal surface is directly connected to the
external surface of the film. This observation is consistent with a grass-like or a dendrite-like
model for the morphology of the ice film. Furthermore, the adsorbate uptake by the ice films
deposited by beam dosing at different incident angles above 90 K was found to be the same as
that by the pc-ice films deposited at 145 K [59], which can be explained by enhanced surface
diffusion at a higher temperature. With increasing deposition temperature, the surface area of

37
σv C3
C2
C'2 σh
C''2
σv
the ice film was also found to be greatly reduced [59], suggesting isolation of the internal
surface from the impinging gas molecules while the areas of the external surfaces of nc-ice and
pc-ice films remain the same.
2.4.1 3-Dimensional Structural Units for the Non-Crystalline Water Hydrogen-Bonded
Network
Spacefill model (left) and connection graph (right) of the bicyclo-octamer (BO)
structural unit are shown on the Figure 2.4.1 below.
Figure 2.4.1. The structure of bicyclo-octamer unit.
The essential symmetry element of the oxygen subnet structure is a C3 rotation axis and
a set of three symmetry planes σv passing through two apical molecules of water and three C2
axes in the plane of symmetry σh, which is perpendicular to C3 and passing through the centers
of three edges parallel to C3. The oxygen subnet forms a molecular basis for the D3h point
group representation. However, disorder in the hydrogen subnet effectively reduces this
symmetry to either Cs, such as shown on the next cartoon, or to E.
It turns out that, the BO packing pattern appears in the structure of the hexagonal ice Ih,

38
which can be assembled from the BO units sharing common edges within the hexagonal
(basal) planes and common vertexes in the c-direction. In contrast, the Ic does not exhibit the
BO arrangement pattern. On the other hand, the tricyclo-decamer and tetradecimal tetrahedral
units, the structure and symmetry of which closely resembles that of Ic ice, can also be used
for constructing larger scale symmetric water clusters. The core element of these two units is
the adamantane-type water cluster, the oxygen subnet of which belongs to the tetrahedral point
group Td.
Figure 2.4.2. Structure and connectivity graph of the tricycle-decamer unit (10 H2O).
The essential symmetry elements of the oxygen subnet for this decamolecular unit are:
a set of 4 C3 rotational axes passing through the apical molecules of water and the centers of
opposite hexagons, three mutually perpendicular C2 axes, and six σd planes. The oxygen
subnet of this unit belongs therefore to the tetrahedral, Td, point group. The TD structural unit
resembles closely the structural pattern of Ic.

39
Figure 2.4.3. The structure and connectivity of tetradecimal structural unit (14 H2O).
The oxygen sub-network belongs to Td symmetry similarly to the tricyclo-decamer, which is a
parent structure to the tetradecimal structural unit.
2.4.2 Icosahedral 280-mer Model of Non-Crystalline Water
Among possible spatially periodic and aperiodic structures, the icosahedral symmetric
model is suggested by Chaplin [1] on the basis of pentagon-dodecahedron (512) central unit,
which acts as a central core element. If the core unit remains non-deformed, an expanded
structure can be generated with the average density of 0.94 g·cm−3. If, on the other hand, the
core shell is deformed, so-called collapsed clusters can be obtained with the densities close to 1
g·cm−3 or higher. The equilibrium between expanded and collapsed structures is in accord
with the concept of Frank and Wey on the flickering cluster representation of liquid water [61].
2.4.2.1 Expanded Cluster
Spacefill structure of the expanded 280-molecule cluster is shown below on Figure
2.4.4:

40
Figure 2.4.4. The spacefill 3-dimensional structure of expanded 280-molecule water cluster of
icosahedral symmetry.
This expanded cluster with ~ 24.3Å of maximum radius consists of the three shells, which are
enclosed one into another and defined according to the distance from the center of cluster. The
molecular distribution in the expanded cluster as a function of the distance from the center of
pentagon-dodecahedron central core and spherical coordinates (θ (0 – 360º)– angle between
projection of radius-vector on XY plane and X–axis; φ (0 – 180º)– angle between radius-vector
and Z–axis) are shown on Figure 2.4.5. While the first peak of density at ~3.88 Å designates
the pentagon-dodecahedron core shell, two following peaks at 6.64 Å and 7.96 Å represent the
second shell, which contains 80 water molecules. The third shell of 180 water molecules
begins at 10.7 Å and spreads up to 12.4 Å.

41
10 20 30 40 50 60 70 803
4
5
6
7
8
9
10
11
12
13
Dis
tanc
e fr
om c
ente
r, Å
Counts
~ L HB (O-O) = 2.70 Å
~ L HB (O--- O) = 2.76 Å
Third Shell
Second Shell
12.412
11.556
10.658
7.962
6.637
3.877
020406080
100120140160180
0
18
36
54
7290
108
126
144
162
198
216
234
252 270 288
306
324
342
020406080
100120140160180
θ, °θ, °θ, °θ, °
φφφφ, °
Figure 2.4.5. The representation of the expanded cluster in the spherical coordinates.
The position of each shell from the center can be associated with the molecular layers
in the tetradecimal tetrahedral units as is clear from a right panel on Figure 2.4.5. It means that
the overall radius of the icosahedral is determined by the height of the tetradecimal tetrahedral
unit. The geometry representation in the spherical coordinate clearly reveals the 5-fold

42
rotational symmetry of the expanded cluster, which is in accord with the symmetry of the first
shell.
The structures of individual the first and the second shells are visualized below on
Figure 2.4.6 and Figure 2.4.7, respectively:
Figure 2.4.6. The pentagon-dodecahedron first shell (512): 20 water molecules, a key structural
element of expanded cluster and the Chaplin's model of liquid water.
It is evident that in this well-defined 5-fold symmetry shell there are three nearest-
neighbors at distance of ~ 2.8 Å for each water molecule, whereas the corresponding
hydrogen-bonded fourth neighbor belongs to the second shell. The number of nearest
neighbors for each molecule from the first shell is four, and they are hydrogen bonded in
accord with the Bernal-Fowler rules. From a stoichiometric perspective it is possible to
construct the dodecahedron shell from three pentagonal rings and five individual water
molecules, which is however less probable in pristine water because such a regular
arrangement would be of low configuration entropy. Pentagonal rings are thought to be a part
of the structure of the liquid water network. The pentagon-dodecahedron shell of the expanded
cluster provides the inherent cavity with a radius of ~ 3.9 Å, which can be occupied by the
guest molecules of appropriate dimensions. From a structural perspective, the guest molecule
could be considered as a pattern-forming entity, which acts as a nucleus around which
assembling the pentagonal rings and individual water molecules assemble. Indeed, the
pentagon-dodecahedron unit is a core structural element of clathrate-hydrates of type I and II,
where they are occupied by the guest molecules with van der Waals diameters not exceeding
~5.2 Å, such as Ar, CH4, Kr, Xe, H2S and CO2. These guest molecules appear to act as
nucleation centers for the formation of pentagon-dodecahedral core unit, which in turns acts as

43
a motif for further growth of the clathrate hydrate lattice. It should be noted that the above
mentioned guest molecules exhibit primarily hydrophobic properties, which cause such a
configuration of the hydrogen bonds network such that there are exclusively hydrogen bonds
directed outwards from the dodecahedron and no bonds directed inwards the core unit (as it
can be seen on the right part of the picture above). Furthermore, it is possible that a certain
arrangement of the hydrogen bonds within the first shell would be more energy favorable than
others, which would lead to a specific rather than random polarization of the dodecahedron
units. In this particular arrangement, given on Figure 2.4.6, ten oxygen atoms of the equatorial
belt of the pentagon-dodecahedron are in the acceptor positions whereas two sets of five atoms
on the "top" and the "bottom" are in the donor positions for the hydrogen bonding with the
second shell.
Figure 2.4.7. Second Shell: 80 water molecules.
Similarly to the first shell, the second shell consists of a two-dimensional mesh of
hydrogen bonded water molecules with three nearest neighbors within the shell. The shell
could be constructed from 12 pentagonal rings (three of which are shown in light gray color on
the central panel of Figure 2.4.7) and 20 individual water molecules. A quarter of the
molecules are hydrogen bonded with the first shell (on the right panel 4 hydrogen atom in
black color are those pointing inwards and therefore acting as a donors in the hydrogen
bonding with the oxygen atoms of the first shell, which are at the equatorial belt), whereas
remaining three quarters are hydrogen bonded to the third shell. There are total of 20
hydrogen bonds between the first and second shells.

44
Figure 2.4.8. Third shell: 180 water molecules.
In contrast with two smaller inner shells, the third outer shell of the expanded cluster
can be constructed exclusively from the pentagonal and hexagonal rings. Linked together, 12
pentagonal and 20 hexagonal rings form an uninterrupted hydrogen bonded mesh with
diameter of ~ 24 Å. The hexagonal rings exhibit both chair and book configurations. This
third shell shows a variety of the HB acceptor and donor configurations (see right panel in
Figure 2.4.7) towards the interior and the exterior water or guest molecules. From a standpoint
of the hydrogen bonding this shell therefore represents a heterogeneous HB structure (although
it is not completely random) due to the irregular arrangement of the HB donor and acceptor
"surface" fragments.

45
2.4.2.2 Construction of the 280-mer Molecule Expanded Cluster from the Structural
Units
The icosahedral extended cluster can be constructed [1] from three above-mentioned 3-
dimensional structural units as shown Figure 2.4.9 and Figure 2.4.10.
Figure 2.4.9. Construction of the 280-mer expanded cluster from the 22 bicyclo-octamer units.
64 H2O or 8 BO units are removed for clarity.

46
Figure 2.4.10. Construction of the expanded cluster from the primitive strucutral units.
(a) combination of 20 tricyclo-decamer units, 12 pentagonal units and a pentagon-
dodecahedron unit (green color) in the center of cluster (water hexagons in the "book"
conformation occur at the connections of two decamers); (b) construction of the expanded
cluster from tetradecimal units.
24.33
22.703
(a)
(b)
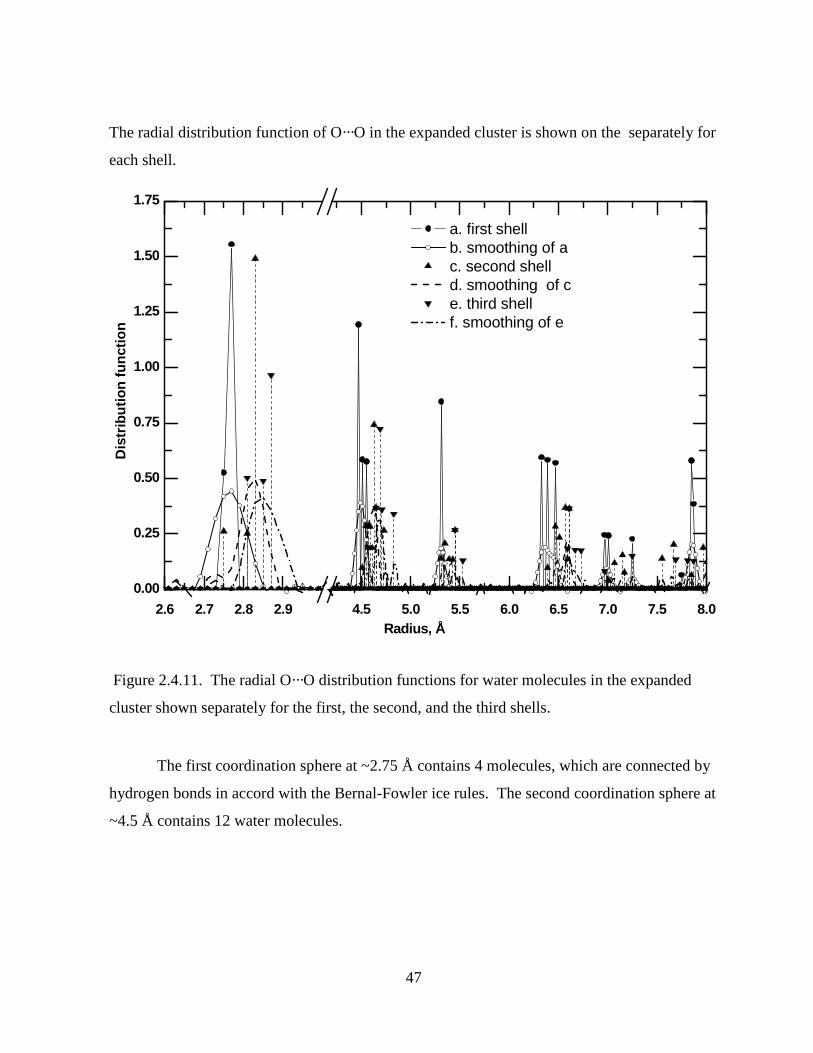
47
The radial distribution function of O···O in the expanded cluster is shown on the separately for
each shell.
2.6 2.7 2.8 2.9 4.5 5.0 5.5 6.0 6.5 7.0 7.5 8.0
0.00
0.25
0.50
0.75
1.00
1.25
1.50
1.75
a. first shell b. smoothing of a c. second shell d. smoothing of c e. third shell f. smoothing of e
Dis
trib
utio
n fu
nctio
n
Radius, Å
Figure 2.4.11. The radial O···O distribution functions for water molecules in the expanded
cluster shown separately for the first, the second, and the third shells.
The first coordination sphere at ~2.75 Å contains 4 molecules, which are connected by
hydrogen bonds in accord with the Bernal-Fowler ice rules. The second coordination sphere at
~4.5 Å contains 12 water molecules.
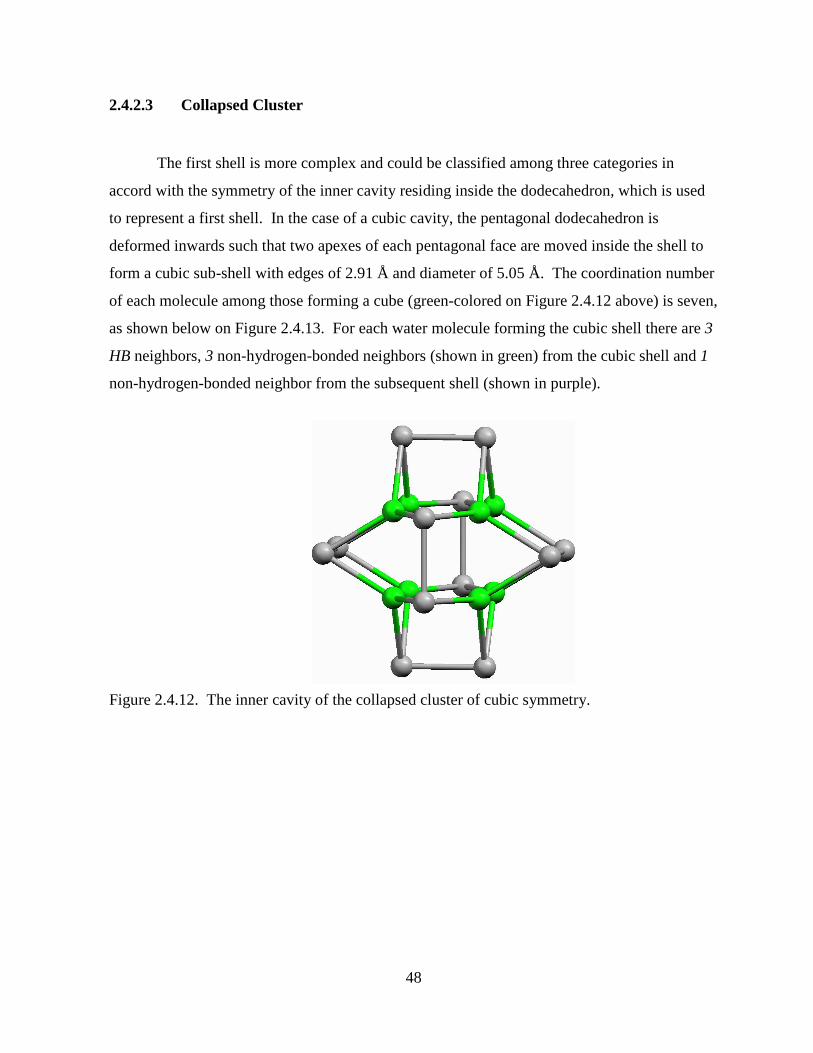
48
2.4.2.3 Collapsed Cluster
The first shell is more complex and could be classified among three categories in
accord with the symmetry of the inner cavity residing inside the dodecahedron, which is used
to represent a first shell. In the case of a cubic cavity, the pentagonal dodecahedron is
deformed inwards such that two apexes of each pentagonal face are moved inside the shell to
form a cubic sub-shell with edges of 2.91 Å and diameter of 5.05 Å. The coordination number
of each molecule among those forming a cube (green-colored on Figure 2.4.12 above) is seven,
as shown below on Figure 2.4.13. For each water molecule forming the cubic shell there are 3
HB neighbors, 3 non-hydrogen-bonded neighbors (shown in green) from the cubic shell and 1
non-hydrogen-bonded neighbor from the subsequent shell (shown in purple).
Figure 2.4.12. The inner cavity of the collapsed cluster of cubic symmetry.

49
Figure 2.4.13. The inner cubic cavity with additional 8 H2O molecules from the second shell.
The water molecules of the second shell are shown in purple color.
The radial distribution functions for the expanded and collapsed clusters shown on and
Figure 2.4.14, respectively, indicate that in the expanded cluster with pentagon-dodecahedron
central unit the coordination shells are substantially better organized in comparison with the
collapsed cluster. In the latter case the deformation of the central unit, which protrude into the
subsequent shells, is manifested in the diffuse radial distribution function.

50
2.50 2.75 3.00 3.25 3.50 3.75 4.00 4.25 4.50 4.75 5.000.0
0.5
1.0
1.5
2.0
2.5
3.0
a. cubic cavity b. tetrahedral cavity c. octahedral cavity d. smoothing of a e. smoothing of b f. smoothing of c g. X-ray diffraction
Rad
ial O
---O
Dis
trib
utio
n fu
nctio
n
Radius, Å
Figure 2.4.14. The radial O···O distribution function for the molecules in the collapsed cluster
for different central cavities: cubic, tetrahedral, and octahedral.
2.5 Ice Adsorbate Interactions: IR Spectroscopy and Computer Simulations
This section outlines major results on the interaction of chemically different adsorbates with
ice media. The ice media is classified among the polycrystalline and the noncrystalline
structures.
Of particular interest is the microstructure of internal and external surfaces of low-density
amorphous ice micro-phases. IR spectroscopy, with and without grazing-angle RA (reflection-
absorption) technique, has been applied successfully for studying the surface properties of
micro-clusters and vapor-deposited ice films. Transmittance IR measurements of low-
temperature (10-15 K) amorphous micro-clusters of H2O and D2O, together with molecular
dynamic simulations of their surfaces, obtained by Devlin and coworkers [23, 24, 54] have

51
shown that the external and internal surfaces of these materials contain two- and three-
coordinated water molecules. Part of these molecules has a non-compensated OH dangling
bonds (DB's), whereas others have an oxygen atom as a non-compensated site. Annealing the
clusters at 60 K and further to 120 K led to complete disappearance of the DB features
associated with two- and three-coordinated surface molecules, respectively. These
observations were explained in terms of reduction in the amount of the internal surface [23, 24,
54]. Using FTIR RAS, Callen et al. [62] detected OD DB's on the outer surface of a 1.5-
monolayer (ML) D2O film at 130 K and OH DB's (at 3699 cm-1) on the surface of a 5-ML H2O
film deposited above the D2O film. The OD DB feature located at 2731 cm−1 was attributed to
three-coordinated surface molecules. Its intensity was found to increase with increasing water
exposure and become saturated at 3 ML's, above which coverage this signal was overwhelmed
by the neighboring main peak of the OD stretch. The absence of the DB features
corresponding to two-coordinated molecules shows that near 130 K newly adsorbed water
molecules have sufficient energy for local surface reconstruction giving rise to the production
of triply coordinated sites. Similar behavior of the OD DB was also observed by Horn et al.
[63] on a much thicker D2O amorphous ice film deposited at 110 K. Both these studies [62,
63] have suggested that the OD/OH DB's are most likely located on the outer surface of the ice
films, after taking in to account the aforementioned signal behavior as a function of film
thickness. On the other hand, a detailed investigation of the behavior of OH DB in the vapor-
deposited ice samples between 94 K and 120 K by Zondlo et al. has shown that the majority of
the OH DB are most likely located on the surface of micropores inside the bulk of amorphous
ice [64]. The intensity of the OH DB feature was found to increase almost linearly with
increasing film thickness up to 200-250 nm at 94 K, and to level off at 0.03-0.05 integrated
absorption unit upon further film growth to 500 nm. This spectral saturation occurs as the
result of the physics of RA and is not related to the amount of the OH DB's. Furthermore, the
DB feature appeared to weaken at a higher deposition temperature. At 120 K and deposition
pressure below 1×10⁻⁶ Torr, the peak intensity became very small (below 0.01 integrated AU)
and decreased with a further increase in the film thickness. Zondlo et al. further concluded
that the lower substrate temperature and faster deposition rate favored the production of an
open water network with abundance of micropores covered by the OH DB's [64]. These
FTIR-RAS studies [62, 63, 64] are consistent with a model that for thin (< 50 nm) amorphous

52
ice film (obtained by slow vapor deposition above 110-120 K) where the internal surface is
small, in which case the DB signal, if detectable, comes predominantly from the OH/OD
groups located on the smooth external surface. Faster deposition rate at these temperatures
most likely leads to the production of a porous water networks with relatively well-developed
internal surfaces. Under these growth conditions, the db signal originates primarily from the
free OH/OD groups located on the surfaces of the micropores [64].
The low-density nc-ice deposits prepared by the vapor condensation on cold surfaces exhibit a
high absorption capacity towards N2 and other inert gases, which exemplifies by more than
200 m2·g−1 of specific surface area for the samples prepared at 77 K (according to Ghormley's
[65], and Keyser and Leu [66]). On the other hand, Adamson et al. [67] and Ocampo and
Klinger [68] have reported much smaller values in the range of 4-12 m2·g−1 for the surface area
of the ice samples also prepared at 77 K and, furthermore, the former authors have found that
the adsorption characteristics of the ice samples kept at liquid nitrogen temperature did not
change over the period of two weeks [67]. These differences in the specific surface area and
have been related, in particular, by Mayer and Pletzer [69], to the condensation mechanism
and, specifically, to whether the condensation of water vapor occurs in the gas phase under
supersonic flow giving highly convoluted and morphologically heterogeneous media,
composed of an assembly of water clusters, or directly on the cold surface, producing much
more compact continuous solid. By varying the direction of the incident flux of water
molecules, Stevenson at el. [59] have observed a systematic change in the morphology of
vapor-deposited low-density ice films, which at glancing angles of the flux exhibits the
nitrogen uptake corresponding to as much as 2700 m2/g at 22 K and to 640 m2/g at 77 K.
Obtained recently by Dohnalek et al. [70], the similar results on large uptakes of argon and
methane species by the LDA indicate a fractal grass-like structure of the low-temperature
vapor-deposit, which appear to be in agreement with the earlier views of Mayer and Pletzer
[71], and Laufer et al. [72] on the low-density amorph as a morphologically porous media.
These experimental results as well as well as the results of the computer simulations [73, 74,
75, 76] indicate, therefore, that the fractal structure of the low-density noncrystalline ice
samples is highly heterogeneous with a significant variation in the local density over the space
occupied by this metastable media, however the characteristic size of an intrinsic "building
block", or cluster, although certainly very small (this case is similar to a glass), remains, as far

53
as we are aware, unknown. The hetero-/homogeneity of LDA clearly self-manifests on
different spatial scales as it would be in any fractal, which suggestively spread from ~ 10 Å for
the cross-sections of the typical fractal regions of self-similar elements of the HB network [74]
to the unknown, but probably larger, size of micropores (~ 20Å? in diameter [71, 77]), and to
much larger morphological macro-features [72]. It is note-worthy that the intrinsic hetero-
/homogeneities in LDA obtained in the MDS [74] appears to be of the typical size of
micropores in the solid adsorbents like active carbons.
The micropores in the LDA ice media were found to be accessible for small chemically
inert non-polar species such as H2, N2, O2, Ar, Kr, CH4, or low-polar CO [24, 66, 70, 71, 78].
Larger and chemically more active species such as acetylene, SO2, HCN, and NH3, do not
readily access the micropores independently on the temperature of an adsorption experiment.
This effect can be attributed to the low mobility of adsorbed species or to the collapse of pores
at more elevated temperatures [78].
Concerning the surfaces of crystalline ice samples, there is a large corpus of convincing
evidences provided primarily by the studies of Devlin, Buch and collaborators [78, 86] that the
surface of the samples prepared under "generic" experimental conditions is structurally
disordered in the entire range of environmentally relevant temperatures. In contrast, the
surface of the ultra-thin crystalline ice films carefully prepared by vapor deposition at low
temperatures on the single-crystal metal substrates is stable and exhibits either a well-ordered
hexagonal structure with a large-amplitude vibration of the water molecules in the topmost
half-bilayer [79], or the reconstructed structure [80]. Using the IR technique, Devlin has
identified the onset temperature of the molecular rotation of the triply-coordinated surface
molecule on the surface of crystalline nanocrystals to be about 60 K, while the motions
involving the molecular interchange on the surface, which likely involves overcoming of the
activation barrier for translational motion and certain type of diffusion, appeared to be frozen
below 130 K on the time scale of 105 sec [81].
Infrared spectroscopy has been extensively used for study reaction of molecules with
ice surfaces [82, 83, 84, 85]. These studies have shown that the molecular adsorbates can be
classified among three categories based on the interaction strength between the adsorbates and
the water molecules. In particular, weak adsorbates such as ozone, carbon monoxide, and
nitrogen were found to desorb rapidly into a vacuum at T < 100 K, and the spatial extent of

54
their interaction with the ice is limited only to the surface water molecules. The second
category includes such adsorbates as H2S and acetylene, which form relatively strong
hydrogen bonds with the ice surface and also interacts with the subsurface water molecules.
The interaction of species from the second category with subsurface water molecule alters the
subsurface ice spectrum [86]. The third category represents those molecules which are capable
penetrating the ice to form hydrates. This category includes hydrochloric acid, ammonia, and
ethylene oxide. In the present studies, the interaction of ice surface with HCl (at 130-150 K)
was found leading to the protonation of water media with formation of the Zundel ions as
discussed in Chapter 4. Strong proton donor/acceptor properties (a capability of forming
strong HB's) of adsorbate are considered critically important for transformation of ice structure
to hydrate [87].
The mechanism of interaction of molecules from the environment with the ice micro-
phases was found to be strongly dependent upon both the physico-chemical properties of
adsorbate and the microstructure of the ice surface [88]. In particular, the molecular properties
of an adsorbate such as an ability to establish the HB (electrophilic-nucleophilic) bonding with
ice surface, the charge density distribution over a molecule, the molecular size and geometry,
and the ionization ability play a leading role in the adsorption process and in the evolution of
adsorbate complexes. In the adsorption of those polar molecules, which are capable of
forming hydrogen bonds with water molecules, a pivotal role in the anchoring of adsorbate on
the ice surface can be attributed to the hydrogen bonding between adsorbate and surface water
molecules with either H or O atoms in dangling position. These atomic species, OH DB and
Od, form the adsorption sites on the ice surface for the polar organic molecules [82, 87].
Accordingly, the polar molecule may be subdivided functionally into two parts: the functional
group, which carries a strong dipole and is involved in the "strong" hydrogen bonding with the
ice surface and the remainder, which is usually almost electro-neutral and, thus, is bounded to
the ice surface by van der Waals forces or weak electrostatics. In the case of acetone, the
carbonyl group (functional group), which carries a significant dipole moment (µ= 2.88 D), is
expected to establish the hydrogen bond with the positively charged hydrogen atom in the
dangling position on the ice surface, whereas the contribution of two methyl groups
(remainder) in adsorption energy is expected to be significantly smaller. However, the
geometry of adsorption complex of many molecules at sub-monolayer coverage may be

55
determined by these "second order" interactions between the remainder and the adsorbent. In
general, the qualitative mechanism of the surface-induced orientation of unsymmetrical
molecules in adsorbate layers is well understood and was termed by Langmuir as the "principle
of independent surface action" [89] or the "force field" as it was stated by Hardy [90].
In the case of acetone, and most likely other ketones and probably aldehydes, the
adsorption centers are H atoms in dangling positions. The geometrical distribution of these
centers on the ideal Ih (0001) basal surface is random, which suggests that this ideal surface
and, consequently, the surfaces of real ice behave as a random heterogeneous surface for these
classes of organic compounds. In the general case, however, the heterogeneity of the ice
surface is also a function of the adsorbate, and for alcohols, which are amphoteric compounds
in terms of hydrogen bonding, the ice surface is expected to be more homogeneous. The two
kinds of hydrogen bonds (O-H)Alc···OIce and (O-H)Ice···OAlc are expected in the case of alcohol
adsorption on ice surface. Although these two HB structures are not equivalent, the binding
energy of the donor and acceptor configurations are expected to be close to each other. This
prepositions leads to classification of the ice surface as a homogeneous structure in the case of
alcohol adsorption. In the case of methanol on Ih (0001), Picaud et al. [91] have shown by
optimizing classical potential (Coulomb and Lennard-Jones) at 0 K that the adsorption energy
for complex where methanol behaves as a donor of OH group is larger only by 0.344
kcal·mole−1 than corresponding value of ~ 9.8 kcal·mole−1 for the complex where the methanol
molecule is OH acceptor. Therefore, there are convincing grounds to suggest that the
adsorbent properties of ice surface depend on the physico-chemical properties of an adsorbate.
The adsorbate-adsorbate attraction can be substantial in magnitude with relatively long-
range spatial extent in the group of polar molecules with a large dipole moment, to which
acetone belongs. This interaction is known to be of importance in the determination of the
behavior of the adsorption isotherm and the properties of adsorbed phase [92]. The inter-
adsorbate interaction becomes predominant at close to and above the monolayer coverage even
for those molecules, which are capable to strong hydrogen bonding with ice surface. For
instance, the acetone-acetone interaction is evident in the RA spectra as reported in Chapter 5.
In contrast with the picture described above, the adsorption of non-polar molecules or
molecules with a low ability to donor-acceptor bonding does not occur on H/O dangling
positions on the surface water molecules. Adsorption processes in this case are similar to the

56
condensation on the ice surface, where the ice surface could be considered as the provider of
van der Waals potential. This adsorbate-ice interaction is expected to be much less sensitive to
the ice surface structure on the atomic scale than the strong electrostatics between functional
group and H or O dangling positions in the case of polar molecule. This, however, does not
assume the absence of the influence of adsorbate on the energy of dangling groups [99]. The
suitable candidates for the class of "weak" organic adsorbates, except hydrocarbons, are
halogen tetra-substituted methanes and even chlorofluorocarbons. In fact, Graham et al. [93]
have shown that adsorption of fluoroform on Ih (0001) ice surface at temperatures less than 75
K can lead, despite its significant dipole moment of 1.65 D, to the formation of ordered
complete monolayer (coverage θ ~ 0.9), in which fluoroform molecules occupy the "free
space" at the centers of each water hexagon with the C-H bond pointing inside. The ice
surface is expected to behave itself as a homogeneous site surface in similar cases. The
present studies report the interaction of chloroform with ice surface accompanied with two
hydrogen bond coordinations, OD···Cl−CCl2H and Cl3C−H···O−OH, as reported in Chapter 5.
The large-scale structure of the ice near-surface region, e.g. the microporous structure
of the ice films deposited below ~120 K [64] or its large-scale disordering at temperatures
above ~ 190 K [94], obviously will affect the time evolution of adsorption complexes by
facilitating the trapping and the penetration of adsorbate into ice.
Local organization and energetic parameters of the adsorbate complex on the surface
could remain, however, independent from the large-scale structure of the ice surface. The
occluded guest species also form the complexes with water molecules inside the adsorbent
medium. The structure of these complexes inside the host medium could be different from that
on the surface but the principle hydrogen bonding coordination most likely is similar for both
the surface and the occluded complexes. For instance, the present spectral studies reveal that
the acetone-water complexes are different on the surface and in the bulk of the ice condensate
but the principle HB configurations are most likely the same for the surface and the bulk
complexes.
Another aspect of cryogenic adsorption on the ice surface is associated with the
adsorbate-induced ordering of the originally disordered near-surface region of noncrystalline
and polycrystalline ices. The kinetics and extent of the adsorbate-induce ordering is a function
of temperature and adsorption energy. In fact, adsorption of molecules that are capable of

57
forming relatively strong hydrogen bonding with surface water molecules such as hydrogen
sulfide and acetylene was found to cause noticeable reconstruction of near-surface region
towards a more crystalline arrangement [95]. In contrast, weakly bonded adsorbates with
small dipole moment or quadrupolar molecules such as carbon monoxide and nitrogen do not
influence the ice near-surface region [95]. Therefore, it is expected that polar organic
adsorbates will cause strong reconstruction of the subsurface ice region by the formation of
hydrogen bonds with the surface water molecules.
Next part of this section reports a detail analysis of the spectral data on the adsorption
complexes of cyanoacetylene, thiophene and acetone with a focus on the adsorbate-water and
the adsorbate-adsorbate interactions and the adsorbate-induce reconstruction of the near-
surface region of ice. These three chemical moieties are expected to exhibit different behavior
upon adsorption on the ice surface. In contrast to acetone, which is evidently an acceptor of
hydrogen bonds (with no or very minor donor capacity), cyanoacetylene, N≡C−C≡C−H, is
expected to exhibit both a donor and an acceptor HB properties. Thiophene is expected to be a
weak HB acceptor. In the case of cyanoaetylene, the strong adsorbate-adsorbate interaction is
expected because of a large dipole moment of this molecule. It turns out, that, in spite of
significant differences in the physico-chemical properties, all the abovementioned species
exhibit similar adsorption behavior on the ice surface. This circumstance clearly underscores
the water property to average the individual characteristics of guest species.
FTIR spectroscopy was used in transmittance mode to study the adsorption complexes
of cyanoacetylene (µ= 3.72 D) [96] and in the reflection-absorption mode for acetone (µ= 2.88
D) [97], and thiophene (µ= 0.55 D) [98] complexes on polycrystalline and non-crystalline ice
films. In particular, Borget et al. [96] have shown that solid cyanoacetylene pre-deposited on
ice at 15 K begins to interact with OH DB's after becoming mobile at 25 K with formation of
the acceptor C−N···H−OH complex, which was found to be stable between 25 and 45 K. The
formation of this adsorption complex was accompanied by a 25 cm−1 red shift in the frequency
position of OH DB signal. Further annealing of this adsorbate-ice structure to 80 K led to
progressive restoration of the original OH signal, which was interpreted in terms of the
transformation of the acceptor complex to the donor C−H···O complex. The last was found to
be stable in the temperature range 45-110 K. The cyanoacetylene desorption was observed
between 110 and 140 K with activation energy of 39 kJ·mole−1 estimated from the TPD data.

58
The DFT calculations showed that the length of hydrogen bond is shorter in the donor complex
(2.057 Å) than a corresponding value for the acceptor complex (2.189 Å), which suggests
domination of the nucleophilicity over electrophilicity for water molecules. The donor
adsorption complex is expected, according to DFT calculations, to flatten on the ice surface
due to the weak hydrogen bonding (3Å) between dangling hydrogen atom and π-system of the
adsorbate unlike the acceptor complex, the predicted geometry of which allocates the
adsorbate to be perpendicular to the ice surface [96]. Such interaction between the π-system
and the OH DB, which is critical for geometry of the adsorption complex, seems to be in
contradiction with the spectral observations, which showed that the frequency position of OH
DB is identical for bare ice and for the adsorbate-ice system at 80 K. In particular, Rowland et
al. [99] have shown, using a differential IR spectroscopy method, that saturated adsorption of
N2, CH4, and CO at 80 K on non-crystalline and crystalline nano-particles cause a noticeable
red shift in the frequency position of OD/H DB's. Consequently, we can expect to observe
significant red shift for the OH DB's peak on ice surface covered by polar molecule such as
cyanoacetylene independent of particular structural details of the adsorption complexes due to
the long-range electrostatic interaction between adsorbate and ice surface. Furthermore,
Delzeit et al. [95] have demonstrated that molecules such as acetylene, which may be
considered as a non-polar "analog" of cyanoacetylene with much lower ability to hydrogen
bond, introduces ordering in the subsurface area of non-crystalline ice particles due to
hydrogen bonding with surface dangling groups. No such reconstruction was reported by
Borget et al. [96] for the adsorption of cyanoacetylene. The present author has also found
unexpected similarity can be reported for the effect of partial reemergence of the free OH
dangling features in N2 covered non-crystalline ice upon annealing the system from 50 K to 80
K, which was observed and attributed by Rowland et al. [24] to the desorption of nitrogen
from the pores of specific sizes, and the analogous desorption behavior of cyanoacetylene [96],
despite the apparent difference in the chemical nature of adsorbates. Borget et al. [96],
unfortunately, have not discussed the influence of adsorbate-adsorbate interaction on the
structure and the temperature evolution of adsorption complexes, which can be significant and
even predominant over the adsorbate-ice interaction due to large dipole moment of
cyanoacetylene. Indeed, the activation energy of adsorption complex desorption at 39 kJ/mol
appears to be close to the sublimation enthalpy of solid cyanoacetylene found at 42.3kJ/mol
59
[100].
The FTIR-RAS studies of thiophene adsorption on Pt (111) and ice surfaces at
cryogenic temperatures by Haberkern et al. [98] have shown that adsorption on metal and
crystalline ice surfaces proceeds with consecutive formation of a compressed monolayer, a
disordered phase and a crystalline adsorbate film. The thiophene growth mode was found to
be largely determined by adsorbate-adsorbate interactions. In contrast with this, thiophene
adsorption on non-crystalline ice at 125 K (unlike 85 K) revealed the formation of ice-specific
adsorption complexes, the appearance of which was attributed to a large number of OH
dangling groups on the surface of non-crystalline ice and to a certain mobility of adsorbate at
this temperature. The geometry of these adsorption complexes was found to be different from
previous cases and suggests that the orientation of the molecule ring is much closer to the
surface normal than in the compressed monolayer [98]. In the last case, the combination of the
surface heterogeneity and adsorbate mobility allows adsorbate-specific adsorption complexes
to be formed. Independently from the ice structure or the exposure temperature, Haberkern et
al. [98] have found that the intensity of the IR signal corresponding to the OH DB's decreases
upon thiophene exposure. Moreover, the thiophene deposition causes characteristic changes in
the shape of main peak of OH stretching band, which is in agreement with observations of
Rowland et al.[23], and Delzeit et al.[95].
In a series of two papers, Schaff and Roberts have shown, using FTIR-RAS and TPD,
that acetone adsorbs on the surface of the amorphous D2O and H2O ices giving two distinct
adsorption complexes [82, 97]. The first complex is referred to as acetone bounded to surface
O-D/H DB by the hydrogen bond, whereas the second complex is described as physisorbed
acetone. TPD experiments with the amorphous ice covered by adsorbate revealed two
desorption peaks at 133 K and 157 K, which were related respectively to the physisorbed and
hydrogen-bonded complexes. The surface concentration of the last complex was observed to
achieve saturation at ~ 1.2 L (1 L = 1×10⁻⁶ Torr×sec), after which point the exclusive growth
of the physisorbed complex continues. The activation energy of desorption of the hydrogen-
bonded complex was estimated as 39 ± 2 kJ/mol, the value which appears to be slightly larger
than the sum of the enthalpies of vaporization and fusion of acetone at 34.8 kJ/mol. In contrast
to this, in the case of the desorption from crystalline ice, the hydrogen-bonded complex was
almost completely absent and the physisorbed complex was predominant. This observation

60
was explained by qualitative difference in the surface concentration of OD/H dangling bonds
on the non-crystalline and polycrystalline ices. However, in the partial contradiction to this,
the FTIR-RA peak associated with the OD/H DB's was completely attenuated at the same
intensity level by ~1L of acetone adsorption on non-crystalline ice and by less than 0.25 L on
polycrystalline ice at 95 K. The spectral feature of the carbonyl stretching mode in the FTIR-
RA spectra of acetone on non-crystalline ice was reported to be at ~1703 cm−1 for very low
coverage and at 1716-1717 cm−1 for the condensed multilayer of adsorbate. The first peak was
attributed to hydrogen-bonded acetone complex based on the red-shifted frequency position of
the band and its intensity saturation with acetone exposure. The relative intensities of IR-RA
spectral bands of adsorbed acetone complex were found to be coverage-independent for
adsorption on nc-ice with the C=O stretch as the most intense one, whereas on pc-ice these
intensities varied strongly with acetone exposure. These data were interpreted in terms of a
nearly constant orientation of acetone with the respect to surface normal in the adsorbate
complexes on nc-ice in contrast to adsorption on pc-ice, which was accompanied by distinct
coverage-dependent orientational regimes [97]. There is an interesting similarity with the
Haberkern et al. [98] data on thiophene adsorption since in both cases the adsorption
complexes at low coverage on nc-ice revealed the preferential orientation of the adsorbate with
the molecular plane to be closer to the surface normal than in adsorption on pc-ice. At this
point, we can suggest that these results contain information about the large-scale structure of
adsorbate and depend upon the heterogeneity of the ice surface structure. Molecular dynamics
simulations of acetone adsorption on Ih (0001) ice surface done by Picaud and Hoang [101]
show that the hydrogen-bonded acetone molecule is oriented almost parallel to the ice surface
(75º from the normal at 125 K) at low coverages. This orientation is the result of van der
Waals attraction or "weak" hydrogen bonding of the remainder to the surface. The same
arguments can be used to justify a plausible preposition about similar orientation of thiophene
adsorption complex at the same coverage range. If this is the case, the near-to- perpendicular
(with respect to the normal to the substrate surface) orientation of the molecular plane
observed by Haberkern et al. [98] and Schaff and Roberts [97] at low coverage on nc-ice can
be explained by the preferential adsorption of organic molecules on the micropores surface,
which is most likely to be perpendicular to the substrate surface.
The bibliographic analysis presented in this section reveals that polar organic substances can

61
be effectively used for probing the state of condensed water media on different spatial and time
scales. All the above-mentioned adsorbates interact with the dangling bonds of ice surface,
which can be observed in the differential IR spectra. Not only the local configuration of the
adsorbate-water complexes can be determined from these IR spectra but also tentative
conclusions regarding the lager-scale structure of the ice deposit can be drawn. The spectral
part of the present studies follow this path by using such polar organic molecules as acetone,
acetaldehyde, methanol and chloroform for analysis of the surface state and the dynamics in
ice deposits.
62
References:
1. M. Chaplin, "Water Structure and Behavior", 2005, http://www.lsbu.ac.uk/water/.
2. J. Urquidi, C. H. Cho, S. Singh, G. W. Robinson, J. Mol. Struct. 485-486 (1999), 363.
3. G. W. Robinson, C. H. Cho, J. Urquidi, J. Chem. Phys. 111 (1999), 698.
4. B. Kamb, "Structural Chemistry and Molecular Biology", (1968), 507, ed. A. Rich and
N. Davidson, W. H. Freeman, San Francisco.
5. J. D. Bernal, R. H. Fowler, J. Chem. Phys. 1 (1933) 515.
6. J. D. Bernal, "The Geometry of the Structure of Liquids", (1963) 25 in the "Liquids:
Structure, Properties, Solid Interaction", (1965), ed. T. J. Hughel, Elsevier Publishing
Company, New York.
7. G. E. Walrafen, W.-H. Yang, Y. C. Chu, "Raman Evidence for the Clathratelike
Structure of Highly Supercooled Water" (1996) 287 in the "Supercooled Liquids"
(1997), ed. J. T. Fourkas, D. Kivelson, U. Mohanty, K. A. Nelson, ACS Symposium
Series 676, ACS, Washington DC.
8. A. H. Narten, H. A. Levy, Science 165 (1969) 447.
9. D. Eisenberg, W. Kauzman, "The Structure and Properties of Water", (1969) Clarendon
Press, Oxford.
10. M. Kopp, "Molecular Motions in Ice", Dissertation, (1972) Swiss Federal Institute of
Technology, Zurich, Verlag Zurich.
11. V. F. Petrenko, R. W. Whitworth, "Physics of Ice", (1999) Oxford University Press,
Oxford.
12. P. V. Hobbs, “Ice Physics”, Clarendon Press, Oxford (1974); and references therein.
13. I. Kohl, E. Mayer, A. Hallbrucker, Phys. Chem. Chem. Phys. 2 (2000) 1579.
14. P. Jenniskens, S. F. Banham, D. F. Blake, M. R. S. McCoustra, J. Chem. Phys. 107
(1997) 1232.
15. N. Materer, U. Starke, A. Barbieri, M. A. Van Hove, G. A. Somorjai, G.-J. Kroes, C.
Minot, Surf. Sci. 381 (1997)190.
16. J.-C. Li, J. Chem. Phys. 105 (1996) 6733.
17. A. I. Kolesnikov, J.-C. Li, S. Dong, I. F. Bailey, R. S. Eccleston, W. Hahn, S. F.
Parker, Phys. Rev. Lett. 79 (1997)1869.

63
18. J. Braun, A. Glebov, A. P. Graham, A. Menzel, J. P. Toennies, Phys. Rev. Lett. 80
(1998), 2638.
19. A. Hallbrucker, E. Mayer, G. P. Johari, J. Phys. Chem. 93 (1989) 4986.
20. J. E. Bertie, H. J. Labbe, E. Whalley, J. Chem. Phys. 50 (1969) 4501.
21. W. Hagen, A. G. G. M. Tielens, J. M. Greenberg, Chem. Phys. 56 (1981) 367.
22. B. Rowland, J. P. Devlin, J. Chem. Phys. 94 (1991) 812.
23. B. Rowland, N. S. Kadagathur, J. P. Devlin, V. Bush, T. Feldman, M. J. Wojcik, J.
Chem. Phys. 102 (1995) 8328.
24. B. Rowland, M. Fisher, J. P. Devlin, J. Chem. Phys. 95 (1991)1378.
25. T. Loerting, C. Salzmann, I. Kohl, E. Mayer, A. Hallbrucker, Phys. Chem. Chem. Phys.
3 (2001) 5355.
26. W. F. Kuhs, M. S. Lehmann, "The structure of ice-Ih" in the Water Science Reviews 2
(1986) 1, Cambridge University Press, Cambridge.
27. W. F. Kuhs, D. V. Bliss, J. L. Finney, J. de Physique 48 (1987) 631.
28. B. Kamb, W. C. Hamilton, S. J. LaPlaca, A. Prakash, J. Chem. Phys. 55 (1971) 1934.
29. J. D. Londono, W. F. Kuhs, J. L. Finney, J. Chem. Phys. 98 (1993) 4878.
30. H. Engelhard, B. Kamb, J. Chem. Phys. 75 (1981) 5887.
31. B. Kamb, A. Prakash, C. Knobler, Acta Cryst. 22 (1967) 706.
32. W. F. Kuhs, J. L. Finney, C. Vettier, D. V. Bliss, J. Chem. Phys. 81 (1984) 3612.
33. R. J. Hemley, A. P. Jephcoat, H. K. Mao, C. S. Zha, L.W. Finger, D. E. Cox, Nature
330 (1987) 737.
34. C. M. B. Line, R. W. Whitworth, J. Chem. Phys. 104 (1996) 10008.
35. C. Lobban, W. F. Kuhs, J. L. Finney, Nature 391 (1998) 255.
36. J. E. Bertie, L. D. Calvert, E. Whalley, J. Chem. Phys. 38 (1964) 840.
37. G. P. Johary, A. Hallbrucker, E. Mayer, Science 273 (1996) 90.
38. J. Huang, L. S. Bartell, J. Phys. Chem. 99 (1995) 3924.
39. G. P. Johari, Phil. Magazine B 78 (1998), 375.
40. E. Whalley, Science 211 (1981) 389.
41. E. Whalley, J. Phys. Chem. 87 (1983), 4179.
42. T. Takahashi, T. Kobayashi, J. Cryst. Growth 64 (1983) 593.
64
43. M. Riikonen, M. Sillanpää, L. Virta, D. Sullivan, J. Moilanen, I. Luukkonen, App. Opt.
39 (2000), 6080.
44. M. A. Zondlo, P. K. Hudson, A. J. Prenni, M. A. Tolbert, Annu. Rev. Phys. Chem. 51
(2000) 473.
45. J. R. Reimers, R. O. Watts, M. L. Klein, Chem. Phys. 64 (1982) 95.
46. J. E. Bertie, E. Whalley, J. Chem. Phys. 40 (1964) 1646.
47. A. L. Sumner, P. B. Shepson, Nature 398 (1999) 230.
48. S. Solomon, R. R. Garcia, F. S. Rowland, D. J. Wuebbles, Nature 321 (1986) 755.
49. M. J. Molina, L. T. Molina, C. E. Kolb, Ann. Rev. Phys. Chem. 47 (1996) 327.
50. S. A. Sanford, in “Polarimetry of the interstellar medium”, Astron. Soc. Pac. Conf.
Series 97 (1996) 29.
51. A. H. Hardin, K. B. Harvey, Spectrochim. Acta. 29A (1973) 1139.
52. W. Hagen, A. G. G. M. Tielens, J. M. Greenberg, Chem. Phys. 56 (1981) 367.
53. P. Jenniskens, D. F. Blake, Science 265 (1994) 753.
54. P. Jenniskens, S. F. Banham, D. F. Blake, M. R. S. McCoustra, J. Chem. Phys. 107
(1997) 1232.
55. D. E. Brown, S. M. George, C. Huang, E. K. L. Wong, K. B. Rider, R. S. Smith, B. D.
Kay, J. Phys. Chem. 100 (1996) 4988.
56. G. P. Johari, Phil. Mag. B 78 (1998) 375.
57. J. A. Ghormley, J. Chem. Phys. 46 (1967) 1321.
58. A. W. Adamson, L. M. Dormant, J. Am. Chem. Soc. 88 (1966) 2055.
59. K. P. Stevenson, G. A. Kimmel, Z. Dohnálek, R. S. Smith, B. D. Kay, Science 283
(1999) 1505.
60. A.-L. Barabási, H. E. Stanley, “Fractal Concepts in Surface Growth” 1995, Cambridge,
Cambridge University Press.
61. H. S. Frank, W.-Y. Wen, Disc. Faraday Soc. 24 (1957) 133.
62. B. W. Callen, K. Griffiths, P. R. Norton, Surf. Sci. Lett. 261 (1992) L44.
63. A. B. Horn, M. A. Chesters, M. R. S. McCoustra , J. R. Sodeau, J. Chem. Soc. Faraday
Trans. 88 (1992) 1077.
64. M. A. Zondlo, T. B. Onasch, M. S. Warshawsky, M. A. Tolbert, G. Mallick, P. Arentz,
65
M. S. Robinson, J. Phys. Chem. B 101 (1997) 10887.
65. J. A. Ghormley, J. Chem. Phys. 46 (1967) 1321.
66. L. F. Keyser, M.-T. Leu, J. Colloid Interface Sci. 155 (1993)137.
67. A. W. Adamson, L. M. Dormant, M. Orem, J. Colloid Interface Sci. 25 (1967) 206.
68. J. Ocampo, J. Klinger, J. Colloid Interface Sci. 2 (1982) 377.
69. E. Mayer, R. Pletzer, J. Chem. Phys. 80 (1984) 2939.
70. Z. Dohlanek, G. A. Kimmel, P. Ayotte, R. S. Smith, B. D. Kay, J. Chem. Phys. 118
(2003) 364.
71. E. Mayer, R. Pletzer, Nature 319 (1986) 298.
72. D. Laufer, E. Kochavi, A. Bar-Nun, Phys. Rev. B 36 (1987) 9219.
73. V. P. Shpakov, P. M. Rodger, J. S. Tse, D. D. Klug, V. R. Belosludov, Phys. Rev.
Lett. 88 (2002) 155502.
74. V. P. Voloshin, E. A. Zhelegovskaya, G. G. Malenkov, Yu. I. Naberukhin, J. Struct.
Chem. 42 (2001) 794.
75. H. Tanaka, J. Chem. Phys. 105 (1996) 5099.
76. J. P. Devlin, V. Buch, J. Phys. Chem. 99 (1995) 16534.
77. M. S. Westley, G. A. Baratta, R. A. Baragiola, J. Chem. Phys., 108 (1998) 3321.
78. J. P. Devlin, J. Geophys. Res. 106(E12) (2001) 33333.
79. N. Materer, U. Starke, A. Barbieri, M. A. Van Hove, G. A. Somorjai, G.-J. Kroes, C.
Minot, Surf. Sci. 381 (1997)190.
80. D. E. Brown, S. M. George, J. Phys. Chem. 100 (1996) 15460.
81. J. P. Devlin, J. Chem. Phys. 112 (2000) 5527.
82. J. E. Schaff, J. T. Roberts, J. Phys. Chem. 98 (1994) 6900.
83. H. Ogaswara, N. Horimoto, M. Kawai, J. Chem. Phys. 112 (2000) 8229.
84. Borget, F.; Chiavassa, T.; Allouche, A.; J. P. Aycard, J. Phys. Chem., B 105
(2001) 449.
85. A. Allouche, P. Verlaque,; J. Pourcin, J. Phys. Chem., B 102 (1998) 89.
86. V. Buch, J. P. Devlin,eds., "Water in Confining Geometeries", 2003, Springler, Berlin.
87. L. Delzeit, K. Powell, N. Uras, J. P. Devlin, J. Phys. Chem. 101 (1997) 2327.
88. C. Girardet, C. Toubin, Surf. Sci. Reports. 44 (2001) 59.

66
89. A. W. Adamson, A. P. Gast, "Physical Chemistry of Surfaces.", 6th edition, 1997, J.
Wiley, New York.
90. W. D. Harkins, "The Physical Chemistry of Surface Films", 1952, Reinhold Pub.
Corp., New York.
91. S. Picaud, C. Toubin, C. Girardet, Surf. Sci. 454-456 (2000) 178.
92. W. Rudzinski, D. H. Everett, "Adsorption of Gases on Heterogeneous Surfaces",
1992, Academic Press, London.
93. A. P. Graham, A. Menzel, J. P. Toennies, J. Chem. Phys. 111 (2000) 1169.
94. Y. A. Mantz, F. M. Geiger, L. T. Molina, M. J. Molina, B. L. Trout, J. Chem. Phys.
113 (2000) 10733.
95. L. Delzeit, M. S. Devlin, B. Rowland, J. P. Devlin, V. Buch, J. Phys. Chem. 100 (1996)
10076.
96. F. Borget, T. Chiavassa, A. Allouche, F. Marinelli, J-P. Aycard, J. Am. Chem. Soc.
123 (2001) 10668.
97. J. E. Schaff, J. T. Roberts, Langmuir 14 (1998) 1478.
98. H. Haberkern, S. Haq, P. Swiderek, Surf. Sci. 490 (2001)160.
99. B. Rowland, N. S. Kadagathur, J. P. Devlin, V. Buch, T. Feldman, M. J. Wojcik, J.
Chem. Phys. 102 (1995) 8328.
100. R. M. Stephenson, S. Malanowski, "Handbook of the Thermodynamics of Organic
Compounds",1987, Elsevier, New York.
101. S. Picaud, P. N. M. Hoang, J. Chem. Phys. 112 (2000) 9898.

67
CHAPTER 3
Experimental
3.1 Experimental Objectives
The present experiment consists of Fourier Transform Infrared Reflection-Absorption
Spectroscopy (FTIR RAS) measurements performed on the films deposited under ultra-high
vacuum conditions at cryogenic temperatures. The chemical objects of these FTIR RAS
measurements comprise of: (i) crystalline Ic/Ih and noncrystalline phases of the pristine ice
vapour-deposited on the copper support; (ii) crystalline Ic/Ih ice films obtained by annealing
the pre-deposited non-crystalline samples; (iii) pristine deposits of acetone, C3H6O,
acetaldehyde, CH3CHO, methanol, CH3OH, and chloroform, CHCl3; (iv) the aforementioned
organic species adsorbed on the crystalline and noncrystalline ice substrates; (v) water-organic
solids prepared by a co-deposition of the vapors of water and an organic component; (vi)
noncrystalline ice films treated by hydrochloric acid, HCl, and subsequently exposed by
acetone or acetaldehyde. The present author decided to limit a discussion to the detail
description of the interaction of acetone and chloroform species with the ice surface. A wide
focus of the present studies does not allow reporting a complete volume of the experimental
and computational results.
Although spectral observations on the ice films under constant external conditions, i.e.
when the temperature of the Cu support and the chamber pressure are maintained at an
approximately constant level for a period of 1-2 hours, have been performed in an attempt to
obtain spectral information from an object at a steady state, the present experiment should be
considered dynamic. In other words, during the spectral observations including the collection
of a single spectral sample (the shortest sample time is ~20 sec) the physico-chemical state of
the object in question is in the process of irreversible change. This latter circumstance resides,
on the one hand, in the dynamical properties of HB network of ice and, on the other hand, in
the large surface-to-volume ratio of the materials studied in the present work. The former is
primarily applied to the noncrystalline ice micro-phases, which exhibit a "strong dynamics" at
a temperature range above ~130 K when the crystallization to Ic occurs (see Chapter 2 for
details). Furthermore, the cubic ice itself is a metastable substance, which converts to the

68
hexagonal structure at a rate, which becomes noticeable on the laboratory scale at temperatures
near 230 K. It is evident therefore that within the entire temperature range accessible by the
present experimental setup, i.e. 125-180 K, the ice substrate remains in metastable state.
However, since the rate of inter-basin hopping is generally small under cryogenic conditions,
at certain temperature intervals a quasi-equilibrium state could take place for a sufficient
period, while at other temperatures a faster dynamic is expected such that there is a little hope
of observing a sample at steady state. The small dimension of the objects, i.e. ultra thin films
and/or nano-crystals, also plays a significant role in promoting dynamical processes because
the characteristic length of the inter-basin hopping (see Chapter 1 and Chapter 2) is nearly
comparable with the characteristic size of the object, and, therefore, the surface effects are very
significant. The latter circumstances are of fundamental importance for studying the
penetration, diffusion, and phase transitions in solid water media.
Among others, one of the most important experimental requirements for this kind of
experiments resides in attaining the high spectral sensitivity and background stability (i.e. high
signal to noise ratio), which are necessary for observing very weak spectral features associated
with the vibrational motion of the surface molecules of water phases or organic moieties. The
extraction of topological and dynamical information from the spectral data necessitates the
utilization of computer models on different physical and chemical levels. Specifically,
handling the reflection-absorption spectra requires modeling of the reflection-absorbance
optical phenomenon, which originates from the out-of-normal radiation of the dielectric
sample on the metal substrate. Ignoring the dielectric effects introduced by the RA method of
the spectral experiment, which often lead to a significant frequency shift and deformation of
the adsorption bands, could cause a misinterpretation of spectral features. Although a general
theory of the RAS exists, in each particular experimental case a special attention is necessary
to differentiate between the optical manifestation of the fundamental vibrations in the films in
question and those optical features, which appear as a result of the RA mode.
Regarding molecular modeling, determination of a possible structure for a particular
adsorbate-ice complex requires building a set of atomistic classical and/or quantum-
mechanical models. From this latter set of models, the most realistic representation can be
chosen by comparing the measured and calculated IR frequencies. Despite their primarily
experimental appeal within the framework of the present studies, the computer models and

69
calculations are described separately in Chapter 4. The experimental results are discussed in
Chapter 5.
3.2 UHV/FTIR RAS Chamber: Design and Construction
The home-designed and constructed UHV chamber for the present experiment is shown
in Figure 3.2.1. The main components of this UHV chamber include: (i) the main chamber for
the spectral experiment atop of the supporting 6-way cross chamber, to which a horizontal
stainless steel appendix supporting the leak valves and gas/liquid sample handling system is
attached; (ii) titanium-sublimation and turbo-molecular pumps mounted on the supporting
chamber and on the horizontal appendix, respectively; (iii) sample holder with the heating
element on the back side mounted on the X-Y-Z manipulator; (iv) liquid-N2 dewar and two
copper brazes to the sample holder for cooling; (v) two differentially-pumped optical windows
(CaF2 or KRS-5) for the IR beam entrance and exit. The Bruker FTIR Equinox-55
Spectrometer with air-cooled globar source is used for the spectral analysis of the films vapor
deposited on the sample holder made of copper disk. From the standpoint of optics, the copper
disk acts as a mirror, which reflects the incident IR beam hitting the sample at grazing angle
from the sample holder towards the liquid-N2 cooled MCT (mercury-cadmium-telluride)
detector mounted on the optical table on the opposite side of the vacuum chamber.

70
C
A: main chamber; 19 ports; Ø 17'', h 15''.B: supporting chamber; six-way cross.C: X-Y-Z manipulator.D: titanium sublimation pump.E: turbomolecular pump (250 l/s) and gate valve.F: supporting moveable platform.G: multiport accessory flanges.H: variable leak valve.
GA
B
F
HE
D
Figure 3.2.1. Schematic layout of the UHV chamber. Only three of the 19 ports of the central
ultrahigh vacuum chamber (with a base vacuum better than 3×10⁻⁹ Torr) relevant to the present
experiment are shown. Two of the ports that are used to house the CaF2 windows are pumped
differentially. The FTIR spectrometer (Bruker Equinox 55) and the two aluminium boxes that
enclose the light-stirring optics and the MCT detector are purged with the dry N2 gas
continuously to minimize ambient contaminations.

71
The FTIR-RAS experiments were conducted in a home-built UHV chamber evacuated
by a 250 l/sec turbo-molecular pump to a base pressure of better than 5×10⁻⁹ Torr. Ice was
condensed from water vapor onto an optically flat polycrystalline Cu disk (2.25-inch diameter)
mounted on a four-motion manipulator. Figure 3.2.2 shows schematically the glancing-
incidence optical arrangement of the experiment, which allows signal optimization at zero path
difference by easy adjustment of the position of the target with respect to the optical path of
the infrared beam. The 1.5-inch diameter infrared beam from a Bruker Equinox 55 FTIR
spectrometer equipped with an air-cooled Globar source was directed onto the Cu disk at ~83º
from the surface normal by a focusing 90º parabolic mirror with a 16-inch focal length. The
specularly reflected light was collected by a second identical 90º parabolic mirror of a 16-inch
focal length positioned on the opposite side of chamber, and finally focused by a 1.7-inch
focal-length parabolic mirror onto a liquid-nitrogen-cooled Mercury-Cadmium-Telluride
(MCT) detector (energy range: 7000-600 cm-1; sensitivity >2.5×1010 cm Hz1/2/W). Two CaF2
optical windows mounted on differentially pumped 8-inch conflat flanges were used to provide
passage of the infrared beam onto the sample inside the UHV chamber. Enclosed in two
aluminium boxes, the entire optical path outside the UHV compartment is purged with dry N2
gas in order to remove water vapors, which otherwise will interfere with the useful signal from
the condensed water phases by introducing absorption peaks of the gas phase water molecules
at frequencies close to that of condensed phase. The stability of the dry N2 gas flux into the
external enclosure and the spectrometer contributes very significantly to the opportunity of
obtaining the IR spectra free from water vapor interferences, which in the present case must be
eliminated.
Two copper braids directly welded to a liquid-nitrogen-cooled stainless steel/copper
container inside the UHV chamber facilitate the cooling of the Cu disk. During cooling, the
liquid-nitrogen reservoir functions as a cryo-pump by reducing the pressure in the vacuum
chamber to 3×10⁻⁹ Torr. A deposited film can be annealed at temperatures above the lowest
achievable in the present setup value of ~125 K, by resistive heating of the backside of the Cu
disk while the annealing regime was monitored manually by the reading of the temperature
controller. The substrate temperature was measured by two K-type thermocouples
mechanically fastened to the front face of the Cu disk. The precision of relative temperature
measurement is ± 2 K, whereas the uniformity of temperature across the sampling area on the
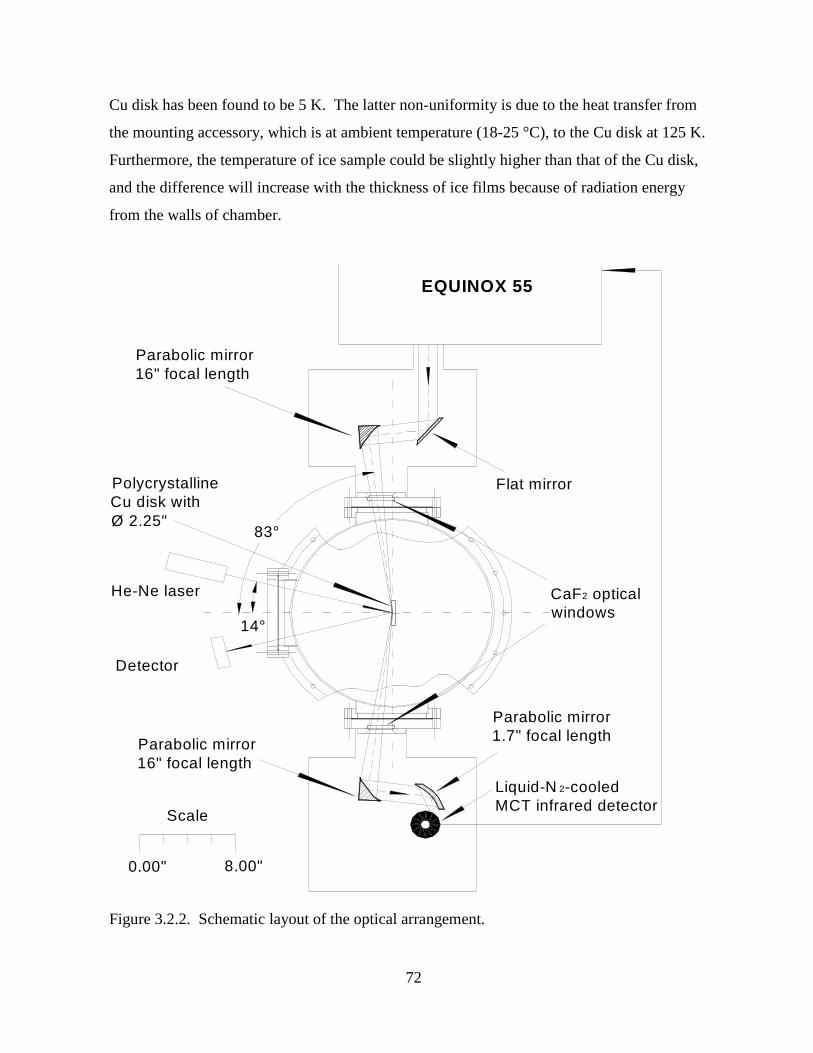
72
Cu disk has been found to be 5 K. The latter non-uniformity is due to the heat transfer from
the mounting accessory, which is at ambient temperature (18-25 °C), to the Cu disk at 125 K.
Furthermore, the temperature of ice sample could be slightly higher than that of the Cu disk,
and the difference will increase with the thickness of ice films because of radiation energy
from the walls of chamber.
EQUINOX 55
Polycrystalline Cu disk with Ø 2.25"
Liquid-N 2-cooledMCT infrared detector
CaF2 optical windows
83°
He-Ne laser
Detector
Flat mirror
Parabolic mirror 16" focal length
Parabolic mirror16" focal length
14°
Scale
0.00" 8.00"
Parabolic mirror 1.7" focal length
Figure 3.2.2. Schematic layout of the optical arrangement.

73
3.3 Samples and Accessories Preparation and Manipulation
In the present studies, the following chemical reagents have been used:
1) Acetone Liq (Fisher Scientific, 99.6% purity).
2) Acetaldehyde Liq (99.5+% purity) Aldrich.
3) Methanol Liq (Fisher Chemicals, Acetone free)
4) Chloroform Liq (Fisher Chemicals, preservation C2H5OH ~0.75%).
5) Hydrogen Chloride Gas (Technical Grade, Matheson Gas Products Inc.)
6) D2O (99.9 atomic % of Deuterium, Iosotec Inc, Matheson). Due to periodic contacts with
the ambient atmosphere, the D2O sample became discernibly enriched by the HDO species.
7) H2O, Millipore.
All substances have been used without further purification. The outgassing of liquid samples
was performed in the external gas handling system through repeated freeze-pump-thaw cycles
immediately prior dosing.
For ion sputtering and flushing of the external gas handling system, Ar gas (Praxair,
Ultra pure grade) has been used.
The IR spectra of selected liquid and gaseous samples have been measured in the gas
IR Cell ( ICL international crystal Laboratories) with KRS-5 windows and 10 cm optical
length and in the liquid IR cell (ICL international crystal Laboratories) with the KRS-5
windows and 0.015 mm thickness.
The ZnSe polarizer (1200 wires/mm, SpectraTech) with a spectral window in interval
20000-500 cm−1 has been used for the polarization FTIR RAS experiments.
3.4 FTIR RA Spectral Acquisition
Ice film samples with thicknesses up to 1.5 µ have been deposited by backfilling the
entire UHV compartment with water vapour using a precision leak valve (Varian). Liquid
water (Millipore) and organic liquids, which are kept in separate quartz ampoules attached to
the gas handling system outside the UHV compartment, has been purified by multiple
repeating of a freeze-pump-thaw cycle immediately prior to use. Pressure measurements were
obtained by an uncorrected ionization gauge. The thickness of the ice film and the
corresponding deposition rate have been estimated by observing the optical interference
fringes of a He-Ne laser beam reflected off the sample using a phototransistor as the detector.

74
The laser interference patterns are shown below on Figure 3.5.2. It should be noted that the
laser interference method provides information about the film thickness for a relatively small
area (typically 1-2 mm diameter as defined by the illuminating laser spot size) in comparison
with the total surface covered by ice, from which the FTIR-RA spectra are taken. Using a
laser source with an adjustable beam size (1-10 mm diameter), Brown et al. showed that the
thickness of the ice film deposited on Ru (001) was uniform over this area range [1]. In our
experiment, the substrate surface was polycrystalline and relatively rough on a microscopic
scale, which could introduce thickness non-uniformity. Since the sampling area was quite
large (approximately the size of the target or 25 cm2), the resulting spectra of the as-grown ice
film represent the signal averaged over the entire area of the ice film with the possibility of a
non-uniform thickness. With the sample held at 131 K, the initial deposition rate (after a
typical induction period of 1 minute) was estimated to be 0.43 nm/sec at 1×10⁻⁶ Torr ambient
pressure or 2 nm/sec at 5×10⁻⁶ Torr. The deposition rate was found to decrease slightly with
increasing film thickness. It should be noted that the sensitivity of the optical interference
method is limited in the case of very thin films and for films with thickness that satisfies the
conditions of constructive and destructive interference (see Figure 3.5.2). During deposition of
the ice film at a selected temperature, FTIR-RA spectra of the growing film were collected,
unless stated otherwise, over a 20-second period by averaging 10 scans at 10 kHz (or 40 scans
at 40 kHz) at a preset spectral resolution of 1 cm−1, or alternatively 12 scans at 80 kHz at 0.5
cm−1 resolution. Background spectra over 5000-1000 cm−1 were collected immediately before
the water exposure for the bare Cu surface with 1000 scans at the respective resolution
settings. Spectral data are presented in the dimensionless absorbance unit, AU = −log(R/R0),
where R/R0 is the ratio of reflectance of the Cu substrate with and without the ice film.
3.5 Fresnel Method for Simulating the FTIR RA Spectra of Polycrystalline and
Noncrystalline Ice Films
In general, the film thickness affects significantly the shape, frequency position and
spectral intensity of the RA bands, and these dielectric effects have been discussed in detail by
Greenler [2] and Decius and Hexter [3]. McIntyre and Aspens have used the Fresnel equations
for reflection coefficients for parallel- and perpendicular-polarized light to simulate the RA
spectra of an absorbing dielectric film [4]. First derived for a homogeneous dielectric film,

75
these equations have been extended and written in modified form to describe reflection-
absorbance of light in a vacuum-absorbing dielectric film-metal system [5]. A classical
Fresnel model for the reflection coefficients of σ- and π- polarized components of IR light on
the interface of vacuum-ice-metal phases have been applied in the present work for modeling
the RA spectra of growing non-crystalline and polycrystalline ice micro phases. The model
describes the evolution of OH stretch band and interference patterns as functions of the ice
optical indexes and film thickness:
( )
( )( )
( )( )
, 2
21
2
21
2
2
2312
2312123
2312
2312123
21
12
2
⋅⋅=
−⋅⋅+−⋅+
=
−⋅⋅+−⋅+
=
+
−=
+−
=
−==
∧∧
∧∧
∧
∧
λζπβ
ββ
ββ
ζεζε
ζεζε
ζµζµζµζµ
ϕϕζ
ππ
πππ
σσ
σσσ
π
σ
d
iexprr
iexprrr
iexprr
iexprrr
r
r
sinncosn
__
___
__
___
kjjk
kjjkjk_
kjjk
kjjkjk_
jjjj
(3.1)
where φ1 and n1 are the real angle of incidence (83º) and index of refraction of the vacuum
phase (1) on Figure 3.5.1, while nj is the complex refractive index of phase j. Parameters rσ_jk
and rπ_jk are the Fresnel coefficients of the interface between the two phases j and k for
perpendicular and parallel polarized radiation. The symbols, µk , µj and εk , εj stand,
respectively, for the magnetic permeabilities and complex dielectric constants of the two
condensed 2 and 3 phases. Parameters rσ_123 and rπ_123 are the Fresnel coefficients for reflection
in three-phase system vacuum (1)-ice (2)-metal (3). β is the change in phase of the beam
during one traversal of the ice film of thickness d. This algorithm has been implemented in
Math CAD and C/C++ programs written for simulating of RA spectra of noncrystalline and
polycrystalline ices of given thickness.
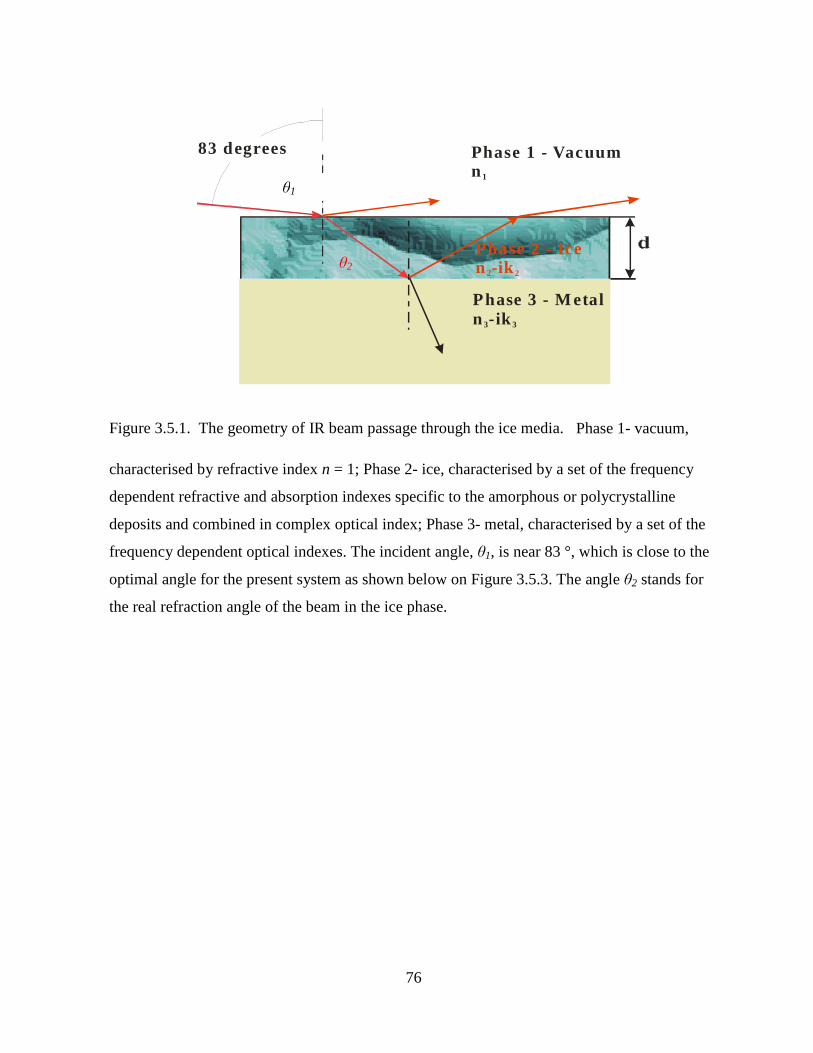
76
Figure 3.5.1. The geometry of IR beam passage through the ice media. Phase 1- vacuum,
characterised by refractive index n = 1; Phase 2- ice, characterised by a set of the frequency
dependent refractive and absorption indexes specific to the amorphous or polycrystalline
deposits and combined in complex optical index; Phase 3- metal, characterised by a set of the
frequency dependent optical indexes. The incident angle, θ1, is near 83 °, which is close to the
optimal angle for the present system as shown below on Figure 3.5.3. The angle θ2 stands for
the real refraction angle of the beam in the ice phase.
83 degrees Phase 1 - Vacuumn 1
Phase 3 - Metaln -ik3 3
Phase 2 - Icen -ik2 2
θ1
θ2

77
As an example, the time evolution of a laser interface pattern from an ice film grown at
131 K and water pressure of 1×10⁻⁶ Torr is shown Figure 3.5.2.
0 500 1000 1500 2000 2500 3000 3500-40
-30
-20
-10
0
10
20
245
490
735
980
1110860
612
368
Ref
eren
ce s
igna
l
Time, sec
122.5
Figure 3.5.2. The He-Ne laser interference patterns for the growing pristine ice film.
The approximated film thicknesses are indicated by arrows.
The thickness of ice film can be approximated at the maxima and minima on the
interference curve in accord with the following equation (note that the He-Ne laser operated on
λ = 632.8 nm, the incident angle, θ1, is 14°):
For the spectral region of 6962-482 cm−1, the values of real n and imaginary k parts of
the complex refractive index of the ice layer (ñice = nice − ikice) used in the present simulation
for pc-ice are those derived by Toon et al. for ice films deposited at 163 K over a wide range
ce.interferen veconstructifor nm 245 Thephase. ice thein beamlaser theof angle refraction for the stands
; 22
2
212
2
=
=⋅⋅−⋅⋅
d
mtansindcos
dn
θ
λθθθ
(3.2)

78
of thickness from 500 nm to 30 µ [6]. For nc-ice, Fresnel simulations are carried out using the
corresponding values of n and k for amorphous ice films deposited at 77 K reported by Leger
et al. [7]. Optical constants of Cu at room temperature compiled by Palik et al. [8] are used to
generate the (n, k) constants of Cu at the same wavenumbers as the set of complex refractive
indexes ñj of the ice reported in the literature. Given the very small value of the magnetic
susceptibility for Cu (−5.5 ×10⁻⁶ cgs) [9], the magnetic permeability of Cu is set to unity in our
calculations. The calculated spectra are plotted as absorbance unit (AU) versus wavenumber
(cm−1), where AU is defined in an expanded form as: AU = log [(R0 σ + R0 π)/(R σ + R π)] with
R0 σ, π and R σ, π as the reflectance of σ- or π-polarized light from the vacuum-Cu system (i.e.
the bare substrate without ice) and vacuum-ice-Cu system (the substrate deposited with ice),
respectively. These calculated spectra are referred to as Fresnel spectra in the present work.
As in the Fresnel notation, the σ- and π-polarizations are defined with respect to the
plane of incidence (which corresponds to the plane perpendicular to the metal surface that
contains the propagation vectors of the incident, reflected and refracted waves). If the electric
field vector of the incidence wave is normal to the plane of incidence (i.e., parallel to the metal
surface), such a polarization is denoted as σ-polarization. On the other hand, when the electric
field vector of the incidence wave is parallel to the plane of incidence (i.e., normal to the metal
surface), π-polarized wave is obtained. To illustrate the importance of the reflection geometry,
we show in Figure 3.5.3 the calculated RA spectra of the OH stretch region for a 1-nm-thick
pc-ice film as a function of the incident angle based on the Fresnel model. Because the normal
incidence spectrum is analogous to the transmittance IR spectrum, Figure 3.5.3 shows in effect
the changes in the spectral features from the transmittance mode to RA mode. In particular,
the normal incidence spectrum shows three discernible features at 3145, 3205 and 3335 cm−1
(Figure 3.5.3, Curve A) to be in good agreement with the experimental transmittance spectrum
reported by Buch and Devlin [10]. While there is essentially no changes in the reflectivity of
the vacuum-ice interface in this spectral region and in the absorption profile of the σ-polarized
component (Figure 3.5.3, Curve A), dramatic changes in the absorption profile of the π-
polarized component are observed (Figure 3.5.3, Curves D and E), which accounts for the
changes in the shape of the overall band from 0° to 15°. The evolution of the absorption
profile is due to excitation of the longitudinal lattice modes by the electric field component of
the incoming radiation perpendicular to the surface as a function of the near-normal incident

79
angle [11]. This excitation occurs at higher frequencies than the transverse excitation and is
clearly absent in the transmittance (or normal incidence) mode [3]. Furthermore, increasing
the incident angle above 15° (towards more glancing-angle incidence) significantly increases
the intensity of the spectrum without affecting the general shape (Figure 3.5.3, Curves F-K)
[2]. Evidently, the shape of the spectrum (determined predominantly by longitudinal
excitations) is not particularly sensitive to the incident angle in the glancing incidence regime,
and the experimental sampling angle (83°) used in the present work provides near optimal
spectral intensity.
In the case of a thin ice film on the metal surface, the Fresnel model shows that
reflection-absorption of the σ-polarized light is negligible for a film thickness up to 200 nm,
which also suggests that vibrational modes with transition dipole moment parallel to the metal
surface would remain undetectable until this critical thickness has been reached. This
conclusion is particularly important for spectral observation of the OH DB's, because any OH
DB oriented parallel to the metal surface is undetectable by RA spectroscopy in the case of thin
films (see Figure 3.5.4 d below). In contrast, the absorbance of π-polarized light by thin films
is strongly enhanced due to significant amplification of the electric field in the vicinity of the
metal surface. In addition, the interference patterns in the transparent spectral region of ice
away from the observed resonances can be described by two-beam interference produced by
reflection from two parallel interfaces [5, 12]. In the case of relatively thick films, the
interference patterns are observed over the entire spectral region of 5000-1000 cm−1, and the
corresponding absorption maxima are seen to travel from higher to lower frequencies with
increasing film thickness. As shown by Robinson et al. [12], there are two sets of interference
patterns, which are associated with destructive interference of σ- and π-polarized components
of the infrared light. The present work shows that the σ-patterns in the 5000-1000 cm−1 optical
window exhibit absorption maxima starting with film thicknesses of 350 nm, while the
corresponding features of the π-patterns appear at thicknesses above 750 nm. Moreover, the
emergence of an interference pattern in the optical region of any vibrational mode of ice causes
considerable amplification in the intensity of the band.

80
3800 3700 3600 3500 3400 3300 3200 3100 3000 2900
0
2
4
6
8
3335
3205
3145
E
D
B
C
A
A. 0o 6o- σσσσ 9o- σσσσB. 6o C. 9o D. 6o- ππππ
E. 9o- ππππ
Abs
orba
nce
( x
10-5)
Wavenumber, cm -1
0
200
400
600
800 3375 3300
3180
H
G
F
Fresnel pc-ice, 1 nm
KJ
I
F. 30o G. 45o H. 60o I. 75o J. 83o K. 86o
Figure 3.5.3. Fresnel spectra of the 1-nm pc-ice film at different incident angles.
The simulations were performed using optical constants obtained for films deposited at 163 K
[6]) for non-polarized light at different incident angles. (A) 0º or normal incidence, (B) 6º, (C)
9º, (F) 30º, (G) 45º, (H) 60º, (I) 75º, (J) 83º and (K) 86º. The σ-polarized components of the
Fresnel spectra for incident angles of 6º and 9º are the same as Curve A, while the
corresponding π-polarized components are shown as Curves D and E respectively.
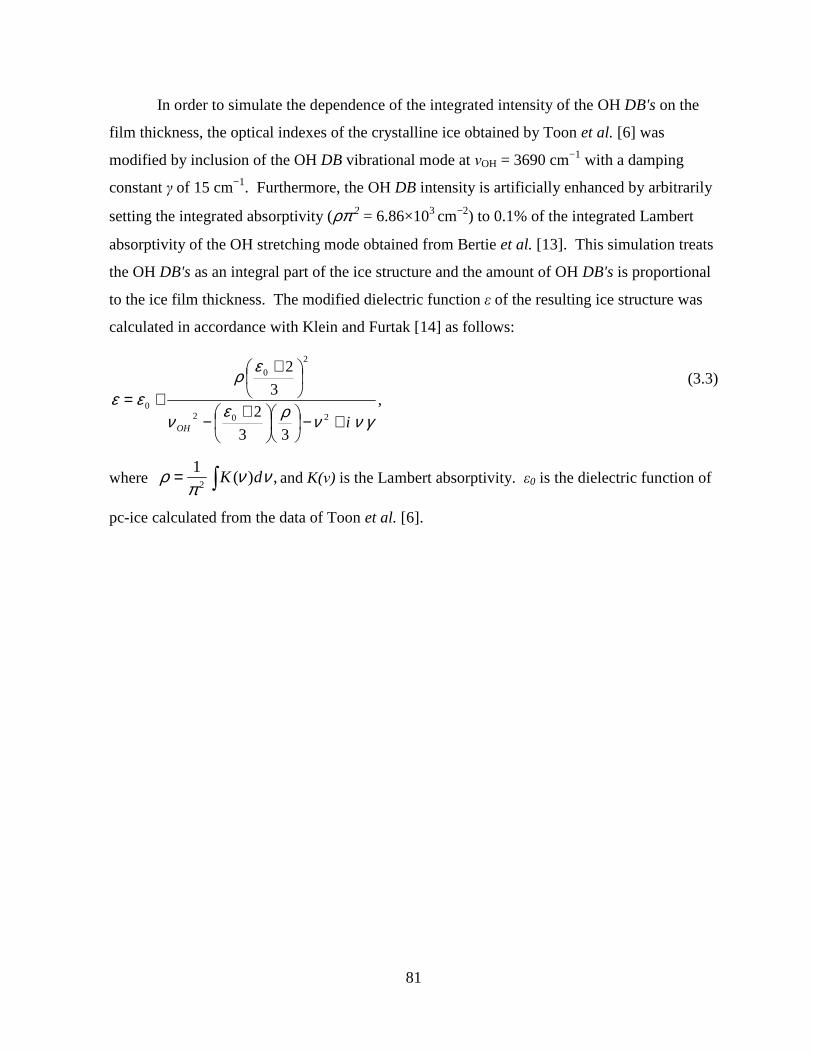
81
In order to simulate the dependence of the integrated intensity of the OH DB's on the
film thickness, the optical indexes of the crystalline ice obtained by Toon et al. [6] was
modified by inclusion of the OH DB vibrational mode at νOH = 3690 cm−1 with a damping
constant γ of 15 cm−1. Furthermore, the OH DB intensity is artificially enhanced by arbitrarily
setting the integrated absorptivity (ρπ 2 = 6.86×103 cm−2) to 0.1% of the integrated Lambert
absorptivity of the OH stretching mode obtained from Bertie et al. [13]. This simulation treats
the OH DB's as an integral part of the ice structure and the amount of OH DB's is proportional
to the ice film thickness. The modified dielectric function ε of the resulting ice structure was
calculated in accordance with Klein and Furtak [14] as follows:
,
33
2
3
2
202
2
0
0
γννρεν
ερεε
iOH +−
+−
+
+= (3.3)
where ,)(1
2 ∫= ννπ
ρ dK and K(ν) is the Lambert absorptivity. ε0 is the dielectric function of
pc-ice calculated from the data of Toon et al. [6].
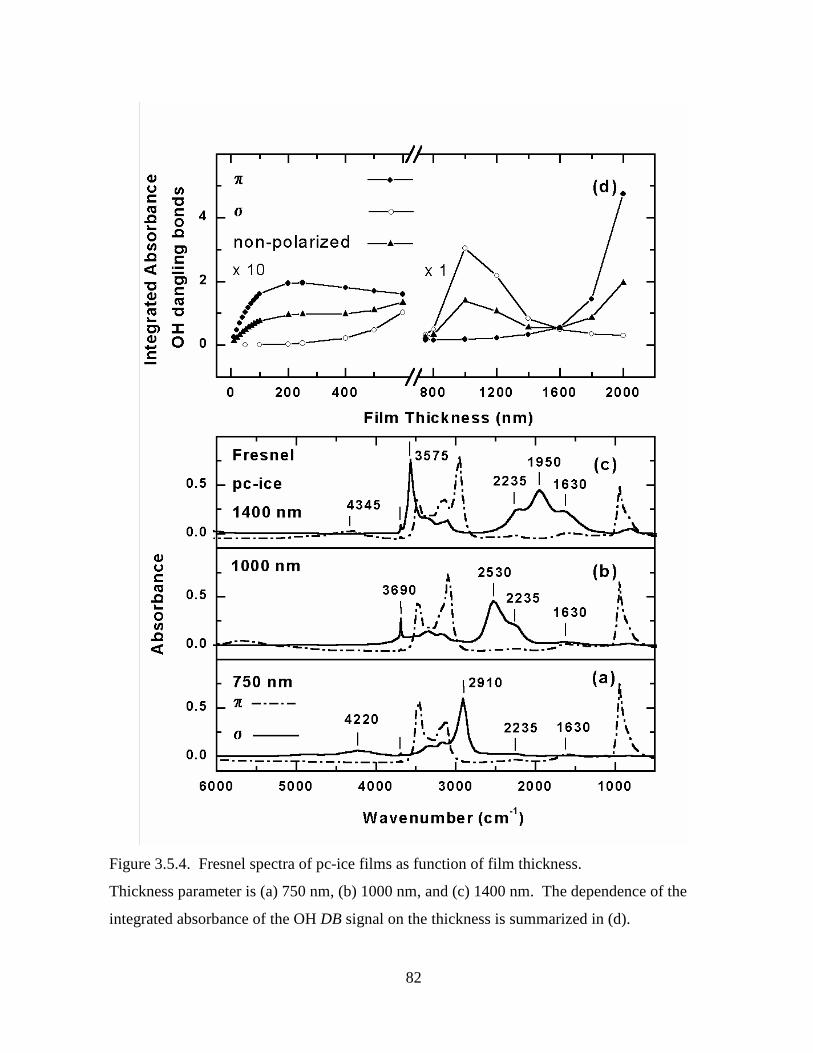
82
Figure 3.5.4. Fresnel spectra of pc-ice films as function of film thickness.
Thickness parameter is (a) 750 nm, (b) 1000 nm, and (c) 1400 nm. The dependence of the
integrated absorbance of the OH DB signal on the thickness is summarized in (d).

83
The calculations show that the destructive σ-polarized interference feature travels from
4220 cm−1 (Figure 3.5.4 a) to 3575 cm−1 (Figure 3.5.4 c) as the thickness is increased from 750
nm to 1400 nm. The passage of this σ-polarized feature over the optical window of the OH DB
band at 3690 cm−1 (Figure 3.5.4 b) causes the amplification in the integrated intensity of the
OH DB signal as summarized in Figure 3.5.4 d. Once the σ-interference feature passes over,
the OH DB signal returns to its normal intensity. Furthermore, the passage of a second
destructive σ-polarized interference feature, which travels from 2910 cm−1 (Figure 3.5.4 a) to
1950 cm−1 (Figure 3.5.4 c) over the same thickness range, causes significant amplification in
the intensities of the combination band (at 2235 cm−1) and bending band (at 1630 cm−1).
Figure 3.5.4 d also shows that the integrated intensities of the OH DB feature for the π-
polarized and non-polarized waves increase linearly with the film thickness up to 100 nm and
level off at greater thickness due to the physics of reflection-absorbance. This spectral
dependence on the film thickness is in agreement with the experimental data of Zondlo et al
[15]. The integrated intensity of the OH DB feature for π-polarization remains nearly constant
in the thickness range 200-1200 nm, in spite of the increase in the amount of the OH DB's
assumed in the model. The marked increase in the integrated intensity for thickness above
1600 nm (Figure 3.5.4 d) is evidently caused by the emergence of a destructive π-polarized
interference pattern, which travels from 4345 cm−1 to a lower frequency (Figure 3.5.4 c).

84
References:
1. D. E. Brown, S. M. George, C. Huang, E. K. L. Wong, K. B. Rider, R. S. Smith, B. D.
Kay, J. Phys. Chem. 100 (1996) 4988.
2. R. G. Greenler, J. Chem. Phys. 44 (1966) 310.
3. J. C. Decius, R. M. Hexter, “Molecular Vibrations in Crystals”, McGraw-Hill, New
York (1977).
4. J. D. E. McIntyre, D. E. Aspens, Surf. Sci. 24 (1971) 417.
5. M. Born, E. Wolf, “Principles of Optics”, 6th edition, (1996) Pergamon, New York.
6. O. B. Toon, M. A. Tolbert, B. G. Koehler, A. M. Middelebrook, J. Geophys. Res. 99
(1994) 631.
7. A. Leger, S. Gauthier, D. Deforneau, D. Rouan, Astron. Astrophys. 117 (1994) 164.
8. E. D. Palik (Ed.) “Handbook of the optical constants of solids”, (1985) Academic,
Toronto.
9. R. C. Weast (Ed.) “Handbook of Chemistry and Physics”, 64th edition, (1983-1984)
CRC Press, Florida, page E-110.
10. V. Buch, J. P. Devlin, J. Chem. Phys. 110 (1999) 3437.
11. L. Schriver-Mazzuoli, A. Schriver, A. Hallou, J. Mol. Spect. 554 (2000) 289.
12. M. S. Robinson, G. Mallick, J. L. Spillman, P. A. Carreon, S. Shalloo, App. Optics 38
(1999) 91.
13. J. E. Bertie, H. J. Labbe, E. Whalley, J. Chem. Phys. 50 (1969) 4501.
14. M. V. Klein, T. E. Furtak, "Optics", J. Wiley & Sons, New York (1986).
15. M. A. Zondlo, T. B. Onasch, M. S. Warshawsky, M. A. Tolbert, G. Mallick, P. Arentz,
M. S. Robinson, J. Phys. Chem. B 101 (1997) 10887.

85
CHAPTER 4
Theoretical Analysis and Computer Simulations of the Interaction of Small Polar
Molecules with Water Media
4.1 Quantum Mechanical Analysis of the Hydrogen Bonding in Water Media
A key concept for understanding the structure of water medium and their interaction
mechanisms with guest molecules of different chemical classes resides in hydrogen bonding
(HB). It is generally established [1, 2, 3, 4, 5, 6 ] that there is a specific attraction between a
molecular system containing electropositive hydrogen atoms, which are usually covalently
bonded to a strongly electronegative neighbouring atom, and an electronegative molecular
counterpart, which comprises of electronegative atoms (such as oxygen, nitrogen, halogens
etc.) carrying lone electron pairs. In other words, a particular stable molecular configuration is
classified among hydrogen-bonded systems if the hydrogen atom is directly involved in the
bonding between two subsystems. A geometric manifestation of hydrogen bond in such a
stable configuration resides in the localization of a hydrogen atom in the proximity of a line
connecting the two atomic centres. Two hydrogen-bonded molecular counterparts are
designated as a donor and an acceptor of the HB. The former is a molecular subsystem, which
bears the electropositive hydrogen atom directly involved in the bonding, whereas the
electronegative acceptor provides an electron density coordinated against that hydrogen atom.
As any other chemical bond, HB can be characterized by its directionality and saturability, i.e.
one electropositive hydrogen atom could form a single hydrogen bond or, in other words, the
linear configuration is a global minimum, whereas a HB structure with a bifurcated hydrogen
atom, which coordinates with two acceptors, corresponds to a transition state or to a less stable
local minimum. In the context of weak hydrogen bonds these characteristics are especially
important for distinguishing between the HB and such intermolecular forces as pure
electrostatics between charged or dipole-carrying counterparts on the one side and the
dispersion interaction, which exhibits different distance and orientational dependence and is
non-saturable, on the other side. It should be noted that the unique properties of hydrogen
atoms are evident and play a fundamental role in the formation of a hydrogen bond. At first

86
glance, the absence of a core electron shell is the most distinct relevant feature of the hydrogen
atom, which makes it smaller than all other elements. With reduced electron density readily
achievable by covalent bonding with a more electronegative counterpart, the hydrogen atom
becomes mobile and can penetrate an adjacent basin of electron density supplied by the HB
acceptor. Therefore, a capability of penetrating the electron density of HB acceptor should be
highest in the case of hydrogen atom, which is free from the inner shell electrons. Being the
dominant contribution to the total electron energy in the overlap region for van der Waals
complexes by increasing the kinetic energy of electrons, the repulsive part of the electron
exchange is expected to be less pronounced in the case of hydrogen. This view is supported by
the observation that the more electropositive the hydrogen atom is the stronger is the hydrogen
bond. In other words, the classical electrostatic interaction between electrical multipoles,
which brings two HB counterparts together, leads to hydrogen bonding, because there is no
significant repulsion originated from the Pauli exclusion for the electron densities on the HB
acceptor and hydrogen atom.
The present section attempts to show that quantum mechanical calculations of isolated
water clusters at different levels of theory are useful (even necessary) for interpreting
experimental spectral and structural data on the aqueous and pristine water systems. In
particular, spectrum-structure correlation could be adviced on the basis of a computational
analysis restricted to relatively small, finite ensembles of water molecules. In some cases,
such a spectrum-structure correlation scheme can be examined by comparing the
computational and experimental results. By comparing computational and experimental data
on isolated water clusters and protonated water system, the present author illustrate different
aspects of hydrogen bonding in water media such as bifurcated hydrogen bond, strong and
weak hydrogen bonds and their spectral manifestations. From technical perspective, this
section provides detailed information on the structure and properties of 26-mer water cluster,
the largest pristine water cluster considered in the present studies. It appears that even this
system of very small size could provide interesting and clear insight in the structural and
vibrational properties of such complex systems as acidic aqueous solutions. As this section
will show, there are reasonable grounds for suggesting that the information obtained by the
computational analysis of small water clusters is also useful for understanding real water

87
media with enormous number of water molecules, which are often computationally
inaccessible. The key problem of this Chapter is hydrogen bonding in the network of water
molecules.
In a majority of cases, the electropositive hydrogen atom participates only in a single
hydrogen bond, and the preferential location of the hydrogen atom appears to be in the
proximity of a line connecting two functions, HB acceptor and HB donor. This specific spatial
localization of the hydrogen atom can be viewed as a geometric criterion for the presence of
the hydrogen bond. However, in organic crystals, such as glycine [7] and crystalline hydrates,
[8] hydrogen atoms were found in a bifurcated position, i.e. a hydrogen atom is locked at
approximately equal distances from two neighbouring electronegative atoms. For water
media, Giguere [9] has adopted this notation of a bifurcated hydrogen atom, which originates
from crystallographic studies, and further suggested that the bifurcated HB's (bHB) play a
discernible role in the hydrogen bonding network in liquid water and fill a gap between linear
hydrogen bonds and free non-hydrogen bonded species. Giguere proposed the following
geometry for the bifurcated hydrogen bond in the tetrahedral HB network:
Figure 4.1.1. The configuration of bifurcated hydrogen bond in the tetrahedral water network.
Reproduced from Giguere [9].

88
It is not immediately obvious from Giguere's original work [9] whether this structure
represents a local minimum or a transition state between two neighboring minima with
classical linear hydrogen bonds. Based on this work, Geiger and Mausbach [10], in particular,
treat the arrangement in Figure 4.1.1 as a "transient structure", which, however, is
"characteristic for the liquid water and responsible for the structural and dynamical distinction
from amorphous solids". It is of interest to note that in the course of the present work on ab
initio and semiempirical quantum mechanical and classical calculations, the bHB's have been
found in fully optimized water clusters comprising of 26 molecules. The configuration of the
bHB appears to be quite different from that given by Giguere and corresponds to a
coordination number of 5 for a central molecule as shown in Figure 4.1.2. The bHB
configuration is characterized by a central molecule bonded to three neighbours with linear
HB's whereas the fourth neighbour, expected in the ideal tetrahedral configuration (Figure
4.1.1), is replaced by a pair of molecules to which a central molecule donates the hydrogen
atom, leading to the formation of an additional bifurcated HB characterized by larger Hd···OAc
distances. The difference in the bond lengths is evident and is in accord with Giguere's
prediction, while the configuration of bHB observed in the present studies is different from that
in Figure 4.1.1.

89
Figure 4.1.2. Structure of 26-mer water cluster optimized at the HF/6-31g(d,p) level.
Bifurcated HB's are an integral part of the local minimum at this level of theory. The arrow
indicates the direction of bifurcated hydrogen bond.
2.236 Å
2.384 Å
1.907 Å
1.970 Å
1.931 Å

90
Figure 4.1.3. Molecular neighborhood of the water molecule that acts as a triple acceptor in
the 26-mer cluster optimized at HF/6-31g(d,p) level.
In the example in Figure 4.1.2, the central molecule is located on the edge of cluster
and is potentially accessible for additional acceptor coordination from the top, which could
lead to even higher coordination numbers. A word of caution should be said about the
bifurcated hydrogen bond, because it is not obvious whether the specific features of the
hydrogen bond per se present in this (or similar) local arrangement(s) and indeed whether the
2.155 Å 2.062 Å
1.814 Å
2.212 Å
A
B

91
bifurcation is a leading factor in this arrangement or it is a result of other stronger
intermolecular interactions among neighbours (B3LYP for instance shows no bifurcated HB's).
In this particular case, the delocalization energy of the electron density transfer from the lone
pair orbitals of two OAc to the antibonding σ*(O−H) of bHB donor are 2.9 kcal·mole−1 and 4.9
kcal·mole−1 (as calculated by the NBO program [11]), whereas the average value of
delocalization energy for all 43 HB's found in this cluster is 12.5 kcal·mole−1 with the
maximum value at 24.8 kcal·mole−1. This noticeable difference between the average
delocalization energy for the cluster and the delocalization energies for the bHB indicates that
the covalence of bHB is on the low side of the covalence of hydrogen bonds in water medium
and, therefore, dipolar (purely electrostatic) forces could play a leading role in the formation of
bifurcated hydrogen bonds. The same cluster also shows a local arrangement where a central
water molecule A in Figure 4.1.3 serves as an acceptor of three and as a donor of a single HB
with unused additional donor capacity.
The extra molecule B in an interstitial position is coordinated with the acceptor A by a
linear hydrogen bond, bringing a total number of acceptor HB's of molecule A to three. Such
an acceptor configuration is apparently impossible in a proper tetrahedral network, but is found
in this distorted network indicating that the acceptor capacity of the water molecule in not
necessarily two. This unique structural feature is expected to contribute to the physical
properties of this cluster in an unusual way (in comparison with a regular tetrahedral network).
The IR spectrum is among the observable physical properties of the water media, in which the
presence of structural features different from typical tetrahedral arrangements should be
evident. This matter will be considered in some details following a discussion on the
distribution functions. The HB network in this cluster therefore exhibits significant local
deviations from a tetrahedral pattern. There are all possible kinds of close small rings in the
cluster: three-, four-, five- and six-member cycles are evident. The starting configuration of
this cluster contains two interconnected layers of three adjoined, nearly ideal hexagons.
During the optimization the edges of the cluster collapse into a sequence of the book
configurations of hexagonal rings as a result of the 1−4 intermolecular attraction. It should be
noted that bHB's and triple acceptor structural features were found in HF and TIP4P clusters
whereas B3LYP cluster shows no sign of bifurcated HB.

92
The O-O, O-H and H-H pairwise radial distribution functions for this cluster are in
surprisingly good correspondence with those of liquid water and low- and high-density
noncrystalline solids reported by Finney et al. [12] and reproduced below in Figure 4.1.4 and
Figure 4.1.5.
Figure 4.1.4. Radial distribution functions for the low-density and high-density amorphous
solids at 80 K. Reproduced from Finney et al. [12].

93
(a)
0.0 0.5 1.0 1.5 2.0 2.5 3.0 3.5 4.0 4.5 5.0 5.5 6.0 6.5 7.0 7.5 8.0
0.00
0.50
1.00
1.50
2.00
2.50
gr(O
O)
distance, Å
(b)
0.0 0.5 1.0 1.5 2.0 2.5 3.0 3.5 4.0 4.5 5.0 5.5 6.0 6.5 7.0 7.5 8.0
0.00
0.25
0.50
0.75
1.00
1.25
1.50
1.75
gr(O
H)
distance, Å

94
(c)
0.0 0.5 1.0 1.5 2.0 2.5 3.0 3.5 4.0 4.5 5.0 5.5 6.0 6.5 7.0 7.5 8.0
0.00
0.25
0.50
0.75
1.00
1.25
1.50
1.75
2.00
2.25
2.50
gr(H
H)
distance, Å
Figure 4.1.5. Distribution functions of the 26-mer cluster at the HF/6-31g(d,p) level.
(a) O···O; (b) O···H and (c) H···H pairwise distribution functions. The solid lines represent the
FFT (Fourier transform) smoothing of the data points performed by the OriginPro program
[13].
The main features of the O···O radial distribution function include the position and
intensity of the first peak, which represent the nearest neighbours of a water molecule, and
those of subsequent peaks, which correspond to the second and the third coordination spheres.
For the O···O data, Finney et al. [12] have shown that the integration between 2.3 and 3.3 Å
(i.e. the first coordination shell) gives 3.9 ±0.1 nearest neighbours for the low-density amorph,
which nearly coincides with that of crystalline ice at 220 K. The liquid water value of 4.3
±0.12 nearest neighbors is discernibly larger than 4 whereas there are 5 nearest neighbours in
the high-density amorph, suggesting the presence of an additional water molecule in the first
coordination shell. A comparative analysis of the small water clusters in Section 4.3.3

95
indicates that compact water clusters exhibits the spatial characteristics that are in accord with
Finney et al. [12] data for the HDA media, whereas open monocyclic water structures are more
appropriate for the LDA media. The O···H distribution function (Figure 4.1.4 for the Finney's
experiment [12] and Figure 4.1.5 (b) HF results) shows two distinct maxima at ~ 1.8 Å (2 Å in
the HF cluster) and 3.25 Å, which correspond to (O−H*)d···O*Ac 1
O:2H (the figures enumerates
the sequence of atoms along a chain of hydrogen bonds whereas the superscripts label
elements) hydrogen-bonded and (H*−O−H)d···O*Ac 1
O:4H configurations, respectively. The
O···H density at larger separations originates from remote H···O pairs such as
(H*−O−H*)···(H−O−H)···O*Ac 1
O:5H and 1O:7H. Finally, the H···H distribution function (Figure
4.1.4 for the Finney's experiment [12] and Figure 4.1.5 (b) for the HF results) exhibits a
distinct first peak at ~2.4 Å (2.5 Å in the HF cluster) for the (H−O−H*)d···(O−H*) Ac 1
H:3H
configurations, whereas the second diffuse peak most likely describes the
(H*−O−H)d···(O−H1,2*)
Ac 1H:5H configurations (Figure 4.1.4 and Figure 4.1.5). In spite of all
the obvious differences in the techniques and objects used by Finney et al.[12] and by the
present author, the good accord between the experimental [12] and calculated ab initio
distribution functions indicates the applicability of direct quantum mechanical simulations of
small water clusters for the interpretation and, perhaps, prediction of the properties of real
systems. In particular, the observation of bHB's in this HF cluster (and also in the TIP4P
cluster) shows that bifurcated bonds are an integral part of the network corresponding to a
given local minimum. The present quantum mechanical analysis provides evidences that the
covalence character of bifurcated hydrogen bonds is much less pronounced than in the average
hydrogen bond in water media, which suggests the electrostatic (dipolar) origin of the
bifurcated configuration.
If a set of minima are obtained in the course of computer simulations, then the
comparison of their properties and structural characteristics could lead to practically relevant,
property-structure correlations. The sizes of the water clusters for such simulations should not
necessarily be very large because the main features of water media are rooted to a larger
degree in the properties of a single water molecule, water dimer and in details of the tri-body
interaction. The aperiodicity of present clusters and the large surface-to-volume ratio could be
considered as inadequate for the description of continuous water media because in the finite

96
clusters a significant number of water molecules are in the asymmetric force field. With
respect to this concern, it should be pointed out that noncrystalline water media exhibits a high
degree of heterogeneity and the correlation volume could be small. Therefore, it is plausible
that in real noncrystalline water media a large number of molecules exist in a spatially
heterogeneous force field and a signature of this could be found in the vibrational IR spectra.
The comparison between the 26-mer cluster optimized at the HF level and with the TIP4P
classical Lennard-Jones and electrostatic potential clearly shows differences, which are to be
expected from a general viewpoint on hydrogen bonding in the water media. In particular,
both the HB cooperativity of the water network and the electron correlation lead to additional
molecular polarization, which in turn should result in the compression of the medium. Indeed,
optimized for an infinite water media and therefore effectively augmented with the multi-body
and electron correlation effects, the TIP4P potential leads to more compressed finite structures
than that obtained with HF that does not treat the electron correlation beyond the Pauly
exclusion. The B3LYP results are comparable with the TIP4P as demonstrated in Figure 4.1.6
for the same 26-mer cluster that tentatively indicates the adequacy of the B3LYP functional in
handling the electron correlation in the water media. Firstly, a surprisingly good agreement
between the TIP4P and B3LYP distribution functions shows that despite fundamentally
different force fields two clusters exhibit nearly identical spatial characteristics. Secondly, the
mismatch between HF and B3LYP results is most likely due to differences in the treatment of
exchange-correlation interactions in the system. The B3LYP functional overestimates the
lengths of covalent bonds and correspondingly underestimates the lengths of hydrogen bonds
(i.e. it overestimates the energies of HB's). Such a computational property of B3LYP leads to
interesting spectral features, analysis of which is closely associated with the polarization and
spectral properties of short hydrogen bonds. These bonds in turn play a fundamental role in
the pressure-induced dynamics of the ice VIII→ice VII→ice X conversion and possibly in the
surface properties of water media. In contrast, HF underestimates the lengths of covalent
bonds and correspondingly overestimates the lengths of hydrogen bonds.

97
0.0 0.5 1.0 1.5 2.0 2.5 3.0 3.5 4.0 4.5 5.0 5.5 6.0 6.5 7.0 7.5 8.0
0.00
0.25
0.50
0.75
1.00
1.25
2.00
3.00
4.8
4.6
4.2
3.9
2.9
TIP4P HF/6-31g(d,p) TIP4P smoothing HF smoothing
gr(O
O)
distance, Å
2.8
0.0 0.5 1.0 1.5 2.0 2.5 3.0 3.5 4.0 4.5 5.0 5.5 6.0 6.5 7.0 7.5 8.0
0.00
0.25
0.50
0.75
1.00
1.25
2.00
3.00 TIP4P B3LYP/6-31g(d,p) TIP4P smoothing B3LYP smoothing
gr(O
O)
distance, Å

98
0.0 0.5 1.0 1.5 2.0 2.5 3.0 3.5 4.0 4.5 5.0 5.5 6.0 6.5 7.0 7.5 8.0
0.00
0.25
0.50
0.75
1.00
1.25
1.50
1.75
2.00
2.25
2.50
2.75
3.37
3.212.01
TIP4P HF/6-31g(d,p) TIP4P smoothing HF smoothing
gr(O
H)
distance, Å
1.86
0.0 0.5 1.0 1.5 2.0 2.5 3.0 3.5 4.0 4.5 5.0 5.5 6.0 6.5 7.0 7.5 8.0
0.00
0.25
0.50
0.75
1.00
1.25
1.50
1.75
2.00
2.25
2.50
2.75
TIP4P B3LYP/6-31g(d,p) TIP4P smoothing B3LYP smoothing
gr(O
H)
distance, Å

99
0.0 0.5 1.0 1.5 2.0 2.5 3.0 3.5 4.0 4.5 5.0 5.5 6.0 6.5 7.0 7.5 8.0
0.00
0.25
0.50
0.75
1.00
1.25
1.50
1.75
2.00
2.25
2.50
4.0
2.3
TIP4P HF/6-31g(d,p) TIP4P smoothing HF smoothing
gr(H
H)
distance, Å
2.5
0.0 0.5 1.0 1.5 2.0 2.5 3.0 3.5 4.0 4.5 5.0 5.5 6.0 6.5 7.0 7.5 8.0
0.00
0.25
0.50
0.75
1.00
1.25
1.50
1.75
2.00
2.25
2.50
4.0
TIP4P B3LYP/6-31g(d,p) TIP4P smoothing B3LYP smoothing
gr(H
H)
distance, Å

100
Figure 4.1.6. Distribution functions of the 26-mer cluster at HF, B3LYP and TIP4P levels.
The quantum-mechanical calculations have been done with the 6-31g(d,p) basis set. The lines
represent the FFT smoothing of the computed points.
The quantum mechanical treatment of the 26-mer cluster reveals the configurations
including a bifurcated hydrogen bond and those with a triple HB acceptor, which suggests that
these hydrogen bonds are a part of the structure at the given local minimum. Furthermore,
simulated IR spectra exhibit unusual features associated with the vibrational stretch mode of
the water molecule acting as an acceptor of three HB's and as a single donor. The combined
induction effect of three acceptors causes an additional polarization of the OH bond
coordinated against the oxygen atom of the fourth neighbour, which consequently becomes
more ionic than those in more regular tetrahedral configurations. At the same time, the
hydrogen bond itself becomes more covalent. Consequently, it could be expected that the
corresponding stretching mode exhibits a red-shift and a strong intensity gain. Indeed, such an
unusually red-shifted and very strong stretching mode at 2649 cm−1 associated with the
stretching vibration of the triple HB acceptor can be clearly seen on the B3LYP spectra
displayed in Figure 4.1.7(a). The main OH stretching mode is located above 3000 cm−1 while
the non-coordinated OHfree groups exhibit a separate peak at 3870 cm−1, which is close to the
ν3 mode of isolated water molecule found at 3913 cm−1. Moreover, there is a separate OH
stretch band at 3797 cm−1, which is associated with the long HB's in the cluster. The
experimental spectral studies by Devlin and coworkers and computational studies by Buch and
coworkers reveal the presence of such bands in the IR spectra of ice nanoparticles, which are
associated with the disrupted HB's [14, 15 and references therein]. Therefore, there is an
apparent connection between the structure of cluster and its IR spectra, calculated in the
present static model (in the sense that the system Hamiltonian is uncoupled from the bath)
within a harmonic approximation. The HF IR spectrum of this cluster shown in Figure 4.1.7(b)
demonstrates a noticeable distinction from that at B3LYP, which reveals no distinct IR features
for the triple acceptor mode and for the free OH groups. Such a spectral difference is
associated with the stronger structural compression and higher bond polarization observed with
B3LYP in comparison with the HF calculations (see Figure 4.1.6). The more the structure is

101
compressed, the more the OH bond becomes ionic (at the expense of its covalence) while the
HB's gain the covalence. The spectral consequence of these structural changes is a red shift
and strengthening of the stretching modes. The frequencies of the OHfree stretch band for the
HF cluster are found near 4223 cm−1 whereas the frequency of ν3 mode for an isolated H2O is
4265 cm−1, i.e. both frequencies are very close, which suggests similar bonding properties of
the OH groups in isolated water molecules and on the surface of water media. In real water
spectra, the ν3 vibration is located at 3756 cm−1 [16] , whereas the same vibration for dangling
bonds on ice films is located at 3698 cm−1 (present studies) , i.e. there is only a minor medium-
induced shift for this mode, which therefore appears to be isolated and decoupled from the
vibrational pool in the water media. Overall, the simulated IR spectra reproduce the main
spectral features observed for condensed water: a broad and intense stretching band at higher
frequencies, a weaker bending band at the intermediate frequency range and the libration and
translational modes at the low frequency range (Figure 4.1.7).

102
(a) B3LYP/6-31g(d,p), 26-mer H 2O cluster
4000 3500 3000 2500 2000 1500 1000 500 0
0
500
1000
1500
2000
2500
B3LYP
H2O out-of-plane
H2O
in-p
lane
free
OH
H2O libration
OH
···O
wea
k
H2O bend
OH
free
, 387
0
IR in
tens
ity, k
m·m
ole
-1
Wavenumber,cm -1
triple HB acceptor(HOH)
triple···O
2649
OH stretch
(OH)HB
out-of-plane
(b) HF/6-31g(d,p), 26-mer H 2O cluster
4400 4200 4000 3800 2000 1500 1000 500 0
0
500
1000
1500
2000
2500
HF
H2O librationO
H··
·O w
eak
H2O bend
OH
free
, 422
4
IR in
tens
ity, k
m·m
ole
-1
Wavenumber,cm -1
triple HB acceptor(HOH)
triple···O
3852
OH stretch

103
Figure 4.1.7. Calculated IR spectra for the 26-mer cluster at (a) B3LYP and (b) HF levels.
The calculations were performed with the 6-31g(d,p) basis set. The frequency lines are given
with the Lorentzian profile generated by the Gaussian View program. The spectral feature at
2649 cm−1 in (a) corresponds to O−H···O unit with O···O and O−H distances at 2.565 Å and
1.031 Å, respectively.
The OHfree (non-hydrogen-bonded OH group in water molecule) spectral features at
frequencies around 3690 cm−1 (3870 cm−1 and 4224 cm−1 in Figure 4.1.7 (a) and (b)
respectively) are observed in spectra of any condensed water madia as a relatively sharp band
on the high-frequency side of the main stretching band. In contrast, distinct peaks that are
associated with the highly HB-coordinated water molecules with short hydrogen bonds (like a
2649 cm−1-peak of the triple HB acceptor in Figure 4.1.7 (a)) are rarely observed. A unique
example is given in the experimental studies of Buck and Huisken [17] using the infrared laser
depletion spectroscopy of size-selected water clusters and explored in a theoretical work by
Sadlej et al. [18]. The IR depletion spectra of selected water clusters are reproduced in Figure
4.1.8 and show that the heptamer spectrum includes two distinct lines at ~2950 cm−1, which
are attributed by Sadlej et al. to the stretching modes of two donor-acceptor-acceptor (daa ≡
da2) hydrogen bonded water molecules with short hydrogen bonds in two the most stable
isomers. It should be stressed that the appearance of short HB's is a direct result of cooperative
enhancement of the intermolecular HB interaction in a chain of hydrogen bonded molecules.
(The question of cooperativity of the hydrogen bonds is discussed in the section 4.2.2.) It is
instructive to compare the histograms of nearest neighbour O···O distances between pairs of
hydrogen bonded molecules obtained by Sadlej et al. [18] for 6-9 molecule water clusters at
the MP2/DZP1 level (reproduced in Figure 4.1.9) with those obtained in the present work for
the hexamer prizm at B3LYP/LBS and SBS, and 26-mer structures described above at the HF/6-
31g(d,p), B3LYP/6-31g(d,p) and TIP4P levels.

104
Figure 4.1.8. The experimental IR depletion spectra of size-selected water clusters with 7, 8,
9, 10 molecules and mixture of 10-20-mer clusters. Reproduced from Buck and Huisken [17].
The upper curve represents the spectrum of cluster distribution with sizes from 10 to 20
molecules. Those on the two top rows correspond to the prism isomer used by Sadlej et al.
[18].

105
Figure 4.1.9. The histogram of nearest neighbor O···O distances between pairs of hydrogen
bonded molecules in the 6-10-mer clusters at MP2 level. Reproduced from Sadlej et al. [18].
The number of water molecules in the clusters is labelled by n, whereas particular
configurations of clusters are labelled by subscripts to capital letters Hx, H, O, D, N standing
for hexamer, heptamer, octamer, decamer and nonamer, respectively. The structures of these
clusters are shown in Fig. 1, 2, and 3 in the Sadlej et al. report [18].

106
1
2
3
4
5
6
2.5 2.6 2.7 2.8 2.9 3.0 3.10
1
2
3
4
5
6
0
1
2
0
1
2
2.6 2.7 2.8 2.9 3.0 3.10
1
2
1
2
3
4
5
B3LYP/6-31g(d,p) W26
O-O Hydrogen Bond distance, Å
HF/6-31g(d,p)
TIP4P
B3LYP/LBS W6 prizm
d2a1-da2
1-da2
1-da2
2-da2
2-d2a
2
B3L
YP
/6-3
1g(d
,p)
da2
1-d2a
1-d2a
1-d2a
2-da2
2-da2
2
d2a1-da2
1-da2
1-da2
2-da2
2-d2a
2
B3L
YP
/6-3
1g(d
,p)
Num
eric
al m
olec
ular
den
sity
Figure 4.1.10. The histogram of nearest neighbour O···O distances between pairs of hydrogen
bonded molecules in the 26-mer and 6-mer water clusters at HF, B3LYP and TIP4P levels.

107
The left column includes the histograms for a 26-mer cluster (W26) at different levels of theory,
whereas the right column includes the histograms for two different W6 prism isomers
calculated at B3LYP level with 6311++g(3df, 3pd) and 631g(d,p) basis sets. For the prizm
structures, the following notations are used for labelling the hydrogen bond configurations of
each water molecule: d and a stands for a donor and for an acceptor of hydrogen bond; the
superscript indicates the number of donor or acceptor valences used by a molecule in question;
the subscript enumerates either of the two tri-molecule ring in the prizm structure.
Sadlej et al. [18] clearly demonstrates that the O−H stretch peaks below 3000 cm−1 in
the heptamer correspond to short hydrogen bonds with O*−H···O* (superscript stars indicate
the atoms in question) distances slightly below 2.6 Å. This is in qualitative agreement with the
present calculations on a 26-mer cluster. Sadlej's calculations show also that there are short
HB's in nonamer and decamer, but for these two clusters the range below 3000 cm−1 has been
inaccessible to the experiment and, therefore, the computational results cannot be compared
with the experiment below 3000 cm−1. However, the experimental depletion spectrum for a set
of clusters with the size range from 10 to 20 on upper panel of Figure 4.1.8 shows no distinct
bands below 3000 cm−1, while the presence of short HB's in this set of water clusters could be
expected on rather general basis. In this sense, the low frequency band experimentally
observed at 2950 cm−1 for the heptamer is a unique experimental indication of the presence of
short HB's in isolated water clusters. The present author is not aware of any other
experimental data which shows the distinct spectral features corresponding to the short
hydrogen bonds in isolated water clusters or in continuous water media. Meanwhile, a few
preliminary observations can be made on the basis of Figure 4.1.9 and Figure 4.1.10 regarding
the distribution of the O···O hydrogen bonded pairs in different clusters and the effects of basis
set quality and computational methods on these distributions. The HF calculations with a
small 6-31g(d,p) basis set apparently overestimate the intermolecular distances in comparison
with the B3LYP results, which is in accord with the OO pair distribution functions shown in
Figure 4.1.6. The TIP4P cluster exhibits the narrowest distribution in comparison with both
HF and B3LYP. For a prism isomer, the small basis set 6-31g(d,p) (referred as SBS, an
abbreviation of small basis set) leads to shorter intermolecular distances in comparison with

108
much more flexible large basis set 6-311++g(3df, 3pd) (referred as LBS, an abbreviation of
large basis set) basis set at B3LYP level, which is in accord with significant overestimation of
the HB pairwise energy with SBS. A comparison of the intermolecular distance distribution for
the same prism isomer calculated at MP2/DZ1P ((9s5p1d)/[3s2p1d] for O, (4s1p)/[2s1p] for H
and the single set of p polarization functions for H and O) by Sadlej et al. [18] and in the
present studies at the B3LYP/LBS level shows that the cluster is significantly more contracted
in the former case. This contraction apparently results in the appearance of short HB's with
stretching modes below 3000 cm−1, whereas a utilization of more flexible basis sets could lead
to relaxed structures with no spectral bands below 3000 cm−1.
Therefore, there are grounds for speculating that employment of "restricted" basis sets
could cause an additional contraction of water clusters in comparison with the real structures in
the same configuration. One obvious consequence of such an event would be the
underestimation of frequencies of the O−H stretching modes. In principle, this hypothesis
could be verified or discarded by systematic studies of the influence of the basis set quality on
the properties of water clusters but the present author is not aware of any such an attempt for
cluster sizes beyond six molecules.
An examination of the symmetric hydrogen bond with a double-minimum potential
reveals that the polarizability of such a hydrogen bond is two orders of magnitude larger than
that of their separated counterparts, which leads to a continuous IR absorption (Zundel
continuum) as shown by Zundel in an example of H5O2+ cation at the SCF level [19]. In the
case of non-symmetric HB's with discernible covalence, the polarizability is still high enough
to cause a very extensive broadening. Instead of strong peaks generated by static models (such
as quantum mechanical harmonic computations), very broad features are expected at
frequencies below 3000 cm−1 for the protonated systems with highly polarizable hydrogen
bonds [19 b]. The characteristic feature of protonated water clusters is the presence of strong
and short hydrogen bonds, which in the static model correspond to intense peaks red shifted
with respect to the main OH stretching band. A particular structure of the protonated 26-mer is
shown in Figure 4.1.11, which clearly reveals the presence of H3O+ cation coordinated in the
water matrix (Eigen structure). The O−H distances between covalently bonded three
hydrogen atoms and the central oxygen atom are close to each other (this justifies the

109
definition of H3O+ structural unit), yet it is evident that the O−H distances are modulated by
the hydrogen bonding with neighboring water molecules. The shorter the HB the longer the
corresponding O−H bond, which is in accord with a general view on the properties of
hydrogen bond network. The three HB's donated by the H3O+ cation belong to a category of
short and strong hydrogen bonds whereas the accepted HB is evidently very long and weak,
which again is in accord with general properties of hydrogen bond.
1.974 Å1.469 Å
1.043 Å
1.067 Å
1.451 Å
1.052 Å
1.402 Å
Figure 4.1.11. The structure of protonated O center in the 26-mer cation at B3LYP level.
The calculations were performed with 6-31g(d,p) basis set. The H3O+ fragment coordinated
with the water matrix is clearly visible.
Figure 4.1.12 compares the IR spectra for a protonated 26-mer cluster (H53O26+)
obtained at the B3LYP/SBS level and that of a neutral cluster of the same configuration.
Similar to Figure 4.1.7 (a), there are very intense red-shifted absorption bands associated with
the stretching modes of [O−H]+···O strong bonds around a protonated oxygen center. The
hydrogen bond environment around the hydronium cation H3O+ within 26-molecule cluster is

110
evidently not symmetric within the framework of a static picture and, therefore, a continuous
absorption is not expected.
500 1000 1500 2000 2500 3000 3500 4000
0
500
1000
1500
2000
2500
3000
3500
neutral cation
1781
, asy
mm
δδ δδ H
3O+ b
and
2601
, sym
m νν νν
H3O
+
B3LYP/SBS 26-mer cluster
H2O
Lib
ratio
n
H2O Bend
OH
free
, 386
7
IR in
tens
ity, k
m·m
ole
-1
Wavenumber,cm -1
OH Stretch
2086
, asy
mm
νν νν H
3O+
1413
, sym
m δδ δδ
H3O
+
2312
, asy
mm
νν νν H
3O+
Figure 4.1.12. Calculated IR spectra of the 26-mer H53O26+ cation (blue curve) and neutral
26-mer H52O26 (red curve) clusters optimized at B3LYP/6-31g(d,p) level.
The frequency lines are given with Lorentzian profile of 10 cm−1 width generated by the
Gaussian View program. The spectral features at 2601 cm−1, 2312 cm−1 and 2086 cm−1
correspond to the stretching modes of H3O+ coordinated with the rest of cluster. The length
of O−H bonds around the protonated oxygen atom are 1.0425 Å, 1.0522 Å, 1.0674 Å and
1.974 Å, whereas the corresponding O···O distances are 2.5118 Å, 2.5029 Å, 2.468 Å and
2.884 Å, respectively.
In contrast to the static picture, in the real system the vibrational modes are coupled to
each other through anharmonic forces, which could lead to a potentially strong coupling

111
between the stretching modes and librational or/and translational motion. Depending on the
magnitude of anharmonic forces, such a coupling could result in a considerable broadening of
the stretching modes. Moreover, the cluster interacts with its environment, which affects the
vibrational motion in the cluster. If this or another HB in the cluster is highly polarizable then
it will be especially sensitive to the electrical fluctuations in the environment, which results in
a further broadening of the vibrational band [19 (a)]. It is instructive to compare the
differential harmonic spectra between a 26-mer cation and a neutral cluster with the
differential spectra between 1.0 M solutions of HCl and HBr acids and pure water reported by
Kim et al. [20] and reproduced in Figure 4.1.13 (b). Kim et al. [20] have performed
instantaneous normal mode analysis for a variety of different configurations comprising the
hydronium cation and its immediate neighbourhood and attributed, in particular, a positive
differential peak at 2700-2950 cm−1 to a linear combination of the O−H stretch normal modes
of symmetrically hydrated hydronium cation (see Figure 4.1.11). The present normal mode
analysis of 26-molecule cation and neutral clusters strongly disagrees with Kim's assignment.
The presence of the positive peak at 2700-2950 cm−1 in Figure 4.1.13 is due to the contraction
of the cluster caused by protonation and does not include the stretching vibration of hydronium
cation per se. The positive peak includes the stretching vibrations of short hydrogen bonds,
the number of which has been increased by the protonation. This conclusion is supported by
histograms of the distribution of distances between the hydrogen-bonded water molecules in
neutral and protonated clusters. Indeed, as evident from Figure 4.1.14 (upper panel) for the
neutral cluster, the number of pairs with O···O distances below 2.6 Å is 1, whereas the same
value for the protonated cluster rises to 8. Among these 8 pairs only 3 are due to the
hydronium cation while the remaining 5 pairs correspond to short HB's among those water
molecules, which are not bound directly to the hydronium species. On the other hand, the
region between 2.6 and 2.65 Å (especially bins 2.62 and 2.63) is denser in the neutral cluster,
which presumably is responsible for the negative peak at 3100-3200 cm−1observed in the
experimental IR spectra of dilute acids by Kim et al. [20]. The shape of the main OH stretch
band directly depends on the distribution of the O···O HB distances (the HB angles are also
important but as a less significant factor). The same statement remains valid for the spectra of
diluted protonated aqueous systems including the immediate region below 3000 cm−1. As seen

112
in Figure 4.1.13 (a) the main spectral contribution of the stretching modes of hydronium cation
is located below 2500 cm−1. The comparison with experimental spectra of acidic solution
indicates that in this region there are no distinct spectral bands, but there is a clear signature of
continuous absorption. The interpretation of positive peak at 2700-2950 cm−1 by Kim et al.
[20] is primarily restricted to the vibrations of hydronium or diaquohydrogen cations. The
vibrational analysis is limited to only 6 water molecules, which are surrounding the hydronium
cation and are not interconnected. Any computational observation of a collective response of
the water structure on the protonation is, therefore, precluded at the very beginning. The OH
stretching band clearly shows the collective response on protonation rather than a localized
reaction. It should be noted that the appearance of a positive peak at 2700-2950 cm−1, if the
latter is indeed produced by the collective response of the water media, is a manifestation of a
significant increase in the transition dipole moments of corresponding vibrations upon the
contraction of HB contacts. Without such an enhancement in the oscillator strength, this
positive peak most likely would not be observed because the density of those low-frequency
oscillators is relatively small in diluted systems (see Figure 4.1.14). The positive peak at 1700
-1800 cm−1 corresponds most likely to the asymmetric deformational band of hydronium
cation in the water matrix.
Let us further illustrate Zundel's findings with a relevant example of the hydrochloric
acid on ice, selected spectra of which collected in the present studies are shown in Figure
4.1.15. A practically continuum absorption beginning from the low-frequency side of the main
OH stretching mode at 3389 cm−1 is evidently observed along with the peaks attributed to the
vibrations of protonated water species and that of Cl−···H−Cl species at 2115 cm−1. These IR-
RAS spectra are in good accord with the transmission IR spectra from the ice particles covered
with HCl reported recently by Devlin et al. [21] and presented for the comparison in Figure
4.1.16. As temperature increases the continuum absorbance strengthens, which is interpreted
by Devlin et al. [19] following the Zundel's approach as a signature of D5O2+ ionic species
formed by the dissociation of adsorbed DCl molecules. Accordingly, a Zundel profile
observed in the IR-RAS spectra of HCl/noncrystalline H2O in Figure 4.1.15 could be attributed
as well to the H5O2+ or, perhaps, to the protonated water clusters of different sizes (most likely
larger than diaquohydrogen cation).
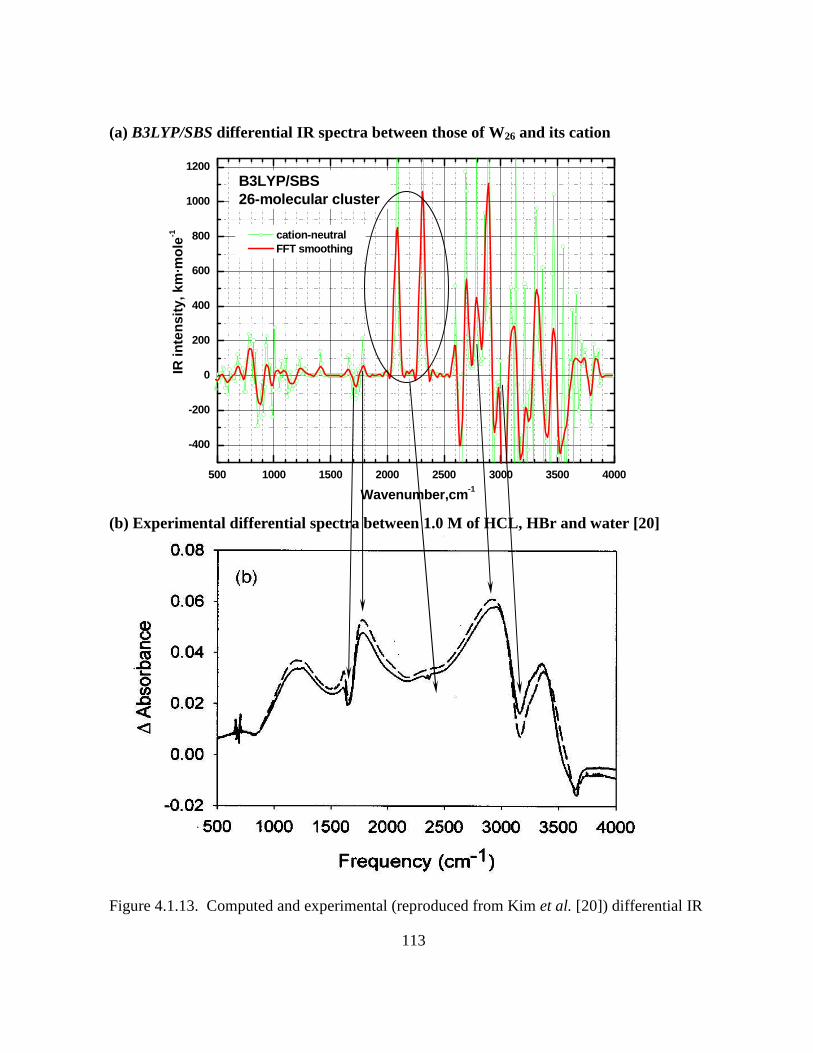
113
(a) B3LYP/SBS differential IR spectra between those of W26 and its cation
500 1000 1500 2000 2500 3000 3500 4000
-400
-200
0
200
400
600
800
1000
1200
cation-neutral FFT smoothing
B3LYP/SBS 26-molecular cluster
IR in
tens
ity, k
m·m
ole
-1
Wavenumber,cm -1
(b) Experimental differential spectra between 1.0 M of HCL, HBr and water [20]
Figure 4.1.13. Computed and experimental (reproduced from Kim et al. [20]) differential IR

114
spectra between protonated 26-mer H53O26+ and pristine, H52O26, water clusters.
The difference (a) between computed harmonic IR spectra of cation and neutral 26-mer
clusters at B3LYP/SBS, i.e. IRCalc (H53O26+)−IRCalc (H52O26) and (b) between the experimental
IR absorption spectra of 1.0 MHCl (solid line), HBr (dashed line) and pristine water, i.e.
IRexp(HXaq)−IR(H2O). Reproduced from Kim et al. [20].
2.4 2.5 2.6 2.7 2.8 2.9 3.0 3.1 3.20
1
2
3
4
5
0
1
2
3
4
5
6
B3LYP/SBS W26
neutral
O-O Hydrogen Bond distance, Å
Num
eric
al m
olec
ular
den
sity
B3LYP/SBS W26
cation
Figure 4.1.14. The histograms of nearest neighbour O···O distances between pairs of hydrogen
bonded water molecules for 26-mer neutral and protonated cluster at B3LYP/6-31g(d,p).

115
Evidently, the IR absorption by the stretching modes of ionic water clusters leads to
very broad features, which could be difficult for the spectral detecting especially when the
concentration of such species is small. However, in those cases when the protonated water
species or short HB's are abundant, a Zundel's profile should be discernible.
3750 3500 3250 3000 2750 2500 2250 2000 1750 1500 1250-5.0
0.0
5.0
10.0
15.0
20.0
25.0
30.0
(c)
(b)
1275
1700
2115
2620
3698
, OH
free
ion bandsCl-···HCl
Abs
orba
nce,
x 1
0-3
Wavenumber, cm -1
HCl on H2O ice
PHCl
~ 0.1 Torr, Tini
=128 K
Zundel continuum
pristine H2O ice
3389
(a)
Figure 4.1.15. FTIR-RAS spectra of the HCl-ice films in comparison with that of pristine ice.
(a) pristine thin ice film vapour deposited at 128 K (solid line); (b) 3.5 min into the exposure to
~ 1·10−2 Torr of HCl (squares); (c) 4 min into pumping after the 5-minutes exposure to ~
1·10−2 Torr of HCl (triangles). In should be noted that in order to show clearly a Zundel
continuum the spectra were artificially shifted on the ordinate scale to coincide at
approximately 3750 cm−1.

116
(a)

117
(b)
Figure 4.1.16. Differential IR spectra of H/DCL on ice. Reproduced from Devlin et al. [21].
The upper panel shows the FTIR difference spectra of HCl on ice particles at 50 K and ~ 15%
coverage: (a) HCl on H2O, (b) and (c) HCl on D2O (d) background spectrum. The lower panel
shows the FTIR difference spectra for the DCl adsorbate on D2O at ~ 30% coverage for
different temperatures.
The present quantum mechanical calculations of H5O2+ cation show extremely large
red shift in the O···H+ ···O stretch mode with respect to that in water dimer due to 20-fold
decrease in the force constant of corresponding vibrations. The following Figure 4.1.17 and

118
Figure 4.1.18 represent these computational results.
-0.20 -0.15 -0.10 -0.05 0.00 0.05 0.10 0.15 0.20-2.0
-1.5
-1.0
-0.5
0.0
0.5
1.0
1.5
2.0
2.5
3.0
3.5
4.0
4.5
5.0
5.5
6.0
6.5
7.0
7.5
8.0
EMP2 W2
E2 W2
SCF W2
EMP2 H-OH E2 H-OH SCF H-OH EMP2 H
5O
2
+
E2 H5O
2
+
SCF H5O
2
+
MP2/aug-cc-pvtz E profiles for H + in H5O
2
+;
H-O-H*···OH2 and H *-OH
E2 W2
SCF W2
MP2 W2
E2H5O
2
+SCF H
5O
2
+
δδ δδ E
, kca
l·mol
e-1
δδδδ r(OH), Å
EM
P2
H5O
2+
Figure 4.1.17. Potential energy profiles along the O−H coordinate for H2O, (H2O)2 and H5O2+.
The calculations were performed on MP2/aug-cc-pvtz level. In the case of H5O2+ all interatomic
distances were fixed except two angular variables for H+ whereas in the cases of water monomer
and dimer all variables were allowed to vary with exception of a dihedral angle preserving the Cs
symmetry in the dimer case. SCF, E2, and EMP2 designate the HF energy, the second order MP
correction to the HF energy and the sum of these values, i.e. the total MP2 energy, respectively.

119
(a) Harmonic spectrum of H3O+
4000 3800 3600 1600 1400 1200 1000 800 600 400 200 0
0
50
100
150
200
250
300
350
400
450
500
550
W W
2
H3O+
asy
m. d
efor
m.
δδ δδ H
3O+ (
ν ν ν ν 44 44 )
E
asym. stretch νννν3333 H
3O+ E
sym
. def
orm
. δδ δδ
H3O
+ (ν ν ν ν
22 22 ) A
1
IR In
tens
ity, k
m·m
ole
-1
Wavenumber, cm -1
sym
. str
etch
H3O
+ ( νν νν11 11 )
A1
MP2/aug-cc-pvtz
∆ ∆ ∆ ∆ =
-246
cm
-1
(b) Harmonic spectrum of H5O2+
4000 3900 3800 3700 1600 1400 1200 1000 800 600 400 200 0
0
50
100
150
200
250
300
3501000
2000
3000
W W
2
H5O
2
+
δδ δδ (
O-H
-O)+ ||
C2
δδ δδ (O
-H-O
)+ _|_
C2
MP2/aug-cc-pvtz
out-
of-p
hase
ben
d δδ δδ
H2O
+ νν νν
(O
-H-O
)+
∆ ∆ ∆ ∆ = -103 cm -1
str
etch
νν νν
(O-H
-O)+
IR In
tens
ity, k
m·m
ole
-1
Wavenumber, cm -1
∆ ∆ ∆ ∆ = -2808 cm -1
sym
. str
etch
νν νν
H-O
-H··
·O
Figure 4.1.18. Comparison of the harmonic frequencies of water monomer and dimer with that

120
of (a) H3O+ and (b) H5O2
+ cations at the MP2/aug-cc-pvtz level.
Table 4.1.1. IR frequencies of single water molecule, dimer and water in condense state.
The intensity of calculated IR bands are given in [103 m·mole−1]. MI, D, M, G.P. stands for
matrix isolation IR experiments, dimer, monomer, and gas phase.
Method Gas Phase Monomer
Gas Phase Dimer
∆(D.-M.) Liquid State ∆(L-G.P.) Solid State, Ih
∆(Ih-G.P.)
ν3
Exper.
3490 {62.7} 3280 {54.5}
−266 −377
ν3 (LO)+ ν1 out-of-phase
3380
−376
3755.79
ν3 (TO) 3220
−536
Exper., MI 3725.7 {s} 3714.4a {m} 3697.7d {m}
−11.3 −28.0
MP2-aug 3947.71 {75} 3935.28a {97} 3915.15d
{115} −12.4 −32.6
B3LYP/LBS 3912.56 {59} 3903.03a {82} 3885.66d {81}
−9.5 −26.9
B3LYP/SBS D.B. 3872-3852 3847 tri-HB
3795 (3.03, 2.96 Å)
3718-3692 (2.87-2.90 Å)
3912.85 {20}
3650-3632 (ν3)
3615-3607
ν1 Exper. 3656.65 3490 {62.7}
3280 {54.5} −266 −377
ν1 in-phase 3150
−507
Exper., MI 3632.5 {m} 3625.6a {w} 3547.5d {m} HB
−6.9 −85.0
MP2-aug 3821.88 {6} 3813.93a { 11} 3718.74d {297} HB
−8.0 −103.1
B3LYP/LBS 3813.48 {5} 3807.02a {10} 3695.96d {329} HB
−6.5 −117.5
B3LYP/SBS 3799.61 {2} ν2
Exper. 1594.59 1645 {20.8} +50 (2νLib +ν2 ) 1560
Exper., MI 1596.9 {s} 1618.1d {w} HB 1600.3a {w}
+21.2 +0.4
MP2-aug 1628.37 {72} 1650.27d {36} HB 1629.31a {87}
+21.9 +0.9
B3LYP/LBS 1626.54 {72} 1648.42d {39} HB 1626.92a {90}
+21.9 −0.4
B3LYP/SBS 1665.26 {70}
121
The formation of symmetric HB in the diaquohydrogen cation with O···O and O···H
distances at 2.39055 Å and 1.19716 Å, (the < O···H···O is 173.57 °) respectively, causes a
dramatic change in the potential well for the hydrogen atom vibration with respect to those in
H2O and (H2O)2, as evident from Figure 4.1.17. At the MP2 level, a potential well for the
diaquohydrogen cation is extremely flat as the result of two equivalent bonds between the
central hydrogen atom and the two oxygen atoms, the covalence of which is about half of the
"normal" O−H bond. This potential profile originates from the merging of two potential
minima where the hydrogen atom is allocated closer to that or another oxygen atom. Indeed,
on the SCF level there is a small barrier that separates these two minima, whereas the barrier is
evidently absent on the MP2 level. As a consequence of the C2 symmetry, the potential curve
is nearly harmonical in the vicinity of the minimum. However, due to the relaxed shape of the
potential the central hydrogen atom participates in an oscillation with the amplitude much
larger than that of a typical covalent O−H bond. At relatively large distances from a minimum
the potential profile for H5O2+ deviates discernibly from the harmonical shape, which not only
affects the numerical value of the frequency of the vibrational band but also provides the path
for vibrational perturbation due to anharmonic coupling. The "normal" O−H potential profiles
for water monomer and dimer are much sharper and appear to be very similar to each other,
which leads to only minor frequency shift for the O−H stretch modes upon the dimer
formation. Indeed, in the matrix isolation experiments [22] the following shifts are observed:
ν3 of H2O monomer: 3756 cm−1G.P. → 3725.7 cm−1
MI (G.P. and MI stands for gasphase and
matrix isolated species); ν1 of H2O monomer: 3657 cm−1G.P. → 3632.5 cm−1
MI; ν3 of (H2O)2
HB-donor in MI is at 3697.7 cm−1, i.e. there is a 28 cm−1-shift from the monomer value; ν1
(H2O)2 HB-donor in MI is at 3547.5 cm−1, i.e. there is a 85 cm−1-shift from corresponding MI
monomer value. The frequency shift for the ν1 mode upon dimer formation computed at the
MP2/aug-cc-pvtz level amounts to 103 cm−1, which is in a reasonable agreement with the
experiments. These frequency shifts indicate that the potential well of the (O−H)donor bond is
only slightly perturbed by the dimer formation. The bond order parameters and atomic charges
show discernible changes upon a dimer formation. For instance, the Mayer and Wiberg bond
order parameters change from 0.96 and 0.74 for O−H in H2O to 0.87 and 0.7, respectively, for
(O−H)donor in the dimer, which represent 9% and 5 % decrease in the covalence of this bond.

122
On the other hand, the Mulliken charge on the hydrogen atom involved in the HB bonding
changes from +0.21 to +0.29, which together with decrease in the covalence indicates that the
O−H bond becomes more ionic and less covalent being involved in the hydrogen bonding.
This trend in the bond character is in accord with the frequency red shift and intensity rise
exhibited by stretching modes of H2O upon dimerization. The protonation of H2O modifies
the character O−H bonds in a similar way, they become more ionic and less covalent as
represented by Mayer (M.B.) and Wiberg (W.B.) bond indexes (0.86 in H3O+ vs. 0.96 in H2O
(10% decrease in M.B.) and 0.63 in H3O+ vs. 0.74 in H2O (15% decrease in W.B.)), which
causes red frequency shifts and significant intensification of the stretching modes (the
frequency shift is −246 cm−1 for the ν1). The oxonium cation exhibits also a new spectral
feature at ~900 cm−1, which corresponds to a symmetric bending mode ν2 (A1). It appears that
protonation of water molecules perturbs the O−H bonds in a stronger fashion in comparison
with that upon a dimer formation. The bond indexes tentatively provide a quantitative
description of these perturbation events although they are not absolute. The diaquohydrogen
cation exhibits apparently unique spectral characteristics because of the vibrational profile
corresponding to the symmetric hydrogen bond with a single minimum on the MP2 level.
Within the framework of static approach (when there are no external perturbations applied and
an isolated harmonic system is at minimum) the stretching band of O←H→O+ vibration
appears at ~ 900 cm−1, i.e. is red-shifted from a standard location by ~2800 cm−1 as evident
from Figure 4.1.18. Such a low vibrational frequency is again associated with a very broad
profile of the potential well at its minimum as shown in Figure 4.1.17. The bond indexes for
the ordinary O−H bonds and those in a symmetric HB minimum are significantly different:
M.B.s are 0.96 for H2O, 0.86 for H3O+, 0.87 for HB in the dimer, 0.99 for OHfree in the dimer,
0.53 for the symmetric HB in H5O2+, 0.93 for the rest of O−H bonds in H5O2
+; W.B.s are 0.74
for H2O, 0.63 for H3O+, 0.70 for HB in the dimer, 0.74 for OHfree in the dimer, 0.34 for the
symmetric HB in H5O2+, and 0.67 for the rest of O−H bonds in H5O2
+. The Mayer bond index
decreases by 45 % upon formation of the symmetric HB in comparison with the water
monomer, while the Wiberg index decreases by 54 %. In other words, the covalence of a
symmetric HB is about half of that for typical O−H bond. The excess of positive electric
charge is not concentrated on the central hydrogen atom but is redistributed on two

123
neighbouring oxygen atoms as it is indicated by the Mulliken and NBO charges in accord with
donor-acceptor interaction of H3O+ and OH2.
It should be noted that in the original work on H5O2+, Zundel and coworkers [19] have
used the HF method, which produces a double-minimum potential well, whereas in the present
work the potential profile for isolated diaquohydrogen cation shows only a single minimum at
the MP2 level (see Figure 4.1.17). The quantum motion of a proton depends on the potential
profile and in this respect the presence of barrier plays a fundamental role in the vibrational
properties of this system. The dynamical properties of the symmetric HB in a diaquohydrogen
cation with a double minimum are unique, which lead to the Zundel profile described above.
The underlying reasons for appearance of continuous absorption reside in the extremely high
polarizability of the double-minimum HB. In the presence of small energy barrier separating
the two proton minima, the solution of the vibrational Schrödinger equation for proton motion
comprises, in particular, two lowest levels energetically close to each other, which are
described by symmetric and asymmetric wave functions:
Figure 4.1.19. Double minimum proton potential and wave functions Ψ0+ and Ψ0− of the two
lowest states of Zundel ion. Reproduced from Janoshek et al. [19 a].
An external perturbation, imposed on the present system, causes a mixing of these two
states, which, in turn, leads to the localization of a proton into the left or right minima, i.e. the
system becomes polarized by a small perturbation. The central proton bears a discernible
positive charge and its localization will cause positive charging of that or another water
counterpart. In other word, the H5O2+ can be represented by the following polarized resonance

124
structures: {H3O+···OH2↔H2O···H3O
+}, each of which shows asymmetric charge distribution.
The high polarizability is responsible for the following consequences: (i) the symmetric HB is
sensitive to the electric perturbations imposed by the neighbouring molecules; (ii) these bonds
strongly affect each other, i.e. the resonance energy transfer is highly probable in these
systems; and (iii) the stretching O−H···O mode is strongly coupled with the low-frequency
intermolecular vibrations. It should be noted again that in a truly symmetric single minimum
well the vibrational potential is nearly harmonical and therefore this oscillation will be
uncoupled from the rest of system. Although the MP2 calculations show that the isolated
diaquohydrogen cation exhibits a single potential well minimum, the relative oscillation of
water molecules or external force field could lead to the double-minimum potential and to
continuous absorption. In the case of symmetric HB with a single minimum such as in the
(FH···F)− anions, the polarizability is still large, which causes extreme broadening of the
stretching mode in the KHF2 crystal [23]. On the other hand, stretching and deformational
bands become much sharper and less intense upon dilution in a potassium chloride crystal
matrix as shown by Salthouse and Waddington [23], who attributed this phenomenon to the
electrostatic coupling between oscillators. In the case of KHF2 crystal the broadening is
caused by the resonance energy transfer between strongly coupled oscillators, while the
dilution of the system break this relaxation path. It appears that the coupling of the (FH···F)−
stretching mode with the low-frequency vibrations is not effective in this case [23].
The IR spectra of diaquohydrogen cation measured by the infrared multiphoton
photodissociation technique by Asmis et al. [24] are reproduced below in Figure 4.1.20
together with the Lorentzian profiles of the harmonic spectra obtained in the present work and
shown in Figure 4.1.18. Let us first compare the experimental results of Asmis et al. [24] with
the harmonic picture. There is an apparent agreement between the experimental and calculated
spectra with respect to the two experimental bands b at 921 cm−1 and e at 1741 cm−1, which
appear to correspond to the ν (O···H···O)+ stretch at 911 cm−1 /MP2 or 920 cm−1/B3LYP and
out-of-phase bending mode of the two water molecule at 1761 cm−1/MP2 or 1742
cm−1/B3LYP, respectively.

125
0
500
1000
1500
2000
2500
3000
800 1000 1200 1400 1600 1800
0
500
1000
1500
2000
2500
3000
Wavenumber, cm -1
IR In
tens
ity, k
m·m
ole
-1
H5O
2
+ MP2/aug-cc-pvtz
H5O
2
+
B3LYP/6-311++g(3df, 3pd)
Figure 4.1.20. Experimental [24] and computed IR spectra of H5O2+. The experimental d

126
band could include both bending modes of δ (O···H···O)+ unit, whereas there is no fundamental
band at the MP2 or B3LYP level that would correspond to the experimentally observed c band.
The IR spectra of acidic aqueous systems are characterized by the Zundel profile. For
instance, the transmission IR spectra from H2SO4/H2O films at different temperatures by
Middelbrook et al. [25] show continuous absorption associated with the protonated water
species. Caused by the changes of concentration of an acid and temperature, the evolution of
the OH stretch mode and all spectral profile at lower frequencies of the water/sulphuric acid
hydrogen-bond network is closely associated with Zundel absorption and, therefore, reflects
the ionic vibrational dynamics in the protonated medium. Ritzhaupt and Devlin [26] have
reported the spectra of different crystalline and amorphous hydrates of HNO3 and amorphous
hydrates of HCl , where the frequency region below 3600 cm−1 is determined by Zundel
profiles, which could again be due to protonated water clusters with short HB's. Even for a
monohydrate of HNO3, i.e. HNO3·H2O, a signature of nearly continuous absorption below the
main OH stretch band at 3300-3200 cm−1 is observed [26].
The ability of quantum mechanical calculations of providing detailed information about
the normal modes, intensities and the spectral features associated with the structure of the
given local minimum is evident. In resuming this part, let us suggest that a quantum
mechanical analysis of small water clusters is useful for disclosing the underlying structure of
the water network, which often remains hidden in the course of molecular dynamic
simulations. The analysis of a water structure at a local minimum, when the atoms are located
at their equilibrium positions, is indeed important for discosing unique structural and spectral
features in the hydrogen bond network. The quantum mechanical calculations of clusters
provide the frequencies and intensities of the available vibrational bands and, therefore, allow
a direct comparison with the experimental spectral data. Such an analysis not only provides
the structural details of a particular local minimum but with a proper design of cluster
configurations it can also bring a valuable information about the structure and properties of
infinite aperiodic water media. Suggested by Chaplin, such an algorithm for designing the
initial configurations of water clusters that could simulate the inifiniter water media has been
discussed in Chapter 2.

127
4.2 Theoretical Background of the Ab Initio and Density Functional Theory
Calculations
4.2.1 Computational Methods and Supermolecular Approach to the Multimolecular
Complexes
The computational methods of the formation (binding) energy are classified among
supermolecular and perturbation techniques. Within a supermolecular technique the formation
or binding energy is defined as: ( )BAABformationEEEE +−= , where EAB, EA and EB designate the
ground-state energies of subsystems A, B and united complex AB. For typical interactions
between close-shell subsystems, Eform is a factor of four to seven orders of magnitude smaller
than the total energy of either the united complex or the subsystems [28]. Moreover, the
deviation of the calculated energy of the ground states for A, B and AB from their real values
could be much larger than the formation energy Eform. Therefore, a reliable approximation for
the formation energy can be obtained only if a fortunate cancellation of large numerical errors
happens. Such a cancellation has been observed for the following computational methods:
Möller-Plesset perturbation theory and the density functional theory [28]. However, there is
no rigorous proof that the cancellation of errors should occur. A computational method should
obey the following necessary conditions in order to provide reliable approximations for the
formation energy: (i) size extensiveness and size consistence [27]; (ii) an adequate description
of the electron correlation; and (iii) the electronic energies of subsystems A and B should be
calculated with the basis set of the entire complex AB [38]. The alternative to the
supermolecular approach is a perturbation technique, which computes the formation energy
directly as a sum of physically distinct terms: ...EEEEEexchpolexchpolform
++++= 2211 , where E1pol is
a classical electrostatic interaction, E2pol is a sum of the classical induction and quantum
mechanical dispersion energies and E1exch and E2
exch terms represent exchange contributions
[28].
The computational results presented in the ab initio part of the present studies are based
on the supermolecular approach, upon which a united complex ABC…Z is considered to
consist of the interacting subsystems A, B, C, …Z. The total energy of the united complex
ABC…Z can be defined within the supermolecular approach and, in particular, within the

128
Möller-Plesset (abbreviated as usually by MP) perturbation method as follows:
EE
EEEE
iZ...ABC.....
WYX
iXYW
X X YX
iXY
iX
i)X(G;X
i)Z...ABC(G;Z...ABC
∆∑∆
∑ ∑ ∑∆∆
++>>
+
>+++=
(4.1)
where X, Y, W = A, B, C…Z; and superscript i denotes the particular order of the Möller-Plesset
perturbation theory, maximum of which is 2 in the present studies. G(X) (X stands for any
particular subsystem) indicates that isolated subsystem X is considered in its own equilibrium
geometry, whereas G(ABC…Z) indicates that subsystem is considered in the geometry it
assumes in the united complex. The one-body term EiX∆ in eq. (4.1) is associated with the
relaxation of a subsystem X upon the complex formation and is defined by the following
equation:
EEE iGX;X
i)Z...ABC(G;X
iX −=∆ , (4.2)
where Ei
)Z...ABC(G;X denotes the energy evaluated at the equilibrium complex geometry, in
which a subsystem X exists in the complex ABC…Z. The two-body term EiCD∆ represents the
pairwise interaction between two monomers C and D in the configuration they assume within
the complex ABC…Z.
∑−∆=
=DCX
iZABCGX
iZABCGCD
iCD EEE
,)...(;)...(;
, (4.3)
Higher order many-body terms are defined recursively, for example a three-body term is
defined by the following equation:
∑∆−∑−∆=>=
=F,D,CX;YX
iXY
F,D,CX
i)Z....ABC(G;X
i)Z...ABC(G;CDF
iCDF EEEE
(4.4)
where the EiCDF∆ term represents a three-body contribution arising from the three relaxed-
geometry monomers arranged in the same configuration as in the complex ABC…Z. The four-
and higher order terms are evaluated recursively according to the formula (4.4). This multi-
body decomposition procedure could also be formally performed at the DFT level of
calculations (while apparently ignoring the superscript in the energy components).
The exact spinless Born-Oppenheimer Hamiltonians for isolated subsystems A and B
and for a united complex AB can be decomposed in the spirit of the MP theory on a Fock
operator, FX, and a fluctuating operator, WX, as follow:

129
or AB. B, A, X where; =+= WFH XXTotalX
(4.5)
The Fock, FX, and fluctuating, WX, operators for the spin-orbits χi(r,σ)= φiα(r)α(σ)+ φi
β(r)β(σ) (where φi(r) stands for the space orbital, and α(σ), β(σ) are the spin wave functions of σ
spin-coordinate for an electron) are defined as usually by the following equations [41]:
( ) ( ) ( )
( ) ( ) ( ) ( ) ( ) ( ) ( ) ( )
( ) ( ) ( ) ( ) ( ) ( ) ( ) ( )
( ) ( ) ( ) ( )
( ) ( ) ( ) ( )
( ) ( )
electrons. theindexes orbitals,-spin occupied over the runs
;
:as defined is potentialFock Hartree- thewhile
; 1 21
;1
;1
;212 2121
;212 2121
whereor AB, B A, X;
iaia
iaia
1222
1222
ib
(i)K -(i)J
iKiJrW
Kjir
ji
Jijr
ji
iχr
χir
xdiK
iχr
χir
xdiJ
iKiJihF
occ
Xb b
occ
Xb b)i(VHF
occ
Xb b
Xi
occ
Xb b
Xi,j ijX
jjij
j
jjij
j
baba bi
*bab
abbai
b
*bab
occ
Xb b
Xi
occ
Xb b
XiX
∑∑
∑−∑
∑−∑=
=
=
=
∫=
=
∫=
=
∑−∑ ∑+∑
∈∈=
∈∈ ∈∈
∈∈
∈∈=
χχχχχχ
χχχχχχ
χχχχχ
χχχχχ
(4.6)
J and K are the Coulomb and exchange operators, respectively. The MP2 correction to
the total energies of subsystem A or B and the united complex AB introduced by the
fluctuating operator WX is a small perturbation to the corresponding HF energies. For example
for the water molecule on the MP2/aug-cc-pvtz level, <ФH2O|FH2O| ФH2O>= −76.0602820
Hartree whereas the second-order correction ∑
∑
−−+< <
N
ji ba baji
OHabij ΦWΦ
εεεε02 is only −0.2687104
Hartree. On the other hand, the contribution of the second-order correlation to the formation
energy of a complex can be very significant as shown below in Table 4.2.1. The interaction
energy at the MP2 level between two subsystems A and B that form the united complex AB is
given by the following equations:
( ) ( )( );
; 2222
111000
EEEE
EEEEEEEMPB
MPA
MPAB
MPInt
MPB
MPA
MPAB
MPB
MPA
MPAB
SCFInt
+−∆
+−++−∆=
=
(4.7)

130
Further analysis of the interaction energy of subsystems A and B is based on the
intermolecular MP perturbation (IMPT) theory [29], which employs a partitioning scheme of
the exact Hamiltonian for a dimer comprising monomers A and B, HAB, which is different from
the MP theory (eq. (4.5)):
( ). : toleads ly,respective
, and for and andfor parameters expansion formal theof onIntroducti
;;
;
BBAABAAB
BABA
raintBAAB
BAraint
raintBAAB
WsWstVFFHWWssVt
WFFHVWWW
VWFFH
++++=
++−=+=
+++=
(4.8)
The WX operators are defined in the spirit of Möller-Plesset perturbation theory according to
eq. (4.6) for the subsystem units. This paritioning is based on an observation that the intra-
molecular or intra-atomic E2 correlation corrections are often much larger than the binding
energy (which certainly the case for van der Waals complexes and HB systems). With this
form of Hamiltonian paritioning (4.8), the total interaction energy between molecular units A
and B combined in the united complex AB can be expressed formally by [29]:
ε nijjB
n i j
iA
nTotal sstE ∑ ∑ ∑=
= = =0 0 0
(4.9)
In particular, a corresponding equation at zero-order on V and WA;B reads:
( )
.Φ
ΕΕE
ΦΦΦ
ΦΦFF
XHFX
Bbb
AaaAB
HFB
HFA
HFAB
HFAB
HFABBA
0 as label touselater for the convenient isIt
units. separated infinitely for the obtained B and Ain
orbitals HF occupied theof energies theof sum a is
and where
;
000 0
000
∑+∑==
=
=+
ε
ε
(4.10)
The first-order (first-order on V and zero-order on subsystem fluctuating potential) interaction
energy in the symmetry adapted perturbation theory (SAPT) approach [28, 29] is given by:
rizerantisymmet is where; 100 AΦAΦ
ΦVAΦ
HFAB
HFAB
HFAB
HFAB
=ε
(4.11)
and can be represented with a framework of the HF theory as a sum of the electrostatic and
exchange contributions as follows:

131
.ΦVΦHFHF
polexchpol 00 100 , 100100100 by defined ispart ticelectrosta thewhere εεεε +=
(4.12)
Therefore, the εpol100 term describes the electrostatic interaction between undeformed HF A and
B subsystems, and represents primarily the dipole-dipole interaction energy (for electrically
neutral systems). Furthermore, a sum of the terms that are zero-order on V and the first order
on WA and WB, ε000, ε010, and ε001, equals to the sum of the HF energies of the isolated
subsystems. The terms ε020 and ε002 that are second order on WA and WB are equal to EMP2A and
EMP2B, respectively. Indeed,
εεεcdcdΕababΕEE
)(r)(*)(*xdxdklop
lkopklopklop,abab
avaababΦ(i)K(i)JrΦ
ΦWΦWWW
occ
Bcd Bbb
occ
Aab Aaa
SCFB
SCFA
kpo l
occ
Aab
HF
Aa
occ
Aab
HFA
occ
Ab b
Xi
occ
Ab b
Ai,j ij HF
A
HFAA
HFAA,BA
001010000
11221
where001 and 010
21
21
(2)121
and where2
1
211
21
++=∑−∑+∑−∑
∫=
−=∑−=
=∑−∑∑−∑ ∑∑
∈∈=+
−
∈
∈∈=
∈∈
∈−
∈=
====
χχχχ
εε
(4.13)
It is convenient to introduce the reduced resolvent of the unperturbed Fock operator defined in
eqs. (4.6) and (4.10)for the ground state of the AB united complex or for those of subsystems
A or B treated separately:
or B. A, AB,for stands where1 0
0 X,EE
nnR
n XnX
XXX ∑ −=
= (4.14)
In particular,
0010 XXXR −= (4.15)
Consider the ε020 term, which describes the correction to the HF energy of a subsystem A due
to the second order perturbation of the MP fluctuation operator WA defined in eqs. (4.6) and
(4.8):
WRWWRW AAAAAAAA 0 0020 justor 00=ε (4.16)
which is the second-order MP2 correction to the HF energy of subsystem A. Exactly the same
result holds for its B counterpart, ε002.
The next very important term at the MP2 level of theory is the second-order on V, ε200

132
term, which can be calculated as usual for the one-dimensional RS perturbation theory without
considering perturbations introduced by WA and WB MP operators:
systems. B and Atingnoninterac for the state excited- y theaccordingl is and B, and
Asubsystems ingnonineract theof energies state ground theof sum a is where
0
0
10
0
2
200
HFnE
HFE
,VRVEE
nVε
ABn
AB
nAB
ABnAB
ABAB∑ =
−=
=
(4.17
)
Evaluated at the uncoupled Hartree-Fock level, i.e. ignoring electron exchange between
subsystems A and B, the ε200 term can be decomposed into three parts in accord with the
decomposition of the |nAB> in eq. (4.17) onto the following terms: |0A> ·|nB> , when subsystem
A is the ground HF state while B is in excited states; |nA> ·|0B> , when subsystem B is in the
ground state while A is excited; and finally |nA> ·|nB> when both A and B are in excited HF
states.
∑
=
=
≠≠=
∑
=
==∑
−+
−+
−=∑ −
=
0
1
0
0
2 0
2
0
2
0
1 0
2
1 0
2
200 0000
nA
nB
nB
nA
nAB ABnAB
ABAB
BnB
BAB
nB
nA AnA
ABA
n ABnAB
ABAB
EE
nV
EE
nV
EE
nV
EE
nVε
(4.18)
Therefore, in accord with the decomposition (4.18) the following equality takes place:
εεεε 200200200200dispindBindA ++=
(4.19)
The induction energy terms ε200indA and ε200
indB represent an important attractive
component of the interaction energy. The induction attraction originates from the electrostatic
interaction of the permanent multipoles (if they exist) of one subsystem with the induced
miltipoles of another subsystem. The long-range induction interaction vanishes asymptotically
as r−4 or r−6 for the ion-molecule or the dipole-molecule systems, respectively. The dispersion
term ε200disp is attractive for the subsystems in their ground states and the leading term in the
decomposition of ε200disp into the power of r vanishes as r−6.
Another group of the perturbation terms that should be taken in account at the MP2
level of supermolecular perturbation theory includes the ε120 and ε102 terms of the second-order
on the fluctuation potentials WA and WB and the first order on the interaction potential V. This
is an intramolecular correction to the electrostatic interaction between undeformed subsystems
A and B.

133
Summarizing the aforementioned results and considering the results of Chałasiński and
Szeczęśniak [30,31], the Hartree-Fock energy of the united complex AB is expressed by the
following equation:
.
n
nindindBindA
HFB
HFA
HFAB defexchEEE −+∑+++++
>=
2
00200200100 εεεε
(4.20)
The "exch-def" stands for the exchange-deformation effects. According to Chałasiński and
Szeczęśniak [31] no satisfactory definition nor evaluation of these exchange-deformation
effects have been achieved.
The expression for the second order MP2 correction to the HF energy of the AB
complex can be expressed by the following formal equation:
.defexchEEE
j,i
n
nij.corrinddisp
MPB
MPA
MPAB −+∑+++++
≥≥
−=
1
2
102120200222 εεεε
(4.21)
Eq. (4.21) provides a good approximation for the origin of the second order MP2
correction at large separation distance R (i.e. a distance between centers of mass of A and B).
In the case of the spherically-symmetric, neutral interacting subsystems, the dispersion energy
term ε200disp
dominates over others. In the case of systems with permanent multipoles, the
leading term is a sum of the ε120 and ε102 (ε120 + ε102 is labelled by ε12), which is an
intramolecular correction to the electrostatic interaction energy ε10 due to the correction of the
multipoles introduced by the MP perturbation.
Concerning the exchange terms in eqs. (4.20) and (4.21), it should be noted that these
terms vanish exponentially with R. At those distances, where the overlap of the electron
clouds is significant, i.e. near the potential minimum, the exchange corrections to the induction
and dispersion energies become important but the exchangeless induction and dispersion
energies remain useful approximations.
In order to decompose the supermolecular interaction energy within the framework of
the intermolecular perturbation theory, the ∆E0 and ∆E1 terms in equations (4.1)-(4.4) should
be considered in their combination by defining the self-consistent field (SCF) interaction
energy ∆ESCF as follows:
EEESCF ∆+∆∆ = 10 (4.22)
By intermolecular perturbation theory (eqs. (4.5)-(4.13)), the ∆ESCF can be decomposed as

134
follows:
EEE defSCFHLSCF ∆+∆∆ −= (4.23)
where ∆EHL is the Heitler-London interaction energy between mutually undeformed SCF
subsystems, whereas the ∆ESCF-def describes the SCF deformation contribution. The former
∆EHL term can be further divided following eqs. (4.10)-(4.13) into the electrostatic term, ε10elst
and exchange term, ε10exch, and zero-order exchanged terms, the latter two of which are
combined together into the ∆EHLexch term as follows [30, 31]:
∆++∆+∆ == εεε 101010exchelst
HLexchelst
HL EE (4.24)
It turns out that the ∆ term is small comparatively with the others if the basis set of the
entire system is employed for the calculations of the SCF energies of the isolated subsystems
and therefore it is included into the Heitler-London exchange interaction. The first-order (with
respect to the perturbation operator V) electrostatic energy ε10elst (see eqs. (4.10)-(4.13) )can be
interpreted as the energy of electrostatic interaction between isolated subsystems with
unperturbed charge distribution, which is a direct analog to the classical electrostatic energy of
the interaction between permanent muiltipoles associated with the unperturbed subsystems.
The latter term ∆ESCF-def in eq. (4.23) represents those effects that originate from the relaxation
of electron orbitals in the Coulomb field created by the subsystems under the restriction
imposed by the Pauli exclusion principle. This term is determined asymptotically by the
classic induction effects and can be formally expressed in accord with eqs. (4.17)-(4.20) as
follows [31]:
)(2
0, defexch
n
nrelaxind
SCFdefE −+
∞
== ∑∆ ε
(4.25)
in which case the latter exchange-deformation term is originated from the Pauli exclusion
principle, whereas the first sum accounts for the induction effects regardless of the Pauli
principle violation. In other words, the first sum mathematically represents the classic
induction effects, which ignore the overlap between electron densities of two subsystems and
the electron exchange, whereas the second term appears in this equation in order to account for
the effects caused by the electron overlap and exchange between electrons of two subsystems.
The second order correction in the supermolecular perturbation theory is given in

135
accord with eq.(4.21) by the following formal expression [31]:
EEE .corrindexch.corrdispexchdispMP ∆+∆++∆ −−−−= 2212202 εε (4.26)
where the term ∆E2exch-disp-corr combines the exchange-correlation and exchange-dispersion
effects and ∆E2exch-disp-corr term corresponds to the induction correlation terms.
According to the perturbation theory of the intermolecular interaction, a nonadditivity
of the multi-body interaction (i.e. EInter.(ABC) ≠ EInter.(AB)+ EInter.(AC)+ EInter.(CB)) comprises
of three components: exchange, polarization, and dispersion. Firstly, the polarization
nonadditivity will be discussed because it is apparently among the most important factors for
the HB systems. In the case of a trimer, the presence of the third subsystem C modifies the
charge distribution on the other two subsystems A and B that, in turn, changes the AB pairwise
interaction. This effect is accounted for by eq. (4.25), and, therefore, it constituents the SCF-
deformation nonadditivity, which is detectable already on the HF level of calculations.
The dispersion nonadditivity can be interpreted in terms of the instantaneous multipole
electrostatic interaction, which resulted from the intersystem electron correlation [31]. In order
to reproduce this nonadditivity effect in the ab initio calculations, a highly correlated treatment
is required. The minimum level of the theory necessary for its reproduction is at the MP3
level. Therefore, the dispersion nonadditivity remains beyond the scope of the present studies,
which were conducted at the MP2 level.
The exchange nonadditivity could be associated with the electron density redistribution
on the subsystems caused by a quantum exchange effect, which decreases the overlap of the
electron clouds in the intermolecular region [30, 31]. The SCF and MP2 levels of theory
account for the exchange nonadditivity as evident from the eqs. (4.25) and (4.26). The
additivity of the first-order electrostatic interaction energy ε10elst ensures that the nonadditivity
being observed at the SCF level is due to the exchange and induction effects.
Along with the ab initio methods at the MP2 level of theory, the DFT technique with
the Becke's three parameters hybrid exchange-correlation semiempirical functional using the
Lee-Yang-Parr correlation functional (B3LYP) was extensively used in the present studies for
an investigation of the properties of the model HB systems, which include water clusters and
those with acetone, acetaldehyde, and methanol molecules attached [32].
The B3LYP exchange-correlation functional, EXC_B3LYP, as it has been implemented in

136
the G98 and G03 packages, is expressed by the following equation [32, 33]:
1
1 88 3
;ECE)C(
EBE)A(EAELYPC
VWNC
BeckeX
HFX
SlaterXLYPB_XC
⋅+⋅−+
+∆⋅+⋅−+⋅=
(4.27)
where ESlaterX is the Slater exchange functional and EVWN
C is the Vosko-Wilks-Nasar
correlation functional within the Local Density approximation; EHFX is the Hartree-Fock
exchange operator (see eq. (4.6)); ∆EX Becke88 is the Becke’s gradient correction to the LSDA
for the exchange, and, finally, EC LYP is the gradient correction for the correlation after Lee,
Yang, and Parr. As it follows from the eq. (4.27), the widely used B3LYP hybrid functional
combines the exact exchange correlation given by the exchange energy of the Slater
determinant with the Kohn-Sham orbitals with the density functional approximation for the
correlation effects of dynamical nature. Three empirical coefficients A, B, and C in eq. (4.27)
were determined by fitting sets of the atomization energies, the ionization potentials and the
proton affinities of atoms and molecules in the Pople’s G1 database [33]. A specific feature of
this B3LYP functional form resides in the value of constant A, 0.2, which determines the
contribution of "exact" exchange to the total exchange-correlation potential. The parameter B
and C are set to 0.72 and 0.81, respectively [32, 33]. The accuracy of computation results
obtained with this potential apparently depends on the value of that or another empirical
constant. While a majority of the functionals performs reasonably well on the calculation of
total exchange energy, the results in the calculations of the binding energies and the
contribution of the exchange-correlation energy to the binding energy, especially in the cases
of weakly bounded multimolecular complexes, were found to be less accurate [34]. In part, it
was related to the structure of databases, to which the empirical constants of the DFT
functionals have been adjust. As Lacks and Gordon pointed out, these databases include
usually strongly bound molecular systems, in which the driving force of bonding is the
electrostatic first-order energy (eqs.(4.12) and (4.20)), whereas in the weakly bound van der
Waals systems, the bonding is driven by weak exchange-correlation effects in the space region
of low electron density and large density gradient, located far from the nuclei [34]. However,
recent results with the B3LYP and other similar hybrid functionals indicate an acceptable
performance in comparison with the ab initio correlated treatments in those cases when the
calculations were performed on the complexes of molecules with permanent dipoles [35]. Let

137
us again recall that this family of functionals was found to fail in the prediction of bonding
between atoms of inert gases [34]. By consideration of these data (which will be reviewed in
necessary details below in this Chapter), one can assume that the B3LYP-based calculations
should accurately reproduce major components of the interaction energy in the case of HB
complexes with polar molecules such as water molecules considered in the present work.
The Dunning's correlated aug-cc-pvtz basis set [36] for water molecule contains 92
atomic basis functions (127 Gaussian primitives): 46 functions are localized on oxygen atom
and 23 functions on each hydrogen atom. The oxygen set includes: 5 s-orbitals (4+1 diffus.), 4
sets of p{−1,0,1} -orbitals (3+1 diffus.), 3 sets of 5 d{−2,−1,0,1,2}-orbitals (2+1 diffus.) and 2 sets of
7 f{−3,−2,−1,0,1,2,3} -orbitals (1+1 diffus.). The hydrogen set includes: 4 s-orbitals (3+1 diffus.), 3
sets of p{−1,0,1}-orbitals ( 2+1 diffus.) and 2 sets of 5 d{−2,−1,0,1,2}-orbitals (1+1 diffus.).
Although smaller than this aug-cc-pvtz but still flexible, the Frisch-Pople 6-311++g(3df, 3pd)
basis set [37] for a water molecule contains 75 atomic basis functions (100 Gaussian
primitives): 39 atomic basis funcitons are localized on oxygen atom (5 sets of s-orbitals: 1×1s;
3×2s; 1×3s (diffuse function); 4 sets of p -orbitals: 3×2p{x;y;z}, 1×3p{x;y;z} (diffuse function); 3
sets of d-orbitals: 3×3d{−2;−1;0;1;2} ; and a single set of f orbitals: 1×4f{−3;−2;−1;0;1;2;3} ) and 18
atomic basis functions on each hydrogen atom (4 s-orbitals, 3 sets of p-orbitals and a single set
of d-orbitals). In comparison with the 6-311++g(3df, 3pd), the aug-cc-pvtz basis set contains
formally an extra set of 7 f-orbitals for carbon and oxygen atoms and an extra set of 5 d-
orbitals for hydrogen atom. The SCF and MP2 density matrixies for water molecule were
found to be very different for these two basis sets, which results in different Mulliken atomic
populations and bond order parameters.
The electronic energies of formation of H2O and OH radicals, their dipole moments and
vibrational frequencies exhibit strong dependence upon the method of calculations: SCF, MP2
or B3LYP, which clearly demonstrates the significance of electron correlation in computing the
molecular properties. As demonstrated in Table 4.2.1, a few observations regarding the effects
of electron correlation on the properties of water molecule and OH radical can be made.
Evidently, the E2 or B3LYP exchange-correlation corrections to the HF-SCF energies amount
to only a small fraction of the total molecular energy. The E2 is only ~0.35% of the total
internal energy for water at MP2/aug-cc-pvtz and the B3LYP exchange-correlation correction

138
is ~0.53% of the total energy for water at B3LYP/aug-cc-pvtz, being themselves very large
values on the absolute scale, i.e. −168.62 kcal·mole−1 and −254.82 kcal·mole−1, respectively.
Evidently, the semi-empirical Becke's exchange-correlation stabilizing correction to the
Hartree-Fock energy is significantly larger than the second-order Möller-Plesset perturbation
term. It should also be noted that B3LYP gives −0.5022597 Hartree as the electronic energy of
hydrogen atom, which is apparently significantly lower than the exact solution of Schrödinger
equation, −0.5 Hartree. The latter can be attributed to the self-interaction error corresponding
to the inbalance between the HF exchange and other terms in the B3LYP exchange-correlation
potential. The contribution of correlation corrections to the formation energies of water
molecule and OH radical becomes very significant and amounts to more than a third of the
energy of formation. For instance, the computed enthalpies of formation for water molecule
are −141.564 kcal·mole−1, −218.779 kcal·mole−1, and −217.281 kcal·mole−1 at the SCF/aug-cc-
pvtz, MP2/aug-cc-pvtz, B3LYP/aug-cc-pvtz levels (Table 4.2.1), respectively, whereas the
experimental value is approximately −222 kcal·mole−1, which clearly indicates the deficiency
of the Hartree-Fock results. Both MP2 and B3LYP techniques with aug-cc-pvtz and LBS sets
appear to give a surprisingly good agreement (within a few percents) with the experimental
values (see for more details Table 4.2.1). This is indeed astonishing because the absolute
electronic energies of water molecule computed with these two techniques are different by
~86.1 kcal·mole−1, corresponding to 40 % of the formation energy. It is also obvious that the
formation energies for the water molecule and the OH radical, being large values on the
absolute scale, −222 kcal·mole−1 and −102 kcal·mole−1, are only small fractions of the
corresponding total electronic energies of O and H2O themselves. The values of intra-atomic
or intra-molecular correlations are (typically much) larger than the formation energy. Similar
observations are perhaps in the foundation of the perturbation approach to the binding energy
(SAPT for instance), which otherwise is obtained as a difference of very large numbers, which
are more or less precise approximations to the electronic energies of subsystems. The
computation of the binding or formation energy in the supermolecular approach relies on the
cancellation of errors, i.e. the computed electronic energies of subsystems and united complex
are different from the real energies in the same degree. From an observation that the HF
method significantly underestimates the formation energy of water and OH radical while the
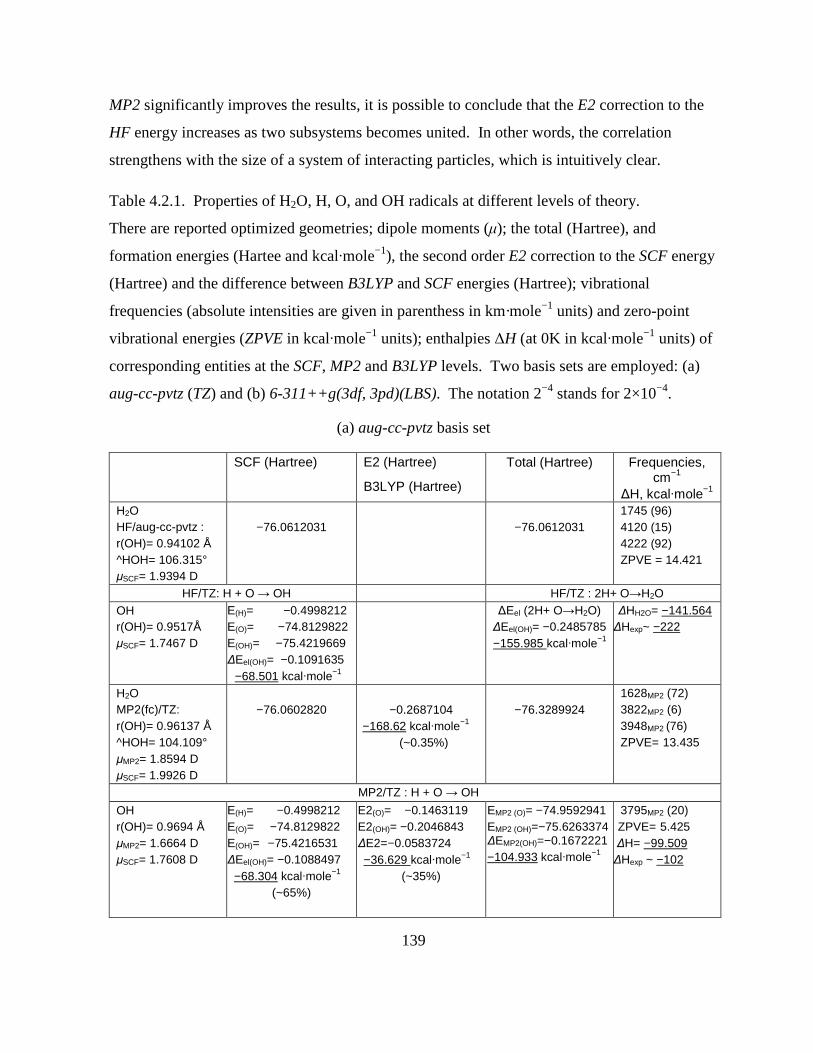
139
MP2 significantly improves the results, it is possible to conclude that the E2 correction to the
HF energy increases as two subsystems becomes united. In other words, the correlation
strengthens with the size of a system of interacting particles, which is intuitively clear.
Table 4.2.1. Properties of H2O, H, O, and OH radicals at different levels of theory.
There are reported optimized geometries; dipole moments (µ); the total (Hartree), and
formation energies (Hartee and kcal·mole−1), the second order E2 correction to the SCF energy
(Hartree) and the difference between B3LYP and SCF energies (Hartree); vibrational
frequencies (absolute intensities are given in parenthess in km·mole−1 units) and zero-point
vibrational energies (ZPVE in kcal·mole−1 units); enthalpies ∆H (at 0K in kcal·mole−1 units) of
corresponding entities at the SCF, MP2 and B3LYP levels. Two basis sets are employed: (a)
aug-cc-pvtz (TZ) and (b) 6-311++g(3df, 3pd)(LBS). The notation 2−4 stands for 2×10⁻⁴.
(a) aug-cc-pvtz basis set
SCF (Hartree) E2 (Hartree)
B3LYP (Hartree)
Total (Hartree) Frequencies, cm−1
∆H, kcal·mole−1 H2O HF/aug-cc-pvtz : r(OH)= 0.94102 Å ^HOH= 106.315° µSCF= 1.9394 D
−76.0612031
−76.0612031
1745 (96) 4120 (15) 4222 (92) ZPVE = 14.421
HF/TZ: H + O → OH HF/TZ : 2H+ O→H2O OH r(OH)= 0.9517Å µSCF= 1.7467 D
E(H)= −0.4998212 E(O)= −74.8129822 E(OH)= −75.4219669 ∆Eel(OH)= −0.1091635
−68.501 kcal·mole−1
∆Eel (2H+ O→H2O) ∆Eel(OH)= −0.2485785 −155.985 kcal·mole−1
∆HH2O= −141.564 ∆Hexp~ −222
H2O MP2(fc)/TZ: r(OH)= 0.96137 Å ^HOH= 104.109° µMP2= 1.8594 D µSCF= 1.9926 D
−76.0602820
−0.2687104
−168.62 kcal·mole−1 (~0.35%)
−76.3289924
1628MP2 (72) 3822MP2 (6) 3948MP2 (76) ZPVE= 13.435
MP2/TZ : H + O → OH
OH r(OH)= 0.9694 Å µMP2= 1.6664 D µSCF= 1.7608 D
E(H)= −0.4998212 E(O)= −74.8129822 E(OH)= −75.4216531 ∆Eel(OH)= −0.1088497
−68.304 kcal·mole−1 (~65%)
E2(O)= −0.1463119 E2(OH)= −0.2046843 ∆E2=−0.0583724 −36.629 kcal·mole−1
(~35%)
EMP2 (O)= −74.9592941 EMP2 (OH)=−75.6263374 ∆EMP2(OH)=−0.1672221 −104.933 kcal·mole−1
3795MP2 (20) ZPVE= 5.425
∆H= −99.509 ∆Hexp ~ −102

140
BSSE:MP2/TZ : H + O → OH
µ(H)SCF= 0.0003 D
µ(O)SCF= 0.0043 D
EBSSE(H)= −0.4998362
EBSSE(O)= −74.8131960
EBSSE(H)−E(H)=−1.5−5
−0.00941 kcal·mole−1
EBSSE(O)−E(O)=−2.1−4
−0.134 kcal·mole−1
E2BSSE
(O)= −0.1481146 E2BSSE
(O)− E2(O)= −1.8−3 −1.131 kcal·mole−1
EBSSEMP2 (O)=−74.961311
EBSSEMP2 (O)− EMP2 (OH)=
2.0−3 −1.267 kcal·mole−1
MP2/TZ : 2H+ O→H2O
∆Eel (H2O)= −0.2476574 −155.407 kcal·mole−1
(~67%)
∆E2=−0.1223985 −76.806 kcal·mole−1
(~33%)
∆EMP2(H2O)=−0.3700559 −232.214 kcal·mole−1
∆H= −218.779
B3LYP/TZ: H2O H2O: r(OH)= 0.9619 Å ^HOH= 105.079° µB3LY P= 1.8473 D µSCF = 1.9770 D
−76.0602926 ∆BLYP −0.4059041
−254.709 kcal·mole−1 (~0.53%)
−76.4661967
1627 (76) 3796 (5) 3899 (63) ZPVE = 13.327
E difference, EMP2−EB3LYP (H2O)
0.0000106 0.007 kcal·mole−1
0.1371937 86.090 kcal·mole−1
0.1372043 86.097 kcal·mole−1
B3LYP/TZ : H + O → OH
OH r(OH)= 0.9753 Å µB3LYP= 1.6497 D µSCF = 1.7655 D
E(H) = −0.4998212 E(O) = −74.8129822 E(OH)= −75.4214174 ∆Eel = −0.1086140
−68.156 kcal·mole−1 (~63%)
BLYP(H)= −0.0024385 BLYP(O)= −0.2811974 BLYP(OH)= −0.3471819 ∆BLYP= −0.0635460 −39.876 kcal·mole−1
(~37%)
EB3LYP(H)= −0.5022597 EB3LYP(O)= −75.0941796 EB3LYP(OH)=−75.7685993 ∆EB3LYP= −0.1721600 −108.032 kcal·mole−1
3695 (13) ZPVE= 5.282
∆H= −102.750
B3LYP/TZ : 2H + O → H2O ∆Eel= −0.2476680
−155.414 kcal·mole−1 (~67%)
∆BLYP= −0.1198297 −75.194 kcal·mole−1
(~33%)
∆EB3LYP=−0.3674977
−230.608 kcal·mole−1
∆H= −217.281
(b) 6-311++g(3df, 3pd)(LBS) basis set
SCF (Hartree) E2 (Hartree)
B−LYP (Hartree)
Total (Hartree) Frequencies, cm−1 ∆H,
kcal·mole−1 H2O: HF/LBS r(OH)= 0.9403 Å ^HOH= 106.257° µSCF= 1.9681D
−76.0593511
−76.0593511
1745 (93) 4132 (15) 4231 (89) ZPVE=14.450
HF/LBS : H + O → OH HF/LBS : 2H + O → H2O ∆Eel (H + O → OH) r(OH)= 0.9506Å µSCF= 1.7620 D
E(H)= −0.4998179 E(O)= −74.8093404 E(OH)= −75.4193389 ∆Eel(OH)= −0.1101806
−69.139 kcal·mole−1
∆Eel (2H+ O→H2O) ∆Eel(OH)= −0.2503749 −157.113 kcal·mole−1
∆HH2O=−142.663 ∆Hexp~ −222

141
MP2(fc)/LBS:H2O H2O: r(OH)= 0.9589 Å ^HOH= 104.037° µMP2= 1.8992 D µSCF= 2.0193 D
−76.0585564
−0.2657301
−166.748 kcal·mole−1 (~0.35%)
−76.3242865
1624 (67) 3870 (6) 3989 (73) ZPVE=
13.556 Eaug−ELBS (MP2) −0.0017362
−1.089 kcal·mole−1 −0.0029803
−1.870 kcal·mole−1 −0.0047059
−2.953 kcal·mole−1
MP2/LBS : H + O → OH OH: r(OH)= 0.9664 Å µMP2= 1.6853 D µSCF= 1.7744 D
E(H)= −0.4998179 E(O)= −74.8093404 E(OH)= −75.4190866 ∆Eel(OH)= −0.1099283
−68.981 kcal·mole−1 (~65%)
E2(O)= −0.1430809 E2(OH)= −0.2017211 ∆E2= −0.0586402
−36.797 kcal·mole−1 (~35%)
EMP2(O)= −74.9524213 EMP2(OH)= −75.6208078 ∆EMP2(OH)= −0.1685686
−105.778 kcal·mole−1
µ(H)SCF= 0.0034 D
µ(O)SCF= 0.0138 D
EBSSE(H)= −0.4998226
EBSSE(O)= −74.8102230
EBSSE(H)−E(H)=−4.7−6
−0.003 kcal·mole−1 EBSSE
(O)−E(O)=−8.8−4 −0.554 kcal·mole−1
E2BSSE
(O)= −0.1459534 E2BSSE
(O)− E2(O)= −2.9−3 −1.803 kcal·mole−1
EBSSEMP2 (O)=−74.95618
EBSSEMP2 (O)− EMP2 (OH)=
3.8−3 −2.356 kcal·mole−1
3850MP2 (20) ZPVE= 5.505 ∆H= −100.273 ∆Hexp ~ −102
MP2/LBS : 2H + O → H2O ∆Eel= −0.2495802
−156.614 kcal·mole−1 (~67%)
∆E2= −0.1226492 −76.964 kcal·mole−1
(~33%)
∆EMP2= −0.3722294 −233.578 kcal·mole−1
∆H= −220.022 ∆Hexp~ −222
B3LYP/LBS H2O: r(OH)=0.96114Å ^HOH=105.041° µB3LYP= 1.8897 D µSCF = 2.005 D
−76.0584308
∆BLYP −0.4060808
−254.820 kcal·mole−1
(~0.53%)
−76.4645116
1627 (72) 3813 (5) 3913 (59) ZPVE= 13.370
kcal·mole−1 E difference, EMP2−EB3LYP (H2O)
−0.0001256 −0.079 kcal·mole−1
0.1403507 88.071 kcal·mole−1
0.1402251 87.993 kcal·mole−1
B3LYP/LBS : H + O → OH ∆Eel (H + O → OH) r(OH)= 0.9742 Å µB3LYP= 1.6739 D µSCF= 1.7805 D
E(H)= −0.4998179 E(O)= −74.8093404 E(OH)= −75.4187878 ∆Eel(OH)= −0.1096295
−68.794 kcal·mole−1 (~63%)
BLYP(H)= −0.0024391 BLYP(O)= −0.2815744 BLYP(OH)= −0.3474571 ∆BLYP= −0.0634436 −39.811 kcal·mole−1
(~37%)
EB3LYP(H)= −0.5022570 EB3LYP(O)= −75.0909148 EB3LYP(OH)=−75.766245 ∆EB3LYP= −0.1730731 −108.605 kcal·mole−1
3714 (12) ZPVE= 5.310
kcal·mole−1
∆H= −103.295 kcal·mole−1
B3LYP/LBS : 2H + O → H2O ∆Eel (2H+ O→H2O) ∆Eel= −0.2494546
−156.535 kcal·mole−1 (~68%)
∆BLYP= −0.1196282 −75.068 kcal·mole−1
(~32%)
∆EB3LYP= −0.3690828 −231.603 kcal·mole−1
∆H= −218.233 kcal·mole−1
4.2.1.1 Counterpoise Procedure for the Basis Set Superposition Error
Common chemical approach of partitioning the chemical matter on molecules leads to
difficulties within the framework of the ab initio calculations, which in their MO-LCAO
versions do not recognize the division of the whole system into individual parts. If for the sake
of simplicity, we consider the system AB to be composed of two molecules A and B, each of
which is stable, when isolated, then the binding energy could be defined as the difference
142
between energy of the complex, AB, and the combined energy of molecules A and B at infinite
separation. This definition, of course, should be further clarified with respect to whether the
binding energy is restricted to the electronic energy of the potential well, or the binding energy
also includes the difference of zero-point vibrational energise between the complex and
isolated monomers. Furthermore, the energy change in the vibrational, rotational and
translational degrees of freedom upon the complex formation should be taken in account if the
binding energy is treated as a thermodynamical entity. If the latter energy can be measured
experimentally (as the enthalpy of complex formation), the electronic binding energy, in a
majority of experimental cases, can only be approximated because it is very difficult to
determine or calculate precisely the zero-point vibrational energy. On the other hand, the
electronic ab initio or semi-empirical calculations provide the electronic energy of the potential
well defined as the difference between directly computed energies of the complex AB at its
optimum geometry and molecules A, and B in their optimum geometries. Following the idea
of partitioning the complex AB into subunits A and B, it appears logical to define another
entity, an interaction energy between molecules A and B when they assume together the
equilibrium positions within the complex, by subtracting the energies of A and B calculated
separately at their equilibrium geometry in the complex from the total energy of the complex.
The intermolecular perturbation theory considers explicitly the presence of interacting separate
units within the complex by implementing the specific perturbation partitioning scheme of the
total Hamiltonian given by eqs.(4.8)-(4.9) above (i.e. by introducing explicitly the Hamiltonian
of each monomer unit defined in eq.(4.8) and the system perturbation operator V defined in
eq.(4.8). Therefore, the SAPT ( symmetry adopted perturbation theory) version of the
intermolecular perturbation theory provides directly the interaction energy components unlike
the supermolecular approach, in which numerically small interaction energy appears from the
subtraction of two large numbers corresponding to the electronic energies of monomer units
from the total energy of the complex, which is also a large number. Technically, in the
calculation of the interaction energy using the supermolecular approach the electronic energy
of the individual monomers A and B is computed with the inclusion of the basis set of
counterpart. Since the electronic energy, being a variational property, decreases with
increasing the number of the basis functions, the computed electronic energy of the monomer

143
A (or B) within the complex AB depends on whether the basis set of entire complex is used or
just the basis set of the monomer itself. In the former case the calculated energy (of the
negative sign) will be larger by the absolute value than in the latter. On the other hand, the
binding energy is defined with respect to the electronic energies of individual molecules A and
B, parameters of which are usually optimized in their individual basis sets. However, if the
molecule A in its equilibrium monomer geometry will be brought into the contact with
molecule B similarly to that in the complex AB and the basis set of entire complex will be
employed (but the interaction with B is set to zero, i.e. A does not fill physically the presence
of B), then the electronic energy of monomer A will decrease. The reason for the energy
lowering for physically the same molecule is entirely due to the expansion of the basis set
employed. This artificial stabilization of the monomers upon the inclusion of the basis set of
counterpart is called basis set superposition error (BSSE). In other words, monomer unit A and
B attains additional non-physical stabilization in the complex comparatively to their individual
states due to the inclusion of the basis set of counterpart in the calculation of its own energy.
The same problem apparently presents during the optimization procedure. However, if the
entire complex is considered as a whole without attempting to partition the system on the
molecular parts then, of course, the BSSE does not exist because the basis set of entire complex
is always used. Therefore, the BSSE appears as a result of employing the supermolecular
approach to the chemical system under the question. Depending upon the size of basis set used
for the calculations, the BSSE could numerically amounts to a significant fraction of the
binding energy itself, which, of course, invites the correction procedure.
The commonly used method of avoiding this computational artefact, which, otherwise,
will cause significant overestimation of the binding energy, is to add to the binding energy the
combined difference of the energies of A and B at their equilibrium complex geometries
computed without and with the basis set of counterpart, respectively. This widely accepted
procedure known as a counterpoise correction was originally proposed by Boys and Bernardi
[38]. From a practical point of view, the binding energies for the water and water-organic
molecule HB complexes calculated in the present studies at ab initio or DFT levels are
corrected according to the counterpoise procedure, which can be expressed mathematically by
the following commonly accepted scheme [39, 40] (superscript and subscript indicate the basis

144
set and the geometry, respectively):
( ) ( ) ( ) ( )[ ]( ) ( ) ( ) ( )[ ]
( ) ( )[ ] ( ) ( )[ ]( ) ( ) ( ) ( )[ ]
( ) ( ) ( )[ ] ( ) ( )[ ]( )
( ) ( )[ ] ( ) ( )[ ]BΕAΕBΕAΕD.E.
D.E.ABEBΕAΕBΕAΕABE
CPBΕAΕABΕABE
BΕAΕBΕAΕCP
BΕAΕABΕABE
BΕAΕABΕABE
BB
AA
BAB
AAB
INT
BB
AA
BAB
AABINT
BB
AA
ABABBSSEcorr
ABAB
ABAB
BAB
AAB
ABAB
ABAB
ABABINT
BB
AA
ABAB
+−+=
+∆==+−++∆=
=++−=∆
+−+=
+−=∆
+−=∆
(v)
Energy) on(Deformati (iv)
correction secounterpoi - (iii)
(I.E.)Energy nInteractio - (ii)
(B.E.)Energy Binding classical- (i)
(4.28)
As follows from eq.(4.28), the counterpoise-corrected (BSSE-corrected) binding energy is
different from the interaction energy by a term, which can be physically interpreted as the
deformation energy of monomers upon the dimer formation. Both, the interaction and
deformation terms, are BSSE independent unlike their combination, the binding energy. A
water dimer or Acetone-W1 complexes can serve as a typical example of the weak HB
complexes, where the deformation energy terms are usually very small comparatively to the
interaction energy. The detailed analysis of these terms using the example of water dimer
indicates that even numerically small terms could effect the minimum location in those
situations when the potential energy surface is flat (this circumstance realises in the weak HB
complexes, and water clusters are excellent example of that). Moreover, in the case for
relatively large water complexes (such as water hexamers, W6) calculated at the B3LYP level
of theory, the deformation energies of a single water molecule can be as large as ~1
kcal·mole−1. Though small comparatively to the total O−H binding energy in H2O at ~120
kcal·mole−1 [41], these values are nearly comparable with the pairwise interaction energies in
these clusters, which indicates the general importance of the deformation terms and the
fundamental difference between the binding and interaction energies. Indeed, for particular
mono-hydrogen bonded complex of acetone and water hexagon, the interaction energy
between the acetone molecule and the water ring hexagon at the B3LYP/6-311++G(3df, 3pd)
level of theory is found to be −6.513 kcal·mole−1 whereas the binding energy is only −3.439

145
kcal·mole−1. This notable difference between the two values, the interaction and the binding
energies, originates from the deformation of a hexagon ring. Large values of the deformation
energy upon adsorption of the guests could be viewed as a characteristic feature of the water
clusters and could be further associated with the general flexibility of the water media.
Returning to the case of water dimer, it should be noted that the difference between the
interaction and the binding energies is almost negligible numerically at the MP2/aug-cc-pvtz
level but perceptible at the SCF level. Furthermore, the inclusion of the counterpoise
correction on the stage of the potential energy profiling along the O−O coordinate leads to a
shift of the minimum to a larger separation distance and, surprisingly, to the deepening of the
potential well. The latter observations indicate that CP or other similar methodology affect not
only the numerical values of the binding energy at a given minimum but also the location of
that minima and, more generally, the PES (potential energy surface) of a complex in question.
4.2.2 Cooperativity Effects in the Water Media
In the QM analysis of the HB systems with multiple hydrogen bonds, the multi-body
contributions to the total interaction energy can be used for elucidation of the cooperative
nature of the HB network. The cooperativity in the HB network resides in those effects that
make the “whole system to be larger than the sum of the parts” (in terms of interaction energy).
The network of HB's is bound more strongly together than any of individual links in the
absence of the others due to contribution of the multi-body corrections to the pairwise
interactions as it is represented by eqs.(4.1)-(4.4). In particular, Table 4.4.2 compares
calculated in the present work bonding energies in the water dimer (CS) and cyclic sequential
hexamer (S6) at the MP2 and B3LYP levels with different basis sets. The cooperativity effect
in cyclic hexamer leads to the following energetic and structural effects in transition from
dimer to hexamer. The partial bonding energy between hydrogen bonded pair (obtained by
division of the total binding energy on the number of hydrogen bonds in the system) is
significantly larger in hexamers than the dimer: B.E./HB (binding energy per hydrogen bond) =
−4.710 kcal·mole−1 (dimer) vs. −7.112 kcal·mole−1 (hexamers) at MP2/aug-cc-pvtz and −4.524
kcal·mole−1 (dimer) vs. −7.033 kcal·mole−1 (hexamers) at the B3LYP/LBS level. Furthermore,
the O···O distance between pair of hydrogen bonded neighbors decreases significantly on
transition from dimer to hexamer: 2.90719 Å (dimer) vs. 2.70686 Å (hexamers) at MP2/aug-

146
cc-pvtz and 2.91484 Å vs. 2.71299 Å at B3LYP/LBS levels. The increase in the length of O−H
bond also reflects the cooperativity effect in the sequential chain of water hexamers. If in the
dimer the length of O−H bond increases by 0.00721 Å and 0.00776 Å on the MP2/aug-cc-pvtz
and B3LYP/LBS levels, respectively, in the hexamers the same values rise to 0.02222 Å and
0.02384 Å. It is possible to assume that relatively short intermolecular distances in the
hexagonal ice (~ 2.7 Å) are originated from the cooperativity effect of hydrogen bond. Indeed,
as Table 4.2.3 shows, the intermolecular distance in the water dimer is substantially
underestimated while the bonding energy is significantly overestimated by those classical
water potentials, which is optimized for the proper description of a bulk water medium. The
classical potentials apparently cannot handle the cooperativity effects in finite water clusters,
which lead to artefacts in the dimer properties.
The HB cooperativity leads to the common occurrence of the long chain or more
complex arrangements of the HB's in the organic crystal structures. Moreover, the
cooperativity is a powerful enough to cause the formation of the stable molecular aggregates in
the liquid phases such as six-member rings in the liquid formamide [42]. It should be noted
that one could observe a correlation between the cooperativity and the topology of the HB
network. Following a discussion in the Scheiner’s book on the hydrogen bonding [43], let us
consider a pair of molecules AH and CH, each of which contains a proton to donate (in order
to form a hydrogen bond) and one or more lone electron pairs located on the A and the B
moieties, which makes them to be appropriate for accepting a proton. In the case of linear
arrangement H−C···H−A, an electron density shifts from the region of H−C bond to the region
of HB between C and H, and then further, from the H−A bond towards A moiety. As the result
of the HB formation between HC and HA moieties, the electron density on A increases
whereas the electron density on H−C bond decreases. The dimer HC···HA can potentially act
as a HB donor or acceptor, and, therefore, another molecule HD could be attached to HC
moiety of the dimer leading to a trimer with the following structure H−D···H−C···H−A, which
will be referenced thereinafter as a sequential configuration. Since the electron density on the
proton of HC subsystem is lower in the dimer than in HC monomer, the HB between HD and
HC is expected to be stronger due to the induction effect of HA part. Similarly, if HD acts as a
HB-donor and interacts with the H−A part of the dimer, the HB bond in the trimer

147
H−C···H−A···H−D is stronger than that in the dimer complex H−A···H−D because the electron
density on A is higher in the trimer's case due to the dative effect of HC part, which is
apparently absent in the dimer H−A···H−D. The calculations confirm this reasoning,
indicating that the induction effects are primarily accounted for the cooperativity in the HB
network. The presence of carbonyl group in acetone (Ac) and acetaldehyde (AcAl) molecules
creates a possibility of forming bifurcated W2−Ac and W2−AcAl complexes, in which oxygen
atom acts as a double proton acceptor. This configuration is relatively unfavorable from the
prospective of cooperative enhancement because the formation of first HB causes a depletion
of the electron density on the oxygen atom of carbonyl group, which, therefore, is expected to
weaken the second HB in accord with the above stated reasons. On the other hand, the 2:1
complexes are expected to be energetically (not thermodynamically because of the entropy
reduction) more stable than W + W−Ac or W+ W−AcAl (water molecule and 1:1 complexes),
and the present QM calculations indeed confirm this general expectation. The effect of
cooperativity has been in particular investigated on the SCF and MP2 levels for the HB linear
chain containing up to seven HCN molecules by King and Weinhold [44]. Their calculations
clearly show a progressive increase in the average SCF (with rather small 6-31+G(d) basis set)
binding energy from 4.2 kcal·mole−1 for the dimer to 7.68 kcal·mole−1 for the combination of
two trimers, and a concomitant decrease in the frequency and very large intensity increase of
the ν (C−H) stretch bands with number of the monomer units in the chain. It should be noted
that the observed cooperativity effect causing significant enhancement in the individual HB's
was found to exhibit relatively slow saturation with the chain length that suggests the presence
of even stronger HB's in larger molecular associates with a distribution of the energy of
individual HB's along the chain. The strongest bonds are expected to be located at the central
part of the chain whereas the weaker HB's are expected to be at the edges. Natural bond
orbital analysis performed by King and Weinhold [44] demonstrated that the cooperativity
effect in the (HCN)n system can be qualitatively rationalized on the basis of a simple
nN→σ*CH charge transfer picture of the HB, which is part of the exchange-deformation
included in the SCF deformation energy ∆ESCFdef given by eq.(4.23). The interesting feature
of the (HCN)n HB complexes is a character of the changes in the CN bond lengths and
corresponding frequencies: an act of donating of a proton makes the CN bond longer and

148
causes red shift in the ν(CN) frequency while it becomes shorter if molecule acts as acceptor
with concomitant blue shift in the frequency. The latter tendency is opposite, in particular, to a
water-acetone complex, in which C=O bond becomes longer with concomitant red shift in
frequency upon HB bonding. The changes in the carbonyl group upon HB bonding have been
explained by Nyquist [45] in terms of increasing weight of the ionic C+−O− resonance form,
which weakens the C=O bond. It appears that this explanation does not work in the case of
(HCN)n system. King and Weinhold further argued that the cooperativity effects in the HB
network systems, which have been observed experimentally and confirmed by the theoretical
calculations, appear to be in a contradiction with the electrostatic picture on the HB (i.e. due to
primarily ∆EHL + Σεn00ind terms, eqs. 4.20), which must, therefore, be augmented by the
exchange-deformation terms in order to account for the cooperativity phenomenology. The
discussion on the cooperativity could be viewed as logical continuation of the earlier
contradictions between two approaches to the HB, one of which stresses the electrostatic nature
of HB and is due to Pauling followed, in particular, by Bauer and Magat, and Lennard-Jones
and Pople, and later Morokuma [46]. The opposite view stresses an importance of the charge-
transfer or, more generally, exchange-correlation effects as a key element of the HB, and it is
due to Mulliken followed, in particular, by Ratajczak, Orville-Thomas [47], and recently
advocated by Weinhold [44]. The nonadditivity of multibody interaction energy resides in the
non-additivity of polarization, dispersion, and exchange components, the cooperativity in the
HB networks of water molecule. For instance, Table 4.2.4 and Table 4.2.5 represent a
multibody contribution to the binding energy of the sequential water hexamer on the MP2 and
B3LYP levels. It appears that the pairwise interaction energy decreases in transition from
dimer to hexamers, i.e. −4.749 kcal·mole−1 (dimer) vs. −4.013 kcal·mole−1 (hexamers) on the
MP2 level or −4.566 kcal·mole−1 vs. −3.908 kcal·mole−1 on the B3LYP level. On the other
hand a strong three-body effect, which reflects the significance of induction in the sequential
array of HB's, is evident. Indeed, it amounts to −12.938 of total −42.196 kcal·mole−1 in the
hexamers on the MP2 level. Therefore, the cooperativity effect in the sequential array could
be primarily associated with the induction interaction on the three-body level.

149
Table 4.2.2. Binding energies of the water dimer W2 (Cs) and cyclic hexamer W6 (S6).
The calculations were performed on the MP2(fc) (frozen core approximation) and B3LYP
levels with the aug-cc-pvtz (TZ)and 6311++g(3df, 3pd)(LBS) basis sets. ΘC stands for the
inclination angle of acceptor with respect to the O---O line. L(O-O) and ∆L (OD-H) designate
intermolecule distance and the change in the O-H distance upon hydrogen bonding. SCF, E2
and EMP2 designate the HF energy, second order MP correction and the total MP2 energy.
Dimer (Cs), kcal·mol-1 Hexamer (S6), kcal·mol-1 MP2 B3LYP MP2 B3LYP
Basis set TZ LBS TZ LBS TZ LBS LBS SCF −3.482 −3.777 −29.899 −31.536 E2 −1.699 −1.528 −16.473 −15.521
B.E.
EMP2 −5.181 −5.305
−4.571
−4.832 −46.372 −47.057
−44.232
SCF −3.406 −3.419 −29.287 −29.128 E2 −1.303 −1.149 −13.382 −12.020
−4.710 −4.568
−4.518
−4.524
B.E. BSSE
corr.
EMP2 Expt. −5.44 (−5.5)
−42.669 −41.148
−42.196
−2.607 −2.346 −2.393 −2.350 B.E. BSSE corr. + ∆ZPVE
Expt. ∆H*373K = −3.59 (-3.63)
−29.421
B.E. BSSE corr.
per HB −4.710 −4.568 −4.518 −4.524 −7.112 −6.858 −7.033
∆L (O−H)donor 0.00721 0.00704 0.00787 0.00776 0.02222 0.02177 0.02384 2.90719 2.90384 2.91724 2.91484 L (O−O)
Expt. 2.976 2.70686 2.70395 2.71299
56.6 56.1 56.8 58.0 ΘC, º Expt. 58
HB ang., º 171.7 173.0 172.1 172.6 179.2 179.2 178.6 2.6201 2.6820 2.6337 2.6341 Dipole
Moment, D Expt. ~ 2.6 0
Table 4.2.3. Optimized geometry and dimerization energy for the linear water dimer for the
selected classical potentials [59].
Potential O···O distance, Å ΘC, deg˚ B.E., kcal·mol−1
SPC 2.75 26 6.59 TIP3P 2.74 27 6.50 BF 2.72 47 6.06 ST2 2.85 52 6.84 TIPS2 2.79 46 6.20 TIP4P 2.75 46 6.24

150
Table 4.2.4. Multi-body decomposition of the binding energy for the water dimer W2 (Cs) and
the water cyclic hexamer W6 (S6) at the MP2(fc)/aug-cc-pvtz level. SCF, E2 and EMP2
designate the HF energy, second order MP correction and the total MP2 energy.
Dimer (Cs) Hexamer (S6) µHartree kcal·mol−1 µHartree kcal·mol−1
SCF −5549 −3.482 −47647 −29.899 E2 −2707 −1.699 −26252 −16.473
B.E.
EMP2 −8256 −5.181 −73899 −46.372 SCF −5428 −3.406 −46673 −29.287 E2 −2077 −1.303 −21325 −13.382
B. E. BSSE corr.
EMP2 −7505 −4.710 −67998 −42.669 SCF 162 0.102 1288 0.808 E2 −130 −0.082 −787 −0.494
Deformation E. per molecule
EMP2 32 0.020 501 0.314 SCF −5752 −3.610 −3671 −2.304 E2 −1816 −1.140 -2724 −1.710
1-2
EMP2 −7569 −4.749 -6396 −4.013 SCF −1369 −0.859 E2 −28 −0.017
1-3
EMP2 −1396 −0.876 SCF −748 −0.469 E2 23 0.015
1-4
EMP2 -724 −0.454 SCF −32482 −20.383 E2 −16442 −10.317
Pairwise
Terms
Σ total
EMP2 −48924 −30.700 1-2-3 1-2-4 SCF -2422 -1.520 -347 -0.218 E2 38 0.024 1 0.001 EMP2 -2383 -1.496 -346 -0.217
1-2-5 1-3-5 SCF -406 -0.255 -77 -0.048 E2 1 0.001 -1 -0.001 EMP2 -404 -0.254 -78 -0.049
Σ total SCF -19203 -12.050 E2 245 0.154
Three-body Terms
for W6
EMP2 -18958 -11.896 1-2-3-4 1-2-3-5 SCF -290 -0.182 -61 -0.038 E2 -38 -0.024 -11 -0.007 EMP2 -328 -0.206 -72 -0.045
1-2-4-5 Σ total SCF -124 -0.078 -2478 -1.555 E2 -15 -0.009 -338 -0.212
Four-body terms
for W6
EMP2 -139 -0.087 -2816 -1.767
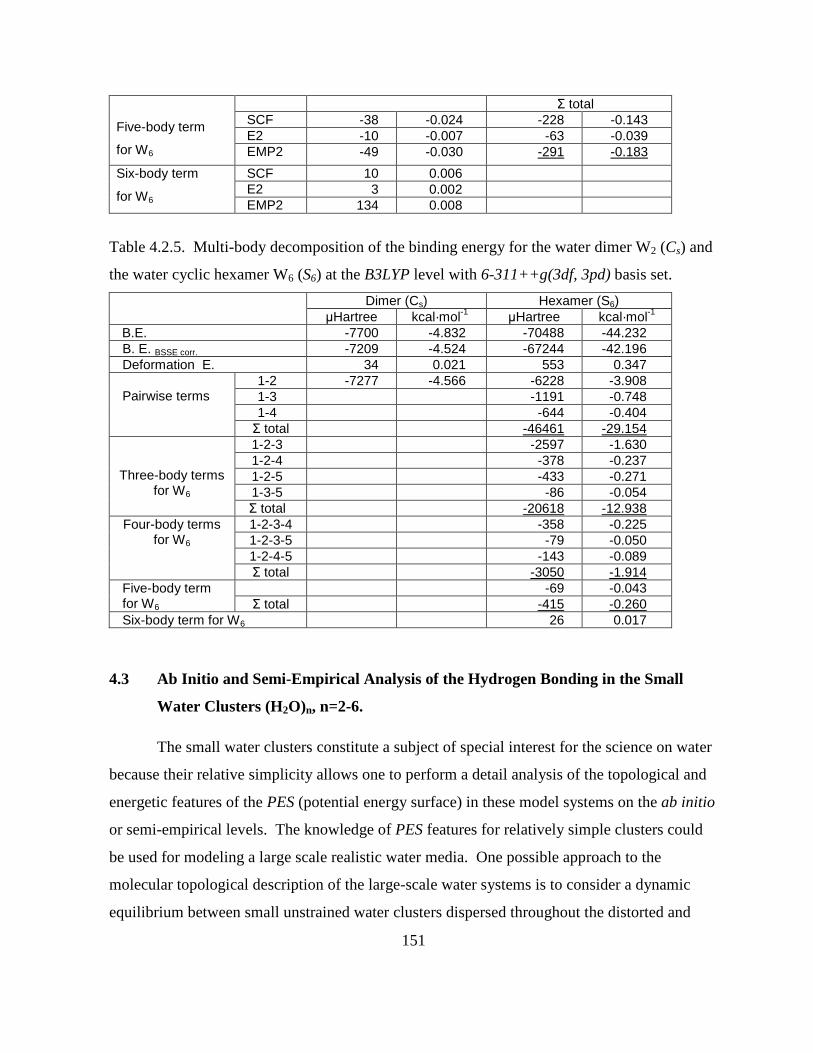
151
Σ total SCF -38 -0.024 -228 -0.143 E2 -10 -0.007 -63 -0.039
Five-body term
for W6 EMP2 -49 -0.030 -291 -0.183
SCF 10 0.006 E2 3 0.002
Six-body term
for W6 EMP2 134 0.008
Table 4.2.5. Multi-body decomposition of the binding energy for the water dimer W2 (Cs) and
the water cyclic hexamer W6 (S6) at the B3LYP level with 6-311++g(3df, 3pd) basis set.
Dimer (Cs) Hexamer (S6) µHartree kcal·mol-1 µHartree kcal·mol-1
B.E. -7700 -4.832 -70488 -44.232 B. E. BSSE corr. -7209 -4.524 -67244 -42.196 Deformation E. 34 0.021 553 0.347
1-2 -7277 -4.566 -6228 -3.908 1-3 -1191 -0.748 1-4 -644 -0.404
Pairwise terms
Σ total -46461 -29.154 1-2-3 -2597 -1.630 1-2-4 -378 -0.237 1-2-5 -433 -0.271 1-3-5 -86 -0.054
Three-body terms
for W6 Σ total -20618 -12.938 1-2-3-4 -358 -0.225 1-2-3-5 -79 -0.050 1-2-4-5 -143 -0.089
Four-body terms for W6
Σ total -3050 -1.914 -69 -0.043 Five-body term
for W6 Σ total -415 -0.260 Six-body term for W6 26 0.017
4.3 Ab Initio and Semi-Empirical Analysis of the Hydrogen Bonding in the Small
Water Clusters (H2O)n, n=2-6.
The small water clusters constitute a subject of special interest for the science on water
because their relative simplicity allows one to perform a detail analysis of the topological and
energetic features of the PES (potential energy surface) in these model systems on the ab initio
or semi-empirical levels. The knowledge of PES features for relatively simple clusters could
be used for modeling a large scale realistic water media. One possible approach to the
molecular topological description of the large-scale water systems is to consider a dynamic
equilibrium between small unstrained water clusters dispersed throughout the distorted and

152
irregular HB network of water molecules. This picture, conforming most closely to the liquid
water at near-freezing temperatures and at the supercooled region, when the probability of
forming the ordered unstrained clusters is expected to be significantly higher than at more
elevated temperatures, is consistent with the cluster model of the liquid water, which
originates from the studies of Frank [48], and Nemethy and Scheraga [49, 50]. In the search
for plausible structurally recognizable local forms of liquid water, the cluster approach
naturally turns to those water polyhedra, which have been observed in the crystalline water
phases and in the clathrate-hydrate crystalline lattices. In particular, the building block of
many of the clathrate-hydrate structures, pentagonal dodecahedron, appears among potential
elementary units for the cold liquid water, whereas another plausible candidate, bicycle
octagon, occurs over the structure of the hexagonal ice, Ih. Considered as isolated structures,
these bulky unstrained water polyhedra exemplify most likely the global minima on the PES
for a given number of the water molecules. The relative configuration of the water molecules
determines the possible sequences and geometries of the hydrogen bonds throughout the
cluster according to the Bernal-Fowler and Pauling ice rules [51, 6]. The latter states that in
the HB network each participant can donate at most two hydrogen bonds to the closest
neighbours and receive at most two bonds from another two closest neighbours, or in other
words, a tetra-coordinated water molecule act as a double donor and as a double acceptor of
HB's. These ice rules play a key role in the understanding of the topological and energy
properties of cubic, Ic, and hexagonal, Ih, ices by providing an elegant classification tool for
the assignment of different HB configurations and by explaining the origin of an energy
degeneration of allowed HB configurations.
Regarding the hydrogen bond topology, the notations of configuration and
conformation are adopted from the general language of organic chemistry and employed in the
present discussion. The relative position of hydrogen-bonded water molecules in the cluster
and the sequence of hydrogen bonds connecting these molecules together constitute a
configuration as shown below in on the example of water tetragons. In particular, in the
present studies there are found the following configurations: sequential ring and tetrahedron.
A transition from one configuration to another should involve, therefore, the creation and/or
disruption of some HB's participating in the initial and final networks. The OH groups that are

153
not involved in the HB network within the given configuration, form the dangling bonds
(labelled as (OH)d). An important property of these resides in the potential of becoming
employed in the HB network. In the studies on isolated water clusters, in which the ratio of
highly coordinated molecules to the low coordinated molecules is necessarily small (unlike the
real water media, where the bulk to surface ratio is usually very large) the dangling bonds
often play one of the leading roles in the reconfiguration of a cluster. For example, the
transition from sequential ring to the tetrahedron occurs if W1 becomes a double acceptor with
2 DBs and W3 becomes a double donor (see Table 4.3.2). Analysis of the water tetramer
family reveals the main structural and energetic features, which characterize the small water
clusters W3-W6. The most noticeable structural feature of isolated water cluster, which
controls the existence of particular configuration, resides in double donor (d2) local
arrangement. The double donor water molecule bears significant negative charge due to the
donation from two HB neighbors. This negative charge attracts the non-compensated positive
charge on OH DB located on the remote water molecules. As a consequence of this attraction
the configuration changes such that additional HB will be established between the d2 and OH
DB by "internal reaction": d2 + OH (DB)→HB. The sequential configurations are found to be
the most stable among all others possible local minima for the water clusters of a given size as
shown in particular in Table 4.3.2 for W4. If an initial configuration includes the d 2 and the
OH DB, such a configuration is found unstable. This unstable configuration will convert to
another configuration with a larger number of HB's, which belongs to a different
configurational class as discussed below in section 4.3.3. Therefore, distorted HB's originate
from a collapse of the d 2 and the OH DB structural features of finite water clusters.
Figure 4.3.7 demonstrates the effect of cluster geometry on the energy properties for a
W1-W4 set, calculated on B3LYP and TIP4P levels. It is evident that the binding energy of the
sequential tetramer rings is the largest among all other clusters. The different orientation of
dangling bonds within a given configuration does not significantly influence the total binding
energy despite the apparent dipolar repulsion between OH bonds (see Table 4.3.2). The
binding energy for the non-sequential configurations such as tetrahedron is discernibly larger
as well as for those, which include multiple double donors and double acceptors. Another
example is given by the transition from a bifurcated hexagonal ring configuration, comprising

154
a double donor in the first position and a double acceptor at the forth position in the ring, to the
book configuration due to 1-4 hydrogen bonding. The former configuration appears therefore
to be metastable with respect to that particular book configuration, in which it transforms
during the minimization trial with the B3LYP/6-311++G(3df, 3pd) level of theory. Apart from
the role that a dangling bond plays as a structure-forming element, this example also
demonstrates a potential structural significance of the non-coordinated lone pairs on the
oxygen atom of a water molecule (labelled as Od ). In other words, the OHd and Od moieties
should be considered as a potential donor and acceptor of the hydrogen bond, respectively.
These structural features are assumed to constitute the surface of water media. In the studies
on ice surface [52], Fletcher has considered the preferential orientation of the incompletely
coordinated water molecules on the surface of ice and found that the preferential orientation
depends on the relative polarity of the OHd and Od molecular parts. Fletcher shown that the
dipole-quadrupole interaction is a major contributor to the energy difference between two
imaginary surface configurations with the OHd or Od outwards and concluded, based on the
static values of the quadrupole tensor for water molecules, that the configuration with OHd
outward is more stable (latter [53], however, he has reversed this assignment because the
earlier derivations erroneously included the spherical part of the quadrupole tensor [52], which
should be ignored). The experimental evidence, primarily from the spectroscopic area [54],
indicate the OH DB’s as the dominant species on the water medium surface, in accord with the
conclusion of main Fletcher's work (despite the mathematical error involved [52, 53]). Of
course, the polarity of the OH DB’s or Od moieties depends on the nearest molecular
environment, which makes this property to be a structure-dependent and dynamic feature. The
lone pairs on the Od moiety occupy two molecular orbitals, which within the framework of
natural bond orbital approach are at −0.91948 Hartree with the sp-hybridization directed along
bisector of the H−O−H angle and at −0.50561 Hartree with the p-hybridization directed
perpendicular to the molecular plane whereas two nearly identical bond OH orbitals are found
at −0.97481 Hartree with nearly sp3-hybridization (MP2(fc)/aug-cc-pvtz). The high energy of
the p-hybridized lone pair on O atom indicates the relatively high polarizability, which in turn
could lead to potentially significant dependence of the dipole and quadrupole moments on the
neighborhood.

155
Among many possible configurations with a given number of the water molecules, a
special case comprises monocyclic arrangements, which often could be characterized by a high
symmetry and an optimal conformation of the hydrogen bonds. Irrespectively to the size of the
ring and the conformational arrangement of the HB's, a key characteristic of this class of HB
network resides in the hydrogen bonding only among the nearest neighbours, which leads
therefore to the general equivalence between a number of molecules, hydrogen bonds and
dangling groups. The monocyclic class can be further divided on two subclasses: sequential
and non-sequential. In the sequential subclass, each water molecule donates hydrogen bond to
the next closest neighbour and accepts a hydrogen bond from the nearest neighbor. The
combination of a single donor (d) and single acceptor (a) coordination of a doubly bonded
water molecule will be abbreviated as (da) thereinafter. The non-coordinated OH group of
each molecule in the sequential arrangement appears in the dangling position usually above or
below the plane of ring. In the non-sequential subclass, in contrast with the sequential
subclass, some water molecules acts as a double donor of the hydrogen bonds whereas some
other molecules act accordingly as a double acceptor. The double donor is labeled by d2
whereas double acceptor is labelled by a2, respectively. From the perspective of structural
stability, the sequential monocyclic class has been found among the most stable configurations
including those with a higher number of the hydrogen bonds involved. As it is shown below in
this Chapter, the origin of this exceptional stability of sequential monocyclic arrangement can
be attributed to the strong tri-body contribution (non-additive) to the total binding energy and
the optimum relative orientation of the next-neighbor dipoles leading to the significant
negative 1-3 pairwise contribution.
The non-sequential subclass has been found to be generally unstable and convert either
to sequential configuration or to the multi-cyclic class of configurations. In contrast to the
monocyclic class of configurations, in those cases when the HB network contains multiple
cycles, a number of the HB's becomes larger than the number of molecules involved, which
causes an appearance of triply- and/or tetra-coordinated water molecules. In these cases, a
water molecule at branching points acts as a double acceptor and/or as a double donor in
accord with the ice rules. On the other hand, the sequence of HB's, i.e. the number of donor
and acceptor sites within the structure, will be considered as an attribute of the configuration

156
although it is possible that non-sequential unstable configuration will produce on minimization
a stable sequential configuration but in the non-optimal conformation. With respect to the
hydrogen bond between a pair of water molecules, the relative position of hydrogen atoms not
involved in this hydrogen bond will be referred to as a conformation. For the isolated
sequential HB rings different conformations includes "up" (+) and "down" (−) axial orientations
of the non-coordinated free OH groups, i.e. OH dangling bonds. In addition to the axial
conformations there are local minima associated with the nearly equatorial orientation of the
dangling bonds such those found for pentagonal and hexagonal rings. The existence of
equatorial minima is in accord with the flexibility of hydrogen bonds. Conformation ↔
configuration regrouping due to the molecular rotation is referred to as the Bjerrum's
transitions. With respect to a water tetramer, two configurations are theoretically possible: a
ring and a tetrahedron. The ring configuration can be characterized by the sequential cyclic
arrangement of four HB's: 1d→ a2d→a3d→a4d→a1. In particular, the cyclic arrangements
of the HB systems are stabilized by the cooperative effect exemplified primarily on the tri-
body level. On the other hand, in the tetrahedral configuration of four water molecules that has
been also found to be a true local minimum of higher energy, there is an additional hydrogen
bond acting as a bridge between the first and the third molecules and consequently increasing
the total number of HB's to five. Of course, this additional HB coordination causes the
weakening of those HB's that constitute the bonding in the cyclic part, such that the potential
energy of this tetrahedral complex appears to be higher than that of a ring despite a larger
number of the HB's. The possibility of attaining different configuration should be viewed as a
representation of the flexibility in the HB network because a smooth relaxed potential of the
individual bond allows such degree of deformation, which is necessary for the transition to
another local minimum. Furthermore, the energy of a given geometric arrangement of water
molecules depends not only on their relative position associated with the position of oxygen
atoms, but also to in a certain degree on the relative position of hydrogen atoms not involved in
the hydrogen bonding (dangling bonds in the case of cyclic configuration), or, in other words,
on the HB conformation. Therefore, it can be assumed that for a given number of water
molecules, the relative stability of a particular H2O-configuration depends on the HB
conformation attained by the hydrogen atoms. Within the given configuration, the system can

157
transfer from one HB conformation into another by the Bjerrum's mechanism, which assumes
that the transport over rotational transition states could violate the ice rule in the case of 4 HB-
coordinated water molecules, become possible at certain temperature. In the case of tetragonal
sequential ring configuration with 2 HB-coordinated arrangement, a transition from the lowest-
energy sequential S4-symmetry (da)4[+−+− ] axial arrangement into the next Ci (da)4[++−− ]
conformation of slightly higher energy requires the rotation of two neighbouring water
molecule whereas a transition to the (da)4[+++− ] conformer requires the rotation of only a single
water molecule without breaking the sequential HB ring arrangement. Unlike the B3LYP
results, the minimization of these axial conformers in the sequential tetramer configuration at
classical TIP4P potential leads to the most stable S4 conformer indicating small energy barrier
for the molecular rotation in the open cyclic structures. An observation that different HB
conformations in the small water clusters appear at different energies invites re-examining
Pauling's hypothesis on an energetic equivalence of the HB conformations attained in the Ih
according to the ice rule. In part this energy difference is due to Coulomb repulsion between
positively changed hydrogen atoms, which is stronger in the cis- than in trans-conformations.
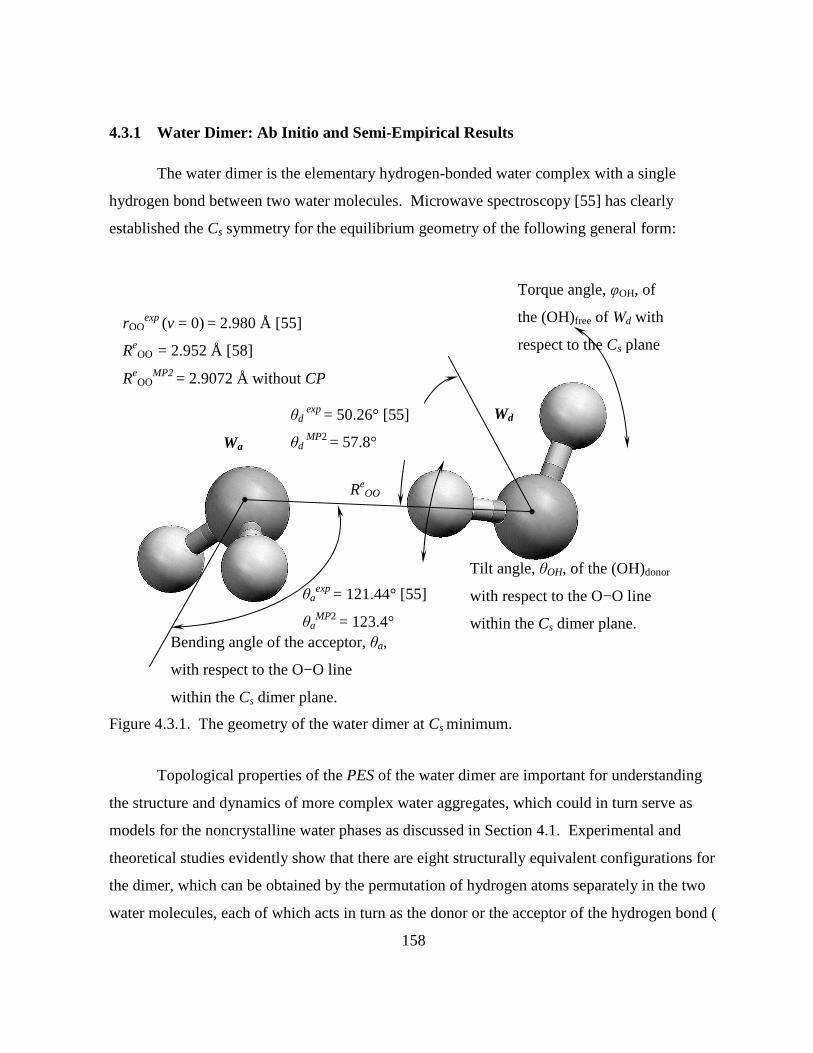
158
4.3.1 Water Dimer: Ab Initio and Semi-Empirical Results
The water dimer is the elementary hydrogen-bonded water complex with a single
hydrogen bond between two water molecules. Microwave spectroscopy [55] has clearly
established the Cs symmetry for the equilibrium geometry of the following general form:
Figure 4.3.1. The geometry of the water dimer at Cs minimum.
Topological properties of the PES of the water dimer are important for understanding
the structure and dynamics of more complex water aggregates, which could in turn serve as
models for the noncrystalline water phases as discussed in Section 4.1. Experimental and
theoretical studies evidently show that there are eight structurally equivalent configurations for
the dimer, which can be obtained by the permutation of hydrogen atoms separately in the two
water molecules, each of which acts in turn as the donor or the acceptor of the hydrogen bond (
Wd
Wa
Torque angle, φOH, of
the (OH)free of Wd with
respect to the Cs plane
ReOO
θd exp
= 50.26° [55]
θd MP2
= 57.8°
Tilt angle, θOH, of the (OH)donor
with respect to the O−O line
within the Cs dimer plane.
θaexp
= 121.44° [55]
θaMP2
= 123.4° Bending angle of the acceptor, θa,
with respect to the O−O line
within the Cs dimer plane.
rOOexp (v = 0) = 2.980 Å [55]
ReOO
= 2.952 Å [58]
ReOO
MP2 = 2.9072 Å without CP
159
the intermolecular permutations are not allowed) [56, 57]. All 8 forms assume the geometry
given above in accord with the presence of a single global minimum on the dimer PES (with
the Cs symmetry). In the present studies, the cross-sections of the PES were determined at the
MP2(fc)/aug-cc-pvtz level of theory without correcting on the basis set superposition error,
which is consistent with the minimization procedure implemented in the Gaussian program,
because the latter ignores the BSSE effects on the location of minimum. Although it is
straightforward to perform the PES mapping with the counterpoise correction (see section
4.2.1.1) for the basis set superposition error, we have not undertaken this task in the present
studies with the exception of an O−O distance scan, which is of the primer importance for
allocating the potential well and for determining the potential depth. Indeed, different results
were obtained with and without the counterpoise correction. The equilibrium geometry of
water dimer has been experimentally determined by Dyke et al. [55] using microwave
spectroscopy with the equilibrium O−O distance at 2.980 Å and the bending angles for the
acceptor and donor at 121.44° and 50.26°, respectively. A correction for the effects of
anharmonicity performed by van Duijneveldt-van de Rijdt and van Duijneveldt [58] reduces
the intermolecular distance to a value of 2.952 Å, which in this numerical representation can
be directly compared with the ab initio calculations. The empirical potential well depth is
found at −5.4 ±0.2 kcal·mole−1 by Reimers et al. [59], who extrapolated the results of semi-
empirical analysis of the second virial coefficient of steam, and at −5.44 ±0.7 kcal·mole−1 by
Curtiss et al. [60] from the data on the thermal conductivity of water vapor. The empirical
potential well depth is obtained by subtracting the energy changes in the translational,
rotational and vibrational degrees of freedom upon dimer formation from the experimental
enthalpy of dimerization. Therefore, empirical well depth appears to be dependent on the zero
point vibrational energy of dimer, which in the calculations of potential well depth was
estimated at 2.25 kcal·mole−1 on the basis of SCF/4-31G level of theory [60, 61]. Regarding
the anharmonicity influence on the empirical depth, Mas and Szalewicz argued that
introduction of accurate zero-point vibrational energy in the calculation of the empirical well
depth will bring the value up to −5.2 kcal·mole−1 [62]. Complete optimization by Frisch et al.
[63] at the MP2 (fu) (i.e. all electrons are included in Möller-Plesset calculations) level with
the 6-311++G(2d, 2p) basis set led to the equilibrium distance of 2.911 Å and to the BSSE

160
corrected binding energies at −3.43 kcal·mole−1 (SCF) and −4.57 kcal·mole−1(MP2) obtained
with larger 6-311++G(3df, 3pd) 150-function basis set and frozen core approximation. In the
present studies (Table 4.3.1), the calculations at MP2(fc) (i.e. 1s electron pairs on oxygen
atoms were excluded from MP2 calculations) level with the 6-311++G(3df, 3pd) basis set lead
to 2.90384 Å (ROO), −3.419 kcal·mole-1 (SCF), −4.568 kcal·mole-1 (MP2),respectively, which
closely correlates with the results of Frisch et al. [63]. Utilization of a relatively larger aug-cc-
pvtz 184-AO's basis set in the present studies at MP2(fc) level leads to 2.90719 Å (ROO),
−3.406 kcal·mole-1 (SCF), −4.710 kcal·mole-1, respectively, with the full energy for the global
minimum at −152.66624093383 Hartree. With the same computational settings, Xantheas et
al. [64] have reported a value of −152.66624091 Hartree for the global minimum whereas the
equilibrium distance and BSSE corrected binding energy was found at 2.91 Å and
−4.71kcal·mole−1 in a good agreement with the present result. Concerning the complete basis
set limits for the binding energy of the water dimer at the MP2(fc) level of theory with the
Dunning's aug-cc-pvxz basis sets, Xantheas [65] recommends a value of −4.9 kcal·mole−1,
which is noticeably smaller than the accepted experimental value of −5.4 ±0.2 kcal·mole−1 but
in somewhat better agreement with the corrected value, −5.2 kcal·mole−1 [62]. With a very
large 262-function [13s,8p,4d,2f/8s,4p,2d] basis set Kim et al. [66] have obtained at the MP2
level the following values: −152.79031 Hartree (total energy), 2.925 Å (ROO), 122.3°(θa),
−3.69 kcal·mole-1 (SCF), −4.66 kcal·mole-1 (EMP2), respectively, with the approximated value
of ~ −5.0 kcal·mole−1 for the complete basis set limit, which is approaching the experimental
value.

161
Table 4.3.1. The comparative table for the ab initio and B3LYP data for water monomer and
dimer.
Parameter Expt.
H2O The HF limit is at −76.0675 [73]
Electronic energy, Hartree
−76.4802 [66]
MP2 (fc)/aug-cc-pvtz (C2V) EMP2 = −76.3289924 ESCF = −76.0602820 MP2(fc)/LBS (C2V) EMP2 = −76.3242865 ESCF = −76.0585564
B3LYP/aug (C2V) E = −76.4661967 B3LYP/LBS (C2V) E = −76.4645116
MP2(fc)/LBS at MP2(fu)/6-311++g(2d, 2p) Frisch geom. [63]: EMP2(fc) = −76.32428 EMP4(fc)= −76.33868 ; MP2/aug-cc-pvtz : EMP2 = −76.3289924 MP2/aug-cc-pv5z EMP2 = −76.3602282 ; [28,18,8,3/18,8,3] [67]: EMP2 = −76.40404 ESCF = −76.06742 ; [13,8,4,2/8,4,2] [65]: EMP4 = −76.40706 EMP2 = −76.39118 ESCF = −76.06756 ; (fc) aug-cc-pvtz at Frisch geom. [73]: ESCF= −76.0606 EMP2 = −76.3290 EMP4 = −76.3436
ZPVE, kcal·mole−1
13.18 [4] 13.4351aug
13.5560LBS
13.3267aug
13.3702LBS
[13,8,4,2/8,4,2] [65] 13.50MP2
L(O−H), Å 0.957 [68] 0.9576257 [69]
0.96137aug
0.95887LBS
0.96185aug
0.96114LBS
Frisch geom.[63]: 0.9571 ; [13,8,4,2/8,4,2] [65]:
0.959MP2
<H−O−H, ° 104.50 [68] 104.51 [69]
104.11aug
104.04LBS
105.08aug
105.04LBS
Frisch geom.[63]: 104.34 ; [13,8,4,2/8,4,2] [65]
104.2MP2
Dipole, D 1.855 [55] 1.8595aug 1.8993LBS
1.8473aug 1.8897LBS
[13,8,4,2/8,4,2] [65] 1.850MP2
Dimer MP2/aug-cc-pvtz (C2V)
Eel = −152.666241 Hartree
B3LYP/LBS (C2V) Eel = −193.2323224
Hartree
B3LYP/LBS (C2V) [20] Eel=−193.232326
Hartree
By implementing the partial optimization (with the nonoptimized geometric parameters
of individual water molecules) at the MP2 level with the BSSE counterpoise correction and
progressively improved basis sets with the basis functions located at the middle of the O−H
bonds, van Duijneveldt and van Duijneveldt [58] have obtained the following data:
−152.643549 Hartree (total energy at MP2 level), 2.949 Å (ROO), 124.8°(θa), 57.6°(θd), −3.69

162
kcal·mole-1 (SCF), −4.73 kcal·mole-1 (EMP2), respectively. Using the SAPT approach and the
partial optimization of dimer (both monomer units assume the same vibrationally averaged
geometry different however from the monomer equilibrium geometry by small extension of the
O−H bond), Mas and Szalewicz [62] have estimated the interaction energy in the dimer at
−5.05 kcal·mole-1, which is in a very good agreement with the anharmonicity-corrected
experimental value for the binding energy. Indeed, the vibrationally averaged geometry of the
water monomer used by Mas and Szalewicz [62], r(O−H) = 0.9716257 Å and 104.69° for the
^H−O−H angle, appears to be reasonably closed to that obtained by a complete optimization in
the present work on the MP2(fc)/aug-cc-pvtz level, WDonor: r(O−H)donor = 0.96858 Å,
r(O−H)free = 0.96041 Å, WAceptor: r(O−H)ac = 0.96227 Å and ^H−O−H at ~104.5° although
shorter O−H distances in the present geometry are noted. A key difference between these two
geometries resides in the optimal O−O distance, which is 2.953 Å in the Mas and Szalewicz
geometry and 2.907 Å in the present geometry. It is obvious that the monomer units are
different from each other, and exist in the geometries different from that of isolated water
molecule especially with the respect to the length of (O−H)donor bond, which is larger than the
equilibrium O−H distance in the isolated water molecule. Moreover, since the elongation of
the (O−H)d bond appears as an essential attribute of the HB systems (at least from the
spectroscopic point of view), it is logical to perform a complete optimization of the dimer
including the optimization of the internal coordinates of both water molecules. From the
viepoint of binding energies, the results of van Duijnevent and van Duijnevent [58], and Mas
and Szalewicz [62] neglect the deformation energy of the monomers (see eqs.(4.2) and (4.28)
above), which is usually a very small positive value at the MP2 level, although it could be
negative at either SCF or second-order correction levels. MP2/aug-cc-pvtz calculations using
the Mas and Szalewicz geometry [62] reveal that the total deformation energy of both
molecules is +0.271 kcal·mole−1 (+1.250 kcal·mole−1 at SCF level) measured with respect to
the optimized monomer geometry at the MP2/aug-cc-pvtz level of theory or +0.237
kcal·mole−1 (MP2) and +1.630 kcal·mole−1 (SCF) using the monomer obtained by Polyanski et
al. geometry [69]. On the other hand, the combined deformation energy at the minimum of the
dimer, obtained in the present studies at the MP2/aug-cc-pvtz level, was determined to be
+0.040 kcal·mole−1 for the MP2 and +0.203 kcal·mole−1 for the SCF levels, respectively (see

163
Figure 4.3.5.). If the deformational energy at the MP2 level is indeed negligible, the SCF
deformation part is discernible and could play a role in the location of minimum, and
contribute to the SCF limit of the binding energy. In this sense, the Mas and Szalevicz [62]
and van Duijnevent and van Duijnevent [58] results are associated with the interaction energy
rather than with the binding energy as discussed in the section 4.2.1.1. Regarding the SCF
complete basis set limit for the interaction energy, Rybak at el. [70] and Szalewicz et al.[71]
have reported the value of −3.73±0.05 kcal·mole−1 at the near-equilibrium geometry
determined at the SCF level of theory with a very large basis set by Popkie et al.[72] while
Feller [73] has reported a value of −3.55 kcal·mole−1 using the Frisch's geometry [63]. These
were reported in literature with no further explanations for such significant differences in the
SCF limit of the interaction energy in the water dimer. Feller extrapolated his MP2 level
results using the aug-cc-pvxz basis sets to the value of −4.95 ±0.05 kcal·mole−1 as the complete
basis set limit, which appears to be identical with Xantheas's estimate of the binding energy
[65].
An investigation of the influence of the basis set on the components of the interaction
energy [58, 74, 75] (eqs.(4.20)-(4.24) above) reveals that ∆EHL, or the interaction energy
between undeformed SCF subsystems that includes the attraction of permanent dipoles (as a
leading term) and the Heitler-London exchange repulsion, is very sensitive to the basis set and,
in particular, to the exponent of the polarization function. This strong basis set dependence of
the electrostatic component of the binding energy is primarily due to the sensitivity of the
dipole moment of the monomer units to the basis set. Smaller basis sets such as the standard
6-31G(d,p) (10s4p1d/4s1p) [321/21] split valence basis poorly describe the electrostatic part of
the binding energy because of the significant overestimation of the dipole moments of
monomer units [74]. Despite this unfavorable feature, the computationally efficient 6-
31G(d,p) basis set is utilized in the present studies for the calculations of the large water
clusters. On the other hand, the basis sets constructed by Sadlej [75, 76] and White and
Davidson [77] for the purposes of computationally effectiveness while preserving necessary
accuracy should be definitely considered as better candidates for the calculations of larger-size
water clusters. In contrast to the ε 10
elst component of ∆EHL (eq. 4.23), both the Heitler-London
exchange energy ∆EexchHL and SCF deformation energy ∆ESCF−def (eq. 23) contributions to the

164
binding energy appears weakly dependent on the basis-set quality [58]. Mas and Szalewicz
[62] have reported the following partitioning of the interaction energy at the approximate
optimum geometry: ∆EHL = −1.76 kcal·mole−1 decomposed into ε10elst
= −7.73 kcal·mole−1 and
ε10
exch= +5.97 kcal·mole−1; ∆ESCF−def = −2.03 kcal·mole−1 decomposed on ε20ind,relax = −2.50
kcal·mole−1, ε20exch−def = +1.29 kcal·mole−1 and higher order exchange-deformation terms at
−0.82 kcal·mole−1, which brings the SCF (∆EHL + ∆ESCF−def ) interaction energy to −3.79
kcal·mole−1. The higher order perturbation corrections within the SAPT approach add −1.26
kcal·mole−1 to the interaction energy while the second order correction on the MP2 level was
found at −1.13 kcal·mole−1 with the large 243-function basis set bringing the total MP2 level
interaction energy to −4.92 kcal·mole−1. The similarity in the values of the SAPT and MP2
corrections indicate that the second-order MP2 correction to the SCF energy provides a
reasonable approximation to the total interaction energy. The largest attractive contributor to
the MP2 correction is the dispersion energy (see eqs.(4.19) and (4.20)), which was found by
Mas and Szalewicz at −2.35 kcal·mole−1. The MP2/aug-cc-pvtz (with the 184-function basis
set) calculations with the Mas and Szalewicz geometry give values of −3.750 kcal·mole−1 for
the SCF interaction energy accompanied with the −1.039 kcal·mole−1 MP2 correction, which
brings the total MP2 level interaction energy to −4.789 kcal·mole−1. It is interesting to note
that the induction term counterbalanced by the exchange-deformation appears as the largest
contributor to the interaction energy in the water dimer closely followed by the Heitler-London
interaction and the dispersion energy. Being three times larger than the induction attraction
(associated with the ε200indA + ε200
indB terms in eq. (4.19)) and at nearly the same proportion of
the dispersion attraction, ε200disp, the electrostatic ε10
elst term is the leading component among
the purely attractive terms. Therefore, the dispersion interaction is a significant component of
the interaction energy in the water dimer.
In the following section the partial cross-sections of the PES of the dimer are discussed
starting from the variation of the binding and the interaction energies along the O−O
coordinate.

165
4.3.1.1 Cross-section of the Potential Energy Surface of Water Dimer along the O−O
Coordinate
Firstly, within the framework of the supermolecular approach, the dependence of the
total electron energy as a function of the O−O coordinate was determined relative to the
minimum of the total electronic energy of fully optimized dimer on the MP2/aug-cc-pvtz level
(without the BSSE correction). At each point along the O−O coordinate the dimer is
optimized with respect to all other degrees of freedom. The computational results represented
in Figure 4.3.2 (a, b) clearly shows that the MP2 minimum at ~2.907 Å is shifted to a shorter
O−O distance by ~ 0.1 Å with respect to the SCF minimum, which appears to be very flat in
accord with the notation of the weak hydrogen bond in the dimer. It should be noted that the
present MP2 energy profile over the entire region of simulations can be fitted by the following
Morse function, 4.562·[1 − exp(1.556 · (2.90719 − r))]2. The relative flatness of the SCF
profile originates from the balance of the electrostatic and induction attractive effects on one
side and the corresponding exchange and exchange-induction repulsive terms on another side
(see the SAPT data of Mas and Szalewicz [62]). Therefore, the theoretical minimum and the
shape of the potential energy curve near the minimum is determined by the second order
correction on the MP2 level with the main attractive contributor being the dispersion energy.
In other words, since the SCF profile is flat at minimum (as expected), the location of latter on
the O−O coordinate is defined primarily by the distance dependence of the dispersion energy
and other higher order perturbation corrections, the leading attractive term of which varies
proportionally to the r−6 within the framework of London oscillation model [28]. Another non-
negligible component of the second order correlation part of the interaction energy, ε12
corresponding to the intramolecular correlation correction to the electrostatic interaction (see
eq. (4.26)) was found to be repulsive near the minimum at the level of ~6% of the electrostatic
attraction, ε10elst. Figure 4.3.2 (b) clearly shows that the MP second-order correction moves the
minimum by ~ 0.1 Å towards the repulsive part of the SCF curve, which is defined primarily
by the exchange repulsion. It is interesting to observe, however, that the experimentally
determined value for intermolecular distance in the dimer ( 2.952 Å [58]) appears to be
between the MP2 and SCF minima, which presumably indicates the deficiency of the MP2
correction, assuming that the SCF profile is reproduced more precisely. Rybak et al. [70] have

166
found that only ε20exch−disp and ε22
disp terms are discernable, which are both at comparable
absolute value but with the former being repulsive while the latter attractive. The latter term,
ε22
disp, does not present on the MP2 level of theory, which therefore indicates the deficiency of
the MP2 correction.
(a)
2.25 2.50 2.75 3.00 3.25 3.50 3.75 4.00 4.25 4.50 4.75 5.00 5.25-1.5
-1.0
-0.5
0.0
0.5
1.0
1.5
2.0
2.5
3.0
3.5
4.0
4.5
5.0
MP2
SCF
Global minimum (Hartree and kCal/mole):
E(MP2) = -152.666240934
E(SCF) = -152.126112938
dMP2 = - 0.540127995
B.E.(MP2) = - 0.007505432 (- 4.710)B.E.(SCF) = - 0.005428458 (- 3.406)B.E.(dMP2) = - 0.002076973 (- 1.303)
3.05 SCF
Ene
rgy,
kC
al/m
ole
O-O distance, Å
2.90719 MP2
Variation of the electron energy with the O···O distance for (H2O)2
EMP2

167
(b)
2.75 2.80 2.85 2.90 2.95 3.00 3.05 3.10 3.15 3.20-0.5
-0.4
-0.3
-0.2
-0.1
0.0
0.1
0.2
0.3
0.4
0.5
0.6
0.7
0.8
0.9
1.0
MP2
SCF
3.05 SCF
Ene
rgy,
kC
al/m
ole
O-O distance, Å
2.90719 MP2
Variation of the electron energy with the O···O distance for (H2O)2
EMP2
Figure 4.3.2. Potential energy profile for the water dimer along the O−O coordinate.
The calculations were performed at the MP2/aug-cc-pvtz level of theory. The data points are
shown without the BSSE correction. (a) Wide and (b) narrow range of the O−O distances.
SCF, MP2 and EMP2 designate the HF energy, second-order MP correction and total MP2
energy.
If the previous discussion has considered the variation of the total electron energy of
the complex with respect to the minimum (i.e. no partitioning the system on the monomer units
was considered), the next Figure 4.3.3 represents the variation of binding and interaction
energies along the O−O coordinate with respect to the combined energy of the two monomers
separated infinitely (i.e. with respect to the total energy of a single monomer taken twice). The
binding and interaction energies of dimer were calculated in accord with eq.(4.28), in other

168
words the counterpoise correction has been employed in the calculation of the binding energy,
which is given with respect to the electronic energy of the monomers at their optimum
geometry. Firstly, a substantial difference between the binding and interaction energies at the
SCF level should be noted, which is due to the discernible contribution of the deformation
energy to the SCF binding energy.
(a)
2.50 2.75 3.00 3.25 3.50 3.75 4.00 4.25 4.50 4.75-5.0
-4.5
-4.0
-3.5
-3.0
-2.5
-2.0
-1.5
-1.0
-0.5
0.0
0.5
B.E.BSSE corr.
EMP2
B.E.BSSE corr.
SCF
B.E.BSSE corr.
MP2
I.E. EMP2 I.E. SCF I.E. MP2
2.95 MP2
Å with CP corr.
B. E. BSSE corr.
and I. E. at 2.95 Å (kCal·mole -1)
B.E.(EMP2)= -4.714; I.E.(EMP2) = -4.750B.E.(SCF) = -3.505; I.E.(SCF) = -3.708B.E.(dMP2)= -1.209; I.E.(dMP2) = -1.042
3.05 SCF
Å
MP2
SCF
EMP2
2.90719 MP2
Å without CP corr.
Variation of the B.E. and I.E. with the O···O distance for (H2O)2
Ene
rgy,
kC
al/m
ole
O-O distance, Å
B.E.BSSE corr.
= -3.585 kCal·mole -1 (SCF)
I.E. = -3.786 kCal·mole -1 (SCF)

169
(b)
2.85 2.90 2.95 3.00 3.05 3.10-4.80
-4.75
-4.70
-4.65
-4.60
-4.55
-4.50
-4.45
-3.75
-3.50
-3.25
-3.00
B.E.BSSE corr.
EMP2
I.E. EMP2 B.E.
BSSE corr. SCF
I.E. SCF
2.95 MP2
Å with CP corr.
3.05 SCF
Å SCF
EMP22.90719
MP2Å without CP corr.
Variation of the B.E. and I.E. with the O···O distance for (H2O)2
Ene
rgy,
kC
al/m
ole
O-O distance, Å
Figure 4.3.3. Profile of the BSSE corrected binding and interaction energies of water dimer
along the O···O coordinate at the MP2/aug-cc-pvtz level of theory. (a) Wide and (b) narrow
range of the variation of O−O distance.
On the other hand, it appears that this difference become smaller at the MP2 level
(Figure 4.3.3 (b)) due to the opposite sign contribution of the deformation energy to the
second-order correlation correction, as it is evident from the Figure 4.3.3 (a). Indeed, if, at the
minimum near ~2.95 Å, the MP2 binding energy ( −4.714 kcal·mole-1) is found to be relatively
close to the MP2 interaction energy (−4.750 kcal·mole-1). The SCF binding (−3.505 kcal·mole-
1) and interaction (−3.708 kcal·mole-1) energies are found to be discernibly different.
Secondly, the transition from the O−O profile of the PES obtained by the optimization of the

170
energy of entire complex (Figure 4.3.2) to the O−O profiles of the binding and interaction
energies leads to a shift of the minimum to a larger separation distance as it appears in Figure
4.3.3 (b). The minimum of the total electron energy found at 2.90719 Å can be associated with
the BSSE-corrected value of binding energy (−4.710 kcal·mole-1) and the interaction energy
(−4.7493 kcal·mole-1) whereas the O−O profiling of the binding and interaction energies
reveals that their respective minima should be allocated at the larger separation distance
because at 2.95000 Å these values are at −4.714 kcal·mole-1 and at −4.750 kcal·mole−1,
respectively. The main reasons for such a shift could be attributed to the flatness of the
potential surface in the region of minimum and to the dependence of BSSE correction on the
separation. Indeed, Figure 4.3.4 shows that the counterpoise correction to the binding energy
is not small near the minimum and more importantly it varies with the O−O separation
distance. Therefore, the equilibrium geometry of the system depends on the BSSE correction
that becomes (physically atificaial) force variable in the minimization procedure. It is evident
from Figure 4.3.4 that the gradient of the BSSE correction is not zero at the point of the
classical minimum (2.90719 Å), where the electron energy of the system is at minimum and
the gradients along all spatial coordinates are zeros. If, as in the present case, the classical
minimum is flat, i.e. the gradients are close to zero over a discernible spatial region, the
gradient of the BSSE correction could become a non-negligible factor creating an additional
force on the particle constituting the system in question. The origin of this force resides in the
incompleteness of the mathematical basis used for the wave function expansion, and from this
prespective is purely a computational factor. To the best of the present author knowledge,
there is no straightforward way to include this spatial dependence of the BSSE correction
directly in the minimization subroutine within the Gaussian set of programs. From a physical
point of view, the minimum of the electron energy of the system would be the only meaningful
representation of the properties of real system. However, the mathematical incompleteness of
the basis leads to the different computational reality when the minimization of the total energy
of the complex provides only one possible representation of the properties of the
multimolecular complex whereas the minimization of the BSSE corrected binding energy or
minimization of the interaction energy provides different computational representation of the
system.

171
2.50 2.75 3.00 3.25 3.50 3.75 4.00 4.25 4.50 4.75
0.0
0.1
0.2
0.3
0.4
0.5
0.6
0.7
0.8
EMP2
SCF
dMP2
Variation of the CP correction with the O···O distance for (H2O)
2
O-O distance, Å
Ene
rgy,
kC
al/m
ole
Figure 4.3.4. Profiles of the BSSE counterpoise correction for the water dimer along the O−O
coordinate at the MP2/aug-cc-pvtz level.
Conventionally, the preference of one representation over another is established by
comparing the computational and the experiment results, which appears favoring in many
cases the counterpoise correction approach [38, 40, 62, 66, 70]. In the case of the water
dimer, such a comparison does not lead to the definitive resolution taking in consideration a
large uncertainty in the experimental and computational data. Furthermore, the mismatch
between minima of the binding and interaction energies is expected according to eq. (4.28).
This expectation is associated with the dependence of the deformation energies of two water
molecules on the separation distance shown in Figure 4.3.5

172
2.50 2.75 3.00 3.25 3.50 3.75 4.00 4.25 4.50 4.75-0.16
-0.12
-0.08
-0.04
0.00
0.04
0.08
0.12
0.16
O-O distance, Å
Ene
rgy,
kC
al/m
ole
D EMP2 D SCF D MP2 A EMP2 A SCF A MP2
Deformation energy of donor and acceptorwater molecules
Figure 4.3.5. Profiles of the deformation energies of two water monomers in the dimer along
the O···O coordinate at MP2/6-311++g(3df, 3pd).
It appears that the deformation of the donor is not negligible in the area of minimum
and diminishes with the distance. The latter could contribute to the shift of the binding energy
minimum further to a larger intermolecular distance relative to the minimum of the interaction
distance. The contribution of the deformation energy to the CP corrected binding energy
according to eq. (4.28) is physically meaningful, because the deformation of monomers as a
physico-chemical molecular process should accompany the formation of multimolecular
systems. It appears that the shift in the potential minimum from smaller to a larger separation
distance upon the inclusion in computational analysis of the CP leads to a better apparent
agreement with the experimental value. Furthermore, the comparison of the corrected and
non-corrected values for the potential well depth also favours the counterpoise procedure,
although there is no general agreement on this issue. In this sense, the computational results

173
are also subject of the errors and uncertainties that are difficult to estimate and correct.
Finally, the change in the geometry of the dimer as a function of the O−O distance is
shown in Figure 4.3.6. Firstly, it should be noted that the relative orientation of two water
molecules changes with the O−O distance from that shown in Figure 4.3.1, where the oxygen
atom of acceptor is located outside the openings of H−O−H angle of the donor, to the
arrangement where O atom of the acceptor is within the opening of HOH angle of the donor.
This tendency is in agreement with the observation that C2V-symmetry configuration of the
dimer with double HB is a transition state. The rearrangement takes place when the molecules
with the almost linear Oacceptor···(H−O)donor arrangement are separated by 3.75-4 Å. As
molecules moves closer than 3.75 Å, the linear HB arrangement becomes unstable and H atom
of the donor is pushed out from the O−O line. The Van der Waals (VdW) minimum for the
water dimer according to the TIP4P model is located at ~3.540 Å indicating that the deviation
of the HB bond from the linear configuration at short distances is due to the VdW repulsion,
which originates from the exchange effects. Accordingly, the bending angle of acceptor
decreases with the shortening of separation. The present calculations confirm that the
extension of the (H−O)donor bond of donor is an importance signature of the HB. Indeed, as
Figure 4.3.6 shows that the length of (H−O)donor bond increases with the shortening of
separation until it reaches maximum near the potential minimum.
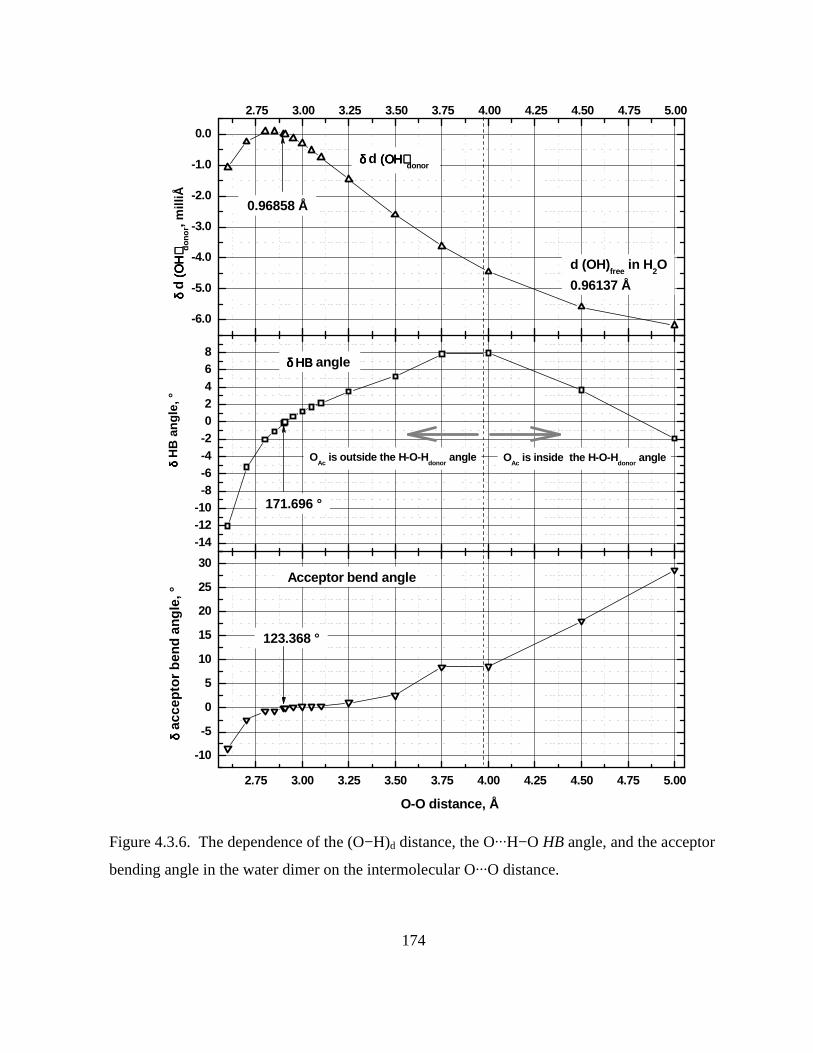
174
-6.0
-5.0
-4.0
-3.0
-2.0
-1.0
0.0
2.75 3.00 3.25 3.50 3.75 4.00 4.25 4.50 4.75 5.00
-14-12-10-8-6-4-202468
2.75 3.00 3.25 3.50 3.75 4.00 4.25 4.50 4.75 5.00
-10
-5
0
5
10
15
20
25
30
d (OH)free
in H2O
0.96137 Å
δ δ δ δ d
(ΟΗ
)(Ο
Η)
(ΟΗ
)(Ο
Η) do
nor, m
illiÅ
δ δ δ δ d (ΟΗ)(ΟΗ)(ΟΗ)(ΟΗ)donor
0.96858 Å
OAc
is inside the H-O-Hdonor
angleOAc
is outside the H-O-Hdonor
angle
δ ΗΒ δ ΗΒ δ ΗΒ δ ΗΒ angle
δδ δδ H
B a
ngle
, °
171.696 °
Acceptor bend angle
δδ δδ ac
cept
or b
end
angl
e, °
O-O distance, Å
123.368 °
Figure 4.3.6. The dependence of the (O−H)d distance, the O···H−O HB angle, and the acceptor
bending angle in the water dimer on the intermolecular O···O distance.

175
4.3.2 Water Tetramers
An analysis of the water tetramer family reveals the main structural and energetic
features that are also found in the small water clusters W3-W6. The most noticeable structural
feature of isolated water clusters, which controls the existence of particular configuration,
resides in double donor (d2) local arrangement. The double donor water molecule bears
significant negative charge due to the donation from two HB neighbors. This negative charge
attracts the non-compensated positive charge on OH DB (OH dangling bond) located on the
remote water molecules. As a consequence of this attraction the configuration changes such
that additional HB will be established between the d2 and OH DB by "internal reaction": d2 +
OH (DB)→HB. The sequential configurations are found to be the most stable among all others
possible local minima for the water clusters of a given size as shown in Table 4.3.2 for W4. If
the initial configuration includes the d2 and OH DB such configuration is found unstable. This
latter configuration converts to that with a larger number of HB's. Therefore, the distorted
HB's are formed by joint of d2 and OH DB. For example, a tetragonal configuration T-HB5
with a distorted network of the HB's shown in the second row of Table 4.3.2 is formed as a
result of the excitation of a stable sequential configuration Ring I SR4-HB4 if the molecule W3
attains the d2 configuration. This W3 reconfiguration triggers a structural collapse: the d2 W3
will be approached by the dangling bond of W1 forming the tetragonal compact structure.
It is appropriate to clarify the notation of the conformational space for a given
configurational minimum. A sequential tetragonal ring could serve as a simple example of this
notation. Indeed, both complexes a Ring I SR4-HB4 (da)4[ − + − +] and a Ring II SR4-HB4
(da)4[+ + − −] belong to the same configuration, which defines a sequence of the hydrogen
bonds. On the other hand, it is obvious that these structures do not coinside because the DBs
are oriented differently with respect to each other and to the ring plane. A specific orientation
of the DBs with respect to each other and to the ring is called a conformation. The
conformational space "diffuses" the energy of a particular configuration over a range of
energies, which depends on the dipole-dipole interaction of these DBs.
Figure 4.3.7 demonstrates the effect of cluster geometry on the energy properties of the
W1-W4 set calculated at the B3LYP and TIP4P levels. It is evident that the binding energy of a

176
sequential ring configuration is the largest. The different orientation of dangling bonds within
a given configuration does not significantly influence the total binding energy despite apparent
dipolar repulsion between OH bonds (see Table 4.3.2). The binding energy for the non-
sequential configurations such as a tetrahedron is discernibly smaller as well as that for the
configurations with multiple double donors and double acceptors.
W1 W2 W3 SR-S4 SR II SR III SR IV T BR I dBR II
-35
-30
-25
-20
-15
-10
-5
0
5
10
15
Ene
rgy,
kC
al·m
ole
-1
Water Clusters with 1-4 molecules
Energy characteristics of 1-4 Water Clustersat b3lyp and TIP4P level of theory
B.E. b3lyp/SBS B.E. b3lyp/LBS dU(0K) b3lyp/SBS dU(0K) b3lyp/LBS dG(298.15K) b3lyp/SBS dG(298.15K) b3lyp/LBS B.E. TIP4P
Figure 4.3.7. Binding energies and thermodynamic functions for the water tetramer clusters.
Binding energies with BSSE corrections, ∆U*0K (the thermodynamic energy of the formation
of a complex at 0 K), and ∆G*298.15K (the standard Gibbs energy of the formation of a
complex at 298.15K) for the water clusters of 1-4 molecules at their local minima and
transition states calculated at B3LYP/6-31G(d,p) (SBS), /6-311++G(3df, 3pd) (LBS) and
classical TIP4P levels of theory.

177
2 1
3
4
The notations for the cluster's states are given in Table 4.3.2. The energetic for the W2
cluster at B3LYP/SBS in Figure 4.3.7 is given for the Cs distorted geometry, which appears to
be a first order transition state (TS) with this basis set.
Table 4.3.2. Local minima and transition states in the HB systems with 4 water molecules.
The computations are performed at the B3LYP level of theory with the 6-31G(d,p) (SBS) and
the 6-311++G(3df, 3pd) (LBS) basis sets and with the classical TIP4P potential. The
energies, distances and angles are given in [kcal·mole−1], [Å] and [°] units. L and ∆L
designate the distance and the change of the distance between entities in question. ∆ZPVE
stands for the zero-point vibrational energy contribution to the binding energy, B.E.. ∆G*298.15
represents the standard Gibbs energy of the complex formation at 289.15 K. HBang. and
/O−O−Oang. designate the hydrogen bond angle O*-H···O* and the angle between three oxygen
atom connected by the chain of HB’s. The interaction energy, pairwise, tri and multibody
contributions to the interaction energy are indicated by appropriate subscripts. For classical
TIP4P calculations the total interaction energy and electrostatic interaction energies are
reported.
Structure / Symmetry B.E.BSSE corr. B.E. BSSE corr.
+ ∆ZPVE /∆G*
298.15
TIP4P L (O1−O2) /L(O1−O3) /L(O2−O4)
∆L (O−H)Donor
HBang. /O−O−Oang.
−31.57SBS −4.87 W1W2 −1.67 W1W3 −22.80Pair
−9.87Tri
−0.76Tetra
−22.42SBS / +3.805SBS
Sequential Ring I SR4-HB4 (da)4[ − + − +] / S4 distorted −25.67LBS
−4.18 W1W2
−1.36 W1W3
−19.43 Pair −6.84 Tri
−0.63 Tetra
−17.23LBS / +8.102LBS
−27.87Total
−36.07Electr
W1W2
−6.06Total
−8.18Electr
W1W3
−1.80Total
−1.67Electr
2.69624SBS
/3.81067SBS
2.74086LBS /3.87604LBS 2.722TIP4P /3.840 TIP4P
0.02785SBS
0.02194LBS
169SBS
/ ~90SBS 168LBS
/ ~90LBS 171TIP4P / ~90 TIP4P
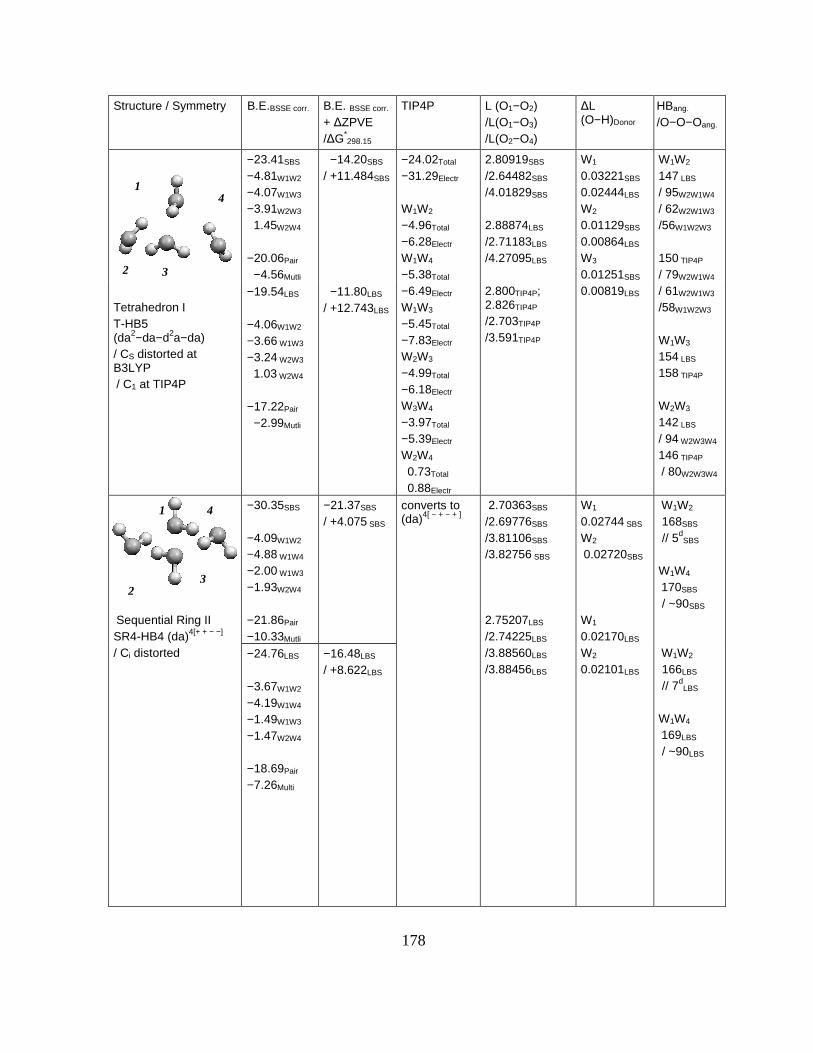
178
1
3
4
Structure / Symmetry B.E.BSSE corr. B.E. BSSE corr.
+ ∆ZPVE /∆G*
298.15
TIP4P L (O1−O2) /L(O1−O3) /L(O2−O4)
∆L (O−H)Donor
HBang. /O−O−Oang.
−23.41SBS
−4.81W1W2 −4.07W1W3 −3.91W2W3 1.45W2W4 −20.06Pair
−4.56Mutli
−14.20SBS / +11.484SBS
Tetrahedron I T-HB5 (da2−da−d2a−da) / CS distorted at B3LYP / C1 at TIP4P
−19.54LBS
−4.06W1W2
−3.66 W1W3 −3.24 W2W3 1.03 W2W4
−17.22Pair
−2.99Mutli
−11.80LBS / +12.743LBS
−24.02Total −31.29Electr
W1W2 −4.96Total −6.28Electr W1W4
−5.38Total −6.49Electr W1W3
−5.45Total −7.83Electr
W2W3
−4.99Total −6.18Electr W3W4
−3.97Total −5.39Electr W2W4
0.73Total 0.88Electr
2.80919SBS /2.64482SBS /4.01829SBS 2.88874LBS /2.71183LBS
/4.27095LBS 2.800TIP4P; 2.826TIP4P
/2.703TIP4P
/3.591TIP4P
W1 0.03221SBS 0.02444LBS
W2 0.01129SBS 0.00864LBS W3
0.01251SBS 0.00819LBS
W1W2 147 LBS
/ 95W2W1W4
/ 62W2W1W3
/56W1W2W3
150 TIP4P
/ 79W2W1W4
/ 61W2W1W3 /58W1W2W3
W1W3 154 LBS 158 TIP4P
W2W3 142 LBS
/ 94 W2W3W4
146 TIP4P
/ 80W2W3W4
−30.35SBS
−4.09W1W2
−4.88 W1W4 −2.00 W1W3
−1.93W2W4 −21.86Pair
−10.33Mutli
−21.37SBS / +4.075 SBS
Sequential Ring II SR4-HB4 (da)4[+ + − −] / Ci distorted −24.76LBS
−3.67W1W2 −4.19W1W4 −1.49W1W3
−1.47W2W4 −18.69Pair
−7.26Multi
−16.48LBS / +8.622LBS
converts to (da)4[ − + − + ]
2.70363SBS /2.69776SBS
/3.81106SBS
/3.82756 SBS 2.75207LBS
/2.74225LBS
/3.88560LBS
/3.88456LBS
W1
0.02744 SBS W2
0.02720SBS W1 0.02170LBS
W2
0.02101LBS
W1W2 168SBS // 5d
SBS
W1W4
170SBS / ~90SBS W1W2 166LBS // 7d
LBS W1W4
169LBS / ~90LBS
2
2
3
4 1

179
Structure / Symmetry B.E. BSSE corr. B.E. BSSE corr.
+ ∆ZPVE /∆G*
298.15
TIP4P L (Oi−Oj)
∆L (OD−H) HBang. /O−O−Oang.
/Dihedral H−O−O−H
Sequential Ring III SR4-HB4 (da)4[ − + + + ] / C1
−31.18SBS −4.91W1W2 −4.83W1W4 −4.18W2W3
−4.12W3W4
−1.96W1W3 −1.67W2W4 −21.67Pair
−10.34Multi
−21.25SBS / +4.168 SBS
converts to (da)4[ − + − + ]
W1W2
2.69814SBS
W1W4
2.69581SBS
W2W3
2.70558SBS
W4W3
2.70493SBS
W1W3
3.81763SBS
W2W4
3.82085 SBS
W1
0.02756 SBS W2
0.02754 SBS W3
0.0268 SBS W4
0.02677 SBS
W1W2 170 SBS
W2W3
168SBS
W3W4 168SBS
W1W4 170SBS
/ ~90SBS
Sequential Ring IV SR4-HB4 (da)4[ + + + + ] / Ci distorted
−28.42SBS −4.14W1W2
−4.31W1W4 −1.71W1W3 −1.61W2W4
−20.22Pair
−9.98Multi
−19.82SBS / +5.236SBS
converts to (da)4[ − + − + ]
2.70374SBS
/2.71076SBS
/3.79147SBS
/3.84444SBS
W1
0.02577SBS
W2 0.02620SBS
W1W2 168SBS W1W4
168SBS / 89SBS; 90SBS W1W2 // 5d
SBS W1W4
// 23dSBS
Bifurcated Ring I BR4-HB4 (da)+(a)2+ − (d)2(da)− / C1 at TIP4P
converts to SR4-HB4 (da)4[ + + + −]
−22.39Total
−28.72Electr
W1W2
−5.60Total −7.08Electr
W1W4
−6.14Total −8.11Electr
W2W3
−5.95Total −7.44 Electr W3W4
−4.28Total −5.93Electr
W1W3
+0.25Total +0.40Electr W2W4 −0.65 Total −0.55Electr
2.781 2.735 2.782 2.763 3.702 4.108
1
2 3
4
1 2
3
4
2
1
3
4

180
Structure / Symmetry B.E. BSSE corr. B.E. BSSE corr.
+ ∆ZPVE /∆G*
298.15
TIP4P L (Oi−Oj)
∆L (OD−H) HBang. /O−O−Oang.
/Dihedral H−O−O−H
Doubly Bifurcated Ring II dBR4-HB4 (a)2−(d)2−(a)2−(d)2
/ D2h Transition State of the second order at B3LYP/SBS
−15.69SBS −5.20 W1W2 +1.60 W2W4 +1.74W1W3
−17.47Pair
+1.62Multi
−9.87SBS / +13.069SBS
−20.42Total −25.79Electr W1W2
−6.15Total −7.55Electr W2W4 +2.67Total +2.81Electr W1W3 +1.50Total +1.59Electr
W1W2
2.98206SBS 2.790TIP4P W2W4 4.21424SBS 3.695TIP4P
W1W3 4.22030SBS 4.182TIP4P
W2
0.00394SBS
W1W2
170SBS 174TIP4P / ~90SBS ~83W2W1W4 ~97W1W2W3
4.3.3 Comparative Analysis of Small Water Clusters
After a detail review of the water tetramers configurations in the preceding section, let
us compare the structural and energy properties of two classes of the water clusters: open
monocyclic sequential clusters shown in Figure 4.3.8 and closed compact water clusters shown
in Figure 4.3.9. A regular hexagon of S6 symmetry is shown in the left column of Figure 4.3.8
is a basic structural element of the hexagonal, Ih, and cubic, Ic, ices, ice II and low-density
noncrystalline media. A puckered form of regular pentagon of C1 symmetry shown in the
central column of Figure 4.3.8 appears to be a structural element of the ice III/IX .
The hydrogen bond length show a characteristic contraction in a sequence tetragon-pentagon-
hexagon due to the multi-body induction effects in the hydrogen-bond network discussed in
section 4.2.2. A main bonding factor among multi-body terms is a tri-body interaction in the
sequential 1-2-3 HB chain: da-da-da. As evident from Figure 4.3.8, the tri-body contribution
can reach up to 30% of the total interaction energy. The hydrogen bond is strongest and
shortest in the hexagon because of the longest sequential chain: 6 da units. This noticeable
contraction of the hydrogen bond length is a direct consequence of the cooperation effect.
Indeed, the pairwise 1-2 interaction energy decreases from a tetramer to hexamer, i.e. a W2
1 2
3 4

181
dimer isolated from the rest of the cluster attains larger intermolecular separation distance.
However, the presence of neighboring molecule causes the contraction of the water HB
network.
The 1-3 distances show a characteristic geometric dependence on the number of apexes
in polygon. A tetragonal configuration becomes a good candidate for the structural element of
the high-density noncrystalline media. This result follows directly from the cosine theorem as
shown in Figure 4.3.8 (bottom row).
The presence of double donor in the open polygonal structure will lead to the collapse
of the network towards multicycle 3-dimentional configurations. This property of water
clusters provides a "natural" path for the transition from one class of the clusters to another.

182
2.713 Å
4.674 Å5.405 Å
2.720 Å
4.402 Å
4.403 Å
2.734 Å
2.741 Å
3.876 Å
EForm(EL.)= −42.196
(−29.421 / −4.904HB)
Inter. E= −44.279 / −7.380
Pairwise IE= −29.154 / −3.90812
3-body IE= −12.938
4-body IE= −1.914
5+6-body IE= −0.273
EForm(EL.)= −34.016
(−23.448 / −4.690HB)
Inter. E= −35.755 / −7.151
Pairwise IE= −24.209 / −3.93112
3-body IE= −10.750
4+5-body IE= −0.796
EForm(EL.)= −25.670 (−17.225 / −4.306HB)
Inter. E= −26.903 / −6.726
Pairwise IE= −19.434 / −4.86712
3-body IE= −6.838
4-body IE= −0.631
L(1-3) = 2 · L(1-2) · cos(180/n) →
L(1-2)=2.720Å
n=6; 4.7
n=5; 4.4
n=4; 3.85
Figure 4.3.8. Properties of cyclic regular tetramer, pentamer and hexamer water structures.
The calculations were performed on the B3LYP/6-311++g(3df, 3pd) level. There are reported
electron formation energies, corresponding ZPVE corrected values and those per hydrogen
bond (in parantheses E.F.+∆ZPVE / E.F.+∆ZPVE : n HB’s) and the interaction energies with
pairwise and multibody components are reported. L(x-y) designates the distance between
corresponding atoms.

183
6HBs / 4DBs
3.972
2.664
2.896
2.799
2.780
2.755
2.955
2.8842.681
2.707 2.8713.498
3.802
2.8452.822
3.497
3.523
2.833
2.891
2.633
EForm(EL.)= −40.587
(−26.811 / −4.469Mol /
−2.979HB)
Inter. E= −42.492
/ −7.082Mol / −4.721HB
EForm(EL.)= −39.065
(−25.712 / −4.286Mol /
− 3.214HB)
Inter. E= −41.067
/ −6.845Mol / −5.133HB
EForm(EL.)= −30.881
(−20.143 / −4.029Mol / − 3.357HB)
Inter. E= −32.343
/ −6.469Mol / −5.390HB
Pairwise IE= −24.633
/ −3.61512
Multi-body IE= −7.710
8HBs / 5 DBs9HBs / 3DBs
Figure 4.3.9. Compact water clusters:prism and cage for hexamer and tri-leaf for pentamer.
The calculations were performed on the B3LYP/6-311++g(3df, 3pd) level. There are reported
electron formation energies, corresponding ZPVE corrected values and those per hydrogen
bond (in parantheses E.F.+∆ZPVE / E.F.+∆ZPVE : n molecules / E.F.+∆ZPVE : n HB’s) and
the interaction energies with pairwise and multibody components are reported. The
configurations are labelled as follows from left to right: prism, cage configurations for water
hexamer and tri-leaf configuration for water pentamer.

184
Figure 4.3.9 compares the B3LYP/LBS computational results for the prism and cage
configurations of water hexamer and for the tri-leaf configuration of water pentamer.
The electronic energies of these clusters as well as the energies corrected for the vibrational
part are higher than those for corresponding open analogs despite a larger number of the
hydrogen bonds in the compact structures. In the present case, therefore, the electronic energy
of clusters is not directly related to the number of formal hydrogen bonds whereas the
structural parameters of the clusters are still determined primarily by the hydrogen bonds. The
comparison of pairwise and multi-body terms for the open and closed pentameric
configurations reveals that the pairwise interaction energy increases by a very small fraction
upon transition from the open to the compact structure, i.e. −24.209 kcal·mole−1 versus
−24.633 kcal·mole−1 whereas a multi-body term exhibits a discernible decline, i.e −11.546
kcal·mole−1 versus −7.710 kcal·mole−1. This result is an additional evidence for the
significance of the cooperativity (induction) effects in the water network.
It appears that the 1-3 distances in a tri-leaf and in a cage are in good agreement with
the scattering data reported by Finney et al. [12] for the high-density noncrystalline media.
On the other hand, in the prism configuration the 1-3 distances are larger than those in the
HDA and appear to be more appropriate for the LDA. It is, therefore, possible to assume that
compact closed clusters such as a hexamer cage or a pentamer tri-leaf are responsible for the
short 1-3 distances in high-density amorphous media as displayed in Figure 4.1.4 ( Finney et
al. neutron diffraction data on LDA and HAD [12]). It should be noticed that Ice II also
contains short 1-3 pairs but does certainly not comprises the closed structural units.
The lengths of hydrogen bond exhibit a characteristic trend in accord with the electon
density distribution. The shortest hydrogen bonds are found between such a pair of water
molecules where one of the counterparts is a da2 (donor and double acceptor) molecule. All
configurations in Figure 4.3.9 provide evidence to support this statement.

185
4.4 Acetone-Water Clusters: MP2 and B3LYP Studies
A molecule of acetone (Ac) exhibits interesting intramolecular electronic effects
associated primarily with the hyperconjugation between p-lone pair of oxygen atom of the
carbonyl group and the σ-bonds of the carbon skeleton. Analysis of these intramolecular
effects performed within the NBO framework appears to be useful for estimating the collective
molecular response on the carbonyl group perturbation induced by water molecules.
Furthermore, the correlated changes in the IR absorption bands of such fundamental molecular
vibrations as carbonyl and carbon-carbon stretching modes can be viewed as a manifestation of
the collective electronic response on the perturbation induced by HB-ed water molecules
coordinated against carbonyl group. The electronic response on the perturbation of carbonyl
group hyperconjugated with the carbon skeleton leads to the weakening of the carbon-oxygen
double bond ant to the strengthening of the carbon-carbon σ-bonds, which in turn can be
observed as a red shift of carbonyl mode and corresponding correlated blue shift in the carbon-
carbon stretching mode. The MP2(fc) and B3LYP calculations of free acetone molecule show
that at relevant local minimum in Figure 4.4.1, which is expected to be the deepest one if the
other minima exist or, otherwise, the global minimum, the symmetry group of molecule is C2
(B3LYP/LBS optimization has been performed under the C1 symmetry but the final geometry
definitely belongs to the C2 point group). In the literature [78, 79], acetone molecule is often
classified among a C2V symmetry group but present calculations indicate that two
perpendicular symmetry planes are definitely lost because two methyl groups turn away from
the perfect eclipsed conformation such that the dihedral angles become: H'in-planeαCsp3Csp3H
"in-
planeα = 0.044° at MP2/aug-cc-pvtz and 7.396° at B3LYP/LBS (two H'
α and H"α are the methyl
protons closest to the molecular plane); Hout-of-planeβCsp3Csp3H
out-of-planeβ = 0.028° at MP2/aug-cc-
pvtz and 4.801° at B3LYP/LBS. If the MP2 geometry is indeed very close to C2V, the B3LYP
geometry in contrary is distinctly different, which rises a question on the origin of this
noticeable difference in connection with possible intra-molecular hydrogen bonding between
the H'α and H"
α protons and the oxygen atom of the carbonyl group.

186
Table 4.4.1. Geometrical, bond (Wiberg, W.B., and Mayer-Mulliken, M.M.) and population
parameters for the acetone molecule model at the MP2/aug-cc-pvtz and the B3LYP/LBS.
L and C stand for the distance and the atomic charge of corresponding entity. The structure of
acetone molecule is shown on Figure 4.4.1.
Parameter Expt. [80a]
MP2/aug-cc-pvtz (C2) MP2 density matrix
Eel = −192.7901428 Hartree
B3LYP/LBS (C1) Present work
Eel = −193.2323224 Hartree
B3LYP/LBS (C2V) [79]
Eel=−193.232326 Hartree
L(C=O)vib=0 L(C=O)z.p. [81]
Freq. [82] - gas ph.
1.222 Å 1.210±4−3Å 1731 cm−1
1.21972 Å W.B.= 1.6895; M.M.= 1.3145
CNBO(O)= −0.51254 CMull(O)= −0.628283
CNBO(Csp2)= +0.56489 CMull(Csp2)= +0.418028
1756 cm−1
1.20863 Å W.B.= 1.8166; M.M.=+1.4647
CNBO(O)= −0.55987 CMull(O)= −0.702619
CNBO(Csp2)= +0.58467 CMull(Csp2)= +0.746161
1790.5 cm−1
1.2088 Å
L(C'sp3−Csp2)
L(C"sp3−Csp2)
Freq. [82]
1.507 Å 1215.5cm−1
1.50866 Å W.B.= 0.9462; M.M.= 0.8705
CNBO(Csp3)= −0.67966 CMull(Csp3)= −0.839865
1254.5 cm−1
1.51398 Å W.B.= 1.0096; M.M.= 0.7005
CNBO(Csp3)= −0.66919 CMull(Csp3)= −0.169331
1234 cm−1
1.5137 Å
<C'sp3−Csp2−C"
sp3 117.02° 116.282° 116.524° 116.60°
<C'sp3−Csp2−O 121.49 121.859° 121.738° 121.70°
<C'sp3−Csp2−C"
sp3−O 180.000° 180.000° 180.000° Dipole moment 2.86 D 2.9820 MP2 D
3.4770SCF D 3.0806 D 3.0813 D
L(C'sp3−H'
α ) L(O−H'
α) <H'
α−C'sp3−Csp2
1.08567 Å 2.52500 Å 110.065°
W.B.= 0.8945; M.M.= 0.8968 W.B.(OH'
α) = 0.0025 M.M. (OH'
α)= 0.0225 CNBO(H'
α)= +0.22240 CMull(H'
α)= +0.296034
1.08630 Å 2.52425 Å 110.145°
W.B.= 0.9372; M.M.= 0.9931 W.B.(OH'
α) = 0.0038 M.M. (OH'
α)= 0.0019 CNBO(H'
α)= +0.22270 CMull(H'
α)= +0.016004
L(C'sp3−H'
β) L(C'
sp3−H"β)
1.09069 Å / 1.09070 Å W.B.= 0.8852; M.M.= 0.8512 W.B.= 0.8852; M.M.= 0.8512
1.09182 Å / 1.09222 Å W.B.= 0.9265; M.M.= 0.9762 W.B.= 0.9243; M.M.= 0.9783
^H'α−C'
sp3−C"sp3−H"
α 0.044° 7.396° 0.000° ^H'
β1−C'sp3−C"
sp3−H"β2 0.028° 4.801° 0.000°

187
Figure 4.4.1. Atomic labelling and molecular structure of the acetone molecule.
There are shown two coordination positions for accepting 2 HB's. The Wiberg bond indexes
for C=O, Csp2−C'sp3, C'sp3−H'α and C'sp3−H'β1 (C'sp3−H'β2) are 1.8166, 1.0096, 0.9372, and
0.9265 (0.9243), respectively.
Evidently, Table 4.4.1 shows that a good general agreement is found between the
geometric parameters obtained in the experiment [80a] and those calculated by both methods,
which indicates a general capacity of both computational methods, MP2 and B3LYP, to predict
geometric parameters of carbonyl compounds. In the present case, a surprisingly good
agreement is found between the computed values for the Csp2=O bond length at 1.21972 Å
(MP2/aug) and 1.20863 Å (B3LYP/LBS) and experimental value at 1.210 ± 4×10⁻³ Å [81].
Secondly, the computed dipole moment of acetone molecule is discernibly larger than the
experimental value (Table 4.4.1), which leads to the overestimation of intermolecular
interaction energy in the acetone-water clusters. The MP2 value for the dipole moment is in
better agreement with experiment than that obtained by the B3LYP calculations.
If the carbonyl group C=O is a characteristic feature of the acetone molecule, a
tautomeric form, enol, contains the hydroxyl group with neighboring carbon-carbon double
C'sp3 C"
sp3
H'α H"
α
Csp2
H'β1
H'β2
H"β1
H"β2
O in-plane coordination
position 2
in-plane coordination
position 1

188
bond: (CH3)2−C=O (Ac)↔CH3−C(OH)=CH2 (En). The electronic energy of enolic structure
was found to be +11.493 kcal·mole−1 and +11.359 kcal·mole−1 with respect to the acetone form
at the B3LYP and the MP2 levels, respectively. This large energy excess indicates that the
anticipated abundance of the enolic form is very small. However, in the water media, where
the hydrogen bonding between the organic and water molecules is highly probable, the enolic
form could be stabilized by additional donor coordination as follows:
(CH3)2−C=O (Ac) + nH2O ↔ [(CH3)2−C=O (Ac)·2H2O]HB + (n−2)H2O +∆HAc
CH3−C(OH)=CH2 (En)+mH2O ↔ [CH3−C(OH)=CH2 (En)·3H2O]HB + (m−3)H2O +∆HEn
It is possible to assume that the enolic tautomer will form 3HB's with water molecules: 2
acceptor-type coordination + 1 donor-type coordination; whereas the carbonyl tautomer is
expected to form only 2 acceptor-type HB's. Therefore, a simple estimation could be made for
the enthalpies of hydration of both tautomers: if ∆HAc (Ac·2H2O) = −6.704 kcal·mole−1
(B3LYP/LBS) then ∆HEn ~ 3/2· ∆HAc = −10.056 kcal·mole−1. It appears therefore that a
plausible gain in the hydration energy is not sufficient for making enolic form energetically
comparable with its carbonyl counterpart (of course, the above values for ∆HAc and ∆HEn are
just zero-order approximations). An isolated acetone molecule and the acetone dimer with
anti-parallel orientation of the carbonyl groups represent a γ-class of the acetone-water network
structures. A characteristic feature of this class is the absence of hydrogen bond between
acetone species and water network. The acetone-water interaction is limited to the electrostatic
and van der Waals forces. Specific spectral examples of these complexes are given in Chapter
5.
In order to correlate the experimentally observed frequencies for acetone/water system
the following complexes were designed and optimized on the B3LYP/LBS and TIP4P (and for
simple complexes on MP2/aug) level of theory the following complexes: (i) Ac·W- single HB
complex with in-plain coordination of water molecule; (ii) two different Ac·2W complexes:
bifurcated complex with 2 HB's between the carbonyl group and water molecules and
sequential complex with 1 HB between water molecule and carbonyl group of acetone
(structure of this complex is given in Figure 4.4.3);(iii) two different Ac·3W complexes with 2
HB's between water molecules and carbonyl group; the difference between these two

189
complexes resides in the HB sequence of the hydrogen bonds within water network (Table
4.4.2 and Table 4.4.3); (iv) three different Ac·W6 (cyclic hexagon)- two complexes comprise
bifurcated double hydrogen-bonded acetone with the first and third water molecules; the
difference between this pair resides in the sequence of hydrogen bonding network; the third
complex is constructed from acetone molecule bounded to a hexagone with single hydrogen
bond, structure of which is given in Figure 4.4.6. Table 4.4.3 provides a detail structural and
energy partitioning information for the above listed complexes whereas Table 4.4.4
demonstrates the vibrational frequency response of acetone molecule on the coordination in the
different complexes.
The present quantum mechanical calculations reveal that the global minimum for the
coordination of water molecules around acetone molecule includes two in-plane positions for
the acceptor hydrogen bonded (see Figure 4.4.1). No local minima for the back-side or for the
perpendicular to the carbonyl group coordinations have been found in the present studies in
contrast to a previous report of Liao et al. [78], who obtained the local minima for the water
molecule coordination with the CH3 group from the back side of acetone molecule at B3LYP/6-
311g(d,p) level. Moreover, the present author has undertaken the optimization of these latter
complexes (laballed as 1b and 2b in the Liao et al. work) at B3LYP/6-311++g(3df,3pd) level
starting from the geometries provided by Mebel et al. [83] and has found no minima
corresponding to the suggested geometries. This result clearly indicates that the existence of
the back-side minima depends on the quality of the basis set and, therefore, could be a
computational artefact. It should be noted that in order to provide convincing evidences for the
existence of the back-side local minima the ab initio MP2 level calculations are required. To
the best of the present author’s knowledge, these MP2 calculations have not yet been
performed. However, at the present moment there are sufficient evidences for suggesting that
the back-side minima (if indeed exist) are very shallow and depend strongly on the global
configuration of water molecules around the acetone molecule. The global configuration is
controlled by the hydrogen bonding of water molecules in the in-plane positions as shown in
Figure 4.4.1.
An interesting example of the acetone-water hydrogen bond coordination is given by a
pair of the local minima, in both of which the acetone species acts as an acceptor of a single
190
hydrogen bond in the in-plane configuration. The structures and other parameters of these
complexes are given in Figure 4.4.2 and Figure 4.4.3. The acetone-water dimer (Figure 4.4.2)
represents a characteristic HB in-plane arrangement, where the acetone molecule accepts a
hydrogen bond from its counterpart. In other words, the lone pairs on the oxygen atom of
acetone molecule donate the electron density towards the spatial region between OAc and HW
as represented by the Wiberg index value of 0.0306. This value is much smaller than typical
values for a "normal" covalent bond, which points out the weak covalence of the hydrogen
bond interaction in general and of the present HB interaction, in particular. The discernible
reduction of the Wiberg index for O−H bond in the water molecule from 0.7923 for the
isolated molecule to 0.7342 in the acetone-water dimer provides a convincing evidance of the
orbital interaction between the two lone pairs of acetone molecule, nO1 and nO2, and the
antibonding σ*(O−H) orbital of the OH group. The reduction of electron density in the OH
group that is involved in the HB coordination is compensated by the increase of the electron
density on the adjacent OH bond. Regarding the carbonyl group of acetone molecule, it is
evident that the HB coordination leads to a significant reduction of its covalence, which
follows from the comparison of corresponding Wiberg indexes: 1.8166 for the isolated acetone
and 1.7725 for the acetone-water dimer. In contrast, the carbon-carbon bond gains the
covalence as a result of the HB coordination as indicated by the corresponding Wiberg index,
which increases from 1.0096 for the isolated molecule to 1.0207 (1.0173 for the second C-C
bond) for the acetone-water dimer. The electrostatic attraction between hydrogen atom Hα of
acetone and the oxygen atom of water molecule is also evident from a specific location and the
orientation of water molecule with respect to the acetone framework. However, no evidences
of the HB character of this interaction are found in the present studies. Indeed, a Wiberg
parameter for the OW···Hα Ac atomic pair is vanishingly, i.e. 3.1×10⁻³ versus 3.1×10⁻² for the
HW···OAc. The localization and orientation of the water molecule around acetone moiety is
controlled primarily by the hydrogen bond coordination with the carbonyl group. This
orientation is, however, modulated by the electrostatic and van der Waals interaction with the
remainder of the acetone molecule. The above discussion further strengthens the partition
scheme for polar organic molecules suggested in Chapter 2 (section 2.5). The anchoring
interaction of small polar molecules with water is due to the hydrogen bond coordination while
191
the overall intermolecular interactions could be significantly "perturbed" by the less specific
forces. This simple classical scheme forms the general foundation for the structural part of the
present studies and provides reliable chemical orienteers for the interpretation of the spectral
data on an intuitive level.
The insertion of second water molecules that which is hydrogen-bonded to the former
water molecule causes strengthening of the water-acetone hydrogen bond. Indeed, the Wiberg
index for the HW···OAc pair rises from 0.0306 to 0.0416 whereas those for C=O and O−HHB
bonds decrease from 1.7725 to 1.7474 and from 0.7342 to 0.7095, respectively. The origin of
this strengthening effect resides in the induction electron effect of the second water molecule
on the first molecule as described above in section 4.2.2.
In terms of the intermolecular interation energy a comparion of two complexes
Ac·H2O and sequential Ac·(H2O)2 also provides interesting information. The acetone-water
intraction energy rises significantly upon addition of the second molecule from −5.727
kcal·mole−1 to −9.046 kcal·mole−1. Peculiarly, a tri-body term, −2.069 kcal·mole−1, is larger
than the pair-wise interaction energy, −1.650 kcal·mole−1, of acetone and non-hydrogen-
bonded water molecule, W2 in Figure 4.4.3. This numerical result highlights the significance
of the cooperativity effects on the coordination of polar organic species and the water network.
Specific spectral examples of the effects of the water network configuration on acetone-water
hydrogen bonding are given in Chapter 5 (section 5.5.1). The Ac·(H2O)2 sequential complex
could be considered as comprising the acetone molecule and the water dimer. It turns out that
the intermolecular WW interaction is only slightly weakened by the attachment of acetone
species (see Figure 4.4.3), which could be viewed as a manifestation of the flexibility of water
HB network. In the present terminology, these two complexes are part of the β class of the
acetone-water coordination network. A characteristic feature of this class is a single hydrogen
bond between the acetone species and the water network.
A bifurcated Ac·2H2O complex with 2HB's represents a parent structure for the α-class
of the acetone-water coordination network. This class is characterized by two hydrogen bonds
between a carbonyl group of acetone and two water molecules located in the in-plane positions
as shown in Figure 4.4.1 and Figure 4.4.4. Pairwise interaction energy between an acetone
molecule and a hydrogen bonded water molecule appears to be nearly identical in the mono

192
and bi-coordinated structures. This numerical result underscores that a carbonyl group of
acetone is suited for accepting one or two hydrogen bonds.
In the present studies on the ab initio and semi-empirical levels, no evidence for a triple
acceptor capacity of the carbonyl group of acetone was found. Therefore, the present studies
tentatively suggest that the α- (bi-coordinated acetone species), the β- (mono-coordinated
species) and the γ- (non-coordinated species) classes exhaust the possibilities of acetone-water
coordination. Although the previous statement is only a tentative preposition at present
moment (a TIP4P optimization leads in some cluster configurations to a triply-coordinated
acetone species, and the enolic tautomeric form of acetone could become a non-negligible
factor in the coordination of acetone-water species), as long as there are no direct experimental
and theoretical evidences for higher-order acetone-water coordination, this preposition on the
bi-coordination of acetone species remains a valid working model for the description of
experimental spectral data.
It is found that the frequencies of carbonyl and carbon-carbon skeleton vibrations are
directly related to the coordination of water molecules around acetone. The perturbation effect
depends on two different coordinations in the acetone-water network (see Figure 4.4.2 and
Figure 4.4.3): the acetone-water coordination involving hydrogen bonding of water molecules
to the carbonyl group and the coordination within a network of water molecules. The
frequency shift in acetone molecule can be used as an indicator of a specific sequence of the
hydrogen bonds in the water network due to the induction effect in the chain of hydrogen
bonds. Figure 4.4.5 provides a simple Lewis resonance form interpretation of the perturbation
effect of hydrogen bonding on the acetone framework. It is evidently that the relative weight
of the carbonyl resonance form (the parent covalent resonance form where all electron pairs
are fully localized on corresponding atoms or pairs of atoms is used as a reference with the
weight of 100 %) decreases while the relative weigth of the enolic resonance form increase on
the hydrogen bond coordination. The frequency of stretching mode dependces strongly on the
covalence character of the bond involved in a vibrational motion. The decrease of the
contribution of a carbonyl resonance form manifests the "weakening" of the carbonyl group
with the concomitant frequency decrease. In contrast, the increase of the enolic form weight
suggests the strengthening of the carbon-carbon skeleton with the concomitant rise of a
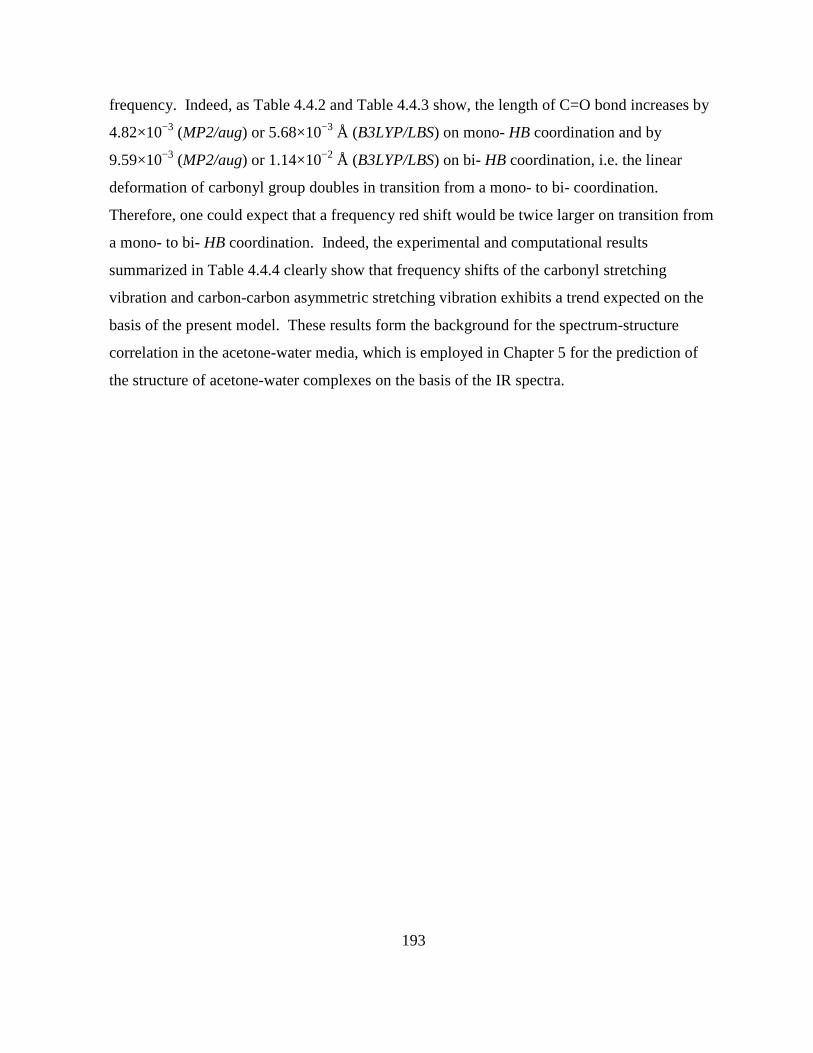
193
frequency. Indeed, as Table 4.4.2 and Table 4.4.3 show, the length of C=O bond increases by
4.82×10⁻³ (MP2/aug) or 5.68×10⁻³ Å (B3LYP/LBS) on mono- HB coordination and by
9.59×10⁻³ (MP2/aug) or 1.14×10⁻² Å (B3LYP/LBS) on bi- HB coordination, i.e. the linear
deformation of carbonyl group doubles in transition from a mono- to bi- coordination.
Therefore, one could expect that a frequency red shift would be twice larger on transition from
a mono- to bi- HB coordination. Indeed, the experimental and computational results
summarized in Table 4.4.4 clearly show that frequency shifts of the carbonyl stretching
vibration and carbon-carbon asymmetric stretching vibration exhibits a trend expected on the
basis of the present model. These results form the background for the spectrum-structure
correlation in the acetone-water media, which is employed in Chapter 5 for the prediction of
the structure of acetone-water complexes on the basis of the IR spectra.

194
F.E. BSSE Corr. −5.58090 F.E.BSSE. Corr.+ZPVE −3.71543
I.E. −5.72664
Figure 4.4.2. Acetone (Ac)·H2O / 1HB complex is a parent structure for the β-class.
The computations were performed at the B3LYP 6-311++G(3df, 3pd); D.M. = 3.2433 D. The
Wiberg bond indexes are given in italic. There are reported the electronic and ZPVE corrected
formation energy (F.E.) and the interaction (I.E.) energies in the kcal·mole−1 units.
2.863 Å
1.910 Å
<166°
2.605 Å 3.473 Å
<136°
1.7725
1.0207
1.0173
0.9267
0.9180
0.9363
0.7342
0.7944
0.0306

195
B.E. / W2 dimer
−7.73646 B.E. / W2 dimer
+ZPVE
−5.58482
F.E. BSSE Corr. −12.56842 F.E.BSSE. Corr.+ZPVE −8.24264
Total I.E. −13.37816 Pairwise I.E. (Ac−W2) −6.97645
I.E. (Ac−W2) −9.04560 Tri-body term −2.06915
I.E. (Ac−W1) −5.33 (76%) I.E. (Ac−W2) −1.65 (24%)
I.E. (W2 dimer ) −4.56622 I.E. (W2) −4.33257
1.830 Å
2.793 Å
<168 °
1.867 Å 2.828 Å
<168 °
2.427 Å
3.394 Å
<146 °
Ac
W2
W1
0.70950.7844
0.0416
1.7474
0.0384
0.7218
0.7949
0.0090
0.8847
0.92061.0255
1.0218
Figure 4.4.3. Acetone (Ac)·2H2O sequential / 1HB complex from the β-class.
The computations were peformed at the B3LYP 6-311++G(3df, 3pd); D.M. = 1.8960 D. The
Wiberg bond indexes are given in italic. The formation and interaction energies are given in
the kcal·mole−1 units. There are reported the binding energy of the acetone molecule to the
water dimer (B.E./W2), the electronic and ZPVE corrected formation energy of the entire
complex and the interaction energies and their components. For comparison, the interaction
energy of water molecules in the isolated water dimer W2 (I.E. W2 dimer) is also provided.

196
F.E. BSSE Corr. −10.34439 F.E.BSSE. Corr.+ZPVE −6.70434
Total I.E. −10.67958 I.E. (W2) 0.70885
I.E. (Ac−W2) −11.38843 Tri-body term 0.09385
I.E. (Ac−W1) −5.74114 I.E. (Ac−W2) −5.74114
Figure 4.4.4. Acetone (Ac)·2H2O (C2)/2HB complex is a parent structure for the α-class.
The computations were performed at the B3LYP 6-311++G(3df, 3pd); D.M. = 1.8960 D. The
Wiberg bond indexes are given in italic. The formation and interaction energies are given in
the kcal·mole−1 units. There are reported the electronic and ZPVE corrected formation energy
of the entire complex, the interaction energies and their components. In the present case, W2
designates the pair of non-hydrogen-bonded water molecules, whereas each separate molecule
is labelled by superscript.
2.891 Å
1.942 Å
2.590 Å
3.463 Å
< 165°
< 137°
1.7311
1.02770.9244
0.9245
0.7408
0.7939
0.0259
0.0043Ac
W1 W2

197
Figure 4.4.5. Resonance Lewis forms for Ac, Ac-W, and Ac-W2 complexes were obtained by
NBO program on the bases of the SCF density matrix for the optimal geometries.
The computations were performed at the MP2/aug-cc-pvtz. There reported the relative weights
of corresponding resonance forms. The parent structure would gain a weight of 100% if the
electron delocalization will be ignored.
C O
C
C
Parent resonance form:Ac 89.73 % Ac-W 88.87 %Ac-W2 88.18 %
H
H
H
H
H
H
C
O
H3C CH3 Carbonyl resonance forms:Ac 2.35 % x 2Ac-W 2.09 + 2.06 %Ac-W2 1.84 % x 2
C
O
CH3 CH3
C
O
H2C CH3
H
C
O
H3C CH2
H
Enolic resonance forms:Ac 0.97 % x 4Ac-W 4.26 %Ac-W2 1.33 % x 2 + 1.00 % x 2
C
O
H3C CH3
C
O
H3C CH3
H O
H
HO
H
Ac-W 0.58 %Ac-W2 0.43 % x 2
Ac-W 0.33 %Ac-W2 0.35 % x 2

198
Table 4.4.2. MP2(fc) comparative analysis of the Ac-W and Ac-W2 complexes.
The calculations are performed with the aug-cc-pvtz basis set. The subscript indexes SCF, 2,
and MP2 stand for the SCF, seconds order MP correction to the SCF energy and total MP2
energy. The energy values are given in kcal·mole−1, the linear and angular geometric
parameters are given in Å and degress ° units, respectively. L and ∆L stands for the distance
and the change of the distance between corresponding entities. ∆ZPVE designates the
contribution of zero-point vibrational energy. W and W2 designate single water molecule and
two water attached to the acetone molecule; W1 and W2 label the first and second molecules in
Ac-W2 complex.
Geometry
B.E. B.E. BSSE. corr.
/MP2+∆ZPVE ∆Ei
X Deformation E.
∆EiXY
Pairwise ∆Ei
XYZ Complex
∆LCAc−OAc /∆L OW-H
L OW-OAc / L HW-OAc
HB Ang.
SCF MP2 SCF MP2 Ac W1 / W3
Ac···W C1
0.00482 / 0.01078
2.8387 / 1.8927
163.6 −4.106 −6.966 −4.007 −6.304 /−4.388
0.352SCF −0.2812 0.070MP2
0.294SCF
−0.2072 0.086MP2
−4.652SCF
−1.8082 −6.460MP2
Ac ···W2
C2 Ac···W1 Ac···W2 W1···W2
0.00959 / 0.00925
2.8597 / 1.9201
162.2
-7.559
-13.237
-7.356 −11.887
0.779SCF
−0.5802 0.199MP2
0.237SCF −0.1652 0.072MP2
−4.742SCF
−1.7702
−6.512MP2
0.853SCF −0.1332 0.720MP2
0.023SCF
0.0512
0.074MP2

199
Table 4.4.3. B3LYP comparative analysis of the the Ac-W, Ac-W2 and Ac-W3 complexes.
The B3LYP calculations are performed with the 6-311++g(3df, 3pd)basis set. The short
notations are described in preceding Table 4.4.2.
Geometry Å, deg.
B.E. B.E. BSSE. corr. /+∆ZPVE
∆EiX
Deformation E. ∆Ei
XY pairwise
∆EiXYZ
∆EiUXYZ
Complex
∆LCAc-OAc /∆L OW-H
L OW-OAc / L HW-OAc
HB Ang.
Ac W1 / W3
Ac - W E symm.
0.00568 / 0.0105
2.8629 / 1.9101
166.1 -5.836 −5.581 / −3.715
0.069 0.076
−5.727
Ac - W2
C2 symm. 1. Ac - W1 Ac - W2 2. W1-W2
0.01138 / 0.00886
2.8907 / 1.9424
165.1
−10.885
−10.344 / −6.704
0.220 0.058
−5.741
0.709
Σ Total −10.773
0.094
Ac-W3 C2 symm. 1. Ac - W1 Ac - W2 2. Ac - W3 3. W1-W3 W2-W3 4. W1-W2
0.00959 / 0.00843
2.9087 / 1.9443
172.7 −16.786 −15.698 / -9.464
0.162 0.049 / 0.042
−4.781
−1.520
−2.962
0.781
Σ Total −16.227
3-body
Ac-W1-W2 0.403
Ac-W1-W3 −0.470
W1-W2-W3 0.592 Σ Total 0.524 4-body 0.172

200
Table 4.4.4. Experimental and computed frequencies for the Ac-Wn HB complexes.
The spectral data are from 1[82], [84](S&R for Shaff and Roberts) and from the present
studies2. MI stands for the matrix isolation; the intensities of IR bands are designated as s,
m, w,vw for strong, moderate, weak and very weak; sh stands for shoulder. The relative
intensities of the computated IR bands are given as superscript. The acetone dimer is a
transition state labeled as T.S. The water cyclic hexagone is labeled by Hex.
Ac(Ad)-ice:
Ac RA differ. peaks
QM Calculations Ac and Ac-W MI
experiment
[85]
[86] Chem. states S&R DFT B3LYP/6-311++g(3df,3pd)
Sym. N Mode Gas ;
Liquid1;
/Liquid2;
Ac
Ac-W pc nc nc
(D2O)
Ac
C1→C2
Ac-
WC1
Ac-
2WC2
Ac-3W Ac-
Hex
1:2
Ac-
Hex
1:1
2Ac
T.S.
1 νasCH 3018.5Gs
3004.82
3012vw 31433.2 31480.2 31480.02 31480.7 31453.6 31442.5 31410
31414.0
2 νs CH 2937Gs
29241
/ 29262
2922 w 30343.6 30353.2 30352.8 30380.7 30283.4 30312.5 30360
3036 3.0
3 ν C=O 1731Gs
17101
/ 17142
1721.3
1721.5
1715.9
1716.6
1708sh
1701 s
1711sh
1703 s
1716s Ph.
1703 Ch.
1790100 1771100
1751100 1758100 1732100 1765100 1781100
17710
4 δasCH3
In
1435Gs
14341
1429.1
1429.4
1420.9
1420.8
1428 vw 1441 m 147114.5 14738.7
14783.5 1474 7.5 14749.5 14756.3 147221.7
1472 0
A1
5 δsCH3
In
1363.5Gs
13641
/ 13612
1353.9
1354.0
1358.7
1359.0
1362 138810.3 139216
139813 1396 8.8 139711 138919
138717.2
1387 0
9 νasCH3
out
30800.1 30820.5 30841.3 3087 0.4 30891.7 30832.8 3086 0.2
3086 0
A2
10 δasCH3
out
14651.0 14662.9 14638.0 14615.7 14713.5 14693.3 1469 0.4
1465 0
13 ν CH 3018.5s
30041
/ 30052
3016.3 3012vw 3003 m 31426.0 31453.4 31480.2 31471.8 31373.6 31394.3 3139 7.2
31390
14 ν CH 2937G s
29371
30270.5 30290.3 30280.6 30310.1 300412 30224.8 3029 0
30290.6
15 δasCH3 1410 s
14181
/ 14192
1419 m 14600.3 14611.6 14630.7 14610.4 14634.3 14627.0 1462 0
1460 0.3
B1
16 δsCH3
out
1363.5G s
13611
/ 13612
1361.6
1361.8
1368.3
1368.2
1372 m 1374 m 1372 vs 138826.9
139818 139921 139818 139316 140315
1388 31.9
1387 0

201
Ac and Ac-W
MI
Ac(Ad)-ice:
Ac RA differ. peaks
QM Calculations Sym. N Mode Gas ;
Liquid1;
/Liquid2; Ac Ac-W Chem. states S&R DFT B3LYP/6-311++g(3df,3pd)
B1 17 νasCC 1215.5G s
12211 /
12222
1216.5
1216.4
1230.4
1230.2
1239 m
1242 m
1239 m
1238 vs
123437.3
124929
126126
125920
125920
1247 38 1242 31.4
1237 0
20 ν CH 2972G s
29641 /
29672
2972.4 3088 8.4 30904.8 30902.9 30941.7 30961.7 30893.1 3094 0
3094 7.0
21 δas
CH3in
1454G s 14889.8 14908.0 14936.8 14885.6 14935.1 14927.5 1492 0
148810.2
B2
22 ρ CH3 1090.5G s
10921 /
10922
1091.6
1091.6
1094.5
1095.8
11201.4
11241.6 11251.8 11241.4 11254.7 11202.2 11230
11223.7
Figure 4.4.6 shows the QM models of acetone coordination in different water hexagone
configurations, which are used to simulate the ice surface: a β-complex, a mono-coordinated
acetone and two different α-complexes, a bi-coordinated acetone: symmetric and asymmetric.
The asymmetry of the carbonyl group coordination in the two latter complexes is caused
primarily by differences in the HB coordination of those water molecules, which are directly
bounded to the carbonyl group. In the central unit, the left HB water molecule is a single
donor and double acceptor, whereas the right water molecule is a double donor and single
acceptor. The induction effect in a chain of hydrogen bonds causes either the additional
polarization or depolarization of a particular OH bond. The acceptor coordination increases
the polarization of an OH bond whereas the donor coordination decreases the polarization.
The presence of two acceptors attached to the left water molecule (Figure 4.4.6, central panel)
decreases the electron density on hydrogen atom and, therefore, facilitates its penetration
capacity.
The interaction energies of acetone molecule with different water HB networks are
shown in Figure 4.4.7. Evidently, the interaction energy is two/three times larger for the
complexes from α-class in comparision with the complexes from β-class. The total interaction
energy increases proportionally to the cluster size. The interaction energy within the water
HB network depends on a sequence of hydrogen bonds. The presence of double donor in a

202
finite water network significantly destabilizes a HB structure. Indeed, the intermolecular
interaction energy in the water network of the asymmetric α-complex (central structure in
Figure 4.4.6) is noticeably smaller than that in the β-complex with sequential arrangement. It
should be noted that the presence of acetone molecule stabilizes the water network in the α-
asymmetric configuration, which otherwise would collapse to the book configuration. This
example supports the Devlin-Buch conlcusion [87] that the adsorption of polar organic
molecules induces ordering in the disordered near-surface region. The adsorption of such
polar molecules as acetone prevents the open d2 cyclic configurations on ice surface from a
collapse towards the compact structures.

203
ααααββββ1 HB
2.9242.929
2 HB
2.859
2.9282.783
da2
d2a
d2a
d2a
d2ad2
Ref
1.630 / 1.063
3.696 / 3.532
−7.570 / −5.373from W6
−3.874 / −1.841from W6
−5.940 / −4.310from W6
αααα
Figure 4.4.6. Different coordination of acetone on the water cyclic hexamer.
The computations were performe at the B3LYP 6-311++G(3df, 3pd) level. The left panel
shows a β-structure with mono-coordinated acetone molecule, whereas the central and right
panels show α-structures: asymmetric and symmetric complexes, respectively. The relative
electronic and ZPVE corrected energies (E.E./ E.E.+∆ZPVE in red and wight colors) are given
with respect to the most stable symmetric configuration. In addition, the electronic and ZPVE
corrected energies (in green color) of the present complexes are given with respect to the
isolated acetone and water cyclic hexamer species.

204
Ac-W1 Ac-W2 (2HB) Ac-W3 (2HB) Ac-W6(1HB) Ac-W6(2HB) asy m
-50
-45
-40
-35
-30
-25
-20
-15
-10
-5
0
-50
-45
-40
-35
-30
-25
-20
-15
-10
-5
0
Ene
rgy,
kcal
·mol
e-1
Total I.E. Ac-W I.E. W I.E.
Figure 4.4.7. The interaction energy parameters for acetone-water clusters from the β- and the
α-classes at the B3LYP/6-311++g(3df, 3pd) level.
The frequencies of the carbonyl and carbon-carbon asymmetric stretching modes for
selected acetone-water complexes along with the corresponding Wiberg covalence bonding
indexes are shown in Figure 4.4.8. Firstly, the frequency of carbonyl vibrations decreases in
the sequence of γ→β→α class whereas the frequency of carbon-carbon stretch increase in the
same sequence. This trend is in good accord with the resonance analysis presented above in
Figure 4.4.5. The decrease of the carbonyl group frequency is nearly proportional to the
increase in the bond length. The Wiberg indexes appear to be useful for predicting the general
trend in the frequency change upon hydrogen bonding between acetone and water species. It
should be noted that the the α-asymmetric complex (central structure in Figure 4.4.6) exhibits
the strongest frequency shift, which correlates with a maximum value of the total acetone-
water interaction energy found for this complex.
205
1790 1780 1770 1760 1750 1740 1270 1260 1250 1240 1230
0
100
200
300
400
500
600
1.21
9 Å
1.21
5 Å
νννν17171717
as C-C stretch (B1)
B3LYP/6-311++g(3df, 3pd)
νννν3333 C=O stretch ((((ΑΑΑΑ
1111))))
Acetone Acetone-1W 1HB Acetone-2W 1HB Acetone-2W 2HB C
2
Acetone-3W seq Acetone-3W 2HB C
2
Acetone-6W 1HB Acetone-6W dd 2HB Acetone-6W 2HBdimer
Inte
nsity
, km
·mol
e-1
Wavenumber, cm -1
1.773; 0.0311.214 Å
1.0211.017
1.8171.209 Å
1.010
1.731; 2x0.0261.220 Å
1.028
1.027
1.734; 2x0.0231.218 Å1.737; 0.027; 0.014
1.218 Å
1.0251.026
1.6940 0.0395; 0.02241.224 Å
1.747; 0.0421.217 Å
1.0351.035
Figure 4.4.8. The frequencies of the carbonyl and the carbon-carbon stretching vibrations for
selected acetone-water clusters at the B3LYP/6-311++g(3df, 3pd) level.
The Wiberg bond indexes for the C=O and C-C bonds and the OAc···HW atomic pair are
reported together with the length of the C=O bond.

206
Resuming this section devotied to a quantum mechanical investigation of the acetone-
water complexes the following should be stated: (i) the coordination of carbonyl group in the
water media comprises double hydrogen bond (α-class) and single hydrogen bond complexes
(β-class), in which water molecules assume the in-plane coordination around the carbonyl
group; (ii) the higher order hydrogen bond coordination around the carbonyl group of acetone
is of low probability - no evidences have been found so far for these configurations (except a
specially designed complex in the TIP4P potential); (iii) it is possible that a triply-coordinated
carbonyl group will transform into the enolic form; (iv) the vibration frequencies of carbonyl
and carbon-carbon asymmetric stretch motions are sensitive to the hydrogen bond coordination
with water molecules and can be used as fingerprints for a specific hydrogen bond
configuration of acetone species in the water media; (v) the cooperativity effect in a chain of
hydrogen bond water network strongly affects the global coordination of water molecules
around organic molecules with carbonyl functional group. Although a primary coordination of
the carbonyl group is given by the class, each class of the acetone-water clusters include
different complexes because the electronic properties of water molecules directly attached to
the carbonyl group are modulated by their hydrogen bond environment.

207
References:
1. G. C. Pimentel, A. L. McClellan, “The Hydrogen Bond”, 1960, W.H. Freeman &CO,
San Francisco and London.
2. L. Pauling, J. Am. Chem. Soc., 57 (1935) 2680.
3. J. D. Bernal, R. H. Fowler, J. Chem. Phys., 1 (1933) 515.
4. D. Eisenberg, W. Kauzmann, “The Structure and Properties of Water”, 1969,
Clarendon Press, Oxford.
5. P. V. Hobbs, “Ice Physics”, 1974, Clarendon Press, Oxford.
6. V. F. Petrenko, R. W. Whitworth, "Physics of Ice", 1999, Oxford University Press,
Oxford.
7. G. Albrecht, R. B. Corey, J. Am. Chem. Soc. 61 (1939) 1087.
8. M. Folk, O. Knop, Chapter 2 in "Water. A comprehensive treatise", vol. 2, ed. F.
Franks, 1973, Plenum Press, New York.
9. P. A. Giguer, J. Chem. Phys. 87 (1987) 4835.
10. A. Geiger, P. Mausbach, "Molecular Dynamics Simulation Studies of the Hydrogen
Bond Network in Water", in "Hydrogen-Bonded Liquids", v. 329, 1989, ed. J. C. Dore,
J. Teixeira, NATO ASI Series (C), Kluwer Academic Publisher, London.
11. (a) E. D. Glendening, J. K. Badenhoop, A. E. Reed, J. E. Carpenter, J. A. Bohmann, C.
M. Morales, F. Weinhold, NBO 5.0, Theoretical Chemistry Institute, University of
Wisconsin, Madison, 2001; (b) F. Weinhold, NBO 5.0 Program Manual, Department
of Chemistry University of Wisconsin, Madison, Wisconsin, 1996-2001.
12. J. L. Finney, A. Hallbrucker, I. Kohl, A. K. Soper, D. T. Bowron, Phys. Rev. Lett. 88
(2002) 225503-1.
13. OriginPro 7.5 SR0, v. 7.5714, OriginLab Corporation, Northampton, USA.
14. J. P. Devlin, V. Buch, J. Phys. Chem. 99 (1995) 16534.
15. B. Rowland, N. S. Kadagathur, J. P. Devlin, V. Buch, T. Feldman, M. J. Wojcik, J.
Chem. Phys. 102 (1995) 8328.
16. W. S. Benedict, N. Gailar, E. K. Plyler, J. Chem. Phys. 24 (1956) 1139.
17. U. Buck, F. Huisken, Chem. Rev. 100 (2000) 3863.

208
18. J. Sadlej, V. Buch, J. K. Kazimir, U. Buck, J. Phys. Chem. 103 (1999) 4933.
19. (a) R. Janoshek, E. G. Weidemann, H. Pfeiffer, G. Zundel, J. Am. Chem. Soc. 94
(1972) 2387; (b) G. Zundel, Adv. Chem. Phys. 111 (2000), 1.
20. J. Kim, U. W. Schmitt, J. A. Gruetzmacher, G. A. Voth, N. E. Scherer, J. Chem. Phys.
116 (2002) 737.
21. J. P. Devlin, N. Uras, J. Sadlej, V. Buch, Nature 417 (2002) 269.
22. A. J. Tursi, E. R. Nixon, J. Chem. Phys. 52 (1970) 1521
23. J. A. Salthouse, T. C. Waddington, J. Chem. Phys. 48 (1968) 5274.
24. K. R. Asmis, N. L. Pivonka, G. Santamrogio, M. Brümmer, C. Kaposta, D. M.
Neumark, L. Wöste, Science 299 (2003) 1375.
25. A. M. Middlebrook, L. T. Iraci, L. S. McNeill, B. G. Koehler, M.A. Wilson, O. W.
Saastad, M. A. Tolbert, D. R. Hanson, J. Geophys. Res. 98 (1993) 20473.
26. G. Ritzhaupt, J. P. Devlin, J. Chem. Phys. 95 (1991) 90.
27. R. J. Bartlett, Ann. Rev. Phys. Chem. 32 (1981) 359.
28. B. Jeziorski, R. Moszynski, K. Szalewicz, Chem. Rev. 94 (1994) 1887.
29. K. Szalewicz, B. Jeziorski, Mol. Phys. 38 (1979) 191.
30. G. Chałasiński, M. M. Szeczęśniak, Mol. Phys. 63 (1988) 205.
31. G. Chałasiński, M. M. Szeczęśniak, Chem. Rev. 94 (1994) 1723.
32. A. D. Becke, J. Chem. Phys. 88 (1988) 1053.
33. A. D. Becke, J. Chem. Phys. 98 (1993) 5648.
34. D. J. Lacks, R. G. Gordon, Phys. Rev. 47 (1993) 4681.
35. P.R. Rablen, J.W. Lockman, W.L. Jorgensen, J. Phys. Chem. A 102 (1998) 3782.
36. T. H. Dunning, J. Chem. Phys. 90 (1989) 1007.
37. M. J. Frisch, J. A. Pople, J. S. Binkley, J. Chem. Phys. 80 (1984) 3265.
38. S. F. Boys, F. Bernardi, Mol. Phys. 19 (1970) 553.
39. Prof. J. D. Goddard, private communications, University of Guelph, 2003.
40. P. S. Sedano, Ph.D. Thesis "Implementation and application of basis set superposition
error-correction schemes to the theoretical modeling of weak intermolecular
interactions", Department of Chemistry, University of Girona, Girona, Spain, 2001.

209
41. S. Huzinaga, "The Method of Molecular Orbitals", on Russian, 1983, Moscow,
Publisher "World", Russia.
42. R. Ludwig, F. Weinhold, T. C. Farrar, J. Chem. Phys. 102 (1995) 5118.
43. S. Scheiner, "Hydrogen Bonding. A Theoretical Perspective", Topics in Physical
Chemistry, 1997, Oxford University Press.
44. B. F. King, F. Weinhold, J. Chem. Phys. 103 (1995) 333.
45. R. A. Nyquist, Vib. Spect. 7 (1994) 1, and Ref. therein.
46. K. Morokuma, K. Kitaura, "Variational approach (SCF ab-inito calculations) to the
study of molecular interactions: the origin of molecular interactions", in 47.
47. H. Ratajczak, W. J. Orville-Thomas, "Molecular Interactions", v. 1, 1980,
Wiley&Sons, Chichester.
48. H. S. Frank, Proc. Royal. Soc. London, Ser. A 247 (1958) 481.
49. G. Nemethy, H. A. Scheraga, J. Chem. Phys. 36 (1962) 3382.
50. G. Nemethy, H. A. Scheraga, J. Chem. Phys. 41 (1964) 680.
51. J. D. Bernal, R. H. Fowler, J. Chem. Phys. 1 (1933) 515.
52. N. H. Fletcher, Phil. Mag. 18 (1968) 1287.
53. N. H. Fletcher, "The Surface of Ice", p. 132 in the "Physics and Chemistry of Ice", ed.
E. Whalley, S. J. Jones, L.W Gold, 1973, Royal Society of Canada, Toronto University
Press, Ottawa.
54. G. L. Richmond, Chem. Rev. 102 (2002) 2693.
55. T. R. Dyke, K. M. Mack, J. S. Muenter, J. Chem. Phys. 66 (1977) 498.
56. T. R. Dyke, J. Chem. Phys. 66 (1977) 492.
57. B. J. Smith, D. J. Swanton, J. A. Pople, H. F. Schaefer III, L. Radom, J. Chem. Phys.
92 (1990) 1240.
58. J. G. C. M. van Duijneveldt-van de Rijdt, F. B. van Duijneveldt, J. Chem. Phys. 97
(1992), 5019.
59. J. R. Reimers, R. O. Watts, M. L. Klein, Chem. Phys. 64 (1982) 95.
60. L. A. Curtiss, D. J. Frurip, M. Blander, J. Chem. Phys. 71 (1979) 2703.
61. L. A. Curtiss, J. A. Pople, J. Mol. Spect. 55 (1975) 1.

210
62. E. M. Mas, K Szalewicz, J. Chem. Phys. 104 (1996) 7606.
63. M. J. Frisch, J. E. Del Bene, J. S. Binkley, H. F. Schaefer III, J. Chem. Phys. 84 (1986)
2279.
64. S. S. Xantheas, C. J. Burnham, R. J. Harrison, J. Chem. Phys. 116 (2002) 1493.
65. S. S. Xantheas, J. Chem. Phys. 104 (1996) 8821.
66. K. S. Kim, B. J. Min, U-S. Choi, K. Lee, J. Chem. Phys. 97 (1992) 6649.
67. E. Clementi, G. Gorongui, O.G. Stradella, in "Modern Techniques in Computational
Chemistry: MOTTEC-91, ed. E. Clementi, 1991, ES-COM, Leiden, Netherlands.
68. W. S. Benedict, N. Gailar, E. K. Plyler, J. Chem. Phys. 24 (1956) 1139.
69. O. L. Polyansli, P. Jensen, J. Tennyson, J. Chem. Phys. 101 (1994) 7651.
70. S. Rybak, B. Jeziorski, K. Szalewicz, J. Chem. Phys. 95 (1991) 6576.
71. K. Szalewicz, S. J. Cole, W. Kołos, R. Bartlett, J. Chem. Phys. 89 (1988) 3662.
72. H. Popkie, H. Kistenmacher, E. Clementi, J. Chem. Phys. 59 (1973) 1325.
73. D. Feller, J. Chem. Phys. 96 (1992) 6104.
74. S. M. Cybulski, G. Chałasinski, R. Moszyński, J. Chem. Phys. 92 (1990) 4375.
75. M. M. Szczęśniak, R. J. Brenstein, S. M. Cybulski, S. Scheiner, J. Phys. Chem. 94
(1990) 1781.
76. A. J. Sadlej, Coll. Czech. Chem. Commun. 53 (1988) 1995.
77. J. C. White, E. R. Davidson, J. Chem. Phys. 93 (1990) 8029.
78. D-W. Liao, A. M. Mebel, Y-T. Chen, S-H. Lin, J. Chem. Phys. A 101 (1997) 9925.
79. W. O. George, B. F. Jones, Rh. Lewis, J. M. Price, J. Mol. Struc. 550-551 (2000) 281.
80. (a) E.Bloom, C. Altona, Mol. Phys. 31 (1976) 1377; (b) K. B. Wiberg, Y. Thiel, L.
Goodman, J. Leszczynski, J. Phys. Chem. 99 (1995) 13850.
81. T. Iijima, Bull. Chem. Soc. Japan 45 (1972) 3526.
82. G. Dellepiane, J. Overend, Spectrochimica Acta 22 (1966) 593.
83. (a) A. M. Mebel, Private communication, 2005.
(b) D-W. Liao, A. M. Mebel, Y-T. Chen, S-H. Lin, J. Chem. Phys. A 101 (1997) 9925.
84. J. E. Schaff, J. T. Roberts, J. Phys. Chem. 98 (1994) 6900.
85. X. K. Zhang, E.G. Lewars, R. E. March, J. M. Parnis, J. Phys. Chem. 97 (1993) 4320.

211
86. A. Engdahl, Chem. Phys. 178 (1993) 305.
87. V. Buch, J. P. Devlin,eds., "Water in Confining Geometeries", 2003, Springler, Berlin.

212
CHAPTER 5
Experimental Results and Interpretations
5.1 The IR spectral Examination of the Ice Films Vapor Deposition at 125-185 K: Ice
Spectral Bands and Dangling Bonds
The polycrystalline and non-crystalline ice films vapor-deposited at 128-185 K were
investigated by grazing-angle FTIR RAS. The polycrystalline (pc-ice) phase was found above
155 K while the non-crystalline (nc-ice) phase was formed below 145 K. The nature of the
polycrystalline and non-crystalline ice phases can be differentiated by comparing the
respective RA spectra with spectral simulations based on the Fresnel reflection method. The
OH stretching band, ν1 and ν3 at 3800-2800 cm−1 exhibits complex behavior as a function of
film thickness (from less than 10 nm to 1500 nm), which can be simulated and attributed
primarily to the physics of absorption-reflection based on the Fresnel equations for reflection
coefficients for π- and σ-polarized light in a vacuum-dielectric film-metal system. The spectral
evolution of the OH stretch with the film thickness is found to be similar for both
polycrystalline and non-crystalline phases. In addition, spectral features of the incompletely
coordinated OH groups at 3700-3690 cm−1 have been observed for a majority of nc- and pc-ice
samples grown under different deposition conditions over the entire temperature range, which
shows that these OH dangling bonds are an integral part of the surfaces of both non-crystalline
and polycrystalline ice phases. For thin films less than 200 nm thick, both kinds of ice are
found to have a comparable amount of OH dangling bonds. In contrast, the thicker films (with
thickness greater than 700 nm) of the non-crystalline phase contain a noticeably larger amount
of OH dangling bonds than the polycrystalline films of comparable thickness. This thickness
dependence of the OH dangling bond feature suggests that the OH dangling bonds are located
most likely on the external surfaces of the crystalline grains and/or of the ice film itself at
larger thickness for polycrystalline phase and on the tracery external surface in the case of non-
crystalline phase.
5.1.1 Polycrystalline Ice at 155-185 K
Figure 5.1.1a shows the experimental FTIR-RA spectra of the initial stage of water

213
deposition at 5×10⁻⁷ Torr with the Cu substrate held at 160 K, which correspond approximately
to 10 seconds (Figure 5.1.1a, Curve A) and 30 seconds (Figure 5.1.1a, Curve B) into the phase
formation. These spectra are compared with the Fresnel spectrum for pc-ice with film
thickness of 0.5 nm (Figure 5.1.1a, Curve C). Evidently, there is a significant difference
between the experimental and Fresnel spectra. In particular, the OH stretch band for the
Fresnel spectrum (Figure 5.1.1a, Curve C) is blue-shifted by ~ 45 cm-1 and has a different
shape from the experimental spectra (Figure 5.1.1a, Curves A-B), which suggests that the ice
deposit is heterogeneous and consists predominantly of small particles that scatter the IR light.
For the initial steps of the ice phase formation, the production of crystalline nuclei, instead of a
uniform film, is therefore confirmed. This observation is consistent with the general tendency
to minimize the surface area of a newly forming phase. As suggested by Mayer and Pletzer
[1], the formation of the primary crystalline ice nuclei may have already occurred, at least
partially, in the gas phase near the cold substrate surface.

214
0.00
0.04
0.08
0.12
E
3250
160 K, 1x10 -6 Torr x 1000
3720 3680
7
8
CD
(b) 3365
3165
3280Expt. A. 30 sec (15 nm)B. 45 sec (20 nm)Fresnel C. 15 nm; D. 20 nm B
A
Abs
orba
nce
Wavenumber (cm -1)
B
A
0.00
0.04
0.08
0.12
0.16
0.20
3720 3680
-8
-4
160 K, 1x10 -6 Torr
3165
33103390
115 sec (53 nm)Expt. Fresnel
x 1000(c)
3800 3700 3600 3500 3400 3300 3200 3100 3000 2900
0.000
0.002
0.0043160
3355
160 K, 5x10 -7 Torr
C
Expt. A. 10 secB. 30 secFresnel C. 0.5 nm
B
A
(a)
Figure 5.1.1. Comparison of experimental IR-RA spectra of the OH stretch region at 160 K
for the early stage of formation of a polycrystalline ice (pc-ice) film with Fresnel simulations.
(a) Experimental spectra (at 2 cm−1 resolution) for an ice film obtained by vapour deposition at
5×10⁻⁷ Torr for (A) 10 and (B) 30 seconds are compared with (C) the Fresnel spectrum of a
0.5-nm-thick pc-ice film (using optical constants obtained for films deposited at 163 K [2]). (b)
Experimental spectra (at 2 cm−1 resolution) for an ice film obtained by vapour deposition at
1×10⁻⁶ Torr for (A) 30 and (B) 45 seconds (corresponding to estimated thicknesses of 15 and
20 nm respectively) are compared with the Fresnel spectrum of pc-ice with film thicknesses of

215
(C) 15. (c) Experimental spectra (at 0.5 cm−1 resolutions) for an ice film obtained by vapour
deposition at 1×10⁻⁶ Torr for 115 seconds (corresponding to an estimated film thickness of 53
nm) is compared with the Fresnel spectrum of a pc-ice film of the same thickness. Inserts in
(b) and (c) show expanded views (with the ordinate expanded by 1000) of the OH dangling
bond region (3760-3640 cm−1) for the respective films.
Continued deposition would result in the emergence of a polycrystalline film with RA
spectra corresponding to intermediate scattering and Fresnel spectra (Figure 5.1.1b) and
ultimately to the Fresnel spectra (Figure 5.1.1c). In particular, Figure 5.1.1b and Figure 5.1.1c
show the experimental RA spectra for water deposition at 1×10⁻⁶ Torr with the substrate held
at 160 K corresponding approximately to 30 and 45, and 115 seconds, respectively, into the
phase formation. Fresnel spectra are generated with the appropriate film thicknesses that
closest approximate the respective experimental spectra. At the 115-second deposition, the
experimental spectrum evolves into that best described by the Fresnel model (Figure 5.1.1c).
The ice phase as depicted in Figure 5.1.1b therefore corresponds to an intermediate state
between the Fresnel thin-film and ensemble of ice particles. In this intermediate state,
accumulation of a sufficient amount of crystalline nuclei on the substrate surface would
eventually accelerate deposition in the inter-grain region. Figure 5.1.1b and Figure 5.1.1c also
reveal the presence of a weak OH DB feature at 3693 cm−1 in the ice phase deposited at 160 K,
with the observed frequency corresponding to a 3-coordinated OH group [3]. It is of interest
to note that these OH DB's exist even at the early stage of ice formation and presumably on the
surfaces of the crystalline grains that give rise to the scattering spectra.
By using proton-ordered and disordered Ic and Ih ice models, Buch and Devlin made
use of four oscillating dipoles tetrahedrally arranged around a central O atom as the basis to
calculate the OH stretching band [4]. They attributed the central peak of the OH stretching
band at 3220 cm−1 to the zero wave-vector modes of two transversal (TO) branches and a
longitudinal (LO) branch (which corresponds to two dipoles moving "in" with the other two
diploes moving "out" in a way that correlates with the asymmetric stretching character of the
ν3 molecular mode of an isolated water molecule). The asymmetric ν3 character of the OH
central peak is in agreement with the spectral assignment made by Whalley [5]. The shoulder
located at the lower-frequency side of the central peak appears to originate from the transversal

216
modes strongly perturbed by intramolecular interactions and was therefore attributed to the in-
phase ν1 TO branch by Buch and Devlin [4], again in accord with Whalley’s earlier assignment
[5]. The state with the lowest OH stretch frequency corresponds to the globally in-phase ν1
vibration, which dominates in the Raman spectra obtained with parallel polarization [6]. In the
higher-frequency region of the OH stretching band, an intermediate branch (i.e., one that
exhibits no systematic variation in the angle between the dipole moment of the lattice and the
wave-vector) and non-zero wave-vector modes of the aforementioned longitudinal branch were
found [4]. Originated from the higher-frequency out-of-phase ν1 vibration of the four dipoles
surrounding the O atom, the intermediate branch was characterized by a small dipole moment
near the center of the Brillouin zone, in marked contrast to the longitudinal modes (with origin
from the ν3 molecular vibration), which carry a significant dipole moment over the entire
Brillouin zone [4].
Buch and Devlin further demonstrated that the OH stretch absorption band can be
strongly affected by the shape of the ice medium and by the polarization of the electric field
[4]. In particular, in the case of an ice slab, the modes of the higher-frequency intermediate
and longitudinal branches are stimulated with surface-perpendicular polarization while the
lower-frequency transversal modes of the ν1 branch are preferentially excited with surface-
parallel polarization. The dependence of the absorption spectra on the shape is caused by the
long-range dipole-dipole interaction, which was found to include a shape-dependent
component associated with the surface polarization charge [7]. The oscillating surface charge
creates an electric field inside the sample that changes the energy gap between the ground and
excited vibrational levels [7], and consequently the corresponding vibrational frequencies
become shape-dependent. However, the shape-dependent effect predicted by the model was
found to be considerably stronger than that observed experimentally [4]. This discrepancy was
attributed to a limitation on the spatial extent of the vibrational excited states imposed by the
imperfections in the pc-ice medium.

217
3800 3700 3600 3500 3400 3300 3200 3100 3000 2900
0.00
0.04
0.08
0.12 E
3225
Wavenumber (cm -1)
pc ice, 160 K
C D
(a)
3365
3165
3280A. 30 sec B. 45 sec C. Fresnel (20 nm) D. Im (ε ε ε ε ) E. Im (- 1/εεεε )
Abs
orba
nce
B
A
0.0
0.1
0.2
GF
H
pc ice, 160 K
3165
33103390
F. 115 sec G. Fresnel (53 nm)H. Im(- 1/εεεε )
(b)
Figure 5.1.2. Comparison of the OH stretching band of the experimental FTIR-RA spectra of
polycrystalline (pc) ice deposits with simulated Fresnel and Berreman profiles.
The pc-ice film was obtained by vapour deposition at 160 K and 1×10⁻⁶ Torr for 30 (A), 45 (B)
and 115 seconds (F) and compared with the Fresnel spectra of 20-nm (C) and 53-nm (G) thick
pc-ice films and the Berreman (E, H) and transmission profiles (D), all arbitrarily normalized.
218
The Buch-Devlin simulation of IR absorption by an ice slab for the surface-
perpendicular polarization [4] could be directly compared with the experimental RA spectra of
ultrathin ice films on a metal surface at grazing-angle illumination with π-polarized or non-
polarized light. Upon reflection on a highly conductive metal, the σ-polarized component of
the incident electric field is almost completely eliminated near its surface and only the π-
polarized component of the electric field remains, which provides the physical justification for
comparing the experimental RA spectra with the simulated spectrum for excitation of an ice
slab by just the (surface-perpendicular) π- polarization. In particular, the Buch-Devlin model
[4] predicts that the absorption spectra of the ice slab for the surface-perpendicular polarization
are primarily originated from excitation of the intermediate and ν3 LO branches, of which the
former is of a higher frequency. Figure 5.1.2 compares our experimental RA spectra of the
OH stretching band obtained for ultrathin pc-ice deposits (with an estimated thickness below
50 nm) with the corresponding Fresnel spectra and with the Berreman and transmission
profiles [8] (arbitrarily normalized to the band maxima of the respective experimental spectra).
The Berreman profile corresponds to the energy loss function defined as Im(−ε−1) = ε''/(ε'2 +
ε''2), where the dielectric function ε = ε' – i ε'' (with its real ε' and imaginary ε'' parts), while the
transmission profile is given by Im(ε) (i.e., ε''). The Fresnel spectra and both of these profiles
are generated based on the spectral data reported by Toon et al. [2]. Evidently, the spectra for
pc-ice deposited at 160 K and 1×10⁻⁶ Torr for 30 sec and 45 sec (Curves A and B, Figure
5.1.2a) are in good accord in shape with the Buch-Devlin spectrum for the ice slab (see Figure
5.1.2c in Ref. [4), supporting the assignment of the higher-frequency shoulder at 3365 cm−1 to
the intermediate branch and of the 3280-cm−1 feature to the ν3 LO band. The band maximum
for the 3280-cm−1 peak is also found to be in good agreement with that of the ν3 LO band
(3299 cm−1) predicted by Whalley [5]. Furthermore, the 45-sec spectrum (Curve B, Figure
5.1.2a) closely follows the energy loss function as represented by the Berreman profile (Curve
E, Figure 5.1.2a), which again indicates that the blue shift of the central OH stretch peak with
respect to the transmission profile (Curve D, Figure 5.1.2a) is due to stimulation of the
longitudinal modes of the ν3 branch. The apparent enhancement of the higher-frequency part
of the OH stretch with the corresponding weakening of the lower-frequency part could be
associated with the blue shift of the most intense ν3 branch alone and not to the actual changes
in their own respective intensities. As expected for thicker deposits, the 115-sec RA spectrum

219
shown in Figure 5.1.2b (Curve F) evidently begins to deviate from the Berreman profile
(Curve H, Figure 5.1.2b) and converge to the Fresnel spectrum (Curve G, Figure 5.1.2b),
indicating the onset of the formation of a stratified ice film with smooth interfaces. The
continual blue shift of the OH stretch and the apparent changes in the relative intensities of the
band components (band shape deformation) with increasing thickness are likely caused by
optical effects in the film on a metal substrate [9]. Accordingly, at the initial stage of pc-ice
film formation the ice deposit exists in the form of crystallites, which causes the experimental
spectra to deviate from the Fresnel model. This is illustrated by the differences between the
30-sec and 45-sec spectra (both with a common shape, Curves A and B in Figure 5.1.2a) and
the corresponding Fresnel spectrum. In this case, the frequency position of a band associated
with the ν3 LO modes becomes dependent upon the particle shapes of the crystallites [6,7].
Further water deposition leads to the formation of a relatively thick film and a smooth
vacuum-ice interface, and the corresponding spectra would be expected to be more similar to
the Fresnel spectra. Figure 5.1.3 shows the experimental spectra for relatively thick films
obtained by water vapour deposition at 1×10⁻⁶ Torr with the substrate held at 160 K for 3.5
(Figure 5.1.3a), 20 (Figure 5.1.3b), 33.5 (Figure 5.1.3c) and 52.5 minutes (Figure 5.1.3d). In
addition to the OH stretch features at 3410, 3325 and 3180 cm-1 shown in Figure 5.1.3a, the
features near 1630 cm-1 and 2240 cm-1 have been attributed to the OH bending band (ν2)
possibly coupled with the first overtone (2νR) of the hindered rotational lattice mode (νR ≈ 850
cm-1 [10]) and to the combination band of the OH bending and hindered rotational mode
and/or the second overtone (3νR) of the hindered rotational mode, respectively [11].

220
0.0
0.1
0.2
0.3
0.0
0.1
0.2
0.3
0.0
0.1
0.2
0.3
4800 4000 3200 2400 1600
0.0
0.1
0.2
0.3
2255
1630
3190
3120
3030
3345
3485
3620
1200 nm(d)pc-ice160 K
3190
3345
3480
4280
3115
2900
2245 1620
Expt. Fresnel Fresnel, ππππ Fresnel, σσσσ
750 nm(c)
3110
3335 32003470
16202240
450 nm(b)
Abs
orba
nce
Wavenumber (cm -1)
16302240
3325
31803325
3410100 nm(a)
Figure 5.1.3. Comparison of experimental IR-RA spectra of thick polycrystalline films with
the corresponding Fresnel spectra for non-polarized light and their σ- and π- components.
The films were obtained by vapour deposition at 160 K and 1 ×10⁻⁶ Torr for (a) 3.5, (b) 20,
(c) 33.5 and (d) 52.5 minutes. The IR-RA spectra (at 0.5 cm-1 resolution) are compared with
the corresponding Fresnel spectra for non-polarized light and their σ- and π- polarized
components (arbitrarily normalized) involving 100-, 450-, 750- and 1200-nm-thick films,
respectively.
With the exception of the feature at 2255 cm-1 for the 1200-nm-thick film, these two
vibrational bands are found to be essentially stationary with a general increase in the spectral

221
intensity with increasing film thickness (Figure 5.1.3). Furthermore, there is excellent
agreement in the OH stretch region between the experimental spectrum and the corresponding
Fresnel spectrum of a pc-ice film with thickness of 100 nm (Figure 5.1.3a). Indeed, the good
accord between the experiment and the Fresnel simulation for even thicker films allows the
thickness parameter in the Fresnel calculation to be used as a semi-empirical estimate of the
thickness of the as-grown film. We have also performed optical interference measurements of
the as-grown film and the film thickness so obtained is found to be in good accord with the
corresponding Fresnel thickness parameter (depicted in Figure 5.1.3).
With increasing film thickness from 20 nm (Figure 5.1.1b) to ~50 nm (Figure 5.1.1c),
the experimental band maximum is shifted to a higher frequency, with a concomitant increase
in the intensity of the high-frequency shoulder near 3390-3400 cm−1. The absorbance of the
OH stretch feature appears to level off at ~70 integrated AU’s with increasing film thickness
up to 100 nm (Figure 5.1.3a). Further film growth from 100 nm to 250 nm does not change
the spectral intensity and band shape significantly. As the water deposition continues, the OH
stretch region becomes considerably more complex, as depicted in Figure 5.1.3b-d. In
particular, at least three spectral features are evident near 3410, 3325 and 3180 cm-1 for the
100-nm-thick pc-film (Figure 5.1.3a), which originate from the three corresponding features at
3375, 3300 and 3180, respectively, identified previously for the Fresnel spectrum of a 1-nm
thick film. The shoulder feature at 3180 cm-1 for the 100-nm-thick film becomes a more
prominent peak at 3200 cm-1 for the 450-nm-thick film, while the more intense features at
3325 and 3410 cm-1 shift to 3335 and 3470 cm-1, respectively (Figure 5.1.3b). These three
observed features remain relatively “stationary” in frequencies with increasing film thickness
above 450 nm (Figure 5.1.3c-d).
To investigate the evolution of the remaining OH features in Figure 5.1.3 with
increasing film thickness, we have evaluated the σ- and π-components of the Fresnel spectra,
which are arbitrarily normalized to the corresponding maxima of the overall calculated spectra.
It is important to note that the absorbance of the overall Fresnel spectrum of an ice film is not a
simple linear combination of their constituent σ- and π-components. The present discussion is
therefore limited to the identification of the contributing features of individual σ- and π-
components to the overall spectrum by their respective peak locations. Evidently, the
frequency position, shape, and intensity of the OH stretch are determined almost entirely by

222
the π-polarized component of the IR light for films with thickness below ~250 nm (Figure
5.1.3a), where the contribution of the σ-component is seen to be negligible. Similar results
have also been reported for very thin films, with thickness below ~10 nm, in earlier theoretical
studies by Greenler [12] and McIntyre and Aspens [13]. For film thickness above 250 nm,
there is a general increase in the overall intensity of the σ-polarized profile. The low-
frequency shoulder in the σ-polarized profile is seen to travel from 3110 cm-1 (for the 450-nm-
thick film in Figure 5.1.3b) to 2900 cm-1 (for the 750-nm-thick film in Figure 5.1.3c), which
contributes to the corresponding feature at 3110 cm-1 and at 2900 cm-1 in the respective
experimental spectra. Further increase in the film thickness to 1200 nm causes this σ-
polarized feature to move further towards the lower frequency, giving rise to the strong
enhancement to the spectral intensity of the feature observed at 2255 cm-1 (Figure 5.1.3d). As
illustrated in Chapter 3, this phenomenon is evidently caused by destructive interference of the
σ-polarized IR light in a uniform film. Furthermore, a second σ-polarized feature near 4280
cm-1 appearing in the spectrum for the 750-nm-thick film (Figure 5.1.3c) is also found to
migrate to 3620 cm-1 for the 1200-nm-thick film (Figure 5.1.3d). This migration of
interference peaks is believed to be responsible for the intensity enhancement of the OH DB (at
3693 cm-1) for the film thickness between 850 nm and 1200 nm. Similar interference peak
movement is also evident for the π-polarized feature at 3115 cm-1 for the 750-nm-thick film
(Figure 5.1.3c), which travels to 3030 cm-1 as the film thickness is increased to 1200 nm
(Figure 5.1.3d). The observation of destructive interference peak movements generally reflects
the quality of film uniformity obtainable for pc-ice by vapour deposition.
In the case of grazing-angle incidence, there is an opportunity to qualitatively
categorize three different regions of thickness according to the spectral behaviour of the OH
stretch mode. The extent of each region is a function of the incident angle and is therefore
relative in value. In our case of 83º angle of incidence, the OH stretch band intensity is
proportional to the film thickness in the first thickness region of approximately below 50 nm,
and the shape of the band reflects the absorbance profile without being affected by the
frequency profile of the vacuum-ice reflectance. In the intermediate thickness region of 50-
250 nm, the intensity of the OH stretch is saturated, in this case, at 70 integrated AUs (this
limit depends on the incident angle) and remains unchanged despite further increase in the film
thickness. Instead, a gradual blue shift in the maximum of the OH band towards the high-

223
frequency minimum of the vacuum-ice reflection curve in the region of the OH stretch
resonance (the so-called Christiansen effect [14]) is observed. The OH stretch band and the
entire spectrum in the first two regions of film thickness can be principally described by the
interaction of the π-polarized component of the IR light with the film. In the third thickness
region starting at ~300 nm, the optical behaviour of the OH stretch band with increasing film
thickness is determined primarily by the reflectance of the incoming IR light from the vacuum-
ice interface, because the refracted beam is completely absorbed by the ice in the frequency
range of the OH stretch band. The splitting of the OH stretch observed in Figure 5.1.3b-d
takes place due to the reflective character of the OH band. Unlike thinner films, the RA
spectrum in this third region of thickness is the result of contributions from both π- and σ-
polarized components.
Although we have presented glancing-incidence FTIR-RAS data for ice films deposited
at 160 K, similar data have also been obtained for ice films deposited at temperature as low as
155 K and as high as 185 K. These films have been classified as pc-ice based on similar
Fresnel simulations discussed above. Our present data for pc-ice are found to be in good
accord with the RA spectra for films deposited at 165 K over the 100-1000-nm thickness range
reported by Zondlo et al. [15]. Our spectrum for a 20-nm-thick pc-ice film (Figure 5.1.1b) is
also similar to that observed by Horn et al. for a pc-ice film obtained by crystallization at 155
K of an amorphous film grown at 80 K [16]. Figure 5.1.4a compares our spectrum for a 70-
nm-thick pc-ice film (obtained at 83° incidence) with the RA spectrum obtained at 75°
incidence by Jenniskens et al. [17] for an ice film deposited at 80 K followed by annealing at
160 K for 175 seconds. The spectrum by Jenniskens et al. is found to be in good agreement
with a Fresnel spectrum calculated for an 80-nm-thick pc-ice film at 75° incidence and is
consistent with the present work. Furthermore, Barone et al. has reported a RA spectrum for
an ice film deposited at 140 K followed by annealing to 160 K, which is found to be in good
agreement with our present data, and further attributed the observed dramatic change in the RA
spectrum after annealing above 150 K to ordering of the amorphous ice to a more crystalline
lattice [18]. The good agreement of our spectra with the spectra reported in these early studies
[10, 15, 18] therefore confirms the polycrystalline character of the ice films prepared by direct
vapour deposition at temperature above 155 K.

224
3800 3700 3600 3500 3400 3300 3200 3100 3000 2900
0.00
0.05
0.10
0.15
0.20
0.00
0.05
0.10
0.15
0.20
3325
33203405
3405
nc-ice, 131 K 35 nm, 83o
Jenniskens et al. as-grown, 80 K, 75 o
Fresnel - nc-ice 75 nm, 75o
nc-ice
Abs
orba
nce
Wavenumber (cm -1)
(b)
3320
33803170
33003400 pc-ice, 160 K
70 nm, 83o Jenniskens et al. 160 K, 175 sec, 75 o
Fresnel - pc-ice 80 nm, 75o
pc-ice(a)
Figure 5.1.4. Comparison of the present experimental IR-RA spectra obtained at 83º of
incident with the corresponding RA spectra reported by Jenniskens et al. at 75º incidence [17].
The present spectra for (a) a 70-nm thick polycrystalline ice (pc-ice) film deposited at 160 K
(recorded at 0.5 cm−1 resolution) and (b) a 35-nm-thick non-crystalline ice (nc-ice) film
deposited at 131 K (recorded at 2 cm−1 resolution) are compared with the corresponding RA
spectra reported by Jenniskens et al. [17] at 75º incidence for ice films deposited at 80 K
followed by annealing at 160 K for 175 sec, and as-grown at 80 K, respectively. The latter
spectra are also compared with the respective Fresnel spectra for an 80-nm-thick pc-ice film
and a 75-nm-thick nc-ice film calculated at 75º incidences.
5.1.2 Noncrystalline Ice at 128-145 K
Figure 5.1.5 compares the experimental spectra of thin nc-ice films deposited at 1×10⁻⁶
Torr for 40, 65, and 90 seconds with the substrate held at 131 K with Fresnel spectra for nc-ice
with corresponding film thicknesses of 6, 18 and 35 nm, respectively. As expected with

225
increasing film thickness in this range, the overall OH stretch band increases in intensity. The
small blue shift in the peak maximum from 3395 cm−1 (Figure 5.1.5, Curve A) to 3402 cm−1
(Figure 5.1.5, Curve C) along with a slight increase in the relative intensity of the high-
frequency shoulder with increasing film thickness is due principally to the physical optical
effects as illustrated in the Fresnel simulations and not to structural changes in the nc-ice
network during film growth. The Fresnel spectra are evidently in reasonable agreement with
the experiment for the nc-ice film in this thickness range, with notable discrepancies found in
the width and the higher-frequency part of the band. The difference in the deposition
temperature could lead to the formation of different water networks that could exhibit an OH
stretch band with a different frequency position and shape. In particular, Hagen et al. have
shown that annealing an amorphous ice sample deposited at 10 K to 130 K leads to a red shift
of the OH stretch in the transmittance IR spectrum, along with narrowing of the spectral line
and an increase in the peak intensity [19]. These irreversible spectral changes were attributed
to structural reconstruction in the water network that occurs below the temperature of phase
transformation to Ic (135-140 K) during the annealing process [19]. In addition, reversible
spectral changes in the OH feature involving red shift, band narrowing and enhanced peak
intensity with decreasing sampling temperature were also observed, which therefore indicates
that the optical constants of the nc-ice films also depend on the temperature of the film (at
which measurement is made). In keeping with the observations by Hagen et al. [19], these
discrepancies could be attributed to the differences in the structures of the water network at
different deposition temperatures. The stronger higher-frequency part of the Fresnel spectra
obtained with optical constants at 77 K than the experimental spectra collected at 131 K
suggests that stronger hydrogen bonding and more structural uniformity in the water network
could be obtained at a higher deposition temperature. Moreover, the OH stretch band in the
Fresnel spectrum for the nc-ice film is blue-shifted and wider in comparison with that of the
corresponding Fresnel spectrum for a pc-ice film (and with the experimental pc-ice spectrum),
consistent with the aforementioned temperature behavior observed by Hagen et al. [19].

226
3800 3700 3600 3500 3400 3300 3200 3100 3000 2900
0.00
0.02
0.04
0.06
0.08
0.10
0.12
0.14
0.16
3330
3402
33303397
33253395
nc-ice131 K
C
B
A
Expt. Fresnel A - 6 nmB - 18 nmC - 35 nm
Abs
orba
nce
Wavenumber (cm -1)
Figure 5.1.5. Comparison of experimental IR-RA spectra (at 2 cm-1 resolution) for non-
crystalline ice (nc-ice) films deposited at 131 K and 1×10⁻⁶ Torr for (A) 40, (B) 65, and (C) 90
seconds with the corresponding Fresnel spectra for film thicknesses of 6, 18, and 35 nm,
respectively.
Figure 5.1.6 compares the experimental and the corresponding Fresnel spectra of nc-ice
and pc-ice films of three different thicknesses: 18-20 nm, 50-60 nm and 90-100 nm. Like the
nc-ice film of a smaller thickness (Figure 5.1.5), the FTIR-RA spectra of the thicker nc-ice
films are also found to be in general accord with the corresponding Fresnel spectra. Unlike pc-
ice, discrepancies are clearly notable in the shape and the higher-frequency part of the Fresnel
spectra when compared with the experiment for nc-ice. For films with a larger thickness, there
is an apparent blue shift in the OH stretch band maximum for nc-ice relative to that for pc-ice
[e.g., 3410 cm−1 vs 3385 cm−1 for 50-60 nm (Figure 5.1.6b), and 3425 cm−1 vs 3410 cm−1 for
90-100 nm (Figure 9c)] and in the frequency position of the band center of the OH stretch
[e.g., 3320 cm−1 vs 3300 cm−1 for 50-60 nm (Figure 5.1.6b) and 3330 cm−1 vs 3310 cm−1 for
90-100 nm (Figure 5.1.6c)].

227
0.0
0.1
0.2
0.3
0.0
0.1
0.2
3800 3700 3600 3500 3400 3300 3200 3100 3000 2900
0.0
0.1
0.2
3160
3310
33303425 341090-100 nm(c)
3385 33203410
3160
330050-60 nm(b)
Abs
orba
nce
Wavenumbers (cm 1)
Expt. 131 K
Fresnel, nc-ice
Expt. 160 K
Fresnel, pc-ice
3400
3165
3365 3280
3325 18-20 nm(a)
Figure 5.1.6. Comparison of experimental IR-RA spectra and the corresponding Fresnel
spectra in the OH stretch region for non-crystalline ice (nc-ice) and polycrystalline ice (pc-ice)
deposited at 1×10⁻⁶ Torr and 131 K and 160 K, respectively.
The corresponding thickness parameter used for the Fresnel simulations are (a) 18 (20) nm for
45 seconds of deposition for nc-ice (pc-ice), (b) 60 (50) nm for 120 (115) seconds of
deposition for nc-ice (pc-ice), and (c) 90 (100) nm for 220 (240) seconds of deposition for nc-
228
ice (pc-ice). The nominal spectral resolution is 2 cm−1 for nc-ice spectra and 0.5 cm−1 for pc-
ice spectra. The low-frequency shoulder clearly observable at 3160-3165 cm−1 in the spectra
of pc-ice is less prominent in the nc-ice spectra (Figure 5.1.6a).
The blue shift and the less discernible shape of the entire OH stretching mode for nc-
ice reflect the structural differences in the organization of the water networks between nc-ice
and pc-ice, indicating the weaker hydrogen bonding system with a larger variation in such
structural parameters as the nearest-neighbour separation and the OH-O angle. In the case of
the 18-20-nm-thick film, the corresponding spectrum for nc-ice can best be approximated by
the Fresnel model (Figure 5.1.6a), which suggests that the structure of the nc-ice film is more
homogeneous.
Figure 5.1.7 further demonstrates the spectral differences in the bending and
combination bands between nc-ice and pc-ice for the same film thicknesses. In particular, the
OH bending band for nc-ice spectra is blue shifted to 1665 cm-1 from 1650 cm-1 for pc-ice
(Figure 5.1.7a) and appears to be narrower without the weak low-frequency shoulder at 1570-
1550 cm-1 characteristic of pc-ice. The small but discernible red shift in the band maximum of
the combination band of nc-ice (2230 cm-1) in comparison with that for the pc-ice (2240 cm-1,
Figure 10a) is in qualitative spectral agreement with the transmittance spectrum reported by
Hardin and Harvey [10]. These spectral differences are manifested more clearly with
increasing film thickness (Figure 5.1.7b-c). The difference in the frequency positions and
relative intensities of the spectral features of the OH stretching and bending modes can
therefore be used to identify the nature of the ice film deposited below 145 K as nc-ice.
However, it is not straightforward to determine the magnitude and nature of the structural
differences between nc-ice and pc-ice based on FTIR-RAS data alone. Figure 5.1.8 shows the
experimental spectra for relatively thick films obtained by water vapour deposition at 1×10⁻⁶
Torr for 3.5, 20.5 and 33.5 minutes and at 5 × 10⁻⁶ Torr for 11 minutes with the substrate held
at 131 K, which correspond to nc-ice film thicknesses of 110, 450, 750 and 1250 nm,
respectively, as estimated by the optical interference method. As before, the features near
1655 cm-1 and 2230 cm-1 (Figure 5.1.8a) can be assigned, respectively, as the OH bending
band and the combination band of the OH bending and hindered rotation modes [11]; and these
features remain essentially “stationary” in peak positions with increasing film thickness.

229
0.00
0.02
0.00
0.01
2600 2400 2200 2000 1800 1600 1400 1200
0.00
0.01
2228
15501657 1630
2240
90-100 nm(c)
1640
2240 22281560165750-60 nm(b)
2240 2230
1665
1570
Abs
orba
nce
Wavenumber (cm -1)
Expt. 131 K Expt. 160 K
165018-20 nm(a)
Figure 5.1.7. Comparison of experimental IR-RA spectra and the corresponding Fresnel
spectra in the OH bending and combination band region for non-crystalline ice (nc-ice) and
polycrystalline ice (pc-ice) deposited at 1×10⁻⁶ Torr and 131 K and 160 K, respectively.
The corresponding thickness parameter estimated in the Fresnel simulations of the OH stretch
region (Figure 5.1.6) are (a) 18 (20) nm for 45 seconds of deposition for nc-ice (pc-ice), (b) 60
(50) nm for 120 (115) seconds of deposition for nc-ice (pc-ice), and (c) 90 (100) nm for 220
(240) seconds of deposition for nc-ice (pc-ice). The nominal spectral resolution is 2 cm−1 for
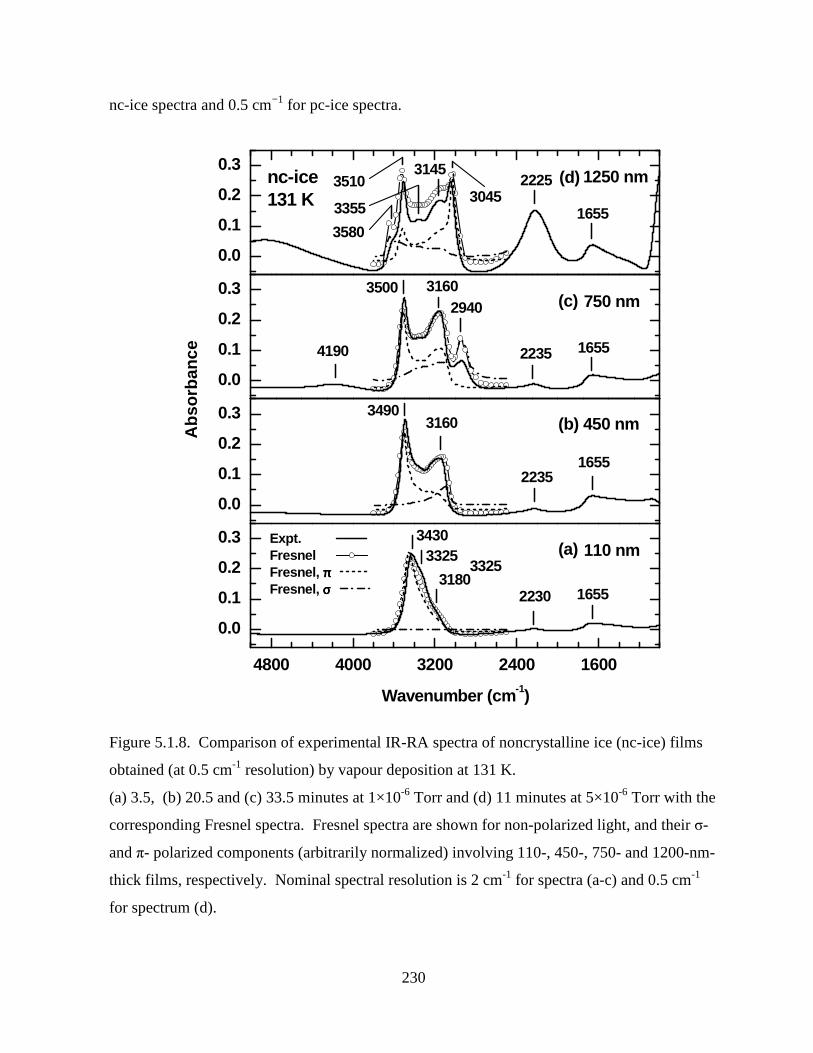
230
nc-ice spectra and 0.5 cm−1 for pc-ice spectra.
0.0
0.1
0.2
0.3
0.0
0.1
0.2
0.3
0.0
0.1
0.2
0.3
4800 4000 3200 2400 1600
0.0
0.1
0.2
0.3
2225
1655
3145
30453355
3510
3580
1250 nm(d)nc-ice131 K
3500
4190
31602940
2235 1655
750 nm(c)
Expt. Fresnel Fresnel, ππππ Fresnel, σσσσ
31603490
16552235
450 nm(b)
Abs
orba
nce
Wavenumber (cm -1)
16552230
3325
31803325
3430110 nm(a)
Figure 5.1.8. Comparison of experimental IR-RA spectra of noncrystalline ice (nc-ice) films
obtained (at 0.5 cm-1 resolution) by vapour deposition at 131 K.
(a) 3.5, (b) 20.5 and (c) 33.5 minutes at 1×10⁻⁶ Torr and (d) 11 minutes at 5×10⁻⁶ Torr with the
corresponding Fresnel spectra. Fresnel spectra are shown for non-polarized light, and their σ-
and π- polarized components (arbitrarily normalized) involving 110-, 450-, 750- and 1200-nm-
thick films, respectively. Nominal spectral resolution is 2 cm-1 for spectra (a-c) and 0.5 cm-1
for spectrum (d).

231
The spectral evolution of the OH stretch (near 3430 cm-1 for the 110-nm-thick film
shown in Figure 5.1.8a) with growth of the nc-ice film is also similar to that observed for the
pc-ice film growth (Figure 5.1.3). In particular, three relatively “stationary” features at 3490-
3510 (band maximum), 3355, and 3160-3145 cm-1 can be resolved for film thickness greater
than 450 nm (Figure 5.1.8b-d). The band maximum for nc-ice is seen to shift to a higher
frequency (Figure 5.1.8), and the integrated intensity of the absorption band becomes saturated
at ~ 70 integrated AU at film thickness near 120 nm, as observed similarly for pc-ice. We also
show in Figure 5.1.8 the σ- and π-polarized components arbitrarily normalized to the
maximum of the overall Fresnel spectrum. For film thickness below 250 nm, the shape of the
OH stretch band is predominantly determined by reflection-absorption of the π-polarized
component of the incident light (Figure 5.1.8a), with negligible contribution from the σ-
polarized component. For film thickness greater than 250 nm, the σ-polarized component
generally strengthens with the emergence of an interference feature travelling from ~3160 cm-1
at 450 nm (Figure 5.1.8b) to 2940 cm-1 at 750 nm (Figure 5.1.8c) and to 2225 cm-1 at 1250 nm
(Figure 5.1.8d). Another σ-polarized interference feature near 4190 cm-1 for film thickness of
750 nm (Figure 5.1.8c) is also seen to travel to 3580 cm-1 for the 1250-nm-thick film (Figure
5.1.8d). The passage of this second interference feature through the spectral window of the
OH DB causes amplification of the OH DB signal for nc-ice films with thickness of 800-1400
nm (as shown later in Figure 5.1.9). It is evident that the π-polarized components contribute
prominently to the three aforementioned “stationary” OH stretch features over the film
thickness range covered in Figure 5.1.8. The movement of the main π-polarized feature (near
3430 cm-1 for the 110-nm-thick film in Figure 5.1.8a) to a higher frequency with increasing
film thickness gives rise to the observed blue shift of the band maximum. As noted earlier,
this shift is related to the physics of reflection-absorbance and not to possible structural
changes in the nc-ice network with an increase in the film thickness. For thicker films, the π-
polarized interference feature observed at ~3160 cm-1 for the 750-nm-thick film (Figure 5.1.8c)
is also found to travel to a lower frequency with increasing film thickness, e.g. 3045 cm-1 for
the 1250-nm-thick film (Figure 5.1.8d). The evolution of the underlying σ- and π-polarized
Fresnel contributions to the overall spectrum of nc-ice with increasing film thickness (Figure
5.1.8) is therefore similar to that found for pc-ice (Figure 5.1.3).
It is important to note that we have also performed FTIR-RAS experiments on ice

232
grown at a different temperature between 128 K and 145 K. Similar spectral results have been
obtained, therefore suggesting that the ice films obtained by vapour deposition over 128-145 K
can be characterized as nc-ice as discussed above.
There have been numerous earlier studies exploring the nature of nc-ice and pc-ice. In
particular, as it was shown by an earlier study of thermal evolution of the hyperquenched water
droplets by using X-ray diffraction and differential calorimetry, an ice phase predominantly in
the form of vitreous ice could be obtained at deposition temperature below 140 K [25]. It
should be noted that the temperatures for glass-to-liquid transition and for crystallization to Ic
are found to be 129-143 K and 165 K, respectively [ 20, 25]. The temperature of
crystallization of amorphous ice to Ic is generally a function of the deposition temperature and
post-deposition history of the amorphous sample, which reflects the complex heterogeneous
nature of amorphous ice [21]. Furthermore, the thermal evolution data for hyperquenched
solid water prepared at 130-150 K [25] suggests the formation of a mixture of cubic ice and
glassy materials. Hyperquenching above 160 K was found to produce predominantly cubic ice
with at most 20% amorphous component [25], which could persist up to the Ic-to-Ih phase
transition temperature (230 K). Based in part on the time evolution of FTIR-RA spectra of
thin ice films (vapour-deposited at 80 K with an estimated thickness of ~20 nm) post-annealed
to 160 K, Jenniskens et al. [17] concluded that the amorphous ice so obtained, when annealed
to above the glass-to-liquid transition temperature, becomes a “viscous” liquid that coexists
with Ic in the temperature range 140-210 K.
In the present work, crystallization of nc-ice deposited at 131 K is found to occur upon
annealing to temperature starting from ~160 K. The spectra of the samples deposited at 131 K
followed by annealing to 165 K (not shown) are found to be essentially identical to the spectra
of pc-ice prepared by direct deposition at 160 K. In light of these results, the character of pc-
ice deposited at 160 K in the present experiment (Figure 5.1.1 and Figure 5.1.3) could be
interpreted as predominantly cubic ice. Although the deposition temperature for pc-ice used in
the present experiment is well below the Ic-to-Ih transition temperature (230 K), the present
FTIR-RAS data does not exclude the possible presence of hexagonal ice because of the nearly
identical optical properties of the Ic and Ih phases. Based on the analysis of the OH stretch,
the present data does not reveal any spectral evidence for the presence of nc-ice for films
deposited above 155 K. However, the presence of non-crystalline material in, e.g., the inter-

233
grain regions of pc-ice or the surface region of the film cannot be ruled out due particularly to
the weaker absorption of nc-ice relative to pc-ice. For ice deposited below 145 K, we have not
found any spectral evidence of the existence of polycrystalline fragments, based on the shapes
and frequency positions of the OH stretching and bending modes. The nc-ice obtained at 131
K (Figure 5.1.8) could therefore be attributed predominantly to amorphous solid.
Figure 5.1.4b compares the present experimental spectrum recorded at 83° incidence
for nc-ice deposited at 131 K with that collected at 75° incidence for nc-ice obtained at 80 K
by Jenniskens et al. [17]. The latter spectrum was found to be in good accord with the Fresnel
spectrum for a 75-nm-thick nc-ice film calculated at 75º incidence using the optical constants
of amorphous ice at 77 K reported by Leger et al. [22]. Apart from the differences in the
intensity caused by the different angles of incidence, the spectrum obtained in the present work
at 131 K is similar that of the amorphous ice obtained at 80 K by Jenniskens et al. [17],
suggesting that the nature of nc-ice obtained in the present work could be interpreted as
amorphous solid. Furthermore, Jenniskens et al. observed no discernible spectral changes
upon annealing the sample to 145 K and attributed the subsequent changes observed upon
further annealing to 155 K to crystallization of amorphous ice to cubic ice, which was
confirmed for thin ice films by electron diffraction. This observation is also in qualitative
agreement with the temperature range (128-145 K) over which the nc-ice films have been
prepared. However, in contrast to the time evolution of the OH band observed for the film
post-annealed at 160 K by Jenniskens et al. [17], no similar behavior for ice films grown in the
present work was observed and therefore the presence of viscous liquid cannot be confirmed.
Furthermore, the OH DB signal at 3692 cm-1 detected on the as-grown amorphous ice at 80 K
was found to disappear after post-annealing the ice film to 160 K by Jenniskens et al.[17]. In
contrast, the OH DB signal on nc-ice grown at 131 K in the present work (spectra not shown)
is found to persist up to 160-165 K, during which crystallization occurs.
5.1.3 OH Dangling Bonds
The OH DB signal can be detected for ice films deposited over a wide range of
temperature, from 128 K in the case of nc-ice to as high as 185 K for pc-ice film, which
indicates the remarkable thermal stability of the elements of ice surface containing these OH
dangling groups. The spectral intensity of the OH DB feature observed at 3700-3690 cm-1 [15]

234
as a function of film thickness for pc-ice (obtained at 160 K) and nc-ice (obtained at 131 K) is
shown in Figure 5.1.9. Given that the OH DB feature is generally very weak relative to the
OH stretch feature and could therefore be susceptible to spectral noise and baseline instability
at these frequencies, only the general trend in the dependence of the OH DB signal on the film
thickness can be inferred. According to the metal surface selection rule, only the OH DB's that
have a dipole moment component perpendicular to the metal surface could contribute to the
RA signal in the case of a thin ice film (below 200 nm), as shown in Chapter 3. The
observation of the OH DB RA signal on thin nc-ice films by Zondlo et al. [15] shows that the
OH DB band could be detected only with the π-polarized light. A significant amount of the
OH DB's that have dipole moments oriented parallel to the metal surface would remain
invisible at this thickness range (below < 200 nm) to the RAS technique. With the exceptions
of complete randomization of the OH DB orientation and of a fixed angular geometry for all
DB's, the observed RA signal is not necessarily proportional to the amount of OH DB's in the
ice film.

235
0 200 400 600 800 1000 1200 1400
0.00
0.05
0.10
0.15
0.20
0.25
0.00
0.01
0.02
0.03
3720 3680-12
-10A25 nm
-38
-36
B 520 nm
-42
-40 C750 nm
x 1000
C
BA
(b) nc-ice, 131 K
In
tegr
ated
Abs
orba
nce
of O
-H D
angl
ing
Bon
d S
igna
l
Film Thickness (nm)
x 1000
3720 3680 3640
-9
-6 A. 53 nm
-33
-30 B. 520 nm
-18
-15C. 1050 nm
A
B
C
(a) pc-ice, 160 K
Figure 5.1.9. Integrated absorbance intensity of the OH dangling bond signal as a function of
the film thickness for (a) polycrystalline ice (pc-ice) deposited at 160 K and 1×10⁻⁶ Torr, and
(b) non-crystalline ice (nc-ice) deposited at 131 K and 5×10⁻⁶ Torr.
The curves are used to guide the eyes only. The film thickness is estimated by optical
interference method and is found to be in reasonable agreement with the thickness parameter
used in the respective Fresnel simulations. Insets (with the ordinate expanded by 1000) show
the OH dangling bond feature at selected film thicknesses marked by arrows.

236
For film thickness smaller than ~200 nm, the OH DB signals for both pc-ice and nc-ice
are found to be relatively weak and essentially independent of the film thickness (given the
large uncertainty). The spectral intensity of the OH DB appears to diminish in the 150-850 nm
thickness range for pc-ice but remains relatively constant up to a film thickness of 600 nm for
nc-ice. For the 850-1200-nm-thick pc-ice and nc-ice films (Figure 5.1.9), the passage of the σ-
polarized interference pattern over the optical window 3710-3680 cm-1 appears to significantly
enhance the OH DB signal (by over 20 folds), which is in a good qualitative accord with the
spectral simulation shown in Chapter 3. This strong optical amplification in the observed
signal does not necessarily correspond to the increase in the total amount of the OH DB's in the
material. The same phenomenon has also been observed for other absorption bands, most
notably the combination band at 2255 cm-1 (Figure 5.1.3d). Apparently, the amplification is
much stronger in the case of nc-ice (Figure 5.1.9b) than pc-ice (Figure 5.1.9a). Since the
amplification is related to the passage of the σ-polarized interference pattern, the experimental
observation of such an optical effect shows that the dipole moments of the OH DB's have
surface-parallel components. For pc-ice films (Figure 5.1.9a), essentially the same magnitude
of the OH DB signal for the 850-1150-nm-thick film as that for a thin film (< 200 nm) is
observed. The lack of OH DB signal in the intervening thickness region therefore does not
necessarily indicate the absence of the OH DB, but rather spectral interference that
overwhelms the OH DB feature. This observation suggests that the total amount of the OH DB
remains essentially the same with film growth, and the OH DB dipole moments are oriented
more or less randomly with the respect to the metal surface. Accordingly, we attribute the
spectral signal at ~3693 cm-1 to OH DB groups on the external surfaces of the crystalline
grains in the early stage of pc-ice deposition (with film thickness below 50 nm), while for
thicker films these OH DB's are thought to be located on the external surface of the pc-ice film
itself. The OH DB's that exist on the outer surfaces of crystalline grains in the initial stage of
pc-ice film formation would be effectively saturated by water molecules that fill the interstitial
space during the film deposition process. Although the local nature of the water network in the
inter-grain regions remains controversial, the present results suggest a near-crystalline
structure for these regions in the water network.
The behavior of the OH DB signal is different in the case of nc-ice films. In particular,
the intensity of the signal for nc-ice films thicker than 1400 nm is still significantly higher than

237
that for thin films (< 150-200 nm), unlike pc-ice films. This difference suggests that the total
amount of OH DB in nc-ice may in fact increase with film growth, which is in general accord
with the observation made by Zondlo et al. that the total amount of OH DB's in low-density ice
(obtained at 94 K) increases with increasing film thickness [15]. In order to account for the
proportionality of the abundance of the OH DB's with respect to the amount of ice, the latter
work further concluded that the OH DB's are located on the surfaces of multiple micropores
inside the amorphous solid ice network [15]. The existence of the OH DB's on the internal
surfaces of open and close micropores has also been predicted for film growth of low-density
ice under appropriate conditions by Zhdanov and Norton using Monte Carlo simulation [23].
The observed thickness profile of the OH DB signal shown in Figure 5.1.9b is similar to the
simulated profile shown in Chapter 3, which confirms the increase in the total amount of OH
DB's with increasing film thickness and the essentially random orientation of the OH DB's.
The large difference in the deposition temperature between our experiment and that of Zondlo
et al. is expected to cause some difference in the organization of the non-crystalline network
that might result in a smaller amount of the internal micropores in the case of the higher-
temperature deposit. The temperature dependence of the amount of micropores in nc-ice has
been explained earlier by an increase in the surface mobility of incoming molecules with
increasing temperature [15, 23]. We conclude therefore that the OH DB's are likely located on
the highly convoluted external surface of the nc-ice film, which is in general accord with the
studies by Callen et al. [24], Rowland and Devlin [3], Horn et al. [16], and Zondlo et al. [15].
We further suggest that the nc-ice vapour-deposited at 128 K or higher temperature may have a
“tracery” organisation at least in the near-surface region that could give rise to the OH DB
signal. In the case of thin nc-ice film, the OH DB's are most likely located on the external
surface of the film, while with the increase in the film thickness the “openwork” character of
the near-surface region (that would enhance the OH DB signal) is likely preferred. However,
the presence of micropores at a higher temperature above 131 K cannot be ruled out.
Unlike the earlier studies, we have observed this OH DB signal to persist after
annealing a <50-nm-thick nc-ice film from 131 K to 165 K, i.e. above the temperature of
crystallization to cubic ice. This observation appears to support the aforementioned hypothesis
that the OH DB's are localized on the external surfaces of thin nc-ice and pc-ice films, and
suggests that the local structure of the surface of the nc-ice and pc-ice films are similar.

238
5.1.4 Summary
FTIR Reflection-Absorption Spectroscopy has been used to study the film growth of
polycrystalline and non-crystalline ice obtained by vapour deposition over a range of film
thickness from 10 nm to 1500 nm. Simulated spectra of the OH stretch region (3800-2800
cm−1) based on the Fresnel reflection with the appropriate optical constants obtained from the
literature [2, 22] are found to give good agreement with the experimental spectra. The intricate
nature of the film growth process of ice at different temperatures can be qualitatively
characterized as pc-ice or nc-ice, with their respective structures and properties (such as film
thickness). Our experiment shows that pc-ice and nc-ice are most likely to form at deposition
temperature above 155 K and below 145 K, respectively. Further analysis using the σ- and π-
polarized components of the Fresnel spectra shows that the intensities and shapes of specific
bands in a RA spectrum could be significantly affected by migration of interference peaks with
increasing film thickness, which in turn complicates spectral identification and population
analysis of the corresponding groups in the case of solid-state spectroscopy. The scattering
character of the RA spectra for the early stage of film deposition of pc-ice and to a certain
extent nc-ice generally confirms the heterogeneous character of the early deposit, which
composes of nanoscale-sized water aggregates. The experimental confirmation of the Fresnel
model upon further film growth illustrates the evolution to a more homogeneous film growth
mechanism.
Weak RA peak at 3700-3690 cm-1 attributable to incompletely coordinated OH groups
has also been observed for a majority of pc-ice and nc-ice films deposited under different
conditions, indicating that the OH dangling bonds are an integral structural component of the
surfaces of both pc-ice and nc-ice. Although the weak OH DB signals of both pc-ice and nc-
ice are essentially independent of the film thickness below ~200 nm, the intensity of the DB
feature for thicker films (particularly those of nc-ice) appears to be subjected to significant
spectral amplification due to the passing of destructive interference patterns through the OH
stretch spectral region over a specific film thickness range. Up to 20-fold enhancement has
been observed in the case of the 1100 nm-thick nc-ice film. Furthermore, the OH DB signal
has been found on pc-ice films deposited at temperature as high as 185 K, and on nc-ice
deposited at 131 K and annealed to 165 K, which is above the temperature of crystallization to
cubic ice. This behaviour of OH DB signal is consistent with the picture that the OH DB's are
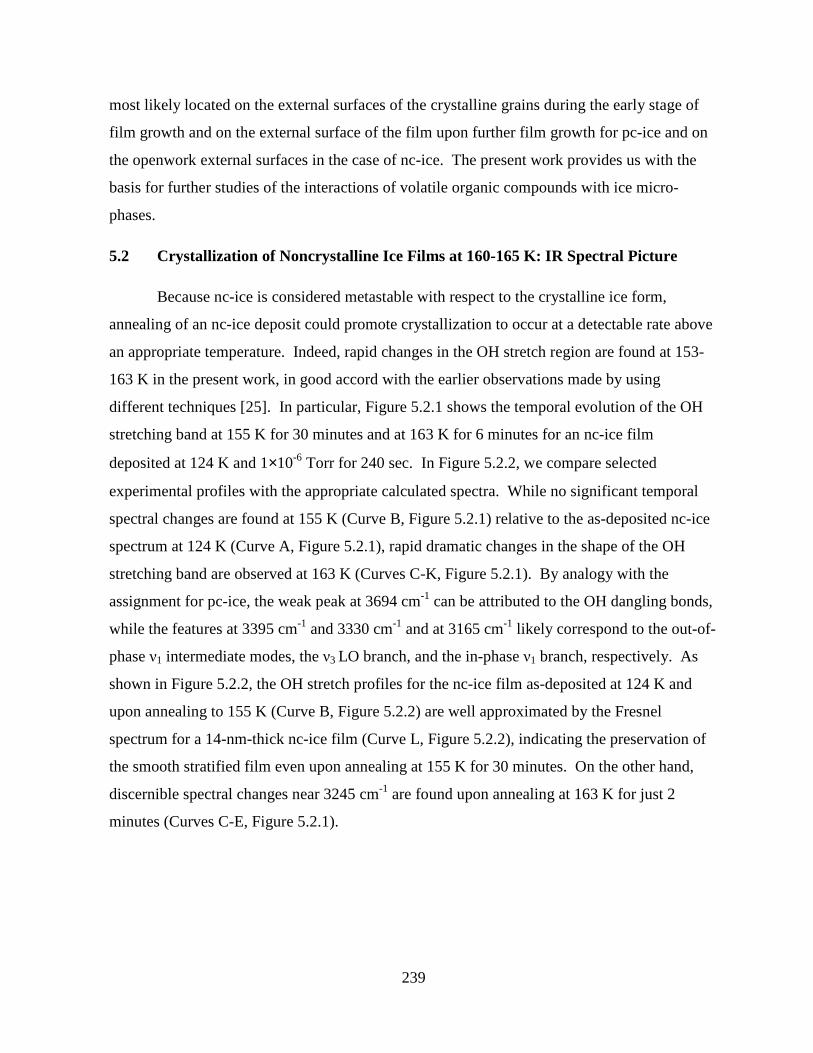
239
most likely located on the external surfaces of the crystalline grains during the early stage of
film growth and on the external surface of the film upon further film growth for pc-ice and on
the openwork external surfaces in the case of nc-ice. The present work provides us with the
basis for further studies of the interactions of volatile organic compounds with ice micro-
phases.
5.2 Crystallization of Noncrystalline Ice Films at 160-165 K: IR Spectral Picture
Because nc-ice is considered metastable with respect to the crystalline ice form,
annealing of an nc-ice deposit could promote crystallization to occur at a detectable rate above
an appropriate temperature. Indeed, rapid changes in the OH stretch region are found at 153-
163 K in the present work, in good accord with the earlier observations made by using
different techniques [25]. In particular, Figure 5.2.1 shows the temporal evolution of the OH
stretching band at 155 K for 30 minutes and at 163 K for 6 minutes for an nc-ice film
deposited at 124 K and 1×10⁻⁶ Torr for 240 sec. In Figure 5.2.2, we compare selected
experimental profiles with the appropriate calculated spectra. While no significant temporal
spectral changes are found at 155 K (Curve B, Figure 5.2.1) relative to the as-deposited nc-ice
spectrum at 124 K (Curve A, Figure 5.2.1), rapid dramatic changes in the shape of the OH
stretching band are observed at 163 K (Curves C-K, Figure 5.2.1). By analogy with the
assignment for pc-ice, the weak peak at 3694 cm-1 can be attributed to the OH dangling bonds,
while the features at 3395 cm-1 and 3330 cm-1 and at 3165 cm-1 likely correspond to the out-of-
phase ν1 intermediate modes, the ν3 LO branch, and the in-phase ν1 branch, respectively. As
shown in Figure 5.2.2, the OH stretch profiles for the nc-ice film as-deposited at 124 K and
upon annealing to 155 K (Curve B, Figure 5.2.2) are well approximated by the Fresnel
spectrum for a 14-nm-thick nc-ice film (Curve L, Figure 5.2.2), indicating the preservation of
the smooth stratified film even upon annealing at 155 K for 30 minutes. On the other hand,
discernible spectral changes near 3245 cm-1 are found upon annealing at 163 K for just 2
minutes (Curves C-E, Figure 5.2.1).

240
3800 3700 3600 3500 3400 3300 3200 3100 3000 2900 2800
0.00
0.02
0.04
0.06
0.08
0.10
0.12
0.14
0.16
0.18
0.20
3365 3165
3410
33003240
3224
3236
A. 124K
3244
3694
K. 300 sec
J. 270 sec
I. 240 sec
H. 210 sec
G. 180 sec
F. 150 sec
E. 120 sec
D. 90 sec
C. 163K 60 sec
B. 155K 30 min
Crystallization of H2O thin filmby annealing at 163K.H~14 nm; Tdep=124K
Dynamics of the OH stretching modeduring the annealing periodof ~6 min
33073163
3310
3400
3694
Abs
orba
nce
Wavenumber, cm-1
Figure 5.2.1. Typical evolution of the OH stretching mode of the nc-ice film upon annealing.
A ~15-nm-thick H2O ice film was prepared by vapor-deposited at 1×10⁻⁶ Torr × 2min and 124
K (A) and further annealed (B) at 155 K for 30 min and (C-K) at 163 K for 6 min. The spectral
resolution is 1 cm−1, and each spectrum is the result of averaging of 50 scans at 80 kHZ.

241
This feature develops into a strong, well-defined peak at 3250 cm-1 upon further annealing at
the same temperature for 3 more minutes (Curves F-K, Figure 5.2.1). In contrast, the
dangling-bond feature at 3694 cm−1 remains essentially unchanged except for the minor red
shift during this anneal.
Figure 5.2.2 also compares selected spectra obtained during the 163-K anneal with the
RA spectrum of the 30-sec pc-ice film deposited at 160 K and with the Berreman and
transmission profiles for pc-ice films. Evidently, the major differences between the OH stretch
profiles of the annealed nc-ice film (Curves G, H, and K, Figure 5.2.2) and that of the as-
grown 30-sec pc-ice film (Curve O, Figure 5.2.2) are the location and relative intensity of the
ν3 LO manifold (at 3250 cm-1 vs 3270 cm-1). According to the theoretical study by Wojcik et
al. [26], the emergence of a prominent ν3 LO band during annealing in the present work can be
used as evidence of a rapid increase in the density of excited vibrational states in this narrow
frequency region, which in turn indicates the onset of a crystallization process. The intensity
increase of the overall OH stretching band during the anneal (Curves G, H, and K, Figure
5.2.2) is also consistent with the general chemical principle that crystallization leads to
strengthening of the hydrogen bonds in the ice medium [27]. Furthermore, the peak maximum
of the observed ν3 band (3250 cm-1) is found to be in between those of the Berreman profile
(3300 cm-1, Curve M, Figure 5.2.2) and the transmission profile (3225 cm-1, Curve N, Figure
5.2.2). (It should be noted that the Berreman profile and the transmission profile are arbitrarily
normalized to the experimental spectra shown as Curve G and Curve K, respectively.) The
intermediate peak location is due to the presence of surface modes in the crystallites, as
discussed by Englman and Ruppin [28] and Martin [29]. Moreover, the formation and growth
of the crystallites introduce tension into the film and could lead to cracking in a sufficiently
thin film.
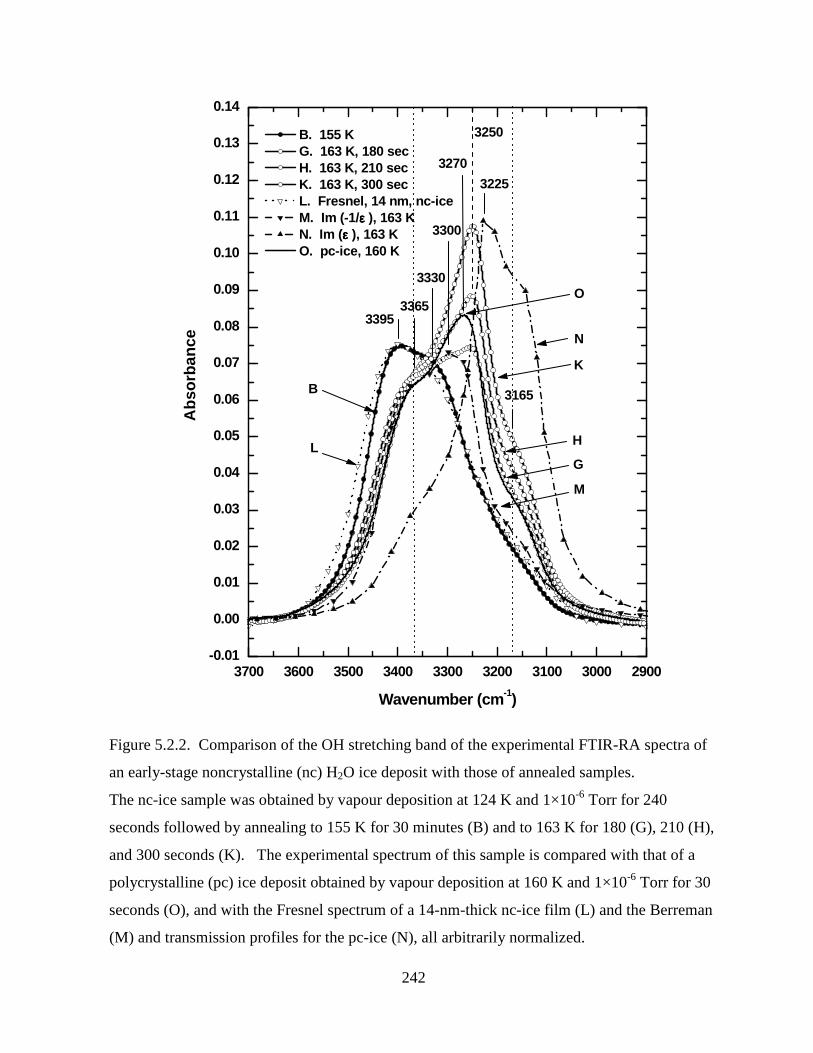
242
3700 3600 3500 3400 3300 3200 3100 3000 2900-0.01
0.00
0.01
0.02
0.03
0.04
0.05
0.06
0.07
0.08
0.09
0.10
0.11
0.12
0.13
0.14
3270
M
L
N
3300
3365
3165
3330
G
O
3225
K
H
B
3250
3395
B. 155 K G. 163 K, 180 sec H. 163 K, 210 sec K. 163 K, 300 sec L. Fresnel, 14 nm, nc-ice M. Im (-1/εεεε ), 163 K N. Im (εεεε ), 163 K O. pc-ice, 160 K
Abs
orba
nce
Wavenumber (cm -1)
Figure 5.2.2. Comparison of the OH stretching band of the experimental FTIR-RA spectra of
an early-stage noncrystalline (nc) H2O ice deposit with those of annealed samples.
The nc-ice sample was obtained by vapour deposition at 124 K and 1×10⁻⁶ Torr for 240
seconds followed by annealing to 155 K for 30 minutes (B) and to 163 K for 180 (G), 210 (H),
and 300 seconds (K). The experimental spectrum of this sample is compared with that of a
polycrystalline (pc) ice deposit obtained by vapour deposition at 160 K and 1×10⁻⁶ Torr for 30
seconds (O), and with the Fresnel spectrum of a 14-nm-thick nc-ice film (L) and the Berreman
(M) and transmission profiles for the pc-ice (N), all arbitrarily normalized.

243
Figure 5.2.3 shows the temporal evolution of the OH and OD stretching modes of
deuterated nc-ice as deposited at 120 K at 1.5×10⁻⁶ Torr for 9 minutes and during annealing to
162 K. Evidently, no discernible change is observed in the OD stretching mode upon
annealing from 120 K to 162 K (Curves A-H, Figure 5.2.3a). Furthermore, the temporal
evolution in the OD stretch features at 162 K for nearly 5 minutes (Curves H-N, Figure 5.2.3a)
is found to be remarkably similar to that of OH stretch observed earlier in the undeuterated nc-
ice sample (Figures 4 and 5), which again indicates the onset of rapid crystallization at this
temperature. (Figure 5.2.3a also shows only minor changes in the dangling-bond signal of the
OD surface groups at 2727 cm-1 during crystallization.) Moreover, the uncoupled OH
stretching mode of HOD in the deuterated ice sample exhibits a red shift from 3300 cm-1 at
120 K (Curve A, Figure 5.2.3b) to 3280 cm-1 at 162 K (Curve N, Figure 5.2.3b) with
concomitant narrowing of the peak, which is also consistent with the crystallization process.
The changes in this vibrational mode are in excellent agreement with the transmission spectra
for thick amorphous and polycrystalline ice samples obtained by Bergren et al. [30]. Between
120 K (Curve A, Figure 5.2.3b) and the crystallization onset at 162 K (Curve H, Figure
5.2.3b), there is a small but discernible blue shift of 7 cm-1 accompanied with peak broadening
in this structure-sensitive mode, which could be argued as spectral evidence for further
disordering of this nc-ice deposit immediately before crystallization. This spectral change
might also be associated with an endothermic peak in the calorimetric upscan of an nc-ice
medium often appearing just before the crystallization onset, which has been attributed to a
glass-to-liquid transition in the earlier studies [25] because frequency shifts for the structure-
sensitive modes (including, e.g., the aforementioned modes) are expected in the case of a
supercooled liquid state. In particular, Jenniskens et al. have used this approach to interpret
their FTIR-RAS data for the transition of nc-ice to pc-ice [17]. Smith et al. [31] also attributed
the significant enhancement in the self-diffusivity of nc-ice over this temperature range to a
glass-to-liquid transition. However, the observed blue shift for this nc-ice feature is also in
remarkably good agreement with the blue shift of the corresponding feature for pc-ice solids
upon annealing (from 3275.2 cm-1 at 120 K to 3280.5 cm-1 at 150 K) observed by Sivakumar et
al. using Raman spectroscopy [32]. Indeed, we also observed a corresponding red shift in the
OH stretch feature in the crystallized ice (Curve N, Figure 5.2.3b) upon re-cooling from 162 K
to 120 K (not shown). The blue shift in the isolated OH stretch observed for nc-ice upon

244
annealing in the present work is therefore most likely just the natural consequence of thermal
expansion of the ice medium. We favour the latter simpler explanation over the former
explanation invoking the glass-to-liquid transition because such an equilibrium thermodynamic
effect is expected to occur regardless of the existence of the glass-to-liquid transition.
Together with the early spectroscopic studies on ice crystallization by Hardin and Harvey [10]
and Hagen et al. [19], the present data therefore provides no conclusive spectroscopic evidence
for the existence of a distinct glass-to-liquid transition in nc-ice in the 120-163 K range.
Although any difference in the rates of relaxation processes is expected to manifest in the
shape and width of the OH stretch band, we cannot rule out the possibility that the local
structures of the water glass and supercooled liquid states happen to be almost identical, in
which case the intermolecular interactions in both media are so close to each other that no
spectral differences in the OH/OD stretching region could be resolved. In a separate
experiment, we also obtained FTIR-RA spectra for an organic guest species, acetone or
acetaldehyde, co-deposited with water to form a noncrystalline guest-ice matrix at 130 K. The
temporal evolution of the spectral features of the embedded guest species upon annealing
followed by crystallization of the ice at 165 K shows only steady escape of the guest species
from the matrix. While spectral differences between the adsorption/absorption states of the
guest species in the nc-ice and pc-ice samples were clearly resolved, no signature of the
intermediate states in the guest-supercooled liquid water matrix in the 130-165 K temperature
region could be observed. Similar spectral observations of a steady escape and the absence of
any frequency shift for dimethylether in a dimethylether-water matrix at 130-160 K have also
been reported recently by Schriver-Mazzuoli et al., although the spectral changes for
dimethylether have been found at 120-130 K and attributed to clathrate-hydrate formation [33].
These results further support our above observation of direct transition from nc-ice to pc-ice
(i.e. without an intermediate glass-to-liquid transition). Furthermore, the results on
crystallization kinetics of thin compact nc ice films by Dohnalek et al. [34] are also consistent
with the direct solid-to-solid phase transformation.

245
2700 2600 2500 2400 2300 2200
0
4
8
12
16
20
24
28
32
OD in D2O
2470
2530
2490
2440
2350
(a)
N. 282 sec
M. 235 sec
L. 188 sec
K. 141 sec
J. 94 sec
I. 47 sec
H. 162 K
G. 158 K
F. 152 K
E. 146 K
D. 132 K
C. 126 K
B. 120 K 7.5 min
A. 120 K
as-grown
Wavenumber (cm -1)
3400 3300 3200
-24
-20
-16
-12
-8
-4
0
4
x 10-2x 10-3
OH in HDO
33073300
3280
(b)
N.
M.
L.
K.
J.
I.H.
G.F.
E.
D.
C.
B.
A.
Abs
orba
nce
Figure 5.2.3. Evolution of (a) the OD stretching band (for D2O) and (b) the OH stretching
band (for HDO) in the experimental FTIR-RA spectra upon annealing of nc-ice film.
An early-stage noncrystalline ice deposit was obtained by vapour deposition at 120 K and
1.5×10⁻⁶ Torr for 9 minutes (A), followed by annealing to 120 K for 7.5 minutes (B) and to
132 K (C), 146 K (E), 152 K (F), 158 K (G), and 162 K (H) for 47 (I), 94 (J), 141 (K), 188 (L),

246
235 (M), and 282 seconds (N).
Concerning the state of surfaces at nc-ice and pc-ice films investigated in the present
studies, it should be noted that the amount of OH dangling bonds as estimated by the intensity
of the corresponding spectral feature at 3694 cm-1 (Fig. 4) on the as-grown thin (and compact)
nc-ice films is similar to that on pc-ice films prepared by crystallization of nc-ice films or by
direct deposition. However, the present FTIR RAS data on acetone adsorption appear to
indicate a dynamical difference in the surface states of the adsorbate on nc-ice and pc-ice
films. This difference is clearly related not only to the “snap-shot” structure of the surface but
also to the stability and dynamics of the surface and near-surface regions of nc- and pc-ice
films as discussed by Buch et al. [35].
In summary, the temporal evolution of the OH (and OD) stretch manifold(s) in the
(deuterated) nc-ice deposits upon annealing followed by crystallization has been investigated
by using FTIR-RAS at grazing-angle incidence. The present section provides a microscopic
interpretation of the spectral data using the theoretical results of Buch and Devlin [4] and
Whalley’s assignment [5]. For the ultrathin nc-ice deposits, crystallization near 160 K has
been demonstrated for the first time to be marked spectroscopically by an abrupt enhancement
along with a concomitant red shift in the longitudinal branch of the ν3 OH (OD) stretching
mode at 3250 (2440) cm-1. These observations are consistent with strengthening of the
hydrogen bonds in the molecular water network and with increased ordering of an ice medium
during crystallization. Furthermore, the spectral dynamics of the OH and OD stretch
manifolds and of the isolated OH stretching mode in a deuterated ice matrix near 160 K
observed in the present work indicate that rapid crystallization proceeds directly from a
noncrystalline to a crystalline state, i.e. without any long-lived intermediate state that involves
hydrogen-bonded network structurally different from that of nc-ice at a lower temperature (120
K). While the present interpretation of the OH spectral dynamics does not favor the existence
of a glass-to-liquid transition during crystallization, we cannot rule out the existence of a
supercooled liquid state that happens to have a nearly identical local structure to glass. Further
studies possibly involving non-spectroscopic data would be of great interest to resolve this
intricate fundamental issue about ice.

247
5.3 The FTIR RA Spectral Analysis of Pristine Films of Organic Substances on Metal
Surface at Cryogenic Temperatures
Crystals of acetone, acetaldehyde, methanol, and chloroform have been studied over
the long history of spectral studies of organic crystals at cryogenic temperatures. The present
work differs from the classical studies by the method of observation, i.e. a reflection-
absorption method versus transmittance. In the case of vibrational modes with large transition
moment the RAS mode provides a different perspectiv on the organic phase prepared by the
vapor deposition. In the transmittance studies transversal modes are the major contributor to
the spectra, and the appearance of longitudinal and/or surface modes is possible in a case of
small-size crystals. In contrast, in the reflection-absorption studies, the longitudinal modes are
always excited, whereas the transversal modes appear typically in the spectra of relatively
thick films. In order to distinguish unambiguously between TO and LO modes in the
reflection-absorption IR studies of organic crystals, a polarizer should be used.
An expected picture on the basis of the site group and factor group splitting in a
crystalline solid could be significantly affected by the presence of strong LO/TO splitting for
the modes of strong transition dipole moment. The LO/TO splitting is also expected for
carbonyl band of solid acetone and acetaldehyde, and for the hydroxyl group band of solid
methanol.
5.3.1 Solid Chloroform on the Cu Substrate at 125-165 K
A molecule of chloroform, CHCl3, is considered to belong to a C3V point symmetry
group, which leads to the following symmetry species for the vibrational modes of isolated
molecule:
EAV
EAR
EAT
EAAN
Γ⊕Γ=Γ
Γ⊕Γ=Γ
Γ⊕Γ=Γ
Γ⊕Γ⊕Γ=Γ
33
54
1
2
1
213
(5.1)
There are 9 (3×5−6=9) vibrational modes for isolated chloroform molecule, three of which
form a basis for the A1 representation and other 6 from the E representation. The latter 6
vibrational normal modes appear as three sets of doubly degenerated vibrations. The reduction
of molecular symmetry on transition from a gas to solid phase could cause the lifting of the

248
degeneracy and, therefore, the number of observed spectral transitions could rise from 6 in the
gas phase to 9 in the condensed phase.
In the optical range between 5000 and 1000 cm−1 there are three fundamental modes:
ν1(A1) stretching C−H mode and two degenerate ν4 (E) C−H bending modes, which are found
in the liquid chloroform at 3019 cm−1 and 1216 cm−1, respectively [36]. The transition dipole
moments of these two vibrational manifolds are perpendicular to each other: the transition
dipole of stretching modes is collinear with the direction of C3 axis, whereas, in particular, the
vectors of transitional dipole moments for bending modes are perpendicular to the C3 axis.
Together with these fundamental transitions, the present studies reveal the following overtones
and combinational bands in the given spectral range: the combinational band of ν1+ν4 modes
with the E symmetry, multiplet of which is found in the solid chloroform at the frequency
range 4232-4201 cm−1 with π-polarization; the combinational band ν1 + ν2 of A1 symmetry
found in the liquid phase at 3683 cm−1 [36] and in the present studies at frequency range of
3692-3676 cm−1 with π-polarization ; the overtone of ν4 (E) of A1+E symmetry found in the
liquid phase at 2400 cm−1 [36] and in the present studies at frequency range of 2431-2393 cm−1
with π-polarization; the overtone of ν5 (E) of A1 + E symmetry found in the liquid phase at
1521 cm−1 [36] and in the present studies at 1533-1513 cm−1 with π-polarization; the
combinational band of ν4 + ν6 of A1 + E symmetry found in the liquid phase at 1475 cm−1 [36]
and in the present studies near 1482 cm−1 with π-polarization; the combinational band of ν2 +
ν5 of E symmetry found in the liquid phase at 1423 cm−1 [36] and in the present studies in the
frequency range of 1428-1419 cm−1 with π-polarization; and finally the overtone of ν2 (A1) of
A1 symmetry found in liquid at 1334 cm−1 [36]and in the present studies also at 1334 cm−1 with
π-polarization. The present studies are concentrated primarily on the fundamental modes ν1
and ν4, the combinational modes ν1 + ν4 and ν1 + ν2, and the overtone of ν4 because these modes
are found to be sufficiently intense for the spectral observation during and after annealing.
The crystallographic studies by Fourme and Renaud [37] reveal that at 185 K
chloroform crystalline structure belongs to a Pnma (D2h16) orthorhombic space group with 4
molecules in the crystallographic unit cell, occupying Cs-symmetry positions. A molecular
packing in the solid chloroform is represented on Figure 5.3.1 with the following dimensions
of the crystallographic unit cell: a = 7.485 Å; b = 9.497 Å; c = 5.841 Å [37]. The presence of a
mirror plane populated by molecules creates a natural arrangement motif such that the

249
molecular structure could be regarded as consisting of layers oriented parallel to the (010)
crystallographic plane. Within the layer there are 2 non-equivalent pairs of 2 nearest neighbors
for each molecule such that the C−H group of one molecule is coordinated with two out-of-
plane chlorine atoms of a molecule from the first pair, separated by 2.95 Å, and with an in-
plane chlorine atom from a molecular nearest neighbor of the second pair with a separation
distance of 3.12 Å. The former distance is equal to the sum of average van der Waals radii of
hydrogen and chlorine atoms: 1.20 Å (H) + 1.77 Å (Cl) [38], whereas the latter is slightly
larger. Therefore, the chloroform structure contains a network of oriented dipoles, in which a
hydrogen atom of chloroform molecule is coordinated with three chlorine atoms of nearest
neighbors: 2 out-of-plane and 1 in-plane.
The question on the contributions of electrostatic, induction, dispersion and exchange
forces to the total interaction between nearest neighbors remains unanswered, and an
assumption on the hydrogen bonding acting between chloroform molecules requires detail
examination. The intensity of the C−H stretching mode, ν1 (A1), rises by an order of
magnitude upon transition from the gas in to liquid phase, which should be regarded as a
signature of the hydrogen bond formation.
Each molecular layer is polarized along the [100] direction such that the collective
dipole moments of two adjacent layers are anti-parallel. It is clear that the dipole-dipole
attraction stabilizes the interlayer arrangement and also contributes to the interlayer interaction.
It should be noted that the molecular localization at the Cs-symmetry site within the (010)
plane prevents this layer from being closely packed. The dipole moments of the two nearest
neighbors along the [001] direction are collinear such that it leads to electrostatic repulsion
between them. Indeed, a in-plane chlorine atom of one molecule is in contact with two out-of-
plane chlorine atoms of another molecule with an interatomic distance of 3.76 Å (see Figure
5.3.1). This latter distance is noticeably larger than the average van der Waals diameter of
chlorine atom in polychloroalkyls at 3.54 Å [38] due to presumably a dipolar repulsion.
Contacting by chlorine atoms, two adjacent layers interact by the electrostatic and van der
Waals forces with the closest Cl···Cl contact at 3.60 Å. The closest interlayer
Cl3C−H···Cl−CHCl2 contact is at 3.70 Å, which is ~0.7 Å larger than the sum of average van
der Waals radii of hydrogen and chlorine atoms: 1.2 Å (H) + 1.77 Å (Cl). A simple structural
analysis given above allows predicting of the relative frequency positions of ν4 (E) modes due

250
to the site symmetry effect. Firstly, the close contact between hydrogen and chlorine atoms of
neighboring molecules within the (010) mirror layer could be assumed to affect the frequency
of the C−H bending mode in a degree prevailing over the similar effect of the hydrogen-
chlorine contacts in the direction perpendicular to the layers. Therefore, an A' bending modes
localized within the layer is expected to be at a higher frequency than that of A'' bending mode
with transition dipole moment polarized in [010] direction.
The rows of centro-symmetric pairs of chloroform molecules with antiparallel dipoles
(although the distance between the counterparts of the pair is not the shortest among all
molecular pairs observed in the chloroform structure) are present in the crystalline
arrangement, parallel to the [010] direction.
a
bc
Figure 5.3.1. The crystallographic structure of chloroform. The structure belongs to the
Pnma, D2h16, space group with the 4 molecules per crystallographic unit cell [37].
A molecule of chloroform occupies the Cs-symmetry position with the angle between the C−H
bond and [100] axis of 14.36°. A hydrogen atom is coordinated with three chlorine atoms such
that the H···Cl distances are 2.95 Å, 2.95 Å and 3.12 Å, which provides the anisotropic

251
bonding in the [100] direction within the (010) planes.
The correlation diagram for symmetry species of isolated molecule, the site and factor-group
symmetry representation is given in Table 5.3.1.
Table 5.3.1. The correlation diagram for crystalline chloroform phase, space group Pnma,
factor group D2h.
Vibrational
Modes
Molecule
C3V
Site
Cs
Unit Cell
D2h
Ag R ν1,2,3 A1 (IR, R)
B1g R
B2g R
A2 B3g R
Au
B1u IR, b
B2u IR, a
ν4,5,6
E (IR, R)
A'
A"
B3u IR, c
There are 4 molecules in the unit cell, which, therefore, leads to two IR-active modes
for the ν1 C−H stretching vibrations, polarized along a and c axes and to three IR-active modes
for the ν3 C−H deformational vibrations. Concerning the C−H stretch manifold it is possible to
suggest that the B2u (a) factor group mode should be significantly more intense than the
corresponding B3u (c) mode because the C−H vector is at an angle of 14.36° with the [100]
direction. If the oriented gas model can be assumed, then the ratio of IR intensities for B2u (a)
and B3u (c) species of ν1 modes becomes: I(B2u) (a)/ I(B3u) (c)=tan−2(14.36°)~15, i.e. the
intensity of B2u (a) is expected to be by the order of magnitude higher than that of B3u (c). The
opposite conclusion holds for the ratio of B2u (a) and B3u (c) components of the deformational
C−H band ν3, I(B3u) (c)/ I(B2u) (a) ~15, i.e. the intensity of c-polarized bending mode
component is an order of magnitude higher than that of a-polarized component. We will

252
proceed to further analysis of the experimental RA spectra of chloroform based on the latter
predictions of the gas oriented model.
The IR and Raman spectra of solid chloroform have been studied by Kimoto and
Yamada [39], D'Alessio et al. [40], Andrews et al. [41], and Shurvell [42]. The relevant
results can be summarized as follows: (i) the sample prepared by vapor condensation on the
KRS-5 window at 100 K exhibits IR spectra, which change with time and on temperature rise;
(ii) the IR spectra of the as-grown samples contain only sharp peaks, which indicates on the
absence of amorphous phases; (iii) spectra stable with respect to time and a temperature
change were obtained only after careful annealing of the pre-deposited sample to temperatures
around 140-150 K; (iv) the differential thermo-analysis [39] and proton magnetic resonance
[43] reveals no phase transition up to the melting point; (v) quadrupole resonance on Cl35
nuclei is detectable up to the melting point (209.7 K), which shows that the molecular
reorientation is very slow, i.e. there is no molecular reorientation at frequencies above 1×10⁴
Hz. The spectral studies of Kimoto and Yamada [39] indicate the existence of metastable
crystalline phase in addition to stable phase in the solid chloroform rapidly deposited by gas
spraying onto the N2-liquid cool KRS-5 window. The present studies corroborate with that
observation and further investigate the temporal evolution of the IR RA spectra of as-grown
and thermo-annealed chloroform films. Figure 5.3.2 (I and II) show the two spectral manifolds
of the C−H stretching and bending modes observed on the growing films with π- and σ-
polarized IR beam. The ratio of intensities of at 1204 cm−1 deformation band and 3011 cm−1
stretch band (correspond to the stable crystalline phase Pnma) is 2.3 and 0.6 for π- and σ-
polarized beam, respectively. In the polycrystalline chloroform the ratio of intensities of total
deformation manifold to the stretch manifold was found to be 2.5 by Kimoto and Yamada [39]
and given in Table 5.3.2.

253
Table 5.3.2. The IR spectral data on the C−H stretching and bending modes of chloroform.
Present spectral data on solid film and bibliographic data on the gas, liquid and solid phases
of chloroform ([39]) are compared. SP, MP, and AP stands for the stable crystalline phase,
the metastable crystalline phase and amorphous phase, respectively. The absolute (integrated)
intensities are shown in parentheses expressed in the nonstandard cm·millimole−1 units [39].
Band Gas [39] Liquid [39] Solid
ν1 (A1) 3034 (44) 3015 (707) 3029MP
3011SP (1200 [39])
3019AP
ν4 (E) 1221 (4200) 1216 (2900) 1223SP
1208SP (3000 [39])
1204SP
1223MP
1219MP
I (ν4) / I (ν1) ~ 100 4 2.5 [39]
I(1204)/I(3011) = 2.3 (π)
= 0.6 (σ)

254
I π-polarization
-0.5
0.0
0.5
1.0
1.5
2.0
-0.4
-0.2
0.0
0.2
0.4
3040 3035 3030 3025 3020 3015 3010 3005
-0.8
-0.4
0.0
0.4
0.8
1.2
1.6
1225 1220 1215 1210 1205 1200 1195
-1.0
0.0
1.0
2.0
3.0
4.0
5.0
νννν4444(E) δδδδ CH
PCHCl
3
=1 x 10⁻⁶ Torr, T = 125 K(a)ππππ-polarization
νννν1111(A
1) νννν CH
I(1223) / I(3029) ~ 1.9(b)
I(1204) / I(3012) ~ 2.3
3012
3029
Wavenumber, cm -1
40 sec after (a)
12041220
1223
Abs
orba
nce,
x 1
0-3
II σ-polarization
6.4
6.6
6.8
6.0
6.4
6.8
7.2
7.6
3040 3035 3030 3025 3020 3015 3010 3005
6.4
6.8
7.2
7.6
8.0
8.4
8.8
9.2
1225 1220 1215 1210 1205 1200 1195
6.4
6.8
7.2
7.6
8.0
8.4
8.8
νννν4444(E) δδδδ CH
Abs
orba
nce,
x 1
0-3
Wavenumber, cm -1
PCHCl
3
=1 x 10⁻⁶ Torr, T = 125 Kσσσσ-polarization
νννν1111(A
1) νννν CH
(a)
I(1223) / I(3029) ~ 0.6(b)
3012
3029
I(1204) / I(3012) ~ 0.6
660 sec after (a)
400 sec after (a)
12041219
1223

255
Figure 5.3.2. (I) π- and (II) σ- polarized spectral regions for (a) ν1 (C−H) stretching and (b) ν4
(C−H) deformation bands of growing CHCl3 films at deposition temperature of 125 K.
The ratios of intensity (approximated by the height of the corresponding band) of these bands
shown on the graphs indicate that the C−H bond is oriented preferentially parallel to the metal
surface.
4260 4240 4220 4200-3.25
-3.20
-3.15
-3.10
-3.05
-3.00
-2.95
-2.90
-2.85
-2.80
-2.75
-2.70
3700 3680 3660
-3.00
-2.98
-2.96
-2.94
-2.92
-2.90
-2.88
-2.86
3040 3030 3020 3010 3000-3.0
-2.0
-1.0
0.0
1.0
2.0
3.0
4.0
5.0
6.0
7.0
8.0
2440 2420 2400-1.6
-1.5
-1.4
-1.3
-1.2
-1.1
-1.0
-0.9
-0.8
1220 1210 1200
0
2
4
6
8
10
12
14
16
18
20
4201
4208
4228
4232
νννν1111++++νννν4444
E
Abs
orba
nce
Wavenumber, cm -1
3676
3692
νννν1111++++νννν2222
A1
3019
3012
3029
νννν1111(A
1) νννν CH
2430
2392
2413
2222νννν4444(A
1+ E)
1207
1204
1220
νννν4444(E) δδδδ CH
1223
Figure 5.3.3. The π-spectrum of CHCl3 film vapour deposited at P = 1×10⁻⁶ Torr and 125 K.
The spectral signatures of two crystalline phases are evident.
These numerical values indicate that in the solid chloroform film deposited on the
metal film in the present studies the molecular axis is oriented preferentially parallel to the
metal surface. In other words, the axis a, [100] on Figure 5.3.1, is preferentially parallel to the
metal surface. Figure 5.3.3 shows the π-spectrum of chloroform, which includes, apart from
the fundamental modes, the overtone of the deformational band, 2ν4, and the two

256
combinational manifolds of the C−H stretch and the bending mode as well as the C−H stretch
and the C−Cl stretch modes. The correlation diagram shown on Table 5.3.1 indicates that
C−H stretch could exhibit doublet whereas the deformational C−H mode could exhibit triplet
upon the dynamic splitting. The stretching mode located at 3029 cm−1 was found to disappear
converting to low-frequency peak at 3011 cm−1, which remains the only peak of the stable
Pnma chloroform phase. For the C−H deformational manifold, the annealing leads to
significant decrease of the high-frequency peak at 1223 cm−1 and almost complete
disappearance of 1220 cm−1 peak. The evolution of combinational ν1 + ν4 band and overtone
2ν4 upon annealing supports this assignment: the high-frequency doublet at 4232 cm−1 and
4228 cm−1 and the overtone band at 2413 cm−1 completely disappear on annealing, which
indicates that they are originated from the combination of 3029 cm−1 and 1223 cm−1 and from
the 1223 cm−1 peaks. Therefore, peaks at 3029 cm−1, 1223 cm−1, and 1220 cm−1 belongs to the
metastable phase, which transforms upon annealing to the crystalline stable phase. Resuming
this part let us point out the present studies reveal that chloroform molecules are preferentially
oriented with the molecular axis nearly parallel to the substrate surface.
5.3.2 Solid Acetone on the Cu Substrate at 125-165 K
This section provides a qualitative description of the main RA spectral features, which
are characteristic to crystalline acetone solid phase/s and which can be used for the spectral
identification of the acetone crystalline clusters in acetone-water systems and for
distinguishing between different physisorption acetone states on the ice surfaces.
Twenty four fundamental vibrations of isolated acetone molecule form a basis for the
irreducible representations of a C2V molecular point group as follows: 8A1 + 4A2 + 7B1 + 5B2.
Six normal modes (3A1 + 2B1 + 1B2) are associated with the motion of the acetone skeleton,
whereas the remaining eighteen modes are primarily associated with the motion of hydrogen
atoms. Among the skeleton vibrations, the carbonyl stretching fundamental ν3 (A1) found in
the gas phase spectra at 1731 cm−1 and the asymmetric C−C stretching fundamental ν17 (B1) at
1215.5 cm−1 [44] are of primarily interest for the present studies because their frequencies are
found to be sensitive to the molecular neighborhood of acetone molecules [45, 46]. Moreover
their relative intensities can be used for the prediction of the space orientation of acetone
molecules in condensed state. Among the modes associated with a hydrogen atom motion, the

257
symmetric CH3 deformation bands ν5 (A1) and ν16 (B1) will be primarily used in the course of
this paper for the identification purposes.
The crystallographic structures of two solid acetone phases, metastable orthorhombic
Cmcm phase and stable Pbca phase prepared by the low temperature crystallization, have been
determined by Allan et al. [47]. The crystals of both phases are composed from acetone
molecules arranged in layers such that the carbonyl groups lie within (Cmcm) or closely to the
layer (Pbca) while the carbon skeleton is oriented perpendicularly (Cmcm) or near
perpendicularly to the layer (Pbca).
Figure 5.3.4. Molecular arrangement of the acetone molecules in a crystal of the metastable C-
centered orthorhombic acetone phase Cmcm. a = 6.514, b = 5.4159, c = 10.756 Å, Z = 4 [47].
Coordination number of acetone in the layer is 4. Carbon-carbon skeleton is in dark and
oxygen atoms are in bright color.
a
b
c

258
a
b
c
Figure 5.3.5. Structure of the Cmcm layer of acetone molecules in the Cmcm phase [47].
Within the (001) layer, a number of the nearest neighbours is 4 (O···O distance is 4.24 Å) with
2 additional close neighbours (O···O distance is 5.41 Å).
4.24 Å
5.41 Å

259
Figure 5.3.6. The molecular arrangement in the crystal of stable orthorhombic acetone phase
(Pbca), T = 150 K, a = 8.873, b = 8.000, c = 22.027 Å, Z = 16 [47], dimensions 2a x 2b x 1c.
a b
c
Perpendicular motif, d1(3-1) = 3.49 Å , d2(4-5) = 3.46 Å
The molecular arrangement in the crystal of stable orthorhombicacetone phase (Pbca). T = 150 K, a = 8.873, b = 8.000, c = 22.027 Å, Z = 16.2a x 2b x 1c
Anti-parallel motif, d(1-2) = 3.30 Å
1
2
1
2
3
4
5

260
A metastable orthorhombic Cmcm phase can be prepared by slow cooling of the liquid
through the melting point at ambient pressure; within a few hours it transforms into a stable
primitive phase [47]. A characteristic feature of the Cmcm phase structure shown in Figure
5.3.4 is a skew-parallel motif of the acetone molecules arranged in the layer such that the first
coordination sphere of acetone molecule contains 4 closest neighbors and 2 additional close
molecules at a larger separation distance, which indicates that this structure is not close-packed
(Figure 5.3.5). This structure is not close-packed because the molecular axis lies within the
(001) layer as shown on Figure 5.3.5. Accordingly, this phase was found metastable and
transforming slowly into a Pbca orthorhombic phase, the structure of which shown in Figure
5.3.6 [47]. This stable phase consists of two kinds of close-packed layers with coordination
number 6, juxtaposed along the c-axis. The building block for one of the layers is a pair of
closely touching acetone molecules mutually related by an inversion center, which in
combination with the set of b-glide planes produces the close-packed centrosymmetric
structure such that its projection on ab-plane forms pgg layer shown on Figure 5.3.7. The
second layer is a closely-packed pg structure formed by the operation of a b-glide plane on the
row of closely-packed acetone molecules such that molecules derived by its action from the
initial molecules falls into a hollow between two molecules of the first row (Figure 5.3.8). The
carbonyl groups are oriented such that the angles between carbon-oxygen bonds, which is the
direction of intermediate principal axis IB in isolated molecule, and crystallographic C-axis are
bigger than 80º (~ 82º 44' for one of the layers and ~ 80º 27' for another). Accordingly, the
minor principal axis IA, along which the dipole moment of C-C asymmetric stretch is
oscillating in isolated molecule, forms with the crystallographic C-axis angles less than 10º (~
8º 11' for one of the layers and ~ 9º 7' for another).

261
Figure 5.3.7. The pgg-layer in the Pbca stable acetone phase [47].
a
b
c
I
I

262
Figure 5.3.8. The pg-layer in the Pbca stable acetone phase [47].
The habitus and growth modes of the acetone crystals on a polycrystalline Cu substrate
and on the ice films can be explored in some degree by FTIR-RA spectroscopy, and in turn,
the information about crystal growth and an orientation on the surface is essential for an
interpretation of the spectra. Quantitative analysis of the available crystal structures can
provide some information about possible habitus and orientation of the acetone physisorbed
films. Considering the possible habitus of the acetone crystal of Pbca phase, the fastest growth
may be predicted for the (100) direction because an attachment of acetone molecule to the
(100) plane would lead to establishing of three tight in-layer contacts (Figure 5.3.8) while the
a
b c
(010)
Slow
growth
Fast growth
(100)

263
slowest growth can be expected for the (001) plane (Figure 5.3.6). In such a case, the (001)
and (100) faces would be the most and the least abundant faces of the Pbca phase crystal,
respectively. The morphological significance of the (001) plane may be associated with a low
interlayer attachment energy Eatt, which is primarily due to van der Waals nature of the
interlayer contacts, in combination with the relatively large layer energy EL originating from
close-packing of the pg and the pgg-layers [48].
Table 5.3.3. The correlation diagram for the Cmcm acetone phase.
R
R
R
R
IR(Z)
IR(Y)
IR(X)
Ag
B1g
B2g
B3g
Au
B1u
B2u
B3u
A1
A2
B1
B2
A1
A2
B1
B2
IR R
R
IR R
IR R
16
8
14
10
8
4
7
5
Activityin crystal
Factor Group of Space Group (Cmcm)
D2 h17
Site GroupC2V(Y)
Molecular Symmetry Group C2V
Activity in isolated molecule
Degrees of vibrational freedom per Bravias cell (x 2)
Degrees of vibrational freedom per molecule
R
R
R
R
IR(Z)
IR(Y)
IR(X)
Ag
B1g
B2g
B3g
Au
B1u
B2u
B3u
A1
A2
B1
B2
A1
A2
B1
B2
IR R
R
IR R
IR R
16
8
14
10
8
4
7
5
Activityin crystal
Factor Group of Space Group (Cmcm)
D2 h17
Site GroupC2V(Y)
Molecular Symmetry Group C2V
Activity in isolated molecule
Degrees of vibrational freedom per Bravias cell (x 2)
Degrees of vibrational freedom per molecule
4863360Degrees of freedom
IR51017B3u
IR80019B2u
IR71019B1u
41005Au
R71109B3g
R41005B2g
R51107B1g
R80109Ag
ActivityN VibN RotN TransN AcousN TotD2 h
4863360Degrees of freedom
IR51017B3u
IR80019B2u
IR71019B1u
41005Au
R71109B3g
R41005B2g
R51107B1g
R80109Ag
ActivityN VibN RotN TransN AcousN TotD2 h
264
Table 5.3.4. The correlation diagram for the Pbca acetone phase.
The crystallographic unit cell of the crystal structure of the metastable Cmcm phase contains
four molecule units occupying C2V symmetry positions, while the unit cell of the stable
orthorhombic Pbca phase contains 16 acetone molecules in general symmetry positions. The
symmetry correlation diagrams for the k = 0 vibrational modes of these crystal phases are
given on Table 5.3.3and Table 5.3.4, respectively.
For the crystal of Cmcm group, the factor group analysis shows (Table 5.3.3) that there
is one-to-one correspondence between the IR active vibrational modes of the isolated molecule
and IR active vibrational modes of the crystal, therefore a factor group splitting in vibrational
modes for this metastable phase is not expected and polarization of each mode is preserved. In
contrast, for the crystal of Pbca group (Table 5.3.4), the correlation of the molecular (C2V), site
(C1) and factor groups (D2 h15) shows that each of 8 irreducible representations of the factor
group holds two crystal vibrational modes originated from particular normal mode of the
molecule. That is, the factor-group splitting causes each molecular mode to generate three
pairs of the crystal IR-active vibrational modes polarized along three crystallographic axes,
respectively. In particular, the appearance of multi-component absorption band can be
expected for molecular non-degenerated modes such as carbonyl stretch ν3 (A1) and carbon-
8 x 16 A1 = 8 x [2 x (Ag + B1g + B2g + B3g + Au + B1u + B2u + B3u)]4 x 16 A2 = 4 x [2x (Ag + B1g + B2g + B3g + Au + B1u + B2u + B3u)]7 x 16 B1 = 7 x [2 x (Ag + B1g + B2g + B3g + Au + B1u + B2u + B3u)]5 x 16 B2 = 5 x [2 x (Ag + B1g + B2g + B3g + Au + B1u + B2u + B3u)]
RRRR
IR(Z)IR(Y)IR(X)
AgB1gB2gB3gAuB1uB2uB3u
C1
A1
A2
B1
B2
IR R
R
IR R
IR R
128
64
112
80
8
4
7
5
ActivityFactor Group of Space Group (Pbca)
D2 h15
Site GroupC1
Molecular Symmetry Group C2V
ActivityDegrees of vibrational freedom per Bravias cell (x 16)
Degrees of vibrational freedom per molecule
RRRR
IR(Z)IR(Y)IR(X)
AgB1gB2gB3gAuB1uB2uB3u
C1
A1
A2
B1
B2
IR R
R
IR R
IR R
128
64
112
80
8
4
7
5
ActivityFactor Group of Space Group (Pbca)
D2 h15
Site GroupC1
Molecular Symmetry Group C2V
ActivityDegrees of vibrational freedom per Bravias cell (x 16)
Degrees of vibrational freedom per molecule

265
carbon asymmetric stretch ν17 (B1), along with lifting off the degeneracy of molecular modes
such as methyl group symmetric deformation modes ν5 (A1) and ν16 (B1) and C−H stretch ν1(A1)
and ν13(B1) modes. For crystal structures with the centrosymmetric unit cells, to which the two
acetone phases described above belong, the IR and Raman active vibration modes are expected
to be at different frequencies with an exception of occasional coincidences for limited number
of modes. The normal modes that correspond to the ungerade symmetry a species B1u, B2u, and
B3u of the factor group D2h, are IR active, while all gerade modes are Raman active. The
prediction of the mutual exclusion followed from correlation diagrams (Table 5.3.3and Table
5.3.4), however, appears to be in contradiction with the experimental IR data by Krause et al.
[49] and Raman data by Harris and Levin [50] on solid acetone, a comparison of which shows
that the frequencies for the majority of the IR and Raman bands coincide with one another. On
basis of this observation, Krause et al. [49] have suggested that a unit cell of the acetone
crystals is not centrosymmetric. Concerning a sensitivity of the techniques to spatial extent
and arrangement of crystals, it is self-evident that IR and Raman spectroscopies provide
information about short-range local molecular neighbourhood while X-ray diffractometry
probes crystals on a long-range scale of an assembly of many molecular/atomic layers. In
particular, considered as a dynamically independent from the closest layers, the intramolecular
IR and Raman modes originated from the motion of acetone molecules in the pg-layer (Figure
5.3.8) could coincide. However, for the modes related to intramolecular motions in the pgg-
layer, which was found to be composed of centro-symmetrical pairs of acetone molecules
according to the X-ray diffraction data, frequency exclusion should take place. The break in
the symmetry of unit cell of the acetone crystals and, specifically, the pgg-structure may be
associated with a disorder in methyl-group positions, which has been mentioned by Ibberson et
al. [51] in relation with the acetone phase transition taking place at ~ 150 K. In fact, instead of
complete frequency exclusion: the lower frequency components (presumably belonging to A1
factor-group component) of the carbonyl ν3 (A1) and the carbon-carbon asymmetric stretch ν17
(B1) (Table 5.3.5) modes are found to be more intense in Raman spectra than corresponding
high-frequency components, which is exactly opposite to a ratio of the same components in the
IR spectra indicating that the symmetry of the pgg-layer is broken probably due to the methyl-
group disorder.

266
1720 1700 1400 1300 1200 1100
0.0
0.2
0.4
0.6
0.8
1.0
1.2
1.4
1.6(b.II)
1714
1717
17091707
1705
1699
1435
1419 1403
1372
1351
1346
1239
1097
x10x10
x100
x 100
x 10 x 30 x 30x 30
Solid Ac. T = 130 KP= 1 x 10⁻⁶ Torrππππ-polarization
Wavenumber (cm -1)
3000 2900 2800
-2
-1
0
1
2
(b.I)
2969
2921
3004
0
2
4
6
8
10
12σσσσ -polarization
(a.II)
D
C
B
A1714
1714
17051699
1706
1706 170516991714
1705
1704
1699
1713
1705
1702
1698
Abs
orba
nce
-4.5
-3.0
-1.5
0.0
1.5
3.0
4.5
6.0
1417
Solid Ac. T = 130 Kσσσσ -polarization
(a.III)
D
A
1437
1417
1403
1362
13501345
1436 1403
13761364
13501345
1242
1235
1226
1241
1235
1226
1096
1096
x 5
0
2
4
6
8
(a.I)
D
C
B
A
29993003
2970 2921
29702922
2999
3003
3003
2999
29692921
x 10
x 10
x 5
Figure 5.3.9. The (a) σ- and (b) π-polarized spectra of acetone films during fast condensation
at 130 K and PAc=5×10⁻⁵ Torr and PAc=1×10⁻⁶ Torr, respectively. Spectra A through D on
panel (a) correspond to the deposition time of 60 sec; 140 sec; 220 sec; 360 sec, respectively;
the spectrum on panel (b) corresponds to the deposition time of 600 sec.
The acetone solid film deposited in our experiments is, certainly, a mixture of the
crystalline and the noncrystalline fragments, which would be most likely classified by the X-
ray diffraction method as a noncrystalline phase. However, the IR spectra of these solid
acetone films appear to be comparable with the spectra of corresponding crystalline phase
because IR spectroscopy probes a short-range molecular arrangement. Figure 5.3.9 shows the
RA spectra obtained with σ- (Figure 5.3.9a) and π-polarized (Figure 5.3.9b) beams from solid
acetone films vapour-deposited on Cu substrate at 130 K.

267
Table 5.3.5. The frequencies of fundamental vibrations of the acetone in solid crystalline state.
The apparent peak positions (i.e. without deconvolution) are listed.
Oriented solid [49] Non-polarized beam Polarization Face1 Face 2
Sym N Mode Vapor [44]
Raman (solid) [50] θ θ + 90 θ θ + 90
Deposit 1 T=150K, ν3 A1 is strong
Deposit 2 T=130 K νas (CC) B1 is strong
π T=130K δs (CH3) B1 is strong
σ T=130K
1 ν CH 3018.5 s
3004(49) 3005.1w 3005.1m 3008.6m 3008.3s 3002w 3004vw 3003s 2999s
2 ν CH 2937s 2920(100) 2922.1w 2919.7w 2920.1w 2919.1m 2921vw 2921w 2921vw 2921m 3
ν (C=O)
1731s 1717sh (14) 1697(72)
1712.9vs1706.9vs 1698.3s
1715.6vs 1705.1s 1698w
1727.8s 1706.2 vs
1728.0s 1706.3 vs
1718vs 1711.3s 1699.2vw
1716.5m 1714sh 1709w 1707sh 1699vw
1717w 1714sh 1709w 1707w 1699vw
1714vw 1706s 1705s 1699m
4 δas (CH3) 1435s 1431(31) 1418.2vs 1422.4vs 1420.7m 1420.6s 1419w 1419vw 1417vw 5 δs (CH3) 1363.5
vs 1351(12) 1351.1w
1346.4s 1350.5vs 1350.2m 1349.6s 1351m
1346w 1351vw 1346vw
1351vw 1346vw
1350w 1345w
6 β (CH3) 1072(7) 1070w 1070.8w 7 νs (CC) 785w 796(100) 795.3w 794.4w 797.5vw
790.7w 797.1w 790.7m
A1
(Z)
8 γ CC 385w 497(5) 9 ν CH 2972(58) 10 δ (CH3) 1426sh
(29) 1428vw 1431w 1436w 1435sh 1435sh 1436sh
11 β (CC) 872(4) 873.9vw 873.9w 874 vw 875.4 w
A2
12 χ (CH3)
13 ν CH 3018.5 s
3004(49) 3005.1 wm
3005.1m 3008.6m 3008.3 ms
3004w
14 ν CH 2937s 2920(100) 2922.1w 2919.7w 2920.1w 2919.1m 2921vw 2921w 15 δas(CH3) 1410s 1408(3) 1402.4m 1403.4w 1393.3m 1393.4s 1405vw 1402vw 1403vw 1403vw 16
δs (CH3)
1363.5
1366sh(2)
1372.8w 1369.8m 1365.7w
1372vw 1368.6w 1364m
1364.5 vs
1364.8 vs
1371sh 1365.5m
1372vs 1372vs 1376vw 1364vw 1362vw
17
νas (CC)
1215.5 s
1240sh(4) 1229(13) 1223sh (12)
1239.3w 1228.0 wm
1239.4s 1226.8w
1235.9w 1233.0w 1226.7 vw
1236.3s 1226.3w
1237sh 1234m
1238.5vs 1226sh
1239vs 1242vw 1235vw 1226vw
18 ρ (CH3) 891m 905(5) 908.6w 908.5m 904.5w 905.8s
B1
(X)
19
β (CCO)
530s 533(19) 537.1wm 535.3
537.0m 533.0
535sh 532.3 wm
535sh 532.1s
20 ν (CH) 2972s 2972(58) 2971.6w 2972.1w 2977.5w 2977.9 vw
2969vw 2969m
21 δ (CH3) 1454s 1444sh (15)
1467.8w 1447.8w 1439.2m
1445.0s 1435.7w
1457.8s 1442.3s
1460.6w 1457.7m1439.8m
22 ρ (CH3) 1090.5 s
1098(4) 1098.9s 1098.7 ms
1100.6s 1100.1 wm
1096w 1097vw 1097vw 1096w
B2 (Y)
23 γ (C=O) 484 w 402(12) 396.2wm 393.9w 391.9m 394.2 wm
The following short forms are used: β- in-plane bend; γ- out-of-plane bend; δ- deformation; ν-
stretch; ρ- rocking; χ- non-planar twisting. The relative intensities of IR bands are reported as
s- strong, m- medium, w-weak, vw- very weak; sh designate a shoulder to the stronger peak.

268
Firstly, a self-evident conclusion following from Figure 5.3.9b.II at the π-beam is that,
in the solid acetone films deposited at significant oversaturation, molecules are in such an
average relative configuration that the molecular plane is perpendicular and the carbonyl group
is near parallel to the metal surface. This conclusion is based on the observation, that, in
contrast with the corresponding intensities in transmission IR spectra of gas and liquid phases
[44], the RA peaks at 1372 and 1239 cm−1, which originate from the CH3 deformational ν16
(B1) and the C-C-C stretching ν17 (B1) molecular modes, are much stronger than the RA bands
at 1716 cm−1 and at 1419 cm−1 originated from the carbonyl stretch ν3 (A1) and the CH3
asymmetric deformation ν4 (A1) molecular modes, respectively. This particular ratio of the RA
intensities of these modes in solid acetone phase is the result of metal surface selection rules,
which cause the intensities of the modes with transition dipole moment perpendicular to the
metal surface, specifically the ν16 and the ν17 (B1), to be much stronger than the intensities of
such modes as the ν3 and the ν4 (A1) with transition dipole moment near parallel to the surface.
In the IR spectra of acetone gas and liquid phases, the carbonyl stretch ν3 (A1) is the most
intense mode, the CH3 symmetric deformational band ν16 (B1) and the C−C asymmetric stretch
ν17 (B1) are close to each other by intensity and slightly less intense than the carbonyl stretch,
while the CH3 asymmetric deformational bands is the least intense in comparison with the
bands mentioned above. The RA spectra of solid acetone phase obtained with σ-polarized
light at Figure 5.3.9a also provide a clear support of this conclusion, because in contrast with
the spectra obtained with π-polarized beam, the carbonyl stretch manifold at 1706-1702 cm−1 is
the most intense band, whereas the CH3 symmetric deformation band ν16 (B1) at 1362 cm−1 and
C−C asymmetric deformation stretch ν17 (B1) at 1235 cm−1 are found to be at substantially
lower intensity. This observation is in a good agreement with the RAS studies of the
orientation of acetone molecules in multilayer films on Au (111) surface reported by Syomin
and Koel [52]. This is in spite of the circumstance that in the present case the substrate is a
polycrystalline Cu with a relatively rough surface, which could cause the acetone film to be a
random polycrystalline deposit with an uncertainty in the relative orientation of crystallites.
However, the apparent similarity of the RA spectra of solid acetone films, deposited on single-
crystal Au(111) surface [52] and on polycrystalline Cu surface (Figure 5.3.9b), show that there
is a preferential orientation of the acetone crystallites on a surface of the metal substrate, and
the acetone phase growth mode at certain deposition conditions does not depend upon the

269
status of metal substrate.
A different molecular orientation was observed in the present studies at slow deposition
at ~ 150 K, when a carbonyl group is preferentially oriented near to the perpendicular to metal
surface while the molecular plane is oriented near to the parallel to metal surface. Taking into
account that the oversaturation is apparently much less in this case, we could assume that the
orientation of crystallites on the substrate (if the phase composition remains the same) depends
on the deposition rate and, more generally, on the supersaturation .
Independently upon the phase structure of an acetone deposit, the spectral picture on
Figure 5.3.9 is consistent with a crystalline structure, in which an average direction formed by
C-C molecular skeletons is near perpendicular and an average plane formed by C=O groups is
near parallel to a metal surface. Furthermore, considering the Cmcm and Pbca phase structures
(Figure 5.3.5 and Figure 5.3.6), it is possible to conclude that crystallographic C-axis of
crystallites is near perpendicular while the AB-plane is near parallel to a metal surface, which
appears to be consistent with (001) plate-like morphological habitus of the crystallites. The
morphological significance of the (001) plane of acetone crystals (Pbca phase) may be
associated with low interlayer attachment energy Eatt, which is primarily due to the van der
Waals nature of the interlayer contacts, in combination with relatively high layer energy EL
originated from closely-packed pg and pgg-layers and substantial dipole-dipole intermolecular
interaction [53].
The factor group and LO/TO splitting observed in the RA spectra of solid acetone
deposit are inconsistent with the correlation diagram of Cmcm phase and, thus, will be
analyzed on basis of the correlation diagram of the Pbca phase. It is instructive to begin
spectral analysis from the crystal bands, which are originated from the B1 molecular vibrations,
because corresponding π-components are of high intensity in RA spectra showing no sign of
the factor-group splitting, but with characteristic LO/TO splitting and thickness dependence of
adsorption peaks. In particular, the very strong peaks at 1372 and 1239 cm−1 observed with π-
polarized light (Figure 5.3.9b.II) are the LO components, which can be both classified as B1u
crystal modes originating from the CH3 symmetric deformation ν16 and the C−C stretch bands
ν17, respectively. Accordingly, in the spectra obtained with σ-polarized light (obviously that in
the experiment only incomplete polarization can be achieved) the peaks at 1376 and 1241 cm−1
(Figure 5.3.9a.III and Table 5.3.5) are LO components of these modes, while the

270
corresponding σ-polarized TO components are located at 1362 and 1235 cm−1. The
incompleteness of polarization and the very strong intensities of LO modes allow to observe
them under σ-polarization. It should be noted that the B2u and B3u CH3 symmetric deformation
crystal modes were not identified among the observed RA peaks because, even if they present
(Pbca group), the intensities are expected to be very low in accord with the crystal structure of
Pbca phase. Therefore, these modes appear to be practically undetectable in the RA spectra
being overwhelmed by corresponding B1u peaks. The σ-polarized peak at 1364-1362 cm−1
(Figure 5.3.9a.III) is most likely multi-component but, at the present moment, we feel that its
further decomposition would be neither useful nor reliable. For the crystal modes originating
from molecular C−C asymmetric stretch, the additional σ-polarized adsorption band was found
at 1226 cm−1 (Figure 5.3.9a.III). The weak adsorption peaks at frequencies 1228-1226 cm−1
have been also detected in transmission IR spectra by Krause et al.[49] for solid acetone at 18
K and classified among those vibrational modes that are originated from ν17 molecular
fundamental, while in the Raman spectra of polycrystalline acetone at 77 K two peaks at 1229
cm-1 and 1223 cm−1 (shoulder) were detected by Harris and Levin [50], who have assigned the
peak at 1229 cm-1 to ν17 fundamental (see Table 5.3.5). Accordingly, we tentatively attribute
the low frequency very weak IR peak at 1226 cm−1to the C−C stretch vibrational modes having
origin in the centrosymmetric skeleton motion of the pairs of acetone molecules in pgg-layers
(Figure 5.3.7), which appears in the IR spectra because of the symmetry break and otherwise
would not be detectable. The vibrational mode that corresponds to asymmetric CH3
deformation molecule mode ν15 of B1 symmetry was found to be a very weak feature at 1403
cm−1 in the RA spectra obtained with both polarizations (Figure 5.3.9b.II and a.III), though it is
more distinct in the spectra obtained with π-polarization.
The crystal vibrations that are originated from following A1 symmetry species of C2V
molecular point group including the carbonyl stretch ν3, CH3 symmetric ν5 and asymmetric ν4
deformation modes and C-H stretch ν1 were detected in the IR-RA spectra of solid acetone.
The two doublets at 1350 TO(1351 LO)/1345 TO(1346 LO) cm−1 and 3003 TO/2999 TO cm−1
(Figure 5.3.9 a.I, a.III and Table 5.3.5) can be tentatively attributed to the B2u and B3u crystal
modes that correspond to CH3 symmetric deformation band ν5 and C−H stretch ν1,
respectively, in accord with correlation diagram for the Pbca space group. The δsym CH3 mode
exhibits most likely a factor-group splitting on doublet 1350/1345 cm−1 in the σ-spectra which

271
can be viewed as a spectral signature of Pbca phase. These modes are polarized in the AB-
plane, while the 1362 TO/1372 LO cm−1 mode is polarized along the C-axis. The crystal
modes corresponding to the CH3 asymmetric deformation mode ν4 were found at 1417(1419)
cm−1 with no sign of splitting (Figure 5.3.9 a.III, b.II). The complex carbonyl stretch band (ν3)
shows splitting at both settings of the polarizer (Figure 5.3.9a.II and b.II, and Table 5.3.5),
which is thought to be primarily the result of factor-group splitting affected by LO/TO splitting
and by possible presence of different acetone micro-phases. The interpretation of this RA
band observed with σ-polarized light is significantly complicated (and that is a typical case for
thick films) due to the emergence of interference patterns in the spectral region of a particular
absorption band. Clearly, the π-polarized complex band at 1716 cm−1 (Figure 5.3.9 b.II) could
include the LO components of all Bnu crystal vibrational modes, while, tentatively, the TO
components of B1u (Z) mode can be found at 1713 cm−1 (Figure 5.3.9 a.II), and for B2u and B3u
crystal modes at 1706/1705 cm−1 polarized in the AB crystallographic plane (Figure 5.3.9 a.II).
The corresponding LO components could be tentatively allocated at 1709 and 1707 cm−1 in
Figure 5.3.9b.II. Based on the present spectra, the low frequency RA band at 1699 cm−1
should be assigned to a fundamental mode resulting from a factor-group splitting, which could
be in correlation with the strongest Raman C=O sub band at 1697 cm−1 (while the second less
strong Raman C=O sub band was observed at 1717 cm−1 [50]) and with the IR transmission
band at 1698 cm−1 [49].
Figure 5.3.10 displays the carbonyl group region of the Fresnel spectra (see Chapter 3)
of acetone liquid films of 0.8 µ and 1 µ thickness with the optical constant of liquid acetone
obtained from [54]. In transmittance mode, there is a single IR peak with maximum at ~1714
cm−1 as shown by the imaginary part of dielectric function (curve 1). For this disordered
medium the π-component (LO mode) appears at 1727 cm−1 with discernible shoulder at 1714
cm−1 (the interference pattern, absent for thinner acetone films) whereas the σ-component (TO
mode plus interference patters) at 1710 and 1705 cm−1 for 0.8 µ and 1 µ films, respectively.
The non-polarized Fresnel spectrum of single fundamental vibration exhibits clearly a strong
LO/TO splitting. The magnitude of this LO/TO splitting expected for a liquid acetone is ~ 20
cm−1, which is as strong as the factor group splitting in the acetone crystal or even stronger. In
addition the frequency position of both LO and TO modes depends on the film thickness. This
general picture for carbonyl group vibration in liquid acetone was found reproduced precisely

272
in the experimental spectra of solid acetone deposit at 130 K. Indeed, for the non-polarized
beam (Figure 5.3.10, curves 8 and 9) there is a clear σ-polarized TO manifold which travels
from 1707 cm−1 to 1705 cm−1 as film thickness increases. At the same time, the π-polarized
manifold at 1717 cm−1 achieves optical saturation (curve 8) and the peak shifts to ~1720 cm−1
(curve 9) and declines in the intensity as film thickness increases. Similar optical dependence
of non-polarized RA spectra on the film thickness was found for pristine ice (see for instance
Figure 5.1.3 in the present Chapter). Therefore, the observed experimental spectral evolution
as function of acetone film thickness is clearly associated with the LO/TO splitting, which
severely obscures the crystal structure-associated factor group or site group splitting of
fundamental vibrations. The magnitude of the LO/TO splitting is proportional to the oscillator
strength and to the transition dipole-transition dipole inter-vibrator coupling, which explains
why this optical RA effect is so noticeable for all fundamental vibrations in solid acetone as it
is shown on Figure 5.3.11. It is of interest to observe a significant amplification of the ν5 (A1)
δs CH3 TO mode factor-group doublet at 1349 and 1344 cm−1 upon a passage of the σ-
interference pattern from neighboring strong ν16 (B1) δs CH3 at 1360 cm−1, which confirms
conclusion derived on basis of Figure 5.3.9. A small red-shift in their frequency positions is
due to the dielectric effects in the thick acetone film. A conclusion that the pair of ν16 (B1) δs
CH3 at 1372 (π, LO)-1362 (σ, TO) cm−1 and the pair of ν17 (B1) vas C−C at 1242 (π, LO)-1235
(σ, TO) cm−1 on Figure 5.3.9 are LO/TO splits of the same fundamental vibrations is in accord
with the spectra on Figure 5.3.11 and Fresnel model for carbonyl group on Figure 5.3.10.
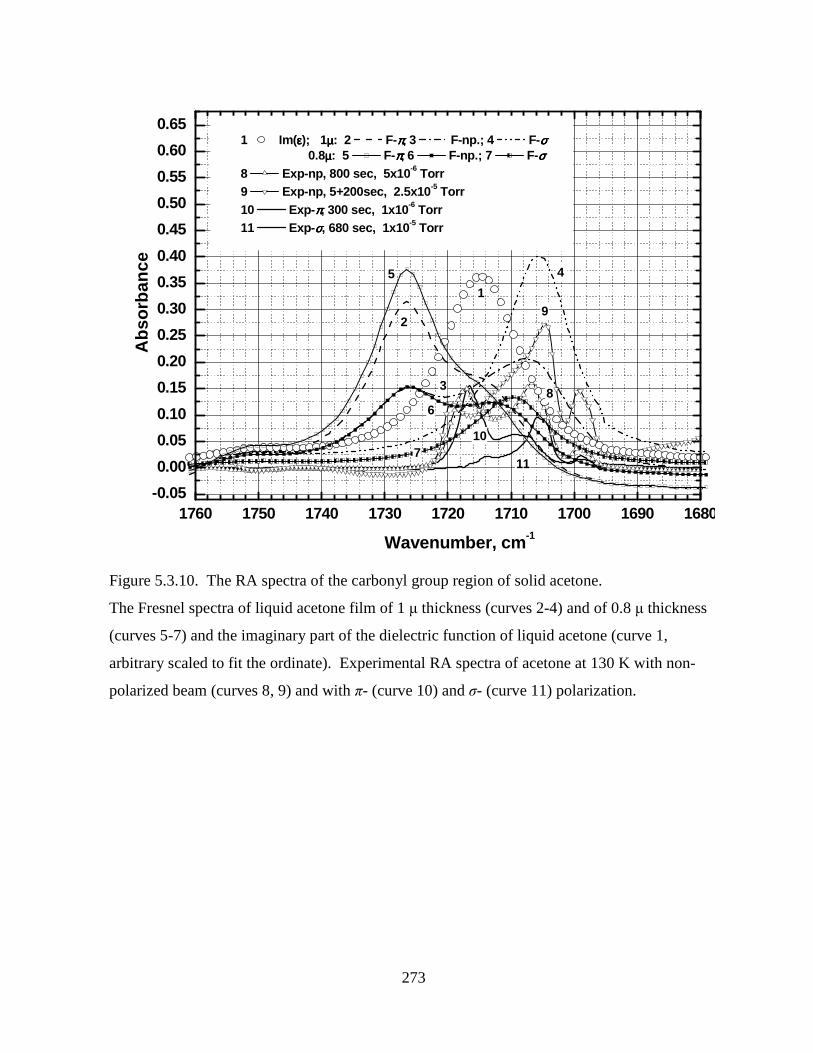
273
1760 1750 1740 1730 1720 1710 1700 1690 1680-0.05
0.00
0.05
0.10
0.15
0.20
0.25
0.30
0.35
0.40
0.45
0.50
0.55
0.60
0.65
711
8
10
6
9
5 4
3
2
1 Im(εεεε); 1µµµµ: 2 F-ππππ;;;; 3 F-np.; 4 F-σσσσ 0.8µµµµ: 5 F-ππππ;;;; 6 F-np.; 7 F-σσσσ8 Exp-np, 800 sec, 5x10 -6 Torr9 Exp-np, 5+200sec, 2.5x10 -5 Torr10 Exp-ππππ, 300 sec, 1x10 -6 Torr 11 Exp-σσσσ, 680 sec, 1x10 -5 Torr
Wavenumber, cm -1
Abs
orba
nce
1
Figure 5.3.10. The RA spectra of the carbonyl group region of solid acetone.
The Fresnel spectra of liquid acetone film of 1 µ thickness (curves 2-4) and of 0.8 µ thickness
(curves 5-7) and the imaginary part of the dielectric function of liquid acetone (curve 1,
arbitrary scaled to fit the ordinate). Experimental RA spectra of acetone at 130 K with non-
polarized beam (curves 8, 9) and with π- (curve 10) and σ- (curve 11) polarization.

274
1750 1700 1650 1600 1550 1500 1450 1400 1350 1300 1250 1200
0.00
0.05
0.10
0.15
0.20
0.25
0.30
0.35
2
1 Exp-np, 800 sec, 5x10 -6 Torr2 Exp-np, 5+200sec, 2.5x10 -5 Torr
1233
, νν νν17
TO
+I.P
. νν νν as
CC
1241
, νν νν17
LO
νν ννas
CC
1344
, νν νν5 T
O δδ δδ
sCH
3
1349
, νν νν5 T
O δδ δδ
sCH
3
1360
, νν νν16
TO
+I.P
. δδ δδ sC
H3
C-C
asy
m.s
tret
ch m
anifo
ld
CH3 deformation manifold
Abs
orba
nce
Wavenumber, cm -1
C=O manifold
1376
, νν νν16
LO
δδ δδsC
H3
fact
or-g
roup
spl
ittin
g
1
Figure 5.3.11. Experimental RA spectra of acetone at 130 K with non-polarized beam. The
LO/TO splitting is evident for the CH3 deformation and C−C asymmetric stretch modes.
Resuming this section on the spectral analysis of organic solids (chloroform and
acetone) it is possible to suggest that the relative orientation of crystallites depends on the
oversaturation or, in other words, on a combined effect of the substrate temperature and the
pressure of the organic substance near the substrate surface. Further detailed studies are
required in order to clarify these possible orientational effects of the combined action of
substrate temperature and deposition pressure. If convincing evidence regarding preferential
orientation will be obtained (the present studies provide a preliminary evidence for the
existence of these effects) that provides a simple mean to control the average orientation of
very small crystallites (nano-size) of organic solids on metal surface. For both chloroform and
acetone, the deposition at high oversaturation was found leading to the orientation, where the
molecular axis and the corresponding dipole moments are nearly parallel to the substrate.

275
5.4 The Interaction of Chloroform with Noncrystalline I ce
The adsorption of chloroform on the ice surface is accompanied with a red-shift of the
frequency OH dangling bonds, which can be resolved in the FTIR RAS experiment. This
circumstance is important for confirming that the interaction of adsorbate with the OH
dangling bonds leads to surface complexes, where the adsorbate is indeed coordinated with the
OH dangling bonds. Furthermore, the spectral observation of this new band of OH groups
coordinated with the chloroform surface species can be used for monitoring the temporal or
thermal evolution of the water-chloroform interface. Apart from the stretching mode of
surface OH groups, the present spectral studies of the chloroform interaction with the ice
surface are based on observation of C−H stretch and C−H deformational bands at frequency
regions near 3015 cm−1 and 1220 cm−1, respectively. To the best of the author's knowledge,
the spectral evidences of the chloroform-oxygen function interaction, which would based on
the direct observation of the chloroform fundamentals, are practically absent, in particular,
because the frequency location of C−H stretching and bending modes appears to be insensitive
to the complex formation [55, 56]. However, Szczepaniak [Ref. from 56, no numerical data of
Szczepaniak's original work have been presented] has observed a considerable shift in the C−D
deformation band upon complexation with acetone in n-hexane solution. On the other hand,
the combinational bands and overtones of these fundamental modes were found to be sensitive
to the complexation with the oxygen organic functions. Indeed, very early (and still unique)
IR studies on the chloroform-oxygen function complexes by Buswell et al. [57] reveal that in
the chloroform-acetone complex in CCl4 the overtone (2ν4) of ν4 (E) C−H deformation band
located for chloroform/CCl4 solution at ~2410 cm−1 exhibits a distinct peak at 2457 cm−1. The
latter indicates, with high probability, a hypsochromic shift of the deformational fundamental
by approximately 20-25 cm−1 upon complexation, which would be in accord with the
Szczepaniak's observation. For the saturated solution of water in chloroform, Choppin and
Duwney [58] have observed a combinational band, ν1 O−H + ν1 C−H, which has been interpreted
as a spectral signature of the hydrogen-bonded complex Cl3C−H···OH2. By examining the
C=O stretching mode, Whetsel and Kagarise [59] spectrally detected 1:1 and 1:2 hydrogen-
bonded complexes between acetone and chloroform in cyclohexane solution. Therefore, there
are numerous spectral evidences that chloroform can act as a HB donor in the complexes with
oxygen functions including water species. While the frequency position of C−H stretching

276
mode, ν1 (A1), of chloroform species appears to be practically independent on the
complexation, the C−H bending mode ν4 (E) is most likely hypsochromically shifted. In a case
of the coordination with water molecules chloroform can hypothetically act also as an acceptor
of hydrogen bond from water molecule with the formation of a complex with structure
HO−H···Cl−CCl2H. By co-depositing the mixtures of halomethanes and D2O vapour on cold
(12 K) CsI window, Holmes and Sodeau [60] have determined the spectral location of the
stretching modes of OH groups coordinated with corresponding halomethane species. For the
chloroform species in D2O matrix, the ν3 mode of water molecule in the HO*−H*···CHCl3
complex (of unknown structure) is found at 2690 cm−1, which is consistent with 38 cm−1 red-
shift with respect to the DB peak at 2728 cm−1 for pristine ice. The present spectral studies
reveal that adsorption of chloroform on noncrystalline D2O proceeds though the formation of
hydrogen-bonded complex between an OD DB and a chloroform molecule as it is evident from
Figure 5.4.1. The OD vibration in hydrogen bonded complex was found at 2690 cm−1 in
excellent accord with Holmes and Sodeau [60]: the formation of HB complexes is
accompanied by the depletion of OD DB's (a negative band in differential spectra on Figure
5.4.1). Moreover, a spectral signature is found for the hydrogen-bonded complex where the
chloroform species acts as a donor and the oxygen subnetwork of ice as an acceptor as it is
evident from a broad C−H deformation feature at ~1245 cm−1 (Figure 5.4.2). The lower
frequency band at 1220 cm−1 corresponds to the physisorbed species in accord with the
discussion in section 5.3.1.

277
3000 2800 2600 2400 1280 1240 1200-10.0
-8.0
-6.0
-4.0
-2.0
0.0
2.0
4.0
b
C-H bend
C-H stretch
OD···Cl-CHCl2 HB complex
x10-4A
bsor
banc
e
Wavenumber, cm -1
CHCl3 on D
2O
amorph
P=3x10⁻⁷Torr, T = 125 K
OD dangling bonds
a
Figure 5.4.1. Differential RA spectra of chloroform adsorbed on noncrystalline ice at 125 K.
Spectra (a) and (b) correspond to 13 min and 20 min into deposition, respectively. An
acquisition time of a single spectrum is 40 sec. Spectral resolution is 1 cm−1.

278
1290 1280 1270 1260 1250 1240 1230 1220 1210 1200-1.0
0.0
1.0
2.0
3.0
CHCl3 HB complex
Abs
orba
nce
Wavenumber, cm -1
x10-4
CH
Cl 3
phys
isor
ptio
n
Figure 5.4.2. The spectral region of C−H deformational band for chloroform on ice at 125 K.
This spectrum is the result of averaging of 10 consecutive spectra the first and the last of which
are shown on Figure 5.4.1 above. The solid line represents the FFT smoothing of experimental
data.

279
5.5 Interaction of Organic Substances with Oxygen-containing Functional Groups
with Noncrystalline and Polycrystalline Ices
The present spectral studies of initial stages of adsorption of acetone, acetaldehyde,
methanol and chloroform on the noncrystalline and polycrystalline ices reveals that hydrogen-
bonded complexes between adsorbates and OH DB's play a leading role on the surface
accommodation. We proceed to the detail analysis of the spectral features of acetone-water
systems at cryogenic temperature.
5.5.1 The Interaction of Acetone with OH Dangling Bonds on Ice Films
In order to examine the role of the OH DB's in the surface chemistry of the ice micro-
phases, the adsorption of acetone (a soft Lewis base) on pc-ice and nc-ice films is investigated
by FTIR-RA spectroscopy. Based on temperature programmed desorption and FTIR-RA data
of acetone adsorbed on thin nc-ice film (<20 nm thick) at 95 K, Schaff and Roberts proposed
that the interaction between the adsorbate and the ice surface involves hydrogen bonding
between the carbonyl group of acetone and the OH DB's in ice [61]. For the pc-ice prepared
by crystallization of the nc-ice post-annealed at 160 K, no OH DB was observed and
consequently neither was the acetone-H-O DB complex detected by Schaff and Roberts [61].
However, in the present studies the OH DB signals are observed for both pc-ice and nc-ice
(Figure 5.2.1 above). Therefore, the formation of the acetone-H-O DB complexes involving
hydrogen bonding is expected on these ice films. Figure 5.5.1 shows the RA difference spectra
for various exposures of acetone under different exposure pressure conditions on a 30-nm-
thick pc-ice film (obtained by vapour deposition at 160 K followed by soaking at the base
pressure for 30 minutes). The difference spectra correspond to the difference of RA spectra for
ice films with and without the acetone exposures and therefore should reveal spectral features
corresponding primarily to the acetone-ice complexes.

280
1760 1680 1400 1300 1200-0.001
0.000
0.001
0.002
0.003
0.004
0.005
1655
1242
1241
1239
1242
12261241
G. Soak 200 sec
F. 170 sec
E. 15 sec
D. Soak450 sec
C. 280 sec
B. 40 sec
A. 15 sec
1237
1444
1444
1705
1702
1373
1372 1362
13721362
1362
1372
Abs
orba
nce
Wavenumber (cm -1)
1424
1428
1424
1428
1428
1703
1655
1720
1708
1708
1701
1701
5 x 10⁻⁷ Torr 1 x 10⁻⁷ Torr
3800 3600 3400 3200
0.000
0.004
0.008
0.012
0.016
0.020
0.024
3430
G
F
E
D
C
B
A
3390
3370
3145
3130
3140
3140
3370
3370
3245
3243
3250
3550
35503694
3694
3694
Acetone/pc-ice160 K
x 3
x 3
Figure 5.5.1. Experimental RA difference spectra of acetone obtained under different
conditions on a polycrystalline ice (pc-ice) film deposited at 160 K and 5×10⁻⁷ Torr.
The acetone exposures are performed at 160 K and 1×10⁻⁷ Torr for (A) 15, (B) 40 and (C) 280
seconds, and at 5×10⁻⁷ Torr for (E) 15 and (F) 170 seconds. A post-exposure soaking period at
the ambient chamber pressure of 6×10⁻⁹ Torr for (D) 450 and (G) 200 seconds is performed
after the acetone deposition in (C) and (F), respectively.
For the exposure pressure of 1×10⁻⁷ Torr, the adsorption of acetone is manifested in the
difference spectra (Figure 5.5.1) by negative RA difference features in the OH DB and the
O−H stretching and bending regions, and by the positive RA difference features that
correspond to the fundamentals of acetone, including the carbonyl stretch, ν3(A1), at 1701
cm−1, asymmetric, ν21(B2), ν4(A1) and symmetric ν16(B1), ν5(A1) CH3 deformation bands at
1444, 1428, 1372 and 1362 cm−1 respectively, and asymmetric C−C stretch, ν17(B1) at 1242
cm−1. The intensity of the carbonyl stretching band is found to saturate along with the negative

281
OH DB signal with increasing exposure, which provides strong evidence for the formation of a
surface complex between acetone and the surface OH DB. The relative positions of the
fundamental frequencies of the acetone-ice complex also support the hypothesis for the
existence of hydrogen bonding in the adsorbate complex, given the red (blue) shift of the
carbonyl stretch at 1701 cm−1 (asymmetric C−C stretch at 1242 cm−1) found in the present case
in comparison with that for pure liquid at 1710 cm−1(1221 cm−1) [62], isolated acetone matrix
at 1725 cm−1(1217 cm−1) [62] and isolated acetone-water matrix at 1716 cm−1 (1230 cm−1)
[63]. These notable frequency shifts can therefore be attributed to the formation of strong
hydrogen bonding between O of the carbonyl group in acetone and H of the OH DB (referred
as α-complex in the present work). The definition and structural description of the α-, the β-
and the γ- classes of the acetone-water network are provided in Chapter 4. The emergence of
the high-frequency shoulder near 1708 cm−1 in the carbonyl stretch band (Figure 5.5.1, Curve
B) at a higher acetone exposure indicates bonding of additional acetone molecules to surface
water molecules by a single hydrogen bond (β-complexes). The interaction with other acetone
molecules by electrostatic and van der Waals forces also contribute substantially to the spectral
picture. The negative changes observed in the O−H stretching (3550 cm−1 and 3430 cm−1) and
bending (1655 cm−1) regions indicate the loss of ice signal due to acetone adsorption, which
could be attributed to the reconstruction of the near-surface region (consistent with the picture
proposed by Devlin, Buch and coworkers [64, 65] and to possible sublimation of the acetone-
ice complexes. The group of positive peaks at 3370 cm−1, 3243 cm−1, and 3130 cm−1 can be
attributed to the bulk modes of crystalline ice, the intensity of which are enhanced by
adsorbate-induced reconstruction in the near-surface region of ice (Figure 5.5.1, Curve C).
The sublimation process of the acetone-water complexes exposes newly formed surface sites
for further adsorption of incoming acetone molecules. The dynamic nature of the adsorption-
desorption process is illustrated by the general reduction in the acetone fundamental features
after the sample is left (soaking) at the ambient pressure of 6×10⁻⁹ Torr for a post-exposure
period of 450 seconds (Figure 5.5.1, Curve D). Furthermore, the reduction in intensity for the
high-frequency shoulder at 1708 cm−1 appears to be greater than that for the main carbonyl
peak at 1701 cm−1, suggesting a greater desorption rate for the β-complex (relative to the α-
complex).
For acetone exposure at 5×10⁻⁷ Torr, the intensity of the carbonyl stretch saturates at a

282
higher level (Figure 5.5.1, Curve E) at 1.4 times of that for exposure at 1×10⁻⁷ Torr (Figure
5.5.1, Curve B). The saturation level is apparently not directly proportional to the exposure
pressure that indicates the possible transition from Langmuir type adsorption driven by
hydrogen bonding towards more complex adsorption mechanisms, which involve the
multilayer adsorption and acetone trapping into the ice. The presence of a new feature at 1226
cm−1 attributable to asymmetric C−C stretch and an additional broad shoulder at 1720 cm−1 in
the carbonyl band, along with enhancement in intensity of the asymmetric deformational band
at 1444 cm−1 (Figure 5.5.1, Curves E and F), identify the emergence of a new acetone-ice
complex (γ-complex), structure of which is thought to be close to the acetone clathrate-hydrate
in the sense of the adsorbate-water network interaction based on the data of previous works
[66, 67] and present observations. The present work assumes that the structures of γ-class
include both the non-hydrogen bonded acetone species and the enclathrated acetone species.
After the sample is allowed to soak at 160 K under an ambient pressure of 6×10⁻⁹ Torr for a
post-exposure period of 200 seconds (Figure 5.5.1, Curve G), the spectral features of the γ-
complex are found to disappear, leaving only the β- and α-complexes on the surface. The
proposed enclathration of acetone molecules (γ-complex), which occurs in the surface structure
of the pc-ice under the acetone exposure at certain temperature and pressure ranges (above
~160 K and 5×10⁻⁷ Torr of acetone), provides an additional indication of the existence of
disordered fragments in the near surface structure of pc-ice. The dynamic formation of acetone
clathrate-hydrate like intermediates is caused by rearrangement of these disordered fragments
[66].
In order to obtain the structure of acetone species on the ice surface molecular dynamic
simulations have been performed at 130 K with 6, 12, and 24 acetone molecules on an ice slab
made up of 8 bilayers with 96 water molecules in each bilayer. In order to preserve the
crystallinity of the ice structure, the four bottom bilayers (i.e., the 5th to 8th bilayers) were kept
rigid during the simulations. The initial coordinates of the water molecules in the ice slab were
obtained from Buch et al. [68]. For simulations the CHARMM program has been used
employing the TIP4P model for the water molecules [69] and the CHARMM parameterization
parameters for acetone-acetone and acetone-water interaction [70]. The system trajectorise
have been collected typically over 500 ps of run time. The typical configuration of a 6Ac/ice
model system reveals the presence of both the α- and the β- structures on the ice surface as

283
shown on Figure 5.5.2. The α-complexes prevail over the β-complexes at this concentration is
excellent agreement with the spectral picture shown in Figure 5.5.1 curve A. There is an
excellent agreement between the α-class topology of the hydrogen bond coordination of
carbonyl group in the acetone-water system obtained in the present studies by the quantum
mechanical and classical molecular dynamics methods.
Figure 5.5.2. MDS snapshot of the acetone-ice surface at the molar ratio Ac/H2O = 6.25×10⁻².
The molar ratio is defined as NAc/96, where NAc is a number of acetone molecules on the ice
surface and there are 96 water molecules in the surface bylayer of initial ice configuration.
The carbon skeleton of an acetone molecule is shown in dark.
At higher coverage of the surface of ice slab, i.e. when molar Ac/H2O become 0.25, the β-
structures prevail and the presence of non-coordinated γ-structures is evident from Figure
5.5.3 in an excellent agreement with spectral picture displayed on Figure 5.5.1, curves E-G.

284
Figure 5.5.3. MDS snapshot of the acetone-ice surface at the molar ratio Ac/H2O = 0.25.
The carbon skeleton of an acetone molecule is shown in dark and the oxygen atoms of acetone
molecules are shown in black to contrast with the rest.
The acetone adsorption experiments have also been performed on thin nc-ice films
(with an estimated Fresnel thickness of 5 nm) deposited at 131 K. The corresponding
differential RA spectra are shown on Figure 5.5.4. Despite the differences in the nature and
film thickness of the ice film, similar behavior in the adsorption of acetone (to that on pc-ice),
with gradual saturation of the OH DB signal along with a concomitant increase in the
intensities of the acetone fundamentals, has been observed for acetone exposure pressure of
1×10⁻⁸ Torr. Furthermore, the saturation of the negative OH DB signal for nc-ice at essentially
the same level as that for pc-ice provides further evidence that the OH DB's are located on the
external surfaces of both thin pc-ice and nc-ice films. This result, together with the similarity
in the FTIR-RA spectra for acetone adsorption on thin nc-ice and pc-ice films, suggests a
similar surface structure for nc-ice and pc-ice in this thickness range (below 50 nm), consistent

285
with the conclusions of Devlin, Buch and coworkers [64, 65]. The initial adsorption of acetone
species on the copper disk leads to the γ-complexes, which includes finite acetone islands
comprising dimers and/or short oligomeric chains with an anti-parallel packing motif (see
Figure 5.3.7 and Figure 5.3.8). The intermolecular interaction in these finite acetone clusters is
weaker than in the crystalline acetone phase.
1720 1680 1440 1360 1280 1200
0.0
2.0
4.0
8.0
9.0ββββ
αααα
137312381711
1703
Soak 200 sec
240 sec
80 sec
40 sec
20 sec
Ac/nc-ice, < 5nmT= 135 K, P= 1 x 10 -8 Torr
x 3
x 3
Wavenumber, cm -1
4000 3600 3200 2800
0.0
4.0
8.0
12.0
3145
3250
3696
Ac/nc-iceT= 135 K, P= 1 x 10 -8 Torr
x 3
x 3
3012
0.0
4.0
20.0
αααα
γγγγγγγγ
ββββ 13621372
1366
1708
1226
1240
1718
170170 sec
20 sec
Ac/CuT= 145 K, P= 1 x 10 -6 Torr
Ac/pc-iceT= 160 K, P= 1 x 10 -7 Torr
x 3
x 3
x 3
αααα
Abs
orba
nce
0.0
2.0x 10-3
x 10-3x 10⁻³
3694
Ac/pc-iceT= 160 K, P= 1 x 10 -7 Torr
x 3
x 10-3
Figure 5.5.4. The FTIR-RA spectra of acetone species from the α-, the β- and the γ- classes on
the thin nc- and pc-ice media, and on the bare Cu.
The metastable character of the non-crystalline ice is revealed in the temporal evolution
of the O-H stretch main feature towards that, which is corresponding to pc-ice. The adsorption
of acetone was found to promote this crystallization process, leading in same cases to the
relatively deep reconstruction of the entire ice film.
In the case of pc-ice film 1100 nm thick deposited at 185 K, similar adsorption
behavior of acetone is also observed, with the intensity of the negative OH DB signal after
saturation by acetone found to be similar to those observed in the aforementioned cases. This

286
result again supports the conclusion that OH DB's are located on the external surface of thick
pc-ice films, consistent with the dependence of the OH DB signal on film thickness shown in
Figure 5.1.9.
To investigate the kinetic behavior of acetone adsorption on pc-ice and nc-ice films
1200-nm thick (grown at 160 K and 131 K, respectively), we expose acetone at 1×10⁻⁶ Torr on
pc-ice and at 1×10⁻⁷ Torr on nc-ice at the respective substrate temperatures. Figure 5.5.5
shows the integrated absorbance of the OH DB feature (at 3694 cm-1) and the carbonyl stretch
(at ~1705 cm-1) in the difference spectrum as a function of the acetone dosage (in units of
1×10⁻⁶ Torr second or Langmuir). It should be noted that the exposure pressure of acetone
could significantly affect the composition of the acetone-ice complexes and the overall
adsorbate coverage of the ice films. The nc-ice sample used in this experiment (Figure 5.5.5b)
exhibits a similar OH DB intensity profile as a function of film thickness as that shown in
Figure 5.1.9b. Moreover, Figure 5.1.9b shows the OH DB intensity to be ~0.15 integrated
absorbance unit for a film thickness of 1200 nm, which corresponds approximately to the same
value as the loss of the DB feature in the difference spectra at saturation (Figure 5.5.5b).
Figure 5.5.5 shows that the amount of acetone adsorbed on both nc-ice and pc-ice films as
approximated by the intensity of the respective carbonyl stretch bands is proportional to the
amount of OH DB's present in the ice structure. This proportionality is present as long as there
is no formation of solid acetone phase, which might be difficult to avoid for acetone exposure
at the lower temperature range (e.g., the deposition temperature of nc-ice near 131 K). Indeed,
the continual growth of the carbonyl stretch band intensity for acetone adsorption on nc-ice
(Figure 5.5.5b) after OH DB band saturation might be caused by physiadsorption of acetone.
However, the markedly more intense RA signals observed for acetone adsorption on the nc-ice
sample in comparison with the pc-ice case for the same exposure (e.g. at 100 ×10-6 Torr
second) indicates that nc-ice has a significantly larger surface area than pc-ice, in general
agreement with the results by Stevenson et al. [71] and Zondlo et al. [15].

287
Figure 5.5.5. Integrated absorbance of OH dangling bond (solid circle) and C=O stretch (open
circle) features in the RA difference spectra as a function of acetone exposure at (a) 160 K and
1×10⁻⁶ Torr on a polycrystalline ice (pc-ice) film 1200 nm thick, and (b) 131 K and 5×10⁻⁷ Torr
on a non-crystalline ice (nc-ice) film 1200 nm thick.
The curves are used to guide the eyes only.

288
The OH DB's are located most likely on the external surface of nc-ice, which has a
considerably higher convoluted tracery structure than pc-ice. The general increase in the
intensity of the OH DB's from 700 nm to 1400 nm observed for nc-ice (Figure 5.1.9b) shows
the evolution of the surface structure of nc-ice towards a more three-dimensional openwork
structure that is accessible to gas exposure at the same time.
5.5.2 Concluding Remarks
In summary, the OH DB's (with characteristic features at 3700-3690 cm-1) are an
integral part of the nc-ice and pc-ice phases and they play a pivotal role in the surface
chemistry of ice films. The surface structural elements containing these OH DB's are found to
be stable over a wide temperature range of 128-185 K covered in the present work. Unlike the
earlier work, we also observe the OH dangling bond signal originated on pc-ice films
deposited at temperature as high as 185 K. The thin nc-ice and pc-ice films contain
comparable amounts of OH DB's, which are located on the external surfaces of both phases
with similar structures. The nature of the external surface (containing the OH DB's) remains
unchanged upon film growth for pc-ice with a general increase in the amount of OH DB's, in
contrast to film growth for nc-ice where the surface evolves into a more convoluted openwork
structure. The acetone adsorption experiment shows that the (CH3)2C=O···2(H−O) DB
complex is formed first by hydrogen bonding between the O atom of carbonyl group in
acetone and 2 hydrogen atoms of the hydroxyl cover in the ice film. In addition to the bi-
coordinated HB α-complex, the mono-coordinated HB β-complexes and non-HB-coordinated
γ-complexes, the latter of which involve interactions with other acetone molecules and
substrate water molecules by electrostatic, van der Waals and other mechanisms including the
intermediate formation of acetone clathrate-hydrate structures, can be observed at higher
pressure exposures. The consequence of the presence of OH DB's on the surface of pc-ice at
relatively high temperatures may have significant implications on the types of plausible
atmospheric surface reactions that could occur on and in ice in the important 190-220 K
stratospheric temperature range.
The combination of spectral and computational studies reported in the present work reveals
that the acetone species on the surface and in the bulk of nc- and pc-ices exist as bi- (α-class),
mono-(β-class) HB-coordinated and non-HB-coordinated (γ-class) species. The spectrum-

289
structure correlation scheme developed in the present work allows connecting the observed
spectral features to the local configurations of acetone molecules on the ice surface or in the
bulk of water condense phase.
290
References:
1. E. Mayer, R. Pletzer, J. Chem. Phys. 80 (1984) 2939.
2. O. B. Toon, M. A. Tolbert, B. G. Koehler, A. M. Middelebrook, J. Geophys. Res. 99
(1994) 631.
3. Rowland, J. P. Devlin, J. Chem. Phys. 94 (1991) 812.
4. V. Buch, J. P. Devlin, J. Chem. Phys. 110 (1999) 3437.
5. E. Whalley, Can. J. Chem. 55 (1977) 3429.
6. J. P. Devlin, J. Chem. Phys. 90 (1989) 1322.
7. D. Fox, R. Hexter, J. Chem. Phys. 41 (1964)1125.
8. D.W. Berreman, Phys. Rev. 130 (1963) 2193.
9. R. G. Tobin, Phys. Rev. 45 (1992) 12100.
10. A. H. Hardin, K. B. Harvey, Spectrochim. Acta 29A (1973) 1139.
11. J. E. Bertie, E. Whalley, J. Chem. Phys. 40 (1964) 1637.
12. R. G. Greenler, J. Chem. Phys. 44 (1966) 310.
13. J. D. E. McIntyre, D. E. Aspens, Surf. Sci. 24 (1971) 417.
14. G. Turrell, “Infrared and Raman spectra of crystals”, Academic, New York (1972).
15. M. A. Zondlo, T. B. Onasch, M. S. Warshawsky, M. A. Tolbert, G. Mallick, P. Arentz,
M. S. Robinson, J. Phys. Chem. B 101 (1997) 10887.
16. A. B. Horn, M. A. Chesters, M. R. S. McCoustra , J. R. Sodeau, J. Chem. Soc. Faraday
Trans. 88 (1992) 1077.
17. P. Jenniskens, S. F. Banham, D. F. Blake, M. R. S. McCoustra, J. Chem. Phys. 107
(1997) 1232.
18. S. B. Barone, M. A. Zondlo, M. A. Tolbert, J. Phys. Chem. 103 (1999) 9717.
19. W. Hagen, A. G. G. M. Tielens, J. M. Greenberg, Chem. Phys. 56 (1981) 367.
20. A. Hallbrucker, E. Mayer, G. P. Johari, J. Phys. Chem. 93 (1989) 4986.
21. A. Kouchi, T. Yamamoto, Prog. Crystal Growth and Charact. 30 (1995) 83.
22. A. Leger, S. Gauthier, D. Deforneau, D. Rouan, Astron. Astrophys. 117 (1983) 164.
23. V. P. Zhdanov, P. R.. Norton, Surf. Sci. 449 (2000) L228.
24. B. W. Callen, K. Griffiths, P. R. Norton, Surf. Sci. Lett. 261 (1992) L44.
25. I. Kohl, E. Mayer, A. Hallbrucker, Phys. Chem. Chem. Phys. 2 (2000) 1579.

291
26. M. J. Wojcik, V. Buch, J. P. Devlin, J. Chem. Phys. 99 (1993) 2332.
27. A. V. Iogansen, Spectrochim. Acta A 55 (1999) 1585.
28. R. Englman, R. Ruppin, J. Phys. C. (Proc. Phys. Soc.) 1 (1968) 614.
29. T. P. Martin, Phys. Rev. 177 (1969) 1349.
30. M. S. Bergren, D. Schuh, M. G. Sceats, S. A. Rice, J. Chem. Phys. 69 2(1978) 332.
31. R. S. Smith, Z. Dohnalek, G. A. Kimmel, K. P. Stevenson, B. D. Kay, ACS
Symposium Series 820, American Chemical Society 198 (2002).
32. T. C. Sivakumar, S. A. Rice, M. G. Sceats, J. Chem. Phys. 69 (1978) 3468.
33. L. Schriver-Mazzuoli, J. M. Coanga, A. Schriver, P. Ehrenfreund, Vib. Spec. 30 (2002)
245.
34. Z. Dohnalek, R. L. Ciolli, G. A. Kimmel, K. P. Stevenson, R. S. Smith, B. D. Kay, J.
Chem. Phys. 110 (1999) 5489.
35. V. Buch, L. Delzeit, C. Blackledge, J. P. Devlin, J. Phys. Chem. 100 (1996) 3732.
36. N. B. Colthup, L. H. Daly, S. E. Wiberley, "Introduction to Infrared and Raman
Spectroscopy", 3d Edition, Academic Press, Boston (1990).
37. R. Fourme, M. Renaud, C. R. Acad. Sc. Paris B 263 (1966) 69.
38. A. Bondi, J. Phys. Chem. 68 (1964) 441.
39. A. Kimoto, H. Yamada, Bull. Chem. Soc. Japan 41 (1968) 1096.
40. E. A. D'Alessio, E. Dodoero, C. Pomposiello, J. Chem. Phys. 57 (1972) 4136.
41. B. Andrews, A. Anderson, B. Torrie, Chem. Phys. Lett. 104 (1984) 65.
42. H. F. Shurvell, J. Chem. Phys. 58 (1973) 5807.
43. H. S. Gutowsky, D. W. McCall, J. Chem. Phys. 41 (1968) 548.
44. G. Dellepiane, J. Overend, Spectrochimica Acta 22 (1966) 593-614.
45. X. K. Zhang, E. G. Lewars, R. E. March, J. M. Parnis, J. Phys. Chem. 97 (1993) 4320.
46. L. Andrews, G. L. Johnson, J. Phys. Chem. 88 (1984) 5887-5893.
47. D. R. Allan, S. J. Clark, R. M. Ibberson, S. Parson, C. R. Pulham, S. Linsday, Chem.
Comm. 9 (2000) 557-558.
48. I. Weissbuch, R. Popovitz-Biro, M. Lahav, L. Leiserovitz, Acta Cryst. B51 (1995)
115.
49. P. F. Krause, B. G. Glagola, J. E. Katon, J. Chem. Phys. 61 (1974) 5331.

292
50. W. C. Harris, I. W. Levin, J. Mol. Spec. 43 (1972) 117.
51. R. M. Ibbreson, W. I. F. David, O. Yamamuro, Y. Miyoshi, T. Matsuo, H. Suga, J.
Phys. Chem. 99 (1995) 14167.
52. D. Syomin, B. E. Koel, Surf. Sci. 498 (2002) 53.
53. I. Weissbuch, R. Popovitz-Biro, M. Lahav, L. Leiserovitz, Acta Cryst. B51 (1995)
115-148.
54. T. G. Goplen, Ph. D. Thesis, 1976, University of Minnesota.
55. C. M.Huggins, G. C. Pimentel, J. Chem. Phys. 23 (1955) 896.
56. L. M. Fell, H. F. Shurvell, Can. J. App. Spec. 41 (1996) 90.
57. A. M. Buswell, W. H. Rodebush, M. F. Roy, J. Am. Chem. Soc. 60 (1938), 2528.
58. G. R. Choppin, J. R. Downey, Spectrochim. Acta 30A (1974) 43.
59. K. B. Whetsel, R. E. Kagarise, Spectrochim. Acta 18 (1962) 329.
60. N. S. Holmes, J. R. Sodeau, J. Phys. Chem. A 103 (1999) 4673.
61. J. E. Schaff, J. T. Roberts, J. Phys. Chem. 98 (1994) 6900.
62. G. Dellepiane, J. Overend, J. Spectrochim. Acta. 22 (1966) 593.
63. X. K. Zhang, E. G. Lewars, R. E. March, J. M. Parnis, J. Phys. Chem. 97 (1993) 4320.
64. B. Rowland, N. S. Kadagathur, J. P. Devlin, V. Buch, T. Feldman, M. J. Wojcik, J.
Chem. Phys. 102 (1995) 8328.
65. L. Delzeit, M. S. Devlin, B. Rowland, J. P. Devlin, V. Buch, J. Phys. Chem. 100 (1996)
10076.
66. D. Blake, L. Allamandola, S. Sanford, D. Hudgins, F. Freund, Science 254 (1991) 5.
67. K. Consani, J. Phys. Chem. 91, 5586 (1987).
68. V. Buch, P. Sandler, J. Sadlej, J. Phys. Chem. B 102 (1998) 8641.
69. W. L. Jorgensen, J. Chandrasekhar, J. F. Madura, R. W. Impley, M. L. Klein, J. Chem.
Phys. 79 (1983) 926.
70. B. P. Brooks, P. E. Bruccoleri, B. D. Olafson, D. J. States, S. Swaminathan, M.
Karplus, J. Comput. Chem. 4 (1983) 187. 71. K. P. Stevenson, G. A. Kimmel, Z. Dohnálek, R. S. Smith, B. D. Kay, Science 283
(1999) 1505.

293
CHAPTER 6
Surface Adsorption and Trapping of Inert Gases on Hexagonal Ice by Molecular
Dynamics Simulations
6.1 Introduction
Classical molecular dynamics (MD) simulations of Xe on the basal (0001) face of
hexagonal ice at 180 K have been performed in order to investigate the mechanism of
adsorption and the initial stage of absorption of a Van der Waals particle into crystalline ice.
The potential of mean force (PMF) as a function of the relative position of the Xe atom
perpendicular to the ice surface is found to increase abruptly as the particle propagates from
the disordered outermost region to the deeper hexagonally ordered region. A set of local
minima observed in the PMF appears to correspond directly to the layer-by-layer crystal
structure of hexagonal ice. Along with the unbound state, the first two minima (with similar
free energies) that correspond to the accommodation of the guest particle on and inside the
disordered outermost bilayer, respectively, were found to be populated during the MD runs.
The multiple transitions of the system among these three states were also observed in accord
with the PMF profile, which also suggests that the penetration of any ordered hexagonal
bilayer by the Xe atom is unlikely. Furthermore, MD simulations of pristine ice (i.e. without
Xe) over a 3-ns simulation period show that the initially perfect-ordered hexagonal crystalline
structure of the outermost bilayer undergoes transformation to a non-crystalline phase, in
which fragmented domains with hexagonal ordering persist. Moreover, the accommodation of
the Xe atom inside the outermost bilayer could facilitate further disordering of the hexagonal
structure of this bilayer with the formation of a completely disordered Xe/Rn-ice surface
phase.
Molecular mechanisms of adsorption, trapping, penetration and subsequent diffusion of
different chemical species on ice are of fundamental importance to understanding a variety of
physicochemical processes, including reactions of trace gases with ice and/or acid particles in
the stratosphere and upper troposphere, interfacial chemistry on snowflakes, ice and other
water-covered particles in the biosphere, clathrate hydrates formation, and compositional
evolution of ice particulates in interstellar space [1,2,3]. To date, both experimental and

294
theoretical studies of the behaviour of different chemical species on ice have not revealed a
universal molecular mechanism for adsorption and absorption [4], most likely due to an
inherent complexity of the structure and the dynamics of the surface and the bulk of ice micro-
phases. Of special interest is the adsorption and absorption behaviour of an “inert” Van der
Waals (VdW) gas particle (such as Xe) on ice. In particular, Xe was reported to penetrate the
ice structure to form clathrate hydrate experimentally first without an induction period by
Pietrass et al. [5] but later with an induction period by Moudrakovski et al. [6]. However, the
mechanism concerning enclathration of Xe into the ice structure remains controversial.
According to Sloan and Fleyfel, the formation of clathrate hydrate should be accompanied by
considerable reconstruction of the ice lattice, which includes the formation of a surface liquid
layer generated by mechanical action (surface agitation) on the ice sample [7]. On the other
hand, Pietrass et al. have shown that Xe clathrate hydrate can be formed at a temperature as
low as 195 K and a pressure of only 0.3 MPa, and concluded the absence of liquid water layer
on ice [5]. Furthermore, Moudrakovski et al. have demonstrated that the kinetics of clathrate
hydrate formation depends on the microcrystalline structure of ice, in which the average size of
crystallites depends on the history of the sample [6]. In any event, guest species must
penetrate the interface of the ice structure at a considerable depth (100-1000 Å) in order to
form clathrate hydrates. It is obvious that the penetration of a non-crystalline medium should
be easier and involves a different mechanism than the penetration of crystalline ice [8]. For
example, Jenniskens and Blake have associated the anomalous gas retention and release from
the “water-rich ices” above 150 K with the presence of non-crystalline micro phases [9].
Given the early studies on this subject [5,6,7,8,10], Xe (Rn) therefore appear to be useful
probes for further exploring the adsorption and absorption mechanisms of a prototypical VdW
particle on ice.
The penetration of crystalline ice structure by “oversized” guest particles (with a VdW
volume larger than the opening of a perfect water hexagon) is usually preceded by populating
the adsorption sites. As it was demonstrated by Buch et al. for the CF4/ice system [11] and by
Kroes and Clary for the HCl/ice system [12], there are at least two types of accessible
adsorption states on the disordered surface of crystalline ice: those on and inside the
disordered outermost bilayer. In the present work, we are adopting the same terminology by
referring to the sites on and inside the disordered outermost bilayer as on-layer and in-layer

295
adsorption states, respectively. However, as noted in the earlier studies [11,12], the guest-ice
interaction energy for the in-layer adsorption state is larger than that of the on-layer adsorption
state. The existence of these two types of adsorption states was also demonstrated by Girardet
and Toubin in the MD simulations of HCl and HOCl on ice at 200 K [4]. Further penetration
of the guest particles into the bulk was found to be accompanied by a significant increase in
the free energy of the system [4], which is most likely caused by partial disruption of an
initially perfectly ordered hydrogen-bonded structure of the second and inner bilayers. The
energies and structural parameters of the adsorption states should depend on the equilibrium
organization of the outermost bilayer of the ice surface, which inherently assumes that the
temperature of the guest/ice system is an important parameter for the adsorption and
absorption mechanisms. On the other hand, using a short (3 ps) MD simulation, Al-Halabi et
al. [13,14] showed that for 110-190 K hyperthermal HCl molecules with energies exceeding
100 kJ/mol could either adsorb on or directly penetrate the ideal (0001) hexagonal surface
through the openings of surface hexagons, leading to the absorption of the guest particle at an
interstitial site between the water bilayers.
Of relevance to atmospheric chemistry is the temperature range of 180-270 K, over
which surface melting of ice occurs with disordering of the outermost bilayer and then
proceeds further in depth with the formation of a quasi-liquid layer at the higher temperature
end (i.e., near 270 K) [4,15]. In particular, MD studies of the surface dynamics of TIP4P ice Ih
by Bolton and Pettersson showed that already at 180 K the equilibrium organization of the
outermost bilayer is non-crystalline with the emergence of different surface polygons (from
pentagons to octagons) in dynamical coexistence [16], which is in accord with the early results
of Kroes [17] at 190 K. Bolton and Pettersson further demonstrated that in the case of Ar
impinging on ice the dynamics of the ice surface is responsible for the reversible adsorption-
trapping-desorption cycle [18]. In particular, Ar was found to penetrate the disordered
outermost bilayer quickly, visiting for a relatively short time (with an average life time of 120
ps) the absorption sites in the heptagon and octagon structures before leaving the ice surface
[18]. This study has in effect suggested that Ar atoms cannot penetrate the ordered second
bilayer of crystalline ice structure [18]. On the other hand, the enclathration of Ar into ice was
observed experimentally by Hallbrucker and Mayer [19] at 200 K and 1 bar, at which
conditions the formation of a quasi-liquid surface layer is not expected. It should be noted that

296
the process of direct penetration of the hyperthermal particle described by Al-Halabi et al.
[13,14], in which dynamic rearrangement of the surface water hexagons plays little or no role,
should be distinguished from that of trapping into the disordered outermost bilayer predicted
by Buch et al. [11], Kroes and Clary [12], and Bolton and Pettersson [18]. These studies raise
further questions about the absorption and trapping mechanisms of a VdW particle in
crystalline ice. In the present work, we investigate the details of these fundamental surface
processes on crystalline ice at 180 K by classical MD simulations using Xe as the probe atom.
6.2 Methods and Computational Details
MD simulations of Xe and Rn atom on the basal (0001) plane of a proton-disordered
hexagonal ice slab were performed using the CHARMM program [20] employing the TIP4P
model for the water molecules [21]. The VdW interactions between any pair of the non-
bonded atoms for the Xe-Xe, Rn-Rn, and Xe-H2O and Rn-H2O systems were described by the
Lennard-Jones (12,6) potential (LJ). The CHARMM program uses the arithmetic-mean
combining rule for the Rminij (Rminij= ½[Rminii + Rminjj]) LJ parameters and the geometric-
mean combining rule for the εij (εij= [εii·εjj]½) LJ parameters [70]. The LJ parameters for the
Xe-Xe VdW interaction were adopted from Tanaka [22] with the following values for εXeXe =
−0.4591 kcal·mole−1 and RminXeXe = 4.5426 Å. The LJ parameters for the VdW interactions
for the Xe-O and Xe-H pairs are as follows: εXeO = −0.27026 kcal·mole−1 and RminXeO =
3.8712 Å, and εXeH = −0.15121 kcal·mole−1 and RminXeH = 3.0714 Å. The LJ parameters for
the Rn-Rn VdW interaction were adopted form Lazaridis and Paulaitis [23] with the following
values for εRnRn=−0.5760 kcal·mole−1 and RminRn= 4.8940 Å.
Periodic boundary conditions were imposed in the x and y directions of the basal
surface of ice such that the rectangular MD simulation box with (x, y) size of (26.945 Å,
31.113 Å) contains one Xe atom and an ice slab made up of 8 bilayers with 96 water molecules
in each bilayer. In order to preserve the crystallinity of the ice structure, the four bottom
bilayers (i.e., the 5th to 8th bilayers) were kept rigid during the simulations. The initial
coordinates of the water molecules in the ice slab were obtained from Buch et al. [24].
MD trajectories were generated using the leap-frog integrator with 1 fs integration step
at a constant temperature of 180 K. The SHAKE algorithm was employed for keeping the
water molecules rigid by constraining the distances between the atoms in a molecule [25]. The

297
cutoff distance for non-bonded interactions was set to 13 Å in order to be consistent with the
simulation box size.
The free energy change can be obtained by calculating the potential of mean force
(PMF) [26]. In particular, the PMF as a function of z coordinate of the Xe atom (along the
perpendicular direction to the ice surface), W(z), was obtained by carrying out the umbrella
sampling [27], where the potential energy of the Xe-ice system was changed by applying an
umbrella potential Vs(z) = ks(z-zs)2 to the Xe atom in order to restrict the sampling range of z in
a given run around a prescribed zs value. Sixty separated MD runs were performed using a
series of different zs values chosen for each simulation, so that successive simulations sample
overlapping regions in the range 17.5 Å < z < 32.5 Å. The force constants ks in the umbrella
potential were set to 5.2516 kcal/(mol⋅Å2) and 2.6258 kcal/(mol⋅Å2) in the simulations where
the motion of the Xe atom was restricted outside and inside the ice, respectively. The first
simulation run was started with the ideal hexagonal crystalline structure of ice (obtained from
Buch et al. [68]), while the starting configuration for each subsequent run was taken from the
previous one. For each run, the MD trajectory over a 150 ps period was collected for further
analysis. The WHAM technique [28] adopted from Lemak and Gunn [29] was employed for
calculating in a canonical ensemble the probability distribution of z-coordinate of Xe, P(z),
which could in turn be used to determine the PMF according to the relation W(z) = −kBT
lnP(z) (where kB is the Boltzmann constant).
To study the surface dynamics of Xe and Rn, the MD simulations have been extended
to 1, 2 and 4 Xe and 4 Rn atoms on the ice surface without applying an umbrella potential to
the system at a constant temperature of 180 K. With the Xe/Rn atoms initially located
randomly at the adsorption site ε1 (and at z ~29 Å), the MD trajectories were propagated for a
3 ns period.
Structural evolution of the ice surface has been followed by observing the order
parameter, which is an average of three translational order parameters introduced by Kroes
[17], along the MD trajectories for the ice and Xe/Rn-ice systems. This order parameter ST
equals 1 for perfectly ordered hexagonal lattice while it is of the order 1/N (~ 0.02) for a
structure without hexagonal order, where N = 48 is the number of water molecules in a half
bilayer of ice structure in the simulation box.
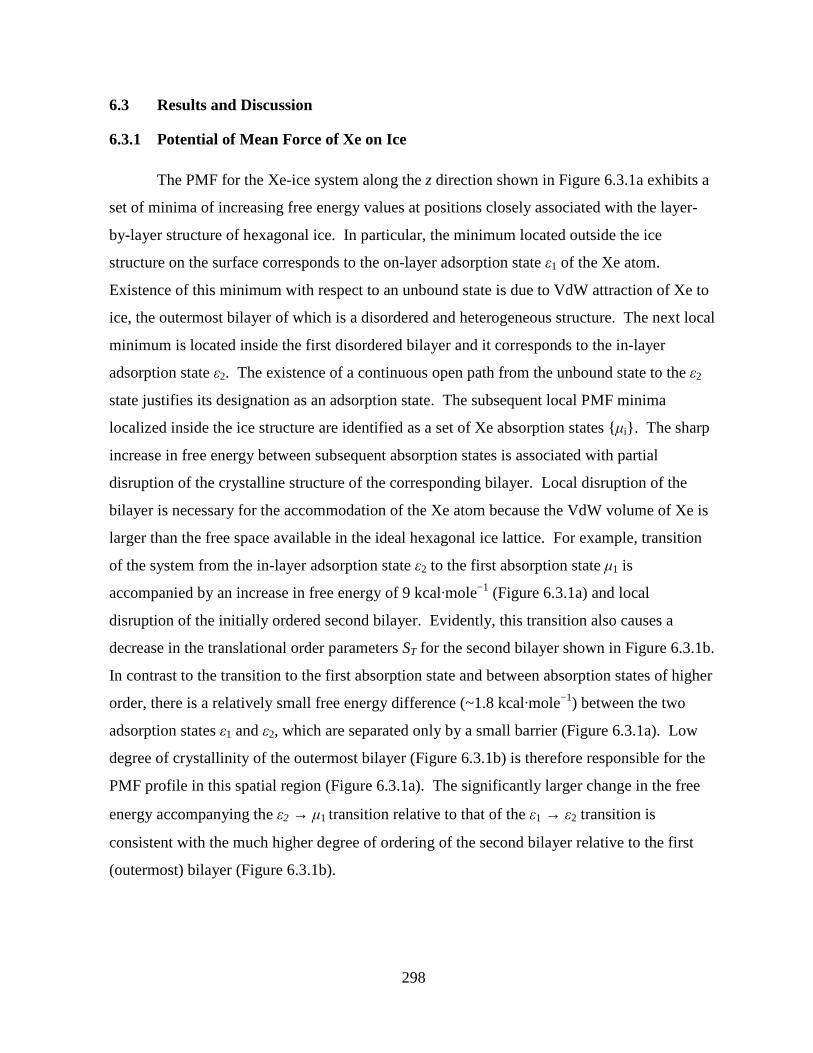
298
6.3 Results and Discussion
6.3.1 Potential of Mean Force of Xe on Ice
The PMF for the Xe-ice system along the z direction shown in Figure 6.3.1a exhibits a
set of minima of increasing free energy values at positions closely associated with the layer-
by-layer structure of hexagonal ice. In particular, the minimum located outside the ice
structure on the surface corresponds to the on-layer adsorption state ε1 of the Xe atom.
Existence of this minimum with respect to an unbound state is due to VdW attraction of Xe to
ice, the outermost bilayer of which is a disordered and heterogeneous structure. The next local
minimum is located inside the first disordered bilayer and it corresponds to the in-layer
adsorption state ε2. The existence of a continuous open path from the unbound state to the ε2
state justifies its designation as an adsorption state. The subsequent local PMF minima
localized inside the ice structure are identified as a set of Xe absorption states {µi}. The sharp
increase in free energy between subsequent absorption states is associated with partial
disruption of the crystalline structure of the corresponding bilayer. Local disruption of the
bilayer is necessary for the accommodation of the Xe atom because the VdW volume of Xe is
larger than the free space available in the ideal hexagonal ice lattice. For example, transition
of the system from the in-layer adsorption state ε2 to the first absorption state µ1 is
accompanied by an increase in free energy of 9 kcal·mole−1 (Figure 6.3.1a) and local
disruption of the initially ordered second bilayer. Evidently, this transition also causes a
decrease in the translational order parameters ST for the second bilayer shown in Figure 6.3.1b.
In contrast to the transition to the first absorption state and between absorption states of higher
order, there is a relatively small free energy difference (~1.8 kcal·mole−1) between the two
adsorption states ε1 and ε2, which are separated only by a small barrier (Figure 6.3.1a). Low
degree of crystallinity of the outermost bilayer (Figure 6.3.1b) is therefore responsible for the
PMF profile in this spatial region (Figure 6.3.1a). The significantly larger change in the free
energy accompanying the ε2 → µ1 transition relative to that of the ε1 → ε2 transition is
consistent with the much higher degree of ordering of the second bilayer relative to the first
(outermost) bilayer (Figure 6.3.1b).

299
Figure 6.3.1. (a) Order-parameters and (b) Potential of mean force, W(z), as a function of the
b
a

300
z-coordinate (the direction perpendicular to the ice surface) for the Xe-ice system at 180 K.
The broken lines show the relative density profile of the oxygen atoms for a pristine ice lattice.
The two adsorption sites outside the ice surface and inside the outermost bilayer and the two
absorption sites inside the ice slab are labeled by ε1, ε2, µ1, and µ2, respectively. (a)
Translational order parameter ST for the top (solid circles) and bottom (open circles) layers of
the outermost and second outermost bilayers of the ice slab as a function of zs, the constrained
position of the Xe atom in the series of umbrella sampling simulations. The lines are drawn
for eye guidance only.
The PMF profile of the Xe-ice system at 180 K (Figure 6.3.1a) appears to be
qualitatively similar to the free energy profiles of HCl and HOCl on hexagonal ice at 200 K
reported by Girardet and Toubin (see Fig. 18 in Ref. [4]). Although the VdW sizes of these
molecules and Xe are larger than the opening of the hexagon of water molecules, the observed
similarity in the PMF profiles is unexpected because the interactions of HCl and HOCl with
ice include strong electrostatic potential in addition to the VdW potential. There are, however,
notable quantitative differences between these systems. In particular, the free energy change
for the ε2 → µ1 transition for the Xe-ice system at 180 K is about twice that for the HCl-ice and
HOCl-ice systems at 200 K, which may be attributed either to a decrease in the activation
energy of structural reconstruction of ice due to electrostatic interaction, or to an increase in
the degree of disorder of the second bilayer with increasing temperature. It is also noteworthy
that the PMF profiles for guest-ice systems considered in the present work and by Girardet and
Toubin [4] represent the resistance of the ice structure against the disruption introduced by the
guest particle penetration. Moreover, the similarities in the PMF profiles suggest that
intermolecular interactions in the ice structure itself appear to be more important, at least at a
qualitative level, for the determination of the PMF profile than a specific guest-ice interaction.
Finally, the present PMF profile for the Xe-ice system (Figure 6.3.1a) clearly shows
that at 180 K there are relatively large probabilities of occupying an unbound state and the
adsorption states (ε1 and ε2) of the Xe atom while those of occupying µ1 and higher-order
absorption states (such as µ2) are very small. These results are connected to the order-disorder
equilibrium in the ice surface and near-surface region.

301
6.3.2 Order-disorder of the Xe-Ice Surface
Earlier experimental and theoretical studies of the surface properties of ice
[4,15,16,17,30,31] suggested that an equilibrium state of the pristine hexagonal ice surface
below 170 K is dominated by a hexagonally ordered crystalline structure, while for 180-220 K
it most likely involves significant disorder in the outermost bilayer but with nearly perfect
crystalline organization for the inner bilayers. In particular, Nada and Furukawa [15]
concluded from their MD simulations of TIP4P hexagonal ice that the relaxation time for this
system at 185 K is less than 1 ns, within which the outermost bilayer is found to evolve into a
disordered structure. Such a disordered structure is characterized by the presence of water
admolecules that “jump out” from the outermost bilayer [15]. In addition, over the MD
simulation time of tens of nanoseconds at temperatures above 180 K, Bolton and Pettersson
[16] have observed inter-bilayer migration of water molecules with preferential motion into the
inner layers, which leads to the appearance of non-zero density between the first and second
outermost bilayers and an increase in the number of molecules in the second bilayer.
However, it should be noted that there is no direct correspondence between the temperature
used in the MD simulations and the experimental temperature because, for instance, the
melting point of a proton-ordered TIP4P hexagonal ice was calculated by Volt et al. to be ~214
K at 1 atm [32], which is significantly lower than the experimentally observed value of 273 K.
In the present study, the translational order parameter ST for pristine hexagonal ice at
180 K was monitored over a period of 3 ns along a MD trajectory started from a non-
equilibrium configuration. In particular, ST for both the top and bottom layers of the outermost
bilayer are found to decrease from an initial value of ~0.5 and level off near 0.3 after 1 ns
(Figure 6.3.2), which indicates the onset of a long-lived state of ice having a partially
disordered first bilayer.

302
Figure 6.3.2. Translational order parameter ST of (a) the top and (b) bottom layers of the
outermost bilayer as a function of simulation time for two MD trajectories.
Open and solid symbols correspond to the trajectories of pristine ice and Xe-ice systems
respectively. Each point represents the ST value averaged over 100 ps.

303
Although molecules primarily from the top bilayer were occasionally observed in the
interlayer region, no density in this region is found in the molecular density profile of ice
shown in Figure 6.3.1a, which is consistent with the lack of significant inter-bilayer migration
in this long-lived state. Figure 6.3.3a shows a typical configuration of the oxygen atoms of the
water molecules in the first bilayer in this stable state, which evidently consists of a few
admolecules and a set of different polygons formed by 5, 6 and 7 water molecules. The
existence of admolecules also manifests itself as a shoulder near 28 Å in the density profile
(Figure 6.3.1a), which is in agreement with the calculations by Nada and Furukawa [15].
Similar polygonal non-crystalline structure for the top bilayer of ice at 180 K was also reported
by Bolton and Pettersson [16,18]. It should be noted that despite a significant overall disorder
in the first bilayer, there are regions on the ice surface where the nearly perfect hexagonal
structure is preserved (Figure 6.3.3a, lower right). The structural organization of the outermost
bilayer of hexagonal ice at 180 K as revealed by the present MD simulations is therefore
characterized by the coexistence of dynamical polygons, slightly distorted hexagonal
fragments, admolecules, and occasional inter-bilayer water molecules. This structure exhibits
uneven local distribution of molecular density inside the bilayer, and the areas of rarefied
density provide the openings for guest particle trapping in the ε2 adsorption state.
The present MD simulations show that the presence of a Xe atom on the ice surface
promotes further disordering of the outermost bilayer and increases the number of molecules
appearing in between the first and second bilayers. As shown in Figure 6.3.2, the ST
parameters for the Xe-ice system are found to level off at 0.025 and 0.05 for the top and
bottom layers respectively. These ST values are therefore notably smaller than the
corresponding ST values of 0.3 for the pristine ice system (Figure 6.3.2), indicating the
formation of a long-lived disordered state for the Xe-ice system with a substantially lower
concentration of hexagonally ordered fragments. Indeed, the snapshot of the outermost bilayer
for the Xe-ice system (Figure 6.3.3b) clearly demonstrates the noticeably more disordering of
the outermost bilayer relative to that for the pristine ice system

304
Figure 6.3.3. Snapshot of the positions of oxygen atoms in the outermost bilayer (open
circles) for t = 3 ns on a typical trajectory of (a) the pristine ice, and (b) the Xe-ice system.
The position of the Xe atom is shown as a solid circle. The positions A, B, and C correspond
to the ε2 adsorption sites in the outermost bilayer visited by the Xe atom. The oxygen
positions of the ideal hexagonal ice structure are represented by the junction points of the
honeycomb grid drawn with dashed lines in (a, b).
305
Kinetically, the disordering process in the outermost bilayer is found to proceed at a higher rate
at those moments when the Xe atom is located in the in-layer adsorption state ε2. It should be
noted that the corresponding water density profile of the Xe-ice system is found to be nearly
identical to that of the pristine ice system (Figure 6.3.1a). However, the presence of Xe in the
ε2 state enhances molecular motion in the inter-bilayer region of the ice lattice with barely
discernible density in between the first and second bilayers. The formation of the Xe-
containing phase on the ice slab surface is therefore not only much more laterally disordered
from the hexagonal arrangement but also more diffuse in the z direction relative to the
outermost bilayer of pristine ice at 180 K. In effect, the Xe-ice phase formation causes partial
“fluidization” of the surface of the ice slab by facilitating a more fluid-like outermost bilayer,
which is in accord with the model introduced by Molina [33]. In contrast to the Xe-ice system,
the MD simulations of HCl adsorption on a 18 Å-thick Ih ice film supported by MgO at 190 K
by Toubin et al. [34] have demonstrated that ordering of the outermost bilayer persists for the
HCl adsorption and absorption processes at a coverage of 0.3 monolayer with a slight increase
in the ST parameter from 0.4 to 0.5. Similar ST values for different HCl-ice adsorption
/absorption complexes obtained by MD simulations were also reported by Kroes and Clary
[12] and by Gertner and Hynes [35]. At higher HCl coverages of 0.6 and 1.0 monolayer, the
ST parameters for the outermost bilayer were found to decrease to the level of 0.2 and 0.1,
respectively [34], which are still higher than that of the Xe-ice system after 2 ns of simulation.
This notable difference in the ST parameters for the Xe-ice and HCl-ice systems could be
attributed to the effect of an electrostatic component of HCl-ice interaction. In particular, the
presence of the hydrogen bonding between HCl and surface water molecules theoretically
shown by Kroes and Clary [12] could account for the preservation of partial ordering of the ice
surface. This picture is consistent with the Devlin-Buch model for the interaction of the
chemically different adsorbates with ice [36,37].

306
6.3.3 Surface Dynamics of Xe
In order to illustrate the details of the molecular mechanism in populating the ε1 and ε2
adsorption states by the guest particle, the dynamics of 1, 2 and 4 Xe atoms on the ice surface
at 180 K has been followed by MD simulation over a period of 3 ns [38]. In particular, the Xe
atom impinging on a disordered ice surface is found to be accommodated either in the ε1 state
or directly in the ε2 state, the latter of which is possible if the guest particle accidentally enters
the openings in the outermost bilayer (Figure 6.3.3). Figure 6.3.4a shows a typical trajectory
of a single Xe atom on the ice surface. Evidently, starting initially in the ε1 state, the Xe atom
has repeatedly visited the ε2 state, penetrating the outermost disordered bilayer and being
trapped at different locations (A, B and C), before finally accommodated in the ε2 state for
more than 1 ns (Figure 6.3.4b). In the ε1 state, the Xe atom has high lateral mobility (Figure
6.3.4a), which allows it to probe an ensemble of dynamic polygons of different sizes and
shapes and indeed to penetrate into, where appropriate, the accessible opening. In contrast, the
ε2 adsorption state is characterized by its limited lateral mobility, which constrains the Xe atom
to a polygon site.
Figure 6.3.4c shows the corresponding interaction energy of Xe-ice along the same
trajectory shown in Figure 6.3.4a. Evidently, the interaction energy for the ε2 state appears to
be larger by 2-3 kcal·mole−1 than that for the ε1 state for positions A and C but remains
unchanged for position B. The energy difference at B and C is caused by different specific
configurations of the water molecules surrounding the Xe atom. In position C, the Xe atom is
located directly above the center of the water hexagon of the second bilayer and is tightly
surrounded by 10 water molecules of the first bilayer. On the other hand, the Xe atom at
position B is found to be atop of a water molecule from the second bilayer with a loosely
bound neighborhood in the first bilayer. For the ε2 adsorption state, the preferred trapping site
for the Xe atom therefore includes the center of hexagon of the second bilayer. The dynamics
of a single Xe atom on the ice surface is similar to that observed for Ar by Bolton and
Pettersson [18] with the important difference that the characteristic occupancy times of the ε1
and ε2 states for the Xe atom (over 1 ns) are an order of magnitude greater than that for the Ar
atom (120 ps).
MD simulations of 2 and 4 Xe atoms on the ice surface demonstrate reversible

307
transitions of Xe atoms between three states: (a) unbound (gaseous) state, (b) on-layer
adsorption state ε1, and (c) in-layer adsorption state ε2 on a time scale of 3 ns. The interaction
among Xe atoms gives rise to interesting dynamical phenomena, including the formation of
weakly bound pairs of Xe atoms (Xe dimers) in both the ε1 and ε2 states, and fast exchange of
Xe atoms in these states. Break up of the Xe dimers could result in desorption of individual
Xe atoms from the surface. These results will be presented in a follow-up paper [38]. The
dynamics of the system observed in these simulations [38] is in good accord with the PMF for
Xe-ice system represented in Figure 6.3.1a.
Figure 6.3.4. Typical trajectory of the Xe atom on the ice surface (a) in the (x, y) plane and (b)
along the corresponding z-coordinate of the Xe atom.
The positions A, B, and C correspond to the ε2 adsorption sites in the outermost bilayer visited
by Xe atom. (c) Interaction energy (Eint) of Xe atom with the ice slab as a function of time for
the same trajectory.
The present studies consider also the surface dynamics of the Rn-ice system at very similar
simulation conditions. The surface and penetration dynamics of Rn appears to be in accord
with that of Xe atoms. The MD simulations of acetone and methanol on ice surface are at the
initial stage. It should be noted that typical snapshots of the surface state of acetone-ice system
were found to provide interesting insight on the deposition dynamics (Chapter 5).

308
6.4 The Diffusive Transport in Systems comprising of the Gas and Liquid phases
In addition to the above-reported molecular dynamic studies, the diffusional transport
of inert guests such as acetone from gas phase to liquid aqueous media has been studied on two
theoretical levels: (i) mathematical solution of the mass balance equation for two phases
separated by interface and (ii) kinetic modeling of the penetration process. The formulas
obtained within the frameworks of these two different methods appear to be useful for analysis
experimental and theoretical data on the penetration processes and mass accommodation
coefficient.
In particular, the former analytical approach (i) shows that even at relatively low
pressure of the ambient atmosphere gas diffusion plays often a leading role in controlling the
overall guest transport from the gas to liquid phase. Furthermore, it is shown that the Fuchs-
Sutugin [39] steady-state or Schwartz and Freiberg [40] time-dependent approximations are
not applicable for the transport into aerosol particles of tens of microns in diameter at
temperatures above 0 °C. These findings indicate that it is impossible to ignore the gas phase
resistance in analysis experimental data on the aerosol transport. Moreover, the published
experimental data obtained from microscopic aerosols do not allow making any conclusion
regarding specifically interfacial resistance for the gas-to-liquid transport.
The latter kinetic method (ii), which follows the Langmuir approach, provides simple
expressions for the interfacial contribution to the resistance in gas-to-aerosol transport as
function of rate constants and surface accommodation activity. In particular, the total
concentration of adsorption centers on the external interface or the absorption centers on the
internal interface of liquid phase controls the interfacial transport.

309
References:
1. F. Domine, P. B. Shepson, Science 297 (2002) 1506.
2. M. A. Zondlo, P. K. Hudson, A. J. Prenni, M. A. Tolbert, Annu. Rev. Phys. Chem. 51
(2000) 473.
3. A. Kouchi, T. Yamamoto, Prog. Crystal Growth and Charact. 30 (1995) 83.
4. C. Girardet, C. Toubin, Surf. Sci. Rep. 44 (2001) 159.
5. T. Pietrass, H. C. Gaede, A. Bifone, J. A. Ripmeester, J. Am. Chem. Soc. 117 (1995)
7520.
6. I. L. Moudarkovski, A. A. Sanchez, C. I. Ratcliffe, J. A. Ripmeester, J. Phys. Chem. B
105 (2001) 12338.
7. E. D. Sloan, Jr., F. Fleyfel, AIChE J. 37 (1991) 1281.
8. D. Laufer, E. Kochavi, A. Bar-Nun, Phys. Rev. B 36 (1987) 9219.
9. P. Jenniskens, D. F. Blake, Science 265 (1994) 753.
10. G. Notesco, D. Laufer, A. Bar-Nun, T. Owen, Icarus 142 (1999) 298.
11. V. Buch, L. Delzeit, C. Blackledge, J. P. Devlin, J. Phys. Chem. 100 (1996) 3732.
12. G-J. Kroes, D. C. Clary, J. Phys. Chem. 96 (1992) 7079.
13. Al-Halabi, A. W. Klein, G. J. Kroes, J. Chem. Phys. 115 (2001) 482.
14. Al-Halabi, A. W. Klein, G. J. Kroes, Chem. Phys. Lett. 307 (1999) 505.
15. H. Nada, Y. Furukawa, Surf. Sci. 446 (2000) 1.
16. K. Bolton, J. B. C. Pettersson, J. Phys. Chem. B 104 (2000) 1590.
17. G-J. Kroes, Surf. Sci. 275 (1992) 365.
18. K. Bolton, J. B. C. Pettersson, Chem. Phys. Lett. 312 (1999) 71.
19. A. Hallbrucker, E. Mayer, J. Chem. Soc., Faraday Trans. 86 (1990) 3785.
20. B. P. Brooks, P. E. Bruccoleri, B. D. Olafson, D. J. States, S. Swaminathan, M.
Karplus, J. Comput. Chem. 4 (1983) 187.
21. W. L. Jorgensen, J. Chandrasekhar, J. F. Madura, R. W. Impley, M. L. Klein, J. Chem.
Phys. 79 (1983) 926. 22. H. Tanaka, Fluid Phase Equilibria 144 (1998) 361.
23. T. Lazaridus, M. E. Pauliatis, J. Phys. Chem. 98 (1994) 635.

310
24. V. Buch, P. Sandler, J. Sadlej, J. Phys. Chem. B 102 (1998) 8641.
25. J. P. Ryckaert, G. Ciccotti, H. J. C. Berendsen, J. Comput. Phys. 23 (1977) 327. 26. D. A. McQuarrie, “Statistical mechanics”, 1976, Harper and Row, New York.
27. G. M. Torrie, J. P. Valleau, J. Comput. Phys. 23 (1977) 187.
28. S. Kumar, D. Bouzida, R. H. Swendsen, P. A. Kollman, J. M. Rosenberg, J. Comput.
Chem. 13 (1992) 1011.
29. A. S. Lemak, J. R. Gunn, J. Phys. Chem. B 104 (2000) 1097.
30. N. Materer, U. Starke, A. Barbieri, M. A. Van Hove, G. A. Somorjai, G.-J. Kroes, C.
Minot, Surf. Sci. 381 (1997) 190.
31. F. M. Geiger, A. C. Tridico, J. M. Hicks, J. Phys. Chem. B 103 (1999), 8205.
32. M. J. Volt, J. Huinik, J. P. van der Eerden, J. Chem. Phys. 110 (1999) 55.
33. M. J. Molina, in “The Chemistry of the Atmosphere: Its Impact on Global Change”,
1994, Blackwell Scientific, Oxford, p. 27-38.
34. C. Toubin, S. Picaud, P. N. M. Hoang, C. Girardet, B. Demirdjian, D. Ferry, J.
Suzanne, J. Chem. Phys. 116 (2002) 5150.
35. B. J. Gertner, J. T. Hynes, Faraday Discus. 110 (1998) 301.
36. L. Delzeit, M. S. Devlin, B. Rowland, J. P. Devlin, V. Buch, J. Phys. Chem. B 100
(1996) 10076.
37. L. Delzeit, K. Powell, N. Uras, J. P. Devlin, J. Phys. Chem. B 101 (1997) 2327.
38. S. Mitlin, B. Torrie, A. S. Lemak, K. T. Leung, to be published.
39. N. A. Fuchs, A. G. Sutugin, "Highly Dispersed Aerosols", 1970, Ann Arbor Science
Publishers, London.
40. S. E. Schwartz, R. L. Freiberg, Atmos. Environ. 15 (1984) 1129.
311
CHAPTER 7
General Conclusions
1. For the analysis of the physico-chemical properties of condensed media comprising
either pristine water or bi-component systems of water and polar organic substances of
environmental significance there have been developed:
a. An Ultra High Vacuum cryogenic apparatus.
b. An experimental system comprising the Ultra High Vacuum chamber optically
coupled to the Fourier Transform Infrared Spectrometer for conducting Reflection-
Absorption Spectral studies of condensed films.
c. Methods of spectral analysis of the processes of growth, aging and thermo-
annealing in condensed films. It is found that analysis of IR RA spectra allows
detailed characterization of (i) the intermolecular interaction in adsorbate-substrate
systems; (ii) the physico-chemical state of ice surface and bulk; (iii) the
morphology of pristine and mixed phases. With the help of time-dependent FTIR
RAS the dynamics of these processes has been studied.
d. Mathematical methods and a computer program for simulating IR RA spectra on
the basis of the Fresnel optical model.
2. The experimental studies of pristine ice films reveal that:
a. Condensed water exists either as noncrystalline porous media or as a
polycrystalline medium. The formation of one form or the other is controlled by
the deposition temperature.
b. The surfaces of both noncrystalline and polycrystalline media contain non-
coordinated hydroxyl groups, which act as adsorption centers for the
accommodation of polar organic molecules. The adsorption and absorption
properties of condensed water are found to depend on the surface area and the
accessibility of a surface for the guest molecules. These characteristics depend
directly on the crystallinity of condensed ice.

312
c. For very thin ice films (< 50 nm) the total surface area is the same for both types of
ice media. In the case of thick films (> 100 nm), the surface area of noncrystalline
porous media is substantially larger than that for polycrystalline ice films.
d. Upon annealing the noncrystalline structure undergoes a rapid crystallization into a
polycrystalline phase at certain temperature range. The hydroxyl cover of the
external surface of noncrystalline thin ice films exhibits no a discernible change on
the crystallization. On the other hand, the isothermal soaking of thick
noncrystalline ice films leads to a discernible reduction in the total amount of
hydroxyl noncoordinated groups due to the decrease of the internal surface of
pores.
3. The experimental studies of pristine organic solids reveal that:
a. The vapor deposition of chloroform leads to the formation of two crystalline
phases: a stable orthorhombic Pnma (D2h16) phase and a metastable phase.
The metastable phase is found to transform into the stable Pnma phase upon
annealing.
b. The vapor deposition of acetone leads directly to the formation of crystalline
orthorhombic Pbca or mixed Pbca/Cmcm phases with a discernible preferential
orientation of the carbonyl group and carbon-carbon molecular skeleton relative
to the substrate surface, which depends on deposition temperature.
4. The experimental studies of adsorption/desorption of organic molecules on ice reveal
that:
a. At an initial stage of adsorption on the ice surface, the organic molecules in
question interact directly with surface hydroxyl groups of ice forming
hydrogen-bonded complexes. The structure of these complexes depends on: (i)
the functional group of the organic molecule; (ii) the crystallinity of ice film;
(iii) the surface concentration of organic species.

313
b. Subsequent adsorption leads to the formation of: (i) isolated non-crystalline
nano-clusters of organic molecules; (ii) the solid phase of the corresponding
organic substance at high exposure.
5. Condensation of a mixture of water and organic substances over a wide cryogenic
temperature range forms noncrystalline solids, in which organic molecules in question are
hydrogen bonded to the water network. The present studies reveal that thermo-annealing of
water-organic mixtures leads to separation of chemical components such that the ice
crystallization is accompanied by partial evaporation of organic component. The intermediate
formation of of clathrate-hydrates of small organic molecules such as acetone could be
suggested on the basis of present IR spectral data.
6. Computational analysis on quantum mechanical and classical molecular dynamics
levels of isolated water clusters and those carrying proton or a organic component reveal that:
a. The structural parameters and the IR spectra of these clusters are mutually
related to the intermolecular water network of hydrogen bonds.
b. The IR spectrum is primarily a function of the distribution of lengths of
hydrogen bonds.
c. The existence and stability of certain configurations of water clusters depend on
the distribution of hydrogen atoms across an oxygen carcass.
d. A unique topology in the hydrogen bond coordination between the organic and
water molecules is found.
7. Diffusional and kinetic modeling of the gas-to-liquid diffusion of stable chemical
species in the wide range of the external parameters reveals that: (i) the mass accommodation
coefficient for small organic molecules on the water aerosols depends on the ration of diffusion
coefficients in the rarefied and condensed phases; (ii) the experimental values for mass
accommodation coefficients do not depend on the rate of surface process.
8. Classical dynamics simulations of adsorption and diffusion of inert guests inside the
water media lattice reveal that:

314
a. For non-polar molecules such as Xe (Rn) there are two different sets of surface
adsorption centers. A first set comprises on-layer adsorbates, which freely
travel over entire available surface. A second set comprises in-layer adsorbates,
for which the adsorption field is confined to small openings in the ice surface.
b. Penetration of the ice surface by guest molecules is accompanied by a
significant local disruption in the network of hydrogen bonds. The hopping of
water molecules between structural layers in the ice lattice could be a rate
determining factor for non-polar guest molecule penetration.