Studies of heart rate control - EliScholar
201
Yale University EliScholar – A Digital Platform for Scholarly Publishing at Yale Yale Medicine esis Digital Library School of Medicine 1970 Studies of heart rate control Bruce Arnold Reitz Yale University Follow this and additional works at: hp://elischolar.library.yale.edu/ymtdl is Open Access esis is brought to you for free and open access by the School of Medicine at EliScholar – A Digital Platform for Scholarly Publishing at Yale. It has been accepted for inclusion in Yale Medicine esis Digital Library by an authorized administrator of EliScholar – A Digital Platform for Scholarly Publishing at Yale. For more information, please contact [email protected]. Recommended Citation Reitz, Bruce Arnold, "Studies of heart rate control" (1970). Yale Medicine esis Digital Library. 3059. hp://elischolar.library.yale.edu/ymtdl/3059
-
Upload
khangminh22 -
Category
Documents
-
view
1 -
download
0
Transcript of Studies of heart rate control - EliScholar

Yale UniversityEliScholar – A Digital Platform for Scholarly Publishing at Yale
Yale Medicine Thesis Digital Library School of Medicine
1970
Studies of heart rate controlBruce Arnold ReitzYale University
Follow this and additional works at: http://elischolar.library.yale.edu/ymtdl
This Open Access Thesis is brought to you for free and open access by the School of Medicine at EliScholar – A Digital Platform for ScholarlyPublishing at Yale. It has been accepted for inclusion in Yale Medicine Thesis Digital Library by an authorized administrator of EliScholar – A DigitalPlatform for Scholarly Publishing at Yale. For more information, please contact [email protected].
Recommended CitationReitz, Bruce Arnold, "Studies of heart rate control" (1970). Yale Medicine Thesis Digital Library. 3059.http://elischolar.library.yale.edu/ymtdl/3059

MUDD
LIBRARY
Medical


Digitized by the Internet Archive in 2017 with funding from
The National Endowment for the Humanities and the Arcadia Fund
https://archive.org/details/studiesofheartraOOreit


STUDIES OF HEART RATE CONTROL
Mechanism of Ventricu1ophasic Arrhythmia
Further Characterization of the Paradoxica
Effect of Vaga1 Stimulation on Hea rt Rate
Bainbridge Reflex: Volume Infusion in the
Canine Cardiac Autotransplant
Bruce Arnold Reitz
B.S. Stanford University 1966
Thes i s Presented to the Faculty
of the Yale University School of Medicine in Partial Fulfillment of the Requirements
for the Degree of Doctor of Medicine
Department of Surgery Apri1 1970

ifeor..

This work was supported in part by a summer fellowship
(PHS-1-501 -FR-05358-08 Admin.) and by a contract of the Artificial
Heart Program, National Institutes of Health; the computing
facilities are supported by NIH grant RR-00311..


HEARTFELT GRATITUDE IS DUE MANY PERSONS with whom it was
my pleasure to work during the course of these experiments.
The Experimental Cardiovascu1 ar Surgery Laboratory at
Stanford Medical School, in the Division of C-V Surgery,
provided a setting with the spirit and excitement of a group
of people on "a frontier". VERY SINCERE THANKS
To Dr Eugene Dong, Jr, for guidance and "the blackboard talks"
To Dr Norman E. Shumway, for the opportunity
To Dr Edward Stinson, for the example
To Stephen Spittler, Margaret Miller, Paula Harris, Chris Churma,
and Linda Crouse, for always excellent assistance
And for support and encouragement,
To Drs John P. Steward and Bernard W. Nelson


NOW WE SEE ONLY PUZZLING REFLECTIONS IN A MIRROR,
BUT THEN WE SHALL SEE FACE TO FACE. MY KNOWLEDGE
NOW IS PARTIAL, THEN IT WILL BE WHOLE, LIKE GOD'S
KNOWLEDGE OF ME. IN A WORD, THERE ARE THREE THINGS
THAT LAST FOREVER: FAITH, HOPE, AND LOVE; BUT THE
GREATEST OF THEM ALL IS LOVE.
I Corinthians 13: 12-13 (NEB)


TABLE OF CONTENTS
STUDIES OF HEART RATE CONTROL Introduction ]
SECTION I: Mechanism of Ventricu1ophasic Arrhythmia 8 Materials and Methods 9 Results
Presence of VPA in the Autograft 12 Quantitative Relations in the VPA 14 Simulation of VPA by Vagal Stimulation in the Normal Dog 19
Discussion 23
SECTION II; Further Characterization of the Paradoxical Effect of Vagal Stimulation on Heart Rate 30
Materials and Methods 32 Results
Pacemaker Response to Single Stimulation 37 Constant Low Frequency Vagal Stimulation 41 Constant Low Frequency Vagal Stimulation with Continually Varying Stimulus-Stimulus Interval 46
Discussion Pacemaker Response to Single Stimulation 51 Pacemaker Response to Constant Low Frequency Stimulation 52
SECTION Ml; Bainbridge Reflex; Volume infusion in the Canine Cardiac Autograft 58
Materials and Methods 63 Results 64
Pharmacologic Alteration of the Response 68 Discussion ~/k
REFERENCES 77


STUDIES OF HEART RATE CONTROL
INTRODUCTION
In recent years clinical cardiac transp1antation has become
a reality. The obstacles to be overcome before clinical trial,
were recognized early as being "1) preservation of the heart graft
during its extracorporea1 phase, 2) the surgical technique, 3) the
effect of total cardiac denervation, and 4) the homograft rejection
mechanism."' Although many of the problems remain unsolved, the
development of present techniques, the assessment of denervated
heart function, and the study of the immunological problems involved,
have contributed to our knowledge in clinical medicine and have made
the present patient trials feasible as well as provided knowledge
of basic physiological mechanisms.
Transp1antation of the canine heart was first reported by
Carrel and Guthrie.in their experiment the heart of a small
dog was placed in the neck of a larger one by "anastomosing the cut
ends of the jugular vein and the carotid artery to the aorta»the
2 pulmonary artery, one of the vena cava and a pulmonary vein."
With back perfusion of the coronary circulation established, a
strong contraction ensued at the rate of 88 per minute until the
experiment ended at two hours. The next report of heterotopic homo-
4 graft heart transp1antation was that of Mann and coworkers in 1933.
Refinements included the use of heparin in the donor and understanding
the importance of coronary air embolism; beating hearts were main-
tained up to 8 days post-transp1 ant with the observation the "histo¬
logically the heart was completely infiltrated with lymphocytes,
-1-


large mononuclears and po1ymorphonuc1ears„Experiments of this
type began to appear more frequently in the early 1950 ' s.5“ 1 ^
Marcus, e_t aj_, stated in 1951 that "whether (a transplanted heart)
might so function as to replace its counterpart in the host is a
matter of fantastic speculation for the furture."0 They also
suggested the value of a heterotopic heart graft for the study of
a denervated heart,b>7 and Luisada and Marcus first studied the
effects of adrenaline, digitalis, and morphine, with comparison of
o the response of the graft to that of the normal recipient heart.
Complete isotopic replacement of the canine heart and lungs
1 5 was reported by Neptune and associates, using total body hypo¬
thermia, with support of the circulation by the transplanted heart
for six hours. Blanco, e_t a_|_, were next to attempt isotopic replace¬
ment of the heart and both lungs;^ with a similar technical proced¬
ure, a pump-oxygenator, and potassium arrest, they attained a max¬
imum survival of hours. Webb and Howard^ performed both heart
and total lung transp1antation, heart and left lung alone, and auto-
transp1antation of the heart and both lungs. With both lungs dener¬
vated they were unable to attain survival with spontaneous respiration,
and thus the autograft preparations were not available for study of
16 cardiac denervation. These same authors together with Neely,
reported a method for isotopic homologous cardiac transplantation
involving multiple venous anastomosis, and attained survival in ten
with the longest being 7l hours.
Two reports by Berman, Goldberg, and Akman appeared in 1958.
These authors described a method for homologous heart transp1 antation
which consisted of a left atrial "cuff" about the pulmonary veins,
17J8
-2-


and anastomosis of the SVC, 1VC, PA, and aorta. Their results
with three animals were support of the circulation for up to 21
minutes with no external cardiac pacing, and two hours with externaj
electrical stimulation, until ventricular fibrillation ended the
experiment.^ This technique was an advance over previous proced¬
ures, though the initial results were not encouraging.
A major advance in the technical feasibity of cardiac transplan¬
tation was the development by Lower and associates^ of a rapid
procedure for transp1antation which involved a running atrial
suture line rather than multiple venous anastomoses. With this method
they were able to initially attain survival up to 21 days. From
this point onwards, a technical procedure was available which wou1d
allow more complete study of the other obstacles to cardiac trans¬
plantation as well as make available a completely denervated heart
preperation for long term study.
An alternative approach to the study of denervated heart had been
the technique of neural ablation. Apparently the earliest attempt
was that of Friedenthal in 1902.^0 He purported to show the viabil¬
ity of an animal (a dog that survived 8 months) with chronic cardiac
denervation by means of vagotomy and stellate gang 1 i onectorny, but
neglected to study possible changes of heart rate under different
circumstances. Further pioneering work was done in Cannon’s lab-
oratory, with more rigorous criteria for the demonstration of de¬
nervation. This method was used by various investigators to study the
effect of drugs and exercise on the heart apart from central nervous
system control.22-24 however, these experiments were sometimes con¬
tradictory and standard criteria for the completeness of denervation
-3-


were not used. In I960, Gilbert and associates described a method
for intrathoracic cardiac denervation in which the great vessels
were skeletonized and middle mediastinal autonomic sturctures were
excised from T3 to the diaphragm.^5>26 technique became known
as Cooper-Gi1 bert regional neural ablation, and has been used by
other investigators, particularly Donald and Shepa rd. ^9“ 3 1 The
proof of denervation consists of no demonstrable change in heart
rate following either vagal nerve or stellate ganglion stimulation,
and by depletion of cardiac catacholamines.^^ The results of
all these studies clearly showed the ability of denervated heart
to support the circulation of an animal, the altered responsive¬
ness of the denervated heart to various cardioactive drugs,^ and
the mechanism of increasing cardiac output by increasing stroke
volume rather than rate.
The alternative approach of excision and re imp 1 antation of the
heart was clearly necessary, however, because of the analogy to the
more extensive procedure of homograft heart transp1antation. The
technical difficulty of this procedure was pointed out in the first
attempts by Cass and Brock.^ The method for homograft heart trans¬
plantation developed by Lower and associates,^ was next applied to
34 autotransplantation by Hurley, e_t a_l_, and provided the first
35 long-term survivors which could be adequately studied. The
success of this method was due to the atrial anastomosis and the
use of an Ivalon band to bolster the fragile supravalvular aorta.
With survivors of over 23 months, it was possible to study the late
effects of this procedure.
Simultaneously a second method for canine cardiac autotrans-
-4-


37 plantation was developed by Willamn and coworkers, resembling
the method of Berman, e t a 1 . * ^ This procedure involved transecting
the SVC, IVC, PA, and aorta, as well as the cuff of left atrial
tissue surrounding the openings of the pulmonary veins, and then re
suturing these vessels. Thirteen of the first 40 animals lived
longer than two days. All developed signs of congestive heart
failure, leading these authors to conclude that there was "a spec¬
ific adverse effect of severing the heart from the body."37
Animals prepared in this manner were later studied with cardio¬
active drugs,^ blood volume expansion,^ and work capacity using
40 a right heart bypass technique under anesthesia.
The experience of the Stanford group was somewhat different
with autograft animals. It was found that severe congestive heart
failure was not a problem; digitalis and diuretics were not routine
, 3 4-36,41 , .' ly necessary. The hemodynamic effects of denervation were
cha racte r i zed in these animals. It was found that the blood volumie
was increased, that there was a decreased urine output in response
to a volume load, and that the heart rate changes gradually and to
41 a lesser extent in response to exercise. The effect of volume
loading on hemodynamics in the awke unanesthetized animal has also
42 been recently studied.
The laboratory models necessary for adequate evaluation of
cardiac transp1 antation were therefore available with the canine
homograft and autograft. in addition, methods were developed for
study of the rejection process and its amelioration by therapy,
and for the study of unarnb i gous 1 y denervated heart. What soon
-5-


became apparent in using the autograft animal prepared by the
34 method of Hurley, e_t a_l_, was the development of a model for
studying the control system of heart rate and contractility.
With excision of the right and left atria in such a manner
as to leave right and left atrial cuffs about the great veins,
the sino-atrial node (S-A node) is left within the animal. In
the homograft preperation of Goldberg, et a 1,^ and the autograft
37 of V/i liman and associates, the SVC and 1VC were transected and
the entire right atrium removed, including the S-A node. With
the S-A node intact, however, vagal and sympathetic input, carried
by neural elements in the adventitia of the SVC, is able to affect
the firing rate in this pacemaker according to CNS command. In
engineering terminology, this is then an open-loop control system
for heart rate and contractility regulation. The loop is open
since feedback changes in rate and contractility are not trans¬
mitted across the suture line to the free running ventricles.
This situation differs from that in complete heart block since
sympathetic input to the ventricles and vagal input to the atrio¬
ventricular node is interrupted. If heart rate control were made
"closed loop" by stimulating the donor atria and ventricles off
of the P-wave of the innervated atrial remnant, a pure open-loop
with respect to inotropic control would exist; a condition not
possible heretofore in an animal with complete heart block.
S-A nodal tissue is formed in the sulcus terminales at the
junction of the SVC and the right atrium.
-6-


The use of these particular properties of the cardiac autograft,
which developed from studies of heart transplantation, is the start-
ing point for the experiments which constitute this thesis. This
particular model is well suited for studies of heart rate control,
especially of the many reflexes whose afferent or efferent arcs are
manifested by heart rate.
The experiments presented here are divided into three sections.
The first describes observations on the relationship between the
timing of the arterial pressure pulse and the length of the atrial
cycle in the autograft. This section is entitled the "Mechanism
of Ventricu1ophasic Arrhythmia," which is a clinically seen arryth-
mia simulated by this model.
The second part presents a series of experiments which evolved
directly from the observations in section one. These are experi¬
ments with vagal stimulation in an anesthetized normal dog which
has been vagotomized and given propranolol to block sympathetic
influences. This preperation serves to explain some of the find¬
ings in part one, as well as elucidate the peculiar paradoxical
effect o*: vagal stimulation on heart rate which has been recently
described. This section is entitled "Further Characterization of
the Paradoxical Effect of Vagal Stimulation on Heart Rate."
The final section again concerns the autograft model. The
highly controversial "Bainbridge Reflex" is studied in the awake
unanesthetized animal, and evidence is presented which substanti¬
ates the original description of tachycardia associated with
volume infusion.
-7-


SECTION I: MECHANISM OF VENTRICULOPHASiC ARRHYTHMIA
In studying chronic heart block in dogs, Ehrlanger and
Blackman observed that "the first auricular cycle following a
ventricular contraction is long but the successive auricular
cycles shorten until the ventricles again contract."^3 This
arrhythmia (later termed the ventricu1ophasic arrhythmia - VPA -
since it is a variation in atrial rate associated with ventric¬
ular activity) was subsequently described in several patients
44 45 with complete heart block. ’ A number of clinical papers have
since appeared which have described the incidence of the arrhythmia,
• 46-48 the importance of efferent vagal innervation, correlation of
49-50 the arrhythmia with arterial pressure, and calculation of an
50-51 apparent latency for the reflex involved. The majority of
authors ascribe its origin to variations of vagal tone caused by
the arterial pressure pulse acting on the carotid sinus, though
several have suggested the local mechanical action of ventricular
. . 52,53 contraction is important.
In recent years, the dog with an autotransp1 anted heart has
provided an experimental model in some ways similar to complete
34 heart block. In the standard preperation' ' a normally innervated
atrial remnant (termed "recipient atrium") is apposed to completely
dennervated atrial and ventricular tissue (termed "donor"). We
have observed the VPA in such an animal. The purpose of this report
is threefold: 1) to characterize this phenomenon in the autograft,
2) to suggest that the probable mechanism is a modulation of vagal
tone together with a varying response of the atrial pacemaker to
46
-8-


vagal input, 3) to support this hypothesis
ments of direct vagal stimulation of normal
by cervical vagotomy and propranolol (to be
deta i 1 in SECT ION I l) .
by describing experi-
dogs "dennervated"
described in more
MATER IALS AND METHODS
Experiments with two awake unanesthetized autotransp1 an ted
dogs were done when the animals were active and healthy 2-8
3/4
weeks following operation. Chronic instrumentation included a
totally implantable aortic pressure transducer (Microsystems)
positioned in the sacrificed left subclavian artery at its origin,
a bipolar recording electrode (Electro Catheter Corporation, New
Jersey) sutured to the "recipient atrium" near the lateral SVC-RA
junction, and a standard pacing wire sutured to the donor left
atrial appendage. These instruments, their position, and the wave
form obtained from them, are illustrated by Figure 1„
Experiments were done with the trained animals resting quietl
in the right lateral position. The arterial pressure, the lead II
e1ectrocardiogram, and the "recipient atrium" electrical activity
were simultaneously displayed on an Offner Type R Dynograph and
recorded on an Ampex FR-1300 FM tape recorder for subsequent dig¬
ital computer processing. Protocols consisted of recording "rem¬
nant atrium" and "donor" ventricular activity under resting condi¬
tions and with "donor" atrial pacing at intervals of 1000, 900,
800, and 700 msec. Other experiments were done in the presence of
atropine sulphate (0.15 mg/kg I.V.) and with rapid !„V. infusion
of isotonic saline (40-60 ml/min).
-9-


Donor heort ECG
-—Li—L—Lr—-Li—L*—L—L—L—L
FIGURE 1: Instrumentation routinely employed in the canine cardiac
autograft. E1ectrocard?ograms from the external lead II and the
"Host" heart via the bipolar lead. Chronically implanted arter¬
ial pressure transducer in the left subclavian and the left ven¬
tricle. An EMF flow meter is positioned on the ascending aorta.
10-


A second group of experiments involved 5 normal dogs anes¬
thetized with morphine (Img S.C0), warmed a 1pha-ch1ora1ose (60
mg/kg I.V.), and urethane (600 mg/kg I.V.). Both cervical vagus
nerves were transected and bipolar platinum wire electrodes placed
on the cardiac end of the right vagus. Trains of one, three, and
five impulses (10-14 V amplitude, 2 msec duration, 10 msec apart)
were given at intervals of 1000, 900, 800, and 700 msec through
a stimulus isolation unit from a Grass S4D stimulator. The
stimulator was externally controlled by programmed output from
the ACME IBM 360/50-1800 computing facility at the Stanford Med¬
ical Center. The stimulus delivered and activity from a bipolar
electrode placed transvenous1y in the right atrium were recorded
as described above. Propranolol (1 mg/kg I 0V0) was given to
block sympathetic activity.
Tape records from both types of experiments were analog to
digital converted using the ACME IBM 3^0/50-1800 computer. The
digital records were then processed in one of two ways: 1) auto¬
graft experiments were displayed on a television monitor and R-
onset and P-onset events tagged by hand (estimated accuracy of
this method is +10 msec), 2) normal dog stimulus-stimulus and
P-P intervals were automatica11y measured as the time between
crossings of the derivative of the analog signal to some preset
level (accuracy of + 2 msec). In addition, the computer was pro¬
grammed to give averaged arterial pressure waveforms, and these
were plotted by a Houston instruments Plotter.


RESULTS
Presence of VPA in the Autograft
In both the autograft animals studied the length of the "rem¬
nant" atrial cycle (P-P interval) varied according to the timing of
"donor" ventricular activity as indicated by the R-wave. This is
demonstrated by the records in Figure 2. Recordings from lead II
of the electrocardiogram and the bipolar electrode sutured to the
"remnant atrium" (the AKG) are displayed. (A) represents the
animal resting quietly on his right side. The R-R interval is
constant at 650 msec; the P-P intervals vary from 58O-76O msec.
In this record the R-waves are consistently falling near the end
of the P-P interval, and it is clear that the longer P-P intervals
are those in which the preceeding R-wave is closest to the initial
P-wave of the interval.
Conditions which lead to a decrease in efferent vagal activity
were associated with disappearanee of VPA. Administering atropine
sulphate (0.15 mg/kg i.V.) caused P-P intervals to decrease to a
fixed value whereas ventricular activity was unchanged. Under
these conditions there was no variation in "remnant" atrial cycle
length within the limits of accuracy of measurements.
Part (B) of Figure 2 represents a second case where vagal
activity is abolished, this time following a rapid infusion of
isotonic saline to increase venous pressure (see SECTION III). In
this experiment the R-R interval increased from 650 to 825 msec;
the P-P intervals decreased to 420 msec with no variation in re¬
lation to the R-wave. Similar behavior could be noted if the dog
was brought from the recumbent position to the standing position,
-12-


A. 650
TIME SECS J J'
FIGURE 2: EKG recorded from a canine cardiac autotransplanted dog.
The standard lead M and the atrial bipolar lead are shown (AKG).
P-waves in the AKG are indicated by "P11 to differentiate them from
R-wave artifact. (A) Control conditions with the animal resting
quietly, showing variation in the P-P interval depending on the posi¬
tion of the R-wave. (B) The same animal following infusion of 300 cc
of isotonic saline. The R-R interval has increased to 825 msec; the
P-P interval has decreased and is fixed at 420 msec.
-13-


which is associated with reciprocal sympathetic activation and
vagal withdrawal. These characteristics agree with the behavior
noted by previous studies of VPA in patients with complete heart
block/f5_5 1
Quantitative Relations in the VPA
When the "donor" heart is paced at various intervals the
quantitative relationship between ventricular activity and result¬
ing P-P intervals can be studied. Respiratory rate was not con¬
trolled in these studies and reflex respiratory changes in cycle
length are seen in the autograft, increasing the variability
somewhat. Respiratory fluctuations are assumed to average out
in the period of time that measurements were taken. The results
of recording on three seperate occasions from one autograft are
plotted in Figure 3. In the upper half of the Figure the averaged
arterial pressure waveforms for the four conditions have been
plotted. In the lower part, the average P-P interval length is
given, with intervals grouped according to the R-wave to P-wave
time (R-P). Time zero represents the R-wave onset; the R-P group
from 0-50 msec represents the average of all P-P intervals which
begin 0-30 msec following an R-wave onset, and so on. It is first
noted that the mean P-P interval increases as the R-R interval
decreases, and since arterial pressure rises, this is consistent
with normal autonomic innervation of the "recipient atrium".
Secondly, the P-P interval length appears to be related to the
time within the ventricular cycle that the initial P-wave occurs,
and apparently to the arterial pressure at the beginning of the
-14-


FIGURE 3: Three experiments averaged to give the arterial pressure
waveform and the remnant atrial cycle length at four pacing intervals:
1000, 900, 800, and 700 msec. The atrial cycle length appears to be
proportional to arterial pressure existing at the beginning of the
interval, except for the last 100-150 msec of the R-R interval when
atrial cycle length appears to increase.
-15-


P-P interval, as reported earlier by Bevegard, et. in patients.
Thirdly, Figure 3 shows that the minimum P-P interval occurs in each
instance in which the initial p-wave falls in the 150-100 msec before
an R-wave; P-P intervals beginning slightly later are longer though
the arterial pressure is low. This same feature was seen in the
data of Bevegard, et and is an instance in which arterial
pressure is not directly related to the length of the P-P interval.
This same data is plotted in a second manner in Figure 4, such
that the initial P-wave of the P-P intervals is held constant and
the position of the R-wave is varied on the horizontal axis. This
Figure demonstrates the same findings as in Figure 3, but accentuates
the position of the minimum P-P interval in the period where the
initial P-wave falls 100-150 msec before the R-wave.
Clinical studies in complete heart block have also demonstrated
synchronization of atrial and ventricular activity in some cases,^
and recently Levy, et and Reid,-^ have shown that the basis
for this phenomenon may lie in the pattern of response of the S-A
node to vagal stimulation. The same type of synchronization phen¬
omenon is seen in the autograft. Table I gives the n, mean, and
standard deviation of the P-P intervals grouped by the value for
R-P. The n thus represents the distribution of P-waves throughout
the R-R cycle. This distribution is apparently random except for
the case where the donor heart is being paced at 700 msec intervals.
There is a predominance of P-waves which fall 400-500 msec alter an
R-wave (or 200-300 msec before an R-wave). The average value for
the P-P intervals in this case is near 700 msec, so that the conditions
for apparent synchronization exist.
-16-


FIGURE 4: The results of three experiments averaged to give the
P-P interval length for that interval which begins at the time
before (P-R) or the time after (R-P) an R-wave.
-17-


_R-R INTERVAL (msec)_ 1000_900_ 800_ 700
R-P (msec) n m SD n m SD n m SD n m SD
0-50 9 573 42 7 653 33 17 673 43 2 740 7 51-100 10 575 42 9 648 38 17 676 38 5 772 92
101-150 9 564 37 5 673 45 14 710 63 10 733 54
151-200 7 577 36 9 665 29 18 689 43 8 748 45 201-250 13 571 42 12 669 30 18 682 53 5 752 51 251-300 8 569 48 7 662 30 17 713 74 6 746 71 301-350 6 565 55 6 648 32 21 688 80 6 729 61
351-400 12 553 27 6 652 41 16 670 78 19 760 21
401-450 7 550 36 8 628 38 12 678 84 34 742 43 451-500 5 542 17 7 651 52 14 669 51 39 733 47 501-550 9 561 99 9 631 29 14 641 19 6 727 41
551-600 8 563 67 8 609 19 6 652 54 9 712 42
601-650 9 561 67 4 633 9 4 639 42 8 717 82
651-700 8 567 73 8 607 36 11 606 43 Z 716 88
701-750 10 549 85 4 597 52 25 632 68
751-800 9 553 65 4 592 60 8 665 57 801-850 8 536 82 17 601 41
851-900 8 536 81 8 603 22
901-950 9 567 37 951-1000 573 82
n = number
m = mean
SD = standard deviation
TABLE I: Values for the P-P intervals from three experiments
averaged, with the n and standard deviation. P-P intervals are
grouped according to the R-R interval and the R-P time.
-18-


Simulation of VPA by Vagal Stimulation in the Normal Dog
Studies of direct cervical vagus stimulation in the dog,
both with single stimuli^ and constant low-frequency stimulation'^*'^
have demonstrated a characteristic variation in response depending
on the timing of the stimulation within the heart cycle. The
pattern of response was consistent with the variation in P-P
interval seen in the autograft with VPA. it seemed reasonable,
therefore, to simulate the arrhythmia in normal dogs by stimulat¬
ing the cut right vagus nerve following bilateral vagotomy and
propranolol administrat ion. in this simulation, vagal stimulation
at 1000, 900, 800, and 700 msec is analogous to ventricular activ¬
ity at these intervals (Vagal stimulation substituting for arter¬
ial baroreceptor reflexes). The number of impulses delivered per
stimulation can account for ventricular activity with higher numbers
of impulses simulating greater arterial pressure.
The standard stimulation protocol consisted of two minutes
of stimulation at a given interval with one through five impulses
per stimulation. The results of these experiments which pertain
to VPA will be presented here; the results which characterize the
synchronization phenomenon for different stimulus intervals and
also for different numbers of impulses with the same stimulus
interval will be presented in SECTION li0
When the stimulation interval is varied a single curve is
found relating the resultant P-P interval to the P-stimulus delay.
Figure 5 illustrates a vagal stimulation experiment in which four
impulse trains (12 V amplitude, 2 msec duration, 10 msec apart) was
delivered to the cardiac end of the cut right vagus nerve. This
-19-

-200 -100 0 100 200 300 400 500
P- STIMULUS (M SEC)
FIGURE 5: Vagal stimulation in an anesthetized normal dog after
vagotomy and propranolol. Four impulses were applied to the right
vagus at a stimulus-stimulus interval of 1000, 900, 800, and 700 msec.
The resultant P-P interval is plotted against the P-stimulus time.
Note (he clustering of P-P intervals at 700 and 800 msec, when the
stimu1 us-stimu1 us intervals are also 700 and 800 msec.
-20-


Figure demonstrates that as the stimulus-stimulus interval is
varied from 1000 msec to 700 msec, the resulting P-P intervals
fall on a single defined curve, which we will call the pacemaker
response curve after Levy, e_t a_l_,55 who presented such a curve
for one impulse only. At stimulus-stimulus intervals of 700 and
800 msec, the P-P intervals obtained are also 700 and 800 msec.
This is the phenomenon of synchronization or entrainment, and will
be described and explained more completely in SECTION II. The
curves which are found at other numbers of impulses show a similar
well defined form, but vary in some characteristics, especially in
amplitude. When a single best-fit curve is drawn through the
pacemaker response curves for one to five impulses per stimulation,
a family of curves relating P-P interval to the P-stimulus delay
results. This is illustrated by Figure 6, and it is clear that
there is a correspondence to the family of curves presented in
Figure 4, for P-P intervals in the cardiac autograft plotted against
the time between R-wave and initial P-wave of the P-P interval.
The difference in the timing of the minimum P-P intervals in these
two Figures should be noted; 100-150 msec P-R for Figure 4, and
280-300 msec P-stimulus in the vagal stimulation experiment.
-21-

.

P-STIMULUS (M SEC.)
FIGURE 6: The best-fit curve for one to five impulses
ulation drawn through the pacemaker response curve for
number of impulses.
—|
500
per stim-
the given
-22-


DISCUSS ION
The cycle length of the innervated atrial remnant of the cardiac
autotransp1 anted dog has been shown to be related to the timing of
ventricular activity. The length of the P-P interval appears to
be related to the arterial pressure at the beginning of the interval
except for the period 150-100 msec before the following R-wave,
when intervals lengthen though the pressure continues to fall.
Changes which influence vagus nerve activity will predictably
affect VPA. Atropine will abolish it, as will volume infusion
and rising from a recumbent to a standing position. It appears,
therefore, that VPA is present in the autograft, and is comparable
44-53 to the arrhythmia seen in patients with complete heart block.
Vagal stimulation in the normal dog which has been denervated
by vagotomy and propranolol, appears to mimic the pattern observed
in VPA. Figure A corresponds to the heart rate response when the
vagus is stimulated at constant low frequencies and with varying
number of impulses. The displacement of the curves in the hori¬
zontal axis by 130-200 msec represents the neural and mechanical
conduction time between the R-wave and cervical vagus activation
in the dog studied.
A further correspondence between the autograft model and
previous clinical work‘d is the calculation of the apparent
latency involved. The latency time of the reflex was taken to
be the time between rise in arterial pressure and the end of the
first P-P interval which could be lengthened by this pressure rise.
This latency was found to be directly related to the length of the
minimum P-P interval, with latencies between 400 and 600 msec. It
-23-


the data of Figure 3 is used to calculate latency, it is found
to be directly related to the minimum P-P interval, with a
slope of 45° (plotted in Figure 7). When analyzed, the factors
which may contribute to the actual neural conduction latency are
tound to be somewhat less,, The time between R-wave onset and
rise of arterial pressure is 40-60 msec (from Figure 3). Direct
measurements of cardioinhibitory fibers in the cervical vagus
O
nerve of the dog by Jewett5 show a burst of firing 80-240 msec
following the rise of arterial pressure. The neural conduction
time measured from the cervical vagus to the post-synaptic gang-
58 59 lion in the heart is estimated to be 10-20 msec. ’
The long reflex time for VPA, and its variation with the
heart cycle, first led us to study vagal stimulation. Reflex
times, if they involve set neural pathways, are 1) usually
much smaller, and 2) do not vary in the same animal as markedly.
An alternative explanation was that there existed a variable
response to vaga1 input depending on the timing. Since the study
59 of single impulse stimulation by Brown and Eccles in 1934, no
quantitative study of this question existed until the recent re-
55,56 ports already cited which involved constant low Frequency
vagal stimulation. These studies, together with the present work,
do demonstrate a marked variation in heart rate response to a
uniform vagal input depending on its timing. When delivered
early in a heart cycle, the same stimulus will increase the P-P
interval to a much greater extent than when delivered only several
msec later. This fact helps greatly to explain the pattern of the
VPA.
-24-


FIGURE 7: Calculated apparent latency for the VPA in the autograft
after tie method of Bevegard, e_t a_l_.^ Apparent latency is the
time between rise in arterial pressure and the end of the first
P-P interval which is lengthened above the minimum interval. This
is plotted against the minimum P-P interval.
-25-


The hypothesis which is suggested by these experiments, and
which would explain the pattern of VPA, can be briefly summarized.
Variation in atrial rate depending on ventricular activity is pri¬
marily effected by vagal input mediated by the arterial barorecep-
tors. This vagal input will have a varying influence depending on
the timing with which it arrives at the S-A node. Arriving in
the first 250-300 msec of the interval, that same interval will be
lengthened; coming later, the following interval will be lengthened,
but a lesser amount. The timing relations are illustrated by the
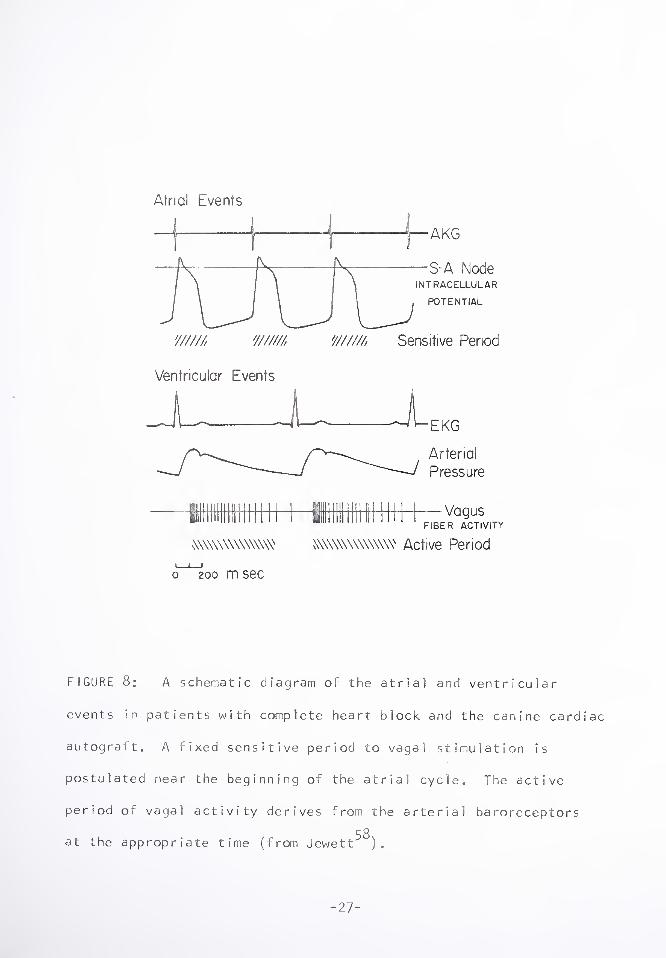
schematic diagram in Figure 8. This Figure represents what may
occur in patients with complete heart block, or the canine cardiac
autograft, in which the atrial and ventricular events are thought
to be seperate. If we postulate a fixed sensitive period of 250-
300 msec at the beginning of the atrial cycle, and an active period
of vagus activity beginning 120-280 msec following the R-wave (see
above), then the interactions of these two factors will result in
the P-P interval observed. The minimum point in the P-P interval
response curve of Figure 4, is a time when small vagal activity
and the insensitive part of the atrial cycle coincide. When the
sensitive period and the active period overlap, the P-P interval
is lengthened. Since vagus fiber activity is greatest with the phase
p O
of rising arterial pressure, the maximum lengthening results when
the R-wave preceeds the P-wave in the period 100-200 msec before
the P, as the active period begins to coincide best with the sen¬
sitive at r i a 1 period.
This interpretation of a sensitive early period in the atrial
cycle helps to explain the apparent latencies also. If the sensitive
-26

Atrial Lvents
—Vagus FIBER ACTIVITY
mwwwww WWWWWWWW Active Period
I_i-!
o 200 m sec
FIGURE 8: A schematic diagram of the atrial and ventricular
events in patients with complete heart block and the canine cardiac
autogralt. A fixed sensitive period to vagal stimulation is
postulated near the beginning of the atrial cycle. The active
period of vagal activity derives from the arterial baroreceptors
r O
at the appropriate time (from Jewett ).
-27-


period is a fixed time regardless of the mean P-P interval,
then the apparent latency would vary as the mean P-P interval
(i*e., be proportional to the part of the atrial cycle which
was "insensitive"). A vagal input arriving in the insensitive
period would not affect heart rate until the next sensitive
period arrived, thus making it seem as if a relatively long
latency existed.
Experimental evidence suggestive of an early fixed sensi¬
tive period to vagal stimulation derives from e1ectrophysiology.
Studies of the S-A node in non-mammalian systems has shown that
the effect of vagal stimulation is greatest during phase three
(rapid repolarization)and "least marked just prior to the
upstroke of the action potential".^ Microelectrode recordings
from S-A node of the dog heart show that the period of complete
repolarization of the action potential is approximately 200 msec,
and that the variation in the length of the heart cycle is due
6 1 to the variation in the length of the period of s1ow depo1 arization.
The variation in response may be due to a variation in the sensitivity
of node cells to the neurotransmitter acetylcholine. Acetylcholine
is well known to increase the permeability to potassium, and the
potassium permeability of the membrane is changing greatly in
the various parts of the heart cycle (In order to produce the
action potential), so that a variation in response to acetylcholine
might not be unexpected. Further experiments at the cellular
level are necessary to answer this question.
The finding of synchronization at an R-R interval of 700 msec
in the autograft studied, with the atrial and ventricular rates
-28-


approximately equal to each other (Table l), with a predominate
P-R interval of 400-500 msec, also suggests that the sinus node
response to vagal input is at work. The necessary requirement
for this phenomenon, as described previous1y^Jand in the
present SECTION 11, is that the pacemaker response curve have
a portion with a slope which is positive. This mechanism will
be more completely described below.
It appears, therefore, that the pattern of VPA is entirely
exp 1 ainab 1e by the va riation in response at the S-A node, given
a constant vagal input by way of the baroreceptors0 The relation
between arterial pressure at the beginning of the P-P interval
50 and the resulting cycle length, as observed previously, is a
coincidental phenomenon but not a causal mechanism.
-29-


SECTION II: FURTHER CHARACTERIZATION OF THE
PARADOXICAL EFFECT OF VAGAL STIMULATION ON HEART RATE
In mammalian physiology courses it is commonly demonstrated
and taught that increasing the frequency of vagal stimulation
slows the heart rate. In mathematical models simulating the
effect of inhibitory vagal stimuli on heart rate, the cardiac
period is assumed to be linearly related to the instantaneous
concentration of acetylcholine, and the effect of the phase of
62 the cardiac cycle is explicitly neglected. On the other hand,
it has recently been found in pacemaker neurons of invertebrates
^ 3 and in a computer model, that under certain conditions para¬
doxical entrainment may occur. It was demonstrated that within
certain well defined zones of frequency, increasing inhibitory
frequency results in an i ncrease in pacemaker frequency; also
shown vjas that increasing excitatory frequency may result in a
decrease in pacemaker frequency. This phenomenon is defined as
"paradoxica1". The basic requirement as elaborated by Perkel,
63 et a 1, is that the pacemaker neuron must have a varying phase
sensitivity to the inhibitory or excitatory input, and that the
derivative of this function must be positive. Statistical methods
to adequately describe this behavior, employing intervals
rather than mean firing rates, was subsequently presented by
64-66 these authors.
Two recent studies in mammalian systems have demonstrated
that the paradoxical behavior exists when vagus nerve stimulation
interacts with the cardiac pacemaker.^Reid used cats and
-30-


rats, extirpating the stellate ganglion and stimulating both
vagii with single impulses at low frequencies near the heart
rate. In both these animals he showed well defined stable zones
of entrainment wherein vagal stimulation frequency and heart rate
were "locked", both at ratios of 1:1, and at multiples such as
1:3, 1:2, 2:3, 2:1, 3:K These findings were those predicted by
Perkel, e_t aJL However, attempts to obtain locking to bilateral
accelerator nerve stimulation were rarely successful, and no
stable zones could be determined as pacemaker activity contin¬
ually drifted in either direction in an unpredietab1e manner.
35 Simultaneously, Levy, e_t aj_, used open chested dogs with
stellate ganglion decentra1ization, and stimulated both cervical
vagii with single pulses. These workers found the same para¬
dox ica1 behavior and, in addition, defined a pacemaker response
curve relating the P-P interval to the P-Stimulus delay for one
impulse. The shape of this response curve was sinusoidal, with
a portion therefore having a positive slope, fulfilling the
^ 3 criteria for entrainment. ' As they explained, in this portion
of the curve a negative feedback mechanism would operate, such
that regularly spaced input with an increasing interval would
fall on a part of the curve which results in a greater P-P
interval. And similarly, if the vagal input comes at a con¬
tinually decreasing interval in this range, the P-P interval
which results will be less, and this causes the heart rate to
appear to lock to the inhibitory input.
The experiments to be described here are directed towards
further explication of the paradoxical response to vagal stirn-
-31-

ulation. First, the exact description of the pacemaker response
curve for single event stimulations is presented for the first
time with varying numbers of impulses per stimulation. The
phase character!stics of the curves obtained predict the para¬
doxical phenomenon. In addition, they will be shown to have a
remarkable discontinuity which provides specific regulation of
heart rate without closed loop interaction.
Secondly, experiments with continuous vagal nerve stimula¬
tion are described using descrete changes in input frequency as
we 1 1 as continuously varying input. This is done both with one
impulse per stimulation and with multiple impulses (up to 5) per
stimulation. The effect of this maneuver is to vary the "mean
vagal tone", altering the mean pacemaker rate, and demonstrates
for the first time that locking may also occur by keeping the
input frequency constant and varying the number of impulses per
stimulation.
MATERiALS AND METHODS
Altogether sixteen adult mongrel dogs were used in these
experiments, varying in weight from 12 to 18 kg. Anesthesia
was provided by morphine sulphate (Img S.C.), warmed alpha-
chloralose (60 mg/kg I 0Ve), and urethane (600 mg/kg I.V.).
An endotracheal tube was placed and the animal allowed to
breath on his own. Both cervical vagus nerves were cut and
bipolar platinum wire electrodes placed on the cardiac end of
the right vagus. In most experiments, stimulation was done
after administering propranolol (Img/kg I.V.).
-32-


All experiments were controlled and processed on-line by
an ACME-IBM 360/50-1800 computing facility. Stimulations were
generated according to various protocols to be described below.
Data was collected in each case from a transvenous1y placed intra-
atrial electrode, which gave a clear signal of the P-wave. This
record was displayed on an Offner Type R Dynograph; the signal
was sinu1taneous1y differentiated and this signal also displayed
on the Offner. The zero crossing of the derivative of the P-wave
was then measured by the computer for the timing of this event
(accuracy + 2 msec). The stimulation was provided in each case
by a Grass S4D stimulator through a stimulus isolation unit, and
the tilling of the first impulse from the stimulator also measured
by the computer with an accuracy of + 2 msec. In some cases these
two si ]nals were led into cardiotachometer couplers of the Offner
and an analogue record of heart rate or stimulation rate obtained.
All experiments were recorded on an Ampex FR-1300 FM tape recorder
and subsequent high speed Offner printouts checked against the
computer output for accuracy.
Virious programs for administering stimuli were written de¬
pending on the protocol desired. Figure 9 is a schematic diagram
of the single stimulation experiments, with one or several
impuls s. The bipolar intra-atrial recording electrode signal
is pla ed into the Offner channel 3; this is next differentiated
and th derivative led into channel 6. The analogue signal is
then cirried to the IBM-1800 and analogueto digital converted
and pa sed to the iBM 360/50. Here the signal is !) stored on
file, jnd 2) triggers the 1BM 360/50 to begin filling a buffer
-33-


FIGURE 9: A block diagram demonstrating the experimental
arrangement of vagal stimulation experiments in the normal dog.
See the text for explanation.
-34-


in the IBM-1800, depending on a pre-set value for the P-stimulus
delay desired, and the number of impulses desired. The buffer
is simultaneously digital to analogue converted and delivered
to the external control of the Grass S4D stimulator which then
gives a 10-12 V, 2 msec wide, and 10 msec apart (for multiple
impulses) stimulation. The stimulus is also analogue to digital
converted by the i BM-1800 and filed in the IBM 360/50. In this
protocol one stimulation event is given, and then 25 consecu¬
tive P-P intervals are measured before another stimulus is
given.
The experimental design for constant low frequency vagal
stimulation is given by Figure 10. The same basic method is
used except that a standard function generator is used to trig¬
ger the IBM-1800 to deliver the impulses. With the function
generator a constant stimu1 us-stimu1 us interval can be produced
with any discrete value; and with the addition of a voltage
controlled oscillator, could also produce continually varying
stimulus-stimulus intervals about some set center period at any
desired number of cycles per second. Figure 10 shows the
wiring schematic for an experiment using the voltage controlled
oscillator. The function generator delivers a triangular volt¬
age input with amplitude of + 2 volts and at 0.001 cycles per
second (one cycle in 1000 seconds). With the center period set
to a 500 msec interval and the variation allowed being + 250 msec,
the signal delivered to the IBM-1800 will have intervals varying
from 250 to 750 msec and back again in 1000 seconds. Again the
IBM-1800 triggers the stimulator, and in this case five impulses
-35-

'

Function generator
o o
fu nction generator
(* . ^ center period
Voltage osci 1
!
rontrol led 1 ator
Recorder channel Ij
IBM 1800 interupt
D-*A |
puls e train
Stimulator Cjrass 5'4D
+Z volts
-Z 0.001 CPS
Stim-stim interval U- 5°0
50 mm/m in
b. 250
Intarupt
X„ 50 50
Stimulator
LjJJJJ.
Jk_
lAA. uu
50 50
\50msac\ 1000
isol a t i on unit
>- -*— Vagus nerve
e> polar intra-atrial
recording electrode
| Recorder channel 3 j
j 1800
i A-D A-D \
r Acme 3to0/50
R
1500/77sec|
mm,/sac so
ECG
£,\-_Etv— ^ R iRIk
<525msec |
50 1000
274 1
File
FIGURE 10: Block diagram of an alternate experimental arrange¬
ment for delivering continuously varying stimulation intervals.
More complete explanation is given in the text.
-36-


are delivered. The record of the intra-atrial electrode is
also displayed showing the prominent P-waves obtained.
Use of the digital computer to control and process these
experiments provided a number of advantages. These may be
briefly listed as 1) flexibility of stimulation protocol, 2)
ability to vary the number of impulses per stimulation, 3)
greater accuracy, 4) ease of processing data, and 5) subsequent
ease of plotting data using automatic analogue plotters.
RESULTS
Pacemaker Response to Single Stimulation
Previous studies of the effect of single vagal stimulation
on the heart rate have generally been qualitative. The only
detailed experiments were those of Brown and Eccles in 1934.
These authors delivered single shock stimuli to the right and
left vagus in cats, and showed that the right vagus is always
more effective in altering heart rate than the left. In addition
they quantitated the timing relations and demonstrated that a
stimulus arriving in the last 170 msec of a 305 msec P-? interval,
would not lengthen that interval, though the neural conduction
time from the neck to the heart was 10-20 msec.
In the present work we studied vagal stimulation in eight
dogs after the administration of propranolol to block sympathetic
activity; two of these dogs were studied before the addition of
this drug. In a typical experiment, the mean interval before
vagotomy and drugs was 450-500 msec, with a prominent sinus
arrhythmia. After bilateral vagotomy the interval decreased
-37-


to approximately 300 msec; with the administration of 1 mg/kg
propranolol I.V. this interval promptly increased to 400-425
msec, and showed no variation*
In each case, one through five impulses were applied as
a single stimulation event and the resulting P-P interval measured.
The decay of the response over subsequent intervals was also
studied, but will not be presented here. The records from two
seperate stimulations with five impulses are shown in Figure 11.
The train of five impulses placed early n the heart cycle length¬
ens the same interval (a); a similar st mulus delivered at 370
msec after the P-onset affects only the ollowing interval, and
lengthens it to 705 msec. Figure 12 summarizes a typical experiment
for one, three, and five impulse stimuli applied at various times
in the heart cycle in the presence of propranolol. The horizontal
axis is the P-onset to stimulus interval the vertical axis is the
length of the P-P interval beginning witl the P-onset. This pace¬
maker response curve demonstrates a cont nua'ily increasing P-P
interval as the onset of the vagal stimu ation is moved from a
point several hundred msec before, to 261 msec within the interval.
At that point, every subsequent stimulus regardless of the number
of impilses, fails to increase the lengtf of the interval in which
it falls.
" The shape of the curve for one impulse is similar to that
reported earlier. There is a constant increase in the P-P
interval as the stimulus is moved up to c nd through the first
part of the cycle. The top part of the curve is "rounded off"
to return to control values at a P-stimu:us near 263 msec. The
-38-


li J l> i j
A i . J ~r'i
( \s^ 1 'j" / h i V
R PR
I A /
il |
i
f
f
i 1
1
1
y
f—-
\
L-
PR PR
(b)
[-»——I——S-J-1
0 500 mmc
FIGURE 11: Effect of a single stimulation with five impulses
to the cardiac end of the right vagus nerve of the dog. (a) Stim¬
ulus at 260 msec from the P-wave onset with lengthening of the same
interval to 1190 msec (control 460 msec). (b) Stimulus at 370 msec
with lengthening of the following interval to 705 msec.
-39-


$
1200-
P-P Interval
(msec) 8
1000-
<b ° o
° s o
o o
o° cC
®0
800-
* ln jfi Jo
□ 0°
iQP
a
□ □
o □ No. of Stim
* I
□ 3
o 5
600-
aaP aa
& ^
A“ A
A
400-
100 -200 -100 200 300
P-Stimulus Interval (msec) 4 00 500
FIGURE 12: Effect of one, three, and five impulses applied as
a single stimulation to the cardiac end of the right cervical
vagus. The resulting length of the P-P interval is plotted in
relation to placement of the stimulus.
-40-

shape of the curves for three to five impulses were different,
however, in that the linear increase in interval length approach¬
ed a sharp turnover point where a stimulus beginning but 2 msec
later would not affect that interval. The slopes increased
slightly with an increase in the number of impulses, approach¬
ing one with five impulses,. The form of the pacemaker response
curve for the same animal without propranolol was similar with
control P-P intervals of 3&0 msec, an increased slope, and a
rapid turnover from maximal lengthening to no lengthening at a
P-stimulus of 170 msec.
Constant Low Frequency Vagal Stimulation
Continous vagal stimulation increased the P-P interval
and increasing the number of impulses per stimulation increased
the response. Stimulation with one impulse delivered at intervals
between 1200 and 500 msec reproduced the results described by
Levy and coworkers,^ with a sinusoidal pacemaker response curve
and the phenomenon of synchronization. When more than one im¬
pulse per stimulation was used, the pacemaker response curve
was increased in amplitude and with a slightly different form.
The rising part of the curve was linear, becoming sharply dis¬
continuous at a point 250-300 msec within the P-P interval.
This is shown in Figure 5 for an experiment with four impulses
per stimulation, with the stimulus-stimulus intervals varying
from 1000 to 700 msec. Clustering of the P-stimulus intervals
is noted at 160 msec for a P-P interval and stimulus-stimulus
interval of 800 msec; and at -50 msec for a P-P and stimulus-
-41-


stimulus intervals of 700 msec. The synchronization cane in
each case on the portion of the curve which had a positive
slope. Impulses delivered at 1000 and 900 msec in this case,
wander randomly throughout the heart cycle. If a single best-
fit line is drawn through the pacemaker response curves obtained
by this method at different numbers of impulses per stimulation,
a family of curves is obtained, and this is plotted in Figure 6.
When the stimulation was carried out for multiple impulses
at a fixed st imu 1 us-st imwl us interval, clustering of the P-stim-
ulus intervals was again found. This observation supports the
concept that synchronIztion can also occur without varying the
input frequency, but rather by modulating the mean rate of the
output (the pacemaker)* The results of stimulation at a constant
interval of 1000 msec, and with the number of impulses per stim¬
ulation varied from one to five impulses, are presented in Fig¬
ure 13. The coordinates are the same as those of Figure 5; the
clustering of P-stimulus intervals is again noted. A seperate
and distinct pacemaker response curve is produced by each stim¬
ulation with a given number of impulses. This is especially
pronounced with one and three impulses where stimulations fall
randomly throughout the heart cycle, and thus more clearly delin¬
eate the response curves. When two impulses were given, the P-
stimulus times were clustered with either or two values, 200 or
360 msec; four and five impulses resulted in single clusters at
approximately 240 and 140 msec respectively. It is apparent that
the points are falling on the appropriate curves delineated by
Figure 6, as the pacemaker response curves for the given number
-42-


P-P INTERVAL (MSEC.)
IMPULSES • 5
X 4 -8- 3
o 2 © i
J9 ©
CONSTANT STIMULUS
INTERVAL OF 6000
j_i_i_j_j_f-1
tO© 400 &00
P- STIMULUS (MSEC.)
FIGURE 13: The P-P interval which results when one through five
impulses per stimulation is delivered to the right cervical vagus
at a constant stimu1 us-stimu1 us interval of 1000 msec.
-43-

of impulses.
Similar patterns of behavior are noted at each stimulation
interval. Methods of describing the phenomenon of locking of
two interacting oscillators have been worked out for similar
neuronal models, ^’ and involve the use of frequency histo¬
grams to describe the relation of the output oscillator response
to the phase of the input. Such histograms are given in Figure
14; the per cent distribution of the P-stimulus intervals for a
representative experiment is plotted. The number of stimulation
events for each seperate histogram ranged from 60 to 86. The
per cent of stimulations at each P-stimulus value is given on
the vertical axis; P-stimulus values on the horizonta1 axis
are in groups of 20 msec from 0 to 700 msec. Different cogs
varied slightly in the values obtained, but the same patterns
were clear. Each “set" of histograms where either the number of
impulses were constant and the stimulation interval varied, or
the stimulation interval constant and the number of impulses
incremented, showed one of three types of patterns in the condi¬
tions studied. Pattern one is an apparent random distribution
of P-stimulus intervals throughout the heart cycle, such as at
three impulses and 900 msec stimulation interval. A second
pattern showed one predominate P-stimulus interval such as the
group at 600-640 msec with four impulses at 700 msec stimulation
interval. The third pattern seen in the ranges studied is that
there are two predominate modes of P-stimulus intervals, as in
four impulses at 1000 msec. The interpretation of these rind-
ings will be discussed below.
-44-


Pcrc
crr
t-
FIGURE 14; Frequency histograms of the distribution of P-stimulus
intervals obtained when the number of impulses per stimulation and
the stimulus-stimulus interval is varied.


Constant Low hrequency Vagal Stimulation With Continually
Varying Stimulus-Stimulus Interval
A more complete description of the synchronization phen¬
omenon, and especially of the ranges within which it occurs,
was obtained by experiments in which the stimulation interval
was continuously varied from 1050 to 450 msec, and back again,
in a period of ten minutes. The results of such an experiment
are illustrated by Figure 15. Here the cardiotachometer record
from the Offner for atrial rate and stimulation rate is given
for vagal stimulation with two and three impulses, and with
stimulation rate varying from 58 to 132 per minute. Both
tracings clearly delineate the range in which the paradoxical
increase in stimulation rate ( the "stable zone", entrainment,
55 56 63 and synchronization^ ’ ’ ) causes a 1:1 increase in heart rate.
For two impulses, this extends from 84 to 92 beats per minute;
at three impulses, the stable zone is between 70 and SO beats
per minute.
In the ranges of stimulation rate studied outside of this
stable zone, increasing frequency of stimulation results in a
decrease in the mean rate of the heart as expected. However,
a second period of entrainment is noted at three impulses in the
range of stimulation from 124 to 132 stimulations per minute.
This area shows a second stable zone with locking at a ratio or
two stimulations per one heart cycle. ihis kind of second order
locking is more clearly seen with five impulses per stimulation
as shown in Figure 16. In this experiment, locking at 1:1 ratio
occurred from the bottom rate or 58 to 92 beats per minute. 1 he
-46-

-

2 IMPULSES ,/OVU\rv/\ a/vA/V/^jn/Xj >.
3Cr« P-S»imu!us — (msec) -50-
-I5qL
Heart Rate (BPM)
- SO
- 120
3 IMPULSES
200
-200l
• • Heart Rate \-120
(BPM) 130
60
Stimulation Rate ____ (SPM)
0 30 60 SECS ) I I I I I « I I I I I I
- 60
; 120
- ISO
FIGURE 15: The card?otachometer record from the Cffner dynograph
of the heart rate and the stimulation rate in an experiment with
vagal stimulation using two and three impulses per stimulation. The
stimulation rate is continuously varied. The P-stimulus existing
during the periods of synchronization have been indicated in each
case.
-47-


5 IMPULSES
H i
600
500 -
P-STIMULUS L
CMSEC) 100
■too
* « HEART RATE M20
(BPM) '-ieo
. + ♦ * +
0 30 60 SECS !_i_i_i_i_i—1_i—i—i t i.J
STIMULATION RATE <SPM>
: 120
L »0
FIGURE 16: Similar to Figure 15, except that five impulses
per stimulation is used and entrainment with two stimulations
per one heart cycle is demonstrated.
-48-


stability zone for two stimuli per one heart cycle extends
from a stimulation rate of 88 to 126 (heart rate exactly
half over this range).
When the individual records for each experiment were
analyzed for the P-stimulus interval which pertained over each
stability zone, the interval was found to continuously vary.
The data for two and three impulses is given directly under the
stable zone in Figure 15; with five impulses per stimulation
in Figure 16. When the stimulation rate increases, the P-stim¬
ulus interval goes from a positive value (P preceding stimulus)
to a negative value (P following stimulus). The opposite trend
holds when the stimulation rate decreases. An experimental
record which graphicly demonstrates this phase-shift within the
period of paradoxical response is given in Figure 17. in this
experiment five impulses per stimulation was given and the stim¬
ulus-stimulus interval continously varied. Entrainment exists
in the record with the P-P interval following the stimu1 us-stimu1 us
interval. As the stimulus-stimulus interval decreases from (a) to
(d), the P-P interval decreases also, and the P-stimulus goes
from an initial positive 250 msec to a negative 150 msec.
The upper limit of heart rate in the 1:1 stability zone
appears fairly constant near 90-92 beats per minute. It is
noted that the P-stimulus interval is also fairly constant at
this point with a value near -150 msec. The values (or the P-
stimulus intervals with 2:1 locking also follows similar trends
in regards to the direction of change as shown by the inset graph
of P-stimulus in Figure 16.


Phase ShiPt with Paradoxical Entrainment
FIGURE 17: An experimental record demonstrating the P-stimul
phase shift during a period of entrainment with decreasing
stimulus-stimulus interval.


DISCUSS ION
Pacemaker Response to Single Stimulation
These results demonstrate the dependence of atrial cycle
length on the timing as well as the strength of vagal stimula¬
tion. The description of pacemaker response curves for multiple
impulse stimulations extends the quantitative data provided by
Brown and Eccles.9-'1 The finding of an insensitive period 150-
200 msec at the end of the P-P interval is confirmed, and found
to hold when the amount of neurotransmitter released is increas¬
ed by giving a train of impulses. The shape of the response
curves, especially the linear positive slope, fulfills the criteria
63 set forth in the model of Perkel, e_t aj_, and predicts that a
paradoxical heart rate response will occur in the vagai-cardiac
system
The shape of the de1 ay-interva1 curve also implies that
the time of arrival of a vagal volley could be important for
controlling heart rate on a beat to beat basis in the intact dog.
Increased vagal activity at the point of maximum response lengthens
the same interval; coming just slightly later, the same activity
would not only not lengthen that interval, but would lengthen the
following interval a lesser amount. This behavior is a form of
negative feedback with respect to time existing at the heart.
When vagal activity is present, those factors which accelerate
the conduction of the beat (short atrioventricular conduction
time, rapid ventricular ejection and accelerated pulse wave
transmission) might result in the arrival of the vagal volley in
the sensitive period with greater slowing. When those factors
-51-


are depressed, cardio-acce1eration would result.
Calculations of the time between P-wave onset and cervical
vagal activity from arterial baroreceptor response vary from
200-420 msec, taking into consideration the normal ranges for
P-R interval and Jewett's data for single cardioinhibitory fiber
58 activity in the cervical vagus of the dog. The shortest time
is within the highly inhibitory zone and the longest is outside.
The question remains as to whether the last period of 150-
200 msec in the atrial cycle, when stimulation has no effect on
that cycle, represents a latency as suggested by Brown and Eccles,
or whether it is a refractoriness to the neurotransmitter acetyl¬
choline as discussed in SECTION !0 The actual neural conduction
time between cervical vagus and the heart is 10-20 msec,'* ' ^ and
virtually all of the latency would have to exist between presynaptic
nerve endings and the pacemaker cells. Regardless, if this lack
of response is due to latency or refractoriness or some other
mechanism, the sharp turnover point provides a way to control
heart rate at the heart itself.
Pacemaler Response to Constant Low Frequency Stimulation
Tie recent studies of the paradoxical effect of vagal stim-
ulatior on heart rate have been confirmed. Within well defined
ranges of vagal stimulation rate, increasing the frequency of
stimulation is accompanied by an increase in the heart rate. A
sinusoidal pacemaker response curve for one impulse was confirmed.
With tie use of multiple impulses per stimulation a series of
pacemaf e r response curves was defined. In addition, the previous
-52-


results were extended by demonstrating that a second type of
interaction occurs when the number of impulses per stimulation
(the "strength of stimulation") was increased for the same
rates of stimulation. In this situation, the mean rate of the
output oscillator (the pacemaker) is lowered, while the input
rate is maintained.
The second type of entrainment is explained by consider¬
ing the pacemaker response curves for various numbers of impulses
given in Figure 6. With increasing number of impulses, the
amplitude of the curves is increased as is the maximum slope.
Thus, the range over which entrainment will occur is increased.
The shape of the response curves is predicted from the shape of
the response to single event stimulations (Figure 12). The sharp
discontinuity with four and five impulses is seen in both. The
rising part of the curves with continuous stimulation in the last
part of the P-P interval is best explained as the result of the
preceding stimulation coming in closer to the beginning of the
measured interval. With single event stimulation, and thus no
preceding stimulation, this portion of the pacemaker response
curve is flat. Likewise, the fact that with continuous stimula¬
tion this portion of the curve is higher for five impulses than
for one, reflects the increased mean concentration of acetyl¬
choline (the increased mean vagal tone).
The result of the second type of entrainment on the P-stim¬
ulus interval is demonstrated by the histograms of Figure 14.
The first pattern where P-stimulus intervals are random throughout
the atrial cycle, describes conditions where either the number
-53-


of impulses (strength) of stimulation, or the stimulation
rate, is not sufficient to allow impulses to fall on the
positive part of the sinusoidal pacemaker response curve.
The stimulation interval must equal a P-P interval which will
result with the given number of impulses per stimulation
cu rve arriving at a part of the response where the slope is positive.
Under these conditions, small changes in either input or
output will result in exactly compensatory changes by means of
55,63 negative feedback as previously described.
The single predominate grouping of P-stimulus intervals
in most cases describes the situation where one vagal stimulus
falls in one heart cycle. The stimulation is of sufficient
"strength" to increase the P-P interval to the stimulation inter¬
val, and be on the positive part of the pacemaker response curve.
The histograms of Figure 14 illustrates what happens to such a
stable situation when the stimulation rate, or the.number of
impulses, is changed. In the first case, a stable 1:1 ratio
is demonstrated by five impulses at 900 msec stimulation interval;
decreasing the stimulation interval to 800 msec must then decrease
the P-stimulus at which locking will occur since the P-P interval
resulting from the stimulation must equal the new stimulation rate,
and this is a point to the left or the pacemaker response curve.
The same thing happens when the stimulation interval is changed
to 700 msec. With a constant stimu1 us-stimu1 us interval a second
mechanism operates. If a locking situation exists, as in three
impulses at 700 msec, when the number of impulses is changed to
four, the pacemaker curve becomes the one for four impulses, which
-54-

*

is or greater amplitude and slightly increased slope* The new
locking point will then simply be the intersection of a horizontal
line at the locking interval with the new response curve, and the
P-stimulus will necessarily be less. In this case it goes slight¬
ly negative (stimulus precedes p) which shows upon the histogram
as being in the last part of the P-P interval; when changed to
five impulses, it moves to the left more.
The third pattern of histogram seen, where there are two
predominate groups of P-stimulus intervals accounts for complex
ratios of entrainment. For example, two groups of P-stimulus
intervals are seen in Figure 13 in the case of two impulses. There
are groupings near 200 and 350 msec. When a stimulation falls in
the interval at 200 msec, that interval becomes 840 msec long. The
next stimulation will then fall (1000-640) equals 360 msec into
the next interval, accounting for the second group. The second
stimulation lengthens its interval to only 600 msec, so that the
following interval (described by the negative P-stimulua points
to the left of the zero point) will be 1000-j(600-360)+56oj equa 1 s
200, and the conditions are set for a repeat cycling. This is
then a 2:3 locking situation, with two stimulation cycles equal to
three heart cycles.
These same principles are well demonstrated in the P-stirnulus
values shown in Figures 15, 16, and 17- With increasing stimula¬
tion rate in the stable zone, the P-stimulus interval must continu¬
ously change from a positive to a negative value. This is the
necessary adjustment to allow locking to occur. With multiple
impulses, the upper limit of the stable zone appears fixed at
-55-


90-92 beats per minute. With increasing numbers of impulses
per stimulation the bottom rate of the stable zone decreases.
This is explained by the pacemaker response curves. The min¬
imum interval of each curve is nearly equivalent; the maximum
interval, however, varies greatly depending on the number of
impulses. Thus the range of the stable zone increases with
increasing numbers of impulses, but the upper rate (minimum
interval) is relatively fixed.
As demonstrated here and previously,'*'*’00 the locking
phenomenon may be seen at many multiples of the input;output
ratios. For example 2:1, 1:1, 2:3, 1:2, etc., may be seen. All
of the patterns can be explained by the pacemaker response curve
for the particular strength of stimulus used. It should be
emphasized that changing the rate of stimulation does not change
the response curve, whereas changing the number of impulses
will.
The locking phenomenon herein described is almost certainly
67 observed in clinical situations of complete heart block, In
the canine cardiac autotransp1 ant,^ in the human cardiac trans-
69 70-72 planted patient, in so-called isorhythmic A-V dissociation,
and in the lockinq of the atrial rate to the ventricular rate in
73 67 patients with pacemakers. Segars, e_t aj_, presented a patient
with complete heart block who demonstrated 2:1 atrial to ventric¬
ular entrainment, with only small fluctuations in P-R and R-P
intervals. With exercise, an acceleration of atrial rate occurred
and entrainment disappeared. Many previous attempts have been made
to explain the mechanism of isorhythmic A-V dissociation, and it
-56-


is clear that a number of different mechanisms may operate
including retrograde activation of the atria from a nodal pace-
74 71 maker. In some records presented in the literature, it is
possible that entrainment due to vagal input from arterial ba ro-
receptors is active, though this possibility has not heretofore
been considered.
it may also be an important mechanism for heart rate
control in the intact cardiac system. The information of an
58 arterial pressure rise reaches the cervical vagus in 80-240 msec.
This is information in discrete bursts of vagal activity which will
in some cases fall on the rising part of the pacemaker response
curves. The results presented here demonstrate that the range
over which stability occurs is increased as the strength of stim¬
ulus increases, perhaps allowing for smooth changes in heart rate
to occur where discrete jumps may have resulted with a flat pace¬
maker response curve. The exact role for this extremely interesting
general biological mechanism remains to be determined in the vagal
cardiac system.
-57-

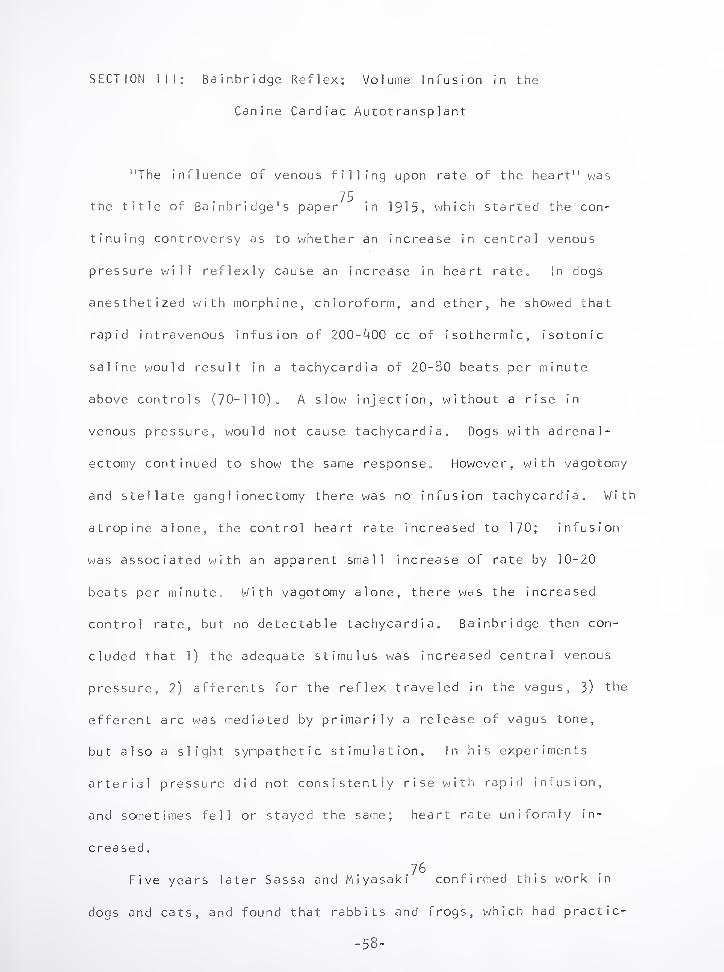
SECTION III: Bainbridge Reflex: Volume Infusion in the
Canine Cardiac Autotransplant
"The influence of venous filling upon rate of the heart" was
75 the title of Bainbridge's paper in 1915, which started the con¬
tinuing controversy as to whether an increase in central venous
pressure will reflexly cause an increase in heart rate. In dogs
anesthetized with morphine, chloroform, and ether, he showed that
rapid intravenous infusion of 200-400 cc of isothermic, isotonic
saline would result in a tachycardia of 20-80 beats per minute
above controls (70-110). A slow injection, without a rise in
venous pressure, would not cause tachycardia. Dogs with adrenal¬
ectomy continued to show the same response. However, with vagotomy
and stellate gang 1ionectomy there was no infusion tachycardia. With
atropine alone, the control heart rate increased to 170; infusion
was associated with an apparent small increase of rate by 10-20
beats per minute. With vagotomy alone, there was the increased
control rate, but no detectable tachycardia. Bainbridge then con¬
cluded that 1) the adequate stimulus was increased central venous
pressure, 2) afferents for the reflex traveled in the vagus, 3) the
efferent arc was mediated by primarily a release of vagus tone,
but also a slight sympathetic stimulation. In his experiments
arterial pressure did not consistently rise with rapid infusion,
and sometimes fell or stayed the same; heart rate uniformly in¬
creased.
76 , . Five years later Sassa and Miyasaki confirmed this work in
dogs and cats, and found that rabbits and frogs, which had practic-
-58-


ally no vagus tone, did not exhibit the infusion tachycardia.
Arterial pressure was said not to vary in these experiments, and
atropine and vagotomy abolished the tachycardia with a rise in the
mean control heart rate.
77 These results were confirmed by Anrep and Segall in 1926,
in anesthetized dogs. They studied "Marey's Law" as well, which
defines the inverse relation between blood pressure and heart rate.
At this time the role of the arterial baroreceptors was not under¬
stood. They confirmed the infusion tachycardia, its abolishment 9
with vagotomy, the partial response with atropine alone and with
stellate gang 1ionectomy alone. He stressed the point that blood
pressure did not change with the infusion, and thus did not inter¬
fere by way of "Marey's Law"0
This seemed to be the end of agreement among physiologists
concerning the reflex. Papers began to appear which questioned
73 the existence of the reflex. DeGraff and Sands used dogs anes¬
thetized with morphine and chloretone, and found heart rate increase
with infusion in only 50 % of trials. Vagotomy did not completely
abolish the tachycardia, which still occurred in 1/3 of the experi¬
ments. However, they cannulated the right and left carotid arteries
simultaneously to measure mean and pulsatile pressure, thus excluding
the baroreceptors in an unpredictable way from the circulation.
79 i Warthen in 1935, gave massive infusions (up to 2j liters)
and found tachycardia consistently in anesthetized dogs. He did
80 not do vagotomy or study the effects of atropine. Ba11in and Katz
studied both chloralose anesthetized dogs and those without anes¬
thesia. No definite cardiac acceleration was noted.
-59-

Further contradictory results were presented by Aviado, et a 1,
in complex cross circulation experiments in dogs. They found both
infusion tachycardia and bradycardia and could not determine which
factors governed these responses. Blood pressure changes were also
inconstant.
A new concept for understanding the infusion tachycardia was
advanced by English workers in the mid 1950's. Coleridge and
82 83 Linden, and later Jones, found that the initial heart rate
determined the direction of heart rate changes. When the control
rate was less than 110, the rate would increase; when greater
than 110, the rate would slow. This was interpreted as an attempt
by the circulation to maximize cardiac output and thus restore
venous pressure to its initial level. For example, a high initial
heart rate would imply inadequate or compromised filling were an
infusion given, so that some mechanism for decreasing rate would
allow cardiac output to increase, thus reducing venous pressure.
Unfortunate 1y they do not suggest what the actual mechanisms may be.
These same results were verified in unanesthetized animals by
84 Hirsch and associates. They found that the initial heart rate
determined the direction of change. By means of vagotomy and pharm¬
acologic sympathectomy (dibenamfne) they concluded that the tachy¬
cardia depended on sympathetic activity and that the bradycardia was
due to local mechanisms.
At this time an alternative, non-reflex mechanism for infusion
85 tachycardia was demonstrated in isolated heart preperations. Blinks
used isolated dog heart and rabbit atrium and found that a rise of
atrial pressure or stretch of the atria would cause tachycardia.
-60-

■

Local anesthetic would not abolish the rise in heart rate, suggest¬
ing this was an intrinsic property of the nyocardium0 These findings
were confirmed for frog's auricle°b and mammalian heart as well.
It is interesting that these changes had not been seen earlier in
Starling's isolated heart-lung preperation, with wide variations
oq
in filling pressure. ^
90 Donald and Shepard reported the only study of heart rate
changes in chronically denervated dogs. They showed some slight
increase in heart rate with infusion. Initial rates ranged from
70-94 beats per minute; with saline or dextran infusion, the
rate increased by 4-31 beats per minute. These increases were not
striking, and occurred from 22 to 45 minutes following infusion,
when venous pressure had returned to normal, and other factors
such as change in the level of anesthesia may have been occurring.
91 Finally, a recent study by Kinnison, e_t aj_, has cleared
92 some of the controversy over the existence of the reflex. These
workers used a technique of small balloon catheters in the anesthetized
but intact dog to selectively modify pressures within various parts
of the circulation. When arterial blood pressure was held constant
a quantitative relationship between right atrial pressure and heart
rate was observed. The relationship was positive regardless of
the initial heart rate though the slope decreased as the initial
control rate increased, suggesting a maximum attainable heart rate
of 240. This apparently represented a pure right sided reflex, and
was abolished by vagotomy, fulfilling Bainbridge's criteria. In
other experiments, with right atrial pressure held constant, an
inverse relation was seen between arterial pressure and heart rate.
-61-

'

This appeared to be the pure left sided reflex mediated by ba ro-
receptors and responsible for "Marey's Law". In situations where
both venous and arterial pressures changed, "simultaneous right
and left sided heart rate influence can be predicted by taking the
91 algebraic summation of their independent influence."
It becomes clear from examining the controversy over the
existence of the infusion tachycardia that there are multiple
factors of importance. The level and type of anesthesia is
important, with some kinds of anesthetics having deletorious
93 effects on cardiac reflexes as well as cardiac performance.
The type of animal used and the mean level of vagus tone must be
considered.^ The type of fluid, the temperature, and the possible
3k change in hematocrit will influence the experiment. The in¬
fluence of local, direct stretch on the irritability of the myo-
85-87 cardium must be considered. And finally, any analysis of
reflexes which change heart rate must take into account all other
reflexes which influence rate. In the case of the right atrial
pressure reflex, it must be adequately demonstrated that arterial
pressure is held constant.
Studies in the canine cardiac autotransp1 ant were undertaken
with these factors in mind. With a completely denervated and free
running pump, and the innervated atrial -emnant intact, it may be
possible to answer the following questiois. Does volume infusion
cause tachycardia of 1) the denervated h lart by way of local
stretch, 2) the innervated atrial remnant in any consistent way;
and does atropine or beta-b1ockade modif/ the response of either.
-62-


MATERIALS AND METHODS
Experiments were done using four canine cardiac autotransplants
34 prepa red according to the p rocedu re described previously. The
instrumentation in these animals included chronically implanted
aortic EMF flow probe (Biotronex), pressure transducers in the left
subclavian artery and the left ventricle (Microsystems), left
atrial and right ventricular pacing wires, and a bipolar recording
electrode sutured to the remnant atrial wall. Since right atrial
pressure was not measured directly in these experiments, data is
also presented from volume infusion in non-rejecting canine
95 honografts'' which were instrumented with pulmonary artery tMF flow
probe, pacing wires, left subclavian catheter, and right and left
atrial catheters for pressure measurements using the Statham strain
gauges.
The animals were awake, unanestheti :ed, and resting quietly
in the right lateral position. Infusions we re given through a
f19 gauge Butterfly needle into the main foreleg vein. Both iso¬
tonic saline and 6% dextran (M.W. 40,000 were used, administered
at a rate of 20-80 cc per minute. The volume of infusion varied
between 300 cc of dextran to 800 cc of saline. Infusions in homo¬
grafts were administered in the same manner, but 300 cc of 6/ dextran
was consistently used. Recordings from all instruments and the
EKG were simultaneously displayed on an Offner type R Dynograph
and recorded on an Ampex FR-1300 tape recorder for subsequent dig¬
ital computer processing.
The taped recordings of the EKG and the remnant atrium were
analogue to digital converted using the ACME IBM 380/50-1800
-63-

-

computer facility. The digital records were then displayed on
a television monitor and processed according to the technique
described in SECTION I. The mean and standard deviation of the
P-P interval and the R-R interval were computed for a ten second
period each 50 cc of infusion. Arterial pressure, aortic flow,
left ventricular end diastolic pressure, right and left atrial
pressure, were all obtained from the analogue print-out of the
original Offner recording.
RESULTS
Four canine cardiac autotransp1 anted animals were used for
eleven volume infusion experiments. in all of these animals,
volume infusion was accompanied by 1) no change in donor heart
rate, or 2) a small change in donor rate which could be of either
direction, and 3) a consistent, immediate increase in the remnant
atrial rate. This is demonstrated by an experiment shown in Figure
18; 300 cc of saline was administered, and it is seen that the
R-R interval of 730 msec remains fixed, whereas the atrial rate,
P-P interval, decreases from 725 to 400 msec. The results from
the eleven experiments are displayed in Figure 19. The atrial
rate from the remnant atrium is indicated by the circles, and is
seen to increase in each case, regardless of the initial heart rate.
It is also noticed that the slopes of the heart rate change de¬
crease as the pre-infusion rate is increased, consistent with the
91 findings of Kinnison, et _aj_. The donor heart rate (triangles)
may stay the same, increase slightly, or decrease slightly. Table
II lists the values for the mean and standard deviation of pre and
-64-


FIGURE 18: The response of the remnant atrium (P-P interval)
and of the donor heart (R-R interval) to a rapid intravenous
infusion of 300 cc of isotonic saline.
-65-


4
Pre -Post infusion Heart Rate
FIGURE 19: Eleven volume infusion experiments in four canine
cardiac autotransp1 anted dogs. Remnant atrium rate (circles)
uniformly increased; ventricular rate (triangles) changes
slightly or not at all.
-66-


O CO -- o sO Cn ■— CNJ Osl .—
4~> in + 1 + 1 + | + 1 +1 + o
CL. oo ON o OO O 00 PA O o LA OA CD oa -d- LA LA OA
Q_
CL.
OO CM ON LA OA CNJ CM — CM
(D + | + 1 + | + 1 + | + L_ o_ o o LA O sO NO
CO CD o CM LA CNJ LA _J Dt r\ O'- sO OA
< > QC LU
h- -d- CNJ o ■— CNJ CNJ
— -d" •— ■— ■— —
4-> + 1 + 1 + | + 1 + | + in O cO o o LA Osl o
Q_ CD o LA I— CO OA O r-'- SO sO cn
QC 1
cc CT\ CM
o LA OO -Lf —
(D + 1 + | + 1 + | + 1 + l_
Q_ LA LA LA O LA LA CD OO OA LA LA ■—
cn SO r\ sO OO O
~ZL 0) O CL “ > CO ID Li_
CO CO CO CO CO <J~)
u o o o o o o — o o o o O o o
LA LA OA LA OO LA
OA LA — CNI
1
r^ Os! A- cn »— .— CNJ i
CD i 1 1 cn NO o CM OA OA c o
x: in A-> •M D CD z jQ
.— • —
E z “ 0) C
H3 > E m LU o
ON ON t CM
+ 1 + 1 + 1 + 1 +
OA o LA CO O CO o .— -d- .— CNJ OA OA OA
ON o CM
cn r^ •j-
+ 1 + 1 + 1 + 1 + i
O LA CM LA o ON CM .— -d- CNJ CNJ CD LA ~d“ sO
O .— LA o sO ■— ■— OA J-
+ 1 + 1 + 1 + 1 + 1
UN o O o o CNJ -ct CO -d- CNI
OO ON o o A-
"O o
LA >— C\] CO O • — I— r— >— •— •- L_
CD
+ 1 + | + 1 + 1 + 1 Cl C CD
O -d" CvJ o o “O L_
OA <— OA o LA c 4—*
OO ON CnJ oo sO O X •— U CD
<D "D in
sO
c NO CD
A-i II CO CO <o oo Q
CD O
i_ O •
O o CO o O 4- CD o o o o O C OO r"- LA LA OA C • —
O «— •— CD 4-J in CD
• — o > •— CD c
~o O -M
TD o L_ in CD •—
“O SO o »— ON OO c II
<— CNJ ■— CNJ *— CD 1 1 1 1 1 4-» ln
sO SO CO OO ON in
+ | .. CD
c Cl fD
z — z z CD h" < 21
TABLE I: Effect of Volume Infusion on Heart Rate in the Autograft
67-


post-infusion intervals, together with the type and amount of
fluid used in each case.
With the relatively large amounts of fluid used in these
studies, the hemodynamic variables changed surprisingly little.
The only consistent change which can be seen in these autografts
and non-rejecting homografts is a rise of atrial pressures and
of ventricular end-diasto 1ic pressures. The arterial blood
pressure, left ventricular pressure, and aortic and pulmonary
artery flow, do not significantly change with increasing end-
diastolic and atrial pressures. Ventricular function curves are
therefore essentially flat for this denervated heart preperation.
These results are demonstrated in Figure 20, where it is shown that
arterial pressure and flow in two non-rejecting homografts {k days
post-operative and the R-wave voltage greater than 1 mv) and one
autograft are constant during an infusion, whereas atrial pressures
rise. This apparently fulfills the criteria for a controlled and
constant arterial pressure stressed by Kinnison.
Pharmacologic Alteration of the Response
In an attempt to assess the importance of sympathetic and
parasympathetic innervation for the infusion tachycardia, atropine
(2mg I.V.) and propranolol (1 mg/kg I.Ve) were administered to
two autografts. In two dogs, propranolol was given prior to volume
infusion; in one dog atropine alone was given; and in one dog
atropine and propranolol together were used. In one additional
experiment, propranolol was given immediately following the infusion
of 300 cc of 6% dextran.
-68-


FIGURE 20: The Offner Dynograph print-out records of three
complete volume infusion experiments.
(A) Homograft, 4th day post-operative, 300 cc of saline given.
The lead II EKG, PA flow, arterial pressure, and right and left
atrial pressures are displayed for a short segment each 50 cc of
infusion. Time markers indicating one second intervals are placed
under the LA pressure trace of the control condition.
(B) Homograft, 4th day post-operative, 300 cc dextran given.
Same as in (A), except that the heart rate is also displayed.
(C) Autograft, 9th day post-operative, 300 cc dextran given.
The heart rate, PA flow, LV pressure, and the arterial pressure
is displayed. Time marker indicates 5 seconds.
i
-69-


(A)
EKG
°-WW(VVl^ftVWWWWVVVVVV^YVYWWVW HOMOGRAFT 'SG': 4TH DAY PO.
PA. FLOW
160- 1I111 I i 11 I| ( I | ! | | I j 111J I 1 ) 11 I )i II I! i.l ' H *! ! H I f, 11 I U | !!1! | * I' j |l 1111111 f. • I! ! 1 I 1 1 1 1 ! II! ||| IIII (j 11 II I
: 0— i A ■.* . A A . ■■r- r' ft VJ Ifi IpJW W rj W W l, t r. 'r/rjr. <■ r. r. | i f ( ,-,rt
ARTERIAL PRESSURE
r.,\,v.i-.iviv.f.r,r. f f.ft.I.ft-f’f-M'f. f«f,f.f.|\f,f»f,f>f,f.|\ MWl'MiMr'tol
ioo |||||| iijij11||||l 1111 I f 11u M, ji j11111111111 i h 111 i i 111111111 j, i i j \1| i u (1
ATRIAL PRESSURE - LA RA LA RA
h2° 2 °=WVva yYv^yHf^ LA RA LA I RA
1fWwW*W#f'T#n1WV»W I I I I II
CC SALINE 0 50 100 150 200 250 300 300
(B)
HOMOGRAFT 'SY' 4TH DAY PO
lllllllllll
MV
lllllllllll III!1 IIIIIIN! I lillllll L 1
60
BPM 120-
180-
160—
HEART RATE
PA FLOW
ARTERIAL PRESSURE
■—ffrrttfffftr wmimMM WWHWWf »NW« ' MM HG 50_
0_ AT RIAL PRESSURE
LA
cm H2° 2oi~?r77r ~
RA LA RA LA RA LA
50 100 150 200 250 300
-70-


(C)
AUTOGRAFT 'SH' 9 DAYS PO
m
B PM 120-
GO
■■n
PA. FLOW 160-
L.V PRESSURE
ST S stl :fc:
! I
'! !
=FF
MM HG 100-
0-
150—
MM HG
ARTERIAL PRESSURE
n 5 SEC
0- CC DEXTRAN 50 100 150 200 250 300
-71-


With beta-blockade the infusion tachycardia was found to
be greatly reduced. Figure 21 shows the atrial remnant heart
rate of a single autograft before and after infusion both with
and without drugs. It is seen that propranolol (Inderal) reduced
the control rate from 128 to 110 beats per minute; the donor
heart rate was similarly affected, changing from 82 to 74. With
infusion of 500 cc of 6% dextran, the atrial rate gradually in¬
creased from 110 + 3-2 to 122 + 2.8 beats per minute. The donor
rate in the same period changed from 74+2 to 84 + 0.5 beats per
minute. In a second dog, propranolol changed the remnant atrial
rate from 126 + 10 to 109 + 6; with the infusion of 300 cc dextran
this rate increased slightly to 115 + 7. When propranolol is
given to an autograft following a normal volume infusion experiment,
the accelerated atrial remnant rate will return to near control
values within two minutes.
Atropine was given I.V. to the same autograft prior to infusion.
Figure 21 shows the control pre-infusion rate increased from 132 + 8
to 174 + 2; following 500 cc of saline, the atrial rate was 176 + 2
beats per minute. The ventricular rate was unaffected by atropine
and increased slightly from 58 to 61 with the infusion.
When both atropine and propranolol were given simultaneously
the control atrial rate went from 164 + 3 to 148 + 3. At the
same time the ventricular rate decreased from 67 to 63 with the
drugs. Then 500 cc of 6% dextran was given accompanied by essential¬
ly no change in atrial rate (152 + 2) and a further small decrease
of ventricular rate to 60 + 2 beats per minute.
-72-

1

2 4 Or
g
< 4 O h
DOG 2
NORMAL ATROPINE INDERAL ATROPINE &
INDERAL
Pre-Post infusion Atrial Rate
FIGURE 21: The pre and post-infusion atrial rates of a single
autograft both with and without drugs: atropine (2 mg I SV,) and
propranolol (inderal) (1 mg/kg |0V.). The control rate before
the drug is given by the squares.
-73-

■
.

DISCUSS I ON
Volume infusion in the canine cardiac autotransp1 ant is
associated with an increase in remnant atrial rate and incon¬
stant or no change in the donor ventricular rate. The measurement
of pressures and flows during infusion demonstrate that cardiac
output and left sided pressures change very little if at all,
whereas right sided venous pressures increase.
The lack of response of the totally denervated heart to
an increase in end-diasto 1ic pressure is contrary to previous
96,97 assumptions of Starling's law of the heart. These experi-
98 ments may demonstrate that homeometric autoragu1 at ion does not
exist in the heart deprived of catacholamines or of some other
factor supplied by autonomic innervation. A second interpretation
may be that these animals are chronically on the "failure" end
of the ventricular function curve due to increased resting blood
volumes, and subsequent addition of volume will thus not lead to
an increase in contracti1ity, work, and cardiac output. It is
interesting that ventricular function curves of stroke work again¬
st right atrial pressure in dogs denervated by chronic neural
r 99 ablation are of the normal form.
The demonstration of atrial remnant tachycardia with volume
infusion appears to substantiate the concept of a Bainbridge reflex.
The rapid, immediate increase in rate which is greatly diminished or
abolished by atropine and propranolol support the interpretation
that this is a reflex phenomenon mediated by vagus withdrawal and
aympathetic activity. Not enough experiments were done to deter¬
mine which factor is of relatively greater importance; both appear
-74-


to function.
The contribution of stretch of the myocardium and local
changes in irritability is inferred by these experiments. Though
we describe the donor heart rate by R-R intervals and speak of
"ventricular" rate, more than half of these experiments were done
when the donor heart was in atrial rhythm, the dominate pace¬
maker being in the denervated atrial tissue. In the remainder
of the experiments the donor heart was in nodal rhythm. if
local stretch is of importance, and could account for the in-
92 fusion tachycardia as some suggest, then both rates should
change simultaneously since both "pacemakers" are exposed to the
same degree of stretching pressure. This, however, is not the case
and donor heart rate may either stay the same, increase, or decrease
slightly, leading to the conclusion that in the awake dog this
mechanism for control of heart rate is relatively unimportant.
No turnover point is seen in these experiments for the change
9'l in atrial rate, in agreement with Kinnison, e_t aj_. This agree¬
ment is thought due to the fact that arterial pressure is constant
during infusion. The maximum heart rate attainable (near 230 in
these animals) is apparently the limiting factor for the tachycardia
when the control heart rate is low there is a relatively greater
increase in rate than when the control rate is high. These results
suggest that in the normal dog experiments with no control over
arterial pressure, an infusion to a dog with a high control heart
rate will influence left-sided control mechanisms through an in¬
crease in arterial pressure; when the control rate is low, the
right-sided reflex would dominate, causing an infusion tachycardia.
-75-


That this occurs, and the mechanism for it, must be studied by
further experiment.
Finally, these experiments also support the concept that
the atrial stretch receptors lie in the back wall of the atria.
100,101 , , Some workers have shown evidence that pressure (stretch)
sensitive receptors lie in the junction of the pulmonary veins
and the left atria. Again, the fortuitous use of the atrial
cuff would allow these reseptors their innervation while depriv¬
ing the remainder of the heart its own.
-76-


REFERENCES
I. Shumway, N. E., Cardiac Transp1 atation, Hea rt Bull, 12:
57-60,1963.
2o Carrel, A., and Guthrie, C0 COJ The Transplantation of
Veins and Organs, Am Med, 10:1101-1102,1905.
3. Carrel, A., The Surgery of Blood Vessels, etc. The Johns
Hop Hosp Bull, 18:18-28,1907.
4. Mann, Fc C., Priestly, J. T„, Markowitz, J., and Yater, W. M.,
Transplantation of the intact Mammalian Heart, Arch Surg, 26:
219-224,1933.
5. Sinitsin, N«, P., A Transp1antation of the Heart (Russian Text),
Klin Med,(Mosk) 31:5,1953.
6. Marcus, E0, Wong, Sc N„ T., and Luisada, A0 A., Homologous
Heart Grafts: Transp1antation of the Heart in Dogs, Surg
Forum, 2:212-217,1951.
7. _, _, and Liu, W. C., Homologous
Heart Grafts, Arch Surg, 66:179-191, 1953-
8. Luisada, As Ae, and Marcus, E., The Behavior of a Transplanted
Heart, Ca rdiologia, 25:197-211,1954.
9. Downie, Hc G., Homotransp1 antation of the Dog Heart, Arch
Surg, 66:624-636,195 .
10. Weslowski, S. A., and Fennessey, J„ F., Pattern of Failure
of the Homografted Heart, C i rc, 8:750-755,1953.
II. Sayegh, S„ F0, Creech, 0o, and Harding, J. H„, Transplanta-
tion of the Homologous Heart, Surg ~orum, 8:317-319,1957.
-77-


12. , and _, Transp 1 an ta t i on of the Homol¬
ogous Canine Heart, J Thor Surg, 34:692-703,1957.
13- Neptune, W. B„, Cookson, Be A., Bailey, C.P., Appier, R0,
and Rajkowski, F., Complete Homologous Heart Transp1antation,
Arch Surg, 66:174-178,1953.
14. Blanco, G., Adam, A., Rodriguez-Rerez, D„, and Fernandez, A.,
Complete Homotransp1antation of Canine Heart and Lungs, Arch
Surg, 76:20-23,1958.
15. Webb, VI. R„, and Howard, H. S., Ca rd i o-Pu 1 mona ry Transplan¬
tation, Surg Forum, 8:313-317,1957.
16. _, _, and Neely, W. A., Practical Methods
of Homologous Cardiac Transp1antation, J Thor Surg, 37:361-366,
1959.
17. Goldberg, M., Berman, E. F., and Akman, L. C., Homologous
Transp1antation of the Canine Heart, J_fnt Col Surg, 30:
575-586,1958.
18. Berman, E. F., Goldberg, M., and Akman, L., Experimental
Replacement of the Heart in the Dog, Trans Bull, 5:10-11,
1958.
19. Lower, R. R„, Stofer, R. C., and Shumway, N„ E., Homovita1
Transp1antation of the Heart, J Thor Card Surg, 41:196-204,
1961 .
20. Friedentha1, H., Ueber die Entferuung der Extracardia 1en
Herznernen bei Sangethieren, Arch ur Physio1, 135-145,1902.
21. Cannon, W0 B., Lewis, J. T., and Britton, S 0 VI., Studies on
the Conditions of Activity in Endocrine Glands. XVII A Lasting
-78-


Preperation of the Denervated Heart for Detecting Internal
Secretion, Am J Physio1, 77:326-352,1926.
22* Burrett, Js B„, The Sensitization of the Denervated Heart
to Adrenaline, Am J Phys i o 1 , 131:409~4l5,1940.
23. Essex, H. E., Herrick, J. F„, Baldes, E. J., and Mann, F. C.,
Effects of Exercise on the Coronary Blood Flow, Heart Rate and
Blood Pressure of Trained Dogs with Denervated and Partially
Denervated Hearts, Am J Physiol, 138:687-697,1952-43.
24. Greenberg, R., and Lambeth, Cc BOJ Response of Chronic Dener¬
vated Heart to Acety1choline.and Epinephrine, Am J Physiol,
169:369-376,1952.
25. filbert, J. W., Cooper, Te, Bloodwell, R, D0, Greenfield, L. J
Collins, N0 P., and Crout, Re J., Chronic Extrinsic Cardiac
ienervation: Physiologic and Pharmacologic Studies Following
regional Neural Ablation, Surq Forum,11:263-265,1960.
26. (ooper, T., Gilbert, J8 W., Bloodwell, R. D., and Crout, J0 R.
(hronic Extrinsic Cardiac Denervation by Regional Neural
/blation, Circ Res, 9:275-281,1961.
27. Greenfield, L „ J„, Ebert, P „ A., Austen, W. Ge, and Morrow,
/ „ G., The Effect of Total Cardiac Denervation on the Cardio¬
vascular Responses to Hypothermia and Acute Hemorrhage, Surg,
51:356-359,1962.
28. Stone, H. L., Bishop, V. S., and Dong, EOJ Ventricular
Function in Cardiac Denervated and Cardiac Sympathectomized
Conscious Dogs, Circ Res, 20:587-593,1967.
29. [onald, D. E„, and Shepard, J. T„, Response to Exercise in
-79-


Dogs With Cardiac Denervation, Am J Phys i ol , 205:393-400,
1963.
30. _. and _, Sustained Capacity for Exer¬
cise in Dogs After Complete Cardiac Denervation, Am J Ca rdio1,
14:853-859,1964.
31. Shepard, J. T., and Donald, D, E., Ability of Denervated
Heart _i_n v i vo to Maintain Output Against Increased Resis¬
tance, Physiologist, 6:274,1963.
32. Cooper, T. , e_t a_]_, Pha rmacolog i c Responses of the Denervated
Heart, In Heart Substitutes, Mecharical and Transplant, ed by
A. N. Brest, Page 247-253, Charles C. Thomas, Springfield,
Illinois, 1966.
33. Cass, M. H., and Brock, R., Heart Excision and Replacement,
Guy's Hosp Rep, 108:285-290,1959.
34. Hurley, E. J., Dong, E., Stofer, Rc C„, and Shumway, N. E.,
Isotopic Replacement of the Totally Excised Canine Heart,
J Surg Res, 2:90-94,1962.
35. _, _, Lower, R. R., Hancock, E. W„,
_, and _, An Approach to Extracorporea 1
Surgery of the Heart, J Thor Card Surg, 44:776-784,1962.
36. Dong, E „, Fowkes, W. C., Hurley, E. J„, Hancock, E. W. , and
Pillsbury, R. C., Hemodynamic Effects of Cardiac Transplanta¬
tion, C ? rc (Supp1e) 29:77-80,1964.
37- Wiliman, V. L„, Cooper, T„, Cian, L„ G., and Hanlon, C. R.,
Autotransp 1 antat ion of the Canine Heart, Surg, Gyn & 0b,
115:299-302,1962.
-80-


38. _ , _, _, and _, Neural
Responses Following Autotransp1antation of the Canine Heart,
Circ, 27:713-716,1963.
39. _, Merjary, J. P., and Hanlon, C. Rp, Responses
of the Autotransp1 anted Heart to Blood Volume Expansion,
Ann of Surg, 166:513~517,1967.
40. Daggett, W„ M., Willman, V. Lc, Cooper, T., and Hanlon, C. R0,
Work Capacity and Efficiency of the Autot ransp 1 anted Heart,
Circ (Supple), 35-36:96-104,1967.
41. Shumway, N. E., Principal Investibator, Progress Report:
Transplantation of the Heart, NIH Grant HE 08696, May, 1968.
42. Reitz, B0 A., and Dong, E., unpublished observations.
43. Ehrlanger, J0, and Blackman, J. R., Further Studies in the
Physiology of Heart-Block in Mamma 1s: Chronic Auriculo-
Ventricular Heart Block in the Dog, Hea rt, 1:177-229,1909.
44. Hecht, A. F., Der Mechanismus der Herzaktion in Kindesalter,
Seine Physiologie und Pathologie, Ergebn, D Inn Med V Kinderh,
11:324,1913.
45. Wilson. F. N., and Robinson, A„ C., Two Cases of Complete
Heart Block Showing Unusual Features, Arch lnt Med, 21:166-
175,1918.
46. Graybid, A., and White, P0 D., Complete Auricu1oventricu1 ar
Dissociation : A Clinical Study of 72 Cases with a Note on
a Curious Form of Auricular Arrhythmia Frequently Observed,
Am J Med Sci, 192:334-344,1936.
47. Roth, lQ R„, and Kisch, B., The Mechanism of Irregular Sinus
-81-

•
Rhythm in Auricu1oventricu1 ar Heart Block, Am Heart J, 36:
257-276,1948.
48. Carlsten, A,, On the Negative Control of Auricular and
Ventricular Rates and Rhythms in Total Heart Block, Acta
Med Scand, 149:271-286,1954.
49. Carlsten, A., and Heyman, F., Effect of Brief Carotid-Sinus
Pressure on Atrial and Ventricular Rhythms in Complete Heart
Block, Acta Med Scand, 177:281-286,1965.
50. Bevegard, S., Jonsson, B., and Karlof, L., The instantaneous
Effect of Aortic Pressure on Atrial Rate in Complete Atrio¬
ventricular Block, Acta Med Scand (Supple), 472:54-58,1967.
51. Ashman, R„, and Gouanx, J„ L., Reflex Inhibition of the Human
Heart: Complete A-V Block and Parasystole, Proc Soc Exp Biol,
37:25-27,1937-38.
52. Parsonnet, A. E., and Miller, R0, The Influence of Ventricular
Systole Upon the Auricular Rhythm in Complete and Incomplete
Heart Block, Am Hpart J, 27:676, 1544.
53. Rosenbaum, M,, and Lepeschkin, E6, The Effect of Ventricular
Systole on Auricular Rhythm in Auricu1 oventricu1 ar Block, Circ
11:240-261,1955.
54. Marriott, H. J0 L., Atrioventricu1 ar Synchronization and Accro
chage, Circ, 14:38,1956.
55. Levy, M. N„, Martin, P„ J., lano, 7., and Zieske, H„, Paradox-
ical Effect of Vagus Nerve Stimulation on Heart Rate in Dogs,
Circ Res, 25:303-314,1969.
56. Reid, J„ V. 0„, The Cardiac Pacemaker; Effects of Regularly
-82-


Spaced Nervous Input, Am Heart J, 78:58-64,1969.
57- Reitz, B0 A., and Dong, E», Phasic Sensitivity to Vagal
Stimulation in the Heart, in preperation (see also SECTION li).
58. Jewett, D, L., Activity of Single Efferent Fibers in the
Cervical Vagus Nerve of the Dog, With Special Reference to
Possible Cardio-1nhibitory Fibers, J Physio1, 175:321-357,
1964.
59. Brown, G„ L., and Eccles, J, C., The Action of a Single Vagal
Volley on the Rhythm of the Heart Beat, J Physio1, 82:211-241,
1934.
60. Hutter, 0. F0 and Trautwein, W., Vagal and Sympathetic Effects
on the Pacemaker Fibers in the Sinus Venosus of the Heart,
J Gen Physiol, 39:715-733,1956.
6l„ Hoffman, Bc F., and Cranefield, P. F„, Electrophysiology of
the Heart, McGraw Hill, Inc, New York, I960, page 111.
62. Warner, H. R., and Cox, A. J., A Mathematical Model of Heart
Rate Control by Sympathetic and Vagus Efferent Information,
J App1 Physio1, 17:349-355,1962.
63. Perkel, D. H., Schulman, J. H„, Bullock, T, H., Moore, G. P.,
and Segundo, J. P„, Pacemaker Neurons: Effects of Regularly
Spaced Synaptic Input, Sc ? ence, 145:61-63,1964.
64. Moore, G. P., Perkel, D. Hs, and Segundo, J. P„, Statistical
Analysis and Functional I nterpretat ion of Neuronal Spike Data,
Ann Rev Physiol, 28:493-522,.1966.
65. Perkel, D. H., Gerstein, G. L., and Moore, Ge P., Neuronal
Spike Trains and Stochastic Point Processes I. The Single
-83-

,

Spike Train, Biophys J, 7:391-^+18,1967.
66. _, _, and _, Neuronal Spike Trains and
Stochastic Point Processes II, Simultaneous Spike Trains,
Biophys J, 7:419-440,1967.
67. Segars, M., Lequime, J., and Denolin, H., Synchronization of
Auricular and Ventricular Beats During Complete Heart Block,
Am Heart J, 33:685-691,1947.
68. As described in SECTION I
69. Unpublished observations, Dr E, B. Stinson.
70. Marriott, H. J, L., Atrioventricu1 ar Synchronization and
Accrochage, Circ , 14:38-43,1956.
71. Schbart, A. F„, Marriott, H, J. L„, and Gorsten, R. J,,
Isorhythmic Dissociation: Atrioventricular Dissociation
with Synchronization, Am J Med, 24:209-214,1958.
72. Pick, A., A-V Dissociation: A Proposal for a Comprehensive
C1 assificat ion and Constant Terminology, Am Heart J, 66:147-
150,1963.
73. Burchell, H„ B., Experience with Electronic Pacemakers,
In Mechanism and Therapy of Cardiac Arrhythmias, ed by
L. S. Dreifus, £t aj, New York, Grune and Stratton, 1966,
page 538.
74. Waldo, A„, e_t aj_, The Mechanism of Synchron izat ion in Iso-
Rhythmic A-V Dissociation, C ? rc , 28:880-898,1968.
75. Bainbridge, F0 A„, The Influence of Venous Filling Upon
Rate of the Heart, J Physio1, 50:65-84,1915.
76. Sassa, K., and Miyusaki, H., The influence of Venous Pressure
-84-

‘
i

on the Heart Rate, J Physiol, 54:203-212,1920.
77. Anrep, G. V., and Segall, H. N., Central and Reflex Regu¬
lation of the Heart Rate, J Physiol, 61:215-231,1926.
78. DeGraff, A. C., and Sands, J., Are Reflexes From the Large
Veins or Auricles of Importance in the Regulation of the
Circulation?, Am J Physiol, 74:400-415,1925.
79. V/arthen, H. J., Massive Intravenous Injections: An Exper¬
imental Study, Arch of Surg, 30:199-227,1935.
80. Ba11in, I. R., and Katz, L„ Nt! Observations on the Localization
of the Receptor Area of the Bainbridge Reflex, Am J Physiol,
135:202-213,1941.
81. Aviado, D. M., Li, T. H., Kalow, W„, Schmidt, C0 F., et a 1,
Respiratory and Circulatory Reflexes from the Perfused Heart
and Pulmonary Circulation of the Dog, Am J Physiol, 165:
261-277,1951 .
82. Coleridge, J. C. G., and Linden, R J., The Effect of intra¬
venous Infusions Upon the Heart Rare of the Anesthetized Dog,
J Physiol, 128:310-319,1955.
83. Jones, J. J., The Bainbridge Reflex., J Phys iol, 160:298-305,
1962.
84. Hirsch, L. J., Boyd, E„, and Katz, L. N., Effect of Intravenous
Volume Infusion on Heart Rate in Unanesthetized Dogs, Am J Physiol,
206:992-996,1964.
85. Blinks, J. R., Positive Chronotrop c Effects of Increasing
Right Atrial Pressure in the Isola ed Mammalian Heart,
Am J Physiol, 192:111-113,1958.
-85-


86. Pathak, C. L., Effect of Stretch on Formation and Conduc¬
tion of Electrical Impulses in the Isolated Sinoauricu1 ar
Chamber of the Frog's Heart, Am J Physio1, 194:111-113,
1958.
87. _, Effects of Changes in Intraluminal Pressure
on Inotropic and Chronotropic Responses of Isolated Mam¬
malian Hearts, Am J Physiol, 194:197-199,1958.
88. Goetz, K, L., Effect of Increased Pressure Within a Right
Heart Cul-de-sac on Heart Rate in Dogs, Am J Physiol, 209:
507-512,1965.
89. Knowlton, F0 P„, and Starling, E, H„, The Influence of
Variations in Temperature and Blood Pressure on the Per¬
formance of the Isolated Mammalian Heart, J Physiol, 44:
206-224,1912.
90. Donald, D. E0, and Shepard, J. T„, Changes in Heart Rate
on Intravenous Infusion in Dogs with Chronic Cardiac Dener¬
vation, Proc Soc Exp Biol Med, 113:315-317,1963=
91. Kinnison, G„ L „, et_ aj_, Reflex Changes in Heart Rate and
Ventilation Induced by Central Blood Pressure Changes,
Am J Physiol , 208:1222-1230,1964.
92. Pathak, C» L., The Fallacy of the Bainbridge Reflex, Am
Heart J, 72:577-581,1966.
93o Van Citters, Ra L., Franklin, D. L„, and Rushmer, R. F.,
Left Ventricular Dynamics in Dogs During Anesthesia with
A 1pha-Ch1ora1ose and Sodium Pentobarbital, Am J Cardiol,
13:349-354,1964.
-86-


3k. Sunahara, F„ A., and Beck, L., Cardiovascular Effects of
Acutely Produced Anemia in the Normal Dog, Am J Physio1,
176:139-142,1954.
95. Stinson, E. B„, Reitz, B. A0, Griepp, R0 B„, and Dong, E.,
Hemodynamic Changes in Canine Cardiac Homografts with
Volume Infusion, in preparation.
96. Sarnoff, S. J„, Myocardial Contractility as Described by
Ventricular Function Curves: Observation on Starling's
Law of the Heart, Physiol Rev, 35:107-122.
97. Tang, R. D0, e_t aj_, Factors Influencing Myocardial Con¬
tractility, Academic Press, New York, 19&7°
980 Sarnoff, S. J., Mitchell, J. H., Gilmore, J. P„, and
Remansnyder, J. P., Homeometric Autoregulation in the
Heart, Circ Res, 8: 1077-1091,1960»
99o Stone, H. L., Bishop, Ve S., and Dong, E., Ventricular
Function in Cardiac Denervated and Cardiac Sympathectomized
Conscious Dogs, Circ Res, 20:587-593,1987«
100o Paintal, A. S0, A Study of Right and Left Atrial Receptors,
J Physiol, 120:596,1953.
101. Edis, A. J., and Shepard, J. Te, Circulatory Reflexes from
Stretch of Pulmonary Vein-Atrial Junctions, Phys ? o1ogist,
12:213,1969.
-87-


YALE MEDICAL LIBRARY
Manuscript Theses
Unpublished theses submitted for the Master's and Doctor's degrees and
deposited in the Yale Medical Library are to be used only with due regard to the
rights of the authors. Bibliographical references may be noted, but passages
must not be copied without permission of the authors, and without proper credit
being given in subsequent written or published work.
This thesis by has been
used by the following persons, whose signatures attest their acceptance of the
above restrictions.
NAME AND ADDRESS DATE