Fuzzy Evaluation of Heart Rate Signals for Mental Stress Assessment
18
IEEE TRANSACTIONS ON FUZZY SYSTEMS, VOL. 15, NO. 5, OCTOBER 2007 791 Fuzzy Evaluation of Heart Rate Signals for Mental Stress Assessment Mohit Kumar, Matthias Weippert, Reinhard Vilbrandt, Steffi Kreuzfeld, and Regina Stoll Abstract—Mental stress is accompanied by dynamic changes in autonomic nervous system (ANS) activity. Heart rate variability (HRV) analysis is a popular tool for assessing the activities of au- tonomic nervous system. This paper presents a novel method of HRV analysis for mental stress assessment using fuzzy clustering and robust identification techniques. The approach consists of 1) online monitoring of heart rate signals, 2) signal processing (e.g., using the continuous wavelet transform to extract the local features of HRV in time-frequency domain), 3) exploiting fuzzy clustering and fuzzy identification techniques to render robustness in HRV analysis against uncertainties due to individual variations, and 4) monitoring the functioning of autonomic nervous system under dif- ferent stress conditions. Our experiments involved 38 physically fit subjects (26 male, 12 female, aged 18–29 years) in air traffic con- trol task simulations. The subjective rating scores of mental work- load were assessed using NASA Task Load Index. Fuzzy clustering methods have been used to model the experimental data. Further, a robust fuzzy identification technique has been used to handle the uncertainties due to individual variations for the assessment of mental stress. Index Terms—Heart rate variability (HRV), continuous wavelet transform, NASA-task load index, fuzzy clustering, robustness, fuzzy identification. I. INTRODUCTION A SSESSMENT of mental stress under different workload conditions is a recurrent issue in many engineering and medicine fields. Although mental stress cannot be measured di- rectly, the physiological response of an operator can be inter- preted to assess the level of mental stress. Several physiological parameters (like electroencephalograph, blood pressure, heart rate, heart rate variability (HRV), electrodermal activity (EDA), event-related potentials, and electromyograh) have been found sensitive toward any changes occurring in the mental stress level of an operator. Cardiac activity is the most common physiolog- ical measure for the assessment of mental workload [1]. An elec- trocardiogram (ECG) is a cardiac measure that shows sensitivity towards variations in workload [2]. Heart rate variability (a mea- sure of electrocardiographic activity) has been widely accepted in the literature for the assessment of mental workload (see, e.g., [2]–[8]). Manuscript received October 6, 2005; revised January 18, 2006, April 2, 2006, and May 22, 2006. This work was supported by the Center for Life Sci- ence Automation, Rostock, Germany. M. Kumar and S. Kreuzfeld are with the Center for Life Science Automation, D-18119 Rostock, Germany. M. Weippert, R. Vilbrandt, and R. Stoll are with the Institute of Preventive Medicine, Faculty of Medicine, University of Rostock, D-18055 Rostock, Ger- many. Color versions of one or more of the figures in this paper are available online at http://ieeexplore.ieee.org. Digital Object Identifier 10.1109/TFUZZ.2006.889825 The autonomic nervous system (ANS), which controls car- diac muscle, is of interest for stress detection. ANS is concerned with the regulation of heart rate, blood pressure, breathing rate, body temperature, and other visceral activities. The ANS ac- tivity is divided into two branches: sympathetic and parasympa- thetic, which influence the sinus node of the heart, thereby mod- ulating heart rate. The sympathetic activity is primarily related to the preparation of body for stressful situations by boosting of energy. On the other hand, parasympathetic activity (most active under restful situations) counterbalances the effects of the sym- pathetic activity and restores the body to a resting state. Under normal situations, there is a balance between these two activi- ties. However, during stress this balance will be altered and an analysis of heart rate signals could be potentially used to detect this alteration in system balance [9]–[14]. HRV is a measure of the variability in heart rate, i.e., vari- ability in interbeat interval (IBI), which is defined as the time in milliseconds between consecutive R waves of an electrocardio- gram. The IBI series (R-R intervals) can be analyzed using some mathematical theories (e.g., fast Fourier transform, wavelet the- ories, chaos) to assess ANS activities. The analysis of HRV pro- vides a theoretical framework for ANS assessment by identi- fying the sympathetic and parasympathetic activities. The anal- ysis of HRV in frequency domain could provide various infor- mation about cardiovascular control [15], [16]. Overall spectra of human HRV can be divided into three main frequency zones: below 0.04 Hz is very low frequency (VLF), between 0.04 and 0.15 Hz is low frequency (LF), and between 0.15 and 0.5 Hz is high frequency (HF). The LF is affected by both the sympa- thetic and parasympathetic activities, and the HF is found to be dominated by the parasympathetic activity [17]. The VLF is re- lated to factors like temperature, hormones, etc. [18]. The ratio of the LF to HF power has been associated with the sympatho- vagal balance [18]. An emerging body of literature seems to suggest that HRV analysis can be potentially used to measure mental stress. How- ever, a practical problem, which is so far not well addressed in the literature, is to derive some form of mathematical (quantita- tive) relations between parameters of ANS activity and mental stress. The problem can be formally stated as follows. Problem 1: Given a 3-min IBI series (R-R intervals), estimate the level of mental stress on a scale ranging from 0 to 100 by monitoring the functioning of autonomic nervous system using HRV analysis. The solution of above problem not only would provide a physiological interpretation of a so-called mental stress but also has the direct applications in engineering fields like adaptive automation and man–machine interface design. The major difficulties in solving Problem 1 are the following. 1063-6706/$25.00 © 2007 IEEE Authorized licensed use limited to: Universitaetsbibl Rostock. Downloaded on February 19, 2009 at 04:36 from IEEE Xplore. Restrictions apply.
-
Upload
independent -
Category
Documents
-
view
2 -
download
0
Transcript of Fuzzy Evaluation of Heart Rate Signals for Mental Stress Assessment
IEEE TRANSACTIONS ON FUZZY SYSTEMS, VOL. 15, NO. 5, OCTOBER 2007 791
Fuzzy Evaluation of Heart Rate Signals for MentalStress Assessment
Mohit Kumar, Matthias Weippert, Reinhard Vilbrandt, Steffi Kreuzfeld, and Regina Stoll
Abstract—Mental stress is accompanied by dynamic changes inautonomic nervous system (ANS) activity. Heart rate variability(HRV) analysis is a popular tool for assessing the activities of au-tonomic nervous system. This paper presents a novel method ofHRV analysis for mental stress assessment using fuzzy clusteringand robust identification techniques. The approach consists of 1)online monitoring of heart rate signals, 2) signal processing (e.g.,using the continuous wavelet transform to extract the local featuresof HRV in time-frequency domain), 3) exploiting fuzzy clusteringand fuzzy identification techniques to render robustness in HRVanalysis against uncertainties due to individual variations, and 4)monitoring the functioning of autonomic nervous system under dif-ferent stress conditions. Our experiments involved 38 physically fitsubjects (26 male, 12 female, aged 18–29 years) in air traffic con-trol task simulations. The subjective rating scores of mental work-load were assessed using NASA Task Load Index. Fuzzy clusteringmethods have been used to model the experimental data. Further,a robust fuzzy identification technique has been used to handlethe uncertainties due to individual variations for the assessmentof mental stress.
Index Terms—Heart rate variability (HRV), continuous wavelettransform, NASA-task load index, fuzzy clustering, robustness,fuzzy identification.
I. INTRODUCTION
ASSESSMENT of mental stress under different workloadconditions is a recurrent issue in many engineering and
medicine fields. Although mental stress cannot be measured di-rectly, the physiological response of an operator can be inter-preted to assess the level of mental stress. Several physiologicalparameters (like electroencephalograph, blood pressure, heartrate, heart rate variability (HRV), electrodermal activity (EDA),event-related potentials, and electromyograh) have been foundsensitive toward any changes occurring in the mental stress levelof an operator. Cardiac activity is the most common physiolog-ical measure for the assessment of mental workload [1]. An elec-trocardiogram (ECG) is a cardiac measure that shows sensitivitytowards variations in workload [2]. Heart rate variability (a mea-sure of electrocardiographic activity) has been widely acceptedin the literature for the assessment of mental workload (see, e.g.,[2]–[8]).
Manuscript received October 6, 2005; revised January 18, 2006, April 2,2006, and May 22, 2006. This work was supported by the Center for Life Sci-ence Automation, Rostock, Germany.
M. Kumar and S. Kreuzfeld are with the Center for Life Science Automation,D-18119 Rostock, Germany.
M. Weippert, R. Vilbrandt, and R. Stoll are with the Institute of PreventiveMedicine, Faculty of Medicine, University of Rostock, D-18055 Rostock, Ger-many.
Color versions of one or more of the figures in this paper are available onlineat http://ieeexplore.ieee.org.
Digital Object Identifier 10.1109/TFUZZ.2006.889825
The autonomic nervous system (ANS), which controls car-diac muscle, is of interest for stress detection. ANS is concernedwith the regulation of heart rate, blood pressure, breathing rate,body temperature, and other visceral activities. The ANS ac-tivity is divided into two branches: sympathetic and parasympa-thetic, which influence the sinus node of the heart, thereby mod-ulating heart rate. The sympathetic activity is primarily relatedto the preparation of body for stressful situations by boosting ofenergy. On the other hand, parasympathetic activity (most activeunder restful situations) counterbalances the effects of the sym-pathetic activity and restores the body to a resting state. Undernormal situations, there is a balance between these two activi-ties. However, during stress this balance will be altered and ananalysis of heart rate signals could be potentially used to detectthis alteration in system balance [9]–[14].
HRV is a measure of the variability in heart rate, i.e., vari-ability in interbeat interval (IBI), which is defined as the time inmilliseconds between consecutive R waves of an electrocardio-gram. The IBI series (R-R intervals) can be analyzed using somemathematical theories (e.g., fast Fourier transform, wavelet the-ories, chaos) to assess ANS activities. The analysis of HRV pro-vides a theoretical framework for ANS assessment by identi-fying the sympathetic and parasympathetic activities. The anal-ysis of HRV in frequency domain could provide various infor-mation about cardiovascular control [15], [16]. Overall spectraof human HRV can be divided into three main frequency zones:below 0.04 Hz is very low frequency (VLF), between 0.04 and0.15 Hz is low frequency (LF), and between 0.15 and 0.5 Hzis high frequency (HF). The LF is affected by both the sympa-thetic and parasympathetic activities, and the HF is found to bedominated by the parasympathetic activity [17]. The VLF is re-lated to factors like temperature, hormones, etc. [18]. The ratioof the LF to HF power has been associated with the sympatho-vagal balance [18].
An emerging body of literature seems to suggest that HRVanalysis can be potentially used to measure mental stress. How-ever, a practical problem, which is so far not well addressed inthe literature, is to derive some form of mathematical (quantita-tive) relations between parameters of ANS activity and mentalstress. The problem can be formally stated as follows.
Problem 1: Given a 3-min IBI series (R-R intervals), estimatethe level of mental stress on a scale ranging from 0 to 100 bymonitoring the functioning of autonomic nervous system usingHRV analysis.
The solution of above problem not only would provide aphysiological interpretation of a so-called mental stress but alsohas the direct applications in engineering fields like adaptiveautomation and man–machine interface design. The majordifficulties in solving Problem 1 are the following.
1063-6706/$25.00 © 2007 IEEE
Authorized licensed use limited to: Universitaetsbibl Rostock. Downloaded on February 19, 2009 at 04:36 from IEEE Xplore. Restrictions apply.
792 IEEE TRANSACTIONS ON FUZZY SYSTEMS, VOL. 15, NO. 5, OCTOBER 2007
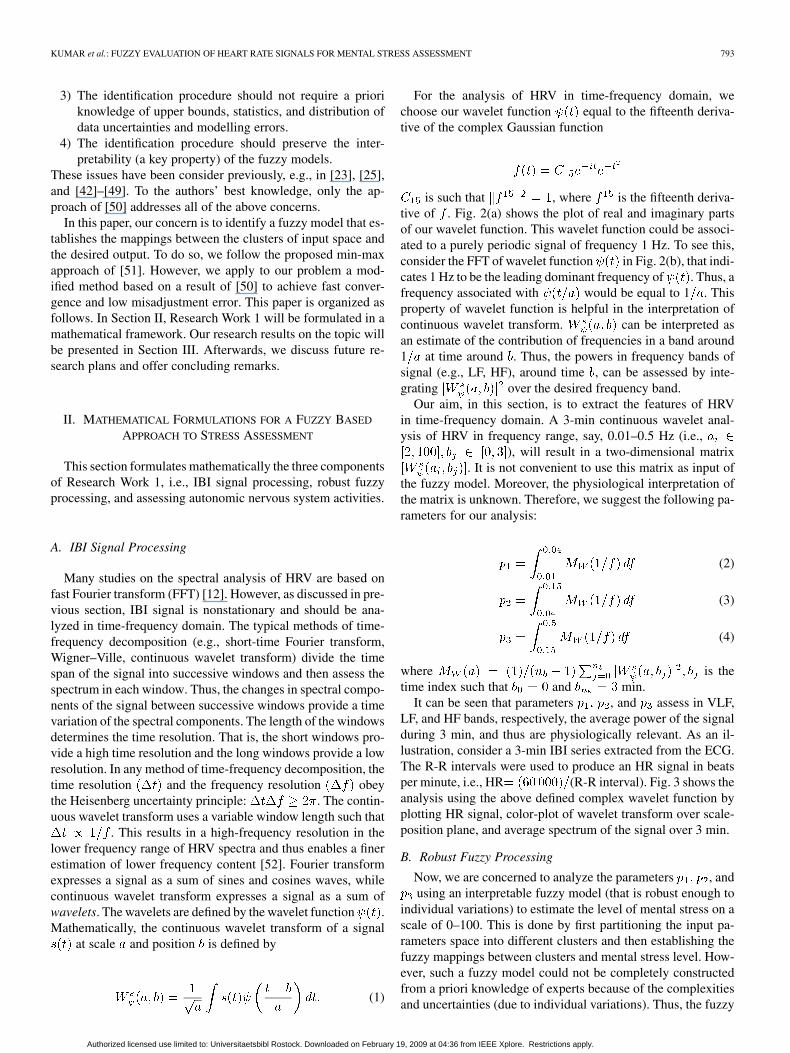
Fig. 1. Three components of research work.
1) HRV signal is nonstationary, i.e., it is characterized by timevariations in its frequency components.
2) The alterations in HRV signal due to a change in the level ofmental stress (these alterations would be used to detect thecorresponding change) are subjective to individuals. Thechanges, which result in the HRV pattern of individualsdue to a change in stress level, are different among indi-viduals. This difference in behavior among the individualsmay arise due to different body conditions, gender, age,physical fitness, emotional states, and so on.
To overcome the first difficulty, spectral components ofHRV can be determined in the time-frequency domain using awavelet transform [19]. Moreover, the logarithmic resolutionof the wavelet transform enables the finer estimation of verylow frequencies components. To resolve the second difficulty,some of the approaches coming from the area of neural networkhave been used (see [20] and references therein). This is doneby combining HRV analysis with a neural network such thatindividual variations are learnt by a neural network. However,neural network–based approaches are like a “black box,” sincethese do not provide a human-understandable insight intorelationships between ANS activities and level of mental stress.
Fuzzy inference systems based on fuzzy set theory of Zadeh[21] are considered suitable for dealing with many real-worldproblems (which are characterized by complexities, uncertain-ties, and a lack of knowledge of the governing physical laws).The fuzzy systems not only are capable of learning complexinput–output relationships but also offer additionally the ad-vantage of providing an insight into relationships (i.e., inter-pretability). Thus, an identification of input–output mappingsusing a fuzzy model has become a common practice in litera-ture; see, e.g., [22]–[29]. Also, in [30], a fuzzy inference systemwas used for interpreting ANS activities to estimate stress quan-titatively.
The solving of Problem 1 would require, with respect to thestate of art, a research work.
Research Work 1: This work involves development of amodel (preferably fuzzy because of its uncertainties handlingand interpretability advantages) robust enough to individual
variations for establishing relationships between 3 min HRVanalysis and mental stress (on a scale of 0–100). Once thismodel has been developed, the relationships between auto-nomic nervous system activities and mental stress could beestablished.
Fig. 1 shows the three components of Research Work 1. Re-search Work 1(a) deals with the extraction of IBI signal featuresin time-frequency domain using continuous wavelet transform.These features of IBI signal are interpreted to estimate the levelof mental stress in component Research Work 1(b). In compo-nent Research Work 1(c), the sympathetic and parasympatheticactivities of ANS are assessed using some mathematical anal-ysis of IBI signal, and thus the functioning of ANS is monitoredunder different stress conditions. It is not difficult to realize thatResearch Work 1(b) is a bottleneck and plays the most importantrole in deciding the accuracy of the analysis. From a mathemat-ical point of view, Research Work 1(b) is simply a problem ofrobust identification of a fuzzy model using input–output datain the presence of data uncertainties and modelling errors. Thus,we present a brief review of the literature in the field and iden-tify the need of further research.
When it comes to the development of fuzzy models, a largenumber of fuzzy identification techniques have been developedusing ad hoc approaches, neural networks, genetic algorithms,clustering techniques, and Kalman filtering [22], [24], [26],[28], [29], [31]–[40]. Most of the online fuzzy identifica-tion techniques in the literature use gradient-descent-basedalgorithms (such as backpropagation) for the adjustment ofnonlinear fuzzy model parameters. However, in the presence ofdata uncertainties and modelling errors, gradient-descent-basedtechniques are not suitable due to their nonrobust nature. Webelieve that while studying fuzzy identification methods, thefollowing issues should be addressed.
1) Fuzzy model identification is an ill-posed problem [41].The identification of not only linear parameters (conse-quents) but also the nonlinear parameters (antecedents) offuzzy model should mathematically take into account datauncertainties and modelling errors.
2) The identification procedure should be an online method.
Authorized licensed use limited to: Universitaetsbibl Rostock. Downloaded on February 19, 2009 at 04:36 from IEEE Xplore. Restrictions apply.
KUMAR et al.: FUZZY EVALUATION OF HEART RATE SIGNALS FOR MENTAL STRESS ASSESSMENT 793
3) The identification procedure should not require a prioriknowledge of upper bounds, statistics, and distribution ofdata uncertainties and modelling errors.
4) The identification procedure should preserve the inter-pretability (a key property) of the fuzzy models.
These issues have been consider previously, e.g., in [23], [25],and [42]–[49]. To the authors’ best knowledge, only the ap-proach of [50] addresses all of the above concerns.
In this paper, our concern is to identify a fuzzy model that es-tablishes the mappings between the clusters of input space andthe desired output. To do so, we follow the proposed min-maxapproach of [51]. However, we apply to our problem a mod-ified method based on a result of [50] to achieve fast conver-gence and low misadjustment error. This paper is organized asfollows. In Section II, Research Work 1 will be formulated in amathematical framework. Our research results on the topic willbe presented in Section III. Afterwards, we discuss future re-search plans and offer concluding remarks.
II. MATHEMATICAL FORMULATIONS FOR A FUZZY BASED
APPROACH TO STRESS ASSESSMENT
This section formulates mathematically the three componentsof Research Work 1, i.e., IBI signal processing, robust fuzzyprocessing, and assessing autonomic nervous system activities.
A. IBI Signal Processing
Many studies on the spectral analysis of HRV are based onfast Fourier transform (FFT) [12]. However, as discussed in pre-vious section, IBI signal is nonstationary and should be ana-lyzed in time-frequency domain. The typical methods of time-frequency decomposition (e.g., short-time Fourier transform,Wigner–Ville, continuous wavelet transform) divide the timespan of the signal into successive windows and then assess thespectrum in each window. Thus, the changes in spectral compo-nents of the signal between successive windows provide a timevariation of the spectral components. The length of the windowsdetermines the time resolution. That is, the short windows pro-vide a high time resolution and the long windows provide a lowresolution. In any method of time-frequency decomposition, thetime resolution and the frequency resolution obeythe Heisenberg uncertainty principle: . The contin-uous wavelet transform uses a variable window length such that
. This results in a high-frequency resolution in thelower frequency range of HRV spectra and thus enables a finerestimation of lower frequency content [52]. Fourier transformexpresses a signal as a sum of sines and cosines waves, whilecontinuous wavelet transform expresses a signal as a sum ofwavelets. The wavelets are defined by the wavelet function .Mathematically, the continuous wavelet transform of a signal
at scale and position is defined by
(1)
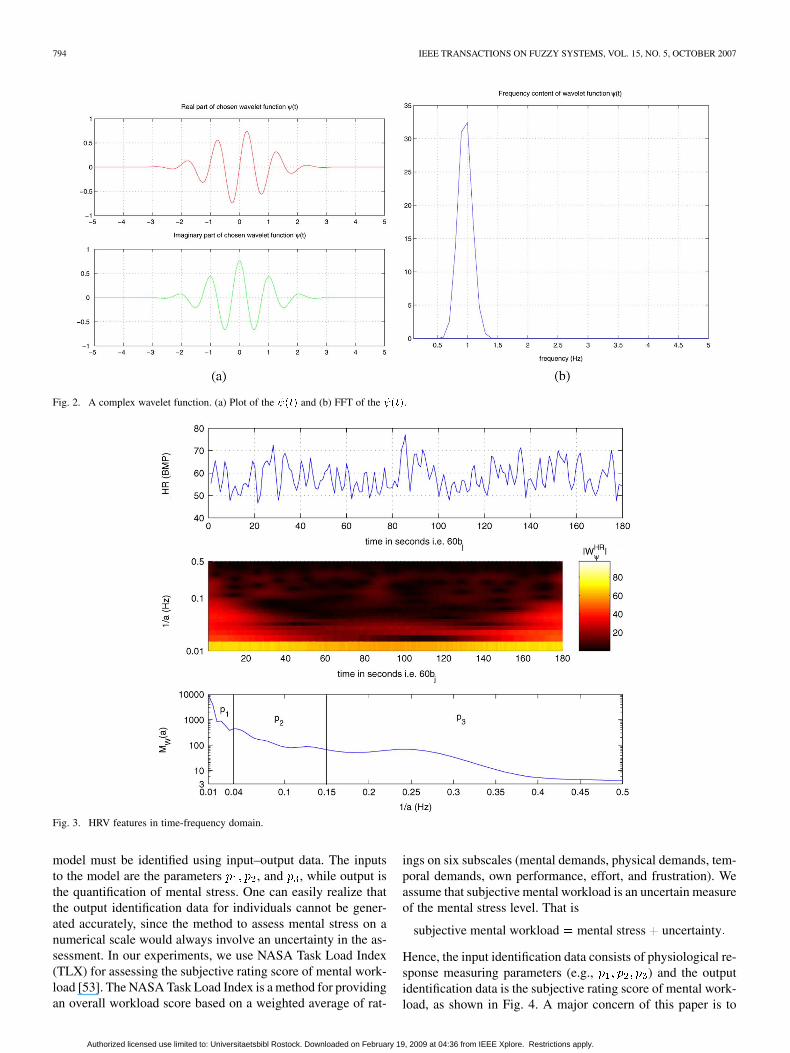
For the analysis of HRV in time-frequency domain, wechoose our wavelet function equal to the fifteenth deriva-tive of the complex Gaussian function
is such that , where is the fifteenth deriva-tive of . Fig. 2(a) shows the plot of real and imaginary partsof our wavelet function. This wavelet function could be associ-ated to a purely periodic signal of frequency 1 Hz. To see this,consider the FFT of wavelet function in Fig. 2(b), that indi-cates 1 Hz to be the leading dominant frequency of . Thus, afrequency associated with would be equal to 1 . Thisproperty of wavelet function is helpful in the interpretation ofcontinuous wavelet transform. can be interpreted asan estimate of the contribution of frequencies in a band around1 at time around . Thus, the powers in frequency bands ofsignal (e.g., LF, HF), around time , can be assessed by inte-grating over the desired frequency band.
Our aim, in this section, is to extract the features of HRVin time-frequency domain. A 3-min continuous wavelet anal-ysis of HRV in frequency range, say, 0.01–0.5 Hz (i.e.,
), will result in a two-dimensional matrix. It is not convenient to use this matrix as input of
the fuzzy model. Moreover, the physiological interpretation ofthe matrix is unknown. Therefore, we suggest the following pa-rameters for our analysis:
(2)
(3)
(4)
where is thetime index such that and min.
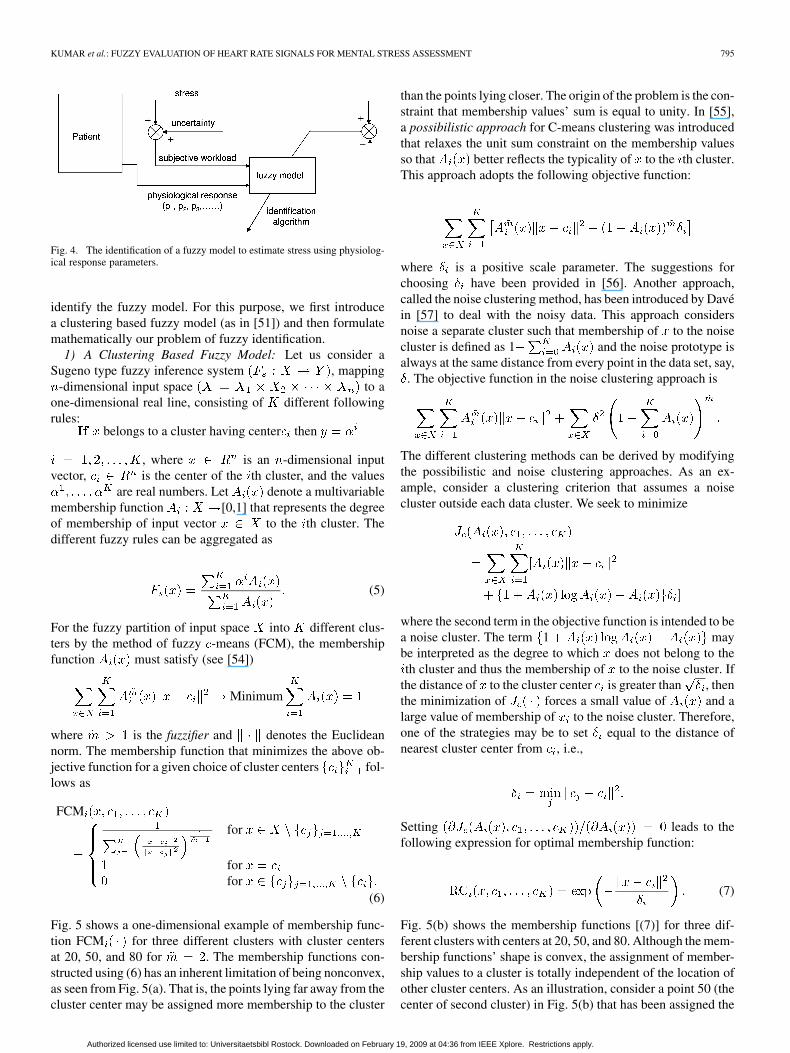
It can be seen that parameters , and assess in VLF,LF, and HF bands, respectively, the average power of the signalduring 3 min, and thus are physiologically relevant. As an il-lustration, consider a 3-min IBI series extracted from the ECG.The R-R intervals were used to produce an HR signal in beatsper minute, i.e., HR (R-R interval). Fig. 3 shows theanalysis using the above defined complex wavelet function byplotting HR signal, color-plot of wavelet transform over scale-position plane, and average spectrum of the signal over 3 min.
B. Robust Fuzzy Processing
Now, we are concerned to analyze the parameters , andusing an interpretable fuzzy model (that is robust enough to
individual variations) to estimate the level of mental stress on ascale of 0–100. This is done by first partitioning the input pa-rameters space into different clusters and then establishing thefuzzy mappings between clusters and mental stress level. How-ever, such a fuzzy model could not be completely constructedfrom a priori knowledge of experts because of the complexitiesand uncertainties (due to individual variations). Thus, the fuzzy
Authorized licensed use limited to: Universitaetsbibl Rostock. Downloaded on February 19, 2009 at 04:36 from IEEE Xplore. Restrictions apply.
794 IEEE TRANSACTIONS ON FUZZY SYSTEMS, VOL. 15, NO. 5, OCTOBER 2007
Fig. 2. A complex wavelet function. (a) Plot of the (t) and (b) FFT of the (t).
Fig. 3. HRV features in time-frequency domain.
model must be identified using input–output data. The inputsto the model are the parameters , and , while output isthe quantification of mental stress. One can easily realize thatthe output identification data for individuals cannot be gener-ated accurately, since the method to assess mental stress on anumerical scale would always involve an uncertainty in the as-sessment. In our experiments, we use NASA Task Load Index(TLX) for assessing the subjective rating score of mental work-load [53]. The NASA Task Load Index is a method for providingan overall workload score based on a weighted average of rat-
ings on six subscales (mental demands, physical demands, tem-poral demands, own performance, effort, and frustration). Weassume that subjective mental workload is an uncertain measureof the mental stress level. That is
subjective mental workload mental stress uncertainty
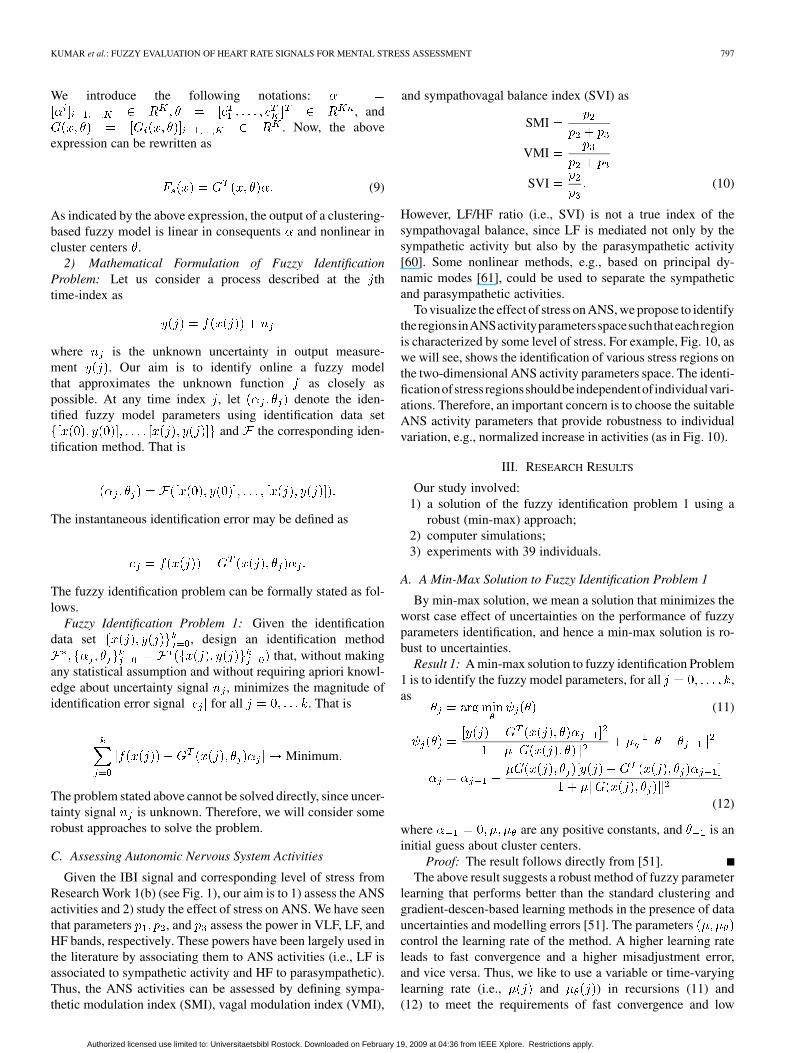
Hence, the input identification data consists of physiological re-sponse measuring parameters (e.g., ) and the outputidentification data is the subjective rating score of mental work-load, as shown in Fig. 4. A major concern of this paper is to
Authorized licensed use limited to: Universitaetsbibl Rostock. Downloaded on February 19, 2009 at 04:36 from IEEE Xplore. Restrictions apply.
KUMAR et al.: FUZZY EVALUATION OF HEART RATE SIGNALS FOR MENTAL STRESS ASSESSMENT 795
Fig. 4. The identification of a fuzzy model to estimate stress using physiolog-ical response parameters.
identify the fuzzy model. For this purpose, we first introducea clustering based fuzzy model (as in [51]) and then formulatemathematically our problem of fuzzy identification.
1) A Clustering Based Fuzzy Model: Let us consider aSugeno type fuzzy inference system , mapping
-dimensional input space to aone-dimensional real line, consisting of different followingrules:
belongs to a cluster having center then
, where is an -dimensional inputvector, is the center of the th cluster, and the values
are real numbers. Let denote a multivariablemembership function [0,1] that represents the degreeof membership of input vector to the th cluster. Thedifferent fuzzy rules can be aggregated as
(5)
For the fuzzy partition of input space into different clus-ters by the method of fuzzy -means (FCM), the membershipfunction must satisfy (see [54])
Minimum
where is the fuzzifier and denotes the Euclideannorm. The membership function that minimizes the above ob-jective function for a given choice of cluster centers fol-lows as
FCMfor
forfor
(6)
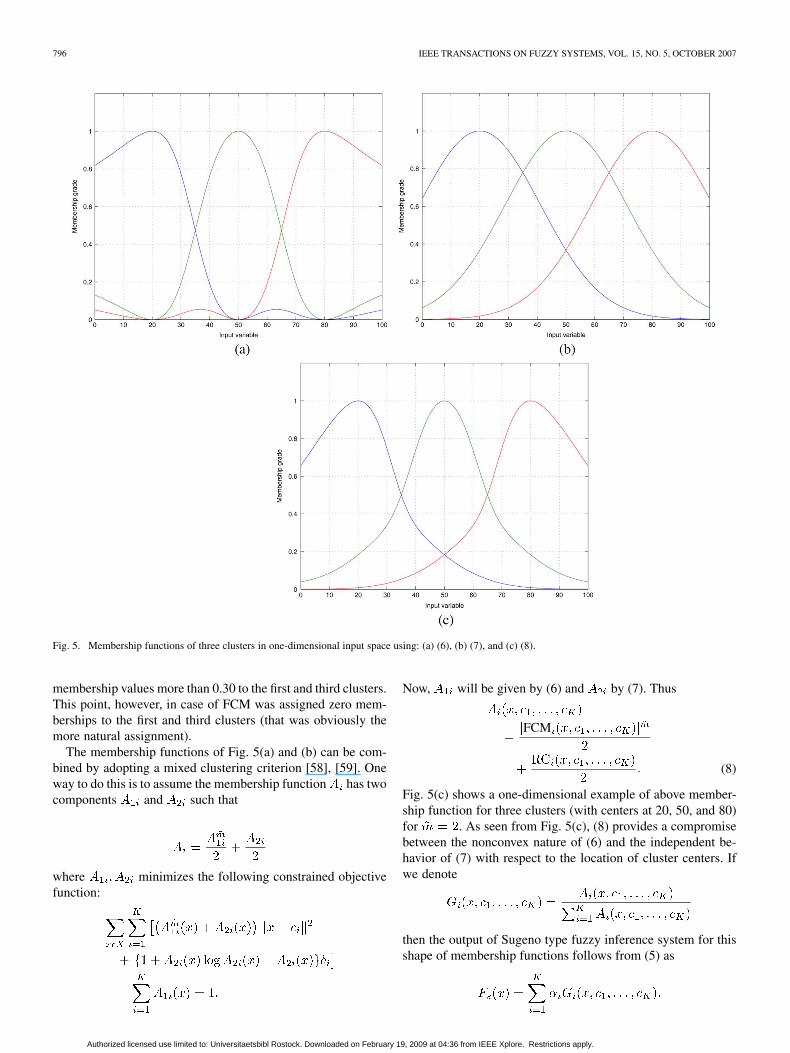
Fig. 5 shows a one-dimensional example of membership func-tion FCM for three different clusters with cluster centersat 20, 50, and 80 for . The membership functions con-structed using (6) has an inherent limitation of being nonconvex,as seen from Fig. 5(a). That is, the points lying far away from thecluster center may be assigned more membership to the cluster
than the points lying closer. The origin of the problem is the con-straint that membership values’ sum is equal to unity. In [55],a possibilistic approach for C-means clustering was introducedthat relaxes the unit sum constraint on the membership valuesso that better reflects the typicality of to the th cluster.This approach adopts the following objective function:
where is a positive scale parameter. The suggestions forchoosing have been provided in [56]. Another approach,called the noise clustering method, has been introduced by Davéin [57] to deal with the noisy data. This approach considersnoise a separate cluster such that membership of to the noisecluster is defined as 1 and the noise prototype isalways at the same distance from every point in the data set, say,. The objective function in the noise clustering approach is
The different clustering methods can be derived by modifyingthe possibilistic and noise clustering approaches. As an ex-ample, consider a clustering criterion that assumes a noisecluster outside each data cluster. We seek to minimize
where the second term in the objective function is intended to bea noise cluster. The term 1 maybe interpreted as the degree to which does not belong to theth cluster and thus the membership of to the noise cluster. If
the distance of to the cluster center is greater than , thenthe minimization of forces a small value of and alarge value of membership of to the noise cluster. Therefore,one of the strategies may be to set equal to the distance ofnearest cluster center from , i.e.,
Setting leads to thefollowing expression for optimal membership function:
(7)
Fig. 5(b) shows the membership functions [(7)] for three dif-ferent clusters with centers at 20, 50, and 80. Although the mem-bership functions’ shape is convex, the assignment of member-ship values to a cluster is totally independent of the location ofother cluster centers. As an illustration, consider a point 50 (thecenter of second cluster) in Fig. 5(b) that has been assigned the
Authorized licensed use limited to: Universitaetsbibl Rostock. Downloaded on February 19, 2009 at 04:36 from IEEE Xplore. Restrictions apply.
796 IEEE TRANSACTIONS ON FUZZY SYSTEMS, VOL. 15, NO. 5, OCTOBER 2007
Fig. 5. Membership functions of three clusters in one-dimensional input space using: (a) (6), (b) (7), and (c) (8).
membership values more than 0.30 to the first and third clusters.This point, however, in case of FCM was assigned zero mem-berships to the first and third clusters (that was obviously themore natural assignment).
The membership functions of Fig. 5(a) and (b) can be com-bined by adopting a mixed clustering criterion [58], [59]. Oneway to do this is to assume the membership function has twocomponents and such that
where minimizes the following constrained objectivefunction:
Now, will be given by (6) and by (7). Thus
FCM
(8)
Fig. 5(c) shows a one-dimensional example of above member-ship function for three clusters (with centers at 20, 50, and 80)for . As seen from Fig. 5(c), (8) provides a compromisebetween the nonconvex nature of (6) and the independent be-havior of (7) with respect to the location of cluster centers. Ifwe denote
then the output of Sugeno type fuzzy inference system for thisshape of membership functions follows from (5) as
Authorized licensed use limited to: Universitaetsbibl Rostock. Downloaded on February 19, 2009 at 04:36 from IEEE Xplore. Restrictions apply.
KUMAR et al.: FUZZY EVALUATION OF HEART RATE SIGNALS FOR MENTAL STRESS ASSESSMENT 797
We introduce the following notations:, and
. Now, the aboveexpression can be rewritten as
(9)
As indicated by the above expression, the output of a clustering-based fuzzy model is linear in consequents and nonlinear incluster centers .
2) Mathematical Formulation of Fuzzy IdentificationProblem: Let us consider a process described at the thtime-index as
where is the unknown uncertainty in output measure-ment . Our aim is to identify online a fuzzy modelthat approximates the unknown function as closely aspossible. At any time index , let denote the iden-tified fuzzy model parameters using identification data set
and the corresponding iden-tification method. That is
The instantaneous identification error may be defined as
The fuzzy identification problem can be formally stated as fol-lows.
Fuzzy Identification Problem 1: Given the identificationdata set , design an identification method
that, without makingany statistical assumption and without requiring apriori knowl-edge about uncertainty signal , minimizes the magnitude ofidentification error signal for all . That is
Minimum
The problem stated above cannot be solved directly, since uncer-tainty signal is unknown. Therefore, we will consider somerobust approaches to solve the problem.
C. Assessing Autonomic Nervous System Activities
Given the IBI signal and corresponding level of stress fromResearch Work 1(b) (see Fig. 1), our aim is to 1) assess the ANSactivities and 2) study the effect of stress on ANS. We have seenthat parameters , and assess the power in VLF, LF, andHF bands, respectively. These powers have been largely used inthe literature by associating them to ANS activities (i.e., LF isassociated to sympathetic activity and HF to parasympathetic).Thus, the ANS activities can be assessed by defining sympa-thetic modulation index (SMI), vagal modulation index (VMI),
and sympathovagal balance index (SVI) as
SMI
VMI
SVI (10)
However, LF/HF ratio (i.e., SVI) is not a true index of thesympathovagal balance, since LF is mediated not only by thesympathetic activity but also by the parasympathetic activity[60]. Some nonlinear methods, e.g., based on principal dy-namic modes [61], could be used to separate the sympatheticand parasympathetic activities.
To visualize the effect of stress on ANS, we propose to identifytheregionsinANSactivityparametersspacesuchthateachregionis characterized by some level of stress. For example, Fig. 10, aswe will see, shows the identification of various stress regions onthe two-dimensional ANS activity parameters space. The identi-ficationofstress regionsshouldbeindependentof individualvari-ations. Therefore, an important concern is to choose the suitableANS activity parameters that provide robustness to individualvariation, e.g., normalized increase in activities (as in Fig. 10).
III. RESEARCH RESULTS
Our study involved:1) a solution of the fuzzy identification problem 1 using a
robust (min-max) approach;2) computer simulations;3) experiments with 39 individuals.
A. A Min-Max Solution to Fuzzy Identification Problem 1
By min-max solution, we mean a solution that minimizes theworst case effect of uncertainties on the performance of fuzzyparameters identification, and hence a min-max solution is ro-bust to uncertainties.
Result 1: A min-max solution to fuzzy identification Problem1 is to identify the fuzzy model parameters, for all ,as
(11)
(12)
where are any positive constants, and is aninitial guess about cluster centers.
Proof: The result follows directly from [51].The above result suggests a robust method of fuzzy parameter
learning that performs better than the standard clustering andgradient-descen-based learning methods in the presence of datauncertainties and modelling errors [51]. The parameterscontrol the learning rate of the method. A higher learning rateleads to fast convergence and a higher misadjustment error,and vice versa. Thus, we like to use a variable or time-varyinglearning rate (i.e., and ) in recursions (11) and(12) to meet the requirements of fast convergence and low
Authorized licensed use limited to: Universitaetsbibl Rostock. Downloaded on February 19, 2009 at 04:36 from IEEE Xplore. Restrictions apply.
798 IEEE TRANSACTIONS ON FUZZY SYSTEMS, VOL. 15, NO. 5, OCTOBER 2007
misadjustment error. That is
(13)
(14)
where . Let us for simplicity assume the ratio of an-tecedents learning rate to consequents learning rate at any timeis constant, i.e.,
where is a constant. Assume that input–output datacould be modelled as
(15)
where is given by (13) and given by (14) is an estimateof some true vector . Here, includes measurement noiseand modelling errors. For our analysis, we define the followingerror measures:
1) consequents-error vector ;2) a priori estimation error
:3) a priori recursion error ;4) a posteriori recursion error .
A possible strategy to choose values for fast con-vergence and low misadjustment error is suggested in [50] forthe identification of fuzzy models. The method of [50] for theidentification of cluster centers and consequents is stated in Re-sult 2.
Result 2: The learning of fuzzy model parameters using avariable learning rate follows as
(16)
(17)
(18)
(19)
where .Proof: See Appendix 1.
To study the stability of the learning method [(16)–(19)],we associate to the learning method a discrete-time nonlinearsystem of the form
(20)
where is the state of the system that changes from toduring a recursion of the algorithm (16)–(19), and is a con-tinuous nonlinear function. Let denote the a priorirecursion error (i.e., ) and
denote the a posteriori recursion error (i.e.,). This transition of the error from to
, during a recursion of the algorithm, is due to the transi-tion of state in system (20) from to . Therefore,(a linear combination of the elements of state vector ) is amodified state of the discrete-time system (20).
The algorithm (16)–(19) will be considered stable if, for abounded magnitude of disturbances , the errorsremain bounded and, for a small disturbance signal, the errorbecomes small no matter what the initial error is. Linking thealgorithm stability to the stability of the nonlinear system (20),we consider the input-to-state stability (ISS) (see, e.g., [62]),where input corresponds to and state corresponds to
. The ISS approach also has been considered in [44] to suggestsome stable fuzzy learning schemes.
Let us first recall some definitions and results (from [62])concerning ISS for discrete-time nonlinear systems. A function
is a -function if it is continuous, strictly in-creasing, and . A functionis a -function if, for each fixed , the function isa -function and, for each fixed , the function isdecreasing and as . A function
is a -function if it is a -function and as.
Definition 1: The learning algorithm in (16)–(19) will be con-sidered stable from disturbances to errors if thereexists a -function and a -func-tion such that, for each (i.e.,
) and each , it holds that
The following theorem provides the stability condition.Theorem 1: If there exists a continuous function
-functions and a -function such that
, then the learning algorithm, fromto , is stable.
Proof: The result follows from [62].Result 3: The learning algorithm in (16)–(19), from distur-
bances to errors , is stable.
Authorized licensed use limited to: Universitaetsbibl Rostock. Downloaded on February 19, 2009 at 04:36 from IEEE Xplore. Restrictions apply.
KUMAR et al.: FUZZY EVALUATION OF HEART RATE SIGNALS FOR MENTAL STRESS ASSESSMENT 799
Proof: It follows from (19) using, that
Define a positive and radically unbounded functionand consider
The above expression implies
Using inequality , wehave
Substituting from (18), the above inequality becomes
Defining a constant, it follows from the above inequality that
If we define -functionsand a -function , then
and thus by Theorem 1, the result follows.
Now, we study the convergence properties of the learning al-gorithm. For this purpose, consider from (19) that
Taking the squared norm on both sides, we have
(21)
To study the convergence properties, assume that ; thenwe have
and (21) is reduced to
Substituting leads to
The above expression shows the convergence property in a sensethat the squared norm of consequents-error vector is a non-increasing function of time index . Further, it indicates that asmaller value of should lead to a faster convergence and viceversa.
The proposed method for the identification of fuzzy modelparameters can be implemented using a Gauss–Newton basedalgorithm provided in Appendix II.
B. Simulation Studies
The purpose of simulation studies is to compare the proposedapproach with the standard techniques and to verify the fast con-vergence and low misadjustment error of the learning algorithm.Consider a nonlinear function
where and . The goal is toidentify the function using the identification data sequence
generated according to
Authorized licensed use limited to: Universitaetsbibl Rostock. Downloaded on February 19, 2009 at 04:36 from IEEE Xplore. Restrictions apply.
800 IEEE TRANSACTIONS ON FUZZY SYSTEMS, VOL. 15, NO. 5, OCTOBER 2007
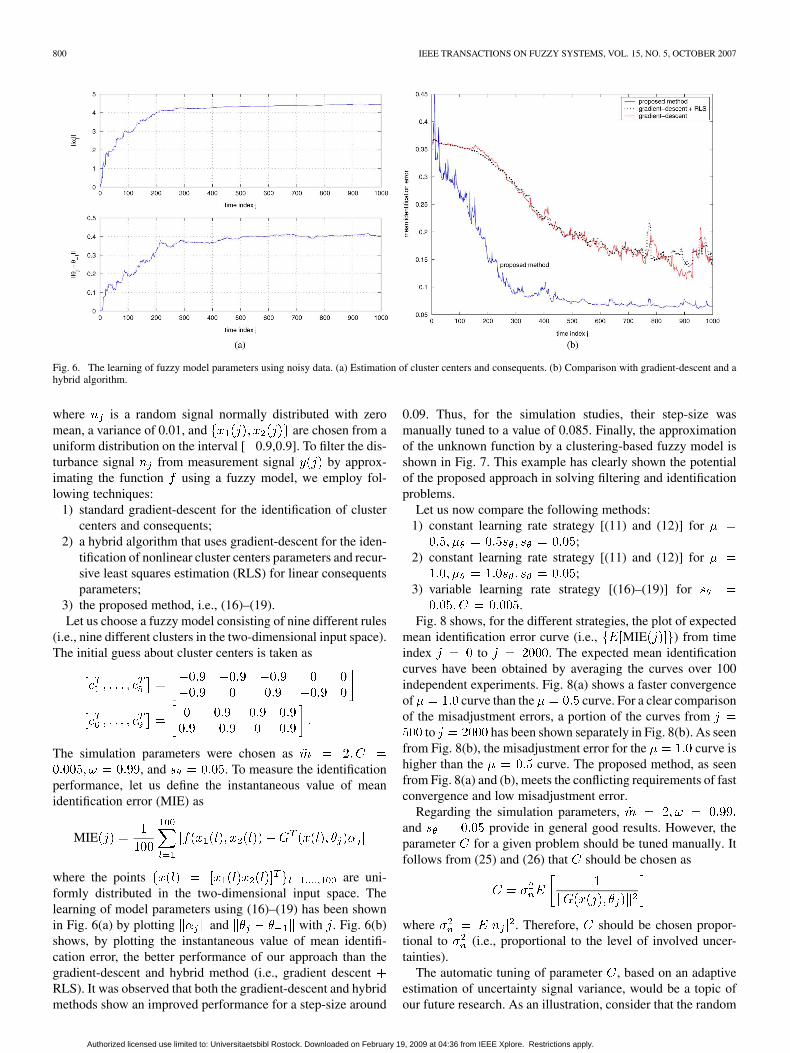
Fig. 6. The learning of fuzzy model parameters using noisy data. (a) Estimation of cluster centers and consequents. (b) Comparison with gradient-descent and ahybrid algorithm.
where is a random signal normally distributed with zeromean, a variance of 0.01, and are chosen from auniform distribution on the interval [ 0.9,0.9]. To filter the dis-turbance signal from measurement signal by approx-imating the function using a fuzzy model, we employ fol-lowing techniques:
1) standard gradient-descent for the identification of clustercenters and consequents;
2) a hybrid algorithm that uses gradient-descent for the iden-tification of nonlinear cluster centers parameters and recur-sive least squares estimation (RLS) for linear consequentsparameters;
3) the proposed method, i.e., (16)–(19).Let us choose a fuzzy model consisting of nine different rules
(i.e., nine different clusters in the two-dimensional input space).The initial guess about cluster centers is taken as
The simulation parameters were chosen as, and . To measure the identification
performance, let us define the instantaneous value of meanidentification error (MIE) as
MIE
where the points are uni-formly distributed in the two-dimensional input space. Thelearning of model parameters using (16)–(19) has been shownin Fig. 6(a) by plotting and with . Fig. 6(b)shows, by plotting the instantaneous value of mean identifi-cation error, the better performance of our approach than thegradient-descent and hybrid method (i.e., gradient descentRLS). It was observed that both the gradient-descent and hybridmethods show an improved performance for a step-size around
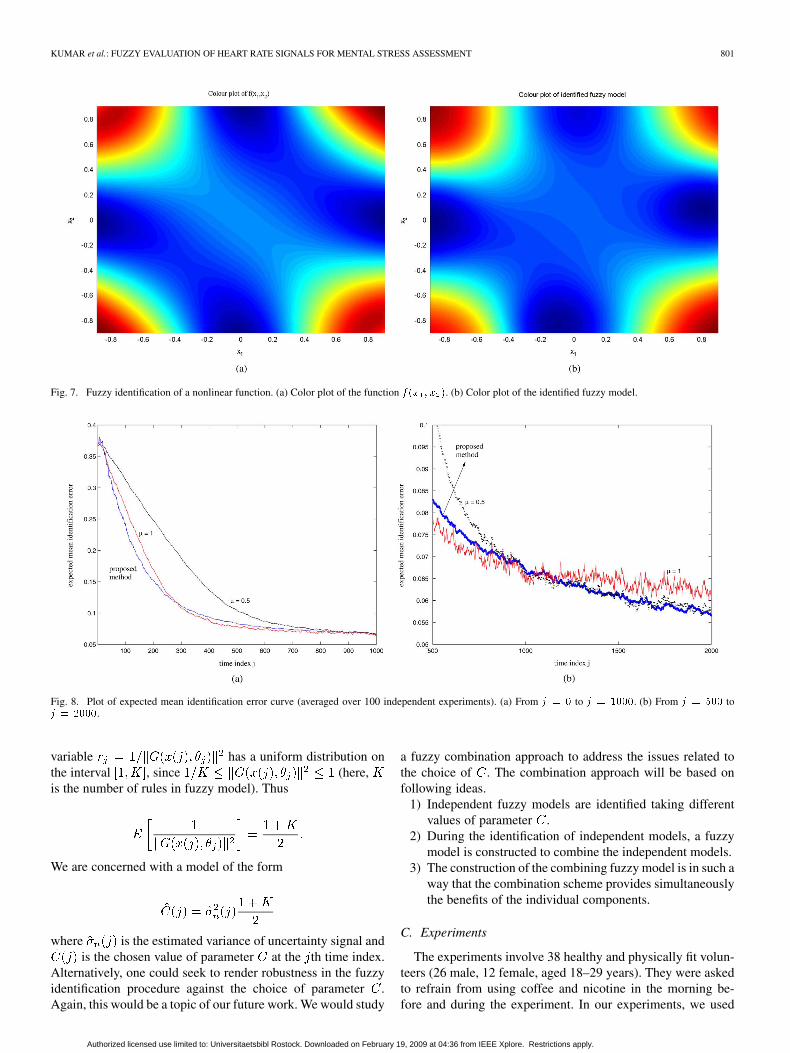
0.09. Thus, for the simulation studies, their step-size wasmanually tuned to a value of 0.085. Finally, the approximationof the unknown function by a clustering-based fuzzy model isshown in Fig. 7. This example has clearly shown the potentialof the proposed approach in solving filtering and identificationproblems.
Let us now compare the following methods:1) constant learning rate strategy [(11) and (12)] for
;2) constant learning rate strategy [(11) and (12)] for
;3) variable learning rate strategy [(16)–(19)] for
.Fig. 8 shows, for the different strategies, the plot of expected
mean identification error curve (i.e., MIE ) from timeindex to . The expected mean identificationcurves have been obtained by averaging the curves over 100independent experiments. Fig. 8(a) shows a faster convergenceof curve than the curve. For a clear comparisonof the misadjustment errors, a portion of the curves from
to has been shown separately in Fig. 8(b). As seenfrom Fig. 8(b), the misadjustment error for the curve ishigher than the curve. The proposed method, as seenfrom Fig. 8(a) and (b), meets the conflicting requirements of fastconvergence and low misadjustment error.
Regarding the simulation parameters,and provide in general good results. However, theparameter for a given problem should be tuned manually. Itfollows from (25) and (26) that should be chosen as
where . Therefore, should be chosen propor-tional to (i.e., proportional to the level of involved uncer-tainties).
The automatic tuning of parameter , based on an adaptiveestimation of uncertainty signal variance, would be a topic ofour future research. As an illustration, consider that the random
Authorized licensed use limited to: Universitaetsbibl Rostock. Downloaded on February 19, 2009 at 04:36 from IEEE Xplore. Restrictions apply.
KUMAR et al.: FUZZY EVALUATION OF HEART RATE SIGNALS FOR MENTAL STRESS ASSESSMENT 801
Fig. 7. Fuzzy identification of a nonlinear function. (a) Color plot of the function f(x ; x ). (b) Color plot of the identified fuzzy model.
Fig. 8. Plot of expected mean identification error curve (averaged over 100 independent experiments). (a) From j = 0 to j = 1000. (b) From j = 500 toj = 2000.
variable has a uniform distribution onthe interval , since (here,is the number of rules in fuzzy model). Thus
We are concerned with a model of the form
where is the estimated variance of uncertainty signal andis the chosen value of parameter at the th time index.
Alternatively, one could seek to render robustness in the fuzzyidentification procedure against the choice of parameter .Again, this would be a topic of our future work. We would study
a fuzzy combination approach to address the issues related tothe choice of . The combination approach will be based onfollowing ideas.
1) Independent fuzzy models are identified taking differentvalues of parameter .
2) During the identification of independent models, a fuzzymodel is constructed to combine the independent models.
3) The construction of the combining fuzzy model is in such away that the combination scheme provides simultaneouslythe benefits of the individual components.
C. Experiments
The experiments involve 38 healthy and physically fit volun-teers (26 male, 12 female, aged 18–29 years). They were askedto refrain from using coffee and nicotine in the morning be-fore and during the experiment. In our experiments, we used
Authorized licensed use limited to: Universitaetsbibl Rostock. Downloaded on February 19, 2009 at 04:36 from IEEE Xplore. Restrictions apply.
802 IEEE TRANSACTIONS ON FUZZY SYSTEMS, VOL. 15, NO. 5, OCTOBER 2007
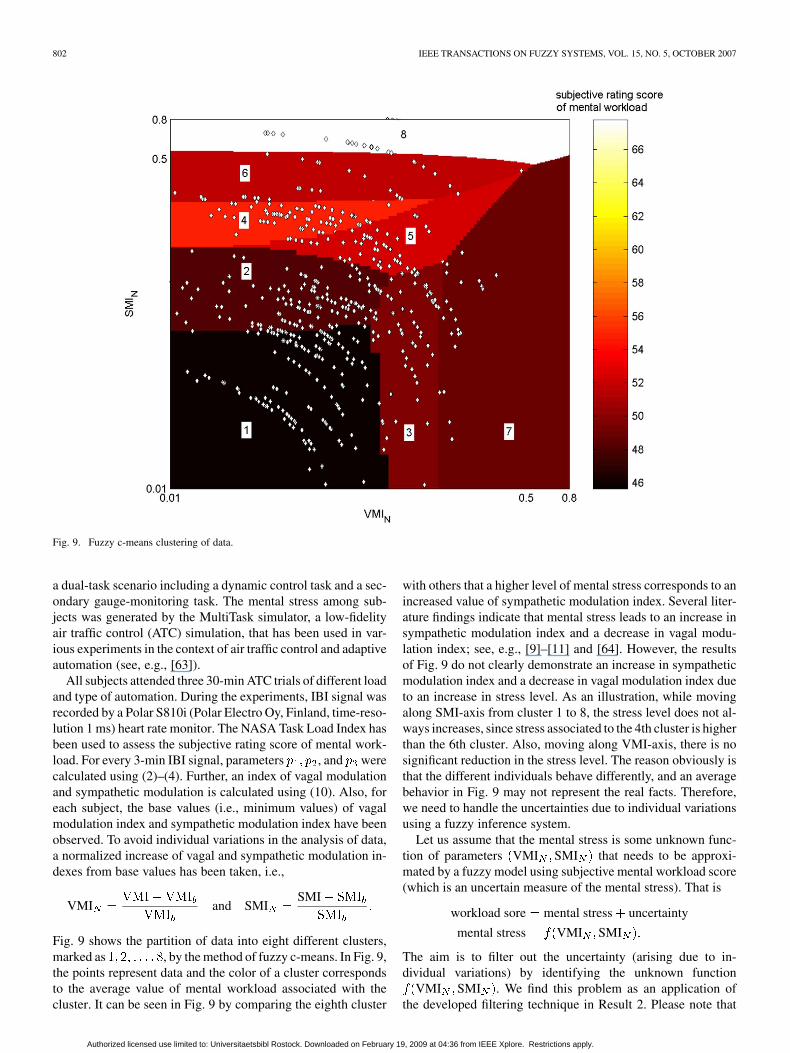
Fig. 9. Fuzzy c-means clustering of data.
a dual-task scenario including a dynamic control task and a sec-ondary gauge-monitoring task. The mental stress among sub-jects was generated by the MultiTask simulator, a low-fidelityair traffic control (ATC) simulation, that has been used in var-ious experiments in the context of air traffic control and adaptiveautomation (see, e.g., [63]).
All subjects attended three 30-min ATC trials of different loadand type of automation. During the experiments, IBI signal wasrecorded by a Polar S810i (Polar Electro Oy, Finland, time-reso-lution 1 ms) heart rate monitor. The NASA Task Load Index hasbeen used to assess the subjective rating score of mental work-load. For every 3-min IBI signal, parameters , and werecalculated using (2)–(4). Further, an index of vagal modulationand sympathetic modulation is calculated using (10). Also, foreach subject, the base values (i.e., minimum values) of vagalmodulation index and sympathetic modulation index have beenobserved. To avoid individual variations in the analysis of data,a normalized increase of vagal and sympathetic modulation in-dexes from base values has been taken, i.e.,
VMI and SMISMI
Fig. 9 shows the partition of data into eight different clusters,marked as , by the method of fuzzy c-means. In Fig. 9,the points represent data and the color of a cluster correspondsto the average value of mental workload associated with thecluster. It can be seen in Fig. 9 by comparing the eighth cluster
with others that a higher level of mental stress corresponds to anincreased value of sympathetic modulation index. Several liter-ature findings indicate that mental stress leads to an increase insympathetic modulation index and a decrease in vagal modu-lation index; see, e.g., [9]–[11] and [64]. However, the resultsof Fig. 9 do not clearly demonstrate an increase in sympatheticmodulation index and a decrease in vagal modulation index dueto an increase in stress level. As an illustration, while movingalong SMI-axis from cluster 1 to 8, the stress level does not al-ways increases, since stress associated to the 4th cluster is higherthan the 6th cluster. Also, moving along VMI-axis, there is nosignificant reduction in the stress level. The reason obviously isthat the different individuals behave differently, and an averagebehavior in Fig. 9 may not represent the real facts. Therefore,we need to handle the uncertainties due to individual variationsusing a fuzzy inference system.
Let us assume that the mental stress is some unknown func-tion of parameters VMI SMI that needs to be approxi-mated by a fuzzy model using subjective mental workload score(which is an uncertain measure of the mental stress). That is
workload sore mental stress uncertainty
mental stress VMI SMI
The aim is to filter out the uncertainty (arising due to in-dividual variations) by identifying the unknown function
VMI SMI . We find this problem as an application ofthe developed filtering technique in Result 2. Please note that
Authorized licensed use limited to: Universitaetsbibl Rostock. Downloaded on February 19, 2009 at 04:36 from IEEE Xplore. Restrictions apply.

KUMAR et al.: FUZZY EVALUATION OF HEART RATE SIGNALS FOR MENTAL STRESS ASSESSMENT 803
Fig. 10. Mental stress assessment by a fuzzy model identified using the proposed approach.
the problem here is different from standard fuzzy identificationproblem, where data could be divided into training and testdata. The data here, being uncertain, cannot be used for thevalidation of the identified fuzzy model.
The proposed fuzzy filtering and identification method in(16)–(19) has been applied with
, and . Finally, the color plot of Fig. 10 shows theassessment of mental stress from parameters (VMI SMI )using the identified fuzzy model.
Fig. 10 clearly shows an increase of SMI and a decreaseof VMI with an increase in the level of mental stress, andthus agrees completely with the previous literature findings andphysiological understanding of mental stress that sympatheticactivity is primarily related to the preparation of body forstressful situations and parasympathetic or vagal activity (mostactive under restful situations) counterbalances the effects ofthe sympathetic activity and restores the body to a resting state.By comparing the results of Figs. 9 and 10, one could easilyappreciate the good performance of the identified fuzzy modelfrom a physiological viewpoint that:
1) low sympathetic activity and high vagal activity lowstress.
2) high sympathetic activity and low vagal activity highstress.
Hence, we see that the identified fuzzy model is capable of fil-tering out uncertainties in the assessment of mental stress. For
the sake of comparison, let us investigate the potential of a linearmodel of the form
stress SMI VMI
in filtering out the uncertainties by identifying the relationshipbetween stress and SMI VMI . To identify the parameters
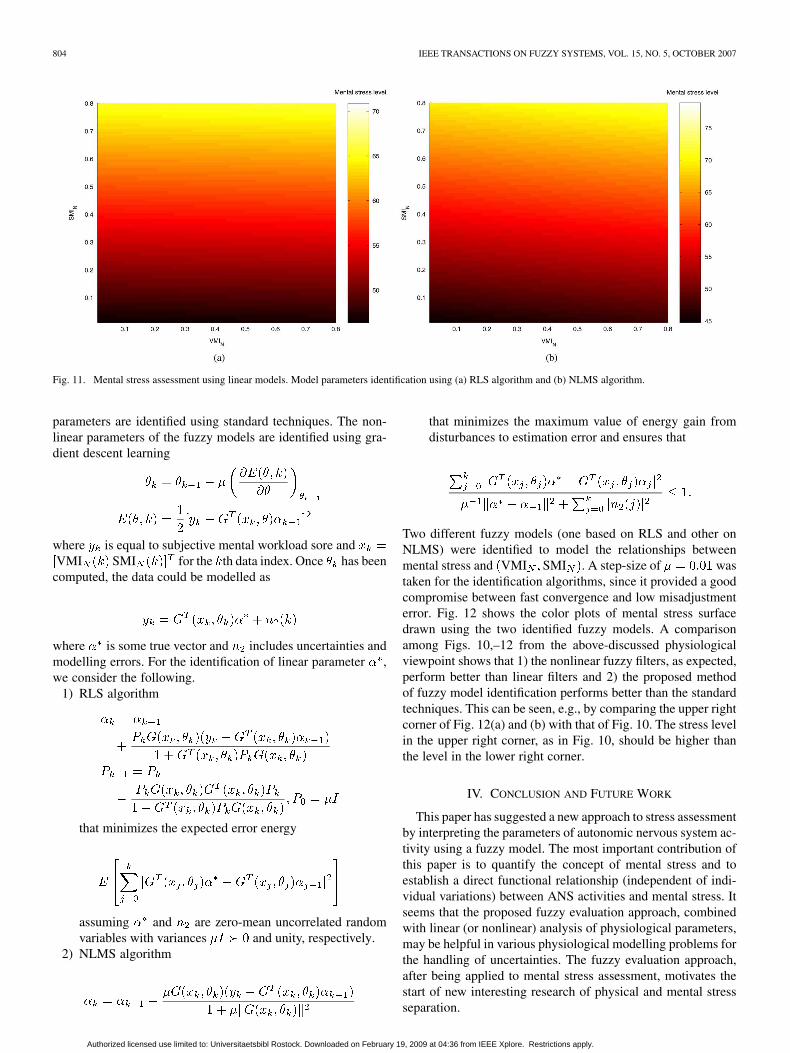
, we employ classical filtering i.e., RLS, and ro-bust filtering, i.e., normalized least mean squares algorithm(NLMS). A step-size of 0.005 was used for RLS and NLMS inidentifying the model parameters till the algorithms nearly con-verged. Fig. 11 shows the plots of mental stress surface overSMI VMI plane drawn using the identified linear models.As seen from Fig. 11, the linear models, unlike the fuzzy model,could not capture the nonlinear relationships between physio-logical parameters and mental stress level. The linear models inFig. 11, unlike fuzzy model, fail to provide any insight into therelationships between VMI and mental stress level.
We have seen that a fuzzy model, identified using the pro-posed approach, could handle the involved uncertainties (arisingdue to individual variation) in the assessment of mental stressbased on the interpretation of physiological parameters. Now,we study two more nonlinear fuzzy filters for filtering out theuncertainties in mental stress assessment. The fuzzy filters are ofsame structure as considered in this text [i.e., (9)], however, the
Authorized licensed use limited to: Universitaetsbibl Rostock. Downloaded on February 19, 2009 at 04:36 from IEEE Xplore. Restrictions apply.
804 IEEE TRANSACTIONS ON FUZZY SYSTEMS, VOL. 15, NO. 5, OCTOBER 2007
Fig. 11. Mental stress assessment using linear models. Model parameters identification using (a) RLS algorithm and (b) NLMS algorithm.
parameters are identified using standard techniques. The non-linear parameters of the fuzzy models are identified using gra-dient descent learning
where is equal to subjective mental workload sore andVMI SMI for the th data index. Once has been
computed, the data could be modelled as
where is some true vector and includes uncertainties andmodelling errors. For the identification of linear parameter ,we consider the following.
1) RLS algorithm
that minimizes the expected error energy
assuming and are zero-mean uncorrelated randomvariables with variances and unity, respectively.
2) NLMS algorithm
that minimizes the maximum value of energy gain fromdisturbances to estimation error and ensures that
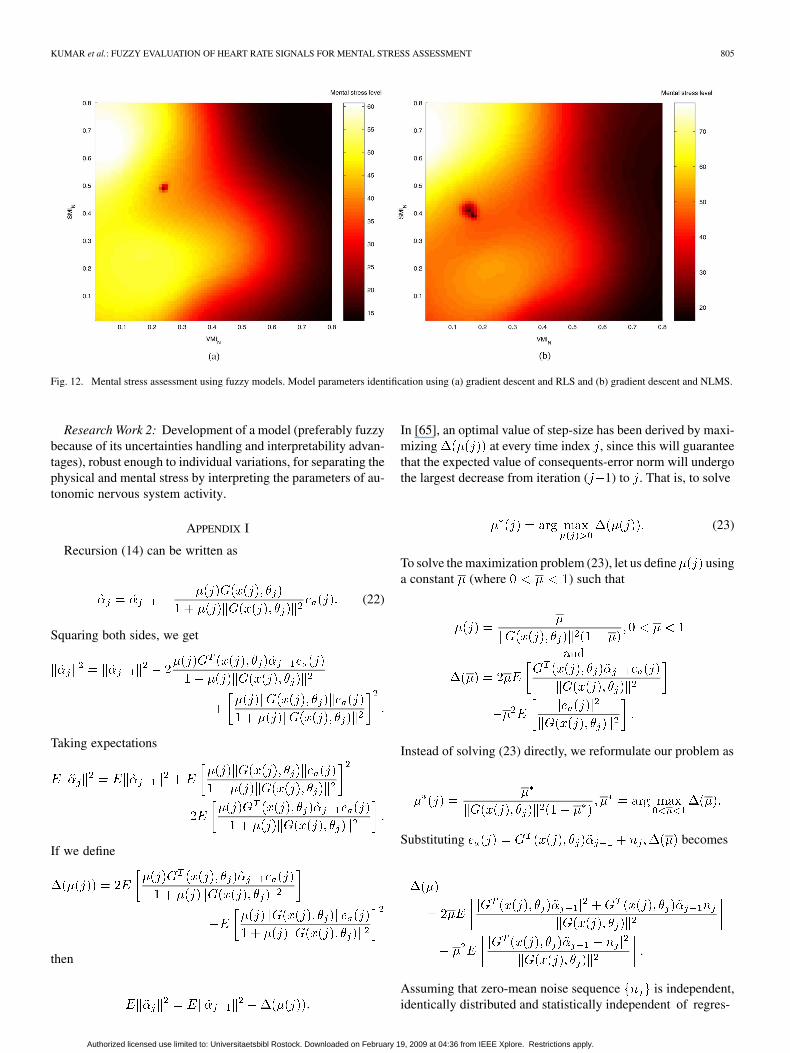
Two different fuzzy models (one based on RLS and other onNLMS) were identified to model the relationships betweenmental stress and VMI SMI . A step-size of wastaken for the identification algorithms, since it provided a goodcompromise between fast convergence and low misadjustmenterror. Fig. 12 shows the color plots of mental stress surfacedrawn using the two identified fuzzy models. A comparisonamong Figs. 10,–12 from the above-discussed physiologicalviewpoint shows that 1) the nonlinear fuzzy filters, as expected,perform better than linear filters and 2) the proposed methodof fuzzy model identification performs better than the standardtechniques. This can be seen, e.g., by comparing the upper rightcorner of Fig. 12(a) and (b) with that of Fig. 10. The stress levelin the upper right corner, as in Fig. 10, should be higher thanthe level in the lower right corner.
IV. CONCLUSION AND FUTURE WORK
This paper has suggested a new approach to stress assessmentby interpreting the parameters of autonomic nervous system ac-tivity using a fuzzy model. The most important contribution ofthis paper is to quantify the concept of mental stress and toestablish a direct functional relationship (independent of indi-vidual variations) between ANS activities and mental stress. Itseems that the proposed fuzzy evaluation approach, combinedwith linear (or nonlinear) analysis of physiological parameters,may be helpful in various physiological modelling problems forthe handling of uncertainties. The fuzzy evaluation approach,after being applied to mental stress assessment, motivates thestart of new interesting research of physical and mental stressseparation.
Authorized licensed use limited to: Universitaetsbibl Rostock. Downloaded on February 19, 2009 at 04:36 from IEEE Xplore. Restrictions apply.
KUMAR et al.: FUZZY EVALUATION OF HEART RATE SIGNALS FOR MENTAL STRESS ASSESSMENT 805
Fig. 12. Mental stress assessment using fuzzy models. Model parameters identification using (a) gradient descent and RLS and (b) gradient descent and NLMS.
Research Work 2: Development of a model (preferably fuzzybecause of its uncertainties handling and interpretability advan-tages), robust enough to individual variations, for separating thephysical and mental stress by interpreting the parameters of au-tonomic nervous system activity.
APPENDIX I
Recursion (14) can be written as
(22)
Squaring both sides, we get
Taking expectations
If we define
then
In [65], an optimal value of step-size has been derived by maxi-mizing at every time index , since this will guaranteethat the expected value of consequents-error norm will undergothe largest decrease from iteration ( 1) to . That is, to solve
(23)
To solve the maximization problem (23), let us define usinga constant (where ) such that
Instead of solving (23) directly, we reformulate our problem as
Substituting becomes
Assuming that zero-mean noise sequence is independent,identically distributed and statistically independent of regres-
Authorized licensed use limited to: Universitaetsbibl Rostock. Downloaded on February 19, 2009 at 04:36 from IEEE Xplore. Restrictions apply.
806 IEEE TRANSACTIONS ON FUZZY SYSTEMS, VOL. 15, NO. 5, OCTOBER 2007
sion sequence can be approximated as
(24)
where . Maximizing (24) leads to
If we define a vector, then
(25)
Thus, to compute the optimal learning rate , we first needto at least compute the term . To do this, we follow theapproach of [65] to estimate as
for a smoothing factor , being motivated by thefact that
Thus, we propose to estimate as
(26)
where is a constant. Now, the estimation strategy in (13) and(14) for optimal learning rate becomes (16)–(19).
APPENDIX IIA GAUSS–NEWTON BASED ALGORITHM
Given input–output data pairs , to computethe parameters
, we suggest a Gauss–Newton based algorithm. Thealgorithm consists of the following steps.
1) Choose initial guess about cluster centers , number ofmaximum epochs , epoch count EC ,and data index .
2) If ECa) if
i) define
and let be the unique solution of the fol-lowing linear least squares problem:
where is the Jacobian matrix of vectorwith respect to , determined by the method offinite differences. The Jacobian is a fullrank matrix, as a result of using regularization.
ii) compute .iii) compute
iv) and go to step 2a).b) EC EC , and
go to step 2.The major computational complexity of the above algorithmlies in solving the linear least squares problem
. A Matlab code was developed to implement the al-gorithm, where the linear least squares problem was solved bycomputing the Moore–Penrose pseudoinverse. The average timein seconds required for one pass of the algorithm (i.e., step 2a)on a Pentium 2.53 GHz computer was approximately equal to(number of clusters) (4000).
REFERENCES
[1] W. W. Wierwille and F. T. Eggemeier, “Recomendations for mentalworkload measurement in a test and evaluation environment,” HumanFactors, vol. 35, no. 2, pp. 263–281, 1993.
[2] A. F. Kramer, “Physiological metrics of mental workload: A review ofrecent progress,” in Multiple-Task Performance, D. L. Damos, Ed.London, U.K.: Taylor and Francis, 1991, pp. 279–328.
[3] J. Aasman, G. Mulder, and L. J. M. Mulder, “Operator effort and themeasurement of heart-rate variability,” Human Factors, vol. 29, pp.161–170, 1987.
[4] L. J. M. Mulder and G. Mulder, “Cardiovavscular reactivity and mentalworkload,” in The Beat-by-Beat Investigation of Cardiovascular Func-tion, O. Rompelman and R. I. Kitney, Eds. Oxford, U.K.: OxfordUniv. Press, 1987, pp. 216–253.
[5] E. J. Sirevaag, A. F. Kramer, C. D. Wickens, M. Reisweber, D. L.Strayer, and J. F. Grenell, “Assessment of pilot performance and mentalworkload in rotary wing aircraft,” Ergonomics, vol. 36, pp. 1121–1140,1993.
[6] A. J. Tattersall and G. R. Hockey, “Level of operator control andchanges in heart rate variability during simulated flight maintenance,”Human Factors, vol. 37, no. 4, pp. 682–698, 1995.
[7] G. F. Wilson, “Air-to-ground training missions: A psychophysiologicalworkload analysis,” Ergonomics, vol. 36, pp. 1071–1087, 1993.
[8] G. F. Wilson and F. T. Eggemeier, “Psychophysiological assessmentof workload in multitask environments,” in Multiple-Task Perfor-mance, D. L. Damos, Ed. London, U.K.: Taylor and Francis, 1991,pp. 329–360.
Authorized licensed use limited to: Universitaetsbibl Rostock. Downloaded on February 19, 2009 at 04:36 from IEEE Xplore. Restrictions apply.
KUMAR et al.: FUZZY EVALUATION OF HEART RATE SIGNALS FOR MENTAL STRESS ASSESSMENT 807
[9] A. Lindqvist, E. Keskinen, K. Antila, L. Halkola, T. Peltonen, and I.Valimaki, “Heart rate variability, cardiac mechanics, and subjectivelyevaluated stress during simulator flight,” Aviation Space Environ. Med.,vol. 54, pp. 685–690, 1983.
[10] T. Kamada, S. Miyake, M. Kumashiro, H. Monou, and K. Inoue,“Power spectral analysis of heart rate variability in type As and typeBs during mental workload,” Psychosom. Med., vol. 54, pp. 462–470,1992.
[11] M. Kollai and B. Kollai, “Cardiac vagal tone in generalised anxietydisorder,” Br. J. Psychiatr., vol. 161, pp. 831–835, 1992.
[12] Task Force of the European Society of Cardiology and the North Amer-ican Society of Pacing and Electrophysiology, “Heart rate variability.standards of measurement, physiological interpretation, and clinicaluse,” Eur. Heart J., vol. 17, pp. 354–381, 1996.
[13] W. A. Tiller, R. McCraty, and M. Atkinson, “Cardiac coherence: Anew, noninvasive measure of autonomic nervous system order,” Alt.Therapies, vol. 2, no. 1, pp. 52–65, 1996.
[14] J. K. Lenneman and R. W. Backs, “The validity of factor analyticallyderived cardiac autonomic components for mental workload assess-ment,” in Engineering Psychophysiology: Issues and Applications,R. Backs and W. Boucsein, Eds. Mahwah, NJ: Lawrence Erlbaum,2000, pp. 161–175.
[15] B. M. Sayers, “Analysis of heart rate variability,” Ergonomics, vol. 16,no. 1, pp. 17–32, 1973.
[16] S. Akselrod, D. Gordon, F. A. Ubel, D. C. Shannon, A. C. Barger,and R. J. Cohen, “Power spectrum analysis of heart rate fluctuation:A quantitative probe of beat to beat cardiovascular control,” Science,vol. 213, pp. 220–222, 1981.
[17] C. Yang and T. Kuo, “Assessment of cardiac sympathetic regulation byrespiratory-related arterial pressure variability in the rat,” J. Physiol.,vol. 515, pp. 887–896, 1999.
[18] A. M. Bianchi, L. T. Mainardi, C. Merloni, S. Chierchia, andS. Cerutti, “Continuous monitoring of the sympatho-vagal balancethrough spectral analysis,” IEEE Eng. Med. Bio., vol. 16, pp.64–73, 1997.
[19] J. Morlet, G. Arens, I. Fourgeau, and D. Giard, “Wave propagation andsampling theory,” Geophysics, vol. 47, pp. 203–236, 1982.
[20] O. Fukuda, Y. Nagata, K. Homma, and T. Tsuji, “Evaluation of heartrate variability by using wavelet transformation and a recurrent neuralnetwork,” in 23rd Annu. Int. Conf. IEEE Eng. Med. Biol., Istanbul,Turkey, 2001.
[21] L. A. Zadeh, “Outline of a new approach to the analysis of complexsystems and decision processes,” IEEE Trans. Syst., Man, Cybern., vol.SMC-3, pp. 28–44, Jan. 1973.
[22] R. Babuska, Fuzzy Modeling for Control. Boston, MA: Kluwer Aca-demic, 1998.
[23] M. Kumar, R. Stoll, and N. Stoll, “Robust solution to fuzzyidentification problem with uncertain data by regularization—Fuzzyapproximation to physical fitness with real world medical data:An application,” Fuzzy Opt. Decision Making, vol. 3, no. 1, pp.63–82, Mar. 2004.
[24] L. X. Wang and J. M. Mendel, “Generating fuzzy rules by learningfrom examples,” IEEE Trans. Syst., Man, Cybern., vol. 22, no. 6, pp.1414–1427, 1992.
[25] M. Kumar, R. Stoll, and N. Stoll, “Robust adaptive fuzzy identifica-tion of time-varying processes with uncertain data: Handling uncer-tainties in the physical fitness fuzzy approximation with real worldmedical data: An application,” Fuzzy Opt. Decision Making, vol. 2, pp.243–259, Sep.. 2003.
[26] J.-S. R. Jang, “ANFIS: Adaptive-network-based fuzzy inference sys-tems,” IEEE Trans. Syst., Man, Cybern., vol. 23, pp. 665–685, May1993.
[27] M. Kumar, R. Stoll, and N. Stoll, “Regularized adaptation of fuzzyinference systems. Modelling the opinion of a medical expert aboutphysical fitness: An application,” Fuzzy Opt. Decision Making, vol. 2,Dec. 2003.
[28] D. Nauck and R. Kruse, “A neuro-fuzzy approach to obtain inter-pretable fuzzy systems for function approximation,” in Proc. IEEEInt. Conf. Fuzzy Syst. 1998 (FUZZ-IEEE’98), Anchorage, AK, May1998, pp. 1106–1111.
[29] F. Herrera, M. Lozano, and J. Verdegay, “Generating fuzzy rules fromexamples using genetic algorithms,” in Proc. 5th Int. Conf. Inf. Process.Manag. Uncertainty Knowledge-Based Syst. (IPMU’94), Paris, France,Jul. 1994, pp. 675–680.
[30] P. Rani, J. Sims, R. Brackin, and N. Sarkar, “Online stress detectionusing psychophysiological signal for implicit human-robot coopera-tion,” Robotica, vol. 20, no. 6, pp. 673–686, 2002.
[31] J. S. R. Jang, C. T. Sun, and E. Mizutani, Neuro-Fuzzy and Soft Com-puting: A Computational Approach to Learning and Machine Intelli-gence. Upper Saddle River, NJ: Prentice-Hall, 1997.
[32] K. Nozaki, H. Ishibuchi, and H. Tanaka, “A simple but powerfulheuristic method for generating fuzzy rules from numerical data,”Fuzzy Sets Syst., vol. 86, pp. 251–270, 1997.
[33] P. Thrift, “Fuzzy logic synthesis with genetic algorithms,” in Proc. 4thInt. Conf. Genetic Algorithms, 1991, pp. 509–513.
[34] J. Liska and S. S. Melsheimer, “Complete design of fuzzy logic systemsusing genetic algorithms,” in Proc. 3rd IEEE Int. Conf. Fuzzy Syst.,1994, pp. 1377–1382.
[35] J. Abonyi, R. Babuska, and F. Szeifert, “Modified Gath-Geva fuzzyclustering for identification of takagi-sugeno fuzzy models,” IEEETrans. Syst., Man, Cybern., pt. B, pp. 612–621, Oct. 2002.
[36] J. J. Shan and H. C. Fu, “A fuzzy neural network for rule acquiring onfuzzy control systems,” Fuzzy Sets Syst., vol. 71, pp. 345–357, 1995.
[37] A. Gonzalez and R. Pérez, “Completeness and consistency conditionsfor learning fuzzy rules,” Fuzzy Sets Syst., vol. 96, pp. 37–51,1998.
[38] D. Simon, “Design and rule base reduction of a fuzzy filter for theestimation of motor currents,” Int. J. Approx. Reason., vol. 25, pp.145–167, Oct. 2000.
[39] ——, “Training fuzzy systems with the extended Kalman filter,” FuzzySets Syst., vol. 132, pp. 189–199, Dec. 2002.
[40] S. Wu and M. J. Er, “Dynamic fuzzy neural networks—Anovel ap-proach to function approximation,” IEEE Trans. Syst., Man., Cybern.B, vol. 30, pp. 358–364, 2000.
[41] M. Burger, H. Engl, J. Haslinger, and U. Bodenhofer, “Regularizeddata-driven construction of fuzzy controllers,” J. Inverse Ill-PosedProblems, vol. 10, pp. 319–344, 2002.
[42] D. S. Chen and R. C. Jain, “A robust back propagation learning algo-rithm for function approximation,” IEEE Trans. Neural Netw., vol. 5,pp. 467–479, May 1994.
[43] W. Y. Wang, T. T. Lee, C. L. Liu, and C. H. Wang, “Function approx-imation using fuzzy neural networks with robust learning algorithm,”IEEE Trans. Syst., Man., Cybern. B, vol. 27, pp. 740–747, Sep.. 1997.
[44] W. Yu and X. Li, “Fuzzy identification using fuzzy neural networkswith stable learning algorithms,” IEEE Trans. Fuzzy Syst., vol. 12, no.3, pp. 411–20, Jun. 2004.
[45] T. Johansen, “Robust identification of Takagi-Sugeno-Kang fuzzymodels using regularization,” in Proc. IEEE Conf. Fuzzy Syst., NewOrleans, LA, 1996, pp. 180–186.
[46] X. Hong, C. J. Harris, and S. Chen, “Robust neurofuzzy rule baseknowledge extraction and estimation using subspace decompositioncombined with regularization and d-optimality,” IEEE Trans. Syst.,Man., Cybern. B, vol. 34, no. 1, pp. 598–608, 2004.
[47] M. Kumar, R. Stoll, and N. Stoll, “SDP and SOCP for outer and robustfuzzy approximation,” in Proc. 7th IASTED Int. Conf. Artificial Int. SoftComp., Banff, Canada, Jul. 2003.
[48] ——, “A robust design criterion for interpretable fuzzy models withuncertain data,” IEEE Trans. Fuzzy Syst., vol. 14, no. 2, pp. 314–328,Apr. 2006.
[49] ——, “Robust adaptive identification of fuzzy systems with uncertaindata,” Fuzzy Opt. Decision Making, vol. 3, no. 3, pp. 195–216, Sep..2004.
[50] M. Kumar, N. Stoll, and R. Stoll, “An energy-gain bounding approachto robust fuzzy identification,” Automatica, vol. 42, no. 5, pp. 711–721,May 2006.
[51] M. Kumar, R. Stoll, and N. Stoll, “A min-max approach to fuzzy clus-tering, estimation, and identification,” IEEE Trans. Fuzzy Syst., vol. 14,pp. 248–262, Apr. 2006.
[52] M. B. Lotric, A. Stefanovska, D. Stajer, and V. Urbancic-Rovan,“Spectral components of heart rate variability determined by waveletanalysis,” Physiol. Meas., vol. 21, pp. 441–457, 2000.
[53] S. G. Hart and L. E. Staveland, “Development of a multi-dimensionalworkload rating scale: Results of empirical and theoretical research,”in Human Mental Workload, P. A. Hancock and N. Meshkati, Eds.Amsterdam, The Netherlands: Elsevier, 1988.
[54] J. C. Bezdek, Pattern Recognition with Fuzzy Objective Function Al-gorithms. New York: Plenum, 1981.
[55] R. Krishnapuram and J. M. Keller, “A possibilistic approach to clus-tering,” IEEE Trans. Fuzzy Syst., vol. 1, pp. 98–110, May 1993.
[56] R. Krishnapuram and J. M. Keller, “The possibilistic c-means algo-rithm: Insights and recommendations,” IEEE Trans. Fuzzy Syst., vol.4, pp. 385–393, Aug. 1996.
[57] R. N. Davé, “Characterization and detection of noise in clustering,”Pattern Recognit. Lett., vol. 12, no. 11, pp. 657–664, 1991.
Authorized licensed use limited to: Universitaetsbibl Rostock. Downloaded on February 19, 2009 at 04:36 from IEEE Xplore. Restrictions apply.
808 IEEE TRANSACTIONS ON FUZZY SYSTEMS, VOL. 15, NO. 5, OCTOBER 2007
[58] J. S. Zhang and Y. W. Leung, “Improved possibilistic c-means clus-tering algorithms,” IEEE Trans. Fuzzy Syst., vol. 12, pp. 209–217, Apr.2004.
[59] N. R. Pal, K. Pal, J. M. Keller, and J. C. Bezdek, “A possibilistic fuzzyc-means clustering algorithm,” IEEE Trans. Fuzzy Syst., vol. 13, pp.517–530, Aug. 2005.
[60] M. S. Houle and G. E. Billman, “Low-frequency component of heartrate variability spectrum: A poor marker of sympathetic activity,”Amer. J. Physiol., vol. 276, pp. 215–223, 1999.
[61] Y. Zhong, H. Wang, K. H. Ju, K.-M. Jan, and K. H. Chon, “Nonlinearanalysis of the separate contributions of autonomic nervous systemsto heart rate variability using principal dynamic modes,” IEEE Trans.Biomed. Eng., vol. 51, pp. 255–262, Feb. 2004.
[62] Z. P. Jiang and Y. Wang, “Input-to-state stability for discrete-time non-linear systems,” Automatica, vol. 37, no. 6, pp. 857–869, 2001.
[63] M. P. Clamann, M. C. Wright, and D. B. Kaber, “Comparison of per-formance effects of adaptive automation applied to various stages ofhuman-machine system information processing,” in Proc. 46th Annu.Meeting Human Factors Ergon. Soc., Santa Monica, CA, 2002, pp.342–346.
[64] R. McCraty, M. Atkinson, W. Tiller, G. Rein, and A. D. Watkins, “Theeffects of emotions on short-term power spectrum analysis of heart ratevariability,” Amer. J. Cardiol., vol. 76, no. 14, pp. 1089–1093, 1995.
[65] H.-C. Shin, A. H. Sayed, and W.-J. Song, “Variable step-size nlms andaffine projection algorithms,” IEEE Signal Process. Lett., vol. 11, pp.132–135, Feb. 2004.
Mohit Kumar received the B.Tech. degree inelectrical engineering from the National Institute ofTechnology, Hamirpur, India, in 1999, the M.Tech.degree in control engineering from the Indian Insti-tute of Technology, Delhi, in 2001, and the Ph.D.degree (summa cum laude) in electrical engineeringfrom Rostock University, Germany, in 2004.
He was a Research Scientist with the Institute ofOccupational and Social Medicine, Rostock, from2001 to 2004. Currently, he is with the Center forLife Science Automation, Rostock. His research
interests include robust adaptive fuzzy identification, fuzzy logic in medicine,and robust adaptive control.
Matthias Weippert received the first state examina-tion for lectureship in biology and physical educationfrom Rostock University, Germany, in 2003.
He was a Research Scientist with the Institute ofOccupational and Social Medicine, Rostock, during2004–2005. Since 2006, he has been with the Insti-tute of Preventive Medicine, Rostock. His researchinterests include performance diagnostics and stress-strain-reactions in occupational and sports medicine.
Reinhard Vilbrandt received the university entrancediploma from CJD Rostock, Germany, in 1997. Hereceived the intermediate diploma and the Dipl. Ing.degree from Rostock University, Germany, in 2000and 2004, respectively, both in automation.
He is a Scientific Assistant with the Instituteof Preventive Medicine, Rostock University. Hewas with the civil service during 1997–1998 at aresidential home for the elderly. His thesis topic was“Mobile System for Flexible Recordation of Physicaland Physco-Mental Load.” He is responsible for the
integration and development of mobile measurement into a central database.
Steffi Kreuzfeld received the Dr.Med. degree fromRostock University, Germany, in 2003.
She has been with the Institute of Occupational andSocial Medicine since 2004.
Regina Stoll received the Dipl.-Med. degree, theDr.Med. degree in occupational medicine, and theDr.Med.Habil degree in occupational and sportsmedicine from Rostock University, Germany, in1980, 1984, and 2002, respectively.
She is Head of the Institute of PreventiveMedicine, Rostock. She is a Member of the Facultyof Medicine and a Faculty Associate with the Collegeof Computer Science and Electrical Engineering,Rostock University. She is a member of the AdjunctFaculty in the Industrial Engineering Department,
North Carolina State University. Her research interests include occupationalphysiology, preventive medicine, and cardiopulmonary diagnostics.
Authorized licensed use limited to: Universitaetsbibl Rostock. Downloaded on February 19, 2009 at 04:36 from IEEE Xplore. Restrictions apply.