Liquid phase deposition synthesis of hexagonal molybdenum trioxide thin films
Upload
independentCategory
view
0download
0
9620003–004X/97/0910–0962$05.00
American Mineralogist, Volume 82, pages 962–978, 1997
Structure of synthetic monoclinic Na-rich birnessite and hexagonal birnessite:II. Results from chemical studies and EXAFS spectroscopy
EWEN SILVESTER,1,† ALAIN MANCEAU,1,* AND VICTOR A. DRITS2
1Environmental Geochemistry Group, LGIT-IRIGM, University of Grenoble and CNRS, 38041 Grenoble Cedex 9, France2Geological Institute of the Russian Academy of Sciences, 7 Pyzhevsky prospekt, 109017 Moscow, Russia
ABSTRACT
Solution chemical techniques were used to study the conversion of synthetic Na-richbuserite (NaBu) to hexagonal (H1-exchanged) birnessite (HBi) at low pH. The low-pHreaction is broadly characterized by the exchange of structural Na1 with solution H1 andthe partial loss of Mn21 to the aqueous phase. The desorption of Na1 in two temporallydistinct steps indicates the existence of two types of binding sites for this cation. Mn21
appears to originate from a partial disproportionation of Mn31 in the NaBu layers, accord-ing to the sequence
31 31 41 21 41 21Mn 1 Mn → Mn 1 Mn → Mn 1 Vacancy 1 Mn .layer layer layer layer layer aq
EXAFS measurements on Na-rich birnessite (NaBi) show that this mineral is primarily alayered structure formed by edge-sharing MnO6 octahedra, with no evidence for triple-corner (TC) sharing Mn. HBi is significantly different with strong evidence for TC-sharingMn and therefore layer vacancies. The relative numbers of edge (E)-sharing and TC-shar-ing neighbors determined from EXAFS measurements on HBi is consistent with SAEDresults (Drits et al. 1997), which suggest that the layer vacancies are restricted to everythird row of Mn cations, with 50% of the Mn sites along these rows vacant. The densityof vacancies in the entire layer is therefore one in six of layer Mn sites. Polarized EXAFSmeasurements on orientated films of NaBi and HBi confirm the absence of TC-sharingMn in NaBi and indicate that Mn adsorbed at layer vacancy sites in HBi at pH 4 isdominantly Mn31. The intensity of the TC-sharing contribution to the Mn EXAFS spectraof HBi samples increases with increasing pH from pH 2 to 5, and supports a mechanismof formation involving both the direct migration of layer Mn31 to interlayer TC-sharingpositions and re-adsorption of Mn21 from solution onto layer vacancy sites. The migrationof Mn31 cations into the interlayer releases the steric strain associated with the Jahn-Tellerdistortion of these octahedra. This model of the NaBu-to-HBi conversion explains thetransformation from orthogonal to hexagonal layer symmetry, respectively, as reported byDrits et al. (1997).
Analysis of the Zn EXAFS spectrum of Zn21-exchanged birnessite shows that Zn21 alsooccupies TC-sharing positions at layer vacancy sites. The results of this study stronglysuggest that lattice cation vacancies are of critical importance in adsorption and electrontransfer processes occurring at the surface of this mineral.
INTRODUCTION
Hydrous manganese oxides (HMO) play a pivotal rolein the redox and adsorption processes that occur in soil,groundwater, oceanic, and aquatic systems (e.g., Kraus-kopf 1957; McKenzie 1967; Werhli et al. 1995). In lab-oratory-based studies of such processes, synthetically pre-pared manganese oxides are commonly used as modelmaterials to avoid the inherent complexity of natural ma-terials (e.g., Gray and Malati 1979a, 1979b; Catts and
* Author to whom correspondence should be addressed.† Present address: CSIRO Division of Minerals, Box 312,
Clayton South, 3169, Australia.
Langmuir 1986; McKenzie 1980). Synthetic buserite andbirnessite, being of mixed Mn valency and generally dis-ordered in nature, mimic the essential features of naturallayered HMO and have been used as model manganeseoxide materials. Recent electron transfer studies per-formed using synthetic Na-rich buserite (Crowther et al.1983; Xyla et al. 1992; Manceau and Charlet 1992) re-vealed considerable information on the reaction mecha-nisms involved, however the relatively poor structuralcharacterization of this mineral remains a principal limi-tation in understanding these reactions at the atomic level.In particular, a knowledge of the spatial distribution oflower valency states of Mn (Mn31 and Mn21 ) as well as
963SILVESTER ET AL.: BIRNESSITE STRUCTURE
the abundance and distribution of lattice cation vacanciesis required.
Buserite and birnessite can be broadly described ashaving a layered structure, formed by edge-sharing MnO6
octahedra. The interlayer region between adjacent layersis occupied by various combinations of cationic speciesand H2O according to the particular buserite or birnessitespecies. For synthetic Na-rich buserite the interlayer re-gion is occupied by Na1 ions and H2O. Partial dehydra-tion leads to the formation of the Na-rich birnessite phaseand is associated with a change in the interlayer spacingfrom 10 to 7 A (Giovanoli 1980), a difference that isapproximately equal to the diameter of molecular H2O(2.8 A).
Adsorption and redox processes are typically studiedunder low pH conditions. With the exception of the stud-ies by Giovanoli et al. (1970b, 1980) there has been veryfew investigations of the structure of the low pH formsof synthetic buserite and birnessite. Chemical analysesshow that below pH 7, Na1 in the solid exchanges for H1
from solution, whereas structural studies reveal a changein the interlayer spacing from 10 to 7 A (Giovanoli et al.1970b). This change in interlayer spacing is similar tothat observed between synthetic Na-rich buserite andNa-rich birnessite, although it is reasonable to supposethat at low pH the decrease of the interlayer spacing is atleast partly associated with loss of Na1 from the interlay-er. Selected-area electron diffraction (SAED) and X-raydiffraction (XRD) studies of synthetic Na-rich birnessiteand H-exchanged birnessite microcrystals show that thehigh pH to low pH transformation is characterized by achange from a monoclinic unit cell (Post and Veblen1990; Giovanoli et al. 1970a) to a hexagonal unit cell, aswas demonstrated by Drits et al. (1997) and, to someextent, demonstrated previously (Giovanoli et al. 1970b).
The synthetic forms of Na-rich buserite and Na-richbirnessite that were prepared in this study are referred toby the names NaBu and NaBi, respectively. The low pHforms of synthetic buserite and birnessite are all charac-terized by a 7 A layer spacing, regardless of whether theyare in the form of a suspension or as a dry powder. Onthe basis of both the similar chemical nature of the lowpH forms of synthetic buserite and birnessite and the ob-servation that all are 7 A hexagonal species, we believethat they are, collectively, most appropriately referred toas hexagonal birnessite (HBi).
In this article, the results from chemical studies of theNaBu to HBi conversion process and extended X-ray ab-sorption fine structure (EXAFS) spectroscopic studies ofboth NaBi and HBi are presented and discussed in lightof the structural observations of Drits et al. (1997). Oneof the primary aims of these articles is to present struc-tural and chemical models for NaBi and HBi that can beused to assist in the interpretation of the adsorption andelectron transfer processes that occur on the surfaces ofthese minerals.
EXPERIMENTAL DESCRIPTION
Preparation of Na-rich buserite and Na-rich birnessite
The method of preparation and preliminary character-ization of NaBu has been described previously (Drits etal. 1997). Particles were stored in a hydrated state at thesynthesized solids concentration (;50 g/L) in polypro-pylene containers at 5 8C before use.
For the preparation of orientated films of NaBi the fol-lowing procedure was used. Approximately 5 cm3 of theNaBu suspension was ultrasonicated for several minutesto ensure good dispersion of the platelets. Then a smallquantity of this suspension was deposited within a 2 cmdiameter retaining gasket placed on a glass plate. Thesuspension was allowed to dry slowly in air yielding asolid disk of oriented NaBi. The quantity of suspensiondeposited within the gasket was calculated to yield a diskof optimum thickness for the X-ray absorption measure-ments, according to the criterion described in a latersection.
Preparation of hexagonal birnessite
All chemical modifications of the NaBu suspensionswere conducted at 25 8C with exclusion of light in con-stant ionic strength (0.1 mol/dm3 NaNO3) aqueous me-dium saturated with argon gas. The concentration of sol-ids was approximately 2 g/dm3. Kinetic studies of theexchange process were conducted in a batch reactor andwere initiated in the following way: NaBu was dispersedin the ionic strength medium (typically 10 mL of a 50g/dm3 suspension into 250 mL) without adjustment of pH.The pH after dilution was typically in the range 8–9. Af-ter an equilibration time of 30 min the pH of the suspen-sion was then rapidly adjusted to, and maintained at, thedesired value by addition of a small aliquot of 1.0 mol/dm3 HNO3 and then 0.1 mol/dm3 HNO3, as controlled byan automatic titration assembly. H1 additions were re-corded directly on a computer. During the course of thereaction the concentration of aqueous Mn and adsorbedNa as well as the average Mn oxidation state were deter-mined using the methods described in the followingsections.
Orientated films of HBi were prepared as described forNaBi, except that it was necessary to decant some of theaqueous phase to obtain a suspension of sufficiently highconcentration for film preparation.
Aqueous Mn. Aqueous Mn was separated from thesolid phase by filtration of 3–5 cm3 of the suspensionthrough a 0.05 mm pore size filter. Manganese in solutionwas shown to be exclusively in the form of Mn21 by useof a Mn21-specific complexing agent (Chiswell et al.1990). This is the expected result given the very low sol-ubilities of Mn31 and Mn41 in aqueous solutions over thepH range studied (pH 2–5) (Baes and Mesmer 1976). Ingeneral the solution concentrations of Mn were deter-mined by either atomic absorption spectroscopy (AAS)or by oxidation to MnO using potassium periodate2
4
(KIO4) (Kolthoff et al. 1952). In this second method, sam-
964 SILVESTER ET AL.: BIRNESSITE STRUCTURE
ple absorbances were measured at 526 nm and comparedto absorbances of known standards (e526nm 5 2410 dm3/mol·cm21).
Structural Na. A 5 cm3 sample of the suspension wascollected and centrifuged. The bulk of the aqueous phasewas removed and the centrifuge tube then weighed withthe remaining concentrated suspension. This suspensionwas allowed to air dry over several weeks until a constantweight was attained. The dried solid phase was dissolvedwith 1 cm3 of 10% hydroxylamine hydrochloride(NH3OH·Cl) solution and diluted with 1% HNO3 to a suit-able concentration for analysis. Total Mn and Na weremeasured by inductively coupled plasma (ICP) spectros-copy. Structural Na was calculated as the difference be-tween the total Na measured and that contributed by theincluded aqueous phase, allowing calculation of theNa1/Mn ratio in the solid phase.
Average Mn oxidation state. The method used for themeasurement of the average oxidation state of Mn in thebuserite samples followed that of Freeman and Chapman(1971), except for the measurement of the total Mn con-tent. A mixture of 5.00 cm3 of 0.200 N (0.100 M) sodiumoxalate and 2.5 cm3 of concentrated H2SO4 was preparedimmediately before sampling. A 25 cm3 sample of thebuserite suspension (at ; 2 g/dm3) was added to this mix-ture. Excess sodium oxalate was titrated with a previouslystandardized 0.05 N potassium permanganate (KMnO4)solution using an auto-titration system. The determinationof the Mn content of the buserite sample was achievedby measurement of the total Mn concentration in the ti-trated solution with correction for the concentration ofMn added as KMnO4 in the titration procedure. This de-termination was carried out by oxidation of all Mn toMnO using the potassium periodate method described2
4
above.
Preparation of Zn21-exchanged birnessiteThe Zn21-exchanged birnessite (ZnBi) sample was pre-
pared by addition of a Zn(NO3)2 solution to a HBi sus-pension that had been pre-equilibrated at pH 4. The totalZn concentration after dilution was approximately 5 31023 mol/dm3 and the HBi concentration 2 g/dm3. Afterallowing several hours for equilibration, the solid was fil-tered and dried, yielding ZnBi solid.
EXAFS measurementsMn EXAFS spectra were recorded at the LURE syn-
chrotron radiation laboratory (Orsay, France) on the EX-AFS I station. The positron energy of the storage ringDCI was 1.85 GeV and the current between 200 and 300mA. The incident X-ray beam was monochromatizedwith a channel-cut Si(331) crystal. X-ray absorption datafor Mn were recorded over the energy range 6400–7300eV, corresponding to a Bragg angle of between 508 and438. In this angular range the linear polarization is closeto 100% (Hazemann et al. 1992). To avoid sample thick-ness and heterogeneity effects (Stern and Kim 1981;Manceau and Gates 1997) it was necessary that Dm , 1,
where Dm is the absorption edge step. Homogeneous andflat self-supported films of controlled thickness were pre-pared for both powder and polarized EXAFSmeasurements.
Angular measurements were performed in transmissionmode by turning film layers around a rotation axis normalto both the beam direction and the electric field vector e.The angular dependence of the EXAFS x function is givenby (Heald and Stern 1977; Brouder 1990): x(a) 5 [x(08)2 x(908)]cos2 a 1 x(908) where a is the angle between eand the layer plane. This relationship applies for all pho-toelectron energies and by means of linear regression andextrapolation, can be used to determine x(908), which can-not be measured experimentally (Manceau et al. 1988, un-published manuscript). Powder EXAFS spectra were re-corded at a 5 358 to eliminate any orientation effects(Manceau et al. 1990). X-ray absorption spectra were an-alyzed according to standard procedures (Teo 1986). AKaiser function window was used in Fourier transforms tominimize the intensity of side lobes resulting from trun-cation effects (Manceau and Combes 1988). Manceau(1995) has shown that side lobes associated with the useof a Kaiser window function are of the order of 5% of theintensity of main structural peaks. This low intensity al-lows greater sensitivity to less pronounced structural fea-tures in the RDF and provides strong evidence that peakintensities above this value should be interpreted in struc-tural terms. Interatomic distances and numbers of atomicneighbors were determined using experimental phase shiftand amplitude functions derived from suitable referencematerials. For Mn-O and Mn-Mn interactions experimentalfunctions were obtained from stoichiometric l-MnO2 inwhich Mn41 atoms are surrounded by six nearest O atomsat 1.91 A and six nearest Mn atoms at 2.84 A (Thackerayet al. 1993). For Zn-Mn interactions experimental func-tions were derived from the phyllomanganate chalcophan-ite (ZnMn3O7·9H20) in which Zn21 has six Mn neighborsat an average distance of 3.49 A (Post and Appleman1988) (Fig. 11). Through the use of such reference mate-rials it is reasonable to expect an absolute accuracy in thefitted number of neighbors of approximately 10%. The rel-ative accuracy within a series of minerals of similar struc-tures should be better than 10%.
RESULTS
Chemical studies of the NaBu to HBi conversion
Figure 1a shows the kinetic behavior of the adsorbedand solution species involved in the structural alterationof NaBu at pH 4. The reaction is characterized by aninitial rapid process in which both Mn21 and part of theNa1 are released from the solid and exchanged with H1
from solution. This step is followed by a slower processin which the remaining Na1 is released and Mn21 (par-tially) re-adsorbs. The separation of Na1 desorption intotwo distinct temporal processes implies that Na1 occupiesat least two types of sites in NaBu. The solid and dashedlines shown for the profiles of Mn21 and H1, respectively,
965SILVESTER ET AL.: BIRNESSITE STRUCTURE
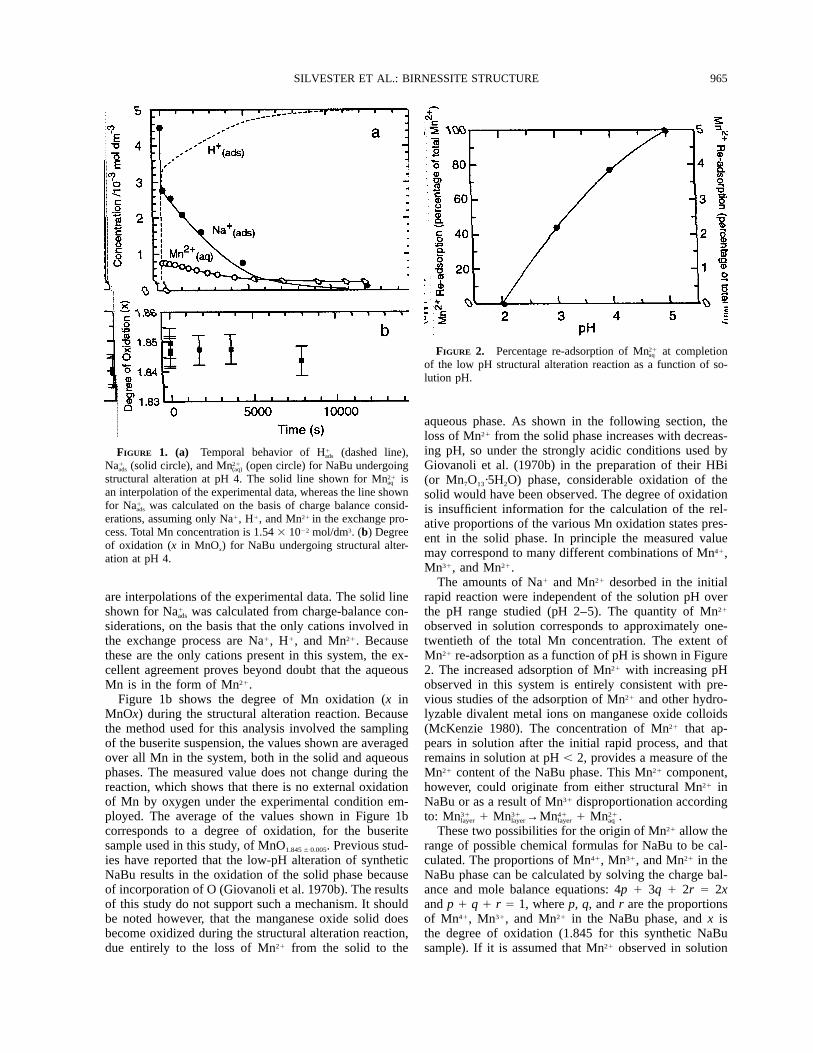
FIGURE 1. (a) Temporal behavior of H (dashed line),1ads
Na (solid circle), and Mn (open circle) for NaBu undergoing1 21ads (aq)
structural alteration at pH 4. The solid line shown for Mn is21aq
an interpolation of the experimental data, whereas the line shownfor Na was calculated on the basis of charge balance consid-1
ads
erations, assuming only Na1, H1, and Mn21 in the exchange pro-cess. Total Mn concentration is 1.54 3 1022 mol/dm3. (b) Degreeof oxidation (x in MnOx) for NaBu undergoing structural alter-ation at pH 4.
FIGURE 2. Percentage re-adsorption of Mn at completion21aq
of the low pH structural alteration reaction as a function of so-lution pH.
are interpolations of the experimental data. The solid lineshown for Na was calculated from charge-balance con-1
ads
siderations, on the basis that the only cations involved inthe exchange process are Na1, H1, and Mn21. Becausethese are the only cations present in this system, the ex-cellent agreement proves beyond doubt that the aqueousMn is in the form of Mn21.
Figure 1b shows the degree of Mn oxidation (x inMnOx) during the structural alteration reaction. Becausethe method used for this analysis involved the samplingof the buserite suspension, the values shown are averagedover all Mn in the system, both in the solid and aqueousphases. The measured value does not change during thereaction, which shows that there is no external oxidationof Mn by oxygen under the experimental condition em-ployed. The average of the values shown in Figure 1bcorresponds to a degree of oxidation, for the buseritesample used in this study, of MnO1.845 6 0.005. Previous stud-ies have reported that the low-pH alteration of syntheticNaBu results in the oxidation of the solid phase becauseof incorporation of O (Giovanoli et al. 1970b). The resultsof this study do not support such a mechanism. It shouldbe noted however, that the manganese oxide solid doesbecome oxidized during the structural alteration reaction,due entirely to the loss of Mn21 from the solid to the
aqueous phase. As shown in the following section, theloss of Mn21 from the solid phase increases with decreas-ing pH, so under the strongly acidic conditions used byGiovanoli et al. (1970b) in the preparation of their HBi(or Mn7O13·5H2O) phase, considerable oxidation of thesolid would have been observed. The degree of oxidationis insufficient information for the calculation of the rel-ative proportions of the various Mn oxidation states pres-ent in the solid phase. In principle the measured valuemay correspond to many different combinations of Mn41,Mn31, and Mn21.
The amounts of Na1 and Mn21 desorbed in the initialrapid reaction were independent of the solution pH overthe pH range studied (pH 2–5). The quantity of Mn21
observed in solution corresponds to approximately one-twentieth of the total Mn concentration. The extent ofMn21 re-adsorption as a function of pH is shown in Figure2. The increased adsorption of Mn21 with increasing pHobserved in this system is entirely consistent with pre-vious studies of the adsorption of Mn21 and other hydro-lyzable divalent metal ions on manganese oxide colloids(McKenzie 1980). The concentration of Mn21 that ap-pears in solution after the initial rapid process, and thatremains in solution at pH , 2, provides a measure of theMn21 content of the NaBu phase. This Mn21 component,however, could originate from either structural Mn21 inNaBu or as a result of Mn31 disproportionation accordingto: 31 31 41 21Mn 1 Mn →Mn 1 Mn .layer layer layer aq
These two possibilities for the origin of Mn21 allow therange of possible chemical formulas for NaBu to be cal-culated. The proportions of Mn41, Mn31, and Mn21 in theNaBu phase can be calculated by solving the charge bal-ance and mole balance equations: 4p 1 3q 1 2r 5 2xand p 1 q 1 r 5 1, where p, q, and r are the proportionsof Mn41, Mn31, and Mn21 in the NaBu phase, and x isthe degree of oxidation (1.845 for this synthetic NaBusample). If it is assumed that Mn21 observed in solution

966 SILVESTER ET AL.: BIRNESSITE STRUCTURE
FIGURE 3. (a) Manganese radial distribution functions fromEXAFS measurements at the Mn K edge for l-MnO2, ramsdel-lite, pyrolusite, and romanechite. (b) Fourier-filtered xMn-Mn con-tributions to EXAFS spectra (solid lines) with fits (open circles)for ramsdellite, pyrolusite, and romanechite. Fitted parametersare given in Table 1.
is present in the structure of NaBu, then r 5 0.049 (one-twentieth of the total Mn), and the chemical formula forNaBu is Na Mn Mn Mn O;2. However, if the1 41 31 21
0.3 0.739 0.212 0.049
Mn21 component is derived from disproportionation ofMn31, then r 5 0 and the chemical formula is Na -1
0.3
Mn Mn O;2. It should be noted that in the latter case41 310.69 0.31
the Na1 and Mn31 contents are almost equal to the max-imum values predicted for the type II NaBi microcrystalson the basis of the SAED results of Drits et al. (1997).Given that the Na1 to total Mn ratio is quite different inthe two types of microcrystals observed for this syntheticNaBu, with approximately 0.2:1 for type I microcrystalsand 0.33:1 for type II microcrystals (Drits et al. 1997),the experimentally obtained value would suggest a dom-inance of type II. This conclusion is consistent with theobservations made by Drits et al (1997) in their SAEDanalysis.
Complete desorption of Na1 was observed across thepH range studied (pH 2–5), with the interlayer chargebalance maintained by exchange with H1 and Mn21, invarying proportions depending on the solution pH. Forthis reason, the exchange stoichiometry varies continu-ously with pH between the limiting cases of:
1 1 1 1Na 1 H → H 1 Na (pH , 2) (1)ads aq ads aq
and
1 21 14Na 1 Mn 1 2Hads aq aq
21 1 1→ Mn 1 2H 1 4Na (pH . 4) (2)ads ads aq
Given that Na1 desorption and Mn21 re-adsorption appearto be independent processes, we ascribe no particularstructural significance to the stoichiometry of Equation 2.
Information from EXAFS spectroscopy
Analysis of reference manganese dioxides. The trans-ferability of the phase-shift and amplitude functions de-rived from l-MnO2 was tested on the manganese oxidesramsdellite (g-MnO2) (Bystrom 1949), pyrolusite (b-MnO2) (de Wolff 1959; Shuey 1975), and romanechite(Turner and Post 1988). Radial distribution functions(RDFs) derived from EXAFS measurements at the Mn Kedge for these minerals are shown in Figure 3a along withthe RDF for l-MnO2. The RDF for l-MnO2 demonstratesthe suitability of this material as a source of phase andamplitude data, with well-isolated peaks at distances, un-corrected for phase shift, of 1.5–1.6 and 2.5 A corre-sponding to six O neighbors at 1.91 A and six Mn neigh-bors at 2.84 A, respectively.
The RDFs for the other manganese oxides exhibitprominent peaks at ;1.6, 2.4–2.6, and ;3.1 A. Giventhat a nominal correction of 0.3–0.4 A applies to thesedistances due phase shift effects, the observed peaks canbe assigned to the interactions between Mn-O, Mn-Mn(edge-sharing octahedra), and Mn-Mn (corner-sharing oc-tahedra), respectively (Manceau and Combes 1988). Inthe case of romanechite the intensity of the Mn-Mn cor-ner-sharing peak is about 20% of the Mn-Mn edge-shar-
ing peak. Based on the previous discussion regarding thesize of side lobes associated with the use of a Kaiserwindow in the Fourier-transform procedure, it is clear thatthis peak is structural in origin instead of a side lobe ofthe main Mn-Mn edge-sharing peak.
967SILVESTER ET AL.: BIRNESSITE STRUCTURE
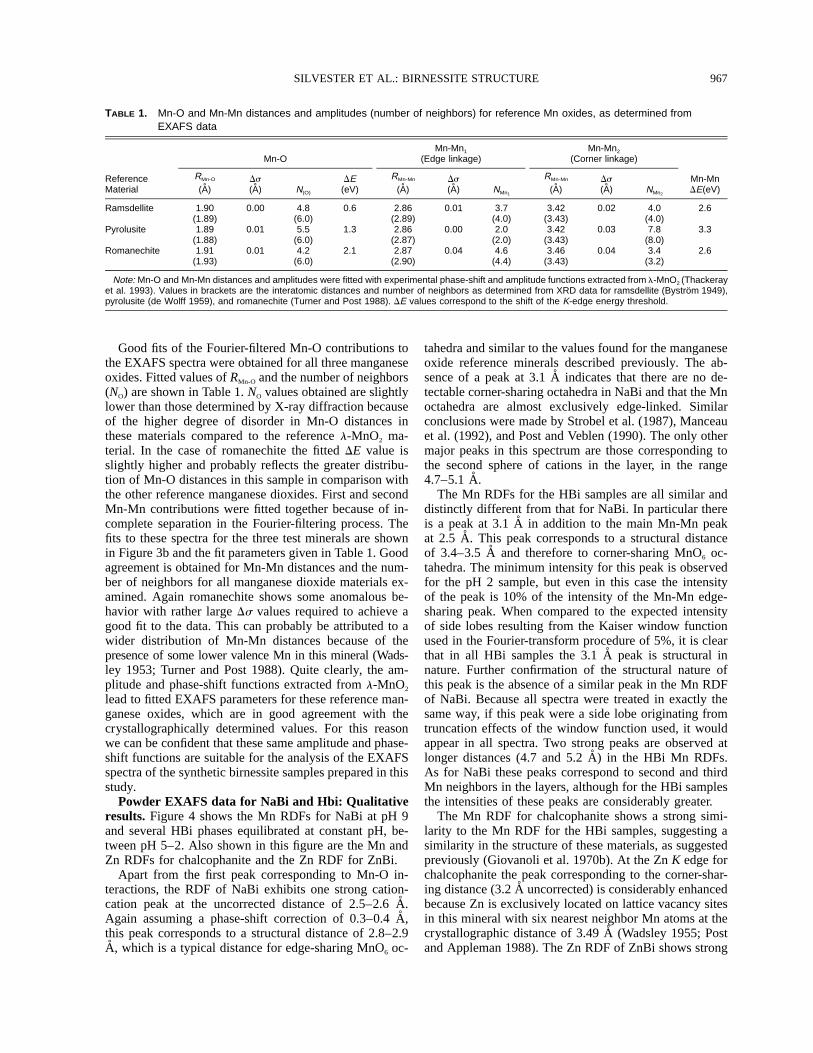
TABLE 1. Mn-O and Mn-Mn distances and amplitudes (number of neighbors) for reference Mn oxides, as determined fromEXAFS data
ReferenceMaterial
Mn-O
RMn-O
(A)Ds(A) N(O)
DE(eV)
Mn-Mn1
(Edge linkage)
RMn-Mn
(A)Ds(A) NMn1
Mn-Mn2
(Corner linkage)
RMn-Mn
(A)Ds(A) NMn2
Mn-MnDE(eV)
Ramsdellite 1.90(1.89)
0.00 4.8(6.0)
0.6 2.86(2.89)
0.01 3.7(4.0)
3.42(3.43)
0.02 4.0(4.0)
2.6
Pyrolusite 1.89(1.88)
0.01 5.5(6.0)
1.3 2.86(2.87)
0.00 2.0(2.0)
3.42(3.43)
0.03 7.8(8.0)
3.3
Romanechite 1.91(1.93)
0.01 4.2(6.0)
2.1 2.87(2.90)
0.04 4.6(4.4)
3.46(3.43)
0.04 3.4(3.2)
2.6
Note: Mn-O and Mn-Mn distances and amplitudes were fitted with experimental phase-shift and amplitude functions extracted from l-MnO2 (Thackerayet al. 1993). Values in brackets are the interatomic distances and number of neighbors as determined from XRD data for ramsdellite (Bystrom 1949),pyrolusite (de Wolff 1959), and romanechite (Turner and Post 1988). DE values correspond to the shift of the K-edge energy threshold.
Good fits of the Fourier-filtered Mn-O contributions tothe EXAFS spectra were obtained for all three manganeseoxides. Fitted values of RMn-O and the number of neighbors(NO) are shown in Table 1. NO values obtained are slightlylower than those determined by X-ray diffraction becauseof the higher degree of disorder in Mn-O distances inthese materials compared to the reference l-MnO2 ma-terial. In the case of romanechite the fitted DE value isslightly higher and probably reflects the greater distribu-tion of Mn-O distances in this sample in comparison withthe other reference manganese dioxides. First and secondMn-Mn contributions were fitted together because of in-complete separation in the Fourier-filtering process. Thefits to these spectra for the three test minerals are shownin Figure 3b and the fit parameters given in Table 1. Goodagreement is obtained for Mn-Mn distances and the num-ber of neighbors for all manganese dioxide materials ex-amined. Again romanechite shows some anomalous be-havior with rather large Ds values required to achieve agood fit to the data. This can probably be attributed to awider distribution of Mn-Mn distances because of thepresence of some lower valence Mn in this mineral (Wads-ley 1953; Turner and Post 1988). Quite clearly, the am-plitude and phase-shift functions extracted from l-MnO2
lead to fitted EXAFS parameters for these reference man-ganese oxides, which are in good agreement with thecrystallographically determined values. For this reasonwe can be confident that these same amplitude and phase-shift functions are suitable for the analysis of the EXAFSspectra of the synthetic birnessite samples prepared in thisstudy.
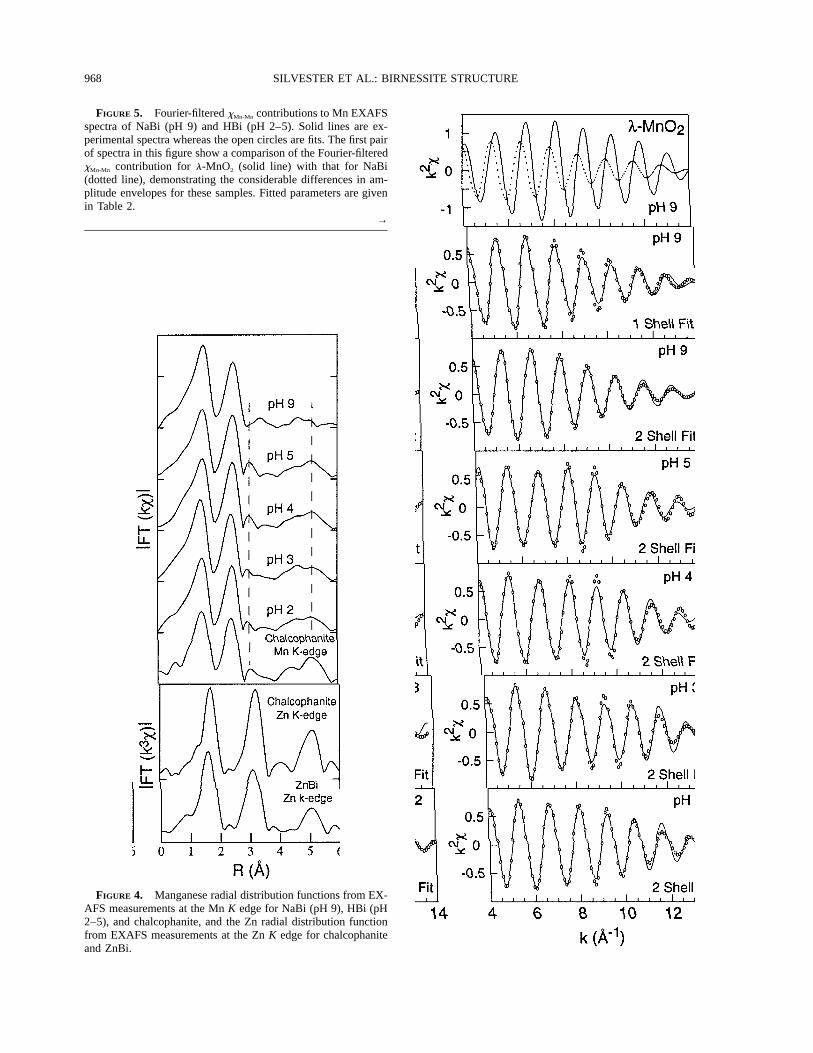
Powder EXAFS data for NaBi and Hbi: Qualitativeresults. Figure 4 shows the Mn RDFs for NaBi at pH 9and several HBi phases equilibrated at constant pH, be-tween pH 5–2. Also shown in this figure are the Mn andZn RDFs for chalcophanite and the Zn RDF for ZnBi.
Apart from the first peak corresponding to Mn-O in-teractions, the RDF of NaBi exhibits one strong cation-cation peak at the uncorrected distance of 2.5–2.6 A.Again assuming a phase-shift correction of 0.3–0.4 A,this peak corresponds to a structural distance of 2.8–2.9A, which is a typical distance for edge-sharing MnO6 oc-
tahedra and similar to the values found for the manganeseoxide reference minerals described previously. The ab-sence of a peak at 3.1 A indicates that there are no de-tectable corner-sharing octahedra in NaBi and that the Mnoctahedra are almost exclusively edge-linked. Similarconclusions were made by Strobel et al. (1987), Manceauet al. (1992), and Post and Veblen (1990). The only othermajor peaks in this spectrum are those corresponding tothe second sphere of cations in the layer, in the range4.7–5.1 A.
The Mn RDFs for the HBi samples are all similar anddistinctly different from that for NaBi. In particular thereis a peak at 3.1 A in addition to the main Mn-Mn peakat 2.5 A. This peak corresponds to a structural distanceof 3.4–3.5 A and therefore to corner-sharing MnO6 oc-tahedra. The minimum intensity for this peak is observedfor the pH 2 sample, but even in this case the intensityof the peak is 10% of the intensity of the Mn-Mn edge-sharing peak. When compared to the expected intensityof side lobes resulting from the Kaiser window functionused in the Fourier-transform procedure of 5%, it is clearthat in all HBi samples the 3.1 A peak is structural innature. Further confirmation of the structural nature ofthis peak is the absence of a similar peak in the Mn RDFof NaBi. Because all spectra were treated in exactly thesame way, if this peak were a side lobe originating fromtruncation effects of the window function used, it wouldappear in all spectra. Two strong peaks are observed atlonger distances (4.7 and 5.2 A) in the HBi Mn RDFs.As for NaBi these peaks correspond to second and thirdMn neighbors in the layers, although for the HBi samplesthe intensities of these peaks are considerably greater.
The Mn RDF for chalcophanite shows a strong simi-larity to the Mn RDF for the HBi samples, suggesting asimilarity in the structure of these materials, as suggestedpreviously (Giovanoli et al. 1970b). At the Zn K edge forchalcophanite the peak corresponding to the corner-shar-ing distance (3.2 A uncorrected) is considerably enhancedbecause Zn is exclusively located on lattice vacancy sitesin this mineral with six nearest neighbor Mn atoms at thecrystallographic distance of 3.49 A (Wadsley 1955; Postand Appleman 1988). The Zn RDF of ZnBi shows strong
968 SILVESTER ET AL.: BIRNESSITE STRUCTURE
FIGURE 5. Fourier-filtered xMn-Mn contributions to Mn EXAFSspectra of NaBi (pH 9) and HBi (pH 2–5). Solid lines are ex-perimental spectra whereas the open circles are fits. The first pairof spectra in this figure show a comparison of the Fourier-filteredxMn-Mn contribution for l-MnO2 (solid line) with that for NaBi(dotted line), demonstrating the considerable differences in am-plitude envelopes for these samples. Fitted parameters are givenin Table 2.
→
FIGURE 4. Manganese radial distribution functions from EX-AFS measurements at the Mn K edge for NaBi (pH 9), HBi (pH2–5), and chalcophanite, and the Zn radial distribution functionfrom EXAFS measurements at the Zn K edge for chalcophaniteand ZnBi.

969SILVESTER ET AL.: BIRNESSITE STRUCTURE
TABLE 2. EXAFS parameters for Mn-Mn pairs in NaBi and HBi and the Zn-Mn pair in ZnBi
Sample
Mn-Mn1
RMn-Mn1
(A)Ds(A) NMn
Me-Mn2
RMe-Mn2
(A)Ds(A) NMn
Me-Mn½
DE(eV)
Mn-Mn¾
RMn-Mn3
(A)Ds(A) NMn
DE(eV)
NaBi pH9HBi pH5HBi pH4
2.882.872.87
0.00.010.01
3.94.14.1
3.023.523.49
0.010.030.03
2.92.02.0
21.221.0
1.6 5.015.61
0.020.02
5*16*
0.80.8
HBi pH3HBi pH2ZnBi
2.862.87
0.010.01
4.34.6
3.473.473.45
0.020.030.01
2.01.75.8
2.01.62.5
* Values unreliable due to multiple scattering effects.
similarity to the Zn RDF of chalcophanite, although thecorner-sharing peak occurs at a slightly shorter distance.This observation strongly suggests that Zn21 occupiessimilar structural positions in these two materials. The ZnRDF for chalcophanite also shows an atomic neighbor at4.1 A, corresponding to Zn-Zn interactions between thepairs of Zn21 cations across lattice vacancy sites, i.e.,above and below vacancy sites. It is interesting to notethat this peak is absent in the Zn RDF of ZnBi.
Quantitative analysis. Figure 5 shows fits to Fourier-filtered Mn-Mn interactions for the NaBi and HBi sam-ples. Also shown is a comparison of the Fourier-filteredMn-Mn edge-sharing interaction for the reference l-MnO2 material with that for NaBi (first pair of spectra inFig. 5). Fitting parameters and best-fit values for the num-ber of neighbors and distances for the synthetic birnessitesamples are given in Table 2. The second spectrum inFigure 5 shows the Fourier-filtered EXAFS spectrum ofthe Mn-Mn edge-sharing distance in NaBi (solid line)along with a one-shell fit to this spectrum. The assump-tion of a single structural distance provides an approxi-mate fit to this spectrum. The amplitude mismatch in therange 9–11 A21 and the phase mismatch at higher k val-ues, however, suggest the presence of at least one otherMn-Mn distance. Support for this conclusion is providedby the comparison of the NaBi spectrum with the spec-trum of l-MnO2, demonstrating the considerable differ-ences in the shapes of the amplitude envelopes for thesetwo samples. A two-shell fit to the NaBi EXAFS data(third spectrum) yields good agreement over the entire krange, corresponding to distances of 2.88 6 0.05 A (NMn
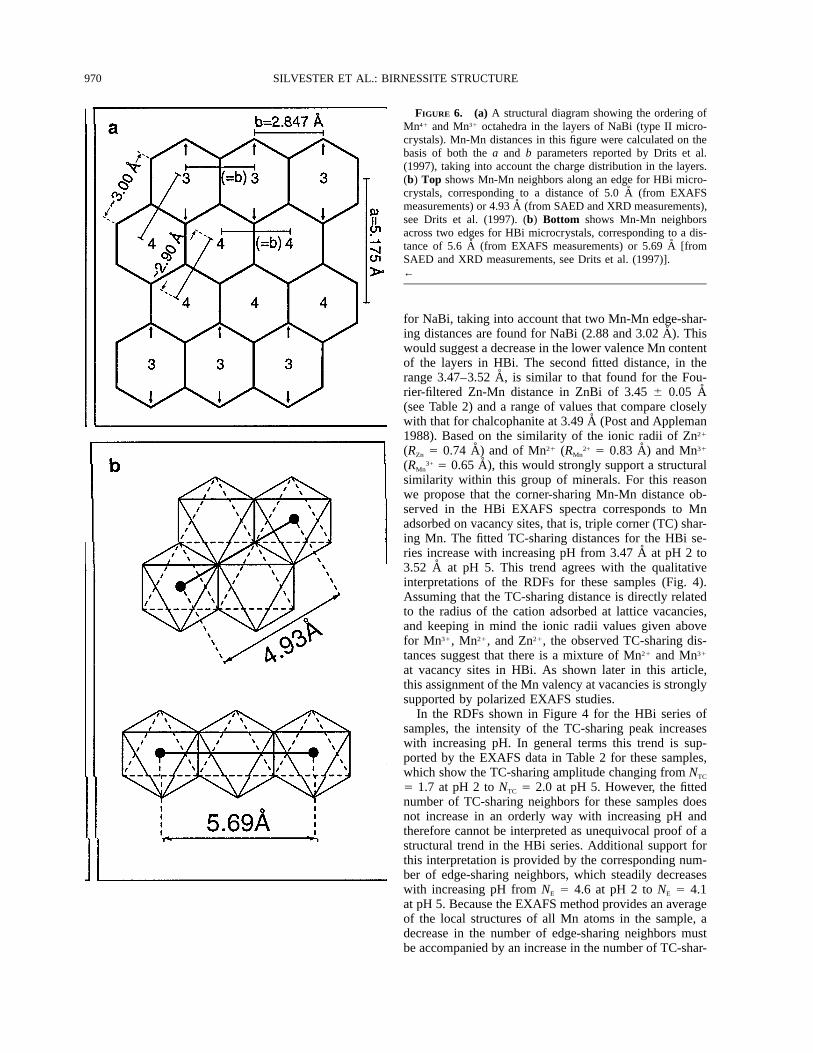
5 3.9) and 3.02 6 0.05 A (NMn 5 2.9). Assuming a dom-inance of type II microcrystals [on the basis of the chem-ically derived Na1 to total Mn ratio and the SAED ob-servations (Drits et al. 1997)], in which every third rowof Mn octahedra running in the [010] direction containsdominantly Mn31, the expected Mn-Mn distances and am-plitudes can be estimated. Figure 6a shows the expectedMn-Mn distances in the layers of NaBi, calculated on thebasis of both the a and b parameters reported previously(Drits et al. 1997) and the charge distribution in the lay-ers. Mn41-Mn41 and Mn31-Mn31 distances in the [010]direction equal the b parameter value of 2.847 A withNMn 5 2.0. The Mn-Mn distances in the (110,110) direc-
tions are longer because of the elongation of the Mn31
octahedra. As expected, the longest Mn-Mn distances inthese directions occur between Mn41-Mn31 pairs becauseof the localization of layer distortion on the Mn31 richrows. Mn41-Mn41 distances in the (110,110) directions,however, also increase because of the migration of Mn41
cations toward the Mn31 rich rows, as a result of the in-complete charge compensation of the shared O atoms. Weestimate that Mn-Mn distances in these directions varyperiodically between ;3.00 A for Mn41-Mn31 pairs and;2.90 A for Mn41-Mn41 pairs with NMn 5 2.7 and NMn 51.3, respectively. The two-shell fit to the Fourier-filteredMn-Mn EXAFS spectrum of NaBi can be understood ifit is assumed that all Mn-Mn pairs in the [010] directionand Mn41-Mn41 pairs in the (110,110) directions are fittedas one shell with an average distance of ;2.87 A (NMn 53.3) and Mn41-Mn31 pairs in the (110,110) directions arefitted as a longer distance shell at ; 3.00 A (NMn 5 2.7).These values compare well with the experimental EXAFSresults of NMn 5 3.9 at 2.88 A and NMn 5 2.9 at 3.02 A.Of course it would be structurally more accurate to fit theNaBi edge-sharing peak as a three-shell system. Unfor-tunately, because of the limited reciprocal space of EX-AFS spectra (14 A21) it is not possible to resolve dis-tances that are separated by less than ;0.12 A. In general,however, the EXAFS results support the structural modeldeveloped by Drits et al. (1997) for the layers of NaBi.As discussed by Drits et al. (1997), very few lattice va-cancies in the NaBi sample exist, which means that thetotal number of neighbors should be close to six. TheEXAFS-derived value of 6.8 6 0.7 is consistent with theabsence of vacancies in the layers of NaBi.
For all the HBi samples it was necessary to fit both theedge-sharing and corner-sharing peaks, at 2.5 A and 3.1A, respectively, together because of the incomplete sep-aration of these two peaks in the Fourier-filtering process.The Fourier-filtered EXAFS spectra shown in Figure 5for the HBi samples (both peaks combined) therefore dis-play a wave beating in the range 6–10 A21, which can berelated to the expected difference in shell distances of 0.5# DR[ 5 (3p/2k)] # 0.8. Reasonable two-shell fits areobtained across the entire k range for all spectra. For allthe HBi samples the Mn-Mn edge-sharing distance is 2.876 0.02 A, a distance that is shorter than that observed
970 SILVESTER ET AL.: BIRNESSITE STRUCTURE
FIGURE 6. (a) A structural diagram showing the ordering ofMn41 and Mn31 octahedra in the layers of NaBi (type II micro-crystals). Mn-Mn distances in this figure were calculated on thebasis of both the a and b parameters reported by Drits et al.(1997), taking into account the charge distribution in the layers.(b) Top shows Mn-Mn neighbors along an edge for HBi micro-crystals, corresponding to a distance of 5.0 A (from EXAFSmeasurements) or 4.93 A (from SAED and XRD measurements),see Drits et al. (1997). (b) Bottom shows Mn-Mn neighborsacross two edges for HBi microcrystals, corresponding to a dis-tance of 5.6 A (from EXAFS measurements) or 5.69 A [fromSAED and XRD measurements, see Drits et al. (1997)].←
for NaBi, taking into account that two Mn-Mn edge-shar-ing distances are found for NaBi (2.88 and 3.02 A). Thiswould suggest a decrease in the lower valence Mn contentof the layers in HBi. The second fitted distance, in therange 3.47–3.52 A, is similar to that found for the Fou-rier-filtered Zn-Mn distance in ZnBi of 3.45 6 0.05 A(see Table 2) and a range of values that compare closelywith that for chalcophanite at 3.49 A (Post and Appleman1988). Based on the similarity of the ionic radii of Zn21
(RZn 5 0.74 A) and of Mn21 (RMn2+ 5 0.83 A) and Mn31
(RMn3+ 5 0.65 A), this would strongly support a structural
similarity within this group of minerals. For this reasonwe propose that the corner-sharing Mn-Mn distance ob-served in the HBi EXAFS spectra corresponds to Mnadsorbed on vacancy sites, that is, triple corner (TC) shar-ing Mn. The fitted TC-sharing distances for the HBi se-ries increase with increasing pH from 3.47 A at pH 2 to3.52 A at pH 5. This trend agrees with the qualitativeinterpretations of the RDFs for these samples (Fig. 4).Assuming that the TC-sharing distance is directly relatedto the radius of the cation adsorbed at lattice vacancies,and keeping in mind the ionic radii values given abovefor Mn31, Mn21, and Zn21, the observed TC-sharing dis-tances suggest that there is a mixture of Mn21 and Mn31
at vacancy sites in HBi. As shown later in this article,this assignment of the Mn valency at vacancies is stronglysupported by polarized EXAFS studies.
In the RDFs shown in Figure 4 for the HBi series ofsamples, the intensity of the TC-sharing peak increaseswith increasing pH. In general terms this trend is sup-ported by the EXAFS data in Table 2 for these samples,which show the TC-sharing amplitude changing from NTC
5 1.7 at pH 2 to NTC 5 2.0 at pH 5. However, the fittednumber of TC-sharing neighbors for these samples doesnot increase in an orderly way with increasing pH andtherefore cannot be interpreted as unequivocal proof of astructural trend in the HBi series. Additional support forthis interpretation is provided by the corresponding num-ber of edge-sharing neighbors, which steadily decreaseswith increasing pH from NE 5 4.6 at pH 2 to NE 5 4.1at pH 5. Because the EXAFS method provides an averageof the local structures of all Mn atoms in the sample, adecrease in the number of edge-sharing neighbors mustbe accompanied by an increase in the number of TC-shar-
971SILVESTER ET AL.: BIRNESSITE STRUCTURE
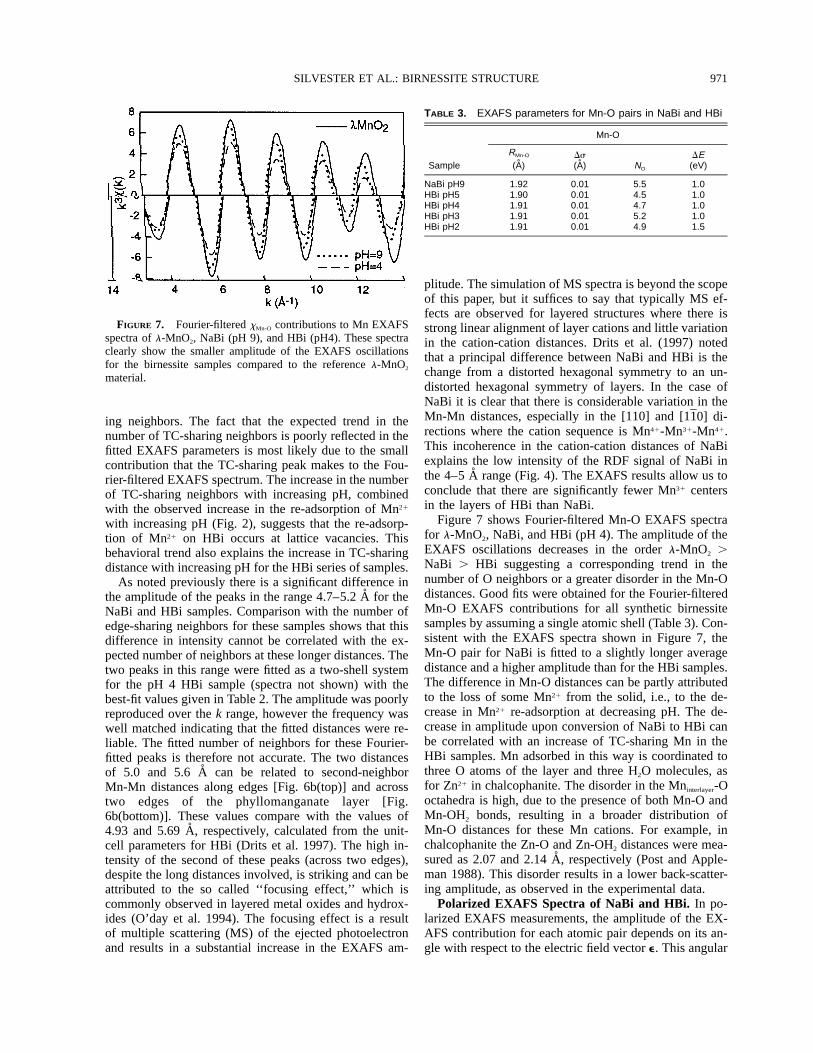
FIGURE 7. Fourier-filtered xMn-O contributions to Mn EXAFSspectra of l-MnO2, NaBi (pH 9), and HBi (pH4). These spectraclearly show the smaller amplitude of the EXAFS oscillationsfor the birnessite samples compared to the reference l-MnO2
material.
TABLE 3. EXAFS parameters for Mn-O pairs in NaBi and HBi
Sample
Mn-O
RMn-O
(A)Ds(A) NO
DE(eV)
NaBi pH9HBi pH5HBi pH4HBi pH3HBi pH2
1.921.901.911.911.91
0.010.010.010.010.01
5.54.54.75.24.9
1.01.01.01.01.5
ing neighbors. The fact that the expected trend in thenumber of TC-sharing neighbors is poorly reflected in thefitted EXAFS parameters is most likely due to the smallcontribution that the TC-sharing peak makes to the Fou-rier-filtered EXAFS spectrum. The increase in the numberof TC-sharing neighbors with increasing pH, combinedwith the observed increase in the re-adsorption of Mn21
with increasing pH (Fig. 2), suggests that the re-adsorp-tion of Mn21 on HBi occurs at lattice vacancies. Thisbehavioral trend also explains the increase in TC-sharingdistance with increasing pH for the HBi series of samples.
As noted previously there is a significant difference inthe amplitude of the peaks in the range 4.7–5.2 A for theNaBi and HBi samples. Comparison with the number ofedge-sharing neighbors for these samples shows that thisdifference in intensity cannot be correlated with the ex-pected number of neighbors at these longer distances. Thetwo peaks in this range were fitted as a two-shell systemfor the pH 4 HBi sample (spectra not shown) with thebest-fit values given in Table 2. The amplitude was poorlyreproduced over the k range, however the frequency waswell matched indicating that the fitted distances were re-liable. The fitted number of neighbors for these Fourier-fitted peaks is therefore not accurate. The two distancesof 5.0 and 5.6 A can be related to second-neighborMn-Mn distances along edges [Fig. 6b(top)] and acrosstwo edges of the phyllomanganate layer [Fig.6b(bottom)]. These values compare with the values of4.93 and 5.69 A, respectively, calculated from the unit-cell parameters for HBi (Drits et al. 1997). The high in-tensity of the second of these peaks (across two edges),despite the long distances involved, is striking and can beattributed to the so called ‘‘focusing effect,’’ which iscommonly observed in layered metal oxides and hydrox-ides (O’day et al. 1994). The focusing effect is a resultof multiple scattering (MS) of the ejected photoelectronand results in a substantial increase in the EXAFS am-
plitude. The simulation of MS spectra is beyond the scopeof this paper, but it suffices to say that typically MS ef-fects are observed for layered structures where there isstrong linear alignment of layer cations and little variationin the cation-cation distances. Drits et al. (1997) notedthat a principal difference between NaBi and HBi is thechange from a distorted hexagonal symmetry to an un-distorted hexagonal symmetry of layers. In the case ofNaBi it is clear that there is considerable variation in theMn-Mn distances, especially in the [110] and [110] di-rections where the cation sequence is Mn41-Mn31-Mn41.This incoherence in the cation-cation distances of NaBiexplains the low intensity of the RDF signal of NaBi inthe 4–5 A range (Fig. 4). The EXAFS results allow us toconclude that there are significantly fewer Mn31 centersin the layers of HBi than NaBi.
Figure 7 shows Fourier-filtered Mn-O EXAFS spectrafor l-MnO2, NaBi, and HBi (pH 4). The amplitude of theEXAFS oscillations decreases in the order l-MnO2 .NaBi . HBi suggesting a corresponding trend in thenumber of O neighbors or a greater disorder in the Mn-Odistances. Good fits were obtained for the Fourier-filteredMn-O EXAFS contributions for all synthetic birnessitesamples by assuming a single atomic shell (Table 3). Con-sistent with the EXAFS spectra shown in Figure 7, theMn-O pair for NaBi is fitted to a slightly longer averagedistance and a higher amplitude than for the HBi samples.The difference in Mn-O distances can be partly attributedto the loss of some Mn21 from the solid, i.e., to the de-crease in Mn21 re-adsorption at decreasing pH. The de-crease in amplitude upon conversion of NaBi to HBi canbe correlated with an increase of TC-sharing Mn in theHBi samples. Mn adsorbed in this way is coordinated tothree O atoms of the layer and three H2O molecules, asfor Zn21 in chalcophanite. The disorder in the Mninterlayer-Ooctahedra is high, due to the presence of both Mn-O andMn-OH2 bonds, resulting in a broader distribution ofMn-O distances for these Mn cations. For example, inchalcophanite the Zn-O and Zn-OH2 distances were mea-sured as 2.07 and 2.14 A, respectively (Post and Apple-man 1988). This disorder results in a lower back-scatter-ing amplitude, as observed in the experimental data.
Polarized EXAFS Spectra of NaBi and HBi. In po-larized EXAFS measurements, the amplitude of the EX-AFS contribution for each atomic pair depends on its an-gle with respect to the electric field vector e. This angular
972 SILVESTER ET AL.: BIRNESSITE STRUCTURE
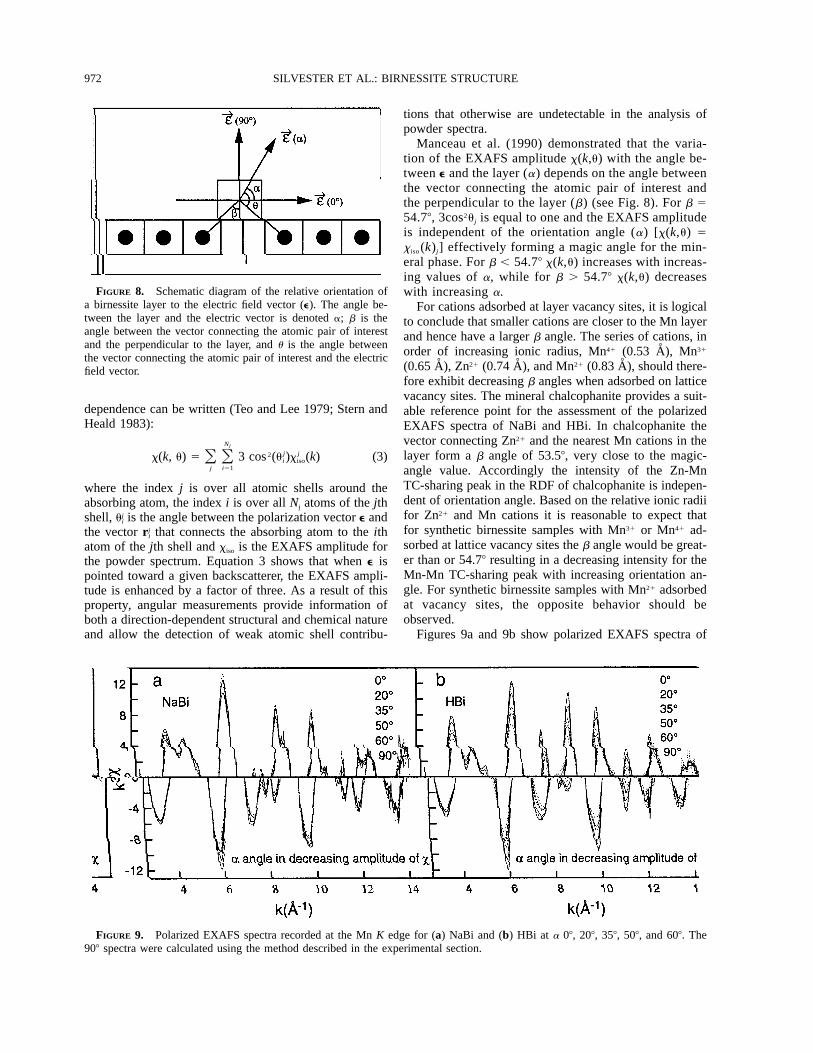
FIGURE 8. Schematic diagram of the relative orientation ofa birnessite layer to the electric field vector (e). The angle be-tween the layer and the electric vector is denoted a; b is theangle between the vector connecting the atomic pair of interestand the perpendicular to the layer, and u is the angle betweenthe vector connecting the atomic pair of interest and the electricfield vector.
FIGURE 9. Polarized EXAFS spectra recorded at the Mn K edge for (a) NaBi and (b) HBi at a 08, 208, 358, 508, and 608. The908 spectra were calculated using the method described in the experimental section.
dependence can be written (Teo and Lee 1979; Stern andHeald 1983):
Nj
j j2x(k, u) 5 3 cos (u )x (k) (3)O O i isoj i51
where the index j is over all atomic shells around theabsorbing atom, the index i is over all Nj atoms of the jthshell, is the angle between the polarization vector e andjui
the vector that connects the absorbing atom to the ithjri
atom of the jth shell and xiso is the EXAFS amplitude forthe powder spectrum. Equation 3 shows that when e ispointed toward a given backscatterer, the EXAFS ampli-tude is enhanced by a factor of three. As a result of thisproperty, angular measurements provide information ofboth a direction-dependent structural and chemical natureand allow the detection of weak atomic shell contribu-
tions that otherwise are undetectable in the analysis ofpowder spectra.
Manceau et al. (1990) demonstrated that the varia-tion of the EXAFS amplitude x(k,u) with the angle be-tween e and the layer (a) depends on the angle betweenthe vector connecting the atomic pair of interest andthe perpendicular to the layer (b) (see Fig. 8). For b 554.78, 3cos2uj is equal to one and the EXAFS amplitudeis independent of the orientation angle (a) [x(k,u) 5xiso (k)j] effectively forming a magic angle for the min-eral phase. For b , 54.78 x(k,u) increases with increas-ing values of a, while for b . 54.78 x(k,u) decreaseswith increasing a.
For cations adsorbed at layer vacancy sites, it is logicalto conclude that smaller cations are closer to the Mn layerand hence have a larger b angle. The series of cations, inorder of increasing ionic radius, Mn41 (0.53 A), Mn31
(0.65 A), Zn21 (0.74 A), and Mn21 (0.83 A), should there-fore exhibit decreasing b angles when adsorbed on latticevacancy sites. The mineral chalcophanite provides a suit-able reference point for the assessment of the polarizedEXAFS spectra of NaBi and HBi. In chalcophanite thevector connecting Zn21 and the nearest Mn cations in thelayer form a b angle of 53.58, very close to the magic-angle value. Accordingly the intensity of the Zn-MnTC-sharing peak in the RDF of chalcophanite is indepen-dent of orientation angle. Based on the relative ionic radiifor Zn21 and Mn cations it is reasonable to expect thatfor synthetic birnessite samples with Mn31 or Mn41 ad-sorbed at lattice vacancy sites the b angle would be great-er than or 54.78 resulting in a decreasing intensity for theMn-Mn TC-sharing peak with increasing orientation an-gle. For synthetic birnessite samples with Mn21 adsorbedat vacancy sites, the opposite behavior should beobserved.
Figures 9a and 9b show polarized EXAFS spectra of
973SILVESTER ET AL.: BIRNESSITE STRUCTURE
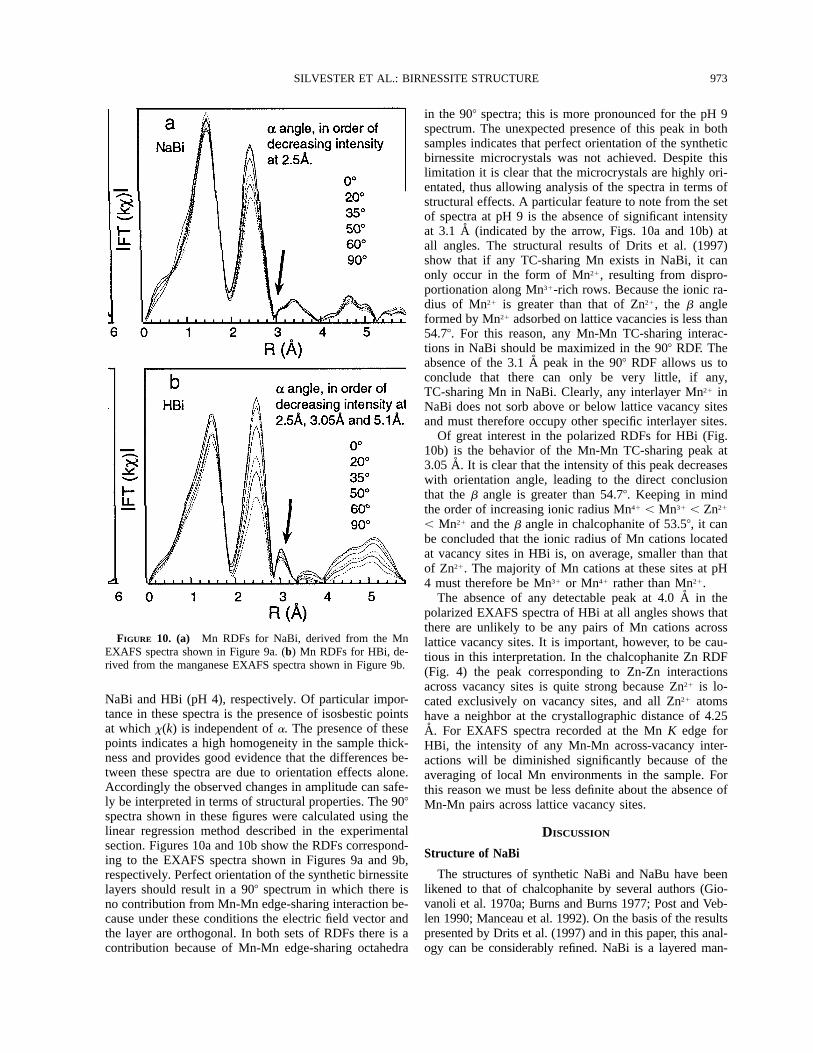
FIGURE 10. (a) Mn RDFs for NaBi, derived from the MnEXAFS spectra shown in Figure 9a. (b) Mn RDFs for HBi, de-rived from the manganese EXAFS spectra shown in Figure 9b.
NaBi and HBi (pH 4), respectively. Of particular impor-tance in these spectra is the presence of isosbestic pointsat which x(k) is independent of a. The presence of thesepoints indicates a high homogeneity in the sample thick-ness and provides good evidence that the differences be-tween these spectra are due to orientation effects alone.Accordingly the observed changes in amplitude can safe-ly be interpreted in terms of structural properties. The 908spectra shown in these figures were calculated using thelinear regression method described in the experimentalsection. Figures 10a and 10b show the RDFs correspond-ing to the EXAFS spectra shown in Figures 9a and 9b,respectively. Perfect orientation of the synthetic birnessitelayers should result in a 908 spectrum in which there isno contribution from Mn-Mn edge-sharing interaction be-cause under these conditions the electric field vector andthe layer are orthogonal. In both sets of RDFs there is acontribution because of Mn-Mn edge-sharing octahedra
in the 908 spectra; this is more pronounced for the pH 9spectrum. The unexpected presence of this peak in bothsamples indicates that perfect orientation of the syntheticbirnessite microcrystals was not achieved. Despite thislimitation it is clear that the microcrystals are highly ori-entated, thus allowing analysis of the spectra in terms ofstructural effects. A particular feature to note from the setof spectra at pH 9 is the absence of significant intensityat 3.1 A (indicated by the arrow, Figs. 10a and 10b) atall angles. The structural results of Drits et al. (1997)show that if any TC-sharing Mn exists in NaBi, it canonly occur in the form of Mn21, resulting from dispro-portionation along Mn31-rich rows. Because the ionic ra-dius of Mn21 is greater than that of Zn21, the b angleformed by Mn21 adsorbed on lattice vacancies is less than54.78. For this reason, any Mn-Mn TC-sharing interac-tions in NaBi should be maximized in the 908 RDF. Theabsence of the 3.1 A peak in the 908 RDF allows us toconclude that there can only be very little, if any,TC-sharing Mn in NaBi. Clearly, any interlayer Mn21 inNaBi does not sorb above or below lattice vacancy sitesand must therefore occupy other specific interlayer sites.
Of great interest in the polarized RDFs for HBi (Fig.10b) is the behavior of the Mn-Mn TC-sharing peak at3.05 A. It is clear that the intensity of this peak decreaseswith orientation angle, leading to the direct conclusionthat the b angle is greater than 54.78. Keeping in mindthe order of increasing ionic radius Mn41 , Mn31 , Zn21
, Mn21 and the b angle in chalcophanite of 53.58, it canbe concluded that the ionic radius of Mn cations locatedat vacancy sites in HBi is, on average, smaller than thatof Zn21. The majority of Mn cations at these sites at pH4 must therefore be Mn31 or Mn41 rather than Mn21.
The absence of any detectable peak at 4.0 A in thepolarized EXAFS spectra of HBi at all angles shows thatthere are unlikely to be any pairs of Mn cations acrosslattice vacancy sites. It is important, however, to be cau-tious in this interpretation. In the chalcophanite Zn RDF(Fig. 4) the peak corresponding to Zn-Zn interactionsacross vacancy sites is quite strong because Zn21 is lo-cated exclusively on vacancy sites, and all Zn21 atomshave a neighbor at the crystallographic distance of 4.25A. For EXAFS spectra recorded at the Mn K edge forHBi, the intensity of any Mn-Mn across-vacancy inter-actions will be diminished significantly because of theaveraging of local Mn environments in the sample. Forthis reason we must be less definite about the absence ofMn-Mn pairs across lattice vacancy sites.
DISCUSSION
Structure of NaBi
The structures of synthetic NaBi and NaBu have beenlikened to that of chalcophanite by several authors (Gio-vanoli et al. 1970a; Burns and Burns 1977; Post and Veb-len 1990; Manceau et al. 1992). On the basis of the resultspresented by Drits et al. (1997) and in this paper, this anal-ogy can be considerably refined. NaBi is a layered man-

974 SILVESTER ET AL.: BIRNESSITE STRUCTURE
ganese oxide formed by edge-sharing MnO6 octahedra andin this sense is similar to chalcophanite. In the chalco-phanite layers one in every seven cation sites is vacant,with Zn21 ions coordinated above and below these sites(Wadsley 1955; Post and Appleman 1988). NaBi differsconsiderably, with no evidence for significant numbers oflayer vacancies or corner-sharing Mn octahedra. The re-sults of the polarized EXAFS measurements provide strongconfirmation of this last point. NaBi and chalcophanitemust therefore have considerably different interlayer struc-tures. In chalcophanite the mechanism of layer-layer sta-bilization is the hydrogen bonding between TC-sharingZn21 ions and adjacent layers. Layer-layer stabilization inNaBi must occur by means of the strong association ofNa1 with the excess negative charge in the layers, com-bined with some degree of hydrogen bonding between lay-er O atoms and interlayer H2O molecules. Both the absenceof layer vacancies and the high proportion of layer Mn31
in NaBi are consistent with the Rietveld refinement of syn-thetic NaBi by Post and Veblen (1990). In particular theMn site-occupancy factor was found by these authors tobe close to 1.0 (indicating very few vacancies) and themean Mn-O distance was equal to that expected for a layerwith 75% Mn41 and 25% Mn31. These values are of courseapproximate but lie within the range of chemical formulaefor NaBu and NaBi presented earlier, between
and ,1 41 31 21 1 41 31Na Mn Mn Mn O Na Mn Mn O0.3 0.739 0.212 0.049 ;2 0.3 0.69 0.31 ;2
corresponding to the possible presence or absence of Mn21,respectively, in NaBu and NaBi.
The XRD data of Kuma et al. (1994) showed that theconversion of synthetic NaBu to NaBi is characterized by areduction of the a parameter, which on the basis of the con-clusions drawn by Drits et al. (1997) shows a decrease inthe Mn31 content of the layers. As was discussed by Dritset al. (1997), the maximum possible Na1 and Mn31 contentin NaBu is given by the formula , be-1 41 31Na Mn Mn O0.33 0.67 0.33 ;2
cause an Na1 content greater than this requires Na1-Na1
pairs at distances of 2.85 A. It appears reasonable to con-clude that the experimentally determined chemical formulain which the Mn21 content is assumed to be zero,
, gives the best chemical description of1 41 31Na Mn Mn O0.3 0.69 0.31 ;2
NaBu, corresponding almost to the maximum Mn31 and Na1
content possible. It is most likely that the process of dryingNaBu to form NaBi results in the disproportionation ofsome Mn31 (approximately one-third), according to the l 56b periodicity along Mn31-rich rows (Drits et al. 1997), andthe migration of Mn21 into the interlayer region, yieldingthe chemical formula: ,1 21 41 31Na Mn (Mn Mn M O )0.3 0.049 0.739 0.212 0.049 ;2
where M represents a layer vacancy. SAED studies (Dritset al. 1997) show that for the more dominant of the micro-crystal types observed for NaBi (type II) the idealizedchemical formula is ).1 21 41 31Na Mn (Mn Mn M O0.33 0.055 0.722 0.222 0.055 ;2
Clearly there is very good agreement between this chemicalformula and that measured experimentally when the maxi-mum possible content of Mn21 is assumed. The results fromthe polarized EXAFS measurements on NaBi indicate theabsence of TC-sharing Mn in this mineral. This result wouldstrongly indicate that Mn21 that migrates into the interlayer
does not reside at layer vacancy sites, although the fewMn21 cations involved forces us to be less conclusive onthis point.
Implicit in the development of a structural formula forNaBi is the conclusion that the quantity of Mn21 that isobserved in solution upon conversion of NaBu to HBi isthe same as that which exists within the structure of NaBi.The strong correlation between the solution level of Mn21
observed at pH , 2, corresponding to one-twentieth of thetotal Mn, with that expected from the l 5 6b periodicity ofone-eighteenth of total Mn, supports this interpretation. Putanother way, it appears from the results of this study thatboth the conversion of NaBu to NaBi by means of dehy-dration and the conversion of NaBu to HBi at low pH resultin an equivalent amount of layer Mn31 disproportionation.
Structure of HBiThere appears to be a close similarity between chalco-
phanite and HBi, based on the evidence from the XRD(Drits et al. 1997) and EXAFS results, which demonstratethe existence of TC-sharing Mn cations located on latticevacancy sites. The Mn-Mn TC-sharing peak is observed forall HBi samples. Given that there is no re-adsorption ofMn21 at pH 2 (Fig. 2) during the structural alteration ofNaBu, part of the TC-sharing component must come froma direct structural re-arrangement of the MnO6 edge-sharinglayers. This observation, combined with the observedchange between a distorted hexagonal layer structure forNaBi and an undistorted layer structure for HBi, suggeststhat upon lowering the pH, there is a significant migrationof lower valence Mn into the interlayer region. This con-clusion is also in accord with the observed decrease in theMn-Mn edge-sharing distance between NaBi and HBi. Theresults of polarized EXAFS for HBi have shown that Mnadsorbed at lattice vacancy sites has a smaller ionic radiusthan Zn21 and is therefore dominantly Mn31 or Mn41. Quiteclearly, any mechanism of NaBu to HBi conversion inwhich the migration of Mn41 from layer to TC-sharing po-sitions occurs, would result in a relative increase in the low-er valence content of the layers, in total contradiction of theexperimental data. For this reason, the results obtained bypolarized EXAFS must be interpreted as evidence for adominance of Mn31 adsorbed on layer vacancies in HBi.
As discussed by Drits et al. (1997), HBi microcrystalsexhibit a weak superstructure, with the unit-cell parametersA 5 3a and B 5 b. This superstructure was interpreted asarising from the distribution of layer vacancies and associ-ated TC-sharing Mn cations. Manganese cations coordinatedto vacancy sites would also be associated with three inter-layer H2O molecules, resulting in an enhanced scatteringintensity in the a-b plane. This interpretation of the super-structure in HBi leads to the conclusion that lattice vacanciesare restricted to the rows that originally contained Mn31 inNaBu and NaBi, i.e., every third row running along the[010] direction.
From the EXAFS data obtained for HBi prepared at pH5, which has the maximum number of TC-sharing and min-imum number of edge-sharing Mn, it is possible to estimate

975SILVESTER ET AL.: BIRNESSITE STRUCTURE
FIGURE 11. Proposed structural models for NaBi, HBi, andZnBi as determined from the results of this study. The numberson the faces of the octahedra in the NaBi structure refer to thesequence of Mn valency in the [110] or [10] directions. Thenumbers on the TC-sharing octahedra in the HBi structure indi-cate that a mixture of Mn31 and Mn21 cations occupy these sites.Also shown is a structural model for chalcophanite from Wadsley(1955) and Post and Appleman (1988).
the density of vacancies in the layers. The outcome of thiscalculation depends on the assumed vacancy distribution inthe layers. For the reasons given above, vacancies are as-sumed to be restricted to every third row in the [010] di-rection. If all Mn31 cations along the Mn31-rich rows of
NaBu were to migrate from layer to interlayer positions, theexpected numbers of TC-sharing and edge-sharing neigh-bors in the EXAFS fitting procedures would be 2.7, for bothdistances. The experimental values of NTC 5 2.0 and NE 54.1 for HBi at pH 5 clearly demonstrate that not all of theMn31 cations migrate from the layers. It is readily shownthat these experimental values in fact correspond closely tothat expected where there is a 50% density of vacancies inthese rows, with every layer vacancy having an associatedTC-sharing Mn. The theoretical number of TC- and edge-sharing neighbors corresponding to this cation distributionis 2.0 and 4.0, respectively.
It would appear that there are two principal mechanismsof TC-sharing Mn formation in HBi. One involves the directmigration of Mn31 from the layer to the interlayer and thesecond the adsorption of Mn21 from solution onto latticevacancy sites. This second mechanism explains the increasein the TC-sharing distance and amplitude with increasingpH for the HBi series of samples. At pH 5 the re-adsorptionof Mn21 results in complete occupancy of the vacancy sites,consistent with the number of edge- and TC-sharing neigh-bors for this sample, whereas at pH 2 no re-adsorption ofMn21 occurs. Within the framework of this model, two ex-treme cation distributions for the HBi series of samples canbe identified. All HBi samples have a vacancy density of50% along every third cation row. At pH 2, 67% of vacancysites have an associated TC-sharing Mn and all are Mn31.At pH 5 there is 100% occupancy of the lattice vacancies,with a valency distribution of 67% Mn31 and 33% Mn21.This model is consistent with a dominance of Mn31 inTC-sharing positions under all pH conditions.
Because all Na1 is lost from the interlayer region uponforming HBi, layer-layer stabilization must occur by meansof hydrogen bonding by TC-sharing Mn ions with adjacentlayers, similar to that observed for chalcophanite. This mod-el of the interlayer structure provides an explanation for thechange in interlayer spacing from 10 A for NaBu to 7 Afor HBi. One important difference between HBi and chal-cophanite is that in the latter mineral Zn21 cations occur inpairs at lattice vacancies whereas the evidence here suggeststhat this does not occur in HBi. The absence of a peak at4.1 A in the RDF of ZnBi shown in Figure 4 indicates thatthere are also very few pairs of Zn21 cations at layer va-cancy sites for this synthetic phase. In this sense ZnBi isvery similar to HBi, which suggests that the mechanism ofHBi to ZnBi conversion proceeds by means of displacementof Mn cations adsorbed at layer vacancies by Zn21 cations.The reason for the absence of cation pairs across layer va-cancies in HBi and ZnBi is not clear from the results of thisstudy, but it is possibly related to the distribution of latticevacancies in the layers.
Diagrams of the structures of NaBi, HBi, and ZnBi, asdetermined from the results of this study, are shown in Fig-ure 11. Also shown in this figure, for purposes of compar-ison, is the structure of chalcophanite from the results ofprevious studies (Post and Appleman 1988; Wadsley 1955).
976 SILVESTER ET AL.: BIRNESSITE STRUCTURE
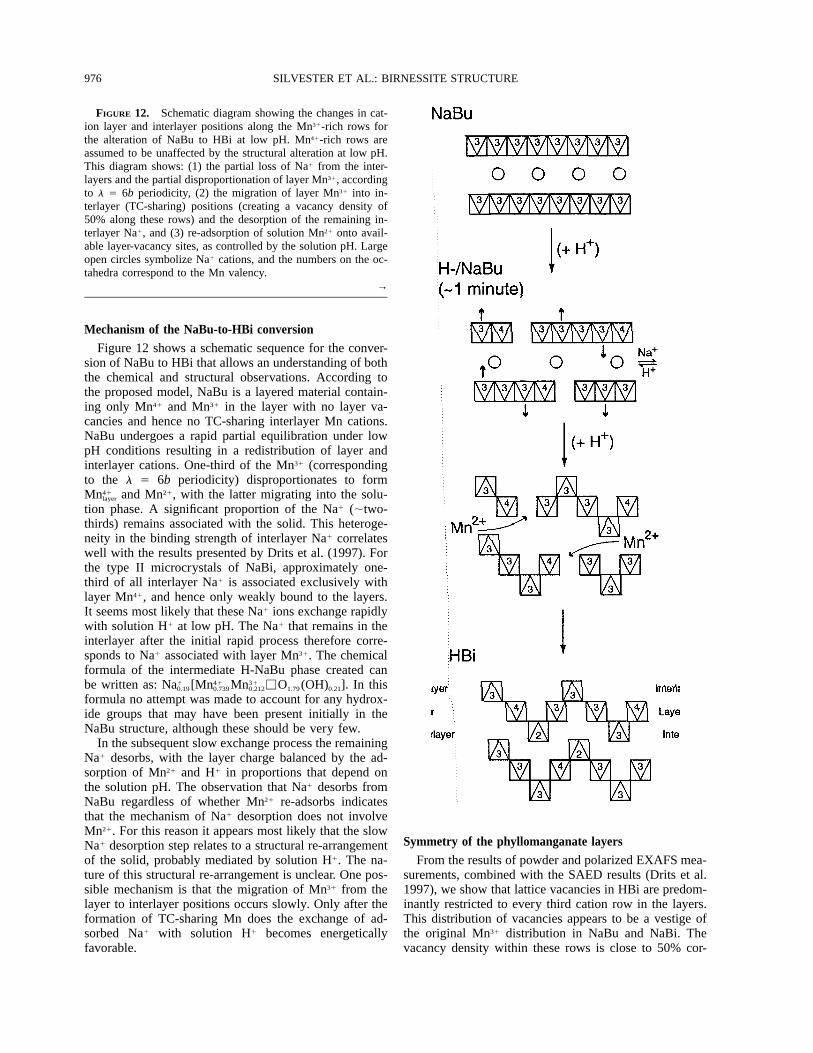
FIGURE 12. Schematic diagram showing the changes in cat-ion layer and interlayer positions along the Mn31-rich rows forthe alteration of NaBu to HBi at low pH. Mn41-rich rows areassumed to be unaffected by the structural alteration at low pH.This diagram shows: (1) the partial loss of Na1 from the inter-layers and the partial disproportionation of layer Mn31, accordingto l 5 6b periodicity, (2) the migration of layer Mn31 into in-terlayer (TC-sharing) positions (creating a vacancy density of50% along these rows) and the desorption of the remaining in-terlayer Na1, and (3) re-adsorption of solution Mn21 onto avail-able layer-vacancy sites, as controlled by the solution pH. Largeopen circles symbolize Na1 cations, and the numbers on the oc-tahedra correspond to the Mn valency.
→
Mechanism of the NaBu-to-HBi conversionFigure 12 shows a schematic sequence for the conver-
sion of NaBu to HBi that allows an understanding of boththe chemical and structural observations. According tothe proposed model, NaBu is a layered material contain-ing only Mn41 and Mn31 in the layer with no layer va-cancies and hence no TC-sharing interlayer Mn cations.NaBu undergoes a rapid partial equilibration under lowpH conditions resulting in a redistribution of layer andinterlayer cations. One-third of the Mn31 (correspondingto the l 5 6b periodicity) disproportionates to form
and Mn21, with the latter migrating into the solu-41Mnlayer
tion phase. A significant proportion of the Na1 (;two-thirds) remains associated with the solid. This heteroge-neity in the binding strength of interlayer Na1 correlateswell with the results presented by Drits et al. (1997). Forthe type II microcrystals of NaBi, approximately one-third of all interlayer Na1 is associated exclusively withlayer Mn41, and hence only weakly bound to the layers.It seems most likely that these Na1 ions exchange rapidlywith solution H1 at low pH. The Na1 that remains in theinterlayer after the initial rapid process therefore corre-sponds to Na1 associated with layer Mn31. The chemicalformula of the intermediate H-NaBu phase created canbe written as: . In this1 41 31Na [Mn Mn MO (OH) ]0.19 0.739 0.212 1.79 0.21
formula no attempt was made to account for any hydrox-ide groups that may have been present initially in theNaBu structure, although these should be very few.
In the subsequent slow exchange process the remainingNa1 desorbs, with the layer charge balanced by the ad-sorption of Mn21 and H1 in proportions that depend onthe solution pH. The observation that Na1 desorbs fromNaBu regardless of whether Mn21 re-adsorbs indicatesthat the mechanism of Na1 desorption does not involveMn21. For this reason it appears most likely that the slowNa1 desorption step relates to a structural re-arrangementof the solid, probably mediated by solution H1. The na-ture of this structural re-arrangement is unclear. One pos-sible mechanism is that the migration of Mn31 from thelayer to interlayer positions occurs slowly. Only after theformation of TC-sharing Mn does the exchange of ad-sorbed Na1 with solution H1 becomes energeticallyfavorable.
Symmetry of the phyllomanganate layersFrom the results of powder and polarized EXAFS mea-
surements, combined with the SAED results (Drits et al.1997), we show that lattice vacancies in HBi are predom-inantly restricted to every third cation row in the layers.This distribution of vacancies appears to be a vestige ofthe original Mn31 distribution in NaBu and NaBi. Thevacancy density within these rows is close to 50% cor-
977SILVESTER ET AL.: BIRNESSITE STRUCTURE
responding to a total vacancy density in the layers of onein six of all Mn sites. Both the occupancy of lattice va-cancy sites by TC-sharing Mn cations and the valencedistribution of the adsorbed Mn appear to be pH depen-dent. The model developed for the structure of HBi re-quires that some Mn31 cations remain in the layers. Thisconclusion is unequivocal given that there is no changein the average oxidation state of Mn during the conver-sion of NaBu to NaBi. Assuming that these layer Mn31
cations are restricted to the vacancy-rich rows, one-thirdof the available cation sites in these rows must be occu-pied by Mn31, equivalent to one in nine of all layer cationsites. This quantity of Mn31 is apparently insufficient tocause a distortion of the hexagonal layer symmetry. Sev-eral studies have reported the structural and electrochem-ical properties of g-MnOx as a function of the degree ofMn oxidation (e.g., Giovanoli and Leuenberger 1969;Ruetschi 1984; Chabre and Pannetier 1995). It is gener-ally observed that the structural and electronic propertiesof g-MnOx change dramatically about the mid-point be-tween pure Mn31 and Mn41 oxide materials, i.e., about x5 1.75 in MnOx. At degrees of Mn oxidation greater thanthis, bulk Jahn-Teller distortion of the structure is not ob-served. This observation was explained in terms of therandom distribution and directional orientation of Mn31
centers throughout the structure. In considering the elec-tronic and structural difference between NaBi and HBi itis important to distinguish between the oxidation state ofthe layers and the oxidation state of the solid as a whole,which does not change between NaBu or NaBi and HBi.Taking into account the lattice vacancy density of one insix and the Mn31 abundance in the vacancy-rich rows of33% in HBi, it is readily calculated that, whereas thelayers of NaBi correspond to an MnOx solid with x 51.845, in HBi the layers correspond to x 5 1.94. Putanother way, the migration of Mn31 from the layer to theinterlayers effectively results in an oxidation of the layers.This greatly reduced proportion of Mn31 in the layers ofHBi is consistent with a reduction (quasi-absence) of lay-er distortion. An additional factor involved in the elec-tronic distribution of NaBi and HBi is that compensationof the layer charge is achieved by Na1 and H1, respec-tively. It is reasonable to assume that the interlayer mo-bility of Na1 is considerably lower than that for protons,on the basis of both the ion sizes and the existence of thechain mechanism for proton diffusion. It is most likelythat both the migration of lower valence Mn to the inter-layer region and the change in the interlayer speciationfrom Na1 to H1 are contributing factors in the changebetween the monoclinic symmetry of NaBi and the hex-agonal symmetry of HBi. The structural modification thatoccurs at low pH results in two principal effects that pro-vide a more energetically favorable situation. First, theremoval of lower valence Mn from the layer relieves thesteric strain associated with the presence of Mn31 rows.Second, the formation of TC-sharing Mn atoms createsan interlayer structure that stabilizes the layer-layer dis-tance in HBi.
ACKNOWLEDGMENTS
The authors thank R. Giovanoli who advised us on the preparation ofNa-rich birnessite and more generally on the properties of this material.We also thank the staff at L.U.R.E. for operating the synchrotron facility.We were kindly assisted by Bruno Lanson in the preparation of this manu-script in its final form.
REFERENCES CITED
Baes, C.F. and Mesmer, R.E. (1976) The hydrolysis of cations. p. 219–226. Wiley, New York.
Burns, R.G. and Burns, V.M. (1977) The mineralogy and crystal chemistryof deep-sea manganese nodules, a polymetallic resource of the twenty-first century. Philosophical Transactions of the Royal Society of London(A), 286, 283–301.
Brouder, C. (1990) Angular dependence of X-ray absorption spectra. Jour-nal of Physics, 2, 701–738.
Crowther, D. L., Dillard, J.G., and Murray, J.G. (1983) The mechanismof Co(II) oxidation on synthetic birnessite. Geochimica et Cosmochim-ica Acta, 47, 1399–1403.
de Wolff, P.M. (1959) Interpretation of some g-MnO2 diffraction patterns.Acta Crystallographica, 12, 341–345.
Drits, V.A., Silvester, E., Gorshkov, A.I., and Manceau, A. (1997) Thestructure of monoclinic Na-rich birnessite and hexagonal birnessite: I.Results from X-ray diffraction and selected-area electron diffraction.American Mineralogist, 82, 946–961.
Freeman, D.S. and Chapman, W.G. (1971) An improved oxalate methodfor the determination of active oxygen in manganese dioxide. Analyst,96, 865–869.
Giovanoli, R. (1980) On natural and synthetic manganese nodules. In J.M.Varenstov and J. Grasselly, Eds., Geology and geochemistry of man-ganese, vol. 1, p. 154–202. Academia Kiado, Budapest.
Giovanoli, R. and Leuenberger, U. (1969) Uber die Oxydation von Man-ganoxidhydroxid. Helvetica Chimica Acta, 52, 2333–2347.
Giovanoli, R., Stahli, E., and Feitknecht, W. (1970a) Uber Oxidhydroxidedes vierwertigen Mangans mit Schichtengitter. 1. Mitteilung: Natrium-mangan(II,III)manganat(IV). Helvetica Chimica Acta, 53, 454–464.
(1970b) Uber Oxidhydroxide des vierwertigen Mangans mit Schi-chtengitter. 2. Mitteilung: Mangan(III)-manganat(IV). Helvetica Chim-ica Acta, 53, 454–464.
Gray, M.J. and Malati, M.A. (1979a) Adsorption from aqueous solutionby d-manganese dioxide. I. Adsorption of the Alkaline-earth cations.Journal of Chemical Technology and Biotechnology, 29, 127–134.
(1979b) Adsorption from aqueous solution by d-manganese di-oxide. II. Adsorption of some heavy metal cations. Journal of ChemicalTechnology and Biotechnology, 29, 135–144.
Hazemann, J.L., Manceau, A., Sainctavit, P., and Malgrange, C. (1992)Structure of the aFexAl12xOOH solid solution. I. Evidence by polarizedEXAFS for an epitaxial growth of hematite-like clusters in diaspore.Physics and Chemistry of Minerals, 19, 25–38.
Heald, S.M. and Stern, E.A. (1977) Anisotropic x-ray absorption in lay-ered compounds. Physical Review B, 16, 5549–5559.
Kolthoff, I.M. and Sandell, E.B. (1952) Textbook of Quantitative Inor-ganic Analysis (3rd edition), p. 681. Macmillan, New York.
Krauskopf, K.B. (1957) Separation of manganese from iron in sedimentaryprocesses. Geochimica et Cosmochimica Acta, 12, 61–84.
Kuma, K., Usui, A., Paplawsky, W., Gedulin, B., and Arrhenius, G. (1994)Crystal structures of synthetic 7 A and 10 A manganates substituted bymono- and divalent cations. Mineralogical Magazine, 58, 425–447.
Manceau, A. (1995) The mechanism of anion adsorption on iron oxides:Evidence for the bonding of arsenate tetrahedra on free Fe(O,OH)6 edg-es. Geochimica et Cosmochimica Acta, 59, 3647–3653.
Manceau, A. and Combes, J.M. (1988) Structure of Mn and Fe oxides andoxyhydroxides: a topological approach by EXAFS. Physics and Chem-istry of Minerals, 15, 283–295.
Manceau, A. and Gates, W.P. (1997) Surface structural model for ferri-hydrite. Clays and Clay Minerals, in press.
Manceau, A., Bonnin, D., Kaiser, P., and Fretigny, C. (1988) PolarizedEXAFS of biotite and chlorite. Physics and Chemistry of Minerals, 16,180–185.
978 SILVESTER ET AL.: BIRNESSITE STRUCTURE
Manceau, A., Bonnin, D., Stone, W.E.E., and Sanz, J. (1990) Distributionof Fe in the octahedral sheet of trioctahedral micas by polarized EX-AFS. Comparison with NMR results. Physics and Chemistry of Min-erals, 17, 363–370.
Manceau, A. and Charlet, L. (1992) X-ray absorption spectroscopic studyof the sorption of Cr(III) at the oxide-water interface. Journal of Colloidand Interface Science, 148, 425–442.
Manceau, A., Gorshkov, A.I., and Drits, V.A. (1992) Structural chemistryof Mn, Fe, Co, and Ni in manganese hydrous oxides: II. Informationfrom EXAFS spectroscopy and electron and X-ray diffraction. Ameri-can Mineralogist, 77, 1144–1157.
McKenzie, R.M. (1967) The sorption of cobalt by manganese minerals insoils. Australian Journal of Soil Research, 5, 235–246.
(1980) The adsorption of lead and other heavy metals on oxidesof manganese and iron. Australian Journal of Soil Research, 18, 61–73.
O’Day, P.A., Rehr, J.J., Zabinsky, S.I., and Brown, G.E. (1994) Extendedx-ray absorption fine structure (EXAFS) analysis of disorder and mul-tiple-scattering in complex crystalline solids. Journal of the AmericanChemical Society, 116, 2938–2949.
Post, J.E. and Appleman, D.E. (1988) Chalcophanite, ZnMn3O7·3 H2O:New crystal structure determinations. American Mineralogist, 73,1401–1404.
Post, J.E. and Veblen, D.R. (1990) Crystal structure determinations ofsynthetic sodium, magnesium, and potassium birnessite using TEM andthe Rietveld method. American Mineralogist, 75, 477–489.
Ruetschi, P. (1984) Cation-vacancy model for MnO2. Journal of the Elec-trochemical Society, 131, 2737–2744.
Shuey, R.T. (1975) Developments in economic geology, 4. Semiconduct-ing ore minerals, p. 389–396. Elsevier, Amsterdam.
Stern, E.A. and Heald, S.M. (1983) Basic principles and applications of
EXAFS. In E. Koch, Ed., Handbook on synchrotron radiation, Amster-dam, North Holland p. 955–1014.
Stern, E.A. and Kim, K. (1981) Thickness effect on the extended x-rayabsorption fine structure amplitude. Physical Review B, 23, 3781–3787.
Strobel, P., Charenton, J.C., and Lenglet, M. (1987) Structural chemistryof phyllomanganates: experimental evidence and structural models. Re-vue de Chimie Minerale, 24, 199–220.
Teo, B.K. (1986) EXAFS: Basic principles and data analysis, 349 p.Springer-Verlag, Berlin.
Teo, B.K. and Lee, P.A. (1979) Ab initio calculations of amplitude andphase functions for extended X-ray absorption fine structure spectros-copy. Journal of the American Chemical Society, 101, 2815–2832.
Thackeray, M.M., de Kock, A., and David, W.I.F. (1993) Synthesis andstructural characterisation of defect spinels in the lithium-manganese-oxide system. Material Research Bulletin, 28, 1041–1049.
Turner, S. and Post, J.E. (1988) Refinement of the substructure and su-perstructure of romanechite. American Mineralogist, 73, 1155–1161.
Wadsley, A.D. (1953) The crystal structure of psilomelane, (Ba,H2O)2Mn5O10. Acta Crystallographica, 6, 433–438.
(1955) The crystal structure of chalcophanite, ZnMn3O7.3 H2O.Acta Crystallographica, 8, 165–172.
Werhli, B., Friedl, G., and Manceau, A. (1995) Reaction rates and productsof manganese oxidation at the sediment-water interface. In C.P. Huang,C.R. O’Melia, and J.J. Morgan, Eds., Advances in chemistry series No.244, Aquatic chemistry: Interfacial and interspecies processes. Ameri-can Chemical Society, Washington.
Xyla, A.G., Sulzberger, B., Luther, G.W., Hering, J.G., Van Capellen, P.,and Stumm, W. (1992) Reductive dissolution of manganese(III,IV)(hydr)oxides by oxalate: The effect of pH and light. Langmuir, 8, 95–103.
MANUSCRIPT RECEIVED JUNE 21, 1996MANUSCRIPT ACCEPTED MAY 23, 1997
Copyright © 2022 FDOKUMEN