From EXAFS of reference compounds to U(VI) speciation in ...
12
actinide physics and chemistry J. Synchrotron Rad. (2022). 29, 303–314 https://doi.org/10.1107/S1600577521013473 303 Received 2 November 2021 Accepted 20 December 2021 Edited by K. Kvashnina, ESRF – The European Synchrotron, France Keywords: uranium; EXAFS; Raman spectroscopy; PXRD. Supporting information: this article has supporting information at journals.iucr.org/s From EXAFS of reference compounds to U(VI) speciation in contaminated environments Anna Krot, a * Irina Vlasova, a * Alexander Trigub, b Alexey Averin, c Vasily Yapaskurt a and Stepan Kalmykov a a Lomonosov Moscow State University, Leninskie Gory 1-3, Moscow 119991, Russian Federation, b National Research Center ‘Kurchatov Institute’, Ploshchad Akademika Kurchatova 1, Moscow 123182, Russian Federation, and c A. N. Frumkin Institute of Physical Chemistry and Electrochemistry, Russian Academy of Sciences, Leninskiy Prospekt 31, Moscow 119071, Russian Federation. *Correspondence e-mail: [email protected], [email protected] Understanding the speciation of technogenic uranium in natural systems is crucial for estimating U migration and bioavailability and for developing remediation strategies for contaminated territories. Reference EXAFS data of model laboratory-prepared uranium compounds (‘standards’) are necessary to analyze U-contaminated samples from nuclear legacy sites. To minimize errors associated with measurements on different synchrotrons, it is important not only to compare data obtained on environmentally contaminated samples with the literature but also with ‘standards’ collected at the same beamline. Before recording the EXAFS spectra, all reference compounds were thoroughly characterized by Raman spectroscopy and powder X-ray diffraction. The U(VI) local molecular environments in the reference compounds, i.e. uranyl oxy- hydroxides, phosphates, carbonates and uranates, were examined using XAFS. Based on the EXAFS fitting results obtained, including the nature of the bonding, interatomic distances and coordination numbers, parameters that are typical for a particular U compound were differentiated. Using data for ‘standards’, U speciation in the sample of radioactively contaminated soil was determined to be a mixture of U oxyhydroxide and carbonate phases. 1. Introduction Uranium speciation in contaminated soils, groundwater, vadose zones and bottom sediments of waste storage pools governs the migration behavior in plumes of mine tailings and legacy sites of nuclear weapon production (Zachara et al., 2013; Peterson et al., 2018; Kaplan et al., 2020; Stetten et al., 2020). Decommissioning of closed enterprises and deconta- mination of territories require knowledge of U species to predict U migration in the environment (Maher et al., 2013; Mehta, 2017; Katsenovich et al., 2018). The complexity of U behavior in the environment due to the presence of carbo- nates, organic matter, Fe oxides, bacterial activity etc . requires a detailed study of individual U species under controlled laboratory conditions. In environmental systems, technogenic U is usually present as a mixture of various UO 2 2+ compounds or as UO 2 particles (Kr ˇepelova ´ et al., 2008; Qafoku & Icenhower, 2018; Marshall et al., 2015; Romanchuk et al., 2021). Along with surface complexation with minerals and incorporation into solids like calcite, an essential mechanism of U immobilization is the formation of intrinsic U(VI) phases. The other type of UO 2 2+ formation in the environment is the oxidation of U(IV) phases. Various methods can be applied for a detailed investigation of U compounds. For the characterization of environmental samples, these methods have to be nondestructive and sensi- tive to trace concentrations of radionuclides. The most ISSN 1600-5775
-
Upload
khangminh22 -
Category
Documents
-
view
0 -
download
0
Transcript of From EXAFS of reference compounds to U(VI) speciation in ...
actinide physics and chemistry
J. Synchrotron Rad. (2022). 29, 303–314 https://doi.org/10.1107/S1600577521013473 303
Received 2 November 2021
Accepted 20 December 2021
Edited by K. Kvashnina, ESRF – The European
Synchrotron, France
Keywords: uranium; EXAFS; Raman
spectroscopy; PXRD.
Supporting information: this article has
supporting information at journals.iucr.org/s
From EXAFS of reference compounds to U(VI)speciation in contaminated environments
Anna Krot,a* Irina Vlasova,a* Alexander Trigub,b Alexey Averin,c Vasily Yapaskurta
and Stepan Kalmykova
aLomonosov Moscow State University, Leninskie Gory 1-3, Moscow 119991, Russian Federation, bNational Research
Center ‘Kurchatov Institute’, Ploshchad Akademika Kurchatova 1, Moscow 123182, Russian Federation, andcA. N. Frumkin Institute of Physical Chemistry and Electrochemistry, Russian Academy of Sciences, Leninskiy Prospekt 31,
Moscow 119071, Russian Federation. *Correspondence e-mail: [email protected], [email protected]
Understanding the speciation of technogenic uranium in natural systems is
crucial for estimating U migration and bioavailability and for developing
remediation strategies for contaminated territories. Reference EXAFS data of
model laboratory-prepared uranium compounds (‘standards’) are necessary to
analyze U-contaminated samples from nuclear legacy sites. To minimize errors
associated with measurements on different synchrotrons, it is important not
only to compare data obtained on environmentally contaminated samples with
the literature but also with ‘standards’ collected at the same beamline. Before
recording the EXAFS spectra, all reference compounds were thoroughly
characterized by Raman spectroscopy and powder X-ray diffraction. The U(VI)
local molecular environments in the reference compounds, i.e. uranyl oxy-
hydroxides, phosphates, carbonates and uranates, were examined using XAFS.
Based on the EXAFS fitting results obtained, including the nature of the
bonding, interatomic distances and coordination numbers, parameters that
are typical for a particular U compound were differentiated. Using data for
‘standards’, U speciation in the sample of radioactively contaminated soil was
determined to be a mixture of U oxyhydroxide and carbonate phases.
1. Introduction
Uranium speciation in contaminated soils, groundwater,
vadose zones and bottom sediments of waste storage pools
governs the migration behavior in plumes of mine tailings and
legacy sites of nuclear weapon production (Zachara et al.,
2013; Peterson et al., 2018; Kaplan et al., 2020; Stetten et al.,
2020). Decommissioning of closed enterprises and deconta-
mination of territories require knowledge of U species to
predict U migration in the environment (Maher et al., 2013;
Mehta, 2017; Katsenovich et al., 2018). The complexity of U
behavior in the environment due to the presence of carbo-
nates, organic matter, Fe oxides, bacterial activity etc. requires
a detailed study of individual U species under controlled
laboratory conditions. In environmental systems, technogenic
U is usually present as a mixture of various UO22+ compounds
or as UO2 particles (Krepelova et al., 2008; Qafoku &
Icenhower, 2018; Marshall et al., 2015; Romanchuk et al.,
2021). Along with surface complexation with minerals and
incorporation into solids like calcite, an essential mechanism
of U immobilization is the formation of intrinsic U(VI) phases.
The other type of UO22+ formation in the environment is the
oxidation of U(IV) phases.
Various methods can be applied for a detailed investigation
of U compounds. For the characterization of environmental
samples, these methods have to be nondestructive and sensi-
tive to trace concentrations of radionuclides. The most
ISSN 1600-5775
favorable element-sensitive direct method to determine the U
valence state and local atomic environment is X-ray absorp-
tion fine-structure spectroscopy (XAFS). Raman scattering
m-spectroscopy provides useful information about the
U-containing phases (Lu et al., 2018), although its application
to natural samples is complicated due to the complex phase
composition and the relatively high detection limit of the
method. In the context of determining the speciation of
elements in natural environments, XAFS spectroscopy is a
technique with the lowest detection limits and, at the same
time, the highest selectivity towards the element of interest.
Additionally, Raman scattering, with no elemental selectivity,
has the advantage of microscopic resolution, which makes
analysis of individual micro-objects possible.
XAFS is sensitive to oxidation state (XANES, X-ray
absorption near-edge structure) and local environment of U
(EXAFS, extended X-ray absorption fine structure): inter-
atomic distances, coordination numbers (CNs) and disorder
parameter �2 (Debeye–Waller factor). This method is widely
used to investigate U speciation in model systems (Thompson
et al., 1997; Kelly et al., 2007, 2010, and references therein), as
well as in environmental samples such as those from Hanford
liquid waste disposal sediments (Bostick et al., 2002; Catalano
et al., 2004; Arai et al., 2007), and coal and coal-combustion
products in Kentucky power plants (Hower et al., 2016). Many
of the published spectra resolve local parameters of only axial
and equatorial O (Oax and Oeq) coordination spheres. This
restriction significantly limits the amount of information
about U speciation that can be obtained from environmental
samples.
This paper is devoted to EXAFS and m-Raman spectra
analyses of laboratory-prepared U(VI) reference compounds
and, relying on obtained ‘standard’ data, analysis of U
speciation in contaminated environments: a soil sample from
a uranium conversion plant (Angarsk, Russia). Phosphates,
carbonates and oxyhydroxides of U(VI) along with UO2 are
solid intrinsic phases of uranium in contaminated zones of
nuclear legacy sites: contaminated soils, groundwater and
near-surface disposals of liquid waste (Romanchuk et al.,
2021). Uranates are thermodynamically stable phases under
the conditions of surface reservoirs of liquid nuclear waste
with high pH values.
We discuss the possibility of extending the fitting range of
the U local environment to 5 A.
2. Materials and methods
2.1. Materials
Uranyl orthophosphate tetrahydrate (UO2)3(PO4)2(H2O)4
was synthesized by the method described by Yagoubi et
al. (2013). In the first step, 0.752 g of UO2(NO3)2�6H2O
(1.5 mmol) was dissolved in 7 ml H2O, and then 430 ml of
H3PO4 (645 mmol) was added. The mixture was kept under
constant stirring for 6 h at 70�C. The solution over the preci-
pitated pale-yellow crystals was removed with a pipette, and
the remaining suspension was dried at 60�C until complete
evaporation of the liquid was achieved. The crystals were
sequentially washed with distilled water and acetone and
dried in air.
Uranyl-ammonium carbonate (NH4)4UO2(CO3)3 was
obtained by the following procedure (Zhang et al., 2016):
0.501 g of UO2(NO3)2�6H2O (1 mmol) was dissolved in 3 ml
Milli-Q H2O, and a yellow precipitate was formed during
slow dropwise addition of 5 ml of solution containing 1.646 g
(NH4)2CO3 (17 mmol) in Milli-Q H2O. The obtained super-
natant was centrifuged at 7000 rpm for 2 min. The resulting
yellow precipitate was decanted and dried in air.
A mixture of natural autunite Ca(UO2)2(PO4)2 and
torbernite Cu(UO2)2(PO4)2 minerals was obtained from the
Taboshar ore deposit, Tadjikistan.
Metaschoepite was synthesized by dissolution of 0.57 g
(2 mmol) freshly prepared amorphous UO3 in 20 ml distilled
water and stirring of the mixture at 40�C for 2 weeks. Amor-
phous UO3 was obtained from uranium peroxide UO4�2H2O.
A solution of 0.01 mol UO2(NO3)2 was heated to 80�C, and
15 ml of 10% H2O2 was added dropwise with constant stirring.
The reaction mixture was kept at 90�C for 1 h. The solution
was cooled and centrifuged four times (6000 rpm, 3 min): once
for separation of the precipitated peroxide and three times
with water for washing. After drying at 50�C, the precipitate
was placed in an oven and calcined in air at 425�C for 2 h to
obtain a brown powder of amorphous UO3 (Watt et al., 1950;
Cordfunke, 1961, 1962; Cordfunke & Giessen, 1963).
Calcium uranate CaUO4 and diuranate CaU2O7 were
prepared by the solid-state reaction of stoichiometric amounts
of CaCO3 and U3O8 [obtained by heating UO2(NO3)2�6H2O
at 900�C in air for 5 h]. The precursors were ground into a fine
powder, placed into platinum crucibles and calcined three
times in air for 10–20 h at 850�C. Then, the powders were
pressed into pellets and calcined in the same way three more
times, each time followed by crushing, thorough remixing and
re-pressing into pellets (Sali et al., 2000; Prieur et al., 2019).
As an example of an environmental U-contaminated soil
fraction studied of a nuclear legacy site, a fraction of soil
collected from the area of a uranium conversion plant
(Angarsk, Russia) was studied. The grain size of the sample
was less than 100 mm. The mineral composition included
grains of quartz, feldspar, clay minerals and, in the accessory
fraction, hematite, dolomite and chlorite. The uranium
concentration in the sample varied in the range from 2 mg g�1
to 4 mg g�1. A more detailed analysis of the morphology
and mineral composition of contaminated soil is given by
Maryakhin et al. (2021). In the discussion below, the sample
of uranium contaminated soil will be referred to as the
UCS sample.
2.2. Analysis
To determine the structure of the compounds studied,
powder X-ray diffraction (PXRD) was used. PXRD data were
collected with an Empyrean (Panalytical) diffratometer at
room temperature using Cu K� radiation. The diffraction
patterns were recorded in the 2� range from 5� to 60� with a
step size of 0.017� (2�) and a time per step of 150 s. The
actinide physics and chemistry
304 Anna Krot et al. � U(VI) speciation in contaminated environments J. Synchrotron Rad. (2022). 29, 303–314
HighScore Plus software (Degen et al., 2014) was used to
process the spectra and identify the phases.
Raman spectra were collected using a Renishaw inVia
Raman microscope equipped with an He–Ne diode laser
with an excitation wavelength of 633 nm and a diode-pumped
solid-state laser with an excitation wavelength of 405 nm and
Senterra Bruker microscope with solid-state Nd:YAG 532 nm
laser and Ar 785 nm laser. The size of the focused spot on the
sample was approximately 3 mm, and the power density was
low enough to avoid surface oxidation/degradation of the
samples due to local heating by the laser beam.
To determine the composition of natural minerals and
obtain SEM images of the UCS sample, a JEOL JSM-6480LV
scanning electron microscope (JEOL, Japan) equipped with
an X-Max-50 energy-dispersive spectrometer (Oxford
Instruments, UK) was used. An accelerating voltage of 20 kV
and a current of 0.7 nA were used. Quantification was
performed using a set of standards, listed in Table S1 of the
supporting information.
X-ray absorption spectroscopy (XAS) data were recorded
at the Structural Material Science (STM) beamline of the
Kurchatov specialized synchrotron radiation source, KISI-
Kurchatov (Moscow, Russia). Uranium LIII-edge spectra were
collected at room temperature in transmission mode for
standards and in fluorescence mode for the UCS sample.
Monochromatization of the X-ray beam was performed using
a channel-cut Si (220) monochromator. To obtain high-quality
experimental data, at least three scans were measured for each
sample. To record EXAFS regions, a step size of 0.05 A�1 was
used. Each XAS scan took nearly 30 min. Energy calibration
was performed using a UO2 reference sample between the
second and third ionization chambers. Each standard sample
was mixed with cellulose and pressed into a thin pellet, and the
required amount of U phase to obtain qualitative data was
calculated using the HEPHAESTUS program database. The
UCS sample was pressed into a thin pellet without cellulose.
Calibration and processing of the spectra obtained were
carried out using the IFEFFIT software (Ravel & Newville,
2005). Several scans were merged and calibrated via the
ATHENA program. The UO2 reference was used as a cali-
bration standard, with a maximum of the first derivative at
17170.2 eV (Bes et al., 2016). Fitting was performed via the
ARTEMIS program. The theoretical scattering amplitude
functions and phase shifts were calculated with the FEFF6
code (Rehr et al., 1992). For scattering function calculations,
CIFs were retrieved from the Crystallography Open Database
(COD). For CaU2O7 and (UO2)3(PO4)2�4H2O, structures of
other compounds containing the same scattering atoms were
used (CaUO4 and UO2HPO4, respectively). Scattering func-
tions for the UCS sample analysis were calculated using
crystallography data of schoepite, CaMgUO2(CO3)3 and
Ca(H3O)2(UO2)2(SiO4)2. The amplitude reduction factor (S02)
was set to 0.9, as previously determined for the U LIII-edge
spectra. The shift in the threshold energy (�E0) was the same
for all coordination spheres and varied as a global parameter.
The CNs were constrained at crystallographic values where
possible. In all spectra, multiple scattering paths of Oax—U—
Oax were included in the fit, with R and the Debye–Waller
parameter defined as R = 2R(U—Oax) and �2 = 2�2(U—Oax),
respectively. For cases of carbonates and phosphates, multiple
scattering paths involving C/P and Odistant atoms were also
included.
3. Results and discussion
3.1. PXRD data of reference samples and natural mineralsmixture
To correctly interpret the EXAFS and Raman data, all
studied compounds had to be free of impurities. Phase iden-
tification was carried out by PXRD. The diffractograms
obtained are shown in Fig. S1 of the supporting information.
Uranyl-ammonium carbonate (NH4)4UO2(CO3)3 and uranyl
orthophosphate tetrahydrate (UO2)3(PO4)2�4H2O were found
to be pure single-phase compounds, and the patterns were
in good agreement with published data (PDF 01–073–0040
and PDF 00–037–0369, respectively). The mineral system
contained three phases: metaautunite Ca(UO2)2(PO4)2�3H2O
(00–039–1351), torbernite Cu(UO2)2(PO4)2�8H2O (00–036–
0406) and metazeunerite Cu(UO2)2(AsO4)2�8H2O (01–077–
0124). The presence of arsenate impurities was confirmed by
scanning electron microscopy with energy-dispersive X-ray
(SEM-EDX) analysis and will be discussed in more detail
below. The synthesized metaschoepite contained several
dehydrated phases: UO3�H2O (00–013–0242), UO3�0.8H2O
(00–010–0309) and metaschoepite phase UO3�2H2O (01–070–
4765). The main phase was found to be metaschoepite, and the
two former phases were the products of metaschoepite reac-
tion in air. In the discussion below, we present this synthetic
sample metaschoepite [(UO2)8O2(OH)12](H2O)10, considering
the presence of two dehydrated phases. Calcium uranate
CaUO4 (01–085–0577) was found to contain diuranate impu-
rities (00–044–0581), confirmed by Raman spectroscopy.
Diuranate CaU2O7 also contains some uranate impurities of
different compositions (00–022–0817).
3.2. SEM-EDX analysis of a natural mixture of phosphateminerals
The assumed composition of the mineral sample is a
mixture of (meta-)autunite Ca(UO2)2(PO4)2�nH2O, (meta-)-
torbernite Cu(UO2)2(PO4)2�mH2O and (meta-)zeunerite
Cu(UO2)2(AsO4)2�kH2O. Individual crystals of Ca and Cu
minerals were distinctly different in color, appearing yellow
and green, respectively, as seen in the optical microscopy
images (Fig. S2). The composition was clarified by SEM-EDX
analysis, and the results are shown in Table S2. In autunite, a
Sr impurity was observed, which was present at approximately
6 at.% Ca content, and an As impurity was present at 6–7 at.%
P content. Substitutions of Ca by Sr and P by As are common
in natural systems due to the similar chemical properties and
effective ionic radii (Shannon & Prewitt, 1969): 1.00 A and
1.16 A for Ca2+ and Sr2+, and 0.17 A and 0.34 A for P+5 and
As+5. The molar ratios of U to Ca (in areas where some Ca
ions were replaced by Sr, the ratio of U to the total content of
actinide physics and chemistry
J. Synchrotron Rad. (2022). 29, 303–314 Anna Krot et al. � U(VI) speciation in contaminated environments 305
divalent metals was estimated) and to P (with a similar esti-
mation as needed) agree well with the composition of autu-
nite. The arsenic impurity in the torbernite part was more
significant (approximately 30 at.%); however, the molar ratio
of U to the sum of P and As remained consistent with the
composition of torbernite. Since there were many As atoms,
it was assumed that As did not isomorphically replace P in
torbernite but formed its intrinsic phase.
3.3. Raman spectroscopy of reference samples and naturalminerals mixture
Raman spectra were recorded using lasers with excitation
wavelengths of 405 nm, 532 nm, 633 nm and 785 nm. Spectra
recorded at optimum measurement conditions (i.e. the best
signal-to-noise ratio and no contribution of uranium lumi-
nescence) will be discussed (633 nm or 785 nm). Band posi-
tions and their comparison with literature data are given in the
supporting information (Tables S3–S7).
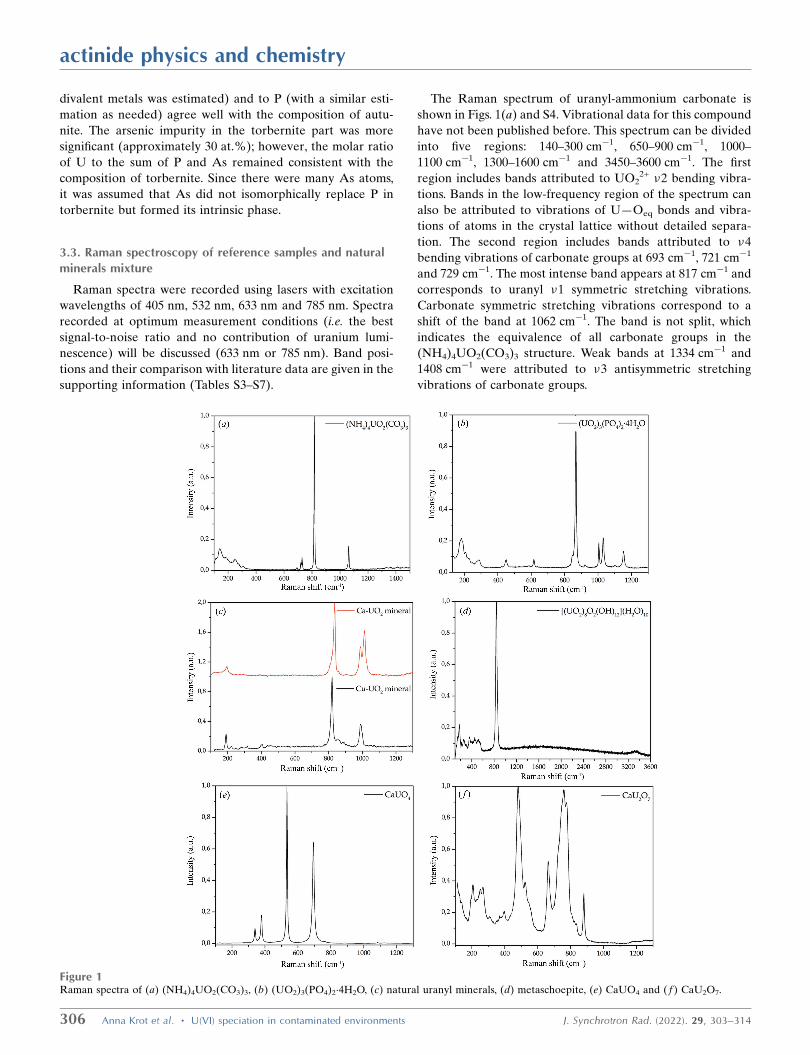
The Raman spectrum of uranyl-ammonium carbonate is
shown in Figs. 1(a) and S4. Vibrational data for this compound
have not been published before. This spectrum can be divided
into five regions: 140–300 cm�1, 650–900 cm�1, 1000–
1100 cm�1, 1300–1600 cm�1 and 3450–3600 cm�1. The first
region includes bands attributed to UO22+ �2 bending vibra-
tions. Bands in the low-frequency region of the spectrum can
also be attributed to vibrations of U—Oeq bonds and vibra-
tions of atoms in the crystal lattice without detailed separa-
tion. The second region includes bands attributed to �4
bending vibrations of carbonate groups at 693 cm�1, 721 cm�1
and 729 cm�1. The most intense band appears at 817 cm�1 and
corresponds to uranyl �1 symmetric stretching vibrations.
Carbonate symmetric stretching vibrations correspond to a
shift of the band at 1062 cm�1. The band is not split, which
indicates the equivalence of all carbonate groups in the
(NH4)4UO2(CO3)3 structure. Weak bands at 1334 cm�1 and
1408 cm�1 were attributed to �3 antisymmetric stretching
vibrations of carbonate groups.
actinide physics and chemistry
306 Anna Krot et al. � U(VI) speciation in contaminated environments J. Synchrotron Rad. (2022). 29, 303–314
Figure 1Raman spectra of (a) (NH4)4UO2(CO3)3, (b) (UO2)3(PO4)2�4H2O, (c) natural uranyl minerals, (d) metaschoepite, (e) CaUO4 and ( f ) CaU2O7.
Bartlett & Cooney (1989) derived an empirical equation
that allows us to estimate the U Oax bond length in the
UO22+ cation from the Raman shift of the �1 stretching
vibration:
RU¼O ðAÞ ¼ 106:5 �1ðUO2Þ�2=3þ 0:575� 0:03: ð1Þ
According to this equation, for uranyl-ammonium carbonate,
R(U Oax) = 1.79 � 0.03 A.
The Raman spectrum of uranyl orthophosphate is shown in
Figs. 1(b) and S5. The Raman shifts are in good agreement
with previously reported data (Armstrong, 2009; Pham-Thi &
Colomban, 1985). The band observed at 3505 cm�1 corre-
sponds to OH� vibrations in H2O molecules. In the 900–
1200 cm�1 region, bands of medium intensity were observed
at 1005 cm�1, 1031 cm�1, 1103 cm�1 and 1153 cm�1, corre-
sponding to PO43� antisymmetric stretching vibrations. A
weak band at 923 cm�1 could be attributed to the �1 PO43�
vibrations or to a distortion of linearity in the uranyl cation
and correspond to UO22+ antisymmetric stretching vibrations.
The strong band at 867 cm�1 and a nearby weak band with a
shift of 846 cm�1 correspond to UO22+ symmetric stretching
vibrations. In the 400–700 cm�1 region, bands were observed
at 450 cm�1 and 617 cm�1 and were attributed to �2 and �4
bending vibrations in the phosphate anion, respectively.
Uranyl bending vibrations and vibrations of U—Oeq bonds
gave rise to groups of bands from 136 cm�1 to 289 cm�1 in the
lowest-frequency region of the spectrum.
According to equation (1), the bond length in UO22+ is
1.75 � 0.03 A.
Optical microscopy imaging allowed differentiation of the
Cu and Ca components of the mixture by color: green crystals
corresponded to Cu minerals and yellow crystals corre-
sponded to Ca minerals. Spectra of the two parts of the
mixture were collected individually.
In the spectrum of the Cu mineral part, bands related to
vibrations of both phosphate and arsenate ions were observed
(Fig. S6). In the low-frequency region, bands at 191 cm�1,
221 cm�1, 247 cm�1 and 282 cm�1 were attributed to UO22+ �2
bending vibrations. In the 300–500 cm�1 region, bands were
observed at 317 cm�1, 405 cm�1, 439 cm�1 and 455 cm�1. The
band at 317 cm�1 was associated with AsO43� �2 bending
vibrations, at 405 cm�1 and 439 cm�1 with PO43� �2 bending
vibrations, and the band at 455 cm�1 may correspond to both
�2 vibrations of phosphate and �4 vibrations of arsenate. The
strongest band with a wide shoulder was observed at 855 cm�1
and corresponds to uranyl symmetric stretching vibrations.
The band at 890 cm�1 was attributed to AsO43� antisymmetric
stretching vibrations. The strong band at approximately
1000 cm�1 corresponds to the same vibrations of PO43�.
Unlike the UO2–Cu pair, no arsenate minerals isostructural
with phosphate were observed in the UO2–Ca system. In
addition, according to the SEM-EDX results, the As impurity
in the yellow crystals was insignificant, excluding the possibi-
lity of the formation of an intrinsic phase of uranyl-calcium
arsenate. Meta-autunites of various deposits are known to
contain up to 10% of the Sr substitution phase [according to
the RRUFF database (http://rruff.info/)]. Therefore, taking
into account the SEM-EDX and PXRD data, the yellow
crystals are considered to be Ca-UO2 phosphate mineral
autunite Ca(UO2)2(PO4)2�nH2O with minor Sr impurity.
The Raman spectrum of the autunite crystal is shown in
Fig. 1(c). The low-frequency region contains two bands at
195 cm�1 and 202 cm�1, which are attributed to uranyl cation
�2 bending vibrations. Weak bands typical of phosphate
bending vibrations in the 400–700 cm�1 region were not
observed. The strongest broad band at �830 cm�1 was fitted
(PsdVoigt1 function) by three bands at 796 cm�1, 818 cm�1
and 836 cm�1. These bands were attributed to UO22+ �1
stretching vibrations. The weak band at 860 cm�1 was attrib-
uted to UO22+ �3 antisymmetric stretching vibrations. The
doublet broad band at approximately 1000 cm�1 was fitted
using the same function by three bands at 989 cm�1,
1013 cm�1 and 1027 cm�1. These bands were attributed to
phosphate antisymmetric stretching vibrations.
The Raman spectra confirmed the SEM-EDX data: the
arsenate bands were observed and distinguished from the
phosphate bands. The influence of interlayer cations on uranyl
results in a 16 cm�1 shift of the most intense UO22+ �1
stretching band. In the Ca-uranyl phosphate mineral autunite
spectrum, this band appears at 836 cm�1, and in the Cu-uranyl
phosphate torbernite spectrum it appears at 820 cm�1.
Therefore, the U—Oax bond length in torbernite is expected
to be longer than that in autunite. According to the Bartlett–
Cooney equation (1), the distance to the Oax atoms in Cu-
uranyl phosphate is 1.79 � 0.03 A, whereas in Ca-uranyl
phosphate this distance is 1.78 � 0.03 A. Such a difference,
however, is unresolvable by EXAFS spectroscopy. The
EXAFS-fitted value of 1.75 A within the calculation and
experimental errors is closer to the autunite value. This agrees
with our previous findings that pointed out the predominance
of the Ca-mineral phase in natural mixtures.
The spectra of both Ca and Cu parts are in good agreement
with previously published data (Frost & Weier, 2004).
The spectrum of synthetic metaschoepite is presented in
Fig. 1(d). In the range up to 600 cm�1, a group of weak bands
was observed. These bands were attributed to UO22+ bending
vibrations, U—Oeq bond vibrations and lattice modes (in the
range <200 cm�1). The strong band at approximately 850 cm�1
was fitted by two bands at 840 cm�1 and 866 cm�1, which were
attributed to UO22+ symmetric and antisymmetric stretching
vibrations, respectively. These peak positions are consistent
with the 838 cm�1 and 855 cm�1 values published by Frost
et al. (2007) (Fig. S7). In the region corresponding to OH
vibrations in H2O molecules, one weak broad band was
observed. This indicates a distortion in the positions of water
molecules. More detailed interpretation of this band is difficult
due to the low signal-to-noise ratio in the corresponding
spectral range. The calculated U Oax bond length is
1.77 � 0.03 A.
With optical magnification of the CaUO4 powder (Fig. S8),
two phases with different colors were observed: yellow and
orange. The yellow phase was predominant and represents
calcium monouranate CaUO4 [Fig. 1(e)]. The spectrum
contains four narrow symmetric bands at 340 cm�1, 379 cm�1,
actinide physics and chemistry
J. Synchrotron Rad. (2022). 29, 303–314 Anna Krot et al. � U(VI) speciation in contaminated environments 307
534 cm�1 and 695 cm�1. The spectrum of the orange phase
contains the same four bands corresponding to CaUO4
(dominant compound) and a group of bands whose positions
exactly coincide with those in the spectrum of calcium
diuranate CaU2O7 (Fig. S8). CaUO4 powder contains an
impurity of calcium diuranate CaU2O7, which was confirmed
by both PXRD and Raman spectroscopy.
In the CaU2O7 Raman spectrum [Fig. 1( f)], bands were
observed at 206 cm�1, 251 cm�1, 267 cm�1, 308 cm�1,
369 cm�1, 398 cm�1, 483 cm�1, 525 cm�1, 664 cm�1, 725 cm�1,
758 cm�1, 780 cm�1 and 881 cm�1. The bands at 664 cm�1,
758 cm�1 and 780 cm�1 were attributed to stretching vibra-
tions of primary U—O bonds, and the weak band at
�820 cm�1 was attributed to �3 antisymmetric stretching
vibrations. The bands at 400–600 cm�1 were attributed to
secondary U—O bond stretching. The bands in the 300–
400 cm�1 region correspond to U—O bending vibrations, and
low-frequency region bands may correspond to lattice vibra-
tion modes (Volkovich et al., 1998, 2001).
m-Raman spectroscopic analysis of synthesized and natural
U-containing compounds was an important part of their
characterization. This method requires a small amount of
sample (a few milligrams) and provides a considerable amount
of information at the microscale. Common features of all
investigated samples include (i) strong �1 vibration bands of
UO22+ at �840 cm�1 and (ii) a group of bands attributed
to bending vibrations in the lower-frequency region 200–
300 cm�1. By comparing the Raman shifts of the remaining
bands, it is possible to distinguish uranyl compounds.
The Raman data were helpful in EXAFS fitting: by splitting
the bands, we can draw conclusions regarding the equivalence
or nonequivalence of functional groups in the structure and
determine whether to separate CNs for the same groups or
not. More importantly, Raman scattering spectra provide
information about bond lengths in uranyl moieties: the
interatomic distances calculated using the Bartlett–Cooney
equation for all compounds were in good agreement with the
values determined from the EXAFS spectra.
3.4. XAFS data
3.4.1. Development of the fitting range. When processing
the results of EXAFS experiments, the question of the accu-
racy of the obtained CNs and distances invariably arises. It
is known that the accuracy of the calculated parameters
decreases with increasing R. Fitting the spectra was performed
in the R-range up to 4–5 A. The validity of considering such
a wide R-range and the degree of accuracy of the values
obtained is unclear and requires further discussion. To esti-
mate the accuracy of the R and CN calculations and to assess
the maximal R-range, where it is acceptable, the following
approach was used. It assumes that uncertainties of the fitted
parameters and the maximal R-range, where parameters of the
U local environment could be assessed with acceptable accu-
racy, would be similar in all samples measured at the same
beamline. We chose U(IV) oxide UO2, which has a well known
refined structure, as the reference compound and fitted its
EXAFS spectrum. The EXAFS spectrum and its Fourier
transform are shown in Fig. S10. In the next step, deviations of
the obtained R values from known structural data from XRD
and previous EXAFS calculations (Table S8) were assessed.
The spectrum of the reference UO2 was recorded at the same
time as the discussed U compounds. Uncertainties in the
measurements in this case should be the same, which means
that the range of R values where the parameters are deter-
mined with high accuracy is the same for all recorded spectra
and the reference UO2. The confidential fitting range for the
investigated compounds was developed by assessing the errors
of the UO2 fitting model.
In EXAFS spectra for standard compounds with known
structures, CNs are usually fixed at their crystallographic
values; thus, the question of errors does not arise. In this case,
only the deviation of calculated interatomic distances is of
interest. Therefore, to estimate the errors, a UO2 fitting model
with fixed CNs was constructed. The results of this fit and
comparison with literature structural data are shown in
Table S8. The largest difference in interatomic distances was
observed in the first coordination sphere: 0.01–0.04 A. The
inconsistency of the literature data probably occurred due to
point defects in the anionic sublattice. For the coordination
sphere of heavy atoms, such as U, the difference between the
literature structural data and the EXAFS results is smaller:
the U—U distance from the EXAFS fitting coincides with the
value from the structural data. Differences for longer
distances are approximately 0.01–0.02 A.
Therefore, the difference between the distances obtained
from structural data and those determined from the EXAFS
results does not exceed 0.04 A for values of up to 4.5 A. For
the coordination spheres of heavy atoms, the difference is
smaller and has a value of approximately 0.01 A.
3.4.2. Standard U compounds. The first step of interpreting
the X-ray absorption spectra of U compounds is the deter-
mination of the U valence state. The white line and the
maximum of the first derivative positions in the XANES
spectra (Fig. S9) confirmed that, in all standard compounds, U
is present in the +6 valence state. The determination of the
valence state was of particular importance for uranates since
such compounds containing uranium in a mixed-valent state
are known: Cs2U4O12 (Berghe et al., 2000, 2002), other alkali
uranates MUO3 (M = Na, K, Rb) with a perovskite-type
derivative structure (Bartram & Fryxell, 1970; Chippindale et
al., 1989; Soldatov et al., 2007) and Ba2U2O7 (Alpress, 1965).
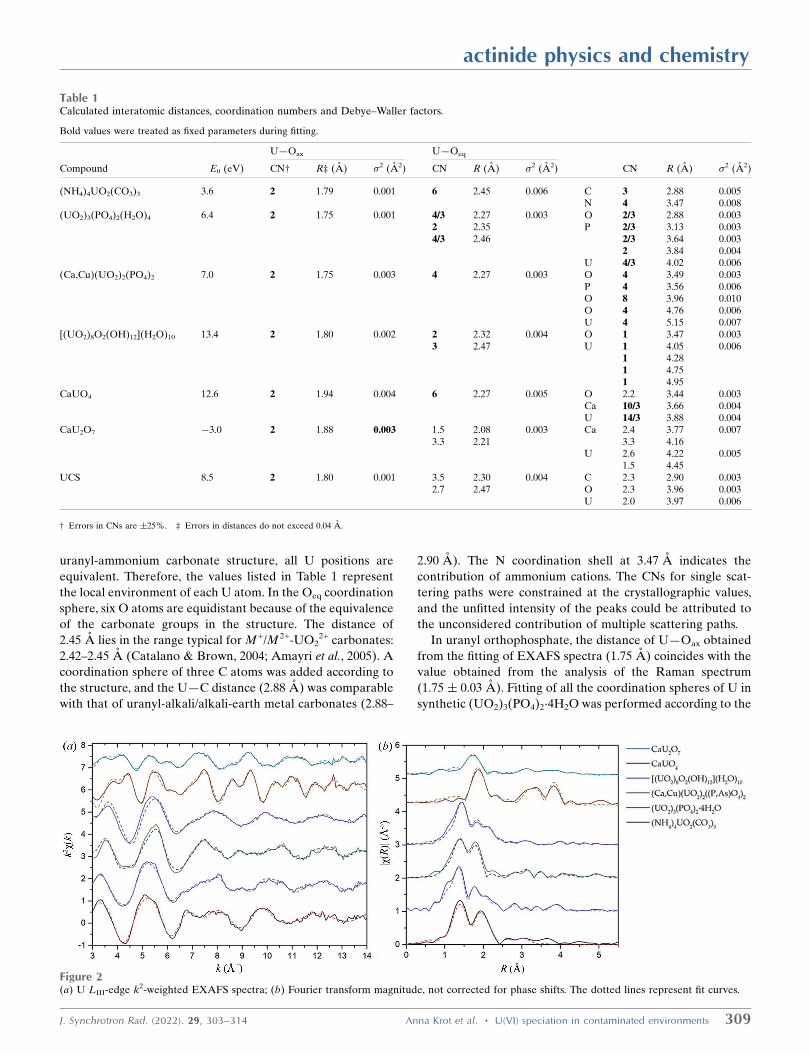
EXAFS spectra and their Fourier transforms with fitting
curves are presented in Fig. 2. Fourier transforms were
performed in the k-range from 3 A�1 to 14 A�1 for uranates,
(NH4)4UO2(CO3)3 and uranyl phosphate minerals and from
3 A�1 to 15 A�1 for metaschoepite and (UO2)3(PO4)2(H2O)4.
The calculated parameters of the local surroundings of U in
standard compounds and the UCS sample are listed in Table 1.
The errors provided in Table 1 were estimated in the UO2
fitting procedure.
The distance to Oax (1.79 A) obtained from fitting the
(NH4)4UO2(CO3)3 EXAFS spectrum coincides with the value
calculated from the Raman shift (1.79 � 0.03 A). In the
actinide physics and chemistry
308 Anna Krot et al. � U(VI) speciation in contaminated environments J. Synchrotron Rad. (2022). 29, 303–314
uranyl-ammonium carbonate structure, all U positions are
equivalent. Therefore, the values listed in Table 1 represent
the local environment of each U atom. In the Oeq coordination
sphere, six O atoms are equidistant because of the equivalence
of the carbonate groups in the structure. The distance of
2.45 A lies in the range typical for M +/M 2+-UO22+ carbonates:
2.42–2.45 A (Catalano & Brown, 2004; Amayri et al., 2005). A
coordination sphere of three C atoms was added according to
the structure, and the U—C distance (2.88 A) was comparable
with that of uranyl-alkali/alkali-earth metal carbonates (2.88–
2.90 A). The N coordination shell at 3.47 A indicates the
contribution of ammonium cations. The CNs for single scat-
tering paths were constrained at the crystallographic values,
and the unfitted intensity of the peaks could be attributed to
the unconsidered contribution of multiple scattering paths.
In uranyl orthophosphate, the distance of U—Oax obtained
from the fitting of EXAFS spectra (1.75 A) coincides with the
value obtained from the analysis of the Raman spectrum
(1.75 � 0.03 A). Fitting of all the coordination spheres of U in
synthetic (UO2)3(PO4)2�4H2O was performed according to the
actinide physics and chemistry
J. Synchrotron Rad. (2022). 29, 303–314 Anna Krot et al. � U(VI) speciation in contaminated environments 309
Figure 2(a) U LIII-edge k2-weighted EXAFS spectra; (b) Fourier transform magnitude, not corrected for phase shifts. The dotted lines represent fit curves.
Table 1Calculated interatomic distances, coordination numbers and Debye–Waller factors.
Bold values were treated as fixed parameters during fitting.
U—Oax U—Oeq
Compound �E0 (eV) CN† R‡ (A) �2 (A2) CN R (A) �2 (A2) CN R (A) �2 (A2)
(NH4)4UO2(CO3)3 3.6 2 1.79 0.001 6 2.45 0.006 C 3 2.88 0.005N 4 3.47 0.008
(UO2)3(PO4)2(H2O)4 6.4 2 1.75 0.001 4/3 2.27 0.003 O 2/3 2.88 0.0032 2.35 P 2/3 3.13 0.0034/3 2.46 2/3 3.64 0.003
2 3.84 0.004U 4/3 4.02 0.006
(Ca,Cu)(UO2)2(PO4)2 7.0 2 1.75 0.003 4 2.27 0.003 O 4 3.49 0.003P 4 3.56 0.006O 8 3.96 0.010O 4 4.76 0.006U 4 5.15 0.007
[(UO2)8O2(OH)12](H2O)10 13.4 2 1.80 0.002 2 2.32 0.004 O 1 3.47 0.0033 2.47 U 1 4.05 0.006
1 4.281 4.751 4.95
CaUO4 12.6 2 1.94 0.004 6 2.27 0.005 O 2.2 3.44 0.003Ca 10/3 3.66 0.004U 14/3 3.88 0.004
CaU2O7 �3.0 2 1.88 0.003 1.5 2.08 0.003 Ca 2.4 3.77 0.0073.3 2.21 3.3 4.16
U 2.6 4.22 0.0051.5 4.45
UCS 8.5 2 1.80 0.001 3.5 2.30 0.004 C 2.3 2.90 0.0032.7 2.47 O 2.3 3.96 0.003
U 2.0 3.97 0.006
† Errors in CNs are �25%. ‡ Errors in distances do not exceed 0.04 A.
known uranyl orthophosphate structure. It contains U in two
nonequivalent positions: intralayer (within the layer) U and
interlayer U in the ratio of 2 :1. Intralayer U is present in
pentagonal-bipyramid polyhedra surrounded by four phos-
phate tetrahedra, creating uranyl phosphate sheets. This
intralayer uranyl is bound to three monodentate phosphate
groups and one bidentate phosphate group. The sheets formed
in this way are joined by uranyl polyhedra in the interlayer,
creating a framework structure. Interlayer uranyl is bound to
two phosphate anions of neighboring sheets in a monodentate
manner. The EXAFS spectrum represents the average local
environment of U in two positions. The environment around
U in the interlayer and intralayer positions contributes to CN
values with coefficients of 1/3 and 2/3, respectively (according
to the 2:1 ratio of these types of U in the structure). O atoms
in the equatorial plane at distances of 2.27 A and 2.35 A
are attributed to intralayer uranium positions. The shorter
interatomic distance with CN = 2 � 2/3 = 4/3 is attributed to
two O atoms in the bidentate phosphate anion, and longer
distances with CN = 3 � 2/3 = 2 are attributed to three O
atoms in monodentate phosphate. The CNs were multiplied by
2/3 according to the structure to consider the nonequivalence
of U positions (the coefficient for U in the intralayer positions
mentioned above). Note that with the given k range (3–
15 A�1, �k = 12 A�1) the expected resolution in R-space is
approximately 0.13 A. The difference in calculated distances
to Oeq subshells in uranyl orthophosphate is <0.13 A, which
might indicate higher uncertainties in these values. The P
coordination shell is split into monodentate and bidentate
phosphate subshells at distances of 3.13 A and 3.84 A, where
the bidentate phosphate is closer than the monodentate
phosphate. CNs were calculated in the same way as the
equatorial O coordination sphere. The P subshells at 3.13 A
and 3.84 A are attributed to phosphates around uranyl in the
intralayer position: one bidentate and three monodentate
bound anions. Therefore, the CNs should be multiplied by 2/3.
The P subshell at 3.64 A with CN = 2 � 1/3 contains two
monodentate phosphate anions bound to uranyl in the inter-
layer position. For monodentate phosphate in an autunite-
type structure (layers of uranyl octahedra connected to four
phosphates in a monodentate manner), common U—P
distances are approximately 3.6 A. In the case of uranyl
orthophosphate, the distance to the phosphate anions in the
sheet is longer. The value of 3.84 A is in good agreement with
the result of Catalano & Brown (2004) for the same ortho-
phosphate (3.80 A) and for phosphuranylite (3.81 A), which
also represents a framework structure (Demartin et al., 1991).
A more distant U subshell (4.02 A) is attributed to two
intralayer U neighbors. The uranium coordination shell is split
into two subshells: one with CN 2� 2/3 at a distance of 4.02 A
and one with the same CN at a longer distance, which is
beyond the detection limit and was not fitted. The total CN for
the nearest U coordination shell within the sheet is 4. In the
interlayer position, the U—Oeq distance is 2.46 A, greater than
that for intralayer atoms. This result is reasonable, as chemical
bonds within the sheet are stronger than those between the
interlayer uranyl and phosphates of neighboring sheets. Water
molecules were added to the model as ligands that saturate the
coordination sphere of interlayer U (otherwise, the CN of
interlayer U would be 2, which is chemically unrealistic). The
best fit was achieved after the addition of 2 � 1/3 H2O,
resulting in 4-coordinate U in the interlayer.
The studied natural minerals were identified as a mixture
of Ca(UO2)2(PO4)2 and Cu(UO2)2(PO4)2 hydrates with a
predominant Ca-phase and a Cu(UO2)2(AsO4)2 impurity
phase. The minerals were isostructural; therefore, the U atoms
have identical environments, differing only in the partial
substitution of P for As and in interlayer cations. EXAFS
spectroscopy is sensitive to the main phases and represents the
average local U environment. According to SEM-EDX results
(Table S2), As-substituted torbernite is about 1/3 of the total
amount of Cu-minerals. At the same time, Cu phases do not
exceed 20% of the mixture since the main phase is Ca-mineral
autunite. Total As content is <7%. Therefore, the contribution
of As impurities to the EXAFS spectrum is negligible. Inter-
layer cations also contribute slightly to the EXAFS data since
their distribution around the absorbing atom is not regular
and their scattering properties are weak. The addition of Ca
and Cu to the fitting model did not improve the fit. Taking into
account the negligible contribution of interlayer cations and
As in the EXAFS spectrum, three species present in the
natural mixture of isostructural autunite-type minerals cannot
be distinguished by EXAFS spectroscopy. The spectrum of
this sample was considered the standard of U in an autunite-
type structure. The U—Oax distance (1.75 A) is less than the
typical value for layered autunite-type minerals (1.77–1.78 A)
but coincides with the result for synthetic orthophosphate
(UO2)3(PO4)2�4H2O. The distance to the equatorial O coor-
dination sphere (2.27 A) also coincides with the value calcu-
lated for monodentate coordinated phosphate in synthetic
(UO2)3(PO4)2�4H2O and agrees well with literature data
(2.28–2.29 A). The O coordination shell at 3.49 A reflects the
contribution of interlayer water molecules. The equatorial O
shell and P coordination shell in all three minerals of the
natural mixture appear at approximately the same distances.
The addition of distant O coordination spheres at 3.96 A and
4.76 A and multiple scattering paths associated with P and
distant O significantly improved the model. The coordination
sphere of four neighboring U atoms appears at 5.15 A. The
calculated value is close to that obtained previously by
Catalano & Brown (2004) for various autunite-type minerals
(�5.2 A).
The distance to both axial and equatorial O coordination
spheres in minerals coincides with that in uranyl phosphate
and is reduced in comparison with that of carbonate. At the
same time, the P shell is located farther (for bidentate and
monodentate phosphate, the distances are �3.15 and 3.6–
3.8 A, respectively) than the C shell in carbonate (�2.9 A).
Relying on interatomic distances, it is possible to differentiate
between monodentate and bidentate coordinated phosphate
ions: the bidentate-bound P coordination sphere is located at a
distance of �3.15 A, whereas the monodentate coordination
sphere is located at a distance of 3.6–3.8 A. Monodentate
phosphates connected to uranyl in layered structures are
actinide physics and chemistry
310 Anna Krot et al. � U(VI) speciation in contaminated environments J. Synchrotron Rad. (2022). 29, 303–314
closer and appear at �3.6 A, whereas in framework structures
a larger distance of �3.8 A to the monodentate-bound phos-
phates was observed. There are significant differences
between autunite-type phosphates, uranyl orthophosphate
and carbonates in axial and equatorial O coordination shells.
According to the XRD data, the synthesized oxyhydroxide
sample consists of predominantly metaschoepite and two
additional dehydrated phases. The structural similarity of
these three phases within a layer allows us to interpret the
interatomic distances (R) calculated from the EXAFS spectra
as correct parameters specific for uranyl oxyhydroxide
compounds and use the spectrum as the standard of U in
the oxyhydroxide structure. U oxyhydroxides are layered
compounds that contain U—O sheets with U atoms and
pentagonal-bipyramidal coordination, joined together by
interlayer water molecules. In the metaschoepite structure,
compared with schoepite (Finch et al., 1997), the two most
weakly bound water molecules are removed from the inter-
layer space, and ten H2O molecules remain. The structure of
the layers does not change on conversion from schoepite to
metaschoepite, and the cell parameters change only slightly:
a decreases by �0.3 A. During the transformation of meta-
schoepite to dehydrated schoepite, all interlayer water mole-
cules are removed and the layers recrystallize. The sheets of
both (meta-)schoepite and dehydrated schoepite represent
�-UO2(OH)2-type structures. Metaschoepite is characterized
by the presence of ordered anionic vacancies at a 1:8 ratio,
and the dehydrated schoepite vacancies are disordered. The
compositions of the layers in metaschoepite and dehydrated
schoepite are the same, and UO3�0.75H2O and U atoms adopt
fivefold coordination. The structures of three oxyhydroxide
phases in our sample within the layer differ only in the
ordering of the O vacancies. Therefore, the EXAFS spectrum
correctly describes the local surroundings of U atoms in the
oxyhydroxide layers, as the ordering of vacancies is not
detectable by EXAFS spectroscopy. The interlayer space
differs by the number of remaining water molecules, which will
affect only the CN of interlayer H2O in the EXAFS model.
Despite the presence of several phases in our sample, it
could be used as a standard of U in oxyhydroxide-type
structures. The calculated parameters for the metaschoepite
[(UO2)8O2(OH)12](H2O)10 sample are presented in Table 1.
The distance to the axial O coordination sphere (1.80 A)
within its uncertainty agrees with the value obtained from the
Raman spectrum (1.77 � 0.03 A). The distances to the axial
and equatorial O subshells agree well with known structural
data and are similar to typical values from the literature
(Allen et al., 1996; Froideval et al., 2006; Aamrani et al., 2007).
The uranium coordination sphere is also split: it is fitted by
four U atoms at different distances in the range 4–5 A. The O
coordination shell at 3.46 A corresponds to interlayer water
molecules. The best fit was achieved by fixing the CN for
this shell to 1.
Unlike other U+6 compounds, uranates do not contain
uranyl UO22+ ions in their structure. That is, there are no
strongly bound axial oxygen atoms at distances of �1.8 A.
In the structure of calcium monouranate CaUO4, layers and
chains of UO8 hexagonal bipyramids alternate with Ca—O
layers. For two oxygen atoms in the axial plane of U-poly-
hedra, a distance larger than that for axial O in uranyl is
characteristic. The calculated values of 1.94 A and 2.27 A for
axial and equatorial oxygen coordination spheres are in good
agreement with the EXAFS and PXRD data obtained by
Prieur et al. (2019). For more distant coordination spheres,
the CNs and interatomic distances have not been previously
published. Our calculated distance to the neighboring U
coordination shell (3.88 A) coincides with the a and b para-
meters of the crystal lattice, as reported by Prieur and co-
authors; in the CaUO4 structure, a = b = 3.87745 A (Prieur et
al., 2019). The U atoms in layers are located at the vertices of
the rhombus. In chains, due to geometry, the U atoms are at
the same distances. The CN of U was calculated with consid-
eration of the following points: the number of neighboring
atoms around U is six in the layers and four in the chains at a
distance equal to a. The positions in the layers are occupied by
1/3 of all the atoms, and the remaining 2/3 of U atoms are in
chains. Hence, the CN of U is equal to (6 � 1/3) + (4 � 2/3) =
14/3. The CN for Ca was calculated similarly: CNCa = (2� 1/3)
+ (4 � 2/3) = 10/3. The CN for O atoms at 3.44 A was treated
as a variable, as it is difficult to assess correctly.
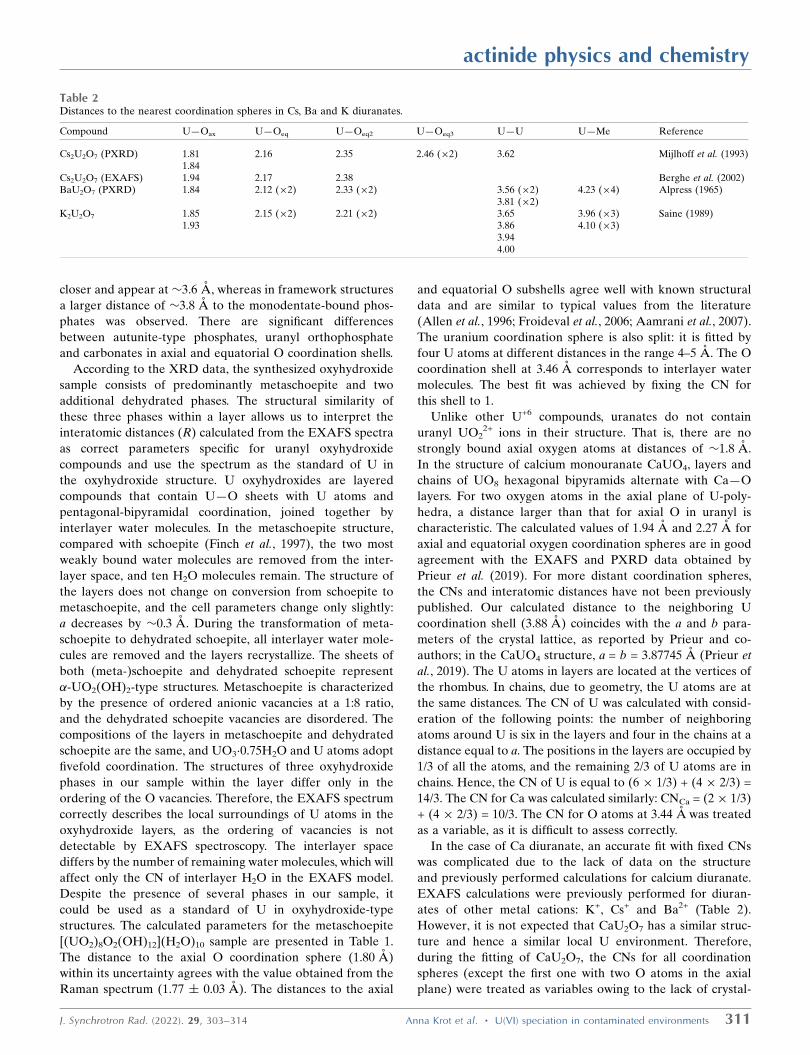
In the case of Ca diuranate, an accurate fit with fixed CNs
was complicated due to the lack of data on the structure
and previously performed calculations for calcium diuranate.
EXAFS calculations were previously performed for diuran-
ates of other metal cations: K+, Cs+ and Ba2+ (Table 2).
However, it is not expected that CaU2O7 has a similar struc-
ture and hence a similar local U environment. Therefore,
during the fitting of CaU2O7, the CNs for all coordination
spheres (except the first one with two O atoms in the axial
plane) were treated as variables owing to the lack of crystal-
actinide physics and chemistry
J. Synchrotron Rad. (2022). 29, 303–314 Anna Krot et al. � U(VI) speciation in contaminated environments 311
Table 2Distances to the nearest coordination spheres in Cs, Ba and K diuranates.
Compound U—Oax U—Oeq U—Oeq2 U—Oeq3 U—U U—Me Reference
Cs2U2O7 (PXRD) 1.81 2.16 2.35 2.46 (�2) 3.62 Mijlhoff et al. (1993)1.84
Cs2U2O7 (EXAFS) 1.94 2.17 2.38 Berghe et al. (2002)BaU2O7 (PXRD) 1.84 2.12 (�2) 2.33 (�2) 3.56 (�2) 4.23 (�4) Alpress (1965)
3.81 (�2)K2U2O7 1.85 2.15 (�2) 2.21 (�2) 3.65 3.96 (�3) Saine (1989)
1.93 3.86 4.10 (�3)3.944.00
lographic data for this structure or previously performed
EXAFS calculations. Several attempts have been made to
construct a realistic fitting model; coordination spheres of O,
Ca and U were added in different variations to fit peaks in the
3–5 A region. In Table 1, the parameters of the best fitting
model are listed. The distance to the axial O (1.88 A) is greater
than that in uranyl compounds (1.76–1.82 A). A longer
distance to the first coordination shell compared with that
of UO22+ compounds is typical for uranates and is the most
obvious and easily detectable distinctive feature of uranates.
The Debye–Waller factor of axial oxygens is greater than that
for uranyl compounds: O atoms in the axial plane in uranates
are less ordered and weakly bound to U. The second coordi-
nation shell is split and contains four to five O atoms in the
equatorial plane at distances of 2.08 A and 2.21 A, which are
less than those of other metal uranates (Table 2). A significant
difference from K, Cs and Ba diuranates is the order of the
coordination spheres: in our case, the Ca shell is located closer
than the U shell. At the same time, in CaU2O7, the distances to
the U shell are greater than those known for other diuranates.
Notably, the calculated values could be affected by the
impurity of other Ca uranates, which was observed in the
XRD data. The accuracy of the obtained values is reduced due
to this factor.
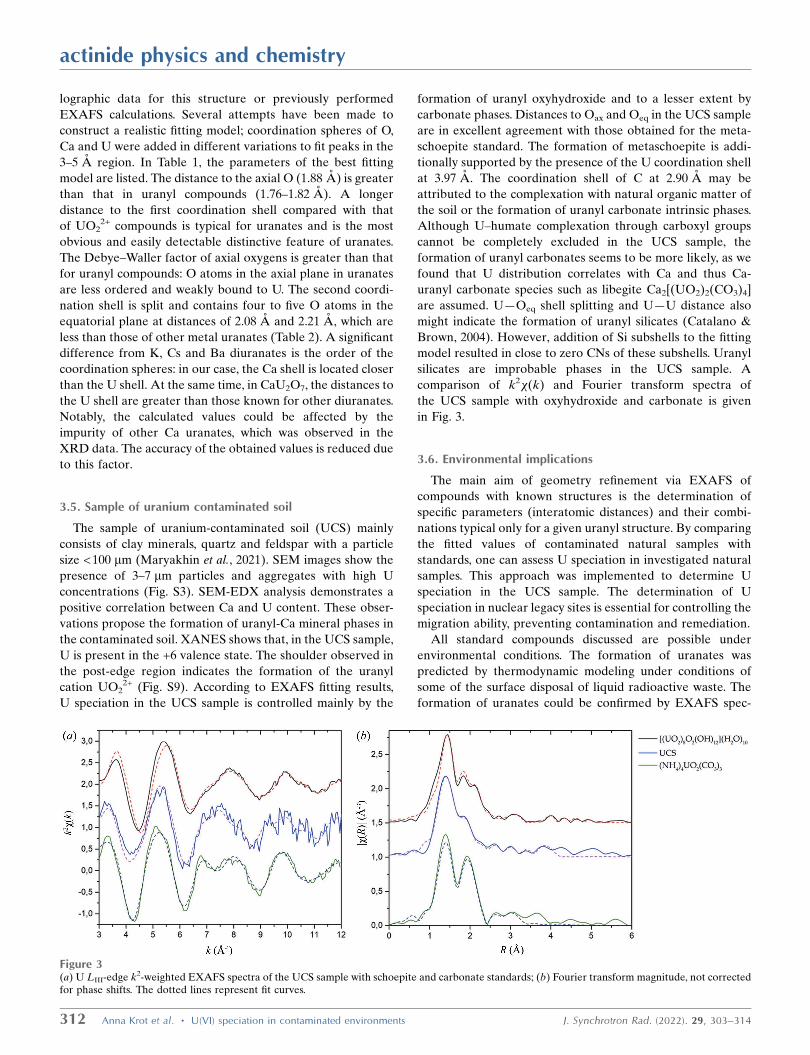
3.5. Sample of uranium contaminated soil
The sample of uranium-contaminated soil (UCS) mainly
consists of clay minerals, quartz and feldspar with a particle
size <100 mm (Maryakhin et al., 2021). SEM images show the
presence of 3–7 mm particles and aggregates with high U
concentrations (Fig. S3). SEM-EDX analysis demonstrates a
positive correlation between Ca and U content. These obser-
vations propose the formation of uranyl-Ca mineral phases in
the contaminated soil. XANES shows that, in the UCS sample,
U is present in the +6 valence state. The shoulder observed in
the post-edge region indicates the formation of the uranyl
cation UO22+ (Fig. S9). According to EXAFS fitting results,
U speciation in the UCS sample is controlled mainly by the
formation of uranyl oxyhydroxide and to a lesser extent by
carbonate phases. Distances to Oax and Oeq in the UCS sample
are in excellent agreement with those obtained for the meta-
schoepite standard. The formation of metaschoepite is addi-
tionally supported by the presence of the U coordination shell
at 3.97 A. The coordination shell of C at 2.90 A may be
attributed to the complexation with natural organic matter of
the soil or the formation of uranyl carbonate intrinsic phases.
Although U–humate complexation through carboxyl groups
cannot be completely excluded in the UCS sample, the
formation of uranyl carbonates seems to be more likely, as we
found that U distribution correlates with Ca and thus Ca-
uranyl carbonate species such as libegite Ca2[(UO2)2(CO3)4]
are assumed. U—Oeq shell splitting and U—U distance also
might indicate the formation of uranyl silicates (Catalano &
Brown, 2004). However, addition of Si subshells to the fitting
model resulted in close to zero CNs of these subshells. Uranyl
silicates are improbable phases in the UCS sample. A
comparison of k2�(k) and Fourier transform spectra of
the UCS sample with oxyhydroxide and carbonate is given
in Fig. 3.
3.6. Environmental implications
The main aim of geometry refinement via EXAFS of
compounds with known structures is the determination of
specific parameters (interatomic distances) and their combi-
nations typical only for a given uranyl structure. By comparing
the fitted values of contaminated natural samples with
standards, one can assess U speciation in investigated natural
samples. This approach was implemented to determine U
speciation in the UCS sample. The determination of U
speciation in nuclear legacy sites is essential for controlling the
migration ability, preventing contamination and remediation.
All standard compounds discussed are possible under
environmental conditions. The formation of uranates was
predicted by thermodynamic modeling under conditions of
some of the surface disposal of liquid radioactive waste. The
formation of uranates could be confirmed by EXAFS spec-
actinide physics and chemistry
312 Anna Krot et al. � U(VI) speciation in contaminated environments J. Synchrotron Rad. (2022). 29, 303–314
Figure 3(a) U LIII-edge k2-weighted EXAFS spectra of the UCS sample with schoepite and carbonate standards; (b) Fourier transform magnitude, not correctedfor phase shifts. The dotted lines represent fit curves.
troscopy by observing O atoms in the axial plane at an
increased distance of 1.88–1.94 A, which is unique to uranates
and not observed in uranyl compounds.
Specifically, the mixture of natural autunite-type minerals
(Ca,Cu)(UO2)2[(P,As)O4]2 should be pointed out. Although
the sample is a mixture of several uranyl phases, it could be
used as a standard for uranyl in autunite-type structures, the
most common structure among uranyl phosphate minerals.
The application of Raman spectroscopy to environmental
samples is complicated. The presence of large amounts of
minerals in natural samples prevents the observation of bands
of minor phases, such as U contamination. However, the use of
Raman spectroscopy to identify U compounds in bottom
sediments of liquid waste storage, slurry storage, uranium
mining tailings and other objects with a high uranium content
seems to be completely justified.
The determination of U speciation is important in terms
of rehabilitation and nuclear waste management. In the case
of contaminated natural samples of unknown composition,
extended research applying a number of analytical approaches
is required to develop an accurate EXAFS fitting model and
establish U speciation.
4. Conclusions
Several U(VI) synthesized compounds, including
(NH4)4UO2(CO3)3, orthophosphate (UO2)3(PO4)2�4H2O,
oxyhydroxide [(UO2)8O2(OH)12](H2O)10, uranate CaUO4,
diuranate CaU2O7 and a natural mixture of autunite-type
minerals (Ca,Cu)(UO2)2[(P,As)O4]2, were investigated by
PXRD, EXAFS and Raman spectroscopy. Based on the
obtained EXAFS data regarding the nature, interatomic
distance and CNs of atoms in the nearest U surrounding, we
identified parameters that are common for a particular U
compound. All standard compounds studied have specific
features that are typical only for particular structures. The first
feature is the distance and splitting of the Oeq coordination
sphere: carbonates in the [UO2(CO3)3]4� structure do not
exhibit Oeq sphere splitting, have CN = 6 and distances that
are greater than those observed for 4-coordinate U in the
autunite-type structure, which also does not exhibit Oeq sphere
splitting. Notably, only interatomic distances are useful for
comparison with environmental samples. Natural samples
usually contain a mixture of several species, and their average
CNs are different from the values in pure compounds. Second,
the distances to central atoms in surrounding anions are
characteristic. Carbonates can be easily distinguished: a
distance of �2.9 A is unique and typical only for the C coor-
dination sphere. Another more complicated question is
whether these ligands are inorganic carbonates or organic
groups from natural organic matter. To answer this question,
additional investigation of the spectrum is required. In some
cases, it is possible to assess the Corg :Cinorg ratio by including
multiple scattering paths and Odistant coordination spheres
with varying CNs; small CNs for these coordination shells will
indicate a smaller contribution of carbonates and the pre-
dominance of organic groups, and vice versa. In the example
of (UO2)3(PO4)2�4H2O, we showed that it is possible to
differentiate monodentate and bidentate coordination of
phosphate: for bidentate coordination, the typical distance is
�3.2 A, and for monodentate coordination this distance is
3.6–3.8 A. Third, distances to neighboring U atoms provide
useful information. U subshells at�4–4.3 A and �4.8–5 A are
typical for oxyhydroxide-type structures. An indication of an
autunite-type structure (along with distances to the Oeq and P
atoms) is the presence of a U coordination sphere at �5.20 A.
In comparison, in uranyl orthophosphate, a U coordination
sphere appears at �4 A. Moreover, no contribution of
neighboring U is observed in the case of uranyl-ammonium
carbonate.
By comparing characteristic features of standard U
compounds mentioned above with U local surrounding para-
meters of the UCS sample and applying additional analytical
techniques such as SEM-EDX, U speciation in the contami-
nated soil was determined as predominantly uranyl oxyhydr-
oxide phase and carbonate of the uranyl-calcium phase.
The obtained EXAFS data on the standards will help us
to estimate U speciation in natural contaminated samples.
Additional structural information regarding U-containing
phases may be provided by PXRD, SEM-EDX and m-Raman
spectroscopy in the case of high U concentrations in radio-
active wastes. Based on the knowledge of U speciation in
nuclear legacy sites, it will be possible to control U contam-
ination in the environment by creating immobilization
barriers, establishing appropriate disposal conditions and
developing rehabilitation strategies.
5. Related literature
The following references, not cited in the main body of the
paper, have been cited in the supporting information: Allen &
Griffiths (1979); Boyanov et al. (2007, 2017); Denecke et al.
(2005); Faulques et al. (2018); Frost et al. (2004); Jovani-Abril
(2014); O’Loughlin et al. (2003); Opel et al. (2007); Wasserstein
(1951).
Acknowledgements
The authors acknowledge Yury Nevolin for his support in the
synthesis of the U compounds and Andrey Shiryaev for
recording the XRD data. The Raman and PXRD measure-
ments were performed using FMI IPCE RAS equipment. The
authors are also grateful to three anonymous reviewers, whose
careful revisions significantly improved the manuscript. The
authors declare no conflict of interest.
Funding information
This work was financially supported by the Russian Science
Foundation grant No. 19–73–20051 (synthesis, PXRD, Raman
and XAS data recording) and the Russian Ministry of Science
and Education grant No. 075–15–2019–1891 (conceptualiza-
tion and data processing).
actinide physics and chemistry
J. Synchrotron Rad. (2022). 29, 303–314 Anna Krot et al. � U(VI) speciation in contaminated environments 313
References
Aamrani, S., Gimenez, J., Rovira, M., Seco, F., Grive, M., Bruno, J.,Duro, L. & de Pablo, J. (2007). Appl. Surf. Sci. 253, 8794–8797.
Allen, G. C. & Griffiths, A. J. (1979). J. Chem. Soc. Dalton Trans. 2,315–319.
Allen, P. G., Shuh, D. K., Bucher, J. J., Edelstein, N. M., Palmer, C. E.A. & Marquez, L. N. (1996). MRS Proc. 432, 139.
Alpress, J. G. (1965). J. Inorg. Nucl. Chem. 27, 1521–1527.Amayri, S., Reich, T., Arnold, T., Geipel, G. & Bernhard, G. (2005).
J. Solid State Chem. 178, 567–577.Arai, Y., Marcus, M. A., Tamura, N., Davis, J. A. & Zachara, J. M.
(2007). Environ. Sci. Technol. 41, 4633–4639.Armstrong, C. R. (2009). Synthesis, Spectroscopic, and Thermo-
dynamic Study of Uranyl and Neodymium Phosphate Solid Phases,pp. 33–37. Washington, USA.
Bartlett, J. R. & Cooney, R. P. (1989). J. Mol. Struct. 193, 295–300.Bartram, S. F. & Fryxell, R. E. (1970). J. Inorg. Nucl. Chem. 32, 3701–
3706.Bes, R., Rivenet, M., Solari, P., Kvashnina, K. O., Scheinost, A. C. &
Martin, P. M. (2016). Inorg. Chem. 55, 4260–4270.Bostick, B. C., Fendorf, S., Barnett, M. O., Jardine, P. M. & Brooks,
S. C. (2002). Soil Sci. Soc. Am. J. 66, 99–108.Boyanov, M. I., Latta, D. E., Scherer, M. M., O’Loughlin, E. J. &
Kemner, K. M. (2017). Chem. Geol. 464, 110–117.Boyanov, M. I., O’Loughlin, E. J., Roden, E. E., Fein, J. B. & Kemner,
K. M. (2007). Geochim. Cosmochim. Acta, 71, 1898–1912.Catalano, J. G. & Brown, J. E. (2004). Am. Mineral. 89, 1004–1021.Catalano, J. G., Heald, S. M., Zachara, J. M. & Brown, G. E. (2004).
Environ. Sci. Technol. 38, 2822–2828.Chippindale, A. M., Dickens, P. G. & Harrison, W. T. A. (1989). J.
Solid State Chem. 78, 256–261.Cordfunke, E. H. P. (1961). J. Inorg. Nucl. Chem. 23, 285–286.Cordfunke, E. H. P. (1962). J. Inorg. Nucl. Chem. 24, 303–307.Cordfunke, E. H. P. & Van Der Giessen, A. A. (1963). J. Inorg. Nucl.
Chem. 25, 553–555.Degen, T., Sadki, M., Bron, E., Konig, U. & Nenert, G. (2014). Powder
Diffr. 29, S13–S18.Demartin, F., Diella, V., Donzelli, S., Gramaccioli, C. M. & Pilati, T.
(1991). Acta Cryst. B47, 439–446.Denecke, M. A., Janssens, K., Proost, K., Rothe, J. & Noseck, U.
(2005). Environ. Sci. Technol. 39, 2049–2058.Faulques, E., Perry, D. L. & Kalashnyk, N. (2018). Vib. Spectrosc. 99,
184–189.Finch, R. J., Hawthorne, F. C., Miller, M. L. & Ewing, R. C. (1997).
Powder Diffr. 12, 230–238.Froideval, A., Del Nero, M., Gaillard, C., Barillon, R., Rossini, I. &
Hazemann, J. L. (2006). Geochim. Cosmochim. Acta, 70, 5270–5284.
Frost, R. L., Carmody, O., Erickson, K. L., Weier, M. L. & Cejka, J.(2004). J. Mol. Struct. 703, 47–54.
Frost, R. L., Cejka, J. & Weier, M. L. (2007). J. Raman Spectrosc. 38,460–466.
Frost, R. L. & Weier, M. (2004). Spectrochim. Acta A Mol. Biomol.Spectrosc. 60, 2399–2409.
Hower, J. C., Dai, S. & Eskenazy, G. (2016). Coal Comb. Gas. Prod. 8,44–53.
Jovani-Abril, R. (2014). Doctoral thesis. Universidad de Santiago deCompostela (USC), Spain; Institute for Transuranium Elements(ITU), Germany.
Kaplan, D. I., Smith, R., Parker, C. J., Baker, M., Cabrera, T.,Ferguson, B. O., Kemner, M., Laird, M., Logan, C., Lott, J.,Manglass, L., Martinez, N. E., Montgomery, D., Seaman, J. C.,Shapiro, M. & Powell, B. A. (2020). ACS Earth Space Chem. 4,1360–1366.
Katsenovich, Y. P., Cardona, C., Szecsody, J., Lagos, L. E. & Tang, W.(2018). Appl. Geochem. 92, 94–103.
Kelly, S. D. (2010). Dev. Soil Sci. 34, 411–466.
Kelly, S. D., Kemner, K. M. & Brooks, S. C. (2007). Geochim.Cosmochim. Acta, 71, 821–834.
Krepelova, A., Reich, T., Sachs, S., Drebert, J. & Bernhard, G. (2008).J. Colloid Interface Sci. 319, 40–47.
Lu, G., Haes, A. J. & Forbes, T. Z. (2018). Coord. Chem. Rev. 374,314–344.
Maher, K., Bargar, J. R. & Brown, G. E. (2013). Inorg. Chem. 52,3510–3532.
Marshall, T. A., Morris, K., Law, G. T. W., Mosselmans, F. W., Bots, P.,Roberts, H. & Shaw, S. (2015). Miner. Mag. 79, 1265–1274.
Maryakhin, M. A., Vlasova, I. E., Varlakova, G. A., Germanov, A. V.,Varlakov, A. P., Kalmykov, S. N., Petrov, V. G., Pomanchuk, A. Yu.,Yapaskurt, V. O. & Trigub, A. L. (2021). Radiochemistry, 63, 119–126.
Mehta, S. (2017). Appl. Geochem. 84, 133–153.Mijlhoff, F. C., Ijdo, D. J. W. & Cordfunke, E. H. P. (1993). J. Solid
State Chem. 102, 299–305.O’Loughlin, E. J., Kelly, S. D., Cook, R. E., Csencsits, R. & Kemner,
K. M. (2003). Environ. Sci. Technol. 37, 727–727.Opel, K., Weiß, S., Hubener, S., Zanker, H. & Bernhard, G. (2007).
Radiochim. Acta, 95, 143–149.Peterson, R. A., Buck, E. C., Chun, J., Daniel, R. C., Herting, D. L.,
Ilton, E. S., Lumetta, G. I. & Clark, S. B. (2018). Environ. Sci.Technol. 52, 381–396.
Pham-Thi, M. & Colomban, Ph. (1985). J. Less-Common Met. 108,189–216.
Prieur, D. B., Popa, K., Vigier, J. F., Scheinost, A. C. & Martin, P. M.(2019). J. Nucl. Mater. 516, 303–308.
Qafoku, N. P. & Icenhower, J. P. (2008). Rev. Environ. Sci. Biotechnol.7, 355–380.
Ravel, B. & Newville, M. (2005). J. Synchrotron Rad. 12, 537–541.Rehr, J. J., Albers, R. C. & Zabinsky, S. I. (1992). Phys. Rev. Lett. 69,
3397–3400.Romanchuk, A. Yu., Vlasova, I. E. & Kalmykov, S. N. (2021). Front.
Chem. 8, 630.Saine, M. C. (1989). J. Less-Common Met. 154, 361–365.Sali, S. K., Sampath, S. & Venugopal, V. (2000). J. Nucl. Mater. 277,
106–112.Shannon, R. D. & Prewitt, C. T. (1969). Acta Cryst. B25, 925–946.Soldatov, A. V., Lamoen, D., Konstantinovic, M. J., Van den Berghe,
S., Scheinost, A. C. & Verwerft, M. (2007). J. Solid State Chem. 180,54–61.
Stetten, L., Lefebvre, P., Le Pape, P., Mangeret, A., Blanchart, P.,Merrot, P., Brest, J., Julien, A., Bargar, J. R., Cazala, C. & Morin, G.(2020). J. Hazard. Mater. 384, 121362.
Thompson, H. A., Brown, G. E. & Parks, G. A. (1997). Am. Mineral.82, 483–496.
Van den Berghe, S., Laval, J.-P., Gaudreau, B., Terryn, H. & Verwerft,M. (2000). J. Nucl. Mater. 277, 28–36.
Van den Berghe, S., Verwerft, M., Laval, J.-P., Gaudreau, B., Allen,P. G. & Van Wyngarden, A. (2002). J. Solid State Chem. 166, 320–329.
Volkovich, V. A., Griffiths, T. R., Fray, D. J. & Fields, M. (1998). Vib.Spectrosc. 17, 83–91.
Volkovich, V. A., Griffiths, T. R. & Thied, R. C. (2001). Vib. Spectrosc.25, 223–230.
Wasserstein, B. (1951). Nature, 168, 380.Watt, G. W., Achorn, S. L. & Marley, J. L. (1950). J. Am. Chem. Soc.
72, 3341–3343.Yagoubi, S., Renard, C., Abraham, F. & Obbade, S. (2013). J. Solid
State Chem. 200, 13–21.Zachara, J. M., Long, P. E., Bargar, J., Davis, J. A., Fox, P.,
Fredrickson, J. K., Freshley, M. D., Konopka, A. E., Liu, C.,McKinley, J. P., Rockhold, M. L., Williams, K. H. & Yabusaki, S. B.(2013). J. Contam. Hydrol. 147, 45–72.
Zhang, L., Zhou, J., Zhang, J., Su, J., Zhang, S., Chen, N., Jia, Y., Li, J.,Wang, Y. & Wang, J.-Q. (2016). J. Synchrotron Rad. 23, 758–768.
actinide physics and chemistry
314 Anna Krot et al. � U(VI) speciation in contaminated environments J. Synchrotron Rad. (2022). 29, 303–314