L-edge XANES analysis of photoexcited metal complexes in solution
�������� ����� ��
Redox-dependent changes in manganese speciation in Baltic Sea sedimentsfrom the Holocene Thermal Maximum: an EXAFS, XANES and LA-ICP-MSstudy
Conny Lenz, Thilo Behrends, Tom Jilbert, Miguel Silveira, Caroline P.Slomp
PII: S0009-2541(14)00045-XDOI: doi: 10.1016/j.chemgeo.2014.01.013Reference: CHEMGE 17132
To appear in: Chemical Geology
Received date: 29 July 2013Revised date: 17 January 2014Accepted date: 20 January 2014
Please cite this article as: Lenz, Conny, Behrends, Thilo, Jilbert, Tom, Silveira, Miguel,Slomp, Caroline P., Redox-dependent changes in manganese speciation in Baltic Seasediments from the Holocene Thermal Maximum: an EXAFS, XANES and LA-ICP-MSstudy, Chemical Geology (2014), doi: 10.1016/j.chemgeo.2014.01.013
This is a PDF file of an unedited manuscript that has been accepted for publication.As a service to our customers we are providing this early version of the manuscript.The manuscript will undergo copyediting, typesetting, and review of the resulting proofbefore it is published in its final form. Please note that during the production processerrors may be discovered which could affect the content, and all legal disclaimers thatapply to the journal pertain.
ACC
EPTE
D M
ANU
SCR
IPT
ACCEPTED MANUSCRIPT
1
Redox-dependent changes in manganese speciation in Baltic Sea
sediments from the Holocene Thermal Maximum: an EXAFS, XANES
and LA-ICP-MS study
Conny Lenz1,2,*, Thilo Behrends2, Tom Jilbert2, Miguel Silveira3 and Caroline P. Slomp2
1Department of Geology, Lund University, Sölvegatan 12, SE-223 62 Lund, Sweden
2Department of Earth Sciences, Faculty of Geosciences, Utrecht University, P.O. Box 80.021, 3508 TA Utrecht, The Netherlands
3Katholieke Universiteit Leuven, DUBBLE beamline, ESRF, 38043 Grenoble, France
*Corresponding author
Tel.nr.: 0046 46 2227881 (C. Lenz)
e-mail addresses:
[email protected] (C. Lenz)
[email protected] (T. Behrends)
[email protected] (T. Jilbert)
[email protected] (M. Silveira)
[email protected] (C.P. Slomp)
Keywords: manganese speciation, EXAFS spectrometry, sediment, anoxic basin, Baltic
Sea

ACC
EPTE
D M
ANU
SCR
IPT
ACCEPTED MANUSCRIPT
2
Abstract
Manganese (Mn) enrichments in sediments of the deep basins of the Baltic Sea are
believed to consist of Ca-Mn-carbonates that form from Mn-oxides following periodic
inflows of oxygen-rich North Sea waters. However, a range of Mn-bearing mineral phases,
that besides Mn-carbonates (e.g. Ca-rhodochrosite), can include Mn-sulfides are known to
be present in marine sediments, with formation mechanisms that are sensitive to redox
conditions. In this study, we use high resolution synchrotron EXAFS and XANES
combined with LA-ICP-MS and micro-XRF, to investigate the nature of the Mn
enrichments in sediments from the Holocene Thermal Maximum (approx. 8000-4000 cal.
yrs BP) at a site in the northern Gotland Basin. Analyses were performed on epoxy-
embedded sediment sequences. We specifically address the role of changes in redox
conditions in bottom waters, as inferred from sediment molybdenum (Mo) contents, for
Mn sequestration. We find that an up-core increase in Mo, indicating a transition into more
anoxic and sulfidic (euxinic) bottom water conditions, is accompanied by a decline in total
sediment Mn contents. While Mn-carbonates dominate the Mn mineral fraction in the low-
Mo interval, in the more sulfidic, high Mo interval, Mn is associated with framboidal
pyrite. Mn/Fe ratios in the sulfidic interval vary between the investigated sequences but
reach values of up to 7.7 mol percent. This exceeds ratios previously reported for
sedimentary pyrite and EXAFS spectra indicate that sulfide bound Mn is predominately
tetrahedrally coordination when Mn/Fe ratios are high. This suggests that Mn is
incorporated in other Fe-S phases such as mackinawite besides pyrite. There is also
evidence for the presence of a low concentration of Mn associated with detrital
aluminosilicates throughout the investigated intervals. Our results suggest that increased
ACC
EPTE
D M
ANU
SCR
IPT
ACCEPTED MANUSCRIPT
3
bottom water euxinia inhibited the formation of Mn-carbonate at this site during the
Holocene Thermal Maximum, possibly due to a more rapid reduction of Mn-oxides in
more sulfidic bottom waters.
ACC
EPTE
D M
ANU
SCR
IPT
ACCEPTED MANUSCRIPT
4
1. Introduction
Manganese (Mn) enrichments in sediments overlain by anoxic bottom waters are common
in many modern and ancient coastal marine basins (Calvert and Pedersen, 1993; Huckriede
and Meischner, 1996; Pedersen and Price, 1982; Russell and Morford, 2001). Typically,
these enrichments consist of authigenic Mn-carbonate phases often associated with
considerable amounts of calcium (Ca), e.g. Ca-rhodochrosite and kutnahorite (Middelburg
et al., 1987; Suess, 1979). The formation of these Mn-carbonates is thought to be related to
short oxygenation events of otherwise anoxic and Mn(II)-rich bottom waters. While Mn-
oxides are initially formed directly following such an oxygenation event, the re-
establishment of anoxia leads to their redissolution. The resulting high dissolved Mn
concentrations in high alkalinity pore waters are particularly conducive for Mn-carbonate
formation. Commonly, Mn-carbonate enrichments are taken as a good proxy for periods of
oxygenation in otherwise anoxic basins (e.g. Calvert and Pedersen, 1996; Huckriede and
Meischner, 1996). However, there are indications that formation of Mn-sulfides in the
sediment is also possible provided that Fe availability is low (Böttcher and Huckriede,
1997; Lepland and Stevens, 1998).
The Baltic Sea is one of the world´s largest present-day anoxic basins. Following its
transition from a freshwater lake to a brackish coastal system approx. 8500 cal. yr BP ago,
it has known two previous periods of extensive hypoxia. These are the Medieval Warm
Period (2000-800 cal. yr BP) and the Holocene Thermal Maximum (8000-4000 cal. yr BP)
(Zillén et al., 2008). The onset of the latter period is characterized by the intrusion of saline
ACC
EPTE
D M
ANU
SCR
IPT
ACCEPTED MANUSCRIPT
5
waters into the previous fresh water lake resulting in major changes in biogeochemical
cycles and redox conditions. Large amounts of Mn previously bound in Mn oxides in
surface sediments (similar to the Gulf of Bothnia today (Glasby et al., 1997; Slomp et al.,
2013)) were released and Mn(II) likely became enriched in the bottom water (Sohlenius et
al., 2001).
Analyses of total Mn in discrete samples for two sites in the euxinic basins in the Baltic
Sea suggest that more Mn was buried in the sediment during the initial phase of the
Holocene Thermal Maximum than in the later stages (Jilbert and Slomp, 2013). While Mn-
carbonate layers are visible in the sediment as distinct white layers during this initial phase
(Sohlenius et al., 2001), the possible contribution of Mn associated with sulfide phases and
detrital minerals such as clays to total Mn is as yet unclear. To probe the redox state and
binding form of Mn in solids X-ray absorption spectroscopy can be used. X-ray absorption
near edge structure (XANES) can be used to deduce the oxidation state of Mn and to
identify Mn minerals based on the comparison with reference spectra. The redox state of
Mn may be derived from the shape of the X-ray absorption feature before the Mn K-edge
(pre-edge feature)(Chalmin et al., 2009), from the position of the Mn K-edge and the
maximum absorption feature (Bargar et al., 2000; Manceau et al., 2012; Schulze et al.,
1995). The coordination environment of Mn is reflected in the extended X-ray absorption
fine structure (EXAFS). EXAFS spectra have been used to identify Mn phases in soils and
sediments (Friedl et al., 1997; Manceau and Gallup, 2005). Modeling of EXAFS provides
information on the short-range structure of Mn phases (Manceau and Combes, 1988) and
has been applied in the field of Earth Sciences in multiple cases (Bargar et al., 2005;
ACC
EPTE
D M
ANU
SCR
IPT
ACCEPTED MANUSCRIPT
6
Grangeon et al., 2010; Jürgensen et al., 2004; McKeown and Post, 2001; Silvester et al.,
1997; Villalobos et al., 2003; Webb et al., 2005). In heterogeneous samples, the spatial
distribution of Mn species has been determined on a micrometer scale by EXAFS and
XANES analyses by applying an X-ray micro beam (Bargar et al., 2009; Pecher et al.,
2003). The relative concentration of different Mn phases in mixed samples can be obtained
by linear combination fitting of XANES or EXAFS spectra (e.g. Bargar et al., 2000).
In this study, we investigate the distribution and speciation of Mn in sediments deposited
in the northern Gotland Basin during the Holocene Thermal Maximum. Special attention is
given to the identification of different Mn species in the sediment using EXAFS and
XANES. To our knowledge, this is the first time these techniques are used to study the
geochemistry of Mn in marine sediments. Insight in the environmental conditions during
the formation of the various sediment Mn phases is obtained using high resolution laser
ablation-inductively coupled plasma-mass spectrometry (LA-ICP-MS), micro-XRF
mapping and geochemical analyses of discrete sediment samples. We identified Mn
carbonate as the dominate feature controlling Mn distributions with depth in the sediment.
However, with increasing euxinia, Mn sequestration in the form of carbonate is diminished
and, although less abundant, Mn associated with Fe-sulfide becomes the dominate phase.
Mn associated with aluminosilicates is present as a third Mn-phase at low background
concentrations.
2 Materials and Methods
ACC
EPTE
D M
ANU
SCR
IPT
ACCEPTED MANUSCRIPT
7
2.1 Sediment sampling and analysis
A gravity core was recovered from station LL19 (20.3108E 58.8807N) in the Northern
Gotland Basin in June 2009 with R/V Aranda. Sediment sections were sampled from the
core using 20 cm long aluminum trays and the sediment was embedded in Spurr´s epoxy
resin using the method of (Jilbert et al., 2008), but without desalinisation as described by
(Jilbert and Slomp, 2013). The resulting sediment blocks were cut perpendicular to the
plane of sedimentation and the surface was polished. Two blocks were selected for further
analysis in this study, Block 14 covers 290.87 to 292.36 cm sediment depth and Block 22
reaches from 313.28 to 314.685 cm.
The remaining sediment was sampled at 1 cm resolution in a glovebox under nitrogen,
freeze dried and ground. To determine the total organic carbon (TOC) content, 0.5 g of
each sample was treated with 1 M HCl (one rinse of 12 hours, followed by addition of new
HCl and a second rinse of 4 hours) to remove inorganic carbon. After ovendrying at 60°C
and grinding, TOC was measured with a Fisons NA 1500 NCS analyzer. Precision
(≤0.1‰) and accuracy were established using international (Graphite quartzite standard
NAXOS (GQ)), and in-house standards (Ammonium Sulphate (ASS), Acetanilide, and
Atropine). Another subsample of 0.1 g was used for a total destruction with a mixture of
2.5 ml HF and 2.5 ml HClO4/HNO3 in closed Teflon bombs at 90°C. The acid was
evaporated and the remaining gel was redissolved in 1M HNO3. The resulting solution was
analyzed for manganese (Mn), calcium (Ca), iron (Fe), sulfur (S) and molybdenum (Mo)
using ICP-OES. Relative precision (<5%) and accuracy were established by duplicates and
standards (ISE-921).
ACC
EPTE
D M
ANU
SCR
IPT
ACCEPTED MANUSCRIPT
8
2.2. µXRF and LA-ICP-MS
The resin embedded sediment blocks were mounted in an EDAX Orbis Micro XRF
Analyzer (Rh tube at 30 kV, 500 µA, no filter, 300 ms dwell time). The distribution of Mn,
Fe and S in 1.5 cm x 0.5 cm areas of the blocks was mapped at a resolution of 30µm. The
blocks were subsequently analyzed by laser ablation - inductively coupled plasma - mass
spectrometry (LA-ICP-MS) line scanning. A 193 nm laser beam (Lambda Physik, pulse
repetition 10 Hz, spot diameter 120 µm, energy density 8 Jcm-2) was focused onto the
surface of the sediment block in a sealed ablation chamber on a motorized stage. The stage
was then set in steady motion with a velocity of 0.0275mm/s perpendicular to the plane of
lamination, resulting in an overlapping series of ablation craters. Ablated sample material
was transported by He-Ar carrier gas to a Thermo Element 2 ICP-MS, where aluminum
(27Al), iron (57Fe), manganese (55Mn), sulfur (34S), bromine (81Br) and molybdenum (98Mo)
were measured. LA-ICP-MS data for each element were calibrated by reference to the
sensitivities (counts/ppm) of the glass standard NIST SRM 610 (Jochum et al., 2011) and
corrected for the natural abundances of the analyzed isotopes. All data are reported
normalized to Al to correct for variations in sample yield during laser ablation. For S/Al
data, a further sensitivity factor wapplied which compensates for the contrasting relative
yield of S from NIST SRM 610 with respect to embedded sediments.
2.3 Synchrotron EXAFS and XANES
X-ray absorption and fluorescence was measured at the DUBBLE beamline at the ESRF
(BM26A). The layout of the beamline and the X-ray optics are described by (Borsboom et
ACC
EPTE
D M
ANU
SCR
IPT
ACCEPTED MANUSCRIPT
9
al., 1998) and (Nikitenko et al., 2008). Vertical X-ray fluorescence profiles and XAS
spectra were collected with a focused beam to a spot of about 30 µm diameter by using
polycapillary optics or with a vertically focused beam to an horizontal line of 6.0 x 0.4
mm. Due to the lower photon flux upon using polycapillary optics, EXAFS spectra were
only collected with a vertically focused beam. X-ray absorption was measured in
fluorescence mode using a 9-element Ge-detector. For recording the vertical element
profiles, a Vortex silicon drift detector was applied. XAS spectra were processed using the
Athena software 0.8.61 (Ravel and Newville, 2005) and Artemis 0.8.14 was used to fit the
EXAFS spectra. Details about the EXAFS fitting are given in the supplementary content.
Principal component analysis (PCA) and iterative target transformation factor (ITFA)
analysis on all normalized XANES spectra were performed with the ITFA software
(Rossberg et al., 2003). For the statistical analysis, the energy range 6530-6620 eV was
used. The ITFA analysis requires that the relative concentration of each component is
constrained in at least one sample. For this, the spectra having the highest loading of the
respective component were assumed to contain only this component.
3 Results
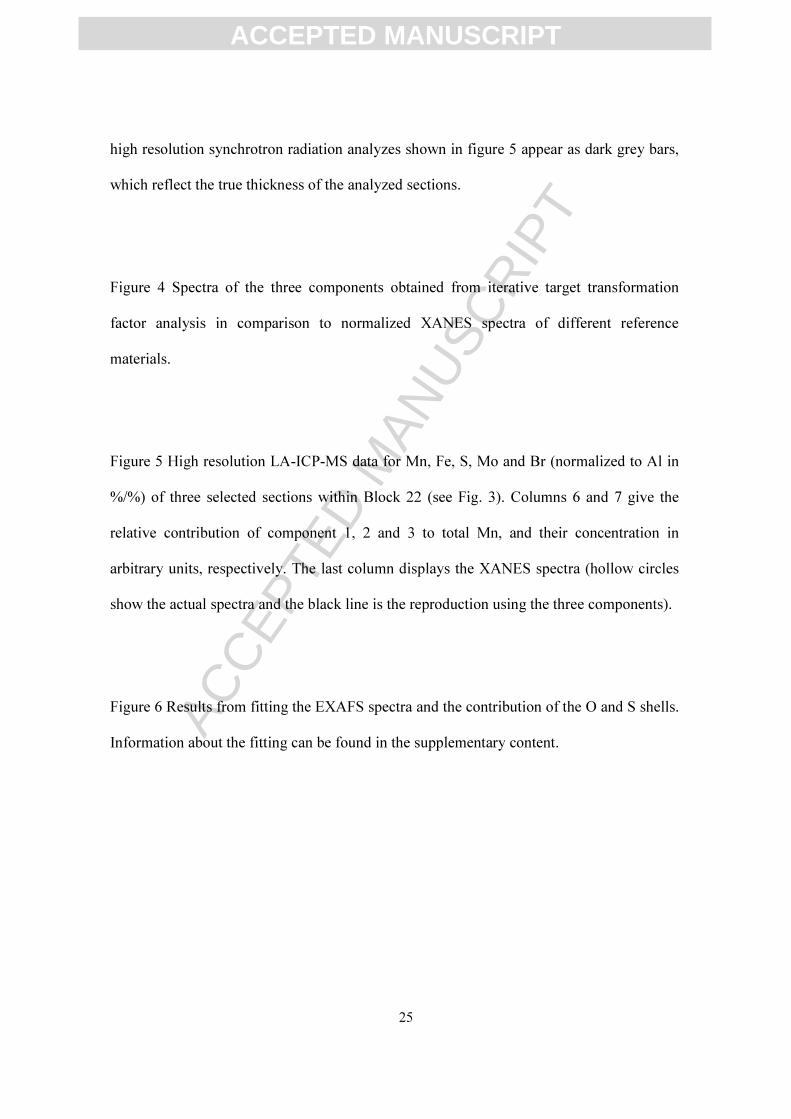
3.1. Sediment geochemistry
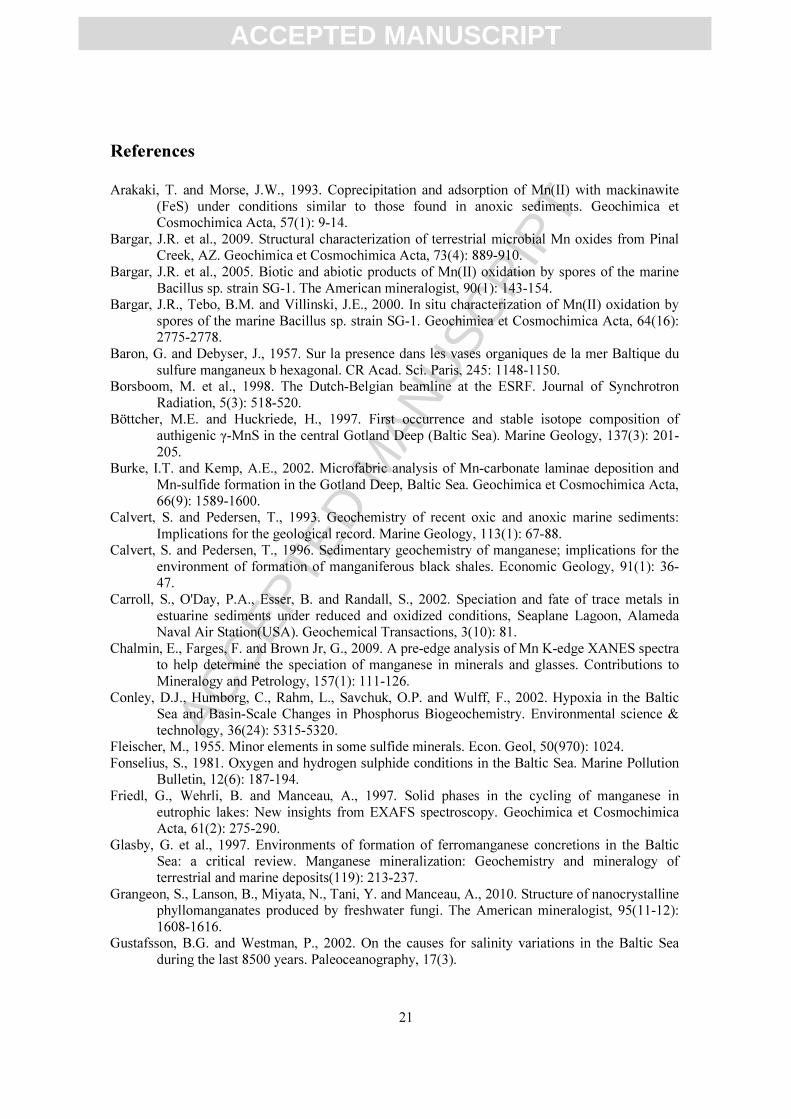
The interval of laminated sediments corresponding to the Holocene Thermal Maximum
(HTM) in the Baltic Sea (Zillén et al., 2008) is identified in the LL19 core as a series of
Corg enrichments between 265 cm and 345 cm depth (Fig. 1). S and Mo contents show
similar profiles to that of Corg, implying low-oxygen conditions at times of high Corg burial

ACC
EPTE
D M
ANU
SCR
IPT
ACCEPTED MANUSCRIPT
10
(Sohlenius et al., 2001). Sequences of high Mn enrichments are found in the lower part of
this interval (Mn >1%, 315 to 345 cm), whereas the upper part has lower Mn contents (Mn
<1%, 265 to 315 cm) (Fig. 1). Many of the individual Mn peaks correspond to peaks in Ca,
suggesting the presence of Ca-rhodochrosite in these layers.
The two sections from the HTM interval selected for high resolution analyses have
contrasting characteristics with respect to both Mn contents and redox conditions. One
section represents a marked transition from high to low Mn contents associated with an
increase in organic C, S and Mo (Block 22; Fig. 1). The second section was retrieved from
the upper part of the profile in a zone without pronounced Mn enrichments, but with high
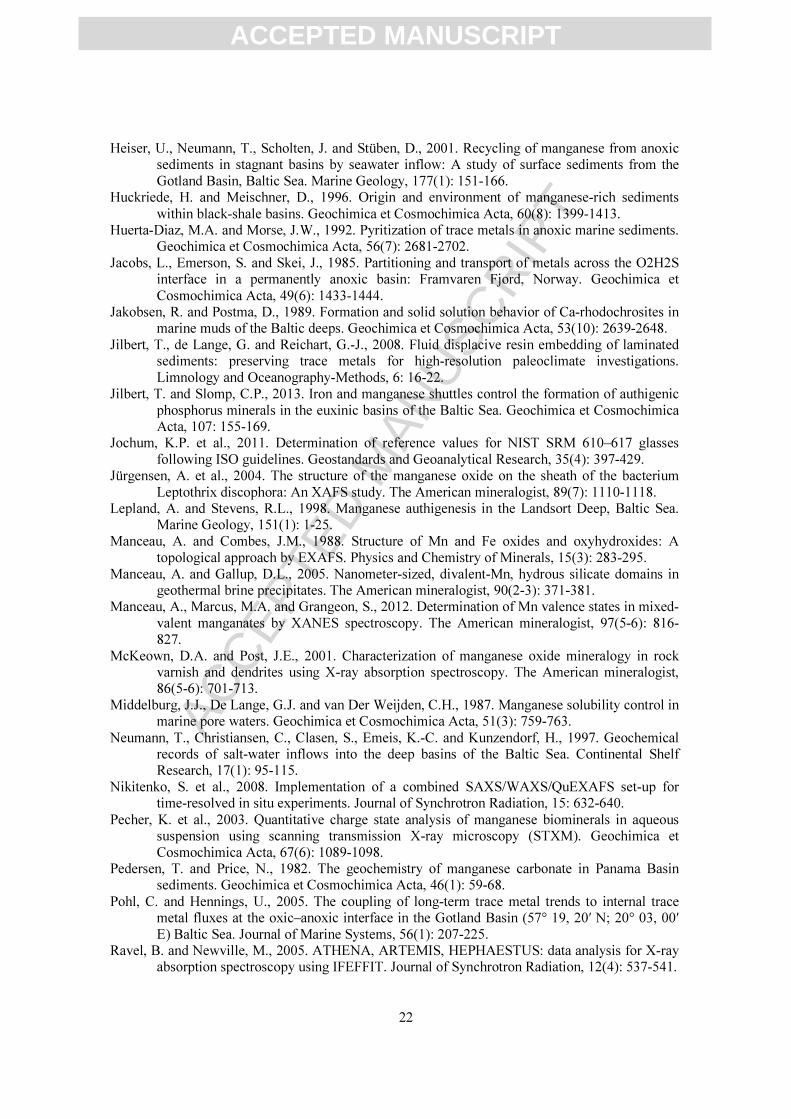
organic C, S and Mo contents (Block 14; see Fig. 1). Micro-XRF maps of these two
sections further illustrate their contrasting composition (Fig. 2). Block 22 is characterized
by massive Mn-rich layers in the lower part, and Mn, S and Fe laminations in the upper
part. Block 14 has homogeneous Mn-poor sediments in the lower part, and Mn, S and Fe
laminations in the upper part.
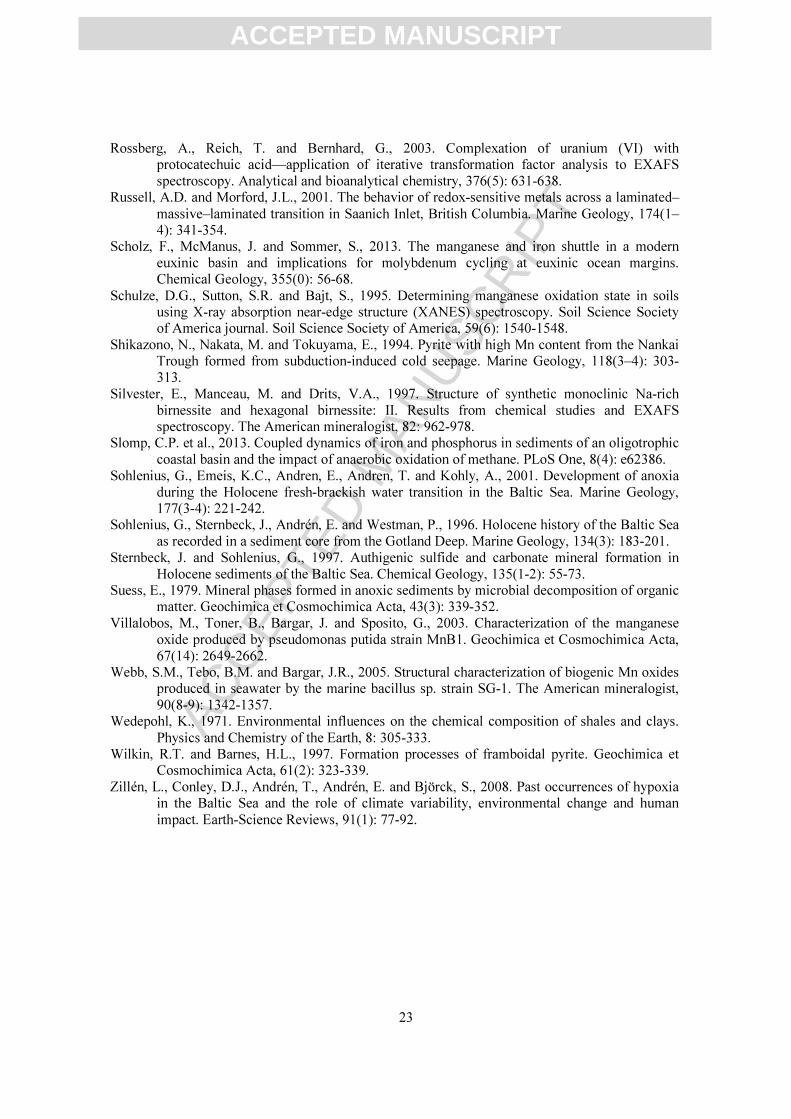
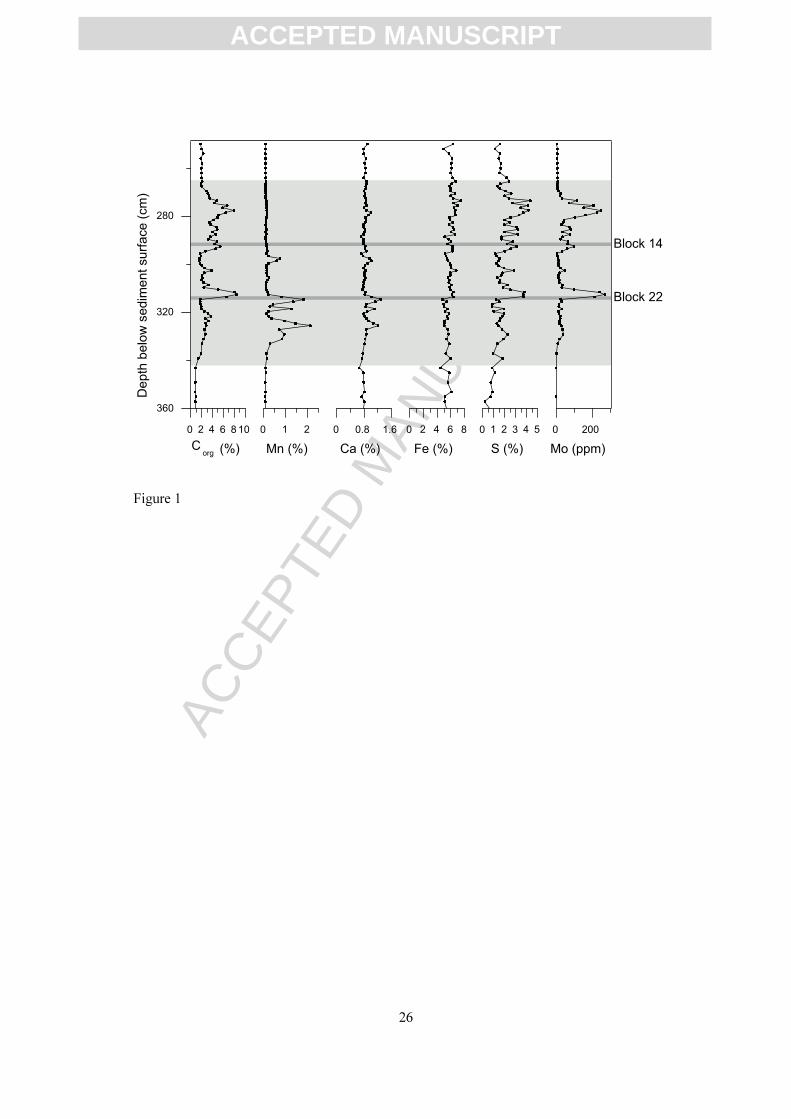
High resolution LA-ICP-MS profiling of Block 14 shows generally low Mn concentrations
(Fig. 3). However, enrichments of Mn in this interval correlate with Fe, S and Mo (Fig. 3).
These enrichments follow the visible laminations in the sediments, with interchanging
black and grey layers. A similar pattern of Mn, Fe, S and Mo-rich laminations can also be
recognized in the upper laminated part of Block 22 (Fig. 3). Although Mn and Fe are
correlated in the laminated parts of both blocks, the Mn/Fe ratio is higher in the upper part
of Block 22 than in Block 14 (7.7 versus 3.4 mol %, respectively; Fig. S1 in
ACC
EPTE
D M
ANU
SCR
IPT
ACCEPTED MANUSCRIPT
11
supplementary content). In contrast, the lower part of Block 22 is characterized by
exceptionally high Mn concentrations, which are not related to Fe, S and Mo. These
pronounced enrichments of Mn were visually recognizable as white layers, indicating the
presence of rhodochrosite.
3.2 Manganese speciation (synchrotron XAS)
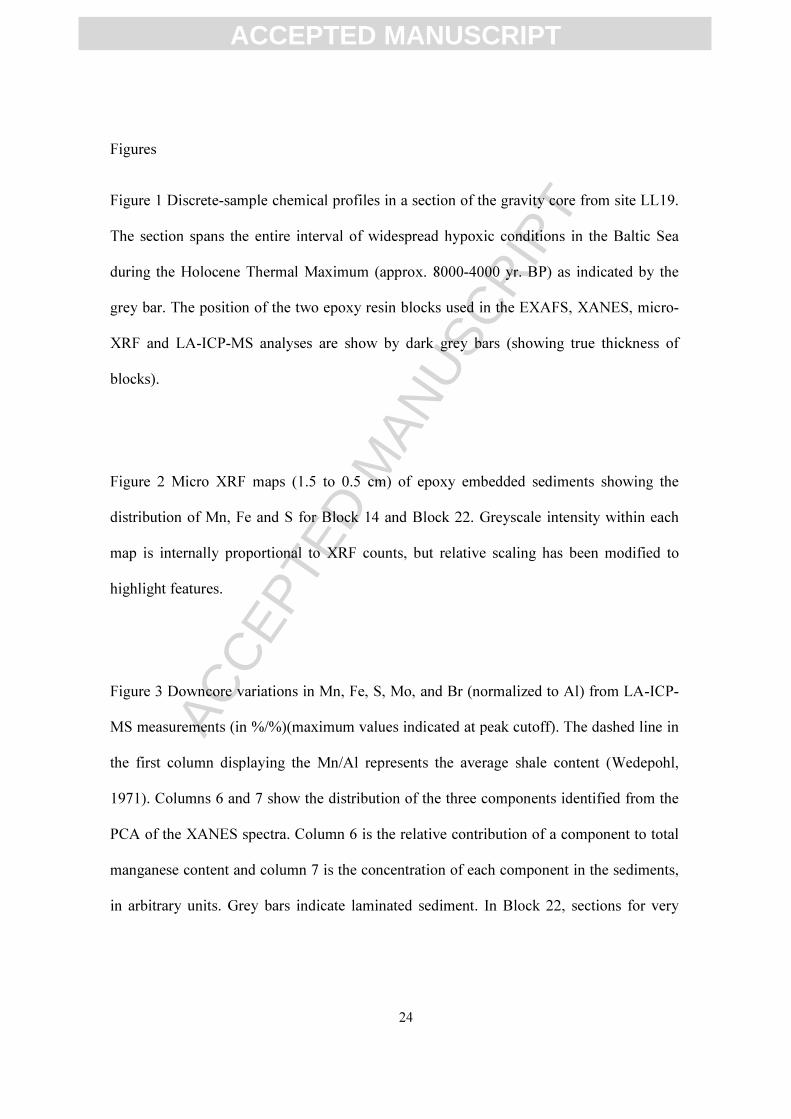
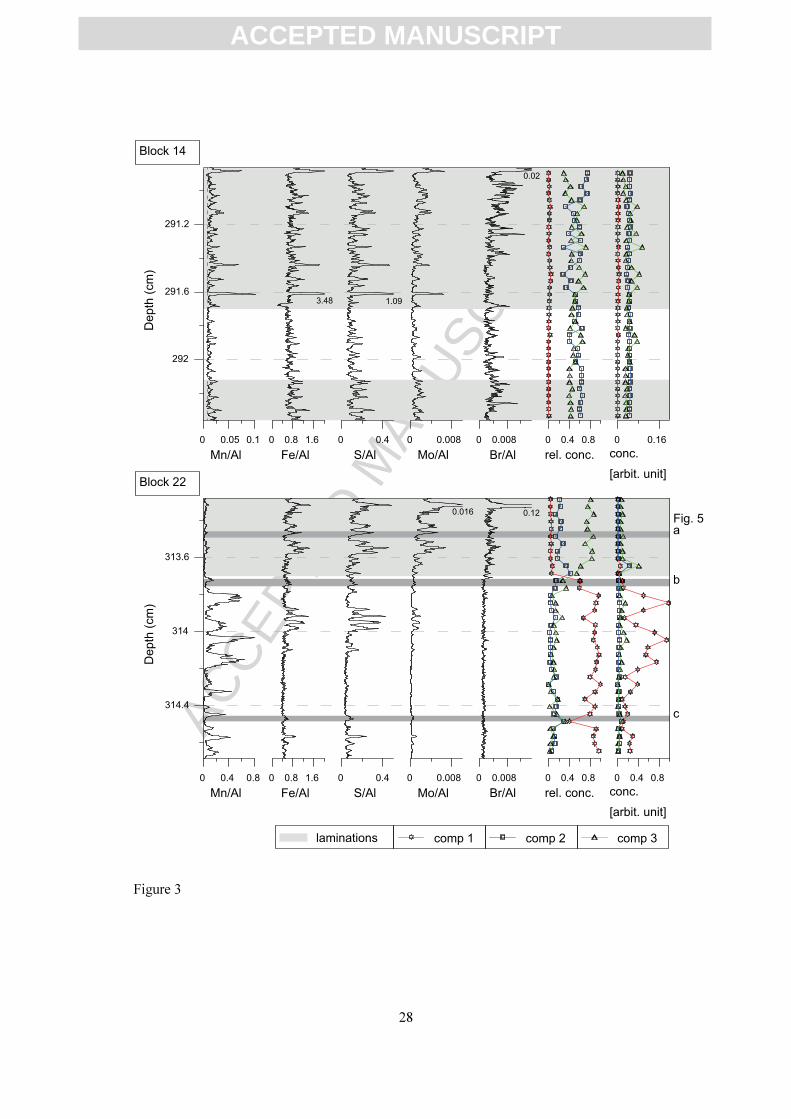
Principal component analysis indicates that three XANES spectra are sufficient to
reproduce the main features of all collected sample spectra (Fig. 4). Using ITFA analysis,
three end-member spectra were extracted. One of the spectra (component 1) was identical
to the spectrum of the rhodochrosite reference (Fig. 4). The two other end-member spectra
(component 2 and component 3) did not show close similarity with any of the measured
references. The relative contribution of the three components to the individual spectra can
be used to infer the relative concentration of the respective Mn species.
Component 1 was the dominant Mn species in the lower part of Block 22 (Fig. 3). Elevated
Mn concentrations coincided with high concentrations of component 1, in accordance with
the expectation that the white layers with high Mn concentrations contain rhodochrosite. In
the laminated parts of Block 22 and in the whole of Block 14, rhodochrosite (component 1)
was almost absent, while components 2 and 3 became the abundant species (Fig. 3).
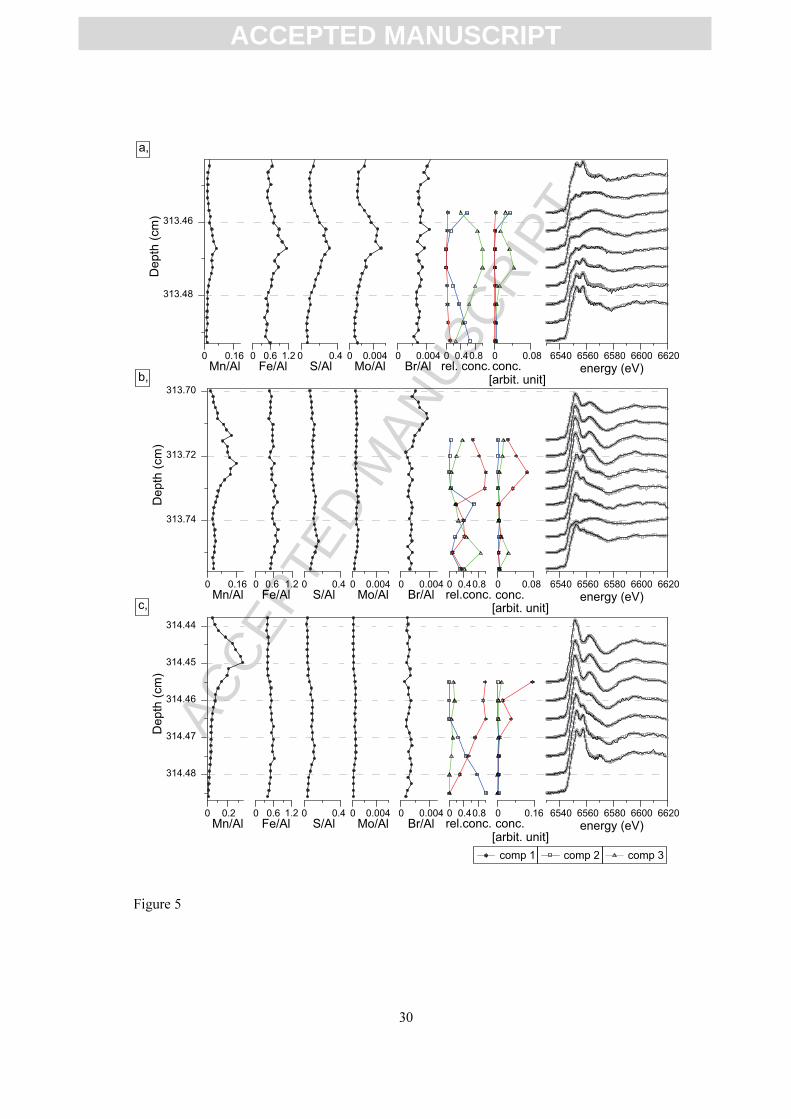
Since the spatial resolution achievable with the regular beam was insufficient to investigate
the very high resolution details of vertical profiles of the three components, focused beam
profiles were collected from Block 22 for this purpose (Fig. 5). One profile was collected
ACC
EPTE
D M
ANU
SCR
IPT
ACCEPTED MANUSCRIPT
12
from the Mn-poor upper part of the block (Fig. 5a), and two profiles were collected from
the Mn-rich lower part (Fig. 5b, c). The relative importance of the three components varies
with depth in each focused-beam profile. In the laminated sediments of the upper part of
the block, component 1 (rhodochrosite) is absent and component 2 and 3 alternate as
dominant species (Fig. 5a). In the lower part of the block, rhodochrosite is the dominant
component in the layers with highest Mn concentrations (Fig. 5b,c). These rhodochrosite
layers appear to be preceded by intervals of high relative abundance of component 2.
Intervals with high relative concentrations of component 3 are present in the lower part of
the block (Fig. 5b, c) but are not observed directly adjacent to rhodochrosite layers.
Changes in the relative concentration of individual components do not necessarily coincide
with changes in their absolute concentration. For example, while the relative importance of
component 2 varies considerably, the absolute concentration remains almost constant
(Figs. 3, 5). This suggests that component 2 represents detrital Mn deposited at a constant
rate irrespective of the environmental regime. In contrast, component 3 exhibits high
relative concentrations when its absolute concentration is high in the laminated sequences
(Figs. 3, 5). This implies that the absolute concentration of component 3 follows the total
Mn concentration in the laminated intervals, which, in turn, is correlated to Fe, S and Mo.
Hence, component 3 likely reflects Mn species deposited in environments characterized by
oxygen depletion. As mentioned previously, component 1 (identified as rhodochrosite) is
the dominate species in the white layers and therefore, the total concentration of
component 1 follows the total Mn concentrations in these layers.
ACC
EPTE
D M
ANU
SCR
IPT
ACCEPTED MANUSCRIPT
13
Analyses of EXAFS spectra indicate that component 2 and 3 represent Mn coordinated
with O and S, respectively. EXAFS spectra collected from spots with high relative
abundance of component 2 or 3 could be reproduced using a model with O and S in the
first coordination shell (Fig. 6) but only when including both elements. In this model,
component 2 reflects Mn octahedrally bound to O, and component 3 Mn associated with S.
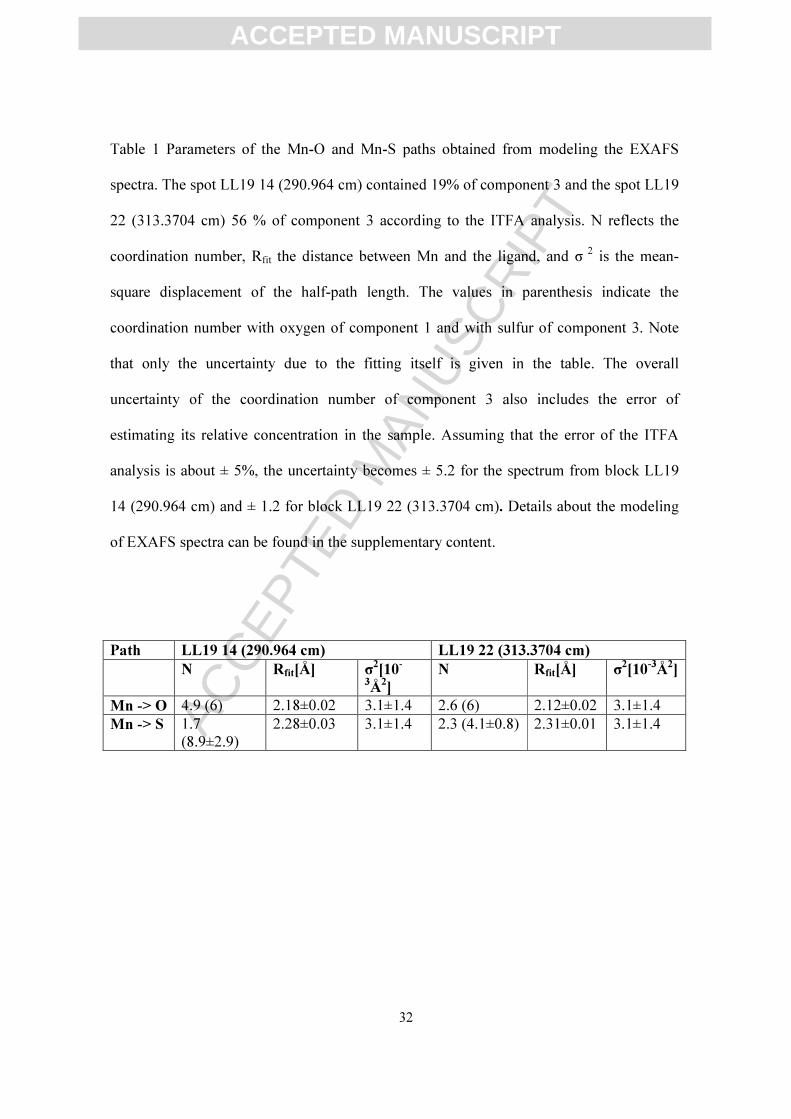
Values of the optimized fitting parameters are listed in table 1 and details of the fitting
procedure are described in the supplementary content.
4 Discussion
4.1 Identification of Mn species by XANES/EXAFS
Our XANES results indicate that component 1 is rhodochrosite. EXAFS spectra collected
on spots with high concentrations of component 1 also show great similarity with those of
rhodochrosite (data not shown). Rhodochrosite has been found in a range of marine
sedimentary environments (Calvert and Pedersen, 1993) and is commonly observed in
sediments of various deep basins of the Baltic Sea, such as the Gotland Deep and Landsort
Deep (Huckriede and Meischner, 1996; Jakobsen and Postma, 1989; Lepland and Stevens,
1998; Sternbeck and Sohlenius, 1997). In all cases, rhodochrosite precipitation requires a
high Mn(II) concentration and high alkalinity, allowing supersaturation. In the Baltic Sea,
these conditions are commonly achieved following massive Mn-oxide deposition during
inflows of oxic, saline water into the deep basins (Huckriede and Meischner, 1996;
Neumann et al., 1997; Sohlenius et al., 1996; Sternbeck and Sohlenius, 1997).
ACC
EPTE
D M
ANU
SCR
IPT
ACCEPTED MANUSCRIPT
14
Component 2 most likely reflects a detrital aluminosilicate Mn pool. This is motivated by
the constant concentrations of component 2 in the high resolution profiles (Figs. 3, 5). The
XANES spectrum of component 2 extracted by ITFA analysis (Fig. 6) has two pronounced
maxima (state energies) and has similarities with spectra of synthetic richterite with an
average Mn valence state of 2.5 (richterite #1 (Chalmin et al., 2009)). The XANES
spectrum of component 2 is similar to Mn XANES spectra collected from estuarine
sediments which have been attributed to Mn in detrital phyllosilicates and oxide minerals
(Carroll et al., 2002). It is possible that the extracted spectrum does not originate from one
mineral phase but is a combination of two or more spectra from Mn-containing minerals,
which are deposited contemporaneously and in a constant ratio throughout the investigated
sequences. Fitting of the EXAFS spectra points towards an octahedral coordination of Mn
with O in component 2. A contribution of Mn-oxides to the extracted spectrum of
component 2 is very unlikely due to the differences in the shape of the pre-edge, main edge
position, and the shape of the XANES spectrum (Fig. 4). Comparison of the pre-edge of
component 2 with reference spectra indicates that component 2 contains predominantly
Mn(II). Quantitative analyses of the pre-edge to infer precisely the Mn(II) to Mn(III) ratio
as described by (Chalmin et al., 2009) could not be performed as the quality of the spectra
around the pre-edge was insufficient for quantitative deconvolution. In conclusion,
concentration profiles in combination with the interpretation of XANES and EXAFS
spectra indicate that component 2 represents the Mn aluminosilicate fraction.
Mn in component 3 is associated with sulfides and this Mn pool accounts for Mn burial
under euxinic conditions. Analysis of EXAFS spectra indicates that Mn is coordinated with
ACC
EPTE
D M
ANU
SCR
IPT
ACCEPTED MANUSCRIPT
15
S in component 3. Authigenic formation of Mn-sulfide under euxinic condition has been
reported for the Baltic Sea (Baron and Debyser, 1957; Böttcher and Huckriede, 1997;
Lepland and Stevens, 1998; Suess, 1979). The extracted XANES spectrum of component
3, however, cannot be matched with spectra of pure Mn-sulfides. Instead, the strong
correlation with Fe and S (Fig. 3) suggests that component 3 represents Mn co-precipitated
with Fe-sulfides. The dominant Fe-sulfide phase in the laminated part of the blocks seems
to be framboidal pyrite. Scanning electron micrographs show layers enriched with electron
dense spherical aggregates with diameters between 1-5 µm (Fig. S2 and S3 in
supplementary content). These aggregates consist of smaller particles, which is typical for
the morphology of framboidal pyrite (Wilkin and Barnes, 1997). This interpretation is
supported by energy dispersive X-ray (EDX) spectroscopy, demonstrating that the
spherical particles consist predominately of Fe and S (Fig. S4). Enrichments of Mn in the
laminated part of the block concur with these particles suggesting that the sulfide bound
Mn is associated with the framboidal pyrite aggregates (Fig. S3).
Although the sulfide coordinated Mn seems to co-occur with framboidal pyrite, not all of
the Mn might isomorphically substitute Fe in the pyrite structure. Isomorphic replacement
of Fe by Mn has been described for sedimentary pyrite but reported Mn to Fe ratios are
lower than the Mn to Fe ratio in the laminated part of Block 22. Shikazono et al. (1994)
compiled reported Mn/Fe ratios in pyrite which are typically below 2 Mol % with one
exception of high ratios between 2-8 Mol % measured in one core by Huerta-Diaz and
Morse (1992). Jacobs et al. (1985) determined Mn/ Fe ratios roughly between 2.5 and 3 %
in framboidal pyrite from a permanent anoxic basin in Norway. These values are
ACC
EPTE
D M
ANU
SCR
IPT
ACCEPTED MANUSCRIPT
16
comparable to the Mn/Fe ratios in Block 14 (Fig. S1 supplementary material) while those
in Block 22 around 7.7 Mol % exceed all reported values considerably. This suggests that
part of the Mn does not replace structural Fe in pyrite (Fleischer, 1955).
Fitting of EXAFS spectra support the suggestion that part of the sulfide bound Mn is not
incorporated into the pyrite structure. Optimized Mn-S distances of around 2.3 Å, obtained
from EXAFS fitting, are close to the Fe-S distance of mackinawite (2.26 Å) but longer
than that of pyrite (2.2 Å). At one spot where the contribution of component 3 to the
EXAFS spectrum is relatively high (LL19 22 313.3704 cm), the optimized degeneracy of
the Mn-S path proposes that Mn is tetrahedrally coordinated with S (Tab. 1). A larger
coordination number is obtained when fitting the spectrum with low content of component
3 (LL19 14 290.964 cm, Tab. 1) but due to the low concentration of component 3 at this
spot, the value for the coordination number is only weakly constrained. Hence, component
3 might comprise sulfidic Mn in different phases and coordination environments. In pyrite,
Mn is octahedrally coordinated with S while in mackinawite Fe is tetrahedrally
coordinated. Consequently, when Mn/Fe ratios are high, substitution of Fe by Mn in
mackinawite seems to be more prevalent than in pyrite when comparing these two
authigenic Fe-S minerals. When Mn/Fe ratios are high in sedimentary pore waters,
precipitating mackinawite can contain a few mole percent MnS (Arakaki and Morse,
1993). However, further research is required to unequivocally identify the Mn bearing
phase in these sediments.
4.2 Temporal variability in the deposition of manganese species
ACC
EPTE
D M
ANU
SCR
IPT
ACCEPTED MANUSCRIPT
17
In the lower part of the HTM interval at LL19, Mn concentrations are relatively high,
while Corg, S and Mo concentrations are relatively low (Fig. 1). In the upper part of the
HTM interval, the opposite is true; namely, Corg, S and Mo concentrations are relatively
high, while Mn concentrations fall to very low values. The profile of total Mn is primarily
determined by the distribution of rhodochrosite.
Rhodochrosite deposition in the Baltic Sea occurs following inflow events in the deep
anoxic basins (Burke and Kemp, 2002; Huckriede and Meischner, 1996; Neumann et al.,
1997; Scholz et al., 2013; Sohlenius et al., 1996; Sternbeck and Sohlenius, 1997). Our data
clearly indicate that during the most severe reducing conditions in the upper part of the
HTM interval, rhodochrosite precipitation at site LL19 was negligible. There are several
possible explanations for this observation.
Firstly, a reduced frequency of inflow events could explain the lack of rhodochrosite. The
frequency of inflow events at LL19 may well have varied during the HTM due to isostatic
changes in the depth of the Danish Straits (Gustafsson and Westman, 2002) and associated
changes in the paleo-depth of the Northern Gotland basin. However, we do not expect that
the inflow frequency was greatly reduced, as reduced inflows would be expected to
decrease the stratification of the water column (Conley et al., 2002; Fonselius, 1981) and
hence improve ventilation, whereas our proxies suggest highly reducing conditions (Fig.
1).
ACC
EPTE
D M
ANU
SCR
IPT
ACCEPTED MANUSCRIPT
18
Second, the lower rhodochrosite content of the upper HTM interval could be related to a
declining availability of Mn in the water column relative to the lower HTM interval. The
availability of Mn for rhodochrosite precipitation in Baltic Sea sediments is expected to
have been at a maximum immediately following the Ancylus-Littorina transition. At the
time, large areas of the seafloor that were likely rich in Mn oxides were covered by low
oxygen waters resulting in large-scale release of Mn(II) and widespread precipitation of
rhodochrosite (Sohlenius et al., 2001). Hence, during the lower HTM interval, inflow
events caused relatively intense accumulations of rhodochrosite, burying a large amount of
Mn into the sediments, potentially lowering the supply of Mn for further precipitation
during the upper HTM. However, this would require very efficient removal of Mn from the
water column and there is no evidence that Mn-carbonate formation has such strong impact
on water column chemistry. In the present day Baltic Sea, for example, Mn-carbonate
precipitation has not led to major changes in Mn(II) in the water column on the time scale
of decades (e.g. Pohl and Hennings, 2005).
A third possible explanation for low rhodochrosite contents in the upper HTM interval is
that inflow events continued to precipitate Mn oxides, but that these were either
redissolved before conversion to rhodochrosite, or resuspended after conversion by
turbulent near-bottom processes, and thus dissolved (e.g. Heiser et al., 2001). The more
reducing conditions may have increased the rate of reduction of Mn oxides by hydrogen
sulfide, in the upper sediments at the onset of a stagnation period. By this mechanism, Mn
oxides deposited during inflows may have been efficiently removed and subsequently
released as Mn(II) before substantial conversion to rhodochrosite could occur.
ACC
EPTE
D M
ANU
SCR
IPT
ACCEPTED MANUSCRIPT
19
5 Conclusions
In this study, the speciation of Mn in Baltic Sea sediments from the Holocene Thermal
Maximum (HTM) is investigated. Three major groups of Mn phases are identified. The
most abundant Mn species is Mn-carbonate. Its occurrence is restricted to the lower part of
the studied sequence, where Mn contents are highest and where low organic C, S and Mo
contents indicate relatively oxic conditions. These Mn-carbonates are present as distinct
white layers and are formed following inflow events of oxygenated North Sea water as
described by Huckriede and Meischner (1996). Further up core our results show laminated
sediments with high contents of Corg, S and Mo indicating more reducing conditions. In
this environment the major Mn species, although less abundant than the Mn-carbonate at
greater depth, is Mn bound in Fe-sulfides. Electron microscopy indicates that this Mn is
enriched in aggregates of framboidal pyrite. The tetrahedral coordination given by the
EXAFS spectra of the Mn Fe-sulfide species, however, suggests that in addition to pyrite
other Fe-S minerals such as mackinawite might host Mn. The third Mn-species consists of
Mn-alumino-silicate and is present at a constant background concentration. We have
reviewed the various possible explanations for the lack of Mn-carbonate formation with
increasingly reducing conditions during the HTM and conclude that increased rates of Mn
oxide reduction linked to the more sulfidic bottom water conditions are likely responsible.
Acknowledgements
ACC
EPTE
D M
ANU
SCR
IPT
ACCEPTED MANUSCRIPT
20
We thank the staff of the Dubble beamline for their support and Prof. Dr. Laszlo Vince
from the University Gent, Belgium, for providing us the polycapillary optics. The
performance of the experiment at the ESRF was financially supported by The Netherlands
Organization for Scientific Research, NWO (experiment 26-01-909). Additional funding
was provided by Utrecht University (via UU short stay fellowship 2011), the EU-BONUS
project HYPER, NWO (Vidi), and the European Research Council under the European
Community’s Seventh Framework Programme for ERC Starting Grant #278364. Dr.
Oliver Plümper performed the electron microscopy analyses and we are grateful for his
support. We thank the captain and crew of RV Aranda and all participants of the cruise to
the Baltic Sea in 2009 for their assistance with the field work.
ACC
EPTE
D M
ANU
SCR
IPT
ACCEPTED MANUSCRIPT
21
References
Arakaki, T. and Morse, J.W., 1993. Coprecipitation and adsorption of Mn(II) with mackinawite
(FeS) under conditions similar to those found in anoxic sediments. Geochimica et Cosmochimica Acta, 57(1): 9-14.
Bargar, J.R. et al., 2009. Structural characterization of terrestrial microbial Mn oxides from Pinal Creek, AZ. Geochimica et Cosmochimica Acta, 73(4): 889-910.
Bargar, J.R. et al., 2005. Biotic and abiotic products of Mn(II) oxidation by spores of the marine
Bacillus sp. strain SG-1. The American mineralogist, 90(1): 143-154. Bargar, J.R., Tebo, B.M. and Villinski, J.E., 2000. In situ characterization of Mn(II) oxidation by
spores of the marine Bacillus sp. strain SG-1. Geochimica et Cosmochimica Acta, 64(16): 2775-2778.
Baron, G. and Debyser, J., 1957. Sur la presence dans les vases organiques de la mer Baltique du
sulfure manganeux b hexagonal. CR Acad. Sci. Paris, 245: 1148-1150. Borsboom, M. et al., 1998. The Dutch-Belgian beamline at the ESRF. Journal of Synchrotron
Radiation, 5(3): 518-520. Böttcher, M.E. and Huckriede, H., 1997. First occurrence and stable isotope composition of
authigenic γ-MnS in the central Gotland Deep (Baltic Sea). Marine Geology, 137(3): 201-
205. Burke, I.T. and Kemp, A.E., 2002. Microfabric analysis of Mn-carbonate laminae deposition and
Mn-sulfide formation in the Gotland Deep, Baltic Sea. Geochimica et Cosmochimica Acta, 66(9): 1589-1600.
Calvert, S. and Pedersen, T., 1993. Geochemistry of recent oxic and anoxic marine sediments:
Implications for the geological record. Marine Geology, 113(1): 67-88. Calvert, S. and Pedersen, T., 1996. Sedimentary geochemistry of manganese; implications for the
environment of formation of manganiferous black shales. Economic Geology, 91(1): 36-47.
Carroll, S., O'Day, P.A., Esser, B. and Randall, S., 2002. Speciation and fate of trace metals in
estuarine sediments under reduced and oxidized conditions, Seaplane Lagoon, Alameda Naval Air Station(USA). Geochemical Transactions, 3(10): 81.
Chalmin, E., Farges, F. and Brown Jr, G., 2009. A pre-edge analysis of Mn K-edge XANES spectra to help determine the speciation of manganese in minerals and glasses. Contributions to
Mineralogy and Petrology, 157(1): 111-126.
Conley, D.J., Humborg, C., Rahm, L., Savchuk, O.P. and Wulff, F., 2002. Hypoxia in the Baltic Sea and Basin-Scale Changes in Phosphorus Biogeochemistry. Environmental science &
technology, 36(24): 5315-5320. Fleischer, M., 1955. Minor elements in some sulfide minerals. Econ. Geol, 50(970): 1024.
Fonselius, S., 1981. Oxygen and hydrogen sulphide conditions in the Baltic Sea. Marine Pollution Bulletin, 12(6): 187-194.
Friedl, G., Wehrli, B. and Manceau, A., 1997. Solid phases in the cycling of manganese in
eutrophic lakes: New insights from EXAFS spectroscopy. Geochimica et Cosmochimica Acta, 61(2): 275-290.
Glasby, G. et al., 1997. Environments of formation of ferromanganese concretions in the Baltic Sea: a critical review. Manganese mineralization: Geochemistry and mineralogy of
terrestrial and marine deposits(119): 213-237.
Grangeon, S., Lanson, B., Miyata, N., Tani, Y. and Manceau, A., 2010. Structure of nanocrystalline phyllomanganates produced by freshwater fungi. The American mineralogist, 95(11-12):
1608-1616. Gustafsson, B.G. and Westman, P., 2002. On the causes for salinity variations in the Baltic Sea
during the last 8500 years. Paleoceanography, 17(3).
ACC
EPTE
D M
ANU
SCR
IPT
ACCEPTED MANUSCRIPT
22
Heiser, U., Neumann, T., Scholten, J. and Stüben, D., 2001. Recycling of manganese from anoxic sediments in stagnant basins by seawater inflow: A study of surface sediments from the
Gotland Basin, Baltic Sea. Marine Geology, 177(1): 151-166. Huckriede, H. and Meischner, D., 1996. Origin and environment of manganese-rich sediments
within black-shale basins. Geochimica et Cosmochimica Acta, 60(8): 1399-1413. Huerta-Diaz, M.A. and Morse, J.W., 1992. Pyritization of trace metals in anoxic marine sediments.
Geochimica et Cosmochimica Acta, 56(7): 2681-2702.
Jacobs, L., Emerson, S. and Skei, J., 1985. Partitioning and transport of metals across the O2H2S interface in a permanently anoxic basin: Framvaren Fjord, Norway. Geochimica et
Cosmochimica Acta, 49(6): 1433-1444. Jakobsen, R. and Postma, D., 1989. Formation and solid solution behavior of Ca-rhodochrosites in
marine muds of the Baltic deeps. Geochimica et Cosmochimica Acta, 53(10): 2639-2648.
Jilbert, T., de Lange, G. and Reichart, G.-J., 2008. Fluid displacive resin embedding of laminated sediments: preserving trace metals for high-resolution paleoclimate investigations.
Limnology and Oceanography-Methods, 6: 16-22.
Jilbert, T. and Slomp, C.P., 2013. Iron and manganese shuttles control the formation of authigenic
phosphorus minerals in the euxinic basins of the Baltic Sea. Geochimica et Cosmochimica Acta, 107: 155-169.
Jochum, K.P. et al., 2011. Determination of reference values for NIST SRM 610–617 glasses
following ISO guidelines. Geostandards and Geoanalytical Research, 35(4): 397-429.
Jürgensen, A. et al., 2004. The structure of the manganese oxide on the sheath of the bacterium
Leptothrix discophora: An XAFS study. The American mineralogist, 89(7): 1110-1118. Lepland, A. and Stevens, R.L., 1998. Manganese authigenesis in the Landsort Deep, Baltic Sea.
Marine Geology, 151(1): 1-25.
Manceau, A. and Combes, J.M., 1988. Structure of Mn and Fe oxides and oxyhydroxides: A
topological approach by EXAFS. Physics and Chemistry of Minerals, 15(3): 283-295.
Manceau, A. and Gallup, D.L., 2005. Nanometer-sized, divalent-Mn, hydrous silicate domains in geothermal brine precipitates. The American mineralogist, 90(2-3): 371-381.
Manceau, A., Marcus, M.A. and Grangeon, S., 2012. Determination of Mn valence states in mixed-
valent manganates by XANES spectroscopy. The American mineralogist, 97(5-6): 816-
827.
McKeown, D.A. and Post, J.E., 2001. Characterization of manganese oxide mineralogy in rock varnish and dendrites using X-ray absorption spectroscopy. The American mineralogist, 86(5-6): 701-713.
Middelburg, J.J., De Lange, G.J. and van Der Weijden, C.H., 1987. Manganese solubility control in marine pore waters. Geochimica et Cosmochimica Acta, 51(3): 759-763.
Neumann, T., Christiansen, C., Clasen, S., Emeis, K.-C. and Kunzendorf, H., 1997. Geochemical records of salt-water inflows into the deep basins of the Baltic Sea. Continental Shelf Research, 17(1): 95-115.
Nikitenko, S. et al., 2008. Implementation of a combined SAXS/WAXS/QuEXAFS set-up for time-resolved in situ experiments. Journal of Synchrotron Radiation, 15: 632-640.
Pecher, K. et al., 2003. Quantitative charge state analysis of manganese biominerals in aqueous suspension using scanning transmission X-ray microscopy (STXM). Geochimica et
Cosmochimica Acta, 67(6): 1089-1098. Pedersen, T. and Price, N., 1982. The geochemistry of manganese carbonate in Panama Basin
sediments. Geochimica et Cosmochimica Acta, 46(1): 59-68.
Pohl, C. and Hennings, U., 2005. The coupling of long-term trace metal trends to internal trace metal fluxes at the oxic–anoxic interface in the Gotland Basin (57° 19, 20′ N; 20° 03, 00′
E) Baltic Sea. Journal of Marine Systems, 56(1): 207-225. Ravel, B. and Newville, M., 2005. ATHENA, ARTEMIS, HEPHAESTUS: data analysis for X-ray
absorption spectroscopy using IFEFFIT. Journal of Synchrotron Radiation, 12(4): 537-541.
ACC
EPTE
D M
ANU
SCR
IPT
ACCEPTED MANUSCRIPT
23
Rossberg, A., Reich, T. and Bernhard, G., 2003. Complexation of uranium (VI) with protocatechuic acid—application of iterative transformation factor analysis to EXAFS
spectroscopy. Analytical and bioanalytical chemistry, 376(5): 631-638. Russell, A.D. and Morford, J.L., 2001. The behavior of redox-sensitive metals across a laminated–
massive–laminated transition in Saanich Inlet, British Columbia. Marine Geology, 174(1–4): 341-354.
Scholz, F., McManus, J. and Sommer, S., 2013. The manganese and iron shuttle in a modern
euxinic basin and implications for molybdenum cycling at euxinic ocean margins. Chemical Geology, 355(0): 56-68.
Schulze, D.G., Sutton, S.R. and Bajt, S., 1995. Determining manganese oxidation state in soils using X-ray absorption near-edge structure (XANES) spectroscopy. Soil Science Society of America journal. Soil Science Society of America, 59(6): 1540-1548.
Shikazono, N., Nakata, M. and Tokuyama, E., 1994. Pyrite with high Mn content from the Nankai Trough formed from subduction-induced cold seepage. Marine Geology, 118(3–4): 303-
313.
Silvester, E., Manceau, M. and Drits, V.A., 1997. Structure of synthetic monoclinic Na-rich
birnessite and hexagonal birnessite: II. Results from chemical studies and EXAFS spectroscopy. The American mineralogist, 82: 962-978.
Slomp, C.P. et al., 2013. Coupled dynamics of iron and phosphorus in sediments of an oligotrophic
coastal basin and the impact of anaerobic oxidation of methane. PLoS One, 8(4): e62386.
Sohlenius, G., Emeis, K.C., Andren, E., Andren, T. and Kohly, A., 2001. Development of anoxia
during the Holocene fresh-brackish water transition in the Baltic Sea. Marine Geology, 177(3-4): 221-242.
Sohlenius, G., Sternbeck, J., Andrén, E. and Westman, P., 1996. Holocene history of the Baltic Sea
as recorded in a sediment core from the Gotland Deep. Marine Geology, 134(3): 183-201.
Sternbeck, J. and Sohlenius, G., 1997. Authigenic sulfide and carbonate mineral formation in
Holocene sediments of the Baltic Sea. Chemical Geology, 135(1-2): 55-73. Suess, E., 1979. Mineral phases formed in anoxic sediments by microbial decomposition of organic
matter. Geochimica et Cosmochimica Acta, 43(3): 339-352.
Villalobos, M., Toner, B., Bargar, J. and Sposito, G., 2003. Characterization of the manganese
oxide produced by pseudomonas putida strain MnB1. Geochimica et Cosmochimica Acta,
67(14): 2649-2662. Webb, S.M., Tebo, B.M. and Bargar, J.R., 2005. Structural characterization of biogenic Mn oxides
produced in seawater by the marine bacillus sp. strain SG-1. The American mineralogist,
90(8-9): 1342-1357. Wedepohl, K., 1971. Environmental influences on the chemical composition of shales and clays.
Physics and Chemistry of the Earth, 8: 305-333. Wilkin, R.T. and Barnes, H.L., 1997. Formation processes of framboidal pyrite. Geochimica et
Cosmochimica Acta, 61(2): 323-339.
Zillén, L., Conley, D.J., Andrén, T., Andrén, E. and Björck, S., 2008. Past occurrences of hypoxia in the Baltic Sea and the role of climate variability, environmental change and human
impact. Earth-Science Reviews, 91(1): 77-92.
ACC
EPTE
D M
ANU
SCR
IPT
ACCEPTED MANUSCRIPT
24
Figures
Figure 1 Discrete-sample chemical profiles in a section of the gravity core from site LL19.
The section spans the entire interval of widespread hypoxic conditions in the Baltic Sea
during the Holocene Thermal Maximum (approx. 8000-4000 yr. BP) as indicated by the
grey bar. The position of the two epoxy resin blocks used in the EXAFS, XANES, micro-
XRF and LA-ICP-MS analyses are show by dark grey bars (showing true thickness of
blocks).
Figure 2 Micro XRF maps (1.5 to 0.5 cm) of epoxy embedded sediments showing the
distribution of Mn, Fe and S for Block 14 and Block 22. Greyscale intensity within each
map is internally proportional to XRF counts, but relative scaling has been modified to
highlight features.
Figure 3 Downcore variations in Mn, Fe, S, Mo, and Br (normalized to Al) from LA-ICP-
MS measurements (in %/%)(maximum values indicated at peak cutoff). The dashed line in
the first column displaying the Mn/Al represents the average shale content (Wedepohl,
1971). Columns 6 and 7 show the distribution of the three components identified from the
PCA of the XANES spectra. Column 6 is the relative contribution of a component to total
manganese content and column 7 is the concentration of each component in the sediments,
in arbitrary units. Grey bars indicate laminated sediment. In Block 22, sections for very
ACC
EPTE
D M
ANU
SCR
IPT
ACCEPTED MANUSCRIPT
25
high resolution synchrotron radiation analyzes shown in figure 5 appear as dark grey bars,
which reflect the true thickness of the analyzed sections.
Figure 4 Spectra of the three components obtained from iterative target transformation
factor analysis in comparison to normalized XANES spectra of different reference
materials.
Figure 5 High resolution LA-ICP-MS data for Mn, Fe, S, Mo and Br (normalized to Al in
%/%) of three selected sections within Block 22 (see Fig. 3). Columns 6 and 7 give the
relative contribution of component 1, 2 and 3 to total Mn, and their concentration in
arbitrary units, respectively. The last column displays the XANES spectra (hollow circles
show the actual spectra and the black line is the reproduction using the three components).
Figure 6 Results from fitting the EXAFS spectra and the contribution of the O and S shells.
Information about the fitting can be found in the supplementary content.
ACC
EPTE
D M
ANU
SCR
IPT
ACCEPTED MANUSCRIPT
26
Figure 1
360
320
280
De
pth
be
low
se
dim
en
t su
rfa
ce (
cm)
0 2 4 6 8 10
Corg (%)
0 1 2
Mn (%)
0 0.8 1.6
Ca (%)
0 2 4 6 8
Fe (%)
0 1 2 3 4 5
S (%)
0 200
Mo (ppm)
Block 14
Block 22

ACC
EPTE
D M
ANU
SCR
IPT
ACCEPTED MANUSCRIPT
27
Figure 2
SFeMnMn Fe S
313.6
314
314.4
291.2
291.6
292
De
pth
(c
m)
Block 14 Block 22
ACC
EPTE
D M
ANU
SCR
IPT
ACCEPTED MANUSCRIPT
28
Figure 3
314.4
314
313.6
De
pth
(cm
)
0 0.4 0.8
Mn/Al0 0.8 1.6
Fe/Al0 0.4
S/Al0 0.008
Mo/Al0 0.008
Br/Al0 0.4 0.8
rel. conc.0 0.4 0.8
conc.
[arbit. unit]
Block 22
292
291.6
291.2
De
pth
(cm
)
0 0.05 0.1
Mn/Al0 0.8 1.6
Fe/Al0 0.4
S/Al0 0.008
Mo/Al0 0.008
Br/Al0 0.4 0.8
rel. conc.0 0.16
conc.
[arbit. unit]
comp 1 comp 2 comp 3laminations
Block 14
Fig. 5a
b
c
0.120.016
0.02
3.48 1.09
ACC
EPTE
D M
ANU
SCR
IPT
ACCEPTED MANUSCRIPT
29
Figure 4
6540 6560 6580 6600 6620
energy [eV]
no
rma
lize
d µ
(E)
6530 6540 6550 6560 6570
energy [eV]
de
riva
tive
no
rma
lize
d µ
(E)
component 1
component 2
component 3
rhodochrosite
alabandite
rambergite
Mn phosphate
hausmannite
bixbyite
pyrolusite
birnesite
component 1
component 2
component 3
rhodochrosite
alabandite
rambergite
Mn phosphate
hausmannite
bixbyite
pyrolusite
birnesite
ACC
EPTE
D M
ANU
SCR
IPT
ACCEPTED MANUSCRIPT
30
Figure 5
314.48
314.47
314.46
314.45
314.44
De
pth
(cm
)
0 0.2Mn/Al
0 0.6 1.2Fe/Al
0 0.4S/Al
0 0.004Mo/Al
0 0.004Br/Al
0 0.40.8rel.conc.
0 0.16conc.
[arbit. unit]
6540 6560 6580 6600 6620
energy (eV)
c,
b,
6540 6560 6580 6600 6620
energy (eV)
313.74
313.72
313.70
De
pth
(cm
)
0 0.16Mn/Al
0 0.6 1.2Fe/Al
0 0.4S/Al
0 0.004Mo/Al
0 0.004Br/Al
0 0.40.8rel.conc.
0 0.08conc.
[arbit. unit]
a,
6540 6560 6580 6600 6620
energy (eV)
313.48
313.46
De
pth
(cm
)
0 0.16Mn/Al
0 0.6 1.2Fe/Al
0 0.4S/Al
0 0.004Mo/Al
0 0.004Br/Al
0 0.40.8rel. conc.
0 0.08conc.
[arbit. unit]
comp 3comp 2comp 1

ACC
EPTE
D M
ANU
SCR
IPT
ACCEPTED MANUSCRIPT
31
Figure 6
2 4 6 8 10 12
k[Å-1]
χ(k
)*k
3
0 1 2 3 4 5
R[Å]
Iχ(R
)I [Å
-4]
0 1 2 3 4 5
R[Å]
Re
{χ(R
)} [Å
-4]
313.3704 cmfit
290.964 cmfit
290.964 cmfit
313.3704 cmfit
313.3704 cmfit
290.964 cmfit
O
O
O
O
O
O
S
S
S
S
S
S
ACC
EPTE
D M
ANU
SCR
IPT
ACCEPTED MANUSCRIPT
32
Table 1 Parameters of the Mn-O and Mn-S paths obtained from modeling the EXAFS
spectra. The spot LL19 14 (290.964 cm) contained 19% of component 3 and the spot LL19
22 (313.3704 cm) 56 % of component 3 according to the ITFA analysis. N reflects the
coordination number, Rfit the distance between Mn and the ligand, and σ 2 is the mean-
square displacement of the half-path length. The values in parenthesis indicate the
coordination number with oxygen of component 1 and with sulfur of component 3. Note
that only the uncertainty due to the fitting itself is given in the table. The overall
uncertainty of the coordination number of component 3 also includes the error of
estimating its relative concentration in the sample. Assuming that the error of the ITFA
analysis is about ± 5%, the uncertainty becomes ± 5.2 for the spectrum from block LL19
14 (290.964 cm) and ± 1.2 for block LL19 22 (313.3704 cm). Details about the modeling
of EXAFS spectra can be found in the supplementary content.
Path LL19 14 (290.964 cm) LL19 22 (313.3704 cm) N Rfit[Å] σ2[10-
3Å2] N Rfit[Å] σ2[10-3Å2]
Mn -> O 4.9 (6) 2.18±0.02 3.1±1.4 2.6 (6) 2.12±0.02 3.1±1.4 Mn -> S 1.7
(8.9±2.9) 2.28±0.03 3.1±1.4 2.3 (4.1±0.8) 2.31±0.01 3.1±1.4
ACC
EPTE
D M
ANU
SCR
IPT
ACCEPTED MANUSCRIPT
33
Highlights
Mn contents in the northern Gotland Basin vary during the Holocene Thermal Maximum.
In these sediments, three major Mn species are identified.
Mn-carbonates are most abundant and are restricted to relatively oxic conditions.
Mn is bound in Fe-sulfides when conditions are anoxic and sulfidic.
Mn bound in aluminosilicates is present at a constant but low background content.
Copyright © 2022 FDOKUMEN