
Structure of high-pressure diesel sprays
12
Paper presented to the ICE-2001 Int. Conference, Capri, Italy, September 2001 Structure of High Pressure Diesel Sprays M. Gavaises * and C. Arcoumanis * City Uvinersity, London A. Theodorakakos and G. Bergeles National Technical University of Athens, Greece * formerly of Imperial College of Science, London ABSTRACT A comprehensive set of computational and experimental results for high-pressure diesel sprays are presented and discussed. The test cases investigated include injection of diesel into air under both atmospheric and high pressure/temperature chamber conditions, injection against pressurized and cross-flowing CF 6 simulating respectively the density and flow conditions of a diesel engine at the time of injection, as well as injection into the piston bowl of both research and production turbo-charged high- speed DI diesel engines. A variety of high-pressure injection systems and injector nozzles have been used including mechanical and electronic high-pressure pumps as well as common-rail systems connected to nozzles incorporating a varying number of holes with diameters ranging from conventional to micro-size. Results from spray imaging, phase Doppler anemometry and CFD calculations of both the internal nozzle flow and the subsequent spray development have been combined to identify the relative importance of the geometric/operating parameters that control the structure of diesel sprays and areas of further research. INTRODUCTION Over the last few years numerous studies have focused on improving the present understanding of the structure of diesel sprays and identifying the parameters affecting it. It is now well recognised that the fuel injection system of direct-injection (DI) Diesel engines as well as the chamber pressure/temperature conditions play the dominant role on the spray development and pollutant formation mechanisms. The demand for well atomised sprays has led to an increase of the fuel injection pressure up to 1400 bar and beyond [1], and to the design of electronic systems [2-4] (common-rail, high pressure pumps and unit injectors) which can accurately control the injection period, injection quantity and number of injections per cycle. In addition, manufacturing of nozzles with an increased number of smaller holes allows more uniform distribution of the fuel in the piston bowl and reduced fuel penetration. Computer models simulating the various flow processes within the fuel injection system as well as the subsequent spray structure have been developed over the years since they are in principle capable of providing information which cannot be easily obtained from experiments. One-dimensional fuel injection system models are widely used in order to predict the transient pressure wave phenomena developing within the fuel injection system while CFD models can provide the details of the flow in the sac volume and injection holes. These models not only predict the operating characteristics of the injection system itself, but also provide the necessary information required by CFD spray sub-models as initial conditions for the subsequent spray calculations. Following its exit from the injection hole, the consensus is that the liquid fuel is atomised into a large number of small droplets, although recent experimental evidence [5] supports the idea of ligament in addition to droplet dispersion. Whatever is the result of the near-nozzle atomisation mechanism, this process is controlled to a large extend by hole cavitation [6]. Unfortunately, at present the link between the flow characteristics inside the injection hole and the atomisation process of the injected liquid can only be identified by using simplified phenomenological models which incorporate some of the basic features of the nozzle flow. Such features include the liquid velocity increase at the nozzle exit due to the volume occupied by the cavitation bubbles and the associated higher liquid turbulence levels which, together with the surface distortion of the emerging jet due to the presence of the cavitation films, lead to jet disintegration. Eulerian-Eulerian two- phase spray models are in principle able to resolve numerically in a relatively comprehensive manner the near-nozzle flow distribution, but the simpler conventional Eulerian-Lagrangian methodology is widely used in most commercial and university CFD spray codes [7], despite its obvious weakness to describe the fuel distribution in the nozzle exit region. In addition, in most cases, liquid wall impingement takes place in DI diesel engines and thus, under these conditions, Lagrangian spray models form an attractive methodology for representing the motion and interaction of the two phases. In any case, empirical sub-models have to be used to account for the droplet flow processes taking place in the sub-grid length and time scales, including droplet secondary break-up, droplet-droplet interactions, turbulent dispersion, droplet evaporation and droplet wall impingement. The present paper presents typical results of computational studies previously performed at IC and NTUA and focusing on the development and
-
Upload
independent -
Category
Documents
-
view
5 -
download
0
Transcript of Structure of high-pressure diesel sprays
Paper presented to the ICE-2001 Int. Conference, Capri, Italy, September 2001
Structure of High Pressure Diesel Sprays
M. Gavaises* and C. Arcoumanis* City Uvinersity, London
A. Theodorakakos and G. Bergeles National Technical University of Athens, Greece
* formerly of Imperial College of Science, London
ABSTRACT
A comprehensive set of computational and experimental results for high-pressure diesel sprays are presented and discussed. The test cases investigated include injection of diesel into air under both atmospheric and high pressure/temperature chamber conditions, injection against pressurized and cross-flowing CF6 simulating respectively the density and flow conditions of a diesel engine at the time of injection, as well as injection into the piston bowl of both research and production turbo-charged high-speed DI diesel engines. A variety of high-pressure injection systems and injector nozzles have been used including mechanical and electronic high-pressure pumps as well as common-rail systems connected to nozzles incorporating a varying number of holes with diameters ranging from conventional to micro-size. Results from spray imaging, phase Doppler anemometry and CFD calculations of both the internal nozzle flow and the subsequent spray development have been combined to identify the relative importance of the geometric/operating parameters that control the structure of diesel sprays and areas of further research. INTRODUCTION
Over the last few years numerous studies have focused on improving the present understanding of the structure of diesel sprays and identifying the parameters affecting it. It is now well recognised that the fuel injection system of direct-injection (DI) Diesel engines as well as the chamber pressure/temperature conditions play the dominant role on the spray development and pollutant formation mechanisms. The demand for well atomised sprays has led to an increase of the fuel injection pressure up to 1400 bar and beyond [1], and to the design of electronic systems [2-4] (common-rail, high pressure pumps and unit injectors) which can accurately control the injection period, injection quantity and number of injections per cycle. In addition, manufacturing of nozzles with an increased number of smaller holes allows more uniform distribution of the fuel in the piston bowl and reduced fuel penetration.
Computer models simulating the various flow processes within the fuel injection system as well as the subsequent spray structure have been developed
over the years since they are in principle capable of providing information which cannot be easily obtained from experiments. One-dimensional fuel injection system models are widely used in order to predict the transient pressure wave phenomena developing within the fuel injection system while CFD models can provide the details of the flow in the sac volume and injection holes. These models not only predict the operating characteristics of the injection system itself, but also provide the necessary information required by CFD spray sub-models as initial conditions for the subsequent spray calculations. Following its exit from the injection hole, the consensus is that the liquid fuel is atomised into a large number of small droplets, although recent experimental evidence [5] supports the idea of ligament in addition to droplet dispersion. Whatever is the result of the near-nozzle atomisation mechanism, this process is controlled to a large extend by hole cavitation [6]. Unfortunately, at present the link between the flow characteristics inside the injection hole and the atomisation process of the injected liquid can only be identified by using simplified phenomenological models which incorporate some of the basic features of the nozzle flow. Such features include the liquid velocity increase at the nozzle exit due to the volume occupied by the cavitation bubbles and the associated higher liquid turbulence levels which, together with the surface distortion of the emerging jet due to the presence of the cavitation films, lead to jet disintegration. Eulerian-Eulerian two-phase spray models are in principle able to resolve numerically in a relatively comprehensive manner the near-nozzle flow distribution, but the simpler conventional Eulerian-Lagrangian methodology is widely used in most commercial and university CFD spray codes [7], despite its obvious weakness to describe the fuel distribution in the nozzle exit region. In addition, in most cases, liquid wall impingement takes place in DI diesel engines and thus, under these conditions, Lagrangian spray models form an attractive methodology for representing the motion and interaction of the two phases. In any case, empirical sub-models have to be used to account for the droplet flow processes taking place in the sub-grid length and time scales, including droplet secondary break-up, droplet-droplet interactions, turbulent dispersion, droplet evaporation and droplet wall impingement.
The present paper presents typical results of computational studies previously performed at IC and NTUA and focusing on the development and
experimental validation of combined fuel injection system and spray CFD computer models. The simulation cases include diesel fuel sprays injected from various nozzles against a variety of back chamber conditions such as fuel injection from multi- and single-hole nozzles against air under atmospheric or high-pressure/temperature conditions and injection against pressurized and cross-flowing CF6, as reported in [8,9]. Nozzles with varying number of holes and diameters ranging from conventional to micro-size have been investigated. The injection pressure has been generated by a variety of injection systems, including mechanical distributor-type pumps, advanced electronically-controlled high-pressure pumps and common-rail systems [10,11]. Spray calculations have also been performed inside the piston bowl of an optical DI diesel engine (Hydra) equipped with a high-pressure electronically-controlled injection system and connected to a 6-hole vertical injector [12]. In addition, calculations of the air-flow, spray development and combustion have been performed for a high-speed turbo-charged DI diesel engine equipped with a high-pressure injection system connected to a production 5-hole nozzle but also to a prototype 22-hole injector. Model validation has taken place against extensive experimental data including phase Doppler anemometry (PDA) and high-resolution CCD-based spray images. Examples of such experimental results have been included here since they provide evidence of the physical processes affecting spray structure, which can guide future model developments.
First, a brief presentation of the various models used is given followed by a description of the validation cases investigated. Then, computational and experimental results are presented and discussed, highlighting the most important findings and areas of future research.
COMPUTATIONAL MODELS
In this section the various computer models used in the present investigation are briefly described, since details can be found in [13,14].
Fuel injection equipment (FIE) model
This is a 1-D model that predicts the transient pressure distribution within the injection system using as input the pump-pipe-nozzle geometry. It is based on the mass and momentum conservation equations for the calculation of the flow in pipes and volumes and the equilibrium of forces for the calculation of the displacement of the valves [10,11]. Special emphasis has been given to the CFD simulation of the nozzle flow itself [15-17] and to a phenomenological 1-D hole cavitation flow model [18,19], which uses experimental correlations for the reduction of the hole discharge coefficient as a function of cavitation number, and then, it predicts the onset of cavitation at the nozzle hole entrance and the effective hole area at the exit of the injection hole for the case that the cavitation structures reach the nozzle hole exit. Furthermore, the
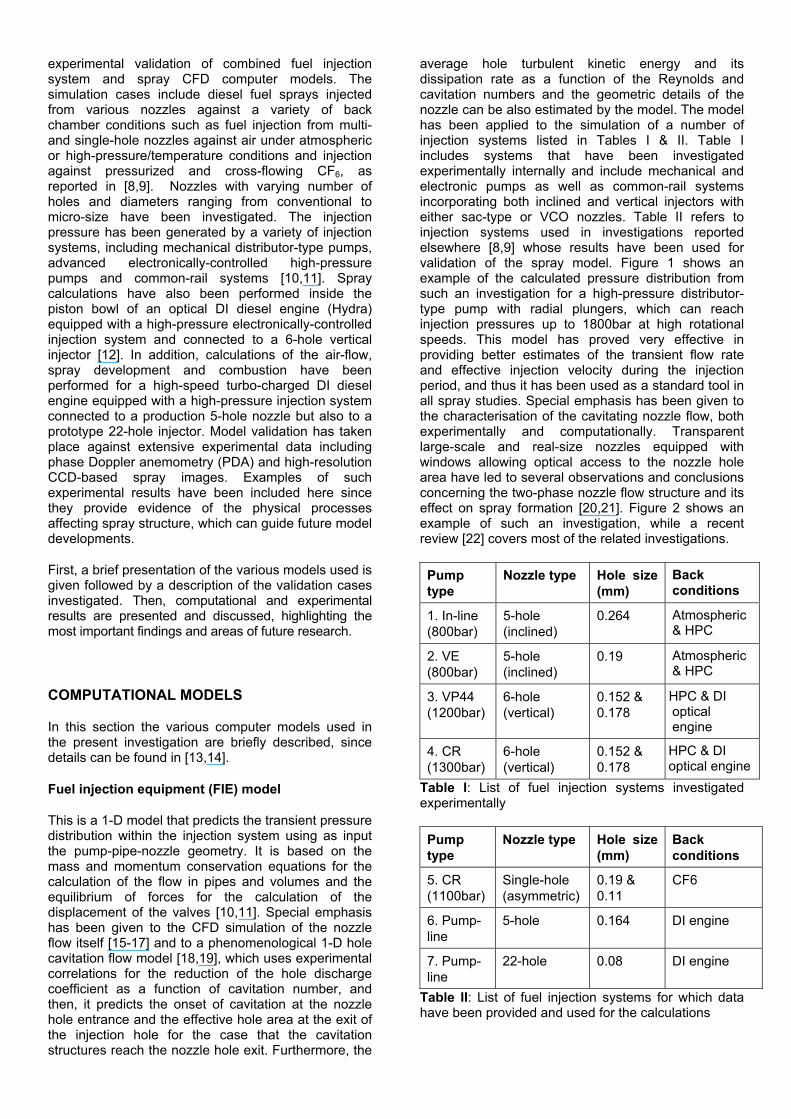
average hole turbulent kinetic energy and its dissipation rate as a function of the Reynolds and cavitation numbers and the geometric details of the nozzle can be also estimated by the model. The model has been applied to the simulation of a number of injection systems listed in Tables I & II. Table I includes systems that have been investigated experimentally internally and include mechanical and electronic pumps as well as common-rail systems incorporating both inclined and vertical injectors with either sac-type or VCO nozzles. Table II refers to injection systems used in investigations reported elsewhere [8,9] whose results have been used for validation of the spray model. Figure 1 shows an example of the calculated pressure distribution from such an investigation for a high-pressure distributor-type pump with radial plungers, which can reach injection pressures up to 1800bar at high rotational speeds. This model has proved very effective in providing better estimates of the transient flow rate and effective injection velocity during the injection period, and thus it has been used as a standard tool in all spray studies. Special emphasis has been given to the characterisation of the cavitating nozzle flow, both experimentally and computationally. Transparent large-scale and real-size nozzles equipped with windows allowing optical access to the nozzle hole area have led to several observations and conclusions concerning the two-phase nozzle flow structure and its effect on spray formation [20,21]. Figure 2 shows an example of such an investigation, while a recent review [22] covers most of the related investigations.
Pump type
Nozzle type Hole size (mm)
Back conditions
1. In-line (800bar)
5-hole (inclined)
0.264 Atmospheric & HPC
2. VE (800bar)
5-hole (inclined)
0.19 Atmospheric & HPC
3. VP44 (1200bar)
6-hole (vertical)
0.152 & 0.178
HPC & DI optical engine
4. CR (1300bar)
6-hole (vertical)
0.152 & 0.178
HPC & DI optical engine
Table I: List of fuel injection systems investigated experimentally
Pump type
Nozzle type Hole size (mm)
Back conditions
5. CR (1100bar)
Single-hole (asymmetric)
0.19 & 0.11
CF6
6. Pump-line
5-hole 0.164 DI engine
7. Pump-line
22-hole 0.08 DI engine
Table II: List of fuel injection systems for which data have been provided and used for the calculations

Figure 1: Example of calculated pressure distribution inside a high-pressure fuel injection system used to derive the nozzle flow exit characteristics for all fuel systems investigated (a) fuel pump, line & nozzle and (b) sac volume and injection holes.
Figure 2: Nozzle hole cavitation as visualised with a CCD camera in (a) a real-size 6-hole nozzle equipped with a transparent window that allows optical access into one of the injection holes and (b) a fully transparent large-scale replica injector. Various cavitating structures have been identified to co-exist inside the injection hole: incipient (bubbly) cavitation, film cavitation and string (vortex-type) cavitation.
Two-phase CFD spray model
The CFD code used here and developed by [13] solves numerically the full Navier-Stokes equations describing the turbulent motion of the fluid; relevant publication are for example [23,24]. The time-averaged forms of the continuity, momentum and conservation equations for scalar variables are numerically solved using collocated Cartesian velocity components on a Cartesian non-uniform, curvilinear, non-orthogonal numerical grid while turbulence is simulated by the two equation k-ε model. The discretisation method is based on the finite volume approach and the pressure is computed with a method resembling the SIMPLE algorithm; the spatial discretisation scheme used here is the first-order hybrid. Moving boundaries and variable inlet and outlet conditions can be assigned by the user of the model, thus making this code applicable to any complex geometry of engineering interest. The CFD spray model [14] is based on the numerical solution of the Eulerian-Lagrangian two-phase flow conservation equations expressing the local spray development and its interaction with the surrounding gas. The simulation of the spray is based on the discrete droplet model (DDM) [25] according to
which the spray is represented by a number of droplet parcels, each containing a large number of identical and non-interacting droplets; the properties of the representative droplets are randomly chosen from calculated distribution functions using a Monte-Carlo approximation. The model assumes that the inter-phase transport of mass, momentum and energy is quasi-steady and the transfer coefficients of mass, momentum and energy to and from the droplets are independent of the proximity of neighbouring droplets and can be represented by empirical correlations.
As already mentioned, the droplet initial properties are determined by the flow conditions at the exit of the injection holes which are determined by the FIE and hole cavitation models. Following the start of injection, various spray sub-models are used for the calculation of the liquid core atomisation [6,26,27], the droplet deceleration [28], the secondary break-up [18], the droplet collisions [29], the droplet evaporation [7], the droplet impingement [30-32] and the droplet turbulent dispersion [33]. Amongst them, special attention has been given to the modelling of the liquid fragmentation process. A cavitation-induced atomisation model [6] has been introduced allowing for the effect of the presence of cavitation bubbles on the liquid jet disintegration to be estimated. In addition, empirical correlations for the estimation of the droplet secondary break-up, combined with the maximum entropy formalism [34,35], have been implemented into the code allowing for estimation of the droplet size distribution at each time of droplet disintegration over a wide range of Weber numbers; correlations for the drag coefficient and the evaporation process of deformed droplets are also included into the model. It should be emphasized that this type of cavitation modelling is phenomenological and further research is required in order to accurately represent most of the aforementioned physical processes. In particular, the atomisation process of the liquid core remains one of the most grey areas in the modelling of dense fuel sprays. An area of expanding research is related to the validity of the Eulerian-Lagrangian methodology itself in representing the spray in the near-nozzle region. Recent evidence [5] supports the observation that swirling ligaments, rather than droplets, originating from the entry of the flow into the injection holes, penetrate into the combustion chamber. To resolve such spray details, Eulerian-Eulerian methodologies are under development, since they have the additional advantage of resolving the numerical inaccuracies present in all Lagrangian models in the near nozzle region. Furthermore, such methodologies are in principle capable of capturing the shock waves that may form in the gas just at the exit of the nozzle holes, since in advanced high-pressure systems the jet likely exits with transonic velocity. A significant break though would be the simultaneous solution of the cavitating nozzle flow itself together with the jet disintegration mechanism in the near nozzle region, and a Lagrangian methodology after the formation of liquid droplets. However, a number of numerical difficulties including the long computational time and the need for sub-grid scale modelling of the physical processes, currently limit the applicability of such methodology to
min max
(a) (b)
(a) (b)
Film cavitation Bubbly-flow String cavitation
Solenoid
Radial plungers High pressure pipe Injector
fundamental research rather than to cases of practical interest.
EXPERIMENTAL TECHNIQUES - TEST CASES
The test cases investigated correspond to the conditions given in Tables I & II. In brief, they include injection of diesel fuel into the atmosphere as well as into a high pressure (up to 40bar) and high temperature (up to 800K) chamber. In addition, the case of fuel injection against pressurised (6bar, 30kg/mm3) and cross-flowing (4.5m/s) CF6 gas has been investigated. Free as well as impinging sprays have been simulated while non-evaporating and evaporating conditions have also been tested in an attempt to isolate and simplify the various physical processes taking place in the engine cylinder, and thus, to guide droplet sub-model development. Various test cases refer to engine sprays. For example, an optical 1.9L DI diesel engine with flat piston and side windows has been used to characterise the spray development and the effect of the air flow, injection conditions and nozzle-type on the engine exhaust emissions [36,37]. In addition, the validated air flow and spray models have been used to provide information about the mixture formation and combustion process in a high-speed turbo-charged engine, using nozzles with varying number of holes and diameters ranging from conventional (0.164mm) to micro-size (0.08mm).
For model validation, CCD-based and high-speed spray images, Mie scattering, LIF as well as phase Doppler anemometry (PDA) have been extensively used. Although a range of cameras, lasers and software have been tested, only some characteristics of those systems are briefly mentioned here.
The imaging system included a Sensicam unintensified CCD camera with Nicon zoom lenses and an argon gas spark light which was used for the illumination of the sprays. The resolution of the camera sensor was 1280×1024 pixels at a sensitivity of 12bit. The sensor was Peltier cooled to –15oC for increased sensitivity and low noise operation. The shutter speed could be adjusted between 100ns to 1ms with a freely programmable multiple exposure capability; the actual setting was 1µs. For optimizing the image quality, the trigger signal was sent to the light source rather than to the camera system and the shutter was set to open 0.38µs after the arrival of the signal. The trigger pulses after the start of injection were generated in a PC-based timing control system with purpose-built hardware and software. The timing control system was capable of producing different TTL pulses in time and duration based on an external clock (shaft-encoder signals). The use of this system was extended from the atmospheric spray to the engine sprays. Since the sampling frequency of the camera was not adequate to provide a number of successive images within a cycle, an ensemble of images from different cycles were used to deduce the spray development.
PDA measurements in diesel sprays encounter some difficulties. One example is the high droplet number density in the spray leading to a distinct possibility that two or more droplets could occupy the measuring volume at the same time. A partial solution is to use very small control volumes to reduce this ‘multiple occupancy’, or small apertures to focus on a fraction of the control volume. The non-sphericity of liquid ligaments leading to droplets is another parameter influencing the accuracy of the measurements, especially near the nozzle exit, thus requiring a second validation criterion to guaranty valid measurements. A 70o scattering angle was used for all measurements, which showed little dependence of the slope of the calibration curve to any change in the refractive index of the liquid at high temperatures. For non-evaporating sprays, the beam from an argon-ion laser operating in the 514.5nm line was focused onto the surface of a circular diffraction grating in a custom-made transmitting optical unit. An Aerometrics receiver and counter-type analyser were used for processing the acquired data. The counter has a maximum sampling frequency of 20MHz, adjustable high pass filter cut-off frequency and maximum data rate of 50MHz. An 8ms long gate signal was used for data acquisition to cover the whole injection duration. Each time typically 1000 validated samples were collected. At each position a minimum of 6000 samples were taken, requiring six different runs, which were conducted successively. In order to focus on only one out of the six sprays exiting from the nozzle which was important not only for the PDA measurements but also for imaging, a nozzle tip cap was bolted to the end of the injector adapter. The cap was designed to direct all but one of the spray plumes into a small chamber but without affecting the internal hole flow. Another benefit of the cap was the reduction of the fuel quantity injected into the chamber, which makes scavenging of the chamber easier. The PDA measurements were performed for various speed and load conditions at three axial locations relative to the nozzle exit and several radial ones from the nozzle centre line. While the axial locations were in the range 10-25 mm from the nozzle exit, the radial measurement positions varied depending on the axial plane due to the conical shape of the spray. A typical scatter plot of the PDA velocity measurements can be seen in Figure 3. A Shell gas oil SH liquid fuel was used for almost all the tests. Up to 700K no indication of auto-ignition was detected but combustion of the fuel was observed from about 750K. Since it was considered important to investigate droplet characteristics at a temperature high enough for auto-ignition to occur despite the fact that no PDA measurements could be made in the presence of natural chemiluminescence during combustion, another fuel had to be used. In an effort to get diesel-like oil but with relatively low ignition quality, a low cetane-number blend was obtained from an oil company in the UK; this fuel was estimated to have a cetane number as low as 20 but with the remaining of its properties being very similar to those of standard diesel.

-1 0 1 2 3-20
0
20
40
60
80
100
Dro
plet
Vel
ocity
(m
/s)
Figure 3: Photograph of the laser beams of the phase Doppler anemometer applied to spray characterisation inside the high-pressure/temperature chamber and raw velocity data of typical temporal velocity measurements under high pressure and temperature conditions.
RESULTS AND DISCUSSION
In this section typical results of the various test cases are presented. The main aim of the cases selected for presentation here is to highlight the steps which lead to physical model development but also to present computational/experimental results capable of revealing details of the structure of diesel sprays under realistic engine conditions.
The most important but also the less understood process in diesel sprays is the near nozzle fuel atomisation. The difficulties to model that process arise from the fact that many parameters are simultaneously affecting the droplet size. Due to the large number of droplets formed, any attempt to apply detailed CFD/DNS calculations is limited to simplified research cases rather than to practical calculations. The limited physical understanding is complicated by the fact that the cavitating nozzle flow controls to a large extend the atomisation process. Due to the very small time and length scales and the very high velocities of injection, experimental results are limited either to qualitative photographic investigations in the near nozzle region or to more detailed PDA measurements but at distances far from the nozzle hole, where all the relative phenomena are suppressed, thus allowing only speculations about the detailed mechanisms leading to the measured droplet sizes. The phenomenological atomisation models currently used include aerodynamic linear instability theories, the effect of the injected liquid turbulence on the growth of the surface waves assumed to cause the disintegration of the liquid but also cavitation-induced models which although they consider some of the details of the cavitating nozzle on the time and length scales of atomisation, still require further improvements. The development and experimental validation of such a model can be based on PDA measurements [38], and sample results are given in Figure 4. At distances from 10 up to 60mm from the nozzle hole the temporal variation of the mean droplet size and velocity was used to guide model predictions under atmospheric pressure and non-evaporating conditions, thus involving mainly the effects of atomisation and single droplet secondary break-up.
Different atomisation mechanisms have been considered as well as various break-up and size distribution models for different injection pressures. Overall, the analysis has led to the conclusion that if the two coefficients of the cavitation-induced atomisation model are calibrated to match the experimental data, the model could provide significant improvements relative to other existing models for all cases examined which included a range of cavitation numbers, fuel quantities, injection durations and injection velocities.
Figure 4: Comparison between PDA measurements and model predictions, using various fuel atomisation and droplet size distribution models [System 2 of Table I, atmospheric conditions].
Another important finding of the investigation was related to the radial distribution of the droplet sizes during the spray development where contradicting measurements have been reported in the literature. It is generally believed that larger droplets are found in the centre of the spray while the smaller ones are concentrated in the periphery. Calculations performed using both a radially uniform distribution of droplet sizes formed during the atomisation process and by accounting for the droplets inertia, have led to the conclusion that in the near nozzle region, i.e. at distances up to 10mm where most of the droplet secondary break-up processes occur, the larger droplets are found indeed in the central part of the
(a) (b)
10mm 20mm
10mm 20mm
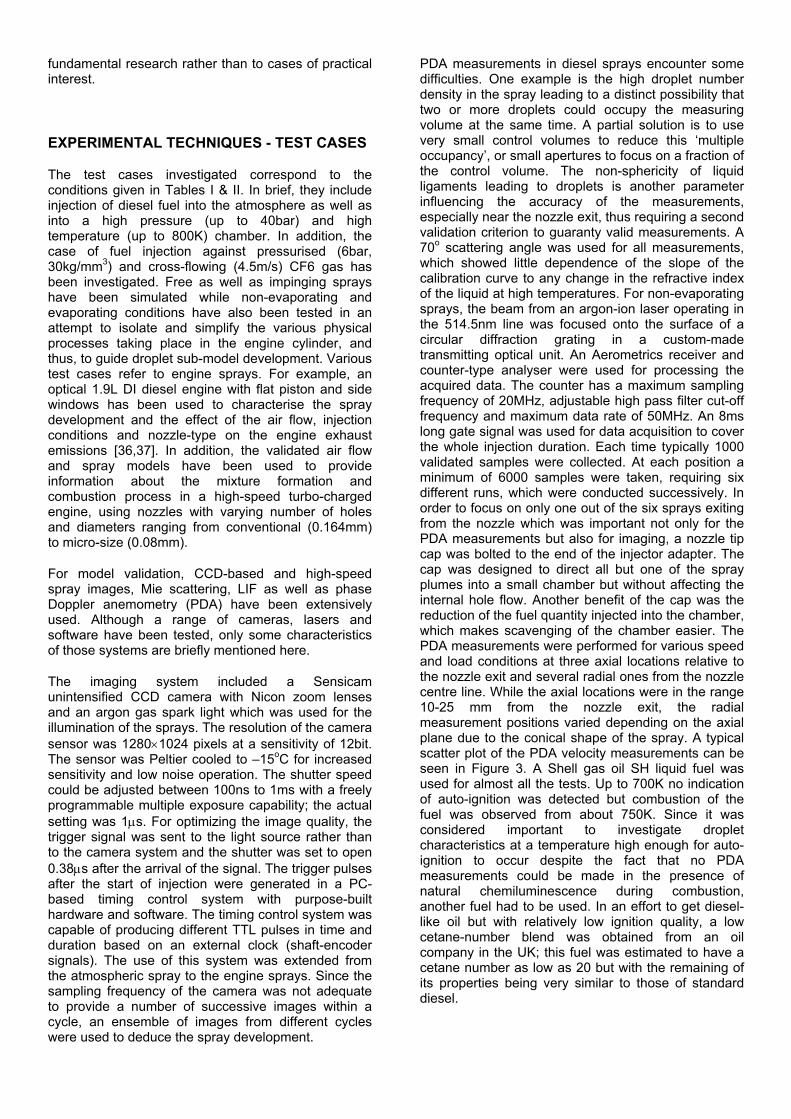
spray, in agreement with measurements. However, at distances further away, the relative effect of droplet evaporation, coalescence and droplet turbulent dispersion controls the spatial re-distribution of the droplets. As shown in Figure 5, which refers to a spray injected with an injection pressure of 1100bar from a 0.11mm single-hole nozzle against pressurised CF6 having a density similar to that found in a diesel engine at the time of injection, small droplets, initially found at the spray periphery, are captured in the recirculation zones formed at the spray edges, where they coalesce and form local maxima both in the mean droplet size but also on the fuel mass distribution. However, in evaporating sprays, it has been computationally confirmed that the faster evaporation of the peripheral small droplets and the significant cooling of the air found in the central part of the spray reduce or even suppress such complicated structures to be formed.
[ ][ ][ ]SMD (µm)
0 16 32
[ ][ ][ ]SMD (µm)
0 16 32
[ ][ ][ ]Log(Ml/Mg·106)
0 6 12
[ ][ ][ ]Log(Ml/Mg·106)
0 6 12
Figure 5: Predicted (a) droplet size and (b) fuel mass distributions for a free spray under non-evaporating conditions injected against pressurized CF6 gas [Single-hole nozzle, PINJ=1100 bar, ρGAS= 30kg/m3].
A point of importance related to these observations is the nozzle flow itself. Under certain conditions the nozzle flow may consist of one or more vortices originating from the sac volume and the hole entrance. If the rotational motion is strong enough it may, in extreme cases such as VCO nozzles, create a hollow cone spray or significantly increase the observed spray angle, which would imply that the centrifugal forces associated with the swirling motion, could direct the larger droplets towards the periphery of the spray. Although this hypothesis cannot have a universal validity, it emphasises again that the link of the detailed nozzle flow with the spray structure becomes the parameter that determines the spatial distribution of the droplets even at large distances from the nozzle hole exit.
As already mentioned, droplet secondary break-up phenomena are important since they determine to a large extent the droplet size in the peripheral spray regions, where early auto-ignition sites are usually observed; but also the size and velocity of the droplets impinging on the piston bowl in small high-speed DI
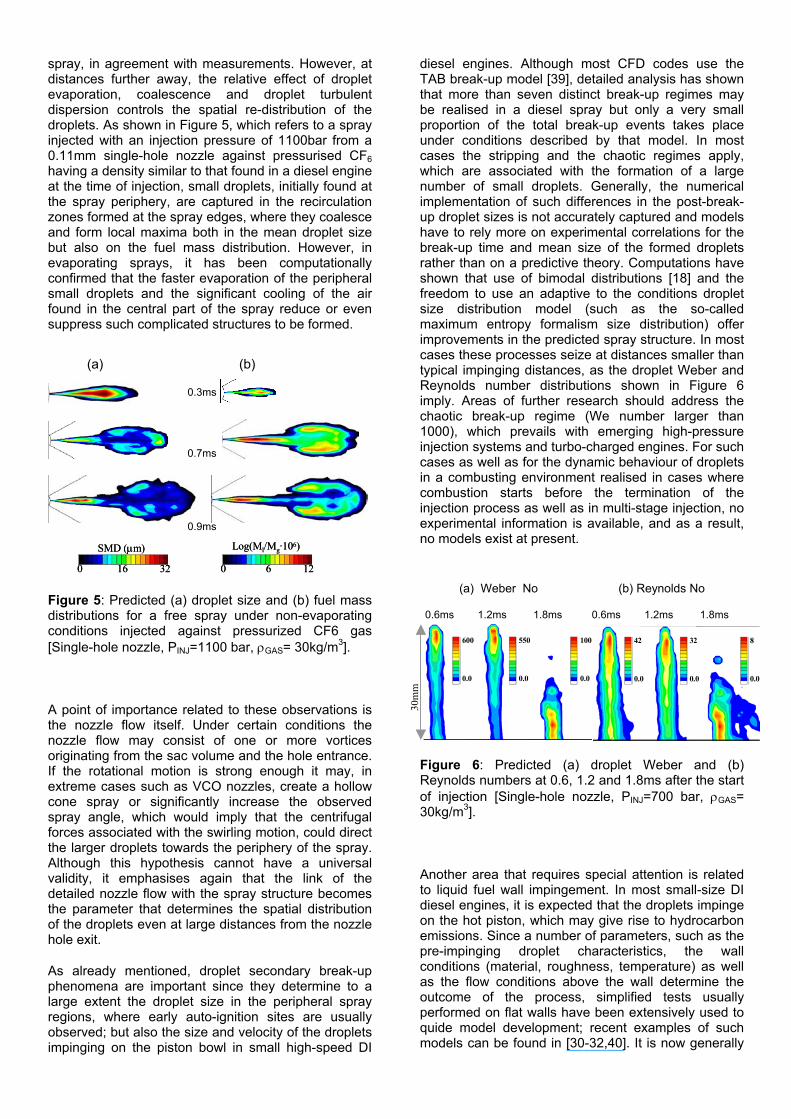
diesel engines. Although most CFD codes use the TAB break-up model [39], detailed analysis has shown that more than seven distinct break-up regimes may be realised in a diesel spray but only a very small proportion of the total break-up events takes place under conditions described by that model. In most cases the stripping and the chaotic regimes apply, which are associated with the formation of a large number of small droplets. Generally, the numerical implementation of such differences in the post-break-up droplet sizes is not accurately captured and models have to rely more on experimental correlations for the break-up time and mean size of the formed droplets rather than on a predictive theory. Computations have shown that use of bimodal distributions [18] and the freedom to use an adaptive to the conditions droplet size distribution model (such as the so-called maximum entropy formalism size distribution) offer improvements in the predicted spray structure. In most cases these processes seize at distances smaller than typical impinging distances, as the droplet Weber and Reynolds number distributions shown in Figure 6 imply. Areas of further research should address the chaotic break-up regime (We number larger than 1000), which prevails with emerging high-pressure injection systems and turbo-charged engines. For such cases as well as for the dynamic behaviour of droplets in a combusting environment realised in cases where combustion starts before the termination of the injection process as well as in multi-stage injection, no experimental information is available, and as a result, no models exist at present.
600
0.0
550
0.0
100
0.0
Figure 6: Predicted (a) droplet Weber and (b) Reynolds numbers at 0.6, 1.2 and 1.8ms after the start of injection [Single-hole nozzle, PINJ=700 bar, ρGAS= 30kg/m3].
Another area that requires special attention is related to liquid fuel wall impingement. In most small-size DI diesel engines, it is expected that the droplets impinge on the hot piston, which may give rise to hydrocarbon emissions. Since a number of parameters, such as the pre-impinging droplet characteristics, the wall conditions (material, roughness, temperature) as well as the flow conditions above the wall determine the outcome of the process, simplified tests usually performed on flat walls have been extensively used to quide model development; recent examples of such models can be found in [30-32,40]. It is now generally
0.3ms 0.7ms 0.9ms
42
0.0
32
0.0
8
0.0
30m
m
(a) (b)
(a) Weber No (b) Reynolds No
0.6ms 1.2ms 1.8ms 0.6ms 1.2ms 1.8ms

accepted that the splashing regime usually prevails under diesel engine conditions, associated with an amount of fuel remaining on the piston wall as a liquid film. However, contradictions in the various models do exist while in most cases the wall temperature is not considered as an input parameter. Despite the difficulties that arise from the incomplete physical understanding of the detailed impingement process, spray models are presently used to obtain information about the structure of impinging sprays. Figure 7 shows an example of such a calculation and comparison with the spray edge as deduced from the CCD-based spray images reported in [9]. Different impingement models have been studied and overall they predict a similar spray shape which maches closely the photographic spray images.
Experiment(spray edge from CCD images)
Simulation(droplet parcels)
Figure 7: Predicted development of an impinging diesel spray and comparison with spray images (only edges are shown)[System 5 of Table II, PINJ=700bar, ρGAS=20kg/m3, UCROSS=4.5m/s from left to the right].
Thorough examination of the gas/liquid phase structure has revealed that although the overall spray shape may be predicted reasonably well despite important parameters such as the wall temperature being neglected, the detailed droplet distribution is affected equally by the detailed single-droplet impingement mechanism and the droplet/flow interaction above the wall. Figure 8 shows the predicted air flow field and mean droplet velocity at 1.2ms afer the start of injection. It is interesting to note that downstream of the spray, in the direction of the cross flowing gas which was used to simulate the swirling motion of the air inside the piston bowl of high speed DI diesel engines, small vortices are formed which act as traps for both the reflected from the wall droplets but also for those swept by the cross-flowing gas before reaching the flat wall. In these areas, droplet coalescence processes may lead to a local peak in the calculated droplet size, as shown in Figure 9.
Upstreamwall vortex
Air entrainment
Wall jet and head vortex
0.0 m/s 120.0
Figure 8: (a) Predicted air-entrainment and (b) mean droplet velocity of an impinging diesel spray at 1.2ms after the start of injection [System 5 of Table II, single-hole nozzle, PINJ=700bar, ρGAS=30kg/m3, UCROSS=4.5m/s from left to the right].
0.0 µm 40.0 0.0 Log10(Ml/Mg ·106) 16.0 0.0 Log10(N/mm3) 3.0
Side local peak from droplet collisions
Centre local peak from droplets ejected from the wall
Side local peak in number of droplets due to splashing
Most of the fuel mass is concentrated in the main spray region
Droplet size Droplet mass Droplet number density
0.0 µm 40.0 0.0 Log10(Ml/Mg ·106) 16.0 0.0 Log10(N/mm3) 3.00.0 µm 40.00.0 µm 40.0 0.0 Log10(Ml/Mg ·106) 16.00.0 Log10(Ml/Mg ·106) 16.0 0.0 Log10(N/mm3) 3.0
Side local peak from droplet collisions
Centre local peak from droplets ejected from the wall
Side local peak in number of droplets due to splashing
Most of the fuel mass is concentrated in the main spray region
Droplet size Droplet mass Droplet number density
Figure 9: (a) Predicted droplet SMD, (b) droplet mass and (c) droplet number density distributions at 0.9ms after the start of injection [Single-hole nozzle, PINJ=700bar, ρGAS= 30kg/m3, UCROSS=4.5m/s from left to the right].
For non-evaporating conditions, the droplet size, fuel mass and droplet number density distributions over the flat wall have relealed that most of the fuel mass is located in the central spray region and not at the periphery of the spray, implying that a percentage of the spray mass sticks on the wall forming a liquid film. The local peaks in the droplet number density distributions have been found not to coincide with the maxima in the liquid mass distribution, which has led to the conclusion that, at these peripheral spray locations, droplet splashing is the main post-
0.2ms 0.4ms 0.6ms 0.8ms 1.0ms 1.2ms 1.4ms 1.6ms
Main spray
Downstreamvortices withlow mean velocityenhancing dropletcollisions
0.0 m/s 300.0
(a) (b)
(a) (b) (c)

impingement droplet formation mechamism. For more realistic in-cylinder evaporating conditions, some of these mixing processes are supressed while the detailed geometry of the piston bowl also affects the distribution of the fuel in the combustion chamber, as clearly shown in Figure 10, which presents the liquid mass and fuel vapour distribution as calculated inside the piston bowl of a Hydra optical DI diesel engine at 0.4ms after the start of injection. However, in both cases, wall impingement is found to significantly affect the size distribution of the liquid droplets.
Figure 10: Predicted (a) liquid fuel mass and (b) fuel vapour distributions inside the piston bowl of an optical DI diesel engine, operating with an electronic distributor-type pump [Peak PINJ=1200bar, DHOLE=0.152mm].
The obvious step towars the simulation of sprays under realistic chamber pressure/temperature conditions is the modelling of the evaporation process. Existing models usually assume a uniform droplet fuel temperature, and in some cases variable temperature within the droplet can be estimated but with small effect on the overall fuel evaporation rate. Modelling of the evaporation process of real multi-component fuels [41] represents an attractive methodology that provides information required in detailed chemical kinetics models predicting engine exhaust emissions. However, the development and mixing of evaporating sprays is not yet fully understood. Systematic experiments reported in [42-44] showed that liquid penetration is limited to a short distance from the injection nozzle which is independent of the injection
Figure 11: Effect of chamber temperature on diesel spray structure as visualised inside a high pressure/temperature chamber using a CCD camera [System 3 of Table I, DHOLE=0.152mm, PBACK=17.2bar].
0.0 1.0 2.0 3.00
10
20
30
40
Radial Position (m m )
Ove
rall
SMD
(µm
)
0.0 1.0 2.0 3.0 4.00
10
20
30
40
Radial Position (m m )
Ove
rall
SMD
(µm
)
0.0 1.0 2.0 3.0 4.0 5.00
10
20
30
40
Ove
rall
SMD
(µm
)
Radial Position (m m )
0.0 1.0 2.0 3.00
10
20
30
40
Radial Position (mm)
Ove
rall
SMD
(µm
)
0.0 1.0 2.0 3.0 4.00
10
20
30
40
Ove
rall
SMD
(µm
)
Radial Position (mm)
0.0 1.0 2.0 3.0 4.0 5.00
10
20
30
40
Radial Position (mm)
Ove
rall
SMD
(µm
)
Figure 12: Measured by PDA effect droplet SMD as affected by injection pressure, back pressure and temperature [System 4 of Table I, DHOLE=0.152mm].
(a) 300K (b) 700K
Low PCH High PCHlow PINJ low PINJ
high PINJ high PINJ
Low PCH High PCHlow PINJ low PINJ
high PINJ high PINJ
min max
(a) Liquid fuel mass (b) Fuel vapour
(a) 300K (b) 700K
pressure, thus implying that there is a point in time and space during the spray development where all the injected fuel vaporises in a quasi-steady mode.
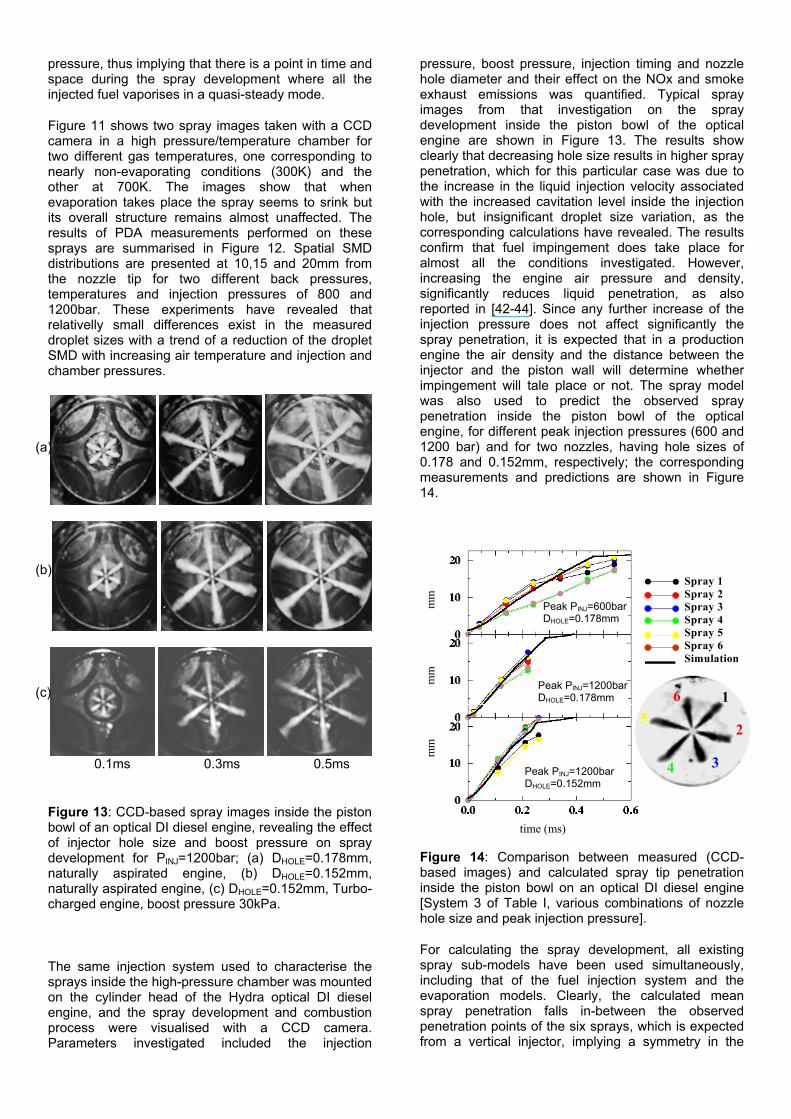
Figure 11 shows two spray images taken with a CCD camera in a high pressure/temperature chamber for two different gas temperatures, one corresponding to nearly non-evaporating conditions (300K) and the other at 700K. The images show that when evaporation takes place the spray seems to srink but its overall structure remains almost unaffected. The results of PDA measurements performed on these sprays are summarised in Figure 12. Spatial SMD distributions are presented at 10,15 and 20mm from the nozzle tip for two different back pressures, temperatures and injection pressures of 800 and 1200bar. These experiments have revealed that relativelly small differences exist in the measured droplet sizes with a trend of a reduction of the droplet SMD with increasing air temperature and injection and chamber pressures.
Figure 13: CCD-based spray images inside the piston bowl of an optical DI diesel engine, revealing the effect of injector hole size and boost pressure on spray development for PINJ=1200bar; (a) DHOLE=0.178mm, naturally aspirated engine, (b) DHOLE=0.152mm, naturally aspirated engine, (c) DHOLE=0.152mm, Turbo-charged engine, boost pressure 30kPa.
The same injection system used to characterise the sprays inside the high-pressure chamber was mounted on the cylinder head of the Hydra optical DI diesel engine, and the spray development and combustion process were visualised with a CCD camera. Parameters investigated included the injection
pressure, boost pressure, injection timing and nozzle hole diameter and their effect on the NOx and smoke exhaust emissions was quantified. Typical spray images from that investigation on the spray development inside the piston bowl of the optical engine are shown in Figure 13. The results show clearly that decreasing hole size results in higher spray penetration, which for this particular case was due to the increase in the liquid injection velocity associated with the increased cavitation level inside the injection hole, but insignificant droplet size variation, as the corresponding calculations have revealed. The results confirm that fuel impingement does take place for almost all the conditions investigated. However, increasing the engine air pressure and density, significantly reduces liquid penetration, as also reported in [42-44]. Since any further increase of the injection pressure does not affect significantly the spray penetration, it is expected that in a production engine the air density and the distance between the injector and the piston wall will determine whether impingement will tale place or not. The spray model was also used to predict the observed spray penetration inside the piston bowl of the optical engine, for different peak injection pressures (600 and 1200 bar) and for two nozzles, having hole sizes of 0.178 and 0.152mm, respectively; the corresponding measurements and predictions are shown in Figure 14.
mm
mm
mm
Figure 14: Comparison between measured (CCD-based images) and calculated spray tip penetration inside the piston bowl on an optical DI diesel engine [System 3 of Table I, various combinations of nozzle hole size and peak injection pressure].
For calculating the spray development, all existing spray sub-models have been used simultaneously, including that of the fuel injection system and the evaporation models. Clearly, the calculated mean spray penetration falls in-between the observed penetration points of the six sprays, which is expected from a vertical injector, implying a symmetry in the
1
2
34
5 6
Spray 1 Spray 2 Spray 3 Spray 4 Spray 5 Spray 6 Simulation
0.1ms 0.3ms 0.5ms
Peak PINJ=600bar DHOLE=0.178mm
Peak PINJ=1200bar DHOLE=0.178mm
Peak PINJ=1200bar DHOLE=0.152mm
(a) (b) (c)
mm
mm
mm
time (ms)
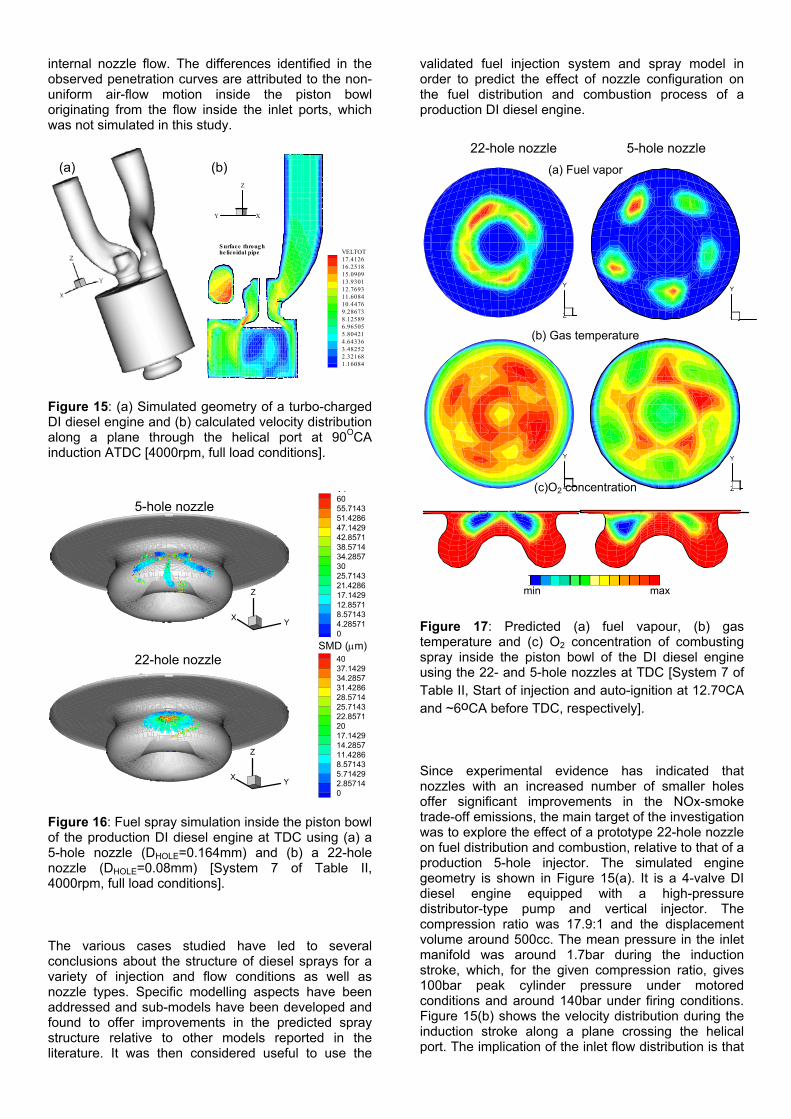
internal nozzle flow. The differences identified in the observed penetration curves are attributed to the non-uniform air-flow motion inside the piston bowl originating from the flow inside the inlet ports, which was not simulated in this study.
XY
Z
VELTOT17.412616.251815.090913.930112.769311.608410.44769.286738.125896.965055.804214.643363.482522.321681.16084
S urface throughhe licoidal pipe
Figure 15: (a) Simulated geometry of a turbo-charged DI diesel engine and (b) calculated velocity distribution along a plane through the helical port at 90OCA induction ATDC [4000rpm, full load conditions].
X Y
Z
V46055.714351.428647.142942.857138.571434.28573025.714321.428617.142912.85718.571434.285710
X Y
Z
4037.142934.285731.428628.571425.714322.85712017.142914.285711.42868.571435.714292.857140
Figure 16: Fuel spray simulation inside the piston bowl of the production DI diesel engine at TDC using (a) a 5-hole nozzle (DHOLE=0.164mm) and (b) a 22-hole nozzle (DHOLE=0.08mm) [System 7 of Table II, 4000rpm, full load conditions].
The various cases studied have led to several conclusions about the structure of diesel sprays for a variety of injection and flow conditions as well as nozzle types. Specific modelling aspects have been addressed and sub-models have been developed and found to offer improvements in the predicted spray structure relative to other models reported in the literature. It was then considered useful to use the
validated fuel injection system and spray model in order to predict the effect of nozzle configuration on the fuel distribution and combustion process of a production DI diesel engine.
Y
Z
Y
Z
Y
Z
Y
Z
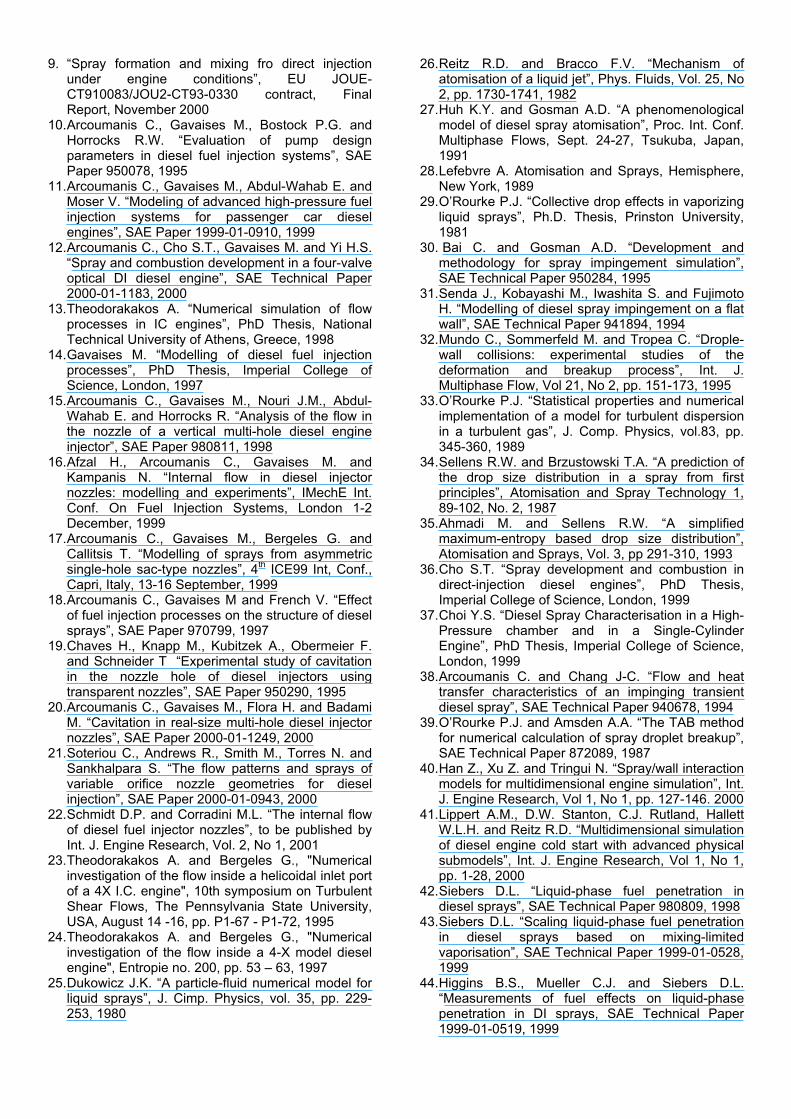
Figure 17: Predicted (a) fuel vapour, (b) gas temperature and (c) O2 concentration of combusting spray inside the piston bowl of the DI diesel engine using the 22- and 5-hole nozzles at TDC [System 7 of Table II, Start of injection and auto-ignition at 12.7oCA and ~6oCA before TDC, respectively].
Since experimental evidence has indicated that nozzles with an increased number of smaller holes offer significant improvements in the NOx-smoke trade-off emissions, the main target of the investigation was to explore the effect of a prototype 22-hole nozzle on fuel distribution and combustion, relative to that of a production 5-hole injector. The simulated engine geometry is shown in Figure 15(a). It is a 4-valve DI diesel engine equipped with a high-pressure distributor-type pump and vertical injector. The compression ratio was 17.9:1 and the displacement volume around 500cc. The mean pressure in the inlet manifold was around 1.7bar during the induction stroke, which, for the given compression ratio, gives 100bar peak cylinder pressure under motored conditions and around 140bar under firing conditions. Figure 15(b) shows the velocity distribution during the induction stroke along a plane crossing the helical port. The implication of the inlet flow distribution is that
5-hole nozzle 22-hole nozzle
min max
SMD (µm)
(a) Fuel vapor
(b) Gas temperature
(c)O2 concentration
(a) (b) 22-hole nozzle 5-hole nozzle
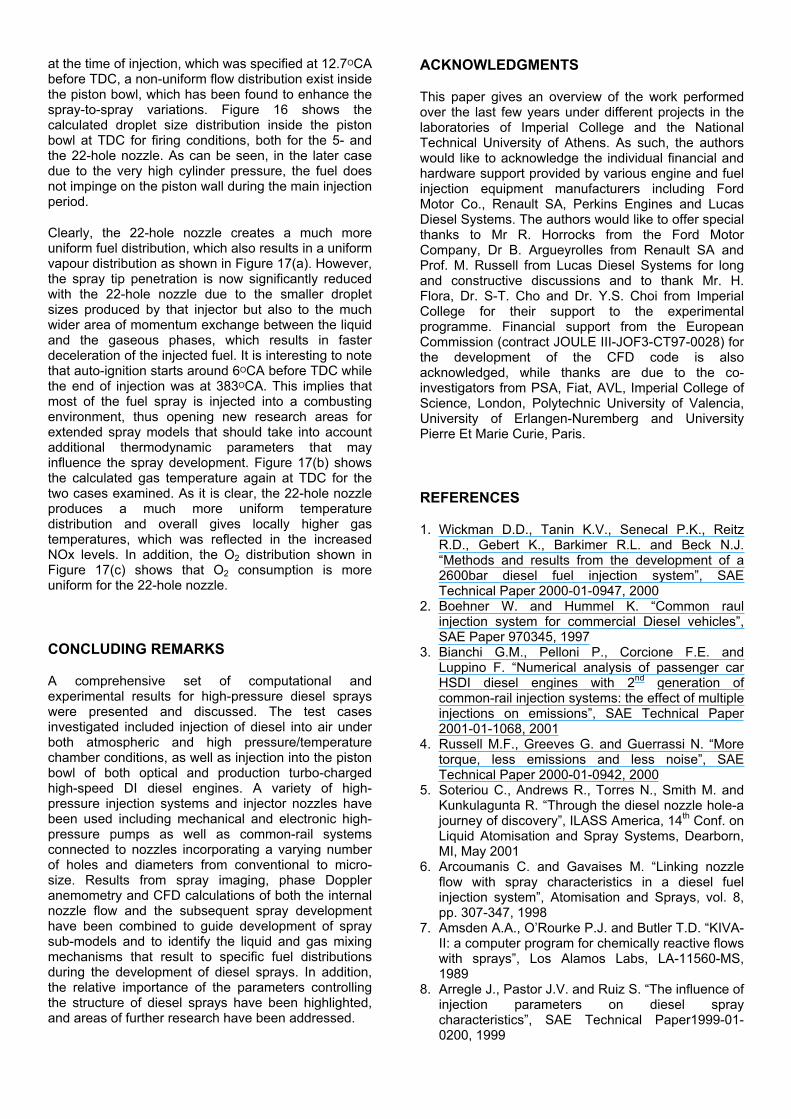
at the time of injection, which was specified at 12.7OCA before TDC, a non-uniform flow distribution exist inside the piston bowl, which has been found to enhance the spray-to-spray variations. Figure 16 shows the calculated droplet size distribution inside the piston bowl at TDC for firing conditions, both for the 5- and the 22-hole nozzle. As can be seen, in the later case due to the very high cylinder pressure, the fuel does not impinge on the piston wall during the main injection period.
Clearly, the 22-hole nozzle creates a much more uniform fuel distribution, which also results in a uniform vapour distribution as shown in Figure 17(a). However, the spray tip penetration is now significantly reduced with the 22-hole nozzle due to the smaller droplet sizes produced by that injector but also to the much wider area of momentum exchange between the liquid and the gaseous phases, which results in faster deceleration of the injected fuel. It is interesting to note that auto-ignition starts around 6OCA before TDC while the end of injection was at 383OCA. This implies that most of the fuel spray is injected into a combusting environment, thus opening new research areas for extended spray models that should take into account additional thermodynamic parameters that may influence the spray development. Figure 17(b) shows the calculated gas temperature again at TDC for the two cases examined. As it is clear, the 22-hole nozzle produces a much more uniform temperature distribution and overall gives locally higher gas temperatures, which was reflected in the increased NOx levels. In addition, the O2 distribution shown in Figure 17(c) shows that O2 consumption is more uniform for the 22-hole nozzle.
CONCLUDING REMARKS
A comprehensive set of computational and experimental results for high-pressure diesel sprays were presented and discussed. The test cases investigated included injection of diesel into air under both atmospheric and high pressure/temperature chamber conditions, as well as injection into the piston bowl of both optical and production turbo-charged high-speed DI diesel engines. A variety of high-pressure injection systems and injector nozzles have been used including mechanical and electronic high-pressure pumps as well as common-rail systems connected to nozzles incorporating a varying number of holes and diameters from conventional to micro-size. Results from spray imaging, phase Doppler anemometry and CFD calculations of both the internal nozzle flow and the subsequent spray development have been combined to guide development of spray sub-models and to identify the liquid and gas mixing mechanisms that result to specific fuel distributions during the development of diesel sprays. In addition, the relative importance of the parameters controlling the structure of diesel sprays have been highlighted, and areas of further research have been addressed.
ACKNOWLEDGMENTS
This paper gives an overview of the work performed over the last few years under different projects in the laboratories of Imperial College and the National Technical University of Athens. As such, the authors would like to acknowledge the individual financial and hardware support provided by various engine and fuel injection equipment manufacturers including Ford Motor Co., Renault SA, Perkins Engines and Lucas Diesel Systems. The authors would like to offer special thanks to Mr R. Horrocks from the Ford Motor Company, Dr B. Argueyrolles from Renault SA and Prof. M. Russell from Lucas Diesel Systems for long and constructive discussions and to thank Mr. H. Flora, Dr. S-T. Cho and Dr. Y.S. Choi from Imperial College for their support to the experimental programme. Financial support from the European Commission (contract JOULE III-JOF3-CT97-0028) for the development of the CFD code is also acknowledged, while thanks are due to the co-investigators from PSA, Fiat, AVL, Imperial College of Science, London, Polytechnic University of Valencia, University of Erlangen-Nuremberg and University Pierre Et Marie Curie, Paris.
REFERENCES
1. Wickman D.D., Tanin K.V., Senecal P.K., Reitz R.D., Gebert K., Barkimer R.L. and Beck N.J. “Methods and results from the development of a 2600bar diesel fuel injection system”, SAE Technical Paper 2000-01-0947, 2000
2. Boehner W. and Hummel K. “Common raul injection system for commercial Diesel vehicles”, SAE Paper 970345, 1997
3. Bianchi G.M., Pelloni P., Corcione F.E. and Luppino F. “Numerical analysis of passenger car HSDI diesel engines with 2nd generation of common-rail injection systems: the effect of multiple injections on emissions”, SAE Technical Paper 2001-01-1068, 2001
4. Russell M.F., Greeves G. and Guerrassi N. “More torque, less emissions and less noise”, SAE Technical Paper 2000-01-0942, 2000
5. Soteriou C., Andrews R., Torres N., Smith M. and Kunkulagunta R. “Through the diesel nozzle hole-a journey of discovery”, ILASS America, 14th Conf. on Liquid Atomisation and Spray Systems, Dearborn, MI, May 2001
6. Arcoumanis C. and Gavaises M. “Linking nozzle flow with spray characteristics in a diesel fuel injection system”, Atomisation and Sprays, vol. 8, pp. 307-347, 1998
7. Amsden A.A., O’Rourke P.J. and Butler T.D. “KIVA-II: a computer program for chemically reactive flows with sprays”, Los Alamos Labs, LA-11560-MS, 1989
8. Arregle J., Pastor J.V. and Ruiz S. “The influence of injection parameters on diesel spray characteristics”, SAE Technical Paper1999-01-0200, 1999
9. “Spray formation and mixing fro direct injection under engine conditions”, EU JOUE-CT910083/JOU2-CT93-0330 contract, Final Report, November 2000
10. Arcoumanis C., Gavaises M., Bostock P.G. and Horrocks R.W. “Evaluation of pump design parameters in diesel fuel injection systems”, SAE Paper 950078, 1995
11. Arcoumanis C., Gavaises M., Abdul-Wahab E. and Moser V. “Modeling of advanced high-pressure fuel injection systems for passenger car diesel engines”, SAE Paper 1999-01-0910, 1999
12. Arcoumanis C., Cho S.T., Gavaises M. and Yi H.S. “Spray and combustion development in a four-valve optical DI diesel engine”, SAE Technical Paper 2000-01-1183, 2000
13. Theodorakakos A. “Numerical simulation of flow processes in IC engines”, PhD Thesis, National Technical University of Athens, Greece, 1998
14. Gavaises M. “Modelling of diesel fuel injection processes”, PhD Thesis, Imperial College of Science, London, 1997
15. Arcoumanis C., Gavaises M., Nouri J.M., Abdul-Wahab E. and Horrocks R. “Analysis of the flow in the nozzle of a vertical multi-hole diesel engine injector”, SAE Paper 980811, 1998
16. Afzal H., Arcoumanis C., Gavaises M. and Kampanis N. “Internal flow in diesel injector nozzles: modelling and experiments”, IMechE Int. Conf. On Fuel Injection Systems, London 1-2 December, 1999
17. Arcoumanis C., Gavaises M., Bergeles G. and Callitsis T. “Modelling of sprays from asymmetric single-hole sac-type nozzles”, 4th ICE99 Int, Conf., Capri, Italy, 13-16 September, 1999
18. Arcoumanis C., Gavaises M and French V. “Effect of fuel injection processes on the structure of diesel sprays”, SAE Paper 970799, 1997
19. Chaves H., Knapp M., Kubitzek A., Obermeier F. and Schneider T “Experimental study of cavitation in the nozzle hole of diesel injectors using transparent nozzles”, SAE Paper 950290, 1995
20. Arcoumanis C., Gavaises M., Flora H. and Badami M. “Cavitation in real-size multi-hole diesel injector nozzles”, SAE Paper 2000-01-1249, 2000
21. Soteriou C., Andrews R., Smith M., Torres N. and Sankhalpara S. “The flow patterns and sprays of variable orifice nozzle geometries for diesel injection”, SAE Paper 2000-01-0943, 2000
22. Schmidt D.P. and Corradini M.L. “The internal flow of diesel fuel injector nozzles”, to be published by Int. J. Engine Research, Vol. 2, No 1, 2001
23. Theodorakakos A. and Bergeles G., "Numerical investigation of the flow inside a helicoidal inlet port of a 4X I.C. engine", 10th symposium on Turbulent Shear Flows, The Pennsylvania State University, USA, August 14 -16, pp. P1-67 - P1-72, 1995
24. Theodorakakos A. and Bergeles G., "Numerical investigation of the flow inside a 4-X model diesel engine", Entropie no. 200, pp. 53 – 63, 1997
25. Dukowicz J.K. “A particle-fluid numerical model for liquid sprays”, J. Cimp. Physics, vol. 35, pp. 229-253, 1980
26. Reitz R.D. and Bracco F.V. “Mechanism of atomisation of a liquid jet”, Phys. Fluids, Vol. 25, No 2, pp. 1730-1741, 1982
27. Huh K.Y. and Gosman A.D. “A phenomenological model of diesel spray atomisation”, Proc. Int. Conf. Multiphase Flows, Sept. 24-27, Tsukuba, Japan, 1991
28. Lefebvre A. Atomisation and Sprays, Hemisphere, New York, 1989
29. O’Rourke P.J. “Collective drop effects in vaporizing liquid sprays”, Ph.D. Thesis, Prinston University, 1981
30. Bai C. and Gosman A.D. “Development and methodology for spray impingement simulation”, SAE Technical Paper 950284, 1995
31. Senda J., Kobayashi M., Iwashita S. and Fujimoto H. “Modelling of diesel spray impingement on a flat wall”, SAE Technical Paper 941894, 1994
32. Mundo C., Sommerfeld M. and Tropea C. “Drople-wall collisions: experimental studies of the deformation and breakup process”, Int. J. Multiphase Flow, Vol 21, No 2, pp. 151-173, 1995
33. O’Rourke P.J. “Statistical properties and numerical implementation of a model for turbulent dispersion in a turbulent gas”, J. Comp. Physics, vol.83, pp. 345-360, 1989
34. Sellens R.W. and Brzustowski T.A. “A prediction of the drop size distribution in a spray from first principles”, Atomisation and Spray Technology 1, 89-102, No. 2, 1987
35. Ahmadi M. and Sellens R.W. “A simplified maximum-entropy based drop size distribution”, Atomisation and Sprays, Vol. 3, pp 291-310, 1993
36. Cho S.T. “Spray development and combustion in direct-injection diesel engines”, PhD Thesis, Imperial College of Science, London, 1999
37. Choi Y.S. “Diesel Spray Characterisation in a High-Pressure chamber and in a Single-Cylinder Engine”, PhD Thesis, Imperial College of Science, London, 1999
38. Arcoumanis C. and Chang J-C. “Flow and heat transfer characteristics of an impinging transient diesel spray”, SAE Technical Paper 940678, 1994
39. O’Rourke P.J. and Amsden A.A. “The TAB method for numerical calculation of spray droplet breakup”, SAE Technical Paper 872089, 1987
40. Han Z., Xu Z. and Tringui N. “Spray/wall interaction models for multidimensional engine simulation”, Int. J. Engine Research, Vol 1, No 1, pp. 127-146. 2000
41. Lippert A.M., D.W. Stanton, C.J. Rutland, Hallett W.L.H. and Reitz R.D. “Multidimensional simulation of diesel engine cold start with advanced physical submodels”, Int. J. Engine Research, Vol 1, No 1, pp. 1-28, 2000
42. Siebers D.L. “Liquid-phase fuel penetration in diesel sprays”, SAE Technical Paper 980809, 1998
43. Siebers D.L. “Scaling liquid-phase fuel penetration in diesel sprays based on mixing-limited vaporisation”, SAE Technical Paper 1999-01-0528, 1999
44. Higgins B.S., Mueller C.J. and Siebers D.L. “Measurements of fuel effects on liquid-phase penetration in DI sprays, SAE Technical Paper 1999-01-0519, 1999


![Effect of nutrient sprays on granulation and fruit quality of [] Dancy tangerine'mandarin](https://static.fdokumen.com/doc/165x107/63286a59f406ae55d2051207/effect-of-nutrient-sprays-on-granulation-and-fruit-quality-of-dancy-tangerinemandarin.jpg)

