Experimental Investigation of Impinging Diesel Sprays for ...
Upload
khangminh22Category
view
1download
0
Application of foliar sprays containing copper, zinc and boron to mature clonal tea (Camellia sinensis): effect on yield and quality
by
Chikondi Njoloma
Submitted in partial fulfilment of the requirements for the degree in M.Sc. (Agric) Agronomy
In the Faculty of Natural and Agricultural Sciences University of Pretoria
Supervisor: Dr N.J. Taylor Co-Supervisor:Prof. Z. Apostolides
June 2012
©© UUnniivveerrssiittyy ooff PPrreettoorriiaa

DEDICATION
To my dear husband Fexter

DECLARATION
I, undersigned, hereby declare that the dissertation submitted herewith for the degree MSc
(Agric) Agronomy to the University of Pretoria, contains my own independent work and has not
been submitted for any degree at any other university.
Signed__________________________________________
Chikondi Njoloma (28469242)

ii
ACKNOWLEDGEMENTS
I thank the almighty God for enabling me to accomplish this work. Thanks to Tea Research
Foundation of Central Africa (TRFCA) board of management for seeing the need for me to
undergo this study and for providing funding for this study without which this study would be a
non-starter. I would like to thank TRFCA technical staff, Mr. M.H. Mabvimba and Ms T.
Malema who helped with data collection. I also would like to thank the Director and all scientists
of the TRFCA for critiquing this document.
I am indebted to my supervisors Dr. Nicolette Taylor and Prof. Zeno Apostolides for their
constructive comments and their contribution towards this work.I would like to express my
gratitude to Eastern Produce Malawi for allowing me to use their fields at Mianga and Glenorchy
estates for the experiments and for all the support that they provided during the entire period of
my study.
Finally, I would like to thank my parents, relatives and friends for their support as well as
prayers. My special thanks should go to my dear husband Fexter and my children Brian,
Florence and Chisomo for their patience and understanding during the time when I could not be
available for them.

iii
TABLE OF CONTENTS
DECLARATION ........................................................................................................................................... i
ACKNOWLEDGEMENTS .......................................................................................................................... ii
TABLE OF CONTENTS ............................................................................................................................. iii
LIST OF TABLES ....................................................................................................................................... vi
LIST OF FIGURES ................................................................................................................................... viii
ABSTRACT ........................................................................................................................................... 1
CHAPTER 1: GENERAL INTRODUCTION ........................................................................................ 3
CHAPTER 2: LITERATURE REVIEW ................................................................................................ 5
2.1 Origin of tea ............................................................................................................................................ 5
2.2 Tea Production: Agronomic requirements and management practices .................................................. 7
2.2.1 Rainfall .......................................................................................................................................... 7
2.2.2 Temperature and solar radiation ................................................................................................... 8
2.2.3 Soil ................................................................................................................................................ 8
2.2.4 Planting ......................................................................................................................................... 9
2.2.5 Mulching ..................................................................................................................................... 10
2.2.7 Pruning ........................................................................................................................................ 11
2.2.8 Plucking ...................................................................................................................................... 12
2.2.9 Tea Manufacturing ...................................................................................................................... 13
2.2.10 Pest, disease and weed control .................................................................................................... 15
2.3 Acidification of tea soils ....................................................................................................................... 16
2.4 Copper, Zinc and Boron in crop production ......................................................................................... 18
2.4.1 Copper ......................................................................................................................................... 19
2.4.2 Zinc ............................................................................................................................................. 22

iv
2.4.3 Boron........................................................................................................................................... 25
2.5 Application of plant nutrients through foliar sprays ............................................................................. 27
2.5.1 Mechanisms for foliar uptake of nutrients .................................................................................. 29
2.5.2 Effect of chemical form on foliar absorption .............................................................................. 33
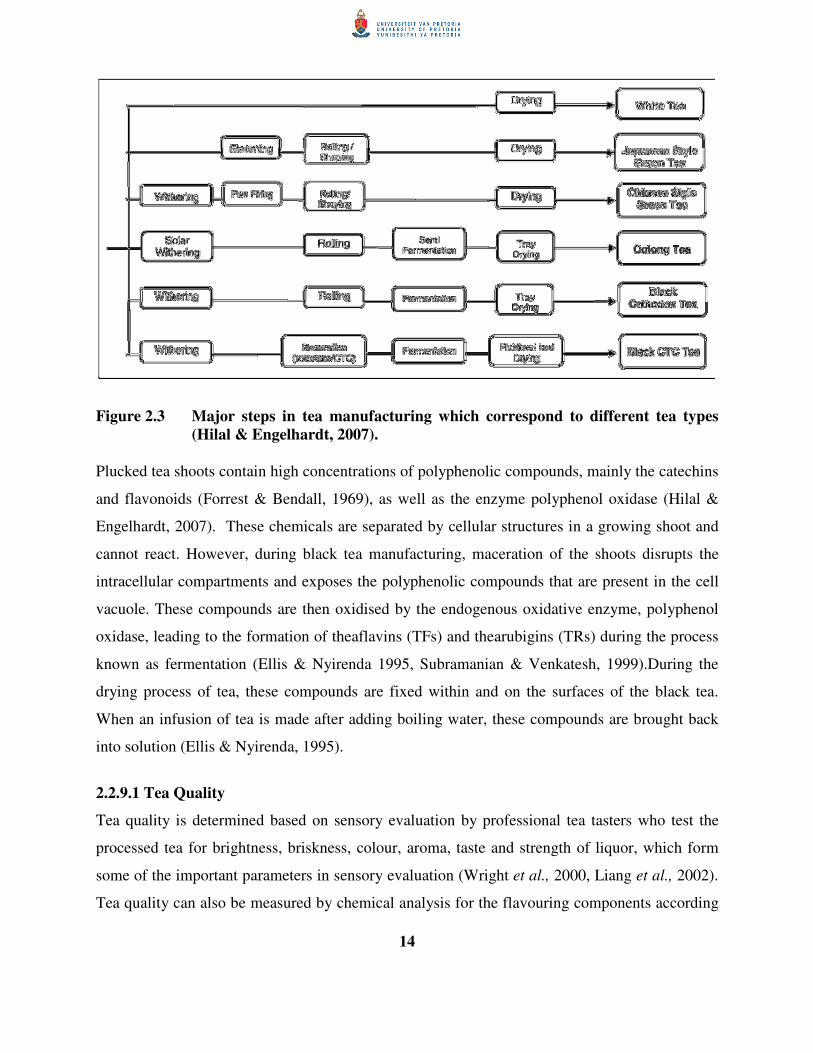
2.5.3 Solubility of fertiliser in water .................................................................................................... 33
2.5.4 Chelatisation ............................................................................................................................... 34
2.5.5 Environmental factors related to foliar uptake ............................................................................ 38
2.5.6 Additional factors related to foliar uptake .................................................................................. 40
2.5.7 Translocation of foliar applied nutrients to other parts of a plant ............................................... 42
2.6 Conclusion ............................................................................................................................................ 44
CHAPTER 3: MATERIALS AND METHODS ................................................................................... 46
3.1 Study Sites ............................................................................................................................................ 46
3.2 Experimental design and Treatments ................................................................................................... 47
3.3 Selection of chemicals and their application concentrations ................................................................ 49
3.4 Spraying ............................................................................................................................................. 50
3.5 Soil analysis .......................................................................................................................................... 51
3.6 Foliar analysis ....................................................................................................................................... 52
3.7 Yield and yield components (made tea yield, shoot density and shoot dry mass) ............................... 52
3.8 Made tea Quality .................................................................................................................................. 52
3.8.1 Determination of black tea quality by sensory evaluation and biochemical analysis ................. 52
3.9 Statistical analysis ................................................................................................................................ 56
CHAPTER 4: RESULTS AND DISCUSSION .......................................................................................... 57
4.1 Effect of foliar sprays of Cu, Zn and B containing fertilisers on tea yield and yield components ....... 57
4.1.2 Conclusion .................................................................................................................................. 64

v
4.2. Effect of foliar sprays of Cu, Zn and B containing fertilisers on tea quality ........................................ 65
4.2.1 Effect of foliar sprays of Cu, Zn and B on taster’s scores and valuation .................................... 65
4.2.2 Effect of foliar sprays of Cu, Zn and B on contents of theaflavin, thearubigin and caffeine ...... 68
4.2.3 Conclusion .................................................................................................................................. 72
4.3 Effect of foliar sprays of Cu, Zn and B containing fertilisers on tea foliar nutrient levels................... 73
4.3.1 Levels of Cu, Zn and B in leaves of tea bushes treated with different foliar sprays ................... 75
4.3.2 Foliar concentration of other nutrient elements .......................................................................... 77
4.3.3 Soil nutrient status in the experimental plots .............................................................................. 79
4.3.4 Conclusion .................................................................................................................................. 83
CHAPTER 5: GENERAL CONCLUSIONS AND RECOMMENDATIONS ..................................... 85
CHAPTER 6: REFERENCES .................................................................................................................. 89

vi
LIST OF TABLES
CHAPTER 2
Table 2. 1 Correlations between fractions of Cu and soil properties (adopted from Zhang et al., 2006)
.......................................................................................................................................... 21
Table 2. 2 Correlations between fractions of Zn and soil properties (adopted from Zhang et.al., 2006)
............................................................................................................................................. 24
Table 2. 3 Green leaf yield for different nutrient elements and the estate control (adopted from Barua
& Dutta, 1972) .................................................................................................................... 25
Table 2. 4 Impact of various concentrations of foliar applied boric acid on yield and yield attributing
characters in tea (adopted from Gohian et al., 2000) .......................................................... 27
Table 2. 5 Solubility of different foliar fertilisers in water (adopted from Fageria et al., 2009) ......... 34
Table 2. 6 Ratios of the final concentration of Zn between the cuticle and the radioactive solution as a
function of time and chemical form (Ferrandon & Chamel, 1988) .................................... 36
Table 2. 7 Amount of Zn found in washing solution (three changes) after retention experiments (72
hours) with zinc sulphate, zinc chloride and zinc EDTA (Ferrandon & Chamel, 1988) .... 36
CHAPTER 3
Table 3.1 Amount of water (rainfall and irrigation) received by the plants at Glenorchy and Mianga
estates from January to July 2010. ....................................................................................................... 46
Table 3.2Dates of fertiliser application at Mianga and Glenorchy estates.................................................. 50
Table 3.3 Total amount of Cu, Zn and B applied per plot during the four foliar applications from March
to June 2010.......................................................................................................................................... 51

vii
CHAPTER 4
Table 4. 1 Percentage change in yield, relative to the control (T1), due to application of B, Zn and Cu containing fertilisers ............................................................................................................ 59
Table 4. 2 Mean tea shoot density as a result of different foliar treatments of Zn, Cu and B at Mianga . ............................................................................................................................................. 60
Table 4. 3 Mean tea shoot density as a result of different foliar treatments of Zn, Cu and B at Glenorchy ............................................................................................................................ 61
Table 4. 4 Average shoot dry mass for different categories of shoots at Mianga and Glenorchy ....... 62
Table 4. 5 Tea taster’s scores as affected by different micronutrient foliar treatments at Glenorchy
estate ................................................................................................................................... 66
Table 4. 6 Tea tsater’s scores as affected by different micronutrient foliar treatments at Mianga estate
............................................................................................................................................. 67
Table 4. 7 Biochemical parameters of made tea as affected by different treatments at Glenorchy estate ............................................................................................................................................. 69
Table 4. 8 Biochemical parameters of made tea as affected by different treatments at Mianga estate .... ............................................................................................................................................. 69
Table 4. 9 Nutrient status and other soil characteristics for the two sites at the beginning of the trials before foliar spraying (Mean values of soil samples collected at 0-15cm and 30-45cm
depths) ................................................................................................................................. 74
Table 4. 10 Foliar levels of Cu, Zn and B as affected by the foliar sprays at Mianga and Glenorchy
estates .................................................................................................................................. 75
Table 4. 11 Concentrations of Al , S, N, P, K, Ca, Mg and Fe in tea leaves treated with various foliar
sprays at Glenorchy ............................................................................................................. 78
Table 4. 12 Concentrations of Al, S, N, P, K, Ca, Mg and Fe in tea leaves treated with various foliar
sprays at Mianga ................................................................................................................. 79
Table 4. 13 Soil pH and contents of N, P, K, Ca, Mg, Al, B, Zn, Cu, Fe, Mn, Mo, ash, carbon and clay
in soils from the experimental plots samples collected in May 2010 ................................. 81

viii
LIST OF FIGURES
CHAPTER 2
Figure 2. 1 Major worldwide tea producing countries (http://www.palaisdesthes.com/en/tea/tea-producing-countries.htm, accessed online on 13 May, 2011) ............................................... 6
Figure 2. 2 Tea growing districts in Malawi (Munthali, 2007) ............................................................... 7
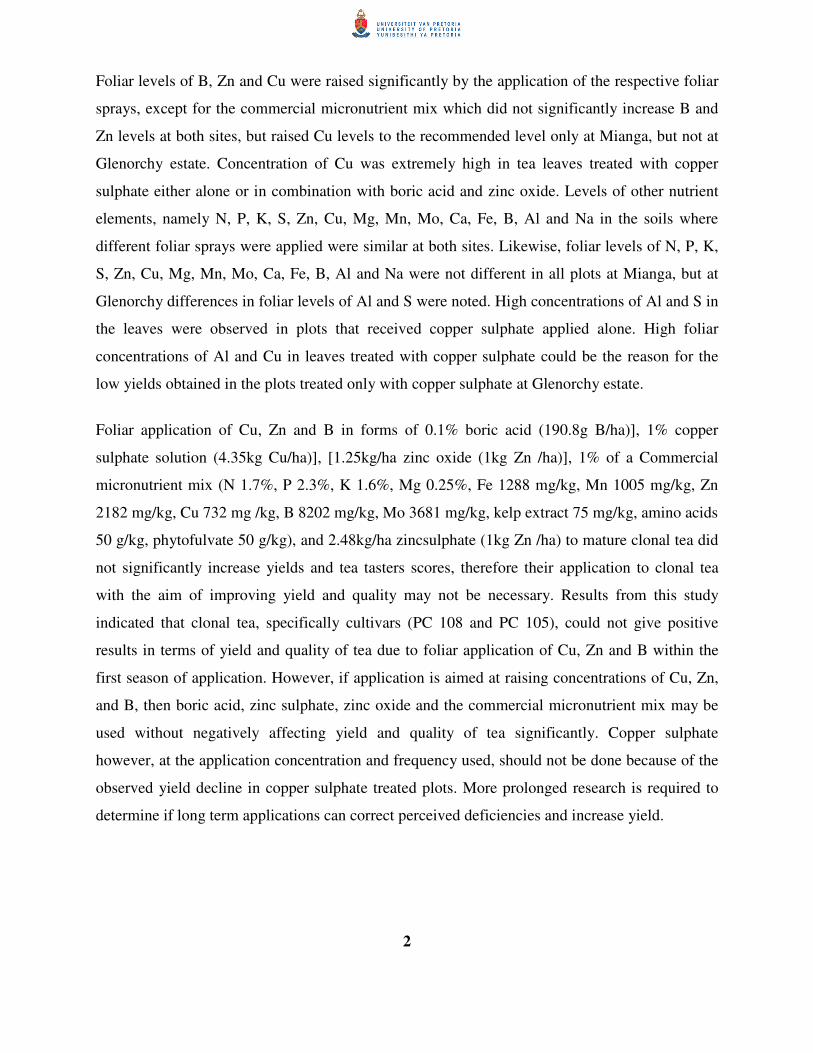
Figure 2. 3 Major steps in tea manufacturing which correspond to different tea types (Hilal &
Engelhardt, 2007). ............................................................................................................... 14
Figure 2. 4 Distribution of nutrient levels in leaves of Camelliasinensis collected from 170 mature clonal tea fields of Eastern Produce Malawi in 2007 (2007 leaf analysis data collected by the C.Njoloma from the estates (Eastern Produce Malawi)). .............................................. 18
Figure 2. 5 Ultrastructure of the outer wall of an epidermal leaf cell showing ectodesmata (Wojcik, 2004). .................................................................................................................................. 32
Figure 2. 6 Chelatisation, as explained by Fritz (1985) ......................................................................... 35
Figure 2. 7 Zinc concentration in shoot tissue of wheat grown in nutrient solutions for various periods of time (5 and 7 weeks) either without Zn supply (-Zn control), or Zn supplied in the root environment (Zn control), or as foliar sprays (ZnO, Zn sulphate, Zn EDTA and Biomin Zn) (from Haslett et al., 2001). ........................................................................................... 38
CHAPTER 3
Figure 3. 1 Layout of treatment plots at Mianga estate (Figure not drawn to scale) ............................. 48
Figure 3. 2 Layout of treatment plots at Glenorchy estate (Figure not drawn to scale) ........................ 48
CHAPTER 4
Figure 4. 1 Made tea yield for different foliar treatments of Zn, Cu and B containing fertilisers ................................................................................................................................. 58

1
ABSTRACT
Most of the fields planted with clonal tea in Malawi are deficient in micronutrients. This was
evident in leaf analysis data collected in 2007 from 170 mature clonal tea fields of some of the
tea estates in Malawi, which showed very high incidences of B, Zn and Cu deficiencies. Current
fertiliser recommendations have emphasised much on macronutrients, such as N, Pand K, but
little attention has been paid to micronutrient elements despite continuous removal through
harvesting. A study was therefore conducted to assess the effect of foliar applications of Cu, Zn
and B containing fertilisers on yield and quality of mature clonal tea plants. Field experiments
were laid out in randomised blocks in two fields planted with cultivars PC 105 and 108 at
Mianga and Glenorchy estates in the Mulanje district in Malawi and were replicated four times at
each site. The treatments were T1 (control, no spray), T2 [ 0.1% boric acid (190.8g B/ha)], T3
[1% copper sulphate solution (4.35kg Cu/ha)], T4 [1.25kg/ha zinc oxide (1kg Zn /ha)], T5 [0.1%
boric acid, 1% copper sulphate solution, 1.25kg/ha zinc oxide], T6 [1% of Commercial
micronutrient mix ( N 1.7%, P 2.3%, K 1.6%, Mg 0.25%, Fe 1288 mg/kg, Mn 1005 mg/kg, Zn
2182 mg/kg, Cu 732 mg /kg, B 8202 mg/kg, Mo 3681 mg/kg, kelp extract 75 mg/kg, amino acids
50 g/kg, phytofulvate 50 g/kg)], and T7 [2.48kg/ha zinc sulphate (1kg Zn /ha)].
Micronutrient foliar sprays affected yield significantly at Glenorchy tea estate, but had no
significant effect on yield at Mianga estate. Copper sulphate solution applied at 1% concentration
decreased yield, but the other foliar applications did not impact yield relative to the control at
Glenorchy. Tea quality by taster’s scores was not affected at Mianga estate, whilst at Glenorchy
quality was affected, with the commercial micronutrient mix giving the lowest total score.
Individual parameters that contributed to the differences in total scores at Glenorchy estate
included brightness, briskness, colour of liquor, colour of infusion and colour with milk.
Thearubigin (TR) concentration was the only biochemical quality parameter that was affected by
the micronutrient foliar sprays. The level of TR was increased in all treatments that received the
foliar sprays and the control treatment gave the lowest amount of TRs at both sites. An increase
in the Thearubigin/Theaflavin (TR/TF) ratio, obtained in all treatments that received the foliar
sprays, provides evidence that more catechins were being converted to TRs than TFs during
fermentation.
2
Foliar levels of B, Zn and Cu were raised significantly by the application of the respective foliar
sprays, except for the commercial micronutrient mix which did not significantly increase B and
Zn levels at both sites, but raised Cu levels to the recommended level only at Mianga, but not at
Glenorchy estate. Concentration of Cu was extremely high in tea leaves treated with copper
sulphate either alone or in combination with boric acid and zinc oxide. Levels of other nutrient
elements, namely N, P, K, S, Zn, Cu, Mg, Mn, Mo, Ca, Fe, B, Al and Na in the soils where
different foliar sprays were applied were similar at both sites. Likewise, foliar levels of N, P, K,
S, Zn, Cu, Mg, Mn, Mo, Ca, Fe, B, Al and Na were not different in all plots at Mianga, but at
Glenorchy differences in foliar levels of Al and S were noted. High concentrations of Al and S in
the leaves were observed in plots that received copper sulphate applied alone. High foliar
concentrations of Al and Cu in leaves treated with copper sulphate could be the reason for the
low yields obtained in the plots treated only with copper sulphate at Glenorchy estate.
Foliar application of Cu, Zn and B in forms of 0.1% boric acid (190.8g B/ha)], 1% copper
sulphate solution (4.35kg Cu/ha)], [1.25kg/ha zinc oxide (1kg Zn /ha)], 1% of a Commercial
micronutrient mix (N 1.7%, P 2.3%, K 1.6%, Mg 0.25%, Fe 1288 mg/kg, Mn 1005 mg/kg, Zn
2182 mg/kg, Cu 732 mg /kg, B 8202 mg/kg, Mo 3681 mg/kg, kelp extract 75 mg/kg, amino acids
50 g/kg, phytofulvate 50 g/kg), and 2.48kg/ha zincsulphate (1kg Zn /ha) to mature clonal tea did
not significantly increase yields and tea tasters scores, therefore their application to clonal tea
with the aim of improving yield and quality may not be necessary. Results from this study
indicated that clonal tea, specifically cultivars (PC 108 and PC 105), could not give positive
results in terms of yield and quality of tea due to foliar application of Cu, Zn and B within the
first season of application. However, if application is aimed at raising concentrations of Cu, Zn,
and B, then boric acid, zinc sulphate, zinc oxide and the commercial micronutrient mix may be
used without negatively affecting yield and quality of tea significantly. Copper sulphate
however, at the application concentration and frequency used, should not be done because of the
observed yield decline in copper sulphate treated plots. More prolonged research is required to
determine if long term applications can correct perceived deficiencies and increase yield.

3
CHAPTER 1: GENERAL INTRODUCTION
Zinc, B and Cu are among the important micronutrient elements in tea production (Sultana et al.,
1978, Malenga 1979, Mitini-Nkhoma 1987, Barbora et al., 1993, Malenga 1994, Gohian et al.,
2000). It becomes a matter of concern when deficiencies of these are evident because either yield
or quality of tea is adversely affected. Although these micronutrient elements are required in
minute quantities, for a continuously cropped plant like tea, there is always a drain on these
elements which eventually leads to deficiencies if not replaced (Dale, 1971).
High incidences of Cu, B and Zn deficiencies in leaf analyses of these elements were shown
from approximately 170 mature clonal tea fields in 2007, from some of the estates in Malawi.
Unfortunately, current fertiliser recommendations in tea, especially in Malawi and Zimbabwe,
emphasise the application of major nutrients, particularly N, P and K, whilst micronutrients are
not regularly applied in tea bushes, hence their removal from the soil continues without an
organized replacement plan (Verma &Ranade 2010).
There are numerous commercial micronutrient products available for use by the growers. These
range from single elemental products to multi-micronutrient pre-mixes. These multi-
micronutrient pre-mixes have the potential to serve as a remedy to micronutrient deficiencies,
especially in cases where multiple micronutrient deficiencies occur. If proven more
effective,they can serve as better alternatives to those that are currently recommended, such as
zinc oxide and copper sulphate.
As most of the tea fields in Malawi are deficient in micronutrients and little attention is given to
the application of these micronutrients, foliar applications may be able to improve both tea yield
and quality in deficient plantations.A study was therefore conducted in order to evaluate the
effect of different formulations of foliar applied Cu, Zn and B on yield and quality of deficient
clonal tea plants. Specifically, the study aimed at evaluating the effects of foliar sprays,including
one commercial micronutrient mix, on yield and yield components, contents of polyphenolic
compounds in made tea, as well as on tea taster’s scores. It also aimed at establishing the effect
of foliar sprays on concentrations of B, Cu, Zn and other nutrient elements in the leaves of
treated tea bushes. It was hypothesised that foliar applied fertilisers containing Cu, Zn and

4
Bwould have significant effects on yield and quality of deficient tea plants, and
couldsignificantly raise nutrient levels in deficient plants.

5
CHAPTER 2: LITERATURE REVIEW
2.1 Origin of tea
Tea (Camelliasinensis) is an evergreen perennial crop, of the family Theaceae or Camellia that is
grown in tropical, subtropical and temperate climates of the world. Its young leaves are plucked
and processed into a beverage that is consumed worldwide. China was the first country to use it
as a drink (Paul et al., 1997). There are two main varieties of tea namely: Camellia sinensis var
assamica, which has relatively large leaves and Camellia sinensis var sinensis, with small, semi-
erect leaves. The assamica variety originated from the forests of Assam in north-eastern India
and sinensis tea from Sichuan province in south-western China (Kamau, 2008). These areas are
found at the point of intersection between latitude 29° N and longitude 98° E (Mondal et al.,
2004) and are characterised by a monsoon climate, with high rainfall and high humidity during
warm, wet summers and cool, dry winters (Kamau, 2008). Due to extensive hybridisation, most
of the tea cultivars that are commercially grown at present exhibit characteristics intermediate
between assamica and sinensis (Mondal et al., 2004). The crop is successfully grown in areas
that are located between latitudes 45° N and 34° S, covering about 52 countries (Mondal et al.,
2004). The main tea producing countries are Bangladesh, China, India, Indonesia, Sri-Lanka,
Vietnam in Asia, Burundi, Kenya, Malawi, Rwanda, Tanzania, Uganda, Zimbabwe in Africa,
Argentina and Brazil in South America, and Iran and Turkey in the Middle East (Hicks, 2009).
Figure 2.1 shows some of the major tea producing countries in the world.
Tea cultivation in Malawi started in 1896 (Ellis & Nyirenda, 1995) and until today, tea has been
cultivated on a commercial basis. Tea is the second largest export crop in Malawi, contributing
7.9% to Malawi’s total export earnings (MCCI, 2008) and contributes approximately 4% to the
world’s tea exports (Dharmasena, 2003). The Malawian tea industry produces black tea that is
exported to European, Asian and American markets.In Malawi, tea is only grown in Thyolo,
Mulanje and Nkhatabay districts (Munthali, 2007) (Figure 2.2).

6
Figure 2.1 Major worldwide tea producing countries (http://www.palaisdesthes.com/en/tea/tea-producing-countries.htm, accessed online on 13 May, 2011)

7
Figure 2.2 Tea growing districts in Malawi (Munthali, 2007)
2.2 Tea Production: Agronomic requirements and management practices
2.2.1 Rainfall
Tea is grown in a wide range of climatic conditions from equatorial to humid temperate climates
(Kamau, 2008). A minimum annual rainfall of 1200mm is a requirement, however,for optimum
growth and yield an annual rainfall amount ranging between 2500 mm and 3000 mm is ideal

8
(Anandacoomaraswamy et al., 2000). Annual rainfall of less than 1150 mm reduces tea yields
and irrigation is recommended for such areas (Kamau, 2008).
2.2.2 Temperature and solar radiation
Atmospheric temperature, soil temperature and solar radiation are important factors that
influence tea shoot development and extension (Matthews & Stephens 1998, Carr & Stephens,
1992). Tea grows very well within a temperature range of 18-25 °C. Temperatures below 13 °C
and above 30 °C are detrimental to shoot growth (De Costa et al., 2007). Kamau, (2008) also
indicated that daytime temperatures above 30 °C and night temperatures below 10 °C cause a
decline in the extension and development of shoots and growth of leaves. Base temperature for
tea shoot extension has been reported to vary from 7 °C to 15 °C, with an average of 12.5 °C (De
Costa et al., 2007). Night and day soil temperatures also influence flowering of the tea bushes.
According to De Costa et al., (2007), high soil temperatures during the day and low night
temperatures induce flowering of the tea bushes, implying a reduction in vegetative growth (De
Costa et al., 2007).
Temperature and photoperiod trigger axillary buds, which remain on plucked shoots, to enter a
dormant state (Matthews & Stephens, 1998). A decline in day length and temperature leads to
bud dormancy and this mostly occurs between the months of January and June in Tanzania and
Malawi (Matthews & Stephens, 1998). Tanton (1982) stated that “day length does not affect
shoot extension when nights are cool (10 °C), but growth rate is depressed by short days (11 h)
when nights are warm (20 °C)”. Tea requires an average of five sunshine hours per day (17 MJ d-
1) for optimum growth. Solar radiation levels above 350 W m-2 saturate the single top leaves of a
tea bush, while the whole canopy of tea plants become light saturated at 700-800 W m-2 (Kamau,
2008).
2.2.3 Soil
Tea is generally cultivated in a wide range of soil types, but there are specific soil characteristics
that are required for successful tea cultivation. These include soil pH and some physical
characteristics such as depth, structure and texture (Kamau, 2008). Tea requiresdeep, well
drained, permeable, acidic soils, with pH within the range of 4.5 to 5.5 for its optimal growth and
development (De Silva, 2007). Other reports have indicated pH ranges of 4.0-6.0 to be ideal for

9
tea (Othieno, 1992). Due to changes in the chemistry of the soils, pH of the soils in tea gardens
may diverge from the normal levels and in such situations amendment chemicals, such as lime,
are used to correct it.
A soil depth of at least 2 m and a crumbly, structured soil with about 50% pore space is required
for optimum growth of tea (Dey, 1969). Tea thrives well in soils of texture ranging from sandy
loam to clays, silts and loams of all kinds, however, due to their low field capacity, sandy soils
are not desirable unless mechanisms are put in place to ensure a good distribution of water and
nutrients (Kamau, 2008). High organic matter levels in tea gardens have been reported compared
to other agro-ecosystems (Solomon et al., 2002).
In Malawi, tea is grown on soil types that have been washed from a granite massif and on
sedimentary gneissic soil types (Willson & Clifford, 1992). In some parts of the Mulanje district,
the soils are deep, well drained latosols within the textural classes of clays or sandy clays
(Cloughley et al., 1983). The soils are characterised by low pH, as well as high organic matter
content.
2.2.4 Planting
Planting is done when rains have started and there is sufficient rain to wet the soil at least twice
the planting depth and when there is a high probability that rainfall will continue (Grice, 1990).
In Malawi, planting is done between November and mid-February (Grice, 1989). Conservation
measures are a pre-requisite in all areas to be planted with tea especially on sloping grounds.
Contour planting either in single or double hedged rows, is suitable in hilly terrains. Rooted
plants raised in nurseries either from seeds or from cuttings are used for planting in the fields.
Different plant spacings have been recommended for both rain-fed and irrigated tea. For rain-fed
tea the recommended spacings are: 120 by 90 cm, 120 by 85 cm, 120 by 80 cm, 120 by 80 cm,
120 by 75 cm, 120 by 70 cm, 150 by 90 cm and they give population densities (plants ha-1) of
9259, 9804, 10417, 111111, 11905, and 7692 respectively. Under irrigation 120 by 65 cm or 120
by 60 cm, giving population densities of 12821, 13889 respectively are recommended (Grice,
1989, Kamau, 2008). A double hedge plant layout of 120 by 60 by 90 cm, which gives a plant
population of 12345 plants ha-1, recommended for irrigated tea has been followed by other

10
growers (Grice, 1990). Most tea growing countries have adopted the spacing of 120 by 60 cm,
which has been found to produce superior yields compared to the other plant spacings (Bore et
al., 1998).
2.2.5 Mulching
It is recommended to mulch tea with grass immediately after planting and the practice needs to
be maintained for the first two seasons (Kayange & Grice, 1991). Other materials such as plastic
sheets can be used for mulching in areas where grass is scarce (Kayange, 1986). Mulching
reduces loss of soil moisture due to evaporation, protects the soil from the severe destructive
action of raindrop impact and the burning of soil organic matter by sunshine, and maintains a
high degree of permeability to incident rain and irrigation. Mulching also modulates soil
temperature within the upper layers of the soil (Grice, 1984). Plant survival, bush development
and yields are better in mulched tea plants than in unmulched tea plants. Yield improvement due
to mulching young tea for the first two years was noticeable in the fifth and sixth seasons
(Kayange & Grice, 1991).
2.2.6 Fertiliser application
Like all other plants, tea requires various nutrients for normal growth and productivity. Under
normal circumstances, plants get the required nutrients from the soil, except for small quantities
of N and other elements that are obtainable from air and rainwater through absorption by the
leaves (Kamau, 2008). However, most soils cannot supply adequate quantities of most nutrient
elements and growers supplement the soil nutrients with fertilizers. Furthermore, tea harvesting
involves removal of young tender shoots which contain considerable amounts of nutrients and
the main elements that are removed from tea fields through harvesting include N, P and K, with
quantities varying depending on tea producing area, cultivar and type of plucking (Kamau,
2008). For instance, N removal by plucking ranges from 40 to 160 kg N ha-1 assuming made tea
yields of 1-4 t ha-1 (Kamau, 2008). According to Sedaghathoor et al. (2009), the content of N in
the flushing tea shoot is the highest followed by K, Ca, P, S, Mg and Zn, with the harvestable
shoot containing 3.5-5% nitrogen on a dry matter basis.
Fertilization rates for N, P, K depends largely on genotype and age of the bush and they also vary
from region to region (Kamau, 2008). For example, in Malawi during the planting year, 60 g of

11
single super phosphate per plant needs to be applied in a planting pit at planting and 30 g of
ammonium sulphate applied three weeks after planting (Grice, 1990). Thereafter, annual N, P
and K applications are done in N:P:K ratio of 15:3:5 at rates ranging from 50 kg ha-1 N, 10 kg ha-
1 P and 17 kg ha-1 K to 300 kg ha-1 N, 60 kg ha-1 P and 100 kg ha-1 K for vegetatively
propagated cultivars and from 20 kg ha-1 N, 0 kg ha-1 P and 0 kg ha-1 K to 250 kg ha-1 N, 50 kg
ha-1 P and 83 kg ha-1 K for seedling tea (Grice, 1990). Other nutrient elements that are removed
from the fields in smaller amounts include Mg, S, Ca, Fe, Mn, B, Cu and Zn (Kamau, 2008).
2.2.7 Pruning
Pruning in tea basically involves the artificial removal of all or most of the leaf bearing branches
of the plant (Nissanka et al., 2004). Although pruning of the tea bush results in no productivity
and suddenly exposes the pruned branches to the hot sun, thereby making them prone to sun
scorch, it is a necessary operation in any tea plantation because unpruned tea would outgrow the
height at which plucking (harvesting) is possible (Grice 1990). Normally, the height of tea plants
under cultivation is maintained between 60 and 100 cm in order to facilitate easy plucking (Grice
& Clowes, 1990). In addition to maintaining the plucking table height, pruning helps renew
maintenance foliage and keep yields at high levels, (Kamau, 2008), improves bush hygiene and
reduces incidents of pest and diseases (Dutta, 2011).
During the pruning year, yield is greatly reduced but a year after pruning there is an increase in
yield up to the second year at which maximum yields are obtainedand thereafter, there is a
gradual decline in yield (Malenga, 1997, Nissanka et al., 2004, Dutta 2011). Recovery from
pruning is dependent upon the health of the plant, amount of energy reserves present and the
process of ageing (Kamau, 2008). Different pruning rounds have been recommended for
different areas. For example, in Malawi, tea can be pruned every two to four years (Grice, 1990).
However, skiffing can be done to prolong the pruning rounds (Nissanka et al., 2004). Skiffing is
light pruning, which involves removing the green wood in mature tea at about 15 cm above the
normal pruning height (Kamau, 2008).
In young tea, pruning operations are done in order to achieve a proper bush frame formation by
suppressing the centrally dominant apical growth and ensure an even distribution of number and
thickness of branches (TTRA, 2008a). The prunings are left within the field in order to protect

12
fields from erosion and maintain soil fertility, since considerable amounts of N, P, and K are
returned to the soil from the prunings (Kamau, 2008).
2.2.8 Plucking
Harvesting in tea involves nipping off of tender apical portions of shoots consisting of a terminal
bud and 2 to 3 leaves above the plucking table and is referred to as plucking (Kamau, 2008,
TTRA, 2008b). A collection of individual shoots containing two leaves and a bud (2+b) or three
leaves and a bud (3+b) (Matthews & Stephens 1998) comprise the economic yield of the tea
plant. Plucking is a vital aspect of tea production. The quality of plucking determines the quality
of tea to be manufactured, whilst the cost of plucking has a major influence on the profitability of
the enterprise (Wilkie, 1993). Tea is normally harvested by hand, however, due to scarcity and
high costs of labour, mechanical plucking using either machines or shears has become inevitable
in most tea growing areas (Grice & Clowes, 1990).
The determination of plucking rounds takes into consideration the standard of leaf on the crop
and value of made tea. These are connected to the need to pluck the tea at a time that coincides
with the majority of shoots that are due for plucking (Grice & Clowes, 1990). For example,
during the rainy season in Malawi, the 2+b and 3+b standards are attained when the shoots are
42 days old.
Yield in tea is mainly affected by mean individual shoot dry mass, basal shoot population density
(number of shoots m-2) and time taken for an axillary bud to grow into a shoot suitable for
plucking, which is also known as the shoot replacement cycle (Grice & Clowes, 1990, TTRA,
2008b). Shoot mass is dependent on shoot size, and dry matter content which varies with season
and management practices, such as fertiliser application and irrigation (Carr, 2000). Shoot
population is not only affected by management factors, but also varies with cultivar (Carr, 2000).
Shoot replacement cycle depends upon growth and development, which mainly depends on
climate, although irrigation and misting can help increase the number of shoot replacement
cycles in a year (Grice & Clowes, 1990).
Shoot growth rate, which is affected by cultivar, climate and type or standard of plucking, is an
important factor to consider in plucking. Initially, the bud is very small, with a size of about 2

13
mm, and grows into a 6 cm long shoot with only a leaf and a bud (1+b) at 5 weeks and thereafter,
its size increases rapidly between the fifth and the eighth week, when it grows into three leaves
and a bud shoot (Ellis & Grice 1976). If shoots are allowed to grow freely, the terminal bud
eventually becomes dormant after a specified number of leaves, normally up to 12, have
unfolded (Ellis & Grice 1976, Carr 2000). A tea shoot that has a dormant terminal bud is known
as a banjhi shoot (Carr, 2000). Tea growers in Malawi and the other parts of central Africa get
most of the yield (over 80%) in the hot, wet season from mid November to April and low yields
in the cool, dry season (May to August) and hot, dry season (September to mid November)
(Squire, 1977). This is due to changes in shoot growth rates between seasons.
Plucking is performed at regular intervals, also known as plucking rounds, and they vary from 4-
21 days depending on the growing conditions and harvesting policy (TTRA, 2008b, Cloughley et
al., 1983). In Malawi and Zimbabwe, 10/11 day plucking rounds are recommended for hand and
shear plucking, while a 14 day round is recommended for machine plucking (Grice & Clowes,
1990,Nyasulu, 2000). For optimum productivity, there is a need to harmonise plucking
operations with pruning, as both stimulate growth (Kamau, 2008).
2.2.9 Tea Manufacturing
Different types of teas are produced from the green tea shoots of Camelliasinensis depending on
the manufacturing process they undergo. The common tea types are white, green, oolong and
black teas (Hilal & Engelhardt, 2007). The major process that differentiates black and oolong tea
from the other types is fermentation. The different processes are summarised in Figure 2.3.
14
Figure 2.3 Major steps in tea manufacturing which correspond to different tea types (Hilal & Engelhardt, 2007).
Plucked tea shoots contain high concentrations of polyphenolic compounds, mainly the catechins
and flavonoids (Forrest & Bendall, 1969), as well as the enzyme polyphenol oxidase (Hilal &
Engelhardt, 2007). These chemicals are separated by cellular structures in a growing shoot and
cannot react. However, during black tea manufacturing, maceration of the shoots disrupts the
intracellular compartments and exposes the polyphenolic compounds that are present in the cell
vacuole. These compounds are then oxidised by the endogenous oxidative enzyme, polyphenol
oxidase, leading to the formation of theaflavins (TFs) and thearubigins (TRs) during the process
known as fermentation (Ellis & Nyirenda 1995, Subramanian & Venkatesh, 1999).During the
drying process of tea, these compounds are fixed within and on the surfaces of the black tea.
When an infusion of tea is made after adding boiling water, these compounds are brought back
into solution (Ellis & Nyirenda, 1995).
2.2.9.1 Tea Quality
Tea quality is determined based on sensory evaluation by professional tea tasters who test the
processed tea for brightness, briskness, colour, aroma, taste and strength of liquor, which form
some of the important parameters in sensory evaluation (Wright et al., 2000, Liang et al., 2002).
Tea quality can also be measured by chemical analysis for the flavouring components according

15
to Willson & Clifford (1992). These components have been found to show significant
correlations with individual sensory quality parameters (Liang et al., 2002), for example, the
quantities of TFsdetermine brightness and briskness, whilst strength and colour are due to
TRs(Grice, 1990).
Tea containing high levels of antioxidant/pro-oxidant phenolic molecules, mainly catechins,
flavanols, TFs and TRs, is deemed to be of good quality (Obanda et al., 1997) and is preferred
because of the beneficial effects of these polyphenolic compounds on human health. The
catechins and flavonoids found in plucked leaves have also been found to contain anti-cancer
properties (Azam et al., 2004). The harvestable shoots of tea contain high concentrations of these
polyphenolic compounds,which contribute more than 20% to the dry mass of the shoots (Ellis &
Nyirenda, 1995).It is for this reason that tea is considered a healthy drink, on top of being a
source of mineral elements such as Zn, Mn, Fe, Cu, Mg, Ti, Al, Sr, Br, Na, K, P, I and F
(Seenivasan et al., 2008).
2.2.10 Pest, disease and weed control
Pest and disease attack poses the biggest challenge in tea production in most tea growing areas
because it leads to a significant reduction in crop. The common pests of tea include Helopeltis
schouteden,popularly knownasmosquito bugs, Teragra quadrangula (carpenter moth), and
termites (Ancistrotermes sp.) (Rattan, 1990). Insect pest attack in tea generally leads to yield
loss between 11 and 55% if left uncontrolled (Hazarika et al., 2009). According to Rattan (1984),
yield losses of up to 55% and 30% due to mosquito bug attack and spider mites have been
recorded in Malawi and Kenya respectively (Rattan, 1984 & Sudoi, 1995). Mosquito bugs attack
both young and old tea and termites and carpenter moths cause serious damage to young tea.
Other pests include jelly grubs, caterpillars, aphids, tea leaf weevils, mites (red spider mites
(Oligonychus coffeae), yellow tea mite (Polyphagotarsonemus latus Banks), scarlet mites
(Blevipalpusphoenicis, B. obovatus and B. californicus), scale insects and tea thrips(Scirtothrips
aurantii) (Lightfoot, 2009). The most common weed species in tea gardens are black jack
(Bidens pilosa), wandering jew (Commelina benghalensis), couch grass (Cynodondactylon) and
nut grass (Cypericearotundus) (Lightfoot, 2009).

16
In the past, a number of organosynthetic pesticides have been used to control pest, disease and
weed attack. According to Hazarika et al., (2009), this has led to rapid conversion of harmless
species into pests, development of resistance and presence of undesirable pesticide residues in
made tea, which has become a major area of concern among most tea consumers. Whilst
chemical control is recommended in situations of severe attack, tea growers are encouraged to
use Integrated Pest Management (IPM) techniques and monitor the use of chemicals in order to
prevent overuse of pesticides and subsequent residues in made tea (Lightfoot, 2009, Hazarika et
al., 2009). For this reason only eight chemicals are recommended for use by growers in Malawi
and Zimbabwe for the control of pests, diseases and weeds (Lightfoot, 2009). For the control of
red spider mites, yellow tea mite and scarlet mites, sulphur products such as polysulphide
sulphur, calcium polysulphide and sulphur are recommended. For the control of fungal diseases,
copper products such as cupric hydroxide and copper oxychloride are recommended. For control
of post-emergent and pre-emergent weeds, glyphosate and S-metolachlor are recommended
respectively (Lightfoot, 2009).
2.3 Acidification of tea soils
Lower soil pH levels than the optimum is not uncommon in most tea gardens. Tea soils become
acidified by the tea plants themselves due to rhizodeposition of large quantities of organic acids,
such as oxalic acid, citric acid and malate (Shi et.al., 1999). Fertilisation with nitrogenous
fertilisers, such as ammonium sulphate and urea,has also contributed to soil acidification in tea
soils (Barak et al., 1997, Shi et al., 1999, Dang, 2005).
Nitrogen is the most important major nutrient element required by tea plants followed by K and
P. Like most plants where vegetative parts (young shoots) constitute the economic yield, tea
requires high levels of N for sustainable yields (Dang, 2005). This is why N application rates of
as high as 1000 kg ha-1 per year have been applied to tea plants in order to increase yield (Okano
& Matsuo, 1996, Owuor et al., 2000). Reports have indicated that N fertilisation significantly
increases the levels of extractable aluminium, whilst decreasing soil pH and the levels of
exchangeable base cations, such as K, Ca and Mg (Ruan et al., 2006).
At low pH, nutrient deficiencies may arise because soil conditions do not allow for efficient
uptake of nutrients, mainly due to Al toxicity, which has been recognized as a major factor

17
limiting plant growth in acidic soils (Marschner, 1986). Ahsan (1994) also indicated that the
dominance of exchangeable Al in low pH soils causes Al toxicity, which is responsible for low
crop yield in tea fields. The exchangeable Al3+,and H+cations replace other polyvalent cations on
the clay minerals in the soil renderingthem unavailable to plants. This phenomenon was
demonstrated by Fung et al. (2008) in studies on growth and nutrient uptake of tea under
different Al concentrations. It was shown that the uptake of Cu, Zn and Fe were significantly
reduced in Al treatments, with Cu and Zn uptake severely restricted.
Furthermore, due to prunings that are left in the tea fields, high levels of organic litter are
maintained in tea fields. Upon decomposition of these residues organic acids are released, which
acidify the rhizosphere thereby increasing the availability of Al and its complexes (Ruan et al.,
2003, Ruan et.al., 2006, Jin et. al., 2008,). Excess levels of Al in the rhizosphere leads to
restricted growth of plant roots, because cell division in root apical meristematic cells ceases
when exposed to Al (Marschner, 1986). Certain nutrient elements, such as Cu, are also
reportedly less available due to immobilisation in the organic matter (Marcos et al., 1998).
A soil pH survey performed in tea fields in Malawi by Nyasulu (2006) confirmed the low pH
status of Malawian tea soils, in which a majority of fields registered pH readings below the
optimum range of 4.5 to 5.5. Latosolic soils,on which tea is mostly grown in Malawi, are usually
characterised by a high capacity to release Fe and Al sesquioxides, increased loss of silica and
high dominance of new clay minerals such as smectites, allophone, halloysite and increased
weathering kaolinite (Bell, 1992). As these minerals are highly weathered and leached, they are
inherently low in Zn and other micronutrients (Alloway, 2008). This may explain why
deficiencies of Cu, Zn and other micronutrients were observed in a majority of tea fields in
Malawi (Figure2.4).

18
Figure 2.4 Distribution of nutrient levels in leaves of Camelliasinensis collected from 170 mature clonal tea fields of Eastern Produce Malawi in 2007 (2007 leaf analysis data collected by the C.Njoloma from the estates (Eastern Produce Malawi)).
More than 80% of 170 tea fields under vegetatively propagated cultivars in some of the tea
estates in Malawi were deficient in Cu, Zn and B. According to Willson & Gunther (1981), the
critical level of Cu, Zn and B in tea leaves is >15 mg/kg, >30 mg/kg and 30 mg/kg respectively
and 3-10 mg/kg, 2-15 mg/kg and >1.0 mg/kg for Cu, Zn and B in the soil respectively.
2.4 Copper, Zinc and Boron in crop production
In a naturally balanced agro-ecosystem, crop plants would find all the nutrients they require from
the soil. It is, however, widely acknowledged that most agro-ecosystems are far from balanced
and cultivated soils cannot supply the nutrients in sufficient quantities. This is because of the
disturbance in the nutrient cycle that has been aggravated by high population density, which has
led to continuous cultivation, in order to get maximum harvestable product, resulting in the
nutrient cycle incurring huge nutrient losses through the harvestable yield (Nandwa & Bekunda
1998). This is why growershave to supplement nutrients through application of organic or
inorganic fertilizers either to the soil on which the plant is growing or to its aerial parts.
Copper, Zn and B are among the essential micronutrient elements in plant nutrition. Although
required in very small quantities, they play very important physiological roles in plants by taking

19
part in important biochemical reactions within the plant systems and forming part of important
enzymes, some of which aid in metabolism of photosynthetic products and reduction in oxidative
stress (Fernandes &Henriques, 1991). For instance, Cu is associated with a number of enzymes
such as cytochrome oxidase, phenolase, polyphenol oxidase and Cu aids in chlorophyll synthesis
and metabolism of carbohydrates and proteins (Alam & Raza, 2001, Alam et al., 2007). Zinc is
necessary for production of growth regulators such as indole acetic acid (IAA) and acts as an
activator of a number of enzymes (Alam & Raza, 2001). Boron is associated with meristematic
activity, membrane functions and is also necessary for the synthesis of proteins, lignin and
metabolism of pectin (Alam & Raza, 2001). Boron also helps in maintaining osmotic potential
within the plant cells and aids in the translocation of sugars across membranes (Alam & Raza,
2001).
2.4.1 Copper
Copper is one of the essential elements in plant nutrition. Copper exists in two oxidation states
and these are Cu+ and Cu2+ (Yruela, 2005). Copper acts as a structural element in many
regulatory proteins. It also takes part in photosynthetic electron transfer, mitochondrial
respiration, oxidative stress responses, cell wall metabolism and hormone signalling (Fernandes
& Henriques, 1991, Yruela, 2005).
Most Cu containing metalloenzymes are involved in catalysing redox reactions (Fernandes &
Henriques, 1991). Copper has a high redox potential which favours reaction with oxidants. As
reported by Fernandes &Henriquess (1991), Cu forms part of superoxide dismutase, which is a
Cu and Zn containing enzyme that is associated with chloroplasts in higher plants. Different
compartments of plant cells such as chloroplasts, mitochondria, microsomes, glyoxysomes,
peroxisomes, apoplasts and the cytosol produce reactive oxygen species (ROS) and, according to
Alscher et al., (2002), superoxide dismutase presents a plant cell’s first line of defence against
these ROS.
Both deficient and excessive levels of Cu are detrimental to plant growth. Copper deficiencies
are mostly seen on young leaves and reproductive organs (Yruela, 2005). Copper deficient plants
exhibit an alteration in the expression of a number of genes and activation of morphological
changes, such as root and leaf pose. According to Loustalot et al. (1945), metabolism of

20
carbohydrates is impaired due to Cu deficiencies. Typical Cu deficiencies are seen on young
leaves and extend downward along the leaf margins where malformation of leaves, chlorosis and
necrosis occur (Yruela, 2005). Copper deficiencies also decrease the formation of plastocyanin
leading to a reduction in photosystem I electron transport (Yruela, 2005).
Copper is an inherently toxic element by virtue of its redox properties. According to Yruela
(2005), redox cycling between Cu2+ and Cu+ catalyses the production of highly toxic hydroxyl
radicals which subsequently damages DNA, lipids, proteins and other biomolecules. Inhibition of
photosynthesis and suppression of enzyme activities are some of the effects of excess levels of
Cu (Loustalot et al., 1945, Alaoui-Sosse et al., 2004). This is why excess Cu leads to inhibition
of plant growth and impairment of important cellular processes (Yruela, 2005).
2.4.1.1 Factors affecting Cu availability and uptake
Total soil Cu concentration is not related to plant uptake and application of Cu to the soil is not
always followed by an increase in plant Cu levels (Fernandes & Henriques 1991). Copper in the
soil is available in various forms and its bioavailability is closely related to its distribution in
different chemical forms i.e. water soluble, exchangeable, organically bound, associated with
carbonates and hydrous oxides of Fe, Mn and Al, and it is also available in residual forms
(Zhang et al., 2006). It has been reported that Cu exists predominantly in soil as organically
bound (Stevenson, 1991) and residual forms or as acid soluble forms (Alva et al., 2000). It was
observed that soil pH is the main factor, besides organic matter, clay content, CEC and total Cu,
controlling Cu uptake as shown in Table 2.1 where a highly significant negative correlation
between soil pH and exchangeable Cu is shown.

21
Table 2.1 Correlations between fractions of Cu and soil properties (adopted from Zhang et al., 2006)
Property Exchange
able
Cu
Carbonate
bound Cu
Organic matter
bound Cu
Oxide bound
Cu
Residual Cu
pH -0.903*** 0.821*** -0.349* -0.331 -0.352
Organic matter -0.315 0.112 0.017 -0.247 -0.511
Clay -0.503** 0.384* -0.159 0.007 -0.059
CEC -0.181 0.596*** 0.005 -0.010 -0.101
Key: * significant at P < 0.05; ** significant at P < 0.01; *** significant at P< 0.001
2.4.1.2 Effect of Cu on yield and quality of tea
Effects of Cu on yield and quality of tea have been reported by a number of authors (Barua &
Dutta, 1972, Gartrell, 1981, Willson & Clifford, 1992, Barooah et al., 2005, Saikh, 2007). In
some cases an increase in tea yield as a result of Cu applications has been observed, whilst in
other cases application of Cu has caused negative yield responses. In terms of tea quality, Cu is a
very essential element for the formation of polyphenol oxidase, an essential Cu containing
enzyme/catalyst in the fermentation process of black tea manufacturing (Seenivasan et al., 2008).
Copper deficiencies therefore lead to poor fermentation and subsequently poor quality tea.
Other reports have indicated that Cu plays a vital role in enhancing processes involved in the
pro-oxidant actions of tea polyphenols, which is an important mechanism for their anti-cancer
properties (Azam et al., 2004). The high redox potential of Cu indicates its ability to react with
oxidants (Fernandes & Henriquess, 1991). According to Azam et al. (2004), Cu mediates
oxidation of epicatechins and epigallocatechin gallate leading to formation of polymerised
polyphenols and it was observed that Cu oxidised catechins were more efficient anti-cancer pro-
oxidants. This makes Cu an important element, especially nowadays when the market is
focussing on tea with beneficial health properties.
Studies performed in Malawi showed that foliar application of Cu had no effect on yield, but a
lasting improvement in fermentation was observed and a foliar spray of a 0.5-1% solution of

22
CuSO4 rectified deficiencies (Grice, 1990). According to Squire (1977), spraying a 1% CuSO4
solution to Cu deficient tea bushes improved the activity of polyphenol oxidase and subsequently
improved tea quality. Barooah et al. (2005) found that the average content of Cu and Mn in tea
soils strongly correlated with productivity of the tea field. Gartrell (1981) also reported the long
lasting effectiveness of Cu fertilisers, when applied to soil and in some instances, foliar
application of Cu compounds, effectively counteracted deficiencies (Willson & Clifford, 1992).
Copper has been applied as fungicides to tea plants mostly in the form of Cu hydroxide, Cu
oxychloride and Cu oxide and reports by Barua & Dutta (1972), and Saikh (2007) pointed out
that these applications led to a decline inyield. Alaoui-Sosse et al. (2004) also observed that the
growth of cucumber was inhibited as Cu content increased after adding 20 mg g-1 of Cu chloride
in the growing medium. This inhibition was mainly due to a decrease in leaf expansion, which
implies reduced photosynthesis. This was attributed to an altered source-sink relationship when
there was an accumulation of non-structural carbohydrates in the source leaves, which in turn
induced a feedback inhibition on photosynthesis (Alaoui-Sosse et al., 2004). It was suggested
that because only expanding leaves showed reduced growth, leaves became weaker sinks of
photoassimilates as their expansion declined, thereby accounting for the accumulation of non-
structural carbohydrates in the source leaves (Alaoui-Sosse et al. 2004).
2.4.2 Zinc
Zinc is an essential micronutrient, with a particular physiological function in all living systems.
Its essentiality is demonstrated by its role as a cofactor in a number of enzymes in biochemical
pathways that are primarily concerned with carbohydrate metabolism in photosynthesis and
transformation of sugars to starch, protein metabolism, auxin growth regulators, pollen formation
and maintenance of membrane integrity (Alloway, 2008).Zinc is involved in N metabolism of
plants. Spraying of 1-2%ZnSO4 increased nitrate reductase activity and also resulted in a 15-20%
increase in N and protein content of tea shoots (Barbora et al., 1993). Zincis required for the
synthesis of IAA, which is responsible for active shoot growth in tea (Alam & Raza,
2001,Sedaghathoor et al., 2009).
Zinc plays an important role in photosynthesis and mobilisation of assimilates and has been
shown to mobilise photosynthates towards pluckable shoots in tea (Barbora et al,

23
1993).Approximately 9.0% of assimilates were partitioned towards pluckable shoots in tea plants
treated with 1% ZnSO4compared to 5.4% in untreated plants.Caffeine content in tea shoots also
increased following foliar application of Zn(Barbora et al., 1993). Leaf chlorophyll content,
stomatal conductance and net photosynthesis are adversely affected by inadequate supply of
Zn(Barbora et al., 1993).
Stunted growth and reduced leaf size are the most distinctive visible symptoms of a Zn
deficiency, which is a result of disturbances in auxin metabolism (Alloway, 2008). In tea, typical
Zn deficiency symptoms include sickle shaped leaves due to unequal growth of the two halves of
the leaf blade, wavy leaf margins due to more rapid growth of the leaf edge compared to the leaf
blade, greenish-yellow chlorosis spreading from the edge of the leaf to the middle and rosetting
of flushing shoots due to shortened internodes and lack of growth vigour and poor flushing of the
shoots (Barbora et al.,1993).
2.4.2.1 Factors affecting Zn availability and uptake
Zn availability to plants is affected by a number of factors, among which are the presence of
other nutrient elements, growing conditions and physical and chemical properties of the soil
(Barbora et al., 1993). Most tea soils are deficient in Zn and an annual Zn application has been
recommended to promote shoot growth, which is necessary for yield (Verma, 1999). According
to Alloway (2008), conditions that induce Zn deficiencies include low concentration of Zn,
which is typical of sandy soils; low pH; highly weathered parent materials with low Zn content, a
condition which is common in tropical regions; high calcium carbonate content (calcareous
soils); salinity, peat and muck organic soils; high phosphate status; prolonged water logging
conditions and a high concentration of magnesium and bicarbonates in the soil or irrigation
water.
Zinc has a tendency of being strongly bound to organic matter and oxides. According to results
obtained by Zhang et al., (2006) in Table 2.2, it was also reported that Zn has a tendency of
being bound to carbonates in high soil pH conditions when they observed a significant positive
correlations between carbonate bound Zn and soil pH.

24
Table 2.2 Correlations between fractions of Zn and soil properties (adopted from Zhang et.al., 2006)
Property Exchangeable Zn Carbonate
bound
Zn
Organic matter
bound Zn
Oxide bound
Zn
Residual
Zn
pH -0.918*** 0.752*** -0.016 -0.200 0.129
Organic matter -0.272 -0.128 0.395* -0.092 -0.081
Clay -0.478** 0.153 0.096 0.122 0.329
CEC -0.239 0.350* 0.052 -0.160 -0.114
Total Zn 0.290 -0.080 0.860*** 0.984*** 0.836***
* significant at P < 0.05; ** significant at P < 0.01; *** significant at P< 0.001
Soil acidification and high levels of organic matter are common features in most of the soils
where tea is grown, hence Zn deficiencies are expectedly common in such soils. Deficiencies of
Zn in tea have also been reported to be pronounced during periods of prolonged dry spells and in
pruning years and are masked during periods of rapid growth (Rahman & Sharma, 1974). This is
also an indication that soil moisture content has a role to play in Zn availability, as Sud et al.
(1995) reported that higher rainfall aided in the uptake of Zn due to the higher capacity of the
roots to exchange cations. Investigations conducted in tea shoots of china tea showed a
decreased level of Zn with high temperature, which was confirmed by the increased uptake of
Mn at these higher temperatures, since Zn and Mn are antagonistic with respect to their uptake
by plants (Sud et al., 1995).
Negative interaction between Zn and P has been widely reported (Loneragan & Webb, 1993,
Alam et al., 2007, Alloway, 2008). Increased levels of available P in the soil decrease the
concentration of Zn in the plant shoots i.e. uptake of Zn is adversely affected by increased
concentration of P (Loneragan & Webb, 1993, Alam et al., 2007). Addition of phosphate
fertilisers promotes growth, thereby causing a dilution in the Zn concentration in plant tissues to
levels which induce Zn deficiency (Alloway, 2008). Zinc is not readily absorbed by the tea
plants from the soil and its deficiency is not readily corrected by soil application of Zn

25
compounds. Foliar application is the most effective method of increasing Zn concentrations in
tea plants (Sedaghathoor et al., 2009).
2.4.2.2 Effect of Zn on yield and quality of tea
Effects of Zn on tea yields and quality have been reported by several authors (Barua & Dutta
1972, Malenga 1979, Malenga 1986, Dev Chaudhury et al., 1989, Fung & Wong 2001).
Experiments that were conducted at Tocklai in India by Barua & Dutta (1972) indicated a 20%
yield increase in tea due to the application of Zn alone, but when it was applied in combination
with other elements such as B, Mn, Mo and Mg (Table 2.3), no further yield increase was
observed and a reduction in yield relative to the control for some combinations occurred.
Table 2.3 Green leaf yield for different nutrient elements and the estate control (adopted from Barua & Dutta, 1972)
Nutrient element Application rate (kg ha-1) Yield per plot
of 238
bushes (kg)
% gain (+) or loss (-)
over the control
Magnesium (Mg) 13.6 134.8 -8.8
Zinc (Zn) 11.2 177.3 +19.9
Boron (B) 5.6 143.5 -2.9
Manganese (Mn) 5.6 161.1 +8.9
Molybdenum (Mo) 5.6 151.9 +2.8
Zn+B+Mg 11.2Zn+5.6B +13.6Mg 166.4 +12.5
Zn+B+Mn 11.2 Zn+5.6 B+5.6Mn 176.6 +19.4
Zn+B+Mo 11.2 Zn+5.6 B+5.6Mo 164.8 +11.5
Zn+B 11.2 Zn+5.6 B 175.6 +18.7
Control - 147.9 -
2.4.3 Boron
Boron is another essential nutrient element in the physiology of plants. Its roles are closely
linked to the primary cell wall structure, membrane functions and reproductive growth of plants
(Blevins & Lukaszewski, 1998). Boron is involved in the activities related to the development

26
and strengthening of the cell wall, cell division, fruit and seed development, and sugar and
phosphate transport (Power & Woods, 1997). Boron has also been reported to be involved in the
movement of Ca within plants. Boron forms complexes with constituents of cell wallsand plasma
membranes, and it also forms complexes with phenolic compounds (Cakmak & Romheld, 1997).
Boron is therefore crucial in maintaining the integrity of plasma membranes (Cakmak &
Romheld, 1997).
Deficiencies of B are common in soils that are inherently low in B, such as those derived from
acid granite and other igneous rocks and fresh water sedimentary deposits, light textured sandy
and gravely soils, alkaline calcareous soils and those soils that are low in organic matter (Ho,
2000). High rainfall areas also experience B deficiencies due to leaching of [H(BO)]3, which is
the most available form for plant uptake (Camacho-Cristobal et.al., 2008). Both vegetative and
reproductive stages of plant development are affected due to B deficiencies (Dordas & Brown,
2005), especially during periods of rapid growth and meristematic development (Blaser et al.,
1967).
Boron deficiencies induce destruction of the apical meristems of plant roots, leading to
development of swollen root tips (Blaser et al., 1967, Dordas & Brown, 2005). Cell
differentiation is adversely affected under conditions of B deficiency and reports by Blaser et al.
(1967) indicated that it is the xylem cells that are more affected than phloem cells. Generally,
cells of plants growing under severe B deficient conditions die (Dordas & Brown, 2005). As a
result plants growing under B stress may show limited growth in growing tissues (Brown et al.,
2002), conditions of necrosis in growing buds, cracking and breaking of stems and petioles,
whitish upper surfaces of leaves, crinkling of leaf blades, abortion of flowers and shedding of
fruits (Ho, 2000, Brown et al., 2002).
Boron toxicity, just like B deficiencies, has detrimental effects on plant growth. Prasad & Dey
(1979) demonstrated that B application to tea plants at a concentration of 0.6% was toxic to the
plants, as severe scorching and defoliation of leaves was observed. These authors found that
symptoms of B toxicity include the appearance of brown patches of dead tissue from interveinal
regions extending towards leaf margins and curling of leaf blades.

27
2.4.3.1 Effects of B on yield and quality of tea
Information on effects of B application on tea quality is scarce, however, its effects on improving
tea yield have been reported. Foliar application of 0.25% (w/v) boric acid at an application rate
of 1 kg ha-1 yr-1 split in three to four applications increased yield significantly (Gohian et al.,
2000). This increase in yield was mainly attributed to an increase in leaf area index (LAI), as
seen in Table 2.4 (Gohian et al., 2000). As is the case with any nutrient element, yield will not
increase indefinitely as its application increases, as Barua & Dutta (1972) observed a yield loss
when B was applied at the rate of 5.6 kg ha-1 yr-1, an indication that the rate at which it was
applied was high enough to cause toxic effects on tea.
Table 2.4 Impact of various concentrations of foliar applied boric acid on yield and yield attributing characters in tea (adopted from Gohian et al., 2000)
B kg ha-1 Yield kg ha-1 Shoot/100g Inter-nodal length (cm) LAI
0.0 2763 117 2.43 3.58
0.5 3110 127 2.47 3.88
1.0 3212 135 2.43 4.42
1.5 3154 125 2.48 3.95
CD (P=0.05) 156 Ns Ns 0.39
Correction of B deficiencies can be done through soil or foliar applications. When Prasad & Dey
(1979) compared these two methods of B application in young tea, it was found that foliar
applications were as effective as soil application in terms of B uptake and that lower rates used in
foliar applications were as effective as higher rates used in soil applications. It was also observed
that uptake of B from foliar applied boric acid at 0.1%, 0.2%, 0.4%, 0.6% concentrations,
supplying 1.0kg B ha-1, 2.0kg B ha-1, 4.0kg B ha-1, 4.2 kg B ha-1 progressively increased with
increased levels of application (Prasad & Dey,1979).
2.5 Application of plant nutrients through foliar sprays
Foliar fertilisation is the feeding of plants with nutrients through leaves (Wallace & Wallace,
1983) and has gained importance in the growing of cropsand has been the most effective way of

28
supplying trace elements to plants, such as Fe, Zn, Cu, Mn and B, which are required in very
small quantities (Pulschen, 2004). It is advantageous over soil applications in the sense that the
application rates are much lower than for soil applications, and a uniform application is easily
achieved. Furthermore, foliar application allows for the correction of deficiencies in less time
than would be required for soil applications (Fageria et al., 2009). According to Majid &Ballard
(1990), foliar application of nutrient elements is a rapid process, which is applicable for those
elements that are not readily mobile in both plants and in the soil, such as Cu (Mengel & Kirkby,
1982) and Zn (Durzan, 1995). However, there is a risk of leaf burn as a result of foliar sprays,
especially when high concentrations are applied, which may lead to yield losses. Ellis (1971)
reported incidences of leaf scorch when CuSO4 was applied at doses higher than 1%.
Correction of deficiencies needs to be done before visual deficiency symptoms are seen. If
spraying is delayed until deficiency symptoms appear, maximum yields may not be possible. In
addition, there is little residual effect from foliar sprays, which implies that more than one spray
is required per season,especially when deficiencies are severe (Fageria et al.,2009). This results
in higher application costs unless they can be combined with pesticide spray applications
(Mortvedt, unknown). The effects of soil applied nutrients are, on the other hand, long lived
when compared to those of foliar applied nutrients, but there is reduced risk of contamination of
ground water systems with foliar applications and they can be a used to complement soil
applications, especially during periods of critically restricted nutrient supply (Amiri et al., 2008).
There are numerous processes taking place within soils and nutrients applied to the soil are
victimised by a number of reactions such as mineralisation, leaching and organic complex
formation, which results in a decrease in their plant-available fractions. Foliar applications are
effective in raising the concentration of a particular nutrient, especially in the leaves, and the
level of uptake of other nutrients, as reported by Amiri et al. (2008) who studied the influence of
foliar and soil fertilization of N and Zn on yield and fruit quality, and soil, leaf, and fruit mineral
nutrient levels in apples. Other nutrient elements that were affected by foliar Zn and N
application included Mg, Fe and Cu, with a combination of soil and foliar Zn and N application
treatment registering relatively higher levels of these nutrients than the soil treatments alone.
Foliar application of N (10g l-1) and Zn (8g l-1) showed an improvement in apple yield compared
to the soil application. When the application methods were combined, the highest yield was

29
obtained. The fraction of N taken up by the apple trees was greater in foliar treatments than in
soil application, which led to elevated levels of N in the leaves and hence high vegetative growth
(Amiri et al., 2008).
The effectiveness of foliar nutrient application lies in the rate at which the applied nutrients are
absorbed by the leaf and transported to other parts of the plant including the roots (Bukovak &
Wittwer, 1957, Haslett et al., 2001). Transportation of foliar applied nutrient elements is mainly
dependent upon their ability to be transported via the phloem. Some elements are phloem mobile
while others are not. Generally Zn and Cu are reportedly partially mobile (Wooldridge, 2002,
Newett, 2005), while B mobility is species dependent favouring those plant species that produce
simple sugars known as polyols, which tend to complex with B to form polyol-B-polyol
compounds that are transported to meristematic regions (Brown & Hu, 1996, Brown & Shelp,
1997, Power & Woods, 1997, Blevins & Lukaszewski, 1998, Boarretto et.al., 2008). Such sugars
include sorbitol, mannitol or ducitol, however, no evidence is available whether the tea plant is a
producer of such polyols.
2.5.1 Mechanisms for foliar uptake of nutrients
Mechanisms governing the uptake of foliar applied nutrients involve the entry of the applied
nutrients into the leaf tissues and translocation to other parts of the plants. Foliar absorption, like
root absorption, involves both active and passive mechanisms (Fageria et al., 2009). Entry of
nutrients through the leaves starts with entry through aqueous pores that are found on the cuticle
of leaves, then the cell walls of epidermal cells and finally through the plasma membrane by
active transport (Cheristensen, 2005).
The leaf’s ability to absorb nutrients from the surface depends upon the degree of permeability of
the leaf epidermis (outer layer) and the presence and density of stomata, (Newett, 2005). This is
controlled by a number of factors including the structure of the leaf surface (the cuticle, stomata
aperture and stomatal density); number, permeability and arrangement of ectodesmata; degree of
surface wetting (adhesion); concentration of micronutrients in the aqueous blend; and humidity
(Ferrandon & Chamel, 1988, Wojcik, 2004, Durstberger et al., 2008,). The number of
ectodesmata is controlled by the environmental conditions such as air temperature, solar

30
radiation, pathogenic infections and the physiological state of the leaves which also varies with
genotype (Wojcik, 2004).
2.5.1.1 Penetration through the cuticle
Foliar applied elements enter the plants through the cuticular membrane by diffusion, a process
which does not involve expenditure of energy (Cheristensen, 2005). At first the leaf cuticle,
which is composed of cutin, lignin, pectin and wax, was considered a barrier to absorption of
foliar applied nutrients (Yamada et al., 1964, Kannan, 1980, Haslett et al., 2001, Wojcik, 2004,
Schreiber, 2005) and the stomata were thought to be the only pathway through which foliar
applied elements could enter the plant tissues (Kannan, 1980). It is generally accepted that
stomata play a significant role in the uptake of foliar applied elements, however, the mechanisms
by which stomata assist in the penetration of foliar applied elements are not clear, although
recent studies have provided strong supporting evidence of the possibility of stomatal entry of
solutes by diffusion along pore surfaces (Fernandez & Eichert, 2009). Different authors have
given conflicting results regarding significance of stomata on penetration of foliar applied
elements (Yamada et al., 1964, Kannan, 1980, Burkhardt &Schroth 2000, Wojcik, 2004,
Cheristensen 2005, Schreiber, 2005). Furthermore, even the stomata themselves, as well as
trichomes, are known to be covered by a cuticle (Kannan, 1980, Schreiber, 2005).According to
Yamada etal. (1964) in his studies on cuticles of tomato fruit (astomatous) and onion leaves
(stomatous) in order to assess the effect of stomata on the rate of penetration of ions, it was
discovered that penetration rates of ions were not significantly affected by the different types of
cuticles, meaning the presence or absence of stomatal pores does not affect the entry of ions.
However, Kannan (1980) argued that based on the fact that permeability of air and water
molecules through the stomata is greater than through other parts of the leaves, stomatal
penetration of solutes in intact leaves is possible. Burkhardt &Schroth (2000) also conducted a
study on the role of stomatal opening for the uptake of foliar fertilisers by tree crops. This study
showed that stomatal penetration of 15NO3-was possible and it exceeded that of cuticular uptake.
Cheristensen (2005) mentioned that the cuticle within the substomatal openings is thinner than
the rest of the leaf surface providing evidence for the observed high 15NO3-penetration rate.
It has been shown in many instances that foliar applied nutrients find their way into the inner
tissues through the cuticle (Kannan, 1980, Wojcik, 2004). The cuticle contains epicuticular and

31
intracuticular waxes (Wojcik, 2004). Epicuticular waxes are the outermost hydrophobic
component on the leaf surface consisting of ketones, esters and long chain fatty acids and
alcohols (Wojcik, 2004). The intracuticular waxes are found within the cuticular membrane and
are considered more polar than epicuticular waxes (Wojcik, 2004). According to Kannan (1980),
absorption of nutrients through the leaves among plant species is dependent upon the
characteristics of the cuticle, such as thickness, surface wax and wettability, as well as mass of
solute. Cutin found in the cuticular membrane contains many free hydroxyl groups which
weaken the hydrophobic interactions and facilitate entry of nutrients through the cuticular
membrane (Wojcik, 2004). The pectin layer is comprised of negatively charged galacturonic
acids. There is a gradual increase in negative charge from the epicuticular waxes to the pectic
layer, creating an electro-chemical gradient that facilitates movement of cations and water
molecules through the cuticular membrane (Wojcik, 2004).
The applied element then progresses through to the plasma membrane by active transport, which
involves energy expenditure. Penetration or entry of foliar applied nutrient elements from the
outside to the interior of plant tissues was discovered to be possible with the aid of connecting
tissues known as the ectodesmata (Franke, 1961, Wojcik, 2004). Ectodesmata are microscopic
structures (diameter < 1 nm) found mostly in the outer walls of the epidermal cells of leaves and
other above ground plant organs (Kannan, 1980) (Figure 2.5). They occur adjacent to the
cuticular spaces to the plasmalemma membrane and they facilitate cuticular entry of solutes
(Kannan, 1980). Ectodesmata are permeable to solutes with smaller radii such as urea, however,
permeability to larger molecules such as synthetic chelates is limited (Wojcik, 2004). Unlikethe
plasmodesmata, ectodesmata do not communicate with plasmic strings of neighbouring cells,
they terminate on the surface of the outer epidermal cells thereby having a direct protoplasmic
connection between the epidermal cells and the outer surface (Franke, 1961).

32
Figure 2.5 Ultrastructure of the outer wall of an epidermal leaf cell showing ectodesmata(Wojcik, 2004).
In broad leaved crops and trees, the lower surface (abaxial) of the leaf has a higher stomatal
density and higher ectodemata density than the upper surface (adaxial) of the leaf (Fritz, 1978,
Wojcik, 2004). The tea crop however, has stomata only on the abaxial surface of the leaf (Squire,
1977, Olyslaegers et al., 2002). Furthermore, cuticles of the abaxial leaf surface are thinner than
those on the adaxial surface. Unfortunately, application techniques available for foliar fertilisers
allows for more of the applied nutrient on the upper side (adaxial) of the leaf than the lower
(abaxial) surface of the leaf. According to Fritz (1978), the uptake ability of the leaf is not fully

33
utilised because the side of leaf which receives more of the applied nutrients has a lower
absorbability.
2.5.2 Effect of chemical form on foliar absorption
Both positive and negative responses have been observed on the effect of the chemical form in
which the ion is applied on uptake rate of foliar applied nutrients. Metal ions such as Zn and Cu
are applied in different forms namely: inorganic forms such as sulphates, oxides and chlorides;
organic chelates such as EDTA; and organic non chelates (Pulschen, 2004). These possess
different chemical properties and as a result their solubility and mobility differ (Pulschen, 2004,
Wojcik, 2004).
2.5.3 Solubility of fertiliser in water
Suitability of a compound to be used as a foliar spray depends on its solubility and as water is the
main carrier of foliar applied nutrient fertilisers, such substances have to be soluble in water in
order to facilitate uptake (Fageria et al., 2009). Certain compounds, especially oxides, are not
soluble in water and are therefore not suitable for foliar application (Table 2.5).
34
Table 2.5 Solubility of different foliar fertilisers in water (adopted from Fageria et al., 2009)
Nutrient Common name Formula Element % Solubility
Boron Boric acid H3BO3 [B (OH)3] 17 Soluble
Borax Na2B4O7.10H2O 11 Soluble
Naborat (anhydrous) Na2B4O7 20 Soluble
Na pentaborate Na2B10O16.10H2O 18 Soluble
Na tetraborate Na2B4O7.5H2O 14 Soluble
Boron frits 1.5-2.5 Slightly soluble
Zinc
Zinc sulphate (Monohydrate) ZnSO4.H2O 36 Soluble
Zinc sulphate (Heptahydrate) ZnSO4.7H2O 23 Soluble
Zinc chloride ZnCl2 48-50 Soluble
Zinc Oxide ZnO 50-80 Insoluble
Zinc chelate Na2ZnEDTA 9-14 Soluble
Zinc frits 4-9 Slightly soluble
Copper Copper sulphate (monohydrate) CuSO4.H2O 35 Soluble
Copper sulphate (pentahydrate) CuSO4.5H2O 25 Soluble
Copper chloride CuCl2 47 Soluble
Cuprous oxide Cu2O 89 Insoluble
Cupric oxide CuO 75 Insoluble
Copper chelate Na2CuEDTA 13 Soluble
Copper chelate NaCuHEDTA 9 Soluble
2.5.4 Chelatisation
Organic chelates are formed when metallic micronutrients such as Fe, Mn, Zn and Cu combine
with certain organic compounds. In the process the organic molecule encircles the metal cation
forming an outwardly electronically neutral compound (Figure 2.6) (Fritz, 1985). Some chelates
are derived from synthetic products and have high stability while others are derived from natural
products and have a low stability (Lucena etal., 2010). According to Lucena et al. (2010),
complexes are intended for mild deficiencies, non-susceptible crops, fertigation, or foliar sprays
because of their low stability.

35
Figure 2.6 Chelatisation, as explained by Fritz (1985)
Elements applied to plants as foliar sprays need to have a high capacity of being retained on the
cuticle of the leaf so that they are not easily washed away (Ferrandon & Chamel, 1988) and
allow time for the elements to move into the inner tissues of the leaf. The effect of chelatisation
on the cuticular retention of micronutrients was demonstrated by Ferrandon & Chamel (1988). It
was observed that retention of Zn by the cuticle was lower when supplied as a chelate than as
sulphate, as a lower Zn concentration ratio (cuticle:radioactive solution ratio) was found when
Zn was supplied as a chelate rather than an organic salt (Tables 2.6 and 2.7). Additionally, more
Zn was found in the washing solution when ZnCl2 and Zn EDTA were supplied than when
ZnSO4 was supplied, further explaining low absorption of Zn EDTA by the leaf cuticle. The
cuticle is negatively charged and the lower retention of Zn chelate was attributed to the limited
number of metal cations available for retention by the negative sites of the cuticle and the large
size of the complex, which decreased the rate of binding on the leaf surface and hence access to
inner sites (Ferrandon & Chamel, 1988).
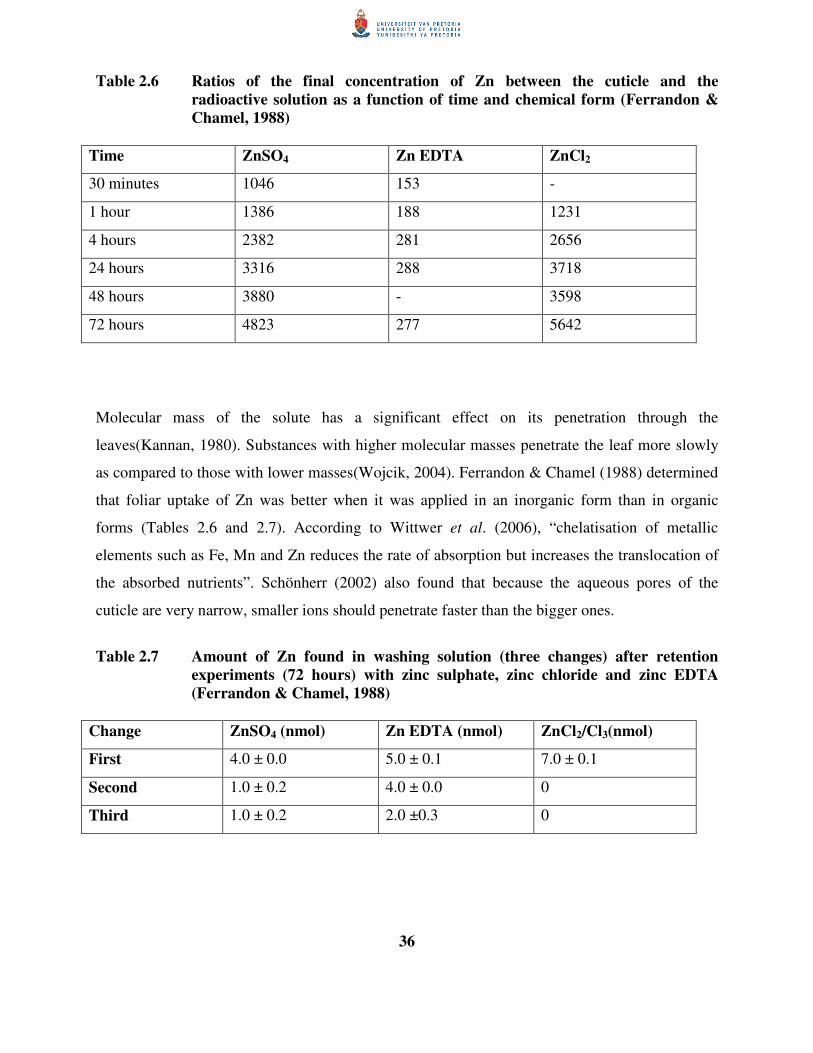
36
Table 2.6 Ratios of the final concentration of Zn between the cuticle and the radioactive solution as a function of time and chemical form (Ferrandon & Chamel, 1988)
Time ZnSO4 Zn EDTA ZnCl2
30 minutes 1046 153 -
1 hour 1386 188 1231
4 hours 2382 281 2656
24 hours 3316 288 3718
48 hours 3880 - 3598
72 hours 4823 277 5642
Molecular mass of the solute has a significant effect on its penetration through the
leaves(Kannan, 1980). Substances with higher molecular masses penetrate the leaf more slowly
as compared to those with lower masses(Wojcik, 2004). Ferrandon & Chamel (1988) determined
that foliar uptake of Zn was better when it was applied in an inorganic form than in organic
forms (Tables 2.6 and 2.7). According to Wittwer et al. (2006), “chelatisation of metallic
elements such as Fe, Mn and Zn reduces the rate of absorption but increases the translocation of
the absorbed nutrients”. Schönherr (2002) also found that because the aqueous pores of the
cuticle are very narrow, smaller ions should penetrate faster than the bigger ones.
Table 2.7 Amount of Zn found in washing solution (three changes) after retention experiments (72 hours) with zinc sulphate, zinc chloride and zinc EDTA (Ferrandon & Chamel, 1988)
Change ZnSO4 (nmol) Zn EDTA (nmol) ZnCl2/Cl3(nmol)
First 4.0 ± 0.0 5.0 ± 0.1 7.0 ± 0.1
Second 1.0 ± 0.2 4.0 ± 0.0 0
Third 1.0 ± 0.2 2.0 ±0.3 0

37
Uptake of anions through the cuticle is poor compared to cations (Fritz, 1985, Burkhardt
&Schroth, 2000). This is attributed to the negative charges that are found within the cuticular
membrane which tend to attract the positively charged ions and bind them within the membrane
for uptake. However, Schönherr (2002) argued that cations and anions penetrate in equivalent
amounts because electrical neutrality must be maintained within the tissues. Grigg (1999) also
mentioned that it is the penetration of cations that occurs first when they are attracted to the
negative charge on the tissue surfaces and move passively according to concentration gradient.
After a certain period, there is a change in the electrical balance within the tissues causing it to
be more positive, thereby enabling the anions to start moving into the tissues in order to maintain
the electrical balance (Grigg, 1999).
Figure 2.7 illustrates concentrations of Zn in shoot tissues of wheat as affected by method of
application and formulation. The plants were grown without any Zn (-Zn control), with Zn
supplied to the root environment (Zn control), and in the other four treatments Zn was applied as
a foliar spray as ZnO, ZnSO4, Zn EDTA and glycine-chelated biomin Zn. It was discovered that
Zn concentration in the shoot tissue was highest when applied as glycine-chelated biomin zinc
(chelated form) followed by zinc sulphate and zinc EDTA and lowest in treatments where zinc
was supplied to the roots (Zn control), foliar ZnO and –Zn control. This may to some extent be
explained by solubility issues, especially in case of ZnO, which is insoluble in water.

38
Figure 2.7 Zinc concentration in shoot tissue of wheat grown in nutrient solutions for various periods of time (5 and 7 weeks), either without Zn supply (-Zn control), or Zn supplied in the root environment (Zn control), or as foliar sprays (ZnO, Zn sulphate, Zn EDTA and Biomin Zn) (from Haslett et al., 2001).
There was limited Zn transportation from the roots to the shoots of the wheat plants. Evidence
for this was obtained in the greater root to shoot Zn concentration ratios observed in –Zn and Zn
controls. The most commonly used Zn (inorganic and chelated forms) in foliar fertilisation are
ZnSO4 and Zn EDTA respectively, and in the studies involving wheat plants, it was shown that
the overall difference between these two forms is very minimal, hence no justification for
preferential use of expensive chelated forms as opposed to cheap inorganic Zn forms (Haslett et
al., 2001).
2.5.5 Environmental factors related to foliar uptake
Environmental factors that affect foliar absorption are indirect in nature (Tukey & Marczynski,
1984). These include relative humidity, light and/or temperature and pH of the nutrient solution
to be applied which affect the development of the epicuticular waxes, which in turn comprise the
entry points of foliar applied nutrients (Tukey & Marczynski, 1984). Environmental factors may
also affect the functionality of the nutrient solution to be applied.

39
2.5.5.1 Effect of Relative Humidity (RH) on absorption
Relative humidity is one of the major factors affecting penetration of salts through cuticular
membranes (Schönherr, 2002). Salts applied on the leaf surfaces have to dissolve for them to
penetrate the cuticle. This is determined by point of deliquescence (POD) and humidity over the
salt residue (Schönherr, 2002). Point of deliquescence is the humidity over a saturated solution
containing a solid salt (Schönherr, 2002). According to Schönherr (2002)when humidity is above
POD, the salt residue on the cuticle dissolves and when it is below POD a salt residue is formed
and penetration ceases.
High humidity favours entry of salts across the cuticle, as it allows for the maintenance of a
moist environment on the applied surface, ensuring the applied substances remain in solution and
are available for absorption for longer periods of time (Tukey & Marczynski, 1984).
Additionally, high air humidity causes swelling of the cuticular membranes, loosening its
components and due to this change in configuration, absorption of hydrophilic compounds
increases (Wojcik, 2004).
2.5.5.2 Effect of solar radiation and temperature on absorption of foliar applied nutrients
The effects of solar radiation on absorption of foliar applied nutrients are related to temperature
effects. In active uptake, accumulation of ions is against a concentration gradient and requires the
use of energy which is derived from respiratory metabolism in the case of roots, and
photosynthesis in the case of leaves (Fageria et al., 2009).In enzymatically isolated tobacco leaf
cells and corn leaf tissues, light enhanced the uptake of ions, which indicates a role for metabolic
energy, supplied through photosynthesis, in ion uptake through the leaves (Kannan, 1980). A
similar observation was made in barley leaf tissues where uptake of salts and organic acid
synthesis was consistently higher in the light than in the dark. This light enhanced uptake was
attributed to the additional source of ATP that was available from oxidative phosphorylation
(Kannan, 1980).
A different view was presented by Pulschen (2004) who expressed concern about negative
indirect effects that solar radiation may have on foliar uptake, however, these effects are mainly
temperature related. As noon is approached, there is an increase in ambient temperature and a
decrease in relative humidity which leads to rapid evaporation of foliar sprays. This may cause

40
rapid drying of sprays fromfoliar surfaces and accumulation of salts on the leaf surfaces,
subsequently causing leaf scorching and burning (Pulschen, 2004). On the other hand, Tukey and
Marczynski (1984) have reported beneficial effects of temperature on foliar absorption,
attributing this to temperature effects on the orientation of the epicuticular waxes. Plants that
were grown at warm temperatures (25 °C) and a relatively high irradiance of 440 Wm-2 had their
epicuticular waxes arranged in an upright manner, leaving small openings between the wax
platelets, thereby increasing the surface area for entry of the foliar nutrients (Tukey &
Marczynski, 1984). On the other hand, in plants that were grown at low temperature of 15 °C
and a low irradiance of 145Wm-2, the waxes looked small and densely packed, preventing
contact with the cell surface underneath(Tukey & Marczynski, 1984).
2.5.6 Additional factors related to foliar uptake
2.5.6.1 Leaf Area
Leaf Area is one of the factors required for efficient uptake of foliar applied nutrients (Fageria et
al., 2009). Applying foliar fertilizers to a large LAI means a large area for interception of spray
material. In certain crops such as wheat, a LAI of 2-4 m2 m-2 is adequate for efficient uptake
(Fageria et al.,2009). The spray material has to be uniformly distributed over the leaf area and
spraying during windy days may cause variability in spray deposition and therefore uptake of
nutrients (Fageria et al., 2009).
2.5.6.2 Effect of pH of nutrient solution on foliar uptake
The pH of the nutrient solution to be used in foliar application plays a role in nutrient uptake. It
has been pointed out by Tukey & Marczynski (1984) that a pH between 2 and 3 is not desirable
because severe injury to leaves is caused at such levels and this negatively affects foliar uptake.
According to Wojcik (2004) the ideal solution pH for maximum uptake of most nutrients is
between 3.0 and 5.5, however, higher pH values have been reported for different elements and
compounds.
2.5.6.3 Concentration of spray solution
Passive transportation of foliar nutrients is positively correlated with the concentration of the
applied solution on the leaf surface. However, this is only true up to certain concentration levels.

41
In certain circumstances, especially when the concentration of the spray material is too high,
injury occurs to the leaf surfaces largely due to malfunctioning of the ectodesmata (Wojcik,
2004). This is mostly accelerated by high day temperatures. According to Fageria et al. (2009),
too high day temperatures cause burning of plant foliage and these authors recommend that best
spray applications are achieved when the plant is not water stressed and when tissues are cool
and turgid. Such conditions are best achieved in the morning, late afternoon or on days when
temperatures are low. This minimises the problem of leaf scorching that is associated with foliar
applications. Maximum concentrations of particular mineral nutrients in foliar applications are
affected by factors including plant species, plant developmental stage, plant nutritional status,
health of the plant and weather conditions (Wojcik., 2004).
2.5.6.4 Effect of surfactants on penetration
Surface-active agents, also known as surfactants, are chemicals that lower surface tension of
liquids (Cheristensen, 2005). Surfactants have been used in a number of plants in which foliar
applications of nutrients, pesticides and fungicides have been made (Crowley et al., 1994,
Gaskin & Murray 1997, Wojcik, 2004,). Surfactants have the ability to increase the area of
contact and time of retention on foliage surfaces and its use has produced variable results on
penetration of foliar applied nutrients. Surfactants mainly influence the spray retention and leaf
wettability (Fernandez & Ebert 2005) by their action on the surface tension between the liquid
and the leaf surface and may either reduce or improve retention (Cheristensen, 2005). They also
reduce the air layer between the liquid and the leaf surfaces thereby increasing penetration of
solutes through stomata and cuticular membranes and limiting the drying of spray droplets
(Wojcik, 2004).
Surfactants possess both lipophilic and hydrophilic groups which decrease the surface tension
between the liquid and the leaf leading to an increase in the leaf wetting (Wojcik, 2004). The
most frequently used surfactants in agriculture are ethoxylated alcohols, alkylphenols, sorbitan,
organosiliconeand alkyl amines (Wojcik, 2004). Schönherr (2002) reported that addition of the
wetting agent alkyl-polyglucoside glucopon 215 CSUP at 0.2 g l-1 reduced the half time of
penetration of CaCl2 from 204 hours to 17 hours, thereby increasing the rate of CaCl2 uptake.
Surfactants fall into two major categories i.e. ionic and non-ionic (Wojcik, 2004, Fernández

42
&Ebert, 2005).According to Wojcik (2004), estimation of the efficiency of non-ionic surfactants
in improving mineral nutrient absorption by leaves is done using the value of hydrophilic-
lipophilic balance (HLB). Surfactants with higher HLB value induce a better cuticular
penetration than those with a lower value (Wojcik, 2004).
Effectiveness of surfactants depends upon species, composition and concentration of surfactants
(Gaskin & Murray, 1997, Fernández & Ebert, 2005). Non-ionic surfactants are more effective
than ionic surfactants because of the inertness and compatibility with most organic ions of non-
ionic surfactants. Non-ionic surfactants also do not form insoluble salts in the presence of hard
water (Cheristensen, 2005). On the other hand, Fernández & Ebert (2005) speculated that anionic
surfactant molecules can be expected to interact with the electrolysed cations forming large
molecules that may block cuticular pores and interfere with leaf permeability. On the contrary,
Reed & Tukey (1987) found no correlation between the degree of absorption of phosphate and
ionic forms of surfactants.
The target leaf surface characteristics also have a bearing on the effectiveness of surfactants and
this varies with species. Surfactants are more effective in species whose leaf surfaces are water
repellent or “hard to wet” species, contrary to easily wetted species where application of
surfactants tend to promote spray run off (Gaskin & Murray, 1997, Reed & Tukey, 1987).
Although there are numerous reports on the beneficial effects of surfactants there have been
reports on the detrimental effects of surfactants on the absorption of foliar applied nutrients.
Reports by Wojcik (2004) have indicated that surfactants such as organosilicone can decrease
leaf nutrient uptake capability due to damage of cellular membranes and/or precipitation of
inorganic salts on the leaf surface. The choice of which surfactant to use is therefore important in
foliar sprays involving use of surfactants.
2.5.7 Translocation of foliar applied nutrients to other parts of a plant
Long distance translocation of nutrient elements occurs in the vascular system, namely the
phloem and xylem, with water as the translocating agent (Brown & Shelp, 1997). Foliar nutrient
uptake mechanisms and pathways are similar to those of plant growth substances, which are
applied to leaves in order to control plant growth, and systemic insecticides to prevent insect

43
infestation (Kannan, 1980). Effectiveness of application of foliar applied nutrient elements
depends highly upon how efficiently the nutrient in question can be transported via the phloem
(Bukovak & Wittwer, 1957). Transportation of substances in the phloem is independent of
transpiration (Brown & Shelp, 1997).
2.5.7.1 Phloem mobility of copper, zinc and boron
The efficiency of foliar applied nutrients depends upon their mobility within a plant and foliar
nutrient application is more successful for those elements that are phloem mobile (Haslett et al.,
2001, Wojcik, 2004. Different nutrient elements are absorbed at different rates, for instance,
studies done in bean plants showed that foliar applied nutrients were absorbed at different rates
and B, Cu and Zn were classified as partially mobile (Wooldridge, 2002, Newett, 2005).
Wooldridge (2002) studied the effect of trace element sprays and fritted trace elements on
growth and Mn, Zn, Cu and B contents of young apple trees. In this study, only the parts of the
plant, such as leaves, shoots and bark that were directly exposed to the Cu sprays had increased
Cu levels compared to the other non exposed parts. However, high B concentrations were
observed in the wood in plants treated with B. It was therefore concluded that Cu is not readily
taken into the tree structures, whereas B is readily exported to the other parts of the plants.
Newett (2005) described Zn and B as nutrients with limited phloem mobility in avocados.
Boron transportation through the phloem depends on the amount of simple sugars, known as
polyols, produced. Sugars such as sorbitol, mannitol or ducitols, tend to complex with B to form
polyol-B-polyol compounds that may be transported by the phloem to meristematic regions
(Brown & Hu, 1996, Brown & Shelp, 1997, Boaretto et al., 2008). Thus even though boron has
been considered phloem immobile, studies have shown that boron is mobile in plant species
which produce sorbitol as a major sugar (Power & Woods, 1997, Blevins & Lukaszewski, 1998).
Movement of foliar applied B has been observed in woody Rosaceae plants such as apples,
Prunus spp. and pear (Brown & Hu 1996). Positive response of foliar applied B has also been
observed in soybeans, which contain large quantities of a polyol known as pinnitol (Blevins &
Lukaszewski, 1998). In some fruit trees, foliar application of B temporarily increased B
concentration in leaves during fall (autumn), but during the late fall and winter B moved from

44
the leaves to the bark. This provides evidence of phloem mobility of B and that it is aided by B-
complexing sugars.
In Zn transport experiments done on wheat, movement of foliar applied Zn was directed mainly
towards the stem, which contained 34% of the applied Zn (65Zn), then the youngest leaf (8%),
followed by the roots (6%) and very little (0.1%) in the older leaves (Haslett et al., 2001). This
provides evidence that foliar applied Zn was effectively absorbed and translocated to other parts
of the wheat plant from the leaves. The presence of Zn in the root tips, especially in the foliar
application treatments, is an indication of the possibility of its movement in the phloem and its
presence in the young leaves is an indication of its movement through the xylem (Haslett et al.,
2001).
A different observation was made in ‘Hass’ avocados (Newett, 2005). Absorption of mineral
elements through the leaves proved difficult in ‘Hass’ avocados, to such an extent that
application was followed by reduced response or no response at all. Evaluation of different
application methods of Zn in ‘Hass’ avocados i.e. soil/irrigation-applied ZnSO4, irrigation
applied Zn chelate (Zn-EDTA), trunk injection of ZnNO3, and foliar application of ZnSO4, ZNO
or Zn metalosates, showed that soil/irrigation supply of ZnSO4 at 3.2 kg tree-1 either annually or
quarterly was the most effective in correcting Zn deficiency by increasing the Zn concentration
in leaf tissues. In foliar applied treatments, it was shown that less than 1% of Zn was actually
absorbed by leaf tissues, with very little translocated to the neighbouring tissues from the
application points (Newett, 2005).
2.6 Conclusion
Fertilization remains a major determinant of yield in tea production. Although fertilization with
micronutrients has been given less consideration in the Malawian tea industry, fertilization with
micronutrients is as beneficial as fertilization with macronutrients. Copper, B and Zn are
required by tea plants in minute quantities, but they play very vital physiological roles and
contribute significantly to the healthy development of the tea crop. Their effects have been
directly linked to yield and quality, but in some instances indirect effects have been observed.
Applications of these elements, depending on the concentration, have contributed to
improvements or declines or no effect at all on the quality, yield, and/or yield components, such

45
as number of shoots, shoot dry mass and leaf area index. However, the levels of these elements at
which optimum yields are attained is what is of interest to most agriculturalists.
Despite the complexity in the interaction of Cu, Zn and B with the various factors affecting their
availability in the tea soils, a holistic approach to determining the optimum supply levels of these
nutrient elements, taking into account all the factors contributing to availability and uptake of
these by the tea plant will result in their optimized use. Because certain concentrations of Cu and
Zn cause yield losses, it is strongly advised to maintain supply of these elements within the
optimum levels to avoid such toxicities which can also have subsequent detrimental effects on
human health.
Foliar application of micronutrients is beneficial in plant production and is more effective,
particularly for the supply of micronutrients such as Zn, Cu and B that are required only in
minute quantities. It is convenient during critical growth periods when demand for nutrients is
high and it is a faster way of correcting deficiencies, since the uptake process is rapid. Foliar
application is preferred especially when soil conditions do not allow for efficient uptake of soil
applied nutrients and it can be used to supplement soil applied nutrients. Furthermore, in a crop
such as tea, whose economic yield comprises young tender shoots that are removed from the
plant regularly, the replenishment of nutrient elements that are lost through this plucked leaf is a
necessity.

46
CHAPTER 3: MATERIALS AND METHODS
3.1 Study Sites
Two similar field experiments were conducted in Malawi in order to achieve the study
objectives. The experiments were performed in Cu, Zn and B deficient tea fields at Mianga and
Glenorchy tea estates in the Thyolo and Mulanje districts of Malawi respectively. The trial at
Mianga was located at an altitude of 960 metres above sea level, latitude16° 5.648'S and
longitude 35° 4.733'E. The trial at Glenorchy was located at an altitude of 650 metres above sea
level, latitude 15° 59.417'S, longitude 35° 28.943'E.
Deficiencies of Cu, B and Zn in these fields were detected following leaf analyses performed in
2007 by various estates in Malawi. Levels of Cu, Zn and B in leaves collected from these fields
were below the recommended levels of 15 mg/kg, 30 mg/kg and 30 mg/kg respectively (Willson
& Gunther, 1981).
The bushes at Glenorchy were planted with a mixture of cultivars PC 108 and 105 in 1996 and
are irrigated. Tea bushes at Mianga were planted in 1986 with PC 105 under rain-fed conditions.
Table 3.1 shows the amount of water (both irrigation and rainfall) received by the plants from
January to June 2010 during the course of the experiments at Glenorchy and Mianga.
Table 3.1 Amount of water (rainfall and irrigation) received by the plants at Glenorchy and Mianga estates from January to July 2010.
Month Glenorchy Mianga
Rainfall (mm) Irrigation (mm) Rainfall (mm)
January, 2010 207.0 - 139.4
February, 2010 308.0 - 314.7
March, 2010 269.4 - 113.9
April, 2010 364.3 - 177.7
May, 2010 67.5 36.0 45.1
June, 2010 111.0 72.0 47.0
Sub total 1327.2 108.0 837.8
Grand total 1435.2 837.8

47
3.2 Experimental design and Treatments There were a total of seven treatments and details are provided as follows:
Treatment 1 (T1) : No spray (control)
Treatment 2 (T2) :0.1% boric acid (776 g B ha-1 yr -1)
Treatment 3 (T3) :1% copper sulphate (17.7 kg Cuha-1 yr -1)
Treatment 4 (T4) :1.25kg/ha zinc oxide (4.0 kg Zn ha-1 yr -1)
Treatment 5 (T5) :0.1% boric acid, 1% copper sulphate solution, 1.25kg/ha zinc oxide (776g
Bha-1 yr -1), 17.7kg Cuha-1 yr -1, 4.0 kg Znha-1 yr -1)
Treatment 6 (T6) :1 % of Agrilibrium micronutrient mix (32.5 g Cuha-1 yr -1, 97.0 g Znha-1
yr -1, 364.2 g Bha-1 yr -1)
Treatment 7 (T7) :2.48kg/ha zinc sulphate (4.0 kg Zn ha-1 yr -1)
The treatments were arranged in a Randomised Complete Block Design with four replicates. The
arrangement of treatment plots in the field is provided in Figures 3.1 and 3.2. Plots at Mianga
had a total of 30 bushes each spaced at 1.20m by 0.75m with a plant population of 11111 plants
ha-1. Plots at Glenorchy had 40 bushes with a spacing of 1.2m x 0.6m and a plant population of
13889 plants ha-1.

48
Figure 3.1 Layout of treatment plots at Mianga estate (Figure not drawn to scale)
Figure 3.2 Layout of treatment plots at Glenorchy estate (Figure not drawn to scale)
T 2
T 7
T 7 T 5
T 6
T 3 T 4 T 2
T 4
REP IV T 4 T 6
T 1
T 5 REP II
T 1
T 5 T 6 REP I
T 7
T 3 T 1
T 3
T 2
T 7
REP III
T 4
T 3
T 1
T 6 T 2
T 5
Rep 4 T 3 T 5 T 7 T 6 T 2 T 1 T 4
Rep 3 T 2 T 6 T 4 T 5 T 1 T 7 T 3
Rep 2 T 1 T 3 T 2 T 4 T 6 T 5 T 7
Rep 1 T 7 T 2 T 5 T 1 T 3 T 6 T 4

49
3.3 Selection of chemicals and their application concentrations
Selection of chemicals was based on their solubility in water considering the fact that the
chemicals were to be applied as foliar spray applications. Boric acid is highly soluble in water
and is more suitable for foliar application than other forms of B such as borax and borates (Zekri
& Obreza, 2009). The application concentration of 0.1% boric acid was chosen based on findings
by Prasad & Dey (1979) who observed a significant increase in uptake of B even at 0.1%
concentration of boric acid in young tea.
Zinc oxide, although insoluble in water (Fageria et.al., 2009), has been reported to have a
positive impact on tea shoot growth and hence yield (Barbora et al., 1993, Alam & Raza, 2001).
In Malawi, studies done on seedling tea have also indicated positive yield response due to soil or
foliar zinc oxide application (Malenga 1979, Malenga 1986, Griceet al., 1988). Some tea
growers in Malawi have been applying zinc oxide to their fields. The application concentration
of 0.1% zinc oxide supplied 1.25kg ha-1 of zinc oxide per application giving 1kg Zn ha-1 per
application or 4kg Zn ha-1 yr -1. The application rate of 1.25kg ha-1 was arrived at according to
studies conducted on seedling tea in Malawi (Grice et.al., 1988). Zinc sulphate was included
because it is soluble in water and hence suitable for foliar application (Fageria et.al., 2009). Zinc
sulphate was applied at 0.4% concentration, a concentration that would supply the same amount
of Zn as that supplied by 0.1% zinc oxide.
Copper sulphate is soluble in water (Fageria et.al., 2009) and studies have shown that application
of copper sulphate solution at 0.5-1% concentration has corrected Cu deficiencies in seedling tea
(Squire, 1977, TPH, 1990). In this study Cu was applied as copper sulphate at 1% concentration.
The commercial micronutrient mix was included among the treatments considering that the fields
were deficient in Cu, B and Zn and micronutrient mixes are convenient when it comes to
correcting multiple micronutrient deficiencies. The concentration of 1% was chosen following
recommendations by the manufacturer.
All plots received two applications of compound T fertiliser (N: P: K ratio of 25:5:10 +3S). The
first application of compound T was done in November, 2009 at 640kg ha-1 i.e. 160kg N ha-1.
The second application was done in January 2010 at 160kg ha-1 i.e. 40kg N ha-1. The plots also

50
received a foliar spray of Tsama EPM mix in January, 2010 containing 102g L-1 of P, 108g litre-1
of Cu and 319gL-1 of Zn applied at 2Lha-1.
3.4 Spraying
Application of foliar sprays was done using a 20-litre knapsack sprayer, which was calibrated
according to the procedures described by Rattan (1988) in order to ensure that the exact dosage
was applied and that the chemicals were evenly distributed onto the tea plants. Spraying was
done in the morning once a month for four months starting in March 2010 until June 2010 at a
spraying volume rate of 1111 l ha-1. Days on which spraying was done coincided with the
plucking days in such a way that spraying immediately followed plucking and the next plucking
was done after 10 or 11 days at each site; this is true for the second through to the third
application. In the first application, the plan was to spray on the plucking day soon after plucking
(end February) but it was not possible because of rains which meant that spraying could only be
done five or six days after plucking. No surfactants were used in this trial because we had
difficulties in the choice of which surfactants to use as not much research has been done on
efficacy of different surfactants in tea, especially in Malawi. Care was taken not to spray on rainy
days. Whenever it rained or rains were expected on the date of spraying, spraying was postponed
to another closest date.
The actual dates of application are provided inTable 3.2 and the quantities of Cu, Zn and B
applied per plot are provided Table 3.3.
Table 3.2Dates of fertiliser application at Mianga and Glenorchy estates
Mianga Glenorchy
Compound T application
(25:5:10 +3S)
November, 2009
and /January 2010
November, 2009
and /January 2010
Tsama EPM micronutrient mix January, 2010 January, 2010
First treatment application 4 March 2010 5 March 2010
Second treatment application 8 April 2010 9 April 2010
Third treatment application 10 May 2010 11 May 2010
Fourth treatment application 10 June 2010 11 June 2010

51
Table 3.3 Total amount of Cu, Zn and B applied per plot during the four foliar applications from March to June 2010
Chemical Element Concentration
of Chemical
Amount of
chemical
applied ha-
1
Amount
of element
applied
ha-1
Amount of
element
applied
plot-1
(Mianga)
Amount of
element
applied plot-1
(Glenorchy)
H3BO3 Boron 0.1 % (m/v) 4.44 kg 776g 2.1g 2.2 g
CuSO4.5H2O Copper 1% (m/v) 69.6 kg 17.7 kg 47.7g 51.0 g
ZnO Zinc 0.1% (m/v) 5.0 kg 4.0 kg 10.8g 11.5 g
ZnSO4.7H2O Zinc 0.4% (m/v) 17.6 kg 4.0 kg 10.8g 11.5 g
Commercial
micronutrient
mix
Copper 1% (v/v) 44.4 litres 32.5g 0.1 g 0.1 g
Zinc 1% (v/v) 44.4 litres 97.0g 0.3 g 0.3 g
Boron 1% (v/v) 44.4 l litres 364.2g 1.0 g 1.0 g
3.5 Soil analysis
At the beginning of the trials, before treatments were initiated, representative soil samples were
randomly collected from the trial plots using a stainless steel soil auger. Cores were taken from
0-15 cm and 30-45 cm depths. Samples from one trial site and from similar sampling depths
were mixed together to form one composite sample. The composite samples were air dried and
ground using a mortar and pestle. The samples were then passed through a 2mm sieve, packed
and sent to the University of Pretoria’s Plant Production and Soil Science laboratory for analysis.
The soil samples were analysed for pH, P, K, Mg, Ca, Na, C, CEC, N, B, Zn, Cu, Fe, Mn, Mo,
Al, ash and particle size distribution.
To check the nutrient status of the soils after application of treatments from each experimental
plot, soil samples were once again collected in May 2010using the same procedures as described
above, except that samples from each treatment were analysed separately.
52
3.6 Foliar analysis
Leaf samples were also collected according to the procedures described by Grice (1990) in May
2010. Leaf samples comprised only the third leaf from selected shoots from each plot and were
oven dried to constant mass at 85 °C (Grice, 1990). The dried leaf samples were sent to the
University of Pretoria’s Plant Production and Soil Science Laboratory and were analysed for N,
P, K, S, Zn, Cu, Mg, Mn, Mo, Ca, Fe, B, Al and Na using standard methods of analysis adopted
at the laboratory.
3.7 Yield and yield components (made tea yield, shoot density and shoot dry mass)
Harvesting was done by hand plucking of tender shoots from the tea bushes on every 10th or 11th
day at both sites from March 2010 to June 2010. At Mianga yield recording started on 8 March
2010 and ended on 21 June 2010 while at Glenorchy, it started on 9 March and finished on 22
June 2010. On each plucking day, mass of plucked leaf from each plot was recorded and
expressed as made tea yield by multiplying the green leaf yield by a factor of 0.22. There were a
total of 11 plucking days (harvests) at each site and yield for all the 11 harvests was summed to
get total yield for the period (March to June 2010).
Shoot density was determined by using a 0.75 m by 1.2 m square grid, which was thrown
randomly on the plucking table at three positions in each plot. Different shoot categories were
counted at each position and the number of shoots per m2 was calculated. This was performed
once a month.
Shoot dry mass was determined from a 200g sample of green leaf from the plucked leaf once a
month. The leaf sample was separated into different categories of shoots, which were: 1L+b,
2L+b, 3L+b and 4L+b shoots. The samples were dried in the oven at 85°C to constant mass.
Data on shoot dry mass was expressed as average shoot mass for each shoot category.
3.8 Made tea Quality
3.8.1 Determination of black tea quality by sensory evaluation and biochemical analysis
In this study, a sample weighing 300 g of green leaf plucked from each of the trial plots was
collected once a month from March to June 2010 from the seven treatments and four replicates.

53
Each sample was processed separately into black tea in the Mini Processing Unit at TRFCA.
From each of the black tea samples, two 50 g samples were weighed and packed separately. One
of the 50 g black tea samples from each plot was sent to Tea Brockers of Central Africa (TBCA)
for sensory evaluation by professional tea tasters while the other 50 g black tea sample was sent
to University of Pretoria for biochemical analysis.
Black tea quality parameters assessed by tea tasters included: brightness, briskness, colour of
liquor, colour of infusion, colour with milk and strength of liquor. A scoring scale of 1 to 10 is
used by the tea tasters for each parameter, 1 being the lowest score and 10 the highest (Clowes &
Mitini–Nkhoma, 1987).
3.8.1.1 Determination of Caffeine, Theaflavin and Thearubigin contents in black tea
Biochemical compounds that were determined included: caffeine by spectrophotometry as
described by Yao et.al. (2006).Thearubigins (TRs) and theaflavins (TFs) by extraction and
spectrophotometry as described by Roberts & Smith (1963) The TR/TF ratio was also
determined.
3.8.1.2 Determination of Caffeine in black tea
Lead acetate solution was prepared by dissolving 25g (CH3COO)2 Pb in 50ml of triple distilled
water (dddH2O). A 0.0324% solution of hydrochloric acid was prepared by diluting 90ul 32%
hydrochloric acid in 100ml of dddH2O. Another solution of sulphuric acid was also prepared by
adding 16.7ml of 98% H2SO4 to 80 ml of dddH2O first and then the solution was made up to
100ml with dddH2O. A 1mg ml-1 stock solution of caffeine was also prepared by transferring
0.1g ± 0.001g caffeine into 100ml of dddH2O in a volumetric flask. Standard solutions of (0,
0.005, 0.01, 0.15, 0.02 and 0.025) mg ml-1 of caffeine were prepared.
3.8.1.3 Preparation of black tea sample for caffeine determination
The black tea sample was prepared by turning on the water bath set at a temperature of 90oC. A
bottle containing sufficient dddH2O was placed in a water bath and was allowed to equilibrate
for 20 minutes. 0.1g ± 0.001g ground black tea leaf was weighed in a 10ml glass tube placed and
was placed in a water bath. 5ml of dddH2O was added onto the tube and was closed with a
rubber stopper. The mixture in the glass tube was incubated for 10 minutes and vortexed after 0,

54
5 and 10 minutes. The solution was centrifuged for 10 minutes at 3000 x g. The supernatant was
transferred into a 10ml volumetric flask and 5.5ml of hot dddH2O was added. The volumentric
flask was filled with cold dddH2O to a 10 ml mark.
3.8.1.4 Caffeine measurement
The prepared tea samples were diluted with water at a ratio of 50:50. 100 ul of diluted tea sample
was added to 50ul HCl solution and 10ul of lead acetate solution and vortexed. The mixture was
allowed to stand for 10 minutes after which 840ul of dddH2O was added to two Eppendorph
tubes of 1ml each and vortexed. The solution was centrifuged for 30 seconds. The supernatant
was transferred into a 1ml Eppendorph tube and 10ul of H2SO4 was added and vortexed. The
solution was allowed to stand for 5 minutes and later 490ul of dddH2O was added and vortexed.
The solution was centrifuged again for 30 seconds. Absorbance was measured on the supernatant
solution at 274nm with UV/visible spectrophotometer. Caffeine concentrations of the standard
solutions were determined and a standard curve was plotted. Caffeine content in the tea sample
was then calculated using the following formula:
Caffeine (%) = (E/1000) x V0 x (100/V1) x (1/0.5)/W = (E/1000) x 10ml x (100/0.1ml) x
(1ml/0.5ml)/0.1g-moisture content)
Where
E = mg caffeine from standard curve (1000 conversion to g)
V0 = total volume of tea solution
V1 = volume of tea used for measurement (100/= dilution of tea sample solution)
1/0.5 = dilution factor (500ul tea solution diluted to 1ml)
W = dry weight of tea sample used.
3.8.1.5 Determination of Theaflavin and Thearubigin content in black tea samples
2.5% Sodium hydrogen carbonate (NaHCO3) solution was prepared. A saturated aqueous oxalic
acid solution was prepared by mixing 10g of oxalic acid with 100ml of dddH2O in a volumetric
flask. 60% methanol solution was also prepared.

55
3.8.1.6 Preparation of black tea sample for TR and TF analysis
A water bath was set at a temperature of 90oC. 0.002±0.001g black tea sample was weighed in a
10ml glass extraction tube. 1litre of dddH2O was heated in 90oC water bath for a minimum of
30minutes for equilibration. Glass extraction tube containing tea sample was then placed in water
bath and 5ml of dddH2O was added into the glass extraction tube. A stopper was put and the
contents were mixed on vortex. The contents were kept in water bath for 10 minutes and were
vortexed for 5 and 10 minutes. Tubes were removed and the contents were left for 5 minutes to
cool down to room temperature. Stopper was removed and the contents were centrifuged for
10minutes at 3500rpm. The supernatant was decanted into a 10ml volumetric flask and was set
aside. Extracted supernatant was filtered with 0.22µM filter coupled to a 10ml syringe.
3.8.1.7 Extraction of TFs and TRs from tea sample
One ml of prepared black tea sample was mixed with 1ml of Isobutyl Methyl Ketone (IBMK)
and the mixture was vortexed for 30 seconds for four times. Two bottom layers of IBMK were
put separately (solutions B and D). One of the two top layers of IBMK was mixed with 168µl of
methanol (solution A) and the other layer was mixed with 500µl of NaHCO3 and vortexed for
another 30 seconds resulting into two layers. The bottom layer was discarded and the top layer
was then mixed with 168µl of methanol (solution C). Solutions A, B, C and D were transferred
into ELISA plates. The optical densities of the solutions were then measured at 375nm and
450nm. Theaflavin and Thearubigin contents in percentage were calculated using the following
formulae:
% theaflavins = 6.25 x Ec x f1
% thearubigins = [(12.5ED + 6.25 (EA-EC)] x f2
Where
f1 = 0.36 for readings at 380nm or f1= 1.07 for readings at 460nm
f2 = 1.13 for readings at 380nm or f2 = 4.40 for readings at 460nm

56
3.9 Statistical analysis
All data,except for data on foliar Cu levels, was subjected to two-way analysis of variance, with
treatment and block effects, using GENSTAT Discovery Edition 3 statistical package. Treatment
means were separated using the Duncan’s Multiple Range Test (DMRT) at p<0.05 level of
significance. Data on foliar Cu did not meet requirements for ANOVA procedures for it did not
follow a normal distribution, therefore non parametric analysis was done by Friedman’s two way
ANOVA by ranks using SAS statistical package (SAS/STAT 9.2) (SAS Institute Inc.,2008).

57
CHAPTER 4: RESULTS AND DISCUSSION
4.1 Effect of foliar sprays of Cu, Zn and B containing fertilisers on tea yield and yield
components
Productivity in tea, just like any other crop, is a function of a number of factors such as climate,
soil, genotype and cultural practices. Fertilisation is one of the major determinants of yield in tea
besides planting material, pruning and harvesting patterns (Drinnan, 2008). A balanced nutrition
with both macronutrients and micronutrients is a requirement for tea to produce satisfactory
yields and products of desired quality. Micronutrients, although they are required in minute
quantities, play important roles in plant growth and development. They function either as
catalysts or at least they are closely linked to catalytic processes within plants. Cu, Zn and B are
among the essential elements for growth and development hence their deficiencies severely limit
crop production.
Fertilisation in tea especially in Malawi has put more emphasis on macro elements such as N, P
and K with little attention paid to fertilisation with micronutrient elements. As a result most
fields have suffered micronutrient deficiencies, especially those of Cu, Zn and B, in recent years.
Foliar applications of Cu, Zn and B containing fertilisers may therefore be able to improve tea
yields. This study was conducted to evaluate the effects of foliar sprays of Cu, Zn and B
containing fertilisers,including one commercial micronutrient mix, on yield and yield
components of tea.
Results have shown that made tea yield was significantly affected by the treatments at Glenorchy
estate (P= 0.001), however,at Mianga tea estate yield was not significantly affected. At
Glenorchy, yield was significantly reduced due to application of copper sulphate alone and when
copper sulphate was applied in combination with boric acid and zinc oxide. Yields from plants
treated with boric acid alone, zinc oxide alone, zinc sulphate alone and the commercial
micronutrient mix were statistically similar to those of the control treatment. The highest
yielding plants were those treated with zinc sulphate and the commercial micronutrient mix.
Results of total yield for 11 harvests (from March to June) for the seven treatments are presented
in Figure 4.1.

58
0
200
400
600
800
1000
1200
1400
1600
1800
2000M
ad
e te
a y
ield
(k
g h
a-1
)
Mianga Glenorchy
Figure 4.1 Made tea yield for different foliar treatments of Zn, Cu and B containing
fertilisers (Note: Vertical bars represent standard error of the means (n=4))
Table 4.1 presents percent change in yield, compared to the control, due to application of various
micronutrient treatments at both sites. At Glenorchy estate, results on made tea yield clearly
indicated that there was a significant yield decrease of 45.2 % when copper sulphate (T3)was
applied alone but when copper sulphate, boric acid and zinc oxide were applied together, yield
significantly decreased by 20.7%. Boric acid applied alone and zinc oxide applied alone non-
significantly reduced yields by 3.3% and 4.7% respectively while commercial micronutrient mix
and zinc sulphate non-significantly increased yields by 2.2% and 2.1 % respectively.
At Mianga estate, yield was not significantly affected by the treatments. Although not
significant, the lowest yield was obtained when copper sulphate was applied alone and the
highest was obtained when zinc sulphate was applied.
a a
a
a
a
a
b ab ab
a
ab
a ab
b

59
Table 4. 1 Percentage change in yield, relative to the control (T1), due to application of B, Zn and Cu containing fertilisers
Note: Means within each column with the same letters are not statistically different at 95% level of
confidence.
#Site A is Mianga estate, Site B is Glenorchy estate
A collection of individual shoots containing two leaves and a bud (2L+b) or three leaves and a
bud (3L+b) comprise the economic yield of the tea plant (Matthews & Stephens 1998). Results
on shoot density for 1L+b, 2L+b, 3L+b,4L+b and bhanjhi shoots and total number of shoots m-
2for the two sites are presented in Tables4.2 and 4.3. At Mianga estate, a significant decrease in
shoot density of 2L+b, 3L+b and total number of shoots was observed when copper sulphate was
applied alone. Plots that received boric acid alone, zinc sulphate, zinc oxide alone, the
commercial micronutrient mix and a mixture of copper sulphate, zinc oxide and boric acid did
not differ from the control, although zinc sulphate application tended to give the highest number
Treatment Concentration
of chemicals
applied
Site A#
Yield (kg
ha-1)
Site B#
Yield
(kg ha-1)
Site
A#chang
e in yield
(kgha-1)
Site
B#change
in yield
(kgha-1)
Site A# %
change in
yield
Site B# %
change in
yield
T1 No treatment 1016ab 1641b - - - -
T 2 0.1% H3BO3 1063ab 1587b 47 -54 4.6 -3.3
T 3 1%
CuSO4.5H2O
728a 898a -288 -742 - 28.3 - 45.2
T 4 0.1% ZnO 1085ab 1564b 69 -77 6.8 -4.7
T 5 0.1% H3BO3 +
1%
CuSO4.5H2O+
0.1% ZnO
795a 1301b -221 -340 - 21.8 - 20.7
T 6 1% Commercial
mix
907ab 1677b -109 36 - 10.7 2.2
T 7 0.4%
ZnSO4.7H2O
1204b 1675b 188 34 18.5 2.07
P value 0.070 0.001
CV % 22.5 15.9
LSD 324.8 348.6

60
of 2L+b, 3L+b shoots m-2 and total number of shoots m-2. There were no significant differences
in the number of banjhi/dormant shoots m-2 as a result of foliar application of Cu, Zn and B in
this study.
Table 4. 2 Mean tea shoot density as a result of different foliar treatments of Zn, Cu and B at Mianga
Trt Concentrations of chemicals applied 1L+b
(number
of shoots
m-2)
2L+b
(number
of shoots
m-2)
3L+b
(number
of shoots
m-2)
4L+b
(number
of shoots
m-2)
Bhanjhi
(number
of shoots
m-2)
Total
(number
of
shoots
m-2)
T 1 No treatment 5.09a 7.52b 2.87b 1.644a 4.074a 21.20b
T2 0.1% H3BO3 5.30ab 7.43b 2.801b 1.273a 3.750a 20.56b
T3 1% CuSO4.5H2O 4.12a 4.91a 1.852 a 0.856a 3.796a 15.53a
T4 0.1% ZnO 5.05a 6.99b 2.315 ab 1.134a 4.074a 19.56b
T5 0.1% H3BO3 +1% CuSO4.5H2O+ 0.1% ZnO 4.68a 6.85b 2.593 b 1.157a 4.144a 19.42b
T6 1% Commercial mix 5.16a 7.04b 2.546ab 1.042a 3.819a 19.61b
T7 0.4% ZnSO4.7H2O 5.30 a 7.87b 2.917b 1.505a 4.028a 21.62b
P0.05 0.089 0.002 0.041 0.119 0.630 0.001
LSD 0.847 1.230 0.665 0.567 0.558 2.397
CV % 11.5 11.9 17.5 31.0 9.5 8.2
Note: Means within each column with the same letters are not statistically different at 95% level of
confidence.
There were highly significant differences in total number of shoots m-2 at Glenorchy. As at
Mianga, shoot density for 2L+b and 3L+b shoots also significantly differed at Glenorchy.
Application of copper sulphate alone or in combination with boric acid and zinc oxide
significantly reduced shoot density for 2L+b and 3L+b shoots and total number of shoots m-2.
Densities of 2L+b and 3L+b shoots and total number of shoots m-2 were similar in plots treated
with boric acid alone, zinc oxide alone, zinc sulphate and the commercial micronutrient mix.
Shoot density of 1L+b differed significantly between T5 (boric acid + copper sulphate + zinc
oxide) and T6 (commercial mix).

61
Table 4. 3 Mean tea shoot density as a result of different foliar treatments of Zn, Cu and B at Glenorchy
Trt Concentrations of chemicals applied 1L+b (number of shoots m-2)
2L+b (number of shoots m-2)
3L+b (number of shoots m-2)
4L+b (number of shoots m-2)
Bhanjhi (number of shoots m-2)
Total (number of shoots m-2)
T 1 No treatment 6.25a 9.21b 3.056b 1.250c 3.588a 23.36 b
T2 0.1% H3BO3 6.16a 8.26b 2.292ab 0.880 abc 4.120a 21.71 b
T3 1% CuSO4.5H2O 5.35a 5.93a 1.667a 0.556 a 4.375a 17.87 a
T4 0.1% ZnO 5.95a 8.91b 2.894b 0.949abc 4.005a 22.71 b
T5 0.1% H3BO3 +1% CuSO4.5H2O+ 0.1%
ZnO
5.02a 5.75a 1.944a 0.764 ab 4.699 a 18.18 a
T6 1% Commercial mix 6.67a 9.49b 3.009b 1.019 bc 4.074a 24.26 b
T7 0.4% ZnSO4.7H2O 6.48a 9.72b 2.986b 1.042bc 3.981 a 24.21 b
P0.05 0.147 < 0.001 0.003 0.045 0.078 < 0.001
LSD 1.308 1.748 0.750 0.397 0.676 3.119
CV % 14.7 14.4 19.8 28.9 11.0 9.6
Note: Means within each column with the same letters are not statistically different at 95% level of
confidence.
Yield in tea is affected by mean individual shoot dry mass (Grice & Clowes, 1990). In the
current study, there were no significant differences in average shoot dry mass among the
treatments as shown in Table 4.4.The differences in yield across the treatments at Glenorchy
tended to arise from differences in densities of 2L+b and 3L+b shoots which comprise the
economic yield of tea (Tables4.2 and 4.3), which eventually contributed to differences in total
number of shoots m-2. Copper sulphate applied either alone or as a mixture with boric acid and
zinc oxide resulted into a significant decrease in shoot population density while shoot population
densities for tea plants that received boric acid alone, zinc oxide alone, zinc sulphate alone and
the commercial micronutrient mix were similar to those of the control, a trend which was similar
to that observed in made tea yield. Similar observations in tea were reported by Grice (1990)
where an increase in yield due to zinc application was due to shoot number and not shoot size.
Micronutrients therefore appear to be important for shoot growth and development, which is a
vital component of yield in tea.

62
Table 4. 4 Average shoot dry mass for different categories of shoots at Mianga and Glenorchy
Trt. Concentrations of chemicals
applied
Mianga (g per shoot) Glenorchy (g per shoot)
1L+b 2L+b 3L+b 4L+b 1L+b 2L+b 3L+b 4L+b
T 1 No treatment 0.192a 0.429a 0.715a 1.095a 0.244a 0.446a 0.715a 1.058a
T2 0.1% H3BO3 0.305a 0.485a 0.805a 1.350a 0.204a 0.365a 0.615a 1.321a
T3 1% CuSO4.5H2O 0.206a 0.461a 0.719a 1.089a 0.199a 0.343a 0.688a 1.003a
T4 0.1% ZnO 0.226a 0.493a 0.795a 1.213a 0.233a 0.424a 0.643a 0.906a
T5 0.1% H3BO3 +1%
CuSO4.5H2O+ 0.1% ZnO
0.250a 0.452a 0.673a 0.987a 0.148a 0.349a 0.672a 1.232a
T6 1% Commercial mix 0.297a 0.470a 0.724a 1.075a 0.219a 0.439a 0.679a 1.108a
T7 0.4% ZnSO4.7H2O 0.250a 0.487a 0.775a 1.227a 0.204a 0.459a 0.871a 1.309a
P0.05 0.095 0.952 0.618 0.182 0.597 0.129 0.261 0.448
LSD 0.086 0.133 0.167 0.278 0.104 0.106 0.207 0.467
CV % 23.5 19.1 15.1 16.3 33.8 17.6 20.0 27.7
Note: Means within each column with the same letters are not statistically different at 95% level of
confidence.
Copper sulphate foliar treatments tended to have an inhibitory effect on the development of
shoots, which eventually led to the decline in shoot density and eventually yield in plots where
copper sulphate was applied either alone or in combination with boric acid and zinc sulphate.
Copper is reported by Fernandes & Henriques, (1991)to be a potent inhibitor of photosynthesis,
influencing photosynthetic electron transport, photophosphorylation and the dark reactions of
photosynthesis. The inhibitory effect on photosynthesis wasalso observed on the activity of
several enzymes that are responsible for the dark reactions of photosynthesis, namely ribulose 1,
5 biphosphate carboxylase in barley and phosphoenolpyruvate carboxylase in Zeamays
(Stiborová et.al., 1986, Iglesias & Andreo 1984). Barua & Dutta (1972) observed a reduction in
yield of tea following copper application and a 20% yield increase due to zinc application. Majid
& Ballard (1990) observed severe scorching and leaf burn when a 1% copper sulphate solution
was applied either alone or in combination with urea in pine plantations, but application of
copper sulphate at 0.1% concentration and urea did not scorch the pine leaves.

63
In the current study, some tea bushes suffered leaf scorching in treatments where copper sulphate
solution was applied either singly or in combination with boric acid and zinc oxide. This was not
the case in any of the other treatments. Copper was the common element in the treatments that
showed leaf scorch, therefore this indicates that copper sulphate was responsible for the leaf
scorch and that the concentration of copper sulphate was too high, leading to low yields in
copper sulphate treated tea bushes. Excessive copper accumulation triggers the production of
reactive oxygen species (Wang et al., 2004). These reactive oxygen species react with cellular
components resulting in oxidation of nucleic acids, as well as peroxidation of lipids, which leads
to enzyme inactivation, membrane disruption, mutation and untimely cell death (Halliwell &
Gutteridge, 1999). This may further explain the scorching of leaves and yield reduction observed
in copper sulphate treated plots.
Zinc is indispensable for the healthy development of the tea shoot that is plucked for
manufacture (Gondwe, 1969). Zinc is important for synthesis of RNA, protein synthesis in plants
and tryptophan which is a precursor of indole acetic acid (IAA) thereby contributing to the
growth of plants (Sharma et. al. 1992). A number of reports have indicated positive yield
response due to Zn application (Dootson, 1976, Malenga 1979, Barbora et al., 1992, Sinha et al.,
1992, Fung & Wong, 2001). Foliar applications of Zn have produced positive yield results when
Zn was applied to mature seedling tea in Malawi (Malenga, 1979, Malenga, 1986). Fung &
Wong (2001) also found a positive correlation between Zn and relative dry mass of tea plants.
Reports by Dootson (1976) indicated that Zn application led to significant yield increase in
mature Indian seedling tea. In the current study, application of Zn either as zinc oxide or as zinc
sulphate did not significantly increase yield, suggesting that the concentrations at which Zn was
applied in the study did not meet the requirements of the clonal tea bushes under study or there
was another factor limiting yield.
Gohian et al. (2000) reported an increase in yield due to increased level of foliar applied B of up
to 1 kg B ha-1year-1 applied in the form of boric acid at 0.25 % concentration. In the current
study, B applied at 776 g ha-1year-1 as boric acid at 0.1% concentration did not have an effect on
tea yields. Boric acid applied in combination with copper sulphate and zinc oxide decreased
yields significantly at Glenorchy estate and non-significantly at Mianga estate however, the

64
decrease in yield in plants treated with boric acid in combination with copper sulphate and zinc
oxide was unlikely to be as a result of boric acid.
4.1.2 Conclusion
From the results on yield, it can be concluded that application of foliar sprays containing Cu, Zn
and B used in this study significantly affected yield at Glenorchy estate but not at Mianga tea
estate. Differences in factors such as water regimes between the two sites could account for
differences in response to the foliar sprays. For instance, tea plants at Glenorchy estate which
responded to the different treatments were under irrigation, while those at Mianga which did not
give any significant response to foliar sprays were under rain-fed conditions. Under rain-fed
conditions, water may be most limiting for growth rather than nutrients.
This study has provided evidence that four applications of copper sulphate at 1% concentration
significantly reduced made tea yield in mature clonal tea. It is likely that the four applications,
applied monthly, of 1% copper sulphate solution caused an accumulation of Cu to toxic levels in
the tea plants, thereby negatively affecting yield. Excess Cu levels in plants inhibit
photosynthesis in such a way that there is an altered source-sink relationship when non-structural
carbohydrates accumulate in the source leaves due to excess Cu levels in leaves. This in turn
induces a feedback inhibition on photosynthesis (Alaoui-Sosse et al. 2004). The impact on yield
observed in the present study was a result of reduced shoot number or shoot population density
and not shoot mass. This may arise from production of insufficient photosynthates for new
growth leading to yield reduction.

65
4.2. Effect of foliar sprays of Cu, Zn and B containing fertilisers on tea quality
Quality of tea is defined based on the inherent biochemical characteristics which are reflected in
the sensory evaluation by professional tea tasters (Paul, 2008). Teas from the central and
southern parts of Africa fall within the low to medium organoleptic quality rating by
international standards (Grice, 1990, Wright et al., 2000). Unlike teas from other growing areas,
especially high altitude areas such as Kenya and other parts of India which are sold mainly for
their aroma, teas from central Africa are sold for their briskness (astringency), brightness, colour
and strength characteristics, which are mainly controlled by chemical compounds known as
theaflavins (TFs) and thearubigins (TRs) (Grice, 1990, Wright et al., 2000). Total TF content of
black tea correlates strongly with the value of the tea and brightness of black tea infusion(Hilton
& Ellis, 1972, Wright et al., 2000). Other reports have also indicated the importance of caffeine
content in the prediction of black tea quality (Cloughley, 1982, Obanda et al., 1997).
There are a number of factors that affect the quality of made tea and these include type of plant
material, climatic factors, nitrogen application levels, plucking standards, and manufacturing
practices (Cloughleyet al., 1983; Hilton & Ellis 1972). For instance, high nitrogen fertilizer rates
and poor plucking standards reduce the quality of black tea (Cloughley et al., 1983; Hilton &
Ellis 1972). Micronutrient elements, particularly Cu, have been reported to have a positive
contribution to the quality of black tea (Squire, 1977, Azam et al., 2004, Seenivasan et al., 2008).
Copper is essential for the formation of polyphenol oxidase, an important Cu and Zn containing
enzyme/catalyst in the fermentation process of black tea manufacturing (Ogunmoyela, et al.,
1994, Seenivasan et al., 2008) and its deficiencies lead to poor fermentation and subsequently
poor quality tea. In the current study, black teas from plots treated with Cu, B and Zn containing
foliar sprays were organoleptically assessed by professional tea tasters from Tea Brokers of
Central Africa and chemically evaluated for contents of TRs, TFs and caffeine.
4.2.1 Effect of foliar sprays of Cu, Zn and B on taster’s scores and valuation
Results of the tea taster’s scores obtained from Glenorchy and Mianga tea estates are presented
in Tables 4.5 and 4.6 as averages of the values obtained from each harvest between March and
June 2010.

66
Table 4. 5 Tea taster’s scores as affected by different micronutrient foliar treatments at Glenorchy estate
Parameter T1 T2 T3 T4 T5 T6 T7 Mean P0.05 CV%
Brightness 2.500b 1.583 a 1.625 a 1.500 a 1.58 a 1.33 a 1.75 a 1.7 0.003 19.6
Briskness 2.583c 2.25 bc 2.125 bc 2.00 b 1.75 ab 1.583 a 2.083 b 2.1 0.002 13.4
Colour of liquor 4.917 b 4.667 b 4.125 a 4.167 a 4.16 a 3.91 a 4.16 a 4.3 0.001 6.3
Colour ofinfusion 4.333 b 4.417 b 4.00 a 4.500 b 4.20 ab 4.33 b 4.50 b 4.3 0.02 4.4
Colour with milk 4.667 bc 4.5 abc 4.75 c 4.083 a 4.20 ab 4.08 a 4.25 abc 4.4 0.042 7.5
Strength of Liquor 4.083 ab 4.00 ab 4.00 ab 4.167b 4.00 ab 3.83a 4.08 ab 4.0 0.299 4.5
Total Score 23.08 b 21.42 ab 20.62 ab 20.25 ab 19.9 ab 19.0 a 20.8 ab 20.7 0.002 5.1
Valuation (U$c/Kg) 230.8c 214.2b 206.21ab 202.5 ab 199.2 ab 190.8a 208.3b 207.4 0.002 5.1
Note: Means accompanied by the same letters within each row are not statistically different at the 95% level of confidence.
Key for table 4.5 T1 means no spray (control) T2 means 0.1% H3BO3, T3 means 1% CuSO4.5H2O T4 means 0.1% ZnO T5 means 0.1% H3BO3 +1% CuSO4.5H2O+ 0.1% ZnO T6 means 1% Commercial mix T7 means 0.4% ZnSO4.7H2O
Treatments showed significant differences in the total taster’s scores at Glenorchy estate. Black
tea from the control treatment (T1) was given the highest total score and valued higher (23.08
and U$c 230.8/kg) compared to the rest of the treatments at Glenorchy, while the commercial
micronutrient mix gave the lowest total score and valuation (19.0 and U$c 190.8/kg
respectively). This may be due to the complexity of the mix, which apart from the micronutrient
elements also contained macronutrients such as N, P, K and Mg (1.7% N, 2.3% P, 1.6% K and
0.25% Mg). Reports have indicated that N is negatively correlated with tea quality (Wright,
2005, Owuor et.al., 2000).
Individual parameters that contributed to the difference in the total score included colour with
milk, colour of infusion, colour of liquor, briskness and brightness, while strength of liquor
remained unaffected. The control treatment scored the highest in terms of brightness and
briskness, whilst all the micronutrient treatments did not differ in brightness. The commercial

67
micronutrient mix treatment had the lowest score for briskness. The Zn treatments also differed
significantly from the control in terms of briskness.
The application of zinc oxide alone, zinc sulphate alone, copper sulphate alone and the
combination of boric acid, zinc oxide and copper sulphate reduced the score of colour of liquor
relative to the control treatment (T1), while boric acid maintained the colour of liquor. With
respect to colour of infusion, the highest score was obtained from tea plants receiving
applications of zinc oxide alone or zinc sulphate alone, but was not significantly different to the
control and boric acid, and commercial micronutrient mix treatments. The lowest score was
obtained from application of copper sulphate alone. The scores on how well the processed leaf
takes up milk (colour with milk) were significantly lower than the control in plots which
received zinc oxide alone and the commercial micronutrient mix.
Table 4. 6 Tea taster’s scores as affected by different micronutrient foliar treatments at Mianga estate
Parameter T1 T2 T3 T4 T5 T6 T7 Mean P0.05 CV%
Brightness 3.000 b 2.688 b 2.188 ab 2.14 ab 1.93a 2.75 b 2.60 b 2.5 0.016 16.5
Briskness 3.15 a 3.00 a 2.67 a 2.46 a 2.15 a 2.85 a 2.75 a 2.7 0.394 23.5
Colour of liquor 4.583ab 4.750 ab 4.833 b 4.58 ab 4.31 a 4.45 ab 4.37 ab 4.6 0.169 6.3
Colour of infusion 4.729 a 4.812 a 4.438 a 4.72 a 4.54 a 4.60 a 4.66 a 4.6 0.625 6.4
Colour with milk 5.000 b 4.875 ab 4.667 ab 4.58 ab 4.31 a 4.64 ab 4.56 ab 4.7 0.291 8.3
Strength of Liquor 4.208 a 4.375 a 4.125 a 4.20 a 4.22 a 4.45 a 4.25 a 4.3 0.638 6.3
Total Score 24.67 b 24.50 b 22.92 ab 22.7 ab 21.4 a 23.7 ab 23.2 ab 23.3 0.109 6.6
Valuation (U$c/Kg) 246.7 b 245.0 b 229.2 ab 227.1 ab 214.8 a 236.0 ab 232.1 ab 233.3 0.119 6.7
Note: Means accompanied by the same letters within each row are not statisticallydifferent at the 95% level of confidence.
Key for table 4.6 T1 means no spray (control), T2 means 0.1% H3BO3, T3 means 1% CuSO4.5H2O T4 means 0.1% ZnO T5 means 0.1% H3BO3 +1% CuSO4.5H2O+ 0.1% ZnO T6 means 1% Commercial mix T7 means 0.4% ZnSO4.7H2O
68
At Mianga estate, the treatment combination of boric acid, copper sulphate and zinc oxide
resulted in a significant lower total score and valuation of made tea quality than the control
treatment.This lower total score can be attributed to significantly lower brightness and colour
with milk scores as compared to the control treatment. No other significant differences in total
scores were noted for the various treatments at Mianga estate when compared with the control.
Generally, foliar applications of Cu, Zn and B significantly reduced the tea taster’s scores and
valuation at Glenorchy tea estate but did not significantly affect these parameters at Mianga
estate. This implies that there was no quality benefit in applying sprays of Cu, Zn and B to
mature clonal tea in this study. In many instances both a reduction in yield and quality were
observed which suggests that in the short term micronutrient applications were detrimental for
tea production.
Only brightness varied significantly across treatments. Brightest tea was obtained from the
control treatment(T1), boric acid applied alone(T2), zinc sulphate applied alone(T6) and from the
plots treated with the commercial micronutrient mix, (T7). A combined application of copper
sulphate, boric acid and zinc oxide (T5) produced the least bright tea while copper sulphate (T3)
and zinc oxide(T4) applied separately produced medium bright tea.
4.2.2 Effect of foliar sprays of Cu, Zn and B on contents of theaflavin, thearubigin and
caffeine
Results on biochemical parameters of made black tea as affected by foliar micronutrient
treatments at Glenorchy and Mianga estates are presented in tables 4.7 and 4.8 as averages of the
values obtained from each harvest between March and June 2010.

69
Table 4. 7 Biochemical parameters of made tea as affected by different treatments at Glenorchy estate
Parameter T1 T2 T3 T4 T5 T6 T7 Mean P CV%
Caffeine (% w/w) 3.58a 3.46a 3.75a 3.64a 3.85a 3.70a 3.58a 3.65 0.755 9.4
Theaflavins (% w/w) 0.63 a 0.59 a 0.55 a 0.59 a 0.54a 0.59a 0.63a 0.59 0.162 8.6
Thearubigins (% w/w) 7.76 a 8.23 abc 8.15 ab 8.10ab 8.30 abc 8.36bc 8.73c 8.23 0.027 4.0
TR/TF ratio 12.45 a 14.06 ab 15.05 b 14.50b 15.38 b 14.31b 14.38b 14.30 0.052 8.1
Table 4. 8 Biochemical parameters of made tea as affected by different treatments at Mianga estate
Parameter T1 T2 T3 T4 T5 T6 T7 Mean P CV%
Caffeine (% w/w) 3.43a 3.44a 3.22a 3.26a 3.45a 3.25a 3.24a 3.33 0.602 7.1
Theaflavins (%w/w) 0.62a 0.62a 0.59a 0.57a 0.57a 0.61a 0.60a 0.60 0.369 6.4
Thearubigins (%w/w) 7.95a 8.51bc 8.23ab 8.69bc 8.43bc 8.86c 8.48bc 8.45 0.010 3.5
TR/TF ratio 12.81a 13.65ab 14.05bc 15.12c 14.85c 14.55bc 14.28bc 14.19 0.006 5.2
Note: Means accompanied by the same letters within each row are not statistically different at 95% level of confidence.
Key for tables 4.7 and 4.8 T1 means no spray (control) T2 means 0.1% H3BO3, T3 means 1% CuSO4.5H2O T4 means 0.1% ZnO T5 means 0.1% H3BO3 +1% CuSO4.5H2O+ 0.1% ZnO T6 means 1% Commercial mix T7 means 0.4% ZnSO4.7H2O
Among the biochemical parameters i.e. caffeine, theaflavins (TFs) and thearubigins (TR), only
levels of TRs varied significantly with treatments at both sites. At Mianga, the control treatment
resulted in teas with the lowest level of TRs (7.95%), which was significantly different to the
plots receiving a combined application of boric acid, copper sulphate and zinc oxide (T5); the
commercial micronutrient mix (T6); zinc sulphate applied alone (T7); boric acid applied alone
(T2) and zinc oxide applied alone (T4). Tea produced from plots which received an application
of copper sulphate alone (T3) did not differ from the control (T1) with respect to TRs. Similarly,
at Glenorchy, the control treatment (T1) produced tea with the lowest TR level (7.76%), while

70
zinc sulphate (T7) gave the highest TR levels(8.73%). Zinc sulphate applied alone (T7) and the
commercial micronutrient mix (T6) had significantly higher TR levels than the control (T1).
Although the biochemical properties of the tea obtained from the trials varied slightly between
sites, with regards TR content, it was obvious that the lowest level of TRs was obtained in the
control treatment at both sites. The amount of TFs in made tea is responsible for the brightness
(the quality aspect responsible for a clear appearance of liquor and coppery colour as opposed to
dull colour) and briskness (the degree of pungency in liquor), while TRs are responsible for
colour of the infusion (Owuor & Reeves 1986). The level of TRs is inversely related to the
brightness of the liquor (Owuor et al., 2006) and results obtained from this study confirm these
findings, whereby a higher score on brightness was obtained in the control treatments at both
sites, where TR levels were the lowest. The ratio of TRs: TFs was subsequently lower in the
control treatments than where micronutrient foliar sprays were applied. This suggests that
application of the micronutrient sprays, especially zinc oxide and copper sulphate aided in the
conversionof more TRs than TFs from catechins and flavanols present in the processed green
shoots during the fermentation process. According to Owuor & Reeves (1986), at the beginning
of fermentation, the rate at which TRs and TFs are formed is similar but at later stages of
fermentation, the rate of TR formation surpasses that of TFs and possibly some TFs are
converted to TRs. This further indicates that micronutrients applied in this study aided in
prolonging the process of TR formation which was reflected in tasters score on brightness.
Application of Cu to tea plants helps in improving the fermentation of the plucked leaf during
manufacture, more especially for slow fermenting cultivars (Dootson 1976, Clowes & Mitini-
Nkhoma 1987). Work done by Dootson (1976) indicated that Zn and Cu application to seedling
tea increased the levels of total catechins, total flavins, as well as polyphenol oxidase levels in
tea leaves. Polyphenol oxidase is the enzyme which catalyses the transformation of polyphenols
(catechins and flavanols) to TFs and TRs during the fermentation process of black tea (Owuor &
Reeves, 1986). The availability and activity of polyphenol oxidase, of which Zn and Cu form
vital components, is therefore an important factor in the formation of TRs and TFs (Ogunmoyela,
et al., 1994). In the current study, levels of TRs were significantly increased when micronutrient
foliar sprays of Cu, Zn as well as B were applied, with greater increases observed when Zn and
Cu were applied as zinc oxide and copper sulphate respectively. Both cultivars investigated in

71
the current study (PC 108 and PC 105) are inherently fast fermenting cultivars (TRFCA,2000)
and addition of Zn and Cu could have sped up the fermentation process, leading to further TFs
being converted to TRs. This could explain why less TRs were observed in the control treatments
than in treatments where micronutrients were applied.
Leaf Cu was found to correlate positively with total phenol and tannin content of tea samples of
Nigerian tea, while the relationship between foliar Zn and total phenol content was non-
significant (Ogunmoyela et al., 1994). Dev Chaudhury et al. (1989) reported no significant
effects of Zn on TF content in tea and the current study’s results are in agreement with these
findings. A positive correlation was found between Zn and catechins, and Zn and caffeine
contents in tea leaves (Ramrakrishna et al., 1987), however, results from the present study show
that caffeine and TF contents in black tea were not affected by the application of Cu, Zn and B
containing sprays used. It is possible that some of the TFs were being converted to TRs which
could explain why differences in the level of TRs were observed, with no difference in TF levels
(Owuor & Reeves (1986). Rahman & Sharma (1974) also reported no significant effect of Zn
foliar sprays on strength, briskness and valuation of orthodox teas.
Altitude is another important factor that determines the quality of made tea. According to Owuor
et.al. (1990), as altitude increases, the quality of made tea improves. This is attributed to the slow
growth rate of teas grown in high altitude areas which is mainly associated with low
temperatures leading to increases the accumulation of catechins and flavanols in the shoots. This
agrees well with what was observed in this study whereby the two sites which have different
altitudes performed differently in their responses to application of micronutrients. Additionally,
long term temperature data indicates that temperatures are lower in Thyolo district where Mianga
is located than in Mulanje district where Glenorchy is located. In this study, Mianga which is at
an altitude of 960 metres above sea levelwith lower temperature generally produced black tea of
higher quality in terms of concentration of TFs and TRs, total score and valuation than
Glenorchy, which is at 650 metres above sea level and with higher temperatures. It is probable
that no treatment differences were observed at Mianga because the altitude had a greater impact
on the black tea quality than the micronutrient elements that were applied.

72
4.2.3 Conclusion
Although a number of researchers have indicated a positive impact due to application of Cu and
Zn on the quality of tea (Squire, 1977, Malenga, 1986, Grice, 1990, Seenivasan et al., 2008),
results obtained in this study have shown a reduction in total taster’s scores and valuation as a
result of Zn and Cu application at Glenorchy estate, while having no significant effect on the
taster’s scores and valuation at Mianga estate.
Zinc and Cu form vital components of the enzyme, polyphenol oxidase, which catalyses the
fermentation process during black tea manufacture which leads to formation of TRs and TFs,
important chemical parameters that determine the quality of black tea (Ogunmoyela, et al.,
1994). Application of Cu, Zn and B in the current study significantly increased levels of TRs
with greater increases observed when Zn and Cu were applied as zinc oxide and copper sulphate
respectively. The study has also shown that micronutrient sprays containing B, Cu and Zn
possibly aided in the conversion of catechins and flavanols present in green leaf to more TRs
than TFs leading to less bright tea and a lower valuation. Levels of caffeine and TFs remained
unaffected by the micronutrient foliar sprays.
The two sites responded differently in terms of taster’s scores and valuation to the application of
Cu, Zn and B micronutrient sprays. This may be due to site differences especially due to the fact
that tea plants at Glenorchy were irrigated and those at Mianga were growing under rainfed
conditions. In addition, the two sites differ in altitude and the higher taster’s scores obtained
from Mianga may to some extent be attributed to the effect of higher altitude and lower
temperatures as compared to low taster’s scores that were obtained at Glenorchy whose altitude
is lower and temperatures possibly higher. It may be for this reason that no significant effect of
application of Cu, Zn and B on black tea quality was observed at Mianga because the altitude
effect was so great that it obscured the effect that the micronutrient elements would have. In
addition, it may take an additional season of micronutrient applications before significant
differences will be observed in the metabolites.

73
4.3 Effect of foliar sprays of Cu, Zn and B containing fertilisers on tea foliar nutrient
levels
The major avenue of nutrient loss from tea fields is plucking, which is a continuous process.
Nitrogen, P and K are the major elements that are significantly removed from the tea plantations
through continuous cropping and B, Cu and Zn are among the micronutrient elements that are
removed in smaller quantities (Kamau, 2008). In Malawi, removal of micronutrient elements
through plucking is not followed by an organised replacement plan, hence the likelihood of
occurrence of micronutrient deficiencies in Malawian tea fields is great.
Application of nutrients through foliar sprays is one way of supplying plants with elements to
ensure good plant health, especially in the case of micronutrient elements such as B, Zn and Cu
that are required in very small quantities. Foliar applicationsare more applicable and efficient
than soil applications, especially when soil factors are prohibitive to efficient uptake of soil
applied nutrient elements. It is suggested to be the fastest way of raising nutrient element levels
in deficient plants (Majid &Ballard, 1990).
Copper, Zn and B interact with some of the macronutrients, as well as micronutrient elements.
Nutrient interaction has been reported between Cu and N. Zekri & Obreza (2009) observed Cu
deficiencies in citrus plants where heavy applications of ammonium fertilisers have been made.
The concentration of Fe increased in leaves treated with 50 µM Cu by 1.4 fold, while Zn
concentration was lowered by 1.2 fold in soybeans at the same Cu concentration (Bernal et al.,
2007), indicating that its levels of application can induce toxicities or deficiencies of other
elements within the plant systems. Labanauskas et al. (1958) observed low levels of Zn, B and
Cu in leaves of avocados when N was applied at high rates as ammonium nitrate. Zn interacts
negatively with P, but positively with Fe, such that increasing Zn supply increases the Fe status
of the plants (Alloway, 2008).
In the present study, elemental analysis of leaf samples was performed to ascertain if the
application of different Cu, Zn and B containing foliar sprays to deficient tea bushes could raise
the levels of Cu, B and Zn in tea leaves to recommended levels and also to establish the effect of
applying the foliar sprays on leaf concentrations of Al, S, N, P, K, Ca, Mg and Fe to elucidate
any possibility of Cu, Zn and B interactions with any of these elements. In order to assess the

74
nutrient status of soils in the experimental plots, laboratory analysis of soil samples collected
from the plots was also performed. Results of the initial soil nutrient analyses are presented in
Table 4.9.
Table 4. 9 Nutrient status and other soil characteristics for the two sites at the beginning of the trials before foliar spraying (Mean values of soil samples collected at 0-15cm and 30-45cm depths)
Soil characteristic Mianga Glenorchy pH 4.9 ± 0.1 4.9 ± 0.1
Carbon (%) 2.0 ± 0.1 2.6 ± 0.1
Ash (%) 87.8 ± 0.5 83.2 ± 1.2
N (%) 0.1 ± 0 0.1 ± 0
CEC (cmol(+)kg-1) 17.3 ± 4.3 23.2 ± 10.7
P (mg kg-1) 51.1 ± 0.6 84.6 ± 7.8
K (mg kg-1) 243 ± 7.1 187.0 ± 1.4
Ca (mg kg-1) 502.0 ± 12.7 373.0 ± 5.7
Mg (mg kg-1) 123.0 ± 2.8 76.5 ± 0.7
Na (mg kg-1) 13.5 ± 0.7 61.5 ± 3.5
Al (mg kg-1) 432.3 ± 19.7 463.8 ± 13.4
B (mg kg-1) 0.2 ± 0 0.8 ± 0.1
Zn (mg kg-1) 2.3 ± 0.2 3.7 ± 0.2
Cu (mg kg-1) 17.1 ± 0.4 39.4 ± 0.2
Fe (mg kg-1) 93.0 + 5.2 64.1 ± 3.3
Mn (mg kg-1) 217 ± 9.4 112.1 ± 9.4
At the beginning of the trials, the soils at both sites had a pH of 4.9, which is within the
recommended pH range for tea production (Willson& Gunther, 1981,De Silva 2007). The
concentration of B at both sites was at deficient levels, below the threshold value of 1.0 mg kg -
1(Willson& Gunther, 1981). Deficiencies of B revealed by the leaf analysis conducted by Estates
as reported in Chapter 2.3 might originate from the fact that the soil was already B deficient and
could not supply enough B to the tea plants. There was sufficient Zn in the soil at both sites,
within the range (2-15 mg kg-1)(Willson& Gunther, 1981), while Cu levels were above the
sufficient range of 3-10 mg kg-1(Willson& Gunther, 1981). Cu and Zn deficiencies observed in
the leaves, as reported in Chapter 2, might be due to soil factors, such as organic matter content
in the soil, that reduced the plants’ ability to absorb Cu and Zn from the soil. The tendency of Cu
and Zn to bind to organic matter fractions has been widely reported and this may explain the
reported deficiencies in the tea leaves (Fernandes & Henriques, 1991, Saha et al., 1999, Alva et

75
al., 2000, Zhang et.al., 2006). Tea soils are known to contain high levels of organic matter, but
unfortunately the organic matter content of the soils from the experimental plots could not be
analysed.
4.3.1 Levels of Cu, Zn and B in leaves of tea bushes treated with different foliar sprays
Changes in leaf micronutrient concentrations were noticeable and significant differences were
found after three applications at both sites. Results of concentration of Cu, Zn and B in tea leaves
treated with foliar sprays at Mianga and Glenorchy tea estates are presented in Table 4.10.
Table 4. 10 Foliar levels of Cu, Zn and B as affected by the foliar sprays at Mianga and Glenorchy estates
Treatment B (mg/kg) Cu (mg/kg) Zn (mg/kg)
Mianga Glenorchy Mianga Glenorchy Mianga Glenorchy T 1 No treatment 7.6a 9.34b 10.4b 9.5b 23.3c 21.9d
T 2 0.1% H3BO3 23.3a 20.9a 10.7b 10.2b 20.7c 18.0d
T 3 1% CuSO4.5H2O 14.4a 16.3ab 215.8a 217.8a 22.3c 18.7d
T 4 0.1% ZnO 8.7a 11.5b 36.6b 12.9b 54.7b 64.3b
T 5 0.1% H3BO3 +1%
CuSO4.5H2O+ 0.1% ZnO
16.0a 16.7ab 196.7a 207.2a 77.3a 39.9c
T 6 1% Commercial mix 19.3a 15.9ab 16.5b 11.8b 27.7c 21.0d
T 7 0.4% ZnSO4.7H2O 14.2a 11.9b 13.4b 10.9b 85.8a 100.4a
P value 0.2789 <0.0001 0.009 <0.0001 <0.0001 <0.0001
CV (%) 65.5 36.6 24.9 68.4 32.7 18.1
NOTE: Means with the same letters within each column are not statistically different at 95% level of
confidence
Concentration of B in leaves was not significantly different among the treatments at Mianga
estate, although levels tended to be higher in plants treated with B, either alone or mixed with
other micronutrients. Concentration of foliar B ranged from 7.6 to 23.3 mg kg-1 at Mianga. At
Glenorchy, leaf B concentration was significantly affected by the treatments (P= <0.0001). Plots
treated with boric acid alone gave the highest B concentration (20.9 mg kg-1) compared to the
control. At both experimental sites, B levels in all treatments, including those containing B, were
lower than the threshold value of 30 mg kg-1. It is therefore likely that the foliar concentration of
B attained by the tea bushes treated with boric acid and the commercial micronutrient mix was

76
too low to cause a significant yield increase. Further foliar applications of B or higher B
application rates than 776 g ha-1yr-1 would thus be required to cause a significant yield increase.
Concentration of Cu varied significantly across treatments at both sites. Application of copper
sulphate at 17.7 kg Cu ha-1 yr-1 alone (T3) and a combined application of copper sulphate, boric
acid and zinc oxide which supplied 17.7 kg Cu ha-1 yr-1(T5) raised the foliar concentration of Cu
to a greater extent than the other treatments at both sites. At Mianga estate, concentration of Cu
in leaves from T3 (1% copper sulphate, 17.7 kg Cu ha-1 yr-1)and T5 [(0.1% boric acid, 1%
copper sulphate solution, 1.25kgha-1 zinc oxide[(17.7kg Cuha-1 yr-1) plots was 215.8mg kg-1 and
196.7 mg kg-1respectively and at Glenorchy, Cu concentration in leaves from T3 [(1% copper
sulphate (17.7 kg Cu ha-1 yr-1) and T5 [(0.1% boric acid, 1% copper sulphate solution, 1.25kgha-1
zinc oxide (17.7kg Cuha-1 yr-1) plots was 217.8mg kg-1 and 207.2mg kg-1 respectively. These Cu
levels in T3 and T5 plots seem to be too high and there was probably too much Cu in these
treatments which caused toxicity problems which led to reduced yields in T3 and T5 plots. The
recommended levels for Cu in tea is >15 mg kg-1 but leaves from T3 and T5 registered far higher
levels of Cu compared to the rest of the treatments. According to Fageria (2001), excess Cu has
destructive effects on the integrity of the chloroplast membrane thereby decreasing the plant’s
photosynthetic activity.
Concentration of Cu in leaves from plots that were treated with the commercial micronutrient
mix, which supplied 32.5 g Cu ha-1 yr-1 did not differ significantly from the plots which were not
treated with any Cu containing spray at both sites. Cu concentration of leaves sampled from plots
treated with the commercial micronutrient mix at Mianga was 16.5 mg kg-1i.e. slightly above the
recommended minimum level of 15 mg kg-1 for tea and 11.8 mg kg-1 at Glenorchy which was
slightly below the recommended minimum Cu concentration. Leaf samples collected from
treatments at both sites which did not receive any Cu generally had Cu levels at or just below the
recommended level. It was generally observed that the concentration of Cu applied in T3
(Copper sulphate) and T5 (Copper sulphate + Zinc oxide +boric acid) was far too high compared
to that applied in T6 (commercial micronutrient mix) which was closer to the optimal
concentration for tea.

77
Foliar sprays had a significant effect on concentration of Zn in leaves that received the different
foliar sprays. At Mianga estate, concentration of Zn was highest (85.8 mg Zn kg-1) in plots
supplied with zinc sulphate (T 7), followed by those treated with a combination of zinc oxide,
copper sulphate and boric acid (T 5) with a concentration of 77.3 mg Zn kg-1 and those treated
with zinc oxide only (T 4) which gave a foliar Zn concentration of 54.7 mg kg-1. However, T6
(commercial micronutrient mix) was not significantly different from the treatments not receiving
any Zn and had a Zn concentration below 30 mg kg-1, the recommended foliar Zn concentration
for tea. At Glenorchy estate, zinc sulphate treatment (T7) gave the highest foliar Zn
concentration (100.4 mg kg-1), followed by zinc oxide applied alone (T 4) which gave a foliar
concentration of 64.3 mg kg-1 and then a combination of zinc oxide, copper sulphate and boric
acid which gave a foliar Zn concentration of 39.9 mg kg-1. The control treatment, T2 (boric acid),
T3 (copper sulphate) and T6 (commercial micronutrient mix) had Zn concentrations below the
recommended Zn level. The commercial micronutrient spray supplied 97 g of Zn ha-1 yr-1 and its
application did not raise the foliar Zn content to the recommended level at both sites. Amongst
the Zn containing sprays used in the study, zinc sulphate and zinc oxide were effective at raising
the foliar Zn concentration. As with Cu it is likely that the concentration at which the
commercial micronutrient mix was applied was too low to supply the right amount of Zn,
although at Mianga foliar Zn concentration was close to the recommended norm.
4.3.2 Foliar concentration of other nutrient elements
Analytical results of leaf samples for nutrient elements, other than B, Zn and Cu, which included
N, P, K, S, Ca, Mg, Al, Fe and Mn, revealed that concentration of Al and S varied significantly
among treatments, while the rest of the elements did not vary significantly at Glenorchy estate,
(Table 4.11), while at Mianga estate, none of these were significantly affected by the treatments
(Table 4.12).
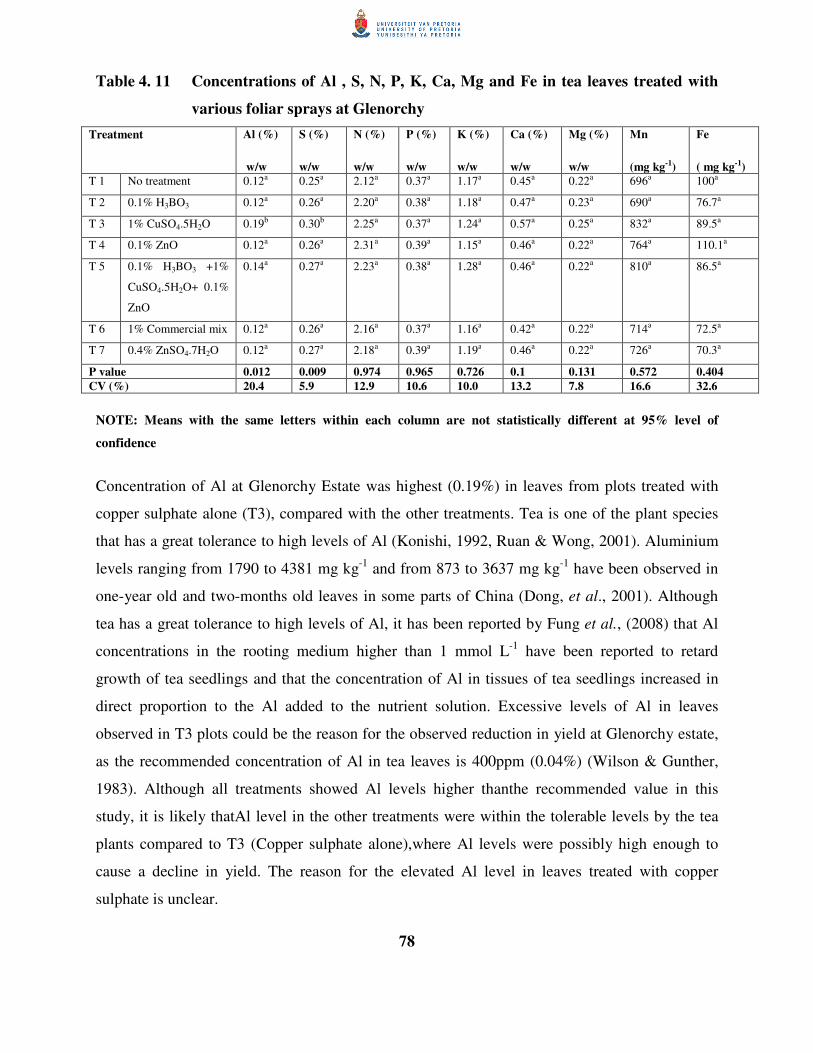
78
Table 4. 11 Concentrations of Al , S, N, P, K, Ca, Mg and Fe in tea leaves treated with
various foliar sprays at Glenorchy
Treatment Al (%)
w/w
S (%)
w/w
N (%)
w/w
P (%)
w/w
K (%)
w/w
Ca (%)
w/w
Mg (%)
w/w
Mn
(mg kg-1)
Fe
( mg kg-1) T 1 No treatment 0.12a 0.25a 2.12a 0.37a 1.17a 0.45a 0.22a 696a 100a
T 2 0.1% H3BO3 0.12a 0.26a 2.20a 0.38a 1.18a 0.47a 0.23a 690a 76.7a
T 3 1% CuSO4.5H2O 0.19b 0.30b 2.25a 0.37a 1.24a 0.57a 0.25a 832a 89.5a
T 4 0.1% ZnO 0.12a 0.26a 2.31a 0.39a 1.15a 0.46a 0.22a 764a 110.1a
T 5 0.1% H3BO3 +1%
CuSO4.5H2O+ 0.1%
ZnO
0.14a 0.27a 2.23a 0.38a 1.28a 0.46a 0.22a 810a 86.5a
T 6 1% Commercial mix 0.12a 0.26a 2.16a 0.37a 1.16a 0.42a 0.22a 714a 72.5a
T 7 0.4% ZnSO4.7H2O 0.12a 0.27a 2.18a 0.39a 1.19a 0.46a 0.22a 726a 70.3a
P value 0.012 0.009 0.974 0.965 0.726 0.1 0.131 0.572 0.404
CV (%) 20.4 5.9 12.9 10.6 10.0 13.2 7.8 16.6 32.6
NOTE: Means with the same letters within each column are not statistically different at 95% level of
confidence
Concentration of Al at Glenorchy Estate was highest (0.19%) in leaves from plots treated with
copper sulphate alone (T3), compared with the other treatments. Tea is one of the plant species
that has a great tolerance to high levels of Al (Konishi, 1992, Ruan & Wong, 2001). Aluminium
levels ranging from 1790 to 4381 mg kg-1 and from 873 to 3637 mg kg-1 have been observed in
one-year old and two-months old leaves in some parts of China (Dong, et al., 2001). Although
tea has a great tolerance to high levels of Al, it has been reported by Fung et al., (2008) that Al
concentrations in the rooting medium higher than 1 mmol L-1 have been reported to retard
growth of tea seedlings and that the concentration of Al in tissues of tea seedlings increased in
direct proportion to the Al added to the nutrient solution. Excessive levels of Al in leaves
observed in T3 plots could be the reason for the observed reduction in yield at Glenorchy estate,
as the recommended concentration of Al in tea leaves is 400ppm (0.04%) (Wilson & Gunther,
1983). Although all treatments showed Al levels higher thanthe recommended value in this
study, it is likely thatAl level in the other treatments were within the tolerable levels by the tea
plants compared to T3 (Copper sulphate alone),where Al levels were possibly high enough to
cause a decline in yield. The reason for the elevated Al level in leaves treated with copper
sulphate is unclear.
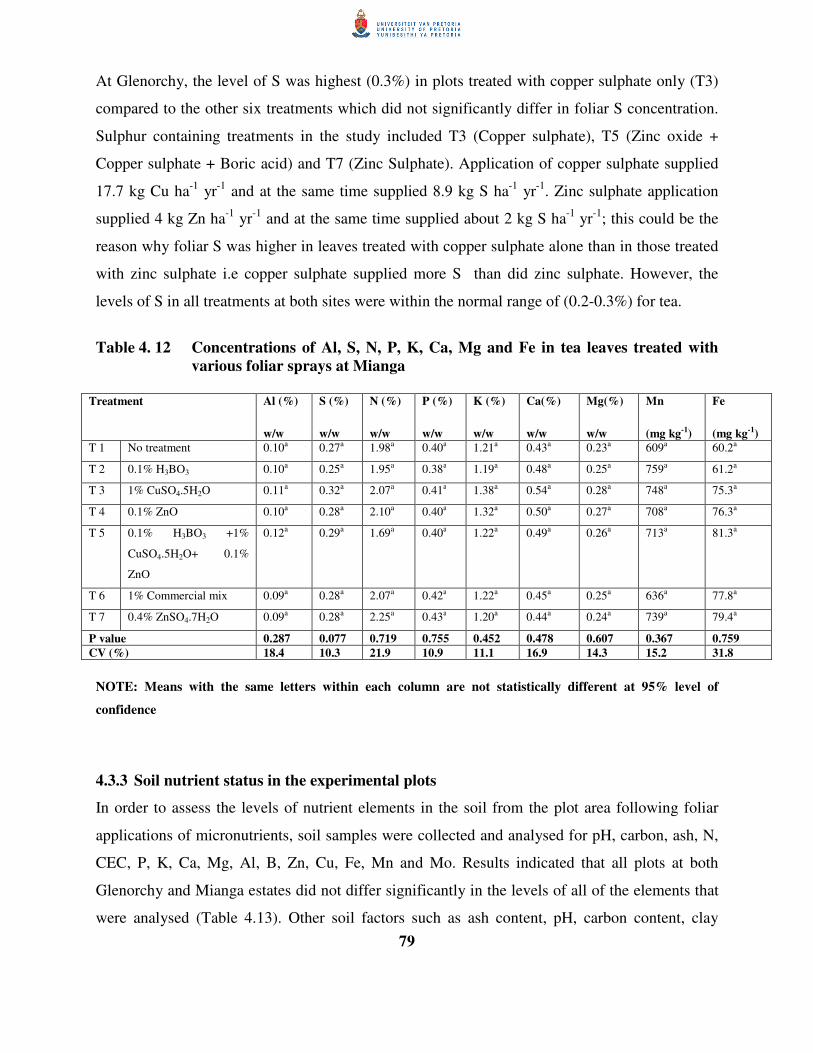
79
At Glenorchy, the level of S was highest (0.3%) in plots treated with copper sulphate only (T3)
compared to the other six treatments which did not significantly differ in foliar S concentration.
Sulphur containing treatments in the study included T3 (Copper sulphate), T5 (Zinc oxide +
Copper sulphate + Boric acid) and T7 (Zinc Sulphate). Application of copper sulphate supplied
17.7 kg Cu ha-1 yr-1 and at the same time supplied 8.9 kg S ha-1 yr-1. Zinc sulphate application
supplied 4 kg Zn ha-1 yr-1 and at the same time supplied about 2 kg S ha-1 yr-1; this could be the
reason why foliar S was higher in leaves treated with copper sulphate alone than in those treated
with zinc sulphate i.e copper sulphate supplied more S than did zinc sulphate. However, the
levels of S in all treatments at both sites were within the normal range of (0.2-0.3%) for tea.
Table 4. 12 Concentrations of Al, S, N, P, K, Ca, Mg and Fe in tea leaves treated with various foliar sprays at Mianga
Treatment Al (%)
w/w
S (%)
w/w
N (%)
w/w
P (%)
w/w
K (%)
w/w
Ca(%)
w/w
Mg(%)
w/w
Mn
(mg kg-1)
Fe
(mg kg-1) T 1 No treatment 0.10a 0.27a 1.98a 0.40a 1.21a 0.43a 0.23a 609a 60.2a
T 2 0.1% H3BO3 0.10a 0.25a 1.95a 0.38a 1.19a 0.48a 0.25a 759a 61.2a
T 3 1% CuSO4.5H2O 0.11a 0.32a 2.07a 0.41a 1.38a 0.54a 0.28a 748a 75.3a
T 4 0.1% ZnO 0.10a 0.28a 2.10a 0.40a 1.32a 0.50a 0.27a 708a 76.3a
T 5 0.1% H3BO3 +1%
CuSO4.5H2O+ 0.1%
ZnO
0.12a 0.29a 1.69a 0.40a 1.22a 0.49a 0.26a 713a 81.3a
T 6 1% Commercial mix 0.09a 0.28a 2.07a 0.42a 1.22a 0.45a 0.25a 636a 77.8a
T 7 0.4% ZnSO4.7H2O 0.09a 0.28a 2.25a 0.43a 1.20a 0.44a 0.24a 739a 79.4a
P value 0.287 0.077 0.719 0.755 0.452 0.478 0.607 0.367 0.759
CV (%) 18.4 10.3 21.9 10.9 11.1 16.9 14.3 15.2 31.8
NOTE: Means with the same letters within each column are not statistically different at 95% level of
confidence
4.3.3 Soil nutrient status in the experimental plots
In order to assess the levels of nutrient elements in the soil from the plot area following foliar
applications of micronutrients, soil samples were collected and analysed for pH, carbon, ash, N,
CEC, P, K, Ca, Mg, Al, B, Zn, Cu, Fe, Mn and Mo. Results indicated that all plots at both
Glenorchy and Mianga estates did not differ significantly in the levels of all of the elements that
were analysed (Table 4.13). Other soil factors such as ash content, pH, carbon content, clay

80
contents and CEC did not show any significant differences among the treatments. These results
show that application of foliar sprays of Cu, Zn and B did not change the properties of soil.
There were differences between the sites in some soil factors before and after treatments were
applied and there were also differences in the manner in which the soil factors changed between
the two sites. These changes may be responsible for the differences in the yield performance of
the plants at the two sites. Considering N, P and K, which are the major nutrient elements
important in tea productivity, N level in soils from both sites were similar, at a concentration of
0.1% (1000 mg kg-1) before treatments were applied at the beginning of the trial and remained
constant even after applying the treatments. Tea soils have to contain at least 50 mg kg-1 of N in
order to achieve optimum yields (Willson & Gunther, 1981) and both fields in this study had
sufficient levels of N throughout the trial period. However, differences were noted in levels of P,
whereby soil P levels at Mianga were far much lower than at Glenorchy. Initially, soil P level at
Mianga and Glenorchy were 51.1 mg kg-1 and 84.6mg kg-1 respectively which were normal for
tea production but after application of the treatments, the soil P level at Mianga was depleted to
levels below the norm (50mg kg-1) while at Glenorchy, the soil P level remained almost constant
at 83.43 mg kg-1. The K levels at Mianga were higher than at Glenorchy before and after
applying the treatments. At both sites, soil K levels were above the recommended for tea
production which is 1 meq/kg (39.1 mg K kg-1). Differences in yields between the two sites
could therefore possibly be attributed to an imbalance in the N, P and K levels in the soil. It is
possible that there was an imbalance among N, P and K levels in the soils at Mianga that was
leading to low yields at this site and it could be the low P level which contributed to the N, P and
K imbalance.

81
Table 4. 13 Soil pH and contents of N, P, K, Ca, Mg, Al, B, Zn, Cu, Fe, Mn, Mo, ash, carbon and clay in soils from the experimental plots samples collected in May 2010
Glenorchy
T1 T2 T3 T4 T5 T6 T7 Mean P 0.05 CV%
Al (mg/kg) 528.9 536.5 521.2 571.3 575.1 540.5 556.9 547.20 0.69 13.4
Ash % 80.07 80.71 80.68 80.63 79.99 80.28 81.61 80.57 0.88 3.00
B (mg/kg) 0.61 0.75 0.68 0.62 0.60 0.57 0.56 0.63 0.19 24.60
CEC (cmol/kg) 25.86 21.19 25.25 24.45 22.95 24.26 23.34 23.90 0.53 19.90
Carbon % 2.70 2.60 2.54 2.64 2.63 2.49 2.58 2.60 0.76 10.50
Ca (mg/kg) 471.00 377.00 392.00 333.00 309.00 353.00 418.00 379.00 0.26 35.20
Clay (%) 31.77 34.10 37.12 33.49 36.67 35.59 36.71 35.06 0.28 36.71
Cu (mg/kg) 33.60 42.90 26.60 33.30 38.50 27.70 39.00 34.51 0.38 47.00
Fe (mg/kg) 63.20 67.50 60.00 67.60 70.00 62.00 73.20 66.21 0.14 15.20
K (mg/kg) 152.00 161.80 174.40 133.50 149.00 158.90 162.40 156.00 0.85 35.10
Mg (mg/kg) 87.40 75.40 77.50 66.10 55.10 65.90 82.90 72.90 0.32 39.20
Mn (mg/kg) 74.70 63.40 68.90 62.00 88.90 63.10 78.80 71.40 0.18 31.40
Mo (mg/kg) 0.01 0.01 0.01 0.01 0.01 0.02 0.01 0.01 0.05 40.30
N (%) 0.13 0.12 0.13 0.12 0.13 0.13 0.14 0.13 0.90 26.60
P (mg/kg) 80.10 81.70 64.80 90.30 92.20 81.10 93.80 83.43 0.34 10.20
Zn (mg/kg) 3.47 4.90 3.11 4.03 4.84 3.62 3.73 3.96 0.53 52.40
pH 4.91 4.98 4.61 4.76 4.71 4.90 4.83 4.81 0.43 5.40
Mianga
Al (mg/kg) 288.90 335.40 347.60 280.40 298.40 287.50 372.10 315.76 0.12 23.60
Ash % 85.81 90.22 89.36 89.62 89.53 89.56 89.24 89.05 0.40 4.50
B (mg/kg) 0.44 0.42 0.41 0.36 0.41 0.39 0.38 0.40 0.87 31.60
CEC (cmol/kg) 19.45 19.10 19.91 19.15 16.65 18.75 19.73 18.96 0.79 22.70
Carbon % 1.54 1.59 1.80 1.43 1.59 1.48 1.61 1.58 0.70 26.40
Ca (mg/kg) 682.00 566.00 606.00 480.00 542.00 549.00 512.00 562.43 0.59 37.60
Clay (%) 30.16 28.76 30.39 33.53 29.91 32.34 33.31 31.20 0.55 18.20
Cu (mg/kg) 5.49 5.56 6.02 6.22 6.10 4.97 6.17 5.79 0.11 16.60
Fe (mg/kg) 95.80 89.90 102.60 95.20 108.00 81.10 105.70 96.90 0.53 29.70
K (mg/kg) 319.10 262.90 285.40 250.50 282.40 288.80 275.00 280.59 0.53 25.40
Mg (mg/kg) 157.20 130.40 151.90 128.00 128.90 146.10 123.90 138.06 0.67 33.20
Mn (mg/kg) 290.00 278.00 298.00 254.00 287.00 245.00 283.00 276.43 0.87 31.00
Mo (mg/kg) 0.02 0.02 0.03 0.03 0.03 0.02 0.02 0.02 0.67 30.60
N (%) 0.10 0.10 0.11 0.08 0.10 0.09 0.09 0.10 0.29 25.30
P (mg/kg) 20.00 23.80 23.30 14.80 25.40 19.90 23.10 21.47 0.80 65.90
Zn (mg/kg) 1.25 1.49 1.59 1.16 1.51 1.09 1.14 1.32 0.66 53.60
pH 5.18 5.13 5.05 5.00 5.01 5.09 4.94 5.06 0.89 7.30
Key for table 4.13 T1 means no spray (control), T2 means 0.1% H3BO3, T3 means 1% CuSO4.5H2O T4 means 0.1% ZnO, T5 means 0.1% H3BO3 +1% CuSO4.5H2O+ 0.1% ZnO, T6 means 1% Commercial mix and T7 means 0.4% ZnSO4.7H2O
Among the micronutrient elements of interest i.e. Cu, B and Zn, the concentration of B in the soil
did not change significantly before and after applying the treatments at both sites. At Mianga,

82
initial B content was 0.2mg kg-1 and changed to an average of 0.4 mg kg-1 while at Glenorchy,
soil B content changed from 0.8 mg kg-1 to an average of 0.63 mg kg-1. According to Willson &
Gunther (1981), the recommended soil B level is at least 1.0 mg kg-1 and at Glenochy soil B
levels were close to the recommended level while at Mianga, the soil B levels were lower than
recommended.
Copper content decreased from 17.1 mg kg-1 to an average of 5.79 mg kg-1 at Mianga and
decreased from 39.4mg kg-1 to an average of 34.5 mg kg-1 at Glenorchy. Soil Cu content was
generally lower at Mianga than at Glenorchy estate, but Cu levels at Mianga were within the
recommended levels for tea of 3 to 10 mg kg-1 while at Glenorchy, Cu level in the soil was
generally above the recommended level. However, Cu levels in the leaves of copper sulphate
treated plants was much higher than in those plants not receiving Cu, implying that foliar applied
Cu was staying on the leaves.
There was a slight decrease in soil Zn level from 2.3 mg kg-1 at Mianga to an average of 1.32mg
kg-1 and no significant increase in soil Zn level at Glenorchy estate. The Zn level at Mianga was
within the recommended range of 2-15mg kg-1 for tea only at the beginning of the trials but it
reduced to levels below the recommended Zn level after the final application of the foliar sprays,
while soil Zn levels at Glenorchy were within the recommended Zn level for tea. Plants at
Glenorchy were probably able to utilise available Zn from the soil plus Zn supplied by the foliar
applications, especially that of zinc sulphate, which could have contributed to the increased yield
at Glenorchy.
Generally, soils at Glenorchy were more well balanced with regards the levels of the most
important major nutrient elements N, P and K, compared to soils at Mianga which had P levels
below the recommended levels for tea and very high levels of K resulting in nutrient imbalances
which may have led to generally lower yields from the trial plots at Mianga compared to
Glenorchy. Additionally, there was a poor yield response to application of foliar sprays
containing Cu, Zn and B due to the imbalance in the nutrient levels of N, P and K, which limited
the plants’ capacity to utilise the applied micronutrient elements.

83
4.3.4 Conclusion
Application of foliar sprays containing Cu and Zn increased the foliar levels of Cu and Zn except
for the micronutrient mix. Leaf analyses have shown that the concentration at which the
micronutrient mix was applied was probably too low to raise the Cu, Zn and B levels to levels
recommended for tea. Levels of Cu in leaves of plants treated with copper sulphate either alone
or in combination with zinc oxide and boric acid were far too high and probably reached toxic
levels. In addition to changes in the levels of Cu, B, and Zn in leaves of the treated plants,
application of copper sulphate either alone or in combination with zinc oxide and boric acid led
to elevated levels of Al in the treated leaves, and the high Al and Cu levels in copper sulphate
treated tea plants could be the reason for low yields observed in those plots treated with copper
sulphate. Although boric acid significantly increased B concentration in leaves of treated plants,
the concentration of B was below the recommended level for tea. Probably, concentrations
higher than 0.1% boric acid or more applications of boric acid would be able to raise the B
content in tea plants to recommended levels and bring about a significant yield increase.
However, there is need to confirm this by further research.
Foliar applications did not have any effect on concentrations of soil Cu, B, Zn, N, P, K, S, Ca,
Mg, Al, Fe,Mn in the soil and the pH at both sites and no significant effect was observed on the
concentration of other elements such as N, P, K, Ca, Mg and Mn in the third leaf of the tea
shoots at both sites except for Al and S which were significantly higher in copper sulphate
treated plots at Glenorchy. This implies that the differences in yield across the treatments and
differences in the concentration of Cu, Zn and B in the tea leaves were not due to differences in
concentrations of Cu, B, Zn, N, P, K, S, Ca, Mg, Al, Fe and Mn in the soil. However, high Al
levels observed in leaves treated with copper sulphate at Glenorchy suggest that copper sulphate
increased Al uptake from the soil by the treated tea plants, but this needs to be confirmed by
further studies.
Generally, low yields observed in trial plots at Mianga were attributed to factors, other than
micronutrient applications, such as an improper balance in the nutrition of N, P and K levels in
the soil at Mianga. In soils at Mianga P was lower than the recommended concentration for tea
and very high levels of K were observed which could possibly have led to poor utilisation of
nutrient elements for optimum yields. This could further lead to poor uptake of the applied

84
micronutrient elements which contributed to the lack of response in yield due to applications at
Mianga estate. However, it is important to indicate that tea is a perennial crop and this study was
conducted within one season therefore the impact of the micronutrient sprays may be seen in the
following seasons.

85
CHAPTER 5: GENERAL CONCLUSIONS AND RECOMMENDATIONS
This study was initiated as a result of high incidences of Cu, B and Zn deficiencies in leaf
analyses from approximately 170 mature clonal tea fields in 2007 from some of the estates in
Malawi. In addition, the current fertiliser recommendations in tea, especially in Malawi and
Zimbabwe, have placed more emphasis on fertilisation with macronutrient elements, particularly
N, P and K, than on micronutrient elements. Furthermore, there are numerous commercial
micronutrient products available for use by the growers which range from single elemental
products to multi-micronutrient pre-mixes whose effect on tea yields and quality has not been
evaluated. The main objective of the study was to evaluate the effect of different formulations of
foliar applied Cu, Zn and B on yield and quality of deficient clonal tea plants. Specifically, the
study was conducted to evaluate the effects of foliar sprays, including one commercial
micronutrient mix, on yield and yield components, contents of polyphenolic compounds in made
tea andon tea taster’s scores. It also aimed at establishing the effect of foliar sprays on
concentrations of B, Cu, Zn and other nutrient elements in the leaves of treated tea bushes. This
study was based on the hypothesis that application of these micronutrients through foliar
application would be able to increase both tea yield and quality in deficient plantations and also
raise the levels of Cu, Zn and B to sufficient levels for optimum growth of tea plants.
Results obtained from this study, especially for the first three applications after which the leaf
samples were analysed, have shown that foliar applications of Cu, Zn and B, in forms of copper
sulphate, zinc (oxide and sulphate) and boric acid respectively, significantly raised the
concentration of Cu, Zn and B in the third leaves of the deficient tea bushes. However, boric acid
did not manage to raise the concentration of B in leaves of treated plants to the recommended
levels, whilst copper sulphate tended to raise the Cu concentrations to extremely high levels.
Deficiencies of Cu, B and Zn were therefore decreased by applying copper sulphate, boric acid,
zinc oxide and zinc sulphate for the respective deficient elements. Applying the micronutrient
mix could not correct the deficiencies, as levels of Cu, Zn and B in the leaves were still below
the norm for tea production. This also suggests the need to evaluate micronutrients mixes at
different concentrations rather than relying on the recommendations of the manufacturers.
Furthermore, copper sulphate application either alone or in combination with zinc oxide and
boric acid led to excessive levels of Al in the third leaf of the tea shoot of the treated plants. This

86
has implications for shoot growth and thus further investigation on the impact of Cu sprays on Al
accumulation should be performed.
Although levels of Cu, Zn and B were raised to recommended levels for tea, there was a non-
significant improvement in yield due to application of Cu, Zn and B containing foliar sprays and
there was also a significant reduction in yield due to application of copper sulphate, regardless of
whether it was applied alone or as a mixture with zinc oxide or zinc sulphate. Extremely high
concentrations of Cu and Al in plants treated with copper sulphate could have led to inhibition of
plant growth and impairment of important cellular processes, especially the photosynthetic
apparatus (Loustalot et al., 1945, Alaoui-Sosse et al., 2004, Yruela, 2005), which possibly
contributed to the significant reduction in yield in those plots. Although no significant yield
losses have been reported in previous studies due to copper sulphate sprayed at 1% concentration
in seedling tea (Grice, 1990), this study has shown that a 1% copper sulphate application to
clonal tea was too high. It is possible that clonal tea, especially PC 105 and PC 108, require
much less Cu than seedling tea or that existing levels of Cu in the leaves were higher in this
study than previous studies. The non-significant yield increase observed in plots treated with zinc
sulphate and the commercial micronutrient mix suggests that among the foliar sprays containing
Cu, Zn and B used in this study, zinc sulphate may be recommended as an alternative source of
Zn to zinc oxide, while the commercial micronutrient mix may be recommended in situations
where multiple micronutrient deficiencies occur in clonal tea fields in Malawi. There is,
however, need to explore the effect of spraying the tea plants with copper sulphate at
concentrations lower than 1% in order to determine which copper sulphate concentration will
give optimum yields while maintaining the required level of Cu in the leaves of clonal tea. When
considering Cu applications, growers also need to consider their fungicide application especially
when using copper oxychloride as a fungicide which is reportedto have a negative impact on tea
yields (Barua & Dutta (1972), and Saikh (2007). Likewise, there is need for further assessment
of the commercial micronutrient mix at higher concentrations or more frequent applications. It is
likely that higher concentrations might give a significant yield increase, as well as maintain
levels of Cu, Zn and B within the recommended levels for tea and probably improve the yields.
Tea taster’s scores and valuation were significantly reduced by almost all Cu, Zn and B
treatments at Glenorchy but not at Mianga. Foliar sprays of Cu, B and Zn, applied as copper

87
sulphate, boric acid, zinc oxide and commercial micronutrient mix, increased the levels of
thearubigins while levels of caffeine and theaflavins remained constant. This means that during
fermentation in black tea manufacture, catechins and flavanols in the green leaves were being
converted to more thearubigins than theaflavins in the treated leaves compared to the control
leaves which resulted in less bright black teas made from the Cu, Zn and B treated leaves. This
implies that the applied micronutrients especially Zn and Cu to the inherently fast fermenting
cultivars (PC 105 and PC 108) (TRFCA, 2000) led to prolonged activity of polyphenol oxidase
which resulted in production of more TRs than TFs (Owuor & Reeves 1986) leading to lower
scores on brightness and briskness of the black tea in the Cu, Zn and B treated plants.
Generally there were differences in yield responses to application of micronutrient foliar sprays
between the two sites (Mianga and Glenorchy), with lower yields being observed across all
treatments at Mianga than at Glenorchy. Differences among treatments were observed in yield of
tea at Glenorchy estate while at Mianga, the treatments performed similarly in terms of yield.
The differences in response to foliar sprays between the two sites may be attributed to
differences in water regimes between the two sites, with water possibly being limiting to growth
during certain dry periods under rain-fed conditions. Tea at Mianga was grown under rain-fed
conditions while tea at Glenorchy had supplementary irrigation, further than this, tea at Mianga
is grown at a higher elevation of 960 metres above sea level than tea at Glenorchy which is
grown at an elevation of 650 metres above sea level. Low yields observed in trial plots at Mianga
were also attributed to an improper balance in the nutrition of N, P and K levels in the soil at
Mianga. P levels were below the norm for tea soils, whilst K was above the norm at Mianga.
This probably led to poor utilisation of nutrient elements which eventually negatively affected
yields at this site.
In conclusion, results from this study indicate that clonal tea, specifically cultivars (PC 108 and
PC 105) did not respond positively to Cu, Zn and B foliar applications in terms of yield and
quality within the first season of application. However, if application is aimed at raising
concentrations of Cu, Zn, and B in deficient plants, then boric acid, zinc sulphate, zinc oxide and
the commercial micronutrient mix may be used without negatively affecting yield and quality of
tea significantly. Application of copper sulphate, however, at the concentration and frequency
used in this study, should not be done as it causes a significant decline in yield, which according

88
to this study has been attributed to very high levels of Al and Cu in leaves treated with copper
sulphate. Long term research is therefore required to determine if long term applications can
correct perceived deficiencies and increase yield and also if other carriers of Cu, Zn and B than
the ones used in this study can significantly improve yield and quality of clonal tea.
In summary, some of the observations made in this study points to the need for further
investigations on (1) any possible interactions between foliar applied copper in the form of
copper sulphate and Al accumulation in tea leaves, (2) the effect of different concentrations of
the commercial micronutrient mix used in this study and other micronutrient mixes carriers on
yield and quality of tea and (3) effect of foliar application of copper sulphate at concentrations
lower than 1% on yield and quality of clonal/ vegitatively propagated tea.
89
CHAPTER 6: REFERENCES
Ahsan, Q. 1994. Some physico-chemical properties of Bangladesh tea soils and their influence
on tea plant. PhD Thesis, University of Dhaka, Bangladesh Jin.
Alam, S.M. & Raza, S. 2001. Micronutrient fertilisers. P J Biol Sci. 4, 11, 1446-1450.
Alam, S., Wahid, M.S., Ali, A., Ahmad, I & Bangash, F.K., 2007. Medicinal Status of colocacia
esculenta Linn and its relation with soil. J Chem Soc Pak. 29, 4, 332-342.
Alaoui-Sosse, B., Genet, P., Vinit-Dunand, F., Toussaint, M., Epron, D. & Badot, P. 2004. Effect
of copper on growth in cucumber plants (Cucumissativus) and its relationships with
carbohydrate accumulation and changes in ion contents. Plant Sci, 166, 1213-1218.
Alloway, B.J. 2008. Zinc in soils and crop nutrition. 2nd ed. International Zinc Association
Brussels, Belgium and International Fertiliser Industry Association, 28 rue Marbeuf, 75008
Paris, France. Available online at www.fertilizer.org, Downloaded on 23 April 2009.
Alscher, R.G., Erturk, N. & Heath, L.S. 2002. Role of superoxide dismutases (SOD) in
controlling oxidative stress in plants. J Exper Bot. 53, 372, 1331-1341.
Alva, A.K., Huang, B. & Paramasivam, S. 2000. Soil pH affects copper fractionation and
phytotoxicity. Soil Sci Soc Am J 64, 955-962.
Amiri, M.E., Fallahi, E. & Golchin, A. 2008. Influence of foliar and ground fertilization on yield,
fruit quality, and soil, leaf, and fruit mineral nutrients in apple. J Plant Nut. 31, 515–525.
Anandacoomaraswamy, A., De Costa, W.A.J.M., Shyamalie, H.W. & Campbell G.S. 2000.
Factors controlling transpiration of mature field-grown tea and its relationship with yield.
Agricultural and Forest Meteorology. 103, 375-386.
Azam, S., Hadi, N., Khan, N.U. & Hadi, S.M. 2004. Pro-oxidant property of green tea
polyphenols epicatechin and epigallocatechin-3-gallate: implications for anticancer
properties. ToxicolVitr 18, 555–561.

90
Barbora, B.C., Barnerjee, M.K. & Chalravartee, J. 1992. Effect of foliar application of nutrients
and other growth promoters on the yield of unpruned tea. Proceedings of the 31st Tocklai
conference, Tea Research Association, Tocklai Experimental station, Jorhat, 785008,
Assam, India, 50-55.
Barbora, B.C., Rahman, F. & Barman, T.S. 1993. Zinc in the nutrition of the tea plant. In: Owuor
P.O. 2001. Effects of fertilisers on tea yields and quality: A review with special reference to
Africa and Sri Lanka. Int J Tea Sci. Available online at
http://www.up.ac.za/dspace/handle/2263/8222, accessed on 2 April 2009.
Barak, P., Jobe, B.O., Krueger A.R., Peterson L.A. & Laird D.A. 1997. Effects of long-term soil
acidification due to nitrogen fertiliser inputs in Wisconsin. Plant Soil. 197, 61-69.
Barooah, A., Barooah, A.K., Yadav, R.N.S., Gohian, K.K., & Adhyapak, M.P. 2005. Soil quality
assessment with respect to Micronutrient status. Proceedings of 34th Tocklai conference
strategies for quality, TRA, Tocklai experimental Station, Jorhat, Assam, India pp 26.
Barua, D.N. & Dutta, K.N. 1972. Trace elements for tea. Two Bud. 19, 63-65.
Bell F.G. 1992. Engineering properties of soil and rocks. Wiley. Com.
Bernal, M., Cases, R., Picorel, R. & Yruela, I. 2007. Foliar and root Cu supply affect differently
Fe- and Zn-uptake and photosynthetic activity in soybean plants. Env Exp Bot. 60, 145–150
Blaser, H.W., Marr, C. & Takanashi, D. 1967. Anatomy of boron deficient Thuja-Plicata. Amer J
Bot. 54, (9) 1107-1113
Blevins, D. G. & Lukaszewski, K. M. 1998. Boron in plant structure and function. Ann Rev
Plant Physiol Plant Mol Biol 49:481–500
Boaretto, R.M., Quaggio, J.A., Mourao, F.F.A.A., Gine, M.F. & Boaretto, A.E. 2008. Absorption
and mobility of boron in young citrus plants.Comm Soil S 39, 2501-2514.

91
Bore, J.K., Njuguna, C.K., Magambo M.J.S., 1998. Effect of high population densities on harvest
index and yields. Final report. Tea. 19, 66-70.
Brown, P.H., Bellaloui, N., Wimmer, M.A., Bassil, E.S., Ruiz, J., Hu, H., Pfeffer, H., Dannel, F.
& Romheld, V. 2002. Boron in plant biology. PlantBiol. 4, 205-223.
Brown, P.H. & Hu, H. 1996. Phloem mobility of boron is species dependent: Evidence for
phloem mobility in sorbitol-rich species. Ann Bot. 77, 497-505.
Brown, P.H. & Shelp, B.J. 1997. Boron mobility in plants. Plant and Soil. 193, 85-101.
Bukovak, M.J. & Wittwer, S.H. 1957. Absorption and mobility of soil applied nutrients. Plant
Physiol. 428-435.
Burkhardt, J. & Schroth, G. 2000. Role of stomatal opening for the uptake of foliar fertilisers by
tree crops in the humid tropics (Amazon, Brazil). Acta Hort. 531, 181-183.
Cakmak, I. & Romheld, V. 1997. Boron deficiency-induced impairment of cellular functions in
plants. Plant and Soil 193, 71-83.
Camacho-Cristobal, R.J., Rexach, J. & Gonzalez-Fontes, A. 2008. Boron in plants: Deficiency
and toxicity. J Int Plant Biol, 50, 1247-1255.
Carr, M.K.V. 2000. Shoot growth plus plucking equals profit. Tea Research Institute of
Tanzania. TRIT occasional publication. 1, 1-14.
Carr, M.K.V. & Stephens, W. 1992. CUPPA-TEA. Climate weather and the yield of tea. In:
Willson K.C. & Clifford M.N. (Eds). Tea Cultivation to consumption. Chapman & Hall,
London, pp 87-135.
Cheristensen, P. 2005. Foliar fertilisation in vine mineral nutrient management programmes.
Vitic Enol, 23, 1-3.

92
Cloughley, J. B., Grice, W. J. &Ellis, R. T.1983. Effects of harvesting policy and nitrogen
application rates on the production of tea in central Africa. I. Yield and crop distributionExpl
Agric. 19, 33-46.
Cloughley, J.B. 1982. Factors influencing the caffeine content of black tea: Part 1- The effect of
field variables. Food Chem. 9, 269-276.
Clowes M.J. & Mitini-Nkhoma S.P.1987. Copper deficiency on young clonal tea growing close
to Mulanje mountain. Quarterly newsletter, Tea Research Foundation of Central Africa, 12-
13
Crowley, D.E., Smith, W. & Faber, B. 1994. Zinc nutrition in avocados. Calif Avocado Soc
Yearb, 78, 155-165.
Dale, M. 1971. Zinc deficiency. TRFCA Quarterly Newsletter. 22, 4-6. Tea Research Foundation
of Central Africa, P.O. Box 51, Mulanje, Malawi.
Dang, M.V. 2005. Soil-plant nutrient balance of tea crops in the northern mountainous region,
Vietnam. Agric Ecosyst& Environ. 105, 413-418.
De Costa, W.A.J.M. Mohotti, A.J., Wijeratne, M.A. 2007. Ecophysiology of tea. Braz J Plant
Physiol. 19, 299-332.
De Silva, M.S.D.L. 2007. The effects of soil amendment on selected properties of tea soils and
tea plants (Camellia sinensis L.) in Australia and Sri Lanka. PhD Thesis. University of
Peradeniya, Sri Lanka.
Dev Chaudhury, M.N., Borddoi, A.K., & Sharma, P.K. 1989. Effect of zinc and manganese on
uptake of nitrogen in tea shoot. Two Bud 36, 1, 18-21.
Dey, S.K. 1969. A study of some soils from Assam, central and east African tea areas. Two Bud
16, 65-69.

93
Dharmasena, K.A.S.D.B. 2003. International black tea market integration and price discovery.
MSc. Thesis. Texas A & M University. U.S.A.
Dong, D., Xie, Z. & Du, Y. 2001. The bioavailability of Al in soils to tea plants. Applied
Geochemistry 16, 1413-1418.
Dootson, J. 1976. The response of tea to aerial zinc and copper sprays. TRFCAQuarterly
Newsletter, 43, 5. Tea Research Foundation of Central Africa, P.O. Box 51, Mulanje,
Malawi.
Dordas, C. & Brown, P.H. 2005. Boron deficiency affects cell viability, phenolic leakage and
oxidative burst in rose cell cultures. Plant and Soil 268, 293-301.
Drinnan, J.E. 2008. Fertiliser strategies for mechanical tea production. Rural Industries Research
and development Cooperation. Australian government. Australia.
Durtsberger, T., Bolha-Nordenkampf, H.R., Meister, M.H. & Zahrl, J. 2008. The foliar uptake of
micronutrients. Acta Hort. 804, 631-636.
Durzan, D.J. 1995. Free amino acids as indicators of little leaf in zinc deficiency in the pistacho
(Pistacia vera L. Cultivar Kerman). Scientia Hort 60,221-233.
Dutta, R. 2011. Impact of age and management factors on tea yield and modelling the influence
of leaf area index on yield variations. ScienceAsia. 37, 83-87.
Ellis, R.T.E. 1971. The general background to plant water relation investigations on tea in
Central Africa and some findings to date. In: SQUIRE G.R. 1977. Seasonal changes of
photosynthesis of tea (Camelliasinensis L.). J Appl Ecology 14, 303-316.
Ellis, R.T. & Nyirenda, H.E. 1995. A successful plant improvement programme on tea (Camellia
sinensis). Expl Agric 31, 307- 323.
Ellis, R.T. & Grice, W.J.1976. Plucking policy and techniques. TRFCA Quarterly Newsletter. 41,
3-14.

94
Fageria, V.D. 2001. Nutrient Interactions in crop plants. Journal of Plant Nutrition. 24 (8) 1269-
1290.
Fageria, N.K., Baligar, C & Clark, R.B., 2002. Micronutrients in crop production. Advances in
Agronomy, 77, 185-268.
Fageria, N.K., Filho, M.P.B., Moreira, A. & Guimaraes, C.M. 2009. Foliar fertilisation of crop
plants. Journal of Plant Nutrition. 32, 1044-1064.
Fernandes, J. C. & Henriques, F. S. 1991. Biochemical, physiological, and structural effects of
excess copper in plants. BotanRev. 57, 246-266.
Fernandez, V. & Eichert, T. 2009. Uptake of hydrophilic solutes through plant leaves: Current
state of knowledge and perspectives of foliar fertilisation. Crit Rev Plant Sci. 28, 38-68.
Fernandez, V. & Ebert, G. 2005. Foliar iron fertilistaion: A critical Review. J Plant Nutr. 28,
2113-2124.
Ferrandon, M. & Chamel, A.R. 1988. Cuticular retention, foliar absorption and translocation of
Fe, Mn and Zn supplied in organic and inorganic forms. J Plant Nutr. 11, 3, 247-263.
Forrest, G. I. & Bendall, D. S. 1969. The Distribution of Polyphenols in the Tea Plant (Camellia
sinensisL.) BiochemJ. 113, 741
Franke, W. 1961. Ectodesmata and foliar absorption. Am J Bot. 48, 683-691.
Fritz, A. 1978. Foliar fertilisation- A technique for improved crop production. Acta Hort. 84, 43-
56.
Fritz, A. 1985. Micronutrient supply: Growing problems in the cultivation of high value crops in
Arid zones. Acta Hort. 158, 293-306.
Fung, K.F., Carr, H.P., Zhang, J. & Wong, M.H. 2008. Growth and nutrient uptake of tea under
different aluminium concentrations. J Sci Food Agric. 88, 1582-1591.

95
Fung, K.F. & Wong, M.H. 2001. Effects of soil pH on the uptake of Al, F and other elements by
tea plants. J Sci Food Agric. 82, 146-152.
Gartrell, J.W. 1981. Distribution and correction of copper deficiency in crops and pastures. In:
ALLOWAY B.J. (ed). 2008a. Micronutrient deficiencies in global crop production.
Department of soil sciences, Whiteknights, Reading RG6 6DW, United Kingdom.
Gaskin, R.E. & Murray, R.J. 1997. effect of surfactants concentration and spray volume on
retention of organosilicone sprays on wheat. Pesticide performance and Technology
Proceedings. 50th N.Z. Plant Protection Conference, 139-142.
Gohian, T., Barbora, A.C. & Deka, A. 2000. Effect of boron on yield and quality of tea. J Plantn
Crops. 28, 1, 67-71.
Gondwe, 1969. Trace elements in some tea soils. QuarterlyNewsletter 14, 12. Tea Research
Foundation of Central Africa, P.O Box 51, Mulanje, Malawi.
Grice, W.J., Clowes, Mst. J., Malenga, N.E.A. & Mkwaila, B. 1988. Update on fertiliser and
foliar nutrient recommendations for tea grown in Malawi. TRFCAQuarterlyNewsletter 89,
4-6.
Grice W.J. & Clowes M.St.J. 1990. Plucking. Tea Planters Handbook. Tea Research Foundation
of Central Africa. P.O. Box 51, Mulanje.
Grice, W.J. 1990. Nutrition. Tea Planter’s Handbook. Tea Research Foundation of Central
Africa. P.O. Box 51, Mulanje. Malawi.
Grice, W.J. 1989. Planting: General considerations. In: Tea Planters Handbook. Tea Research
Foundation of Central Africa. P.O. Box 51, Mulanje, Malawi.
Grice, W.J. 1984. Mulch- An essential prerequisite for planting.TRFCA Quarterly Newsletter.
75, 16-18.
Grigg, G.T. 1999. Foliar nutrition of Turf grasses. Golf Mag. pp 65-68.

96
Halliwell, B. & Gutteridge, J.M.C. 1999. Free radicals in biology and medicine. Oxford Science
Publications, 105-245.
Haslett, B.S., Reid, R.J. & Rengel, Z. 2001. Zinc mobility in wheat: Uptake and distribution of
zinc applied to leaves or roots. Ann Bot. 87, 379-386.
Hazarika, L.K., Bhuyan, M. & Hazarika, B.N. 2009. Insect pests of tea and their management.
Ann Rev Ent 54, 267-284.
Hicks, A. 2009. Current status and future development of global tea production and tea products.
AU J.T. 12,4, 251-264.
Hilal, Y. & Engelhardt, U. 2007. Characterisation of white tea- Comparison to green and black
tea. Journal of Consumer Protection and Food Safety. 2, 414-421.
Hilton, P.J. & Ellis R.T. 1972. Estimation of the market value of central African tea by theaflavin
analysis. J Sci Food Agric. 23, 227-232.
Ho, S. 2000. Boron deficiency of crops in Taiwan. Department of agricultural chemistry,
National Taiwan University, Taipei 106, Taiwan, ROC.
http://www.palaisdesthes.com/en/tea/tea-producing-countries.htm, accessed online on 13 May,
2011
Iglesias, A.A. & Andreo, C.S. 1984. Inhibition of Zea mays phosphoenolpyruvate carboxylase
by copper & cadmium ions. Photosynthetica. 18, 134-138.
Jin, C.W., Du, S.T., Zhang, K. & Lin, X.Y. 2008. Factors determining copper concentration in
tea leaves produced at Yuao county, China. Food Chem Toxicol. 46, 2054–2061.
Kamau, D. 2008. Productivity and resource use in ageing plantations. PhD thesis, Wageningen
University, ISBN 978-90-8504-808-4 Wageningen, The Netherlands.
Kannan, S. 1980. Mechanisms of foliar uptake of plant nutrients: Accomplishments and
prospects. J Plant Nutr. 2, 6, 717-735.

97
Kayange, C.W. 1986. The effects of three grass and plastic mulching treatments on the growth of
tea during the first year in the field. TRFCA Quarterly Newsletter 81, 4-8. Tea Research
Foundation of Central Africa, P.O. Box 51, Mulanje, Malawi.
Kayange ,C.W., & Grice, W.J. 1991. Residual effects of mulching on the tea yield. TRFCA
Quarterly Newsletter. 104, 14-15. Tea Research Foundation of Central Africa, P.O. Box 51,
Mulanje, Malawi.
Konishi, S. 1992. Promotive effects of aluminium on tea plant growth. JARQ, 26, 26-33.
Labanauskas, C.K., Embelton, T.W. & Jones, W.W. 1958. Influence of soil application of
nitrogen, potash, dolomite, and manure on the micronutrient content of avocado leaves.
Proc Am Soc Hort Sci, 71, 285-291.
Liang, Y., Lu J., Zhang, L., Wu, S. & Wu, Y. 2002. Estimation of black tea quality by analysis of
chemical composition and colour difference of tea infusions. Food Chem. 80, 283-290
Lightfoot, C. 2009. Code of practice on use of pesticides in Malawi and Zimbabwe tea fields.
Tea Research Foundation of Central Africa, P.O. Box 51, Mulanje.
Loneragan, J.F. & Webb, M.J. 1993. Interactions between zinc and other nutrients affecting the
growth of plants. In: Alloway, B.J. (ed). 2008. Micronutrient deficiencies in global crop
production. Department of soil sciences, Whiteknights, Reading RG6 6DW, United
Kingdom.
Loustalot, A.J., Burrows, F.W., Gilbert, S.G. & Nason, A. 1945. Effect of copper and zinc
deficiencies on the photosynthetic activity of the foliage of young tung trees. PlantPhysiol
283-288.
Lucena, P.R., Apaolaza, L.H. & Lucena, J.J. 2010. Comparison of iron chelates and complexes
supplied as foliar sprays in nutrient solution to correct iron chlorosis of soybean. J Plant Nutr
Soil Sci. 173, 120-126.

98
Majid, N.M. & Ballard, T.M. 1990. Effects of foliar application of copper sulphate and urea on
the growth of lodgepole pine. Forest Ecology and Management, 37, 151-165.
Malawi Confederation of Chambers of commerce and Industry (MCCI), 2008. The voice of the
private sector, Sat, April 12, 2008.
Malenga, N.E.A. 1997. Long term effect of down pruning mature Indian hybrid tea on yield.
TRFCA Quarterly Newsletter. 116, 18-21. Tea Research Foundation of Central Africa, P.O.
Box 51, Mulanje, Malawi.
Malenga, N.E.A. 1994. Update on tea response to zinc application. TRFCA Quarterly
Newsletter. 113, 9-11. Tea mResearch Foundation of Central Africa, P.O. Box 51, Mulanje,
Malawi.
Malenga, N.E.A. 1986. A summary of latest results from applying zinc oxide to mature tea.
QuarterlyNewsletter 81, 9. Tea Research Foundation of Central Africa, P.O Box 51,
Mulanje, Malawi.
Malenga, N.E.A. 1979. The response of mature tea to aerial zinc application. TRFCA Quarterly
Newsletter. 54, 12. Tea Research Foundation of Central Africa, P.O. Box 51, Mulanje,
Malawi.
Marcos, A., Fisher, A., Rea, G. & Hill, S. 1998. Preliminary study using trace element
concentration and chemometrics approach to determine the geographical origin of tea. J Anal
atom spectru. 521-525.
Marschner, H. 1986. Mineral Nutrition of higher plants. Institute of Plant Nutrition Universiity
Hohenheim Federal Republic of Germany. Academic Press, Harcourt Brace Jovanovich
Publishers, London, San Diego, New york, Berkeley, Boston, Sydney, Tokyo, Toronto.
Matthews, R.B. & Stephens, W. 1998. CUPPA-TEA. A simulation model describing seasonal
yield variation and potential production of tea. 1. Shoot development and extension.
ExplAgric. 34, 345-367.

99
Mengel, K. & Kirkby, E.A. 1982. Principles of plant nutrition. 3rd ed. International Potash
Institute, Bern, Switzerland.
Mitini-Nkhoma, S.P.1987. Copper deficiency in young clonal tea growing close to Mulanje
Mountain. TRFCA Quarterly Newsletter. 88, 12-13. Tea Research Foundation of Central
Africa, P.O. Box 51, Mulanje, Malawi.
Mondal, T.K., Bhattacharya, A., Laxmikumaran M.&Ahuja P.S. 2004. Recent advances of tea
(Camellia sinensis) biotechnology. Plant Cell and Organ Culture. 76, 195-254.
Mortvedt, J. (Unknown). Efficient fertiliser use manual- Micronutrients.
http://www.rainbowplantfood.com/agronomics/efu/micronutrients.pdf accessed on 20
March 2008.
Munthali, M.W. 2007. Intergrated soil fertility management technologies: A counteract to
existing milestone in obtaining achievable economic yields in cultivated lands of poor
smallholder farmers in Malawi. In: Bationa A. (eds). 2007. Advances in integrated soil
fertility management in sub-Saharan Africa: Challenges and opportunities, 531-536.
http://www.palaisdsthes.com/en/tea-producting-countries.htm. Accessed online on 13 May,
2011.
Nandwa, S.M. & Bekunda, M.A. 1998. Research on nutrient flows and balances in East and
Southern Africa: state-of-the-art. Agriculture, Ecosystems and Environment. 71, 5-18.
Newett, S. 2005. Little evidence to support the use of foliar applied nutrients in avocado. Topics
in Subtropics Newsletter, 3, 3, 1-8.
Nissanka, S.P., Coomaraswamy, A.A., Senevirante, C.K. 2004. Change in growth and
productivity from pruning and skiffing as a method to prolong pruning cycle. In: Kamau, D.
2008. Productivity and resource use in ageing plantations. PhD thesis, Wageningen
University, ISBN 978-90-8504-808-4 Wageningen, The Netherlands.
Nyasulu, S.K. 2006. Soil acidity survey report. Tea Research Foundation of Central Africa. P.O
Box 51, Mulanje, Malawi.

100
Nyasulu, S.K. 2000. Mechanical Harvesting of tea- Preliminary results. TRFCA Quarterly
Newsletter. 140, 18. Tea Research Foundation of Central Africa, P.O. Box 51, Mulanje,
Malawi.
Obanda, M., Owuor, P.O. & Taylor, S.J. 1997. Flavanol composition and Caffeine content of
green leaf as quality potential indicators of Kenyan black teas. J Sci Food Agric. 74, 209-
215.
Ogunmoyela, O.A., Obalatu, C.R. & Adetunji, M.T. 1994. Effect of soil micronutrient status on
the fermentation characteristics and organoleptic quality of Nigerian tea. African Crop
Science Journal 2, 1, 87-92
Okano, K. & Matsuo, K. 1996. Seasonal changes in uptake, distribution and redistribution of 15
N-Nitrogen in young tea (Camelliasinensis L.) plants. Jpn.J.Crop Sci. 65, 4, 707-713.
Olyslaegers, G., Nijs, I., Roebben, J. Kockelbergh, F., Vanassche, F., Lakers, M., Verbelen, J.P.,
Samson, R., Lemeur, R. & Impens, I. 2002. Morphological and physiological indicators of
tolerance to atmospheric stress in two sensitive and tea clones in south Africa. ExplAgric. 38,
397-410.
Othieno, C.O. 1992. Soils. In: Willson K.C., Clifford M.N. (Eds), Tea: Cultivation to
Consumption. Chapman & Hall, London pp 137-170.
Owuor, P.O., Ng’etich, W.K. & Obanda, M. 2000. Quality response of clonal black tea to
nitrogen fertiliser, plucking interval and plucking standard. J Sci Food Agric. 80, 438-446.
Owuor, P.O., Obaga, S.O. & Othieno, C.O. 1990. The effects of altitude on the chemical
composition of black tea. J Sci Food Agric, 50, 9-17.
Owuor, P.O., Obanda, M., Nyirenda, H.E., Mphangwe, N.I.K., Wright, L.P. & Apostolides, Z.
2006. The relationship between some chemical parameters and sensory evaluations for plain
black tea (Camellia sinensis) produced in Kenya and comparison with similar teas from
Malawi and South Africa. FoodChem. 97, 644-653.

101
Owuor, P.O. & Reeves, S.G. 1986. Optimising fermentation in black tea manufacture.
FoodChem. 21, 195-203.
Paul, S., Wachira, F.N., Powell, W. & Waugh, R. 1997. Diversity and genetic differentiation
among populations of Indian and Kenyan tea (Camelliasinensis(L) O.Kuntze) revealed by
AFLP markers. Theor Appl Genet. 94, 255-263.
Paul, S.K. 2008. Predictability of price of tea from sensory assessments and biochemical
information using data-mining techniques. J Sci Food Agric. 88, 1354-1362.
Power, P.P. & Woods, W.G. 1997. The chemistry of boron and its speciation in plants. Plant
Soil, 193, 1-13.
Prasad, A. & Dey, S. K. 1979. Studies on the Uptake of Manganese and boron by Young tea
Plants. Two A Bud. 26, 1, 9-13.
Pulschen, L. 2004. Application of micronutrients: Pros and cons of the different application
strategies. IFA( International Fertiliser Industry Association) International Symposium on
Micronutrients. 23-25 February, 2004. New Delhi, India.
Rahman, F. & Sharma, P.C. 1974. Zinc as a fertiliser for tea. Two Bud. 21, 44-45.
Ramrakrishna, R.S., Palmakumbura, S. & Chatt, A. 1987. Varietal variation and correlation of
trace metal levels with catechins and caffeine in Sri Lanka tea. J Sci Food Agric. 38, 4,
331-9.
Rattan, P.S. 1990. Pests and diseases, their identification and control. Tea Planters Handbook,
Tea Research Foundation of Central Africa, P.O. Box 51, Mulanje, Malawi.
Rattan P.S. 1988. Spraying. In: Tea Planter’s Handbook, 1990. Tea Research Foundation of
Central Africa, P.O. Box 51, Mulanje, Malawi.

102
Rattan, P.S., 1984. Incidence and losses caused by Helopeltisspp. from 1980-84. TRFCA
Quarterly Newsletter. 75, 6-12. Tea Research Foundation of Central Africa, P.O. Box 51,
Mulanje, Malawi.
Reed, D.W. & Tukey, Jr. H.B. 1987. Factors affecting foliar absorption of nutrients by selected
landscape and herbaceous plants. J Environ Hort. 5,2, 72-76.
Roberts, E.A.H. & Smith, R.F. 1963. The phenolic substances of manufactured tea. J Sci Food
Agric. 14, 689-670.
Ruan, J., Ma, L. & Shi, Y. 2006. Aluminium in tea plantations: Mobility in soils and plants, and
the influence of nitrogen fertilisation. Environ Geochem Health. 28, 519-528.
Ruan, J.Y., Ma, L.F. & Shi, Y.Z,. (2003). Properties of Rhizosphere Soil of Tea Plants and
Impact of Nitrogen Fertilizers. J. Tea Sci 23,2, 167-170.
Ruan, J. & Wong, M.H. 2001. Accumulation of fluoride and aluminium related to different
varieties of tea plant. Environmental Geochemistry and Health. 23, 53-63.
Saha, J.K., Adhikari, T. & Mandal, B. 1999. Effect of lime and organic matter on distribution of
zinc, copper, iron and manganese in acid soils. Comm Soil Sci Plant Anal. 30, 1819-1829.
Saikh, H. 2007. Effect of copper (Cu++) on the quality and quantity of made tea and exact reason
for the suppression of tea crop for the application of bivalent copper products to the tea
bushes by spraying. Assam Rev Tea News 11 -21.
SAS Institute Inc. 2008. SAS/STAT ®. 9.2. User’s Guide. Cary, NC: SAS Institute Inc.
Schönher, J. 2002. Foliar nutrition using inorganic salts: Laws of cuticular penetration. Acta
Hort. 594, 77-84.
Schreiber, L. 2005. Polar paths of diffusion across plant cuticles: New evidence for an old
hypothesis. Ann Bot. 95, 1069-1073.

103
Sedaghathoor, S., Torkashvand, A.M., Hashemabadi, D. & Kaviani B. 2009. Yield and quality
response of tea plant to fertilisers. Afr J Agri Res. 4, 6, 568-570.
Seenivasan, S., Manikandan, N., Muraleedharan, N. & Selvasundaram, R. 2008. Heavy metal
content of black teas from south India. FoodControl 19, 746–749.
Sharma, P.K., Bordoloi, A.K. & DEV Choudhury, M.N. 1992. Effect of zinc and manganese on
the uptake of nitrogen in tea shoot and quality of made tea. Challenges of the nineties.
Proceedings of the 31st Tocklai Conference, Tea Research Assosciation, Tocklai
Experimental station, Jorhat, 785008, Assam, India, 211-216.
Shi, S., Ding, R., Liu, Y. & Sun, Y. 1999. Acidification of soil by Urea and fallen tea leaves. J.
of Tea Sci. 91: 7-12. In: Han, W., Kemmitt, S.J. & Brookes, P.C. 2007. Soilmicrobial
biomass and activity in Chinese tea gardens of varying stand age and productivity. Soil Biol
Biochem. 39, 1468-1478.
Sinha, M.P., Sarma, S.N. Thakur, K.C. & Goswani, M. 1992. Effect of boron, other
micronutrients and growth promoters on yield of tea.Proceedings of the 31st Tocklai
conference, Tea Research Association, Tocklai Experimental station, Jorhat, 785008,
assam, India, 50-55.
Solomon, D., Lehmann, J., Mamo T., Fritzsche, F. & Zech W. 2002. Phosphorus forms and
dynamics as influenced by land use changes in the sub-humid Ethiopian highlands.
Geodema. 105, 21-48.
Squire, G.R. 1977. Seasonal changes of photosynthesis of tea (Camelliasinensis L.). J Appl
Ecology. 14, 303-316.
Stevenson, F.J. 1991. Organic matter-micronutrient reactions in soil. In: MORTVEDT J.J.,
COX., SHUMAN L.M., WELCH R.M., (eds.). Micronutrients in Agriculture. Soil Science
Society of America, Madison, 145-186.

104
Stiborová, M., Doubravova, M. Brezinova A. & Friedrich, a. 1986. Effect of heavy metal ions on
growth and biochemical characteristics of photosynthesis of barley (Hordeumvulgae) .
Photosynthetica. 20, 418-425.
Subramanian, N., Venkatesh, P., Ganguli, S. & Sinkar, V.P. 1999. Role of polyphenol oxidase
and peroxidase in generation of black tea theaflavins. J AgricFood Chem. 47, 2571-2578.
Sud, R.G., Prasad, R. & Bhargava, M. 1995. Effect of weather conditions on concentration of
calcium, manganese, zinc, copper and iron in green tea (Camelliasinensis (L) O Kuntze)
leaves of North-Western India. J Sci Food Agric 67, 341-346
Sudoi, V. 1995. Relation of Brevipalpusphoenicis Geijkes (Acari: Tenuipalpidae), with clones,
nutrients, growth and yield of tea. In: Kamau, D. 2008. Productivity and resource use in
ageing plantations. PhD thesis, Wageningen University, ISBN 978-90-8504-808-4
Wageningen, The Netherlands.
Sultana, M., Barpujari, N., Dey, S.K. 1978. Studies on the zinc content of tea soils and uptake of
Zn by young tea. Environ and Exp Bot 46, 129-140.
Tanton, T.W. 1982. Environmental factors affecting the yield of tea II. Effects of soil
temperature, daylength and dry air. Exp.Agric. 18, 55-63.
TPH 1990, Tea Planters Handbook, Tea Research Foundation of Central Africa. P.O Box 51,
Mulanje. Malawi.
TRFCA, 2000. Tea Research Foundation of Central Africa Clonal Catalogue, Tea Research
Foundation of Central Africa, P.O. Box 51, Mulanje.
TTRA, 2008a. Pruning. Tocklai Tea Research Association. Kolkata, India.
www.tocklai.net/cultivation/pruning. Accessed online on 24 May, 2011.
TTRA, 2008b. Plucking. Tocklai Tea Research Association. Kolkata, India.
www.tocklai.net/cultivation/pruning. Accessed online on 24 May, 2011.
105
Tukey, Jr. H.B. & Marczynski, S. 1984. Foliar nutrition- Old ideas rediscovered. Acta Hort. 145,
205-212.
Verma, D.P. 1999. Manuring of tea. Global advances in tea science, Aravan Books International
(P) Ltd, New Delhi.
Verma, D.P. & Ranade S.S. 2010. Efficacy of balanced fertilisation of secondary nutrients and
micro-nutrients through IMT manuring technique for sustainable productivity of tea. Plant
Chron. 106, 8, 24-45.
Wallace, A. & Wallace, G. A. 1983. Foliar fertilization with metalosates. J Plant Nutr. 6, 551-
557.
Wang, S., Yang, Z., Yang, H., Lu, B., Li, S. & Lu, Y. 2004. Copper-induced stress and anti-
oxidative responses in roots of Brassicajuncae L. Bot Bull Acad Sin, 45, 203-212.
Wilkie, S. 1993. Shear plucking seminar. Tea Research Foundation of Central Africa. P.O. Box
51, Mulanje, Malawi.
Willson, K.C. & Clifford, M.N. (eds) 1992. Tea: Cultivation to consumption. Chapman & Hall
London, New York, Tokyo, Melbourne, Madras.
Willson, K. & Gunther, M. 1981. CFl Plant tissue analysis service. Chart 298b Tea – Papua
NewGuinea. Consolidated Fertilisers Ltd. In: Drinnan, J.E. 2008 Fertiliser Strategies for
Mechanical Tea Production. Rural Industries Research and Development Corporation.
Wittwer, S.H., Bukovac, M.J., Jyung, W.H., Yamada, Y., De, R., Rasmussen, H.P., Haile,
M.S.N. & Kannan, S. 2006. Penetration of the cuticular membrane and nutrient uptake by
isolated leaf cells. PlantFoods Hum Nutr. 14, 1-2, 105-120.
Wojcik, P. 2004. Uptake of mineral nutrients from foliar fertilisation (Review). J Fruit
Ornamental Plant Res. Special Ed.12, 201-218.

106
Wooldridge, J. 2002. Effect of trace element sprays and fritted trace elements on the growth and
manganese, zinc, copper and boron contents of young Braestar /M793 Apple trees in sand
culture. J Plant Nutr, 25, 1, 43-59.
Wright, L.P., Mphangwe, N.I.K., Nyirenda, H.E. & Apostolides, Z. 2000. Analysis of caffeine
and flavan-3-ol composition in the fresh leaf of Camellia sinensis for predicting the quality
of the black tea produced in Central Africa. J Sci Food Agric. 80, 1823-1830.
Wright, L.P. 2005. Biochemical analysis for identification of quality in black tea
(Camelliasinensis). PhD thesis, University of Pretoria, Republic of South Africa.
Yamada, Y., Wittwer S.H. & Bukovak, M.J. 1964. Penetration of ions through isolated cuticles.
Plant Physiol. 39, 28-32.
Yao, L., Liu, X., Caffin, N., Jiang, Y., Caffin, N., D’Arcy. B., Singanusong, R, R., Dutta, N. &
Xu, N. 2006. Compositional Analysis of teas from Australian supermarket, Food Chem. 94,
115-122.
Yruela, I. 2005 Copper in Plants. Braz J Plant Physiol. 17, 1, 145-156.
Zekri, M. & Obreza, T.A. 2009. Micronutrient deficiencies in citrus: Boron, copper and
molybdenum. IFAS Extension. University of Florida.
Zhang, M., Zhou, C. & Huang, C. 2006. Relationship between extractable metals in acid soils
and metals in acid soils and metals taken up by tea plants. Commn Soil Sci Plan 37, 347-
361.
Copyright © 2022 FDOKUMEN