Structure of DNA sequence d-TGATCA by two-dimensional nuclear magnetic resonance spectroscopy and...
17
Structure of DNA sequence d-TGATCA by two-dimensional nuclear magnetic resonance spectroscopy and restrained molecular dynamics q,qq Ritu Barthwal, a, * Pamita Awasthi, a Monica, a Manpreet Kaur, a Uma Sharma, a Nandana Srivastava, a S.K. Barthwal, b and Girjesh Govil c a Department of Biotechnology, Indian Institute of Technology Roorkee, Roorkee 247 667, India b Department of Physics, Indian Institute of Technology Roorkee, Roorkee 247 667, India c Chemical Physics Group, Tata Institute of Fundamental Research, Homi Bhabha Road, Navy Nagar, Colaba, Mumbai 400 005, India Received 4 November 2003, and in revised form 24 May 2004 Available online 2 July 2004 Abstract The 5 0 d-TpG 3 0 element is a part of DNA sequences involved in regulation of gene expression and is also a site for intercalation of several anticancer drugs. Solution conformation of DNA duplex d-TGATCA containing this element has been investigated by two-dimensional NMR spectroscopy. Using a total of 12 torsional angles and 121 distance constraints, structural refinement has been carried out by restrained molecular dynamics (rMDs) in vacuum up to 100 ps. The structure is characterized by a large positive roll at TpG/CpA base pair step and large negative propeller twist for AT and TA base pairs. The backbone torsional angle, c(O5 0 – C5 0 –C4 0 –C3 0 ), of T1 residue adopts a trans-conformation which is corroborated by short intra nucleotide T1H6–T1H5 0 (3.7 A) distance in nuclear overhauser effect spectroscopy (NOESY) spectra while the backbone torsional angle, b(P–O5 0 –C5 0 –C4 0 ), exists in trans as well as gauche state for T1 and C5 residues. There is evidence of significant flexibility of the sugar–phosphate backbone with rapid inter-conversion between two different conformers at TpG/CpA base pair step. The base sequence dependent variations and local structural heterogeneity have important implications in specific recognition of DNA by ligands. Ó 2004 Elsevier Inc. All rights reserved. Keywords: TpG/CpA basepair step; 2D-NMR of d-TGATCA; Restrained molecular dynamics; Sequence related conformation; DNA flexibility Several natural antibiotics bind to DNA in diverse ways but with a common ability to act as potent in- hibitors of DNA transcription and replication. Many synthetic compounds have been added to this list in search for more potent drugs for use in chemotherapy. Efforts have since been directed towards understanding the molecular basis for DNA sequence specificity for binding by identifying the preferred binding sequences of many key drugs with natural DNA (Arcamone, 1981; Carter, 1982; Neidle et al., 1983; Searle, 1993). The foot printing data have proved to be useful in identifying short DNA sequences, which are the specific binding sites of drugs (Chaires et al., 1990). The mechanism of specific recognition involves reading of the local DNA topography at these binding sites. Therefore the strength and kinetics of specific binding of a ligand to a double stranded DNA depends on the ligand matching these and other contacts in a direct readout of the sequence (Helene and Lancelot, 1982; Searle, 1993). However, the sequence dependent conformation of DNA modifies the three-dimensional pattern of contacts to be made as an indirect readout of the sequence. Therefore the knowl- edge about sequence dependent variations in DNA q This work was supported by a research Grant No. 99/37/02/ BRNS-Cell from Board of Research in Nuclear Sciences (BRNS), Department of Atomic Energy (DAE), and Government of India. qq Supplementary data associated with this article can be found in the online version, at doi:10.1016/j.jsb.2004.05.005. * Corresponding author. Fax: +11-91-1332-273-560. E-mail addresses: [email protected], [email protected] (R. Barthwal), . 1047-8477/$ - see front matter Ó 2004 Elsevier Inc. All rights reserved. doi:10.1016/j.jsb.2004.05.005 Journal of Structural Biology 148 (2004) 34–50 Journal of Structural Biology www.elsevier.com/locate/yjsbi
-
Upload
independent -
Category
Documents
-
view
3 -
download
0
Transcript of Structure of DNA sequence d-TGATCA by two-dimensional nuclear magnetic resonance spectroscopy and...
Journal of
Structural
Journal of Structural Biology 148 (2004) 34–50
Biology
www.elsevier.com/locate/yjsbi
Structure of DNA sequence d-TGATCA by two-dimensionalnuclear magnetic resonance spectroscopy and restrained
molecular dynamicsq,qq
Ritu Barthwal,a,* Pamita Awasthi,a Monica,a Manpreet Kaur,a Uma Sharma,a
Nandana Srivastava,a S.K. Barthwal,b and Girjesh Govilc
a Department of Biotechnology, Indian Institute of Technology Roorkee, Roorkee 247 667, Indiab Department of Physics, Indian Institute of Technology Roorkee, Roorkee 247 667, India
c Chemical Physics Group, Tata Institute of Fundamental Research, Homi Bhabha Road, Navy Nagar, Colaba, Mumbai 400 005, India
Received 4 November 2003, and in revised form 24 May 2004
Available online 2 July 2004
Abstract
The 50 d-TpG 30 element is a part of DNA sequences involved in regulation of gene expression and is also a site for intercalation
of several anticancer drugs. Solution conformation of DNA duplex d-TGATCA containing this element has been investigated by
two-dimensional NMR spectroscopy. Using a total of 12 torsional angles and 121 distance constraints, structural refinement has
been carried out by restrained molecular dynamics (rMDs) in vacuum up to 100 ps. The structure is characterized by a large positive
roll at TpG/CpA base pair step and large negative propeller twist for AT and TA base pairs. The backbone torsional angle, c(O50–C50–C40–C30), of T1 residue adopts a trans-conformation which is corroborated by short intra nucleotide T1H6–T1H50 (3.7�A)
distance in nuclear overhauser effect spectroscopy (NOESY) spectra while the backbone torsional angle, b(P–O50–C50–C40), exists intrans as well as gauche state for T1 and C5 residues. There is evidence of significant flexibility of the sugar–phosphate backbone with
rapid inter-conversion between two different conformers at TpG/CpA base pair step. The base sequence dependent variations and
local structural heterogeneity have important implications in specific recognition of DNA by ligands.
� 2004 Elsevier Inc. All rights reserved.
Keywords: TpG/CpA basepair step; 2D-NMR of d-TGATCA; Restrained molecular dynamics; Sequence related conformation; DNA flexibility
Several natural antibiotics bind to DNA in diverse
ways but with a common ability to act as potent in-
hibitors of DNA transcription and replication. Many
synthetic compounds have been added to this list in
search for more potent drugs for use in chemotherapy.
Efforts have since been directed towards understanding
the molecular basis for DNA sequence specificity for
qThis work was supported by a research Grant No. 99/37/02/
BRNS-Cell from Board of Research in Nuclear Sciences (BRNS),
Department of Atomic Energy (DAE), and Government of India.qq Supplementary data associated with this article can be found in
the online version, at doi:10.1016/j.jsb.2004.05.005.* Corresponding author. Fax: +11-91-1332-273-560.
E-mail addresses: [email protected], [email protected]
(R. Barthwal), .
1047-8477/$ - see front matter � 2004 Elsevier Inc. All rights reserved.
doi:10.1016/j.jsb.2004.05.005
binding by identifying the preferred binding sequences
of many key drugs with natural DNA (Arcamone, 1981;
Carter, 1982; Neidle et al., 1983; Searle, 1993). The foot
printing data have proved to be useful in identifying
short DNA sequences, which are the specific binding
sites of drugs (Chaires et al., 1990). The mechanism of
specific recognition involves reading of the local DNAtopography at these binding sites. Therefore the strength
and kinetics of specific binding of a ligand to a double
stranded DNA depends on the ligand matching these
and other contacts in a direct readout of the sequence
(Helene and Lancelot, 1982; Searle, 1993). However, the
sequence dependent conformation of DNA modifies the
three-dimensional pattern of contacts to be made as an
indirect readout of the sequence. Therefore the knowl-edge about sequence dependent variations in DNA
R. Barthwal et al. / Journal of Structural Biology 148 (2004) 34–50 35
duplex geometry is essential to the understanding of thefunction of DNA in biological processes (Gronenborn
and Clore, 1985; Hagerman, 1990; Steitz, 1990; Trifo-
nov, 1985). Sequence specific variations arise from a
specific three-dimensional arrangement of hydrogen
bonding site in bases/base pairs due to geometric dis-
position of functional groups, DNA helical geometry,
local deformability or bending of DNA and effects of
major/minor groove width. Apart from direct hydrogen-bonding, van der Waal’s and hydrophobic interaction
appear to play a key role in stabilization of protein–
DNA and drug–DNA complex. The discrimination be-
tween G–C and A–T base pair on the basis of patterns
of potential hydrogen bond donors and acceptors in the
major groove is easily possible (Helene and Lancelot,
1982; Searle, 1993). Besides, the major groove also ex-
hibits non-polar patches in the C5 regions of pyrimi-dines with an obvious difference due to the hydrophobic
contact offered by thymine methyl group. In the minor
groove the difference is much lesser although guanine-
2-amino groups presents a way of discrimination between
G–C and A–T base pairs. Intrinsic major and minor
groove width may not be such an important factor in
DNA recognition as there have been evidences of in-
duced fit of bulky ligand in the minor groove so as toaccommodate the ligand in binding site of DNA (Searle,
1993). It is generally regarded that in the deoxyribose
sugar, the N-conformer (characterized by pseudorota-
tion PN ¼ 9�/18�, C30-endo) and S-conformer (C20-endogeometry) are rapidly inter-converting in solution. The
fraction of S-conformer in non-terminal pyrimidines
may be 75–90% while that in purines, may be higher,
about 90–100% (Searle, 1993). Since C30–C40 bond isshared between deoxyribose and sugar–phosphate bond,
the conformational change can be transmitted from the
base to the backbone through the base-sugar confor-
mational correlations. In addition, the conformational
flexibility of the double helix at specific sites may play an
important role in recognition of proteins/drugs/ligands,
perhaps by providing loci with a propensity for con-
formational change which is ultimately reflected in theconformation of DNA–ligand complex upon ligand
binding.
Sequence dependent structural variations have thus
been a subject of considerable interest in past (Celda
et al., 1989; Chary et al., 1987; Dornberger et al., 1998;
Nibedita et al., 1993; Radha et al., 1995; Ravi Kumar
-et al., 1985; Sarma et al., 1988; Schmitz et al., 1992a,b;
Tonelli et al., 1998; Ulyanov et al., 1992; Yanagi et al.,1991). Selection of DNA sequences with anomalously
low gel electrophoretic mobility revealed the importance
of dinucleotide base step TG/CA in DNA bending
(Beutal and Gold, 1992). A growing number of studies
have since suggested the existence of dynamically and
structurally unique TG/CA dimers (Cheung et al., 1984;
Donlan and Lu, 1992; McNamara et al., 1990; Timsit
et al., 1991) which may be involved in DNA bendingand flexibility. TG steps are believed to be crucial struc-
tural elements of various in vivo processes such as reg-
ulation of gene expression and are over-represented in
consensus protein binding sites (Trifonov and Brendal,
1986). The CAC/GTG element in specific binding region
of Cro with the OR3 operator evidently facilitates pro-
tein-induced DNA bending (Lyubchenko et al., 1993). It
has also been observed that two CAC/GTG elements atOL1 and OR2 sites improve interaction with both Cro
and C1 repressor proteins (Kabsch et al., 1982; Sarai
and Takeda, 1989). Possible binding mode of transcrip-
tional factors to regulatory DNA sequences are revealed
by the crystal structure of CAP–DNA complex exhib-
iting two 40o kinks between TG/CA base pairs (Schultz
et al., 1991; Steitz, 1990). The structural elements CATG
and TTTGCA are also a part of immunoglobulin pro-moter regions recognized by transcriptional factors
(Kemler et al., 1989) and octamer motif of immuno-
globulin genes (Weisz et al., 1994). The flexibility in base
triplets containing TG base step has also been attributed
to origin of genetic diseases (Bacolla et al., 1997; Cha-
stain and Sinden, 1998).
DNA bending has also been correlated to changes in
minor groove width (Chuprina et al., 1991) and otherhelicoidal parameters (Dornberger et al., 1998; Weisz
et al., 1994) and is believed to play an important role in
the process of recognition by proteins and minor groove
binding ligands, such as drugs. An understanding of the
structural heterogeneity of the DNA leads to the design
of new drugs targeted to interact directly with the DNA
sequence of interest. In this paper, we have carried out
structural analysis of d-TGATCA based on NMRspectroscopic techniques. This sequence contains 50d-TpG30 step in which intercalation of anticancer drugs—
adriamycin, daunomycin, and epiadriamycin takes
place, the evidence for which has been provided by foot
printing (Chaires et al., 1987, 1990), NMR (Barthwal
et al., 1994) and X-ray crystallography techniques
(d’Langlois Estaintot et al., 1992; Leonard et al., 1992,
1993; Nunn et al., 1991).
Materials and methods
The deoxyoligonucleotide sequence d-TGATCA was
purchased from DNA Chemical International USA and
used as such without any purification. The sample was
prepared by dissolving 5.5mg of DNA (�180 OD units)in 400 ll of D2O (deuterium oxide) containing 16.25mM
phosphate buffer (pH 7.0), 15mM NaCl and �0.1mM
ethylenediaminetetraacetic acid (EDTA). One microliter
of 0.1M sodium 2,2-dimethyl-2-silapentane-5-sulpho-
nate (DSS) was added as internal reference. The con-
centration of DNA duplex is approximately 3.68mM.
The sample was lyophilized several times from D2O and
36 R. Barthwal et al. / Journal of Structural Biology 148 (2004) 34–50
finally made up to 0.4ml with 99.95% D2O just prior torecording of NMR spectra. The NMR spectra were re-
corded at Bruker AM 500 spectrometer operating at
500MHz for proton at the National High Field NMR
facility located at Tata Institute of Fundamental Re-
search (TIFR), Mumbai. The one-dimensional nuclear
magnetic resonance (1D NMR) spectra were recorded at
different temperatures at an interval of 5K in the range
277–325K. All two-dimensional nuclear magnetic reso-nance (2D NMR) experiments, double quantum filtered
correlation spectroscopy (DQF COSY) and NOESY,
were carried out at 295K. The chemical shifts have been
expressed with respect to the internal standard DSS.
Typical parameter for one-dimensional NMR experi-
ments are: pulse width �10 ls, number of data points 8–
16K, spectral width 4000Hz, number of scans 64–128,
digital resolution 0.25–0.50Hz/point. The typical pa-rameters for 2D experiments are 1024–2048 data points
along the t2 dimension, 512 free induction decays in t1
dimension, pulse width �9.5–12 ls, spectral width
4000Hz, number of scans 64–128, digital resolution
2.3Hz/point and relaxation decay 1.0 s. 2D NOESY
experiments were carried out at variable mixing times,
sm, that is, 75, 150, 200, and 250ms.
Cross-peaks in the NOESY spectra were integratedand intensities at mixing times of 75, 150, and 200ms
were translated into inter-proton distances using C5H5–
C5H6 cross-peaks of cytosine as the reference (2.45�A).
A range of �0.2�A was provided to distance to account
for any errors in integration. Pseudoatom corrections
were used for methyl and other equivalent protons. The
NOEs were categorized as strong, medium, and weak
with corresponding distance ranges 1.8–2.4, 2.5–2.9, and3.0–4.0�A set for the respective intensities of cross-peaks.
Force constants of 10.0, 5.0, and 2.0 kcalmol�1 �A�2
were fixed for strong, medium, and weak peaks, re-
spectively. The coupling constants J (H10–H20) and
J (H10–H200) were transformed to torsional angles using
Karplus relationship. These were introduced as dihedral
restraints allowing a range of �10� on the calculated
values with force constant of 20.0 kcalmol�1 rad�2. Thetotal numbers of dihedral and distance restraints used in
the structure calculations using restrained molecular
dynamics were 12 and 121, respectively. An initial model
of double helical B-DNA structure was generated using
INSIGHT II version 97.0, (Molecular Simulations,
MSI, San Diego) using Silicon Graphics O2 workstation
R5000 and is referred to as B-DNA1. The force constant
for hydrogen bonds was fixed as 40 kcalmol�1 �A�2
throughout the simulations. The energy of the molecule
was minimized using 1000 steps each of Steepest Descent
and Conjugate Gradient Methods to remove any inter-
nal strain due to short contacts in starting structure
using CFF91 force fields (Maple et al., 1988, 1990) in
DISCOVER version 97.0 (MSI). Dielectric constant was
fixed as 1:0 � r (r¼ distance) for calculation of electro-
static interactions. Conformational search was per-formed by the following simulated annealing restrained
molecular dynamics protocol: The molecule was heated
to a temperature of 500K in steps of 100K. Molecular
Dynamics was carried out for 25 ps (1000 iterations
steps of 1 fs each) at 500K during which 25 structures
were saved at regular intervals. Each of them was then
slowly cooled to 300K in steps of 50K. The force con-
stants for NOEs for strong, medium, and weak peakswere held constant as 25, 15, and 10 kcalmol�1 �A�2,
respectively while that for experimental dihedral re-
straints was fixed at 50 kcalmol�1 rad�2. At each step of
cooling by 50K the molecule was equilibrated for 25 ps
(2500 iterations steps of 1 fs each). At the end of simu-
lated annealing, 1000 steps of Steepest Descent mini-
mized all the structures until a predefined convergence
limit of root mean square derivative of energy with re-spect to atomic coordinates of <0.01 kcalmol�1 �A�1 was
reached. The final structure thus obtained is referred to
as rMD-B1SA. The complete protocol of rMD studies
with simulated annealing at 500K was repeated
by taking another starting structure (referred to as
B-DNA2) built using AMBER 7.0 and is referred to as
rMD-B2SA. Since the results obtained by NMR indi-
cated existence of a structure within the B-family ofDNA structures, we have also carried out studies using
rather a mild rMD protocol with both the starting
structures B-DNA1 and B-DNA2. In this protocol
the temperature is maintained at 300K throughout the
process of restrained energy minimization and re-
strained molecular dynamics and the corresponding
resulting structures are referred to as rMD-B1 and
rMD-B2. Another rMD structure, obtained after 100 pssimulations with starting structure B-DNA1, is referred
to as rMD-B1-100. All molecular dynamics calculations
have been carried out in vacuum.
Results and discussion
Analysis of NMR spectra
The one-dimensional proton NMR spectra of
d-TGATCA in D2O were recorded at 500MHz at nine
different temperatures in the range 277–325K. Some of
the NMR spectra at 325, 305, and 295K are available as
supplementary material supplied. Most of the protons
shift downfield gradually with the temperature due to
duplex to single strand transition. The chemical shifts ofvarious protons at three different temperatures are given
in Table 1. The downfield shifts in T4CH3, C5H5, and
G2H8 protons on increasing temperature from 277 to
325K are 0.32, 0.29, and 0.17 ppm, respectively. The
changes are quite pronounced in some of the H10 pro-tons due to ring current shifts; the shift in C5H10,T1H10, and G2H10 protons with temperature is 0.33,
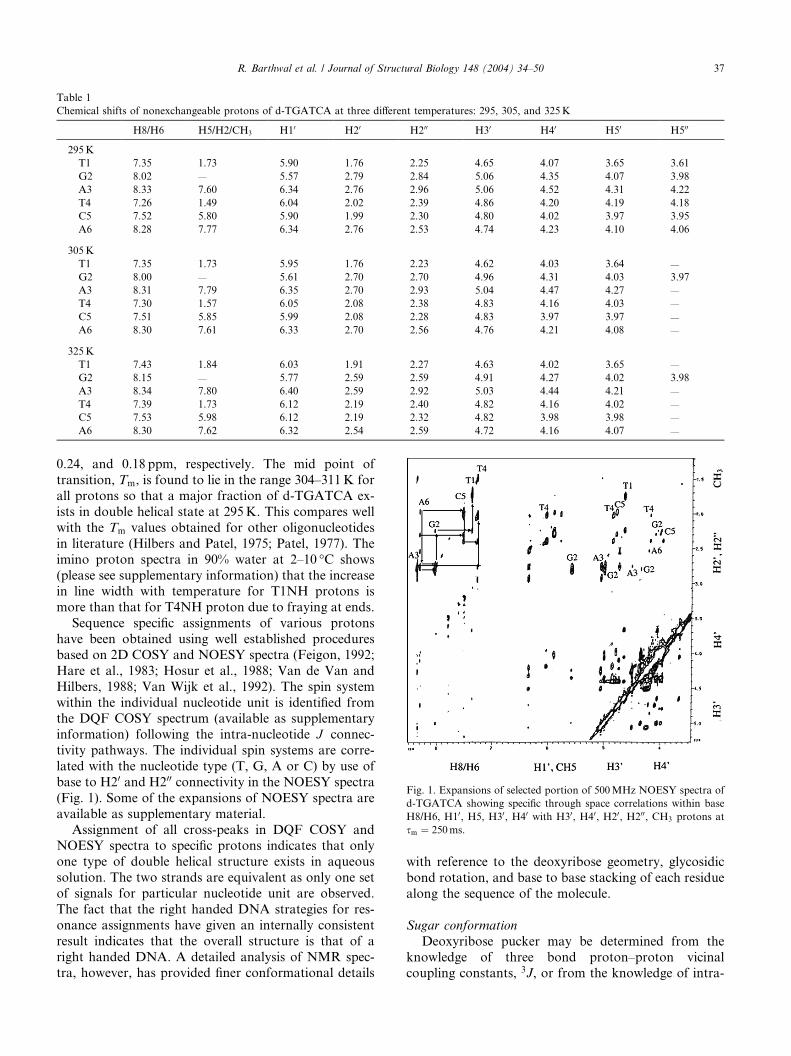
Table 1
Chemical shifts of nonexchangeable protons of d-TGATCA at three different temperatures: 295, 305, and 325K
H8/H6 H5/H2/CH3 H10 H20 H200 H30 H40 H50 H500
295K
T1 7.35 1.73 5.90 1.76 2.25 4.65 4.07 3.65 3.61
G2 8.02 — 5.57 2.79 2.84 5.06 4.35 4.07 3.98
A3 8.33 7.60 6.34 2.76 2.96 5.06 4.52 4.31 4.22
T4 7.26 1.49 6.04 2.02 2.39 4.86 4.20 4.19 4.18
C5 7.52 5.80 5.90 1.99 2.30 4.80 4.02 3.97 3.95
A6 8.28 7.77 6.34 2.76 2.53 4.74 4.23 4.10 4.06
305K
T1 7.35 1.73 5.95 1.76 2.23 4.62 4.03 3.64 —
G2 8.00 — 5.61 2.70 2.70 4.96 4.31 4.03 3.97
A3 8.31 7.79 6.35 2.70 2.93 5.04 4.47 4.27 —
T4 7.30 1.57 6.05 2.08 2.38 4.83 4.16 4.03 —
C5 7.51 5.85 5.99 2.08 2.28 4.83 3.97 3.97 —
A6 8.30 7.61 6.33 2.70 2.56 4.76 4.21 4.08 —
325K
T1 7.43 1.84 6.03 1.91 2.27 4.63 4.02 3.65 —
G2 8.15 — 5.77 2.59 2.59 4.91 4.27 4.02 3.98
A3 8.34 7.80 6.40 2.59 2.92 5.03 4.44 4.21 —
T4 7.39 1.73 6.12 2.19 2.40 4.82 4.16 4.02 —
C5 7.53 5.98 6.12 2.19 2.32 4.82 3.98 3.98 —
A6 8.30 7.62 6.32 2.54 2.59 4.72 4.16 4.07 —
Fig. 1. Expansions of selected portion of 500MHz NOESY spectra of
d-TGATCA showing specific through space correlations within base
H8/H6, H10, H5, H30, H40 with H30, H40, H20, H200, CH3 protons at
sm ¼ 250ms.
R. Barthwal et al. / Journal of Structural Biology 148 (2004) 34–50 37
0.24, and 0.18 ppm, respectively. The mid point of
transition, Tm, is found to lie in the range 304–311K for
all protons so that a major fraction of d-TGATCA ex-
ists in double helical state at 295K. This compares well
with the Tm values obtained for other oligonucleotides
in literature (Hilbers and Patel, 1975; Patel, 1977). The
imino proton spectra in 90% water at 2–10 �C shows
(please see supplementary information) that the increasein line width with temperature for T1NH protons is
more than that for T4NH proton due to fraying at ends.
Sequence specific assignments of various protons
have been obtained using well established procedures
based on 2D COSY and NOESY spectra (Feigon, 1992;
Hare et al., 1983; Hosur et al., 1988; Van de Van and
Hilbers, 1988; Van Wijk et al., 1992). The spin system
within the individual nucleotide unit is identified fromthe DQF COSY spectrum (available as supplementary
information) following the intra-nucleotide J connec-
tivity pathways. The individual spin systems are corre-
lated with the nucleotide type (T, G, A or C) by use of
base to H20 and H200 connectivity in the NOESY spectra
(Fig. 1). Some of the expansions of NOESY spectra are
available as supplementary material.
Assignment of all cross-peaks in DQF COSY andNOESY spectra to specific protons indicates that only
one type of double helical structure exists in aqueous
solution. The two strands are equivalent as only one set
of signals for particular nucleotide unit are observed.
The fact that the right handed DNA strategies for res-
onance assignments have given an internally consistent
result indicates that the overall structure is that of a
right handed DNA. A detailed analysis of NMR spec-tra, however, has provided finer conformational details
with reference to the deoxyribose geometry, glycosidic
bond rotation, and base to base stacking of each residue
along the sequence of the molecule.
Sugar conformation
Deoxyribose pucker may be determined from the
knowledge of three bond proton–proton vicinalcoupling constants, 3J, or from the knowledge of intra-
38 R. Barthwal et al. / Journal of Structural Biology 148 (2004) 34–50
sugar inter-proton distances. Due to limited digital res-olution (2.3Hz/point in present case), spectral overlap
and inherent line widths, there are several limitations.
We have used a combination of two methods and made
an attempt to get an estimate of sugar pucker without
doing rigorous calculations and spectral simulations.
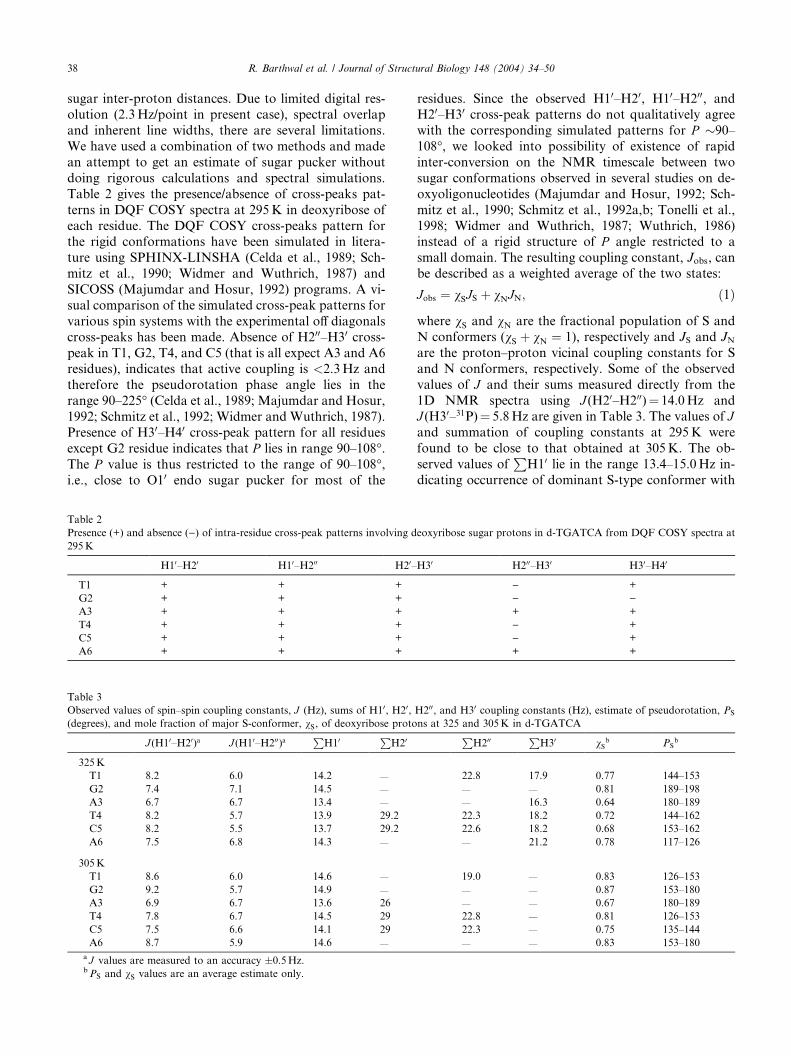
Table 2 gives the presence/absence of cross-peaks pat-
terns in DQF COSY spectra at 295K in deoxyribose of
each residue. The DQF COSY cross-peaks pattern forthe rigid conformations have been simulated in litera-
ture using SPHINX-LINSHA (Celda et al., 1989; Sch-
mitz et al., 1990; Widmer and Wuthrich, 1987) and
SICOSS (Majumdar and Hosur, 1992) programs. A vi-
sual comparison of the simulated cross-peak patterns for
various spin systems with the experimental off diagonals
cross-peaks has been made. Absence of H200–H30 cross-peak in T1, G2, T4, and C5 (that is all expect A3 and A6residues), indicates that active coupling is <2.3Hz and
therefore the pseudorotation phase angle lies in the
range 90–225� (Celda et al., 1989; Majumdar and Hosur,
1992; Schmitz et al., 1992; Widmer and Wuthrich, 1987).
Presence of H30–H40 cross-peak pattern for all residues
except G2 residue indicates that P lies in range 90–108�.The P value is thus restricted to the range of 90–108�,i.e., close to O10 endo sugar pucker for most of the
Table 2
Presence (+) and absence ()) of intra-residue cross-peak patterns involving d
295K
H10–H20 H10–H200 H20–
T1 + + +
G2 + + +
A3 + + +
T4 + + +
C5 + + +
A6 + + +
Table 3
Observed values of spin–spin coupling constants, J (Hz), sums of H10, H20,(degrees), and mole fraction of major S-conformer, vS, of deoxyribose proto
J (H10–H20)a J (H10–H200)aP
H10P
H20
325K
T1 8.2 6.0 14.2 —
G2 7.4 7.1 14.5 —
A3 6.7 6.7 13.4 —
T4 8.2 5.7 13.9 29.2
C5 8.2 5.5 13.7 29.2
A6 7.5 6.8 14.3 —
305K
T1 8.6 6.0 14.6 —
G2 9.2 5.7 14.9 —
A3 6.9 6.7 13.6 26
T4 7.8 6.7 14.5 29
C5 7.5 6.6 14.1 29
A6 8.7 5.9 14.6 —
a J values are measured to an accuracy �0.5Hz.bPS and vS values are an average estimate only.
residues. Since the observed H10–H20, H10–H200, andH20–H30 cross-peak patterns do not qualitatively agree
with the corresponding simulated patterns for P �90–
108�, we looked into possibility of existence of rapid
inter-conversion on the NMR timescale between two
sugar conformations observed in several studies on de-
oxyoligonucleotides (Majumdar and Hosur, 1992; Sch-
mitz et al., 1990; Schmitz et al., 1992a,b; Tonelli et al.,
1998; Widmer and Wuthrich, 1987; Wuthrich, 1986)instead of a rigid structure of P angle restricted to a
small domain. The resulting coupling constant, Jobs, can
be described as a weighted average of the two states:
Jobs ¼ vSJS þ vNJN; ð1Þ
where vS and vN are the fractional population of S and
N conformers (vS þ vN ¼ 1), respectively and JS and JNare the proton–proton vicinal coupling constants for S
and N conformers, respectively. Some of the observed
values of J and their sums measured directly from the
1D NMR spectra using J (H20–H200)¼ 14.0Hz andJ (H30–31P)¼ 5.8Hz are given in Table 3. The values of Jand summation of coupling constants at 295K were
found to be close to that obtained at 305K. The ob-
served values ofP
H10 lie in the range 13.4–15.0Hz in-
dicating occurrence of dominant S-type conformer with
eoxyribose sugar protons in d-TGATCA from DQF COSY spectra at
H30 H200–H30 H30–H40
) +
) )+ +
) +
) +
+ +
H200, and H30 coupling constants (Hz), estimate of pseudorotation, PS
ns at 325 and 305K in d-TGATCAP
H200P
H30 vSb PS
b
22.8 17.9 0.77 144–153
— — 0.81 189–198
— 16.3 0.64 180–189
22.3 18.2 0.72 144–162
22.6 18.2 0.68 153–162
— 21.2 0.78 117–126
19.0 — 0.83 126–153
— — 0.87 153–180
— — 0.67 180–189
22.8 — 0.81 126–153
22.3 — 0.75 135–144
— — 0.83 153–180
R. Barthwal et al. / Journal of Structural Biology 148 (2004) 34–50 39
vS P 0:63. The value of vS is estimated using the relation(Van Wijk et al., 1992)
vS ¼X
H 0�
� 9:4�=ð15:7� 9:4Þ; ð2Þ
while other couplings have been used to get an estimate
of pseudo rotation phase angle of S-conformer (Van
Wijk et al., 1992). Some of the results are given in Table
3. Since J=P
J are measured to an accuracy of �0.5Hz
(and are not obtained by simulations of spectra), noattempt is made to estimate the values of PN, /N, and /S
and the average value of 18�, 36�, and 36�, respectivelyhave been used. The visual inspection of H10 peaks at
305K shows clearly that G2 is closest to B-DNA
structure and that difference between J (H10–H20) and
J (H10–H200) decreases in the order of G2>A6>T1>T4>C5>A3 which is in agreement with the measure-
ment ofP
H10 and hence calculated values of vS whichare 0.87, 0.83, 0.83, 0.81, 0.75, and 0.67 for six residues
G2, A6, T1, T4, C5, and A3, respectively. But the DQF
COSY at 295K shows that B-DNA character decreases
in the order G2>T1, T4, C5>A6, A3 since in the A3
and A6 residues, both the H200–H30 and H30–H40 cross
peaks are observed. This is due to the fact that J (H200–
H30) and J (H30–H40) values are sensitive to variation in
PS and vS both. Therefore A6 residue has PS value,which is different from that in T1 residue while vS for
both these residues are nearly same. In fact for A3 and
A6 residues, two sets of PS, that is, 99–108�, 180–189�,and 153–180�, 117�, respectively fit into the experimental
results. The value indicated in Table 3, that is 180–189�and 153–180� for A3 and A6 residues, respectively were
selected out of the two sets on the basis of the intensity
of H10–H40 cross-peak in NOESY spectra, discussedlater. We have used the values of PS and vS obtained in
Table 3 to carry out back calculations of all the coupling
constants. It is found that whenever H200–H30 and/or
H30–H40 cross peak pattern was not observed in DQF
COSY spectra at 295K, the calculated value of J was in
the range 1.5–2.2Hz which isbelow the experimental
resolution of 2.3Hz/point. This shows that the estimates
of PS and vS obtained on the basis of 1D NMR spectraare consistent with the DQF COSY spectra.
It is generally believed that the non-terminal pyrimi-
dines in the B-DNA conformation are characterized by
the presence of major S-conformer with vS ¼ 0:75–0.90while the mole fraction of S-conformer for purines tends
to be higher, being �0.90 to 1.00 (Searle, 1993). The
results obtained are contrary to this belief. We observed
that A3 residue has vS ¼ 0:67, a value much lower thanexpected (0.90–1.0). Similar result was also obtained in
our studies on DNA hexamer d-CGATCG (Barthwal
et al., 2003) in which A3 residue had vS lower than 0.9–
1.0; the value of vS was 0.83. Further the present results
show that vS in d-TGATCA (at 305K) decreases in
the order G2>A6, T1>T4>C5>A3 while that in
d-CGATCG is found to decrease in the order G2>A3,T4>G6, C5, C1. The B-DNA character, as judged on
the basis of presence/absence of H200–H30 and H30–H40
DQF COSY peak patterns in d-TGATCA decreases in
the order G2>T1, T4, C5>A3, and A6 while that in d-
CGATCG (Barthwal et al., 2003) decreases in the order
G2>A3, T4>G6, C1, and C5. This clearly shows se-
quence dependent variations in conformation of oligo-
nucleotides. The G2 residue in both the DNA sequencesd-CGATCG and d-TGATCA, happens to possess the
maximum B-DNA character. It is an interesting obser-
vation in view of the fact that the anticancer drugs
adriamycin, daunomycin and epiadriamycin, bind
maximally to d-C/TpG step with direct hydrogen bonds
with G2 residue (Chaires et al., 1987; d’Langlois
Estaintot et al., 1992; Leonard et al., 1992, 1993; Nunn
et al., 1991). We obtained vS fromP
H10 values of allresidues as a function of temperature in the range 295–
325K (part of data are shown in Table 3). It was found
that percentage of S-conformer decreased with temper-
ature in all the residues in d-TGATCA. The decrease
was most significant for T4 residue (DvS � 0:09) and was
minimum for A3 residue (DvS � 0:04). Thus the equi-
librium N$S between the two inter converting con-
formers is affected by temperature and shifts towardsN-conformer at high temperatures. This question has
been raised by Van Wijk et al. (1992) but there are no
explicit reports on change in N$S equilibrium with
temperature in oligonucleotides in literature. NMR
spectroscopy methods are most suitable to address this
aspect. In d-CGATCG we observed that the terminal
G6 residue showed maximal change in vS (�0.09)
while pyrimidines were less affected by temperature.These results once again highlight the sequence de-
pendent subtle variations in conformation of oligonu-
cleotides.
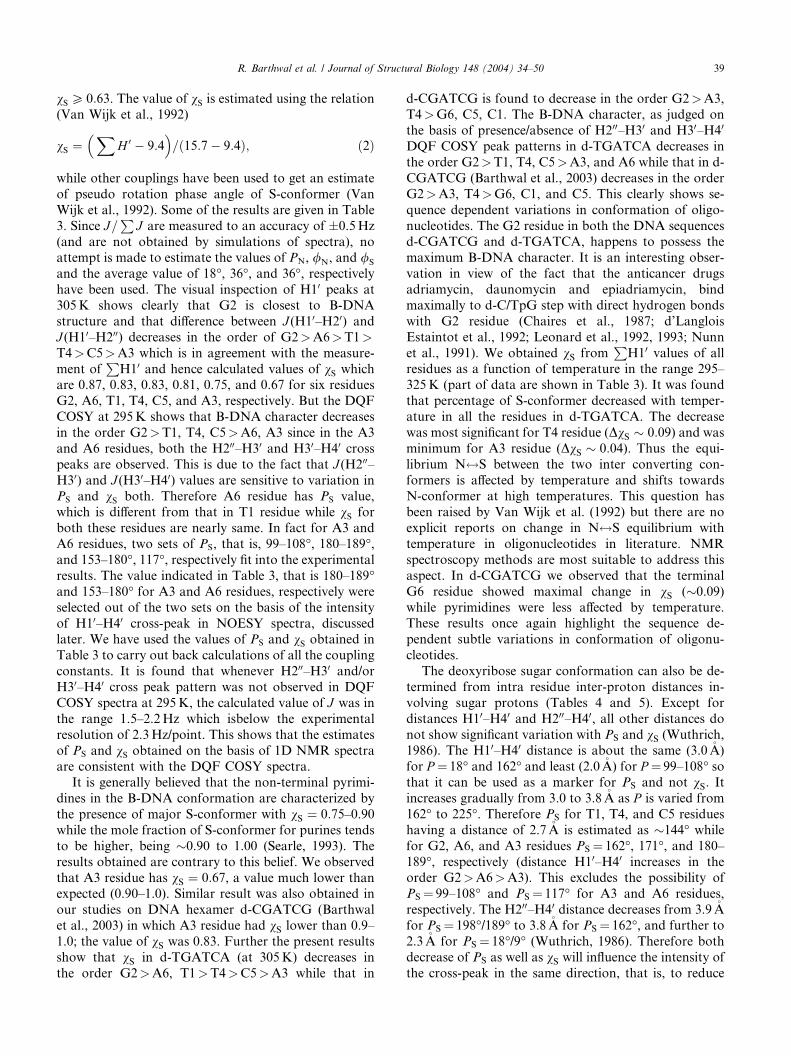
The deoxyribose sugar conformation can also be de-
termined from intra residue inter-proton distances in-
volving sugar protons (Tables 4 and 5). Except for
distances H10–H40 and H200–H40, all other distances donot show significant variation with PS and vS (Wuthrich,1986). The H10–H40 distance is about the same (3.0�A)
for P ¼ 18� and 162� and least (2.0�A) for P ¼ 99–108� sothat it can be used as a marker for PS and not vS. Itincreases gradually from 3.0 to 3.8�A as P is varied from
162� to 225�. Therefore PS for T1, T4, and C5 residues
having a distance of 2.7�A is estimated as �144� while
for G2, A6, and A3 residues PS ¼ 162�, 171�, and 180–
189�, respectively (distance H10–H40 increases in theorder G2>A6>A3). This excludes the possibility of
PS ¼ 99–108� and PS ¼ 117� for A3 and A6 residues,
respectively. The H200–H40 distance decreases from 3.9�Afor PS ¼ 198�/189� to 3.8�A for PS ¼ 162�, and further to
2.3�A for PS ¼ 18�/9� (Wuthrich, 1986). Therefore both
decrease of PS as well as vS will influence the intensity of
the cross-peak in the same direction, that is, to reduce
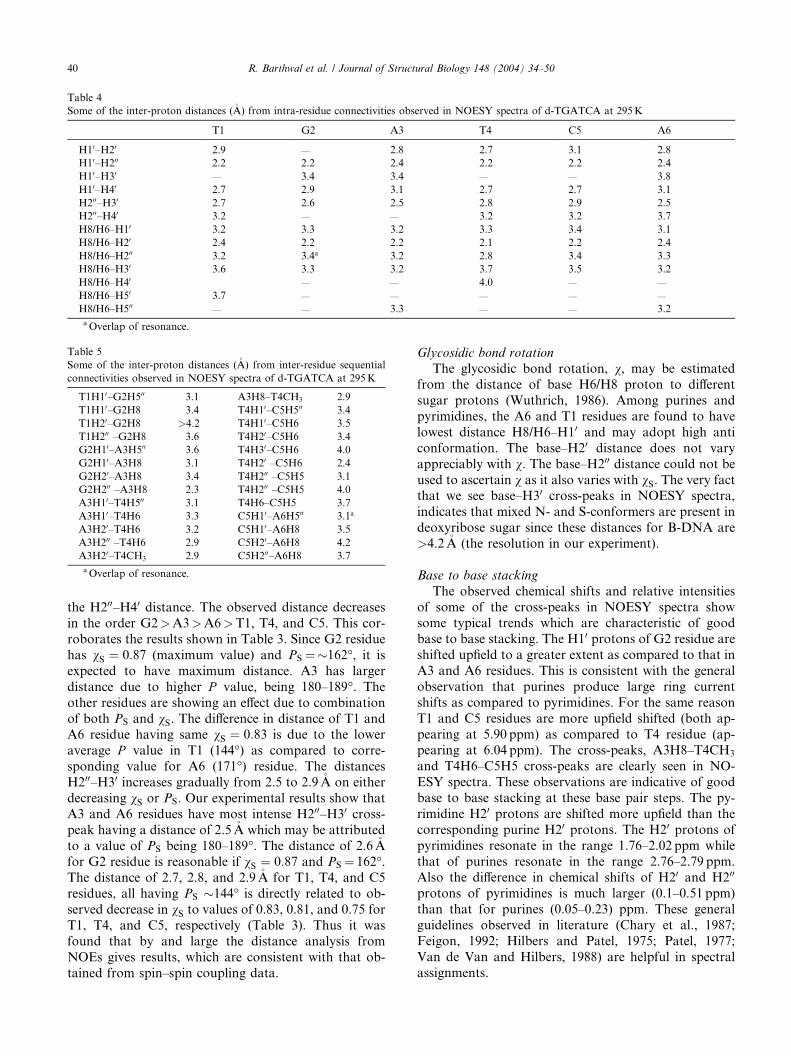
Table 5
Some of the inter-proton distances (�A) from inter-residue sequential
connectivities observed in NOESY spectra of d-TGATCA at 295K
T1H10–G2H500 3.1 A3H8–T4CH3 2.9
T1H10–G2H8 3.4 T4H10–C5H500 3.4
T1H20–G2H8 >4.2 T4H10–C5H6 3.5
T1H200 –G2H8 3.6 T4H20–C5H6 3.4
G2H10–A3H500 3.6 T4H30–C5H6 4.0
G2H10–A3H8 3.1 T4H20 –C5H6 2.4
G2H20–A3H8 3.4 T4H200 –C5H5 3.1
G2H200 –A3H8 2.3 T4H200 –C5H5 4.0
A3H10–T4H500 3.1 T4H6–C5H5 3.7
A3H10–T4H6 3.3 C5H10–A6H500 3.1a
A3H20–T4H6 3.2 C5H10–A6H8 3.5
A3H200 –T4H6 2.9 C5H20–A6H8 4.2
A3H20–T4CH3 2.9 C5H200–A6H8 3.7
aOverlap of resonance.
Table 4
Some of the inter-proton distances (�A) from intra-residue connectivities observed in NOESY spectra of d-TGATCA at 295K
T1 G2 A3 T4 C5 A6
H10–H20 2.9 — 2.8 2.7 3.1 2.8
H10–H200 2.2 2.2 2.4 2.2 2.2 2.4
H10–H30 — 3.4 3.4 — — 3.8
H10–H40 2.7 2.9 3.1 2.7 2.7 3.1
H200–H30 2.7 2.6 2.5 2.8 2.9 2.5
H200–H40 3.2 — — 3.2 3.2 3.7
H8/H6–H10 3.2 3.3 3.2 3.3 3.4 3.1
H8/H6–H20 2.4 2.2 2.2 2.1 2.2 2.4
H8/H6–H200 3.2 3.4a 3.2 2.8 3.4 3.3
H8/H6–H30 3.6 3.3 3.2 3.7 3.5 3.2
H8/H6–H40 — — 4.0 — —
H8/H6–H50 3.7 — — — — —
H8/H6–H500 — — 3.3 — — 3.2
aOverlap of resonance.
40 R. Barthwal et al. / Journal of Structural Biology 148 (2004) 34–50
the H200–H40 distance. The observed distance decreases
in the order G2>A3>A6>T1, T4, and C5. This cor-
roborates the results shown in Table 3. Since G2 residue
has vS ¼ 0:87 (maximum value) and PS ¼�162�, it is
expected to have maximum distance. A3 has larger
distance due to higher P value, being 180–189�. The
other residues are showing an effect due to combination
of both PS and vS. The difference in distance of T1 andA6 residue having same vS ¼ 0:83 is due to the lower
average P value in T1 (144�) as compared to corre-
sponding value for A6 (171�) residue. The distances
H200–H30 increases gradually from 2.5 to 2.9�A on either
decreasing vS or PS. Our experimental results show that
A3 and A6 residues have most intense H200–H30 cross-peak having a distance of 2.5�A which may be attributed
to a value of PS being 180–189�. The distance of 2.6�Afor G2 residue is reasonable if vS ¼ 0:87 and PS ¼ 162�.The distance of 2.7, 2.8, and 2.9�A for T1, T4, and C5
residues, all having PS �144� is directly related to ob-
served decrease in vS to values of 0.83, 0.81, and 0.75 for
T1, T4, and C5, respectively (Table 3). Thus it was
found that by and large the distance analysis from
NOEs gives results, which are consistent with that ob-
tained from spin–spin coupling data.
Glycosidic bond rotation
The glycosidic bond rotation, v, may be estimated
from the distance of base H6/H8 proton to different
sugar protons (Wuthrich, 1986). Among purines and
pyrimidines, the A6 and T1 residues are found to have
lowest distance H8/H6–H10 and may adopt high anti
conformation. The base–H20 distance does not vary
appreciably with v. The base–H200 distance could not be
used to ascertain v as it also varies with vS. The very factthat we see base–H30 cross-peaks in NOESY spectra,
indicates that mixed N- and S-conformers are present in
deoxyribose sugar since these distances for B-DNA are
>4.2�A (the resolution in our experiment).
Base to base stacking
The observed chemical shifts and relative intensities
of some of the cross-peaks in NOESY spectra showsome typical trends which are characteristic of good
base to base stacking. The H10 protons of G2 residue are
shifted upfield to a greater extent as compared to that in
A3 and A6 residues. This is consistent with the general
observation that purines produce large ring current
shifts as compared to pyrimidines. For the same reason
T1 and C5 residues are more upfield shifted (both ap-
pearing at 5.90 ppm) as compared to T4 residue (ap-pearing at 6.04 ppm). The cross-peaks, A3H8–T4CH3
and T4H6–C5H5 cross-peaks are clearly seen in NO-
ESY spectra. These observations are indicative of good
base to base stacking at these base pair steps. The py-
rimidine H20 protons are shifted more upfield than the
corresponding purine H20 protons. The H20 protons ofpyrimidines resonate in the range 1.76–2.02 ppm while
that of purines resonate in the range 2.76–2.79 ppm.Also the difference in chemical shifts of H20 and H200
protons of pyrimidines is much larger (0.1–0.51 ppm)
than that for purines (0.05–0.23) ppm. These general
guidelines observed in literature (Chary et al., 1987;
Feigon, 1992; Hilbers and Patel, 1975; Patel, 1977;
Van de Van and Hilbers, 1988) are helpful in spectral
assignments.

R. Barthwal et al. / Journal of Structural Biology 148 (2004) 34–50 41
Restrained molecular dynamics studies
Restrained molecular dynamics permits the system
to undergo conformational and momentum changes so
that different parts of the phase space accessible to the
molecule can be explored and stable conformations are
identified by energy minimization. Simulations were
carried out by starting with two different structures: B-
DNA built using INSIGHT II and other built usingAMBER 7.0 software package. Simulated annealing
was carried out up to a temperature of 500K but it
was found that convergence to a final structure could
be readily achieved even at 300K. The stereo view of
various rMD structures is shown in Fig. 2A. The rMD-
B1SA structure superimposed over the standard B-
DNA structure is shown in Fig. 2B indicating the
difference between the two structures. Several struc-tures obtained after equilibration at different time in-
tervals during the dynamics run at 500 and 300K were
examined. It was observed that they differ only mar-
ginally from each other in their overall feature irre-
spective of the rMD protocol followed and starting
structure. Further no significant drift in either potential
energy or restraint deviations was observed during the
final equilibration. It can therefore be concluded thatthe system reached a minimum energy conformation. A
structure obtained without introducing NMR con-
straints and by following same steps of rMD protocols
was found to be quite different. This confirms that the
structure is indeed defined by experimental restraints
and not the refinement procedure or variables used.
The root mean square deviation in any of the rMD
Fig. 2. Sequential stereo view of the: (A) various rMD structures and (B) rMD
structure.
structures and either of the starting structures is quitelarge but among various final structures was very low.
This is generally acknowledged as an indication that
convergence has been achieved. Table 6 indicates an
assessment of refined structures after equilibration (at
the end of 25/100 ps) in terms of energetics including
restraint violations energies and root mean square de-
rivative of energy with respect to atomic coordinates.
The total potential energy of the rMD-B1, rMD-B1SA,rMD-B2, rMD-B2SA, and rMD-B1-100 structures lie
in the range of 404–428 kcalmol�1 which is signifi-
cantly lower than the corresponding energies of initial
B-DNA structures (695–709 kcalmol�1). The forcing
potential, which indicates contribution to potential
energy due to violations of both experimental distances
and torsional angle data, exhibits a decrease from 934–
2858 to 198–200 kcalmol�1 after restrained energyminimization and restrained molecular dynamics. The
energy gradient with respect to atomic coordinates lies
in the range 0.07–0.17 kcalmol�1 �A�1 in various struc-
tures. A summary of experimental restraints and sta-
tistical analysis of family of structures generated by
restrained molecular dynamics (rMD) is shown in
Table 7.
Conformational features of rMD structures
All helical parameters, backbone torsional angles,
and sugar conformations of the resulting rMD struc-
tures were thoroughly analyzed with the program
CURVES, version 5.1 (Lavery and Sklenar, 1996). The
structural characteristics of various rMD structures are
discussed in the following.
-B1SA structure of d-TGATCA superimposed with standard B-DNA
Table 6
Energy terms (kcalmol�1) and root mean square gradient of energy with respect to atomic coordinates (kcalmol�1 �A�1) for starting models and rMD
structures of d-TGATCA
Structure Total Bond Angle Dihedral Vdw Repul-
sion
Disper-
sive
Electro-
static
Re-
straintaGradi-
entbDdavc
B-DNA1 695 74 466 105 343 1607 )1264 )295 934 25.16 0.55
rMD-B1 422 75 475 133 14 957 )942 )280 200 0.117 0.24
rMD-B1SA 424 75 476 132 15 953 )938 )278 199 0.133 0.27
rMD-B1-100 428 75 484 131 11 954 )942 )276 195 0.070 0.25
B-DNA2 709 98 451 106 343 1606 )1264 )289 2858 37.74 0.58
rMD-B2 414 83 473 132 17 945 )928 )294 198 0.077 0.24
rMD-B2SA 404 81 472 128 14 954 )940 )293 199 0.171 0.26
a This contribution has been subtracted from the total energy.bRoot mean square gradient of energy with respect to atomic coordinates (kcalmol�1 �A�1).c Average distance deviation.
Table 7
Summary of experimental restraints and statistical analysis of family of structures generated by restrained molecular dynamics (rMD)
Parameter Residue No. of restraints
Distance restraints
Intra-residue T1 17
G2 13
A3 19
T4 15
C5 15
A6 16
Inter-residue T1–G2 4
G2–A3 4
A3–T4 6
T4–C5 8
C5–A6 4
Dihedral restraints 12
Average pairwise RMSD B-DNA1¼ 0, rMD-B1¼ 0.87, rMD-B1SA¼ 0.97, rMD-B1–100¼ 1.01, B-DNA2¼ 0, rMD-
B2¼ 0.85, rMD-B2SA¼ 0.87.
Average residuewise RMSD T1¼ 2.51, G2¼ 1.28, A3¼ 1.04, T4¼ 1.06, C5¼ 0.92, and A6¼ 0.90.
42 R. Barthwal et al. / Journal of Structural Biology 148 (2004) 34–50
Helicoidal parameters
Plot of various helix axis parameters (global, unless
specified otherwise) of d-TGATCA in different struc-
tures as a function of residue position in duplex is shown
in Fig. 3 along with that for two classical structures of
A-DNA and B-DNA. Base sequence dependent varia-
tions in helicoidal parameters are evident. The results on
rMD structures are closer to that of B-DNA as com-pared to that of A-DNA. The helicoidal parameters are
classified into three categories: global base pair-axis
parameters, intra-base pair or global base–base param-
eters and the inter-base pair or base pair-step parame-
ters Among the base pairs-axis parameters, the
x-displacement (dx) are �)1.0�A for all residues which is
close to a value of )0.7�A as seen in canonical B-DNA
structure. The y-axis displacement (dy) varies from +0.2to )0.2�A along the sequence. The base pairs are inclined
(g) at an angle of )5� to )7� with no significant variation
with base sequence. The tip angle (h) fluctuates from )5�to )7� at 50 end to �+7� at 30 end. Such variations have
been reported in literature in deoxyoligonucleotides
(Mujeeb et al., 1993; Weisz et al., 1994). Among the
intra-base parameters, the shear (Sx) and stretch (Sy)values do not vary very much from their ideal values.
The shear lies within � 0.2�A while the shear lies with in
the range 0 to )0.2�A. The stagger (Sz) values lies withinthe range 0.1–0.4�A but have large positive values for the
two middle base pairs. The buckle varies within �0.3�A.
The variations in the propeller twist are significantly
large. For the two base pairs in the middle, that is, A3T4and T4A3, large negative values in the range 23–28� areobserved. The base pairs at either end show a small
positive propeller twist. Large negative values of pro-
peller twist in AT and TA base pairs have been reported
in literature (Dornberger et al., 1998; Mujeeb et al.,
1993; Weisz et al., 1994) and may possibly occur to
avoid steric clashes between the CH3 group of thymine
and 50 neighboring sugar in AX/XT base pairs step(Hunter, 1993). The positive value of propeller twist for
terminal base pairs may be attributed to fraying effects
at both ends of oligonucleotides (Fig. SI 4, supplemen-
tary information). The base pair opening lies between
)8� and )17� for all base pairs and is larger in magni-
tude for non-terminal base pairs.
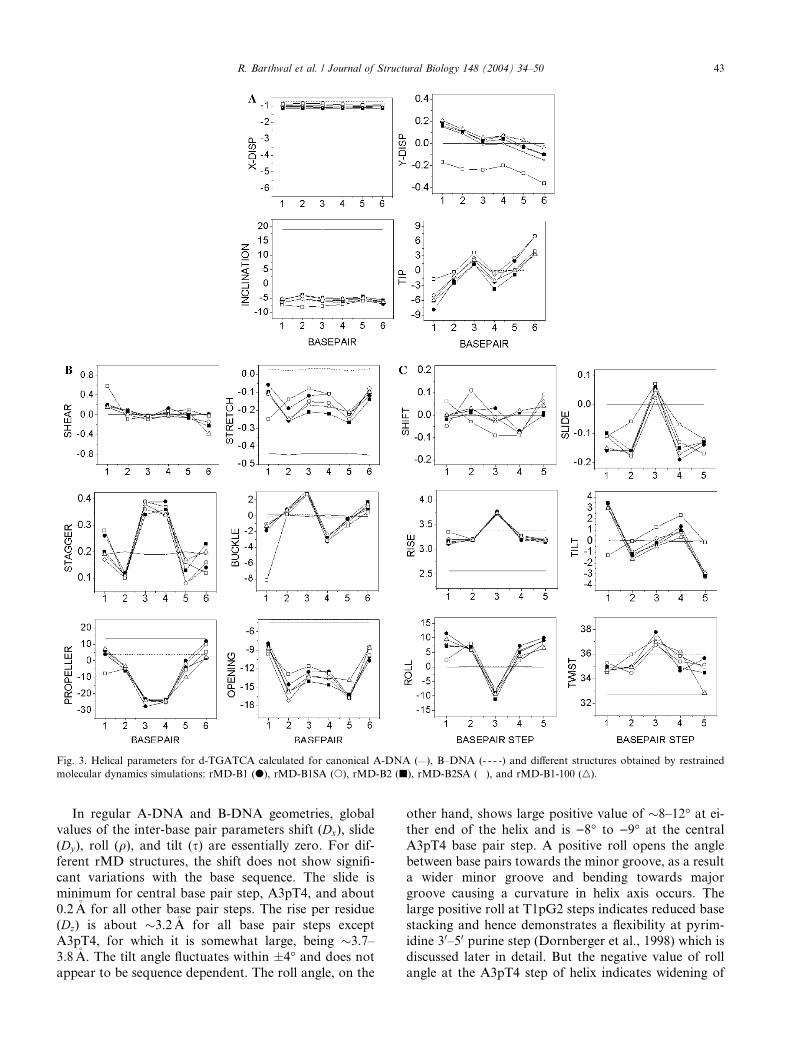
Fig. 3. Helical parameters for d-TGATCA calculated for canonical A-DNA (—), B–DNA (- - - -) and different structures obtained by restrained
molecular dynamics simulations: rMD-B1 (d), rMD-B1SA (s), rMD-B2 (j), rMD-B2SA (�), and rMD-B1-100 (n).
R. Barthwal et al. / Journal of Structural Biology 148 (2004) 34–50 43
In regular A-DNA and B-DNA geometries, global
values of the inter-base pair parameters shift (Dx), slide
(Dy), roll (q), and tilt (s) are essentially zero. For dif-
ferent rMD structures, the shift does not show signifi-
cant variations with the base sequence. The slide is
minimum for central base pair step, A3pT4, and about0.2�A for all other base pair steps. The rise per residue
(Dz) is about �3.2�A for all base pair steps except
A3pT4, for which it is somewhat large, being �3.7–
3.8�A. The tilt angle fluctuates within �4� and does not
appear to be sequence dependent. The roll angle, on the
other hand, shows large positive value of �8–12� at ei-ther end of the helix and is )8� to )9� at the central
A3pT4 base pair step. A positive roll opens the angle
between base pairs towards the minor groove, as a result
a wider minor groove and bending towards major
groove causing a curvature in helix axis occurs. Thelarge positive roll at T1pG2 steps indicates reduced base
stacking and hence demonstrates a flexibility at pyrim-
idine 30–50 purine step (Dornberger et al., 1998) which is
discussed later in detail. But the negative value of roll
angle at the A3pT4 step of helix indicates widening of
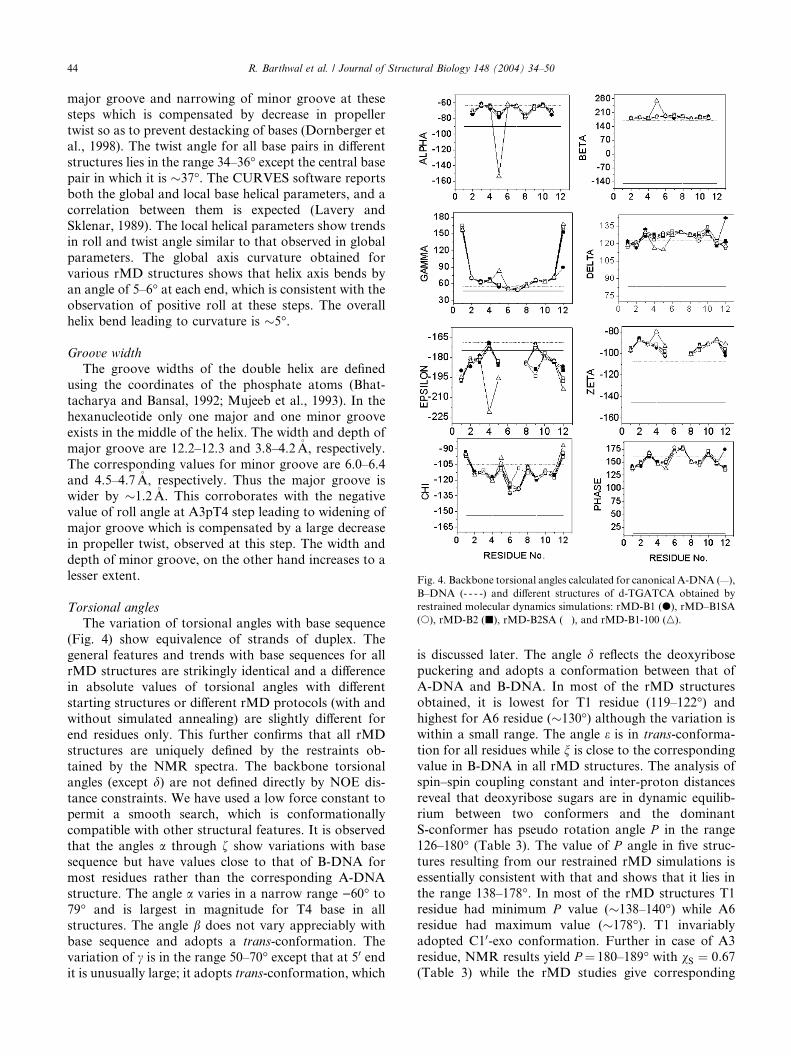
Fig. 4. Backbone torsional angles calculated for canonical A-DNA (—),
B–DNA (- - - -) and different structures of d-TGATCA obtained by
restrained molecular dynamics simulations: rMD-B1 (d), rMD–B1SA
(s), rMD-B2 (j), rMD-B2SA (�), and rMD-B1-100 (n).
44 R. Barthwal et al. / Journal of Structural Biology 148 (2004) 34–50
major groove and narrowing of minor groove at thesesteps which is compensated by decrease in propeller
twist so as to prevent destacking of bases (Dornberger et
al., 1998). The twist angle for all base pairs in different
structures lies in the range 34–36� except the central basepair in which it is �37�. The CURVES software reports
both the global and local base helical parameters, and a
correlation between them is expected (Lavery and
Sklenar, 1989). The local helical parameters show trendsin roll and twist angle similar to that observed in global
parameters. The global axis curvature obtained for
various rMD structures shows that helix axis bends by
an angle of 5–6� at each end, which is consistent with the
observation of positive roll at these steps. The overall
helix bend leading to curvature is �5�.
Groove width
The groove widths of the double helix are defined
using the coordinates of the phosphate atoms (Bhat-
tacharya and Bansal, 1992; Mujeeb et al., 1993). In the
hexanucleotide only one major and one minor groove
exists in the middle of the helix. The width and depth of
major groove are 12.2–12.3 and 3.8–4.2�A, respectively.
The corresponding values for minor groove are 6.0–6.4
and 4.5–4.7�A, respectively. Thus the major groove iswider by �1.2�A. This corroborates with the negative
value of roll angle at A3pT4 step leading to widening of
major groove which is compensated by a large decrease
in propeller twist, observed at this step. The width and
depth of minor groove, on the other hand increases to a
lesser extent.
Torsional angles
The variation of torsional angles with base sequence
(Fig. 4) show equivalence of strands of duplex. The
general features and trends with base sequences for all
rMD structures are strikingly identical and a difference
in absolute values of torsional angles with different
starting structures or different rMD protocols (with and
without simulated annealing) are slightly different for
end residues only. This further confirms that all rMDstructures are uniquely defined by the restraints ob-
tained by the NMR spectra. The backbone torsional
angles (except d) are not defined directly by NOE dis-
tance constraints. We have used a low force constant to
permit a smooth search, which is conformationally
compatible with other structural features. It is observed
that the angles a through f show variations with base
sequence but have values close to that of B-DNA formost residues rather than the corresponding A-DNA
structure. The angle a varies in a narrow range )60� to79� and is largest in magnitude for T4 base in all
structures. The angle b does not vary appreciably with
base sequence and adopts a trans-conformation. The
variation of c is in the range 50–70� except that at 50 endit is unusually large; it adopts trans-conformation, which
is discussed later. The angle d reflects the deoxyribose
puckering and adopts a conformation between that of
A-DNA and B-DNA. In most of the rMD structures
obtained, it is lowest for T1 residue (119–122�) and
highest for A6 residue (�130�) although the variation is
within a small range. The angle e is in trans-conforma-
tion for all residues while n is close to the corresponding
value in B-DNA in all rMD structures. The analysis ofspin–spin coupling constant and inter-proton distances
reveal that deoxyribose sugars are in dynamic equilib-
rium between two conformers and the dominant
S-conformer has pseudo rotation angle P in the range
126–180� (Table 3). The value of P angle in five struc-
tures resulting from our restrained rMD simulations is
essentially consistent with that and shows that it lies in
the range 138–178�. In most of the rMD structures T1residue had minimum P value (�138–140�) while A6
residue had maximum value (�178�). T1 invariably
adopted C10-exo conformation. Further in case of A3
residue, NMR results yield P ¼ 180–189� with vS ¼ 0:67(Table 3) while the rMD studies give corresponding

R. Barthwal et al. / Journal of Structural Biology 148 (2004) 34–50 45
value of P as 164�, respectively. Thus, in case of residuewith high population of minor conformer, average tor-
sional angles fail to provide adequate structural de-
scription of sugar conformation. The average value of
pseudo rotation phase angle and hence the sugar puck-
ering differ for the purine and pyrimidine nucleotides;
the average value being 164� and 146�, respectively. Thepyrimidine nucleotides thus prefer smaller phase angle
as compared to purines (Weisz et al., 1994). Sugarpucker and glycosidic torsional angles are typically the
parameters best defined by NMR and define the geom-
etry within a nucleotide. It is observed that glycosidic
bond rotation in all structures lies in the range )94� to133�. At the 50 end of the helix there is tendency for v to
adopt high anti-conformation of �)94� in all structures,
which was also manifested by the lowest base H6–H10
distance observed in T1 residue in NOESY spectra.
Structural features of TpG/CpA base pair step
Structural flexibility of DNA at TpG/CpA base pair
step has been reported by NMR (Cheung et al., 1984;
Donlan and Lu, 1992; Dornberger et al., 1998; Weisz
et al., 1994), X-ray crystallographic (Gorin et al., 1995;
Grzeskowiak, 1996) and other techniques (Beutal and
Gold, 1992; Lyubchenko et al., 1993) in literature. Astriking feature of X-ray crystallographic structures is a
large twist angle of 50� observed at TpG/CpA step
(Gorin et al., 1995; Grzeskowiak, 1996). As a conse-
quence of high twist and slide values, the inter-proton
distance, T3H200–G4H8 and C7H200–A8H8 at these steps
in decanucleotide d-CATGGCCATG were found to be
5.2�A. Further, the distance between base protons H8/
H6 at TpG and CpA base steps is P6.2�A (Grzeskowiak,1996). Alternatively two subsets, CAþ and CA�, withmean twist value of 30.5� and 49�, respectively have beenshown to exist in the X-ray crystal structures of DNA
samples (Gorin et al., 1995). Our NMR results do not
give any evidence of the existence of these structural
features. We have examined time-dependent fluctuations
of several inter-proton sequential distances for the TpG/
Table 8
Comparison of some of the structural features of TpG and CpA base pair s
Present NMR results NMR
(Dornberger et al.)
TpG CpA TpG/CpA
Twist (�) 34.6 35.3 34.9, 34.8
Slide, dy
(�A)
0.13 �0.13 0.21, 0.24
Roll (�) 8–12 9–10 10–15
B-200 (�A) 3.6 3.7 3.1, 3.4
B-10 (�A) 3.4 3.5 —
B-20 (�A) >4.2 4.2 4.6, 4.5
B-B (�A) 5.1a 5.3a —
B, base proton H8/H6.a From rMD-B1SA structure.
CpA base pair step during 100 ps rMD simulations withdifferent starting geometries. We found that the varia-
tion in T1H200–G2H8 and C5H200–A6H8 lies within
�0.3�A. The twist angle at TpG/CpA step in several
conformers saved at different time intervals in an rMD
simulation showed deviation within �4�. These are in
agreement with those obtained in literature by NMR
techniques (Dornberger et al., 1998; Weisz et al., 1994).
We have observed NOE cross-peaks for sequential NOEconnectivities H8–H10, H20, and H200 at CpA step and
H8–H10, H200 at TpG step even at low mixing times with
distances lying in the range 3.4–4.2�A (Table 8). The
twist, roll, and slide values in various rMD structures
are �35�, 8–12�, and )0.13�A, respectively. These results
compare well with those obtained by NMR techniques
(Dornberger et al., 1998; Weisz et al., 1994) and a twist
angle of �34� reported by electrophoretic techniques(Kabsch et al., 1982).
The NMR conformers have been characterized by a
large positive roll angle at TpG step resulting in opening
towards a major groove and a concomitant local ex-
pansion of minor groove (Weisz et al., 1994). This in-
creases the inter-strand distance between A3H2 and
C5H10 protons to a value >4.5�A compatible with ab-
sence of cross-peak in the 2D NOESY spectra. We didnot observe NOE cross-peak for any of the inter-strand
or intra-strand inter-proton distances A3H2–C5H10,A6H2–G2H10, and A3H2–T4H10 (Chuprina et al.,
1991), the corresponding distance is apparently >4.2�A,
the resolution in our NOESY spectra. We observed that
large positive roll of 9–12� at TpG step is accompanied
by a tilt of 3–4� in our structures, which is consistent with
the Tilt-Roll plot relationship at TpG step shown earlier(Dornberger et al., 1998). Large positive roll angle up to
�20� were observed in several NMR structures of DNA
duplexes at the TpG steps (Dornberger et al., 1998;
Mujeeb et al., 1993; Weisz et al., 1994) and were also
predicted by Monte Carlo Calculations (Zhurkin et al.,
1991) emphasizing the unusual conformational behavior
and flexibility of this pyrimidine 30–50 purine step. The
teps
NMR
(Weisz et al.)
X-ray
(Grzeskowiak et al.)
X-ray
(Gorin et al.)
TpG/CpA TpG/CpA TpG/CpA
36, 40, 37 50 30.5 CAþ
49.0 CA�
0.1–0.1 High —
20–5, 4 — —
— 5.2 —
— — —
— — —
— P 6.2 —
46 R. Barthwal et al. / Journal of Structural Biology 148 (2004) 34–50
preference of positive roll angle in TpG/CpA base pairstep to avoid a cross-strand steric clash in minor groove
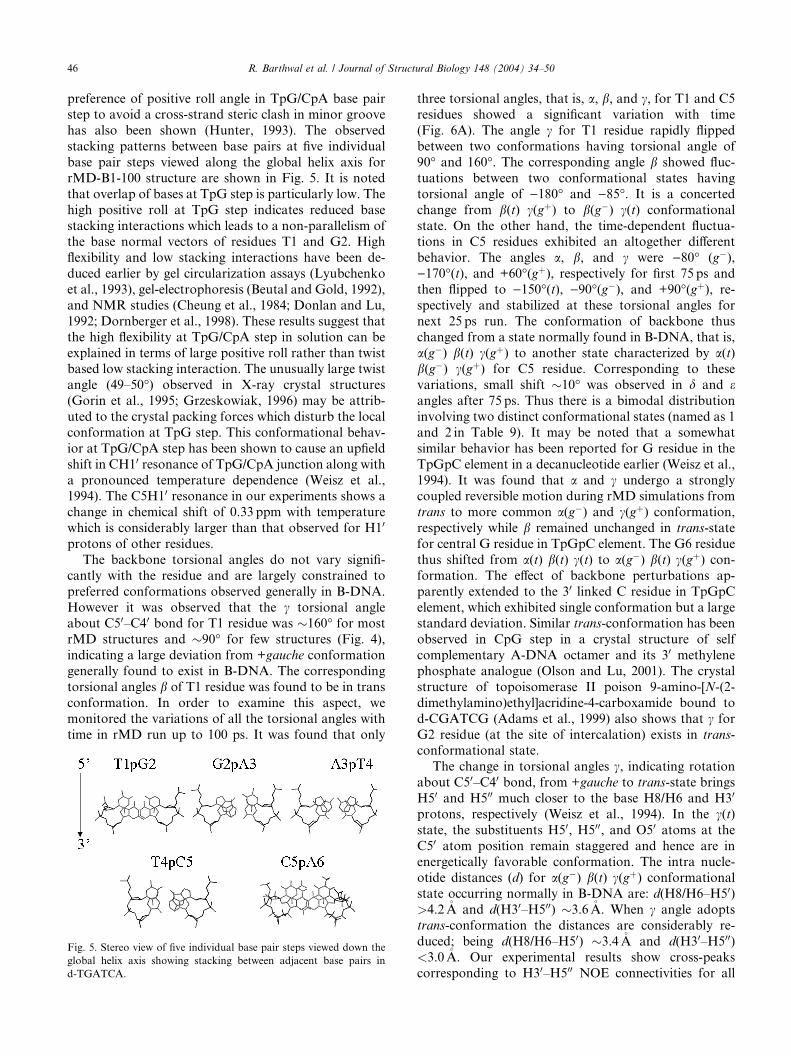
has also been shown (Hunter, 1993). The observed
stacking patterns between base pairs at five individual
base pair steps viewed along the global helix axis for
rMD-B1-100 structure are shown in Fig. 5. It is noted
that overlap of bases at TpG step is particularly low. The
high positive roll at TpG step indicates reduced base
stacking interactions which leads to a non-parallelism ofthe base normal vectors of residues T1 and G2. High
flexibility and low stacking interactions have been de-
duced earlier by gel circularization assays (Lyubchenko
et al., 1993), gel-electrophoresis (Beutal and Gold, 1992),
and NMR studies (Cheung et al., 1984; Donlan and Lu,
1992; Dornberger et al., 1998). These results suggest that
the high flexibility at TpG/CpA step in solution can be
explained in terms of large positive roll rather than twistbased low stacking interaction. The unusually large twist
angle (49–50�) observed in X-ray crystal structures
(Gorin et al., 1995; Grzeskowiak, 1996) may be attrib-
uted to the crystal packing forces which disturb the local
conformation at TpG step. This conformational behav-
ior at TpG/CpA step has been shown to cause an upfield
shift in CH10 resonance of TpG/CpA junction along with
a pronounced temperature dependence (Weisz et al.,1994). The C5H10 resonance in our experiments shows a
change in chemical shift of 0.33 ppm with temperature
which is considerably larger than that observed for H10
protons of other residues.
The backbone torsional angles do not vary signifi-
cantly with the residue and are largely constrained to
preferred conformations observed generally in B-DNA.
However it was observed that the c torsional angleabout C50–C40 bond for T1 residue was �160� for most
rMD structures and �90� for few structures (Fig. 4),
indicating a large deviation from +gauche conformation
generally found to exist in B-DNA. The corresponding
torsional angles b of T1 residue was found to be in trans
conformation. In order to examine this aspect, we
monitored the variations of all the torsional angles with
time in rMD run up to 100 ps. It was found that only
Fig. 5. Stereo view of five individual base pair steps viewed down the
global helix axis showing stacking between adjacent base pairs in
d-TGATCA.
three torsional angles, that is, a, b, and c, for T1 and C5residues showed a significant variation with time
(Fig. 6A). The angle c for T1 residue rapidly flipped
between two conformations having torsional angle of
90� and 160�. The corresponding angle b showed fluc-
tuations between two conformational states having
torsional angle of )180� and )85�. It is a concerted
change from b(t) c(gþ) to b(g�) c(t) conformational
state. On the other hand, the time-dependent fluctua-tions in C5 residues exhibited an altogether different
behavior. The angles a, b, and c were )80� (g�),)170�(t), and +60�(gþ), respectively for first 75 ps and
then flipped to )150�(t), )90�(g�), and +90�(gþ), re-
spectively and stabilized at these torsional angles for
next 25 ps run. The conformation of backbone thus
changed from a state normally found in B-DNA, that is,
a(g�) b(t) c(gþ) to another state characterized by a(t)b(g�) c(gþ) for C5 residue. Corresponding to these
variations, small shift �10� was observed in d and eangles after 75 ps. Thus there is a bimodal distribution
involving two distinct conformational states (named as 1
and 2 in Table 9). It may be noted that a somewhat
similar behavior has been reported for G residue in the
TpGpC element in a decanucleotide earlier (Weisz et al.,
1994). It was found that a and c undergo a stronglycoupled reversible motion during rMD simulations from
trans to more common a(g�) and c(gþ) conformation,
respectively while b remained unchanged in trans-state
for central G residue in TpGpC element. The G6 residue
thus shifted from a(t) b(t) c(t) to a(g�) b(t) c(gþ) con-formation. The effect of backbone perturbations ap-
parently extended to the 30 linked C residue in TpGpC
element, which exhibited single conformation but a largestandard deviation. Similar trans-conformation has been
observed in CpG step in a crystal structure of self
complementary A-DNA octamer and its 30 methylene
phosphate analogue (Olson and Lu, 2001). The crystal
structure of topoisomerase II poison 9-amino-[N-(2-
dimethylamino)ethyl]acridine-4-carboxamide bound to
d-CGATCG (Adams et al., 1999) also shows that c for
G2 residue (at the site of intercalation) exists in trans-conformational state.
The change in torsional angles c, indicating rotation
about C50–C40 bond, from +gauche to trans-state brings
H50 and H500 much closer to the base H8/H6 and H30
protons, respectively (Weisz et al., 1994). In the c(t)state, the substituents H50, H500, and O50 atoms at the
C50 atom position remain staggered and hence are in
energetically favorable conformation. The intra nucle-otide distances (d) for a(g�) b(t) c(gþ) conformational
state occurring normally in B-DNA are: d(H8/H6–H50)>4.2�A and d(H30–H500) �3.6�A. When c angle adopts
trans-conformation the distances are considerably re-
duced; being d(H8/H6–H50) �3.4�A and d(H30–H500)<3.0�A. Our experimental results show cross-peaks
corresponding to H30–H500 NOE connectivities for all

Fig. 6. Trajectory analysis of 100 ps restrained molecular dynamics simulations in rMD-B1-100 structure of d-TGATCA showing variations in: (A)
torsional angles a, b, c, d, �, and f in each nucleotide residue: T1, magenta; G2, green; A3, black; T4, blue; C5, red; A6, orange. (B) Intra nucleotide
inter-proton distances H8/H6–H10, H8/H6–H50, H10–H40, H200–H40, and H30–H500 as well as inter-nucleotide inter-proton distance H8/H6–H200 atdifferent base pair steps: T1pG2, green; G2pA3, blue; A3pT4, red; T4pC5, black; C5pA6, orange. (For interpretation of the references to color in this
figure legend, the reader is referred to the web version of this paper.)
R. Barthwal et al. / Journal of Structural Biology 148 (2004) 34–50 47
residues. Some of the distances could not be ascertained
accurately due to overlap of peaks but they were foundto lie in the range 3.0–3.6�A. On the other hand, the
NOE cross-peak corresponding to base H8/H6–H50 wasobserved only for T1 residue, the distance being 3.7�A(Table 4). This is consistent with the results on rMD
simulations which show that c shifts from gþ to t state
for T1 residue only. For C5 residue it alters by �30� butremains close to g+ state. Unfortunately there are no
direct inter-proton distances in our NOESY spectra,
which could ascertain the change in conformation dueto change in torsional angle a and b. It may thus be
concluded that due to conformational flexibility at TpG/
CpA steps, the T1 and C5 residues change from b(t)c(gþ) to b(g�) c(t) and a(g�) b(t) c(gþ) to a(t) b(g�) c(gþ)states, respectively.
In order to understand the flexibility of backbone in
d-TGATCA, we examined the inter-proton distances of
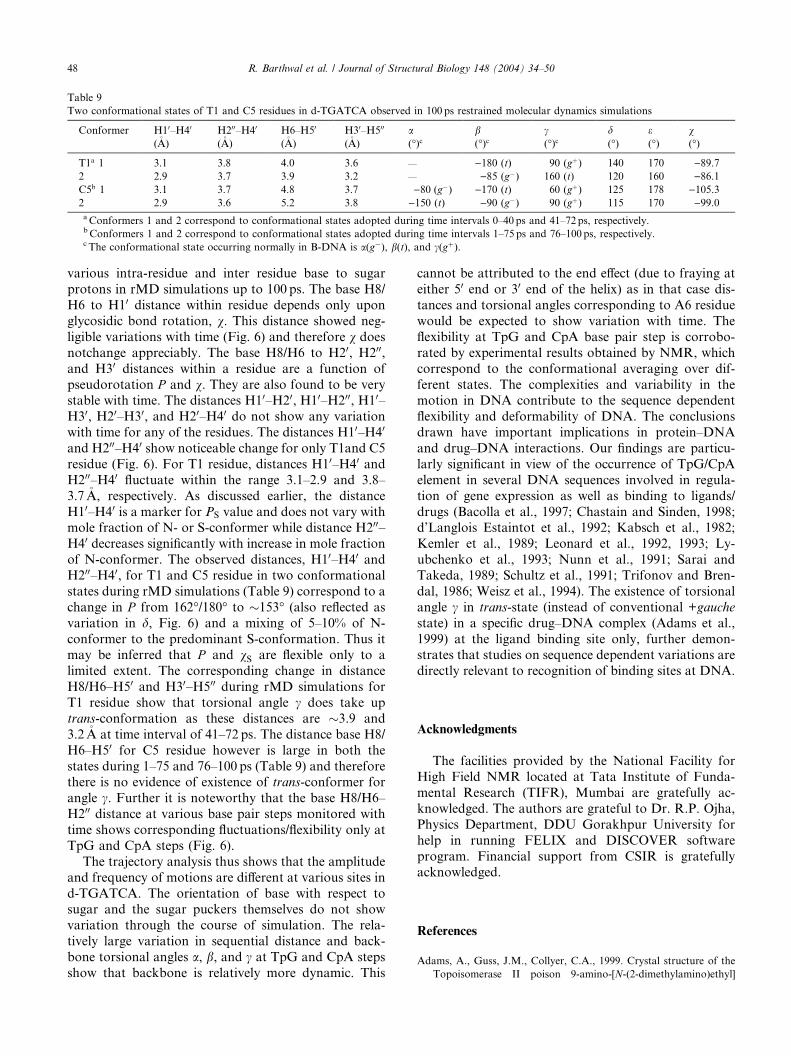
Table 9
Two conformational states of T1 and C5 residues in d-TGATCA observed in 100 ps restrained molecular dynamics simulations
Conformer H10–H40
(�A)
H200–H40
(�A)
H6–H50
(�A)
H30–H500
(�A)
a(�)c
b(�)c
c(�)c
d(�)
e(�)
v(�)
T1a 1 3.1 3.8 4.0 3.6 — )180 (t) 90 (gþ) 140 170 )89.72 2.9 3.7 3.9 3.2 — )85 (g�) 160 (t) 120 160 )86.1C5b 1 3.1 3.7 4.8 3.7 )80 (g�) )170 (t) 60 (gþ) 125 178 )105.32 2.9 3.6 5.2 3.8 )150 (t) )90 (g�) 90 (gþ) 115 170 )99.0aConformers 1 and 2 correspond to conformational states adopted during time intervals 0–40 ps and 41–72ps, respectively.b Conformers 1 and 2 correspond to conformational states adopted during time intervals 1–75 ps and 76–100 ps, respectively.c The conformational state occurring normally in B-DNA is a(g�), b(t), and c(gþ).
48 R. Barthwal et al. / Journal of Structural Biology 148 (2004) 34–50
various intra-residue and inter residue base to sugar
protons in rMD simulations up to 100 ps. The base H8/
H6 to H10 distance within residue depends only upon
glycosidic bond rotation, v. This distance showed neg-
ligible variations with time (Fig. 6) and therefore v does
notchange appreciably. The base H8/H6 to H20, H200,and H30 distances within a residue are a function of
pseudorotation P and v. They are also found to be verystable with time. The distances H10–H20, H10–H200, H10–H30, H20–H30, and H20–H40 do not show any variation
with time for any of the residues. The distances H10–H40
and H200–H40 show noticeable change for only T1and C5
residue (Fig. 6). For T1 residue, distances H10–H40 andH200–H40 fluctuate within the range 3.1–2.9 and 3.8–
3.7�A, respectively. As discussed earlier, the distance
H10–H40 is a marker for PS value and does not vary withmole fraction of N- or S-conformer while distance H200–H40 decreases significantly with increase in mole fraction
of N-conformer. The observed distances, H10–H40 andH200–H40, for T1 and C5 residue in two conformational
states during rMD simulations (Table 9) correspond to a
change in P from 162�/180� to �153� (also reflected as
variation in d, Fig. 6) and a mixing of 5–10% of N-
conformer to the predominant S-conformation. Thus itmay be inferred that P and vS are flexible only to a
limited extent. The corresponding change in distance
H8/H6–H50 and H30–H500 during rMD simulations for
T1 residue show that torsional angle c does take up
trans-conformation as these distances are �3.9 and
3.2�A at time interval of 41–72 ps. The distance base H8/
H6–H50 for C5 residue however is large in both the
states during 1–75 and 76–100 ps (Table 9) and thereforethere is no evidence of existence of trans-conformer for
angle c. Further it is noteworthy that the base H8/H6–
H200 distance at various base pair steps monitored with
time shows corresponding fluctuations/flexibility only at
TpG and CpA steps (Fig. 6).
The trajectory analysis thus shows that the amplitude
and frequency of motions are different at various sites in
d-TGATCA. The orientation of base with respect tosugar and the sugar puckers themselves do not show
variation through the course of simulation. The rela-
tively large variation in sequential distance and back-
bone torsional angles a, b, and c at TpG and CpA steps
show that backbone is relatively more dynamic. This
cannot be attributed to the end effect (due to fraying at
either 50 end or 30 end of the helix) as in that case dis-
tances and torsional angles corresponding to A6 residue
would be expected to show variation with time. The
flexibility at TpG and CpA base pair step is corrobo-
rated by experimental results obtained by NMR, which
correspond to the conformational averaging over dif-
ferent states. The complexities and variability in themotion in DNA contribute to the sequence dependent
flexibility and deformability of DNA. The conclusions
drawn have important implications in protein–DNA
and drug–DNA interactions. Our findings are particu-
larly significant in view of the occurrence of TpG/CpA
element in several DNA sequences involved in regula-
tion of gene expression as well as binding to ligands/
drugs (Bacolla et al., 1997; Chastain and Sinden, 1998;d’Langlois Estaintot et al., 1992; Kabsch et al., 1982;
Kemler et al., 1989; Leonard et al., 1992, 1993; Ly-
ubchenko et al., 1993; Nunn et al., 1991; Sarai and
Takeda, 1989; Schultz et al., 1991; Trifonov and Bren-
dal, 1986; Weisz et al., 1994). The existence of torsional
angle c in trans-state (instead of conventional +gauche
state) in a specific drug–DNA complex (Adams et al.,
1999) at the ligand binding site only, further demon-strates that studies on sequence dependent variations are
directly relevant to recognition of binding sites at DNA.
Acknowledgments
The facilities provided by the National Facility for
High Field NMR located at Tata Institute of Funda-
mental Research (TIFR), Mumbai are gratefully ac-
knowledged. The authors are grateful to Dr. R.P. Ojha,
Physics Department, DDU Gorakhpur University for
help in running FELIX and DISCOVER software
program. Financial support from CSIR is gratefullyacknowledged.
References
Adams, A., Guss, J.M., Collyer, C.A., 1999. Crystal structure of the
Topoisomerase II poison 9-amino-[N-(2-dimethylamino)ethyl]
R. Barthwal et al. / Journal of Structural Biology 148 (2004) 34–50 49
acridine-4-carboxamide bound to the DNA hexanucleotide
d(CGATCG)2. Biochemistry 38, 9221–9233.
Arcamone, F., 1981. Doxorubicin Anticancer Antibiotics in Medicinal
Chemistry. Academic Press, New York.
Bacolla, A., Gellibolian, R., Shimizu, M., Amirhaeri, S., Kang, S.,
Ohshima, K., Larson, J.E., Harvey, S.C., Stollar, B.D., Wells,
R.D., 1997. Flexible DNA: genetically unstable CTG.CAG and
CGG.CCG from human hereditary neuromuscular disease genes.
J. Biol. Chem. 272, 16783–16792.
Barthwal, R., Mujeeb, A., Govil, G., 1994. Interaction of daunomycin
with deoxydinucleotide d-CpG by two dimensional proton mag-
netic resonance techniques. Arch. Biochem. Biophys. 313, 189–205.
Barthwal, R., Monica, Awasthi, P., Srivastava, N., Sharma, U., Kaur,
M., Govil, G., 2003. Structure of DNA hexamer sequence d-
CGATCG by two-dimensional nuclear magnetic resonance spec-
troscopy and restrained molecular dynamics. J. Biomol. Struct.
Dyn. 21, 407–423.
Beutal, B.L., Gold, L., 1992. In vitro evolution of intrinsically bent
DNA. J. Mol. Biol. 228, 803–812.
Bhattacharya,D., Bansal,M., 1992. J. Biomol. Struct.Dyn. 10, 213–226.
Carter, S.K., 1982. Anthracycline Antibiotics in Cancer Therapy.
Nijhof, Boston.
Celda, B., Widmer, H., Leupin, W., Chazin, W.J., Denny, W.A.,
Wuthrich, K., 1989. Conformational studies of d-
(AAAAATTTTT)2 using constraints from nuclear overhauser
effects and from quantitative analysis of the cross peak fine
structures in two-dimensional 1H nuclear magnetic resonance
spectra. Biochemistry 28, 1462–1471.
Chaires, J.B., Fox, K.R., Herrara, J.E., Waring, M.J., 1987. Site and
sequence specificity of the daunomycin–DNA interaction. Bio-
chemistry 26, 8227–8236.
Chaires, J.B., Herrera, J.E., Waring, M.J., 1990. Preferential binding
of daunomycin to 50TACG and 50TAGC sequences revealed by
footprinting titration experiments. Biochemistry 29, 6145–6153.
Chary, K.V.R., Hosur, R.V., Govil, G., Zu-kun, T., Miles, H.T., 1987.
Systematic study of nuclear overhauser effect vis-�a-vis local helical
parameters, sugar puckers, and glycosidic torsions in B DNA:
insensitivity of NOE to local transitions in B DNA oligonucleo-
tides due to internal structural compensations. Biochemistry 26,
1315–1322.
Chastain, P.D., Sinden, R.R., 1998. CTG repeats associated with
human genetic disease are inherently flexible. J. Mol. Biol. 275,
405–411.
Cheung, S., Arndt, K., Lu, P., 1984. Correlation of Lac-operator
imino proton exchange kinetics with its function. Proc. Natl. Acad.
Sci. USA 81, 3665–3669.
Chuprina, V.P., Lipanov, A.A., Fedoroff, O.Y., Kim, S.G., Kintanar,
A., Reid, B.R., 1991. Sequence effects on local DNA topology.
Proc. Natl. Acad. Sci USA 88, 9087–9091.
d’Langlois Estaintot, B., Gallios, B., Brown, T., Hunter, W.N., 1992.
The molecular structure of a 40-epiadriamycin complex with
d(TGATCA) at 1.7�A resolution: comparison with the structure
of 40-epiadriamycin d(TGATCA) and d(CGATCG) complexes.
Nucleic Acids Res. 20, 3561–3567.
Donlan, M.E., Lu, P., 1992. Transcriptional enhancer related DNA
sequences: anomalous 1H NMR NOE crosspeaks. Nucleic Acids
Res. 20, 525–532.
Dornberger, U., Flemming, J., Fritzsche, H., 1998. Structure determi-
nation and analysis of helix parameters in the DNA decamer
d(CATGGCCATG)2 comparison of results from NMR and
crystallography. J. Mol. Biol. 284, 1453–1463.
Feigon, J., 1992. 1H NMR spectroscopy of DNA. Methods Enzymol.
211, 235–253.
Gorin, A.A., Zhurkin, V.B., Olson, W.K., 1995. B-DNA twisting
correlates with base-pair morphology. J. Mol. Biol. 247, 34–48.
Gronenborn, A., Clore, G.M., 1985. Investigation of the solution
structure of short nucleic acid fragments by means of nuclear
overhauser enhancements measurements. Prog. NMR Spectrosc.
17, 1–32.
Grzeskowiak, K., 1996. Sequence dependent structural changes in B-
DNA. Chem. Biol. 3, 785–790.
Hagerman, J.P., 1990. Sequence-directed curvature of DNA. Annu.
Rev. Biochem. 59, 755–781.
Hare, D.H., Wemmer, D.E., Chou, S.H., Drobny, G., Reid, B.R.,
1983. Assignment of non-exchangeable proton resonances of
d(CGCGAATTCGCG)2 using two dimensional methods. J. Mol.
Biol. 171, 319–336.
Helene, C., Lancelot, G., 1982. Interactions between functional groups
in protein–nucleic acid associations. Prog. Biophys. Mol. Biol. 39,
1–68.
Hilbers, C.W., Patel, D.J., 1975. Proton nuclear magnetic resonance
investigations of the nucleation and propagation reactions associ-
ated with the helix-coil transition of d-ApTpGpCpApT in H2O
solution. Biopolymers 14, 2656–2660.
Hosur, R.V., Govil, G., Miles, H.T., 1988. Application of two-
dimensional NMR spectroscopy in the determination of solution
conformation of nucleic acids. Magn. Res. Chem. 26, 927–944.
Hunter, C.A., 1993. Sequence-dependent DNA structure: the role of
base stacking interactions. J. Mol. Biol. 230, 1025–1054.
Kabsch, W., Sander, S., Trifonov, E.N., 1982. The helical twist angle
of B DNA. Nucleic Acids Res. 10, 1097–1104.
Kemler, I., Schreiber, E., Muller, M.M., Matthias, P., Schaffner, W.,
1989. Octamer transcription factors bind to two different sequence
motifs of the immunoglobulin heavy chain promoter. EMBO J. 8,
2001–2008.
Lavery, R., Sklenar, H., 1996. CURVES 5.1. Helical Analysis of
Irregular Nucleic Acids, Laboratory of Theoretical Biology.
CNRS, Paris.
Lavery, R., Sklenar, J., 1989. The definitions of generalized helicoidal
parameters and of axis curvature for irregular nucleic acids. J.
Biomol. Struct. Dyn. 6, 655–667.
Leonard, G.A., Brown, T., Hunter, W.N., 1992. Anthracycline binding
to DNA: high resolution structure of d(TGTACA) complexed with
40-epiadriamycin. Eur. J. Biochem. 204, 69–74.
Leonard, G.A., Hambley, G.A., Mc Aulley Hecht, K., Brown, T.,
Hunter, W.N., 1993. Anthracycline–DNA interactions at unfavor-
able base-pairs triplet binding sites: structures of d(CGGCCG)/
daunomycin and d (TGGCCA)/adriamycin complexes. Acta Cryst.
B D49, 458–467.
Lyubchenko, Y.L., Shlyakhtenko, L., Appella, S.E., Harrington, R.E.,
1993. CA runs increase DNA flexibility in the complex of k cro
protein with the OR3 site. Biochemistry 32, 4121–4127.
Majumdar, A., Hosur, R.V., 1992. Simulation of 2D NMR spectra for
determination of solution conformations of nucleic acids. Prog.
NMR Spectrosc. 24, 109–158.
Maple, J.R., Dinur, U., Hagler, T., 1988. Derivation of force field for
molecular mechanics and dynamics from ab initio energy surfaces.
Proc. Natl. Acad. Sci. USA 85, 5350–5354.
Maple, J.R, Thacher, T.S., Dinur, U., Hagler, A.T., 1990. Biosym
forcefield research results in new techniques for the extraction of
inter and intra molecular forces. Chem. Design Automation News
5, 5–10.
McNamara, P.T., Bolshoy, A., Trifonov, E.N., Harrington, R.E.,
1990. Sequence-dependent kinks induced in curved DNA. J.
Biomol. Struct. Dyn. 8, 529–538.
Mujeeb, A., Kerwin, S.M., Kenyon, G.L., James, T.L., 1993. Solution
structure of conserved DNA sequence from the HIV-I genome:
restrained molecular dynamics simulation with distance and
torsion angle restraints derived from two-dimensional NMR
spectra. Biochemistry 32, 13419–13431.
Neidle, S., Sanderson, M.R., Waring, M.J., 1983. Molecular Aspects
of Anticancer Drug Action. MacMillan, London.
Nibedita, R., Kumar, R.A., Majumdar, A., Hosur, R.V., Govil, G.,
1993. Solution structure of GCCAAT recognition motif by 2D
50 R. Barthwal et al. / Journal of Structural Biology 148 (2004) 34–50
NMR, spectral simulation, molecular modeling, and distance
geometry calculations. Biochemistry 32, 9053–9064.
Nunn, C.M., Meervelt, L.V., Zhang, S., Moore, M.H., Kennard, O.,
1991. DNA–drug interactions. The crystal structures of d(TGT-
ACA) and d(TGATCA) complexed with daunomycin. J. Mol. Biol.
222, 167–177.
Olson, W.K., Lu, X.J., 2001. 3DNA Version 1.4.1, A 3-dimensional
Nucleic Acid Structure Analysis and Rebuilding Software Package.
Department of Chemistry, Rutgers University, NJ.
Patel, D.J., 1977. Mutagen–nucleic acid complexes at the poly-
nucleotide duplex level in solution: intercalation of proflavin into
poly(dA–dT) and the melting transition of the complex. Biopoly-
mers 16, 1635–1656.
Radha, P.K., Madan, A., Nibedita, R., Hosur, R.V., 1995. Solution
structure of the conserved segment of myb cognate DNA sequence
by 2D NMR, spectral simulation, restrained energy minimization,
and distance geometry calculations. Biochemistry 34, 5913–5922.
Ravi Kumar, M., Hosur, R.V., Roy, K.B., Miles, H.T., Govil, G.,
1985. Resonance assignment of the 500MHz proton NMR
spectrum of self complementary dodecanucleotide d-GGATCCG-
GATCC: altered conformation at BamHI cleavage sites. Biochem-
istry 34, 7703–7711.
Sarai, A., Takeda, Y., 1989. Lambda repressor recognizes the
approximately 2-fold symmetric half-operator sequences asymmet-
rically. Proc. Natl. Acad. Sci. USA 86, 6513–6517.
Sarma, M.H., Gupta, G., Sarma, R.H., 1988. Structure of a bent
DNA: two-dimensional NMR studies on d(GAAAATTTTC)2.
Biochemistry 27, 3423–3432.
Schmitz, U., Sethson, I., Egan, W.M., James, T.L., 1992a. Solution
structure of a DNA octamer containing the Pribnow box via
restrained molecular dynamics simulation with distance and
torsion angle constraints derived from two-dimensional nuclear
magnetic resonance spectral fitting. J. Mol. Biol. 227, 510–531.
Schmitz, U., Zon, G., James, T.L., 1992b. Deoxyribose conformation
in [d(GTATATAC)]2: evaluation of sugar pucker by simulation of
double quantum filtered COSY cross peaks. Biochemistry 29,
2357–2366.
Schultz, S.C., Shields, G.C., Steitz, T.A., 1991. Crystal structure of a
CAP–DNA complex: the DNA is bent by 90�. Science 253, 1001–
1007.
Searle, M.S., 1993. NMR studies of drug–DNA interactions. Prog.
NMR Spectrosc. 25, 403–480.
Steitz, T.A., 1990. Structural studies of protein–nucleic acid interac-
tion: the sources of sequence-specific binding. Q. Rev. Biophys. 23,
205–280.
Timsit, T., Vilbois, E., Moras, D., 1991. Nature 354, 167–170.
Tonelli, M., Ragg, E., Bianucci, A.M., Lesiak, K., James, T.L., 1998.
Nuclear magnetic resonance structure of d(GCATATGA-
TAG)�d(CTATCATATGC): a consensus sequence for promoters
recognized by rK RNA polymerase. Biochemistry 37, 11745–
11761.
Trifonov, E.N., Brendal, V., 1986. GNOMIC—A Dictionary of
Genetic Codes. vch Verlagsgesellschaft Weinheim, Germany.
Trifonov, E.N., 1985. Curved DNA. CRC Crit. Rev. Biochem. 19, 89–
106.
Ulyanov, N.B., Goria, A.A., Zhurkin, V.B., Chen, B., Sarma, M.H.,
Sarma, R.H., 1992. Novel solution conformation of DNA observed
in d(GAATTCGAATTC) by two-dimensional NMR spectroscopy.
Biochemistry 31, 3918–3930.
Van de Van, F.J.M., Hilbers, C.W., 1988. Nucleic acids and nuclear
magnetic resonance. Eur. J. Biochem. 178, 1–38.
Van Wijk, J., Huckriede, B.D., Ippel, J.H., Altona, C., 1992.
Spectroscopic methods for analysis of DNA: furanose sugar
conformation in DNA from NMR coupling constants. Methods
Enzymol. 211, 286–307.
Weisz, K., Shafer, R.H., William, E., James, T.L., 1994.
Solution structure of octamer motif in immunoglobin genes via
restained molecular dynamics calculations. Biochemistry 33, 354–
366.
Widmer, H., Wuthrich, K., 1987. Simulated two-dimensional NMR
cross peak fine structures for 1H spin systems in polypeptides and
polydeoxynucleotides. J. Magn. Reson. 74, 316–336.
Wuthrich, K., 1986. NMR of Proteins and Nucleic Acids. Wiley, New
York.
Yanagi, K., Prive, G.G., Dickerson, R.E., 1991. Analysis of local helix
geometry in three B DNA decamers and eight dodecamers. J. Mol.
Biol. 217, 201–214.
Zhurkin, V.B., Ulyanov, N.B., Gorin, A.A., Jernigan, R.L., 1991.
Static and statistical bending of DNA evaluated by Monte Carlo
simulations. Proc. Natl. Acad. Sci. USA 88, 7046–7050.