bazı 2-sübstitüe-1h-benzimidazol türevleri üzerinde çalışmalar
Upload
independentCategory
view
6download
0
A
bd
a
tc
a©
K
1
lttspsslml
BM
0d
Neurobiology of Aging 32 (2011) 1138–1148
Regional age-related effects in the monkey brain measuredwith 1H magnetic resonance spectroscopy
Itamar Ronen a,b,∗, Xiaoying Fan a, Steve Schettler b, Sahil Jain a,b, Donna Murray b,Dae-Shik Kim a,b, Ronald Killiany a,b, Douglas Rosene b
a Center for Biomedical Imaging, Boston University School of Medicine, Boston, MA 02118, USAb Department of Anatomy and Neurobiology, Boston University School of Medicine, Boston, MA 02118, USA
Received 3 December 2008; received in revised form 19 May 2009; accepted 27 May 2009Available online 27 June 2009
bstract
The rhesus monkey is a useful model for examining age-related effects on the brain, because of the extensive neuroanatomical homologyetween the monkey and the human brain, the tight control for neurological diseases as well as the possibility of obtaining relevant behavioralata and post-mortem tissue for histological analyses.
Here, proton magnetic resonance spectroscopy (1H-MRS) was used together with high-resolution anatomical MRI images to carefullyssess regional concentrations of brain metabolites in a group of 20 rhesus monkeys.
In an anterior volume of interest (VOI) that covered frontal and prefrontal areas, significant positive correlations of myo-inositol and ofotal creatine concentrations with age were detected, whereas N-acetyl aspartate (NAA) and choline compounds (Cho) were not significantlyorrelated with age. In an occipito-parietal VOI, all metabolites showed no statistically significant age-dependent trend.
Strong correlations were found between NAA concentration and gray matter fraction in the VOIs as well as between choline compoundsnd white matter fraction.
2009 Elsevier Inc. All rights reserved.
eywords: Magnetic resonance spectroscopy; Aging brain; Rhesus monkey; Brain metabolites
mosMP2(acm
. Introduction
Normal aging is associated with a vast array of physio-ogical, structural and neurochemical changes in the brainhat ultimately result in some level of cognitive and func-ional decline. The advent of non-invasive imaging andpectroscopic tools has made it possible to investigate theserocesses in a non-invasive manner, both in cross-sectiontudies as well as in longitudinal ones. Magnetic resonancepectroscopy (MRS) is a non-invasive tool that can be uti-
ized to measure the presence and concentration of certainetabolites in living tissue at the millimolar concentrationevel. Several works have reported age-related effects on
∗ Corresponding author at: Department of Anatomy and Neurobiology,oston University School of Medicine, 715 Albany Street L-1004, Boston,A 02118, USA. Tel.: +1 617 414 2360; fax: +1 617 414 2371.
E-mail address: [email protected] (I. Ronen).
wyvnttct
197-4580/$ – see front matter © 2009 Elsevier Inc. All rights reserved.oi:10.1016/j.neurobiolaging.2009.05.020
etabolite concentrations in frontal and prefrontal areasf the human brain as measured by magnetic resonancepectroscopy (MRS). Earlier single volume-of-interest (SV)
RS measurements (Chang et al., 1996; Soher et al., 1996;fefferbaum et al., 1999; Saunders et al., 1999; Leary et al.,000) reported no significant age effects on N-acetyl aspartateNAA), a metabolite associated with neuronal viability, andpositive correlation with age in the concentration of cholineompounds (Cho), whose increase is typically attributed toyelin degeneration and cell membrane breakdown. A laterork (Brooks et al., 2001) included tissue parcellation anal-sis and the age-related effects on cerebrospinal fluid (CSF)olume in the quantification of the MRS data, and reported aegative correlation of frontal NAA levels with age, whereas
he Cho and total creatine and phosphocreatine concentra-ions (tCr) did not significantly correlate with age (creatine isonsidered to be a global measure of brain energetics). Addi-ional works showed similar trends (Lundbom et al., 1999;
gy of Ag
Kncvacosmawie
h2sorvociicw
tcrheabislit(aFpat
mpmsscbaGR
alaw11
wurti2a2(mo
cWodadiricic
2
2
6keawstUow(nhc
I. Ronen et al. / Neurobiolo
adota et al., 2001; Schuff et al., 2001), whereas others foundo significant spectroscopic age-related changes in NAA con-entration in gray matter, leading to the belief that neuronaliability in gray matter is resistant to aging (Adalsteinsson etl., 2000). SV-MRS with short echo time (TE) reveals moreomplex spectral information, and allows the quantificationf more metabolites. Using short TE SV-MRS, it has beenhown that glutamine and glutamate concentrations in theotor cortex correlated well with NAA and correlated neg-
tively with age (Kaiser et al., 2005). In the same study itas shown that the white matter concentration of myoinos-
tol (MI), a glial marker mostly present in astrocytes (Brandt al., 1993), exhibited positive correlation with age.
A recent meta-analysis of age-related MRS studies inumans was recently published in this journal (Haga et al.,007) and the diversity of results obtained in the MRS studiesurveyed in this work underscores the difficulty in inferringn age-related processes from human MRS data. This largeange of MRS results stems from a variety of reasons, such asarious levels of sophistication in the data analysis, but onef the main sources of inhomogeneity in the results is a con-omitant inhomogeneity of the sampled cohort. Differencesn life styles, overall health and genetic make-up of partic-pants in human studies are likely to affect the variance oforrelates of aging, and the variance is expected to increaseith age.Of the several alternative models used for aging research,
he non-human primate model for aging and age-relatedhanges in the brain is a particularly attractive one for severaleasons. The extended homology between the monkey and theuman brains makes it possible to make cross-species infer-nces both about brain neurophysiology and neuroanatomys well as about behavioral trends that can be tested inoth species. Secondly, the ability to closely control for thendividual history of subjects in a monkey population is inharp contrast to the large variance in health conditions andife styles found in the human population, differences thatnevitably have consequences on brain physiology. Moreover,he monkey brain is less susceptible to Alzheimer diseaseAD) (Roth et al., 2004), which in the case of human studiesre prone to become confounds in the study of normal aging.inally, the monkey aging model allows for several researchaths that are less available in human studies, such as widerccess to post-mortem tissue and various in vivo interventionshat can be tested in the frame of age-related phenomena.
One of the attractive features of the non-human primateodel is the neuroanatomical homology between frontal and
refrontal cortical areas between humans and non-human pri-ates, which has been shown to be highly relevant to the
tudy of behavioral deficits in executive functions in bothpecies, including age-related deficits. The role of prefrontalortex in cognitive tasks in the rhesus monkey model has
een studied extensively through lesions preformed on keyreas in the frontal and prefrontal cortex (Mishkin, 1957;ross, 1963; Butter and Doehrman, 1968; Goldman andosvold, 1970; Iversen and Mishkin, 1970). Subsequently,swwf
ing 32 (2011) 1138–1148 1139
ge-related cognitive decline in the rhesus monkey has beeninked with regional age-related processes that selectivelyffect areas in the frontal and prefrontal cortex associatedith specific types of cognitive impairments (Presty et al.,987; Rapp and Amaral, 1989; Arnsten and Goldman-Rakic,990; Bachevalier et al., 1991).
Although very few MRS studies in non-human primatesere aimed at aging, the monkey model has been extremelyseful for a variety of MRS studies concerned with neu-ochemical changes in the brain. MRS was applied tohe investigation of neuropathology associated with simianmmunodeficiency virus (Greco et al., 2002; Williams et al.,005), a primate model of Parkinson disease (Brownell etl., 1998) and exposure to early-life stressors (Mathew et al.,003). One MRS study used monkeys as a model for agingHerndon et al., 1998) and showed an increase in the ratio ofyo-insositol to total creatine (mI/tCr) in a frontal volume
f interest.In this study we focus on investigating the neurochemical
orrelate of normal aging of the non-human primate brain.e use a tightly controlled population of 20 monkeys to
btain carefully quantified age-related cross-sectional MRSata and show for the first time a regional differentiation inge-related trajectories in metabolite concentrations in twoifferent regions in the monkey brain: an anterior region thatncluded frontal and prefrontal cortical areas and the ante-ior parts of the corpus callosum, and a posterior region thatncluded parts of the visual cortex. The results are then dis-ussed in the frame of age-related changes as documentedn the past in several detailed histological and immunohisto-hemical studies.
. Materials and methods
.1. Animals and animal procedures
20 adult rhesus monkeys (11 males and 9 females), ages–27 years, (Macaca mulatta) were used for this study. Mon-eys that participated in this study had no history of invasivexperimental manipulations. The selection criteria excludedny animals exposed experimentally to neuroactive drugs asell as any animals with a health history of any neurological
ymptoms. All animal procedures were approved by the Insti-utional Animal Care and Use Committee (IACUC) of Bostonniversity School of Medicine. Table 1 shows the distributionf age/sex across the population. Monkeys were anesthetizedith an initial dose of ketamine (10 mg/kg i.m.) and xylazine
0.05 mg/kg i.m.) and brought to the scanner. In the scan-er, animals were put in a stereotactic MRI-compatible headolder specially designed to fit within the radiofrequencyoil used for the experiment. Body temperature was mea-
ured prior to the experiment and immediately after the scanas over. A MRI-compatible pulse-oxymeter sensor suppliedith the MRI scanner was positioned on the monkey’s rearoot for continuous reading of heart rate, and a respiration belt
1140 I. Ronen et al. / Neurobiology of Ag
Table 1Monkey population data.
Identifier Sex Age (year)
M1 M 6.1M2 M 6.3M3 M 7.2M4 M 8.4M5 M 8.8M6 M 10.2M7 F 11.4M8 F 14.1M9 M 15.2M10 M 15.2M11 F 15.9M12 F 16.1M13 F 16.9M14 F 17.0M15 F 17.6M16 F 18.5M17 M 20.2M18 F 20.6M19 M 24.4M
wra2
2
INiwcq
2
sete
tTdn1s
fsc
attswspsasd1lial(VaaicarbraopwS2ctspVeoaahaptT
2
2
fprocessing was performed using a C++ home-written mul-
20 M 26.5
as positioned under the monkey’s abdomen for respirationate reading. Ketamine and xylazine boosters were provideds needed throughout the experiment, typically once every5 min.
.2. Hardware
All experiments were performed on a 3T whole bodyntera MRI scanner (Philips Medical Systems, Best, Theetherlands). Radiofrequency (RF) coil used for this exper-
ment was the six-channel synergy receive-only head coil,hile RF transmission was done through the quadrature body
oil. The six channels in the head coil were combined inuadrature mode.
.3. MRI and MRS experiments
A short survey scan consisted of coronal/sagittal/axialtacks of three slices each (T1 fast field-echo (T1FFE), rep-tition time and echo time (TR/TE) = 9 ms/3.5 ms, 5 mmhickness, 10 mm separation) was followed by a sensitivityncoding (SENSE) reference scan.
High-resolution T1-weighted scans were performed withhe following parameters: 3D T1 turbo field-echo (3D-1TFE), TR/TE = 8 ms/3 ms, turbo factor = 200, inter-shotelay = 2800 ms, magnetization preparation = inversion,o. of averages = 6, field of view = 130 mm × 155 mm ×55 mm, resolution = 0.6 mm × 0.6 mm × 0.6 mm. Totalcan time = 45 min.
Single volume-of-interest (SV) MRS scans were per-
ormed as following: sequence used was point resolvedpectroscopy (PRESS) with TR/TE = 3500 ms/38 ms. Phaseycles = 16, no. of averages = 256. Water suppression wast(i
ing 32 (2011) 1138–1148
chieved with selective excitation (bandwidth = 140 Hz athe water resonance) and dephasing using gradients onhree axes. Four outer volume suppression bands on theagittal plane (width = 30 mm, separation from VOI = 5 mm)ere applied to further minimize contamination from the
calp and other lipid-rich areas. A scan without water sup-ression (no. of averages = 8) was performed for watercaling of the metabolite peaks. Receiver gain values forll water suppressed spectra and non-water suppressedpectra were kept, respectively constant to allow for repro-ucible water peak based scaling. VOI dimensions were3 mm anterior–posterior, 13 mm dorsal–ventral and 25 mmeft–right for a total of 4.2 mm3. The positioning of the VOIsn the anterior location and the posterior location was dones consistently as possible across monkeys. Fig. 1 shows theocation of the anterior VOI (panels a–c) and posterior VOIpanels d–f) on the sagittal, coronal and axial planes. BothOIs were positioned symmetrically on the medio-lateralxis. The anterior VOI was pushed as anterior and as dorsals possible with the dorsal face of the VOI parallel to the skulln the anterior–posterior direction (panel a), without allowingontaminations from the fat in the eye orbits (panel c) as wells from the scalp above the VOI lateral edges (panel b). Thisequirement, coupled with a relatively small variance in therain size and shape across monkeys, allowed for a reliablyeproducible positioning of the volume. Areas included in thenterior VOI are anterior cingulate cortex, rostrum and genuf the corpus callosum, supplementary motor area (SMA) andarts of Brodmann area 46. The medio-lateral axis of the VOIas approximately 25 mm dorsal and 32 mm anterior to thealeem–Logothetis reference planes (Saleem and Logothetis,007), with a typical 15◦ forward tilt with respect to the verti-al reference plane. The posterior VOI was positioned abovehe cerebellum and as posterior as possible, parallel to thekull in the anterior–posterior direction (panel d), excludingossible contamination from the posterior–dorsal edge of theOI (panels e and f). Areas included in the posterior VOI arearly visual areas (e.g. V2, V3), area MT, and posterior areasf the medial–parietal cortex. Areas included in this VOIre not known to have an age-related behavioral outcome,lthough microstructural changes in occipital white matterave been studied (Peters et al., 2001a,b). The medio-lateralxis of the VOI was approximately 28 mm dorsal and 10 mmosterior to the Saleem–Logothetis reference planes, with aypical 45◦ tilt with respect to the vertical reference plane.otal scan time = 45 min.
.4. Data processing and analysis
.4.1. MRI processingMRI and MRS data were exported in Philips research
ormat (PAR/REC and SDAT/SPAR, respectively). Image
imodal MRI viewing and analysis tool, and MATLAB®
Mathworks, Natick MA). The high-resolution T1-weightedmages were skull-stripped and segmented into three tissue

I. Ronen et al. / Neurobiology of Aging 32 (2011) 1138–1148 1141
F sagittalt
taheBa
smb
FtC
ig. 1. Typical anterior VOI (panels a–c) and posterior VOI (panels d–f) inhe MRI coordinates and thus not parallel to the VOIs sides.
ypes: gray matter, white matter and CSF. The fullyutomated segmentation was based on a combination ofidden Markov random field model and an associated
xpectation–maximization algorithm (Zhang et al., 2001).ased on the segmentation results, three tissue-specific prob-bility maps were generated for the three tissue types. Fig. 2mtu
ig. 2. (a) Coronal view of a skull-stripped T1-weighted image. The contours of thhe same slice. Dark gray: CSF, light gray: gray matter, white: white matter; (c) samSF probability map; (f) intersection between the gray matter probability map and
(a and d), coronal (b and e) and axial (c and f) views. Views are defined by
hows a coronal view of a T1-weighted image of one of theonkeys (panel a), along with the segmentation results (panel
) and the three tissue probability maps for grey matter, white
atter and CSF (panels c–e) generated from the segmen-ation. The coordinates/angulation values of the VOIs weresed to generate a mask that includes all pixels that belong to
e anterior VOI are marked in dashed gray line; (b) segmentation results ofe slice: gray matter probability map; (d) white matter probability map; (e)
the VOI.

1 gy of Aging 32 (2011) 1138–1148
tlgpb“pFipa
f
weapo
2
(1acwiw“tTietmcca
C
wCvou
ostrmt
Fa
3
3
mmFttcdf
3
142 I. Ronen et al. / Neurobiolo
he VOI. To avoid round-off errors generated by the arbitraryocation and angulation of the VOI with respect to the imagerid, the VOI mask was created as a probability map, whereixels that were fully within the VOI were given the proba-ility p = 1, pixels outside the VOI obtained p = 0 and pixelscut” by an edge of the VOI were given a probability valueproportional to the fraction of the pixel within the VOI.
ig. 2f shows the intersection of the anterior VOI probabil-ty map with the gray matter probability map on the coronallane. The tissue fractions within the VOI were calculatedccording to
tissue =∑N
n=1pn, tissue · pn, VOI∑N
n=1pn, VOI
here ftissue is the tissue fraction within the VOI and tissue isither gray matter, white matter or CSF, pn,tissue is the prob-bility of a pixel n to belong to the tissue, and pn,VOI is therobability of the pixel n to belong to the VOI. The sum runsn all N pixels in the image.
.4.2. MRS data processingExported MRS data was analyzed using LCModel
www.s-provencher.com, Oakville, ON, CA, (Provencher,993)). LCModel estimates metabolite concentration boths a fraction of the creatine/phosphocreatine peak (totalreatine, or tCr), as well as against the spectrum of theater peak, obtained without water suppression. The result-
ng concentrations retain a certain amount of uncertaintyith respect to actual concentrations and are thus given in
institutional units” (i.u.), but given a consistent experimen-al setting (similar VOIs, experimental parameters, such asR/TE of the PRESS sequence, RF coil, receiver gain), the
nter-experimental stability of the LCModel i.u. output isxtremely high and is used as the “gold standard” for quan-ification of in vivo proton MRS data. The i.u. values for the
etabolites of interest (NAA, tCr, Cho and MI) were furtherorrected to the contribution of CSF, where the metaboliteoncentration is negligible. The correction is thus performedccording to
corr. = CLCModel · 1
1 − fCSF
here Ccorr. is the corrected metabolite concentration,LCModel is the water-scaled metabolite concentration pro-ided by the LCModel calculation and fCSF is the fractionf the CSF in the VOI. Statistical analyses were performedsing SPSS v. 16 (SPSS Inc., Chicago, IL).
All data sets acquired (N = 20) were used for the analysisf the frontal VOI, and one was discarded from the analy-is of the posterior VOI because of segmentation errors inhe occipital pole/cerebellar area, leaving N = 19 for poste-
ior VOI data. Analyses of age and tissue type effects onetabolite concentrations were bivariate Pearson’s correla-ions (two-tailed).
mNbp
ig. 3. Tissue fractions in (a) the anterior VOI and (b) the posterior VOIgainst age. GM: gray matter, WM: white matter, CSF: cerebrospinal fluid.
. Results
.1. Tissue content and tissue fraction analysis
The tissue probability maps obtained from the tissue seg-entation results were used to calculate the gray matter, whiteatter and CSF fractions within each VOI. The graphs inig. 3a and b show the correlation of tissue fractions within
he anterior and posterior VOIs with age. Within each VOIhe variance of all three tissue fractions was about 10% of theorresponding tissue fraction, attesting for the good repro-ucibility of the VOI positioning. A summary of the tissueraction findings within the VOIs is given in Table 2.
.2. MRS results
This study aimed at the quantitative assessment of fouretabolites: N-acetyl aspartate (NAA) is co-measured with
-acetyl aspartyl glutamate (NAAG), and for simplicity wille referred to as NAA. Soluble choline compounds – phos-hocholine and glycerophosphocholine – are denoted as Cho.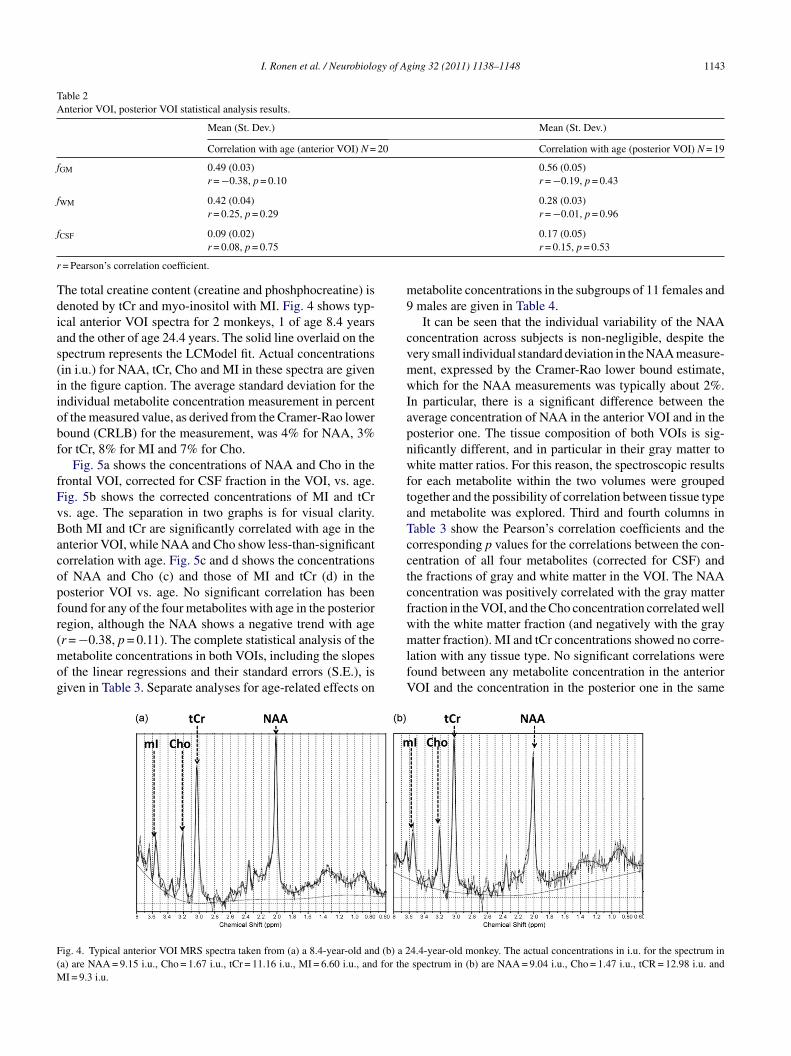
I. Ronen et al. / Neurobiology of Aging 32 (2011) 1138–1148 1143
Table 2Anterior VOI, posterior VOI statistical analysis results.
Mean (St. Dev.) Mean (St. Dev.)
Correlation with age (anterior VOI) N = 20 Correlation with age (posterior VOI) N = 19
fGM 0.49 (0.03) 0.56 (0.05)r = −0.38, p = 0.10 r = −0.19, p = 0.43
fWM 0.42 (0.04) 0.28 (0.03)r = 0.25, p = 0.29 r = −0.01, p = 0.96
f
r
Tdias(iiobf
fFvBacopfr(mog
m9
cvmwIapnwftaTcctcfwm
F(M
CSF 0.09 (0.02)r = 0.08, p = 0.75
= Pearson’s correlation coefficient.
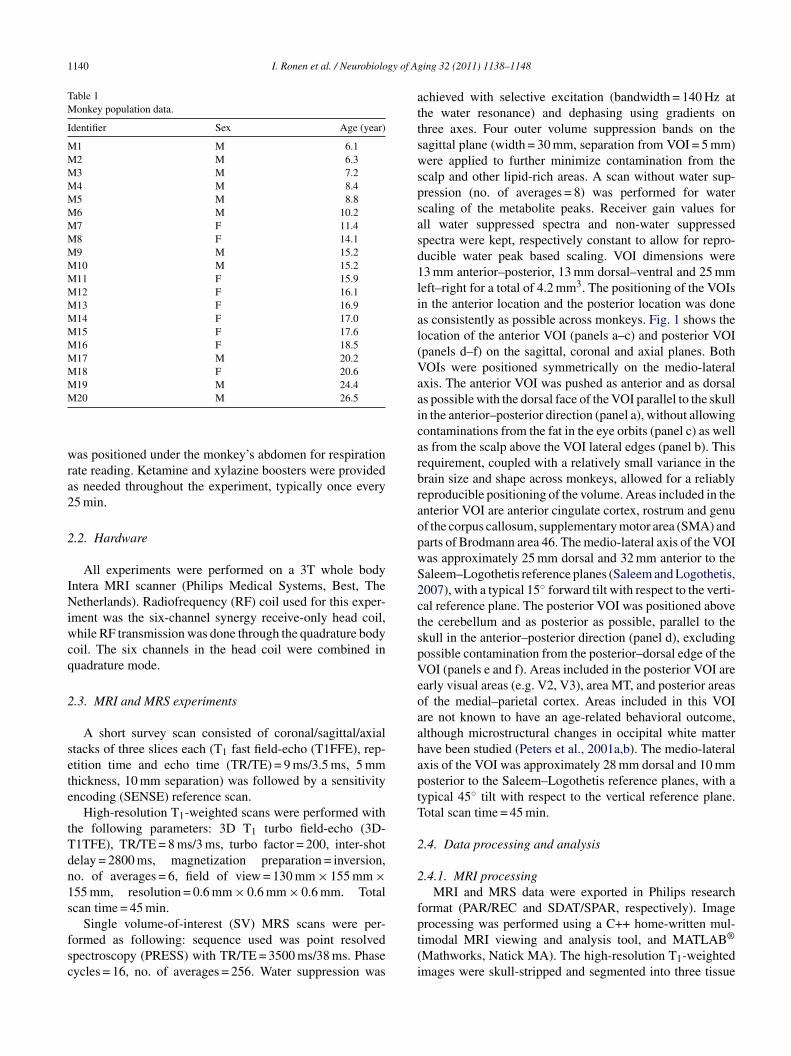
he total creatine content (creatine and phoshphocreatine) isenoted by tCr and myo-inositol with MI. Fig. 4 shows typ-cal anterior VOI spectra for 2 monkeys, 1 of age 8.4 yearsnd the other of age 24.4 years. The solid line overlaid on thepectrum represents the LCModel fit. Actual concentrationsin i.u.) for NAA, tCr, Cho and MI in these spectra are givenn the figure caption. The average standard deviation for thendividual metabolite concentration measurement in percentf the measured value, as derived from the Cramer-Rao loweround (CRLB) for the measurement, was 4% for NAA, 3%or tCr, 8% for MI and 7% for Cho.
Fig. 5a shows the concentrations of NAA and Cho in therontal VOI, corrected for CSF fraction in the VOI, vs. age.ig. 5b shows the corrected concentrations of MI and tCrs. age. The separation in two graphs is for visual clarity.oth MI and tCr are significantly correlated with age in thenterior VOI, while NAA and Cho show less-than-significantorrelation with age. Fig. 5c and d shows the concentrationsf NAA and Cho (c) and those of MI and tCr (d) in theosterior VOI vs. age. No significant correlation has beenound for any of the four metabolites with age in the posterioregion, although the NAA shows a negative trend with ager = −0.38, p = 0.11). The complete statistical analysis of the
etabolite concentrations in both VOIs, including the slopesf the linear regressions and their standard errors (S.E.), isiven in Table 3. Separate analyses for age-related effects on
lfV
ig. 4. Typical anterior VOI MRS spectra taken from (a) a 8.4-year-old and (b) a 2a) are NAA = 9.15 i.u., Cho = 1.67 i.u., tCr = 11.16 i.u., MI = 6.60 i.u., and for the
I = 9.3 i.u.
0.17 (0.05)r = 0.15, p = 0.53
etabolite concentrations in the subgroups of 11 females andmales are given in Table 4.It can be seen that the individual variability of the NAA
oncentration across subjects is non-negligible, despite theery small individual standard deviation in the NAA measure-ent, expressed by the Cramer-Rao lower bound estimate,hich for the NAA measurements was typically about 2%.
n particular, there is a significant difference between theverage concentration of NAA in the anterior VOI and in theosterior one. The tissue composition of both VOIs is sig-ificantly different, and in particular in their gray matter tohite matter ratios. For this reason, the spectroscopic results
or each metabolite within the two volumes were groupedogether and the possibility of correlation between tissue typend metabolite was explored. Third and fourth columns inable 3 show the Pearson’s correlation coefficients and theorresponding p values for the correlations between the con-entration of all four metabolites (corrected for CSF) andhe fractions of gray and white matter in the VOI. The NAAoncentration was positively correlated with the gray matterraction in the VOI, and the Cho concentration correlated wellith the white matter fraction (and negatively with the grayatter fraction). MI and tCr concentrations showed no corre-
ation with any tissue type. No significant correlations wereound between any metabolite concentration in the anteriorOI and the concentration in the posterior one in the same
4.4-year-old monkey. The actual concentrations in i.u. for the spectrum inspectrum in (b) are NAA = 9.04 i.u., Cho = 1.47 i.u., tCR = 12.98 i.u. and
1144 I. Ronen et al. / Neurobiology of Aging 32 (2011) 1138–1148
Fig. 5. Metabolite concentrations vs. age in the anterior VOI (panels a and b) and in the posterior VOI (panels c and d). Concentrations are given in institutionalunits (i.u.). MI and tCr in the anterior VOI showed significant positive correlation with age, and NAA in the posterior VOI exhibited a less-than-significantnegative trend.
F easuret ich negt
mom
4
a
owTaRh
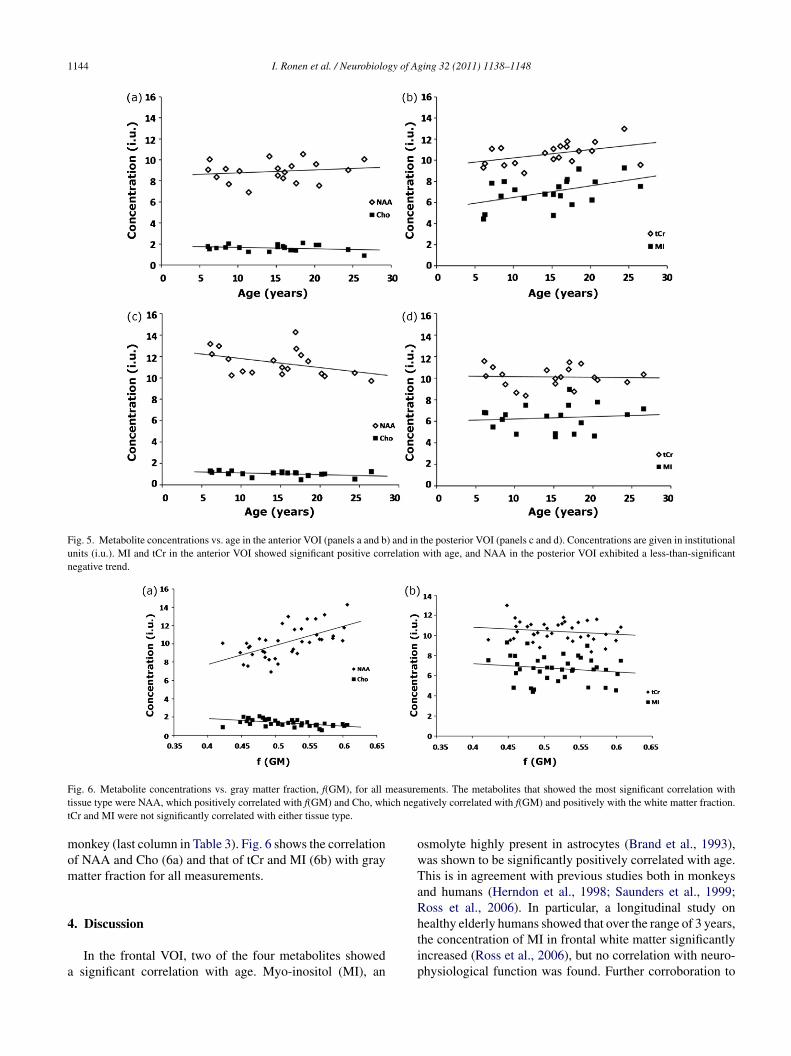
ig. 6. Metabolite concentrations vs. gray matter fraction, f(GM), for all missue type were NAA, which positively correlated with f(GM) and Cho, whCr and MI were not significantly correlated with either tissue type.
onkey (last column in Table 3). Fig. 6 shows the correlationf NAA and Cho (6a) and that of tCr and MI (6b) with grayatter fraction for all measurements.
. Discussion
In the frontal VOI, two of the four metabolites showedsignificant correlation with age. Myo-inositol (MI), an
tip
ments. The metabolites that showed the most significant correlation withatively correlated with f(GM) and positively with the white matter fraction.
smolyte highly present in astrocytes (Brand et al., 1993),as shown to be significantly positively correlated with age.his is in agreement with previous studies both in monkeysnd humans (Herndon et al., 1998; Saunders et al., 1999;oss et al., 2006). In particular, a longitudinal study onealthy elderly humans showed that over the range of 3 years,
he concentration of MI in frontal white matter significantlyncreased (Ross et al., 2006), but no correlation with neuro-hysiological function was found. Further corroboration to
I. Ronen et al. / Neurobiology of Ag
Tabl
e3
MR
Sst
atis
tical
anal
ysis
resu
lts:m
etab
olite
grou
pst
atis
tics,
corr
elat
ion
with
age,
tissu
ety
pean
dV
OI
loca
tion.
Con
cent
ratio
n(i
.u.)
mea
n(S
t.D
ev.)
Con
cent
ratio
n(i
.u.)
mea
n(S
t.D
ev.)
Cor
rela
tion
with
f GM
(bot
hV
OIs
)N
=39
Cor
rela
tion
with
f WM
(bot
hV
OIs
)N
=39
Cor
rela
tion
betw
een
VO
IsN
=19
Cor
rela
tion
with
age
(ant
erio
rV
OI)
N=
20C
orre
latio
nw
ithag
e(p
oste
rior
VO
I)N
=19
Slop
e(i
.u./y
ear)
(S.E
.)Sl
ope
(i.u
./yea
r)(S
.E.)
NA
A9.
11(1
.29)
11.4
1(1
.24)
r=0.
60,p
<0.
001
r=−0
.71,
p<
0.00
1r
=0.
02,p
=0.
95r
=0.
18,p
=0.
44,0
.03
(0.0
4)r
=−0
.38,
p=
0.11
,−0.
08(0
.04)
Cho
1.62
(0.3
)1.
06(0
.24)
r=−0
.62,
p<
0.00
1r=
0.66
,p<
0.00
1r
=0.
18,p
=0.
47r
=−0
.24,
p=
0.31
,−0.
01(0
.01)
r=
−0.3
6,p
=0.
13,−
0.02
(0.0
1)
MI
7.00
(1.3
5)6.
32(1
.22)
r=
−0.2
5,p
=0.
15r
=0.
20,p
=0.
215
r=
−0.1
3,p
=0.
61r=
0.47
,p=
0.03
,0.1
1(0
.05)
r=
0.13
,p=
0.59
,0.0
2(0
.04)
tCr
10.6
0(1
.02)
10.1
2(0
.94)
r=
−0.2
8,p
=0.
1r
=0.
16,p
=0.
345
r=
0.31
,p=
0.2
r=0.
45,p
=0.
04,0
.079
(0.0
4)r
=0.
02,p
=0.
95,−
0.01
(0.0
4)
trbmtbceairnticcf
nhariaictbMtt(
or2ftcitnspolaumptpcwnt
ing 32 (2011) 1138–1148 1145
he connection between the frontal increase in MI and age-elated processes that mainly affect white matter was giveny immunohistochemistry (Sloane et al., 2000), where whiteatter specific astrocytic hypertrophy was found in frontal,
emporal and parietal areas of post-mortem rhesus monkeyrains, with no concomitant increases in gray matter astro-ytic hypertrophy were found in the examined areas. Rosst al. hypothesized that increasing MI may be a marker ofging or a preclinical neurodegenerative process. Here theres corroborative evidence for the link with aging, but in thehesus model it is most likely that the link with preclinicaleurodegeneration can be excluded. Myo-inositol concentra-ion in the anterior VOI also positively correlated with agen the males and females subgroups with similar correlationoefficient (r = 0.5 for both sexes) but the statistical signifi-ance of this trend was low (p = 0.12 for females and p = 0.15or males).
The increase in tCr in the anterior VOI with age is sig-ificant, and similar increases were found in some of theuman MRS aging studies in frontal regions (McIntyre etl., 2007) but not in others (Brooks et al., 2001). An age-elated decrease in creatine kinase activity has been reportedn humans and rats, as measured with 31P NMR (Smith etl., 1997) and it is possible that age-related increased tCrs associated with reduction in energetic capability of brainells with age. The age-related increase in tCr, as found inhis study and others, emphasizes the importance of water-ased quantification of metabolite concentration in in vivoRS, rather than relative quantification with respect to the
Cr level. Anterior tCr was significantly correlated with age inhe group of females (p = 0.02) but not in the group of malesp = 0.28).
In neither VOI was there a highly significant correlationf NAA concentration with age. The meta-analysis of age-elated MRS studies in humans mentioned earlier (Haga et al.,007) reports that five out of eight studies show no change inrontal NAA concentrations (with one showing increase andwo studies showing decrease), whereas occipital NAA con-entrations were rarely studied—one study showed decreasen occipital NAA and one shows no change. In this study,he NAA concentration in the anterior VOI showed no sig-ificant age-related trend, whereas that in the posterior VOIhowed a less-than-significant decrease with age (r = −0.38,= 0.11). This decrease becomes significant when the resultsbtained from group of 9 male monkeys are separately ana-yzed (see Table 4). With such a low number of monkeys andhighly inhomogeneous distribution of ages in this partic-
lar group, these results call for further corroboration withore data from middle-aged and older monkeys. It has been
reviously shown that in the rhesus monkey brain there is ahinning of cortical layer 1 both in Brodmann area 46 in therefrontal cortex (Peters et al., 1998) as well as in the visual
ortex (Peters et al., 2001a,b), a thinning that is not associatedith loss in neurons. The finding in this work that NAA isot significantly correlated with age in the frontal VOI whenhe data obtained from the entire population is analyzed may
1146 I. Ronen et al. / Neurobiology of Aging 32 (2011) 1138–1148
Table 4MRS statistical analysis results (separate analyses for males and females).
Concentration (i.u.) Mean (St. Dev.) Concentration (i.u.) Mean (St. Dev.) Concentration (i.u.)Mean (St. Dev.)
Concentration (i.u.)Mean (St. Dev.)
Correlation with age (anterior VOI)females (N = 11)
Correlation with age (posterior VOI)females (N = 10)
Correlation with age(anterior VOI) males(N = 9)
Correlation with age(posterior VOI)males (N = 9)
NAA 8.74 (1.17) 11.52 (1.27) 9.11 (0.76) 11.29 (1.28)r = 0.13, p = 0.72 r = .154, p = 0.672 r = 0.40, p = 0.28 r = −0.74, p = 0.02
Cho 1.62 (0.3) 1.00 (0.24) 1.62 (0.32) 1.12 (0.25)r = 0.529, p = 0.09 r = 0.03, p = 0.92 r = −0.56, p = 0.12 r = −0.55, p = 0.13
MI 7.1 (1.24) 6.49 (1.47) 6.89 (1.56) 6.13 (0.92)r = 0.50, p = 0.12 r = 0.10, p = 0.78 r = 0.52, p = 0.15 r = 0.08, p = 0.84
tCr 10.72 (0.89) 10.09 (1.04) 10.44 (1.20) 10.15 (0.87)
sfresm
obttbVfcIafsstNoa
titaVmmdfa
(gt
ihmmhwgCc1ot
5
mmtmtwtctpfMd
bcam
r = 0.69, p = 0.02 r = 0.39, p = 0.27
upport the notion of resistance of gray matter neurons inrontal gray matter to healthy aging, and that significant age-elated morphometric changes in gray matter in such areas,.g. (Alexander et al., 2008) result from changes in other con-tituents rather than the total number of neurons, although theechanism underlying these changes still remains unclear.Regional differences in age effects on the concentration
f metabolites measured in this study can also be assessedy examining the difference in slopes ([metabolite]/age) ofhe linear regression results obtained from the two VOIs, ashey are given in Table 2. As expected, differences are seenetween the slope of [MI]/age and [tCr]/age between the twoOIs, although the standard errors for the slopes are too large
or the differences to be determined as statistically signifi-ant, as they are less than two S.E. apart from each other.nterestingly, the slope of [NAA]/age in the anterior VOInd that in the posterior VOI are more than one S.E. apartrom each other. Although this does not reach the level oftatistical significance, and neither does any of linear regres-ions for [NAA]/age in either VOI, this finding, taken withhe almost significant negative trend (r = −0.38 p = 0.11) ofAA concentration in the posterior VOI, could be indicativef differences in regional age effects on NAA concentration,lthough further corroboration is needed.
It should be noted that the accuracy of the estimation ofhe metabolite concentrations in this study is limited by thenability to obtain MRS data from VOIs with a single tissueype (GM or WM). The added variance is due to the differentmounts of MR-visible water in GM and WM, and when theOI contains only one tissue type and CSF, it is possible toodel the tissue water content in the quantification of theetabolites, as done, e.g. in Brooks et al. (2001). The confi-
ence in the age effect on MI and tCr concentrations in therontal VOI is increased, however, thanks to the fact that noge effect on tissue type was observed in either VOIs.
Although the spatial resolution of the MRS measurement
4.2 cm3) was not sufficient to selectively place the VOIs onray matter and white matter areas, it was shown that segmen-ation data from high-resolution, high-contrast anatomicalwsat
r = 0.41, p = 0.28 r = −0.23, p = 0.56
mages that are co-registered with the VOI coordinates canelp generate reliable information about the distribution ofetabolites across tissue types. Higher prevalence of certainetabolites in specific brain tissue type has been reported in
uman MRS studies, and is for the most part in accordanceith what this study reports. Higher NAA concentration inray matter (Christiansen et al., 1993; Charles et al., 1994;hang et al., 1996; Saunders et al., 1999) and higher Chooncentration in white matter (May et al., 1986; Barker et al.,993) were previously reported. In this study, as well as inther studies (Michaelis et al., 1991; Christiansen et al., 1993)he MI concentration did not seem to be tissue-preferential.
. Conclusions and future studies
It is shown here that MRS in combination with tissue seg-entation can be used to investigate regional age effects onetabolite concentrations in the rhesus monkey model for
he aging brain. The results shown here are in good agree-ent with some of the findings reported from post-mortem
issue analyses, e.g. increase in GFAP+ in frontal and parietalhite matter (Sloane et al., 2000) and the cortical thinning
hat was unaccompanied by significant decline in neuronalount in gray matter areas (Peters et al., 1998). The rela-ionship between the neuroanatomical changes detected inost-mortem tissue and age-related MRS findings has to beurther more robustly cross-validated by studies that provide
RS/MRI data, histological data and immunohistochemicalata from the same group of monkeys.
One of the shortcomings of this study is the limited num-er of metabolites that could be accurately assessed withoutonfounds. A recent MRS study in humans showed regionalge-related changes in glutamate, an excitatory neurotrans-itter (Kaiser et al., 2005). Data for glutamate concentrations
ere available in this study, but the reliability of these mea-urements is confounded by the use of ketamine as thenesthetic agent, and the effect that ketamine has on glu-amate metabolism (Rowland et al., 2005). Thus, a different

gy of Ag
ac
sv(aoM2
C
p
A
a
R
A
A
A
B
B
B
B
B
B
C
C
C
G
G
G
H
H
I
K
K
L
L
M
M
M
M
M
P
P
I. Ronen et al. / Neurobiolo
nesthesia protocol is needed for the exploration of regionalhanges in glutamine/glutamate concentrations.
Single VOI MRS has the distinct advantage of allowingimple and robust quantification of the metabolites in theolume. The implementation of MR spectroscopic imagingMRSI) in future studies will allow, on the other hand, largerrea coverage and further insight into the tissue preferentialityf brain metabolites, as has been shown in human age-relatedRSI studies (Pfefferbaum et al., 1999; Schuff et al., 1999,
001).
onflict of interest
None of the authors on this manuscript has any actual orotential conflict of interest pertinent to this work.
cknowledgements
This work is supported by NIH grants P01-AG000001-31nd R21-AG028781.
eferences
dalsteinsson, E., Sullivan, E.V., Kleinhans, N., Spielman, D.M., Pfef-ferbaum, A., 2000. Longitudinal decline of the neuronal markerN-acetyl aspartate in Alzheimer’s disease. Lancet 355 (9216), 1696–1697.
lexander, G.E., Chen, K., Aschenbrenner, M., Merkley, T.L., Santerre-Lemmon, L.E., Shamy, J.L., Skaggs, W.E., Buonocore, M.H., Rapp,P.R., Barnes, C.A., 2008. Age-related regional network of magnetic res-onance imaging gray matter in the rhesus macaque. J. Neurosci. 28 (11),2710–2718.
rnsten, A.F., Goldman-Rakic, P.S., 1990. Analysis of alpha-2 adrenergicagonist effects on the delayed nonmatch-to-sample performance of agedrhesus monkeys. Neurobiol. Aging 11 (6), 583–590.
achevalier, J., Landis, L.S., Walker, L.C., Brickson, M., Mishkin, M.,Price, D.L., Cork, L.C., 1991. Aged monkeys exhibit behavioral deficitsindicative of widespread cerebral dysfunction. Neurobiol. Aging 12 (2),99–111.
arker, P.B., Soher, B.J., Blackband, S.J., Chatham, J.C., Mathews, V.P.,Bryan, R.N., 1993. Quantitation of proton NMR spectra of the humanbrain using tissue water as an internal concentration reference. NMRBiomed. 6 (1), 89–94.
rand, A., Richter-Landsberg, C., Leibfritz, D., 1993. Multinuclear NMRstudies on the energy metabolism of glial and neuronal cells. Dev. Neu-rosci. 15 (3–5), 289–298.
rooks, J.C., Roberts, N., Kemp, G.J., Gosney, M.A., Lye, M., Whitehouse,G.H., 2001. A proton magnetic resonance spectroscopy study of age-related changes in frontal lobe metabolite concentrations. Cereb. Cortex11 (7), 598–605.
rownell, A.L., Jenkins, B.G., Elmaleh, D.R., Deacon, T.W., Spealman,R.D., Isacson, O., 1998. Combined PET/MRS brain studies showdynamic and long-term physiological changes in a primate model ofParkinson disease. Nat. Med. 4 (11), 1308–1312.
utter, C.M., Doehrman, S.R., 1968. Size discrimination and transposition
in monkeys with striate and temporal lesions. Cortex 4 (1), 35–45.hang, L., Ernst, T., Poland, R.E., Jenden, D.J., 1996. In vivo proton mag-netic resonance spectroscopy of the normal aging human brain. Life Sci.58 (22), 2049–2056.
P
ing 32 (2011) 1138–1148 1147
harles, H.C., Lazeyras, F., Krishnan, K.R., Boyko, O.B., Patterson, L.J.,Doraiswamy, P.M., McDonald, W.M., 1994. Proton spectroscopy ofhuman brain: effects of age and sex. Prog. Neuropsychopharmacol. Biol.Psychiatry 18 (6), 995–1004.
hristiansen, P., Toft, P., Larsson, H.B., Stubgaard, M., Henriksen, O., 1993.The concentration of N-acetyl aspartate, creatine + phosphocreatine, andcholine in different parts of the brain in adulthood and senium. Magn.Reson. Imaging 11 (6), 799–806.
oldman, P.S., Rosvold, H.E., 1970. Localization of function within thedorsolateral prefrontal cortex of the rhesus monkey. Exp. Neurol. 27 (2),291–304.
reco, J.B., Sakaie, K.E., Aminipour, S., Lee, P.L., Chang, L.L., He, J.,Westmoreland, S., Lackner, A.A., Gonzalez, R.G., 2002. Magnetic res-onance spectroscopy: an in vivo tool for monitoring cerebral injury inSIV-infected macaques. J. Med. Primatol. 31 (4–5), 228–236.
ross, C.G., 1963. Locomotor activity following lateral frontal lesions inrhesus monkeys. J. Comp. Physiol. Psychol. 56, 232–236.
aga, K.K., Khor, Y.P., Farrall, A., Wardlaw, J.M., 2007. A systematic reviewof brain metabolite changes, measured with (1)H magnetic resonancespectroscopy, in healthy aging. Neurobiol. Aging.
erndon, J.G., Constantinidis, I., Moss, M.B., 1998. Age-related brainchanges in rhesus monkeys: a magnetic resonance spectroscopic study.Neuroreport 9 (9), 2127–2130.
versen, S.D., Mishkin, M., 1970. Perseverative interference in monkeys fol-lowing selective lesions of the inferior prefrontal convexity. Exp. BrainRes. 11 (4), 376–386.
adota, T., Horinouchi, T., Kuroda, C., 2001. Development and aging ofthe cerebrum: assessment with proton MR spectroscopy. AJNR Am. J.Neuroradiol. 22 (1), 128–135.
aiser, L.G., Schuff, N., Cashdollar, N., Weiner, M.W., 2005. Age-relatedglutamate and glutamine concentration changes in normal humanbrain: 1H MR spectroscopy study at 4 T. Neurobiol. Aging 26 (5),665–672.
eary, S.M., Brex, P.A., MacManus, D.G., Parker, G.J., Barker, G.J., Miller,D.H., Thompson, A.J., 2000. A (1)H magnetic resonance spectroscopystudy of aging in parietal white matter: implications for trials in multiplesclerosis. Magn. Reson. Imaging 18 (4), 455–459.
undbom, N., Barnett, A., Bonavita, S., Patronas, N., Rajapakse, J.,Tedeschi, Di Chiro, G., 1999. MR image segmentation and tissuemetabolite contrast in 1H spectroscopic imaging of normal and agingbrain. Magn. Reson. Med. 41 (4), 841–845.
athew, S.J., Shungu, D.C., Mao, X., Smith, E.L., Perera, G.M., Kegeles,L.S., Perera, T., Lisanby, S.H., Rosenblum, L.A., Gorman, J.M., Coplan,J.D., 2003. A magnetic resonance spectroscopic imaging study of adultnonhuman primates exposed to early-life stressors. Biol. Psychiatry 54(7), 727–735.
ay, G.L., Wright, L.C., Holmes, K.T., Williams, P.G., Smith, I.C., Wright,P.E., Fox, R.M., Mountford, C.E., 1986. Assignment of methylene pro-ton resonances in NMR spectra of embryonic and transformed cells toplasma membrane triglyceride. J. Biol. Chem. 261 (7), 3048–3053.
cIntyre, D.J., Charlton, R.A., Markus, H.S., Howe, F.A., 2007. Long andshort echo time proton magnetic resonance spectroscopic imaging of thehealthy aging brain. J. Magn. Reson. Imaging 26 (6), 1596–1606.
ichaelis, T., Merboldt, K.D., Hanicke, W., Gyngell, M.L., Bruhn, H.,Frahm, J., 1991. On the identification of cerebral metabolites in localized1H NMR spectra of human brain in vivo. NMR Biomed. 4 (2), 90–98.
ishkin, M., 1957. Effects of small frontal lesions on delayed alternation inmonkeys. J. Neurophysiol. 20 (6), 615–622.
eters, A., Moss, M.B., Sethares, C., 2001a. The effects of aging on layer1 of primary visual cortex in the rhesus monkey. Cereb. Cortex 11 (2),93–103.
eters, A., Sethares, C., Killiany, R.J., 2001b. Effects of age on the thicknessof myelin sheaths in monkey primary visual cortex. J. Comp. Neurol.
435 (2), 241–248.eters, A., Sethares, C., Moss, M.B., 1998. The effects of aging on layer 1in area 46 of prefrontal cortex in the rhesus monkey. Cereb. Cortex 8 (8),671–684.

1 gy of Ag
P
P
P
R
R
R
R
S
S
S
S
S
S
S
W
148 I. Ronen et al. / Neurobiolo
fefferbaum, A., Adalsteinsson, E., Spielman, D., Sullivan, E.V., Lim, K.O.,1999. In vivo spectroscopic quantification of the N-acetyl moiety, cre-atine, and choline from large volumes of brain gray and white matter:effects of normal aging. Magn. Reson. Med. 41 (2), 276–284.
resty, S.K., Bachevalier, J., Walker, L.C., Struble, R.G., Price, D.L.,Mishkin, M., Cork, L.C., 1987. Age differences in recognition mem-ory of the rhesus monkey (Macaca mulatta). Neurobiol. Aging 8 (5),435–440.
rovencher, S.W., 1993. Estimation of metabolite concentrations fromlocalized in vivo proton NMR spectra. Magn. Reson. Med. 30 (6),672–679.
app, P.R., Amaral, D.G., 1989. Evidence for task-dependent memory dys-function in the aged monkey. J. Neurosci. 9 (10), 3568–3576.
oss, A.J., Sachdev, P.S., Wen, W., Brodaty, H., 2006. Longitudinal changesduring aging using proton magnetic resonance spectroscopy. J. Gerontol.A: Biol. Sci. Med. Sci. 61 (3), 291–298.
oth, G.S., Mattison, J.A., Ottinger, M.A., Chachich, M.E., Lane, M.A.,Ingram, D.K., 2004. Aging in rhesus monkeys: relevance to human healthinterventions. Science 305 (5689), 1423–1426.
owland, L.M., Bustillo, J.R., Mullins, P.G., Jung, R.E., Lenroot, R., Land-graf, E., Barrow, R., Yeo, R., Lauriello, J., Brooks, W.M., 2005. Effects ofketamine on anterior cingulate glutamate metabolism in healthy humans:a 4-T proton MRS study. Am. J. Psychiatry 162 (2), 394–396.
aleem, K.S., Logothetis, N.K., 2007. Atlas of the Rhesus Monkey Brain inStereotaxic Coordinates. Academic Press.
aunders, D.E., Howe, F.A., van den Boogaart, A., Griffiths, J.R., Brown,M.M., 1999. Aging of the adult human brain: in vivo quantitation ofmetabolite content with proton magnetic resonance spectroscopy. J.Magn. Reson. Imaging 9 (5), 711–716.
Z
ing 32 (2011) 1138–1148
chuff, N., Amend, D.L., Knowlton, R., Norman, D., Fein, G., Weiner, M.W.,1999. Age-related metabolite changes and volume loss in the hippocam-pus by magnetic resonance spectroscopy and imaging. Neurobiol. Aging20 (3), 279–285.
chuff, N., Ezekiel, F., Gamst, A.C., Amend, D.L., Capizzano, A.A.,Maudsley, A.A., Weiner, M.W., 2001. Region and tissue differencesof metabolites in normally aged brain using multislice 1H magneticresonance spectroscopic imaging. Magn. Reson. Med. 45 (5), 899–907.
loane, J.A., Hollander, W., Rosene, D.L., Moss, M.B., Kemper, T., Abra-ham, C.R., 2000. Astrocytic hypertrophy and altered GFAP degradationwith age in subcortical white matter of the rhesus monkey. Brain Res.862 (1–2), 1–10.
mith, C.D., Landrum, W., Carney, J.M., Landfield, P.W., Avison, M.J.,1997. Brain creatine kinase with aging in F-344 rats: analysis by satura-tion transfer magnetic resonance spectroscopy. Neurobiol. Aging 18 (6),617–622.
oher, B.J., van Zijl, P.C., Duyn, J.H., Barker, P.B., 1996. Quantitative protonMR spectroscopic imaging of the human brain. Magn. Reson. Med. 35(3), 356–363.
illiams, K., Westmoreland, S., Greco, J., Ratai, E., Lentz, M., Kim, W.K.,Fuller, R.A., Kim, J.P., Autissier, P., Sehgal, P.K., Schinazi, R.F., Bischof-berger, N., Piatak, M., Lifson, J.D., Masliah, E., Gonzalez, R.G., 2005.Magnetic resonance spectroscopy reveals that activated monocytes con-tribute to neuronal injury in SIV neuroAIDS. J. Clin. Invest. 115 (9),2534–2545.
hang, Y., Brady, M., Smith, S., 2001. Segmentation of brain MRimages through a hidden Markov random field model and theexpectation–maximization algorithm. IEEE Trans. Med. Imaging 20 (1),45–57.
Copyright © 2022 FDOKUMEN