Structure, microstructure and magnetic properties of Sr 1− x Ca x CrO 3 (0⩽ x⩽1
7
RESEARCH ARTICLE Copyright © 2013 American Scientific Publishers All rights reserved Printed in the United States of America SENSOR LETTERS Vol. 11, 1–7, 2013 Structural, Microstructural and Magnetic Properties of Nanocrystalline Ni 75 Fe 25 Compound Produced by Mechanical Alloying A. Kaibi 1 ∗ , A. Guittoum 2 , N. Fenineche 3 , N. Souami 2 , and M. Kechouane 1 1 Laboratoire de Physique des Matériaux (LPM), Faculté de Physique, USTHB, BP 32 El Alia, Algiers, Algeria 2 Centre de Recherche Nucléaire d’Alger, 02 Bd Frantz Fanon, BP 399, Algiers, Algeria 3 Laboratoire LERMPS, UTBM site de Montbéliard, France (Received: 10 September 2012. Accepted: 10 May 2013) The mechanical alloying process was used to prepare nanocrystalline Ni 75 Fe 25 powders. Several milling times have been used ranging from 3 h up to 96 h. The microstructure, structure and mag- netic properties were studied by scanning electron microscopy, X-ray diffraction, and hysteresis measurements. From X-ray diffraction spectra, we showed that the Ni 3 Fe phase starts to form after 6 h milling time and dominates after 24 h of milling. When the milling time increases, the grain size decreases to 14 nm, the mean level of microdistorsions increases to 0.67%. The SEM images taken at different milling time allowed us to follow the morphology of the materials at different stages. Ele- mental mapping experiments (EDX) indicate that the Fe and Ni elemental distributions are closely correlated indicating that the two elements are completely alloyed and the Ni(Fe) solid solution is formed at 24 h of milling time. From hysteresis curves, we derived the saturation magnetization, M s , and the coercive field, H c . It is observed that M s monotonously increases with increasing milling time. This increase in M s may be attributed to the completion of alloying process and also to the reduction of magnetocrystalline anisotropy due to the grain refinement. For milling times larger than 3 h, H c sharply decreases and reaches a minimum value of 5 Oe after 96 h. The decrease of H C is attributed to the decrease in the grain size. We show that nanocrystalline Ni 75 Fe 25 powder exhibits a soft magnetic behaviour. Keywords: Ni 3 Fe Compound, Microstructure, X-Ray Diffraction, Mössbauer Spectroscopy, Coercivity, Magnetization, Mechanical Alloying. 1. INTRODUCTION Nanocrystalline NiFe alloys have received a lot of attention during the last decades due to their interesting magnetic properties. 1 These alloys are intensively used in electrical and electronic devices due to their excellent soft magnetic properties. 2 Many methods were used to prepare nanocrystalline NiFe alloys. Among these methods, mechanical alloying is a powerful method which enables the elaboration of nanostructured powders. 1 3–5 In general, due to the contin- uous severe plastic deformation, a gradual refinement of the internal structure of the powders to nanometer scales occurs during high-energy milling. 6 It is well known that the magnetic properties of NiFe alloys can be affected to ∗ Corresponding author; E-mail: [email protected] a considerable extent by the milling conditions such as the milling time. 2 7 8 NiFe alloys around the Permalloy compositions are well known for their high performance as soft magnetic mate- rials and have been the subject of various studies. For example, Frase et al. 9 studied the effect of the grain size reduction on the behavior of the saturation magnetiza- tion, M s , and the coercive field, H c . They found that H c increases when the grain size decreases. They attributed this increasing of H c to the high internal stresses. About M s , they showed that it decrease with grains size reduc- tion. Chicinas et al. 10 Popa et al. 11–13 studied the depen- dence of saturation magnetization, M s , as a function of milling time (t = 3 h and 52 h) for Ni 75 Fe 25 . They showed that, M s increases with milling time until 24 h and then decreases. The increase (decreases) of M s was attributed to the reduction of structural defects and to the introduction Sensor Lett. 2013, Vol. 11, No. xx 1546-198X/2013/11/001/007 doi:10.1166/sl.2013.3069 1
Transcript of Structure, microstructure and magnetic properties of Sr 1− x Ca x CrO 3 (0⩽ x⩽1

RESEARCH
ARTIC
LE
Copyright © 2013 American Scientific PublishersAll rights reservedPrinted in the United States of America
SENSOR LETTERSVol. 11, 1–7, 2013
Structural, Microstructural and Magnetic Properties ofNanocrystalline Ni75Fe25 Compound Produced by
Mechanical Alloying
A. Kaibi1�∗, A. Guittoum2, N. Fenineche3, N. Souami2, and M. Kechouane11Laboratoire de Physique des Matériaux (LPM), Faculté de Physique, USTHB, BP 32 El Alia, Algiers, Algeria
2Centre de Recherche Nucléaire d’Alger, 02 Bd Frantz Fanon, BP 399, Algiers, Algeria3Laboratoire LERMPS, UTBM site de Montbéliard, France
(Received: 10 September 2012. Accepted: 10 May 2013)
The mechanical alloying process was used to prepare nanocrystalline Ni75Fe25 powders. Severalmilling times have been used ranging from 3 h up to 96 h. The microstructure, structure and mag-netic properties were studied by scanning electron microscopy, X-ray diffraction, and hysteresismeasurements. From X-ray diffraction spectra, we showed that the Ni3Fe phase starts to form after6 h milling time and dominates after 24 h of milling. When the milling time increases, the grain sizedecreases to 14 nm, the mean level of microdistorsions increases to 0.67%. The SEM images takenat different milling time allowed us to follow the morphology of the materials at different stages. Ele-mental mapping experiments (EDX) indicate that the Fe and Ni elemental distributions are closelycorrelated indicating that the two elements are completely alloyed and the Ni(Fe) solid solution isformed at 24 h of milling time. From hysteresis curves, we derived the saturation magnetization, Ms,and the coercive field, Hc. It is observed that Ms monotonously increases with increasing millingtime. This increase in Ms may be attributed to the completion of alloying process and also to thereduction of magnetocrystalline anisotropy due to the grain refinement. For milling times larger than3 h, Hc sharply decreases and reaches a minimum value of 5 Oe after 96 h. The decrease of HC isattributed to the decrease in the grain size. We show that nanocrystalline Ni75Fe25 powder exhibitsa soft magnetic behaviour.
Keywords: Ni3Fe Compound, Microstructure, X-Ray Diffraction, Mössbauer Spectroscopy,Coercivity, Magnetization, Mechanical Alloying.
1. INTRODUCTIONNanocrystalline NiFe alloys have received a lot of attentionduring the last decades due to their interesting magneticproperties.1 These alloys are intensively used in electricaland electronic devices due to their excellent soft magneticproperties.2
Many methods were used to prepare nanocrystallineNiFe alloys. Among these methods, mechanical alloyingis a powerful method which enables the elaboration ofnanostructured powders.1�3–5 In general, due to the contin-uous severe plastic deformation, a gradual refinement ofthe internal structure of the powders to nanometer scalesoccurs during high-energy milling.6 It is well known thatthe magnetic properties of NiFe alloys can be affected to
∗Corresponding author; E-mail: [email protected]
a considerable extent by the milling conditions such as themilling time.2�7�8
NiFe alloys around the Permalloy compositions are wellknown for their high performance as soft magnetic mate-rials and have been the subject of various studies. Forexample, Frase et al.9 studied the effect of the grain sizereduction on the behavior of the saturation magnetiza-tion, Ms , and the coercive field, Hc. They found that Hc
increases when the grain size decreases. They attributedthis increasing of Hc to the high internal stresses. AboutMs , they showed that it decrease with grains size reduc-tion. Chicinas et al.10 Popa et al.11–13 studied the depen-dence of saturation magnetization, Ms , as a function ofmilling time (t = 3 h and 52 h) for Ni75Fe25. They showedthat, Ms increases with milling time until 24 h and thendecreases. The increase (decreases) of Ms was attributed tothe reduction of structural defects and to the introduction
Sensor Lett. 2013, Vol. 11, No. xx 1546-198X/2013/11/001/007 doi:10.1166/sl.2013.3069 1

RESEARCH
ARTIC
LE
tructural, Microstructural and Magnetic Properties of Nanocrystalline Ni75Fe25 Compound Kaibi et al.
of antisite disorder, respectively. From the literature, it isclear that there is not a standard evolution of Ms and Hc
versus milling time. We believe that this difference maybe due to the changes in structural properties which areinfluenced by the condition of elaboration and also to thekind of planetary ball mill.In this perspective, we performed the present study
which concerns the elaboration, by the vario-planetary ballmill P4, of NiFe nanostructured powders. The effect ofmilling time on the structural and magnetic properties willbe studied. The details of the experimental techniques forthe preparation and the characterizations of the Ni75Fe25nanoparticles will be given in Section 2. In Section 3,we will discuss the different results derived from scan-ning electron microscopy (Section 3.1.), X-ray diffraction(Section 3.2) and magnetic measurements (Section 3.3).Scanning Electron Microscopy (SEM) coupled to EDXexperiments were performed in order to follow the evo-lution of particles morphology, i.e., as a function of themilling time; X-ray Diffraction was used for a betterunderstanding of the evolution of Ni75Fe25 phase duringthe elaboration, magnetic measurements were performedto study the behaviour of saturation magnetization andcoercive field versus milling time. A conclusion will begiven in Section 4.
2. EXPERIMENTAL PROCEDURE2.1. Materials and Mechanical Alloying ProcessFe (99.99%, < 212 �m) and Ni (99.99%, < 149 �m) pow-ders were separately weighted and mixed to get the desiredcomposition. The mechanical alloying process was per-formed in a vario-planetary high-energy ball mill (FritschP4). The rotation speeds of the main disk, �, and vials,�, were −240 rpm and 200 rpm respectively. To preventoxidation phenomena, the mixed powder was sealed in acylindrical vial under argon atmosphere with stainless steelballs. The ball to powder mass ratio of 20:1 was chosen.Several milling times were used ranging from 3 to 96 h.To avoid excessive heating during milling, each 15 minof milling was followed by a pause of 15 min under Aratmosphere.
2.2. CharacterizationX-ray investigations were performed using a Philips X’PertPro diffractometer in continuous scanning mode with CuK� radiation. The X-ray diffraction spectra were analyzedwith the HighScore Plus software.14
Each peak was fitted by a pseudo-Voigt (PV) functionwhich is a linear combination of a Lorentzian (L) and aGaussian (G) function: PV�2��= L�2��+ �1−�G�2��where is a refinable “mixing” parameter called shapeparameter which describes the amount of Gaussian pro-file versus the amount of Lorentzian profile. After remov-ing the CuK�2 radiation from the profiles by using theRachinger method and the instrumental broadening by
using a Si reference sample, the physical breadths aredetermined for each peak of the pattern. The mean sizeof the nanocrystallites, �D�, was calculated according toScherrer’s formula included in the software and definedby:
�D� = K ·�/L · cos� (1)
where K represents the shape factor which varies withcrystal shape, � is the wavelength of the CuK�1 radia-tion, � is the Bragg angle and L is the breadth of theLorentzian contribution to the peak, which has its originin the reduced size of the crystallites. The average micros-train, ���, on the other hand, was calculated by using thetangent formula included in the software and given by:
��� = G/�4 tan �� (2)
where G is the breadth of the Gaussian contribution to thepeak, which has its origin in the presence of microdistor-sions. The magnetic measurements were realized using ahysteresimeter Bull M 2000/2010, which enabled to mea-sure magnetic properties, namely coercivity and saturationmagnetization.
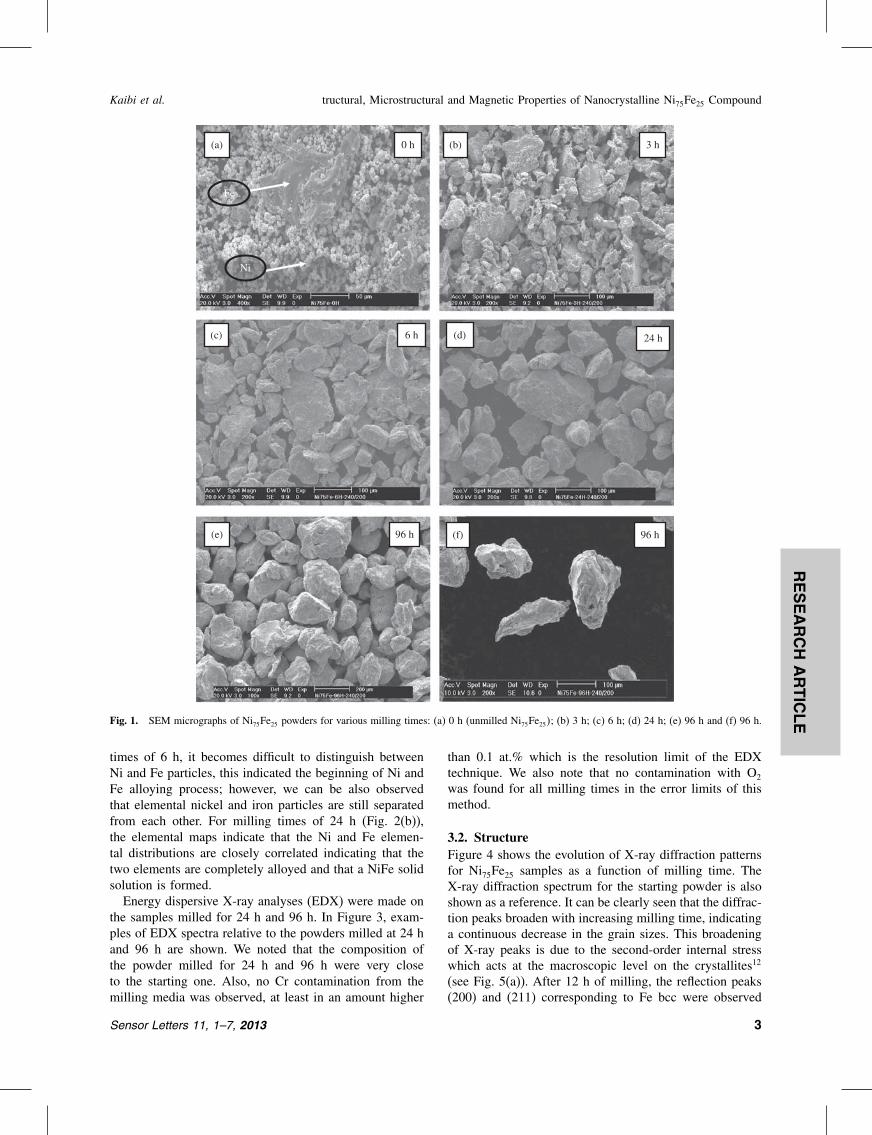
3. RESULTS AND DISCUSSION3.1. MicrostructureThe powder morphology was studied by SEM. Figure 1shows the morphological evolution of Ni75Fe25 alloy as afunction of milling time (0 h, 3 h, 6 h, 24 h and 96 h). Itcan be seen that different morphologies are present duringthe mechanical alloying stages. For the starting materialit is clearly evidenced that there are iron particles (thelarger ones) and nickel particles (the smaller ones). As aresult of intensive fracture and cold welding, as shown inFigure 1(b), composites particles are formed after 3 h ofmilling. Some of these particles have a layered alternativestructure formed of superposed Ni and Fe layers, e.g., for3 h of milling (Fig. 1(b)) typical of materials prepared bymechanical alloying for ductile or brittle elements, as indi-cated by Davis et al.11 and Otmani et al.12 This layeredstructure is gradually destroyed with prolonged millingtime. With increasing milling time, it can be seen that thereis a stage where the formation of platelet–shaped particlesis favored, e.g., for 6 h of milling (see Fig. 1(c)) and for the24 h milled sample only one kind of particles, correspond-ing to the Ni75Fe25 compound are present in this stagewhere round-shaped particles dominate, (see Fig. 1(d)). Byincreased milling times, the mechanical alloying progressand the refinement of particles size continues and for thelongest milling time (96 h, see Figs. 1(e) and (f)), powderparticles becomes with small diameters and are relativelyhomogenous in size.Elemental mapping by EDX coupled to the SEM was
carried out on the mechanically alloyed powders. Figure 2.shows the maps of Ni and Fe distribution for the selectedareas of some samples. Figure 2(a) shows that for milling
2 Sensor Letters 11, 1–7, 2013
RESEARCH
ARTIC
LE
Kaibi et al. tructural, Microstructural and Magnetic Properties of Nanocrystalline Ni75Fe25 Compound
0 h(a) (b) 3 h
6 h(c)
Fe
Ni
96 h(e) 96 h(f)
24 h(d)
Fig. 1. SEM micrographs of Ni75Fe25 powders for various milling times: (a) 0 h (unmilled Ni75Fe25�; (b) 3 h; (c) 6 h; (d) 24 h; (e) 96 h and (f) 96 h.
times of 6 h, it becomes difficult to distinguish betweenNi and Fe particles, this indicated the beginning of Ni andFe alloying process; however, we can be also observedthat elemental nickel and iron particles are still separatedfrom each other. For milling times of 24 h (Fig. 2(b)),the elemental maps indicate that the Ni and Fe elemen-tal distributions are closely correlated indicating that thetwo elements are completely alloyed and that a NiFe solidsolution is formed.Energy dispersive X-ray analyses (EDX) were made on
the samples milled for 24 h and 96 h. In Figure 3, exam-ples of EDX spectra relative to the powders milled at 24 hand 96 h are shown. We noted that the composition ofthe powder milled for 24 h and 96 h were very closeto the starting one. Also, no Cr contamination from themilling media was observed, at least in an amount higher
than 0.1 at.% which is the resolution limit of the EDXtechnique. We also note that no contamination with O2
was found for all milling times in the error limits of thismethod.
3.2. StructureFigure 4 shows the evolution of X-ray diffraction patternsfor Ni75Fe25 samples as a function of milling time. TheX-ray diffraction spectrum for the starting powder is alsoshown as a reference. It can be clearly seen that the diffrac-tion peaks broaden with increasing milling time, indicatinga continuous decrease in the grain sizes. This broadeningof X-ray peaks is due to the second-order internal stresswhich acts at the macroscopic level on the crystallites12
(see Fig. 5(a)). After 12 h of milling, the reflection peaks(200) and (211) corresponding to Fe bcc were observed
Sensor Letters 11, 1–7, 2013 3

RESEARCH
ARTIC
LE
tructural, Microstructural and Magnetic Properties of Nanocrystalline Ni75Fe25 Compound Kaibi et al.
6 h(a)
Fe
6 h(a)
Ni
24 h(b)
Fe
24 h(b)
Ni
Fig. 2. Maps of Ni and Fe distributions for different milling times: (a) 6 h and (b) 24 h.
to disappear and the Ni peaks slightly shift toward slowerangles. This proves that Fe atoms dissolve in the Ni lat-tice leading to the formation of fcc Ni(Fe) solid solution.The slightly angular shift is attributed to the formation
Fig. 3. Energy dispersive X-ray analyses (EDX) spectra of samplesmilled for 24 h and 96 h.
of the new fcc phase and also to the first-order internalstress induced by milling.12 However, in order to confirmwhether the NiFe solid solution is completely formed at12 h of milling, we performed a deconvolution of the mostintense peak by using the High Score Plus software14 (seeFig. 5(b)). By comparing the peaks position to the JCPSfiles included in the Database of the software, we evi-denced the presence of two peaks. The first one is charac-teristic of fcc NiFe (taenite) and the second one is relatedto bcc Fe. Hence, we conclude that the solid Ni(Fe) solu-tion is not yet completely formed after 12 h of milling.
40 50 60 70 80 90 100 110
96 h
84 h
24 h
12 h
6 h
3 h
0 hFeFe NiNiFeNiNi, Fe
2 theta (°)
Inte
nsity
(a.
u)
γ−Ni3Fe
Fig. 4. X-ray diffraction spectra of mechanically alloyed Ni75Fe25 forvarious milling times.
4 Sensor Letters 11, 1–7, 2013

RESEARCH
ARTIC
LE
Kaibi et al. tructural, Microstructural and Magnetic Properties of Nanocrystalline Ni75Fe25 Compound
41 42 43 44 45 46 47
96 h
84 h
24 h
12 h
6 h
3 h
0 hNi, Fe
2 theta(°)
Inte
nsity
(a.
u)
γ−Ni3Fe(a)
Fig. 5. (a) Superposition of the most intense X-ray diffraction peakfor different milling times, (b) Deconvolution of the most intense X-raydiffraction peak of the sample milled for 12 h.
Moreover, we also performed a deconvolution of the spec-trum of the sample milled for 24 h (not shown here)and we remark that only the fcc NiFe (taenite) phase ispresent. Hence, we conclude that the fcc NiFe is com-pletely formed after 24 h of milling time.Figure 6 shows the change of lattice parameter (a) ver-
sus milling time for Ni75Fe25 samples. The lattice param-eter was calculated using all the diffraction lines of Nibefore the formation of Ni(Fe) solid solution and all thefcc Ni(Fe) ones after its formation (i.e., after 24 h ofmilling). The lattice parameter (a) increased slightly withmilling time, from 0.35167± 0.00014 nm for pure Ni to0.35599± 0.00014 nm after 24 h of milling. Then (a)decreased to 0.35565±0.00014 nm after 96 h of milling.The increase of lattice parameter with milling time may bedue to the disordering of the alloys and also to the forma-tion of the solid solution.15 For the longest milling time,the lattice parameter value is slightly higher than the valueof 0.35453 nm reported for the bulk Ni3Fe alloy.16
Figure 7 shows the evolution of the average crystallitesize, �D�� and the mean level of microdistorsions, ���, as afunction of milling time. It is clear that the crystallite size
0 20 40 60 80 1000.351
0.352
0.353
0.354
0.355
0.356
0.357
Milling time h
a (n
m)
Fig. 6. Lattice parameter, a (nm), versus milling time for Ni75Fe25samples.
0 20 40 60 80 1000
20
40
60
80
<D>
<D
> (
nm)
Milling time (h)
0.0
0.1
0.2
0.3
0.4
0.5
0.6
0.7
0.8<ε>
<ε>
(%
)
Fig. 7. Average crystallite sizes �D� (nm) and mean internal strain ���(%) of Ni75Fe25 versus milling time.
monotonously decreases with increasing milling time. Thereduction of �D� is accompanied by an increase of ���.The average crystallite size decreases from 65±2 nm forthe unmilled powder (0 h, corresponding to the Ni pow-der) to 14±2 nm for a milling time of 96 h and the meanlevel of microdistorsions increases from 0.162±0.05% to0.723±0.05% for a milling time of 96 h. The final grainsize value achieved in our work is comparable to thatobtained by Chicinas et al.10 (12 nm) after 52 h of millingand Popa et al.17 (18 nm) after 28 h.
3.3. Magnetic StudiesExamples of hysteresis curves (magnetization vs. appliedfield H ) are shown in Figure 8 for samples milled at 6 and96 h. From these curves, we have deduced the saturationmagnetization Ms and the coercive field Hc.Figure 9 presents the evolution of Ms versus milling
time. It is observed that the magnetization increasesmonotonically with increasing milling time. The simi-lar behaviour of Ms has been already reported by manyauthors.2�18�19 This increase of Ms can be attributed to
Sensor Letters 11, 1–7, 2013 5

RESEARCH
ARTIC
LE
tructural, Microstructural and Magnetic Properties of Nanocrystalline Ni75Fe25 Compound Kaibi et al.
–6000 –4000 –2000 0 2000 4000 6000
–200
–150
–100
–50
0
50
100
150
200M
(uem
/g)
H(Oe)
6 h96 h
Fig. 8. Hysteresis curves (magnetization vs. applied field H ) for sam-ples milled at 6 and 96 h for Ni75Fe25 samples.
0 20 40 60 80 100
80
100
120
140
160
180
200
Sat
urat
ion
Mag
netiz
atio
n, M
s, (
emu/
g)
Milling time (h)
Fig. 9. Saturation magnetization of Ni75Fe25 powders versus millingtimes.
the completion of alloying and the reduction in magne-tocrystalline anisotropy due to the grain refinement, whichleads to an easier rotation of the domain walls.20 Indeed,the grain refinement diminishes the magneto-crystallineanisotropy due to averaging over randomly oriented nano-sized grains. At low grain sizes, each grain may be treatedas a single magnetic domain eliminating the influence frommagnetic domain walls.21
In Figure 10 we present the evolution of the coercivefield, Hc, as function of milling time t. we can distinguishtwo regions in the Hc versus t curve. Between 0 and 3 h,the coercive field increases and reaches a maximum 41Oe at 3 h. It is believed to be due to the grain refinementand the introduction of microstrain into the material.22 Inthe early stages, the grain size exceeds the domain wallthickness such that the grain boundaries can act as imped-iments to the motion of the domain walls.18 For millingtimes larger than 3 h, the coercive field sharply decreasesand reaches a value of 5 Oe after 96 h of milling. Sincethe grain size decreases with milling time, the decrease of
0 20 40 60 80 100
0
5
10
15
20
25
30
35
40
45
Coe
rciv
e fie
ld, H
c, (
Oe)
Milling time (h)
Fig. 10. Hc Coercive field of Ni75Fe25 powders versus milling times.
Hc is attributed to the grain size reduction effect whichovercomes the effect of microstrains in this milling timerange.4 Also, as pointed out before, the decrease in themagneto-crystalline anisotropy due to the grain refinementleads to an easier rotation of the magnetization and henceto a decrease in Hc. After 96 h of milling time, the mate-rial is characterized by a small grain size (about 14 nm)and by a soft magnetic behaviour (Hc about 5 Oe).
4. CONCLUSIONMechanical alloying of elemental Ni and Fe powders wassuccessfully used to elaborate nanostructured soft mag-netic Ni75Fe25 powders. From SEM study, we concludethat for the longest milling time the powder particlesbecomes with small diameters and are relatively homoge-nous in size. The analysis of X-ray diffraction spectra con-firms the complete formation of fcc NiFe (taenite) after24 h of milling. The grain size reduction to 14 nm causesan increase in the magnetization and a decrease in the coer-civity. Small grains (14 nm) and soft magnetic behaviourwere achieved after 96 h milling time.
References and Notes1. Z. W. Lin and J. G. Zhu, J. Magn. Magn. Mater. 299, 29 (2006).2. H. Shokrollahi, J. Mater. Design 30, 3374 (2009).3. B. V. Neamtu, I. Chicinas, O. Isnard, F. Popa, and V. Popa, Inter-
metallics 19, 19 (2011).4. R. Hamzaoui, O. Elkedim, N. Fenineche, E. Gaffet, and J. Craven,
J. Mater. Sci. Eng. 360, 299 (2003).5. R. Koohkan, S. Sharafi, H. Shokrollahi, and K. Janghorban, J. Magn.
Magn. Mater. 320, 1089 (2008).6. C. C. Koch, J. Nanostr. Mater. 9, 13 (1997).7. A. Guittom, A. Layadi, A. Bourzami, et al., J. Magn. Magn. Mater.
320, 1385 (2008).8. A. Guittoum, A. Layadi, A. Bourzami et al., J. Philosophical Mag-
azine 88, 1085 (2008).9. H. N. Frase, R. D. Shull, and L.-B. Hong, et al., J. Nanostr. Mater.
11, 987 (1999).
6 Sensor Letters 11, 1–7, 2013

RESEARCH
ARTIC
LE
Kaibi et al. tructural, Microstructural and Magnetic Properties of Nanocrystalline Ni75Fe25 Compound
10. I. Chicinas, V. Pop, and O. Isnard, J. Magn. Magn. Mater. 242–245,885 (2002).
11. V. Pop, O. Isnard, and I. Chicinas, J. Alloys Compds. 361, 144(2003).
12. I. Chicinas, V. Pop, O. Isnard, J. M. Le Breton, and J. Juraszek,Alloys Compd. 352, 34 (2003).
13. C. N. Chinnasamy, A. Narayanasamy, N. Ponpandian,K. Chattopadhyay, and M. Saravanakumar, Mater. Sci. Eng.304–306, 408 (2001).
14. High ScorePlus Software, PANalytical (2004).15. C. Suryanarayana, J. Prog. Mater. Sci. 46, 1 (2001).16. JCPDS Card No. 38 0419.
17. F. Popa, Elaboration and Study of Soft Magnetic Powders (NiFe,NiFe-X, NiFe-X-Y). at Nanocrystalline State Elaborated by HighEnergy Ball Alloying, Ph.D. Thesis, Université de Grenoble, France(2008), pp. 93–94.
18. M. D. Chermahini and H. Shokrollahi, J. Alloys Compds. 480, 161(2009).
19. E. Jartych, J. K. Zurawicz, D. Oleszak, and M. Pekala, Magn. Magn.Mater. 208, 221 (2000).
20. H. R. M. Hosseini and A. Bahrami,Mater. Sci. Eng. B 123, 74 (2005).21. H. Shokrollahi and K. Janghorban, J. Magn. Magn. Mater. 317, 61
(2007).22. C. Kuhrt and L. Schultz, J. Appl. Phys. 73, 6588 (1993).
Sensor Letters 11, 1–7, 2013 7