
Ab initio description of heterostructural alloys: Thermodynamic and structural properties of...
15
arXiv:1003.3614v2 [cond-mat.mtrl-sci] 17 Jun 2010 Ab-initio description of heterostructural alloys: Thermodynamic and structural properties of Mg x Zn 1−x O and Cd x Zn 1−x O A. Schleife, M. Eisenacher, C. R¨ odl, F. Fuchs, J. Furthm¨ uller, and F. Bechstedt Institut f¨ ur Festk¨ orpertheorie und -optik, Friedrich-Schiller-Universit¨ at and European Theoretical Spectroscopy Facility (ETSF), Max-Wien-Platz 1, 07743 Jena, Germany (Dated: June 18, 2010) Pseudobinary heterostructural alloys of ZnO with MgO or CdO are studied by composing the system lo- cally of clusters with varying ratio of cations. We investigate fourfold (wurtzite structure) and sixfold (rocksalt structure) coordination of the atoms. By means of density functional theory we study a total number of 256 16-atom clusters divided into 22 classes for the wurtzite structure and 16 classes for the rocksalt structure for each of the alloy systems. The fraction with which each cluster contributes to the alloy is determined for a given temperature T and composition x within (i) the generalized quasi-chemical approximation, (ii) the model of a strict-regular solution, and (iii) the model of microscopic decomposition. From the cluster fractions we derive conclusions about the miscibility and the critical compositions at which the average crystal structure changes. Thermodynamic properties such as the mixing free energy and the mixing entropy are investigated for the three different statistics. We discuss the consequences of the two different local lattice structures for characteristic atomic distances, cohesive energies, and the alloys’ elasticities. The differences in the properties of Mg x Zn 1−x O and Cd x Zn 1−x O are explained and discussed. PACS numbers: 61.66.Dk, 64.75.+g, 71.15.NC I. INTRODUCTION Recently, ZnO has attracted renewed attention as a closely lattice-matched substrate for GaN and also as a potentially useful active optoelectronic material in its own right 1–4 . When doped with Al it plays a role as a transparent conducting oxide in solar cells 5 , but also microelectronic and sensory devices may be fabricated involving oxides like ZnO 6,7 . Further, it is environmentally friendly, biocompatible, and tends to form nanostructures 8 . The tailoring of material properties is an important reason for combining ZnO with other group-II oxides in alloys and heterostructures. Mixed Mg x Zn 1−x O crystals allow to tune the energy gap from about 3.4 eV of wurtzite (wz) ZnO to- wards the ultraviolet spectral region with at least 4.4 eV in Mg x Zn 1−x O 9–11 . Conversely, pseudobinary Cd x Zn 1−x O al- loys tend to close the gap and are, therefore, suitable candi- dates for optoelectronic devices in the visible spectral range 12 . Moreover, quantum-well and other heterostructures based on the combinations Mg x Zn 1−x O/ZnO and ZnO/Cd x Zn 1−x O al- low an additional tailoring of electronic and optical properties by means of quantum-confinement effects 6,12,13 . The combination of these group-II oxides in alloys and het- erostructures raises several fundamental questions, since there is a crystal structure mismatch: While some binary II-VI com- pounds occur in the fourfold-coordinated wz structure (e.g. ZnO), others show the sixfold-coordinated rocksalt (rs) struc- ture (e.g. MgO, CdO) under ambient conditions 14,15 . Isova- lent and isostructural alloys of II-VI constituents are generally thermodynamically unstable, because their mixing enthalpy in either the rs structure or the wz structure is positive 16 .A thermodynamical miscibility only exists at very high temper- atures, i.e., where the mixing entropy is sufficiently large; at lower temperatures there is a tendency for a phase separation of the alloys 17 . However, isovalent but heterostructural II-VI alloys seem to be stable under certain conditions: X x Zn 1−x O alloy films occur in wz structure for x < 0.55 (X = Mg) 18–20 or x < 0.32 (X = Cd, grown under non-equilibrium condi- tions) 12,13 . Depending on the composition x the film prepa- ration may give rise to a non-uniformity of pseudobinary thin films as observed experimentally for Mg x Zn 1−x O 21 . With increasing molar fractions x (Mg or Cd content) a change of the coordination (fourfold to sixfold) of the atoms is ex- pected. Both hexagonal and cubic Mg x Zn 1−x O thin films are reported 22 . The situation in pseudobinary Cd x Zn 1−x O is less clear. The rs structure of CdO seems to limit the equilibrium solubility in wz-ZnO to molar fractions below x = 0.07 23,24 . On the other hand, metal-organic chemical va- por deposition (MOCVD) techniques produced alloys up to x = 0.7 13 . Molecular beam epitaxy (MBE) leads to epilayers with a structure close to the wz one without an indication for a phase separation up to a Cd concentration of x = 0.32 12 . Summarizing, there is no microscopic picture of how the heterostructural aspect influences the properties of isovalent pseudobinary alloys with oxygen as anion. Stability, sol- ubility, and tendency of decomposition of systems such as Mg x Zn 1−x O or Cd x Zn 1−x O are barely understood, so is their different behavior. One reason is that most of the existing theoretical studies are limited to ordered structures such as MgZnO 2 25,26 or somewhat more complex geometries 16 . On the other hand, the theoretical methods for the de- scription of the thermodynamic and structural properties of pseudobinary alloys of the type A x B 1−x C have been devel- oped over the last 20 years. A basic approach is to simu- late the configurational average by representing all possible occurring local bonding configurations using certain crystal geometries. There is one study 27 in which the chemically dis- ordered Mg x Zn 1−x O alloys have been simulated using spe- cial quasi-random structures 28 . In another approach 29,30 the mixing free energy of a random alloy is described combining a cluster-expansion method 31–33 with the generalized quasi- chemical approximation (GQCA) 34 . In several publications
Transcript of Ab initio description of heterostructural alloys: Thermodynamic and structural properties of...

arX
iv:1
003.
3614
v2 [
cond
-mat
.mtr
l-sci
] 17
Jun
201
0
Ab-initio description of heterostructural alloys: Thermodynamic and structural properties ofMgxZn1−xO and CdxZn1−xO
A. Schleife, M. Eisenacher, C. Rodl, F. Fuchs, J. Furthmuller, and F. BechstedtInstitut fur Festkorpertheorie und -optik, Friedrich-Schiller-Universitat and EuropeanTheoretical Spectroscopy Facility (ETSF), Max-Wien-Platz 1, 07743 Jena, Germany
(Dated: June 18, 2010)
Pseudobinary heterostructural alloys of ZnO with MgO or CdOare studied by composing the system lo-cally of clusters with varying ratio of cations. We investigate fourfold (wurtzite structure) and sixfold (rocksaltstructure) coordination of the atoms. By means of density functional theory we study a total number of 25616-atom clusters divided into 22 classes for the wurtzite structure and 16 classes for the rocksalt structure foreach of the alloy systems. The fraction with which each cluster contributes to the alloy is determined for a giventemperatureT and compositionx within (i) the generalized quasi-chemical approximation,(ii) the model of astrict-regular solution, and (iii) the model of microscopic decomposition. From the cluster fractions we deriveconclusions about the miscibility and the critical compositions at which the average crystal structure changes.Thermodynamic properties such as the mixing free energy andthe mixing entropy are investigated for the threedifferent statistics. We discuss the consequences of the two different local lattice structures for characteristicatomic distances, cohesive energies, and the alloys’ elasticities. The differences in the properties of MgxZn1−xOand CdxZn1−xO are explained and discussed.
PACS numbers: 61.66.Dk, 64.75.+g, 71.15.NC
I. INTRODUCTION
Recently, ZnO has attracted renewed attention as a closelylattice-matched substrate for GaN and also as a potentiallyuseful active optoelectronic material in its own right1–4. Whendoped with Al it plays a role as a transparent conducting oxidein solar cells5, but also microelectronic and sensory devicesmay be fabricated involving oxides like ZnO6,7. Further, itis environmentally friendly, biocompatible, and tends to formnanostructures8.
The tailoring of material properties is an important reasonfor combining ZnO with other group-II oxides in alloys andheterostructures. Mixed MgxZn1−xO crystals allow to tunethe energy gap from about 3.4 eV of wurtzite (wz) ZnO to-wards the ultraviolet spectral region with at least 4.4 eV inMgxZn1−xO9–11. Conversely, pseudobinary CdxZn1−xO al-loys tend to close the gap and are, therefore, suitable candi-dates for optoelectronic devices in the visible spectral range12.Moreover, quantum-well and other heterostructures based onthe combinations MgxZn1−xO/ZnO and ZnO/CdxZn1−xO al-low an additional tailoring of electronic and optical propertiesby means of quantum-confinement effects6,12,13.
The combination of these group-II oxides in alloys and het-erostructures raises several fundamental questions, since thereis a crystal structure mismatch: While some binary II-VI com-pounds occur in the fourfold-coordinatedwz structure (e.g.ZnO), others show the sixfold-coordinated rocksalt (rs) struc-ture (e.g. MgO, CdO) under ambient conditions14,15. Isova-lent and isostructural alloys of II-VI constituents are generallythermodynamically unstable, because their mixing enthalpyin either thers structure or thewz structure is positive16. Athermodynamical miscibility only exists at very high temper-atures, i.e., where the mixing entropy is sufficiently large; atlower temperatures there is a tendency for a phase separationof the alloys17. However, isovalent but heterostructural II-VIalloys seem to be stable under certain conditions: XxZn1−xO
alloy films occur inwz structure forx < 0.55 (X = Mg)18–20
or x < 0.32 (X = Cd, grown under non-equilibrium condi-tions)12,13. Depending on the compositionx the film prepa-ration may give rise to a non-uniformity of pseudobinary thinfilms as observed experimentally for MgxZn1−xO21. Withincreasing molar fractionsx (Mg or Cd content) a changeof the coordination (fourfold to sixfold) of the atoms is ex-pected. Both hexagonal and cubic MgxZn1−xO thin filmsare reported22. The situation in pseudobinary CdxZn1−xOis less clear. Thers structure of CdO seems to limit theequilibrium solubility in wz-ZnO to molar fractions belowx= 0.0723,24. On the other hand, metal-organic chemical va-por deposition (MOCVD) techniques produced alloys up tox= 0.713. Molecular beam epitaxy (MBE) leads to epilayerswith a structure close to thewzone without an indication fora phase separation up to a Cd concentration ofx= 0.3212.
Summarizing, there is no microscopic picture of how theheterostructural aspect influences the properties of isovalentpseudobinary alloys with oxygen as anion. Stability, sol-ubility, and tendency of decomposition of systems such asMgxZn1−xO or CdxZn1−xO are barely understood, so is theirdifferent behavior. One reason is that most of the existingtheoretical studies are limited to ordered structures suchasMgZnO2
25,26or somewhat more complex geometries16.
On the other hand, the theoretical methods for the de-scription of the thermodynamic and structural properties ofpseudobinary alloys of the type AxB1−xC have been devel-oped over the last 20 years. A basic approach is to simu-late the configurational average by representing all possibleoccurring local bonding configurations using certain crystalgeometries. There is one study27 in which the chemically dis-ordered MgxZn1−xO alloys have been simulated using spe-cial quasi-random structures28. In another approach29,30 themixing free energy of a random alloy is described combininga cluster-expansion method31–33 with the generalized quasi-chemical approximation (GQCA)34. In several publications
2
about pseudobinary alloys with the first-row elements N or Oas anions27,30,35, this method has been applied together withan ab-initio description of total energies and atomic geome-tries. However, in all these studies the (local) crystal structurehas been fixed beingwz, zb, or rs. Only recently the isova-lent but heterostructural MgO-ZnO system has been studiedby combining thers with the wz crystal structure within acluster expansion16,36. Energetic stability has been found inthe sixfold-coordinated structure for Zn concentrations below67%, giving rise to spontaneously ordered alloys16. Withouta configurational average and studying only certain clusterswith fixed molar fractions36 no conclusions are possible fordifferent growth situations. Coherent potential approximationcalculations37 for various crystal phases allowed for the con-struction of a phase diagram with a phase transition fromwztors close tox= 0.33. However, the coherent potential approxi-mation, as a single-site theory, is expected to be more reliableclose to the binary end components, whereas for intermediatecompositionsx the single-site approximation is questionable.
In this paper we extend the generalized quasi-chemical ap-proach for one local crystal structure to alloys that consist oftwo binary compounds with two different equilibrium crystalstructures, i.e.,rs andwz. The results of the GQCA are com-pared to two other cluster statistics, that may be considered aslimiting cases of the GQCA with respect to the number of pos-sible atom arrangements. The theory is applied to heterostruc-tural MgxZn1−xO and CdxZn1−xO alloys. In Section II wepresent a cluster expansion for thers crystal structure alongwith the combined statistics that deals withwzandrs clusterssimultaneously. The computational approaches that are usedfor carrying out the actual calculations are explained in Sec-tion III. Results for the thermodynamic properties are givenin Section IV and for the structural and elastic properties inSection V. Finally, Section VI concludes the paper.
II. ALLOY STATISTICS AND THERMODYNAMICS
A. Cluster expansion for wurtzite and rocksalt structures
We study pseudobinary alloys AxB1−xC with N atomsof type C on the anion sublattice andN atoms of type Aor B on the cation sublattice. Within a cluster expansionmethod29–32,34 the macroscopic alloy is divided into an en-semble ofM clusters consisting of 2n atoms (n anions andncations) each. The total number of cations or anions is thengiven byN = nM.
From combinatorics it follows that, for a given crystal struc-ture, there are 2n different possibilities of arranging A- or B-type atoms on then cation sites of one cluster (the occupationof the anion sublattice is fixed). Due to the symmetry of thecrystal lattice, the clusters can be grouped inJ+ 1 differentclasses, withJ depending on the actual crystal structure. Eachclassj ( j = 0, . . . ,J) containsg j clusters of the same total en-ergyε j , with the degeneracy factorsg j fulfilling the relation∑ j g j = 2n.
To each macroscopic alloy one can assign a cluster set{M0,M1, . . . ,MJ} which describes how many clusters of each
class occur in the alloy. A single classj contributes to themacroscopic alloy with its cluster fractionx j that is definedby x j = M j/M. Thex j fulfill the constraint
J
∑j=0
x j = 1, (1)
which stems directly from the relationM =∑ j M j for the clus-ter set. Then cation sites of each cluster are occupied withn jatoms of species A and(n− n j) atoms of species B. Sincethe molar fraction of A atoms for the entire alloy AxB1−xCis fixed byx, the cluster fractionsx j have to obey the secondconstraint
J
∑j=0
n jx j = nx. (2)
Using such a cluster expansion any macroscopic alloy can bebuilt from the microscopic clusters, each of which contributeswith its cluster fraction. Consequently, within this frame-work each propertyP of the macroscopic system can be tracedback to the respective propertiesPj of the clusters. Given theweightsx j(x,T) for an alloy of a certain compositionx at atemperatureT and the valuesPj of the property for each clus-ter, one can calculate the propertyP(x,T) for the alloy usingthe Connolly-Williams method30,38,
P(x,T) =J
∑j=0
x j(x,T)Pj . (3)
With this approach structural, elastic, and thermodynamicproperties, including lattice parameters and bulk moduli canbe accessed.
Both the MgxZn1−xO alloy and the CdxZn1−xO alloy con-sist of two monoxides, which show different equilibrium lat-tice structures: MgO and CdO crystallize in the cubicrsphase, while the equilibrium structure of ZnO is the hexag-onal wz phase under ambient conditions. In this work wefollow previous argumentations35,39 that it is sufficient to in-clude next-nearest-neighbor correlations to capture large partsof the physics involved in the problem. Consequently, we use16-atom cluster cells (i.e.,n = 8) and assume that possiblecorrelations between the different clusters are small.
While we rely on the cluster expansion for thewzstructurewhich is described in Ref. 35, we present a new one for alloyswith rs crystal structure in this work. The corresponding unitcells and the labeling of the cation positions for both types,wz and rs clusters, are illustrated in Fig. 1. In Table I wegive the numbern j of A cations, the degeneracy factorsg j ,and one representative of the symmetry-equivalent clusters foreach classj (characterized by the cation sites that are occupiedwith A atoms). The degeneracyg j for each class as well asthe total number of classesJ+ 1 do not only depend on thenumber of atoms in the clusters, but also on the actual pointgroup of the crystal. Forn= 8 we obtain 22 classes in thewzcase and 16 classes for thers structure (see Table I). Takinginto account the degeneraciesg j a total of 256 clusters percrystal structure are studied for each pseudobinary materialsystem.
3
(a)
1 2
34
5
678
(b)
1
2
3
5
4
76 8
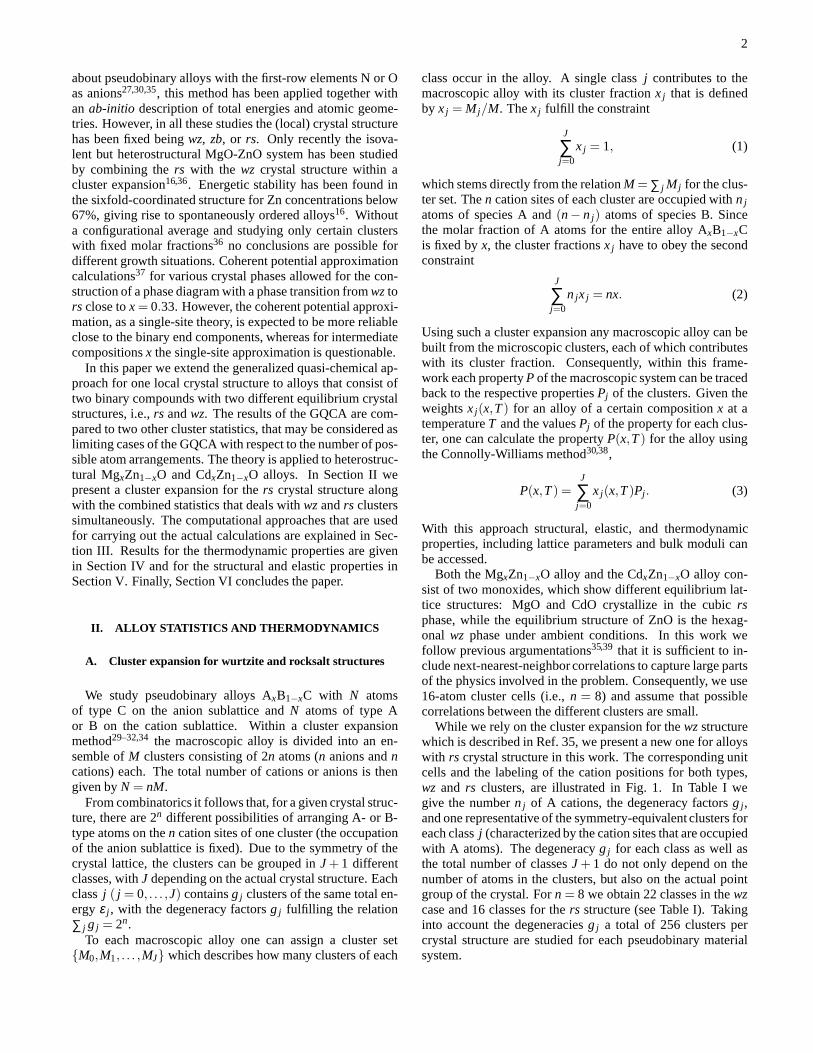
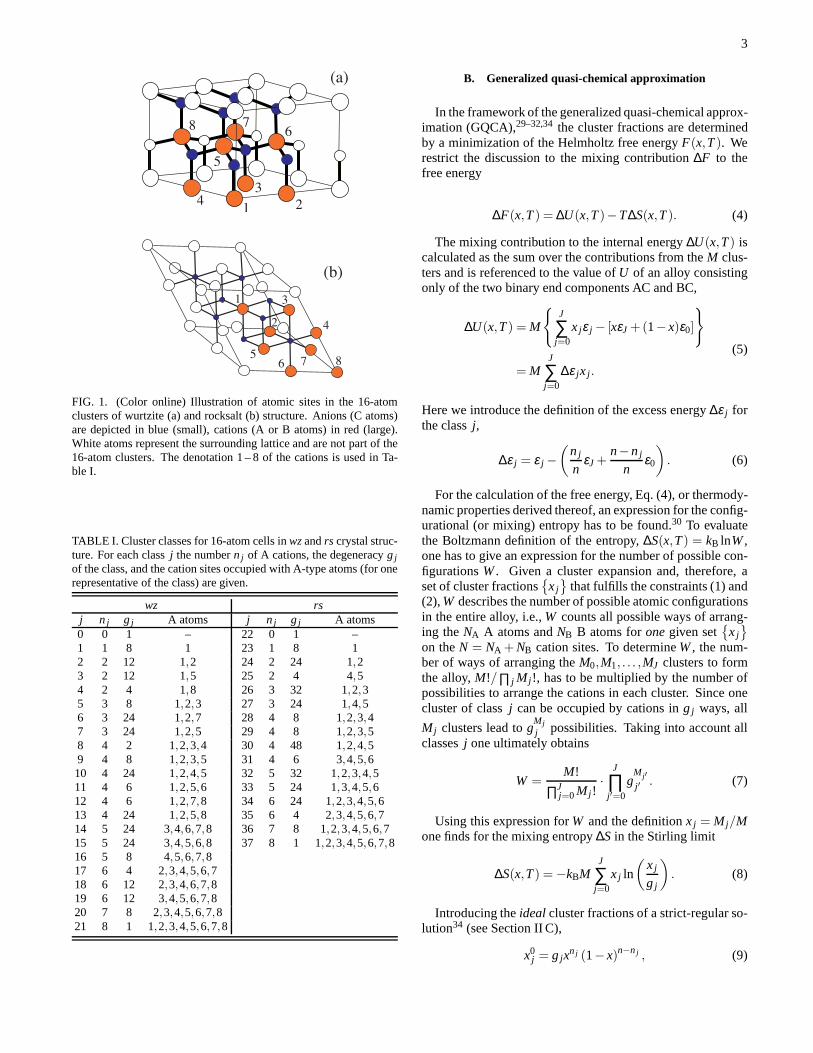
FIG. 1. (Color online) Illustration of atomic sites in the 16-atomclusters of wurtzite (a) and rocksalt (b) structure. Anions(C atoms)are depicted in blue (small), cations (A or B atoms) in red (large).White atoms represent the surrounding lattice and are not part of the16-atom clusters. The denotation 1 – 8 of the cations is used in Ta-ble I.
TABLE I. Cluster classes for 16-atom cells inwzandrs crystal struc-ture. For each classj the numbern j of A cations, the degeneracyg jof the class, and the cation sites occupied with A-type atoms(for onerepresentative of the class) are given.
wz rsj n j g j A atoms j n j g j A atoms0 0 1 – 22 0 1 –1 1 8 1 23 1 8 12 2 12 1,2 24 2 24 1,23 2 12 1,5 25 2 4 4,54 2 4 1,8 26 3 32 1,2,35 3 8 1,2,3 27 3 24 1,4,56 3 24 1,2,7 28 4 8 1,2,3,47 3 24 1,2,5 29 4 8 1,2,3,58 4 2 1,2,3,4 30 4 48 1,2,4,59 4 8 1,2,3,5 31 4 6 3,4,5,610 4 24 1,2,4,5 32 5 32 1,2,3,4,511 4 6 1,2,5,6 33 5 24 1,3,4,5,612 4 6 1,2,7,8 34 6 24 1,2,3,4,5,613 4 24 1,2,5,8 35 6 4 2,3,4,5,6,714 5 24 3,4,6,7,8 36 7 8 1,2,3,4,5,6,715 5 24 3,4,5,6,8 37 8 1 1,2,3,4,5,6,7,816 5 8 4,5,6,7,817 6 4 2,3,4,5,6,718 6 12 2,3,4,6,7,819 6 12 3,4,5,6,7,820 7 8 2,3,4,5,6,7,821 8 1 1,2,3,4,5,6,7,8
B. Generalized quasi-chemical approximation
In the framework of the generalized quasi-chemical approx-imation (GQCA),29–32,34the cluster fractions are determinedby a minimization of the Helmholtz free energyF(x,T). Werestrict the discussion to the mixing contribution∆F to thefree energy
∆F(x,T) = ∆U(x,T)−T∆S(x,T). (4)
The mixing contribution to the internal energy∆U(x,T) iscalculated as the sum over the contributions from theM clus-ters and is referenced to the value ofU of an alloy consistingonly of the two binary end components AC and BC,
∆U(x,T) = M
{
J
∑j=0
x jε j − [xεJ +(1− x)ε0]
}
= MJ
∑j=0
∆ε jx j .
(5)
Here we introduce the definition of the excess energy∆ε j forthe classj,
∆ε j = ε j −(
n j
nεJ +
n−n j
nε0
)
. (6)
For the calculation of the free energy, Eq. (4), or thermody-namic properties derived thereof, an expression for the config-urational (or mixing) entropy has to be found.30 To evaluatethe Boltzmann definition of the entropy,∆S(x,T) = kB lnW,one has to give an expression for the number of possible con-figurationsW. Given a cluster expansion and, therefore, aset of cluster fractions
{
x j}
that fulfills the constraints (1) and(2),W describes the number of possible atomic configurationsin the entire alloy, i.e.,W counts all possible ways of arrang-ing theNA A atoms andNB B atoms foronegiven set
{
x j}
on theN = NA +NB cation sites. To determineW, the num-ber of ways of arranging theM0,M1, . . . ,MJ clusters to formthe alloy,M!/∏ j M j !, has to be multiplied by the number ofpossibilities to arrange the cations in each cluster. Sinceonecluster of classj can be occupied by cations ing j ways, all
M j clusters lead togM jj possibilities. Taking into account all
classesj one ultimately obtains
W =M!
∏Jj=0M j !
·J
∏j ′=0
gM j′j ′ . (7)
Using this expression forW and the definitionx j = M j/Mone finds for the mixing entropy∆S in the Stirling limit
∆S(x,T) =−kBMJ
∑j=0
x j ln
(
x j
g j
)
. (8)
Introducing theidealcluster fractions of a strict-regular so-lution34 (see Section II C),
x0j = g jx
n j (1− x)n−n j , (9)
4
the mixing entropy can be rewritten into30,34
∆S(x,T) =−kB
{
N [xlnx+(1− x) ln(1− x)]
+MJ
∑j=0
x j ln(x j
x0j
)}
.(10)
Although the expressions forW according to Eq. (7) and theone derived in Ref. 30 differ, Eq. (10) shows that they bothlead to the same entropy in the Stirling limit.
Equations (5) and (8) fully determine the Helmholtz mix-ing free energy as a function ofx and T, given that thecluster fractionsx j are known forx and T. In the GQCAthe x j are determined by the requirement that∆F(x,T) as-sumes a minimum with respect to the cluster distribution, i.e.,∂∆F(x,T)/∂x j = 0. Hence, the Lagrange formalism with theconstraints (1) and (2) yields
xGQCAj (x,T) =
g jηn j e−β ∆ε j
∑Jj ′=0g j ′η
n j′ e−β ∆ε j′, (11)
whereasβ = 1/kBT. The parameterη has to be determinedfrom the condition that thexGQCA
j obey the constraint (2).
The cluster fractionsxGQCAj according to Eq. (11) describe
the probability for the occurrence of each cluster classj inan alloy which has been prepared under thermodynamic equi-librium conditions that minimize the free energy.
Since we study two cases, isostructural (wz or rs only) aswell as heterostructural (combinedwzandrs) alloys, we dis-tinguish three situations: (i)wz clusters only, (ii)rs clustersonly, or (iii) simultaneous occurrence ofwz and rs clusters.Depending on the clusters included in the calculation, thevalue forJ has to be set toJ = 21, 15, or 37 (see Table I) andthe minimization of∆F has to be performed for givenx andT accordingly, which leads, via Eq. (11), to the correspondingxGQCA
j for each case.
C. Strict-regular solution and microscopic decomposition limit
In the literature several techniques for the deposition ofMgxZn1−xO films are reported, e.g. pulsed laser deposition(PLD) with growth temperatures of 950. . .1050 K10, radiofrequency magnetron sputtering at 700 K40, and reactiveelectron beam evaporation (REBE) at a substrate tempera-ture of 550 K21. Similar techniques have been applied forCdxZn1−xO layers, however, at much lower substrate tem-peratures, e.g. MBE with a growth temperature as low as450 K12, (plasma-enhanced) MOCVD at a growth tempera-ture of 625 K13,24, or PLD at 700 K23. Subsequent repeatedtemper steps are reported in some cases. The films are typi-cally deposited onc-plane (0001) sapphire, but alsoa-planesapphire or more exotic substrates have been used. Therefore,the respective experimental situation suggests the studying ofcertain non-equilibrium preparation conditions, for which theactual cluster statistics may be modified by kinetic barriers,frozen high-temperature states, as well as interface or surface
influences. In order to simulate a dependence of the clusterdistribution on the preparation conditions we study two limit-ing cases:
(i) The strict-regular solution (SRS) model34. In this case,the ideal cluster fractionsx0
j according to Eq. (9) are usedwhich arise from a purely stochastic distribution of the clus-ters. Thesex0
j do neither depend on the temperature nor theclusters’ excess energies but are only determined byx andn j .The numberW is then simply given by all possible arrange-ments ofNA = xN A atoms andNB = (1−x)N B atoms on theN = NA +NB cation sites of the alloy, i.e.,
WSRS=N!
NA !NB!. (12)
In the Stirling limit the mixing entropy in this case reducesto
∆SSRS(x) =−kBN [xlnx+(1− x) ln(1− x)] . (13)
The idealx0j according to Eq. (9) and∆SSRS can be inter-
preted as the high-temperature limit of the GQCA, since forincreasing temperatures thexGQCA
j approach thex0j and, con-
sequently,∆S [cf. Eq. (8)] approaches∆SSRS.(ii) The microscopic decomposition model (MDM). In this
limiting case the cations of type A (B) are more likely to occurclose to cations of type A (B). Consequently, only the clustersrepresenting the two binary components AC and BC are al-lowed, withxM being the number of AC clusters and(1−x)Mthe number of BC clusters. This is equivalent to merely alinear interpolation between the binary end components and,therefore, the results are equal to predictions from Vegard’srule30,41. Furthermore, for positive excess energies∆ε j [cf.Eq. (6)] thexMDM
j represent the low-temperature limit of theGQCA. The cluster fractions for the MDM are given by
xMDMj =
1− x for j = 0x for j = J0 otherwise
. (14)
The number of atomic configurations follows immediatelyfrom Eq. (7) by taking into account only the two clusters withj = 0 and j = J, i.e.,
WMDM =M!
[xM]! [(1− x)M]!. (15)
Using thexMDMj we obtain for the mixing entropy
∆SMDM (x) =−kBM [xlnx+(1− x) ln(1− x)]
=1n
∆SSRS(x),(16)
i.e., a reduced configurational entropy. In the MDM the result-ing length scale of decomposition of the alloy into the binarycompounds is not well defined as usual in a thermodynamicapproach. The minimum length scale is given by the assumedcluster size itself. Whether clusters of the same type (AC orBC) build larger regions of pure AC and BC material on amesoscopic or macroscopic length scale depends on the clus-ter interaction (which is not taken into account). In general,

5
the MDM describes alloys that have been prepared under con-ditions where mixing does not lead to a gain of internal en-ergy. Indeed, in the MDM description one finds from Eq. (5)∆U(x) = 0 for the mixing contribution to the internal energy.
III. QUANTUM MECHANICAL CALCULATIONS OFCLUSTERS
A. Computational methods
The statistical methods introduced in Section II trace theproperties of an alloy of compositionx at temperatureT backto the corresponding properties of individual clusters usingEq. (3). Therefore, the respective calculations have to beperformed for each of the 22 (wz) and 16 (rs) clusters ofMgxZn1−xO and CdxZn1−xO.
Ground-state properties, such as the total energy of a clusteror its structural properties, are well described within densityfunctional theory (DFT)42,43 applying the supercell method,where a cluster is identified with the unit cell of an artificialcrystal. Explicit calculations are performed using the ViennaAb-initio Simulation Package (VASP)44. For the semi-localgeneralized-gradient approximation (GGA) to the exchangeand correlation (XC) potential in the Kohn-Sham equation43
we rely on the PW91 parametrization as suggested by Perdewand Wang45,46. Although such a semi-local treatment of XCcannot correctly describe excitation properties (such as QP en-ergies or excitonic effects47,48), it allows for a very good de-scription of lattice constants and cohesive energies. For theoxides studied in this work, the GGA tends to slightly un-derestimate binding energies and slightly overestimate latticeconstants15. However, these ground-state properties are notsystematically improved by a different treatment of XC, forinstance by adding an additional on-site Hubbard interactionU49 or a certain amount of Fock exchange50.
The electron-ion interaction is modeled within theprojector-augmented wave (PAW) method51,52. We treat theMg 2p and Mg 3s as well as the O 2s and O 2p electrons asvalence electrons. For Zn and Cd, the Zn 3d and Cd 4d stateshave to be included as valence states, respectively, togetherwith the Zn 4sand Cd 5selectrons. The electronic wave func-tions are expanded into plane waves up to a cutoff energy of450 eV and the Brillouin zone (BZ) is sampled by 2×2×2(wz) or 4×4×4 (rs) Monkhorst-Pack (MP)k points53. Wechecked that these parameters give results for the total ener-gies of the clusters that are converged within 0.08 %. This cor-responds to a very small level of inaccuracy, especially sincethe total energies of the different binary end components differby at least 10 % of their total energy.
In order to obtain the equilibrium values for the cell vol-umes, total energies, and bulk moduli we minimize the totalenergy for several cell volumes and fit the resulting volumedependence of the total energy to the Murnaghan equation ofstate54. For each cluster geometry, we compute fully relaxedatomic positions, i.e., optimized lattice constants and internalcell parameters, ensuring that the forces acting on the ionsarewell below 5 meV/A.
B. Results
To describe the geometry of the two different crystal struc-tures on the same footing we discuss the average cation-cation(second-nearest neighbor) distanced2. The results for thecluster energiesε j , the cation-cation distancesd2, j (averagedover all cation-cation distances of one cluster), thewz latticeparametersc j of the cluster cell andu j (averaged over allu’sof one cluster), the cell volumesVj , and the bulk moduliB0, jare listed in Table II for allwz cluster cells and Table III forall cluster classes of thers crystal structure.
The energies of the clustersε j in Tables II and III showan almost linear variation with the numbern j of Mg (Cd)atoms, decreasing (increasing) from pure ZnO to pure MgO(CdO). Small negative (positive) non-linear deviations appearfor Mgn j Zn8−n j O8 (Cdn j Zn8−n j O8) with absolute values of afew meV (tenths of an eV).
The cation-cation distancesd2, j show a weak decrease(strong increase) with the numbern j of Mg (Cd) atoms asexpected from the corresponding values for the binary endcomponents. While the nearest-neighbor distances or bondlengths (not listed in Tables II and III) of the ZnO-MgO sys-tem decrease only very slightly fromdZn-O ≈ 2.002/2.167Ato dMg-O ≈ 1.997/2.128 A for wz/rs, we find a completelydifferent situation for the ZnO-CdO system, where the bondlengths dCd-O ≈ 2.230/2.388 A are rather different fromdZn-O. For the bulk moduliB0, j we observe a decrease withincreasing numbern j of Mg or Cd atoms, independent of thecrystal structure. This trend follows the behavior of the co-valent radii of the cations that also show an anomalous trendof 1.36 A, 1.25 A, and 1.48A along the row Mg, Zn, andCd55. For our calculated lattice parameters, equilibrium vol-umes, and bond lengths we find very good agreement with asimilar study36. However, the deviations are remarkable forthe total energies and, consequently, lead to different resultsfor, e.g., the mixing free energy. We attribute these differ-ences to the use of the local-density approximation (LDA) toXC, and to the neglect of the Zn 3d and Cd 4d electrons asvalence electrons in Ref. 36.
IV. THERMODYNAMIC PROPERTIES
By including the temperature-dependentmixing entropy wealso obtain a temperature dependence of the cluster fractionsand, therefore, of the derived properties. In this work wediscuss the alloy properties at two selected temperatures,(i)room temperature (T = 300 K) where many measurementsare performed, and (ii) an exemplary growth temperature ofT = 1100 K.
A. Excess energies
The excess energy [cf. Eq. (6)]∆ε j represents the energyof formation of a certain Xn j Znn−n j On cluster in thewzor rsstructure with respect to ZnO and XO (X = Mg, Cd) in the re-spective crystal structure. They are fundamental quantities for
6
0 0.2 0.4 0.6 0.8 1Mg fraction nj/n
-0.015
-0.010
-0.005
0.000E
xces
s en
ergy
∆ε j (
eV/p
air)
(a)
0 0.2 0.4 0.6 0.8 1Mg fraction nj/n
0.00
0.05
0.10
0.15
0.20
0.25
0.30
Exc
ess
ener
gy ∆
ε j (eV
/pai
r)
(c)
0 0.2 0.4 0.6 0.8 1Cd fraction nj/n
0.00
0.05
0.10
0.15
0.20
Exc
ess
ener
gy ∆
ε j (eV
/pai
r)
(b)
0 0.2 0.4 0.6 0.8 1Cd fraction nj/n
0.0
0.1
0.2
0.3
0.4
Exc
ess
ener
gy ∆
ε j (eV
/pai
r)
(d)
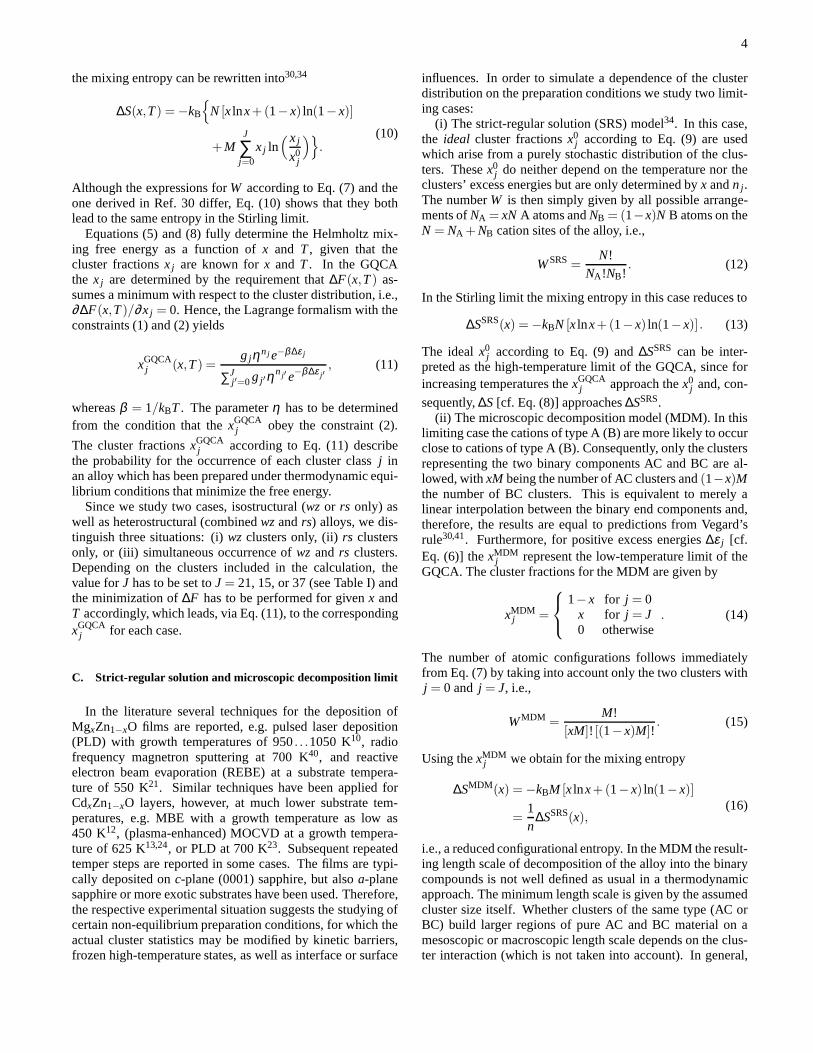
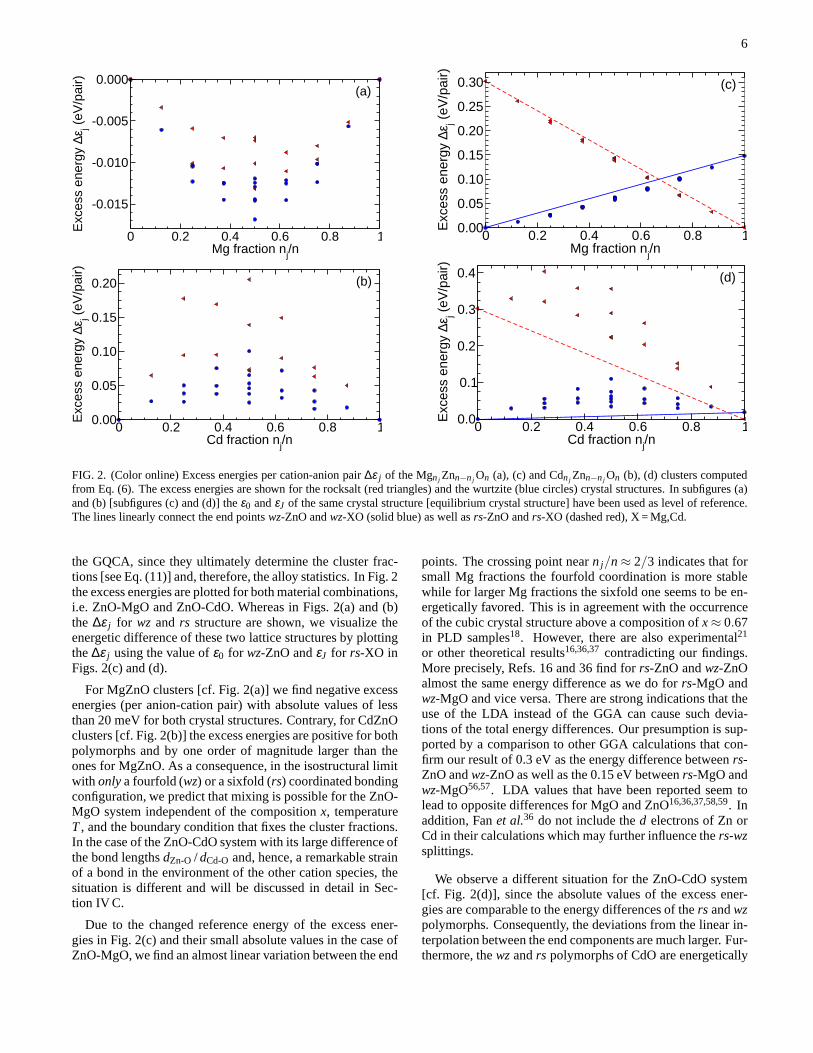
FIG. 2. (Color online) Excess energies per cation-anion pair ∆ε j of the Mgnj Znn−nj On (a), (c) and Cdnj Znn−nj On (b), (d) clusters computedfrom Eq. (6). The excess energies are shown for the rocksalt (red triangles) and the wurtzite (blue circles) crystal structures. In subfigures (a)and (b) [subfigures (c) and (d)] theε0 andεJ of the same crystal structure [equilibrium crystal structure] have been used as level of reference.The lines linearly connect the end pointswz-ZnO andwz-XO (solid blue) as well asrs-ZnO andrs-XO (dashed red), X = Mg,Cd.
the GQCA, since they ultimately determine the cluster frac-tions [see Eq. (11)] and, therefore, the alloy statistics. In Fig. 2the excess energies are plotted for both material combinations,i.e. ZnO-MgO and ZnO-CdO. Whereas in Figs. 2(a) and (b)the ∆ε j for wz and rs structure are shown, we visualize theenergetic difference of these two lattice structures by plottingthe∆ε j using the value ofε0 for wz-ZnO andεJ for rs-XO inFigs. 2(c) and (d).
For MgZnO clusters [cf. Fig. 2(a)] we find negative excessenergies (per anion-cation pair) with absolute values of lessthan 20 meV for both crystal structures. Contrary, for CdZnOclusters [cf. Fig. 2(b)] the excess energies are positive for bothpolymorphs and by one order of magnitude larger than theones for MgZnO. As a consequence, in the isostructural limitwith onlya fourfold (wz) or a sixfold (rs) coordinated bondingconfiguration, we predict that mixing is possible for the ZnO-MgO system independent of the compositionx, temperatureT, and the boundary condition that fixes the cluster fractions.In the case of the ZnO-CdO system with its large difference ofthe bond lengthsdZn-O / dCd-O and, hence, a remarkable strainof a bond in the environment of the other cation species, thesituation is different and will be discussed in detail in Sec-tion IV C.
Due to the changed reference energy of the excess ener-gies in Fig. 2(c) and their small absolute values in the case ofZnO-MgO, we find an almost linear variation between the end
points. The crossing point nearn j/n≈ 2/3 indicates that forsmall Mg fractions the fourfold coordination is more stablewhile for larger Mg fractions the sixfold one seems to be en-ergetically favored. This is in agreement with the occurrenceof the cubic crystal structure above a composition ofx≈ 0.67in PLD samples18. However, there are also experimental21
or other theoretical results16,36,37contradicting our findings.More precisely, Refs. 16 and 36 find forrs-ZnO andwz-ZnOalmost the same energy difference as we do forrs-MgO andwz-MgO and vice versa. There are strong indications that theuse of the LDA instead of the GGA can cause such devia-tions of the total energy differences. Our presumption is sup-ported by a comparison to other GGA calculations that con-firm our result of 0.3 eV as the energy difference betweenrs-ZnO andwz-ZnO as well as the 0.15 eV betweenrs-MgO andwz-MgO56,57. LDA values that have been reported seem tolead to opposite differences for MgO and ZnO16,36,37,58,59. Inaddition, Fanet al.36 do not include thed electrons of Zn orCd in their calculations which may further influence thers-wzsplittings.
We observe a different situation for the ZnO-CdO system[cf. Fig. 2(d)], since the absolute values of the excess ener-gies are comparable to the energy differences of thers andwzpolymorphs. Consequently, the deviations from the linear in-terpolation between the end components are much larger. Fur-thermore, thewzandrs polymorphs of CdO are energetically
7
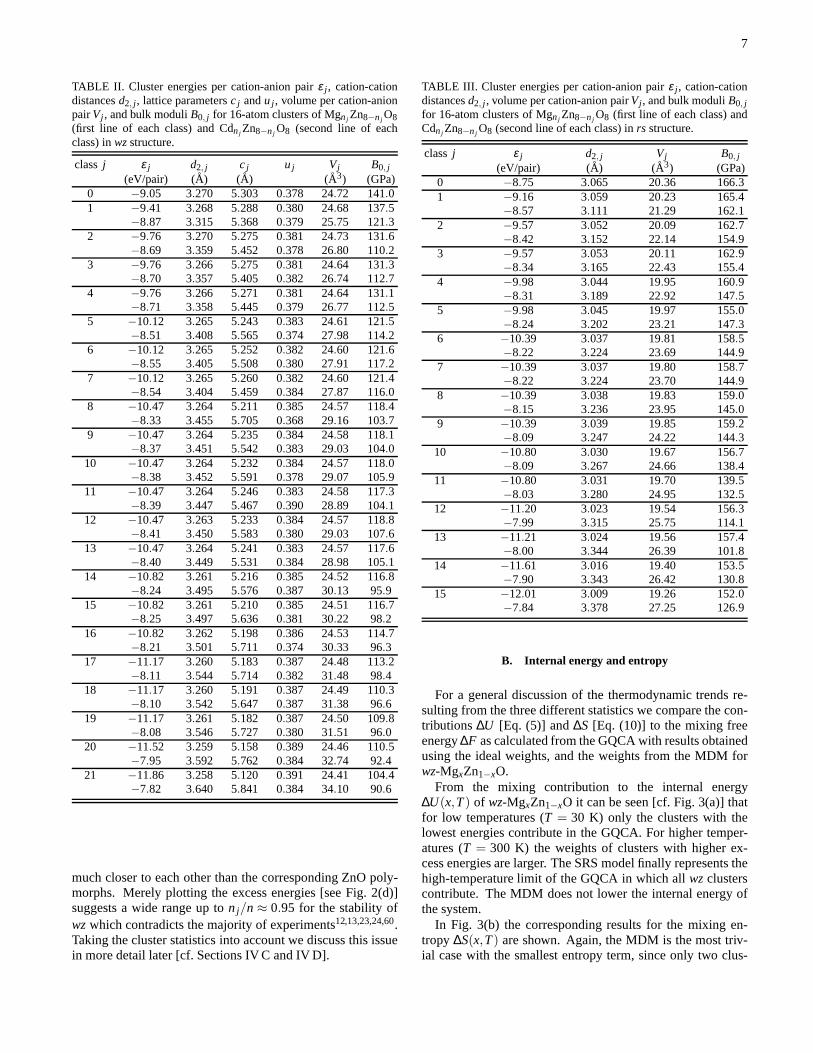
TABLE II. Cluster energies per cation-anion pairε j , cation-cationdistancesd2, j , lattice parametersc j andu j , volume per cation-anionpairVj , and bulk moduliB0, j for 16-atom clusters of Mgnj Zn8−nj O8(first line of each class) and Cdnj Zn8−nj O8 (second line of eachclass) inwzstructure.
classj ε j d2, j c j u j Vj B0, j(eV/pair) (A) (A) (A3) (GPa)
0 −9.05 3.270 5.303 0.378 24.72 141.01 −9.41 3.268 5.288 0.380 24.68 137.5
−8.87 3.315 5.368 0.379 25.75 121.32 −9.76 3.270 5.275 0.381 24.73 131.6
−8.69 3.359 5.452 0.378 26.80 110.23 −9.76 3.266 5.275 0.381 24.64 131.3
−8.70 3.357 5.405 0.382 26.74 112.74 −9.76 3.266 5.271 0.381 24.64 131.1
−8.71 3.358 5.445 0.379 26.77 112.55 −10.12 3.265 5.243 0.383 24.61 121.5
−8.51 3.408 5.565 0.374 27.98 114.26 −10.12 3.265 5.252 0.382 24.60 121.6
−8.55 3.405 5.508 0.380 27.91 117.27 −10.12 3.265 5.260 0.382 24.60 121.4
−8.54 3.404 5.459 0.384 27.87 116.08 −10.47 3.264 5.211 0.385 24.57 118.4
−8.33 3.455 5.705 0.368 29.16 103.79 −10.47 3.264 5.235 0.384 24.58 118.1
−8.37 3.451 5.542 0.383 29.03 104.010 −10.47 3.264 5.232 0.384 24.57 118.0
−8.38 3.452 5.591 0.378 29.07 105.911 −10.47 3.264 5.246 0.383 24.58 117.3
−8.39 3.447 5.467 0.390 28.89 104.112 −10.47 3.263 5.233 0.384 24.57 118.8
−8.41 3.450 5.583 0.380 29.03 107.613 −10.47 3.264 5.241 0.383 24.57 117.6
−8.40 3.449 5.531 0.384 28.98 105.114 −10.82 3.261 5.216 0.385 24.52 116.8
−8.24 3.495 5.576 0.387 30.13 95.915 −10.82 3.261 5.210 0.385 24.51 116.7
−8.25 3.497 5.636 0.381 30.22 98.216 −10.82 3.262 5.198 0.386 24.53 114.7
−8.21 3.501 5.711 0.374 30.33 96.317 −11.17 3.260 5.183 0.387 24.48 113.2
−8.11 3.544 5.714 0.382 31.48 98.418 −11.17 3.260 5.191 0.387 24.49 110.3
−8.10 3.542 5.647 0.387 31.38 96.619 −11.17 3.261 5.182 0.387 24.50 109.8
−8.08 3.546 5.727 0.380 31.51 96.020 −11.52 3.259 5.158 0.389 24.46 110.5
−7.95 3.592 5.762 0.384 32.74 92.421 −11.86 3.258 5.120 0.391 24.41 104.4
−7.82 3.640 5.841 0.384 34.10 90.6
much closer to each other than the corresponding ZnO poly-morphs. Merely plotting the excess energies [see Fig. 2(d)]suggests a wide range up ton j/n ≈ 0.95 for the stability ofwzwhich contradicts the majority of experiments12,13,23,24,60.Taking the cluster statistics into account we discuss this issuein more detail later [cf. Sections IV C and IV D].
TABLE III. Cluster energies per cation-anion pairε j , cation-cationdistancesd2, j , volume per cation-anion pairVj , and bulk moduliB0, jfor 16-atom clusters of Mgnj Zn8−nj O8 (first line of each class) andCdnj Zn8−nj O8 (second line of each class) inrs structure.
classj ε j d2, j Vj B0, j(eV/pair) (A) (A3) (GPa)
0 −8.75 3.065 20.36 166.31 −9.16 3.059 20.23 165.4
−8.57 3.111 21.29 162.12 −9.57 3.052 20.09 162.7
−8.42 3.152 22.14 154.93 −9.57 3.053 20.11 162.9
−8.34 3.165 22.43 155.44 −9.98 3.044 19.95 160.9
−8.31 3.189 22.92 147.55 −9.98 3.045 19.97 155.0
−8.24 3.202 23.21 147.36 −10.39 3.037 19.81 158.5
−8.22 3.224 23.69 144.97 −10.39 3.037 19.80 158.7
−8.22 3.224 23.70 144.98 −10.39 3.038 19.83 159.0
−8.15 3.236 23.95 145.09 −10.39 3.039 19.85 159.2
−8.09 3.247 24.22 144.310 −10.80 3.030 19.67 156.7
−8.09 3.267 24.66 138.411 −10.80 3.031 19.70 139.5
−8.03 3.280 24.95 132.512 −11.20 3.023 19.54 156.3
−7.99 3.315 25.75 114.113 −11.21 3.024 19.56 157.4
−8.00 3.344 26.39 101.814 −11.61 3.016 19.40 153.5
−7.90 3.343 26.42 130.815 −12.01 3.009 19.26 152.0
−7.84 3.378 27.25 126.9
B. Internal energy and entropy
For a general discussion of the thermodynamic trends re-sulting from the three different statistics we compare the con-tributions∆U [Eq. (5)] and∆S [Eq. (10)] to the mixing freeenergy∆F as calculated from the GQCA with results obtainedusing the ideal weights, and the weights from the MDM forwz-MgxZn1−xO.
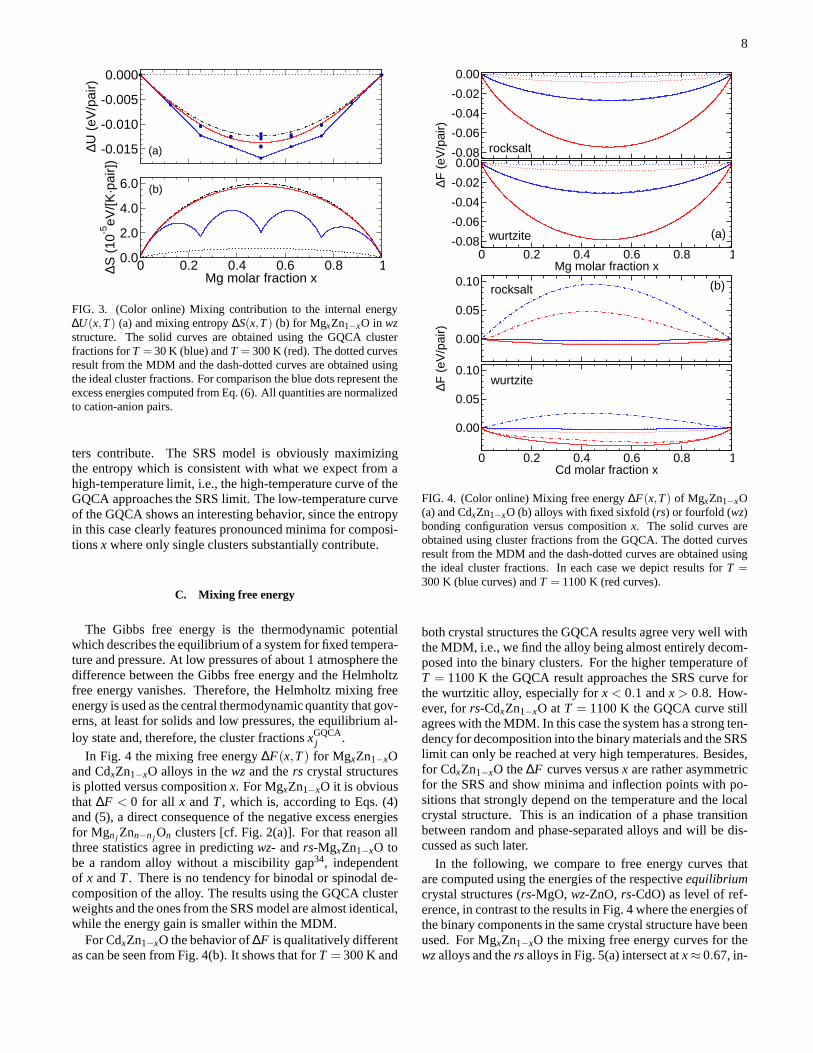
From the mixing contribution to the internal energy∆U(x,T) of wz-MgxZn1−xO it can be seen [cf. Fig. 3(a)] thatfor low temperatures (T = 30 K) only the clusters with thelowest energies contribute in the GQCA. For higher temper-atures (T = 300 K) the weights of clusters with higher ex-cess energies are larger. The SRS model finally represents thehigh-temperature limit of the GQCA in which allwzclusterscontribute. The MDM does not lower the internal energy ofthe system.
In Fig. 3(b) the corresponding results for the mixing en-tropy ∆S(x,T) are shown. Again, the MDM is the most triv-ial case with the smallest entropy term, since only two clus-
8
-0.015
-0.010
-0.005
0.000∆U
(eV
/pai
r)
0 0.2 0.4 0.6 0.8 1Mg molar fraction x
0.0
2.0
4.0
6.0
∆S (
10-5
eV/[K
·pai
r])
(a)
(b)
FIG. 3. (Color online) Mixing contribution to the internal energy∆U(x,T) (a) and mixing entropy∆S(x,T) (b) for MgxZn1−xO in wzstructure. The solid curves are obtained using the GQCA clusterfractions forT = 30 K (blue) andT = 300 K (red). The dotted curvesresult from the MDM and the dash-dotted curves are obtained usingthe ideal cluster fractions. For comparison the blue dots represent theexcess energies computed from Eq. (6). All quantities are normalizedto cation-anion pairs.
ters contribute. The SRS model is obviously maximizingthe entropy which is consistent with what we expect from ahigh-temperature limit, i.e., the high-temperature curveof theGQCA approaches the SRS limit. The low-temperature curveof the GQCA shows an interesting behavior, since the entropyin this case clearly features pronounced minima for composi-tionsx where only single clusters substantially contribute.
C. Mixing free energy
The Gibbs free energy is the thermodynamic potentialwhich describes the equilibrium of a system for fixed tempera-ture and pressure. At low pressures of about 1 atmosphere thedifference between the Gibbs free energy and the Helmholtzfree energy vanishes. Therefore, the Helmholtz mixing freeenergy is used as the central thermodynamic quantity that gov-erns, at least for solids and low pressures, the equilibriumal-loy state and, therefore, the cluster fractionsxGQCA
j .In Fig. 4 the mixing free energy∆F(x,T) for MgxZn1−xO
and CdxZn1−xO alloys in thewzand thers crystal structuresis plotted versus compositionx. For MgxZn1−xO it is obviousthat ∆F < 0 for all x andT, which is, according to Eqs. (4)and (5), a direct consequence of the negative excess energiesfor Mgn j Znn−n j On clusters [cf. Fig. 2(a)]. For that reason allthree statistics agree in predictingwz- andrs-MgxZn1−xO tobe a random alloy without a miscibility gap34, independentof x andT. There is no tendency for binodal or spinodal de-composition of the alloy. The results using the GQCA clusterweights and the ones from the SRS model are almost identical,while the energy gain is smaller within the MDM.
For CdxZn1−xO the behavior of∆F is qualitatively differentas can be seen from Fig. 4(b). It shows that forT = 300 K and
0 0.2 0.4 0.6 0.8 1Mg molar fraction x
-0.08
-0.06
-0.04
-0.02
0.00-0.08
-0.06
-0.04
-0.02
0.00
∆F (
eV/p
air)
(a)
rocksalt
wurtzite
0 0.2 0.4 0.6 0.8 1Cd molar fraction x
0.00
0.05
0.10
0.00
0.05
0.10
∆F (
eV/p
air)
(b)rocksalt
wurtzite
FIG. 4. (Color online) Mixing free energy∆F(x,T) of MgxZn1−xO(a) and CdxZn1−xO (b) alloys with fixed sixfold (rs) or fourfold (wz)bonding configuration versus compositionx. The solid curves areobtained using cluster fractions from the GQCA. The dotted curvesresult from the MDM and the dash-dotted curves are obtained usingthe ideal cluster fractions. In each case we depict results for T =300 K (blue curves) andT = 1100 K (red curves).
both crystal structures the GQCA results agree very well withthe MDM, i.e., we find the alloy being almost entirely decom-posed into the binary clusters. For the higher temperature ofT = 1100 K the GQCA result approaches the SRS curve forthe wurtzitic alloy, especially forx < 0.1 andx > 0.8. How-ever, forrs-CdxZn1−xO atT = 1100 K the GQCA curve stillagrees with the MDM. In this case the system has a strong ten-dency for decomposition into the binary materials and the SRSlimit can only be reached at very high temperatures. Besides,for CdxZn1−xO the∆F curves versusx are rather asymmetricfor the SRS and show minima and inflection points with po-sitions that strongly depend on the temperature and the localcrystal structure. This is an indication of a phase transitionbetween random and phase-separated alloys and will be dis-cussed as such later.
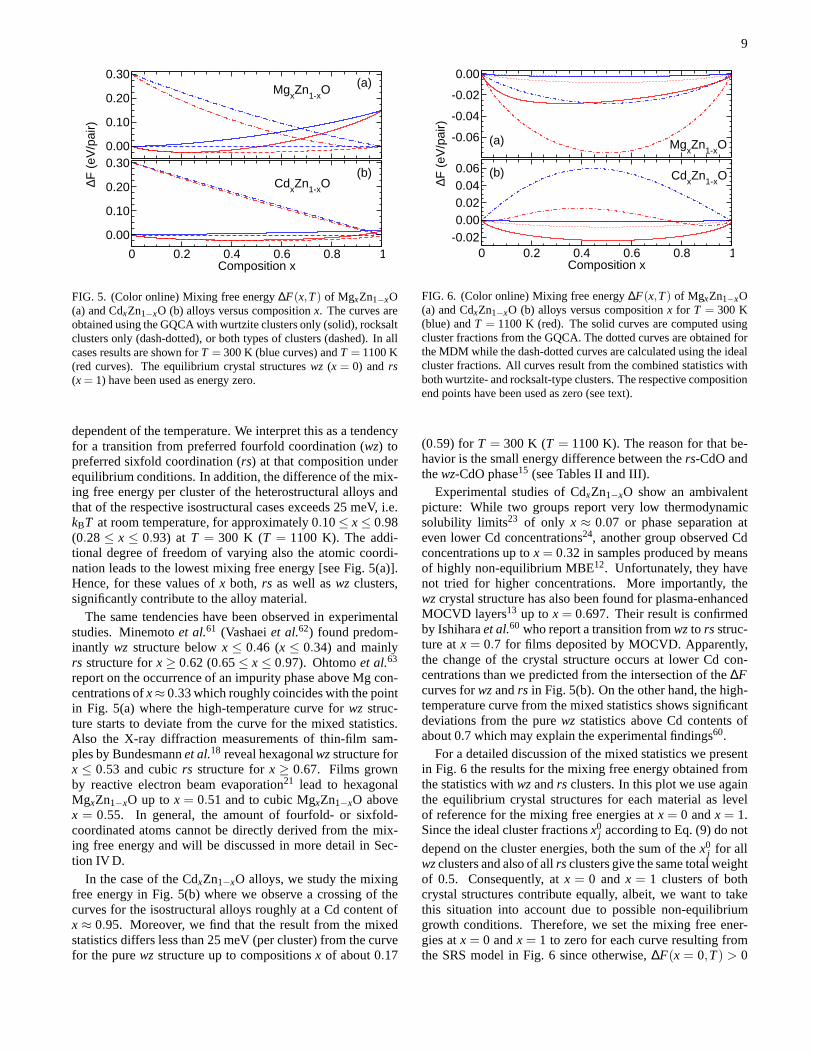
In the following, we compare to free energy curves thatare computed using the energies of the respectiveequilibriumcrystal structures (rs-MgO, wz-ZnO, rs-CdO) as level of ref-erence, in contrast to the results in Fig. 4 where the energies ofthe binary components in the same crystal structure have beenused. For MgxZn1−xO the mixing free energy curves for thewzalloys and thers alloys in Fig. 5(a) intersect atx≈ 0.67, in-
9
0 0.2 0.4 0.6 0.8 1Composition x
0.00
0.10
0.20
0.300.00
0.10
0.20
0.30∆F
(eV
/pai
r)(a)
(b)
MgxZn1-xO
CdxZn1-xO
FIG. 5. (Color online) Mixing free energy∆F(x,T) of MgxZn1−xO(a) and CdxZn1−xO (b) alloys versus compositionx. The curves areobtained using the GQCA with wurtzite clusters only (solid), rocksaltclusters only (dash-dotted), or both types of clusters (dashed). In allcases results are shown forT = 300 K (blue curves) andT = 1100 K(red curves). The equilibrium crystal structureswz (x = 0) andrs(x= 1) have been used as energy zero.
dependent of the temperature. We interpret this as a tendencyfor a transition from preferred fourfold coordination (wz) topreferred sixfold coordination (rs) at that composition underequilibrium conditions. In addition, the difference of themix-ing free energy per cluster of the heterostructural alloys andthat of the respective isostructural cases exceeds 25 meV, i.e.kBT at room temperature, for approximately 0.10≤ x≤ 0.98(0.28≤ x ≤ 0.93) at T = 300 K (T = 1100 K). The addi-tional degree of freedom of varying also the atomic coordi-nation leads to the lowest mixing free energy [see Fig. 5(a)].Hence, for these values ofx both, rs as well aswz clusters,significantly contribute to the alloy material.
The same tendencies have been observed in experimentalstudies. Minemotoet al.61 (Vashaeiet al.62) found predom-inantly wz structure belowx ≤ 0.46 (x ≤ 0.34) and mainlyrs structure forx ≥ 0.62 (0.65≤ x ≤ 0.97). Ohtomoet al.63
report on the occurrence of an impurity phase above Mg con-centrations ofx≈ 0.33 which roughly coincides with the pointin Fig. 5(a) where the high-temperature curve forwz struc-ture starts to deviate from the curve for the mixed statistics.Also the X-ray diffraction measurements of thin-film sam-ples by Bundesmannet al.18 reveal hexagonalwzstructure forx ≤ 0.53 and cubicrs structure forx ≥ 0.67. Films grownby reactive electron beam evaporation21 lead to hexagonalMgxZn1−xO up tox = 0.51 and to cubic MgxZn1−xO abovex = 0.55. In general, the amount of fourfold- or sixfold-coordinated atoms cannot be directly derived from the mix-ing free energy and will be discussed in more detail in Sec-tion IV D.
In the case of the CdxZn1−xO alloys, we study the mixingfree energy in Fig. 5(b) where we observe a crossing of thecurves for the isostructural alloys roughly at a Cd content ofx ≈ 0.95. Moreover, we find that the result from the mixedstatistics differs less than 25 meV (per cluster) from the curvefor the purewz structure up to compositionsx of about 0.17
0 0.2 0.4 0.6 0.8 1Composition x
-0.020.000.020.040.06
-0.06
-0.04
-0.02
0.00
∆F (
eV/p
air)
(b)
(a) MgxZn1-xO
CdxZn1-xO
FIG. 6. (Color online) Mixing free energy∆F(x,T) of MgxZn1−xO(a) and CdxZn1−xO (b) alloys versus compositionx for T = 300 K(blue) andT = 1100 K (red). The solid curves are computed usingcluster fractions from the GQCA. The dotted curves are obtained forthe MDM while the dash-dotted curves are calculated using the idealcluster fractions. All curves result from the combined statistics withboth wurtzite- and rocksalt-type clusters. The respectivecompositionend points have been used as zero (see text).
(0.59) for T = 300 K (T = 1100 K). The reason for that be-havior is the small energy difference between thers-CdO andthewz-CdO phase15 (see Tables II and III).
Experimental studies of CdxZn1−xO show an ambivalentpicture: While two groups report very low thermodynamicsolubility limits23 of only x ≈ 0.07 or phase separation ateven lower Cd concentrations24, another group observed Cdconcentrations up tox= 0.32 in samples produced by meansof highly non-equilibrium MBE12. Unfortunately, they havenot tried for higher concentrations. More importantly, thewzcrystal structure has also been found for plasma-enhancedMOCVD layers13 up tox = 0.697. Their result is confirmedby Ishiharaet al.60 who report a transition fromwzto rs struc-ture atx = 0.7 for films deposited by MOCVD. Apparently,the change of the crystal structure occurs at lower Cd con-centrations than we predicted from the intersection of the∆Fcurves forwzandrs in Fig. 5(b). On the other hand, the high-temperature curve from the mixed statistics shows significantdeviations from the purewz statistics above Cd contents ofabout 0.7 which may explain the experimental findings60.
For a detailed discussion of the mixed statistics we presentin Fig. 6 the results for the mixing free energy obtained fromthe statistics withwzandrs clusters. In this plot we use againthe equilibrium crystal structures for each material as levelof reference for the mixing free energies atx = 0 andx = 1.Since the ideal cluster fractionsx0
j according to Eq. (9) do not
depend on the cluster energies, both the sum of thex0j for all
wzclusters and also of allrs clusters give the same total weightof 0.5. Consequently, atx = 0 andx = 1 clusters of bothcrystal structures contribute equally, albeit, we want to takethis situation into account due to possible non-equilibriumgrowth conditions. Therefore, we set the mixing free ener-gies atx = 0 andx = 1 to zero for each curve resulting fromthe SRS model in Fig. 6 since otherwise,∆F(x = 0,T) > 0

10
0 0.2 0.4 0.6 0.8 1Composition x
0.000.200.400.600.801.000.000.200.400.600.801.00
Fra
ctio
n xw
z , xrs
(b)
(a)wurtzite
wurtzite
rocksalt
rocksalt
MgxZn1-xO
CdxZn1-xO
FIG. 7. (Color online) Crystal-structure fractionsxwz (dashed curves)andxrs (dash-dotted curves) of MgxZn1−xO (a) and CdxZn1−xO (b)alloys versus compositionx. We calculated the curves using thecluster fractions from the GQCA forT = 300 K (blue curves) andT = 1100 K (red curves). The solid green lines are obtained usingthe ideal cluster fractions. For comparison the black curves show theresult from the MDM for both crystal structures.
and∆F(x = 1,T) > 0 hold for temperaturesT > 0 K due tothe weights of the SRS model.
First of all, Fig. 6 points out that the GQCA and the MDMcoincide for both materials at low temperatures. Contrary,theSRS model and the GQCA result in a remarkable differenceindependent of the temperature. This is not surprising, sincethe SRS model neglects the large energetic differences be-tween the two crystal structures by merely assigning the idealweights to the clusters. While we find for MgxZn1−xO, whichshows negative excess energies, that the ideal cluster fractionsare energetically favored over the ones resulting from GQCAor the MDM [cf. Fig. 6(a)], the opposite is true for CdxZn1−xO[cf. Fig. 6(b)], where the excess energies are positive.
D. Phase transitions and phase diagram
For a better understanding of the structural composition ofthe alloys as a function ofx andT we calculate the contribu-tions ofwzandrs clusters to the mixed statistics results. Forthat purpose we define thewzcharacterxwz and thers charac-terxrs of the alloy as the sum over the corresponding weights,i.e.,
xwz=21
∑j=0
x j andxrs =37
∑j=22
x j , (17)
with xwz+ xrs = 1. For given compositionx, temperatureT, and statistical modelxwz (xrs) measures the relative con-tribution of clusters with fourfold (sixfold) atomic coordi-nation to the studied (non-decomposed) XxZn1−xO sample(X = Mg,Cd). The results forxwz andxrs as a function ofxandT are shown for both pseudobinary materials in Fig. 7.This figure clarifies how the dominating crystal structure inthe alloy depends on the thermodynamic conditions as well as
0 0.2 0.4 0.6 0.8 1Composition x
500
1000
1500
2000
Tem
pera
ture
T (
K)
FIG. 8. (Color online) Phase diagram computed for CdxZn1−xO us-ing the SRS model for the cluster statistics. We show binodal(black)and spinodal (blue) curves forwz clusters only (dashed curves),rsclusters only (dash-dotted curves), as well as for the mixedstatis-tics including both sixfold and fourfold atomic coordination (solidcurves).
the respective cluster statistics (GQCA, SRS, MDM). As dis-cussed before, the SRS model for the cluster fractions givesrise to equal contributions ofrs andwz clusters (see Fig. 7).We confirm our discussion of the results for the mixing freeenergy by finding the GQCA curves close to the MDM re-sults for both materials at room temperature. As expected,higher preparation temperatures tend to move the intersectionxwz= xrs to larger Mg or Cd molar fractionsx. More specif-ically, we find that point at aboutx = 0.5 (T = 300 K) andx = 0.6 (T = 1100 K) for MgxZn1−xO, while the tempera-ture dependence is more pronounced for CdxZn1−xO wherethe intersection forT = 1100 K occurs at aboutx ≈ 0.87.Consequently, the local crystal structure and bonding config-uration of the CdxZn1−xO alloy depends much more on theactual growing conditions which explains the ambivalent ex-perimental findings for that material system.12,13,23,24,60
As discussed before, the occurrence of two pronouncedminima as well as inflection points in the curve for the mixingfree energy of CdxZn1−xO obtained from the SRS model (cf.Fig. 6) is an indication for a possible phase separation.29 Dueto its negative excess energies [cf. Fig. 2(a)] the MgxZn1−xOalloy does not show such a behavior. To study the conse-quences we construct the common tangent line to the freeenergy curves obtained from the SRS model for CdxZn1−xOalloys at severalT. The resulting tangent pointsx1 = x1(T)andx2 = x2(T) describe the boundaries of the miscibility gapand their variation with the temperature defines the binodalline in the T - x phase diagram shown in Fig. 8. From themaximum of the resultingT - x curves we find the critical pa-rametersTcrit = 1030 K andxcrit = 0.34 for thewzstatistics aswell asTcrit = 1940 K andxcrit = 0.4 for the mixed statistics.For the purers statistics the critical temperature is larger than2500 K. Inside the miscibility gap the alloy consists of a mix-ture of Cdx1Zn1−x1O and Cdx2Zn1−x2O with the mixing freeenergy
∆Fmix(x,T) =x2− xx2− x1
∆F(x1,T)+x− x1
x2− x1∆F(x2,T), (18)
which is lower than∆F(x,T).
11
0 0.2 0.4 0.6 0.8 1Composition x
-7.0
-6.5
-6.0
-10
-9
-8
-7-E
coh (
eV/p
air)
(b)
(a)MgxZn1-xO
CdxZn1-xO
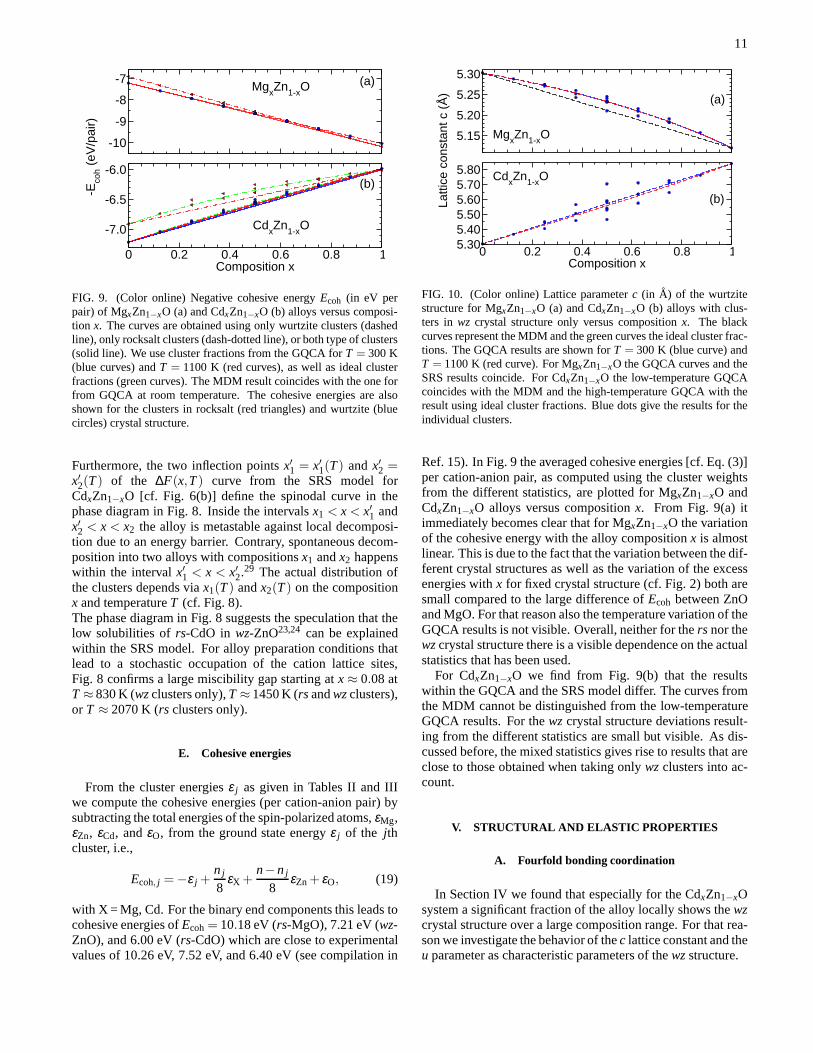
FIG. 9. (Color online) Negative cohesive energyEcoh (in eV perpair) of MgxZn1−xO (a) and CdxZn1−xO (b) alloys versus composi-tion x. The curves are obtained using only wurtzite clusters (dashedline), only rocksalt clusters (dash-dotted line), or both type of clusters(solid line). We use cluster fractions from the GQCA forT = 300 K(blue curves) andT = 1100 K (red curves), as well as ideal clusterfractions (green curves). The MDM result coincides with theone forfrom GQCA at room temperature. The cohesive energies are alsoshown for the clusters in rocksalt (red triangles) and wurtzite (bluecircles) crystal structure.
Furthermore, the two inflection pointsx′1 = x′1(T) andx′2 =x′2(T) of the ∆F(x,T) curve from the SRS model forCdxZn1−xO [cf. Fig. 6(b)] define the spinodal curve in thephase diagram in Fig. 8. Inside the intervalsx1 < x< x′1 andx′2 < x < x2 the alloy is metastable against local decomposi-tion due to an energy barrier. Contrary, spontaneous decom-position into two alloys with compositionsx1 andx2 happenswithin the intervalx′1 < x < x′2.29 The actual distribution ofthe clusters depends viax1(T) andx2(T) on the compositionx and temperatureT (cf. Fig. 8).The phase diagram in Fig. 8 suggests the speculation that thelow solubilities of rs-CdO in wz-ZnO23,24 can be explainedwithin the SRS model. For alloy preparation conditions thatlead to a stochastic occupation of the cation lattice sites,Fig. 8 confirms a large miscibility gap starting atx ≈ 0.08 atT ≈ 830 K (wzclusters only),T ≈ 1450 K (rs andwzclusters),or T ≈ 2070 K (rs clusters only).
E. Cohesive energies
From the cluster energiesε j as given in Tables II and IIIwe compute the cohesive energies (per cation-anion pair) bysubtracting the total energies of the spin-polarized atoms, εMg,εZn, εCd, andεO, from the ground state energyε j of the jthcluster, i.e.,
Ecoh, j =−ε j +n j
8εX +
n−n j
8εZn+ εO, (19)
with X = Mg, Cd. For the binary end components this leads tocohesive energies ofEcoh= 10.18 eV (rs-MgO), 7.21 eV (wz-ZnO), and 6.00 eV (rs-CdO) which are close to experimentalvalues of 10.26 eV, 7.52 eV, and 6.40 eV (see compilation in
0 0.2 0.4 0.6 0.8 1Composition x
5.305.405.505.605.705.80
5.15
5.20
5.25
5.30
Latti
ce c
onst
ant c
(Å
)
(b)
(a)
MgxZn1-xO
CdxZn1-xO
FIG. 10. (Color online) Lattice parameterc (in A) of the wurtzitestructure for MgxZn1−xO (a) and CdxZn1−xO (b) alloys with clus-ters in wz crystal structure only versus compositionx. The blackcurves represent the MDM and the green curves the ideal cluster frac-tions. The GQCA results are shown forT = 300 K (blue curve) andT = 1100 K (red curve). For MgxZn1−xO the GQCA curves and theSRS results coincide. For CdxZn1−xO the low-temperature GQCAcoincides with the MDM and the high-temperature GQCA with theresult using ideal cluster fractions. Blue dots give the results for theindividual clusters.
Ref. 15). In Fig. 9 the averaged cohesive energies [cf. Eq. (3)]per cation-anion pair, as computed using the cluster weightsfrom the different statistics, are plotted for MgxZn1−xO andCdxZn1−xO alloys versus compositionx. From Fig. 9(a) itimmediately becomes clear that for MgxZn1−xO the variationof the cohesive energy with the alloy compositionx is almostlinear. This is due to the fact that the variation between thedif-ferent crystal structures as well as the variation of the excessenergies withx for fixed crystal structure (cf. Fig. 2) both aresmall compared to the large difference ofEcoh between ZnOand MgO. For that reason also the temperature variation of theGQCA results is not visible. Overall, neither for thers nor thewzcrystal structure there is a visible dependence on the actualstatistics that has been used.
For CdxZn1−xO we find from Fig. 9(b) that the resultswithin the GQCA and the SRS model differ. The curves fromthe MDM cannot be distinguished from the low-temperatureGQCA results. For thewzcrystal structure deviations result-ing from the different statistics are small but visible. As dis-cussed before, the mixed statistics gives rise to results that areclose to those obtained when taking onlywzclusters into ac-count.
V. STRUCTURAL AND ELASTIC PROPERTIES
A. Fourfold bonding coordination
In Section IV we found that especially for the CdxZn1−xOsystem a significant fraction of the alloy locally shows thewzcrystal structure over a large composition range. For that rea-son we investigate the behavior of thec lattice constant and theu parameter as characteristic parameters of thewzstructure.
12
0 0.2 0.4 0.6 0.8 1Composition x
0.370
0.375
0.380
0.385
0.380
0.385
0.390In
tern
al c
ell p
aram
eter
u
(b)
(a)MgxZn1-xO
CdxZn1-xO
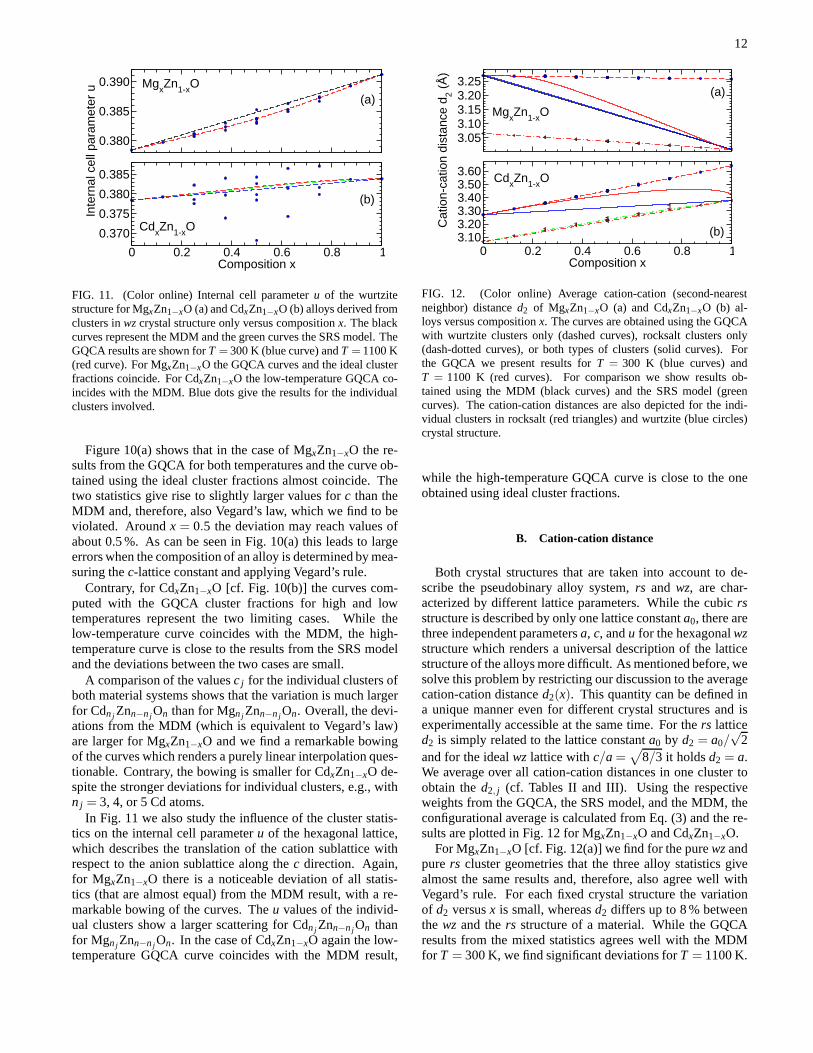
FIG. 11. (Color online) Internal cell parameteru of the wurtzitestructure for MgxZn1−xO (a) and CdxZn1−xO (b) alloys derived fromclusters inwzcrystal structure only versus compositionx. The blackcurves represent the MDM and the green curves the SRS model. TheGQCA results are shown forT = 300 K (blue curve) andT = 1100 K(red curve). For MgxZn1−xO the GQCA curves and the ideal clusterfractions coincide. For CdxZn1−xO the low-temperature GQCA co-incides with the MDM. Blue dots give the results for the individualclusters involved.
Figure 10(a) shows that in the case of MgxZn1−xO the re-sults from the GQCA for both temperatures and the curve ob-tained using the ideal cluster fractions almost coincide. Thetwo statistics give rise to slightly larger values forc than theMDM and, therefore, also Vegard’s law, which we find to beviolated. Aroundx = 0.5 the deviation may reach values ofabout 0.5 %. As can be seen in Fig. 10(a) this leads to largeerrors when the composition of an alloy is determined by mea-suring thec-lattice constant and applying Vegard’s rule.
Contrary, for CdxZn1−xO [cf. Fig. 10(b)] the curves com-puted with the GQCA cluster fractions for high and lowtemperatures represent the two limiting cases. While thelow-temperature curve coincides with the MDM, the high-temperature curve is close to the results from the SRS modeland the deviations between the two cases are small.
A comparison of the valuesc j for the individual clusters ofboth material systems shows that the variation is much largerfor Cdn j Znn−n j On than for Mgn j Znn−n j On. Overall, the devi-ations from the MDM (which is equivalent to Vegard’s law)are larger for MgxZn1−xO and we find a remarkable bowingof the curves which renders a purely linear interpolation ques-tionable. Contrary, the bowing is smaller for CdxZn1−xO de-spite the stronger deviations for individual clusters, e.g., withn j = 3, 4, or 5 Cd atoms.
In Fig. 11 we also study the influence of the cluster statis-tics on the internal cell parameteru of the hexagonal lattice,which describes the translation of the cation sublattice withrespect to the anion sublattice along thec direction. Again,for MgxZn1−xO there is a noticeable deviation of all statis-tics (that are almost equal) from the MDM result, with a re-markable bowing of the curves. Theu values of the individ-ual clusters show a larger scattering for Cdn j Znn−n j On thanfor Mgn j Znn−n j On. In the case of CdxZn1−xO again the low-temperature GQCA curve coincides with the MDM result,
0 0.2 0.4 0.6 0.8 1Composition x
3.103.203.303.403.503.60
3.053.103.153.203.25
Cat
ion-
catio
n di
stan
ce d
2 (Å
)
(a)
(b)
MgxZn1-xO
CdxZn1-xO
FIG. 12. (Color online) Average cation-cation (second-nearestneighbor) distanced2 of MgxZn1−xO (a) and CdxZn1−xO (b) al-loys versus compositionx. The curves are obtained using the GQCAwith wurtzite clusters only (dashed curves), rocksalt clusters only(dash-dotted curves), or both types of clusters (solid curves). Forthe GQCA we present results forT = 300 K (blue curves) andT = 1100 K (red curves). For comparison we show results ob-tained using the MDM (black curves) and the SRS model (greencurves). The cation-cation distances are also depicted forthe indi-vidual clusters in rocksalt (red triangles) and wurtzite (blue circles)crystal structure.
while the high-temperature GQCA curve is close to the oneobtained using ideal cluster fractions.
B. Cation-cation distance
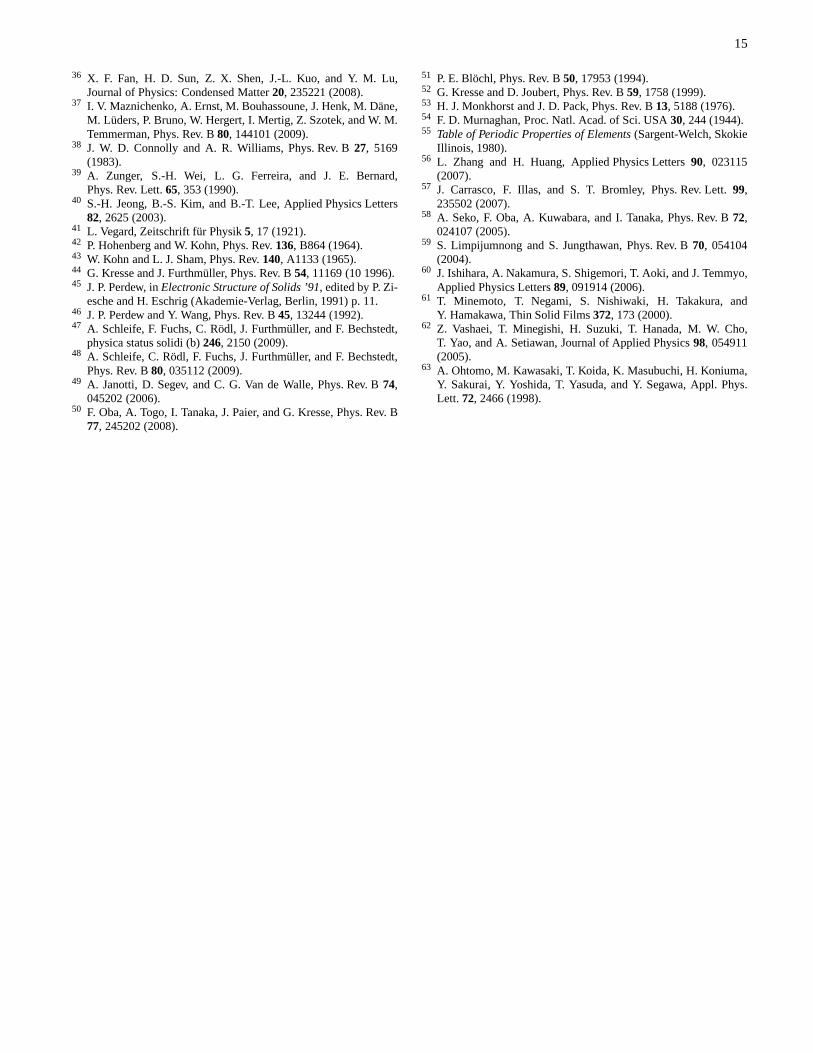
Both crystal structures that are taken into account to de-scribe the pseudobinary alloy system,rs and wz, are char-acterized by different lattice parameters. While the cubicrsstructure is described by only one lattice constanta0, there arethree independent parametersa, c, andu for the hexagonalwzstructure which renders a universal description of the latticestructure of the alloys more difficult. As mentioned before,wesolve this problem by restricting our discussion to the averagecation-cation distanced2(x). This quantity can be defined ina unique manner even for different crystal structures and isexperimentally accessible at the same time. For thers latticed2 is simply related to the lattice constanta0 by d2 = a0/
√2
and for the idealwz lattice withc/a=√
8/3 it holdsd2 = a.We average over all cation-cation distances in one cluster toobtain thed2, j (cf. Tables II and III). Using the respectiveweights from the GQCA, the SRS model, and the MDM, theconfigurational average is calculated from Eq. (3) and the re-sults are plotted in Fig. 12 for MgxZn1−xO and CdxZn1−xO.
For MgxZn1−xO [cf. Fig. 12(a)] we find for the purewzandpure rs cluster geometries that the three alloy statistics givealmost the same results and, therefore, also agree well withVegard’s rule. For each fixed crystal structure the variationof d2 versusx is small, whereasd2 differs up to 8 % betweenthe wz and thers structure of a material. While the GQCAresults from the mixed statistics agrees well with the MDMfor T = 300 K, we find significant deviations forT = 1100 K.

13
0 0.2 0.4 0.6 0.8 1Composition x
100
120
140
160
100
120
140
160B
ulk
mod
ulus
B0 (
GP
a)
(b)
(a)
MgxZn1-xO
CdxZn1-xO
FIG. 13. (Color online) Bulk modulusB0 (in GPa) of MgxZn1−xO (a)and CdxZn1−xO (b) alloys versus compositionx. The curves are ob-tained using the GQCA with wurtzite clusters only (dashed curves),rocksalt clusters only (dash-dotted curves), or both type of clusters(solid curves). For the GQCA we present results forT = 300 K (bluecurves) andT = 1100 K (red curves). For comparison we also showresults obtained using the MDM (black curves) and the SRS model(green curves). The bulk moduli are also depicted for the individualclusters in rocksalt (red triangles) and wurtzite (blue circles) crystalstructure.
In the high-temperature case the cation-cation distance inthepseudobinary alloy remains very close to the value of thepure wz structure up to compositions of aboutx ≈ 0.2 [cf.Fig. 12(a)]. For higher Mg contentsd2 approaches the valueof rs-MgO.
For CdxZn1−xO [cf. Fig. 12(b)] the variation ofd2 is muchlarger than for MgxZn1−xO since the cation-cation distancevaries much more between ZnO and CdO. The results fromall three statistics for the purewzclusters and the purers clus-ters agree well with Vegard’s rule except of a small deviationfor the SRS model forrs-CdO. Again the most remarkablechange is observed for the mixed cluster expansion. At roomtemperature the curve connects thewzandrs end componentsalmost linearly. For the higher temperature ofT = 1100 K thecation-cation distance closely follows thewz trend up to Cdconcentrations of more than 0.5. Overall, the different struc-tural configurations can be clearly distinguished at fixedx viathe average cation-cation distance. When both lattice struc-tures can occur in the alloy we even find a more pronouncedtemperature dependence.
C. Bulk modulus
Besides the cation-cation distance we also study the bulkmodulusB0 for MgxZn1−xO and CdxZn1−xO using the threestatistics evolving from the cluster weights of the GQCA, theSRS model, and the MDM. The results are plotted togetherwith the values for the individual clusters in Fig. 13.
For MgxZn1−xO [cf. Fig. 13(a)] in the purers or wzstruc-ture the GQCA results show a temperature dependence andalso differ from the linear interpolation of the MDM, whereasthe SRS curve is very close to the high-temperature result of
the GQCA. The reason for this behavior is the stronger devi-ation of the bulk moduli for the individual clusters from thelinear interpolation. As can be seen in Fig. 13(a) for thersstructure we find a certain cluster with an especially low bulkmodulus atx = 0.625 which, therefore, coincides with theminimum of the GQCA curves. For the GQCA results usingthe mixed statistics we find a strong temperature dependence,since the room-temperature curve closely follows the MDMcurve, while the high-temperature result matches the purewzcurve up tox≈ 0.2 and then approaches the purers curve atx= 1.
In the case of CdxZn1−xO [see Fig. 13(b)] we find bothGQCA curves for the purers lattice structure close to theMDM result. This is only true for the low-temperature re-sult of the purewz structure, whereas the high-temperaturecurve differs remarkably in this case. For bothrs andwzstruc-ture, the SRS model shows the largest deviation from the lin-ear interpolation. Again this can be attributed to the strongervariation of the values forB0 of the individual clusters withrespect to the MDM curve with the strongest deviation occur-ring for rs at x = 0.75 [cf. Fig. 13(b)]. For the mixed statis-tics for CdxZn1−xO we find again that the low-temperaturecurve closely follows the linear interpolation, while the high-temperature curve shows pronounced deviations. At low con-centrations it follows the high-temperature GQCA curve ofthe purewzstructure and does not even fully approach therslimit due to the very small energetical difference of these twopolymorphs for CdO (cf. Fig. 7).
VI. SUMMARY AND CONCLUSIONS
In summary, we studied pseudobinary AxB1−xC alloyswhose binary end components crystallize in different crystalstructures under ambient conditions. To study MgxZn1−xOand CdxZn1−xO with rs (MgO, CdO) andwz (ZnO) equilib-rium lattice structures we adopted the cluster expansion forwz and presented a corresponding expansion for 16-atomrsclusters. To include simultaneously locally different bondingconfigurations with either fourfold (wz) or sixfold (rs) coor-dination the GQCA has been extended correspondingly. Be-sides the GQCA which minimizes the mixing free energy withrespect to the cluster fractionsx j we took two other distribu-tionsx j into account to simulate also certain non-equilibriumgrowth procedures. We have combined these methods withab initio density functional calculations using the semi-localGGA to treat exchange and correlation. This provides knowl-edge of structural and energetic properties for each of the clus-ters which we use together with the cluster fractions to per-form the configurational averages and, hence, to derive an av-eraged alloy property for given composition and temperature.
Correspondingly, we find that the alloys’ thermodynamicsis determined by the local chemical bonding and the clusterstatistics and, therefore, the conditions under which the alloyis prepared. The mixing free energies indicate a change frompreferredwz crystal structure to preferredrs crystal struc-ture at aboutx ≈ 0.675 for MgxZn1−xO and aboutx ≈ 0.95for CdxZn1−xO. We find that for MgxZn1−xO as well as

14
CdxZn1−xO the random alloy is always the most favorable.Only for CdxZn1−xO in the SRS limit we observe the occur-rence of a miscibility gap and binodal as well as spinodal de-composition ranges with the critical parametersTcrit = 1030 Kand xcrit = 0.34 for purewz structure,Tcrit = 1940 K andxcrit = 0.4 for the mixed statistics, and a critical temperatureabove 2500 K for purers crystal structure. In any case wewere able to calculate even the temperature- and composition-dependent amount ofwz and rs clusters in the system. Theresulting ambivalent picture which is strongly dependent onthe actual conditions, is verified by a variety of experimentalresults. For both material systems there are experiments thatagree with our predictions but also other experiments with de-viating findings, showing that also measured properties of al-loy films have to be related to growth conditions, depositionmethod, possible subsequent temper steps, etc.
For structural properties such as cation-cation distancesand bulk moduli we also find a significant dependence onthe statistics that has been employed for the alloy modeling.
In addition, the pronounced temperature dependence of thestructural parameters and also the boundary conditions duetothe growth mechanism should lead to distinct experimentalobservations of the alloy composition.
ACKNOWLEDGMENTS
We thank Lara K. Teles and R. Goldhahn for valuablediscussions. The research leading to these results has re-ceived funding from the European Community’s SeventhFramework Programme (FP7/2007-2013) under grant agree-ment No. 211956 and by the Deutsche Forschungsgemein-schaft (Project No. Be 1346/20-1). We acknowledge grants ofcomputer time from the Supercomputerzentrum Stuttgart andthe HPC-EUROPA2 project (project number: 228398) withthe support of the European Commission – Capacities Area –Research Infrastructures. A. Schleife thanks the Carl-Zeiss-Stiftung for support.
1 D. C. Reynolds, D. C. Look, and B. Jogai, Solid State Commun.99, 873 (1996).
2 D. C. Reynolds, D. C. Look, B. Jogai, and T. C. Collins, Phys.Rev. B56, 13753 (1997).
3 M. Joseph, H. Tabata, and T. Kawai, Jpn. J. Appl. Phys. Part 238,L1205 (1999).
4 U. Ozgur, Y. I. Alivov, C. Liu, A. Teke, M. A. Reshchikov,S. Dogan, V. Avrutin, S.-J. Cho, and H. Morkoc, J. Appl. Phys.98, 041301 (2004).
5 D. S. Ginley and C. Bright, MRS Bull.25, 58 (2000).6 S. Tsukazaki, A. Ohtomo, T. Kita, Y. Ohno, H. Ohno, and
M. Kawasaki, Science315, 1388 (2007).7 A. P. Ramirez, Science315, 1377 (2007).8 L. Schmidt-Mende and J. L. MacManus-Driscol, Materials Today
10, 40 (2007).9 A. Ohtomo and A. Tsukazaki, Semicond. Sci. Technol.20, S1
(2005).10 R. Schmidt, B. Rheinlander, M. Schubert, D. Spemann, T. Butz,
J. Lenzner, E. M. Kaidashev, M. Lorenz, A. Rahm, H. C. Sem-melhack, and M. Grundmann, Appl. Phys. Lett.82, 2260 (2003).
11 S. Sadofev, S. Blumstengel, J. Cui, J. Puls, S. Rogaschewski,P. Schafer, Y. G. Sadofyev, and F. Henneberger, Appl. Phys.Lett.87, 091903 (2005).
12 S. Sadofev, S. Blumstengel, J. Cui, J. Puls, S. Rogaschewski,P. Schafer, and F. Henneberger, Appl. Phys. Lett.89, 201907(2006).
13 S. Shigemori, A. Nakamura, J. Ishihara, T. Aoli, and J. Temmyo,Jpn. J. Appl. Phys.43, L1088 (2004).
14 W. Martienssen and H. Warlimont, eds., “Springer handbook ofcondensed matter and materials data,” (Springer-Verlag, Berlin,2005).
15 A. Schleife, F. Fuchs, J. Furthmuller, and F. Bechstedt, Phys. RevB 73, 245212 (2006).
16 M. Sanati, G. L. W. Hart, and A. Zunger, Phys. Rev. B68, 155210(2003).
17 E. Segnit and A. Holland, J. Am. Ceram. Soc.48, 409 (1965).18 C. Bundesmann, A. Rahm, M. Lorenz, M. Grundmann, and
M. Schubert, J. Appl. Phys.99, 113504 (2006).
19 Z. Liu, Z. Mei, T. Zhang, Y. Liu, Y. Guo, X. Du, A. Hallen, J. Zhu,and A. Kuznetsov, Journal of Crystal Growth311, 4356 (2009),ISSN 0022-0248.
20 X. Du, Z. Mei, Z. Liu, Y. Guo, T. Zhang, Y. Hou, Z. Zhang,Q. Xue, and A. Y. Kuznetsov, Advanced Materials21, 4625(2009).
21 J. Chen, W. Z. Shen, N. B. Chen, D. J. Qiu, and H. Z. Wu, Journalof Physics: Condensed Matter15, L475 (2003).
22 N. B. Chen, H. Z. Wu, D. J. Qiu, T. N. Xu, J. Chen, and W. Z.Shen, J. Phys.: Condens. Matter16, 2973 (2004).
23 T. Makino, Y. Segawa, M. Kawasaki, A. Ohtomo, R. Shiroki,K. Tamura, T. Yasuda, and H. Koinuma, Appl. Phys. Lett.78,1237 (2001).
24 F. Bertram, S. Giemsch, D. Forster, J. Christen, R. Kling,C. Kirchner, and A. Waag, Appl. Phys. Lett.88, 061915 (2006).
25 W. R. Lambrecht, S. Limpigumnong, and B. Segall, MRS InternetJ. Nitride Semicond. Res.451, G6.8 (1999).
26 R. Thangavel, M. Rajagopalan, and J. Kumar, Solid State Com-mun.137, 507 (2006).
27 Y.-G. Kim, E.-C. Lee, and K. J. Chang, J. Korean Phys. Soc.39,S92 (2001).
28 S.-H. Wei, L. G. Ferreira, J. E. Bernard, and A. Zunger,Phys. Rev. B42, 9622 (1990).
29 A.-B. Chen and A. Sher,Semiconductor Alloys(Plenum, NewYork, 1995).
30 L. K. Teles, J. Furthmuller, L. M. R. Scolfaro, J. R. Leite, andF. Bechstedt, Phys. Rev. B62, 2475 (2000).
31 J. M. Sanchez, F. Ducastelle, and D. Gratias, Physica A128, 334(1984).
32 A. Zunger, inStatistics and Dynamics of Alloy Phase Transfor-mations, edited by P. E. A. Turchi and A. Gonis (Plenum Press,New York, 1994) Chap. First-principles statistical mechanics ofsemiconductor alloys and intermetallic compounds, p. 361.
33 J. Z. Liu and A. Zunger, Phys. Rev. B77, 205201 (2008).34 A. Sher, M. van Schilfgaarde, A.-B. Chen, and W. Chen, Phys.
Rev. B36, 4279 (1987).35 C. Caetano, L. K. Teles, M. Marques, A. D. P. Jr., and L. G. Fer-
reira, Phys. Rev.74, 045215 (2006).
15
36 X. F. Fan, H. D. Sun, Z. X. Shen, J.-L. Kuo, and Y. M. Lu,Journal of Physics: Condensed Matter20, 235221 (2008).
37 I. V. Maznichenko, A. Ernst, M. Bouhassoune, J. Henk, M. Dane,M. Luders, P. Bruno, W. Hergert, I. Mertig, Z. Szotek, and W.M.Temmerman, Phys. Rev. B80, 144101 (2009).
38 J. W. D. Connolly and A. R. Williams, Phys. Rev. B27, 5169(1983).
39 A. Zunger, S.-H. Wei, L. G. Ferreira, and J. E. Bernard,Phys. Rev. Lett.65, 353 (1990).
40 S.-H. Jeong, B.-S. Kim, and B.-T. Lee, Applied Physics Letters82, 2625 (2003).
41 L. Vegard, Zeitschrift fur Physik5, 17 (1921).42 P. Hohenberg and W. Kohn, Phys. Rev.136, B864 (1964).43 W. Kohn and L. J. Sham, Phys. Rev.140, A1133 (1965).44 G. Kresse and J. Furthmuller, Phys. Rev. B54, 11169 (10 1996).45 J. P. Perdew, inElectronic Structure of Solids ’91, edited by P. Zi-
esche and H. Eschrig (Akademie-Verlag, Berlin, 1991) p. 11.46 J. P. Perdew and Y. Wang, Phys. Rev. B45, 13244 (1992).47 A. Schleife, F. Fuchs, C. Rodl, J. Furthmuller, and F. Bechstedt,
physica status solidi (b)246, 2150 (2009).48 A. Schleife, C. Rodl, F. Fuchs, J. Furthmuller, and F. Bechstedt,
Phys. Rev. B80, 035112 (2009).49 A. Janotti, D. Segev, and C. G. Van de Walle, Phys. Rev. B74,
045202 (2006).50 F. Oba, A. Togo, I. Tanaka, J. Paier, and G. Kresse, Phys. Rev.B
77, 245202 (2008).
51 P. E. Blochl, Phys. Rev. B50, 17953 (1994).52 G. Kresse and D. Joubert, Phys. Rev. B59, 1758 (1999).53 H. J. Monkhorst and J. D. Pack, Phys. Rev. B13, 5188 (1976).54 F. D. Murnaghan, Proc. Natl. Acad. of Sci. USA30, 244 (1944).55 Table of Periodic Properties of Elements(Sargent-Welch, Skokie
Illinois, 1980).56 L. Zhang and H. Huang, Applied Physics Letters90, 023115
(2007).57 J. Carrasco, F. Illas, and S. T. Bromley, Phys. Rev. Lett.99,
235502 (2007).58 A. Seko, F. Oba, A. Kuwabara, and I. Tanaka, Phys. Rev. B72,
024107 (2005).59 S. Limpijumnong and S. Jungthawan, Phys. Rev. B70, 054104
(2004).60 J. Ishihara, A. Nakamura, S. Shigemori, T. Aoki, and J. Temmyo,
Applied Physics Letters89, 091914 (2006).61 T. Minemoto, T. Negami, S. Nishiwaki, H. Takakura, and
Y. Hamakawa, Thin Solid Films372, 173 (2000).62 Z. Vashaei, T. Minegishi, H. Suzuki, T. Hanada, M. W. Cho,
T. Yao, and A. Setiawan, Journal of Applied Physics98, 054911(2005).
63 A. Ohtomo, M. Kawasaki, T. Koida, K. Masubuchi, H. Koniuma,Y. Sakurai, Y. Yoshida, T. Yasuda, and Y. Segawa, Appl. Phys.Lett. 72, 2466 (1998).


![The infrared spectrum of the O⋯H⋯O fragment of H[sub 5]O[sub 2][sup +]: Ab initio classical molecular dynamics and quantum 4D model calculations](https://static.fdokumen.com/doc/165x107/633857c36c6d131be60d0b92/the-infrared-spectrum-of-the-oho-fragment-of-hsub-5osub-2sup-ab-initio.jpg)