Crystal structure, thermal expansion and conductivity of anisotropic La 1− x Sr x Ga 1−2 x Mg 2...
16
Journal of Solid State Chemistry 172 (2003) 396–411 Crystal structure, thermal expansion and conductivity of anisotropic La 1x Sr x Ga 12x Mg 2x O 3y (x ¼ 0:05; 0.1) single crystals L. Vasylechko, a,b, V. Vashook, c D. Savytskii, a A. Senyshyn, a R. Niewa, b M. Knapp, d H. Ullmann, c M. Berkowski, e A. Matkovskii, a,f and U. Bismayer g a Institute of Telecommunications, Radioelectronics and Electronics Technique, Lviv Polytechnic National University, 12 Bandera St., Lviv 79013, Ukraine b Max-Planck-Institut fu¨r Chemische Physik fester Stoffe, No¨thnitzerstrasse 40, Dresden D-01187, Germany c Institute of Physical Chemistry and Electrochemistry, Dresden University of Technology, Dresden D-01062, Germany d Institute for Materials Science, Darmstadt University of Technology, Petersenstrasse 23, Darmstadt D-64287, Germany e Institute of Physics Polish Academy of Sciences, Al. Lotniko´w 32/46, Warsaw 02-668, Poland f Institute of Physics, HPU, 16 Rejtana St., Rzeszow 35-310, Poland g University of Hamburg, Grindelallee 48, Hamburg D-20146, Germany Received 30 July 2002; received in revised form 22 November 2002; accepted 24 November 2002 Abstract Crystal structure and anisotropy of the thermal expansion of single crystals of La 1x Sr x Ga 12x Mg 2x O 3y (x ¼ 0:05 and 0.1) were measured in the temperature range 300–1270 K. High-resolution X-ray powder diffraction data obtained by synchrotron experiments have been used to determine the crystal structure and thermal expansion. The room temperature structure of the crystal with x ¼ 0:05 was found to be orthorhombic (Imma, Z ¼ 4; a ¼ 7:79423ð3Þ A ˚ , b ¼ 5:49896ð2Þ A ˚ , c ¼ 5:53806ð2Þ A ˚ ), whereas the symmetry of the x ¼ 0:1 crystal is monoclinic (I2/a, Z ¼ 4; a ¼ 7:82129ð5Þ A ˚ , b ¼ 5:54361ð3Þ A ˚ , c ¼ 5:51654ð4Þ A ˚ , b ¼ 90:040ð1Þ1). The conductivity in two orthogonal directions of the crystals has been studied. Both, the conductivity and the structural data indicate three phase transitions in La 0.95 Sr 0.05 Ga 0.9 Mg 0.1 O 2.92 at 520–570 K (Imma–I2/a), 770 K (I2/a–R3c) and at 870 K (R3c–R-3c), respectively. Two transitions at 770 K (I2/a–R3c) and in the range 870–970 K (R3c–R-3c) occur in La 0.9 Sr 0.1 Ga 0.8 Mg 0.2 O 2.85 . r 2003 Elsevier Science (USA). All rights reserved. Keywords: Sr- and Mg-doped LaGaO 3 ; Single crystals; Perovskites; Crystal structure; Thermal expansion; Phase transitions; Conductivity 1. Introduction Several publications described different aspects of transport and structure properties of Sr- and Mg-doped lanthanum gallates (LSGM) [1–7]. These materials are of interest as potential electrolytes in solid oxide fuel cells. Nevertheless, there are uncertainties concerning the crystal structure. Feng and Goodenough [2] reported a cubic structure for La 0.9 Sr 0.1 Ga 0.8 Mg 0.2 O 2.85 (LSGM- 10) at room temperature (RT), whereas Ishihara et al. [3] described the crystal structure of pure and doped LaGaO 3 to be orthorhombic (OR). Drennan et al. [4] by X-ray diffraction, scanning and transmission electron microscopy observed an OR (space group Pnma) structure for LSGM-10 at RT and a phase transition to rhombohedral (Rh) structure at 445 K. Based on high-resolution powder neutron diffraction data, Slater et al. [5,6] concluded that the RT structure is monoclinic (Mcl) (space group I2/a). Two-phase transitions appear between 723 and 1273 K: monoclinic(pseudo-OR)– monoclinic(pseudo-Rh)–rhombohedral (R3c). Recently, Lerch et al. [7] investigated the structure of La 0.9 Sr 0.1 Ga 0.8 Mg 0.2 O 2.85 using powder neutron diffraction at 273, 1073, and 1273 K. The authors reported a distorted perovskite-type structure (space group Imma) for the RT phase and an ideal cubic perovskite-type structure (Pm3m) for the HT-modification. The discrepancies described above are not surprising because LSGM adopts a perovskite-type structure with extremely weak deformations from the cubic aristotype. It is very difficult to distinguish between different kinds Corresponding author. Fax: +38-0322-742164. E-mail address: [email protected] (L. Vasylechko). 0022-4596/03/$ - see front matter r 2003 Elsevier Science (USA). All rights reserved. doi:10.1016/S0022-4596(03)00016-1
-
Upload
independent -
Category
Documents
-
view
0 -
download
0
Transcript of Crystal structure, thermal expansion and conductivity of anisotropic La 1− x Sr x Ga 1−2 x Mg 2...

Journal of Solid State Chemistry 172 (2003) 396–411
Crystal structure, thermal expansion and conductivity of anisotropicLa1�xSrxGa1�2xMg2xO3�y (x ¼ 0:05; 0.1) single crystals
L. Vasylechko,a,b,� V. Vashook,c D. Savytskii,a A. Senyshyn,a R. Niewa,b M. Knapp,d
H. Ullmann,c M. Berkowski,e A. Matkovskii,a,f and U. Bismayerg
a Institute of Telecommunications, Radioelectronics and Electronics Technique, Lviv Polytechnic National University,
12 Bandera St., Lviv 79013, UkrainebMax-Planck-Institut fur Chemische Physik fester Stoffe, Nothnitzerstrasse 40, Dresden D-01187, Germany
c Institute of Physical Chemistry and Electrochemistry, Dresden University of Technology, Dresden D-01062, Germanyd Institute for Materials Science, Darmstadt University of Technology, Petersenstrasse 23, Darmstadt D-64287, Germany
e Institute of Physics Polish Academy of Sciences, Al. Lotnikow 32/46, Warsaw 02-668, Polandf Institute of Physics, HPU, 16 Rejtana St., Rzeszow 35-310, Poland
gUniversity of Hamburg, Grindelallee 48, Hamburg D-20146, Germany
Received 30 July 2002; received in revised form 22 November 2002; accepted 24 November 2002
Abstract
Crystal structure and anisotropy of the thermal expansion of single crystals of La1�xSrxGa1�2xMg2xO3�y (x ¼ 0:05 and 0.1) were
measured in the temperature range 300–1270K. High-resolution X-ray powder diffraction data obtained by synchrotron
experiments have been used to determine the crystal structure and thermal expansion. The room temperature structure of the crystal
with x ¼ 0:05 was found to be orthorhombic (Imma, Z ¼ 4; a ¼ 7:79423ð3Þ A, b ¼ 5:49896ð2Þ A, c ¼ 5:53806ð2Þ A), whereas the
symmetry of the x ¼ 0:1 crystal is monoclinic (I2/a, Z ¼ 4; a ¼ 7:82129ð5Þ A, b ¼ 5:54361ð3Þ A, c ¼ 5:51654ð4Þ A, b ¼ 90:040ð1Þ1).The conductivity in two orthogonal directions of the crystals has been studied. Both, the conductivity and the structural data
indicate three phase transitions in La0.95Sr0.05Ga0.9Mg0.1O2.92 at 520–570K (Imma–I2/a), 770K (I2/a–R3c) and at 870K (R3c–R-3c),
respectively. Two transitions at 770K (I2/a–R3c) and in the range 870–970K (R3c–R-3c) occur in La0.9Sr0.1Ga0.8Mg0.2O2.85.
r 2003 Elsevier Science (USA). All rights reserved.
Keywords: Sr- and Mg-doped LaGaO3; Single crystals; Perovskites; Crystal structure; Thermal expansion; Phase transitions; Conductivity
1. Introduction
Several publications described different aspects oftransport and structure properties of Sr- and Mg-dopedlanthanum gallates (LSGM) [1–7]. These materials areof interest as potential electrolytes in solid oxide fuelcells. Nevertheless, there are uncertainties concerningthe crystal structure. Feng and Goodenough [2] reporteda cubic structure for La0.9Sr0.1Ga0.8Mg0.2O2.85 (LSGM-10) at room temperature (RT), whereas Ishihara et al. [3]described the crystal structure of pure and dopedLaGaO3 to be orthorhombic (OR). Drennan et al. [4]by X-ray diffraction, scanning and transmission electronmicroscopy observed an OR (space group Pnma)
structure for LSGM-10 at RT and a phase transitionto rhombohedral (Rh) structure at 445K. Based onhigh-resolution powder neutron diffraction data, Slateret al. [5,6] concluded that the RT structure is monoclinic(Mcl) (space group I2/a). Two-phase transitions appearbetween 723 and 1273K: monoclinic(pseudo-OR)–monoclinic(pseudo-Rh)–rhombohedral (R3c). Recently,Lerch et al. [7] investigated the structure of La0.9Sr0.1Ga0.8Mg0.2O2.85 using powder neutron diffraction at273, 1073, and 1273K. The authors reported a distortedperovskite-type structure (space group Imma) for theRT phase and an ideal cubic perovskite-type structure(Pm3m) for the HT-modification.
The discrepancies described above are not surprisingbecause LSGM adopts a perovskite-type structure withextremely weak deformations from the cubic aristotype.It is very difficult to distinguish between different kinds
�Corresponding author. Fax: +38-0322-742164.
E-mail address: [email protected] (L. Vasylechko).
0022-4596/03/$ - see front matter r 2003 Elsevier Science (USA). All rights reserved.
doi:10.1016/S0022-4596(03)00016-1

of slightly distorted perovskite-type structures by con-venient X-ray powder diffraction methods. The variantsof the structure differ mainly in the amount of distortionarising from the coupled tilting of corner-shared BO6
octahedra. Such deformations can be recognized inpowder diffraction patterns from the splitting of themain perovskite diffraction intensities and/or by theappearance of weak superstructure reflections arisingfrom the concomitant enlargement of the unit cell. High-resolution powder diffraction techniques with highsignal-to-noise ratios are required to detect such smallstructural deformations.
Thermal expansions of Sr- and Mg-doped LaGaO3
samples have been measured by some authors [2, 8–10].Ishihara et al. [8] reported linear thermal expansion forLaGaO3-based oxides with an average thermal expan-sion coefficient of 11.0� 10�6K�1 from RT to 1570K.This value is slightly larger than the value reported byFeng and Goodenough [2]. The replacement of La by Srincreases the thermal expansion slightly. Hayashi et al.[10] measured the thermal expansion of Sr- and Mg-doped LaGaO3 in the temperature range 100–873Kusing a push-rod differential dilatometer. The thermalexpansion coefficients became larger with increasing Srand Mg contents, leading to smaller binding energies inthe oxides in the presence of oxygen vacancies. Allmeasurements mentioned above were performed onpolycrystalline ceramic samples and hence, only averagethermal expansion coefficients were reported. No dataon the thermal expansion of LSGM single crystals indifferent crystallographic directions are so far availablein the literature.
Electrical conductivities of A- and B-site dopedlanthanum gallates have been measured by severalinvestigators [1–3, 11–13]. Experimental set-ups wereused in order to increase the ionic conductivity, and tosuppress the electronic conductivity, or to enhancemixed conduction of LaGaO3. Highest conductivityvalues were found in La0.9Sr0.1Ga0.8Mg0.2O3�x [11]. Theactivation energy of the conductivity of LSGM ceramicsvaries from 1.08 to 0.74 eV depending on samplecomposition and temperature range. All conductivitymeasurements were carried out on ceramic samples. Theinvestigation of single crystalline samples could detectanisotropies of physical properties in different crystal-lographic directions and correlations between structuralfeatures and ionic conductivity.
In the present study the high-resolution powderdiffraction technique using synchrotron radiation hasbeen applied to determine the structure ofLa1�xSrxGa1�2xMg2xO3�y (x ¼ 0:05 and 0.1) crystalsand its precise evolution with temperature. Small peakhalf-widths and high collimation and signal-to-noiseratios allow to observe even slight deviations betweenlattice parameters and to detect very weak super-structure reflections.
2. Experimental
La1�xSrxGa1�2xMg2xO3�y (x ¼ 0:05 and 0.1) singlecrystals with diameters of 15mm and lengths of 25–30mm were grown from the melt in Ar atmosphereusing the Czochralski technique. In order to determinethe composition chemical analysis of the crystals hasbeen carried out. The La content was determined fromsulfuric acid solution by direct titration with Trilon B(Ga was masked by acetylacetone). The amount of Gawas determined by substitutional titration using Cucomlexonat and Trilon B (La was masked by NH4F).For the Sr and Mg analysis, samples were melted usingNa2CO3+Na4B2O7� 10H2O flux. The melt was dis-solved in HCl (1:1). The Mg concentration wasdetermined by atomic absorption spectroscopy usingan AAS-1N spectrometer (Carl Zeiss, Jena) with apropene/butane/air flame at wavelength 285.2 nm. Srwas determined by atomic-emission spectroscopy (CarlZeiss, Jena) at wavelength 470.7 nm. Our chemicalanalysis gives evidence that the cation concentration inthe crystals is practically identical to that of the startingcompositions (Table 1).
Examination of the crystals at RT by a Guiniertransmission camera (HUBER image plate, CuKa1radiation, l=1.54056 A) showed pure perovskite-typestructure for both crystals. No traces of additionalphases were detected. DTA/DSC examination of theLSGM-05 crystal using a STA 409 calorimeter(NETZSCH, Selb, SiC-furnace, heating rate 10.0K/min) from RT to 970K showed an endothermic signalon heating indicating a phase transformation at 718K.The transition was found to be reversible and thecorresponding exothermal peak has been observed oncooling at 698K. Examination of the LSGM-10 crystaldid not reveal any further phase transition up to 1670K.
It is well-known that RGaO3 crystals, and especiallyLaGaO3, has a strong tendency of twin formation [14–16]. Reasons for twinning in LaGaO3 are the structuralphase transition at 420K as well as weak deviationsfrom a paraelastic cubic structure. In LSGM thedeviation from the paraelastic cubic structure is evensmaller than in LaGaO3, and therefore, the twinstructure of LSGM crystals is more complex. Thistwinning is further enhanced by structural instabilities.
Attempts to separate single domain specimens suita-ble for single-crystal measurements were not successful.The Laue pattern of a twinned LSGM-05 crystal isshown in Fig. 1. The splitting of the reflections resultsfrom the twin structure. Because of the strong twinning,the crystal structure had finally to be studied by thepowder diffraction technique. For this purpose, thecrystals were crushed, powdered in agate mortar, andpowders were sieved through the 20 mm mesh. In orderto study the LSGM structure and its thermal evolutionin detail in the temperature range from 300 to 1260K
L. Vasylechko et al. / Journal of Solid State Chemistry 172 (2003) 396–411 397
high-resolution powder diffraction experiments havebeen performed at the synchrotron laboratory HASY-LAB [17]. The diffraction experiments were carried outusing the powder diffractometer (beamline B2),equipped with a STOE furnace. For beam conditioninga Ge (111) double-crystal monochromator and a Ge(111) crystal analyzer in front of a NaI scintillationcounter were inserted. The wavelength was calibratedusing the positions of five silicon reflections. The samplewas mounted inside a STOE furnace in Debye–Scherrergeometry equipped with a Eurotherm temperaturecontroller and a capillary spinner.
In order to detect the critical temperatures and toobtain the thermal expansion coefficients measurementsof the thermal evolution of 25 characteristic reflectionswere carried out in the temperature range 300–1260K.To obtain precise reflection positions, intensities andvalues of HWFMs for every peaks, the experimentalprofiles were fitted using the profile decompositionprogram PROFAN [18]. Lattice parameters were refinedby least-squares method taking into account therefinement of the ‘‘zero shift’’ values. Full diffraction
patterns were collected at RT and 1260K for theLSGM-10 sample and at RT, 670, 820 and 1020K forLSGM-05. Structure refinement was performed by thefull-profile Rietveld method using the program packageWinCSD [18].
For conductivity measurements twinned single-crystalplates of 1mm thickness with a surface area 20–50mm2
were cut from crystal boules with two orientations,perpendicular and parallel to the pulling axis, respec-tively. X-ray examination of the large surfaces of theplates cut perpendicular to the pulling axis showed thepresence of (001)o, (211)o and (010)o oriented domainswith predominance of the (211)o ones. Surfaces orientedparallel to the pulling axis showed the presence of (100)oand (011)o blocks. The Miller’s indices correspond toOR symmetry with Imma space group. The relativeamount of domains with different orientations could beestimated for each sample from the intensity ratios ofthe corresponding reflections.
The plates were coated with platinum paste (Heraeus)sintered at 1270K for 1 h in air. Platinum wires with0.1mm diameter were attached to the samples. A quasi-four-point method was used for AC conductivitymeasurements in air in the temperature range 300–1300K with a heating/cooling rate of 3.5K/min. Themeasurements were carried out using a HP4284 devicecomputer controlled at four frequencies (100, 1000,10,000, and 100,000Hz). The imaginary part of theresistance was small in comparison with the real part,and the real part did not change significantly withfrequency.
3. Results and discussion
Investigation of the samples using high-resolutionpowder diffraction techniques and synchrotron radia-tion at RT confirmed single-phase compositions of bothLSGM-05 and LSGM-10 samples. No traces of otherphases were detected, even by high-resolution techniquewith very high signal-to-noise ratio. Extremely narrowdiffraction peaks of LSGM (typical HWFM values were0.013–0.031) similar to those of pure LaGaO3 andNdGaO3 single crystals indicate the homogeneity of thecrystals.
Table 1
Chemical analysis of the LSGM-05 and LSGM-10 crystals
Sample Contents La2O3 (wt%) SrO (wt%) Ga2O3 (wt%) MgO (wt %) Composition
LSGM-05 Nominal 62.323 2.086 33.968 1.623 La0.95Sr0.05Ga0.9Mg0.1O2.92
Experimental 62.39 2.25 33.47 1.69 La0.953Sr0.054Ga0.888Mg0.105O2.92
LSGM-10 Nominal 61.086 4.317 31.238 3.359 La0.9Sr0.1Ga0.8Mg0.2O2.85
Experimental 60.99 4.47 31.17 3.37 La0.898Sr0.103Ga0.798Mg0.201O2.85
Fig. 1. Laue pattern for a LSGM-05 crystal, obtained using the micro-
beam (Lawrence Berkeley National Laboratory, Advanced Light
Source). Reflections are split into four individual peaks due to
twinning.
L. Vasylechko et al. / Journal of Solid State Chemistry 172 (2003) 396–411398

Very high resolution of the diffraction patterns allowsto observe reflection splitting, which could not bedetected by classical X-ray techniques. The characterof the splitting (number of reflections and their relativeintensities) indicated the OR distortions of the perovs-kite-type structure. Analysis of systematic absencesindicated a body-centered lattice. All reflections of theRT patterns were indexed according to the body-centered OR lattice. The refined values of the latticeparameters were as follows: a ¼ 7:7942 A, b ¼ 5:4990 A,c ¼ 5:5381 A for LSGM-05 and a ¼ 7:7:8211 A,b ¼ 5:5165 A, c ¼ 5:5435 A for LSGM-10. As shown inSection 3.2, the RT structures of both LSGM-10 andLSGM-05 in the temperature range 570–720K are infact Mcl.
3.1. Thermal expansion
The analysis of the thermal evolution of the experi-mental profiles showed the splitting of reflections typicalof an OR distortion of the perovskite lattice. Thesplitting remains visible up to 670 and 720K for theLSGM-05 and LSGM-10, respectively. Above thesetemperatures the character of splitting changes drasti-cally. As an example, the thermal evolution of the(020)o+(211)o+(002)o triplet of the LSGM-10 sample isshown in Fig. 2. On heating from 770K the magnitudesof the OR peaks decrease and disappear completelyabove 870K. Simultaneously, additional reflectionsappear in the pattern. The reflection splitting above870K clearly indicates Rh symmetry for the HT phases.At 770K co-existence of both OR and Rh phases hasbeen found. As it was recently reported [19,20], the
simultaneous presence of RT and HT phases (in sometemperature regions of the phase transformation) istypical for La1�xRExGaO3 solid solutions. Rh distor-tions remain visible at least up to 1260K for bothsamples. The splitting of reflections indicating thedeviation from the cubic lattice in LSGM-10 at HT isextremely small (typically, 0.02–0.041). Only highcollimation of the synchrotron beam allows it to detect.
The temperature dependences of the lattice para-meters and cell volumes of the crystals are presented inFig. 3. Due to the very weak distortion the latticeparameters of LSGM-05 below 673K and LSGM-10below 770K are refined in OR symmetry. It is evidentthat a rhombohedral-to-monoclinic (pseudo-OR) phasetransition in the LSGM-05 and LSGM-10 crystalsoccurs at temperatures 720 and 770K, respectively.
0
200
400
28.0 28.1 28.2 28.3 28.4 28.5 28.6
0
200
400
12731173
9731073
873773673573473373
(211)o
(002)o(020)o
rh
(10-4)
(110)rh
Tem
pera
ture
, KIn
tens
ity, a
.u.
2 Theta, deg
Fig. 2. Thermal evolution of (211)o+(002)o+(020)o triplet and
(10-4)rh+(110)rh doublet of the LSGM-10 structure in the temperature
range 300–1260K.
400 600 800 1000 12003.88
3.89
3.90
3.91
3.92
3.93
3.94
59.059.560.060.561.061.562.0
Vp
bp
ap
cp
LSGM-05
Temperature, K
Latti
ce c
onst
ants
, A
C
ell V
olum
e A
3
400 600 800 1000 1200
3.90
3.91
3.92
3.93
3.94
3.95
59.560.060.561.061.562.0
LSGM-10
Vp
cp
ap
bpLa
ttice
con
stan
ts, A
Cel
l Vol
ume
A3
Temperature, K
Fig. 3. Thermal expansion of the LSGM-05 and LSGM-10 crystals in
the temperature range 300–1260K. Lattice constants of OR and Rh
phases normalized to the pseudo-cubic perovskite cell according to:
apc ¼ ao=2; bpc ¼ bo=O2; cpc ¼ co=O2; apc ¼ arh=O2; cpc ¼ crh=O12:
L. Vasylechko et al. / Journal of Solid State Chemistry 172 (2003) 396–411 399

The value of the critical temperature of LSGM-05 is ingood agreement with the DSC data. The latticeconstants of both RT and HT phases increase almostmonotonically with temperature. Deviations will bediscussed in the next paragraphs. Practically, a linearvolume can be observed for the LSGM-10 in the wholetemperature range investigated and discontinuity in thecell volume was detected. Deviation of the cell volumefrom the linear behavior is observed for the LSGM-05sample in the temperature range 770–1020K (Fig. 3).This deviation does not coincide with the temperature ofthe structural phase transition; instead it is shifted tohigher temperatures by about 150K. In order to checkthis observation, diffraction experiments were repeatedat different experimental conditions (wavelength, beamcollimation, etc.). Nevertheless, the same evolution oflattice parameters and cell volumes were obtained.
The structural transformations found in both crystalsare clearly reflected by the temperature dependency ofthe conductivity (see below).
Taking into account the critical temperatures of thephase transitions, the average linear thermal expansioncoefficients a(ave) of LSGM-05 and LSGM-10 werecalculated for two temperature ranges (Table 2). Thevalues of a(ave) are in good agreement with earlierresults (for example, [8,10]). The Mcl and OR phases ofboth crystals show slightly smaller a(ave) values than theHT Rh phases (Table 2). Pronounced anisotropy of thethermal expansion is observed for both crystals. Theanisotropy is especially noticeably in the Rh phases ofboth crystals, where the difference between a-values ina- and c-direction reached 45% (Table 2).
3.2. Crystal structure
For detailed studies of the RT and HT structuresadditionally to the RT measurements diffraction pat-terns of LSGM-05 at 670, 820, 1020K and of LSGM-10at 1260K were collected.
3.2.1. LSGM-05 structure
Taking into account systematic absences, whichindicate a body-centered lattice, the RT structure ofLSGM-05 has been refined in space group Imma.Structure refinement using anisotropic approximation
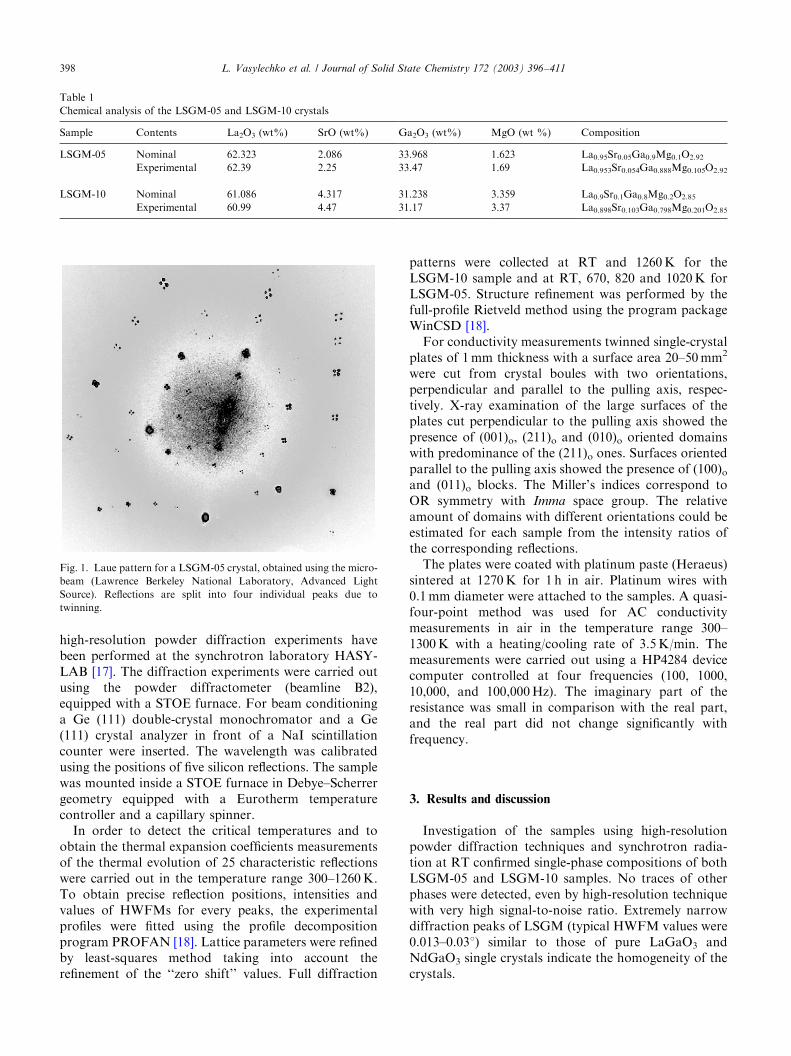
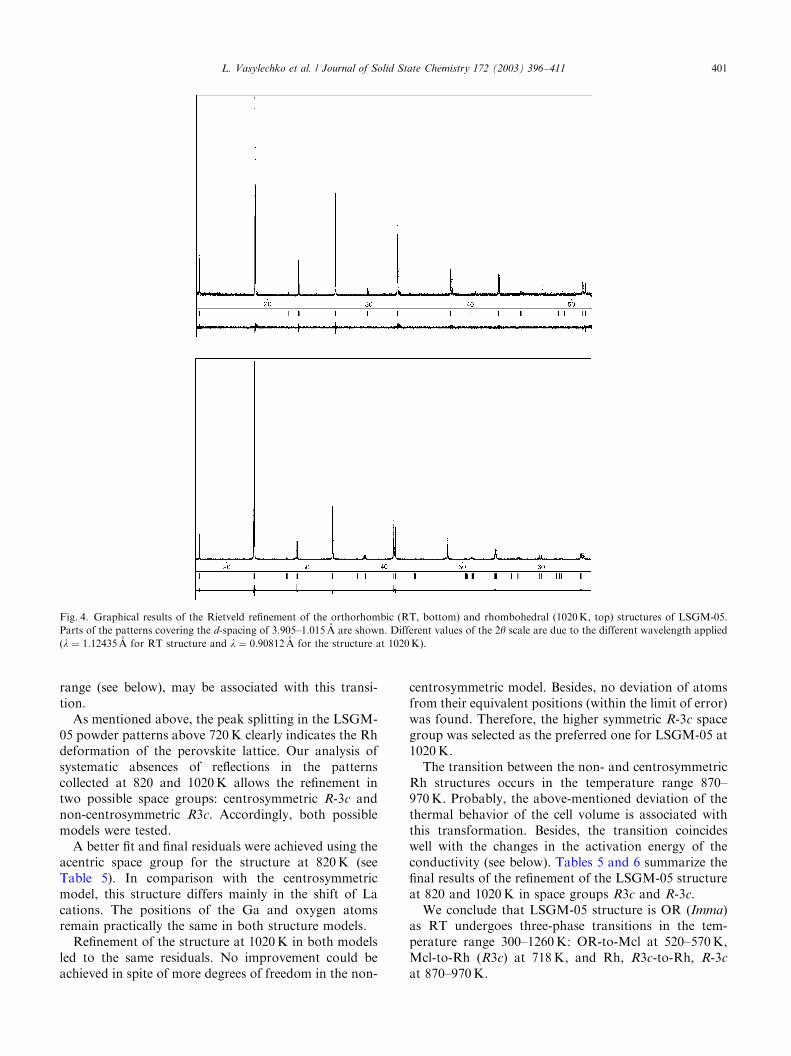
of the displacement factors for all atoms resulted in anexcellent fit of experimental and calculated profiles(Fig. 4) and led to the residuals RI ¼ 0:0282; RP ¼0:0855: The final values of the positional parameters, aswell as atomic displacement factors (adf’s) are collectedin Table 3; the corresponding interatomic distances aresummarized in Table 4.
The LSGM-05 structure at 670K was refined usingthe same model with quite satisfactory result (see Table3). Nevertheless, a detailed examination of the diffrac-tion profiles showed a broadening of some reflections.Broadening occurs for those reflections, which areexpected to split in a Mcl cell. For the RT structuresuch systematic broadening has not been observed(Fig. 5). Taking into account these results, as well asthe data of [6], a new refinement of both structures inMcl symmetry (space group I2/a) was performed.Somewhat better final residuals in comparison with theOR model could be obtained for the LSGM-05 structureat 670K, whereas no improvement of the fit or finalresiduals could be achieved for the RT structure (seeTable 3).
Fig. 6 presents experimental and fitted data in the d-spacing range of 2.242–2.27 A, corresponding to the(202)o and (220)o reflections of the OR phase, whichwere obtained for both, the OR and Mcl structuremodels. The figure shows that better fit is associatedwith the Mcl model for the LSGM-05 structure at670K, whereas for the RT structure no improvement isvisible. Within experimental error, Mcl angles obtained(b ¼ 90:002ð3Þ1) showed no deviation from the ortho-gonal lattice in the RT structure, whereas for thestructure at 670K a small Mcl distortion(b ¼ 90:035ð2Þ1) was found.
In order to study the transition between the OR andMcl structures in LSGM-05 an analysis of the HWFMvalues of the specified reflections in the temperaturerange 300–670K has been performed (Fig. 7). Consider-able broadening of the (404)o and (211)o Bragg peaksindicating the Mcl distortion begins at 570K, whereasthe HWFM values of other reflections remain practi-cally unchanged. Hence, it may be concluded that theOR-to-Mcl phase transition of LSGM-05 occurs in thetemperature range 520–570K. The change in slope ofthe conductivity, which is observed in this temperature
Table 2
Linear thermal expansion coefficients (K�1) of LSGM-05 and LSGM-10 along different crystallographic directions
LSGM-05 LSGM-10
300–670K
(Imma and I2/a structures)
720–1260K
(R3c and R-3c structures)
300–720K
(I2/a structure)
820–1260K
(R3c and R-3c structures)
aðaÞ 10.1� 10�6 9.0� 10�6 10.0� 10�6 9.6� 10�6
aðbÞ 11.0� 10�6 9.0� 10�6 12.0� 10�6 9.6� 10�6
aðcÞ 8.6� 10�6 14.0� 10�6 9.0� 10�6 14.0� 10�6
a (ave) 9.9� 10�6 10.7� 10�6 10.3� 10�6 11.1� 10�6
L. Vasylechko et al. / Journal of Solid State Chemistry 172 (2003) 396–411400
range (see below), may be associated with this transi-tion.
As mentioned above, the peak splitting in the LSGM-05 powder patterns above 720K clearly indicates the Rhdeformation of the perovskite lattice. Our analysis ofsystematic absences of reflections in the patternscollected at 820 and 1020K allows the refinement intwo possible space groups: centrosymmetric R-3c andnon-centrosymmetric R3c. Accordingly, both possiblemodels were tested.
A better fit and final residuals were achieved using theacentric space group for the structure at 820K (seeTable 5). In comparison with the centrosymmetricmodel, this structure differs mainly in the shift of Lacations. The positions of the Ga and oxygen atomsremain practically the same in both structure models.
Refinement of the structure at 1020K in both modelsled to the same residuals. No improvement could beachieved in spite of more degrees of freedom in the non-
centrosymmetric model. Besides, no deviation of atomsfrom their equivalent positions (within the limit of error)was found. Therefore, the higher symmetric R-3c spacegroup was selected as the preferred one for LSGM-05 at1020K.
The transition between the non- and centrosymmetricRh structures occurs in the temperature range 870–970K. Probably, the above-mentioned deviation of thethermal behavior of the cell volume is associated withthis transformation. Besides, the transition coincideswell with the changes in the activation energy of theconductivity (see below). Tables 5 and 6 summarize thefinal results of the refinement of the LSGM-05 structureat 820 and 1020K in space groups R3c and R-3c.
We conclude that LSGM-05 structure is OR (Imma)as RT undergoes three-phase transitions in the tem-perature range 300–1260K: OR-to-Mcl at 520–570K,Mcl-to-Rh (R3c) at 718K, and Rh, R3c-to-Rh, R-3c
at 870–970K.
Fig. 4. Graphical results of the Rietveld refinement of the orthorhombic (RT, bottom) and rhombohedral (1020K, top) structures of LSGM-05.
Parts of the patterns covering the d-spacing of 3.905–1.015 A are shown. Different values of the 2y scale are due to the different wavelength applied
(l ¼ 1:12435 A for RT structure and l ¼ 0:90812 A for the structure at 1020K).
L. Vasylechko et al. / Journal of Solid State Chemistry 172 (2003) 396–411 401
Table 3
Refined structural parameters of LSGM-05 (RT and 670K) and LSGM-10 (RT)
Atoms Parameters LSGM-05, RT LSGM-10, RT LSGM-05, 670K
Imma I2/a Imma I2/a Imma [1] I2/a
a (A) 7.79423(3) 7.79424(3) 7.82114(6) 7.82129(5) 7.8229(2) 7.8227(2)
b (A) 5.49896(2) 5.53807(2) 5.51645(4) 5.54361(3) 5.5208(2) 5.5555(1)
c (A) 5.53806(2) 5.49892(2) 5.54352(3) 5.51654(4) 5.5555(1) 5.5208(2)
b (deg) 90 90.002(3) 90 90.040(1) 90 90.035(2)
V (A3) 237.362(2) 237.363(2) 239.175(5) 239.187(5) 239.94(2) 239.93(2)
La/Sr x 0.25 0.25 0.25 0.25 0.25 0.25
y 0 �0.0027(3) 0 �0.0041(3) 0 �0.003(3)
z �0.0032(2) 0 �0.0032(4) 0 �0.004(2) 0
Beq 1.24(2) 1.33(2) 1.18(3) 1.29(3) 2.3(2) 2.4(2)
Site 0.95/0.05 0.95/0.05 0.90/0.10 0.90/0.10 0.95/0.05 0.95/0.05
Ga/Mg x 0 0 0 0 0 0
y 0 0.5 0 0.5 0 0.5
z 0.5 0 0.5 0 0.5 0
Beq 0.92(4) 1.01(4) 0.88(6) 0.86(5) 1.7(3) 1.6(3)
Sitea 0.893(4)/0.107(4) 0.893(4)/0.107(4) 0.786(5)/0.214(5) 0.765(4)/0.235(4) 0.90(3)/0.10(3) 0.87(3)/0.13(3)
O1 x 0.25 0.25 0.25 0.25 0.25 0.25
y 0 0.4325(13) 0 0.440(2) 0 0.450(12)
z 0.4315(13) 0 0.436(2) 0 0.442(11) 0
Beq 1.7(3) 1.8(3) 1.7(4) 1.9(5) 1.7(23) 2.0(23)
Sitea 0.99(1) 0.97(1) 0.91( 2) 0.81( 2) 0.96(8) 0.96(8)
O2 x �0.0356(7) 0.4661(9) 0.4651(11) 0.4674(14) �0.030(10) 0.465(7)
y 0.75 0.771(2) 0.75 0.735(4) 0.75 0.773(14)
z 0.25 0.228(2) 0.25 0.271(3) 0.25 0.234917)
Beq 1.8(2) 1.8(2) 2.2(3) 2.1(3) 2.0(18) 2.1(18)
Sitea 0.900(7) 0.919(8) 0.91( 1) 0.93(1) 0.86(6) 0.89(6)
RI 0.0282 0.0293 0.0457 0.0438 0.080 0.0773
RP 0.0855 0.0853 0.1473 0.1291 0.2310 0.1933
Anisotropic thermal parameters for LSGM-05 and LSGM-10 in orthorhombic and monoclinic lattices
Atoms LSGM-05, RT LSGM-10, RT LSGM-05, 670K
Imma I2/a Imma I2/a Imma I2/a
La(Sr) B11 1.07(3) 1.09(3) 1.15(5) 1.11(4) 2.4(3) 2.8(4)
B22 1.80(3) 0.96(3) 1.28(4) 1.19(4) 2.4(3) 2.0(3)
B33 0.84(3) 1.95(4) 1.12(4) 1.57(5) 2.2(4) 2.4(4)
B12 0 0 0 0 0 0
B13 0 �0.2(2) 0 �0.28(6) 0.2940 0.2940
B23 0 0 0 0 0 0
Ga(Mg) B11 0.87(7) 0.86(7) 0.96(11) 0.93(10) 1.5(6) 0.9(6)
B22 0.95(7) 1.09(6) 0.81(10) 0.96(8) 1.8(6) 1.6(5)
B33 0.96(5) 1.07(7) 0.87(9) 0.69(10)a 1.7(5) 2.3(6)
B12 0 0.3(2) 0 0.1(2) 0 �0.5(13)
B13 0 �0.4(6) �0.0(3) 0.50(14) �0.4(13) 0.7(7)
B23 0 0.1(3) 0 �0.4(4) 0 0.9(16)
O1 B11 1.3(4) 1.5(5) 0.9(6) 1.3(7) 2.3(34) 2.9(37)
B22 1.9(4) 2.1(5) 1.6(7) 2.4(9) 1.8(36) 0.9(46)
B33 1.9(5) 2.0(5) 2.6(8) 2.0(8) 0.9(49) 2.1(37)
B12 0 0 0 0 0 0
B13 0 2.1(13) 0 1.0(11) 0 1.2(53)
B23 0 0 0 0 0 0
O2 B11 1.1(4) 1.9(4) 2.4(7) 2.3(6) 2.6(42) 2.9(38)
B22 2.3(3) 1.6(3) 2.4(5) 2.0(4) 2.0(24) 1.5(26)
L. Vasylechko et al. / Journal of Solid State Chemistry 172 (2003) 396–411402
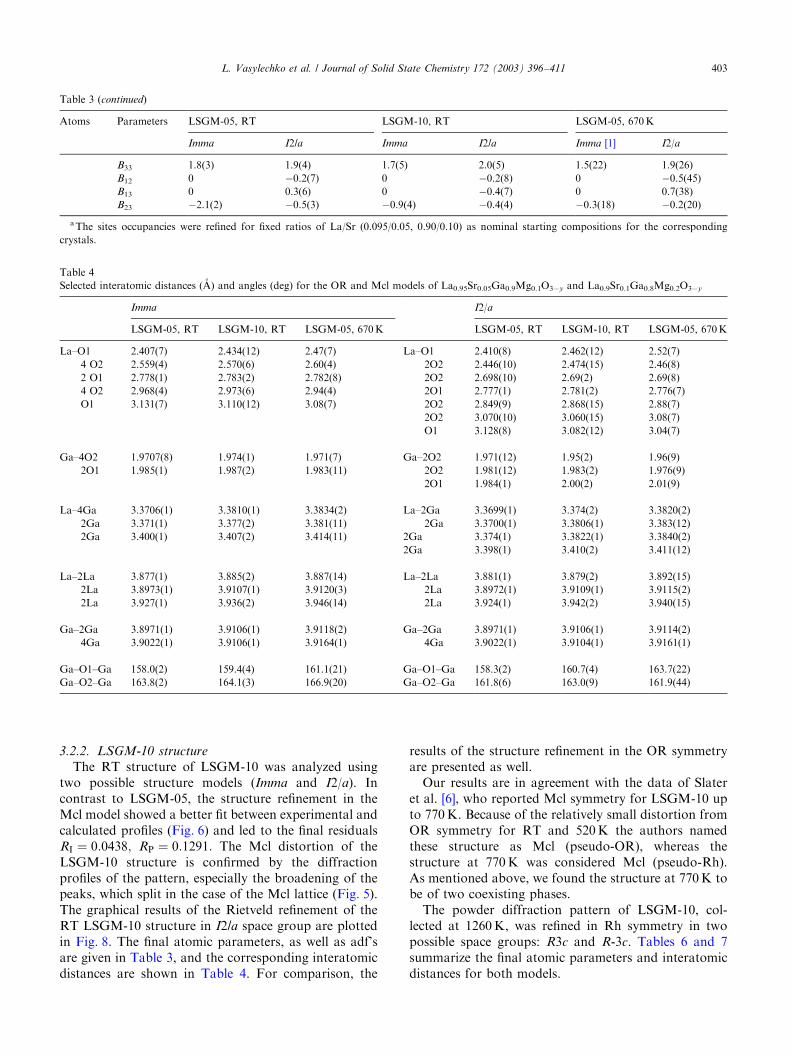
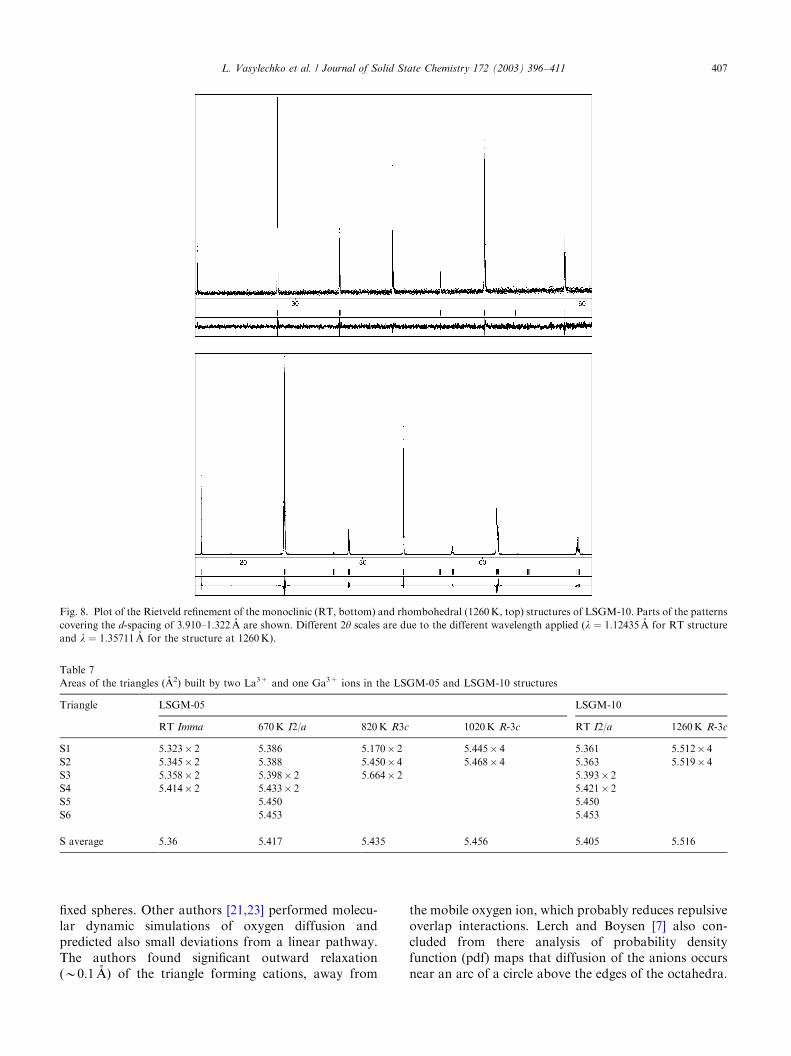
3.2.2. LSGM-10 structure
The RT structure of LSGM-10 was analyzed usingtwo possible structure models (Imma and I2/a). Incontrast to LSGM-05, the structure refinement in theMcl model showed a better fit between experimental andcalculated profiles (Fig. 6) and led to the final residualsRI ¼ 0:0438; RP ¼ 0:1291: The Mcl distortion of theLSGM-10 structure is confirmed by the diffractionprofiles of the pattern, especially the broadening of thepeaks, which split in the case of the Mcl lattice (Fig. 5).The graphical results of the Rietveld refinement of theRT LSGM-10 structure in I2/a space group are plottedin Fig. 8. The final atomic parameters, as well as adf’sare given in Table 3, and the corresponding interatomicdistances are shown in Table 4. For comparison, the
results of the structure refinement in the OR symmetryare presented as well.
Our results are in agreement with the data of Slateret al. [6], who reported Mcl symmetry for LSGM-10 upto 770K. Because of the relatively small distortion fromOR symmetry for RT and 520K the authors namedthese structure as Mcl (pseudo-OR), whereas thestructure at 770K was considered Mcl (pseudo-Rh).As mentioned above, we found the structure at 770K tobe of two coexisting phases.
The powder diffraction pattern of LSGM-10, col-lected at 1260K, was refined in Rh symmetry in twopossible space groups: R3c and R-3c. Tables 6 and 7summarize the final atomic parameters and interatomicdistances for both models.
Table 3 (continued)
Atoms Parameters LSGM-05, RT LSGM-10, RT LSGM-05, 670K
Imma I2/a Imma I2/a Imma [1] I2/a
B33 1.8(3) 1.9(4) 1.7(5) 2.0(5) 1.5(22) 1.9(26)
B12 0 �0.2(7) 0 �0.2(8) 0 �0.5(45)
B13 0 0.3(6) 0 �0.4(7) 0 0.7(38)
B23 �2.1(2) �0.5(3) �0.9(4) �0.4(4) �0.3(18) �0.2(20)
aThe sites occupancies were refined for fixed ratios of La/Sr (0.095/0.05, 0.90/0.10) as nominal starting compositions for the corresponding
crystals.
Table 4
Selected interatomic distances (A) and angles (deg) for the OR and Mcl models of La0.95Sr0.05Ga0.9Mg0.1O3�y and La0.9Sr0.1Ga0.8Mg0.2O3�y
Imma I2/a
LSGM-05, RT LSGM-10, RT LSGM-05, 670K LSGM-05, RT LSGM-10, RT LSGM-05, 670K
La–O1 2.407(7) 2.434(12) 2.47(7) La–O1 2.410(8) 2.462(12) 2.52(7)
4 O2 2.559(4) 2.570(6) 2.60(4) 2O2 2.446(10) 2.474(15) 2.46(8)
2 O1 2.778(1) 2.783(2) 2.782(8) 2O2 2.698(10) 2.69(2) 2.69(8)
4 O2 2.968(4) 2.973(6) 2.94(4) 2O1 2.777(1) 2.781(2) 2.776(7)
O1 3.131(7) 3.110(12) 3.08(7) 2O2 2.849(9) 2.868(15) 2.88(7)
2O2 3.070(10) 3.060(15) 3.08(7)
O1 3.128(8) 3.082(12) 3.04(7)
Ga–4O2 1.9707(8) 1.974(1) 1.971(7) Ga–2O2 1.971(12) 1.95(2) 1.96(9)
2O1 1.985(1) 1.987(2) 1.983(11) 2O2 1.981(12) 1.983(2) 1.976(9)
2O1 1.984(1) 2.00(2) 2.01(9)
La–4Ga 3.3706(1) 3.3810(1) 3.3834(2) La–2Ga 3.3699(1) 3.374(2) 3.3820(2)
2Ga 3.371(1) 3.377(2) 3.381(11) 2Ga 3.3700(1) 3.3806(1) 3.383(12)
2Ga 3.400(1) 3.407(2) 3.414(11) 2Ga 3.374(1) 3.3822(1) 3.3840(2)
2Ga 3.398(1) 3.410(2) 3.411(12)
La–2La 3.877(1) 3.885(2) 3.887(14) La–2La 3.881(1) 3.879(2) 3.892(15)
2La 3.8973(1) 3.9107(1) 3.9120(3) 2La 3.8972(1) 3.9109(1) 3.9115(2)
2La 3.927(1) 3.936(2) 3.946(14) 2La 3.924(1) 3.942(2) 3.940(15)
Ga–2Ga 3.8971(1) 3.9106(1) 3.9118(2) Ga–2Ga 3.8971(1) 3.9106(1) 3.9114(2)
4Ga 3.9022(1) 3.9106(1) 3.9164(1) 4Ga 3.9022(1) 3.9104(1) 3.9161(1)
Ga–O1–Ga 158.0(2) 159.4(4) 161.1(21) Ga–O1–Ga 158.3(2) 160.7(4) 163.7(22)
Ga–O2–Ga 163.8(2) 164.1(3) 166.9(20) Ga–O2–Ga 161.8(6) 163.0(9) 161.9(44)
L. Vasylechko et al. / Journal of Solid State Chemistry 172 (2003) 396–411 403

In contrast to the results of Slater who described the1270K structure in R3c space group [6], we did not findindications for an acentric lattice. In spite of theincreased number of parameters, the refinement in thenon-centrosymmetric space group did not lead to animproved fit; instead it showed even somewhat worseresiduals. These facts as well as detailed comparativeanalysis of both structure models show that the high-symmetry phase in R-3c space group is preferable for theHT structure of LSGM-10. Possibly two different Rhphases exist in this structure above 770K, similar as inLSGM-05. A second phase transition from the Mcl(pseudo-Rh) to the Rh structure occurred in the
temperature range 770–1020K (as reported in [6]). Thisis in fact the transition between two different Rhstructures. Another confirmation of this assumption isthe change of the activation energy of the conductivity,which is observed in Arrhenius plots of the correspond-ing curves (Chapters 3 and 4).
3.3. Site occupancies and oxygen diffusion pass
Refinements of the Ga/Mg and oxygen site occupan-cies performed at fixed La/Sr ratio are in goodagreement with the nominal starting composition forboth crystals (see Table 3). Repeated refinements of the
0.0 0.1 0.2 0.3 0.40.01
0.02
0.03
0.04
0.05
0.06
0.07
(213)(402)(231)
(411)(031)(013)
(022)
(202)(211)
(420)
(222)
(400)(220)
(020)(002)(011)
(200)
LSGM-05, 303 K
HW
FM
, deg
.
HW
FM
, deg
.
HW
FM
, deg
.
1/d2, A-2
0.01
0.02
0.03
0.04
0.05
0.06
0.07
(213)(402)
(220)(020),(002)
(420)(231)
(400)(022)
(202)
(211)(011)(200)
LSGM-05, 673 K
0.01
0.02
0.03
0.04
0.05
0.06
0.07
(031)(013)
(220)(213)
(231)(420)
(402)
(411)(222)
(400)(022)
(202)
(020)(002)
(211)
(011)(200)
LSGM-10, 303 K
1/d2, A-2 1/d2, A-2
0.0 0.1 0.2 0.3 0.4 0.0 0.1 0.2 0.3 0.4
Fig. 5. HWFM values of LSGM reflections. Systematic broadening of the (211)o, (202)o and (402)o orthorhombic reflections associated with the
monoclinic deformation of LSGM-05 (670K) and LSGM-10 (RT).
Fig. 6. Examples of profile fitting of (220)o and (202)o reflections for LSGM-05 and LSGM-10 using different structure models and symmetries.
L. Vasylechko et al. / Journal of Solid State Chemistry 172 (2003) 396–411404

300 400 500 600 7000.01
0.02
0.03
0.04
0.05
0.06
(440)o
(404)o
(002)o
(211)o
(020)o
HW
FM
, deg
.
Temperature, K300 400 500 600 700
0.75
1.00
1.25
1.50
1.75
2.00
2.25
2.50 (404)
o/(440)
o ratio
(211)o/(020)
o ratio
FW
HM
rat
io
Temperature, K
Fig. 7. Thermal evolution of the HWFM values of (440)o, (404)o, (211)o, (020)o and (002)o reflections (left) and their ratio (right) for the LSGM-05
structure.
Table 5
Refined structural parameters of the rhombohedral structures of LSGM-05 and LSGM-10 crystals
LSGM-05, 820K LSGM-05, 1020K LSGM-10, 1260K
R-3c R3c R-3c R3c R-3c R3c
a (A) 5.55622(8) 5.55628(8) 5.56689(6) 5.56687(5) 5.5894(1) 5.58985(8)
c (A) 13.5086(3) 13.5088(3) 13.5528(2) 13.5528(2) 13.6644(4) 13.6654(3)
V (A3) 361.16(2) 361.17(2) 363.73(1) 363.73(1) 369.79(2) 369.79(2)
La/Sr x 0 0 0 0 0 0
y 0 0 0 0 0 0
z 0.25 0.2604(8) 0.25 0.2541(12) 0.25 0.257(6)
Beq 1.5(2) 2.72(14) 2.3(2) 2.45(8) 2.0(12) 2.0(5)
B11, B22 0.9(3) 1.5(2) 2.2(2) 2.27(9) 1.9(13) 1.9(6)
B33 2.9(4) 5.2(3) 2.6(3) 2.6(2) 2.2(24) 2.2(11)
B12 1/2B11 1/2B11 1/2B11 1/2B11 1/2B11 1/2B11
B13, B23 0 0 0 0 0 0
Site 0.95/0.05 0.95/0.05 0.95/0.05 0.95/0.05 0.95/0.05 0.95/0.05
Ga/Mg x 0 0 0 0 0 0
y 0 0 0 0 0 0
z 0 �0.0010(10) 0 0.0006(14) 0 0.007(5)
Beq 1.5(5) 1.5(2) 1.8(2) 1.82(13) 2.5(16) 1.9(8)
B11, B22 0.3(5) 1.7(3) 1.9(3) 1.99(15) 2.8(18) 2.4(9)
B33 3.8(9) 0.9(4) 1.7(5) 1.5(2) 1.8(32) 1.0(15)
B12 1/2B11 1/2B11 1/2B11 1/2B11 1/2B11 1/2B11
B13, B23 0 0 0 0 0 0
Sitea 0.87(6)/0.13(6) 0.90(3)/0.10(3) 0.91(3)/0.09(3) 0.90(1)/0.10(1) 0.81(2)/0.09(2) 0.80(2)/0.20(2)
O x 0.463(11) 0.462(4) 0.453(7) 0.453(3) 0.461(9) 0.451(9)
y 0 0.006(5) 0 0.004(6) 0 �0.003(16)
z 0.25 0.252(3) 0.25 0.246(4) 0.25 0.243(7)
Beq 5.0(22) 5.2(15) 5.3(16) 4.1(26) 7.6(64) 4.7(34)
B11 6.0(21) 2.2(38) 9.5(83) 6.7(34)
B22 4.4(20) 4.1(10) 4.5(87) 3.8(46)
B33 4.8(23) 3.6(11) 7.2(93) 3.2(55)
B12 1/2B22 �0.3(41) 1/2B22 2.3(30)
B13 �2.1(8) �0.9(38) �1.2(34) 0.7(��)
B23 2B13 �1.1(8) 2B13 0.1(32)
Sitea 0.98(6) 0.97(3) 0.95(5) 0.95(2) 0.94(4) 0.93(4)
RI 0.0593 0.0581 0.0522 0.0522 0.0294 0.0314
RP 0.2008 0.1957 0.1466 0.1478 0.1522 0.1579
aThe sites occupancies were refined at the fixed La/Sr (0.095/0.05, 0.9/0.1) nominal starting composition for the corresponding crystals.
L. Vasylechko et al. / Journal of Solid State Chemistry 172 (2003) 396–411 405
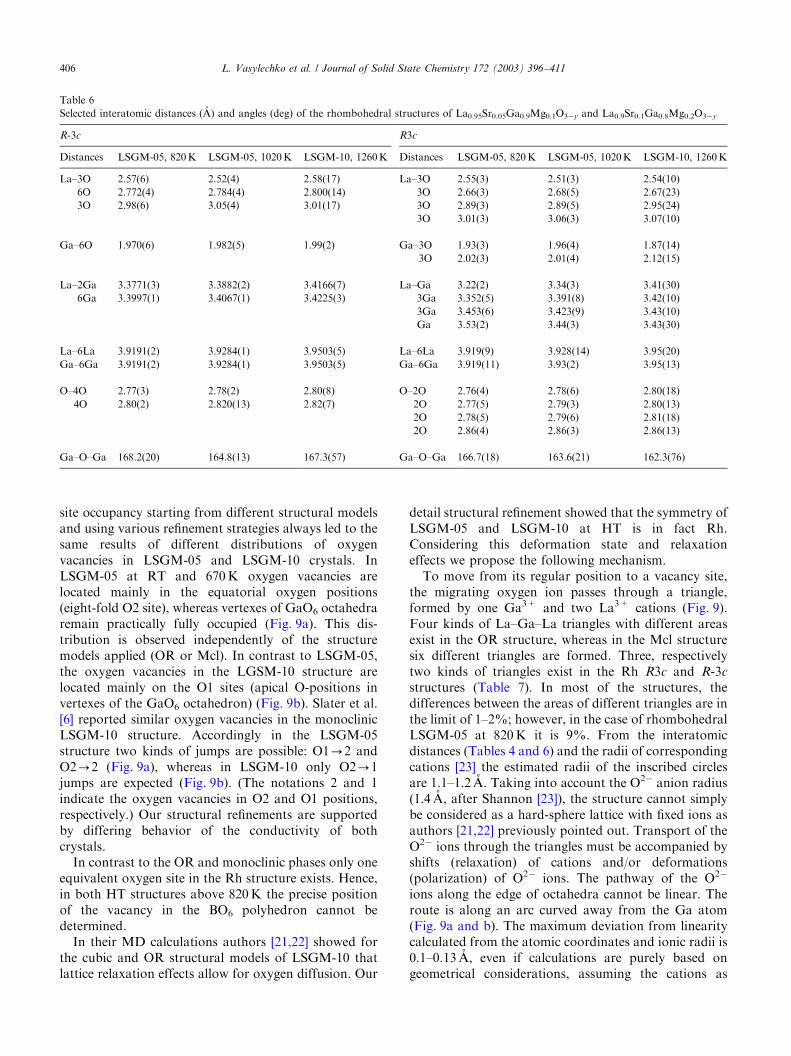
site occupancy starting from different structural modelsand using various refinement strategies always led to thesame results of different distributions of oxygenvacancies in LSGM-05 and LSGM-10 crystals. InLSGM-05 at RT and 670K oxygen vacancies arelocated mainly in the equatorial oxygen positions(eight-fold O2 site), whereas vertexes of GaO6 octahedraremain practically fully occupied (Fig. 9a). This dis-tribution is observed independently of the structuremodels applied (OR or Mcl). In contrast to LSGM-05,the oxygen vacancies in the LGSM-10 structure arelocated mainly on the O1 sites (apical O-positions invertexes of the GaO6 octahedron) (Fig. 9b). Slater et al.[6] reported similar oxygen vacancies in the monoclinicLSGM-10 structure. Accordingly in the LSGM-05structure two kinds of jumps are possible: O1-2 andO2-2 (Fig. 9a), whereas in LSGM-10 only O2-1jumps are expected (Fig. 9b). (The notations 2 and 1indicate the oxygen vacancies in O2 and O1 positions,respectively.) Our structural refinements are supportedby differing behavior of the conductivity of bothcrystals.
In contrast to the OR and monoclinic phases only oneequivalent oxygen site in the Rh structure exists. Hence,in both HT structures above 820K the precise positionof the vacancy in the BO6 polyhedron cannot bedetermined.
In their MD calculations authors [21,22] showed forthe cubic and OR structural models of LSGM-10 thatlattice relaxation effects allow for oxygen diffusion. Our
detail structural refinement showed that the symmetry ofLSGM-05 and LSGM-10 at HT is in fact Rh.Considering this deformation state and relaxationeffects we propose the following mechanism.
To move from its regular position to a vacancy site,the migrating oxygen ion passes through a triangle,formed by one Ga3+ and two La3+ cations (Fig. 9).Four kinds of La–Ga–La triangles with different areasexist in the OR structure, whereas in the Mcl structuresix different triangles are formed. Three, respectivelytwo kinds of triangles exist in the Rh R3c and R-3c
structures (Table 7). In most of the structures, thedifferences between the areas of different triangles are inthe limit of 1–2%; however, in the case of rhombohedralLSGM-05 at 820K it is 9%. From the interatomicdistances (Tables 4 and 6) and the radii of correspondingcations [23] the estimated radii of the inscribed circlesare 1.1–1.2 A. Taking into account the O2� anion radius(1.4 A, after Shannon [23]), the structure cannot simplybe considered as a hard-sphere lattice with fixed ions asauthors [21,22] previously pointed out. Transport of theO2� ions through the triangles must be accompanied byshifts (relaxation) of cations and/or deformations(polarization) of O2� ions. The pathway of the O2�
ions along the edge of octahedra cannot be linear. Theroute is along an arc curved away from the Ga atom(Fig. 9a and b). The maximum deviation from linearitycalculated from the atomic coordinates and ionic radii is0.1–0.13 A, even if calculations are purely based ongeometrical considerations, assuming the cations as
Table 6
Selected interatomic distances (A) and angles (deg) of the rhombohedral structures of La0.95Sr0.05Ga0.9Mg0.1O3�y and La0.9Sr0.1Ga0.8Mg0.2O3�y
R-3c R3c
Distances LSGM-05, 820K LSGM-05, 1020K LSGM-10, 1260K Distances LSGM-05, 820K LSGM-05, 1020K LSGM-10, 1260K
La–3O 2.57(6) 2.52(4) 2.58(17) La–3O 2.55(3) 2.51(3) 2.54(10)
6O 2.772(4) 2.784(4) 2.800(14) 3O 2.66(3) 2.68(5) 2.67(23)
3O 2.98(6) 3.05(4) 3.01(17) 3O 2.89(3) 2.89(5) 2.95(24)
3O 3.01(3) 3.06(3) 3.07(10)
Ga–6O 1.970(6) 1.982(5) 1.99(2) Ga–3O 1.93(3) 1.96(4) 1.87(14)
3O 2.02(3) 2.01(4) 2.12(15)
La–2Ga 3.3771(3) 3.3882(2) 3.4166(7) La–Ga 3.22(2) 3.34(3) 3.41(30)
6Ga 3.3997(1) 3.4067(1) 3.4225(3) 3Ga 3.352(5) 3.391(8) 3.42(10)
3Ga 3.453(6) 3.423(9) 3.43(10)
Ga 3.53(2) 3.44(3) 3.43(30)
La–6La 3.9191(2) 3.9284(1) 3.9503(5) La–6La 3.919(9) 3.928(14) 3.95(20)
Ga–6Ga 3.9191(2) 3.9284(1) 3.9503(5) Ga–6Ga 3.919(11) 3.93(2) 3.95(13)
O–4O 2.77(3) 2.78(2) 2.80(8) O–2O 2.76(4) 2.78(6) 2.80(18)
4O 2.80(2) 2.820(13) 2.82(7) 2O 2.77(5) 2.79(3) 2.80(13)
2O 2.78(5) 2.79(6) 2.81(18)
2O 2.86(4) 2.86(3) 2.86(13)
Ga–O–Ga 168.2(20) 164.8(13) 167.3(57) Ga–O–Ga 166.7(18) 163.6(21) 162.3(76)
L. Vasylechko et al. / Journal of Solid State Chemistry 172 (2003) 396–411406
fixed spheres. Other authors [21,23] performed molecu-lar dynamic simulations of oxygen diffusion andpredicted also small deviations from a linear pathway.The authors found significant outward relaxation(B0.1 A) of the triangle forming cations, away from
the mobile oxygen ion, which probably reduces repulsiveoverlap interactions. Lerch and Boysen [7] also con-cluded from there analysis of probability densityfunction (pdf) maps that diffusion of the anions occursnear an arc of a circle above the edges of the octahedra.
Fig. 8. Plot of the Rietveld refinement of the monoclinic (RT, bottom) and rhombohedral (1260K, top) structures of LSGM-10. Parts of the patterns
covering the d-spacing of 3.910–1.322 A are shown. Different 2y scales are due to the different wavelength applied (l ¼ 1:12435 A for RT structure
and l ¼ 1:35711 A for the structure at 1260K).
Table 7
Areas of the triangles (A2) built by two La3+ and one Ga3+ ions in the LSGM-05 and LSGM-10 structures
Triangle LSGM-05 LSGM-10
RT Imma 670K I2/a 820K R3c 1020K R-3c RT I2/a 1260K R-3c
S1 5.323� 2 5.386 5.170� 2 5.445� 4 5.361 5.512� 4
S2 5.345� 2 5.388 5.450� 4 5.468� 4 5.363 5.519� 4
S3 5.358� 2 5.398� 2 5.664� 2 5.393� 2
S4 5.414� 2 5.433� 2 5.421� 2
S5 5.450 5.450
S6 5.453 5.453
S average 5.36 5.417 5.435 5.456 5.405 5.516
L. Vasylechko et al. / Journal of Solid State Chemistry 172 (2003) 396–411 407

Different oxygen vacancy distributions in LSGM-05and LSGM-10, as well as their structural characteristicsseem to explain the different conductivity in bothcrystals.
3.4. Conductivity
Fig. 10 illustrates the thermal evolution of theconductivity (s) of the crystal sample LSGM-10 1(Table 8) measured at different frequencies. Theconductivity values in the high-temperature regionapproach the same value at all frequencies. The
frequency of 1000Hz was chosen as a reference forfurther conductivity studies in this work. The conduc-tivity was measured in the temperature range 570–1270K. The small imaging part of the resistance couldbe neglected for all samples.
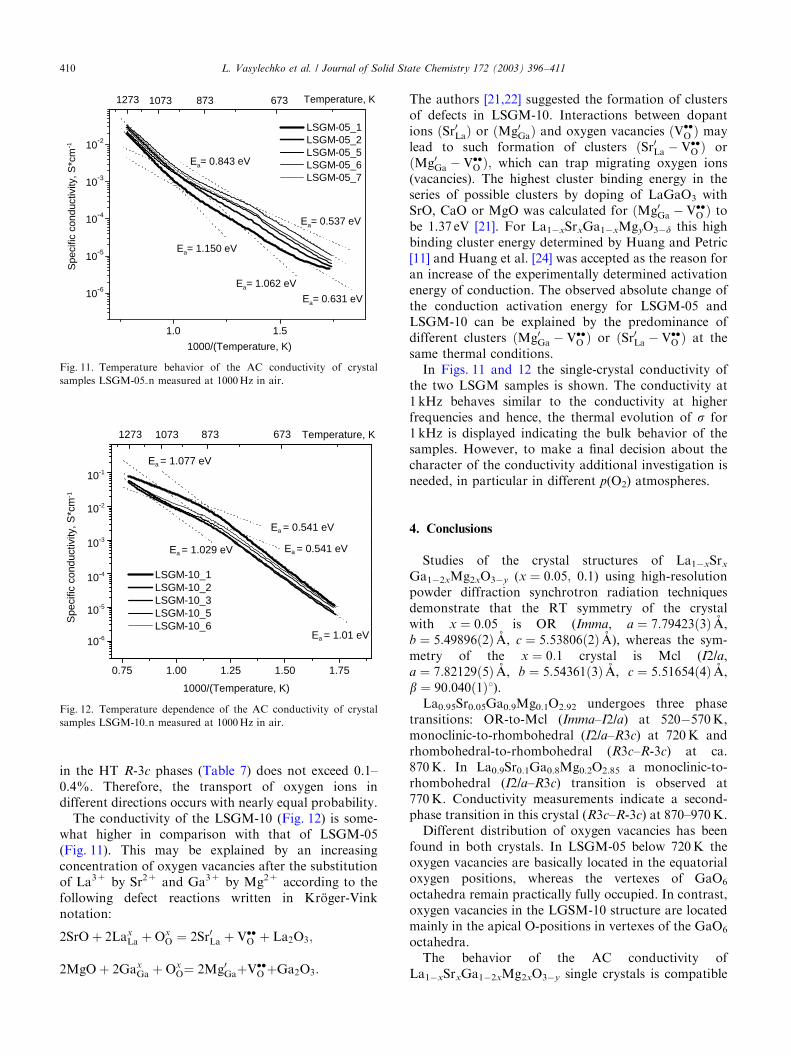
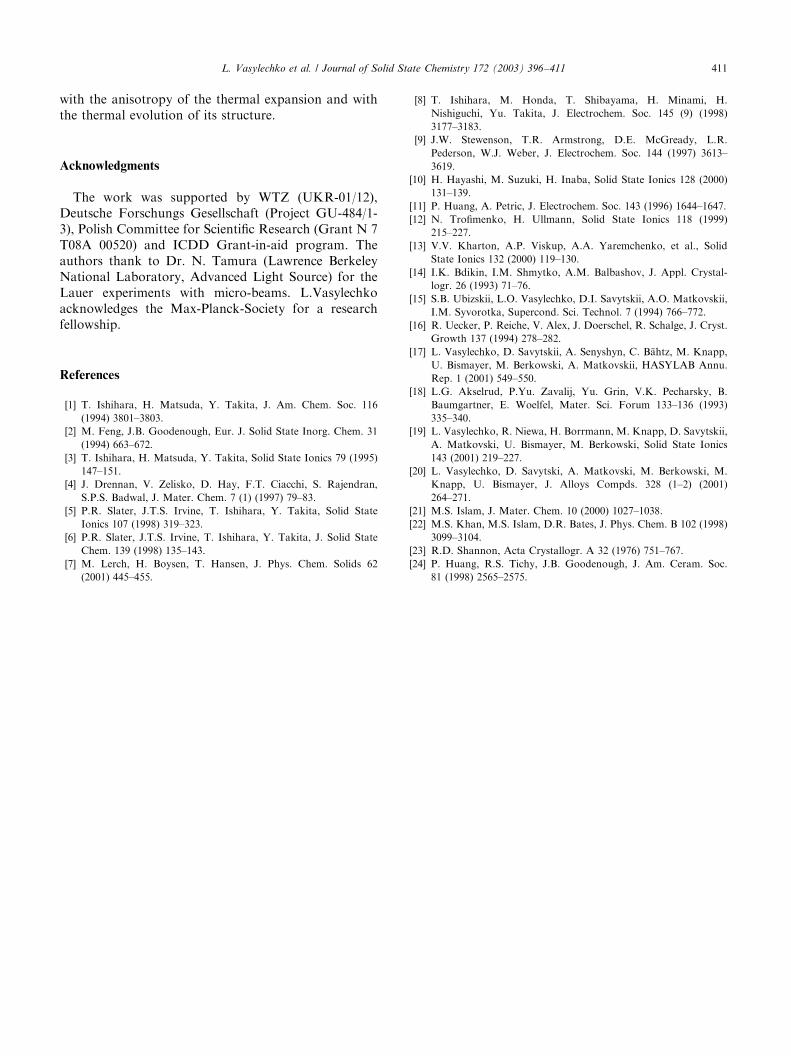
Figs. 11 and 12 display the behavior of the conduc-tivity versus temperature during heating/cooling of theLSGM-05 and LSGM-10 samples, respectively. Theconductivity values collected on heating resemble thedata on cooling. Three temperature intervals withdifferent activation energies are seen in Table 8 forLSGM-05 and LSGM-10 between 570 and 1270K.
Generally the activation energy decreases at highertemperatures if cubic symmetry is approached. Thestudied samples remain Rh and anisotropic at hightemperatures and, hence, the activation energy does notfollow the classical trend. Changes of the slope of theconductivity curves coincide with the structural transi-tions and thermal expansion anomalies (see Sections 3.1and 3.2).
In Fig. 11, an increase of the slope of the conductivityversus temperature for LSGM-05 1 and LSGM-05 2 isdisplayed. The change in slope above 570K is related tothe transition of the crystals from the orthorhombic RTmodification to the Mcl phase. Further heating ofLSGM-05 is accompanied by anomaly in the conduc-tivity near 710K, which is consistent with the observeddiscontinuities of the thermal expansion (Fig. 3) andwith the transition of the Mcl to the Rh (R3c) phase.Surprisingly, the minimum of the activation energy isobserved in the temperature range 720–970K (Table 8),which corresponds to the acentric Rh structure ofLSGM-05. Probably, the reason of such behavior inR3c phase is the La–Ga–La triangles with maximum
Fig. 9. Projection of the LSGM-05 (left) and LSGM-10 (right) structure showing different locations of oxygen vacancies and possible pathways
of anion migration.
1.0 1.5 2.0 2.510-9
10-8
10-7
10-6
10-5
10-4
10-3
10-2
10-1
100Temperature, K
100000 Hz
10000 Hz
1000 Hz
100 Hz
1000/Temperature, K
AC
con
duct
ivity
, S/c
m
LSGM-10_1
47367387310731273
Fig. 10. Temperature dependence of the real part of the AC
conductivity of crystal sample LSGM-10 1 measured at different
frequencies.
L. Vasylechko et al. / Journal of Solid State Chemistry 172 (2003) 396–411408
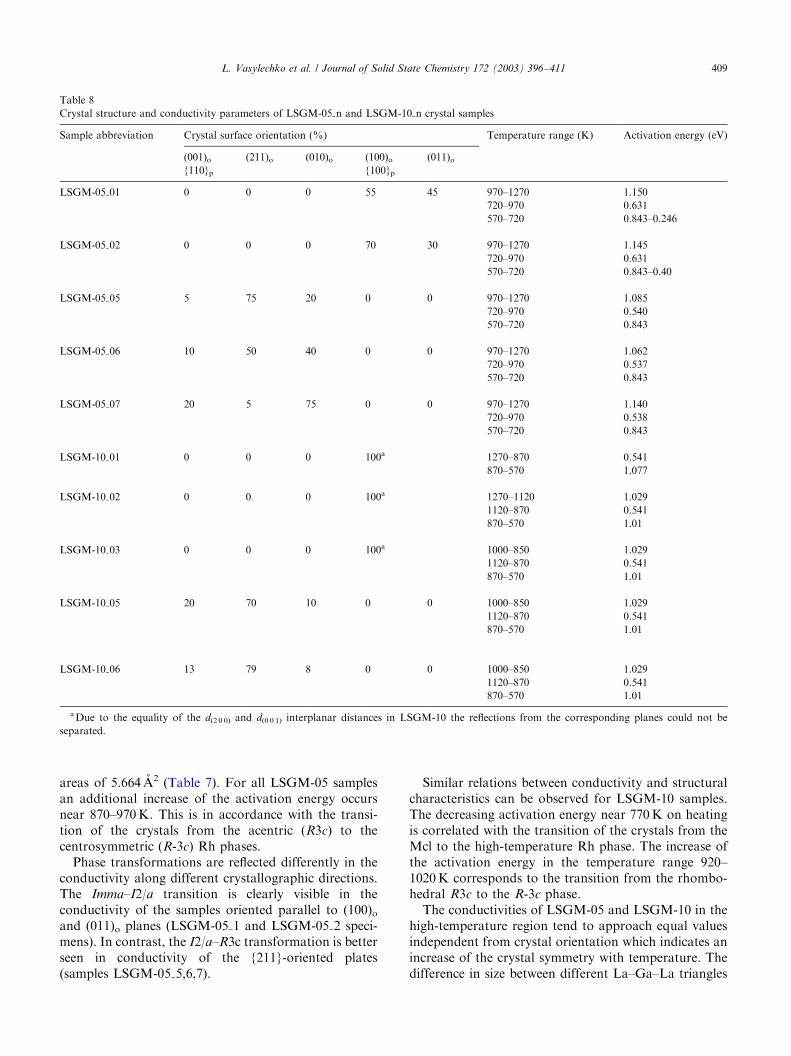
areas of 5.664 A2 (Table 7). For all LSGM-05 samplesan additional increase of the activation energy occursnear 870–970K. This is in accordance with the transi-tion of the crystals from the acentric (R3c) to thecentrosymmetric (R-3c) Rh phases.
Phase transformations are reflected differently in theconductivity along different crystallographic directions.The Imma–I2/a transition is clearly visible in theconductivity of the samples oriented parallel to (100)oand (011)o planes (LSGM-05 1 and LSGM-05 2 speci-mens). In contrast, the I2/a–R3c transformation is betterseen in conductivity of the {211}-oriented plates(samples LSGM-05 5,6,7).
Similar relations between conductivity and structuralcharacteristics can be observed for LSGM-10 samples.The decreasing activation energy near 770K on heatingis correlated with the transition of the crystals from theMcl to the high-temperature Rh phase. The increase ofthe activation energy in the temperature range 920–1020K corresponds to the transition from the rhombo-hedral R3c to the R-3c phase.
The conductivities of LSGM-05 and LSGM-10 in thehigh-temperature region tend to approach equal valuesindependent from crystal orientation which indicates anincrease of the crystal symmetry with temperature. Thedifference in size between different La–Ga–La triangles
Table 8
Crystal structure and conductivity parameters of LSGM-05 n and LSGM-10 n crystal samples
Sample abbreviation Crystal surface orientation (%) Temperature range (K) Activation energy (eV)
(001)o (211)o (010)o (100)o (011)o{110}p {100}p
LSGM-05 01 0 0 0 55 45 970–1270 1.150
720–970 0.631
570–720 0.843–0.246
LSGM-05 02 0 0 0 70 30 970–1270 1.145
720–970 0.631
570–720 0.843–0.40
LSGM-05 05 5 75 20 0 0 970–1270 1.085
720–970 0.540
570–720 0.843
LSGM-05 06 10 50 40 0 0 970–1270 1.062
720–970 0.537
570–720 0.843
LSGM-05 07 20 5 75 0 0 970–1270 1.140
720–970 0.538
570–720 0.843
LSGM-10 01 0 0 0 100a 1270–870 0.541
870–570 1.077
LSGM-10 02 0 0 0 100a 1270–1120 1.029
1120–870 0.541
870–570 1.01
LSGM-10 03 0 0 0 100a 1000–850 1.029
1120–870 0.541
870–570 1.01
LSGM-10 05 20 70 10 0 0 1000–850 1.029
1120–870 0.541
870–570 1.01
LSGM-10 06 13 79 8 0 0 1000–850 1.029
1120–870 0.541
870–570 1.01
aDue to the equality of the d(2 0 0) and d(0 0 1) interplanar distances in LSGM-10 the reflections from the corresponding planes could not be
separated.
L. Vasylechko et al. / Journal of Solid State Chemistry 172 (2003) 396–411 409
in the HT R-3c phases (Table 7) does not exceed 0.1–0.4%. Therefore, the transport of oxygen ions indifferent directions occurs with nearly equal probability.
The conductivity of the LSGM-10 (Fig. 12) is some-what higher in comparison with that of LSGM-05(Fig. 11). This may be explained by an increasingconcentration of oxygen vacancies after the substitutionof La3+ by Sr2+ and Ga3+ by Mg2+ according to thefollowing defect reactions written in Kroger-Vinknotation:
2SrOþ 2LaxLa þOx
O ¼ 2Sr0La þ VO þ La2O3;
2MgOþ 2GaxGa þOx
O¼ 2Mg0GaþVOþGa2O3:
The authors [21,22] suggested the formation of clustersof defects in LSGM-10. Interactions between dopantions ðSr0LaÞ or ðMg0GaÞ and oxygen vacancies ðV
O Þ maylead to such formation of clusters ðSr0La � V
O Þ orðMg0Ga � V
O Þ; which can trap migrating oxygen ions(vacancies). The highest cluster binding energy in theseries of possible clusters by doping of LaGaO3 withSrO, CaO or MgO was calculated for ðMg0Ga � V
O Þ tobe 1.37 eV [21]. For La1�xSrxGa1�xMgyO3�d this highbinding cluster energy determined by Huang and Petric[11] and Huang et al. [24] was accepted as the reason foran increase of the experimentally determined activationenergy of conduction. The observed absolute change ofthe conduction activation energy for LSGM-05 andLSGM-10 can be explained by the predominance ofdifferent clusters ðMg0Ga � V
O Þ or ðSr0La � VO Þ at the
same thermal conditions.In Figs. 11 and 12 the single-crystal conductivity of
the two LSGM samples is shown. The conductivity at1 kHz behaves similar to the conductivity at higherfrequencies and hence, the thermal evolution of s for1 kHz is displayed indicating the bulk behavior of thesamples. However, to make a final decision about thecharacter of the conductivity additional investigation isneeded, in particular in different p(O2) atmospheres.
4. Conclusions
Studies of the crystal structures of La1�xSrx
Ga1�2xMg2xO3�y (x ¼ 0:05; 0.1) using high-resolutionpowder diffraction synchrotron radiation techniquesdemonstrate that the RT symmetry of the crystalwith x ¼ 0:05 is OR (Imma, a ¼ 7:79423ð3Þ A,b ¼ 5:49896ð2Þ A, c ¼ 5:53806ð2Þ A), whereas the sym-metry of the x ¼ 0:1 crystal is Mcl (I2/a,a ¼ 7:82129ð5Þ A, b ¼ 5:54361ð3Þ A, c ¼ 5:51654ð4Þ A,b ¼ 90:040ð1Þ1).
La0.95Sr0.05Ga0.9Mg0.1O2.92 undergoes three phasetransitions: OR-to-Mcl (Imma–I2/a) at 520�570K,monoclinic-to-rhombohedral (I2/a–R3c) at 720K andrhombohedral-to-rhombohedral (R3c–R-3c) at ca.870K. In La0.9Sr0.1Ga0.8Mg0.2O2.85 a monoclinic-to-rhombohedral (I2/a–R3c) transition is observed at770K. Conductivity measurements indicate a second-phase transition in this crystal (R3c–R-3c) at 870–970K.
Different distribution of oxygen vacancies has beenfound in both crystals. In LSGM-05 below 720K theoxygen vacancies are basically located in the equatorialoxygen positions, whereas the vertexes of GaO6
octahedra remain practically fully occupied. In contrast,oxygen vacancies in the LGSM-10 structure are locatedmainly in the apical O-positions in vertexes of the GaO6
octahedra.The behavior of the AC conductivity of
La1�xSrxGa1�2xMg2xO3�y single crystals is compatible
1.0 1.5
10-6
10-5
10-4
10-3
10-2
LSGM-05_1 LSGM-05_2 LSGM-05_5 LSGM-05_6 LSGM-05_7
Temperature, K
Spe
cific
con
duct
ivity
, S*c
m-1
1000/(Temperature, K)
67387310731273
Ea= 0.631 eV
Ea= 1.062 eV
Ea= 1.150 eV
Ea= 0.537 eV
Ea= 0.843 eV
Fig. 11. Temperature behavior of the AC conductivity of crystal
samples LSGM-05 n measured at 1000Hz in air.
0.75 1.00 1.25 1.50 1.75
10-6
10-5
10-4
10-3
10-2
10-1
Ea = 1.01 eV
Ea = 0.541 eV
Ea = 0.541 eV
Ea = 1.077 eV
Ea = 1.029 eV
LSGM-10_1 LSGM-10_2 LSGM-10_3 LSGM-10_5 LSGM-10_6
Spe
cific
con
duct
ivity
, S*c
m-1
1000/(Temperature, K)
Temperature, K10731273 873 673
Fig. 12. Temperature dependence of the AC conductivity of crystal
samples LSGM-10 n measured at 1000Hz in air.
L. Vasylechko et al. / Journal of Solid State Chemistry 172 (2003) 396–411410
with the anisotropy of the thermal expansion and withthe thermal evolution of its structure.
Acknowledgments
The work was supported by WTZ (UKR-01/12),Deutsche Forschungs Gesellschaft (Project GU-484/1-3), Polish Committee for Scientific Research (Grant N 7T08A 00520) and ICDD Grant-in-aid program. Theauthors thank to Dr. N. Tamura (Lawrence BerkeleyNational Laboratory, Advanced Light Source) for theLauer experiments with micro-beams. L.Vasylechkoacknowledges the Max-Planck-Society for a researchfellowship.
References
[1] T. Ishihara, H. Matsuda, Y. Takita, J. Am. Chem. Soc. 116
(1994) 3801–3803.
[2] M. Feng, J.B. Goodenough, Eur. J. Solid State Inorg. Chem. 31
(1994) 663–672.
[3] T. Ishihara, H. Matsuda, Y. Takita, Solid State Ionics 79 (1995)
147–151.
[4] J. Drennan, V. Zelisko, D. Hay, F.T. Ciacchi, S. Rajendran,
S.P.S. Badwal, J. Mater. Chem. 7 (1) (1997) 79–83.
[5] P.R. Slater, J.T.S. Irvine, T. Ishihara, Y. Takita, Solid State
Ionics 107 (1998) 319–323.
[6] P.R. Slater, J.T.S. Irvine, T. Ishihara, Y. Takita, J. Solid State
Chem. 139 (1998) 135–143.
[7] M. Lerch, H. Boysen, T. Hansen, J. Phys. Chem. Solids 62
(2001) 445–455.
[8] T. Ishihara, M. Honda, T. Shibayama, H. Minami, H.
Nishiguchi, Yu. Takita, J. Electrochem. Soc. 145 (9) (1998)
3177–3183.
[9] J.W. Stewenson, T.R. Armstrong, D.E. McGready, L.R.
Pederson, W.J. Weber, J. Electrochem. Soc. 144 (1997) 3613–
3619.
[10] H. Hayashi, M. Suzuki, H. Inaba, Solid State Ionics 128 (2000)
131–139.
[11] P. Huang, A. Petric, J. Electrochem. Soc. 143 (1996) 1644–1647.
[12] N. Trofimenko, H. Ullmann, Solid State Ionics 118 (1999)
215–227.
[13] V.V. Kharton, A.P. Viskup, A.A. Yaremchenko, et al., Solid
State Ionics 132 (2000) 119–130.
[14] I.K. Bdikin, I.M. Shmytko, A.M. Balbashov, J. Appl. Crystal-
logr. 26 (1993) 71–76.
[15] S.B. Ubizskii, L.O. Vasylechko, D.I. Savytskii, A.O. Matkovskii,
I.M. Syvorotka, Supercond. Sci. Technol. 7 (1994) 766–772.
[16] R. Uecker, P. Reiche, V. Alex, J. Doerschel, R. Schalge, J. Cryst.
Growth 137 (1994) 278–282.
[17] L. Vasylechko, D. Savytskii, A. Senyshyn, C. Bahtz, M. Knapp,
U. Bismayer, M. Berkowski, A. Matkovskii, HASYLAB Annu.
Rep. 1 (2001) 549–550.
[18] L.G. Akselrud, P.Yu. Zavalij, Yu. Grin, V.K. Pecharsky, B.
Baumgartner, E. Woelfel, Mater. Sci. Forum 133–136 (1993)
335–340.
[19] L. Vasylechko, R. Niewa, H. Borrmann, M. Knapp, D. Savytskii,
A. Matkovski, U. Bismayer, M. Berkowski, Solid State Ionics
143 (2001) 219–227.
[20] L. Vasylechko, D. Savytski, A. Matkovski, M. Berkowski, M.
Knapp, U. Bismayer, J. Alloys Compds. 328 (1–2) (2001)
264–271.
[21] M.S. Islam, J. Mater. Chem. 10 (2000) 1027–1038.
[22] M.S. Khan, M.S. Islam, D.R. Bates, J. Phys. Chem. B 102 (1998)
3099–3104.
[23] R.D. Shannon, Acta Crystallogr. A 32 (1976) 751–767.
[24] P. Huang, R.S. Tichy, J.B. Goodenough, J. Am. Ceram. Soc.
81 (1998) 2565–2575.
L. Vasylechko et al. / Journal of Solid State Chemistry 172 (2003) 396–411 411