Structure-Based Analysis of Tissue-Specific Post ... - mediaTUM
202
TECHNISCHE UNIVERSITÄT MÜNCHEN Lehrstuhl für Genomorientierte Bioinformatik Structure-Based Analysis of Tissue-Specific Post-translational Modifications NERMIN PINAR KARABULUT Vollständiger Abdruck der von der Fakultät Wissenschaftszentrum Weihenstephan für Ernährung, Landnutzung und Umwelt der Technischen Universität München zur Erlangung des akademischen Grades eines Doktors der Naturwissenschaften genehmigten Dissertation. Vorsitzender: Prof. Dr. Aurélien Tellier Prüfer der Dissertation: 1. Prof. Dr.rer.nat. Dmitrij Frischmann 2. Prof. Dr.rer.nat. Jürgen Cox (University of Copenhagen) Die Dissertation wurde am 07.04.2016 bei der Technischen Universität München eingereicht und durch die Fakultät Wissenschaftszentrum Weihenstephan für Ernährung, Landnutzung und Umwelt am 20.06.2016 angenommen. [ July 10, 2016 at 22:13 – classicthesis version 4.2 ]
-
Upload
khangminh22 -
Category
Documents
-
view
0 -
download
0
Transcript of Structure-Based Analysis of Tissue-Specific Post ... - mediaTUM
TECHNISCHE UNIVERSITÄT MÜNCHEN
Lehrstuhl für Genomorientierte Bioinformatik
Structure-Based Analysis of Tissue-Specific Post-translationalModifications
NERMIN PINAR KARABULUT
Vollständiger Abdruck der von der Fakultät WissenschaftszentrumWeihenstephan für Ernährung, Landnutzung und Umwelt der TechnischenUniversität München zur Erlangung des akademischen Grades eines
Doktors der Naturwissenschaften
genehmigten Dissertation.
Vorsitzender: Prof. Dr. Aurélien TellierPrüfer der Dissertation:
1. Prof. Dr.rer.nat. Dmitrij Frischmann2. Prof. Dr.rer.nat. Jürgen Cox (University ofCopenhagen)
Die Dissertation wurde am 07.04.2016 bei der Technischen UniversitätMünchen eingereicht und durch die Fakultät WissenschaftszentrumWeihenstephan für Ernährung, Landnutzung und Umwelt am 20.06.2016angenommen.
[ July 10, 2016 at 22:13 – classicthesis version 4.2 ]

Nermin Pinar Karabulut: Structure-Based Analysis of Tissue-Specific Post-translational Modifications, A dissertation in Bioinformatics, © January2016
supervisor:Dmitrij Frishman
[ July 10, 2016 at 22:13 – classicthesis version 4.2 ]

Life is not easy for any of us. But what of that? We must haveperseverance and above all confidence in ourselves. We must believethat we are gifted for something and that this thing must be attained.
— Marie Curie
Dedicated to my mother Nuray Tümer.
[ July 10, 2016 at 22:13 – classicthesis version 4.2 ]

[ July 10, 2016 at 22:13 – classicthesis version 4.2 ]
A B S T R A C T
Ever since the posttranslational modifications (PTMs) were discov-ered and associated to evolution of many diseases, both experimentaland computational studies have gained pace to better understand themechanism behind PTMs. This thesis aims to investigate two kindsof PTMs – acetylation and phosphorylation – in a tissue-specific man-ner by utilizing the sequence and structural characteristics containedin their environments. In the first part, we present a comprehensivetissue-based analysis of sequence and structural features of lysineacetylation sites (LASs). We show that acetylated substrates are char-acterized by tissue-specific motifs both in linear amino acid sequenceand in spatial environments. We further demonstrate that the gen-eral tendency of LASs to reside in ordered regions and, specifically,in α-helices, is also subject to tissue specific variation. In line withprevious findings we show that LASs are generally more evolution-arily conserved than non-LASs, especially in proteins with knownfunction and in structurally regular regions. On the other hand, asrevealed by metabolic pathway analysis, LASs have diverse cellu-lar functions in different tissues and are frequently associated withtissue-specific protein domains. In the second part, we present thefirst comprehensive analysis of global and tissue-specific sequenceand structure properties of phosphorylation sites utilizing recent pro-teomics data. We identified tissue-specific motifs in both sequenceand spatial environments of phosphorylation sites. Target site pref-erences of kinases across tissues indicate that, while many kinasesmediate phosphorylation in all tissues, there are also kinases that ex-hibit more tissue-specific preferences which, notably, are not causedby tissue-specific kinase expression. We also demonstrate that manymetabolic pathways are differentially regulated by phosphorylationin different tissues. The findings obtained from these two parts of thethesis may imply the existence of tissue-specific enzymes and pro-teases regulating posttranslational modifications. In the last part ofthe thesis, we present the first tissue-specific phosphorylation site pre-diction approach, TSPhosPred (Tissue-Specific Phosphorylation Pre-diction) based on the feature set consisting of sequence-based andstructure-based environment characteristics of phosphorylation sitesas well as functional annotations. Experimental structures along withpredicted structures are also utilized, and yield an improved accu-racy over existing tools in both cross-validation and independent test-ing. Supportively, the cross-tissues prediction strengthens the neces-sity and the significance of tissue-specific models to obtain improvedprediction of phosphorylation sites.
v
[ July 10, 2016 at 22:13 – classicthesis version 4.2 ]

Z U S A M M E N FA S S U N G
Seit der Entdeckung von Posttranslationaler Modifikation (PTM) undihrer Bedeutung in vielen Krankheiten ist die Anzahl an experimen-tellen und theoretischen Studien, die sich mit den Mechanismus hin-ter den PTM beschäftigen gestiegen. In dieser Doktorarbeit analysie-ren wir Acetylierung und Phosphorylierung auf GewebespezifischeSequenzen und Strukturen. Im ersten Teil der Arbeit zeigen wir eineumfassende Sequenz- und Struktur-Analyse von GewebespezifischenLysin Acetylierung Stellen (LASs). Wir zeigen, dass acetylierte Sub-strate durch gewebespezifische Sequenz und Struktur Motive gekenn-zeichnet sind. Des weiteren zeigen wir, dass LASs bevorzugt in struk-turell geordneten Regionen und Alpha-Helixen vorkommen. Überein-stimmend mit vorhergehenden Studien zeigen wir, dass LASs stärkerkonserviert sind als nicht LASs, vor allem in Proteinen mit bekannterFunktion und in strukturell regelmäßigen Regionen. Die Analyse vonStoffwechselwegen zeigten, dass LASs eine Vielzahl an gewebespezi-fische Funktionen haben die häufig mit gewebespezifische Proteindo-mänen assoziiert ist. Der zweite Teil enthält eine umfassende Analy-se von globalen und gewebespezifischen Sequenzen und Strukturenvon Phosphorylierungsstellen. Wir identifizierten gewebespezifischeMotive sowohl in der Sequenz als auch der Struktur von Phospho-rylierungsstellen. Die beobachtete gewebespezifische Präferenz vonKinase Zielen zeigte, dass diese gewebespezifische Präferenz einigerKinasen von deren Genexpression unabhängig ist. Wir zeigten auch,dass viele Stoffwechselwege durch gewebespezifische Phosphorylie-rung reguliert sind. Die Ergebnisse aus beiden Teilen der Doktorar-beit implizieren die Existenz von Enzymen und Proteasen die gewebe-spezifische Phosphorylierung regulieren. Im letzten Teil der Doktor-arbeit stellen wir die erste gewebespezifischen Phosphorylierungsstel-len vorhersage Methode TSPhosPred (Tissue-Specific Phosphorylati-on Prediction) vor. TSPhosPred nutzt zur gewebespezifischen Phos-phorylierungsstellen Vorhersage die Phosphorylierungsstellen spezi-fische Sequenz- und Struktur-eigenschaften. Durch die Kombinationvon vorhergesagten und experimentell validierten Strukturen erreichtTSPhosPred bessere Genauigkeit als bereits bekannte Methoden. Diegewebespezifischen Kreuzvalidierung validierte die Bedeutung undNotwendigkeit eines gewebespezifischen Modelles zur verbessertenVorhersage von Phosphorylierungsstellen.
vi
[ July 10, 2016 at 22:13 – classicthesis version 4.2 ]

P U B L I C AT I O N S
Some ideas and figures have appeared previously in the followingpublications:
N.P. Karabulut and D. Frishman. Tissue-Specific Sequence and Struc-tural Environments of Lysine Acetylation Sites. Journal of StructuralBiology 191(1): 39-48, 2015.
N.P. Karabulut and D. Frishman. Sequence- and Structure-Based Anal-ysis of Tissue-Specific Phosphorylation Sites. Journal of Proteomics, sub-mitted, 2016.
N.P. Karabulut and D. Frishman. Prediction of Tissue-Specific Phos-phorylation Sites by Integrating Sequence- and Structure-Based Fea-tures, manuscript in preparation.
Poster: N.P. Karabulut, S. Tyanova, D. Frishman. Sequence and Struc-ture Analysis of Tissue-Specific Lysine Acetylation Sites. 22nd An-nual International Conference on Intelligent Systems for Molecular Biology(ISMB), Boston, USA, 2014.
Poster: N.P. Karabulut, S. Tyanova, D. Frishman. Tissue-Specific Se-quence and Structural Environments of Lysine Acetylation Sites. ITFor Life Science @ Bayer, Leverkusen, Germany, 2014.
vii
[ July 10, 2016 at 22:13 – classicthesis version 4.2 ]

[ July 10, 2016 at 22:13 – classicthesis version 4.2 ]
A C K N O W L E D G M E N T S
I wish to express my sincere appreciation and gratitude to my super-visor Dmitrij Frishman for giving me the opportunity to conduct myPhD thesis at the TU München, his support, and worthwhile guid-ance through my Ph.D. study.
Besides my supervisor, I am also thankful to Prof. Dr. Aurelien Tellier,who was so kind to immediately agree on becoming the chair of myexamination committee, and to Dr. Jürgen Cox, who again so kindlyagreed on becoming the second examiner of my examination commit-tee. I am really grateful to them.
I gratefully acknowledge the support of the TUM Graduate School’sThematic Graduate Center Regulation and Evolution of Cellular Sys-tems (RECESS) at the TU München. And special thanks to ClaudiaLuksch for her assistance and help during the RECESS program.
Furthermore, I would like to express my gratitude to my colleagues:Peter Hönigschmid for his expert advice on my machine learningproject; Stefka Tyanova for introducing me to post-translational mod-ifications when I first started my Ph.D. study, and for keeping heradvices on my project; Florian Goebels for being my office-mate, andsharing his knowledge and experience with me all the time; UsmanSaeed for always being open to discuss every problem and help forthe grid issues; Drazen Jalsovec for his IT administrative support andespecially for helping on grid problems; and to the entire Frishmanlab for the friendship we had together.
I am thankful to Florian Goebels and Simon Goebels for the Germantranslation of Abstract of this thesis.
I am especially grateful to Leonie Corry - The Angel - for helpingme out with everything one can imagine. I will always be appreci-ated for her helpfulness, especially when I first moved to Germany.My new life in Germany would have been so hard if I did not knowher.
Last but not least, a very big acknowledgement my family and friendsdefinitely deserve. Especially, I thank to my lovely mother for hergreat love and always being there in every kind of situation. And avery special thanks to my beloved friend Nazire for everything shehas brought to my life, and making this Ph.D. life more joyful andmeaningful.
ix
[ July 10, 2016 at 22:13 – classicthesis version 4.2 ]

[ July 10, 2016 at 22:13 – classicthesis version 4.2 ]
C O N T E N T S
i introduction 1
1 introduction 3
1.1 Experimental Methods 4
1.2 Acetylation 6
1.3 Phosphorylation 7
1.4 Computational Methods 8
1.5 Thesis Motivation and Outline 10
ii tissue-specific sequence and structural envi-ronments of lysine acetylation sites 11
2 tissue-specific sequence and structural environ-ments of lysine acetylation sites 13
2.1 Materials and Methods 13
2.1.1 Data collection and preprocessing 13
2.1.2 Sequence (1D) environments of acetylated andreference (non−acetylated) lysine residues 14
2.1.3 Lysine acetylation sites with known 3D structure 15
2.1.4 Statistics 16
2.1.5 Three-dimensional (3D) environments of acety-lated and reference (non-acetylated) lysine residues 16
2.1.6 Conservation analysis of lysine acetylation sites 16
2.1.7 Structural features of lysine acetylation sites 17
2.1.8 Analysis of structural folds and functional do-mains 17
2.1.9 KEGG pathway analysis 17
2.1.10 Abundance of KAT paralogs 17
2.2 Results and Discussion 18
2.2.1 Global and tissue-specific sequence motifs of ly-sine acetylation sites 18
2.2.2 Global and tissue-specific sequence motifs of ly-sine acetylation sites in proteins with known 3Dstructure 21
2.2.3 Spatial environments of lysine acetylation sites 21
2.2.4 Evolutionary conservation of lysine acetylationsites 22
2.2.5 Tissue-specific structural properties of lysine acety-lation sites 24
2.2.6 Proteins containing acetylated lysines are involvedin tissue-specific biological pathways 25
2.3 Conclusion 27
iii sequence- and structure-based analysis of tissue-specific phosphorylation sites 29
3 sequence- and structure-based analysis of tissue-specific phosphorylation sites 31
xi
[ July 10, 2016 at 22:13 – classicthesis version 4.2 ]
xii contents
3.1 Materials and Methods 31
3.1.1 Datasets of phosphorylated and reference (non-phosphorylated) sites 31
3.1.2 Identification of sequence motifs 33
3.1.3 Obtaining 3D structures of phosphorylated pro-teins 33
3.1.4 Statistics 34
3.1.5 Spatial (3D) environments of phosphorylated andreference (non-phosphorylated) serine/threonine/-tyrosine residues 34
3.1.6 Structural properties of phosphorylation sites 34
3.1.7 Analysis of structural folds and functional do-mains 34
3.1.8 KEGG pathway analysis 35
3.1.9 Kinase analysis 35
3.1.10 Tissue-specific expression of kinases 35
3.2 Results and Discussion 36
3.2.1 Analysis of sequence motifs of global phospho-rylation sites 36
3.2.2 Tissue-based analysis of sequence motifs of phos-phorylated sites 37
3.2.3 Tissue-based analysis of phosphorylation sequencemotifs in proteins with known 3D structure 40
3.2.4 Tissue-specific spatial motifs of phosphorylationsites 41
3.2.5 Structural properties of phosphorylation sites 42
3.2.6 Phosphorylated proteins take part in tissue-specificbiological pathways 43
3.2.7 Kinases target tissue-specific phosphorylation sites 46
3.3 Conclusions 49
iv prediction of tissue-specific phosphorylation sites
by integrating sequence- and structure-based
features 51
4 prediction of tissue-specific phosphorylation sites
by integrating sequence- and structure-based fea-tures 53
4.1 Materials and Methods 53
4.1.1 Data collection and preprocessing 53
4.1.2 Training and independent test sets 54
4.1.3 Feature extraction 56
4.1.4 Machine learning 62
4.1.5 Prediction performance assessment 63
4.1.6 Comparing with existing tools 63
4.2 Results and Discussions 64
4.2.1 Predictive performance of sequence environmentssurrounding phosphorylation sites 64
4.2.2 KNN scores as features 66
[ July 10, 2016 at 22:13 – classicthesis version 4.2 ]

contents xiii
4.2.3 Influence of spatial amino acid content and struc-tural environment of phosphorylation sites on pre-diction 67
4.2.4 The contribution of functional annotations on phos-phorylation prediction 67
4.2.5 Predictive performance of the random forest modelon tissue-specific phosphorylation sites 78
4.2.6 Prediction on independent test data 81
4.2.7 Cross-tissues performance evaluation on indepen-dent testing 82
4.2.8 Performance comparison with the existing pre-diction tools 82
4.3 Conclusions 84
v summary 87
5 summary 89
vi appendix 91
a appendix 93
bibliography 175
[ July 10, 2016 at 22:13 – classicthesis version 4.2 ]

L I S T O F F I G U R E S
Figure 1 Evolution of post−translational modifications lead-ing to proteome complexity. 4
Figure 2 Summary of mass spectrometry (MS)−based pro-teomics for the lysine acetylation. 5
Figure 3 Number of LASs and non-LASs from the LAS1Dand LAS3D datasets in different tissues. 15
Figure 4 The comparison of 1D and 3D environments ofglobal lysine acetylation sites. 18
Figure 5 Two sample logo analysis of LASs from the LAS1Ddataset in different tissues. 19
Figure 6 Sequence (1D) and structural (3D and pure 3D)environments of LASs from the LAS3D datasetrepresented by two sample logos and circularplots, respectively. 23
Figure 7 KEGG pathway analysis of the acetylated pro-teins from the LAS3D dataset. 26
Figure 8 A graphical summary of the followed method-ology for phosphorylation sites. 32
Figure 9 The comparison of 1D and 3D environments ofglobal serine phosphorylation sites. 36
Figure 10 Two sample logo analysis of PSSs from the PS1D-70 dataset in different tissues. 38
Figure 11 Sequence (1D) and structural (3D and pure 3D)environments of PSSs, PTSs, and PYSs from thePS3D-90 dataset represented by two sample lo-gos and circular plots, respectively. 39
Figure 12 KEGG pathway analysis of the serine phospho-rylated proteins from the PS1D-70 dataset. 43
Figure 13 Tissue preferences of kinases targeting serine phos-phorylated sites in the PS1D-70 dataset. 45
Figure 14 Comparison of the Ser/Thr kinase expressionacross tissues. 47
Figure 15 Tripartite graph showing interactions betweenserine phosphorylation motifs, kinases and tis-sues. 48
Figure 16 Comparison of KNN scores between serine phos-phorylation and non-phosphorylation sites de-pending on tissues in the PS1D data. 64
Figure 17 Comparison of KNN scores between serine phos-phorylation and non-phosphorylation sites de-pending on tissues in the PS3D data. 65
Figure 18 Comparison of KNN scores between threoninephosphorylation and non-phosphorylation sitesdepending on tissues in the PS1D data. 65
xiv
[ July 10, 2016 at 22:13 – classicthesis version 4.2 ]
List of Figures xv
Figure 19 Comparison of KNN scores between threoninephosphorylation and non-phosphorylation sitesdepending on tissues in the PS3D data. 66
Figure 20 ROC curves of serine phosphorylation predic-tion models obtained from 10-fold cross-validationin different tissues without using the KNN score. 68
Figure 21 ROC curves of serine phosphorylation predic-tion models obtained from independent testingin different tissues without using the KNN score. 69
Figure 22 ROC curves of serine phosphorylation predic-tion models obtained from 10-fold cross vali-dation in different tissues with using the KNNscore. 70
Figure 23 ROC curves of serine phosphorylation predic-tion models obtained from independent testingin different tissues with using the KNN score. 71
Figure 24 ROC curves of threonine phosphorylation pre-diction models obtained from 10-fold cross-validationin different tissues without using the KNN score. 72
Figure 25 ROC curves of threonine phosphorylation pre-diction models obtained from independent test-ing in different tissues without using the KNNscore. 73
Figure 26 ROC curves of threonine phosphorylation pre-diction models obtained from 10-fold cross-validationin different tissues with using the KNN score. 74
Figure 27 ROC curves of threonine phosphorylation pre-diction models obtained from independent test-ing in different tissues with using the KNN score. 75
Figure 28 Two sample logo analysis of LASs in differenttissues in the LAS1D dataset. 94
Figure 29 Two sample logo analysis of LASs from the LAS1Ddataset in brain. 95
Figure 30 Two sample logo analysis of LASs from the LAS1Ddataset in brown fat. 95
Figure 31 Two sample logo analysis of LASs from the LAS1Ddataset in heart. 96
Figure 32 Two sample logo analysis of LASs from the LAS1Ddataset in intestine. 96
Figure 33 Two sample logo analysis of LASs from the LAS1Ddataset in kidney. 97
Figure 34 Two sample logo analysis of LASs from the LAS1Ddataset in liver. 97
Figure 35 Two sample logo analysis of LASs from the LAS1Ddataset in lung. 98
Figure 36 Two sample logo analysis of LASs from the LAS1Ddataset in muscle. 98
Figure 37 Two sample logo analysis of LASs from the LAS1Ddataset in pancreas. 99
[ July 10, 2016 at 22:13 – classicthesis version 4.2 ]
xvi List of Figures
Figure 38 Two sample logo analysis of LASs from the LAS1Ddataset in perirenal fat. 99
Figure 39 Two sample logo analysis of LASs from the LAS1Ddataset in skin. 100
Figure 40 Two sample logo analysis of LASs from the LAS1Ddataset in spleen. 100
Figure 41 Two sample logo analysis of LASs from the LAS1Ddataset in stomach. 101
Figure 42 Two sample logo analysis of LASs from the LAS1Ddataset in testis fat. 101
Figure 43 Two sample logo analysis of LASs from the LAS1Ddataset in testis. 102
Figure 44 Two sample logo analysis of LASs from the LAS1Ddataset in thymus. 102
Figure 45 1D environment of LASs from the LAS3D datasetin different tissues. 103
Figure 46 3D environment of LASs from the LAS3D datasetin different tissues. 104
Figure 47 Pure 3D environment of LASs from the LAS3Ddataset in different tissues. 105
Figure 48 Secondary structure analysis of LASs and theresidues surrounding them from the LAS3D datasetin different tissues. 106
Figure 49 SCOP class analysis of LASs and the residuessurrounding them in different tissues in the LAS3Ddataset. 107
Figure 50 Global and tissue-specific occurrence of acety-lated proteins from the LAS3D dataset in pro-tein domains. 107
Figure 51 The comparison of 1D and 3D environments ofglobal PTSs. 108
Figure 52 The comparison of 1D and 3D environments ofglobal PYSs. 109
Figure 53 Two sample logo analysis of PSSs in differenttissues in the PS1D-70 dataset. 110
Figure 54 Two sample logo analysis of PSSs from the PS1D-70 dataset in blood. 111
Figure 55 Two sample logo analysis of PSSs from the PS1D-70 dataset in brain. 111
Figure 56 Two sample logo analysis of PSSs from the PS1D-70 dataset in brainstem. 112
Figure 57 Two sample logo analysis of PSSs from the PS1D-70 dataset in cerebellum. 112
Figure 58 Two sample logo analysis of PSSs from the PS1D-70 dataset in cortex. 113
Figure 59 Two sample logo analysis of PSSs from the PS1D-70 dataset in heart. 113
Figure 60 Two sample logo analysis of PSSs from the PS1D-70 dataset in intestine. 114
[ July 10, 2016 at 22:13 – classicthesis version 4.2 ]
List of Figures xvii
Figure 61 Two sample logo analysis of PSSs from the PS1D-70 dataset in kidney. 114
Figure 62 Two sample logo analysis of PSSs from the PS1D-70 dataset in liver. 115
Figure 63 Two sample logo analysis of PSSs from the PS1D-70 dataset in lung. 115
Figure 64 Two sample logo analysis of PSSs from the PS1D-70 dataset in muscle. 116
Figure 65 Two sample logo analysis of PSSs from the PS1D-70 dataset in pancreas. 116
Figure 66 Two sample logo analysis of PSSs from the PS1D-70 dataset in perirenal fat. 117
Figure 67 Two sample logo analysis of PSSs from the PS1D-70 dataset in spleen. 117
Figure 68 Two sample logo analysis of PSSs from the PS1D-70 dataset in stomach. 118
Figure 69 Two sample logo analysis of PSSs from the PS1D-70 dataset in testis. 118
Figure 70 Two sample logo analysis of PSSs from the PS1D-70 dataset in thymus. 119
Figure 71 Two sample logo analysis of PTSs in differenttissues in the PS1D-70 dataset. 120
Figure 72 Two sample logo analysis of PYSs in differenttissues in the PS1D-70 dataset. 121
Figure 73 Two sample logo analysis of PSSs in differenttissues in the PS3D-90 dataset. 122
Figure 74 Two sample logo analysis of PTSs in differenttissues in the PS3D-90 dataset. 123
Figure 75 Two sample logo analysis of PYSs in differenttissues in the PS3D-90 dataset. 124
Figure 76 3D environment of PSSs from the PS3D-90 datasetin different tissues. 125
Figure 77 3D environment of PTSs from the PS3D-90 datasetin different tissues. 126
Figure 78 3D environment of PYSs from the PS3D-90 datasetin different tissues. 127
Figure 79 Pure 3D environment of PSSs from the PS3D-90
dataset in different tissues. 128
Figure 80 Pure 3D environment of PTSs from the PS3D-90
dataset in different tissues. 129
Figure 81 Pure 3D environment of PYSs from the PS3D-90
dataset in different tissues. 130
Figure 82 Disorder region analysis of PSSs and the residuessurrounding them from the PS1D-70 dataset indifferent tissues. 131
Figure 83 Disorder region analysis of PTSs and the residuessurrounding them from the PS1D-70 dataset indifferent tissues. 132
[ July 10, 2016 at 22:13 – classicthesis version 4.2 ]
Figure 84 Disorder region analysis of PYSs and the residuessurrounding them from the PS1D-70 dataset indifferent tissues. 133
Figure 85 Secondary structure analysis of PSSs and theresidues surrounding them from the PS3D-90
dataset in different tissues. 134
Figure 86 Secondary structure analysis of PTSs and theresidues surrounding them from the PS3D-90
dataset in different tissues. 135
Figure 87 SCOP class analysis of serine phosphorylationsites and the residues surrounding them in dif-ferent tissues in the PS3D-90 dataset. 136
Figure 88 KEGG pathway analysis of the threonine phos-phorylated proteins from the PS1D-70 dataset. 137
Figure 89 KEGG pathway analysis of the tyrosine phos-phorylated proteins from the PS1D-70 dataset. 137
Figure 90 Global and tissue-specific occurrence of serinephosphorylated proteins from the PS3D-90 datasetin protein domains. 137
Figure 91 Global and tissue-specific occurrence of threo-nine phosphorylated proteins from the PS3D-90
dataset in protein domains. 138
Figure 92 Global and tissue-specific occurrence of tyrosinephosphorylated proteins from the PS3D-90 datasetin protein domains. 138
L I S T O F TA B L E S
Table 1 Experimental methodologies for identifying post-translational modifications. 6
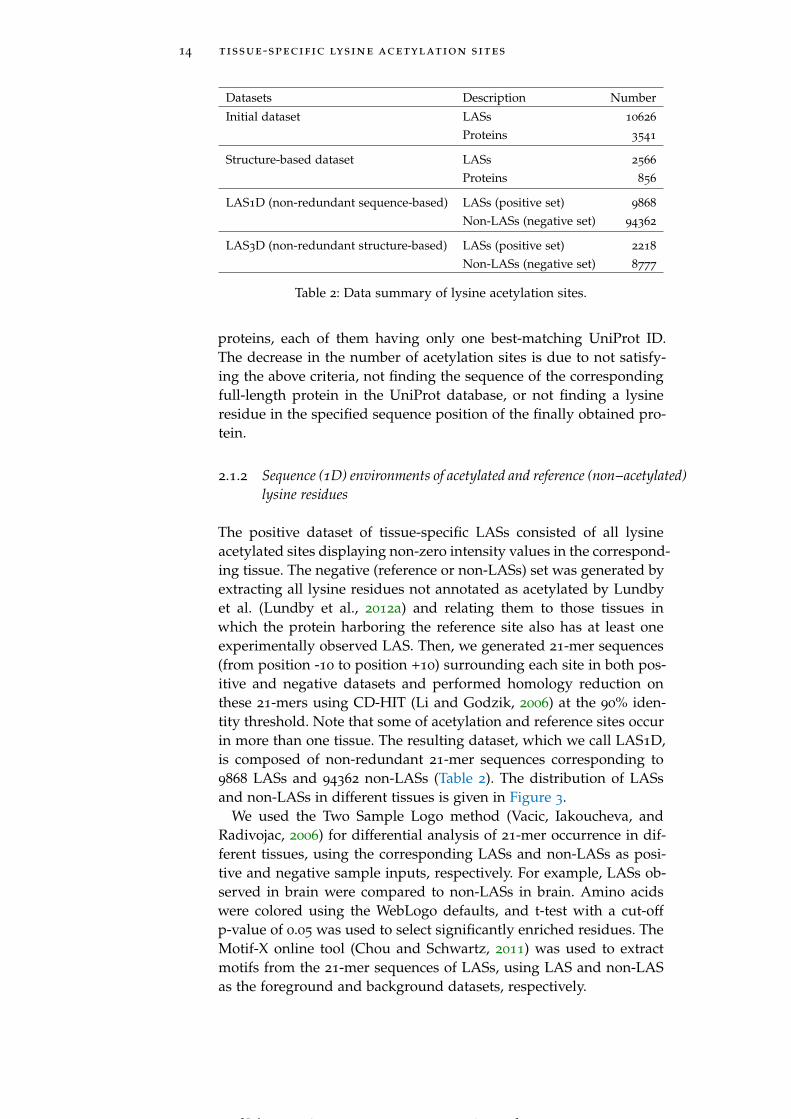
Table 2 Data summary of lysine acetylation sites. 14
Table 3 Data summary of phosphorylation sites. 32
Table 4 Data summary of phosphorylation sites used inclassification. 54
Table 5 Data summary of phosphorylation sites used intraining depending on tissue and residue typesin both PS1D and PS3D datasets. 55
Table 6 The summary of features used to train each pre-diction model. 57
Table 7 The summary of k values chosen for each pre-diction model in different tissues. 60
Table 8 Classification performance analysis of 10-fold crossvalidation for each prediction model in differenttissues with/without using the KNN score. 78
xviii
[ July 10, 2016 at 22:13 – classicthesis version 4.2 ]
List of Tables xix
Table 9 Classification performance analysis of indepen-dent testing for each prediction model in differ-ent tissues with/without using the KNN score. 81
Table 10 Cross-tissues prediction performance of serinephosphorylated sites based on independent test-ing in different tissues using the seqBinaryEnccategory without the KNN score. 83
Table 11 Performance comparison with existing tools. 84
Table 12 Summary of sequence motifs associated with LASsin the LAS1D dataset. 143
Table 13 Summary of sequence motifs associated with LASsin the LAS3D dataset. 145
Table 14 Tissue-specific evolutionary conservation analy-sis of LASs and non-LASs. 146
Table 15 Accessibility and B-factor analysis of LASs indifferent tissues. 150
Table 16 Sequence motifs of all phosphorylation sites at70% sequence similarity with the p < 0.000001
significance threshold. 159
Table 17 Two sample logo comparison of phosphoryla-tion sites between our study and the study ofLundby et al. in brain. 160
Table 18 Two sample logo comparison of phosphoryla-tion sites between our study and the study ofLundby et al. in testis. 161
Table 19 Accessibility and B-factor analysis of PSS in dif-ferent tissues in the PS3D-90 dataset. 165
Table 20 Accessibility and B-factor analysis of PTS in dif-ferent tissues in the PS3D-90 dataset. 169
Table 21 Accessibility and B-factor analysis of PYS in dif-ferent tissues in the PS3D-90 dataset. 173
[ July 10, 2016 at 22:13 – classicthesis version 4.2 ]

[ July 10, 2016 at 22:13 – classicthesis version 4.2 ]

Part I
I N T R O D U C T I O N
[ July 10, 2016 at 22:13 – classicthesis version 4.2 ]

[ July 10, 2016 at 22:13 – classicthesis version 4.2 ]
1I N T R O D U C T I O N
Protein post-translational modification (PTM) is a mechanism occur-ring after the translation is completed by ribosomes. It generally refersto the covalently addition of a functional group to a protein that al-ters the chemical makeup and function of the protein, and eventuallyleads to different biological outcomes in response to requirements ofthe cell. PTMs play important roles in protein signaling (Morrisonet al., 2002), cellular differentiation (Grotenbreg and Ploegh, 2007),protein degradation (Geiss-Friedlander and Melchior, 2007), localiza-tion (Sirover, 2012), and regulations of gene expression (Wang etal., 2015) and protein-protein interactions (Duan and Walther, 2015).PTM cross-talk where the PTM of a protein can also regulate thePTMs of other proteins may also occur that leads to more aspectsof protein functions. Modifications are most often regulated by en-zymes including kinases, acetyltransferases, glycosyltransferases etc.,whereas reversible modifications (removal of functional groups andreverse of the biological activity) are carried by proteases such asphosphatases, deacetylases, glycosidases and so on. Many proteinsharbor post-translational modifications, and many domains withinproteins are even modified on more than one residue. Moreover, reg-ulatory enzymes also go under auto-modification, yielding a large in-terconnected network. This complex network carries high importancesince the abnormal regulation of PTMs is connected to evolution ofmany diseases, such as cancer (See Figure 1 for proteome complex-ity).
To date, more than 400 different PTM types on more than 90000
PTM sites have been identified by experimental analysis (Khoury,Baliban, and Floudas, 2011). These modifications include phospho-rylation, acetylation, glycosylation, ubiquitination, methylation, lipi-dation and so on where phosphorylation and acetylation are the twoof most studied PTM types. Identification of PTMs harbors a greatinsight in understanding the mechanism behind it; however, therestill exist many technical challenges in the development of specificdetection and purification methods, and these methods are costlyand labor-intensive. Alternatively, many computational methods havebeen improved for in silico identification of modification sites. In theremaining part of the Introduction section, we (i) introduce the exist-ing experimental approaches in identifying PTMs, (ii) place a greaterfocus on phosphorylation and acetylation, which are the PTM typessubjected to study in this thesis, (iii) give a background informationabout computational approaches based on phosphorylation, and (iv)describe the thesis motivation that leaded us to conduct this research.
3
[ July 10, 2016 at 22:13 – classicthesis version 4.2 ]
4 introduction
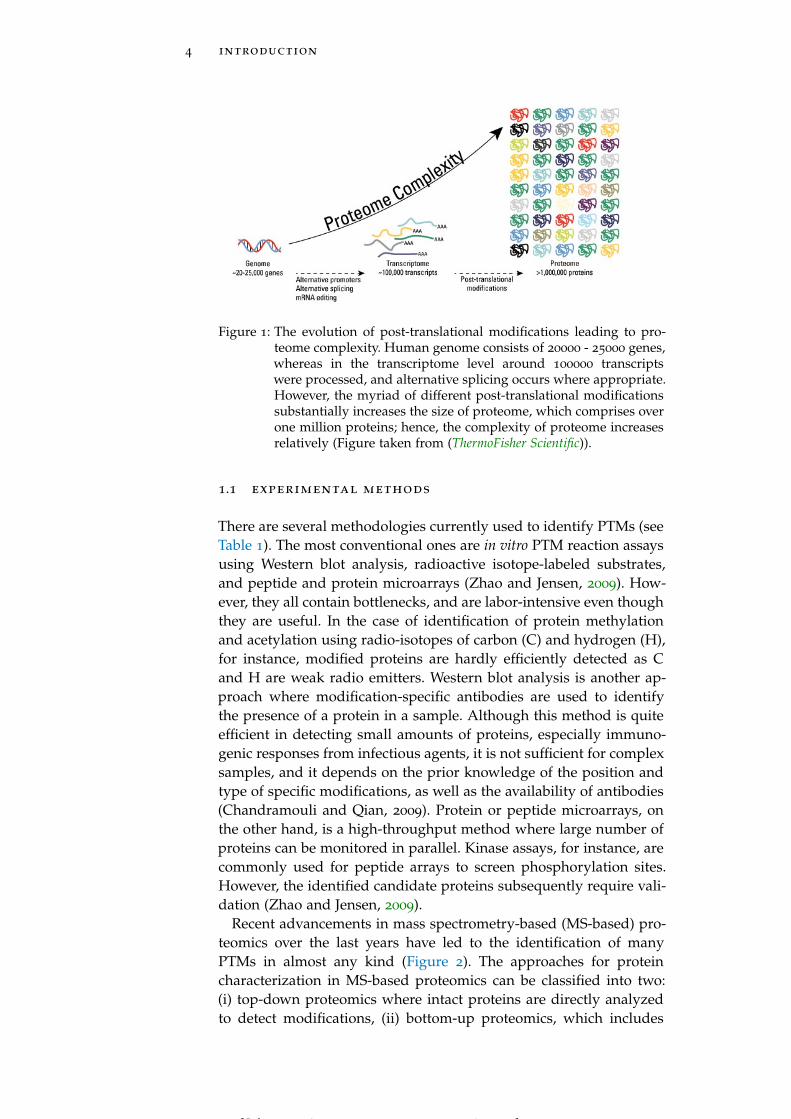
Figure 1: The evolution of post-translational modifications leading to pro-teome complexity. Human genome consists of 20000 - 25000 genes,whereas in the transcriptome level around 100000 transcriptswere processed, and alternative splicing occurs where appropriate.However, the myriad of different post-translational modificationssubstantially increases the size of proteome, which comprises overone million proteins; hence, the complexity of proteome increasesrelatively (Figure taken from (ThermoFisher Scientific)).
1.1 experimental methods
There are several methodologies currently used to identify PTMs (seeTable 1). The most conventional ones are in vitro PTM reaction assaysusing Western blot analysis, radioactive isotope-labeled substrates,and peptide and protein microarrays (Zhao and Jensen, 2009). How-ever, they all contain bottlenecks, and are labor-intensive even thoughthey are useful. In the case of identification of protein methylationand acetylation using radio-isotopes of carbon (C) and hydrogen (H),for instance, modified proteins are hardly efficiently detected as Cand H are weak radio emitters. Western blot analysis is another ap-proach where modification-specific antibodies are used to identifythe presence of a protein in a sample. Although this method is quiteefficient in detecting small amounts of proteins, especially immuno-genic responses from infectious agents, it is not sufficient for complexsamples, and it depends on the prior knowledge of the position andtype of specific modifications, as well as the availability of antibodies(Chandramouli and Qian, 2009). Protein or peptide microarrays, onthe other hand, is a high-throughput method where large number ofproteins can be monitored in parallel. Kinase assays, for instance, arecommonly used for peptide arrays to screen phosphorylation sites.However, the identified candidate proteins subsequently require vali-dation (Zhao and Jensen, 2009).
Recent advancements in mass spectrometry-based (MS-based) pro-teomics over the last years have led to the identification of manyPTMs in almost any kind (Figure 2). The approaches for proteincharacterization in MS-based proteomics can be classified into two:(i) top-down proteomics where intact proteins are directly analyzedto detect modifications, (ii) bottom-up proteomics, which includes
[ July 10, 2016 at 22:13 – classicthesis version 4.2 ]
1.1 experimental methods 5
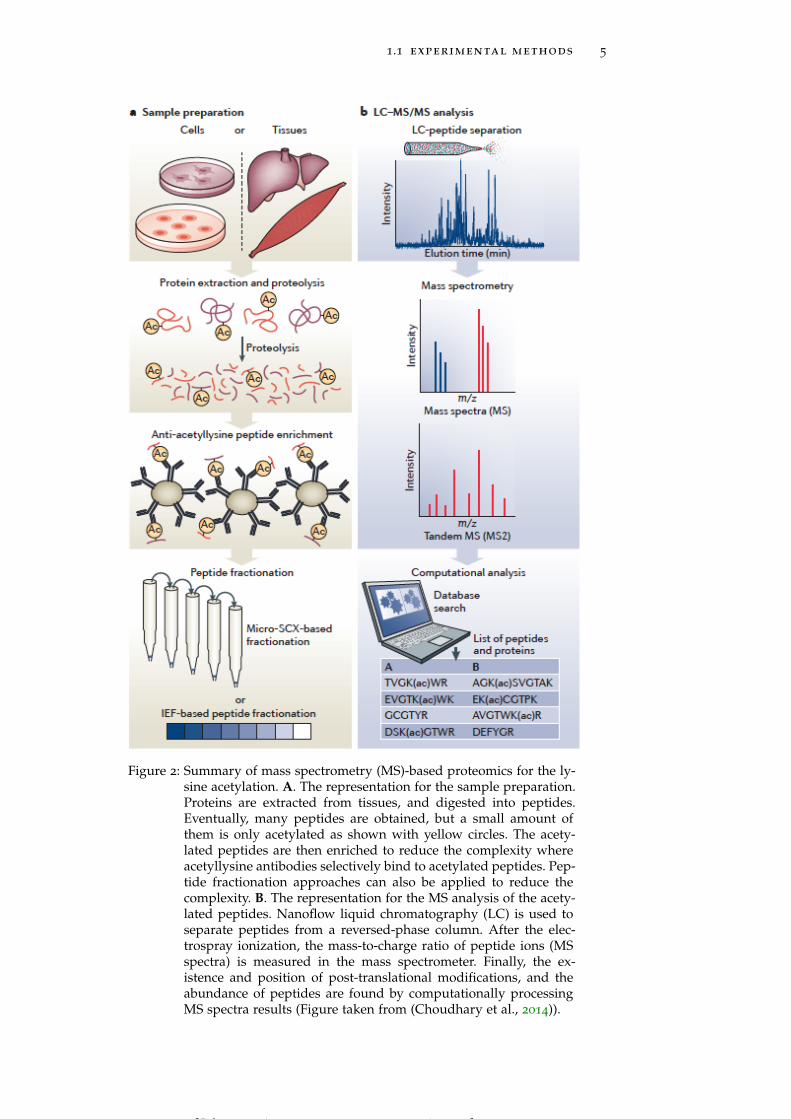
Figure 2: Summary of mass spectrometry (MS)-based proteomics for the ly-sine acetylation. A. The representation for the sample preparation.Proteins are extracted from tissues, and digested into peptides.Eventually, many peptides are obtained, but a small amount ofthem is only acetylated as shown with yellow circles. The acety-lated peptides are then enriched to reduce the complexity whereacetyllysine antibodies selectively bind to acetylated peptides. Pep-tide fractionation approaches can also be applied to reduce thecomplexity. B. The representation for the MS analysis of the acety-lated peptides. Nanoflow liquid chromatography (LC) is used toseparate peptides from a reversed-phase column. After the elec-trospray ionization, the mass-to-charge ratio of peptide ions (MSspectra) is measured in the mass spectrometer. Finally, the ex-istence and position of post-translational modifications, and theabundance of peptides are found by computationally processingMS spectra results (Figure taken from (Choudhary et al., 2014)).
[ July 10, 2016 at 22:13 – classicthesis version 4.2 ]
6 introduction
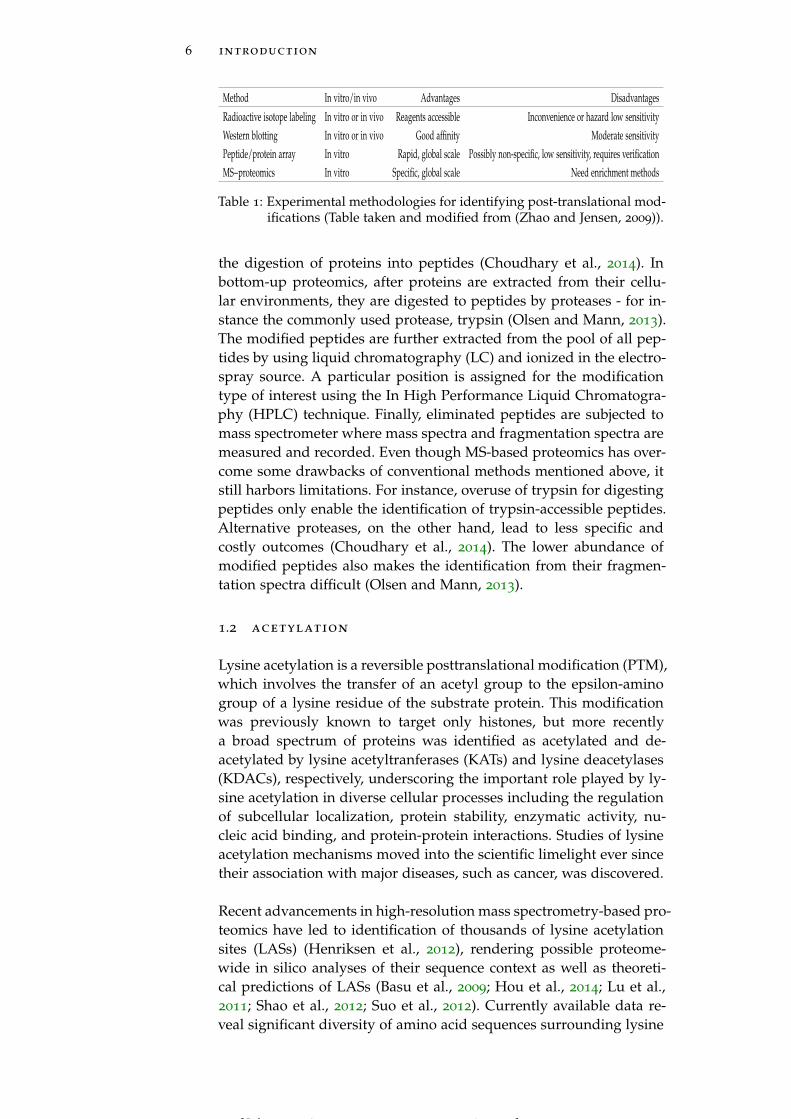
Method In vitro/in vivo Advantages Disadvantages
Radioactive isotope labeling In vitro or in vivo Reagents accessible Inconvenience or hazard low sensitivityWestern blotting In vitro or in vivo Good affinity Moderate sensitivityPeptide/protein array In vitro Rapid, global scale Possibly non-specific, low sensitivity, requires verificationMS−proteomics In vitro Specific, global scale Need enrichment methods
Table 1: Experimental methodologies for identifying post-translational mod-ifications (Table taken and modified from (Zhao and Jensen, 2009)).
the digestion of proteins into peptides (Choudhary et al., 2014). Inbottom-up proteomics, after proteins are extracted from their cellu-lar environments, they are digested to peptides by proteases - for in-stance the commonly used protease, trypsin (Olsen and Mann, 2013).The modified peptides are further extracted from the pool of all pep-tides by using liquid chromatography (LC) and ionized in the electro-spray source. A particular position is assigned for the modificationtype of interest using the In High Performance Liquid Chromatogra-phy (HPLC) technique. Finally, eliminated peptides are subjected tomass spectrometer where mass spectra and fragmentation spectra aremeasured and recorded. Even though MS-based proteomics has over-come some drawbacks of conventional methods mentioned above, itstill harbors limitations. For instance, overuse of trypsin for digestingpeptides only enable the identification of trypsin-accessible peptides.Alternative proteases, on the other hand, lead to less specific andcostly outcomes (Choudhary et al., 2014). The lower abundance ofmodified peptides also makes the identification from their fragmen-tation spectra difficult (Olsen and Mann, 2013).
1.2 acetylation
Lysine acetylation is a reversible posttranslational modification (PTM),which involves the transfer of an acetyl group to the epsilon-aminogroup of a lysine residue of the substrate protein. This modificationwas previously known to target only histones, but more recentlya broad spectrum of proteins was identified as acetylated and de-acetylated by lysine acetyltranferases (KATs) and lysine deacetylases(KDACs), respectively, underscoring the important role played by ly-sine acetylation in diverse cellular processes including the regulationof subcellular localization, protein stability, enzymatic activity, nu-cleic acid binding, and protein-protein interactions. Studies of lysineacetylation mechanisms moved into the scientific limelight ever sincetheir association with major diseases, such as cancer, was discovered.
Recent advancements in high-resolution mass spectrometry-based pro-teomics have led to identification of thousands of lysine acetylationsites (LASs) (Henriksen et al., 2012), rendering possible proteome-wide in silico analyses of their sequence context as well as theoreti-cal predictions of LASs (Basu et al., 2009; Hou et al., 2014; Lu et al.,2011; Shao et al., 2012; Suo et al., 2012). Currently available data re-veal significant diversity of amino acid sequences surrounding lysine
[ July 10, 2016 at 22:13 – classicthesis version 4.2 ]
1.3 phosphorylation 7
acetylation sites, making it difficult to derive consensus acetylationmotifs. This diversity might be due to the broad variety of KATs andKDACs encoded, for example, in the human and mouse genomes (22
KATs and 18 KDACs) as well as to non-enzymatic lysine acetylation(Choudhary et al., 2014). Most of the LASs known today have not yetbeen associated to their cognate KATs and KDACs due to the techni-cal challenges in detecting KAT- and KDAC-specific acetylation sitesby high-throughput in vitro acetylation assays. To close this gap, Liet al. made a commendable effort in manually assigning 384 knownLASs to three selected KAT families (Li et al., 2012), which, however,is still a far cry from close to 5000 experimentally confirmed LASsknown from literature as of 2012.
Beyond linear sequence motifs, it has been hypothesized that the localstructural environments of lysines can influence their predispositionto be recognized by KATs. Indeed, Kim et al. (Kim et al., 2006) foundthat in mouse proteins, acetylated lysines prefer α-helical conforma-tion, avoid disordered regions, and typically reside on protein surface.At the same time Okanishi et al. (Okanishi et al., 2013), while con-firming the tendency of acetylated lysines to be exposed, did not findany relationship between acetylation propensity and local secondarystructure in Thermus thermophilus. Both studies were performed onrather limited datasets of acetylation sites. Recent availability of muchlarger proteome-wide acetylation assays warrants a deeper look intothe role of structure in shaping the substrate spectrum of KATs.
1.3 phosphorylation
Protein phosphorylation is a reversible posttranslational modification(PTM) that represents the most common PTM type in eukaryotes, andplays a crucial role in many essential cellular processes, includingcellular signaling, metabolism, differentiation, regulation of proteinactivity and subcellular localization (Roskoski, 2015). Protein phos-phorylation and de-phosphorylation are controlled by more than 500
protein kinases and more than 100 phosphatases, respectively, which,in their turn, are regulated by phosphorylation, yielding a complexpicture of interconnected signaling pathways. As many of these path-ways are disease-related, understanding the mechanisms of phospho-rylation has become a high priority for drug design.
Quantitative mass spectrometry-based phosphoproteomics have re-sulted in a massive amount of serine/threonine/tyrosine phospho-rylation sites. However, methods to experimentally identify kinasesubstrates are still costly and laborious that a substantial amount ofexperimentally identified phosphorylation sites is still lack of exper-imentally annotated kinase family. PhosphoSitePlus includes 209000
phosphorylation sites where only 13751 of them (6.6%) were identi-fied with corresponding kinases (Imamura et al., 2014). As a result,many studies made in silico attempts to derive consensus sequencemotifs depending on kinase family (Chen et al., 2011; Damle and Mo-
[ July 10, 2016 at 22:13 – classicthesis version 4.2 ]
8 introduction
hanty, 2014; Gnad, Gunawardena, and Mann, 2011; Miller et al., 2008;Obenauer, Cantley, and Yaffe, 2003). Miller et al. introduced NetPhor-est, which is an atlas of sequence motifs for phosphorylation sitestargeted by 179 protein kinases and 104 phospho-binding domains.It further classifies the non-annotated experimentally identified phos-phorylation sites to related kinases and phospho-binding domains.This atlas also contributes to understanding of different characteris-tics of phosphorylation signaling. Damle et al. built a network us-ing experimentally identified kinase-substrate pairs and domains ofphosphoproteins, revealing novel patterns for domain preferences ofkinases. This network showed that many of the kinases phosphory-late only a few proteins domains, whereas only a small number of ki-nases phosphorylate a broad spectrum of protein domains. Althoughmany of these studies emphasized on substrate-specificity across ki-nases where this substrate-specificity depends on sequence surround-ings of phosphorylation sites, Chen et al. used motifs to derive morebiological information, and proposed that phosphorylation distribu-tion is dependent on cellular compartment type (Chen et al., 2014).Accordingly, cellular compartment-specific sequence motifs for phos-phorylation were extracted, and experimentally identified phosphory-lation sites were subsequently classified into corresponding cellularcompartments.
Studies also showed that spatial amino acid content surroundingphosphorylation sites along with structural preferences play also animportant role in kinase active site (Durek et al., 2009; Iakouchevaet al., 2004; Su and Lee, 2013; Tyanova et al., 2013). Durek et al.mapped experimentally identified phosphorylation sites onto three-dimensional structures, and categorized based on associated kinase.The spatial environments of phosphorylation sites were characterizedin both global and kinase-specific manners, and further incorporatedalong with sequence information in prediction of phosphorylationsites. The preceding study by (Su and Lee, 2013) conducted a simi-lar analysis as Durek et al., but with a more comprehensive dataset.Tyanova et al., on the other hand, introduced a different aspect forthe analysis of structural properties of phosphorylation sites. Ratherthan the static way, the dynamic properties of phosphorylation siteswith structural features were investigated at six time points of thecell division cycle. This study showed that phosphorylation sites takepart in different functions depending on the need at different timescales, and the tendency of phosphorylation sites regulated at differ-ent time points of the cell division cycle is associated to structuralenvironments of those phosphorylation sites.
1.4 computational methods
Protein phosphorylation, as we mentioned in Section 1.3, is a com-plex interconnected network carrying high importance since the ab-normal regulation of phosphorylation is connected to evolution ofdiseases, such as cancer. The identified number of phosphorylation
[ July 10, 2016 at 22:13 – classicthesis version 4.2 ]
1.4 computational methods 9
sites to date, however, could not show the same pace as its impor-tance in cellular processes due to the fact that experimental meth-ods, i.e. mass spectrometry (MS)-based phosphoproteomics, are ex-pensive and labor-intensive. As a consequence, computational ap-proaches have been substantially studied to elucidate more phospho-rylation sites, contributing to understanding of the mechanism be-hind phosphorylation.
Based on the targeting area, available predictors can be classified intofour: (i) Kinase-specific predictors, which are based on the idea thateach kinase family targets different subset of substrates depending onthe sequence amino acid content around phosphorylation sites (Blomet al., 2004; Fan et al., 2014; Gao and Xu, 2010; Li, Du, and Xu, 2010;Suo et al., 2014; Xue et al., 2010), or sequence content in combinationwith structural characteristics of phosphorylation sites (Blom, Gam-meltoft, and Brunak, 1999; Durek et al., 2009; Hjerrild et al., 2004;Linding et al., 2008; Saunders et al., 2008; Su and Lee, 2013). Thesepredictors take a protein sequence and the type of the kinase as in-puts, and calculate the probability of each candidate site (serine/thre-onine/tyrosine residues) in the query protein phosphorylated by thegiven kinase. (ii) Organism-specific predictors, where not only humanphosphorylation sites, but also phosphorylation sites in other species(Durek et al., 2010; Gao and Xu, 2010; Trost and Kusalik, 2013) havealso been predicted. (iii) Subcellular-specific predictors, which utilizethe information on localization of phosphorylation sites in subcellu-lar compartments (Chen et al., 2014). (iv) Global predictors, whichdistinguish globally phosphorylated phosphorylation sites from non-phosphorylated counterparts. This kind of predictors calculates theprobability of a candidate site in the query sequence to be phospho-rylated by any existing kinase (Dou, Yao, and Zhang, 2014; Zhao etal., 2012) (see also reviews from (Trost and Kusalik, 2011; Xue et al.,2010)).
The above-mentioned studies have achieved great performance inphosphorylation site prediction, but they harbor some drawbacks.Namely, the regulation mechanism behind phosphorylation depend-ing on different tissues has been shown, and the existence of tissue-specific kinases and phosphatases has been proposed in some partsof this thesis and previous studies. These findings decrease the ro-bustness of models current predictors generate. On the other hand,most of the existing predictors only utilized the sequence featuressurrounding phosphorylation sites. However, it has been shown inthis thesis and previous studies that phosphorylation sites also har-bor structural characteristics (Durek et al., 2009; Su and Lee, 2013;Tyanova et al., 2013). The redundancy elimination has also been per-formed at very generous thresholds where predictors using sequencefeatures would yield bias results. The prediction performance on phos-phorylation prediction eventually remained not accurate and suffi-cient – high specificity, but low sensitivity.
[ July 10, 2016 at 22:13 – classicthesis version 4.2 ]
10 introduction
1.5 thesis motivation and outline
The enzymes that catalyze PTM events have different expression lev-els in different tissues and cellular compartments. Comprehensivestudies of protein glycosylation (Kaji et al., 2012), phosphorylation(Lundby et al., 2012b) and acetylation (Lundby et al., 2012a) revealedthousands of differentially modified sites, opening up the possibilitythat PTM sites may possess substantially different sequence and spa-tial properties across tissues, depending on which particular enzymecatalyzes a particular modification event. The existence of compartment-specific sequence signatures for phosphorylation (Chen et al., 2014;Wijk et al., 2014) and lysine acetylation (Choudhary et al., 2009; Kimet al., 2006; Lundby et al., 2012a; Shao et al., 2012) has already beenfirmly established, whereas their tissue-specific preferences still re-main unexplored. This thesis focuses on tissue-specific sequence andstructural preferences of acetylation and phosphorylation sites in Chap-ter 2 and Chapter 3, respectively. In Chapter 4, we present the firsttissue-specific phosphorylation site prediction approach, TSPhosPred(Tissue-Specific Phosphorylation Prediction), which aims to addressthe drawbacks of current phosphorylation site predictors. We believethat this thesis will enlarge the horizon of phosphorylation and acety-lation, and contributes to understanding of the complex evolution ofpost-translational modifications.
[ July 10, 2016 at 22:13 – classicthesis version 4.2 ]

Part II
T I S S U E - S P E C I F I C S E Q U E N C E A N DS T R U C T U R A L E N V I R O N M E N T S O F LY S I N E
A C E T Y L AT I O N S I T E S
[ July 10, 2016 at 22:13 – classicthesis version 4.2 ]

[ July 10, 2016 at 22:13 – classicthesis version 4.2 ]
2T I S S U E - S P E C I F I C S E Q U E N C E A N D S T R U C T U R A LE N V I R O N M E N T S O F LY S I N E A C E T Y L AT I O N S I T E S
Lysine acetylation is a reversible post−translational modification thatregulates a broad spectrum of biological activities across various cel-lular compartments, cell types, tissues, and disease states. While com-partment−specific trends in lysine acetylation have recently been in-vestigated, its tissue-specific preferences remain unexplored. Here wepresent the first comprehensive tissue-based approach analyzing thesequence and structural features of lysine acetylation sites (LASs)based on the recent experimental data of (Lundby et al., 2012a). Weassessed the extent of evolutionary conservation of LASs and its de-pendence on functional and structural properties of proteins by com-paring rat, mouse, and C.elegans acetylomes. We further investigatedtissue-specific functional roles and domain preferences of acetylatedproteins.
2.1 materials and methods
2.1.1 Data collection and preprocessing
The dataset used in our analysis contains 15474 lysine acetylationsites (LASs) in 4541 proteins identified by high-resolution tandemmass spectrometry in 16 rat tissues: brain, heart, muscle, lung, kidney,liver, stomach, pancreas, spleen, thymus, intestine, skin, testis, testisfat, perirenal fat, and brown fat (Lundby et al., 2012a). For each lysine-acetylated peptide in each tissue we obtained information about theUniProt (Consortium, 2014) IDs of the best-matching proteins (oneor more), the sequence position of the acetylated site, and the inten-sity values (summed up extracted ion current of all isotopic clustersassociated with the peptide in the corresponding tissue).
In order to find the best-matching UniProt ID for each acetylatedpeptide we applied the following procedure: (i) All fragments wereexcluded from consideration. (ii) If there was only one UniProt IDassociated with an acetylated peptide, and its sequence position andthe sequence of the corresponding full-length protein in the UniProtdatabase were known, then we directly used that protein. (iii) Oth-erwise, we aligned all pairs of proteins and then chose the pair hav-ing the maximum sequence identity out of all pairs sharing at least90% sequence identity. The idea behind this approach is to find thoseUniProt proteins corresponding to the given peptide that show atleast some consistency in terms of their overall primary structure. Ifno pair of proteins associated with the given peptide showed morethan 90% sequence identity, this peptide was excluded from consid-eration. (iv) Finally, out of two aligned best−matching proteins weretained the longer one. We obtained 10626 acetylation sites on 3541
13
[ July 10, 2016 at 22:13 – classicthesis version 4.2 ]
14 tissue-specific lysine acetylation sites
Datasets Description Number
Initial dataset LASs 10626
Proteins 3541
Structure-based dataset LASs 2566
Proteins 856
LAS1D (non-redundant sequence-based) LASs (positive set) 9868
Non-LASs (negative set) 94362
LAS3D (non-redundant structure-based) LASs (positive set) 2218
Non-LASs (negative set) 8777
Table 2: Data summary of lysine acetylation sites.
proteins, each of them having only one best-matching UniProt ID.The decrease in the number of acetylation sites is due to not satisfy-ing the above criteria, not finding the sequence of the correspondingfull-length protein in the UniProt database, or not finding a lysineresidue in the specified sequence position of the finally obtained pro-tein.
2.1.2 Sequence (1D) environments of acetylated and reference (non−acetylated)lysine residues
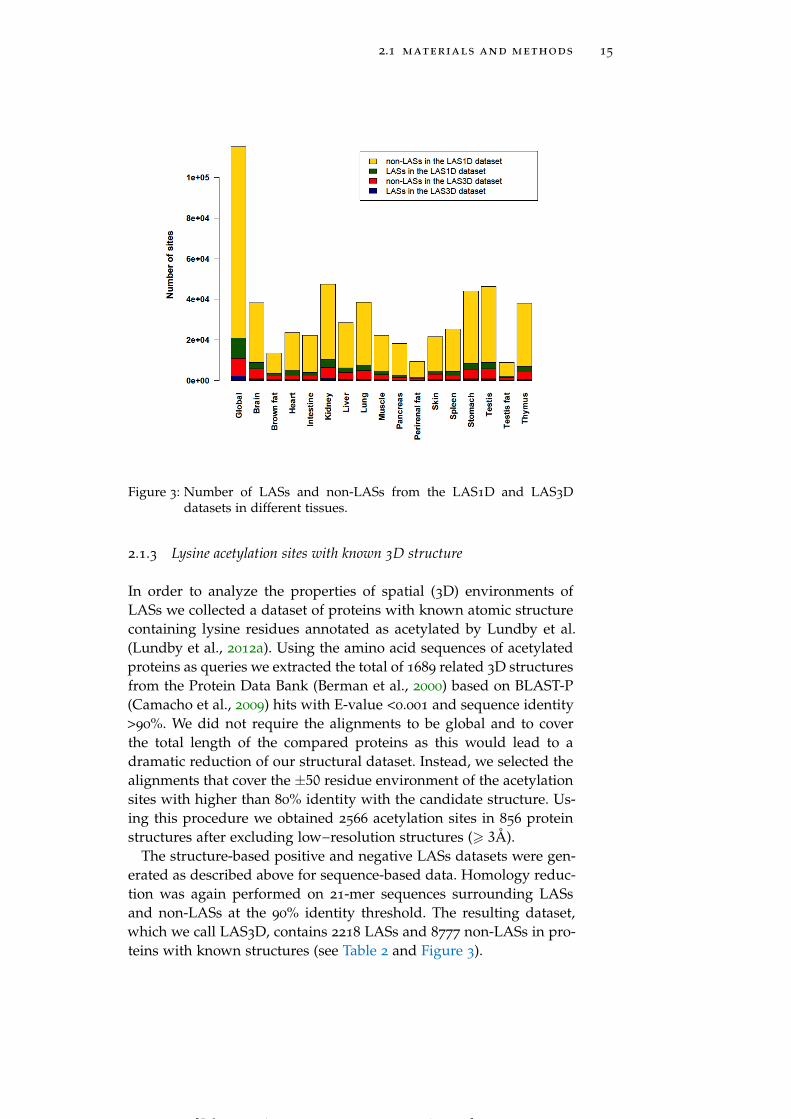
The positive dataset of tissue-specific LASs consisted of all lysineacetylated sites displaying non-zero intensity values in the correspond-ing tissue. The negative (reference or non-LASs) set was generated byextracting all lysine residues not annotated as acetylated by Lundbyet al. (Lundby et al., 2012a) and relating them to those tissues inwhich the protein harboring the reference site also has at least oneexperimentally observed LAS. Then, we generated 21-mer sequences(from position -10 to position +10) surrounding each site in both pos-itive and negative datasets and performed homology reduction onthese 21-mers using CD-HIT (Li and Godzik, 2006) at the 90% iden-tity threshold. Note that some of acetylation and reference sites occurin more than one tissue. The resulting dataset, which we call LAS1D,is composed of non-redundant 21-mer sequences corresponding to9868 LASs and 94362 non-LASs (Table 2). The distribution of LASsand non-LASs in different tissues is given in Figure 3.
We used the Two Sample Logo method (Vacic, Iakoucheva, andRadivojac, 2006) for differential analysis of 21-mer occurrence in dif-ferent tissues, using the corresponding LASs and non-LASs as posi-tive and negative sample inputs, respectively. For example, LASs ob-served in brain were compared to non-LASs in brain. Amino acidswere colored using the WebLogo defaults, and t-test with a cut-offp-value of 0.05 was used to select significantly enriched residues. TheMotif-X online tool (Chou and Schwartz, 2011) was used to extractmotifs from the 21-mer sequences of LASs, using LAS and non-LASas the foreground and background datasets, respectively.
[ July 10, 2016 at 22:13 – classicthesis version 4.2 ]
2.1 materials and methods 15
Figure 3: Number of LASs and non-LASs from the LAS1D and LAS3Ddatasets in different tissues.
2.1.3 Lysine acetylation sites with known 3D structure
In order to analyze the properties of spatial (3D) environments ofLASs we collected a dataset of proteins with known atomic structurecontaining lysine residues annotated as acetylated by Lundby et al.(Lundby et al., 2012a). Using the amino acid sequences of acetylatedproteins as queries we extracted the total of 1689 related 3D structuresfrom the Protein Data Bank (Berman et al., 2000) based on BLAST-P(Camacho et al., 2009) hits with E-value <0.001 and sequence identity>90%. We did not require the alignments to be global and to coverthe total length of the compared proteins as this would lead to adramatic reduction of our structural dataset. Instead, we selected thealignments that cover the ±50 residue environment of the acetylationsites with higher than 80% identity with the candidate structure. Us-ing this procedure we obtained 2566 acetylation sites in 856 proteinstructures after excluding low−resolution structures (> 3Å).
The structure-based positive and negative LASs datasets were gen-erated as described above for sequence-based data. Homology reduc-tion was again performed on 21-mer sequences surrounding LASsand non-LASs at the 90% identity threshold. The resulting dataset,which we call LAS3D, contains 2218 LASs and 8777 non-LASs in pro-teins with known structures (see Table 2 and Figure 3).
[ July 10, 2016 at 22:13 – classicthesis version 4.2 ]

16 tissue-specific lysine acetylation sites
2.1.4 Statistics
Statistical analyses were performed using the R environment (Team,2009) and custom Java programs. We used the non-parametric two-sample Kolmogorov-Smirnov test and the Fisher test to assess the sig-nificance of the differences between numerical and categorical datasets,respectively. Relative frequency of a certain property (e.g. conserva-tion) of LASs and their sequence neighborhoods observed in a giventissue was compared to that of non-LASs and their sequence neigh-borhoods observed in the same tissue. We used the non-parametricKruskal-Wallis test to perform multiple comparisons between expres-sion profiles of KAT paralogs across tissues.
2.1.5 Three-dimensional (3D) environments of acetylated and reference (non-acetylated) lysine residues
Spatial amino acid environments of LASs in the LAS3D dataset weredetermined by calculating the occurrence of 20 different amino acidtypes within the radial distances of 2 to 12 Å from the acetylated ly-sine residue in accordance with the previous studies analyzing thespatial environment of phosphorylation sites (Durek et al., 2009; Suand Lee, 2013). Distances between amino acid residues were definedbased on the minimal distance between any pair of atoms belongingto these residues. In order to isolate the influence of spatial struc-ture from 1D sequence motifs we also defined pure 3D amino acidenvironments of LASs by excluding from consideration those aminoacids already present in the sequence vicinity of LASs, as defined inthe previous section. In both cases the Fisher exact test was employedto assess the significance of the differences between LASs and non-LASs in each tissue, and these differences were efficiently visualizedusing our in-house software tool. For each radial distance rangingfrom 2 to 12 Å (in increments of 1Å) and for each amino acid type wecalculated (i) the significance (p-value) of the amino acid at that posi-tion using Fisher exact test, and (ii) the odds ratio of the amino acidat that position by dividing the normalized occurrence of acetylatedamino acids to that of non-acetylated amino acids.
2.1.6 Conservation analysis of lysine acetylation sites
Using an approach similar to the one given in (Weinert et al., 2011) weextracted Caenorhabditis elegans orthologs of acetylated proteins con-tained in the LAS1D dataset from the InParanoid database (Ostlundet al., 2010) and compared the evolutionary conservation of LASs andnon-LASs based on Needleman-Wunsch alignments (Needleman andWunsch, 1970) between acetylated protein sequences and their C. el-egans counterparts. We assessed the conservation by comparing thefrequency of conserved LASs among all LASs to the frequency of con-served non-LASs among all non-LASs. Note that for this analysis weused all C. elegans orthologs of mouse and rat acetylated proteins,
[ July 10, 2016 at 22:13 – classicthesis version 4.2 ]
2.1 materials and methods 17
including those that are not acetylated. Statistical significance of thedifferences between the conservation of LASs and non-LASs was cal-culated using the Fisher exact test.
2.1.7 Structural features of lysine acetylation sites
The surface accessibility of LASs and non-LASs in the LAS3D datasetalong with their sequence surroundings was calculated using NAC-CESS (Hubbard and Thornton, 1993). We used the absolute (ratherthan relative) accessibility scores of amino acid side chains producedby NACCESS that are larger than zero. The rationale for this choiceis that in contrast to LASs, non-LASs often reside in the core of theprotein and considering such buried non-LASs could lead to biasedresults.
We used DisEMBL (Linding et al., 2003) to predict disordered/un-structured regions within protein sequences. A LAS/non-LAS in theLAS1D dataset was considered to reside in a disordered region if itwas predicted by DisEMBL to be located in a region associated witheither loops/coils, or hot loops, or missing coordinates. Secondarystructure assignments were obtained from the DSSP database (Joostenet al., 2011).
2.1.8 Analysis of structural folds and functional domains
We investigated structural folds of lysine acetylated proteins in eachtissue in the LAS3D dataset according to the class and protein domainlevels of the SCOP database (Murzin et al., 1995) hierarchy. At the pro-tein domain level false discovery rate control was performed for mul-tiple hypothesis correction in each tissue, all p-values were adjusted,and the significance threshold after the correction p < 0.05 was used.At the structural class level, the significance threshold p < 0.01 wasused.
2.1.9 KEGG pathway analysis
We identified enriched pathways across tissues in the Kyoto Encyclo-pedia of Genes and Genomes (KEGG) database (Kanehisa et al., 2006)using the best-matching UniProt identifiers of each LAS and non-LASin the LAS3D dataset (see above). False discovery rate control was per-formed for multiple hypothesis correction in each tissue, all p-valueswere adjusted, and the significance threshold after the correction p <0.01 was used.
2.1.10 Abundance of KAT paralogs
For each experimentally identified human KAT (Li et al., 2012) wefound the mouse ortholog as well as its paralogs using the KEGGdatabase. Protein expression levels of paralogs across tissues wereobtained from the PaxDb database (Wang et al., 2012).
[ July 10, 2016 at 22:13 – classicthesis version 4.2 ]
18 tissue-specific lysine acetylation sites
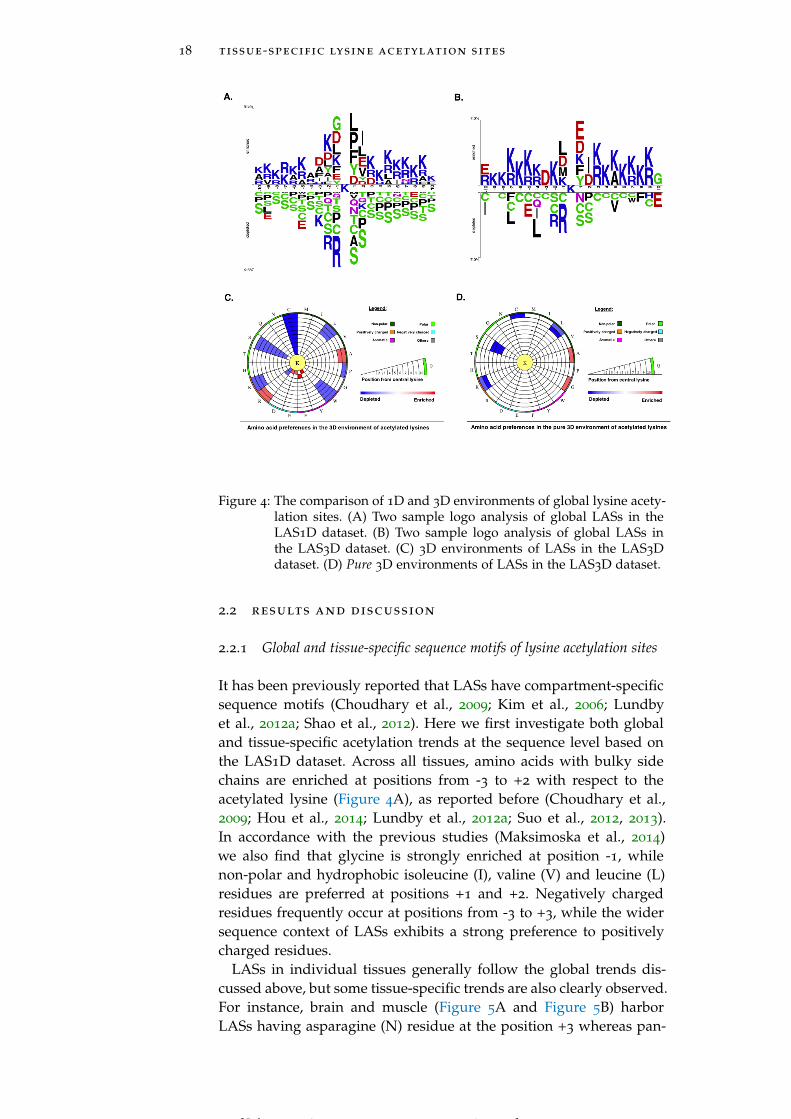
Figure 4: The comparison of 1D and 3D environments of global lysine acety-lation sites. (A) Two sample logo analysis of global LASs in theLAS1D dataset. (B) Two sample logo analysis of global LASs inthe LAS3D dataset. (C) 3D environments of LASs in the LAS3Ddataset. (D) Pure 3D environments of LASs in the LAS3D dataset.
2.2 results and discussion
2.2.1 Global and tissue-specific sequence motifs of lysine acetylation sites
It has been previously reported that LASs have compartment-specificsequence motifs (Choudhary et al., 2009; Kim et al., 2006; Lundbyet al., 2012a; Shao et al., 2012). Here we first investigate both globaland tissue-specific acetylation trends at the sequence level based onthe LAS1D dataset. Across all tissues, amino acids with bulky sidechains are enriched at positions from -3 to +2 with respect to theacetylated lysine (Figure 4A), as reported before (Choudhary et al.,2009; Hou et al., 2014; Lundby et al., 2012a; Suo et al., 2012, 2013).In accordance with the previous studies (Maksimoska et al., 2014)we also find that glycine is strongly enriched at position -1, whilenon-polar and hydrophobic isoleucine (I), valine (V) and leucine (L)residues are preferred at positions +1 and +2. Negatively chargedresidues frequently occur at positions from -3 to +3, while the widersequence context of LASs exhibits a strong preference to positivelycharged residues.
LASs in individual tissues generally follow the global trends dis-cussed above, but some tissue-specific trends are also clearly observed.For instance, brain and muscle (Figure 5A and Figure 5B) harborLASs having asparagine (N) residue at the position +3 whereas pan-
[ July 10, 2016 at 22:13 – classicthesis version 4.2 ]
2.2 results and discussion 19
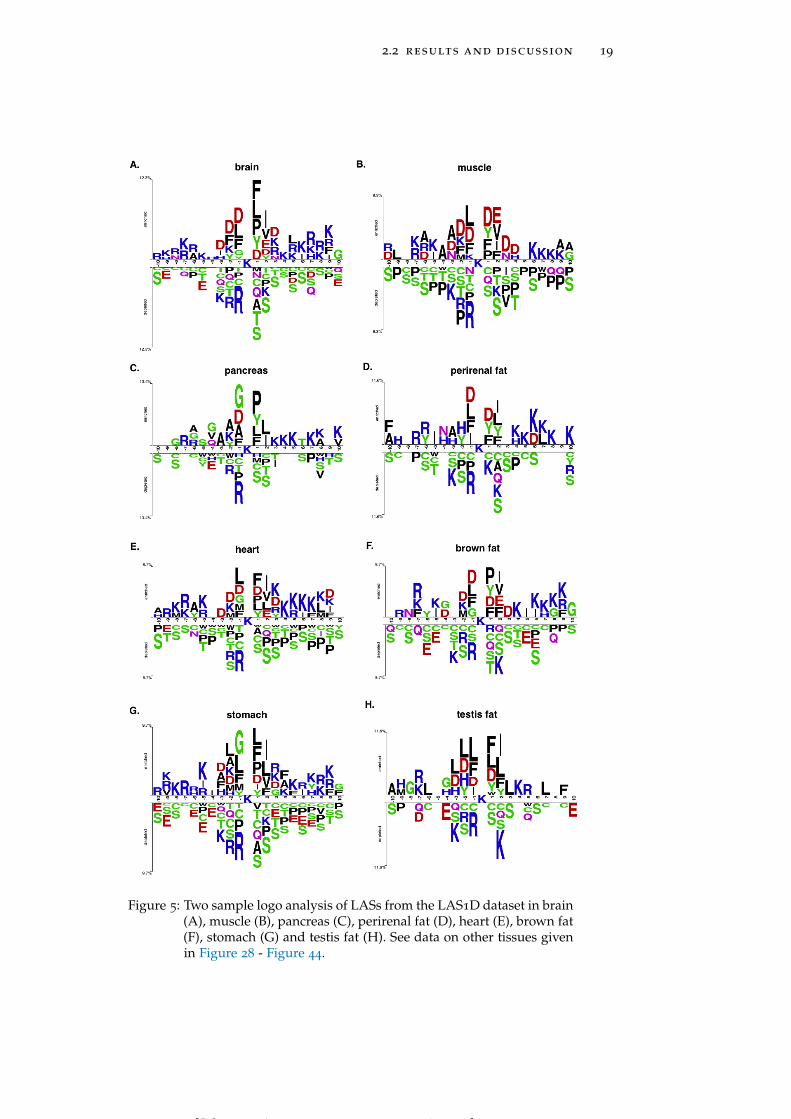
Figure 5: Two sample logo analysis of LASs from the LAS1D dataset in brain(A), muscle (B), pancreas (C), perirenal fat (D), heart (E), brown fat(F), stomach (G) and testis fat (H). See data on other tissues givenin Figure 28 - Figure 44.
[ July 10, 2016 at 22:13 – classicthesis version 4.2 ]
20 tissue-specific lysine acetylation sites
creas and perirenal fat (Figure 5C and Figure 5D) include LASs hav-ing glutamine (Q) and asparagine residues, respectively, highly en-riched at position -4. LASs in heart and stomach (Figure 5E and Fig-ure 5G) show a strong preference for methionine (M) residue at bothpositions -1 and -2, while in brown fat and muscle (Figure 5F andFigure 5B) LASs need methionine only at position -2. Histidine (H)residues are strongly preferred by LASs in testis fat at positions -2,-3 and -4 (Figure 5H). In the downstream region of the acetylatedlysines negatively charged residues occur less frequently in thymus,pancreas, perirenal fat and spleen (See Figure 28 – Figure 44 for moredetailed graphs for these and other tissues).
Besides the two-sample logo analysis, we also used the Motif-X soft-ware to delineate tissue-specific sequence motifs in the LAS1D datasetthat significantly deviate from the global sequence pattern (Table 12).For instance, the motifs I-AcK and I-X-X-AcK are only associated withbrain-specific LASs. Similarly, the motif E-X-AcK-Y is not observedin any tissues except for intestine. We therefore conclude that tissue-specific sequence motifs are not just random subsets of global motifs,but rather reflect the required environment for acetylation in eachtissue.
Acetylation is regulated both enzymatically, by lysine acetyltran-ferases (KATs), lysine deacetylases (KDACs) and bromo-domain- con-taining acetyllysine binders, and non-enzymatically (Choudhary etal., 2014). While the existence of compartment-specific KATs is stillbeing debated (Lundby et al., 2012a; Sadoul et al., 2011), our find-ings may imply the existence of tissue-specific KATs and KDACs. Wewere not able to detect significant differences in the abundance ofparalogs of experimentally identified KATs across different tissues,which implies that tissue-specific motifs are not a result of tissue-specific KAT expression. On the other hand, previous studies haveproposed that even though KATs might share a conserved substrate-binding site, different non-catalytic subunits of KATs may cause thediversity in substrate sequences (Berndsen et al., 2008; Clements etal., 2003; Poux and Marmorstein, 2003). Thus, the tissue-specific sub-strate sequences reported here may be suggestive of the existence oftissue-specific non-catalytic subunits of KATs. Moreover, the fact thatchaperones associated with KATs influence their substrate specificity(Berndsen et al., 2008; Fillingham et al., 2008; Recht et al., 2006) raisesthe opportunity that this influence may be exercised in a tissue depen-dent manner. On the other hand, we speculate that non-enzymaticacetylation might also vary from tissue to tissue depending on theconcentration of metabolites (acetyl-CoA, acetyl-phosphate etc.) andthe pH level (Choudhary et al., 2014), leading to diverse substratesequences. Such diversity could conceivably be caused by the follow-ing reasons: (i) absence of the recognition site by KATs, resulting inrandom sequences being favored for deprotonation of amino groupsby acetyl-CoA, (ii) the requirement for specific lysine environmentfor CoA donation of acetyl-CoA, (iii) regulation of enzymatic lysineacetylation by non-enzymatic acetylation (crosstalk), such that if non-enzymatic acetylation does not occur due to the low abundance of a
[ July 10, 2016 at 22:13 – classicthesis version 4.2 ]
2.2 results and discussion 21
metabolite, the regulated acetylation of another lysine would be ob-structed and the substrate sequence of the corresponding KAT wouldbe underrepresented in that tissue.
2.2.2 Global and tissue-specific sequence motifs of lysine acetylation sitesin proteins with known 3D structure
We conducted a separate analysis of lysine acetylation sequence mo-tifs in the LAS3D dataset, which only contains proteins with known3D structure. Since this dataset is obviously depleted in disorderedregions and hence has a somewhat different amino acid composition,the corresponding lysine acetylation motifs exhibit somewhat differ-ent residue preferences compared with the full LAS1D dataset. Theenrichment of the disorder promoting glycine residue, for instance, isnot observed at position -1 of the global LAS signature (Figure 4B).On the other hand, in some tissues, including brain, kidney and testisthe sequence neighborhoods of LASs are enriched in positively andnegatively charged residues, while in pancreas LASs require arginineonly at the amino acid position -7 (Figure 45). In pancreas, LASs inthe LAS3D dataset exhibit a strong preference for negatively chargedaspartic acid (D) residue at the amino acid position +3 and negativelycharged glutamic acid (E) at the amino acid position -2, which is instrong contract to the tendencies found for pancreas based on theentire LAS1D dataset (see above). Brain is characterized by the fre-quent occurrence of negatively charged residues between amino acidpositions -2 to +3. LASs in intestine are special in that they are as-sociated with enriched glycine (G) and methionine (M) residues atpositions -1 and -8, respectively, whereas none of the LASs observedin other tissues have such preferences. Interestingly, as opposed toglobal LAS signatures, LASs in stomach and testis fat do not harborany negatively charged residues, while LASs in kidney and thymusshow a strong preference for polar asparagine (N) residue at aminoacid position -3.
2.2.3 Spatial environments of lysine acetylation sites
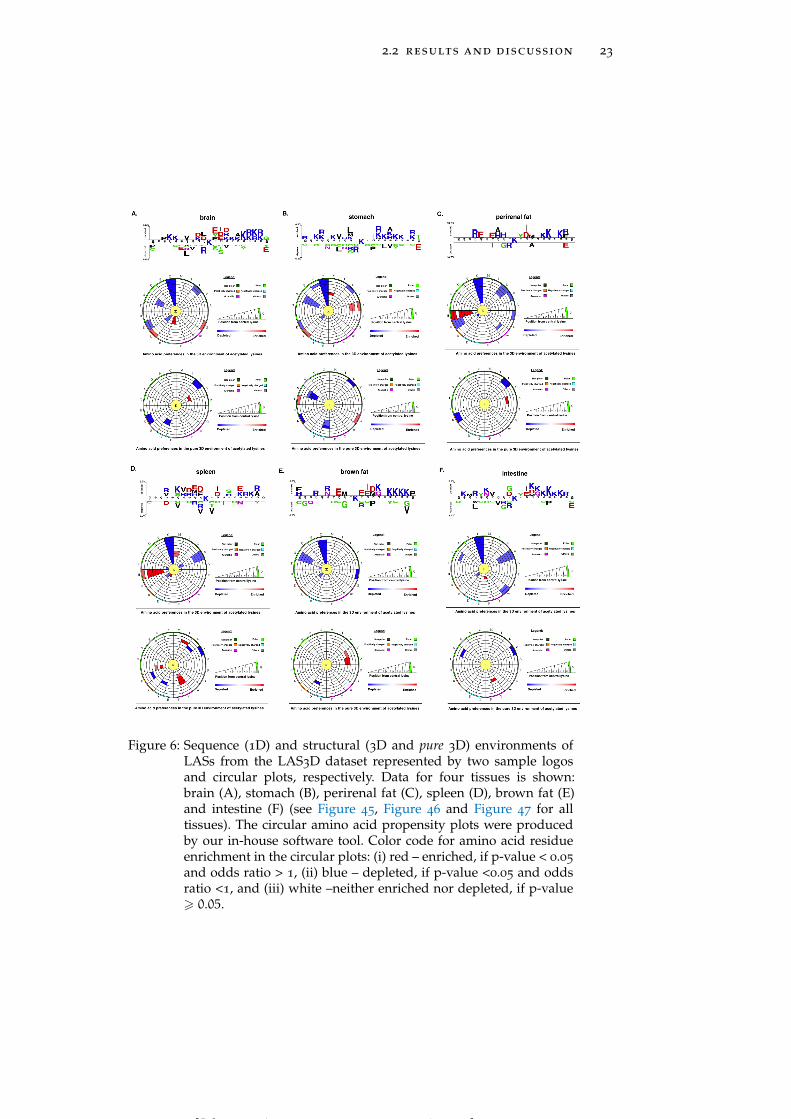
In the spatial surroundings of LASs across all tissues there is a strongdepletion of cysteine (C), which is also avoided in the sequence mo-tifs discussed above. In the close proximity of global acetylation sites(around 2-3 Å away), strong enrichment of hydrophobic, aromatic,low flexibility and order-promoting tyrosine (Y) and phenylalanine(F) residues is observed (Figure 4C). Another prominent trend isstrong enrichment of positively charged, surface exposed, highly flex-ible and disorder promoting arginine residue at larger distances (10
to 11 Å). Interestingly, enrichment of positively charged residues inthe 3D environment of global LASs is not as strong as in the 1D se-quence neighborhood.
Tissue-specific spatial environment analysis reveals some additionalstatistical trends. LASs in brain and stomach (Figure 6A and Fig-
[ July 10, 2016 at 22:13 – classicthesis version 4.2 ]
22 tissue-specific lysine acetylation sites
ure 6B) have a strong preference for glutamic acid and methionineresidues, respectively, whereas perirenal fat and spleen (Figure 6Cand Figure 6D) harbor LASs whose spatial environment is enrichedin histidine (H). Thus, patterns of amino acid usage around LASsare generally consistent between 1D and 3D environments, althoughsome of the tendencies found at the primary structure level, suchas the enrichment of negatively charged residues in brown fat (Fig-ure 6E) and the enrichment of glycine and tyrosine residues in intes-tine (Figure 6F), are not observed in the 3D environments (see Fig-ure 46 for more detailed graphs for all tissues).
Amino acid residues participating in local sequence motifs aroundLASs are also situated in their spatial vicinity. In order to disentan-gle the effects of sequence neighbors from those of spatial neighborswe conducted a separate analysis of pure structural environments(see Section 2.1). While only a weak enrichment of alanine (A) andglycine residues is observed in global pure 3D environment trends(Figure 4D), tissue-specific preferences are more strongly pronounced.One of the striking examples is the strong enrichment of tyrosinesat a distance between 4 Å and 7 Å in spleen (Figure 6D). Similarly,LASs residing in brown fat have a preference for hydrophobic ala-nine and valine (V) residues in their pure 3D environments, which isnot observed when sequence context is also considered (Figure 6E).Spleen harbors LASs enriched in tyrosine and isoleucine (I) residuesin their pure 3D environment, whereas tyrosine residues in the 1Denvironment, and both tyrosine and isoleucine residues in the 3D en-vironment are not enriched (Figure 6D). We thus find that, beyondsequence motifs, there are statistically significant patterns of residuepreferences in the spatial environment of LASs, which implies thatthe substrate-specificity of KATs and KDACs may be characterizedby both of sequence and spatial environments of LASs (see Figure 47
for more detailed graphs for all tissues).
2.2.4 Evolutionary conservation of lysine acetylation sites
Previous studies, in which the conservation of lysine acetylation inDrosophila melanogaster or in humans was compared to that in ne-matodes and zebrafish (Weinert et al., 2011), indicate that LASs aresignificantly more conserved than non-LASs. With an approach sim-ilar to the one given in (Weinert et al., 2011), we created sequencealignments between rat and mouse proteins from the LAS1D datasetand their C. elegans orthologs obtained from the InParanoid database(Ostlund et al., 2010). We then compared the conservation frequencyof global rat and mouse LASs and non-LASs to the conservation fre-quency of these sites in the C. elegans counterparts. As expected, wefind that acetylated lysine residues (conservation frequency of 45.7%)are more conserved than non-acetylated lysine residues (conserva-tion frequency of 41.3%) (p-value < 6.17 x 10⁻⁷), although at the tis-sue level this trend was only significant in brain (48.12% and 40% ofLASs and non-LASs with p-value < 0.0028), lung (49.03% and 44.54%of LASs and non-LASs with p-value < 0.0061) and thymus (50.87%
[ July 10, 2016 at 22:13 – classicthesis version 4.2 ]
2.2 results and discussion 23
Figure 6: Sequence (1D) and structural (3D and pure 3D) environments ofLASs from the LAS3D dataset represented by two sample logosand circular plots, respectively. Data for four tissues is shown:brain (A), stomach (B), perirenal fat (C), spleen (D), brown fat (E)and intestine (F) (see Figure 45, Figure 46 and Figure 47 for alltissues). The circular amino acid propensity plots were producedby our in-house software tool. Color code for amino acid residueenrichment in the circular plots: (i) red – enriched, if p-value < 0.05
and odds ratio > 1, (ii) blue – depleted, if p-value <0.05 and oddsratio <1, and (iii) white –neither enriched nor depleted, if p-value> 0.05.
[ July 10, 2016 at 22:13 – classicthesis version 4.2 ]
24 tissue-specific lysine acetylation sites
and 45.31% of LASs and non-LASs with p-value < 0.0011). We specu-late that the weaker evolutionary conservation of acetylated positionsat the tissue level is due to the tissue-specific variation of proteinabundance levels, as was already shown for phosphoproteins (Levy,Michnick, and Landry, 2012). We subsequently compared the conser-vation of LASs and non-LASs separately in irregular/regular regions,ordered/disordered regions, and functional/unknown proteins, mo-tivated by the previous reports that the conservation of phosphory-lation sites strongly depends on these key factors (Levy, Michnick,and Landry, 2012). We find that according to the KEGG database59.85% of all conserved global LASs reside in proteins with knownfunctions, whereas for conserved global non-LASs this percentage ismuch lower, at 50.16% (p < 9.35 x 10⁻¹⁴). This observation is alsosignificant in all tissues except liver and pancreas (Table 14). On theother hand, both global LASs and non-LASs are more frequently andequally conserved in disordered and regular regions (57.19% and58.37%, respectively for disordered regions; 60.43% and 60.95%, re-spectively, for regular regions). We therefore conclude that acetyla-tion sites follow the evolutionary trends similar to phosphorylationprocesses in that they are more conserved in proteins with knownfunction and in structurally regular regions.
2.2.5 Tissue-specific structural properties of lysine acetylation sites
In line with the previous reports (Kim et al., 2006; Rojas et al., 1999;Suo et al., 2012), both global LASs and the residues surrounding themtend to be consistently more solvent exposed than non-acetylatedlysines and their 1D environment by about 10% on average (see Ta-ble 15). No tissue-specific solvent exposure preference was observed.Structural preferences of lysine acetylation sites display tissue-specificcharacter. For instance, LASs and the residues surrounding them inall tissues except for thymus, spleen and pancreas reside significantlymore often in ordered regions than in disordered regions, as globalLASs also do. On the other hand, no enrichment of LASs for disor-dered regions in any tissue was observed.
In all tissues except pancreas, testis fat, muscle and perirenal fatboth LASs and the residues in their close proximity tend to reside inα-helices more often than in other types of secondary structure (Fig-ure 48). Beyond the enrichment in α-helices, we also find that LASs instomach tend to avoid loops whereas LASs in testis are depleted in β-sheets. In addition, in many tissues residues adjacent to LASs on theC-terminal side are depleted in β-sheets. No structural preferences ofLASs could be observed in testis fat.
In terms of SCOP fold preferences global LASs and non-LASs showthe same behavior in that they are mainly found in all-α proteins(Figure 49). The same trend exists in many individual tissues exceptfor muscle and brown fat where acetylation sites are significantly en-riched in (α+β) proteins. On the other hand, LASs in heart, skin andtestis are significantly depleted in (α/β) proteins. Based on the anal-ysis of B-factors we also find that LASs preferentially occur in more
[ July 10, 2016 at 22:13 – classicthesis version 4.2 ]
2.2 results and discussion 25
rigid regions of protein structures. LASs and the residues surround-ing them have smaller B-factors than non-LASs do (Table 15).
2.2.6 Proteins containing acetylated lysines are involved in tissue-specificbiological pathways
It has been firmly established that the structural environment of phos-phorylated residues is a key factor determining kinase specificity andultimately the functional role of phosphorylation processes (Su andLee, 2013; Tyanova et al., 2013). We therefore investigated whetherlysine acetylated proteins are specialized for various functions in dif-ferent tissues. It is worth reminding that in all cases we compare theenrichment or depletion of acetylated proteins in specific pathwaysrelative to non-acetylated proteins in each individual tissue (see Sec-tion 2.1), so the trends presented below cannot be the consequenceof mere presence or absence of certain functions in those tissues.In accordance with previous studies (Henriksen et al., 2012; Kim etal., 2006; Lu et al., 2011; Patel, Pathak, and Mujtaba, 2011), we findthat global lysine acetylated proteins are involved in energy genera-tion processes including the TCA cycle, fatty acid metabolism, andglycine/serine/threonine metabolism. However, there are also signif-icant differences between global and tissue-specific lysine acetylatedproteins in terms of their biological pathway preferences (Figure 7).Similar to the trends in globally acetylated proteins, lysine acetylatedproteins in all tissues except for spleen, pancreas, testis fat and livertake part in the citrate cycle (TCA cycle) pathway. On the other hand,proteins involved in RNA transport show significant enrichment inacetylation sites only in brain. Acetylation appears to play a role inthe terpenoid backbone biosynthesis pathway only in liver. We alsoidentified tissue-specific acetylation patterns in several disease path-ways. It appears that only in heart acetylated proteins are involvedin the regulation of Type II diabetes mellitus, whereas Epstein-Barrvirus infection is only regulated by testis-specific acetylated proteins.
It has been shown in several studies that acetylated proteins notonly take part in nuclear processes, such as regulation of gene tran-scription, but are also involved in signaling pathways. On the otherhand, it has also been previously proposed that differential lysineacetylation between human liver and leukemia cells might be celltype-dependent (Choudhary et al., 2009; Patel, Pathak, and Mujtaba,2011). Our findings indicate the existence of biological processes thatare affected by acetylation in a tissue-specific manner. Compoundsmodulating KAT-, KDAC- and bromo domain-containing proteinsshow promise as potential drugs against cancer, cardiac illness, dia-betes, and neurodegenerative disorders (Choudhary et al., 2014; Patel,Pathak, and Mujtaba, 2011). Our observation that acetylated proteinsare involved in a number of tissue-specific disease pathways, com-bined with the speculation about the existence of tissue-specific KATs,KDACs and bromo domain-containing proteins discussed above, mayserve as an indication that small molecules and drugs can be designedto target tissue-specific disease pathways.
[ July 10, 2016 at 22:13 – classicthesis version 4.2 ]
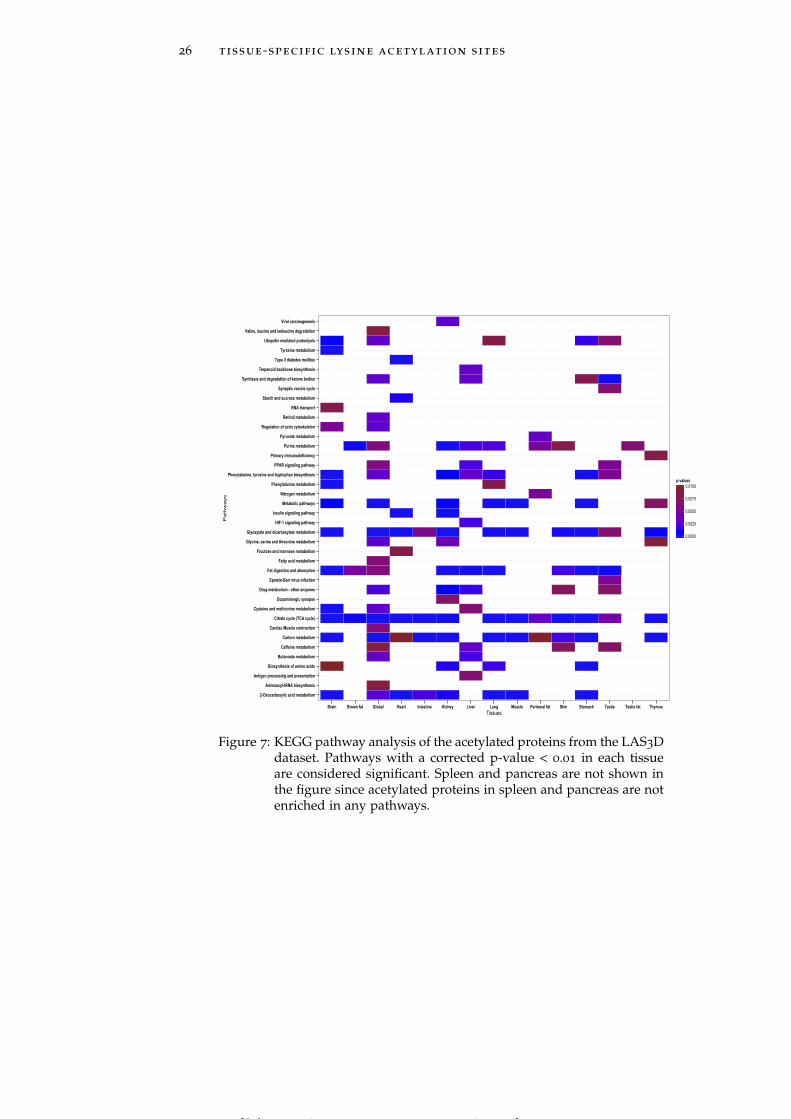
26 tissue-specific lysine acetylation sites
2-Oxocarboxylic acid metabolism
Aminoacyl-tRNA biosynthesis
Antigen processing and presentation
Biosynthesis of amino acids
Butanoate metabolism
Caffeine metabolism
Carbon metabolism
Cardiac Muscle contraction
Citrate cycle (TCA cycle)
Cysteine and methionine metabolism
Dopaminergic synapse
Drug metabolism - other enzymes
Epstein-Barr virus infection
Fat digestion and absorption
Fatty acid metabolism
Fructose and mannose metabolism
Glycine, serine and threonine metabolism
Glyoxylate and dicarboxylate metabolism
HIF-1 signaling pathway
Insulin signaling pathway
Metabolic pathways
Nitrogen metabolism
Phenylalanine metabolism
Phenylalanine, tyrosine and tryptophan biosynthesis
PPAR signaling pathway
Primary immunodeficiency
Purine metabolism
Pyruvate metabolism
Regulation of actin cytoskeleton
Retinol metabolism
RNA transport
Starch and sucrose metabolism
Synaptic vesicle cycle
Synthesis and degradation of ketone bodies
Terpenoid backbone biosynthesis
Type II diabetes mellitus
Tyrosine metabolism
Ubiquitin mediated proteolysis
Valine, leucine and isoleucine degradation
Viral carcinogenesis
Brain Brown fat Global Heart Intestine Kidney Liver Lung Muscle Perirenal fat Skin Stomach Testis Testis fat ThymusTissues
Pathways
0.0000
0.0025
0.0050
0.0075
0.0100p-values
Figure 7: KEGG pathway analysis of the acetylated proteins from the LAS3Ddataset. Pathways with a corrected p-value < 0.01 in each tissueare considered significant. Spleen and pancreas are not shown inthe figure since acetylated proteins in spleen and pancreas are notenriched in any pathways.
[ July 10, 2016 at 22:13 – classicthesis version 4.2 ]
2.3 conclusion 27
Unsurprisingly, tissue-specific preferences regarding biological path-ways are accompanied by the variation in occurrence of acetylationsites within key protein domains such as aldehyde reductase (dehy-drogenase), creatine kinase C-terminal domain, mitochondrial classkappa glutathione S-transferase, and phosphoglucose isomerase (Fig-ure 50). Proteins containing the zeta isoform domain are exclusivelyacetylated in brain. The zeta type protein kinase C (PKC) is expressedin brain where it is involved in mitogenic signaling, cell proliferation,cell polarity, inflammatory response, and maintenance of long-termpotentiation and memories. While it has been reported that two spe-cific sites of this kinase need to be phosphorylated for its full activa-tion (Consortium, 2014), our findings suggest that some of its sitesmay also need to be acetylated. Class mu GST domain-containingacetylated proteins are enriched testis. Mu belongs to the cytosolicsuperfamily of Glutathione S-transferases (GSTs), which catalyze thejoining of glutathione (GSH) to xenobiotic substrates for detoxifica-tion. GSTs also play role in the cell signaling processes. Overexpres-sion of GSTP1-1 – an isozyme of the mammalian GST family - hasbeen associated to cancer. GSTP1-1 is a very important drug targetand its acetylation in testis warrants further investigation. Proteinscontaining malate dehydrogenase (a component of the TCA cycle, seeabove) and annexin v domains (whose function is still unknown) areacetylated in many tissues.
2.3 conclusion
In this work we present evidence that lysine acetylation sites dis-play tissue-specific preferences for certain residues both in their linearamino acid sequence and in spatial environments. We further demon-strate that LASs are generally more evolutionarily conserved thannon-LASs, the trend that is especially pronounced in proteins withknown function and in structurally regular regions. The occurrenceof LASs and the residues surrounding them in disordered regionsand regular secondary structures also displays a tissue-specific char-acter. These findings imply the existence of tissue-specific KATs andKDACs able to differentiate between various types of local structuralenvironments beyond mere amino acid content in sequence and inspatial environments. Lysine acetylated proteins are specialized forvarious functions in different tissues, and this specialization is sup-ported by tissue-specific key domain preferences. Since compoundsmodulating KAT-, KDAC- and bromo domain-containing proteins arepotential drugs against many diseases, including cancer, the specula-tion about the existence of tissue-specific KATs, KDACs and bromodomain-containing proteins indicates the need for tissue-specific drugtarget designs.
[ July 10, 2016 at 22:13 – classicthesis version 4.2 ]

[ July 10, 2016 at 22:13 – classicthesis version 4.2 ]

Part III
S E Q U E N C E - A N D S T R U C T U R E - B A S E DA N A LY S I S O F T I S S U E - S P E C I F I C
P H O S P H O RY L AT I O N S I T E S
[ July 10, 2016 at 22:13 – classicthesis version 4.2 ]

[ July 10, 2016 at 22:13 – classicthesis version 4.2 ]
3S E Q U E N C E - A N D S T R U C T U R E - B A S E D A N A LY S I SO F T I S S U E - S P E C I F I C P H O S P H O RY L AT I O N S I T E S
Phosphorylation is the most widespread and studied reversible post-translational modification, and play a role in the regulation of almostevery cellular activity. Sequence and structural properties of globalphosphorylation sites, as well as of those specific for individual cel-lular compartments, have been previously investigated. By contrast,tissue-specific preferences of phosphorylation sites at the sequenceand structure level remain largely unexplored. In this study we per-formed a comprehensive tissue-specific analysis of the sequence andstructural environments of phosphorylation sites as well as globallyphosphorylated sites, employing a recent experimental data by Lundbyet al. (Lundby et al., 2012b) that provides new insights into the under-lying mechanism of phosphorylation. We demonstrate that substraterecognition by kinases is guided by both sequence and structural fea-tures of phosphorylation sites in a tissue specific manner. Based onthe known kinase-substrate associations we demonstrate that manykinases are active in a tissue-specific manner, an effect which is ap-parently not caused by tissue-specific expression of kinase genes. Wealso examined differential functional roles and domain preferences ofphosphorylation sites across tissues (see Figure 8 for summary).
3.1 materials and methods
3.1.1 Datasets of phosphorylated and reference (non-phosphorylated) sites
We used the dataset from of 31480 phosphorylation sites in 7280 pro-teins identified by high-resolution tandem mass spectrometry in 14
rat tissues: brain (dissected into cerebellum, cortex and brainstem),heart, muscle, lung, kidney, liver, stomach, pancreas, spleen, thymus,intestine, testis, perirenal fat, and blood (Lundby et al., 2012b). TheUniProt (Consortium, 2014) IDs of the best-matching proteins (oneor more), the sequence position of the phosphorylation site, and theintensity values (summed up extracted ion current of all isotopic clus-ters associated with the peptide in the corresponding tissue) weregathered for each phosphorylation site in each tissue.
The best-matching UniProt ID for each phosphorylated peptidewas identified as described previously in Chapter 2. Briefly, we alignedall pairs of proteins associated with a given peptide and chose thelonger protein of the pair having the maximum sequence identity outof all pairs. We obtained 17917 phosphorylation sites on 5443 pro-teins, each of them having only one best-matching UniProt ID. Thisdataset contains 14661 phosphorylated serine sites (PSSs), 2832 phos-phorylated threonine sites (PTSs), and 424 phosphorylated tyrosinesites (PYSs) (Table 3). The decrease in the number of phosphorylation
31
[ July 10, 2016 at 22:13 – classicthesis version 4.2 ]
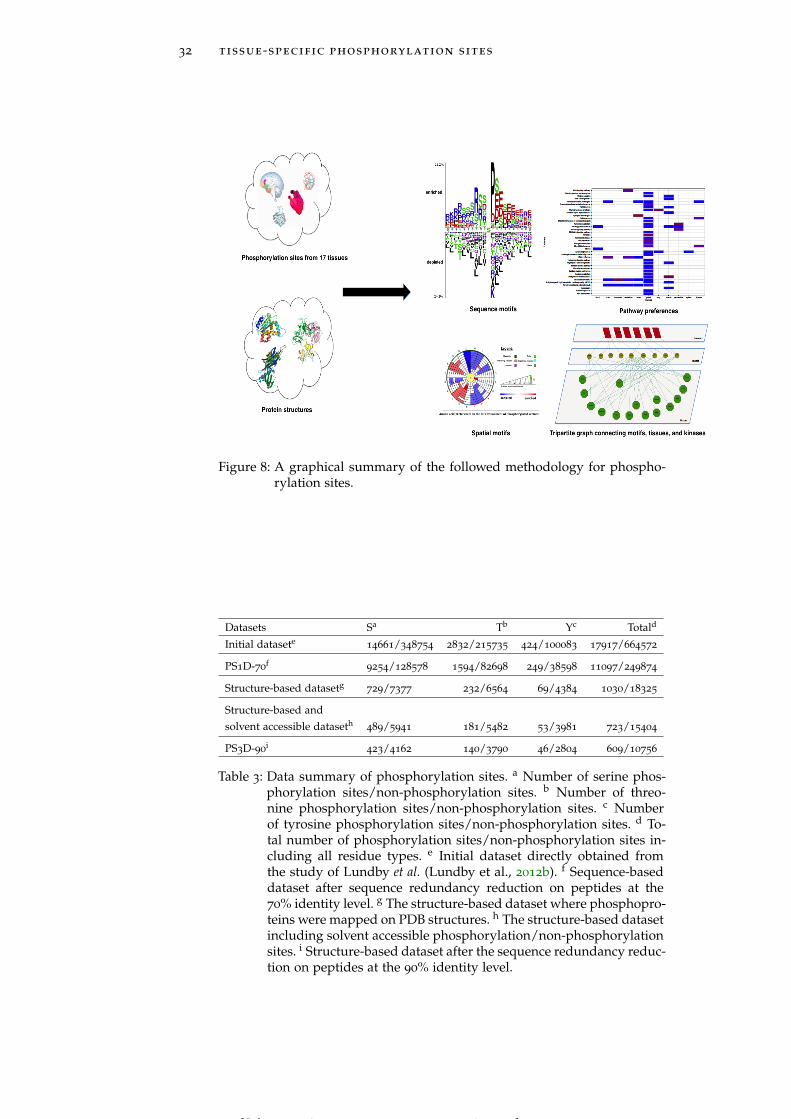
32 tissue-specific phosphorylation sites
Figure 8: A graphical summary of the followed methodology for phospho-rylation sites.
Datasets Sa Tb Yc Totald
Initial datasete14661/348754 2832/215735 424/100083 17917/664572
PS1D-70f
9254/128578 1594/82698 249/38598 11097/249874
Structure-based datasetg729/7377 232/6564 69/4384 1030/18325
Structure-based andsolvent accessible dataseth
489/5941 181/5482 53/3981 723/15404
PS3D-90i
423/4162 140/3790 46/2804 609/10756
Table 3: Data summary of phosphorylation sites. a Number of serine phos-phorylation sites/non-phosphorylation sites. b Number of threo-nine phosphorylation sites/non-phosphorylation sites. c Numberof tyrosine phosphorylation sites/non-phosphorylation sites. d To-tal number of phosphorylation sites/non-phosphorylation sites in-cluding all residue types. e Initial dataset directly obtained fromthe study of Lundby et al. (Lundby et al., 2012b). f Sequence-baseddataset after sequence redundancy reduction on peptides at the70% identity level. g The structure-based dataset where phosphopro-teins were mapped on PDB structures. h The structure-based datasetincluding solvent accessible phosphorylation/non-phosphorylationsites. i Structure-based dataset after the sequence redundancy reduc-tion on peptides at the 90% identity level.
[ July 10, 2016 at 22:13 – classicthesis version 4.2 ]
3.1 materials and methods 33
sites may be due to failure in finding either the best-matching UniProtID, or a serine (S)/threonine (T)/tyrosine (Y) residue in the specifiedsequence position, or the sequence of the corresponding full-lengthprotein in the UniProt database.
We also generated a negative (reference or non-PSSs, non-PTSs, nonPYSs) dataset by extracting all S/T/Y residues not annotated as phos-phorylated by Lundby et al. and matching them to those tissues inwhich the protein containing the reference site had at least one ex-perimentally observed PSS/PTS/PYS. Then, the 21-mer sequences(from -10 to +10) surrounding each site in both positive and nega-tive datasets were extracted, and homology reduction on these 21-mers were performed using CD-HIT (Li and Godzik, 2006) at the 70%identity threshold. Some of phosphorylation and reference sites arefound in more than one tissue. The statistics of the resulting datasets,PS1D-70, can be found in Table 3 (11097 phosphorylation sites in 5286
proteins).
3.1.2 Identification of sequence motifs
We used the Two Sample Logo method (Vacic et al., 2006) to findenriched and depleted residues in the 21-mer sequences occurringin different tissues, using the associated PSSs/PTSs/PYSs and non-PSS/non-PTSs/non-PYSs as positive and negative sample inputs, re-spectively. For instance, PSSs/PTSs/PYSs found in kidney were com-pared to non-PSS/non-PTSs/non-PYSs in kidney. The Motif-X onlinetool (Chou and Schwartz, 2011) was employed to detect sequence mo-tifs from 21-mer sequences where PSSs/PTSs/PYSs and non-PSS/non-PTSs/non-PYSs were used as the foreground and background datasets,respectively.
3.1.3 Obtaining 3D structures of phosphorylated proteins
We applied the same procedure as we described in Chapter 2 to col-lect 3D structures of phosphorylated proteins. We extracted the to-tal of 2079 related 3D structures from the Protein Data Bank basedon BLAST-P hits. After requiring at least 80% identity within the se-quence segment spanning ±50 sequence positions around the phos-phorylated residue, we obtained 1030 phosphorylation sites in 399
protein structures with the resolution better that 3Å.Once the structure-based positive and negative PSSs/PTSs/PYSs
datasets were generated as described above for the sequence-baseddata, homology reduction was again performed at the 90% identitylevel, taking into account only solvent accessible phosphorylationsites. The resulting dataset, which we call PS3D-90, contains 609 phos-phorylation sites (423 PSSs, 140 PTSs and 46 PYSs) and 10756 non-phosphorylation sites (4162 PSSs, 3790 PTSs and 2804 PYSs) in 332
proteins with known structures (Table 3). The number of PSSs, PTSsand PYSs in each tissue can be found in Table 19, Table 20 and Ta-ble 21, respectively. Since the number of PYS per tissue in the PS3D-
[ July 10, 2016 at 22:13 – classicthesis version 4.2 ]
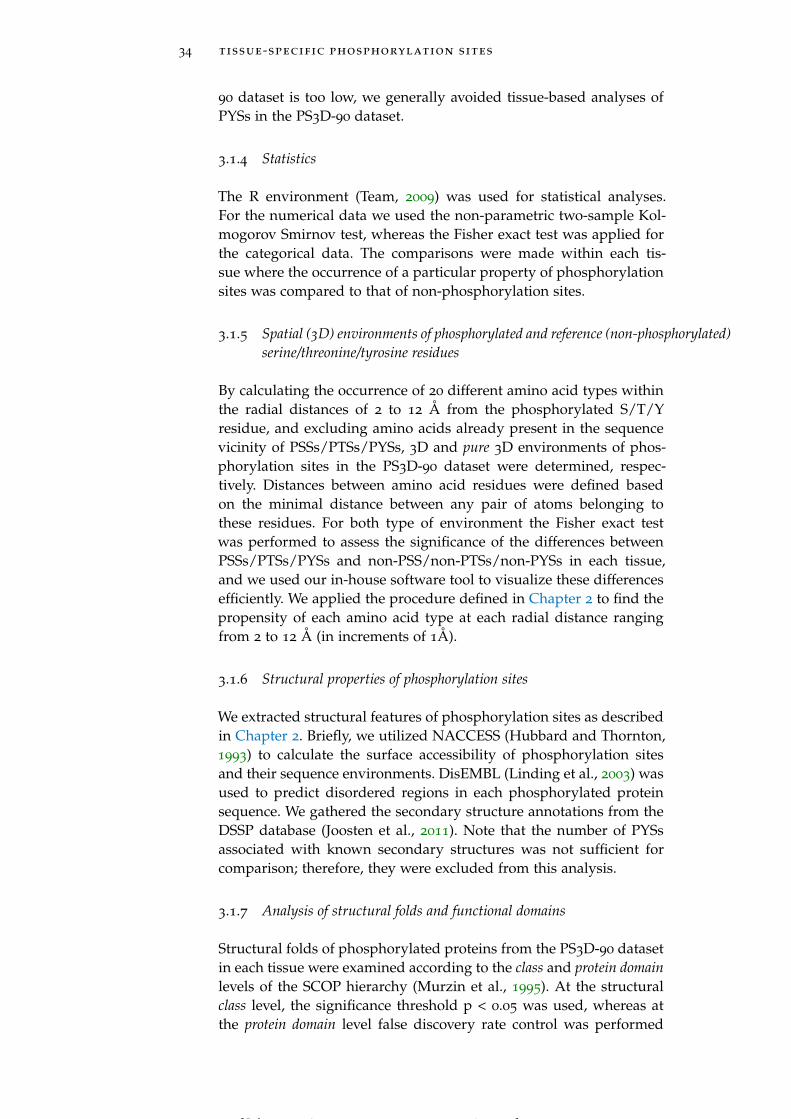
34 tissue-specific phosphorylation sites
90 dataset is too low, we generally avoided tissue-based analyses ofPYSs in the PS3D-90 dataset.
3.1.4 Statistics
The R environment (Team, 2009) was used for statistical analyses.For the numerical data we used the non-parametric two-sample Kol-mogorov Smirnov test, whereas the Fisher exact test was applied forthe categorical data. The comparisons were made within each tis-sue where the occurrence of a particular property of phosphorylationsites was compared to that of non-phosphorylation sites.
3.1.5 Spatial (3D) environments of phosphorylated and reference (non-phosphorylated)serine/threonine/tyrosine residues
By calculating the occurrence of 20 different amino acid types withinthe radial distances of 2 to 12 Å from the phosphorylated S/T/Yresidue, and excluding amino acids already present in the sequencevicinity of PSSs/PTSs/PYSs, 3D and pure 3D environments of phos-phorylation sites in the PS3D-90 dataset were determined, respec-tively. Distances between amino acid residues were defined basedon the minimal distance between any pair of atoms belonging tothese residues. For both type of environment the Fisher exact testwas performed to assess the significance of the differences betweenPSSs/PTSs/PYSs and non-PSS/non-PTSs/non-PYSs in each tissue,and we used our in-house software tool to visualize these differencesefficiently. We applied the procedure defined in Chapter 2 to find thepropensity of each amino acid type at each radial distance rangingfrom 2 to 12 Å (in increments of 1Å).
3.1.6 Structural properties of phosphorylation sites
We extracted structural features of phosphorylation sites as describedin Chapter 2. Briefly, we utilized NACCESS (Hubbard and Thornton,1993) to calculate the surface accessibility of phosphorylation sitesand their sequence environments. DisEMBL (Linding et al., 2003) wasused to predict disordered regions in each phosphorylated proteinsequence. We gathered the secondary structure annotations from theDSSP database (Joosten et al., 2011). Note that the number of PYSsassociated with known secondary structures was not sufficient forcomparison; therefore, they were excluded from this analysis.
3.1.7 Analysis of structural folds and functional domains
Structural folds of phosphorylated proteins from the PS3D-90 datasetin each tissue were examined according to the class and protein domainlevels of the SCOP hierarchy (Murzin et al., 1995). At the structuralclass level, the significance threshold p < 0.05 was used, whereas atthe protein domain level false discovery rate control was performed
[ July 10, 2016 at 22:13 – classicthesis version 4.2 ]
3.1 materials and methods 35
for multiple hypothesis correction in each tissue, and the significancethreshold after the correction p < 0.05 was used after all p-valueswere adjusted. Note that the numbers of PTSs and PYSs associatedwith known SCOP folds were not sufficient for comparison; therefore,they were excluded from this analysis.
3.1.8 KEGG pathway analysis
Using the best-matching UniProt identifiers of each PSSs/PTSs/PYSsand non-PSSs/non-PTSs/non-PYSs in the PS1D-70 dataset, pathwaysobtained from Kyoto Encyclopedia of Genes and Genomes (KEGG)database (Kanehisa et al., 2006) were analyzed across tissues, andenriched pathways were detected. False discovery rate control wasperformed for multiple hypothesis correction in each tissue, and thesignificance threshold after the correction p < 0.01 was used after allp-values were adjusted.
3.1.9 Kinase analysis
In order to analyze enriched kinases across tissues, we used the substrate-matched kinase data given by Lundby et al. (Lundby et al., 2012b)where phosphorylated protein sequences were matched against mo-tifs of known kinases using the PHOSIDA Motif Matcher toolkit (Gnad,Gunawardena, and Mann, 2011). This toolkit finds the matches of 33
previously identified kinase motifs around each phosphorylation sitein a particular protein sequence. The list of matched kinases is asfollows: AKT, ATM, ATR, AURORA, AURORA-A, CAMK2, CDK1,CDK2, CHK1, CHK2, CK1, CK2, ERK/MAPK, GSK3, NEK6, PKA,PKD, PLK, PLK1, and RAD53. Based on these assignments, matchedkinases of 8836 out of 11097 phosphorylation sites could be deter-mined for the PS1D-70 dataset. We compared the counts of PSSs/PTSs/PYSs in each tissue phosphorylated by each kinase to the occurrenceof non-PSSs/non-PTSs/non-PYSs in the corresponding tissue. Falsediscovery rate control was performed for multiple hypothesis correc-tion in each kinase class, all p-values were adjusted, and the signifi-cance threshold after the correction p < 0.01 was used.
Relationships between kinases, tissues and motifs were visualizedby means of a tripartite graph as implemented in Cytoscape (Shan-non et al., 2003). Only the motifs that are significantly enriched ineach tissue (Table 16) and the corresponding kinase motifs providedin Phosida (Gnad, Gunawardena, and Mann, 2011) were consideredwhile drawing the graph.
3.1.10 Tissue-specific expression of kinases
For each kinase we identified the corresponding rat UniProt ID fromthe PhosphoSitePlus database (Hornbeck et al., 2012), which con-tains experimentally identified kinase-substrate data. If no rat infor-mation was found, we attempted to find mouse and human UniProt
[ July 10, 2016 at 22:13 – classicthesis version 4.2 ]
36 tissue-specific phosphorylation sites
Figure 9: (A) Two sample logo analysis of global PSSs in the PS1D-70 dataset.(B) Two sample logo analysis of global PSSs in the PS3D-90 dataset.(C) 3D environments of global PSSs in the PS3D-90 dataset. (D)Pure 3D environments of global PSSs in the PS3D-90 dataset.
IDs, in this order of preference. If a query kinase could not be iden-tified in the rat, mouse or human proteomes based on the Phos-phoSitePlus database, it was excluded from further analysis. Proteinexpression levels of kinases across tissues were obtained from thePaxDb database (Wang et al., 2012). Since no tissue-specific expres-sion data for rat proteins is provided in PaxDb, we used PaxDb datafor the mouse orthologs of rat or human kinases obtained from theKEGG database. For some of the kinases considered in this studyPhosphoSitePlus contains information for multiple isoforms (for in-stance, GSK3A and GSK3B isoforms for GSK3). In such cases, theexpression of each isoform was analyzed separately. To assess theexistence of tissue-specific kinase expression, a one-sample t-Test wasused. The expression value of a particular kinase in a particular tissuewas compared to expression values of the same kinase in all tissues.All p-values were adjusted and the significance threshold after thecorrection p < 0.01 was used.
3.2 results and discussion
3.2.1 Analysis of sequence motifs of global phosphorylation sites
We first examined global phosphorylation trends at the sequence levelbased on the PS1D-70 dataset. In general our findings are in line pre-vious studies (Chen et al., 2014; Schwartz and Gygi, 2005; Villen et al.,2007; Zhao et al., 2012). Proline (P) residues are enriched at position+1 with respect to globally phosphorylated serine and threonine sites(Figure 9A and Figure 51). Negatively charged glutamic acid (E) and
[ July 10, 2016 at 22:13 – classicthesis version 4.2 ]
3.2 results and discussion 37
aspartic acid (D) residues as well as polar serines are also enriched inthe upstream regions of phosphorylated serine, threonine and tyro-sine (Y) sites (Figure 9A, Figure 51A, and Figure 52A). There is also astrong trend for charged lysine (K) and arginine (R) residues to be en-riched in the sequence neighborhood of phosphorylated serines andthreonines, except for the positions from +1 to +4.
3.2.2 Tissue-based analysis of sequence motifs of phosphorylated sites
Previous studies have shown that beyond the general trends, phos-phorylation sites exhibit kinase-specific sequence and spatial motifsas well as compartment-specific sequence motifs (Chen et al., 2014;Durek et al., 2009; Su and Lee, 2013). The availability of experimen-tally identified tissue-specific phosphorylation sites has now enabledus to examine phosphorylation trends across tissues. Our analysisof the PS1D-70 dataset revealed clear tissue-specific preferences. Forinstance, only PSS in perirenal fat have phenylalanine (F) residuesat position +1 (Figure 10A), whereas only PSS in pancreas and testishave a preference for glutamine (Q) residues at position -2 (Figure 10Band Figure 10C). Only in cortex, glycine (G) residues are enriched atposition -3 with respect to central phosphorylated serine sites (Fig-ure 10D). Histidine residues are only enriched at position +6 in blood(Figure 10E), whereas PSS in stomach and liver show preferences forasparagine (N) residues at position +3 (Figure 10F and Figure 10G). Incontrast to the global trends, none of the tissue-specific phosphoryla-tion sites show any enrichment for serine residues at position +1 (SeeFigure 53 – Figure 70 for more detailed graphs for these and othertissues). Tissue-specific trends for PTSs are also quite prominent. Forinstance, only PTS in cortex show a preference for methionine (M)residues at position -6, whereas asparagine residues are strongly pre-ferred at positions -7 and -8 only in muscle (Figure 71). Glutamineresidues are enriched for PTSs in blood at position -7.
We utilized the Motif-X software to identify enriched sequence mo-tifs that are exclusively tissue-specific and cannot be detected whenanalyzing global trends (Table 16). For instance, the motifs pS-P-E,pS-P-X-X-E, E-X-X-X-X-X-X-X-X-pS-P, E-X-X-X-X-pS, pS-X-X-X-X-X-X-X-X-D, pS-X-X-X-X-X-X-X-X-E, E-X-X-X-X-X-X-X-X-pS and pS-X-X-X-X-X-X-X-X-K are only associated with brain-specific PSS. On the otherhand, the motif pS-X-X-X-X-D is only observed in PSS in liver. Theseobservations indicate that individual tissues harbor specific sequenceenvironments for phosphorylation.
Lundby et al. have already investigated sequence motifs of phospho-rylation sites in two tissues - brain and testis - but in their work com-parison was performed between tissue-specific and global phospho-rylation sites. Using global sequence signatures of phosphorylationsites as a background dataset for studying tissue-specific motifs mayfail to reveal potential systematic biases existing in the foregrounddataset and can lead to random and non-informative motif signals(Yao et al., 2013). In this work we investigate the enrichment or de-pletion of phosphorylation sites relative to their non-phosphorylated
[ July 10, 2016 at 22:13 – classicthesis version 4.2 ]
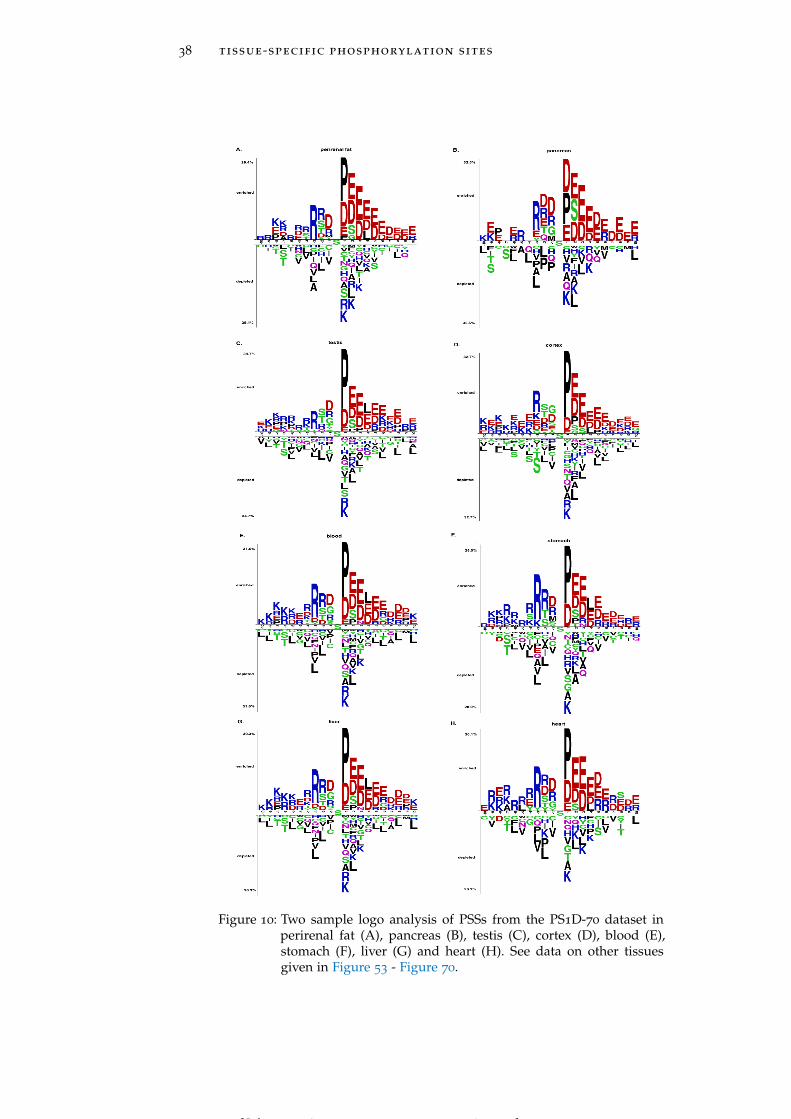
38 tissue-specific phosphorylation sites
Figure 10: Two sample logo analysis of PSSs from the PS1D-70 dataset inperirenal fat (A), pancreas (B), testis (C), cortex (D), blood (E),stomach (F), liver (G) and heart (H). See data on other tissuesgiven in Figure 53 - Figure 70.
[ July 10, 2016 at 22:13 – classicthesis version 4.2 ]
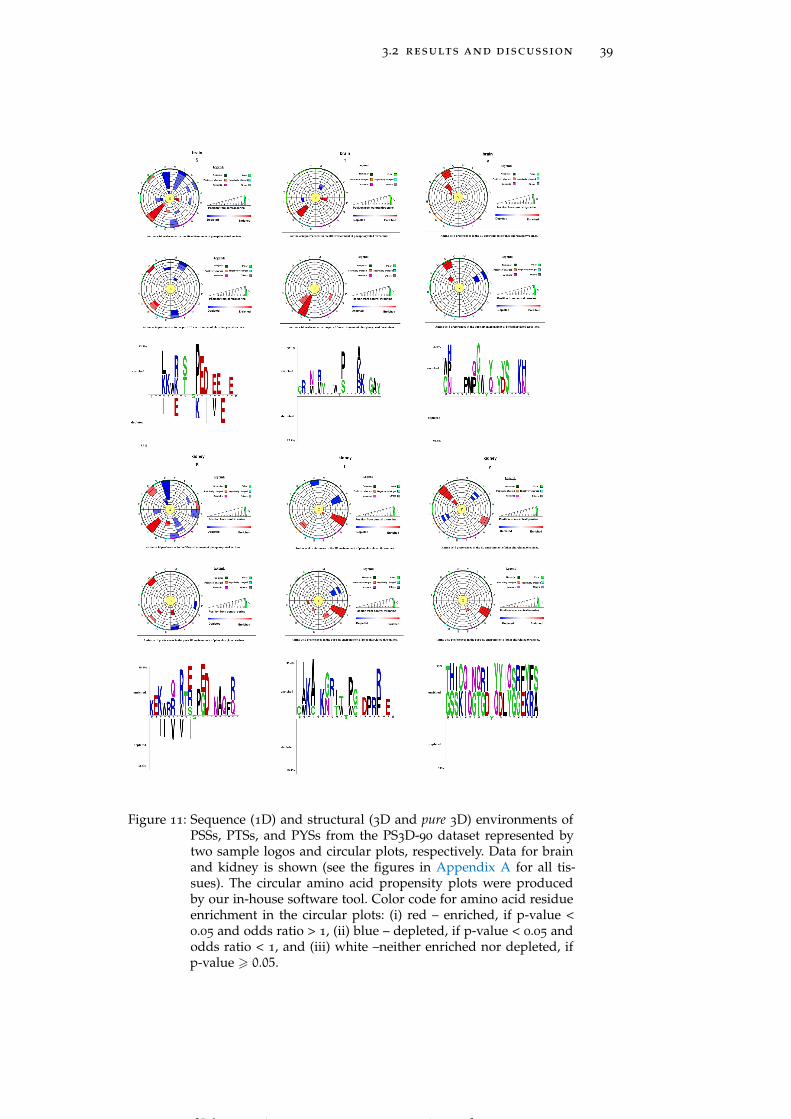
3.2 results and discussion 39
Figure 11: Sequence (1D) and structural (3D and pure 3D) environments ofPSSs, PTSs, and PYSs from the PS3D-90 dataset represented bytwo sample logos and circular plots, respectively. Data for brainand kidney is shown (see the figures in Appendix A for all tis-sues). The circular amino acid propensity plots were producedby our in-house software tool. Color code for amino acid residueenrichment in the circular plots: (i) red – enriched, if p-value <0.05 and odds ratio > 1, (ii) blue – depleted, if p-value < 0.05 andodds ratio < 1, and (iii) white –neither enriched nor depleted, ifp-value > 0.05.
[ July 10, 2016 at 22:13 – classicthesis version 4.2 ]
40 tissue-specific phosphorylation sites
counterparts in each individual tissue, thus ensuring that the trendsfound are not due to the tissue-dependent variation of protein abun-dance or individual biological roles of proteins. In other words, en-riched motifs identified through this approach are solely due to phos-phorylation processes occurring in a particular tissue and not anyother tissue-specific properties. We detected 15.4% and 17.1% moreenriched/depleted residues in the sequence environment of phospho-rylation sites in brain and testis, respectively, based on two samplelogos, even though some trends for certain residues at particular po-sitions overlap in both studies (58.8% and 57.5% in brain and testis,respectively) (see Table 17 and Table 18). Note that we applied sepa-rate two sample logo analyses for serine and threonine sites, whereasLundby et al. combined both residues. Furthermore, discriminativemotif analysis using the Motif-X software yielded qualitatively dif-ferent tissue-specific motifs compared to the motifs obtained in theprevious study by Lundby et al. One of the most significant motifswe identified - E-X-X-X-X-pS - is only observed in brain but not inany other tissue (Table 16), whereas residue E in the correspondingposition has not been even found enriched using the former method(X and pS here represent any residue and phosphorylated serine, re-spectively). We found that the residue G is enriched at position -1in testis and the positively charged residues R and K are enrichedat almost all positions in downstream regions of phosphorylated ser-ines in both brain and testis, whereas none of these effects could beobserved using global phosphorylation sites as a background set. Sim-ilarly, residue P is enriched in all tissues at position +1 in our anal-ysis; however, Lundby et al. found P to be enriched at that positionin brain, but not in testis. We also found the motif pS-X-X-R to behighly specific for testis, while the residue R is in fact depleted in thecorresponding position in the previous study.
High specificity of kinase action is an important requisite for exquisiteregulation of signal transduction processes (Kobe et al., 2005). In ac-cordance with this notion, compartment-specific kinases have beenproposed in a previous work (Chen et al., 2014), whereas the exis-tence of compartment- and tissue-specific acetyltransferases (KATs)has also been discussed in Chapter 2 and (Lundby et al., 2012a; Sadoulet al., 2011). The substrate sequence specificity among tissues identi-fied in this work suggests the existence of tissue-specific kinases andphosphatases.
3.2.3 Tissue-based analysis of phosphorylation sequence motifs in proteinswith known 3D structure
As a pre-requisite for the investigation of structural trends (see be-low), we performed a separate analysis of phosphorylation sequencemotifs in the subset of proteins possessing a known 3D structure(dataset PS3D-90). The results obtained are markedly different fromthe ones derived from the PS1D-70 dataset due to the fact that struc-turally characterized proteins are depleted in disordered regions, whichleads to a different amino acid composition. Specifically, negatively
[ July 10, 2016 at 22:13 – classicthesis version 4.2 ]
3.2 results and discussion 41
charged residues, as well as disorder-related glycine and serine residuesare less pronounced in this dataset. For instance, aspartic acid andglutamic acid are not observed at position +1 of the global and tissue-specific PSSs (Figure 9B, Figure 11 and Figure 73). Lysine and ala-nine (A) residues are enriched at positions +4 and +6 of the globalPSS in the PS3D-90 dataset, whereas they are not enriched at thesame positions of the global PSS in the PS1D-70 dataset, where lysineresidues are even depleted at position +4. Glutamic acid residuesare depleted at positions -4 and +7 for structurally known PSS inbrain, whereas they are enriched at these positions in the PS1D-70
dataset. PSS in heart have strong preferences for alanine and prolineresidues at positions -4 and -3, respectively, whereas such preferencescould not be observed in the PS1D-70 dataset, and proline residuesare even depleted at position -3. Asparagine and glutamine residuesare generally enriched in the upstream regions of structurally knowntissue-specific sites, whereas there are mainly depleted in the PS1D-70 dataset.
3.2.4 Tissue-specific spatial motifs of phosphorylation sites
Previous studies found only minor differences between the 3D struc-tural surroundings of phosphorylated and non-phosphorylated sites,whereas stronger trends were observed when taking into accountkinase preferences (Durek et al., 2009). In this study we detectedmore significant spatial motifs associated both with global and tissue-specific PSSs. In accordance with (Durek et al., 2009), arginine, pro-line, leucine and serine residues are enriched in the spatial environ-ment of global PSSs, but we also found aspartic acid, lysine and glu-tamine residues to be enriched (see Figure 9C). Frequent occurrenceof aspartic acid residues has also been observed in 1D and 3D envi-ronments of PSSs in previous studies (Lundby et al., 2012b; Su andLee, 2013).
Similar to the trend in the sequence motifs discussed above cysteine(C) residues are strongly avoided in the spatial surroundings of PSSin all tissues. Strong enrichment of proline and aspartic acid residuesis observed in close proximity of global PSS (around 2-5 Å away, seeFigure 9C), which again parallels the trends in sequence motifs. How-ever, the enrichment of leucine residues, at a distance range of 6 to7 Å, is not found in the sequence environment. On the other hand,no enrichment of glutamic acid is observed in the 3D environmenteven though glutamic acid is highly enriched in the sequence motifsof global PSS.
We also found tissue-specific trends in the spatial environments ofphosphorylation sites (Figure 76, Figure 77 and Figure 78). PSS inbrain have a strong preference for arginine residues, and it is muchmore predominant than the enrichment in the 1D environment. His-tidine and cysteine residues are strongly depleted in the 3D environ-ment of PSS in kidney, whereas no preference for these residues isobserved in the 1D environment. Thus, patterns of amino acid usagearound phosphorylated sites are generally consistent between 1D and
[ July 10, 2016 at 22:13 – classicthesis version 4.2 ]
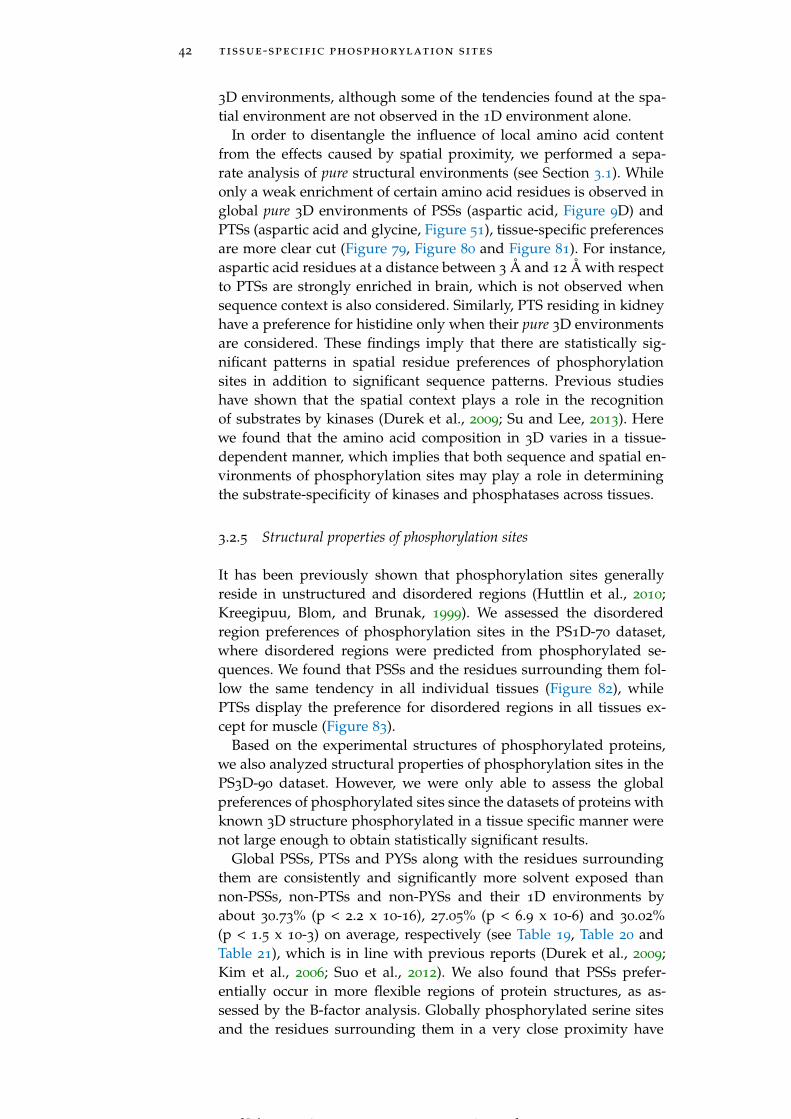
42 tissue-specific phosphorylation sites
3D environments, although some of the tendencies found at the spa-tial environment are not observed in the 1D environment alone.
In order to disentangle the influence of local amino acid contentfrom the effects caused by spatial proximity, we performed a sepa-rate analysis of pure structural environments (see Section 3.1). Whileonly a weak enrichment of certain amino acid residues is observed inglobal pure 3D environments of PSSs (aspartic acid, Figure 9D) andPTSs (aspartic acid and glycine, Figure 51), tissue-specific preferencesare more clear cut (Figure 79, Figure 80 and Figure 81). For instance,aspartic acid residues at a distance between 3 Å and 12 Å with respectto PTSs are strongly enriched in brain, which is not observed whensequence context is also considered. Similarly, PTS residing in kidneyhave a preference for histidine only when their pure 3D environmentsare considered. These findings imply that there are statistically sig-nificant patterns in spatial residue preferences of phosphorylationsites in addition to significant sequence patterns. Previous studieshave shown that the spatial context plays a role in the recognitionof substrates by kinases (Durek et al., 2009; Su and Lee, 2013). Herewe found that the amino acid composition in 3D varies in a tissue-dependent manner, which implies that both sequence and spatial en-vironments of phosphorylation sites may play a role in determiningthe substrate-specificity of kinases and phosphatases across tissues.
3.2.5 Structural properties of phosphorylation sites
It has been previously shown that phosphorylation sites generallyreside in unstructured and disordered regions (Huttlin et al., 2010;Kreegipuu, Blom, and Brunak, 1999). We assessed the disorderedregion preferences of phosphorylation sites in the PS1D-70 dataset,where disordered regions were predicted from phosphorylated se-quences. We found that PSSs and the residues surrounding them fol-low the same tendency in all individual tissues (Figure 82), whilePTSs display the preference for disordered regions in all tissues ex-cept for muscle (Figure 83).
Based on the experimental structures of phosphorylated proteins,we also analyzed structural properties of phosphorylation sites in thePS3D-90 dataset. However, we were only able to assess the globalpreferences of phosphorylated sites since the datasets of proteins withknown 3D structure phosphorylated in a tissue specific manner werenot large enough to obtain statistically significant results.
Global PSSs, PTSs and PYSs along with the residues surroundingthem are consistently and significantly more solvent exposed thannon-PSSs, non-PTSs and non-PYSs and their 1D environments byabout 30.73% (p < 2.2 x 10⁻¹⁶), 27.05% (p < 6.9 x 10⁻⁶) and 30.02%(p < 1.5 x 10⁻³) on average, respectively (see Table 19, Table 20 andTable 21), which is in line with previous reports (Durek et al., 2009;Kim et al., 2006; Suo et al., 2012). We also found that PSSs prefer-entially occur in more flexible regions of protein structures, as as-sessed by the B-factor analysis. Globally phosphorylated serine sitesand the residues surrounding them in a very close proximity have
[ July 10, 2016 at 22:13 – classicthesis version 4.2 ]
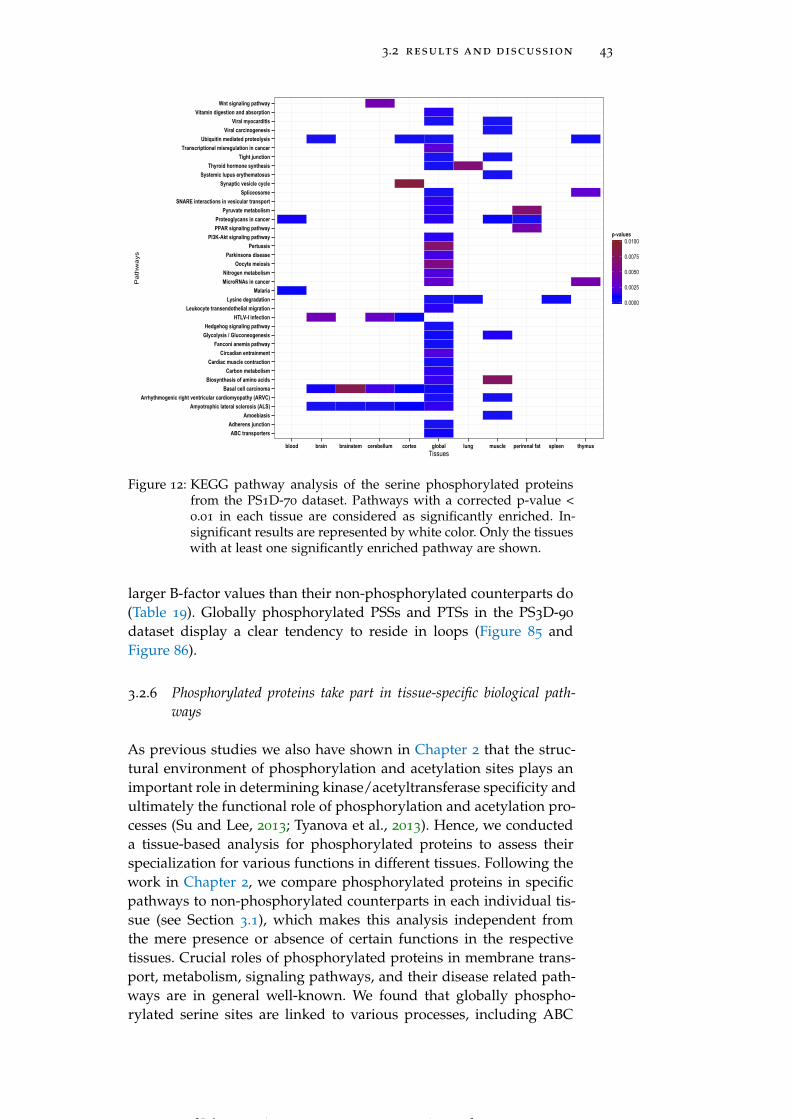
3.2 results and discussion 43
ABC transportersAdherens junction
AmoebiasisAmyotrophic lateral sclerosis (ALS)
Arrhythmogenic right ventricular cardiomyopathy (ARVC)Basal cell carcinoma
Biosynthesis of amino acidsCarbon metabolism
Cardiac muscle contractionCircadian entrainment
Fanconi anemia pathwayGlycolysis / GluconeogenesisHedgehog signaling pathway
HTLV-I infectionLeukocyte transendothelial migration
Lysine degradationMalaria
MicroRNAs in cancerNitrogen metabolism
Oocyte meiosisParkinsons disease
PertussisPI3K-Akt signaling pathway
PPAR signaling pathwayProteoglycans in cancer
Pyruvate metabolismSNARE interactions in vesicular transport
SpliceosomeSynaptic vesicle cycle
Systemic lupus erythematosusThyroid hormone synthesis
Tight junctionTranscriptional misregulation in cancer
Ubiquitin mediated proteolysisViral carcinogenesis
Viral myocarditisVitamin digestion and absorption
Wnt signaling pathway
blood brain brainstem cerebellum cortex global lung muscle perirenal fat spleen thymusTissues
Pathways
0.0000
0.0025
0.0050
0.0075
0.0100p-values
Figure 12: KEGG pathway analysis of the serine phosphorylated proteinsfrom the PS1D-70 dataset. Pathways with a corrected p-value <0.01 in each tissue are considered as significantly enriched. In-significant results are represented by white color. Only the tissueswith at least one significantly enriched pathway are shown.
larger B-factor values than their non-phosphorylated counterparts do(Table 19). Globally phosphorylated PSSs and PTSs in the PS3D-90
dataset display a clear tendency to reside in loops (Figure 85 andFigure 86).
3.2.6 Phosphorylated proteins take part in tissue-specific biological path-ways
As previous studies we also have shown in Chapter 2 that the struc-tural environment of phosphorylation and acetylation sites plays animportant role in determining kinase/acetyltransferase specificity andultimately the functional role of phosphorylation and acetylation pro-cesses (Su and Lee, 2013; Tyanova et al., 2013). Hence, we conducteda tissue-based analysis for phosphorylated proteins to assess theirspecialization for various functions in different tissues. Following thework in Chapter 2, we compare phosphorylated proteins in specificpathways to non-phosphorylated counterparts in each individual tis-sue (see Section 3.1), which makes this analysis independent fromthe mere presence or absence of certain functions in the respectivetissues. Crucial roles of phosphorylated proteins in membrane trans-port, metabolism, signaling pathways, and their disease related path-ways are in general well-known. We found that globally phospho-rylated serine sites are linked to various processes, including ABC
[ July 10, 2016 at 22:13 – classicthesis version 4.2 ]
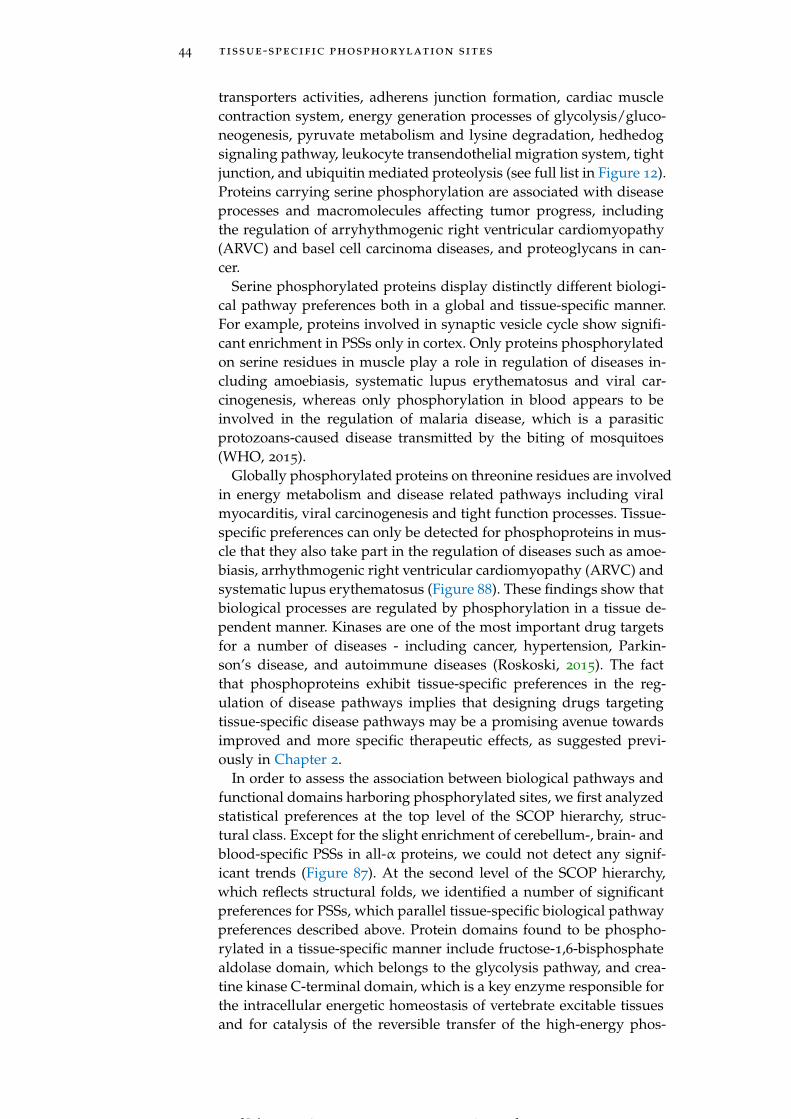
44 tissue-specific phosphorylation sites
transporters activities, adherens junction formation, cardiac musclecontraction system, energy generation processes of glycolysis/gluco-neogenesis, pyruvate metabolism and lysine degradation, hedhedogsignaling pathway, leukocyte transendothelial migration system, tightjunction, and ubiquitin mediated proteolysis (see full list in Figure 12).Proteins carrying serine phosphorylation are associated with diseaseprocesses and macromolecules affecting tumor progress, includingthe regulation of arryhythmogenic right ventricular cardiomyopathy(ARVC) and basel cell carcinoma diseases, and proteoglycans in can-cer.
Serine phosphorylated proteins display distinctly different biologi-cal pathway preferences both in a global and tissue-specific manner.For example, proteins involved in synaptic vesicle cycle show signifi-cant enrichment in PSSs only in cortex. Only proteins phosphorylatedon serine residues in muscle play a role in regulation of diseases in-cluding amoebiasis, systematic lupus erythematosus and viral car-cinogenesis, whereas only phosphorylation in blood appears to beinvolved in the regulation of malaria disease, which is a parasiticprotozoans-caused disease transmitted by the biting of mosquitoes(WHO, 2015).
Globally phosphorylated proteins on threonine residues are involvedin energy metabolism and disease related pathways including viralmyocarditis, viral carcinogenesis and tight function processes. Tissue-specific preferences can only be detected for phosphoproteins in mus-cle that they also take part in the regulation of diseases such as amoe-biasis, arrhythmogenic right ventricular cardiomyopathy (ARVC) andsystematic lupus erythematosus (Figure 88). These findings show thatbiological processes are regulated by phosphorylation in a tissue de-pendent manner. Kinases are one of the most important drug targetsfor a number of diseases - including cancer, hypertension, Parkin-son’s disease, and autoimmune diseases (Roskoski, 2015). The factthat phosphoproteins exhibit tissue-specific preferences in the reg-ulation of disease pathways implies that designing drugs targetingtissue-specific disease pathways may be a promising avenue towardsimproved and more specific therapeutic effects, as suggested previ-ously in Chapter 2.
In order to assess the association between biological pathways andfunctional domains harboring phosphorylated sites, we first analyzedstatistical preferences at the top level of the SCOP hierarchy, struc-tural class. Except for the slight enrichment of cerebellum-, brain- andblood-specific PSSs in all-α proteins, we could not detect any signif-icant trends (Figure 87). At the second level of the SCOP hierarchy,which reflects structural folds, we identified a number of significantpreferences for PSSs, which parallel tissue-specific biological pathwaypreferences described above. Protein domains found to be phospho-rylated in a tissue-specific manner include fructose-1,6-bisphosphatealdolase domain, which belongs to the glycolysis pathway, and crea-tine kinase C-terminal domain, which is a key enzyme responsible forthe intracellular energetic homeostasis of vertebrate excitable tissuesand for catalysis of the reversible transfer of the high-energy phos-
[ July 10, 2016 at 22:13 – classicthesis version 4.2 ]
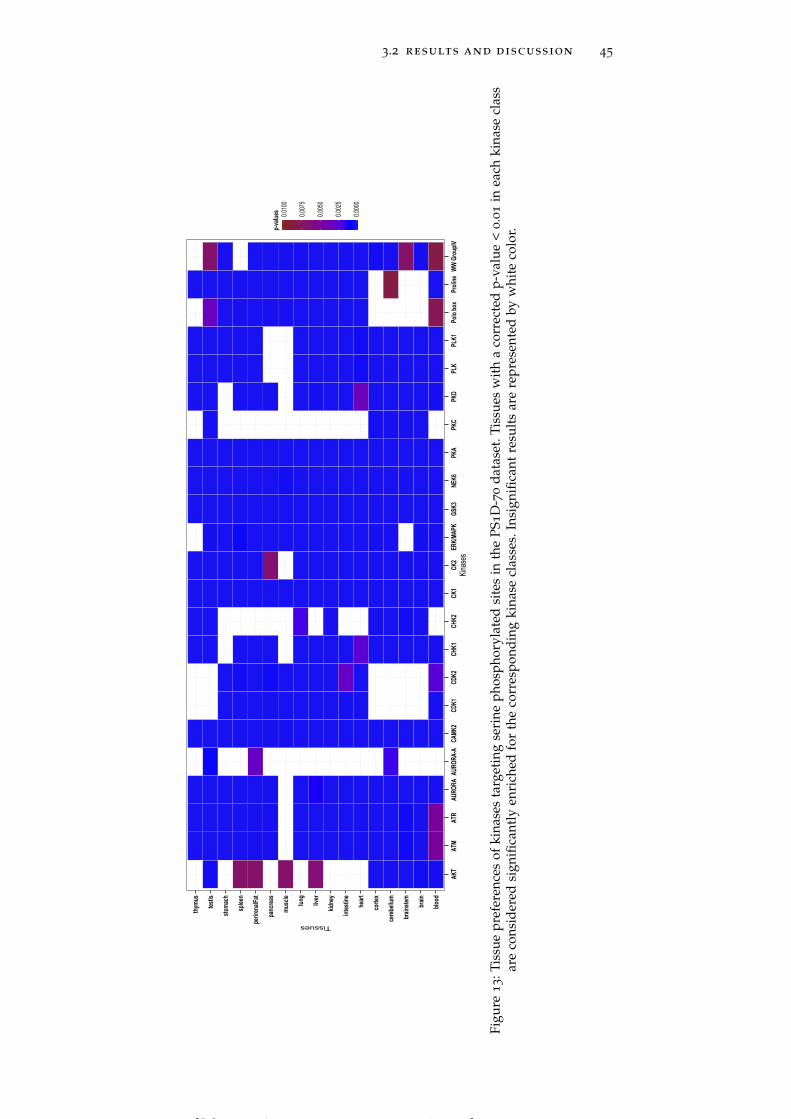
3.2 results and discussion 45
blood
brain
brainstem
cereb
ellum
cortex
heart
intestine
kidney
liver
lung
muscle
pancrea
s
perirenalFat
spleen
stomach
testis
thymus
AKT
ATM
ATR
AURO
RAAURORA-A
CAMK
2CDK1
CDK2
CHK1
CHK2
CK1
CK2
ERK/MA
PKGSK3
NEK6
PKA
PKC
PKD
PLK
PLK1
Polo
box
Proline
WW G
roup
IVKinases
Tissues
0.0000
0.0025
0.0050
0.0075
0.0100
p-values
Figu
re1
3:T
issu
epr
efer
ence
sof
kina
ses
targ
etin
gse
rine
phos
phor
ylat
edsi
tes
inth
ePS
1D
-70
data
set.
Tiss
ues
wit
ha
corr
ecte
dp-
valu
e<
0.0
1in
each
kina
secl
ass
are
cons
ider
edsi
gnifi
cant
lyen
rich
edfo
rth
eco
rres
pond
ing
kina
secl
asse
s.In
sign
ifica
ntre
sult
sar
ere
pres
ente
dby
whi
teco
lor.
[ July 10, 2016 at 22:13 – classicthesis version 4.2 ]
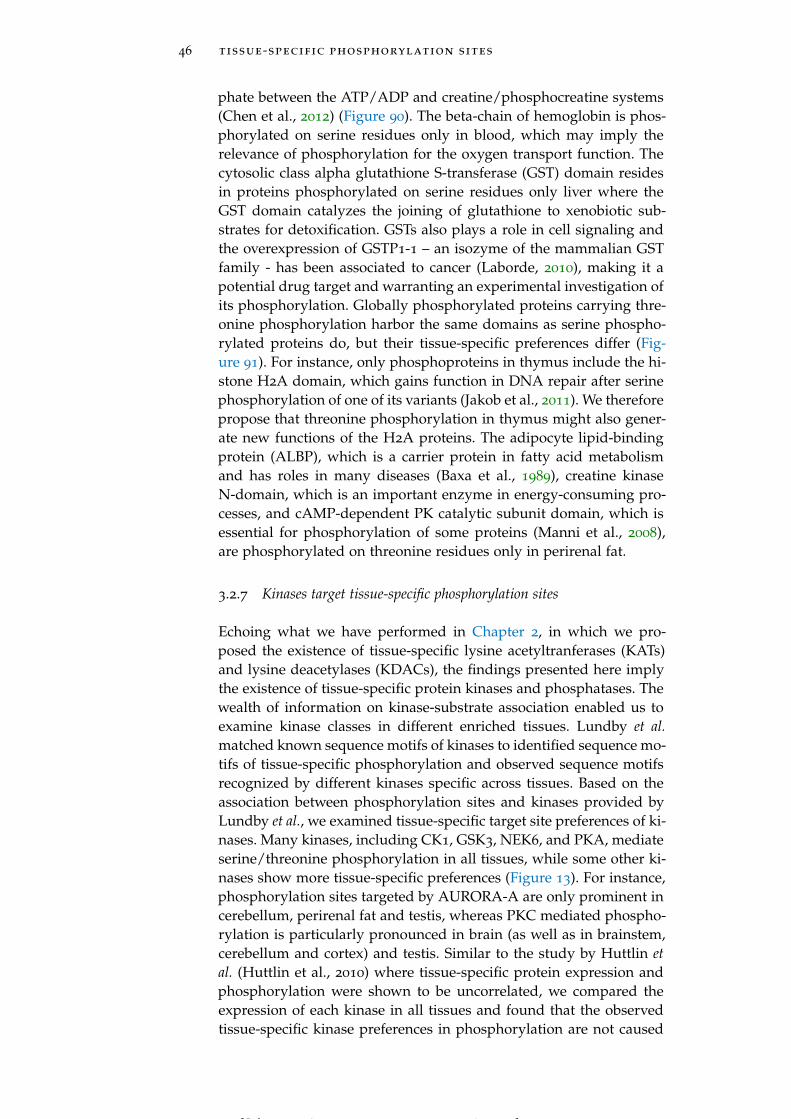
46 tissue-specific phosphorylation sites
phate between the ATP/ADP and creatine/phosphocreatine systems(Chen et al., 2012) (Figure 90). The beta-chain of hemoglobin is phos-phorylated on serine residues only in blood, which may imply therelevance of phosphorylation for the oxygen transport function. Thecytosolic class alpha glutathione S-transferase (GST) domain residesin proteins phosphorylated on serine residues only liver where theGST domain catalyzes the joining of glutathione to xenobiotic sub-strates for detoxification. GSTs also plays a role in cell signaling andthe overexpression of GSTP1-1 – an isozyme of the mammalian GSTfamily - has been associated to cancer (Laborde, 2010), making it apotential drug target and warranting an experimental investigation ofits phosphorylation. Globally phosphorylated proteins carrying thre-onine phosphorylation harbor the same domains as serine phospho-rylated proteins do, but their tissue-specific preferences differ (Fig-ure 91). For instance, only phosphoproteins in thymus include the hi-stone H2A domain, which gains function in DNA repair after serinephosphorylation of one of its variants (Jakob et al., 2011). We thereforepropose that threonine phosphorylation in thymus might also gener-ate new functions of the H2A proteins. The adipocyte lipid-bindingprotein (ALBP), which is a carrier protein in fatty acid metabolismand has roles in many diseases (Baxa et al., 1989), creatine kinaseN-domain, which is an important enzyme in energy-consuming pro-cesses, and cAMP-dependent PK catalytic subunit domain, which isessential for phosphorylation of some proteins (Manni et al., 2008),are phosphorylated on threonine residues only in perirenal fat.
3.2.7 Kinases target tissue-specific phosphorylation sites
Echoing what we have performed in Chapter 2, in which we pro-posed the existence of tissue-specific lysine acetyltranferases (KATs)and lysine deacetylases (KDACs), the findings presented here implythe existence of tissue-specific protein kinases and phosphatases. Thewealth of information on kinase-substrate association enabled us toexamine kinase classes in different enriched tissues. Lundby et al.matched known sequence motifs of kinases to identified sequence mo-tifs of tissue-specific phosphorylation and observed sequence motifsrecognized by different kinases specific across tissues. Based on theassociation between phosphorylation sites and kinases provided byLundby et al., we examined tissue-specific target site preferences of ki-nases. Many kinases, including CK1, GSK3, NEK6, and PKA, mediateserine/threonine phosphorylation in all tissues, while some other ki-nases show more tissue-specific preferences (Figure 13). For instance,phosphorylation sites targeted by AURORA-A are only prominent incerebellum, perirenal fat and testis, whereas PKC mediated phospho-rylation is particularly pronounced in brain (as well as in brainstem,cerebellum and cortex) and testis. Similar to the study by Huttlin etal. (Huttlin et al., 2010) where tissue-specific protein expression andphosphorylation were shown to be uncorrelated, we compared theexpression of each kinase in all tissues and found that the observedtissue-specific kinase preferences in phosphorylation are not caused
[ July 10, 2016 at 22:13 – classicthesis version 4.2 ]
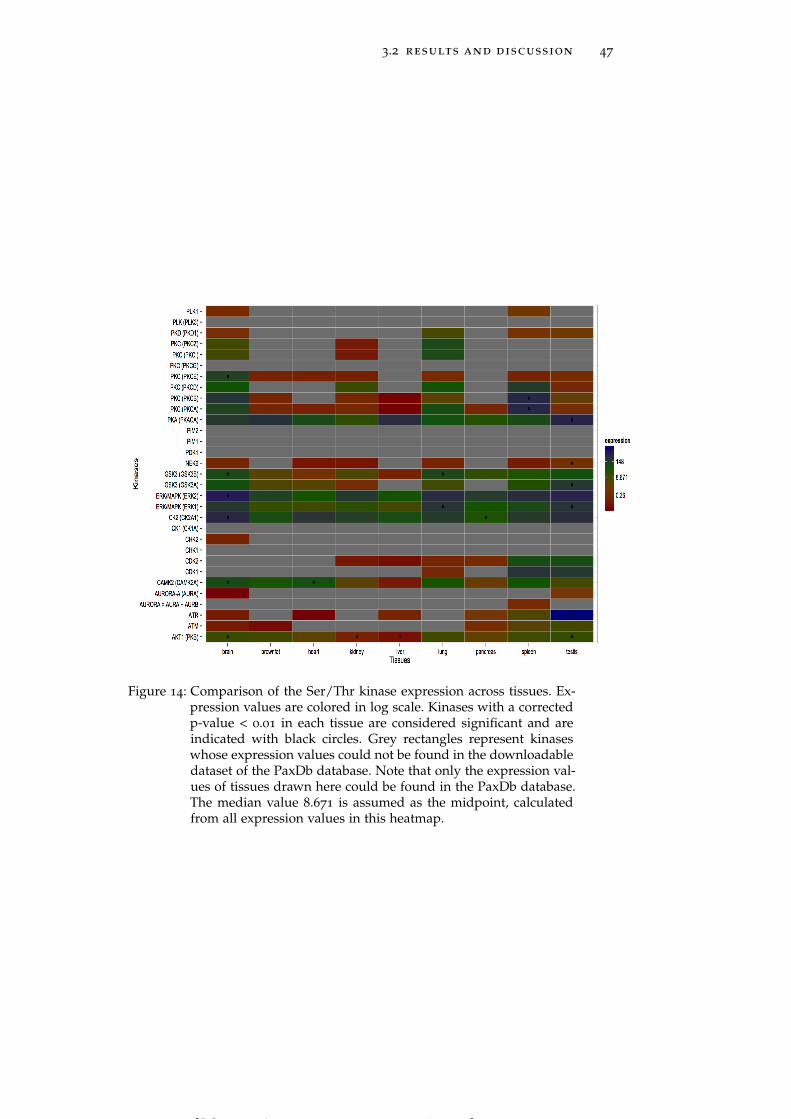
3.2 results and discussion 47
Figure 14: Comparison of the Ser/Thr kinase expression across tissues. Ex-pression values are colored in log scale. Kinases with a correctedp-value < 0.01 in each tissue are considered significant and areindicated with black circles. Grey rectangles represent kinaseswhose expression values could not be found in the downloadabledataset of the PaxDb database. Note that only the expression val-ues of tissues drawn here could be found in the PaxDb database.The median value 8.671 is assumed as the midpoint, calculatedfrom all expression values in this heatmap.
[ July 10, 2016 at 22:13 – classicthesis version 4.2 ]
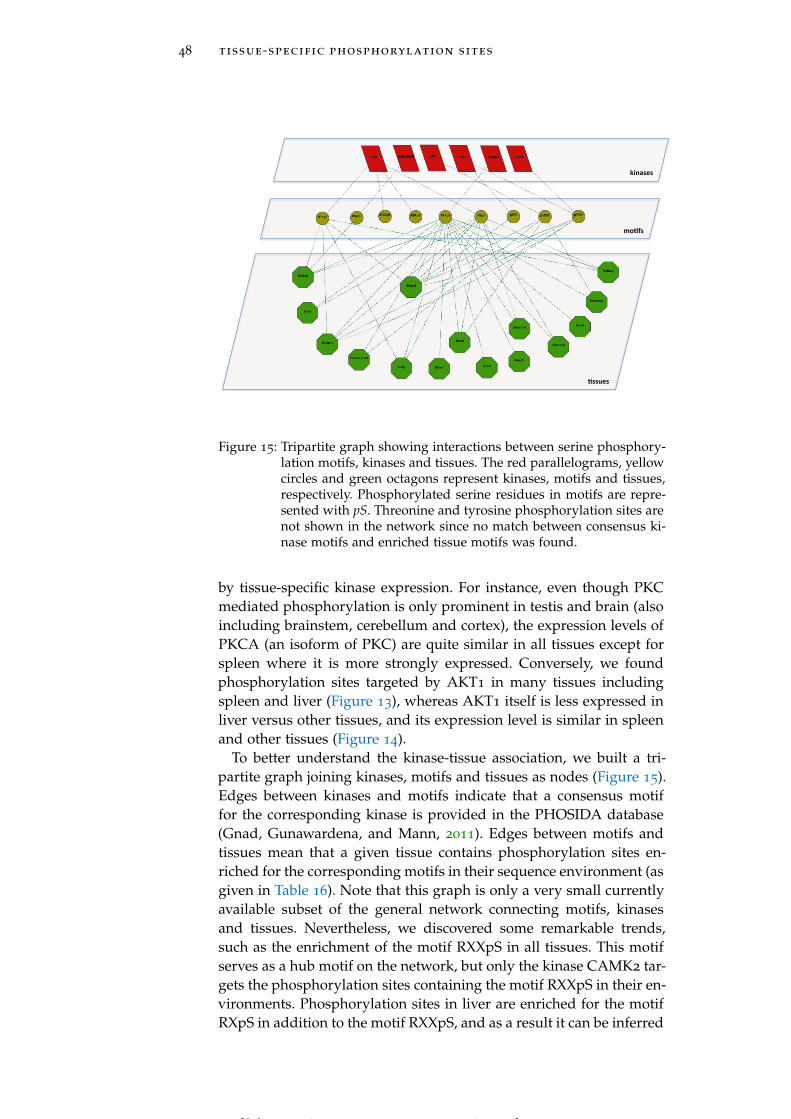
48 tissue-specific phosphorylation sites
kinases
mo*fs
*ssues
Figure 15: Tripartite graph showing interactions between serine phosphory-lation motifs, kinases and tissues. The red parallelograms, yellowcircles and green octagons represent kinases, motifs and tissues,respectively. Phosphorylated serine residues in motifs are repre-sented with pS. Threonine and tyrosine phosphorylation sites arenot shown in the network since no match between consensus ki-nase motifs and enriched tissue motifs was found.
by tissue-specific kinase expression. For instance, even though PKCmediated phosphorylation is only prominent in testis and brain (alsoincluding brainstem, cerebellum and cortex), the expression levels ofPKCA (an isoform of PKC) are quite similar in all tissues except forspleen where it is more strongly expressed. Conversely, we foundphosphorylation sites targeted by AKT1 in many tissues includingspleen and liver (Figure 13), whereas AKT1 itself is less expressed inliver versus other tissues, and its expression level is similar in spleenand other tissues (Figure 14).
To better understand the kinase-tissue association, we built a tri-partite graph joining kinases, motifs and tissues as nodes (Figure 15).Edges between kinases and motifs indicate that a consensus motiffor the corresponding kinase is provided in the PHOSIDA database(Gnad, Gunawardena, and Mann, 2011). Edges between motifs andtissues mean that a given tissue contains phosphorylation sites en-riched for the corresponding motifs in their sequence environment (asgiven in Table 16). Note that this graph is only a very small currentlyavailable subset of the general network connecting motifs, kinasesand tissues. Nevertheless, we discovered some remarkable trends,such as the enrichment of the motif RXXpS in all tissues. This motifserves as a hub motif on the network, but only the kinase CAMK2 tar-gets the phosphorylation sites containing the motif RXXpS in their en-vironments. Phosphorylation sites in liver are enriched for the motifRXpS in addition to the motif RXXpS, and as a result it can be inferred
[ July 10, 2016 at 22:13 – classicthesis version 4.2 ]
3.3 conclusions 49
that the kinases PKA and CAMK2 are highly active in liver. The motifPXpSP, is only targeted by the kinase ERK/MAPK in spleen. In pan-creas the motifs pSXXE and RXXpS are enriched, which are requiredby the kinases CK2 and CAMK2. The kinases CDK1 and CDK2 targetthe motif pSPXR both globally and in a thymus-specific fashion.
3.3 conclusions
Here we present a comprehensive study of phosphorylation sitesat the sequence and structure level in 14 rat tissues based on theproteomics data recently published by Lundby et al. (Lundby et al.,2012b). We show that phosphorylation sites display tissue-specificpreferences for certain residues in their linear amino acid sequence.Primary sequence motifs of phosphorylation sites in two tissues -brain and testis - have already been investigated by Lundby et al., butin their work the comparison was performed between tissue-specificand global phosphorylation sites. By contrast, in this work we com-pare the enrichment or depletion of phosphorylation sites to theirnon-phosphorylated counterparts in each individual tissue, which al-lowed us to uncover some previously unnoticed trends. Beyond theknown tendency of phosphorylation sites and the residues surround-ing them to reside in disordered regions and irregular secondarystructures, we also identified tissue-specific preferences for certainresidues in their spatial environments. In addition to the previouslydescribed tissue-specific sequence motifs targeted by kinases (Huttlinet al., 2010; Lundby et al., 2012b), our findings would seem to indicatethat tissue-specific spatial motifs in the substrates also play a role inkinase targeting. We also demonstrate that while many kinases medi-ate phosphorylation in all tissues, there are also kinases that operatein a tissue-specific manner. Interestingly, tissue-specific kinase pref-erences are not correlated with tissue-specific kinase expression. Thetripartite graph connecting kinases, tissues and motifs reveals thatsome motifs are prominent in many tissues, but are only targeted byfew kinases.
Similar to what we present in Chapter 2, in which we postulatedthat tissue-specific KATs and KDACs may control lysine acetylation,the findings presented here both at the sequence and structure levelconfirm the existence of tissue-specific protein kinases and phosphatases,as initially suggested by Huttlin et al. (Huttlin et al., 2010). Given thestrong dependence of protein function on tissue context, it appearsplausible that the intricate processes involved in kinase action, in-cluding the regulation of the catalytic domain by the hydrophobicspines (Schwartz and Murray, 2011), co-localization of the kinase andthe substrate as a pre-requisite for substrate recruitment (Kobe et al.,2005), substrate sequestration or masking, which modulate availabil-ity for phosphorylation, may be tissue-specific. However, our analysisof the associations between kinases and amino acid sequence motifsfailed to reveal any clear preferences of kinases for individual tissues.We therefore speculate that tissue specialization for kinase-substratebinding may be encoded at the 3D structure level.
[ July 10, 2016 at 22:13 – classicthesis version 4.2 ]

[ July 10, 2016 at 22:13 – classicthesis version 4.2 ]

Part IV
P R E D I C T I O N O F T I S S U E - S P E C I F I CP H O S P H O RY L AT I O N S I T E S B Y I N T E G R AT I N G
S E Q U E N C E - A N D S T R U C T U R E - B A S E DF E AT U R E S
[ July 10, 2016 at 22:13 – classicthesis version 4.2 ]

[ July 10, 2016 at 22:13 – classicthesis version 4.2 ]
4P R E D I C T I O N O F T I S S U E - S P E C I F I CP H O S P H O RY L AT I O N S I T E S B Y I N T E G R AT I N GS E Q U E N C E - A N D S T R U C T U R E - B A S E D F E AT U R E S
The recent advancements in high-throughput techniques enabled theidentification of many novel phosphorylation sites; however, thesetechniques are still time-consuming and costly. Alternatively, manyin silico studies have become very popular. Although successful, theystill harbor some drawbacks as mentioned in Section 1.4, such asutilized features, generosity in redundancy elimination and so on.On the other hand, in Chapter 3 we have presented the evidence fortissue-specific kinases and proteases which regulate phosphorylationin a tissue-specific manner. To make use of this fact and address theabove-mentioned drawbacks, here we present the first tissue-specificphosphorylation site prediction approach, TSPhosPred (Tissue-SpecificPhosphorylation Prediction), based on the random forest (RF) algo-rithm. Our method uses sequence- and structure-based features aswell as functional annotations. In order to obtain more accurate pre-dictions, we also mapped the phosphorylated proteins onto ProteinData Bank (PDB) structures, and utilized experimental structures alongwith predicted structures. Both cross-validation and independent test-ing were applied, and prediction performance of each was presented.We also compared our method with an existing predictor on indepen-dent test data. Cross-tissues prediction was also performed in orderto show the uniqueness of each tissue prediction model.
4.1 materials and methods
4.1.1 Data collection and preprocessing
We used the same phosphorylation dataset, and performed similarpreprocessing steps as defined in Chapter 3. In summary, we usedthe dataset from Lundby et al. where 31480 phosphorylation siteson 7280 proteins were established in 14 rat tissues, including brain(dissected into cerebellum, cortex and brainstem), blood, lung, heart,muscle, pancreas, kidney, liver, stomach, spleen, thymus, intestine,testis, and perirenal fat (Lundby et al., 2012b). In each tissue, the se-quence position, intensity values, and the best-matching proteins ofeach phosphorylation peptide were collected from the dataset. Weutilized the previously described method in Chapter 3 to identify thebest-matching UniProtId for each phosphorylated peptide. Finally,we obtained 17917 phosphorylation sites on 5443 proteins Table 4.
In order to assess the influence of structural information into classi-fication, we obtained 3D structures of phosphorylated proteins fromthe Protein Data Bank (PDB) using the procedure we previously de-
53
[ July 10, 2016 at 22:13 – classicthesis version 4.2 ]

54 prediction of tissue-specific phosphorylation sites
Datasets Description S T Y Total
Initial dataset Phosphorylation 14661 2832 424 17917
Reference 348754 215735 100083 664572
PS1D-50 Phosphorylation 7065 1410 236 8711
Reference 71201 43256 20090 134547
Structural dataset Phosphorylation 729 232 69 1030
Reference 7377 6564 4384 18325
Structural and solvent accessible dataset Phosphorylation 489 181 53 723
Reference 5941 5482 3981 15404
PS3D-70 Phosphorylation 379 126 36 541
Reference 4162 3790 2804 10756
Table 4: Data summary of phosphorylation sites used in classification.
scribed in Chapter 2 and Chapter 3. With the resolution better than3Å, we collected 1030 phosphorylation sites on 399 proteins Table 4.
4.1.2 Training and independent test sets
We generated prediction models for 17 tissues (including dissectedparts of brain), 3 residue types and different subsets of features, eachof them having their own training and independent test sets. All ser-ine (S)/threonine (T)/tyrosine (Y) sites displaying non-zero intensityvalues in a tissue were considered in the positive set. The negative setconsists of all S/T/Y residues not annotated as phosphorylated byLundby et al., and matched to those tissues on which the protein con-taining the negative site has at least one positive site. Even though allthese sites are not necessarily true negatives, a large fraction of themis expected to be. We subsequently extracted the 21-mer sequences(from -10 to +10) surrounding each site in positive and negative sets.
• Sequence-based data - Homology reduction of 21-mers at the 50%identity level was performed separately on both positive and nega-tive sets (PS1D-50) by using CD-HIT (Li and Godzik, 2006). Then,the second step homology reduction was done between positive andnegative sets at the 45% identity level again using CD-HIT. If a 21-mer from positive set and a 21-mer from negative set had more than45% sequence similarity, we kept the 21-mer in the positive set, andeliminated the corresponding similar 21-mer from the negative set.We called the resulting dataset, including positive and negative sets,PS1D.
• Structure-based data - Homology reduction of 21-mers was againperformed separately on both positive and negative sets by using CD-HIT at the 70% identity level due to the lack of structurally knownproteins (PS3D-70). Then, the second step homology reduction wasdone at the 45% sequence identity level as applied for the sequence-based data. We called the resulting dataset, including positive andnegative sets, PS3D.
80% of each positive and negative set in final datasets was ran-domly selected to train models and evaluate the performance in 10-fold cross-validation tests. The remaining 20% was used as indepen-dent test data to evaluate if prediction models are over-fitting for
[ July 10, 2016 at 22:13 – classicthesis version 4.2 ]
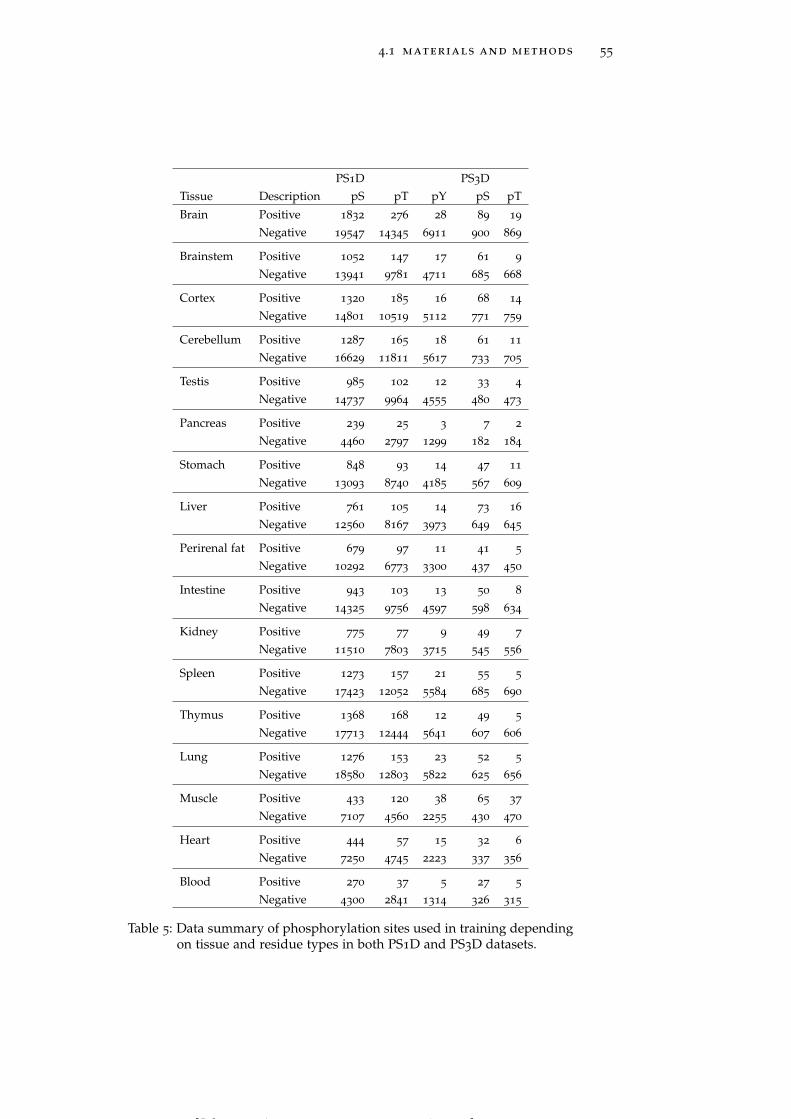
4.1 materials and methods 55
PS1D PS3DTissue Description pS pT pY pS pT
Brain Positive 1832 276 28 89 19
Negative 19547 14345 6911 900 869
Brainstem Positive 1052 147 17 61 9
Negative 13941 9781 4711 685 668
Cortex Positive 1320 185 16 68 14
Negative 14801 10519 5112 771 759
Cerebellum Positive 1287 165 18 61 11
Negative 16629 11811 5617 733 705
Testis Positive 985 102 12 33 4
Negative 14737 9964 4555 480 473
Pancreas Positive 239 25 3 7 2
Negative 4460 2797 1299 182 184
Stomach Positive 848 93 14 47 11
Negative 13093 8740 4185 567 609
Liver Positive 761 105 14 73 16
Negative 12560 8167 3973 649 645
Perirenal fat Positive 679 97 11 41 5
Negative 10292 6773 3300 437 450
Intestine Positive 943 103 13 50 8
Negative 14325 9756 4597 598 634
Kidney Positive 775 77 9 49 7
Negative 11510 7803 3715 545 556
Spleen Positive 1273 157 21 55 5
Negative 17423 12052 5584 685 690
Thymus Positive 1368 168 12 49 5
Negative 17713 12444 5641 607 606
Lung Positive 1276 153 23 52 5
Negative 18580 12803 5822 625 656
Muscle Positive 433 120 38 65 37
Negative 7107 4560 2255 430 470
Heart Positive 444 57 15 32 6
Negative 7250 4745 2223 337 356
Blood Positive 270 37 5 27 5
Negative 4300 2841 1314 326 315
Table 5: Data summary of phosphorylation sites used in training dependingon tissue and residue types in both PS1D and PS3D datasets.
[ July 10, 2016 at 22:13 – classicthesis version 4.2 ]
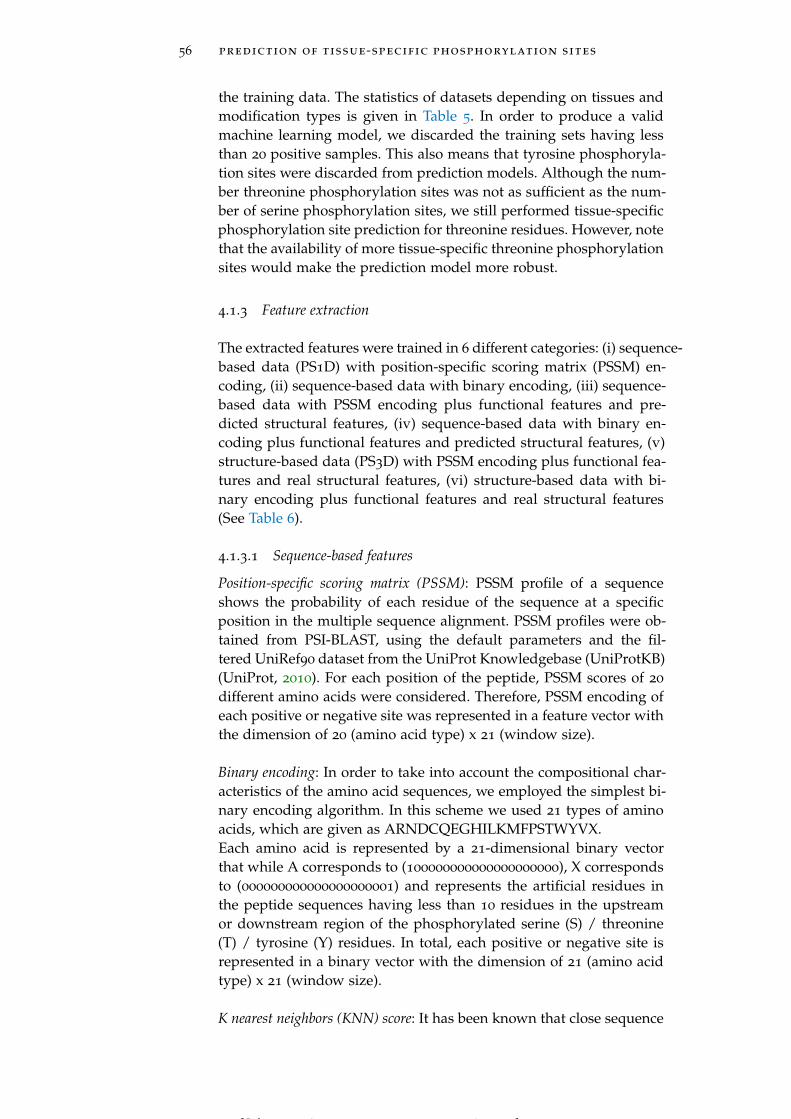
56 prediction of tissue-specific phosphorylation sites
the training data. The statistics of datasets depending on tissues andmodification types is given in Table 5. In order to produce a validmachine learning model, we discarded the training sets having lessthan 20 positive samples. This also means that tyrosine phosphoryla-tion sites were discarded from prediction models. Although the num-ber threonine phosphorylation sites was not as sufficient as the num-ber of serine phosphorylation sites, we still performed tissue-specificphosphorylation site prediction for threonine residues. However, notethat the availability of more tissue-specific threonine phosphorylationsites would make the prediction model more robust.
4.1.3 Feature extraction
The extracted features were trained in 6 different categories: (i) sequence-based data (PS1D) with position-specific scoring matrix (PSSM) en-coding, (ii) sequence-based data with binary encoding, (iii) sequence-based data with PSSM encoding plus functional features and pre-dicted structural features, (iv) sequence-based data with binary en-coding plus functional features and predicted structural features, (v)structure-based data (PS3D) with PSSM encoding plus functional fea-tures and real structural features, (vi) structure-based data with bi-nary encoding plus functional features and real structural features(See Table 6).
4.1.3.1 Sequence-based features
Position-specific scoring matrix (PSSM): PSSM profile of a sequenceshows the probability of each residue of the sequence at a specificposition in the multiple sequence alignment. PSSM profiles were ob-tained from PSI-BLAST, using the default parameters and the fil-tered UniRef90 dataset from the UniProt Knowledgebase (UniProtKB)(UniProt, 2010). For each position of the peptide, PSSM scores of 20
different amino acids were considered. Therefore, PSSM encoding ofeach positive or negative site was represented in a feature vector withthe dimension of 20 (amino acid type) x 21 (window size).
Binary encoding: In order to take into account the compositional char-acteristics of the amino acid sequences, we employed the simplest bi-nary encoding algorithm. In this scheme we used 21 types of aminoacids, which are given as ARNDCQEGHILKMFPSTWYVX.Each amino acid is represented by a 21-dimensional binary vectorthat while A corresponds to (100000000000000000000), X correspondsto (000000000000000000001) and represents the artificial residues inthe peptide sequences having less than 10 residues in the upstreamor downstream region of the phosphorylated serine (S) / threonine(T) / tyrosine (Y) residues. In total, each positive or negative site isrepresented in a binary vector with the dimension of 21 (amino acidtype) x 21 (window size).
K nearest neighbors (KNN) score: It has been known that close sequence
[ July 10, 2016 at 22:13 – classicthesis version 4.2 ]

4.1 materials and methods 57
seqP
SSM
seqB
inar
yEnc
seqP
SSM
+pre
dStr
seqB
inar
yEnc
+pre
dStr
seqP
SSM
+rea
lStr
seqB
inar
yEnc
+rea
lStr
Posi
tion-
spec
ific
scor
ing
mat
rixX
XX
Bina
ryen
codi
ngof
linea
ram
ino
acid
cont
ent
XX
X
Bina
ryen
codi
ngof
spat
iala
min
oac
idco
nten
tX
X
Spat
iale
nviro
nmen
tsi
gnifi
canc
esc
ore
XX
Acc
essi
bilit
ysc
ore
XX
Pred
icte
dac
cess
ibili
tysc
ore
XX
Seco
ndar
yst
ruct
ure
XX
Pred
icte
dse
cond
ary
stru
ctur
eX
X
B-fa
ctor
XX
Dis
orde
red/
orde
red
regi
onX
XX
X
SCO
Pcl
ass
XX
Prot
ein
dom
ain
XX
Path
way
XX
XX
GO
term
sX
XX
X
Tabl
e6:T
hesu
mm
ary
offe
atur
esus
edto
trai
nea
chpr
edic
tion
mod
el.
[ July 10, 2016 at 22:13 – classicthesis version 4.2 ]
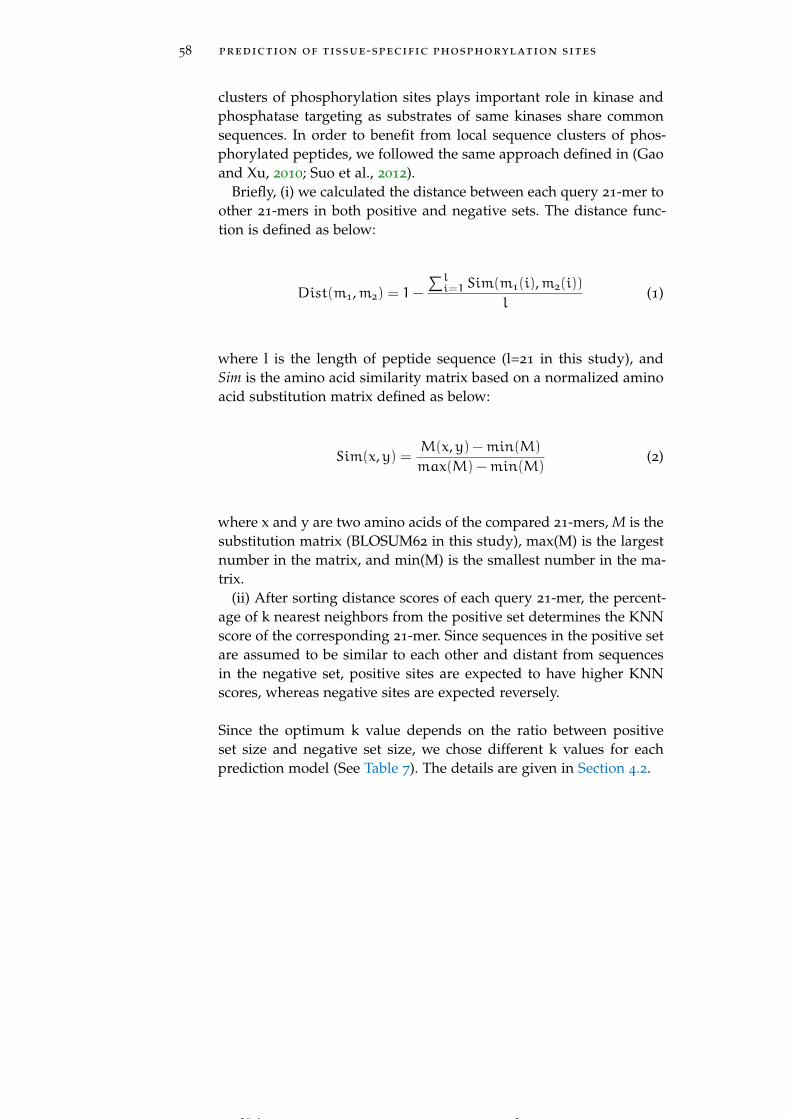
58 prediction of tissue-specific phosphorylation sites
clusters of phosphorylation sites plays important role in kinase andphosphatase targeting as substrates of same kinases share commonsequences. In order to benefit from local sequence clusters of phos-phorylated peptides, we followed the same approach defined in (Gaoand Xu, 2010; Suo et al., 2012).
Briefly, (i) we calculated the distance between each query 21-mer toother 21-mers in both positive and negative sets. The distance func-tion is defined as below:
Dist(m1,m2) = 1−
∑li=1 Sim(m1(i),m2(i))
l(1)
where l is the length of peptide sequence (l=21 in this study), andSim is the amino acid similarity matrix based on a normalized aminoacid substitution matrix defined as below:
Sim(x,y) =M(x,y) −min(M)
max(M) −min(M)(2)
where x and y are two amino acids of the compared 21-mers, M is thesubstitution matrix (BLOSUM62 in this study), max(M) is the largestnumber in the matrix, and min(M) is the smallest number in the ma-trix.
(ii) After sorting distance scores of each query 21-mer, the percent-age of k nearest neighbors from the positive set determines the KNNscore of the corresponding 21-mer. Since sequences in the positive setare assumed to be similar to each other and distant from sequencesin the negative set, positive sites are expected to have higher KNNscores, whereas negative sites are expected reversely.
Since the optimum k value depends on the ratio between positiveset size and negative set size, we chose different k values for eachprediction model (See Table 7). The details are given in Section 4.2.
[ July 10, 2016 at 22:13 – classicthesis version 4.2 ]
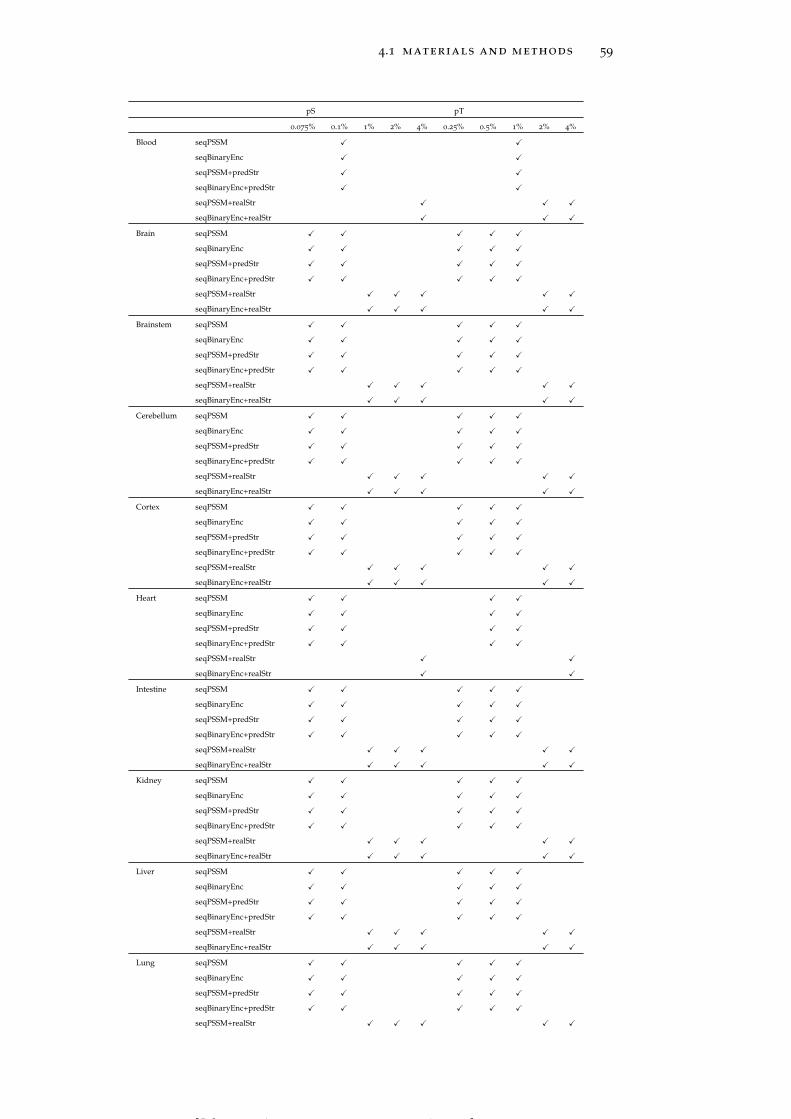
4.1 materials and methods 59
pS pT
0.075% 0.1% 1% 2% 4% 0.25% 0.5% 1% 2% 4%
Blood seqPSSM X X
seqBinaryEnc X X
seqPSSM+predStr X X
seqBinaryEnc+predStr X X
seqPSSM+realStr X X X
seqBinaryEnc+realStr X X X
Brain seqPSSM X X X X X
seqBinaryEnc X X X X X
seqPSSM+predStr X X X X X
seqBinaryEnc+predStr X X X X X
seqPSSM+realStr X X X X X
seqBinaryEnc+realStr X X X X X
Brainstem seqPSSM X X X X X
seqBinaryEnc X X X X X
seqPSSM+predStr X X X X X
seqBinaryEnc+predStr X X X X X
seqPSSM+realStr X X X X X
seqBinaryEnc+realStr X X X X X
Cerebellum seqPSSM X X X X X
seqBinaryEnc X X X X X
seqPSSM+predStr X X X X X
seqBinaryEnc+predStr X X X X X
seqPSSM+realStr X X X X X
seqBinaryEnc+realStr X X X X X
Cortex seqPSSM X X X X X
seqBinaryEnc X X X X X
seqPSSM+predStr X X X X X
seqBinaryEnc+predStr X X X X X
seqPSSM+realStr X X X X X
seqBinaryEnc+realStr X X X X X
Heart seqPSSM X X X X
seqBinaryEnc X X X X
seqPSSM+predStr X X X X
seqBinaryEnc+predStr X X X X
seqPSSM+realStr X X
seqBinaryEnc+realStr X X
Intestine seqPSSM X X X X X
seqBinaryEnc X X X X X
seqPSSM+predStr X X X X X
seqBinaryEnc+predStr X X X X X
seqPSSM+realStr X X X X X
seqBinaryEnc+realStr X X X X X
Kidney seqPSSM X X X X X
seqBinaryEnc X X X X X
seqPSSM+predStr X X X X X
seqBinaryEnc+predStr X X X X X
seqPSSM+realStr X X X X X
seqBinaryEnc+realStr X X X X X
Liver seqPSSM X X X X X
seqBinaryEnc X X X X X
seqPSSM+predStr X X X X X
seqBinaryEnc+predStr X X X X X
seqPSSM+realStr X X X X X
seqBinaryEnc+realStr X X X X X
Lung seqPSSM X X X X X
seqBinaryEnc X X X X X
seqPSSM+predStr X X X X X
seqBinaryEnc+predStr X X X X X
seqPSSM+realStr X X X X X
[ July 10, 2016 at 22:13 – classicthesis version 4.2 ]
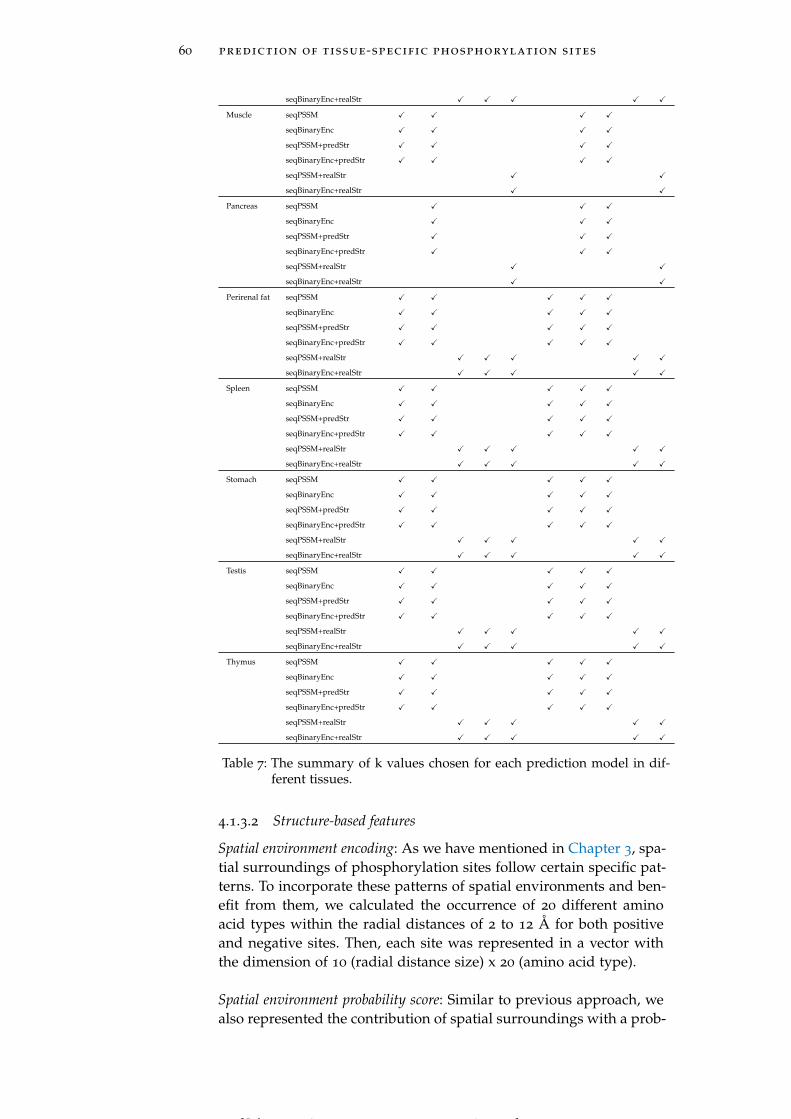
60 prediction of tissue-specific phosphorylation sites
seqBinaryEnc+realStr X X X X X
Muscle seqPSSM X X X X
seqBinaryEnc X X X X
seqPSSM+predStr X X X X
seqBinaryEnc+predStr X X X X
seqPSSM+realStr X X
seqBinaryEnc+realStr X X
Pancreas seqPSSM X X X
seqBinaryEnc X X X
seqPSSM+predStr X X X
seqBinaryEnc+predStr X X X
seqPSSM+realStr X X
seqBinaryEnc+realStr X X
Perirenal fat seqPSSM X X X X X
seqBinaryEnc X X X X X
seqPSSM+predStr X X X X X
seqBinaryEnc+predStr X X X X X
seqPSSM+realStr X X X X X
seqBinaryEnc+realStr X X X X X
Spleen seqPSSM X X X X X
seqBinaryEnc X X X X X
seqPSSM+predStr X X X X X
seqBinaryEnc+predStr X X X X X
seqPSSM+realStr X X X X X
seqBinaryEnc+realStr X X X X X
Stomach seqPSSM X X X X X
seqBinaryEnc X X X X X
seqPSSM+predStr X X X X X
seqBinaryEnc+predStr X X X X X
seqPSSM+realStr X X X X X
seqBinaryEnc+realStr X X X X X
Testis seqPSSM X X X X X
seqBinaryEnc X X X X X
seqPSSM+predStr X X X X X
seqBinaryEnc+predStr X X X X X
seqPSSM+realStr X X X X X
seqBinaryEnc+realStr X X X X X
Thymus seqPSSM X X X X X
seqBinaryEnc X X X X X
seqPSSM+predStr X X X X X
seqBinaryEnc+predStr X X X X X
seqPSSM+realStr X X X X X
seqBinaryEnc+realStr X X X X X
Table 7: The summary of k values chosen for each prediction model in dif-ferent tissues.
4.1.3.2 Structure-based features
Spatial environment encoding: As we have mentioned in Chapter 3, spa-tial surroundings of phosphorylation sites follow certain specific pat-terns. To incorporate these patterns of spatial environments and ben-efit from them, we calculated the occurrence of 20 different aminoacid types within the radial distances of 2 to 12 Å for both positiveand negative sites. Then, each site was represented in a vector withthe dimension of 10 (radial distance size) x 20 (amino acid type).
Spatial environment probability score: Similar to previous approach, wealso represented the contribution of spatial surroundings with a prob-
[ July 10, 2016 at 22:13 – classicthesis version 4.2 ]
4.1 materials and methods 61
ability score. First, we calculated the significance (p-value) of eachamino acid type at a specific position (ranging from 2 to 12 Å inincrements of 1 Å) using Fisher exact test. Then, we multiplied thep-values of all amino acids in the <12 Å radial distance of each site,which gives the spatial environment probability score of each positiveor negative site.
Secondary structure: Secondary structure assignments for all positiveand negative sites along with the residues surrounding them in thePS3D dataset were obtained from the DSSP database (Joosten et al.,2011). The obtained structures were categorized into 3: alpha, betaand loop.
We also utilized PSIPRED (McGuffin, Bryson, and Jones, 2000) tofind predicted secondary structures for all sites in the PS1D dataset.The default parameters with the filtered UniRef90 dataset from theUniProt Knowledgebase (UniProtKB) were used (UniProt, 2010). Theobtained structures were again categorized as alpha, beta and loop.
Solvent accessibility: The solvent accessibility of each positive and neg-ative site along with their sequence surroundings in the PS3D datasetwas calculated using NACCESS (Hubbard and Thornton, 1993).
The accessibility scores for phosphorylation and non-phosphorylationsites in the PS1D dataset were predicted using SPPIDER (Porollo andMeller, 2007).
B-factor: We obtained the B-factors of each site along with sequencesurroundings in the PS3D dataset from Protein Data Bank.
Disordered region: We used DisEMBL (Linding et al., 2003) to pre-dict disordered/unstructured regions within protein sequences. Eachpositive and negative site along with sequence surroundings in bothPS1D and PS3D datasets were considered to reside in a disorderedregion if it was predicted by DisEMBL to be located in a region as-sociated with either loops/coils, or hot loops, or missing coordinates.A positive or negative site was eventually represented with a 1-digitcategorical feature that it can either be in a disordered, or an orderedregion.
Structural folds and functional domains: We incorporated the structuralfolds and domains of each protein in the PS3D dataset from theSCOP database using the class and protein domain levels (Murzin etal., 1995). We represented structural folds in a categorical variablewhere it can be all alpha proteins, all beta proteins, alpha and betaproteins (a+b), alpha and beta proteins (a/b), multi-domain proteins(alpha and beta), small proteins, coiled coil proteins, and membraneand cell surface proteins and peptides.
[ July 10, 2016 at 22:13 – classicthesis version 4.2 ]
62 prediction of tissue-specific phosphorylation sites
4.1.3.3 Functional features
Gene ontology (GO) terms: GO terms of each protein in both PS1Dand PS3D datasets were gathered from the downloadable rat-filtereddataset of Gene Ontology Consortium (Gene Ontology, 2015) as ofMay 26, 2015. We used 3-digit binary encoding where each digit rep-resents the association of each site to biological processes, cellularcomponents and molecular functions.
Pathways: We obtained the pathways each protein takes place fromthe Kyoto Encyclopedia of Genes and Genomes (KEGG) database(Kanehisa et al., 2006). KEGG pathways of phosphorylation and non-phosphorylation proteins from both PS1D and PS3D datasets wereobtained.
4.1.4 Machine learning
Tissue-based phosphorylation site prediction was treated as a binaryclassification problem where each phosphorylated residue type canbe classified as phosphorylated in a particular tissue or not phospho-rylated at all. We used random forest (RF) machine learning tech-nique (Breiman, 2001) implemented in the R (Team, 2009) Caret pack-age (Kuhn, 2008), since there are many advantages of this method. RFensembles the ntree decision trees, and trains each tree with a subsetof training samples (sampling with replacement) that guarantees touse many of samples in the training data for each tree. Random forestgives an output value between 0 and 1 that is the fraction of decisiontrees voting for phosphorylation in a particular tissue. The decisionsare not sensitive to outliers, and it does feature selection by buildingtrees on better performing features.
Since random forest allows using a max of 32 categories for a fea-ture, we separated features (domain and pathway features) havingmore than 32 different values into 2 categorical variables where eachcategorical variable may have a value between 0 and 31. Applyingthis approach, 1024 (32 x 32) different values can be represented.
We generated 2 (residue type) x 17 (tissue type) x 6 (feature cate-gory) prediction models, and each model was trained on 300 treeswith a 10-fold cross-validation by splitting the data into 10 parts andusing 9 parts for training and the remaining part for testing. As seenin Table 4, the number of negative samples surpasses that of positivesamples. To overcome this class imbalance problem, we performedundersampling for the majority class with the ratio of 1:1 that posi-tive and negative sample sizes are equal to each other when growingeach tree. With this approach we guaranteed to use as many nega-tive samples as possible in training, as the number of trees (300 inthis study) used in random forest gets larger. The mtry value, whichis the number of variables randomly sampled as candidates at eachsplit, was tuned based on the best Area Under the Receiver-OperatingCharacteristic Curve (AUC) measure, and the best value of mtry wasused to train each model.
[ July 10, 2016 at 22:13 – classicthesis version 4.2 ]

4.1 materials and methods 63
4.1.5 Prediction performance assessment
In order to evaluate the predictions, we used Accuracy (ACC), Sensi-tivity (SEN), Specificity (SPE), and Area Under the Receiver-OperatingCharacteristic Curve (AUC) measures. AUC is the area under theReceiver-Operating Characteristic Curve plot where axes of the plotare true positive rate (SEN) and false positive rate (FPR). For eachclassifier, we adjusted the optimal cut-off threshold for class probabil-ities (the best of both specificity and sensitivity values), rather thanchoosing the conventional 50% cut-off. The overall qualities of theclassifiers were mostly compared based on AUC values. The evalua-tion measures were formulized below:
ACC =TP+ TN
TP+ TN+ FP+ FN(3)
SEN =TP
TP+ FN(4)
SPE =TN
TN+ FP(5)
FPR =FP
TN+ FP(6)
TP, TN, FP and FN correspond to the numbers of true positives, truenegatives, false positives and false negatives, respectively.
4.1.6 Comparing with existing tools
As we first implemented tissue-specific phosphorylation site predic-tion, there is no other tool performing prediction in a tissue-specificmanner. We, therefore, compared the our performance to predictorsdeveloped for globally phosphorylated site prediction. Musite wasthe only tool that was still available, easily downloadable and usedby the time we conducted this work ((Gao and Xu, 2010; Gao et al.,2010)). M. musculus pre-trained model with default parameters wasused since no pre-trained model for rat is available. When calculat-ing the sensitivity score for Musite, we only counted phosphorylatedserines in a particular tissue as positives. The reason is that in ourtraining sets we only included phosphorylated serine residues in thecorresponding tissue as positive instances. Therefore, true positiverate, or sensitivity, was calculated for Musite results by dividing thenumber of predicted phosphorylated serine residues to the numberof all phosphorylated residues in the corresponding tissue – the otherpredicted phosphorylated serine residues were just ignored.
[ July 10, 2016 at 22:13 – classicthesis version 4.2 ]
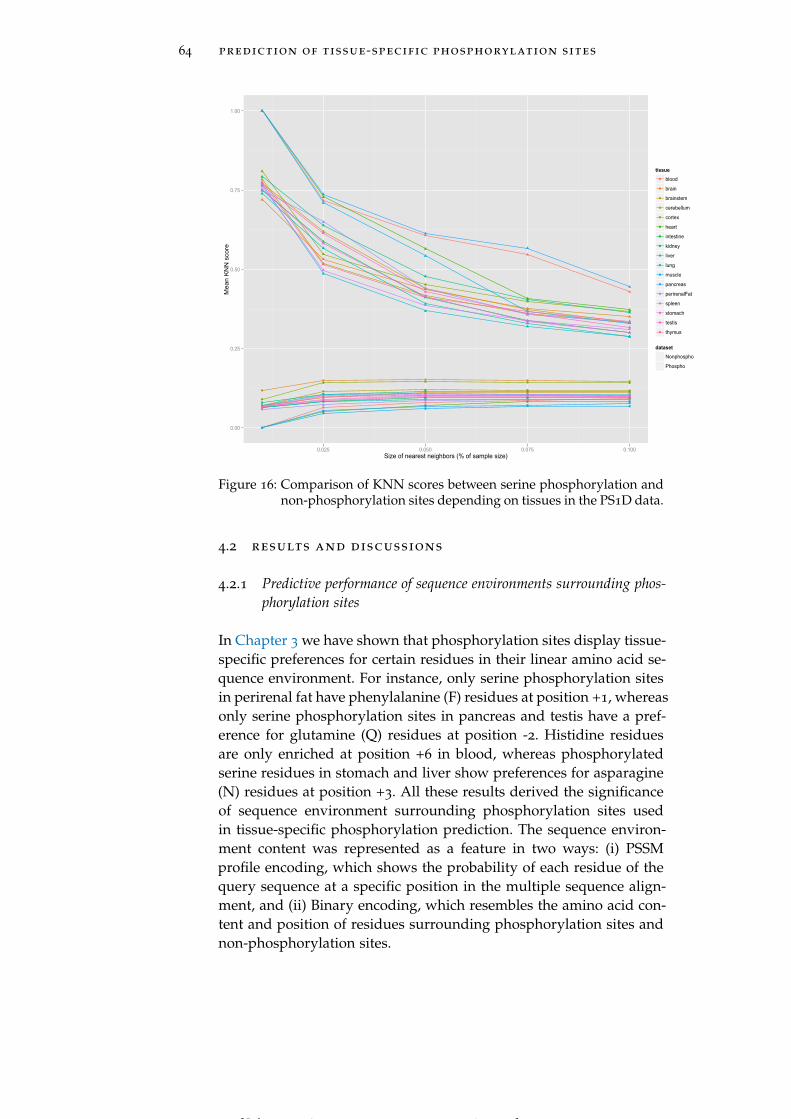
64 prediction of tissue-specific phosphorylation sites
0.00
0.25
0.50
0.75
1.00
0.025 0.050 0.075 0.100Size of nearest neighbors (% of sample size)
Mea
n K
NN
sco
re
tissueblood
brain
brainstem
cerebellum
cortex
heart
intestine
kidney
liver
lung
muscle
pancreas
perirenalFat
spleen
stomach
testis
thymus
datasetNonphospho
Phospho
Figure 16: Comparison of KNN scores between serine phosphorylation andnon-phosphorylation sites depending on tissues in the PS1D data.
4.2 results and discussions
4.2.1 Predictive performance of sequence environments surrounding phos-phorylation sites
In Chapter 3 we have shown that phosphorylation sites display tissue-specific preferences for certain residues in their linear amino acid se-quence environment. For instance, only serine phosphorylation sitesin perirenal fat have phenylalanine (F) residues at position +1, whereasonly serine phosphorylation sites in pancreas and testis have a pref-erence for glutamine (Q) residues at position -2. Histidine residuesare only enriched at position +6 in blood, whereas phosphorylatedserine residues in stomach and liver show preferences for asparagine(N) residues at position +3. All these results derived the significanceof sequence environment surrounding phosphorylation sites usedin tissue-specific phosphorylation prediction. The sequence environ-ment content was represented as a feature in two ways: (i) PSSMprofile encoding, which shows the probability of each residue of thequery sequence at a specific position in the multiple sequence align-ment, and (ii) Binary encoding, which resembles the amino acid con-tent and position of residues surrounding phosphorylation sites andnon-phosphorylation sites.
[ July 10, 2016 at 22:13 – classicthesis version 4.2 ]

4.2 results and discussions 65
0.00
0.25
0.50
0.75
1.00
0 1 2 3 4Size of nearest neighbors (% of sample size)
Me
an
KN
N s
co
re
tissueblood
brain
brainstem
cerebellum
cortex
heart
intestine
kidney
liver
lung
muscle
pancreas
perirenalFat
spleen
stomach
testis
thymus
datasetNonphospho
Phospho
Figure 17: Comparison of KNN scores between serine phosphorylation andnon-phosphorylation sites depending on tissues in the PS3D data.
0.00
0.25
0.50
0.75
1.00
0.00 0.25 0.50 0.75 1.00Size of nearest neighbors (% of sample size)
Me
an
KN
N s
co
re
tissueblood
brain
brainstem
cerebellum
cortex
heart
intestine
kidney
liver
lung
muscle
pancreas
perirenalFat
spleen
stomach
testis
thymus
datasetNonphospho
Phospho
Figure 18: Comparison of KNN scores between threonine phosphorylationand non-phosphorylation sites depending on tissues in the PS1Ddata.
[ July 10, 2016 at 22:13 – classicthesis version 4.2 ]
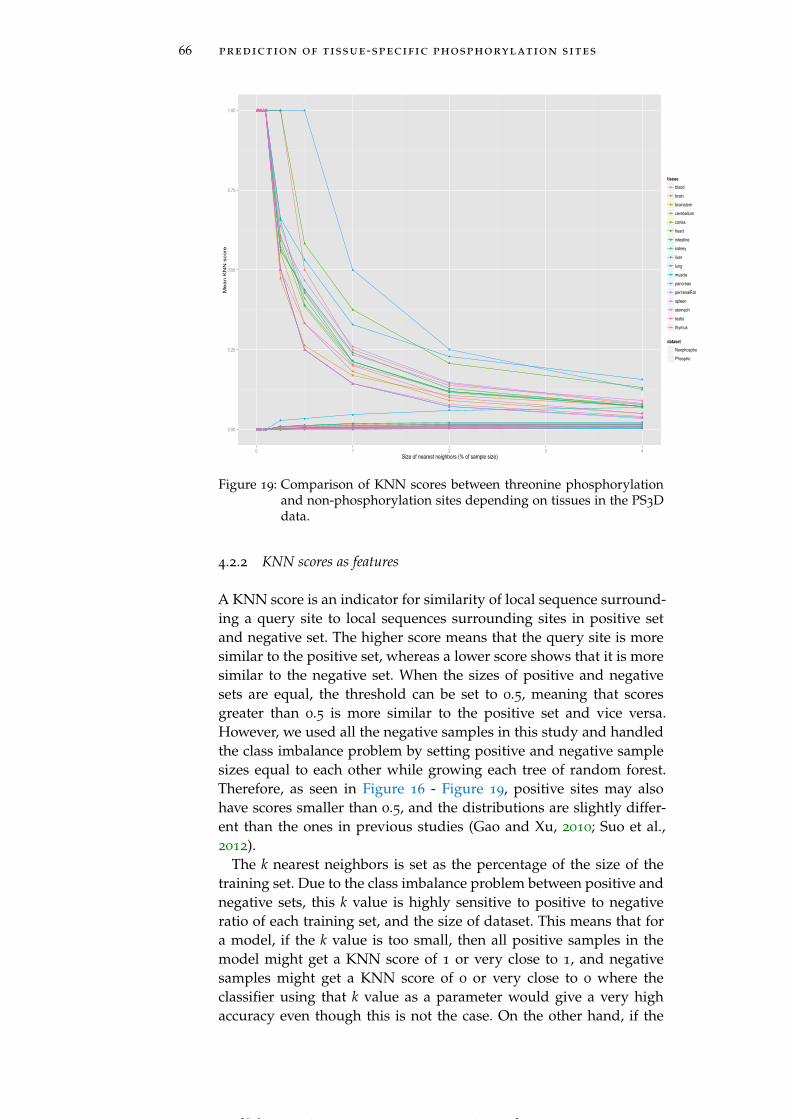
66 prediction of tissue-specific phosphorylation sites
0.00
0.25
0.50
0.75
1.00
0 1 2 3 4Size of nearest neighbors (% of sample size)
Me
an
KN
N s
core
tissueblood
brain
brainstem
cerebellum
cortex
heart
intestine
kidney
liver
lung
muscle
pancreas
perirenalFat
spleen
stomach
testis
thymus
datasetNonphospho
Phospho
Figure 19: Comparison of KNN scores between threonine phosphorylationand non-phosphorylation sites depending on tissues in the PS3Ddata.
4.2.2 KNN scores as features
A KNN score is an indicator for similarity of local sequence surround-ing a query site to local sequences surrounding sites in positive setand negative set. The higher score means that the query site is moresimilar to the positive set, whereas a lower score shows that it is moresimilar to the negative set. When the sizes of positive and negativesets are equal, the threshold can be set to 0.5, meaning that scoresgreater than 0.5 is more similar to the positive set and vice versa.However, we used all the negative samples in this study and handledthe class imbalance problem by setting positive and negative samplesizes equal to each other while growing each tree of random forest.Therefore, as seen in Figure 16 - Figure 19, positive sites may alsohave scores smaller than 0.5, and the distributions are slightly differ-ent than the ones in previous studies (Gao and Xu, 2010; Suo et al.,2012).
The k nearest neighbors is set as the percentage of the size of thetraining set. Due to the class imbalance problem between positive andnegative sets, this k value is highly sensitive to positive to negativeratio of each training set, and the size of dataset. This means that fora model, if the k value is too small, then all positive samples in themodel might get a KNN score of 1 or very close to 1, and negativesamples might get a KNN score of 0 or very close to 0 where theclassifier using that k value as a parameter would give a very highaccuracy even though this is not the case. On the other hand, if the
[ July 10, 2016 at 22:13 – classicthesis version 4.2 ]
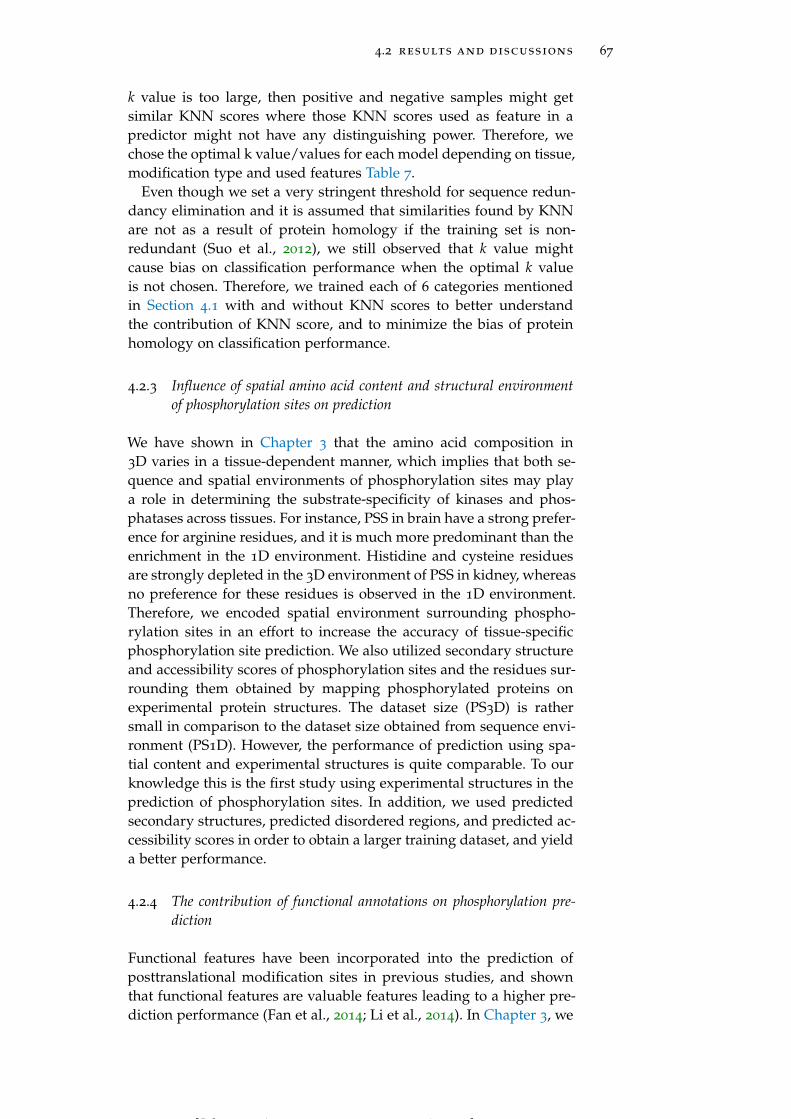
4.2 results and discussions 67
k value is too large, then positive and negative samples might getsimilar KNN scores where those KNN scores used as feature in apredictor might not have any distinguishing power. Therefore, wechose the optimal k value/values for each model depending on tissue,modification type and used features Table 7.
Even though we set a very stringent threshold for sequence redun-dancy elimination and it is assumed that similarities found by KNNare not as a result of protein homology if the training set is non-redundant (Suo et al., 2012), we still observed that k value mightcause bias on classification performance when the optimal k valueis not chosen. Therefore, we trained each of 6 categories mentionedin Section 4.1 with and without KNN scores to better understandthe contribution of KNN score, and to minimize the bias of proteinhomology on classification performance.
4.2.3 Influence of spatial amino acid content and structural environmentof phosphorylation sites on prediction
We have shown in Chapter 3 that the amino acid composition in3D varies in a tissue-dependent manner, which implies that both se-quence and spatial environments of phosphorylation sites may playa role in determining the substrate-specificity of kinases and phos-phatases across tissues. For instance, PSS in brain have a strong prefer-ence for arginine residues, and it is much more predominant than theenrichment in the 1D environment. Histidine and cysteine residuesare strongly depleted in the 3D environment of PSS in kidney, whereasno preference for these residues is observed in the 1D environment.Therefore, we encoded spatial environment surrounding phospho-rylation sites in an effort to increase the accuracy of tissue-specificphosphorylation site prediction. We also utilized secondary structureand accessibility scores of phosphorylation sites and the residues sur-rounding them obtained by mapping phosphorylated proteins onexperimental protein structures. The dataset size (PS3D) is rathersmall in comparison to the dataset size obtained from sequence envi-ronment (PS1D). However, the performance of prediction using spa-tial content and experimental structures is quite comparable. To ourknowledge this is the first study using experimental structures in theprediction of phosphorylation sites. In addition, we used predictedsecondary structures, predicted disordered regions, and predicted ac-cessibility scores in order to obtain a larger training dataset, and yielda better performance.
4.2.4 The contribution of functional annotations on phosphorylation pre-diction
Functional features have been incorporated into the prediction ofposttranslational modification sites in previous studies, and shownthat functional features are valuable features leading to a higher pre-diction performance (Fan et al., 2014; Li et al., 2014). In Chapter 3, we
[ July 10, 2016 at 22:13 – classicthesis version 4.2 ]
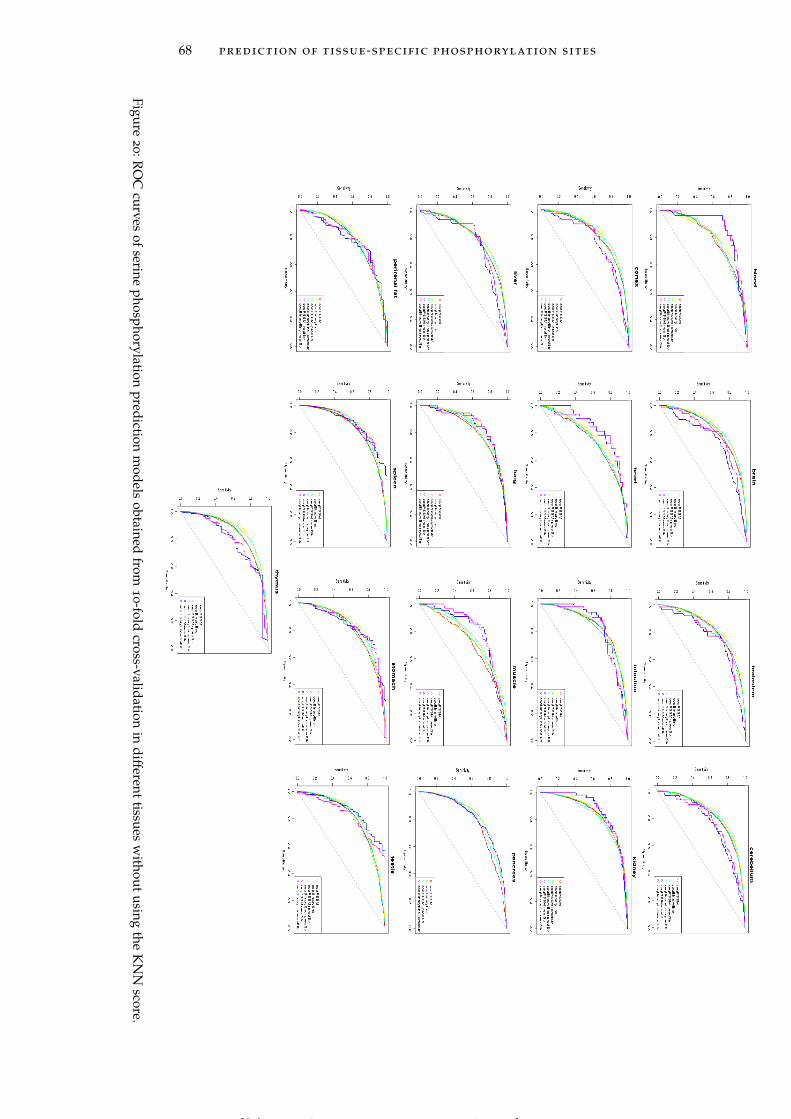
68 prediction of tissue-specific phosphorylation sites
Figure2
0:RO
Ccurves
ofserine
phosphorylationprediction
models
obtainedfrom
10-fold
cross-validationin
differenttissues
without
usingthe
KN
Nscore.
[ July 10, 2016 at 22:13 – classicthesis version 4.2 ]
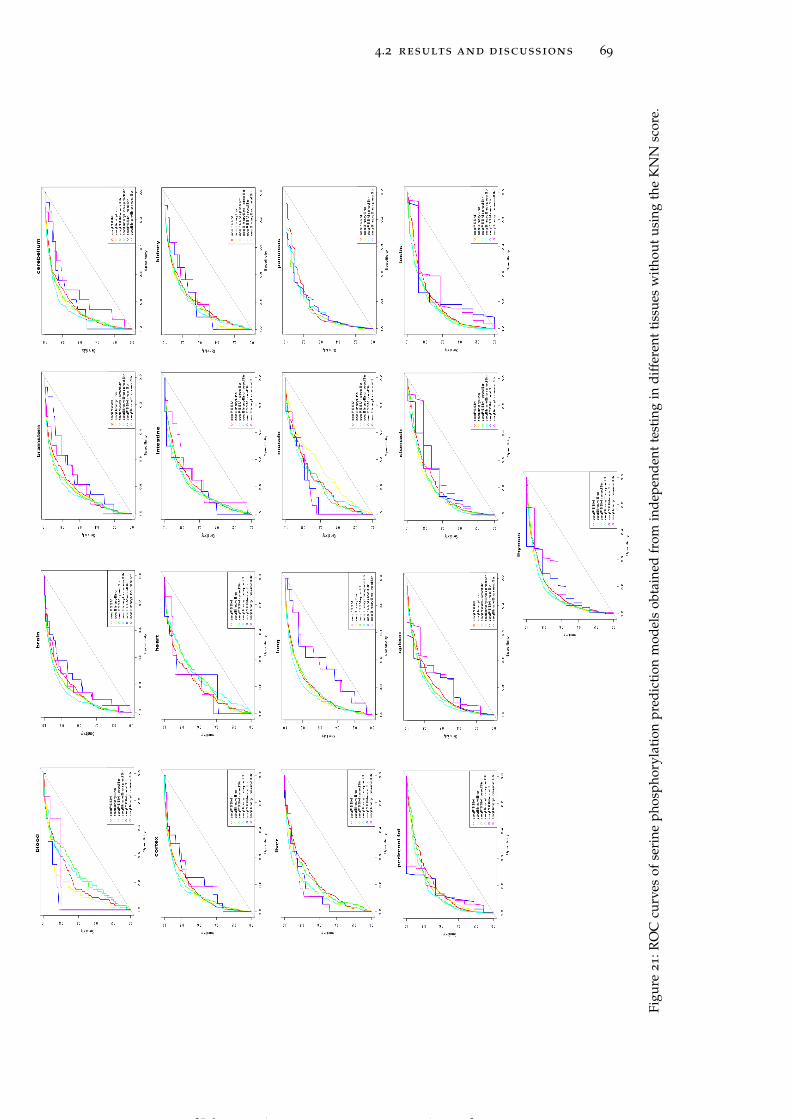
4.2 results and discussions 69
Figu
re2
1:R
OC
curv
esof
seri
neph
osph
oryl
atio
npr
edic
tion
mod
els
obta
ined
from
inde
pend
ent
test
ing
indi
ffer
ent
tiss
ues
wit
hout
usin
gth
eK
NN
scor
e.
[ July 10, 2016 at 22:13 – classicthesis version 4.2 ]
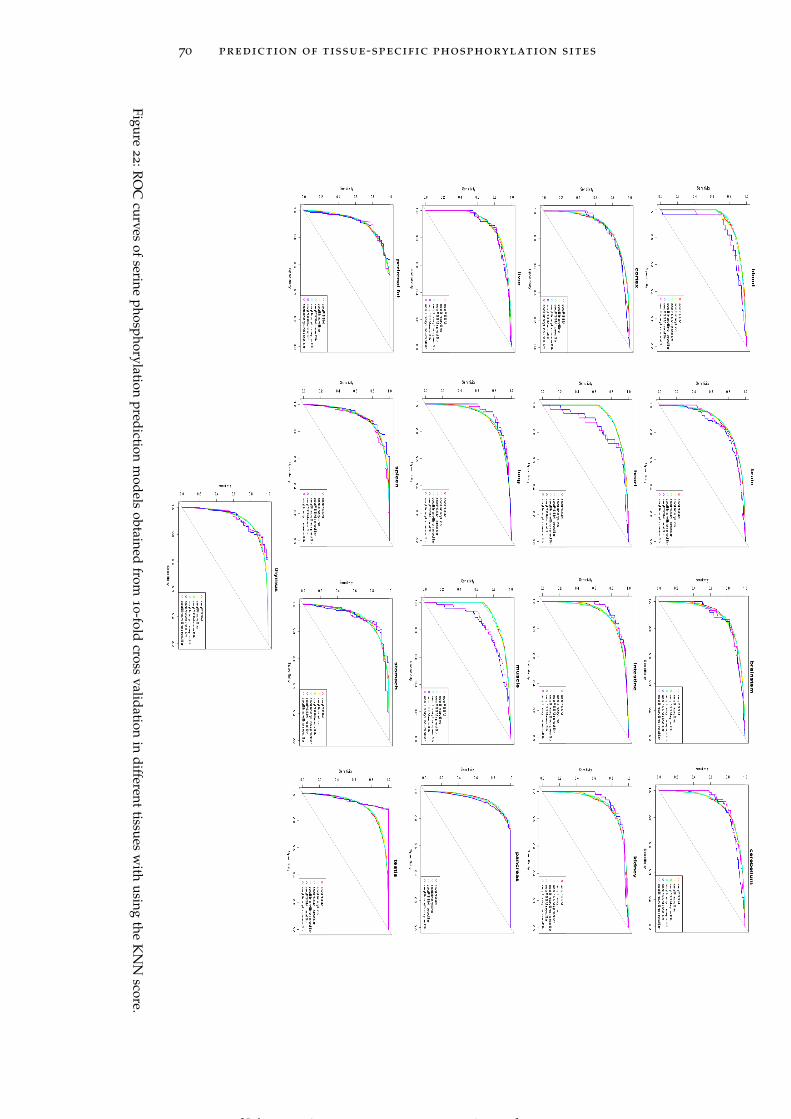
70 prediction of tissue-specific phosphorylation sites
Figure2
2:RO
Ccurves
ofserine
phosphorylationprediction
models
obtainedfrom
10-fold
crossvalidation
indifferent
tissuesw
ithusing
theK
NN
score.
[ July 10, 2016 at 22:13 – classicthesis version 4.2 ]
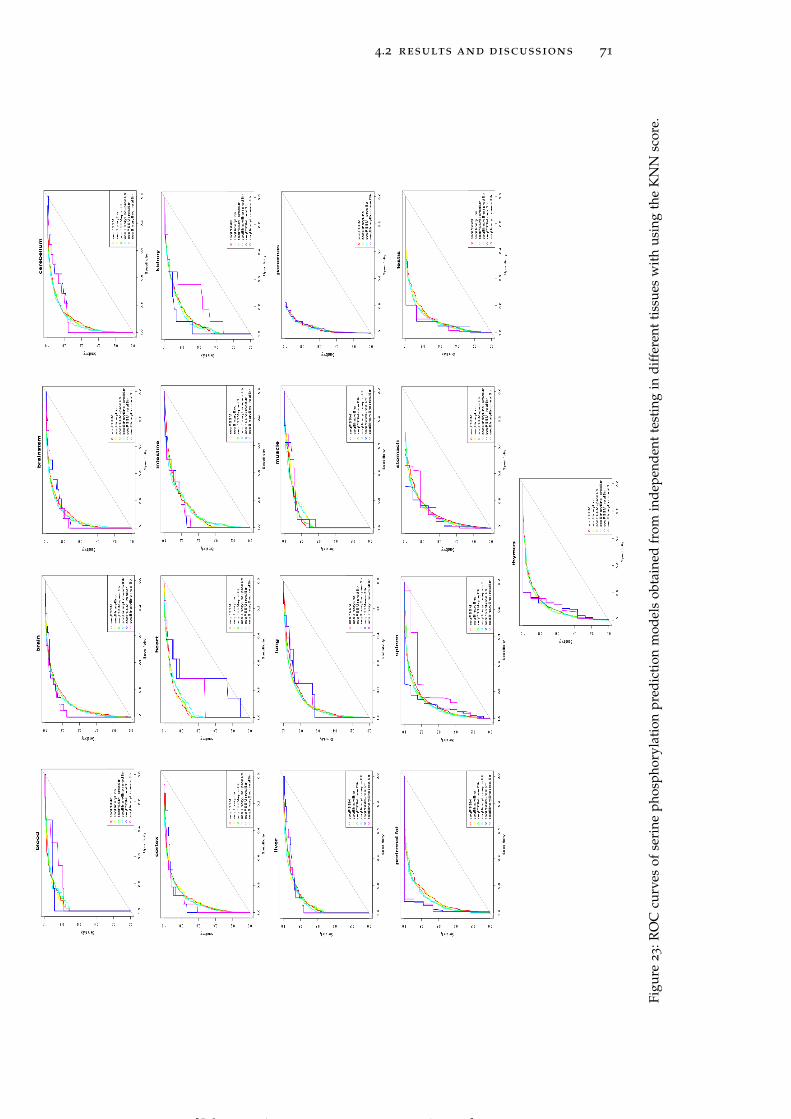
4.2 results and discussions 71
Figu
re2
3:R
OC
curv
esof
seri
neph
osph
oryl
atio
npr
edic
tion
mod
els
obta
ined
from
inde
pend
ent
test
ing
indi
ffer
ent
tiss
ues
wit
hus
ing
the
KN
Nsc
ore.
[ July 10, 2016 at 22:13 – classicthesis version 4.2 ]
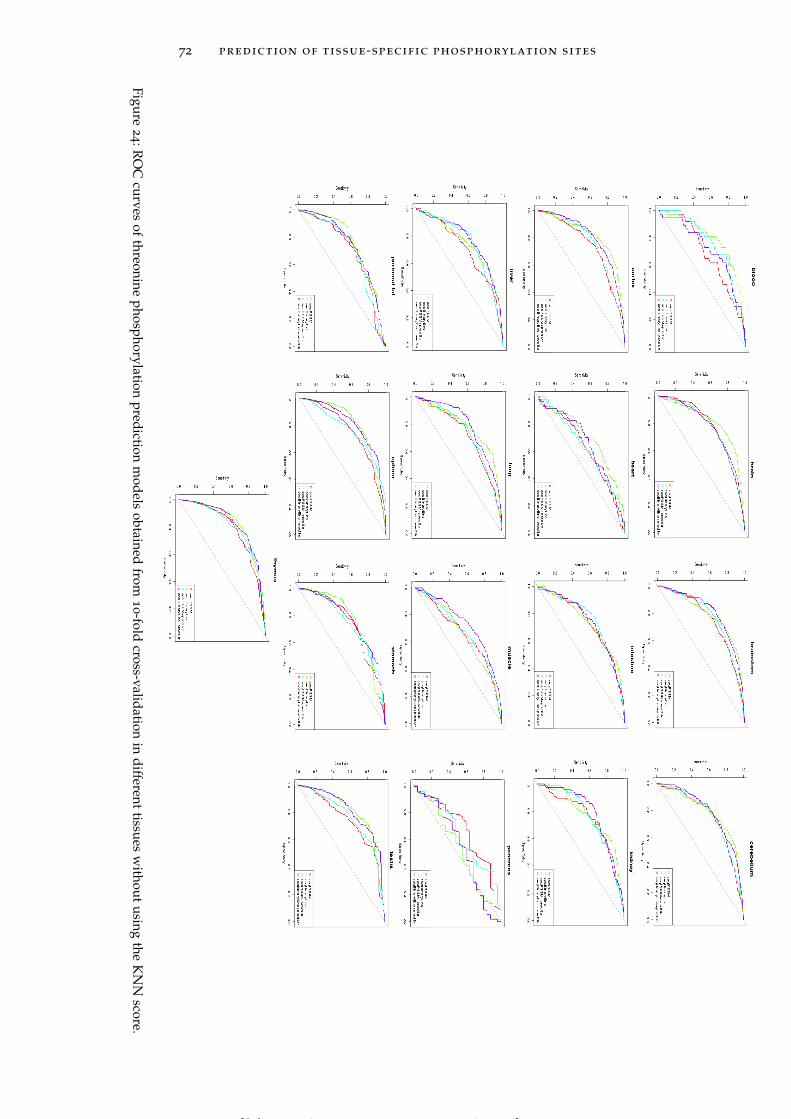
72 prediction of tissue-specific phosphorylation sites
Figure2
4:RO
Ccurves
ofthreonine
phosphorylationprediction
models
obtainedfrom
10-fold
cross-validationin
differenttissues
without
usingthe
KN
Nscore.
[ July 10, 2016 at 22:13 – classicthesis version 4.2 ]
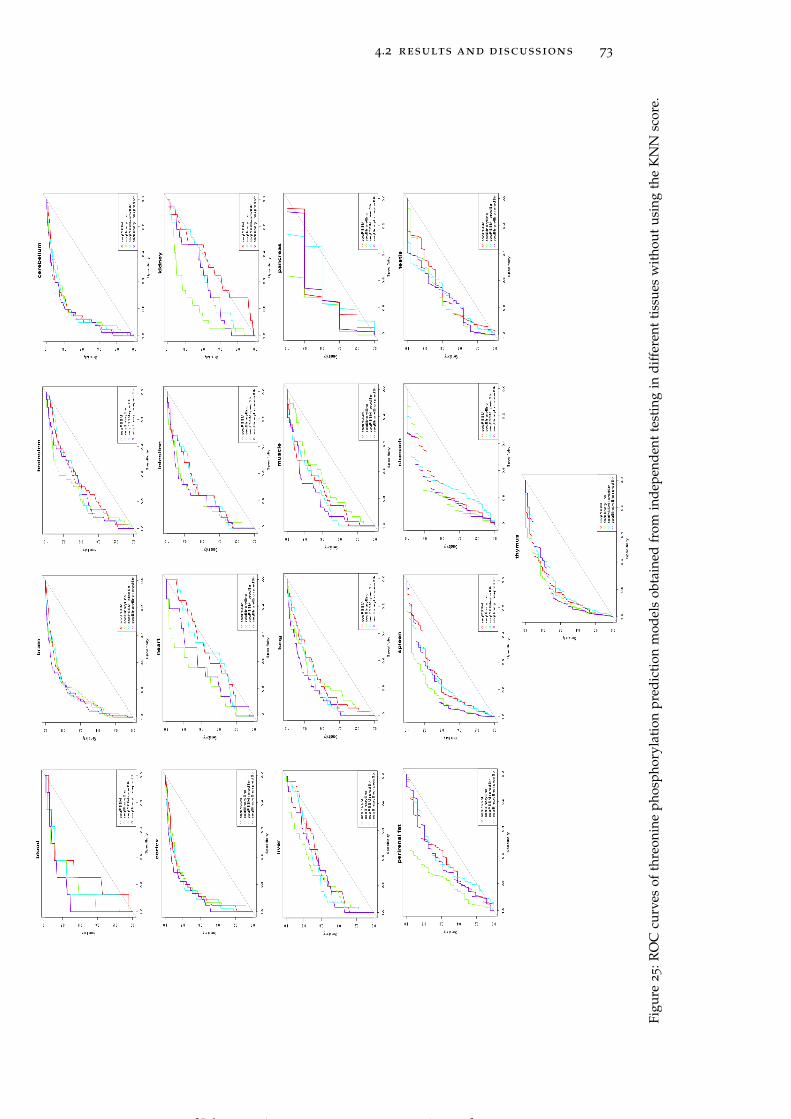
4.2 results and discussions 73
Figu
re2
5:R
OC
curv
esof
thre
onin
eph
osph
oryl
atio
npr
edic
tion
mod
els
obta
ined
from
inde
pend
ent
test
ing
indi
ffer
ent
tiss
ues
wit
hout
usin
gth
eK
NN
scor
e.
[ July 10, 2016 at 22:13 – classicthesis version 4.2 ]
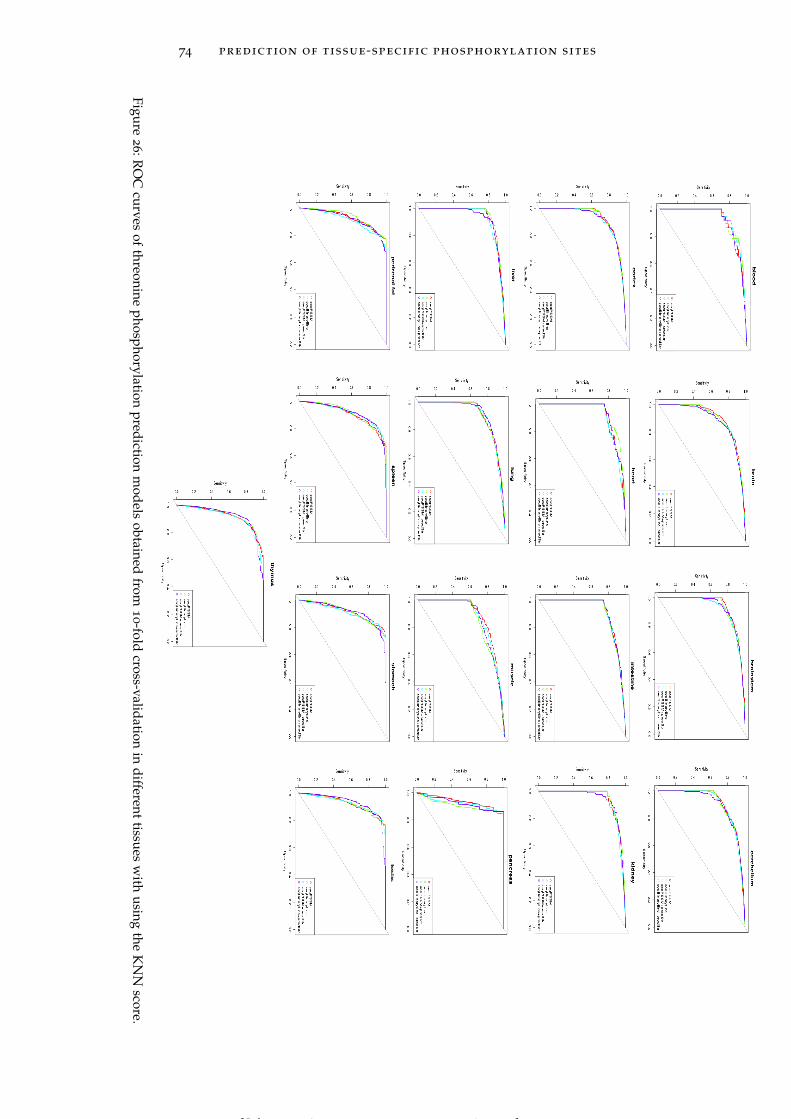
74 prediction of tissue-specific phosphorylation sites
Figure2
6:RO
Ccurves
ofthreonine
phosphorylationprediction
models
obtainedfrom
10-fold
cross-validationin
differenttissues
with
usingthe
KN
Nscore.
[ July 10, 2016 at 22:13 – classicthesis version 4.2 ]
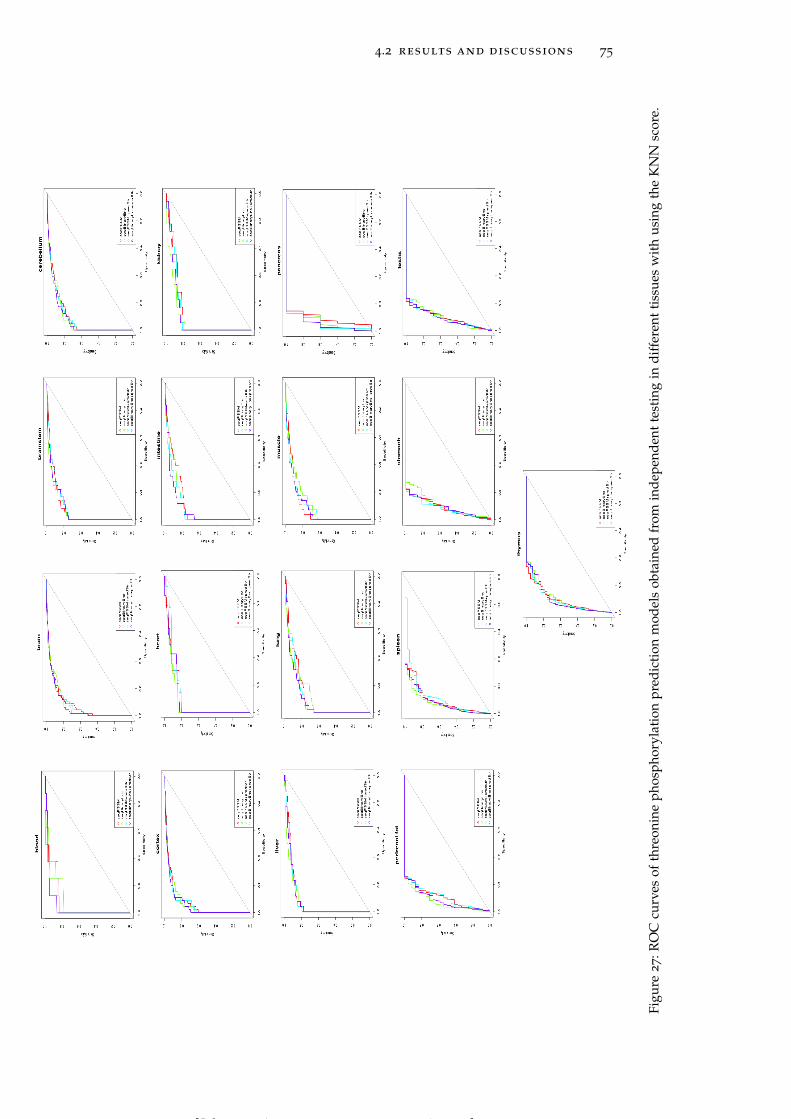
4.2 results and discussions 75
Figu
re2
7:R
OC
curv
esof
thre
onin
eph
osph
oryl
atio
npr
edic
tion
mod
els
obta
ined
from
inde
pend
ent
test
ing
indi
ffer
ent
tiss
ues
wit
hus
ing
the
KN
Nsc
ore.
[ July 10, 2016 at 22:13 – classicthesis version 4.2 ]

76 prediction of tissue-specific phosphorylation sites
have also observed that biological processes are regulated by phos-phorylation in a tissue dependent manner. As a result, we utilized GOannotation and KEGG pathways to assess the contribution of func-tional annotations on tissue-specific phosphorylation site prediction.In this study, functional annotation did not contribute to prediction assignificant as reported by previous studies. The possible reason maybe the fact that we generated the negative set of non-phosphorylationsites from phosphorylated proteins. Since the entire rat proteome wasnot use as the negative set, the decision about the influence of func-tional annotation on tissue-specific phosphorylation prediction mightnot be accurate.
[ July 10, 2016 at 22:13 – classicthesis version 4.2 ]
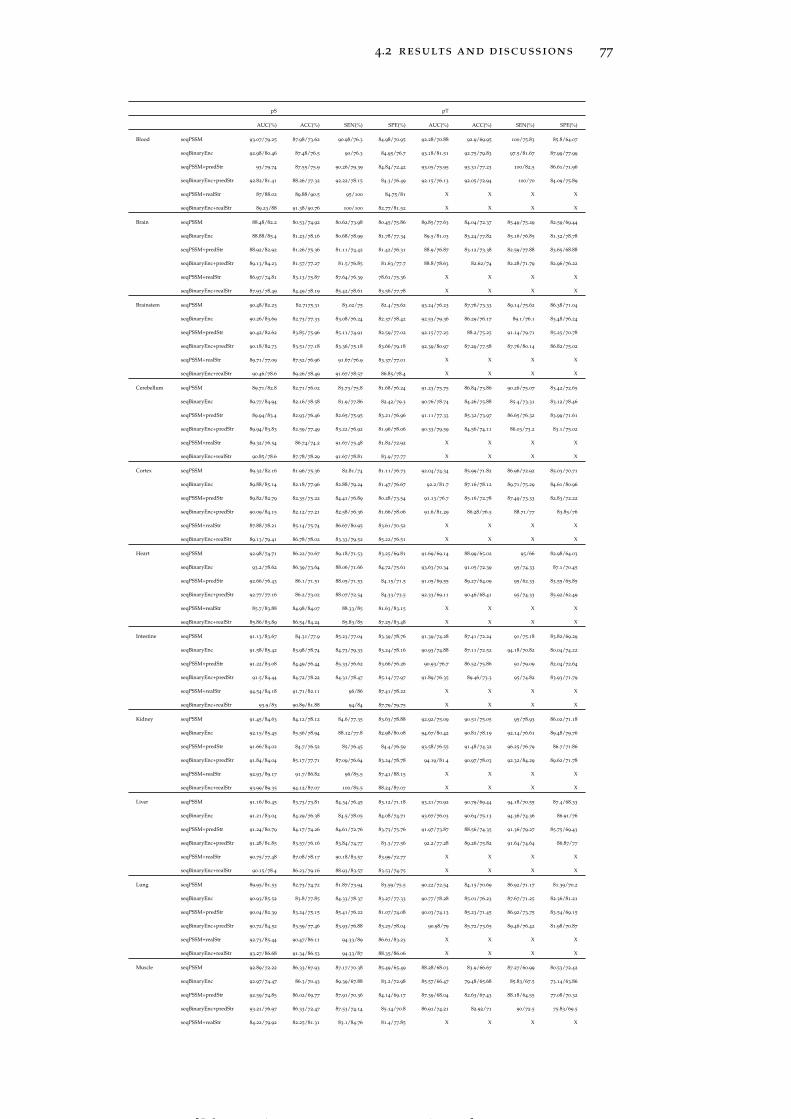
4.2 results and discussions 77
pS pT
AUC(%) ACC(%) SEN(%) SPE(%) AUC(%) ACC(%) SEN(%) SPE(%)
Blood seqPSSM 93.07/79.25 87.98/73.62 90.98/76.3 84.98/70.95 92.28/70.88 92.9/69.95 100/75.83 85.8/64.07
seqBinaryEnc 92.98/80.46 87.48/76.5 90/76.3 84.95/76.7 93.18/81.51 92.75/79.83 97.5/81.67 87.99/77.99
seqPSSM+predStr 93/79.74 87.55/75.9 90.26/79.39 84.84/72.42 93.05/75.95 93.31/77.23 100/82.5 86.61/71.96
seqBinaryEnc+predStr 92.82/81.41 88.26/77.32 92.22/78.15 84.3/76.49 92.15/76.13 92.05/72.94 100/70 84.09/75.89
seqPSSM+realStr 87/88.02 89.88/90.5 95/100 84.75/81 X X X X
seqBinaryEnc+realStr 89.23/88 91.38/90.76 100/100 82.77/81.52 X X X X
Brain seqPSSM 88.48/82.2 80.53/74.92 80.62/73.98 80.45/75.86 89.85/77.63 84.04/72.37 85.49/75.29 82.59/69.44
seqBinaryEnc 88.88/85.4 81.23/78.16 80.68/78.99 81.78/77.34 89.5/81.03 83.24/77.82 85.16/76.85 81.32/78.78
seqPSSM+predStr 88.92/82.92 81.26/75.36 81.11/74.42 81.42/76.31 88.9/76.87 83.12/73.38 82.59/77.88 83.65/68.88
seqBinaryEnc+predStr 89.13/84.23 81.57/77.27 81.5/76.85 81.63/77.7 88.8/78.63 82.62/74 82.28/71.79 82.96/76.22
seqPSSM+realStr 86.97/74.81 83.13/75.87 87.64/76.39 78.61/75.36 X X X X
seqBinaryEnc+realStr 87.93/78.49 84.49/78.19 85.42/78.61 83.56/77.78 X X X X
Brainstem seqPSSM 90.48/82.23 82.7175.31 83.02/75 82.4/75.62 93.24/76.23 87.76/73.33 89.14/75.62 86.38/71.04
seqBinaryEnc 90.26/83.69 82.73/77.33 83.08/76.24 82.37/78.42 92.53/79.36 86.29/76.17 89.1/76.1 83.48/76.24
seqPSSM+predStr 90.42/82.62 83.85/75.96 85.11/74.91 82.59/77.02 92.15/77.25 88.2/75.25 91.14/79.71 85.25/70.78
seqBinaryEnc+predStr 90.18/82.73 83.51/77.18 83.36/75.18 83.66/79.18 92.39/80.97 87.29/77.58 87.76/80.14 86.82/75.02
seqPSSM+realStr 89.71/77.09 87.52/76.96 91.67/76.9 83.37/77.01 X X X X
seqBinaryEnc+realStr 90.46/78.6 89.26/78.49 91.67/78.57 86.85/78.4 X X X X
Cerebellum seqPSSM 89.71/82.8 82.71/76.02 83.73/75.8 81.68/76.24 91.23/75.75 86.84/73.86 90.26/75.07 83.42/72.65
seqBinaryEnc 89.77/84.94 82.16/78.58 81.9/77.86 82.42/79.3 90.76/78.74 84.26/75.88 85.4/73.31 83.12/78.46
seqPSSM+predStr 89.94/83.4 82.93/76.46 82.65/75.95 83.21/76.96 91.11/77.33 85.32/73.97 86.65/76.32 83.99/71.61
seqBinaryEnc+predStr 89.94/83.83 82.59/77.49 83.22/76.92 81.96/78.06 90.33/79.59 84.56/74.11 86.03/73.2 83.1/75.02
seqPSSM+realStr 89.32/76.54 86.74/74.2 91.67/75.48 81.82/72.92 X X X X
seqBinaryEnc+realStr 90.85/78.6 87.78/78.29 91.67/78.81 83.9/77.77 X X X X
Cortex seqPSSM 89.32/82.16 81.96/75.36 82.81/74 81.11/76.73 92.04/74.34 85.99/71.82 86.96/72.92 85.03/70.71
seqBinaryEnc 89.88/85.14 82.18/77.96 82.88/79.24 81.47/76.67 92.2/81.7 87.16/78.12 89.71/75.29 84.61/80.96
seqPSSM+predStr 89.82/82.79 82.35/75.22 84.41/76.89 80.28/73.54 91.13/76.7 85.16/72.78 87.49/73.33 82.83/72.22
seqBinaryEnc+predStr 90.09/84.15 82.12/77.21 82.58/76.36 81.66/78.06 91.6/81.29 86.28/76.5 88.71/77 83.85/76
seqPSSM+realStr 87.88/78.21 85.14/75.74 86.67/80.95 83.61/70.52 X X X X
seqBinaryEnc+realStr 89.13/79.41 86.78/78.02 83.33/79.52 85.22/76.51 X X X X
Heart seqPSSM 92.98/74.71 86.22/70.67 89.18/71.53 83.25/69.81 91.69/69.14 88.99/65.02 95/66 82.98/64.03
seqBinaryEnc 93.2/78.62 86.39/73.64 88.06/71.66 84.72/75.61 93.63/70.34 91.05/72.39 95/74.33 87.1/70.45
seqPSSM+predStr 92.66/76.43 86.1/71.51 88.05/71.53 84.15/71.5 91.05/69.55 89.27/64.09 95/62.33 83.55/65.85
seqBinaryEnc+predStr 92.77/77.16 86.2/73.02 88.07/72.54 84.33/73.5 92.33/69.11 90.46/68.41 95/74.33 85.92/62.49
seqPSSM+realStr 85.7/83.88 84.98/84.07 88.33/85 81.63/83.15 X X X X
seqBinaryEnc+realStr 85.86/83.89 86.54/84.24 85.83/85 87.25/83.48 X X X X
Intestine seqPSSM 91.13/83.67 84.31/77.9 85.23/77.04 83.39/78.76 91.39/74.28 87.41/72.24 91/75.18 83.82/69.29
seqBinaryEnc 91.58/85.42 83.98/78.74 84.73/79.33 83.24/78.16 90.93/74.88 87.11/72.52 94.18/70.82 80.04/74.22
seqPSSM+predStr 91.22/83.08 84.49/76.44 85.33/76.62 83.66/76.26 90.93/76.7 86.52/75.86 91/79.09 82.04/72.64
seqBinaryEnc+predStr 91.5/84.44 84.72/78.22 84.31/78.47 85.14/77.97 91.89/76.35 89.46/73.3 95/74.82 83.93/71.79
seqPSSM+realStr 94.54/84.18 91.71/82.11 96/86 87.41/78.22 X X X X
seqBinaryEnc+realStr 93.9/83 90.89/81.88 94/84 87.79/79.75 X X X X
Kidney seqPSSM 91.45/84.63 84.12/78.12 84.6/77.35 83.63/78.88 92.92/75.09 90.51/75.05 95/78.93 86.02/71.18
seqBinaryEnc 92.15/85.45 85.56/78.94 88.12/77.8 82.98/80.08 94.67/80.42 90.81/78.19 92.14/76.61 89.48/79.76
seqPSSM+predStr 91.66/84.02 84.7/76.52 85/76.45 84.4/76.59 93.58/76.55 91.48/74.32 96.25/76.79 86.7/71.86
seqBinaryEnc+predStr 91.84/84.04 85.17/77.71 87.09/76.64 83.24/78.78 94.19/81.4 90.97/78.03 92.32/84.29 89.62/71.78
seqPSSM+realStr 92.93/89.17 91.7/86.82 96/85.5 87.41/88.15 X X X X
seqBinaryEnc+realStr 93.99/89.35 94.12/87.07 100/85.5 88.24/87.07 X X X X
Liver seqPSSM 91.16/80.45 83.73/73.81 84.34/76.45 83.12/71.18 93.21/70.92 90.79/69.44 94.18/70.55 87.4/68.33
seqBinaryEnc 91.21/83.04 84.29/76.38 84.5/78.05 84.08/74.71 93.67/76.03 90.64/75.13 94.36/74.36 86.91/76
seqPSSM+predStr 91.24/80.79 84.17/74.26 84.61/72.76 83.73/75.76 91.97/73.87 88.56/74.35 91.36/79.27 85.75/69.43
seqBinaryEnc+predStr 91.28/81.85 83.57/76.16 83.84/74.77 83.3/77.56 92.2/77.28 89.26/75.82 91.64/74.64 86.87/77
seqPSSM+realStr 90.75/77.48 87.08/78.17 90.18/83.57 83.99/72.77 X X X X
seqBinaryEnc+realStr 90.15/78.4 86.23/79.16 88.93/83.57 83.53/74.75 X X X X
Lung seqPSSM 89.95/81.53 82.73/74.72 81.87/73.94 83.59/75.5 90.22/72.54 84.15/70.69 86.92/71.17 81.39/70.2
seqBinaryEnc 90.93/85.52 83.8/77.85 84.33/78.37 83.27/77.33 90.77/78.28 85.01/76.23 87.67/71.25 82.36/81.21
seqPSSM+predStr 90.04/82.39 83.24/75.15 85.41/76.22 81.07/74.08 90.03/74.13 85.23/71.45 86.92/73.75 83.54/69.15
seqBinaryEnc+predStr 90.72/84.52 83.59/77.46 83.93/76.88 83.25/78.04 90.98/79 85.72/73.65 89.46/76.42 81.98/70.87
seqPSSM+realStr 92.73/85.44 90.47/86.11 94.33/89 86.61/83.23 X X X X
seqBinaryEnc+realStr 93.27/86.68 91.34/86.53 94.33/87 88.35/86.06 X X X X
Muscle seqPSSM 92.89/72.22 86.33/67.93 87.17/70.38 85.49/65.49 88.28/68.03 83.9/66.67 87.27/60.99 80.53/72.42
seqBinaryEnc 92.97/74.47 86.3/70.43 89.39/67.88 83.2/72.98 85.57/66.47 79.48/65.68 85.83/67.5 73.14/63.86
seqPSSM+predStr 92.59/74.85 86.02/69.77 87.91/70.36 84.14/69.17 87.39/68.04 82.63/67.43 88.18/64.55 77.08/70.32
seqBinaryEnc+predStr 93.21/76.97 86.33/72.47 87.53/74.14 85.14/70.8 86.91/74.21 82.92/71 90/72.5 75.83/69.5
seqPSSM+realStr 84.22/79.92 82.25/81.31 83.1/84.76 81.4/77.85 X X X X
[ July 10, 2016 at 22:13 – classicthesis version 4.2 ]
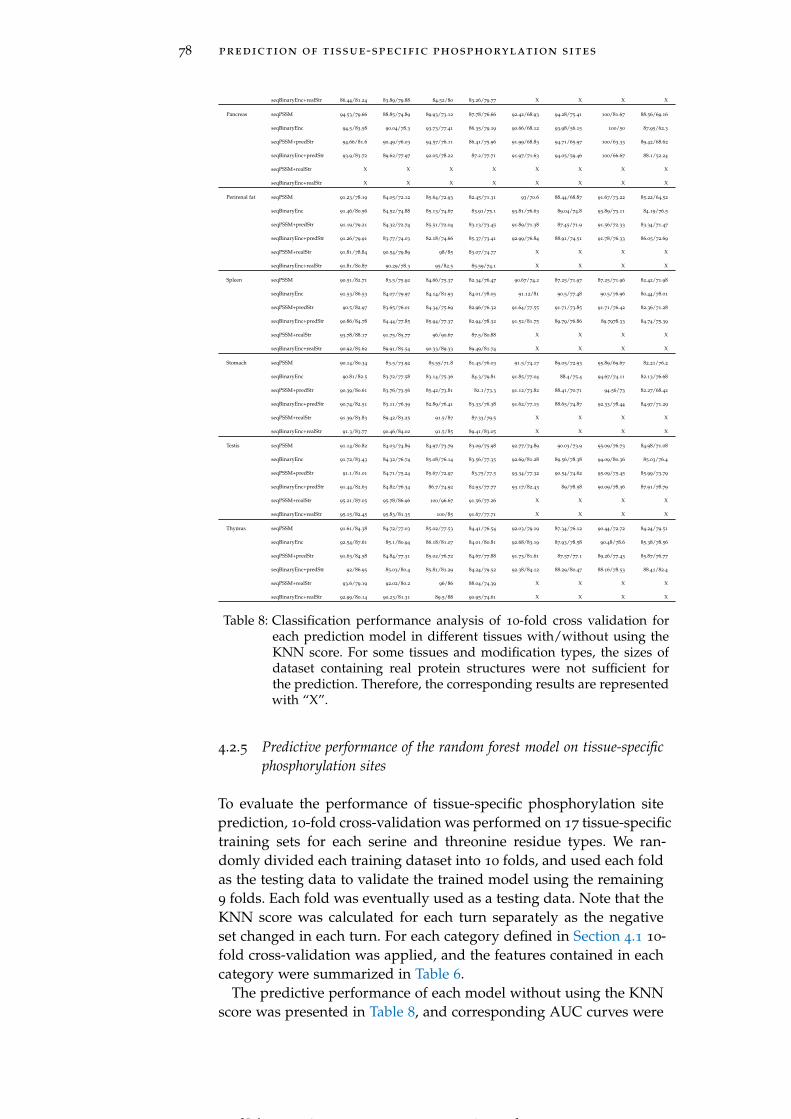
78 prediction of tissue-specific phosphorylation sites
seqBinaryEnc+realStr 86.44/81.24 83.89/79.88 84.52/80 83.26/79.77 X X X X
Pancreas seqPSSM 94.53/79.66 88.85/74.89 89.93/73.12 87.78/76.66 92.42/68.93 94.28/75.41 100/81.67 88.56/69.16
seqBinaryEnc 94.5/83.58 90.04/78.3 93.73/77.41 86.35/79.19 90.66/68.12 93.98/56.15 100/50 87.95/62.3
seqPSSM+predStr 94.66/81.6 90.49/76.03 94.57/76.11 86.41/75.96 91.99/68.83 94.71/65.97 100/63.33 89.42/68.62
seqBinaryEnc+predStr 93.9/83.72 89.62/77.97 92.05/78.22 87.2/77.71 91.97/71.63 94.05/59.46 100/66.67 88.1/52.24
seqPSSM+realStr X X X X X X X X
seqBinaryEnc+realStr X X X X X X X X
Perirenal fat seqPSSM 91.23/78.19 84.05/72.12 85.64/72.93 82.45/71.31 93/70.6 88.44/68.87 91.67/73.22 85.22/64.52
seqBinaryEnc 91.46/80.56 84.52/74.88 85.13/74.67 83.91/75.1 93.81/76.63 89.04/74.8 93.89/73.11 84.19/76.5
seqPSSM+predStr 91.19/79.21 84.32/72.74 85.51/72.04 83.13/73.45 91.89/71.38 87.45/71.9 91.56/72.33 83.34/71.47
seqBinaryEnc+predStr 91.26/79.91 83.77/74.03 82.18/74.66 85.37/73.41 92.99/76.84 88.91/74.51 91.78/76.33 86.05/72.69
seqPSSM+realStr 91.81/78.84 90.54/79.89 98/85 83.07/74.77 X X X X
seqBinaryEnc+realStr 91.81/80.87 90.29/78.3 95/82.5 85.59/74.1 X X X X
Spleen seqPSSM 90.51/82.71 83.5/75.92 84.66/75.37 82.34/76.47 90.67/74.2 87.25/71.97 87.25/71.96 82.42/71.98
seqBinaryEnc 91.53/86.53 84.07/79.97 84.14/81.93 84.01/78.05 91.12/81 90.5/77.48 90.5/76.96 80.44/78.01
seqPSSM+predStr 90.5/82.97 83.65/76.01 84.34/75.69 82.96/76.32 91.64/77.55 91.71/73.85 91.71/76.42 82.36/71.28
seqBinaryEnc+predStr 90.86/84.78 84.44/77.85 85.94/77.37 82.94/78.32 91.52/81.75 89.79/76.86 89.7978.33 84.74/75.39
seqPSSM+realStr 93.78/88.17 91.75/85.77 96/90.67 87.5/80.88 X X X X
seqBinaryEnc+realStr 90.92/85.62 89.91/85.54 90.33/89.33 89.49/81.74 X X X X
Stomach seqPSSM 90.14/80.34 83.5/73.92 85.55/71.8 81.45/76.03 91.5/74.17 89.05/72.93 95.89/69.67 82.21/76.2
seqBinaryEnc 90.81/82.5 83.72/77.58 83.14/75.36 84.3/79.81 91.85/77.04 88.4/75.4 94.67/74.11 82.13/76.68
seqPSSM+predStr 90.39/80.61 83.76/73.56 85.42/73.81 82.1/73.3 91.12/73.82 88.41/70.71 94.56/73 82.27/68.42
seqBinaryEnc+predStr 90.74/82.51 83.11/76.39 82.89/76.41 83.33/76.38 91.62/77.15 88.65/74.87 92.33/78.44 84.97/71.29
seqPSSM+realStr 91.39/83.83 89.42/83.25 91.5/87 87.33/79.5 X X X X
seqBinaryEnc+realStr 91.3/83.77 90.46/84.02 91.5/85 89.41/83.05 X X X X
Testis seqPSSM 91.14/80.82 84.03/74.89 84.97/73.79 83.09/75.98 92.77/74.89 90.03/73.9 95.09/76.73 84.98/71.08
seqBinaryEnc 91.72/83.43 84.32/76.74 85.08/76.14 83.56/77.35 92.69/81.28 89.56/78.38 94.09/80.36 85.03/76.4
seqPSSM+predStr 91.1/81.01 84.71/75.24 85.67/72.97 83.75/77.5 93.34/77.32 90.54/74.62 95.09/75.45 85.99/73.79
seqBinaryEnc+predStr 91.44/82.63 84.82/76.34 86.7/74.92 82.93/77.77 93.17/82.43 89/78.58 90.09/78.36 87.91/78.79
seqPSSM+realStr 95.21/87.05 95.78/86.96 100/96.67 91.56/77.26 X X X X
seqBinaryEnc+realStr 95.15/82.45 95.83/81.35 100/85 91.67/77.71 X X X X
Thymus seqPSSM 91.61/84.38 84.72/77.03 85.02/77.53 84.41/76.54 92.03/79.19 87.34/76.12 90.44/72.72 84.24/79.51
seqBinaryEnc 92.54/87.61 85.1/80.94 86.18/81.07 84.01/80.81 92.68/83.19 87.93/78.58 90.48/78.6 85.38/78.56
seqPSSM+predStr 91.63/84.58 84.84/77.31 85.02/76.72 84.67/77.88 91.73/81.61 87.57/77.1 89.26/77.43 85.87/76.77
seqBinaryEnc+predStr 92/86.95 85.03/80.4 85.81/81.29 84.24/79.52 92.38/84.12 88.29/80.47 88.16/78.53 88.41/82.4
seqPSSM+realStr 93.6/79.19 92.02/80.2 96/86 88.04/74.39 X X X X
seqBinaryEnc+realStr 92.99/80.14 90.23/81.31 89.5/88 90.95/74.61 X X X X
Table 8: Classification performance analysis of 10-fold cross validation foreach prediction model in different tissues with/without using theKNN score. For some tissues and modification types, the sizes ofdataset containing real protein structures were not sufficient forthe prediction. Therefore, the corresponding results are representedwith “X”.
4.2.5 Predictive performance of the random forest model on tissue-specificphosphorylation sites
To evaluate the performance of tissue-specific phosphorylation siteprediction, 10-fold cross-validation was performed on 17 tissue-specifictraining sets for each serine and threonine residue types. We ran-domly divided each training dataset into 10 folds, and used each foldas the testing data to validate the trained model using the remaining9 folds. Each fold was eventually used as a testing data. Note that theKNN score was calculated for each turn separately as the negativeset changed in each turn. For each category defined in Section 4.1 10-fold cross-validation was applied, and the features contained in eachcategory were summarized in Table 6.
The predictive performance of each model without using the KNNscore was presented in Table 8, and corresponding AUC curves were
[ July 10, 2016 at 22:13 – classicthesis version 4.2 ]
4.2 results and discussions 79
plotted in Figure 20 and Figure 24 for serine and threonine residues,respectively. The prediction models for serine phosphorylation sitesin all tissues concluded with considerably high performance – AUCscores ranging from 72.22 to 89.35, whereas prediction models forthreonine phosphorylation sites yielded comparably high performanceresulting in AUCs scores between 66.47 and 84.12. The findings showthat the PSSM encoding, and binary encoding have the greatest im-pact on prediction performance. It is noteworthy to state here that weapplied a very stringent sequence redundancy cut-off. In all tissuesthe binary encoding yielded a slightly higher performance than thePSSM encoding (AUCs of 0.822 and 0.851 for the PSSM encoding, andthe binary encoding, respectively for serine phosphorylation sites incortex). Incorporating the predicted structures and functional annota-tions along with the PSSM or binary encoding almost never improvedthe prediction performance except for muscle and blood. The modelnamed as seqBinary+predStr has the highest AUCs of 0.814 and 0.77
for serine phosphorylation sites in blood and muscle, respectively.The features, in particular accessibility scores and secondary struc-tures of phosphorylation sites and the residues surrounding them,had higher variable importance along with the PSSM or binary en-coding scheme in prediction models. The models for phosphorylatedserine residues using experimental protein structures along with thePSSM or binary encoding scheme, on the other hand, resulted in thehighest performance in some tissues including perirenal fat, muscle,blood, heart, kidney, spleen and stomach. The feature spatial prob-ability score contained in the categories seqPSSM+realStr and seqBi-nary+realStr outperformed among the other features, and leaded to abetter prediction performance by having the highest variable impor-tance in prediction models. These findings pointed out that predictedstructures do not have the distinguishing power in tissue-specificphosphorylation site prediction as much as experimantal structuresdo.
With the addition of KNN score on top of six categories, a muchlarger increase in AUC scores was obtained for almost all predictionmodels in all tissues (See Table 8) – for serine phosphorylation sitesranging from 84.22 to 95.21 (See Figure 22), whereas for threoninephosphorylation sites ranging from 85.57 to 94.67 (See Figure 26). Inparticular, the prediction models for serine phosphorylation sites inblood and pancreas achieved very high performance, AUCs of 92.82
and 94.66, respectively even though the percentage of k nearest neigh-bors in those tissues was set to only 1% of the training dataset. Thisshows that the KNN score is a valuable feature in tissue-specific phos-phorylation site prediction, but choosing the non-optimal k valuewould result in highly biased predictions. Our observations haveshown that a very stringent sequence redundancy elimination is re-quired prior to the KNN score calculation, and if the positive set tonegative set size ratio is rather than 1:1, the k value becomes so sensi-tive to the size of dataset, and finding the optimal k value gets priorimportance.
[ July 10, 2016 at 22:13 – classicthesis version 4.2 ]
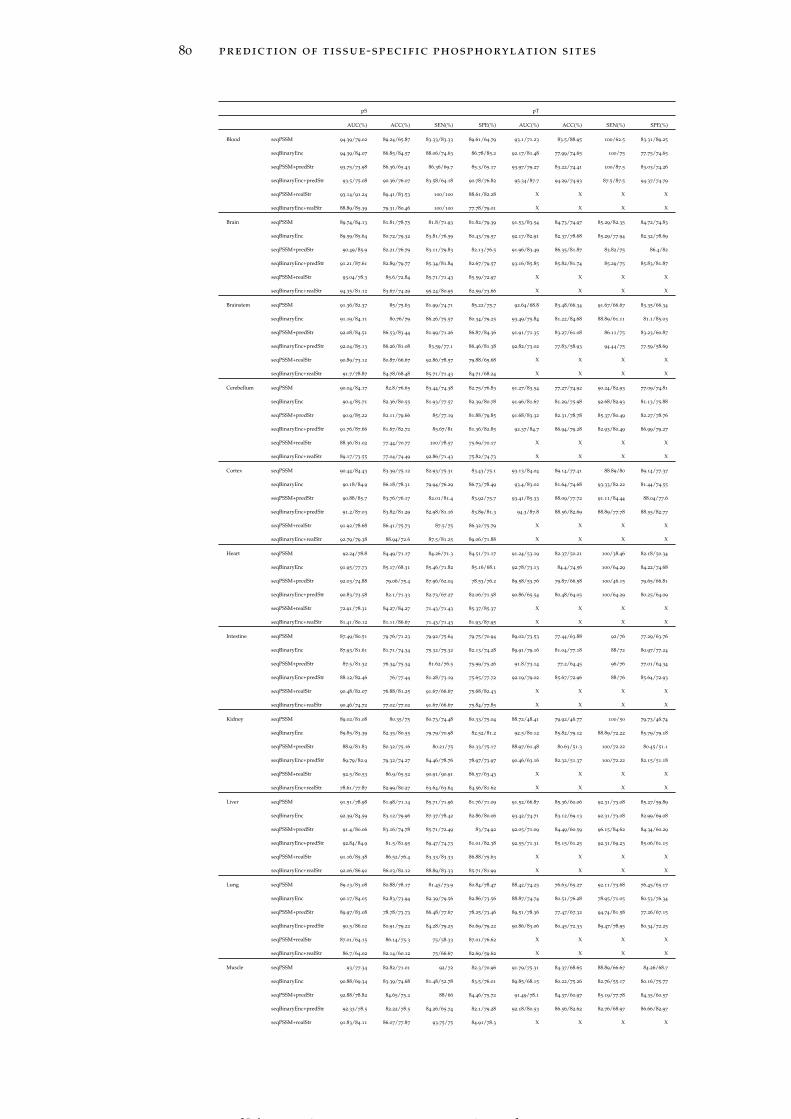
80 prediction of tissue-specific phosphorylation sites
pS pT
AUC(%) ACC(%) SEN(%) SPE(%) AUC(%) ACC(%) SEN(%) SPE(%)
Blood seqPSSM 94.39/79.02 89.24/65.87 83.33/83.33 89.61/64.79 93.1/71.23 83.5/88.95 100/62.5 83.31/89.25
seqBinaryEnc 94.39/84.07 86.85/84.57 88.06/74.63 86.78/85.2 92.17/81.48 77.99/74.65 100/75 77.75/74.65
seqPSSM+predStr 93.75/73.98 86.36/65.43 86.36/69.7 85.3/65.17 93.97/79.27 83.22/74.41 100/87.5 83.03/74.26
seqBinaryEnc+predStr 93.5/75.08 90.36/76.07 83.58/64.18 90.78/76.82 95.34/87.7 94.29/74.93 87.5/87.5 94.37/74.79
seqPSSM+realStr 93.14/91.24 89.41/83.53 100/100 88.61/82.28 X X X X
seqBinaryEnc+realStr 88.89/85.39 79.31/80.46 100/100 77.78/79.01 X X X X
Brain seqPSSM 89.74/84.13 81.81/78.75 81.8/71.93 81.82/79.39 91.53/83.54 84.73/74.97 85.29/82.35 84.72/74.83
seqBinaryEnc 89.59/85.64 80.72/79.32 83.81/76.59 80.43/79.57 92.17/82.91 82.37/78.68 85.29/77.94 82.32/78.69
seqPSSM+predStr 90.49/85.9 82.21/76.79 83.11/79.83 82.13/76.5 91.96/83.49 86.35/81.87 83.82/75 86.4/82
seqBinaryEnc+predStr 91.21/87.61 82.89/79.77 85.34/81.84 82.67/79.57 93.16/85.85 85.82/81.74 85.29/75 85.83/81.87
seqPSSM+realStr 93.04/78.3 85.6/72.84 85.71/71.43 85.59/72.97 X X X X
seqBinaryEnc+realStr 94.35/81.12 83.67/74.29 95.24/80.95 82.59/73.66 X X X X
Brainstem seqPSSM 91.36/82.37 85/75.63 81.99/74.71 85.22/75.7 92.64/68.8 83.48/66.34 91.67/66.67 83.35/66.34
seqBinaryEnc 91.19/84.11 80.76/79 86.26/75.57 80.34/79.25 93.49/75.84 81.22/84.68 88.89/61.11 81.1/85.03
seqPSSM+predStr 92.08/84.51 86.53/83.44 81.99/71.26 86.87/84.36 91.91/71.35 83.27/61.08 86.11/75 83.23/60.87
seqBinaryEnc+predStr 92.04/85.13 86.26/81.08 83.59/77.1 86.46/81.38 92.82/73.02 77.83/58.93 94.44/75 77.59/58.69
seqPSSM+realStr 90.89/73.12 80.87/66.67 92.86/78.57 79.88/65.68 X X X X
seqBinaryEnc+realStr 91.7/78.87 84.78/68.48 85.71/71.43 84.71/68.24 X X X X
Cerebellum seqPSSM 90.04/84.17 82.8/76.65 83.44/74.38 82.75/76.83 91.27/83.54 77.27/74.92 90.24/82.93 77.09/74.81
seqBinaryEnc 90.4/85.71 82.36/80.55 81.93/77.57 82.39/80.78 91.96/81.67 81.29/75.98 92.68/82.93 81.13/75.88
seqPSSM+predStr 90.9/85.22 82.11/79.66 85/77.19 81.88/79.85 91.68/83.32 82.31/78.78 85.37/80.49 82.27/78.76
seqBinaryEnc+predStr 91.76/87.66 81.67/82.72 85.67/81 81.36/82.85 92.37/84.7 86.94/79.28 82.93/80.49 86.99/79.27
seqPSSM+realStr 88.36/81.02 77.44/70.77 100/78.57 75.69/70.17 X X X X
seqBinaryEnc+realStr 89.17/73.55 77.04/74.49 92.86/71.43 75.82/74.73 X X X X
Cortex seqPSSM 90.44/84.43 83.39/75.12 82.93/75.31 83.43/75.1 93.13/84.04 89.14/77.41 88.89/80 89.14/77.37
seqBinaryEnc 90.18/84.9 86.18/78.31 79.94/76.29 86.73/78.49 93.4/83.02 81.64/74.68 93.33/82.22 81.44/74.55
seqPSSM+predStr 90.88/85.7 83.76/76.17 82.01/81.4 83.92/75.7 93.41/85.33 88.09/77.72 91.11/84.44 88.04/77.6
seqBinaryEnc+predStr 91.2/87.03 83.82/81.29 82.98/81.16 83.89/81.3 94.3/87.8 88.56/82.69 88.89/77.78 88.55/82.77
seqPSSM+realStr 91.92/78.68 86.41/75.73 87.5/75 86.32/75.79 X X X X
seqBinaryEnc+realStr 92.79/79.38 88.94/72.6 87.5/81.25 89.06/71.88 X X X X
Heart seqPSSM 92.24/78.8 84.49/71.17 84.26/71.3 84.51/71.17 91.24/53.19 82.37/50.21 100/38.46 82.18/50.34
seqBinaryEnc 91.95/77.73 85.17/68.31 85.46/71.82 85.16/68.1 92.78/73.13 84.4/74.56 100/64.29 84.22/74.68
seqPSSM+predStr 92.03/74.88 79.06/75.4 87.96/62.04 78.53/76.2 89.58/53.76 79.87/66.58 100/46.15 79.65/66.81
seqBinaryEnc+predStr 90.83/73.58 82.1/71.33 82.73/67.27 82.06/71.58 90.86/65.54 80.48/64.05 100/64.29 80.25/64.09
seqPSSM+realStr 72.91/78.31 84.27/84.27 71.43/71.43 85.37/85.37 X X X X
seqBinaryEnc+realStr 81.41/80.12 81.11/86.67 71.43/71.43 81.93/87.95 X X X X
Intestine seqPSSM 87.49/80.51 79.76/71.23 79.92/75.64 79.75/70.94 89.02/73.53 77.44/63.88 92/76 77.29/63.76
seqBinaryEnc 87.93/81.61 81.71/74.34 75.32/75.32 82.13/74.28 89.91/79.16 81.04/77.18 88/72 80.97/77.24
seqPSSM+predStr 87.5/81.32 76.34/75.34 81.62/76.5 75.99/75.26 91.8/73.14 77.2/64.45 96/76 77.01/64.34
seqBinaryEnc+predStr 88.12/82.46 76/77.44 81.28/73.19 75.65/77.72 92.19/79.02 85.67/72.96 88/76 85.64/72.93
seqPSSM+realStr 90.48/82.07 76.88/81.25 91.67/66.67 75.68/82.43 X X X X
seqBinaryEnc+realStr 90.46/74.72 77.02/77.02 91.67/66.67 75.84/77.85 X X X X
Kidney seqPSSM 89.02/81.08 80.35/75 80.73/74.48 80.33/75.04 88.72/48.41 79.92/46.77 100/50 79.73/46.74
seqBinaryEnc 89.85/83.39 82.35/80.55 79.79/70.98 82.52/81.2 92.5/80.12 85.82/79.12 88.89/72.22 85.79/79.18
seqPSSM+predStr 88.9/81.83 80.32/75.16 80.21/75 80.33/75.17 88.97/61.48 80.63/51.3 100/72.22 80.45/51.1
seqBinaryEnc+predStr 89.79/82.9 79.32/74.27 84.46/78.76 78.97/73.97 90.46/63.16 82.32/51.37 100/72.22 82.15/51.18
seqPSSM+realStr 92.5/80.53 86.9/65.52 90.91/90.91 86.57/63.43 X X X X
seqBinaryEnc+realStr 78.61/77.87 82.99/80.27 63.64/63.64 84.56/81.62 X X X X
Liver seqPSSM 91.51/78.98 81.98/71.14 85.71/71.96 81.76/71.09 91.52/66.87 85.36/60.06 92.31/73.08 85.27/59.89
seqBinaryEnc 92.39/84.59 83.12/79.96 87.37/78.42 82.86/80.06 93.42/74.71 83.12/69.13 92.31/73.08 82.99/69.08
seqPSSM+predStr 91.4/80.06 83.16/74.78 85.71/72.49 83/74.92 92.05/71.09 84.49/60.59 96.15/84.62 84.34/60.29
seqBinaryEnc+predStr 92.84/84.9 81.5/81.95 89.47/74.73 81.01/82.38 92.55/71.31 85.15/61.25 92.31/69.23 85.06/61.15
seqPSSM+realStr 91.16/85.38 86.52/76.4 83.33/83.33 86.88/75.63 X X X X
seqBinaryEnc+realStr 92.06/86.92 86.03/82.12 88.89/83.33 85.71/81.99 X X X X
Lung seqPSSM 89.13/83.08 80.88/78.17 81.45/73.9 80.84/78.47 88.42/74.25 76.63/65.27 92.11/73.68 76.45/65.17
seqBinaryEnc 90.17/84.05 82.83/73.94 82.39/79.56 82.86/73.56 88.87/74.74 80.51/76.28 78.95/71.05 80.53/76.34
seqPSSM+predStr 89.97/83.08 78.78/73.73 86.48/77.67 78.25/73.46 89.51/78.36 77.47/67.32 94.74/81.58 77.26/67.15
seqBinaryEnc+predStr 90.5/86.02 80.91/79.22 84.28/79.25 80.69/79.22 90.86/83.06 80.45/72.33 89.47/78.95 80.34/72.25
seqPSSM+realStr 87.01/64.15 86.14/75.3 75/58.33 87.01/76.62 X X X X
seqBinaryEnc+realStr 86.7/64.02 82.14/60.12 75/66.67 82.69/59.62 X X X X
Muscle seqPSSM 93/77.34 82.82/71.01 92/72 82.3/70.96 91.79/75.31 84.37/68.65 88.89/66.67 84.26/68.7
seqBinaryEnc 90.88/69.34 83.39/74.68 81.48/52.78 83.5/76.01 89.85/68.15 80.22/75.26 82.76/55.17 80.16/75.77
seqPSSM+predStr 92.88/78.82 84.65/75.2 88/66 84.46/75.72 91.49/78.1 84.37/60.97 85.19/77.78 84.35/60.57
seqBinaryEnc+predStr 92.33/78.5 82.22/78.5 84.26/65.74 82.1/79.28 92.18/80.53 86.56/82.62 82.76/68.97 86.66/82.97
seqPSSM+realStr 91.83/84.11 86.07/77.87 93.75/75 84.91/78.3 X X X X
[ July 10, 2016 at 22:13 – classicthesis version 4.2 ]
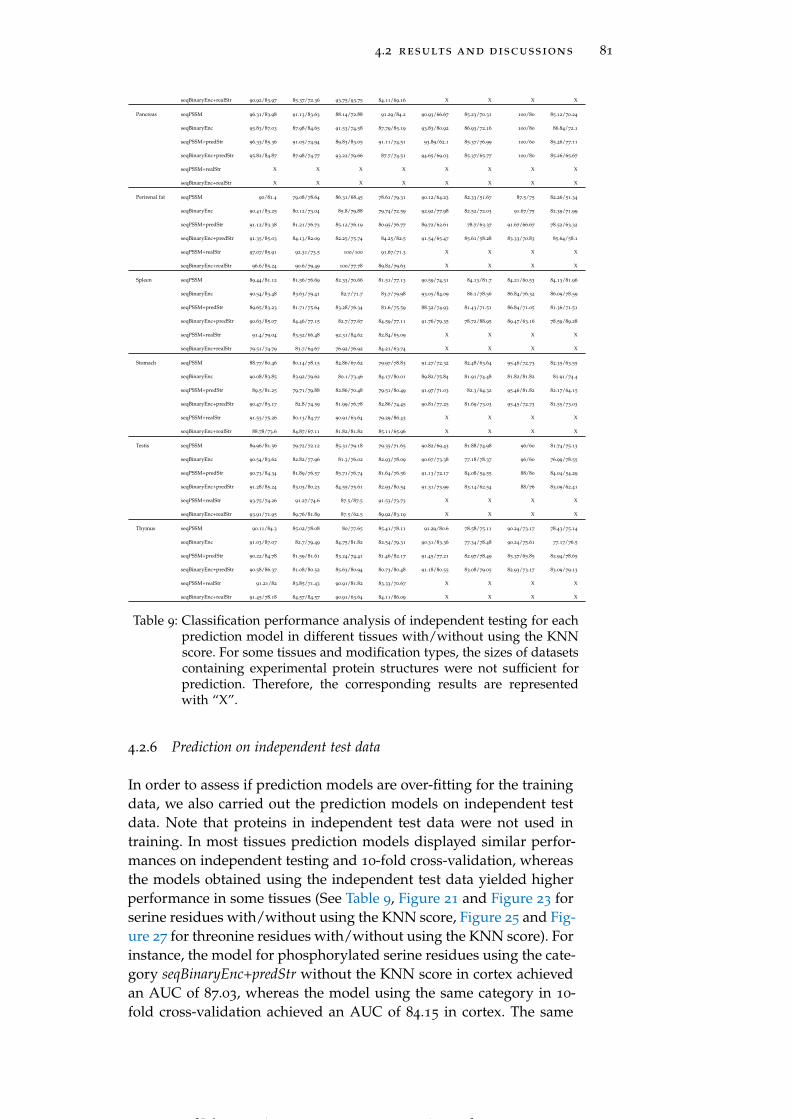
4.2 results and discussions 81
seqBinaryEnc+realStr 90.92/83.97 85.37/72.36 93.75/93.75 84.11/69.16 X X X X
Pancreas seqPSSM 96.31/83.98 91.13/83.63 88.14/72.88 91.29/84.2 90.93/66.67 85.23/70.31 100/80 85.12/70.24
seqBinaryEnc 95.83/87.03 87.98/84.65 91.53/74.58 87.79/85.19 93.83/80.92 86.93/72.16 100/80 86.84/72.1
seqPSSM+predStr 96.33/85.36 91.05/74.94 89.83/83.05 91.11/74.51 93.89/62.1 85.37/76.99 100/60 85.26/77.11
seqBinaryEnc+predStr 95.82/84.87 87.98/74.77 93.22/79.66 87.7/74.51 94.65/69.03 85.37/65.77 100/80 85.26/65.67
seqPSSM+realStr X X X X X X X X
seqBinaryEnc+realStr X X X X X X X X
Perirenal fat seqPSSM 90/81.4 79.08/78.64 86.31/68.45 78.61/79.31 90.12/64.23 82.33/51.67 87.5/75 82.26/51.34
seqBinaryEnc 90.41/83.25 80.12/73.04 85.8/79.88 79.74/72.59 92.92/77.98 82.52/72.03 91.67/75 82.39/71.99
seqPSSM+predStr 91.12/83.38 81.21/76.73 85.12/76.19 80.95/76.77 89.72/62.61 78.7/63.37 91.67/66.67 78.52/63.32
seqBinaryEnc+predStr 91.35/85.03 84.13/82.09 82.25/75.74 84.25/82.5 91.54/65.47 85.61/58.28 83.33/70.83 85.64/58.1
seqPSSM+realStr 97.07/85.91 92.31/73.5 100/100 91.67/71.3 X X X X
seqBinaryEnc+realStr 96.6/85.24 90.6/79.49 100/77.78 89.82/79.63 X X X X
Spleen seqPSSM 89.44/81.12 81.56/76.69 82.33/70.66 81.51/77.13 90.59/74.31 84.13/81.7 84.21/60.53 84.13/81.96
seqBinaryEnc 90.54/83.48 83.63/79.41 82.7/71.7 83.7/79.98 93.05/84.09 86.1/78.56 86.84/76.32 86.09/78.59
seqPSSM+predStr 89.65/83.23 81.71/75.64 83.28/76.34 81.6/75.59 88.32/74.93 81.43/71.51 86.84/71.05 81.36/71.51
seqBinaryEnc+predStr 90.63/85.07 84.46/77.15 82.7/77.67 84.59/77.11 91.76/79.35 78.72/88.95 89.47/63.16 78.59/89.28
seqPSSM+realStr 91.4/79.04 83.52/66.48 92.31/84.62 82.84/65.09 X X X X
seqBinaryEnc+realStr 79.51/74.79 83.7/64.67 76.92/76.92 84.21/63.74 X X X X
Stomach seqPSSM 88.77/80.46 80.14/78.15 82.86/67.62 79.97/78.83 91.27/72.32 82.48/63.64 95.46/72.73 82.35/63.55
seqBinaryEnc 90.08/83.85 83.92/79.62 80.1/73.46 84.17/80.01 89.82/75.84 81.91/74.48 81.82/81.82 81.91/74.4
seqPSSM+predStr 89.5/81.25 79.71/79.88 82.86/70.48 79.51/80.49 91.97/71.03 82.3/64.32 95.46/81.82 82.17/64.15
seqBinaryEnc+predStr 90.47/83.17 82.8/74.59 81.99/76.78 82.86/74.45 90.81/77.25 81.69/73.03 95.45/72.73 81.55/73.03
seqPSSM+realStr 91.53/75.26 80.13/84.77 90.91/63.64 79.29/86.43 X X X X
seqBinaryEnc+realStr 88.78/73.6 84.87/67.11 81.82/81.82 85.11/65.96 X X X X
Testis seqPSSM 89.96/81.56 79.72/72.12 85.31/79.18 79.35/71.65 90.82/69.43 81.88/74.98 96/60 81.74/75.13
seqBinaryEnc 90.54/83.62 82.82/77.96 81.3/76.02 82.93/78.09 90.67/73.38 77.18/78.37 96/60 76.99/78.55
seqPSSM+predStr 90.73/84.34 81.89/76.57 85.71/76.74 81.64/76.56 91.13/72.17 84.08/54.55 88/80 84.04/54.29
seqBinaryEnc+predStr 91.28/85.24 83.03/80.23 84.55/75.61 82.93/80.54 91.31/73.99 83.14/62.54 88/76 83.09/62.41
seqPSSM+realStr 93.75/74.26 91.27/74.6 87.5/87.5 91.53/73.73 X X X X
seqBinaryEnc+realStr 93.91/71.95 89.76/81.89 87.5/62.5 89.92/83.19 X X X X
Thymus seqPSSM 90.11/84.3 85.02/78.08 80/77.65 85.41/78.11 91.29/80.6 78.58/75.11 90.24/73.17 78.43/75.14
seqBinaryEnc 91.03/87.07 82.7/79.49 84.75/81.82 82.54/79.31 90.31/83.36 77.34/78.48 90.24/75.61 77.17/76.5
seqPSSM+predStr 90.22/84.78 81.59/81.61 83.24/74.41 81.46/82.17 91.45/77.21 82.97/78.49 85.37/65.85 82.94/78.65
seqBinaryEnc+predStr 90.58/86.37 81.08/80.52 85.63/80.94 80.73/80.48 91.18/80.55 83.08/79.05 82.93/73.17 83.09/79.13
seqPSSM+realStr 91.21/82 83.85/71.43 90.91/81.82 83.33/70.67 X X X X
seqBinaryEnc+realStr 91.45/78.18 84.57/84.57 90.91/63.64 84.11/86.09 X X X X
Table 9: Classification performance analysis of independent testing for eachprediction model in different tissues with/without using the KNNscore. For some tissues and modification types, the sizes of datasetscontaining experimental protein structures were not sufficient forprediction. Therefore, the corresponding results are representedwith “X”.
4.2.6 Prediction on independent test data
In order to assess if prediction models are over-fitting for the trainingdata, we also carried out the prediction models on independent testdata. Note that proteins in independent test data were not used intraining. In most tissues prediction models displayed similar perfor-mances on independent testing and 10-fold cross-validation, whereasthe models obtained using the independent test data yielded higherperformance in some tissues (See Table 9, Figure 21 and Figure 23 forserine residues with/without using the KNN score, Figure 25 and Fig-ure 27 for threonine residues with/without using the KNN score). Forinstance, the model for phosphorylated serine residues using the cate-gory seqBinaryEnc+predStr without the KNN score in cortex achievedan AUC of 87.03, whereas the model using the same category in 10-fold cross-validation achieved an AUC of 84.15 in cortex. The same
[ July 10, 2016 at 22:13 – classicthesis version 4.2 ]
82 prediction of tissue-specific phosphorylation sites
category in liver also yielded a higher performance using indepen-dent test set (AUC of 84.9) rather than 10-fold cross-validation (AUCof 81.85). These findings imply that the prediction models are notover-fitting for the training data.
4.2.7 Cross-tissues performance evaluation on independent testing
In order to assess the uniqueness performance of each tissue-specificmodel, we performed cross-tissues prediction against 13 tissues. Theprediction was just conducted with the features defined in the seqBina-ryEnc category to reduce the computational time and the complexityof representation of results. The independent test data of each tissuewas created separately. We first split 70% of the sites in the PS1Ddataset for training, and the remaining 30% for the testing. As thereexist phosphorylation sites occurring in more than one tissue, notethat we avoided the cases where a phosphorylation site was used inboth training and testing. We subsequently conducted pairwise testsby assessing the prediction performance of independent test data ofall other 12 tissues on a trained model of a particular tissue. Theprimary models, in almost all tissues, performed the highest phos-phorylation site prediction performance on primary tissues as seenin Table 10 (based on AUCs). The performances did not vary substan-tially in non-primary tissues, because some phosphorylation sites areshared by more than one tissue, and as we do not have sufficienttissue-specific phosphorylation sites, we could not use mutually ex-clusive training sets of phosphorylation sites where each phosphory-lation site just occur in one tissue. In other words, although there isnot any overlap between training and testing sets, for instance train-ing and testing sets of brain and kidney, respectively, this does notmean that a phosphorylation site in brain cannot be phosphorylatedin kidney inherently, because the prediction model for brain was nottrained with phosphorylation sites occurring only in brain. Given thefact that mutually exclusive sets of phosphorylation sites were notused for training the models, these findings still show that more ac-curate phosphorylation site predictions can be obtained when tissue-specific sites are taken into account. This fact supports the importanceof tissue-specific phosphorylation site prediction.
4.2.8 Performance comparison with the existing prediction tools
We compared the performance of our prediction models in differenttissues to that of Musite on independent test dataset (Gao and Xu,2010). We used pre-trained M. Musculus prediction model of Musitewith default parameters since training model on rat is not available.Our method outperformed in all tissues when sensitivity score istaken into account, whereas Musite performed slightly better in termsof specificity (Table 8). Note that when calculating sensitivity scores,we only counted phosphorylated serine residues in a particular tissueas true positives. As we mentioned before, the existing tools present
[ July 10, 2016 at 22:13 – classicthesis version 4.2 ]
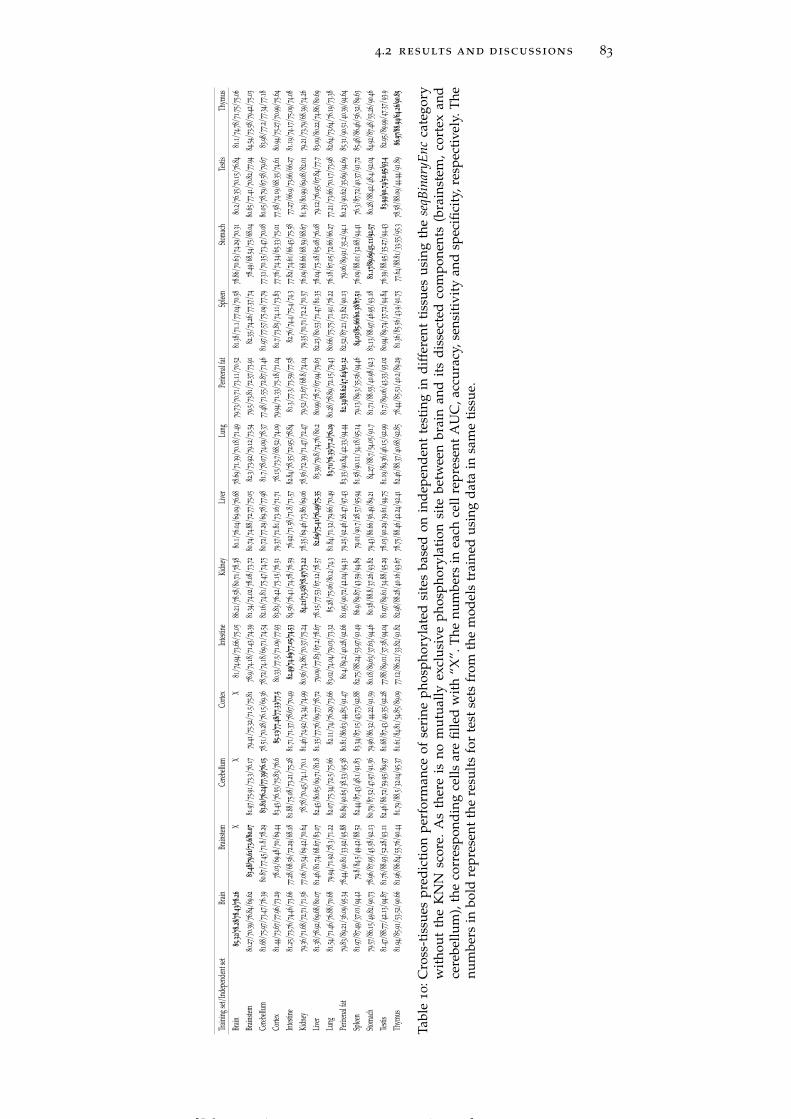
4.2 results and discussions 83
Traini
ngset
/Inde
pend
ents
etBr
ainBr
ainste
mCe
rebell
umCo
rtex
Intest
ineKi
dney
Liver
Lung
Perir
enal
fatSp
leen
Stoma
chTe
stis
Thym
us
Brain
85.32
/78.28
/78.43
/78.26
XX
X8
1/7
4.94
/73
.66/7
5.05
86.21
/78.58
/80
.71/7
8.38
80.1/
76.04
/69
.09/7
6.68
78.69
/71.39
/70
.18/7
1.49
79
.73/7
0.71
/73
.11/7
0.52
81.38
/71
.1/7
7.04
/70
.587
8.86
/70.63
/74
.29/7
0.31
80.2/
76.35
/70
.15/7
6.84
81.1/
74.78
/71
.75/7
5.06
Brain
stem
80
.27/7
0.39
/76
.84/6
9.62
83.48
/79.61
/73.6/
80.07
81.97
/75
.91/7
3.3/
76
.177
9.41
/75
.32/7
1.5/
75
.817
8.9/
74.18
/71
.43/7
4.39
81.34
/74.02
/78
.08/7
3.72
80.74
/74.88
/72
.77/7
5.05
82.3/
73.92
/79
.12/7
3.54
79.5/
73.81
/72
.37/7
3.91
82.35
/74
.26/7
7.37
/74
78.49
/68
.54/7
5/6
8.04
80.65
/77.41
/70
.82/7
7.94
84.54
/73.58
/79
.42/7
5.03
Cereb
ellum
81
.68/7
5.97
/73
.47/7
6.39
80.87
/77
.45/7
1.8/
78
.2983
.81/76
.24/77
.39/76
.157
8.51
/70.28
/76
.15/6
9.36
78.72
/74.18
/69
.71/7
4.54
82.16
/74.81
/75
.47/7
4.75
80.72
/77.29
/69
.78/7
7.98
81.7/
78.07
/74
.09/7
8.37
77.48
/71.55
/72
.87/7
1.46
81
.97/7
7.57
/75
.09/7
7.79
77.31
/70.35
/73
.47/7
0.08
80.05
/78.79
/67
.58/7
9.67
83.98
/77
.2/7
7.34
/77
.18Co
rtex
81
.44/7
3.67
/77
.96/7
3.29
78.03
/69
.48/7
0/6
9.44
83.45
/76
.55/7
5.83
/76.6
85.13
/77.48
/77.33
/77.5
80.33
/77
.5/7
1.09
/77
.938
3.83
/76.42
/75
.15/7
6.51
79.37
/71.81
/73
.16/7
1.71
78.15
/73
.7/6
8.52
/74
.097
9.94
/71.33
/75
.18/7
1.04
81.7/
73.85
/74
.11/7
3.83
77.76
/74.34
/65
.33/7
5.01
77
.58/7
4.19
/68
.35/7
4.61
80.94
/75.27
/70
.99/7
5.64
Intest
ine8
1.25
/73.76
/74
.46/7
3.66
77.28
/68.56
/72
.29/6
8.18
81.88
/75.08
/73
.21/7
5.28
81.71
/71.37
/78
.67/7
0.49
82.49
/74.69
/77.05
/74.53
84.56
/76.41
/74
.78/7
6.59
76.92
/71
.58/7
1.8/
71
.578
2.84
/78.35
/72
.95/7
8.84
81
.3/7
7.3/
73
.59/7
7.58
82
.76/7
4.4/
75.4/
74.3
77
.82/7
4.61
/66
.45/7
5.58
77.27
/66
.9/7
3.66
/66
.278
1.19
/74.17
/75
.09/7
4.08
Kidn
ey7
9.36
/71.68
/72
.71/7
1.56
77.06
/70.54
/69
.42/7
0.64
78
.78/7
0.45
/74.1/
70.1
81
.46/7
4.92
/74
.34/7
4.99
80.56
/74.86
/70
.37/7
5.24
84.21
/73.58
/78.97
/73.22
78.35
/69.46
/73
.86/6
9.06
78.56
/72.39
/71
.47/7
2.47
79
.52/7
3.67
/68
.8/7
4.04
79
.35/7
0.71
/72
.2/7
0.57
76.09
/68.66
/68
.59/6
8.67
81.39
/80.99
/69
.08/8
2.01
79.21
/73.79
/68
.39/7
4.26
Liver
81
.38/7
8.92
/69
.68/8
0.07
81.46
/81.74
/68
.67/8
3.07
82.45
/80
.65/6
9.71
/81.8
81
.35/7
7.76
/69
.77/7
8.72
79.09
/77
.83/6
7.2/
78
.677
8.15
/77.53
/67
.12/7
8.57
82.69
/75.41
/76.49
/75.35
83
.39/7
9.8/
74
.76/8
0.2
80
.99/7
8.7/
67
.94/7
9.63
82
.23/8
0.53
/71
.47/8
1.35
78.04
/75.18
/65
.08/7
6.08
79.12
/76
.95/6
7.84
/77.7
83
.09/8
0.22
/74
.86/8
0.69
Lung
81
.54/7
1.46
/76
.88/7
0.68
79.94
/71
.92/7
8.3/
71
.228
2.07
/75
.34/7
2.5/
75
.668
2.11
/74
/76
.29/7
3.66
83.02
/74.04
/79
.03/7
3.32
85
.28/7
5.06
/80.2/
74.3
81
.84/7
1.32
/79
.66/7
0.49
83.71
/76.35
/77.2/
76.29
80.28
/78.89
/72
.15/7
9.43
80
.66/7
5.75
/71
.91/7
6.22
76.18
/67.05
/72
.66/6
6.27
77.21
/73.66
/70
.17/7
3.98
82.64
/73.64
/76
.19/7
3.38
Perir
enal
fat7
9.83
/89.21
/36
.09/9
5.34
78.44
/90.81
/33
.92/9
5.88
80.89
/90.65
/38
.53/9
5.38
80.81
/86.63
/44
.85/9
1.47
80
.4/8
9.2/
40
.28/9
2.66
81.95
/90.72
/42
.04/9
4.31
79.25
/92.46
/26
.47/9
7.43
83.35
/90.84
/42
.33/9
4.44
82.34
/88.62
/47.64
/91.32
82.52
/87
.21/5
3.82
/90.13
79
.06/8
9.91
/35
.2/9
4.1
80
.23/9
0.62
/35
.69/9
4.69
85.31
/90
.51/4
0.39
/94.64
Splee
n8
1.97
/87
.49/3
7.01
/94
.427
9.8/
84
.5/4
9.42
/88.52
82
.44/8
7.43
/48.1/
91.83
83.34
/87
.15/4
3.73
/92.88
82.75
/88
.24/5
3.97
/91.49
86
.9/8
9.87
/43
.59/9
4.89
79
.01/9
0.7/
28
.57/9
5.94
81.58
/90
.11/3
4.18
/95.14
79
.13/8
9.3/
35
.56/9
4.46
84.03
/85.66
/60.38
/87.51
76.09
/88
.01/3
2.68
/94.41
76
.3/8
7.72
/40
.37/9
1.72
85.48
/86
.46/5
6.32
/89.63
Stoma
ch7
9.57
/86
.15/4
9.82
/90.73
78.96
/87
.95/4
5.58
/92.13
80.79
/87
.52/4
7.97
/91.56
79.96
/86
.32/4
4.22
/91.59
80.18
/89
.63/3
7.63
/94.46
80
.38/8
8.8/
37
.26/9
3.82
79.43
/86
.66/5
6.49
/89.21
84
.27/8
8.7/
54.05
/91
.78
1.71
/88
.55/4
0.98
/92
.38
3.13
/88
.97/4
6.95
/93.18
81.17
/89.69
/45.11
/92.57
80
.28/8
8.42
/48.4/
92.04
84.92
/87
.48/5
5.26
/90.46
Testi
s8
1.47
/88
.77/4
2.13
/94.87
81.76
/88
.93/5
2.28
/93.11
82.46
/86
.72/5
9.95
/89.97
81.68
/87
.43/4
9.35
/92.28
77.88
/89
.01/3
7.38
/94.04
81.97
/89
.61/3
4.88
/95.29
78.03
/90
.29/3
9.61
/94.75
81.19
/89
.36/4
6.15
/92.99
81
.7/8
9.06
/43
.33/9
3.02
80.94
/89
.74/3
7.72
/94.84
76
.39/8
8.95
/35
.27/9
4.43
83.94
/90.74
/50.95
/93.4
82
.95/8
9.99
/47.37
/93
.9Th
ymus
81.94
/85
.91/5
3.52
/90.66
81.96
/86
.84/5
5.76
/90.44
81
.79/8
8.5/
32
.04/9
5.37
81.61
/84
.81/5
4.85
/89.09
77.12
/86
.21/3
3.82
/91.82
82.98
/88
.28/4
0.16
/93.67
78.75
/88
.46/4
2.24
/92.41
82.46
/88
.37/4
0.68
/92.85
78
.44/8
5.51
/40.2/
89.29
81
.36/8
5.56
/43.9/
91.75
77
.64/8
8.81
/33.55
/95
.37
8.58
/88
.09/4
4.44
/91.89
86.97
/88.94
/64.26
/90.85
Tabl
e1
0:C
ross
-tis
sues
pred
icti
onpe
rfor
man
ceof
seri
neph
osph
oryl
ated
site
sba
sed
onin
depe
nden
tte
stin
gin
diff
eren
tti
ssue
sus
ing
the
seqB
inar
yEnc
cate
gory
wit
hout
the
KN
Nsc
ore.
As
ther
eis
nom
utua
llyex
clus
ive
phos
phor
ylat
ion
site
betw
een
brai
nan
dit
sdi
ssec
ted
com
pone
nts
(bra
inst
em,
cort
exan
dce
rebe
llum
),th
eco
rres
pond
ing
cells
are
fille
dw
ith
“X”.
The
num
bers
inea
chce
llre
pres
ent
AU
C,a
ccur
acy,
sens
itiv
ity
and
spec
ifici
ty,r
espe
ctiv
ely.
The
num
bers
inbo
ldre
pres
ent
the
resu
lts
for
test
sets
from
the
mod
els
trai
ned
usin
gda
tain
sam
eti
ssue
.
[ July 10, 2016 at 22:13 – classicthesis version 4.2 ]
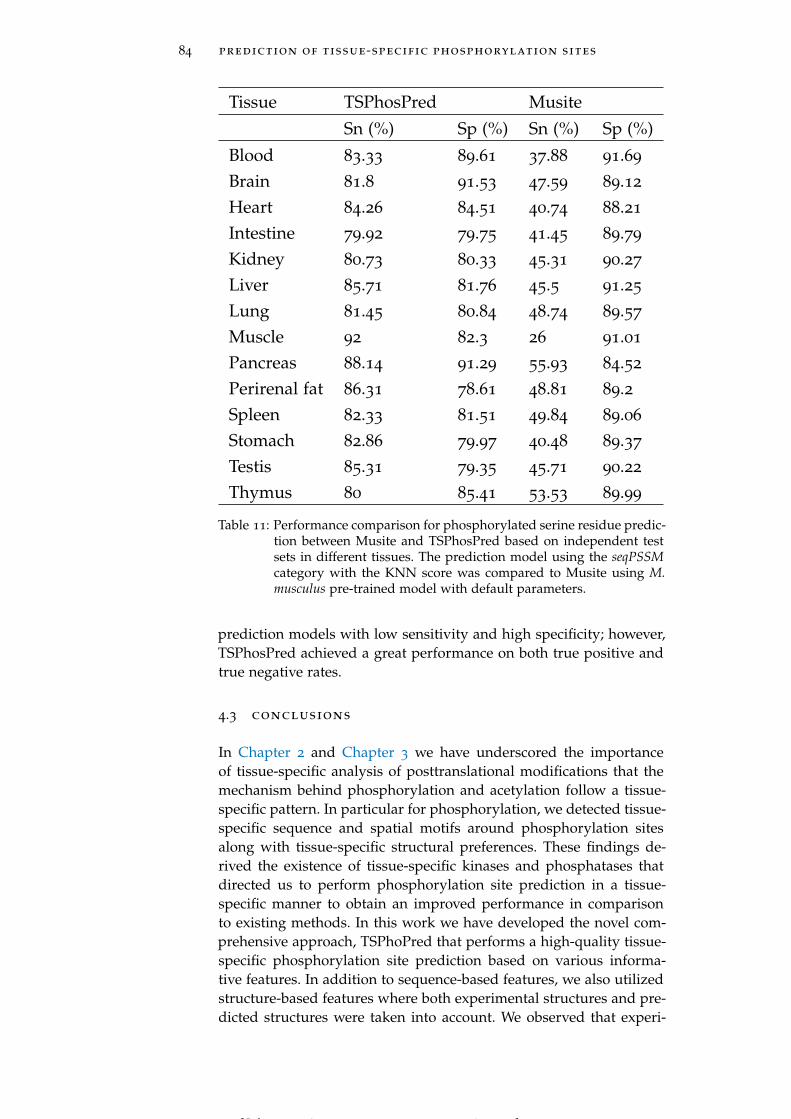
84 prediction of tissue-specific phosphorylation sites
Tissue TSPhosPred Musite
Sn (%) Sp (%) Sn (%) Sp (%)
Blood 83.33 89.61 37.88 91.69
Brain 81.8 91.53 47.59 89.12
Heart 84.26 84.51 40.74 88.21
Intestine 79.92 79.75 41.45 89.79
Kidney 80.73 80.33 45.31 90.27
Liver 85.71 81.76 45.5 91.25
Lung 81.45 80.84 48.74 89.57
Muscle 92 82.3 26 91.01
Pancreas 88.14 91.29 55.93 84.52
Perirenal fat 86.31 78.61 48.81 89.2Spleen 82.33 81.51 49.84 89.06
Stomach 82.86 79.97 40.48 89.37
Testis 85.31 79.35 45.71 90.22
Thymus 80 85.41 53.53 89.99
Table 11: Performance comparison for phosphorylated serine residue predic-tion between Musite and TSPhosPred based on independent testsets in different tissues. The prediction model using the seqPSSMcategory with the KNN score was compared to Musite using M.musculus pre-trained model with default parameters.
prediction models with low sensitivity and high specificity; however,TSPhosPred achieved a great performance on both true positive andtrue negative rates.
4.3 conclusions
In Chapter 2 and Chapter 3 we have underscored the importanceof tissue-specific analysis of posttranslational modifications that themechanism behind phosphorylation and acetylation follow a tissue-specific pattern. In particular for phosphorylation, we detected tissue-specific sequence and spatial motifs around phosphorylation sitesalong with tissue-specific structural preferences. These findings de-rived the existence of tissue-specific kinases and phosphatases thatdirected us to perform phosphorylation site prediction in a tissue-specific manner to obtain an improved performance in comparisonto existing methods. In this work we have developed the novel com-prehensive approach, TSPhoPred that performs a high-quality tissue-specific phosphorylation site prediction based on various informa-tive features. In addition to sequence-based features, we also utilizedstructure-based features where both experimental structures and pre-dicted structures were taken into account. We observed that experi-
[ July 10, 2016 at 22:13 – classicthesis version 4.2 ]
4.3 conclusions 85
mental structures along with the encoding for linear amino acid con-tent achieved the highest performance for some tissues. The cross-tissues prediction analysis with performance comparison with exist-ing tools shows the originality of, and the necessity for tissue-specificphosphorylation site prediction. TSPhoPred provided not only highspecificity, but also high sensitivity for almost all tissues, and it out-performed the existing tools developed for globally phosphorylatedsites in terms of distinguishing power between phosphorylation sitesand non-phosphorylation sites. However, given the fact that differenttraining datasets might lead various performance results, this is thefirst study on the prediction of tissue-specific phosphorylation sitesthat there is not any existing tool available to make a fair comparisonincluding only tissue-specific sites on training datasets.
This study has underscored that tissue-specific phosphoproteomicsstill harbors potential to reveal the regulatory mechanism of phos-phorylation. Further experimental verifications are required follow-ing the findings here. As future work, a feature selection method canalso be applied before prediction to avoid noisiness, and redundancythat heterogeneous features might lead (Li et al., 2014). Moreover, inorder to better assess the influence of some features on tissue-specificphosphorylation site prediction, i.e. functional annotations, the pre-diction can be performed on a negative set generated from the entirerat proteome containing also non-phosphorylated proteins. However,this approach may also increase the false negative rate, because thephosphorylated proteins have already been well studied with respectto phosphorylation, as a result, extracted non-phosphorylation sitesin those proteins are more likely to be true negatives (Trost and Kusa-lik, 2013). Last but not least, in this study we used the most compre-hensive dataset for tissue-specific phosphorylation sites (containing17 different tissues). However, experimentally identified phosphory-lation sites in single tissues coming from separate studies can alsobe combined to the current training set to increase a training set sizeeven though the aim in this study was to form the training data con-taining phosphorylation sites from the same experiment on the samespecies.
[ July 10, 2016 at 22:13 – classicthesis version 4.2 ]

[ July 10, 2016 at 22:13 – classicthesis version 4.2 ]

Part V
S U M M A RY
[ July 10, 2016 at 22:13 – classicthesis version 4.2 ]

[ July 10, 2016 at 22:13 – classicthesis version 4.2 ]
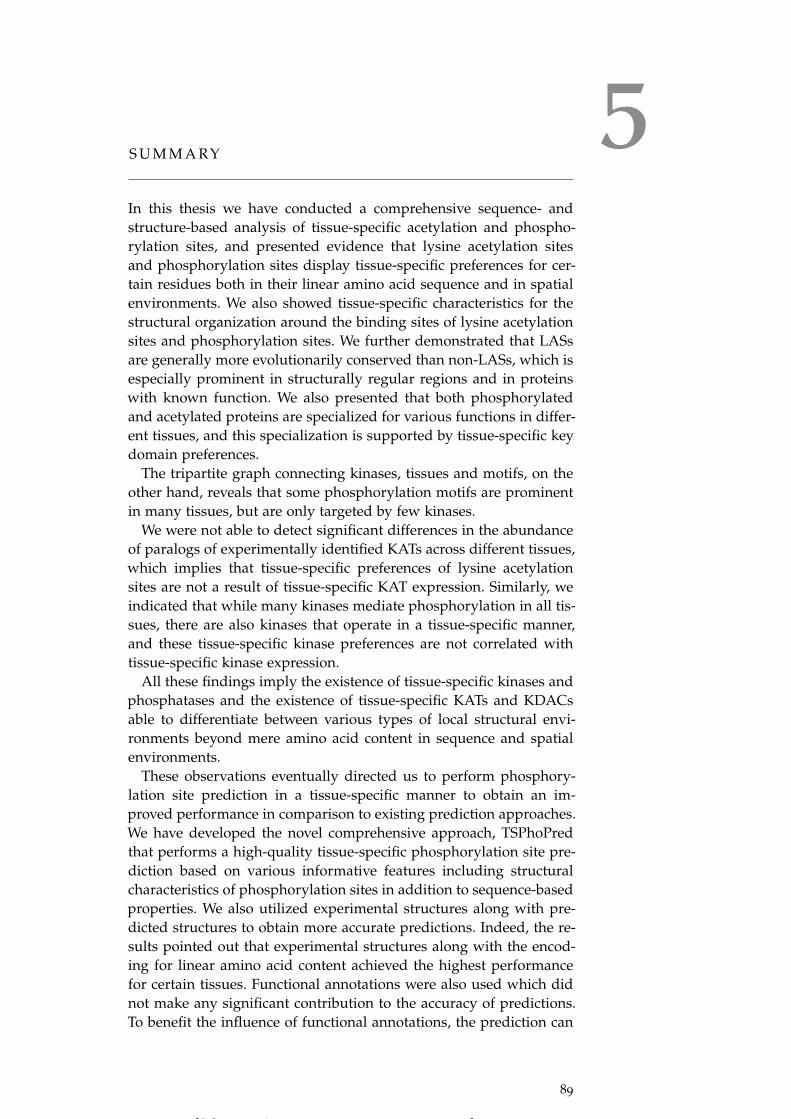
5S U M M A RY
In this thesis we have conducted a comprehensive sequence- andstructure-based analysis of tissue-specific acetylation and phospho-rylation sites, and presented evidence that lysine acetylation sitesand phosphorylation sites display tissue-specific preferences for cer-tain residues both in their linear amino acid sequence and in spatialenvironments. We also showed tissue-specific characteristics for thestructural organization around the binding sites of lysine acetylationsites and phosphorylation sites. We further demonstrated that LASsare generally more evolutionarily conserved than non-LASs, which isespecially prominent in structurally regular regions and in proteinswith known function. We also presented that both phosphorylatedand acetylated proteins are specialized for various functions in differ-ent tissues, and this specialization is supported by tissue-specific keydomain preferences.
The tripartite graph connecting kinases, tissues and motifs, on theother hand, reveals that some phosphorylation motifs are prominentin many tissues, but are only targeted by few kinases.
We were not able to detect significant differences in the abundanceof paralogs of experimentally identified KATs across different tissues,which implies that tissue-specific preferences of lysine acetylationsites are not a result of tissue-specific KAT expression. Similarly, weindicated that while many kinases mediate phosphorylation in all tis-sues, there are also kinases that operate in a tissue-specific manner,and these tissue-specific kinase preferences are not correlated withtissue-specific kinase expression.
All these findings imply the existence of tissue-specific kinases andphosphatases and the existence of tissue-specific KATs and KDACsable to differentiate between various types of local structural envi-ronments beyond mere amino acid content in sequence and spatialenvironments.
These observations eventually directed us to perform phosphory-lation site prediction in a tissue-specific manner to obtain an im-proved performance in comparison to existing prediction approaches.We have developed the novel comprehensive approach, TSPhoPredthat performs a high-quality tissue-specific phosphorylation site pre-diction based on various informative features including structuralcharacteristics of phosphorylation sites in addition to sequence-basedproperties. We also utilized experimental structures along with pre-dicted structures to obtain more accurate predictions. Indeed, the re-sults pointed out that experimental structures along with the encod-ing for linear amino acid content achieved the highest performancefor certain tissues. Functional annotations were also used which didnot make any significant contribution to the accuracy of predictions.To benefit the influence of functional annotations, the prediction can
89
[ July 10, 2016 at 22:13 – classicthesis version 4.2 ]
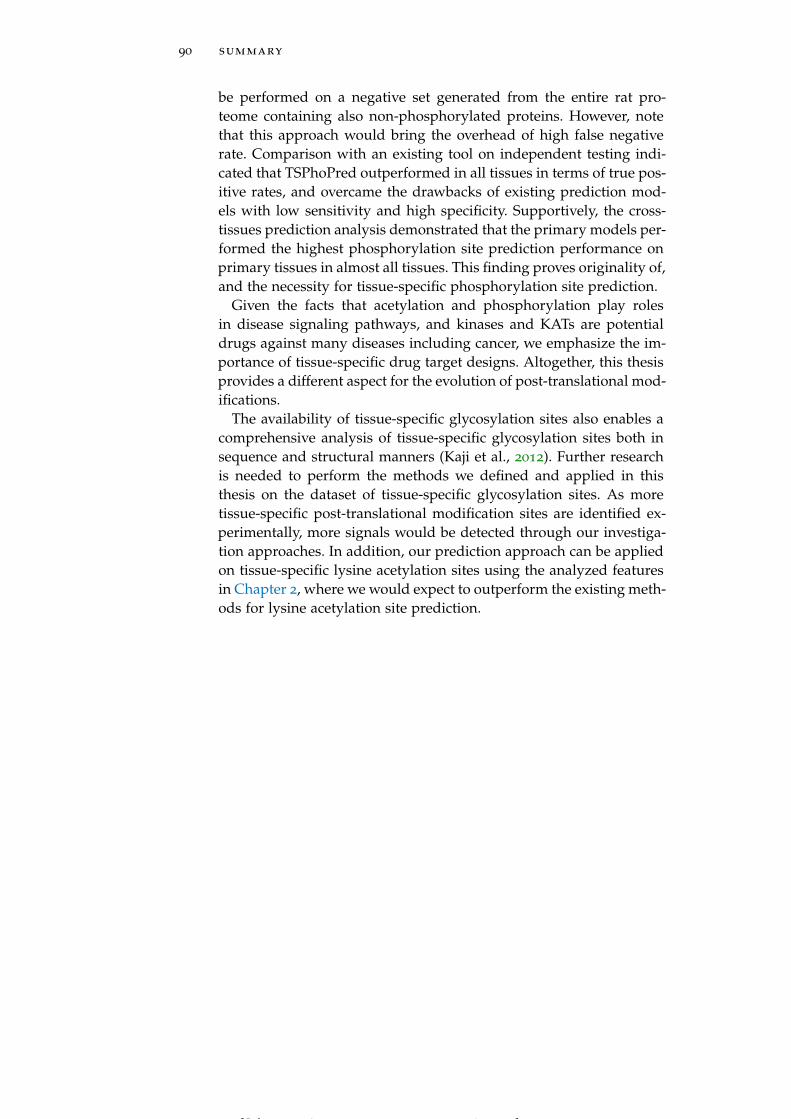
90 summary
be performed on a negative set generated from the entire rat pro-teome containing also non-phosphorylated proteins. However, notethat this approach would bring the overhead of high false negativerate. Comparison with an existing tool on independent testing indi-cated that TSPhoPred outperformed in all tissues in terms of true pos-itive rates, and overcame the drawbacks of existing prediction mod-els with low sensitivity and high specificity. Supportively, the cross-tissues prediction analysis demonstrated that the primary models per-formed the highest phosphorylation site prediction performance onprimary tissues in almost all tissues. This finding proves originality of,and the necessity for tissue-specific phosphorylation site prediction.
Given the facts that acetylation and phosphorylation play rolesin disease signaling pathways, and kinases and KATs are potentialdrugs against many diseases including cancer, we emphasize the im-portance of tissue-specific drug target designs. Altogether, this thesisprovides a different aspect for the evolution of post-translational mod-ifications.
The availability of tissue-specific glycosylation sites also enables acomprehensive analysis of tissue-specific glycosylation sites both insequence and structural manners (Kaji et al., 2012). Further researchis needed to perform the methods we defined and applied in thisthesis on the dataset of tissue-specific glycosylation sites. As moretissue-specific post-translational modification sites are identified ex-perimentally, more signals would be detected through our investiga-tion approaches. In addition, our prediction approach can be appliedon tissue-specific lysine acetylation sites using the analyzed featuresin Chapter 2, where we would expect to outperform the existing meth-ods for lysine acetylation site prediction.
[ July 10, 2016 at 22:13 – classicthesis version 4.2 ]

Part VI
A P P E N D I X
[ July 10, 2016 at 22:13 – classicthesis version 4.2 ]

[ July 10, 2016 at 22:13 – classicthesis version 4.2 ]

AA P P E N D I X
93
[ July 10, 2016 at 22:13 – classicthesis version 4.2 ]
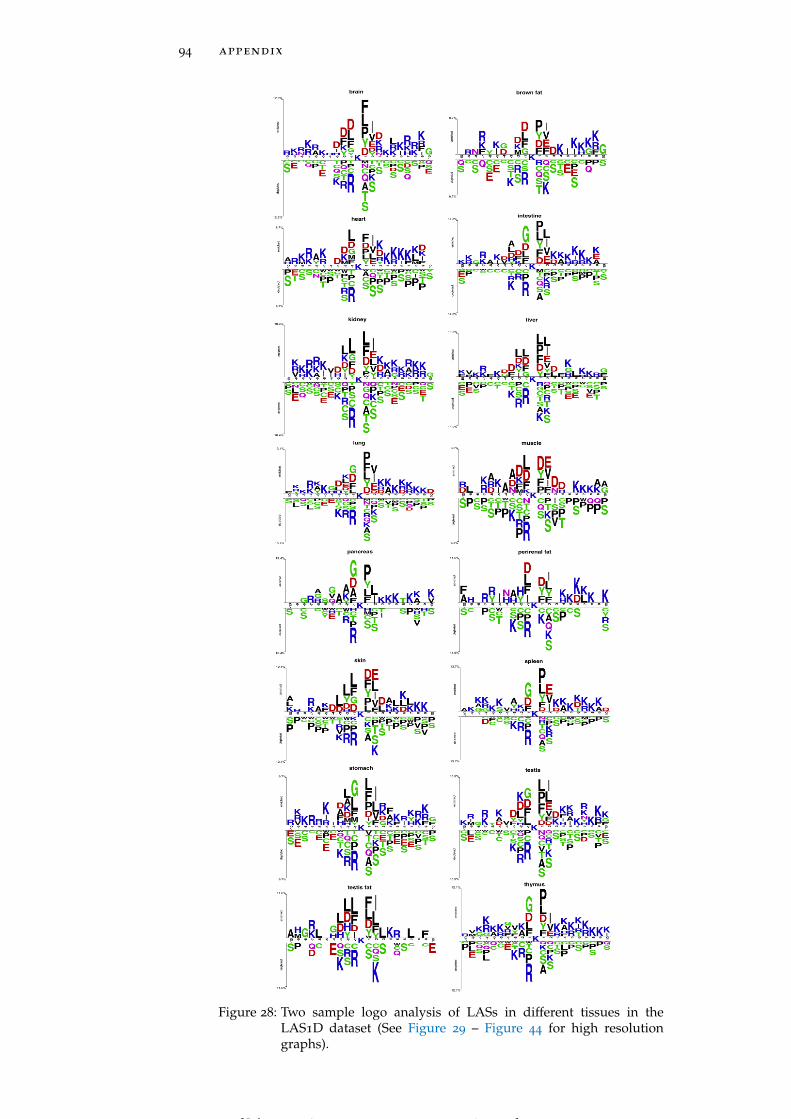
94 appendix
Figure 28: Two sample logo analysis of LASs in different tissues in theLAS1D dataset (See Figure 29 – Figure 44 for high resolutiongraphs).
[ July 10, 2016 at 22:13 – classicthesis version 4.2 ]
appendix 95
Figure 29: Two sample logo analysis of LASs from the LAS1D dataset inbrain.
Figure 30: Two sample logo analysis of LASs from the LAS1D dataset inbrown fat.
[ July 10, 2016 at 22:13 – classicthesis version 4.2 ]
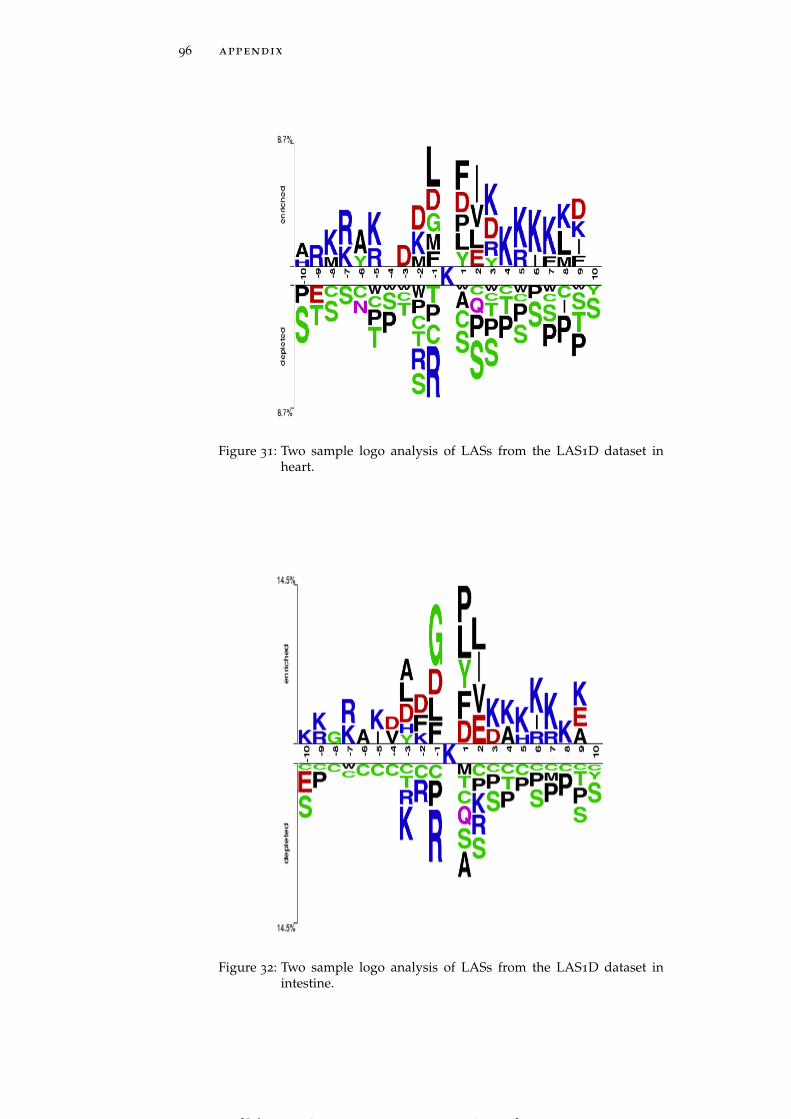
96 appendix
Figure 31: Two sample logo analysis of LASs from the LAS1D dataset inheart.
Figure 32: Two sample logo analysis of LASs from the LAS1D dataset inintestine.
[ July 10, 2016 at 22:13 – classicthesis version 4.2 ]
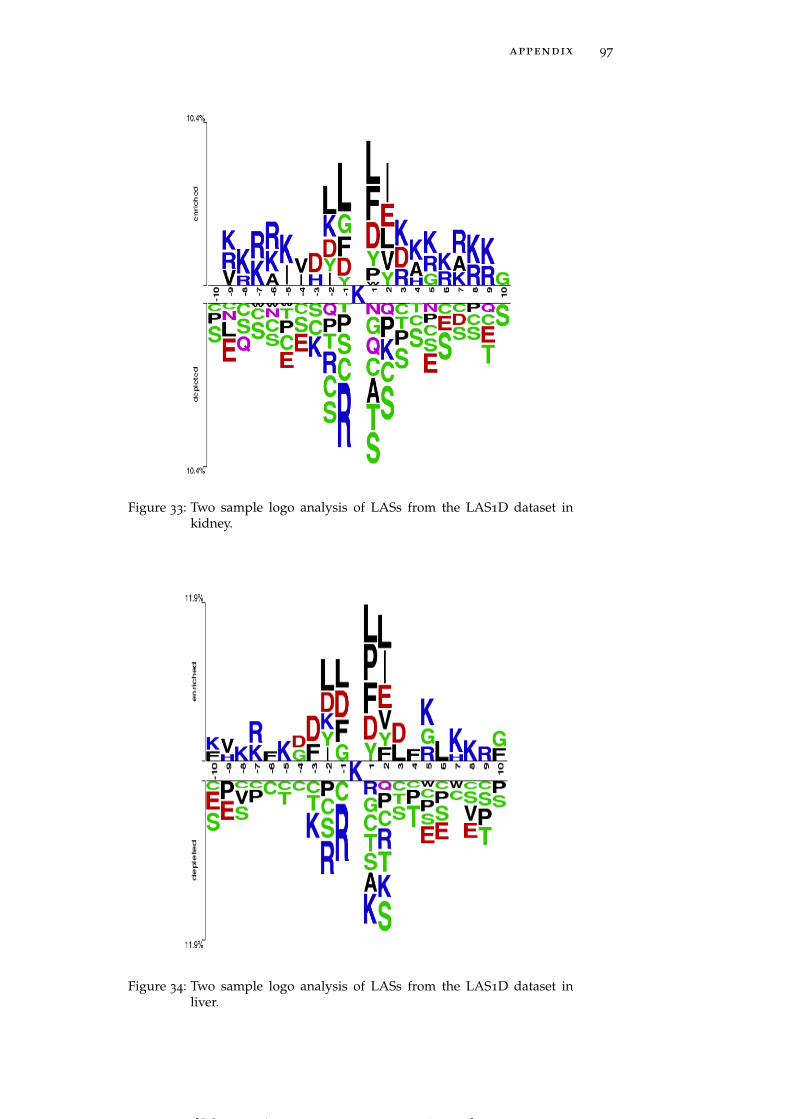
appendix 97
Figure 33: Two sample logo analysis of LASs from the LAS1D dataset inkidney.
Figure 34: Two sample logo analysis of LASs from the LAS1D dataset inliver.
[ July 10, 2016 at 22:13 – classicthesis version 4.2 ]
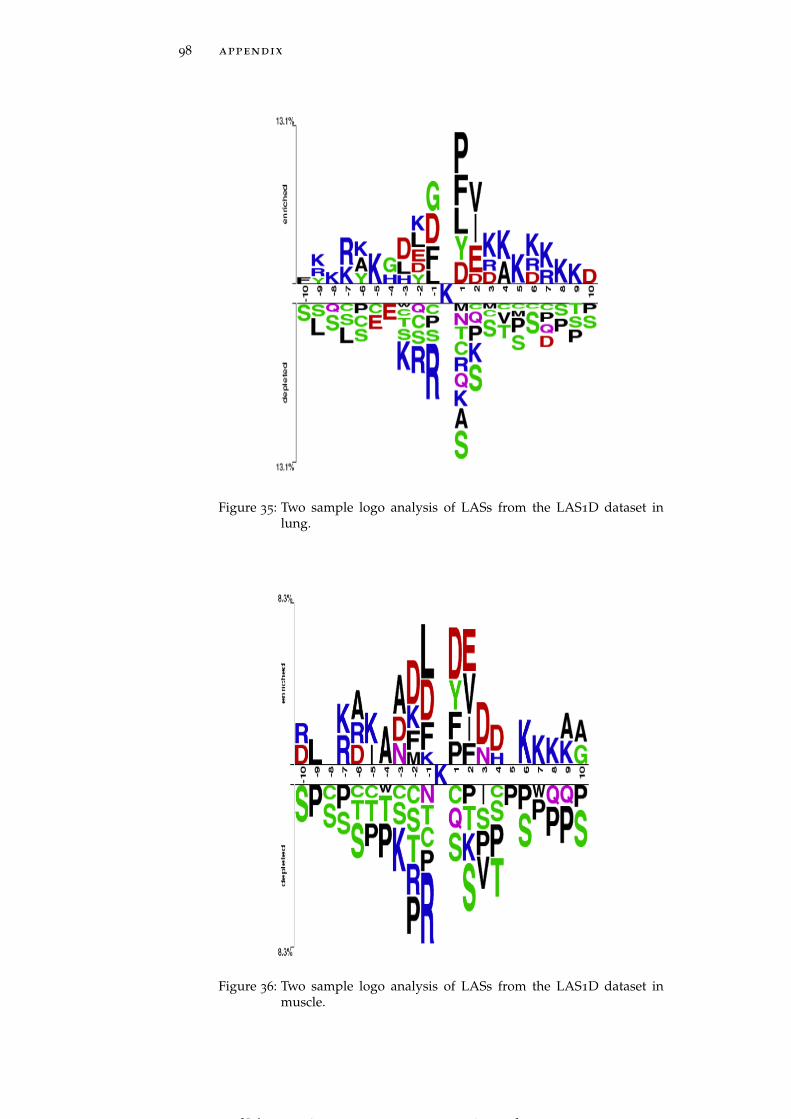
98 appendix
Figure 35: Two sample logo analysis of LASs from the LAS1D dataset inlung.
Figure 36: Two sample logo analysis of LASs from the LAS1D dataset inmuscle.
[ July 10, 2016 at 22:13 – classicthesis version 4.2 ]
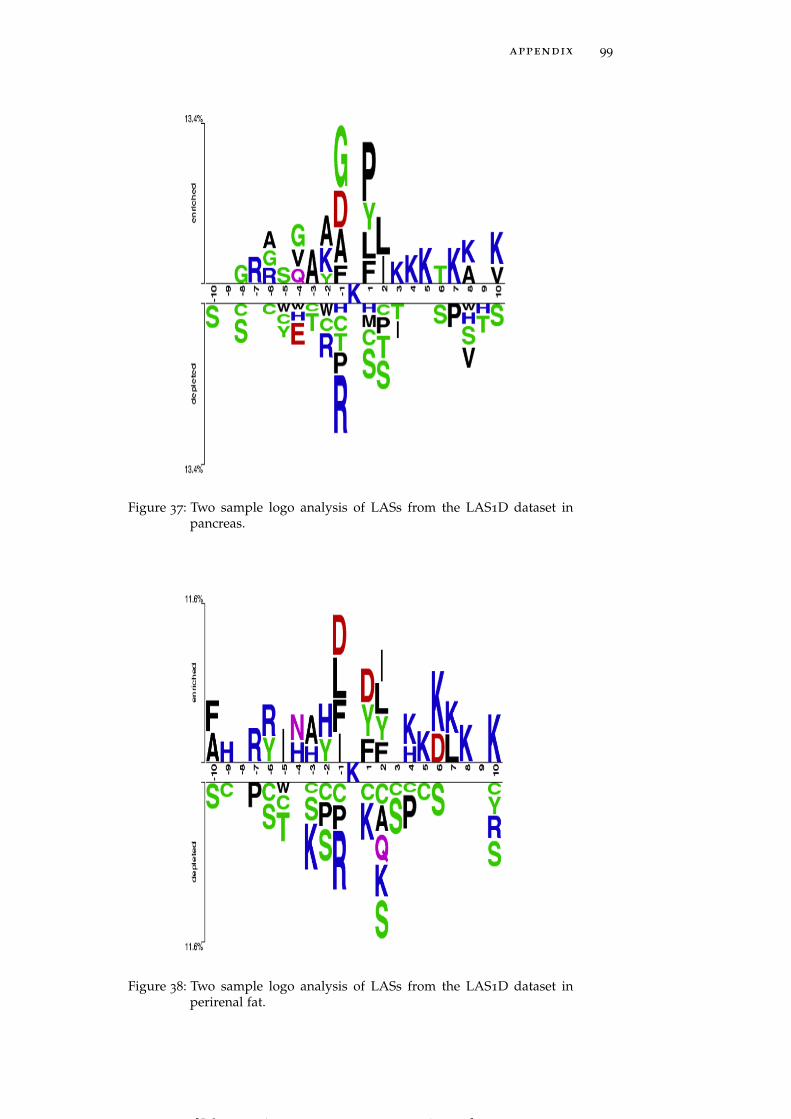
appendix 99
Figure 37: Two sample logo analysis of LASs from the LAS1D dataset inpancreas.
Figure 38: Two sample logo analysis of LASs from the LAS1D dataset inperirenal fat.
[ July 10, 2016 at 22:13 – classicthesis version 4.2 ]
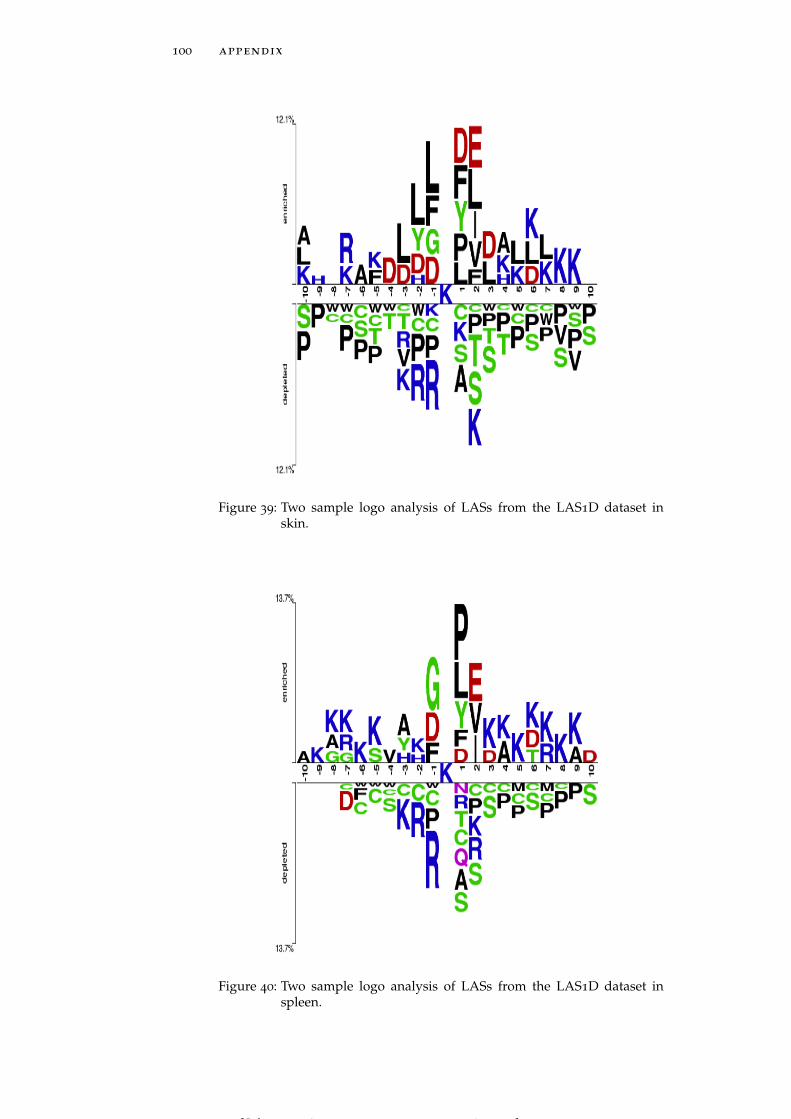
100 appendix
Figure 39: Two sample logo analysis of LASs from the LAS1D dataset inskin.
Figure 40: Two sample logo analysis of LASs from the LAS1D dataset inspleen.
[ July 10, 2016 at 22:13 – classicthesis version 4.2 ]
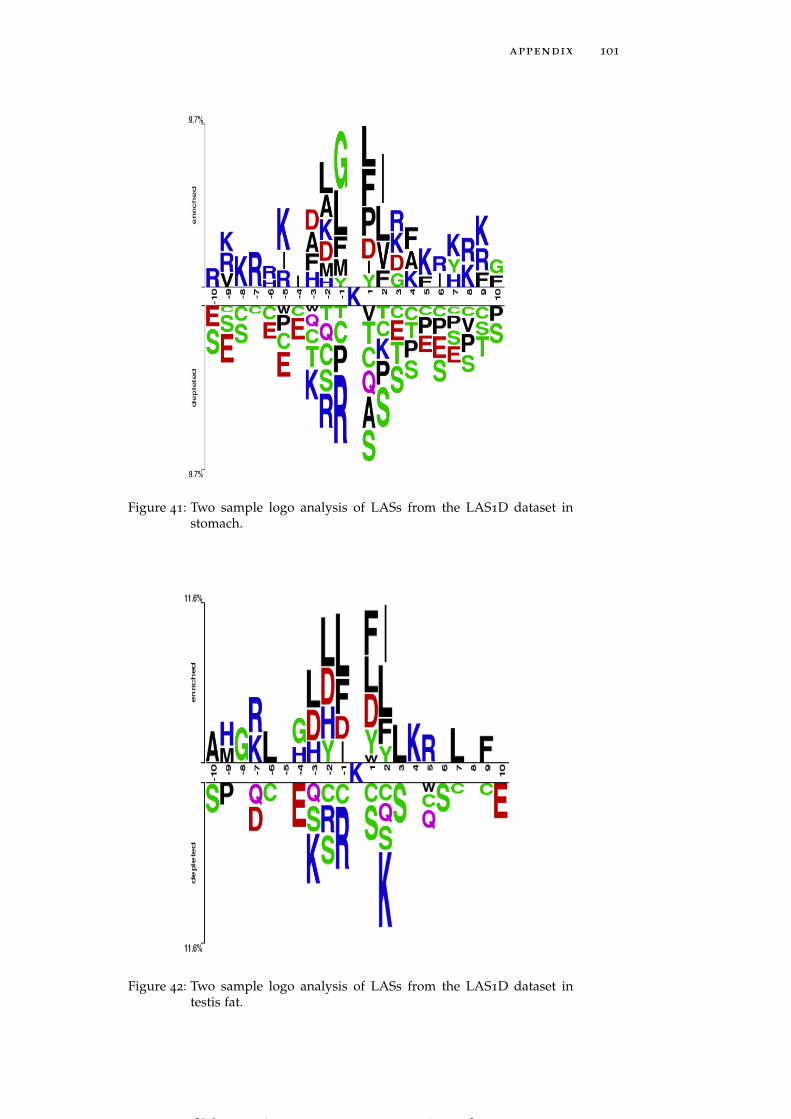
appendix 101
Figure 41: Two sample logo analysis of LASs from the LAS1D dataset instomach.
Figure 42: Two sample logo analysis of LASs from the LAS1D dataset intestis fat.
[ July 10, 2016 at 22:13 – classicthesis version 4.2 ]
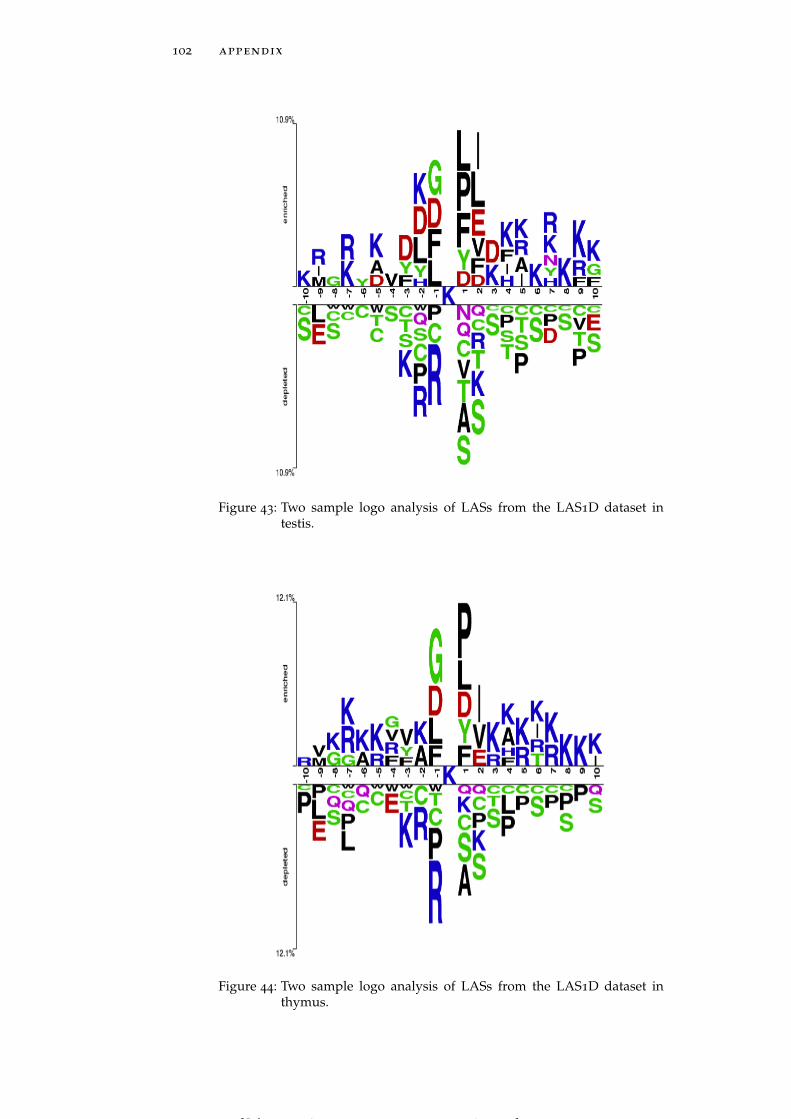
102 appendix
Figure 43: Two sample logo analysis of LASs from the LAS1D dataset intestis.
Figure 44: Two sample logo analysis of LASs from the LAS1D dataset inthymus.
[ July 10, 2016 at 22:13 – classicthesis version 4.2 ]
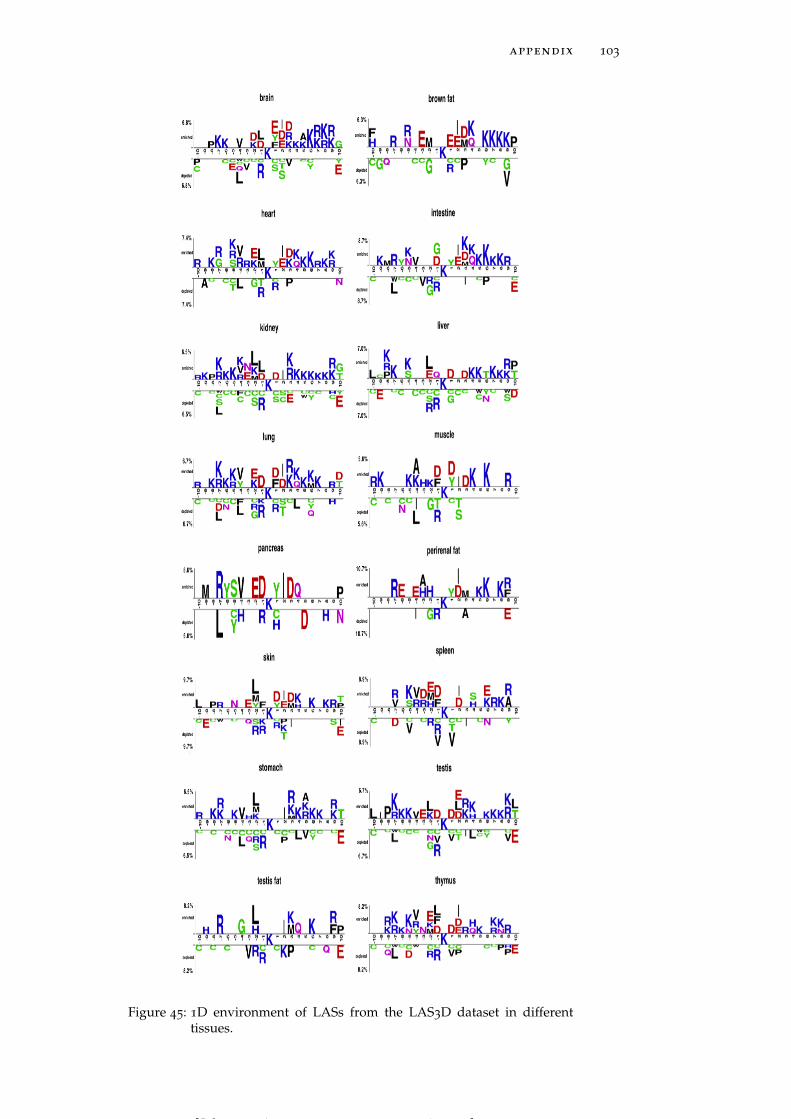
appendix 103
Figure 45: 1D environment of LASs from the LAS3D dataset in differenttissues.
[ July 10, 2016 at 22:13 – classicthesis version 4.2 ]
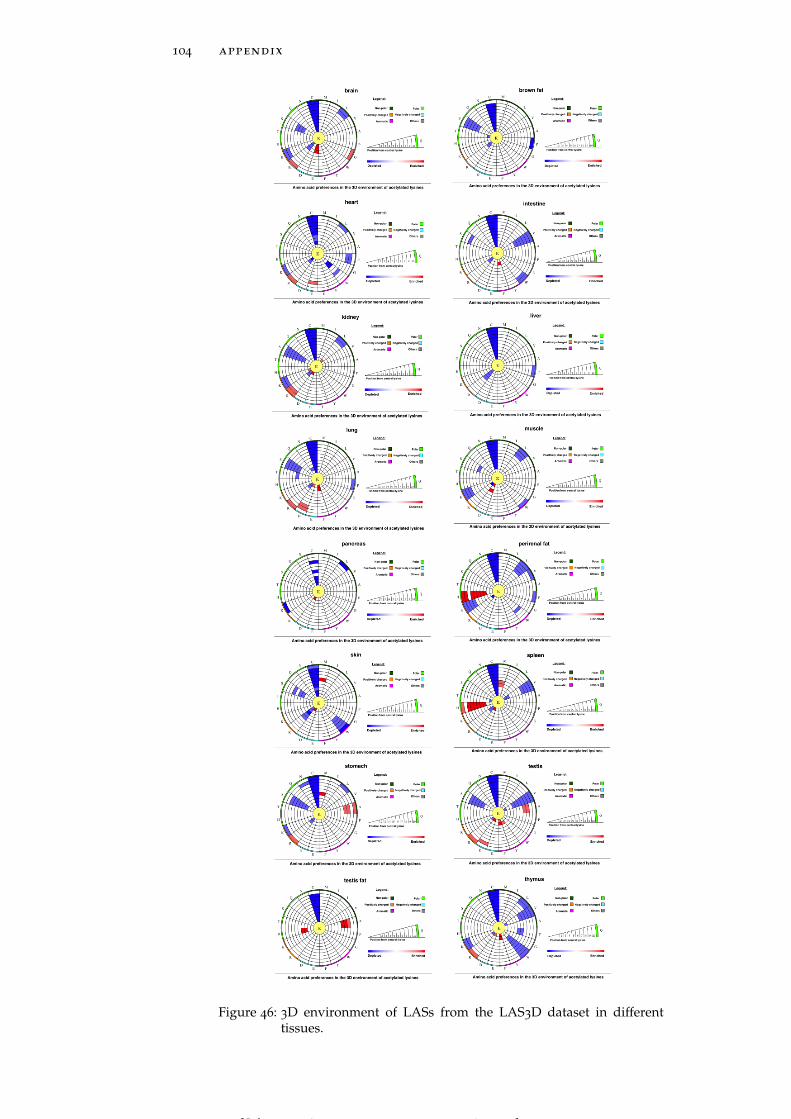
104 appendix
Figure 46: 3D environment of LASs from the LAS3D dataset in differenttissues.
[ July 10, 2016 at 22:13 – classicthesis version 4.2 ]
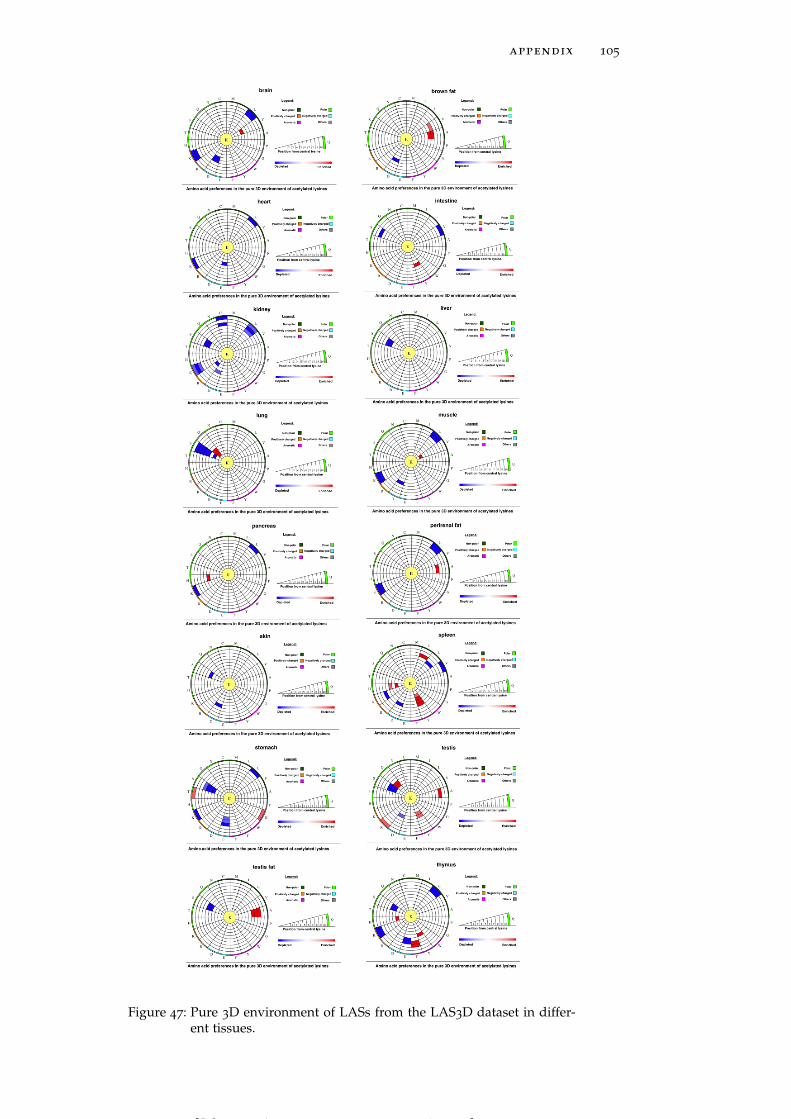
appendix 105
Figure 47: Pure 3D environment of LASs from the LAS3D dataset in differ-ent tissues.
[ July 10, 2016 at 22:13 – classicthesis version 4.2 ]
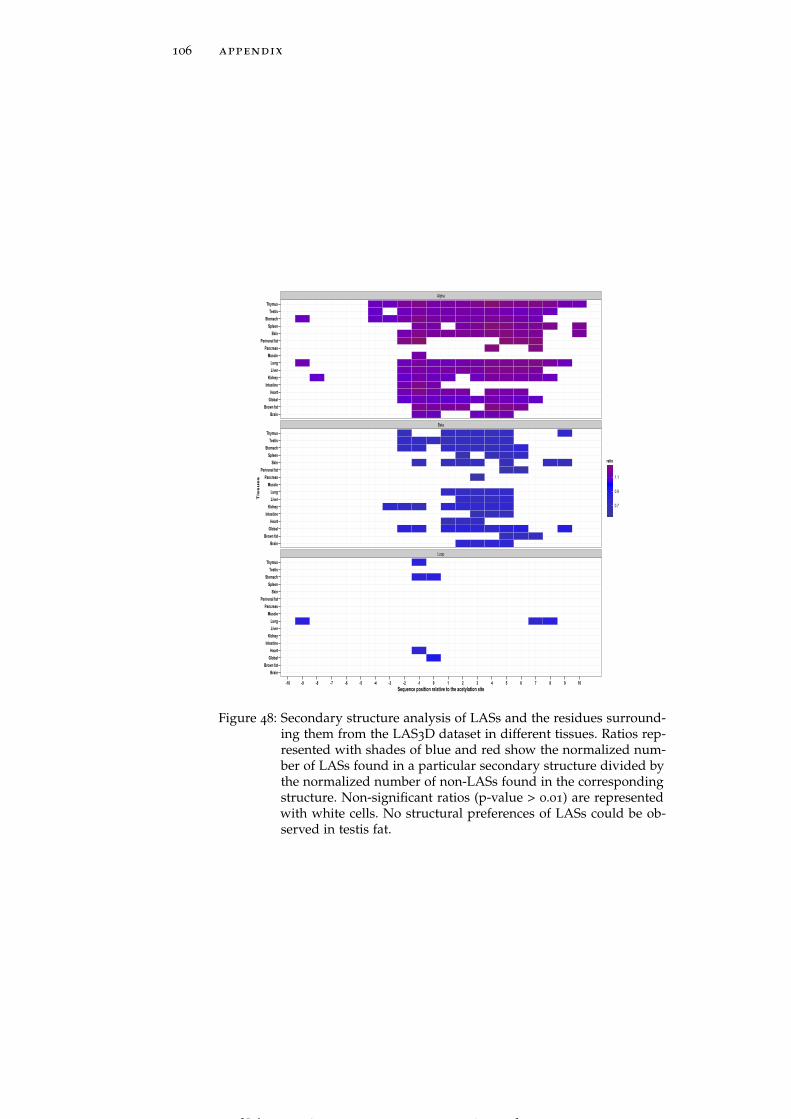
106 appendix
Alpha
Beta
Loop
BrainBrown fatGlobalHeart
IntestineKidneyLiverLung
MusclePancreas
Perirenal fatSkin
SpleenStomachTestis
Thymus
BrainBrown fatGlobalHeart
IntestineKidneyLiverLung
MusclePancreas
Perirenal fatSkin
SpleenStomachTestis
Thymus
BrainBrown fatGlobalHeart
IntestineKidneyLiverLung
MusclePancreas
Perirenal fatSkin
SpleenStomachTestis
Thymus
-10 -9 -8 -7 -6 -5 -4 -3 -2 -1 0 1 2 3 4 5 6 7 8 9 10Sequence position relative to the acetylation site
Tissues
0.7
0.9
1.1
ratio
Figure 48: Secondary structure analysis of LASs and the residues surround-ing them from the LAS3D dataset in different tissues. Ratios rep-resented with shades of blue and red show the normalized num-ber of LASs found in a particular secondary structure divided bythe normalized number of non-LASs found in the correspondingstructure. Non-significant ratios (p-value > 0.01) are representedwith white cells. No structural preferences of LASs could be ob-served in testis fat.
[ July 10, 2016 at 22:13 – classicthesis version 4.2 ]
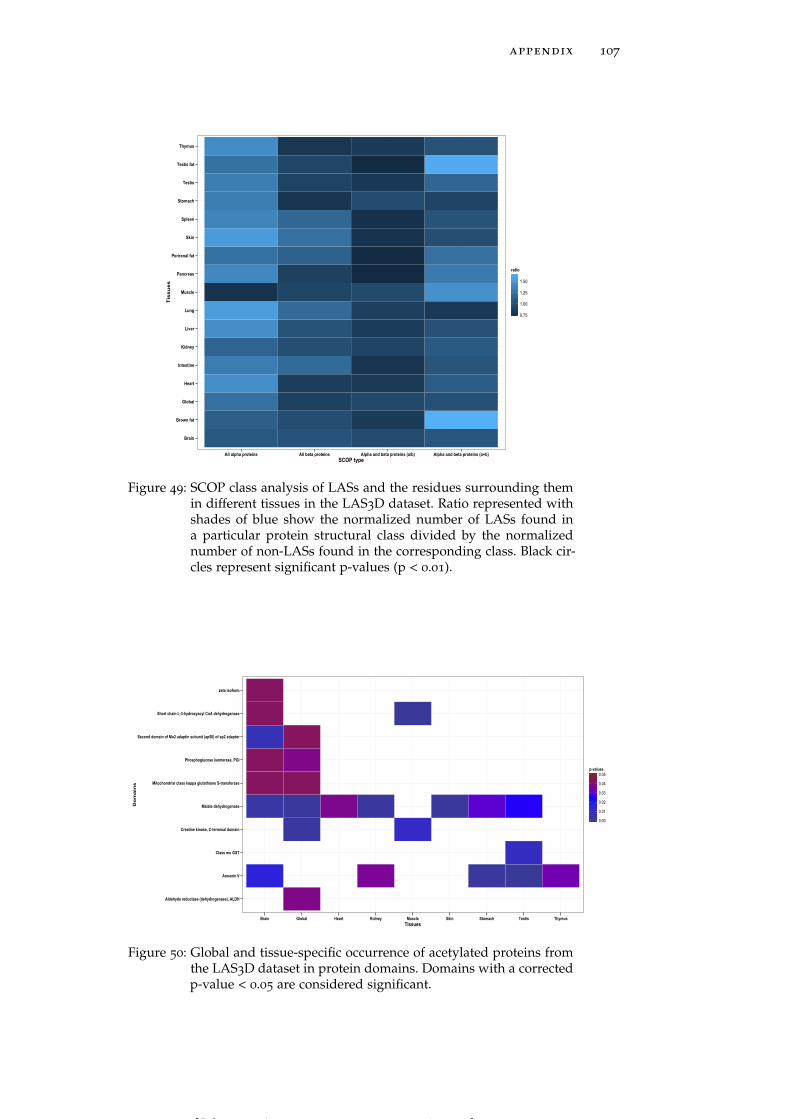
appendix 107
Brain
Brown fat
Global
Heart
Intestine
Kidney
Liver
Lung
Muscle
Pancreas
Perirenal fat
Skin
Spleen
Stomach
Testis
Testis fat
Thymus
All alpha proteins All beta proteins Alpha and beta proteins (a/b) Alpha and beta proteins (a+b)SCOP type
Tissues
0.75
1.00
1.25
1.50
ratio
Figure 49: SCOP class analysis of LASs and the residues surrounding themin different tissues in the LAS3D dataset. Ratio represented withshades of blue show the normalized number of LASs found ina particular protein structural class divided by the normalizednumber of non-LASs found in the corresponding class. Black cir-cles represent significant p-values (p < 0.01).
Aldehyde reductase (dehydrogenase), ALDH
Annexin V
Class mu GST
Creatine kinase, C-terminal domain
Malate dehydrogenase
Mitochondrial class kappa glutathione S-transferase
Phosphoglucose isomerase, PGI
Second domain of Mu2 adaptin subunit (ap50) of ap2 adaptor
Short chain L-3-hydroxyacyl CoA dehydrogenase
zeta isoform
Brain Global Heart Kidney Muscle Skin Stomach Testis ThymusTissues
Domains
0.00
0.01
0.02
0.03
0.04
0.05p-values
Figure 50: Global and tissue-specific occurrence of acetylated proteins fromthe LAS3D dataset in protein domains. Domains with a correctedp-value < 0.05 are considered significant.
[ July 10, 2016 at 22:13 – classicthesis version 4.2 ]
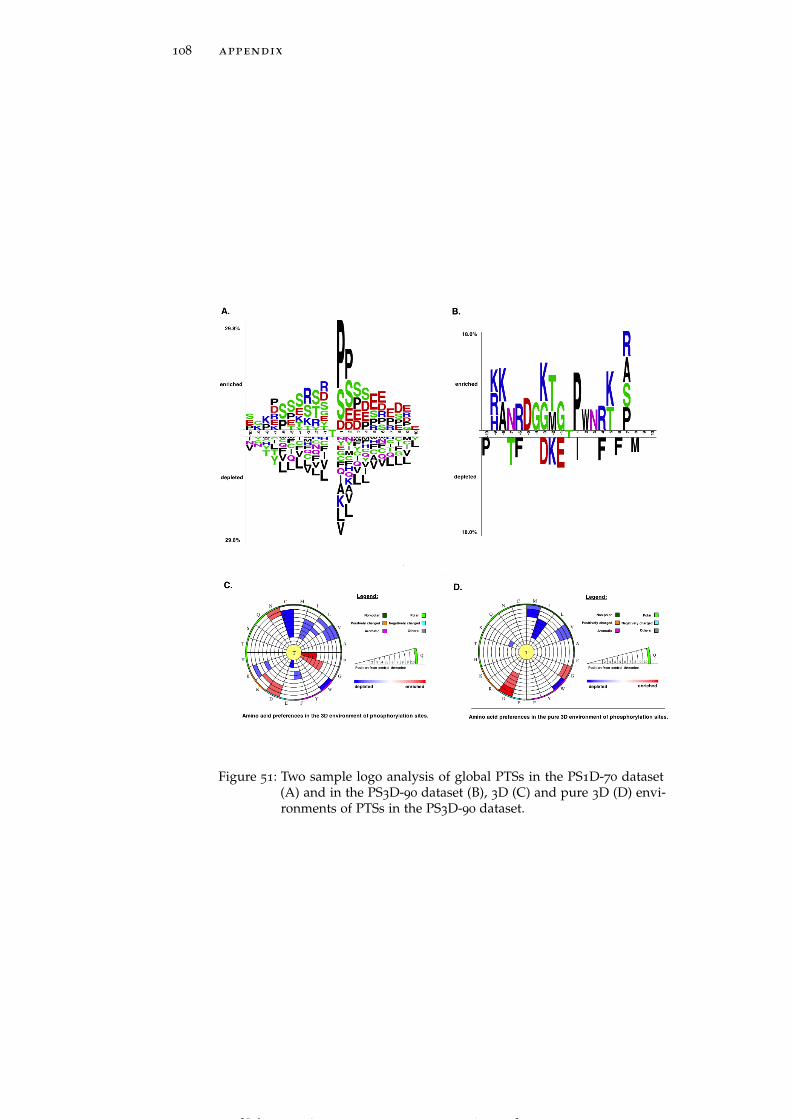
108 appendix
Figure 51: Two sample logo analysis of global PTSs in the PS1D-70 dataset(A) and in the PS3D-90 dataset (B), 3D (C) and pure 3D (D) envi-ronments of PTSs in the PS3D-90 dataset.
[ July 10, 2016 at 22:13 – classicthesis version 4.2 ]
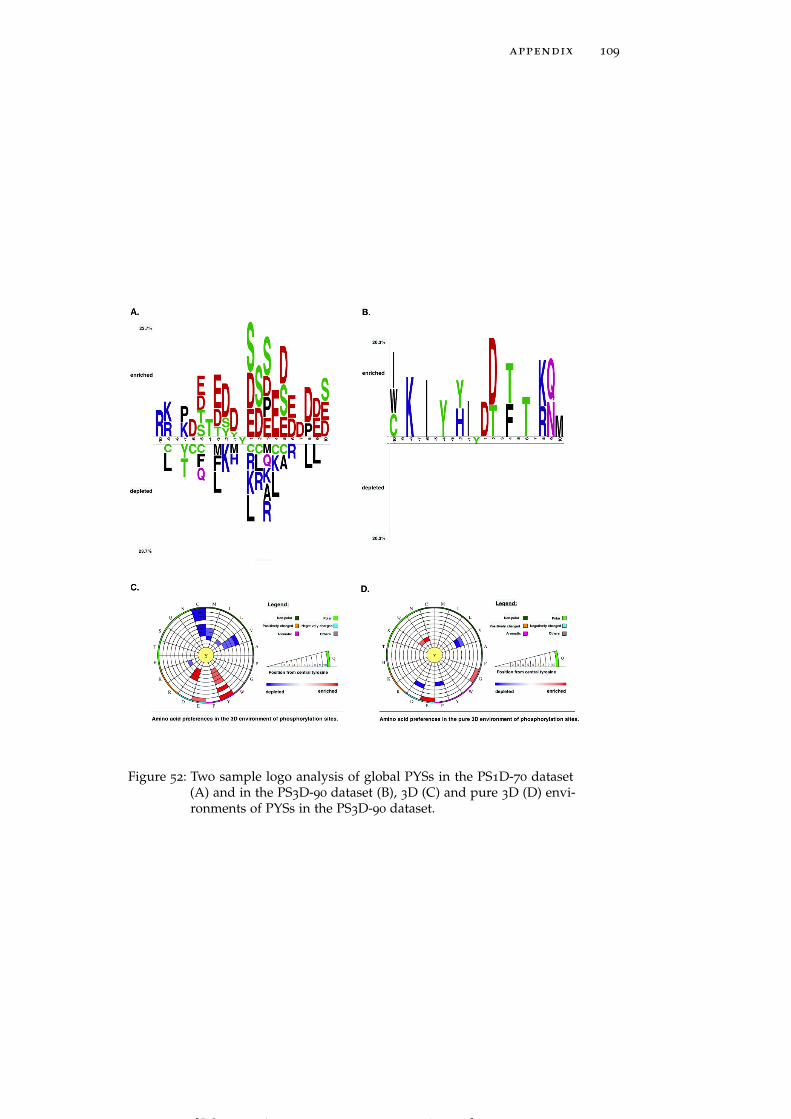
appendix 109
Figure 52: Two sample logo analysis of global PYSs in the PS1D-70 dataset(A) and in the PS3D-90 dataset (B), 3D (C) and pure 3D (D) envi-ronments of PYSs in the PS3D-90 dataset.
[ July 10, 2016 at 22:13 – classicthesis version 4.2 ]

110 appendix
Figure 53: Two sample logo analysis of PSSs in different tissues in the PS1D-70 dataset (See Figure 54 - Figure 70 for high resolution graphs).
[ July 10, 2016 at 22:13 – classicthesis version 4.2 ]
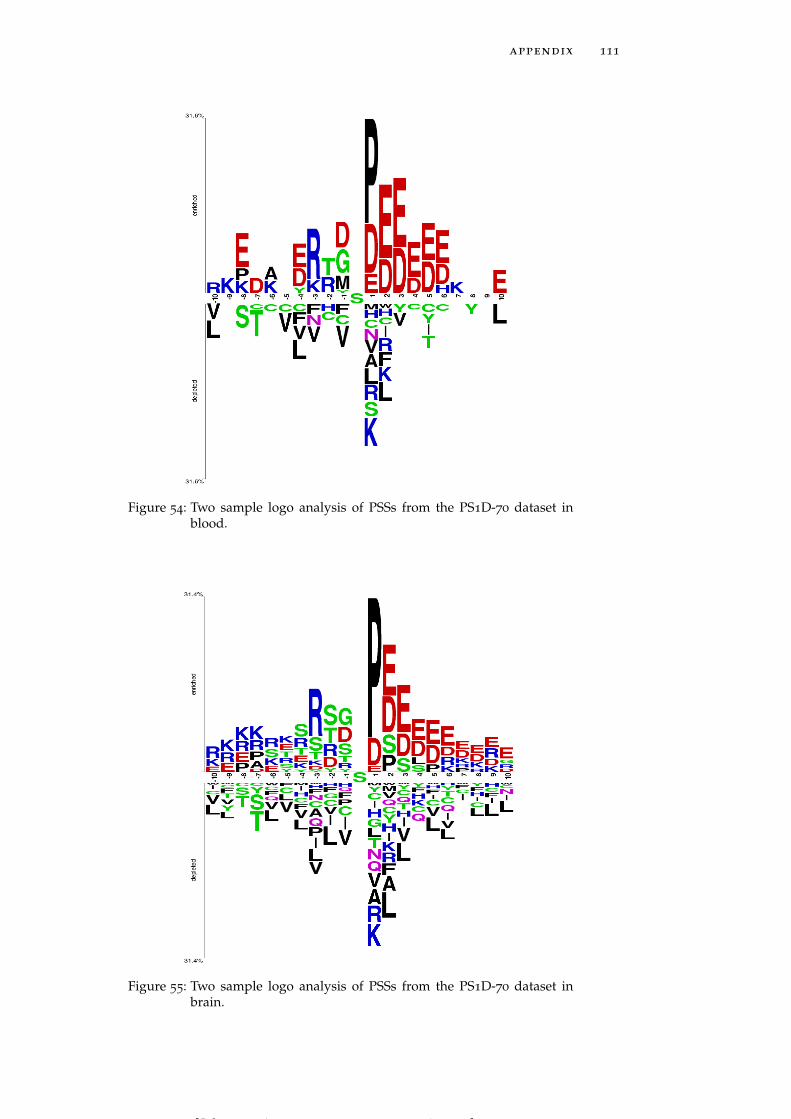
appendix 111
Figure 54: Two sample logo analysis of PSSs from the PS1D-70 dataset inblood.
Figure 55: Two sample logo analysis of PSSs from the PS1D-70 dataset inbrain.
[ July 10, 2016 at 22:13 – classicthesis version 4.2 ]
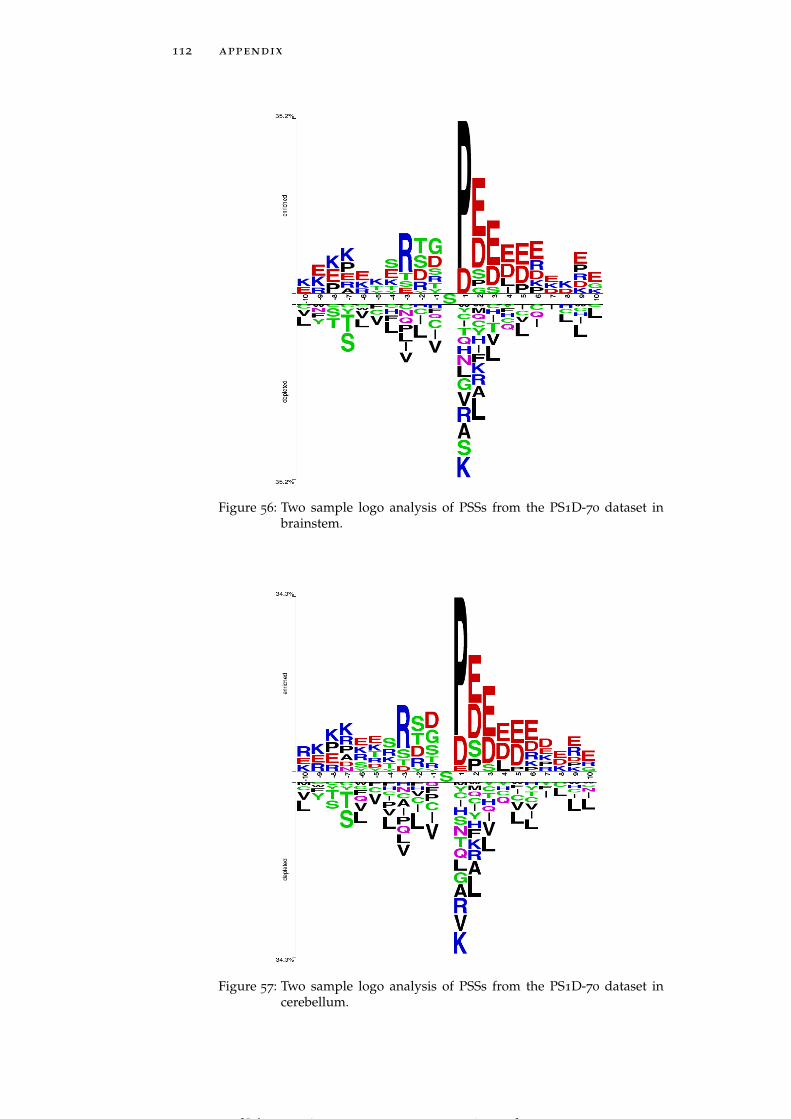
112 appendix
Figure 56: Two sample logo analysis of PSSs from the PS1D-70 dataset inbrainstem.
Figure 57: Two sample logo analysis of PSSs from the PS1D-70 dataset incerebellum.
[ July 10, 2016 at 22:13 – classicthesis version 4.2 ]
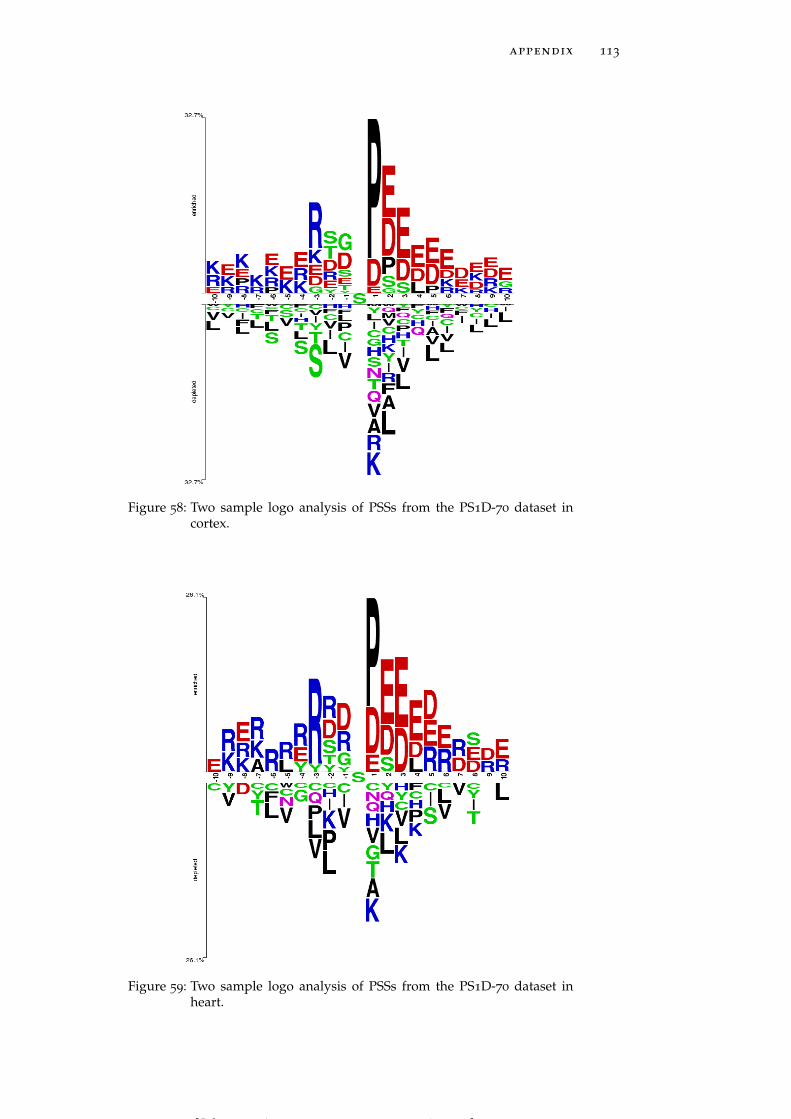
appendix 113
Figure 58: Two sample logo analysis of PSSs from the PS1D-70 dataset incortex.
Figure 59: Two sample logo analysis of PSSs from the PS1D-70 dataset inheart.
[ July 10, 2016 at 22:13 – classicthesis version 4.2 ]
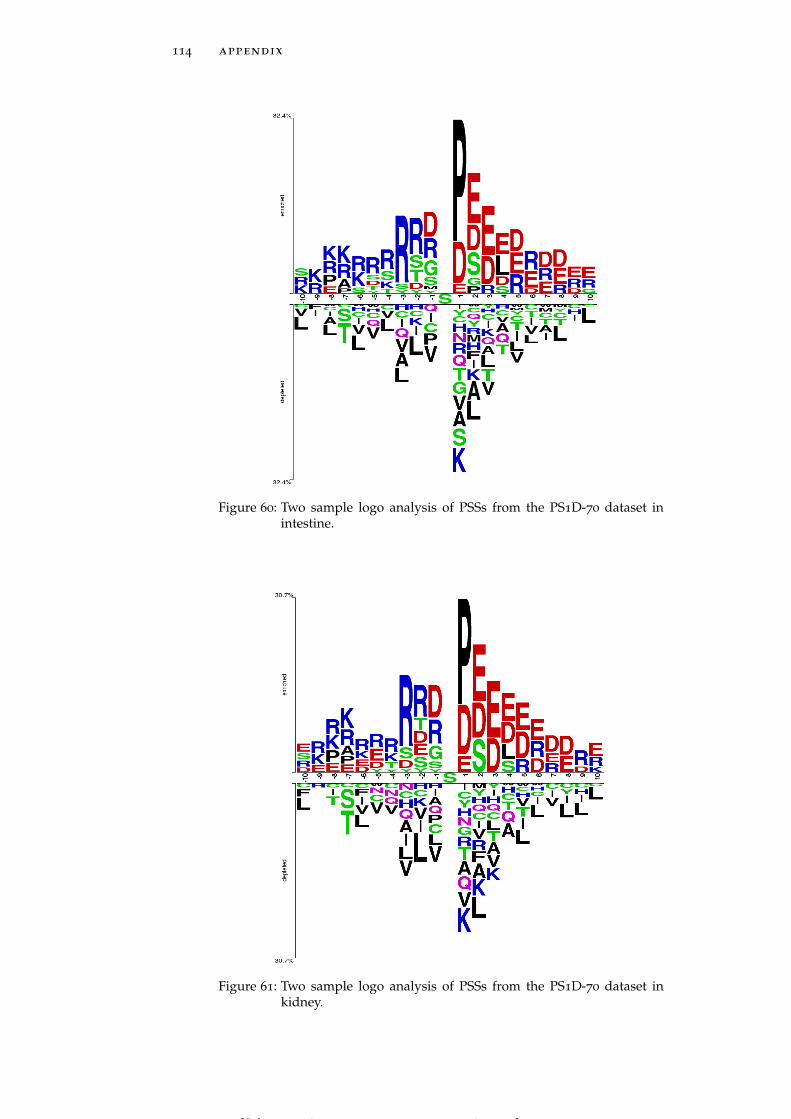
114 appendix
Figure 60: Two sample logo analysis of PSSs from the PS1D-70 dataset inintestine.
Figure 61: Two sample logo analysis of PSSs from the PS1D-70 dataset inkidney.
[ July 10, 2016 at 22:13 – classicthesis version 4.2 ]
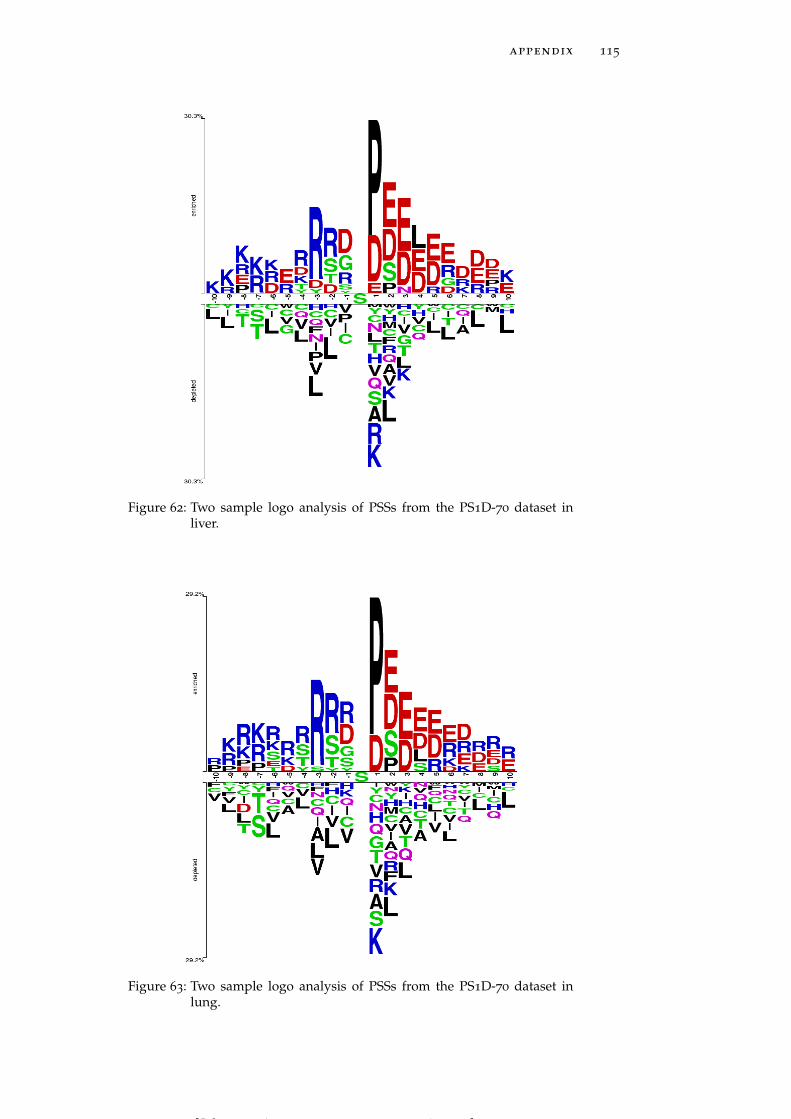
appendix 115
Figure 62: Two sample logo analysis of PSSs from the PS1D-70 dataset inliver.
Figure 63: Two sample logo analysis of PSSs from the PS1D-70 dataset inlung.
[ July 10, 2016 at 22:13 – classicthesis version 4.2 ]
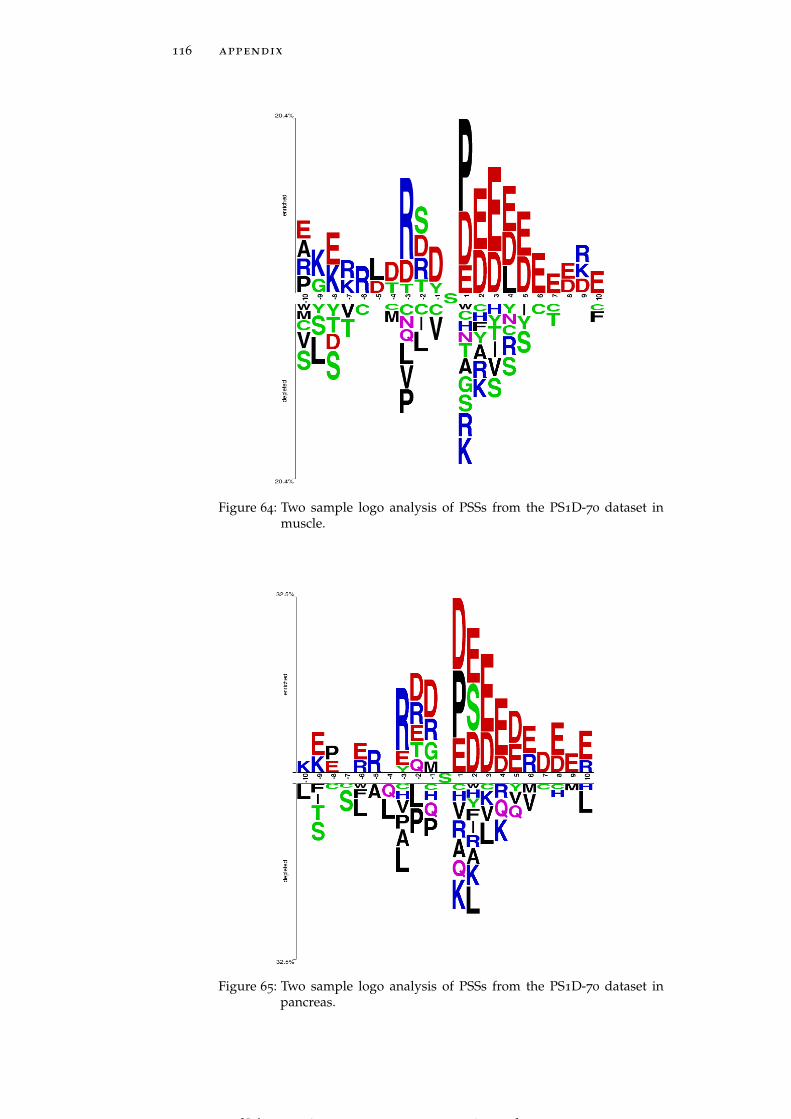
116 appendix
Figure 64: Two sample logo analysis of PSSs from the PS1D-70 dataset inmuscle.
Figure 65: Two sample logo analysis of PSSs from the PS1D-70 dataset inpancreas.
[ July 10, 2016 at 22:13 – classicthesis version 4.2 ]

appendix 117
Figure 66: Two sample logo analysis of PSSs from the PS1D-70 dataset inperirenal fat.
Figure 67: Two sample logo analysis of PSSs from the PS1D-70 dataset inspleen.
[ July 10, 2016 at 22:13 – classicthesis version 4.2 ]
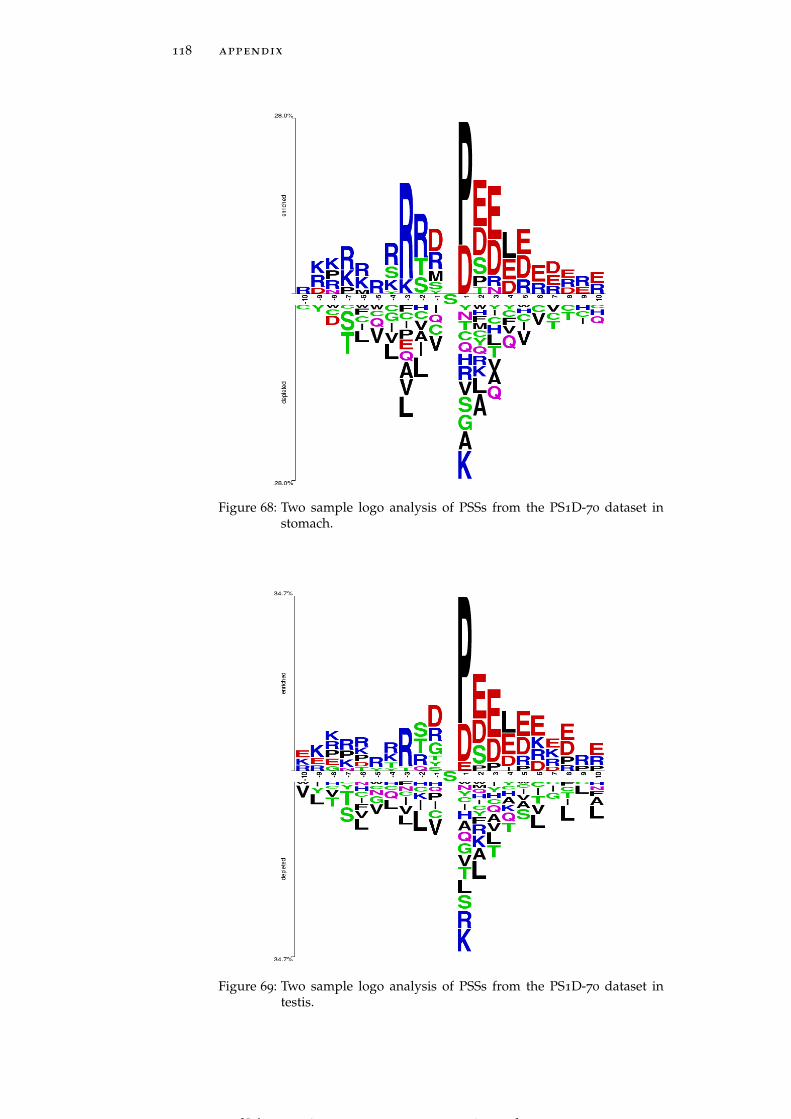
118 appendix
Figure 68: Two sample logo analysis of PSSs from the PS1D-70 dataset instomach.
Figure 69: Two sample logo analysis of PSSs from the PS1D-70 dataset intestis.
[ July 10, 2016 at 22:13 – classicthesis version 4.2 ]
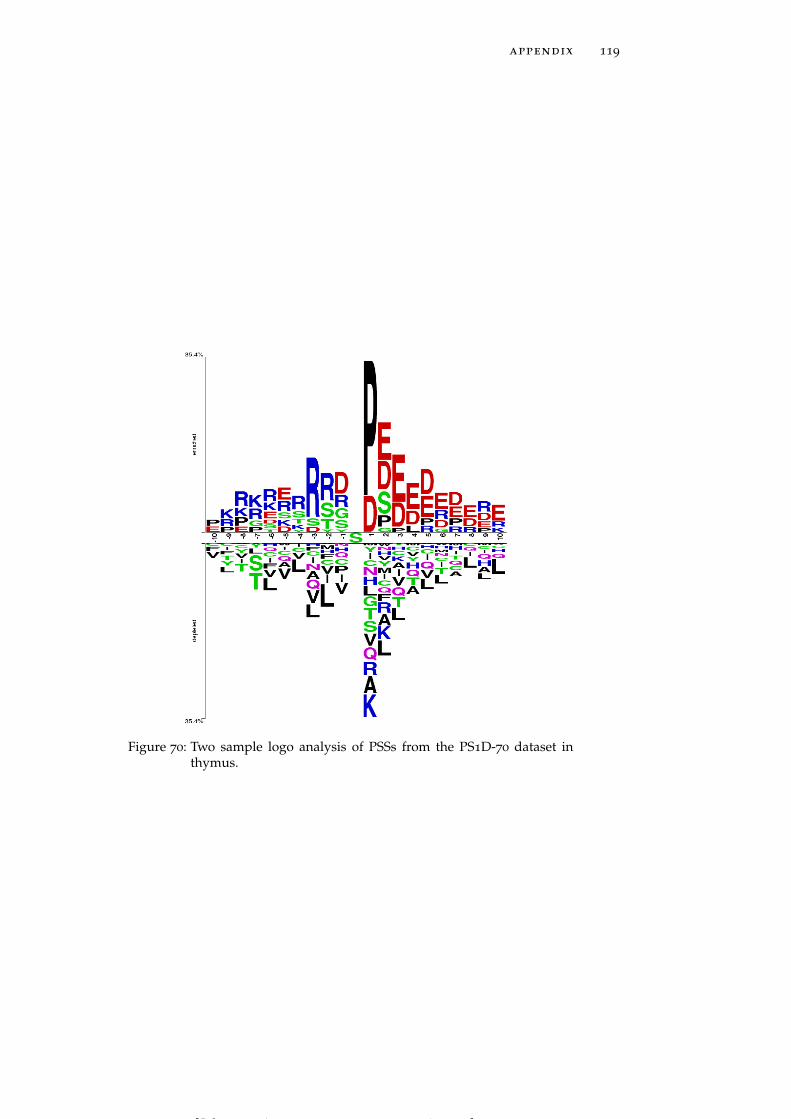
appendix 119
Figure 70: Two sample logo analysis of PSSs from the PS1D-70 dataset inthymus.
[ July 10, 2016 at 22:13 – classicthesis version 4.2 ]
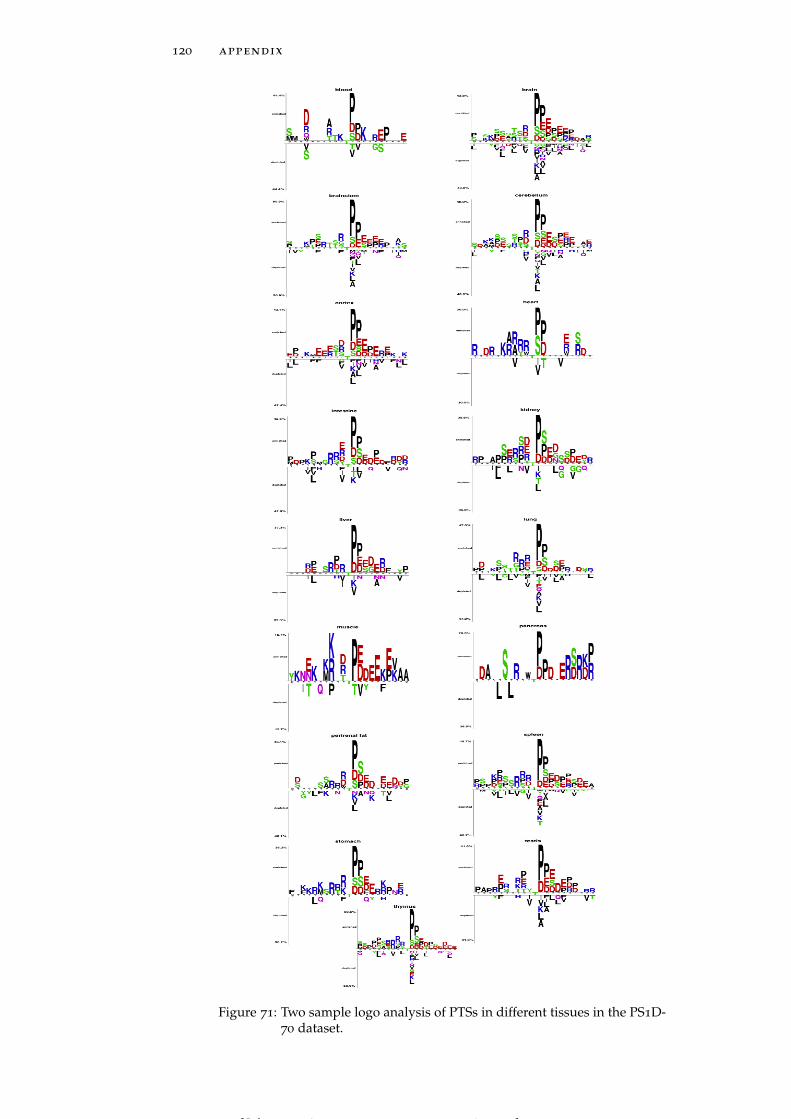
120 appendix
Figure 71: Two sample logo analysis of PTSs in different tissues in the PS1D-70 dataset.
[ July 10, 2016 at 22:13 – classicthesis version 4.2 ]
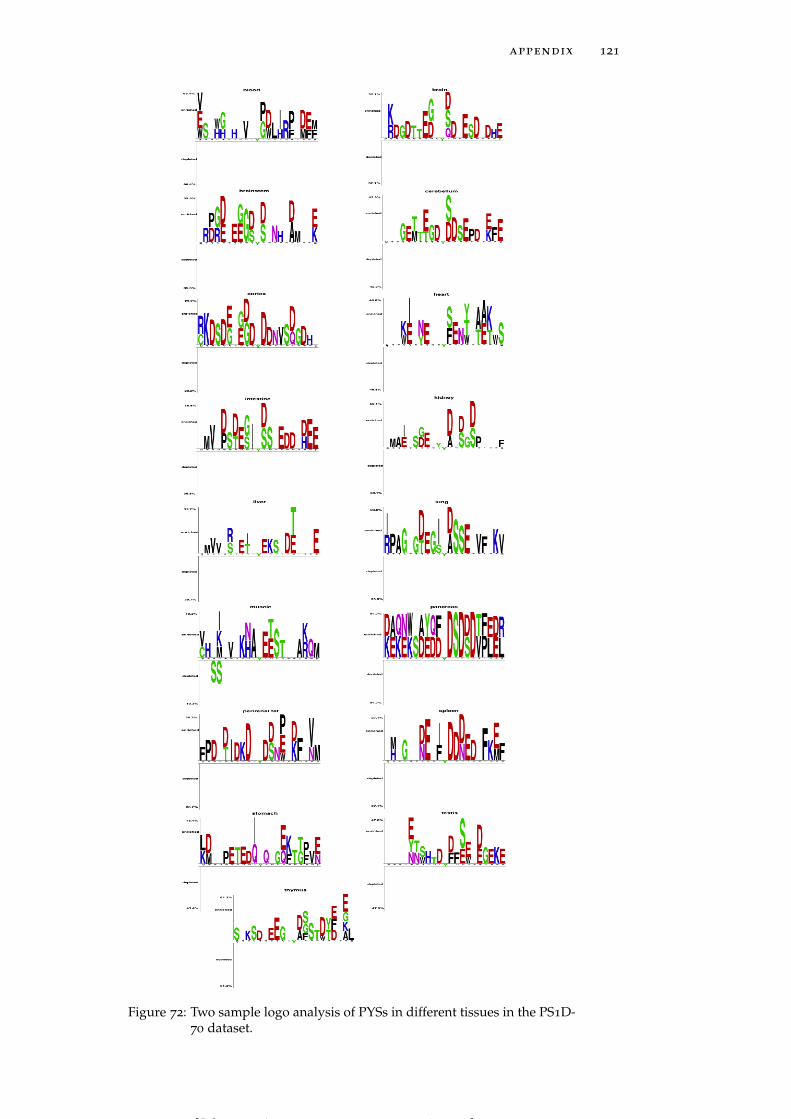
appendix 121
Figure 72: Two sample logo analysis of PYSs in different tissues in the PS1D-70 dataset.
[ July 10, 2016 at 22:13 – classicthesis version 4.2 ]
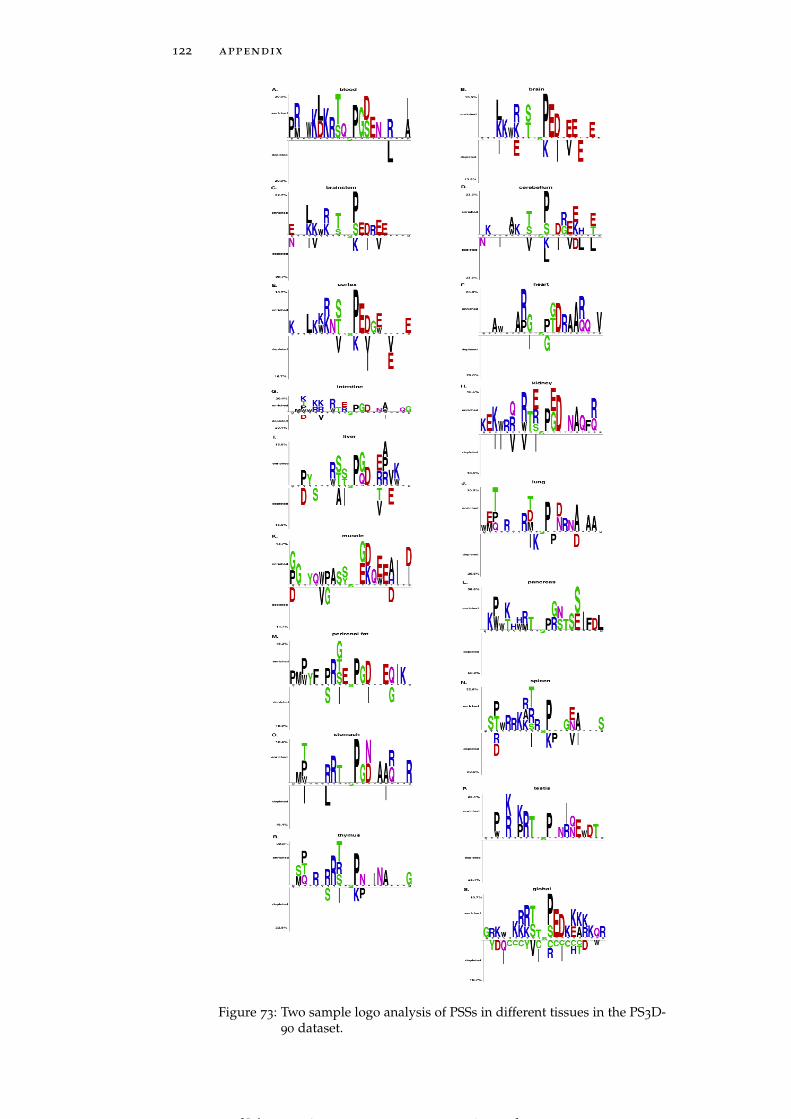
122 appendix
Figure 73: Two sample logo analysis of PSSs in different tissues in the PS3D-90 dataset.
[ July 10, 2016 at 22:13 – classicthesis version 4.2 ]
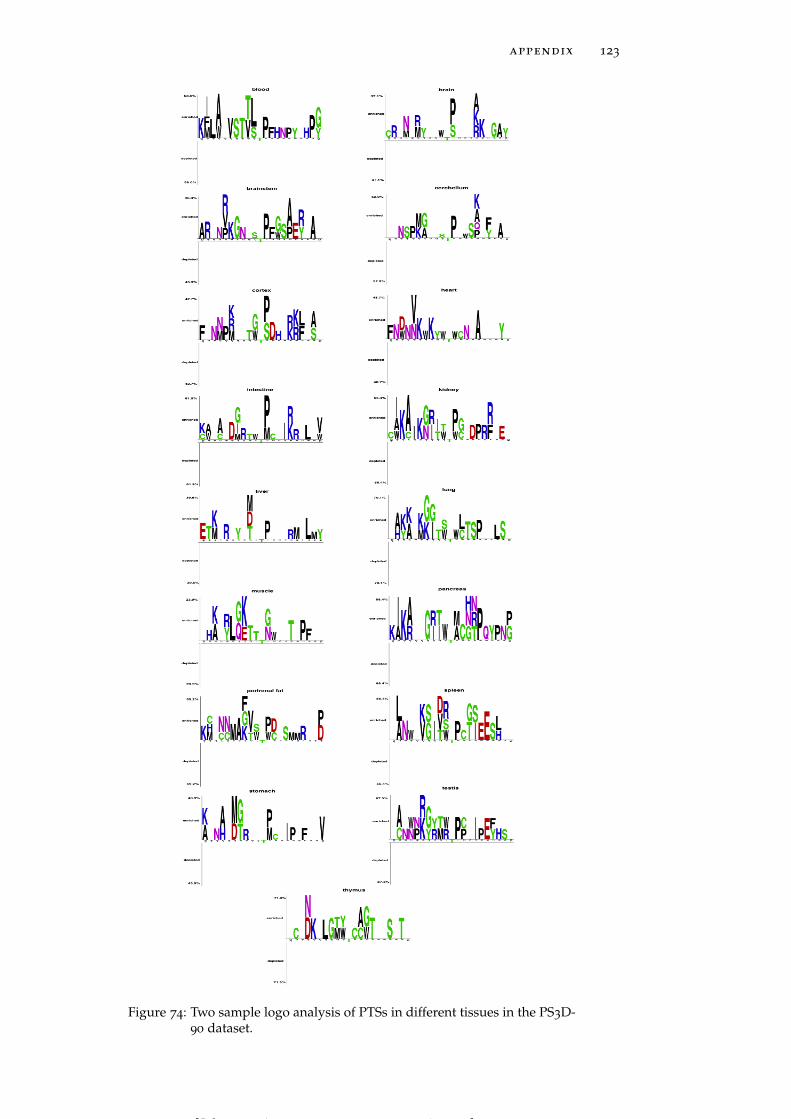
appendix 123
Figure 74: Two sample logo analysis of PTSs in different tissues in the PS3D-90 dataset.
[ July 10, 2016 at 22:13 – classicthesis version 4.2 ]
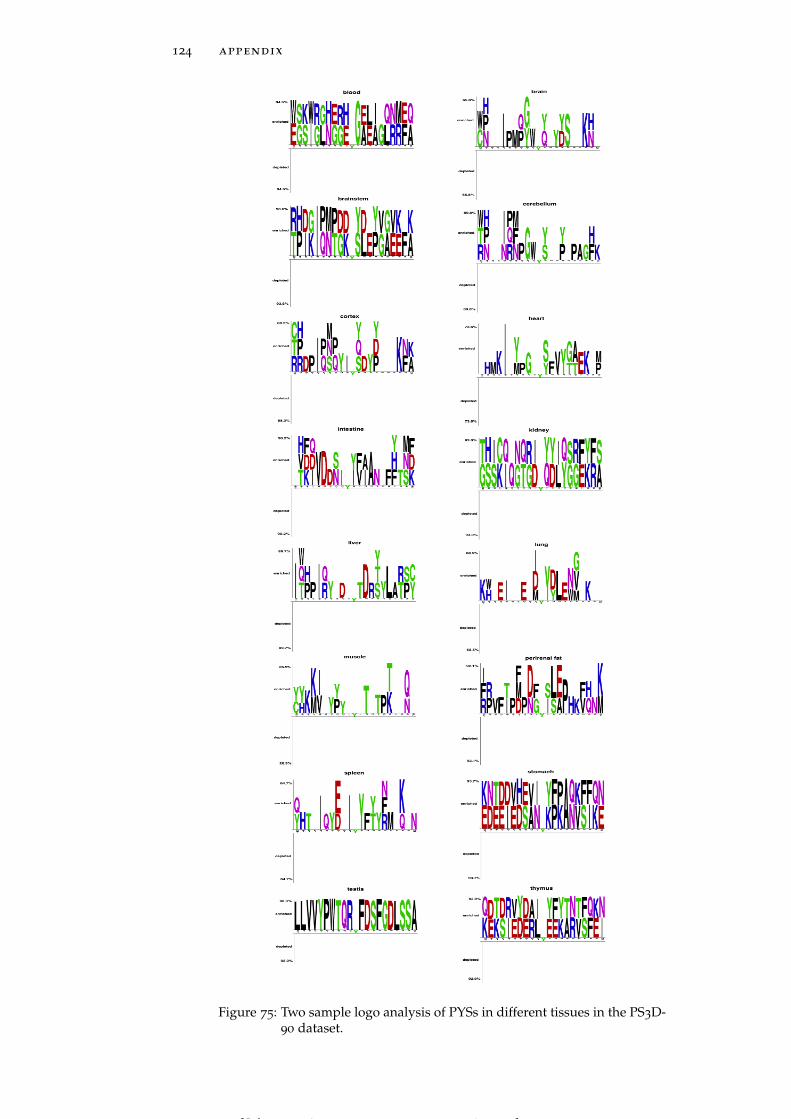
124 appendix
Figure 75: Two sample logo analysis of PYSs in different tissues in the PS3D-90 dataset.
[ July 10, 2016 at 22:13 – classicthesis version 4.2 ]
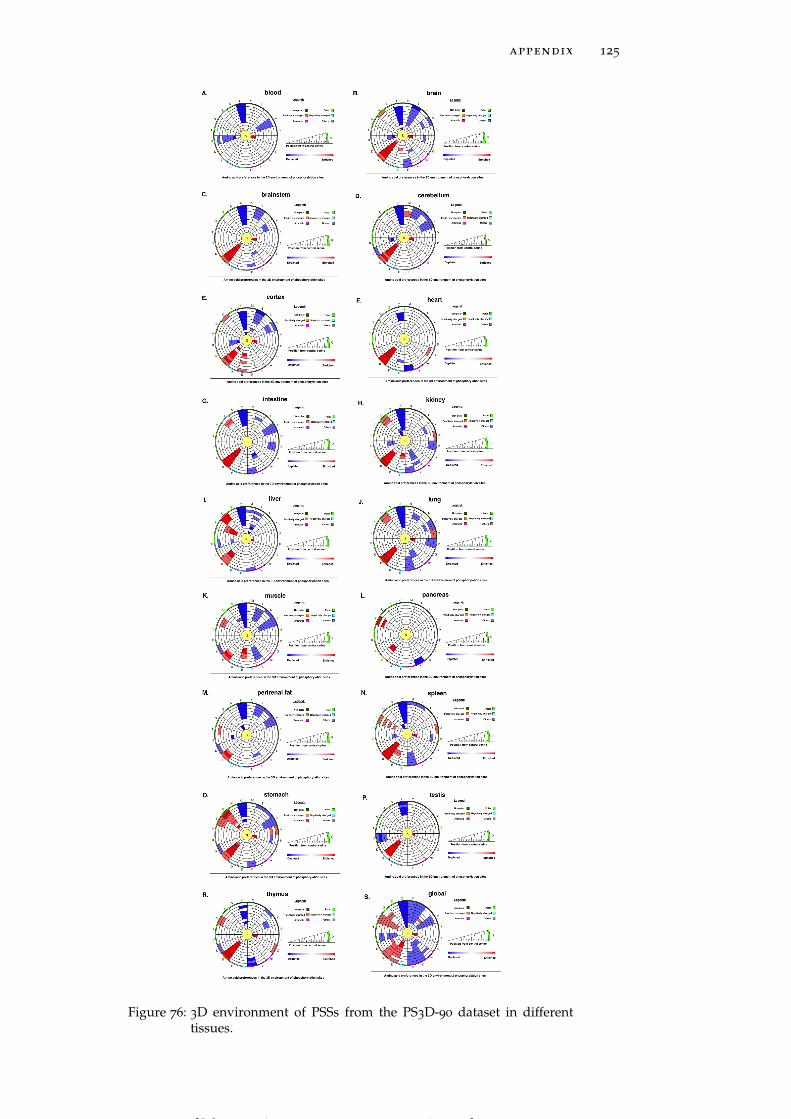
appendix 125
Figure 76: 3D environment of PSSs from the PS3D-90 dataset in differenttissues.
[ July 10, 2016 at 22:13 – classicthesis version 4.2 ]
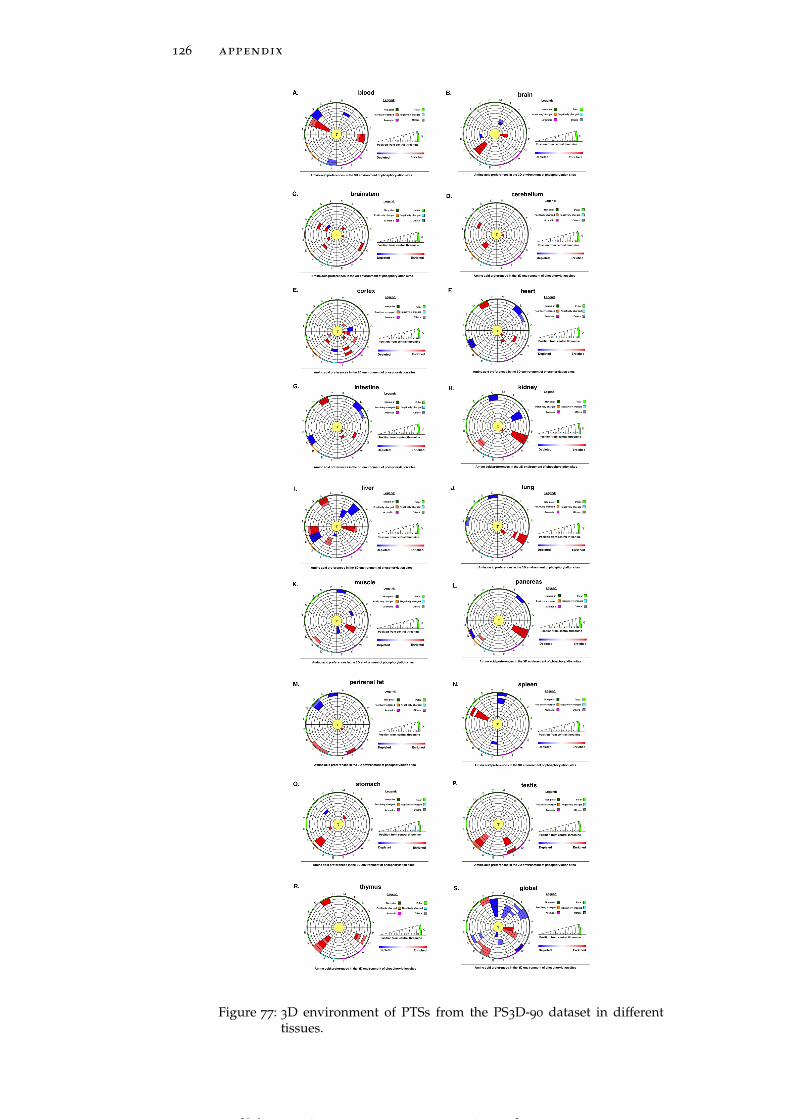
126 appendix
Figure 77: 3D environment of PTSs from the PS3D-90 dataset in differenttissues.
[ July 10, 2016 at 22:13 – classicthesis version 4.2 ]
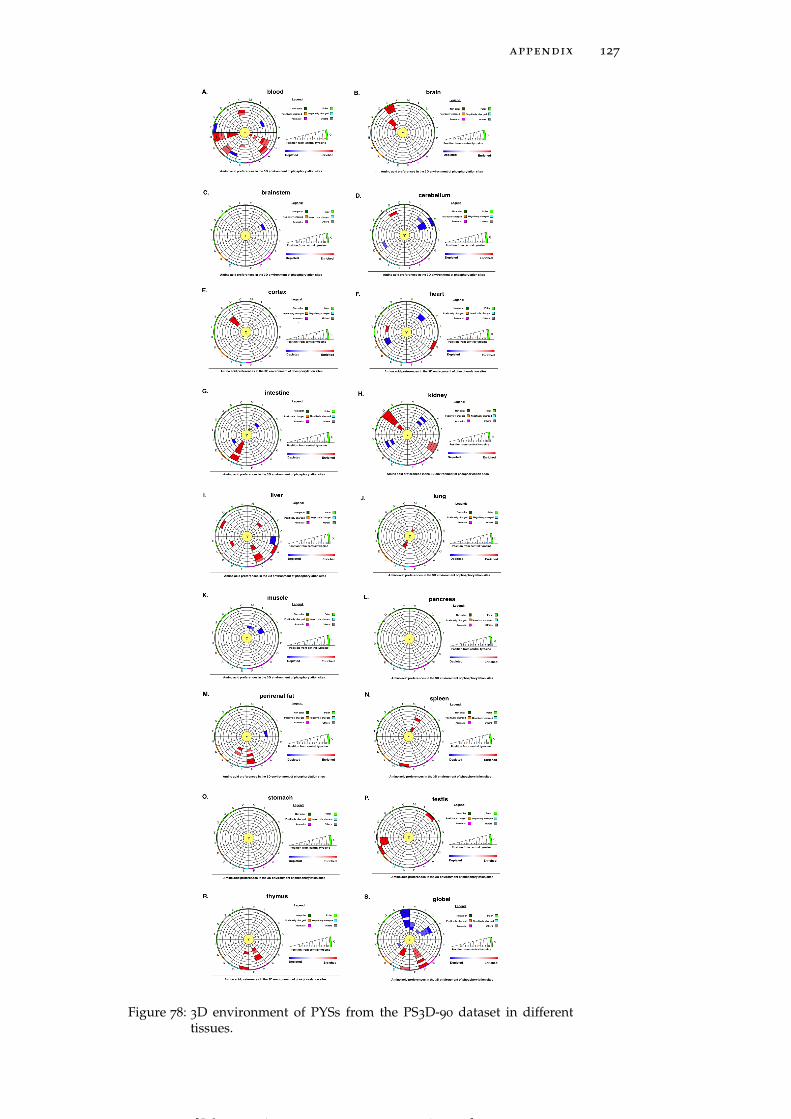
appendix 127
Figure 78: 3D environment of PYSs from the PS3D-90 dataset in differenttissues.
[ July 10, 2016 at 22:13 – classicthesis version 4.2 ]
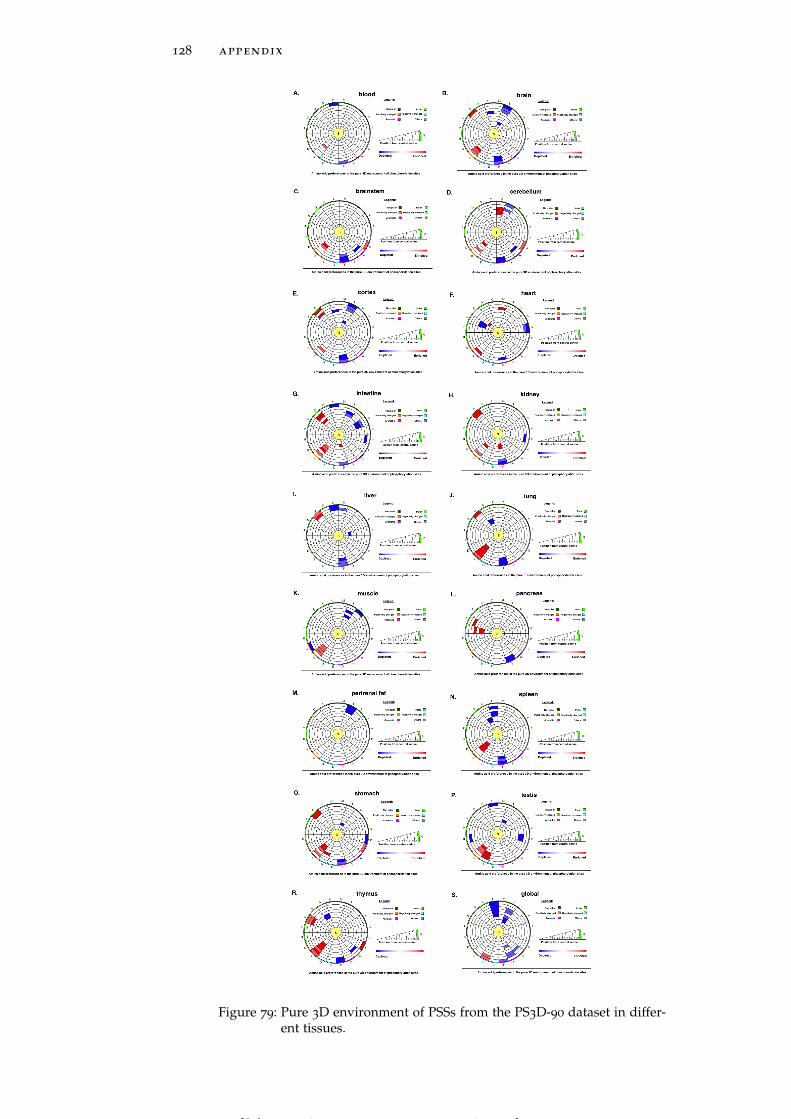
128 appendix
Figure 79: Pure 3D environment of PSSs from the PS3D-90 dataset in differ-ent tissues.
[ July 10, 2016 at 22:13 – classicthesis version 4.2 ]
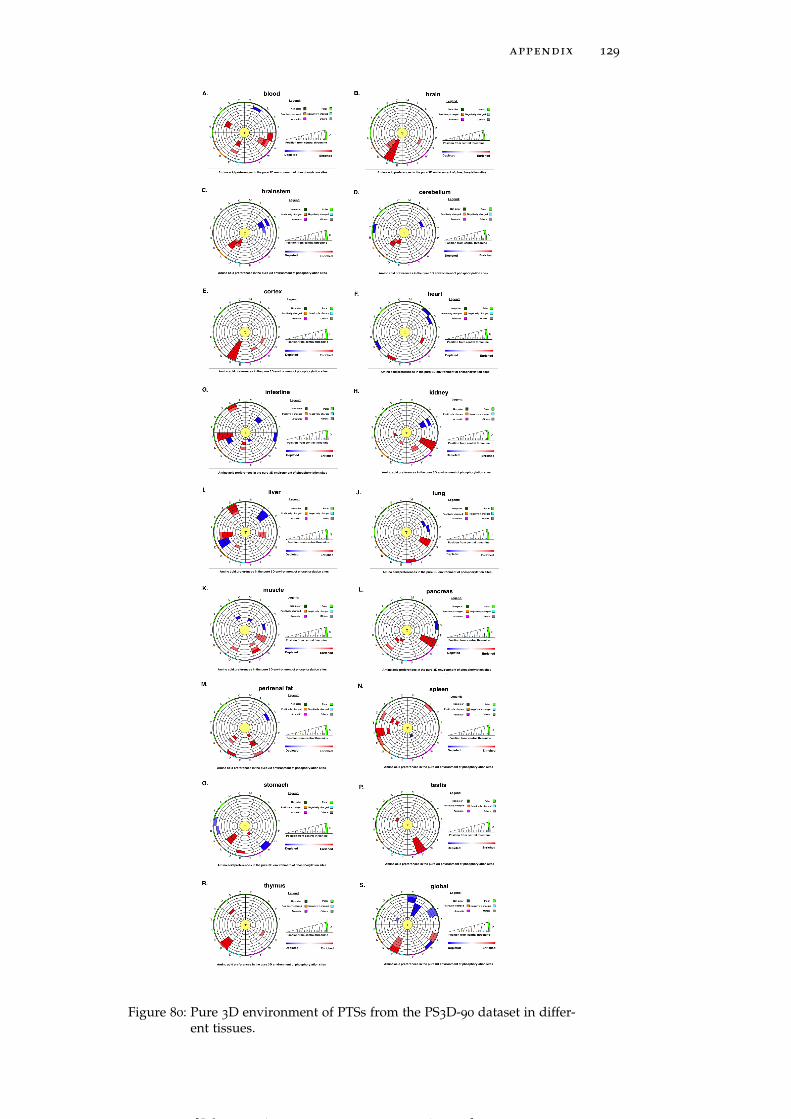
appendix 129
Figure 80: Pure 3D environment of PTSs from the PS3D-90 dataset in differ-ent tissues.
[ July 10, 2016 at 22:13 – classicthesis version 4.2 ]
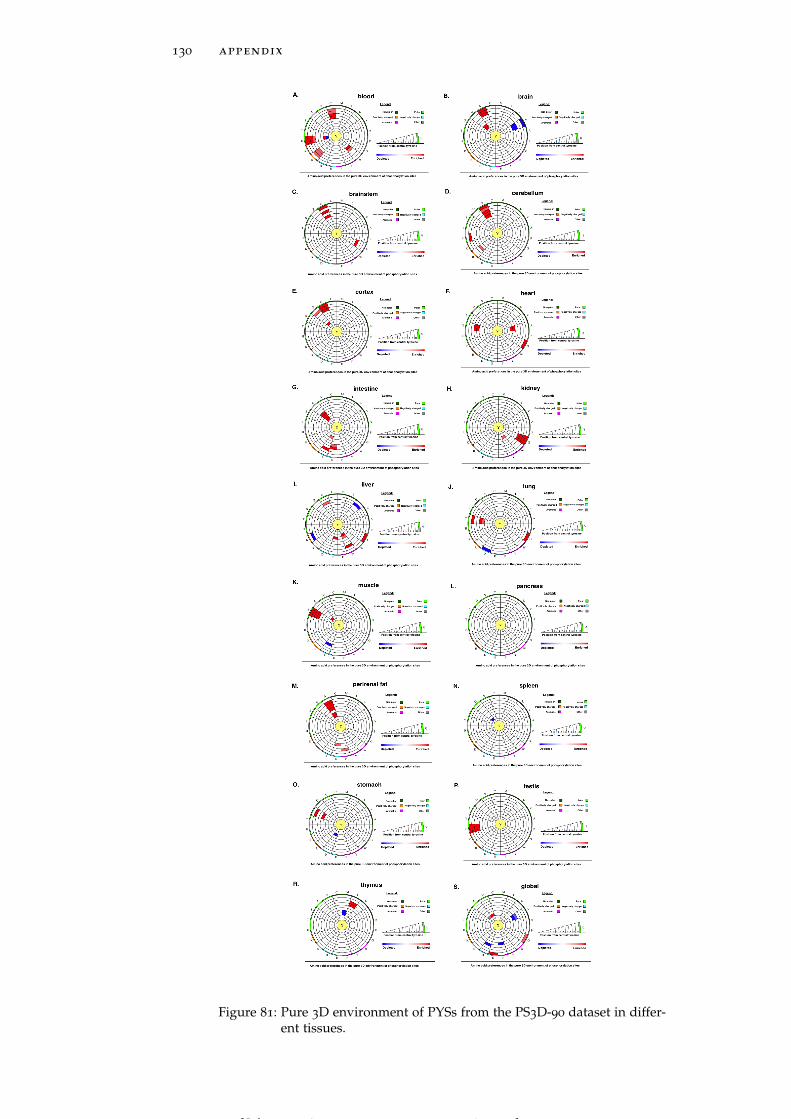
130 appendix
Figure 81: Pure 3D environment of PYSs from the PS3D-90 dataset in differ-ent tissues.
[ July 10, 2016 at 22:13 – classicthesis version 4.2 ]
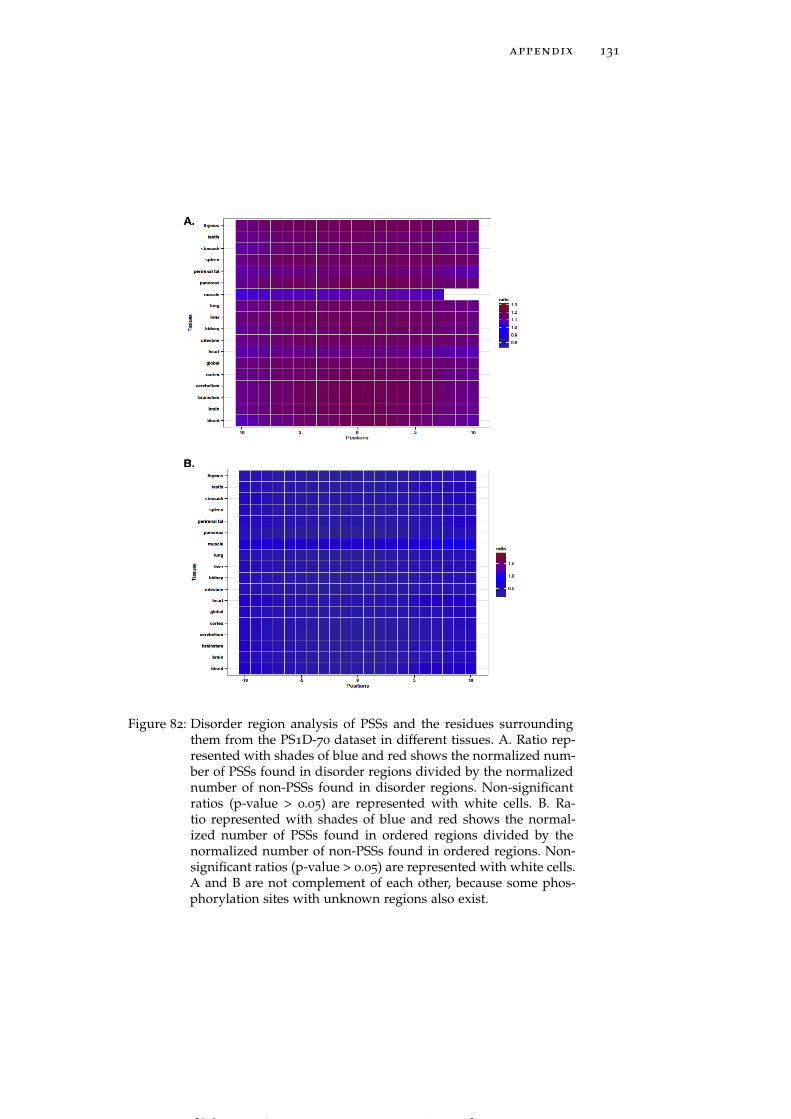
appendix 131
Figure 82: Disorder region analysis of PSSs and the residues surroundingthem from the PS1D-70 dataset in different tissues. A. Ratio rep-resented with shades of blue and red shows the normalized num-ber of PSSs found in disorder regions divided by the normalizednumber of non-PSSs found in disorder regions. Non-significantratios (p-value > 0.05) are represented with white cells. B. Ra-tio represented with shades of blue and red shows the normal-ized number of PSSs found in ordered regions divided by thenormalized number of non-PSSs found in ordered regions. Non-significant ratios (p-value > 0.05) are represented with white cells.A and B are not complement of each other, because some phos-phorylation sites with unknown regions also exist.
[ July 10, 2016 at 22:13 – classicthesis version 4.2 ]
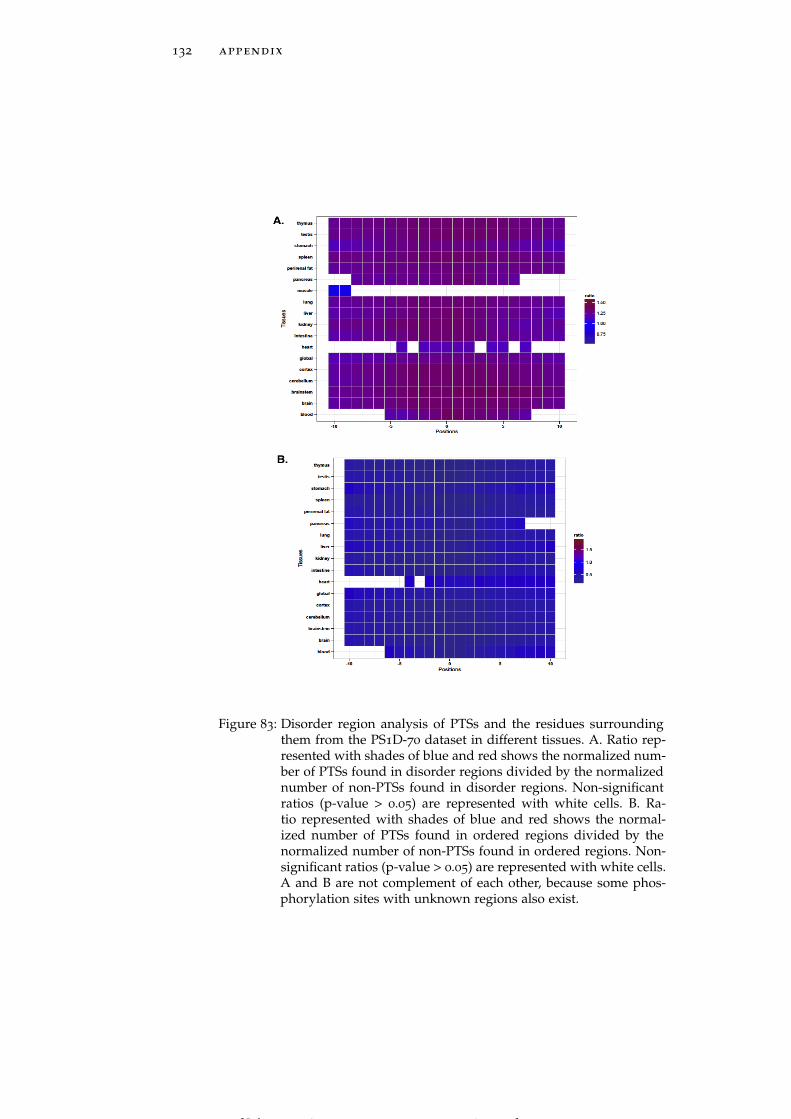
132 appendix
Figure 83: Disorder region analysis of PTSs and the residues surroundingthem from the PS1D-70 dataset in different tissues. A. Ratio rep-resented with shades of blue and red shows the normalized num-ber of PTSs found in disorder regions divided by the normalizednumber of non-PTSs found in disorder regions. Non-significantratios (p-value > 0.05) are represented with white cells. B. Ra-tio represented with shades of blue and red shows the normal-ized number of PTSs found in ordered regions divided by thenormalized number of non-PTSs found in ordered regions. Non-significant ratios (p-value > 0.05) are represented with white cells.A and B are not complement of each other, because some phos-phorylation sites with unknown regions also exist.
[ July 10, 2016 at 22:13 – classicthesis version 4.2 ]
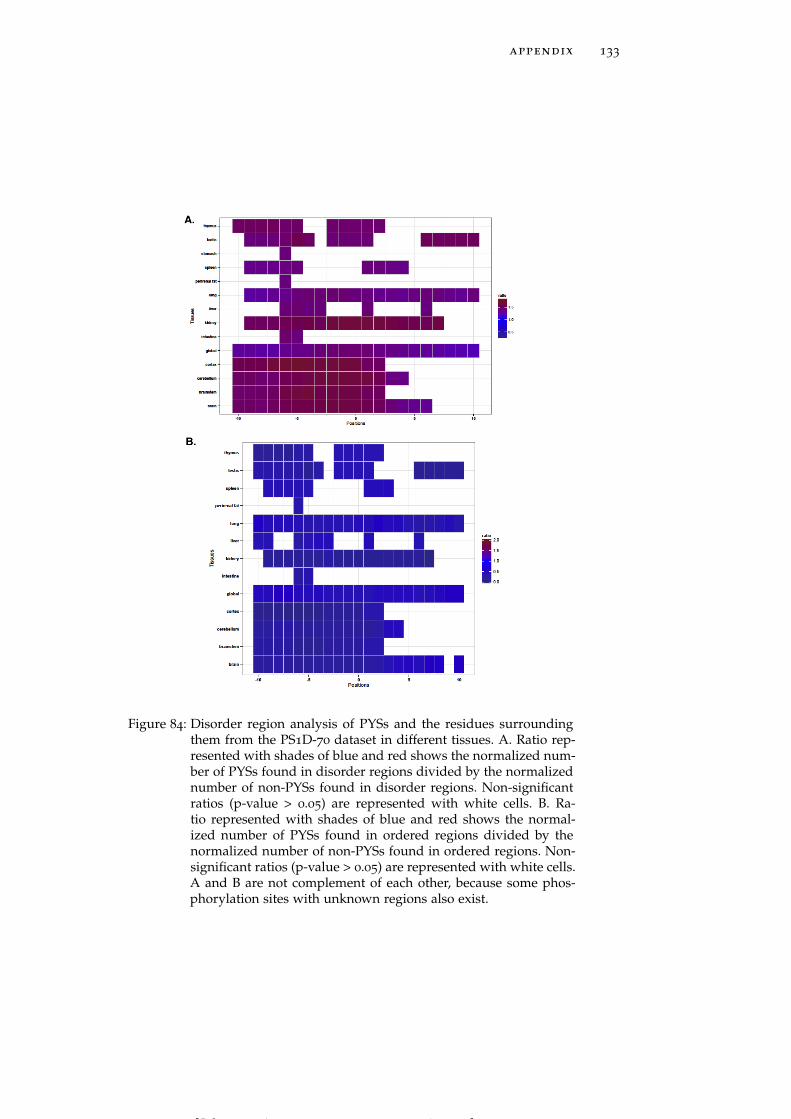
appendix 133
Figure 84: Disorder region analysis of PYSs and the residues surroundingthem from the PS1D-70 dataset in different tissues. A. Ratio rep-resented with shades of blue and red shows the normalized num-ber of PYSs found in disorder regions divided by the normalizednumber of non-PYSs found in disorder regions. Non-significantratios (p-value > 0.05) are represented with white cells. B. Ra-tio represented with shades of blue and red shows the normal-ized number of PYSs found in ordered regions divided by thenormalized number of non-PYSs found in ordered regions. Non-significant ratios (p-value > 0.05) are represented with white cells.A and B are not complement of each other, because some phos-phorylation sites with unknown regions also exist.
[ July 10, 2016 at 22:13 – classicthesis version 4.2 ]

134 appendix
Alpha
Beta
Loop
bloodbrain
brainstemcerebellum
cortexglobalheart
intestinekidneyliverlung
musclepancreas
perirenalFatspleen
stomachtestis
thymus
bloodbrain
brainstemcerebellum
cortexglobalheart
intestinekidneyliverlung
musclepancreas
perirenalFatspleen
stomachtestis
thymus
bloodbrain
brainstemcerebellum
cortexglobalheart
intestinekidneyliverlung
musclepancreas
perirenalFatspleen
stomachtestis
thymus
-9 -8 -7 -6 -5 -4 -3 -2 -1 0 1 2 3 4 5 6 7 8 9 10Sequence position relative to the phosphorylation site
Tissues
0
1
2
ratio
Figure 85: Secondary structure analysis of PSSs and the residues surround-ing them from the PS3D-90 dataset in different tissues. Ratios rep-resented with shades of blue and red show the normalized num-ber of PSSs found in a particular secondary structure divided bythe normalized number of non-PSSs found in the correspondingstructure. Non-significant ratios (p-value > 0.05) are representedwith white cells.
[ July 10, 2016 at 22:13 – classicthesis version 4.2 ]

appendix 135
Alpha
Beta
Loop
braincerebellum
cortexglobalheart
intestinekidneyliver
musclepancreas
perirenalFatspleen
stomachtestis
thymus
braincerebellum
cortexglobalheart
intestinekidneyliver
musclepancreas
perirenalFatspleen
stomachtestis
thymus
braincerebellum
cortexglobalheart
intestinekidneyliver
musclepancreas
perirenalFatspleen
stomachtestis
thymus
-10 -9 -8 -7 -6 -5 -4 -3 -2 -1 0 1 2 3 4 5 6 7 8 9 10Sequence position relative to the phosphorylation site
Tissues
0
1
2
ratio
Figure 86: Secondary structure analysis of PTSs and the residues surround-ing them from the PS3D-90 dataset in different tissues. Ratios rep-resented with shades of blue and red show the normalized num-ber of PTSs found in a particular secondary structure divided bythe normalized number of non-PTSs found in the correspondingstructure. Non-significant ratios (p-value > 0.05) are representedwith white cells.
[ July 10, 2016 at 22:13 – classicthesis version 4.2 ]
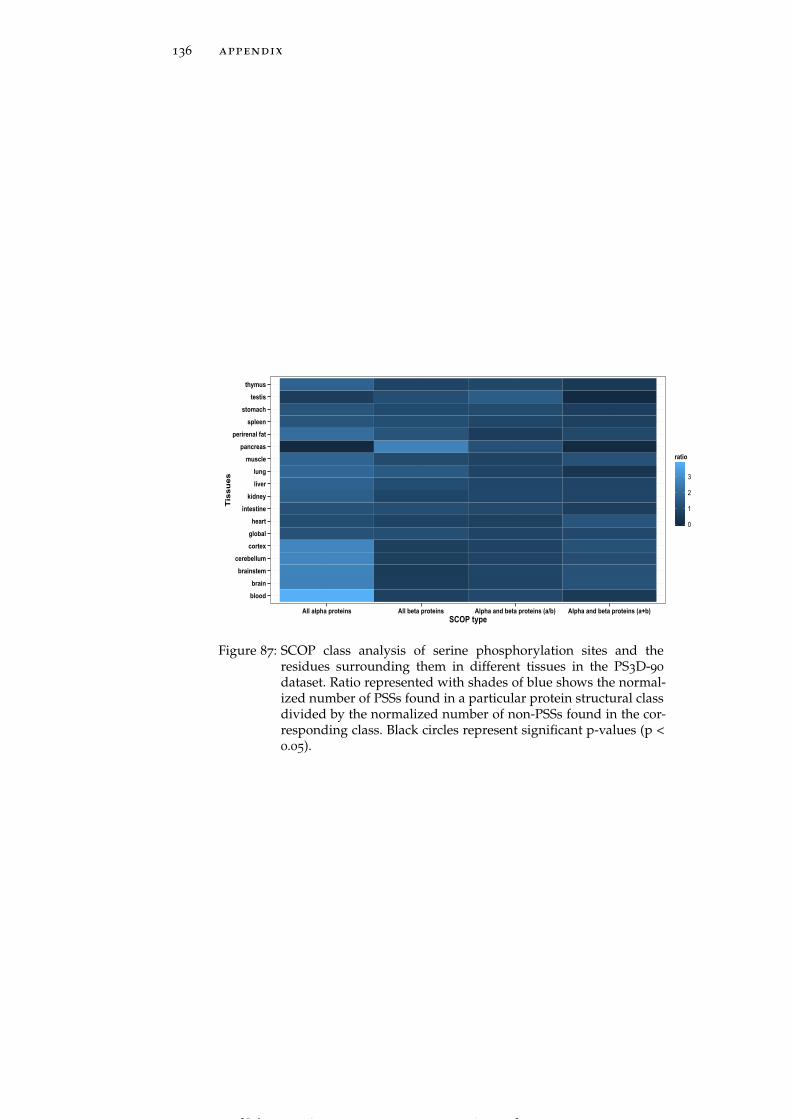
136 appendix
blood
brain
brainstem
cerebellum
cortex
global
heart
intestine
kidney
liver
lung
muscle
pancreas
perirenal fat
spleen
stomach
testis
thymus
All alpha proteins All beta proteins Alpha and beta proteins (a/b) Alpha and beta proteins (a+b)SCOP type
Tissues
0
1
2
3
ratio
Figure 87: SCOP class analysis of serine phosphorylation sites and theresidues surrounding them in different tissues in the PS3D-90
dataset. Ratio represented with shades of blue shows the normal-ized number of PSSs found in a particular protein structural classdivided by the normalized number of non-PSSs found in the cor-responding class. Black circles represent significant p-values (p <0.05).
[ July 10, 2016 at 22:13 – classicthesis version 4.2 ]
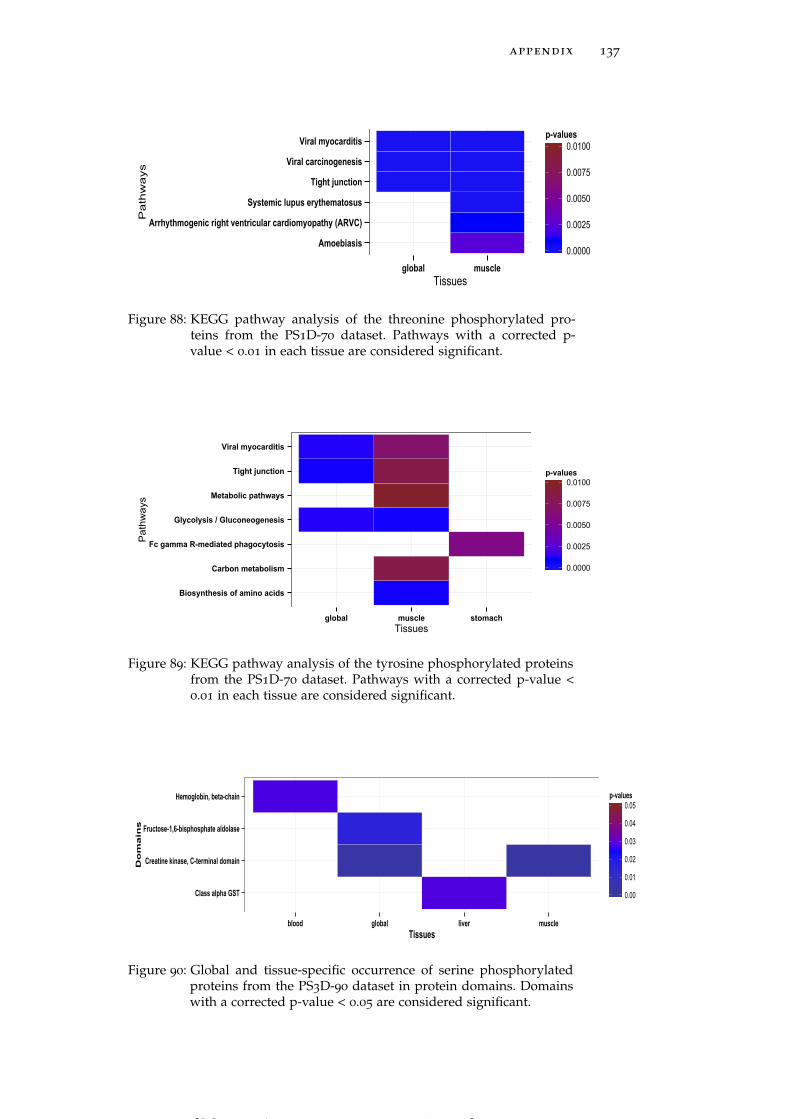
appendix 137
Amoebiasis
Arrhythmogenic right ventricular cardiomyopathy (ARVC)
Systemic lupus erythematosus
Tight junction
Viral carcinogenesis
Viral myocarditis
global muscleTissues
Pathways
0.0000
0.0025
0.0050
0.0075
0.0100p-values
Figure 88: KEGG pathway analysis of the threonine phosphorylated pro-teins from the PS1D-70 dataset. Pathways with a corrected p-value < 0.01 in each tissue are considered significant.
Biosynthesis of amino acids
Carbon metabolism
Fc gamma R-mediated phagocytosis
Glycolysis / Gluconeogenesis
Metabolic pathways
Tight junction
Viral myocarditis
global muscle stomachTissues
Pathways
0.0000
0.0025
0.0050
0.0075
0.0100p-values
Figure 89: KEGG pathway analysis of the tyrosine phosphorylated proteinsfrom the PS1D-70 dataset. Pathways with a corrected p-value <0.01 in each tissue are considered significant.
Class alpha GST
Creatine kinase, C-terminal domain
Fructose-1,6-bisphosphate aldolase
Hemoglobin, beta-chain
blood global liver muscleTissues
Domains
0.00
0.01
0.02
0.03
0.04
0.05p-values
Figure 90: Global and tissue-specific occurrence of serine phosphorylatedproteins from the PS3D-90 dataset in protein domains. Domainswith a corrected p-value < 0.05 are considered significant.
[ July 10, 2016 at 22:13 – classicthesis version 4.2 ]
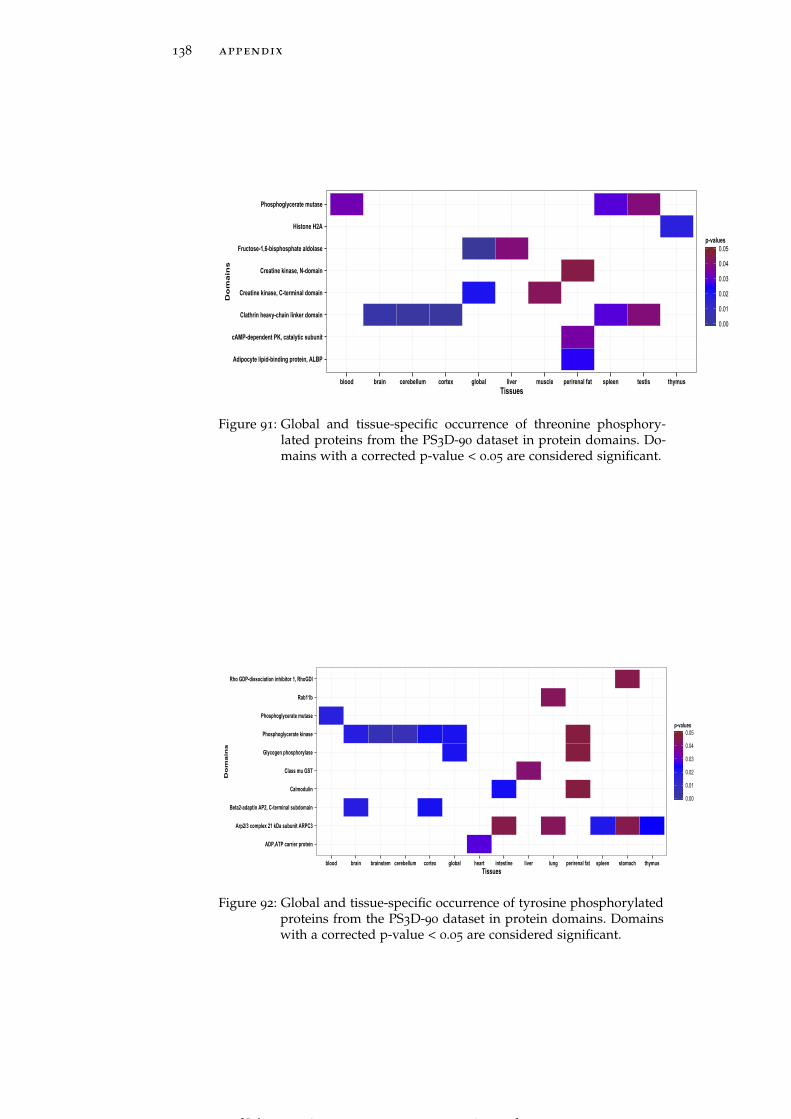
138 appendix
Adipocyte lipid-binding protein, ALBP
cAMP-dependent PK, catalytic subunit
Clathrin heavy-chain linker domain
Creatine kinase, C-terminal domain
Creatine kinase, N-domain
Fructose-1,6-bisphosphate aldolase
Histone H2A
Phosphoglycerate mutase
blood brain cerebellum cortex global liver muscle perirenal fat spleen testis thymusTissues
Domains
0.00
0.01
0.02
0.03
0.04
0.05p-values
Figure 91: Global and tissue-specific occurrence of threonine phosphory-lated proteins from the PS3D-90 dataset in protein domains. Do-mains with a corrected p-value < 0.05 are considered significant.
ADP,ATP carrier protein
Arp2/3 complex 21 kDa subunit ARPC3
Beta2-adaptin AP2, C-terminal subdomain
Calmodulin
Class mu GST
Glycogen phosphorylase
Phosphoglycerate kinase
Phosphoglycerate mutase
Rab11b
Rho GDP-dissociation inhibitor 1, RhoGDI
blood brain brainstem cerebellum cortex global heart intestine liver lung perirenal fat spleen stomach thymusTissues
Domains
0.00
0.01
0.02
0.03
0.04
0.05p-values
Figure 92: Global and tissue-specific occurrence of tyrosine phosphorylatedproteins from the PS3D-90 dataset in protein domains. Domainswith a corrected p-value < 0.05 are considered significant.
[ July 10, 2016 at 22:13 – classicthesis version 4.2 ]
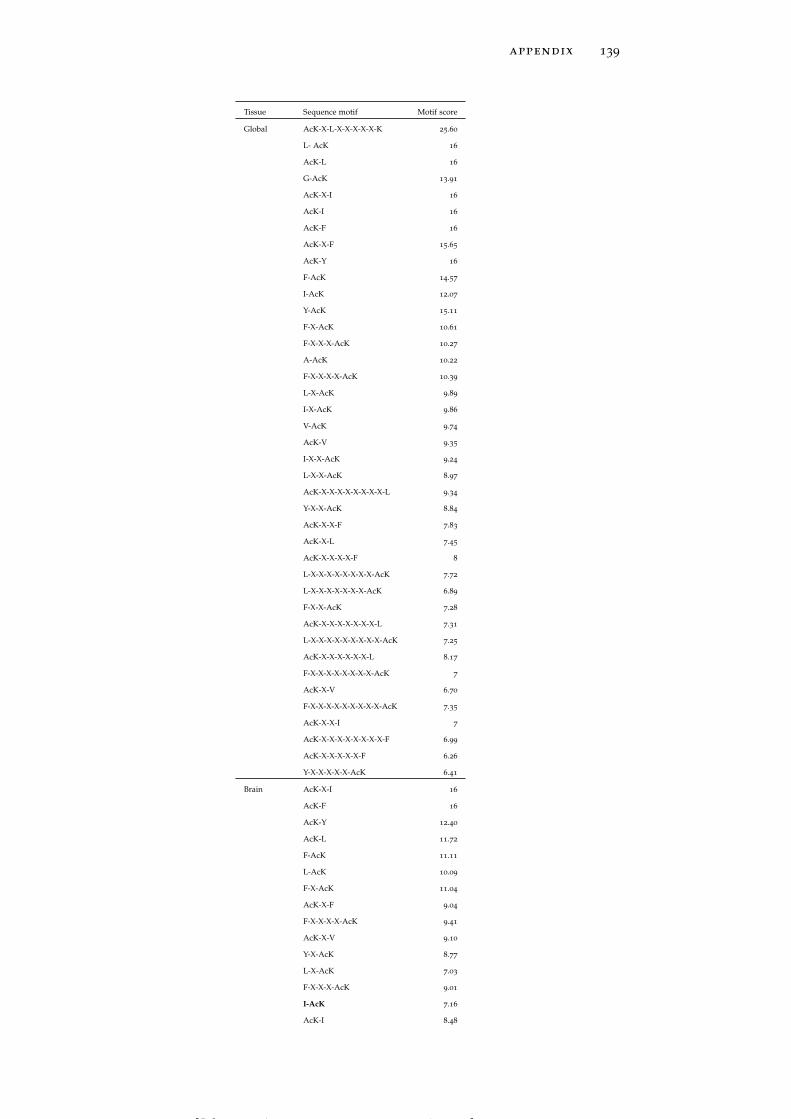
appendix 139
Tissue Sequence motif Motif score
Global AcK-X-L-X-X-X-X-X-K 25.60
L- AcK 16
AcK-L 16
G-AcK 13.91
AcK-X-I 16
AcK-I 16
AcK-F 16
AcK-X-F 15.65
AcK-Y 16
F-AcK 14.57
I-AcK 12.07
Y-AcK 15.11
F-X-AcK 10.61
F-X-X-X-AcK 10.27
A-AcK 10.22
F-X-X-X-X-AcK 10.39
L-X-AcK 9.89
I-X-AcK 9.86
V-AcK 9.74
AcK-V 9.35
I-X-X-AcK 9.24
L-X-X-AcK 8.97
AcK-X-X-X-X-X-X-X-X-L 9.34
Y-X-X-AcK 8.84
AcK-X-X-F 7.83
AcK-X-L 7.45
AcK-X-X-X-X-F 8
L-X-X-X-X-X-X-X-X-AcK 7.72
L-X-X-X-X-X-X-X-AcK 6.89
F-X-X-AcK 7.28
AcK-X-X-X-X-X-X-X-L 7.31
L-X-X-X-X-X-X-X-X-X-AcK 7.25
AcK-X-X-X-X-X-X-L 8.17
F-X-X-X-X-X-X-X-X-AcK 7
AcK-X-V 6.70
F-X-X-X-X-X-X-X-X-X-AcK 7.35
AcK-X-X-I 7
AcK-X-X-X-X-X-X-X-X-F 6.99
AcK-X-X-X-X-X-F 6.26
Y-X-X-X-X-X-AcK 6.41
Brain AcK-X-I 16
AcK-F 16
AcK-Y 12.40
AcK-L 11.72
F-AcK 11.11
L-AcK 10.09
F-X-AcK 11.04
AcK-X-F 9.04
F-X-X-X-X-AcK 9.41
AcK-X-V 9.10
Y-X-AcK 8.77
L-X-AcK 7.03
F-X-X-X-AcK 9.01
I-AcK 7.16
AcK-I 8.48
[ July 10, 2016 at 22:13 – classicthesis version 4.2 ]
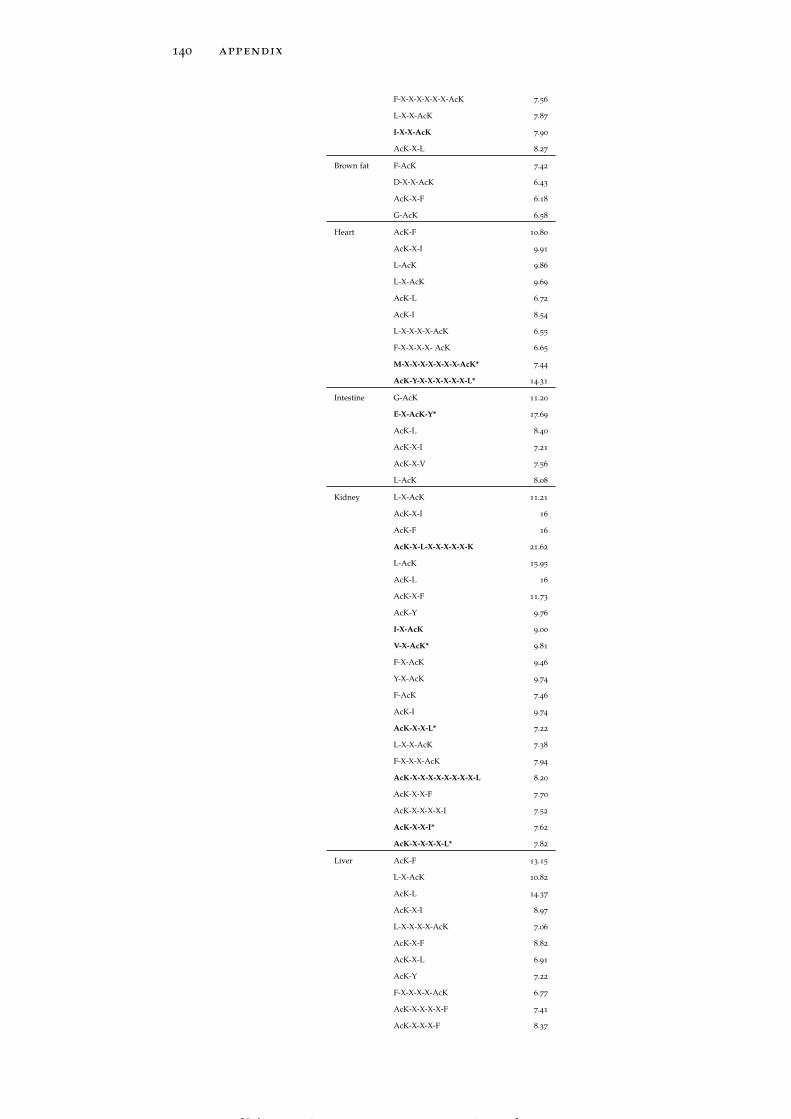
140 appendix
F-X-X-X-X-X-X-AcK 7.56
L-X-X-AcK 7.87
I-X-X-AcK 7.90
AcK-X-L 8.27
Brown fat F-AcK 7.42
D-X-X-AcK 6.43
AcK-X-F 6.18
G-AcK 6.58
Heart AcK-F 10.80
AcK-X-I 9.91
L-AcK 9.86
L-X-AcK 9.69
AcK-L 6.72
AcK-I 8.54
L-X-X-X-X-AcK 6.55
F-X-X-X-X- AcK 6.65
M-X-X-X-X-X-X-X-AcK* 7.44
AcK-Y-X-X-X-X-X-X-L* 14.31
Intestine G-AcK 11.20
E-X-AcK-Y* 17.69
AcK-L 8.40
AcK-X-I 7.21
AcK-X-V 7.56
L-AcK 8.08
Kidney L-X-AcK 11.21
AcK-X-I 16
AcK-F 16
AcK-X-L-X-X-X-X-X-K 21.62
L-AcK 15.95
AcK-L 16
AcK-X-F 11.73
AcK-Y 9.76
I-X-AcK 9.00
V-X-AcK* 9.81
F-X-AcK 9.46
Y-X-AcK 9.74
F-AcK 7.46
AcK-I 9.74
AcK-X-X-L* 7.22
L-X-X-AcK 7.38
F-X-X-X-AcK 7.94
AcK-X-X-X-X-X-X-X-X-L 8.20
AcK-X-X-F 7.70
AcK-X-X-X-X-I 7.52
AcK-X-X-I* 7.62
AcK-X-X-X-X-L* 7.82
Liver AcK-F 13.15
L-X-AcK 10.82
AcK-L 14.37
AcK-X-I 8.97
L-X-X-X-X-AcK 7.06
AcK-X-F 8.82
AcK-X-L 6.91
AcK-Y 7.22
F-X-X-X-X-AcK 6.77
AcK-X-X-X-X-F 7.41
AcK-X-X-X-F 8.37
[ July 10, 2016 at 22:13 – classicthesis version 4.2 ]
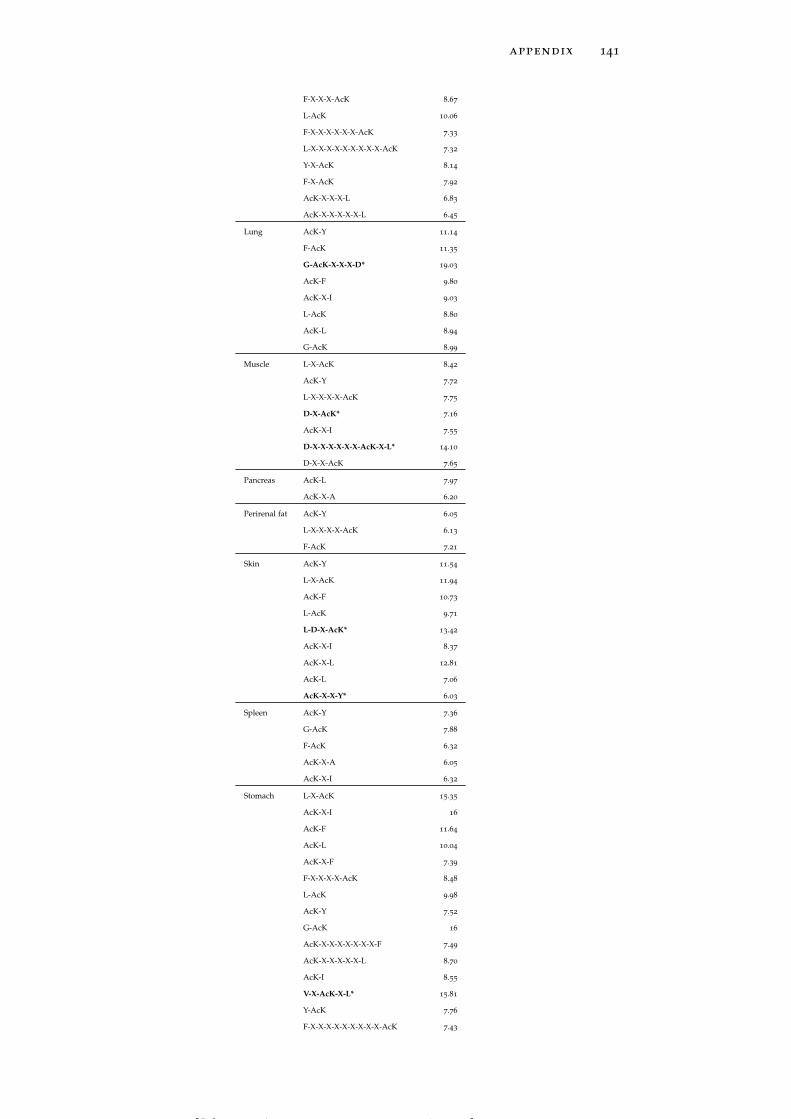
appendix 141
F-X-X-X-AcK 8.67
L-AcK 10.06
F-X-X-X-X-X-X-AcK 7.33
L-X-X-X-X-X-X-X-X-X-AcK 7.32
Y-X-AcK 8.14
F-X-AcK 7.92
AcK-X-X-X-L 6.83
AcK-X-X-X-X-X-L 6.45
Lung AcK-Y 11.14
F-AcK 11.35
G-AcK-X-X-X-D* 19.03
AcK-F 9.80
AcK-X-I 9.03
L-AcK 8.80
AcK-L 8.94
G-AcK 8.99
Muscle L-X-AcK 8.42
AcK-Y 7.72
L-X-X-X-X-AcK 7.75
D-X-AcK* 7.16
AcK-X-I 7.55
D-X-X-X-X-X-X-AcK-X-L* 14.10
D-X-X-AcK 7.65
Pancreas AcK-L 7.97
AcK-X-A 6.20
Perirenal fat AcK-Y 6.05
L-X-X-X-X-AcK 6.13
F-AcK 7.21
Skin AcK-Y 11.54
L-X-AcK 11.94
AcK-F 10.73
L-AcK 9.71
L-D-X-AcK* 13.42
AcK-X-I 8.37
AcK-X-L 12.81
AcK-L 7.06
AcK-X-X-Y* 6.03
Spleen AcK-Y 7.36
G-AcK 7.88
F-AcK 6.32
AcK-X-A 6.05
AcK-X-I 6.32
Stomach L-X-AcK 15.35
AcK-X-I 16
AcK-F 11.64
AcK-L 10.04
AcK-X-F 7.39
F-X-X-X-X-AcK 8.48
L-AcK 9.98
AcK-Y 7.52
G-AcK 16
AcK-X-X-X-X-X-X-X-F 7.49
AcK-X-X-X-X-X-L 8.70
AcK-I 8.55
V-X-AcK-X-L* 15.81
Y-AcK 7.76
F-X-X-X-X-X-X-X-X-X-AcK 7.43
[ July 10, 2016 at 22:13 – classicthesis version 4.2 ]
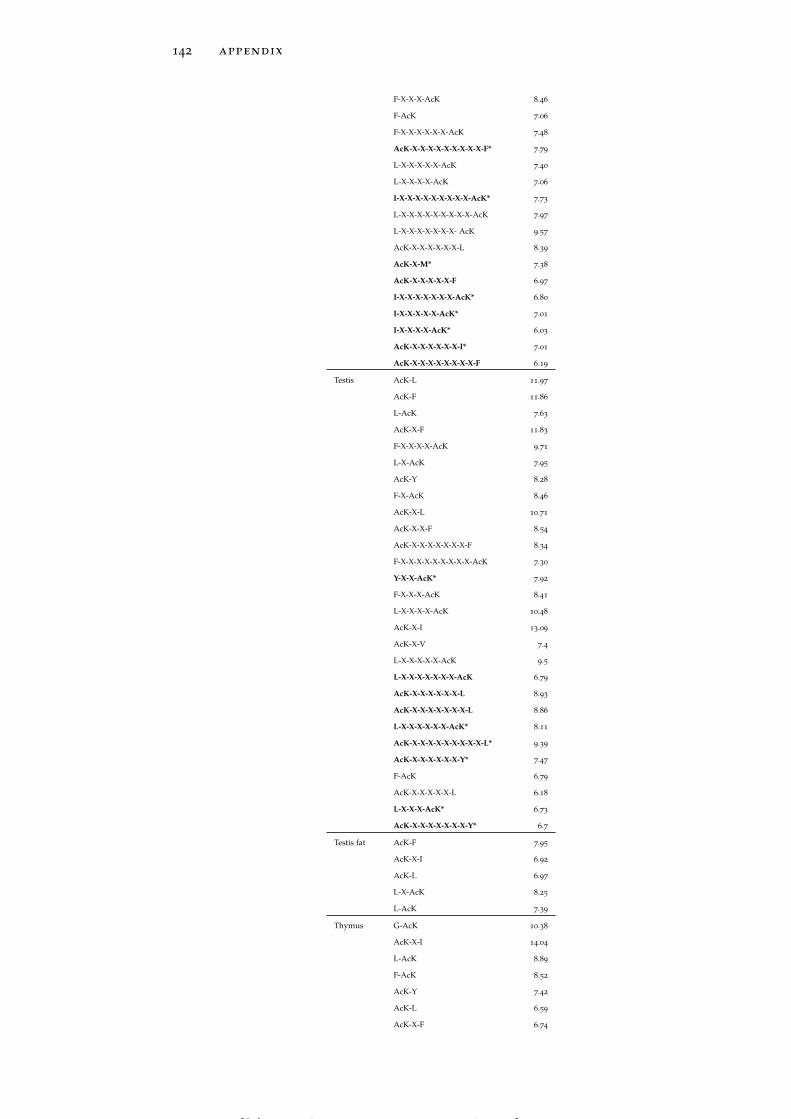
142 appendix
F-X-X-X-AcK 8.46
F-AcK 7.06
F-X-X-X-X-X-X-AcK 7.48
AcK-X-X-X-X-X-X-X-X-X-F* 7.79
L-X-X-X-X-X-AcK 7.40
L-X-X-X-X-AcK 7.06
I-X-X-X-X-X-X-X-X-X-AcK* 7.73
L-X-X-X-X-X-X-X-X-X-AcK 7.97
L-X-X-X-X-X-X-X- AcK 9.57
AcK-X-X-X-X-X-X-L 8.39
AcK-X-M* 7.38
AcK-X-X-X-X-X-F 6.97
I-X-X-X-X-X-X-X-AcK* 6.80
I-X-X-X-X-X-AcK* 7.01
I-X-X-X-X-AcK* 6.03
AcK-X-X-X-X-X-X-I* 7.01
AcK-X-X-X-X-X-X-X-X-F 6.19
Testis AcK-L 11.97
AcK-F 11.86
L-AcK 7.63
AcK-X-F 11.83
F-X-X-X-X-AcK 9.71
L-X-AcK 7.95
AcK-Y 8.28
F-X-AcK 8.46
AcK-X-L 10.71
AcK-X-X-F 8.54
AcK-X-X-X-X-X-X-X-F 8.34
F-X-X-X-X-X-X-X-X-X-AcK 7.30
Y-X-X-AcK* 7.92
F-X-X-X-AcK 8.41
L-X-X-X-X-AcK 10.48
AcK-X-I 13.09
AcK-X-V 7.4
L-X-X-X-X-X-AcK 9.5
L-X-X-X-X-X-X-X-AcK 6.79
AcK-X-X-X-X-X-X-L 8.93
AcK-X-X-X-X-X-X-X-L 8.86
L-X-X-X-X-X-X-AcK* 8.11
AcK-X-X-X-X-X-X-X-X-X-L* 9.39
AcK-X-X-X-X-X-X-Y* 7.47
F-AcK 6.79
AcK-X-X-X-X-X-L 6.18
L-X-X-X-AcK* 6.73
AcK-X-X-X-X-X-X-X-Y* 6.7
Testis fat AcK-F 7.95
AcK-X-I 6.92
AcK-L 6.97
L-X-AcK 8.25
L-AcK 7.39
Thymus G-AcK 10.38
AcK-X-I 14.04
L-AcK 8.89
F-AcK 8.52
AcK-Y 7.42
AcK-L 6.59
AcK-X-F 6.74
[ July 10, 2016 at 22:13 – classicthesis version 4.2 ]

appendix 143
AcK-I 6.56
AcK-F 7.05
AcK-X-X-X-X-X-I* 6.02
Table 12: Summary of sequence motifs associated with LASs in the LAS1Ddataset. Motifs in bold correspond to tissue-specific motifs. Motifsin bold with stars (*) are not observed in global LASs. AcK and Xrepresent acetylated lysine residues and wildcard residues, respec-tively. Only statistically significant motifs are shown (p < 0.000001).
[ July 10, 2016 at 22:13 – classicthesis version 4.2 ]

144 appendix
Tissue Sequence motif Motif score
Global K-X-X-X-X-X-AcK-X-X-X-X-X-X-X-X-D 8.40
AcK-X-D-X-X-X-X-X-K 9.76
AcK-F-X-X-X-X-K 8.19
K-X-D-X-X-X-X-X-AcK 9.67
K-X-X-X-X-X-AcK-X-X-X-T 7.44
D-X-X-AcK 4.07
AcK-X-X-X-X-X-X-X-K 3.77
K-X-X-X-X-AcK-X-X-X-X-X-X-X-X-X-F 10.94
K-X-X-X-X-AcK 6.05
R-X-X-X-X-X-X-X-X-X-AcK 3.80
K-X-X-X-X-X-X-X-AcK 3.93
AcK-X-X-X-X-K 4.74
G-X-X-X-AcK 4.53
K-X-X-X-T-X-AcK 7.25
K-X-AcK 3.39
AcK-X-K 4.28
Brain K-F-X-X-X-X-AcK* 8.02
AcK-F-X-X-X-X-K 7.95
AcK-X-X-F-X-X-X-X-K* 7.02
K-X-X-X-X-X-X-X-AcK 3.59
K-X-X-X-X-X-AcK 3.46
E-X-AcK-V* 8.81
AcK-X-X-X-X-X-X-X-A* 3.83
AcK-X-X-X-X-X-K* 3.67
K-X-X-X-X-X-X-X-X-AcK 4.29
AcK-X-X-X-X-X-X-R* 4.11
Brown fat F-X-X-X-X-X-X-AcK* 3.30
F-AcK 3.33
K-X-X-X-X-X-X-X-AcK 3.54
Heart M-AcK* 4.12
E-X-AcK* 4.38
K-X-X-X-X-X-AcK-X-X-X-X-E* 6.90
K-X-X-X-X-X-X-X-AcK 3.25
G-X-X-X-X-X-X-X-X-X-AcK-X-X-X-K* 7.80
Intestine No motif
Kidney R-X-X-X-X-X-X-X-X-X-AcK 4.49
K-X-X-X-X-X-AcK 3.70
AcK-X-X-X-X-X-K 3.37
K-X-X-X-X-X-X-X-AcK-X-X-R* 7.15
L-X-AcK-X-X-X-K* 7.04
Liver D-X-X-X-X-AcK* 3.33
D-X-X-X-X-X-AcK* 3.09
Lung AcK-X-X-R* 3.29
AcK-X-D-X-X-X-X-X-K 6.37
Muscle K-X-X-X-X-X-AcK 3.79
AcK-X-X-X-X-X-K 4.53
K-X-X-X-X-X-X-X-X-AcK 4.64
AcK-X-X-X-X-X-X-X-X-K* 4.01
Pancreas S-X-X-X-X-AcK 3.05
Perirenal fat No motif
Skin F-AcK 3.34
L-X-X-X-L-X-AcK* 6.39
AcK-X-X-Y* 3.25
Spleen S-X-X-X-X-AcK 3.27
AcK-X-X-X-X-X-K 3.52
K-X-X-X-X-X-X-X-AcK 3.22
[ July 10, 2016 at 22:13 – classicthesis version 4.2 ]
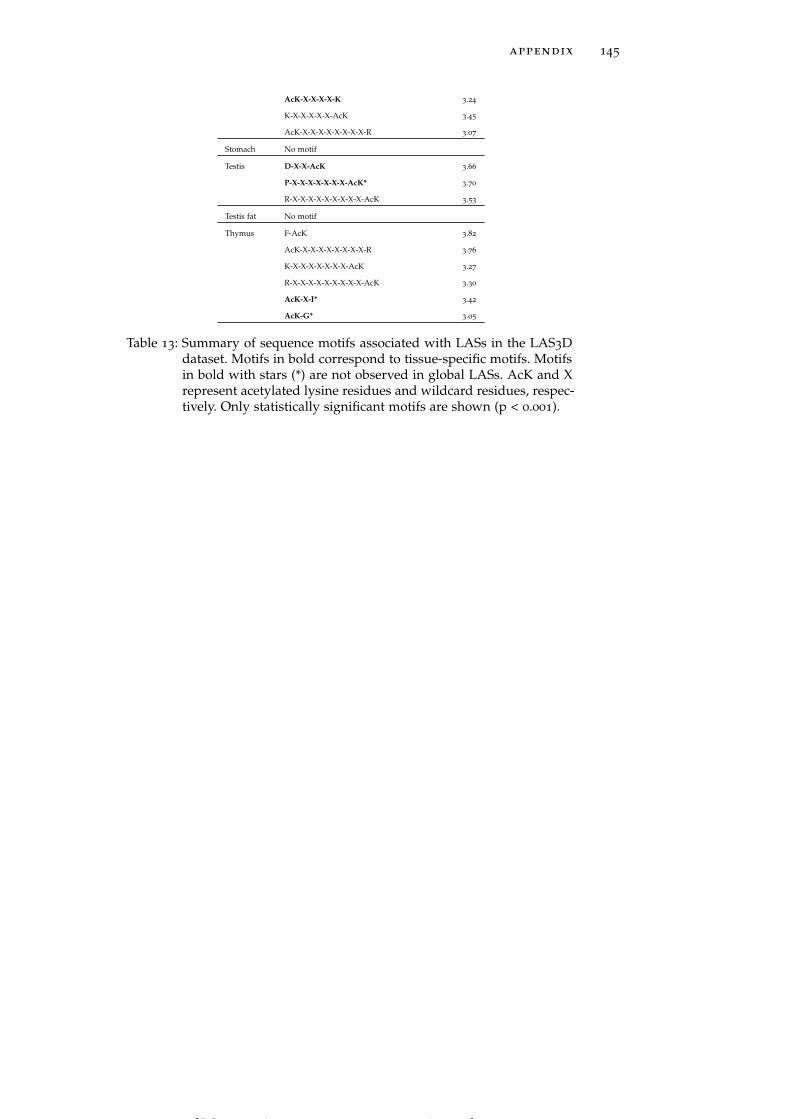
appendix 145
AcK-X-X-X-X-K 3.24
K-X-X-X-X-X-AcK 3.45
AcK-X-X-X-X-X-X-X-X-R 3.07
Stomach No motif
Testis D-X-X-AcK 3.66
P-X-X-X-X-X-X-X-AcK* 3.70
R-X-X-X-X-X-X-X-X-X-AcK 3.53
Testis fat No motif
Thymus F-AcK 3.82
AcK-X-X-X-X-X-X-X-X-R 3.76
K-X-X-X-X-X-X-X-AcK 3.27
R-X-X-X-X-X-X-X-X-X-AcK 3.30
AcK-X-I* 3.42
AcK-G* 3.05
Table 13: Summary of sequence motifs associated with LASs in the LAS3Ddataset. Motifs in bold correspond to tissue-specific motifs. Motifsin bold with stars (*) are not observed in global LASs. AcK and Xrepresent acetylated lysine residues and wildcard residues, respec-tively. Only statistically significant motifs are shown (p < 0.001).
[ July 10, 2016 at 22:13 – classicthesis version 4.2 ]
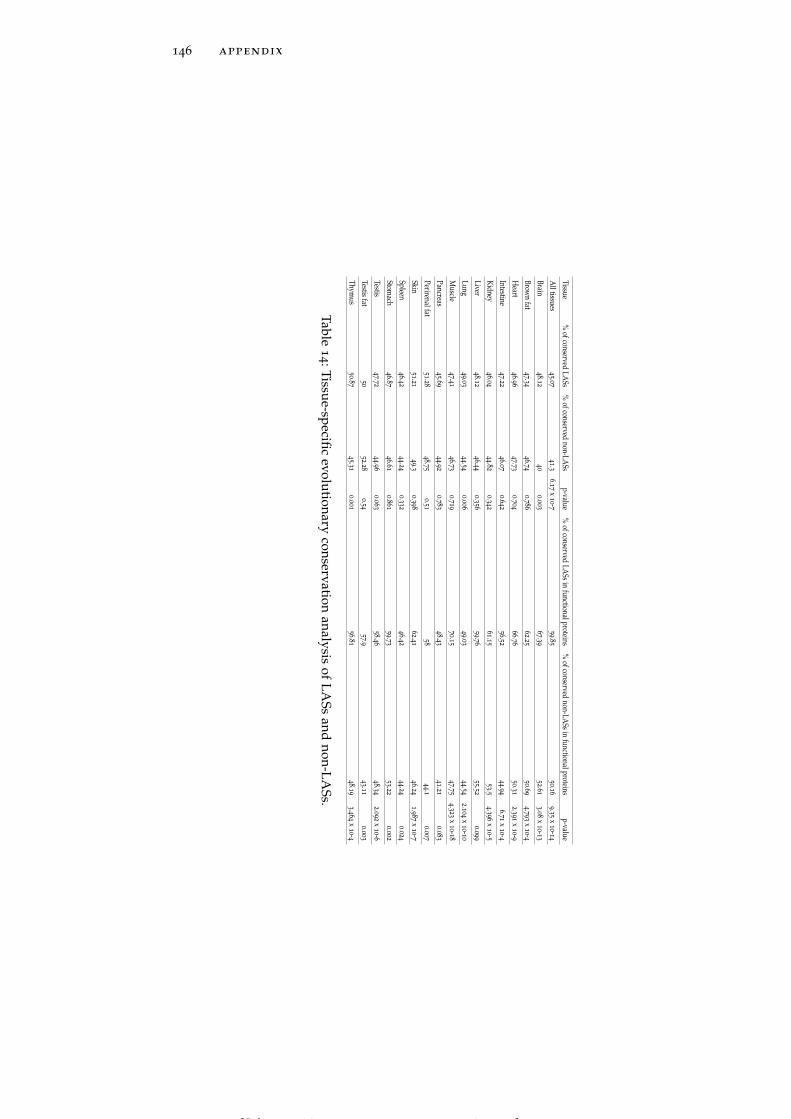
146 appendix
Tissue%
ofconservedLA
Ss%
ofconservednon-LA
Ssp-value
%ofconserved
LASsin
functionalproteins%
ofconservednon-LA
Ssinfunctionalproteins
p-value
Alltissues
45.0
741.3
6.17
x10-
759.8
550.1
69.3
5x
10-
14
Brain48.1
240
0.003
67.3
952.6
13.0
8x
10-
13
Brown
fat47.3
446.7
40.7
86
62.2
550.6
94.7
93
x10-
4
Heart
46.9
647.7
30.7
04
66.7
650.3
12.3
91
x10-
9
Intestine47.2
246.0
70.6
42
56.5
244.9
46.7
1x
10-
4
Kidney46.0
444.8
20.3
42
61.1
553.5
4.396
x10-
5
Liver48.1
246.4
40.3
56
59.7
655.5
20.0
99
Lung49.0
344.5
40.0
06
49.0
344.5
42.1
04
x10-
10
Muscle
47.4
146.7
30.7
19
70.1
547.7
54.3
23
x10-
18
Pancreas45.6
944.9
20.7
83
48.4
341.2
10.0
83
Perirenalfat51.2
848.7
50.5
158
44.1
0.007
Skin51.2
149.3
0.398
62.4
146.2
41.9
87
x10-
7
Spleen46.4
244.2
40.3
32
46.4
244.2
40.0
24
Stomach
46.8
746.6
10.8
61
59.7
353.2
20.0
02
Testis47.7
244.9
60.0
63
58.4
648.3
42.0
92
x10-
6
Testisfat50
52.2
80.5
457.9
43.1
10.0
03
Thymus
50.8
745.3
10.0
01
56.8
148.1
93.4
64
x10-
4
Table1
4:Tissue-specificevolutionary
conservationanalysis
ofLA
Ssand
non-LASs.
[ July 10, 2016 at 22:13 – classicthesis version 4.2 ]
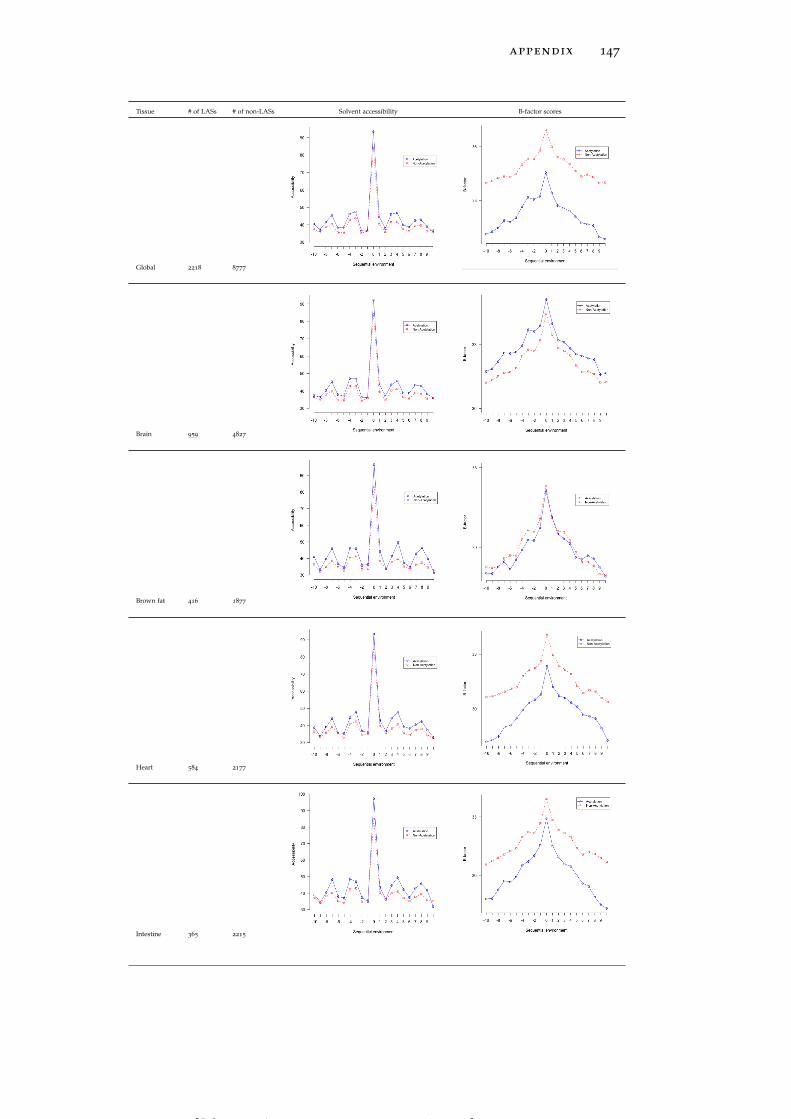
appendix 147
Tissue # of LASs # of non-LASs Solvent accessibility B-factor scores
Global 2218 8777
Brain 959 4827
Brown fat 416 1877
Heart 584 2177
Intestine 365 2215
[ July 10, 2016 at 22:13 – classicthesis version 4.2 ]
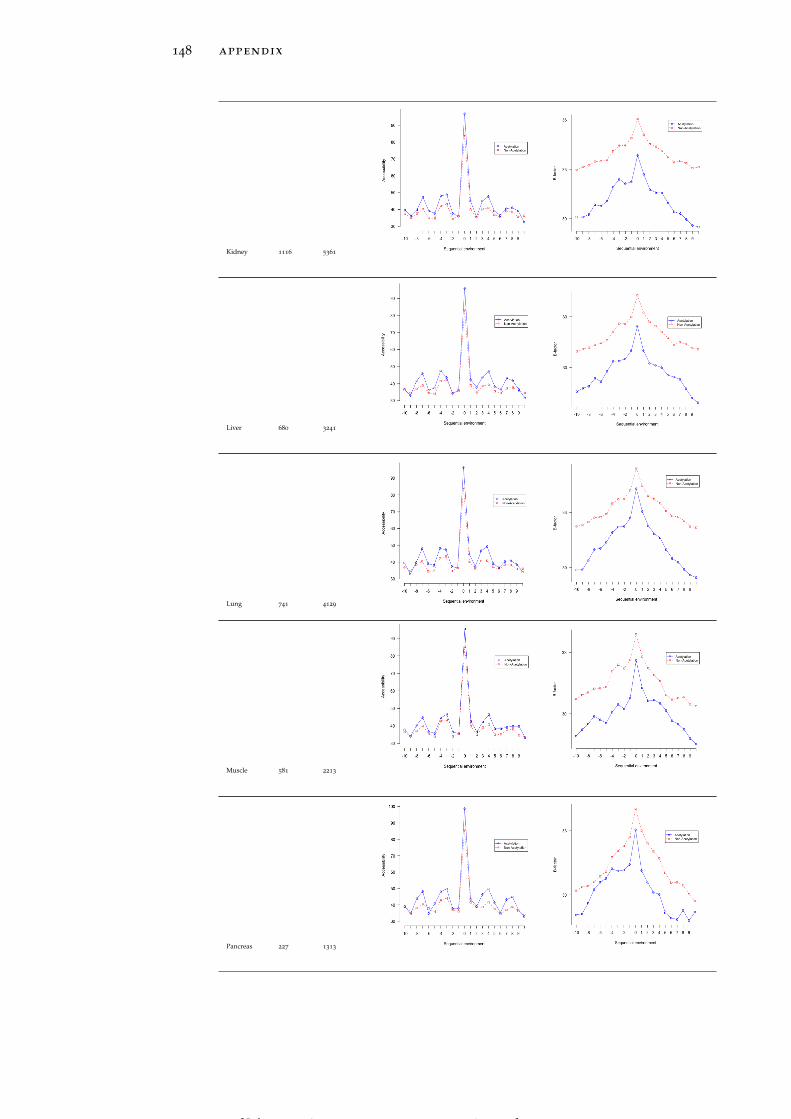
148 appendix
Kidney 1116 5361
Liver 680 3241
Lung 741 4129
Muscle 581 2213
Pancreas 227 1313
[ July 10, 2016 at 22:13 – classicthesis version 4.2 ]
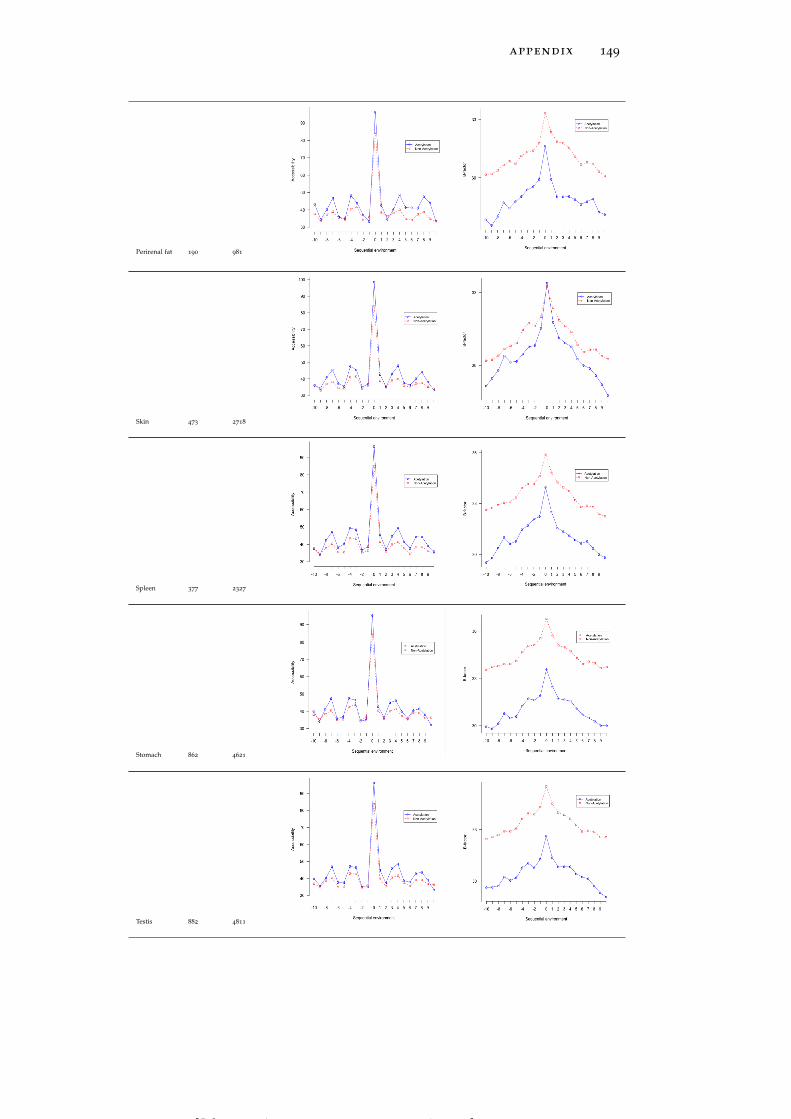
appendix 149
Perirenal fat 190 981
Skin 473 2718
Spleen 377 2327
Stomach 862 4621
Testis 882 4811
[ July 10, 2016 at 22:13 – classicthesis version 4.2 ]
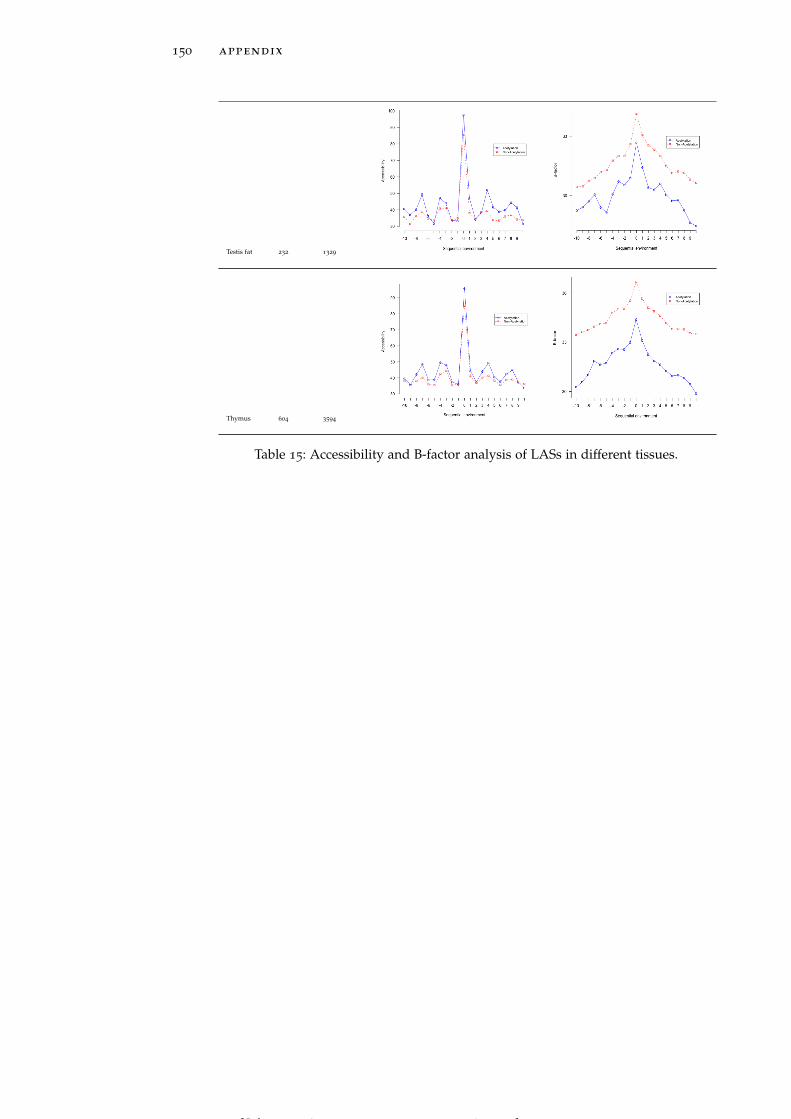
150 appendix
Testis fat 232 1329
Thymus 604 3594
Table 15: Accessibility and B-factor analysis of LASs in different tissues.
[ July 10, 2016 at 22:13 – classicthesis version 4.2 ]
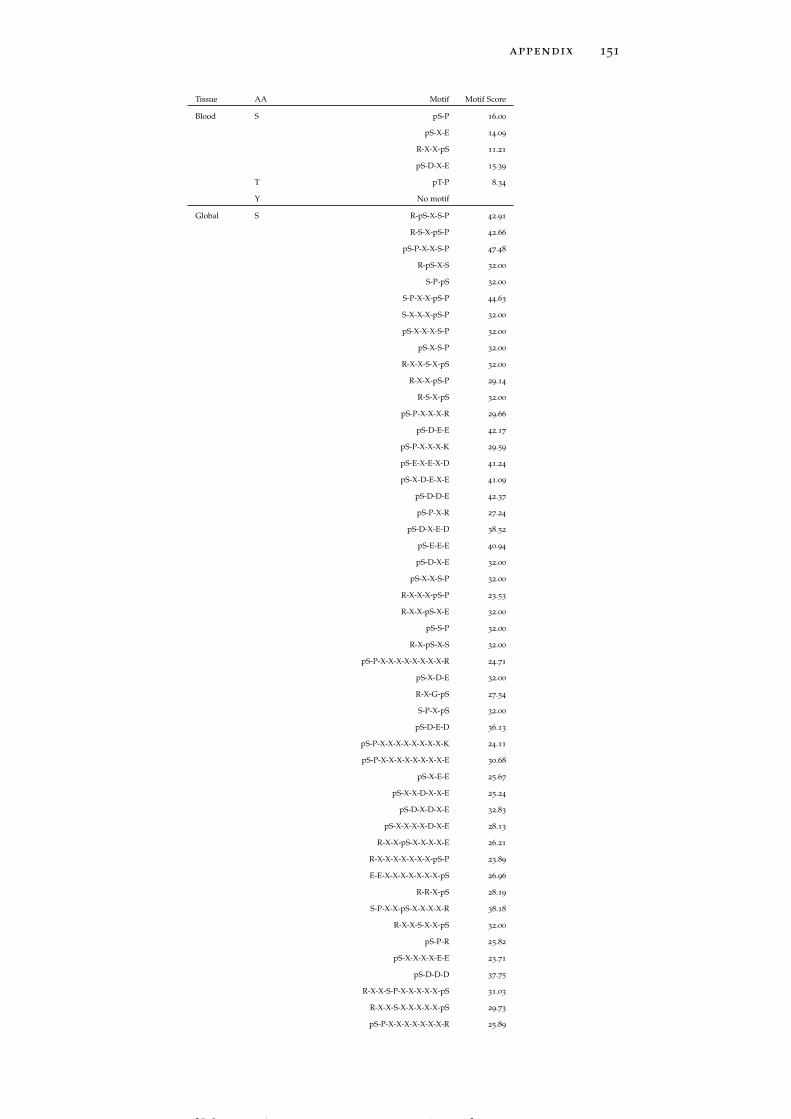
appendix 151
Tissue AA Motif Motif Score
Blood S pS-P 16.00
pS-X-E 14.09
R-X-X-pS 11.21
pS-D-X-E 15.39
T pT-P 8.34
Y No motif
Global S R-pS-X-S-P 42.91
R-S-X-pS-P 42.66
pS-P-X-X-S-P 47.48
R-pS-X-S 32.00
S-P-pS 32.00
S-P-X-X-pS-P 44.63
S-X-X-X-pS-P 32.00
pS-X-X-X-S-P 32.00
pS-X-S-P 32.00
R-X-X-S-X-pS 32.00
R-X-X-pS-P 29.14
R-S-X-pS 32.00
pS-P-X-X-X-R 29.66
pS-D-E-E 42.17
pS-P-X-X-X-K 29.59
pS-E-X-E-X-D 41.24
pS-X-D-E-X-E 41.09
pS-D-D-E 42.37
pS-P-X-R 27.24
pS-D-X-E-D 38.52
pS-E-E-E 40.94
pS-D-X-E 32.00
pS-X-X-S-P 32.00
R-X-X-X-pS-P 23.53
R-X-X-pS-X-E 32.00
pS-S-P 32.00
R-X-pS-X-S 32.00
pS-P-X-X-X-X-X-X-X-X-R 24.71
pS-X-D-E 32.00
R-X-G-pS 27.54
S-P-X-pS 32.00
pS-D-E-D 36.13
pS-P-X-X-X-X-X-X-X-X-K 24.11
pS-P-X-X-X-X-X-X-X-X-E 30.68
pS-X-E-E 25.67
pS-X-X-D-X-X-E 25.24
pS-D-X-D-X-E 32.83
pS-X-X-X-X-D-X-E 28.13
R-X-X-pS-X-X-X-X-E 26.21
R-X-X-X-X-X-X-X-pS-P 23.89
E-E-X-X-X-X-X-X-X-pS 26.96
R-R-X-pS 28.19
S-P-X-X-pS-X-X-X-X-R 38.18
R-X-X-S-X-X-pS 32.00
pS-P-R 25.82
pS-X-X-X-X-E-E 23.71
pS-D-D-D 37.75
R-X-X-S-P-X-X-X-X-X-pS 31.03
R-X-X-S-X-X-X-X-X-pS 29.73
pS-P-X-X-X-X-X-X-X-R 25.89
[ July 10, 2016 at 22:13 – classicthesis version 4.2 ]
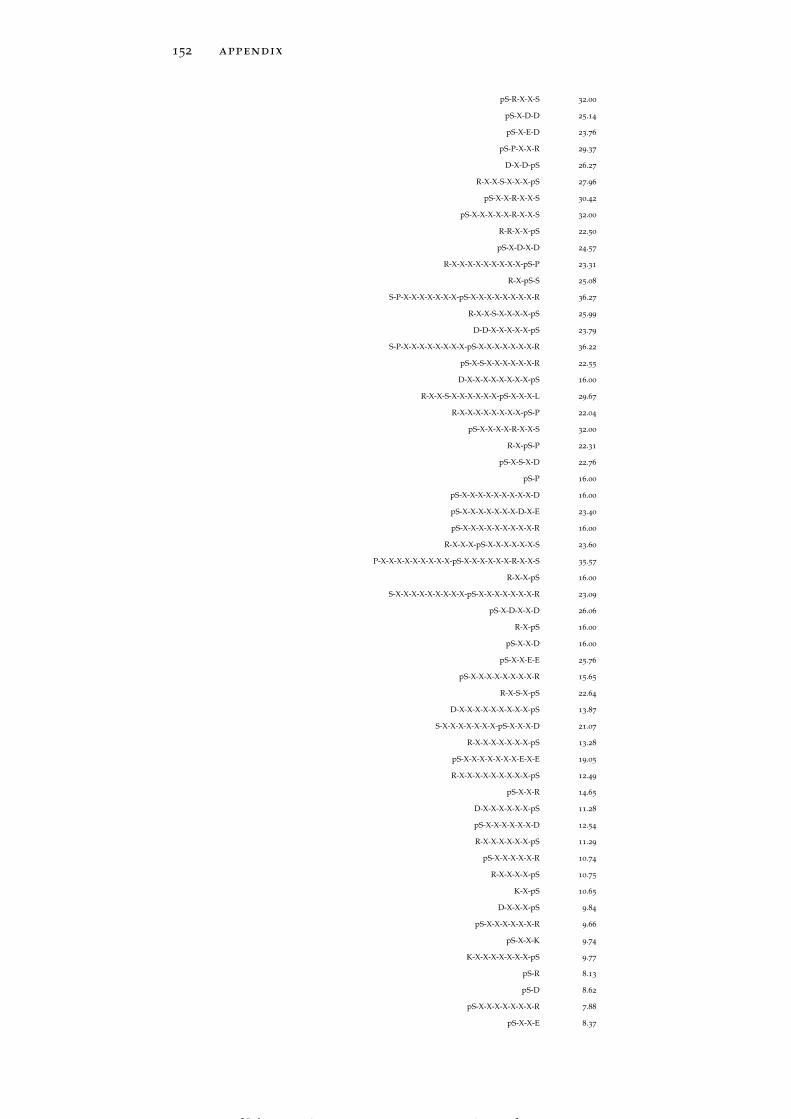
152 appendix
pS-R-X-X-S 32.00
pS-X-D-D 25.14
pS-X-E-D 23.76
pS-P-X-X-R 29.37
D-X-D-pS 26.27
R-X-X-S-X-X-X-pS 27.96
pS-X-X-R-X-X-S 30.42
pS-X-X-X-X-X-R-X-X-S 32.00
R-R-X-X-pS 22.50
pS-X-D-X-D 24.57
R-X-X-X-X-X-X-X-X-X-pS-P 23.31
R-X-pS-S 25.08
S-P-X-X-X-X-X-X-X-pS-X-X-X-X-X-X-X-X-R 36.27
R-X-X-S-X-X-X-X-pS 25.99
D-D-X-X-X-X-X-pS 23.79
S-P-X-X-X-X-X-X-X-X-pS-X-X-X-X-X-X-X-R 36.22
pS-X-S-X-X-X-X-X-X-R 22.55
D-X-X-X-X-X-X-X-X-pS 16.00
R-X-X-S-X-X-X-X-X-X-pS-X-X-X-L 29.67
R-X-X-X-X-X-X-X-X-pS-P 22.04
pS-X-X-X-X-R-X-X-S 32.00
R-X-pS-P 22.31
pS-X-S-X-D 22.76
pS-P 16.00
pS-X-X-X-X-X-X-X-X-X-D 16.00
pS-X-X-X-X-X-X-X-D-X-E 23.40
pS-X-X-X-X-X-X-X-X-X-R 16.00
R-X-X-X-pS-X-X-X-X-X-X-S 23.60
P-X-X-X-X-X-X-X-X-X-pS-X-X-X-X-X-X-R-X-X-S 35.57
R-X-X-pS 16.00
S-X-X-X-X-X-X-X-X-X-pS-X-X-X-X-X-X-X-R 23.09
pS-X-D-X-X-D 26.06
R-X-pS 16.00
pS-X-X-D 16.00
pS-X-X-E-E 25.76
pS-X-X-X-X-X-X-X-X-R 15.65
R-X-S-X-pS 22.64
D-X-X-X-X-X-X-X-X-X-pS 13.87
S-X-X-X-X-X-X-X-pS-X-X-X-D 21.07
R-X-X-X-X-X-X-X-pS 13.28
pS-X-X-X-X-X-X-X-E-X-E 19.05
R-X-X-X-X-X-X-X-X-X-pS 12.49
pS-X-X-R 14.65
D-X-X-X-X-X-X-pS 11.28
pS-X-X-X-X-X-X-D 12.54
R-X-X-X-X-X-X-pS 11.29
pS-X-X-X-X-X-R 10.74
R-X-X-X-X-pS 10.75
K-X-pS 10.65
D-X-X-X-pS 9.84
pS-X-X-X-X-X-X-R 9.66
pS-X-X-K 9.74
K-X-X-X-X-X-X-X-pS 9.77
pS-R 8.13
pS-D 8.62
pS-X-X-X-X-X-X-X-R 7.88
pS-X-X-E 8.37
[ July 10, 2016 at 22:13 – classicthesis version 4.2 ]
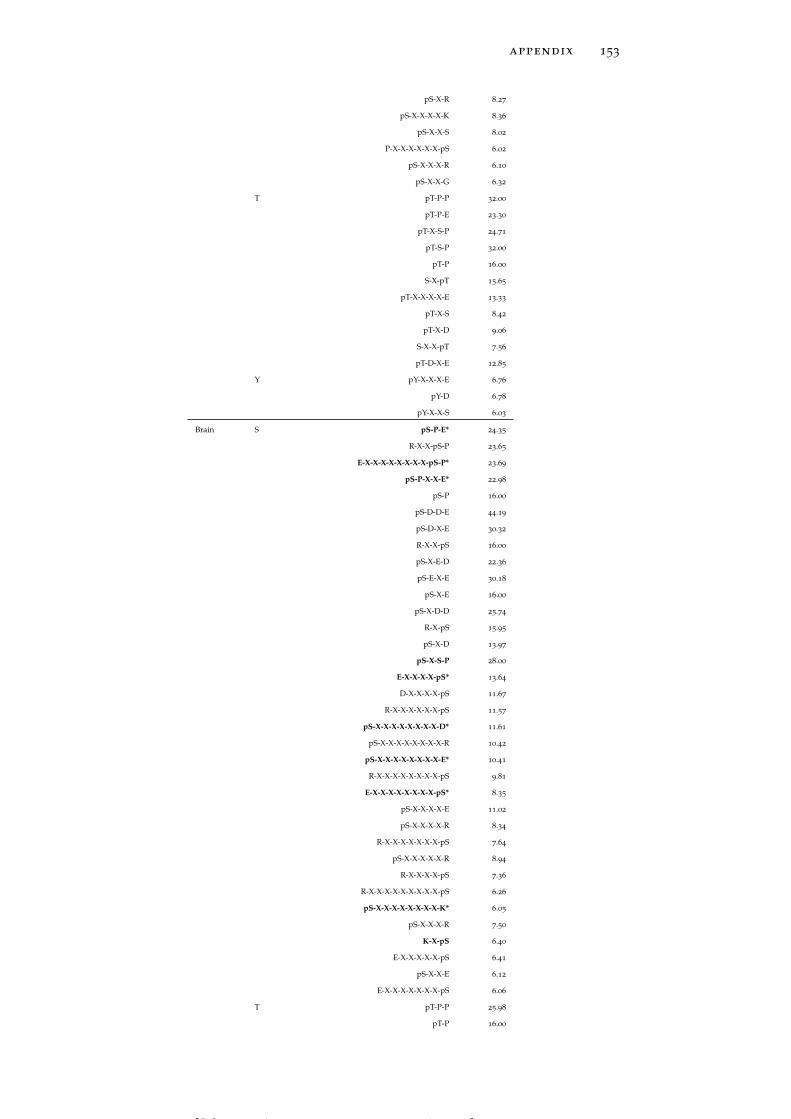
appendix 153
pS-X-R 8.27
pS-X-X-X-X-K 8.36
pS-X-X-S 8.02
P-X-X-X-X-X-X-pS 6.02
pS-X-X-X-R 6.10
pS-X-X-G 6.32
T pT-P-P 32.00
pT-P-E 23.30
pT-X-S-P 24.71
pT-S-P 32.00
pT-P 16.00
S-X-pT 15.65
pT-X-X-X-X-E 13.33
pT-X-S 8.42
pT-X-D 9.06
S-X-X-pT 7.56
pT-D-X-E 12.85
Y pY-X-X-X-E 6.76
pY-D 6.78
pY-X-X-S 6.03
Brain S pS-P-E* 24.35
R-X-X-pS-P 23.65
E-X-X-X-X-X-X-X-X-pS-P* 23.69
pS-P-X-X-E* 22.98
pS-P 16.00
pS-D-D-E 44.19
pS-D-X-E 30.32
R-X-X-pS 16.00
pS-X-E-D 22.36
pS-E-X-E 30.18
pS-X-E 16.00
pS-X-D-D 25.74
R-X-pS 15.95
pS-X-D 13.97
pS-X-S-P 28.00
E-X-X-X-X-pS* 13.64
D-X-X-X-X-pS 11.67
R-X-X-X-X-X-X-pS 11.57
pS-X-X-X-X-X-X-X-X-D* 11.61
pS-X-X-X-X-X-X-X-X-R 10.42
pS-X-X-X-X-X-X-X-X-E* 10.41
R-X-X-X-X-X-X-X-X-pS 9.81
E-X-X-X-X-X-X-X-X-pS* 8.35
pS-X-X-X-X-E 11.02
pS-X-X-X-X-R 8.34
R-X-X-X-X-X-X-X-pS 7.64
pS-X-X-X-X-X-R 8.94
R-X-X-X-X-pS 7.36
R-X-X-X-X-X-X-X-X-X-pS 6.26
pS-X-X-X-X-X-X-X-X-K* 6.05
pS-X-X-X-R 7.50
K-X-pS 6.40
E-X-X-X-X-X-pS 6.41
pS-X-X-E 6.12
E-X-X-X-X-X-X-X-pS 6.06
T pT-P-P 25.98
pT-P 16.00
[ July 10, 2016 at 22:13 – classicthesis version 4.2 ]
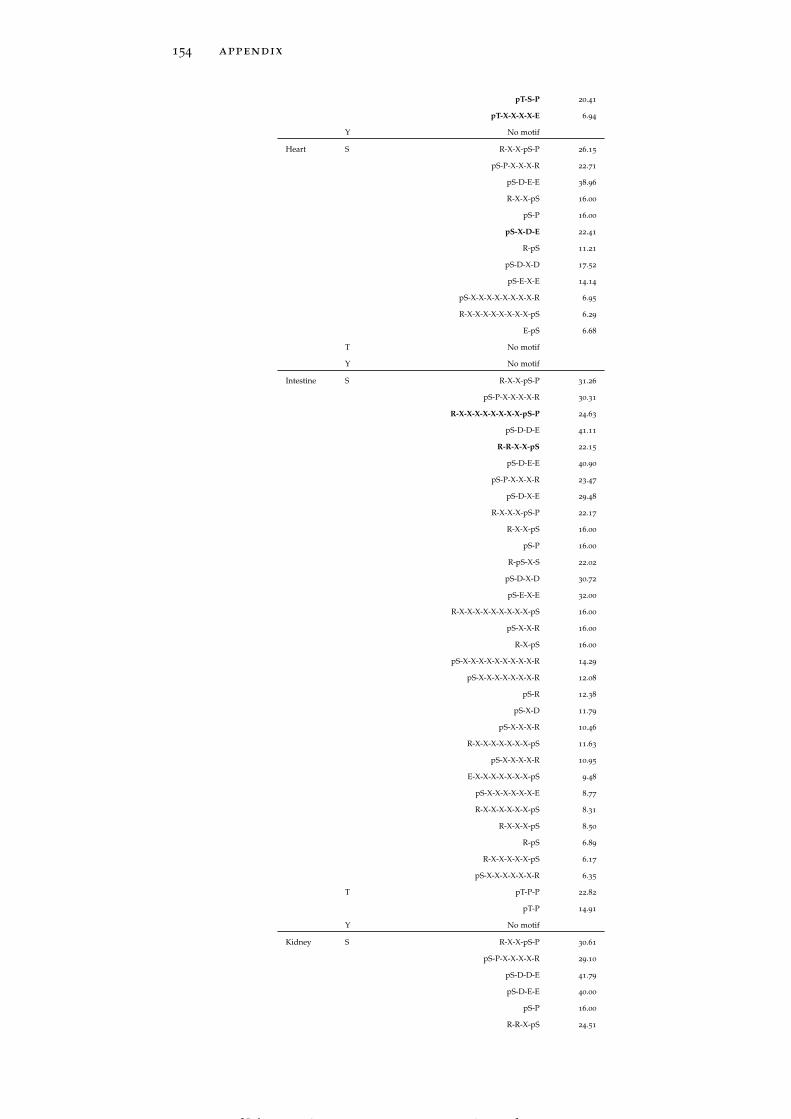
154 appendix
pT-S-P 20.41
pT-X-X-X-X-E 6.94
Y No motif
Heart S R-X-X-pS-P 26.15
pS-P-X-X-X-R 22.71
pS-D-E-E 38.96
R-X-X-pS 16.00
pS-P 16.00
pS-X-D-E 22.41
R-pS 11.21
pS-D-X-D 17.52
pS-E-X-E 14.14
pS-X-X-X-X-X-X-X-X-R 6.95
R-X-X-X-X-X-X-X-X-pS 6.29
E-pS 6.68
T No motif
Y No motif
Intestine S R-X-X-pS-P 31.26
pS-P-X-X-X-X-R 30.31
R-X-X-X-X-X-X-X-X-pS-P 24.63
pS-D-D-E 41.11
R-R-X-X-pS 22.15
pS-D-E-E 40.90
pS-P-X-X-X-R 23.47
pS-D-X-E 29.48
R-X-X-X-pS-P 22.17
R-X-X-pS 16.00
pS-P 16.00
R-pS-X-S 22.02
pS-D-X-D 30.72
pS-E-X-E 32.00
R-X-X-X-X-X-X-X-X-X-pS 16.00
pS-X-X-R 16.00
R-X-pS 16.00
pS-X-X-X-X-X-X-X-X-X-R 14.29
pS-X-X-X-X-X-X-X-R 12.08
pS-R 12.38
pS-X-D 11.79
pS-X-X-X-R 10.46
R-X-X-X-X-X-X-X-pS 11.63
pS-X-X-X-X-R 10.95
E-X-X-X-X-X-X-X-pS 9.48
pS-X-X-X-X-X-X-E 8.77
R-X-X-X-X-X-X-pS 8.31
R-X-X-X-pS 8.50
R-pS 6.89
R-X-X-X-X-X-pS 6.17
pS-X-X-X-X-X-X-R 6.35
T pT-P-P 22.82
pT-P 14.91
Y No motif
Kidney S R-X-X-pS-P 30.61
pS-P-X-X-X-X-R 29.10
pS-D-D-E 41.79
pS-D-E-E 40.00
pS-P 16.00
R-R-X-pS 24.51
[ July 10, 2016 at 22:13 – classicthesis version 4.2 ]
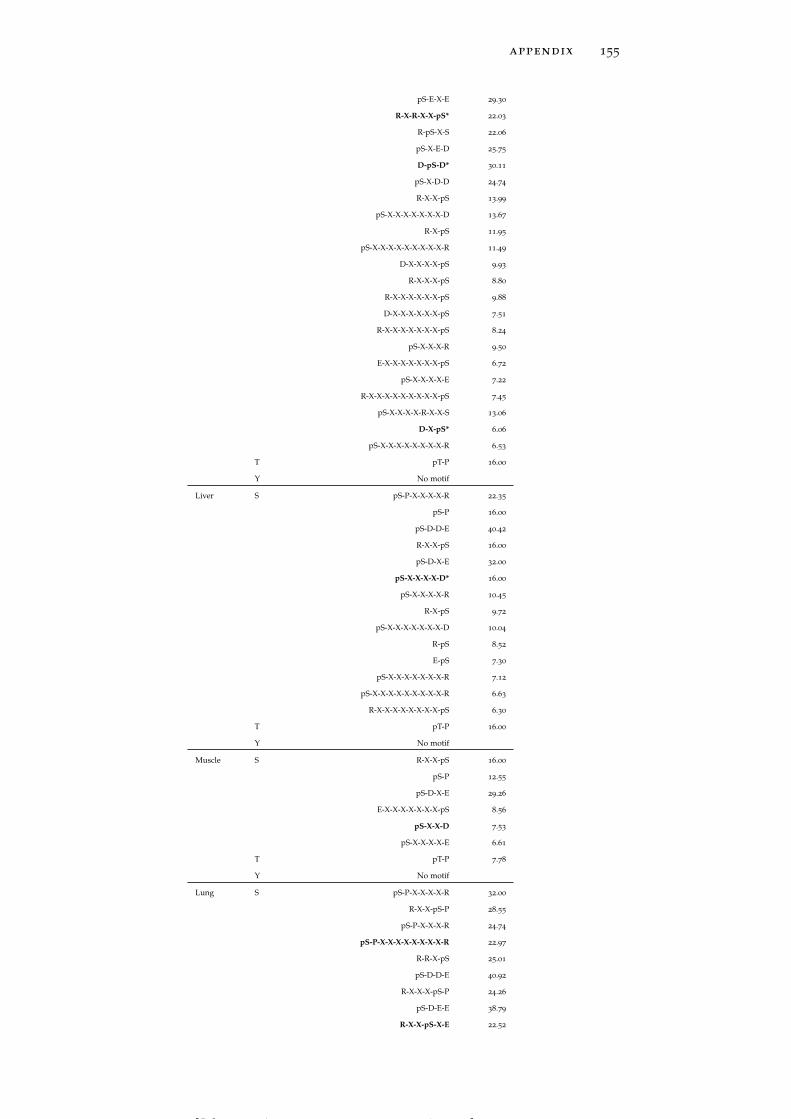
appendix 155
pS-E-X-E 29.30
R-X-R-X-X-pS* 22.03
R-pS-X-S 22.06
pS-X-E-D 25.75
D-pS-D* 30.11
pS-X-D-D 24.74
R-X-X-pS 13.99
pS-X-X-X-X-X-X-X-D 13.67
R-X-pS 11.95
pS-X-X-X-X-X-X-X-X-X-R 11.49
D-X-X-X-X-pS 9.93
R-X-X-X-pS 8.80
R-X-X-X-X-X-X-pS 9.88
D-X-X-X-X-X-X-pS 7.51
R-X-X-X-X-X-X-X-pS 8.24
pS-X-X-X-R 9.50
E-X-X-X-X-X-X-X-pS 6.72
pS-X-X-X-X-E 7.22
R-X-X-X-X-X-X-X-X-X-pS 7.45
pS-X-X-X-X-R-X-X-S 13.06
D-X-pS* 6.06
pS-X-X-X-X-X-X-X-X-R 6.53
T pT-P 16.00
Y No motif
Liver S pS-P-X-X-X-X-R 22.35
pS-P 16.00
pS-D-D-E 40.42
R-X-X-pS 16.00
pS-D-X-E 32.00
pS-X-X-X-X-D* 16.00
pS-X-X-X-X-R 10.45
R-X-pS 9.72
pS-X-X-X-X-X-X-X-D 10.04
R-pS 8.52
E-pS 7.30
pS-X-X-X-X-X-X-X-R 7.12
pS-X-X-X-X-X-X-X-X-X-R 6.63
R-X-X-X-X-X-X-X-X-pS 6.30
T pT-P 16.00
Y No motif
Muscle S R-X-X-pS 16.00
pS-P 12.55
pS-D-X-E 29.26
E-X-X-X-X-X-X-X-pS 8.56
pS-X-X-D 7.53
pS-X-X-X-X-E 6.61
T pT-P 7.78
Y No motif
Lung S pS-P-X-X-X-X-R 32.00
R-X-X-pS-P 28.55
pS-P-X-X-X-R 24.74
pS-P-X-X-X-X-X-X-X-X-R 22.97
R-R-X-pS 25.01
pS-D-D-E 40.92
R-X-X-X-pS-P 24.26
pS-D-E-E 38.79
R-X-X-pS-X-E 22.52
[ July 10, 2016 at 22:13 – classicthesis version 4.2 ]
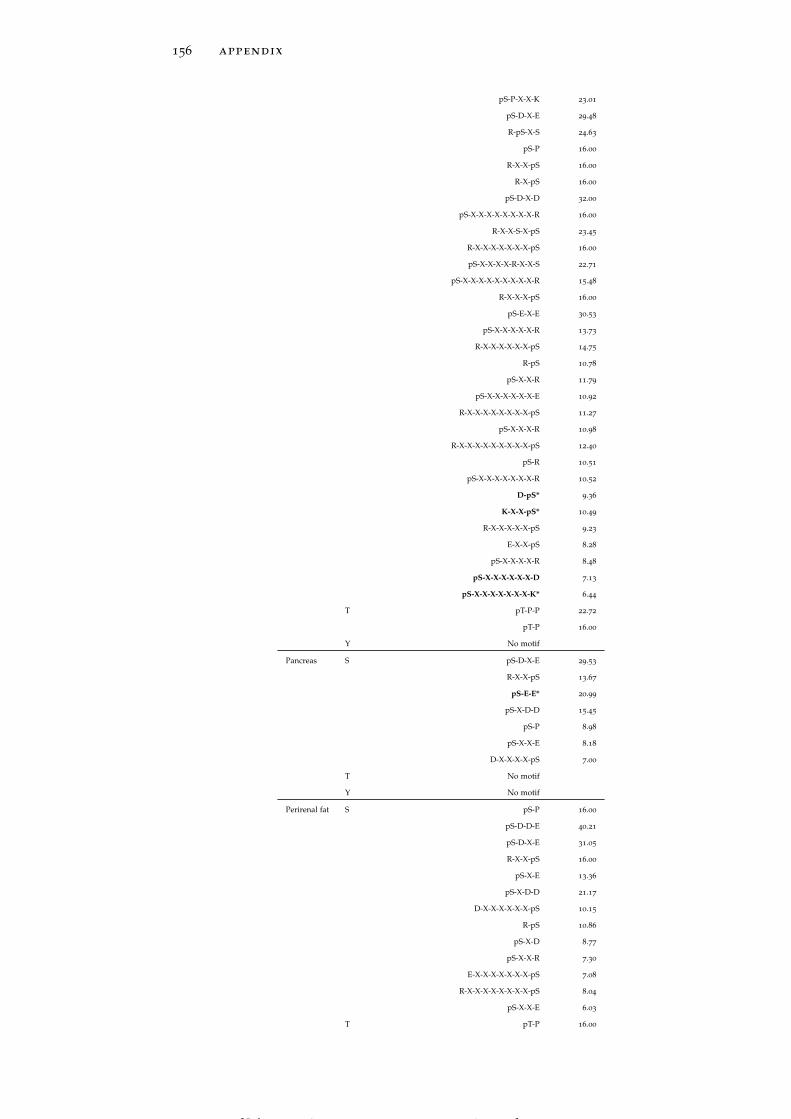
156 appendix
pS-P-X-X-K 23.01
pS-D-X-E 29.48
R-pS-X-S 24.63
pS-P 16.00
R-X-X-pS 16.00
R-X-pS 16.00
pS-D-X-D 32.00
pS-X-X-X-X-X-X-X-X-R 16.00
R-X-X-S-X-pS 23.45
R-X-X-X-X-X-X-X-pS 16.00
pS-X-X-X-X-R-X-X-S 22.71
pS-X-X-X-X-X-X-X-X-X-R 15.48
R-X-X-X-pS 16.00
pS-E-X-E 30.53
pS-X-X-X-X-X-R 13.73
R-X-X-X-X-X-X-pS 14.75
R-pS 10.78
pS-X-X-R 11.79
pS-X-X-X-X-X-X-E 10.92
R-X-X-X-X-X-X-X-X-pS 11.27
pS-X-X-X-R 10.98
R-X-X-X-X-X-X-X-X-X-pS 12.40
pS-R 10.51
pS-X-X-X-X-X-X-X-R 10.52
D-pS* 9.36
K-X-X-pS* 10.49
R-X-X-X-X-X-pS 9.23
E-X-X-pS 8.28
pS-X-X-X-X-R 8.48
pS-X-X-X-X-X-X-D 7.13
pS-X-X-X-X-X-X-X-K* 6.44
T pT-P-P 22.72
pT-P 16.00
Y No motif
Pancreas S pS-D-X-E 29.53
R-X-X-pS 13.67
pS-E-E* 20.99
pS-X-D-D 15.45
pS-P 8.98
pS-X-X-E 8.18
D-X-X-X-X-pS 7.00
T No motif
Y No motif
Perirenal fat S pS-P 16.00
pS-D-D-E 40.21
pS-D-X-E 31.05
R-X-X-pS 16.00
pS-X-E 13.36
pS-X-D-D 21.17
D-X-X-X-X-X-X-pS 10.15
R-pS 10.86
pS-X-D 8.77
pS-X-X-R 7.30
E-X-X-X-X-X-X-X-pS 7.08
R-X-X-X-X-X-X-X-X-pS 8.04
pS-X-X-E 6.03
T pT-P 16.00
[ July 10, 2016 at 22:13 – classicthesis version 4.2 ]
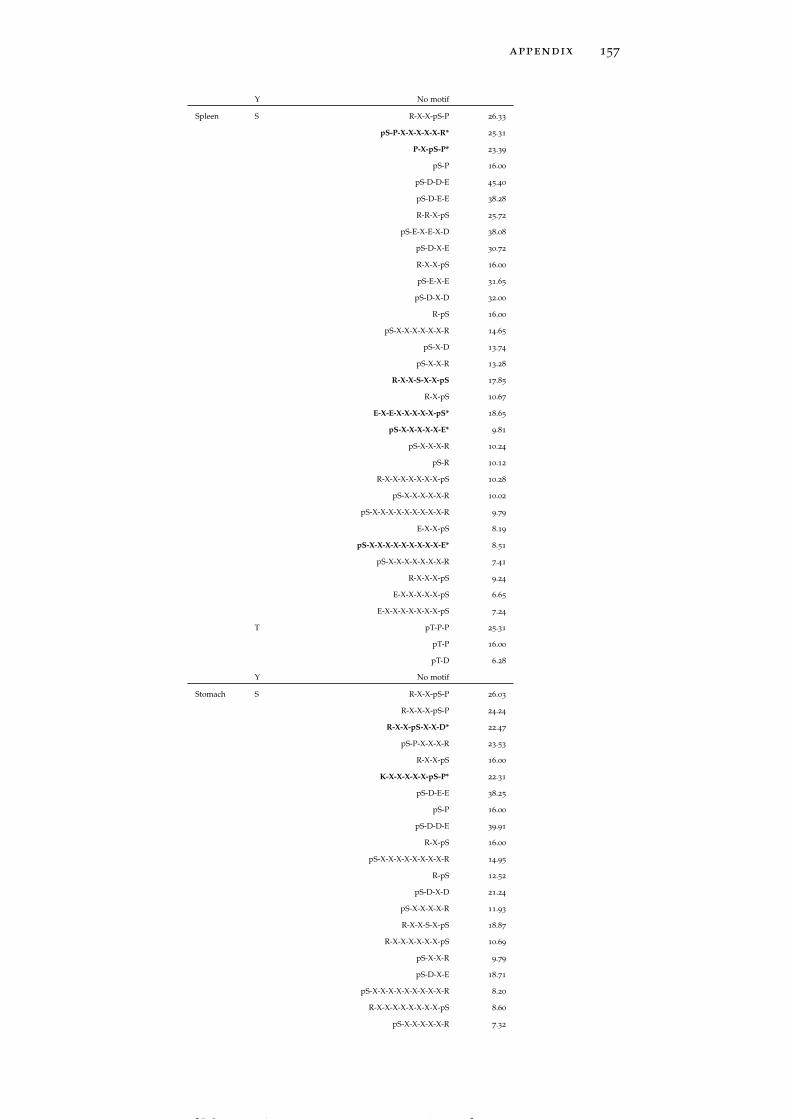
appendix 157
Y No motif
Spleen S R-X-X-pS-P 26.33
pS-P-X-X-X-X-X-R* 25.31
P-X-pS-P* 23.39
pS-P 16.00
pS-D-D-E 45.40
pS-D-E-E 38.28
R-R-X-pS 25.72
pS-E-X-E-X-D 38.08
pS-D-X-E 30.72
R-X-X-pS 16.00
pS-E-X-E 31.65
pS-D-X-D 32.00
R-pS 16.00
pS-X-X-X-X-X-X-R 14.65
pS-X-D 13.74
pS-X-X-R 13.28
R-X-X-S-X-X-pS 17.85
R-X-pS 10.67
E-X-E-X-X-X-X-X-pS* 18.65
pS-X-X-X-X-X-E* 9.81
pS-X-X-X-R 10.24
pS-R 10.12
R-X-X-X-X-X-X-X-pS 10.28
pS-X-X-X-X-X-R 10.02
pS-X-X-X-X-X-X-X-X-X-R 9.79
E-X-X-pS 8.19
pS-X-X-X-X-X-X-X-X-X-E* 8.51
pS-X-X-X-X-X-X-X-R 7.41
R-X-X-X-pS 9.24
E-X-X-X-X-X-pS 6.65
E-X-X-X-X-X-X-X-pS 7.24
T pT-P-P 25.31
pT-P 16.00
pT-D 6.28
Y No motif
Stomach S R-X-X-pS-P 26.03
R-X-X-X-pS-P 24.24
R-X-X-pS-X-X-D* 22.47
pS-P-X-X-X-R 23.53
R-X-X-pS 16.00
K-X-X-X-X-X-pS-P* 22.31
pS-D-E-E 38.25
pS-P 16.00
pS-D-D-E 39.91
R-X-pS 16.00
pS-X-X-X-X-X-X-X-X-R 14.95
R-pS 12.52
pS-D-X-D 21.24
pS-X-X-X-X-R 11.93
R-X-X-S-X-pS 18.87
R-X-X-X-X-X-X-pS 10.69
pS-X-X-R 9.79
pS-D-X-E 18.71
pS-X-X-X-X-X-X-X-X-X-R 8.20
R-X-X-X-X-X-X-X-X-pS 8.60
pS-X-X-X-X-X-R 7.32
[ July 10, 2016 at 22:13 – classicthesis version 4.2 ]
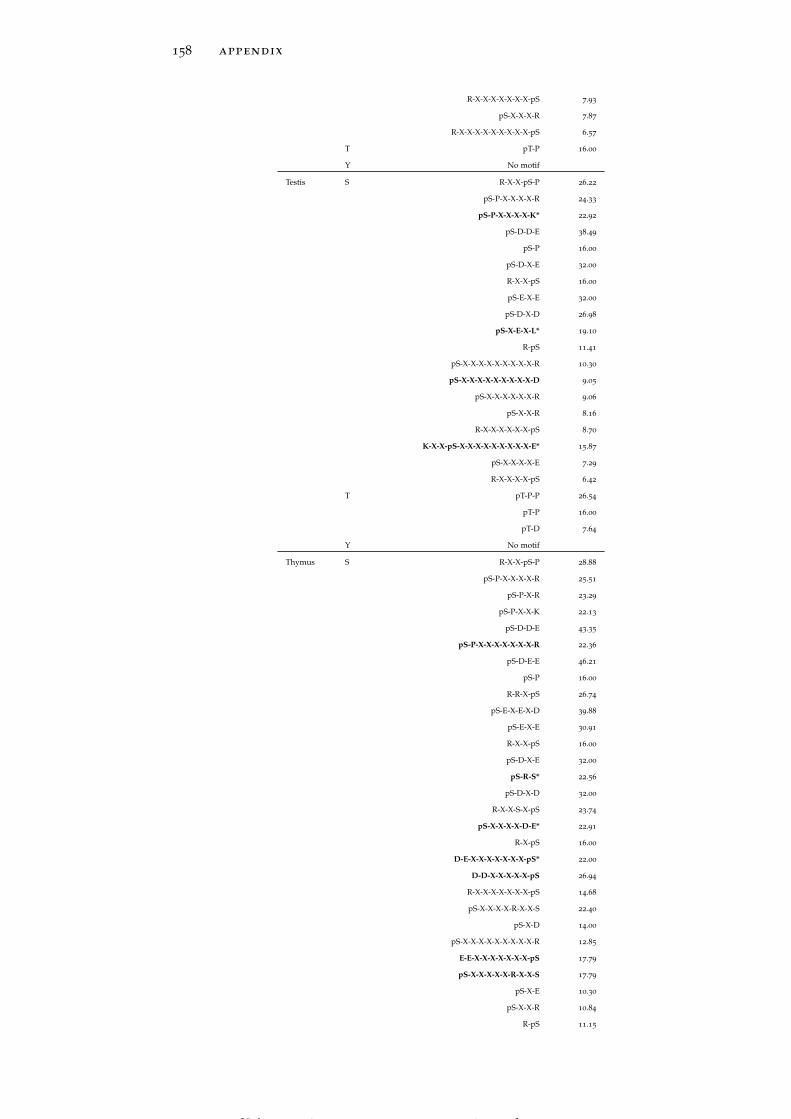
158 appendix
R-X-X-X-X-X-X-X-pS 7.93
pS-X-X-X-R 7.87
R-X-X-X-X-X-X-X-X-X-pS 6.57
T pT-P 16.00
Y No motif
Testis S R-X-X-pS-P 26.22
pS-P-X-X-X-X-R 24.33
pS-P-X-X-X-X-K* 22.92
pS-D-D-E 38.49
pS-P 16.00
pS-D-X-E 32.00
R-X-X-pS 16.00
pS-E-X-E 32.00
pS-D-X-D 26.98
pS-X-E-X-L* 19.10
R-pS 11.41
pS-X-X-X-X-X-X-X-X-X-R 10.30
pS-X-X-X-X-X-X-X-X-X-D 9.05
pS-X-X-X-X-X-X-R 9.06
pS-X-X-R 8.16
R-X-X-X-X-X-X-pS 8.70
K-X-X-pS-X-X-X-X-X-X-X-X-X-E* 15.87
pS-X-X-X-X-E 7.29
R-X-X-X-X-pS 6.42
T pT-P-P 26.54
pT-P 16.00
pT-D 7.64
Y No motif
Thymus S R-X-X-pS-P 28.88
pS-P-X-X-X-X-R 25.51
pS-P-X-R 23.29
pS-P-X-X-K 22.13
pS-D-D-E 43.35
pS-P-X-X-X-X-X-X-X-R 22.36
pS-D-E-E 46.21
pS-P 16.00
R-R-X-pS 26.74
pS-E-X-E-X-D 39.88
pS-E-X-E 30.91
R-X-X-pS 16.00
pS-D-X-E 32.00
pS-R-S* 22.56
pS-D-X-D 32.00
R-X-X-S-X-pS 23.74
pS-X-X-X-X-D-E* 22.91
R-X-pS 16.00
D-E-X-X-X-X-X-X-X-pS* 22.00
D-D-X-X-X-X-X-pS 26.94
R-X-X-X-X-X-X-X-pS 14.68
pS-X-X-X-X-R-X-X-S 22.40
pS-X-D 14.00
pS-X-X-X-X-X-X-X-X-X-R 12.85
E-E-X-X-X-X-X-X-X-pS 17.79
pS-X-X-X-X-X-R-X-X-S 17.79
pS-X-E 10.30
pS-X-X-R 10.84
R-pS 11.15
[ July 10, 2016 at 22:13 – classicthesis version 4.2 ]
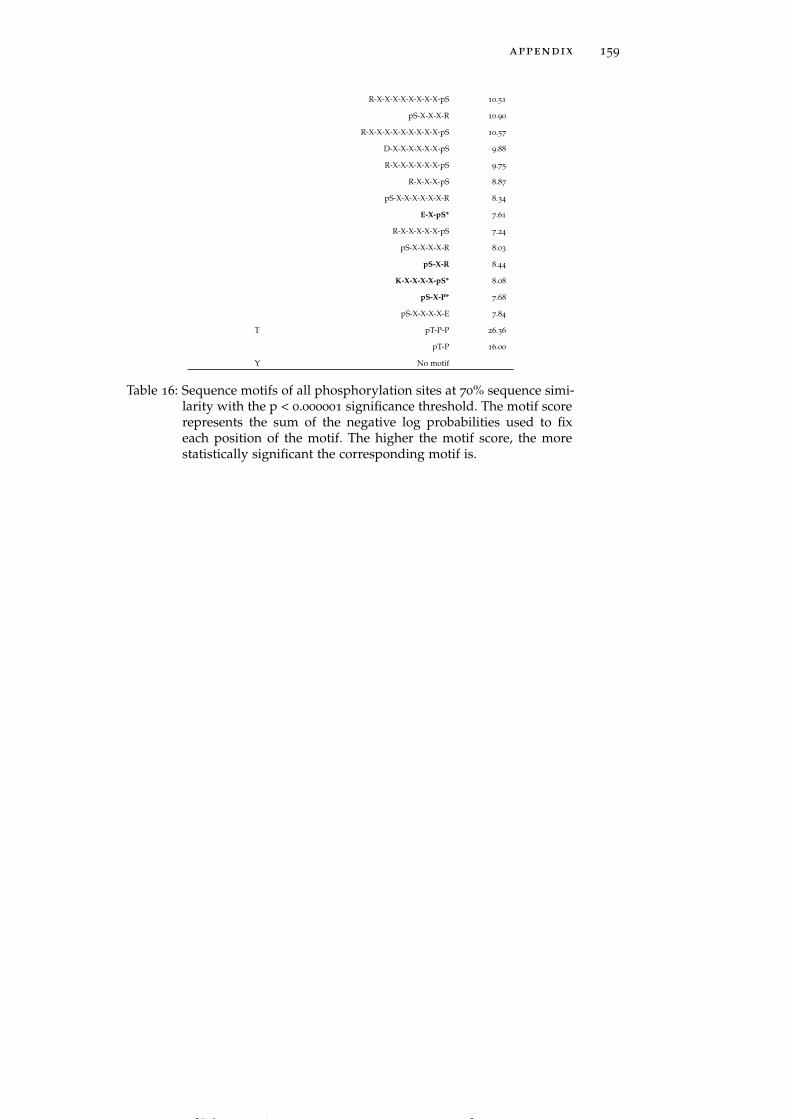
appendix 159
R-X-X-X-X-X-X-X-X-pS 10.51
pS-X-X-X-R 10.90
R-X-X-X-X-X-X-X-X-X-pS 10.57
D-X-X-X-X-X-X-pS 9.88
R-X-X-X-X-X-X-pS 9.75
R-X-X-X-pS 8.87
pS-X-X-X-X-X-X-R 8.34
E-X-pS* 7.61
R-X-X-X-X-X-pS 7.24
pS-X-X-X-X-R 8.03
pS-X-R 8.44
K-X-X-X-X-pS* 8.08
pS-X-P* 7.68
pS-X-X-X-X-E 7.84
T pT-P-P 26.36
pT-P 16.00
Y No motif
Table 16: Sequence motifs of all phosphorylation sites at 70% sequence simi-larity with the p < 0.000001 significance threshold. The motif scorerepresents the sum of the negative log probabilities used to fixeach position of the motif. The higher the motif score, the morestatistically significant the corresponding motif is.
[ July 10, 2016 at 22:13 – classicthesis version 4.2 ]
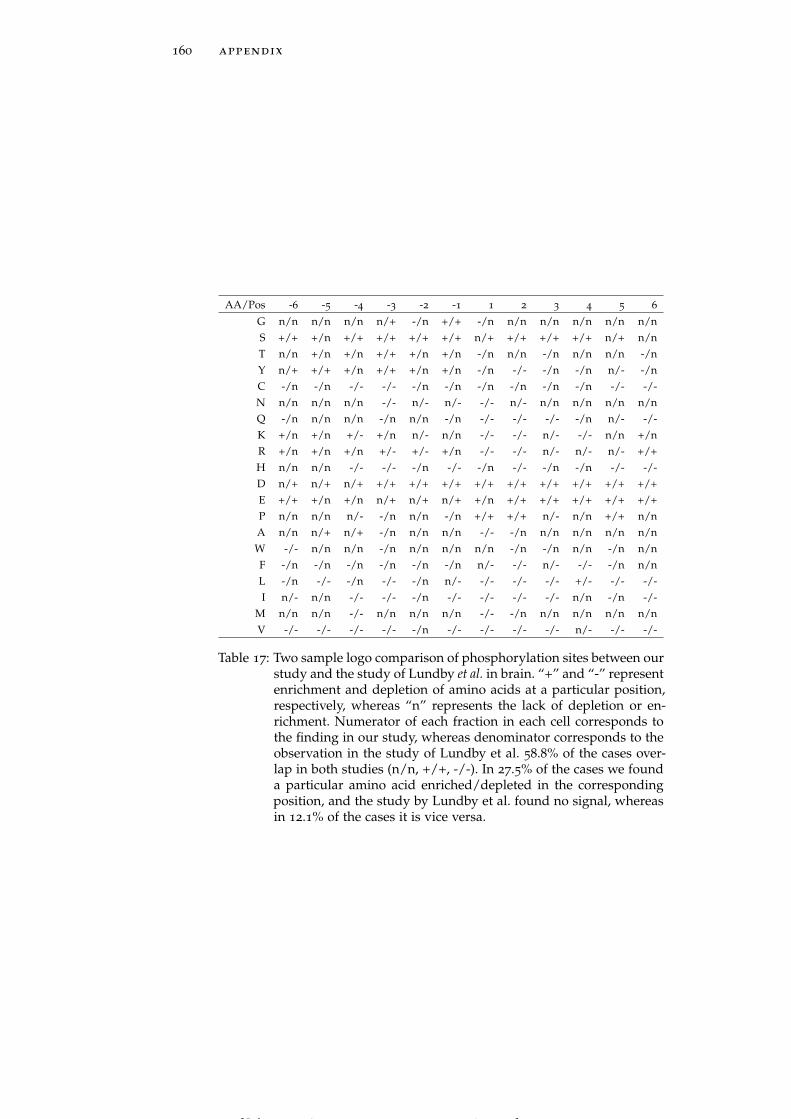
160 appendix
AA/Pos -6 -5 -4 -3 -2 -1 1 2 3 4 5 6
G n/n n/n n/n n/+ -/n +/+ -/n n/n n/n n/n n/n n/nS +/+ +/n +/+ +/+ +/+ +/+ n/+ +/+ +/+ +/+ n/+ n/nT n/n +/n +/n +/+ +/n +/n -/n n/n -/n n/n n/n -/nY n/+ +/+ +/n +/+ +/n +/n -/n -/- -/n -/n n/- -/nC -/n -/n -/- -/- -/n -/n -/n -/n -/n -/n -/- -/-N n/n n/n n/n -/- n/- n/- -/- n/- n/n n/n n/n n/nQ -/n n/n n/n -/n n/n -/n -/- -/- -/- -/n n/- -/-K +/n +/n +/- +/n n/- n/n -/- -/- n/- -/- n/n +/nR +/n +/n +/n +/- +/- +/n -/- -/- n/- n/- n/- +/+H n/n n/n -/- -/- -/n -/- -/n -/- -/n -/n -/- -/-D n/+ n/+ n/+ +/+ +/+ +/+ +/+ +/+ +/+ +/+ +/+ +/+E +/+ +/n +/n n/+ n/+ n/+ +/n +/+ +/+ +/+ +/+ +/+P n/n n/n n/- -/n n/n -/n +/+ +/+ n/- n/n +/+ n/nA n/n n/+ n/+ -/n n/n n/n -/- -/n n/n n/n n/n n/nW -/- n/n n/n -/n n/n n/n n/n -/n -/n n/n -/n n/nF -/n -/n -/n -/n -/n -/n n/- -/- n/- -/- -/n n/nL -/n -/- -/n -/- -/n n/- -/- -/- -/- +/- -/- -/-I n/- n/n -/- -/- -/n -/- -/- -/- -/- n/n -/n -/-
M n/n n/n -/- n/n n/n n/n -/- -/n n/n n/n n/n n/nV -/- -/- -/- -/- -/n -/- -/- -/- -/- n/- -/- -/-
Table 17: Two sample logo comparison of phosphorylation sites between ourstudy and the study of Lundby et al. in brain. “+” and “-” representenrichment and depletion of amino acids at a particular position,respectively, whereas “n” represents the lack of depletion or en-richment. Numerator of each fraction in each cell corresponds tothe finding in our study, whereas denominator corresponds to theobservation in the study of Lundby et al. 58.8% of the cases over-lap in both studies (n/n, +/+, -/-). In 27.5% of the cases we founda particular amino acid enriched/depleted in the correspondingposition, and the study by Lundby et al. found no signal, whereasin 12.1% of the cases it is vice versa.
[ July 10, 2016 at 22:13 – classicthesis version 4.2 ]
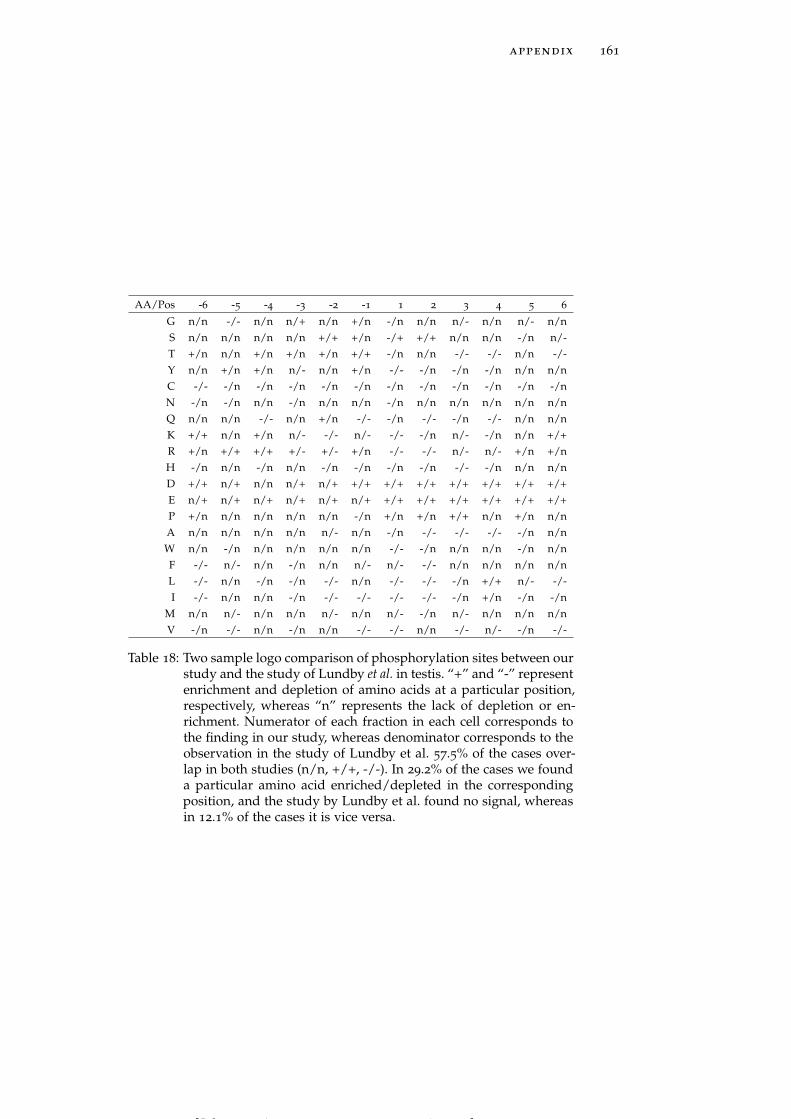
appendix 161
AA/Pos -6 -5 -4 -3 -2 -1 1 2 3 4 5 6
G n/n -/- n/n n/+ n/n +/n -/n n/n n/- n/n n/- n/nS n/n n/n n/n n/n +/+ +/n -/+ +/+ n/n n/n -/n n/-T +/n n/n +/n +/n +/n +/+ -/n n/n -/- -/- n/n -/-Y n/n +/n +/n n/- n/n +/n -/- -/n -/n -/n n/n n/nC -/- -/n -/n -/n -/n -/n -/n -/n -/n -/n -/n -/nN -/n -/n n/n -/n n/n n/n -/n n/n n/n n/n n/n n/nQ n/n n/n -/- n/n +/n -/- -/n -/- -/n -/- n/n n/nK +/+ n/n +/n n/- -/- n/- -/- -/n n/- -/n n/n +/+R +/n +/+ +/+ +/- +/- +/n -/- -/- n/- n/- +/n +/nH -/n n/n -/n n/n -/n -/n -/n -/n -/- -/n n/n n/nD +/+ n/+ n/n n/+ n/+ +/+ +/+ +/+ +/+ +/+ +/+ +/+E n/+ n/+ n/+ n/+ n/+ n/+ +/+ +/+ +/+ +/+ +/+ +/+P +/n n/n n/n n/n n/n -/n +/n +/n +/+ n/n +/n n/nA n/n n/n n/n n/n n/- n/n -/n -/- -/- -/- -/n n/nW n/n -/n n/n n/n n/n n/n -/- -/n n/n n/n -/n n/nF -/- n/- n/n -/n n/n n/- n/- -/- n/n n/n n/n n/nL -/- n/n -/n -/n -/- n/n -/- -/- -/n +/+ n/- -/-I -/- n/n n/n -/n -/- -/- -/- -/- -/n +/n -/n -/n
M n/n n/- n/n n/n n/- n/n n/- -/n n/- n/n n/n n/nV -/n -/- n/n -/n n/n -/- -/- n/n -/- n/- -/n -/-
Table 18: Two sample logo comparison of phosphorylation sites between ourstudy and the study of Lundby et al. in testis. “+” and “-” representenrichment and depletion of amino acids at a particular position,respectively, whereas “n” represents the lack of depletion or en-richment. Numerator of each fraction in each cell corresponds tothe finding in our study, whereas denominator corresponds to theobservation in the study of Lundby et al. 57.5% of the cases over-lap in both studies (n/n, +/+, -/-). In 29.2% of the cases we founda particular amino acid enriched/depleted in the correspondingposition, and the study by Lundby et al. found no signal, whereasin 12.1% of the cases it is vice versa.
[ July 10, 2016 at 22:13 – classicthesis version 4.2 ]
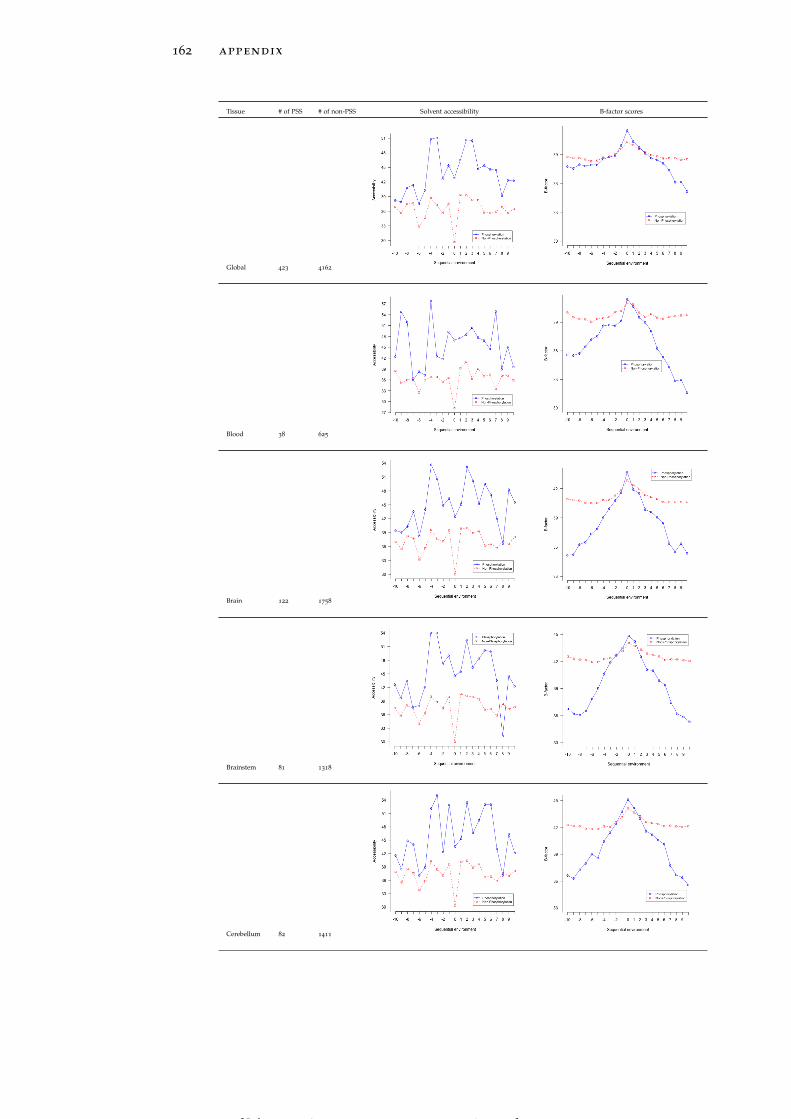
162 appendix
Tissue # of PSS # of non-PSS Solvent accessibility B-factor scores
Global 423 4162
Blood 38 625
Brain 122 1758
Brainstem 81 1318
Cerebellum 82 1411
[ July 10, 2016 at 22:13 – classicthesis version 4.2 ]
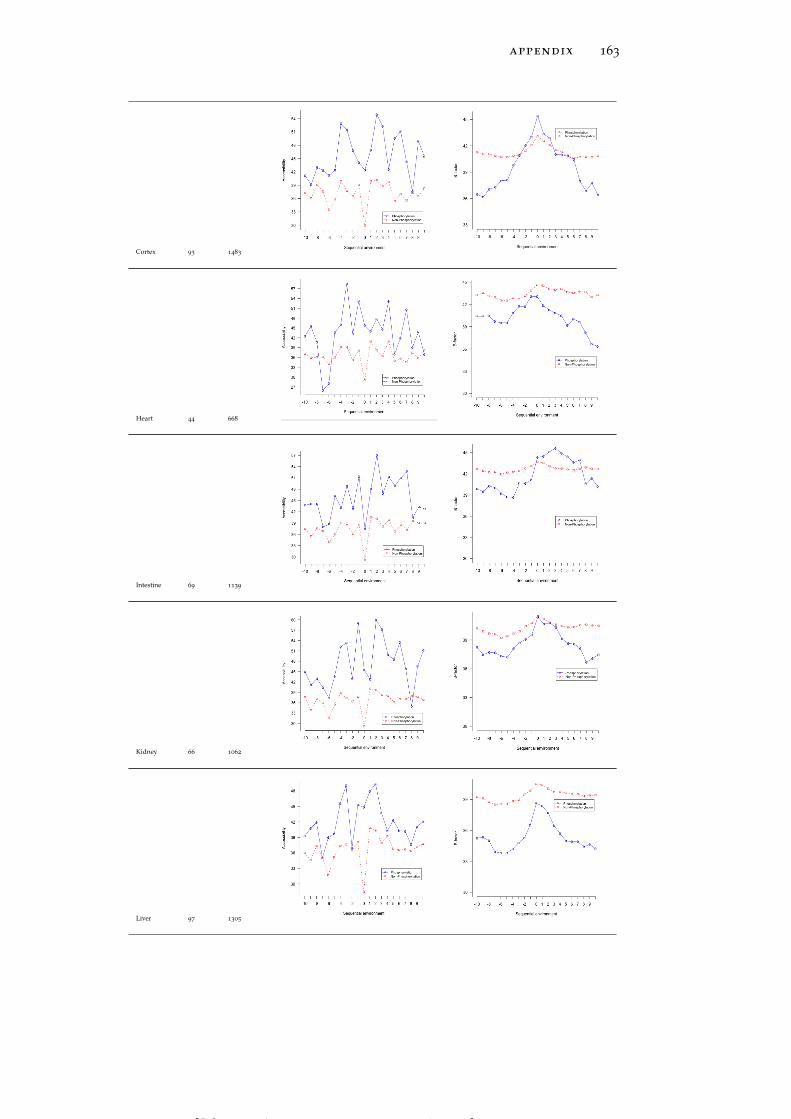
appendix 163
Cortex 93 1483
Heart 44 668
Intestine 69 1139
Kidney 66 1062
Liver 97 1305
[ July 10, 2016 at 22:13 – classicthesis version 4.2 ]

164 appendix
Lung 73 1216
Muscle 95 889
Pancreas 10 349
Perirenal fat 56 850
Spleen 73 1330
[ July 10, 2016 at 22:13 – classicthesis version 4.2 ]
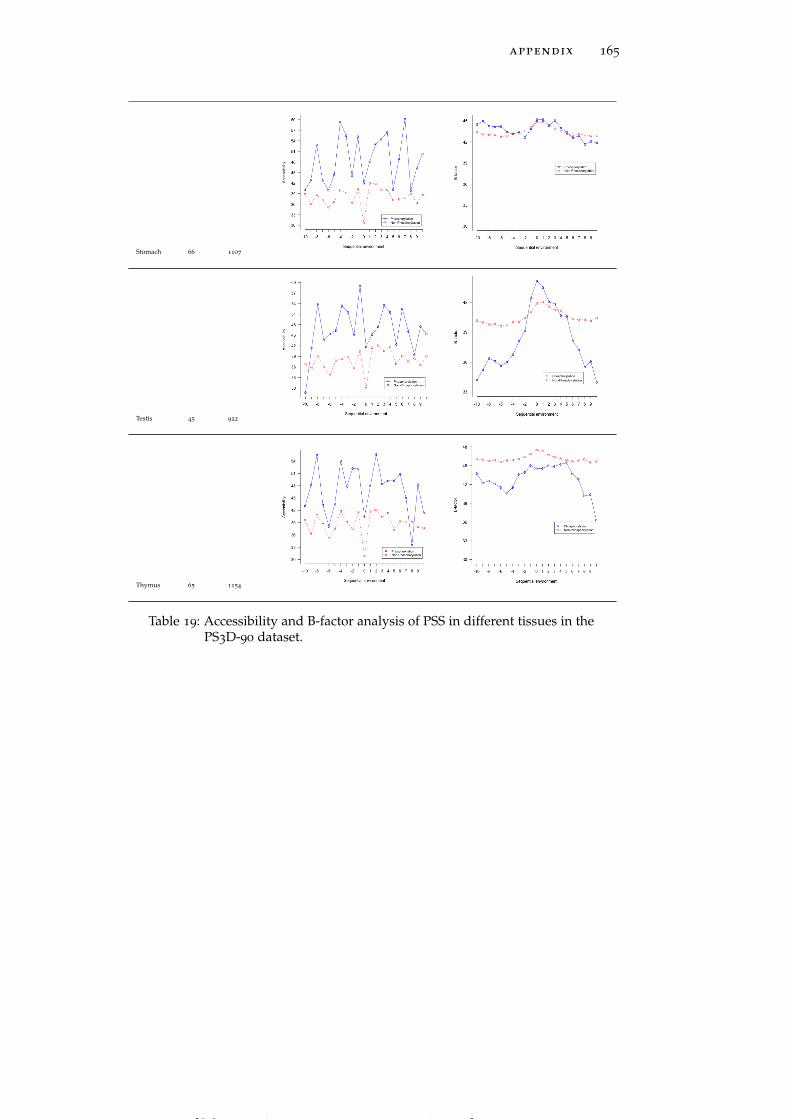
appendix 165
Stomach 66 1107
Testis 45 922
Thymus 65 1154
Table 19: Accessibility and B-factor analysis of PSS in different tissues in thePS3D-90 dataset.
[ July 10, 2016 at 22:13 – classicthesis version 4.2 ]
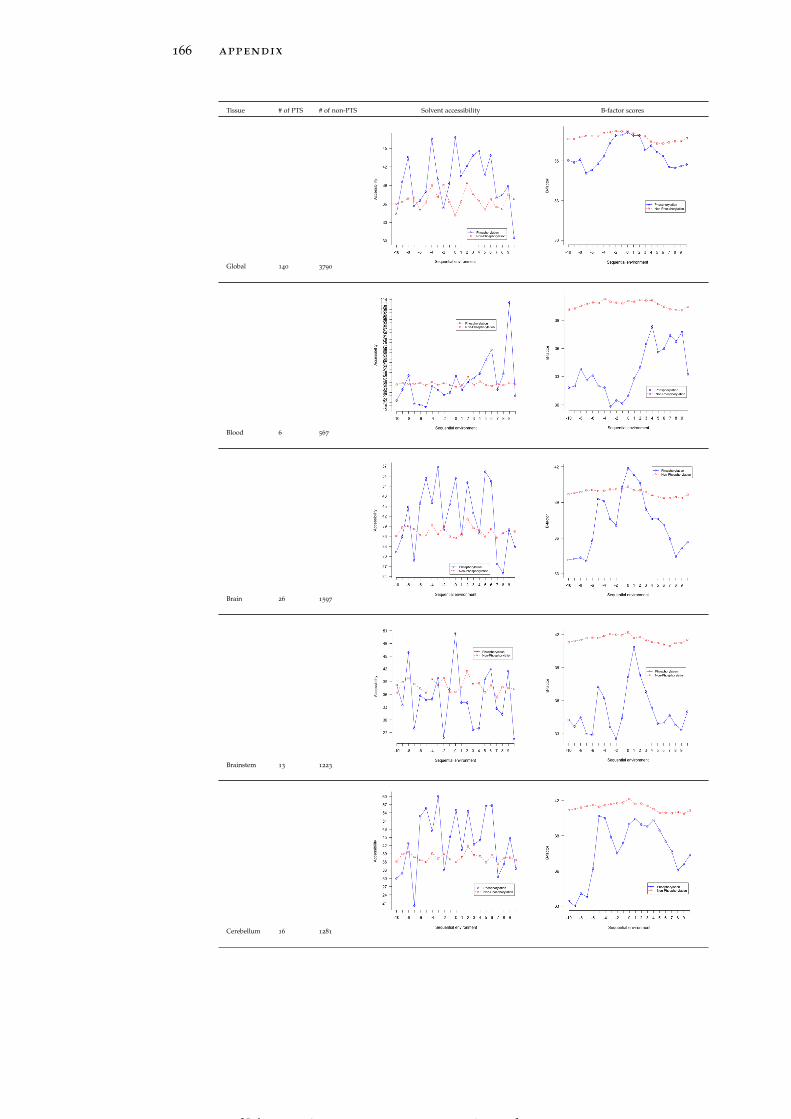
166 appendix
Tissue # of PTS # of non-PTS Solvent accessibility B-factor scores
Global 140 3790
Blood 6 567
Brain 26 1597
Brainstem 13 1223
Cerebellum 16 1281
[ July 10, 2016 at 22:13 – classicthesis version 4.2 ]
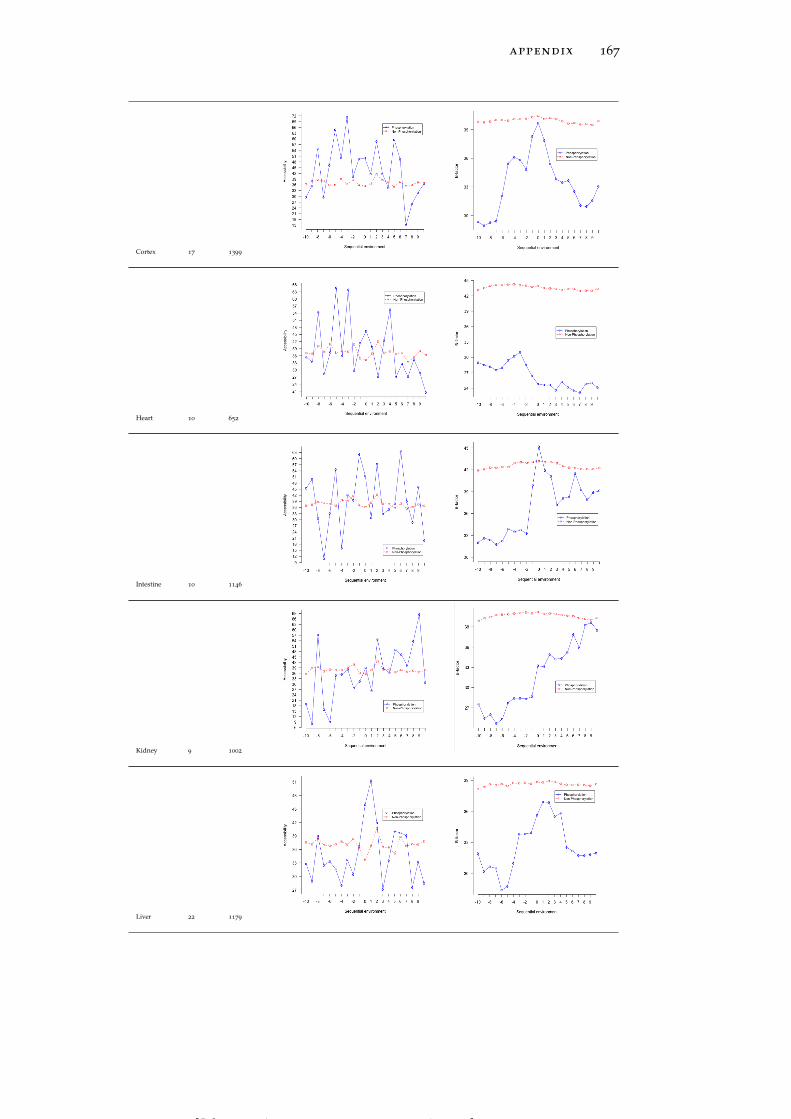
appendix 167
Cortex 17 1399
Heart 10 652
Intestine 10 1146
Kidney 9 1002
Liver 22 1179
[ July 10, 2016 at 22:13 – classicthesis version 4.2 ]
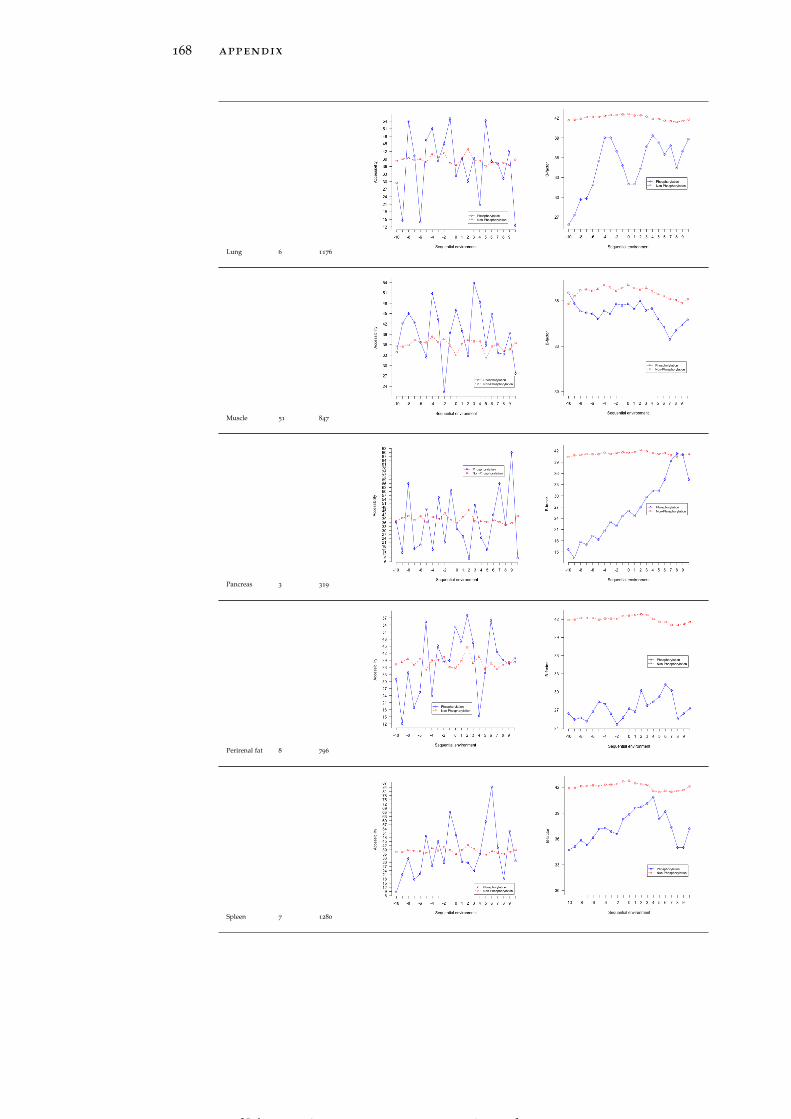
168 appendix
Lung 6 1176
Muscle 51 847
Pancreas 3 319
Perirenal fat 8 796
Spleen 7 1280
[ July 10, 2016 at 22:13 – classicthesis version 4.2 ]
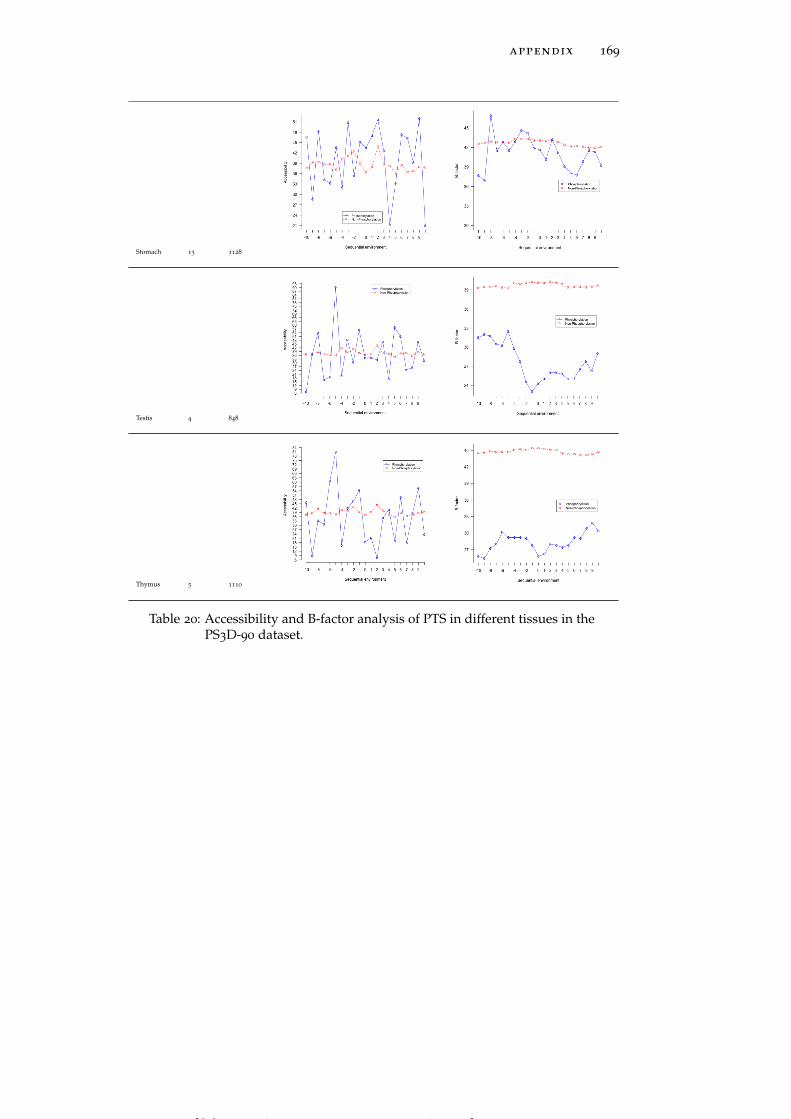
appendix 169
Stomach 13 1128
Testis 4 848
Thymus 5 1110
Table 20: Accessibility and B-factor analysis of PTS in different tissues in thePS3D-90 dataset.
[ July 10, 2016 at 22:13 – classicthesis version 4.2 ]

170 appendix
Tissue # of PYS # of non-PYS Solvent accessibility B-factor scores
Global 46 2804
Blood 2 397
Brain 4 1159
Brainstem 2 829
Cerebellum 3 906
[ July 10, 2016 at 22:13 – classicthesis version 4.2 ]
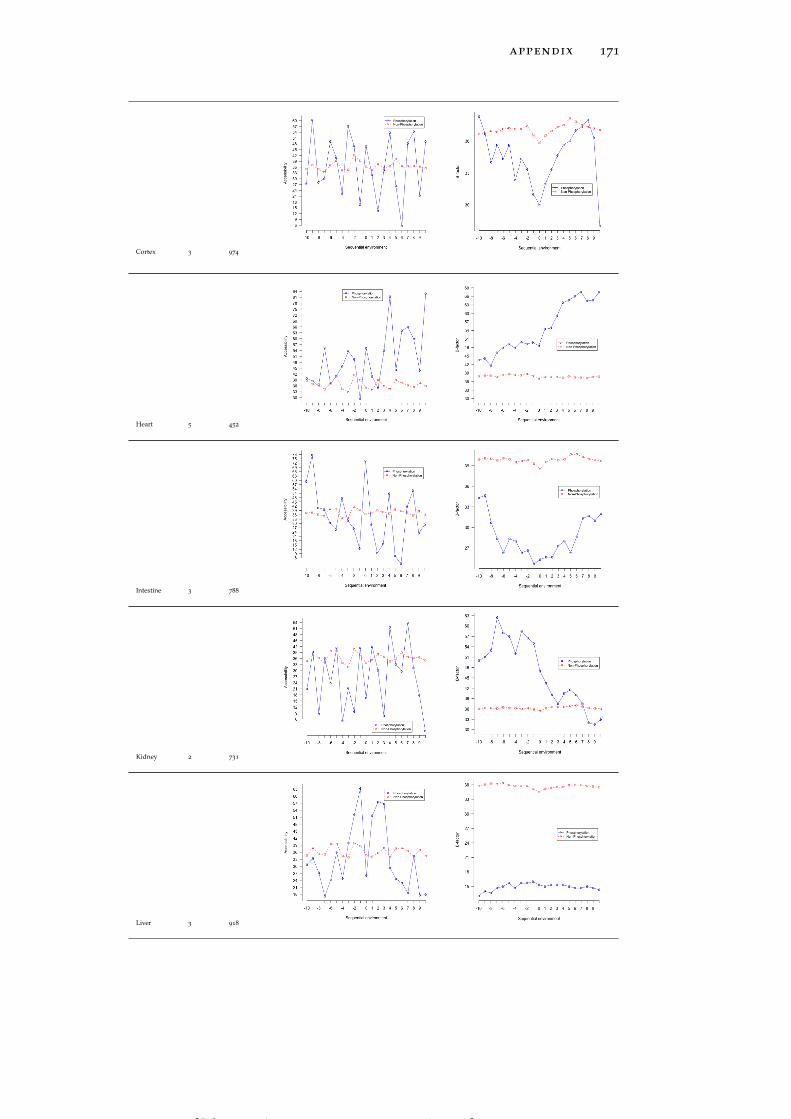
appendix 171
Cortex 3 974
Heart 5 452
Intestine 3 788
Kidney 2 731
Liver 3 918
[ July 10, 2016 at 22:13 – classicthesis version 4.2 ]
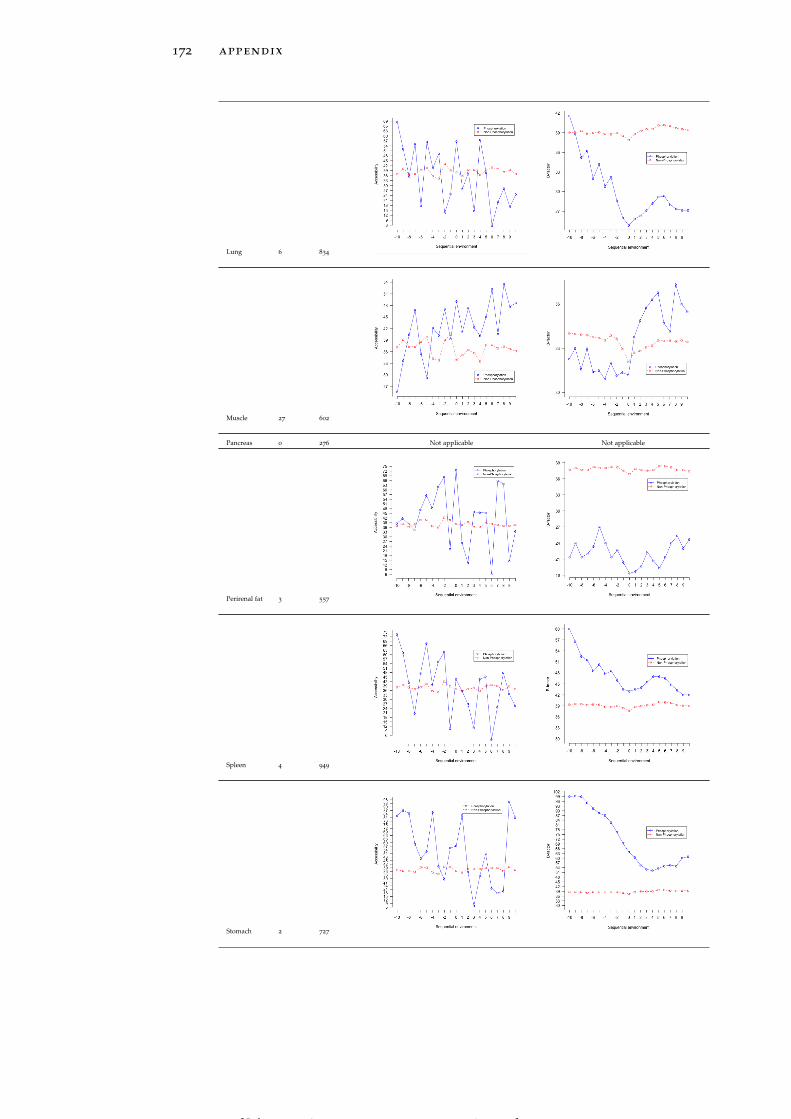
172 appendix
Lung 6 834
Muscle 27 602
Pancreas 0 276 Not applicable Not applicable
Perirenal fat 3 557
Spleen 4 949
Stomach 2 727
[ July 10, 2016 at 22:13 – classicthesis version 4.2 ]

appendix 173
Testis 1 661 Not applicable
Thymus 2 826
Table 21: Accessibility and B-factor analysis of PYS in different tissues in thePS3D-90 dataset.
[ July 10, 2016 at 22:13 – classicthesis version 4.2 ]

[ July 10, 2016 at 22:13 – classicthesis version 4.2 ]
B I B L I O G R A P H Y
Basu, A. et al. (2009). “Proteome-wide prediction of acetylation sub-strates.” In: Proc Natl Acad Sci U S A 106.33, pp. 13785–90.
Baxa, C. A., R. S. Sha, M. K. Buelt, A. J. Smith, V. Matarese, L. L.Chinander, K. L. Boundy, and D. A. Bernlohr (1989). “Humanadipocyte lipid-binding protein: purification of the protein andcloning of its complementary DNA.” In: Biochemistry 28.22, pp. 8683–90.
Berman, H. M., J. Westbrook, Z. Feng, G. Gilliland, T. N. Bhat, H.Weissig, I. N. Shindyalov, and P. E. Bourne (2000). “The ProteinData Bank.” In: Nucleic Acids Res 28.1, pp. 235–42.
Berndsen, C. E., T. Tsubota, S. E. Lindner, S. Lee, J. M. Holton, P. D.Kaufman, J. L. Keck, and J. M. Denu (2008). “Molecular func-tions of the histone acetyltransferase chaperone complex Rtt109-Vps75.” In: Nat Struct Mol Biol 15.9, pp. 948–56.
Blom, N., S. Gammeltoft, and S. Brunak (1999). “Sequence and structure-based prediction of eukaryotic protein phosphorylation sites.” In:J Mol Biol 294.5, pp. 1351–62.
Blom, N., T. Sicheritz-Ponten, R. Gupta, S. Gammeltoft, and S. Brunak(2004). “Prediction of post-translational glycosylation and phos-phorylation of proteins from the amino acid sequence.” In: Pro-teomics 4.6, pp. 1633–49.
Breiman, R. F. (2001). “Vaccines as tools for advancing more thanpublic health: perspectives of a former director of the NationalVaccine Program office.” In: Clin Infect Dis 32.2, pp. 283–8.
Camacho, C., G. Coulouris, V. Avagyan, N. Ma, J. Papadopoulos, K.Bealer, and T. L. Madden (2009). “BLAST+: architecture and ap-plications.” In: BMC Bioinformatics 10, p. 421.
Chen, X., S. P. Shi, S. B. Suo, H. D. Xu, and J. D. Qiu (2014). “Pro-teomic analysis and prediction of human phosphorylation sitesin subcellular level reveal subcellular specificity.” In: Bioinformat-ics.
Chen, Y. C., K. Aguan, C. W. Yang, Y. T. Wang, N. R. Pal, and I.F. Chung (2011). “Discovery of protein phosphorylation motifsthrough exploratory data analysis.” In: PLoS One 6.5, e20025.
Chen, Z., X. J. Chen, M. Xia, H. W. He, S. Wang, H. Liu, H. Gong,and Y. B. Yan (2012). “Chaperone-like effect of the linker on theisolated C-terminal domain of rabbit muscle creatine kinase.” In:Biophys J 103.3, pp. 558–66.
Chou, M. F. and D. Schwartz (2011). “Biological sequence motif dis-covery using motif-x.” In: Curr Protoc Bioinformatics Chapter 13,Unit 13 15–24.
Choudhary, C., C. Kumar, F. Gnad, M. L. Nielsen, M. Rehman, T. C.Walther, J. V. Olsen, and M. Mann (2009). “Lysine acetylationtargets protein complexes and co-regulates major cellular func-tions.” In: Science 325.5942, pp. 834–40.
175
[ July 10, 2016 at 22:13 – classicthesis version 4.2 ]
176 Bibliography
Choudhary, C., B. T. Weinert, Y. Nishida, E. Verdin, and M. Mann(2014). “The growing landscape of lysine acetylation links metabolismand cell signalling.” In: Nat Rev Mol Cell Biol 15.8, pp. 536–50.
Clements, A., A. N. Poux, W. S. Lo, L. Pillus, S. L. Berger, and R. Mar-morstein (2003). “Structural basis for histone and phosphohistonebinding by the GCN5 histone acetyltransferase.” In: Mol Cell 12.2,pp. 461–73.
Consortium, The UniProt (2014). “Activities at the Universal ProteinResource (UniProt).” In: Nucleic Acids Research 42.D1, pp. D191–D198.
Damle, N. P. and D. Mohanty (2014). “Deciphering kinase-substraterelationships by analysis of domain-specific phosphorylation net-work.” In: Bioinformatics 30.12, pp. 1730–8.
Dou, Y., B. Yao, and C. Zhang (2014). “PhosphoSVM: prediction ofphosphorylation sites by integrating various protein sequence at-tributes with a support vector machine.” In: Amino Acids 46.6,pp. 1459–69.
Duan, Guangyou and Dirk Walther (2015). “The Roles of Post-translationalModifications in the Context of Protein Interaction Networks.” In:PLoS Comput Biol 11.2, pp. 1–23.
Durek, P., C. Schudoma, W. Weckwerth, J. Selbig, and D. Walther(2009). “Detection and characterization of 3D-signature phospho-rylation site motifs and their contribution towards improved phos-phorylation site prediction in proteins.” In: BMC Bioinformatics 10,p. 117.
Durek, P., R. Schmidt, J. L. Heazlewood, A. Jones, D. MacLean, A.Nagel, B. Kersten, and W. X. Schulze (2010). “PhosPhAt: the Ara-bidopsis thaliana phosphorylation site database. An update.” In:Nucleic Acids Res 38.Database issue, pp. D828–34.
Fan, W., X. Xu, Y. Shen, H. Feng, A. Li, and M. Wang (2014). “Predic-tion of protein kinase-specific phosphorylation sites in hierarchi-cal structure using functional information and random forest.”In: Amino Acids 46.4, pp. 1069–78.
Fillingham, J., J. Recht, A. C. Silva, B. Suter, A. Emili, I. Stagljar, N.J. Krogan, C. D. Allis, M. C. Keogh, and J. F. Greenblatt (2008).“Chaperone control of the activity and specificity of the histoneH3 acetyltransferase Rtt109.” In: Mol Cell Biol 28.13, pp. 4342–53.
Gao, J. and D. Xu (2010). “The Musite open-source framework forphosphorylation-site prediction.” In: BMC Bioinformatics 11 Suppl12, S9.
Gao, J., J. J. Thelen, A. K. Dunker, and D. Xu (2010). “Musite, a tool forglobal prediction of general and kinase-specific phosphorylationsites.” In: Mol Cell Proteomics 9.12, pp. 2586–600.
Geiss-Friedlander, R. and F. Melchior (2007). “Concepts in sumoyla-tion: a decade on.” In: Nat Rev Mol Cell Biol 8.12, pp. 947–56.
Gene Ontology, Consortium (2015). “Gene Ontology Consortium: go-ing forward.” In: Nucleic Acids Res 43.Database issue, pp. D1049–56.
[ July 10, 2016 at 22:13 – classicthesis version 4.2 ]
Bibliography 177
Gnad, F., J. Gunawardena, and M. Mann (2011). “PHOSIDA 2011:the posttranslational modification database.” In: Nucleic Acids Res39.Database issue, pp. D253–60.
Grotenbreg, G. and H. Ploegh (2007). “Chemical biology: dressed-upproteins.” In: Nature 446.7139, pp. 993–5.
Henriksen, P., S. A. Wagner, B. T. Weinert, S. Sharma, G. Bacinskaja, M.Rehman, A. H. Juffer, T. C. Walther, M. Lisby, and C. Choudhary(2012). “Proteome-wide analysis of lysine acetylation suggests itsbroad regulatory scope in Saccharomyces cerevisiae.” In: Mol CellProteomics 11.11, pp. 1510–22.
Hjerrild, M., A. Stensballe, T. E. Rasmussen, C. B. Kofoed, N. Blom,T. Sicheritz-Ponten, M. R. Larsen, S. Brunak, O. N. Jensen, andS. Gammeltoft (2004). “Identification of phosphorylation sites inprotein kinase A substrates using artificial neural networks andmass spectrometry.” In: J Proteome Res 3.3, pp. 426–33.
Hornbeck, P. V., J. M. Kornhauser, S. Tkachev, B. Zhang, E. Skrzypek,B. Murray, V. Latham, and M. Sullivan (2012). “PhosphoSitePlus:a comprehensive resource for investigating the structure and func-tion of experimentally determined post-translational modificationsin man and mouse.” In: Nucleic Acids Res 40.Database issue, pp. D261–70.
Hou, T., G. Zheng, P. Zhang, J. Jia, J. Li, L. Xie, C. Wei, and Y. Li (2014).“LAceP: lysine acetylation site prediction using logistic regressionclassifiers.” In: PLoS One 9.2, e89575.
Hubbard, S. J. and J. M. Thornton (1993). “’NACCESS’, computer pro-gram.” In:
Huttlin, E. L., M. P. Jedrychowski, J. E. Elias, T. Goswami, R. Rad,S. A. Beausoleil, J. Villen, W. Haas, M. E. Sowa, and S. P. Gygi(2010). “A tissue-specific atlas of mouse protein phosphorylationand expression.” In: Cell 143.7, pp. 1174–89.
Iakoucheva, L. M., P. Radivojac, C. J. Brown, T. R. O’Connor, J. G.Sikes, Z. Obradovic, and A. K. Dunker (2004). “The importance ofintrinsic disorder for protein phosphorylation.” In: Nucleic AcidsRes 32.3, pp. 1037–49.
Imamura, H., N. Sugiyama, M. Wakabayashi, and Y. Ishihama (2014).“Large-scale identification of phosphorylation sites for profilingprotein kinase selectivity.” In: J Proteome Res 13.7, pp. 3410–9.
Jakob, B., J. Splinter, S. Conrad, K. O. Voss, D. Zink, M. Durante,M. Lobrich, and G. Taucher-Scholz (2011). “DNA double-strandbreaks in heterochromatin elicit fast repair protein recruitment,histone H2AX phosphorylation and relocation to euchromatin.”In: Nucleic Acids Res 39.15, pp. 6489–99.
Joosten, R. P., T. A. te Beek, E. Krieger, M. L. Hekkelman, R. W.Hooft, R. Schneider, C. Sander, and G. Vriend (2011). “A seriesof PDB related databases for everyday needs.” In: Nucleic AcidsRes 39.Database issue, pp. D411–9.
Kaji, H. et al. (2012). “Large-scale identification of N-glycosylated pro-teins of mouse tissues and construction of a glycoprotein database,GlycoProtDB.” In: J Proteome Res 11.9, pp. 4553–66.
[ July 10, 2016 at 22:13 – classicthesis version 4.2 ]
178 Bibliography
Kanehisa, M., S. Goto, M. Hattori, K. F. Aoki-Kinoshita, M. Itoh, S.Kawashima, T. Katayama, M. Araki, and M. Hirakawa (2006).“From genomics to chemical genomics: new developments in KEGG.”In: Nucleic Acids Res 34.Database issue, pp. D354–7.
Khoury, G. A., R. C. Baliban, and C. A. Floudas (2011). “Proteome-wide post-translational modification statistics: frequency analysisand curation of the swiss-prot database.” In: Sci Rep 1.
Kim, S. C. et al. (2006). “Substrate and functional diversity of lysineacetylation revealed by a proteomics survey.” In: Mol Cell 23.4,pp. 607–18.
Kobe, B., T. Kampmann, J. K. Forwood, P. Listwan, and R. I. Brinkworth(2005). “Substrate specificity of protein kinases and computationalprediction of substrates.” In: Biochim Biophys Acta 1754.1-2, pp. 200–9.
Kreegipuu, A., N. Blom, and S. Brunak (1999). “PhosphoBase, a databaseof phosphorylation sites: release 2.0.” In: Nucleic Acids Res 27.1,pp. 237–9.
Kuhn, Max (2008). “Building predictive models in R using the caretpackage.” In: Journal of Statistical Software 28.5, pp. 1–26.
Laborde, E. (2010). “Glutathione transferases as mediators of signal-ing pathways involved in cell proliferation and cell death.” In:Cell Death Differ 17.9, pp. 1373–1380.
Levy, E. D., S. W. Michnick, and C. R. Landry (2012). “Protein abun-dance is key to distinguish promiscuous from functional phos-phorylation based on evolutionary information.” In: Philos TransR Soc Lond B Biol Sci 367.1602, pp. 2594–606.
Li, T., P. Du, and N. Xu (2010). “Identifying human kinase-specificprotein phosphorylation sites by integrating heterogeneous infor-mation from various sources.” In: PLoS One 5.11, e15411.
Li, W. and A. Godzik (2006). “Cd-hit: a fast program for clusteringand comparing large sets of protein or nucleotide sequences.” In:Bioinformatics 22.13, pp. 1658–9.
Li, X. D., Y. J. Yang, Y. J. Geng, J. L. Zhao, H. T. Zhang, Y. T. Cheng,and Y. L. Wu (2012). “Phosphorylation of endothelial NOS con-tributes to simvastatin protection against myocardial no-reflowand infarction in reperfused swine hearts: partially via the PKAsignaling pathway.” In: Acta Pharmacol Sin 33.7, pp. 879–87.
Li, Y., M. Wang, H. Wang, H. Tan, Z. Zhang, G. I. Webb, and J. Song(2014). “Accurate in silico identification of species-specific acetyla-tion sites by integrating protein sequence-derived and functionalfeatures.” In: Sci Rep 4, p. 5765.
Linding, R., L. J. Jensen, F. Diella, P. Bork, T. J. Gibson, and R. B. Rus-sell (2003). “Protein disorder prediction: implications for struc-tural proteomics.” In: Structure 11.11, pp. 1453–9.
Linding, R., L. J. Jensen, A. Pasculescu, M. Olhovsky, K. Colwill,P. Bork, M. B. Yaffe, and T. Pawson (2008). “NetworKIN: a re-source for exploring cellular phosphorylation networks.” In: Nu-cleic Acids Res 36.Database issue, pp. D695–9.
[ July 10, 2016 at 22:13 – classicthesis version 4.2 ]
Bibliography 179
Lu, Z., Z. Cheng, Y. Zhao, and S. L. Volchenboum (2011). “Bioinfor-matic analysis and post-translational modification crosstalk pre-diction of lysine acetylation.” In: PLoS One 6.12, e28228.
Lundby, A. et al. (2012a). “Proteomic analysis of lysine acetylationsites in rat tissues reveals organ specificity and subcellular pat-terns.” In: Cell Rep 2.2, pp. 419–31.
Lundby, A., A. Secher, K. Lage, N. B. Nordsborg, A. Dmytriyev, C.Lundby, and J. V. Olsen (2012b). “Quantitative maps of proteinphosphorylation sites across 14 different rat organs and tissues.”In: Nat Commun 3, p. 876.
Maksimoska, J., D. Segura-Pena, P. A. Cole, and R. Marmorstein (2014).“Structure of the p300 histone acetyltransferase bound to acetyl-coenzyme A and its analogues.” In: Biochemistry 53.21, pp. 3415–22.
Manni, S., J. H. Mauban, C. W. Ward, and M. Bond (2008). “Phospho-rylation of the cAMP-dependent protein kinase (PKA) regulatorysubunit modulates PKA-AKAP interaction, substrate phosphory-lation, and calcium signaling in cardiac cells.” In: J Biol Chem283.35, pp. 24145–54.
McGuffin, L. J., K. Bryson, and D. T. Jones (2000). “The PSIPRED pro-tein structure prediction server.” In: Bioinformatics 16.4, pp. 404–5.
Miller, M. L. et al. (2008). “Linear motif atlas for phosphorylation-dependent signaling.” In: Sci Signal 1.35, ra2.
Morrison, R. S., Y. Kinoshita, M. D. Johnson, T. Uo, J. T. Ho, J. K.McBee, T. P. Conrads, and T. D. Veenstra (2002). “Proteomic anal-ysis in the neurosciences.” In: Mol Cell Proteomics 1.8, pp. 553–60.
Murzin, A. G., S. E. Brenner, T. Hubbard, and C. Chothia (1995).“SCOP: a structural classification of proteins database for theinvestigation of sequences and structures.” In: J Mol Biol 247.4,pp. 536–40.
Needleman, S. B. and C. D. Wunsch (1970). “A general method appli-cable to the search for similarities in the amino acid sequence oftwo proteins.” In: J Mol Biol 48.3, pp. 443–53.
Obenauer, J. C., L. C. Cantley, and M. B. Yaffe (2003). “Scansite 2.0:Proteome-wide prediction of cell signaling interactions using shortsequence motifs.” In: Nucleic Acids Res 31.13, pp. 3635–41.
Okanishi, H., K. Kim, R. Masui, and S. Kuramitsu (2013). “Acetylomewith structural mapping reveals the significance of lysine acetyla-tion in Thermus thermophilus.” In: J Proteome Res 12.9, pp. 3952–68.
Olsen, J. V. and M. Mann (2013). “Status of Large-scale Analysis ofPost-translational Modifications by Mass Spectrometry.” In: MolCell Proteomics 12.12, pp. 3444–3452.
Ostlund, G., T. Schmitt, K. Forslund, T. Kostler, D. N. Messina, S.Roopra, O. Frings, and E. L. Sonnhammer (2010). “InParanoid 7:new algorithms and tools for eukaryotic orthology analysis.” In:Nucleic Acids Res 38.Database issue, pp. D196–203.
[ July 10, 2016 at 22:13 – classicthesis version 4.2 ]
180 Bibliography
Patel, J., R. R. Pathak, and S. Mujtaba (2011). “The biology of lysineacetylation integrates transcriptional programming and metabolism.”In: Nutr Metab (Lond) 8, p. 12.
Porollo, A. and J. Meller (2007). “Prediction-based fingerprints ofprotein-protein interactions.” In: Proteins 66.3, pp. 630–45.
Poux, A. N. and R. Marmorstein (2003). “Molecular basis for Gcn5/PCAFhistone acetyltransferase selectivity for histone and nonhistonesubstrates.” In: Biochemistry 42.49, pp. 14366–74.
Recht, J. et al. (2006). “Histone chaperone Asf1 is required for histoneH3 lysine 56 acetylation, a modification associated with S phasein mitosis and meiosis.” In: Proceedings of the National Academy ofSciences 103.18, pp. 6988–6993.
Rojas, J. R., R. C. Trievel, J. Zhou, Y. Mo, X. Li, S. L. Berger, C. D. Al-lis, and R. Marmorstein (1999). “Structure of Tetrahymena GCN5
bound to coenzyme A and a histone H3 peptide.” In: Nature401.6748, pp. 93–8.
Roskoski R., Jr. (2015). “A historical overview of protein kinases andtheir targeted small molecule inhibitors.” In: Pharmacol Res 100,pp. 1–23.
Sadoul, K., J. Wang, B. Diagouraga, and S. Khochbin (2011). “Thetale of protein lysine acetylation in the cytoplasm.” In: J BiomedBiotechnol 2011, p. 970382.
Saunders, N. F., R. I. Brinkworth, T. Huber, B. E. Kemp, and B. Kobe(2008). “Predikin and PredikinDB: a computational frameworkfor the prediction of protein kinase peptide specificity and anassociated database of phosphorylation sites.” In: BMC Bioinfor-matics 9, p. 245.
Schwartz, D. and S. P. Gygi (2005). “An iterative statistical approachto the identification of protein phosphorylation motifs from large-scale data sets.” In: Nat Biotechnol 23.11, pp. 1391–8.
Schwartz, P. A. and B. W. Murray (2011). “Protein kinase biochemistryand drug discovery.” In: Bioorg Chem 39.5-6, pp. 192–210.
Shannon, P., A. Markiel, O. Ozier, N. S. Baliga, J. T. Wang, D. Ram-age, N. Amin, B. Schwikowski, and T. Ideker (2003). “Cytoscape:a software environment for integrated models of biomolecularinteraction networks.” In: Genome Res 13.11, pp. 2498–504.
Shao, J., D. Xu, L. Hu, Y. W. Kwan, Y. Wang, X. Kong, and S. M. Ngai(2012). “Systematic analysis of human lysine acetylation proteinsand accurate prediction of human lysine acetylation through bi-relative adapted binomial score Bayes feature representation.” In:Mol Biosyst 8.11, pp. 2964–73.
Sirover, M. A. (2012). “Subcellular dynamics of multifunctional pro-tein regulation: mechanisms of GAPDH intracellular transloca-tion.” In: J Cell Biochem 113.7, pp. 2193–200.
Su, M. G. and T. Y. Lee (2013). “Incorporating substrate sequence mo-tifs and spatial amino acid composition to identify kinase-specificphosphorylation sites on protein three-dimensional structures.”In: BMC Bioinformatics 14 Suppl 16, S2.
Suo, S. B., J. D. Qiu, S. P. Shi, X. Y. Sun, S. Y. Huang, X. Chen, andR. P. Liang (2012). “Position-specific analysis and prediction for
[ July 10, 2016 at 22:13 – classicthesis version 4.2 ]
Bibliography 181
protein lysine acetylation based on multiple features.” In: PLoSOne 7.11, e49108.
Suo, S. B., J. D. Qiu, S. P. Shi, X. Chen, S. Y. Huang, and R. P. Liang(2013). “Proteome-wide analysis of amino acid variations that in-fluence protein lysine acetylation.” In: J Proteome Res 12.2, pp. 949–58.
Suo, S. B., J. D. Qiu, S. P. Shi, X. Chen, and R. P. Liang (2014). “PSEA:Kinase-specific prediction and analysis of human phosphoryla-tion substrates.” In: Sci Rep 4, p. 4524.
Team, R. Development Core (2009). R: A Language and Environment forStatistical Computing.
ThermoFisher Scientific. https://www.thermofisher.com/de/de/home/life-science/protein-biology/protein-biology-learning-
center/protein-biology-resource-library/pierce-protein-
methods/overview-post-translational-modification.html.Trost, B. and A. Kusalik (2011). “Computational prediction of eukary-
otic phosphorylation sites.” In: Bioinformatics 27.21, pp. 2927–35.— (2013). “Computational phosphorylation site prediction in plants
using random forests and organism-specific instance weights.” In:Bioinformatics 29.6, pp. 686–94.
Tyanova, S., J. Cox, J. Olsen, M. Mann, and D. Frishman (2013). “Phos-phorylation variation during the cell cycle scales with structuralpropensities of proteins.” In: PLoS Comput Biol 9.1, e1002842.
UniProt, Consortium (2010). “The Universal Protein Resource (UniProt)in 2010.” In: Nucleic Acids Res 38.Database issue, pp. D142–8.
Vacic, V., L. M. Iakoucheva, and P. Radivojac (2006). “Two SampleLogo: a graphical representation of the differences between twosets of sequence alignments.” In: Bioinformatics 22.12, pp. 1536–7.
Villen, J., S. A. Beausoleil, S. A. Gerber, and S. P. Gygi (2007). “Large-scale phosphorylation analysis of mouse liver.” In: Proc Natl AcadSci U S A 104.5, pp. 1488–93.
Wang, Benlian, Han Wei, Lakshmi Prabhu, Wei Zhao, Matthew Mar-tin, Antja-Voy Hartley, and Tao Lu (2015). “Role of Novel Ser-ine 316 Phosphorylation of the p65 Subunit of NF-?B in Differ-ential Gene Regulation.” In: Journal of Biological Chemistry 290.33,pp. 20336–20347. eprint: http://www.jbc.org/content/290/33/20336.full.pdf+html.
Wang, M., M. Weiss, M. Simonovic, G. Haertinger, S. P. Schrimpf, M.O. Hengartner, and C. von Mering (2012). “PaxDb, a database ofprotein abundance averages across all three domains of life.” In:Mol Cell Proteomics 11.8, pp. 492–500.
Weinert, B. T., S. A. Wagner, H. Horn, P. Henriksen, W. R. Liu, J. V.Olsen, L. J. Jensen, and C. Choudhary (2011). “Proteome-widemapping of the Drosophila acetylome demonstrates a high de-gree of conservation of lysine acetylation.” In: Sci Signal 4.183,ra48.
Wijk, K. J. van, G. Friso, D. Walther, and W. X. Schulze (2014). “Meta-Analysis of Arabidopsis thaliana Phospho-Proteomics Data Re-veals Compartmentalization of Phosphorylation Motifs.” In: PlantCell 26.6, pp. 2367–2389.
[ July 10, 2016 at 22:13 – classicthesis version 4.2 ]
182 Bibliography
Xue, Y., X. Gao, J. Cao, Z. Liu, C. Jin, L. Wen, X. Yao, and J. Ren (2010).“A summary of computational resources for protein phosphory-lation.” In: Curr Protein Pept Sci 11.6, pp. 485–96.
Yao, C. et al. (2013). “Role of Fas-associated death domain-containingprotein (FADD) phosphorylation in regulating glucose homeosta-sis: from proteomic discovery to physiological validation.” In:Mol Cell Proteomics 12.10, pp. 2689–700.
Zhao, Y. and O. N. Jensen (2009). “Modification-specific proteomics:strategies for characterization of post-translational modificationsusing enrichment techniques.” In: Proteomics 9.20, pp. 4632–41.
Zhao, Y., X. Li, X. Sun, Y. Zhang, and H. Ren (2012). “EMT pheno-type is induced by increased Src kinase activity via Src-mediatedcaspase-8 phosphorylation.” In: Cell Physiol Biochem 29.3-4, pp. 341–52.
[ July 10, 2016 at 22:13 – classicthesis version 4.2 ]