Glacier recession and water resources in Peru’s Cordillera Blanca
Upload
independentCategory
view
8download
0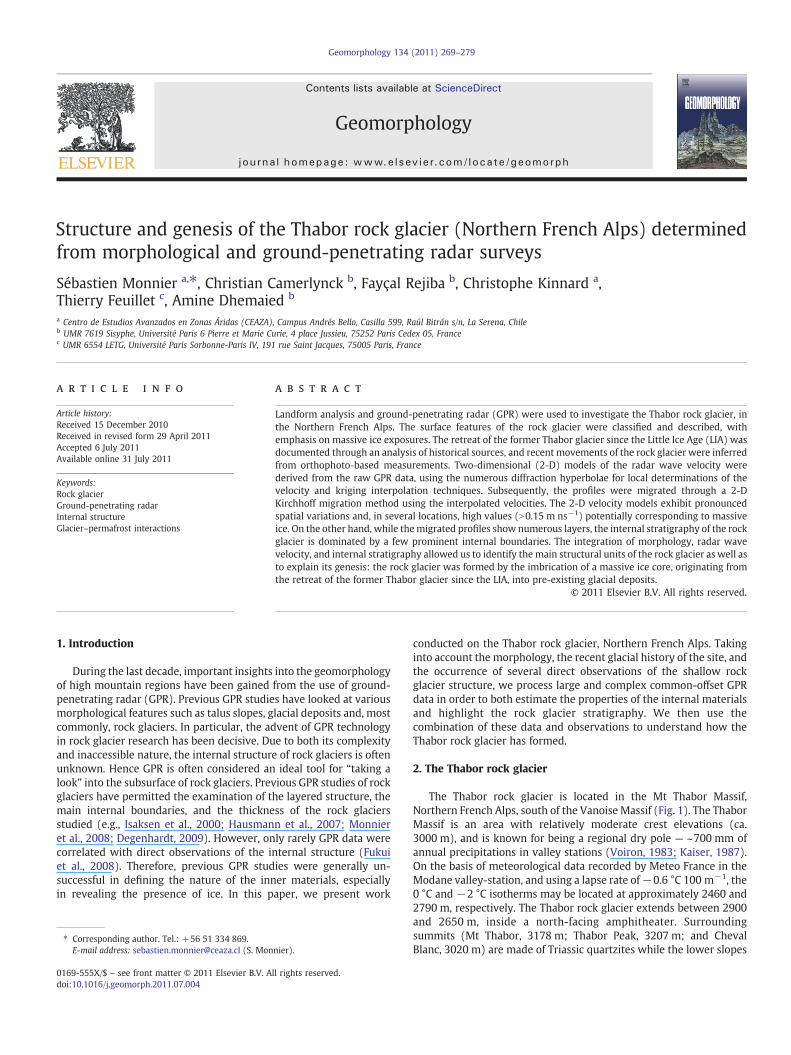
Geomorphology 134 (2011) 269–279
Contents lists available at ScienceDirect
Geomorphology
j ourna l homepage: www.e lsev ie r.com/ locate /geomorph
Structure and genesis of the Thabor rock glacier (Northern French Alps) determinedfrom morphological and ground-penetrating radar surveys
Sébastien Monnier a,⁎, Christian Camerlynck b, Fayçal Rejiba b, Christophe Kinnard a,Thierry Feuillet c, Amine Dhemaied b
a Centro de Estudios Avanzados en Zonas Áridas (CEAZA), Campus Andrés Bello, Casilla 599, Raúl Bitrán s/n, La Serena, Chileb UMR 7619 Sisyphe, Université Paris 6 Pierre et Marie Curie, 4 place Jussieu, 75252 Paris Cedex 05, Francec UMR 6554 LETG, Université Paris Sorbonne-Paris IV, 191 rue Saint Jacques, 75005 Paris, France
⁎ Corresponding author. Tel.: +56 51 334 869.E-mail address: [email protected] (S. Mon
0169-555X/$ – see front matter © 2011 Elsevier B.V. Adoi:10.1016/j.geomorph.2011.07.004
a b s t r a c t
a r t i c l e i n f oArticle history:Received 15 December 2010Received in revised form 29 April 2011Accepted 6 July 2011Available online 31 July 2011
Keywords:Rock glacierGround-penetrating radarInternal structureGlacier–permafrost interactions
Landform analysis and ground-penetrating radar (GPR) were used to investigate the Thabor rock glacier, inthe Northern French Alps. The surface features of the rock glacier were classified and described, withemphasis on massive ice exposures. The retreat of the former Thabor glacier since the Little Ice Age (LIA) wasdocumented through an analysis of historical sources, and recent movements of the rock glacier were inferredfrom orthophoto-based measurements. Two-dimensional (2-D) models of the radar wave velocity werederived from the raw GPR data, using the numerous diffraction hyperbolae for local determinations of thevelocity and kriging interpolation techniques. Subsequently, the profiles were migrated through a 2-DKirchhoff migration method using the interpolated velocities. The 2-D velocity models exhibit pronouncedspatial variations and, in several locations, high values (N0.15 m ns−1) potentially corresponding to massiveice. On the other hand, while themigrated profiles show numerous layers, the internal stratigraphy of the rockglacier is dominated by a few prominent internal boundaries. The integration of morphology, radar wavevelocity, and internal stratigraphy allowed us to identify the main structural units of the rock glacier as well asto explain its genesis: the rock glacier was formed by the imbrication of a massive ice core, originating fromthe retreat of the former Thabor glacier since the LIA, into pre-existing glacial deposits.
nier).
ll rights reserved.
© 2011 Elsevier B.V. All rights reserved.
1. Introduction
During the last decade, important insights into the geomorphologyof high mountain regions have been gained from the use of ground-penetrating radar (GPR). Previous GPR studies have looked at variousmorphological features such as talus slopes, glacial deposits and, mostcommonly, rock glaciers. In particular, the advent of GPR technologyin rock glacier research has been decisive. Due to both its complexityand inaccessible nature, the internal structure of rock glaciers is oftenunknown. Hence GPR is often considered an ideal tool for “taking alook” into the subsurface of rock glaciers. Previous GPR studies of rockglaciers have permitted the examination of the layered structure, themain internal boundaries, and the thickness of the rock glaciersstudied (e.g., Isaksen et al., 2000; Hausmann et al., 2007; Monnieret al., 2008; Degenhardt, 2009). However, only rarely GPR data werecorrelated with direct observations of the internal structure (Fukuiet al., 2008). Therefore, previous GPR studies were generally un-successful in defining the nature of the inner materials, especiallyin revealing the presence of ice. In this paper, we present work
conducted on the Thabor rock glacier, Northern French Alps. Takinginto account the morphology, the recent glacial history of the site, andthe occurrence of several direct observations of the shallow rockglacier structure, we process large and complex common-offset GPRdata in order to both estimate the properties of the internal materialsand highlight the rock glacier stratigraphy. We then use thecombination of these data and observations to understand how theThabor rock glacier has formed.
2. The Thabor rock glacier
The Thabor rock glacier is located in the Mt Thabor Massif,Northern French Alps, south of the Vanoise Massif (Fig. 1). The ThaborMassif is an area with relatively moderate crest elevations (ca.3000 m), and is known for being a regional dry pole — ~700 mm ofannual precipitations in valley stations (Voiron, 1983; Kaiser, 1987).On the basis of meteorological data recorded by Meteo France in theModane valley-station, and using a lapse rate of−0.6 °C 100 m−1, the0 °C and −2 °C isotherms may be located at approximately 2460 and2790 m, respectively. The Thabor rock glacier extends between 2900and 2650 m, inside a north-facing amphitheater. Surroundingsummits (Mt Thabor, 3178 m; Thabor Peak, 3207 m; and ChevalBlanc, 3020 m) are made of Triassic quartzites while the lower slopes
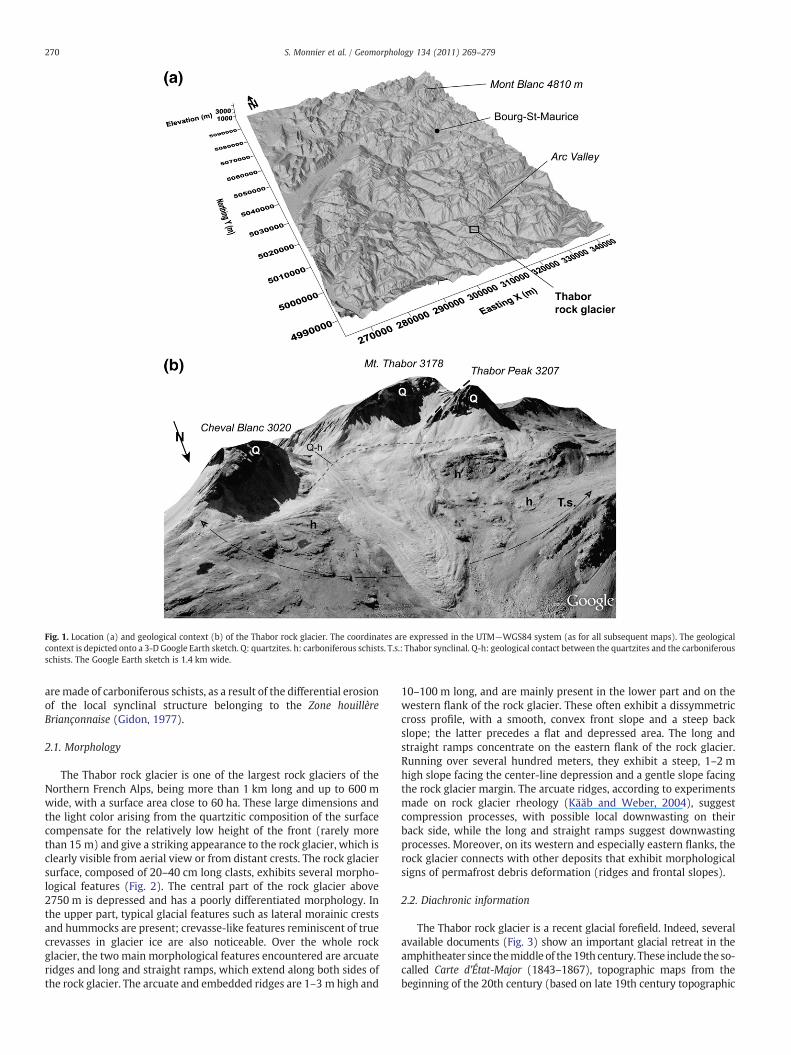
Fig. 1. Location (a) and geological context (b) of the Thabor rock glacier. The coordinates are expressed in the UTM−WGS84 system (as for all subsequent maps). The geologicalcontext is depicted onto a 3-D Google Earth sketch. Q: quartzites. h: carboniferous schists. T.s.: Thabor synclinal. Q-h: geological contact between the quartzites and the carboniferousschists. The Google Earth sketch is 1.4 km wide.
270 S. Monnier et al. / Geomorphology 134 (2011) 269–279
aremade of carboniferous schists, as a result of the differential erosionof the local synclinal structure belonging to the Zone houillèreBriançonnaise (Gidon, 1977).
2.1. Morphology
The Thabor rock glacier is one of the largest rock glaciers of theNorthern French Alps, being more than 1 km long and up to 600 mwide, with a surface area close to 60 ha. These large dimensions andthe light color arising from the quartzitic composition of the surfacecompensate for the relatively low height of the front (rarely morethan 15 m) and give a striking appearance to the rock glacier, which isclearly visible from aerial view or from distant crests. The rock glaciersurface, composed of 20–40 cm long clasts, exhibits several morpho-logical features (Fig. 2). The central part of the rock glacier above2750 m is depressed and has a poorly differentiated morphology. Inthe upper part, typical glacial features such as lateral morainic crestsand hummocks are present; crevasse-like features reminiscent of truecrevasses in glacier ice are also noticeable. Over the whole rockglacier, the twomain morphological features encountered are arcuateridges and long and straight ramps, which extend along both sides ofthe rock glacier. The arcuate and embedded ridges are 1–3 m high and
10–100 m long, and are mainly present in the lower part and on thewestern flank of the rock glacier. These often exhibit a dissymmetriccross profile, with a smooth, convex front slope and a steep backslope; the latter precedes a flat and depressed area. The long andstraight ramps concentrate on the eastern flank of the rock glacier.Running over several hundred meters, they exhibit a steep, 1–2 mhigh slope facing the center-line depression and a gentle slope facingthe rock glacier margin. The arcuate ridges, according to experimentsmade on rock glacier rheology (Kääb and Weber, 2004), suggestcompression processes, with possible local downwasting on theirback side, while the long and straight ramps suggest downwastingprocesses. Moreover, on its western and especially eastern flanks, therock glacier connects with other deposits that exhibit morphologicalsigns of permafrost debris deformation (ridges and frontal slopes).
2.2. Diachronic information
The Thabor rock glacier is a recent glacial forefield. Indeed, severalavailable documents (Fig. 3) show an important glacial retreat in theamphitheater since themiddle of the19th century. These include the so-called Carte d'État-Major (1843–1867), topographic maps from thebeginning of the 20th century (based on late 19th century topographic
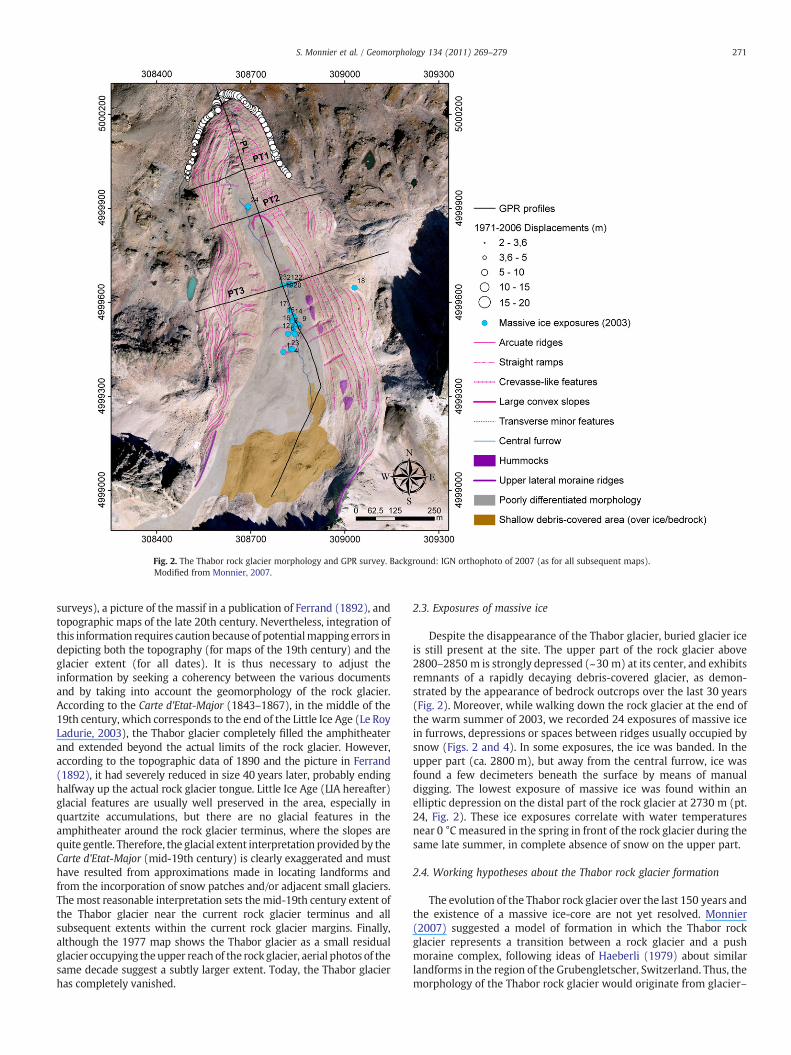
Fig. 2. The Thabor rock glacier morphology and GPR survey. Background: IGN orthophoto of 2007 (as for all subsequent maps).Modified from Monnier, 2007.
271S. Monnier et al. / Geomorphology 134 (2011) 269–279
surveys), a picture of the massif in a publication of Ferrand (1892), andtopographic maps of the late 20th century. Nevertheless, integration ofthis information requires caution because of potentialmapping errors indepicting both the topography (for maps of the 19th century) and theglacier extent (for all dates). It is thus necessary to adjust theinformation by seeking a coherency between the various documentsand by taking into account the geomorphology of the rock glacier.According to the Carte d'Etat-Major (1843–1867), in the middle of the19th century, which corresponds to the end of the Little Ice Age (Le RoyLadurie, 2003), the Thabor glacier completely filled the amphitheaterand extended beyond the actual limits of the rock glacier. However,according to the topographic data of 1890 and the picture in Ferrand(1892), it had severely reduced in size 40 years later, probably endinghalfway up the actual rock glacier tongue. Little Ice Age (LIA hereafter)glacial features are usually well preserved in the area, especially inquartzite accumulations, but there are no glacial features in theamphitheater around the rock glacier terminus, where the slopes arequite gentle. Therefore, the glacial extent interpretation provided by theCarte d'Etat-Major (mid-19th century) is clearly exaggerated and musthave resulted from approximations made in locating landforms andfrom the incorporation of snow patches and/or adjacent small glaciers.The most reasonable interpretation sets the mid-19th century extent ofthe Thabor glacier near the current rock glacier terminus and allsubsequent extents within the current rock glacier margins. Finally,although the 1977 map shows the Thabor glacier as a small residualglacier occupying theupper reach of the rock glacier, aerial photos of thesame decade suggest a subtly larger extent. Today, the Thabor glacierhas completely vanished.
2.3. Exposures of massive ice
Despite the disappearance of the Thabor glacier, buried glacier iceis still present at the site. The upper part of the rock glacier above2800–2850 m is strongly depressed (~30 m) at its center, and exhibitsremnants of a rapidly decaying debris-covered glacier, as demon-strated by the appearance of bedrock outcrops over the last 30 years(Fig. 2). Moreover, while walking down the rock glacier at the end ofthe warm summer of 2003, we recorded 24 exposures of massive icein furrows, depressions or spaces between ridges usually occupied bysnow (Figs. 2 and 4). In some exposures, the ice was banded. In theupper part (ca. 2800 m), but away from the central furrow, ice wasfound a few decimeters beneath the surface by means of manualdigging. The lowest exposure of massive ice was found within anelliptic depression on the distal part of the rock glacier at 2730 m (pt.24, Fig. 2). These ice exposures correlate with water temperaturesnear 0 °C measured in the spring in front of the rock glacier during thesame late summer, in complete absence of snow on the upper part.
2.4. Working hypotheses about the Thabor rock glacier formation
The evolution of the Thabor rock glacier over the last 150 years andthe existence of a massive ice-core are not yet resolved. Monnier(2007) suggested a model of formation in which the Thabor rockglacier represents a transition between a rock glacier and a pushmoraine complex, following ideas of Haeberli (1979) about similarlandforms in the region of the Grubengletscher, Switzerland. Thus, themorphology of the Thabor rock glacier would originate from glacier–
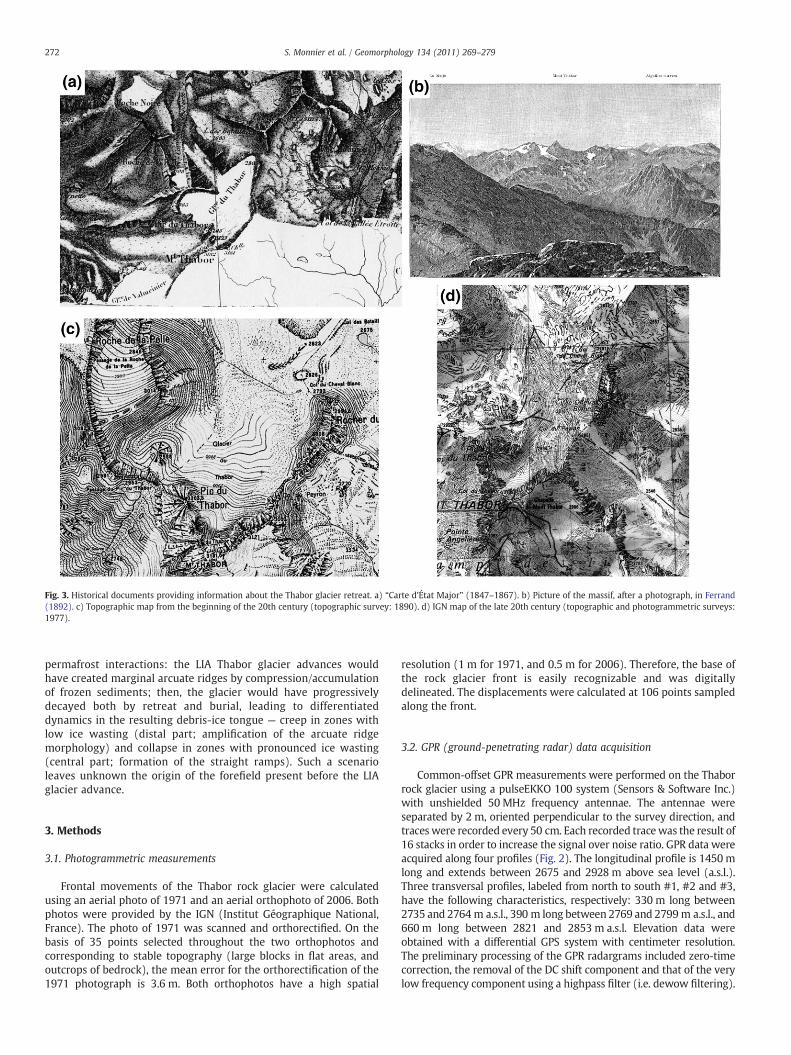
Fig. 3. Historical documents providing information about the Thabor glacier retreat. a) “Carte d'État Major” (1847–1867). b) Picture of the massif, after a photograph, in Ferrand(1892). c) Topographic map from the beginning of the 20th century (topographic survey: 1890). d) IGN map of the late 20th century (topographic and photogrammetric surveys:1977).
272 S. Monnier et al. / Geomorphology 134 (2011) 269–279
permafrost interactions: the LIA Thabor glacier advances wouldhave created marginal arcuate ridges by compression/accumulationof frozen sediments; then, the glacier would have progressivelydecayed both by retreat and burial, leading to differentiateddynamics in the resulting debris-ice tongue — creep in zones withlow ice wasting (distal part; amplification of the arcuate ridgemorphology) and collapse in zones with pronounced ice wasting(central part; formation of the straight ramps). Such a scenarioleaves unknown the origin of the forefield present before the LIAglacier advance.
3. Methods
3.1. Photogrammetric measurements
Frontal movements of the Thabor rock glacier were calculatedusing an aerial photo of 1971 and an aerial orthophoto of 2006. Bothphotos were provided by the IGN (Institut Géographique National,France). The photo of 1971 was scanned and orthorectified. On thebasis of 35 points selected throughout the two orthophotos andcorresponding to stable topography (large blocks in flat areas, andoutcrops of bedrock), the mean error for the orthorectification of the1971 photograph is 3.6 m. Both orthophotos have a high spatial
resolution (1 m for 1971, and 0.5 m for 2006). Therefore, the base ofthe rock glacier front is easily recognizable and was digitallydelineated. The displacements were calculated at 106 points sampledalong the front.
3.2. GPR (ground-penetrating radar) data acquisition
Common-offset GPR measurements were performed on the Thaborrock glacier using a pulseEKKO 100 system (Sensors & Software Inc.)with unshielded 50 MHz frequency antennae. The antennae wereseparated by 2 m, oriented perpendicular to the survey direction, andtraces were recorded every 50 cm. Each recorded tracewas the result of16 stacks in order to increase the signal over noise ratio. GPR data wereacquired along four profiles (Fig. 2). The longitudinal profile is 1450 mlong and extends between 2675 and 2928 m above sea level (a.s.l.).Three transversal profiles, labeled from north to south #1, #2 and #3,have the following characteristics, respectively: 330 m long between2735 and 2764 m a.s.l., 390 m long between 2769 and 2799m a.s.l., and660 m long between 2821 and 2853 m a.s.l. Elevation data wereobtained with a differential GPS system with centimeter resolution.The preliminary processing of the GPR radargrams included zero-timecorrection, the removal of the DC shift component and that of the verylow frequency component using a highpass filter (i.e. dewow filtering).
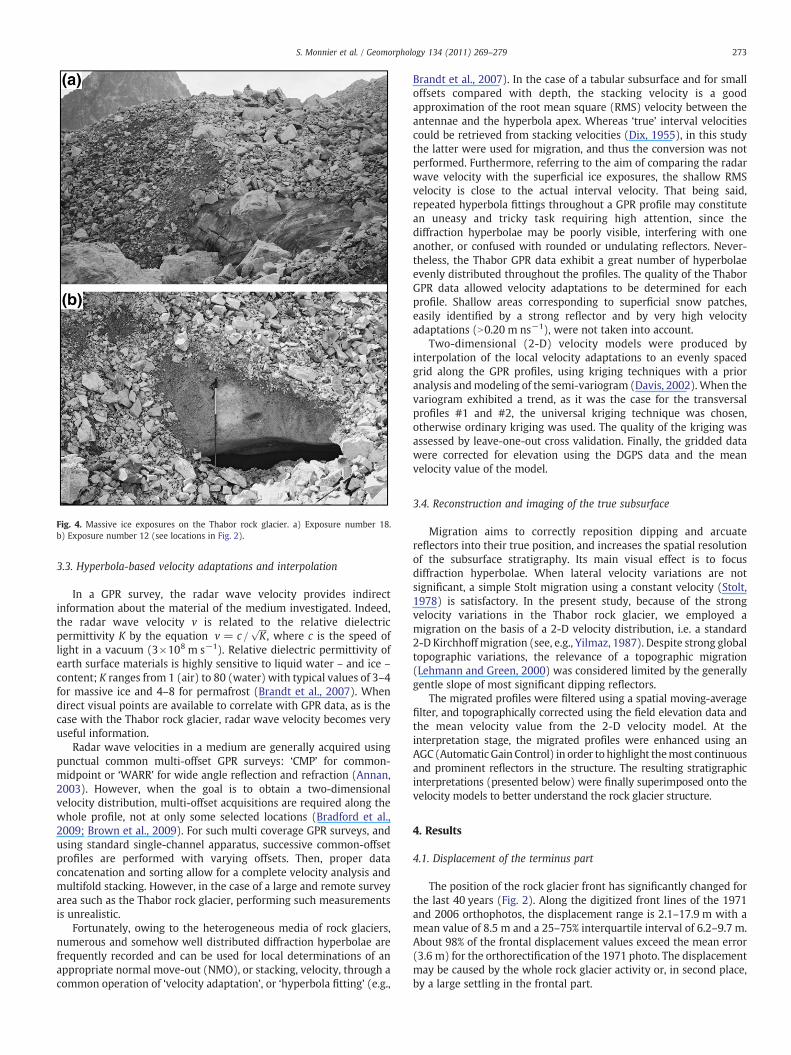
Fig. 4. Massive ice exposures on the Thabor rock glacier. a) Exposure number 18.b) Exposure number 12 (see locations in Fig. 2).
273S. Monnier et al. / Geomorphology 134 (2011) 269–279
3.3. Hyperbola-based velocity adaptations and interpolation
In a GPR survey, the radar wave velocity provides indirectinformation about the material of the medium investigated. Indeed,the radar wave velocity v is related to the relative dielectricpermittivity K by the equation v = c =
ffiffiffiffi
Kp
, where c is the speed oflight in a vacuum (3×10⁸ m s−1). Relative dielectric permittivity ofearth surface materials is highly sensitive to liquid water – and ice –
content; K ranges from 1 (air) to 80 (water) with typical values of 3–4for massive ice and 4–8 for permafrost (Brandt et al., 2007). Whendirect visual points are available to correlate with GPR data, as is thecase with the Thabor rock glacier, radar wave velocity becomes veryuseful information.
Radar wave velocities in a medium are generally acquired usingpunctual common multi-offset GPR surveys: ‘CMP’ for common-midpoint or ‘WARR’ for wide angle reflection and refraction (Annan,2003). However, when the goal is to obtain a two-dimensionalvelocity distribution, multi-offset acquisitions are required along thewhole profile, not at only some selected locations (Bradford et al.,2009; Brown et al., 2009). For such multi coverage GPR surveys, andusing standard single-channel apparatus, successive common-offsetprofiles are performed with varying offsets. Then, proper dataconcatenation and sorting allow for a complete velocity analysis andmultifold stacking. However, in the case of a large and remote surveyarea such as the Thabor rock glacier, performing such measurementsis unrealistic.
Fortunately, owing to the heterogeneous media of rock glaciers,numerous and somehow well distributed diffraction hyperbolae arefrequently recorded and can be used for local determinations of anappropriate normal move-out (NMO), or stacking, velocity, through acommon operation of ‘velocity adaptation’, or ‘hyperbola fitting’ (e.g.,
Brandt et al., 2007). In the case of a tabular subsurface and for smalloffsets compared with depth, the stacking velocity is a goodapproximation of the root mean square (RMS) velocity between theantennae and the hyperbola apex. Whereas ‘true’ interval velocitiescould be retrieved from stacking velocities (Dix, 1955), in this studythe latter were used for migration, and thus the conversion was notperformed. Furthermore, referring to the aim of comparing the radarwave velocity with the superficial ice exposures, the shallow RMSvelocity is close to the actual interval velocity. That being said,repeated hyperbola fittings throughout a GPR profile may constitutean uneasy and tricky task requiring high attention, since thediffraction hyperbolae may be poorly visible, interfering with oneanother, or confused with rounded or undulating reflectors. Never-theless, the Thabor GPR data exhibit a great number of hyperbolaeevenly distributed throughout the profiles. The quality of the ThaborGPR data allowed velocity adaptations to be determined for eachprofile. Shallow areas corresponding to superficial snow patches,easily identified by a strong reflector and by very high velocityadaptations (N0.20 m ns−1), were not taken into account.
Two-dimensional (2-D) velocity models were produced byinterpolation of the local velocity adaptations to an evenly spacedgrid along the GPR profiles, using kriging techniques with a prioranalysis andmodeling of the semi-variogram (Davis, 2002).When thevariogram exhibited a trend, as it was the case for the transversalprofiles #1 and #2, the universal kriging technique was chosen,otherwise ordinary kriging was used. The quality of the kriging wasassessed by leave-one-out cross validation. Finally, the gridded datawere corrected for elevation using the DGPS data and the meanvelocity value of the model.
3.4. Reconstruction and imaging of the true subsurface
Migration aims to correctly reposition dipping and arcuatereflectors into their true position, and increases the spatial resolutionof the subsurface stratigraphy. Its main visual effect is to focusdiffraction hyperbolae. When lateral velocity variations are notsignificant, a simple Stolt migration using a constant velocity (Stolt,1978) is satisfactory. In the present study, because of the strongvelocity variations in the Thabor rock glacier, we employed amigration on the basis of a 2-D velocity distribution, i.e. a standard2-D Kirchhoff migration (see, e.g., Yilmaz, 1987). Despite strong globaltopographic variations, the relevance of a topographic migration(Lehmann and Green, 2000) was considered limited by the generallygentle slope of most significant dipping reflectors.
The migrated profiles were filtered using a spatial moving-averagefilter, and topographically corrected using the field elevation data andthe mean velocity value from the 2-D velocity model. At theinterpretation stage, the migrated profiles were enhanced using anAGC (AutomaticGain Control) in order to highlight themost continuousand prominent reflectors in the structure. The resulting stratigraphicinterpretations (presented below) were finally superimposed onto thevelocity models to better understand the rock glacier structure.
4. Results
4.1. Displacement of the terminus part
The position of the rock glacier front has significantly changed forthe last 40 years (Fig. 2). Along the digitized front lines of the 1971and 2006 orthophotos, the displacement range is 2.1–17.9 m with amean value of 8.5 m and a 25–75% interquartile interval of 6.2–9.7 m.About 98% of the frontal displacement values exceed the mean error(3.6 m) for the orthorectification of the 1971 photo. The displacementmay be caused by the whole rock glacier activity or, in second place,by a large settling in the frontal part.
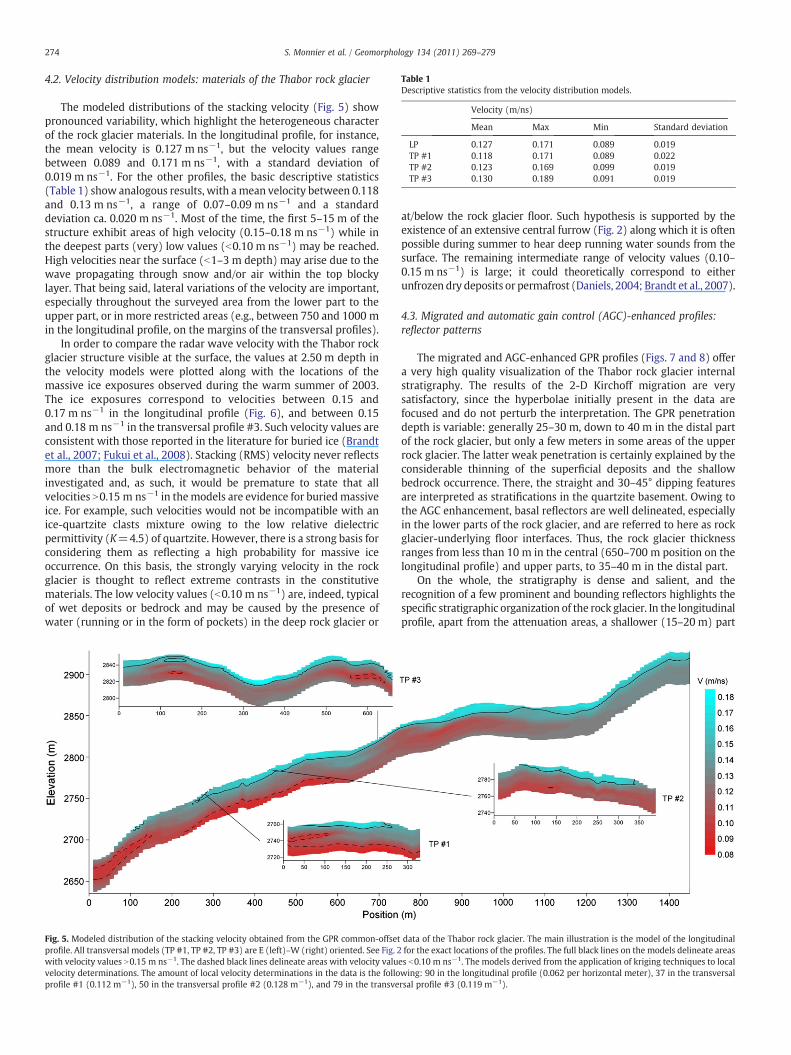
Table 1Descriptive statistics from the velocity distribution models.
Velocity (m/ns)
Mean Max Min Standard deviation
LP 0.127 0.171 0.089 0.019TP #1 0.118 0.171 0.089 0.022TP #2 0.123 0.169 0.099 0.019TP #3 0.130 0.189 0.091 0.019
274 S. Monnier et al. / Geomorphology 134 (2011) 269–279
4.2. Velocity distribution models: materials of the Thabor rock glacier
The modeled distributions of the stacking velocity (Fig. 5) showpronounced variability, which highlight the heterogeneous characterof the rock glacier materials. In the longitudinal profile, for instance,the mean velocity is 0.127 m ns−1, but the velocity values rangebetween 0.089 and 0.171 m ns−1, with a standard deviation of0.019 m ns−1. For the other profiles, the basic descriptive statistics(Table 1) show analogous results, with amean velocity between 0.118and 0.13 m ns−1, a range of 0.07–0.09 m ns−1 and a standarddeviation ca. 0.020 m ns−1. Most of the time, the first 5–15 m of thestructure exhibit areas of high velocity (0.15–0.18 m ns−1) while inthe deepest parts (very) low values (b0.10 m ns−1) may be reached.High velocities near the surface (b1–3 m depth) may arise due to thewave propagating through snow and/or air within the top blockylayer. That being said, lateral variations of the velocity are important,especially throughout the surveyed area from the lower part to theupper part, or in more restricted areas (e.g., between 750 and 1000 min the longitudinal profile, on the margins of the transversal profiles).
In order to compare the radar wave velocity with the Thabor rockglacier structure visible at the surface, the values at 2.50 m depth inthe velocity models were plotted along with the locations of themassive ice exposures observed during the warm summer of 2003.The ice exposures correspond to velocities between 0.15 and0.17 m ns−1 in the longitudinal profile (Fig. 6), and between 0.15and 0.18 m ns−1 in the transversal profile #3. Such velocity values areconsistent with those reported in the literature for buried ice (Brandtet al., 2007; Fukui et al., 2008). Stacking (RMS) velocity never reflectsmore than the bulk electromagnetic behavior of the materialinvestigated and, as such, it would be premature to state that allvelocities N0.15 m ns−1 in themodels are evidence for buriedmassiveice. For example, such velocities would not be incompatible with anice-quartzite clasts mixture owing to the low relative dielectricpermittivity (K=4.5) of quartzite. However, there is a strong basis forconsidering them as reflecting a high probability for massive iceoccurrence. On this basis, the strongly varying velocity in the rockglacier is thought to reflect extreme contrasts in the constitutivematerials. The low velocity values (b0.10 m ns−1) are, indeed, typicalof wet deposits or bedrock and may be caused by the presence ofwater (running or in the form of pockets) in the deep rock glacier or
Fig. 5. Modeled distribution of the stacking velocity obtained from the GPR common-offsetprofile. All transversal models (TP #1, TP #2, TP #3) are E (left)–W (right) oriented. See Fig. 2with velocity values N0.15 m ns−1. The dashed black lines delineate areas with velocity valuvelocity determinations. The amount of local velocity determinations in the data is the folloprofile #1 (0.112 m−1), 50 in the transversal profile #2 (0.128 m−1), and 79 in the transve
at/below the rock glacier floor. Such hypothesis is supported by theexistence of an extensive central furrow (Fig. 2) along which it is oftenpossible during summer to hear deep running water sounds from thesurface. The remaining intermediate range of velocity values (0.10–0.15 m ns−1) is large; it could theoretically correspond to eitherunfrozen dry deposits or permafrost (Daniels, 2004; Brandt et al., 2007).
4.3. Migrated and automatic gain control (AGC)-enhanced profiles:reflector patterns
The migrated and AGC-enhanced GPR profiles (Figs. 7 and 8) offera very high quality visualization of the Thabor rock glacier internalstratigraphy. The results of the 2-D Kirchoff migration are verysatisfactory, since the hyperbolae initially present in the data arefocused and do not perturb the interpretation. The GPR penetrationdepth is variable: generally 25–30 m, down to 40 m in the distal partof the rock glacier, but only a few meters in some areas of the upperrock glacier. The latter weak penetration is certainly explained by theconsiderable thinning of the superficial deposits and the shallowbedrock occurrence. There, the straight and 30–45° dipping featuresare interpreted as stratifications in the quartzite basement. Owing tothe AGC enhancement, basal reflectors are well delineated, especiallyin the lower parts of the rock glacier, and are referred to here as rockglacier-underlying floor interfaces. Thus, the rock glacier thicknessranges from less than 10 m in the central (650–700 m position on thelongitudinal profile) and upper parts, to 35–40 m in the distal part.
On the whole, the stratigraphy is dense and salient, and therecognition of a few prominent and bounding reflectors highlights thespecific stratigraphic organization of the rock glacier. In the longitudinalprofile, apart from the attenuation areas, a shallower (15–20 m) part
data of the Thabor rock glacier. The main illustration is the model of the longitudinalfor the exact locations of the profiles. The full black lines on the models delineate areas
es b0.10 m ns−1. The models derived from the application of kriging techniques to localwing: 90 in the longitudinal profile (0.062 per horizontal meter), 37 in the transversalrsal profile #3 (0.119 m−1).
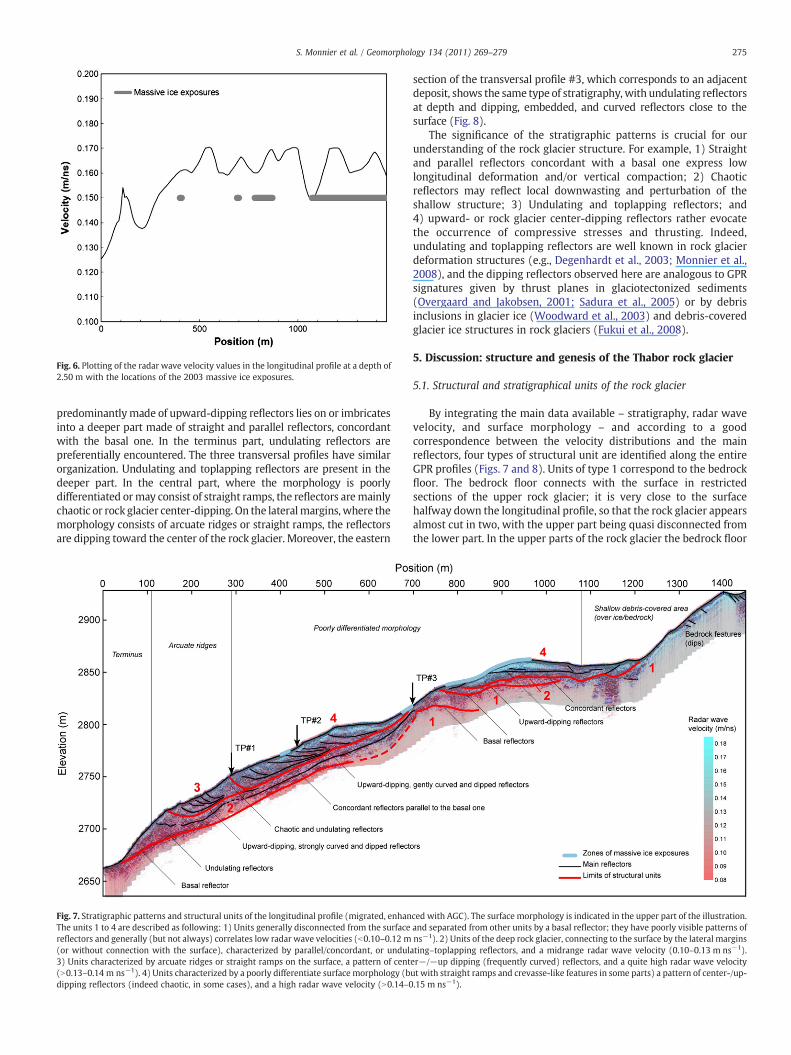
Fig. 6. Plotting of the radar wave velocity values in the longitudinal profile at a depth of2.50 m with the locations of the 2003 massive ice exposures.
275S. Monnier et al. / Geomorphology 134 (2011) 269–279
predominantlymade of upward-dipping reflectors lies on or imbricatesinto a deeper part made of straight and parallel reflectors, concordantwith the basal one. In the terminus part, undulating reflectors arepreferentially encountered. The three transversal profiles have similarorganization. Undulating and toplapping reflectors are present in thedeeper part. In the central part, where the morphology is poorlydifferentiated ormay consist of straight ramps, the reflectors aremainlychaotic or rock glacier center-dipping. On the lateralmargins, where themorphology consists of arcuate ridges or straight ramps, the reflectorsare dipping toward the center of the rock glacier. Moreover, the eastern
Fig. 7. Stratigraphic patterns and structural units of the longitudinal profile (migrated, enhanThe units 1 to 4 are described as following: 1) Units generally disconnected from the surfacereflectors and generally (but not always) correlates low radar wave velocities (b0.10–0.12 m(or without connection with the surface), characterized by parallel/concordant, or undul3) Units characterized by arcuate ridges or straight ramps on the surface, a pattern of cent(N0.13–0.14 m ns−1). 4) Units characterized by a poorly differentiate surface morphology (bdipping reflectors (indeed chaotic, in some cases), and a high radar wave velocity (N0.14–0
section of the transversal profile #3, which corresponds to an adjacentdeposit, shows the same type of stratigraphy, with undulating reflectorsat depth and dipping, embedded, and curved reflectors close to thesurface (Fig. 8).
The significance of the stratigraphic patterns is crucial for ourunderstanding of the rock glacier structure. For example, 1) Straightand parallel reflectors concordant with a basal one express lowlongitudinal deformation and/or vertical compaction; 2) Chaoticreflectors may reflect local downwasting and perturbation of theshallow structure; 3) Undulating and toplapping reflectors; and4) upward- or rock glacier center-dipping reflectors rather evocatethe occurrence of compressive stresses and thrusting. Indeed,undulating and toplapping reflectors are well known in rock glacierdeformation structures (e.g., Degenhardt et al., 2003; Monnier et al.,2008), and the dipping reflectors observed here are analogous to GPRsignatures given by thrust planes in glaciotectonized sediments(Overgaard and Jakobsen, 2001; Sadura et al., 2005) or by debrisinclusions in glacier ice (Woodward et al., 2003) and debris-coveredglacier ice structures in rock glaciers (Fukui et al., 2008).
5. Discussion: structure and genesis of the Thabor rock glacier
5.1. Structural and stratigraphical units of the rock glacier
By integrating the main data available – stratigraphy, radar wavevelocity, and surface morphology – and according to a goodcorrespondence between the velocity distributions and the mainreflectors, four types of structural unit are identified along the entireGPR profiles (Figs. 7 and 8). Units of type 1 correspond to the bedrockfloor. The bedrock floor connects with the surface in restrictedsections of the upper rock glacier; it is very close to the surfacehalfway down the longitudinal profile, so that the rock glacier appearsalmost cut in two, with the upper part being quasi disconnected fromthe lower part. In the upper parts of the rock glacier the bedrock floor
ced with AGC). The surface morphology is indicated in the upper part of the illustration.and separated from other units by a basal reflector; they have poorly visible patterns ofns−1). 2) Units of the deep rock glacier, connecting to the surface by the lateral marginsating–toplapping reflectors, and a midrange radar wave velocity (0.10–0.13 m ns−1).er−/−up dipping (frequently curved) reflectors, and a quite high radar wave velocityut with straight ramps and crevasse-like features in some parts) a pattern of center-/up-.15 m ns−1).
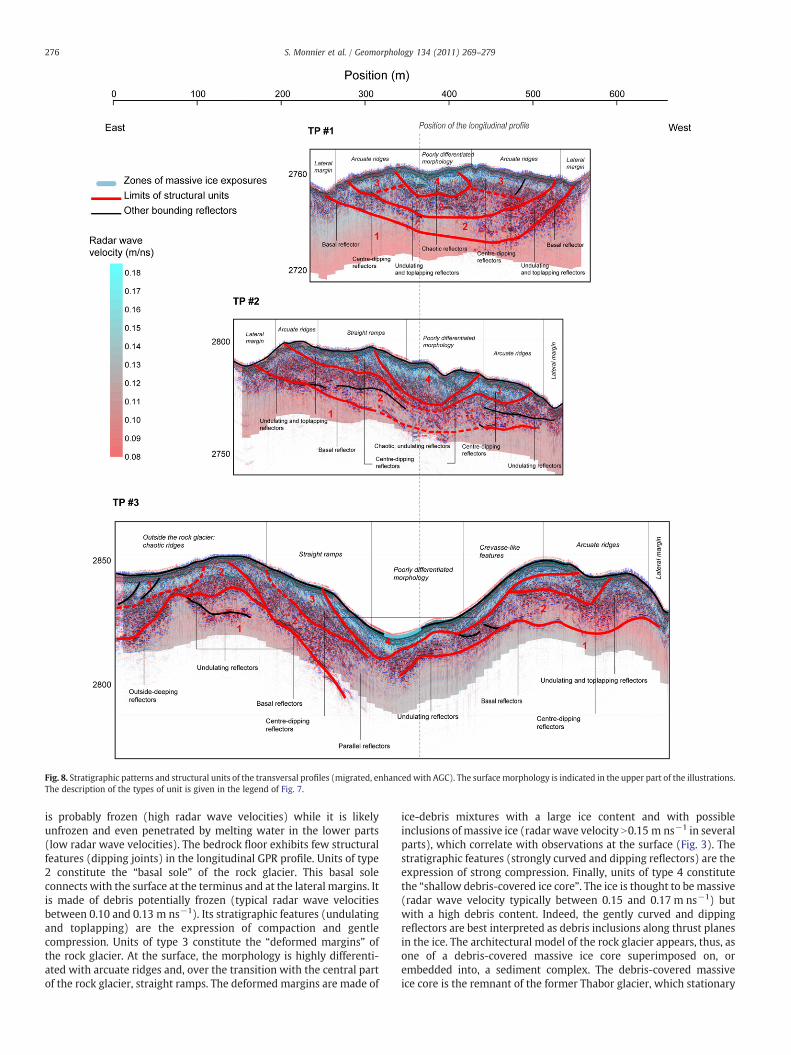
Fig. 8. Stratigraphic patterns and structural units of the transversal profiles (migrated, enhanced with AGC). The surface morphology is indicated in the upper part of the illustrations.The description of the types of unit is given in the legend of Fig. 7.
276 S. Monnier et al. / Geomorphology 134 (2011) 269–279
is probably frozen (high radar wave velocities) while it is likelyunfrozen and even penetrated by melting water in the lower parts(low radar wave velocities). The bedrock floor exhibits few structuralfeatures (dipping joints) in the longitudinal GPR profile. Units of type2 constitute the “basal sole” of the rock glacier. This basal soleconnects with the surface at the terminus and at the lateral margins. Itis made of debris potentially frozen (typical radar wave velocitiesbetween 0.10 and 0.13 m ns−1). Its stratigraphic features (undulatingand toplapping) are the expression of compaction and gentlecompression. Units of type 3 constitute the “deformed margins” ofthe rock glacier. At the surface, the morphology is highly differenti-ated with arcuate ridges and, over the transition with the central partof the rock glacier, straight ramps. The deformed margins are made of
ice-debris mixtures with a large ice content and with possibleinclusions of massive ice (radar wave velocity N0.15 m ns−1 in severalparts), which correlate with observations at the surface (Fig. 3). Thestratigraphic features (strongly curved and dipping reflectors) are theexpression of strong compression. Finally, units of type 4 constitutethe “shallow debris-covered ice core”. The ice is thought to bemassive(radar wave velocity typically between 0.15 and 0.17 m ns−1) butwith a high debris content. Indeed, the gently curved and dippingreflectors are best interpreted as debris inclusions along thrust planesin the ice. The architectural model of the rock glacier appears, thus, asone of a debris-covered massive ice core superimposed on, orembedded into, a sediment complex. The debris-covered massiveice core is the remnant of the former Thabor glacier, which stationary
277S. Monnier et al. / Geomorphology 134 (2011) 269–279
and re-advancing positions since the end of the LIA can finally beeninferred (Fig. 9).
5.2. Origin of the surface features
Given our structural interpretation, the surface morphology(Fig. 2) may be interpreted as being mainly the result of glacier–permafrost interactions. As primarily inferred, the hummocks andvery upper lateral ridges are of glacial origin. The occurrence ofcrevasse-like features at the surface corresponds with the inferredextent of debris-covered ice, hence these features probably relate tofractures within the massive ice core. In the lower-central part of therock glacier, a large convex slope, preceding a crevasse-like feature,evocate an accumulation form and may correspond to a formerterminus of the stagnating glacier (Fig. 9). Straight ramps occur bothin the deformed margins and in the debris-covered ice core; they arethought to result from downwasting by melting of internal ice. Theorigin of the arcuate ridges on the Thabor rock glacier was extensivelydiscussed byMonnier (2007). Further understanding of these featurescan be gained by focusing on the terminus part of the rock glacier inthe longitudinal profile (Fig. 10). The location of the ridges correlatesexactly with the dipping planes. Some of the ridges, especially number4 (Fig. 10c,d), exhibit a peculiar morphology with a steep and sharpback slope preceding a flat and depressed area. This morphology was
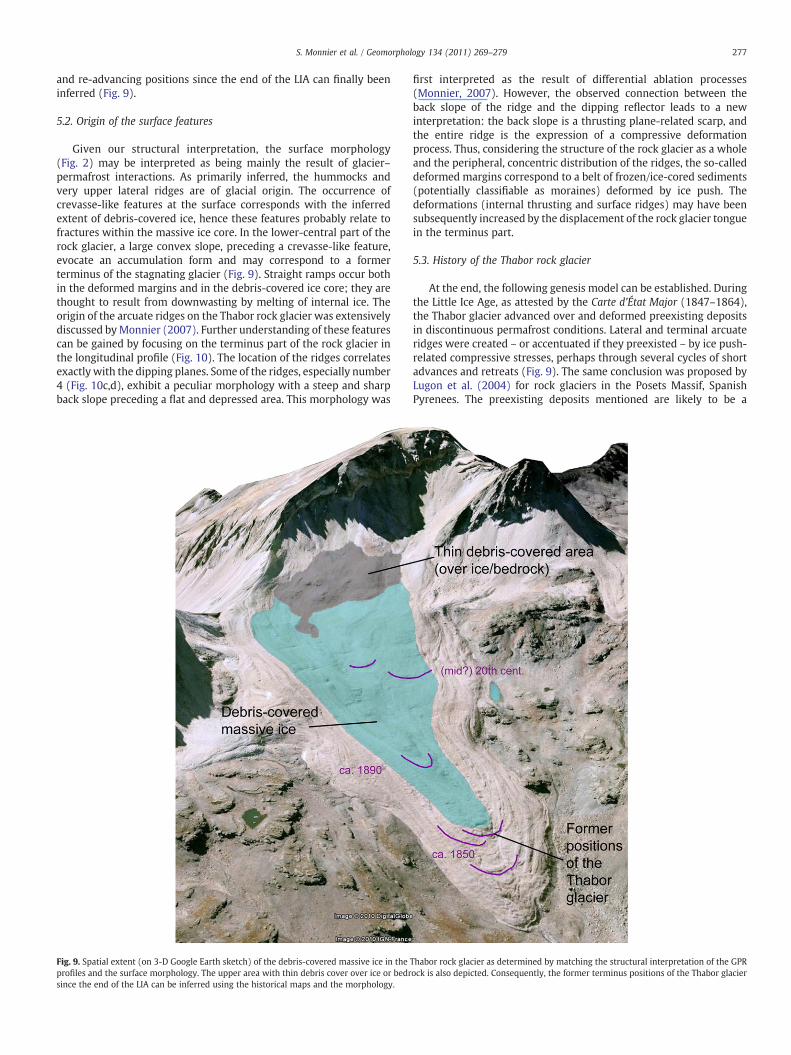
Fig. 9. Spatial extent (on 3-D Google Earth sketch) of the debris-covered massive ice in theprofiles and the surface morphology. The upper area with thin debris cover over ice or bedrsince the end of the LIA can be inferred using the historical maps and the morphology.
first interpreted as the result of differential ablation processes(Monnier, 2007). However, the observed connection between theback slope of the ridge and the dipping reflector leads to a newinterpretation: the back slope is a thrusting plane-related scarp, andthe entire ridge is the expression of a compressive deformationprocess. Thus, considering the structure of the rock glacier as a wholeand the peripheral, concentric distribution of the ridges, the so-calleddeformed margins correspond to a belt of frozen/ice-cored sediments(potentially classifiable as moraines) deformed by ice push. Thedeformations (internal thrusting and surface ridges) may have beensubsequently increased by the displacement of the rock glacier tonguein the terminus part.
5.3. History of the Thabor rock glacier
At the end, the following genesis model can be established. Duringthe Little Ice Age, as attested by the Carte d'État Major (1847–1864),the Thabor glacier advanced over and deformed preexisting depositsin discontinuous permafrost conditions. Lateral and terminal arcuateridges were created – or accentuated if they preexisted – by ice push-related compressive stresses, perhaps through several cycles of shortadvances and retreats (Fig. 9). The same conclusion was proposed byLugon et al. (2004) for rock glaciers in the Posets Massif, SpanishPyrenees. The preexisting deposits mentioned are likely to be a
Thabor rock glacier as determined by matching the structural interpretation of the GPRock is also depicted. Consequently, the former terminus positions of the Thabor glacier
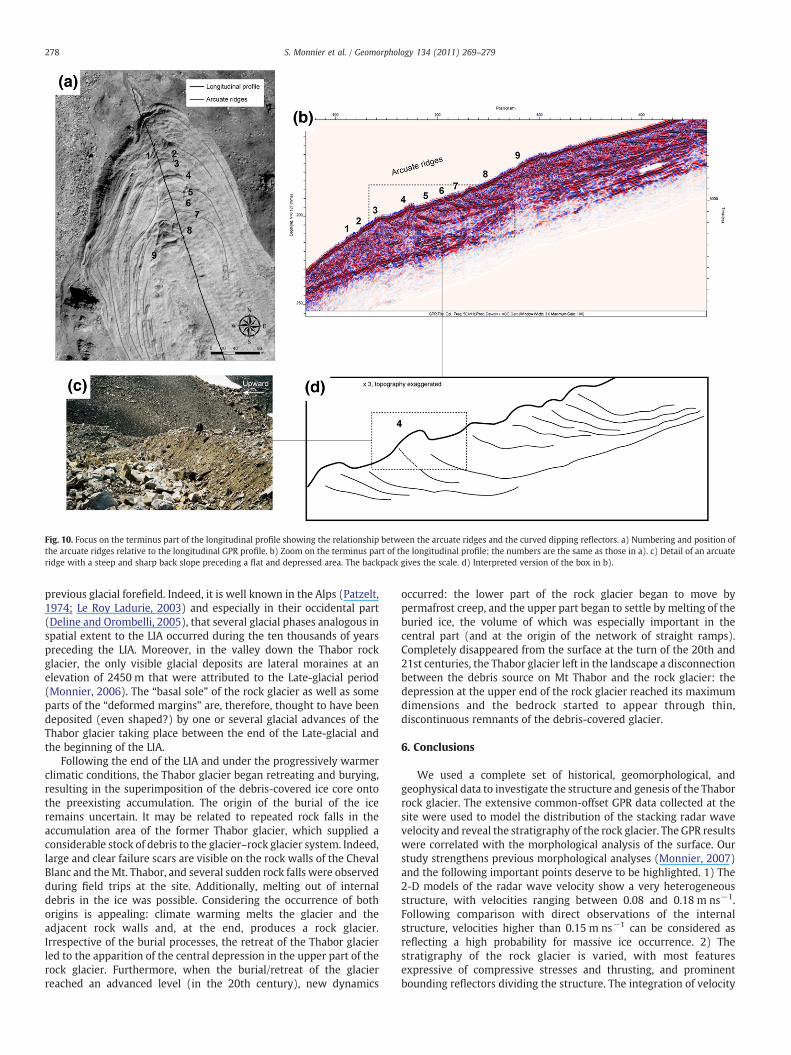
Fig. 10. Focus on the terminus part of the longitudinal profile showing the relationship between the arcuate ridges and the curved dipping reflectors. a) Numbering and position ofthe arcuate ridges relative to the longitudinal GPR profile. b) Zoom on the terminus part of the longitudinal profile; the numbers are the same as those in a). c) Detail of an arcuateridge with a steep and sharp back slope preceding a flat and depressed area. The backpack gives the scale. d) Interpreted version of the box in b).
278 S. Monnier et al. / Geomorphology 134 (2011) 269–279
previous glacial forefield. Indeed, it is well known in the Alps (Patzelt,1974; Le Roy Ladurie, 2003) and especially in their occidental part(Deline and Orombelli, 2005), that several glacial phases analogous inspatial extent to the LIA occurred during the ten thousands of yearspreceding the LIA. Moreover, in the valley down the Thabor rockglacier, the only visible glacial deposits are lateral moraines at anelevation of 2450 m that were attributed to the Late-glacial period(Monnier, 2006). The “basal sole” of the rock glacier as well as someparts of the “deformed margins” are, therefore, thought to have beendeposited (even shaped?) by one or several glacial advances of theThabor glacier taking place between the end of the Late-glacial andthe beginning of the LIA.
Following the end of the LIA and under the progressively warmerclimatic conditions, the Thabor glacier began retreating and burying,resulting in the superimposition of the debris-covered ice core ontothe preexisting accumulation. The origin of the burial of the iceremains uncertain. It may be related to repeated rock falls in theaccumulation area of the former Thabor glacier, which supplied aconsiderable stock of debris to the glacier–rock glacier system. Indeed,large and clear failure scars are visible on the rock walls of the ChevalBlanc and theMt. Thabor, and several sudden rock falls were observedduring field trips at the site. Additionally, melting out of internaldebris in the ice was possible. Considering the occurrence of bothorigins is appealing: climate warming melts the glacier and theadjacent rock walls and, at the end, produces a rock glacier.Irrespective of the burial processes, the retreat of the Thabor glacierled to the apparition of the central depression in the upper part of therock glacier. Furthermore, when the burial/retreat of the glacierreached an advanced level (in the 20th century), new dynamics
occurred: the lower part of the rock glacier began to move bypermafrost creep, and the upper part began to settle by melting of theburied ice, the volume of which was especially important in thecentral part (and at the origin of the network of straight ramps).Completely disappeared from the surface at the turn of the 20th and21st centuries, the Thabor glacier left in the landscape a disconnectionbetween the debris source on Mt Thabor and the rock glacier: thedepression at the upper end of the rock glacier reached its maximumdimensions and the bedrock started to appear through thin,discontinuous remnants of the debris-covered glacier.
6. Conclusions
We used a complete set of historical, geomorphological, andgeophysical data to investigate the structure and genesis of the Thaborrock glacier. The extensive common-offset GPR data collected at thesite were used to model the distribution of the stacking radar wavevelocity and reveal the stratigraphy of the rock glacier. The GPR resultswere correlated with the morphological analysis of the surface. Ourstudy strengthens previous morphological analyses (Monnier, 2007)and the following important points deserve to be highlighted. 1) The2-D models of the radar wave velocity show a very heterogeneousstructure, with velocities ranging between 0.08 and 0.18 m ns−1.Following comparison with direct observations of the internalstructure, velocities higher than 0.15 m ns−1 can be considered asreflecting a high probability for massive ice occurrence. 2) Thestratigraphy of the rock glacier is varied, with most featuresexpressive of compressive stresses and thrusting, and prominentbounding reflectors dividing the structure. The integration of velocity
279S. Monnier et al. / Geomorphology 134 (2011) 269–279
modeling, stratigraphic representation and surface morphologyinformation depicts a rock glacier composed of a shallow (b15 m)debris-covered massive ice core overlying a (potentially frozen) soleof sediments, and embedded into deformed permafrost margins. 3)The genesis of the rock glacier has probably involved several temporalphases since the Late-glacial; however, the current rock glaciermorphology is mainly the product of glacier–permafrost interactionsduring the LIA and subsequent deformation processes. During the LIAthe Thabor glacier advanced over and deformed preexisting depositsbefore the resulting system became modified in the last 150 years byice burial, permafrost creep, and downwasting.
At the end, is the Thabor rock glacier still a true one? Haeberli (1979,p. 46) states that “All transitions between push-moraines and rockglaciers may exist in cases where a glacier was in contact with a rockglacier during neo-glaciation or Holocene advances”. This is exactlywhere the study of the Thabor rock glacier leads us. The actual andimpressively esthetic tongue is neither a debris-covered glacier, nor amorainic complex, nor a rock glacier in the sense of an individualcreeping permafrost body (Barsch, 1992). The Thabor rock glacier is allof that in one feature, and thus expresses the complexity of theinteractions that can occur on the surface as consequences of theenvironmental changes of the last centuries and millennia.
Acknowledgments
The authorswould like to thank friendly and sincerelyMarion Siboniand Guillaume Tanguy who provided valuable and courageous helpduring the field survey. Moreover, the Thabor rock glacier is part of theThabor natural site listed by the Ecology and Sustainable DevelopmentMinister of France; the temporal implantation of scientific material onthis site was permitted by a decree of the Savoy prefecture emitted the30th of June of 2008. The authors renew their acknowledgements to theSavoy prefecture for this permission. Finally, Shelley MacDonellprovided helpful review of the language in the manuscript.
References
Annan, A.P., 2003. Ground Penetrating Radar principles, Procedures and Applications.Sensors & Software Inc., Mississauga.
Barsch, D., 1992. Permafrost creep and rockglaciers. Permafrost and PeriglacialProcesses 3, 175–188.
Bradford, J.H., Nichols, J., Mikesell, T.D., Harper, J.T., 2009. Continuous profiles ofelectromagnetic wave velocity and water content in glaciers: an example fromBench Glacier, Alaska, USA. Annals of Glaciology 50, 1–9.
Brandt, O., Langley, K., Kohler, J., Hamran, S.-E., 2007. Detection of buried ice andsediment layers in permafrost using multi-frequency Ground Penetrating Radar: acase examination on Svalbard. Remote Sensing of Environment 111, 212–227.
Brown, J., Nichols, J., Steinbronn, L., Bradford, J., 2009. Improved GPR interpretationthrough resolution of lateral velocity heterogeneity: example from an archaeolog-ical site investigation. Journal of Applied Geophysics 68, 3–8.
Ground Penetrating Radar, In: Daniels, D.J. (Ed.), 2nd Edition. The Institution ofElectrical Engineers, London. 726 pp.
Davis, J.C., 2002. Statistics and Data Analysis in Geology, Third edition. John Wiley &Sons, New York. 638 pp.
Degenhardt, J.J., 2009. Development of tongue-shaped and multilobate rock glaciers inalpine environments — interpretations from ground penetrating radar surveys.Geomorphology 109, 94–107.
Degenhardt, J.J., Giardino, J.R., Junck, M.B., 2003. GPR survey of a lobate rock glacier inYankee Boy Basin, Colorado, USA. In: Bristow, C.S., Jol, H.M. (Eds.), GroundPenetrating Radar in Sediments: Geological Society of London, Special Publications,21, pp. 167–179.
Deline, P., Orombelli, G., 2005. Glacier fluctuations in the Western Alps during theNeoglacial, as indicated by the Miage morainic amphitheatre (Mont Blanc massif,Italy). Boreas 34, 456–467.
Dix, C.H., 1955. Seismic velocities from surface measurements. Geophysics 20, 180–195.Ferrand, H., 1892. Autour de Modane: la chaîne frontalière franco-italienne entre le
Mont Thabor et le Mont Cenis. Annuaire du Club Alpin Français, pp. 3–49.Fukui, K., Sone, T., Strelin, J.A., Torielli, C.A., Mori, J., Fujii, Y., 2008. Dynamics and GPR
stratigraphy of a polar rock glacier on James Ross Island, Antarctic Peninsula.Journal of Glaciology 54, 445–451.
Gidon, M., 1977. Carte géologique simplifiée des Alpes occidentales, du Léman à Dignes(1/2500000). Didier Richard Editions and BRGM, Grenoble and Orléans, 2 maps,instructions 18 p.
Haeberli, W., 1979. Holocene push-moraine in alpine permafrost. Geografiska Annaler61A, 43–48.
Hausmann, H., Krainer, K., Brückl, E., Mostler, W., 2007. Internal structure and icecontent of Reichenkar rock glacier (Stubai Alps, Austria) assessed by geophysicalinvestigations. Permafrost and Periglacial Processes 18, 351–367.
Isaksen, K., Ødegård, S.R., Eiken, T., Sollid, J.L., 2000. Composition, flow anddevelopment of two tongue-shaped rock glaciers in the permafrost of Svalbard.Permafrost and Periglacial Processes 11, 241–257.
Kääb, A., Weber, M., 2004. Development of transverse ridges on rock glaciers: fieldmeasurements and laboratory experiments. Permafrost and Periglacial Processes15, 379–391.
Kaiser, B., 1987. Les versants de Vanoise : enjeux traditionnels et fonctionnementmorphoclimatique. Ph.D., University Paris 7, 1088 p.
Le Roy Ladurie, E., 2003. Histoire du Climat depuis l'an mil. Flammarion, Paris. 541 pp.Lehmann, F., Green, A., 2000. Topographic migration of georadar data: implications for
acquisition and processing. Geophysics 65, 836.Lugon, R., Delaloye, R., Serrano, E., Reynard, E., Lambiel, C., Gonzales-Trueba, J.J., 2004.
Permafrost and Little Ice Age glacier relationships, Posets Massif, Central Pyrenees,Spain. Permafrost and Periglacial Processes 15, 207–220.
Monnier, S., 2006. Les glaciers rocheux, objets géographiques. Analyse spatialemultiscalaire et investigations environnementales. Application aux Alpes deVanoise. Ph.D., University Paris 12, 339 p.
Monnier, S., 2007. Du glacier au glacier rocheux, depuis la fin du Petit âge glaciaire, aupied du Mont Thabor (Alpes du Nord, France). Quaternaire 18, 283–294.
Monnier, S., Camerlynck, C., Rejiba, F., 2008. Ground-penetrating radar survey andstratigraphic interpretation of the Plan du Lac rock glaciers, Northern French Alps.Permafrost and Periglacial Processes 19, 19–30.
Overgaard, T., Jakobsen, P.R., 2001. Mapping of glaciotectonic deformation in an icemarginal environment with ground penetrating radar. Journal of AppliedGeophysics 47, 191–197.
Patzelt, G., 1974. Holocene variations of glaciers in the Alps. Colloques Internationauxdu CNRS 219, 51–59.
Sadura, S., Martini, I.P., Endres, A.L., Wolf, K., 2005. Morphology and GPR stratigraphy ofa frontal part of an end moraine of the Laurentide Ice Sheet: Paris Moraine nearGuelph, ON, Canada. Geomorphology 75, 212–225.
Stolt, R.H., 1978. Migration by Fourier transform. Geophysics 43, 23–48.Voiron, H., 1983. Les régimes nivométriques de la Vanoise. Travaux scientifiques du
Parc national de la Vanoise XIII, pp. 81–89.Woodward, J., Murray, T., Clark, R.A., Stuart, G.W., 2003. Glacier surge mechanisms
inferred from ground-penetrating radar: Kongsvegen, Svalbard. Journal ofGlaciology 49, 473–480.
Yilmaz, O., 1987. Seismic Data Processing (Investigation in Geophysics 10). Society ofExploration Geophysicists, Tulsa. 2027 pp.
Copyright © 2022 FDOKUMEN