
Structural studies of Erwinia carotovora L-Asparaginase by X ...
61
-
Upload
khangminh22 -
Category
Documents
-
view
0 -
download
0
Transcript of Structural studies of Erwinia carotovora L-Asparaginase by X ...

Master of Science thesis
Structural studies of Erwinia carotovora L-Asparaginase
by X-ray crystallography
Charlotta S. Andersson
LiTH - IFM - EX - - 06/1580 - - SE

Structural studies of Erwinia carotovora L-Asparaginase by
X-ray crystallography
Physics and Measurement Technology, Linköping University
Charlotta S. Andersson
LiTH - IFM - EX - - 06/1580 - - SE
Master of Science thesis: 20 p
Level: D
Supervisor: Tassos Papageorgiou,Turku Centre for Biotechnology, Turku
Examiner: Lars-Göran Mårtensson,Physics and Measurement Technology, Linköping University
Linköping: March 2006

Avdelning, Institution
Division, DepartmentDatum
Date
Språk
Language
2 Svenska/Swedish
2 Engelska/English
2
Rapporttyp
Report category
2 Licentiatavhandling
2 Examensarbete
2 C-uppsats
2 D-uppsats
2 Övrig rapport
2
URL för elektronisk version
ISBN
ISRN
Serietitel och serienummer
Title of series, numberingISSN
Titel
Title
Författare
Author
Sammanfattning
Abstract
Nyckelord
Keywords
Bacterial L-asparaginases (E.C.3.5.1.1) are enzymes that catalyze thehydrolysis of L-asparagine to aspartic acid. For the past 30 years theseenzymes have been used as therapeutic agents in the treatment of acutechildhood lymphoblastic leukemia. The presence of a low rate glutam-inase activity however causes serious side-e�ects to patients in treat-ment, as glutamine depletion give rise to neurotoxicity, anaphylaxis,and other hypersensitivity reactions. The interest in the enzyme fromErwinia carotovora originates from the fact that it shows a decreasedglutaminase activity, and therefore the enzyme is expected to exhibitfewer side e�ects when used in therapy.The main focus of this thesis is the crystal structure determination
of L-asparaginase from Erwinia carotovora in the presence of asparticacid at 2.5 Å resolution. The structure was re�ned to an R/Rfree factorof 19.9/28.6 with good stereochemistry.L-Asparaginases are homotetrameric enzymes with a known 222 sym-
metry and an identical fold. The Erwinia carotovora asparaginase con-sists of eight monomers of 330 amino acid residues each. In this casethe enzyme is active as a dimer of tetramers. The two tetramers havean inner twofold non-crystallographic symmetry. Each monomer formstwo identi�able domains a large N-domain and a small C-domain. Theactive sites are found at a topological switch-point between those do-mains.
Physics and Measurement Technology,581 83 LinköpingSWEDEN
March 31, 2006
�
LiTH - IFM - EX - - 06/1580 - - SE
�
http://urn.kb.se/resolve?urn=urn:nbn:se:liu:diva-6188
Strukturbestämning av L-Asparaginase från Erwinia carotovora genomröntgenkristallogra�
Structural studies of Erwinia carotovora L-Asparaginase by X-ray crys-tallography
Charlotta S. Andersson
××
Protein crystallography, enzyme, crystal structure determination, as-paraginase, leukemia treatment.

Abstract
Bacterial L-asparaginases (E.C.3.5.1.1) are enzymes that catalyze thehydrolysis of L-asparagine to aspartic acid. For the past 30 years theseenzymes have been used as therapeutic agents in the treatment of acutechildhood lymphoblastic leukemia. The presence of a low rate glutam-inase activity however causes serious side-e�ects to patients in treat-ment, as glutamine depletion give rise to neurotoxicity, anaphylaxis,and other hypersensitivity reactions. The interest in the enzyme fromErwinia carotovora originates from the fact that it shows a decreasedglutaminase activity, and therefore the enzyme is expected to exhibitfewer side e�ects when used in therapy.
The main focus of this thesis is the crystal structure determination ofL-asparaginase from Erwinia carotovora in the presence of aspartic acidat 2.5 Å resolution. The structure was re�ned to an R/Rfree factor of19.9/28.6 with good stereochemistry.
L-Asparaginases are homotetrameric enzymes with a known 222 sym-metry and an identical fold. The Erwinia carotovora asparaginase con-sists of eight monomers of 330 amino acid residues each. In this casethe enzyme is active as a dimer of tetramers. The two tetramers havean inner twofold non-crystallographic symmetry. Each monomer formstwo identi�able domains a large N-domain and a small C-domain. Theactive sites are found at a topological switch-point between those do-mains.
Keywords: Protein crystallography, enzyme, crystal structure deter-mination, asparaginase, leukemia treatment.
Andersson, 2006. vii

viii
Acknowledgements
This thesis was performed in the Protein Crystallography group at theTurku Centre for Biotechnology (Turun Biotekniikkankeskus, BTK)under the supervision of Tassos Papageorgiou, PhD. It has been adream come true to �nally step into the world of structural biologyand protein structure determination.
Firstly I would like to thank my supervisor Tassos Papageorgiou, headof the Protein Crystallography group in BTK. I would like to thank himfor his support but by far most for letting me explore the world of struc-tural Biology. In the group of Protein Crystallography I would also liketo express my gratitude to Anni Kauko for being a true educationalistin the area of crystallography, and also in the area of understanding thestandards in Finnish society. I must thank Susanna Saarinen whom hasenlightened my otherwise dark and cold hours in the graphics room.
I would like to express my sincere gratitude to my supervisor Lars-Göran Mårtensson and his co-worker Per Hammarström for enabling apro�ling-course in Protein chemistry and protein engineering. I cameto Linköping solely to participate in this course, and I made the rightchoice. Also I must pay my regards to Marianne Kratz or else noneof this would have been possible. Furthermore my opponent KatarinaNorén also deserves my thanks, not just for reading and questioningmy work but for being a part of my time in Linköping.
I would also like to thank the people closest to me, whose support havehelped me to �nish this graduate work. I thank my family for theirencouragement and patience. Also I pay my deepest regards to myfriends Maria Finne and Patrik Ståhl whom have taken me under theirwings in Turku, and whom have been not just great friends but alsogood tutors of life. Thank you all for a great opportunity!
Andersson, 2006. ix

x
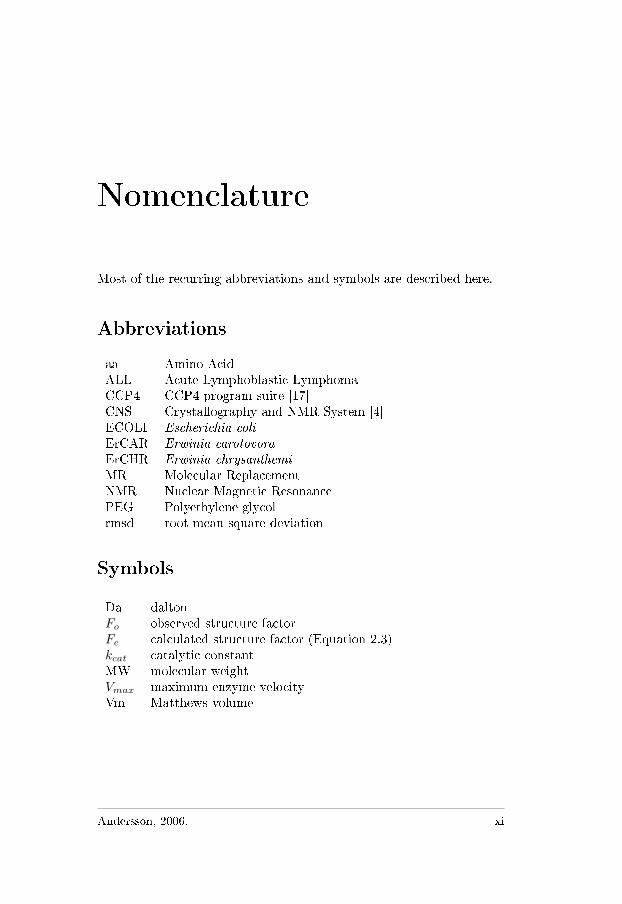
Nomenclature
Most of the recurring abbreviations and symbols are described here.
Abbreviations
aa Amino AcidALL Acute Lymphoblastic LymphomaCCP4 CCP4-program suite [17]CNS Crystallography and NMR System [4]ECOLI Escherichia coli
ErCAR Erwinia carotovora
ErCHR Erwinia chrysanthemi
MR Molecular ReplacementNMR Nuclear Magnetic ResonancePEG Polyethylene glycolrmsd root mean square deviation
Symbols
Da daltonFo observed structure factorFc calculated structure factor (Equation 2.3)kcat catalytic constantMW molecular weightVmax maximum enzyme velocityVm Matthews volume
Andersson, 2006. xi

xii
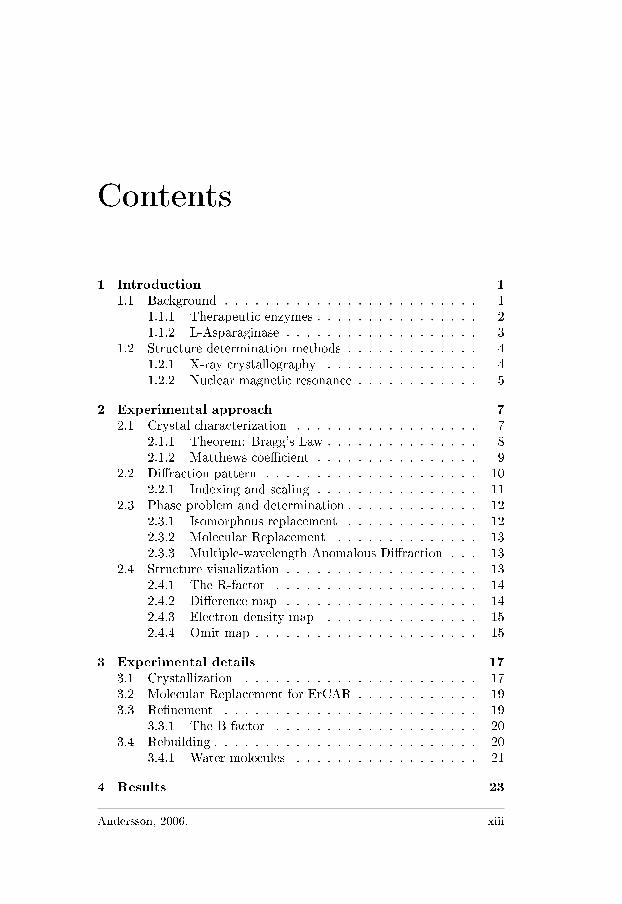
Contents
1 Introduction 11.1 Background . . . . . . . . . . . . . . . . . . . . . . . . . 1
1.1.1 Therapeutic enzymes . . . . . . . . . . . . . . . . 21.1.2 L-Asparaginase . . . . . . . . . . . . . . . . . . . 3
1.2 Structure determination methods . . . . . . . . . . . . . 41.2.1 X-ray crystallography . . . . . . . . . . . . . . . 41.2.2 Nuclear magnetic resonance . . . . . . . . . . . . 5
2 Experimental approach 72.1 Crystal characterization . . . . . . . . . . . . . . . . . . 7
2.1.1 Theorem: Bragg's Law . . . . . . . . . . . . . . . 82.1.2 Matthews coe�cient . . . . . . . . . . . . . . . . 9
2.2 Di�raction pattern . . . . . . . . . . . . . . . . . . . . . 102.2.1 Indexing and scaling . . . . . . . . . . . . . . . . 11
2.3 Phase problem and determination . . . . . . . . . . . . . 122.3.1 Isomorphous replacement . . . . . . . . . . . . . 122.3.2 Molecular Replacement . . . . . . . . . . . . . . 132.3.3 Multiple-wavelength Anomalous Di�raction . . . 13
2.4 Structure visualization . . . . . . . . . . . . . . . . . . . 132.4.1 The R-factor . . . . . . . . . . . . . . . . . . . . 142.4.2 Di�erence map . . . . . . . . . . . . . . . . . . . 142.4.3 Electron density map . . . . . . . . . . . . . . . 152.4.4 Omit map . . . . . . . . . . . . . . . . . . . . . . 15
3 Experimental details 173.1 Crystallization . . . . . . . . . . . . . . . . . . . . . . . 173.2 Molecular Replacement for ErCAR . . . . . . . . . . . . 193.3 Re�nement . . . . . . . . . . . . . . . . . . . . . . . . . 19
3.3.1 The B-factor . . . . . . . . . . . . . . . . . . . . 203.4 Rebuilding . . . . . . . . . . . . . . . . . . . . . . . . . . 20
3.4.1 Water molecules . . . . . . . . . . . . . . . . . . 21
4 Results 23
Andersson, 2006. xiii
xiv Contents
4.1 Quality of the structure . . . . . . . . . . . . . . . . . . 234.2 Data collection and re�nement statistics . . . . . . . . . 264.3 Structural features of L-asparaginase . . . . . . . . . . . 27
4.3.1 The monomer structure . . . . . . . . . . . . . . 274.3.2 Description of the active site . . . . . . . . . . . 294.3.3 The tetramer structure . . . . . . . . . . . . . . 304.3.4 The octamer structure . . . . . . . . . . . . . . . 32
5 Discussion 33
6 Conclusion 35
A Protein Structure 41A.1 Primary Structure . . . . . . . . . . . . . . . . . . . . . 41A.2 Secondary Structure . . . . . . . . . . . . . . . . . . . . 43
B Algorithms and mathematical functions 45B.1 The Patterson function . . . . . . . . . . . . . . . . . . . 45B.2 The intensity function . . . . . . . . . . . . . . . . . . . 45B.3 The least square method . . . . . . . . . . . . . . . . . . 46
C bExternal color print
Chapter 1
Introduction
This text is written as a master of science �nal thesis at Linköping Univer-sity by Charlotta Andersson with Tassos Papageorgiou as supervisor andLars-Göran Mårtensson as examiner, with Emacs in LATEX in 2005/2006.The project was supported by the Sigrid Jusélius Foundation.
This �rst chapter introduces L-asparaginases in clinical use. It will givesome background on the studied enzyme and its importance in the humanbiological system.
1.1 Background
L-Asparaginases are enzymes that primarily catalyze the conversion ofL-asparagine to L-aspartic acid and ammonia, they are also able tohydrolyze L-glutamine but at a lower rate (further information can befound in section 1.1.2). Asparaginases are expressed in many bacterialorganisms, but only L-asparaginases from Escherichia coli (ECOLI)and Erwinia chrysantemi (ErCHR) have been used as chemothera-peutics in Acute Lymphoblastic Lymphoma (ALL) for the last threedecades [1, 6]. Although there are therapeutic asparaginases present onthe market, recent discoveries have indicated that the L-asparaginasefrom Erwinia carotovora (ErCAR) might be more e�cient and also toexhibit fewer side-e�ects [7, 8]. The need for new therapeutic enzymesis of great interest in both biotechnology and medicine. The aim of thisstudy was to determine and analyze the three-dimensional structure ofL-asparaginase from ErCAR.
By structure determination of biological molecules theories of chemicalbonding and properties can be laid out and tested. This is possible
Andersson, 2006. 1
due to a close connection between the three-dimensional structure andthe properties of the biological macromolecules. Knowledge of a proteinstructure o�ers a clue to what role a protein plays in the body and whatmodi�cations are possible to make. Also the three-dimensional struc-tures hold a key towards the development of new drugs/medicines andprovide a good starting point of protein-engineering studies. Prospec-tive studies of structural features eventually will contribute to the op-timization of a protein's therapeutic e�ect and minimization of its tox-icity.
1.1.1 Therapeutic enzymes
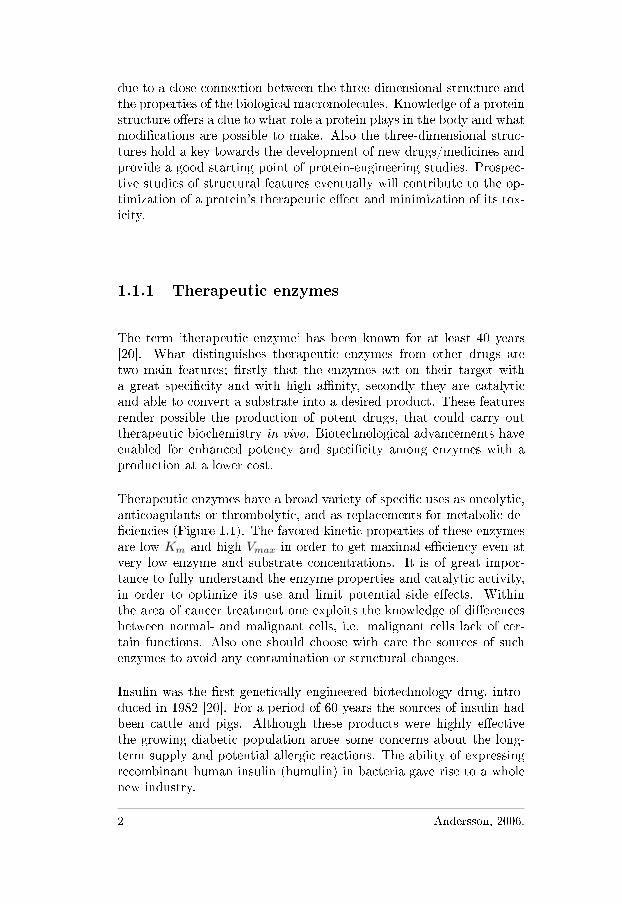
The term 'therapeutic enzyme' has been known for at least 40 years[20]. What distinguishes therapeutic enzymes from other drugs aretwo main features; �rstly that the enzymes act on their target witha great speci�city and with high a�nity, secondly they are catalyticand able to convert a substrate into a desired product. These featuresrender possible the production of potent drugs, that could carry outtherapeutic biochemistry in vivo. Biotechnological advancements haveenabled for enhanced potency and speci�city among enzymes with aproduction at a lower cost.
Therapeutic enzymes have a broad variety of speci�c uses as oncolytic,anticoagulants or thrombolytic, and as replacements for metabolic de-�ciencies (Figure 1.1). The favored kinetic properties of these enzymesare low Km and high Vmax in order to get maximal e�ciency even atvery low enzyme and substrate concentrations. It is of great impor-tance to fully understand the enzyme properties and catalytic activity,in order to optimize its use and limit potential side e�ects. Withinthe area of cancer treatment one exploits the knowledge of di�erencesbetween normal- and malignant cells, i.e. malignant cells lack of cer-tain functions. Also one should choose with care the sources of suchenzymes to avoid any contamination or structural changes.
Insulin was the �rst genetically engineered biotechnology drug, intro-duced in 1982 [20]. For a period of 60 years the sources of insulin hadbeen cattle and pigs. Although these products were highly e�ectivethe growing diabetic population arose some concerns about the long-term supply and potential allergic reactions. The ability of expressingrecombinant human insulin (humulin) in bacteria gave rise to a wholenew industry.
2 Andersson, 2006.
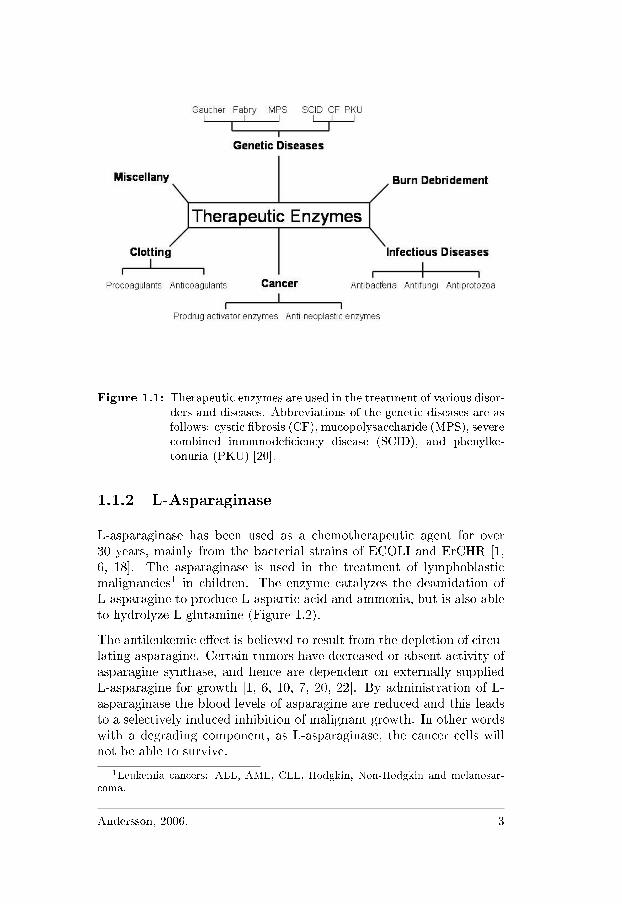
Figure 1.1: Therapeutic enzymes are used in the treatment of various disor-ders and diseases. Abbreviations of the genetic diseases are asfollows: cystic �brosis (CF), mucopolysaccharide (MPS), severecombined immunode�ciency disease (SCID), and phenylke-tonuria (PKU) [20].
1.1.2 L-Asparaginase
L-asparaginase has been used as a chemotherapeutic agent for over30 years, mainly from the bacterial strains of ECOLI and ErCHR [1,6, 18]. The asparaginase is used in the treatment of lymphoblasticmalignancies1 in children. The enzyme catalyzes the deamidation ofL-asparagine to produce L-aspartic acid and ammonia, but is also ableto hydrolyze L-glutamine (Figure 1.2).
The antileukemic e�ect is believed to result from the depletion of circu-lating asparagine. Certain tumors have decreased or absent activity ofasparagine synthase, and hence are dependent on externally suppliedL-asparagine for growth [1, 6, 10, 7, 20, 22]. By administration of L-asparaginase the blood levels of asparagine are reduced and this leadsto a selectively induced inhibition of malignant growth. In other wordswith a degrading component, as L-asparaginase, the cancer cells willnot be able to survive.
1Leukemia cancers: ALL, AML, CLL, Hodgkin, Non-Hodgkin and melanosar-coma.
Andersson, 2006. 3
Figure 1.2: The enzymatic reaction catalyzed by L-asparagine.
There is always a back-side with administrating drugs to a biologicalsystem. The side-e�ects in asparaginase therapy are mainly dependenton the glutaminase activity. The main side-e�ects are hypersensitivityreactions, anaphylaxis, hepatoxicity, diabetes, and coagulation abnor-malities [6, 7]. The elimination of glutaminase activity could result in asafer and more reliable treatment of leukemia. It has been shown thatL-asparaginase from ErCAR has decreased glutaminase activity about1.5%, and also di�erent immunological speci�city compared to ECOLI[6], therefore one would expect to exhibit fewer side-e�ects [8]. Otherstudies indicate a di�erence in the catalytical ability, where ErCAR hasan approximately 200-fold higher kcat than ECOLI [7].
According to previous reports, slight di�erences between ECOLI andErCHR strains in respect to toxicity and e�cacy, have been found[6]. ECOLI is more toxic, since it has shown more coagulation abnor-malities, although it keeps a higher clinical e�cacy than ErCHR. TheErwinia strain has mostly been used as an alternative in cases whereallergic reactions force the discontinuation of the ECOLI treatment [20].
1.2 Structure determination methods
There are a few methods used for the visualization of the complexarrangement of atoms within molecules. At present the only two tech-niques that can elucidate proteins to atomic resolution are X-ray di�rac-tion and Nuclear magnetic resonance (NMR) analysis [5].
1.2.1 X-ray crystallography
To be able to perform X-ray crystallography, it is necessary to growcrystals, since they have a repeated unit cell within them. The X-raydi�raction from one unit cell would not be signi�cant but needs tobe ampli�ed. This is achieved by the repetition of unit cells within
4 Andersson, 2006.
a crystal. Electrons of structure atoms will scatter the incoming X-rays and cause a di�raction pattern speci�c for an ordered array ofmolecules. Using the mathematical Fourier transform these patternscan be converted into maps of electron density showing the position ofatoms.
Solving the structure with X-ray crystallography demands an indepen-dent knowledge of the primary structure for interpretation of the den-sity map. A more thorough explanation is presented in Chapter 2.
1.2.2 Nuclear magnetic resonance
From NMR the obtained structure will not be as detailed and accurateas with X-ray crystallography but rather a general topology for thepolypeptide chain. The advantage here is that the protein used is insolution rather than in a crystal lattice. NMR spectra are generatedby a magnetic �eld with applied radio-frequency pulses, where the ab-sorption of energy by a nucleus gives a change in it's orientation in themagnetic �eld [11]. Transient time domain signals are detected as thesystem returns to equilibrium [5]. Spin-spin interactions, interatomicshielding and ring currents are properties that make each atom identi�-able. NMR gives much more detailed information about the �exibilityof the protein structure in solution but is limited to small molecules(up to 20 kDa).
Andersson, 2006. 5
Chapter 2: Explanation of the ground theory of x-ray crystallogra-phy. This chapter introduces standard procedures for structuredetermination on protein molecules, brie�y describing the theo-retical properties of a crystal, interpretation of di�raction pat-terns to visualization of atom positioning.
Chapter 3: Experimental details, about the procedures used for struc-ture determination. Initial modeling and improvement of theatomic model, called re�nement, together with rebuilding willbe explained under this part.
Chapter 4: Brings on the results, describing the structural parts of L-asparaginase along with data collection and re�nement statistics.
Chapter 5+6: Discussion and conclusion, questioning the results andchoice of methods as well as suggestions for further improvements.
Appendix A: Description of the protein structure.
Appendix B: Describes some of the algorithms and mathematicalfunctions used in the creation of the model and re�nement.
Appendix C: External color print of some pictures from chapter 4,reference to this will be done in the Thesis.
6 Andersson, 2006.
Chapter 2
Experimental approach
The most commonly used experimental technique for obtaining a detailedpicture of a protein molecule allowing the resolution of individual atomsis X-ray di�raction. Obtaining a di�raction pattern is achieved by placinga crystal in a narrow, focused beam of monochromatic X-rays. Thesebeams can't be focused by lenses and therefore measurements are basedon directions and intensity of the di�racted X-rays. Scattering of the X-raybeams by the electron clouds of the atoms provide the basis for an X-rayexperiment.
A single molecule is a very weak scatterer of X-rays, hence most of theincoming X-rays will just pass through the single molecule without beingdi�racted. Use of crystals will give a positive interference and reinforcea detectable di�raction pattern. A data collection from the di�ractionpattern of protein crystals is recorded and then processed to acquire acomprehensive electron density map. The crystal is rotated around an axisperpendicular to the beam and in each rotation phase the image of thedi�raction spots is recorded by a detector. The resolution at which thedi�raction is recorded will be crucial for the structure determination as itrelates with the level of accuracy for the observed molecule.
2.1 Crystal characterization
The basic building block of a crystal is the unit cell, in theory in�nitelyrepeated in three dimensions. A unit cell is characterized by three vec-tors, denoted a, b, and c starting with the shortest one, correspondingto the edges of a parallelepiped. The cell is also de�ned by three angles
Andersson, 2006. 7
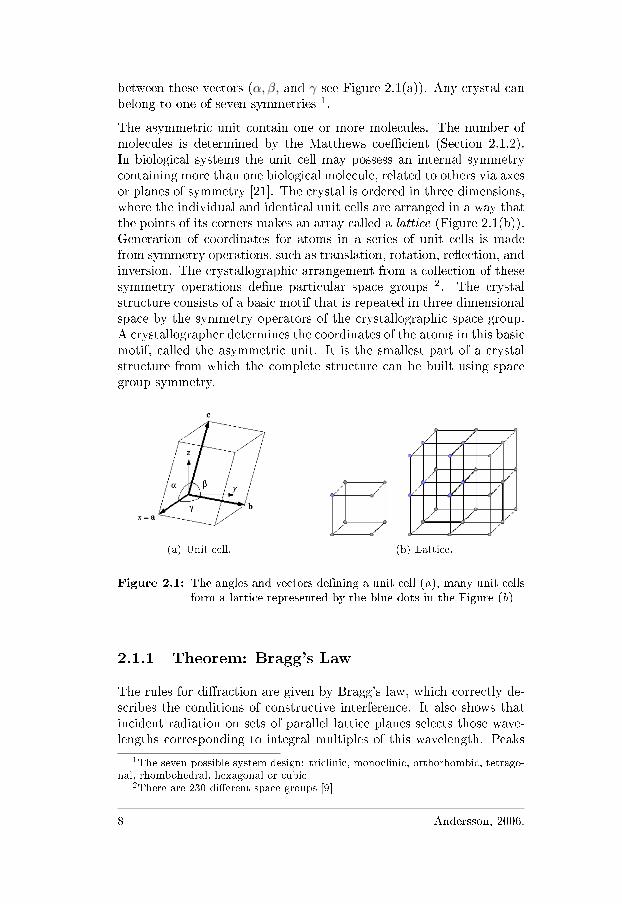
between these vectors (α, β, and γ see Figure 2.1(a)). Any crystal canbelong to one of seven symmetries 1.
The asymmetric unit contain one or more molecules. The number ofmolecules is determined by the Matthews coe�cient (Section 2.1.2).In biological systems the unit cell may possess an internal symmetrycontaining more than one biological molecule, related to others via axesor planes of symmetry [21]. The crystal is ordered in three dimensions,where the individual and identical unit cells are arranged in a way thatthe points of its corners makes an array called a lattice (Figure 2.1(b)).Generation of coordinates for atoms in a series of unit cells is madefrom symmetry operations, such as translation, rotation, re�ection, andinversion. The crystallographic arrangement from a collection of thesesymmetry operations de�ne particular space groups 2. The crystalstructure consists of a basic motif that is repeated in three dimensionalspace by the symmetry operators of the crystallographic space group.A crystallographer determines the coordinates of the atoms in this basicmotif, called the asymmetric unit. It is the smallest part of a crystalstructure from which the complete structure can be built using spacegroup symmetry.
(a) Unit cell. (b) Lattice.
Figure 2.1: The angles and vectors de�ning a unit cell (a), many unit cellsform a lattice represented by the blue dots in the Figure (b)
2.1.1 Theorem: Bragg's Law
The rules for di�raction are given by Bragg's law, which correctly de-scribes the conditions of constructive interference. It also shows thatincident radiation on sets of parallel lattice planes selects those wave-lengths corresponding to integral multiples of this wavelength. Peaks
1The seven possible system design: triclinic, monoclinic, orthorhombic, tetrago-nal, rhombohedral, hexagonal or cubic
2There are 230 di�erent space groups [9]
8 Andersson, 2006.
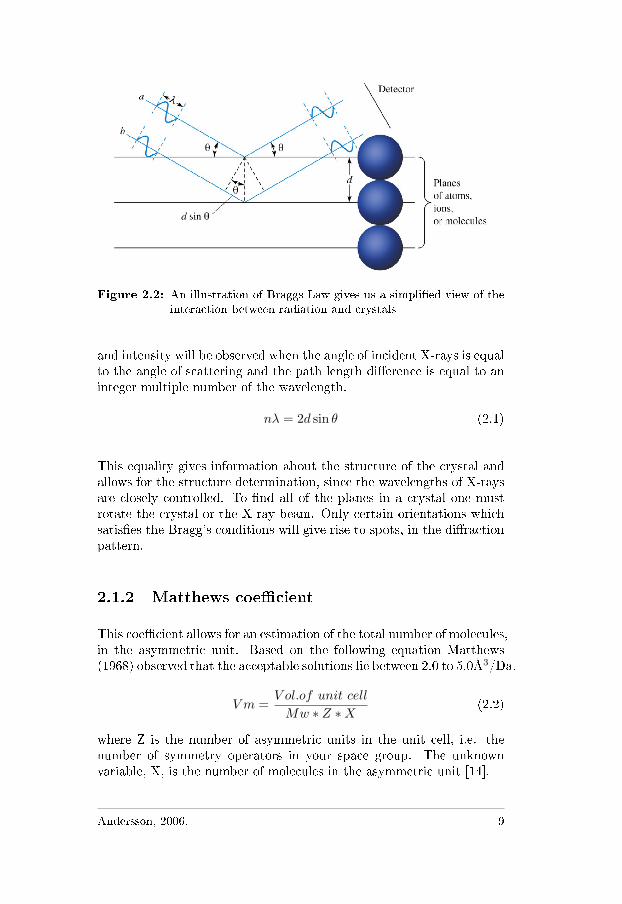
Figure 2.2: An illustration of Braggs Law gives us a simpli�ed view of theinteraction between radiation and crystals
and intensity will be observed when the angle of incident X-rays is equalto the angle of scattering and the path length di�erence is equal to aninteger multiple number of the wavelength.
nλ = 2d sin θ (2.1)
This equality gives information about the structure of the crystal andallows for the structure determination, since the wavelengths of X-raysare closely controlled. To �nd all of the planes in a crystal one mustrotate the crystal or the X-ray beam. Only certain orientations whichsatis�es the Bragg's conditions will give rise to spots, in the di�ractionpattern.
2.1.2 Matthews coe�cient
This coe�cient allows for an estimation of the total number of molecules,in the asymmetric unit. Based on the following equation Matthews(1968) observed that the acceptable solutions lie between 2.0 to 5.0Å3/Da.
V m =V ol.of unit cell
Mw ∗ Z ∗X(2.2)
where Z is the number of asymmetric units in the unit cell, i.e. thenumber of symmetry operators in your space group. The unknownvariable, X, is the number of molecules in the asymmetric unit [14].
Andersson, 2006. 9
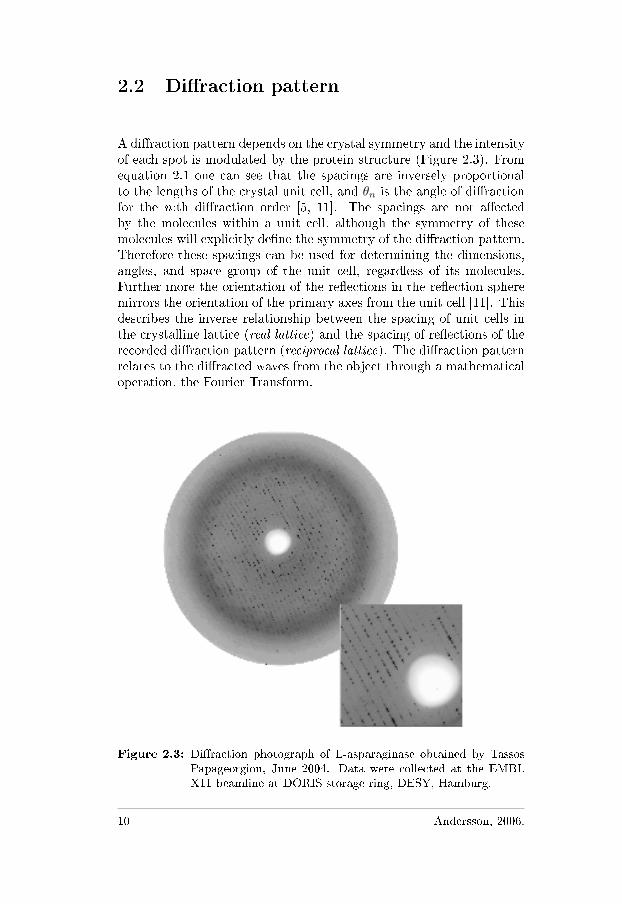
2.2 Di�raction pattern
A di�raction pattern depends on the crystal symmetry and the intensityof each spot is modulated by the protein structure (Figure 2.3). Fromequation 2.1 one can see that the spacings are inversely proportionalto the lengths of the crystal unit cell, and θn is the angle of di�ractionfor the n:th di�raction order [5, 11]. The spacings are not a�ectedby the molecules within a unit cell, although the symmetry of thesemolecules will explicitly de�ne the symmetry of the di�raction pattern.Therefore these spacings can be used for determining the dimensions,angles, and space group of the unit cell, regardless of its molecules.Further more the orientation of the re�ections in the re�ection spheremirrors the orientation of the primary axes from the unit cell [11]. Thisdescribes the inverse relationship between the spacing of unit cells inthe crystalline lattice (real lattice) and the spacing of re�ections of therecorded di�raction pattern (reciprocal lattice). The di�raction patternrelates to the di�racted waves from the object through a mathematicaloperation, the Fourier Transform.
Figure 2.3: Di�raction photograph of L-asparaginase obtained by TassosPapageorgiou, June 2004. Data were collected at the EMBLX11 beamline at DORIS storage ring, DESY, Hamburg.
10 Andersson, 2006.
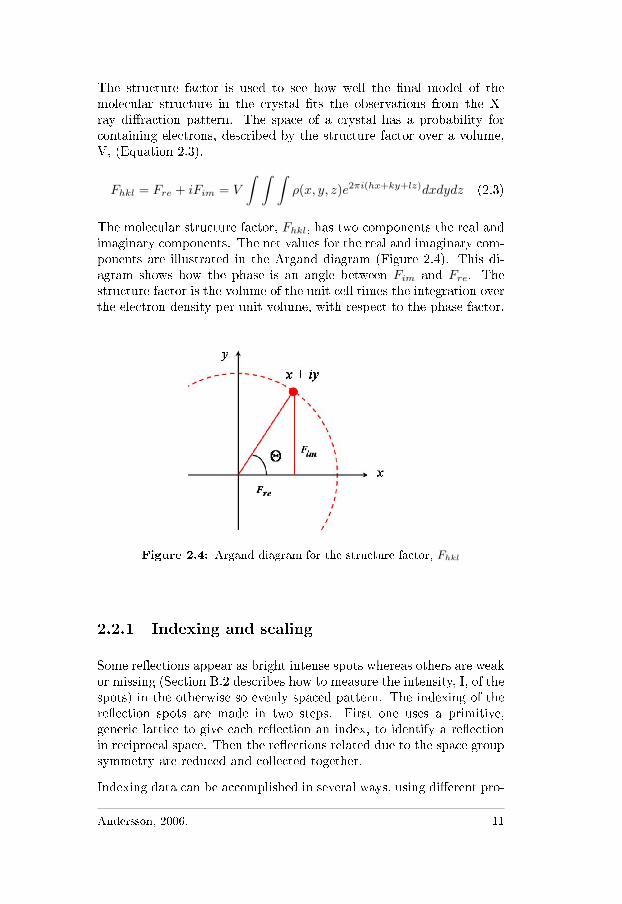
The structure factor is used to see how well the �nal model of themolecular structure in the crystal �ts the observations from the X-ray di�raction pattern. The space of a crystal has a probability forcontaining electrons, described by the structure factor over a volume,V, (Equation 2.3).
Fhkl = Fre + iFim = V
∫ ∫ ∫ρ(x, y, z)e2πi(hx+ky+lz)dxdydz (2.3)
The molecular structure factor, Fhkl, has two components the real andimaginary components. The net values for the real and imaginary com-ponents are illustrated in the Argand diagram (Figure 2.4). This di-agram shows how the phase is an angle between Fim and Fre. Thestructure factor is the volume of the unit cell times the integration overthe electron density per unit volume, with respect to the phase factor.
Figure 2.4: Argand diagram for the structure factor, Fhkl
2.2.1 Indexing and scaling
Some re�ections appear as bright intense spots whereas others are weakor missing (Section B.2 describes how to measure the intensity, I, of thespots) in the otherwise so evenly spaced pattern. The indexing of there�ection spots are made in two steps. First one uses a primitive,generic lattice to give each re�ection an index, to identify a re�ectionin reciprocal space. Then the re�ections related due to the space groupsymmetry are reduced and collected together.
Indexing data can be accomplished in several ways, using di�erent pro-
Andersson, 2006. 11
grams, for exampleHKL3. This has automated a procedure that earlierwas made manually. An important factor for indexing data is the R-symm factor, which gives a hint of the amount of errors in the dataset. Existing re�ections are compared to symmetry-related ones thusthe lower the R-symm factor, the better.
Rsymm =∑
hkl
∑i |Ii(h, k, l)− I(h, k, l)|∑hkl
∑i Ii(h, k, l)
(2.4)
Another factor to be taken into consideration while evaluating the qual-ity of the data is the completeness, i.e. the ratio of the number ofmeasured re�ections to the number of all re�ections possible. A rule ofthumb is not to let this factor go beneath 80% [2].
The concept upon scaling the data is utilized in order to get a reliabledata set, free from disturbances caused from external factors. Thisfollows the same concept as in indexing only with a scale factor.
2.3 Phase problem and determination
To obtain the relation between the protein and its di�raction patternone needs to know the amplitudes and phases. The �rst can be directlymeasured but the second not. With known phases a picture of themolecule could easily be computed but that information is lost in theexperiment. This is the phase problem and a large part of crystallogra-phy is devoted to solving it. In crystallography the aim is to determinethe positions of atoms (x, y, and z).
There are a few methods available for deriving the phase, the most com-monly used are: isomorphous replacement (IR), molecular replacement(MR), and Multiple-wavelength Anomalous Di�raction (MAD).
2.3.1 Isomorphous replacement
This method involves incorporation of heavy atoms into a protein crys-tal, giving changes in the X-ray intensities. This demands keeping anisomorphous crystal towards the heavy atoms, like none signi�cant dis-tortion to the structure, none altering of it's space groups, and leavethe unit cell parameters intact. There is a very large repertoire ofcompounds known to produce this sorts of derivatives [11]. The in-tensity di�erence is used to deduce the positions of the heavy metals
3The HKL have been written by Dr. Zbyszek Otwinowski (Southwestern MedicalCenter, University of Texas) and Dr. Wladek Minor (University of Virginia).
12 Andersson, 2006.
within the crystal unit cell. Fourier summations of these di�erencesgive vector maps between the di�erent heavy atoms, called Pattersonmaps. These vector maps simplify the solution for the atomic arrange-ment. With a knowledge of the atomic position it is now possible touse the R-symm factor (Equation 2.4) for calculating the amplitudesand phases.
2.3.2 Molecular Replacement
This is a conceptually straightforward technique, using co-ordinatesof a well de�ned structure as a �search structure�. Common elementsbetween the previously known structure and the one being solved willgenerate the desired phase data. It is therefore of great importance touse structures that are very similar to each other, due to the correctnessof the phasing. Computer applications for carrying out MR lies withinthe knowledge of modern crystallography and computing, for exampleCNS [4].
2.3.3 Multiple-wavelength Anomalous Di�raction
Certain X-ray wavelengths cause the electrons to absorb energy which,in turn, causes a change in the scattering, called anomalous scattering.The size of this change of energy is negligible for light atoms but mea-surable for heavy atoms, such as iron, zinc and mercury. This producesa measurable di�erence of intensity in the di�raction pattern like theone in IR. This method is especially useful for metallo-proteins and canbe applied directly on the native protein, however it is not as strong aswith two derivatives with di�erent atomic coordinates.
2.4 Structure visualization
For visualization of the electron density one needs to solve the FourierTransform for the di�raction pattern, since electron density is consid-ered a function [4]. The problem with Fourier maps is that they requirephases in order to be calculated and the only data available is the setof amplitudes from the di�raction images. Calculation of the electrondensity map is made from recombining mathematically the individ-ual re�ections of the di�raction pattern [5, 11]. The electron densityρ(x, y, z) in the unit cell is given by:
ρ(x, y, z) =1V
∑h
∑k
∑l
F (h, k, l)eiα(h,k,l) e−2πi(hx+ky+lz) (2.5)
Andersson, 2006. 13
Consequently this shows that every re�ection contains information aboutall parts in the unit cell, like every atom contributes to each re�ection.The quality of the map is dependent on the resolution of the di�rac-tion data, and the resolution is highly in�uenced from the quality ofthe crystal.
2.4.1 The R-factor
The model will strongly a�ect the calculated electron density map, dueto the phase problem. To be able to evaluate how well the model �tsthe map one can use the R-factor (Equation 2.6). This is the averagefractional error in the calculated amplitude compared to the observedamplitude [3, 11, 21]. A structure is judged by the crystallographicfactor R, de�ned as the average fractional error in the sum of the dif-ferences between calculated structure factor Fc and observed structurefactor Fo.
R =∑
(|Fobs(h, k, l)| − k|Fcalc(h, k, l)|)2 (2.6)
The following statistical concept of cross-validation is based on thepartition of the observed re�ections into a test set and a working set.The test set is omitted from a small portion of the data and taken afterre�nement, which in other words will give the correlation coe�cientbetween the re�ned model against the complete data set.
Rfree =Σ‖Fobs(h, k, l)| − |Fcalc(h, k, l)‖
Σ|Fobs(h, k, l)|(2.7)
A rule of thumb for a good structure will be between Rfree 15-20%,whilst a random structure keeps an Rfree around 60% [4, 11].
2.4.2 Di�erence map
This map visualizes the di�erence between the observed and calculatedamplitudes within the model map. Since the Fourier Transform is ad-ditive, this is achieved through subtraction of the structure factors:Fo − Fc. This is a convenient way for �nding solvent molecules, locat-ing missing atoms or residues, as well as �nding mistakes in the spatialalignment. This will show the di�erence of electron density betweenthe original model and the one obtained after phasing.
The Fo −Fc map will have negative features representing the densitiescreated by the model which are not seen in the structure. Its positive
14 Andersson, 2006.
features comes from densities present in the crystal which are not inthe model.
2.4.3 Electron density map
The 2Fo−Fc show the current best estimate of the electron density forthe structure. This is the map in which the model is ought to �t, andtherefore it is particularly useful for rebuilding. It does not show theexact atom positions, but rather suggests placements, and it is alteredfrom maximum likelihood re�nement. One should remember that thequality of this map relies highly on the quality of the phases, ie. a mapwith high R-factor is rather doubtful since it then is badly correlatedto the model.
2.4.4 Omit map
Due to incorrect spatial ordering of the model, bias might be introducedinto the density map. A way to investigate these more doubtful regionsis to calculate an omit map. An estimate of phase angles will be madefor a small volume at a time, where parts of the model are left out,and the calculation is made from the remainder of the structure. Thismethod is certainly less accurate but will give an unbiased estimate introubled regions of the model. The main problem in this case is tochoose the proper scaling factors for Fo and Fc. As part of the modelis left out the sum of Fc will be smaller than Fo.
Andersson, 2006. 15

16 Andersson, 2006.
Chapter 3
Experimental details
Interpretation of the electron density maps requires knowledge of the pri-mary sequence. Building the initial model is a trial and error process, sincethe initial models often contain a lot of errors and poor phases. Startingwith a matching between the known polypeptide sequence and its density,is followed by �nding the best �t of atoms in the density. Although onlydensity maps with atomic resolution resolve individual atoms the mapsenable the identi�cation of the side-chains. The atomic model is neverperfect but it can be improved by a process called re�nement, where themodel is adjusted to improve the agreement to its measured di�ractiondata.
The B-factor re�ects the spreading or blurring of electron density andrepresents the mean square displacement (Subsection 3.3.1). Also thesuccess of the atomic model is measured, this time through the standardcrystallographic R-factor (Subsection 2.4.1).
3.1 Crystallization
In order to perform an X-ray experiment one needs to grow large andstable crystals with a su�cient long-range order. Two experimentalmethods used to form crystals are: vapor di�usion and equilibriumdialysis. Usually equilibrium dialysis is used for crystallization at lowor high salt concentrations, whilst the more common vapor di�usion isused at small volumes [21]. Crystals are grown under slow, controlledprecipitation from aqueous solutions under non-denaturing conditions.Precipitation is caused by ionic compounds, organic solvents or mostcommonly with PEG. Whether the protein will be able to form crystals
Andersson, 2006. 17
or not depends on many properties of the solution, like protein concen-tration, pH, temperature, and ionic strength.
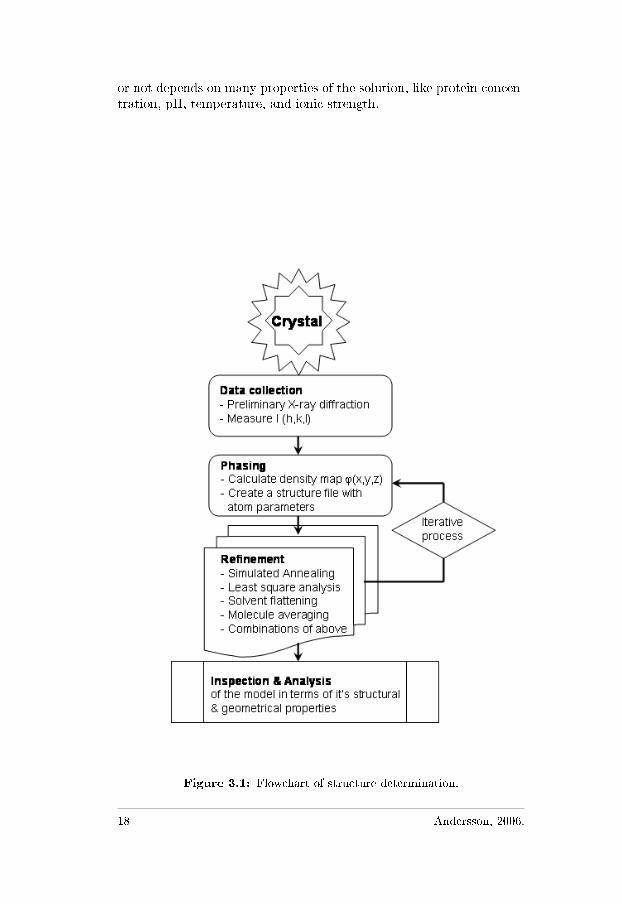
Figure 3.1: Flowchart of structure determination.
18 Andersson, 2006.
3.2 Molecular Replacement for ErCAR
For �nding the phases in the di�raction pattern the method used wasMR, the phases were found by using PHASER [15]. By the use of apreviously known structure it is quite easy to de�ne another molecule,where the search-model was a poly-alanine asparaginase from ErCHR.
An important starting point is to withdraw information about sym-metry and cell dimensions from the crystal. This information o�ers anestimation of the molecular content in the asymmetric unit (Subsection2.1.2). The internal symmetry of an oligomer does not show up in thecrystal symmetry, and the �rst step will be to �nd out how these arearranged within the asymmetric unit [2]. It is possible to �nd out thearrangement for di�erent subunits. In rigid objects one subunit is re-lated to another by an operation of rotation and translation. Rotationis made through the Patterson function (Equation B.1). A rotation ofthe search-molecule is made around a reference point until it is parallelto the unknown structure in the unit cell. Translation is a movementin the three dimensional space and is made after the rotation to get thesearch-model �on top� of the displaced molecule. Translation also usesthe Patterson function, but slightly di�erently. This time the modelmolecule is placed at all positions of the unit cell, and for each positionthe vectors are calculated and compared to the actual function of theunknown molecule.
Using a model-structure to generate the phase angles will create somebias in the electron density map. Some features represented in themodel are not correctly represented by the unknown structure and theother way around, but they will be visible on the map. Careful exami-nation of the electron density di�erence map and rebuilding is neededto remove the bias.
3.3 Re�nement
Re�nement is an iterative process in which the atomic model is modi-�ed, structure factor amplitudes are calculated from the modi�ed model,and the agreement between these calculated structure factor amplitudesand the observed ones is determined. The goal is to �nd the model thatproduces the best agreement between the experimental and the calcu-lated factor amplitudes, by the Least square method (Appendix B.3).
All re�nement as well as the electron density map calculations were
Andersson, 2006. 19
done with the program CNS 1 and Refmac 2. CNS seems superiorat early re�nement stages (R worse than 30%), since it uses a tightstereochemistry, simulated annealing, and is keeping a good radius ofconvergence. Refmac uses a more aggressive minimization algorithmand is therefore more suitable for later stages of the re�nement.
The rigid body protocol was applied in an early stage of the re�nement,at a resolution of 3 Å. Explicit re�nement was done on water moleculesand with the bound L-aspartate in a later stage of the procedure. Inrigid body re�nement large sections of the protein, such as subunits,move as rigid bodies. In the simplest case the entire protein is treated asone rigid body, which results in 6 degrees of freedom. L-Asparaginaseis a dimer of tetramers, so a natural rigid body-scheme would be totreat each subunit as a separate body. Rigid body re�nement is usefulin the early stages of structure determination and it is usually donewith low resolution data determination (15-3Å).
3.3.1 The B-factor
The B-factor is also called temperature factor or the Debye-Waller fac-tor. Originally the B-factor was introduced as a measure of the thermalmotion of the atom [4, 11]. In other terms this re�ects the extent ofdisorder of each atom to the di�raction pattern. Since it's only assigneda single parameter, one can assume this to be an isotropic thermal mo-tion, and the best model should contain thermal motion for all threedirections in space (Bx, By, and Bz). The B-factor will also re�ect howoften an atom is positioned in a particular spot in space, note that pro-teins shows di�erent �exibility in various regions. This is the partial
occupancy of an atom that is within the crystal a speci�ed spatial area.
Bfactor = e−Bi sin2 θ
λ2 (3.1)
In a practical meaning the B-factor is a good measure for the overalldisorder of the atom. Accordingly this will a�ect the observed intensityby the B-factor (Equation 3.1) from the original intensity, I0.
3.4 Rebuilding
Manual rebuilding of a structure is required because the use of e�cientalgorithms the human eye contributes to the greatest process in patternrecognition and interpretation. The main idea for a functional program
1Crystallography and NMR System, [4].2Supported program within the CCP4-suite, [17].
20 Andersson, 2006.
for rebuilding is to display electron density map and the actual model inthree-dimensional space. The programs enable for introducing new fea-tures into the model, like adding residues, positional and orientationalchange, and also changing the torsional angles of particular residues.For the rebuilding and also for visual inspection the program 'O' wasused in this project [12].
3.4.1 Water molecules
An important part of the structure are water molecules since a well or-dered water molecule may even contribute more to the scattering thanthe poorly ordered parts of the protein. The waters are clearly visiblethrough experimental maps and in di�erence maps. It is important tomake inspections of the added waters, so that waters will not put in fea-tures that are representative of other things. Whilst some waters areadded manually others are automatically added by ARP/WARP3,from the ccp4 suite. One should keep in mind that double conforma-tions, ligands etc might be occupied by this automated procedure, thusa visual inspection is always required. Waters with a B-factor higherthan 50 2 were all excluded from the structure.
3Used with Refmac, supported by the CCP4-suite [17]
Andersson, 2006. 21

22 Andersson, 2006.
Chapter 4
Results
After conducting iterative re�nement, with additional steps the decreasingR-factor �nally reached an acceptable level below 0.20. This Chapterpresents the results and gives a view of the three-dimensional propertiesin the enzyme. Some Figures in this chapter appear better in color andtherefore these black and white �gures will be referring to separate colorprints.
4.1 Quality of the structure
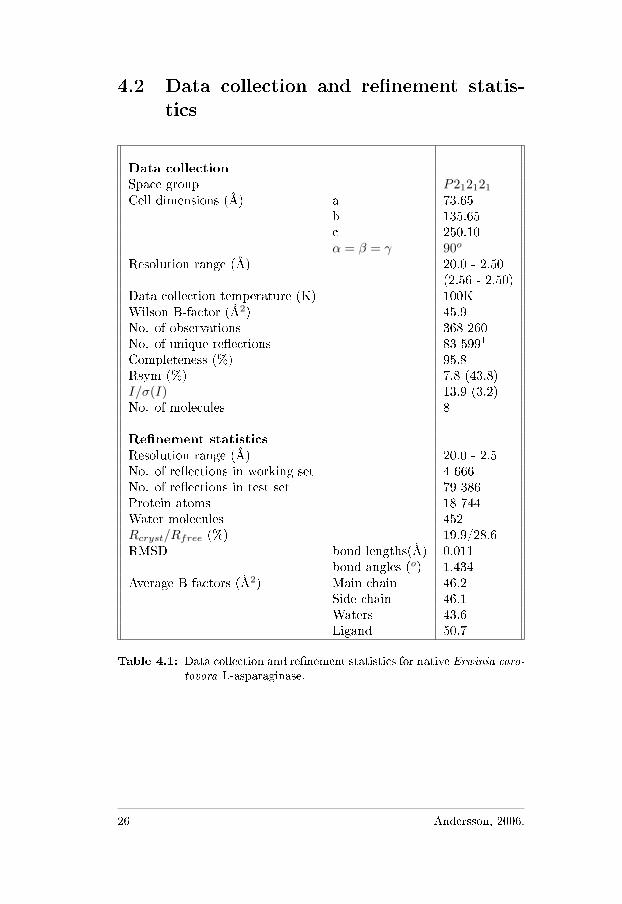
The structure was re�ned to an R = 19,9 % (Rfree = 28.6%). Foreight molecules in the asymmetric unit the Matthews coe�cient isVM = 2.4 Å3/Da, from Equation 2.2. This indicates close packingof eight L-asparaginase molecules in a unit cell, each molecule contains327 residues, with a total amount of 453 water molecules. The spacegroup of L-asparaginase from Erwinia carotovora was determined tobe P212121 based on the systematic absences [2, 9] (for data collectionand re�nement statistics see Table 4.1).
The re�nement started o� with CNS and continued in CCP4, after afew cycles of rebuilding the density for the loop between residues 20and 35 was still unclear. Some attempts were made to rebuild thispart, but failed due to lack of su�cient density. The �nal statisticsfrom the re�nement are presented in Table 4.1.
The Ramachandran plot in Figure 4.1 shows the distribution of (φ, ψ)conformational angles along the polypeptide backbone of the protein.This is a very good indicator of the quality in the modeled protein. Thedistribution gives a picture of the secondary structure as some angles
Andersson, 2006. 23
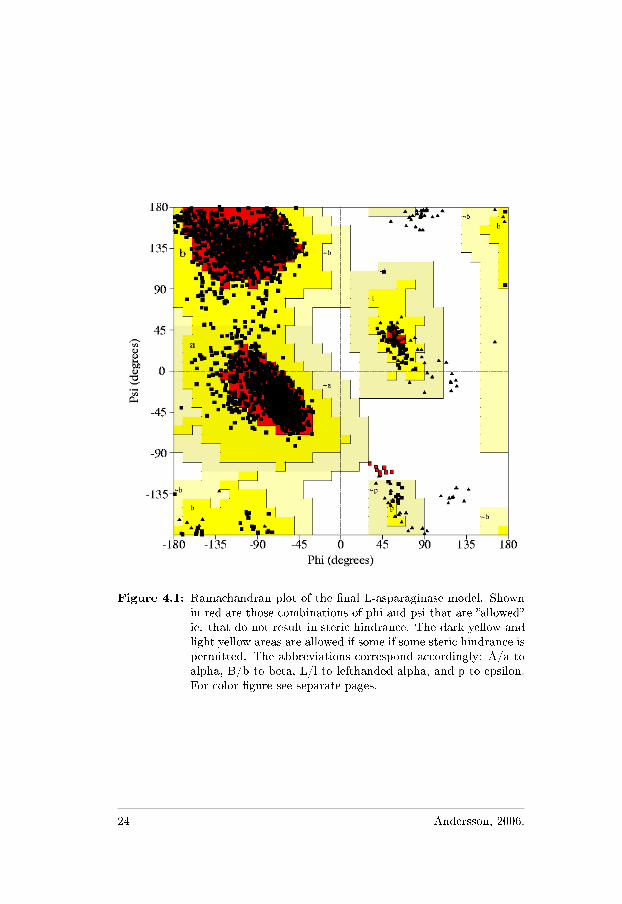
Figure 4.1: Ramachandran plot of the �nal L-asparaginase model. Shownin red are those combinations of phi and psi that are �allowed�ie. that do not result in steric hindrance. The dark yellow andlight yellow areas are allowed if some if some steric hindrance ispermitted. The abbreviations correspond accordingly: A/a toalpha, B/b to beta, L/l to lefthanded alpha, and p to epsilon.For color �gure see separate pages.
24 Andersson, 2006.
are preferred in helices and others in sheets. Most of the main-chaintorsion angles are found in the most favored region of the Ramachan-dran plot (86.9%) or in the additionally allowed regions (12.2%). Fewconformational angles are in the �generously allowed� and �forbidden�regions (0.5 and 0.4% respectively) the last one mainly due to Thr204from all the independent subunits.
A study of the B-factors shows how conformations near the surface,expectedly mobile due to solvent exposure, will have low contributionsto scattering. This appears especially in the loop, around 20 residueslong, that is sited near the active site. High B-factors indicates thatcoordinates cannot be entirely trusted, this goes for both side- andmain-chains.
Andersson, 2006. 25
4.2 Data collection and re�nement statis-
tics
Data collectionSpace group P212121
Cell dimensions (Å) a 73.65b 135.65c 250.10α = β = γ 90o
Resolution range (Å) 20.0 - 2.50(2.56 - 2.50)
Data collection temperature (K) 100KWilson B-factor (Å2) 45.9No. of observations 368 260No. of unique re�ections 83 5991
Completeness (%) 95.8Rsym (%) 7.8 (43.8)I/σ(I) 13.9 (3.2)No. of molecules 8
Re�nement statisticsResolution range (Å) 20.0 - 2.5No. of re�ections in working set 4 666No. of re�ections in test set 79 386Protein atoms 18 744Water molecules 452Rcryst/Rfree (%) 19.9/28.6RMSD bond lengths(Å) 0.011
bond angles (o) 1.434Average B factors (Å2) Main chain 46.2
Side chain 46.1Waters 43.6Ligand 50.7
Table 4.1: Data collection and re�nement statistics for native Erwinia caro-
tovora L-asparaginase.
26 Andersson, 2006.
4.3 Structural features of L-asparaginase
4.3.1 The monomer structure
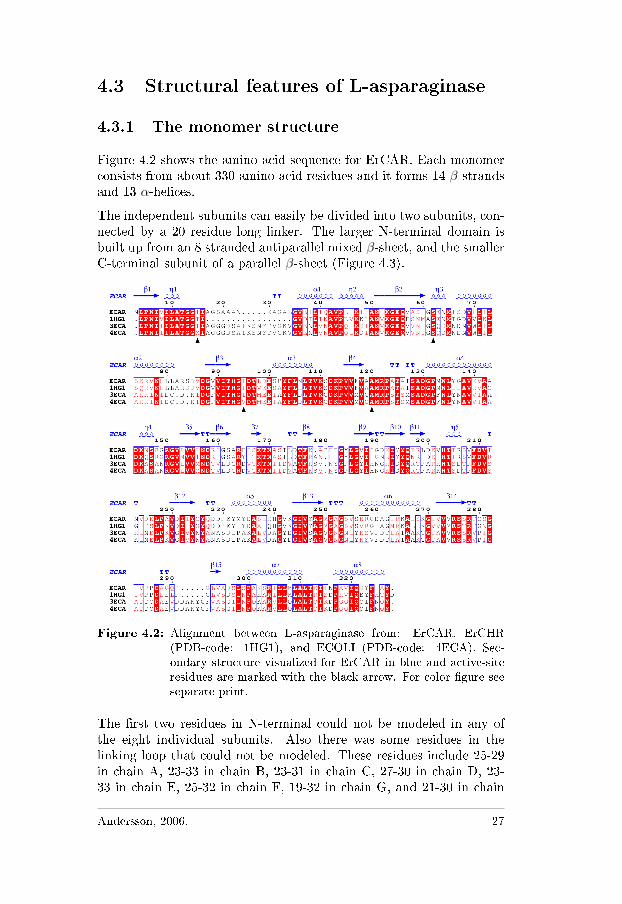
Figure 4.2 shows the amino acid sequence for ErCAR. Each monomerconsists from about 330 amino-acid residues and it forms 14 β-strandsand 13 α-helices.
The independent subunits can easily be divided into two subunits, con-nected by a 20 residue long linker. The larger N-terminal domain isbuilt up from an 8 stranded antiparallel mixed β-sheet, and the smallerC-terminal subunit of a parallel β-sheet (Figure 4.3).
Figure 4.2: Alignment between L-asparaginase from: ErCAR, ErCHR(PDB-code: 1HG1), and ECOLI (PDB-code: 4ECA). Sec-ondary structure visualized for ErCAR in blue and active-siteresidues are marked with the black arrow. For color �gure seeseparate print.
The �rst two residues in N-terminal could not be modeled in any ofthe eight individual subunits. Also there was some residues in thelinking loop that could not be modeled. These residues include 25-29in chain A, 23-33 in chain B, 23-31 in chain C, 27-30 in chain D, 23-33 in chain E, 25-32 in chain F, 19-32 in chain G, and 21-30 in chain
Andersson, 2006. 27
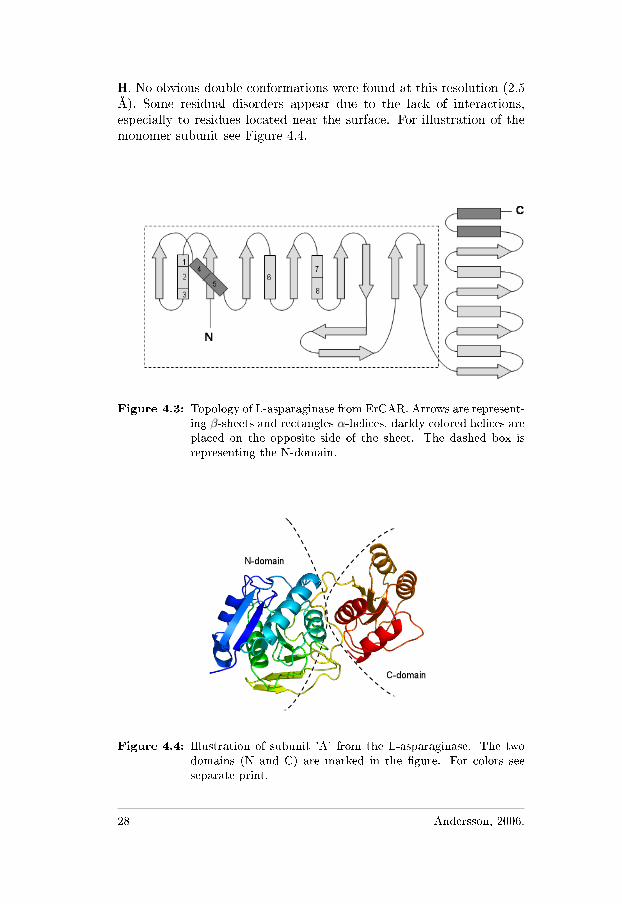
H. No obvious double conformations were found at this resolution (2.5Å). Some residual disorders appear due to the lack of interactions,especially to residues located near the surface. For illustration of themonomer subunit see Figure 4.4.
Figure 4.3: Topology of L-asparaginase from ErCAR. Arrows are represent-ing β-sheets and rectangles α-helices, darkly colored helices areplaced on the opposite side of the sheet. The dashed box isrepresenting the N-domain.
Figure 4.4: Illustration of subunit 'A' from the L-asparaginase. The twodomains (N and C) are marked in the �gure. For colors seeseparate print.
28 Andersson, 2006.
4.3.2 Description of the active site
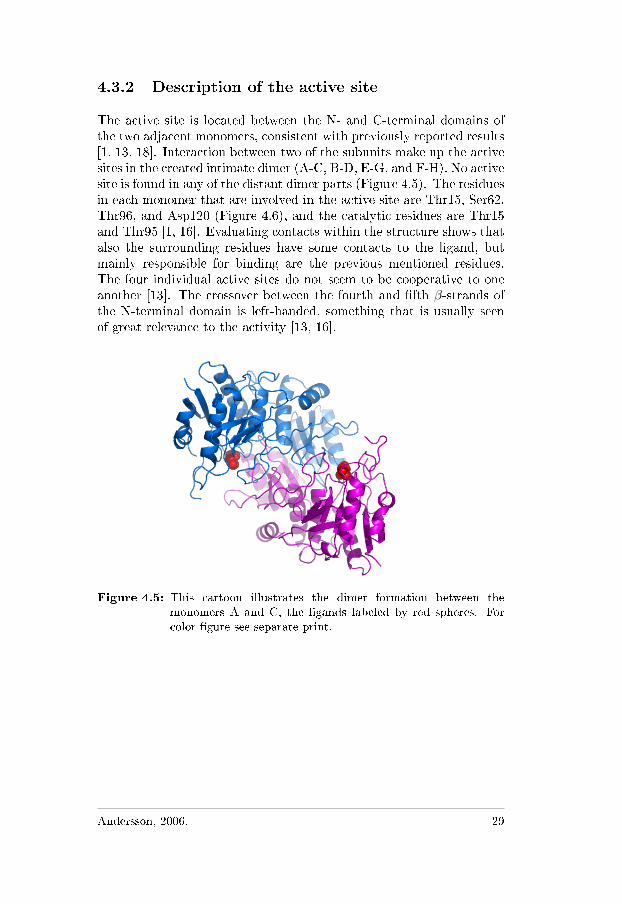
The active site is located between the N- and C-terminal domains ofthe two adjacent monomers, consistent with previously reported results[1, 13, 18]. Interaction between two of the subunits make up the activesites in the created intimate dimer (A-C, B-D, E-G, and F-H). No activesite is found in any of the distant dimer parts (Figure 4.5). The residuesin each monomer that are involved in the active site are Thr15, Ser62,Thr96, and Asp120 (Figure 4.6), and the catalytic residues are Thr15and Thr95 [1, 16]. Evaluating contacts within the structure shows thatalso the surrounding residues have some contacts to the ligand, butmainly responsible for binding are the previous mentioned residues.The four individual active sites do not seem to be cooperative to oneanother [13]. The crossover between the fourth and �fth β-strands ofthe N-terminal domain is left-handed, something that is usually seenof great relevance to the activity [13, 16].
Figure 4.5: This cartoon illustrates the dimer formation between themonomers A and C, the ligands labeled by red spheres. Forcolor �gure see separate print.
Andersson, 2006. 29
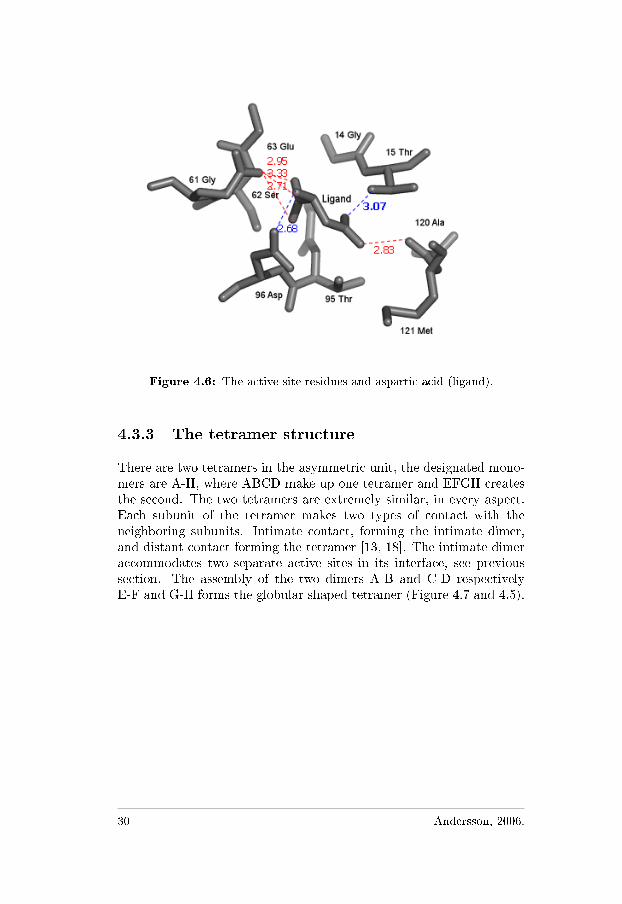
Figure 4.6: The active site residues and aspartic acid (ligand).
4.3.3 The tetramer structure
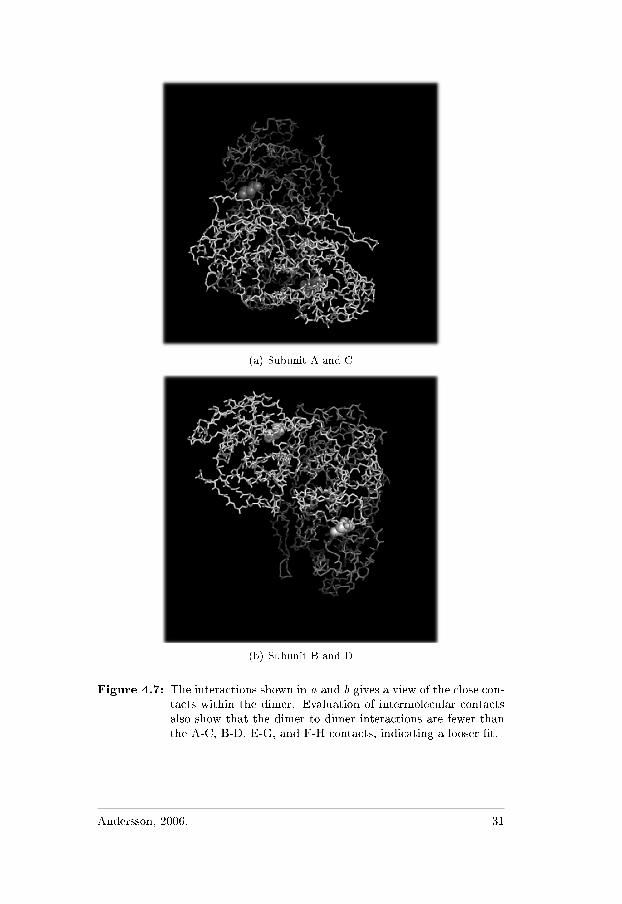
There are two tetramers in the asymmetric unit, the designated mono-mers are A-H, where ABCD make up one tetramer and EFGH createsthe second. The two tetramers are extremely similar, in every aspect.Each subunit of the tetramer makes two types of contact with theneighboring subunits. Intimate contact, forming the intimate dimer,and distant contact forming the tetramer [13, 18]. The intimate dimeraccommodates two separate active sites in its interface, see previoussection. The assembly of the two dimers A-B and C-D respectivelyE-F and G-H forms the globular shaped tetramer (Figure 4.7 and 4.5).
30 Andersson, 2006.
(a) Subunit A and C
(b) Subunit B and D
Figure 4.7: The interactions shown in a and b gives a view of the close con-tacts within the dimer. Evaluation of intermolecular contactsalso show that the dimer to dimer interactions are fewer thanthe A-C, B-D, E-G, and F-H contacts, indicating a looser �t.
Andersson, 2006. 31
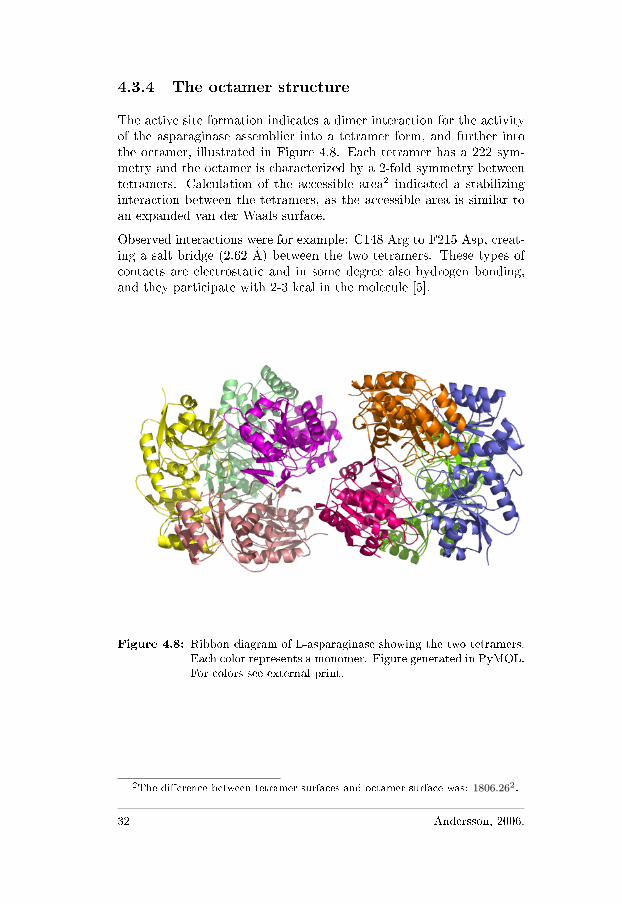
4.3.4 The octamer structure
The active site formation indicates a dimer interaction for the activityof the asparaginase assemblier into a tetramer form, and further intothe octamer, illustrated in Figure 4.8. Each tetramer has a 222 sym-metry and the octamer is characterized by a 2-fold symmetry betweentetramers. Calculation of the accessible area2 indicated a stabilizinginteraction between the tetramers, as the accessible area is similar toan expanded van der Waals surface.
Observed interactions were for example: C148 Arg to F215 Asp, creat-ing a salt bridge (2.62 Å) between the two tetramers. These types ofcontacts are electrostatic and in some degree also hydrogen bonding,and they participate with 2-3 kcal in the molecule [5].
Figure 4.8: Ribbon diagram of L-asparaginase showing the two tetramers.Each color represents a monomer. Figure generated in PyMOL.For colors see external print.
2The di�erence between tetramer surfaces and octamer surface was: 1806.262.
32 Andersson, 2006.
Chapter 5
Discussion
Figure 4.2 shows the amino acid sequence alignment resulting from Er-CAR, ErCHR, and ECOLI. After superposition of Cα ErCAR showsa 78% sequence identity with the asparaginase from ErCHR (rmsd at0.42). The sequence identity to ECOLI was 49% (rmsd at 0.88), andit shows even lower identity to the other bacterial L-asparaginases. Acomparison shows that the active site residues in ErCAR are likely to bethe same as those observed for the structure of ErCHR L-asparaginase.Also the topological structure (Figure 4.3) resembles the previous stud-ied asparaginases [18, 19]. But there seems to be a di�erence betweenthe ErCAR and ECOLI, since ECOLI has a single disul�de bond ineach subunit [18], which is not present in the ErCAR. This disul�debond is placed near the surface near the substrate 'canal', giving extrastabilization to the ECOLI enzyme.
All known asparaginase are homo-tetramers with 222 symmetry, witha molecular mass of 140-150kDa [1, 7, 16, 18, 19]. These have fouridentical subunits, each monomer consisting of 330 amino acids. Thesymmetry found in ErCAR matches previous determined structures,although in the aspects of the total amount of subunits as well as incertain sequential parts there are some visible di�erences between thosefeatures. L-Asparaginase from ErCAR appear as a dimer of tetramers,showing a close connection between the two tetramers.
The �rst three residues in the N-terminal end cannot be seen in thestructure, due to high mobility in the surface residues. Also the electrondensity for the the active site �exible loop, residue 15-30, was absentfor the eight monomers thus indicating a highly mobile region.
The Ramachandran plot revealed that Thr204 was found in the disal-lowed conformation, from all eight monomers in the enzyme. This has
Andersson, 2006. 33
also been observed in previous studies on ErCHR [13]. The explana-tion has been that Thr204 is part of the inter-domain linker, and thisfragment is characterized by an increased �exibility. This phenomenahas also been recognized in ECOLI, but this time in Thr198 and Ser199[18].
34 Andersson, 2006.
Chapter 6
Conclusion
Despite a low resolution (2.5 Å) the �nal modeling has been successful.Further improvements on the missing residues, from the gap, could bemade collecting new data at a higher resolution. To be able to dothis a new crystal batch is needed. Continuing with some engineeringstudies on the protein could improve the stability of the protein and itsfeatures, to achieve a lower glutaminase activity with fewer side-e�ects.
The accuracy of the model is presented in the results, the modelingwas somewhat troublesome due to its size and the protein �exibility.The crystal structure will be a good starting point for further studiesand evaluation of the precise role of speci�c residues in the activities ofasparaginase.
Andersson, 2006. 35

36 Andersson, 2006.
Bibliography
[1] Aghaiypour K., Wlodawer A., and Lubkowski J.(2001): �Struc-tural basis for the activity and the substrate speci�city of ErwiniaChrysantemi L-Asparaginase�, Biochem. Vol.40 pp.5655-5664.
[2] Blow D.(2002): Outline of Crystallography for Biologists, Oxforduniversity press, New York.
[3] Brunger A.T. (1997): �Free R value: cross validation in crystal-lography�, Methods Enzymol. Vol.277, pp.266-396.
[4] Brunger A.T., Adams P.D., Clore M., DeLano W.L., Gros P.,Grosse-Kunstleve R.W., Jiang J.-S., Nigles M., Pannu N.S., ReadR.J., Rice L. M., Simonson T., andWarren G.L.(1998): Crystallog-raphy & NMR System: A new software suite for macromolecular
structure determination. Acta Cryst. Vol.D54, pp.905-921.
[5] Creighton T.E.(1993): Proteins, structure and molecular properties,W.H. Freeman and Company, New York.
[6] Duval M., Suciu S., Ferster A., Rialand X., Nelken B., Lutz P.,Benoit Y., Robert A., Manel A-M., Vilmer E., Otten J., andPhilippe N.(2002): �Comparison of Escherichia coli -asparaginasewith Erwinia-asparaginase in the treatment of childhood lymphoidmalignancies: results of a randomized European Organisation forresearch and treatment of cancer-children's leukemia group phase3 trial�, Blood Vol.99, No.8, pp.2734-2739.
[7] Kotzia G.A., and Labrou N.E.(2005): �Cloning, expressionand characterisation of Erwinia Carotovora L-asparaginase�, J.Biotech. Vol.119, pp.309-323.
[8] Krasotkina J., Borisova A.A., Gevaziev Y.V., and SokolovN.(2004): �One-step puri�cation and kinetic properties of therecombinant L-Asparaginase from Erwinia Carotovora�, Biotech.Appl. Biochem. Vol.39, pp.215-221.
Andersson, 2006. 37

[9] Hahn Th.(2002): International tables for Crystallography 5th edi-tion, Vol. A, Kluwer Academic Publishers, London.
[10] Howard J.B., and Carpenter F.H.(1971): �L-Asparaginase fromErwinia Carotovora, substrate speci�city and enzymatic proper-ties�, J. Biol. Chem. Vol.247 No.4 pp.1020-1030.
[11] van Holde K.E., Johnson W.C., and Ho P.(1998):Physical Biochemistry, Simon & Schuster, New Jersey
[12] Jones T.A. et al.(1991): �Improved methods for building proteinmodels in electron density maps and the location of errors in thesemodels�, Acta Cryst. Vol.A47, pp.110-119
[13] Lubowski J., Dauteer M., Aghaiypour K., Wlodawer A., andDauter Z.(2003): �Atomic resolution structure of Erwinia chrysan-
themi L-asparaginase�, Acta Cryst. Vol.D59, pp.84-92.
[14] Matthews B.W.(1968): �Solvent content of protein crystals�, J.Mol. Biol. Vol.33, pp.491-497.
[15] McCoy A., Grosse-Kunstleve R., Storoni L., and Read R.(2005): �Likelihood-enhanced fast translation functions� ActaCryst. Vol.D61, pp.458-464.
[16] Miller M., Rao M., Wlodawer A., and Gribskov M.R.(1993): �Aleft-handed crossover involved in amidrohydrolase catalysis, crys-tal structure of Erwinia chrysanthemi L-asparaginase with boundL-aspartate� FEBS Vol.328, pp.275-279.
[17] Murshudov G.N., Vagin A.A., and Dodson E.J. (1997): �Re�ne-ment of Macromolecular Structures by the Maximum-LikelihoodMethod�, Acta Cryst. Vol.D53, pp.240-255.
[18] Sanches M., Alexandre J., Barbosa R.G., Toledo de OlivierA R.,Neto J.A., and Polikararpov I.(2002): �Structural comparison ofEscherichia coli L-asparaginase in two monoclinic space groups�.Acta Cryst. Vol.D59, pp.416-422.
[19] Swain A., Jaskolski M., Housset D., Rao M., and WlodawerA.(1992): �Crystal structure of Escerichia coli L-asparaginase, anenzyme used in cancer therapy� Biochem. Vol.90, pp.1474-1478.
[20] Vellard M.(2003): �The enzyme as drug: application of enzymesas pharmaceuticals� Biotechn. Vol.14, pp.1-7.
[21] Whitford D.(2005): Proteins - structure and function, John Wiley& Sons Ltd, West Sussex, England.
38 Andersson, 2006.
[22] Wikman, L., Krasotkina, J., Kuchumova, A., Sokolov, N., an Pa-pageorgiou, A.(2005): �Crystallization and preiliminary crystallo-graphic analysis of L-asparaginase from Erwinia Carotovora�, ActaCryst. Vol.F61 pp.407-409.
Andersson, 2006. 39

40 Andersson, 2006.
Appendix A
Protein Structure
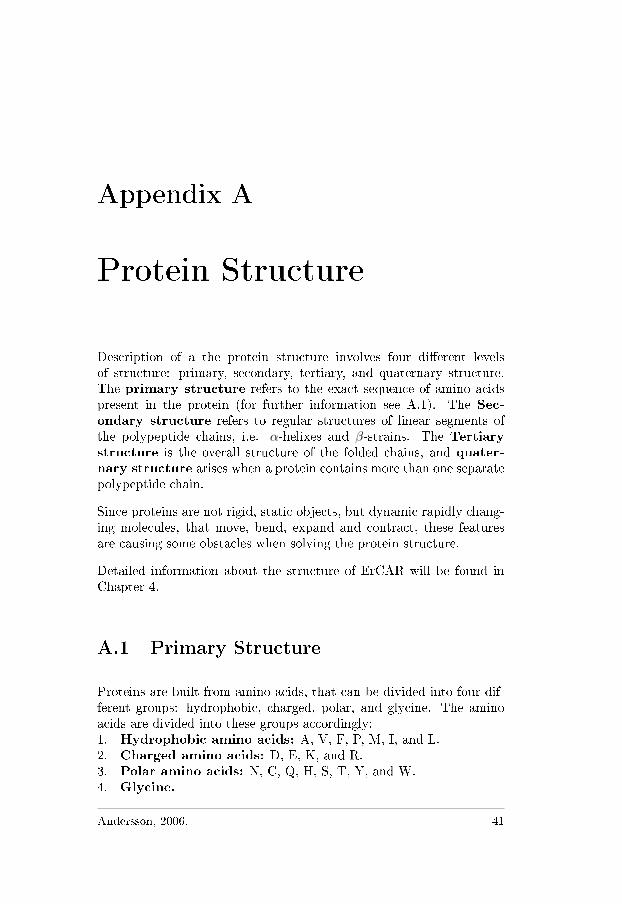
Description of a the protein structure involves four di�erent levelsof structure: primary, secondary, tertiary, and quaternary structure.The primary structure refers to the exact sequence of amino acidspresent in the protein (for further information see A.1). The Sec-ondary structure refers to regular structures of linear segments ofthe polypeptide chains, i.e. α-helixes and β-strains. The Tertiarystructure is the overall structure of the folded chains, and quater-nary structure arises when a protein contains more than one separatepolypeptide chain.
Since proteins are not rigid, static objects, but dynamic rapidly chang-ing molecules, that move, bend, expand and contract, these featuresare causing some obstacles when solving the protein structure.
Detailed information about the structure of ErCAR will be found inChapter 4.
A.1 Primary Structure
Proteins are built from amino acids, that can be divided into four dif-ferent groups: hydrophobic, charged, polar, and glycine. The aminoacids are divided into these groups accordingly:1. Hydrophobic amino acids: A, V, F, P, M, I, and L.2. Charged amino acids: D, E, K, and R.3. Polar amino acids: N, C, Q, H, S, T, Y, and W.4. Glycine.
Andersson, 2006. 41
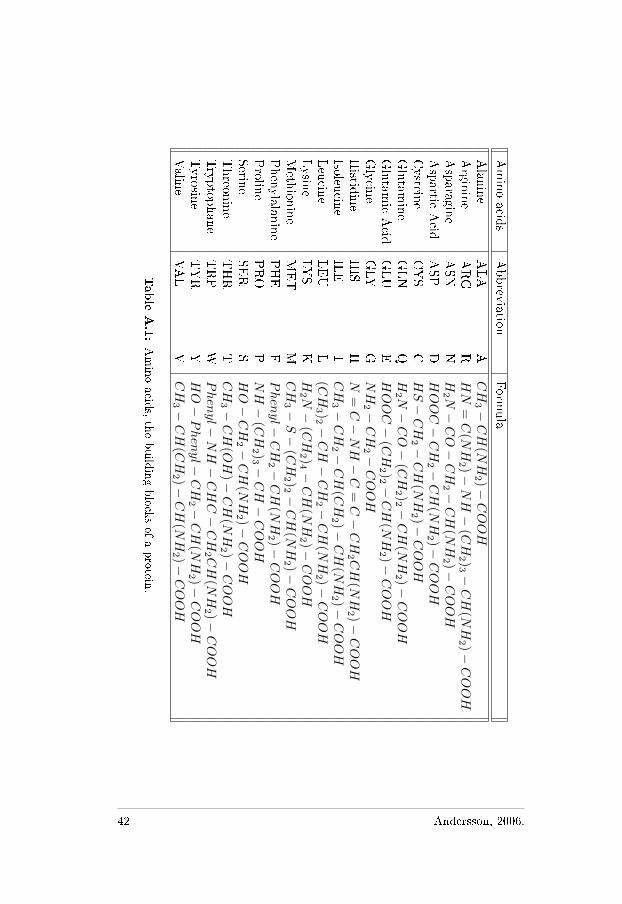
Amino
acidsAbbreviation
Formula
Alanine
ALA
ACH
3 −CH
(NH
2 )−COOH
Arginine
ARG
RHN
=C
(NH
2 )−NH−
(CH
2 )3 −
CH
(NH
2 )−COOH
Asparagine
ASN
NH
2 N−CO−CH
2 −CH
(NH
2 )−COOH
Aspartic
Acid
ASP
DHOOC−CH
2 −CH
(NH
2 )−COOH
Cysteine
CYS
CHS−CH
2 −CH
(NH
2 )−COOH
Glutam
ineGLN
QH
2 N−CO−
(CH
2 )2 −
CH
(NH
2 )−COOH
Glutam
icAcid
GLU
EHOOC−
(CH
2 )2 −
CH
(NH
2 )−COOH
Glycine
GLY
GNH
2 −CH
2 −COOH
Histidine
HIS
HN
=C−NH−C
=C−CH
2 CH
(NH
2 )−COOH
IsoleucineILE
ICH
3 −CH
2 −CH
(CH
2 )−CH
(NH
2 )−COOH
Leucine
LEU
L(CH
3 )2 −
CH−CH
2 −CH
(NH
2 )−COOH
Lysine
LYS
KH
2 N−
(CH
2 )4 −
CH
(NH
2 )−COOH
Methionine
MET
MCH
3 −S−
(CH
2 )2 −
CH
(NH
2 )−COOH
Phenylalanine
PHE
FPhenyl−
CH
2 −CH
(NH
2 )−COOH
Proline
PRO
PNH−
(CH
2 )3 −
CH−COOH
SerineSE
RS
HO−CH
2 −CH
(NH
2 )−COOH
Threonine
THR
TCH
3 −CH
(OH
)−CH
(NH
2 )−COOH
Tryptophane
TRP
WPhenyl−
NH−CHC−CH
2 CH
(NH
2 )−COOH
Tyrosine
TYR
YHO−Phenyl−
CH
2 −CH
(NH
2 )−COOH
Valine
VAL
VCH
3 −CH
(CH
2 )−CH
(NH
2 )−COOH
Table
A.1:Amino
acids,the
buildingblocks
ofaprotein.
42 Andersson, 2006.
A.2 Secondary Structure
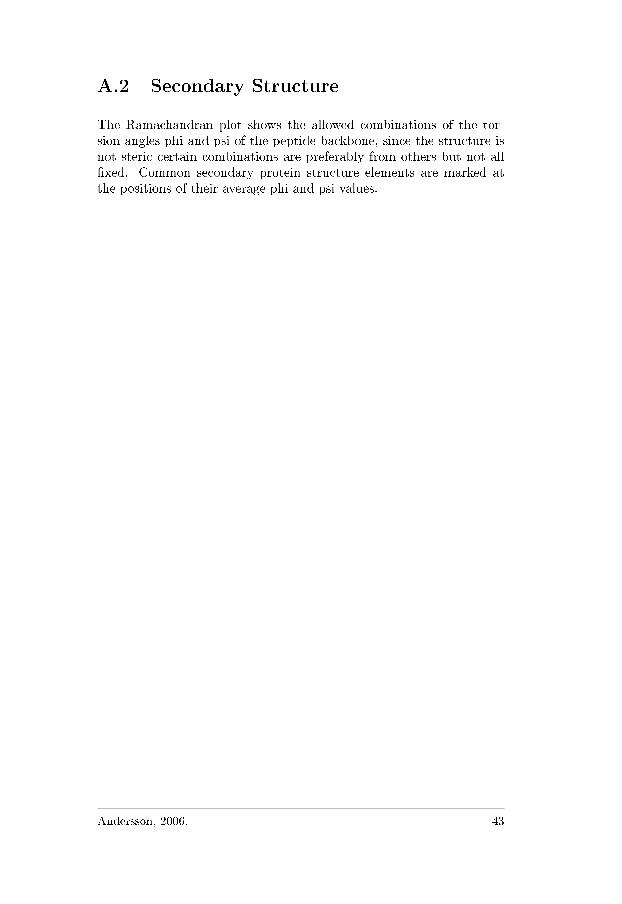
The Ramachandran plot shows the allowed combinations of the tor-sion angles phi and psi of the peptide backbone, since the structure isnot steric certain combinations are preferably from others but not all�xed. Common secondary protein structure elements are marked atthe positions of their average phi and psi values.
Andersson, 2006. 43

44 Andersson, 2006.
Appendix B
Algorithms and
mathematical functions
B.1 The Patterson function
Patterson function for self-rotation [2]:
R(C) =∫
V
P1(u)P2(Cu)dV (B.1)
The Patterson function is also called the self convolution of a structure,or in other words the Fourier Transform of the intensities. For all thepossible rotations the function should �nd the rotation operation thatalign the search molecule with the model.
B.2 The intensity function
To calculate the intensity of the scattering one the product of structurefactor F (Section 2.3) and its complex conjugate [11].
I(s) = |F (hkl)|2 = |F (s)|2 (B.2)
Andersson, 2006. 45
B.3 The least square method
The method generally used in X-ray crystallographic re�nements is themethod of least squares. This �nds model parameters that minimizethe sum of the square di�erence between the observed quantities andthe suggested theoretical model [2].
L2 =∥∥ωi
[yi − fi(x)
]∥∥ =∑
i
ωi
[yi − fi(x)
]2(B.3)
46 Andersson, 2006.
Copyright
The publishers will keep this document online on the Internet - orits possible replacement - for a period of 25 years from the date ofpublication barring exceptional circumstances. The online availabilityof the document implies a permanent permission for anyone to read,to download, to print out single copies for your own use and to useit unchanged for any non-commercial research and educational pur-pose. Subsequent transfers of copyright cannot revoke this permission.All other uses of the document are conditional on the consent of thecopyright owner. The publisher has taken technical and administrativemeasures to assure authenticity, security and accessibility. Accordingto intellectual property law the author has the right to be mentionedwhen his/her work is accessed as described above and to be protectedagainst infringement. For additional information about the LinköpingUniversity Electronic Press and its procedures for publication and forassurance of document integrity, please refer to its WWW home page:http://www.ep.liu.se/
Upphovsrätt
Detta dokument hålls tillgängligt på Internet - eller dess framtida er-sättare - under 25 år från publiceringsdatum under förutsättning attinga extraordinära omständigheter uppstår. Tillgång till dokumentetinnebär tillstånd för var och en att läsa, ladda ner, skriva ut enstakakopior för enskilt bruk och att använda det oförändrat för ickekom-mersiell forskning och för undervisning. Överföring av upphovsrättenvid en senare tidpunkt kan inte upphäva detta tillstånd. All annananvändning av dokumentet kräver upphovsmannens medgivande. Föratt garantera äktheten, säkerheten och tillgängligheten �nns det lös-ningar av teknisk och administrativ art. Upphovsmannens ideella rättinnefattar rätt att bli nämnd som upphovsman i den omfattning somgod sed kräver vid användning av dokumentet på ovan beskrivna sättsamt skydd mot att dokumentet ändras eller presenteras i sådan formeller i sådant sammanhang som är kränkande för upphovsmannens lit-terära eller konstnärliga anseende eller egenart. För ytterligare infor-mation om Linköping University Electronic Press se förlagets hemsidahttp://www.ep.liu.se/
c© 2006, Charlotta S. Andersson
Andersson, 2006. 47