Flexibility vs. Commitment: MNEs' Ownership Strategy - SFU ...
Upload
khangminh22Category
view
1download
0
Structural flexibility and chirality of polar molecules
elucidated with broadband rotational spectroscopy
Dissertation
zur Erlangung des Doktorgrades
des Department Physik
der Universität Hamburg
vorgelegt von
David Schmitz
aus Mainz
Hamburg
2015

Gutachter der Dissertation:
PD Dr. Melanie SchnellProf. Dr. R. J. Dwayne Miller
Gutachter der Disputation:
PD Dr. Melanie SchnellProf. Dr. Nils Huse
Datum der Disputation:
28.07.2015
Vorsitzender des Prüfungsausschusses:
Prof. Dr. Michael Rübhausen
Vorsitzender des Promotionsausschusses:
Prof. Dr. Jan Louis
Leiter des Fachbereichs Physik:
Prof. Dr. Peter Hauschildt
Dekan der Fakultät für Mathematik,
Informatik und Naturwissenschaften:
Prof. Dr. Heinrich Graener

Abstract
An in-depth knowledge of the structure and internal dynamics of molecules and molecular complexesis key for understanding their physical, chemical, and biological properties. Due to the strong relation-ship between molecular structure, intra- and intermolecular forces, and molecular function, structuralinformation is helpful for the prediction of reaction pathways or possible binding. Rotational spec-troscopy is well suited to shed light on the conformational flexibility and chirality of small and medium-sized molecules of biological relevance. Besides its exceptional accuracy in structure determinationof gas phase molecules, rotational spectroscopy also provides information about the intramolecularforces and even the electronic structure.
Recent developments in microelectronics now allow broadband microwave spectrometers to recordwide portions of the rotational spectrum in a very time efficient way. However, analyzing the spectraof larger molecules is challenging due to close lying transitions or overlapping spectra of differentstructural isomers. These challenges are tackled in this thesis by the development of a computer-basedroutine to automate the assignment and double-resonance experiments that provide information aboutthe connectivity of the energy levels involved.
In the framework of this thesis, a broadband chirped-pulse Fourier transform microwave spectrom-eter was designed, constructed and evaluated. Using this spectrometer, different organic moleculesare studied with increasing structural complexity and flexibility. Starting with the family of therather rigid p-halotoluenes (p-chloro-, p-bromo- and p-iodotoluene), their methyl internal rotationand quadrupole coupling is examined. Thereafter, the microwave spectra of the aromatic monoter-penoids thymol and carvacrol are used to determine the barrier of the methyl internal rotation. Twoother monoterpenoids are studied afterwards: menthol and its ketone equivalent menthone. Due tothe cyclohexane ring, their structural flexibility is increased compared to their aromatic counterpartthymol. Using the dense and overlapping spectrum of a mixture of menthone isomers, a computerprogram is described that automatically assigns and fits the rotational transitions based on calculatedrotational constants from structural predictions.
Beyond traditional microwave spectroscopy, the chirped pulse method is extended by a polarizationsensitive double-resonance scheme to differentiate between enantiomers of chiral molecules. Enan-tiomer differentiation and enantiomeric excess determination are presented for the molecule carvone.Furthermore, the phases of the molecular signals in double-resonance experiments are examined andcompared to theoretical predictions. A strong phase change of the signal transition is observed atmolecular resonance that can be exploited to yield information about the energy level arrangementand facilitate spectral assignment.

Zusammenfassung
Die tiefergehende Kenntnis der Struktur und internen Dynamik von Molekülen und Molekülkomplexenist entscheidend für das Verständnis ihrer physikalischen, chemischen und biologischen Eigenschaften.Da die Molekülstruktur mit den Kräften innerhalb eines Moleküls und letztendlich mit seiner Funk-tionalität verknüpft ist, können Strukturinformationen bei der Vorhersage von Reaktionswegen undmöglichen chemischen Verbindungen helfen. Die Rotationsspektroskopie bietet nahezu ideale Vorraus-setzungen für die Untersuchung der strukturellen Flexibilität und Chiralität kleiner und mittelgroßerBiomoleküle. Neben der hohen Genauigkeit bei der Strukturbestimmung von Molekülen in der Gas-phase liefert die Rotationsspektroskopie auch Informationen über intramolekulare Kräfte und dieLadungsverteilung.
Die schnellen Entwicklungen im Bereich der Mikroelektronik haben die technologischen Grundla-gen für die Breitbandspektroskopie im Mikrowellenbereich geschaffen, die große Bereiche des Rotati-onsspektrums gleichzeitig erfassen kann. Die Analyse der Spektren größerer Moleküle wird allerdingsdurch dicht beieinander liegende Rotationsübergänge oder durch überlappende Spektren verschiede-ner Strukturisomere erschwert. Diesen Herausforderungen wird in dieser Arbeit mit der Entwicklungeiner computergestützten Routine zur automatisierten Linienzuordnung begegnet. Des Weiteren wer-den Doppelresonanzexperimente vorgestellt, die Informationen über die Konnektivität der beteiligtenEnergieniveaus liefern.
Im Rahmen dieser Arbeit wird ein breitbandiges Chirp-Puls Fouriertransformations-Mikrowellenspek-trometer entworfen, gebaut und evaluiert. Mithilfe dieses Spektrometers werden diverse organischeMoleküle mit ansteigender Strukturkomplexität und -flexibilität untersucht. Anhand der Familie dereher starren p-Halogentoluole (p-Chlor-, p-Brom- und p-Iodtoluol) wird die interne Rotation der Me-thylgruppe und die Quadrupolkopplung untersucht. Danach wird mithilfe der Mikrowellenspektren deraromatischen Monoterpenoide Thymol und Carvacrol die Barriere der internen Rotation der Methyl-gruppe bestimmt. Zwei weitere Monoterpenoide werden anschließend untersucht: Menthol und seinKetonäquivalent Menthon. Aufgrund des Cyclohexanringes zeigen sie eine höhere Strukturflexibilitätim Vergleich zu ihrem aromatischen Pendant Thymol. Am Beispiel der dichten, sich überlappendenSpektren der Isomerenmischung von Menthon wird ein Computerprogramm getestet, das basierendauf berechneten Rotationskonstanten automatisch die verschiedenen Rotationsübergänge zuordnet.
Über die traditionelle Mikrowellenspektroskopie hinaus wird die Chirp-Puls Methode durch ein po-larisationsempfindliches Doppelresonanzverfahren erweitert, mit dem Ziel, die Enantiomere chiralerMoleküle zu unterscheiden. Die eindeutige Unterscheidung der Enantiomere sowie die Bestimmungdes Enantiomerenüberschusses wird für das Molekül Carvon vorgestellt. Weiterhin wird die Phase desmolekularen Signals im Rahmen verschiedener Doppelresonanzexperimente untersucht und mit theo-retischen Vorhersagen verglichen. Bei resonanter Anregung wird ein starker Phasensprung beobachtet,der genutzt werden kann, um Informationen über die Anordnung der Energieniveaus zu erhalten undum so die Spektrenzuordnung zu erleichtern.

Publications
1. D. Schmitz, V. A. Shubert, T. Betz, and M. Schnell, Multi-resonance effects within asingle chirp in broadband rotational spectroscopy: The rapid adiabatic passage regimefor benzonitrile, J. Mol. Spec. 280, 77-84 (2012).
2. V. A. Shubert, D. Schmitz, and M. Schnell, Communication through the phenyl ring:internal rotation and nuclear quadrupole splitting in p-halotoluenes, Mol. Phys. 111,2189-97 (2013).
3. D. Schmitz, V. A. Shubert, B. M. Giuliano, and M. Schnell, The broadband microwavespectra of the monoterpenoids thymol and carvacrol: Conformational landscape and in-ternal dynamics, J. Chem. Phys. 141, 034304 (2014).
4. V. A. Shubert, D. Schmitz, D. Patterson, J. M. Doyle and M. Schnell, IdentifyingEnantiomers in Mixtures of Chiral Molecules with Broadband Microwave Spectroscopy,Angew. Chem. Int. Ed. 52, 1-5 (2013).
5. V. A. Shubert, D. Schmitz, and M. Schnell, Enantiomer-sensitive spectroscopy and mix-ture analysis of chiral molecules containing two stereogenic centers – Microwave three-wave mixing of menthone, J. Mol. Spec. 52, 31-6 (2014).
6. D. Schmitz, V. A. Shubert, T. Betz, and M. Schnell, Exploring the conformationallandscape of menthol, menthone, and isomenthone: A microwave study, Front. Chem.3, 15 (2015).
7. D. Schmitz, V. A. Shubert, D. Patterson, A. Krin, and M. Schnell, Phase Dependenceof Double-Resonance Experiments in Rotational Spectroscopy, J. Phys. Chem. Lett. 6,1493-98 (2015).
8. V. A. Shubert, D. Schmitz, C. Medcraft, A. Krin, D. Patterson, J. M. Doyle and M.Schnell, Rotational spectroscopy and three-wave mixing of 4-carvomenthenol: A technicalguide to measuring chirality in the microwave regime, accepted at J. Chem. Phys.

Contents
1 Motivation 1
2 Theoretical background 6
2.1 Rotational Hamiltonian . . . . . . . . . . . . . . . . . . . . . . . . . . . . . . 8
2.2 Hyperfine splitting: Nuclear quadrupole coupling . . . . . . . . . . . . . . . . 16
2.3 Internal rotation . . . . . . . . . . . . . . . . . . . . . . . . . . . . . . . . . . 22
2.4 Bloch equations . . . . . . . . . . . . . . . . . . . . . . . . . . . . . . . . . . . 26
2.5 Spectral fitting . . . . . . . . . . . . . . . . . . . . . . . . . . . . . . . . . . . 32
2.6 Quantum chemical calculations . . . . . . . . . . . . . . . . . . . . . . . . . . 33
3 Experimental details 41
3.1 Chirped-pulse microwave spectrometer . . . . . . . . . . . . . . . . . . . . . . 41
3.2 Molecular beam technique . . . . . . . . . . . . . . . . . . . . . . . . . . . . . 47
3.3 Commissioning and performance . . . . . . . . . . . . . . . . . . . . . . . . . 54
4 Communication through the phenyl ring: internal rotation and nuclear
quadrupole splitting in p-halotoluenes 59
4.1 Introduction . . . . . . . . . . . . . . . . . . . . . . . . . . . . . . . . . . . . . 59
4.2 Experimental . . . . . . . . . . . . . . . . . . . . . . . . . . . . . . . . . . . . 62
4.3 Computational Methods . . . . . . . . . . . . . . . . . . . . . . . . . . . . . . 62
4.4 Spectral details and fitting . . . . . . . . . . . . . . . . . . . . . . . . . . . . . 62
4.5 Results and discussion . . . . . . . . . . . . . . . . . . . . . . . . . . . . . . . 65
4.6 Summary and conclusions . . . . . . . . . . . . . . . . . . . . . . . . . . . . . 72

CONTENTS VII
5 The broadband microwave spectra of the monoterpenoids thymol and car-
vacrol: Conformational landscape and internal dynamics 73
5.1 Introduction . . . . . . . . . . . . . . . . . . . . . . . . . . . . . . . . . . . . . 73
5.2 Experimental and computational methods . . . . . . . . . . . . . . . . . . . . 75
5.3 Results . . . . . . . . . . . . . . . . . . . . . . . . . . . . . . . . . . . . . . . . 76
5.4 Discussion . . . . . . . . . . . . . . . . . . . . . . . . . . . . . . . . . . . . . . 86
5.5 Conclusion and outlook . . . . . . . . . . . . . . . . . . . . . . . . . . . . . . 87
6 Exploring the conformational landscape of menthol, menthone, and isomen-
thone: A microwave study 89
6.1 Introduction . . . . . . . . . . . . . . . . . . . . . . . . . . . . . . . . . . . . . 89
6.2 Experimental and computational methods . . . . . . . . . . . . . . . . . . . . 91
6.3 Results and discussion . . . . . . . . . . . . . . . . . . . . . . . . . . . . . . . 93
6.4 Conclusions . . . . . . . . . . . . . . . . . . . . . . . . . . . . . . . . . . . . . 107
7 Enantiomer differentiation by microwave three-wave mixing experiments 109
7.1 Introduction . . . . . . . . . . . . . . . . . . . . . . . . . . . . . . . . . . . . . 109
7.2 Theoretical background . . . . . . . . . . . . . . . . . . . . . . . . . . . . . . 110
7.3 Experimental details . . . . . . . . . . . . . . . . . . . . . . . . . . . . . . . . 113
7.4 Double-resonance experiments . . . . . . . . . . . . . . . . . . . . . . . . . . . 114
7.5 Enantiomer differentiation . . . . . . . . . . . . . . . . . . . . . . . . . . . . . 120
7.6 Enantiomeric excess measurement . . . . . . . . . . . . . . . . . . . . . . . . . 124
7.7 Conclusion and outlook . . . . . . . . . . . . . . . . . . . . . . . . . . . . . . 127
8 Summary and outlook 128
Bibliography 145
A Three-level optical Bloch equations 148
B Fourier series 150

Chapter 1
Motivation
An in-depth knowledge of the structure and internal dynamics of molecules and molecularcomplexes is key for the understanding of their physical, chemical, and biological properties.Due to the strong relationship between the molecular structure, the intra- and intermolecularforces at play, and molecular function, structural information is helpful for the prediction ofreaction pathways or possible binding. The lively interplay between structure determinationand method development enabled various scientific breakthroughs, honored by several Nobelprizes (Yonath 2009 [1], Wüthrich 2002 [2], Ernst 1991 [3], Deisendorf/Huber/Michel 1988[4, 5], Hauptmann/Karle 1985 [6, 7], Klug 1982 [8], Hodgkin 1964 [9]) in the last century.Even though biologically relevant molecules such as proteins, ribonucleic acids (RNA), ordeoxyribonucleic acid (DNA) are huge, their functionality is often dominated by comparablysmall active sites. The understanding of the chemistry on these active sites is fundamentalfor drug development. However, this guest-host binding is a complex procedure dependingupon conformational changes during the molecular recognition process and the chirality ofthe binding partners.
Rotational spectroscopy is well suited to shed light on the conformational flexibility and chi-rality of small and medium-sized molecules of biological relevance. Rotational spectroscopy isknown for its exceptional accuracy in structure determination, but it also provides informationabout the intramolecular forces and even the electronic structure. The former is accessiblevia the effects on the of molecular vibrations, internal rotation, and centrifugal forces onthe Hamiltonian, the latter by quadrupole coupling and dipole moments. Pure rotationalspectroscopy is only applicable to gas-phase samples of molecules with a permanent dipolemoment. However, the permanent dipole moment requirement is not a strong limitation formedium-sized biomolecules because their high asymmetry gives rise to nonzero permanentdipole moment. In contrast, the gas-phase requirement sets a challenging restriction to themaximum size of the molecule and removes the molecules from the more natural solution-phaseenvironment, which has a direct impact on the studied conformational preferences. The sizelimitation is weakened by implementing advanced molecular beam sources e.g. laser ablationsources [10] and by forming molecular clusters with a solvent, the solution effect is mimicked[11–15]. Owing to recent development in the design of molecular sources and the broadband

2 CHAPTER 1. MOTIVATION
capabilities of next generation microwave spectrometers, various building block molecules (e.g. monosaccharides [16], amino acids [17–19], nucleobases [20, 21], neurotransmitters [22]),drugs [23–27] and higher order clusters [15, 28–30] have been studied. Besides pure structuredetermination, complex inter- and intramolecular dynamics have also been analyzed usingmicrowave spectroscopy [26, 31, 32].
Microwave spectroscopy also contributes significantly to the research area of astrochemistry.The molecular signals from dense gas clouds provide information how molecules are formedin space. New and powerful radio telescopes, e.g. Atacama Large Millimeter Array (ALMA)[33] and the Herschel space telescope [34], can provide multispectral images containing thesignatures of several molecules and their isotopologues, molecular ions, and radicals [35–37]. However, the analysis of the spectral data bears several challenges. The moleculesin outer space are far from thermal equilibrium and their internal energies are spread overseveral vibrational states [38, 39]. Furthermore, the harsh environmental conditions in spacepromoting the generation of unstable molecular ions and radicals are not easily reproducedin the laboratory. However, a discharge source is a promising approach to produce radicalswith an adequate efficiency [40].
The application of microwave spectroscopy to study molecular properties is an active areaof research for now almost 70 years. Microwave spectrometry emerged after World War IIsupported by the increased development activities of radio detection and ranging (RADAR)equipment during the war. The first microwave spectrometers measured the absorption ofmonochromatic microwave radiation in a gas cell or waveguide. The microwave radiation wasproduced by klystrons, magnetrons, or traveling-wave tubes and detected by semiconductorcrystals [41, Chap. 14, Chap. 15]. Lock-in amplifiers were used to enhance the sensitivity,while modulating the excitation intensity, the excitation frequency, or the absorption fre-quency by means of the Stark or Zeeman effects [41, Chap. 10, Chap. 11]. The first moleculeinvestigated extensively by microwave spectroscopy was ammonia [42–44]. This relativelysimple symmetric-top molecule already exhibits two challenging spectroscopic effects, namelythe inversion splitting [42, 43] and the hyperfine structure due to the nitrogen quadrupolemoment [44]. The concentrated research on ammonia led to the development of the MASER(microwave amplification by stimulated emission of radiation) [45, 46], the direct predecessorof the LASER (light amplification by stimulated emission of radiation) and the first experi-mental demonstration of stimulated emission.
While subsequent microwave investigations focused on molecules with increasing complexity,Kraitchman laid the theoretical foundation for determining molecular structure via isotopicsubstitution [47]. The invention of the time-domain emission spectrometers using pulsed mi-crowave sources significantly enhanced the sensitivity and the molecular linewidth compared toabsorption spectrometers [48–50]. To overcome the drawbacks of pressure broadening and lowpopulation densities in gas-cell spectroscopy at room temperatures, Balle and Flygare com-bined time-domain spectroscopy with a Fabry-Perot resonator and a supersonic expansion, oneof the milestones in the history of microwave spectroscopy [51]. Grabow et al. improved theexperimental setup by a coaxial arrangement of the molecular beam and the microwave field

3
[52]. The fast scan submillimeter/millimeter spectroscopic technique (FASSST), an absorp-tion spectroscopy technique based on voltage tunable backward wave oscillators (BWO), pro-vided broadband capabilities in the millimeter wave spectral region [53, 54]. Two-dimensionalmicrowave spectroscopy was used in combination with different spectrometer designs to un-ravel coherence pathways, population transfer, and the connectivity of rotational energy levels[55–57].
The invention of the chirped-pulse Fourier transform microwave (CP-FTMW) spectrometerby Pate and coworkers in 2008 was a huge breakthrough in terms of bandwidth, measurementtime, and flexibility [58]. Since then several CP-FTMW spectrometers have been constructedin different frequency ranges [29, 59–74] and novel applications of microwave spectroscopydemonstrated, including investigation of isomerization dynamics [75, 76], two-dimensionalbroadband microwave spectroscopy [77], and, within the framework of this dissertation, thedifferentiation of enantiomers [78, 79]. One of the current development trends are low-costhigh bandwidth CP-FTMW spectrometers for commercial trace gas analysis [80–82]. A CP-FTMW spectrometer has also been used to examine high Rydberg states in Sodium atoms[65]. Employing high gain frequency multiplier chains or frequency mixing CP-FTMW spec-trometry can be extended to the mm-wave region [67, 70, 74, 80, 81].
Even though microwave spectroscopy is well-known for its outstanding accuracy in deter-mining the molecular structure of gas-phase molecules, rotationally resolved UV or IR spec-troscopy may complement the structural information for electronically or vibrationally excitedstates [83–85]. Another advantage of IR or UV spectroscopy over microwave spectroscopy istheir higher time resolution that grants access to ultrafast phenomena via pump-probe exper-iments [86]. Rotational coherence spectroscopy (RCS), a new time-domain technique, circum-vents the limitation of traditional rotational spectroscopy to polar molecules and simplifies thespectral assignment dramatically. RCS is a pump-probe approach, where the pump laser pulsecreates a coherent superposition of rotational states and their evolution (dephasing and rephas-ing) is probed with a second laser pulse [87]. When combined with mass-spectrometry, thedifferent isotopologues are disentangled to determine the substitution structure [88]. However,the complicated and expensive experimental setup of RCS currently outweighs its benefits byfar.
Despite its exceptional structural resolution, microwave spectroscopy faces significant obsta-cles when it comes to structure determination of larger (bio)molecules (e.g. proteins or DNA),solution or solid-phase samples, or ultrafast phenomena (femtosecond timescale). These chal-lenges are addressed by different, partially complementary techniques, e.g. nuclear magneticresonance (NMR), X-ray, and electron diffraction. NMR provides excellent solution-phasestructures of proteins, but each step from the sample preparation to the measurement andthe final data analysis can be very tedious and time consuming [2, 89, 90]. X-ray diffractionis another more widespread method for structure determination (according to the publishedprotein structures on the protein data base [91]), but their samples usually exist under unnat-ural conditions, e.g. molecular crystals or single, isolated molecules/particles, and are exposedto a harsh environment (ultrahigh vacuum). An exception to these conditions is small angle

4 CHAPTER 1. MOTIVATION
X-ray scattering (SAXS), a low resolution technique, providing a rough estimate of the overallshape of the system under study [92–94]. High-resolution X-ray diffraction studies dependon a high quality crystalline sample, which cannot always be produced [1]. This requirementis about to change with the new, bright free-electron laser light sources. Their high photonflux allows the use of nanoprotein crystals [95–97], a single virus [98, 99], or even isolatedgas-phase molecules [100]. On the other hand, the short pulse length of the X-ray laser mustyield an unperturbed diffraction image before the sample transforms into a plasma (diffractionbefore destruction) [101–103]. To enhance the intensity and reduce the measurement time,alignment methods are applied in single molecule imaging [100].
Electron diffraction shares various properties with X-ray diffraction, but the main differenceis in the interaction principle. Electrons interact with the electron cloud and the cores, whileX-rays are scattered off by the electron cloud. This difference leads to about 106 highercross sections for electron diffraction. Consequently, the samples the electrons are interactingwith must be very thin (typically less than 100 nm for biological samples) and resistant tothe high vacuum conditions. The structural collapse upon dehydration is prevented by theuse of negative stains or flash freezing the sample [104]. However, recent developments innanofabrication enable the development of nanofluidic cells to image biological samples insolution [105]. Another advantage of electron diffraction over X-ray diffraction is the smallerwavelength of about 2 pm (compared to 150 pm for X-ray diffraction experiments at the LinacCoherent Light Source) resulting in higher resolution images. Recent sources for X-ray andelectron diffraction provide a time resolution in the femtosecond regime, which enables theobservation of chemically relevant processes [106–109].
The work described herein comprises different objectives, namely the construction of a CP-FTMW spectrometer, the measurement and analysis of the rotational spectra of differentorganic molecules with increasing structural complexity, and the extension of the CP-FTMWtechnique to differentiate between enantiomers of chiral molecules. However, the centralachievement is the design, construction, and evaluation of a chirped-pulse microwave spec-trometer described in Chapter 3. Using this spectrometer different organic molecules arestudied with increasing structural complexity and flexibility. Starting with the family of therather rigid p-halotoluenes (p-chloro-, p-bromo-, and p-iodotoluene), their methyl internalrotation and quadrupole coupling is examined (Chap. 4). Thereafter, the microwave spec-tra of the aromatic monoterpenoids thymol and carvacrol are used to determine the barrierof the methyl internal rotation. Subsequently the results are presented and discussed in anextensive comparison with similar molecules (Chap. 5). Due to the cyclohexane ring, themonoterpenoids menthol and its ketone equivalent menthone are more flexible than theiraromatic counterpart thymol. Consequently their conformational landscape involves moreminimum structures. In Chapter 6, the rotational spectra of menthol, menthone, and isomen-thone are presented together with the assignment of the rotational constants to the calculatedminimum structures.
Beyond traditional microwave spectroscopy, the chirped-pulse method is extended by a po-larization sensitive double-resonance scheme to differentiate between enantiomers of chiral

5
molecules. Enantiomer differentiation as well as enantiomeric excess determination are pre-sented in Chapter 7. In addition, the phase of the molecular signal in double-resonanceexperiments is examined and compared to theoretical prediction based on the dressed-statepicture. The challenging assignment of dense rotational spectra containing several species(e.g. conformers, isotopologues) is tackled in this work with the development of an automaticassignment program (Sec. 6.3) and the microwave signal phase in double-resonance experi-ments is exploited to gain information about the energy level arrangement (Sec. 7.4). Thenext chapter gives an overview of the theoretical methods employed in this work including adescription of the rotational Hamiltonian, the two-level Bloch equations, and a short glanceinto quantum chemical methods.

Chapter 2
Theoretical background
Spectroscopy is a probe of the energy eigenvalues of a quantum system employing staticor dynamic electromagnetic fields. For a molecule of N atoms and M electrons, the time-independent Schrödinger equation is:
H n(Q1, . . . ,QN,q1
, . . . ,qM ) = En n(Q1, . . . ,QN,q1
, . . . ,qM ) (2.1)
where Qi and qj are vectors describing the position of the i-th nuclei and the j-th electron,respectively. n represent the eigenfunctions of the Hamiltonian operator H with their cor-responding eigenvalues En. The Hamiltonian operator can be divided into a kinetic energyterm T and a potential energy term V [110]:
H = T + V =NX
i=1
P2
i
2mi+
MX
j=1
p2
j
2me+ V (Q1, . . . ,QN,q
1
, . . . ,qM ) (2.2)
where Pi and pj are the momentum operators of the atoms and electrons, respectively. Themolecular dynamics and hence the molecular energy eigenvalues are mainly influenced bythe electronic motions and the molecular vibrations and rotations. These different motionstake place on different timescales. Electrons orbiting the nucleus need about a 1 fs for arevolution, much faster than the typical vibrational period of 10 � 100 fs. The rotation of theentire molecule occurs on even slower timescales of 0.1 � 10 ps. These differences in the timeframes enable the separation of the distinct motions employing the central approximation inmolecular spectroscopy: the Born-Oppenheimer approximation.
Within the Born-Oppenheimer approximation, the separation of the electronic and nucleardegrees of freedom becomes possible, exploiting the fact that the nuclei barely move duringa period of the electronic movement [111]. Hence, the Hamiltonian can be evaluated in atwo step procedure. Firstly, the electronic part of the Hamiltonian is solved with the nucleiat fixed positions Qa, and secondly the motion of the nuclei is evaluated using the averagedelectric potential from step one.
Employing a similar strategy, the vibrational and the rotational motion can be separated.

7
v=0
v=3
v=2
v=1
v=4J
J
J
J
v=0
v=3
v=2
v=1
v=4J
J
J
J
12
3
12
3
12
3
12
3
12
3
12
3
12
3
12
3
ener
gy
internuclear distance
X: ground state
A: excited state
re r0
rovibronic transitionrovibrational transition
v=0
v=1J
J
12
3
12
3
rotational transition
Figure 2.1: Potential energy curves of two electronic states of a diatomic molecule. Eachelectronic state is subdivided into several vibrational states, which are again subdividedinto rotational states. The x-axis represents the internuclear distance. The typicalenergy interval of rovibronic transitions are greater than 5000 cm�1 (> 0.6 eV). Theenergy interval of rovibrational transitions is between 300�15000 cm�1 (30�0.7 µm)and rotational transitions can be found in the spectral region of 0.03 � 300 cm�1
(1 � 10000 GHz). The value re describes the equilibrium internuclear distance andr0
is the expectation value of the internuclear distance in the lowest vibrational state(v = 0).
The average contribution of the fast vibrational motions are included parametrically into therotational part of the Hamiltonian. Hence, the total molecular Hamiltonian is represented asa sum of an electronic part Hel, a vibrational part Hvib, a rotational part Hrot, a translationalpart Htrans and a part depending on the nuclear spin Hns:
H = Hel(qj,Qa) + Hvib(Qi) + Hrot(✓,�,�) + Htrans(X, Y, Z) + Hns (2.3)
where ✓, �, � are the Euler angles describing the orientation of the molecule in a laboratory-fixed frame (X, Y , Z), while qj and Qi are internal coordinates describing the position ofelectrons and nuclei in the molecular fixed coordinate system. The molecular energy levelsand the total molecular wave function follow [110]:
En = Eel, n + Evib, n + Erot, n + Etrans, n + Ens, n (2.4)
n = 'el, n(qj,Qa)'vib, n(Qi)'rot, n(✓,�,�)'trans, n(X, Y, Z)'ns, n (2.5)

8 CHAPTER 2. THEORETICAL BACKGROUND
Table 2.1: Possible identification of a, b, c with x, y, z leading to six different represen-tations. The Ir representation is best suited to describe a prolate symmetric top or aslightly asymmetric prolate top. Whereas the IIIr representation is suitable for thedescription of oblate symmetric top or slightly asymmetric oblate tops.
Ir I l IIr II l IIIr III l
x b c c a a by c b a c b az a a b b c c
The potential energy curves of two electronic states and the corresponding vibrational androtational energy levels of a diatomic molecule are depicted in Figure 2.1. Microwave spec-troscopy as employed in the present work probes the rotational part of the Hamiltonian.Hence, the rotational Hamiltonian and the corresponding time-independent Schrödinger equa-tion
Hrot'rot = Erot'rot (2.6)
are discussed in detail in the following section.
2.1 Rotational Hamiltonian
From classical mechanics, the rotational energy of a rigid body is given by:
Erot =1
2!T I! =
L2
2I(2.7)
with the inertia tensor I, the angular velocity !, and the angular momentum L. In a rigidmolecule, only the nuclei contribute significantly to the inertia tensor due to their much largermasses compared to the electrons. The nuclei of a molecule can be treated as point particleswith masses mi at coordinates Qi (xi, yi, zi) in a molecule-fixed coordinate system. Hence,the inertia tensor can be written as:
I =NX
i=0
mi
0
B@y2
i + z2
i �xiyi �xizi
�yixi x2
i + z2
i �yizi
�zixi �ziyi x2
i + y2
i
1
CA (2.8)
Upon diagonalization, the inertia tensor is transformed to the molecule-fixed principal axissystem. The principal moments of inertia are defined by the diagonal elements of the inertiatensor with increasing size Ia Ib Ic. Within the principle axis system the rotationalenergy becomes:
Erot =L2
a
2Ia+
L2
b
2Ib+
L2
c
2Ic(2.9)
where Lg (g = a, b, c) is the component of the angular momentum along the respective prin-cipal axis. The molecular fixed axes (x, y, z) can be assigned to the principal axes (a, b, c)

2.1. ROTATIONAL HAMILTONIAN 9
in six different ways, which are summarized in Table 2.1. Those assignments or representa-tions will become important hereinafter for the evaluation of the rotational Hamiltonian. Thetransformation from the classical rotational energy to the quantum mechanical rigid rotorHamiltonian is straightforward by introducing the angular momentum operator J:
Hrid =J2
2I=
J2
a
2Ia+
J2
b
2Ib+
J2
c
2Ic(2.10)
withJ = r ⇥ p = �i~ (r ⇥ r) (2.11)
where r is the position operator.
Due to the symmetry of the molecule, one of its moments of inertia might vanish or some ofits moments of inertia might be equal. Hence four different classifications are established toclassify molecules in rotational spectroscopy:
Linear molecules: Molecules with Ia = 0 and Ib = Ic are called linear molecules. Theybelong to the point groups C1v or D1h. Typical examples are: hydrogen cyanide(HCN), carbonyl sulfide (OCS).
Spherical-top molecules: Spherical tops are molecules with Ia = Ib = Ic and Td, Oh or Ih
symmetry. Typical examples are: sulfur hexafluoride (SF6), methane (CH4).
Symmetric-top molecules: Two moments of inertia are equal for symmetric-top molecules.If Ia = Ib < Ic, the molecule is an oblate symmetric top (disc-shaped). For prolatesymmetric-top molecules (cigar shaped), Ia < Ib = Ic. A symmetric-top moleculehas Cn symmetry (n > 2) or a S
4
-axis of symmetry. Examples for symmetric topsinclude: ammonia (NH
3
, oblate), iodomethane (ICH3
, prolate), benzene (C6
H6
, oblate),propadiene (C
3
H4
, prolate).
Asymmetric-top molecules: Asymmetric-top molecules are the largest class and as thename indicates, all moments of inertia are different: Ia 6= Ib 6= Ic. Planar molecules arean important subgroup, where Ic � Ib � Ia = 0. Examples of asymmetric-top moleculesare water (H
2
O), phenol (C6
H6
O, planar), all amino acids.
The rigid rotor Hamiltonian (Eqn. 2.10) solely depends on angular momentum operators,which are defined in the molecular axis system. Even though the molecular axis system iswell suited to describe the internal movements of the electrons and the nuclei, the molecu-lar coordinate system (x, y, z) needs to be related to the laboratory-fixed coordinate system(X, Y, Z) for determining the rotational energy of a molecule. Because only the rotation andnot the translational motion of the molecule is of importance for the rotational Hamiltonian,both coordinate systems coincide at the center of mass of the molecule, thus canceling outthe center of mass motion. The orientation of both coordinate systems to each other is de-scribed by the three Euler angles ✓, �, and � depicted in Figure 2.2, and the transformation

10 CHAPTER 2. THEORETICAL BACKGROUND
φχ
Z
z
X
x
Y
y
O
θ
Figure 2.2: Illustration of the Euler angles ✓, �, and � which define the orientation ofa molecule (x, y, z) in the laboratory frame (X, Y, Z).
is expressed by three consecutive rotations about the axes (the explicit rotation matrices arestated in [112]):
1. Rotate X and Y by an angle � about Z into X0 and Y
0 .
2. Rotate X0 and Z by an angle ✓ about Y
0 into X00 and z.
3. Rotate X00 and Y
0 by an angle � about z into x and y.
Now, the different Cartesian components of the angular momentum operator (Eqn. 2.10) canbe expressed in terms of Eulerian angles in the molecule-fixed axis system [112]:
Jx = i~� cos�
sin ✓
@
@�+
cos� cos ✓
sin ✓
@
@�+ sin�
@
@✓
�(2.12)
Jy = i~sin�
sin ✓
@
@�� sin� cos ✓
sin ✓
@
@�+ cos�
@
@✓
�(2.13)
Jz = i~ @
@�(2.14)
as well as in the laboratory-fixed coordinate system:
JX = i~� cos� cos ✓
sin ✓
@
@�+
cos�
sin ✓
@
@�� sin�
@
@✓
�(2.15)
JY = i~� sin� cos ✓
sin ✓
@
@�+
sin�
sin ✓
@
@�+ cos�
@
@✓
�(2.16)
JZ = i~ @
@�(2.17)

2.1. ROTATIONAL HAMILTONIAN 11
The angular momentum operators satisfy the following commutation relations [113, 114]:hJx, Jy
i= �i~Jz,
hJz, Jx
i= �i~Jy,
hJy, Jz
i= �i~Jx (2.18)
hJX , JY
i= i~JZ ,
hJZ , JX
i= i~JY ,
hJY , JZ
i= i~JX (2.19)
hJ2, Jg
i= 0, g = x, y, z (2.20)
hJ2, JG
i= 0, G = X, Y, Z (2.21)
hJg, JG
i= 0 g = x, y, z G = X, Y, Z (2.22)
According to the Heisenberg uncertainty principle, only the operator J2, one of the operatorsJg and one of the operators JG can be measured simultaneously. In accordance with thespectroscopic literature, the components of the angular momentum Jz and JZ are chosen, theprojections of the total angular momentum on the z-axis and Z-axis, respectively. The z-axisis assigned to the principal axis with the highest symmetry making use of the appropriaterepresentation in Table 2.1. Hence a complete set of eigenfunctions |JKMi can be found forthe operators J2, Jz and JZ . With the help of the ladder operator J± = Jx ± iJy and thecommutation relations, the following eigenvalues can be derived [113, 115]:
J2 |JKMi = J(J + 1)~ |JKMi (2.23)
JZ |JKMi = M~ |JKMi (2.24)
Jz |JKMi = K~ |JKMi (2.25)
with quantum numbers:
J = 0, 1, 2, . . .
K = �J, � J + 1, . . . , J � 1, J
M = �J, � J + 1, . . . , J � 1, J
The quantum number J is a measure of the total angular momentum, the quantum numbersK and M describe the projections of the total angular momentum onto the z-axis and Z-axis,respectively. The derivation of explicit wave functions |JKMi is rather lengthy, but they canbe stated in a closed form [116, p. 241]:
|JKMi =
r2J + 1
8⇡2
eiM�d(J)
MK (✓) eiK�
=
r2J + 1
8⇡2
XJKMeiM�eiK� (2.26)
⇥(X
�
(�1)�
�cos 1
2
✓�2J+K�M�2� �� sin 1
2
✓�M�K+2�
�! (J � M � �)! (M � K + �)! (J + K � �)!
)

12 CHAPTER 2. THEORETICAL BACKGROUND
with:XJKM =
p(J + M)! (J � M)! (J + K)! (2J + 1)
The index � in the sum runs from 0 or K � M , whichever is larger, up to J � M or J + K,whichever is smaller.
With the knowledge of the angular momentum operator properties and their eigenstates andeigenfunctions, it is possible to solve the rotational Hamiltonian for the different classes ofmolecules. Because rotational transitions and the corresponding energy levels are mostly inthe frequency ranges of MHz and GHz, the rotational Hamiltonian is usually expressed inunits of frequency rather than units of energy in rotational spectroscopy. The rotationalconstants A, B, and C in units of frequency and with A � B � C are:
A =~
2Ia, B =
~2Ib
, C =~
2Ic(2.27)
The rotational Hamiltonian Hrid is redefined to have units of frequency:
Hrid = AJ 2
a + BJ 2
b + CJ 2
c (2.28)
where the angular momentum operators are now unitless quantities with Jg = ˆJg/~ (g =
x, y, z, X, Y, Z) and J = ˆJ/~. The rotational Hamiltonian of a prolate symmetric-top moleculeemploying the Ir representation (for B = C and with the principal axis a being the highestsymmetry axis) is given by:
Hrid = AJ 2
a + B(J 2
b + J 2
c )
= BJ 2 + (A � B)J 2
z (2.29)
Note that the choice of the representation has no effect on the eigenstates and the eigen-functions, but assigning the z-axis to the principal axis with the highest symmetry eases thecomputation of the Hamiltonian dramatically. The symmetric-top Hamiltonian is a functionof the operators J 2 and J 2
z . Thus, the angular momentum eigenfunctions |JKMi are alsoeigenfunctions of the symmetric-top Hamiltonian. In the absence of any electromagnetic field,the corresponding energy levels EJKM are 2J + 1 times degenerate in M and twofold degen-erate in K with EJKM = EJ�KM . The matrix representation of Hrid is diagonal, and theeigenvalues are independent of M :
Erid = BJ(J + 1) + (A � B)K2 (2.30)
The evaluation of the transition dipole moments of symmetric-top molecules leads to theselection rules for pure rotational spectra: �J = 0, ± 1, �M = 0, �K = 0 [115]. Theselection rule �K = 0 implies that the transition frequency only depends on J . However,centrifugal distortion splits out the transitions with different K for a given J ! J+1 transition,which will be explained later in this section.

2.1. ROTATIONAL HAMILTONIAN 13
�1.0 �0.5 0.0 0.5 1.0
asymmetry parameter �
00
10
11
20
21
30
22, 31
32
33
ener
gy
000
(00
)
101
(1�1
)1
11
(10
)
110
(11
)2
02
(2�2
)
212
(2�1
)
211
(20
)
221
(21
)
220
(22
)
303
(3�3
)
313
(3�2
)
312
(3�1
)
322
(30
)
321
(31
)
331
(32
)
330
(33
)
prolate oblateJKa
JKc
00
11
10
22
21
20, 33
32
31
30
0
5
10
15
20
25
30
35
Figure 2.3: Rotational energy levels of an asymmetric-top molecule as a function of theasymmetry parameter . On the left the quantum numbers for the limiting prolatesymmetric top are given and the right y-axis shows the quantum numbers for thelimiting oblate top. The asymmetric-top energy levels are labeled by two differentschemes: the King-Hainer-Cross notation JK
a
Kc
and the energy ordering labeling J⌧ ,where ⌧ ranges between �K and K and represents the energy ordering of a certainenergy level within a J-stack. The energies are calculated for rotational constants ofA = 3, C = 1 and a varying B rotational constant.
A special case of a symmetric-top molecule is the linear molecule with A = 0 and C = B. Forthe rotational Hamiltonian in the Ir representation follows:
Hrid = BJ 2 (2.31)
Because Jz is zero for a linear molecule, the wavefunctions for a linear molecule |JMi are asubset of the symmetric-top eigenfunctions, independent of the quantum number K and theEuler angle �. It can be shown that the spherical harmonics YJM (✓,�) are simultaneouslyeigenfunctions of the operators J 2 and JZ [112, 115]:
|JMi =
r1
2⇡YJM (✓,�) (2.32)
The asymmetric-top Hamiltonian (Eqn. 2.28) with A 6= B 6= C > 0 can not be solved analyt-ically anymore. The choice of the representation is in principle arbitrary for an asymmetric

14 CHAPTER 2. THEORETICAL BACKGROUND
top, but the stability of the numerical methods employed for solving the asymmetric rotorHamiltonian are greatly enhanced by using the appropriate representation for slightly asym-metric molecules (Ir representation for a slightly asymmetric prolate top with A � B > C
and IIIr representation for a slightly asymmetric oblate top with A > B � C). Here theHamiltonian is set up in terms of J 2, J 2
z and J 2
x � J 2
y employing the Ir representation:
Hrid =1
2(A + C)J 2 +
A � 1
2(B + C)
�J 2
z +1
2(B � C)
⇣J 2
x � J 2
y
⌘(2.33)
The asymmetric-top Hamiltonian Hrot does not commute with Jz any more, which meansthat the projection of the total angular momentum on any of the molecule-fixed axes is notconstant. Nevertheless, the basis set of the asymmetric-top Hamiltonian can be set up bylinear combinations of the angular momentum basis set |JKMi [117, Chap. 7]. The matrixrepresentation of the rotational Hamiltonian in Equation 2.33 is block diagonal in J and M
and has only off-diagonal elements in K. The non-vanishing elements are given by [115]:
hJKM | ˆHrid
|JKMi =
1
2
(B+C)(J(J+1)�K2
)+AK2 (2.34)
hJKM | ˆHrid
|JK±2Mi =
1
4
(B�C)[(J(J+1)�K(K±1))(J(J+1)�(K±1)(K±2))]
1
2 (2.35)
Each J-level can be evaluated individually, because the energy matrix is diagonal in J . Hence,for a specific J-level the matrix is quadratic with 2J +1 rows and columns, both representingK-values ranging from �J to +J . In comparison to the symmetric-top eigenvalues, theEJKM = EJ�KM degeneracy is lifted, but the 2J + 1 degeneracy in M remains in the absenceof an electric field.
The asymmetry parameter is used to describe the asymmetry of a molecule [41, Chap. 4]:
=2B � A � C
A � C(2.36)
For prolate symmetric tops, equals �1 and in the oblate symmetric-top limit is 1 (compareFig. 2.3). For asymmetric-top molecules, the expectation value of the operator Jz is notconstant and the symmetric-top quantum number K is not suited for labeling the energylevels. Therefore, the energy levels of an asymmetric top are labeled using the King-Hainer-Cross notation with the pseudo quantum numbers Ka and Kc indicating the K-values forthe limiting cases of a prolate and oblate symmetric-top molecule, respectively (compare Fig.2.3) [118]. Also the energy ordering of the levels can be extracted from the Ka and Kc values:the difference Ka � Kc gives the position in the energy level ordering ranging from �J to+J . The energy level scheme of an asymmetric-top molecule is illustrated in Figure 2.3 fordifferent values of .
The selection rules for an asymmetric top are more complicated than for a symmetric-topmolecule because all three dipole moment components along the principle axes can be non-vanishing. Each dipole moment component enables a set of transitions with different selectionrules for the pseudo quantum numbers Ka and Kc. They are summarized in Table 2.2.

2.1. ROTATIONAL HAMILTONIAN 15
Table 2.2: Summary of the different types of possible transitions in an asymmetric-topmolecule and the corresponding selection rules for the pseudo quantum numbers Ka
and Kc.
dipole �Ka �Kc
a-type µa 0, ± 2, . . . ±1, ± 3, . . .b-type µb ±1, ± 3, . . . ±1, ± 3, . . .c-type µc ±1, ± 3, . . . 0, ± 2, . . .
The selection rules for J and M are �J = 0, ± 1 and �M = 0. Transitions with �J =
�1 constitute the P -branch and transitions with �J = +1 the R-branch. In contrast tosymmetric-top molecules, also transitions with �J = 0 appear in the spectrum: the Q-branch.In emission spectroscopy only P - and Q-branch transitions are observed. A permanent dipolemoment is a strict requirement for observing pure rotational spectra of any kind of molecule.
In the preceding paragraph, it was assumed for simplicity that molecules are rigid rotors,but real molecules are flexible. Molecular vibrations, internal rotations, and centrifugal forcescan distort the geometry of a molecule from its equilibrium. Because vibrations happen ona much faster timescale than the rotation of a molecule, they can be included parametricallyinto the Hamiltonian. Thus in practice, a different set of rotational constants is used for eachnormal vibrational mode. Internal rotation and centrifugal distortion can not be treated inan effective manner because they alter or contribute to the angular momenta. Whereas thetheory of internal rotation is covered in Section 2.3, the effects of centrifugal distortion areshortly reviewed in the following. In order to correct for centrifugal stretching of the moleculedue to its rotation, higher order terms of the angular momenta need to be included into theHamiltonian. Because of time-reversal symmetry, the odd-order terms vanish and only theeven order terms need to be considered [119]:
Hcd = Hrid +~4
4
X
↵���
⌧↵���J↵J�J�J� + O(6) + . . . (2.37)
↵, �, � and � can take any value of x, y and z. The parameters ⌧↵��� are related to the forceconstants within a molecule. In principle the sum in Equation 2.37 has 34 = 81 components,but Watson demonstrated, that due to symmetry properties and commutation relations, thenumber of components can be reduced to five determinable linear combinations of fourth-ordercorrections [119, 120]. Two different reduction schemes have been established in rotationalspectroscopy: the A- and the S-reduction. The first one is best suited for most asymmetric-top molecules, the latter one, as the name indicates, is designed for symmetric and slightlyasymmetric-top molecules. In the A-reduction, the rotational Hamiltonian including the five

16 CHAPTER 2. THEORETICAL BACKGROUND
quartic centrifugal distortion constants �J , �JK , �K , �J and �K is given by [117, Chap. 8]:
H(A)
cd =1
2(B(A) + C(A))J +
A(A) � 1
2(B(A) + C(A))
�J 2
z
+1
2(B(A) � C(A))(J 2
x � J 2
y ) � �J J 4 � �JKJ 2J 2
z � �KJ 4
z (2.38)
�2�J J 2(J 2
x � J 2
y ) + �KhJ 2
z (J 2
x � J 2
y ) + (J 2
x � J 2
y )J 2
z
i
+O(6) + . . .
For a linear molecule, �J is the only non-vanishing distortion constant and directly linkedto the interatomic forces. Also for some symmetric-top molecules, the distortion constantscan be related to the internuclear forces [121]. But for most asymmetric-top molecules, thedistortional constants cannot provide any detailed information of the forces at play inside amolecule because of the number of different force constants involved. Even though the in-formation is limited for this class of molecules, the distortion constants provide an idea ofthe stiffness of the molecule, especially when compared to other, similar molecules. Quarticdistortional constants are usually much smaller than the rotational constants by three to sixorders of magnitude, but they are gaining importance for high-resolution measurements androtational spectra including high J and/or high K states. However, the main benefit of thecentrifugal distortion terms is the more accurate description of the rotational Hamiltonian,rather than a direct correlation to molecular properties. The rotational constants depend onthe order of the correction and the type of reduction employed, which is indicated by thesuperscript in the Hamiltonian 2.38. The zero-order or ’rigid’ rotational constants can be ex-tracted from the ’nonrigid’ rotational constants and the centrifugal distortion constants [117].This becomes crucial when ’rigid’ rotational constants are required for structure determina-tion or for comparison with rotational constants calculated by quantum chemistry programs.The matrix representation of the nonrigid Hamiltonian is still diagonal in J and M with thefollowing elements [117, Chap. 8]:
hJKM | ˆH(A)
cd
|JKMi =
1
2
(B(A)
+C(A)
)(J(J+1)�K2
)+A(A)K2��
J
J2
(J+1)
2 (2.39)
��
JK
J(J+1)K2��
K
K4
+O(6)+...
hJKM | ˆH(A)
cd
|JK±2Mi = { 1
4
(B(A)�C(A)
)+�J
J(J+1)+
1
2
�JK
[K2
+(K±2)
2]} (2.40)
⇥[(J(J+1)�K(K±1))(J(J+1)�(K±1)(K±2))]
1
2
+O(6)+...
2.2 Hyperfine splitting: Nuclear quadrupole coupling
Most concepts for fine and hyperfine splittings in molecular spectra can be adapted fromatoms. For atoms, spin-orbit coupling of the electrons and the interaction of the magneticnuclear moment with the magnetic fields of the electrons are the main source of fine andhyperfine splittings. However, the ground state of the molecules investigated herein is a

2.2. HYPERFINE SPLITTING: NUCLEAR QUADRUPOLE COUPLING 17
1⌃ state with no electronic angular momentum and a vanishing electronic spin, because allelectrons are paired in a closed-shell configuration. As a consequence, the main contributionto the fine and hyperfine splitting in atomic spectra are negligible for most ground-statemolecules. Of course, excited electronic states or the corresponding molecular ions may stillaccount for nonzero electronic angular momenta or electronic spin. Hence, the more importanthyperfine interaction within these ground-state molecules is the coupling of the nuclear chargedensity ⇢ (r) with the electric potential V (r) generated by the electrons and the other nuclei:
EQ =
ˆ⇢ (r) V (r) dr (2.41)
with the integral evaluated over the whole nuclear volume. The potential produced by theextranuclear charges can be expressed in a multipole expansion and the interaction is thusgiven by:
EQ = V (0)
ˆ⇢ dr
| {z }monopole term
+3X
i=0
@V
@xi
����r=0
ˆxi⇢ dr
| {z }dipole term
+1
2
3X
i=0
3X
j=0
@2V
@xixj
����r=0
ˆxixj⇢ dr
| {z }quadrupole term
+ . . . (2.42)
where the xi are the Cartesian coordinates x, y, z. The integration of the monopole term givesthe constant ZeV (0), where Z is the atomic number of the nucleus. For symmetry reasons,the dipole moment of the nuclear charge distribution vanishes for all nuclei [41, Chap. 5].Hence, the nuclear quadrupole moment is the first nonzero and non-constant term in the seriesaccessible by spectroscopic measurements. The motion and the nuclear charge distribution isdependent on the nuclear spin angular momentum operator I. The eigenvalues of the totalnuclear spin operator I2 in the nuclear spin basis |IMIi are:
I2 |IMIi = ~2I(I + 1) (2.43)
It can be shown that the quadrupole moment vanishes for nuclei with a spin smaller than one[115]. However, many atoms have at least one isotope with a nuclear spin equal or larger thanone, but often this isotope is not the most abundant one or is unstable. Prominent examplesof stable quadrupolar nuclei are nitrogen 14N with I = 1, chlorine 35Cl and 37Cl with I = 3/2,bromine 81Br and 79Br with I = 3/2 and iodine 127I with I = 5/2. Also metals have significantnuclear quadrupole moments, and some have been studied employing microwave spectroscopyin the recent past [122–124]. A compilation of nuclear spins and quadrupole moments of mostisotopes is provided by the International Union of Pure and Applied Chemistry (IUPAC)[125].
Because the electric potential V must satisfy the Laplace equation, the quadrupole term inEquation 2.41 can be expressed as a quantum-mechanical Hamiltonian with the tensors ofsecond rank Qij and Vij [115]:
HQ =1
6Qij · Vij =
1
6
X
i
X
j
Qij Vij (2.44)

18 CHAPTER 2. THEORETICAL BACKGROUND
withVij =
@2V
@xixj
����r=0
(2.45)
andQij =
ˆ �3xixj � �ijr
2
�⇢ dr (2.46)
For an atomic nucleus, the operator Qij can be rewritten in terms of the nuclear spin operatorI. The non-trivial derivation includes irreducible tensor methods, Glebsch-Gordan coefficients,and the Wigner-Eckart theorem. Charles Slichter provides a good review in his book [126].Here only the final result is stated:
HQ =eQ
6I (2I � 1)
X
i
X
j
Vij
3
2
⇣IiIj + Ij Ii
⌘� �ij I
2
�(2.47)
The quantity Q represents the quadrupolar moment of the nucleus (as tabulated in Ref. [125]),and e is the elementary charge. Its product is given by the matrix element of the operatorcomponent Qzz, where z is pointing along the direction of the nuclear spin:
eQ =DIMI = I
���Qzz
��� IMI = IE
(2.48)
Note that Qzz is the only relevant component of the tensor operator Qij for deriving thequadrupolar moment. This result is due to the fact that the nuclear charges are movingrapidly along the z-axis and consequently the charge distribution appears cylindrically sym-metric. Therefore the quadrupolar moment is a measure of the deviation of the nuclear chargedistribution from spherical symmetry. For a positive Q, the charge distribution is elongatedalong z. Q has negative values for a flattened charge distribution [41, Chap. 5].
The general Hamiltonian in Equation 2.47 holds for all kinds of substances with quadrupolarnuclei: solids, liquids and gases. For rotational spectroscopy, the molecules under studyneed to be in the gas phase and thus the nuclear spin I and the angular momentum of themolecule J couple to the total angular momentum F with F = J + I. The angular momentaJ and I are precessing about F, while F is precessing about a space-fixed axis and onlythe absolute value of the total angular momentum F2 and one of its components FZ can bemeasured simultaneously. The corresponding eigenvalues in the product basis of the angularmomentum eigenfunctions |JKMi and the nuclear spin eigenfunctions |IMIi are:
F2 |JKIFMF i = ~2F (F + 1) (2.49)
FZ |JKIFMF i = MF~ (2.50)
I2 |JKIFMF i = ~2I(I + 1) (2.51)
with
F = J + I, J + I � 1, . . . , |J � I|MF = F, F � 1, . . . , � F

2.2. HYPERFINE SPLITTING: NUCLEAR QUADRUPOLE COUPLING 19
0 500 1000 1500 2000 2500quadrupole coupling parameter �zz (MHz)
0
10
20
30
40
50
60
freq
uen
cydi�
eren
ce(M
Hz)
iodinebromine
J
K
, F : 10
,
5
2
� 00
,
5
2
J
K
, F : 10
,
3
2
� 00
,
5
2
J
K
, F : 10
,
7
2
� 00
,
5
2
J
K
, F : 20
,
1
2
� 10
,
3
2
J
K
, F : 21
,
1
2
� 11
,
3
2
J
K
, F : 32
,
1
2
� 32
,
3
2
0 50 100 150�zz (MHz)
0
50
100
150
200
250
300
freq
.di�
.(k
Hz)
chlorine
Figure 2.4: The frequency differences for two implementations of the quadrupole cou-pling Hamiltonian for different values of the quadrupole coupling constant �zz. Vari-ous transitions of a symmetric-top molecule (B = 890MHz) are used to compare theprediction of the program XIAM neglecting terms in the Hamiltonian that are off-diagonal in J and the prediction of the program SPCAT that considers all relevantterms of the Hamiltonian. The difference between the two implementations dependsheavily on the quantum numbers J , K and F involved in the transition. The valuesof the quadrupole coupling constant �zz of the halogens chlorine (�zz ⇡ 50�70 MHz),bromine (�zz ⇡ 400 � 600 MHz), and iodine (�zz ⇡ 1700 � 2300 MHz) suggest thatalready for the description of the quadrupole coupling of chlorine, the use of the fullHamiltonian is recommended in high-resolution microwave spectroscopy.
The quadrupolar moment operator Qij in the Hamiltonian (Eqn. 2.44) is set up in thenuclear spin axis system with the z-axis pointing along the nuclear spin. Hence the electricfield gradient operator Vij needs to be expressed in the same space-fixed axis system. Thusfor a rotating molecule the electric field gradient operator becomes dependent on the angularmomentum operator J describing the rotation of the molecule. Averaged over the molecularrotation, the charge distribution is cylindrically symmetric along an axis zJ parallel to J.Employing the Laplace equation it can be shown that the Hamiltonian is only dependent on@2V@z2
J
.
In general, the matrix representation of the Hamiltonian HQ is not diagonal in J , because thequadrupole coupling alters the rotational wavefunctions. J is therefore not a ’good’ quantumnumber anymore. Benz et al. derived the matrix elements of HQ using irreducible tensoroperator methods [127]. However, for small quadrupolar moments the off-diagonal terms arenegligible, because J almost coincides with F. In this case, HQ can be expressed in terms ofnuclear spin and angular momentum operators [117, Chap. 9]:
HQ =eQqJ
2 (2J � 1) I (2I � 1)
3⇣I · J
⌘2
+3
2I · J � I2J2
�(2.52)

20 CHAPTER 2. THEORETICAL BACKGROUND
where qJ describes the expectation value of the electric field gradient at the position of thenucleus along zJ :
qJ =
⌧JKM = J
����@2V
@z2
J
���� JKM = J
�(2.53)
The corresponding energies are given by [117, Chap. 9]:
EQ =eQqJ
J
3
4
C (C + 1) � I (I + 1) J(J + 1)
2 (2J � 1) I (2I � 1)(2.54)
C = F (F + 1) � I(I + 1) � J(J + 1)
Whether the simplified Hamiltonian in Equation 2.52 can be used or not is firstly a question ofthe magnitude of the quadrupolar moment and secondly dependent on the spectral resolutionof the experiment. In Figure 2.4, the difference for various transition frequencies obtained byincluding off-diagonal elements on one hand and by neglecting the off diagonal elements on theother hand are plotted for a symmetric-top molecule (B = 890 MHz) against the magnitudeof a virtual quadrupolar moment. The graph shows that for chlorine, bromine, and iodine theoff-diagonal terms are not negligible in state-of-the-art microwave spectrometers.
The scalar molecular property eQqJ is usually expressed in the principal axis system of themolecule, because these quantities are determined experimentally:
�(2) = eQq(2) =
0
B@�aa �ab �ac
�ba �bb �bc
�ca �cb �cc
1
CA (2.55)
with the elements of the second-order tensor q(2): q↵� = @2V@↵@� , where ↵ and � can take any
of the values a, b and c. For weakly coupling nuclei, such as nitrogen and chlorine, only thediagonal elements of �(2) are experimentally accessible. Furthermore, �(2) is symmetric andtraceless (�aa + �bb + �cc = 0).
Upon diagonalization �(2) is rotated into the principal axis system of the field gradient, withthe diagonal elements �xx, �yy and �zz. For diagonalizing �(2), the off-diagonal elements arealso needed, but they are usually not determined by experiments and, if so, they usually bearlarge errors (besides strongly coupling nuclei, such as iodine or rhenium). They are usuallytaken from quantum chemical calculations, which are capable of predicting the elements of�(2) to an acceptable accuracy, depending on the quadrupolar nuclei. The largest componentis assigned to �zz, which points along the bond direction.
The field gradient provides valuable information about the charge distribution in the vicinityof the quadrupolar nucleus. This information is linked to the character of the chemical bondin which the quadrupolar atom is involved, assuming that the atom is only bound to oneother atom. For axially symmetric bonds (such as �-bonds) the following relation holds:�xx = �yy = �1
2
�zz. Any deviation from axial symmetry reflects itself in the asymmetry

2.2. HYPERFINE SPLITTING: NUCLEAR QUADRUPOLE COUPLING 21
Table 2.3: Compilation of the atomic spin I, itsquadrupole moment Q, and the value of the atomicquadrupole coupling constant eQqn10
, where the sub-script n10 labels a p-state with the atomic main quantumnumber n.
I Q (fm2)1 eQqn10
(MHz)2
deuterium 2H 1 +0.286 (2) -
nitrogen 14N 1 +2.001 (10) �10 (n = 2)
chlorine 35Cl 3/2 8.50 (11) +109.74 (n = 3)37Cl 3/2 �6.44 (7) +86.51 (n = 3)
bromine 79Br 3/2 31.8 (5) �769.76 (n = 4)81Br 3/2 +26.6 (4) �643.03 (n = 4)
iodine 127I 5/2 72.0 (20) +2292.71 (n = 5)1 all values from Reference [125]2 all values from Reference [117, Chap. 14]
parameter ⌘ [117, Chap. 14]:⌘ =
�xx � �yy
�zz(2.56)
For example, a double bond is expected to give rise to a nonzero asymmetry parameter. Inplanar molecules a good measure for the ⇡-bonding nature is the Goldstein parameter � [128]:
� =2
3
�xx � �yy
eQqn10
(2.57)
The parameter qn10
is the field gradient produced by the p-electrons of the atoms. Hence, it isan atomic quantity, which can be measured precisely by atomic beam resonance experiments.There is evidence that d-electrons are more effectively screened from the nucleus than p-electrons, which contribute most to the electric field gradient at the nuclear position [117,Chap. 14]. The values of Q and eQqn10
for various elements are listed in Table 2.3.
Maybe the most general information deduced from the nuclear quadrupole coupling hyperfinesplitting is ic, a parameter describing the ionic character of the bond [117, Chap. 14]:
ic = 1 +�zz
eQqn10
(2.58)
ic is zero for completely covalently bound atoms with quadrupolar nuclei and one for totallyionic bonds.
Other approaches have been derived in the past to extract more information about the bondnature from the nuclear quadrupole coupling constants. Townes and Schawlow present atheory to exploit the quadrupole coupling constant for the determination of the electronicstructure. But their theory depends on assumptions that make them applicable only to

22 CHAPTER 2. THEORETICAL BACKGROUND
0 13⇡ 2
3⇡ ⇡ 43⇡ 5
3⇡ 2⇡
torsion angle (rad)
ener
gy
E0,±1
E0,0
E1,±1
E1,0
E2,±1
E2,0
E⌫,�
V3
A states
E states
Figure 2.5: Three fold barrier of an internal rotor with C3V -symmetry, i.e. methyl
group. The horizontal lines represent the energy levels of the internal rotor and theyare marked with the harmonic oscillator quantum number ⌫ and the symmetry label�.
specific classes of molecules [129, Chap. 9].
The selection rules for J and K (or Ka and Kc) of symmetric or asymmetric-top moleculesare still valid. In addition the selection rules for the quantum number F and MF are givenby [115]:
�F = 0, ± 1 (2.59)
�MF = 0, ± 1 (2.60)
Because the rotational energy levels split up into various F -sublevels (compare Eqn. 2.54),the rotational transitions exhibit a hyperfine structure. For example for a molecule containingone atom with a nuclear spin of I = 3/2, nine hyperfine components are present for transitionsinvolving J 0, J 00 > 2. In symmetric-top molecules the K-degeneracy of the transitions is lifted.The hyperfine pattern collapses quickly with increasing J , so that low J transitions are bestsuited to study nuclear quadrupole coupling.
2.3 Internal rotation
Internal rotation is an important example of intramolecular large amplitude motion. Largeamplitude motion refers to internal movement with amplitudes on the order of the molecularbond length, which may alter the molecular structure significantly or convert the moleculefrom one equivalent structure to another one via tunneling. Large amplitude motions areusually the result of shallow double or even multi-well potentials, where the conventionally

2.3. INTERNAL ROTATION 23
isolated rotational and vibrational degrees of freedom are coupled. Depending on the temper-ature of the molecular sample, large amplitude motion includes large librational oscillationsin a shallow potential (mostly observed in molecular clusters), soft internal rotations (likemethyl group internal rotation), inversion motions (e.g. inversion of an amino group), protontunneling, ring puckering, and structural isomerizations.
For this work, only the internal rotation of the methyl group, a symmetric rotor with C3V -
symmetry, is of interest. The one-dimensional rotation of a bound methyl group in themolecular potential V (↵) is described by the following Schrödinger equation:
H'(↵) =
�F
@2
@↵2
+ V (↵)
�' (↵) = E' (↵) (2.61)
where ↵ is the rotation angle and F is the reduced rotational constant for the motion of themethyl rotor relative to the remaining molecular framework (defined in Eqn. 2.69). Becauseof the symmetry properties of the methyl top, the potential V (↵) can be expanded in thefollowing manner:
V (↵) =V
3
2(1 � cos 3↵) +
V6
2(1 � cos 6↵) + O (9) + . . . (2.62)
For most molecules, the expansion can be truncated after the first term, but for some moleculeswith certain symmetry properties higher order terms gain importance. The V
3
part of thepotential even vanishes for toluene or p-substituted halotoluenes (see Chap. 4).
For simplicity only three-fold barriers are considered here, where all but the V3
coefficientvanish in the expansion. The shape of such a potential is illustrated in Figure 2.5. Thesolutions for the Hamiltonian in Equation 2.61 are easily obtained for the two limiting casesV
3
! 0 and V3
! 1. For the free rotor case (V3
= 0) the eigenfunctions '(0) (↵) and theenergy eigenvalues E(0) have the form [117, Chap. 12]:
'(0) (↵) = Aeim↵ (2.63)
E(0) = Fm2 (2.64)
The values for the quantum number m = 0, ±1, ±2, . . . are obtained by applying the boundaryconditions '(0) (↵) = '(0) (↵+ 2⇡). Each level is twofold degenerate, which corresponds tothe different directions of the rotation in a classical picture. For high barriers, V
3
! 1, thepotential can be expanded in cos 3↵ around small values of ↵ in a Taylor series:
cos 3↵ = 1 � 9
2↵2 +
27
8↵4 + . . . (2.65)
If the expansion is truncated after the quadratic term, the well known harmonic oscillatorwavefunctions are solutions for the Hamiltonian with the energies [117, Chap. 12]:
E(1) =p
3V3
F
✓⌫ +
1
2
◆(2.66)

24 CHAPTER 2. THEORETICAL BACKGROUND
0 50 100 150
V3
barrier height (MHz)
0
20
40
60
80
100
120
140
160
ener
gy(M
Hz)
A states
E states
0 5 10±1±2±3
±4
±5
±6
10
20
30
40
ener
gy
0
1
2
3
4m⌫
Figure 2.6: Energy levels of an internal rotor as a function of the barrier height ofa three-fold potential. The reduced rotation constant F was set to 1 MHz. In thelimit V
3
! 0, the energies are twofold degenerate and coincide with the free rotorenergies (quantum number m) as can be seen in the inset. For V
3
! 1 the energiesare threefold degenerate and converge to the harmonic oscillator energies (quantumnumber ⌫).
The quantum number ⌫ can take the integer values 0, 1, 2, . . . and each of the vibrationalsublevels is triply degenerate, which corresponds to a vibration in every well of the potential.If the barrier has finite height, tunneling through the barrier can occur and the formerly triplydegenerate vibrational sublevels split into two degenerate levels designated with the symmetrylabel E (and the quantum number � = ±1) and one nondegenerate level A (and the quantumnumber � = 0). Hence, the newly introduced quantum number � defines the symmetry of thecorresponding torsional wavefunction. For the general problem with a finite value of V
3
, theSchrödinger equation can be rewritten as a Mathieu equation [130]. The solutions are givenby the following Fourier series:
'⌫� (↵) = |⌫�i =1X
k=�1A(⌫)
k ei(3k+�)↵ (2.67)
The calculation of the eigenvalues and the A(⌫)
k coefficients is described in Reference [117,Chap. 12]. In Figure 2.6 the energies of the internal rotor are plotted versus the potentialheight. For V
3
! 0 the energies are twofold degenerate and coincide with the free rotorenergies and for V
3
! 1 the energies are threefold degenerate and coalesce with the harmonicoscillator energies.
For deriving the Hamiltonian, which includes both the overall and the internal rotations, oneneeds to consider the coupling of these two motions. Neglecting any distortional effects, therotational Hamiltonian of a molecule with one internal rotor is expressed in the principal axis
2.3. INTERNAL ROTATION 25
system (PAS) [117, Chap. 12]:
Hint = AJ 2
a + BJ 2
b + CJ 2
c + F⇣j↵ � ⇢aJa � ⇢bJb � ⇢cJc
⌘2
+ V (↵) (2.68)
withj↵ = �i
@
@↵, ⇢g =
�gI↵
Ig, g = a, b, c
andF =
~2rI↵
, r = 1 �X
g=a,b,c
�2
g
I↵
Ig(2.69)
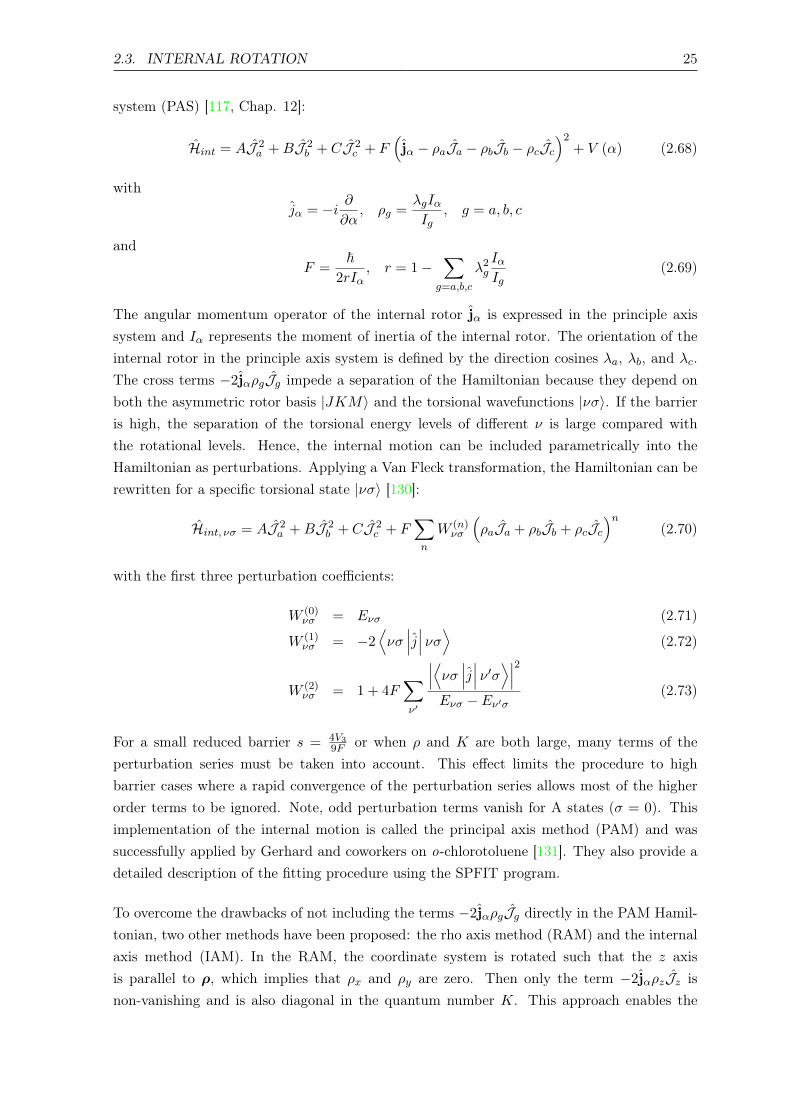
The angular momentum operator of the internal rotor j↵ is expressed in the principle axissystem and I↵ represents the moment of inertia of the internal rotor. The orientation of theinternal rotor in the principle axis system is defined by the direction cosines �a, �b, and �c.The cross terms �2j↵⇢gJg impede a separation of the Hamiltonian because they depend onboth the asymmetric rotor basis |JKMi and the torsional wavefunctions |⌫�i. If the barrieris high, the separation of the torsional energy levels of different ⌫ is large compared withthe rotational levels. Hence, the internal motion can be included parametrically into theHamiltonian as perturbations. Applying a Van Fleck transformation, the Hamiltonian can berewritten for a specific torsional state |⌫�i [130]:
Hint, ⌫� = AJ 2
a + BJ 2
b + CJ 2
c + FX
n
W (n)
⌫�
⇣⇢aJa + ⇢bJb + ⇢cJc
⌘n(2.70)
with the first three perturbation coefficients:
W (0)
⌫� = E⌫� (2.71)
W (1)
⌫� = �2D⌫����j��� ⌫�
E(2.72)
W (2)
⌫� = 1 + 4FX
⌫0
���D⌫����j��� ⌫ 0�
E���2
E⌫� � E⌫0�(2.73)
For a small reduced barrier s = 4V3
9F or when ⇢ and K are both large, many terms of theperturbation series must be taken into account. This effect limits the procedure to highbarrier cases where a rapid convergence of the perturbation series allows most of the higherorder terms to be ignored. Note, odd perturbation terms vanish for A states (� = 0). Thisimplementation of the internal motion is called the principal axis method (PAM) and wassuccessfully applied by Gerhard and coworkers on o-chlorotoluene [131]. They also provide adetailed description of the fitting procedure using the SPFIT program.
To overcome the drawbacks of not including the terms �2j↵⇢gJg directly in the PAM Hamil-tonian, two other methods have been proposed: the rho axis method (RAM) and the internalaxis method (IAM). In the RAM, the coordinate system is rotated such that the z axisis parallel to ⇢, which implies that ⇢x and ⇢y are zero. Then only the term �2j↵⇢zJz isnon-vanishing and is also diagonal in the quantum number K. This approach enables the

26 CHAPTER 2. THEORETICAL BACKGROUND
a
b
hω0
ω ω0
Figure 2.7: Two-level system with a ground state |ai and an excited state |bi. A photonwith the energy ~! can transfer the system from the ground state to the excited state.The system decays after some time by stimulated or spontaneous emission. Thephoton emitted is resonant to the transition with the energy !
0
= (Eb
�Ea
)/~.
separation of the torsional and rotational parts of the Hamiltonian, but the torsional partremains K dependent. The RAM Hamiltonian can be expressed as periodic solutions to theMathieu equation, but the definition differs for the different programs employing this method:Belgi [132], ERHAM [133], the SPFIT front-end IAMCALC [134], and RAM36 [135]. For ob-vious reasons, the RAM is not applicable for molecules with more than one internal rotor.However, Woods proposed to use a combination of the RAM and the PAM, the combined axismethod (CAM) [136, 137]. Hartwig et al. developed the program XIAM, which employs theCAM and is capable of handling molecules with up to three internal rotors [138]. In the XIAMprogram, the torsional states are evaluated in their individual rho-axis system and rotatedto the principal axis system afterwards. In the IAM the term �2j↵⇢zJz is eliminated by asecond rotation, but the mathematical description of the Hamiltonian becomes complicated[139]. Thus, no program was developed employing this method up to now.
2.4 Bloch equations
In the proceeding sections, the unperturbed rotational Hamiltonian was derived. Howeverto spectroscopically obtain information about the different energy levels of the molecule, theinteraction with electromagnetic fields needs to be considered. To account for the interaction,the unperturbed rotational Hamiltonian H
0
is extended by a time dependent interaction termV (t). Usually H
0
is expressed as diagonal matrix with the unperturbed energy eigenvalues onthe main diagonal and V (t) adds off-diagonal elements describing the coupling of the differentstates via the electromagnetic radiation [140]. For simplicity, the following discussion is limitedto two coupling states. In the case of an isolated system of two non-degenerate eigenstates|ai and |bi (compare Fig. 2.7), the unperturbed Hamiltonian H
0
can be written:
H0
=
Ea 0
0 Eb
!(2.74)

2.4. BLOCH EQUATIONS 27
The interaction is induced by a linearly polarized electromagnetic wave F propagating alongthe y-axis with the field amplitude E (r,t):
F =
✓1
2E (r,t) eze
i(ky�!t) +1
2E⇤ (r,t) eze
�i(ky�!t)
◆(2.75)
where ! is the angular frequency and k is the wave vector along the y-axis. For this examplethe field amplitude E is chosen such that it is a real quantity and constant in space and time.Furthermore, the propagation term ky is neglected, because the interaction volume is assumedto be much smaller than the wavelength of the radiation (electric dipole approximation). Theelectromagnetic radiation F is then:
F =1
2Eez
�ei!t + e�i!t
�(2.76)
The interaction Hamiltonian V is given by the product of the space-fixed dipole momentoperator µ and the electromagnetic field F:
V (t) = µ · F =
0 µab
µba 0
!· F =
0 µ
µ 0
!· F (2.77)
The transition dipole moment µab is the complex conjugate of the transition dipole momentµba. If µab is a real quantity (µab = µ⇤
ba = µba ⌘ µ) and the quantization axis of the moleculeis chosen to be parallel to the electromagnetic radiation (in this case along the z-axis), theHamiltonian of the system H can be expressed by:
H = H0
� V =
Ea �1
2
µE �ei!t + e�i!t�
�1
2
µE �ei!t + e�i!t�
Eb
!(2.78)
In rotational spectroscopy, a single molecule in a specific quantum state is not probed, butrather many molecules in a statistical ensemble of quantum states. These mixed states arebest described by the density matrix formalism introduced by von Neumann [141]. Mixedquantum states and the density matrix formalism are explained in detail elsewhere [142], sothat here only the important results and properties are stated. The density operator is definedby:
⇢ =X
n
pn | ni h n| (2.79)
where pn is the probability to encounter a single quantum system of the mixture in the state| ni. The density operator can be expressed in a matrix representation using a convenientset of N basis states [142, Chap. 2]. The corresponding density matrix is a Hermitian N ⇥N
matrix with a trace of one. The diagonal elements represent the population of the differentstates, and the off-diagonal elements characterize the coherences between the different states.The density matrix contains the whole information of the statistical ensemble and especially

28 CHAPTER 2. THEORETICAL BACKGROUND
the expectation value of any observable A is given by:DAE
= Tr⇣⇢A⌘
(2.80)
The time evolution of the density matrix is predicted by the Liouville equation:
i~@⇢ (t)
@t=hH (t) , ⇢ (t)
i(2.81)
The density matrix for the two-level system discussed previously and illustrated in Figure 2.7is defined by:
⇢ =
⇢aa ⇢ab
⇢ba ⇢bb
!(2.82)
Before the time evolution of the density matrix elements is derived, the Hamiltonian can besimplified by applying the rotating wave approximation (RWA), which is conveniently done inthe interaction picture. After transforming the Hamiltonian back to the Schrödinger picture,the evaluation of the Liouville equation yields:
@⇢aa
@t= ⇢aa = �i
⌦
2
�⇢abe
�i!t � ⇢baei!t�
(2.83)
⇢bb = i⌦
2
�⇢abe
�i!t � ⇢baei!t�
(2.84)
⇢ab = i!0
⇢ab � i⌦
2
�⇢aae
�i!t � ⇢bbei!t�
(2.85)
⇢ba = �i!0
⇢ba + i⌦
2
�⇢aae
�i!t � ⇢bbei!t�
(2.86)
with the Rabi frequency ⌦ = Eµ~ and the resonance frequency !
0
= (Eb
�Ea
)/~. The rapidoscillation at the optical frequency ! can be eliminated by transforming to a rotating frame:
%aa = ⇢aa, %bb = ⇢bb
%ab = ⇢abei!t, %ba = ⇢bae
�i!t
The resulting equations are the so-called optical Bloch equations:
%aa = �i⌦
2(%ab � %ba) (2.87)
%bb = i⌦
2(%ab � %ba) (2.88)
%ab = �i�%ab � i⌦
2(%aa � %bb) (2.89)
%ba = i�%ba + i⌦
2(%aa � %bb) (2.90)
where � = ! � !0
is the detuning of the incoming radiation from resonance. The timedependence of the density matrix elements of a two-level system can be illustrated by the

2.4. BLOCH EQUATIONS 29
0 12⇡ ⇡ 3
2⇡ 2⇡ 52⇡ 3⇡
⌦t
�1.0
�0.5
0.0
0.5
1.0
�N
=N
a�
Nb
� = 0
� = �/2
� = �
� = 2�
(a) (b)
Figure 2.8: (a) Rabi oscillations of the population difference �N for different values ofthe detuning neglecting all damping terms. Note, only on resonance can a completepopulation inversion be achieved. (b) The same values for the detuning as in (a) wereused to mark the trace of the Bloch vector on the Bloch sphere. The Bloch vectoritself moves on a cone with different opening angles depending on the detuning. Thedirection of the driving vector is indicated by arrows of different colors. In thisexample, the Bloch vector always has length one, because damping of the populationor the coherences is neglected.
Bloch vector ⇥ precessing about the effective field vector ⇤ [143]:
@⇥
@t= ⇤ ⇥ ⇥ with ⇥ =
0
B@u
v
w
1
CA =
0
B@%ab + %ba
i [%ab � %ba]
%aa � %bb
1
CA =
0
B@2 · Re (%ab)
2 · Im (%ab)
�N
1
CA (2.91)
and
⇤ =
0
B@�⌦
0
�
1
CA
For a pure state two-level system, which can be described by a single state vector | i,the Bloch vector has unit length and the corresponding Hilbert space is the unit sphere,the so-called Bloch sphere. If the system is isolated the system will stay in a pure state.However, interaction with the environment usually introduces damping of the population andthe coherences, and the system cannot be described by pure states any more, but instead bymixed states which lie within the Bloch sphere. Spontaneous emission or inelastic collisionsare damping mechanisms, which act on both the populations and the coherences. They arephenomenologically included into the Bloch equations by the damping constant �
1
[144]. Inaddition the coherence terms might be perturbed by phase changes due to elastic collisions.Hence, a second damping constant � accounts for this process. Finally, the two dampingterms for the coherences are combined in the damping constant �
2
= �1
2
+ � and the Bloch

30 CHAPTER 2. THEORETICAL BACKGROUND
0 2 4 6 8
⌦t
pol
ariz
atio
n(a
rb.
units)
Excitation pulse
FID
Figure 2.9: Scheme of transient emission spectroscopy. The polarization of the molec-ular ensemble builds up during the excitation pulse. When the polarization is max-imized (⇡
2
-conditions), the radiation is switched off the polarization starts to decaydue to damping processes. The resulting free induction decay (FID) is recorded andthe transition frequency is obtained via Fourier transformation.
equations for a two-level system with damping terms yield:
%aa = �i⌦
2(%ab � %ba) + �
1
%bb (2.92)
%bb = i⌦
2(%ab � %ba) � �
1
%bb (2.93)
%ab = � (i� + �2
) %ab � i⌦
2(%aa � %bb) (2.94)
%ba = (i� � �2
) %ba + i⌦
2(%aa � %bb) (2.95)
The probed observable in a spectroscopic experiment is the polarization P with the expecta-tion value [143]: D
PE
= N · Tr (⇢µ) (2.96)
where N is the number of molecules in the ensemble.
Different experimental techniques to probe molecular transitions are discussed in the following:transient absorption, transient emission, and fast passage excitation. As the name suggests,transient absorption refers to an absorption measurement while the molecules under studyare exposed to a monochromatic light field. If the time resolution permits, Rabi oscillations(or optical nutation) can be observed as depicted in Figure 2.8, otherwise only a depletion ofthe incoming light field is observed.
In the transient emission technique, the molecules are excited by a monochromatic pulsewhich is short compared to the damping time constants. Afterwards the damped emissionsignal, the so-called free induction decay (FID), is measured in the time domain. Maximumcoherence leading to a maximum emission signal is achieved by applying a ⇡
2
-pulse, where thelength of the pulse is chosen such that ⌦ · t = ⇡
2
. In contrast a ⇡-pulse leads to populationinversion and a vanishing emission signal. A perfect ⇡-pulse can only be realized for zero

2.4. BLOCH EQUATIONS 31
(a) (b)
Figure 2.10: (a) Bloch sphere representations of a chirped pulse excitation in the rapidadiabatic passage (RAP) regime in the rotating frame. While the chirped pulse goesthrough resonance, the Bloch vector can follow the driving vector smoothly, whichleads to complete population inversion. Far off resonance the Bloch vector rotatesrapidly around the poles of the Bloch sphere. (b) Bloch sphere representations ofa chirped pulse excitation in the linear fast passage (LFP) regime. In this case,the coupling is much weaker and the Bloch vector cannot follow the driving vectoradiabatically anymore. This regime is best suited for maximizing the polarization ofthe molecular ensemble.
detuning and vanishing damping mechanisms. The pulse scheme for the transient emissiontechnique is depicted in Figure 2.9.
In fast passage excitation, the frequency of the excitation radiation is swept through themolecular resonance in a short time. Hence, the effective field vector is no longer constantduring the pulse. Two different regimes are commonly distinguished: the rapid adiabaticpassage (RAP) and the linear fast passage (LFP) [143]. In the RAP regime, the Rabi frequencyis large so that the coupling is strong and the Bloch vector can smoothly follow the effectivefield vector. Depending on the bandwidth of the pulse, this can lead to a ⇡-pulse or populationinversion. In the LFP regime, the coupling is weaker so that the Bloch vector cannot follow theeffective field vector adiabatically. In this regime, no ⇡-pulse can be achieved. The motionof the Bloch vector for the two different regimes for the same driving pulse bandwidth isillustrated in Figure 2.10a and 2.10b. Fast passage excitation is used throughout this thesisand the different regimes are evaluated using the molecule benzonitrile in Section 3.3.
The derivation of the Bloch equations for a two-level system can be applied to more complexenergy level schemes. The application of the rotating wave approximation and the transforma-tion to a rotating frame is straightforward, but the number and complexity of the equationsincreases rapidly, especially when multicolor experiments, pulse-sequences, or complicatedlevel schemes are simulated. In Chapter 7, three-level Bloch equations for the three-wave

32 CHAPTER 2. THEORETICAL BACKGROUND
mixing experiment will be examined.
2.5 Spectral fitting
Key to any successful analysis of molecular spectra is the use of the appropriate Hamiltonian,which considers the quantum mechanical effects accessible with the applied experimentalmethod. As mentioned in the beginning of this chapter, the type of observables influencingthe spectrum are dependent on the time and frequency resolution of the experiment. Forexample, the fast motion of the electrons does not affect the pure microwave spectrum directly,but indeed the averaged molecular charge distribution influences the structure of the moleculeand thus the experimentally determined rotational constants. The same is true for vibrationalmotions, so that a different set of rotational constants can be used for different vibrationalor electronic states. However in the case of large amplitude motion, Coriolis coupling, orFermi resonances, the coupling of the vibrational and rotational states requires an explicitconsideration of the vibrational motion in the Hamiltonian. Hence, for any spectroscopicproblem the question arises: What are the physical quantities affecting the spectrum at aspecific experimental resolution? Sometimes, both a global approach, which aims to describemore states within the same Hamiltonian, and a local or effective approach, which splits theproblem into subsets, can reproduce the experimental data with the same accuracy. Here thechoice is usually a tradeoff between the complexity of the Hamiltonian and the direct accessto the spectroscopic quantities of interest.
After assigning the experimentally obtained transitions to theoretically predicted ones usingthe corresponding quantum numbers, a least square method is used for parameter optimiza-tion. The Hamiltonian should be truncated to a minimum set of parameters, that can repro-duce the spectrum to experimental accuracy [119]. The errors of the fitted parameters arethen dependent on the experimental accuracy and the choice of the Hamiltonian. Differentprograms have been developed to match a specific class of problems. A good overview of manyprograms concerning microwave spectroscopy is provided by the PROSPE website, which ismaintained by Z. Kisiel [145]. In the following, the fitting programs used in this disserta-tion are shortly discussed together with their main benefits. Detailed information about theprograms are given in the chapters, where they are applied to specific problems.
SPFIT/SPCAT: The SPFIT/SPCAT suite of programs is one of the most prominent pro-grams for fitting rotational spectra and was developed by H. Pickett [134, 146]. His im-plementation of the rotational Hamiltonian includes centrifugal distortion, quadrupolecoupling of up to three nuclei, spin-rotation coupling, Coriolis coupling, and Fermi res-onances. As mentioned earlier in this chapter, SPFIT can be used to treat internalrotation splitting in different ways.
XIAM: The program XIAM was developed by Hartwig et al. mainly to fit spectra ofmolecules with internal rotors [138]. The program implements first-order quadrupole

2.6. QUANTUM CHEMICAL CALCULATIONS 33
coupling, which is appropriate for weak coupling nuclei i.e. nitrogen or chlorine, butfails predicting the spectrum of larger coupling atoms i.e. bromine or iodine. Its easeof use, its speed, and its ability to fit up to three internal rotors makes XIAM widelyused in the rotational spectroscopy community.
RAM36: Most programs aiming to predict the spectra by molecules with an internal rotorare limited to V
3
-type potentials. The program RAM36 was recently designed to alsofit V
6
-type potentials. It was successfully tested on toluene [135].
2.6 Quantum chemical calculations
Quantum chemical methods have developed concurrently with the advances in computationcapacities to become a powerful tool for solving the molecular Hamiltonian to determinemolecular parameters. For small and medium size molecules (up to 20 heavy atoms or so),which are of relevance for microwave spectroscopy, these methods have proven to provide goodresults for the molecular charge distribution. In this section, the molecular Hamiltonian andthe common principles of most algorithms are introduced. Afterwards different methods arepresented and their possible benefits for rotational spectroscopy are discussed.
Including only the internal degrees of freedom and ignoring the nuclear spin interaction, themolecular Hamiltonian in Equation 2.2 can be rewritten to:
H = �NX
i=1
~2
2mir2
i
| {z }kinetic energy of
the nuclei
�MX
j=1
~2
2mer2
j
| {z }kinetic energy of
the electrons
�NX
i=1
MX
j=1
Zie2
rij
| {z }nuclei-electron
interaction
+NX
j<k
e2
rjk
| {z }electron-electron
interaction
+NX
i<l
ZiZle2
ril
| {z }nuclei-nuclei
interaction
(2.97)
By applying the Born-Oppenheimer approximation, the electronic wavefunctions are sepa-rated from the nuclei motions and hence the single electron Hamiltonian is given by [147,Chap. 4]:
hj = � ~2
2mer2
j �NX
i=1
Zie2
rij+
NX
k 6=j
ˆe2 |'j |
rjkdr (2.98)
The Hamiltonian describing all electrons in a molecule is just the sum over all single electronHamilton operators hj . Unfortunately, the product of the single electron waveforms is notsuitable to describe the electronic waveform of the molecule because electrons are fermionsand thus subject to the Pauli exclusion principle. Hence, the resulting all electron waveformof the molecule needs to be antisymmetric. John Slater proposed in 1929 to use the nowadayscalled Slater determinate, which results not only in an antisymmetric waveform, but also

34 CHAPTER 2. THEORETICAL BACKGROUND
Table 2.4: Compilation of the scaling behavior of different computational methods independence on the number of basis functions N . Note that scaling refers to how timeincreases with the molecular size, but says nothing about the absolute amount of timerequired for a given molecule.
method Scaling behavior
DFT < N3 [147, p. 273]HF N4 [147, p. 273]
hybrid DFT ⇡ N4 [147, p. 273]MP2 N5 [147, p. 237]
CCSD N6 [147, p. 237]CCSD(T) N7 [147, p. 237]
considers the electronic spin [148]:
(q1
,q2
, . . . ,qM ) =1pM !
����������
�1
(q1
) �2
(q1
) · · · �M (q1
)
�1
(q2
) �2
(q2
) · · · �M (q2
)...
... . . . ...�
1
(qM ) �2
(qM ) · · · �M (qM )
����������
(2.99)
As already defined, M is the total number of electrons and � is the product of the spatialorbital and a spin wavefunction. In order to solve the one electron Hamiltonian in Equation2.98, the wavefunction of all other electrons 'j needs to be known. However, the wavefunctions'j are initially not known because they would result from solving the M single electronHamiltonians. A method to determine the single electron wavefunctions without the exactknowledge of the electron-electron interaction was introduced by Douglas Hartree for atomsand was improved by Wladimir Fock [149–151]. Based on their work, Hartree-Fock (HF)theory evolved and employs a self-consistent field approach [147, Chap. 4]. HF theory is anab initio method and independent of any empirical parameters. Electron exchange correlationis considered in the HF method via the slater determinant, but completely neglects electron-electron correlation. Hence, for most applications in rotational spectroscopy the HF methodlacks accuracy.
Various theories have been developed to include electronic correlation in HF theory. One ofthe more relevant post-HF methods is Møller-Plesset perturbation theory of nth order (MPn)[152] and coupled cluster theory (CC) [153]. Both methods are based on an HF approach.But whereas MPn theory adds the electronic correlation in a perturbative manner directlyto the HF Hamiltonian, coupled cluster theory incorporates the electron-electron correlationinto the molecular wavefunctions. The scaling behavior is worse for both methods comparedto the HF method and increases rapidly when higher order terms are included (compare Table2.4).
Another theoretical approach to obtain information about the electron distribution is densityfunctional theory (DFT), where the charge density ⇢(q) is the fundamental quantity [154].

2.6. QUANTUM CHEMICAL CALCULATIONS 35
The charge density is defined as followed:
⇢(q) = M
ˆ. . .
ˆ| (q
1
,q2
, . . . ,qM )|2 dq1
dq2
. . . dqM (2.100)
where the electronic wavefunctions with their dependence on M position vectors (q1
,q2
, . . . ,qM )are mapped onto the charge density, which is only dependent on a single position vector q.Hohenberg and Kohn proved that the charge density specifies all molecular properties [155].Hence, a functional E [⇢ (q)] must exist that gives the exact ground state energy for the exactground state density [156]:
E [⇢ (q)] = ENe [⇢ (q)] + T [⇢ (q)] + Eee [⇢ (q)] (2.101)
withENe [⇢ (q)] =
ˆ⇢ (q) VNe (q) dq (2.102)
The total functional E [⇢ (q)] can be expressed as a sum of a functional describing the in-teraction of the electrons with the external potential ENe [⇢ (q)], a functional describing thekinetic energy of the electrons T [⇢ (q)] and a functional determining the electronic interactionEee [⇢ (q)]. The choice of the functional ENe [⇢ (q)] is straightforward, whereas the mathemat-ical expression of the other two functionals is subject to ongoing research. Not surprisingly,the functionals are usually similar to the ones used in the HF Hamiltonian, but augmentedwith semi-empirical expressions for the electron correlation. If the exact functional is used,the energy is minimized for the exact charge density. These semi-empirical functionals are op-timized using experimental results or benchmarked with higher level calculations. Axel Beckeintroduced the hybrid functional approach, which involves the exact HF exchange correlationenergy and improved many molecular parameters [157]. Prominent hybrid functionals are theB3LYP (Becke, three parameter, Lee-Yang-Parr) functional [158] and the M06 series of theMinnesota functionals, which also takes dispersion interactions into account [159]. The hugeadvantage of the DFT methods is the low computational cost compared to post-HF ab initiomethods (compare Table 2.4).
For describing the molecular wavefunction, all quantum chemical methods require a math-ematical framework termed the basis set. Most methods employ the linear combination ofatomic orbitals (LCAO) to form the molecular wavefunction. The atomic waveforms can beapproximated by Slater type orbitals (STO), which have a radial part proportional to rle�⇣r
(l is the angular quantum number) [160]. Spherical harmonics are used to describe the an-gular distribution of the orbital similar to the hydrogen atom. Unfortunately the radial partof the Slater type orbitals are difficult to handle mathematically. However, the radial part ofthe STOs can be approximated with a linear combination of Gaussian type orbitals (GTO)of the form rle�↵r2 , which are much easier to handle computationally [161]. Figure 2.11shows the approximation of the s-orbital of the hydrogen by one, two and three contractedGaussian-Type Orbitals.
If only one STO is used to describe a single atomic orbital in a molecule, the basis set is

36 CHAPTER 2. THEORETICAL BACKGROUND
0.0 0.5 1.0 1.5 2.0 2.5 3.0 3.5 4.0
distance r (atomic units)
0.0
0.1
0.2
0.3
0.4
0.5
0.6
amplitu
de
one gaussian
two gaussians
three gaussians
exact s-orbital
Figure 2.11: Approximation of the exact Slater type radial dependence of the s-orbitalof hydrogen with a superposition of N Gaussian functions (N = 1, 2, 3). ThreeGaussian functions already lead to a good approximation of the Slater type radialdependence.
said to be minimal. The STO-nG series of basis sets is an example for minimal basis sets,where the STO is approximated by n GTOs [162]. Multiple-zeta basis sets use more than oneSTO to describe the atomic orbitals, which increases the flexibility of LCAO to mimic themolecular orbitals. Normally, the core electrons are more strongly localized around the nucleithan the valence electrons of the atoms. These differences are considered in a split-valencebasis set, where only one STO is used to describe the core electrons, but the basis of thevalence electrons is built upon more STOs. Polarization functions are sometimes necessary todescribe the polarization of an atomic orbital due to the molecular charge distribution. Theyconsist of STOs with the angular quantum number larger than the highest occupied atomicorbital. For loosely bound electrons in anions, Rydberg states, or van der Waals complexes,diffuse functions are useful to map the electron density correctly. They describe the longrange characteristics of the electronic wavefunction and they are recognized by their small ⇣exponent.
Two classes of basis sets are widely used: Pople-type [163, 164] and Dunning-type basis sets[165]. Both are split-valence basis sets, but the Pople-type basis sets (e.g. 6-311++G**)
provide many options to adjust the basis set to a specific problem (number of valence STOs,type and number of polarization functions and diffuse functions). The Dunning-type basis sets(e.g. aug-cc-pVTZ) provide less options for customization, but they are especially designed for
¶The nomenclature is as follows: The number before the dash indicates the numbers of Gaussians usedto approximate the wavefunction of the core electrons. The numbers after the dash specify the numbers ofGaussians employed for the different STOs approximating the wavefunction of the valence electrons. In thisexample, three STOs are used to approximate the wavefunction of the valence electron. The first STO isapproximated by three GTOs, the second and the third STOs are fitted by one GTO. The ’+’ is used toenable diffuse functions and the ’*’ implements standard polarization functions. Higher order polarizationfunctions can be activated by letters indicating the angular momentum of the polarization function i.e. (d,p).

2.6. QUANTUM CHEMICAL CALCULATIONS 37
102
103
N� of basis functions
10�1
100
101
rela
tive
ener
gy(a
rb.
units)
STO-3G
3-21G
6-21G6-21G*
6-21G**
4-31G 4-31G*4-31G**
6-31G
6-31G*
6-31G**6-31+G**6-31++G**
6-311G
6-311G*6-311G**
6-311+G** 6-311++G**
cc-pVDZ
aug-cc-pVDZ
cc-pVTZ aug-cc-pVTZ
cc-pVQZ
Figure 2.12: Relative energy of optimization calculations for menthone using the B3LYPfunctional and various basis sets. As expected the energy decreases with the numberof basis functions included in the calculation. In the example of menthone, the useof diffuse functions did not reduce the energy significantly. In contrast the use ofpolarization functions has a large impact on the energy.
correlation corrected methods. The choice of the basis set depends on the molecular systemunder study and the available computing power. The computation time of different methodsscale differently. Various scaling factors are summarized in Table 2.4. The energy convergestowards a limit for the HF, post-HF and the DFT methods for an increasing number ofwavefunctions. In Figure 2.12, the calculated energies for the optimized structure of menthoneis shown using the B3LYP functional and different basis stets. It can be seen that diffusefunctions have only a small impact on the energy, whereas the influence of the polarizationfunctions on the energy is significant. If the calculation includes atoms with a high numberof electrons, electron core potential ECP can facilitate the calculations. ECPs integrate andcombine the potential produced by both the inner-shell electrons and the nucleus, whichreduces the basis set for heavy atoms tremendously. A collection of many basis sets andelectron core potentials in different formats are published online on the Basis Set Exchangewebsite [166].
The interplay between theoretical investigations and rotational spectroscopy is manyfold. Notonly do experiments provide a high standard to benchmark quantum-chemical approaches, buttheoretical results are also utilized to interpret and complement experimental outcomes. Thisinterplay is illustrated with the example of the rotational constants, maybe the most importantquantity obtained experimentally by rotational spectroscopy. The rotational constants of acalculated structure can be used to predict the rotational spectrum, thus facilitating the

38 CHAPTER 2. THEORETICAL BACKGROUND
spectral assignment. And the comparison of the experimentally obtained rotational constantswith the calculated ones provides evidence of structural properties of the molecule understudy. However, the outcome of all quantum chemical calculations should be handled withcare and different methods and basis sets should be used to confirm theoretical results.
Puzzarini published an extensive review and a perspective article describing the role of theoryin supporting rotational spectroscopy [167, 168]. The following discussion highlights a fewtopics important for this dissertation.
Molecular structure: In principle one of the outstanding features of rotational spectroscopyis the determination of the effective molecular structure via isotopic substitution. How-ever, the analysis of the rotational spectra of all singly substituted species is rathertedious and the natural abundance of some isotopologues is so small that they needto be artificially enhanced in order to obtain a detectable signal. As mentioned above,information about the structure might be obtained by simply comparing the experimen-tally obtained rotational constants with the calculated ones. For small molecules (upto six heavy atoms) Puzzarini et al. showed excellent agreement for experimentally ob-tained bond length and bond angles and their calculated analogues employing high levelab initio methods (e.g. CCSD(T)) and large basis sets (e.g. cc-pVQZ) [167]. They alsoemployed extrapolation techniques to estimate the structural parameters in the com-plete basis set limit [169]. Using high level calculations and extrapolation techniques,the deviation of the calculated and experimentally obtained structural parameter is onthe order of a few per mille. However, computation time is usually limited and there-fore the calculations for larger molecules are always a compromise between speed andaccuracy. In this work, the MP2 ab initio method and DFT, employing the B3LYP andM06-2X functionals are used with different basis set. If the highest order calculation isnot a feasible option, different low-level calculations employing different methods andbasis sets provide a good cross-check of the results in a decent time [170]. Using theMP2 method and DFT a good overlap of the experimental and the calculated rotationalconstants are demonstrated in Chapter 4, Chapter 5, and Chapter 6.
Dipole moments: Microwave spectroscopy can provide precise values of dipole momentcomponents via Stark effect measurements, but in the spectrometer setup presentedherein this feature is not yet implemented. Even though the dipole moment compo-nents cannot be determined exactly, they are linked to the line strengths of differenttypes of transitions (compare Table 2.2) in asymmetric-top spectra. By evaluating theintensity of the different types of transitions, the relative dipole moment componentscan be estimated. A comparison of this estimation to the calculated dipole momentcomponents is helpful for the assignment of a measured spectrum to a calculated struc-ture. Another use of the calculated dipole moment components is three-wave mixing,where the sign of the product of the dipole moment components determines the enan-tiomer (compare Chap. 7). When calculated dipole moments are compared with thoseobtained by microwave spectroscopy, they need to be expressed in the principal axis

2.6. QUANTUM CHEMICAL CALCULATIONS 39
system. Benchmark calculation for different ab initio methods and basis sets were per-formed by Bak et al. for a set of small molecules [171]. Their main conclusion was thatthe electron correlation treatment of the basis set is more important for the accuracy ofthe calculation than the pure size of the basis set.
Nuclear quadrupole moment coupling: Most quantum chemical calculations provide anestimate of the charge distributions inside a molecule. With knowledge of the chargedistribution, the calculation of the nuclear quadrupole moments is straightforward by ap-plying Equation 2.42. Mostly only the off-diagonal elements of the calculated quadrupoletensor are combined with the experimentally obtained diagonal elements to rotate thequadrupole tensor to the principal axis system of the field gradient (compare Sec. 2.2of this chapter). Relativistic corrections must be taken into account for moleculeswith larger atoms (e.g. halogens) when calculating the nuclear quadrupole momentor the dipole moment, both of which depend on the charge distribution [172]. W. Bai-ley provides a good overview of benchmark calculations for the very common nitrogenquadrupole coupling in different molecules [173].
Force fields: The calculation of the harmonic and anharmonic force field of a molecule pro-vides various benefits for microwave spectroscopy. The force field is necessary to calcu-late the rotational constants of vibrationally excited states. But also if the molecule isin the lowest vibrational state, its zero-point vibrations alter the ground state energy,influence the potential energy surface, and might even change the energy ordering ofthe non-rigid structural isomers. If a substitution structure is obtained by employingKraitchman’s equations [47], the harmonic and anharmonic part of the force field canbe used to account for the change of the rotational constants due to the molecularvibrations. The resulting structure is called semi-experimental equilibrium structureand provides the best estimate for the molecular equilibrium structure from microwavespectroscopy up to now [174].
Potential energy surface: The complexity of the potential energy surface goes along withthe flexibility of a molecule. Large and complex molecules can exhibit many conformersand even at the low temperatures of a molecular beam various conformers might remainsignificantly populated (compare Chap. 5 and Chap. 6). To estimate which conformersexist and their energies, a conformation search or a scan of the potential energy surfaceprovides in-depth information. Most conformation search routines populate the confor-mational space manually or artificially, optimize the resulting structures and comparethe structures and energies of the conformations. If the molecular flexibility is alreadyrestricted to a few coordinates, potential energy surfaces can be calculated by scan-ning along these coordinates. This method is applied in Chapter 5 and Chapter 6 forthe rotation of the isopropyl or the hydroxyl group of the molecules carvacrol, thymol,menthol, and menthone. In molecular beam microwave spectroscopy, not only are therelative energies of the different conformers of interest, but also the barriers betweenthem, because they might provide insight if the molecule can cool down from one local

40 CHAPTER 2. THEORETICAL BACKGROUND
minimum to another one during supersonic expansion [175].

Chapter 3
Experimental details
The experiments were performed with a molecular beam equipped chirped-pulse microwavespectrometer that was newly constructed within the framework of this thesis. The experimen-tal techniques, spectrometer, and molecular beam are detailed in this chapter. This chaptercloses with an evaluation of the experimental performance.
3.1 Chirped-pulse microwave spectrometer
Chirped-pulse Fourier transform microwave spectrometry (CP-FTMW) is a fast passage exci-tation technique pioneered by Pate et al. [58]. Fast passage excitation can be realized in twodifferent ways: sweeping the excitation radiation through the molecular resonance or sweepingthe molecular resonance through the fixed frequency of the excitation radiation. Both sweep-ing processes need to be fast compared to the relaxation time. McGurk et al. introduced thistechnique by irradiating a molecular ensemble with a fixed microwave frequency and quicklysweeping the molecular transition using the molecular Stark effect [49]. With advances inmicroelectronics, the digital synthesis of a microwave chirp became feasible and Pate et al.were the first to apply CP-FTMW in the cm-wavelength region [58]. The waveform of a linearchirp can be described by the following formula of the electric field:
E (t) = E0
ei⇣!
s
t+↵t
2
2
⌘
(3.1)
where ↵ is the chirp rate, defined by start and end frequency of the chirp !s and !e, respec-tively, and the pulse length ⌧pul:
↵ =!e � !s
⌧pul(3.2)
The instantaneous frequency of the chirped microwave pulse is then given by:
! = !s + ↵t (3.3)

42 CHAPTER 3. EXPERIMENTAL DETAILS
Figure 3.1: Experimental setup of the COMPACT microwave spectrometer. The dashedlines are trigger or synchronization lines. Solid lines represent microwave cables.The chirp is generated in the AWG, amplified by the TWTA, and transmitted into thevacuum chamber via a microwave horn. The FID is received with another microwavehorn, amplified with a low-noise amplifier, and finally recorded by an oscilloscope.The trigger pulse control system, the oscilloscope, and the AWG are phase lockedto a Rb-frequency standard. To ensure absolute phase stability, the oscilloscope isdirectly triggered by the AWG by one of its marker channels.
The intensity of the emitted molecular signal is proportional to the number of molecules N ,the transitions frequency !, the square of the transition dipole moment µ2, the amplitudeof the excitation radiation E
0
, the population difference of the two states involved in thetransition �N
0
, and the inverse square root of the chirp rate ↵ [58]:
S / N · ! · µ2 · E0
· �N0
·r⇡
↵(3.4)
One of the objectives of this thesis was the construction of a new chirped-pulse Fouriertransform microwave spectrometer, COMPACT (compact-passage acquired coherence tech-nique). It is a combination of the designs presented by Pate et al. [58] and of that proposedby Grabow [143]. Figure 3.1 shows a scheme of the spectrometer together with a photo ofthe vacuum chamber. The spectrometer covers the frequency region of 2 � 8.5 GHz and wasintentionally chosen to investigate complex molecules with large moments of inertia and thussmall rotational constants, leading to low transition frequencies.
The heart of the spectrometer is a 24 GS/s arbitrary waveform generator (Tektronix AWG7122A) that creates the microwave chirps. The synthesized chirps have a bandwidth of

3.1. CHIRPED-PULSE MICROWAVE SPECTROMETER 43
0 10 20 30 40
time (µs)
inte
nsi
ty(a
rb.
units)
(a)
2000 4000 6000 8000 10000
frequency (MHz)
inte
nsi
ty(a
rb.
units)
(b)
0 10 20 30 40
time (µs)
inte
nsi
ty(a
rb.
units)
(c)
2000 4000 6000 8000 10000
frequency (MHz)
inte
nsi
ty(a
rb.
units)
(d)
0 10 20 30 40
time (µs)
inte
nsi
ty(a
rb.
units)
(e)
2000 4000 6000 8000 10000
frequency (MHz)
inte
nsi
ty(a
rb.
units)
(f)
Figure 3.2: Evaluation of the microwave chirp (1 � 9 GHz, 48 µs) at different stages ofthe experiment. (a) Waveform of the chirped pulse synthesized at 24 GS/s. (b) Thespectrum of the waveform in (a). All frequency components between 1 and 9 GHz areequally abundant. (c) Waveform emitted by the AWG and directly recorded by thescope. The periodic structure upon the waveform and the corresponding spectrum (d)is most likely due to internal back reflections. (e) Waveform recorded after passingthe TWTA. The corresponding spectrum (f) reveals the frequency dependence of theTWTA and the sharp cutoffs at 2 and 8 GHz.

44 CHAPTER 3. EXPERIMENTAL DETAILS
0 10 20 30 40
time (µs)
2000
4000
6000
8000
10000
12000fr
equen
cy(M
Hz)
(a)
0 10 20 30 40
time (µs)
2000
4000
6000
8000
10000
12000
freq
uen
cy(M
Hz)
(b)
Figure 3.3: Spectrographs of the microwave chirp (1 � 9 GHz, 48 µs) of the waveformsrecorded directly after the AWG (a) and after passing the TWTA (b). The mainmicrowave chirp is easily identified as straight line with a positive slope. The line witha negative slope results from mixing with internal clock of the AWG. The spectrographin (b) also exhibits higher harmonics of the chirps introduced by the TWTA, but with amuch reduced intensity. Also remarkable is the noise the TWTA adds to the spectrumin the 2 � 8 GHz bandwidth. The color scale is logarithmic for both spectrographs.
2 � 8.5 GHz and are swept linearly within a short time (typically 1 µs to 4 µs). The mi-crowave excitation chirp is amplified by an adjustable traveling wave tube amplifier (Ampli-fier Research 300T2G8) with up to 300 W output power. All microwave components (cables,connections, microwave horns, switches etc.) bear a frequency dependent performance, butultimately the spectrometer is governed and limited by the frequency dependence of the trav-eling wavetube amplifier (TWTA). Figure 3.2 illustrates the evolution of a linear 1 � 9 GHz
and 48 µs long microwave chirp at different stages of the experiment. The waveform and theFourier transform of the chirp generated by a computer program and sampled at 24 GS/s
are presented in Figures 3.2a and 3.2b. As expected, the waveform and the correspondingspectrum are perfectly flat, because the sampling theorem is fulfilled. Figure 3.2c showsthe waveform emitted by the arbitrary waveform generator (AWG) and directly recorded bythe oscilloscope (Tektronix DPO 71254A) at 100 GS/s. The intensity of the waveform dropsslowly with increasing frequency and it exhibits a periodic structure, which might be due tointernal back reflections. Some sharp intensity peaks are apparent in the spectrum at differ-ent frequencies i.e. 3000 MHz, 3125 MHz, 6250 MHz, etc. (compare Fig. 3.2d). The origin oftheses lines is most likely due to the channel bandwidth of 12.5 GHz of the oscilloscope. Thelast subset in Figure 3.2 shows the microwave chirp recorded after the TWTA. The gain ofthe TWTA was set to 6 %, the highest possible value before the oscilloscope was overdriven,which would result in a clipped waveform. The intensity reduction with increasing frequencyseems to be enhanced compared with the waveform measured directly after the AWG. Butmore importantly are the abrupt intensity cutoffs at 2000 MHz and 8000 MHz, which limitsthe frequency bandwidth of the spectrometer. The frequency dependent performance of theTWTA needs to be kept in mind when the intensities of rotational spectra are compared withtheory.

3.1. CHIRPED-PULSE MICROWAVE SPECTROMETER 45
Two spectrographs are performed to reveal the time-dependence of different frequency com-ponents of the waveform after the AWG and after the TWTA. A chirp should produce a linein a spectrograph with a positive or negative slope depending on the chirp direction. Thespectrograph of the waveform taken directly from the AWG shows a very intense line for themain chirp with a positive slope (Fig. 3.3a). However, there is also a trace with a negativeslope, which crosses the line of the main chirp at 6 GHz. Neill et al. observed a similarbehavior that they explained with frequency mixing of the chirp with the internal clock ofthe AWG at 10 GHz [64]. In the spectrograph generated from the waveform taken after theTWTA (Fig. 3.3b), both the strong trace with a positive slope and the weaker trace with anegative slope are still apparent. In addition, the amplifier introduces harmonics of the chirpup to the fourth order. These sidebands are so weak relative to the primary chirp that in mostcases they should not significantly influence the relative intensity accuracy of the observedmolecular transitions.
Hence, the frequency range is mainly defined by the TWTA and was intentionally chosen forthe investigation of large and complex molecules with large moments of inertia and thus smallrotational constants, leading to low transition frequencies. Furthermore, many molecularfeatures, such as the K manifolds for asymmetric-top molecules, become more complicatedwith increasing rotational quantum number J , so having access to low J transitions is veryvaluable. In cavity-based FTMW spectroscopy, the physical size of the microwave cavitybecomes an important aspect at low frequencies. Microwave reflectors as large as 48 inches(about 122 cm) are used to access the low frequency range down to 1 GHz [176]. Physical sizeis less of a problem with chirped-pulse spectroscopy using horn antennas.
After amplification, the excitation chirp is transmitted into the vacuum chamber using hornantennas (Advanced Technical Materials 250-441EM-NF). The distance between the emittingand the receiving horn antennas is approximately 21 cm. The molecules are seeded intoa rare gas mixture and supersonically expanded into the vacuum chamber using a pulsednozzle (Parker General Valve, Series 9). The valves are mounted on the top of the vacuumchamber about 10 cm above the microwave horns. Usually, neon is used as backing gas atstagnation pressures of 1 � 5 bar, but also helium and argon are available for this purpose.The molecule’s internal degrees of freedom are cooled efficiently in a supersonic expansion. Athermodynamical and hydrodynamical evaluation of the supersonic expansion, including theinfluence of different backing gases, is detailed in the next section. Depending on the moleculeunder study, a gas mixture can be prepared, but for larger molecules the sample needs to beheated in order to bring enough molecules into the gas phase. For those molecules, the samplecontainer can be placed directly prior to the nozzle and both the container as well as the nozzlecan be heated using a heater rope to a maximum temperature of approximately 200 °C. Toavoid condensation, the tubing connecting the container and the nozzle is also heated with aheater rope.
Subsequently, the internally cold molecules interact with the microwave radiation emitted bythe horn antennas. If a frequency within the chirp is resonant with a molecular transition, themolecular sample is polarized, i.e., a macroscopic dipole moment is formed (compare Sec. 2.4).

46 CHAPTER 3. EXPERIMENTAL DETAILS
τprot
τamp
τpul
τsig
τvalve
time
tamp
tpul
texp
tdeloscilloscope
AWG
TWTA
prot. switch
valve
Figure 3.4: Trigger scheme of the experiment. An experimental sequence starts with agas pulse. Hence, the valve is opened for a time ⌧valve. After a time texp, the expan-sion reaches the interaction region and the excitation sequence starts with openingthe protection switch for a time ⌧prot. After a short delay tamp, the TWTA is turnedon and again after a short delay tpul the excitation pulse is emitted. The delay tdel
for the FID recording is set such that the excitation pulse does not interfere with therecorded signal.
The free-induction decay (FID) of the polarization is received by the second horn antennaand amplified with a low-noise microwave amplifier (Miteq Amplifier AMF-5F-0200080-15-10P). The AWG and the oscilloscope (Tektronix DPO 71254A) are phase-locked to a 10 MHz
Rb-disciplined quartz oscillator (Stanford Research FS 725) to ensure phase stability. On thereceiver end, a high-power diode limiter (Aeroflex ACLM-4535) and a solid-state, single-polesingle-throw switch (SPST, Advanced Technical Materials S1517D) are integrated to protectthe sensitive receiver electronics from the high-power excitation pulse (compare Fig. 3.1).In the current setup, the resolution is mainly determined by the length of the recorded FID(typically 10 � 50 µs) resulting in a linewidth as small as 20 kHz at 50 µs.
The photon energy in the microwave spectral region is rather small compared to other spectro-scopic techniques and thus the molecular signal is more difficult to detect. Hence, dependingon the molecular density and the strength of the dipole moment, between hundreds and sev-eral million averages are often necessary to obtain a reasonable signal-to-noise ratio. Ensuringphase stability of the AWG and the oscilloscope during the measurement period is crucial forthe performance of the experiment. Therefore, the oscilloscope is directly triggered by amarker channel of the AWG. For all other components of the experiment, a highly accuratephase stability is not mandatory and would eventually introduce unwanted signal lines in thespectrum if phase stable triggers from microwave switches couple to the microwave signallines.
The experiment sequence is depicted in Figure 3.4. The valve is triggered at time zero and thevalve driver holds it open for a time ⌧valve. The valve opening time was usually set to 380 µs.Afterwards the molecules expand freely into the vacuum for a time texp = 600� 900 µs. Thenthe actual excitation process starts with opening of the protection switch, which protects thesensitive detection electronics from the strong excitation pulse. Hence, the protection switchstays open for the time the TWTA operates and the microwave chirp is emitted. After a delay

3.2. MOLECULAR BEAM TECHNIQUE 47
of tamp, the amplifier is turned on for a time period of ⌧amp. The TWTA amplifies only for thetime the chirp is emitted, usually with a pre-buffer of 500 ns to account for the ramp up timeof the TWTA. Finally, the AWG is triggered to fire the microwave pulse and to trigger theoscilloscope to record the FID for a time ⌧sig. For generating the trigger pulses, a NationalInstruments PXI system (PXIe-1065) is employed. The PXI system has a 100 MHz internalclock, 18 free module slots and a high speed backbone bus connecting all installed modules.A multifunction DAQ unit (NI PXI-6221 M Series) and a timing I/O module (NI PXI-6602)are used to generate and emit the trigger pulses via two front ends, which were designed andmanufactured by the Leibniz-Universität Hannover. The program FTMW++ of Jens-UweGrabow (Leibniz-Universität Hannover) is employed as a soft panel to control the triggersequence. The program runs in a Windows 7 environment on an embedded computer module(PXIe-8108). The program FTMW++ is complemented with self-written LabView scriptsto automate different sets of experiments. The experimental repetition rate is ultimatelylimited by the pumping speed of the vacuum system, but in practice the FID recording bythe oscilloscope already sets an upper limit for the repetition rate. Depending on the lengthof the recorded FID signal, the maximum repetition rate of the experiment ranges between1 � 10 Hz.
The vacuum chamber is a 1 280mm long cylinder with a diameter of 640 mm and a totalvolume of 1 647 l. Both ends are sealed with ISO-K 630 reducer flanges to an ISO-K 200 flange.The horns are mounted to the smaller center flanges on both sides and N-type microwavefeedthroughs are used to couple the microwave excitation chirp into and the molecular signalout of the chamber. The vacuum chamber has two ISO-K 160 flanges and one ISO-K 200flange on both sides for the adjustment of the nozzle and the microwave horns. The chamberhas a ISO-K 500 flange on the top, with various adapters for different nozzles and a vacuumgauge, and two ISO-K 500 flanges on the bottom. The diffusion pump (Leybold DIP 12000)is connected to one of the flanges on the bottom, the other one is blind flanged. The diffusionpump has a pumping speed of 12 000 l/s and is backed by a double stage rotary vane pump(Leybold Trivac D 40 B ATEX) with a pumping speed of 11 l/s. The pressure inside thechamber is controlled by a combined Pirani/cold cathode vacuum gauge (Pfeiffer CompactFullRange Gauge PKR 261), while a Pirani vacuum gauge (Pfeiffer TPR 280) is used tomeasure the pressure in the pre-vacuum line.
3.2 Molecular beam technique
Atomic and molecular beams are a powerful tool in many fields of physics and physical chem-istry. Particularly, high precision experiments and high-resolution spectroscopy benefitedtremendously from these techniques. Otto Stern pioneered the atomic and molecular beamtechnique and received the Nobel prize in 1943 for his contribution in this field. Rabi, Ramsey,and Herschbach advanced the beam technique or adapted it to other scientific areas. Theywere also awarded by the Nobel prize for their contributions on atomic and molecular beamtechniques (Rabi 1944, Herschbach/Lee/Polanyi 1986, Ramsey/Paul/Dehmelt 1989). The

48 CHAPTER 3. EXPERIMENTAL DETAILS
Figure 3.5: Graphical illustration of a beam of ammonia molecules seeded into a backinggas. The change in the density and the temperature of the beam is depicted by thered shaded color.
advantages are manyfold and the most important ones for this work will be highlighted here.First of all, the internal and external degrees of freedom of the system under study can becooled very efficiently within atomic and molecular beams. The low translational temperature(i.e. the velocity distribution within the beam is small) leads to a narrow spectral line-shapein spectroscopic techniques, whereas low rotational and vibrational temperatures limit thenumber of significantly populated levels, which increases the signal intensity for these popu-lated transitions. Furthermore, low internal temperatures greatly facilitate the understandingof the molecular spectrum, because only a small subset of the molecular energy levels con-tribute to it. Another advantage arises when the atomic or molecular beam is so dilute thatthe molecules and atoms are noninteracting and the intrinsic atomic or molecular propertiescan be studied. Then, the collisional broadening decreases drastically and the transient timebroadening dominates the line widths.
In principle, any atomic or molecular beam is a gas expansion from a high pressure area intovacuum (compare Fig. 3.5). In other words, it is an intended and very well controlled leak inthe vacuum chamber [177, 178]. In the following, the focus is set on atomic beams, because themolecular beams used in this work are atomic beams seeded with a small fraction of moleculesas explained later in this section. For ideal monoatomic gases, the velocity distribution P (v)
inside the high pressure container follows the Maxwell-Boltzmann distribution:
P (v) = 4⇡
✓m
2⇡kBT
◆3/2
v2e� mv
2
2k
B
T (3.5)
Hence, the distribution depends only on the atomic mass m and the temperature T insidethe container. Figure 3.6a and Figure 3.6b illustrate the effect of different atomic masses anddifferent sample temperatures on the velocity distribution, respectively.
Depending on the pressure inside the container p0
and the diameter of the container openingD (compare Fig. 3.5), the atomic beam can be classified to be effusive or supersonic. Aneffusive beam is formed when the mean free path length � of the atoms is much larger than thecontainer opening. Then the atom encounters no collisions with other atoms during the expan-sion through the pinhole and consequently no energy is transferred. The velocity distribution

3.2. MOLECULAR BEAM TECHNIQUE 49
0 500 1000 1500 2000 2500 3000
velocity (m/s)
pro
pab
ility
Helium (m=4u)
Neon (m=8u)
Argon (m=16u)
Xenon (m=32u)
(a)
0 500 1000 1500 2000
velocity (m/s)
pro
pab
ility
T=294K
T=200K
T=100K
T=50K
T=10K
(b)
Figure 3.6: (a) Maxwell-Boltzmann velocity distributions of different noble gases atroom temperature (294 K) and (b) Maxwell-Boltzmann velocity distributions of neonat different temperatures.
of an effusive beam follows the Maxwell-Boltzmann distribution multiplied by the velocityv, because the probability that the atom leaves the container through the orifice is propor-tional to its absolute velocity [179]. Even though the effusive beam cannot cool the atoms inthe expansion, it still provides a noninteracting environment, which enabled many importantexperiments (e.g. Stern-Gerlach experiment of atomic spins interacting with magnetic fields[180, 181]). Furthermore, the velocity spread of an effusive atomic beam perpendicular tothe traveling direction can be confined with the use of pinholes or skimmers. This approachis a tradeoff between velocity spread and particle density, but it allows ultimately Doppler-free spectroscopic experiments. Many atomic beam experiments rely on effusive techniques,especially when the cooling behavior is less of an issue. Moreover, effusive beams are lessdemanding on the pumping requirements than supersonic beam techniques.
In contrast to the effusive beam, the supersonic beam can cool the external and internaldegrees of freedom of atoms and molecules very efficiently. A pinhole diameter much largerthan the mean free path length � enables many collisions during the expansion. Due tothe collisional energy transfer, the beam is more confined and the velocity distribution ismuch narrower compared to the Maxwell-Boltzmann velocity distribution at the containertemperature, even though the mean velocity is higher. Figure 3.7 illustrates the velocitydistribution inside the container and in the atomic beam. Under the assumption that theexpansion is isentropic and adiabatic, thermodynamics can be employed to determine theterminal velocity of the beam. In an isentropic and adiabatic expansion the sum of theenthalpy H and the kinetic energy of the directed mass flow is conserved (both the enthalpyand the directed mass are dependent on the distance x to the starting point of the expansion):
H (x) +1
2mv (x)2 = const. (3.6)
If the enthalpy is completely converted into a directed mass flow, the terminal velocity vmax
of the atoms for an ideal gas is only dependent on the container temperature and the mass of

50 CHAPTER 3. EXPERIMENTAL DETAILS
0 500 1000 1500 2000
velocity (m/s)
pro
pab
ility
Container T=294K (x10)
Supersonic expansion T=1K
Figure 3.7: Comparison of the velocity distribution of neon atoms at room temperatureand after supersonic expansion in an atomic beam reaching T = 1 K. The velocitydistribution of the supersonic expansion is shifted to the terminal velocity vmax. Bothdistributions are normalized to one.
the atoms [182]:
vmax =
r5kBT
0
m(3.7)
where T0
is the temperature inside the container and m is the mass of the atom. In realitythe expansion is not perfectly isentropic or adiabatic and the mean velocity of the ensemble ofatoms will never reach the terminal velocity. However, simulations and experiments show thatthe mean velocity is increasing quickly with a fast convergence towards the terminal velocityin the first fraction of the expansion [183]. Hence, the terminal velocity provides already agood estimate for the mean downstream velocity of the beam [182].
Because the supersonic expansion is a very dynamic process depending on various parameterslike collision rate, collision cross-section etc., the thermodynamic properties like pressure,temperature or particle density cannot be stated in a closed form for all positions in the beam.Nevertheless, the mean velocity, the pressure, the temperature, and the particle density onthe centerline of the beam are dependent on only two quantities: the ratio of specific heatsand the local Mach number, both of which are position dependent [182]. The local Machnumber describes the ratio of the particle velocity and the local speed of sound and can bemodeled using hydrodynamics. Different mathematical formulas exist to fit the results of thehydrodynamic simulations for the Mach number within distinct regions of the beam [183].
Herein the dynamics will be explained qualitatively using Figure 3.8. Within the container,the atoms collide frequently, therefore the speed of sound is much faster than the meanparticle velocity, leading to a small Mach number. Inside the expansion, the situation isreversed because the temperature, the pressure, and the particle density decrease rapidly,while the mean velocity increases even faster. Hence, Mach numbers much larger than one
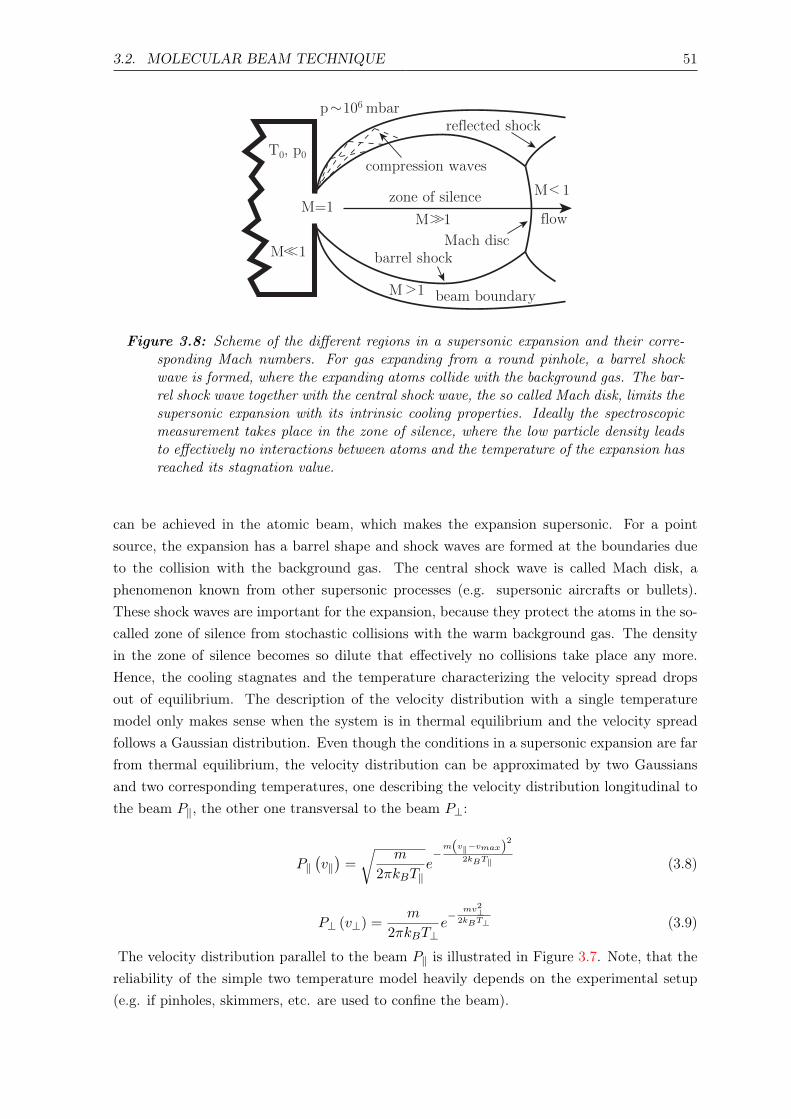
3.2. MOLECULAR BEAM TECHNIQUE 51
beam boundary
T0, p0
p 106 mbar
Dzone of silence
Mach disc
flow
reflected shock
barrel shock
compression waves
M=1M 1
M 1
M 1
M 1
Figure 3.8: Scheme of the different regions in a supersonic expansion and their corre-sponding Mach numbers. For gas expanding from a round pinhole, a barrel shockwave is formed, where the expanding atoms collide with the background gas. The bar-rel shock wave together with the central shock wave, the so called Mach disk, limits thesupersonic expansion with its intrinsic cooling properties. Ideally the spectroscopicmeasurement takes place in the zone of silence, where the low particle density leadsto effectively no interactions between atoms and the temperature of the expansion hasreached its stagnation value.
can be achieved in the atomic beam, which makes the expansion supersonic. For a pointsource, the expansion has a barrel shape and shock waves are formed at the boundaries dueto the collision with the background gas. The central shock wave is called Mach disk, aphenomenon known from other supersonic processes (e.g. supersonic aircrafts or bullets).These shock waves are important for the expansion, because they protect the atoms in the so-called zone of silence from stochastic collisions with the warm background gas. The densityin the zone of silence becomes so dilute that effectively no collisions take place any more.Hence, the cooling stagnates and the temperature characterizing the velocity spread dropsout of equilibrium. The description of the velocity distribution with a single temperaturemodel only makes sense when the system is in thermal equilibrium and the velocity spreadfollows a Gaussian distribution. Even though the conditions in a supersonic expansion are farfrom thermal equilibrium, the velocity distribution can be approximated by two Gaussiansand two corresponding temperatures, one describing the velocity distribution longitudinal tothe beam Pk, the other one transversal to the beam P?:
Pk�vk�
=r
m
2⇡kBTke� m(vk�v
max)2
2k
B
Tk (3.8)
P? (v?) =m
2⇡kBT?e� mv
2
?2k
B
T? (3.9)
The velocity distribution parallel to the beam Pk is illustrated in Figure 3.7. Note, that thereliability of the simple two temperature model heavily depends on the experimental setup(e.g. if pinholes, skimmers, etc. are used to confine the beam).

52 CHAPTER 3. EXPERIMENTAL DETAILS
The stagnation temperature decreases while the extent of the zone of silence increases withan increasing orifice diameter D or an increasing pressure inside the container P
0
[182]. Bothpossibilities to enhance the cooling behavior have severe implications on the pumping require-ments. Another effect which must be considered is the formation of clusters in a supersonicexpansion. Many van der Waals complexes form easily in the cold conditions of an atomicbeam. To avoid clustering, rare gas atoms are used in atomic and molecular beams. In ad-dition, clustering requires three body collisions, that scale as p2
0
D while two body collisionsscale as p
0
D [182]. Consequently, low pressure and large diameter orifices reduce clustering.
In scientific literature, a molecular beam is often a rare gas beam doped with a small fractionof molecules. In principle a pure molecular beam can be formed, but the cooling behavioris worse than in a doped atomic beam, and the formation of dimers, trimers and higherorder molecular clusters is promoted. If the fraction of molecules seeded into an atomicbeam is small, the molecules thermalize with the surrounding atoms and exhibit similarthermodynamic properties. The main application of molecular beams in spectroscopy is theefficient cooling of the internal degrees of freedom, mainly the rotational and vibrationalones [184]. Within the expansion, the internal energy of the molecule is transferred to thetranslational energy of the surrounding atoms via inelastic binary collisions. The coolingefficiency of the internal degrees of freedom is dependent on the position in the expansion andthe energy level structure of the molecule. If the energy differences of the internal degrees offreedom are small, the transfer to translational energy is more efficient, because less collisionsare required to overcome the energy gap. The cooling of electronic excited states is almostimpossible, but this is usually not necessary, because only the electronic ground state of mostmolecules is populated at room temperature. The cooling of the vibrations in a supersonicexpansion heavily depends on the vibrational mode structure. In a diatomic molecule, onlyone vibrational mode exists and the spacing between the different vibrational energy levels iscomparably large. Whereas polyatomic molecule exhibits more low lying vibrational modes,making the collisional cooling more efficient. However, the rotational internal degrees offreedom are most efficiently cooled because of their small energy differences. In the courseof the expansion, the collision rate decreases and at some point this number is so smallthat the degrees of freedom are frozen, which means that the internal energy distributionis no longer changing. As a result, the vibrational energy distribution is frozen in first,followed by the rotational energy distribution. Because a single collision is sufficient to transfertranslational energy from one particle to another, the temperatures describing the internaldegrees of freedom are always larger or equal to the stagnation translational temperature. Thisbehavior would suggest that the best internal cooling is achieved with heavy backing gases,resulting in a low stagnation translational temperature. However, the formation of clustersis enhanced for rare gas atoms with increasing size. Hence, the choice of the backing gasproviding the best internal cooling is a tradeoff between a small terminal velocity distributionand cluster formation.
Figure 3.9a shows the predicted spectrum of the monoterpenoid carvone (C10
H14
O) at dif-ferent rotational temperatures illustrating the benefits of low rotational temperatures for mi-

3.2. MOLECULAR BEAM TECHNIQUE 53
0 20 40 60 80 100
frequency (GHz)
inte
nsi
ty(a
rb.
units)
0.5 K
1.5 K
5.0 K
20.0 K
(a)
0 5 10 15 20 25 30 35
frequency (GHz)
inte
nsi
ty(a
rb.
units)
carvone
(150 g/mol) x1
estradiol
(272 g/mol) x5
cholesterin
(387 g/mol) x10
(b)
Figure 3.9: (a) Simulated rotational spectra of the monoterpenoid carvone (C10
H14
O)at different rotational temperatures in thermal equilibrium. (b) Simulated rotationalspectra of carvone, the female sex hormone estradiol (C
18
H24
O2
), and the impor-tant sterol cholesterol (C
27
H46
O) at a rotational temperature of 0.5 K illustrating theimpact of the size of a molecule on the density and intensity of the rotational transi-tions. The rotational constants of estradiol and cholesterol were estimated via forcefield calculations. The grey shaded area marks the frequency range of the COMPACTspectrometer.
crowave spectroscopy. The transition intensities at lower temperatures are greatly enhanceddue to the population of only a few rotational states. The probability for the population of arotational state Pj in thermal equilibrium is given by the Boltzmann distribution:
Pj =Nj
N=
gje� E
j
k
B
T
R
QR(3.10)
where Nj is the number of molecules in the rotational state with the energy Ej , TR is therotational temperature and gj is the quantum state degeneracy. QR is the rotational partitionfunction, where the sum goes over all rotational states:
QR =X
i
gie� E
i
k
B
T
R (3.11)
The impact of the size of the molecule on the intensity profile is illustrated in Figure 3.9b.The transitions of larger molecules like the female sex hormone estradiol (C
18
H24
O2
) or theimportant sterol cholesterol (C
27
H46
O) are shifted to the low frequency end of the spectrumand their intensities drop dramatically due to their high state density. As described earlier,the molecules in a supersonic expansion are not in thermal equilibrium. Usually, the intensityprofile of the rotational transitions cannot be modeled exactly using a single temperaturedistribution. In some cases, stacks of close lying states provide more effective cooling thanother pathways leading to non-equilibrium conditions [185].

54 CHAPTER 3. EXPERIMENTAL DETAILS
Figure 3.10: (a) Rotational spectrum of trifluoroiodo methane (CF3
I) obtained with theHamburg COMPACT spectrometer after 1, 10, 100 and 1000 acquisitions using twovalves simultaneously and neon as carrier gas. The J ! J + 1 : 0 ! 1 (around3 GHz) and the J ! J + 1 : 1 ! 2 (around 6 GHz) rotational transitions aredisplayed. Both transitions are split due to nuclear quadrupole coupling arising fromthe iodine nucleus. (b) Comparison of the experimental spectrum (J ! J+1 : 1 ! 2rotational transition, positive trace) with a simulation (negative trace) indicating thevery good agreement for both the frequencies and the intensities of the quadrupolehyperfine transitions.
3.3 Commissioning and performance
The commissioning of the spectrometer was performed with the molecules trifluoroiodomethane (CF
3
I) and benzonitrile (C7
H5
N). These molecules were chosen because their rota-tional constants are known [60, 186] and their dipole moments are reasonable large, makingthem easier to detect with rotational spectroscopy. Furthermore at low rotational tempera-tures their most intense transitions are situated in the spectral bandwidth of the COMPACTspectrometer. Also both molecules exhibit nuclear quadrupole splitting, giving rise to distinctintensity patterns that serve as a good test of the intensity accuracy. Moreover, CF
3
I is agas, whereas benzonitrile is a liquid with a relatively high vapor pressure of about 1 mbar atstandard conditions [187]. Hence, no further effort is required to seed a descent amount ofmolecules into the supersonic expansion.
Figure 3.10 shows the rotational spectrum in the spectral region of 2 � 8 GHz of the prolate
This section is partly based on the following publication:
• D. Schmitz, V. A. Shubert, T. Betz, and M. Schnell, Multi-resonance effects within a single chirp inbroadband rotational spectroscopy: The rapid adiabatic passage regime for benzonitrile, J. Mol. Spec.280, 77-84 (2012). (key ideas: 50%, experimental: 40%, data analysis: 40%, writing up: 10%) [69]

3.3. COMMISSIONING AND PERFORMANCE 55
Figure 3.11: Simplified energy level scheme of all relevant energy levels and transitions,neglecting quadrupole hyperfine splitting, of benzonitrile in the frequency bandwidthof the spectrometer. On the right, the molecular structure of benzonitrile is shown.
symmetric top CF3
I, after 1, 10, 100, and 1000 FID acquisitions obtained with the COMPACTspectrometer using two simultaneously operated valves. CF
3
I (spectroscopic constants: B =
1523.27715 (26) MHz, �aa = �3217.424 (12) MHz) was mixed with the carrier gas neon in a3 : 100 pressure ratio and expanded into the chamber via supersonic expansion. The spectrumexhibits huge hyperfine splitting due to nuclear quadrupole coupling of the iodine nucleuswith the total angular momentum. The resulting splitting pattern and its intensities are verycharacteristic and can facilitate the spectral assignments. The main features of the rotationalspectrum are already seen after one FID acquisition. After 1000 acquisitions (about 9 minutesrecording time), all of the spectral features are resolved with a good signal-to-noise ratio.Figure 3.10 displays a comparison of the experimental and the calculated rotational spectrumfor the J ! J + 1 : 1 ! 2 transition of CF
3
I. The experimental intensities of chirped-pulseFTMW spectroscopy, when working in the linear-fast passage regime, are accurate over therelevant frequency range and agree well with the calculated ones. Care must be taken at thelimits of the frequency bandwidth of the spectrometer, where the power of the TWTA dropsrapidly. Reliable intensity information is extremely useful for the assignment of new species,in determining relative dipole moment components, and in estimating the relative populationsof different species, such as conformers, that contribute to the spectrum.
To obtain reliable intensity information, the spectrometer should be operated in the linear-fast passage (LFP) regime, which leaves the population distribution essentially unchanged.However, high power excitation in combination with large molecular dipole moments can drivethe population out of equilibrium in the rapid adiabatic passage (RAP) regime. These strongperturbations of the populations together with broad bandwidth chirp excitation enable step-wise multi-resonance effects as explained in the following on the example of benzonitrile. Theplanar asymmetric-top molecule benzonitrile (rotational constants: A = 5656.01 (17) MHz,B = 1546.8711 (10) MHz, C = 1214.40331 (83) MHz) has only one non-vanishing dipole mo-ment component µa = 4.5152 (68) D, which gives rise to a purely a-type spectrum [186].A simplified energy level scheme of all relevant energy levels and transitions is depicted inFigure 3.11, neglecting the quadrupole hyperfine splitting arising from the nitrogen nucleusquadrupole moment. Three progressive series of rotational transitions are located within the

56 CHAPTER 3. EXPERIMENTAL DETAILS
3000 4000 5000 6000 7000 8000
frequency (MHz)
�1.0
�0.5
0.0
0.5
1.0intensity
(arb.
units,norm
.)
202 ! 303
000 ! 101
111 ! 212
110 ! 211
101 ! 202
212 ! 313
chirp up
chirp down
(a)
3000 4000 5000 6000 7000 8000
frequency (MHz)
�6
�4
�2
0
2
4
6
intensity
(arb.
units,norm
.)
chirp up
chirp down
(b)
Figure 3.12: (a) Rotational spectrum of benzonitrile obtained by employing a low powerexcitation chirp with a positive (chirp-up) and a negative (chirp-down) chirp rate.The transition intensities of the two individual measurements are almost identi-cal. (b) Same experimental procedure as in (a) but employing high power excitationchirps. The intensities of the chirp-up and chirp-down measurements differ signifi-cantly, suggesting population transfer in the RAP regime. The transition 1
10
! 211
was used to normalize the intensities in all experiments.
bandwidth of the spectrometer (compare Fig. 3.11). However, the transition 211
! 312
at8.3 GHz cannot be accessed anymore and the populations of the rotational levels involvedin the transition 1
10
! 211
at 5.3 GHz are not affected by any other transition in the fre-quency range of the spectrometer. Thus, the transition 1
10
! 211
was used to normalize theintensities in the following experiments.
Two sets of experiments were executed to study the effect of stepwise population transfer.Firstly, the molecules were probed with a microwave chirp with a positive chirp rate (chirp-up: 2 � 8.3 GHz, 1 µs) and with a negative chirp rate (chirp-down: 8.3 � 2 GHz, 1 µs) atlow excitation power (gain of the TWTA was set to 50 %, corresponding to about 75 W
output power), and secondly at high excitation power (gain of the TWTA was set to 100 %,corresponding to about 300 W output power). If the populations are affected by the excitationpulse via double-resonance excitation, the obtained intensities for the chirp up and the chirpdown measurements should be different. The excitation chirp probes the population differencein various progressive series of transitions once starting from the low frequency, another timestarting at the high frequency end.
Figure 3.12a presents the rotational spectra of benzonitrile in the 2�8.3 GHz frequency rangeobtained using a chirp-up pulse and a chirp-down pulse at low power setting on the TWTA.The individual rotational transitions are labeled using the JK
a
Kc
quantum numbers. Therelative intensities are nearly identical in both spectra (chirp-up and chirp-down). Thus, atlow power the chirp has a negligible effect on the relative populations of the rotational statesand the excitation can be described within the LFP regime. The situation is different for thehigh power measurement shown in Figure 3.12b. Two important points should be noted: (a)the relative intensities of the individual transitions clearly depend on the direction of the chirp,and (b) the relative intensities differ from those obtained in the low-power measurements for

3.3. COMMISSIONING AND PERFORMANCE 57
5200 5400 5600 5800 6000 6200 6400 6600
frequency (MHz)
inte
nsi
ty(a
rb.
units)
experiment
isotopologues
Ne-cluster
water-cluster
vib. excited
parent species
Figure 3.13: Rotational spectrum of benzonitrile obtained in the frequency region be-tween 5 and 6.7 GHz. Transitions arising from the parent species, its isotopologues,one benzonitrile-water cluster, two benzonitrile-neon clusters, and a vibrationallyexcited state of benzonitrile are indicated.
which the linear fast passage regime is valid (see Fig. 3.12a). These findings can be explainedwith stepwise multi-resonance effects as described within the RAP regime, where populationinversion is possible. As discussed in Section 2.4, the population of the respective energy levelscan be significantly influenced by the chirp. For example, for the chirp-up measurement withinthe J
0Kc
=J series (Fig. 3.12b), the population of the 101
energy level will be enriched in thecourse of the chirp via the 0
00
! 101
transition at 2.76 GHz. This change will then be probedby the same chirp when approaching resonance for the 1
01
! 202
transition at 5.5 GHz. Asa result, the 1
01
! 202
transition is strongly enhanced compared to the 000
! 101
transition.This change in turn leads to an increase of the population of the 2
02
level, within the RAPregime, and thus to an enhancement of the 2
02
! 303
transition at 8.2 GHz.
In principle, tailored microwave chirps together with high power microwave sources allowthe population transfer to a single rotational quantum state. However, complex rotationallevel schemes and the high number of populated levels might complicate this task. In atomicphysics, complete population transfer was already achieved in a simple three-state laddersystem of rubidium (5s, 5p, 5d states) using a chirped laser pulse in the RAP regime [188–191].
Finally, a measurement averaging 624 000 acquisitions of benzonitrile was performed to eval-uate the sensitivity of the spectrometer. Many publications in high resolution spectroscopyexist that describe the spectra and report rotational constants of benzonitrile [186, 192], itsisotopologues [193, 194], the benzonitrile dimer [195], the benzonitrile-water cluster [12], ben-zonitrile rare gas clusters [196], and dipole-bound complexes of benzonitrile with various otherorganic molecules [197]. A signal-to-noise ratio of about 10 000 for the strongest transitions ofbenzonitrile enabled the observation of all mono substituted isotopologues, one benzonitrile-water cluster, two benzonitrile-neon clusters, and a vibrationally excited state of benzonitrile.

58 CHAPTER 3. EXPERIMENTAL DETAILS
5360 5380 5400 5420 5440 5460 5480 5500
frequency (MHz)
inte
nsi
ty(a
rb.
units)
experiment
C7
C1
C2/C6
C3/C5
C4
N
vib. excited
parent species
Figure 3.14: Zoom in of the spectrum to the rotational transition 101
! 202
of ben-zonitrile and its mono substituted isotopologues. The quadrupole splitting patternis observed for all 13C isotopologues, but not for the 15N isotopologue due to itsnuclear spin of 1/2.
The benzonitrile dimer was not observed in the spectrum, because it has a vanishing per-manent dipole moment [195]. The spectrum obtained in the frequency region between 5 and6.7 GHz is presented in the upper trace of Figure 3.13. The lower trace shows the predictedspectra based on fitted rotational constants for the different species identified in the spectrum.The intensities for the parent species of benzonitrile are off the y-axis scale.
A zoom into the spectrum to distinguish the individual isotopologues is presented in Figure3.14. Again the intensities of the parent species are cut off to provide a better visibility ofthe low intensity components in the spectrum. The intensities of the transitions originatingfrom the 13C isotopologues reflect nicely their natural abundance of about 1 %. Because thestructures of the C2 and the C6 isotopologues are equivalent, as well as the structures of theC3 and the C5 isotopologues, their transition intensities are doubled compared to the C1,C4, C7 isotopologues. The substitution of nitrogen 14N to 15N has the largest impact on therotational constant because the nitrogen atom is furthest away from the center of mass ofthe molecule than any other atom. Due to the nuclear spin of 1/2 of 15N, this isotopologueexhibits no quadrupole hyperfine splitting and the population is not distributed over differenthyperfine levels. Hence, the intensity of the transition originating from the 15N isotopologueis comparable to the transitions of the 13C isotopologues even though the natural abundanceof 15N is only 0.4 %. The knowledge of the rotational constants of all singly substitutedcarbon and nitrogen isotopologues enables the determination of the heavy atom structure ofbenzonitrile employing Kraitchman equations [47]. The substitution structure of benzonitrileobtained by microwave spectroscopy was already determined by Rudolph et al. [194].

Chapter 4
Communication through the phenyl
ring: internal rotation and nuclear
quadrupole splitting in p-halotoluenes
4.1 Introduction
The effect of internal rotation in molecules, as well as the magnitude and origin of theforces that impede free internal rotation, has long interested chemists. Internal rotation isunderstood as the rotation of one or several parts of a molecule, such as a methyl group, abouta bond relative to the remaining molecular structure. Molecules containing internal rotorsplay important roles in a variety of chemical environments and thus have been the subjectof numerous previous studies [26, 31, 32]. Evidence of such complex molecules has beenseen in astrochemical observations [199, 200]. Furthermore, the high-resolution data expectedsoon from next-generation array telescopes, such as the extended Very Large Array (eVLA)[201] and the Atacama Large Millimeter/submillimeter Array (ALMA) [33], will rely on high-quality terrestrial laboratory measurements in efforts to understand the spectra obtained fromthem.
Rotational spectroscopy and rotationally resolved ultraviolet (UV) spectroscopy have provento be well-suited methods for exploring the properties of internal rotation [115, 202]. Herein,the COMPACT broadband chirped-pulse microwave spectrometer (Chap. 3) is used thatallows for the quick recording of high-resolution rotational spectra over a wide frequencyrange. This capability, along with the rotational transition line intensities that it provides,makes it particularly suited for investigating the rotational spectra of complex molecules, i.e.
This chapter is completely based on the following publication:
• V. A. Shubert, D. Schmitz, and M. Schnell, Communication through the phenyl ring: internal rotationand nuclear quadrupole splitting in p-halotoluenes, Mol. Phys. 111, 2189-97 (2013). (experimental:33%, data analysis: 40%; writing up: 10%) [198]

60 CHAPTER 4. P-HALOTOLUENES
(a) (b)
Figure 4.1: Scheme of the structure of a p-halotoluene. The halogen atom is labeledwith an X (with X = Cl, Br, I). The rotation angle of the methyl internal rotationis indicated in (a) as well as the principal axis system (b). Note, the principal axissystem coincides with the principal axis system of the field gradient.
when the molecule is highly flexible and when rotational transitions are split by additionalcouplings, e.g. by the presence of quadrupolar nuclei.
The investigation of series of p-halotoluenes (with chlorine, bromine and iodine as the halo-gen substituent, see Scheme 4.1) was chosen to learn about the potential interactions of thequadrupolar nuclei with the internal rotation via the phenyl ring. Due to the symmetry of themolecule, the methyl group internal rotation with respect to the molecular frame is hinderedby a sixfold barrier, V
6
. It is discussed in the literature that internal rotation barriers can beinfluenced by substituents as far as 10 atoms away [203] and these effects can be transmittedthrough conjugated bond systems, such as phenyl rings [204]. The halogen substituents flu-orine (investigated previously) [205], chlorine, bromine, and iodine (this work) differ in theirelectronic behavior. This difference is evidenced by their varying electronegativities and alsotheir sizes, which in the case of the p-halotoluenes lead to differences in overlap of the valencep-orbitals of the halogens with the phenyl ⇡-cloud.
The rotational spectra of the p-halotoluene series contain two sensitive probes for studyingcommunication pathways via the phenyl ring. One is the interaction of the nuclear spin of thehalogen substituents (ICl = 3/2, IBr = 3/2, II = 5/2) with the overall rotation of the molecule.This interaction leads to characteristic line splittings in the spectra that are sensitive to thechemical environment of the quadrupolar nucleus, e.g. the electron density around the atomand thus the character of the chemical bond (detailed in Sec. 2.2). The second probe is thebarrier hindering the internal rotation of the methyl group, as it is sensitive to the characterof the bond between the methyl carbon and the phenyl ring (Sec. 2.3). This bond characterdepends on the electronic structure of the phenyl ring that in turn depends on the othersubstituents on the ring.

4.2. EXPERIMENTAL 61
Figure 4.2: The experimental rotational spectra (black, positive traces) and simulatedspectra (negative traces) of the p-halotoluenes measured in this work. The differentcolors of the simulated spectra correspond to the different isotopologues and m statesof the transitions. Blue: m = 0 for p35ClC
7
H7
, p81BrC7
H7
and pIC7
H7
. Red:m = 1 for p35ClC
7
H7
, p81BrC7
H7
and pIC7
H7
Teal: m = 0 for p37ClC7
H7
andp79BrC
7
H7
. Yellow: m = 1 for p37ClC7
H7
and p79BrC7
H7
. For pClC7
H7
, thegroups of transitions correspond to J = 1 ! 2, 2 ! 3 and 3 ! 4. In pBrC
7
H7
,the groups of transitions correspond to J = 1 ! 2, 2 ! 3, 3 ! 4, 4 ! 5, 5 ! 6and 6 ! 7. For pIC
7
H7
, the groups of transitions correspond to J = 1 ! 2, 2 ! 3,3 ! 4, 4 ! 5, 5 ! 6, 6 ! 7, 7 ! 8 in order of increasing frequency, respectively.
It is the aim of the present investigation to shed more light on the influence of the particularsubstituents and to study the ability of the phenyl ring to communicate information fromone substituent to another. The range in values of both halogen electronegativities andquadrupolar coupling constants should yield information about the influence of both on theinternal rotation barrier. Accompanied by electronic structure calculations, the capabilitiesand high resolution of the broadband chirped-pulse Fourier transform microwave (CP-FTMW)spectrometer presented in Chapter 3 are perfectly suited to such studies of intramolecularinteractions. Spectra are anticipated that contain a larger number of transitions spread overa wide range due to the low-barrier V
6
internal rotation tunneling and nuclear quadrupolecoupling.
In the following, the experimental details (Sec. 4.2) and computational methods (Sec. 4.3)are introduced, followed by a section on the spectral details and fitting (Sec. 4.4). In theResults and Discussion section (Sec. 4.5), the interaction between the internal rotation ofthe methyl group and the nuclear spin of the halogen substituents is addressed. Finally, thischapter closes with a Summary and Conclusions section (Sec. 4.6).

62 CHAPTER 4. P-HALOTOLUENES
4.2 Experimental
The CP-FTMW spectrometer was detailed in Chapter 3 and only a brief description is givenhere. The molecules of interest were introduced into the chamber via supersonic expansionfrom pulsed valves operating at 2 Hz. Two sets of experiments were performed. In the first,the sample holders were placed outside the vacuum and heated to 38 °C, 50 °C and 50 °C forp-chlorotolouene (pClC
7
H7
), p-bromotoluene (pBrC7
H7
) and p-iodotoluene (pIC7
H7
), respec-tively. Neon was used as the carrier gas at an absolute backing pressure of 3.0 bar. In a secondset of experiments employing argon as the buffer gas, the sample holders were placed insidethe vacuum and heated to approximately 85 °C for all species at backing pressures between1.3 and 2.8 bar.
After supersonic expansion into the chamber, the ensemble of molecules was polarized witha 1 µs chirp spanning 2 � 8.5 GHz. For each spectrum, 50 µs of the FID was recorded at aresolution of 10 ps, yielding a frequency resolution of 20 kHz in the Fourier transform (FT)and hence the rotational spectra obtained. Typically, 200 000 � 500 000 FIDs were co-addedfor each spectrum. Prior to performing the FT on pClC
7
H7
and pBrC7
H7
, a Kaiser-Besselwindow was applied for 69 dB sidelobe attenuation [58]. Background lines were present inthe raw FT obtained from the FID and were removed by masking, as elaborated on in thesupplementary material of Reference [198].
4.3 Computational Methods
Electronic structure calculations were performed with the Gaussian 03 [206] and Gaussian09 [207] program suites. Structural optimizations were performed with both Møller-Plessetsecond-order perturbation theory (MP2) and density functional theory employing the Becke,three parameter, Lee-Yang-Parr (B3LYP) exchange-correlation functional (compare Sec. 2.6).The aug-cc-pVTZ basis set was used in both methods. For the pIC
7
H7
calculations, a basis set[208] containing an effective core potential from the ESML basis set exchange was employed[166, 209]. To obtain reasonable quadrupole coupling constants for pIC
7
H7
, B3LYP calcula-tions were repeated using the 6-311G(d,p) basis set [210] from the ESML basis set exchange[166, 209]. B3LYP relaxed energy scans for the internal rotation of the methyl group wereperformed with both the cc-pVTZ and aug-cc-pVTZ basis sets. Relaxed energy MP2 scanswere carried out only with the cc-pVTZ basis set.
4.4 Spectral details and fitting
The p-halotoluenes are asymmetric tops with only a single nonzero dipole moment component,µa, that lies along the principal axis that passes through the halogen and methyl carbon.This configuration gives rise to a-type transitions, i.e. �J = ±1, �Ka = 0 and �Kc = ±1
(compare Table 2.2). Tunneling through the low sixfold barrier splits the rotational energy

4.4. SPECTRAL DETAILS AND FITTING 63
inte
nsity
(arb
. uni
ts)
frequency (GHz) 7.1607.1587.1567.1547.152 7.150
35Cl m = 035Cl m = 1
experimentp-chlorotoluene
Figure 4.3: The experimental and simulated rotational spectra for the JKa
Kc
(m = 0) =303
! 404
and the JKa
Kc
(m = 1) = 313 ! 414 transitions of p35ClC7
H7
between 7.15and 7.16 GHz. The inexact post-application of quadrupole splitting to the RAM36simulations with a self-written program leads to greater disagreement between simu-lation and experiment for the m = 1 transitions. However, the relative intensitiesmatch very well.
levels, and an additional quantum number must be introduced. Herein, to characterize theseinternal rotation energy levels, the quantum number m of the free rotor states is used thatis appropriate for low-barrier cases (Eqn. 2.63 and Eqn. 2.64). This quantum number cantake values of m = 0, ± 1, ± 2, ± 3, . . . and the m 6= 0 free rotor states (i.e. in the limitof V
6
! 0) are doubly degenerate. For barriers of intermediate magnitude, some of thesedegeneracies are lifted. The selection rule for torsional transitions follows �m = 0. Thetransitions associated with m = 0 have the pattern of an ordinary asymmetric rotor and canbe modeled using traditional effective asymmetric rotor Hamiltonians. These transitions maybe conveniently used to determine the rotational constants. A detailed analysis of the m 6= 0
levels requires modifications to the Hamiltonian. Common approaches are the principal axismethod (PAM), rho axis method (RAM) [132], and internal axis method (detailed in Sec.2.3). Only the transitions associated with |m| = 3 are significantly affected by the barrier.They are largely split and allow for an accurate barrier determination. Due to cooling inthe course of the supersonic expansion in the molecular beam used herein, only energy levelsassociated with m = 0 and |m| = 1 are significantly populated and these provide only limitedinformation about the internal rotation barrier height.
Very low barriers to methyl-top internal rotation, such as in the V6
potential of the p-halotoluenes, are well known to be challenging to model and fit accurately. The methodof performing separate fits for the m = 0 and m = 1 states is often used, although withinthe regime of low barriers, interpretation of the results is difficult. In the SPFIT/SPCATprogram of Pickett [146], the m = 1 states can be fit with an extra parameter, Da, that isproportional to the barrier height (see Sec. 2.3). The Da parameter appears in the Hamilto-

64 CHAPTER 4. P-HALOTOLUENES
nian for coupling between internal and overall rotation in the term DaJa and is given by thefollowing equation:
Da = F⇢aW(1)
0� (4.1)
Da is nonzero for the m = 1 states, but is zero for the m = 0 states [131]. In a highbarrier case, the sum in Eqn. 2.70 converges quickly and all the non-vanishing perturbationcoefficients W (1)
01
, W (2)
00
and W (2)
01
can be derived from the two independent fits. Using theperturbation coefficients, the reduced barrier height (compare Sec. 2.3) and the orientation ofthe rotor relative to the principal axis system can be obtained as was shown for the moleculeo-chlorotoluene [131]. However for low barriers, this strategy is more difficult to apply andgives unreliable results [130]. Even though the m = 1 states can be fit using the parameterDa to experimental accuracy, it is not possible to link Da directly to a physical quantity. Inboth high- and low-barrier cases, ideally one would prefer a global fit of all the transitionssimultaneously and to obtain a barrier directly from the output of the program. Towards thisend, the RAM36 program by Ilyushin et al. was recently released and was successful in theanalysis of the toluene internal V
6
barrier [135].
An advantage of SPFIT/SPCAT is the treatment of nuclear quadrupole splitting that is notimplemented in the current version of RAM36. Thus, the following strategy was used to fit andinterpret the experimental data. The m = 0 and m = 1 states were assigned and fit separatelyusing SPFIT/SPCAT. The rotational constants, nuclear quadrupole coupling constants (�aa
and �bb � �cc), and the centrifugal distortion coefficient, DJ , were fit. The m = 1 stateswere fit while allowing the Da parameter to float. In the next step, the quadrupole constantswere set to zero and the unperturbed ‘center frequencies’ predicted using the fitted constantsfor each molecule and isotopologue. These center frequencies were then used as input forRAM36. It is important to note that only the predictions for JK
a
Kc
! J 0K0
a
K0c
transitionsactually observed in the experimental spectra were used.
For pClC7
H7
in RAM36, the rotational constants, centrifugal distortion coefficient (DJ), andinternal rotor parameters (V
6
, F , �2F⇢) were fit. First, the rotational constants and DJ wereobtained by fitting only the m = 0 transitions. Once this step was converged, the m = 1
states were added and the �2F⇢ parameter was allowed to float while keeping the F and V6
parameters fixed at the toluene values [135]. It was found that the fits were most sensitive tothe �2F⇢ parameter, and thus it was fit before moving on to other parameters. Next, F was fitwhile keeping �2F⇢ fixed to its optimized value. Several iterations of fitting F and �2F⇢ wereperformed until both changed by less than 0.02 % from the previous iteration. For pClC
7
H7
,the positions of some low J |m| = 3 transitions near the range of the COMPACT spectrometerwere previously published by Herberich [211], and these transitions were then added to the fitand V
6
allowed to float while keeping all other parameters fixed. For pBrC7
H7
and pIC7
H7
, asimilar approach as above was applied, but V
6
was fixed at the fitted p35ClC7
H7
value. Theapproach of fixing certain parameters while allowing others to be fitted, and iterating throughfitting the parameters, has been suggested previously so that the fits remain physically valid[132, 212]. In the final RAM36 simulations, a rotational temperature of 1 K was used for all

4.5. RESULTS AND DISCUSSION 65
molecules.
It should be noted that the quantum numbers of the unperturbed center frequencies for them 6= 0 states predicted by SPCAT differ from those of RAM36. This difference is due tothe fact that different methods are used to assign Ka and Kc quantum numbers within thePAM and RAM approaches. It is also because for the m = 1 states, the Ka and Kc quantumnumbers are no longer ’good’.
4.5 Results and discussion
The spectra of the p-halotoluenes are presented in the range from 2 to 8.3 GHz in the positivetraces of Figure 4.2 along with the respective simulations, as negative traces, resulting fromthe spectral fits. For pClC
7
H7
and pBrC7
H7
, two isotopologues are present in the molecularbeam in natural abundance (p35ClC
7
H7
, p37ClC7
H7
, p79BrC7
H7
and p81BrC7
H7
). Withinthis study, no lines associated with the 13C-isotopologues were identified. As can be seenfrom Figure 4.2, with higher molecular mass and thus smaller B and C rotational constants,the spacing of the groups of rotational transitions becomes smaller, as expected. Individualsubgroups arising from tunneling through the internal rotation barrier (denoted by m = 0
and m = 1) are further split due to nuclear quadrupole splitting and are color-coded in thesimulation traces. The nuclear quadrupole splitting increases from pClC
7
H7
to pBrC7
H7
topIC
7
H7
as expected from the magnitudes of their atomic nuclear quadrupole coupling valueseQqn10
(summarized in Table 2.3).
Figure 4.3 displays the JKa
Kc
(m = 0) = 303
! 404
and the JKa
Kc
(m = 1) = 313
! 414
rota-tional transitions of p35ClC
7
H7
in the range 7.15 � 7.16 GHz and demonstrates the resolvingpower of the COMPACT spectrometer. In both the transition frequencies and intensities,good agreement between the experimental and the simulated transition intensities is seen.The parameters for the fits are summarized in Tables 4.1-4.3 along with the standard devia-tion (�) and number of lines included in each fit (N °). In Figures 4.2 and 4.3, the simulatedcenter transition frequencies (i.e. without quadrupole splitting) from RAM36 were taken andthen each line was quadrupole split using a self-written MATLAB code employing the first-order perturbation theory for quadrupole coupling presented in Gordy and Cook [117, Chap.9]. For the m = 1 lines, small disagreements between the simulated spectra and experimentwere seen that could be due to K mixing, as was reported for (CH
3
)3
SnCl [124]. For thediscussion on nuclear quadrupole interaction, the results from the SPFIT program are used.The full line lists and assignments are available in the supplementary material of Reference[198].
The initial fits with SPFIT typically gave � values of 5� 10 kHz, well below the experimentalresolution. For both pClC
7
H7
isotopologues (35Cl and 37Cl), the rotational constants B
and C of the m = 0 states agree well with those previously reported by Herberich [211].Furthermore, the B and C rotational constants from the global RAM36 fit also agree verywell, although the A constant differs by about 1 MHz. The A rotational constant would require

66 CHAPTER 4. P-HALOTOLUENESTable
4.1:Rotational
constants,quadrupole
mom
ent,and
internalrotation
parameters
fortwo
isotopologuesof
p-chlorotoluene.N
otethe
errorsgiven
herefor
them
easuredvalues
arestandard
errors.N
°is
thenum
berof
linesincluded
inthe
fitand
�is
thestandard
deviationofthe
fit.
35C
lisotopologue37C
lisotopologue
Experim
entB
3LYP
aM
P2a
Herberich
[211]E
xperiment
B3LY
Pb
MP
2b
Herberich
[211]
A
ef
f
=A
+F
⇢
2
(MH
z)5710
.86(50) c
5568.38
5535.80
5712.18
(66)5710
.77(43) c
5568.38
5535.80
5713.1
(10)
B(M
Hz)
968.24434
(99) c964
.13970
.01968
.246(2)
943.9578
(14) c939
.83945
.65943
.953(4)
C(M
Hz)
827.92238
(99) c826
.04829
.64827
.920(2)
810.1004
(14) c808
.14811
.75810
.099(4)
D
J
(kHz)
0.031
(22) c0.023
(30) c
�
zz
(MH
z)(m
=0)
�71
.155(5) d
�68
.94�
67.15
�71
.7(7)
�56
.069(7) d
�54
.15�
56.6
(13)
�
zz
(MH
z)(m
=1)
�71
.165(7) d
�56
.09(2) d
�
xx
��
yy
(MH
z)(m
=0)
4.802
(13) d6.97
3.64
3.749
(16) d4.48
�
xx
��
yy
(MH
z)(m
=1)
4.7
(1) d4.8
(2) d
�(m
=0)
0.02917
(8) c0.042
0.022
0.0289
(1) c0.034
�(m
=1)
0.0285
(6) c0.037
(2) c
D
a
(kHz)
�11312
.3(12) d
�11298
.2(17) d
V
6
(GH
z)144
.98(88) c
145.02
(88) c
2⇢F
(GH
z)11
.34(24) c
146.1
(4)11
.34(24) c
146.1
(4)
F(G
Hz)
164.6
(2) c164
.6(2) c
I
↵
(amu
·Å2)
3.182
(33) c3.23
3.24
3.182
(33) c3.23
3.24
RA
M36
/m
=0
/m
=1
RA
M36
/m
=0
/m
=1
�(kH
z)5.4
c/6.0
d/6.8
d8.0
c/5.9
d/9.7
d
N°
34c/
78d/
67d
1731
c/59
d/46
d17
aE
lectronicstructure
calculationusing
anaug-cc-pV
TZ
basisset.
bSingle
pointcalculation
on37C
lisotopologueusing
optimised
structureof
35C
lisotopologue.c
Param
eterfrom
globalfitusing
RA
M36.
dParam
eterfrom
localeffectivefits
usingSP
FIT
.

4.5. RESULTS AND DISCUSSION 67Tab
le4.
2:Rot
atio
nalc
onst
ants
,qua
drup
ole
mom
ent,
and
inte
rnal
rota
tion
para
met
ers
for
two
isot
opol
ogue
sof
p-br
omot
olue
ne.
Not
eth
eer
rors
give
nhe
refo
rth
em
easu
red
valu
esar
est
anda
rder
rors
.N
°is
the
num
ber
oflin
esin
clud
edin
the
fitan
d�
isth
est
anda
rdde
viat
ion
ofth
efit
.
79
Br
isot
opol
ogue
81
Br
isot
opol
ogue
Exp
erim
ent
B3L
YP
aM
P2a
Exp
erim
ent
B3L
YP
bM
P2b
A
ef
f
=A
+F
⇢
2
(MH
z)57
06.65
(32)
c55
66.33
5534
.61
5706
.82
(37)
c55
66.33
5534
.61
B(M
Hz)
636.
9736
4(2
4)c
632.
6764
0.32
630.
5593
6(2
7)c
626.
2763
3.87
C(M
Hz)
573.
0287
9(2
7)c
570.
1057
5.97
567.
8319
3(3
0)c
564.
9157
0.75
D
J
(kH
z)0.
0131
(23)
c0.
0092
(25)
c
�
zz
(MH
z)(m
=0)
555.
618
(8)d
519.
2148
0.44
464.
186
(10)
d43
4.66
�
zz
(MH
z)(m
=1)
555.
65(1
)d46
4.22
7(6
)d
�
xx
��
yy
(MH
z)(m
=0)
�26
.31
1(3
4)d
�25
.88
�24
.20
�22
.05
5(3
6)d
�21
.91
�
xx
��
yy
(MH
z)(m
=1)
�26
.21
(15)
d�
22.28
4(2
3)d
�(m
=0)
0.02
279
(3)c
0.02
20.
021
0.02
286
(4)c
0.02
3
�(m
=1)
0.02
27(1
)c0.
0231
0(2
)c
D
a
(kH
z)�
1131
4.8
(31)
d�
1130
8.7
(8)d
V
6
(GH
z)14
4.98
144.
98
2⇢F
(GH
z)11
.32
6(7
7)c
11.32
6(8
4)c
F(G
Hz)
164.
66(5
5)c
163.
01(6
4)c
I
↵
(am
u·Å
2
)3.
240
(11)
c3.
233.
243.
212
(13)
c3.
233.
24
RA
M36
/m
=0
/m
=1
RA
M36
/m
=0
/m
=1
�(k
Hz)
3.0c
/5.
8d/
6.3d
3.4c
/7.
3d/
6.3d
N47
c /92
d /81
d50
c /98
d /81
d
aE
lect
roni
cst
ruct
ure
calc
ulat
ion
usin
gan
aug-
cc-p
VT
Zba
sis
set.
bSi
ngle
poin
tca
lcul
atio
non
81
Br
isot
opol
ogue
usin
gop
tim
ised
stru
ctur
eof
79
Br
isot
opol
ogue
.c
Par
amet
erfr
omgl
obal
fitus
ing
RA
M36
.d
Par
amet
erfr
omlo
cale
ffect
ive
fits
usin
gSP
FIT
.

68 CHAPTER 4. P-HALOTOLUENES
many more J levels than available within spectral range of the COMPACT spectrometer tobe fit with the same accuracy as the B and C rotational constants. Furthermore, A ismodified from the equilibrium structure value due to coupling with the internal rotation of themethyl group. From the RAM36 fit, the barrier height was determined to be 144.98(88) GHz
and 145.02(88) GHz for the 35Cl and 37Cl isotopologues, respectively, slightly lower than the146.1(4) GHz previously reported [211]. However, these barriers are within the uncertaintyof that reported for p-fluorotoluene, V
6
= 144.79(19) GHz [205]. For pClC7
H7
, the fittedparameters from the current data set yield predictions for the |m| = 3 transitions that areimproved over those predicted earlier [211]. The positions of the J = 4 ! 5 and 5 ! 6,Ka = 1, |m| = 3 transitions reported by Herberich [211], for example, are now predictedwithin about 500 kHz for all but one transition. This result offers support for the self-consistentapproach employed here to achieve this fit. The value of V
6
for the pBrC7
H7
and pIC7
H7
fitswas fixed to the V
6
= 144.98(88) GHz barrier height obtained from the p35ClC7
H7
fit.
As noted in the Spectral Details and Fitting section, the fits were most sensitive to the �2F⇢
parameter of RAM36. In each of the p-halotoluenes, this parameter was smaller than thatfor toluene. It contains information about the structure of the methyl top as it dependsupon the moment of inertia of the methyl top, I↵, about the molecule’s principal rotationaxis that passes through the halogen atom. From the fitted constants I↵ ⇡ 3.2(1) amu · Å2
is obtained, a value consistent with the 3.194531(29) amu · Å2 computed from the fitted con-stants for toluene [135]. Although the slightly larger average value is consistent with thetheory that the halogen atom withdraws electron density from the methyl group through thephenyl ring, thus weakening the C-H bonds in the methyl group, the difference is too smallto conclusively confirm this. The B3LYP optimizations predicted that I↵ ⇡ 3.2 amu · Å2 foreach p-halotoluene (including p-fluorotoluene) and toluene. These fitted and calculated valuesare larger than that previously calculated for p-fluorotoluene (3.11 amu · Å2) and that fromacetone (3.138 amu · Å2) that was assumed also to be true for p-chlorotoluene [211].
The fits were not as sensitive to F , and values of approximately 163 GHz were found for each p-halotoluene. These values agree well with those reported for p-fluorotoluene (F = 163.60 GHz)and toluene (F = 163.8952(15) GHz) [135]. The F values reported herein are consistent withprevious observations and current electronic structure calculations. These calculations aresummarized in Tables 4.1, 4.2 and 4.3 and a relaxed potential energy scan for the methylgroup rotation in p35ClC
7
H7
is presented in Figure 4.4. The B3LYP and MP2 calculationspredicted differences in the barrier heights depending upon the halogen substituent. However,experiments (i.e. with rotational temperatures > 50 K according to the RAM36 simulations)observing transitions between |m| = 3 levels of these molecules are required to better elucidatethe effect of the halogen on the methyl group. However, the effect of the methyl group on thehalogen atom can be better understood from the current data than vice versa. The quadrupolecoupling constants obtained from the fits of the quadrupole splitting patterns are sensitiveto the electronic structure around the halogen substituent. These fits were performed withSPFIT separately for the m = 0 and m = 1 transitions. For the p-halotoluenes and similarmolecules in which a halogen substituent lies in the plane of the benzene ring, the size of the

4.5. RESULTS AND DISCUSSION 69
Table 4.3: Rotational constants, quadrupole moment, and internalrotation parameters for p-iodotoluene. Note the errors given herefor the measured values are standard errors. N ° is the number oflines included in the fit and � is the standard deviation of the fit.
Experiment B3LYP MP2a
A
eff
= A + F⇢
2 (MHz) 5707.01 (13)b 5568.30a 5538.90
B (MHz) 490.054574 (54)b 485.56a 494.19
C (MHz) 451.316364 (54)b 447.86a 454.99
D
J
(kHz) 0.00571 (32)b
�
zz
(MHz) (m = 0) �1886.202 (12)d �1848.35c
�
zz
(MHz) (m = 1) �1886.204 (16)d
�
xx
� �
yy
(MHz) (m = 0) 58.380 (34)d 64.93c
�
xx
� �
yy
(MHz) (m = 1) 58.22 (19)d
� (m = 0) 0.01698 (1)d 0.019c
� (m = 1) 0.01693 (6)d
D
a
(kHz) �11325.6 (42)d
V
6
(GHz) 144.98
2⇢F (GHz) 11.326 (17)b
F (GHz) 162.66 (66)b
I
↵
(amu · Å2) 3.2191 (24)b 3.23 3.24
RAM36 / m = 0 / m = 1
� (kHz) 8.7b/ 7.6d/ 8.5d
N ° 57b/ 210d/ 135d
a Electronic structure calculation employing an aug-cc-pVTZ basis set [208]containing an effective core potential from the ESML Basis Set Exchange[166, 209]
b Parameter from global fit using RAM36.c Calculations using the 6-311G(d,p) basis set [210] from the ESML Basis Set
Exchange [166, 209].d Parameter from local effective fits using SPFIT.

70 CHAPTER 4. P-HALOTOLUENES
quadrupole coupling constant component, �zz , depends upon the electron density aroundthe halogen atom. The ratios of �zz between isotope pairs, �zz(35Cl)/�zz(37Cl) = 1.2691 and�zz(79Br)/�zz(81Br) = 1.1970 for the m = 0 states agree well with those reported for BrCl,(�zz(35Cl)/�zz(37Cl) = 1.26889 and �zz(79Br)/�zz(81Br) = 1.197048) [213]. Tables 4.1-4.3present the �zz values obtained in this investigation. The values are in close agreement to thoseof the halobenzenes [64, 214], but magnitudes in the halobenzenes are slightly higher. Thisdifference is explained by the small, positive inductive effect (+I) of the methyl group thatinjects electron density into the benzene ring, thus increasing the electron density availablefor the electron withdrawing halogen.
Of note is the quadrupole coupling constant for p-chlorotoluene. Since the initial study byHerberich in 1967 [211], no improvements to its value have been reported. In their study ofo-chlorotoluene, Gerhard et al. showed that the value of the quadrupole coupling constant forseveral substituted benzenes could be rationalized by examining the other substituents andtheir positions relative to the chlorine on the benzene ring [131]. There are two electroniceffects to consider: mesomeric (M) and inductive (I). A halogen substituent has a +M
effect due to donation of electron density to the aromatic ring through partial overlap ofthe valence halogen p-orbitals with the ⇡-cloud of the aromatic ring, but a �I effect fromstrongly extracting electrons from the ring through the �-bond. A substituent that contributeselectron density to the ring, then, would allow the halogen atom to extract more electrondensity, thus lowering the magnitude of the quadrupole coupling constant. The methyl grouphas a small +I effect. Thus, halotoluenes should have smaller quadrupole coupling constantmagnitudes than the equivalent halobenzenes. However, the previously reported value for thequadrupole coupling constant of p35ClC
7
H7
(�zz = �71.7(7) MHz) [211] is larger than for35chlorobenzene (�71.241(7) MHz) [215]. The experimentally obtained values of the presentstudy are �zz = �71.155(5) MHz and �zz = �71.165(7) MHz from the m = 0 and m = 1 fits,respectively. These improved values are less than that of chlorobenzene, now in line with theexpected trend in quadrupole coupling constant with substituent. A similar trend is also seenfor the bromo- and iodo-substituted benzenes and toluenes.
The Goldstein parameter, � = (2/3)(�xx � �yy)/eQqn10
, is a good measure for the ⇡-bondingnature in planar molecules with an in-plane halogen substituent, where eQqn10
is the quadrupolecoupling constant for the nuclei due to one valence p-electron (see Eqn. 2.57 in Sec. 2.2).The p-halotoluenes are a prototypical example of this behavior, as the � values decrease withincreasing halogen size. The overlap between the atomic valence p-orbital and aromatic ⇡-cloud decreases as the halogen size increases, hence reducing the ⇡-bonding character of thehalogen-carbon bond.
For each quadrupolar halogen and isotopologue, the magnitude of the quadrupole couplingconstant was slightly larger for the m = 1 fit than the m = 0 fit. A potential explanationfor this is that in the m = 0 state, the methyl rotor is perpendicular (staggered) relativeto the aromatic ring, i.e. ↵ = 90.0° (see Fig. 4.1). This configuration allows for optimumhyperconjugation between the HC �-bond and the ⇡-cloud of the ring. However, in an excitedm = 1 state, the average configuration is no longer perpendicular and thus reduces the

4.5. RESULTS AND DISCUSSION 71
0 20 40 60 80 100 120 140 160 180
angle ↵ (�)
0
20
40
60
80
100
120
rela
tive
ener
gy(G
Hz)
Figure 4.4: The results of the B3LYP/aug-cc-pVTZ relaxed potential energy scan forp35ClC
7
H7
. The calculated points are given as filled red circles and the dashed linesare a fit of the results to Equation 4.2. All points are relative to the global minimum.As discussed in the text, the barriers for all of the p-halotoluenes were found to bevery similar experimentally, although the quantum chemical calculations predictedsome differences.
hyperconjugation. If the hyperconjugation injects some electron density into the ring, thenthe quadrupole coupling constant should be smaller in the m = 0 state than in the m = 1
state, as observed.
Quantum chemical calculations on the p-halotoluenes of this study suggest a staggered con-figuration for the methyl group as the lowest energy structure, i.e. ↵ ⇡ 90°. Pratt and Borstderived the same lowest energy configuration in the UV spectroscopy studies on toluene [216].Furthermore, the calculated rotational constants for both methods (B3LYP and MP2) are ingood agreement with the measured ones. Although the calculated quadrupole coupling con-stants are less accurate than the rotational constants, their agreement still provides a goodmeasure for the quality of the structure.
The relaxed potential energy surface scans of the angle, ↵, (see Fig. 4.1) for the rotation ofthe methyl group reproduce the V
6
character of the potential, as depicted in Figure 4.4 forp35ClC
7
H7
. The potential energy curve was fit with
V (↵) =V
6
2(1 � cos (6↵+ ')) (4.2)
where ↵ is the rotation angle and ' is the phase of the rotation. The B3LYP/cc-pVTZ calcu-lations slightly overestimate the barrier height, whereas the B3LYP/aug-cc-pVTZ calculationspredict a barrier that is lower than that observed experimentally. The MP2 barrier heightis almost three times higher than the other calculated or measured values. This effect wasreported earlier [217, 218]. The overestimation of the barrier by MP2 methods is likely dueto the overestimation of the interaction between the methyl hydrogens and phenyl ⇡-cloud.

72 CHAPTER 4. P-HALOTOLUENES
4.6 Summary and conclusions
The rotational spectra of the p-halotoluenes, (chloro-, bromo- and iodo-) were measured andthe rotational constants were obtained, including the moment of inertia of the methyl groupabout its principal rotation axis, and quadrupole coupling constants. The barrier height wasfit for p35ClC
7
H7
and p37ClC7
H7
(V6
= 144.98(88) GHz and 145.02(88) GHz, respectively)by including the data reported by Herberich [211]. These barriers were slightly lower thanthose previously reported for p-chlorotoluene [211], but the same within the uncertainty as forp-fluorotoluene [205]. In the analysis of p-bromo- and p-iodotoluene, the barrier was fixed tothat of p35ClC
7
H7
. The moment of inertia of the methyl group (I↵ ⇡ 3.2 amu · Å2, see Tables4.1-4.3) determined from the fitted data for each molecule and isotopologue was larger thanpreviously reported or assumed for these molecules, suggesting the methyl group hydrogensare less strongly bound to the methyl group than previously thought. The rotational con-stants agree well with those previously published for p-chlorotoluene, and the new rotationalconstants found for pBrC
7
H7
and pIC7
H7
agree well with the electronic structure calculations(Tables 4.1-4.3).
The fits of the quadrupole-split transitions gave insight into the nature of the chemical bondsbetween the halogen and phenyl ring. The methyl group injects additional electron densityinto the phenyl ⇡-cloud, thus providing more electron density for the halogen atom to ex-tract from the phenyl ring. This effect makes the halogen–carbon bond more ionic than inthe halobenzenes, an effect manifested by the decrease in the magnitude of the quadrupolecoupling constant in the halotoluenes.
Unfortunately, the current data only yielded a limited view into the internal rotation barrierheights, although the electronic structure calculations suggested that some differences in thebarriers should exist. Higher-level calculations would offer greater insight on this subject. Ex-perimentally, measurement of the |m| = 3 transitions would provide new data more sensitiveto the barrier height. Such measurements were attempted in the apparatus employed herein,however, the rotational temperatures were still too low even when using argon at low backingpressures as the carrier gas and elevated sample temperatures. According to simulations fromRAM36 [135], rotational temperatures of 45 � 50 K are necessary to measure these lines forp-chloro-, p-bromo- and p-iodotoluene.
The supplementary information of Reference [198] provides the linelists with the corresponding assign-ments.

Chapter 5
The broadband microwave spectra of
the monoterpenoids thymol and
carvacrol: Conformational landscape
and internal dynamics
5.1 Introduction
Terpenes represent one of the largest classes of secondary metabolites in nature and arederived from adding substituents to their core building block, isoprene. They exhibit a hugeassortment of structures and thus a variety of chemical and biological activities [220]. Fur-thermore, terpenoids account for the largest share of the emission of biogenic volatile organiccompounds (BVOC) to the atmosphere [221–223]. BVOCs are subject to oxidation reac-tions in atmospheric chemistry impacting Earth’s climate [224]. Despite their importance,only a few high-resolution spectroscopic studies of terpenes have been reported. Nuygenand coworkers recently published the first microwave spectroscopic investigation of a linearmonoterpene, linalool [225]. Of the monocyclic monoterpenes, only perillaldehyde [226], car-vone, and limonene [227] have been investigated with high-resolution microwave spectroscopy.Kisiel et al. studied the structure and dipole moments of the bicyclic monoterpene camphorusing microwave spectroscopy [228]. These studies are in line with previous work on medium-sized biologically relevant molecules (e. g. monosaccharides [16], amino acids [17–19], nucle-obases [20, 21], neurotransmitters [22], and drugs [24–26]) that demonstrate the suitability ofmicrowave spectroscopy for obtaining information about the molecular structure, conforma-
This chapter is completely based on the following publication:
• D. Schmitz, V. A. Shubert, B. M. Giuliano, and M. Schnell, The broadband microwave spectra ofthe monoterpenoids thymol and carvacrol: Conformational landscape and internal dynamics, J. Chem.Phys. 141, 034304 (2014). (key ideas: D.S. 80%, experimental: 60%, data analysis: 80%, writing up:80%) [219]

74 CHAPTER 5. THYMOL AND CARVACROL
H
O
H
2
7
3
4
6
1
5
8
9
10CH3
H3CCH3
(a) cis-carvacrol
H
O 2
7
3
4
6
1
5
8
9
10
H
CH3
CH3
H3C
(b) trans-carvacrol
O
H
H
2
7
3
4 6
1
5
8
9
10CH3
H3CCH3
(c) cis-thymol
O H
H
2
7
3
4 6
1
5
8
10
9CH3
CH3
H3C
z = a
x = b
y = c
(d) trans-thymol
Figure 5.1: Schemes of the structures of the aromatic monoterpenoids thymol and car-vacrol. They differ in the position of the hydroxyl substituent with respect to the iso-propyl and the methyl groups.The coordinate system next to trans-thymol representsan approximation of the principal axes, which varies slightly between the differentmolecules and conformations. When discussing the orientation of the methyl rotor,the orientation of the axes with respect to the rest of the molecule becomes important.
tional preferences, and internal dynamics of this class of molecules.
In the present investigation, the vibrationally and rotationally cold gas-phase microwavespectra of the monocyclic monoterpenes and structural isomers, thymol, and carvacrol arereported. For both molecules, cis- and trans-conformational isomers can exist and the corre-sponding structures are depicted in Figure 5.1. Thymol and carvacrol differ in the positionof the hydroxyl group, which impacts the flexibility of both the hydroxyl and the methylgroups. Due to their anti-bacterial [229–231], anti-inflammatory [232], and anti-fungal prop-erties [233], thymol and carvacrol are particularly interesting for the pharmacological andfoodstuff industries. They occur naturally as the main constituents in the essential oils ofthyme, oregano, and satureja.
Spectroscopically interesting is the influence of the hydroxyl group on the ability of the methyltop to rotate internally. Microwave spectroscopy is well suited to observe the effects of largeamplitude motion, e. g. internal rotation, and enables the determination of the correspond-ing rotational energy barrier. Since the chemical environment of the moving group differsbetween different molecules, and even between conformers of the same molecule, the deriva-tion of a universal description of internal rotation is challenging. Recent improvements of thetheoretical description of different barrier types show that development in this field is stillhighly active [26, 32, 135, 198]. Herein the influence is discussed of the hydroxyl group on thebarrier to methyl group internal rotation, which can be expected to be largely different forthymol and carvacrol, and the results are compared to structurally similar molecules, such aso- and m-cresol [234, 235]. Furthermore, the influence is evaluated of the hydroxyl group onthe configuration of the isopropyl group and hence the conformational preferences.
This chapter is organized as follows: The experimental setup and the quantum chemicalcalculations are briefly described (Sec. 5.2), followed by a presentation of the experimental and

5.2. EXPERIMENTAL AND COMPUTATIONAL METHODS 75
computational results for each of the molecules under study (Sec. 5.3). The conformationalspace of the molecules and the barriers to internal rotation of the methyl tops are investigated.Subsequently, a discussion and a comparison of the results of thymol and carvacrol to eachother and with literature data is presented. Finally, the findings are summarized and a shortoutlook is given (Sec. 5.5).
5.2 Experimental and computational methods
Thymol (2-isopropyl-5-methylphenol, 99.5 % purity) and carvacrol (5-isopropyl-2-methylphenol,98 % purity) were purchased from Sigma-Aldrich Chemie GmbH, Steinheim, Germany andwere used without further purification. Thymol is a white crystalline powder with a statedmelting point of 48�51 °C and a boiling point of 232 °C. Carvacrol is a yellowish liquid with astated melting point of 3�4 °C and a boiling point of 237 °C. The chemical structures of bothmolecules are depicted in Figure 5.1. The orientation of the OH-group is defined with respectto the C2 atom of the benzene ring and its rotation gives rise to trans- and cis-conformersfor both molecules.
All rotational spectroscopy measurements were performed with the Hamburg COMPACTspectrometer which is detailed in Chapter 3 and thus only the experimental parameters aregiven here. After supersonic expansion into the vacuum chamber, the ensemble of moleculeswas polarized with a 1 µs chirp spanning 2 ! 8.5 GHz. For each spectrum, 50 µs of theFID were recorded at a resolution of 10 ps, yielding a frequency resolution of 20 kHz in theFourier transform and hence the rotational spectra obtained. The molecules were seeded intoa supersonic expansion using a pulsed nozzle (Parker General Valve, Series 9) operating at2 Hz to create a cold molecular jet. The sample holders were placed directly prior to thenozzle and heated to 100 °C or 140 °C for thymol or carvacrol, respectively. A constant flow ofneon at stagnation pressures of 3.0 bar transported the molecules to the nozzle. Note that thetubing between the reservoir and the valve, as well as the valve itself, were heated to avoidcondensation. For carvacrol and thymol, 300 000 FIDs and 438 000 FIDs, respectively, were co-added for each spectrum. After performing the Fourier transformation, residual backgroundlines were removed by masking, which means that the intensities in the spectrum at thefrequencies identified as background lines were set to zero. Different approaches were used toidentify background lines in the spectra: 1. by a comparison of the spectra obtained usingonly the first and last 20 µs of the FID. In the last 20 µs of the FID, the molecular signal isalready significantly reduced; 2. by an individual background measurement with the valveswitched off; 3. by a comparison of the two measurements of thymol and carvacrol.
One of the primary advantages of microwave spectroscopy is its ability to obtain informa-tion about the gas-phase structure of molecules to a high precision. However for a completestructure determination, rotational constants from numerous different isotopologues are re-quired. Such an effort was recently reported for a comparatively large molecule, strawberryaldehyde (C
12
H14
O3
) [236]. However, this approach remains experimentally demanding and

76 CHAPTER 5. THYMOL AND CARVACROL
time intensive. Another way to extract structural information from the experimental datais comparison with quantum chemical calculations (explained in Sec. 2.6). The assignmentof an experimentally obtained spectrum (e.g. by comparison of rotational constants, barrierto internal rotation, dipole moments) to a quantum chemically optimized structure has givengood results, even for larger molecules and complexes [170].
Herein, the experimental results were compared with electronic structure calculations per-formed with the Gaussian 03 [206] and Gaussian 09 [207] program suites. In order to deter-mine the preferred orientations of the isopropyl groups, relaxed energy scans of the potentialenergy surface (PES) of the isopropyl group rotation were carried out. As starting struc-tures for the energy scans, the cis- and trans-conformers of thymol and carvacrol were usedas depicted in Figure 5.1. The Becke, three parameter, Lee-Yang-Parr (B3LYP) exchange-correlation functional was employed with the 6-311++G(d,p) basis set for these scans. Twounequal minima in the PES were found for each starting structure. To further refine thestructures and verify the energy ordering of the individual conformations, optimizations andharmonic frequency calculations were carried out on all minima using several different ba-sis sets and methods: B3LYP/6-311++G(d,p), B3LYP/aug-cc-pVTZ, MP2/6-311++G(d,p)(Møller–Plesset second-order perturbation theory), and M06-2X/6-311++G(d,p) (Minnesotafunctional). In order to get an overview of the internal dynamics, the cis-trans isomerizationbarrier was also computed, as well as the barrier to internal rotation for the different methyltops. These calculations were performed at the B3LYP/6-311++G(d,p) level of theory forselected minima. Here, the barriers to internal rotation for the methyl tops at positions fiveand two of thymol and carvacrol, respectively, are particularly interesting because they areexpected to be similar to that of o- and m-cresol [234, 235]. The barrier to internal rotationof those molecules is small enough that the corresponding splitting of the rotational energylevels into A and E species components should be observed in the spectra.
5.3 Results
Carvacrol
The computational findings and their use to complement and interpret the experimentalresults are first presented. The relaxed PES of the isopropyl group rotation for the cis-and trans-conformers are depicted in Figure 5.2. The potential energy relative to the globalminimum (denoted as trans-B) is plotted as a function of the dihedral angle, H-C7-C5-C6.The trans-carvacrol PES is lower in energy than that of the cis-isomer, with an offset ofapproximately 1.8 kJ/mol. Two minima exist on both the cis- and trans-conformer PESs, withdihedral angles H-C7-C5-C6 of exactly 0� and 180�. As illustrated in Figure 5.2, the methyltops of the isopropyl (C8 and C9) are out-of-plane at the minima. For both the cis and thetrans curves, the lowest minima coincide with a dihedral angle of 180�, where the hydrogenconnected to C7 is opposite to the hydroxyl group. Those conformations are labeled withB and the second local minimum at a dihedral angle of 0� with A. Hence, in total four

5.3. RESULTS 77
�30 0 30 60 90 120 150 180 210 240 270 300 330
dihedral angle H-C7-C5-C6 (�)
0
2
4
6
8
10
12
ener
gy(k
J/m
ol)
1.86 kJ/mol
1.70 kJ/mol
cis-A
trans-A
cis-B
trans-B
cis-carvacrol
trans-carvacrol
Figure 5.2: Scan of the potential energy surface calculated along the H–C7–C5–C6 di-hedral angle according to the labeling in Fig. 5.1 at the B3LYP/6-311++G(d,p) levelof theory for cis- and trans-carvacrol. The position of the observed conformations(A, B) is indicated in the plot and illustrated with the corresponding structure.
conformations were found, two conformers each in the two conformational families of cis- andtrans-carvacrol.
The isomerization barrier between the A and B rotamers that corresponds to rotation ofthe isopropyl group with respect to the rest of the molecule was determined to be approxi-mately 10 kJ/mol for both cis- and trans-conformers. The barrier to cis-trans isomerization,corresponding to rotating the hydroxyl group around the C1-O bond, was computed to be15 kJ/mol for both A and B rotamers. The computational results for the barrier to internalrotation of the methyl group bonded to the C2 carbon are listed in Tables 5.1 and 5.2. Forthe analysis of the hindered rotation, the Hamiltonian of the rigid rotor has to be extended toinclude the kinetic and potential energy terms of the internal rotor. In the case of a threefoldsymmetric top, the potential energy, V , can be described in terms of the internal rotationangle ↵ (compare Eqn. 2.62):
V (↵) =1
2V
3
(1 � cos (3↵)) +1
2V
6
(1 � cos (6↵)) + . . . (5.1)
Depending on the symmetry of the molecular framework, higher order terms may also needto be included. Thus, to convert the computed barrier height into a quantity that can becompared with experimental results, the potential energy scans were fitted using Equation 5.1.For a methyl group in highly symmetric local environments, e.g. as a substituent on a phenylring with symmetric substitution in both ortho positions, such as in thymol (discussed in the

78 CHAPTER 5. THYMOL AND CARVACROL
Table 5.1: Rotational constants, dipole moments, and barriers to internalrotation of the C2 methyl group for cis-carvacrol. Note the errors givenhere for the measured values are standard errors. N ° is the number oflines included in the fit and � is the standard deviation of the fit.
cis-carvacrol A cis-carvacrol B
Experiment B3LYP1 MP22 Experiment B3LYP1 MP22
A (MHz) 2274.0616(37) 2281.04 2265.57 2152.8772(44) 2163.74 2142.48
B (MHz) 643.77212(46) 642.53 643.35 672.34073(50) 669.87 672.76
C (MHz) 564.76557(38) 564.32 563.77 578.22275(42) 577.29 577.62
|µa
| (D) - 0.94 0.77 - 1.12 1.05
|µb
| (D) - 0.94 1.30 - 0.80 1.14
|µc
| (D) - 0.00 0.00 - 0.00 0.00
V
3
(kJ
/mol) - 5.613 - - 5.903 -
N� 15 - - 27 - -
� (kHz) 5.5 - - 8.8 - -
1 aug-cc-pVTZ basis set2 6-311++G(d,p) basis set3 B3LYP/6-311++G(d,p)
next section), the V6
contribution could be significant. For carvacrol, the single hydroxyl groupsubstituted ortho to the methyl group breaks this symmetry so that truncation consideringonly the V
3
term is sufficient. As expected, the barrier heights differ significantly between thecis- and trans-isomers.
As a test case, the internal rotation barrier of a methyl top within the isopropyl group for thetrans-carvacrol A isomer was calculated to ensure that it is too high to have an observableeffect on the spectra. The barrier for this motion and isomer should be the lowest of all ofthe isomers investigated here and was computed to be 13.2 kJ/mol.
For comparison with the experimentally obtained molecular constants, the geometries ofthe four minima were further optimized and frequency calculations were carried out at theB3LYP/6-311++G(d,p), B3LYP/aug-cc-pVTZ, M06-2X/6-311++G(d,p), and MP2/6-311++G(d,p)levels of theory. Trans-carvacrol B was confirmed to be the global minimum by all methodsexcept MP2, which predicts the trans-carvacrol A conformer to be the global minimum. TheB3LYP calculations predict just a 0.3 kJ/mol energy difference between the different trans-rotamers of carvacrol. The energy ordering of the cis- vs. the trans-conformers is, however,confirmed by all calculations. The calculated and fitted rotational constants are presented inTables 5.1 and 5.2. The zero-point corrected energies are summarized in Table 5.3.
All four minimum structures discussed above were identified in the broadband microwavespectrum of carvacrol covering 2� 8.5 GHz. Figure 5.3 shows a fraction of the spectrum from3600 � 3615 MHz, in which transitions from all four conformations can be observed. They

5.3. RESULTS 79
Table 5.2: Rotational constants, dipole moments, and barriers to internalrotation of the C2 methyl group for trans-carvacrol. The errors given herefor the measured values are standard errors. N ° is the number of linesincluded in the fit and � is the standard deviation of the fit. Note that theangles (�, ") and the rotational constant of the methyl top, F
0
, are notfitted and their uncertainties are not considered in the fit. This omissionmainly affects the V
3
parameter, its error, and hence the resulting errorof the V
3
parameter is most likely underestimated. The direction cosinesbetween the internal rotation axis (i) and the principal axes (a, b, c) arealso given, employing the principal axis system orientation depicted inFigure 5.1d.
trans-carvacrol A trans-carvacrol B
Experiment B3LYP1 MP22 Experiment B3LYP1 MP22
A (MHz) 2283.1750(15) 2288.58 2281.82 2159.0853(25) 2169.50 2153.85
B (MHz) 642.240345(30) 641.17 641.27 670.84871(51) 668.31 670.63
C (MHz) 564.09631(25) 563.68 563.13 577.52683(41) 576.48 576.84
|µa
| (D) - 0.90 1.28 - 1.06 1.42
|µb
| (D) - 0.90 0.81 - 0.60 0.45
|µc
| (D) - 0.00 0.00 - 0.00 0.00
⇢ 0.01383 0.0138 0.0140 0.01343 0.0134 0.0135
F
0
(GHz) 161.54 161.5 159.7 161.54 161.5 159.6
" (°) 180.04 180.0 180.0 180.04 180.0 178.4
� (°) 13.04 13.0 12.9 1.024 1.02 0.35
\(i,a) (°) 13.04 13.0 12.9 1.024 1.02 0.35
\(i,b) (°) 103.04 103.0 102.9 91.04 91.0 90.4
\(i,c) (°) 90.04 90.0 90.0 90.04 90.0 90.0
V
3
(kJ
/mol) 4.0871(25) 3.75 - 4.4024(16) 3.95 -
N� 49 - - 42 - -
� (kHz) 8.7 - - 10.9 - -
1 aug-cc-pVTZ basis set2 6-311++G(d,p) basis set3
⇢ was not fitted but computed using the fitted rotational constants4 Values fixed to calculated values (B3LYP/aug-cc-pVTZ)5 B3LYP/6-311++G(d,p)

80 CHAPTER 5. THYMOL AND CARVACROL
Table 5.3: Comparison of the zero-point corrected energies(kJ/mol) and populations of the different structural isomers ofthymol and carvacrol using different methods and basis sets.
B3LYP1 B3LYP2 M06-2X1 MP21 population3
thymol
trans A 0 0 0 0 0.48
trans B 1.06 1.62 2.56 0.75 0.28
cis A 3.38 3.10 1.99 3.58 0.18
cis B 6.00 6.06 6.72 8.28 0.07
carvacrol
trans A 0.29 0.26 2.04 0 0.28
trans B 0 0 0 0.71 0.30
cis A 1.59 1.40 2.50 1.12 0.20
cis B 1.57 1.19 2.76 1.51 0.211 6-311++G(d,p)2 aug-cc-pVTZ3 B3LYP/aug-cc-pVTZ energies used for calculating the Boltzmann pop-
ulation, temperatures of T = 373.15K and T = 413.15K were used forthymol and carvacrol, respectively
all exhibit a-type spectra of near prolate asymmetric rotors and a few b-type transitions.Furthermore, some transitions are split into doublets, which are ascribed to internal rotationof the methyl group connected to the phenyl ring. These splittings were small (⇡ 100 kHz)and were observed only from the two conformations with the most intense spectra. Theseadditional spectral features give us valuable information for spectral assignment. The spectraexhibiting no internal rotation splittings are fit to a rigid rotor model using Pickett’s suiteof programs, SPFIT [146]. The nature of the fitted transitions, at low J , did not permit thedetermination of the distortion constants from the fit. The rotational constants obtained andthe lower line intensities suggest the assignment of the conformers without line splittings to thecis-isomers of carvacrol. These assignments are supported by the computed internal rotationbarrier heights for the C2 methyl group in the cis-isomers (see Table 5.1). With barriersof 5.6 kJ/mol and 5.9 kJ/mol, they are 50 % higher than the barriers for the trans-isomers andthus should yield line splittings too narrow to be resolved in the experiments presented herein.The further assignment of the A- and B-rotamers of cis-carvacrol was straightforward becausetheir rotational constants are sufficiently different and agree well with the calculated values.Table 5.1 shows the results of the spectral assignment of cis-carvacrol. The remaining lines inthe spectrum, which were split due to internal rotation, could be assigned to the trans-isomersof carvacrol.
A more thorough analysis of the effect that internal rotation has on the observed spectrarequires inclusion of the kinetic energy term of the internal rotor into the molecular Hamil-

5.3. RESULTS 81
3602 3604 3606 3608 3610 3612 3614
frequency (MHz)
�1.5
�1.0
�0.5
0.0
0.5
1.0
1.5in
tensi
ty(V
)⇥10
�6
trans B: 2
12
� 3
13
(A-E splitting)
cis B: 2
12
� 3
13
trans A: 2
02
� 3
03
(A-E splitting
not resolved)
cis A: 2
02
� 3
03
Figure 5.3: Part of the microwave spectrum of carvacrol in the region of 3600 �3615 MHz.The upper trace shows the measured spectrum, the lower trace is a simu-lation based on fitted molecular parameters. The small line splitting due to internalrotation is apparent for the 2
12
! 313
transition of trans-carvacrol B. In compari-son, the smaller line splitting of the transition 2
02
! 303
of trans-carvacrol A wasnot resolved. No line splitting was observed for the cis-conformers.
tonian (compare Eqn. 2.68 in Sec. 2.3). In principle this implementation is straightforward,but different coordinate transformations have been proposed for handling the problem effi-ciently [132, 139]. Herein, the combined axis method (CAM) developed by Woods [136, 137]and detailed in Section 2.3) is employed. Besides the barrier height, V
3
, the analysis of theinternal rotation also provides information about the orientation of the internal rotor withinthe molecular framework and its moment of inertia. A threefold barrier results in splittings ofthe energy levels into (non degenerate) A-states and doubly degenerate E-states which varywith the rotational quantum numbers and thus leads to splittings in the spectrum (see Fig.2.6).
The program XIAM is chosen to perform a fit of the spectrum including transitions of both Aand E symmetry. It is capable of treating up to three internal rotors with a V
3
potential andapplies the CAM method [138]. The orientation of the methyl rotor within the principal axissystem is specified using the angles � and ". In the case of a prolate asymmetric top usingthe Ir-representation, � describes the angle between the a-rotational axis of the molecule andthe axis of internal rotation. The angle " describes the angle between the b-rotational axisand the projection of the internal rotor axis onto the xy-plane of the principal axis system ofthe molecule.
The structure calculations for trans-carvacrol indicate that the internal rotation axis almost

82 CHAPTER 5. THYMOL AND CARVACROL
�60 �30 0 30 60 90 120 150 180 210 240 270 300
dihedral angle H-C7-C5-C6 (�)
0
5
10
15
20
25
30
ener
gy(k
J/m
ol)
3.24 kJ/mol
5.97 kJ/mol
trans-A
cis-A
trans-B
cis-B
trans-thymol
cis-thymol
Figure 5.4: Scan of the potential energy surface calculated along the H–C7–C2–C1 di-hedral angle at the B3LYP/6-311++G(d,p) level of theory for cis- and trans-thymol.The two minima of cis-thymol A are equivalent, as are the two for trans-thymol A.The structure of trans-thymol A is most likely stabilized by a hydrogen bond.
coincides with the a-rotational axis. This result implies that � is close to 0� while " is onlypoorly defined. Hence, fits of the data including these angles gave unphysical or divergingresults. Therefore, the angles and the rotational constant of the methyl top (F
0
= ~/2I↵
) wereheld fixed at the calculated values and only the rotational constants of the molecule and thebarrier to internal rotation were allowed to float. The results of these fits are summarized inTable 5.2. As for the cis-rotamers, the assignment of the trans-rotamers to trans-carvacrolA or B was also unambiguous by comparison of the measured and the calculated rotationalconstants. In total 49 lines are assigned to trans-carvacrol A and 42 lines to trans-carvacrolB.
Thymol
Due to their structural similarities, the same analysis protocol is followed for thymol as forcarvacrol. Therefore, the main focus here is on the differences between the molecules ratherthan the analysis details. The relaxed potential energy scan of the internal rotation of theisopropyl group already reveals significant differences compared to carvacrol. As shown inFigure 5.4, the cuts through the potential energy surfaces exhibit three minima of trans- andcis-thymol instead of two as observed for carvacrol. For the A rotamers, the hydrogen atC7 is slightly out of plane, resulting in two equivalent minima. Compared to carvacrol, theenergy difference between the cis- and the trans-conformational families of thymol is much

5.3. RESULTS 83
5000 5500 6000 6500 7000 7500
frequency (MHz)
�4
�2
0
2
4
inte
nsi
ty(V
)
⇥10
�6
trans-A (A-type)
trans-A (E-type)
trans-B (A-type)
cis-A (A-type)
Figure 5.5: A part of the broadband microwave spectrum of thymol in the frequencyregion of 5.0�7.7 GHz. It is dominated by the A and E species components of trans-thymol A. The transitions of trans-thymol B and cis-thymol A are much weaker thanthose of trans-thymol A.
larger (approximately a factor of two and four larger for the A and B rotamers, respectively)because of the additional structural stabilization from the hydrogen bonds formed in thetrans-thymol rotamers. The energy ordering of rotamers A and B is also reversed for thymolas compared to carvacrol at the B3LYP/6-311++G(d,p) level of calculation. Finally, thepotential barrier between rotamers A and B was determined to be around 23 kJ/mol, 2.3-timeshigher than in carvacrol. These results are expected because the hydroxyl group in thymolis able to more strongly interact with the isopropyl group than in carvacrol. The barrierof the cis-trans interconversion by rotating the hydroxyl group around the C1-O bond wascalculated to be 15.4 kJ/mol and 16.1 kJ/mol for the rotamers A and B, respectively.
The structure of thymol also suggests a lower barrier to internal rotation for the methyl groupat the carbon 5. This hypothesis was confirmed by calculations on all four conformations,which yielded barrier heights between 0.04 kJ/mol (cis-thymol) and 0.3 kJ/mol (trans-thymol),values at least ten times smaller than for carvacrol. Therefore, an obvious effect of methylgroup internal rotation on the microwave spectra of all conformations of thymol is expected.The calculated barriers were fit using Equation 5.1 and are summarized in Tables 5.4 and 5.5.Even though the V
6
part of the potential is negligible for trans-thymol, it becomes significantfor cis-thymol, and so both the V
3
and V6
terms are included in Table 5.5. This result is anindication that the interaction of the hydroxyl group with the methyl group becomes weakerso that the local environment of the methyl rotor at carbon 5 approaches C
2V symmetry, asin toluene. To exclude possible effects on the spectra by the rotation of one of the isopropyl

84 CHAPTER 5. THYMOL AND CARVACROL
Table 5.4: Rotational constants, dipole moments, and barriers to internalrotation of the C5 methyl group for trans-thymol. The errors given herefor the measured values are standard errors. N ° is the number of linesincluded in the fit and � is the standard deviation of the fit. The directioncosines between the internal rotation axis (i) and the principal axes (a, b,c) are also given, employing the principal axis system orientation depictedin Figure 5.1d.
trans-thymol A trans-thymol B
Experiment B3LYP1 MP22 Experiment B3LYP1 MP22
A (MHz) 2034.068(71) 2039.45 2024.06 2261.070(62) 2237.63 2229.72
B (MHz) 739.18202(35) 735.91 738.22 708.92030(45) 707.59 708.94
C (MHz) 591.51673(30) 591.73 593.03 611.86246(50) 611.13 611.43
|µa
| (D) - 1.12 1.43 - 1.15 1.50
|µb
| (D) - 0.72 0.53 - 0.82 0.72
|µc
| (D) - 0.10 0.07 - 0.00 0.04
D
p2J
(kHz) 2.44(23) - - - - -
⇢ 0.012990(42) 0.0126 0.0126 - 0.0137 0.0138
F
0
(GHz) 156.26(51) 161.7 160.1 - 161.7 160.1
" (°) 111.73(16) 112.4 105.2 - 0.0 7.1
� (°) 3.8471(46) 3.5 4.6 - 8.3 8.8
\(i,a) (°) 3.8471(46) 3.5 4.6 - 8.3 8.8
\(i,b) (°) 91.423(12) 91.3 91.2 - 81.7 81.2
\(i,c) (°) 86.4267(84) 86.8 85.5 - 90.0 88.9
V
3
(kJ
/mol) 0.3699(11) 0.3183 - - 0.2613 -
N� 54 - - 12 - -
� (kHz) 11.6 - - 4.0 - -
1 aug-cc-pVTZ basis set2 6-311++G(d,p) basis set3 B3LYP/6-311++G(d,p)

5.3. RESULTS 85
methyl groups, a methyl group rotation for trans-thymol A was evaluated. It is very unlikelythat the calculated barrier height of 13.7 kJ/mol will impact the spectrum in a measurable way.
The analysis of the spectrum revealed three conformers, with one having much higher intensitythan the other two. The spectra are dominated by a-type transitions, which is not so apparentin the overview spectrum in Figure 5.5 due to widely split lines from internal rotation of themethyl group. We first concentrate on the analysis of the highest intensity conformer. Forthis species, transition splittings due to methyl group rotation could be identified and weresuccessfully assigned. The smaller internal rotation barrier compared to carvacrol increasedthe line splitting up to 88 MHz. The assignment is made of 39 and 15 a-type lines of A andE symmetry, respectively. For the b-type lines, only those of A symmetry are observed. Aglobal fit including all lines using XIAM was performed, in which the angles � and " andthe rotational constant of the methyl rotor, F
0
, could be fit in addition to the rotationalconstants and barrier height. Only the V
3
part of the potential was retained in the final fit,because, as stated before, the calculations suggest that the V
6
term is negligible (less than3 % compared to the V
3
term). Furthermore, including V6
in the fit did not improve it and ledto unphysical results for V
3
and V6
. Moreover, also included is the internal rotation-overallrotation distortion operator, Dpi2J , which led to better fits, especially for lines with Ka > 1.This more complete assessment for thymol compared to carvacrol was possible due to thelarger line splitting, so that more lines of E symmetry could be assigned. Even though thefit did not diverge, the resulting values of the internal rotor angles � and " were dependenton the starting guess values of the fit. Therefore, the quantum chemically calculated anglesare used as starting values and are assumed to be already close to the real values. Theconvergence of all other constants included in the fit was much more robust. Because ofthe structural similarities of the cis- and trans-isomers, an unambiguous assignment to thecalculated structures based on only the rotational constants is not possible. However, theenergy ordering of the different conformations (Table 5.3) and the barrier height to internalrotation provide sufficient information for a solid assignment. Taking this information intoaccount, the highest intensity conformer must be the trans-thymol A conformer.
As already mentioned, the line intensities of the other two conformers were much weakerand sometimes even barely distinguishable from the noise (S/N ratio is around 2:1 for thelower intensity lines). Nevertheless, 10 lines were identified for one of the conformers and12 lines for the other one. Only a-type transitions of A symmetry could be assigned forboth of them. Even though there was evidence for line splitting as the calculated barrier tointernal rotation predicts, it was not possible to clearly identify any E-symmetry lines. Thecomparison between the fitted and calculated rotational constants suggests that one of theseconformations is cis-thymol A, while the calculated energy ordering (Table 5.3) suggests thatthe other one is trans-thymol B.

86 CHAPTER 5. THYMOL AND CARVACROL
Table 5.5: Rotational constants and dipole moments for cis-thymol. Only cis-thymolA lines were identified in the spectra, and thus only experimental values for this cisconformation of thymol could be determined. The errors given here for the measuredvalues are standard errors. N ° is the number of lines included in the fit and � is thestandard deviation of the fit.
cis-thymol A cis-thymol B
Experiment B3LYP1 MP22 B3LYP1 MP22
A (MHz) 2048.642(32) 2027.07 2009.27 2218.7704 2205.61
B (MHz) 739.25463(50) 735.71 739.12 704.57 705.10
C (MHz) 590.31448(44) 591.02 591.56 608.31 607.78
|µa
| (D) - 1.25 1.15 1.11 0.96
|µb
| (D) - 0.72 1.11 1.01 1.35
|µc
| (D) - 0.04 0.14 0.03 0.36
V
3
(V3
, V
6
) (kJ
/mol) - 0.106 (0.069, 0.057)3 - 0.036 (0.025, 0016)3 -
N� 10 - - - -
� (kHz) 4.4 - - - -
1 aug-cc-pVTZ basis set2 6-311++G(d,p) basis set3 B3LYP/6-311++G(d,p)
5.4 Discussion
The measurements and calculations revealed that the energy differences among the conformersof thymol are larger than for carvacrol. This spread in energies explains the presence of fourconformations in the supersonic expansion for carvacrol, compared to only three for thymol.The comparison of the zero-point corrected energies as well as the calculated populations ofthe different structural isomers given in Table 5.3 further elucidates this result. The calculatedenergy of the cis-thymol B conformer, which was not observed in the spectrum, is at leasttwo times higher than the second highest energy conformer, cis-thymol A, for all methodsand basis sets.
The influence of the substituents on the barrier to methyl rotation was investigated previouslyin various substituted toluenes [131, 135, 234, 235, 237, 239]. Some of the results are listed inTable 5.6 together with the thymol and carvacrol results. This list shows some clear trendsfor internal rotation barriers. The barrier heights of trans-carvacrol A and anti-o-cresol arevery similar because the molecules only differ in that cresol does not contain an isopropylsubstituent. The effects of the internal rotation for cis-carvacrol were not resolvable, but thebarrier height can be expected to be similar to that of syn-o-cresol. A direct comparison of thebarrier heights of trans-thymol A and syn-m-cresol was not possible, because Hellweg et al.also included the V
6
term of the potential [235], which was excluded here because it resulted

5.5. CONCLUSION AND OUTLOOK 87
Table 5.6: Comparison of the barriers to internal rotation of thymol, carvacrol, andsimilar molecules. The barrier heights are listed in increasing order.
V3
(kJ/mol)
toluene V6
= 0.05787337(11) [135]anti-m-cresol 0.038(2) (V
6
= -0.16(2)) [235]syn-m-cresol 0.2684(8) (V
6
= -0.13(1)) [235]trans-thymol A 0.3699(11) (this work)o-tolunitrile 2.24538(4) [237]trans-carvacrol A 4.0875(25) (this work)trans-carvacrol B 4.4025(16) (this work)anti-o-cresol 4.4256(14) [234]o-chlorotoluene 5.527(10) [131]memphenesin (conf. A) 5.736(18) [238]o-xylene 6.23(21) [239]syn-o-cresol 7.912(46) [234]
in unphysical results. However, the V3
contribution to the potential is of the same orderof magnitude. In summary, the barrier height of the methyl rotor seems to depend mainlyon steric effects, as also suggested by Gerhard and coworkers [131]. Hence, more extendedsubstituents close to the rotating methyl group, such as another methyl group (e.g. as inxylene), result in higher barriers than more compact groups, such as a cyano group (e.g. as ino-tolunitrile). For a hydroxyl group, the barrier height very much depends on the orientationof the hydrogen, as expected.
5.5 Conclusion and outlook
The microwave spectra of two monoterpenoids, thymol and carvacrol, were presented. Fourconformations of carvacrol were identified in the cold conditions of the molecular beam. Incontrast, only three conformations of thymol were present. This difference can be explainedby the higher energies of the group of cis-conformers of thymol relative to the global minimumtrans-conformer compared with carvacrol, where the energy differences between the cis- andtrans-conformer groups are smaller.
For thymol and carvacrol, internal rotation of the terminal methyl top was observed and afitted barrier height that is consistent with measurements of similar molecules was obtained.The one order of magnitude difference in the barrier heights observed for these two moleculescan be directly ascribed to the different positions of the hydroxyl substituent on the aromaticring. In carvacrol, the hydroxyl group is substituted ortho to the methyl top and thus stronginteractions arise, resulting in a high barrier to internal rotation. In thymol, the hydroxylgroup is substituted meta to the methyl top and thus the larger distance between these groupsresults in weaker hindrance to methyl rotation and thus a lower internal rotation barrier.
The supplementary information of Reference [219] provides linelists with the corresponding assignments.

88 CHAPTER 5. THYMOL AND CARVACROL
The results of the quantum chemical calculations agreed very well with the experiment. Therotational constants from both the MP2- and B3LYP-based methods are near to the valuesobtained experimentally, indicating that they are accurate enough to model the structures ofthe kinds of molecular systems investigated here.
In future work, extensions to studies of secondary interactions, i.e. hydrogen bonding bysubstitution of a second hydroxyl group onto the aromatic ring, will be interesting. In thenext chapter the chiral monoterpenoid menthol and menthone are investigated. Mentholexhibits the same substituent patterns as thymol, but has a central cyclohexane ring insteadof a phenyl ring. The additional structural flexibility of menthol influences the number ofpotential low-energy conformers and it will be intriguing to draw direct comparisons to planarthymol.

Chapter 6
Exploring the conformational
landscape of menthol, menthone, and
isomenthone: A microwave study
6.1 Introduction
As detailed in the previous chapter, terpenoids represent a large and diverse class of organicmolecules with varying chemical and biological activities [220], such as anti-bacterial [231,241, 242], antioxidant, anti-inflammatory [232], and anti-fungal properties [233, 242]. Toexplain or even predict the molecular origin of a specific chemical or biological behavior,knowledge of the molecular structure, the potential energy surface (PES), the conformationalflexibility, and the internal dynamics is required. In this Chapter, the gas-phase structuresand conformational space of menthol, menthone, and isomenthone are investigated basedon vibrationally and rotationally cold gas-phase microwave spectra and quantum chemicalcalculations. In contrast to thymol and carvacrol (previous chapter), the cyclohexane ring inmenthol adds further flexibility and extends the conformational space.
Menthol is a monoterpene alcohol with several properties that make it a chemically andbiologically interesting system. It is well-known for its minty smell and used as a flavoringagent in many different applications. Menthol is also famous for its cooling sensation whenapplied to skin or mucous membranes [243]. This property is exploited in its widespread useas a cooling-enhancing additive in cigarettes, cough medicines, and antipruritics [244, 245].The three chiral centers of menthol result in eight different stereoisomers, of which the (-)-enantiomers are depicted in Figure 6.1. The stereoisomers, (-)-menthol (1R, 2S, 5R), and(-)-neomenthol (1R, 2R, 5S), are naturally occurring in the essential oil of Mentha x piperita
This chapter is completely based on the following publication:• D. Schmitz, V. A. Shubert, T. Betz, and M. Schnell, Exploring the conformational landscape of menthol,
menthone, and isomenthone: A microwave study, Front. Chem. 3, 15 (2015). (key ideas: 80%,experimental: 80%, data analysis: 80%, writing up: 75%) [240]

90 CHAPTER 6. MENTHOL, MENTHONE, AND ISOMENTHONE
CH 3
O
CH 3 H CH 3
H 2
7
3
46
1
5
8
9
10
12
11
***
(a) (-)-menthol
CH 3
O
CH 3 H CH 3
H
(b) (-)-isomenthol
CH 3
O
CH 3 H CH 3
H
(c) (-)-neomenthol
CH 3
O
CH 3 H CH 3
H
(d) (-)-neoisomenthol
Figure 6.1: Schemes of the structures of the four stereoisomers of menthol. Only the(-)-enantiomers are displayed. In the sample, used for the experiments herein, (-)-menthol (1R, 2S, 5R) is expected to be the main component. The three stereogeniccenters are marked with stars in (a).
L. (peppermint) with (-)-menthol as its major constituent and (-)-neomenthol as an impurity.The R (lat. rectus) or S (lat. sinister) are labels that specify the local configuration at eachchiral center according to the Cahn, Ingold and Prelog nomenclature [246].
Menthone is the ketone analogue of menthol. It bears two chiral centers and hence fourdifferent stereoisomers. The (-)-enantiomers of menthone are shown in Figure 6.2. Menthonehas a similar minty smell as menthol and also occurs naturally in peppermint oil. As withmenthol, menthone is used as an odorant and within asymmetric synthesis [247]. Both mentholand menthone also show potential as vehicles for transdermal drug delivery [244, 248, 249].
Both molecules are of interest for spectroscopic studies due to their chiral properties. Com-prising two stereogenic centers while maintaining a rather simple structure, menthone wasused for demonstrating enantiomeric excess determination techniques [250]. Menthol servedas prototype molecule in a chirality recognition study [251]. The structure of menthol has beeninvestigated before using electron diffraction, NMR, IR spectroscopy, and quantum chemicalcalculations [251–254]. For menthone, only NMR and computational model data exist [255].
The conformational space of menthol is more complex than that of menthone due to theadditional flexibility of the hydroxyl group. Menthol was extensively studied by Albrechtet al. [251] and more recently by Moreno et al. in a combined IR and VCD spectroscopystudy [254]. The microwave spectroscopy findings herein are built upon and related to theirresults. Moreover, the focus is on elucidation of the potential energy surfaces of menthoneand its diastereomer isomenthone. Menthone and menthol share similar structural charac-teristics involving the lowest energy cyclohexane ’chair’ configuration, while the low-energyconformational landscape of isomenthone retains several cyclohexane conformations.
Broadband microwave spectroscopy enables the simultaneous measurement of the rotationalspectra of multiple conformations, providing a wide swath of the spectrum within the band-width of the instrument in a single measurement. This broad acquisition is beneficial for the

6.2. EXPERIMENTAL AND COMPUTATIONAL METHODS 91
CH 3
O
CH 3 H CH 3
2
7
3
46
1
5
8
9
10
11
*
*
(a) (-)-menthone
CH 3
O
CH 3 H CH 3
2
7
3
46
1
5
8
9
10
11
*
*
(b) (-)-isomenthone
Figure 6.2: Schemes of the structures of the (-)-enantiomers of menthone. The twostereogenic centers are marked with stars.
assignment of the individual transitions within a spectrum because recurring patterns can beidentified quickly and linked to a predicted spectrum. However, the presence of several speciesin the rotational spectrum can impede a straightforward assignment. Therefore a computerprogram was developed and used for the analysis of broadband microwave spectra in Section6.3 and applied it to the mixture of menthone isomers (four different species). The programidentifies and fits the different species within a spectrum using calculated ab initio rotationalconstants as initial input values.
6.2 Experimental and computational methods
Menthone (2-isopropyl-5-methylcyclohexanone, 97 % purity, mixture of isomers, i.e., poten-tially containing all four diastereomers ((+/-)-menthone and (+/-)-isomenthone)) and men-thol (2-isopropyl-5-methylcyclohexanol, 99 % purity) were purchased from Sigma-Aldrich Che-mie GmbH, Taufkirchen, Germany and were used without further purification. No furtherinformation was provided about the stereoisomeric composition of the menthol sample. Dueto its synthetic origin, the stereoisomer (-)-menthol is expected to be the main component.Menthol is a white, flaky, and sticky hydrophilic crystalline solid with a stated melting pointof 34 � 36 °C and a boiling point of 216 °C at standard conditions. The mixture of menthoneisomers is a yellowish liquid with a stated boiling point of 85 °C. The schemes of the chemicalstructures of (-)-menthone, (-)-isomenthone, and (-)-menthol are depicted in Figures 6.1 and6.2.
All rotational spectroscopy measurements were performed with the Hamburg COMPACTspectrometer which has been detailed elsewhere [69] and thus only a brief description is givenhere. The molecules were seeded into a supersonic expansion using a pulsed nozzle (ParkerGeneral Valve, Series 9) operating at 2 Hz. The sample holders were placed directly prior to

92 CHAPTER 6. MENTHOL, MENTHONE, AND ISOMENTHONE
2000 3000 4000 5000 6000 7000 8000
frequency (MHz)
inte
nsi
ty(a
rb.
units)
Experiment
Assignment
Figure 6.3: Microwave spectrum of menthol in the region of 2 � 8 GHz. The uppertrace shows the experimental spectrum, the lower trace is a simulation based on fittedmolecular parameters. The spectrum is dominated by a-type and c-type transitions.A rotational temperature of 0.5 K gives the best match between the simulated and theexperimental intensities. A line splitting due to the internal rotation of any of themethyl groups is not observed in the spectrum.
the nozzle and heated to about 112 °C for both menthol and menthone. This temperaturegave the best signal for both molecular samples. A constant flow of neon at a stagnationpressure of 3.0 bar transported the molecules to the nozzle. After supersonic expansion intovacuum, the ensemble of molecules was polarized with a 1 µs chirp spanning 2 ! 8.5 GHz.The chirp was generated with an arbitrary waveform generator, amplified to 300 W with atraveling wave tube amplifier, and transmitted into the vacuum chamber with a horn antenna.Following excitation, the free induction decay (FID) of the macroscopic ensemble of polarizedmolecules was recorded. For each spectrum, 50 µs of the FID were recorded at a resolutionof 10 ps, yielding a frequency resolution of 20 kHz in the Fourier transform and hence therotational spectra obtained. For menthol and menthone, 444 000 FIDs and 128 000 FIDs,respectively, were coadded for each spectrum. The resulting signal-to-noise ratio of (100:1)for the strongest transitions was sufficient to identify the parent isotopologue species of thedifferent conformers. After performing the Fourier transformation, residual background lineswere removed.
Herein, the experimental results were compared with electronic structure calculations per-formed with the Gaussian 09 [256] program suite. For menthol, in order to determine thepreferred orientations of the hydroxyl group and the lowest energy orientation of the iso-propyl group, relaxed energy scans of rotations for the hydroxyl and isopropyl groups with
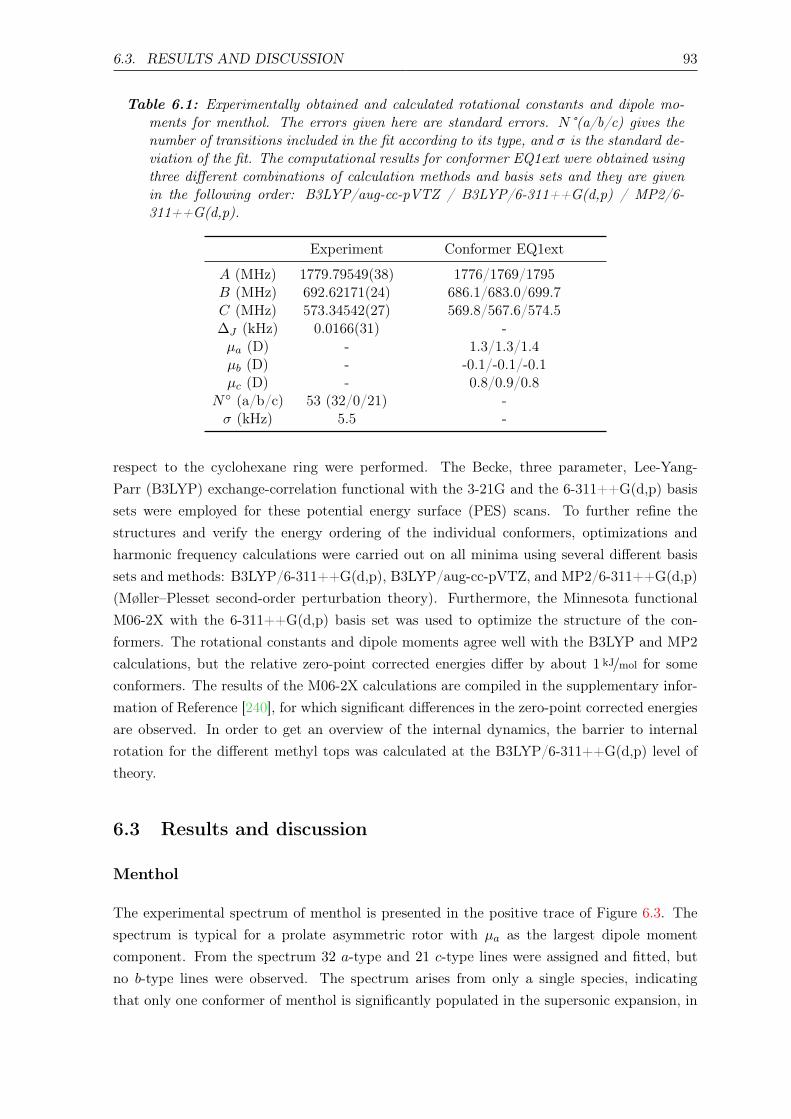
6.3. RESULTS AND DISCUSSION 93
Table 6.1: Experimentally obtained and calculated rotational constants and dipole mo-ments for menthol. The errors given here are standard errors. N °(a/b/c) gives thenumber of transitions included in the fit according to its type, and � is the standard de-viation of the fit. The computational results for conformer EQ1ext were obtained usingthree different combinations of calculation methods and basis sets and they are givenin the following order: B3LYP/aug-cc-pVTZ / B3LYP/6-311++G(d,p) / MP2/6-311++G(d,p).
Experiment Conformer EQ1ext
A (MHz) 1779.79549(38) 1776/1769/1795B (MHz) 692.62171(24) 686.1/683.0/699.7C (MHz) 573.34542(27) 569.8/567.6/574.5�J (kHz) 0.0166(31) -µa (D) - 1.3/1.3/1.4µb (D) - -0.1/-0.1/-0.1µc (D) - 0.8/0.9/0.8
N� (a/b/c) 53 (32/0/21) -� (kHz) 5.5 -
respect to the cyclohexane ring were performed. The Becke, three parameter, Lee-Yang-Parr (B3LYP) exchange-correlation functional with the 3-21G and the 6-311++G(d,p) basissets were employed for these potential energy surface (PES) scans. To further refine thestructures and verify the energy ordering of the individual conformers, optimizations andharmonic frequency calculations were carried out on all minima using several different basissets and methods: B3LYP/6-311++G(d,p), B3LYP/aug-cc-pVTZ, and MP2/6-311++G(d,p)(Møller–Plesset second-order perturbation theory). Furthermore, the Minnesota functionalM06-2X with the 6-311++G(d,p) basis set was used to optimize the structure of the con-formers. The rotational constants and dipole moments agree well with the B3LYP and MP2calculations, but the relative zero-point corrected energies differ by about 1 kJ/mol for someconformers. The results of the M06-2X calculations are compiled in the supplementary infor-mation of Reference [240], for which significant differences in the zero-point corrected energiesare observed. In order to get an overview of the internal dynamics, the barrier to internalrotation for the different methyl tops was calculated at the B3LYP/6-311++G(d,p) level oftheory.
6.3 Results and discussion
Menthol
The experimental spectrum of menthol is presented in the positive trace of Figure 6.3. Thespectrum is typical for a prolate asymmetric rotor with µa as the largest dipole momentcomponent. From the spectrum 32 a-type and 21 c-type lines were assigned and fitted, butno b-type lines were observed. The spectrum arises from only a single species, indicatingthat only one conformer of menthol is significantly populated in the supersonic expansion, in

94 CHAPTER 6. MENTHOL, MENTHONE, AND ISOMENTHONE
�150 �100 �50 0 50 100 150
isopropyl rotation ⌧1 (H11-C7-C2-C1) (�)
�150
�100
�50
0
50
100
150
hydro
xylro
tation
⌧ 2(H
12-O
-C1-
C2)
(�)
Cut A
Cut B
Cut C
eq1ext
eq1int2
eq1int
eq3ext
eq3int
eq3int2
eq2ext
eq2int
eq2int2
0
6
12
18
24
30
36
42
48
ener
gy(k
J/m
ol)
Figure 6.4: Plot of the potential energy landscape of (-)-menthol as a function of theisopropyl and the hydroxyl rotation angles. The data was extracted from a two-dimensional, relaxed potential energy scan using the B3LYP/3-21 functional. Thedashed lines mark cuts through the 3D surface, which were evaluated using a higherlevel of theory (B3LYP/6-311++G(d,p)). The results of these three scans are de-picted in Figure 6.5.
line with the findings of a recent FTIR study [251]. Furthermore, it confirms that mentholis indeed the main stereoisomer in the purchased sample, since isomenthol, neomenthol andneoisomenthol all have different rotational constants and thus can be easily differentiated bytheir rotational spectra. For fitting the spectrum, Pickett’s SPFIT/SPCAT program suiteemploying the Ir representation and the Watson A reduction was used [146]. Table 6.1summarizes the results of the fit. Lines including rotational quantum numbers J = 1 toJ = 7 and a maximum Ka of 4 were observed and assigned.
The conformational flexibility of menthol originates from the cyclohexane configuration andthe orientations of the hydroxyl and isopropyl groups. Rotations of the different methyl groupsdo not contribute to the conformational space because they have C
3V local symmetry for whichrotation gives rise to three equivalent minima. However, they could lead to characteristictunneling splittings if the corresponding barriers are sufficiently low.
It was shown by NMR spectroscopy, gas-phase electron diffraction, and several quantumchemical computation studies that the chair conformation of cyclohexane is preferred in men-thol [252, 253]. In order to get an overview of the potential energy surface, a relaxed twodimensional scan at the B3LYP/3-21G level of theory was performed by rotating the isopropyland hydroxyl groups with all three substituents in equatorial positions. The rotation of thehydroxyl group with respect to the ring occurs around the dihedral angle ⌧
2
(H12-O-C1-C2),while the isopropyl orientation is described with the dihedral angle ⌧
1
(H11-C7-C2-C1) (com-pare Fig. 6.1). The resulting PES is shown in Figure 6.4 and reveals the existence of variousstable rotamers. In this figure the nine lowest energy rotamers are marked using the labeling

6.3. RESULTS AND DISCUSSION 95
Tab
le6.
2:Cal
cula
ted
rela
tive
zero
-poi
ntco
rrec
ted
ener
gies
,ro
tatio
nalc
onst
ants
,di
pole
mom
ents
,an
dto
rsio
nala
ngle
sfo
rth
efiv
elo
west
ener
gyco
nfor
mer
sof
men
thol
.The
labe
ling
sche
me
introd
uced
byM
oren
oet
al.
[254
]is
used
.The
resu
ltswe
reob
tain
edus
ing
thre
edi
ffere
ntco
mbi
natio
nsof
calc
ulat
ion
met
hods
and
basi
sse
tsan
dth
eyar
egi
ven
inth
efo
llowi
ngor
der:
B3L
YP/a
ug-c
c-pV
TZ
/B3L
YP/6
-311
++
G(d
,p)
/M
P2/
6-31
1++
G(d
,p).
conf
orm
erE
Q1e
xtE
Q1i
nt2
EQ
1int
EQ
3ext
EQ
3int
�E
(kJ
/mol)
0.0/
0.0/
0.0
1.0/
0.9/
1.4
1.9/
2.0/
2.1
4.5/
4.2/
3.3
5.3/
5.0/
5.0
A(M
Hz)
1776
/176
9/17
9517
60/1
753/
1774
1762
/175
5/17
7719
54/1
948/
1975
1939
/193
2/19
60
B(M
Hz)
686.
1/68
3.0/
699.
768
5.0/
682.
1/69
8.0
687.
2/68
4.6/
699.
166
8.2/
665.
7/67
4.7
668.
4/66
5.9/
674.
1
C(M
Hz)
569.
8/56
7.6/
574.
558
9.0/
566.
8/57
3.5
568.
6/56
6.1/
573.
157
5.6/
573.
6/58
2.7
574.
4/57
2.2/
581.
5
⌧ 1(°
)149
.1/4
9.5/
58.3
47.4
/47.
6/56
.151
.0/5
2.0/
58.3
-160
.5/-
160.
7/-1
58.7
-162
.1/-
162.
5/-1
59.5
⌧ 2(°
)1-1
76.4
/-17
7.8/
-173
.2-6
9.7/
-69.
4/-6
6.6
66.0
/65.
9/62
.3-1
75.3
/-17
6.6/
-172
.3-6
7.1/
-67.
6/-6
7.7
µa
(D)1
1.3/
1.3/
1.4
0.8/
0.9/
0.8
-0.8
/-0.
9/-0
.91.
5/1.
5/1.
61.
0/1.
1/1.
1
µb
(D)1
-0.1
/-0.
1/-0
.1-1
.1/-
1.2/
-1.3
-1.2
/-1.
2/-1
.3-0
.1/-
0.1/
-0.0
3-1
.0/-
1.1/
-1.0
µc
(D)1
0.8/
0.9/
0.8
-0.7
/-0.
7/-0
.70.
9/0.
9/0.
90.
8/0.
9/0.
8-0
.8/-
0.9/
-0.9
1D
ihed
rala
ngle
and
dipo
lem
omen
tco
mpo
nent
sar
egi
ven
for
(-)-
men
thol
.

96 CHAPTER 6. MENTHOL, MENTHONE, AND ISOMENTHONE
�180 �150 �120 �90 �60 �30 0 30 60 90 120 150
dihedral angle ⌧1 H11-C7-C2-C1 (�)
0
10
20
30
40
ener
gy(k
J/m
ol)
EQ
1
EQ
2
EQ
3
cut A: ⌧2 = �177.4�
cut B: ⌧2 = �69.4�
cut C: ⌧2 = 68.8�
Figure 6.5: Relaxed potential energy scans for the rotation of the isopropyl group of(-)-menthol with fixed orientations of the hydroxyl group at dihedral angles ⌧
2
=[�177.4, � 69.4,68.8]° (H12-O-C1-C2) according to the marks in Figure 6.4, at theB3LYP/6-311++G(d,p) level of theory. All three traces have the same overall fea-tures, while cut A contains the lowest minima. The double minimum structure of cutC around EQ2 might be an artifact due to fixing dihedral angle ⌧
2
.
scheme introduced by Moreno et al. [254].
Three relaxed one-dimensional scans of the rotation of the isopropyl group were also performedwith a larger basis set and the hydroxyl dihedral angle fixed at values of �177.4�, �69.4� and68.8�. These three cuts through the three-dimensional potential energy surface are indicatedby the white dashed lines in Figure 6.4 and were carried out using the B3LYP functional andthe 6-311++G(d,p) basis set. The results are presented in Figure 6.5. The slices go throughthe nine lowest energy structures and give a better understanding of the energy ordering.At the minima positions EQ1 and EQ3, the isopropyl group is out of plane with respect tothe cyclohexane ring. At the minima positions EQ2, the isopropyl group is in plane but thehydrogen H11 is opposite to the hydrogen bonded to C2 (see Fig. 6.1). These structures aremuch higher in energy than those at the minima positions EQ1 and EQ3. The orientation ofthe hydroxyl group at an angle of ⌧
2
= �177.4° gives the lowest energy trace.
This relaxed potential energy scan revealed the energy ordering of the different conformers,and the five lowest energy conformers (EQ1ext, EQ1int2, EQ1int, EQ3ext and EQ3int) below6 kJ/mol were chosen for further analysis at the B3LYP/aug-cc-pVTZ, B3LYP/6-311++G(d,p),and MP2/6-311++G(d,p) levels of theory. The zero-point corrected energies, rotational con-stants, and dipole moments from these calculations are listed in Table 6.2. EQ1ext is thelowest energy conformer at all three levels of theory, in agreement with the gas-phase electrondiffraction data by Egawa et al. [253]. Relaxed potential energy scans were also carried out onconformer EQ1ext for the rotation of the methyl groups. The corresponding barrier heights

6.3. RESULTS AND DISCUSSION 97
are around 12 kJ/mol, too high to affect the observed rotational spectrum and in agreementwith the observations presented herein.
The similarity of the rotational constants for the calculated structures EQ1ext, EQ1int2, andEQ1int complicate a straightforward assignment of the fitted constants of the single observedmenthol conformation (Table 6.1) to one of the three lowest energy conformers compiled inTable 6.2. However, the energy ordering of the conformers, which is the same for all calculationmethods and basis sets employed, suggests that the lowest energy conformer EQ1ext is theobserved one. This observation is supported by the calculated dipole moment componentsof the menthol conformers. Conformer EQ1ext has a very weak dipole moment componentalong the b-axis and no b-type lines were observed in the spectrum. However, for the higherenergy conformers, EQ1int2 and EQ1int, µb is predicted to be the strongest dipole momentcomponent. For the conformers EQ3ext and EQ3int, the calculated A-rotational constantsdiffer by 200 MHz from the experimentally determined one. Hence, the observed mentholconformation is assigned to the lowest energy conformer, EQ1ext. It should be noted that thedeviations of the rotational constants for the four different theoretical levels employed hereare of the same order of magnitude as the deviations between the three EQ1 conformers (i.e.,EQ1ext, EQ1int2, and EQ1int). The predictions of the dipole moment components, however,seem to be significantly more reliable and allow for the structural assignment of the observedmenthol conformer, as stated above.
The observation of only a single menthol conformation can be explained by the potentialenergy surface. The three lowest energy conformers (EQ1ext, EQ1int, EQ1int2) differ inthe rotation of the hydroxyl group. The barrier of this rotation between each conformer isaround 3 kJ/mol (B3LYP/6-311++G(d,p)). As this barrier height is small, it is expected thatthe supersonic expansion cools conformers EQ1int and EQ1int2 into EQ1ext. The sets ofconformers EQ2 and EQ3 are much higher in energy by 5 � 10 kJ/mol and, even though thepopulations in EQ3 might be frozen during supersonic expansion due to the higher isomeriza-tion barriers to EQ1 and EQ2, their populations remain too low to affect the spectrum. Theobservation of the conformer EQ1ext agrees with the gas electron diffraction study of Egawaet al. [253]. In comparison to the conformers EQ1int and EQ1int2, conformer EQ1ext mightbe stabilized by a weak non-conventional hydrogen bond between H11 and the hydroxyl O[251]. The signal-to-noise ratio of approximately 100:1 for the most intense lines did not per-mit the observation of lines originating from 13C- or 18O-isotopologues of menthol to enablemore advanced structure determination.
Menthone and isomenthone
The spectrum of the mixture of menthone isomers was recorded and is presented in the fre-quency range from 4700 to 5650 MHz in the positive trace of Figure 6.6. The high number anddensity of lines of molecular origin and various background lines complicated the assignmentof the individual lines to the particular species. Therefore, a computer-aided assignment rou-tine was developed to facilitate the assignment process. This routine is described in Section

98 CHAPTER 6. MENTHOL, MENTHONE, AND ISOMENTHONE
4800 5000 5200 5400 5600
frequency (MHz)
inte
nsi
ty(a
rb.
units)
Measurement
Assignment
menthone A
menthone B
menthone C
isomenthone-eq-ax A
Figure 6.6: The upper trace is the spectrum of the mixture of the stereoisomers of men-thone and isomenthone in the region of 4700 � 5650 MHz while the lower tracesare simulations based on fitted molecular parameters. Three different conformers ofmenthone and one conformer of isomenthone were identified in the spectrum andsuccessfully assigned. A rotational temperature of 1.5 K for all four species gives thebest match between the simulated and the experimental intensities. A few residuallines with SNR ratios of about 3:1 remain unassigned, which might originate fromcontaminants, clusters, or instrument noise. Line splittings due to internal rotationof one of the methyl groups of menthone or isomenthone were not observed.
6.3. It was possible to assign most of the lines to four different species. For all species, most ofthe assigned transitions are b-type, with fewer a-type transitions and even fewer c-type tran-sitions. This observation suggests that for all four species µb > µa > µc applies. The final fitswere executed employing the SPFIT/SPCAT suite of programs using the Ir representationand the Watson A reduction. The results are compiled in Table 6.3.
According to NMR measurements and quantum chemical calculations by Smith et al., thecyclohexane ring in menthone is in the chair configuration and both substituents, the isopropyland the methyl groups, are in equatorial positions [255]. Hence the degrees of freedom ofmenthone are limited to the rotations of the isopropyl and methyl groups. The relaxedpotential energy surface was calculated for the rotation of the isopropyl group (dihedral angle⌧1
(H11-C7-C2-C1)) at the B3LYP/6-311++G(d,p) level of theory. The result is displayed inFigure 6.7 and exhibits three different minima at orientations similar to those of (-)-menthol.These three structures were optimized at the B3LYP/aug-cc-pVTZ, B3LYP/6-311++G(d,p),and MP2/6-311++G(d,p) levels of theory. The results are summarized in Table 6.4. Thezero-point corrected energies of the three menthone rotamers are within 3 kJ/mol (B3LYP/aug-cc-pVTZ calculation) of each other.

6.3. RESULTS AND DISCUSSION 99
Table 6.3: Experimentally determined rotational constants and quartic distortion con-stants of menthone and isomenthone. The errors given here are standard errors.N�(a/b/c) is the number of lines included in the fit distributed for a-, b-, and c-typetransitions, and � is the standard deviation of the fit.
menthone A menthone B menthone C isomenthone eq-ax A
A (MHz) 1953.43379(43) 2021.98637(36) 2109.38469(65) 1535.27577(48)B (MHz) 694.51551(19) 693.53686(16) 681.13604(27) 812.92526(33)C (MHz) 586.57758(19) 562.13636(16) 598.12413(25) 671.43466(33)�J (kHz) 0.0106(18) 0.0109(18) 0.0183(37) 0.0651(53)
�JK (kHz) 0.0234(36) 0.0473(50) 0.097(11) -0.1844(60)�K (kHz) - - - 0.535(20)N� (a/b/c) 92 (26/66/0) 112 (31/62/19) 57 (21/32/4) 76 (6/67/7)� (kHz) 7.4 6.0 5.8 7.5
While all theoretical methods employed show comparable trends for both the rotational con-stants and the dipole moment components, some differences in the relative zero-point correctedenergies for the individual conformers are found. For example, using MP2/6-311++G(d,p)calculations, menthone B is predicted to be the lowest-energy conformer by 0.8 kJ/mol, whilefor all other approaches, menthone A is predicted to be the lowest-energy species (Table 6.4).An explanation of these results is not straightforward. The two menthone conformers A andB differ in the orientation of the isopropyl group with respect to the cyclohexanone ring.The minimum orientations are the result of an interplay between intramolecular interactions,such as van der Waals and dispersion interactions, potential hydrogen bonding to the ketoneoxygen, or steric hindrance (repulsion of electron clouds). These different contributions to thefinal energy are considered differently in the various theoretical approaches (for example, theB3LYP approach does not account for dispersion that is empirically treated in the M06-2Xapproach and explicitly considered in MP2 calculations).
Thus, although it is possible to unambiguously assign structures to the three experimentallydetermined menthone conformers (Table 6.3), their exact energy ordering cannot be deter-mined for this particular case with the available data.
For isomenthone (cis-configuration) the situation is different. Isomenthone may exist withthe isopropyl and the methyl group substituent either equatorial or axial, which in turninfluences the cyclohexane configuration. Intuitively, three different starting structures arefeasible: the methyl group oriented equatorial and the isopropyl group axial to the cyclohexanering (isomenthone eq-ax), the methyl group oriented axial and the isopropyl group equatorialto the cyclohexane ring (isomenthone ax-eq) and both substituents oriented equatorial tothe ring (isomenthone eq-eq). The diaxial configuration always relaxes to one of the otherconformers during the structural optimizations. It is destabilized by the high steric strainbetween the two substituents.
Again a relaxed potential energy scan was performed by rotating the isopropyl group aroundthe dihedral angle ⌧
1
for the three different starting structures (-)-isomenthone eq-ax, (-)-

100 CHAPTER 6. MENTHOL, MENTHONE, AND ISOMENTHONE
�180 �150 �120 �90 �60 �30 0 30 60 90 120 150 180
dihedral angle ⌧1 H11-C7-C2-C1 (�)
0
10
20
30
40
ener
gy(k
J/m
ol)
C
A
B
Figure 6.7: Scan of the potential energy surface calculated along the dihedral angle ⌧1
H11–C7–C2–C1 according to the labeling in Fig. 6.2 at the B3LYP/6-311++G(d,p)level of theory for (-)-menthone. The position of the minimum conformations (A, B,C) is indicated in the plot and illustrated with the corresponding structure.
isomenthone ax-eq, and (-)-isomenthone eq-eq. Figure 6.8 shows the results for these relaxedpotential energy scans. The global minimum was found for (-)-isomenthone eq-ax at about⌧1
= �60°. Therefore, the set of conformers with ⌧1
being close to �60° is labeled as A. Theset of minimum structures at ⌧
1
⇡ �45° is labeled as B, and the set at ⌧1
⇡ �180° is labeled asC. For all nine minimum structures, optimizations and frequency calculations were carried outusing the B3LYP/aug-cc-pVTZ, B3LYP/6-311++G(d,p), and MP2/6-311++G(d,p) levels oftheory. The results of these calculations for the three lowest energy structures (isomenthoneeq-ax A, isomenthone ax-eq A, and isomenthone ax-eq B) are listed in Table 6.5. The dipolemoment components and the dihedral angle of the isopropyl group are given for the (-)-enantiomers.
Considering only the three lowest energy conformers for menthone and isomenthone (Table6.4 and Table 6.5) the assignment of the experimentally determined species to the calculatedstructures is straightforward. At least one of the experimentally determined rotational con-stants differs significantly from the calculated ones for isomenthone ax-eq A and isomenthoneax-eq B, so that three of the observed species are assigned to menthone A, menthone B,and menthone C and the fourth one to isomenthone eq-ax A. In addition to the rotationalconstants, the distortion constants �J and �JK were included in the fits for all conformers.Inclusion of the constant �K only improved the fitting results of conformer isomenthone eq-ax A. The axially aligned isopropyl group of isomenthone eq-ax seems to lead to a highersensitivity regarding centrifugal distortion.

6.3. RESULTS AND DISCUSSION 101
Table 6.4: Calculated relative zero-point corrected energies, Boltzmann populations, ro-tational constants, dipole moments, and torsional angles for the three lowest energyconformers of menthone. The results were obtained using three different combinationsof theoretical methods and basis sets and they are stated in this order: B3LYP/aug-cc-pVTZ / B3LYP/6-311++G(d,p) / MP2/6-311++G(d,p).
menthone A menthone B menthone C
B3LYP2/B3LYP3/MP23 B3LYP2/B3LYP3/MP23 B3LYP2/B3LYP3/MP23
�E (kJ/mol) 0.0/0.0/0.84 0.19/0.29/0.0 3.0/2.9/3.9
Population (%)1 42.9/43.1/48.4 40.4/39.4/37.2 16.7/17.5/14.5
A (MHz) 1950/1941/1965 2017/2009/2029 2105/2096.3/2117
B (MHz) 688.7/686.1/694.1 689.3/686.4/695.2 675.7/673.1/684.5
C (MHz) 582.4/579.9/590.0 558.7/556.2/566.3 593.3/591.0/601.7
µa (D)4 1.3/1.3/1.2 -1.3/-1.3/-1.2 1.8/1.8/-1.6
µb (D)4 -2.6/-2.7/-2.5 -2.4/-2.5/-2.2 -2.2/-2.3/2.0
µc (D)4 -0.5/-0.5/-0.53 1.1/1.2/1.2 -1.1/-1.1/-1.2
⌧1
(°)4 42.6/42.9/41.9 -48.7/-48.8/-49.3 -179.8/-179.8/176.7
1 Boltzmann distribution calculated at the sample reservoir temperature of 386 K.2 aug-cc-pVTZ basis set3 6-311++G(d,p) basis set4 Dipole moment components and dihedral angle are given for the (-)-enantiomer.
For the three lowest-energy conformers of isomenthone, the different theoretical approachesagree well with each other and the lowest-energy form eq-ax A matches the experimentallydetermined values for the rotational constants. The calculated relative zero-point correctedenergies are also similar when comparing the B3LYP- and MP2-based approaches. However,for calculations employing the M06-2X density functional, significantly different energies arepredicted (Tables 8-10 of the supplementary material of Ref. [240]). While a good agreementis again found for the rotational constants and dipole moment components, the three low-energy conformers given in Table 6.5 are predicted to be nearly isoenergetic using the M06-2Xfunctional, a result for which an explanation is not yet understood and which is also notpredicted by the other approaches.
The cyclohexane ring in all three observed menthone conformers is in a chair configuration andboth substituents in equatorial orientations. Such a structural arrangement is expected dueto steric effects. Hence, the conformational space of menthone is governed by the isopropylrotation. The barriers separating the different menthone conformers are between 12 kJ/mol
and 40 kJ/mol and should be high enough to freeze the population to that at the tempera-ture of the sample reservoir during the cooling process of the supersonic expansion. The

102 CHAPTER 6. MENTHOL, MENTHONE, AND ISOMENTHONE
Table 6.5: Calculated relative zero-point corrected energies, Boltzmann populations, rotationalconstants, dipole moments, and torsional angles for the three lowest energy conformers ofisomenthone. The results were obtained using three different combinations of theoreticalmethods and basis sets and they are stated in this order: B3LYP/aug-cc-pVTZ / B3LYP/6-311++G(d,p) / MP2/6-311++G(d,p).
isomenthone eq-ax A isomenthone ax-eq A isomenthone ax-eq B
B3LYP2/B3LYP3/MP23 B3LYP2/B3LYP3/MP23 B3LYP2/B3LYP3/MP23
�E (kJ/mol) 0.0/0.0/0.0 2.7/2.5/3.7 2.7/2.5/4.4
Population (%)1 44.6/43.2/58.4 19.5/20.0/18.6 19.1/20.0/14.9
A (MHz) 1538/1528/1516 1848/1839/1849 1731/1721/1741
B (MHz) 804.5/802.2/824.6 765.3/762.6/781.4 771.0/768.8/788.6
C (MHz) 662.3/660.2/680.6 624.8/622.5/641.0 674.1/672.0/693.4
µa (D)4 -0.7/-0.7/-0.6 -1.1/-1.1/-0.9 1.1/1.1/0.9
µb (D)4 -3.1/-3.1/-2.9 2.5/2.4/2.2 -2.7/-2.7/-2.5
µc (D)4 -1.0/-1.0/-1.0 -1.4/-1.4/-1.4 -0.7/-0.8/-0.7
⌧1
(°)4 -64.5/-64.1/-64.0 -49.4/-49.4/-49.2 42.6/42.9/42.0
1 Boltzmann distribution calculated at the sample reservoir temperature of 386 K.2 aug-cc-pVTZ basis set3 6-311++G(d,p) basis set4 Dipole moment components and dihedral angle are given for the (-)-enantiomer.
situation is different for isomenthone. Both substituents are arranged cis to the cyclohexanering. Hence, the equatorial orientation of both substituents forces the cyclohexane ring intothe boat configuration, which is higher in energy compared to the chair configuration forunsubstituted cyclohexane. The diaxial orientation of the substituents is prevented by sterichindrance. Consequently, in the lowest energy conformers of isomenthone one substituentneeds to be oriented equatorially and the other one axially. Likely due to the anomeric effect,the lowest energy conformer isomenthone eq-ax A having the isopropyl group oriented axiallyis stabilized. It is surprising that only one conformer of isomenthone was observed. Using theargument that the conformers are frozen out due to the barrier height, one would expect moreconformers of the ax-eq kind. This absence might be explained by the fact that the fraction ofisomenthone in the mixture is only 30 % (analysis by Sigmar-Aldrich), which is confirmed byweaker intensities of isomenthone (SNR of approximately 50:1 for the strongest transitions)compared to menthone A (SNR of approximately 100:1 for the strongest transitions). Thusthe density of the additional conformations in the expansion is likely too low to allow them

6.3. RESULTS AND DISCUSSION 103
�180 �150 �120 �90 �60 �30 0 30 60 90 120 150 180
dihedral angle ⌧1 H11-C7-C2-C1 (�)
0
10
20
30
40
50
ener
gy(k
J/m
ol)
A
C
B
(-)-isomenthone eq-eq
(-)-isomenthone ax-eq
(-)-isomenthone eq-ax
Figure 6.8: Scan of the potential energy surface calculated along the dihedral angle ⌧1
H11–C7–C2–C1 according to the labeling in Fig. 6.2 at the B3LYP/6-311++G(d,p)level of theory for (-)-isomenthone eq-eq, (-)-isomenthone ax-eq and (-)-isomenthoneeq-ax. The labels A, B, C are pointing to the corresponding minima. Only theconformation isomenthone eq-ax A was observed in the microwave spectrum.
to be observed with the signal-to-noise ratio of the spectrum presented here, i.e. with only128000 single acquisitions coadded.
Computer-aided assignment routine
The assignment of the spectrum from the menthone/isomenthone mixture was complicated bythe overlap of different J-transitions that impeded a straightforward analysis. The presenceof background lines led to further complications. Therefore a computer program was devel-oped to facilitate the analysis. Earlier approaches to automate spectral assignment include acomputer program based on a genetic algorithm to fit the details of a rotationally resolvedUV spectrum and subsequently extract the molecular parameters of multiple mixture compo-nents [257]. This approach was implemented with a set of molecular parameters representinga chromosome and thus the molecular parameters of all molecules present in the mixture mustbe within the chromosome. The fitness of a solution was determined by a direct comparisonof the measured and predicted spectrum.
Recently, Seifert and coworkers introduced another approach for an automated assignmentroutine called Autofit [258]. Their method is based on the assignment of three (linearly in-dependent) lines, representing the minimum number of lines for fitting an asymmetric rotorspectrum including only rotational constants. Within a predefined bandwidth, the program

104 CHAPTER 6. MENTHOL, MENTHONE, AND ISOMENTHONE
Figure 6.9: Scheme of the sampling volume of the rotational constants for the computer-aided assignment routine. The cubic sampling volume is divided into eight subcubesand the routine is carried out consecutively in each of the subcubes. Afterwards theresults of the individual subcubes are compared. The blue diamond in the centerindicates the position of the calculated rotational constants and the green triangleindicates the position of the experimentally obtained value for isomenthone eq-ax A.The red shaded area is used to display the results in Figure 6.10.
determines potential peaks for each transition, fits all possible combinations of the assign-ments, and uses the error of the fit to evaluate the solutions. The performance of this programwas tested on multiple silicon-containing species and was capable of identifying not only theparent species, but also its carbon and silicon isotopologues [259].
Here another approach is presented for an automatic assignment and fitting procedure withthe aim of determining the rotational constants to a high precision. In contrast to the Autofitprogram, which assigns and fits three different peaks directly, first the parameter space ofrotational constants is scanned in order to evaluate the goodness of different parameter sets.Only the best parameter sets are used in all subsequent steps, which reduces the computationtime drastically. In a second step, four transitions are assigned automatically dependingprimarily on the frequency and intensity overlap between the measured and predicted spectra.Three transitions are the absolute minimum to fit three rotational constants, but only whenthe effect of the rotational constants on the assigned transitions is sufficiently significant.Therefore four transitions are chosen to stabilize the fit and reduce the number of divergingresults. Diverging and unphysical results are directly excluded and the quality of the fitis assessed by a comparison of the measured and predicted spectra. In the following, thealgorithm is explained in detail using the example of isomenthone eq-ax A and the advantagesand potential pitfalls are highlighted.
Step 1: Definition and filling of the scan volume
As previously mentioned, we work in a three-dimensional parameter space of rotational con-stants with their values along the three axes. In the graphical presentation, the samples are

6.3. RESULTS AND DISCUSSION 105
defined by (A, B, C)-triples plus a color-code describing their fitness. Two parameters arecrucial to the performance of the routine: the volume size and the sample density. The vol-ume should contain the rotational constants of the measured species. Hence the choice ofthe scan volume depends on the accuracy of the first guess, typically coming from quantumchemical calculations. As stated above, all theoretical approaches employed here give compa-rable rotational constants, which is a promising prerequisite for the computer-assisted fittingprocedure.
A disadvantage to increasing the scan volume is the increased probability, that the routineconverges to an artificial local minimum. To avoid this scenario, the initial volume is dividedinto smaller parts and the routine is run on each of them and the results are comparedafterwards. In practice, a cubic volume with 50 MHz edge length centered at the calculatedvalues (blue diamond in Fig. 6.9) is chosen subdivided into eight equally sized subcubes. Thisprocedure is illustrated in Figure 6.9, where the blue diamond indicates the position of thecalculated values and the green triangle is positioned on the manually fitted values.
The choice of the sample density is essential for the successful assignment, but also the mostimportant factor on the computation time. The sample density is correlated with the densityof transitions in the spectrum. A spectrum with a high density of transitions requires a highersample density for successful performance. In the example presented here, each subcube wassampled with 2000 such points.
A prediction is made for each point and an intensity cutoff is applied for both the experi-mental (N = 561) and the predicted data. Then both sets of transitions (experiment andprediction) are compared and an assignment is noted for each experimental peak within apredefined bandwidth of a predicted transition. If multiple experimental peaks are foundwithin this bandwidth, only the closest peak is used for the assignment. The bandwidth forthe assignment is closely related to the sample density. A higher sample density allows asmaller bandwidth, a low sample density requires a larger bandwidth. In the test case thusfar examined, a bandwidth of 10 MHz gives good results.
Finally, the mean-square value of the assignments is calculated and used to judge the fitness ofthe prediction. The samples are ranked according to their fitness and only the most promisingcandidates (in this case, the best 10 %) are selected for the subsequent, computationally moredemanding fitting procedure.
Step 2: Assignment and fitting of the samples within a sub-cube
In this step, the best results of step one are used as starting point for the fitting procedureusing SPFIT. Because only four transitions are used to fit the three rotational constants, thequality of these assignments is essential. Since the correct solution can only be obtained if thefour transitions are assigned correctly in at least one trial, care must be taken in choosing theappropriate four transitions for fitting. As a selection criteria for choosing these transitions,the predicted intensities of the assigned transitions are used. To avoid errors in the predictedintensities from the use of incorrect simulation temperatures or dipole moments, the tentransitions with the highest predicted intensities are chosen. From these ten assignments, four

106 CHAPTER 6. MENTHOL, MENTHONE, AND ISOMENTHONE
(a) (b)
Figure 6.10: Results for the sub-cube shaded red in Figure 6.9. (a) Sample distributionafter the fit employing SPFIT (step 2). The samples are color-coded using the valueof the standard deviation provided by SPFIT. A subtle convergence towards themeasured value (green triangle) is visible. (b) Sample distribution after evaluationof the fitting results (step 3). The samples are now color-coded using the number ofassigned lines of the SPCAT prediction. The concentration of many samples at themeasured rotational constants and the color-code of the samples indicates a correctlyassigned spectrum (up to 18 assigned transitions). The comparison of (a) and (b)illustrates the necessity of the evaluation step 3. Good and bad fitting results arescattered throughout the volume in (a), but (b) reveals that the samples far awayfrom real values predict spectra which have little overlap with the measured one.
at random are chosen to increase the diversity of transitions. Sometimes multiple experimentaltransition can be assigned to a predicted line. In such a case, as many as four consecutive fitsare performed assigning the four most intense experimental peaks to a predicted line.
In summary, the best assignments from step one are fitted. Rules for choosing the propertransitions are mainly based on the intensities of the predicted and measured transitions.Diverging and unphysical fit results are directly eliminated, and only one sample is maintainedfor those which have converged to the same (A, B, C)-triple. The results are weighted usingthe root-mean-square error from the fit. The best fitting results within a sub-cube are plottedin Figure 6.10a.
Step 3: Evaluation of the fitting results
In the final step, the fitting results from step two are reevaluated by a direct comparison ofthe predicted with the measured spectrum. This step is necessary, because the root-mean-square error is not a good check for the quality of a fit of three parameters including onlyfour transitions. The overlap of the experimental transitions and the predicted transitionsis assessed following the same prediction and assignment protocol as in step one, but witha much smaller tolerance (100 kHz in the test cases). The number of assigned transitionsprovides a reliable check of the quality of the assignment. Figure 6.10b shows the final resultwith a very good overlap of the automatically fitted samples and the manually fitted result(green triangle).

6.4. CONCLUSIONS 107
The assignment process depends heavily upon reliably measured and predicted intensities.In the case of untrustworthy experimental intensities, unavailable estimates of the dipolemoments, or unknown rotational temperatures, it might be necessary to repeat the procedureemploying different sets of dipole moment components and temperatures. In the presentstudy, the routine was repeated three times, setting only one dipole moment component tobe nonzero for the predictions in step one and two. However for the evaluation of the fit instep three, all types of rotational transitions were included.
All four isomers present in the menthone/isomenthone mixture were found using as initialinput the rotational constants from the B3LYP/aug-cc-pVTZ calculations. The results arecompiled in the supplementary material of Reference [240], listing the ten best hits for eachof the predicted isomers. Furthermore, the routine was also tested on the spectra (2� 8 GHz)of two other molecules of the monoterpene family: carvone (843 peaks) and carvomenthenol(204 peaks). For these molecules the different conformers (two for carvone and three forcarvomenthenol) were identified without any preprocessing to remove background lines. Theparameters of the routine (bandwidth, cubesize, number of samples) were identical to the onesused for isomenthone eq-ax A. The computation time heavily depends on the line density of thespectrum under study. For carvone, carvomenthenol, and menthone spectra, it took less thanone hour to run the routine using a single core on an Intel quad-core i5 processor (2.3 GHz).
The computer program is still limited to molecular spectra that can be fit using a rigidrotor Hamiltonian, but the implementation of common rotational spectroscopy effects suchas nuclear quadrupole coupling or internal rotation is in progress. It is always possible toextend the parameter space and include more than just the rotational constants into the fit.But with a growing number of included parameters, the set of starting samples increasesexponentially if the same parameter space density is maintained. More lines would need to beincluded into the fit in order to get reliable results, as expected with an increasing number ofassignment possibilities. Hence, the required computation time grows rapidly. To counteractthe increasing computation time, the different fitting parameters can be classified accordingto their impact on the fit. As a consequence, the seed set would no longer be uniformlydistributed along each parameter axis but denser along high impact parameters. Parameterswith a very small effect on the fit, such as the A-rotational constant in a-type spectra, canbe kept constant throughout the fit. This approach should be feasible for spectra includingnuclear quadrupole coupling splitting or centrifugal distortion.
6.4 Conclusions
The microwave spectra of the structurally related monoterpenoids menthol, menthone, andisomenthone and an evaluation of their potential energy surfaces were presented. For menthol,a single conformation was observed under the conditions of the supersonic expansion. The
The supplementary information of Reference [240] provides the linelists with the corresponding assignmentsas well as the results of the automated fitting routine.

108 CHAPTER 6. MENTHOL, MENTHONE, AND ISOMENTHONE
experimentally obtained rotational constants of the observed conformation agreed very wellwith those of the calculated lowest energy conformer.
In the broadband microwave spectrum of a mixture of the diastereomers menthone and iso-menthone, three conformations of menthone and a single conformation of isomenthone wereidentified. Again, the comparison of the experimental rotational constants with the ab initioones revealed a good match. The differences in the conformational landscape for menthoneand isomenthone likely arise from the peculiar steric situation of the central cyclohexane ring,for which a chair configuration with sterically demanding substituents in the equatorial po-sitions is preferred. Due to the arrangement of the stereogenic centers in isomenthone, onesubstituent, i.e., either the methyl or the isopropyl group, must be oriented axially, resultingin large shifts of the conformational landscape from menthone. Complications of assigningthe dense microwave spectra manually led to a computer-aided assignment routine, which wascapable of identifying and fitting all components in the menthone mixture with inputs fromab initio calculated rotational constants.

Chapter 7
Enantiomer differentiation by
microwave three-wave mixing
experiments
7.1 Introduction
Many molecules of biochemical relevance are chiral. The chemistry of life is built almostexclusively on left-handed amino acids and right-handed sugars, a phenomenon that is knownas the ’homochirality of life’. Even though the physical properties of two enantiomers arealmost identical, they might exhibit completely different biological effects, e.g. one maybe beneficial to health while the opposite is toxic. In nature and as products of chemicalsyntheses, chiral molecules often exist in mixtures with other chiral molecules. The analysis ofthese complex mixtures to identify the molecular components, to determine which enantiomersare present, and to measure the enantiomeric excesses (ee) is still one of the challenging andvery important tasks of analytical chemistry.
Established spectroscopic methods to identify enantiomers and determine the ee value rely on
This chapter is partly based on the following publications:• V. A. Shubert, D. Schmitz, D. Patterson, J. M. Doyle and M. Schnell, Identifying Enantiomers in
Mixtures of Chiral Molecules with Broadband Microwave Spectroscopy, Angew. Chem. Int. Ed. 52, 1-5(2013). (experimental: 40%, data analysis: 40%, writing up: 5%, D.P. 5%) [78]
• V. A. Shubert, D. Schmitz, and M. Schnell, Enantiomer-sensitive spectroscopy and mixture analysisof chiral molecules containing two stereogenic centers – Microwave three-wave mixing of menthone, J.Mol. Spec. 52, 31-6 (2014). (key ideas: 20%, experimental: 50%, data analysis: 30%, writing up: 10%)[250]
• D. Schmitz, V. A. Shubert, D. Patterson, A. Krin, and M. Schnell, Phase Dependence of Double-Resonance Experiments in Rotational Spectroscopy, J. Phys. Chem. Lett. 6, 1493-98 (2015) (key ideas:20%; experimental: 40%, data analysis: 80%, writing up: D.S. 40%) [260]
• V. A. Shubert, D. Schmitz, C. Medcraft, A. Krin, D. Patterson, J. M. Doyle and M. Schnell, Rotationalspectroscopy and three-wave mixing of 4-carvomenthenol: A quickstart guide to measuring chirality inthe microwave regime, accepted at J. Chem. Phys. (experimental: 20%, data analysis: 10%; writingup: 5%)

110 CHAPTER 7. ENANTIOMER DIFFERENTIATION
the interaction of linearly or circularly polarized light with the target molecules. This inter-action is relatively weak [261] and thus highly concentrated samples or intense light fields arerequired. These methods, such as circular dichroism, vibrational circular dichroism (VCD),and Raman optical activity spectroscopy, are commercially available and widely used. How-ever, they are less useful for the analysis of molecular mixtures, in particular when more thanone chiral species is present. Only one mixture analysis was reported so far, using Fouriertransform VCD [262]. Recent developments in this area employ synchrotron radiation andfemtosecond lasers to study femtosecond optical activity, photoionization with subsequentfragment detection in coincidence, and circular dichroism in the photoelectron angular distri-butions of chiral molecules [263–267].
In this chapter, the clear differentiation between enantiomers within a mixture of chiralmolecules is demonstrated using broadband rotational spectroscopy. In addition, ee values ofmixtures are measured and an outlook is given on how the absolute configuration of a chiralmolecule can be determined. The experimental technique is based on a method, which wastheoretically developed by Hirota [268] and experimentally demonstrated by Patterson et al.[269, 270]. The underlying physical mechanism arises from the Hamiltonian of an asymmetrictop in a resonant electric field and is widely applicable to chiral molecules with nonzero dipolemoment components µa, µb, µc. In the framework of this thesis, the experimental methodwas adapted to a broadband excitation scheme, which allows the simultaneous measurementof different chiral components within a mixture.
7.2 Theoretical background
The differentiation between enantiomers becomes feasible by an excitation and detectionscheme, which makes use of a closed cycle of transitions involving all three dipole momentcomponents. The simplest case of a closed cycle includes three rotational states connected bythree rotational transitions of a-type, b-type and c-type, which exclusively depend on µa, µb,and µc, respectively. Ignoring small differences due to the parity-violating potential arisingfrom the weak interaction [271], the rotational constants and dipole moment component mag-nitudes (|µa|, |µb|, |µc|) are equal for enantiomeric pairs of any chiral molecule and thus giverise to identical rotational spectra. However, the scalar triple product of the permanent dipolemoment components µa · (µb ⇥ µc) flips sign between enantiomers since the dipole momentsare mirrored. This fact is exploited to differentiate enantiomers in a polarization sensitivedouble-resonance experiment. Therein two transitions of a closed cycle are excited simulta-neously or subsequently and the signal of the third transition is recorded, where the moleculeitself is acting as a sum or difference frequency generator. The phase of the recorded signalchanges by ⇡ radians between opposite enantiomers and allows for their differentiation. In thefollowing, the Bloch equations describing these double-resonance experiments are introduced.
Without loss of generality, the following theoretical description is restricted to one of thedegenerate M -sublevels within the asymmetric-top energy levels to maintain a pure three-level quantum system. The density matrix formalism introduced in Section 2.4 for a two-level

7.2. THEORETICAL BACKGROUND 111
a
c
hω0,ac
hω0,bc
b
ωab
ωbc
hω0,ab
(a)
a
c
hω0,ac
hω0,bc
b
ωac
ωbc
hω0,ab
(b)
c
a
hω0,ac hω0,bc
bωab
ωac
hω0,ab
(c)
Figure 7.1: Schematics of energy level configurations for MW-RF double-resonance ex-periments: (a) progressive arrangement, (b) regressive arrangement with the RF tran-sition !
0,bc connecting the upper two energy levels (⇤-type), and (c) regressive ar-rangement with the RF transition connecting the lower two energy levels (V-type).The resonance frequencies are !
0,ab = Eb
�Ea/~, !
0,bc = Ec
�Eb/~ and !
0,ac = Ec
�Ea/~,
while !ab, !bc and !ac are the frequencies that are actually employed in the experi-ment.
system can easily be extended to a three-level system. Instead of a two-by-two density matrixfor a two-level system, the density matrix for a three-level system has nine elements:
⇢ =
0
B@⇢aa ⇢ab ⇢ac
⇢ba ⇢bb ⇢bc
⇢ca ⇢cb ⇢cc
1
CA (7.1)
The unperturbed Hamiltonian describing a three-level systems is given by:
H0
=
0
B@Ea 0 0
0 Eb 0
0 0 Ec
1
CA (7.2)
with Ec > Eb > Ea. If all transitions of a three-level system are dipole allowed, three differentcombinations of driving two transitions are possible: the progressive regime (|ai ! |bi and|bi ! |ci, Fig. 7.1a), the ⇤-type regressive regime (|ai ! |ci and |bi ! |ci, Fig. 7.1b) and theV-type regressive regime (|ai ! |ci and |ai ! |bi, Fig. 7.1c). For the corresponding Hamil-tonians including the interactions with the electromagnetic fields follows in the progressiveregime H
pro
:
Hpro
=
0
B@Ea �1
2
µabEab
�ei!abt + e�i!abt
�0
�1
2
µbaEba
�ei!abt + e�i!abt
�Eb �1
2
µbcEbc
�ei!bct + e�i!bct
�
0 �1
2
µcbEcb
�ei!bct + e�i!bct
�Ec
1
CA
(7.3)

112 CHAPTER 7. ENANTIOMER DIFFERENTIATION
in the ⇤-type regressive regime Hreg,⇤
:
Hreg,⇤
=
0
B@Ea 0 �1
2
µacEac
�ei!act + e�i!act
�
0 Eb �1
2
µbcEbc
�ei!bct + e�i!bct
�
�1
2
µcaEca
�ei!act + e�i!act
� �1
2
µcbEcb
�ei!bct + e�i!bct
�Ec
1
CA
(7.4)and in the V-type regressive regime H
reg,V
:
Hreg,V
=
0
B@Ea �1
2
µabEab
�ei!abt + e�i!abt
� �1
2
µacEac
�ei!act + e�i!act
�
�1
2
µbaEba
�ei!abt + e�i!abt
�Eb 0
�1
2
µcaEca
�ei!act + e�i!act
�0 Ec
1
CA
(7.5)A few approximations are applied to reduce the complexity. First of all the assumption ismade that the interaction volume is small compared to the wavelength by neglecting thedependence of the electromagnetic field on the wave vector k. Also the initial phases ofboth incoming waves are set to zero. Furthermore, the assumption is made that each of theincoming fields only couples to one of the transition dipole moment components µab, µbc or µac.This assumption is valid for this work, because the transition frequencies are well separated,and the polarization directions of the two incoming waves are perpendicular to each other inthe experimental setup (compare Fig. 7.2). The transition dipole moment components arecomplex quantities with µij = µ⇤
ji (with i 6= j = a, b, c). For an a-type rotational transitionbetween the initial rotational state |ii and the final rotational state |ji the transition dipolemoment component µij can be written [41, Chap. 4]:
µij,g = µa hi| cos (a,G) |ji = µa
ˆ i cos (a,G) ⇤
j d⌧ (7.6)
where cos (a, G) describes the direction cosine between the molecular a-axis and the space-fixed quantization axis G = X, Y, Z in the laboratory frame. The transition dipole momentcomponents for b- or c-type transitions are similar, but with the direction cosine between theb- or c-axis and the space-fixed quantization axis. The selection rules for the different typesof transitions are summarized in Table 2.2. They follow directly from the evaluation of theintegral in Equation 7.6 or by symmetry considerations of the asymmetric-top wavefunctions.
The time dependence of the density matrix elements can be obtained by solving the Liouvilleequation 2.81:
i~@⇢ (t)
@t=hH (t) , ⇢ (t)
i(7.7)
The resulting set of ordinary differential equations (ODE) for the three different regimes arecompiled in Appendix A. After applying the rotating wave approximation and transformationto a rotating frame (described in Sec. 2.4 for a two-level system), the three-level Blochequations are analytically solvable as shown in Reference [57]. In the present work, the fullBloch equations as given in Appendix A were solved numerically using the ODE solver ’zvode’of the Python package SciPy [272]. This solver enabled the use of not only single frequency

7.3. EXPERIMENTAL DETAILS 113
sinusoidal waveforms but also arbitrary waveforms as driving pulses, i.e. chirps, superpositionsof sinusoidal pulses, or completely arbitrary driving pulses.
The expectation value of the measured polarization is identical to the one given in Equation2.96: D
PE
= N · Tr (⇢µ) (7.8)
with:
µ = �
0
B@0 µab µac
µba 0 µbc
µca µcb 0
1
CA (7.9)
Prior to the three-wave mixing experiments, double-resonance experiments were performed tooptimize the experimental conditions. The double-resonance experiments revealed an indirectobservation of the Autler-Townes splitting mapped onto the phase of the recorded signal. Theresults of both types of experiments are fully characterized by the Bloch equation formalism,but the physical meaning is best described within the dressed-state picture for the double-resonance experiments [273]. After the introduction of the changes made to the experimentin the next section, the double-resonance experiments are presented and discussed in Section7.4, followed by the results of the three-wave mixing experiments (enantiomer differentiationin Sec. 7.5 and ee determination in Sec. 7.6).
7.3 Experimental details
To enable double-resonance and three-wave mixing experiments, a few minor modifications areapplied to the COMPACT spectrometer described in Chapter 3. A set of stainless steel elec-trodes is attached to the microwave horns isolated by a teflon spacer. As indicated in Figure7.2, a radio frequency (RF) field is coupled to one of the electrodes and the second electrodeis set to ground. The RF field and the microwave (MW) signal are generated by differentchannels of the same arbitrary waveform generator to ensure optimal phase stability. The RFfield is then amplified by a 100 W power amplifier with a bandwidth of 30�550 MHz (KU PABB 003055-100 A, Kuhne electronics) and coupled to the electrodes by a BNC feedthrough.Two valves separated by 3.5 cm (nozzle orifice separation) with different enantiomers or mix-tures in their respective sample reservoirs can be used. These valves are operated such thatonly the pulse from one valve interacts with the MW and RF excitation pulses within anexperimental cycle. A digital delay generator (Stanford Research, model DG645) is used tochange which valve pulse interacted with the radiation.
Because the three-wave mixing technique makes use of the geometrical orientation of thethree dipole moment components within a chiral molecule, the orthogonal orientation of thepolarization of the excitation fields is important. The laboratory frame along the differentfields are defined as indicated in Figure 7.2. The polarization direction of the microwaveexcitation pulse (called the drive pulse in the following) defines the Z-axis of the laboratoryframe. The RF pulse (the so called twist pulse) is polarized orthogonally to the drive pulse

114 CHAPTER 7. ENANTIOMER DIFFERENTIATION
Figure 7.2: Scheme of the modified COMPACT spectrometer. Only the changes to theCOMPACT spectrometer introduced in Chapter 3 (Fig. 3.1) are indicated. For intro-ducing RF radiation, two electrodes are integrated into the setup. The polarization di-rections of the MW excitation (Z-direction) and the RF pump pulse (Y -direction) areperpendicular with respect to each other. The receiving horn on the left is turned by45° to allow for the observation of the traditional FID signal (along the Z-direction)and the three-wave mixing signal (along the X-direction).
along the laboratory Y -axis. In a three-wave mixing experiment, the signal evolving fromthe third transition of the closed cycle (the so called listen transition) is then polarizedmutually orthogonal to the drive and the twist pulse. For the three-wave mixing experiments,the receiving horn is turned by 45° to allow the observation of the traditional FID signal,which is polarized in Z-direction, as well as the three-wave mixing signal (polarized in X-direction). The receiving horn is not turned for the double-resonance experiments, performedin preparation of the three-wave mixing experiments and described in the next section.
7.4 Double-resonance experiments
Double-resonance experiments are well established in the microwave region of the electromag-netic spectrum and were mainly used to map the coherence transfer within the rotationalenergy level structure [55–57, 77]. The information about the coherence transfer are exploitedto ascertain the energy level structure and hence guide the assignment of dense rotationalspectra [63]. Furthermore, double-resonance experiments are employed to extend the de-tection bandwidth of a spectrometer. The effect of driving a transition that is otherwiseinvisible to the spectrometer (due to a limited detection bandwidth) can be observed on con-

7.4. DOUBLE-RESONANCE EXPERIMENTS 115
O
101
212
211
3713.17 MHz
323.81 MHz
menthone A
(a)
101
212
211
3708.37 MHz
394.20 MHz
menthone B
(b)
322.5 323.0 323.5 324.0 324.5 325.0
radio frequency (MHz)
0.0
0.2
0.4
0.6
0.8
1.0
1.2
1.4
inte
nsi
ty(a
rb.
units)
simulation
measurement
(c)
393.0 393.5 394.0 394.5 395.0 395.5
radio frequency (MHz)
0.0
0.2
0.4
0.6
0.8
1.0
1.2
1.4
inte
nsi
ty(a
rb.
units)
simulation
measurement
(d)
322.5 323.0 323.5 324.0 324.5 325.0
radio frequency (MHz)
-⇡
-�
2
0
�
2
⇡
rel.
phas
e(r
ad) simulation
measurement
(e)
393.0 393.5 394.0 394.5 395.0 395.5
radio frequency (MHz)
-⇡
-�
2
0
�
2
⇡
rel.
phas
e(r
ad)
simulation
measurement
(f)
Figure 7.3: MW-RF double-resonance experiments for menthone A and menthone B(left and right columns). The simulations are based on the three-level optical Blochequations. First row: Energy levels involved in the double-resonance experiments for(a) conformer A and (b) conformer B. Second row: Illustration of the amplitudedependences observed for the FID at the respective MW signal transition frequen-cies, that is, the 1
01
! 212
b-type transitions of the two menthone conformers, asa function of the RF pump frequency. The RF transition 2
12
! 211
is predictedat 323.81 MHz for conformer A (c) and at 394.20 MHz for conformer B (d) fromthe experimentally determined rotational constants. The amplitudes are normalized.Third row: Phase dependence of the FID at MW signal transition frequencies onthe RF pump frequencies for (e) conformer A and (f) conformer B, illustrating thestriking change at RF resonance. Both the amplitude and the phase dependence areextracted from the same experimental data.

116 CHAPTER 7. ENANTIOMER DIFFERENTIATION
nected transitions within the bandwidth of the spectrometer. This scheme is employed in thedouble-resonance experiments herein. The RF excitation pulse and its molecular responsecannot be detected directly by the COMPACT spectrometer, but the effect on the amplitudeand the phase of a connected microwave transition is indeed observable.
As mentioned before, MW-RF double-resonance experiments are carried out to determine thetransition frequency in the RF regime and to adjust the pulse length for optimal coherencetransfer. In the following, the double-resonance experiments are explained using the exampleof a progressive level scheme (compare Fig. 7.1a). For the regressive level schemes, the labelsof the different energy levels need to be interchanged. A coherent superposition is createdusing a MW chirp coupling the states |ai and |bi. This superposition is then perturbed by aRF pulse transferring ab-coherence to ac-coherence. The coherence transfer is maximized ina two step approach: firstly a RF pulse slightly shorter than ⇡-condition is scanned throughresonance. Exactly at resonance best coherence transfer is achieved, which goes along witha maximum depletion of the ab-coherence. Secondly the RF-pulse length is optimized to hitexact ⇡-condition.
Figure 7.3 and Figure 7.4 show the results for MW-RF double-resonance measurements for themolecules menthone (for the two different conformers menthone A and B) and isomenthoneeq-ax (two different cycles), respectively. The same sample and experimental conditions wereused as described in Section 6.2. All measurements reveal a strong depletion of the drivingmicrowave transition at the RF transition resonance. Additionally, the relative phase ofthe microwave signal as observed in the FID changes rapidly when the RF pulse is tunedthrough resonance. The intensity decrease and the abrupt phase change of the microwavesignal at resonance can be simulated using the three-level optical Bloch equations introducedin the previous section. For the simulations, the respective set of optical Bloch equations isemployed in a two pulse scheme. The first pulse is a short and intense ⇡
2
-pulse at the resonancefrequency of the MW transition (|ai ! |bi in the case of a progressive level scheme) to createmaximum ab-coherence. This condition is in contrast to the experiments, where a chirp isused to excite both the |ai ! |bi and the |ai ! |ci transition. To consider only the excitationof the |ai ! |bi transition in the simulations is a valid approach to model the experimentsin the case of menthone or isomenthone, because the |ai ! |ci transition is connected tothe weaker dipole moment component (c-type transition for menthone A and B and a-typetransition for isomenthone eq-ax). The second pulse used in the simulations is a 5 µs RF pulsewith the corresponding detuning from resonance, which is in agreement with the experiment.In the simulations, the Rabi frequency of the RF transition ⌦bc is adjusted to match theexperimental results, i.e. the intensity and the phase behavior for different detunings. Forthe initial populations of the states, a Boltzmann distribution is assumed and the rotationalenergies computed by the SPCAT program [146] are employed.
Various methods can be used to retrieve the amplitude and the phase of a single frequencycomponent within the FID. The Fast Fourier transform (FFT) algorithm provides the ampli-tudes of rotational spectra and also the phase information is encoded in the complex valuedFFT. However, the manual evaluation of the Fourier series gave a much higher accuracy and

7.4. DOUBLE-RESONANCE EXPERIMENTS 117
O
313
404
414
5316.79 MHz
304.26 MHz
isomenthone eq-ax (progressive)
(a)
303
404
414
6070.63 MHz
304.26 MHz
isomenthone eq-ax (regressive)
(b)
303.0 303.5 304.0 304.5 305.0 305.5
radio frequency (MHz)
0.0
0.2
0.4
0.6
0.8
1.0
1.2
1.4
inte
nsi
ty(a
rb.
units)
simulation
measurement
(c)
303.0 303.5 304.0 304.5 305.0 305.5
radio frequency (MHz)
0.0
0.2
0.4
0.6
0.8
1.0
1.2
inte
nsi
ty(a
rb.
units)
simulation
measurement
(d)
303.0 303.5 304.0 304.5 305.0 305.5
radio frequency (MHz)
-�
2
0
�
2
rel.
phas
e(r
ad) simulation
measurement
(e)
303.0 303.5 304.0 304.5 305.0 305.5
radio frequency (MHz)
-�
2
0
�
2
rel.
phas
e(r
ad)
simulation
measurement
(f)
Figure 7.4: MW-RF double-resonance experiments for two different energy level combi-nations (left and right column) of isomenthone eq-ax. The simulations are based onthe three-level optical Bloch equations. First row: energy level schemes visualizingthe connectivity of energy levels and the two double-resonance schemes, progressive(a) and regressive (⇤-type) (b). Second row: Illustration of the amplitude dependenceobserved for the FID at the respective MW signal transition frequency, that is, the313
! 404
b-type transition at 5316.79 MHz (c) and the 303
! 414
b-type transitionat 6070.63 MHz (d), as a function of the RF pump frequency. The RF transition404
! 414
connects the two b-type transitions. Third row: Phase dependence of theFID at MW signal transition frequencies on the RF pump frequency, illustrating thestrong change close to RF resonance that is opposite for the two different energy levelcombinations (progressive (e) and regressive (f)).

118 CHAPTER 7. ENANTIOMER DIFFERENTIATION
b, N
hω0,ab
c, N-1
a, N
hΩbchδbc b, N
hω0,ab
c, N-1
a, N
(a) blue detuned (b) red detuned
hω0,bchω0,bc
1
2
1
2
hδbc
hδbc
ωbcωbc
ωab
hΩbc
c, N
b, N+1c, N
b, N+1hΩbc
hΩbchδbc
Figure 7.5: Dressed-state formalism describing the interaction of the RF pump field !bc
with the molecular energy levels |bi and |ci in a progressive scheme, for (a) blue and(b) red detuning of the RF field with respect to molecular resonance. The unperturbedstates |b,Ni and |c,N � 1i, dressed with N and N �1 photons, respectively (given onthe left-hand side), are transformed into two dressed states, |1i and |2i, due to theinteraction with the RF field and with each other (given on the right-hand side). Forblue detuning (a), the unperturbed |b,Ni state is higher in energy than the |c,N � 1i.This situation is reversed for red detuning (b).
reliability for the amplitude and phase retrieval than the FFT algorithm itself. The mathe-matical description is summarized in Appendix B.
While the intensity depletion at resonance can be explained straightforwardly with maximumcoherence transfer, the explanation for the sudden phase change at resonance is more complex.However, the dressed-state picture provides an accurate physical model, the AC Stark effect,for this typical phase behavior [273]. The AC Stark effect describes the interaction of apolar molecule with a time-dependent, external electromagnetic field. Note that the energylevel arrangements involved in the MW-RF double-resonance experiments perfectly match theconditions for the Autler-Townes effect [273, 274]. The ab-coherence prepared by the MWchirp oscillates with the resonance frequency !
0,ab in the field free case. However, the RFfield splits and shifts the energy levels |bi and |ci depending on the strength of the interaction(Rabi frequency ⌦bc) and the detuning from resonance. The sign of the detuning determinesthe energy ordering of the respective energy levels. Detailed explanations are given in the nextparagraph together with a schematic to illustrate the energy level arrangement (Fig. 7.5).
Schematics for the red- and blue-detuned cases within the dressed-state picture are depictedin Figure 7.5 for the progressive energy level scheme. The states |bi and |ci are dressed withphotons of the RF field of frequency !bc. The unperturbed |bi state dressed with N photons isdescribed as the |b,Ni state. It interacts with the unperturbed |c,N � 1i state, i.e., |ci dressed

7.4. DOUBLE-RESONANCE EXPERIMENTS 119
with N �1 photons. They are virtually separated by the detuning �bc in the unperturbed case(left hand side of Fig. 7.5a and b). For blue detuning 7.5a, the |b,Ni state is higher in energythan the |c,N � 1i state. As a consequence, the |b,Ni state will be shifted towards higherenergies for the dressed state |1i (right-hand side of Fig. 7.5a), while the |c,N � 1i state willbe shifted towards the lower energy state |2i. The situation is reversed for the red-detunedcase (Fig. 7.5b).
When probing these shifts by a transition to the third level |ai with ~!0,ab, which is far
detuned from the dressing RF field, the ab-transition splits up into two components: |a,Ni $|1i with frequency !
0,ab + (⌦bc � �bc)/2 and |a,Ni $ |2i with frequency !0,ab � (⌦bc +
�bc)/2. Both transitions are dipole allowed because the mixed states |1i and |2i are bothcontaminated by the undressed state |b,Ni. This characteristic splitting was first observed byAutler and Townes in 1955 [274]. The difference between the two transitions corresponds to thegeneralized Rabi frequency ⌦bc =
q⌦
02
bc + �2bc, where ⌦0bc is the Rabi frequency ⌦
0bc = µbcFbc/~
introduced in Section 2.4. As mentioned above, in the measurements and the simulationspresented herein the probe ab-coherence is created prior to the perturbation due to the RFpulse. Employing this pulse scheme, the intensities of the two different frequency componentsof the ab-coherence (the Autler-Townes doublet) are simulated for the time the RF pulse isapplied. Unfortunately, the experimental setup does not permit the direct observation of theAutler-Townes splitting because the CP-FTMW spectrometer is constructed to record theFID of weak molecular signals. The sensitive electronic components would be destroyed orat least saturated by any attempt to observe the molecular response during the RF pulse.Nonetheless, the simulations reveal an intensity ratio of:
Ic,N�1
Ib,N= tan2
1
2· arctan
✓�⌦0
bc
�bc
◆�(7.10)
for the Autler-Townes doublet, where the transition between the dressed state evolving fromthe unperturbed state |b,Ni (dressed state |1i or |2i for blue or red detuned light, respectively)and |a,Ni is always stronger in intensity as indicated by the thickness of the wavy lines inFigure 7.5. The same intensity ratio can be derived using the dressed-state approach asdemonstrated in Reference [273] for the reversed pulse scheme (lower transition is pumped andthe upper transition is probed). The simulated intensities of the Autler-Townes splitting arevisualized in a two-dimensional plot (Fig. 7.6a) for various detunings. To resolve the doubletstructure, the simulations are performed with a 50 µs long RF pulse. These simulations revealan avoided crossing at zero detuning. This effect was experimentally observed before in asimilar experiment on quantum dots [275].
Using the dressed-state approach, the phase shift of the ab-coherence for the different de-tunings is easily understood. Without any perturbation due to the RF pulse (⌦0
bc = 0), therelative measured phase is zero, but by disturbing the energy level scheme with the RF pulsethe phase of the ab-coherence is shifted. Hence, depending on the detuning, the amplitudesand frequencies of the Autler-Townes doublet are mapped onto the relative phase of the ab-coherence, measured in a field free environment. In the next section the double-resonance

120 CHAPTER 7. ENANTIOMER DIFFERENTIATION
3712.8 3713.0 3713.2 3713.4 3713.6
MW frequency (MHz)
�400
�200
020
040
0
RF
det
unin
g(k
Hz)
(a)
3713.0 3713.1 3713.2 3713.3 3713.4
MW frequency (MHz)
inte
nsi
ty(a
rb.
units)
-60
-40
-20
0
20
40
60
detuning (kHz)
(b)
Figure 7.6: Illustration of the Autler-Townes doublet for different detunings. (a) Two-dimensional plot with the MW frequencies on the x-axis and the RF detuning on they-axis. (b) Spectra of different detunings close to �bc = 0. Note the intensities of thedoublet are equal for zero detuning.
experiments are extended to differentiate between enantiomers of chiral molecules.
7.5 Enantiomer differentiation
As indicated in the previous sections the differentiation of enantiomers becomes feasible by apolarization sensitive double-resonance experiment. It exploits the fact that the scalar tripleproduct of the permanent dipole moment components switches sign between enantiomers.The experimental procedure is very similar to the double-resonance experiments described inthe previous section. In contrast to the double-resonance experiments not only a three-levelscheme but a closed cycle involving all three types of dipole allowed transitions (a-type, b-type,c-type) is required. This prerequisite implies that all permanent dipole moment components(µa, µb, µc) need to be nonzero as already mentioned in the introduction. The technique itselfis based on efficient coherence transfer, while the orthogonal polarization of the excitationpulses enables the mapping of the molecule-fixed axes onto the laboratory-fixed axes. Thefollowing description is based on Reference [276] and is worked out for clarity only for aprogressive level scheme illustrated in Figure 7.7b. However, the theory itself is valid for anythree-level system (i.e. regressive V- and ⇤-type), but the labeling of the various levels isdifferent then.
The experimental pulse scheme is depicted in Figure 7.7a together with the evolution of theab-, bc- and ac-coherences. Firstly the ab-transition (drive transition) is excited resonantlyemploying a MW pulse polarized along the Z-direction converting population difference into

7.5. ENANTIOMER DIFFERENTIATION 121
t0,MW t0,RF t0,meas
time
inte
nsi
ty(a
rb.
units)
(⇡/2) MW-pulse
(drive)(⇡) RF-pulse
(twist)
recording of the
three-wave mixing signal
ab-coherence (�ab
)
ac-coherence (�ac
)
bc-coherence (�bc
)
(a)
|ai
|bi
|ci
(⇡/2)
MW
-pulse
(drive),�
M=
0
Z-direction
(⇡) RF-pulse
(twist
), �M= ±1
Y-direct
ion
thre
e-wav
em
ixin
gsign
al
(lis
ten),
�M
=⌥1
X-d
irec
tion
(b)
Figure 7.7: (a) Evolution of the ab-, bc- and ac-coherences in a prototype three-wavemixing experiment employing a drive and a twist pulse. Firstly, the drive pulsecreates maximum coherence between the states |ai and |bi, when the pulse matches⇡2
-conditions. The second pulse is resonant to the bc-transition and transfers ab-coherence to ac-coherence. This transfer is maximized, when the pulse matches ⇡-conditions. (b) Scheme of the energy levels and transitions involved in the three-wavemixing experiment. The selection rules for the M quantum number are also indicated.
coherence. Secondly, by applying the RF-pulse polarized along the Y -direction and excitingthe bc-transition (twist transition), ab-coherence is transferred to ac-coherence. Finally, thepolarization induced by the decaying ac-coherence is collected along the X-direction with theturned receiving horn antenna.
Analytic solutions of the three-level optical Bloch equations [276] as well as numerical cal-culations performed herein reveal that the listen signal is most intense by applying ⇡
2
- and⇡-conditions for the drive and the twist pulse, respectively. Due to the M -degeneracy of therotational energy levels and the M -dependence of the transition dipole moment in Equation7.6 only approximate ⇡
2
- and ⇡-conditions are met for rotational transitions of a molecule.Of note is that the MW-pulse polarization defines the laboratory-fixed quantization. Conse-quently, the selection rule for the M quantum number is �M = 0 for the drive transition,because the MW-pulse is polarized parallel to the quantization axis. For the twist transitionthe selection rule �M = ±1 follows, because the twist pulse is polarized perpendicularly tothe quantization axis [115]. Hence the drive and the twist pulse define the orientation ofthe coordinate system. With a transition cycle involving all three types of transitions, thepolarization of the listen transition is mutually orthogonal to both drive and twist pulse. Asmentioned before this coherence transfer scheme only works for closed cycles, which impliesa selection rule �M = ⌥1 for the listen transition.
The coherence transfer scheme explained above is not limited to chiral molecules, but worksfor all molecules with nonzero dipole moment components µa, µb, µc. However, by applying

122 CHAPTER 7. ENANTIOMER DIFFERENTIATION
the drive and the twist pulse polarized perpendicularly to each other and addressing differ-ent dipole moment components, the molecule-fixed coordinate system is projected onto thelaboratory-fixed coordinate system. Hence, the sign of the scalar triple product µa · (µb ⇥ µc)
is mapped onto the phase of the listen transition 'listen
in the following manner [276]:
'listen, t
0
= 'drive, t
0
+ 'twist, t
0
+⇡
2· µa · (µb ⇥ µc)
|µa| · |µb| · |µc|(7.11)
where 'drive, t
0
and 'twist, t
0
are the phases of the drive and twist excitation pulses at a specifictime t
0
, respectively. In consequence, the phase difference of ⇡ radians enables the definitedifferentiation between the two enantiomers of a chiral molecule. The sensitivity of the listentransition to the phases of the excitation pulses is used as an experimental control later inthis chapter.
According to the selection rules of the quantum number J a closed cycle of transitions mustinclude Q-, P - and R-type transitions. Possible cycles are chosen such that all three transitiondipole moment components are maximized and the rotational energy levels involved are suffi-ciently populated for a given rotational temperature. All experiments presented herein wereperformed on enantiopure carvone (Sigma Aldrich, (R)-carvone (98 %) or (S)-carvone (96 %),IUPAC name: 2-Methyl-5-(1-methylethenyl)-2-cyclohexenone). The samples were used with-out further purification and heated to 120 °C. While R-carvone smells like spearmint, S-carvone smells like caraway, nicely demonstrating the different biological functionality of theenantiomers of chiral molecules. Under the cold conditions of a molecular jet, carvone ex-hibits three conformers, which are referred to as EQ1, EQ2 and EQ3, following the nomen-clature of Moreno et al. [227]. The two lowest energy conformers EQ2 and EQ1 were usedfor the following three-wave mixing experiments and their structures are depicted in Figure7.8a and 7.8b. The experimentally determined rotational constants of conformer EQ2 andEQ1 are A = 2237.20549(43) MHz, B = 656.278398(261) MHz, C = 579.641099(193) MHz
and A = 2256.91206(88) MHz, B = 672.906930(241) MHz, C = 554.504807(172) MHz, re-spectively [227]. The ordering of the calculated permanent dipole moment componentsµb > µa > µc is the same for both conformations as well as the sign of the scalar tripleproduct µa · (µb ⇥ µc) for the corresponding enantiomer (+1 for R-carvone and -1 for S-carvone). Also both conformations have comparable magnitudes of the permanent dipolemoment components with µa ⇡ 2 D, µb ⇡ 3 D, and µc ⇡ 0.7 D.
Usually the magnitudes of the permanent dipole moments µa, µb, µc and hence the transitiondipole moments of the rotational transitions included into a cycle differ. Various cycles fora given molecule are ranked based on the product of the intensities of the three individualtransitions. Furthermore a transition along the smallest dipole moment component within theMW bandwidth is used for the drive excitation, because the MW amplifier delivers enoughpower for a short ⇡
2
-pulse even for weak transitions. For a strong three-wave mixing signalit is beneficial to choose the listen transition to be dependent on the largest dipole momentcomponent. In consequence the RF-pulse excites the twist transition in the experimentalsetup. Apparently the bandwidth of the MW excitation and RF excitation needs to cover

7.5. ENANTIOMER DIFFERENTIATION 123
(a) (b)
0 10 20 30 40
measurement count
�⇡�⇡
/2
0
⇡/2
⇡
rel.
phas
e(r
ad) R-carvone:
S-carvone:
RF+ RF-
RF+ RF-RF+ RF-
(c)
0 10 20 30
measurement count
�⇡�⇡
/2
0
⇡/2
⇡
rel.
phas
e(r
ad) R-carvone:
S-carvone:
RF+ RF-
RF+ RF-RF+ RF-
(d)
0 2 4 6 8 10
time (ns)
intensity
(norm
.,arb.
units)
RF+
RF-R-carvone S-carvone
(e)
0 2 4 6 8 10
time (ns)
intensity
(norm
.,arb.
units)
RF+
RF-R-carvone S-carvone
(f)
Figure 7.8: Results of three-wave mixing experiments performed on two different con-formers of carvone. The left column shows the results for conformer EQ2 and theright column the results for conformer EQ1. First row: Energy levels and transitionsinvolved in the three-wave mixing experiments for (a) conformer EQ2 and (b) con-former EQ1. The molecular structures were reproduced from Moreno et al. [227].For both conformations a c-type transition and a b-type transition are used for thedrive and twist excitation, respectively. In the second row the relative phases of thelisten signal are plotted for experiments on the two different enantiomers and employ-ing two different phases for the RF-excitation pulse (phase difference between RF+and RF- is ⇡ radians). The results in (c) and (d) exhibit a stable phase difference of⇡ radians between measurements of different enantiomers and between measurementusing different RF-excitation phase on the same enantiomer. The plots (e) and (f)show a 10 ns portion of the FID for measurements on both enantiomers. The FID isfiltered at the corresponding listen frequency (5098.12 MHz for EQ2 and 2811.42 MHzfor EQ1). A phase difference of ⇡ radians is again apparent.

124 CHAPTER 7. ENANTIOMER DIFFERENTIATION
the frequencies of the drive and twist excitation pulse, respectively. Note, that the drivetransition might not even be visible in a normal CP-FTMW experiment.
For the two conformers of carvone EQ2 and EQ1, potential three-wave mixing cycles wereevaluated and the most promising cycle for each conformer was optimized for maximumcoherence transfer. For EQ2 a cycle was used that involves the rotational states 2
02
, 312
and313
and the corresponding transitions 202
! 312
at 5557.91 MHz (drive, c-type), 312
! 313
at 495.75 MHz (twist, a-type) and 202
! 313
at 5098.12 MHz (listen, b-type). The drivetransition was excited with a microwave chirp spanning the frequency range from 5.52 GHz
to 5.58 GHz in 1 µs. The chirp overlaps temporally with a single frequency twist pulse at495.75 MHz and a total length of 5 µs. The cycle for conformer EQ1 includes the transitions000
! 110
at 2929.82 MHz (drive, c-type), 110
! 111
at 118.40 MHz (twist, a-type) and000
! 111
at 2811.42 MHz (listen, b-type). Here, the microwave excitation chirp is just 250 ns
long and spans 100 MHz at a center frequency of 2.95 GHz. The twist RF pulse is fixed atthe frequency of the molecular resonance (118.40 MHz) with a length of 500 ns. Both cyclesand the pulse sequence are depicted in Figure 7.8a and 7.8b. As mentioned earlier the initialphase of the RF excitation pulse ('
twist
) is exploited as a control that the listen signal purelyoriginates from the three-wave mixing excitation and not from any direct excitation. Hence,the experiments were carried out with an initial phase of '
twist
= ⇡2
labeled as RF+ and'
twist
= �⇡2
labeled as RF�.
Figure 7.8c and 7.8d present the measured phase of the listen transition of conformer EQ2and EQ1 for a set of measurement, respectively. A phase shift of ⇡ radians between the twodifferent enantiomers is apparent for both conformers and the same initial phase of the RFpulse (RF+ or RF�). By switching the phase of the RF pulse from ⇡
2
to �⇡2
, the phasebehavior is reversed as expected, indicating that the signal originates purely from three-wave mixing. Figure 7.8e and 7.8f show a portion of 10 ns of the measured and filteredFID. To extract the listen frequency component from the FID a Butterworth filter designwas applied with a bandwidth of 500 kHz. Again the phase shift of ⇡ radians is apparentbetween the different enantiomers. In a final experiment both conformers were excited in thesame experimental run by stacking the pulse sequence temporally beginning with the shorterpulses of conformer EQ1. The results are depicted in Figure 7.9. The traces for the differentconformers of the same enantiomeric species were extracted from the same portion of the FID,but filtered with the corresponding listen frequencies.
7.6 Enantiomeric excess measurement
The enantiomeric excess (ee) measures the fraction of the excess enantiomer and is defined inthe following way [277]:
ee =
����mR � mS
mR + mS
���� (7.12)
where mR and mS is the total mass of the R- and S-enantiomer in a mixture, respectively.The ee is a very important quantity for drug development to measure, control and optimize

7.6. ENANTIOMERIC EXCESS MEASUREMENT 125
0 2 4 6 8 10
time (ns)
inte
nsi
ty(n
orm
.,ar
b.
units)
Conformer EQ2 (5098.12 MHz)
Conformer EQ1 (2811.41 MHz)
R-carvone
S-carvone
Figure 7.9: Portion of the FID trace of the listen signal of conformer EQ2 and con-former EQ1 excited in the same experiment employing a stacked excitation scheme.The two plots show the same portion of the FID for measurements on the R- and theS-enantiomer but filtered using the corresponding listen frequency (5098.12 MHz forEQ2 and 2811.42 MHz for EQ1). The phase difference of ⇡ radians is evident forboth conformers.
the outcome of asymmetric synthesis routines. Current state-of-the-art measurement tech-niques include optical rotation determination or chiral gas chromatography [278]. Becausethe three-wave mixing signal is a superposition of the signal originating from the R- and theS-enantiomer, its intensity I is directly proportional to the ee:
I = A (T, N) ·
mR
mR + mSsin (!t) +
mS
mR + mSsin (!t + ⇡)
�
I = A (T, N) · sin (!t) ·✓
mR
mR + mS� mS
mR + mS
◆(7.13)
I / A (T, N) · mR � mS
mR + mS/ ee
However, to determine the ee using this linear dependence of the signal intensity on the ee,the proportionality constant A (T, N) must be known. This implies that the intensity fora sample with known ee has to be determined first, but also that effects of the rotationaltemperature T and the number of molecules N on the proportionality constant A (T, N) needto be eliminated. Otherwise, slightly different experimental parameters, which are easilyintroduced by a varying performance of the pulsed nozzle, prevent the exact comparison oftwo different intensity measurements. To overcome this issue, the proportionality constantA (T, N) is normalized with the intensity of the listen transition obtained in a traditional

126 CHAPTER 7. ENANTIOMER DIFFERENTIATION
1
0.5
0
0.5
1
racemic
trial
enan
tiom
eric
exc
ess
R-carvone
0.2 (R)
0.33 (S)
R
S
Figure 7.10: Repeated measurements of enantiomeric excess for carvone: enantiomer-ically pure R-carvone, the racemic mixture, and mixtures with a slight excess ofR-carvone (0.2(R)) and of S-carvone (0.33(S)). At least 50 000 FIDs were averagedfor each data point.
microwave spectroscopy fashion, where both enantiomers contribute to the signal intensity inthe same manner.
Figure 7.10 shows the results of ee determination for four samples with different enantiomericcompositions. An enantiopure sample with a stated ee value of 1(R) was used for calibration.The agreement is satisfying for a proof-of-principle experiment, however it is still possibleto further reduce the experimental error (about 10 %). Different uncertainty sources wereidentified and can be eliminated in future measurements. First of all, the preparation ofthe mixture adds uncertainty to the corresponding ee. This uncertainty is easily reduced byhigh-precision lab equipment or by the preparation of large sample volumes. Furthermore,residual noise on the measured signal intensity induces uncertainty. A larger number ofaverages would reduce the residual noise. However with a longer measurement duration, thetime between a three-wave mixing experiment is performed and the subsequent normalizationmeasurement is increased. Fluctuation in the molecular density or the rotational temperatureare then insufficiently monitored and their cancellation might not be complete. Nevertheless,a sophisticated alternating measurement scheme, where the three-wave mixing experimentand the normalization measurement are essentially performed at the same time (within a fewseconds), would overcome this problem. Finally, the calibration standard also has a limitedaccuracy, which needs to be characterized.

7.7. CONCLUSION AND OUTLOOK 127
7.7 Conclusion and outlook
The COMPACT spectrometer was extended to perform polarization sensitive broadband MW-RF double-resonance experiments. In a first step, these double-resonance experiments wereexploited to study the AC Stark effect in an unconventional way by examining the phase ofthe transient FID. A characteristic phase change is observed when the RF pump frequencyis scanned through resonance. This phase change can be attributed to the Autler-Towneseffect because the RF field shifts the energy levels that are probed by the MW signal pulse.The Autler-Townes splitting is mapped onto the phase of the MW probe signal, causing thecharacteristic phase shift. The nature of the splitting changes with the magnitude and signof the detuning, that is, it depends on the relative arrangement of the energy levels as eitherprogressive or regressive. It can be described very well by simulations exploiting the three-leveloptical Bloch equations.
In a second step, the molecule-sensitive enantiomer differentiation of chiral molecules bymicrowave three-wave mixing was demonstrated. The intrinsically narrow lines in rotationalspectroscopy and the characteristic phase of the three-wave mixing signal for the individualenantiomer allows the analysis of a mixture of chiral molecules. The technique was applied tocharacterize a mixture of conformational isomers of the monoterpenoid carvone. In addition,the ee values of enantiomeric mixtures of carvone were measured.
Future studies aim to determine the absolute configuration of a previously uncharacterizedmolecule. The permanent and the transition dipole moment components are required todetermine the phase of the three-wave mixing signal. The former is obtained by quantumchemical calculations while the latter by evaluating the overlap integral (Eqn. 7.6). However,the determination of the phase relationship of the microwave pulse and the RF pulse in theinteraction region remains challenging due to the different signal paths and the dispersion ofthe different microwave components. In addition, the time period from when the signal andwhen the measurement starts needs to be characterized precisely to derive the absolute phaseof the three-wave mixing signal from the experimentally determined relative phase of a signalstarting at t
0, meas (compare Fig. 7.7a).

Chapter 8
Summary and outlook
The chemical and biological functionality of a molecule is governed by its structural flexibilityand internal dynamics while interacting with other molecules, electromagnetic radiation, orexternal forces. Hence, knowledge of the molecular structure and its internal dynamics isfundamental for strategic drug and advanced material design. Broadband microwave spec-troscopy is a powerful technique to study the structure, the dynamics, and the chirality ofsmall and medium sized molecules of biological relevance. This thesis provides an overview,starting with instrument design, construction, and commissioning through to the applicationof the technique to small molecules of biological interest. In that course, various experimen-tal and theoretical approaches were developed and employed to shed light on the structure,dynamics, and chirality of molecules.
The construction and commissioning of the new chirped-pulse Fourier transform microwavespectrometer COMPACT is described in Chapter 3. The instrumental setup is closely relatedto the design proposed by Pate et al. [58], but adapted to the frequency range from 2 to8 GHz (Fig. 3.1). This frequency range is well suited for studying medium sized moleculesof biological interest due to their small rotational constants (Sec. 3.2). The purity of thesignal sources and the traveling wavetube amplifier was evaluated and revealed the presenceof higher harmonics (Fig. 3.2 and Fig. 3.3). The spectrometer is equipped with a pulsed valveto generate an ensemble of internally cold molecules. The valve creates a supersonic expansionand the molecules are probed in a collision free environment at rotational temperatures ofless than 5 K. The virtually collision free environment and the low temperature dramaticallyreduces the line broadening. It was found that an acquisition time of 50 µs provides a goodtradeoff between measurement time, signal-to-noise ratio, and spectral resolution (25 kHz).The repetition rate of the experiment is limited by the data processing time for high-resolutionmeasurements (about 2 Hz) and by the pumping speed for low-resolution measurements (upto 10 Hz).
The performance of the spectrometer was evaluated using the gas trifluoroiodo methane(CF
3
I) and the liquid benzonitrile (C7
H5
N). The characteristic intensity pattern of thequadrupole splitting due to the iodine nucleus of CF
3
I provides a reliable test case for a

129
comparison of the measured and simulated intensities. The agreement is good in the fre-quency range between 3 and 6 GHz (Fig. 3.10). The situation is different for benzonitrile.Due to benzonitrile’s large permanent dipole moment of 4.5152 (68) D, the chirp alters thepopulations of the individual states significantly in a rapid passage manner, which leads tosubstantial changes of the transition intensities (Fig. 3.12). Finally, a deep averaged measure-ment of 624 000 acquisitions on benzonitrile was performed to evaluate the sensitivity of thespectrometer. This measurement revealed all 13C-isotopologues, the 15N-isotopologue, onebenzonitrile-water cluster, two benzonitrile-neon clusters, and a vibrationally excited state ofbenzonitrile (Fig. 3.13 and Fig. 3.14). With the help of an additional delay generator, theexperimental repetition rate can be further increased by obtaining more than one FID per gaspulse. Further improvements include a new nozzle design to allow for a better jet expansionadjustment under vacuum and the development of a monolithic application to control andfurther automate the measurement procedure.
In the framework of this thesis, the microwave spectra of related, previously uncharacterizedsmall biomolecules were analyzed with increasing complexity: From a series of p-halotoluenesin Chapter 4 and the monoterpenoids thymol and carvacrol in Chapter 5 to the monoter-penoids menthol, menthone, and isomenthone in Chapter 6.
Even though the conformational flexibility is limited for the p-halotoluenes (p-chloro-, p-bromo- and p-iodotoluene), the low-barrier V
6
internal rotation of the methyl group as well asthe strong nuclear quadrupole coupling of the halogen atoms give rise to dense spectra. De-spite the complicated analysis, the observed splitting pattern provides additional informationabout the barrier to internal rotation and the electronic structure (Fig. 4.2 and Fig. 4.3).The spectra were fit in a global manner employing the principle axis method and SPFIT toobtain the rotational constants, nuclear quadrupole coupling constants, and other spectro-scopic constants (Table 4.1, Table 4.2, and Table 4.3). However, the important quantity ofthe barrier height to internal rotation V
6
is not accessible using the principle axis method ina low barrier case. In the rho axis method, the barrier height can be extracted directly fromthe Hamiltonian, but its dependence on the barrier height is very weak for the lowest twom-states. Unfortunately, only transitions involving these two m-states were observed in thespectra obtained. However, with the help of previously published rotational transitions forhigher m-states of p-chlorotoluene [211], the determination of the barrier height became pos-sible and the V
6
internal rotation barrier of the methyl group was found to be 0.058 kJ/mol forboth p-chlorotoluene isotopologues. Another interesting result of this study is that the magni-tudes of the quadrupole coupling constants are increased in the halotoluenes compared to thehalobenzenes. This increase is explained by the +I inductive effect of the methyl group thatinjects additional electron density into the phenyl ⇡-cloud, thus giving more electron densityfor the halogen atom to extract. This additional extraction makes the halogen-carbon bondmore ionic than in the halobenzenes. Furthermore, the ⇡-bonding character of the halogen-carbon bond decreases with increasing size of the halogen atom due to the reduced overlap ofthe valence p-orbital of the halogen and the aromatic ⇡-cloud.
In comparison to the p-halotoluenes, the conformational space is more complex for thymol

130 CHAPTER 8. SUMMARY AND OUTLOOK
and carvacrol, discussed in Chapter 5. These monoterpenoids may exist in trans- or cis-configurations of the hydroxyl group with respect to the isopropyl group. Furthermore, therotation of the isopropyl group gives rise to two rotamers for each cis- and trans-isomer ofthymol and carvacrol (Fig. 5.2 and Fig. 5.4). In the cold conditions of the molecular jet,four different conformations were identified for carvacrol, whereas three conformations wereobserved for thymol (Fig. 5.3 and Fig. 5.5). For both molecules, line splittings due to methylgroup internal rotation were observed. Using the rho axis method and the program XIAM, theV
3
barrier heights could be determined. The experimental barrier heights are 4.0863(25) kJ/mol
for trans-carvacrol A, 4.4024(16) kJ/mol for trans-carvacrol B, and 0.3699(11) kJ/mol for trans-thymol A (Table 5.1, Table 5.2, Table 5.4, and Table 5.5). These results reflect the effect ofthe hydroxyl group on the barrier height. The impact of the substituent on the barrier heightwas also compared to similar molecules, e.g. toluene, cresol, and o-xylene (Table 5.6).
In Chapter 6, the rotational spectra and the experimentally obtained rotational constantsof the monoterpenoids menthol, menthone, and isomenthone are reported. In contrast tothymol and carvacrol, the cyclohexane ring in menthol adds further flexibility and extendsthe conformational space (Fig. 6.4). Even though quantum chemical calculations predictfive conformers below 5 kJ/mol (Table 6.2), only one conformer of menthol was observed inthe spectrum (Fig. 6.3). This observation can be explained by the cooling behavior inthe supersonic expansion and low isomerization barriers for these five conformers to the oneobserved. The comparison of the experimental rotational constants with the ab initio onesrevealed a good match (Table 6.1). The calculations further predict that for the nine lowestenergy conformers of menthol the chair configuration of the cyclohexane ring is preferred.
In the broadband microwave spectrum of a mixture of the diastereomers menthone and iso-menthone, three conformations of menthone and a single conformation of isomenthone wereidentified (Fig. 6.6). Each set of rotational constants was unambiguously linked to a calcu-lated structure (6.3). Again for menthone, a chair configuration with sterically demandingsubstituents in the equatorial positions is preferred (Table 6.4). However, the arrangement ofthe substituents in isomenthone forces the cyclohexane ring into a boat configuration with oneof the substituents oriented axial to the cyclohexane ring for the lowest energy conformations(Table 6.5).
As the number of structural isomers present in the rotational spectrum increases, the manualassignment of the individual rotational transitions becomes complicated. The trend towardsthe study of larger molecules means this situation arises more often because, with an increas-ing size, molecules usually exhibit more conformations or stereoisomers. Another upcomingchallenge is the assignment of dense high-resolution spectra obtained by radio astronomy. Thecomplicated analysis of the overlapping spectra of the mixture of menthone isomers motivatedthe development of a new automated assignment program in Section 6.3. The computer pro-gram compares many predicted spectra with the experimental one in a systemic way, thenpicks and fits the best candidates. The automated routine was capable of identifying andfitting all components in the menthone mixture with ab initio calculated rotational constantsas inputs.

131
Future work in the field of spectral analysis will focus on the theoretical description of internaldynamics, e.g. internal rotation or tunneling, in combination with other spectroscopic effects,e.g. quadrupole coupling. This approach will not necessarily require the development of anew rotational Hamiltonian, but rather an evaluation of the existing approaches and theircombination in an unified framework. Furthermore, automated assignment and fitting ofoverlapping spectra will gain importance for conformationally rich biomolecules. Hence, futuredevelopment faces two main challenges. Firstly, the ample conformational landscape needs tobe evaluated in an accurate and time efficient way to provide high quality starting structuresand rotational constants for the automated assignment routine. Secondly, the assignmentand fitting algorithm needs to handle overlapping spectra of multiple species that likely alsoexhibit line splittings due to internal dynamics or quadrupole coupling.
Even though microwave spectroscopy provides access to most structural properties, the chi-rality of a molecule was always out of reach. Neglecting the small energy shift due to parityviolation, the unperturbed rotational Hamiltonian does not provide any information aboutthe configuration, because the rotational constants are identical. However, the scalar tripleproduct of the permanent dipole moment components switches sign between enantiomers. InChapter 7, this fact is exploited to uncover the molecular handedness in a three-wave mixingscheme. This three-wave mixing approach, proposed by Hirota [268], was successfully imple-mented in a cavity-based spectrometer by Patterson et al. [269, 270]. Within the frameworkof this thesis, the three-wave mixing scheme was adapted for the broadband regime. There-fore the COMPACT spectrometer was slightly modified and equipped with a radio frequencysource polarized perpendicular to the microwave radiation (Fig. 7.2). By exciting two tran-sitions of a closed triad of transitions, the phase of the third transition identifies the excessenantiomer. The experiments were performed on the monoterpenoid carvone determining notonly which enantiomer is in excess ( Fig. 7.8 in Sec. 7.5), but also by how much (Fig. 7.10 inSec. 7.6). The applicability of the three-wave mixing technique to mixtures of chiral moleculeswas demonstrated by the simultaneous measurement of two conformers of carvone (Fig. 7.9).
The determination of the absolute configuration without any a priori knowledge of the mea-sured phase of the different enantiomers is the next step in continuing the three-wave mixingexperiments. This task involves the accurate characterization of the experimental time delaysand the dispersion of the individual high-frequency components as outlined in Section 7.7.Preliminary computations based on four-level optical Bloch equations show that by excitingall three transitions of a closed cycle, the population of a specific enantiomer in a defined stateis enhanced. One application of this experimental technique would be the determination ofthe ee without the dependence on a known sample.
In preparation for the three-wave mixing experiments, double-resonance experiments wereperformed to determine the resonance frequency of the radio frequency transition and to op-timize the duration of the microwave and the radio frequency pulses. Using the diastereomersmenthone and isomenthone, the dependence of pumping a radio frequency transition on boththe amplitude and phase of the coherence of a microwave transition with which it shares acommon rotational level was investigated. The microwave signal intensity in the FID is sig-

132 CHAPTER 8. SUMMARY AND OUTLOOK
nificantly depleted and a strong phase change is observed when scanning the radio frequencythrough molecular resonance (Fig. 7.3 and Fig. 7.4). The direction of the phase changedepends on the energy level arrangement, that is, if it is progressive or regressive. The exper-imental results can be simulated using the three-level optical Bloch equations and are bestdescribed with the AC-Stark effect (Fig. 7.5), giving rise to an Autler-Townes splitting (Fig.7.6). When measuring the rotational spectrum of complex molecules, the double-resonancetechnique can provide additional information to guide the assignment process. One can imag-ine even automated double-resonance experiments to fully determine the connectivity of therotational levels involved, greatly simplifying the assignment.

Bibliography
[1] A. Yonath, “Polar bears, antibiotics, and the evolving ribosome (Nobel Lecture),” Angew. Chem. Int.Ed. 49, 4340 (2010).
[2] K. Wüthrich, “NMR studies of structure and function of biological macromolecules (Nobel Lecture),”Angew. Chem. Int. Ed. 42, 3340 (2003).
[3] R. R. Ernst, “Nuclear Magnetic Resonance Fourier Transform Spectroscopy (Nobel Lecture),” Angew.Chem. Int. Ed. 31, 805 (1992).
[4] R. Huber, “A structural basis of light energy and electron transfer in biology (Nobel lecture),” Angew.Chem. Int. Ed. 28, 848 (1989).
[5] J. Deisenhofer and H. Michel, “Nobel lecture. The photosynthetic reaction centre from the purple bac-terium Rhodopseudomonas viridis.” Bioscience Rep. 9, 383 (1989).
[6] H. Hauptman, “Direct Methods and Anomalous Dispersion (Nobel Lecture),” Angew. Chem. Int. Ed.25, 603 (1986).
[7] J. Karle, “Recovering phase information from intensity data (Nobel Lecture),” Angew. Chem. Int. Ed.25, 614 (1986).
[8] A. Klug, “From Macromolecules to Biological Assemblies (Nobel Lecture),” Angew. Chem. Int. Ed. 22,565 (1983).
[9] D. C. Hodgkin, “The X-ray analysis of complicated molecules,” Nobel Lecture (1964).[10] A. Lesarri, S. Mata, J. C. López, and J. L. Alonso, “A laser-ablation molecular-beam Fourier-transform
microwave spectrometer: The rotational spectrum of organic solids,” Rev. Sci. Instrum. 74, 4799 (2003).[11] S. Melandri, M. E. Sanz, W. Caminati, P. G. Favero, and Z. Kisiel, “The hydrogen bond between water
and aromatic bases of biological interest: An experimental and theoretical study of the 1:1 complex ofpyrimidine with water,” J. Am. Chem. Soc. 120, 11504 (1998).
[12] S. Melandri, D. Consalvo, W. Caminati, and P. G. Favero, “Hydrogen bonding , structure , and dynamicsof benzonitrile-water,” Chem. Phys. 111, 3874 (1999).
[13] S. Blanco, J. C. Lopéz, J. L. Alonso, P. Ottaviani, and W. Caminati, “Pure rotational spectrum andmodel calculations of indole-water,” J. Chem. Phys. 119, 880 (2003).
[14] J. Thomas, O. Sukhorukov, W. Jäger, and Y. Xu, “Direct spectroscopic detection of the orientationof free OH groups in methyl lactate-(water)1,2 clusters: Hydration of a chiral hydroxy ester,” Angew.Chem. Int. Ed. 53, 1156 (2014).
[15] C. Pérez, J. L. Neill, M. T. Muckle, D. P. Zaleski, I. Peña, J. C. Lopez, J. L. Alonso, and B. H. Pate,“Water-Water and Water-Solute Interactions in Microsolvated Organic Complexes.” Angew. Chem. Int.Ed. 53, 993 (2014).
[16] E. J. Cocinero, A. Lesarri, P. Écija, F. J. Basterretxea, J.-U. Grabow, J. A. Fernández, and F. Castaño,“Ribose Found in the Gas Phase,” Angew. Chem. Int. Ed. 51, 3119 (2012).
[17] A. Lesarri, S. Mata, E. J. Cocinero, S. Blanco, J. C. López, and J. L. Alonso, “The structure of neutralproline.” Angew. Chem. Int. Ed. 41, 4673 (2002).
[18] A. Lesarri, E. J. Cocinero, J. C. López, and J. L. Alonso, “The shape of neutral valine.” Angew. Chem.Int. Ed. 43, 605 (2004).
[19] S. Blanco, A. Lesarri, J. C. López, and J. L. Alonso, “The gas-phase structure of alanine.” J. Am. Chem.Soc. 126, 11675 (2004).

134 BIBLIOGRAPHY
[20] J. L. Alonso, I. Peña, J. C. López, and V. Vaquero, “Rotational spectral signatures of four tautomers ofguanine.” Angew. Chem. Int. Ed. 48, 6141 (2009).
[21] J. L. Alonso, V. Vaquero, I. Peña, J. C. López, S. Mata, and W. Caminati, “All Five Forms of CytosineRevealed in the Gas Phase,” Angew. Chem. Int. Ed. 52, 2331 (2013).
[22] C. Cabezas, M. Varela, I. Peña, J. C. López, and J. L. Alonso, “The microwave spectrum of neurotrans-mitter serotonin.” Phys. Chem. Chem. Phys. 14, 13618 (2012).
[23] C. Cabezas, J. L. Alonso, J. C. López, and S. Mata, “Unveiling the Shape of Aspirin in the Gas Phase,”Angew. Chem. Int. Ed. 51, 1375 (2012).
[24] I. Peña, A. M. Daly, C. Cabezas, S. Mata, C. Bermúdez, A. Niño, J. C. Lopéz, J.-U. Grabow, et al.,“Disentangling the Puzzle of Hydrogen Bonding in Vitamin C,” J. Phys. Chem. Lett. 4, 65 (2013).
[25] M. Varela, C. Cabezas, J. C. López, and J. L. Alonso, “Rotational spectrum of paracetamol.” J. Phys.Chem. A 117, 13275 (2013).
[26] N. A. Seifert, D. P. Zaleski, C. Pérez, J. L. Neill, B. H. Pate, M. Vallejo-López, A. Lesarri, E. J.Cocinero, et al., “Probing the C-H...⇡ Weak Hydrogen Bond in Anesthetic Binding: The Sevoflurane-Benzene Cluster,” Angew. Chem. Int. Ed. 53, 3210 (2014).
[27] T. Betz, S. Zinn, and M. Schnell, “The shape of ibuprofen in the gas phase,” Phys. Chem. Chem. Phys.17, 4538 (2015).
[28] C. Pérez, M. T. Muckle, D. P. Zaleski, N. A. Seifert, B. Temelso, G. C. Shields, Z. Kisiel, and B. H.Pate, “Structures of Cage, Prism, and Book Isomers of Water Hexamers from Broadband RotationalSpectroscopy,” Science 336, 897 (2012).
[29] C. Pérez, S. Lobsiger, N. A. Seifert, D. P. Zaleski, B. Temelso, G. C. Shields, Z. Kisiel, and B. H.Pate, “Broadband Fourier transform rotational spectroscopy for structure determination : The waterheptamer,” Chem. Phys. Lett. 571, 1 (2013).
[30] C. Pérez, D. P. Zaleski, N. A. Seifert, B. Temelso, G. C. Shields, Z. Kisiel, and B. H. Pate, “HydrogenBond Cooperativity and the Three-Dimensional Structures of Water Nonamers and Decamers,” Angew.Chem. Int. Ed. 53, 14368 (2014).
[31] M. Schnell and J.-U. Grabow, “Multidimensional large-amplitude motion: revealing concurrent tunnelingpathways in molecules with several internal rotors.” Angew. Chem. Int. Ed. 45, 3465 (2006).
[32] M. Schnell, U. Erlekam, P. R. Bunker, G. von Helden, J.-U. Grabow, G. Meijer, and A. van der Avoird,“Structure of the Benzene Dimer-Governed by Dynamics,” Angew. Chem. Int. Ed. 52, 5180 (2013).
[33] “European Southern Observatory - Atacama Large Millimeter/submillimeter Array.”http://www.eso.org/sci/facilities/alma.html (2014).
[34] “Herschel Space Observatory,” http://sci.esa.int/herschel/ (2014).[35] C. Qi, K. I. Öberg, D. J. Wilner, P. D’Alessio, E. Bergin, S. M. Andrews, G. A. Blake, M. R. Hogerheijde,
et al., “Imaging of the CO snow line in a solar nebula analog,” Science 341, 630 (2013).[36] J. K. Jørgensen, R. Visser, N. Sakai, E. A. Bergin, C. Brinch, D. Harsono, J. E. Lindberg, E. F. van
Dishoeck, et al., “A Recent Accretion Burst in the Low-Mass Protostar Iras 15398-3359: Alma Imagingof Its Related Chemistry,” Astrophys. J. 779, L22 (2013).
[37] A. Belloche, R. T. Garrod, H. S. P. Müller, and K. M. Menten, “Detection of a branched alkyl moleculein the interstellar medium: iso-propyl cyanide,” Science 233, 232 (2014).
[38] S. M. Fortman, J. P. McMillan, C. F. Neese, S. K. Randall, A. J. Remijan, T. Wilson, and F. C. DeLucia, “An analysis of a preliminary ALMA Orion KL spectrum via the use of complete experimentalspectra from the laboratory,” J. Mol. Spec. 280, 11 (2012).
[39] J. L. Neill, E. A. Bergin, D. C. Lis, T. G. Phillips, M. Emprechtinger, and P. Schilke, “Broadbandanalysis techniques for Herschel/HIFI spectral surveys of chemically rich star-forming regions,” J. Mol.Spec. 280, 150 (2012).
[40] M. J. Travers, M. C. McCarthy, P. Kalmus, C. A. Gottlieb, and P. Thaddeus, “Laboratory Detection ofthe Linear Cyanopolyyne HC11N,” Astrophys. J. 469, L65 (1996).
[41] C. H. Townes and A. L. Schawlow, Microwave spectroscopy, 2nd ed. (Courier Dover Publications, Mi-neola, 1975).

BIBLIOGRAPHY 135
[42] C. H. Townes, “The Ammonia Spectrum and Line Shapes Near 1.25-cm Wave-Length,” Phys. Rev. 70,665 (1946).
[43] W. E. Good, “Inversion Spectrum of Ammonia,” Phys. Rev. 70, 213 (1946).[44] B. P. Dailey, R. L. Kyhl, M. W. P. Stranberg, J. H. van Vleck, and E. B. Wilson Jr, “The Hyperfine
Structure of the Microwave Spectrum of Ammonia and the Existence of a Quadrupole Moment in 14N,”Phys. Rev. 70, 984 (1946).
[45] J. P. Gordon, H. J. Zeiger, and C. H. Townes, “Molecular Microwave Oszillator and New Structure inthe Microwave Spectrum of NH3,” Phys. Rev. 99, 282 (1954).
[46] J. P. Gordon, H. J. Zeiger, and C. H. Townes, “The Maser-New Type of Microwave Amplifier, FrequencyStandard and Spectrometer,” Phys. Rev. 99, 1264 (1955).
[47] J. Kraitchman, “Determination of Molecular Structure from Microwave Spectroscopic Data,” Am. J.Phys. 21, 17 (1953).
[48] R. Dicke and R. Romer, “Pulse Techniques in Microwave Spectroscopy,” Rev. Sci. Instrum. 26, 915(1955).
[49] J. McGurk, T. Schmalz, and W. Flygare, “Fast passage in rotational spectroscopy: Theory and experi-ment,” J. Chem. Phys. 60, 4181 (1974).
[50] J. C. McGurk, R. T. Hofmann, and W. H. Flygare, “Transient absorption and emission and the mea-surement of T
1
and T
2
in the J 0 ! 1 rotational transition in OCS,” J. Chem. Phys. 60, 2922 (1974).[51] T. J. Balle and W. Flygare, “Fabry-Perot cavity pulsed Fourier transform microwave spectrometer with
a pulsed nozzle particle source,” Rev. Sci. Instrum. 52, 33 (1981).[52] J.-U. Grabow, W. Stahl, and H. Dreizler, “A multioctave coaxially oriented beam-resonator arrangement
Fourier-transform microwave spectrometer,” Rev. Sci. Instrum. 67, 4072 (1996).[53] F. Lewen, R. Gendriesch, I. Pak, D. G. Paveliev, M. Hepp, R. Schieder, and G. Winnewisser, “Phase
locked backward wave oscillator pulsed beam spectrometer in the submillimeter wave range,” Rev. Sci.Instrum. 69, 32 (1998).
[54] D. T. Petkie, T. M. Goyette, R. P. A. Bettens, S. P. Belov, S. Albert, P. Helminger, and F. C. De Lucia,“A fast scan submillimeter spectroscopic technique,” Rev. Sci. Instrum. 68, 1676 (1997).
[55] B. Vogelsanger, M. Andrist, and A. Bauder, “Two-Dimensional Correlation Experiments in MicrowaveFourier Transform Spectroscopy,” Chem. Phys. Lett. 144, 180 (1988).
[56] B. Vogelsanger, A. Bauder, and H. Mäder, “Twodimensional experiments with collisioninduced transferof populations in microwave Fourier transform spectroscopy,” J. Chem. Phys. 91, 2059 (1989).
[57] B. Vogelsanger and A. Bauder, “Two-dimensional microwave Fourier transform spectroscopy,” J. Chem.Phys. 92, 4101 (1990).
[58] G. G. Brown, B. C. Dian, K. O. Douglass, S. M. Geyer, S. T. Shipman, and B. H. Pate, “A broadbandFourier transform microwave spectrometer based on chirped pulse excitation.” Rev. Sci. Instrum. 79,053103 (2008).
[59] G. S. Grubbs, C. T. Dewberry, K. C. Etchison, K. E. Kerr, and S. A. Cooke, “A search acceleratedcorrect intensity Fourier transform microwave spectrometer with pulsed laser ablation source,” Rev. Sci.Instrum. 78, 6 (2007).
[60] S. L. Stephens and N. R. Walker, “Determination of nuclear spin-rotation coupling constants in CF3Iby chirped-pulse Fourier-transform microwave spectroscopy,” J. Mol. Spec. 263, 27 (2010).
[61] D. A. Obenchain, A. A. Elliott, A. L. Steber, R. A. Peebles, S. A. Peebles, C. J. Wurrey, and G. A.Guirgis, “Rotational spectrum of three conformers of 3,3-difluoropentane: Construction of a 480 MHzbandwidth chirped-pulse Fourier-transform microwave spectrometer,” J. Mol. Spec. 261, 35 (2010).
[62] A. J. Shirar, D. S. Wilcox, K. M. Hotopp, G. L. Storck, I. Kleiner, and B. C. Dian, “Impactof molecular conformation on barriers to internal methyl rotation: The rotational spectrum of m-methylbenzaldehyde,” J. Phys. Chem. A 114, 12187 (2010).
[63] B. Reinhold, I. Finneran, and S. Shipman, “Room temperature chirped-pulse Fourier transform mi-crowave spectroscopy of anisole,” J. Mol. Spec. 270, 89 (2011).

136 BIBLIOGRAPHY
[64] J. L. Neill, S. T. Shipman, L. Alvarez-Valtierra, A. Lesarri, Z. Kisiel, and B. H. Pate, “Rotationalspectroscopy of iodobenzene and iodobenzene-neon with a direct digital 2-8 GHz chirped-pulse Fouriertransform microwave spectrometer,” J. Mol. Spec. 269, 21 (2011).
[65] K. Prozument, A. Colombo, Y. Zhou, G. Park, V. Petrović, S. Coy, and R. Field, “Chirped-PulseMillimeter-Wave Spectroscopy of Rydberg-Rydberg Transitions,” Phys. Rev. Lett. 107, 1 (2011).
[66] L. Evangelisti, G. Sedo, and J. Van Wijngaarden, “Rotational spectrum of 1,1,1-trifluoro-2-butanoneusing chirped-pulse Fourier transform microwave spectroscopy,” J. Phys. Chem. A 115, 685 (2011).
[67] G. B. Park, A. H. Steeves, K. Kuyanov-Prozument, J. L. Neill, and R. W. Field, “Design and evaluationof a pulsed-jet chirped-pulse millimeter-wave spectrometer for the 70-102 GHz region,” J. Chem. Phys.135, 024202 (2011).
[68] M. K. Jahn, D. A. Dewald, D. Wachsmuth, J.-U. U. Grabow, and S. C. Mehrotra, “Rapid capture oflarge amplitude motions in 2,6-difluorophenol: High-resolution fast-passage FT-MW technique,” J. Mol.Spec. 280, 54 (2012).
[69] D. Schmitz, V. A. Shubert, T. Betz, and M. Schnell, “Multi-resonance effects within a single chirp inbroadband rotational spectroscopy: The rapid adiabatic passage regime for benzonitrile,” J. Mol. Spec.280, 77 (2012).
[70] A. L. Steber, B. J. Harris, J. L. Neill, and B. H. Pate, “An arbitrary waveform generator based chirpedpulse Fourier transform spectrometer operating from 260 to 295 GHz,” J. Mol. Spec. 280, 3 (2012).
[71] D. P. Zaleski, J. L. Neill, M. T. Muckle, N. A. Seifert, P. Brandon Carroll, S. L. Widicus Weaver, andB. H. Pate, “A K
a
-band chirped-pulse Fourier transform microwave spectrometer,” J. Mol. Spec. 280,68 (2012).
[72] S. P. Dempster, O. Sukhorukov, Q.-Y. Lei, and W. Jäger, “Rotational spectroscopic study of hydrogencyanide embedded in small 4He clusters Rotational spectroscopic study of hydrogen cyanide embeddedin small 4 He clusters,” J. Chem. Phys. 137, 174303 (2012).
[73] S. Mata, I. Peña, C. Cabezas, J. López, and J. Alonso, “A broadband Fourier-transform microwavespectrometer with laser ablation source: The rotational spectrum of nicotinic acid,” J. Mol. Spec. 280,91 (2012).
[74] K. Prozument, G. Barratt Park, R. G. Shaver, A. K. Vasiliou, J. M. Oldham, D. E. David, J. S. Muenter,J. F. Stanton, et al., “Chirped-pulse millimeter-wave spectroscopy for dynamics and kinetics studies ofpyrolysis reactions.” Phys. Chem. Chem. Phys. 16, 15739 (2014).
[75] B. C. Dian, G. G. Brown, K. O. Douglass, and B. H. Pate, “Measuring picosecond isomerization kineticsvia broadband microwave spectroscopy.” Science 320, 924 (2008).
[76] B. C. Dian, G. G. Brown, K. O. Douglass, F. S. Rees, J. E. Johns, P. Nair, R. D. Suenram, and B. H.Pate, “Conformational isomerization kinetics of pent-1-en-4-yne with 3,330 cm
�1 of internal energymeasured by dynamic rotational spectroscopy.” P. Natl. Acad. Sci. USA 105, 12696 (2008).
[77] D. S. Wilcox, K. M. Hotopp, and B. C. Dian, “Two-dimensional chirped-pulse Fourier transform mi-crowave spectroscopy.” J. Phys. Chem. 115, 8895 (2011).
[78] V. A. Shubert, D. Schmitz, D. Patterson, J. M. Doyle, and M. Schnell, “Identifying Enantiomers inMixtures of Chiral Molecules with Broadband Microwave Spectroscopy,” Angew. Chem. Int. Ed. 52, 1(2013).
[79] S. Lobsiger, C. Perez, L. Evangelisti, K. K. Lehmann, and B. H. Pate, “Molecular Structure and ChiralityDetection by Fourier Transform Microwave Spectroscopy,” J. Phys. Chem. Lett. 6, 196 (2015).
[80] E. Gerecht, K. O. Douglass, and D. F. Plusquellic, “Chirped-pulse terahertz spectroscopy for broadbandtrace gas sensing.” Opt. Express 19, 8973 (2011).
[81] J. L. Neill, B. J. Harris, A. L. Steber, K. O. Douglass, D. F. Plusquellic, and B. H. Pate, “Segmentedchirped-pulse Fourier transform submillimeter spectroscopy for broadband gas analysis.” Opt. Express21, 19743 (2013).
[82] J. L. Neill, B. J. Harris, R. L. Pulliam, M. T. Muckle, R. Reynolds, D. McDaniel, and B. H. Pate,“Pure rotational spectrometers for trace-level VOC detection and chemical sensing,” Proc. SPIE 9101,91010B (2014).

BIBLIOGRAPHY 137
[83] A. R. W. McKellar, “High-resolution infrared spectroscopy with synchrotron sources,” J. Mol. Spec.262, 1 (2010).
[84] M. Schmitt and W. L. Meerts, “Rotationally Resolved Electronic Spectroscopy and Automatic Assign-ment Techniques using Evolutionary Algorithms,” in Handbook of High-resolution Spectroscopy , Vol. 2,edited by M. Quack and F. Merkt (John Wiley & Sons, Ltd, New York, 2011) pp. 1345–72.
[85] D. W. Pratt, “Electronic Spectroscopy in the Gas Phase,” in Handbook of High-resolution Spectroscopy ,Vol. 2, edited by M. Quack and F. Merkt (John Wiley & Sons, Ltd, New York, 2011) pp. 1291–1320.
[86] A. H. Zewail, “Femtochemistry: Atomic-Scale Dynamics of the Chemical Bond Using Ultrafast Lasers,”Angew. Chem. Int. Ed. 39, 2586 (2000).
[87] C. Riehn, “High-resolution pump-probe rotational coherencespectroscopy - Rotational constants andstructure of ground and electronically excited states of large molecular systems,” Chem. Phys. 283, 297(2002).
[88] C. Schröter, K. Kosma, and T. Schultz, “CRASY: mass- or electron-correlated rotational alignmentspectroscopy.” Science 333, 1011 (2011).
[89] K. Wüthrich, “The way of NMR structures of proteins,” Nat. Struct. Biol. 8, 923 (2001).[90] L. E. Kay, “NMR studies of protein structure and dynamics.” J. Magn. Reson. 173, 193 (2005).[91] H. M. Berman, J. Westbrook, Z. Feng, G. Gilliland, T. N. Bhat, H. Weissig, I. N. Shindyalov, and P. E.
Bourne, “The Protein Data Bank.” Nucleic. Acids Res. 28, 235 (2000).[92] D. I. Svergun and M. H. J. Koch, “Small-angle scattering studies of biological macromolecules in solu-
tion,” Rep. Prog. Phys. 66, 1735 (2003).[93] D. I. Svergun, “Small-angle scattering studies of macromolecular solutions,” J. Appl. Crystallogr. 40, 10
(2007).[94] H. D. T. Mertens and D. I. Svergun, “Structural characterization of proteins and complexes using small-
angle X-ray solution scattering.” J. Struct. Biol. 172, 128 (2010).[95] H. N. Chapman, P. Fromme, A. Barty, T. A. White, R. A. Kirian, A. Aquila, M. S. Hunter, J. Schulz,
et al., “Femtosecond X-ray protein nanocrystallography.” Nature 470, 73 (2011).[96] L. Redecke, K. Nass, D. P. DePonte, T. A. White, D. Rehders, A. Barty, F. Stellato, M. Liang, et al.,
“Natively inhibited Trypanosoma brucei cathepsin B structure determined by using an X-ray laser.”Science 339, 227 (2013).
[97] T. R. M. Barends, L. Foucar, S. Botha, R. B. Doak, R. L. Shoeman, K. Nass, J. E. Koglin, G. J.Williams, et al., “De novo protein crystal structure determination from X-ray free-electron laser data.”Nature 505, 244 (2014).
[98] M. M. Seibert, T. Ekeberg, F. R. N. C. Maia, M. Svenda, J. Andreasson, O. Jönsson, D. Odić, B. Iwan,et al., “Single mimivirus particles intercepted and imaged with an X-ray laser.” Nature 470, 78 (2011).
[99] T. Ekeberg, M. Svenda, C. Abergel, F. R. N. C. Maia, V. Seltzer, J.-M. Claverie, M. Hantke, O. Jönsson,et al., “Three-Dimensional Reconstruction of the Giant Mimivirus Particle with an X-Ray Free-ElectronLaser,” Phys. Rev. Lett. 114, 1 (2015).
[100] J. Küpper, S. Stern, L. Holmegaard, F. Filsinger, A. Rouzée, A. Rudenko, P. Johnsson, A. V. Martin,et al., “X-ray diffraction from isolated and strongly aligned gas-phase molecules with a free-electronlaser,” Phys. Rev. Lett. 112, 1 (2014).
[101] R. Neutze, R. Wouts, D. van der Spoel, E. Weckert, and J. Hajdu, “Potential for biomolecular imagingwith femtosecond X-ray pulses.” Nature 406, 752 (2000).
[102] H. N. Chapman, A. Barty, M. J. Bogan, S. Boutet, M. Frank, S. P. Hau-Riege, S. Marchesini, B. W.Woods, et al., “Femtosecond Diffractive Imaging with a Soft-X-ray Free-Electron Laser,” Nat. Phys. 2,839 (2006).
[103] A. Barty, J. Küpper, and H. N. Chapman, “Molecular Imaging Using X-Ray Free-Electron Lasers,”Annu. Rev. Phys. Chem. 64, 415 (2013).
[104] M. Adrian, J. Dubochet, J. Lepault, and A. W. McDowall, “Cryo-electron microscopy of viruses,” Nature308, 32 (1984).

138 BIBLIOGRAPHY
[105] C. Mueller, M. Harb, J. R. Dwyer, and R. J. D. Miller, “Nanofluidic cells with controlled pathlengthand liquid flow for rapid, high-resolution in situ imaging with electrons,” J. Phys. Chem. Lett. 4, 2339(2013).
[106] C. J. Hensley, J. Yang, and M. Centurion, “Imaging of isolated molecules with ultrafast electron pulses,”Phys. Rev. Lett. 109, 1 (2012).
[107] M. Gao, C. Lu, H. Jean-Ruel, L. C. Liu, A. Marx, K. Onda, S.-Y. Koshihara, Y. Nakano, et al., “Mappingmolecular motions leading to charge delocalization with ultrabright electrons.” Nature 496, 343 (2013).
[108] R. J. D. Miller, “Femtosecond Crystallography with Capturing Chemistry in Action,” Science 343, 1108(2014).
[109] J. Tenboer, S. Basu, N. Zatsepin, K. Pande, D. Milathianaki, M. Frank, M. Hunter, S. Boutet, et al.,“Time-resolved serial crystallography captures high-resolution intermediates of photoactive yellow pro-tein,” Science 346, 1242 (2014).
[110] F. Merkt and M. Quack, “Molecular Quantum Mechanics and Molecular Spectra, Molecular Symmetry,and Interaction of Matter with Radiation,” in Handbook of High-resolution Spectroscopy , Vol. 1, editedby M. Quack and F. Merkt (John Wiley & Sons, Ltd, New York, 2011) pp. 1–56.
[111] M. Born and R. Oppenheimer, “Zur Quantentheorie der Molekeln,” Ann. Phys. 84, 457 (1927).[112] P. F. Bernath, “Rotational Spectroscopy,” in Spectra of Atoms and Molecules (Oxford University Press,
Oxford, 1995) Chap. 6.[113] R. N. Zare, Angular Momentum: Understanding Spatial Aspects in Chemistry and Physics (John Wiley
& Sons, Inc., New York, 1988).[114] A. R. Edmonds, Angular Momentum in Quantum Mechanics (Princeton University Press, Princeton,
1996).[115] A. Bauder, “Fundamentals of Rotational Spectroscopy,” in Handbook of High-resolution Spectroscopy ,
Vol. 1, edited by M. Quack and F. Merkt (John Wiley & Sons, Ltd, New York, 2011) pp. 57–116.[116] P. R. Bunker and P. Jensen, Molecular symmetry and spectroscopy, 2nd ed. (NRC Research Press,
Ottawa, 1998).[117] W. Gordy and R. Cook, Microwave Molecular Spectra (John Wiley & Sons Inc., New York, 1964).[118] G. W. King, R. M. Hainer, and P. C. Cross, “The Asymmetric Rotor I. Calculation and Symmetry
Classification of Energy Levels,” J. Chem. Phys. 11, 27 (1943).[119] J. K. G. Watson, “Indeterminacies of Fitting Parameters in Molecular Spectroscopy,” in Handbook of
High-resolution Spectroscopy , Vol. 1, edited by M. Quack and F. Merkt (John Wiley & Sons, Ltd, NewYork, 2011) pp. 587–606.
[120] J. K. G. Watson, “Determination of Centrifugal Distortion Coefficients of Asymmetric Top Molecules,”J. Chem. Phys. 46, 1935 (1967).
[121] H. H. Nielsen, “The Vibration-Rotation Energies of Molecules,” Rev. Mod. Phys. 23, 90 (1951).[122] N. R. Walker, S. G. Francis, S. L. Matthews, J. J. Rowlands, and A. C. Legon, “Microwave spectrum
and structure of carbonyl gold iodide, OCAuI,” Mol. Phys. 104, 3329 (2006).[123] C. Medcraft, R. Wolf, and M. Schnell, “High-resolution spectroscopy of the chiral metal complex
[CpRe(CH3)(CO)(NO)]: a potential candidate for probing parity violation.” Angew. Chem. Int. Ed.53, 11656 (2014).
[124] M. Schnell, J. Hougen, and J. Grabow, “Towards the complete analysis of the rotational spectrum of(CH3)3SnCl,” J. Mol. Spec. 251, 38 (2008).
[125] E. R. Cohen, T. Cvitas, J. G. Frey, B. Holmström, K. Kuchitsu, R. Marquardt, I. Mills, F. Pavese,et al., Quantities, Units and Symbols in Physical Chemistry, IUPAC Green Book, 3rd ed. (IUPAC &RSC Publishing, Cambridge, 2008).
[126] C. P. Slichter, “Electric Quadrupole Effects,” in Principles of Magnetic Resonance (Springer-Verlag,Berlin, 1996) 3rd ed., pp. 485–502.
[127] H. P. Benz, A. Bauder, and H. H. Günthard, “Exact Quadrupole Interaction Energies in RotationalSpectra,” J. Mol. Spec. 21, 156 (1966).
[128] J. H. Goldstein, “Quadrupole Coupling and Bond Character in the Vinyl Halides,” J. Chem. Phys. 24,106 (1956).

BIBLIOGRAPHY 139
[129] C. H. Townes and B. P. Dailey, “Determination of Electronic Structure of Molecules from NuclearQuadrupole Effects,” J. Chem. Phys. 17, 782 (1949).
[130] D. R. Herschbach, “Calculation of Energy Levels for Internal Torsion and Over-All Rotation.” J. Chem.Phys. 31, 91 (1959).
[131] D. Gerhard, A. Hellweg, I. Merke, W. Stahl, M. Baudelet, D. Petitprez, and G. Wlodarczak, “Internalrotation and chlorine nuclear quadrupole coupling of o-chlorotoluene studied by microwave spectroscopyand ab initio calculations,” J. Mol. Spec. 220, 234 (2003).
[132] I. Kleiner, “Asymmetric-top molecules containing one methyl-like internal rotor: Methods and codes forfitting and predicting spectra,” J. Mol. Spec. 260, 1 (2010).
[133] P. Groner, “Effective rotational Hamiltonian for molecules with two periodic large-amplitude motions,”J. Chem. Phys. 107, 4483 (1997).
[134] H. M. Pickett, J. C. Pearson, and C. E. Miller, “Use of Euler series to fit spectra with application towater,” J. Mol. Spec. 233, 174 (2005).
[135] V. V. Ilyushin, Z. Kisiel, L. Pszczólkowski, H. Mäder, and J. T. Hougen, “A new torsion-rotation fittingprogram for molecules with a sixfold barrier: Application to the microwave spectrum of toluene,” J.Mol. Spec. 259, 26 (2010).
[136] R. C. Woods, “A General Program for the Calculation of Internal Rotation Splittings in MicrowaveSpectroscopy,” J. Mol. Spec. 21, 4 (1966).
[137] R. C. Woods, “A General Program for the Calculation of Internal Rotation Splittings in MicrowaveSpectroscopy : Part II. The n-top problem,” J. Mol. Spec. 22, 49 (1967).
[138] H. Hartwig and H. Dreizler, “The Microwave Spectrum of trans-2,3-Dimethyloxirane in Torsional ExcitedStates.” Z. Naturforsch. 51a, 923 (1996).
[139] C. C. Lin and J. D. Swalen, “Internal Rotation and Microwave Spectroscopy,” Rev. Mod. Phys. 31, 841(1959).
[140] M. O. Scully and M. S. Zubairy, “Atom-field interaction - semiclassical theory,” in Quantum Optics(Cambridge University Press, Cambridge, 1997) Chap. 5, pp. 145–192.
[141] J. von Neumann, Mathematical Foundations of Quantum Mechanics (Princeton University Press, Prince-ton, 1996).
[142] K. Blum, Density Matrix Theory and Applications, 3rd ed. (Springer-Verlag, Berlin, 2011).[143] J.-U. Grabow, “Fourier Transform Microwave Spectroscopy Measurement and Instrumentation,” in
Handbook of High-resolution Spectroscopy , Vol. 2, edited by M. Quack and F. Merkt (John Wiley &Sons, Ltd, New York, 2011) pp. 723–800.
[144] J. C. McGurk, T. G. Schmalz, and W. H. Flygare, “A density matrix, bloch equation description ofinfrared and microwave transient phenomena,” in Advances in Chemical Physics, edited by S. A. Riceand I. Prigogine (John Wiley & Sons, Inc., Hoboken, 1975) 25th ed., Chap. 1, pp. 1–68.
[145] Z. Kisiel, “PROSPE Website,” http://www.ifpan.edu.pl/⇠kisiel/prospe.htm (2014).[146] H. M. Pickett, “The Fitting and Prediction of Vibration-Rotation Spectra with Spin Interactions,” J.
Mol. Spec. 148, 371 (1991).[147] C. J. Cramer, Essentials of Computational Chemistry, 2nd ed. (John Wiley & Sons, Ltd, New York,
2004).[148] J. C. Slater, “The Theory of Complex Spectra,” Phys. Rev. 34, 1293 (1929).[149] D. R. Hartree, “The Wave Mechanics of an Atom with a Non-Coulomb Central Field. Part I. Theory
and Methods,” Math. Proc. Cambridge 24, 89 (1928).[150] D. R. Hartree, “The Wave Mechanics of an Atom with a Non-Coulomb Central Field. Part II. Some
Results and Discussion,” Math. Proc. Cambridge 24, 111 (1928).[151] V. Fock, “Näherungsmethode zur Lösung des quantenmechanischen Mehrkörperproblems,” Z. Phys. 61,
126 (1930).[152] C. Møller and M. S. Plesset, “Note on an Approximation Treatment for Many-Electron Systems,” Phys.
Rev. 46, 618 (1934).

140 BIBLIOGRAPHY
[153] J. Cízek, “On the Correlation Problem in Atomic and Molecular Systems. Calculation of WavefunctionComponents in Ursell-Type Expansion Using Quantum-Field Theoretical Methods,” J. Chem. Phys. 45,4256 (1966).
[154] R. G. Parr, “Density Functional Theory,” Annu. Rev. Phys. Chem. 34, 631 (1983).[155] P. Hohenberg and W. Kohn, “Inhomogeneous Electron Gas,” Phys. Rev. 136, 864 (1964).[156] W. Kohn and L. J. Sham, “Self-Consistent Equations Including Exchange and Correlation Effects,” Phys.
Rev. 140, 1133 (1965).[157] A. D. Becke, “A new mixing of Hartree-Fock and local density-functional theories,” J. Chem. Phys. 98,
1372 (1993).[158] K. Kim and K. D. Jordan, “Comparison of Density Functional and MP2 Calculations on the Water
Monomer and Dimer,” J. Phys. Chem. 98, 10089 (1994).[159] Y. Zhao and D. G. Truhlar, “The M06 suite of density functionals for main group thermochemistry,
thermochemical kinetics, noncovalent interactions, excited states, and transition elements: two newfunctionals and systematic testing of four M06-class functionals and 12 other function,” Theor. Chem.Acc. 120, 215 (2008).
[160] J. C. Slater, “Atomic Shielding Constants,” Phys. Rev. 36, 57 (1930).[161] S. F. Boys, “Electronic Wave Functions. I. A General Method of Calculation for the Stationary States
of Any Molecular System,” P. Roy. Soc. A 200, 542 (1950).[162] W. J. Hehre, R. F. Stewart, and J. A. Pople, “Self-Consistent Molecular-Orbital Methods. I. Use of
Gaussian Expansion of Slater-Type Atomic Orbitals,” J. Chem. Phys. 51, 2657 (1969).[163] R. Ditchfield, W. J. Hehre, and J. A. Pople, “Self-Consistent Molecular-Orbital Method. IX. An Extended
Gaussian-Type Basis for Molecular-Orbital Studies of Organic Molecules,” J. Chem. Phys. 54, 724(1971).
[164] R. Krishnan, J. S. Binkley, R. Seeger, and J. A. Pople, “Self-consistent molecular orbital methods . XX. A basis set for correlated wave functions,” J. Chem. Phys. 72, 650 (1980).
[165] T. H. Dunning Jr., “Gaussian basis sets for use in correlated molecular calculations. I. The atoms boronthrough neon and hydrogen,” J. Chem. Phys. 90, 1007 (1989).
[166] D. Feller, “The role of databases in support of computational chemistry calculations,” J. Comput. Chem.17, 1571 (1996).
[167] C. Puzzarini, J. F. Stanton, and J. Gauss, “Quantum-chemical calculation of spectroscopic parametersfor rotational spectroscopy,” Int. Rev. Phys. Chem. 29, 273 (2010).
[168] C. Puzzarini, “Rotational spectroscopy meets theory.” Phys. Chem. Chem. Phys. , 6595 (2013).[169] C. Puzzarini, “Extrapolation to the Complete Basis Set Limit of Structural Parameters : Comparison
of Different Approaches,” J. Phys. Chem. A 113, 14530 (2009).[170] W. Caminati, “Microwave Spectroscopy of Large Molecules and Molecular Complexes,” in Handbook of
High-resolution Spectroscopy , Vol. 2, edited by M. Quack and F. Merkt (John Wiley & Sons, Ltd, NewYork, 2011) pp. 829–852.
[171] K. L. Bak, J. Gauss, T. Helgaker, P. Jørgensen, and J. Olsen, “The accuracy of molecular dipole momentsin standard electronic structure calculations,” Chem. Phys. Lett. 319, 563 (2000).
[172] S. Stopkowicz and J. Gauss, “Relativistic corrections to electrical first-order properties using directperturbation theory.” J. Chem. Phys. 129, 164119 (2008).
[173] W. C. Bailey, “DFT and HF-DFT calculations of 14N quadrupole coupling constants in molecules,”Chem. Phys. 252, 57 (2000).
[174] J. Liévin, J. Demaison, M. Herman, a. Fayt, and C. Puzzarini, “Comparison of the experimental, semi-experimental and ab initio equilibrium structures of acetylene: influence of relativisitic effects and ofthe diagonal Born-Oppenheimer corrections.” J. Chem. Phys. 134, 064119 (2011).
[175] B. C. Dian, A. Longarte, and T. S. Zwier, “Conformational dynamics in a dipeptide after single-modevibrational excitation.” Science 296, 2369 (2002).
[176] S. G. Kukolich and L. C. Sarkozy, “Design, construction, and testing of a large-cavity, 1-10 GHz Flygare-Balle spectrometer.” Rev. Sci. Instrum. 82, 094103 (2011).
[177] N. F. Ramsey, Molecular Beams (Oxford University Press, Oxford, 1985).

BIBLIOGRAPHY 141
[178] J. B. Fenn, “Electrospray wings for molecular elephants (Nobel lecture),” Angew. Chem. Int. Ed. 42,3871 (2003).
[179] N. F. Ramsey, “Thermal Beam Sources,” in Experimental Methods in the Physical Sciences - Atomic,Molecular, and Optical Physics: Atoms and Molecules, Vol. 29, edited by F. Dunning and R. G. Hulet(Academic Press, Waltham, 1996) Chap. 1, pp. 1–20.
[180] W. Gerlach and Otto Stern, “Der experimentelle Nachweis der Richtungsquantelung im Magnetfeld,” Z.Phys. 9, 349 (1922).
[181] W. Gerlach and O. Stern, “Das magnetische Moment des Silberatoms.” Z. Phys. 9, 353 (1922).[182] M. D. Morse, “Supersonic Beam Sources,” in Experimental Methods in the Physical Sciences - Atomic,
Molecular, and Optical Physics: Atoms and Molecules, Vol. 29, edited by F. Dunning and R. G. Hulet(Academic Press, Waltham, 1996) Chap. 2, pp. 21–47.
[183] D. R. Miller, “Free Jet Sources,” in Atomic and Molecular Beam Methods, Vol. 1, edited by G. Scoles(Oxford University Press, Oxford, 1988) Chap. 2, pp. 14–53.
[184] D. H. Levy, “Laser Spectroscopy of Cold Gas-Phase Molecules,” Annu. Rev. Phys. Chem. 31, 197 (1980).[185] R. Jost, “The Cooling of Internal Degrees of Freedom of Polyatomic Molecules in Supersonic Free Jets,”
in Low Temperature Molecular Spectroscopy , edited by R. Fausto (Springer-Verlag, Berlin, 1996) pp.249–70.
[186] K. Wohlfart, M. Schnell, J.-U. Grabow, and J. Küpper, “Precise dipole moment and quadrupole couplingconstants of benzonitrile,” J. Mol. Spec. 247, 119 (2008).
[187] W. M. Hayes, D. R. Lide, and T. J. Bruno, eds., CRC Handbook of Chemistry and Physics, 95th ed.(Taylor & Francis Ltd., Oxford, 2014).
[188] B. Broers, L. D. Noordam, and H. B. van Linden van den Heuvell, “Diffraction and focusing of spectralenergy in multiphoton processes,” Phys. Rev. A 46, 2749 (1992).
[189] B. Broers, H. B. van Linden van den Heuvell, and L. D. Noordam, “Efficient Population Transfer ina Three-Level Ladder System by Frequency-Swept Ultrashort Laser Pulses,” Phys. Rev. Lett. 69, 25(1992).
[190] P. Balling, D. J. Maas, and L. D. Noordam, “Interference in climbing a quantum ladder system withfrequency-chirped laser pulses,” Phys. Rev. A 50, 4276 (1994).
[191] D. Maas, C. Rella, P. Antoine, E. Toma, and L. Noordam, “Population transfer via adiabatic passagein the rubidium quantum ladder system,” Phys. Rev. A 59, 1374 (1999).
[192] G. Wlodarczak, J. Burie, J. Demaison, K. Vormann, and A. Császár, “The Rotational Spectrum ofBenzonitrile : Experimental and Theoretical Determination of the Quartic Centrifugal Distortion Con-stants,” J. Mol. Spec. 134, 297 (1989).
[193] J. Casado, L. Nygaard, and G. O. Sørensen, “Microwave spectra of isotopic benzonitriles. Refined molec-ular structure of benzonitrile.” J. Mol. Struct. 8, 211 (1970).
[194] H. D. Rudolph, J. Demaison, and A. G. Császár, “Accurate determination of the deformation of thebenzene ring upon substitution: equilibrium structures of benzonitrile and phenylacetylene.” J. Phys.Chem. 117, 12969 (2013).
[195] M. Schmitt, M. Böhm, C. Ratzer, S. Siegert, M. V. Beek, and W. L. Meerts, “Electronic excitation inthe benzonitrile dimer: The intermolecular structure in the S
0
and S
1
state determined by rotationallyresolved electronic spectroscopy,” J. Mol. Struct. 795, 234 (2006).
[196] W. L. Meerts, M. Schmitt, and G. C. Groenenboom, “New applications of the genetic algorithm for theinterpretation of high-resolution spectra,” Can. J. Chemistry 82, 804 (2004).
[197] D. R. Borst, D. W. Pratt, and M. Schäfer, “Molecular recognition in the gas phase. Dipole-boundcomplexes of benzonitrile with water, ammonia, methanol, acetonitrile, and benzonitrile itself,” Phys.Chem. Chem. Phys. 9, 4563 (2007).
[198] V. A. Shubert, D. Schmitz, and M. Schnell, “Communication through the phenyl ring: internal rotationand nuclear quadrupole splitting in p-halotoluenes,” Mol. Phys. 111, 2189 (2013).
[199] G. A. Blake, E. C. Sutton, C. R. Masson, and T. G. Phillips, “Molecular abundance in OMC-1: thechemical composition of interstellar molecular clouds and the influence of massive star formation,”Astrophys. J. 315, 621 (1987).

142 BIBLIOGRAPHY
[200] Y. Miao, D. M. Mehringer, Y.-J. Kuan, and L. E. Snyder, “Complex molecules in Sagittarius B2(N):the importance of grain chemistry,” Astrophys. J. 445, 59 (1995).
[201] “The Karl G. Jansky Very Large Array,” https://science.nrao.edu/facilities/vla (2014).[202] D. W. Pratt, “High-resolution Spectroscopy in the Gas Phase: Even Large Molecules Have Well-Defined
Shapes,” Annu. Rev. Phys. Chem. 49, 481 (1998).[203] L. H. Spangler, “Structural Information from methyl internal rotation spectroscopy,” Annu. Rev. Phys.
Chem. 58, 481 (1997).[204] L. B. Favero, J.-U. Grabow, and W. Caminati, “Morphing the Torsional Potential Energy Function
from Local to Global Symmetry through a ⇡ Link: The Rotational Spectrum of ↵,↵,↵-Trifluoro-p-tolualdehyde,” Chem. Eur. J. 18, 2468 (2012).
[205] J. Rottstegge, H. Hartwig, and H. Dreizler, “The rotational spectrum, structure and barrier V
6
to internalrotation of p-fluorotoluene,” J. Mol. Struct. 478, 37 (1999).
[206] M. J. Frisch, G. W. Trucks, H. B. Schlegel, G. E. Scuseria, M. A. Robb, J. R. Cheeseman, J. A.Montgomery Jr., T. Vreven, et al., “Gaussian 03, Revision C.02,” (2004).
[207] M. J. Frisch, G. W. Trucks, H. B. Schlegel, G. E. Scuseria, M. A. Robb, J. R. Cheeseman, G. Scalmani,V. Barone, et al., “Gaussian 09, Revision A.1,” (2009).
[208] K. A. Peterson, B. C. Shepler, D. Figgen, and H. Stoll, “On the Spectroscopic and ThermochemicalProperties of ClO, BrO, IO, and Their Anions,” J. Phys. Chem. A 110, 13877 (2006).
[209] K. L. Schuchardt, B. T. Didier, T. Elsethagen, L. Sun, V. Gurumoorthi, J. Chase, J. Li, and T. L.Windus, “Basis Set Exchange: A Community Database for Computational Sciences,” J. Chem. Inf.Model. 47, 1045 (2007).
[210] M. N. Glukhovtsev, A. Pross, M. P. McGrath, and L. Radom, “Extension of Gaussian-2 (G2) theory tobromine- and iodine-containing molecules: Use of effective core potentials,” J. Chem. Phys. 103, 1878(1995).
[211] G. E. Herberich, “Mikrowellenspektrum, Hinderungspotential der internen Rotation und teilweise r
0
-Struktur des para-Chlorotoluols,” Z. Naturforsch. 22a, 761 (1967).
[212] L.-H. Xu and J. T. Hougen, “Global Fit of Torsional-Rotational Transitions in the Ground and FirstExcited Torsional States of Methanol,” J. Mol. Spec. 173, 540 (1995).
[213] A. Legon and J. Thorn, “Equilibrium nuclear quadrupole coupling constants from the rotational spec-trum of BrCl: a source of the electric quadrupole moment ratios Q(79Br)/Q(81Br) and Q(35Cl)/Q(37Cl),”Chem. Phys. Lett. 215, 554 (1993).
[214] S. A. Peebles and R. A. Peebles, “Determination of the heavy atom structure of bromobenzene byrotational spectroscopy,” J. Mol. Struct. 657, 107 (2003).
[215] I. Merke, C. Keussen, H. Dreizler, and M. Onda, “Quadrupole Hyperfine Structure in the RotationalSpectra of 1,2- and 1,3-Dichlorobenzene,” Z. Naturforsch. 45a, 1273 (1990).
[216] D. R. Borst and D. W. Pratt, “Toluene: Structure, dynamics, and barrier to methyl group rotation inits electronically excited state. A route to IVR,” J. Chem. Phys. 113, 3658 (2000).
[217] P. C. Chen and C. W. Wu, “Ab Initio Molecular Orbital Study of Toluene and Its Derivatives,” J. Phys.Chem. 99, 15023 (1995).
[218] K.-T. Lu, F. Weinhold, and J. C. Weisshaar, “Understanding barriers to internal rotation in substitutedtoluenes and their cations,” J. Chem. Phys. 102, 6787 (1995).
[219] D. Schmitz, V. A. Shubert, B. M. Giuliano, and M. Schnell, “The broadband microwave spectra ofthe monoterpenoids thymol and carvacrol: Conformational landscape and internal dynamics,” J. Chem.Phys. 141, 034304 (2014).
[220] K.-H. Wagner and I. Elmadfa, “Biological Relevance of Terpenoids,” Ann. Nutr. Metab. 47, 95 (2003).[221] M. Kanakidou, J. H. Seinfeld, S. N. Pandis, I. Barnes, F. J. Dentener, M. C. Facchini, R. Van Dingenen,
B. Ervens, et al., “Organic aerosol and global climate modelling: a review,” Atmos. Chem. Phys. 5, 1053(2005).
[222] A. Guenther, C. N. Hewitt, D. Erickson, R. Fall, C. Geron, T. Graedel, P. Harley, L. Klinger, et al., “Aglobal model of natural volatile organic compound emission,” J. Geophys. Res. 100, 8873 (1995).

BIBLIOGRAPHY 143
[223] A. P. Bateman, S. A. Nizkorodov, J. Laskin, and A. Laskin, “Photolytic processing of secondary organicaerosols dissolved in cloud droplets.” Phys. Chem. Chem. Phys. 13, 12199 (2011).
[224] J. Lelieveld, T. M. Butler, J. N. Crowley, T. J. Dillon, H. Fischer, L. Ganzeveld, H. Harder, M. G.Lawrence, et al., “Atmospheric oxidation capacity sustained by a tropical forest.” Nature 452, 737(2008).
[225] H. V. L. Nguyen, H. Mouhib, S. Klahm, W. Stahl, and I. Kleiner, “A touch of lavender: gas-phasestructure and dynamics of the monoterpene linalool validated by microwave spectroscopy.” Phys. Chem.Chem. Phys. 15, 10012 (2013).
[226] J. R. Avilés Moreno, F. Partal Ureña, J. J. López González, and T. R. Huet, “Terpenes in the gasphase: The structural conformation of S-(-)-perillaldehyde investigated by microwave spectroscopy andquantum chemical calculations,” Chem. Phys. Lett. 473, 17 (2009).
[227] J. R. Avilés Moreno, T. R. Huet, and J. J. López González, “Conformational relaxation of S-(+)-carvoneand R-(+)-limonene studied by microwave Fourier transform spectroscopy and quantum chemical cal-culations,” Struct. Chem. 24, 1163 (2012).
[228] Z. Kisiel, O. Desyatnyk, E. Bialkowska-Jaworska, and L. Pszczólkowski, “The structure and electricdipole moment of camphor determined by rotational spectroscopy,” Phys. Chem. Chem. Phys. 5, 820(2003).
[229] W.-X. Du, C. W. Olsen, R. J. Avena-Bustillos, T. H. McHugh, C. E. Levin, and M. Friedman, “Storagestability and antibacterial activity against Escherichia coli O157:H7 of carvacrol in edible apple filmsmade by two different casting methods.” J. Agr. Food Chem. 56, 3082 (2008).
[230] J. Xu, F. Zhou, B.-P. Ji, R.-S. Pei, and N. Xu, “The antibacterial mechanism of carvacrol and thymolagainst Escherichia coli.” Lett. Appl. Microbiol. 47, 174 (2008).
[231] A. Ben Arfa, S. Combes, L. Preziosi-Belloy, N. Gontard, and P. Chalier, “Antimicrobial activity ofcarvacrol related to its chemical structure.” Lett. Appl. Microbiol. 43, 149 (2006).
[232] P. C. Braga, M. Dal Sasso, M. Culici, T. Bianchi, L. Bordoni, and L. Marabini, “Anti-inflammatoryactivity of thymol: inhibitory effect on the release of human neutrophil elastase.” Pharmacology 77, 130(2006).
[233] M. A. Numpaque, L. A. Oviedo, J. H. Gil, C. M. García, and D. L. Durango, “Thymol and carvacrol :biotransformation and antifungal activity against the plant pathogenic fungi Colletotrichum acutatumand Botryodiplodia theobromae,” Trop. Plant Pathol. 36, 3 (2011).
[234] A. Welzel, A. Hellweg, I. Merke, and W. Stahl, “Structural and Torsional Properties of o-Cresol ando-Cresol-OD as Obtained from Microwave Spectroscopy and ab Initio Calculations,” J. Mol. Spec. 215,58 (2002).
[235] A. Hellweg, C. Hättig, I. Merke, and W. Stahl, “Microwave and theoretical investigation of the internalrotation in m-cresol.” J. Chem. Phys. 124, 204305 (2006).
[236] S. T. Shipman, J. L. Neill, R. D. Suenram, M. T. Muckle, and B. H. Pate, “Structure Determination ofStrawberry Aldehyde by Broadband,” J. Phys. Chem. Lett. 2, 443 (2011).
[237] N. Hansen, H. Mäder, and T. Bruhn, “A molecular beam Fourier transform microwave study of o-tolunitrile: 14N nuclear quadrupole coupling and methyl internal rotation effects,” Mol. Phys. 97, 587(1999).
[238] P. Écija, L. Evangelisti, M. Vallejo, F. J. Basterretxea, A. Lesarri, F. Castaño, W. Caminati, and E. J.Cocinero, “Conformational Flexibility of Mephenesin.” J. Phys. Chem. B 118, 5357 (2014).
[239] H. Rudolph, K. Walzer, and I. Krutzig, “Microwave Spectrum, Barrier for Methyl Rotation, MethylConformation, and Dipole Moment of Ortho-Xylene,” J. Mol. Spec. 47, 314 (1973).
[240] D. Schmitz, V. A. Shubert, T. Betz, and M. Schnell, “Exploring the conformational landscape of mentholmenthone and isomenthone: A microwave study,” Front. Chem. 3, 1 (2014).
[241] R. Kotan, S. Kordali, and A. Cakir, “Screening of antibacterial activities of twenty-one oxygenatedmonoterpenes.” Z. Naturforsch. C 62, 507 (2007).
[242] D. L. McKay and J. B. Blumberg, “A Review of the Bioactivity and Potential Health Benefits ofPeppermint Tea (Mentha piperita L .),” Phytother. Res. 20, 619 (2006).

144 BIBLIOGRAPHY
[243] D. M. Bautista, J. Siemens, J. M. Glazer, P. R. Tsuruda, A. I. Basbaum, C. L. Stucky, S.-E. Jordt, andD. Julius, “The menthol receptor TRPM8 is the principal detector of environmental cold.” Nature 448,204 (2007).
[244] G. P. P. Kamatou, I. Vermaak, A. M. Viljoen, and B. M. Lawrence, “Menthol: a simple monoterpenewith remarkable biological properties.” Phytochemistry 96, 15 (2013).
[245] R. Eccles, “Menthol and related cooling compounds.” J. Pharm. Pharmacol. 46, 618 (1994).[246] R. S. Cahn, C. Ingold, and V. Prelog, “Spezifikation der molekularen Chiralität,” Angew. Chem. 78, 413
(1966).[247] T. Harada, Y. Kagamihara, S. Tanaka, K. Sakamoto, and A. Oku, “A Highly Convergent Asymmetric
Synthesis of the C(19)-C(27) Segment of Rifamycin S: An Application of Enantiodifferentiating Acetal-ization with Menthone,” J. Org. Chem. 57, 1637 (1992).
[248] K. R. Brain, D. M. Green, P. J. Dykes, R. Marks, and T. S. Bola, “The role of menthol in skin penetrationfrom topical formulations of ibuprofen 5% in vivo.” Skin Pharmacol. Physiol. 19, 17 (2006).
[249] K. Zhao, S. Singh, and J. Singh, “Effect of menthone on the in vitro percutaneous absorption of tamoxifenand skin reversibility.” Int. J. Pharm. 219, 177 (2001).
[250] V. A. Shubert, D. Schmitz, and M. Schnell, “Enantiomer-sensitive spectroscopy and mixture analysisof chiral molecules containing two stereogenic centers - Microwave three-wave mixing of menthone,” J.Mol. Spec. 300, 31 (2014).
[251] M. Albrecht, J. Will, and M. A. Suhm, “Chirality Recognition in Menthol and Neomenthol: Preferencefor Homoconfigurational Aggregation.” Angew. Chem. Int. Ed. 49, 6203 (2010).
[252] J. Härtner and U. M. Reinscheid, “Conformational analysis of menthol diastereomers by NMR and DFTcomputation,” J. Mol. Struct. 872, 145 (2008).
[253] T. Egawa, M. Sakamoto, H. Takeuchi, and S. Konaka, “Structural Determination of Menthol and Isomen-thol, a Minty Compound and Its Nonminty Isomer, by Means of Gas Electron Diffraction Augmentedby Theoretical Calculations,” J. Phys. Chem. A 107, 2757 (2003).
[254] J. R. Avilés Moreno, F. Partal Ureña, and J. J. López González, “Hydrogen bonding network in a chiralalcohol: (1R,2S,5R)-(-)-menthol. Conformational preference studied by IR-Raman-VCD spectroscopiesand quantum chemical calculations,” Struct. Chem. 24, 671 (2013).
[255] W. B. Smith and C. Amezcua, “NMR versus molecular modelling : menthone and isomenthone,” Magn.Reson. Chem. 36, 3 (1998).
[256] M. J. Frisch, G. W. Trucks, H. B. Schlegel, G. E. Scuseria, M. A. Robb, J. R. Cheeseman, G. Scalmani,V. Barone, et al., “Gaussian 09, Revision A.02,” (2009).
[257] W. L. Meerts and M. Schmitt, “A new automated assign and analysing method for high-resolutionrotationally resolved spectra using genetic algorithms,” Phys. Scr. 73, C47 (2006).
[258] N. A. Seifert, I. A. Finneran, C. Perez, D. P. Zaleski, J. L. Neill, A. L. Steber, Richard D. Suen-ram, A. Lesarri, et al., “Autofit, an Automated Fitting Tool for Broadband Rotational Spectra, andApplications to 1-Hexanal,” J. Mol. Spec. 312, 13 (2015).
[259] N. A. Seifert, S. Lobsiger, B. H. Pate, G. A. Guirgis, J. S. Overby, and J. R. Durig, “SubstitutionStructures of Multiple Silicon-Containing Species by Chirped Pulse FTMW Spectroscopy,” Talk at the68th International Symposium on Molecular Spectroscopy at Ohio State University RC12 (2013).
[260] D. Schmitz, V. A. Shubert, D. Patterson, A. Krin, and M. Schnell, “Phase Dependence of Double-Resonance Experiments in Rotational Spectroscopy,” J. Phys. Chem. Lett. 6, 1493 (2015).
[261] P. J. Stephens, “Theory of Vibrational Circular Dichroism,” J. Phys. Chem. 89, 748 (1985).[262] C. Guo, R. D. Shah, R. K. Dukor, X. Cao, T. B. Freedman, and L. A. Nafie, “Determination of
enantiomeric excess in samples of chiral molecules using fourier transform vibrational circular dichroismspectroscopy: simulation of real-time reaction monitoring.” Anal. Chem. 76, 6956 (2004).
[263] L. Nahon, G. A. Garcia, C. J. Harding, E. Mikajlo, and I. Powis, “Determination of chiral asymmetries inthe valence photoionization of camphor enantiomers by photoelectron imaging using tunable circularlypolarized light,” J. Chem. Phys. 125, 114309 (2006).
[264] H. Rhee, J.-H. Choi, and M. Cho, “Infrared optical activity: electric field approaches in time domain.”Accounts of chemical research 43, 1527 (2010).

BIBLIOGRAPHY 145
[265] C. Lux, M. Wollenhaupt, T. Bolze, Q. Liang, J. Köhler, C. Sarpe, and T. Baumert, “Circular dichroismin the photoelectron angular distributions of camphor and fenchone from multiphoton ionization withfemtosecond laser pulses,” Angew. Chem. Int. Ed. 51, 5001 (2012).
[266] N. Bhargava Ram, C. S. Lehmann, and M. H. M. Janssen, “Probing chirality with a femtosecond reactionmicroscope,” EPJ Web of Conferences 41, 02029 (2013).
[267] M. Pitzer, M. Kunitski, A. S. Johnson, T. Jahnke, H. Sann, F. Sturm, L. P. H. Schmidt, H. Schmidt-Böcking, et al., “Direct determination of absolute molecular stereochemistry in gas phase by Coulombexplosion imaging.” Science 341, 1096 (2013).
[268] E. Hirota, “Triple resonance for a three-level system of a chiral molecule,” P. Jpn. Acad. B 88, 120(2012).
[269] D. Patterson, M. Schnell, and J. M. Doyle, “Enantiomer-specific detection of chiral molecules via mi-crowave spectroscopy,” Nature 497, 475 (2013).
[270] D. Patterson and J. M. Doyle, “Sensitive Chiral Analysis via Microwave Three-Wave Mixing,” Phys.Rev. Lett. 111, 023008 (2013).
[271] M. Quack, J. Stohner, and M. Willeke, “High-resolution spectroscopic studies and theory of parityviolation in chiral molecules.” Annu. Rev. Phys. Chem. 59, 741 (2008).
[272] E. Jones, T. Oliphant, and P. Peterson, “SciPy: Open Source Scientific Tools for Python,” SciPy: OpenSource Scientific Tools for Python (2001).
[273] C. Cohen-Tannoudji, J. Dupont-Roc, and G. Grynberg, “The Dressed Atom Approach,” in Atom-PhotonInteractions Basic: Processes and Applications (Wiley-VCH Verlag GmbH & Co. KGaA, Weinheim,2004) Chap. 6, pp. 407–514.
[274] S. H. Autler and C. H. Townes, “Stark Effect in Rapidly Varying Fields,” Phys. Rev. 100, 703 (1955).[275] B. D. Gerardot, D. Brunner, P. A. Dalgarno, K. Karrai, A. Badolato, P. M. Petroff, and R. J. Warburton,
“Dressed excitonic states and quantum interference in a three-level quantum dot ladder system,” NewJ. Phys. 11, 013028 (2009).
[276] J.-U. Grabow, “Fourier transform microwave spectroscopy: handedness caught by rotational coherence.”Angew. Chem. Int. Ed. 52, 11698 (2013).
[277] A. D. McNaught and A. Wilkinson, Compendium of Chemical Terminology - Gold Book (BlackwellScience, Oxford, 1997).
[278] W. Vetter and K. Bester, “Gas chromatograhic enatioseparation of chiral pollutants-techniques andresults,” in Chiral Analysis, edited by K. Busch and M. Busch (Elsevier B.V., Amsterdam, 2006) Chap. 6,pp. 196–213.
[279] I. Bronstein, K. Semendjaew, G. Grosche, V. Ziegler, and D. Ziegler, Springer-Taschenbuch der Mathe-matik , edited by E. Zeidler (Springer Fachmedien, Wiesbaden, 2013) p. 395.

Acknowledgments
An dieser Stelle möchte ich mich bei allen bedanken, die das Zustandekommen dieser Arbeit unter-stützt haben.
Mein besonderer Dank gilt meiner Betreuerin Melanie Schnell am Max-Planck-Institut für Strukturund Dynamik der Materie, die meine Arbeit geduldig und mit viel Hingabe begleitet hat. Ihre offeneArt und ihr Vertrauen in mich haben es mir sehr leicht gemacht, selbstständig zu arbeiten und auchmeine vielen Auslandsaufenthalte hätte ich ohne ihre Unterstützung nicht verwirklichen können. VielenDank für die kleinen und großen Korrekturen an meiner Arbeit. Es hat mir großen Spaß gemacht, indeiner Gruppe zu arbeiten.
I thank Dwayne Miller for co-supervising my thesis. Even though his schedule is extremely packedwhen he is in Hamburg, he found time for me to discuss the progress of my thesis, whenever it wasneeded.
I thank Alvin Shubert for sharing such a great time with me. You are the best team-mate one canhope for. You taught me how to perform the experiments, analyze the data, and write a publication.Thank you for all that and also for proof-reading my thesis with so much care.
I want to thank David Patterson for helping me with the experiments and the analysis of the double-resonance and three-wave mixing experiments. I thank Jens-Uwe Grabow for the interesting andhelpful discussions about M -states, ⇡-pulses, and trigger systems.
Ich danke Thomas Betz für seine Hilfe bei der Analyse des Mentholspektrums, Anna Krin für dieDoppelresonanzmessungen von Isomenthon und Michela Giuliano für ihre Hilfe bei der Messung undder Analyse des Thymolspektrums.
Ich danke Sabrina Zinn and Simon Merz dafür, dass sie es so lange mit mir in einem Büro ausgehaltenhaben. Ihre humorvolle und hilfsbereite Art, der warme Kaffee am Morgen und die Schoko-Lade habenmir Tag für Tag die Arbeit versüßt.
I would like to thank the CoComol group, Chris Medcraft, Jack Graneek, Cristobal Perez, AmandaSteber, Anna Krin, Thomas Betz, and Sergios Domingos for providing such a nice working atmosphere.I will miss the senseless discussions about islands, warm beer, and croquet.
Many thanks to Wolfgang Jäger, Yunjie Xu, Steve Dempster, Christian Merten, and Javix Thomasthat gave me a warm welcome, when I experienced the Canadian winter.
Meiner Freundin Julia und meinem Sohn Lasse danke ich für die Geduld und das Vertrauen, dass ichtatsächlich irgendwann fertig werde. Ihr seid meine Motivation und mein Ansporn. Diese Arbeit istnur für Euch.

Selbständigkeitserklärung
Ich versichere an Eides statt, dass ich die Inanspruchnahme fremder Hilfen aufgeführt habe,sowie, dass ich die wörtlich oder inhaltlich aus anderen Quellen entnommenen Stellen alssolche kenntlich gemacht habe.
Hamburg, den
Unterschrift

Appendix A
Three-level optical Bloch equations
The three-level optical equations are derived by computing the commutator of the Liouvilleequation 7.7. The following set of ordinary differential equations is derived for the progressiveregime (using the Hamiltonian in Eqn. 7.3):
i~@⇢aa
@t= �Eab
2(µab⇢ba � µ⇤
ab⇢ab)�ei!
ab
t + e�i!ab
t�
i~@⇢bb
@t=
Eab
2(µ⇤
ab⇢ab � µab⇢ba)�ei!
ab
t + e�i!ab
t�
+Ebc
2(µbc⇢cb � µ⇤
bc⇢bc)�ei!
bc
t + e�i!bc
t�
i~@⇢cc
@t= �Ebc
2(µ⇤
bc⇢bc � µbc⇢cb)�ei!
bc
t + e�i!bc
t�
i~@⇢ab
@t= �~!ab,0⇢ab � Eabµab
2(⇢bb � ⇢aa)
�ei!
ab
t + e�i!ab
t�
+Ebcµ⇤
bc
2⇢ac
�ei!
bc
t + e�i!bc
t�
i~@⇢ac
@t= �~!ac,0⇢ac � Eabµab
2⇢bc
�ei!
ab
t + e�i!ab
t�
+Ebcµbc
2⇢ab
�ei!
bc
t + e�i!bc
t�
i~@⇢ba
@t= ~!ab,0⇢ba � Eabµ⇤
ab
2(⇢aa � ⇢bb)
�ei!
ab
t + e�i!ab
t�� Ebcµbc
2⇢ca
�ei!
bc
t + e�i!bc
t�
i~@⇢bc
@t= �~!bc,0⇢bc � Eabµ⇤
ab
2⇢ac
�ei!
ab
t + e�i!ab
t�� Ebcµbc
2(⇢cc � ⇢bb)
�ei!
bc
t + e�i!bc
t�
i~@⇢ca
@t= ~!ac,0⇢ca +
Eabµ⇤ab
2⇢cb
�ei!
ab
t + e�i!ab
t�� Ebcµ⇤
bc
2⇢ba
�ei!
bc
t + e�i!bc
t�
i~@⇢cb
@t= ~!bc,0⇢cb +
Eabµab
2⇢ca
�ei!
ab
t + e�i!ab
t�� Ebcµ⇤
bc
2(⇢bb � ⇢cc)
�ei!
bc
t + e�i!bc
t�

149
for the ⇤-type regressive regime (using the Hamiltonian in Eqn. 7.4):
i~@⇢aa
@t= �Eac
2(µac⇢ca � µ⇤
ac⇢ac)�ei!
ac
t + e�i!ac
t�
i~@⇢bb
@t= �Ebc
2(µbc⇢cb � µ⇤
bc⇢bc)�ei!
bc
t + e�i!bc
t�
i~@⇢cc
@t=
Eac
2(µac⇢ca � µ⇤
ac⇢ac)�ei!
ac
t + e�i!ac
t� Ebc
2(µbc⇢cb � µ⇤
bc⇢bc)�ei!
bc
t + e�i!bc
t�
i~@⇢ab
@t= �~!ab,0⇢ab � Eacµac
2⇢cb
�ei!
ac
t + e�i!ac
t�
+Ebcµ⇤
bc
2⇢ac
�ei!
bc
t + e�i!bc
t�
i~@⇢ac
@t= �~!ac,0⇢ac � Eacµac
2(⇢cc � ⇢aa)
�ei!
ac
t + e�i!ac
t�
+Ebcµbc
2⇢ab
�ei!
bc
t + e�i!bc
t�
i~@⇢ba
@t= ~!ab,0⇢ba +
Eacµ⇤ac
2⇢bc
�ei!
ac
t + e�i!ac
t�� Ebcµbc
2⇢ca
�ei!
bc
t + e�i!bc
t�
i~@⇢bc
@t= �~!bc,0⇢bc +
Eacµac
2⇢ba
�ei!
ac
t + e�i!ac
t�� Ebcµbc
2(⇢cc � ⇢bb)
�ei!
bc
t + e�i!bc
t�
i~@⇢ca
@t= ~!ac,0⇢ca +
Eacµ⇤ac
2(⇢cc � ⇢aa)
�ei!
ac
t + e�i!ac
t�� Ebcµ⇤
bc
2⇢ba
�ei!
bc
t + e�i!bc
t�
i~@⇢cb
@t= ~!bc,0⇢cb � Eacµ⇤
ac
2⇢ab
�ei!
ac
t + e�i!ac
t�
+Ebcµ⇤
bc
2(⇢cc � ⇢bb)
�ei!
bc
t + e�i!bc
t�
and for the V-type regressive regime (using the Hamiltonian in Eqn. 7.5):
i~@⇢aa
@t=
Eab
2(µ⇤
ab⇢ab � µab⇢ba)�ei!
ab
t + e�i!ab
t�
+Eac
2(µ⇤
ac⇢ac � µac⇢ca)�ei!
ac
t + e�i!ac
t�
i~@⇢bb
@t= �Eab
2(µ⇤
ab⇢ab � µab⇢ba)�ei!
ab
t + e�i!ab
t�
i~@⇢cc
@t= �Eac
2(µ⇤
ac⇢ac � µac⇢ca)�ei!
ac
t + e�i!ac
t�
i~@⇢ab
@t= �~!ab,0⇢ab � Eabµab
2(⇢bb � ⇢aa)
�ei!
ab
t + e�i!ab
t�� Eacµac
2⇢cb
�ei!
ac
t + e�i!ac
t�
i~@⇢ac
@t= �~!ac,0⇢ac � Eabµab
2⇢bc
�ei!
ab
t + e�i!ab
t�� Eacµac
2(⇢cc � ⇢aa)
�ei!
ac
t + e�i!ac
t�
i~@⇢ba
@t= ~!ab,0⇢ba � Eabµ⇤
ab
2(⇢aa � ⇢bb)
�ei!
ab
t + e�i!ab
t�
+Eacµ⇤
ac
2⇢bc
�ei!
ac
t + e�i!ac
t�
i~@⇢bc
@t= �~!bc,0⇢bc � Eabµ⇤
ab
2⇢ac
�ei!
ab
t + e�i!ab
t�
+Eacµac
2⇢ba
�ei!
ac
t + e�i!ac
t�
i~@⇢ca
@t= ~!ac,0⇢ca +
Eabµ⇤ab
2⇢cb
�ei!
ab
t + e�i!ab
t�� Eacµ⇤
ac
2(⇢aa � ⇢cc)
�ei!
ac
t + e�i!ac
t�
i~@⇢cb
@t= ~!bc,0⇢cb +
Eabµab
2⇢ca
�ei!
ab
t + e�i!ab
t�� Eacµ⇤
ac
2⇢ab
�ei!
ac
t + e�i!ac
t�

Appendix B
Fourier series
The FID f (t) can be described by a finite discrete Fourier series [279]:
f (t) =a
0
2+
NX
n=0
(an cos (!nt) + bn sin (!nt))
where a0
is the constant DC offset and an and bn are the real valued Fourier coefficients. Forthe frequencies !n follows:
!n =2⇡n
T
where T is total length of the recorded FID. For a specific frequency !n the Fourier coefficientsare determined by the following integrals:
an =2
T
ˆ T
0
f (t) · sin (!nt)
bn =2
T
ˆ T
0
f (t) · cos (!nt)
For a specific frequency !n one component of the series f (t) can be rewritten using anamplitude An and a phase 'n:
fn (t) = An sin (!nt + 'n)
with
An =p
a2
n + b2
n
'n =⇡
2� arctan2 (bn, an)
Copyright © 2022 FDOKUMEN