Structural Change and the Service Sector in Brazil
21
STRUCTURAL CHANGE AND THE SERVICE SECTOR IN BRAZIL Marcio José Vargas da Cruz * Gabriel Porcile * Luciano Nakabashi * Fabio Dória Scatolin * * Department of Economics, Federal University of Paraná (UFPR) Abstract A key question with a long tradition in development economics is which patterns of structural change are more conducive for economic growth and convergence in the international economy. Although some studies show that industry has been loosing ground in the Brazilian economy (both in terms of employment and value added), there are few studies discussing how this process affects the performance of the Brazilian economy. Evidence regarding the quality of the jobs created in other sectors is yet scarce. Both topics are addressed in this paper. It is suggested that that the Brazilian deindustrialization process is not a virtuous one, i.e. it is not the result of a dynamic response to long run trends in technology and demand. On the contrary, most jobs are generated in low-productivity activities in the service sector. Key Words: Economic Growth, Structural Change; Service Sector; Industry; Brazilian Economy. Resumo Uma questão chave na tradição do desenvolvimento econômico é se o caminho da mudança estrutural está propiciando condições favoráveis ao crescimento econômico e à convergência na economia internacional. Apesar de alguns estudos apresentarem evidências de que a indústria perde participação na economia brasileira (em termos de emprego e do valor adicionado), há poucos estudos discutindo como esse processo afeta o crescimento econômico brasileiro. Os estudos sobre o destino dos empregos que poderiam estar sendo gerados na indústria são ainda mais escassos. Portanto, o presente trabalho foca nessas duas questões, analisando seus efeitos sobre a economia como um todo. Os resultados indicam que o processo de desindustrialização no Brasil não é o resultado de um processo virtuoso que acompanha as mudanças na estrutura da demanda e na tecnologia, mas um processo que tem como contrapartida a ampliação de um setor serviços de baixa produtividade. Palavras Chaves: Crescimento Econômico; Mudança Estrutural; Setor de Serviços; Indústria; Economia Brasileira. JEL Classification System: L60; L80; O14.
Transcript of Structural Change and the Service Sector in Brazil
STRUCTURAL CHANGE AND THE SERVICE SECTOR IN BRAZIL
Marcio José Vargas da Cruz *
Gabriel Porcile * Luciano Nakabashi *
Fabio Dória Scatolin *
* Department of Economics, Federal University of Paraná (UFPR)
Abstract A key question with a long tradition in development economics is which patterns of structural change are more conducive for economic growth and convergence in the international economy. Although some studies show that industry has been loosing ground in the Brazilian economy (both in terms of employment and value added), there are few studies discussing how this process affects the performance of the Brazilian economy. Evidence regarding the quality of the jobs created in other sectors is yet scarce. Both topics are addressed in this paper. It is suggested that that the Brazilian deindustrialization process is not a virtuous one, i.e. it is not the result of a dynamic response to long run trends in technology and demand. On the contrary, most jobs are generated in low-productivity activities in the service sector. Key Words: Economic Growth, Structural Change; Service Sector; Industry; Brazilian Economy.
Resumo Uma questão chave na tradição do desenvolvimento econômico é se o caminho da mudança estrutural está propiciando condições favoráveis ao crescimento econômico e à convergência na economia internacional. Apesar de alguns estudos apresentarem evidências de que a indústria perde participação na economia brasileira (em termos de emprego e do valor adicionado), há poucos estudos discutindo como esse processo afeta o crescimento econômico brasileiro. Os estudos sobre o destino dos empregos que poderiam estar sendo gerados na indústria são ainda mais escassos. Portanto, o presente trabalho foca nessas duas questões, analisando seus efeitos sobre a economia como um todo. Os resultados indicam que o processo de desindustrialização no Brasil não é o resultado de um processo virtuoso que acompanha as mudanças na estrutura da demanda e na tecnologia, mas um processo que tem como contrapartida a ampliação de um setor serviços de baixa produtividade. Palavras Chaves: Crescimento Econômico; Mudança Estrutural; Setor de Serviços; Indústria; Economia Brasileira.
JEL Classification System: L60; L80; O14.
2
I. Introduction
In recent years a growing concern has emerged among Brazilian economists as regards the direction of the process of structural change. In part this is related to the fact that the industrial sector has lost ground in terms of its share in both total value added and total employment in the Brazilian economy. Until the seventies the participation of industry was rising, but the debt crisis of the eighties marked a turning point. At that moment the industry suffered a major setback of which it never fully recovered. For some authors (Feijó, Carvalho e Almeida, 2005; Scatolin et al, 2007), a process of deindustrialization has been under way since the eighties and this trend was reinforced by overvaluation of the domestic currency in the nineties and in the last four years.
Moreover, the escalation of commodities prices, and high expectations about a steady growth of demand for natural resources over the next years (fuelled by rapid growth and industrialization in Asia) heightened concerns about the emergence of Dutch disease phenomenon in Brazil. Such a trend would imply that for some years the country could enjoy rapid growth and favorable terms of trade out of increasing commodity exports. In the long run, however, the cost of short-term success would be to reinforce a pattern of specialization which is less dynamic in terms of technological learning, technological externalities and long run demand growth. In other words, the country would experience a kind “natural resources curse”: the rents generated by abundant natural resources at the same time compromise the development of technology-intensive activities. Since only the latter could secure growth and stability in the long run, then Brazil run the risk of trading long-term for short-term success.
Yet other authors consider that focusing on deindustrialization ignores that this process is universal and just reflects the long run dynamics of demand and technical change. Industry tends to decline while the participation of the service sector expands. Rather than a symptom of Dutch disease, deindustrialization would be a kind of “flying Dutch”, a fascinating and fearful legend (confirmed by some distinguished witnesses) which, however, should not be motive of real concern. Seas are safe for navigators in the international economy and the direction of structural change is not a critical issue, at least not at this point in time.
A fall in the participation of industry in total employment is accompanied by an increase in the participation of the service sector. In the developed countries, Rowthorn e Ramaswamy (1997) and Rowthorn (1999) observed that the service sector embraces new knowledge-intensive activities that complement and foster productivity growth in the industry and in the rest of the economy. This amounts to virtuous pattern of structural change in the developed economies. But is this the case of Brazil? In this paper we sought to ´provide an empirical answer to this question by analyzing trends in productivity and the quality of jobs generated in the Brazilian economy.
The paper is organized in three sections, besides the introduction and a summary of the main conclusions. Section II briefly presents a succinct theoretical review of the role of the industrial sector in technological learning and growth and presents some stylized facts. In Section III we focus on deindustrialization and compare Brazil with other regions. In Section IV we address the problem of whether the new jobs that are being created in the service sector are of good “quality”, in the sense of paying higher wages and of being knowledge-intensive. II. Industry and Economic Growth
Several authors regarded industry as the leading sector giving rise to productivity gains, by means
of its role in the generation and diffusion of technology. Kaldor (1962) in his classical work argues that industry is the main locus of technological progress. Furtado (1972) emphasizes this point in his analysis of the Brazilian economy: in his own words, “industrial activity conditions the whole path of the economy
and industrial investment is the channel though which technological progress penetrates”. Hirschmann (1958) highlights as well the role of industry as the sector with the highest potential to produce linkages and bandwagons effects, carrying over the rest of the economy.
3
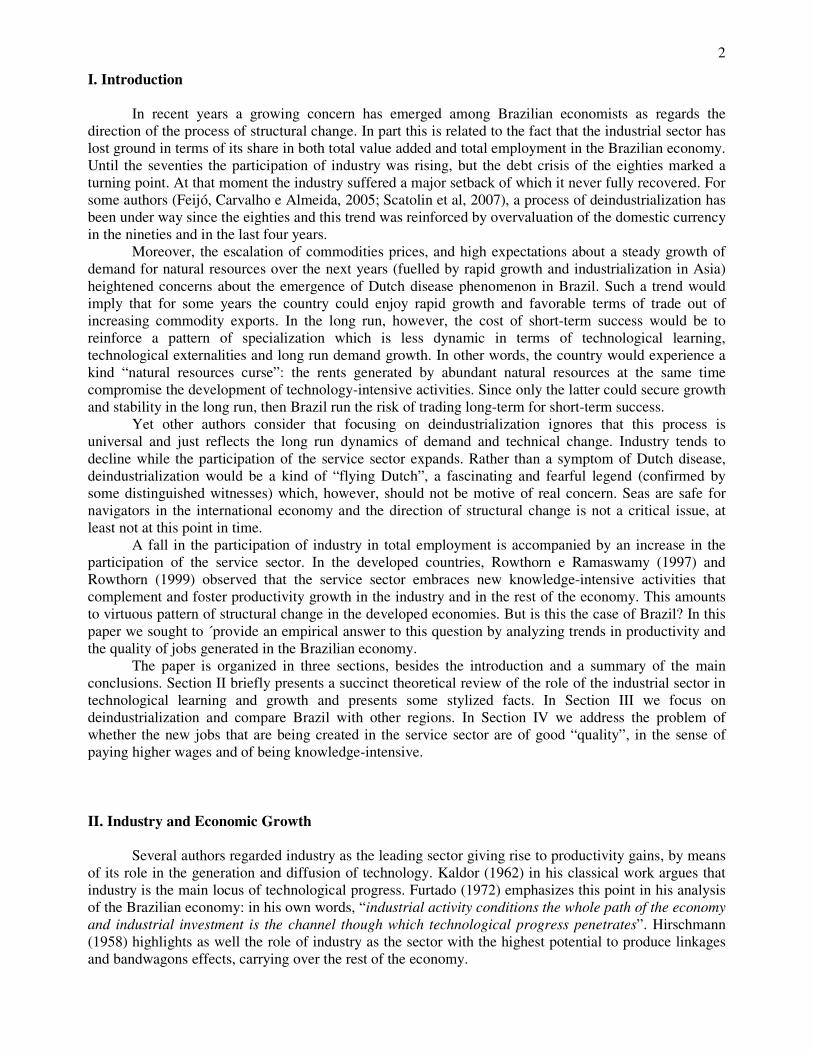
Quite a few authors found evidence of strong linkage effects coming from the industrial sector (see for instance Glaeser et al, 1992; Hansen, 1998). Evidence of significant forward and backward linkages were found in the case of the Brazilian economy by Silva and Silveria Neto (2007) in 1994-2004. Pieper (1998), in a study covering several countries in 1970-90, found a strong correlation between economic growth and the rate of industry growth. This positive association can be seen in graph 1. It is worth noting that the Latin American countries mostly concentrate in the South West quadrant (while Asian countries concentrate in the North East quadrant), featuring low (high) rates of growth of both the economy and the industrial sector.
Graph 1 – GDP and Industrial Growth, 1986-2004.
China
India
Indonesia
Malaysia
Philippines
Singapore
South Korea
Sri Lanka
TaiwanThailand
Bolivia
Chile
Mexico
Peru
Venezuela
Bangladesh
Pakistan
Argentina
Brazil
Colombia
Costa Rica
Ecuador
Guatemala
JamaicaUruguay
0.00
1.00
2.00
3.00
4.00
5.00
6.00
7.00
8.00
9.00
10.00
0.00 2.00 4.00 6.00 8.00 10.00 12.00
taxa de crescimento indústria de transformação: média 1986 - 2004
taxa d
e c
rescim
ento
PIB
: m
édia
1986 - 2
004
Source: elaborated on the basis of data from the Groningen Growth and Development Centre Total Economy Database, January 2007 and International Labor Organziation (ILO).
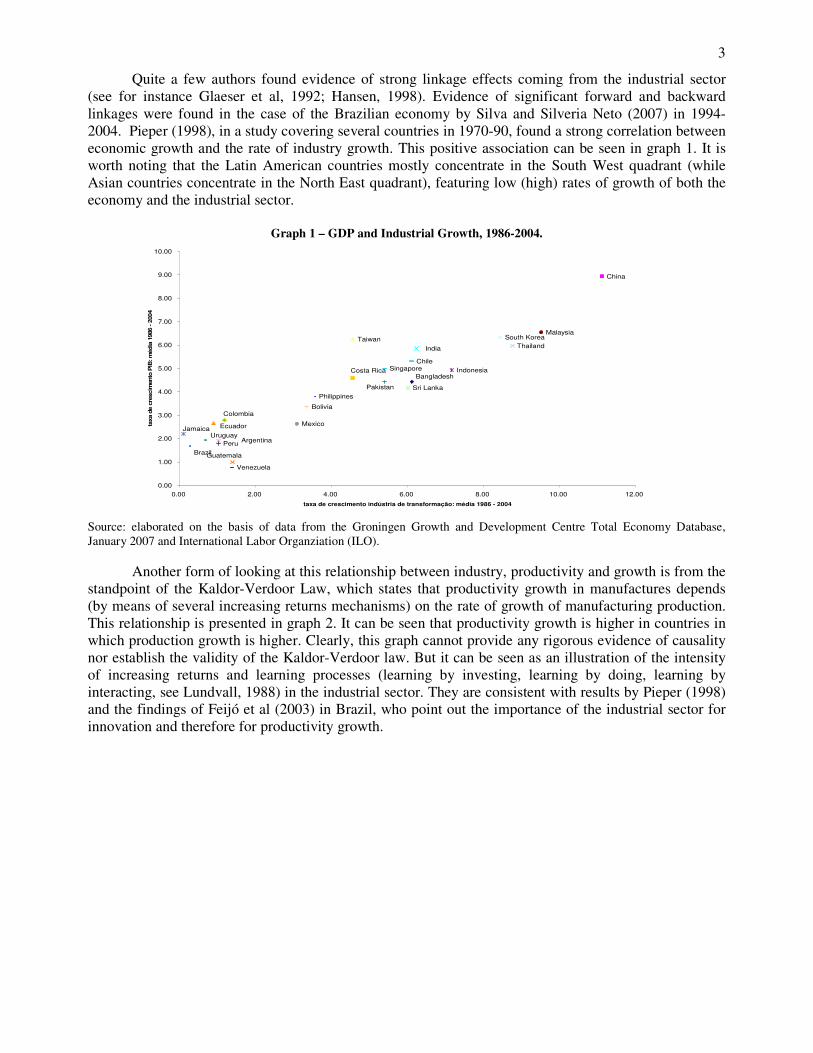
Another form of looking at this relationship between industry, productivity and growth is from the standpoint of the Kaldor-Verdoor Law, which states that productivity growth in manufactures depends (by means of several increasing returns mechanisms) on the rate of growth of manufacturing production. This relationship is presented in graph 2. It can be seen that productivity growth is higher in countries in which production growth is higher. Clearly, this graph cannot provide any rigorous evidence of causality nor establish the validity of the Kaldor-Verdoor law. But it can be seen as an illustration of the intensity of increasing returns and learning processes (learning by investing, learning by doing, learning by interacting, see Lundvall, 1988) in the industrial sector. They are consistent with results by Pieper (1998) and the findings of Feijó et al (2003) in Brazil, who point out the importance of the industrial sector for innovation and therefore for productivity growth.
4
Graph 2 – Rate of Growth of the Industrial Sector and Rate of Growth of Industrial Productivity: The Kaldor-Verdoor Law, 1986-2004
Bangladesh
China
India
Indonesia
Malaysia
Pakistan
Singapore
South Korea
Sri Lanka
Taiwan
ThailandVietnam
Argentina
BoliviaBrazil
Chile
Colombia
Costa Rica
Ecuador
Guatemala
Jamaica
Mexico
Peru
Uruguay
Venezuela
Philippines
-1.00
1.00
3.00
5.00
0.00 2.00 4.00 6.00 8.00 10.00 12.00
taxa de crescimento da indústria de transformação: média 1984-2004
Source: elaborated on the basis of data from the Groningen Growth and Development Centre Total Economy Database, January 2007 and International Labor Organization (ILO).
In a classical contribution Baumol (1967) shifts the focus of the analysis from industry to the service sector. He observed that as the economy evolves jobs are increasingly transferred to the service sector, where productivity growth at slower rates. He understood that this change in the distribution of employment may have crucial implications for long run growth, to the extent that it is very difficult to increase productivity in services without reducing its quality (we will always need four musicians to form a string quartet).
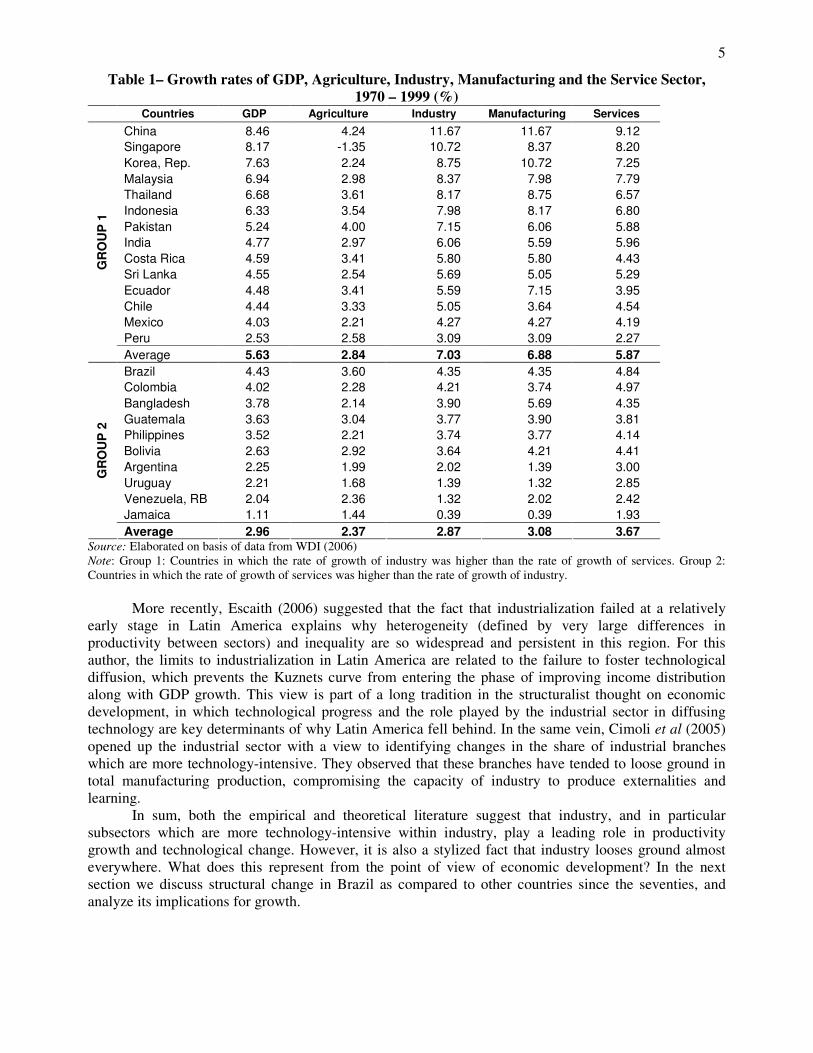
Table 1 shows the GDP growth rate and the growth rate of each economy sectors as defined by Fisher (1939) and Clark (1940) for the broad sample of countries included in Graphs 1 and 2. We defined two groups, one in which the rate of growth of the industrial sector was higher than that of the service sector (Group 1) and a group in which the rate of growth of services was higher (Group 2).
Ranking these countries on the basis of their GDP growth, it can be seen that the 12 countries with the highest growth rates are in Group 1. When the rate of growth of manufacturing is considered, these results are confirmed: manufacturing grew at higher rates than services. But in this case there are two exemptions, Chile (where the extractive industry is very important) and India, where the service sector plays a remarkably dynamic role in economic development (Dasgupta, 2005).
5
Table 1– Growth rates of GDP, Agriculture, Industry, Manufacturing and the Service Sector, 1970 – 1999 (%)
Countries GDP Agriculture Industry Manufacturing Services
China 8.46 4.24 11.67 11.67 9.12
Singapore 8.17 -1.35 10.72 8.37 8.20
Korea, Rep. 7.63 2.24 8.75 10.72 7.25
Malaysia 6.94 2.98 8.37 7.98 7.79
Thailand 6.68 3.61 8.17 8.75 6.57
Indonesia 6.33 3.54 7.98 8.17 6.80
Pakistan 5.24 4.00 7.15 6.06 5.88
India 4.77 2.97 6.06 5.59 5.96
Costa Rica 4.59 3.41 5.80 5.80 4.43
Sri Lanka 4.55 2.54 5.69 5.05 5.29
Ecuador 4.48 3.41 5.59 7.15 3.95
Chile 4.44 3.33 5.05 3.64 4.54
Mexico 4.03 2.21 4.27 4.27 4.19
Peru 2.53 2.58 3.09 3.09 2.27
GR
OU
P 1
Average 5.63 2.84 7.03 6.88 5.87
Brazil 4.43 3.60 4.35 4.35 4.84
Colombia 4.02 2.28 4.21 3.74 4.97
Bangladesh 3.78 2.14 3.90 5.69 4.35
Guatemala 3.63 3.04 3.77 3.90 3.81
Philippines 3.52 2.21 3.74 3.77 4.14
Bolivia 2.63 2.92 3.64 4.21 4.41
Argentina 2.25 1.99 2.02 1.39 3.00
Uruguay 2.21 1.68 1.39 1.32 2.85
Venezuela, RB 2.04 2.36 1.32 2.02 2.42
Jamaica 1.11 1.44 0.39 0.39 1.93
GR
OU
P 2
Average 2.96 2.37 2.87 3.08 3.67 Source: Elaborated on basis of data from WDI (2006) Note: Group 1: Countries in which the rate of growth of industry was higher than the rate of growth of services. Group 2: Countries in which the rate of growth of services was higher than the rate of growth of industry.
More recently, Escaith (2006) suggested that the fact that industrialization failed at a relatively early stage in Latin America explains why heterogeneity (defined by very large differences in productivity between sectors) and inequality are so widespread and persistent in this region. For this author, the limits to industrialization in Latin America are related to the failure to foster technological diffusion, which prevents the Kuznets curve from entering the phase of improving income distribution along with GDP growth. This view is part of a long tradition in the structuralist thought on economic development, in which technological progress and the role played by the industrial sector in diffusing technology are key determinants of why Latin America fell behind. In the same vein, Cimoli et al (2005) opened up the industrial sector with a view to identifying changes in the share of industrial branches which are more technology-intensive. They observed that these branches have tended to loose ground in total manufacturing production, compromising the capacity of industry to produce externalities and learning.
In sum, both the empirical and theoretical literature suggest that industry, and in particular subsectors which are more technology-intensive within industry, play a leading role in productivity growth and technological change. However, it is also a stylized fact that industry looses ground almost everywhere. What does this represent from the point of view of economic development? In the next section we discuss structural change in Brazil as compared to other countries since the seventies, and analyze its implications for growth.
6
III. Structural Change in Brazil and Latin America
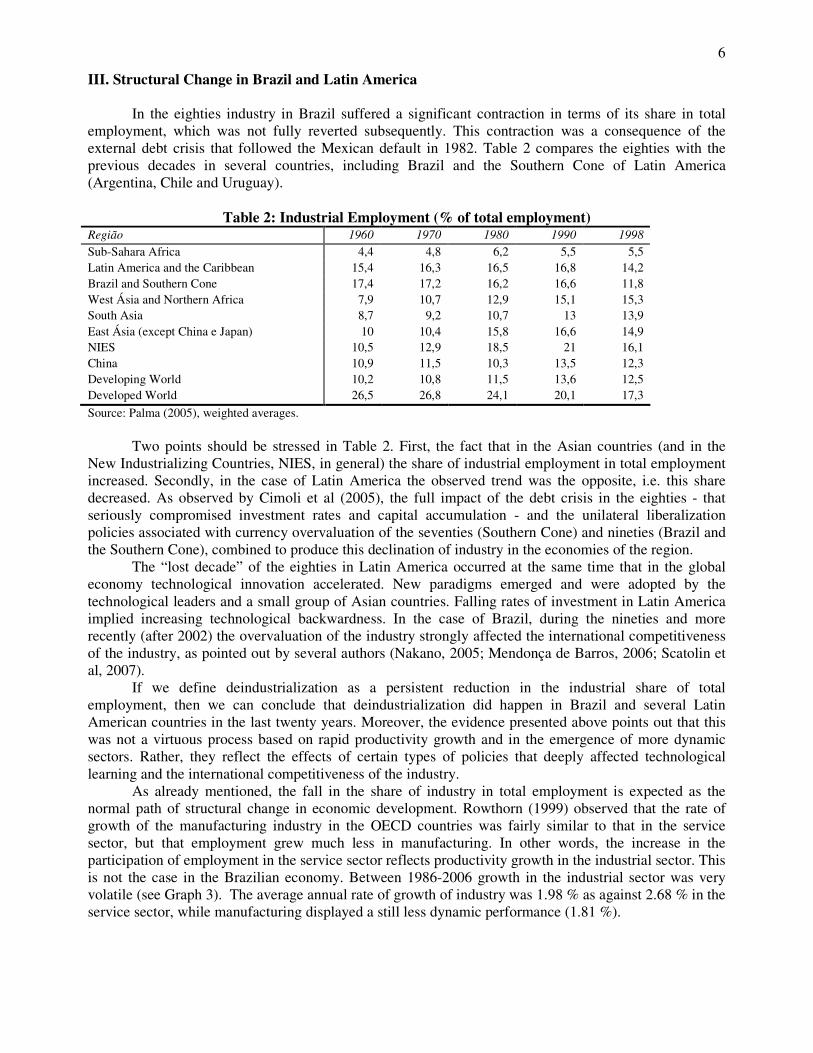
In the eighties industry in Brazil suffered a significant contraction in terms of its share in total employment, which was not fully reverted subsequently. This contraction was a consequence of the external debt crisis that followed the Mexican default in 1982. Table 2 compares the eighties with the previous decades in several countries, including Brazil and the Southern Cone of Latin America (Argentina, Chile and Uruguay).
Table 2: Industrial Employment (% of total employment)
Região 1960 1970 1980 1990 1998
Sub-Sahara Africa 4,4 4,8 6,2 5,5 5,5 Latin America and the Caribbean 15,4 16,3 16,5 16,8 14,2 Brazil and Southern Cone 17,4 17,2 16,2 16,6 11,8 West Ásia and Northern Africa 7,9 10,7 12,9 15,1 15,3 South Asia 8,7 9,2 10,7 13 13,9 East Ásia (except China e Japan) 10 10,4 15,8 16,6 14,9 NIES 10,5 12,9 18,5 21 16,1 China 10,9 11,5 10,3 13,5 12,3 Developing World 10,2 10,8 11,5 13,6 12,5 Developed World 26,5 26,8 24,1 20,1 17,3
Source: Palma (2005), weighted averages.
Two points should be stressed in Table 2. First, the fact that in the Asian countries (and in the New Industrializing Countries, NIES, in general) the share of industrial employment in total employment increased. Secondly, in the case of Latin America the observed trend was the opposite, i.e. this share decreased. As observed by Cimoli et al (2005), the full impact of the debt crisis in the eighties - that seriously compromised investment rates and capital accumulation - and the unilateral liberalization policies associated with currency overvaluation of the seventies (Southern Cone) and nineties (Brazil and the Southern Cone), combined to produce this declination of industry in the economies of the region.
The “lost decade” of the eighties in Latin America occurred at the same time that in the global economy technological innovation accelerated. New paradigms emerged and were adopted by the technological leaders and a small group of Asian countries. Falling rates of investment in Latin America implied increasing technological backwardness. In the case of Brazil, during the nineties and more recently (after 2002) the overvaluation of the industry strongly affected the international competitiveness of the industry, as pointed out by several authors (Nakano, 2005; Mendonça de Barros, 2006; Scatolin et al, 2007).
If we define deindustrialization as a persistent reduction in the industrial share of total employment, then we can conclude that deindustrialization did happen in Brazil and several Latin American countries in the last twenty years. Moreover, the evidence presented above points out that this was not a virtuous process based on rapid productivity growth and in the emergence of more dynamic sectors. Rather, they reflect the effects of certain types of policies that deeply affected technological learning and the international competitiveness of the industry.
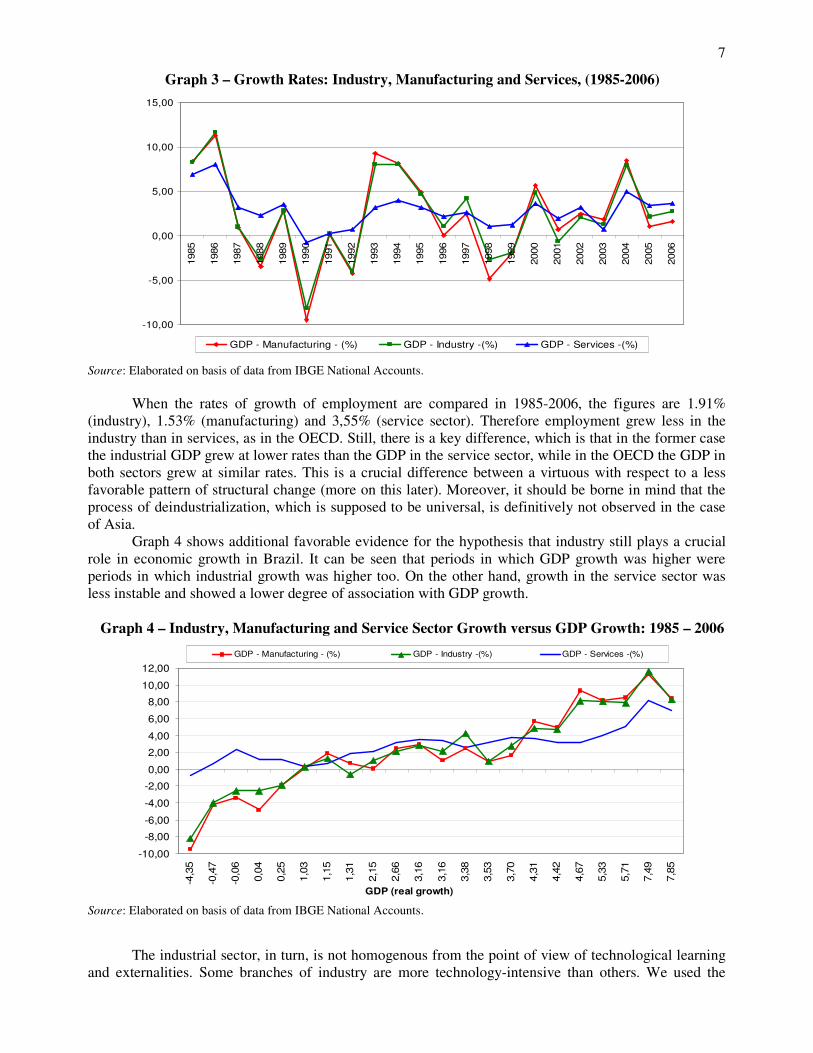
As already mentioned, the fall in the share of industry in total employment is expected as the normal path of structural change in economic development. Rowthorn (1999) observed that the rate of growth of the manufacturing industry in the OECD countries was fairly similar to that in the service sector, but that employment grew much less in manufacturing. In other words, the increase in the participation of employment in the service sector reflects productivity growth in the industrial sector. This is not the case in the Brazilian economy. Between 1986-2006 growth in the industrial sector was very volatile (see Graph 3). The average annual rate of growth of industry was 1.98 % as against 2.68 % in the service sector, while manufacturing displayed a still less dynamic performance (1.81 %).
7
Graph 3 – Growth Rates: Industry, Manufacturing and Services, (1985-2006)
-10,00
-5,00
0,00
5,00
10,00
15,00
1985
1986
1987
1988
1989
1990
1991
1992
1993
1994
1995
1996
1997
1998
1999
2000
2001
2002
2003
2004
2005
2006
GDP - Manufacturing - (%) GDP - Industry -(%) GDP - Services -(%)
Source: Elaborated on basis of data from IBGE National Accounts.
When the rates of growth of employment are compared in 1985-2006, the figures are 1.91% (industry), 1.53% (manufacturing) and 3,55% (service sector). Therefore employment grew less in the industry than in services, as in the OECD. Still, there is a key difference, which is that in the former case the industrial GDP grew at lower rates than the GDP in the service sector, while in the OECD the GDP in both sectors grew at similar rates. This is a crucial difference between a virtuous with respect to a less favorable pattern of structural change (more on this later). Moreover, it should be borne in mind that the process of deindustrialization, which is supposed to be universal, is definitively not observed in the case of Asia.
Graph 4 shows additional favorable evidence for the hypothesis that industry still plays a crucial role in economic growth in Brazil. It can be seen that periods in which GDP growth was higher were periods in which industrial growth was higher too. On the other hand, growth in the service sector was less instable and showed a lower degree of association with GDP growth.
Graph 4 – Industry, Manufacturing and Service Sector Growth versus GDP Growth: 1985 – 2006
-10,00
-8,00
-6,00
-4,00
-2,00
0,00
2,00
4,00
6,00
8,00
10,00
12,00
-4,3
5
-0,4
7
-0,0
6
0,0
4
0,2
5
1,0
3
1,1
5
1,3
1
2,1
5
2,6
6
3,1
6
3,1
6
3,3
8
3,5
3
3,7
0
4,3
1
4,4
2
4,6
7
5,3
3
5,7
1
7,4
9
7,8
5
GDP (real growth)
GDP - Manufacturing - (%) GDP - Industry -(%) GDP - Services -(%)
Source: Elaborated on basis of data from IBGE National Accounts.
The industrial sector, in turn, is not homogenous from the point of view of technological learning and externalities. Some branches of industry are more technology-intensive than others. We used the
8
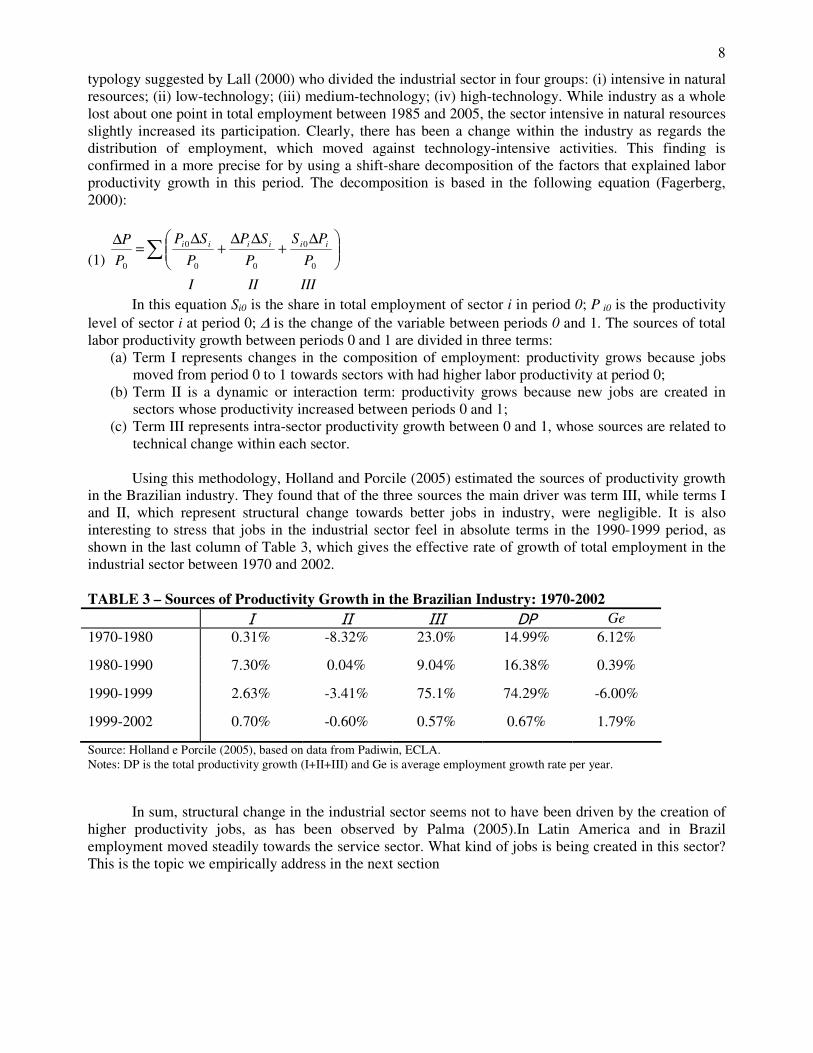
typology suggested by Lall (2000) who divided the industrial sector in four groups: (i) intensive in natural resources; (ii) low-technology; (iii) medium-technology; (iv) high-technology. While industry as a whole lost about one point in total employment between 1985 and 2005, the sector intensive in natural resources slightly increased its participation. Clearly, there has been a change within the industry as regards the distribution of employment, which moved against technology-intensive activities. This finding is confirmed in a more precise for by using a shift-share decomposition of the factors that explained labor productivity growth in this period. The decomposition is based in the following equation (Fagerberg, 2000):
(1)
IIIIII
P
PS
P
SP
P
SP
P
P iiiiii∑
∆+
∆∆+
∆=
∆
0
0
00
0
0
In this equation Si0 is the share in total employment of sector i in period 0; P i0 is the productivity level of sector i at period 0; ∆ is the change of the variable between periods 0 and 1. The sources of total labor productivity growth between periods 0 and 1 are divided in three terms:
(a) Term I represents changes in the composition of employment: productivity grows because jobs moved from period 0 to 1 towards sectors with had higher labor productivity at period 0;
(b) Term II is a dynamic or interaction term: productivity grows because new jobs are created in sectors whose productivity increased between periods 0 and 1;
(c) Term III represents intra-sector productivity growth between 0 and 1, whose sources are related to technical change within each sector.
Using this methodology, Holland and Porcile (2005) estimated the sources of productivity growth
in the Brazilian industry. They found that of the three sources the main driver was term III, while terms I and II, which represent structural change towards better jobs in industry, were negligible. It is also interesting to stress that jobs in the industrial sector feel in absolute terms in the 1990-1999 period, as shown in the last column of Table 3, which gives the effective rate of growth of total employment in the industrial sector between 1970 and 2002. TABLE 3 – Sources of Productivity Growth in the Brazilian Industry: 1970-2002
I II III DP Ge
1970-1980 0.31% -8.32% 23.0% 14.99% 6.12%
1980-1990 7.30% 0.04% 9.04% 16.38% 0.39%
1990-1999 2.63% -3.41% 75.1% 74.29% -6.00%
1999-2002 0.70% -0.60% 0.57% 0.67% 1.79%
Source: Holland e Porcile (2005), based on data from Padiwin, ECLA. Notes: DP is the total productivity growth (I+II+III) and Ge is average employment growth rate per year.
In sum, structural change in the industrial sector seems not to have been driven by the creation of higher productivity jobs, as has been observed by Palma (2005).In Latin America and in Brazil employment moved steadily towards the service sector. What kind of jobs is being created in this sector? This is the topic we empirically address in the next section
9
IV. Structural Change in the Service Sector
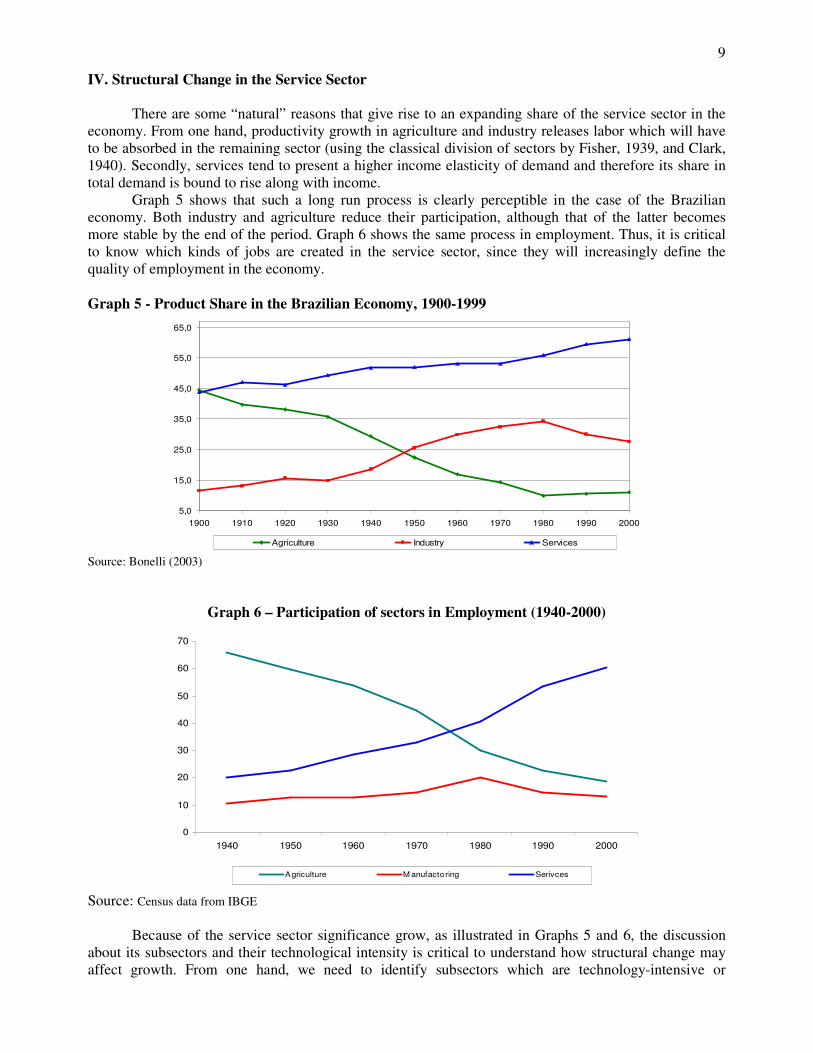
There are some “natural” reasons that give rise to an expanding share of the service sector in the economy. From one hand, productivity growth in agriculture and industry releases labor which will have to be absorbed in the remaining sector (using the classical division of sectors by Fisher, 1939, and Clark, 1940). Secondly, services tend to present a higher income elasticity of demand and therefore its share in total demand is bound to rise along with income.
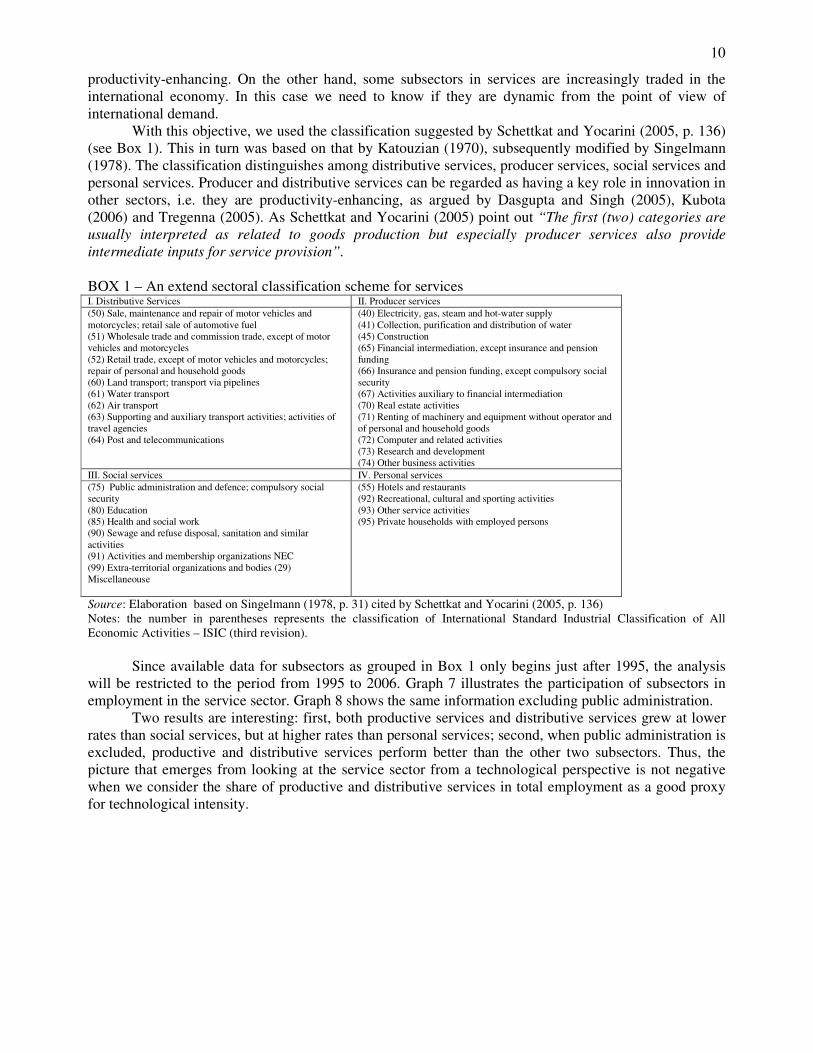
Graph 5 shows that such a long run process is clearly perceptible in the case of the Brazilian economy. Both industry and agriculture reduce their participation, although that of the latter becomes more stable by the end of the period. Graph 6 shows the same process in employment. Thus, it is critical to know which kinds of jobs are created in the service sector, since they will increasingly define the quality of employment in the economy. Graph 5 - Product Share in the Brazilian Economy, 1900-1999
5,0
15,0
25,0
35,0
45,0
55,0
65,0
1900 1910 1920 1930 1940 1950 1960 1970 1980 1990 2000
Agriculture Industry Services
Source: Bonelli (2003)
Graph 6 – Participation of sectors in Employment (1940-2000)
0
10
20
30
40
50
60
70
1940 1950 1960 1970 1980 1990 2000
Agriculture M anufactoring Serivces
Source: Census data from IBGE
Because of the service sector significance grow, as illustrated in Graphs 5 and 6, the discussion
about its subsectors and their technological intensity is critical to understand how structural change may affect growth. From one hand, we need to identify subsectors which are technology-intensive or
10
productivity-enhancing. On the other hand, some subsectors in services are increasingly traded in the international economy. In this case we need to know if they are dynamic from the point of view of international demand.
With this objective, we used the classification suggested by Schettkat and Yocarini (2005, p. 136) (see Box 1). This in turn was based on that by Katouzian (1970), subsequently modified by Singelmann (1978). The classification distinguishes among distributive services, producer services, social services and personal services. Producer and distributive services can be regarded as having a key role in innovation in other sectors, i.e. they are productivity-enhancing, as argued by Dasgupta and Singh (2005), Kubota (2006) and Tregenna (2005). As Schettkat and Yocarini (2005) point out “The first (two) categories are
usually interpreted as related to goods production but especially producer services also provide
intermediate inputs for service provision”.
BOX 1 – An extend sectoral classification scheme for services I. Distributive Services II. Producer services (50) Sale, maintenance and repair of motor vehicles and motorcycles; retail sale of automotive fuel (51) Wholesale trade and commission trade, except of motor vehicles and motorcycles (52) Retail trade, except of motor vehicles and motorcycles; repair of personal and household goods (60) Land transport; transport via pipelines (61) Water transport (62) Air transport (63) Supporting and auxiliary transport activities; activities of travel agencies (64) Post and telecommunications
(40) Electricity, gas, steam and hot-water supply (41) Collection, purification and distribution of water (45) Construction (65) Financial intermediation, except insurance and pension funding (66) Insurance and pension funding, except compulsory social security (67) Activities auxiliary to financial intermediation (70) Real estate activities (71) Renting of machinery and equipment without operator and of personal and household goods (72) Computer and related activities (73) Research and development (74) Other business activities
III. Social services IV. Personal services (75) Public administration and defence; compulsory social security (80) Education (85) Health and social work (90) Sewage and refuse disposal, sanitation and similar activities (91) Activities and membership organizations NEC (99) Extra-territorial organizations and bodies (29) Miscellaneouse
(55) Hotels and restaurants (92) Recreational, cultural and sporting activities (93) Other service activities (95) Private households with employed persons
Source: Elaboration based on Singelmann (1978, p. 31) cited by Schettkat and Yocarini (2005, p. 136) Notes: the number in parentheses represents the classification of International Standard Industrial Classification of All Economic Activities – ISIC (third revision).
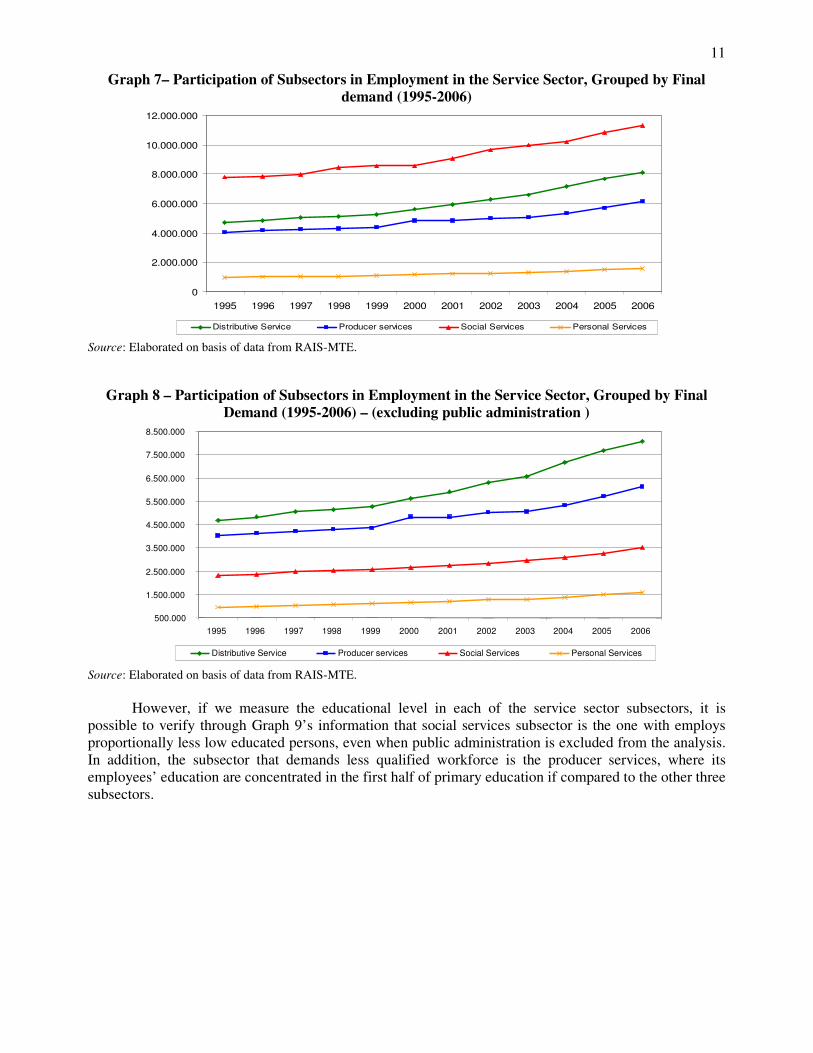
Since available data for subsectors as grouped in Box 1 only begins just after 1995, the analysis will be restricted to the period from 1995 to 2006. Graph 7 illustrates the participation of subsectors in employment in the service sector. Graph 8 shows the same information excluding public administration.
Two results are interesting: first, both productive services and distributive services grew at lower rates than social services, but at higher rates than personal services; second, when public administration is excluded, productive and distributive services perform better than the other two subsectors. Thus, the picture that emerges from looking at the service sector from a technological perspective is not negative when we consider the share of productive and distributive services in total employment as a good proxy for technological intensity.
11
Graph 7– Participation of Subsectors in Employment in the Service Sector, Grouped by Final demand (1995-2006)
0
2.000.000
4.000.000
6.000.000
8.000.000
10.000.000
12.000.000
1995 1996 1997 1998 1999 2000 2001 2002 2003 2004 2005 2006
Distributive Service Producer services Social Services Personal Services
Source: Elaborated on basis of data from RAIS-MTE.
Graph 8 – Participation of Subsectors in Employment in the Service Sector, Grouped by Final
Demand (1995-2006) – (excluding public administration )
Source: Elaborated on basis of data from RAIS-MTE.
However, if we measure the educational level in each of the service sector subsectors, it is possible to verify through Graph 9’s information that social services subsector is the one with employs proportionally less low educated persons, even when public administration is excluded from the analysis. In addition, the subsector that demands less qualified workforce is the producer services, where its employees’ education are concentrated in the first half of primary education if compared to the other three subsectors.
500.000
1.500.000
2.500.000
3.500.000
4.500.000
5.500.000
6.500.000
7.500.000
8.500.000
1995 1996 1997 1998 1999 2000 2001 2002 2003 2004 2005 2006
Distributive Service Producer services Social Services Personal Services
12
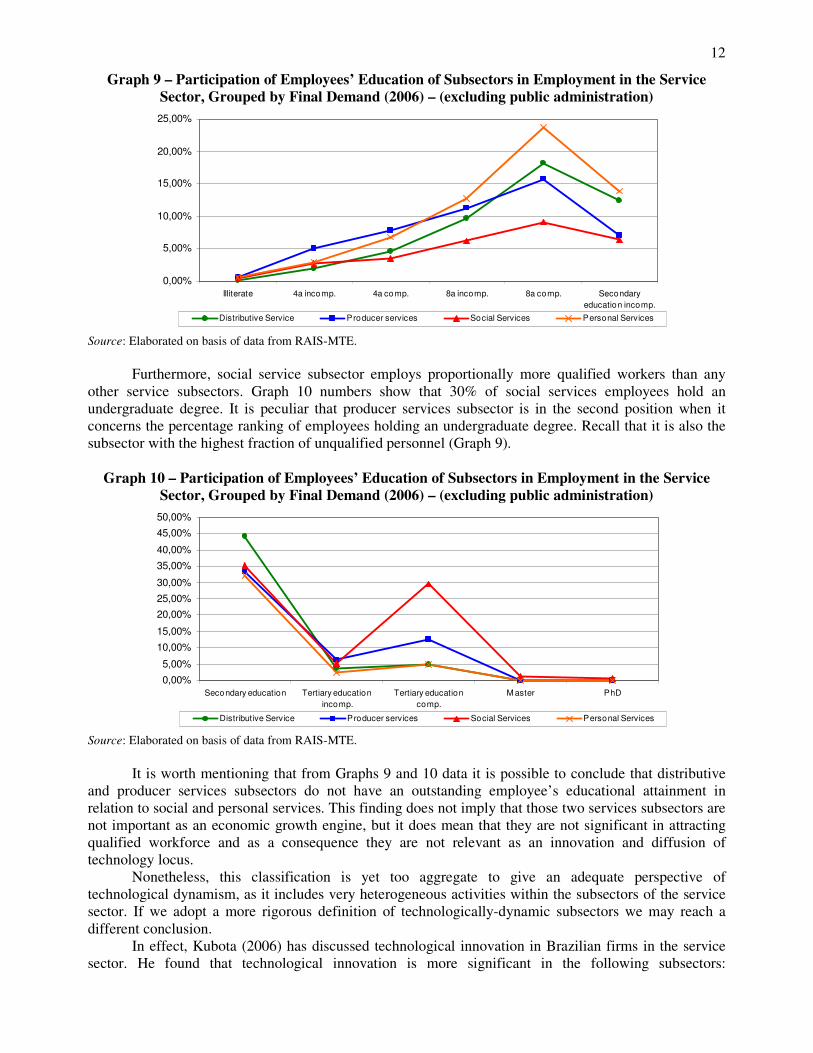
Graph 9 – Participation of Employees’ Education of Subsectors in Employment in the Service Sector, Grouped by Final Demand (2006) – (excluding public administration)
0,00%
5,00%
10,00%
15,00%
20,00%
25,00%
Illiterate 4a incomp. 4a comp. 8a incomp. 8a comp. Secondary
education incomp.
Distributive Service Producer services Social Services Personal Services
Source: Elaborated on basis of data from RAIS-MTE.
Furthermore, social service subsector employs proportionally more qualified workers than any
other service subsectors. Graph 10 numbers show that 30% of social services employees hold an undergraduate degree. It is peculiar that producer services subsector is in the second position when it concerns the percentage ranking of employees holding an undergraduate degree. Recall that it is also the subsector with the highest fraction of unqualified personnel (Graph 9).
Graph 10 – Participation of Employees’ Education of Subsectors in Employment in the Service
Sector, Grouped by Final Demand (2006) – (excluding public administration)
0,00%
5,00%
10,00%
15,00%
20,00%
25,00%
30,00%
35,00%
40,00%
45,00%
50,00%
Secondary education Tertiary education
incomp.
Tertiary education
comp.
M aster PhD
Distributive Service Producer services Social Services Personal Services
Source: Elaborated on basis of data from RAIS-MTE.
It is worth mentioning that from Graphs 9 and 10 data it is possible to conclude that distributive and producer services subsectors do not have an outstanding employee’s educational attainment in relation to social and personal services. This finding does not imply that those two services subsectors are not important as an economic growth engine, but it does mean that they are not significant in attracting qualified workforce and as a consequence they are not relevant as an innovation and diffusion of technology locus.
Nonetheless, this classification is yet too aggregate to give an adequate perspective of technological dynamism, as it includes very heterogeneous activities within the subsectors of the service sector. If we adopt a more rigorous definition of technologically-dynamic subsectors we may reach a different conclusion.
In effect, Kubota (2006) has discussed technological innovation in Brazilian firms in the service sector. He found that technological innovation is more significant in the following subsectors:
13
informatics, telecommunication (information technology and communication - ICT), research and development (R&D). Tregenna (2007, p. 95) analyzed which sectors could be engines of growth and reached a similar conclusion: “Service subsectors such as ICT are highly technologically progressive,
both internally and for other sectors, and have significant growth-inducing or at least growth-supporting
potential, yet are highly capital-intensive. Other service sectors such as domestic work are highly labor
absorbing (in a direct sense), yet would have extremely limited growth-inducing potential. Thus, the literature shows some consensus in considering that subsectors like ICT and R&D are
technology-intensive and or productivity-enhancing, in the sense that they are highly innovative and/or critically contribute to innovation in other sectors. At the same time, these subsectors are tradable and have achieved a much larger participation in world trade than ten years ago. If we compare the participation of the computer, communications and other services, it rose from 31% to 41% of the world trade in services, from 1980 to 2005, according to WDI (2007).
Graphs 11 and 13 illustrate the performance of the subsectors that compose each group. It can be seen that the dynamics of the different subsectors are very different. This leads to a reassessment of the conclusion based on Graphs 8 as regards the direction of the structural change.
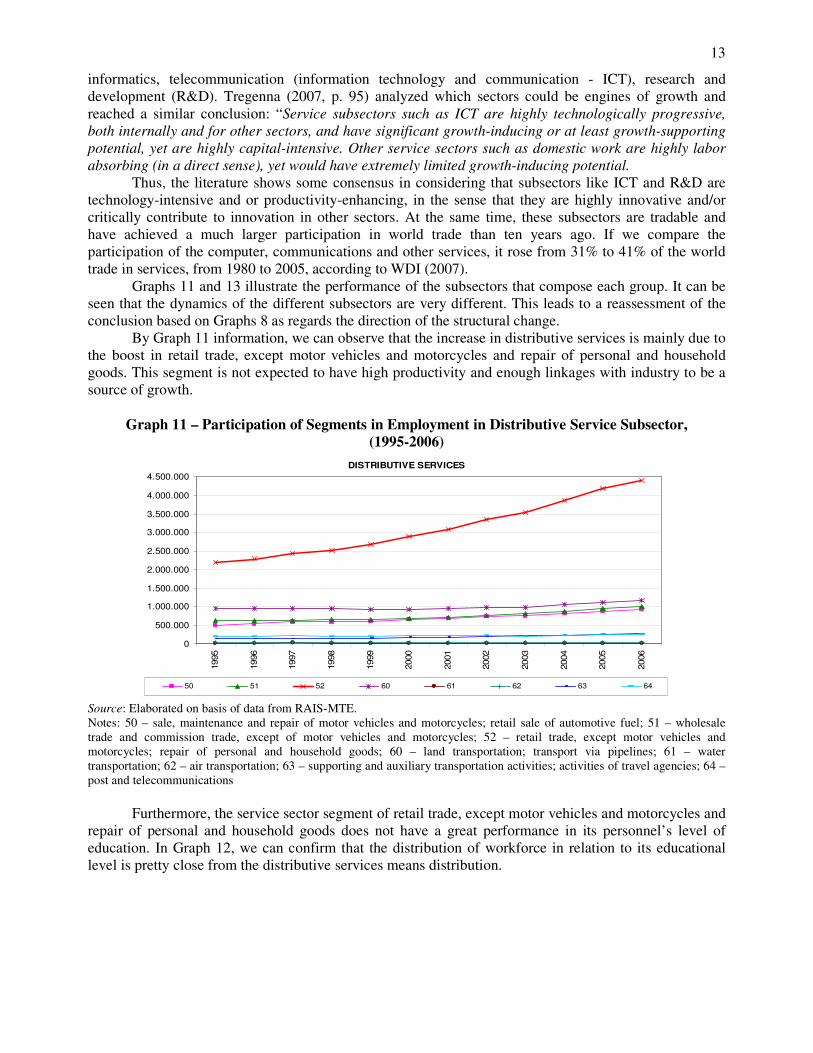
By Graph 11 information, we can observe that the increase in distributive services is mainly due to the boost in retail trade, except motor vehicles and motorcycles and repair of personal and household goods. This segment is not expected to have high productivity and enough linkages with industry to be a source of growth.
Graph 11 – Participation of Segments in Employment in Distributive Service Subsector,
(1995-2006)
DISTRIBUTIVE SERVICES
0
500.000
1.000.000
1.500.000
2.000.000
2.500.000
3.000.000
3.500.000
4.000.000
4.500.000
1995
1996
1997
1998
1999
2000
2001
2002
2003
2004
2005
2006
50 51 52 60 61 62 63 64
Source: Elaborated on basis of data from RAIS-MTE. Notes: 50 – sale, maintenance and repair of motor vehicles and motorcycles; retail sale of automotive fuel; 51 – wholesale trade and commission trade, except of motor vehicles and motorcycles; 52 – retail trade, except motor vehicles and motorcycles; repair of personal and household goods; 60 – land transportation; transport via pipelines; 61 – water transportation; 62 – air transportation; 63 – supporting and auxiliary transportation activities; activities of travel agencies; 64 – post and telecommunications
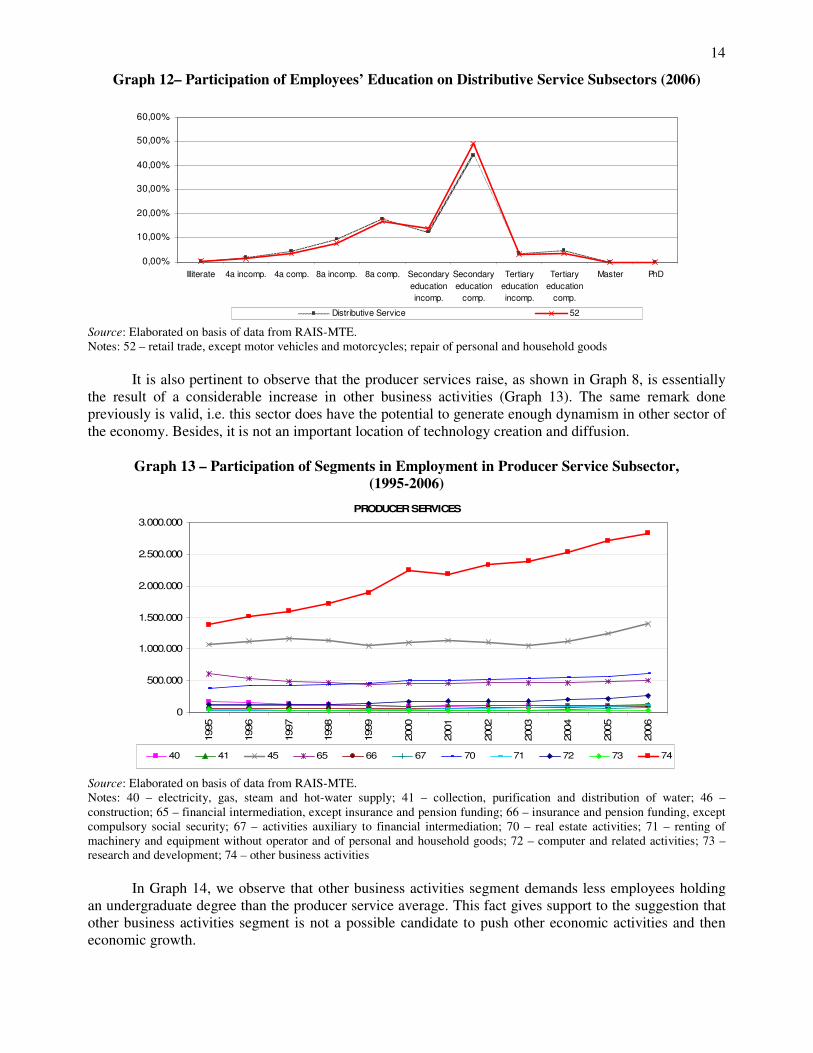
Furthermore, the service sector segment of retail trade, except motor vehicles and motorcycles and repair of personal and household goods does not have a great performance in its personnel’s level of education. In Graph 12, we can confirm that the distribution of workforce in relation to its educational level is pretty close from the distributive services means distribution.
14
Graph 12– Participation of Employees’ Education on Distributive Service Subsectors (2006)
0,00%
10,00%
20,00%
30,00%
40,00%
50,00%
60,00%
Illiterate 4a incomp. 4a comp. 8a incomp. 8a comp. Secondary
education
incomp.
Secondary
education
comp.
Tertiary
education
incomp.
Tertiary
education
comp.
Master PhD
Distributive Service 52
Source: Elaborated on basis of data from RAIS-MTE. Notes: 52 – retail trade, except motor vehicles and motorcycles; repair of personal and household goods
It is also pertinent to observe that the producer services raise, as shown in Graph 8, is essentially
the result of a considerable increase in other business activities (Graph 13). The same remark done previously is valid, i.e. this sector does have the potential to generate enough dynamism in other sector of the economy. Besides, it is not an important location of technology creation and diffusion.
Graph 13 – Participation of Segments in Employment in Producer Service Subsector,
(1995-2006)
PRODUCER SERVICES
0
500.000
1.000.000
1.500.000
2.000.000
2.500.000
3.000.000
1995
1996
1997
1998
1999
2000
2001
2002
2003
2004
2005
2006
40 41 45 65 66 67 70 71 72 73 74
Source: Elaborated on basis of data from RAIS-MTE. Notes: 40 – electricity, gas, steam and hot-water supply; 41 – collection, purification and distribution of water; 46 – construction; 65 – financial intermediation, except insurance and pension funding; 66 – insurance and pension funding, except compulsory social security; 67 – activities auxiliary to financial intermediation; 70 – real estate activities; 71 – renting of machinery and equipment without operator and of personal and household goods; 72 – computer and related activities; 73 – research and development; 74 – other business activities
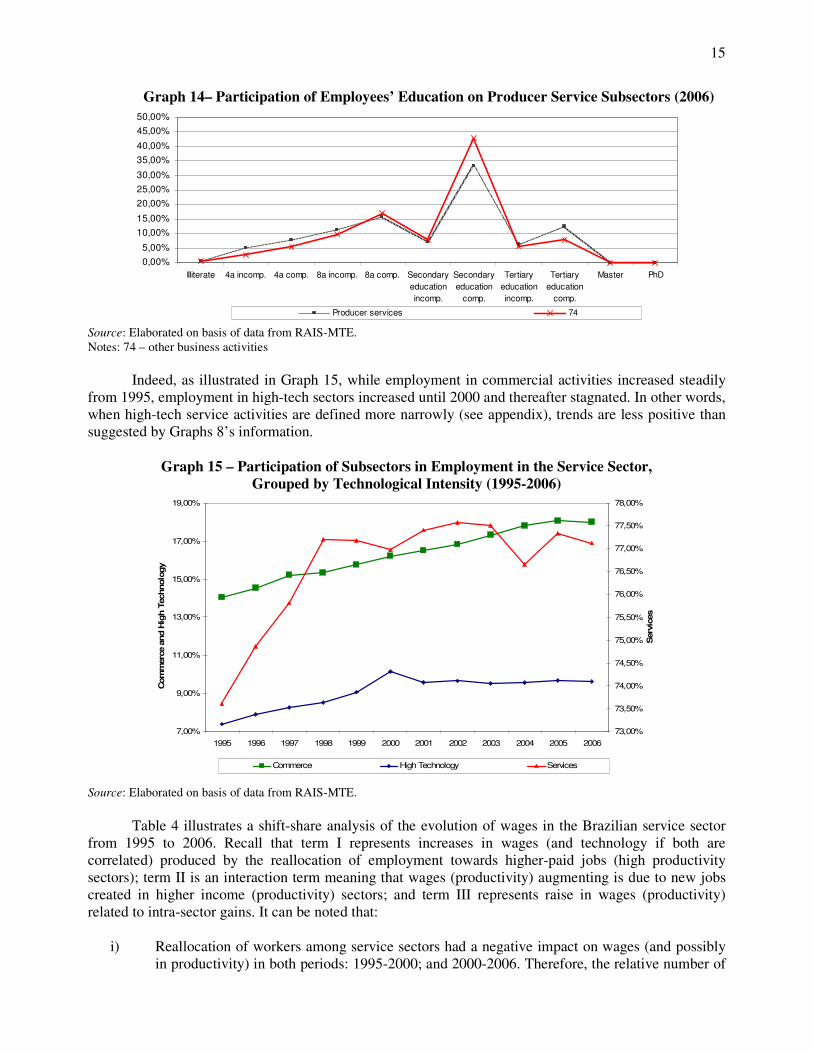
In Graph 14, we observe that other business activities segment demands less employees holding an undergraduate degree than the producer service average. This fact gives support to the suggestion that other business activities segment is not a possible candidate to push other economic activities and then economic growth.
15
Graph 14– Participation of Employees’ Education on Producer Service Subsectors (2006)
0,00%
5,00%
10,00%
15,00%
20,00%
25,00%
30,00%
35,00%
40,00%
45,00%
50,00%
Illiterate 4a incomp. 4a comp. 8a incomp. 8a comp. Secondary
education
incomp.
Secondary
education
comp.
Tertiary
education
incomp.
Tertiary
education
comp.
Master PhD
Producer services 74
Source: Elaborated on basis of data from RAIS-MTE. Notes: 74 – other business activities
Indeed, as illustrated in Graph 15, while employment in commercial activities increased steadily
from 1995, employment in high-tech sectors increased until 2000 and thereafter stagnated. In other words, when high-tech service activities are defined more narrowly (see appendix), trends are less positive than suggested by Graphs 8’s information.
Graph 15 – Participation of Subsectors in Employment in the Service Sector, Grouped by Technological Intensity (1995-2006)
7,00%
9,00%
11,00%
13,00%
15,00%
17,00%
19,00%
1995 1996 1997 1998 1999 2000 2001 2002 2003 2004 2005 2006
Com
merc
e a
nd H
igh T
echnolo
gy .
73,00%
73,50%
74,00%
74,50%
75,00%
75,50%
76,00%
76,50%
77,00%
77,50%
78,00%
Serv
ices .
Commerce High Technology Services
Source: Elaborated on basis of data from RAIS-MTE.
Table 4 illustrates a shift-share analysis of the evolution of wages in the Brazilian service sector
from 1995 to 2006. Recall that term I represents increases in wages (and technology if both are correlated) produced by the reallocation of employment towards higher-paid jobs (high productivity sectors); term II is an interaction term meaning that wages (productivity) augmenting is due to new jobs created in higher income (productivity) sectors; and term III represents raise in wages (productivity) related to intra-sector gains. It can be noted that:
i) Reallocation of workers among service sectors had a negative impact on wages (and possibly
in productivity) in both periods: 1995-2000; and 2000-2006. Therefore, the relative number of
16
workers in lower-quality jobs rose in the period). This effect was more pronounced in the first period (1995-2000);
ii) The interaction term was negative in the first period meaning that new jobs were created in lower income (productivity) service sectors from 1995 to 2000. In the second period, it changes to positive, but it remains close to zero. This may be partially due to the fact that industry lost jobs in absolute terms in the nineties, and fired employees had to accept lower wages in other service sectors. Inversely, the devaluation of 1999 and the higher economy growth rate allowed for a recovery of employment in the service sector;
iii) Wages (productivity) increases are largely explained by intra sectorial developments. This result indicates that remuneration and technology improvements were undertaken by changes in each service sector individually.
In addition, it is important to stress that salary and technology increases were by far more
important in the first period (1995-2000) than in the second one (2000-2006).
TABLE 4 – Sources of Real Wage Growth in the Brazilian Service Sector: 1995-2006
I II III DP Ge
1995-2000 -5,79% -0,84% 18,52% 11,89% 2,91%
2000-2006 -1,97% 0,12% 2,99% 1,13% 5,03%
1995-2006 -7,58% -1,45% 22,18% 0,1315 4,06%
Source: Elaborated on basis of data from RAIS-MTE. Notes: DP is the total productivity growth (I+II+III) and Ge is average employment growth rate per year.
As a conclusion, all the above evidences suggest that the job creation in the service sector is not a part of a virtuous pattern of structural change where the service sector embraces new knowledge intensive activities that complement and foster productivity growth in the industry and in the rest of the economy.
Finally, Table 5 shows the shift-share results for the Brazilian economy as a whole. The numbers are similar from Table 4’ ones. It gives support to the idea that the service sector structure and development turns more relevant on the Brazilian economics performance as the industrial sector loses ground.
TABLE 5 – Sources of Real Wage Growth in the Brazilian Economy: 1995-2006
I II III DP Ge
1995-2000 -4,04% -0,03% 14,66% 10,60% 2,00%
2000-2006 -1,14% 0,47% 3,87% 3,20% 5,00%
1995-2006 -5,02% -0,01% 19,16% 14,13% 3,62%
Source: Elaborated on basis of data from RAIS-MTE. Notes: DP is the total productivity growth (I+II+III) and Ge is average employment growth rate per year.
17
Conclusions This paper discusses structural change in the Brazilian economy. In particular, we focused on how the structural change process may affect long run growth in the Brazilian economy. A fall in industrial employment could emerge out of a virtuous process in which rapid productivity growth in industry leads to the reallocation of labor towards well paid jobs in the service sector. This would be a welfare-enhancing deindustrialization process, as found in the developed countries and probably in India.
We argue that this seems not to be the case in Brazil. From one hand, more technology-intensive activities in the industry itself have lost ground. On the other hand, the jobs created in the service sector concentrate in public administration and commerce, which are less technology-intensive and less complementary to productivity growth in other sectors. Additionally, the service segments that are expanding relatively to others do not have high qualified personnel. Therefore, they are not possible candidates to push other economic activities and then economic growth in place of industrial segments that are losing ground. A shift-share analysis confirms that wages and likely productivity increases in the period are more related to intra-sector gains than to the reallocation of workers to jobs of higher quality.
18
Bibliography
Baumol, W. (1967) “Macroeconomics of Unbalanced Growth: The Anatomy of Urban Crisis”, American
Economic Review, 57(3), pp. 415-26.
Bonelli, R. (2003) “Nível de Atividade e Mudança Estrutural”, em Estatísticas do Século XX. IBGE, Rio de Janeiro, RJ.
Bresser-Pereira, L.C.; Nakano, Y. (2003). Crescimento Econômico com Poupança Externa? Revista de
Economia Política, 23 (2): 3-27.
Cimoli, M.; Porcile, G.; Primi, A.; Vergara, S. (2005) “Cambio Estructural, Heterogeneidad Productiva y Tecnología en América Latina”, in M. CIMOLI (ed) Heterogeneidad Estructural, Asimetrías
Tecnológicas y Crecimiento en América Latina. Santiago: BID-CEPAL.
Dasgupta, S.; Singh, A. (2006). Manufacturing, Services and Premature Deindustrialization in Developing Countries, A Kaldorian Analysis. United Nations University Research Paper, 2006/49: 1-19.
Dasgupta, S.; Singh, A. (2005). Will Services Be the New Engine of Indian Economic Growth? Development and Change, 36 (06): 1035-58.
Escatih, H. (2006) “Disrupted Industrialization and Substitutive Services in Latin America”, Problemas
del Desarrollo, Vol. 37, No. 147, pp. 45-80.
Fagerberg, J. (2000) Technological Progress, Structural Change and Productivity Growth: a Comparative Study. Structural Change and Economic Dynamics, 11: 393-411.
Feijó, C. A. Carvalho, P.G.M.; Almeida, J.S.G. (2005). Ocorreu uma desindustrialização no Brasil? Texto
de Discussão - Instituto de Estudos para o Desenvolvimento Industrial. Disponível em www.iedi.org.br, em 10 de junho de 2006.
Fajnzylber, F. (1983). La Industrialización trunca de América Latina, México, D.F., Centro de Economía Transnacional/Editorial Nueva Imagen, 416 p
Feijó, C.A.; Carvalho, P.G.M.; Rodriguez, M.S. (2003) Concentração Industrial e Produtividade do Trabalho na Indústria de Transformação nos anos 90: Evidências Empíricas. Economia: Revista da
Anpec, 4 (1): 19-52.
Furtado, C. (1972) Análise do Modelo Brasileiro. Rio de Janeiro: Editora Civilização Brasileira, 2a edição.
Glaeser, E.L.; Kallal, H.D.; Scheinkman, J.A.; Shleifer, A. (1992) Growth in Cities. Journal of Political
Economy, 100 (6): 1126-1152.
Hanson, G.H. (1998) Regional Adjustment to Trade Liberalization. Regional Science and Urban
economics, 28 (4): 419-444.
Hirschman, A. O. (1958) The strategy of economic development. New Haven:Yale University Press.
Holland, M e Porcile, G. (2005) “Brecha Tecnológica y Crecimiento en América Latina”, in M. CIMOLI (ed) Heterogeneidad Estructural, Asimetrías Tecnológicas y Crecimiento en América Latina. Santiago: BID-CEPAL.
Kaldor, N. (1957). A Model of Economic Growth. The Economic Journal, 67 (268): 591-624.
19
Kubota, L. C. (2006). A Inovação Tecnológica das firmas de serviços no Brasil. In: Estrutura e Dinâmica do Setor de Serviços no Brasil. IPEA, Brasília.
Mendonça de Barros, L.C. (2006) A doença chama-se hemocromatose. Folha de São Paulo. 11/08/2006.
Nakano, Y. (2005) Crescimento Econômico. O Estado de São Paulo. 20/09/2005.
Nassif, A. (2006) Há evidências de desindustrialização no Brasil? Texto para Discussão do Banco
Nacional de Desenvolvimento Econômico e Social (BNDES), 108.
Palma G. (2005) Quatro fontes de desindustrialização e um novo conceito de Doença Holandesa. Trabalho apresentado na Conferência de Industrialização, Desindustrialização e Desenvolvimento, FIESP e IEDI. Centro Cultural da FIESP, 28 de Agosto de 2005.
Pieper, U. (1998) Deindustrialization and the Social and Economic Sustainability Nexus in Developing Countries: Cross-Country Evidence on Productivity and Employment. Center for Economic Policy
Analysis Working Paper, 10: 1-47.
RAIS. (2006) Relação Anual de Informações Sociais, diversos anos. Ministério do Trabalho e do Emprego: Brasília.
Rowthorn, R. (1999) Indústria de transformação: crescimento, comércio e mudança estrutural. In: O futuro da indústria no Brasil e no Mundo, os desafios do século XXI (1999): 57-76. Rio de Janeiro: Editora Campus.
Rowthorn R.; Ramaswamy. R. (1997) Deindustrialization Causes and Implications. International
Monetary Fund Working Paper n. 42.
Rowthorn R.; Ramaswamy. R. (1999) Growth, Trade, and Deindustrialization. International Monetary
Fund (IMF) Staff Papers, vol. 46, n. 1: 18-41.
Scatolin, F.D.; Cruz, M.J.V.; Porcile, G.; Nakabashi, L. (2007) Desindustrialização? Uma análise comparativa entre Brasil e Paraná. Indicadores Econômicos da FEE, no prelo.
Schettkat, R., Yocarini, L (2006) The sifht services employment: a review of the literature. Structural Change and Economic Dynamics, n. 17.
Silva, M.V.B; Silveira Neto, R.M. (2007). Crescimento do Emprego Industrial no Brasil e Geografia Econômica: Evidências para o Período Pós-Real. Economia: Revista da Anpec, no prelo: 1-17.
Tregenna, F. (2007). Which Sectors can be Engines of Growth and Employment in South? An analysis of Manufacturing and Services. In: UNU-WIDER Conference on Southern Engines of Global Growth. Sept, 7-8, Finland.
WDI (2006). World Development Indicators. World Bank: Washington.
20
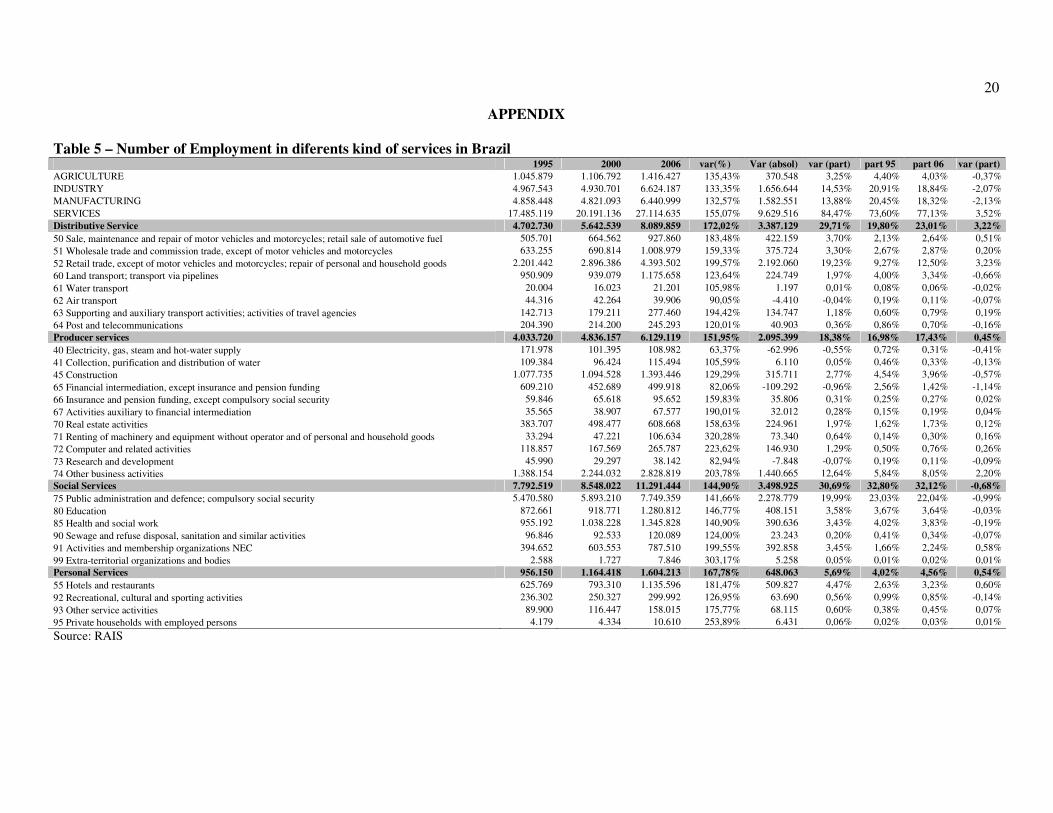
APPENDIX Table 5 – Number of Employment in diferents kind of services in Brazil 1995 2000 2006 var(%) Var (absol) var (part) part 95 part 06 var (part)
AGRICULTURE 1.045.879 1.106.792 1.416.427 135,43% 370.548 3,25% 4,40% 4,03% -0,37% INDUSTRY 4.967.543 4.930.701 6.624.187 133,35% 1.656.644 14,53% 20,91% 18,84% -2,07% MANUFACTURING 4.858.448 4.821.093 6.440.999 132,57% 1.582.551 13,88% 20,45% 18,32% -2,13% SERVICES 17.485.119 20.191.136 27.114.635 155,07% 9.629.516 84,47% 73,60% 77,13% 3,52% Distributive Service 4.702.730 5.642.539 8.089.859 172,02% 3.387.129 29,71% 19,80% 23,01% 3,22%
50 Sale, maintenance and repair of motor vehicles and motorcycles; retail sale of automotive fuel 505.701 664.562 927.860 183,48% 422.159 3,70% 2,13% 2,64% 0,51% 51 Wholesale trade and commission trade, except of motor vehicles and motorcycles 633.255 690.814 1.008.979 159,33% 375.724 3,30% 2,67% 2,87% 0,20% 52 Retail trade, except of motor vehicles and motorcycles; repair of personal and household goods 2.201.442 2.896.386 4.393.502 199,57% 2.192.060 19,23% 9,27% 12,50% 3,23% 60 Land transport; transport via pipelines 950.909 939.079 1.175.658 123,64% 224.749 1,97% 4,00% 3,34% -0,66% 61 Water transport 20.004 16.023 21.201 105,98% 1.197 0,01% 0,08% 0,06% -0,02% 62 Air transport 44.316 42.264 39.906 90,05% -4.410 -0,04% 0,19% 0,11% -0,07% 63 Supporting and auxiliary transport activities; activities of travel agencies 142.713 179.211 277.460 194,42% 134.747 1,18% 0,60% 0,79% 0,19% 64 Post and telecommunications 204.390 214.200 245.293 120,01% 40.903 0,36% 0,86% 0,70% -0,16% Producer services 4.033.720 4.836.157 6.129.119 151,95% 2.095.399 18,38% 16,98% 17,43% 0,45%
40 Electricity, gas, steam and hot-water supply 171.978 101.395 108.982 63,37% -62.996 -0,55% 0,72% 0,31% -0,41% 41 Collection, purification and distribution of water 109.384 96.424 115.494 105,59% 6.110 0,05% 0,46% 0,33% -0,13% 45 Construction 1.077.735 1.094.528 1.393.446 129,29% 315.711 2,77% 4,54% 3,96% -0,57% 65 Financial intermediation, except insurance and pension funding 609.210 452.689 499.918 82,06% -109.292 -0,96% 2,56% 1,42% -1,14% 66 Insurance and pension funding, except compulsory social security 59.846 65.618 95.652 159,83% 35.806 0,31% 0,25% 0,27% 0,02% 67 Activities auxiliary to financial intermediation 35.565 38.907 67.577 190,01% 32.012 0,28% 0,15% 0,19% 0,04% 70 Real estate activities 383.707 498.477 608.668 158,63% 224.961 1,97% 1,62% 1,73% 0,12% 71 Renting of machinery and equipment without operator and of personal and household goods 33.294 47.221 106.634 320,28% 73.340 0,64% 0,14% 0,30% 0,16% 72 Computer and related activities 118.857 167.569 265.787 223,62% 146.930 1,29% 0,50% 0,76% 0,26% 73 Research and development 45.990 29.297 38.142 82,94% -7.848 -0,07% 0,19% 0,11% -0,09% 74 Other business activities 1.388.154 2.244.032 2.828.819 203,78% 1.440.665 12,64% 5,84% 8,05% 2,20% Social Services 7.792.519 8.548.022 11.291.444 144,90% 3.498.925 30,69% 32,80% 32,12% -0,68%
75 Public administration and defence; compulsory social security 5.470.580 5.893.210 7.749.359 141,66% 2.278.779 19,99% 23,03% 22,04% -0,99% 80 Education 872.661 918.771 1.280.812 146,77% 408.151 3,58% 3,67% 3,64% -0,03% 85 Health and social work 955.192 1.038.228 1.345.828 140,90% 390.636 3,43% 4,02% 3,83% -0,19% 90 Sewage and refuse disposal, sanitation and similar activities 96.846 92.533 120.089 124,00% 23.243 0,20% 0,41% 0,34% -0,07% 91 Activities and membership organizations NEC 394.652 603.553 787.510 199,55% 392.858 3,45% 1,66% 2,24% 0,58% 99 Extra-territorial organizations and bodies 2.588 1.727 7.846 303,17% 5.258 0,05% 0,01% 0,02% 0,01% Personal Services 956.150 1.164.418 1.604.213 167,78% 648.063 5,69% 4,02% 4,56% 0,54%
55 Hotels and restaurants 625.769 793.310 1.135.596 181,47% 509.827 4,47% 2,63% 3,23% 0,60% 92 Recreational, cultural and sporting activities 236.302 250.327 299.992 126,95% 63.690 0,56% 0,99% 0,85% -0,14% 93 Other service activities 89.900 116.447 158.015 175,77% 68.115 0,60% 0,38% 0,45% 0,07% 95 Private households with employed persons 4.179 4.334 10.610 253,89% 6.431 0,06% 0,02% 0,03% 0,01%
Source: RAIS
21
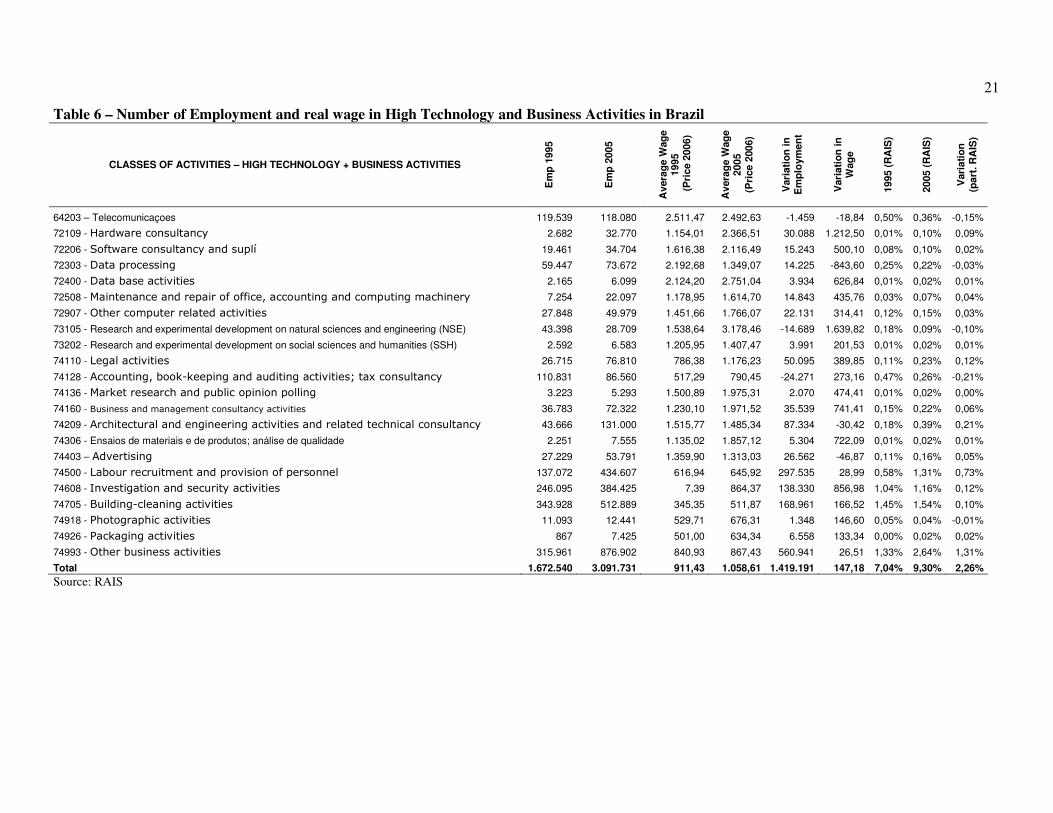
Table 6 – Number of Employment and real wage in High Technology and Business Activities in Brazil
CLASSES OF ACTIVITIES – HIGH TECHNOLOGY + BUSINESS ACTIVITIES
Em
p 1
995
Em
p 2
005
Avera
ge W
ag
e
1995
(P
rice 2
006)
Avera
ge W
ag
e
2005
(Pri
ce 2
006)
Vari
ati
on
in
E
mp
loym
en
t
Vari
ati
on
in
W
ag
e
1995 (
RA
IS)
2005 (
RA
IS)
Vari
ati
on
(p
art
. R
AIS
)
64203 – Telecomunicaçoes 119.539 118.080 2.511,47 2.492,63 -1.459 -18,84 0,50% 0,36% -0,15%
72109 - Hardware consultancy 2.682 32.770 1.154,01 2.366,51 30.088 1.212,50 0,01% 0,10% 0,09%
72206 - Software consultancy and suplí 19.461 34.704 1.616,38 2.116,49 15.243 500,10 0,08% 0,10% 0,02%
72303 - Data processing 59.447 73.672 2.192,68 1.349,07 14.225 -843,60 0,25% 0,22% -0,03%
72400 - Data base activities 2.165 6.099 2.124,20 2.751,04 3.934 626,84 0,01% 0,02% 0,01%
72508 - Maintenance and repair of office, accounting and computing machinery 7.254 22.097 1.178,95 1.614,70 14.843 435,76 0,03% 0,07% 0,04%
72907 - Other computer related activities 27.848 49.979 1.451,66 1.766,07 22.131 314,41 0,12% 0,15% 0,03%
73105 - Research and experimental development on natural sciences and engineering (NSE) 43.398 28.709 1.538,64 3.178,46 -14.689 1.639,82 0,18% 0,09% -0,10%
73202 - Research and experimental development on social sciences and humanities (SSH) 2.592 6.583 1.205,95 1.407,47 3.991 201,53 0,01% 0,02% 0,01%
74110 - Legal activities 26.715 76.810 786,38 1.176,23 50.095 389,85 0,11% 0,23% 0,12%
74128 - Accounting, book-keeping and auditing activities; tax consultancy 110.831 86.560 517,29 790,45 -24.271 273,16 0,47% 0,26% -0,21%
74136 - Market research and public opinion polling 3.223 5.293 1.500,89 1.975,31 2.070 474,41 0,01% 0,02% 0,00%
74160 - Business and management consultancy activities 36.783 72.322 1.230,10 1.971,52 35.539 741,41 0,15% 0,22% 0,06%
74209 - Architectural and engineering activities and related technical consultancy 43.666 131.000 1.515,77 1.485,34 87.334 -30,42 0,18% 0,39% 0,21%
74306 - Ensaios de materiais e de produtos; análise de qualidade 2.251 7.555 1.135,02 1.857,12 5.304 722,09 0,01% 0,02% 0,01%
74403 – Advertising 27.229 53.791 1.359,90 1.313,03 26.562 -46,87 0,11% 0,16% 0,05%
74500 - Labour recruitment and provision of personnel 137.072 434.607 616,94 645,92 297.535 28,99 0,58% 1,31% 0,73%
74608 - Investigation and security activities 246.095 384.425 7,39 864,37 138.330 856,98 1,04% 1,16% 0,12%
74705 - Building-cleaning activities 343.928 512.889 345,35 511,87 168.961 166,52 1,45% 1,54% 0,10%
74918 - Photographic activities 11.093 12.441 529,71 676,31 1.348 146,60 0,05% 0,04% -0,01%
74926 - Packaging activities 867 7.425 501,00 634,34 6.558 133,34 0,00% 0,02% 0,02%
74993 - Other business activities 315.961 876.902 840,93 867,43 560.941 26,51 1,33% 2,64% 1,31%
Total 1.672.540 3.091.731 911,43 1.058,61 1.419.191 147,18 7,04% 9,30% 2,26%
Source: RAIS