Structural Causes of Vulnerability to Flood Hazard in Pakistan
25
Pinning down vulnerability: from narratives to numbers Daanish Mustafa, Sara Ahmed, Eva Saroch and Heather Bell 1 Social vulnerability analyses have typically relied upon narratives to capture the nuances of the concept. While narratives have enhanced our understanding of the multiple drivers of vulner- ability, they have had limited influence on hazards and climate adaptation policy. This is par- tially a function of the different needs and goals of the policy and research communities. The former prioritises generalised quantitative information, while the latter is more concerned with capturing complexity. A theoretically driven and empirically tested quantitative vulnerability and capacities index (VCI) for use at the local scale is presented to help connect vulnerability research and policy. There are four versions of the index for use in rural and urban contexts at the household and community levels. There can be an infinite number of drivers of vulnerability, but the VCI draws upon 12 indicators to represent material, institutional and attitudinal aspects of differential vulnerability and capacities. Keywords: adaptation, coastal Gujarat, disaster risk reduction, local scale, quantitative vulnerability and capacities index Introduction The concept of vulnerability has been one of the most important additions to hazards research in the last three decades. Vulnerability analyses from multiple theoretical perspectives have enriched our understanding of the patterns and causes of damage resulting from environmental extremes. The contribution of vulnerability analyses to the policy realm, however, has been peripheral at best. Policy makers and researchers often operate in different frameworks and have different goals. Three areas of con- tention help to explain the lack of integration of academic vulnerability analyses into policy: 1) policy makers are generally concerned with aggregate populations at the meso and macro-national scales, while vulnerability analysts are usually interested in household and community differentiation at the micro and meso scales (Mustafa, 2002, 2004; Pelling, 2003); 2) many vulnerability analysts are concerned with sys- tematic change and fundamental inequities in the prevailing political and economic structures that policy makers represent and reproduce (Hewitt, 1983; Wisner et al. , 2004); and 3) most policy makers need simple, generalised, actionable, preferably quantitative information for input into policy process, while the work of most vul- nerability analysts results in spatially and temporally nuanced, complex, generally qualitative information directed towards understanding causation rather than prescrib- ing action (for example, Watts and Bohle, 1993; Swift, 1989). This paper addresses the third example of dissonance by presenting a theoretically informed, empirically tested, quantitative vulnerability and capacities index (VCI). doi:10.1111/j.0361-3666.2010.01193.x © 2010 The Author(s). Journal compilation © Overseas Development Institute, 2010 Published by Blackwell Publishing, 9600 Garsington Road, Oxford, OX4 2DQ, UK and 350 Main Street, Malden, MA 02148, USA
Transcript of Structural Causes of Vulnerability to Flood Hazard in Pakistan

Pinning down vulnerability: from narratives to numbers
Daanish Mustafa, Sara Ahmed, Eva Saroch and Heather Bell1
Social vulnerability analyses have typically relied upon narratives to capture the nuances of the concept. While narratives have enhanced our understanding of the multiple drivers of vulner-ability, they have had limited influence on hazards and climate adaptation policy. This is par-tially a function of the different needs and goals of the policy and research communities. The former prioritises generalised quantitative information, while the latter is more concerned with capturing complexity. A theoretically driven and empirically tested quantitative vulnerability and capacities index (VCI) for use at the local scale is presented to help connect vulnerability research and policy. There are four versions of the index for use in rural and urban contexts at the household and community levels. There can be an infinite number of drivers of vulnerability, but the VCI draws upon 12 indicators to represent material, institutional and attitudinal aspects of differential vulnerability and capacities.
Keywords: adaptation, coastal Gujarat, disaster risk reduction, local scale, quantitative vulnerability and capacities index
IntroductionThe concept of vulnerability has been one of the most important additions to hazards research in the last three decades. Vulnerability analyses from multiple theoretical perspectives have enriched our understanding of the patterns and causes of damage resulting from environmental extremes. The contribution of vulnerability analyses to the policy realm, however, has been peripheral at best. Policy makers and researchers often operate in different frameworks and have different goals. Three areas of con-tention help to explain the lack of integration of academic vulnerability analyses into policy: 1) policy makers are generally concerned with aggregate populations at the meso and macro-national scales, while vulnerability analysts are usually interested in household and community differentiation at the micro and meso scales (Mustafa, 2002, 2004; Pelling, 2003); 2) many vulnerability analysts are concerned with sys-tematic change and fundamental inequities in the prevailing political and economic structures that policy makers represent and reproduce (Hewitt, 1983; Wisner et al., 2004); and 3) most policy makers need simple, generalised, actionable, preferably quantitative information for input into policy process, while the work of most vul-nerability analysts results in spatially and temporally nuanced, complex, generally qualitative information directed towards understanding causation rather than prescrib-ing action (for example, Watts and Bohle, 1993; Swift, 1989). This paper addresses the third example of dissonance by presenting a theoretically informed, empirically tested, quantitative vulnerability and capacities index (VCI).
doi:10.1111/j.0361-3666.2010.01193.x
© 2010 The Author(s). Journal compilation © Overseas Development Institute, 2010Published by Blackwell Publishing, 9600 Garsington Road, Oxford, OX4 2DQ, UK and 350 Main Street, Malden, MA 02148, USA

Daanish Mustafa et al.
The VCI is a simple tool to aid development practitioners and policy makers in assess-ing vulnerability in disaster and climate risk regions. The VCI defines and quantifies appropriate criteria related to material (income, education), institutional (infrastruc-ture, social capital) and attitudinal (sense of empowerment) vulnerability, and can be used to measure differential vulnerability at the household and community level in both rural and urban areas. The VCI helps us understand which communities within a region and which households within a community are more vulnerable than others and why. The VCI will allow teams of non-governmental organisations (NGOs) and community activists to collect baseline information on vulnerability in a village or urban community, to target specific interventions and limited resources at vulnerable households, and later to monitor impacts and outcomes of these inter-ventions. The VCI is a simplification of complicated interactions. We understand that in quantifying a concept as complex as vulnerability, competing criteria, scores and weights could be offered and argued about. However, the VCI was conceived of as a tool to help insert vulnerability research into policy rather than as an end in itself. The VCI also has the potential to connect multiple communities of practice. While the focus in climate policy has thus far been on global scale mitigation efforts, there is an increasing recognition of local and national scale adaptation in developmental contexts (Schipper and Pelling, 2006). Where disaster risk reduction (DRR) is effec-tive, ‘institutional structures and management tools to respond to weather-related shocks can form the backbone of local and national adaptation strategies’ in addition to freeing up resources for meeting long-term developmental goals (Schipper and Pelling, 2006, p. 21). The proposed VCI can help strengthen the linkages between the climate change, DRR, and development research and policy agendas by provid-ing a common methodological tool to the three communities of practice. We will first review the key traditions within vulnerability analysis, paying particu-lar attention to the literature concerned with developing measures of vulnerability. Building upon a critical review of the vulnerability literature, we will then present and explain the four applications of the VCI (rural households, urban households, rural communities and urban communities). Results of the ongoing field testing of the index in South Asia will be reported in the penultimate section of the paper, with reflections on further refinement. The paper will conclude by suggesting ways in which a quantification of social vulnerability could inform better hazards policy and contribute to disaster risk reduction, vulnerability mitigation and adaptation to future uncertainty.
Vulnerability research: what is it good for?The conceptualisation and definition of vulnerability has generated considerable debate in the academic community. While physical scientists and engineers have typically equated it with physical exposure to extreme events and adverse outcomes, social scientists have emphasised the role of social structures and differential access to resources in making certain groups more disadvantaged in the face of disasters

Pinning down vulnerability
(Adger, 2006). Some have attempted to bridge the gap between the physical and social scientific perspectives by proposing the concept of a ‘vulnerability of place’, where biophysical exposure intersects with political, economic and social factors to generate specific configurations of vulnerability (Cutter, 1996; Cutter et al., 2000). This paper will not revisit the definitional debates on vulnerability. Instead, our emphasis will be on defining the metrics for recognising, measuring and eventually addressing vulnerability. We understand vulnerability to be more of a chronic state of being than an outcome of environmental extremes and define it as susceptibility to suffer damage from an environmental extreme and relative inability to recover from that damage (as per McCarthy et al., 2001; Mustafa, 1998). Hazards research has come a long way from its initial focus on engineering struc-tural interventions to control the physical risk of hazards. Starting with White (1945, 1973), hazards researchers went beyond engineering solutions to propose the idea of a range of choices open to societies facing hazards. The emphasis shifted towards recognising individual and collective perceptions of risk and the ways in which those perceptions affected hazard-related behaviour. White subscribed to the prag-matist philosophy, one of the few purely American philosophical traditions (Wescoat, 1992). The pragmatist/behaviourist tradition within hazards research stressed the need for scientific research and debate to inform public policy, so as to expand the perceived range of practical choices. Because of its specific policy focus, pragmatist research influenced hazards policy more effectively than most other traditions (Platt, 1986). For instance, White and others laid the groundwork for the US National Flood Insurance Program by showing the viability and utility of flood insurance, flood warning, floodplain management and other non-structural measures. They expanded the range of choice beyond simple dam and levee construction. In the late 1970s and 1980s, hazards research developed a political ecological bent in the critical realist mode, reflecting trends within the broader field of human environment interactions. Work by Hewitt (1983) and Blaikie and Brookfield (1987 changed the direction of hazards research, emphasising the influence of social struc-tural factors on differential access to resources, and hence differential susceptibility to environmental extremes. While the earlier pragmatist tradition blamed differen-tial vulnerability on institutional factors (Burton et al., 1993), political ecologists were more concerned with issues of class, type of economic development, international dependency, gender and deeper social structures in explaining the causal chain of vulnerability (Blaikie et al., 1994; Enarson and Morrow, 1998; Mustafa, 1998; Watts and Bohle, 1993; Wisner, 1993). The tradition spawned a wealth of empirical analyses concerned with unpacking the social structural causes of differential vulnerability (for example, see Mustafa, 1998, 2002; Pelling, 1998, 1999; Tobin and Whiteford, 2002). Hazards researchers have also begun to analyse discourse. Mustafa (2005) posited the concept of a hazardscape, a combination of the material reality of vulnerable spaces and the discourses of the powerful that produce and reproduce the discursive and material reality of the hazardous spaces and the geographies of vulnerabilities within them. Simpson and Corbridge (2006) used discourse analysis to apprehend the emerg-ing geographies of the post-Gujarat earthquake reconstruction.
Daanish Mustafa et al.
Despite the theoretical developments of the past 30 years, measuring vulnerabil-ity is an ongoing challenge. In the words of Adger:
Vulnerability research, if it is to contribute to wider debates on resilience and adaptation, faces significant challenges. . . includ[ing] those of measuring vulnerability within a robust conceptual framework, addressing perceptions of vulnerability and risk, and of governance (Adger, 2006, p. 277).
In the late 1980s, Anderson and Woodrow (1989) proposed the capacities and vulnerability analysis matrix. Although the matrix primarily relied upon qualitative information, it was used by many influential NGOs to monitor systematically the vulnerability of communities and households (ActionAid, 2005; Davis, 2004). The VCI draws heavily upon the insights of this schema. Others have devised quantita-tive vulnerability indices, but most of that work has been at a macro-national scale, relying upon aggregated country-level data sets often in small island countries (for example, Briguglio, 1995; Crowards, 1999; Turvey, 2007; UNDP, 2004; Vincent, 2004; Advisory Board to the Joint Commonwealth Secretariat/World Bank Task Force on Small States, 1999). Few have attempted composite vulnerability indices for the smaller community and household levels (for example, Bosher et al., 2007). Vulnerability research has added nuance to our understanding of the linkages between everyday life and hazards, and of the parallels between geographies of in-justice, poverty and exclusion and the geographies of damage from hazard events. But if the concept of vulnerability is to help us move from understanding reality to changing reality by contributing to disaster risk reduction and adaptation, then metrics must be devised for measuring it. With that end in mind, this paper presents a quantitative index for measuring vulnerability. In formulating the index, we drew upon theoretical insights from past research, empirical research conducted prima-rily in South Asia, and earlier attempts at measuring vulnerability.
Hazardscapes: from narratives to numbersThe conceptual framework of the VCI is rooted in our understanding of hazard-scapes. The hazardscape concept (Mustafa, 2005) puts premium on understanding varying perceptions of hazards as well as the role of discourses from differentially powerful segments of the population in constructing and reproducing geographies of vulnerability. The hazardscape framework is concerned with both material and discursive reality and is consistent with our desire to capture the contextual complex-ity within which vulnerability is constructed and experienced. Formulating any index is invariably an exercise in generalisation. It is bound to present a static snapshot of a dynamic reality and exclude what many may consider to be important variables (Vincent, 2004). As Adger put it:
While it is easy to recognize personally the feeling of vulnerability and perhaps to grasp the outcome of vulnerability in others in a similar situation, the translation of this complex
Pinning down vulnerability
set of parameters into a quantitative metric in many ways reduces its impact and hides its complexity (Adger, 2006, p. 274).
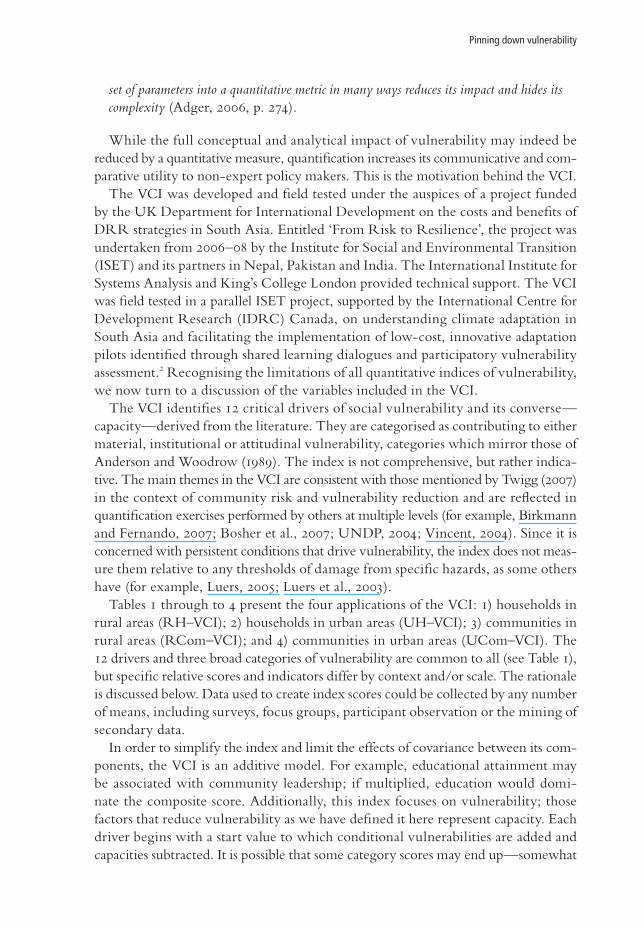
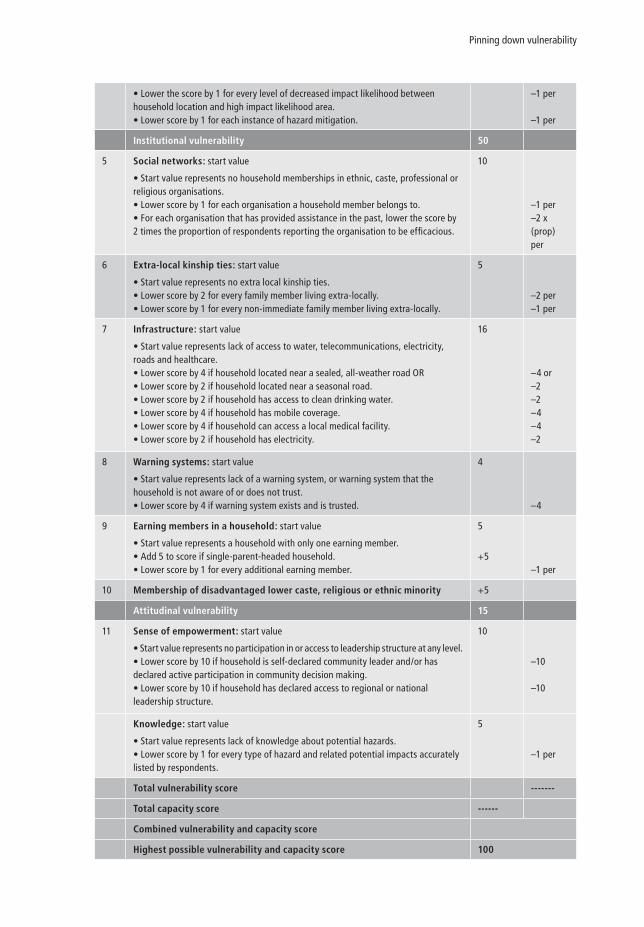
While the full conceptual and analytical impact of vulnerability may indeed be reduced by a quantitative measure, quantification increases its communicative and com-parative utility to non-expert policy makers. This is the motivation behind the VCI. The VCI was developed and field tested under the auspices of a project funded by the UK Department for International Development on the costs and benefits of DRR strategies in South Asia. Entitled ‘From Risk to Resilience’, the project was undertaken from 2006–08 by the Institute for Social and Environmental Transition (ISET) and its partners in Nepal, Pakistan and India. The International Institute for Systems Analysis and King’s College London provided technical support. The VCI was field tested in a parallel ISET project, supported by the International Centre for Development Research (IDRC) Canada, on understanding climate adaptation in South Asia and facilitating the implementation of low-cost, innovative adaptation pilots identified through shared learning dialogues and participatory vulnerability assessment.2 Recognising the limitations of all quantitative indices of vulnerability, we now turn to a discussion of the variables included in the VCI. The VCI identifies 12 critical drivers of social vulnerability and its converse—capacity—derived from the literature. They are categorised as contributing to either material, institutional or attitudinal vulnerability, categories which mirror those of Anderson and Woodrow (1989). The index is not comprehensive, but rather indica-tive. The main themes in the VCI are consistent with those mentioned by Twigg (2007) in the context of community risk and vulnerability reduction and are reflected in quantification exercises performed by others at multiple levels (for example, Birkmann and Fernando, 2007; Bosher et al., 2007; UNDP, 2004; Vincent, 2004). Since it is concerned with persistent conditions that drive vulnerability, the index does not meas-ure them relative to any thresholds of damage from specific hazards, as some others have (for example, Luers, 2005; Luers et al., 2003). Tables 1 through to 4 present the four applications of the VCI: 1) households in rural areas (RH–VCI); 2) households in urban areas (UH–VCI); 3) communities in rural areas (RCom–VCI); and 4) communities in urban areas (UCom–VCI). The 12 drivers and three broad categories of vulnerability are common to all (see Table 1), but specific relative scores and indicators differ by context and/or scale. The rationale is discussed below. Data used to create index scores could be collected by any number of means, including surveys, focus groups, participant observation or the mining of secondary data. In order to simplify the index and limit the effects of covariance between its com-ponents, the VCI is an additive model. For example, educational attainment may be associated with community leadership; if multiplied, education would domi-nate the composite score. Additionally, this index focuses on vulnerability; those factors that reduce vulnerability as we have defined it here represent capacity. Each driver begins with a start value to which conditional vulnerabilities are added and capacities subtracted. It is possible that some category scores may end up—somewhat

Daanish Mustafa et al.
counter-intuitively—as negative. This happy circumstance would indicate a high level of capacity on the part of the household or community. The highest possible score in all four VCI applications is 100. In the RH–VCI the distribution of vulnerability drivers’ scores between the three categories of material, institutional and attitudinal vulnerabilities is 35, 50 and 15 per cent, respectively. In developing the VCI we used Vincent’s (2004) weighting system as a rough guideline. In her analysis of African countries, Vincent assigned a weight of 20 per cent to economic well-being and stability, 20 per cent to demographic structure, 40 per cent to institutional stability and strength of public infrastructure, and 10 per cent each to global interconnectivity and natural resource dependence. Since we are operating at the micro scale, our categories are somewhat different and also include more individualised traits such as sense of empowerment and knowledge. Our material vulnerability category encompasses the first and, in a more indirect fashion, the last two of her categories. In many indices, demographic structure rep-resents the ratio of providers to dependents; in the VCI, this idea is integrated into institutional vulnerability. Relative scores vary slightly as we go from household to community level and from rural to urban area indices, but the relative ranks of the three broad categories in terms of the proportion of total points are consistent. Variables and weighted scores are discussed in detail below.
Table 1 A composite vulnerabilities and capacities index for the household level in rural
areas (RH–VCI)
Vul Cap
Material vulnerabilities 35
1 Income source: start value
• Start value represents 100% dependency on a local level productive asset (for example, fisheries, land, small shops).• Add 2 to the score if the income sources are unstable (for example, daily labour).• Subtract 2 if the local income sources are stable and insensitive to local hazard.• Lower score by 1 for every 10% of non-local income reported.
10
+2
–2–1 per
2 Educational attainment: start value
• Start value represents no member of the household being literate.• Lower score by 1 for every 5 years of schooling of the most educated male member of the household.• Lower score by 2 for each female member’s 5 years of schooling.
5
–1 per
–2 per
3 Assets: start value
• Start value represents no immediately fungible assets (for example, farm implements, animals, jewellery, savings, household items).• Lower score by 1 for every INR 20,000 of fungible assets. —Will have to be calibrated empirically.
8
–1 per
4 Exposure: start value
• Start value represents location in high likelihood impact area relative to the prime hazard (for example, household is located within the 10-year floodplain). • Lower the score by 1 for every level of decreased impact likelihood between household location and high impact likelihood area (for example, subtract 1 for each 10-year floodplain delineation).
10
–1 per
Pinning down vulnerability
• Lower score by 1 for each instance of hazard mitigation (for example, building of a house on higher plinth for floods, low cost construction, which could be rebuilt with local resources).
–1 per
Institutional vulnerability 50
5 Social networks: start value
• Start value represents no household memberships in ethnic, caste, professional or religious organisations.• Lower score by 1 for each organisation a household member belongs to.• For each organisation that has provided assistance in the past, lower the score by 2 times the proportion of respondents reporting the organisation to be efficacious.
10
–1 per–2 x (prop) per
6 Extra-local kinship ties: start value
• Start value represents no extra local kinship ties. • Lower score by 2 for every immediate family member living extra-locally.• Lower score by 1 for every non-immediate family member living extra-locally.
5
–2 per–1 per
7 Infrastructure: start value
• Start value represents lack of access to water, telecommunications, electricity, roads and healthcare.• Lower score by 4 if household located near access to a sealed, all-weather road OR• Lower score by 2 if household located near a seasonal road.• Lower score by 2 if household has access to clean drinking water.• Lower score by 4 if household has mobile coverage.• Lower score by 4 if household can access a local medical facility.• Lower score by 2 if household has access to electricity.
16
–4 or–2–2–4–4–2
8 Warning systems: start value
• Start value represents lack of a warning system, or warning system that the household is not aware of or does not trust.• Lower score by 4 if warning system exists and is trusted.
4
–4
9 Earning members in a household: start value
• Start value represents a household consisting of only one earning member.• Add 5 to score if single-parent-headed household. • Lower score by 1 for every additional earning member.
5
+5
–1 per
10 Membership of disadvantaged lower caste, religious or ethnic minority +5
Attitudinal vulnerability 15
11 Sense of empowerment: start value
• Start value represents no participation in or access to leadership structure at any level.• Lower score by 10 if household is self-declared community leader and/or has declared active participation in community decision making.• Lower score by 10 if household has declared access to regional or national leadership structure.
10
–10
–10
12 Knowledge: start value
• Start value represents lack of knowledge about potential hazards. • Lower score by 1 for every type of hazard and related potential impacts accurately listed by respondents.
5
–1 per
Total vulnerability score -------
Total capacity score ------
Combined vulnerability and capacity score
Highest possible vulnerability and capacity score 100

Daanish Mustafa et al.
Diverse livelihoods have been identified as one of the key elements of resilience to environmental hazards (Moench and Dixit, 2004). Accurate and comparable household level data on income is also extremely hard to get. Therefore, the diversity and stability of livelihoods is included as a contributor to capacity and vulnerability. If livelihood is completely dependent on a local asset, the assigned score is 10 with an additional 2 conditional upon the stability of the income sources. Non-local income and other sources insensitive to local hazards contribute to capacity. At the collective level in the rural areas and at both household and collective level in the urban areas, however, the diversity of income sources is a little less important than the absolute mag-nitude of them. Urban economies are monetised and based on service and industry, while other factors exert greater influence on community level well-being in rural areas. The base score for urban areas is 8 with 2 based on stability. However, wage earners overseas or in other cities can provide a safety net for even urban residents in difficult times. Table 2 outlines the household level vulnerability matrix for urban areas. Formal education in rural contexts is assigned half the score of diverse incomes, and is also scored lower than education in urban settings. In a study conducted in rural Andhra Pradesh in Southern India, Bosher et al. (2007) found that while higher edu-cation was associated with greater access to public facilities and, to a lesser extent, political networks, people with lower levels of formal education enjoyed comparable assets and more access to social networks. In agrarian economies, formal education is not as critical in terms of access to livelihood opportunities or social capital. In urban areas, formal education is vital to gaining access to livelihoods and facilities and is assigned a score of 10 rather than 5. Female access to education is seen as representing higher capacity than male access.
Table 2 A composite vulnerabilities and capacities index for the household level in urban
areas (UH–VCI)
Vul Cap
Material vulnerabilities 35
1 Income source: start value
• Start value represents 100% dependency on local level employment or produc tive asset.• Add 2 to the score if the income sources are unstable (for example, day labour).• Subtract 2 if the local income sources are stable and insensitive to local hazard.• Lower score by 1 for every 10% of non-local income reported.
8
+2
–2–1 per
2 Educational attainment: start value
• Start value represents no member of the household being literate.• Lower score by 1 for every 5 years of schooling of the most educated male member of the household.• Lower score by 2 for each female member’s 5 years of schooling.
10
–1 per
–2 per
3 Assets: start value
• Start value represents no immediately fungible assets. • Lower score by 1 for every INR 20,000 of appropriate fungible assets. —Will have to be calibrated empirically.
5
–1 per
4 Exposure: start value
• Start value represents location in high likelihood impact area relative to the prime hazard.
10
Pinning down vulnerability
• Lower the score by 1 for every level of decreased impact likelihood between household location and high impact likelihood area.• Lower score by 1 for each instance of hazard mitigation.
–1 per
–1 per
Institutional vulnerability 50
5 Social networks: start value
• Start value represents no household memberships in ethnic, caste, professional or religious organisations.• Lower score by 1 for each organisation a household member belongs to.• For each organisation that has provided assistance in the past, lower the score by 2 times the proportion of respondents reporting the organisation to be efficacious.
10
–1 per–2 x (prop) per
6 Extra-local kinship ties: start value
• Start value represents no extra local kinship ties. • Lower score by 2 for every family member living extra-locally.• Lower score by 1 for every non-immediate family member living extra-locally.
5
–2 per–1 per
7 Infrastructure: start value
• Start value represents lack of access to water, telecommunications, electricity, roads and healthcare.• Lower score by 4 if household located near a sealed, all-weather road OR• Lower score by 2 if household located near a seasonal road.• Lower score by 2 if household has access to clean drinking water.• Lower score by 4 if household has mobile coverage.• Lower score by 4 if household can access a local medical facility.• Lower score by 2 if household has electricity.
16
–4 or–2–2–4–4–2
8 Warning systems: start value
• Start value represents lack of a warning system, or warning system that the household is not aware of or does not trust.• Lower score by 4 if warning system exists and is trusted.
4
–4
9 Earning members in a household: start value
• Start value represents a household with only one earning member.• Add 5 to score if single-parent-headed household. • Lower score by 1 for every additional earning member.
5
+5–1 per
10 Membership of disadvantaged lower caste, religious or ethnic minority +5
Attitudinal vulnerability 15
11 Sense of empowerment: start value
• Start value represents no participation in or access to leadership structure at any level.• Lower score by 10 if household is self-declared community leader and/or has declared active participation in community decision making.• Lower score by 10 if household has declared access to regional or national leadership structure.
10
–10
–10
Knowledge: start value
• Start value represents lack of knowledge about potential hazards. • Lower score by 1 for every type of hazard and related potential impacts accurately listed by respondents.
5
–1 per
Total vulnerability score -------
Total capacity score ------
Combined vulnerability and capacity score
Highest possible vulnerability and capacity score 100
Daanish Mustafa et al.
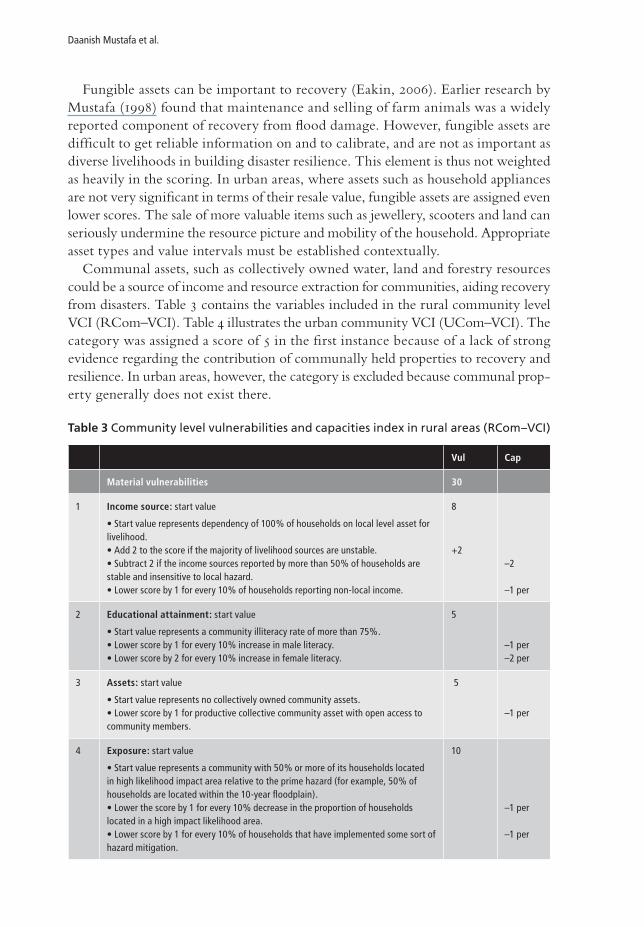
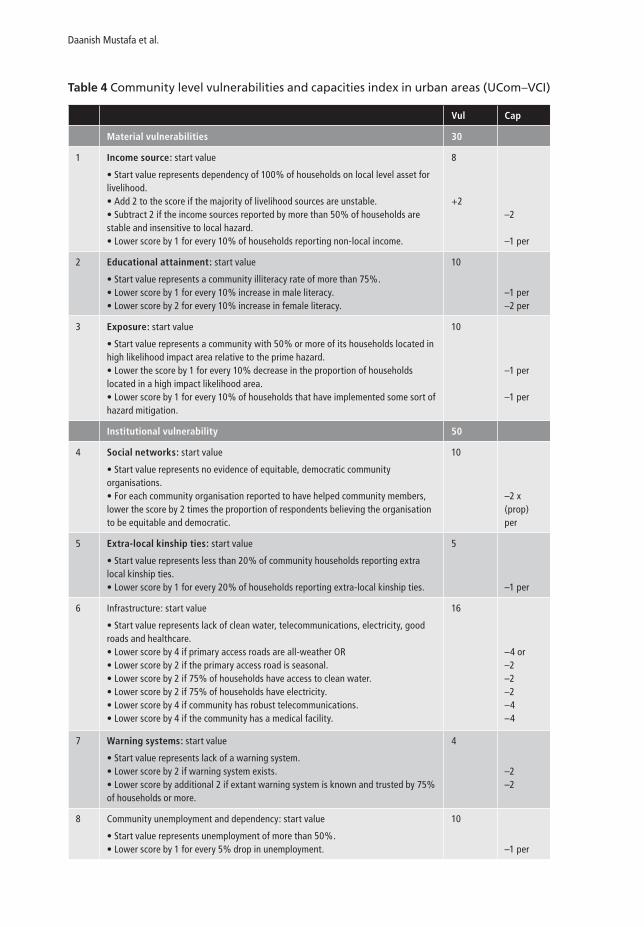
Fungible assets can be important to recovery (Eakin, 2006). Earlier research by Mustafa (1998) found that maintenance and selling of farm animals was a widely reported component of recovery from flood damage. However, fungible assets are difficult to get reliable information on and to calibrate, and are not as important as diverse livelihoods in building disaster resilience. This element is thus not weighted as heavily in the scoring. In urban areas, where assets such as household appliances are not very significant in terms of their resale value, fungible assets are assigned even lower scores. The sale of more valuable items such as jewellery, scooters and land can seriously undermine the resource picture and mobility of the household. Appropriate asset types and value intervals must be established contextually. Communal assets, such as collectively owned water, land and forestry resources could be a source of income and resource extraction for communities, aiding recovery from disasters. Table 3 contains the variables included in the rural community level VCI (RCom–VCI). Table 4 illustrates the urban community VCI (UCom–VCI). The category was assigned a score of 5 in the first instance because of a lack of strong evidence regarding the contribution of communally held properties to recovery and resilience. In urban areas, however, the category is excluded because communal prop-erty generally does not exist there.
Table 3 Community level vulnerabilities and capacities index in rural areas (RCom–VCI)
Vul Cap
Material vulnerabilities 30
1 Income source: start value
• Start value represents dependency of 100% of households on local level asset for livelihood.• Add 2 to the score if the majority of livelihood sources are unstable.• Subtract 2 if the income sources reported by more than 50% of households are stable and insensitive to local hazard.• Lower score by 1 for every 10% of households reporting non-local income.
8
+2
–2
–1 per
2 Educational attainment: start value
• Start value represents a community illiteracy rate of more than 75%.• Lower score by 1 for every 10% increase in male literacy.• Lower score by 2 for every 10% increase in female literacy.
5
–1 per–2 per
3 Assets: start value
• Start value represents no collectively owned community assets. • Lower score by 1 for productive collective community asset with open access to community members.
5
–1 per
4 Exposure: start value
• Start value represents a community with 50% or more of its households located in high likelihood impact area relative to the prime hazard (for example, 50% of households are located within the 10-year floodplain). • Lower the score by 1 for every 10% decrease in the proportion of households located in a high impact likelihood area. • Lower score by 1 for every 10% of households that have implemented some sort of hazard mitigation.
10
–1 per
–1 per

Pinning down vulnerability
Institutional vulnerability 50
5 Social networks: start value
• Start value represents no evidence of equitable, democratic community organisations.• For each community organisation reported to have helped community members, lower the score by 2 times the proportion of respondents believing the organisation to be equitable and democratic.
10
–2 x (prop) per
6 Extra-local kinship ties: start value
• Start value represents less than 20% of community households reporting extra local kinship ties.• Lower score by 1 for every 20% of households reporting extra-local kinship ties.
5
–1 per
7 Infrastructure: start value
• Start value represents lack of clean water, telecommunications, electricity, good roads and healthcare.• Lower score by 4 if primary access roads are all-weather OR• Lower score by 2 if the primary access road is seasonal. • Lower score by 2 if 75% of households have access to clean water.• Lower score by 2 if 75% of households have electricity. • Lower score by 4 if community has robust telecommunications.• Lower score by 4 if the community has a medical facility.
16
–4 or–2–2–2–4–4
8 Warning systems: start value
• Start value represents lack of a warning system.• Lower score by 2 if warning system exists.• Lower score by additional 2 if extant warning system is known and trusted by 75% of households or more.
4
–2–2
9 Community unemployment and dependency: start value
• Start value represents unemployment of more than 50%. • Lower score by 1 for every 5% drop in unemployment.
10
–1 per
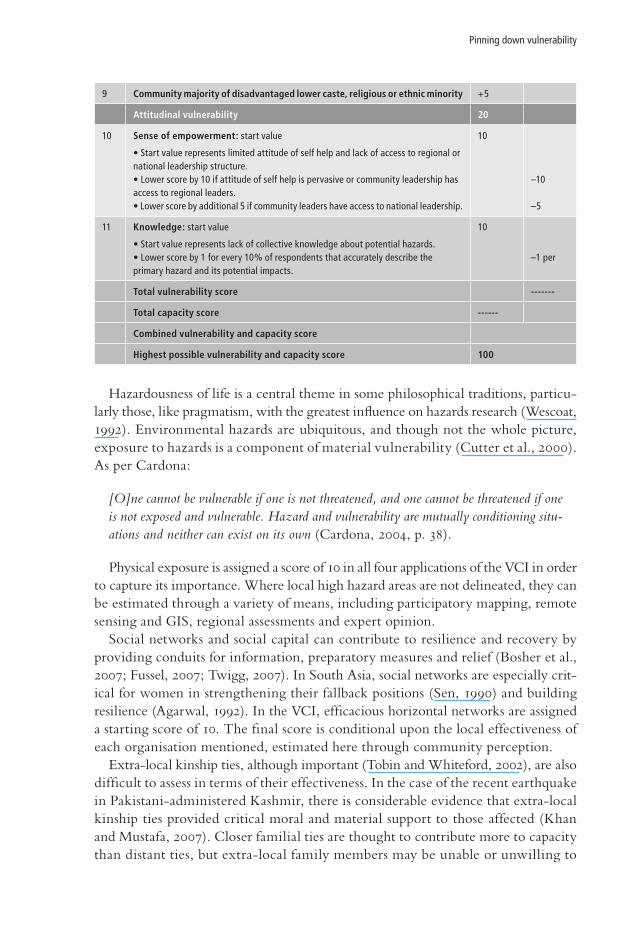
10 Community majority of disadvantaged lower caste, religious or ethnic minority +5
Attitudinal vulnerability 20
11 Sense of empowerment: start value
• Start value represents limited attitude of self help and lack of access to regional or national leadership structure. • Lower score by 10 if attitude of self help is pervasive or community leadership has access to regional leaders.• Lower score by additional 5 if community leaders have access to national leadership.
10
–10
–5
12 Knowledge: start value
• Start value represents lack of collective knowledge about potential hazards. • Lower score by 1 for every 10% of respondents that accurately describe the primary hazard(s) and their potential impacts
10
–1 per
Total vulnerability score -------
Total capacity score ------
Combined vulnerability and capacity score
Highest possible vulnerability and capacity score 100
Daanish Mustafa et al.
Table 4 Community level vulnerabilities and capacities index in urban areas (UCom–VCI)
Vul Cap
Material vulnerabilities 30
1 Income source: start value
• Start value represents dependency of 100% of households on local level asset for livelihood. • Add 2 to the score if the majority of livelihood sources are unstable.• Subtract 2 if the income sources reported by more than 50% of households are stable and insensitive to local hazard.• Lower score by 1 for every 10% of households reporting non-local income.
8
+2
–2
–1 per
2 Educational attainment: start value
• Start value represents a community illiteracy rate of more than 75%.• Lower score by 1 for every 10% increase in male literacy.• Lower score by 2 for every 10% increase in female literacy.
10
–1 per–2 per
3 Exposure: start value
• Start value represents a community with 50% or more of its households located in high likelihood impact area relative to the prime hazard. • Lower the score by 1 for every 10% decrease in the proportion of households located in a high impact likelihood area. • Lower score by 1 for every 10% of households that have implemented some sort of hazard mitigation.
10
–1 per
–1 per
Institutional vulnerability 50
4 Social networks: start value
• Start value represents no evidence of equitable, democratic community organisations.• For each community organisation reported to have helped community members, lower the score by 2 times the proportion of respondents believing the organisation to be equitable and democratic.
10
–2 x (prop) per
5 Extra-local kinship ties: start value
• Start value represents less than 20% of community households reporting extra local kinship ties.• Lower score by 1 for every 20% of households reporting extra-local kinship ties.
5
–1 per
6 Infrastructure: start value
• Start value represents lack of clean water, telecommunications, electricity, good roads and healthcare.• Lower score by 4 if primary access roads are all-weather OR• Lower score by 2 if the primary access road is seasonal. • Lower score by 2 if 75% of households have access to clean water.• Lower score by 2 if 75% of households have electricity.• Lower score by 4 if community has robust telecommunications.• Lower score by 4 if the community has a medical facility.
16
–4 or–2–2–2–4–4
7 Warning systems: start value
• Start value represents lack of a warning system.• Lower score by 2 if warning system exists.• Lower score by additional 2 if extant warning system is known and trusted by 75% of households or more.
4
–2–2
8 Community unemployment and dependency: start value
• Start value represents unemployment of more than 50%. • Lower score by 1 for every 5% drop in unemployment.
10
–1 per
Pinning down vulnerability
9 Community majority of disadvantaged lower caste, religious or ethnic minority +5
Attitudinal vulnerability 20
10 Sense of empowerment: start value
• Start value represents limited attitude of self help and lack of access to regional or national leadership structure. • Lower score by 10 if attitude of self help is pervasive or community leadership has access to regional leaders.• Lower score by additional 5 if community leaders have access to national leadership.
10
–10
–5
11 Knowledge: start value
• Start value represents lack of collective knowledge about potential hazards. • Lower score by 1 for every 10% of respondents that accurately describe the primary hazard and its potential impacts.
10
–1 per
Total vulnerability score -------
Total capacity score ------
Combined vulnerability and capacity score
Highest possible vulnerability and capacity score 100
Hazardousness of life is a central theme in some philosophical traditions, particu-larly those, like pragmatism, with the greatest influence on hazards research (Wescoat, 1992). Environmental hazards are ubiquitous, and though not the whole picture, exposure to hazards is a component of material vulnerability (Cutter et al., 2000). As per Cardona:
[O]ne cannot be vulnerable if one is not threatened, and one cannot be threatened if one is not exposed and vulnerable. Hazard and vulnerability are mutually conditioning situ-ations and neither can exist on its own (Cardona, 2004, p. 38).
Physical exposure is assigned a score of 10 in all four applications of the VCI in order to capture its importance. Where local high hazard areas are not delineated, they can be estimated through a variety of means, including participatory mapping, remote sensing and GIS, regional assessments and expert opinion. Social networks and social capital can contribute to resilience and recovery by providing conduits for information, preparatory measures and relief (Bosher et al., 2007; Fussel, 2007; Twigg, 2007). In South Asia, social networks are especially crit-ical for women in strengthening their fallback positions (Sen, 1990) and building resilience (Agarwal, 1992). In the VCI, efficacious horizontal networks are assigned a starting score of 10. The final score is conditional upon the local effectiveness of each organisation mentioned, estimated here through community perception. Extra-local kinship ties, although important (Tobin and Whiteford, 2002), are also difficult to assess in terms of their effectiveness. In the case of the recent earthquake in Pakistani-administered Kashmir, there is considerable evidence that extra-local kinship ties provided critical moral and material support to those affected (Khan and Mustafa, 2007). Closer familial ties are thought to contribute more to capacity than distant ties, but extra-local family members may be unable or unwilling to
Daanish Mustafa et al.
extend significant help to disaster victims, possibly because of their own precarious livelihood situations. These relationships can become a burden rather than an asset because of social obligations (see Mustafa, 2004). In light of the inconsistent evidence on the contribution of extra-local kinship ties to longer term disaster recovery, this variable was assigned a score of 5. This cautious score may be compensated for by scores in other related variables such as infrastructure and sense of empowerment, which may well be the outcome of the quality of kinship ties. The number of earning members in the household is considered to be an insti-tutional vulnerability because the effects of it are institutionally mediated. Having a large family by itself is not a bad thing, because of the extra labour that comes with large families in rural settings. But dependents, particularly young children and the elderly in the absence of social systems to take care of them, can be a drain on family resources. The category is assigned a base score of 5. Single-parent-headed households, particularly those that are female headed, represent increased vulner-ability and were assigned an additional 5 points. Capacity was considered to increase with increasing numbers of contributing household members. In community con-texts, dependency is represented by unemployment rates. The infrastructural measures are seen here as a function of the quality of govern-ance and institutions in a society. Each of the variables was assigned a capacity score commensurate with our assessment of their importance in facilitating relief and recovery, dissemination of information and warning, access to livelihood opportu-nities, and general well-being, awareness and empowerment (Moench and Dixit, 2007). Warning systems are, however, a special case. At the household level, the existence of a warning system is not sufficient; awareness of it and perceived cred-ibility are just as important. The scores in all the VCI applications are conditional upon awareness and credibility of the warning system. Belonging to an ethnic minority and/or a lower caste can influence vulnerability, but the relationship may be complex. In India, Bosher et al. (2007) found that, while important, the impact of caste on vulnerability was mediated by other factors such as the characteristics of the community they lived in and access to specialised social networks. For ethnic or religious minorities, specialised networks can facilitate access to resources for relief and recovery in addition to employment and education oppor-tunities. The Aga Khan network, which caters to the Ismaili religious community in South Asia and Africa, various church groups helping minority Christian commu-nities in South Asia, and schedule caste politicians directing state resources towards their constituencies are all examples of specialised networks that provide assistance. Mediating factors (for example, social networks) and potentially related outcomes (for example, sense of empowerment and unemployment) are represented elsewhere in the index. In order to keep ethnicity and/or caste from dominating the overall score, the vulnerability score associated with this variable is 5. Sense of empowerment has been related to vulnerability and capacity (Delica-Willison and Willison, 2004) and is evidenced by perceived access to local and regional power structures and a personal sense of efficacy. Proximity to power
Pinning down vulnerability
structures can effectively channel relief and recovery in the aftermath of disasters, and provide access to government services and critical productive resources other-wise unavailable to disadvantaged poor, minority or low-caste groups (Bosher et al., 2007; Mustafa, 2002). Knowledge about potential hazards can also be critical in determining behaviour and vulnerability to hazards (for example, Burton et al., 1993; Crozier et al., 2006). But because perceptions, attitudes and knowledge are constructed socially, the score for the variable is 5. The category, however, has a higher score of 10 at the collective community level both in urban and rural areas.In the next section, we discuss the results of the VCI for coastal Gujarat, India, where our partner NGO, Utthan, has been working on vulnerability mapping and adaptation pilots through the aforementioned IDRC-supported project.3 Results from additional field sites in Uttar Pradesh, north-east India, and Rawalpindi, Pakistan, are outlined in Mustafa et al. (2008).
The VCI: insights and analysis from the field The VCI testing was directed towards finding out whether the relative vulnerabil-ity and capacity scores matched the narrative vulnerability analysis. If the numbers were closely congruent with the narrative analysis results, then we could conclude that the numbers are a reasonable representation of comparative differential vulner-ability. As we will demonstrate based on our case study of three villages in coastal Gujarat, the numbers across the households are generally congruent with the narra-tive vulnerability analyses. Data for VCI can be collected through index specific surveys involving partici-patory rural appraisals (PRAs) (Chambers, 1997), shared learning dialogues (Moench and Dixit, 2007) and questionnaire surveys (Silverman, 2004), or mined from sec-ondary sources. Since we had the resources available to undertake pilot testing of the VCI in some of our project field sites, we decided to do so. For example, in coastal Gujarat we developed an index-specific household and community level questionnaire through an iterative process with Utthan’s field team. Since this was a pilot test, we selected only 30 households from three coastal, multi-hazard prone villages—Sartanpar, Katpar and Tarasara. Selection criteria for the households were purposive and based on our joint understanding of the under-lying factors that affect vulnerability: livelihood diversification; physical location and type of house; gender and social exclusion; and institutional affiliation. Thus, households were selected from a variety of backgrounds, for example, disadvantaged religious or caste-based groups, single-parent (female-headed) households with a large number of dependents, members of community institutions such as the panchayat (elected village council) or self-help groups (SHGs), and those with different sources of income and dwellings. Following is a brief description of each village and an analy-sis of the variations in the household VCI scores.

Daanish Mustafa et al.
Sartanpar village Sartanpar, once a busy port, is a large village with a population of 14,500,4 which is at risk from cyclones, floods and salinity ingression due to high tides during the monsoons. Literacy rate in the village is low and nearly 80 per cent of the popula-tion migrates during the lean agricultural or fishing seasons, the two main local sources of livelihood. Infrastructure in the village is poor. The main access roads are washed out each time there is excessive flooding, which affects people’s mobility for work. The vulnerability scores for the village are plotted in Figure 1. Hansaben (Female–HBGBJ) illustrates the nature of differential vulnerability in Sartanpar. She has one of the highest VCI scores, arising from her insecure, single income source as a daily wage labourer, a large number of dependents, no social support, and the location of her katcha5 house in a low-lying flood prone area of the village. In contrast, Bhagatbhai (Male–BBHBC) has the lowest VCI score. He is the village sarpanch (elected leader of the panchayat) and lives in a pukka6 house with a raised plinth to minimise flood damage. Although he has a high number of depen-dents and his main source of livelihood is fishing, which is risk-prone during the monsoons, Bhagatbhai has a diversified income stream. He owns a shop as well as three more houses that he rents out, minimising his vulnerability. Sudhabhai Makwana (Male–SBVBM) also has a relatively low VCI score despite having a large number of dependents (more than 50 per cent as he lives in a joint
Note: The acronyms are the initials of the survey respondents used in the interest of maintaining their confidentiality and our ability to refer back to our database should there be any questions.Source: Authors.
Figure 1 VCI scores for Sartanpar village, Gujarat
Pinning down vulnerability
family). His household has a fairly well diversified basket of livelihood opportuni-ties as well as pooling of income sources from agriculture, daily labour, diamond polishing, fishing and masonry work. In addition, although the family lives in a katcha house, it is located in the less flood-prone upper part of Sartanpar and they have a number of fungible assets including jewellery, livestock and land, which can be mortgaged in times of adversity. Makwana also has strong extra local kinship ties and, being an active member of the panchayat and various community religious institutions, his attitudinal vulnerability is 0.
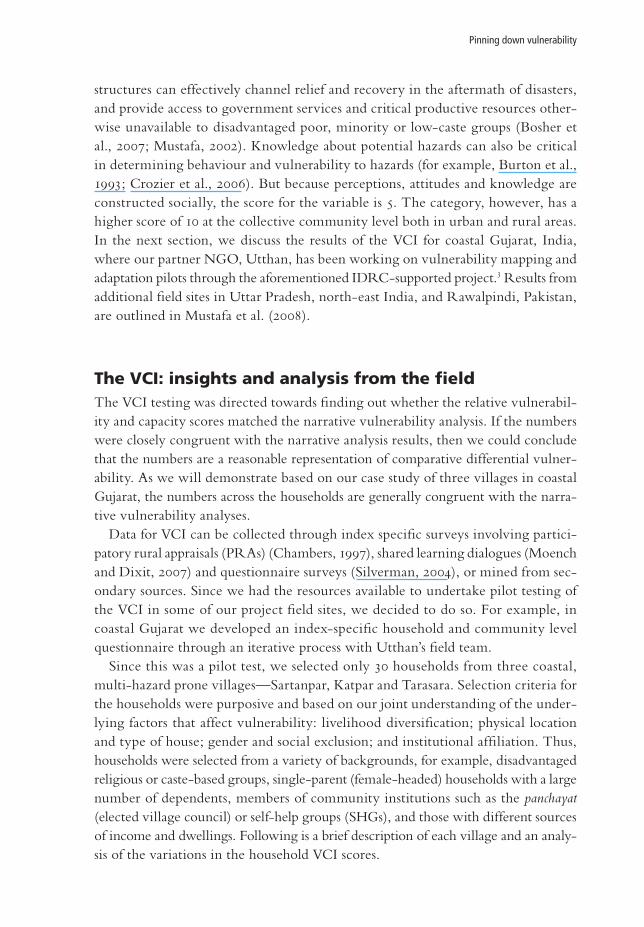
Katpar villageOnce a prosperous ancient port, Katpar village is located in a low-lying area near the Malan estuary in Bhavnagar district, coastal south Gujarat. With a population of some 11,000, the village has poor infrastructure: there are no all-weather roads or drain-age facilities and it is prone to flooding every year during the monsoon months. The household VCI scores for Katpar are considerably higher than those of Sartanpar (Figure 2), and, unlike in Sartanpar, all the sample households save one score on attitudinal vulnerability. Despite being an agricultural labourer and living in a katcha house in a low-lying area of the village, Tappuben (Female–TBKB) has strong social support networks and access to extra-kinship ties that have helped her in difficult times. She is also an active member of multiple village organisations including the disaster management committee and the pani samiti (water and sanitation organisation). Her participation has helped her gain confidence and an articulate ‘voice’ in decision making.
Source: Authors.
Figure 2 VCI scores for Katpar village, Gujarat
Daanish Mustafa et al.
In contrast, Attubhai (Male–ABJB) has the highest VCI score, living as he does in a low-lying katcha house that is flooded every alternate year. The flooding forces him and his wife to move out for a week or two to higher grounds. Attubhai has no diversified income sources and no children at home (no additional labour), nor do they have access to basic infrastructure such as electricity or communication systems. Although they received some flood relief in 2007, given their abject living standards, they were not able to invest substantially in either flood-proofing their home or building their adaptive capacity. Raniben (Female–RBKB) also has a high vulnerability score, being a widow with a large number of dependents (7) and limited diversified income sources or earners (only her eldest son works). Although they live in a pukka house, it is near the coast and subject to flooding during high tides. Given her workload and status, Raniben has barely any time to participate in community organisations or village decision making, so her sense of empowerment is also low.
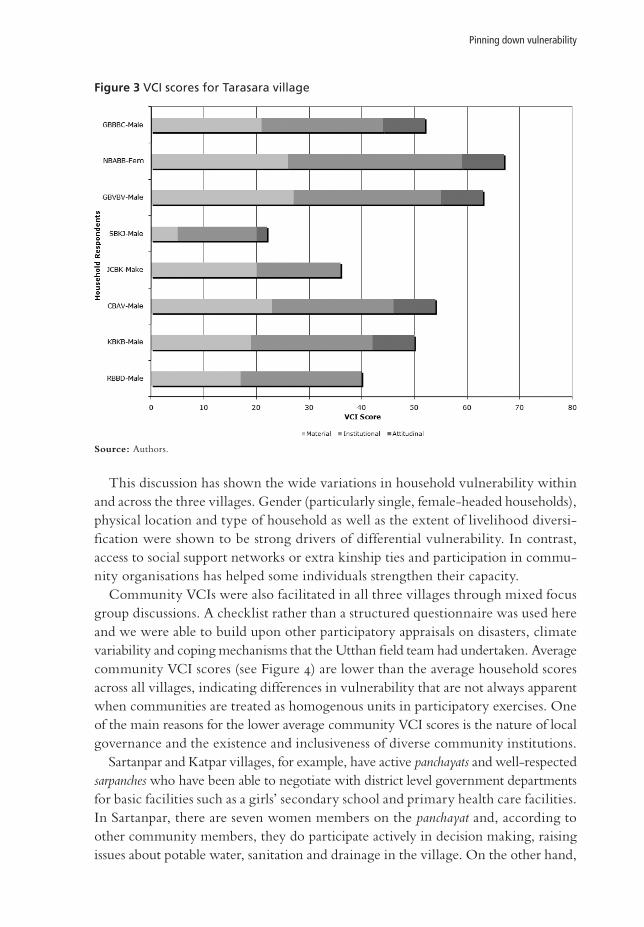
Tarasara village
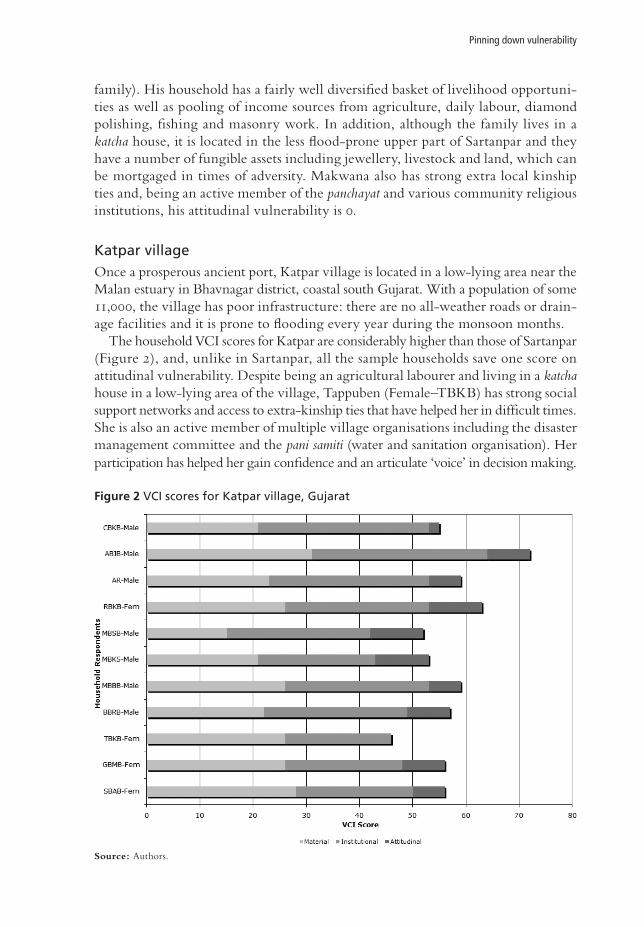
Situated on the banks of the River Shetrunji and its tributary, the Keri, this ancient port village is also prone to cyclones, floods and salinity ingress. Floods affect the agricultural land almost every year, but residential areas are protected by a 500-metre mud-bund (embankment) running parallel to the Keri river; the stone pitching of the bund was one of the interventions introduced by Utthan under the IDRC pilot adaptation project. Almost 35 per cent of households in this village migrate season-ally either to the diamond polishing units in nearby towns or to work as agricultural labourers in adjacent areas. However, with the current economic recession, the diamond industry has been severely impacted. Not only has the flow of migrants searching for work in their villages reversed, but unusually high rates of suicide among unemployed, unskilled diamond workers have been reported in recent months (Rajeev, 2009). VCI scores for Tarasara show a high degree of variation from the very low score of 22 (Male–SBKJ) to a relatively high score of 67 (Female–NBABB) (Figure 3). In the former case, Sureshbhai comes from a high-caste group (Brahmin). Both he and his wife are educated, and they have a small nuclear family with only three dependents. Being from a high-caste household, his wife does not work. Sureshbhai is a teacher in the village school, a secure government job. While the school may be used as a shelter during floods or cyclones, his main source of income remains stable. In addition, he is a member of various village organisations and has access to social networks and extra-kinship ties as well as good infrastructure facilities. Neetaben, on the other hand, is a widow and the sole bread-earner in her family of five. She has little livelihood security as a daily farm labourer and has no access to social support networks or community organisations. Her exposure to risk is high as she lives in a katcha house within the floodplain.
Pinning down vulnerability
This discussion has shown the wide variations in household vulnerability within and across the three villages. Gender (particularly single, female-headed households), physical location and type of household as well as the extent of livelihood diversi-fication were shown to be strong drivers of differential vulnerability. In contrast, access to social support networks or extra kinship ties and participation in commu-nity organisations has helped some individuals strengthen their capacity. Community VCIs were also facilitated in all three villages through mixed focus group discussions. A checklist rather than a structured questionnaire was used here and we were able to build upon other participatory appraisals on disasters, climate variability and coping mechanisms that the Utthan field team had undertaken. Average community VCI scores (see Figure 4) are lower than the average household scores across all villages, indicating differences in vulnerability that are not always apparent when communities are treated as homogenous units in participatory exercises. One of the main reasons for the lower average community VCI scores is the nature of local governance and the existence and inclusiveness of diverse community institutions. Sartanpar and Katpar villages, for example, have active panchayats and well-respected sarpanches who have been able to negotiate with district level government departments for basic facilities such as a girls’ secondary school and primary health care facilities. In Sartanpar, there are seven women members on the panchayat and, according to other community members, they do participate actively in decision making, raising issues about potable water, sanitation and drainage in the village. On the other hand,
Figure 3 VCI scores for Tarasara village
Source: Authors.

Daanish Mustafa et al.
Tarasara village, which faces the same physical hazard risks, has the highest com-munity VCI score. There are no community organisations and village politics are clearly divided into two factions—the Bharatiya Janata Party, which is the ruling party at the state level, and the Congress, which is part of the ruling United Pro-gressive Alliance at the national level. So strong are the factional politics that it has been difficult for Utthan to facilitate even the basic SHG, and no one questions the panchayat. The above case studies illustrate the utility of the VCI index in identifying rela-tively vulnerable households and communities. The VCI also identifies the drivers of differential vulnerability and provides avenues for exploring interventions. The type of illustrative data and analysis presented above could help decision makers spatially and sectorally target their interventions to promote greater resilience in the face of hazards. However, there are significant methodological challenges in taking this VCI forward, beginning with building the capacity of field teams related to conceptualising and assessing vulnerability. To ensure objectivity, the scoring must be done by at least two field researchers, especially for some of the more difficult calibrations on livelihoods, assets and exposure. In addition, the case study cited followed a strong iteration process between the field team and researchers on the relevance of scores and, where necessary, their revision. Currently, we are planning to upscale the VCI through a random survey across more hazard-prone coastal villages so that Utthan and other partners can develop a coastal database on vulnerability as well as monitor adaptation pilots in progress.
Figure 4 Community VCI scores for the three coastal villages in Gujarat
Source: Authors.
Pinning down vulnerability
Conclusion: towards the policy contours of hazardscapesThere has been much debate over the definitions and measurement of social vul-nerability. The VCI is an attempt at a practical compromise that will help bridge the gap between research and fruitful policy. The VCI is necessarily limited in its representation of vulnerability. Any exercise in quantification will cause dissatis-faction; the VCI may appear to overlook connections that some individuals find foundational based on their own experience. Also like any quantification of social processes (for example, gross domestic product per capita and the human development index), the VCI is open to abuse. If the indicators used in the VCI and the resulting scores are used with appropriate caution, however, and treated as approximations of reality rather than reality itself, they can be of substantial use in facilitating the development of a safer environment for the most vulnerable. The field testing of the index is ongoing. So far the results of the field applications indicate that the VCI can effectively express the variation in vulnerability identi-fied by narrative analyses. Furthermore, since many components of the index are based upon global vulnerability literature they should be generalisable globally. However, further testing and refinement is warranted, particularly to establish the generalisability of the index in non-South Asian contexts. First, it must be emphasised that the VCI is a data organisation tool, rather than a data collection tool like a questionnaire. Any number of data collection tools, from PRAs and participant observation to secondary data and basic questionnaires can be used to obtain relevant data. Second, the VCI is meant to complement narrative vulnerability analyses rather than replace them. Third, its main purpose is comparative analysis between households within a community and communities within a region or an urban area; it is not intended to serve as an absolute indicator representing thresholds of low, moderate or high levels of vulnerability. With enough data and testing, thresholds of high, medium and low vulnerability could be derived empirically, but they are not built into the structure of the VCI. Fourth, the quantitative VCI can be used to map differential household and community vulnerability, enhancing the formu-lation and targeting of specific disaster risk reduction and adaptation-related initia-tives at the local scale. Lastly, the VCI is an additive deterministic model and not a stochastic model. Its structural simplicity is intended to facilitate data collection and comparison in other geographical contexts by the types of moderately trained human resources available to the possible institutional users in the global South. One of the strengths of this VCI is that it looks at common core drivers of vulner-ability across household and community scales and across rural and urban divides without changing drastically. Such simplicity can be useful for medium to small NGOs and even government line departments tasked with monitoring vulnerabil-ity to hazards or climate uncertainty. Spatial mapping of social vulnerability is important for capturing the contours of the hazardscapes mentioned above. Mapping the geographies of vulnerability helps individuals and communities recognise their risk, and can help close the perceptual divide between the two. In addition, public mapping of vulnerability may highlight, and perhaps smooth, the sharp relief in the
Daanish Mustafa et al.
power/knowledge of the decision-making elites and the general population. These steep contours have informed the imposition of ineffective technocratic solutions on socially constructed hazardous situations. The VCI can eventually contribute towards more democratic, and perhaps safer, hazardscapes with milder contours of power and knowledge.
AcknowledgmentsThe research for this manuscript was funded by the UK Department for International Development. The help and assistance rendered by Marcus Moench and the staff of the Institute for Social and Environmental Transition is gratefully acknowledged. Also the hard work by the field staff of Utthan, Ahmedabad, the Pakistan Institute of Environment and Development Action Research, Islamabad, and the Gorakhpur Environmental Action Group, Gorakhpur, Uttar Pradesh, in field testing the index is gratefully acknowledged.
CorrespondenceDaanish Mustafa, Department of Geography, King’s College London, Strand, London, WC2R 2LS, United Kingdom. Telephone: +44 207 848 1667; e-mail: [email protected]
Endnotes1 Daanish Mustafa is Senior Lecturer in the Department of Geography, King’s College London,
London, United Kingdom; Sara Ahmed is Senior Programme Specialist (Agriculture and Envi-ronment) at the International Development Research Center, New Delhi, India; Eva Saroch is a Research Associate at the Institute for Social and Environmental Transition, Hyderabad, India; and Heather Bell is Science Advisor at the Pacific Disaster Center, Kihei, Hawaii, United States.
2 Working papers from this research project are available at www.i-s-e-t.org. 3 See www.utthangujarat.org for more information on Utthan and www.climate-transitions.org
for our adaptation project insights and reports. 4 The data on all three villages comes from primary surveys done by Utthan during the course of
the IDRC supported adaptation project from 2006–09. 5 A generic term in India referring to either a thatched wooden or mud house, not constructed with
modern material.6 A term for a house built with modern materials such as brick and cement.
ReferencesActionAid (2005) Participatory Vulnerability Analysis: A Step-by-Step Guide for Field Staff. ActionAid
International, London. Adger, W.N. (2006) ‘Vulnerability’. Global Environmental Change. 16(3). pp. 268–281.
Pinning down vulnerability
Advisory Board to the Joint Commonwealth Secretariat/World Bank Task Force on Small States (1999) ‘Small states: a composite vulnerability index’. Paper presented at the World Bank–Commonwealth Secretariat Conference on Small States. 17–19 February. St. Lucia. ctrc.sice.oas.org/geograph/caribbean/Vul_index.doc.
Agarwal, B. (1992) ‘Gender relations and food security: coping with seasonality, drought and famine in South Asia’. In L. Beneria and R. Feldman (eds.) Unequal Burden, Economic Crises, Persistent Poverty and Women’s Work. Westview Press, Boulder, CO.
Anderson, M. and P. Woodrow (1989) Rising from the Ashes: Development Strategies in Times of Disasters. Westview Press, London.
Birkmann, J. and N. Fernando (2007) ‘Measuring revealed and emergent vulnerabilities of coastal communities to tsunami in Sri Lanka’. Disasters. 32(1). pp. 82–105.
Blaikie, P. and H.C. Brookfield (1987) Land Degradation and Society. Methuen, London.Blaikie, P., T. Cannon, I. Davis and B. Wisner (1994) At Risk: Natural Hazards, People’s Vulnerability,
and Disasters. Routledge, New York, NY.Bosher, L., E. Penning-Rowsell and S. Tapsell (2007) ‘Resources accessibility and vulnerability in
Andhra Pradesh: caste and non-caste influences’. Development and Change. 38(4). pp. 615–640.Briguglio, L. (1995) ‘Small island developing states and their economic vulnerabilities’. World
Development. 23(9). pp. 1615–1632.Burton, I., R. Kates and G. White (1993) Environment as Hazard. Guilford Press, New York, NY.Cardona, O.D. (2004) ‘The need for rethinking the concepts of vulnerability and risk from a holistic
perspective: a necessary review and criticism for effective risk management’. In G. Bankoff, G. Frerks and D. Hilhorst (eds.) Mapping Vulnerability: Disasters, Development and People. Earthscan, London. pp. 37–51.
Chambers, R. (1997) Whose Reality Counts? Putting the First Last. Intermediate Technologies, London.Crowards, T. (1999) An Economic Vulnerability Index for Developing Countries, with Special Reference to the
Caribbean: Alternative Methodologies and Provisional Results. Caribbean Development Bank, Barbados.Crozier, M., J. McClure, J. Vercoe and M. Wilson (2006) ‘The effect of hazard zone information on
judgements about earthquake damage’. Area. 38(2). pp. 143–152.Cutter, S. (1996) ‘Vulnerability to environmental hazards’. Progress in Human Geography. 20(4).
pp. 529–539.Cutter, S., J.K. Mitchell and M.S. Scott (2000) ‘Revealing the vulnerability to people and places: a
case study of Georgetown County, South Carolina’. Annals of the Association of American Geographers. 90(4). pp. 713–737.
Davis, I. (2004) ‘Progress in analysis of social vulnerability and capacity’. In G. Bankoff, G. Frerks and D. Hilhorst (eds.) Mapping Vulnerability: Disasters, Development and People. Earthscan, London. pp. 128–144.
Delica-Willison, Z. and R. Willison (2004) ‘Vulnerability reduction: a task for the vulnerable people themselves’. In G. Bankoff, G. Frerks and D. Hilhorst (eds.) Mapping Vulnerability: Disasters, Development and People. Earthscan, London. pp. 145–158.
Eakin, H. (2006) Weathering Risk in Rural Mexico: Climatic, Economic and Institutional Change. University of Arizona Press, Tucson, AZ.
Enarson, E. and B.H. Morrow (eds.) (1998) The Gendered Terrain of Disaster: Through Women’s Eyes. Greenwood Publications, Westport, CT.
Fussel, H. (2007) ‘Vulnerability: a generally applicable conceptual framework for climate change research’. Global Environmental Change. 17(2). pp. 155–167.
Hewitt, K. (ed.) (1983) Interpretations of Calamity. Allen and Unwin Inc., Winchester, MA. Khan, F. and D. Mustafa (2007) ‘Navigating the contours of Pakistani hazardscapes; disaster experience
vs. policy’. In M. Moench and A. Dixit (eds.) Working with the Winds of Change: Towards Strategies for Responding to the Risks Associated with Climate Change and other Hazards. Institute for Social and Environmental Transition–Nepal and ProVention, Kathmandu. pp. 193–234.
Daanish Mustafa et al.
Luers, A.L. (2005) ‘The surface of vulnerability: an analytical framework for examining environ-mental change’. Global Environmental Change. 15(3). pp. 214–223.
Luers, A.L., D.B. Lobell, L.S. Sklar, C.L. Addams and P.A. Matson (2003) ‘A method for quantifying vulnerability, applied to the agricultural system of the Yaqui valley, Mexico’. Global Environmental Change. 13(4). pp. 255–267.
McCarthy, J.J., O.F. Canziani, N.A. Leary, D.J. Dokken and K.S. White (2001) Climate Change 2001: Impacts, Adaptation, and Vulnerability. Contribution of Working Group II to the Third Assessment Report of the Intergovernmental Panel on Climate Change. Cambridge University Press, Cambridge.
Moench, M. and A. Dixit (eds.) (2004) Adaptive Capacity and Livelihood Resilience: Adaptive Strategies for Responding to Floods and Droughts in South Asia. Institute for Social and Environmental Transition, Boulder, CO.
Moench, M. and A. Dixit (eds.) (2007) Working With the Winds of Change: Towards Strategies for Respond-ing to the Risks Associated with Climate Change and other Hazards. Institute for Social and Environmental Transition–Nepal and ProVention, Kathmandu.
Mustafa, D. (1998) ‘Structural causes of vulnerability to flood hazard in Pakistan’. Economic Geography. 74(3). pp. 289–305.
Mustafa, D. (2002) ‘To each according to his power? Access to irrigation water and vulnerability to flood hazard in Pakistan’. Environment and Planning D: Society and Space. 20(6). pp. 737–752.
Mustafa, D. (2004) ‘Reinforcing vulnerability? The disaster relief, recovery and response to the 2001 flood Rawalpindi/Islamabad, Pakistan’. Environmental Hazards: Human and Policy Dimensions. 5(3/4). pp. 71–82.
Mustafa, D. (2005) ‘The production of an urban hazardscape in Pakistan: modernity, vulnerability and the range of choice’. The Annals of the Association of American Geographers. 95(3). pp. 566–586.
Mustafa, D., S. Ahmed, E. Saroch and Risk to Resilience Study Team (2008) ‘Pinning down vul-nerability: from narrative to numbers’. In M. Moench, M. Caspari and A. Pokhrel (eds.) From Risk to Resilience. Working Paper No. 2. Institute for Social and Environmental Transition–Nepal and ProVention, Kathmandu. pp. 28.
Pelling, M. (1998) ‘Participation, social capital and vulnerability to urban flooding in Guyana’. Journal of International Development. 10(4). pp. 469–486.
Pelling, M. (1999) ‘The political ecology of flood hazard in urban Guyana’. Geoforum. 30(3). pp. 249–261.
Pelling, M. (2003) ‘Toward a political ecology of urban environmental risk: the case of Guyana’. In K.S. Zimmerer and T.J. Bassett (eds.) Political Ecology: An Integrative Approach to Geography and Environment-Development Studies. Guilford Press, New York, NY. pp. 73–93.
Platt, R. (1986) ‘Floods and man: a geographer’s agenda’. In R. Kates and I. Burton (eds.) Geography Resources and Environment: Themes from the Work of Gilbert F. White, Vol. 2. University of Chicago Press, Chicago, IL. pp. 28–68.
Rajeev, P.I. (2009) ‘Rough cut’. Indian Express (New Delhi). 15 February. http://www.indianexpress.com/news/rough-cut/423565/ (accessed on 22 February 2010).
Schipper, L. and M. Pelling (2006) ‘Disaster risk, climate change and international development: scope and challenges for integration’. Disasters. 30(1). pp. 19–38.
Sen, A. (1990) ‘Gender and cooperative conflicts’. In I. Tinker (ed.) Persistent Inequalities: Women and World Development. Oxford University Press, Oxford. pp. 123–149.
Silverman, D. (ed.) (2004) Qualitative Research: Theory, Method and Practice. Sage Publications, Thousand Oaks, CA.
Simpson, E. and S. Corbridge (2006) ‘Geography of things that may become memories: the 2001 earthquake in Kachchh-Gujarat and the politics of rehabilitation in the prememorial era’. Annals of the Association of American Geographers. 96(3). pp. 566–585.
Swift, J. (1989) ‘Why are rural people vulnerable to famine?’ IDS Bulletin. 20(2). pp. 8–15.
Pinning down vulnerability
Tobin, G.A. and L.M. Whiteford (2002) ‘Community resilience and volcano hazard: the eruption of Tungurahua and evacuation of the faldas in Ecuador’. Disasters. 26(1). pp. 28–48.
Turvey, R. (2007) ‘Vulnerability assessment of developing countries: the case of small-island devel-oping states’. Development Policy Review. 25(2). pp. 243–264.
Twigg, J. (2007) Characteristics of a Disaster-Resilient Community: A Guidance Note. Disaster Risk Reduc-tion Interagency Coordination Group, Department for International Development, London.
UNDP (United Nations Development Programme) (2004) Reducing Disaster Risk: A Challenge for Development. UNDP Bureau for Crisis Prevention and Recovery, New York, NY.
Vincent, K. (2004) Creating an Index of Social Vulnerability to Climate Change in Africa. Working Paper No. 56. Tyndall Centre for Climate Research, University of East Anglia, Norwich.
Watts, M.J. and H.J. Bohle (1993) ‘The space of vulnerability: the causal structure of hunger’. Progress in Human Geography. 17(1). pp. 43–68.
Wescoat, J. (1992) ‘Common themes in the work of Gilbert White and John Dewey: a pragmatic appraisal’. Annals of the Association of American Geographers. 82(4). pp. 587–607.
White, G.F. (1945) Human Adjustment to Floods. Research Paper No. 29. Department of Geography, University of Chicago, Chicago, IL.
White, G.F. (1973) ‘Natural hazards research’. In R.J. Chorley (ed.) Directions in Geography. Methuen, London. pp. 193–216.
Wisner, B. (1993) ‘Disaster vulnerability: scale, power, and daily life’. Geojournal. 30(2). pp. 127–140.Wisner, B., P. Blaikie, T. Cannon, and I. Davis (eds.) (2004) At Risk: Natural Hazards, People’s Vul-
nerability and Disaster. Routledge, London.

![.Noah's Flood WTJ2004[1]](https://static.fdokumen.com/doc/165x107/631c39e73e8acd997705cf6b/noahs-flood-wtj20041.jpg)