Urban Adaptation: IPCC Climate Change 2014: Impacts, Adaptation, and Vulnerability

Structural Adaptation and Heterogeneity of Normal andTumor Microvascular NetworksAxel R. Pries1,2., Annemiek J. M. Cornelissen1,3., Anoek A. Sloot4, Marlene Hinkeldey1, Matthew R.
Dreher5, Michael Hopfner1, Mark W. Dewhirst6, Timothy W. Secomb7*
1 Department of Physiology, Charite, Berlin, Germany, 2 Deutsches Herzzentrum Berlin, Berlin, Germany, 3 Laboratoire Matiere et Systemes Complexes (MSC), UMR 7057
CNRS & Universite Paris-Diderot, Paris, France, 4 Department of Man Machine Systems, Faculty of Mechanical Engineering and Marine Technology, Delft University of
Technology, Delft, The Netherlands, 5 National Institutes of Health, Clinical Center, Radiology and Imaging Sciences, Bethesda, Maryland, United States of America,
6 Department of Radiation Oncology, Duke University Medical Center, Durham, North Carolina, United States of America, 7 Department of Physiology, University of
Arizona, Tucson, Arizona, United States of America
Abstract
Relative to normal tissues, tumor microcirculation exhibits high structural and functional heterogeneity leading to hypoxicregions and impairing treatment efficacy. Here, computational simulations of blood vessel structural adaptation are used toexplore the hypothesis that abnormal adaptive responses to local hemodynamic and metabolic stimuli contribute toaberrant morphological and hemodynamic characteristics of tumor microcirculation. Topology, vascular diameter, length,and red blood cell velocity of normal mesenteric and tumor vascular networks were recorded by intravital microscopy.Computational models were used to estimate hemodynamics and oxygen distribution and to simulate vascular diameteradaptation in response to hemodynamic, metabolic and conducted stimuli. The assumed sensitivity to hemodynamic andconducted signals, the vascular growth tendency, and the random variability of vascular responses were altered to simulate‘normal’ and ‘tumor’ adaptation modes. The heterogeneous properties of vascular networks were characterized by diametermismatch at vascular branch points (d3
var) and deficit of oxygen delivery relative to demand (O2def). In the tumor, d3var and
O2def were higher (0.404 and 0.182) than in normal networks (0.278 and 0.099). Simulated remodeling of the tumor networkwith ‘normal’ parameters gave low values (0.288 and 0.099). Conversely, normal networks attained tumor-like characteristics(0.41 and 0.179) upon adaptation with ‘tumor’ parameters, including low conducted sensitivity, increased growth tendency,and elevated random biological variability. It is concluded that the deviant properties of tumor microcirculation may resultlargely from defective structural adaptation, including strongly reduced responses to conducted stimuli.
Citation: Pries AR, Cornelissen AJM, Sloot AA, Hinkeldey M, Dreher MR, et al. (2009) Structural Adaptation and Heterogeneity of Normal and Tumor MicrovascularNetworks. PLoS Comput Biol 5(5): e1000394. doi:10.1371/journal.pcbi.1000394
Editor: Jason A. Papin, University of Virginia, United States of America
Received December 15, 2008; Accepted April 27, 2009; Published May 29, 2009
Copyright: � 2009 Pries et al. This is an open-access article distributed under the terms of the Creative Commons Attribution License, which permitsunrestricted use, distribution, and reproduction in any medium, provided the original author and source are credited.
Funding: This work was supported by National Institutes of Health grants CA040355 and HL034555, a grant from the European Commission (Marie CurieIndividual Fellowship No MCFI-2001-01930 to AJM Cornelissen) and the Dutch Cancer Society. The funders had no role in study design, data collection andanalysis, decision to publish, or preparation of the manuscript.
Competing Interests: The authors have declared that no competing interests exist.
* E-mail: [email protected]
. These authors contributed equally to this work.
Introduction
Solid tumors require an internal vasculature in order to grow
beyond a few mm in size and to metastasize [1]. Tumor vascular
networks are known to be fundamentally different from normal
vasculature (e.g. [2–4]). Vessels are typically immature, tortuous,
dilated, and hyperpermeable and network structures are spatially
and temporally heterogeneous, resulting in regions of hypoxia
within the tumors [5,6]. The characteristics of tumor microvas-
culature are important not only for the growth and development of
tumors, but also for the efficacy of chemo- and radiotherapeutic
treatment [4]. Delivery of cytotoxic agents via the blood
circulation is impaired due to the heterogeneous blood flow
distribution [2,7]. Many treatment modalities are based on the
higher susceptibility of the fast dividing tumor cells, whereas cells
in hypoxic regions exhibit a low tendency to undergo mitosis, and
may not be exposed to effective concentrations of chemothera-
peutic substances. Susceptibility to radiation treatment is dimin-
ished in hypoxic regions, because lack of oxygen reduces the
production of toxic free radicals. Furthermore, hypoxic areas may
lead to clonal selection of highly malignant tumor cells that have
lost sensitivity to apoptosis [8] or that have a drug-resistant
phenotype [9].
These observations have stimulated two different concepts of
vessel targeting in tumor treatment, which may be synergistic [10]
or antagonistic [11]. On one hand, anti-angiogenic substances
could be used to destroy tumor vasculature and consequently lead
to the degradation of the majority of tumor cells, which depend on
those vessels for their supply of oxygen and nutrients [12,13].
However, tumor vascular networks often exhibit equal or even
higher fractional intravascular volumes than normal tissues [14],
showing that poor tumor oxygenation is not primarily related to a
limited amount of vessels within the tumor, but rather to deficient
structure of the vascular networks. Therefore, it was proposed that
‘normalization’ of tumor microvasculature could improve the
delivery of oxygen and drugs to tumor cells and thus increase the
susceptibility to cytotoxic anti-tumor agents or radiation in a
PLoS Computational Biology | www.ploscompbiol.org 1 May 2009 | Volume 5 | Issue 5 | e1000394

combination therapy approach [2,15,16]. It was suggested that
‘normalization’ is a property of some effective anti-angiogenic
agents, such as the VEGF-neutralizing monoclonal antibody
bevacizumab and VEGF- receptor-specific tyrosine kinase inhib-
itors (sunitinib, vatalanib) [17,18]. Such clinically established
substances may restore the impaired balance of angiogenic
stimulators and inhibitors in pathological angiogenesis, thereby
leading to a normalized tumor microvasculature. However, the
mechanisms involved in these processes remain to be elucidated as
a basis for the development of additional approaches for
normalizing tumor microvessel networks. Therefore, we here used
computational simulations based on structural information
obtained by intravital microscopy to identify factors that may
account for the deficient structure of tumor microvascular
networks.
The conceptual basis of the present study is illustrated in
Figure 1. In all tissues, microvascular networks exhibit a degree of
irregularity with respect to topological arrangement and lengths of
vessel segments, as a consequence of the stochastic nature of
angiogenesis and of the geometric constraints for space-filling
vascular trees. The structural heterogeneity in turn leads to
heterogeneous distributions of functional parameters, including
local perfusion and oxygen partial pressure (PO2). In normal
tissues, structural adaptation of vessel diameters in response to
local hemodynamic and metabolic stimuli reduces the heteroge-
neity to a low level, compatible with tissue functional require-
ments. The hypothesis of the present study is that impaired
structural adaptation is a major cause for the high structural and
functional heterogeneity observed in tumor networks.
Results
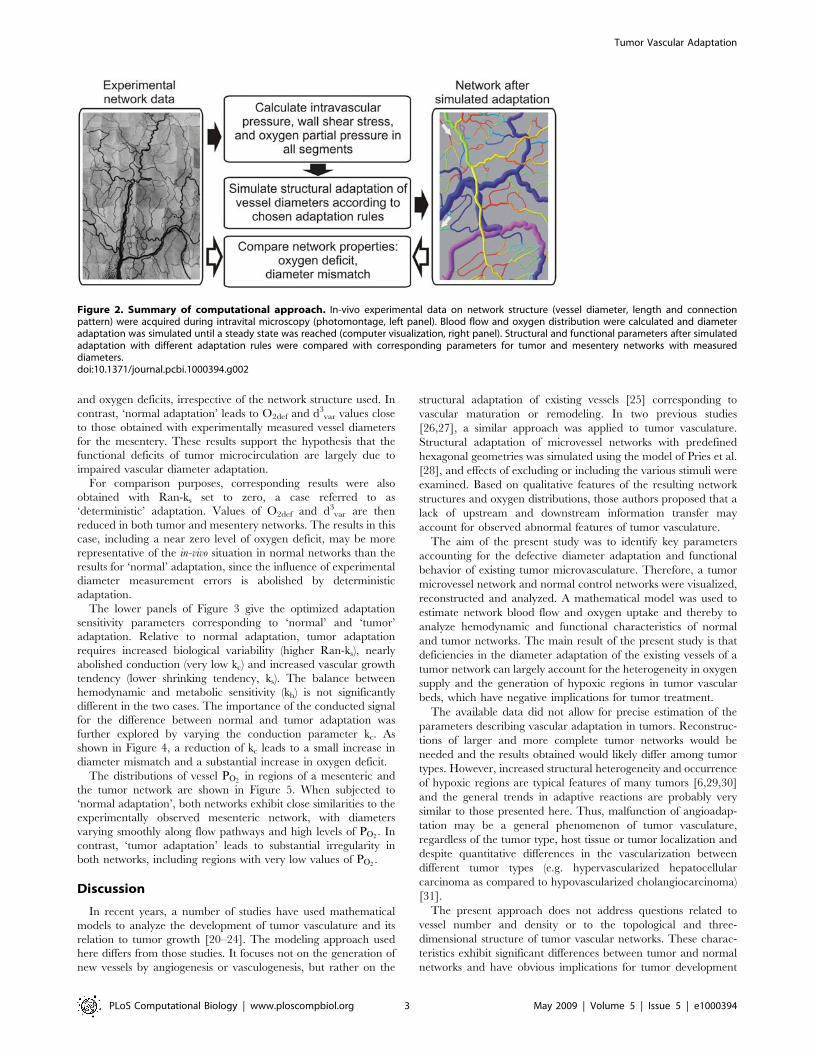
The computational approach is summarized in Figure 2. Data
describing the angioarchitecture of a tumor microvascular network
and three control (mesentery) networks were used to calculate
blood flow, wall shear stress, pressure and PO2for all vessel
segments. These parameters were considered as stimuli in the
simulation of structural adaptation of vessel diameters, which was
carried out using previously established rules for normal vascular
networks [19] and with rules modified to achieve tumor-like
network characteristics. Here, the term ‘rules’ refers to quantitative
relationships between the stimuli acting on a segment vessel and
the resulting structural diameter changes. Network properties
resulting from simulated diameter adaptation were compared with
properties corresponding to vessel diameters as measured
experimentally.
Two parameters were used to characterize network properties
(see Methods). Structural irregularity was described by the diameter
mismatch at bifurcations, d3var, and functional state was described
by the oxygen deficit, O2def. The upper panel of Figure 3 shows
values of O2def and d3var describing functional status and structural
heterogeneity of microvessel networks, calculated from measured
diameters and from diameters predicted by simulated structural
adaptation. When measured diameters are used (filled triangles),
both O2def and d3var are higher for tumor than for normal
networks. This reflects the known irregularity and functional
deficiency of tumor microvasculature.
The simulated adaptation is controlled by several sensitivity
parameters: kh, the hemodynamic sensitivity relative to the
metabolic sensitivity; kp the sensitivity to pressure; kc the
conduction sensitivity; ks a basal vascular tendency to reduce
vessel diameter in absence of growth stimuli (‘shrinking tendency’);
Ran-ks, a parameter describing the randomness of the biological
reaction. These parameters were varied to simulate the effects of
different adaptation modes. For the results obtained by simulated
structural adaptation (open symbols), the values of kh, kc, ks, Ran-
ks were optimized to match normal or tumor characteristics (see
Methods). These results demonstrate that the levels of O2def and
d3var are dependent on the assumed adaptation mode. Use of the
‘tumor adaptation’ mode leads to high structural heterogeneity
Figure 1. Conceptual basis of the study. Blunt headed arrowsdenote negative feedback loop, in which structural adaptation reducesheterogeneity in flow and oxygenation that is generated by heteroge-neous vessel topology and lengths. The hypothesis is that this feedbackloop is weaker (dashed curve) in tumors than in normal tissues. See textfor further explanation.doi:10.1371/journal.pcbi.1000394.g001
Author Summary
Blood vessels of tumors have abnormal structures, beingirregular and tortuous. Oxygen supply to tumors isheterogeneous, with regions of low oxygen that resistradiation treatment and some types of chemotherapy.Blood vessels undergo continual structural change (adap-tation) in response to blood flow and metabolite levels.Our hypothesis is that abnormal adaptation of tumormicrovessels causes their heterogeneous structure andimpaired function. We used computational models toestimate blood flow and oxygen delivery and to simulatediameter adaptation in networks of microvessels, usingnetwork structures derived from microscopic observationsof living normal and tumor tissues. The simulation ofadaptation depends on several parameters that describevessel sensitivity to fluid shear stress, to blood pressure, tooxygen levels, and to signals propagated along vesselwalls (conducted response). We found that structuraladaptation of a tumor network using parameters derivedfrom normal tissues could ‘normalize’ the network, givingit properties similar to a normal tissue. Conversely,adaptation of normal networks using parameters derivedfrom the tumor network, including reduced conductedresponse, gave tumor-like properties. We conclude thatthe deviant properties of tumor microcirculation mayresult largely from defective structural adaptation, includ-ing reduced conducted responses.
Tumor Vascular Adaptation
PLoS Computational Biology | www.ploscompbiol.org 2 May 2009 | Volume 5 | Issue 5 | e1000394
and oxygen deficits, irrespective of the network structure used. In
contrast, ‘normal adaptation’ leads to O2def and d3var values close
to those obtained with experimentally measured vessel diameters
for the mesentery. These results support the hypothesis that the
functional deficits of tumor microcirculation are largely due to
impaired vascular diameter adaptation.
For comparison purposes, corresponding results were also
obtained with Ran-ks set to zero, a case referred to as
‘deterministic’ adaptation. Values of O2def and d3var are then
reduced in both tumor and mesentery networks. The results in this
case, including a near zero level of oxygen deficit, may be more
representative of the in-vivo situation in normal networks than the
results for ‘normal’ adaptation, since the influence of experimental
diameter measurement errors is abolished by deterministic
adaptation.
The lower panels of Figure 3 give the optimized adaptation
sensitivity parameters corresponding to ‘normal’ and ‘tumor’
adaptation. Relative to normal adaptation, tumor adaptation
requires increased biological variability (higher Ran-ks), nearly
abolished conduction (very low kc) and increased vascular growth
tendency (lower shrinking tendency, ks). The balance between
hemodynamic and metabolic sensitivity (kh) is not significantly
different in the two cases. The importance of the conducted signal
for the difference between normal and tumor adaptation was
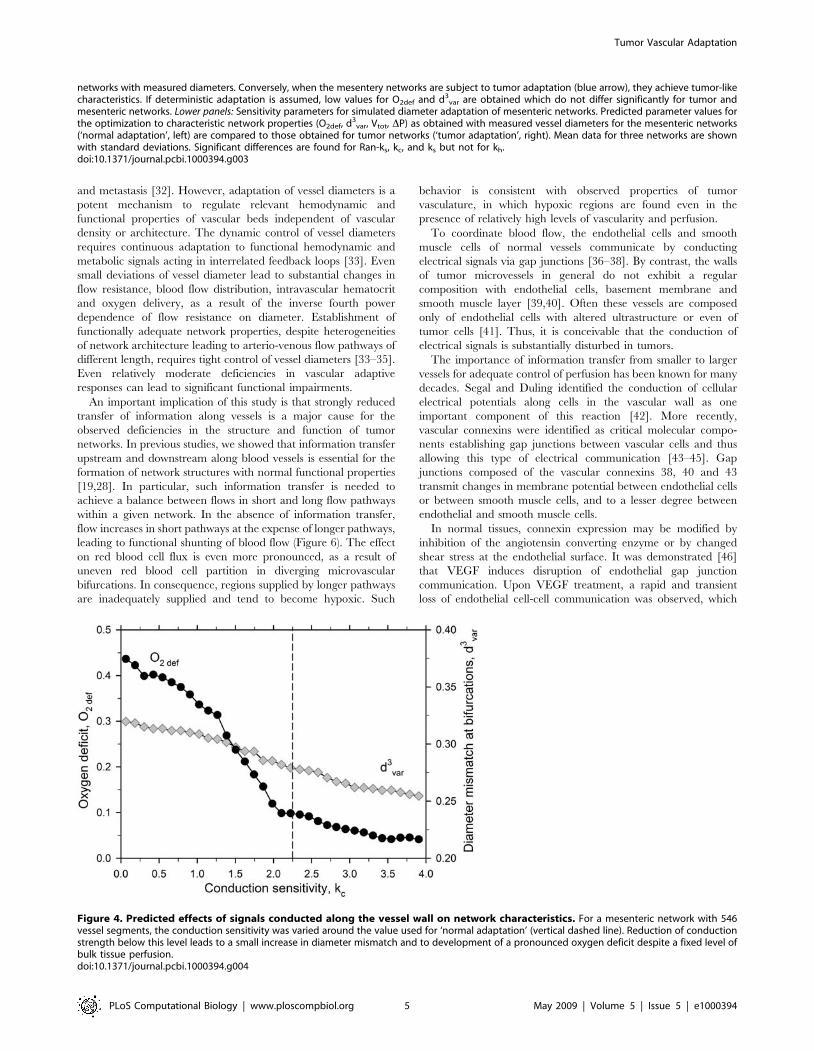
further explored by varying the conduction parameter kc. As
shown in Figure 4, a reduction of kc leads to a small increase in
diameter mismatch and a substantial increase in oxygen deficit.
The distributions of vessel PO2in regions of a mesenteric and
the tumor network are shown in Figure 5. When subjected to
‘normal adaptation’, both networks exhibit close similarities to the
experimentally observed mesenteric network, with diameters
varying smoothly along flow pathways and high levels of PO2. In
contrast, ‘tumor adaptation’ leads to substantial irregularity in
both networks, including regions with very low values of PO2.
Discussion
In recent years, a number of studies have used mathematical
models to analyze the development of tumor vasculature and its
relation to tumor growth [20–24]. The modeling approach used
here differs from those studies. It focuses not on the generation of
new vessels by angiogenesis or vasculogenesis, but rather on the
structural adaptation of existing vessels [25] corresponding to
vascular maturation or remodeling. In two previous studies
[26,27], a similar approach was applied to tumor vasculature.
Structural adaptation of microvessel networks with predefined
hexagonal geometries was simulated using the model of Pries et al.
[28], and effects of excluding or including the various stimuli were
examined. Based on qualitative features of the resulting network
structures and oxygen distributions, those authors proposed that a
lack of upstream and downstream information transfer may
account for observed abnormal features of tumor vasculature.
The aim of the present study was to identify key parameters
accounting for the defective diameter adaptation and functional
behavior of existing tumor microvasculature. Therefore, a tumor
microvessel network and normal control networks were visualized,
reconstructed and analyzed. A mathematical model was used to
estimate network blood flow and oxygen uptake and thereby to
analyze hemodynamic and functional characteristics of normal
and tumor networks. The main result of the present study is that
deficiencies in the diameter adaptation of the existing vessels of a
tumor network can largely account for the heterogeneity in oxygen
supply and the generation of hypoxic regions in tumor vascular
beds, which have negative implications for tumor treatment.
The available data did not allow for precise estimation of the
parameters describing vascular adaptation in tumors. Reconstruc-
tions of larger and more complete tumor networks would be
needed and the results obtained would likely differ among tumor
types. However, increased structural heterogeneity and occurrence
of hypoxic regions are typical features of many tumors [6,29,30]
and the general trends in adaptive reactions are probably very
similar to those presented here. Thus, malfunction of angioadap-
tation may be a general phenomenon of tumor vasculature,
regardless of the tumor type, host tissue or tumor localization and
despite quantitative differences in the vascularization between
different tumor types (e.g. hypervascularized hepatocellular
carcinoma as compared to hypovascularized cholangiocarcinoma)
[31].
The present approach does not address questions related to
vessel number and density or to the topological and three-
dimensional structure of tumor vascular networks. These charac-
teristics exhibit significant differences between tumor and normal
networks and have obvious implications for tumor development
Figure 2. Summary of computational approach. In-vivo experimental data on network structure (vessel diameter, length and connectionpattern) were acquired during intravital microscopy (photomontage, left panel). Blood flow and oxygen distribution were calculated and diameteradaptation was simulated until a steady state was reached (computer visualization, right panel). Structural and functional parameters after simulatedadaptation with different adaptation rules were compared with corresponding parameters for tumor and mesentery networks with measureddiameters.doi:10.1371/journal.pcbi.1000394.g002
Tumor Vascular Adaptation
PLoS Computational Biology | www.ploscompbiol.org 3 May 2009 | Volume 5 | Issue 5 | e1000394

Figure 3. Network characteristics and sensitivity parameters for simulated normal and tumor modes of vascular adaptation. Toppanel: Dependence of oxygen deficit and diameter mismatch on assumed adaptation mode. Filled triangles: results for experimentally measuredvessel diameters for tumor network (red) and mesenteric networks (blue, mean with standard deviation). Open symbols: predicted results usingvessel diameters obtained with normal, tumor or deterministic adaptation models for the tumor network (red squares) and for mesenteric networks(blue circles). When the tumor network is subjected to normal adaptation (red arrow), the resulting characteristics are close to those of mesentery
Tumor Vascular Adaptation
PLoS Computational Biology | www.ploscompbiol.org 4 May 2009 | Volume 5 | Issue 5 | e1000394
and metastasis [32]. However, adaptation of vessel diameters is a
potent mechanism to regulate relevant hemodynamic and
functional properties of vascular beds independent of vascular
density or architecture. The dynamic control of vessel diameters
requires continuous adaptation to functional hemodynamic and
metabolic signals acting in interrelated feedback loops [33]. Even
small deviations of vessel diameter lead to substantial changes in
flow resistance, blood flow distribution, intravascular hematocrit
and oxygen delivery, as a result of the inverse fourth power
dependence of flow resistance on diameter. Establishment of
functionally adequate network properties, despite heterogeneities
of network architecture leading to arterio-venous flow pathways of
different length, requires tight control of vessel diameters [33–35].
Even relatively moderate deficiencies in vascular adaptive
responses can lead to significant functional impairments.
An important implication of this study is that strongly reduced
transfer of information along vessels is a major cause for the
observed deficiencies in the structure and function of tumor
networks. In previous studies, we showed that information transfer
upstream and downstream along blood vessels is essential for the
formation of network structures with normal functional properties
[19,28]. In particular, such information transfer is needed to
achieve a balance between flows in short and long flow pathways
within a given network. In the absence of information transfer,
flow increases in short pathways at the expense of longer pathways,
leading to functional shunting of blood flow (Figure 6). The effect
on red blood cell flux is even more pronounced, as a result of
uneven red blood cell partition in diverging microvascular
bifurcations. In consequence, regions supplied by longer pathways
are inadequately supplied and tend to become hypoxic. Such
behavior is consistent with observed properties of tumor
vasculature, in which hypoxic regions are found even in the
presence of relatively high levels of vascularity and perfusion.
To coordinate blood flow, the endothelial cells and smooth
muscle cells of normal vessels communicate by conducting
electrical signals via gap junctions [36–38]. By contrast, the walls
of tumor microvessels in general do not exhibit a regular
composition with endothelial cells, basement membrane and
smooth muscle layer [39,40]. Often these vessels are composed
only of endothelial cells with altered ultrastructure or even of
tumor cells [41]. Thus, it is conceivable that the conduction of
electrical signals is substantially disturbed in tumors.
The importance of information transfer from smaller to larger
vessels for adequate control of perfusion has been known for many
decades. Segal and Duling identified the conduction of cellular
electrical potentials along cells in the vascular wall as one
important component of this reaction [42]. More recently,
vascular connexins were identified as critical molecular compo-
nents establishing gap junctions between vascular cells and thus
allowing this type of electrical communication [43–45]. Gap
junctions composed of the vascular connexins 38, 40 and 43
transmit changes in membrane potential between endothelial cells
or between smooth muscle cells, and to a lesser degree between
endothelial and smooth muscle cells.
In normal tissues, connexin expression may be modified by
inhibition of the angiotensin converting enzyme or by changed
shear stress at the endothelial surface. It was demonstrated [46]
that VEGF induces disruption of endothelial gap junction
communication. Upon VEGF treatment, a rapid and transient
loss of endothelial cell-cell communication was observed, which
Figure 4. Predicted effects of signals conducted along the vessel wall on network characteristics. For a mesenteric network with 546vessel segments, the conduction sensitivity was varied around the value used for ‘normal adaptation’ (vertical dashed line). Reduction of conductionstrength below this level leads to a small increase in diameter mismatch and to development of a pronounced oxygen deficit despite a fixed level ofbulk tissue perfusion.doi:10.1371/journal.pcbi.1000394.g004
networks with measured diameters. Conversely, when the mesentery networks are subject to tumor adaptation (blue arrow), they achieve tumor-likecharacteristics. If deterministic adaptation is assumed, low values for O2def and d3
var are obtained which do not differ significantly for tumor andmesenteric networks. Lower panels: Sensitivity parameters for simulated diameter adaptation of mesenteric networks. Predicted parameter values forthe optimization to characteristic network properties (O2def, d3
var, Vtot, DP) as obtained with measured vessel diameters for the mesenteric networks(‘normal adaptation’, left) are compared to those obtained for tumor networks (‘tumor adaptation’, right). Mean data for three networks are shownwith standard deviations. Significant differences are found for Ran-ks, kc, and ks but not for kh.doi:10.1371/journal.pcbi.1000394.g003
Tumor Vascular Adaptation
PLoS Computational Biology | www.ploscompbiol.org 5 May 2009 | Volume 5 | Issue 5 | e1000394

involved VEGFR-2-driven activation of the ERK-family of MAP
kinases to downregulate the phosphorylation of the gap junction
forming connexin CX43. The development of chaotic tumor
microvasculature during VEGF-induced angiogenic processes is
thus likely to be based on a dysregulated communication via gap
junctions of vessel forming endothelial cells. An interesting
interpretation of the mechanism underlying normalization therapy
with anti-VEGF treatment may be the restoration of the defective
endothelial gap junction communication of existing vessels by
inhibition of the tumor VEGF/VEGFR system. Future studies,
focusing on expression and function of vascular connexins in
tumors, will be needed to provide in vivo evidence for this
hypothetical mechanism.
Methods
Experimental observations and reconstruction of vascularnetworks
All animal experiments were performed according to the
applicable rules and regulations after obtaining approval by the
University and State authorities for animal welfare. For dorsal skin
fold window chamber experiments, nude mice (Balb/c nu/nu) were
anesthetized with a cocktail of Ketamine and Xylazine (10:1 w/w,
100 mg/kg Ketamine, IP) and prepared for window chamber
implantation using common surgical techniques. A 1-cm diameter
circular incision was made in a dorsal skin fold, over which a
titanium chamber was surgically implanted. A single cell
Figure 5. Computer visualizations of a mesenteric network and the tumor network color coded for PO2. Top row: results obtained with
measured vessel diameters. Middle and bottom rows: simulated ‘normal adaptation’ and ‘tumor adaptation’. The tumor network with measureddiameters and either network subjected to ‘tumor adaptation’ (right column) exhibit high structural heterogeneity and uneven flow distribution incomparison to the mesentery network and either network subjected to ‘normal adaptation’ (left column). For the adapted networks, results ofindividual randomized runs are shown. Values of oxygen deficit (O2def) and diameter mismatch (d3
var) were similar to the mean values reported inFigure 3. For the sake of a better representation of individual vessel segments, only parts of the simulated networks are shown. The mesenterynetwork comprised a total of 546 vessels supplying an area of about 467 mm, whereas the tumor vascular network comprised a total of 290 vesselsin an area of about 160.8 mm.doi:10.1371/journal.pcbi.1000394.g005
Tumor Vascular Adaptation
PLoS Computational Biology | www.ploscompbiol.org 6 May 2009 | Volume 5 | Issue 5 | e1000394

suspension of human squamous cell carcinoma (FaDu) cells was
injected into the opposing fold of skin (16104 cells). A circular glass
cover slip was placed over the incision through which the tumor
and its associated vasculature were later visualized. After 10 days,
2 MDa fluorescein dextran (Invitrogen, Carlsbad CA) was injected
intravenously and confocal imaging (LSM 510, Zeiss, Thornwood
NY) of the vasculature immediately began. The resulting images
were analyzed off-line using an application developed as an
extension to the commercially available visualization and geom-
etry reconstruction system AmiraDev [47]. For measurements of
red blood cell velocity, DiI fluorescently labeled red blood cells
were injected intravenously and the vascular network was epi-
fluorescently imaged with a monochromatic SIT camera (Hama-
matsu C2400-08) and recorded in S-VHS format (Mitsubishi BV-
1000).
Mesenteric vascular networks of three male wistar rats prepared
for intravital microscopy were observed and analyzed as described
previously [48]. The small bowel was exteriorized, and fat-free
portions of the mesentery selected for investigation. Papaverine
(1024 M) was continuously applied to suppress active vessel tone.
Microvascular networks were scanned and video-recorded. From
the video recordings, diameter and length were measured in all
segments between branch points using a digital image analysis
system. The topological and spatial arrangement of segments was
determined. Hematocrit values and centerline velocities for vessels
entering and leaving the network were measured with a digital
image analysis system [49]. Centerline velocity was converted into
mean blood velocity using a previously derived empirical
relationship [50].
Calculation of network hemodynamics and oxygendistribution
For a microvascular network with a given structure, i.e. a given
arrangement of vessel segments with given lengths and diameters,
the procedure to calculate hemodynamic parameters (blood flow,
wall shear stress, blood pressure) and PO2for all vessel segments
has been described earlier [33,51]. Information on connectivity,
diameter and length of the vessels and boundary conditions of
tumor and normal vascular networks was used as input to the
hemodynamic model. For the mesentery networks, the boundary
conditions comprise volume flow rates derived from velocity
measurements and hematocrit for all segments feeding the network
and volume flow rates for the vessels leaving the network, with the
exception of the main venular draining vessel which was assigned a
pressure of 13.8 mmHg to provide a fixed pressure reference. For
the tumor network, the red blood cells were more difficult to track
because of the opacity of the tumor tissue, and centerline velocity
could not be determined for all boundary segments. For the
remaining segments, blood cell velocity classes (slow, medium, and
fast) were assigned from visual inspection of the video recordings.
Estimates for the medium velocities were assigned using linear
least-squares regression between velocity and diameter established
for the vessel segments in which velocities could be measured.
Slow and fast velocities were assigned according to the lower and
higher boundaries of the 80% prediction interval of these
measured data.
For given values of diameter, length and apparent blood
viscosity in each vessel segment, volume flow rates and nodal
(junction of segments) pressures were calculated by iteratively
solving a system of linear equations [51]. Using the resulting
volume flow rates, the hematocrit distribution was updated using a
parametric description of red cell distribution at divergent
bifurcations (phase separation effect) based on experimental
findings in vivo [33,52]. The resulting hematocrit values together
with vessel diameters were then used to estimate local effective
blood viscosity values (Fahraeus-Lindqvist effect) according to a
parametric description of blood rheology in microvessels [53].
Estimations of flow distribution and local hematocrit and viscosity
were iterated until convergence.
In the simplified model for oxygen transport used, oxygen is
assumed to diffuse out of each vessel segment at a fixed rate per
Figure 6. Schematic illustration showing hypothesized effect ofinformation transfer on flow and oxygenation in networks. Top:in normal tissue, information transfer ensures that long pathways (L)receive adequate flow and short pathways (S) are not overperfused.Bottom: in tumor tissue, loss of conducted responses causes functionalshunting via short pathways (S). Long pathways (L) are underperfusedand hypoxic. Red and blue colors denote high and low oxygen levelsrespectively.doi:10.1371/journal.pcbi.1000394.g006
Tumor Vascular Adaptation
PLoS Computational Biology | www.ploscompbiol.org 7 May 2009 | Volume 5 | Issue 5 | e1000394
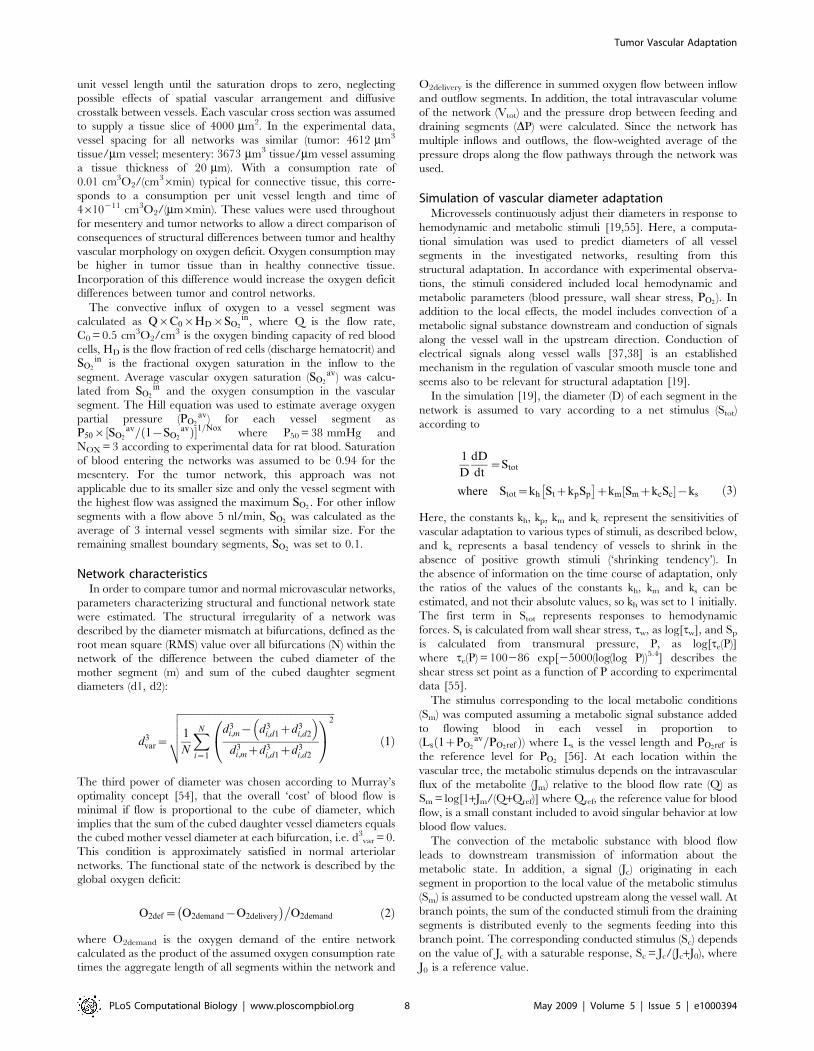
unit vessel length until the saturation drops to zero, neglecting
possible effects of spatial vascular arrangement and diffusive
crosstalk between vessels. Each vascular cross section was assumed
to supply a tissue slice of 4000 mm2. In the experimental data,
vessel spacing for all networks was similar (tumor: 4612 mm3
tissue/mm vessel; mesentery: 3673 mm3 tissue/mm vessel assuming
a tissue thickness of 20 mm). With a consumption rate of
0.01 cm3O2/(cm36min) typical for connective tissue, this corre-
sponds to a consumption per unit vessel length and time of
4610211 cm3O2/(mm6min). These values were used throughout
for mesentery and tumor networks to allow a direct comparison of
consequences of structural differences between tumor and healthy
vascular morphology on oxygen deficit. Oxygen consumption may
be higher in tumor tissue than in healthy connective tissue.
Incorporation of this difference would increase the oxygen deficit
differences between tumor and control networks.
The convective influx of oxygen to a vessel segment was
calculated as Q|C0|HD|SO2
in, where Q is the flow rate,
C0 = 0.5 cm3O2/cm3 is the oxygen binding capacity of red blood
cells, HD is the flow fraction of red cells (discharge hematocrit) and
SO2
in is the fractional oxygen saturation in the inflow to the
segment. Average vascular oxygen saturation (SO2
av) was calcu-
lated from SO2
in and the oxygen consumption in the vascular
segment. The Hill equation was used to estimate average oxygen
partial pressure (PO2
av) for each vessel segment as
P50| SO2
av= 1{SO2
avð Þ½ �1=Noxwhere P50 = 38 mmHg and
NOX = 3 according to experimental data for rat blood. Saturation
of blood entering the networks was assumed to be 0.94 for the
mesentery. For the tumor network, this approach was not
applicable due to its smaller size and only the vessel segment with
the highest flow was assigned the maximum SO2. For other inflow
segments with a flow above 5 nl/min, SO2was calculated as the
average of 3 internal vessel segments with similar size. For the
remaining smallest boundary segments, SO2was set to 0.1.
Network characteristicsIn order to compare tumor and normal microvascular networks,
parameters characterizing structural and functional network state
were estimated. The structural irregularity of a network was
described by the diameter mismatch at bifurcations, defined as the
root mean square (RMS) value over all bifurcations (N) within the
network of the difference between the cubed diameter of the
mother segment (m) and sum of the cubed daughter segment
diameters (d1, d2):
d3var~
ffiffiffiffiffiffiffiffiffiffiffiffiffiffiffiffiffiffiffiffiffiffiffiffiffiffiffiffiffiffiffiffiffiffiffiffiffiffiffiffiffiffiffiffiffiffiffiffiffiffiffiffiffiffiffiffiffiffiffiffiffiffi1
N
XN
i~1
d3i,m{ d3
i,d1zd3i,d2
� �
d3i,mzd3
i,d1zd3i,d2
0@
1A
2vuuut ð1Þ
The third power of diameter was chosen according to Murray’s
optimality concept [54], that the overall ‘cost’ of blood flow is
minimal if flow is proportional to the cube of diameter, which
implies that the sum of the cubed daughter vessel diameters equals
the cubed mother vessel diameter at each bifurcation, i.e. d3var = 0.
This condition is approximately satisfied in normal arteriolar
networks. The functional state of the network is described by the
global oxygen deficit:
O2def~ O2demand{O2delivery
� ��O2demand ð2Þ
where O2demand is the oxygen demand of the entire network
calculated as the product of the assumed oxygen consumption rate
times the aggregate length of all segments within the network and
O2delivery is the difference in summed oxygen flow between inflow
and outflow segments. In addition, the total intravascular volume
of the network (Vtot) and the pressure drop between feeding and
draining segments (DP) were calculated. Since the network has
multiple inflows and outflows, the flow-weighted average of the
pressure drops along the flow pathways through the network was
used.
Simulation of vascular diameter adaptationMicrovessels continuously adjust their diameters in response to
hemodynamic and metabolic stimuli [19,55]. Here, a computa-
tional simulation was used to predict diameters of all vessel
segments in the investigated networks, resulting from this
structural adaptation. In accordance with experimental observa-
tions, the stimuli considered included local hemodynamic and
metabolic parameters (blood pressure, wall shear stress, PO2). In
addition to the local effects, the model includes convection of a
metabolic signal substance downstream and conduction of signals
along the vessel wall in the upstream direction. Conduction of
electrical signals along vessel walls [37,38] is an established
mechanism in the regulation of vascular smooth muscle tone and
seems also to be relevant for structural adaptation [19].
In the simulation [19], the diameter (D) of each segment in the
network is assumed to vary according to a net stimulus (Stot)
according to
1
D
dD
dt~Stot
where Stot~kh StzkpSp
� �zkm SmzkcSc½ �{ks ð3Þ
Here, the constants kh, kp, km and kc represent the sensitivities of
vascular adaptation to various types of stimuli, as described below,
and ks represents a basal tendency of vessels to shrink in the
absence of positive growth stimuli (‘shrinking tendency’). In
the absence of information on the time course of adaptation, only
the ratios of the values of the constants kh, km and ks can be
estimated, and not their absolute values, so kh was set to 1 initially.
The first term in Stot represents responses to hemodynamic
forces. St is calculated from wall shear stress, tw, as log[tw], and Sp
is calculated from transmural pressure, P, as log[te(P)]
where te(P) = 100286 exp[25000(log(log P))5.4] describes the
shear stress set point as a function of P according to experimental
data [55].
The stimulus corresponding to the local metabolic conditions
(Sm) was computed assuming a metabolic signal substance added
to flowing blood in each vessel in proportion to
(Ls 1zPO2
av=PO2refð Þ) where Ls is the vessel length and PO2ref is
the reference level for PO2[56]. At each location within the
vascular tree, the metabolic stimulus depends on the intravascular
flux of the metabolite (Jm) relative to the blood flow rate (Q) as
Sm = log[1+Jm/(Q+Qref)] where Qref, the reference value for blood
flow, is a small constant included to avoid singular behavior at low
blood flow values.
The convection of the metabolic substance with blood flow
leads to downstream transmission of information about the
metabolic state. In addition, a signal (Jc) originating in each
segment in proportion to the local value of the metabolic stimulus
(Sm) is assumed to be conducted upstream along the vessel wall. At
branch points, the sum of the conducted stimuli from the draining
segments is distributed evenly to the segments feeding into this
branch point. The corresponding conducted stimulus (Sc) depends
on the value of Jc with a saturable response, Sc = Jc/(Jc+J0), where
J0 is a reference value.
Tumor Vascular Adaptation
PLoS Computational Biology | www.ploscompbiol.org 8 May 2009 | Volume 5 | Issue 5 | e1000394

In previous studies of the same mesenteric microvascular
networks [56], the parameters J0, PO2ref , Qref, kp, km, kc and ks
were estimated by minimizing the deviations between predicted
and measured segment diameters and velocities using a multidi-
mensional optimization procedure [57], yielding J0 = 27.9,
PO2ref~93:2 mmHg, Qref = 1.98 nl/min, kp = 0.7114, km = 0.6444,
kc = 2.113 and ks = 1.69. In the present study, these values of J0,
PO2ref and Qref were retained. Simulations were carried out here for
both tumor and mesentery networks using the same values of kp, km,
kc and ks and kh = 1. This case was referred to as deterministic
adaptation. In the previous studies [19,56], kh does not appear as a
parameter in Eq. 3.
In considering the structure of tumor and mesenteric networks,
it became evident that more detailed consideration of effects of
experimental errors in diameter measurement and of inherent
variability of biological responses was needed. In particular, a high
degree of biological variability is apparent in tumor networks. To
avoid biasing the results, it was necessary to consider the effects of
such variability also in mesentery networks. First, effects of
experimental errors in diameter measurement were considered.
For a given network, a simulated adaptation with a given set of
adaptation parameters was performed. Then, the characteristic
network properties (O2def, d3var, Vtot, DP) were calculated after
randomly perturbing the obtained vessel diameters obtained from
the simulated adaptation with an assumed mean RMS diameter
measurement error of 1.02 mm according to experimental
estimates for the intravital microscopy setting used [58]. The
same mean RMS error was assumed also for the tumor network.
The network characteristics reported here correspond to the
median of 40 individual diameter randomization runs. The
median was chosen since the observed distributions of the network
characteristics appeared to be significantly skewed.
Next, the inherent variability of biological responses to a given
level of stimulation (‘biological randomness’), was taken into
account by randomizing the shrinking tendency, ks, in the
simulated adaptation by adding for each segment a constant
drawn from a normal distribution with mean 0 and a varying
standard deviation (Ran-ks). This parameter had not been
considered in our previous models. For each parameter setting,
25 simulated adaptations were done with values of ks chosen from
this distribution, with 40 individual diameter randomization runs
for each ks value. The median values from the randomized runs
are reported for global network characteristics. The actual RMS
measurement error for the tumor network may have been larger
than 1.02 mm. In that case, the Ran-ks value estimated for the
tumor (0.23) would be an overestimate.
The sensitivity parameters kh, kp, kc, ks and the randomization
parameter Ran-ks were varied to simulate the effects of different
adaptation modes, holding km constant. Specifically, adaptation
modes were sought that generate network characteristics similar to
those found experimentally for the mesenteric and tumor
microvessel networks. To establish these ‘normal’ and ‘tumor’
adaptation modes, the parameters were optimized to minimize the
difference between the global network characteristics (O2def, d3var,
Vtot, DP) obtained after simulated adaptation and network
characteristics obtained with measured vessel diameters for the
mesenteric and tumor networks.
The choice of parameters to be estimated (kh, kc, ks, Ran-ks) was
made according to the hypothesis that the vascular adaptation
properties in tumors differ from normal terminal vascular beds.
Based on the aberrant morphology and wall structure of tumor
microvessels, it is plausible that such vessels exhibit altered
sensitivity to hemodynamic forces of shear stress and pressure
and a reduced capability to conduct electrical signals. In the
Figure 7. Functional and structural parameters for mesentericnetworks obtained using measured vessel diameters and aftersimulated adaptation. Upper panel: oxygen deficit, O2def. Lowerpanel: variability of cubed diameter at bifurcations, d3
var. Three differentadaptation modes are shown. The ‘deterministic adaptation’ (secondbars from left) uses sensitivity parameters as previously established formesenteric networks [56] without considering diameter measurementerror or biological heterogeneity. Levels for oxygen deficit andstructural heterogeneity are lower than those using measureddiameters. Inclusion of diameter measurement error brings theparameters close to those obtained with experimentally observedvessel diameters (third bars from left). The further addition of abiological variability in vascular sensitivity to local stimuli andoptimization of sensitivity parameters (kh, kc, ks and Ran-ks) allows fora close match of the simulation results to the experimental situation(normal adaptation, right bars). Mean values for three networks areshown with standard deviations.doi:10.1371/journal.pcbi.1000394.g007
Tumor Vascular Adaptation
PLoS Computational Biology | www.ploscompbiol.org 9 May 2009 | Volume 5 | Issue 5 | e1000394

simulated adaptation, these properties are controlled by the
parameters kh and kc, respectively. Also, the overall growth
tendency within a tumor may be higher than in normal tissues due
to a higher expression of vascular growth factors (e.g. VEGF)
which is represented by a reduction of the shrinking tendency, ks.
Inclusion of Ran-ks allowed investigation of the contribution of
intrinsic biological randomness to the differences between
mesenteric and tumor networks. With this choice, the parameter
kh was no longer fixed to 1, as previously assumed. However, as
already noted, the model predictions depend only on the ratios of
kh, km and ks and not on their absolute values. In practice,
estimated values of kh were close to 1, indicating that the overall
balance between hemodynamic and metabolic sensitivities did not
vary significantly between normal and tumor tissues.
Optimization of model parameters for tumor andmesentery networks
Four different settings were used to test whether changed
vascular adaptation may explain structural and functional
differences between normal (N) and tumor (T) microvascular
networks: optimization of the tumor network for experimentally
observed tumor network characteristics (T/T) and for mesenteric
network characteristics (T/N), and optimization of the mesenteric
networks for experimentally observed mesenteric network charac-
teristics (N/N) as well as for tumor network characteristics (N/T).
The target values for the optimizations for O2def, d3var, and DP
were either the respective values for the tumor network (T:
O2def = 0.182, d3var = 0.404, DP = 10.03 mmHg) or the mean
value for the three mesenteric networks (N: O2def = 0.0989,
d3var = 0.278, DP = 49.8 mmHg) obtained with measured vessel
diameters. The target values for Vtot were chosen to reflect the
different size of the networks considered: For T/T and N/N, the
respective values for the individual networks were used (T: 6.59 nl;
N: 43.54 nl, 24.75 nl and 20.78 nl for the three networks
investigated). For T/N, the value obtained for the tumor network
with deterministic adaptation was employed (1.58 nl) and the
relation between this value and the value for the tumor with
measured vessel diameters (6.59/1.58 = 4.17) was used to adjust
target values for Vtot for N/T (190.12 nl, 99.69 nl and 95.5 nl).
The effects of these optimization steps on indices of network
function and structure are illustrated in Figure 7. Deterministic
adaptation leads to values for O2def and d3var substantially lower
than those observed using measured vessel diameters. Inclusion of
the inevitable effects of errors in the experimental determination of
vessel diameters accounts for the majority of the observed
discrepancy. A complete match could be achieved by including
‘biological randomness’ in the biological responses to a given
stimulus, using the parameter Ran-ks and optimizing the
parameters kh, kc and ks. The differences in kh, kc and ks for the
optimized setting for normal adaptation relative to the determin-
istic adaptation were minor (kh = 1.0660.03 versus 1.00;
kc = 2.4660.61 versus 2.11; ks = 1.8560.06 versus 1.69) while
the optimal value for Ran-ks was 0.1060.02.
Acknowledgments
The authors thank Bettina Reglin for the preparation of the network graph
shown in Figure 5 and Steffen Prohaska for his help with the reconstruction
of the tumor vascular network.
Author Contributions
Conceived and designed the experiments: ARP AJMC MWD TWS.
Performed the experiments: ARP AJMC AAS M. Hinkeldey MRD M.
Hopfner. Analyzed the data: ARP AJMC AAS M. Hinkeldey MRD M.
Hopfner MWD TWS. Contributed reagents/materials/analysis tools: ARP
AJMC AAS M. Hinkeldey MRD M. Hopfner MWD TWS. Wrote the
paper: ARP AJMC MWD TWS.
References
1. Folkman J (1971) Tumor angiogenesis: therapeutic implications. N Engl J Med285: 1182–1186.
2. Jain RK (2001) Normalizing tumor vasculature with anti-angiogenic therapy: anew paradigm for combination therapy. Nat Med 7: 987–989.
3. Gazit Y, Berk DA, Leunig M, Baxter LT, Jain RK (1995) Scale-invariantbehavior and vascular network formation in normal and tumor tissue. Phys Rev
Lett 75: 2428–2431.
4. Baish JW, Gazit Y, Berk DA, Nozue M, Baxter LT, Jain RK (1996) Role oftumor vascular architecture in nutrient and drug delivery: an invasion
percolation-based network model. Microvasc Res 51: 327–346.
5. Dewhirst MW, Navia IC, Brizel DM, Willett C, Secomb TW (2007) Multiple
etiologies of tumor hypoxia require multifaceted solutions. Clin Cancer Res 13:375–377.
6. Sorg BS, Moeller BJ, Donovan O, Cao Y, Dewhirst MW (2005) Hyperspectralimaging of hemoglobin saturation in tumor microvasculature and tumor hypoxia
development. J Biomed Opt 10: 44004.
7. Jain RK (2005) Normalization of tumor vasculature: an emerging concept inantiangiogenic therapy. Science 307: 58–62.
8. Graeber TG, Osmanian C, Jacks T, Housman DE, Koch CJ, Lowe SW,Giaccia AJ (1996) Hypoxia-mediated selection of cells with diminished apoptotic
potential in solid tumours. Nature 379: 88–91.
9. Comerford KM, Wallace TJ, Karhausen J, Louis NA, Montalto MC, Colgan SP
(2002) Hypoxia-inducible factor-1-dependent regulation of the multidrugresistance (MDR1) gene. Cancer Res 62: 3387–3394.
10. Teicher BA (1996) A systems approach to cancer therapy. (Antioncogenics+-standard cytotoxics–.mechanism(s) of interaction). Cancer Metastasis Rev 15:
247–272.
11. Ma J, Pulfer S, Li S, Chu J, Reed K, Gallo JM (2001) Pharmacodynamic-mediated reduction of temozolomide tumor concentrations by the angiogenesis
inhibitor TNP-470. Cancer Res 61: 5491–5498.
12. Zhong H, Bowen JP (2006) Antiangiogenesis drug design: multiple pathways
targeting tumor vasculature. Curr Med Chem 13: 849–862.
13. Folkman J (1997) Angiogenesis and angiogenesis inhibition: an overview. EXS
79: 1–8.
14. Goede V, Fleckenstein G, Dietrich M, Osmers RG, Kuhn W, Augustin HG
(1998) Prognostic value of angiogenesis in mammary tumors. Anticancer Res 18:
2199–2202.
15. Hellmann K (2004) Recognition of tumor blood vessel normalization as a newantiangiogenic concept. Nat Med 10: 329–330.
16. Jain RK, Tong RT, Munn LL (2007) Effect of vascular normalization by
antiangiogenic therapy on interstitial hypertension, peritumor edema, andlymphatic metastasis: insights from a mathematical model. Cancer Res 67:
2729–2735.
17. Dickson PV, Hamner JB, Sims TL, Fraga CH, Ng CY, Rajasekeran S,Hagedorn NL, McCarville MB, Stewart CF, Davidoff AM (2007) Bevacizumab-
induced transient remodeling of the vasculature in neuroblastoma xenografts
results in improved delivery and efficacy of systemically administeredchemotherapy. Clin Cancer Res 13: 3942–3950.
18. Hopfner M, Schuppan D, Scherubl H (2008) Growth factor receptors and
related signalling pathways as targets for novel treatment strategies ofhepatocellular cancer. World J Gastroenterol 14: 1–14.
19. Pries AR, Reglin B, Secomb TW (2001) Structural adaptation of microvascular
networks: functional roles of adaptive responses. Am J Physiol Heart Circ Physiol281: H1015–H1025.
20. Chaplain M, Anderson A (2004) Mathematical modelling of tumour-inducedangiogenesis: network growth and structure. Cancer Treat Res 117: 51–75.
21. Pamuk S (2006) A mathematical model for capillary formation and development
in tumor angiogenesis: a review. Chemotherapy 52: 35–37.
22. Stamper IJ, Byrne HM, Owen MR, Maini PK (2007) Modelling the role ofangiogenesis and vasculogenesis in solid tumour growth. Bull Math Biol 69:
2737–2772.
23. Addison-Smith B, McElwain DL, Maini PK (2008) A simple mechanistic modelof sprout spacing in tumour-associated angiogenesis. J Theor Biol 250: 1–15.
24. McDougall SR, Anderson AR, Chaplain MA (2006) Mathematical modelling of
dynamic adaptive tumour-induced angiogenesis: clinical implications andtherapeutic targeting strategies. J Theor Biol 241: 564–589.
25. Zakrzewicz A, Secomb TW, Pries AR (2002) Angioadaptation: keeping the
vascular system in shape. News Physiol Sci 17: 197–201.
26. Alarcon T, Owen MR, Byrne HM, Maini PK (2006) Multiscale modelling of
tumour growth and therapy: the influence of vessel normalisation on
chemotherapy. Computational and Mathematical Methods in Medicine 7:85–119.
27. Maini PK, Alarcon T, Byrne HM, Owen MR, Murphy J (2007) StructuralAdaptation in Normal and Cancerous Vasculature. In: Aletti G, Micheletti A,
Tumor Vascular Adaptation
PLoS Computational Biology | www.ploscompbiol.org 10 May 2009 | Volume 5 | Issue 5 | e1000394

Morale D, Burger M, eds. Math Everywhere, Deterministic and Stochastic
Modelling in Biomedicine, Economics and Industry. Berlin Heidelberg:Springer. pp 165–178.
28. Pries AR, Secomb TW, Gaehtgens P (1998) Structural adaptation and stability
of microvascular networks: theory and simulations. Am J Physiol 275:H349–H360.
29. Welter M, Bartha K, Rieger H (2008) Emergent vascular network inhomoge-neities and resulting blood flow patterns in a growing tumor. J Theor Biol 250:
257–280.
30. Cardenas-Navia LI, Secomb TW, Dewhirst MW (2007) Effects of fluctuatingoxygenation on tirapazamine efficacy: Theoretical predictions. Int J Radiat
Oncol Biol Phys 67: 581–586.31. Kawahara N, Ono M, Taguchi K, Okamoto M, Shimada M, Takenaka K,
Hayashi K, Mosher DF, Sugimachi K, Tsuneyoshi M, Kuwano M (1998)Enhanced expression of thrombospondin-1 and hypovascularity in human
cholangiocarcinoma. Hepatology 28: 1512–1517.
32. Folkman J (2002) Role of angiogenesis in tumor growth and metastasis. SeminOncol 29: 15–18.
33. Pries AR, Reglin B, Secomb TW (2005) Remodeling of blood vessels: responsesof diameter and wall thickness to hemodynamic and metabolic stimuli.
Hypertension 46: 725–731.
34. Pries AR, Secomb TW, Gaehtgens P (1996) Relationship between structural andhemodynamic heterogeneity in microvascular networks. Am J Physiol 270:
H545–H553.35. Cornelissen AJ, Dankelman J, VanBavel E, Spaan JA (2002) Balance between
myogenic, flow-dependent, and metabolic flow control in coronary arterial tree:a model study. Am J Physiol Heart Circ Physiol 282: H2224–H2237.
36. Segal SS (1994) Cell-to-cell communication coordinates blood flow control.
Hypertension 23: 1113–1120.37. Segal SS, Jacobs TL (2001) Role for endothelial cell conduction in ascending
vasodilatation and exercise hyperaemia in hamster skeletal muscle. J Physiol 536:937–946.
38. de Wit C, Roos F, Bolz SS, Pohl U (2003) Lack of vascular connexin 40 is
associated with hypertension and irregular arteriolar vasomotion. PhysiolGenomics 13: 169–177.
39. Carmeliet P, Jain RK (2000) Angiogenesis in cancer and other diseases. Nature407: 249–257.
40. Jain RK, Booth MF (2003) What brings pericytes to tumor vessels? J Clin Invest112: 1134–1136.
41. di Tomaso E, Capen D, Haskell A, Hart J, Logie JJ, Jain RK, McDonald DM,
Jones R, Munn LL (2005) Mosaic tumor vessels: cellular basis and ultrastructureof focal regions lacking endothelial cell markers. Cancer Res 65: 5740–5749.
42. Segal SS, Duling BR (1986) Flow control among microvessels coordinated by
intercellular conduction. Science 234: 868–870.
43. de Wit C, Wolfle SE, Hopfl B (2006) Connexin-dependent communication
within the vascular wall: contribution to the control of arteriolar diameter. Adv
Cardiol 42: 268–283.
44. Figueroa XF, Isakson BE, Duling BR (2004) Connexins: gaps in our knowledge
of vascular function. Physiology (Bethesda) 19: 277–284.
45. Looft-Wilson RC, Payne GW, Segal SS (2004) Connexin expression and
conducted vasodilation along arteriolar endothelium in mouse skeletal muscle.
J Appl Physiol 97: 1152–1158.
46. Suarez S, Ballmer-Hofer K (2001) VEGF transiently disrupts gap junctional
communication in endothelial cells. J Cell Sci 114: 1229–1235.
47. Schmitt S, Evers JF, Duch C, Scholz M, Obermayer K (2004) New methods for
the computer-assisted 3-D reconstruction of neurons from confocal image stacks.
Neuroimage 23: 1283–1298.
48. Pries AR, Ley K, Gaehtgens P (1986) Generalization of the Fahraeus principle
for microvessel networks. Am J Physiol 251: H1324–H1332.
49. Pries AR (1988) A versatile video image analysis system for microcirculatory
research. Int J Microcirc Clin Exp 7: 327–345.
50. Pries AR, Secomb TW, Gaehtgens P (1995) Structure and hemodynamics of
microvascular networks: heterogeneity and correlations. Am J Physiol 269:
H1713–H1722.
51. Pries AR, Secomb TW, Gaehtgens P, Gross JF (1990) Blood flow in
microvascular networks. Experiments and simulation. Circ Res 67: 826–834.
52. Pries AR, Ley K, Claassen M, Gaehtgens P (1989) Red cell distribution at
microvascular bifurcations. Microvasc Res 38: 81–101.
53. Pries AR, Secomb TW, Gessner T, Sperandio MB, Gross JF, Gaehtgens P
(1994) Resistance to blood flow in microvessels in vivo. Circ Res 75: 904–915.
54. Murray CD (1926) The physiological principle of minimum work. I.The
vascular system and the cost of blood volume. Proc Natl Acad Sci USA 12:
207–214.
55. Pries AR, Secomb TW, Gaehtgens P (1995) Design principles of vascular beds.
Circ Res 77: 1017–1023.
56. Pries AR, Reglin B, Secomb TW (2003) Structural response of microcirculatory
networks to changes in demand: information transfer by shear stress. Am J Physiol
Heart Circ Physiol 284: H2204–H2212.
57. Nelder JA, Mead R (1965) A Simplex-Method for Function Minimization.
Computer Journal 7: 308–313.
58. Pries AR, Schonfeld D, Gaehtgens P, Kiani MF, Cokelet GR (1997) Diameter
variability and microvascular flow resistance. Am J Physiol 272: H2716–H2725.
Tumor Vascular Adaptation
PLoS Computational Biology | www.ploscompbiol.org 11 May 2009 | Volume 5 | Issue 5 | e1000394
Copyright © 2022 FDOKUMEN