Streaming State of Mind
30
Streaming State of Mind
-
Upload
khangminh22 -
Category
Documents
-
view
0 -
download
0
Transcript of Streaming State of Mind

Streaming State of Mind

p—2
Forewordby GroupM
new set of expectations, preferences, and viewpoints when it comes to media, brand messaging, and content ownership. For brands to effectively reach today’s streamers, they have to understand this new consumer mindset.
For this study and others going forward, we were able to pair Spotify’s streaming data for its +100 million users alongside GroupM’s LIVE PANEL— a 30-market consumer resource panel built from a Lightspeed database of 5.5M consumers. The LIVE PANEL complements Spotify’s streaming data with an unparalleled source of media insight. For this segmentation study, we recontacted LIVE PANEL respondents to get a sense of consumer attitudes and approaches towards streaming, particularly among younger high-value age groups.
To add some context to the product and LIVE PANEL data, we also surveyed 20,000 people around the globe to uncover the streaming state of mind. Our results reveal rising trends, key metrics, and important truths that can ultimately help make sure your media plan is future-proof, built around high-quality content and made for the consumers of tomorrow.
Rob Norman
Chief Digital Officer GroupM, Chairman GroupM North America
In just over a decade, the concept of streaming has gone from virtually anonymous to completely ubiq-uitous. MP3 players and DVR kits once transformed the way we listened to music and caught up on our favorite shows. Now, it’s our smartphones, smart TVs, and other connected devices that give us instant access to media content. On those devices, services like Netflix, HBO Go, Hulu, Spotify, Pandora, Amazon Prime, and Apple Music have filled the landscape, serving as entry points to the streaming world.
For brands and marketers, these on-demand, on-the-go streaming services have the potential to provide unprecedented levels of consumer under-standing. With streaming data, you don’t just get a basic demographic snapshot, you get to know what songs, artists, and playlists people are listening to—which can help you determine what they’re doing, how they’re feeling, or even what they’re thinking at the exact moment you want to reach them. This level of contextual data could take segmentation to an entirely new level, letting advertisers reach a hyper-specific, targeted audience at key points throughout their day.
Today, streamers make up almost 50% of the online population, according to our survey. So it’s time to see streaming as the norm rather than the niche— as an integral piece of your media plan rather than an afterthought.
Despite its ubiquity, streaming is still remarkably new. And since streaming isn’t a traditional way to consume media, streamers don’t approach it with a traditional mindset. These consumers have an entirely
—ForewordDecember—2016
p—1
Streaming State of Mind
p—4
—Executive Summary
Streaming is now mainstream, and it’s still growing.Nearly one in two internet users are streamers, many of whom are Gen Zers who have grown up with streaming services. It’s time to learn more about this valuable audience, led by young, tech-savvy affluents who continue to shift the media market.
The massive streaming media opportunity is driven by mobile. Over 60% of streaming is now mobile, opening up dozens of new addressable moments for advertisers. In a $1.5B market, mobile music moments like "working" out and "working" alone have opened up to $220M worth of new ad revenue in the seven markets surveyed.
Streamers have a distinct mindset with their own set of behaviors. They’re more likely to engage with all kinds of media (both online and offline) than non-streamers, and 23% more likely to value access over ownership. They’re also more open to content discovery, relying on personalized curation to navigate the vast amount of content there is to stream.
December—2016
p—3
Streaming State of Mind
Executive Summary

p—6
—Table of ContentsDecember—2016
p—5
Streaming State of Mind
Tableof Contents
Section 01 Streaming is now mainstream, and it’s still growing.p—7 Section 02 The massive streaming media opportunity is driven by mobile.p—17 Section 03 Streamers have a distinct mindset with their own set of behaviors.p—27 Section 04 All of these opportunities lead to growth.p—37
Afterwordp—43 Aboutp—45 Appendixp—47

p—7
Streaming State of Mind December—2016
p—8
Key Takeaways
—Section 01
01
Nearly one in two internet users are streamers. On average across the seven markets surveyed, half of internet users reported streaming entertainment content (music/TV/movies) weekly. Half of those streamers have increased their consumption in the last year.
Streamers tend to be younger and earn higher incomes. Music streamers, in particular, skew even younger than video streamers.
As the quickest audience to adopt new digital technology, Leading Edge consumers stream more often and in more places. Their habits are a good indicator of where streaming behavior might be headed in the future.
Gen Z is especially likely to stream, having grown up with streaming services—and they’re teaching their parents how to stream, too.
It's time to get to know this valuable audience led by young, tech-savvy affluents.
Streaming is now mainstream, and it’s still growing.

p—10p—9
Streaming State of Mind December—2016 —Section 01 01
On average across the seven markets covered in this survey, an estimated 31% of internet users say they now stream music on a weekly basis, and 33% say they stream TV and movie content weekly. All in all, this means an impressive 47% are streaming some form of music or video content on a weekly basis.
With this cross-market average approaching a 50% weekly streaming reach, we are now at the point where, in most Western markets, streamers will make up the majority of the online population. In fact, in mature streaming markets, including the United States and Sweden, this symbolic shift to a streaming world has already taken place.
Streamed content consumption is on the rise.
Not only is the reach of streaming steadily growing, but so is the amount of streamed content.
Across all media markets we’ve surveyed, and regardless of the content format, streamers are by far the most likely to report increasing their frequency of consumption over the past year. And with audio streams in the United States and Canada up 59% and 336%1 respectively over the same time period, there’s behavioral data to back up our survey. In fact, estimates indicate that Netflix alone was responsible for a whopping 37% of North American internet traffic volume in 2015, surpassing the total volume of audio and video streamed in the United States just five years ago.2
This means nearly one in two people are now streamers, and on top of that, they’re streaming more forms of media, more frequently than ever before. Streaming has officially hit the mainstream.
Nearly one in two internet users are now streamers.
1—Nielsen, "Mid-Year U.S. Music Report," 2016; Nielsen, "Views From the Top" (article), July 2016 2—Sandvine, Global Internet Phenomena Report, October 2016

p—12
Music and video streaming attract distinctive audiences.
While no two streamers are the same, our study found a couple of particular traits that many of them share. They’re more likely to be in Generation Z, and more likely to fall in top income brackets.
Consistently across markets, streaming shows a clear age gradient, with Gen Z typically two times likelier than baby boomers to report streaming content on a weekly basis. Equally telling, when we look at the over-40 population across markets surveyed, we find that non-streamers outnumber streamers, while the opposite is true of the under-40 population. This demonstrates that while streaming adoption is taking place with those over the age of 40, consumption of streamed content is primarily driven by Gen Z and millennials.
While younger generations are certainly driving all forms of streaming forward, we found that they’re especially gravitating towards music.
Music streamers are 20% more likely to be in Generation Z than video streamers.
I Stream, You StreamAcross markets, 47% of streamers have either listened to music or watched TV & movie content in the past year.
Young and StreamingAge is more than a number. Generation Z is more likely to stream on a weekly basis across all surveyed countries.
01
Estimated marginal impact on likelihood of being weekly streamer given demographic attribute. Logistic regression on weekly streaming controlling for demographics.
— For complete data, see Table 01.01 on pg 49 of the APPENDIX
Q: "Over the past year, how frequently have you personally done each of these activities?" a) listened to streaming music services (e.g. Spotify/Pandora); b) used streaming TV & movie services (e.g. Netflix/Hulu) Share reporting having done respective activity once a week or more often over the past year
0% 100%
0% 100%
0% 100%
0% 100%60%37%44%37%48%37%62%
27%15%17%12%17%13%29%
20%13%17%7%
24%14%11%
13%9%10%18%7%11%22%
Streams either music and/or TV & movie content
Streams both music and TV & movie content
Streams TV & movie content only
Streams music only
US DE UK FR CN AU SE
AVG—13%
AVG—15%
AVG—18%
AVG—47%
0%
150%
US
Gen Z High Income
DE UK FR CN AU SE0%
35%
US DE UK FR CN AU SE
100%AVG
139%
65%8%
32%
24%AVG

Streaming State of Mind December—2016 01
propensity to adapt new technology within digital music and video consumption, as well as their level of digital music and video clout with peers.3
By adopting a diffusion-inspired perspective and looking at the early adopters in the Leading Edge audience, we are able to get some clues about the habits and trends for the streaming population in the future.
The report shows that Leading Edge streamers are indeed much heavier consumers of streaming content—streaming for more hours, across more platforms, and across more more dayparts than more recent adoptees. We see this as a clear indication that streaming begets more streaming.
While streaming has gone mainstream, and streamers are gradually starting to reflect the demographics of the general population, we are at a unique point in time where they still continue to have distinct, differentiating factors particularly valuable to advertisers.
Music streamers are 20% more likely to be a part of Gen Z than video streamers, less likely to have kids, and 10% more likely to be male.
Looking beyond age, our survey also found that streamers tend to be more affluent (20–30% more likely to fall within the wealthiest 25% of consumers). On the other hand, there was less differentiation between streamers and non-streamers when it came to other factors, such as education and gender. This was particularly true in more mature markets, which shows that as streaming becomes more ubiquitous, so do streamers.
The Leading Edge predicts the streaming future.
Along with looking at how streamers’ demographic traits differ, we also looked at how they differ based on their tech-savviness. Taking a note from the theory of diffusion of innovations, we divided streamers into groups based on their (self-proclaimed)
Gen Z Gen Y Gen X Baby Boomers
The Leading Edge Spans GenerationsLeading Edge streamers are not specific to any one age group. These early adopters of technology span almost equally across Generations X, Y, and Z.
Generational breakdown of Leading Edge streamers across markets (approximation)
3— Diffusion of innovation refers to the theory explaining how, why, and how quickly new ideas and technology spread. “Diffusion of Innovations,” written by Everett Rogers popularized this theory first published in 1962 and now in its fifth edition.
— For complete data, see Table 01.02 on pg 49 of the APPENDIX
30% 34% 28% 8%
p—13

p—15p—15
Streaming State of Mind December—2016Streaming State of Mind
p—16
—Section 01
Perhaps more interesting than the (probably) obvious fact that Gen Z streams more than older generations is that they are spreading the word. Controlling for demographic and socioeconomic factors, our streaming propensity model also shows that parents of Gen Z children are more likely to be streamers than people of the same age without Gen Z children around.
Not only is Gen Z two times likelier to stream content weekly than baby boomers, they have other distinguishing factors as well.
5x more likely They are 5x more likely than streaming baby boomers to be streamers of both music and TV & movie content.
90 minutes They stream 90 minutes more content daily than average.
2x more likely They are twice as likely to stream from their smartphones.
Gen Z streams more, and so do their parents.
Share reporting having streamed either music and/or TV & movie content on a weekly basis over the past year
0% 100%
All streamers
Gen Z
0% 100%
AVGUSDEUKFRCNAUSE
AVGUSDEUKFRCNAUSE
Weekly Streaming Average

p—17
Streaming State of Mind December—2016
p—18
—Section 02
Key Takeaways
The mobile explosion spells good news for streaming. Across markets, 60% of music streamers report streaming on mobile, as do 40% of TV & movie streamers.
Mobile is quickly becoming the main platform for music streaming. Spotify internal data shows that 69% of streams now come from mobile, up 17% in the last year alone.
As streaming goes mobile, there are more moments to engage with consumers. For instance, about 20% of mobile music steamers report listening to music while out running errands, and 30% say they stream while showering.
02
In a market worth $1.5B, mobile streaming moments like “working out” and “working” are worth up to $220M in new ad revenue to leverage.
The massive streaming media opportunity is driven by mobile.

p—20p—19
Streaming State of Mind December—2016 —Section 02
These ad-supported free tiers provide brands and advertisers with a unique opportunity to reach a broader audience that already expects to see advertising paired with their content. Since everyone likes it when things are free, the global audience using free music streaming services is massive. At the moment, an estimated 15% of the internet-using population is currently streaming music weekly using strictly free services. That share exceeds 20% in more mature streaming markets such as Sweden and the US. (Paid weekly streamers are a similarly sized audience, making up 17% of the same internet-using population.)
Free music streaming gives marketers the chance to reach an enormous audience that expects to see and respond to advertising. Increasingly, this receptive, highly engaged-audience is on mobile. While all of today’s consumers experience a variety of media across an array of devices, mobile is far and away the platform that sets streaming apart. And when it comes to content, no form of media is more mobile than music.
We know that more people are streaming than ever before, giving marketers a remarkable opportunity to reach a massive new audience on a new medium that’s constantly growing. Of course, you can only reach them through advertising—and some streaming services provide a bigger opportunity to do so than others.
The TV & movie streaming landscape is currently dominated by paid subscriptions, which promise users a high-quality, ad-free viewing experience. This has proven to be an effective strategic decision for the video streaming market...but music is different. If the entry price point for TV & movie streaming is typically a monthly subscription fee, the entry price point for music streaming is even better: free. Because while most music streaming services do offer a paid subscription plan—much like the top video services— some, such as Pandora, Spotify, YouTube, and SoundCloud, also offer a completely free listening experience, supported by ads.
02
Music streaming is where it’s at (the advertising opportunity).

p—22
—Section 02
Music streaming creates more mobile moments.
On average across the seven markets surveyed, more than half of music streamers (61%) reported listening on their smartphones. Smartphone use is also pervasive among TV & movie streamers, just not to the same degree—our study found that 41% of TV & movie streamers watch content on mobile. Since music doesn’t require a screen to listen, it’s uniquely suited to serve those on-the-go moments when your phone might still be in your pocket.
Smartphone owners are on average 50% likelier to be streamers than non-smartphone owners.4
The Free Streaming LandscapeAt a global glance, weekly streaming habits among those who opt out of fee-based subscriptions point to a preference for YouTube and Spotify in the markets surveyed.
As mobile streaming continues to grow, it’s no surprise that Gen Z and Leading Edge streamers are leading the way. Gen Z streamers are two times more likely to report streaming on smartphones than streaming baby boomers. An analysis of GroupM’s LIVE PANEL data goes even further, revealing that if you have a smartphone, you’re probably a streamer.
For these mobile streamers, their favorite songs, shows, and movies are “always-on,” instantly at their fingertips throughout the day. So it’s no surprise that mobile streamers reported streaming about 20–30% more content throughout the day than non-mobile streamers.
Of course, this additional time also translates into additional moments and dayparts. These streamers are more likely to stream content at virtually all relevant moments in the daily routine—from commuting to chilling, from, from workouts to work days, from running errands to running in the park.
Naturally, as people soundtrack their runs, showers, parties, and road trips—moments when they can’t look at a screen—our study found that music has even more moments than video. With the exception of “feeling lazy,” “chilling,” and “at dinner,” music is more likely to be present in almost every type of daily moment. And even when you look beyond moments, simply at parts of the day (mornings, afternoons, and evenings), music plays a larger role in people’s lives throughout the week. Video is slightly more present during evenings, but music is streamed considerably more in mornings and afternoons on all weekdays and weeknights.
For marketers and brands, these (presumably) hard-at-work moments are examples of new engagement opportunities unlocked by streaming. While radio can also play a part, it is only with music streaming that we’ve really invited ad-financed audio into our gyms and offices. The major benefit of these new mobile moments is context; a deeper personalization and connection with your audience, explored more in depth in section four.
02
YouTube65%
Deezer
10%
Spoti�46%
Pandora18%
SoundCloud
9%Google Play
7%
iHeartRadio
4%
Amazon Music
3%
Apple Music
6%
Cross-market share of strictly free (weekly) music streamers reporting using respective service on a weekly basis.
4— This is particularly true in emerging markets such as India, where the connection between smartphone ownership and streaming is even greater.

p—23
December—2016Streaming State of Mind
Mobile moments are massive for advertisers. The estimated ad value of newly unlocked “at work” and “workout” streaming moments is up to $220M in the markets we surveyed alone, driven by mobile music streaming.
02
Interpretation: Controlling for demographics, mobile streamers are on average an estimated 15% more likely to report streaming content during weekday mornings than are non-mobile streamers.
More Time With MobileAcross all dayparts, mobile streamers are more likely to stream than non-mobile streamers.
— For complete data, see Table 02.02 on pg 51 of the APPENDIX
19%17%
13%
15%+15%
6%+6%
17%+17%
+19%
+13%
+17%
0%
10%
20%
0%
10%
20%
Weekendmornings
Weekendafternoons
Weekendevenings
Weekdaymornings
Weekdayafternoons
Weekdayevenings

Music for Every MomentAccording to streamers across the globe, listening to music is an anytime activity. For example, streaming is highest during activities such as housework (53% stream), cooking (42%), or chilling (55%).
02
Q: “In which of these moments do you tend to listen to streaming music services?” Base: Respondents streaming music from smartphone and having used music streaming services at least once in the past three months
— For complete data, see Table 02.03 on pgs 52–53 of the APPENDIX
On road trips
Getting ready
On vacation
Working
While ridingpublic transporation
40%
33%
39%
29% 35%
Feeling lazy
TravelingCommuting
Running
Out runningerrands
Focusing
At cafes
With the kidsRidesharing
YogaActivity
Emotion
With my baby
39%
18%
12%
30%
7%
7%
10%
5%
19%
36%30%
Chilling
Doing housework
When cooking
Workingout
55%
53%
42%
40%
Feeling down
Taking a shower
Studying
Birthdayparties
Outdooractivities
Videogaming
Girls’ nights out
Romance
Sleeping
Biking
At dinner
35% 15%
25%
30%
23%
19%
18%
22%
15%
14%
14%
Mobile Moments Mobile Moments

p—27
Streaming State of Mind December—2016
p—28
—Section 03
Key Takeaways
03
Streamers are media hounds—they consume all types of media, and their appetite is only growing. To fuel that growing appetite, streamers have developed their own set of habits and behaviors.
Streamers are 23% more likely to value access over ownership, and they take more risks when discovering new content.
Personalized curation counts; streamers rely on it for discovery, resulting in a broader set of content preferences in general.
Just because streamers consume more media does not mean they pay less attention to advertising. In fact, our research suggests that streamers consume as much advertising as non-streamers (if not more).
Learn how streamers consume and discover content to connect with this growing audience.
Streamers have a distinct mindset with their own set of behaviors.
p—30p—29
Streaming State of Mind December—2016 —Section 03 03
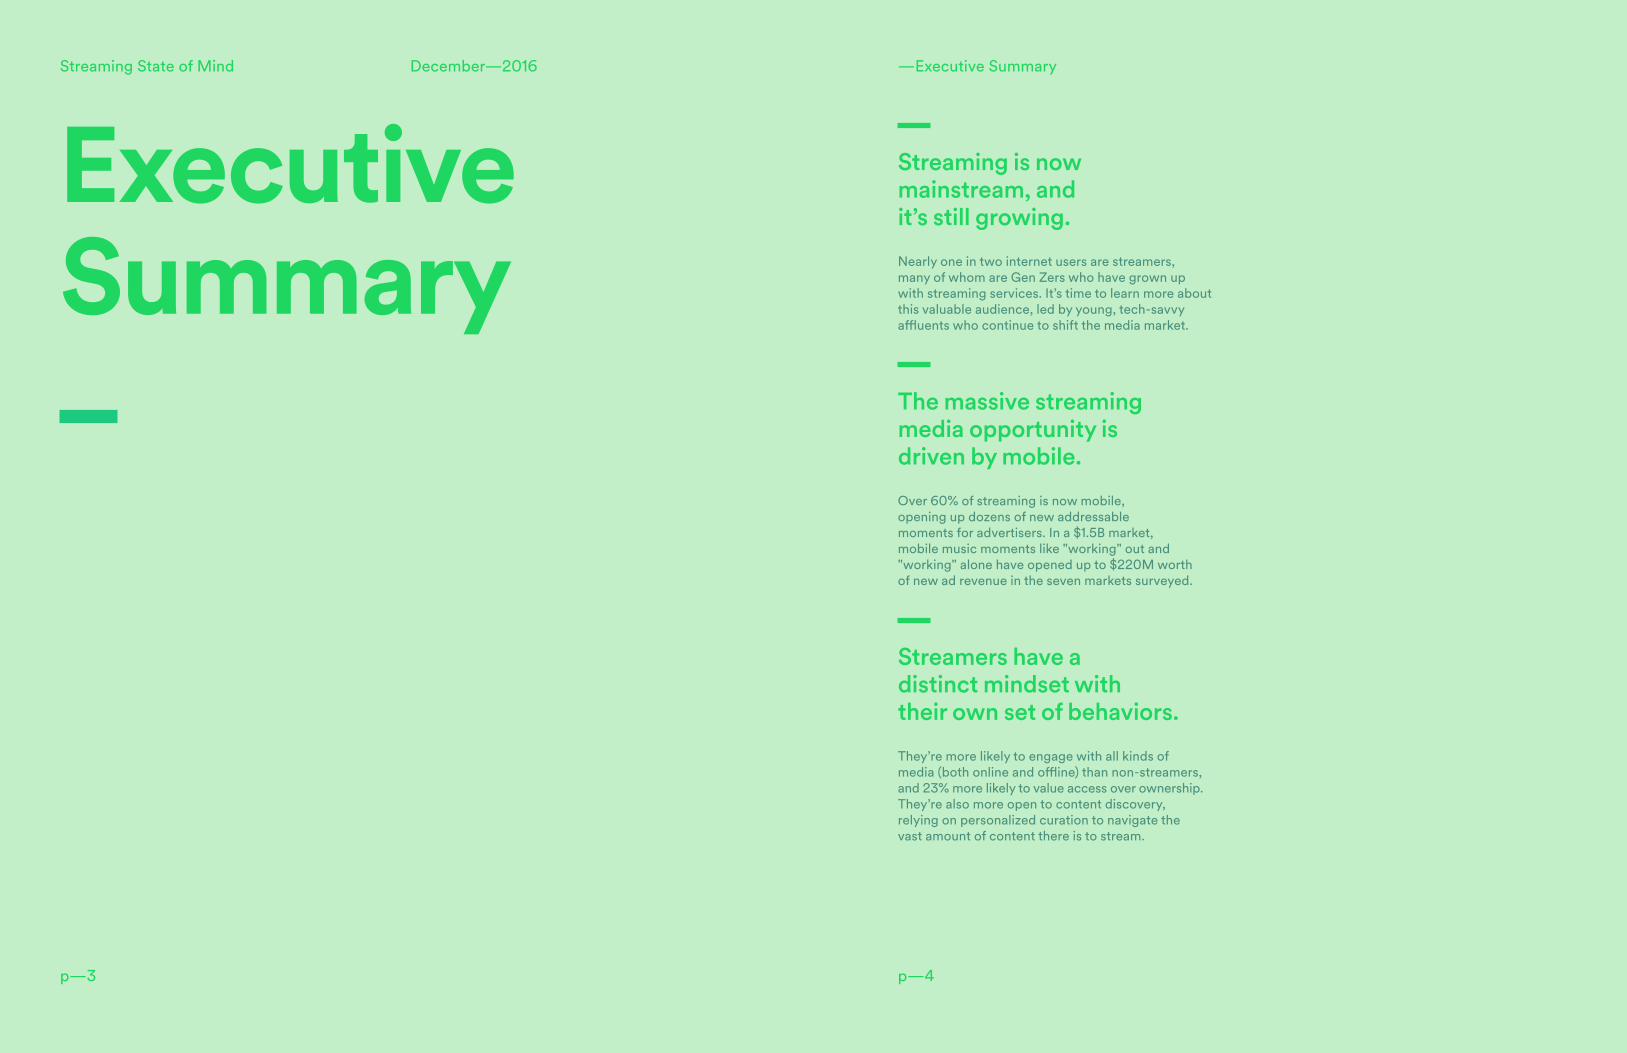
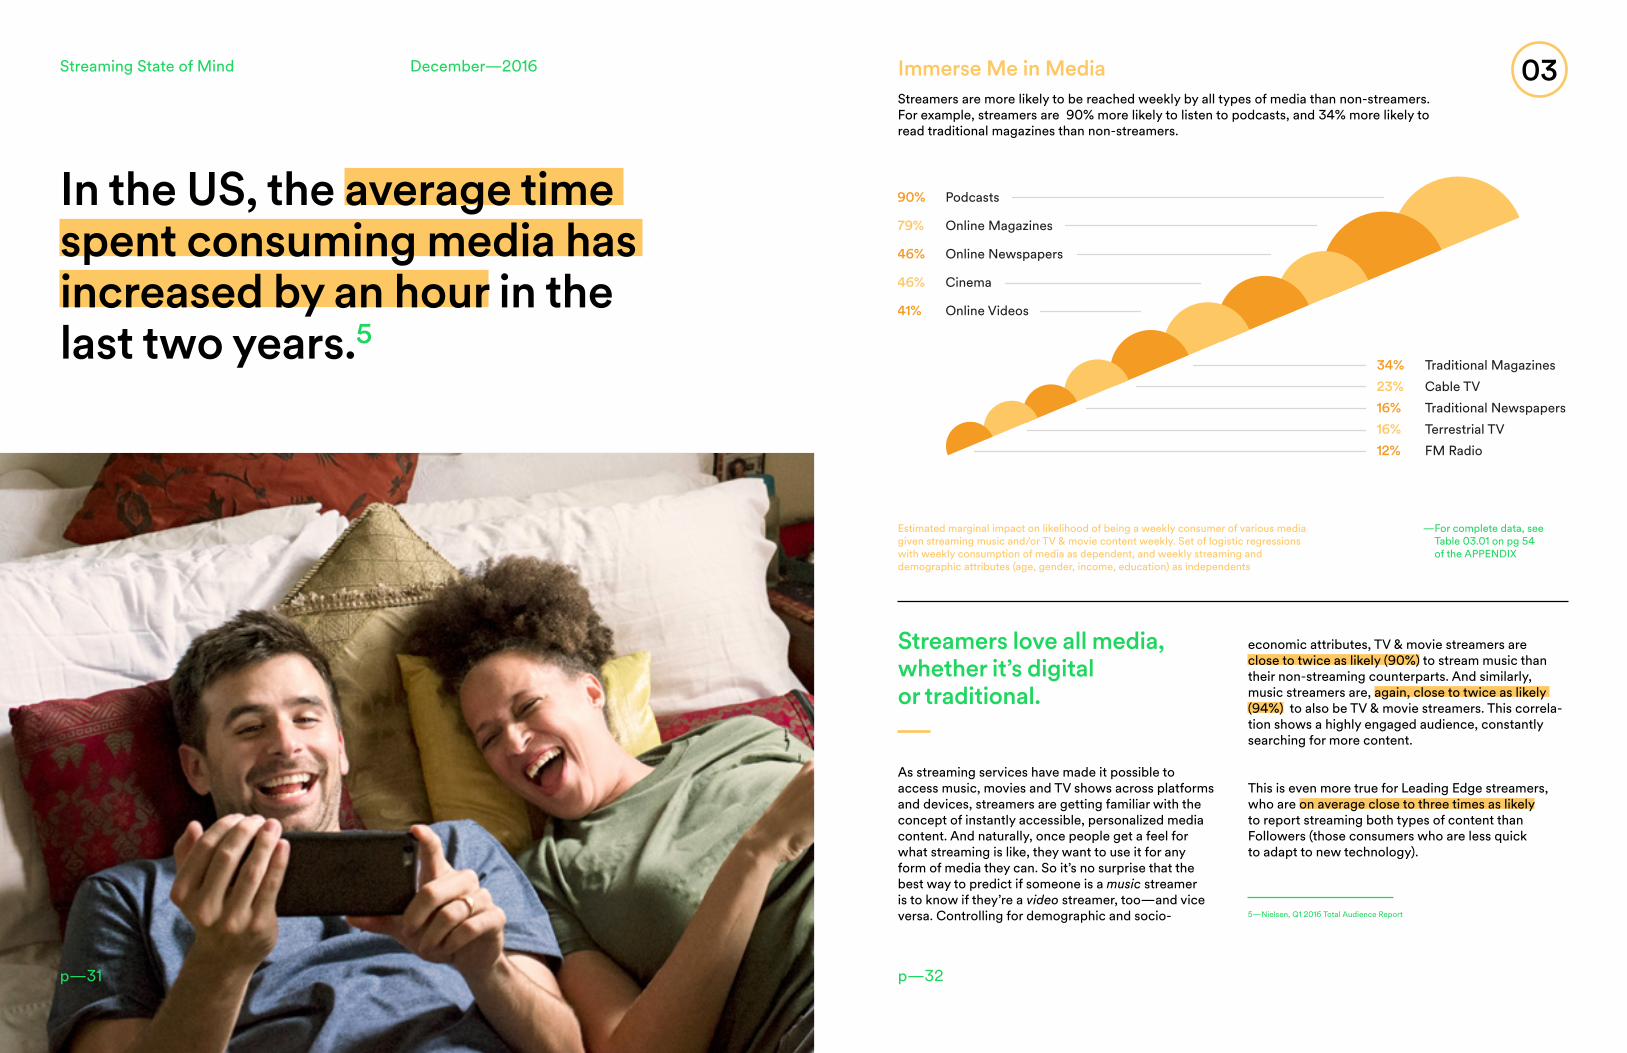
Streaming audio and video content now play a constant role in people's daily lives—and this drives a whole new set of consumer behaviors that we like to call the streaming mindset. As people clamor for more content that they can get anytime, anyplace, their consumption habits span a wider range of media types and drive higher engagement across their day. The result is a greater value on access to content over ownership.
This streaming mindset largely boils down to convenience for consumers. All of the things streamers desire—the ability to stream content across platforms, the availability of any song or any show on demand, and the personalized recommen- dations that come with most streaming services— are there to make their daily life easier. When it’s incredibly easy to consume content, people are more likely to consume a lot of it.
The most obvious effect of this new streaming mindset has been “binge-watching” or “binge- listening.” Never before has it been so easy to breeze through an entire season of The West Wing, or listen to the entire Beatles discography in a day. Content binging is a clear example of how streaming has transformed the way video and audio content is not only consumed, but created and distributed, too. Just a couple of years ago, binging was only for the serious entertainment junkie. Today, it’s the norm.
Still, binging is just one of many new consumer behaviors that streaming has surfaced. By adding a new layer of convenience and personalization, streaming has also transformed how we find new favorite shows and movies, how we prefer to watch and listen across devices, and how we organize our daily media consumption. So what makes the streaming mindset special?
Streamers want it their way.
p—32
Streaming State of Mind December—2016
p—31
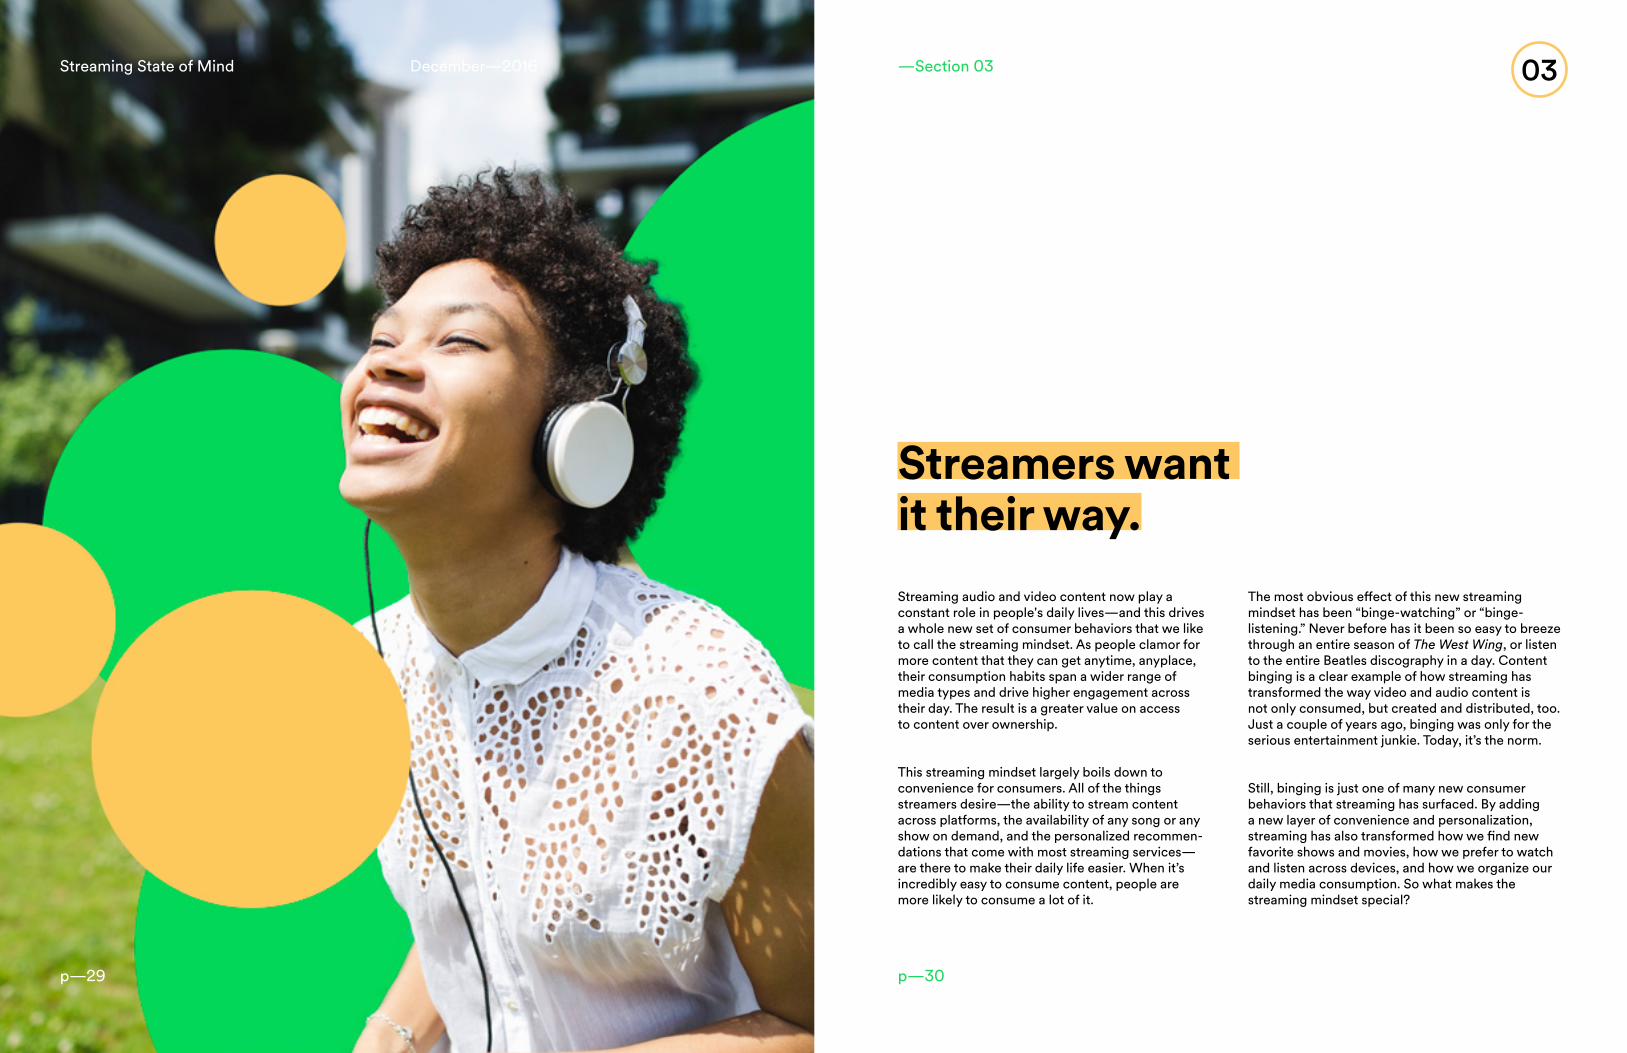
economic attributes, TV & movie streamers are close to twice as likely (90%) to stream music than their non-streaming counterparts. And similarly, music streamers are, again, close to twice as likely (94%) to also be TV & movie streamers. This correla-tion shows a highly engaged audience, constantly searching for more content.
This is even more true for Leading Edge streamers, who are on average close to three times as likely to report streaming both types of content than Followers (those consumers who are less quick to adapt to new technology).
Streamers love all media, whether it’s digital or traditional.
As streaming services have made it possible to access music, movies and TV shows across platforms and devices, streamers are getting familiar with the concept of instantly accessible, personalized media content. And naturally, once people get a feel for what streaming is like, they want to use it for any form of media they can. So it’s no surprise that the best way to predict if someone is a music streamer is to know if they’re a video streamer, too—and vice versa. Controlling for demographic and socio-
In the US, the average time spent consuming media has increased by an hour in the last two years.5
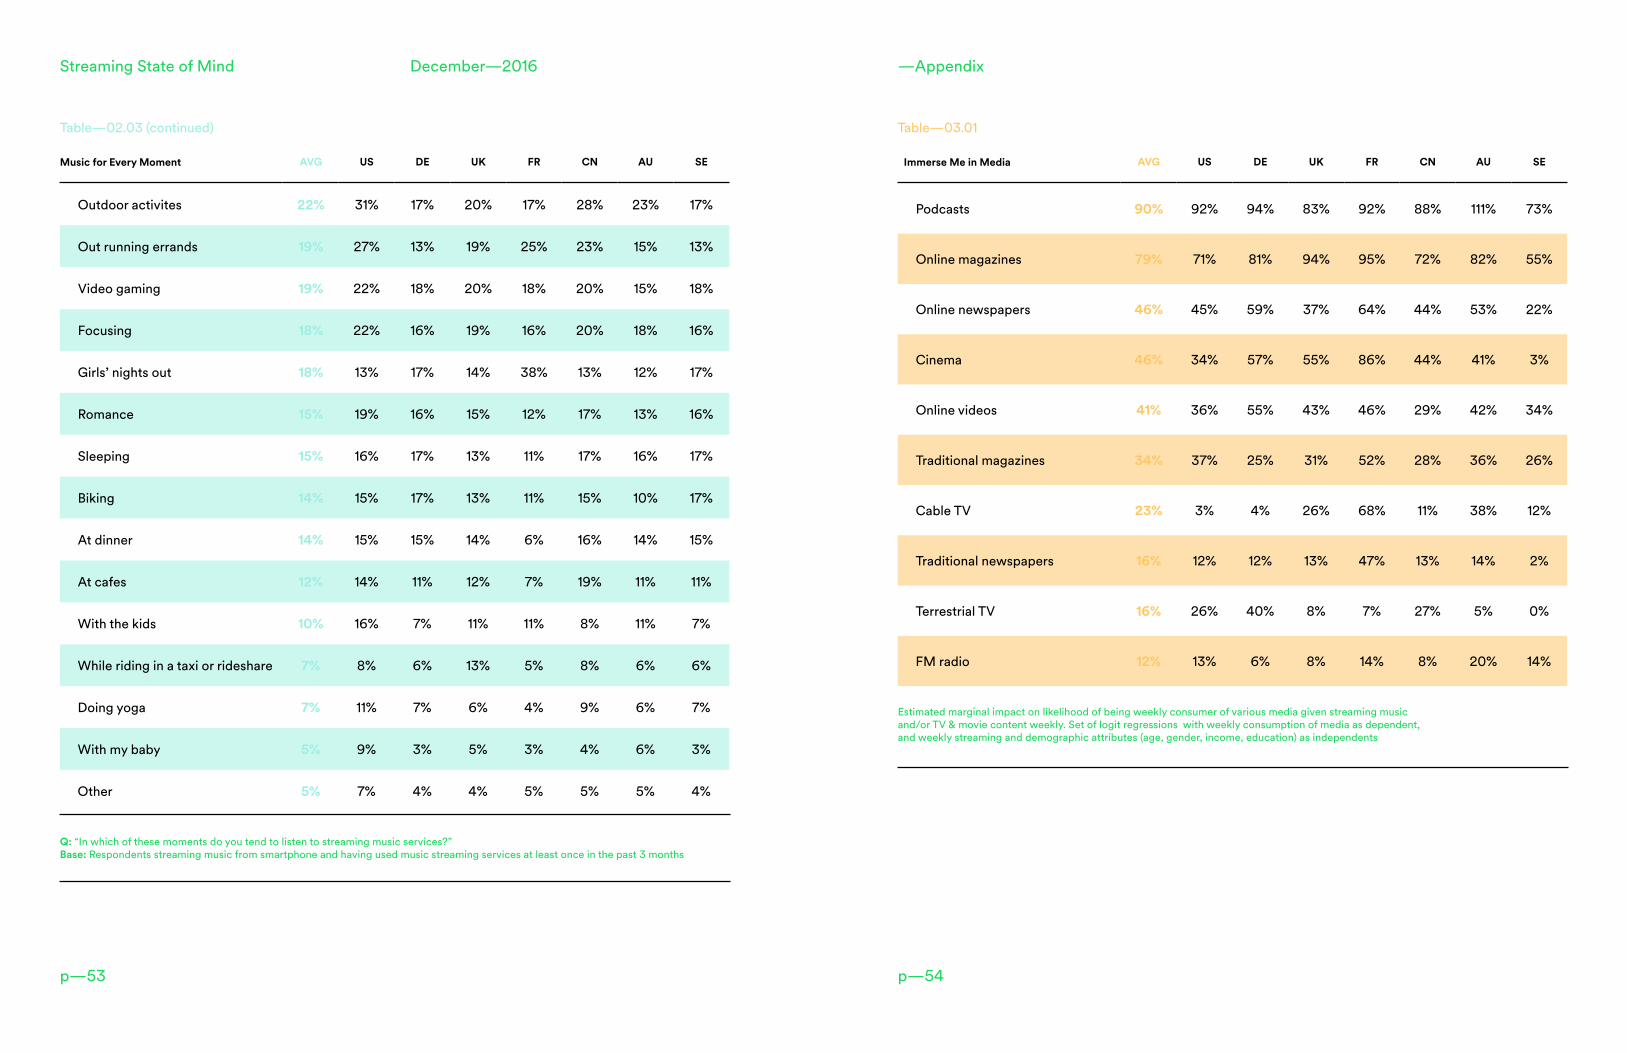
Immerse Me in MediaStreamers are more likely to be reached weekly by all types of media than non-streamers. For example, streamers are 90% more likely to listen to podcasts, and 34% more likely to read traditional magazines than non-streamers.
03
Estimated marginal impact on likelihood of being a weekly consumer of various media given streaming music and/or TV & movie content weekly. Set of logistic regressions with weekly consumption of media as dependent, and weekly streaming and demographic attributes (age, gender, income, education) as independents
— For complete data, see Table 03.01 on pg 54 of the APPENDIX
Online Magazines79%
Podcasts90%
Online Newspapers46%
Cinema46%
Online Videos41%
Cable TV23%Traditional Magazines34%
Traditional Newspapers16%Terrestrial TV16%FM Radio12%
5—Nielsen, Q1 2016 Total Audience Report

p—33
Streaming State of Mind December—2016 —Section 03
To fuel their streaming addiction, streamers want access.
As streaming has become standard, it’s now an expectation for consumers to have access to all media, all the time. In the process, the concept of “ownership” has become outdated. Our study found that streamers are 23% more likely than non-streamers to report valuing access to content over ownership, not only for music but for TV & movie content as well. Controlling for demographic variables, this sentiment runs true across generations. Similarly, streamers in more mature markets (for example, the US) are more likely to endorse an access mindset, suggesting that the sentiment indeed grows over time.
Streamers are 23% more likely to report valuing access to content over ownership than non-streamers.
Why aren’t people running out to the record store to buy their favorite albums? Well, as we start to grow comfortable with the idea that the entire Beatles catalogue won’t disappear from our music streaming service, the need to keep a backup set of CDs in the living room shelf has become less necessary. Plus, with instant access to any song at any time, streamers are more willing to take risks and discover new things. We found that as streamers are streaming more, they’re streaming more diversified content as well, becoming more open and receptive to new types of content.
I'll Give That Content a TryStreamers of music, TV, and movies are listening to more diversified content than non-streamers on average across all surveyed markets.
03
Estimated average number of music/TV/movie genres reportedly consumed by streamers and non-streamers. Propensity model controlling for demographic background variables (age, gender, income, education)
4.8
6.4
3.7
6.0
Average number of music genres listened to by music streamers
Average number of music genres listened to by non-music streamers
Average number of TV & movie genreswatched by TV & movie streamers
Average number of TV & movie genreswatched by non-TV & movie streamers
— For complete data, see Table 03.04 on pg 56 of the APPENDIX
p—35 p—36
Streaming State of Mind December—2016
p—36
—Section 03
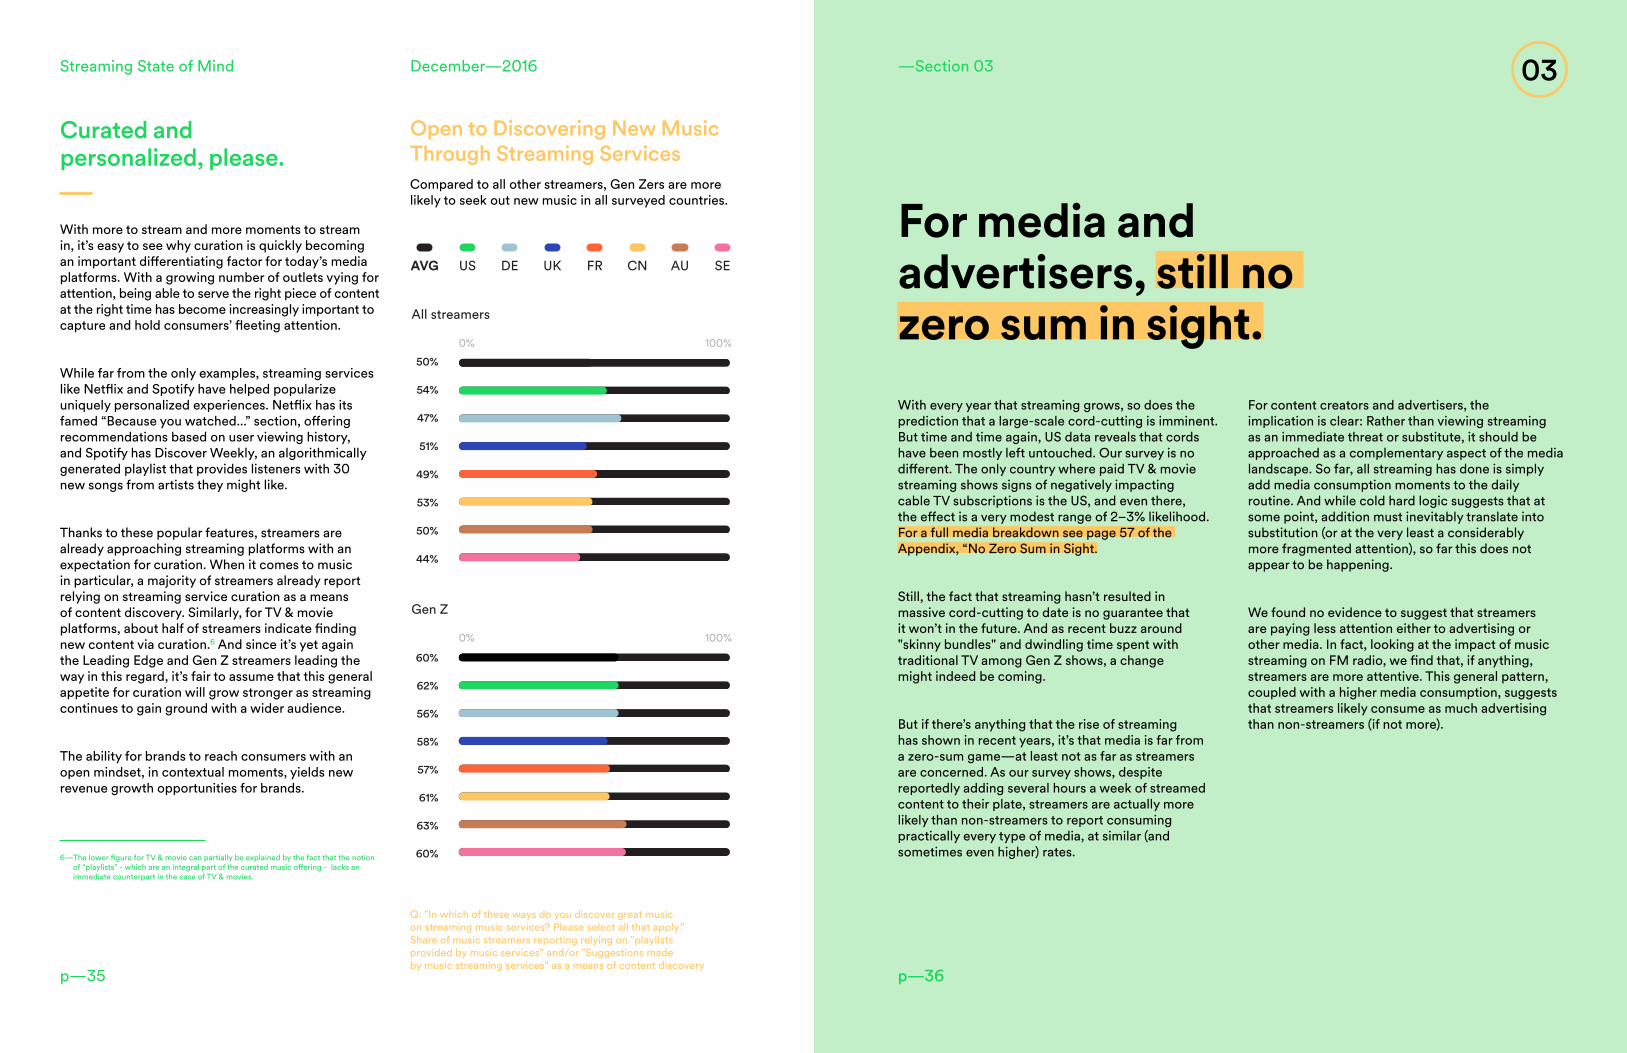
Curated and personalized, please.
With more to stream and more moments to stream in, it’s easy to see why curation is quickly becoming an important differentiating factor for today’s media platforms. With a growing number of outlets vying for attention, being able to serve the right piece of content at the right time has become increasingly important to capture and hold consumers’ fleeting attention.
While far from the only examples, streaming services like Netflix and Spotify have helped popularize uniquely personalized experiences. Netflix has its famed “Because you watched...” section, offering recommendations based on user viewing history, and Spotify has Discover Weekly, an algorithmically generated playlist that provides listeners with 30 new songs from artists they might like.
Thanks to these popular features, streamers are already approaching streaming platforms with an expectation for curation. When it comes to music in particular, a majority of streamers already report relying on streaming service curation as a means of content discovery. Similarly, for TV & movie platforms, about half of streamers indicate finding new content via curation.6 And since it’s yet again the Leading Edge and Gen Z streamers leading the way in this regard, it’s fair to assume that this general appetite for curation will grow stronger as streaming continues to gain ground with a wider audience.
The ability for brands to reach consumers with an open mindset, in contextual moments, yields new revenue growth opportunities for brands.
Open to Discovering New Music Through Streaming ServicesCompared to all other streamers, Gen Zers are more likely to seek out new music in all surveyed countries.
03
With every year that streaming grows, so does the prediction that a large-scale cord-cutting is imminent. But time and time again, US data reveals that cords have been mostly left untouched. Our survey is no different. The only country where paid TV & movie streaming shows signs of negatively impacting cable TV subscriptions is the US, and even there, the effect is a very modest range of 2–3% likelihood. For a full media breakdown see page 57 of the Appendix, “No Zero Sum in Sight.
Still, the fact that streaming hasn’t resulted in massive cord-cutting to date is no guarantee that it won’t in the future. And as recent buzz around "skinny bundles" and dwindling time spent with traditional TV among Gen Z shows, a change might indeed be coming.
But if there’s anything that the rise of streaming has shown in recent years, it’s that media is far from a zero-sum game—at least not as far as streamers are concerned. As our survey shows, despite reportedly adding several hours a week of streamed content to their plate, streamers are actually more likely than non-streamers to report consuming practically every type of media, at similar (and sometimes even higher) rates.
For media and advertisers, still no zero sum in sight.
For content creators and advertisers, the implication is clear: Rather than viewing streaming as an immediate threat or substitute, it should be approached as a complementary aspect of the media landscape. So far, all streaming has done is simply add media consumption moments to the daily routine. And while cold hard logic suggests that at some point, addition must inevitably translate into substitution (or at the very least a considerably more fragmented attention), so far this does not appear to be happening.
We found no evidence to suggest that streamers are paying less attention either to advertising or other media. In fact, looking at the impact of music streaming on FM radio, we find that, if anything, streamers are more attentive. This general pattern, coupled with a higher media consumption, suggests that streamers likely consume as much advertising than non-streamers (if not more).
Q: "In which of these ways do you discover great music on streaming music services? Please select all that apply." Share of music streamers reporting relying on "playlists provided by music services" and/or "Suggestions made by music streaming services" as a means of content discovery
6— The lower figure for TV & movie can partially be explained by the fact that the notion of “playlists” - which are an integral part of the curated music offering - lacks an immediate counterpart in the case of TV & movies.
62%
0% 100%
60%
56%
58%
57%
61%
63%
60%
All streamers
Gen Z
54%
0% 100%50%
47%
51%
49%
53%
50%
44%
USAVG DE UK FR CN AU SE

p—37
Streaming State of Mind December—2016
p—38
—Section 04
Key Takeaways
Advertisers can take advantage of this golden moment in streaming where media consumption is growing, particularly on mobile, enabling new profitable moments.
The new streaming mindset unlocks a deeper understanding of your audience and more opportunities to reach them through contextual targeting.
According to Goldman Sachs, music streaming ad revenue will increase to $7.1 billion or even more of a $31 billion market by 2030. The seeds of this growth are apparent in the new moments available to advertisers.
04
Streaming creates an ecosystem that benefits fans, artists, and brands alike—and it’s key to future-proofing your business.
All of these opportunities lead to growth.

p—40p—39
Streaming State of Mind December—2016 —Section 04 04
Streaming media offers new opportunity.
streamers are increasingly willing to take chances and experiment with unexpected, unfamiliar types of content.
This puts a premium on platforms that offer personalized content curation to people at scale, helping them navigate options in an on-demand world. On Spotify, all listeners have a Discover Weekly playlist that refreshes every Monday morning with 30 songs they’ve never heard before, based on what they already listen to. Along with these algorithmically generated playlists, there are human-powered playlists handcrafted for every possible mood and moment: Relax and Unwind, Swagger, Life Sucks, and more. Programmers track user trends to see which songs get skipped, how long sessions last, and what times of day people stream—optimizing the playlists with new content to keep fans surprised and delighted.
While the consumption of content by streamers has increased over time, this doesn’t mean streamers will binge-watch or binge-listen to anything put in front of them. Quality content is crucial to the value
As content platforms proliferate and consumers increasingly move across devices, content creators and brands face new challenges in reaching an audience. Yet it is the unique behaviors of streamers that are creating new opportunities for the media industry. Whether you’re an artist or an advertiser, future-proofing your strategy against the evolving media landscape—and understanding the mindset of streamers who are leading the charge—is vital. Streaming unlocks a massive new opportunity to deliver the right content to the right people, in the right context and increasingly at scale.
If content is king...
When it comes to content, streamers value access over ownership. Gone are the days of running out to pick up CDs and DVDs. Today, people want instant access to watch or listen to personally tailored content. This makes it remarkably convenient to check out a new song or try a new show with no risk, and potentially high reward. That’s why

p—41
Streaming State of Mind December—2016
p—42
All of these opportunities lead to growth.
Streaming’s global reach will only continue to grow. Based on our analysis, we predict double-digit growth for the streaming market by 2020, especial-ly in catchup markets like Australia (+32%), the UK (+24%) and Germany (+23%). With free content currently being streamed by over 15% of the population, the growth potential is exponential. And as streaming grows, so too will its positive impact on the media landscape.
The shift from analog radio to digital streaming is expanding, driven by consumers' demand for better, personalized curation and media buyers' demand for better analytics. Goldman Sachs recently put global ad-spend on music streaming and FM radio at $31 billion in 2015—twice the global value of recorded music. In that report, streaming is valued at $1.5 billion and rising whereas radio totalled $29.5 billion and steadily declining. As those ad- dollars increasingly 'follow the crowd' the report concludes that music streaming ad spend will increase 380%, from $1.5 billion to $7.1 billion by 2030 whereas FM Radio ad spend will shrink by 19%.
Naturally, this mutually beneficial relationship between the streaming industry and the music industry will benefit the advertising industry, too. Through streaming, consumers are now actively engaging with media across devices and during the moments that matter most to them. It’s up to us to listen and respond in tune.
exchange that the leading edge and Gen Z are particularly open to: free, quality entertainment in exchange for additional brand messaging. Platforms that offer quality original and licensed content offer the best opportunity for brands to connect with fans who are already engaging with content they love.
...context is God.
With so many streamers experimenting with content specifically designed for their mood and moments, streaming provides an unprecedented opportunity for marketers. With streaming, you don’t just know the geographic and demographic data that comes from registration data—you also know what your audience is doing and even how they’re feeling at the exact moment you want to reach them. Knowing the context of your audience can take your targeting to the next level.
To understand the power of context, think about one streamer, listening to the same song, two times in one day. With traditional ad targeting, that user would get served with the same ad twice. But with streaming, you know if that person is listening to that song on a “Workout Pump-Up” playlist on a Monday morning, or on a “Raging Party” playlist on a Saturday night, and tailor your message accordingly. That’s the same user, on the same device, streaming the same content—getting a different message, based entirely on context. The advertising implementations for these moments are astounding, especially when employing some creativity and empathy for the user.
Of course, artists and labels can reap value from the streaming mindset, too. According to a 2010 Billboard report, nearly 40% of concert tickets go unsold. These tickets could be marketed to local fans through highly relevant targeting, a tactic Spotify has been testing in key markets. Goldman Sachs estimated this type of opportunity could save up to $2 billion in revenue for the US live music industry.
04—Section 04
7—Goldman Sachs Group, Music in the Air, October 2016

p—44
—Afterword
p—43
Streaming State of Mind December—2016
Spotify’s Streaming State of Mind study was conducted in collaboration with GroupM, the world’s largest media investment group. This new partnership helped us identify where exactly streaming fits into the industry-wide media landscape by connecting a unique pair of data assets—Spotify’s unprecedented view of today’s music streamers, and GroupM’s insight into the broader consumer mindset. Ultimately, this combination of streaming-specific data and worldwide consumer data allowed us, for the first time, to paint a data-driven picture of the global state of streaming as it stands today.
Because of the unique nature of streaming data, we’re thrilled about the opportunity for brands and marketers to understand people better than ever before. While traditional data sets from media companies have focused around basic user demographics, educated guesses, and ephemeral identifiers, streaming services have unlocked a valuable new set of truly meaningful consumer infor-mation. With on-the-go media becoming an essential part of the consumer’s daily routine, we’re now able to gather deeper contextual data about who people are, what they’re doing, and even what mindset they’re in at any particular moment. This newfound ability to better understand the real people behind the devices will allow artists, producers, brands, and marketers to provide content that’s truly meaningful, rather than intrusive or distracting.
Of course, the reason streaming provides a uniquely personal, powerful set of data is because it’s a uniquely personal, powerful way to interact with media. That’s another huge reason the future of the industry presents such remarkable opportunities for
Afterwordbrands and marketers—it’s a new chance to connect with consumers on an inherently personal, intimate platform. Whether it’s a streamer listening to Drake with noise-cancelling headphones on their commute, or watching the next season of Stranger Things in their bed, streaming provides an entirely new format for users to engage with the media content they want, in the setting of their choice. As a result, marketers have a unique opportunity to reach individuals with direct messaging, tailored specifically to the person streaming and the context they’re in.
Working with GroupM helped us develop a broader sense of how streaming will push the media industry forward in the future. By uncovering consumer insights with regards to media consumption, daily habits, and generational divides, we were able to track the long-term potential for the streaming industry. And that potential is massive. One key finding from our study is that the media landscape is far from a zero-sum game—in fact, streamers are consuming more content than ever before. So it’s safe to say we are bullish for the potential to grow the streaming market, and ultimately thrilled about what that growth means for brands and marketers: Unlimited possibilities for creative, innovative, deeply personal advertising experiences.
Alex Underwood
VP, Head of Global Agency & Partnerships at Spotify
p—46
—About the Study
p—45
Streaming State of Mind December—2016
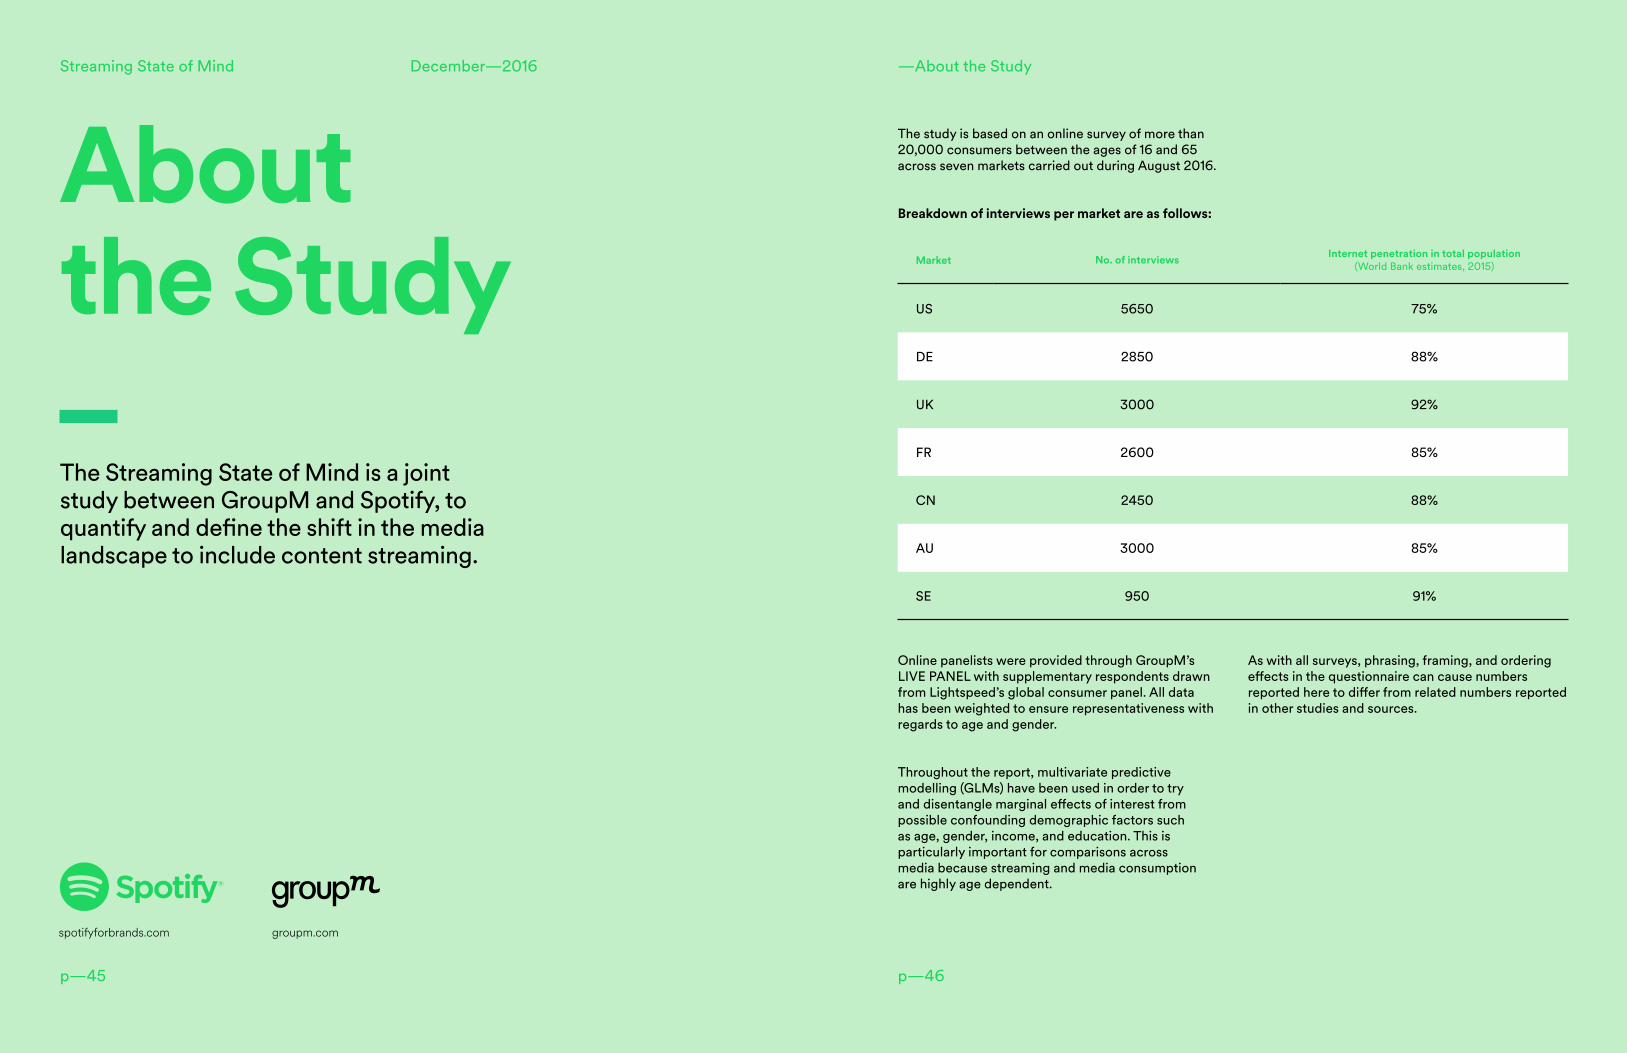
About the StudyThe Streaming State of Mind is a joint study between GroupM and Spotify, to quantify and define the shift in the media landscape to include content streaming.
Market No. of interviews Internet penetration in total population (World Bank estimates, 2015)
US 5650 75%
DE 2850 88%
UK 3000 92%
FR 2600 85%
CN 2450 88%
AU 3000 85%
SE 950 91%
The study is based on an online survey of more than 20,000 consumers between the ages of 16 and 65 across seven markets carried out during August 2016.
Breakdown of interviews per market are as follows:
Online panelists were provided through GroupM’s LIVE PANEL with supplementary respondents drawn from Lightspeed’s global consumer panel. All data has been weighted to ensure representativeness with regards to age and gender.
Throughout the report, multivariate predictive modelling (GLMs) have been used in order to try and disentangle marginal effects of interest from possible confounding demographic factors such as age, gender, income, and education. This is particularly important for comparisons across media because streaming and media consumption are highly age dependent.
As with all surveys, phrasing, framing, and ordering effects in the questionnaire can cause numbers reported here to differ from related numbers reported in other studies and sources.
spotifyforbrands.com groupm.com
p—47 p—48
Streaming State of Mind December—2016 —Appendix
p—47
Streaming State of Mind December—2016
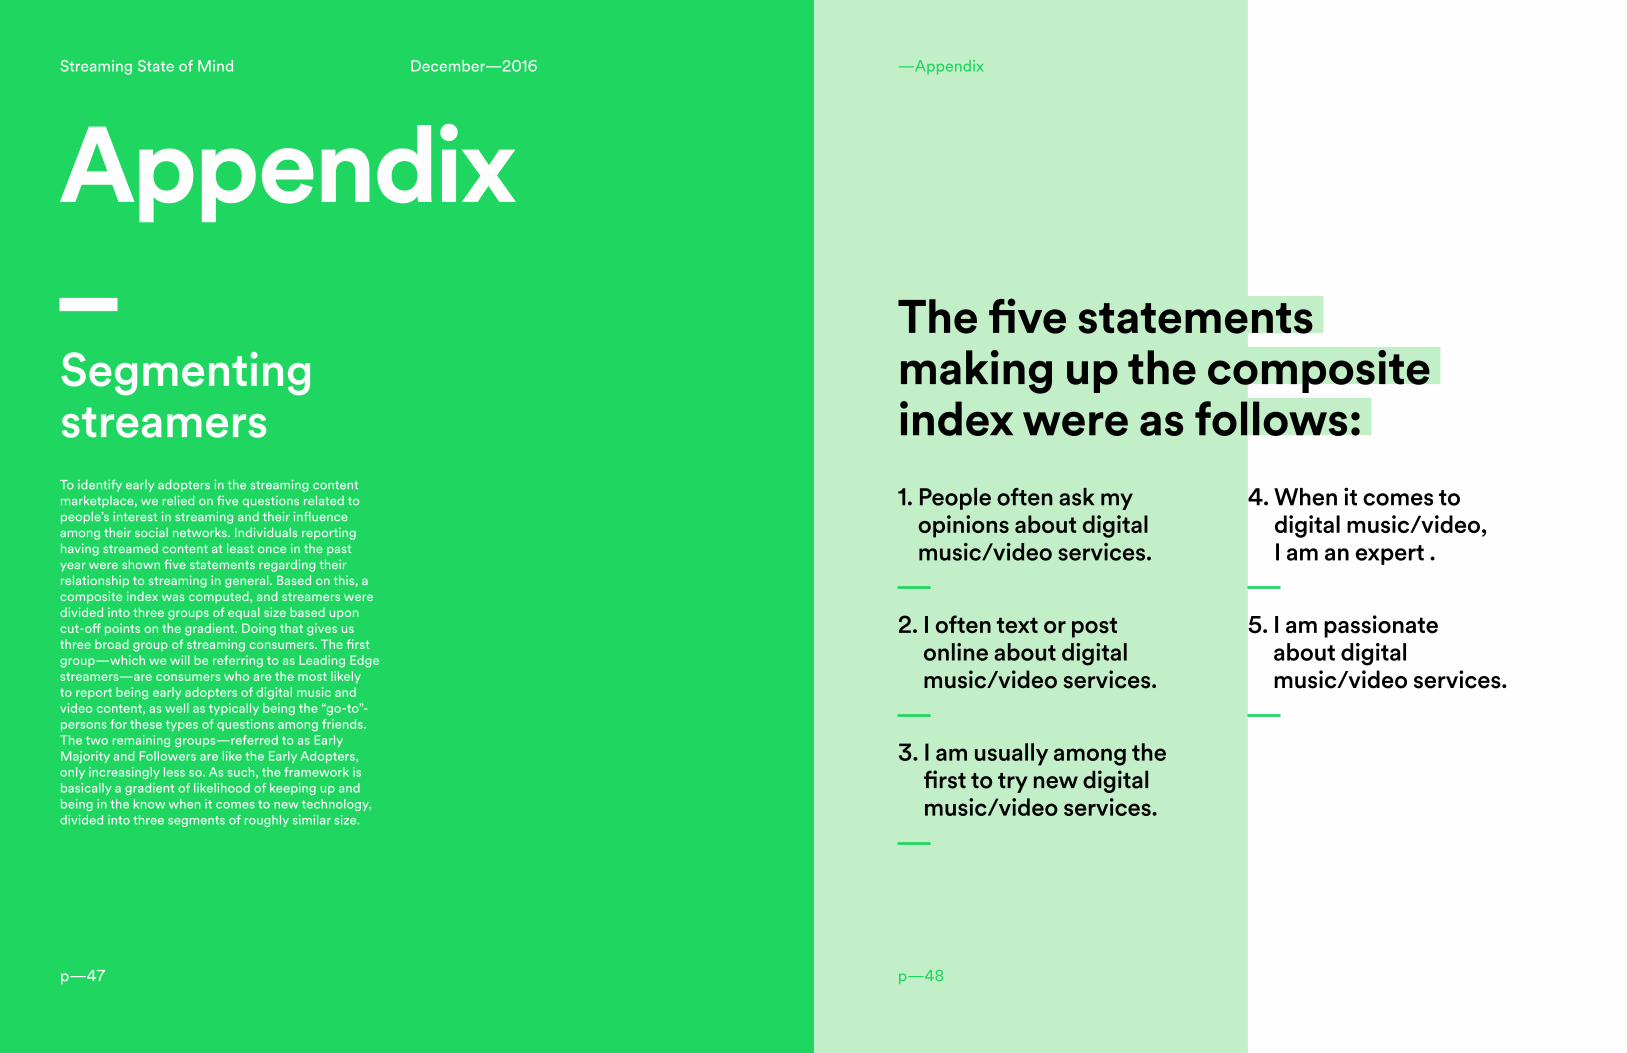
Appendix
To identify early adopters in the streaming content marketplace, we relied on five questions related to people’s interest in streaming and their influence among their social networks. Individuals reporting having streamed content at least once in the past year were shown five statements regarding their relationship to streaming in general. Based on this, a composite index was computed, and streamers were divided into three groups of equal size based upon cut-off points on the gradient. Doing that gives us three broad group of streaming consumers. The first group—which we will be referring to as Leading Edge streamers—are consumers who are the most likely to report being early adopters of digital music and video content, as well as typically being the “go-to”-persons for these types of questions among friends. The two remaining groups—referred to as Early Majority and Followers are like the Early Adopters, only increasingly less so. As such, the framework is basically a gradient of likelihood of keeping up and being in the know when it comes to new technology, divided into three segments of roughly similar size.
1. People often ask my opinions about digital music/video services.
2. I often text or post online about digital music/video services.
3. I am usually among the first to try new digital music/video services.
Segmenting streamers
The five statements making up the composite index were as follows:
4. When it comes to digital music/video, I am an expert .
5. I am passionate about digital music/video services.

p—49 p—50
Streaming State of Mind December—2016 —Appendix
Young and Streaming AVG US DE UK FR CN AU SE
Gen Z 100% 71% 139% 119% 89% 97% 119% 65%
High income 24% 8% 26% 28% 30% 27% 32% 16%
University education 8% 0% 26% 28% 30% 27% 32% 16%
Female -6% -2% -20% -10% -10% 2% -5% 1%
The Leading Edge Spans Generations AVG US DE UK FR CN AU SE
Gen Z 30% 26% 27% 31% 28% 28% 33% 34%
Gen Y 34% 38% 31% 39% 31% 33% 38% 29%
Gen X 28% 29% 29% 22% 31% 29% 25% 30%
Baby boomer 8% 7% 14% 8% 10% 10% 4% 7%
Estimated marginal impact on likelihood of being a weekly streamer given demographic attribute. Logistic regression on weekly streaming controlling for demographics
Interpretation: Controlling for demographic attributes, high-income earners are on average an estimated 24% likelier to be weekly streamers than low-income earners.
Generational breakdown of Leading Edge streamers across market (approximation)
Table—01.01
Table—01.02
Comparison of demographic indices profiles: weekly music streamers vs. weekly TV & movie streamers, index=100 Interpretation: On average across the seven markets, weekly music streamers are 8% likelier to be male and 12% likelier to be Gen Z than are weekly TV & movie streamers
Streaming Profiles: Music vs. TV & Movies AVG US DE UK FR CN AU SE
Gen Z 112 110 117 123 93 120 118 101
Male 108 104 111 107 109 113 107 106
Top income tertile 102 105 107 96 98 109 106 96
University education 102 96 99 99 99 105 110 105
Children 92 98 98 84 94 88 88 94
Table—01.03
p—51 p—52
Streaming State of Mind December—2016 —Appendix
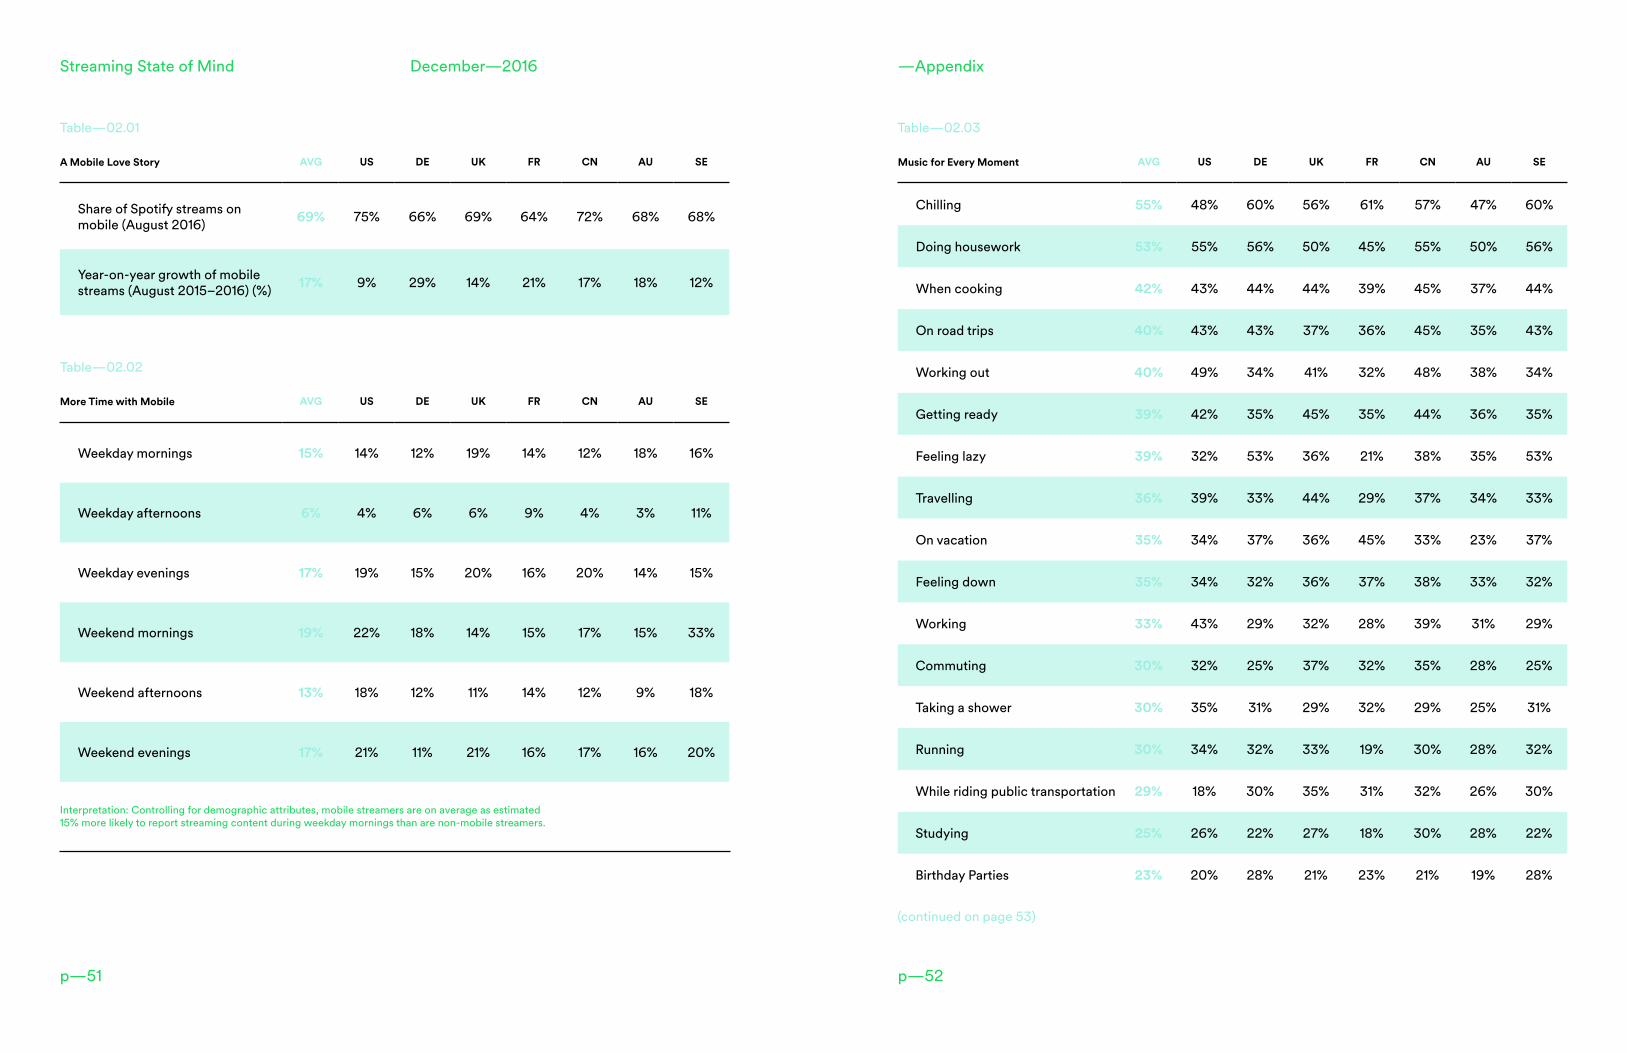
Music for Every Moment AVG US DE UK FR CN AU SE
Chilling 55% 48% 60% 56% 61% 57% 47% 60%
Doing housework 53% 55% 56% 50% 45% 55% 50% 56%
When cooking 42% 43% 44% 44% 39% 45% 37% 44%
On road trips 40% 43% 43% 37% 36% 45% 35% 43%
Working out 40% 49% 34% 41% 32% 48% 38% 34%
Getting ready 39% 42% 35% 45% 35% 44% 36% 35%
Feeling lazy 39% 32% 53% 36% 21% 38% 35% 53%
Travelling 36% 39% 33% 44% 29% 37% 34% 33%
On vacation 35% 34% 37% 36% 45% 33% 23% 37%
Feeling down 35% 34% 32% 36% 37% 38% 33% 32%
Working 33% 43% 29% 32% 28% 39% 31% 29%
Commuting 30% 32% 25% 37% 32% 35% 28% 25%
Taking a shower 30% 35% 31% 29% 32% 29% 25% 31%
Running 30% 34% 32% 33% 19% 30% 28% 32%
While riding public transportation 29% 18% 30% 35% 31% 32% 26% 30%
Studying 25% 26% 22% 27% 18% 30% 28% 22%
Birthday Parties 23% 20% 28% 21% 23% 21% 19% 28%
Table—02.03
(continued on page 53)
More Time with Mobile AVG US DE UK FR CN AU SE
Weekday mornings 15% 14% 12% 19% 14% 12% 18% 16%
Weekday afternoons 6% 4% 6% 6% 9% 4% 3% 11%
Weekday evenings 17% 19% 15% 20% 16% 20% 14% 15%
Weekend mornings 19% 22% 18% 14% 15% 17% 15% 33%
Weekend afternoons 13% 18% 12% 11% 14% 12% 9% 18%
Weekend evenings 17% 21% 11% 21% 16% 17% 16% 20%
Interpretation: Controlling for demographic attributes, mobile streamers are on average as estimated 15% more likely to report streaming content during weekday mornings than are non-mobile streamers.
Table—02.02
A Mobile Love Story AVG US DE UK FR CN AU SE
Share of Spotify streams on mobile (August 2016) 69% 75% 66% 69% 64% 72% 68% 68%
Year-on-year growth of mobile streams (August 2015–2016) (%) 17% 9% 29% 14% 21% 17% 18% 12%
Table—02.01
p—53 p—54
Streaming State of Mind December—2016 —Appendix
Estimated marginal impact on likelihood of being weekly consumer of various media given streaming music and/or TV & movie content weekly. Set of logit regressions with weekly consumption of media as dependent, and weekly streaming and demographic attributes (age, gender, income, education) as independents
Immerse Me in Media AVG US DE UK FR CN AU SE
Podcasts 90% 92% 94% 83% 92% 88% 111% 73%
Online magazines 79% 71% 81% 94% 95% 72% 82% 55%
Online newspapers 46% 45% 59% 37% 64% 44% 53% 22%
Cinema 46% 34% 57% 55% 86% 44% 41% 3%
Online videos 41% 36% 55% 43% 46% 29% 42% 34%
Traditional magazines 34% 37% 25% 31% 52% 28% 36% 26%
Cable TV 23% 3% 4% 26% 68% 11% 38% 12%
Traditional newspapers 16% 12% 12% 13% 47% 13% 14% 2%
Terrestrial TV 16% 26% 40% 8% 7% 27% 5% 0%
FM radio 12% 13% 6% 8% 14% 8% 20% 14%
Table—03.01
Q: “In which of these moments do you tend to listen to streaming music services?” Base: Respondents streaming music from smartphone and having used music streaming services at least once in the past 3 months
Table—02.03 (continued)
Music for Every Moment AVG US DE UK FR CN AU SE
Outdoor activites 22% 31% 17% 20% 17% 28% 23% 17%
Out running errands 19% 27% 13% 19% 25% 23% 15% 13%
Video gaming 19% 22% 18% 20% 18% 20% 15% 18%
Focusing 18% 22% 16% 19% 16% 20% 18% 16%
Girls’ nights out 18% 13% 17% 14% 38% 13% 12% 17%
Romance 15% 19% 16% 15% 12% 17% 13% 16%
Sleeping 15% 16% 17% 13% 11% 17% 16% 17%
Biking 14% 15% 17% 13% 11% 15% 10% 17%
At dinner 14% 15% 15% 14% 6% 16% 14% 15%
At cafes 12% 14% 11% 12% 7% 19% 11% 11%
With the kids 10% 16% 7% 11% 11% 8% 11% 7%
While riding in a taxi or rideshare 7% 8% 6% 13% 5% 8% 6% 6%
Doing yoga 7% 11% 7% 6% 4% 9% 6% 7%
With my baby 5% 9% 3% 5% 3% 4% 6% 3%
Other 5% 7% 4% 4% 5% 5% 5% 4%

p—55 p—56
Streaming State of Mind December—2016
I’ll Give That Content a Try AVG US DE UK FR CN AU SE
Average number of music genres listened to by music streamers 4.8 4.6 4.7 4.8 5.2 4.8 4.6 4.6
Average number of music genres listened to by non-music streamers 3.7 3.3 3.8 3.7 4.0 3.8 3.6 3.7
Average number of TV & movie genres watched by TV & movie streamers 6.4 6.6 6.0 6.4 6.3 6.7 6.2 6.4
Average number of TV & movie genres watched by non-TV & movie streamers
6.0 6.1 5.6 5.9 5.9 6.2 5.9 6.1
Estimated average number of music/TV & movie genres reportedly consumed to by streamers and non-streamersPropensity model controlling for demographic background variables (age, gender, income, education)
Interpretation: Controlling for demographic attributes, music streamers are on average an estimated 94% likelier to be TV & movie streamers than are non-music streamers
Table—03.04
Table—03.03
If I’m Already Streaming That…. AVG US DE UK FR CN AU SE
Increased likelihood of streaming TV & movie content given streaming music
94% 67% 127% 98% 110% 86% 100% 70%
Increased likelihood of streaming music given streaming TV & movie content
90% 64% 105% 80% 167% 58% 82% 74%
Estimated marginal impact on likelihood of streaming music/TV & movie content weekly, given streaming TV & movie/music weekly. Logistic regression controlling for demographic background variables (age, gender, income, education)
—Appendix
Q: “How much more or less frequently are you doing each of these activities, compared to one year ago?” Base: Respondents reporting to have watched/listened/read respective media in the past year
Comment: Percentage figures refers to share of consumers of respective media reporting having increased consumption subtracted by share reporting having decreased it
Table—03.02
Binging Boom? AVG US DE UK FR CN AU SE
Streaming TV & movies (e.g., Netflix) +39% 41% 39% 41% 31% 38% 44% 38%
Streaming music online (e.g., Spotify/Pandora) +31% 33% 37% 32% 24% 34% 34% 23%
Videos online (e.g., YouTube) +24% 27% 18% 25% 22% 24% 26% 25%
Listening to radio/podcasts online +21% 27% 20% 23% 12% 19% 22% 24%
Online newspapers +20% 22% 21% 22% 21% 17% 19% 18%
Online magazines +17% 24% 17% 19% 19% 12% 16% 13%
Cable TV +4% 6% 0% 10% 11% -3% 7% -4%
FM radio +4% 4% 5% 6% 5% 2% -1% 3%
Cinema -1% 5% -7% 1% 0% -4% -4% -1%
Terrestrial TV -8% 1% -11% -10% -1% -8% -6% -22%
Printed newspapers -9% -5% -4% -7% -4% -11% -18% -13%
Printed magazines -9% -1% -6% -7% -3% -15% -18% -14%

p—57 p—58
Streaming State of Mind December—2016 —Appendix
Estimated marginal impact on likelihood of being weekly consumer of various media given being a paid sub-scriber of streaming music and/or TV & movie content weekly. Set of logit regressions with weekly consump-tion of media as dependent, and paid weekly streaming and demographic attributes
No Zero Sum in Sight AVG US DE UK FR CN AU SE
Podcasts 66% 68% 66% 60% 71% 60% 82% 53%
Online magazines 66% 66% 77% 65% 88% 47% 77% 41%
Online newspapers 49% 41% 57% 62% 91% 36% 52% 5%
Cinema 37% 41% 30% 49% 55% 26% 31% 26%
Online videos 26% 27% 31% 20% 51% 16% 25% 13%
Traditional magazines 23% 26% 24% 32% 23% 14% 23% 19%
Cable TV 27% -2% 29% 5% 93% 10% 33% 18%
Terrestrial TV 15% 29% 8% 32% 2% 28% 3% 4%
Traditional newspapers 12% 4% 9% 3% 42% 4% 12% 11%
FM radio 6% 9% 0% 4% 4% 3% 13% 12%
Table—03.05