Streaming Visual Analytics Workshop Report - Pacific ...
128
PNNL- 25266 Prepared for the U.S. Department of Energy under Contract DE-AC05-76RL01830 Streaming Visual Analytics Workshop Report March 2016 KA Cook BR Brisbois ER Burtner AE Mitson BP Kritzstein
-
Upload
khangminh22 -
Category
Documents
-
view
0 -
download
0
Transcript of Streaming Visual Analytics Workshop Report - Pacific ...

PNNL- 25266
Prepared for the U.S. Department of Energy under Contract DE-AC05-76RL01830
Streaming Visual Analytics Workshop Report
March 2016
KA Cook BR Brisbois
ER Burtner AE Mitson
BP Kritzstein


PNNL- 25266
Streaming Visual Analytics Workshop Report
KA Cook BR Brisbois
ER Burtner AE Mitson
BP Kritzstein
March 2016
Prepared for
a U.S. Government agency
under Contract DE-AC05-76RL01830
Pacific Northwest National Laboratory
Richland, Washington 99352


iii
Summary
How can we best enable users to understand complex emerging events and make appropriate
assessments from streaming data? This was the central question addressed at a three-day workshop on
streaming visual analytics. This workshop was organized by Pacific Northwest National Laboratory for a
government sponsor. It brought together forty researchers and subject matter experts from government,
industry, and academia. This report summarizes the outcomes from that workshop. It describes elements
of the vision for a streaming visual analytic environment and set of important research directions needed
to achieve this vision.
Streaming data analysis is in many ways the analysis and understanding of change. However, current
visual analytics systems usually focus on static data collections, meaning that dynamically changing
conditions are not appropriately addressed.
The envisioned mixed-initiative streaming visual analytics environment creates a collaboration between
the analyst and the system to support the analysis process. It raises the level of discourse from low-level
data records to higher-level concepts. The system supports the analyst’s rapid orientation and
reorientation as situations change. It provides an environment to support the analyst’s critical thinking. It
infers tasks and interests based on the analyst’s interactions. The system works as both an assistant and a
devil’s advocate, finding relevant data and alerts as well as considering alternative hypotheses. Finally,
the system supports sharing of findings with others.
Making such an environment a reality requires research in several areas. The workshop discussions
focused on four broad areas: support for critical thinking, visual representation of change, mixed-initiative
analysis, and the use of narratives for analysis and communication.

iv
Acknowledgments
The authors gratefully acknowledge the support of the U.S. Government for sponsoring this workshop.
We thank the invited researchers who generously gave of their time and creativity to develop the ideas
here, including Dustin Arendt, Eli Brown, Nick Cramer, Jordan Crouser, Bill Elm, Alex Endert, Michael
Gleicher, Steve Gomez, Mark Greaves, Lane Harrison, Christopher Healey, Rob Jasper, Ross
Maciejewski, Brian Moon, Chris North, Diane Staheli, and John Stasko. We thank the government
researchers and subject matter experts, without whom this workshop could not have been successful.
We thank the Laboratory for Analytic Sciences not only for their participation but also for their support in
conducting the workshop. We thank Forrest Allen for managing on-site logistics. Special appreciation
goes to Jordan Crouser, who helped plan the workshop. We also thank the facilitators from RTI
International for their support of the workshop.

v
Contents
Summary ...................................................................................................................................................... iii
Acknowledgments ........................................................................................................................................ iv
1.0 Introduction ....................................................................................................................................... 1.1
2.0 Challenges of Streaming Data ........................................................................................................... 2.1
2.1 Analytic Tasks ........................................................................................................................... 2.1
2.2 Data Characteristics................................................................................................................... 2.1
3.0 Capability Needs................................................................................................................................ 3.1
3.1 Key Challenges to Address ....................................................................................................... 3.1
3.2 Capabilities Needed................................................................................................................... 3.2
3.3 Pitfalls to Avoid ........................................................................................................................ 3.4
3.4 Assumptions .............................................................................................................................. 3.5
4.0 Key Ideas from the Workshop ........................................................................................................... 4.1
4.1 Overall Goal: Understanding Change ....................................................................................... 4.1
4.2 Analytic Process Model ............................................................................................................ 4.2
4.2.1 Rapid Orientation and Reorientation .............................................................................. 4.4
4.2.2 Monitoring ...................................................................................................................... 4.5
4.2.3 Investigative Analysis .................................................................................................... 4.6
4.2.4 Evaluation and Model Tuning ........................................................................................ 4.8
4.2.5 Out-briefing and the Use of Narrative ............................................................................ 4.8
4.3 Mixed-initiative Analysis .......................................................................................................... 4.8
4.4 Collaboration ............................................................................................................................. 4.9
5.0 Research Needs.................................................................................................................................. 5.1
5.1 Visual Representation of Change .............................................................................................. 5.1
5.2 Critical Thinking ....................................................................................................................... 5.2
5.3 Mixed Initiative ......................................................................................................................... 5.2
5.4 Narratives .................................................................................................................................. 5.3
6.0 Concept Illustrations .......................................................................................................................... 6.1
6.1 Streaming Analytics Process Model.......................................................................................... 6.1
6.2 Visual Representations of Change ............................................................................................ 6.1
6.3 Changing Perspectives on Historical Events ............................................................................. 6.3
6.4 Alert Stream Management ........................................................................................................ 6.4
6.5 Living Notebook ....................................................................................................................... 6.5
6.6 Narratives .................................................................................................................................. 6.7
6.7 Management of Information and Data Streams ........................................................................ 6.8
6.8 Graceful Degradation of Data ................................................................................................. 6.10
7.0 Conclusion ......................................................................................................................................... 7.1

vi
Appendix A Workshop Structure .............................................................................................................. A.1
Workshop Goal ................................................................................................................................. A.2
Workshop Preparation ...................................................................................................................... A.2
Workshop Structure .......................................................................................................................... A.2
Workshop Agenda ............................................................................................................................ A.3
Working Session Questions .............................................................................................................. A.5
Workshop Participants ...................................................................................................................... A.6
Appendix B Workshop Scenarios ..............................................................................................................B.1
Appendix C Group 1 Workshop Outcomes ...............................................................................................C.1
Identified Information Challenges .....................................................................................................C.2
Identified Human Factor Challenges .................................................................................................C.2
Capabilities Needed ...........................................................................................................................C.3
PITFALLS TO AVOID .....................................................................................................................C.5
ASSUMPTIONS ...............................................................................................................................C.5
DAY IN THE LIFE ...........................................................................................................................C.5
STORYBOARDS AND SUPPORTING DISCUSSIONS ................................................................C.7
Appendix D Group 2 Workshop Outcomes .............................................................................................. D.1
SCENARIO - THREAT ASSESSMENT ......................................................................................... D.2
Identified Information Challenges .................................................................................................... D.2
Capabilities Needed .......................................................................................................................... D.3
PITFALLS TO AVOID .................................................................................................................... D.5
ASSUMPTIONS .............................................................................................................................. D.5
DAY IN THE LIFE .......................................................................................................................... D.5
STORYBOARDS AND SUPPORTING DISCUSSIONS ............................................................... D.6
Appendix E Group 3 Workshop Outcomes ............................................................................................... E.1
SCENARIO - SAFEGUARDING COMPUTER NETWORKS ....................................................... E.2
Identified Information Challenges ..................................................................................................... E.2
Capabilities Needed ........................................................................................................................... E.3
PITFALLS TO AVOID ..................................................................................................................... E.4
ASSUMPTIONS ............................................................................................................................... E.4
DAY IN THE LIFE ........................................................................................................................... E.5
STORYBOARDS AND SUPPORTING DISCUSSIONS ................................................................ E.5
Appendix F Group 4 Workshop Outcomes ................................................................................................ F.1
SCENARIO - INSIDER THREAT ................................................................................................... F.2
Capabilities Needed ........................................................................................................................... F.3
PITFALLS TO AVOID ..................................................................................................................... F.5
ASSUMPTIONS ............................................................................................................................... F.6
DAY IN THE LIFE ........................................................................................................................... F.6
STORYBOARDS AND SUPPORTING DISCUSSIONS ................................................................ F.7

vii
Appendix G Research Questions .............................................................................................................. G.1
PROCESS ......................................................................................................................................... G.2
CATEGORIES IDENTIFIED .......................................................................................................... G.2
DETAILED RESEARCH TOPICS .................................................................................................. G.3
Group 1: Critical Thinking ....................................................................................................... G.3
Group 2: Streams ...................................................................................................................... G.5
Group 3: Human Factors .......................................................................................................... G.6
Group 4: Narrative Generation and Reporting ......................................................................... G.7
Group 5: Steering and Mixed Initiative .................................................................................... G.8
Visual Representation of Change ............................................................................................. G.9
Queries ................................................................................................................................... G.10
Anomaly Detection ................................................................................................................ G.10
Entity Construction ................................................................................................................ G.11
Threat Modeling ..................................................................................................................... G.11
Appendix H Research Themes .................................................................................................................. H.1
CRITICAL THINKING ................................................................................................................... H.2
Research Area Goals ................................................................................................................ H.2
Research Questions .................................................................................................................. H.2
Near-Term, Mid-Term, and Long-Term Steps ......................................................................... H.3
VISUAL REPRESENTATION OF CHANGE ................................................................................ H.5
Research Area Goals ................................................................................................................ H.5
Research Questions .................................................................................................................. H.5
Near-Term, Mid-Term, and Long-Term Steps ......................................................................... H.6
Technical Approach ................................................................................................................. H.8
MIXED INITIATIVE ....................................................................................................................... H.8
Research Area Goals ................................................................................................................ H.8
Research Questions .................................................................................................................. H.9
Near-Term, Mid-Term, and Long-Term Steps ......................................................................... H.9
Technical Approach ............................................................................................................... H.11
NARRATIVES ............................................................................................................................... H.11
Research Area Goals .............................................................................................................. H.11
Research Questions ................................................................................................................ H.11
Near-Term, Mid-Term, and Long-Term Steps ....................................................................... H.13

viii
Figures
Figure 3.1. Pitfalls Illustration. (Chart created during the workshop.) ...................................................... 3.4
Figure 4.1. Stories of Change. (Chart created during the workshop.) ....................................................... 4.1
Figure 4.2. Example of a Change Overlay, in which the Difference between Data at Two Time Points Is
Shown. (Chart created during the workshop.) ................................................................................... 4.2
Figure 4.3. Alternative Views of the Analyst’s Process Model. (Charts created during the workshop.) .. 4.2
Figure 4.4. One Example System Envisioned to Support Streaming Data Analysis. (Chart created during
the workshop.) ................................................................................................................................... 4.3
Figure 4.5. Two Examples of Summary Displays for Orientation to Changes. (Charts created during the
workshop.) ......................................................................................................................................... 4.4
Figure 4.6. Automated Newscast for Reporting and Orientation. (Chart created during the workshop.) .. 4.5
Figure 4.7. A sketch of The Analytic Environment in Reorientation Mode. (Chart created during the
workshop.) ......................................................................................................................................... 4.5
Figure 4.8. Alert Stream Manager for Aggregating and Exploring Related Alerts. .................................. 4.6
Figure 4.9. Example Sandbox. (Chart created during the workshop.) ....................................................... 4.7
Figure 4.10. Hypothesis Space. (Chart created during the workshop.) ...................................................... 4.7
Figure 4.11. Example Devil’s Advocate Function. (Chart created during the workshop.) ........................ 4.9
Figure 6.1. Streaming Visual Analytics Process Model. (Sketch created after the workshop.)................. 6.1
Figure 6.2. Visual Representation of Change. (Sketch developed after the workshop.)............................ 6.2
Figure 6.3. A Change Dashboard in Both Summary and Detail Views. (Sketches created after the
workshop.) ......................................................................................................................................... 6.3
Figure 6.4. Daily Briefing Avatar, which can Support the Analyst’s Orientation and Reorientation in
Response to Events. (Sketch created after the workshop.) ................................................................ 6.4
Figure 6.5. Concept for Managing Alert Streams. (Sketch created after the workshop.) .......................... 6.5
Figure 6.6. Analytic Operating System for Interacting with Alerts. (Sketch created after the workshop.) 6.5
Figure 6.7. Organization of a Living Notebook or Sandbox. (Sketch created after the workshop.) .......... 6.6
Figure 6.8. Living Notebook. (Sketch developed after the workshop.) ..................................................... 6.6
Figure 6.9. Narratives for Supporting Analysis. (Sketch developed after workshop.) .............................. 6.7
Figure 6.10. Example of One Potential Key Frame and Storyline Visualization. (Sketch created after the
workshop.) ......................................................................................................................................... 6.8
Figure 6.11. One Potential View of Streaming Data. (Sketch created after the workshop.)...................... 6.9
Figure 6.12. Immersive Analysis. (Sketch created after the workshop.) ................................................... 6.9
Figure 6.13. Ideas about graceful degradation of data. (Sketch created after the workshop.) ................. 6.10

1.1
1.0 Introduction
The visual analytics research community has made significant strides in supporting analysts in making
sense of batches of data of particular types. However, relatively little research has been performed to
identify the appropriate methods for supporting human-centered analysis in cases where data is streaming.
A government agency tasked the Pacific Northwest National Laboratory (PNNL) with identifying a set of
research challenges in streaming visual analytics. PNNL performed an initial literature survey to outline
the existing research landscape. Next, in coordination with government stakeholders, PNNL planned and
executed a three-day technical workshop to bring together selected researchers and domain experts from
academia, industry, and government to develop a vision for streaming visual analytics and to identify the
research gaps that must be filled to achieve this vision.
The goal of this workshop was to develop a guiding vision for streaming visual analytics and to identify
important research directions needed to achieve this vision. The central question was how can we best
enable users to understand complex emerging events and make appropriate assessments from
streaming data?
The workshop focused specifically on the user’s perspective. It did not explicitly address the development
of specific algorithms or automated analytics. For purposes of this workshop, it was assumed that any
necessary automated analytics were available.
This report summarizes and expands upon the streaming visual analytics workshop outcomes. To provide
additional context for the workshop results and to aid in planning future workshops, this report also
documents the workshop structure and selected elements of the planning process. (See Appendix A –
Workshop Content).
This report is structured as follows.
The main body of the report summarizes the challenges of streaming data, highlights of the vision
developed during the workshop, and essential research topics necessary to achieve the vision. It also
includes a set of design sketches developed after the workshop to illustrate and expand upon some of
the key ideas.
Appendices describe details of workshop execution, the scenarios that drove discussion, and the
products of the working groups.

2.1
2.0 Challenges of Streaming Data
The analysis of streaming data poses challenges due to the nature of the analytic tasks to be performed
and the characteristics of the data to be analyzed. This section outlines some of the notable challenges.
2.1 Analytic Tasks
For purposes of this workshop, the focus is on tasks that require analysis and understanding streams of
data to assess rapidly changing conditions in order to take action. Traditional approaches to analysis
involve examination and investigation using batches of data that represent current situations as of a
particular moment in time. However, in many situations, it is not effective to step back and perform
offline analysis while the world continues to change. When events are unfolding dynamically, it is
necessary to perform analysis in the moment to understand how best to react. In some cases, these events
are unexpected and do not follow an established model; these challenges are particularly important for
streaming data analysis and place particular demands on analysts to perform timely assessments.
To drive the workshop discussions, the organizers developed a series of scenarios centered on a fictitious
multi-week international sporting event taking place in a fictitious city. This setting served the purpose of
ensuring that offline, batch analysis could not suffice. Continual operation of the event had to be assured
and timely assessments were essential. This setting also served to support development of multiple
scenarios that illustrating the need for timely assessment of streaming data.
The scenarios used in the workshop were as follows.
Situation awareness in streaming data
Threat assessment in streaming data
Safeguarding computer networks
Detecting and responding to insider threat
Full text of the scenarios can be found in Appendix B – Workshop Scenarios.
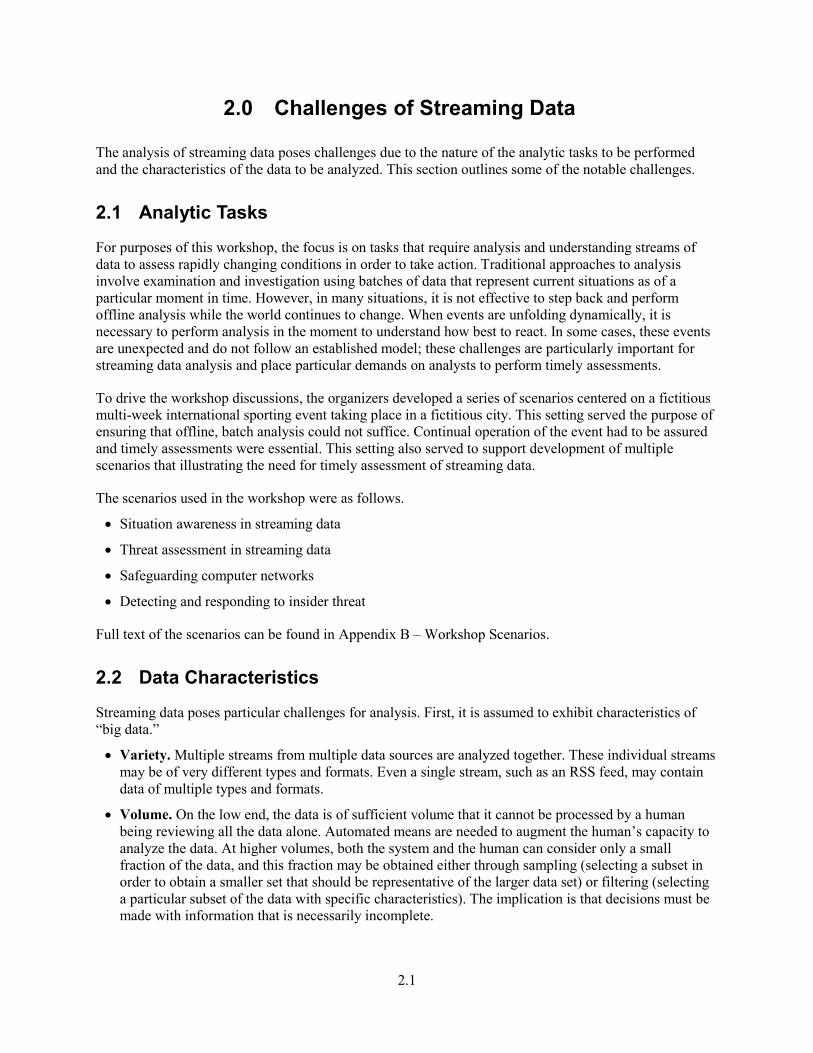
2.2 Data Characteristics
Streaming data poses particular challenges for analysis. First, it is assumed to exhibit characteristics of
“big data.”
Variety. Multiple streams from multiple data sources are analyzed together. These individual streams
may be of very different types and formats. Even a single stream, such as an RSS feed, may contain
data of multiple types and formats.
Volume. On the low end, the data is of sufficient volume that it cannot be processed by a human
being reviewing all the data alone. Automated means are needed to augment the human’s capacity to
analyze the data. At higher volumes, both the system and the human can consider only a small
fraction of the data, and this fraction may be obtained either through sampling (selecting a subset in
order to obtain a smaller set that should be representative of the larger data set) or filtering (selecting
a particular subset of the data with specific characteristics). The implication is that decisions must be
made with information that is necessarily incomplete.

2.2
Velocity. Streams arrive at different rates of speed, and the arrival time of a data item does not
correspond to the date and time of the event it documents. Data may arrive out of order even within a
single stream, depending on the method by which it is streamed. At times of peak demand, some
systems may throttle the data rates or drop data altogether. As data arrives out of order, new data may
drastically affect the interpretation of previous data.
Veracity. Data may be incomplete, conflicting, incorrect, and in some cases intentionally misleading.
Streaming data poses particular problems for traditional visual analytics approaches.
Continuous updates. Unlike typical batch applications, which consider a fixed set of data at a time,
in a streaming environment, new data arrives continuously. To make use of traditional batch-based
visual analytics software, users would have to process batches of data one at a time and consider them
as individual snapshots of data. This approach makes it very difficult to identify changes as they
occur.
Transience. In most visual analytics applications, the underlying data is assumed to be available for
as long as needed. However, it can be assumed that streaming data is of sufficient volume that it
cannot be preserved indefinitely. In the simplest case, the data can be preserved for the lifetime of the
particular analysis. In the more challenging case, the data is available for only a short period relative
to its analytic lifespan.

3.1
3.0 Capability Needs
In the context of the use cases described briefly in section 2.1 and in more detail in Appendix B, this
section identifies the key workshop findings regarding the challenges to be addressed, the capabilities
needed, potential pitfalls, and key assumptions.
Detailed outputs from the individual working groups around each of the four scenarios can be found in
Appendix C through Appendix F.
3.1 Key Challenges to Address
The following are some of the important information challenges identified during the workshop.
Combining large volumes of streaming data from diverse sources. Information must be brought
together from diverse sources to support analysis. How can analysts choose which streams are
required for a situation and understand what their limitations are? How can this data be abstracted
appropriately so that it is understandable to the human analyst? How can this abstraction be balanced
by an ability to track potentially important but unexpected emerging patterns or alerts? How can
assumptions and limitations in particular data sources be exposed to the analyst so that the data can be
combined and interpreted correctly?
Managing change. Data is changing, but analyst understanding of the situation is likely to be
changing as well. New understanding or new data may also change the perceptions of earlier data.
How can the system ensure that analysts do not miss relevant new data? What is needed to manage
situations where new data changes the importance of older data?
Building effective models. Much of streaming data analysis involves either looking for specific
patterns or looking for interesting deviations from expected patterns. Each of these poses particular
challenges.
– Looking for specific patterns is effective if a full set of rules or indicators can be enumerated, but
this is frequently not the case. Additional unexpected patterns can be equally important but may
not be identified automatically because no rule or indicator was defined.
– Rules, indicators, and models of “normal” activity change significantly over time. Having a
baseline model or expectation is very helpful, but this model must also change over time.
Understanding which deviations from normal are significant and which ones are not is a major
challenge.
– Sampling, aggregation, and abstraction to represent the data for human consumption may actually
ignore or disguise small events or small signals that may be important.
Time and pace. There are many information challenges related to the dynamic temporal nature of the
data. Analysis may involve multiple streams that must be analyzed together, but these streams are
unlikely to change at the same rate. There is high potential for latency between when an event occurs
and when an analyst receives information. Incoming data may be out of order, potentially invalidating
previous conclusions. Time to make a decision may be severely limited relative to the volume and
rate of change of the data. There is a risk of losing necessary information or not being able to validate
information due to time constraints.
Incorporating streaming data into the analysis process. Analysts need to consider streaming data
in light of their own hypotheses and what-if assertions. The analyst’s visual interface must support the
user in distinguishing between the data and his or her own assertions. The system must also support

3.2
the analyst’s multiple simultaneous lines of inquiry. Data abstractions must support analyses that
anticipate the future, not simply consider past and present. Systems need to support identification and
testing of biases.
Developing and evolving context. Static information must be incorporated to help bring context to
streaming data. The analyst’s evolving context must also be incorporated and supported. Confidence,
uncertainty, provenance, and data quality must be captured and represented.
Maintaining trust. Veracity of any given stream of data may vary over time. Combinations of
streams pose even greater challenges. How can the system minimize the effect of false positives that
waste users’ time and undermine their trust? How could a faulty or compromised sensor be
identified? How can uncertainty and provenance be represented and preserved in a way that enables
appropriate interpretation of data?
In addition, several challenges related to human limitations were identified.
Dynamically interpreting and re-interpreting data. Analyst interpretations of stories within the
data are as dynamic as the incoming data streams themselves. Users need to be able to identify key
changes or deviations from expected conditions that may require them to question their own models
and assumptions.
Managing attention. In an environment where various automated models and algorithms are
constantly running against incoming data streams to issue alerts, there is a high potential for user
distraction. The system must provide users with a clear understanding of the significance of incoming
data streams and alerts and assist with the triage and analysis process.
Managing complexity. Time-sensitive and highly dynamic tasks can be fatiguing. Analysts need to
track evolving stories or events while understanding the rule sets being used by the system and the
underlying data being processed. In addition, analysts must build their understanding of an ongoing
situation and convey this information to others, even as situations change. This task switching poses
additional burdens on the analyst.
3.2 Capabilities Needed
To address these challenges, a streaming visual analytics system needs to provide the following functions.
Understanding of change. The system must support the analyst in understanding change in many
forms, such as change between previous and current data or deviation from a model of expected
conditions or behavior. New conditions or analytic assertions may necessitate “rewinding” the
analysis to reconsider past data in new contexts. The system must provide support for this as well.
Fusion and reconciliation of multiple data sources and models. This environment will bring
together data of multiple types from multiple sources. It will use analytics of multiple types, each
with its own assumptions and limitations. Models will be of many types, including models to assist
with alerting.
Data must be resolved and associated across multiple time scales and levels of details. Data must be
able to be mapped from low-level data items to higher-level concepts for sharing with the analyst.
The software must both represent the limitations and uncertainties associated with this data and these
models and ensure that data and models are combined in valid ways.

3.3
Adaptive and intuitive visual representations. Because tasks may be complex and time constraints
may be significant, visual representations take on heightened importance as a means of conveying
important information to the analyst and as a means of investigating and understanding events. Visual
representations must adapt to data volumes and rates, as well as different analytic tasks. They must
support the analyst in understanding change and aligning information temporally, spatially, and
conceptually. In addition, the visual representations must present information in a way that draws
attention to the highest priority information and prevents overwhelming the analyst with alerts or
extraneous details.
Mixed-initiative systems. In a streaming environment, the analyst does not have time to provide
explicit direction to the system. Instead, the system should infer user interests and goals from the
user’s actions and initiate appropriate actions to assist the analysts. Computing power is much more
plentiful than analyst time, so the software system should take action proactively to perform
speculative calculations and identify potentially relevant or valuable information. The system should
suggest or recommend alternative explanations of the data.
Maintenance of the analytic context. When reconciling data from multiple sources and analytics, it
is essential that the analyst understand the data and analytic results in context in order that it can be
interpreted appropriately. To support this, data should be enriched as appropriate to show its spatial
and temporal context. Visual representations should highlight both corroboration and conflict of data
from different sources. Users need a rich understanding of which model generated a conclusion. In
addition, the system must make provenance, uncertainty, and confidence measures clear.
Support for the analytic process. The analyst must be able to explicitly and implicitly indicate areas
of interest and follow them over time. The system must provide the analyst with the ability not only
to explore data but also to develop and explore multiple competing hypotheses or lines of reasoning.
These expressions may become complex, including multi-step models, hypotheses, or triggers.
The software must provide an environment in which the analyst can store information, make notes,
record hypotheses, and so on. The analyst should be able to request more information, including more
speculative information, to enrich the analysis. The software should, in turn, be able to map among
objects or entities, rules, narratives, and streams.
The system must support not only understanding of current data but also retrospective examination of
previous data and what-if exploration of potential future scenarios. The analytic process requires fluid
transition among current, prospective, and retrospective analysis.
The analytic environment must permit exploration of data and analytic results at multiple levels of
granularity. The software should also support the analyst in examining available data with respect to
existing real-world models or hypotheses to identify gaps in the data (or evidence). The system
should act as a partner for the analyst, sometimes acting as an assistant and sometimes as a devil’s
advocate.
Steering. The analyst needs the ability to steer or guide models, analytics, and data processes running
behind the scenes, without requiring sophisticated mathematical or computer science expertise. The
system must incorporate the analyst’s explicit articulation of interests and how those findings affect
existing models and algorithms. In addition, the analyst’s actions and annotations provide implicit
expressions of analyst interest and become an additional data stream for the system.
Tuning or steering collections will allow analysts to broaden or narrow the aperture of incoming data
streams as appropriate to the task. This should be accompanied by a stream discovery process in
which the system suggests additional data streams that may be relevant.

3.4
Reports and handoff. The system must provide capabilities to support reporting and narrative
creation. The consumer for this narrative could be supervisors or decision makers, other collaborators
and analysts, or the analyst himself at some future time. The system must provide an ability to create
enriched data snapshots to create a rolling narrative and to aid in creating summary reports that can be
pushed to the appropriate audiences.
Performance monitoring. The system must take proactive steps to prevent analyst fatigue and
should detect when fatigue is setting in.
3.3 Pitfalls to Avoid
The following potential pitfalls were identified by the workshop participants.
Failing to manage demands on the user’s time and attention. The user will still be required to
attend to alerts, develop and follow alternative lines of reasoning, build and refine models, and
interject knowledge into the system. Overwhelming the user with details is a potential danger.
Requiring too much expertise from the analyst. The analyst is not an oracle, but there is a danger
that the system will require that level of expertise from the analyst. The complexity of the user
interface cannot outgrow its intuitive use by analysts.
Figure 3.1. Pitfalls Illustration. (Chart created during the workshop.)
Over-reliance on imperfect models and data. Models have inherent limitations; data is necessarily
incomplete. Relying too heavily on models and analytics will result in errant conclusions. There is a
danger of overfitting models to data or using models that, while accurate, cannot be explained to the
analyst.
Lack of shared language between the analyst and the system. The human-machine interface needs
to be clear and concise. Meaning and uncertainty must be communicated through a common language
that is easily understood by the analyst and easily interpreted by the system. The analyst must be able
to express analytic thinking within the system and understand the actions taken by the system to
support the analysis.
Failing to identify emergent events. There is danger on the part of both the system and the analyst
that only those expected events and issues will be identified and that emerging issues will not be
recognized.
Failing to support the analytic process. The software must counteract, rather than enforce, bias. It
must preserve sufficient history to be able to consider the past and project into the future.
Failing to manage the computational load. In times of heavy load, the system must degrade
gracefully. The system must not become too slow to keep up with analytic demands.

3.5
3.4 Assumptions
The following are important assumptions made by workshop participants.
The system can know about all of the data streams accessible to the analyst.
Everything that can be streamed can be stored in some limited form so that the analyst can rewind and
look at historical information when needed. However, only a subset of data can be stored over time,
and this subset may be very small.
The timeframe for analysis is constrained.
There will be gaps in data and data may be out of order.
Methods for collection, processing, and analytics are available.
Tasks require identification of both expected and unexpected or emergent behaviors.


4.1
4.0 Key Ideas from the Workshop
Several key ideas came from the development of visions for a future streaming visual analytics
environment. This section highlights a selection of those ideas. Greater details about the larger set of ideas
discussed in the workshop can be found in Appendix C through Appendix F.
4.1 Overall Goal: Understanding Change
Streaming visual analytics is focused on identifying, understanding, and telling stories about change.
(Figure 4.1 shows an image from the workshop highlighting this fact.) In some situations, these changes
may be anticipated, such as in alerting systems where particular triggers can be established or rules for
suspicious behavior can be established. In other situations, changes may represent emergent behaviors or
other unexpected or un-modeled situations. Both anticipated and unexpected changes are important to the
analysis process.
Figure 4.1. Stories of Change. (Chart created during the workshop.)
Understanding change requires a model of current or potential future conditions, such that important
deviations from expectations can be recognized. All changes must be understood in context. This context
could include models of past and expected current behavior, compact histories of past behavior, or other
representations.
Existing visual analytics methods do not address the need for understanding change as it occurs.
Traditional batch-based methods do not provide meaningful mechanisms for comparing current and past
conditions.
Understanding change places new demands on the visual analytic environment. As one workshop group
stated, the research community lacks primitives for representation of and interaction with change. This
gap must be filled to support streaming visual analytics. Changes must be examined at multiple different
timescales and resolutions, as relevant changes may not be apparent at too high or too low a resolution.
Among the solutions for examining change are time controls for moving forward and backward and
overlays for showing change between two times (Figure 4.2).

4.2
Figure 4.2. Example of a Change Overlay, in which the Difference between Data at Two Time Points Is
Shown. (Chart created during the workshop.)
Understanding how to identify and measure change algorithmically is nontrivial and depends on context.
If a particular item is in the same state at times t0 and t2, does it matter that the item was in a different state
at time t1? Understanding change also implies understanding other types of temporal patterns, including
synchrony, correlation, and sequential patterns.
During streaming data analysis, the data is not the only element undergoing change. The analyst’s mental
model or understanding of a situation also evolves, particularly when the situation is new or unexpected.
Throughout the investigation, the analyst’s insights and assumptions change the lens through which data
is interpreted. These dual changes—in the data and in the analyst’s mental model and hypotheses about
the situation—make streaming visual analytics a complex challenge.
4.2 Analytic Process Model
While all four scenarios entailed different combinations of analysis and monitoring tasks, consistent
themes emerged around an analytic process model.
Figure 4.3. Alternative Views of the Analyst’s Process Model. (Charts created during the workshop.)

4.3
As shown in Figure 4.3, the major tasks for an analyst in a streaming visual analytic environment include
the following.
1. Orientation – becoming familiar with important developments and events while the analyst is away
from the system, such as on a lunch break or at shift change. The analyst may also need to reorient
after a significant change occurs.
2. Monitoring – actively observing current data, models, or alerts.
3. Investigative analysis – performing more in-depth investigative exploration, hypothesis generation
and testing when something of interest is detected. Through the analysis process, the analyst builds
and refines narratives explaining the ongoing events.
4. Evaluation and model tuning – the analyst takes explicit or implicit actions to select, adjust, and
refine models as appropriate to the ongoing monitoring and analysis.
5. Out-briefing – communicating the results of monitoring or analysis to another audience, whether this
is a decision maker or a collaborator.
Particular portions of the visual analytic environment support each of these tasks. Figure 4.4 illustrates
one example of a potential visual environment that combines these capabilities. In this view, events of
interest are extracted from the stream based on models. A daily plan shows anticipated events. The living
narrative supports both analysis and reporting.
Figure 4.4. One Example System Envisioned to Support Streaming Data Analysis. (Chart created during
the workshop.)

4.4
4.2.1 Rapid Orientation and Reorientation
Analysts need to orient themselves to current situations at multiple stages in the workday, including the
start of the day, after breaks or meetings, and after focusing on other issues for a long time. Several
groups identified alternative methods for helping the analysts orient themselves to ongoing activities,
including a digest or similar view containing relevant information about recent past events, issues of
current interest, and upcoming events (Figure 4.5). This information could be structured as a portal, or it
could be presented through an automated newscast (Figure 4.6), which uses an avatar to present an update
on current conditions using natural language.
An important variant on this theme is the idea of reorientation when a shift in priorities occurs. The
analyst must shift focus from previous analytic questions to something completely new. In some cases,
this situation also necessitates looking back at recent information to consider it in light of the new tasks.
See Figure 4.7.
Figure 4.5. Two Examples of Summary Displays for Orientation to Changes. (Charts created during the
workshop.)

4.5
Figure 4.6. Automated Newscast for Reporting and Orientation. (Chart created during the workshop.)
Figure 4.7. A sketch of The Analytic Environment in Reorientation Mode. (Chart created during the
workshop.)
A natural extension of the need to understand change is the ability to perform current, retrospective, and
prospective analysis. The analyst needs the ability to understand the current situation, to prospectively
anticipate what may happen next, and to examine past data.
4.2.2 Monitoring
The monitoring phase involves observing data streams and alerts arising from streams. In many
situations, the overall number of alerts could be overwhelming, so techniques for triage, prioritization,
and aggregation of alerts will be important. An example of an alert triage system is shown in Figure 4.8.

4.6
Figure 4.8. Alert Stream Manager for Aggregating and Exploring Related Alerts.
One important goal is to raise the level of abstraction for the analyst, so that rather than focusing on the
low-level details of individual records, the analyst’s focus can be elevated to consider the data at the more
conceptual level of entities, relationships, and events.
4.2.3 Investigative Analysis
Either the analyst or the system may identify important alerts or unexpected events that require
investigation. An environment for supporting this analysis activity is critical. This environment can be
thought of as a private sandbox in which the analyst investigates and makes notes (Figure 4.9), or an
environment to test alternative hypotheses organizes and tests hypotheses and capturing supporting and
refuting evidence automatically (Figure 4.10). It could even take the form of a living narrative (Figure
4.4).

4.7
Figure 4.9. Example Sandbox. (Chart created during the workshop.)
Figure 4.10. Hypothesis Space. (Chart created during the workshop.)
The analysis environment is organized around higher-level concepts, rather than low-level data items.
This analysis space could also take the form of a living evidence notebook containing data, hypotheses,
and private notes. The notebook could provide valuable functions such as automatic rearrangement based
on temporal or geospatial characteristics, for example. It could also act as a type of flipbook to allow the
analyst to see change over time.
The analysis space provides support for iterating through hypotheses and performing the convergent and
divergent thinking activities central to the analysis process. Critically, it allows the analyst to consider
multiple threats or investigations simultaneously, understanding that multiple issues could occur at once.
It supports the analyst’s critical thinking. It is also the means by which the system’s devil’s advocate
suggestions are expressed.

4.8
4.2.4 Evaluation and Model Tuning
Models are responsible for many different aspects of the system’s behavior. Models map between low-
level data and the higher-level concepts being acted on by the analyst. Models map low-level data to
patterns of interest, producing alerts. Models correlate data from multiple sources to produce a more
complete understanding of phenomena of interest. The analyst must be able to tune and test these models
using techniques that do not require subject matter expertise on the model in question.
Transparency and control are important to ensuring that the system is effective. Ideally, the analyst also
has explicit or implicit control over data management issues such as data degradation and age-off. Interest
or active use by an analyst indicates that the data should be preserved longer than unused data. When data
must age off, a process of graceful degradation could be used to keep compressed versions of the data,
and then metadata about the content, for some period of time rather than simply deleting all data after a
certain period has elapsed.
4.2.5 Out-briefing and the Use of Narrative
Analysis results must naturally be communicated to others to enable action. In the heat of an event,
reports may be required many times in a shift. The same techniques used for analyst orientation can be
used for out-briefing as well. These are described above.
Another approach to supporting out-briefing is through a “narrative builder.” The narrative builder
automatically captures provenance and attaches narrative to evidence, rules, and streams. The analyst can
continually update the narrative, which is used to support both reporting and analysis. The narrative
builder also displays cues when elements of the narrative are becoming “active” due to system activity on
behalf of the analyst.
The idea of analytic key frames was also discussed at length. Analytic key frames capture critical stages
in the analysis process, complete with data and analytical reasoning. A series of key frames can be used to
summarize an analysis.
4.3 Mixed-initiative Analysis
A strategic task that takes weeks or longer affords the luxury of examining data offline. Streaming data
analysis is inherently tactically focused. Streaming analytic tasks discussed in the workshop entail either
1) continuous monitoring, observation, and responsive action or 2) short time to decision and action.
Given demands on analyst time and attention, automated assistance in the form of mixed-initiative
systems becomes much more urgent than in static data analysis cases.
As one participant stated, “In order for a human to keep up with streams of this size and magnitude, the
computer is going to have to do a lot more work than the human. It can’t be ‘I take an action, the
computer takes an action.’ It has got to be, ‘I take an action and the computer takes a hundred actions or a
thousand actions.’” These actions will not necessarily all be productive, but the system should have
sufficient capacity to try many avenues and proactively report to the analyst only those searches and
computations that are fruitful. The mantra for this approach is, “Waste flops, not thoughts.”
As the analyst monitors streams and investigates hypotheses, the analyst’s actions become a data stream
for the system. The system should infer the analyst’s goal from their actions in the system and should
proactively run potentially appropriate models, examine data, and otherwise take action automatically to
help enrich and support the analysis. At the same time, the system must be judicious in presenting

4.9
recommendations to the user, as analyst attention is precious. The system must make informed decisions
about whether the finding at hand is relevant to the current task, and if not, whether it is sufficiently
urgent to divert the analyst’s attention. The system should act as another analyst on the team.
4.4 Collaboration
Although the use scenarios driving the workshop did not address collaboration explicitly, it is clear that
collaboration plays an important role in streaming visual analytics. Individuals may collaborate on shared
tasks, and around-the-clock analysis requires collaboration among individuals on different shifts to
maintain awareness and continuity.
In addition, the analyst is also collaborating with his prior and future self, capturing key analytic insights
and milestones in the form of analytic key frames for future use and revising previous thinking in light of
new events. The system must support this form of collaboration as well.
In streaming visual analytics, the system is also a full collaborator in the process, acting as both an
assistant and a devil’s advocate. (See Figure 4.11.)
Figure 4.11. Example Devil’s Advocate Function. (Chart created during the workshop.)
Successful human-machine collaboration relies on a shared “mental model” between the analyst and the
system. Both system and analyst must understand the current task and the activities underway. Both
human and system must use good analytic practice by considering multiple hypotheses and being open to
alternative explanations.
This collaboration between the analyst and the system also requires a shared a common language for
communication. Ideally, this shared language could be natural language, which removes any burden from
the analysts to translate their thoughts for the system. However, another alternative might be the
development of an analysis language that expresses analytic concepts in a consistent way that both human
and machine understand.


5.1
5.0 Research Needs
The group’s vision for a streaming visual analytics environment is one in which the analyst and the
system work in concert to assess changes in data to identify and respond to threats. This analytic
environment supports analyst orientation and reorientation to understand changes. It allows the analyst
and the system to work together to iteratively narrow and broaden focus in order to explore changes at
multiple levels and to build and test hypotheses.
To achieve this vision requires research breakthroughs in several key research areas. A complete list of
the research topics brainstormed by the group can be found in Appendix G.
Small groups examined four topical areas in more detail.
Visual representation of change, including techniques to manage user attention and maintain context
Critical thinking in a streaming environment, including structuring and expressing mental models,
hypothesis development and testing, and mechanisms for addressing bias
Mixed-initiative systems and user steering of underlying models and data
Development of narratives and stories of change to support communication and collaboration.
Each of these areas is described in further detail in the sections below.
5.1 Visual Representation of Change
The goal of this research area is to leverage visualization to facilitate decision making at a time scale
appropriate for the problem. Every problem has its own natural time scale. Streaming visual analytics
may not be necessary for problems with very long time scales but is essential for problems with very
short time scales.
Key research questions include the following.
1. Visualization. When is visualization appropriate? When is streaming visualization appropriate?
When and in what ways does the use of static visualizations fail on streaming data?
2. Baselines. How does the system communicate the baseline? How does the system represent the
baseline visually and compare it to what is currently occurring? How do you show a delta or the loss
of data? How should data be aggregated for visual representation?
3. Perceptual, cognitive, and human factors. What are the design criteria and design principles space
around streaming visualization? What are the dimensions of visual change? What encodings can we
consider separable, and what encodings are pre-attentive in a streaming context? Are these the same
as in a static context?
4. Beyond change. In addition to detection of change, other things that may be of central interest
include co-occurrence, synchrony, and correlation. How best can these be represented visually?
5. Interaction. What are the appropriate techniques for interacting with a visualization that is changing?
When do analysts transition from a streaming context to a deep dive forensics context? Is it possible
to combine streaming visual analytics and deep forensic analysis?

5.2
5.2 Critical Thinking
The goal of this research area is to enable the analyst and the system to co-develop and structure
explanations and hypotheses of important changes over dynamic data. This capability involves building
and sustaining the explanation of an ongoing situation or event.
The system and the analyst jointly structure their reasoning and identify gaps and inconsistencies, data
that does not align, and so on. The system and the analyst work collaboratively to create a hierarchy of
hypotheses and evidence fragments. Fragments and explanations will be examined and either
incorporated or pruned using a series of convergent and divergent processes.
The goal is to have the system understand this dynamic analysis process. The analyst’s expression of
information needs and hypotheses, some of which are explicit and some of which are tacit, must be met
with the system’s offer of information in the language of the analyst.
Key research questions include the following.
1. Signatures. How can explicit signatures be built from streaming data, so that ultimately detectors for
triggers of interest can be built?
2. Externalization of hypotheses and explanations. What are the required visual analytics techniques
for explanations and hypotheses, such that the analyst’s reasoning is explicitly expressed and
available for reasoning by the analytic environment?
3. Inference from user interaction. How can model-based systems support the user by inferring data
and analytic task goals through observations of the analyst’s actions of constructing and exploring
hypotheses?
4. Inspection and critique. How can active inspection and critique be used to enable the system to not
only help the analyst find evidence related to hypotheses but also play a devil’s advocate role?
5. Evaluation. How can the combined critical thinking of humans and systems be evaluated?
5.3 Mixed Initiative
The goals of this research area are the following:
1. Balance broadening and focusing activities. At times, systems may broaden the analysis (divergence)
while the analyst provides the focus (convergence); at other times, the systems provide focus while
the people increase the breadth of the investigation.
2. Allow user intuition and minimize bias. How can the system identify the difference between intuition
and bias?
3. Support machine learning interpretability and trust, in an effort to help the analyst understand what
the machine learning system is doing, how much longer it might take, and what it might find.
Steering is assumed to be a part of mixed-initiative systems. The system can initiate many actions, as can
the user. This group assumes a cycle between the user and the system, and each action can result in
steering in either direction. For example, the system could steer the user away from the tunnel or biased
path, or the user could steer the system away from blind alleys.
Key research questions include the following:

5.3
1. Elegant decay. How can the system capture and apply its understanding of the user’s information
need to multi-modal streaming data and optimize compression or decaying of aging data to best
match the need?
2. Broadening and narrowing. The analyst’s process is one of examining alerts and considering
hypotheses, iteratively narrowing and broadening the focus. How can the system classify the analyst’s
activities as convergent or divergent and initiate the appropriate models to both support the analysts’
current goals and complement their activities with others (say, broadening when analysts are
narrowing their focus)?
3. Machine learning interpretability and user trust. How can the user steer the system implicitly and
explicitly? How can the system communicate its actions, key analytical result differences, and other
important information about its actions to the analyst?
5.4 Narratives
The goal of this research area is to enable the construction of narratives that help orient the analyst,
support analysis, and facilitate reporting, all in a streaming environment.
A selection of research questions includes the following.
1. Defining interesting information. How do analysts and systems define what is interesting and
suspicious in order to help support the analytic process? Is this work done by the analyst, the system,
or through human/machine collaboration?
2. Analytic key frames. Analytic “key frames” are a construct to permit summarization of key points in
an analysis process. What should analytic key frames consist of? What should they look like? When
should they be captured?
3. Orientation and reorientation. What visual analytics methods exist to support branching and
competing hypotheses? How do we use visualization to rapidly reorient people, and what are the
mechanisms to support that?
4. Narrative and reporting. What is needed by an analyst to construct a story or explain what is going
on for herself? What is needed when the analyst must tell this story to others? What is the difference
between narrative and analytic reporting?
5. Narrative construction. How can the analyst and the system build a narrative collaboratively and
keep it up to date? What parts should be automatically constructed? What is the right scale of the
data? What are the appropriate goals for automated narrative construction?
6. Streams with respect to narratives. How does the system convey streaming data? How can the
system manipulate streams and inform users of new streams and new data for consideration within
their narrative?
7. Order. How can the analyst resolve “out of order” data? How can the system support this resolution
process?


6.1
6.0 Concept Illustrations
Following the workshop, designers developed sketches illustrating and extending some of the concepts
discussed. This section presents those sketches.
6.1 Streaming Analytics Process Model
The overall streaming analytics process involves three main tasks: monitoring, analysis, and reporting
(Figure 6.1). The analyst must be able to orient to new tasks and new developments at any time. The
analyst’s interface combines visualizations and alerts with a thinking space for analysis. When urgent
changes require reorientation, the shift in tasking could also change the type of data, visualizations, and
recommendations presented to the analyst.
Figure 6.1. Streaming Visual Analytics Process Model. (Sketch created after the workshop.)
Relevant concepts: Streaming process model, narrative, orientation and reorientation
6.2 Visual Representations of Change
Visualizing change in streaming data is an important and challenging task (Figure 6.2). Part of this
challenge lies in the fact that change happens at different scales and with varying complexity. How this

6.2
should be visualized depends on the user’s needs. For example, the user may need to see only one
variable in one location, and therefore could see the raw data stream, or the analyst may need to see
changes in multiple variables across multiple locations, which would make data aggregation a preferred
option. Additionally, analysts (as well as the system) must consider the extent of change that is important
in a given situation. One could imagine a “change threshold” control that analysts can adjust for their
environment.
Figure 6.2. Visual Representation of Change. (Sketch developed after the workshop.)
Designers must consider various aspects of the user experience and user interactions when designing for
change visualization. Designers will have to understand the user’s task and role, as well as the operating
environment. Additionally, designers must think about what interactions might be beneficial for
conveying change. Should users be immersed in an environment when viewing the data (e.g., virtual
reality experience), or do they need simple notifications (possible conveyed by a wearable device), or
perhaps they just need to be able to view the data in two dimensions and get details on demand by
zooming in or out when they need to. Similarly, designers also must consider interactions and experiences
that minimize change blindness.
Change could be represented in a simple dashboard that represents topics and themes of interest. Figure
6.3 illustrates one example. A data lens could be used to allow focus and discovery of hundreds of
concepts that would change the dashboard to particular topics of interest. The user would also provide a
date/timestamp of a past time. The dashboard would show trends, relevant visualizations, and overlays to
show changes from the time provided by the analyst until the current time. A spoken narrative is provided
by the system to augment the experience, allowing the analyst to focus attention on more than one aspect

6.3
of the data. The narrative could even be played through earbuds on the way to work or while getting
coffee.
Relevant concepts: Visual representations of change
Figure 6.3. A Change Dashboard in Both Summary and Detail Views. (Sketches created after the
workshop.)
6.3 Changing Perspectives on Historical Events
Different aspects of data can be highlighted depending on what event and which perspective the analyst
should be primed for and what events evolve. Although ultimately the underlying data would be the same,
the analyst would be primed to attune to a certain set of assumptions or particular conditions based on
predictions of what might happen (possible determined by predictive analytics run on data streams). The
analyst could be primed for these events in the form of a “Daily Brief,” not unlike the recap seen at the
beginning of TV shows that give a quick summary of what happened during the last episode, only
showing the features relevant to the story as it will progress in the upcoming episode. The Daily Brief
could be a series of clips of/about the data, presented or narrated by the system itself in the form of an
intelligent avatar. An illustration can be found in Figure 6.4.
Relevant concepts: Changing perspectives on historical events, narrative, orientation, and reorientation

6.4
Figure 6.4. Daily Briefing Avatar, which can Support the Analyst’s Orientation and Reorientation in
Response to Events. (Sketch created after the workshop.)
6.4 Alert Stream Management
One way to address large streaming data is to provide listeners on the streams that contain user and
system provided descriptions of indicators of interest. This automates the alerting process. However,
analysts still must monitor the large volume of resulting alerts.
Alert streams could be visualized vertically like falling rain, with the most recent at the top and historical
alerts fall to the bottom (Figure 6.5). The alerts would look similar to DNA markings where color is
encoded to show impact and risk scores. The markings could also use transparency and blurred edges to
show measures of trust and relevance. Stream thickness could encode relevance or be adjusted by the user
to train the system about the user’s interests. The analyst could turn streams on and off by choosing from
the list of streams on the far left. This capability would allow the analyst to focus on only threats relevant
to current task. Significant alerts can be compiled across streams and shown as baseball cards to the right
of the rain visualization (see Figure 6.6).

6.5
Figure 6.5. Concept for Managing Alert Streams. (Sketch created after the workshop.)
Figure 6.6. Analytic Operating System for Interacting with Alerts. (Sketch created after the workshop.)
Interacting with a specific alert could activate across all visualizations to show context and related data.
Changes could be shown using visualization overlays and stream deltas. An analyst could work across
multiple displays, giving them access to all the tools described above with common interactions and
metaphors like selection, highlight, and annotation to create an analytic operating system. The analyst
could move seamlessly across the analytic process from monitoring to analysis and reporting. Orienting
and re-orienting would be transparent and as effortless as watching previous clips or key frames for
context between projects or absences.
Relevant concepts: Orientation and reorientation, graceful degradation of data, support for critical
thinking, mixed initiative, alert stream management, narratives
6.5 Living Notebook
Analysts interacting with streaming data could benefit from a “Living Notebook.” A Living Notebook
(shown in Figure 6.7) is a digital artifact (perhaps made from electronic paper with an e-ink display) that
maintains snapshots of data, updates data as it is still streaming, and allows annotations by the user. The
notebook is a place where the analyst can digest the data and use it to aid in critical reasoning tasks.

6.6
Figure 6.7. Organization of a Living Notebook or Sandbox. (Sketch created after the workshop.)
The living notebook could exist in the context of a sandbox or think space for the analyst (Figure 6.8).
The sandbox acts as a canvas for capturing information of interest or working on hypotheses. The analyst
would drag and drop information on to the canvas; provenance and other important context for the
information is preserved. Analysts could group, compare, and contrast through multiple interactions.
Figure 6.8. Living Notebook. (Sketch developed after the workshop.)

6.7
The canvas could be used to capture the analyst’s mental model and even help steer other systems through
annotation, interaction, and information context. Recommendations could surface from other people, data,
analytics, and streams. New data based on the work in the canvas could also surface throughout the
analytic process over multiple sessions, allowing analysts a way to orient and then reorient as their
thoughts and streams change over time.
When an insight is discovered, the analyst could drag it into living notebook on the right of the sandbox
for archiving and report generation. The notebook would link back to the canvas and other analytic tools
for context of thought, history, and evidence.
Relevant concepts: Living notebook, orientation and reorientation, support for critical thinking, data
interaction space, capturing analysts mental models
6.6 Narratives
Because the data is constantly updating, users must have a way to keep up with the data as it streams and
as the situation as it evolves. A narrative benefits analysts in this task. The narrative could manifest to
users in various ways: as a daily or hourly summary of all data, a summary of just the data from the
Living Notebook, or an ongoing narrative built by multiple users throughout the day (see Figure 6.9).
Figure 6.9. Narratives for Supporting Analysis. (Sketch developed after workshop.)
Narratives would operate on several levels. Some would be for personal use, such as the summary derived
from the Living Notebook. Others would be for multiple users to refer to, such as the ongoing group-

6.8
constructed narrative or a daily update to brief a team before the start of a shift. Different users could drag
and drop data from different sources to a main display where the data would be organized temporally and
could be annotated by any user.
Narratives can be represented using key frames and storyline visualizations (Figure 6.10). These key
frames can be points in analysis that the user thinks are worth saving or automated by the system based on
the amount of change from previous analysis. They can be used as bookmarks to rewind if the current line
of reasoning proves fruitless to help return to previous hypotheses or for exploration. The storyline can
show trends in entities and connectedness based on proximity of concepts in the visualization. Selection
scrubbing can link all the visualizations together to show state of information for each key frame and
concept in the story flow.
Figure 6.10. Example of One Potential Key Frame and Storyline Visualization. (Sketch created after the
workshop.)
Relevant concepts: Narrative, orientation and reorientation, support for critical thinking, situational
awareness, data interaction space
6.7 Management of Information and Data Streams
Streaming and dynamic data arrive at different rates and contain multiple information types that are
difficult to fuse and correlate. Information is sampled and does not typically contain an accurate
description of the whole stream. Visual representations of the stream, the information it contains, and trust
or accuracy indication become necessary in order for the analyst to adequately ascertain threats and risk
indicators.
The interface could show information streams as a tenuous fiber that flows through the information space
(Figure 6.11). Each segment of the fiber is encoded to represent time and accuracy using segment length
and thickness. Each segment could also be encoded with color to show risk or relevance to current task.

6.9
Figure 6.11. One Potential View of Streaming Data. (Sketch created after the workshop.)
On interaction with a segment, relationships to information or concepts can be shown through lines to
topic clusters. The lines would animate and move between the clusters in response to further user
interaction. The streams could show degradation of available historical data using a blur on the line itself.
The analyst could key frame the visualization based on interest. Across the bottom of the display, a
timeline visualization shows data amounts sampled across all the streams or a selected subset.
Imagine being immersed in the experience using virtual analytics (Figure 6.12). The streams and
information surround the analyst. The use of audio cues alerts analysts to information outside of their
current vision. They can walk through the information space, moving around areas that might obscure
data or information of interest. Analytic key frames exist above the users in space while the sources for
the streams begin at their feet. The use of gesture allows the analysts to emphasize, highlight, and select.
Analyst can drag information to separate sandbox areas to focus topics and hypotheses. Analysts can
dismiss sources and streams as not of interest or can add new streams as they become available.
Figure 6.12. Immersive Analysis. (Sketch created after the workshop.)
Relevant concepts: Orientation and reorientation, graceful degradation of data, support for critical
thinking, mixed initiative, stream management

6.10
6.8 Graceful Degradation of Data
Archiving all streaming data in its original form would be impossible. However, instead of data simply
disappearing after it has been kept for the allotted period, data could age off gracefully, degrading in
quality first before it disappears completely. Additionally, “Data Impressions” could be made and stored
for much longer. A Data Impression would be the pattern made by a data stream over a certain period of
time (a day or a week, for example) (see Figure 6.13). Therefore, although users could not deeply
investigate the impression, they could at least see the general shape and pattern of the data and derive
meaning from that.
Figure 6.13. Ideas about graceful degradation of data. (Sketch created after the workshop.)
It must also be considered that data streams at different rates and in different quantities. As such, different
data will degrade and eventually disappear at different rates. To avoid confusion due to these different
rates, perhaps the user could adjust controls that would align the age-off rates of different data streams. At
a minimum, the user must be made aware of the age-off rates of various data streams.
Relevant concepts: Graceful degradation of data, streaming rates, visual representation of change

7.1
7.0 Conclusion
The streaming visual analytics workshop brought together a diverse mix of researchers and subject matter
experts to develop a vision for streaming visual analytics and identify the research questions to address in
order to realize this vision. The ideas from this workshop will influence future research and development
directions. While the longer-term vision will take time and effort to fully realize, many opportunities exist
for shorter-term breakthroughs that will significantly enhance the ability to understand change in a
streaming data environment.


A.1
Appendix A
Workshop Structure

A.2
Appendix A
Workshop Structure
Workshop Goal
The goal of this workshop was to develop a guiding vision for streaming visual analytics and to identify
important research directions needed to achieve this vision. Our central question was how can we best
enable users to understand complex emerging events and make appropriate assessments from
streaming data?
The workshop focused specifically on the user’s perspective. It did not explicitly address the development
of specific algorithms or automated analytics. For purposes of this workshop, it was assumed that any
necessary automated analytics were available.
Workshop Preparation
The workshop was planned in conjunction with personnel from the sponsoring organization, the
Laboratory for Analytic Sciences, and Jordan Crouser of Smith College.
The use scenarios were developed by based on an overarching setting that would provide an opportunity
to examine at least four different potential problem spaces in streaming visual analytics. Although it was
an artificial scenario, it was generally straightforward for participants to imagine themselves in the
scenario and identify both the challenge and opportunities that resulted.
Recommended participants were identified with input from all the planners. The goal was to bring
together at least twelve non-government researchers with expertise in areas including visual analytics,
machine learning, and cognitive science. In addition, government researchers and subject matter experts
in various application areas were asked to participate.
Prior to the workshop, the PNNL workshop organizer held telephone discussions with selected non-
government researchers to address their questions about the workshop. These discussions were helpful for
individuals who had not previously considered similar analytic scenarios.
Participants were provided with several read-ahead materials prior to the workshop.
A document describing streaming visual analytics and outlining the workshop scenarios
A literature review outlining current research in streaming visual analytics
A draft agenda.
Workshop Structure
The workshop was structured to provide both small team collaboration and broader sharing across the
entire workshop group.
The workshop was designed to last for three days.

A.3
The goal of the first day was to introduce participants to the topic and to allow the small groups to
begin working together to identify challenges and capability needs for their assigned scenario.
The goal of the second day was to have the small groups delve deeply into their assigned scenario to
develop storyboards for their future vision.
On the third day, participants focused on the research questions that must be answered in order to
achieve their vision. Through a set of plenary and small group activities, more detailed preliminary
research goals were outlined for four research areas.
The workshop began with plenary presentations to set the context for the workshop and outline the goals.
The director of the Laboratory for Analytic Sciences provided the keynote address. Following these
presentations, the workshop alternated between small group working sessions and plenary sessions in
which each group presented their results and got discussion and feedback from the remainder of the
participants.
Participants were pre-assigned to groups in an effort to balance the backgrounds and skills among the
groups. Each group contained a mix of technical experts in the various science disciplines represented and
government personnel who could represent a user’s perspective. Independent facilitators were assigned to
each small group to support process execution and serve as a resource to the group.
Each group captured their notes on paper posted on the wall. Audio recordings were captured during the
group report sessions so that the workshop team could better interpret the complex wall charts following
the workshop.
Workshop Agenda
The following is the workshop agenda used for the event.

A.4
Streaming Visual Analytics Workshop Agenda
North Carolina State University
January 12-14, 2016
Tuesday, January 12
8:30 am Welcome and Introductions
9:45 am Keynote
10:45 am Break
11:00 am Key Questions and Use Scenarios
12:00 pm Lunch
1:00 pm Small Group Working Session #1 – Identify Information Challenges
2:30 pm Break
2:45 pm Working Session #1 Group Reports
3:15 pm Small Group Working Session #2 – Brainstorm New User Capabilities
4:50 pm Wrap-up Announcements
5:00 pm Depart for the day
Wednesday, January 13
8:30 am Announcements
8:40 am Updates to Working Session 2 results
9:00 am Working Session #2 Group Reports
10:00 am Break
10:15 am Small Group Working Session #3 – Script Development
12:00 pm Lunch
1:00 pm Small Group Working Session #3 Group Reports
2:00 pm Small Group Working Session #4 – Storyboarding
3:00 pm Break
3:15pm Small Group Working Session #4 continued
4:00pm Working Session #4 Group Reports
5:00 pm Depart for the day

A.5
Streaming Visual Analytics Workshop Agenda
North Carolina State University
January 12-14, 2016 Thursday, January 14
8:00 am Announcements
8:05 am Working Session #5a – Key Research Gaps Identification and Affinity Mapping
9:45 am Break
10:00 am Working Session #5b – Development of Research Themes
11:30 am Working Session #5b – Report
12:00 pm Lunch
12:30 pm Working Session #6a – Decomposition of Research Themes and Timelines
2:30 pm Working Session #6a – Report
3:00 pm Break
3:15 pm Working Session #6b – Identification of Thought Leaders and Key Dependencies
4:15 pm Action Items
4:30 pm Adjourn
Working Session Questions
Each small group working session focused on specific questions to be addressed by the group regarding
their individual scenarios. The questions addressed in each working session were as follows.
Working Session 1 - Identify Information Challenges
What are the primary information challenges that an analyst faces in this scenario? Consider
– Data problems
– Understanding problems
– Special problems that are introduced by streaming
Working Session 2 - Brainstorm New User Capabilities
What functions will a future streaming human-centered analytic environment have to provide to
address the information challenges we identified? What does the system need to do? What is your
rationale?
What important pitfalls will this system need to avoid?
In this session
– Assume art of the possible.
– Assume the goal is at least five years from now.
– Assume policy is not a barrier.
Working Session 3 – Script Development

A.6
Describe a day in the life of a user working with this future system.
– Focus on the new things this enables that can’t be done now
– Focus on the streaming aspects of the environment
– Sketch visual metaphors for your ideas
– Consider
○ How would you wish things could work?
○ Who are the actors? What are the events? What is the environment?
Working Session 4 - Storyboarding
Create storyboards to show what the envisioned environment would look like to the users.
Working Session 5a - Key Research Gaps Identification and Affinity Mapping
What are the key research gaps that must be addressed in order to create the environment we
described in session 4?
Perform affinity mapping to create groups of key research themes; vote on the highest priority themes
Working Session 5b – Development of Research Themes
Self-select to form groups around the research themes selected above
What is the goal for the research area?
What are the key research questions?
What are the notable topics that are out of scope?
Working Session 6a - – Decomposition of Research Themes and Timelines
What are the key steps to needed achieve these goals? Organize these near-term, mid-term, longer-
term
What technical approaches should be explored to get to the desired outcome?
Working Session 6b - Identification of Thought Leaders and Key Dependencies.
Identify thought leaders in the area – brainstorming on sticky notes.
Workshop Participants
The following were the participants by type. Participant Group Total
Invited researchers from academia and private industry 12
LAS and affiliated researchers and domain experts 9
Government researchers 7
PNNL workshop team 5
PNNL Analysis in Motion Initiative team 3
Facilitators 4
Total 40

B.1
Appendix B
Workshop Scenarios

B.2
Appendix B
Workshop Scenarios
This appendix includes the background document provided to participants to acquaint them with the use
cases that drove the workshop.
BACKGROUND
What is Visual Analytics?
People in many fields are faced with the challenge of making good assessments based on complex and
conflicting data. In some instances, such problems can be addressed by running computer algorithms on
the data to produce the best answer. In other cases, domain knowledge exists only in the person’s brain,
and this knowledge is critical to the appropriate interpretation of the data. In these situations, a reasonable
assessment can only be produced by having a knowledgeable person examine the data, sort through the
evidence, and reach a conclusion.
Visual analytics helps people address complex problems that require human insight. Behind the scenes,
visual analytics software applies algorithms to data. The products of these algorithms are presented to the
user through interactive visualizations that help reveal patterns, relationships, trends, and anomalies.
Visual analytics software allows people to explore and evaluate the expected and unexpected evidence in
their data to reach informed assessments. This process may be iterative, with people looking at multiple
sets of data repeatedly as they ask new questions based on what they learned.
What is Streaming Visual Analytics?
Complex assessments are often done using snapshots of data, and visual analytics software generally
focuses on static datasets. However, the world is changing continually, and data are changing and
growing with it. Streaming visual analytics software will allow people to examine and make sense of data
as it evolves and changes.
We assume that streaming data is also big data. This data may include multiple streams, each arriving at
different rates and having different characteristics. Data may be sampled or filtered, so there is no
guarantee that all relevant data is available. Even the sampled or filtered data is too big to preserve for
more than a short time, so intelligent decisions must be made quickly about what data is relevant and
what is not. Furthermore, as situations evolve, people may learn something new that changes what is
considered relevant, so there is a need to adjust filters and sampling strategies.
SCENARIOS
To frame the small group discussions, we will use the following interrelated scenarios.
A large, multi-week international sporting event is taking place in a fictitious city. The analysts are part of
a team responsible for ensuring that everything goes smoothly during the event and that all issues are
addressed as quickly as possible.

B.3
For purposes of this workshop, assume that multiple data streams are available to the analyst team in
essentially real time. In addition, there is much supporting data, including models and plans, schedules,
human resources information, and maps of locations and networks, for example.
Group 1: Situation Awareness
Much planning has gone into preparations for this event. Now that the event is getting underway, the
analyst’s responsibility is to monitor available data streams to maintain situation awareness and rapidly
assess when unexpected events require response. Imagine tracking all ticket sales, event attendance,
camera and sensor feeds, weather conditions and forecasts, traffic flow, news reports, social media, and
threat reports in an effort to identify issues as they arise.
To determine threats, phenomena of interest or anomalies in data, a baseline or model of normal
operations needs to be established. We can assume that preliminary planning has been done to establish
what traffic flow and attendance is likely to be during the weeks-long event. However, these plans are
unlikely to be fully accurate.
The analyst’s primary goal is to identify potential problems quickly. The analyst’s job is to establish the
baseline – what normal actually looks like – based on the available data feeds and to evolve that baseline
as changes occur. As unexpected data or patterns are found, the analyst must assess them to determine
whether they are likely to indicate problems that require action, or whether they are innocuous.
Group 2: Threat Assessment
A threat to the event has been identified. The analyst in this scenario is responsible for assessing the threat
to determine whether it is credible enough to warrant actions such as evacuating stadiums and canceling
events. There are high consequences associated with this decision. Evacuations and cancellations are
essential if the threat is imminent, but are costly and logistically difficult.
The analyst’s job is to examine a wide variety of available data streams, including all ticket sales, event
attendance, camera and sensor feeds, weather conditions and forecasts, traffic flow, news reports, social
media, and threat reports, to identify whether or not the evidence supports the potential threat. The
situation is changing in real time. Some preliminary reports have been contradicted by later data, data
sources may not fully align, and some key data may be missing or erroneous.
The analyst’s goal is to get to the bottom of this threat, recognizing that situations and data are continually
evolving. The analyst must break down this big question – is the threat legitimate? – into a set of smaller
questions that can be addressed by assessing the available data.
Group 3: Safeguarding Computer Networks
The sporting event is run by a complex, moderately scaled network of file and web servers, computers
and mobile devices. This network is critical to day-to-day operation of the event. All systems are
integrated through three different networks that bridge across locations and services for financial
transactions, sales, ticketing, personnel, system tracking, athlete profiles, and event support. Most of the
terminals at the gates are software defined and exist across a cloud architecture. Schedules are maintained
for servicing, timecard, event logistics and operations. Communications are all digital and handled
through the same network. All vendors use the network for financial transactions as do event ticket sales
and gate admittance. Emergency response is handled through a separate but closely coupled network. The

B.4
cyber threat is very real as financial, transaction, personnel records and athlete information are all
sensitive.
Network analysts are responsible for monitoring usage logs, data flow sensors, and data streams in real
time to identify patterns of interest and anomalies that could indicate network attacks or unexpected
outages. The analysts need to understand the network architecture, bandwidth constraints, and what
systems are communicating with each other and overall state and health of the system. They have to
identify potential vulnerabilities and patch them before they can be exploited, while having minimal
impact to system performance.
Group 4: Insider Threat
There are 80,000 staff members and 40,000 volunteers working during the event in various capacities.
Most have internet access and about half have access to some level of data and information on the system.
Two-thirds of the staff share systems with other staff members based on work schedules and need for
access. All staff members have gone through a high-level background check but the volunteers have not.
Many staff members bring personal devices into the park and have access to the internet and email
services while at work. All have signed information waivers on hire and all online activity is logged by IT
and operations personnel. Insider threat is a real possibility for theft, data corruption and information
release.
This analyst’s job is to identify insider threats that jeopardize the event, including cyber events such as
tampering with financial data or competition results, as well as physical events such as entering restricted
locations inappropriately to tamper with athletic equipment. The analyst has access to streaming network
error logs and system accesses by individual employees. In addition, the analyst has information about the
individuals and their assigned roles and permitted accesses.
The analyst is responsible for characterizing what “normal” employee behavior looks like, understanding
that people in different roles will have different normal patterns. Most importantly, the analyst wants to
identify unusual behaviors or activities that indicate that a particular employee is activing suspiciously.
Not all unexpected behaviors are suspicious ones, however, so it is important to be able to discriminate
which behaviors pose the greatest risk and what likely outcomes may be.
This task is complicated by the fact that insiders who are acting inappropriately may actively try to hid
their actions or make it appear if their actions are not their own (such as using a colleague’s mobile device
instead of their own).

C.1
Appendix C
Group 1 Workshop Outcomes

C.2
Appendix C
Group 1 Workshop Outcomes
SCENARIO - SITUATION AWARENESS
Much planning has gone into preparations for this event. Now that the event is getting underway, the
analyst’s responsibility is to monitor available data streams to maintain situation awareness and rapidly
assess when unexpected events require response. Imagine tracking all ticket sales, event attendance,
camera and sensor feeds, weather conditions and forecasts, traffic flow, news reports, social media, and
threat reports in an effort to identify issues as they arise.
To determine threats, phenomena of interest or anomalies in data, a baseline or model of normal
operations needs to be established. We can assume that preliminary planning has been done to establish
what traffic flow and attendance is likely to be during the weeks-long event. However, these plans are
unlikely to be fully accurate.
The analyst’s primary goal is to identify potential problems quickly. The analyst’s job is to establish the
baseline – what normal actually looks like – based on the available data feeds and to evolve that baseline
as changes occur. As unexpected data or patterns are found, the analyst must assess them to determine
whether they are likely to indicate problems that require action, or whether they are innocuous.
Identified Information Challenges
Defining and managing evolving indicators and rule sets as they change over time. This requires
the availability of past data and scenarios such that it is possible to compare current situations to
analogous past situations to be able to establish a baseline and understand what is considered normal.
Choosing and combining streams. Recognizing that multiple data streams may be available, how
can analysts choose which streams are required for a task? Depending on the particular analyst’s
focus, which streams must s/he focus on and attend to?
Velocity and volume of streaming data. This is not simply an engineering issue. Streaming data
volume and velocity will demand different abstractions. It is no longer feasible to assume that an
analyst will have time to manually sift through and select specific data streams. It is necessary to
determine how to successfully select the relevant components of data, form the correct abstraction of
that data, and maintain that abstraction over time.
Evolving baselines. A “baseline” model may not be static. There may be an expectation of change
and the system must take this into account.
Trust. Veracity of any given stream of data may vary over time. Combinations of streams pose even
greater challenges. It is important to understand what degree of trust to associate with each stream.
Identified Human Factor Challenges
Dynamic interpretations. The analyst’s interpretations of stories within the data are as dynamic as
the incoming data streams themselves. As a result, the analyst must be flexible, agile, and willing to
manage and adjust the narrative along with the changing data environment.

C.3
Endurance and transitions. Fatigue, working across multiple shifts, and successfully handing off
analytic tasks across shifts are some of the primary and recurring challenges within a streaming
analytic environment, especially considering given scenarios like this that play out over the course of
multiple weeks.
Managing attention. In an environment where various automated models and algorithms are
constantly running against incoming data streams to issue alerts, the system should be able to help
manage users’ attention. It must provide users with a clear understanding of the significance of
incoming data streams and alerts and assist with the triage and analysis process.
Managing and interacting with rules, narratives, and streams. Analysts need to simultaneously
track evolving stories or events while understanding the rulesets being used by the system and the
underlying data being processed.
Task switching between analysis and communication tasks. Analysis is fundamentally about
building and conveying stories. Even in a streaming analytic environment, there is a point at which
analysts must stop watching the story change and crystalize their knowledge so they can convey this
information to others, even while the story is still changing. Orchestrating a process to collectively
tell stories of change will be required in an effort to keep analytical teams synchronized.
Capabilities Needed
Umbrella functions
– Analytic tools that perform functions such as basic enrichment, geo-location, inference, and
translation.
– Integration of data of multiple sensitivity levels.
– A streaming data ingest area where the streams are normalized, characterized, and organized.
– The ability to map events in a stream to objects and then to narratives
– Data curation is taken to the next level
– Anticipatory features are built in
Adaptive sensing
– The ability to retrieve potentially relevant data steams
– Detecting relevant data and changes within data streams
– Collection steering
Differentiating normal and abnormal
Leveraging models for alerting
– Models for automated detection. The system would look for features within the data and
determine if they provide evidence to support or refute the hypotheses and meet parameters of a
specific model, or an alert. An event could be detected based on a set of models.
– Versioning and undo for model updates; allow for error.
– Maintenance of a set of models and alerts that can be explicitly or implicitly modified by the
analyst. This model maintenance task must be balanced with a recognition of human cognitive
limitations and biases.

C.4
– A interactive streaming visual analytics in which the user could visualize models, raw data
streams, analytics and alerts in concert with historical and static data to provide context.
Determining how to best fuse, overlay, and enrich data will be important to making sense of the
data.
– The ability to select samples, evaluate with the model and grade
– The ability to display statistics about false positive and false negative rates for rules
– The ability to prioritize and organize alerts
Building and dynamically tracking narratives of concerns
– A “sandbox”, a living narrative in which the analyst can develop and test ideas, store conclusions,
and use as a means for sharing with other analysts
– Provide support for tracking evolving evidence
– Provide dynamic reports – a tight coupling between streams, sensemaking, and reporting, in
which the streams are continually up to date with current reporting
– Show change in context
– Dynamically track and update hypotheses
– Present model-based detection of events and present stream findings with respect to narratives
– Select particular narratives to report or share
Fight like you train. Generate training scenarios and train for high-rate reporting.
Collaborative support and cueing handoff
– Analysts need the ability to implicitly or explicitly provide data back to the system to steer
collections, update hypotheses, etc.
– The ability to track user actions and provenance
– Shape and hold provenance during the translation from stream to object to rule to narrative.
– Provide the ability to interactively change focus so that the analyst can examine different aspects
of the stream
– Provide support for determination of veracity of sources
Viewing the data
– Ability to “auto-fuse” data enrichment snapshots to create rolling narrative
– Novel approaches to persistent exposure to data, such as Google Glass
– Visualization streaming data or its summary
– Suggest or create explanations of data, recommendations
– Compare or view historical and current data
– Make use of common representations of maps, timelines, graphs, and so on
Performance monitoring. Monitoring the health status of analysts to detect cognitive depletion.

C.5
PITFALLS TO AVOID
Requiring too much expertise from the analyst. The analyst is not an oracle, but there is a danger
that the system will require that level of expertise from the analyst. The system should not be so
complex that the analyst cannot specify queries or understand hypothesis language. The system
cannot assume that analysts have statistics backgrounds or that they know exactly when and how
models should be updated. The system cannot burden the analyst with cumbersome tasks of
maintaining rules, models, and algorithms. Outside help will be needed to help support the analyst in
this effort.
Complacency. There is a danger that the analyst may become complacent and overly reliant on
incomplete models. There is also a danger of cognitive tunneling – failing to see beyond the current
focus of attention.
Failing to manage demands on the user time and attention. The user will still be required to attend
to alerts, develop and follow alternative lines of reasoning, build and refine models, and interject
knowledge into the system. Overwhelming the user with details is a potential danger.
Failing to manage the computational load. In times of heavy load, the system must degrade
gracefully. The system must not become too slow to keep up with analytic demands.
Failing to support the analysis process. The system must support the analytic workflow and enable
collaboration.
Lack of transparency. Analysts must be able to understand what the system is doing.
ASSUMPTIONS
We assume that we know about all of the data streams accessible to the analyst.
We assume that we can shape / sample the data streams.
Everything that can be streamed can be stored in some limited form so that the analyst can rewind and
look at historical information when needed.
DAY IN THE LIFE
The analyst’s day follows a general process. See Figure C.1 for an illustration of parts of the process.

C.6
Figure C.1. A Portion of the Streaming Analysis Process Defined for Situational Awareness. (Chart
created during the workshop.)
Orientation. The analyst starts the day by getting oriented to new developments with the living
narrative view.
The majority of the day is taken up by several different tasks that are performed iteratively as needed.
– Evaluate the outputs of models and automated analytics running on the data. Assume there will be
many automated analytics. These are the analyst’s daily worries. The analyst looks at the results
of those models, and the events of interest they produce, to understand what is going on
– Revise and build the narrative based on this analysis. The narrative will be very dynamic as the
situation changes.
– Communicate and alert other teams, colleagues, and customers of important new developments
that are relevant to them.
– The analyst also must tune models
– The analyst produces reports at shift change and likely throughout the day as well.
The interaction should be natural, potentially even pushing toward a spoken interaction.
A mixed initiative system envisioned that could support a more natural dialog, as opposed to forcing the
analyst to learn a specific query language. Mixed initiative techniques will be used to do the following.
Prioritize alerts

C.7
Recommend other items based on the analyst’s interests
Organize things that are important
Aid in contextualizing
Optimize processing, storage, and capacity
Provenance capture is assumed throughout. Multiple devices, from wall displays to tablet displays, will
support collaboration and sharing.
Visualizations to support a collaborative environment include switching between multiple “stream views”
as well as choosing particular entities of interest from detailed “object views”.
STORYBOARDS AND SUPPORTING DISCUSSIONS
The orientation phase of the process is illustrated in Figure C.2.
Figure C.2. Orientation. (Chart created during the workshop.)
As shown in the top of the image, a pre-orientation process takes place before the analyst comes to work.
The analyst puts on a personal health & data tracker watch to see what is going on in the analytical space
before coming to work. This watch also tracks the user’s health throughout the day. This information
could also be superimposed on the bathroom mirror or presented in notebook form. The bottom portion of
the figure illustrates collaborative orientation. Multiple team members and their responsibilities are shown
in a large display. Color-coding indicates areas of particular issues.

C.8
As shown in Figure C.3, the Event/Narrative Dashboard is meant for overall awareness and understanding
of everything in the system. At the highest level, it provides an overview of everything that is active,
whether due to system action or analyst action. Dashboards containing a grid of multiple views showing
the relevant data in map, temporal, and other views.
Figure C.3 The Event/Narrative Dashboard. (Chart created during the workshop.)
As shown in Figure C.4, the Event/Narrative View also contains views of streams of interest and objects
or people of interest. For example, the stream (shown in blue in the top illustration) contains multiple
articles, which can be selected and examined individually. Additional data types such as audio, video, and
transaction data can be included here. Support for understanding data in all languages is provided.

C.9
Figure C.4. Additional Components of the Event/Narrative View. (Chart created during the workshop.)
As shown in Figure C.5, the Narrative Builder uses text as a means for communicating results. As events
occur, the analyst drags evidence into the Narrative Builder. The Narrative Builder automatically captures
provenance and attaches narrative to evidence, rules, and streams. The analyst can continually update the
narrative.
The Narrative Builder also displays cues when elements of the narrative are becoming “active” due to
system action. When the system is finding events about an actor, place, or other elements of the narrative,
that fact is visible in the Narrative Builder.
In an alerting screen, the analyst can drag an item of interest to a specific screen location to notify the
collaborator and bring up a shared workspace to be able to discuss the item.

C.10
Figure C.5. Narrative Builder. (Chart created during the workshop.)
As shown in Figure C.6, the readout and orient view supports the need to report events either at shift
change or for large group briefings. Streams are processed and read as a news broadcast to the audience
using an avatar.
Figure C.6. Avatar to Support Read-out and Orientation. (Chart created during the workshop.)

D.1
Appendix D
Group 2 Workshop Outcomes

D.2
Appendix D
Group 2 Workshop Outcomes
SCENARIO - THREAT ASSESSMENT
A threat to the event has been identified. The analyst in this scenario is responsible for assessing the threat
to determine whether it is credible enough to warrant actions such as evacuating stadiums and canceling
events. There are high consequences associated with this decision. Evacuations and cancellations are
essential if the threat is imminent, but are costly and logistically difficult.
The analyst’s job is to examine a wide variety of available data streams, including all ticket sales, event
attendance, camera and sensor feeds, weather conditions and forecasts, traffic flow, news reports, social
media, and threat reports, to identify whether or not the evidence supports the potential threat. The
situation is changing in real time. Some preliminary reports have been contradicted by later data, data
sources may not fully align, and some key data may be missing or erroneous.
The analyst’s goal is to get to the bottom of this threat, recognizing that situations and data are continually
evolving. The analyst must break down this big question – is the threat legitimate? – into a set of smaller
questions that can be addressed by assessing the available data.
Identified Information Challenges
Models vs. data. In a streaming analytic environment, the analyst will be creating hypotheses and
inserting hypothetical what-if assertions. How can users distinguish their hypotheses and assertions
from the data? How can multiple lines of inference be represented and managed simultaneously?
Awareness of change. How can the analyst and the system avoid missing new information? What is
needed to manage situations where new data changes the importance of older data? Useful data may
not fit models – at least at first – and new information may seem out of context. How can intelligent
decisions be made about whether to preserve this data?
Provenance. How can assumptions be captured along with data? What is needed to maintain
provenance of the analysis? Both data and model updates must be captured and noted.
Data quality. How can error and uncertainty in data streams be encoded or visualized?
Understanding analytics. What is the interplay between data and algorithms? How can this be made
transparent to the analyst?
Abstraction.
– How can the system represent insights and share them between analysts and between tools?
– Current systems lack interaction mechanism to communicate concepts like “future” and
“change”. Analysts need methods for simulating future data that would likely result from
different actions.
– Today, evidence is considered to be data or facts. Does encompass models and changes need to
be considered evidence as well?
De-biasing. Can models help de-bias analysts’ cognitive biases?

D.3
Temporality. There is the potential for latency between when an event occurs and when an analyst
actually receives the information. Incoming data may be out of order, potentially invalidating
previous conclusions. Other potential challenges include contradictory data, competing data, and
missing data.
Balancing the known and the unknown. Focusing purely on known threats poses the risk that
unknown and new threats will be missed. How can we distinguish the important data that does not fit
existing models from the unimportant data that does not fit models?
Capabilities Needed
Representing meaning and uncertainty within data is a key capability need. This requires meaningful
abstractions. We need a mission-based language for describing events, actors, and behaviors and
other signals being pulled out of lower level data, as well as a way to communicate confidence and
uncertainty about whether those events, actors, and behaviors are present in the data.
Tuning or steering collections will allow analysts to broaden or narrow the aperture of incoming data
streams as appropriate to the task. This should be accompanied by a stream discovery process in
which the system suggests additional data streams that may be relevant. Altering or adjusting the
incoming data flow might be done in an effort to locate specific data that supports or refutes
hypotheses under consideration.
It will be important to enable analyst interaction with the system in order to provide key selectors or
features of interest so that the system can help find relevant data.
Analysts will need a mechanism to express signatures of interest or patterns of activity and to then
turn those signature or pattern requests into a type of trigger that could alert the analyst if a set of
particular conditions is met. This type of complex query process will aid with the automatic detection
of events of potential interest.
The system should support cross-cueing across multiple streams. If one stream contains indicators of
a particular event, the system should look for known correlates in other streams. For example, if a
threat report suggests looking for a van of a specific color, the system should be able to analyze
individual frames within a video to locate examples of potential matches of the van and color (See
Figure D.1.
Figure D.1. In This Example, Multiple Video Feeds Set off Alarms due to the Detection of a “Yellow
Truck,” One of the Key Selectors within the Streaming Data Feed. (Chart created during the
workshop.)

D.4
Analysts should be able to create an “example” event containing the types of data, based on their
insights, which suggest the type of event they are searching for or trying to prevent. As a result, the
system may be better tuned to extract particular features of interest from incoming data streams. This
mechanism focuses on specific feature extraction and not dependent models.
Building upon the general query or “example event” idea, the next step would involve building and
tuning models requiring the application of more complex analytics involving higher-level
interpretations, which presumably require computation that is far more complex.
Analysts will need to interact with and, when appropriate, tune models through implicit or explicit
feedback and guidance to the system.
Models must be customized in advance to capture information needed by the analyst.
Accurate visual representations of data, especially visualization of the collection of data streams over
time, will be important for determining how to align similar items temporally. Detailed assessments
of temporal data may aid in predicting future events through trend detection contained in historical
data.
Analysts will need to clearly observe data gaps in their models. For example, if a set of conditions
would need to be true to support a particular hypothesis, the system should be able to show what
pieces of evidence are missing. The system should also show the analyst when a piece of data
supports two or more different interpretations and where conflicts exist.
Analysts should be able to assess and process data to varying levels of granularity so that patterns
may be detected at multiple levels.
Analysts need both visual and interaction primitives for representing change. The system will need to
explicitly inform an analyst what the data situation looked like previously versus currently. Even after
leaving the analytic environment for a few minutes, an analyst needs to understand what happened
during that gap and to be able to quickly re-acclimate to the current environment.
The system must support interaction not only to enable the analyst to explore, but also to help create a
line of reasoning.
The user constitutes an additional data stream. The analyst’s knowledge and inference should be
integrated into the system. Analysts should be able to clearly identify and articulate what they believe
is of interest in various data streams and how those findings affect existing models and algorithms.
Understanding model outputs is an important component of the analytic environment. The system
must make it possible for analysts to understand potentially complex information about what the data
and analytics are reporting, the meaning behind the data, and the process by which results were
produced. The analysts must understand functionally what analytics do. The rationale for analytic
results and recommendations must be explainable at a functional level so that analysts can determine
whether the results can be trusted.
Documenting the overall analytic process will be required in order for analysts to document reasoning
and track findings. This may begin as a record keeping and process tracking process, but ultimately it
will contribute to how analysts communicate findings to others.
A successful “handoff” of information will also require the ability for analysts to create snapshots of
data and progress. Individual findings and threads of evidence, which support an evolving narrative,
will ultimately contribute to the assembly of a finished analytic product.
Projecting potential future events of interest using data simulations will be required in order to help
analysts work out the implications of “might be” or “what if” scenarios.

D.5
PITFALLS TO AVOID
Lack of shared language between the analyst and the system. The human-machine interface needs
to be clear and concise. Meaning and uncertainty must be communicated through a common language
that is easily understood by the analyst and easily interpreted by the system. Systems perceived as too
brittle, non-expressive, or incomplete are unlikely to be used.
Usability. The complexity of the user interface cannot outgrow its intuitive use by analysts. Training
must be provided. If excessive training or specialized knowledge is required, the system will never be
adopted or used effectively.
Bias. As analysts steer analytics and select data streams, there is a risk that they may inadvertently
reinforce their own cognitive biases.
Limitations of streams. Given limitations on computing and storage resources, it will be important
to optimize both computational and human resources within tight time constraints. There may also be
important differences between streaming data visualization and static data visualization that must be
considered.
ASSUMPTIONS
No assumptions were explicitly identified by this group.
DAY IN THE LIFE
The analyst’s task is to consider the credibility of a threat. As shown in Figure D.2, a day in the life of an
analyst includes the following tasks.
Process data via models. As data streams in, it is processed by a set of models that transforms and
filters the data in multiple ways. These models also help associate data across streams, such that
relevant data is not separated by type, but brought together based on relatedness of content.
Assess vulnerabilities. The analyst examines vulnerabilities and assesses their potential impacts.
Given that a threat has been identified, the analyst considers what things must be protected. This
helps to focus analyst attention.
Test hypotheses. The goal is to explore and test hypotheses to determine if the threat is credible. The
analyst explores the threat and evidence contained in multiple streams of data.

D.6
Figure D.2. Process Model for an Analyst Performing Threat Assessment. (Charts created during the
workshop.)
In this scenario, analysts believe that someone is going to drive a yellow rental truck containing a bomb to
an event and detonate it. When a yellow rental truck is detected, then the analyst looks at other data to test
whether this may be the specific truck of interest, to identify who rented it, and so forth. Streaming data
allows hypotheses be tested in real time.
In a natural disaster such as a potential chemical release during an earthquake, the analyst tests to see if
such threats are credible.
Consider alternative hypotheses. The analyst must avoid focusing on one specific hypothesis,
which could be incorrect. Both the system and the analyst should generate alternative hypotheses. The
system provides a few special features to support this.
– Living evidence notebook. Both the system and the analyst can populate this living notebook
with relevant information to help track data and hypotheses. The notebook can also track
alternative explanation hypotheses and test potential alternative outcomes.
– Devil’s advocacy analysis, performed automatically, critiques the analysis to assist with
determining if hypotheses make sense.
Report on findings using a living report. The living report makes dynamic adjustments keep
summaries current. This includes accommodating changes in data over time and visually representing
new information.
STORYBOARDS AND SUPPORTING DISCUSSIONS
As shown in Figure D.3, using a view driven by sensors, signals, feeds, the system fuses multiple streams
into a common dashboard that covers vulnerabilities, threats, and hypotheses. On the left is the living
report, which can be swiped down onto a living notebook. In the center is the analysis dashboard,
showing an overview of vulnerabilities, threats, and hypotheses, along with an overlays showing change.

D.7
On the right are the active hypotheses. (A more detailed view of the Hypotheses display is shown in
Figure D.4.)
Figure D.3. Three-panel Analytic Environment. (Chart created during the workshop.)
Figure D.4. A Closer Look at the Hypotheses View. (Chart created during the workshop.)
This environment provides the ability to overlay information, such as on a map or grid. It also provides
the ability to detect change over time and provide change overlays on the display as shown in Figure D.5.

D.8
Figure D.5. An Example of the Change Overlay Illustrating Differences between Past and Current
Conditions. (Chart created during the workshop.)
The system allows the analyst to compare or flip through changes at various time points. In addition, the
environment provides a newspaper view to summarize the full set of conditions at various points in time.
The view can be flipped through just like a flipbook to be able to show changes.
A living evidence notebook supports collaboration and information sharing. This notebook will support
gathering evidence, associating it with hypotheses and with other data captured at the same point in time.
The notebook will support pivoting in many directions by “choosing the z axis” for the notebook. An
especially powerful approach is pivoting on time, location, or the combination of the two. Pages of the
notebook can contain relevant audio and video streams. Pages can be removed, rearranged, or thrown
onto a large display for collaboration.
Data cannot be stored indefinitely, so it should degrade gracefully. For example, current video may be
available, but cannot be preserved permanently. With graceful degradation, data would predictably
transition from high-resolution video to lower resolution video, to video key frames, and eventually to a
representative image or two (see Figure D.6). This supports maintenance of some level of history without
preserving the entire set of data.

D.9
Figure D.6. Illustration of Graceful Data Degradation. (Chart created at the workshop.)


E.1
Appendix E
Group 3 Workshop Outcomes

E.2
Appendix E
Group 3 Workshop Outcomes
SCENARIO - SAFEGUARDING COMPUTER NETWORKS
The sporting event is run by a complex, moderately scaled network of file and web servers, computers
and mobile devices. This network is critical to day-to-day operation of the event. All systems are
integrated through three different networks that bridge across locations and services for financial
transactions, sales, ticketing, personnel, system tracking, athlete profiles, and event support. Most of the
terminals at the gates are software defined and exist across a cloud architecture. Schedules are maintained
for servicing, timecard, event logistics and operations. Communications are all digital and handled
through the same network. All vendors use the network for financial transactions as do event ticket sales
and gate admittance. Emergency response is handled through a separate but closely coupled network. The
cyber threat is very real as financial, transaction, personnel records and athlete information are all
sensitive.
Network analysts are responsible for monitoring usage logs, data flow sensors, and data streams in real
time to identify patterns of interest and anomalies that could indicate network attacks or unexpected
outages. The analysts need to understand the network architecture, bandwidth constraints, and what
systems are communicating with each other and overall state and health of the system. They have to
identify potential vulnerabilities and patch them before they can be exploited, while having minimal
impact to system performance.
Identified Information Challenges
Time-to-decision on high-volume streaming data. Limited time to make a decision and take action
is complicated because of the amount of data that must be considered in the available time. Decisions
must be made while the data is still relevant. There is a risk of losing necessary information or not
being able to validate information due to time constraints. It will be critical to accurately and
consistently validate data as it comes in.
Building effective models. It is difficult to generate valid and meaningful models of “normal”
behavior, especially when events are infrequent. Integrating human analysts into the process is
critical. Sampling, aggregation, and abstraction to represent the data for human consumption may
actually ignore or disguise small events or signals that may be important. As data comes in, some of it
may be difficult to process by the system. The system could force-fit data from different sources into
a single model, resulting in inaccurate comparisons that the user does not have sufficient context to
identify.
Human limitations. Analysts may be biased towards certain data, tools, or hypotheses, which will
affect their analyses. In addition, there are expected limitations on human abilities to detect articular
features in a visual representation. This will be exacerbated in a streaming analytics environment
where detection of change is also a requirement.
Veracity and trust. False positive alarms undermine user trust in the system. How can meaningful
alarms be distinguished from unimportant or trivial ones? How can the system establish and maintain
trust in the sensors and data sources supplying data to the system? How could faulty or compromised
sensor be identified?

E.3
Sensor-level decisions. When time and data volume problems escalate, some decisions may be
pushed to the distributed sensors themselves.
Capabilities Needed
Provide context. When working with cyber data, which is inherently abstract and complex, context is
critically important. Network topologies are abstract, and events do not necessarily have a spatial or
temporal context. It would be valuable to have tools that
– Provide context for events that have a spatial component
– Provide the ability to mark anomalies as threats
– Allow the user to provide feedback to smart analytics running behind the scenes
– Give the analyst the ability to annotate, mark, and enrich data
– Capture and show context
– Make the provenance of information clear
– Make it straightforward to understand confidence in model outputs. Users need a rich
understanding of which model generated a conclusion, along with the numerical confidence score
associated with it.
Understand and represent history. It is important that the analyst have a clear understanding of
previous notifications and activities. Data will not be preserved indefinitely, so the system must help
the analyst determine what events and data are important enough to keep track of and provide those as
context to analysts.
Explore multiple lines of reasoning. The analyst should be able to pivot between hypotheses,
focusing on one for a time and then returning to others. The context in which the hypotheses are being
generated and tested must be preserved.
Adaptive models. How can models and analytics, including baseline models, be created and exposed
to the analyst in a way that allows the analyst to shape and steer them? These adaptations could be in
response to explicit direction or through implicit input such as notations made during the analytic
process.
Human-assisted feature engineering. Incorporating analysts’ mental models of their specific
expectations within the data environment could be used prior to the actual event in an effort to pre-
process data.
Adapting the visual representation to the stream. The goal is to help overcome human limitations.
The analyst should not be required to mentally track how pre-conceived notions about the data
environment compare to actual events.
– Can the system visualize the difference between the analyst’s expectation of behavior on the
network and actual behavior?
– Visual representations should adapt to the data as it is received. For example, how can the
visualization adapt to sudden changes in scale or volume as a network (or its data load) grows?
– The system should provide for cross-group coordination and publishing. The system must help
the analyst bridge the gap between exploration and explanation.
Veracity. The goal is to ensure that the visualizations are telling the true story about what the data
contains.

E.4
– Visualizations should show how sensors corroborate (or disagree with) one another.
– Monitoring hardware and software compliance and managing the validity of network certificates
and data encryption will be required for a secure operating environment.
PITFALLS TO AVOID
Failure to manage volume and preserve appropriate history. Given high data volume relative to
storage capacity, there is a danger that it will not be possible to identify the appropriate subset of data
to keep and how to make use of it.
Modeling failures. There is a danger of overfitting models to training data. In addition, some models
lack transparency, so it may not be clear why or how they work.
System complexity. Complex data may result in cascading data failures. For example, if an intrusion
detection system provides false positives, and other models process those outputs to build bigger
event predictions, small problems within the environment can grow exponentially over time.
Failure to manage emergent behaviors.
Ignoring human limitations. There are limits in human perceptual bandwidth, and there are limits in
terms of collaboration among analysts. These must be taken into account in design and
implementation of the system.
ASSUMPTIONS
It is not possible to store all necessary data over time
Priorities
– System availability with a continuity of operations plan
– System Integrity
Services available
– Security store of results
– Presence / location of athletes
– Feed low level data to specific hypothesis from other groups
– Assist physical security
– Receive baseline of information and threats for analysis and ingestion by analytics
Entities are identified and tagged
Plentiful information is available related to network actors
Limited time frame
Control over who performs the setup and manages existing Infrastructure
Vulnerability scanning will take place during the event
There will be gaps in data
Data may be out of order
Methods for processing, collection, and analytics exist

E.5
Chain of command and infrastructure exist
Vulnerabilities require that we have steps enabled to signal alerts when something is not behaving as
expected.
DAY IN THE LIFE
Assume that, given this special event, teams work in 12-hour shifts with shift change at 6:00. The mission
of the team is to make sure that critical network operations continue to function. The relevant data streams
include personnel information, athlete profiles, financial transactions, gate sensors, and security cameras.
In addition, the analyst monitors external data that might provide information about new threats that could
emerge. These external data and internal data can be joined together.
The analyst’s process is as follows:
As the start of the shift, the analyst gets oriented on the changes that took place in the previous shift,
including policy changes, issues, and actions taken. This could take place in a meeting, or this could
be done by reviewing the notes and provenance trail from previous shifts.
The analyst monitors to ensure that systems are operational. For example, the analyst makes sure that
expected events occur as expected, such as data reports on scores. The analyst also monitors
applications, web sites, and other to ensure they are available and correct.
When an event occurs, such as a web site defacement, the operations team moves into incident
response mode
– The operations team passes this information to forensics for investigation
– The operations team makes any necessary changes, including policy changes, to prevent
recurrence.
Multiple events may occur at once, with the web site defacement meant to be a distraction while a
more significant issue like a gate malfunction is taking place. This might be reported by a monitoring
system or by individuals at the site.
The analyst uses data fused from multiple sensors to confirm or disconfirm reports from any
individual sensor. This guards against issues resulting from compromised sensors.
If the analyst steps away for a few minutes, they catch up with what recent developments were missed
using a summary of the missed information.
STORYBOARDS AND SUPPORTING DISCUSSIONS
This group developed ideas ranging from practical solutions for the immediate next generation of
software to more futuristic concepts.
As shown in Figure E.1, the group developed a set of principles for visualization, which are of practical
consideration now.

E.6
Figure E.1. Visualization Principles and the Memory Castle. (Chart created during the workshop.)
This group also developed the following ideas.
The memory castle (also shown at the bottom of Figure E.1) takes advantage of the ubiquity of
screens to allow the analysts to take parts of their visualization and place them on the wall. This
allows the analyst to spatialize their investigation such that they can remember it and maintain
context. These visualizations show information only when an automated analytic has identified a
problem. Rather than requiring the analyst to stare at streams of data watching for issues, only issues
that have already been identified are presented.
Analysts can interact with and control parameters of the analytic algorithms through a set of controls.
They can request more or less of particular types of information. The system alerts the analyst when
unusual events or patterns are identified, and places them in context of what is normally expected
using a clear natural language explanation rationale for its results.
The Alert Triage Interface lets the analyst control the parameters of models and analytics. (See Figure
E.2.) The alert stream could be overwhelming, so the analyst sets levels as to what can be handled.
Thresholds are set based on alert categories to control the overall volume of the alerts. The software
shows the overall volume available alerts as well as the amount being presented to the analyst. Alerts
are tagged as they occur. Tags can be used for filtering. Filtering alerts creates a risk of missing
important alerts.

E.7
Figure E.1. Alert Triage Interface. (Chart created during the workshop.)
An alternative approach for triaging alerts is to present all alerts through a dynamic, streaming
treemap containing a hierarchical breakdown of the alerts to be considered (E.3). This encoding
organizes the alerts and preserves the analyst’s mental mapping. The analyst decides what is
highest priority and what groups of alerts can be addressed together. When the analyst chooses a
specific alert, it is presented as a paragraph of information augmented by categorical data.
Analysts can highlight portions of the description of an alert, and other similar alerts are
highlighted in the visualization. Analysts can group the similar alerts and take action based on the
group of alerts. The system can take action based on those alerts. Once responded to, the analyst
can address the next set of critical alerts.

E.8
Figure E.3. Alert Stream Manager. (Chart created during the workshop.)

E.9
Figure E.4. Network Behavior Interface. (Charts created during the workshop.)
The Network Behavior interface (shown in Figure E.4) maps lower-level network data to higher-level
concepts, permitting the analyst to think about logical network maps and meaningful behaviors. In
this scenario, a geospatial mapping might be useful. The map indicates areas of system degradation,
high priority alerts, the appearance of unexpected entities on the network, and locations where the
network team has recently taken action. Given that network availability is the priority, as outage
trends are identified, this must be communicated to the team members who are looking for
coordinated network attacks.
Time is a critical element of the analysis. Volatile or frequently changing entities and recent changes
are both encoded in the map. Time controls allow the analyst to play back recent events.
Cyber entities have very compact histories available; these histories describe characteristics of the
traffic over the past day, with some activities characterized as normal and others unexpected. It is

E.10
assumed an analytic will be available to identify what percentage of the traffic is expected and what
percentage is unexpected.
Figure E.5. Streaming Topology Changes. (Chart created during the workshop.)
As shown in Figure E.5, streaming topology changes include nodes entering a network or edges
between nodes being created or removed. For these purposes, changes in node and edge properties are
not considered. Understanding streaming topology changes will be a necessary task. Assuming a
predicative model of the network’s future state with confidence scores, how should change be
represented in a diagram of a network as data streams in? How should the canvas respond to
streaming changes to topology? The canvas grows and shrinks to accommodate nodes smoothly

E.11
between time steps. This diagram helps the analyst and administrator understand if communication
frequency is as expected. The system shows historical context, what is currently coming out of the
screen, and a prediction of what may be coming next.


F.1
Appendix F
Group 4 Workshop Outcomes

F.2
Appendix F
Group 4 Workshop Outcomes
SCENARIO - INSIDER THREAT
There are 80,000 staff members and 40,000 volunteers working during the event in various capacities.
Most have Internet access and about half have access to some level of data and information on the system.
Two-thirds of the staff share systems with other staff members based on work schedules and need for
access. All staff members have gone through a high-level background check but the volunteers have not.
Many staff members bring personal devices into the park and have access to the Internet and email
services while at work. All have signed information waivers on hire and all online activity is logged by IT
and operations personnel. Insider threat is a real possibility for theft, data corruption, and information
release.
This analyst’s job is to identify insider threats that jeopardize the event, including cyber events such as
tampering with financial data or competition results, as well as physical events such as entering restricted
locations inappropriately to tamper with athletic equipment. The analyst has access to streaming network
error logs and system accesses by individual employees. In addition, the analyst has information about the
individuals and their assigned roles and permitted accesses.
The analyst is responsible for characterizing what “normal” employee behavior looks like, understanding
that people in different roles will have different normal patterns. Most importantly, the analyst wants to
identify unusual behaviors or activities that indicate that a particular employee is acting suspiciously. Not
all unexpected behaviors are suspicious ones, however, so it is important to be able to discriminate which
behaviors pose the greatest risk and what likely outcomes may be.
This task is complicated by the fact that insiders who are acting inappropriately may actively try to hide
their actions or make it appear if their actions are not their own (such as using a colleague’s mobile device
instead of their own).
Identified Information Challenges
Fusing information from diverse sources. Information must be fused from diverse sources across
both the physical and cyber infrastructure, and communicating that information to the analysts is a
challenge. While it may not be realistic to assume that any one nugget of data will uncover
“wrongdoing”, it may take combinations or sequences of items to point to a situation, entity, or event
of interest.
Varying timescales. Some streams may be fast moving, while some may be slower moving. How can
streams of varying timescales be monitored to make effective decisions? There are also different
analytic timescales: some issues may be fast moving and demand rapid decisions, while others may
permit longer periods of observation and monitoring.
Balancing privacy and security. How can one protect personal information while still maintaining
security and guarding against insider threat? What is the ethics and policy framework that protects
people? How do we guard against bias? The consequence to individuals wrongly accused can be
significant, so how can the likelihood of error be minimized?
Information sharing. In this scenario, the analyst team will need to regularly consider what
information is appropriate for sharing and collaboration, as well as the skill level of each analyst

F.3
receiving shared data. Elevating situations to expert analysts should be carefully managed and not
develop into a default response across the team. Throughout, privacy considerations must be attended
to.
Confidence. Establishing confidence in both data and the results obtained from analytics is important.
Decision makers need to understand the analysts’ confidence level in an assessment prior to taking
action. This is especially true when considering an insider threat situation and determining whether to
take action on support staff. How can confidence in an alert be measured? How can the
trustworthiness of a source be represented?
Intent. How can analysts identify whether a threat is intentional or unwitting on the part of the
individual(s) involved?
Attribution. Some incoming data may be very easy to associate with a particular individual. Other
types of incoming data, perhaps based on sensors or other acquisition hardware, may be difficult to
establish association with an individual.
Dealing with the unknown and unexpected. It is impossible to manually develop a complete set of
rules that accounts for all possibilities. There will always be an element of the unknown. What is
needed to identify and alert on important but unknown or unexpected events?
Understanding how a threat fits into a larger narrative. Potential threats may be many and varied.
Examples may include information exfiltration, disgruntled employees, financial disruption, cyber
vandalism, general system disruption, purposely leaving a door open for unauthorized access by
another, deleting a system log, or disrupting a camera. Any one of these issues could be a critical
piece of a larger developing narrative.
Capabilities Needed
“Unsupervised supervised” machine learning. In a streaming environment, it is not feasible for the
software to wait for explicit direction from the analyst. Instead, as the analyst begins working on a
problem, the system should infer as much as it can from the user’s action and initiate appropriate
actions, including appropriate analytics, proactively in order to assist in the analyst’s broadening or
narrowing task. This dynamic enrichment takes several forms.
– As the analyst focuses or narrows in on specific areas, the system should take initiative to find
links, clusters, or other analytic results that helps to identify additional hypotheses or to otherwise
broaden the analysis.
– They system can use analyst attention to bound the space and make intractable problems
tractable. The system should map the appropriate approach to the appropriate scale. Techniques
that are not supportable at higher data volumes might be feasible once the user has narrowed their
field of interest.
– The system should proactively calculate and present information that is relevant based on the
analyst’s task. This data needs to be presented in an intuitive format that allows the analyst to sort
through the information rapidly.
– Inferring user intent from interactions will be necessary.
– The information the system is most certain of should be presented first. An example is the
prioritized watch list shown in Figure F.1.
– The system should provide goal recognition and model steering.

F.4
Figure F.1. A Representation of a Watchlist Visualization Shared across an Analytic Team. (Chart
created during the workshop.)
Provide adaptive visualization appropriate to the data and task
Support the analyst’s thinking process
– Allow the analyst to identify and follow both individual suspects and suspect groups that persist
throughout the analysis.
– Provide a private sandbox for an analyst to explore ideas and hypotheses
– Provide a shared analytic sandbox to support sharing of evidence across users
– Provide details on demand. The information the system is most certain of should be presented
first; a “more” button should allow the analyst to get additional information, including more
speculative information.
Reconciling multiple models. Different models and results have different meanings. The system
needs to reconcile these results in valid ways.
Alert triage and prioritization. The system should support management and investigation of alerts.
– A manager or supervisory function should be provided to support assignment of individuals to
particular alerts or tasks.
– Intuitive visual encodings will help support the triage and prioritization process.
Temporal reach-back. If the analyst thinks something may have been missed, the system needs to
allow a “rewind” as much as feasible. Some of this retrospective data may be raw, and some may be
summarized. This data may appear in multiple layers.
Fusing data from multiple sources. Data should be fused by time, person, and location. Data
should be fused from public and private sources without contamination and without revealing analysis
methods. Fusion must take into account varying timescales among the multiple sources.
Collaboration across teams.
– Support for shared flagging of a suspect,

F.5
– Analyst comments could be treated as a watch stream
Support summarization for reporting. The system needs to aid in creating summary reports and
pushing it audiences.
PITFALLS TO AVOID
Learned clusters may be semantically meaningless
Bad visual encodings
Load issues:
– More data to monitor (excess load on person)
– Making data bigger (excess load on system)
– Missed data
– Analyst fatigue and failure to manage analyst attention
System analytic failures
– Not showing important data
– Narrowing scope without analyst knowledge
– Making false assumptions
– Alert overload
– Presenting excess false positives
– False negatives
– Reconciliation of multiple models in invalid ways
– Ineffective mapping between user’s interaction and the associated feedback to a model
– System anchoring: clusters may be systematically memorialized
Visual representations and interface failures
– Inadequate or failed representation of uncertainty
– Overload of data
Human analytic challenges
– Making false assumptions
– Assuming user intent
– Failure to issue reports within allocated timeframes
Policy issues
– Auto violations – situations in which the computer takes an automatic action that violates a
policy.
– Lack of explicit user consent to monitoring
Security issues
– Inadvertently enabling threat to learn analysis methods

F.6
Supervision issues
– Lack of appropriate monitoring of the analysts; failure to balance reporting tasks with analytic
tasks
ASSUMPTIONS
Analysts have access to data based on background checks
Analysts can monitor all social media data and public records
DAY IN THE LIFE
A day in the life of an analyst involves multiple activities, as shown in Figure F.2.
Orient. The analyst catches up on what has happened since the analyst’s last shift. Based on that
orientation, the analyst will either shift into monitoring or analysis activities. A digest view provides a
summary of changes since the last shift. The digest could take the place of large group meetings.
Monitor current data for issues or events of interest. The monitoring phase primarily involves
examining analytics and actions being performed for the analyst by the system. The goal is to take the
monitoring burden off the analyst through support from the computer system. If something of interest
is found, the analyst moves into the analysis phase.
Analyze relevant issues. The analysis process is much more hands-on and active for the analyst. The
analysis uses a sandbox to capture data and hypotheses. The analysis also feeds back into the
monitoring processes as another data stream. The analyst can construct clusters, create profiles and
feed their analyses into an automatically generated report.
Develop a report and out-brief the analysis.
Figure F.2. Analytic Workflow. (Chart created during the workshop.)

F.7
This process is iterative, with the analyst performing monitoring, analysis, and reporting throughout the
day.
STORYBOARDS AND SUPPORTING DISCUSSIONS
This scenario focuses on the analyst’s need to make a sudden shift in the information and hypotheses they
must attend to. Figure F.3 presents the full storyboard for this scenario. Visualization is central to the
analysis, but the visualization may change depending on the phase of the process. For example, in the
monitoring environment, all public data would display; in the private sandbox, the analyst’s own data is
reflected.
Figure F.3. The Storyboard Developed by Group 4. (Charts created during the workshop.)
The analyst starts the shift by reviewing the daily digest view. This could happen in the office or on a
mobile device on the bus on the way into the office.
The Daily Digest view, shown in Figure F.4, acclimates an analyst to changes since the last shift, updates
on recent incidents, and the status of data feeds. The Daily Digest is analogous to a portal, summarizing
relevant information that provides context for the day’s analysis. It can also be used to update the analyst
new information after the analyst’s attention has been focused in a different area for a long time.

F.8
Figure F.4. The Daily Digest View and a Portion of the Monitor View. (Chart created during the
workshop.)
The analyst examines the Daily Digest to get status updates and to see changes to the watch list, which
contains a prioritized list of potential threats. The analyst also reviews upcoming events and the
associated potential threats.
Moving into monitoring mode, the analyst considers potential threats related to an upcoming event, a
gymnastics competition.
In the Monitor display (shown in Figure F.5 and Figure F.6), shared data and analytic results are
displayed. The display includes information such as
A watchlist of potential threats with critical measures
Baseball cards containing information for specific entities and showing relevant information from
across multiple streams (Figure F.6)
Data feeds and metadata about them. Feeds are automatically enriched with entities of interest.
A river of annotations coming from other analysts to support collaboration and coordination.
Automatically created groups of interest.

F.9
Figure F.5. Monitor Mode. (Chart created during the workshop.)

F.10
Figure F.6. Baseball Card View. (Chart created during the workshop.)
Suddenly, a new report comes in of a new threat at the pool, and the analyst is charged with determining
whether this is a credible threat. As shown in Figure F.7, the analyst must re-orient and switch focus to
this new priority. The models re-prioritize the potential threats and identify two new potential volunteers
as high-priority suspects. The system also provides a rationale as to why these individuals were
considered highest priority.

F.11
Figure F.7. Reorientation in the Light of Sudden Priority Change. (Chart created during the workshop.)

F.12
Figure F.8. Additional Views Supporting Reorientation. (Chart created during the workshop.)
The reorientation view supports drilling in to understand more about these suspects. It displays their
baseball cards and shows their recent relevant activity across all the streams. This view is analogous to the
feed monitoring view. It allows the analyst to hover on particular suspects to see more data.
There is an assumption that there is a 30-minute history preserved in the data. During reorientation, the
analyst looks at the last 30 minutes of history for the two suspect volunteers. They also look at
information from multiple streams regarding where they were as opposed to where they were assigned to
be. As shown in Figure F.9, the analyst consults a social network to identify connections between
individuals and looks at network traffic to check for evidence of suspicious activity by these individuals.

F.13
The analyst’s sandbox (Figure F.9) is a private area in which the analyst can capture personal notes and
annotations on the data. It replicates the contents of the Monitor display, but adds the analyst’s private
data.
The analyst takes all the data and analytics to the sandbox. As an alternative, the user might have a 3D
analysis space in which the analyst can do vellum overlays of various types of data, including flagged
activity, command history, public records, and arrest records. Other analytics could include face
recognition with annotation, sentiment analysis, and automated analysis of unexpected behaviors.
Throughout the workflow, the analyst articulates thoughts and hypotheses, potentially through something
like a think-aloud protocol. In this vision, it is possible to compress the analyst’s mental model flow using
speech to text, good summarization, key word extraction, entity extraction, and analyst activity
recognition to capture the analysis.
Figure F.9. Sandbox Views. (Charts created during the workshop.)


G.1
Appendix G
Research Questions

G.2
Appendix G
Research Questions
PROCESS
Workshop participants brainstormed the set of research topics that must be addressed in order to achieve
the visions outlined in the previous appendices. After all the ideas were gathered, the group performed an
affinity mapping exercise to organize the ideas into categories. In some cases, related categories were
further rolled up into groups. The full list of brainstormed research topics from this exercise appears
below, organized by group (where appropriate) and category.
CATEGORIES IDENTIFIED
Group 1: Critical Thinking
– Structuring and Expressing Human Mental Models
– Context
– Hypotheses
– Tradecraft
– Bias
– Ethics and Policy
Group 2: Streams
– Stream Fusion
– Aggregation and Abstraction
– Data Age-off
Group 3: Human factors
– Attention Management
– Collaboration
– Optimizing Training
– Evaluation
Group 4: Narrative Generation and Reporting
– Automated Narrative Generation
– Reporting
Group 5: Steering and Mixed Initiative
– Steering
– Mixed Initiative
Visual Representation of Change

G.3
Queries
Anomaly Detection
Entity Construction
Threat Modeling
DETAILED RESEARCH TOPICS
Group 1: Critical Thinking
Structuring and Expressing Human Mental Models
How to infer vis/data needs from user interaction?
Intuitive and expressive ontology for communicating about the meaning of data
Visual way to express a hypothesis
Machine learning methods for quickly learning an analyst’s mental model
Expressive model/ policy building tools
Languages/interfaces to support stream-bonding
Integrating analyst mental model with data
Interaction mining
Building/inferring user data goal models
Building / inferring reusable user task models
Mixing / converging analyst-interaction view of “related” with system’s view
Mental model externalization
Expressing hypotheses that the computer understands
Standardized hypothesis syntax / languages
Stable information space matched to domain knowledge model
Data importance and goal recognition from analyst attention and workflow
Inferring analytical intent from interaction
Context
Ways of determining relevance based on implicit user cues
Representing / leveraging context
Integrating context (semantics) into visualization (dynamic)
Gisting meaning from human-generated text streams (I don’t want to have to read lowest level data)
Automatic ingestion or translation of foreign language data without loss of meaning or context or
semantics
How can location or other info be determined / inferred when not specified in the data?

G.4
Hypotheses
How to communicate upstream and downstream hypotheses?
How to move beyond mouse and keyboard?
More flexibility and expressiveness
How to do non-text queries
Visualization of hypothesis space and coverage
How to build a hypothesis manager can nudge hypothesis generation / evidence collection
“Brain dump”. How can an analyst hand off his or her own mental model of a partial analysis?
How can we relate hypothesis tracking tools to other well used branch / merge domains (e.g. git UI)
Hypothesis representation
Unambiguous and intuitive way for system to know user train of thought, hypothesis, etc.
Visualization of putative / hypothetical future states (of data)
Visualization of hypotheses at scale (lots and lots of hypotheses)
Tradecraft
Abstract cyber tradecraft (not packets on a network, not malware analysis)
Analyst “scratchpad”
Integrate with current tradecraft (which will evolve)
Supply chain and risk management of blue and red
Understand behavior from cyber observations (tradecraft / workflow of adversary)
Analysis under uncertainty
Bias
How do you visually represent the “expectation” models about streams?
How does one (visually?) update models and baselines that have been developed?
Understanding bias
De-biasing – identifying when and how
How to build appropriate trust / confidence / uncertainty models?
How to show/communicate models?
How to validate / trust / manage models (since they are designed for future data)?
Devil’s Advocate SIRI – how to infer a non-stated view? How to communicate alternatives?
Ethics and Policy
Ethics and policy research

G.5
Group 2: Streams
Stream Fusion
How to fuse multiple data types / streams in real time?
Notions for presenting cross-stream insights – more than layers and annotations
Fusion: How do we combine disparate data sources into a single model?
Effective way to blend representations of physical vs. conceptual phenomena (e.g., geo-temporal vs.
multi-part hypothesis)
Dynamic visualizations that integrate static context
Streaming analytics/vis platform
Steering sensors/streams
How to aggregate multiple streams (e.g. video)
How to understand implications of cross-stream data?
Multi-resolution temporal analysis (implication is that there is much greater detail in current data and
that data resolution degrades ad time goes on)
How does visualization play well with other data, representations, and analytic output?
Methods for projecting stream convergences
Gap: combining hypothesis/human analysis (streams) with data streams
Aggregation and Abstraction
Effective summarization of real-time streams
Gap: Providing temporal context to explain decisions made at past moments in time
Static representations that communicate complex dynamic changes
Compact way of understanding long-term events
What is needed to support analyst lag in stream?
Computational optimization of existing algorithms to work in a high-speed streaming environment.
Gap: smart compact visual summaries so that sensemaking of prior stream is optimized.
“Play/Pause/Resume” design guidelines for catching up
Focus + context in a streaming setting is not well understood
What is a reasonable amount of prior data to store in a streaming system? Is it just a space issue or
can we bound it on properties of the data as needs and display?
Unsupervised/non-causal data modeling – overlaid on visual analytics
Scalable visual representations for visualization (places with minimal data analytics)
Data Age-Off
Visualizing incomplete or untrustworthy data
Store / aggregate data based on perceptual interfaces

G.6
Methods to automatically “age-off” data for compression but as losslessly as possible (e.g. image
compression)
Gap: ability to automatically save/retain data of likely importance
How to tactfully age data? Can it be decayed or compressed? When/how do we degrade or delete
data?
Correlation algorithms for multi-modal stream data
How to preserve analytical provenance when the data/context may have aged off?
Policies for data retention that enable effective reach-back
How to do visual analysis of data captured or stored at different levels of degradation?
Group 3: Human Factors
Attention Management
Study of perception, human visual perception limitations for visualization in visual design
Design principles for interruption and context switching
Stabilizing time-varying visualizations
Reconfigurable tools that go beyond dashboards
Understanding biometric responses to analysis, sensemaking, discovery
Analyst impact over time – effectiveness at hour 1 vs hour 4
Display ecologies
Interfaces: how does the user communicate complex commands, queries, annotations, etc. to the
system?
Pre-cognitive support for analyst attention focusing
Shaping visual analytics / data analytic goals through language and other minimal complexity
interaction
Evaluation – what are the limits of human attention in a streaming context with respect to different
dynamic visual encodings?
What ways can the user be steered or cognitively primed by analytics?
We don‘t understand the best practices / techniques for biometric feedback that could help
automatically capture “aha”s.
How do we build systems that avoid change blindness or overwhelming the user?
Complexity: how do users deal with complex algorithms they do not understand?
Attention: how do we make sure the user does not miss the situation?
Visualizations that support rapid reorientation.
Predicting user load and attention to permit management of attention.
Collaboration

G.7
How to optimize collaborative computer workspaces?
How do users work together to solve a common problem?
Collaboration – includes crowdsourcing
Collaboration in a rapidly-changing environment
Optimizing Training
First-hand exercise for researchers
How to design an interface that minimizes training time needed
Optimized user training
Evaluation
How do you evaluate these systems?
Methods to validate against current strategies of analysts
More bench-mark streaming datasets are needed
Evaluation of machine-learning utility
Against what metrics do we evaluate the performance of streaming analytics systems?
How do we test that these streaming visual analytics enable analysts to achieve their goals better than
with what is already used?
When do you use streaming visual analytics?
When do streaming visual analytics work well? When are they moderately effective, or ineffective?
Why?
Group 4: Narrative Generation and Reporting
Automated Narrative Generation
Automated narrative generation (listed verbatim by three people)
Constructing narrative from disparate information streams
Non-visual representation of streams
How to “re-write” the visualization of past stories as new data shows up?
Reporting
What form should living reports have?
How to author living reports?
How to make updates to living reports trackable?
Instantaneous, minimal-effort annotation
Develop visual representations of the living narrative, ones that can evolve and change
What is ideal form for Narrative? Mostly text? Some interaction? Mostly visualization?
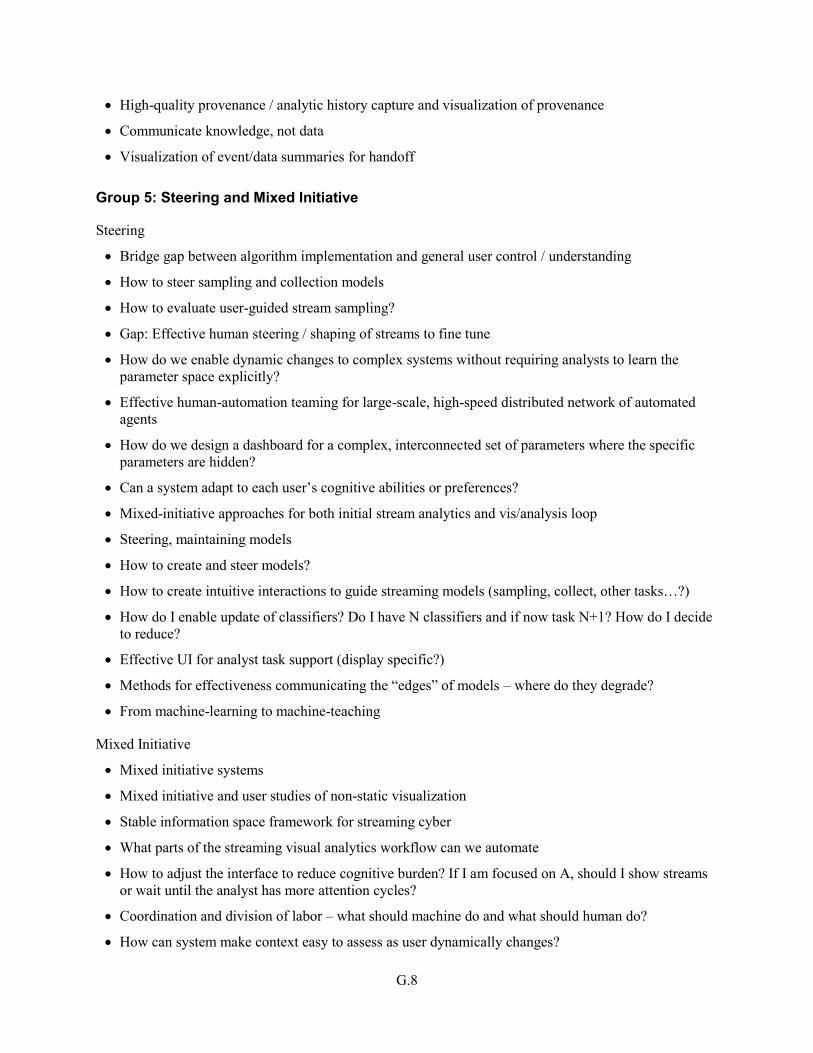
G.8
High-quality provenance / analytic history capture and visualization of provenance
Communicate knowledge, not data
Visualization of event/data summaries for handoff
Group 5: Steering and Mixed Initiative
Steering
Bridge gap between algorithm implementation and general user control / understanding
How to steer sampling and collection models
How to evaluate user-guided stream sampling?
Gap: Effective human steering / shaping of streams to fine tune
How do we enable dynamic changes to complex systems without requiring analysts to learn the
parameter space explicitly?
Effective human-automation teaming for large-scale, high-speed distributed network of automated
agents
How do we design a dashboard for a complex, interconnected set of parameters where the specific
parameters are hidden?
Can a system adapt to each user’s cognitive abilities or preferences?
Mixed-initiative approaches for both initial stream analytics and vis/analysis loop
Steering, maintaining models
How to create and steer models?
How to create intuitive interactions to guide streaming models (sampling, collect, other tasks…?)
How do I enable update of classifiers? Do I have N classifiers and if now task N+1? How do I decide
to reduce?
Effective UI for analyst task support (display specific?)
Methods for effectiveness communicating the “edges” of models – where do they degrade?
From machine-learning to machine-teaching
Mixed Initiative
Mixed initiative systems
Mixed initiative and user studies of non-static visualization
Stable information space framework for streaming cyber
What parts of the streaming visual analytics workflow can we automate
How to adjust the interface to reduce cognitive burden? If I am focused on A, should I show streams
or wait until the analyst has more attention cycles?
Coordination and division of labor – what should machine do and what should human do?
How can system make context easy to assess as user dynamically changes?

G.9
How can system report to user on the many analytics it has run on her behalf?
Dynamic assembly of rules linking streams – making these visible and interactive
How to avoid cognitive tunneling in mixed-initiative systems – can you undo or go back?
Gap: Missing visual analytics methods / system that process multitude of incoming streams so that it
doesn’t totally push it to computational automation
When can we take the human out of the streaming visual analytics workflow?
Balance human/machine effort while maintaining trust
Re-use of visualize formalism at various time scales – use month-long visual analytics in micro-
second applications and vice versa
Visual Representation of Change
Visualizing change of data at different rates
Is there a taxonomy of the visual representations of change?
What are the design principles for systems that display ephemeral data?
Quantify human ability to detect features in streaming data
How does one visually represent “change” in different types of streams / data types?
Visualization of multiple streams
How to guide user attention to recent developments?
It isn’t clear which types of charts (graph diagrams, bars, etc.) work well in a fast-changing system
How to visualize past / present / future in geospatial view to assess threat impact?
Communication: how do we visually communicate change, trends, and dynamism?
Spatially-conservative temporal visualization
New visual designs for streaming data (hard?)
Visualizing change in a way meaningful to analysts
Visualization for cueing analysts in large, fast data. If too many alerts, user shuts down. Hard to ID
what is important, hard to handle as the stream moves fast.
Coordination / synchronization of data: time, granularity, delay, etc.
Design principles: How should user be alerted of changes
Visualizing historical context of real-time data
Aggregation: how do we deal with converting samples to windows?
Non-monitoring streaming visualizations
What are the right streaming visual analytics for a particular task and data velocity?
How can analysts manipulate and then visualize streaming data?
Visualizing data uncertainty – must show data and confidence
Updating with late (and opposite/conflicting) data

G.10
Create and show context?
Integrating / extending existing visualization and analytics to address streaming visual analytics goals
How to visually encode the incoming data
Pitfalls:
– Data rates/velocity – what’s too fast
– High velocity – Available tasks: what can a human do? What about at medium or low velocity?
How to visualize mismatched and changing temporal context?
Design principles for streaming visualization
Visualizing streaming data and conveying different rates
How to visually encode data recency?
How to create data from the human SME?
How to capture / recreate the mental state required to make a conclusion
How to transform between different data forms – speech -> text -> image etc., while analyst thinks
aloud?
Perhaps analysis focused visualizations where hypotheses are emphasized over depictions of streams
Queries
More robust query by example
Query by analytic result
View results of a query as they rapidly change
Query by heuristic
Guidance for interrogating data beyond clustering / filtering
Anomaly Detection
Interactive machine learning
Pattern of life – view recurring patterns and digressions from streams
Include analogs for fuzzy analytical concepts (i.e. “strange” or “unexpected”)
Understandable anomaly detection
Complementary anomaly detection
Trustworthy anomaly detection
Steerable anomaly detection
Change detection at multiple time scales
Intent inference analytics
Could anomaly detection be improved by putting humans in the loop earlier in the data stream?

G.11
Entity Construction
How to create dynamic detectors on the fly
Automated entity construction
Constructing a natural representation of low-level event data
Threat Modeling
Integrate Threat model into alert system
Gap – user need is to orient oneself in a stream or combination of streams, either initially or after
breaks/interruptions
How can threats be anticipated without overloading on “alerts”?
Abilities to test complex models of threat (Why do certain changes matter?)
Rule creation for identification of abnormal – visual input, automated input, adaptive
Models of previous threats
Detecting and tracking deception in the streams
How to visualize trigger/indicator space, especially with spotty collection and alternative scenarios


H.1
Appendix H
Research Themes

H.2
Appendix H
Research Themes
Workshop participants divided into four self-selected groups to develop selected research themes
identified in Appendix G – Research Questions. Four research areas were developed in detail.
1. Critical thinking
2. Visual representation of change
3. Mixed initiative
4. Narratives
This appendix documents the goals identified by these working groups, as well as the overarching
research questions associated with each area and the short-term, medium-term, and long-term steps
needed to achieve the stated goal.
CRITICAL THINKING
Research Area Goals
The goal of this research area is to enable the analyst and the system to co-develop and structure
explanations and hypotheses of important changes over dynamic data. Achieving this goal involves
building and sustaining the explanation of an ongoing situation or event.
This research goal assumes that there is a system behavior to connect evidence and streams to higher-
level explanations. In addition, there are preset triggers, events, or circumstances designed to trigger alerts
that allow a system, with the appropriate models, to make connections between various streams and
evidential narratives. It will be critical to determine the best mechanism for human analysts to locate and
establish these links to their own potential explanations and hypotheses.
During this process, the system and the analyst will jointly structure their reasoning and identify gaps and
inconsistencies, data that does not align, and so on. The system and the analyst will work collaboratively
to create a hierarchy of hypotheses and evidence fragments. Fragments and explanations will be examined
and either incorporated or pruned using a series of convergent and divergent processes. The system will
understand when hypotheses have been set aside.
The goal is to have the system understand this dynamic analysis process. The analyst’s expression of
information needs and hypotheses, some of which are explicit and some of which are tacit, must be met
with the system’s offer of information in a natural way that does not resort to computer-speak.
Research Questions
1. What are the system interactions that will allow analysts to impart their thinking expressively to the
system with minimal burden?

H.3
2. An evaluation goal is to determine how to assess the analyst’s return on investment. How can the
system help the analyst through the analytical process, including communication to others? How can
systems be designed to support effective collaboration with others and to add context to streaming
data environments, narratives, and final analytic products?
3. What are reasonable tasks and models to use, and what are appropriate adaptation strategies? If an
analyst has been interacting with a system, can this interaction be used as a means of implicitly
changing a model or something else in the system? Can it be used to shift how visualizations present
data?
4. How can an analyst and system do “smart pruning” of data in a streaming environment and manage it
in real time while also keeping it as a reference for narrative generation?
5. How can models be aligned appropriately? How can the precise system models be combined with
much fuzzier human models to produce appropriate results?
6. Sometimes the system is an assistant and sometimes it needs to be the devil’s advocate. How can this
balance be struck and managed appropriately?
Figure H.1. A Representation of the Near-term, Mid-term, and Long-term Goals Associated with Critical
Thinking. (Chart created during the workshop.)
Near-Term, Mid-Term, and Long-Term Steps
The group considered the near-term (2 years), mid-term (3-5 years), and long-term (5-8 years) steps to
achieve its overall goal. The group identified five specific areas of interest of focus, which differ
somewhat from the high-level research questions described above.
1. Building explicit signatures from streaming data

H.4
Near-term: Extracting a signature based on the user explicitly identifying events. The user would
supply a bucket of important or relevant data to the system and instruct the system to build detectors
for the signatures in the data. The user is explicitly expressing interest in particular sets of signatures.
This work would build on signatures science, feature extraction techniques, and similarity metrics.
Mid-term: The system can expand beyond indicators of a single event to identify indicators of
similar events or similar signatures. This represents a generalization of previous signatures. This
capability will require significant tuning by the user.
Long-term: Develop a system that has historical knowledge and, as a result, can infer events of
interest more accurately. The analyst shifts more into the role of a supervisor and manages the
automation rather than being a teacher and corrector.
Ultimately, this feature will provide the ability to build and deploy detectors for triggers of interest.
2. Visual analytics of explanations and hypotheses (the user perspective) – The ability to represent
pieces of an explanation where system support is requested or required.
Short-term: Foundational work in exploring visual analytics around building explanations and pieces
of hypotheses. This research investigates how to represent and express, in a complete and natural
way, explanations of the world that are important to an analyst. This work could draw on
visualization of threaded narrative and discussion.
Mid-term: Moving beyond the analyst explicitly expressing an explanation, the next step is a far
more interactive system that helps the analyst figure out what pieces to put together and how to
structure information coherently.
Long-term: The ability to begin linking data to above structure.
Ultimately, this step will create the capability to discover and elevate the data that is most relevant to
critical thinking as expressed through the explanations and hypotheses that the analyst is attempting to
support or refute.
3. Model-based system to support the user (the system perspective)
Near-term: The ability to infer data and analytic task goals by observing what the analysts are doing
as they construct their hypotheses and working within the system. Foundational approaches are based
on task models and logs of user activity.
Mid-term: The system moves beyond the tasks being performed individually and begins to
understand how to share and collaborate across multiple perspectives on an analytic team.
Long-term: Develop a full complement of models able to understand what analysts are doing and
how data relates to their tasks.
Ultimately, the resulting capability is an ensemble modeling system that aids the user at multiple levels
within the workflow.
4. Active inspection and critique (model perspective) – The system not only helps the analyst find
evidence related to hypotheses about what is going on in the world but also plays a devil’s advocate
role. Sometimes it acts as the assistant and sometimes it acts as a critic.

H.5
Near-term: The system will identify gaps and inconsistencies in the explanations that the analyst
is creating within hypotheses fragments. This feature is a primarily a syntactic assessment or
structural assessment. Bases are in structured argumentation and intelligent tutoring.
Mid-term: The system will automatically seek out evidence and refute the explanation provided
by the analyst or support suggestion of an alternative.
Long-term: The system will generate its own hypotheses for analyst consumption.
Ultimately, this step will improve critical thinking by critiquing refuting explanations and robustly
proposing alternatives.
5. Build robust evaluations based on critical thinking
Near-term: Evaluate or re-visit previous work in evaluation in the context of instructional science.
There is available work in evaluating critical thinking to determine if the process is going correctly.
The idea is to start with what is known from pedagogy and apply it to critical thinking and analysis
support. This work will entail developing initial metrics and datasets for evaluation.
Mid-term: Develop metrics for machine learning evaluations based on instructional science. This
work is moving from evaluating how people do critical thinking to evaluating how machines perform
critical thinking.
Long-term: Apply these evaluation metrics to the joint output to the analyst and system, working
together as a team, to think critically about an analysis problem.
This will result in a robust method for evaluating the combined human and system critical thinking.
VISUAL REPRESENTATION OF CHANGE
Research Area Goals
The goal is to leverage visualization to facilitate decision making at a time scale appropriate for the
problem. Every problem has its own natural time scale. Streaming visual analytics is essential for
problems with very short timeframes.
Research Questions
Visualization. When is visualization appropriate? When is streaming visualization appropriate?
When and in what ways does the use of static visualizations fail on streaming data?
Baselines. How does the system communicate the baseline? How does the system represent the
baseline visually and compare it to what is currently occurring? How should the system show change
or the loss of data? How should data be aggregated for visual representation?
Perceptual, cognitive, and human factors. What are the design criteria and design principles for
streaming visualization? What are the dimensions of visual change, what encodings can we consider
separable, and what encodings are pre-attentive in a streaming context? Are these the same as in a
static context?
Beyond change. In addition to detection of change, other things that may be of central interest
include co-occurrence, synchrony, and correlation.

H.6
Interaction. How can users interact with a visualization that is changing? When do analysts transition
from a streaming context to a deep dive forensics context? Is it possible to combine streaming visual
analytics and deep forensic analysis?
Items considered out of scope at this time include the following.
Forensic analysis
Uncertainty visualization
Figure H.2. Short-term and Medium-term Steps for Visual Representation of Change. (Chart created
during the workshop.)
Near-Term, Mid-Term, and Long-Term Steps
The group considered the near-term (2 years), mid-term (3-5 years), and long-term (5-8 years) steps to
achieve their overall goal.
Foundational activities
Near-term:
– Identify and classify streams and suites of streams, and developing a suite of streaming data
collections to use as examples
– Identify classes of stream interactions around concepts such as change, concurrence, sequence,
and synchrony

H.7
– Perform a design space analysis to identify knowns and information gaps
– Develop taxonomies and frameworks, drawing from design and from related work in other fields
Mid-term:
– Examine and question constraints, including screen size
Cognition
Near-term:
– Perform model task studies to understand analyst cognition
– Perform cognitive task analysis in streaming environments
– Learn from studies in other domains working with streaming and emergent data (such as surgical
teams, marketers, electrical grid)
Mid-term:
– Look at perception studies focused on how people process incoming streams
– Investigate cognitive/perceptual implications of streaming analytic tasks to measure cognition
Long-term:
– Studies examining fatigue and the implications of automation
Prototyping and Experimentation
Near-term:
– Establish evaluation frameworks, define scenarios, and create testbeds based on sample problems
– Experimental comparison of streaming vs. non-streaming approaches
Mid-term:
– Prototype methods for visualizing normal vs. baseline and deviations from the baseline
– Design and evaluate background vs. foreground representations such that change thresholds differ
– Support visual analysis of multiple streams
– Develop a taxonomy of attributes and visual representations for overlaying and juxtaposing data
to support analysis of change and synchrony
– Develop novel representations of multiple data streams
– Develop visualizations of dynamic intent data, in which users can infer information about the
intent of the actors
– Develop design guidelines, vocabularies, and principles based on earlier activities
– Build out libraries and toolkits of change of enabled visualization
– D3-like libraries for streaming
– Deploy streaming visual analytic prototypes in an operational environment

H.8
Long-term:
o Develop multimodal interactions with visualization
o Recommender systems and data streams working with analyst’s profile.
Technical Approach
Potential technical approaches include
Design critiques
Literature analysis
Prototyping and evaluation, including empirical studies and live exercises
The ultimate goal is SMARTS: Semantically Meaningful Analytic Reasoning about Time-Series
Datasets.
MIXED INITIATIVE
Research Area Goals
The goals of this research area are as follows. (See Figure H.3.)
1. Balance broadening and focusing activities. At times, systems may broaden the analysis (divergence)
while the analyst provides the focus (convergence); at other times, the systems provide focus while
the people increase the breadth of the investigation.
2. Allow user intuition and minimize bias. How can the system identify the difference between intuition
and bias?
3. Support machine learning interpretability and trust, in an effort to help the analyst understand what
the machine learning system is doing, how much longer it might take, and what it might find.
Figure H.3. The Goals of the Mixed Initiative Research Area. (Chart created during the workshop.)

H.9
Overall, the goal is to waste flops, not thoughts. CPU cycles are cheap, but the analyst’s time and
intellect are not. While the goal is to maximize the value provided by the system, it is much better for the
system to cast a wide net and calculate many things, knowing that some calculations may not produce
meaningful results.
Research Questions
1. Managing upstream and downstream models
How can an analyst manage a model that is in charge of data aging? How can aging be controlled so
that some data ages off but not other data?
What can be forecasted effectively? Some data is likely to be more straightforward to produce
forecasts from than others. What is the relative level of uncertainty in the forecasts?
2. Visual representation and interaction. What are the most impactful visual representations and
interactions to use? How do we augment the feature space? Static data is often thought about as static
data observations and attributes. In a streaming data environment, not only are the observations
streaming in, but the attribute space is changing because the models may be getting more specific,
providing more dimensions to the data. How can we add not only rows (observations) but also
columns (attributes) to the data?
3. Machine learning interpretability and trust. How can the machine learner communicate about the
model so the user can steer it? How can the system steer collection and give more context to what the
user is looking at? How can the training of models be minimized and automatically steer the model on
the fly as the user changes and refines focus? How can the system infer user interest, and how can this
be made transparent?
Steering is assumed to be part of mixed initiative. The system can take many initiatives, as can the user.
This group assumes a cycle between the user and the system, and each interaction can result in steering in
either direction. For example, the system could steer the user away from the tunnel or biased path, or the
user could steer the system away from unproductive directions.
Near-Term, Mid-Term, and Long-Term Steps
Elegant decay. This research deals with providing more elegant approaches to managing the aging
and discarding of data. This entails capturing the user need, applying that need to multi-modal
streaming data, and optimizing compression or decaying data to best match the user’s need. Ideally,
the system could iterate on this in support of the user, considering the feature space in the decay
function rather than simply decaying the data. This work should also provide an intuitive user
interface through which the user can tune the decay function.
Now:
– We can manually run compression algorithms instead of automatically deleting aging data.
– User interest modeling
– Infer matches between user’s tasks and data models
Near-term:
– Automatically run compression algorithms to perform smart compression. Degrading or filtering
out information over time while still maintaining meaning within data elements is important. If a

H.10
model is able to indicate which facets of data are important, compression of data may assist with
discarding other facets/data points that are not relevant.
– Evaluate user interest models
– Explicit tuning of the task model
Mid-term:
– Save data that matches user results or use interests
– Learn task models on the fly as information comes in
– Implicit tuning of task models
Long-term:
– Optimize the compression and decay model to address the user’s needs.
– Instant and accurate capture of user intent
Broadening and narrowing the scope of what the analyst and system are doing. The goal is to
understand and support the user’s goal by complementing this activity with system-initiated
narrowing and broadening activities.
Near-term:
– Ability to classify a user’s activity as broadening or narrowing and support these goals
– Ability to apply user focus to all streams
Mid-term:
– Ability to select complementary system actions or models
– Look for cross-stream connections to support user focus
– Characterize and manage model dependencies, including other model outputs and particular data
streams.
Long-term:
– Auto-selection of complementary models
Machine learning interpretability and user trust
Now:
– Steer explicitly and re-run models
– Steer implicitly from user action and re-run
– Trust: want a no-judgment playground in which analysts understand their actions can be undone.
Near-term:
– Steer explicitly as data is flowing
– Steer implicitly from user action as data flows
– Query by state

H.11
– Expand set of comprehensibly interactive learners
– Auto-fork multiple models
Mid-term:
– How to communicate key result differences to the user?
– How to manage multiple runnings that might fit the user’s need?
Long-term:
– Cross-stream steering based on user focus
– Auto-tune machine learning to the user’s need
– Internet of models
Technical Approach
Enforcing a cross-disciplinary approach appears essential to moving this work forward. The machine
learning community is clearly performing related work, and the database community is considering
techniques for data aging.
NARRATIVES
Research Area Goals
The goal of this research area is to enable the construction of narratives that help orient the analyst,
support analysis, and facilitate reporting, all in a streaming environment.
Research Questions
The group identified numerous research questions. An example of their notes can be seen in Figure H.4.
Defining interesting information. How do analysts and systems define what is interesting and
suspicious in order to help support the analytic process? Is this work done by the analyst, the system,
or through human/machine collaboration?
Analytic key frames. As the data is streaming, analysts need to take snapshots of their data and
analysis. We think of these as analytic key frames, just as one might identify key representative
frames in a video. What should an analytic key frame contain? When should it be captured?
Orientation and reorientation. What visual analytics methods exist to support branching and
competing hypotheses? How do we use visualization to rapidly reorient people, and what are the
mechanisms to support that?
Narrative and reporting. What is needed by an analyst to construct a story or explain what is going
on for himself? What is needed when the analyst must tell this story to others? What is the difference
between narrative and analytic reporting?
Narrative construction. How do we build a narrative collaboratively and keep it up to date? What
parts should be automatically constructed? What is the right scale of the data and how can goals be
established focused on automated narrative construction?

H.12
Streams with respect to narratives. How does the system convey streaming data? How can both
analyst and system manipulate streams and inform users of new streams and new data for
consideration within their narrative?
Order. How do we resolve “out of order” data and how do we go back in time to resolve this with
binding information?
Effectiveness. What makes an effective narrative? More research is needed to determine what makes
it effective in terms of both helping the analyst understand the narrative and telling the story about the
narrative to someone else.
Tailoring. How can narrative be tailored to the needs of the consumer and how do we compress the
narrative? How do we decide the timeframe tolerance? What is the right resolution to keep different
snippets while maintaining coherency?
New capabilities. At what point do we introduce capabilities that the analyst didn’t initially know
were available to them, in order to manipulate the narrative?
Figure H.4. Research Questions Related to Narratives. (Chart created during the workshop.)

H.13
Near-Term, Mid-Term, and Long-Term Steps
Narrative includes both drama (discourse) and story. In this research, the goal is to focus on the story and
minimize discourse. It is important to minimize the potential for misunderstanding. Any approach taken
should strive to minimize anything that could lead to ambiguity in interpretation.
Near-term:
– Define the analytic key frame. What is it composed of? Does it include data, images, audio,
semantics?
– Identify lessons on constructing effective narrative from other fields, including film, writing,
journalism. Get examples from these fields to learn what makes an effective narrative and how
those lessons translate to this context.
– Conduct a literature review on how people recover from disruption. We hypothesize that analytic
key frames could be useful in recovering from disruption.
– Perform literature review to identify how current strategies for orientation in environments that
require shift work, for example.
– Generate the key frames from data such as social media, for example news stories or Periscope, to
demonstrate as building blocks for narrative
– Design sketches or concept of operations for how key frames could work in a streaming
environment
– Use VAST Challenge 2016 live challenge as a testbed for way to generate key frames, by
capturing participant thoughts on what might make meaningful key frames during their work
Mid-term:
– Semantic technologies and feature extraction for informing key frames and narratives.
– Strategic interruption for reorientation. How can key frames help orient or re-orient someone if
there has been a dramatic shift? There is plentiful literature on recovery from interruption, in
which case your attention returns to the original focus after the interruption. How is that different
from reorientation, in which case user attention is redirected to something completely different?
Does this produce the same spike in working memory and the same frustration? If they are
similar, what does this information tell us? If they are different, in what ways?
– Trust-building during collaborative and co-created narrative development.
– Streaming data testbeds with ground truth.
Long-term:
– How to incorporate evolving data in the narrative?
– Pilot the use of key frames.
– Investigate techniques for reorienting people effectively. The group discussed at length potential
techniques for reorienting someone with a “new truth” if data and events have transpired since
her last shift that dramatically affected their previous understanding of the situation. How
aggressively can her past data and understanding be reframed to prime the analyst for
understanding the new situation? What is effective? What is ethical? (For example, consider a
television show’s “Last time on…” opening, which may or may not faithfully represent the actual
content of the previous show.)