Strain localisation and grain breakage in sand under shearing at high mean stress: insights from in...
18
1 23 Acta Geotechnica ISSN 1861-1125 Volume 10 Number 1 Acta Geotech. (2015) 10:15-30 DOI 10.1007/s11440-014-0364-6 Strain localisation and grain breakage in sand under shearing at high mean stress: insights from in situ X-ray tomography R. Alikarami, E. Andò, M. Gkiousas- Kapnisis, A. Torabi & G. Viggiani
Transcript of Strain localisation and grain breakage in sand under shearing at high mean stress: insights from in...
1 23
Acta Geotechnica ISSN 1861-1125Volume 10Number 1 Acta Geotech. (2015) 10:15-30DOI 10.1007/s11440-014-0364-6
Strain localisation and grain breakage insand under shearing at high mean stress:insights from in situ X-ray tomography
R. Alikarami, E. Andò, M. Gkiousas-Kapnisis, A. Torabi & G. Viggiani

1 23
Your article is protected by copyright and
all rights are held exclusively by Springer-
Verlag Berlin Heidelberg. This e-offprint is
for personal use only and shall not be self-
archived in electronic repositories. If you wish
to self-archive your article, please use the
accepted manuscript version for posting on
your own website. You may further deposit
the accepted manuscript version in any
repository, provided it is only made publicly
available 12 months after official publication
or later and provided acknowledgement is
given to the original source of publication
and a link is inserted to the published article
on Springer's website. The link must be
accompanied by the following text: "The final
publication is available at link.springer.com”.
RESEARCH PAPER
Strain localisation and grain breakage in sand under shearingat high mean stress: insights from in situ X-ray tomography
R. Alikarami • E. Ando • M. Gkiousas-Kapnisis •
A. Torabi • G. Viggiani
Received: 23 December 2013 / Accepted: 21 November 2014 / Published online: 21 December 2014
� Springer-Verlag Berlin Heidelberg 2014
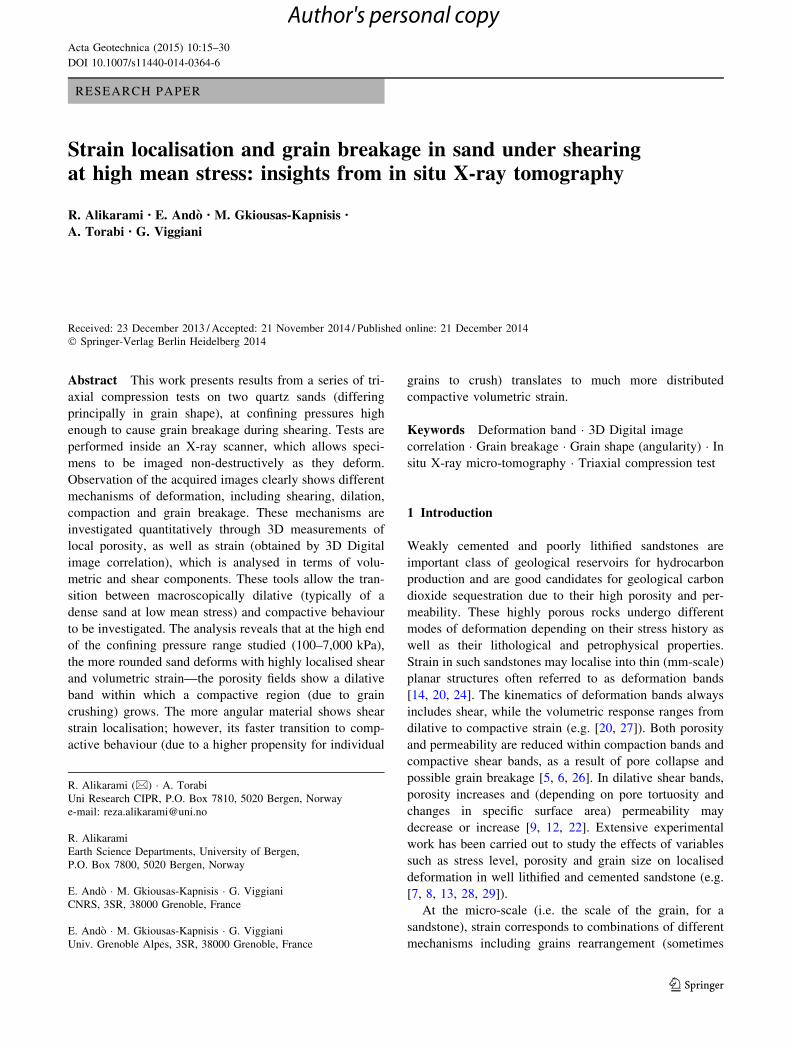
Abstract This work presents results from a series of tri-
axial compression tests on two quartz sands (differing
principally in grain shape), at confining pressures high
enough to cause grain breakage during shearing. Tests are
performed inside an X-ray scanner, which allows speci-
mens to be imaged non-destructively as they deform.
Observation of the acquired images clearly shows different
mechanisms of deformation, including shearing, dilation,
compaction and grain breakage. These mechanisms are
investigated quantitatively through 3D measurements of
local porosity, as well as strain (obtained by 3D Digital
image correlation), which is analysed in terms of volu-
metric and shear components. These tools allow the tran-
sition between macroscopically dilative (typically of a
dense sand at low mean stress) and compactive behaviour
to be investigated. The analysis reveals that at the high end
of the confining pressure range studied (100–7,000 kPa),
the more rounded sand deforms with highly localised shear
and volumetric strain—the porosity fields show a dilative
band within which a compactive region (due to grain
crushing) grows. The more angular material shows shear
strain localisation; however, its faster transition to comp-
active behaviour (due to a higher propensity for individual
grains to crush) translates to much more distributed
compactive volumetric strain.
Keywords Deformation band � 3D Digital image
correlation � Grain breakage � Grain shape (angularity) � In
situ X-ray micro-tomography � Triaxial compression test
1 Introduction
Weakly cemented and poorly lithified sandstones are
important class of geological reservoirs for hydrocarbon
production and are good candidates for geological carbon
dioxide sequestration due to their high porosity and per-
meability. These highly porous rocks undergo different
modes of deformation depending on their stress history as
well as their lithological and petrophysical properties.
Strain in such sandstones may localise into thin (mm-scale)
planar structures often referred to as deformation bands
[14, 20, 24]. The kinematics of deformation bands always
includes shear, while the volumetric response ranges from
dilative to compactive strain (e.g. [20, 27]). Both porosity
and permeability are reduced within compaction bands and
compactive shear bands, as a result of pore collapse and
possible grain breakage [5, 6, 26]. In dilative shear bands,
porosity increases and (depending on pore tortuosity and
changes in specific surface area) permeability may
decrease or increase [9, 12, 22]. Extensive experimental
work has been carried out to study the effects of variables
such as stress level, porosity and grain size on localised
deformation in well lithified and cemented sandstone (e.g.
[7, 8, 13, 28, 29]).
At the micro-scale (i.e. the scale of the grain, for a
sandstone), strain corresponds to combinations of different
mechanisms including grains rearrangement (sometimes
R. Alikarami (&) � A. Torabi
Uni Research CIPR, P.O. Box 7810, 5020 Bergen, Norway
e-mail: [email protected]
R. Alikarami
Earth Science Departments, University of Bergen,
P.O. Box 7800, 5020 Bergen, Norway
E. Ando � M. Gkiousas-Kapnisis � G. Viggiani
CNRS, 3SR, 38000 Grenoble, France
E. Ando � M. Gkiousas-Kapnisis � G. Viggiani
Univ. Grenoble Alpes, 3SR, 38000 Grenoble, France
123
Acta Geotechnica (2015) 10:15–30
DOI 10.1007/s11440-014-0364-6
Author's personal copy
referred to as ‘‘particulate flow’’), grain breakage (catacl-
asis) and cement breakage. A full understanding of strain
localisation in sandstones requires investigation of these
mechanisms, all of which strongly depend on grain shape
and angularity. Experience and knowledge from our pre-
vious work on natural compactive shear bands formed in
very porous and friable sandstone (e.g. [23, 25]) were the
motivation to explore the behaviour of sand at high mean
stress. In this paper, sand is adopted as a model material
that allows the investigation (at substantially lower mean
stresses than that needed for sandstone) of all deformation
mechanisms mentioned above at the grain scale—with the
exception of cement breakage.
X-ray tomography is proving to be an ideal tool for the
investigation of the micro-mechanisms of deformation in
sand—for example recent work from Laboratoire 3SR,
Grenoble, has clearly demonstrated the effect of grain
angularity on the macroscopic mechanical behaviour of
sand as well its effect on the formation and development of
shear bands in different types of sand [2–4], all this at
relatively low mean stress, which rules out grain breakage.
A series of dry triaxial compression tests on two dif-
ferent sands have been performed in situ (i.e. performing
X-ray scans at various points throughout loading) inside the
X-ray scanner in Laboratoire 3SR (Grenoble), at mean
stresses up to 7,000 kPa—which proves to be high enough
to cause grain breakage. The two sands tested are both
quartz sands, with similar grain size distributions but dif-
ferent angularities: Ottawa 50–70 sand (rounded) and Ho-
stun HN31 sand (angular).
The structure of the paper is as follows: the materials
and testing method are first described; this is followed by a
description of the tests performed. The typical, macro-
scopic measurements obtained from triaxial testing are
detailed for all tests. The image processing tools used to
make micro-scale measurements on the acquired X-ray
images are then briefly described. These measurements are
further used to explain the differences in the macroscopic
responses observed. The paper closes with a discussion of
the results obtained.
2 Experiments
2.1 Materials tested
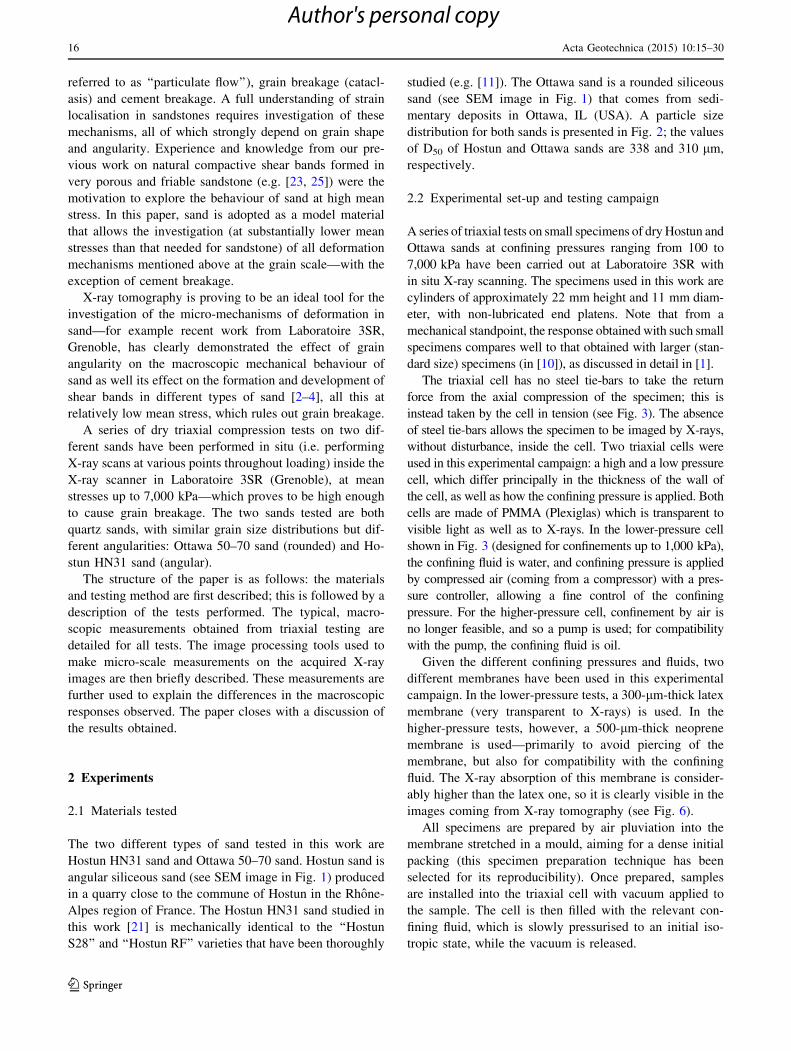
The two different types of sand tested in this work are
Hostun HN31 sand and Ottawa 50–70 sand. Hostun sand is
angular siliceous sand (see SEM image in Fig. 1) produced
in a quarry close to the commune of Hostun in the Rhone-
Alpes region of France. The Hostun HN31 sand studied in
this work [21] is mechanically identical to the ‘‘Hostun
S28’’ and ‘‘Hostun RF’’ varieties that have been thoroughly
studied (e.g. [11]). The Ottawa sand is a rounded siliceous
sand (see SEM image in Fig. 1) that comes from sedi-
mentary deposits in Ottawa, IL (USA). A particle size
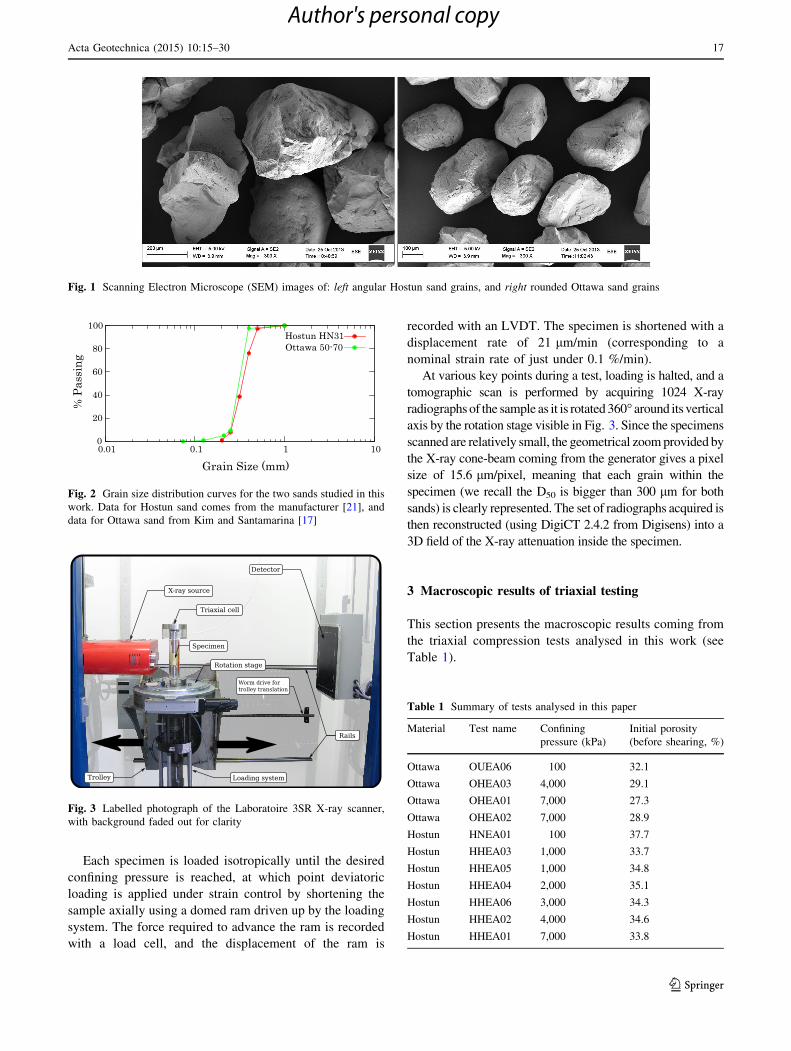
distribution for both sands is presented in Fig. 2; the values
of D50 of Hostun and Ottawa sands are 338 and 310 lm,
respectively.
2.2 Experimental set-up and testing campaign
A series of triaxial tests on small specimens of dry Hostun and
Ottawa sands at confining pressures ranging from 100 to
7,000 kPa have been carried out at Laboratoire 3SR with
in situ X-ray scanning. The specimens used in this work are
cylinders of approximately 22 mm height and 11 mm diam-
eter, with non-lubricated end platens. Note that from a
mechanical standpoint, the response obtained with such small
specimens compares well to that obtained with larger (stan-
dard size) specimens (in [10]), as discussed in detail in [1].
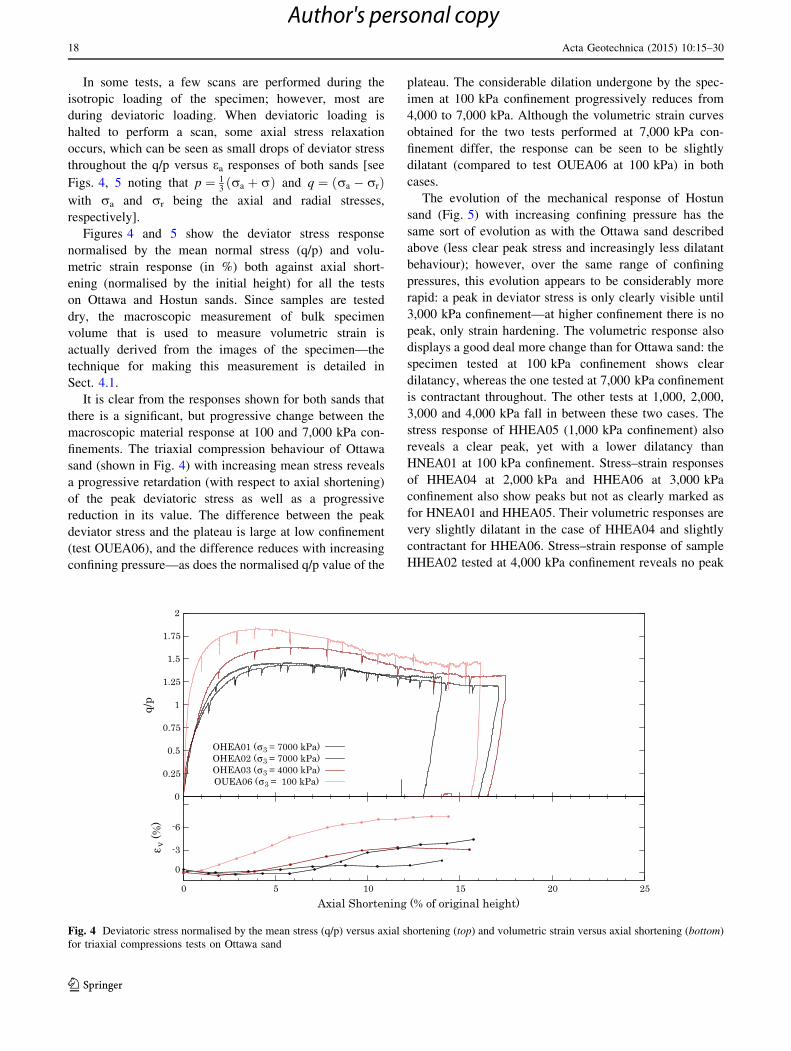
The triaxial cell has no steel tie-bars to take the return
force from the axial compression of the specimen; this is
instead taken by the cell in tension (see Fig. 3). The absence
of steel tie-bars allows the specimen to be imaged by X-rays,
without disturbance, inside the cell. Two triaxial cells were
used in this experimental campaign: a high and a low pressure
cell, which differ principally in the thickness of the wall of
the cell, as well as how the confining pressure is applied. Both
cells are made of PMMA (Plexiglas) which is transparent to
visible light as well as to X-rays. In the lower-pressure cell
shown in Fig. 3 (designed for confinements up to 1,000 kPa),
the confining fluid is water, and confining pressure is applied
by compressed air (coming from a compressor) with a pres-
sure controller, allowing a fine control of the confining
pressure. For the higher-pressure cell, confinement by air is
no longer feasible, and so a pump is used; for compatibility
with the pump, the confining fluid is oil.
Given the different confining pressures and fluids, two
different membranes have been used in this experimental
campaign. In the lower-pressure tests, a 300-lm-thick latex
membrane (very transparent to X-rays) is used. In the
higher-pressure tests, however, a 500-lm-thick neoprene
membrane is used—primarily to avoid piercing of the
membrane, but also for compatibility with the confining
fluid. The X-ray absorption of this membrane is consider-
ably higher than the latex one, so it is clearly visible in the
images coming from X-ray tomography (see Fig. 6).
All specimens are prepared by air pluviation into the
membrane stretched in a mould, aiming for a dense initial
packing (this specimen preparation technique has been
selected for its reproducibility). Once prepared, samples
are installed into the triaxial cell with vacuum applied to
the sample. The cell is then filled with the relevant con-
fining fluid, which is slowly pressurised to an initial iso-
tropic state, while the vacuum is released.
16 Acta Geotechnica (2015) 10:15–30
123
Author's personal copy
Each specimen is loaded isotropically until the desired
confining pressure is reached, at which point deviatoric
loading is applied under strain control by shortening the
sample axially using a domed ram driven up by the loading
system. The force required to advance the ram is recorded
with a load cell, and the displacement of the ram is
recorded with an LVDT. The specimen is shortened with a
displacement rate of 21 lm/min (corresponding to a
nominal strain rate of just under 0.1 %/min).
At various key points during a test, loading is halted, and a
tomographic scan is performed by acquiring 1024 X-ray
radiographs of the sample as it is rotated 360� around its vertical
axis by the rotation stage visible in Fig. 3. Since the specimens
scanned are relatively small, the geometrical zoom provided by
the X-ray cone-beam coming from the generator gives a pixel
size of 15.6 lm/pixel, meaning that each grain within the
specimen (we recall the D50 is bigger than 300 lm for both
sands) is clearly represented. The set of radiographs acquired is
then reconstructed (using DigiCT 2.4.2 from Digisens) into a
3D field of the X-ray attenuation inside the specimen.
3 Macroscopic results of triaxial testing
This section presents the macroscopic results coming from
the triaxial compression tests analysed in this work (see
Table 1).
Fig. 1 Scanning Electron Microscope (SEM) images of: left angular Hostun sand grains, and right rounded Ottawa sand grains
0
20
40
60
80
100
0.01 0.1 1 10
% P
assi
ng
Grain Size (mm)
Hostun HN31Ottawa 50-70
Fig. 2 Grain size distribution curves for the two sands studied in this
work. Data for Hostun sand comes from the manufacturer [21], and
data for Ottawa sand from Kim and Santamarina [17]
Fig. 3 Labelled photograph of the Laboratoire 3SR X-ray scanner,
with background faded out for clarity
Table 1 Summary of tests analysed in this paper
Material Test name Confining
pressure (kPa)
Initial porosity
(before shearing, %)
Ottawa OUEA06 100 32.1
Ottawa OHEA03 4,000 29.1
Ottawa OHEA01 7,000 27.3
Ottawa OHEA02 7,000 28.9
Hostun HNEA01 100 37.7
Hostun HHEA03 1,000 33.7
Hostun HHEA05 1,000 34.8
Hostun HHEA04 2,000 35.1
Hostun HHEA06 3,000 34.3
Hostun HHEA02 4,000 34.6
Hostun HHEA01 7,000 33.8
Acta Geotechnica (2015) 10:15–30 17
123
Author's personal copy
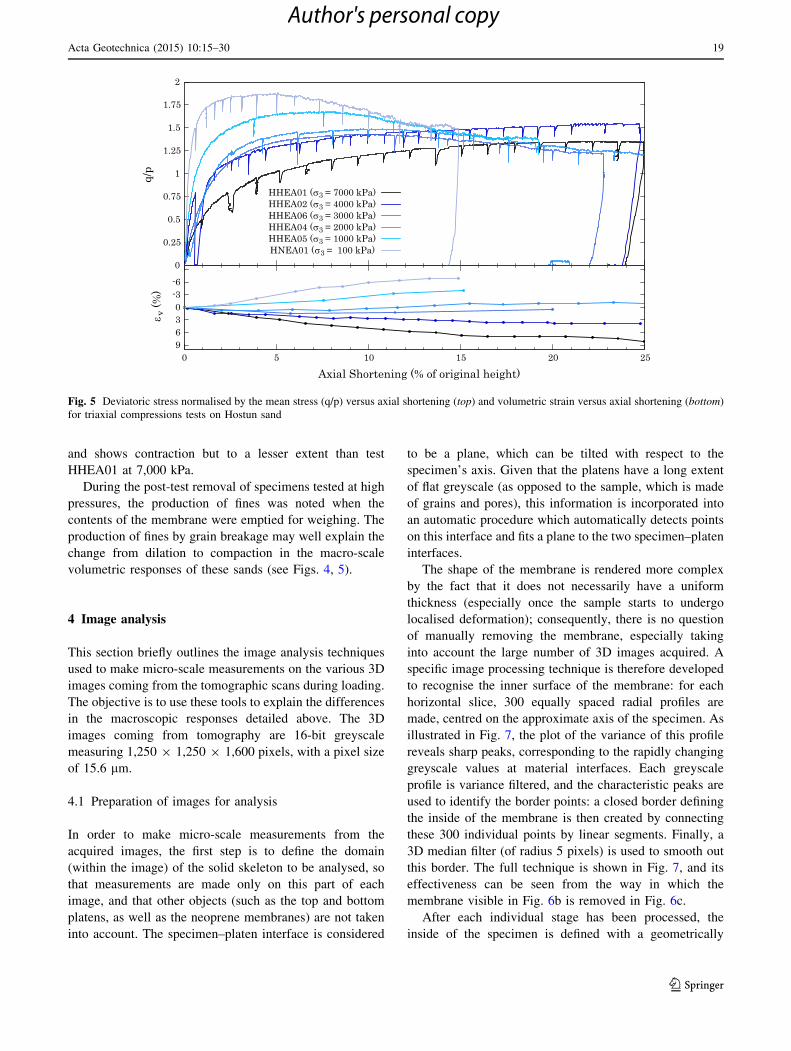
In some tests, a few scans are performed during the
isotropic loading of the specimen; however, most are
during deviatoric loading. When deviatoric loading is
halted to perform a scan, some axial stress relaxation
occurs, which can be seen as small drops of deviator stress
throughout the q/p versus ea responses of both sands [see
Figs. 4, 5 noting that p ¼ 13
ra þ rð Þ and q ¼ ra � rrð Þwith ra and rr being the axial and radial stresses,
respectively].
Figures 4 and 5 show the deviator stress response
normalised by the mean normal stress (q/p) and volu-
metric strain response (in %) both against axial short-
ening (normalised by the initial height) for all the tests
on Ottawa and Hostun sands. Since samples are tested
dry, the macroscopic measurement of bulk specimen
volume that is used to measure volumetric strain is
actually derived from the images of the specimen—the
technique for making this measurement is detailed in
Sect. 4.1.
It is clear from the responses shown for both sands that
there is a significant, but progressive change between the
macroscopic material response at 100 and 7,000 kPa con-
finements. The triaxial compression behaviour of Ottawa
sand (shown in Fig. 4) with increasing mean stress reveals
a progressive retardation (with respect to axial shortening)
of the peak deviatoric stress as well as a progressive
reduction in its value. The difference between the peak
deviator stress and the plateau is large at low confinement
(test OUEA06), and the difference reduces with increasing
confining pressure—as does the normalised q/p value of the
plateau. The considerable dilation undergone by the spec-
imen at 100 kPa confinement progressively reduces from
4,000 to 7,000 kPa. Although the volumetric strain curves
obtained for the two tests performed at 7,000 kPa con-
finement differ, the response can be seen to be slightly
dilatant (compared to test OUEA06 at 100 kPa) in both
cases.
The evolution of the mechanical response of Hostun
sand (Fig. 5) with increasing confining pressure has the
same sort of evolution as with the Ottawa sand described
above (less clear peak stress and increasingly less dilatant
behaviour); however, over the same range of confining
pressures, this evolution appears to be considerably more
rapid: a peak in deviator stress is only clearly visible until
3,000 kPa confinement—at higher confinement there is no
peak, only strain hardening. The volumetric response also
displays a good deal more change than for Ottawa sand: the
specimen tested at 100 kPa confinement shows clear
dilatancy, whereas the one tested at 7,000 kPa confinement
is contractant throughout. The other tests at 1,000, 2,000,
3,000 and 4,000 kPa fall in between these two cases. The
stress response of HHEA05 (1,000 kPa confinement) also
reveals a clear peak, yet with a lower dilatancy than
HNEA01 at 100 kPa confinement. Stress–strain responses
of HHEA04 at 2,000 kPa and HHEA06 at 3,000 kPa
confinement also show peaks but not as clearly marked as
for HNEA01 and HHEA05. Their volumetric responses are
very slightly dilatant in the case of HHEA04 and slightly
contractant for HHEA06. Stress–strain response of sample
HHEA02 tested at 4,000 kPa confinement reveals no peak
-6
-3
0
0 5 10 15 20 25
ε v (%
)
Axial Shortening (% of original height)
0
0.25
0.5
0.75
1
1.25
1.5
1.75
2
q/p
OHEA01 (σ3 = 7000 kPa)OHEA02 (σ3 = 7000 kPa)OHEA03 (σ3 = 4000 kPa)OUEA06 (σ3 = 100 kPa)
Fig. 4 Deviatoric stress normalised by the mean stress (q/p) versus axial shortening (top) and volumetric strain versus axial shortening (bottom)
for triaxial compressions tests on Ottawa sand
18 Acta Geotechnica (2015) 10:15–30
123
Author's personal copy
and shows contraction but to a lesser extent than test
HHEA01 at 7,000 kPa.
During the post-test removal of specimens tested at high
pressures, the production of fines was noted when the
contents of the membrane were emptied for weighing. The
production of fines by grain breakage may well explain the
change from dilation to compaction in the macro-scale
volumetric responses of these sands (see Figs. 4, 5).
4 Image analysis
This section briefly outlines the image analysis techniques
used to make micro-scale measurements on the various 3D
images coming from the tomographic scans during loading.
The objective is to use these tools to explain the differences
in the macroscopic responses detailed above. The 3D
images coming from tomography are 16-bit greyscale
measuring 1,250 9 1,250 9 1,600 pixels, with a pixel size
of 15.6 lm.
4.1 Preparation of images for analysis
In order to make micro-scale measurements from the
acquired images, the first step is to define the domain
(within the image) of the solid skeleton to be analysed, so
that measurements are made only on this part of each
image, and that other objects (such as the top and bottom
platens, as well as the neoprene membranes) are not taken
into account. The specimen–platen interface is considered
to be a plane, which can be tilted with respect to the
specimen’s axis. Given that the platens have a long extent
of flat greyscale (as opposed to the sample, which is made
of grains and pores), this information is incorporated into
an automatic procedure which automatically detects points
on this interface and fits a plane to the two specimen–platen
interfaces.
The shape of the membrane is rendered more complex
by the fact that it does not necessarily have a uniform
thickness (especially once the sample starts to undergo
localised deformation); consequently, there is no question
of manually removing the membrane, especially taking
into account the large number of 3D images acquired. A
specific image processing technique is therefore developed
to recognise the inner surface of the membrane: for each
horizontal slice, 300 equally spaced radial profiles are
made, centred on the approximate axis of the specimen. As
illustrated in Fig. 7, the plot of the variance of this profile
reveals sharp peaks, corresponding to the rapidly changing
greyscale values at material interfaces. Each greyscale
profile is variance filtered, and the characteristic peaks are
used to identify the border points: a closed border defining
the inside of the membrane is then created by connecting
these 300 individual points by linear segments. Finally, a
3D median filter (of radius 5 pixels) is used to smooth out
this border. The full technique is shown in Fig. 7, and its
effectiveness can be seen from the way in which the
membrane visible in Fig. 6b is removed in Fig. 6c.
After each individual stage has been processed, the
inside of the specimen is defined with a geometrically
-6-30369
0 5 10 15 20 25
ε v (%
)
Axial Shortening (% of original height)
0
0.25
0.5
0.75
1
1.25
1.5
1.75
2
q/p
HHEA01 (σ3 = 7000 kPa)HHEA02 (σ3 = 4000 kPa)HHEA06 (σ3 = 3000 kPa)HHEA04 (σ3 = 2000 kPa)HHEA05 (σ3 = 1000 kPa)HNEA01 (σ3 = 100 kPa)
Fig. 5 Deviatoric stress normalised by the mean stress (q/p) versus axial shortening (top) and volumetric strain versus axial shortening (bottom)
for triaxial compressions tests on Hostun sand
Acta Geotechnica (2015) 10:15–30 19
123
Author's personal copy

complex border around the inside of the membrane boun-
ded by two planes. The number of voxels (3D pixels)
within this space can be counted, using the pixel size, and
used to calculate the bulk volume of the specimen as
imaged.
4.2 Local measurement of porosity
Porosity is a key measurement for granular materials, and
its spatial distribution is of particular interest given the
different volumetric strain responses seen with macro-scale
measurements. Porosity is defined as the ratio of the vol-
ume of voids to the total volume. This can be measured
locally, by defining a 3D subvolume within a 3D image and
measuring the volume of the voids within the subvolume.
In previous work [16], voids have been counted by bina-
rising the greyscale 3D image into a black and white image
of the solid and void phases by applying a threshold.
Observation of the images obtained in this work, particu-
larly for Hostun sand at high confining pressure and after
(a) (b) (c)
0 10(mm)
Fig. 6 Horizontal slice of a specimen of Hostun sand a under low confining pressure, b, c under high confining pressure but before and after
membrane removal, respectively
Gre
ylev
el
Distance along profile
Distance along profile
Vari
ance
Original greyscale imageHHEA01-03
Analysis area
Analysis area
Identification of first pointwithin 10% of first peak
Repeat for 300 edge points
Connect points & fill domainrestrict domain (lines)Calculate variance
Final mask for this slice
Greyscale intersected with maskHHEA01-03 – `Membrane Removed''
Smooth border within restricted domain (in 3D)
Fig. 7 Illustration of the technique developed for the identification and removal of the membrane from the 3D images acquired with the high
pressure cell setup
20 Acta Geotechnica (2015) 10:15–30
123
Author's personal copy

shearing, shows that grain breakage does indeed occur (see
Fig. 15 for example), and that the finer grains produced can
be small compared to the pixel size of the images. This
smaller grain phase partially fills voxels and consequently
looks like a homogeneous material of X-ray attenuation in
between grain and void, thus invalidating the inherent two-
phase hypothesis for binarisation. In this work, the volume
of voids in each subvolume is calculated on the greyscale
(as opposed to binary) 3D images; values of pore and grain
greyscale are measured manually on a small selection of
pores and grains throughout the specimen. Any voxel
having a greyscale value equal to, or higher than, the grain
greyscale value identified is 100 % solid, and any voxel
having a greyscale value equal to, or lower than, the pore
greyscale value identified is 100 % pore. Greyscale values
between these two greyscale limits are interpolated with a
linear relationship.
Local measurements of porosity are therefore made by
defining local subvolumes, centred on a number of regu-
larly spaced nodes. The size of the cubic subvolumes is
selected as a reasonable trade-off between sensitivity and
representativity of the measurement. Subvolume sizes of
620 9 620 9 620 lm and 470 9 470 9 470 lm are used
to make measurements on Hostun and Ottawa sand,
respectively.
4.3 Digital image correlation (DIC)
In order to make measurements of local kinematics
between two 3D images of a deforming specimen, Con-
tinuum digital image correlation, as implemented in To-
mowarp by Hall [15], has been used to follow regularly
distributed cubic subvolumes between two different grey-
scale images. The method relies on image correlation and
attempts to find a pattern (i.e. the greyscale inside a given
subvolume) extracted in the reference configuration and
looks for this pattern in the deformed configuration. When
the best matching pattern is found (by optimising a corre-
lation coefficient mapping one image to the other), the
displacement of the subvolume is a natural output and is
measured to subpixel precision. This gives the displace-
ment of a series of points spread throughout the reference
configuration, giving therefore, a full-field measurement of
the kinematics between the two states. By deriving this
displacement field, the 3D strain tensor can be obtained.
The first two invariants of the strain tensor (representing
volumetric and shear strain) are chosen for display in the
results shown in Sect. 5.
Image correlation has an increased probability of mak-
ing matching errors when a considerable amount of grain
breakage occurs between steps. This is due to the consid-
erably different patterns from one image to another that
naturally make the patterns harder to match. In order to
minimise these potential errors, small increments are ana-
lysed in this work. It is worth noting that DIC is used
incrementally, i.e. to measure the displacement field from
image i-1 to image i, rather than from the initial configu-
ration up to image i. This is different from the ‘‘total’’
porosity measurements presented in Sect. 5.
5 Measurements from image analysis
5.1 Tests on Ottawa sand
This section uses the 3D images acquired during the dif-
ferent tests on Ottawa sand to investigate the micro-
mechanisms at play during triaxial shearing of the speci-
mens tested at 100, 4,000 and 7,000 kPa confining
pressure.
Figure 8 shows vertical slices from the final states
imaged in each test on Ottawa sand analysed in this work.
The slices are oriented to contain the axis of the sample and
the normal to the single shear band that is apparent in all
cases. In all images acquired at high pressure, the mem-
brane and platens have been removed using the technique
described in Sect. 4.1. These images reveal that in
OUEA06, a clear dilatant shear band crosses the sample,
whereas for the two samples tested at 7,000 kPa confine-
ment, a narrow compactive shear band is also visible,
containing crushed material. OHEA03 is an intermediate
case, i.e. with no change or slight change in porosity inside
the shear band.
Figure 9 shows the porosity maps obtained for some key
steps during the triaxial shearing of three of the specimens.
Prior to shearing, all specimens have relatively uniform
distribution of porosities ranging from n = 27 % to
n = 32 %. Specimen OUEA06 (tested at 100 kPa con-
finement) presents a clear, dilatant shear band that develops
early in the test—at 3.9 % axial shortening (around the
position of the peak stress), localised dilation is visible,
with a porosity in the band of around n = 46 % by the end
of the test. OHEA03 (4,000 kPa) does not seem to show
localised changes in porosity at 3.9 % axial strain; how-
ever, around its peak (at 7.7 % shortening, which is con-
siderably later than OUEA06), localised dilation is visible.
This dilative band continues to develop with increasing
shearing and becomes more pronounced by the end of the
test (reaching a value of n = 39 %). The sample tested at
7,000 kPa confinement (OHEA01) has a considerably dif-
ferent behaviour, which is captured well by looking at the
porosity maps: by the end of the test, a band of reduced
porosity is noticeable, reaching n = 33 % (2 % lower than
the surrounding material). Looking back towards the
beginning of the test, two mechanisms can be seen: there is
a clear and relatively uniform densification of the sample
Acta Geotechnica (2015) 10:15–30 21
123
Author's personal copy

between 0 and 4.3 % shortening. Thereafter, a dilatant
shear band is visible at 12.9 % shortening (achieving a
porosity of n = 36 %), and at 14.3 % shortening, within
this dilatant band, a zone of contraction starts to develop at
the bottom of the band (on the right side of the specimen)
and appears to progressively develop within the dilatant
band as shearing continues: by 17.2 % shortening, it
crosses the entire specimen. This contractive band is
consistent in space with the zone of crushed material vis-
ible in Fig. 8.
Figure 10 shows the DIC results (vertical sections of the
calculated fields of volumetric and shear strain) for some
selected increments of the three tests analysed. Interest-
ingly, incremental volumetric strain fields can reveal
mechanisms that change in total porosity simply are not
sensitive enough to pick up. While over the peak, the
Axial shortening (%)
OHEA06100 kPa
Axial shortening (%)
OHEA034000 kPa
Axial shortening (%)
0.0 % 3.9 % 7.8 % 8.6 % 12.5 % 14.4 %
0.0 % 3.9 % 7.7 % 11.6 % 13.6 % 15.5 %
0.0 % 4.3 % 12.9 % 14.3 % 15.7 % 17.2 %
OHEA017000 kPa
≤ 25% porosity ≥ 60% porosity
Fig. 9 Porosity maps of some selected states of the specimens of Ottawa sand during shearing
0 10(mm)
Fig. 8 Vertical slices through the last image acquired in each test on Ottawa sand
22 Acta Geotechnica (2015) 10:15–30
123
Author's personal copy

volumetric strain fields from DIC merely confirm the
dilating bands shown by the porosity fields, the increments
analysed at the end of the tests reveal that as shearing
continues, the volumetric strain in the bands of localised
shear strain either disappears (for the test at lowest con-
finement) or becomes compactive (in all the other tests),
0% ≥ 10% ≤-5% ≥ 5%
Volumetric Strain(Compaction positive)Shear Strain
OUEA06100 kPaVolumetric Strain
Shear Strain
01-020.0% - 1.0%
06-074.8% - 5.7%
08-097.8% - 8.6%
14-1513.5% - 14.4%
OHEA034000 kPaVolumetric Strain
Shear Strain
01-020.0% - 1.9%
03-043.8% - 5.8%
05-067.7% - 9.7%
08-0913.6% - 15.5%
OHEA017000 kPaVolumetric Strain
Shear Strain
03-050.0% - 1.4%
07-084.3% - 5.8%
10-128.5% - 11.6%
15-1615.7% - 17.2%
Fig. 10 DIC Results for OUEA06, OHEA03 and OHEA01
Acta Geotechnica (2015) 10:15–30 23
123
Author's personal copy
likely due to grain breakage. The shear strain fields show
that in all tests, the shear band gets thinner after the peak.
5.2 Tests on Hostun sand
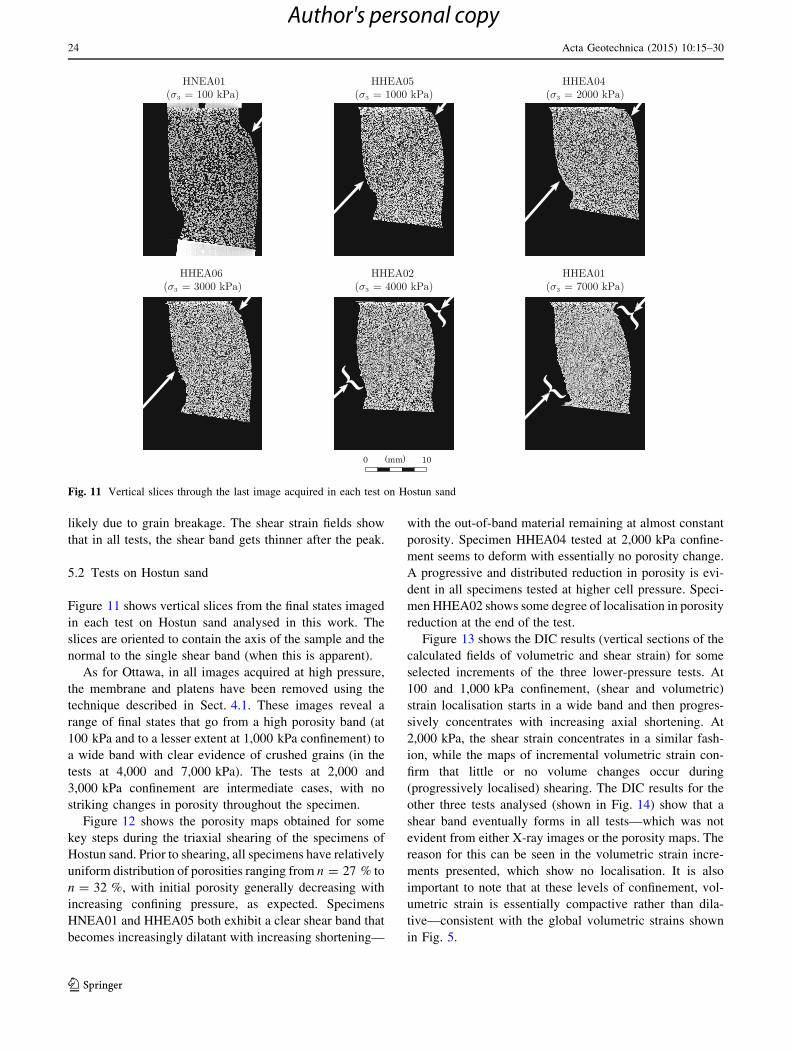
Figure 11 shows vertical slices from the final states imaged
in each test on Hostun sand analysed in this work. The
slices are oriented to contain the axis of the sample and the
normal to the single shear band (when this is apparent).
As for Ottawa, in all images acquired at high pressure,
the membrane and platens have been removed using the
technique described in Sect. 4.1. These images reveal a
range of final states that go from a high porosity band (at
100 kPa and to a lesser extent at 1,000 kPa confinement) to
a wide band with clear evidence of crushed grains (in the
tests at 4,000 and 7,000 kPa). The tests at 2,000 and
3,000 kPa confinement are intermediate cases, with no
striking changes in porosity throughout the specimen.
Figure 12 shows the porosity maps obtained for some
key steps during the triaxial shearing of the specimens of
Hostun sand. Prior to shearing, all specimens have relatively
uniform distribution of porosities ranging from n = 27 % to
n = 32 %, with initial porosity generally decreasing with
increasing confining pressure, as expected. Specimens
HNEA01 and HHEA05 both exhibit a clear shear band that
becomes increasingly dilatant with increasing shortening—
with the out-of-band material remaining at almost constant
porosity. Specimen HHEA04 tested at 2,000 kPa confine-
ment seems to deform with essentially no porosity change.
A progressive and distributed reduction in porosity is evi-
dent in all specimens tested at higher cell pressure. Speci-
men HHEA02 shows some degree of localisation in porosity
reduction at the end of the test.
Figure 13 shows the DIC results (vertical sections of the
calculated fields of volumetric and shear strain) for some
selected increments of the three lower-pressure tests. At
100 and 1,000 kPa confinement, (shear and volumetric)
strain localisation starts in a wide band and then progres-
sively concentrates with increasing axial shortening. At
2,000 kPa, the shear strain concentrates in a similar fash-
ion, while the maps of incremental volumetric strain con-
firm that little or no volume changes occur during
(progressively localised) shearing. The DIC results for the
other three tests analysed (shown in Fig. 14) show that a
shear band eventually forms in all tests—which was not
evident from either X-ray images or the porosity maps. The
reason for this can be seen in the volumetric strain incre-
ments presented, which show no localisation. It is also
important to note that at these levels of confinement, vol-
umetric strain is essentially compactive rather than dila-
tive—consistent with the global volumetric strains shown
in Fig. 5.
0 10(mm)
Fig. 11 Vertical slices through the last image acquired in each test on Hostun sand
24 Acta Geotechnica (2015) 10:15–30
123
Author's personal copy

≤ 25% porosity ≥ 60% porosity
Axial shortening (%)
HNEA01 100 kPa
Axial shortening (%)
HHEA051000 kPa
Axial shortening (%)
HHEA042000 kPa
Axial shortening (%)
HHEA063000 kPa
Axial shortening (%)
HHEA024000 kPa
Axial shortening (%)
HHEA017000 kPa
0.0% 2.5% 3.9% 6.1% 8.6% 13.0%
0.0% 3.8% 7.6% 11.4% 15.2% 19.2%
0.0% 5.9% 7.9% 13.6% 17.3% 26.3%
0.0% 5.8% 8.6% 11.4% 17.1% 20.0%
0.0% 3.5% 9.0% 17.3% 20.1% 24.8%
0.0% 5.2% 9.4% 13.7% 19.3% 25.0%
Fig. 12 Porosity maps of some selected states of the specimens of Hostun sand during shearing
Acta Geotechnica (2015) 10:15–30 25
123
Author's personal copy

0% ≥ 10% ≤ -5% ≥ 5%
Volumetric Strain(Compaction positive)Shear Strain
HNEA01100 kPaVolumetric Strain
Shear Strain
01-020.0% - 0.6%
02-040.6% - 1.7%
08-093.9% - 5.1%
15-1613.3% - 14.8%
HHEA051000 kPaVolumetric Strain
Shear Strain
01-020.0% - 3.8%
03-047.6% - 11.4%
02-033.8% - 7.6%
05-0615.2% - 19.2%
HHEA042000 kPaVolumetric Strain
Shear Strain
01-020.0% - 2.0%
04-055.9% - 7.9%
09-1015.5% - 17.3%
13-1423.3% - 26.3%
Fig. 13 DIC Results for tests HNEA01, HHEA05 and HHEA04
26 Acta Geotechnica (2015) 10:15–30
123
Author's personal copy
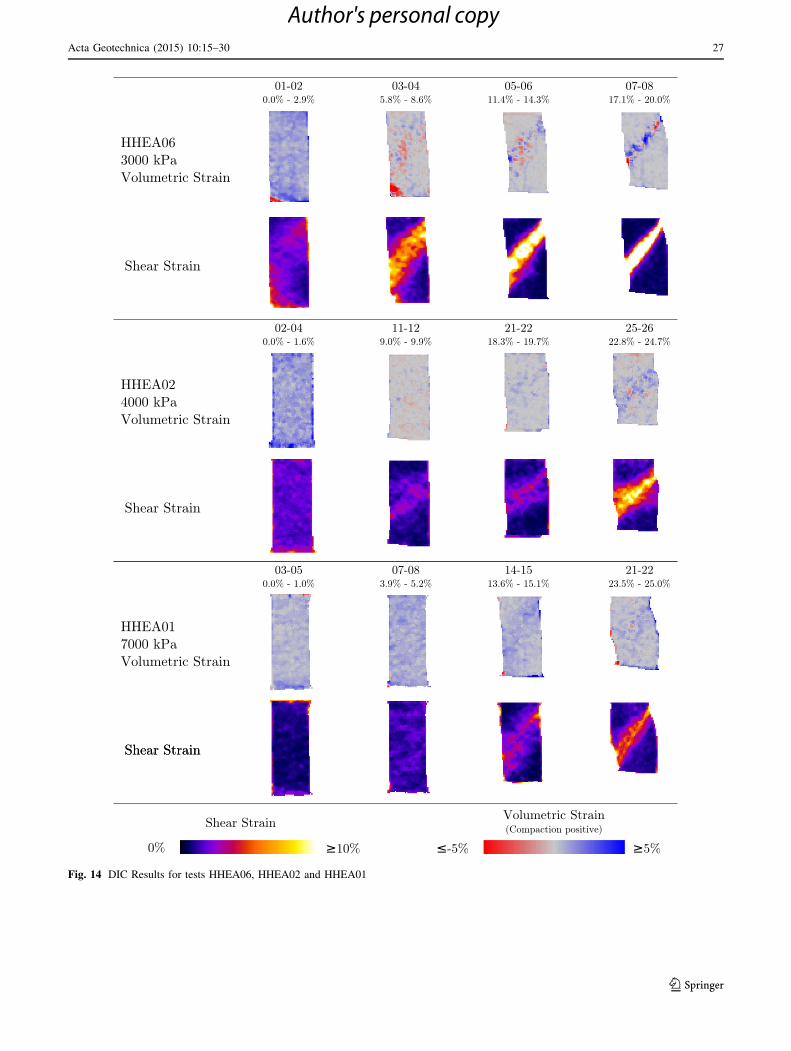
Fig. 14 DIC Results for tests HHEA06, HHEA02 and HHEA01
Acta Geotechnica (2015) 10:15–30 27
123
Author's personal copy
6 Discussion and conclusions
The range of cell pressures used in this experimental
campaign has resulted in a significant evolution of the
mechanical response of both tested sands, at the macro-
scopic level. The tendency for increasing confinement is
for the volumetric response to change from dilative to
contractive, and for the peak of the deviator stress to
become less pronounced. This is entirely consistent with
previous experimental findings (e.g. [18, 19, 30]), all of
which attribute this change in macroscopic behaviour to the
appearance of grain crushing with increasing mean stress—
which is supported by post-mortem sieve analyses.
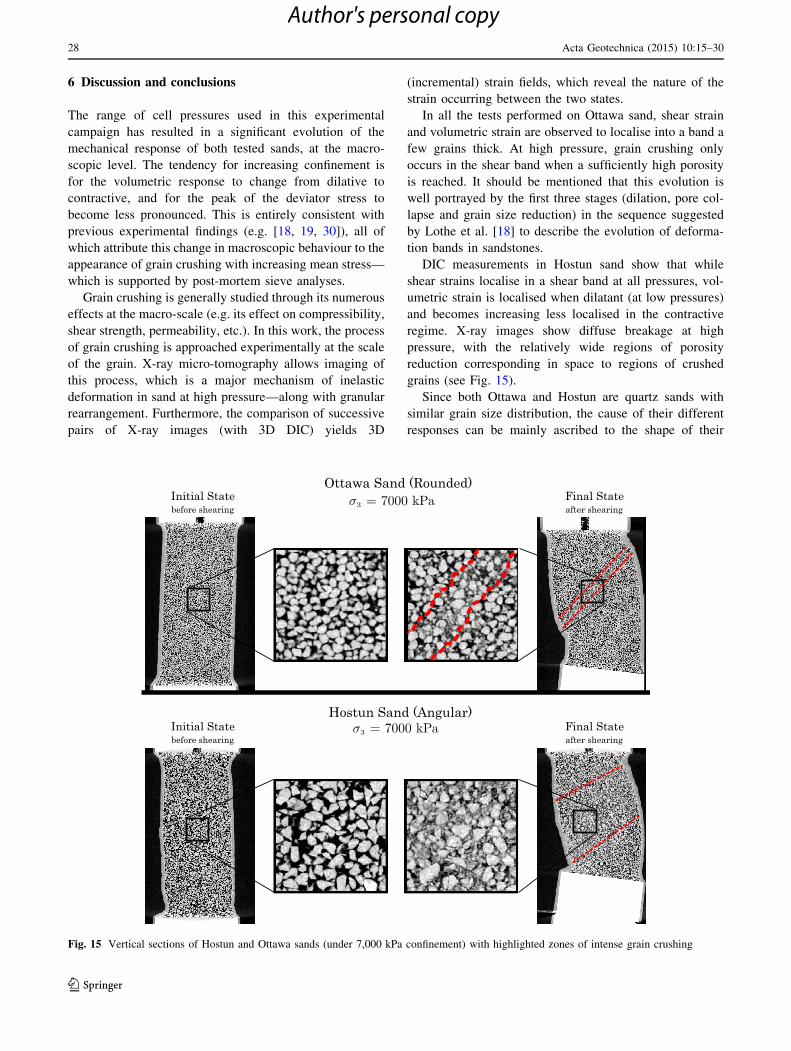
Grain crushing is generally studied through its numerous
effects at the macro-scale (e.g. its effect on compressibility,
shear strength, permeability, etc.). In this work, the process
of grain crushing is approached experimentally at the scale
of the grain. X-ray micro-tomography allows imaging of
this process, which is a major mechanism of inelastic
deformation in sand at high pressure—along with granular
rearrangement. Furthermore, the comparison of successive
pairs of X-ray images (with 3D DIC) yields 3D
(incremental) strain fields, which reveal the nature of the
strain occurring between the two states.
In all the tests performed on Ottawa sand, shear strain
and volumetric strain are observed to localise into a band a
few grains thick. At high pressure, grain crushing only
occurs in the shear band when a sufficiently high porosity
is reached. It should be mentioned that this evolution is
well portrayed by the first three stages (dilation, pore col-
lapse and grain size reduction) in the sequence suggested
by Lothe et al. [18] to describe the evolution of deforma-
tion bands in sandstones.
DIC measurements in Hostun sand show that while
shear strains localise in a shear band at all pressures, vol-
umetric strain is localised when dilatant (at low pressures)
and becomes increasing less localised in the contractive
regime. X-ray images show diffuse breakage at high
pressure, with the relatively wide regions of porosity
reduction corresponding in space to regions of crushed
grains (see Fig. 15).
Since both Ottawa and Hostun are quartz sands with
similar grain size distribution, the cause of their different
responses can be mainly ascribed to the shape of their
Ottawa Sand (Rounded)
Hostun Sand (Angular)
Initial Statebefore shearing
Final Stateafter shearing
Initial Statebefore shearing
Final Stateafter shearing
Fig. 15 Vertical sections of Hostun and Ottawa sands (under 7,000 kPa confinement) with highlighted zones of intense grain crushing
28 Acta Geotechnica (2015) 10:15–30
123
Author's personal copy
grains (rounded in the former and angular in the latter).
One may hypothesise that in the more angular material, the
amount of energy required to break a grain is lower due to
the presence of sharper contacts that concentrate stresses
on the grain. Therefore, for a given stress level, one would
expect more crushing in the angular material—which is
exactly what is observed. The massive grain crushing
observed in Hostun sand at 7,000 kPa confinement sug-
gests that the material is close to the stress conditions
required for distributed grain breakage. In Ottawa sand,
even at 7,000 kPa confinement, breakage only occurs after
a strong reduction in porosity, which for a given stress
increases interparticle forces—this happens only inside the
narrow compactive shear band of localised strain (see
Fig. 15). These differences manifest themselves in the
macroscopic response of the two sands, most evidently in
their volumetric response—with the specimens of Ottawa
sand never showing overall compaction, whereas Hostun
crosses this threshold between 2,000 and 3,000 kPa
confinement.
The findings of this study on sand highlight the central
role played by grain shape on both the stress level needed
to break grains as well as the patterns of deformation
(localised versus diffuse). It is the authors’ contention that
these findings are also largely applicable to poorly lithified
sandstones. These results are of particular interest for
hydrocarbon production and CO2 storage in sandstone,
where the overall reservoir permeability and its evolution
are key for the rate at which extraction/injection processes
can occur. In the triaxial compression tests analysed in this
work, similar materials differing only by the shape of their
grains exhibited very different distributions of particle
breakage, diffuse in the angular material and highly
localised in the rounded one—with obvious implications
for the permeability and its directional variation. The stress
paths encountered in a natural reservoir are clearly quite
different from triaxial compression; however, one might
expect grain shape to play an equally important role under
any deviatoric stress path, such as those induced by oil
production or CO2 injection.
Acknowledgments This study is part of the IMPACT Project, a
consortium R&D project 207806, at the Centre for Integrated Petro-
leum Research Uni Research CIPR, funded by the Research Council
of Norway and Statoil. The authors would like to thank Alessandro
Tengattini for his help in the quantitative analysis and interpretation
of the test results.
References
1. Ando E (2013) PhD Thesis, Experimental investigation of micro-
structural changes in deforming granular media using X-ray
tomography, Universite de Grenoble
2. Ando E, Hall SA, Viggiani G, Desrues J, Besuelle P (2012)
Grain-scale experimental investigation of localised deformation
in sand: a discrete particle tracking approach. Acta Geotech
7:1–13. doi:10.1007/s11440-011-0151-6
3. Ando E, Hall SA, Viggiani G, Desrues J, Besuelle P (2012)
Experimental micromechanics: grain-scale observation of sand
deformation. Geotech Lett 2:107–112. doi:10.1680/geolett.12.
00027
4. Ando E, Hall SA, Viggiani G, Desrues J (2013) Experimental
micro-mechanics of granular media studied by X-ray tomogra-
phy: recent results and challenges. Geotech Lett 3:142–146.
doi:10.1680/geolett.13.00036
5. Antonellini M, Aydin A (1994) Effect of faulting on fluid flow in
porous sandstones; petrophysical properties. AAPG Bull
78:355–377
6. Aydin A, Berryman J (2010) Analysis of the growth of strike-slip
faults using effective medium theory. J Struct Geol
32:1629–1642. doi:10.1016/j.jsg.2009.11.007
7. Baud P, Klein E, Wong T (2004) Compaction localization in porous
sandstones: spatial evolution of damage and acoustic emission
activity. J Struct Geol 26:603–624. doi:10.1016/j.jsg.2003.09.002
8. Besuelle P (2001) Compacting and dilating shear bands in porous
rocks: theoretical and experimental conditions. J Geophys Res
106:13435–13442. doi:10.1029/2001JB900011
9. Cashman S, Cashman K (2000) Cataclasis and deformation-band
formation in unconsolidated marine terrace sand, Humboldt
County, California. Geology 28(2):111–114. doi:10.1130/0091-
7613(2000)28\111:CADFIU[2.0.CO;2
10. Colliat-Dangus JL, Desrues J, Foray P (1988) Triaxial testing of
granular soi1 under elevated cell pressure. In: Donaghe RT,
Chaney RC, Silver ML (eds) Advanced triaxial testing of soi1
and rock, ASTM STP 977. American Society for Testing and
Materials, Philadelphia, pp 290–310
11. Desrues J, Viggiani G (2004) Strain localization in sand: an
overview of the experimental results obtained in Grenoble using
stereophotogrammetry. Int J Numer Anal Methods Geomech
28(4):279–322. doi:10.1002/nag.338
12. Du Bernard X, Eichhubl P, Aydin A (2002) Dilation bands: a new
form of localized failure in granular media. Geophys Res Lett
29(24):2176. doi:10.1029/2002GL015966
13. Fortin J, Stanchits S, Dresen G, Gueguen Y (2006) Acoustic
emission and velocities associated with the formation of com-
paction bands. J Geophys Res 111:B10203. doi:10.1029/
2005JB003854
14. Fossen H, Schultz RA, Shipton ZK, Mair K (2007) Deformation
bands in sandstone: a review. J Geol Soc 164:755–769. doi:10.
1144/0016-76492006-036
15. Hall SA (2006) A methodology for 7D warping and deformation
monitoring using time-lapse seismic data. Geophysics
71(4):O21–O31. doi:10.1190/1.2212227
16. Hall SA, Bornert M, Desrues J, Pannier Y, Lenoir N, Viggiani G,
Besuelle P (2010) Discrete and continuum analysis of localised
deformation in sand using X-ray lCT and volumetric digital
image correlation. Geotechnique 60:315–322. doi:10.1680/geot.
2010.60.5.315
17. Kim HK, Santamarina J (2008) Sand–rubber mixtures (large
rubber chips). Can Geotech J 45(10):1457–1466. doi:10.1139/
T08-070
18. Lothe AE, Gabrielsen RH, Bjørnevoll HN, Larsen T (2002) An
experimental study of the texture of deformation bands: effects
on the porosity and permeability of sandstones. Pet Geosci
8:195–207. doi:10.1144/petgeo.8.3.195
19. Miura N, Yamanouchi T (1973) Compressibility and drained
shear characteristics of a sand under high confining pressures.
Technology reports of the Yamaguchi University 1(2):271–290
20. Schultz RA, Siddharthan R (2005) A general framework for the
occurrence and faulting of deformation bands in porous granular
rocks. Tectonophysics 411:1–18. doi:10.1016/j.tecto.2005.07.008
Acta Geotechnica (2015) 10:15–30 29
123
Author's personal copy
21. Sibleco France (2011) Fiche Technique Type HN31. http://www.
sibelco.fr/item_img/medias/images/ft12_hn31.pdf
22. Sulem J, Ouffroukh H (2006) Shear banding in drained and
undrained triaxial tests on a saturated sandstone: porosity and
permeability evolution. Int J Rock Mech Min Sci 43:292–310.
doi:10.1016/j.ijrmms.2005.07.001
23. Torabi A (2014) Cataclastic bands in immature and poorly lith-
ified sandstone, examples from Corsica, France. Tectonophysiscs.
doi:10.1016/j.tecto.2014.05.014
24. Torabi A, Berg S (2011) Scaling of fault attributes: a review. Mar
Pet Geol 28(8):1444–1460. doi:10.1016/j.marpetgeo.2011.04.003
25. Torabi A, Zarifi Z (2014) Energy release rate for propagating
deformation bands and their hosted cracks. Int J Rock Mech Min
Sci 67:184–190
26. Torabi A, Fossen H, Alaei B (2008) Application of spatial cor-
relation functions in permeability estimation of deformation
bands in porous rocks. J Geophy Res 113:B08208. doi:10.1029/
2007JB005455
27. Vajdova V, Baud P, Wong T (2004) Permeability evolution
during localized deformation in Bentheim sandstone. J Geophys
Res 109:B10406. doi:10.1029/2003JB002942
28. Wong T, Baud P (2012) The brittle-ductile transition in porous
rock: a review. J Struct Geol 44:25–53. doi:10.1016/j.jsg.2012.
07.010
29. Wong T, David C, Zhu W (1997) The transition from brittle
faulting to cataclastic flow in porous sandstone: mechanical
deformation. J Geophys Res 102:3009–3025. doi:10.1029/
96JB03281
30. Zoback MD, Byerlee JD (1976) Effect of high-pressure defor-
mation on permeability of Ottawa sand. AAPG Bull
60(9):1531–1542
30 Acta Geotechnica (2015) 10:15–30
123
Author's personal copy