Stochastic Approach to Test Pattern Generator Design
20
1. Introduction The fast growing complexity of modern integrated circuits and rapid changes in technology pose a number of challenges in testing of electronic products. With the introduction of surface mounted devices, small pitch packaging becomes prevalent, which makes the access to the test points on a board either impossible or at least very costly. Traditional in-circuit test techniques that utilize a bed-of-nails to make contact to individual leads on a printed circuit board have become inadequate. This forced the development of a boundary-scan approach that is already widely adopted in practice (Khalil et al., 2002; Parker, 2003). But, a limited number of input/output pins represents a bottleneck in testing of complex embedded cores where transfers of large amounts of test patterns and test results between the automatic test equipment (ATE) and the unit-under-test (UUT) are required. However, the implementation of a built-in self-test (BIST) (Garvie & Thompson, 2003) of the UUT with on-chip test pattern generation (TPG) and on-chip output response analysis logic presents an efficient solution. Then the communication with external ATE is reduced to test initiation and transfer of test results. This approach has the drawback, while BIST implementation leads to the area overhead, causing longer signal routing paths. Therefore, we need to minimize this BIST logic. Different TPG structures have been proposed in the past. In general, they can be classified as ROM-based deterministic, algorithmic, exhaustive and pseudo-random. In the first approach, deterministic patterns are stored in a ROM and a counter is used for their addressing, (Edirisooriya & Robinson, 1992). The approach is limited to small test pattern sets. Algorithmic TPG are mostly used for testing regular structures such as RAMs (van de Goor, 1991). Exhaustive TPG is counter-based approach that is not able to generate specific sequence of test vectors. With some modifications, however, counter-based solutions are able to generate deterministic test patterns, (Chakrabarty et al., 2000). Pseudo-random TPG is most commonly applied technique in practice; here Linear Feedback Shift Register (LFSR) or Cellular Automata (CA) are employed to generate pseudo-random test patterns. In order to decrease the complexity of a TPG, designers usually try to embed deterministic test patterns Gregor Papa 1 and Tomasz Garbolino 2 1 Computer Systems Department, Jožef Stefan Institute, Ljubljana 2 Institute of Electronics, Silesian University of Technology, Gliwice 1 Slovenia 2 Poland Stochastic Approach to Test Pattern Generator Design 4
Transcript of Stochastic Approach to Test Pattern Generator Design

1. Introduction
The fast growing complexity of modern integrated circuits and rapid changes in technologypose a number of challenges in testing of electronic products. With the introduction of surfacemounted devices, small pitch packaging becomes prevalent, which makes the access to thetest points on a board either impossible or at least very costly. Traditional in-circuit testtechniques that utilize a bed-of-nails to make contact to individual leads on a printed circuitboard have become inadequate. This forced the development of a boundary-scan approachthat is already widely adopted in practice (Khalil et al., 2002; Parker, 2003). But, a limitednumber of input/output pins represents a bottleneck in testing of complex embedded coreswhere transfers of large amounts of test patterns and test results between the automatic testequipment (ATE) and the unit-under-test (UUT) are required. However, the implementationof a built-in self-test (BIST) (Garvie & Thompson, 2003) of the UUT with on-chip test patterngeneration (TPG) and on-chip output response analysis logic presents an efficient solution.Then the communication with external ATE is reduced to test initiation and transfer of testresults. This approach has the drawback, while BIST implementation leads to the areaoverhead, causing longer signal routing paths. Therefore, we need to minimize this BISTlogic.Different TPG structures have been proposed in the past. In general, they can be classifiedas ROM-based deterministic, algorithmic, exhaustive and pseudo-random. In the firstapproach, deterministic patterns are stored in a ROM and a counter is used for theiraddressing, (Edirisooriya & Robinson, 1992). The approach is limited to small test patternsets. Algorithmic TPG are mostly used for testing regular structures such as RAMs (van deGoor, 1991). Exhaustive TPG is counter-based approach that is not able to generate specificsequence of test vectors. With some modifications, however, counter-based solutions are ableto generate deterministic test patterns, (Chakrabarty et al., 2000). Pseudo-random TPG ismost commonly applied technique in practice; here Linear Feedback Shift Register (LFSR) orCellular Automata (CA) are employed to generate pseudo-random test patterns. In order todecrease the complexity of a TPG, designers usually try to embed deterministic test patterns
Gregor Papa1 and Tomasz Garbolino2
1Computer Systems Department, Jožef Stefan Institute, Ljubljana2Institute of Electronics, Silesian University of Technology, Gliwice
1Slovenia2Poland
Stochastic Approach to Test Pattern Generator Design
4

into the vector sequence generated by some linear register. Such embedding can be doneeither by re-seeding a TPG or modifying its feedback function (Hellebrand et al., 1995). Somesolutions also modify or transform the vector sequence produced by a LFSR in such a waythat it contains deterministic test patterns (Bellos et al., 2002; Fiser, 2007; Hakmi et al., 2007;Touba & McCluskey, 2001).Regarding the way the test patterns are delivered to the UUT, there are also differentapproaches. In the test-per-scan approach each test pattern first needs to be shifted in a scanpath during several clock cycles before it is applied to the inputs of the UUT (Hakmi et al.,2007; Touba & McCluskey, 2001). This usually leads to long testing times. If a shorter testduration is required, test-per-clock method has to be adopted (Chakrabarty et al., 2000; Fiser,2007; Garbolino & Papa, 2008), so that each test pattern is produced and stimulates the UUTinputs in a single clock cycle.Some types of non-concurrent on-line BIST (Aktouf et al., 1999) may require TPG structuresthat are capable to generate the set of precomputed deterministic test patterns in the minimumnumber of clock cycles. In one of the first approaches the set of predefined test vectors isencoded into an appropriately designed network of the OR gates (Dufaza et al., 1993). Inturn, the solution proposed in (Bellos et al., 2002) uses a network of XOR gates to transforma sequence of consecutive vectors produced by a LFSR into a sequence of deterministictest patterns. In (Garbolino & Papa, 2008; 2010) a Multi-Input Signature Register (MISR) iscombined with a combinational logic which modifies its state diagram in such a way that theMISR generates a sequence of expected deterministic test patterns. A method of designing adeterministic TPG based on non-uniform CA was proposed in (Cao et al., 2008), while anothersolution employs a group of small Finite State Machines (FSMs) to generate a relatively shortvector sequence that contains all deterministic test patterns (Sudireddy et al., 2008).The proposed LFSR structures are based on D-type flip-flops, while in recent years LFSRcomposed of D-type and T-type flip-flops or even of T-type flip-flops only, has been gainingpopularity. The main reason is its low area overhead and high operating speed (Garbolino& Hlawiczka, 1999; Garbolino et al., 2000). Some applications of such a type of LFSRs canbe found in (Garbolino & Hlawiczka, 2002; Garbolino & Papa, 2008; Novák et al., 2004).In particular, works (Garbolino & Hlawiczka, 2002) and (Garbolino & Papa, 2008) presentsome concepts of optimizing the LFSR structure containing D-type and T-type flip-flops forgeneration of deterministic test pattern sets.Evolutionary stochastic techniques for the optimization of hardware are widely used (Bolzaniet al., 2007; Drechsler & Drechsler, 2002; Guo et al., 2007; Mazumder & Rudnick, 1999).In (Sanchez & Squillero, 2007) a software-based methodology that automatically generatestest programs is described. The methodology is based on an evolutionary algorithm ableto generate test programs for different microprocessor cores. In (Corno et al., 2000) anautomatic approach, based on genetic algorithm (GA), targeting processor cores is describedthat computes a test program able to attain high fault coverage figures.GA has also been used for the derivation of test pattern sets for target UUTs (Corno, Prinetto,Rebaudengo & Sonza Reorda, 1996), and for optimization of test sequence for weightedpseudo-random test generation to achieve the best test efficiency (Favalli & Dalpasso, 2002).As regards the synthesis of the TPG logic for actual generation of the derived test patters, GAapproach has also been used for the solutions based on CA (Corno, Prinetto & Sonza Reorda,1996). A detailed summary and analysis of various test pattern generation techniques basedon GA is presented in (Fin & Fummi, 2003).
76 Stochastic Optimization - Seeing the Optimal for the Uncertain

The work presents a design approach of a deterministic TPG logic based on a LFSR, that iscomposed of D-type and T-type flip-flops. The use of LFSR for TPG eliminates the need ofa ROM for storing the seeds since a LFSR itself jumps from a state to the next required state(seed) by inverting the logic value of some of the bits of its next state. In contrast to (Garbolino& Papa, 2010) here the counter is connected to the inputs of the modification function. Thesearch for the proper LFSR employs a GA to find an acceptable practical solution in a largespace of possible LFSR implementations, where the goal is to develop a TPG that wouldgenerate only the required test vectors. Here, we concurrently optimize the TPG structure(type of flip-flops, presence of inverters), the order of patterns in test sequence, and thebit-order of a test pattern.The rest of the chapter is organized as follows: in Section 2 we describe the TPG structure,and give an example of area minimization through the modification of the TPG structure andits test vectors; in Section 3 we describe the GA and the work of its operators; in Section 4 wedescribe the optimization process and evaluate it; and in Section 5 we draw the conclusion.
2. TPG structure
A TPG is initialized with a given deterministic seed and run until the desired fault coverage isachieved. The test application time using an LFSR is significantly larger than what is requiredfor applying the test set generated using a deterministic TPG; vector set generated by a LFSRincludes not only useful vectors but also many other vectors that do not contribute to the faultcoverage. In our approach, the goal is to develop a TPG that would generate only the requiredtest vectors (i.e., with no intermittent non-useful vectors).
Fig. 1. Block diagram of the n-bit TPG.
A general block diagram of the proposed n bit test pattern generator is shown in Figure 1. ATPG contains k MSIRs which operation is synchronized by a common clock signal clk. A MISRis a variant of a LFSR that is additionally equipped with parallel inputs. A bit vector applied tothe parallel inputs of a MISR influences the sequence of vectors produced at the outputs of theregister. The k′ MISRs have width N while the width of k” remaining registers is N + 1, whereN = n/k , k” = (n MOD k) and k′ = k − k”. Parallel inputs of all MISRs are connected tothe outputs of the common block of a combinational logic, which is called a modifying logicbecause its aim is to modify the MISRs’ state diagrams. Outputs of all registers are in turnfed back to the inputs of the modifying logic block. Moreover, the modifying logic may beoptionally fed by the outputs of a test pattern counter (TPC), which anyway has to be presentin any BIST structure. We expect that the latter property should simplify optimization of themodifying logic and enable its further reduction by a synthesis tool. In this study we take intoaccount two types of TPCs, namely binary and one-hot counter.
77Stochastic Approach to Test Pattern Generator Design

Fig. 2. Scheme of the j-th N-bit MISR.
A scheme in Figure 2 shows an internal structure of the MSIR and interconnections betweenthe register and the modifying logic. The MISR is composed of N cells connected in series andalways has a global feedback path connecting the serial output (SO) of the last stage to theserial input (SI) of the first stage. Some other cells, depending on their internal structure, mayalso have their feedback tap (FT) inputs connected to the global feedback path (connectionsmarked by a dotted line). The parallel input (PI) of each cell is controlled by an output of themodifying logic. Parallel outputs (PO) of the cells constitute the actual outputs of a TPG andat the same time they are fed back to the inputs of the modifying logic module.A general scheme of the i-th cell of the MISR is presented in Figure 3. The cell contains aD- or T-type flip-flop. The input of the flip-flop is fed by the logic implementing a XOR orXNOR function of the cell’s inputs: serial input SI, parallel input PI and - in a case of some cellstructures - feedback tap input FT. The output Q of the flip-flop is connected to the paralleloutput PO of the cell either directly or via an inverter. It is also connected to the serial outputSO of the cell. All elements of the cell that are optional and may or may not be present inits particular configuration are marked grey in Figure 3. Thus, a single cell may have 16different structures. An exception are the first and the last cell of a MISR, which have only 8different structures. In consequence, the number α of different structures of a N-bit MISR isα = 16N−2 + 82 = 24N−2.
Fig. 3. A general scheme of an i-th cell of a MISR.
The modifying logic - which is a simple combinational logic and acts as a decoder - allowsthat in the subsequent clock cycles the contents of the MISR assumes the values specified bythe target test pattern set. Hence the MISR and the modifying logic are application specific:they are synthesized according to the required test pattern set.
78 Stochastic Optimization - Seeing the Optimal for the Uncertain

Particularly important parameter in the case of deterministic test pattern generators is the areaoverhead, which is influenced by:
• a structure of each stage in each MISR,
• an order of the test patterns in a test sequence,
• a bit-order of the test patterns,
• a number of MISRs in a TPG.
The first factor influences the complexity of both the MISR and the modifying logic, only. Therelationships are illustrated below with the use of a simple TPG designed for TSMC 0.35 μmtechnology.
Initial structure and test vectors
Having the set of seven 5-bit vectors the resulting structure of a TPG is shown in Figure 4.It is assumed that all flip-flops in the scheme are scannable. A T-type flip-flops comprise ascannable D-type flip-flop and a XOR gate. The total complexity of the initial structure of aTPG is 55 equivalent gates.
Fig. 4. TPG structure modification: initial solution.
Flip-flop type replacement
Replacing the T-type flip-flop with the D-type one in the stage No. 4 of a TPG, the newconfiguration of a TPG is presented in Figure 5. The replacement of the type of the flip-flophas lead to reduction of the total complexity of a TPG structure to 51 equivalent gates.
Column permutation
Permutation of columns of the test pattern sequence further decreases the area of a TPG. Ifwe permute columns in the test sequence as illustrated in Figure 6, a TPG is simplified to thestructure with the area of 49 equivalent gates.
Vectors permutation
Further we can permute test patterns in the test sequence. Exchanging the order of testpatterns in the test sequence, like shown in Figure 7, simplifies a TPG structure to the areaof 38 equivalent gates.
79Stochastic Approach to Test Pattern Generator Design

Fig. 5. TPG structure modification: after replacing the flip-flop type.
Fig. 6. TPG structure modification: after permutating columns.
Fig. 7. TPG structure modification: after permutating vectors.
Fig. 8. TPG structure modification: after MSIR structure splitting.
80 Stochastic Optimization - Seeing the Optimal for the Uncertain

Structure splitting
Splitting a MISR structure into several parts (Figure 8) may potentially lead to the furtherreduction of its area. Implementing the exemplar TPG in the form of two independent MISRsresults in the structure whose complexity is only 35 equivalent gates.A change of the MISR structure, the order of the test patterns in a test sequence, the bit-orderof the test patterns and the number of parts a MISR is split to may result in a substantialreduction of the TPG area. The solution space is very broad: for an n-bit TPG producing thesequence of m test patterns there are about 24n−2km!n!n possible solutions; therefore, effectiveoptimization procedure is required to find an acceptable practical solution.
3. Genetic algorithm
The intelligent stochastic optimization is implemented through genetic algorithm (GA)(Goldberg, 1989). The GA’s intrinsic parallelism allows searching within a broad databaseof solutions in the search space simultaneously. There is some risk of converging to a localoptimum, but efficient results in other optimization problem areas (Korošec & Šilc, 2008;Papa & Koroušic-Seljak, 2005; Papa & Šilc, 2002) encouraged us to use GA approach in TPGsynthesis optimization. Our version of the GA, which was already presented in (Garbolino& Papa, 2010), is adapted to the problem to be able to optimize multiple design aspects, i.e.,type of flip-flops, presence of inverters, order of patterns in test sequence, and bit-order of atest pattern.
3.1 TPG encodingIn the initialization phase of the GA the structure of a TPG, order of test patterns, and theirbit order are encoded with three different chromosomes. These three chromosomes do notinteract with each other, but are used to concurrently optimize the structure of a TPG, the orderof the test patterns, and the bit order of test patterns. They have to be optimized concurrentlysince their influence on the final solution is interdependent.The first chromosome, which encodes the structure of n-bit TPG, looks like
C1 = i11i12i13i14 . . . in1in2in3in4, (1)
where ijx represents a binary value; j (j = 1, 2, . . . , n) determines each flip-flop and xdetermines the properties of a flip-flop (see Table 1).
position property value 0 value 11 flip-flop type D-type T-type2 inverted input no inverter inverter3 feedback input no feedback feedback4 inverted output no inverter inverter
Table 1. Flip-flop properties
The second and third chromosome, which encode the order of the test patterns, and the bitorder of test patterns, look like
C2 = a1a2 . . . am, (2)
81Stochastic Approach to Test Pattern Generator Design

Fig. 9. Crossover: TPG configuration (top), pattern and bit orders (bottom).
where m is the number of test vectors and aj (j = 1, 2, . . . , m) is the label number of the testvector from the initial vector list, and
C3 = b1b2 . . . bn, (3)
where n is the number of flip-flops in the structure and bj (j = 1, 2, . . . , n) is the label numberof the bit order of the initial test patterns.
3.2 Population initializationThe population consists of N chromosomes, of each type. Depending on requirements andinput settings, the initial chromosome of the configuration can be set as (i) random values onall positions, (ii) with values 0 on all positions, (iii) with values 1 on all positions, (iv) basedon some input configuration. For the last three possibilities the values are permutated withsome given probability to avoid identical chromosomes.The initial chromosomes for orders are set as (i) random distribution of order values or (ii)consecutive order of numbers. In the latest case some chromosomes are permutated to ensureversatile chromosomes. While the numbers in these two chromosomes represent the orderof patterns or bits in patterns, their values cannot be duplicated and also consecutive valuescannot be missed; both conditions must be considered during the initialization.
3.3 Genetic operatorsThe elitism strategy prevents losing the best found solution by memorizing it. Bettersolutions have more influence on the new generation due to the substitution of the least-fitchromosomes with the equal number of the best-ranked chromosomes. The ratio of allchromosomes in the population to be replaced is set by r.In a two-point crossover scheme, chromosome mates are chosen randomly and, with aprobability pc, all values between two randomly chosen positions are swapped. This leadsto the two new solutions that replace the original solutions. Figure 9(top) shows the exampleof crossover with crossover points on positions 3 and 12.The crossover in case of test patterns order and bit-order of the test patterns is performed withthe interchange of positions that store the ordered numbers within the range (order-basedcrossover); for an example within the range [2, 4], see Figure 9(bottom).In the mutation process each value of the chromosome mutates with a probability pm . Sincea high mutation rate results in a random walk through GA search space, pm has to be lowenough. Two different types of mutation are applied (see Figure 10 for details): bit inversionthat changes the configuration for the first chromosome and position-based mutation for theother two chromosomes, where pattern order and bit order are changed.
82 Stochastic Optimization - Seeing the Optimal for the Uncertain

Fig. 10. Mutation: TPG configuration (top), pattern and bit orders (bottom).
3.4 Fitness evaluationAfter modifying the solutions, the whole new population is ready to be evaluated. Theexternal evaluation tool is used to evaluate each new chromosome created by GA, and TPGcost approximation is obtained for each solution. The obtained cost approximation does notexactly represent an area overhead of the given solution. It rather reflects in quantitativeform some set of properties of TPG that make its structure either more or less susceptible foreffective area reduction during actual synthesis process.On the basis of the equations for the register’s next-state, values of the outputs of themodifying logic for each vector but last in the test sequence can be derived. In (Garbolino& Papa, 2008) an Espresso (UC Berkeley, 1988) boolean optimization software was used forapproximate cost estimation of the modifying logic. On the one hand, the cost approximationprovided by the Espresso software was quite accurate in majority of cases. On the other hand,however, its use led to long computation times of a GA what limited the applicability of thecomplete tool to small and medium size circuits only. Moreover, the approach proposedin (Garbolino & Papa, 2008) was focused on reducing an area of the modifying logic only,neglecting the complexity of MISR at all.In this work the authors used a new function fc for cost evaluation of the TPG, whichwas already proposed in (Garbolino & Papa, 2010). The detailed formula of the function isprovided below:
fc(TPGi) = CMISRxiX
+ CMFbiB
1− lin
1− ein
, (4)
where
• n is the width of test patterns, the number of stages of the TPG, the maximum number ofoutputs of the module implementing modification function;
• m is the number of patterns in a test sequence;
• i is the index of the given individual in the population, i.e. the index for the TPG structureand its parameters;
• TPGi is the structure of the TPG corresponding to the i-th individual in the population;
• CMF and CMISR are the coefficients that enable a user to control whether to put more stresson minimizing the complexity of modifying logic or a MISR, respectively;
• xi is the number of XOR gates required to implement the MISR for the TPGi structure;
• X is the maximum number of XOR gates that may be used to built up the n-bit MISRcomposed of D- and T-type flip-flops (X = 3n − 1 in the case where there is a T-typeflip-flop, feedback tap and parallel input in every stage of the MISR);
• bi is the total number of bit flips at the outputs of the module implementing modificationfunction for the TPGi structure, produced during the generation of deterministic testpatterns in consecutive m clock cycles;
83Stochastic Approach to Test Pattern Generator Design

• B is the maximum possible number of bit flips at the outputs of the module implementingmodification function during m consecutive clock cycles (B = n(m− 2));
• li is the number of the outputs of the module implementing modification function for theTPGi structure that keep constant value during generating deterministic test patterns inconsecutive m clock cycles;
• ei is the total number of MISR inputs that can be fed from the same output of the moduleimplementing modification function for the TPGi structure.
The cost evaluation function aims at reducing the size of the modifying logic module byminimizing the number of bit flips bi at the outputs of the module. In addition, it favorssuch structures of the TPG in which some number (li) of parallel inputs of the MISR canbe driven by a constant value or where several (ei) parallel inputs of the MISR can bedriven by the same output of the modifying logic module. At the same time the functionpromotes the less complex structures of the MISR by reducing the number xi of XOR gatesthat are necessary to construct the register. Through appropriately setting the values of CMFand CMISR coefficients, the user may decide whether the function will put more stress onminimizing the complexity of modifying logic or a MISR.Note that the functionality of the inverter at the input of the flip-flop can be implemented bysubstituting the XOR gate with the XNOR one, or vice versa. Similarly, instead of adding theNOT gate at the Q output of the flip-flop, the complemented output Q can be used. Therefore,an employment of the inverted inputs or outputs of the MISR does not influence the cost ofthe register and that is why the number of inverters has not been involved in the TPG costevaluation function fc.It turned out that the TPG structures with lower value of the cost evaluation function tend tohave lower area overhead than those with higher value of the function. Moreover, althoughthe function delivers less accurate cost approximation than Espresso software, it is much fasterand it tries to reduce the area overhead of the whole TPG instead of modifying logic only.
4. Results
The initial TPG structure is based on the desired sequence of test patterns. The GA operatorstry to make new configuration while checking the allowed TPG structure and using theexternal evaluation tool. The evaluation tool calculates the cost of a given structure. Thebest structure, found during the optimization, is chosen and implemented.Considering the chromosome length and short pre-experimental tests we set GA parametersto give the results in an acceptable computing time. Population size for each circuit was in therange from 60 to 300 (depending on circuit complexity), while the number of generations wasabout 5 times the population size. Crossover and mutation probabilities did not change withcircuits and were 0.8 and 0.01, respectively.The results are presented for all ISCAS’85 and some ISCAS’89 test benchmark circuits.These circuits are used to benchmark various test pattern generation systems. ISCASbenchmark suite has been introduced in simple netlist format at the International Symposiumof Circuits and Systems in 1985 (ISCAS’85), and was expanded with additional circuits at 1989Symposium. ISCAS’85 benchmarks are purely combinational circuits while these belongingto the ISCAS’89 set are sequential structures equipped with a scan path.The compact sets of deterministic test patterns for ISCAS’85 and ISCAS’89 circuits wereobtained from MINTEST ATPG tool (Hamzaoglu & Patel, 1998). For each benchmark, the
84 Stochastic Optimization - Seeing the Optimal for the Uncertain
Circuit Test Numberpattern of testwidth patterns
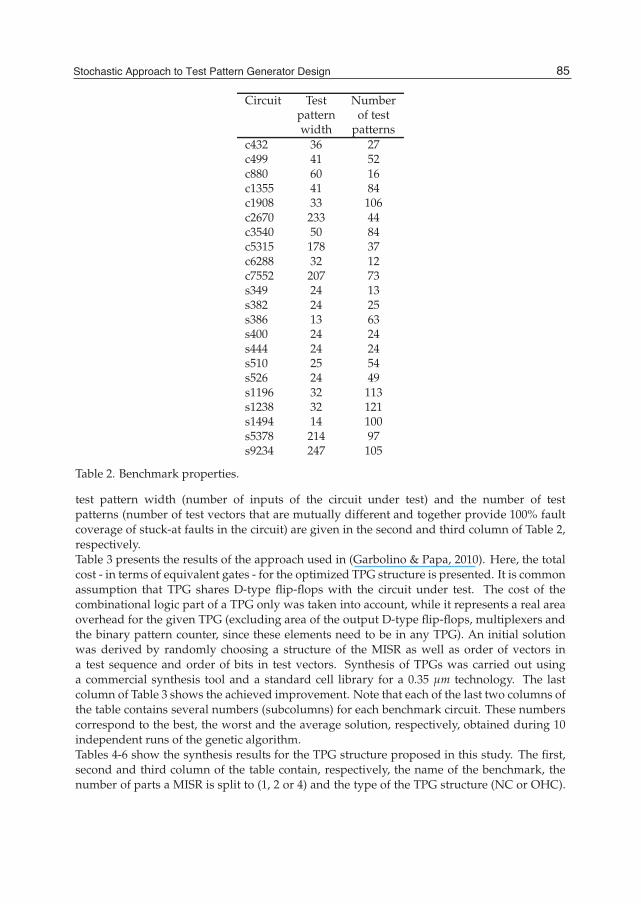
c432 36 27c499 41 52c880 60 16c1355 41 84c1908 33 106c2670 233 44c3540 50 84c5315 178 37c6288 32 12c7552 207 73s349 24 13s382 24 25s386 13 63s400 24 24s444 24 24s510 25 54s526 24 49s1196 32 113s1238 32 121s1494 14 100s5378 214 97s9234 247 105
Table 2. Benchmark properties.
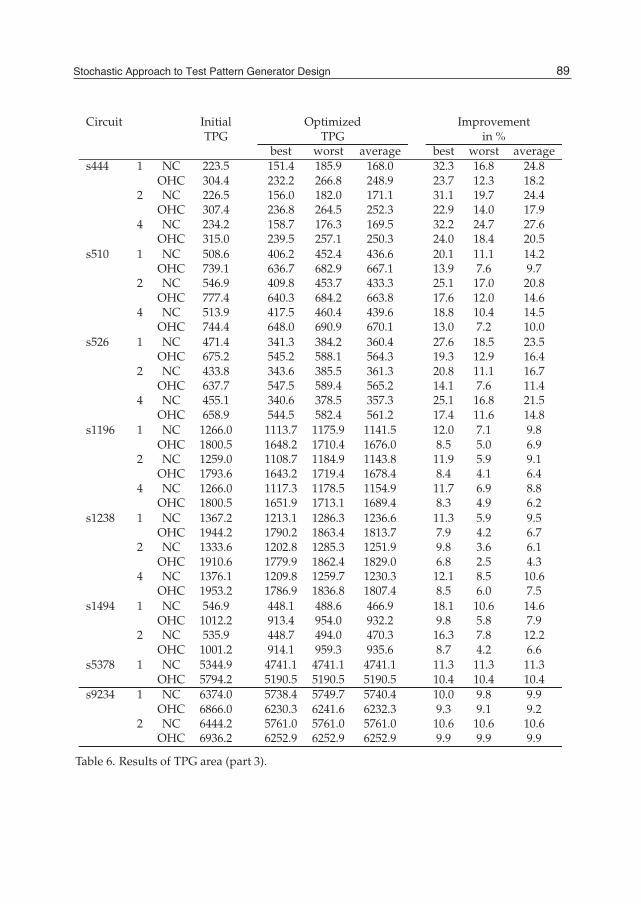
test pattern width (number of inputs of the circuit under test) and the number of testpatterns (number of test vectors that are mutually different and together provide 100% faultcoverage of stuck-at faults in the circuit) are given in the second and third column of Table 2,respectively.Table 3 presents the results of the approach used in (Garbolino & Papa, 2010). Here, the totalcost - in terms of equivalent gates - for the optimized TPG structure is presented. It is commonassumption that TPG shares D-type flip-flops with the circuit under test. The cost of thecombinational logic part of a TPG only was taken into account, while it represents a real areaoverhead for the given TPG (excluding area of the output D-type flip-flops, multiplexers andthe binary pattern counter, since these elements need to be in any TPG). An initial solutionwas derived by randomly choosing a structure of the MISR as well as order of vectors ina test sequence and order of bits in test vectors. Synthesis of TPGs was carried out usinga commercial synthesis tool and a standard cell library for a 0.35 μm technology. The lastcolumn of Table 3 shows the achieved improvement. Note that each of the last two columns ofthe table contains several numbers (subcolumns) for each benchmark circuit. These numberscorrespond to the best, the worst and the average solution, respectively, obtained during 10independent runs of the genetic algorithm.Tables 4-6 show the synthesis results for the TPG structure proposed in this study. The first,second and third column of the table contain, respectively, the name of the benchmark, thenumber of parts a MISR is split to (1, 2 or 4) and the type of the TPG structure (NC or OHC).
85Stochastic Approach to Test Pattern Generator Design

Circuit Optimized ImprovementTPG in %
best worst average best worst average
c432 329.3 358.9 347.5 12.2 4.3 7.4c499 448.7 517.9 485.7 20.9 8.7 14.4c880 345.6 402.2 367.9 11.4 -3.1 5.7c1355 698.9 789.4 747.8 2.1 -10.6 -4.8c1908 1078.8 1165.2 1127.8 12.0 5.0 8.0c2670 2669.4 2777.5 2727.9 -0.8 -4.9 -3.0c3540 1353.8 1437.3 1395.5 4.5 -1.4 1.5c5315 1744.7 1845.2 1807.4 8.7 3.4 5.4c6288 128.7 173.0 146.0 30.9 7.1 21.6c7552 3876.6 4048.6 3948.9 0.3 -4.1 -1.6s349 85.2 175.3 103.5 47.9 -7.3 36.6s382 180.3 207.6 196.6 28.7 17.9 22.2s386 280.7 310.0 295.2 15.5 6.7 11.2s400 173.6 199.3 184.6 32.8 22.9 28.6s444 176.6 194.6 188.0 29.1 21.9 24.5s510 438.1 473.3 458.0 16.0 9.2 12.1s526 362.6 400.2 380.3 17.2 8.7 13.2s1196 1195.5 1279.7 1244.9 5.8 -0.8 1.9s1238 1271.0 1314.9 1292.0 7.3 4.1 5.7s1494 487.3 537.9 515.5 8.3 -1.2 3.0s5378 4909.4 5107.7 4963.6 7.0 3.3 6.0s9234 5994.8 6405.6 6150.4 7.1 0.8 4.7
Table 3. Results of TPG area based on the approach in (Garbolino & Papa, 2010).
The label NC denotes the TPG which modifying logic is fed solely by the outputs of a MISRor MISRs while the label OHC is a symbol of the TPG that contains the one-hot counter. Forthe sake of clarity the TPG structure discussed in (Garbolino & Papa, 2010) as well as thetwo proposed in this study are henceforth denoted as TPG+BC, TPG+NC and TPG+OHC,respectively.Columns 4 and 5 of Tables 4-6 include the cost - in terms of equivalent gates - of the initialand optimized TPG structure, respectively. An initial solution was derived in the same waylike in (Garbolino & Papa, 2010). The same synthesis tool and target technology were alsoused to carry out synthesis of TPGs. The achieved improvement is shown in the last columnof each of the tables. Similarly to Table 3 each of the last two columns of Tables 4-6 containsseveral numbers (subcolumns) for each benchmark circuit. These numbers correspond to thebest, the worst and the average solution, respectively, obtained during 10 independent runsof the genetic algorithm. In the case of the TPG+NC structure the cost of the combinationallogic part of a TPG only is taken into account, excluding area of the output D-type flip-flops,multiplexers and binary pattern counter, since these elements need to be in any TPG. The costof the TPG+OHC structure is calculated in a similar way but it also includes the area of theone-hot counter. The obtained value is further diminished by the area of the binary counter.The last step results from the fact that in the TPG+OHC structure the one-hot counter replacesthe binary counter in a role of a test pattern counter. Since the area of a test pattern counter
86 Stochastic Optimization - Seeing the Optimal for the Uncertain

Circuit Initial Optimized ImprovementTPG TPG in %
best worst average best worst averagec432 1 NC 389.9 261.8 288.7 270.1 32.8 25.9 30.7
OHC 486.7 358.6 385.5 366.9 26.3 20.8 24.62 NC 381.2 255.5 281.1 266.0 33.0 26.3 30.2
OHC 478.0 352.3 377.9 362.8 26.3 20.9 24.14 NC 372.9 243.8 294.1 259.5 34.6 21.1 30.4
OHC 469.7 340.6 390.9 356.3 27.5 16.8 24.2c499 1 NC 564.8 361.6 404.8 384.1 36.0 28.3 32.0
OHC 784.7 581.4 624.7 604.0 25.9 20.4 23.02 NC 569.8 364.9 403.5 387.8 36.0 29.2 31.9
OHC 789.7 584.8 623.3 607.6 25.9 21.1 23.14 NC 525.6 363.9 399.5 386.4 30.8 24.0 26.5
OHC 745.4 583.8 619.4 606.3 21.7 16.9 18.7c880 1 NC 392.2 188.9 204.2 198.1 51.8 47.9 49.5
OHC 440.4 237.2 252.5 246.3 46.1 42.7 44.12 NC 398.8 185.6 207.2 197.9 53.5 48.0 50.4
OHC 447.1 233.9 255.5 246.2 47.7 42.9 44.94 NC 388.5 190.6 224.2 201.6 50.9 42.3 48.1
OHC 436.8 238.9 272.5 249.9 45.3 37.6 42.8c1355 1 NC 761.1 514.3 549.2 535.6 32.4 27.8 29.6
OHC 1141.2 894.4 929.4 915.8 21.6 18.6 19.82 NC 739.1 513.9 554.2 536.9 30.5 25.0 27.4
OHC 1119.3 894.1 933.0 916.9 20.1 16.6 18.14 NC 772.7 518.6 560.5 542.8 32.9 27.5 29.8
OHC 1152.9 898.8 940.7 923.0 22.0 18.4 19.9c1908 1 NC 1206.8 1048.1 1110.0 1071.7 13.1 8.0 11.2
OHC 1704.1 1545.4 1607.3 1568.9 9.3 5.7 7.92 NC 1235.1 971.0 1103.4 1051.7 21.4 10.7 14.9
OHC 1732.3 1468.2 1600.6 1548.9 15.2 7.6 10.64 NC 1189.2 1005.2 1134.3 1040.6 15.5 4.6 12.5
OHC 1686.4 1502.5 1631.6 1537.8 10.9 3.3 8.8c2670 1 NC 2772.2 2040.4 2079.3 2049.2 26.4 25.0 26.1
OHC 2949.5 2217.7 2256.6 2226.5 24.8 23.5 24.52 NC 2668.4 2030.4 2092.6 2051.3 23.9 21.6 23.1
OHC 2845.7 2207.7 2269.9 2228.5 22.4 20.2 21.7c3540 1 NC 1422.7 1204.5 1292.3 1261.4 15.3 9.2 11.3
OHC 1802.9 1584.7 1672.5 1641.6 12.1 7.2 8.92 NC 1439.0 1240.4 1306.3 1267.1 13.8 9.2 11.9
OHC 1819.2 1620.6 1686.4 1647.2 10.9 7.3 9.54 NC 1405.1 1242.4 1314.3 1271.4 11.6 6.5 9.5
OHC 1785.2 1622.6 1694.4 1651.6 9.1 5.1 7.5
Table 4. Results of TPG area (part 1).
87Stochastic Approach to Test Pattern Generator Design

Circuit Initial Optimized ImprovementTPG TPG in %
best worst average best worst averagec5315 1 NC 1884.7 1384.8 1424.4 1401.9 26.5 24.4 25.6
OHC 2024.8 1524.8 1564.4 1541.9 24.7 22.7 23.82 NC 1849.1 1374.5 1408.7 1394.5 25.7 23.8 24.6
OHC 1989.2 1514.5 1548.8 1534.5 23.9 22.1 22.94 NC 1909.4 1390.8 1418.4 1403.0 27.2 25.7 26.5
OHC 2049.4 1530.8 1558.4 1543.0 25.3 24.0 24.7c6288 1 NC 186.6 80.2 90.1 84.5 57.0 51.7 54.7
OHC 213.6 107.1 117.1 111.5 49.8 45.2 47.82 NC 192.6 77.5 91.5 84.5 59.8 52.5 56.1
OHC 219.6 104.5 118.4 111.3 52.4 46.1 49.34 NC 182.0 73.2 91.1 82.1 59.8 49.9 54.9
OHC 208.9 100.1 118.1 108.7 52.1 43.5 48.0c7552 1 NC 3857.3 3218.6 3225.6 3219.3 16.6 16.4 16.5
OHC 4178.9 3540.2 3547.2 3540.9 15.3 15.1 15.32 NC 3861.3 3183.0 3218.3 3214.8 17.6 16.7 16.7
OHC 4182.9 3504.7 3539.9 3536.4 16.2 15.4 15.5s349 1 NC 153.3 72.8 94.1 84.2 52.5 38.6 45.1
OHC 185.6 105.1 126.4 116.5 43.4 31.9 37.22 NC 153.3 73.8 90.1 81.9 51.8 41.2 46.6
OHC 185.6 106.1 122.4 114.2 42.8 34.0 38.54 NC 159.7 76.8 92.8 83.5 51.9 41.9 47.7
OHC 192.0 109.1 125.1 115.8 43.1 34.8 39.7s382 1 NC 249.1 170.6 186.3 178.2 31.5 25.2 28.5
OHC 335.3 256.8 272.4 264.3 23.4 18.7 21.22 NC 262.8 172.3 192.9 181.2 34.4 26.6 31.0
OHC 348.9 258.5 279.1 267.4 25.9 20.0 23.44 NC 257.1 164.7 191.3 176.5 36.0 25.6 31.3
OHC 343.3 250.8 277.4 262.7 26.9 19.2 23.5s386 1 NC 332.0 268.8 287.7 278.9 19.0 13.3 16.0
OHC 610.4 547.2 566.1 557.3 10.4 7.2 8.72 NC 324.3 253.5 288.7 269.1 21.8 11.0 17.0
OHC 602.7 531.9 567.1 547.5 11.8 5.9 9.2s400 1 NC 243.2 152.0 193.3 172.5 37.5 20.5 29.1
OHC 324.0 232.9 274.1 253.3 28.1 15.4 21.82 NC 233.5 154.7 181.3 169.6 33.8 22.4 27.4
OHC 314.3 235.5 262.1 250.4 25.1 16.6 20.34 NC 225.2 154.7 184.9 171.8 31.3 17.9 23.7
OHC 306.0 235.5 265.8 252.7 23.0 13.2 17.4
Table 5. Results of TPG area (part 2).
88 Stochastic Optimization - Seeing the Optimal for the Uncertain
Circuit Initial Optimized ImprovementTPG TPG in %
best worst average best worst averages444 1 NC 223.5 151.4 185.9 168.0 32.3 16.8 24.8
OHC 304.4 232.2 266.8 248.9 23.7 12.3 18.22 NC 226.5 156.0 182.0 171.1 31.1 19.7 24.4
OHC 307.4 236.8 264.5 252.3 22.9 14.0 17.94 NC 234.2 158.7 176.3 169.5 32.2 24.7 27.6
OHC 315.0 239.5 257.1 250.3 24.0 18.4 20.5s510 1 NC 508.6 406.2 452.4 436.6 20.1 11.1 14.2
OHC 739.1 636.7 682.9 667.1 13.9 7.6 9.72 NC 546.9 409.8 453.7 433.3 25.1 17.0 20.8
OHC 777.4 640.3 684.2 663.8 17.6 12.0 14.64 NC 513.9 417.5 460.4 439.6 18.8 10.4 14.5
OHC 744.4 648.0 690.9 670.1 13.0 7.2 10.0s526 1 NC 471.4 341.3 384.2 360.4 27.6 18.5 23.5
OHC 675.2 545.2 588.1 564.3 19.3 12.9 16.42 NC 433.8 343.6 385.5 361.3 20.8 11.1 16.7
OHC 637.7 547.5 589.4 565.2 14.1 7.6 11.44 NC 455.1 340.6 378.5 357.3 25.1 16.8 21.5
OHC 658.9 544.5 582.4 561.2 17.4 11.6 14.8s1196 1 NC 1266.0 1113.7 1175.9 1141.5 12.0 7.1 9.8
OHC 1800.5 1648.2 1710.4 1676.0 8.5 5.0 6.92 NC 1259.0 1108.7 1184.9 1143.8 11.9 5.9 9.1
OHC 1793.6 1643.2 1719.4 1678.4 8.4 4.1 6.44 NC 1266.0 1117.3 1178.5 1154.9 11.7 6.9 8.8
OHC 1800.5 1651.9 1713.1 1689.4 8.3 4.9 6.2s1238 1 NC 1367.2 1213.1 1286.3 1236.6 11.3 5.9 9.5
OHC 1944.2 1790.2 1863.4 1813.7 7.9 4.2 6.72 NC 1333.6 1202.8 1285.3 1251.9 9.8 3.6 6.1
OHC 1910.6 1779.9 1862.4 1829.0 6.8 2.5 4.34 NC 1376.1 1209.8 1259.7 1230.3 12.1 8.5 10.6
OHC 1953.2 1786.9 1836.8 1807.4 8.5 6.0 7.5s1494 1 NC 546.9 448.1 488.6 466.9 18.1 10.6 14.6
OHC 1012.2 913.4 954.0 932.2 9.8 5.8 7.92 NC 535.9 448.7 494.0 470.3 16.3 7.8 12.2
OHC 1001.2 914.1 959.3 935.6 8.7 4.2 6.6s5378 1 NC 5344.9 4741.1 4741.1 4741.1 11.3 11.3 11.3
OHC 5794.2 5190.5 5190.5 5190.5 10.4 10.4 10.4s9234 1 NC 6374.0 5738.4 5749.7 5740.4 10.0 9.8 9.9
OHC 6866.0 6230.3 6241.6 6232.3 9.3 9.1 9.22 NC 6444.2 5761.0 5761.0 5761.0 10.6 10.6 10.6
OHC 6936.2 6252.9 6252.9 6252.9 9.9 9.9 9.9
Table 6. Results of TPG area (part 3).
89Stochastic Approach to Test Pattern Generator Design

is excluded from the cost calculation for the TPG+BC and TPG+NC structures, it seems to bejustified to subtract its area from the total cost of the TPG+OHC structure as well.Analysis of the contents of Tables 3-6 leads to the following observations.
• Average improvement values are positive for all benchmarks except three in the case ofthe TPG+BC structure and for all benchmarks in the case of the TPG+NC and TPG+OHCstructures. Therefore, an application of the proposed optimization algorithm leads toreduction in area overhead of the TPG in majority of cases. Moreover, if the result isnegative (increase in area overhead in comparison with an initial solution) there is highprobability that running GA tool again will provide improvement in results.
• The TPG+NC is the structure that is the most susceptible for a significant area reduction byan application of the proposed optimization algorithm while the TPG+BC structure seemsto be the most resistive for optimization.
• The degree of TPG area optimization is much better in the case of small and medium sizetest patterns sets (e.g. more than 50% improvement). This may partially result from thefact that in the case of large pattern sets the population size and the number of generationswere limited so that the runtime of GA tool was acceptable.
• A huge reduction of TPG area is possible for particular test sets - like in the case of c880,c6288 and s349 benchmarks. A closer examination of these cases revealed that GA toolfound TPG structures where some parallel inputs of the MISR can be tied either to thepower supply or to the ground while several other PIs of the MISR are fed from the sameoutput of the modifying logic.
• Dividing the MISR into several shorter registers may lead to a further reduction of the TPGarea. However, an improvement is rather insignificant.
In the framework of this study all experiments were carried out on a PC equipped with thequad-core Intel 2.66 GHz microprocessor and 4 GB of RAM. Computation time, that variesfrom several seconds up to several hours for different circuits, is proportional to the numberof patterns in a test set and the number of bits in test patterns as well as the size of populationand the number of generations of GA. However, in order to obtain satisfactory results ofGA execution the population size and the number of generations need to be proportionallyincreased with the growth of the size of a test pattern set. Thus, the size of a test pattern setinfluences computation time both directly and indirectly through the parameters of GA.On the other hand, since TPG design is off-line and one-time optimization process,optimization effectiveness is considered more important than reducing the computation time.Therefore execution times that are less than one day are still acceptable. Moreover, accordingto the observations for large test pattern sets containing more than several vectors some timeconsuming procedures of the evaluation software can be turned off (it was actually done in(Garbolino & Papa, 2010)) without a significant influence on the final result. In consequence,this will lead to essential reduction of computation time.In order to evaluate the TPG+NC structure optimized by the GA algorithm, which has beenproposed in this study, the authors compared it with some other state-of-the-art solutions(Bellos et al., 2002) and (Cao et al., 2008) as well as with TPGs presented in some of theirprevious works (Garbolino & Papa, 2008) and (Garbolino & Papa, 2010). Table 7 reports thearea overhead of all the above-mentioned TPG structures for several benchmarks. Becausetest pattern sets that were used in (Bellos et al., 2002) and (Cao et al., 2008) differ from those
90 Stochastic Optimization - Seeing the Optimal for the Uncertain
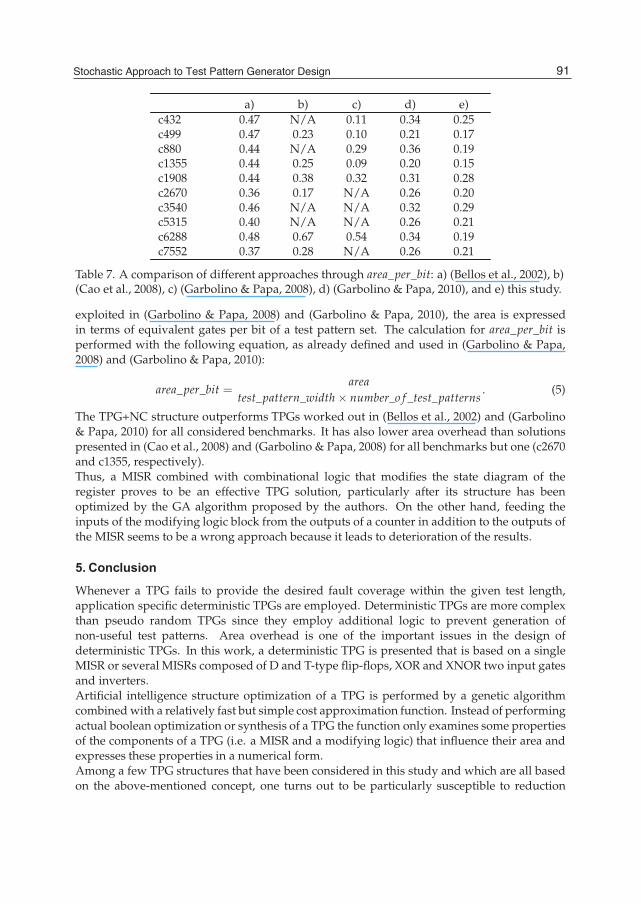
a) b) c) d) e)c432 0.47 N/A 0.11 0.34 0.25c499 0.47 0.23 0.10 0.21 0.17c880 0.44 N/A 0.29 0.36 0.19c1355 0.44 0.25 0.09 0.20 0.15c1908 0.44 0.38 0.32 0.31 0.28c2670 0.36 0.17 N/A 0.26 0.20c3540 0.46 N/A N/A 0.32 0.29c5315 0.40 N/A N/A 0.26 0.21c6288 0.48 0.67 0.54 0.34 0.19c7552 0.37 0.28 N/A 0.26 0.21
Table 7. A comparison of different approaches through area_per_bit: a) (Bellos et al., 2002), b)(Cao et al., 2008), c) (Garbolino & Papa, 2008), d) (Garbolino & Papa, 2010), and e) this study.
exploited in (Garbolino & Papa, 2008) and (Garbolino & Papa, 2010), the area is expressedin terms of equivalent gates per bit of a test pattern set. The calculation for area_per_bit isperformed with the following equation, as already defined and used in (Garbolino & Papa,2008) and (Garbolino & Papa, 2010):
area_per_bit =area
test_pattern_width× number_o f _test_patterns. (5)
The TPG+NC structure outperforms TPGs worked out in (Bellos et al., 2002) and (Garbolino& Papa, 2010) for all considered benchmarks. It has also lower area overhead than solutionspresented in (Cao et al., 2008) and (Garbolino & Papa, 2008) for all benchmarks but one (c2670and c1355, respectively).Thus, a MISR combined with combinational logic that modifies the state diagram of theregister proves to be an effective TPG solution, particularly after its structure has beenoptimized by the GA algorithm proposed by the authors. On the other hand, feeding theinputs of the modifying logic block from the outputs of a counter in addition to the outputs ofthe MISR seems to be a wrong approach because it leads to deterioration of the results.
5. Conclusion
Whenever a TPG fails to provide the desired fault coverage within the given test length,application specific deterministic TPGs are employed. Deterministic TPGs are more complexthan pseudo random TPGs since they employ additional logic to prevent generation ofnon-useful test patterns. Area overhead is one of the important issues in the design ofdeterministic TPGs. In this work, a deterministic TPG is presented that is based on a singleMISR or several MISRs composed of D and T-type flip-flops, XOR and XNOR two input gatesand inverters.Artificial intelligence structure optimization of a TPG is performed by a genetic algorithmcombined with a relatively fast but simple cost approximation function. Instead of performingactual boolean optimization or synthesis of a TPG the function only examines some propertiesof the components of a TPG (i.e. a MISR and a modifying logic) that influence their area andexpresses these properties in a numerical form.Among a few TPG structures that have been considered in this study and which are all basedon the above-mentioned concept, one turns out to be particularly susceptible to reduction
91Stochastic Approach to Test Pattern Generator Design
of its area by the use of the proposed GA-based tool. Experimental results prove that thisTPG structure outperforms - with respect to the area overhead - several other state-of-the artsolutions.
6. References
Aktouf, C., Robach, C., Kac, U. & Novak, F. (1999). On-line testing of embedded architecturesusing idle computations and clock cycles, 5th IEEE International On-line TestingWorkshop, pp. 28–32.
Bellos, M., Kagaris, D. & Nikolos, D. (2002). Test set embedding based on phaseshifters, EDCC-4: Proceedings of the 4th European Dependable Computing Conference onDependable Computing, Springer-Verlag, London, UK, pp. 90–101.
Bolzani, L., Sanchez, E., Schillaci, M. & Squillero, G. (2007). Co-evolution of test programs andstimuli vectors for testing of embedded peripheral cores, pp. 3474 –3481.
Cao, B., Xiao, L. & Wang, Y. (2008). A low power deterministic test pattern generator for bistbased on cellular automata, Electronic Design, Test and Applications, IEEE InternationalWorkshop on 0: 266–269.
Chakrabarty, K., Iyengar, V. & Murray, B. T. (2000). Deterministic built-in test patterngeneration for high-performance circuits using twisted-ring counters, IEEE Trans.Very Large Scale Integr. Syst. 8(5): 633–636.
Corno, F., Prinetto, P., Rebaudengo, M. & Sonza Reorda, M. (1996). Gatto: a geneticalgorithm for automatic test pattern generation for large synchronous sequentialcircuits, Computer-Aided Design of Integrated Circuits and Systems, IEEE Transactionson 15(8): 991 –1000.
Corno, F., Prinetto, P. & Sonza Reorda, M. (1996). A genetic algorithm for automatic generationof test logic for digital circuits, Tools with Artificial Intelligence, 1996., Proceedings EighthIEEE International Conference on, pp. 10 – 16.
Corno, F., Sonza Reorda, M., Squillero, G. & Violante, M. (2000). A genetic algorithm-basedsystem for generating test programs for microprocessor ip cores, pp. 195 –198.
Drechsler, R. & Drechsler, N. (2002). Evolutionary Algorithms for Embedded System Design,Kluwer Academic Publishers, Norwell, MA, USA.
Dufaza, C., Chevalier, C. & L.F.C., L. Y. V. (1993). Lfsrom - a hardware test pattern generatorfor deterministic iscas85 test sets, Proc. 2nd IEEE Asian Test Symposium, Bejing, China,pp. 160–165.
Edirisooriya, G. & Robinson, J. (1992). Design of low cost rom based test generators,Proceedings IEEE VLSI Test Symposium, pp. 61–66.
Favalli, M. & Dalpasso, M. (2002). An evolutionary approach to the design of on-chippseudorandom test pattern generators, DATE ’02: Proceedings of the conference onDesign, automation and test in Europe, IEEE Computer Society, Washington, DC, USA,p. 1122.
Fin, A. & Fummi, F. (2003). Genetic algorithms: the philosopher’s stone or an effectivesolution for high-level tpg?, HLDVT ’03: Proceedings of the Eighth IEEE InternationalWorkshop on High-Level Design Validation and Test Workshop, IEEE Computer Society,Washington, DC, USA, p. 163.
92 Stochastic Optimization - Seeing the Optimal for the Uncertain

Fiser, P. (2007). Pseudo-random pattern generator design for column-matching bist, DSD’07: Proceedings of the 10th Euromicro Conference on Digital System Design Architectures,Methods and Tools, IEEE Computer Society, Washington, DC, USA, pp. 657–663.
Garbolino, T. & Hlawiczka, A. (1999). A new lfsr with d and t flip-flops as an effectivetest pattern generator for vlsi circuits, EDCC-3: Proceedings of the Third EuropeanDependable Computing Conference on Dependable Computing, Springer-Verlag, London,UK, pp. 321–338.
Garbolino, T. & Hlawiczka, A. (2002). Efficient test pattern generators based on specificcellular automata structures, Microelectronics Reliability 42(6): 975 – 983.
Garbolino, T., Hlawiczka, A. & Kristof, A. (2000). Fast and low-area tpgs based on t-typeflip-flops can be easily integrated to the scan path, ETW ’00: Proceedings of the IEEEEuropean Test Workshop, IEEE Computer Society, Washington, DC, USA, p. 161.
Garbolino, T. & Papa, G. (2008). Test pattern generator design optimization based on geneticalgorithm, IEA/AIE ’08: Proceedings of the 21st international conference on Industrial,Engineering and Other Applications of Applied Intelligent Systems, Springer-Verlag,Berlin, Heidelberg, pp. 580–589.
Garbolino, T. & Papa, G. (2010). Genetic algorithm for test pattern generator design, AppliedIntelligence 32(2): 193–204.
Garvie, M. & Thompson, A. (2003). Evolution of self-diagnosing hardware, ICES’03:Proceedings of the 5th international conference on Evolvable systems, Springer-Verlag,Berlin, Heidelberg, pp. 238–248.
Goldberg, D. E. (1989). Genetic Algorithms in Search, Optimization and Machine Learning,Addison-Wesley Longman Publishing Co., Inc., Boston, MA, USA.
Guo, R., Li, B., Zou, Y. & Zhuang, Z. (2007). Hybrid quantum probabilistic coding geneticalgorithm for large scale hardware-software co-synthesis of embedded systems,pp. 3454 –3458.
Hakmi, A.-W., Wunderlich, H.-J., Zoellin, C., Glowatz, A., Hapke, F., Schloeffel, J. & Souef, L.(2007). Programmable deterministic built-in self-test, pp. 1 –9.
Hamzaoglu, I. & Patel, J. H. (1998). Test set compaction algorithms for combinationalcircuits, ICCAD ’98: Proceedings of the 1998 IEEE/ACM international conference onComputer-aided design, ACM, New York, NY, USA, pp. 283–289.
Hellebrand, S., Rajski, J., Tarnick, S., Venkataraman, S. & Courtois, B. (1995). Built-in test forcircuits with scan based on reseeding of multiple-polynomial linear feedback shiftregisters, IEEE Trans. Comput. 44(2): 223–233.
Khalil, M., Robach, C. & Novak, F. (2002). Diagnosis strategies for hardware or softwaresystems, J. Electron. Test. 18(2): 241–251.
Korošec, P. & Šilc, J. (2008). Using stigmergy to solve numerical optimization problems,Computing and Informatics 27(3): 377–402.
Mazumder, P. & Rudnick, E. M. (1999). Genetic algorithms for VLSI design, layout & testautomation, Prentice Hall PTR, Upper Saddle River, NJ, USA.
Novák, O., Plíva, Z., Nosek, J., Hlawiczka, A., Garbolino, T. & Gucwa, K. (2004). Test-per-clocklogic bist with semi-deterministic test patterns and zero-aliasing compactor, J.Electron. Test. 20(1): 109–122.
Papa, G. & Koroušic-Seljak, B. (2005). An artificial intelligence approach to the efficiencyimprovement of a universal motor, Eng. Appl. Artif. Intell. 18(1): 47–55.
93Stochastic Approach to Test Pattern Generator Design

Papa, G. & Šilc, J. (2002). Automatic large-scale integrated circuit synthesisusing allocation-based scheduling algorithm, Microprocessors and Microsystems26(3): 139–147.
Parker, K. (2003). The boundary-scan handbook, Third edition, Kluwer Academic Publishers.Sanchez, E. & Squillero, G. (2007). Evolutionary techniques applied to hardware optimization
problems: Test and verification of advanced processors, in L. Jain, V. Palade &D. Srinivasan (eds), Advances in Evolutionary Computing for System Design, Vol. 66 ofStudies in Computational Intelligence, Springer Berlin / Heidelberg, pp. 303–326.
Sudireddy, S., Kakade, J. & Kagaris, D. (2008). Deterministic built-in tpg with segmented fsms,pp. 261 –266.
Touba, N. & McCluskey, E. (2001). Bit-fixing in pseudorandom sequences for scan bist, IEEETransactions on Computer-Aided Design of Integrated Circuits And Systems 20(4): 545–555.
UC Berkeley (1988). Espresso, http://www-cad.eecs.berkeley.edu:80/software/software.html.
van de Goor, A. J. (1991). Testing semiconductor memories: theory and practice, John Wiley & Sons,Inc., New York, NY, USA.
94 Stochastic Optimization - Seeing the Optimal for the Uncertain