Procyanidins from Wild Grape (Vitis amurensis) Seeds ... - MDPI
Upload
independentCategory
view
2download
0
Physiologia Plantarum 134: 534–546. 2008 Copyright ª Physiologia Plantarum 2008, ISSN 0031-9317
Stimulation of the grape berry expansion by ethylene andeffects on related gene transcripts, over the ripening phaseChristian Chervina,*, Arak Tira-umphona, Nancy Terrierb, Mohamed Zouinea, Dany Severacc andJean-Paul Roustana
aUMR 990, Genomique et Biotechnologie des Fruits, INRA-INP/ENSAT, Universite de Toulouse, BP 32607, 31326 Castanet-Tolosan, Cedex, FrancebUMR Sciences Pour l’Œnologie, INRA, 2, place Viala, 34060 Montpellier, Cedex, FrancecMontpellier GenomiX, CNRS UMR 5203, Institut de genomique fonctionnelle, INSERM U661, Universite de Montpellier II, 34000 Montpellier, France
Correspondence
*Corresponding author,
e-mail: [email protected]
Received 22 May 2008; revised
4 July 2008
doi: 10.1111/j.1399-3054.2008.01158.x
Grape is considered as a non-climacteric fruit, the maturation of which is
independent of ethylene. However, previous work had shown that ethylene is
capable of affecting the physiological processes during maturation of grape
berries. Experiments were designed to screen the gene pool affected by
ethylene at the ripening inception in Cabernet Sauvignon berries. The resultsshowed that only 73 of 14 562 genes of microarray slides were significantly
modulated by a 24-h ethylene treatment (4 ml l21), performed 8 weeks after
flowering. The study then focused on accumulation of several mRNAs affected
by ethylene in relation to the berry size. Indeed, we observed that ethylene
application at veraison led to a berry diameter increase. This increase is mainly
because of sap intake and cell wall modifications, enabling cell elongation.
This was related to changes in the expression pattern of many genes, classified
in two groups: (1) ‘water exchange’ genes: various aquaporins (AQUA) and (2)‘cell wall structure’ genes: polygalacturonases, xyloglucan endotransglucosy-
lases (XTH), pectin methyl esterases, cellulose synthases and expansins. The
expression patterns were followed either along berry development or in three
berry tissues (peel, pulp and seeds). Ethylene stimulates the accumulation of
most gene transcripts in 1 h, and in several parts of the berry, this stimulation
may last for 24 h in some cases. One XTH and one AQUA seem to be good
candidates to explain the ethylene-induced berry expansion. This work brings
more clues about the ethylene involvement in the development and ripening ofgrape berries.
Introduction
Grape (Vitis vinifera L.) has been classified as non-
climacteric (Coombe and Hale 1973), but evidence
suggests that climacteric and non-climacteric fruit may
in fact share similar pathways of ripening (Barry and
Giovannoni 2007). Indeed, recent studies have shown
that grape berry tissues have a fully functional pathway for
ethylene synthesis and that this pathway is activated just
before veraison (Chervin et al. 2004) when berries start to
accumulate sugars and, in red cultivars, accumulate
anthocyanins. Furthermore, this study showed that
ethylene perception is critical for some berry changes
associated with ripening, including anthocyanin accu-
mulation and berry expansion (Chervin et al. 2004).
Abbreviations – AQUA, aquaporin; CS, cellulose synthase; EX, expansin; 1-MCP, 1-methylcyclopropene; PG, polygalacturonase;
qPCR, quantitative polymerase chain reaction; PME, pectin methyl esterase; TAI, transcript accumulation index; XTH, xyloglucan
endotransglucosylase.
534 Physiol. Plant. 134, 2008
Physiologia Plantarum An International Journal for Plant Biology

Besides, Tesniere et al. (2004) reported the involvement
of ethylene signalling in the regulation of ADHexpression
in grapevine. There were other reports about the role of
ethylene in non-climacteric fruit such as strawberries
(Trainotti et al. 2005) and citrus (Katz et al. 2004).
These reports lead us to checkmore globally the effectsof ethylene on gene expression during berry ripening
in grape, and many new tools and technologies for dis-
secting the gene expression profiling were available, e.g.
microarray technology. Recent experiments using this
technology showed the variation of expression of many
genes during grape berry development (Deluc et al.
2007, Pilati et al. 2007, Terrier et al. 2005, Waters et al.
2005).Inmost fruit, an important part of the ripening process is
berry expansion and berry softening and it is widely
recognized that changes in cell walls accompany fruit
ripening. Gross changes in wall composition may not
always occur, and indeed more subtle structural mod-
ifications of constituent polysaccharides are often ob-
served during softening (Brady 1987, Brummell and
Harpster 2001).The softening process is complex as breakdown or
modifications of different components are usually
accompanied by the incorporation of newly synthesized
components into the wall (Gibeaut and Carpita 1994,
Seymour and Gross 1996). The synthesis of cell wall
polymers is probably continuous throughout ripening,
and a change in the turnover rate of particular component
will affect the overall wall composition (Brummell andHarpster 2001). Modifications of wall components might
also be expected in ripening grape berries, and indeed
several researchers investigated the modification of cell
wall components and the expression of the gene for cell
wall degradation-related enzymes during softening of the
grape berries (Ishimaru and Kobayashi 2002, Nunan et al.
2001, Terrier et al. 2005, Waters et al. 2005), but the
signals leading to berry expansion and softening are notfully understood.
Materials and methods
Plant material
Grapevines (V. vinifera L.) cv. Cabernet Sauvignon,
grafted on 110 Richter rootstock, are grown in Toulouse,south-west of France (Domaine de Candie), in a non-
irrigated vineyard. For the two seasons during which the
experimentations have been performed, 2005 and 2006,
full bloom occurred around mid-June and veraison
occurred on weeks 8–9 after full bloom. The cluster
harvestwas recorded 14 or 15 weeks after full bloom. The
equivalence between the time in weeks after full bloom
and E-L growth scale (Coombe 1995) was the same for
both years, and is given in Figs 1 and 2.
Treatments of grape clusters with ethylene, berrydiameter and deformability measurements
Ethylene was applied for 24 h, once a week, at various
times following full bloom. Ethylene gas was injected
once at time 0; it was applied using a polyethylene bag
wrapped around the cluster, at an initial concentration of
4 ml l21 and the clusterswere kept inside the bag for 24 h
or 1 h, depending on the experiment. Control clusters
were also wrapped in plastic bags for 24 h or 1 h. For
these experiments, clusters growing in a shaded area ofthe vineswere chosen to avoid direct exposure to sunlight
and overheating associated with such a treatment. Five
replicates were performed using five clusters (each one
from a different vine) at a similar stage of development.
After treatments, the clusters were sampled and stored at
280�C pending further analyses. Every week, the berry
diameter and the deformability were measured on 50
berries randomly chosen on the five clusters treated byethylene and untreated controls using skinfold callipers
(British Indicators, BurgessHill,West Sussex,UK) accord-
ing to the method described by Coombe (1992).
Fig. 1. Variations of diameter (A) and deformability (B) of Cabernet
Sauvignon berries affected by an ethylene treatment (4 ml l21 for 24 h) at
week 8, as a function of the time after full bloom. The first assessments in
the ‘ethylene’ samples were made 1 week after the treatment; n ¼ 50,
error bars represent SE; * and ** show significant differences at 5 and
1%, respectively. Veraison happened between weeks 9 and 10. The
numbers in italics in the right graph show E-L growth stages (Coombe
1995).
Physiol. Plant. 134, 2008 535

RNA extraction for microarray and quantitativepolymerase chain reaction
Total RNA extraction was performed as previouslydescribed (Boss et al. 1996) with some modifications for
microarray and quantitative polymerase chain reaction
(qPCR). For themicroarray, the RNAswere extracted from
whole berries, whereas for qPCR they were extracted
from isolated skin, pulp or seed tissues. To obtain pure
RNAwithout DNA contamination, we used RNeasy mini
kit (Qiagen, Courtaboeuf, France) and applied 10 ml of
RNase-Free DNase I (Qiagen) onto the Rneasy columnbefore elution; all other steps were performed according
to Rneasy kit instructions. The absence of DNA was
checked using UFGT intron primers (UFGTi-F 5#-CTGCAGGGCCTAACTCACTC-3# and UFGTi-R 5#-TAGGTAGCACTTGGCCCATC-3#). DNase-treated RNA
(4 mg) was reverse transcribed using Omniscript Reverse
Transcription Kit (Qiagen). Checking the quality of cDNA
was performed by PCR with EF1-a primers (Supportinginformation Table S1).
Microarray experiments
The microarray experiment reported here was performed
with three biological replications (year 2005) and two
Fig. 2. Comparison of the diameter changes (n ¼ 50 berries) and variations of gene TAI in Cabernet Sauvignon berries, at various times after full bloom.
The transcript accumulation index was set at 1 for week 2 in each gene set; n ¼ 6 replications in qPCR experiments, error bars represent SE. Veraison
happened between weeks 9 and 10. The numbers in italics in the top left graph show E-L growth stages (Coombe 1995).
536 Physiol. Plant. 134, 2008

treatments: applying ethylene at 4 ml l21 or nothing
(controls) and leaving the polyethylene bags for 24 h
around the clusters, before sampling, freezing the berries in
liquid nitrogen and storing them at 280�C until further
analysis. This was performed 8 weeks after full bloom in
triplicate (three separate clusters, each one on a differentvine). Then three berries of each sample were regrouped in
a nine berry biological replicate to extract RNAs. We pro-
cessed three separate RNA extractions for each treatment.
We used the Array-Ready Oligo SetTM for the Grape
(Vitis vinifera) Genome Version 1.0 containing 14 562
70mer probes representing 14 562 transcripts from The
Institute for Genomic Research (TIGR) GrapeGene Index
(VvGI), release 3. Oligonucleotides were re-annotatedwith the most recent release of the DFCI Grape Gene
Index Version 5.0, June 2006 (Supporting information
Table S2). Oligonucleotides were spotted onmirror slides
and the probes were labelled with Cy3 and Cy5 dyes as
described in Terrier et al. (2005). The experiment was
performed with six slides (three biological replicates and
a dye-swap, detailed in Supporting information Table S2).
Hybridizedmicroarrayswere scanned simultaneously forCy3- and Cy5-labelled probes with an Axon Genepix
4000B scanner (MDS Inc., Toronto, Canada).
qPCR experiments
The qPCR was performed using 100 ng of total RNA in
a 10 ml reaction volume using SYBR GREEN PCR Master
Mix (Applied Biosystems, Courtaboeuf, France) on anABI
PRISM 7900HT sequence-detection system (RNA sam-
ples obtained in 2006). The primers used are described in
Supporting information (Table S1). All qPCR experiments
were run using three biological replicates, in addition to
three technical replicates in 384-well plates.Relative fold differences were calculated based on the
comparative Ct method using the EF1-a as an internal
standard. To demonstrate that the efficiencies of the
different gene primers were approximately equal, the
absolute value of the slope of log input amount vsDCtwas
calculated for all the study gene and the referent gene
(EF-a) as previously described (Terrier et al. 2005). To
determine relative fold differences for each sample ineach experiment, the Ct value for all the genes was
normalized to the Ct value for EF1-a and was calculated
relative to a calibrator using the formula 22DDCt.
As EF1-a RNAs were used as internal standards, we
checked that ethylene was not influencing significantly
the EF1-a RNA accumulation (data not shown).
Statistical analyses and similarity search
For berry diameter and deformability, the means of the
control and ethylene treatments were compared using
t-tests. Regarding the microarray experiment, for each
slide, data from both channels corresponding to Cy3- and
Cy5-labelled probes were normalized using the LOWESS
algorithm in TIGR Microarray Data Analysis System. No
threshold value was applied for signal intensities and all
the data were used for statistical analysis. Data from allthe slides were log-transformed and normalized (centred
on 0, variance equalized to 1), those data are available in
Supporting information (Table S2). The significance was
calculated at the 0.01 level by paired t-test in Multi-
experiment Viewer from TIGR.
All genes that were affected by ethylene were ten-
tatively identified by BLASTN similarity search with mRNA
sequences from the whole genome sequencing project(http://www.genoscope.cns.fr/externe/English/Projets/
Projet_ML/projet.htm). The complete mRNA sequen-
ces corresponding to these genes were used to identify
the correspondingArabidopsis thaliana proteins homo-
logues (http://www.arabidopsis.org/) using BLASTX tool
and an e-value <1e25. These grape genes were then
assigned the functions corresponding to the Arabidop-
sis homologues according to gene ontology annota-tions for (GOSLIM) in TAIR.
Results
Ethylene effects on transcript accumulation at thebeginning of veraison: microarray experiments
Sampling for the microarray experiments has been
performed after a rather long time following ethylene
treatment (24 h after ethylene application), expecting to
find pathways that are involved in the physiology of berry
ripening, pathways for which the induction because of
ethylene is sustained over many hours, more than the
related signalling pathways. Experimentswere performed
on whole berries to detect global responses to ethylene,and in a second part, more detail expression patterns
were performed on different tissues of the berry in to
discriminate the response.
Table 1 show that ethylene modulate the expression of
73 genes of 14 562 genes analysed by microarray (three
biological replications with a dye swap, P < 0.01).
Among these genes, the transcription of 43 genes was
stimulated (ratio >1), whereas it was reduced (ratio < 1)for 31 genes. Functional classification and the biological
process were assigned for these genes as described in
Materials and methods. This functional categorization
indicate that ethylene response involves many loci
encoding proteins implicated in response to abiotic or
biotic stimuli, transport, transcription factors, cell orga-
nization and biogenesis and other process. The fact that
Physiol. Plant. 134, 2008 537

Table 1. Genes for which transcript accumulation is significantly affected by a 24-h treatment with 4 ml l21 ethylene, in Cabernet Sauvignon berries,
8 weeks after full bloom. aList of genes validatedwith t-test statistics and a P < 0.01. bTranscripts deriving from the genome sequence identified using BLASTN
as containing the sequence of the oligonucleotides on the grape arrays. cDescription has beenobtainedby BLASTX ofmRNAsequences from thewhole genome
sequencing project to Arabidopsis thaliana homologues, as described in Materials and methods. dProteins with a function involved in cell elongation (and
possibly berry expansion). The complete table with gene ontology groups and more details is available as supporting information (Table S3).
Oligo IDa Transcript IDb Descriptionc Ratio (ethylene/control)
Vv10010857 GSVIVT00026503001 Cupin family protein 2.26
Vv10009536 GSVIVT00034564001 Late embryogenesis abundant protein 2.12
Vv10003986 GSVIVT00019700001 Peroxiredoxin (PER1) 2.08
Vv10008997 GSVIVT00024981001 Cupin family protein 1.90
Vv10004533 GSVIVT00013854001 Major intrinsic family proteind 1.86
Vv10001169 GSVIVT00033512001 Expressed protein 1.86
Vv10006755 GSVIVT00028844001 Aldehyde dehydrogenase (ALDH2) 1.79
Vv10007437 GSVIVT00010950001 Cellulose synthase family proteind 1.73
Vv10011262 GSVIVT00019627001 DNAJ heat shock N-terminal domain-containing protein 1.71
Vv10003792 GSVIVT00025571001 Endopolygalacturonase, putatived 1.70
Vv10006756 GSVIVT00030581001 Nudix hydrolase homologue 18 1.62
Vv10010965 GSVIVT00011591001 Basic endochitinase 1.61
Vv10000294 GSVIVT00011782001 Unknown 1.61
Vv10000366 GSVIVT00020394001 Beta amylase, putative 1.56
Vv10003783 GSVIVT00025569001 Alkaline alpha galactosidase, putative 1.52
Vv10006086 GSVIVT00015029001 Amino acid permease 6 1.50
Vv10004510 GSVIVT00035855001 Leucine-rich repeat transmembrane protein kinase, putative 1.50
Vv10004205 GSVIVT00027622001 No apical meristem family protein (RD26) 1.47
Vv10007239 GSVIVT00029908001 Trehalose-6-phosphate phosphatase 1.43
Vv10005690 GSVIVT00023225001 RNA polymerase sigma subunit SigF (sigF) 1.38
Vv10008292 GSVIVT00000656001 Glutamate synthase (GLU1) 1.38
Vv10004211 GSVIVT00006236001 Xyloglucan:xyloglucosyl transferased 1.37
Vv10003953 GSVIVT00014680001 Pathogenesis-related thaumatin family protein 1.34
Vv10005506 GSVIVT00031954001 ATP-dependent Clp protease putative 1.30
Vv10007442 GSVIVT00032365001 GHMP kinase family protein 1.29
Vv10000394 GSVIVT00033629001 Calcium-binding protein, putative 1.25
Vv10004402 GSVIVT00035972001 Arginine decarboxylase 2 (SPE2) 1.24
Vv10011468 GSVIVT00026451001 T-complex protein 11 1.23
Vv10013206 GSVIVT00008470001 Expressed protein 1.20
Vv10010716 GSVIVT00021505001 Cation exchanger, putative 1.19
Vv10008088 GSVIVT00023445001 Auxin-responsive factor (ARF8) 1.19
Vv10011080 GSVIVT00021669001 Phytosulphokines related 1.19
Vv10013102 GSVIVT00027080001 Ankyrin-repeat family protein 1.19
Vv10000779 GSVIVT00019025001 MIF4G domain-containing protein 1.19
Vv10002216 GSVIVT00037931001 Serine C-palmitoyltransferase (LCB2) 1.18
Vv10011103 GSVIVT00027238001 Unknown 1.17
Vv10008745 GSVIVT00031723001 Peroxidase 12 (PER12) (P12) (PRXR6) 1.15
Vv10003852 GSVIVT00024941001 Unknown 1.15
Vv10009962 GSVIVT00000758001 Structural maintenance chromosome (SMC) family protein 1.14
Vv10004009 GSVIVT00037443001 VHS domain-containing protein 1.10
Vv10012808 GSVIVT00016472001 Expressed protein 1.1
Vv10000894 GSVIVT00034747001 Ankyrin-repeat family protein 1.09
Vv10008032 GSVIVT00021497001 Yippee family protein 0.95
Vv10009881 GSVIVT00001121001 Zinc finger (C3HC4-type RING finger) family protein 0.92
Vv10011766 GSVIVT00030453001 Auxin efflux carrier family protein 0.91
Vv10002604 GSVIVT00036531001 Myb family transcription factor 0.89
Vv10009788 GSVIVT00011638001 Mannitol dehydrogenase, putative 0.88
Vv10001998 GSVIVT00023547001 Potassium transporter (HAK5) 0.86
Vv10003910 GSVIVT00014415001 Tubulin beta-1 chain (TUB1) 0.86
Vv10004817 GSVIVT00026731001 Heat shock protein 70, putative 0.86
Vv10004103 GSVIVT00028932001 DNA-binding family protein 0.85
Vv10001035 GSVIVT00005651001 Expressed protein 0.82
538 Physiol. Plant. 134, 2008

about 10% of these loci share homology with transcrip-tion factors indicate that this mechanism requires
complex regulatory control.
Interestingly, 12% of these genes are similar to proteins
involved in cell transport and it is known that the berry
ripening phase is partly dependent to the phloem down-
loading activity and associated metabolisms (Coombe
1992).
Among many functions, we noticed that ethyleneregulates the expression of genes involved in the grape
berry cellular expansion or softening such as xyloglucan
endotransglucosylase (XTH) (ratio 1.37), endopolygalac-
turonase (ratio 1.70), cellulose synthase (CS) (ratio 1.73),
expansin (EX) (ratio 0.70) or aquaporins (AQUA) (ratio
0.56 or 1.86), the latter being probably involved in water
and sap transport within cells.
Some genes showed significant repression or inductionby ethylene despite a ratio very close to 1 (more than 0.75
or less than 1.25), this means that there were very small
variations in the hybridization signals of the three repli-
cates, but the impact of such results on berry physiology
have to be considered with care.
Because in a previous work (Chervin et al. 2004), we
found that application of an inhibitor of ethylene
perception led to berries with a smaller diameter thancontrols, we decided to check the effect of ethylene on
berry diameter and deformability. We decided to further
check by qPCR the ethylene effect on the transcript
accumulation of a few genes that were shown to be
upregulated by ethylene in the microarray experiments,but first we verified the ethylene effect on berry size.
Ethylene effect on berry diameter and transcriptaccumulation of genes related to cell expansion:physiological measurements and qPCRexperiments
The results of Fig. 1A show that ethylene, when applied at
a low dose (4 ml l21) at week 8 post-flowering, induced
an increase in the berry diameter over the following
weeks. This diameter increase was acquired within the
week following the treatment and the difference with
controls was maintained over the remaining ripening
period. The results of Fig. 1B show that the difference indiameter was not paralleled by a difference in berry
deformability, suggesting that the ethylene may affect
cell wall changes and sap influx, leading to greater
cell expansion rates for a few days following the
application, but that turgor is not affected by this hor-
monal treatment.
When ethylene treatment was performed on grape
berry at week 2 toweek 7 after full bloom, and fromweek10 to week 12, the diameter and the deformability of
grape berries were not affected by ethylene (data not
shown). Thus, the cells were sensitive to ethylene mostly
at the beginning of veraison.
Then, we decided to check the variation in transcript
accumulation of the genes detected in the 24-h-induction
Table 1. Continued
Oligo IDa Transcript IDb Descriptionc Ratio (ethylene/control)
Vv10008728 GSVIVT00008725001 Homeobox-leucine zipper protein (HB-2) 0.81
Vv10002941 GSVIVT00014920001 Cytochrome P450 family protein 0.81
Vv10001518 GSVIVT00026288001 Cytochrome P450 76C2, putative 0.80
Vv10014094 GSVIVT00035958001 Zinc knuckle (CCHC-type) family protein 0.80
Vv10002056 GSVIVT00034638001 Class IV chitinase (CHIV) 0.80
Vv10011620 GSVIVT00024749001 E3 ubiquitin ligases 0.77
Vv10001666 GSVIVT00033153001 Ubiquitin-conjugating enzyme family protein 0.76
Vv10007063 GSVIVT00025111001 ABC transporter family protein 0.75
Vv10000906 GSVIVT00007730001 SWIB complex BAF60b domain-containing protein 0.75
Vv10000393 GSVIVT00025379001 Omega-6 fatty acid desaturase, endoplasmic reticulum (FAD2) 0.75
Vv10008566 GSVIVT00014406001 Ferredoxin-NADP(1) reductase, putative 0.75
Vv10000324 GSVIVT00023677001 Dienelactone hydrolase family protein 0.72
Vv10007508 GSVIVT00028977001 5#-AMP-activated protein kinase related 0.72
Vv10003885 GSVIVT00015518001 Plastocyanin 0.71
Vv10000425 GSVIVT00000851001 Expansin, putatived 0.70
Vv10002996 GSVIVT00008438001 Expressed protein 0.69
Vv10001255 GSVIVT00006912001 Thiazole biosynthetic enzyme, chloroplast (ARA6) 0.69
Vv10011114 GSVIVT00030529001 Bet v I allergen family protein 0.64
Vv10003860 GSVIVT00029136001 Chlorophyll A–B-binding protein 0.64
Vv10001209 GSVIVT00032674001 Protease inhibitor/seed storage/lipid transfer proteins 0.63
Vv10003711 GSVIVT00022146001 Major intrinsic family proteind 0.56
Physiol. Plant. 134, 2008 539
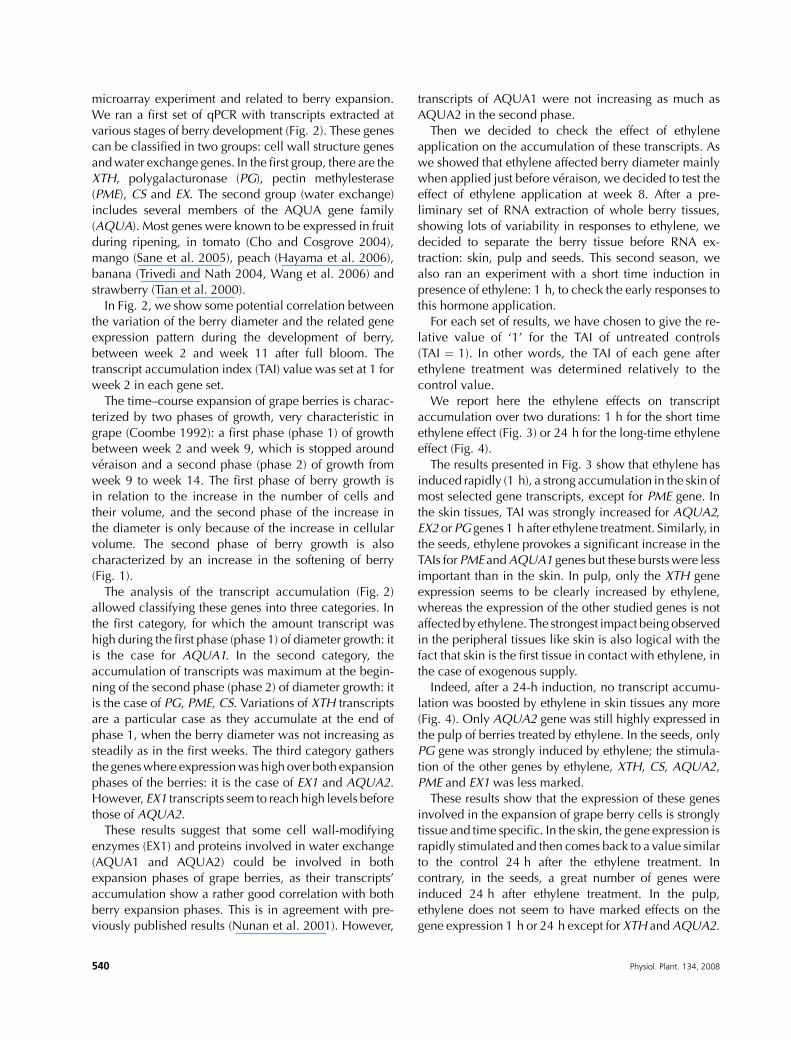
microarray experiment and related to berry expansion.
We ran a first set of qPCR with transcripts extracted at
various stages of berry development (Fig. 2). These genes
can be classified in two groups: cell wall structure genes
andwater exchange genes. In the first group, there are the
XTH, polygalacturonase (PG), pectin methylesterase(PME), CS and EX. The second group (water exchange)
includes several members of the AQUA gene family
(AQUA). Most genes were known to be expressed in fruit
during ripening, in tomato (Cho and Cosgrove 2004),
mango (Sane et al. 2005), peach (Hayama et al. 2006),
banana (Trivedi and Nath 2004, Wang et al. 2006) and
strawberry (Tian et al. 2000).
In Fig. 2, we show some potential correlation betweenthe variation of the berry diameter and the related gene
expression pattern during the development of berry,
between week 2 and week 11 after full bloom. The
transcript accumulation index (TAI) value was set at 1 for
week 2 in each gene set.
The time–course expansion of grape berries is charac-
terized by two phases of growth, very characteristic in
grape (Coombe 1992): a first phase (phase 1) of growthbetween week 2 and week 9, which is stopped around
veraison and a second phase (phase 2) of growth from
week 9 to week 14. The first phase of berry growth is
in relation to the increase in the number of cells and
their volume, and the second phase of the increase in
the diameter is only because of the increase in cellular
volume. The second phase of berry growth is also
characterized by an increase in the softening of berry(Fig. 1).
The analysis of the transcript accumulation (Fig. 2)
allowed classifying these genes into three categories. In
the first category, for which the amount transcript was
high during the first phase (phase 1) of diameter growth: it
is the case for AQUA1. In the second category, the
accumulation of transcripts was maximum at the begin-
ning of the second phase (phase 2) of diameter growth: itis the case of PG, PME, CS. Variations of XTH transcripts
are a particular case as they accumulate at the end of
phase 1, when the berry diameter was not increasing as
steadily as in the first weeks. The third category gathers
the geneswhere expressionwas high over both expansion
phases of the berries: it is the case of EX1 and AQUA2.
However, EX1 transcripts seem to reach high levels before
those of AQUA2.These results suggest that some cell wall-modifying
enzymes (EX1) and proteins involved in water exchange
(AQUA1 and AQUA2) could be involved in both
expansion phases of grape berries, as their transcripts’
accumulation show a rather good correlation with both
berry expansion phases. This is in agreement with pre-
viously published results (Nunan et al. 2001). However,
transcripts of AQUA1 were not increasing as much as
AQUA2 in the second phase.
Then we decided to check the effect of ethylene
application on the accumulation of these transcripts. As
we showed that ethylene affected berry diameter mainly
when applied just before veraison, we decided to test theeffect of ethylene application at week 8. After a pre-
liminary set of RNA extraction of whole berry tissues,
showing lots of variability in responses to ethylene, we
decided to separate the berry tissue before RNA ex-
traction: skin, pulp and seeds. This second season, we
also ran an experiment with a short time induction in
presence of ethylene: 1 h, to check the early responses to
this hormone application.For each set of results, we have chosen to give the re-
lative value of ‘1’ for the TAI of untreated controls
(TAI ¼ 1). In other words, the TAI of each gene after
ethylene treatment was determined relatively to the
control value.
We report here the ethylene effects on transcript
accumulation over two durations: 1 h for the short time
ethylene effect (Fig. 3) or 24 h for the long-time ethyleneeffect (Fig. 4).
The results presented in Fig. 3 show that ethylene has
induced rapidly (1 h), a strong accumulation in the skin of
most selected gene transcripts, except for PME gene. In
the skin tissues, TAI was strongly increased for AQUA2,
EX2 or PG genes 1 h after ethylene treatment. Similarly, in
the seeds, ethylene provokes a significant increase in the
TAIs for PME andAQUA1 genes but these burstswere lessimportant than in the skin. In pulp, only the XTH gene
expression seems to be clearly increased by ethylene,
whereas the expression of the other studied genes is not
affected by ethylene. The strongest impact being observed
in the peripheral tissues like skin is also logical with the
fact that skin is the first tissue in contact with ethylene, in
the case of exogenous supply.
Indeed, after a 24-h induction, no transcript accumu-lation was boosted by ethylene in skin tissues any more
(Fig. 4). Only AQUA2 gene was still highly expressed in
the pulp of berries treated by ethylene. In the seeds, only
PG gene was strongly induced by ethylene; the stimula-
tion of the other genes by ethylene, XTH, CS, AQUA2,
PME and EX1 was less marked.
These results show that the expression of these genes
involved in the expansion of grape berry cells is stronglytissue and time specific. In the skin, the gene expression is
rapidly stimulated and then comes back to a value similar
to the control 24 h after the ethylene treatment. In
contrary, in the seeds, a great number of genes were
induced 24 h after ethylene treatment. In the pulp,
ethylene does not seem to have marked effects on the
gene expression 1 h or 24 h except for XTH andAQUA2.
540 Physiol. Plant. 134, 2008

These could be of great importance in the stimulation ofberry expansion by ethylene observed in Fig. 1.
Independent of cell elongation, the influence of
ethylene on transcript accumulation was checked by
qPCR for some additional genes, that were known torespond to ethylene either in the present microarray
experiment or in recent papers about ethylene effects on
plant metabolism (De Paepe et al. 2004, Van Zhong
Fig. 3. The mRNA level (transcript accumulation index) of various genes in three tissue types after 1 h of ethylene treatment in Cabernet Sauvignon
berries at week 8 after full bloom, was expressed relatively to controls (set at 1), reference gene EF1-a. n ¼ 3 replications, error bars show SE.
Physiol. Plant. 134, 2008 541

Fig. 4. The mRNA level (TAI) of various genes in three tissue types after 24 h of ethylene treatment in Cabernet Sauvignon berries at week 8 after full
bloom was expressed relatively to controls (set at 1), reference gene EF1-a. n ¼ 3 replications, error bars show SE.
542 Physiol. Plant. 134, 2008
and Burns 2003). The primer list and gene accession
numbers are given as Supporting information (Table S1).
After 1-h incubation with ethylene, we obtained the
following ‘ethylene/control’ ratios for the TAI: 29, 5.6,
4.9, 3 and 1.5 for the cupin2, peroxiredoxin, ethylene
responsive element (ERE)-binding protein, cupin1 andflavonone-3-hydroxylase, respectively, in the skin tissues.
After 24-h incubation with ethylene, we obtained simi-
larly the following ratios: 2.2, 1.8, 1.8, 1.7 and 1.6 for the
chalcone synthase, peroxiredoxin, cupin2, ACC oxydase
and alcohol dehydrogenase, respectively.
Discussion
According to our knowledge, this is themost extensive set
of data targeting the role of ethylene in the grape berry
expansion and softening processes. Fruit softening in
grapes is clearly a complex process that involves subtle
changes in different components of cell wall and in many
cases would require only small amounts of enzyme
activity indicating that a low change in gene expressions
related to the control of cellwall composition could allowthe beginning of softening. The fact that low doses
of ethylene stimulated the grape berry expansion (Fig. 1)
are in accordance with the fact that low doses of 1-
methylcyclopropene (1-MCP), an ethylene inhibitor, limi-
ted the berry expansion (Chervin et al. 2004). Because at
this stage of development, the berry growth relies mainly
on cell elongation, these results are in accordance with
previous results showing that ethylene stimulates plantcell elongation (Smalle et al. 1997).
In grape berries, it is noticeable that the applied
ethylene treatment had a discrete impact on the global
transcriptome on a quantitative and qualitative point
of view: only 73 genes are significantly differentially
expressed and the magnitude of the variation is rather
low. But real-time PCR experiments presented in this
paper revealed that this could be explained by the longlag time (24 h) between ethylene treatment and berry
sampling and mixing of tissues because RNA was
extracted from whole berry. Extended impact on tran-
scription was measured when berries were sampled only
1 h after treatment and that the different tissues of the
berries were separated before RNA extraction. This
confirms that the transcriptional response of the plant to
ethylene is quite rapid and tissue specific (Barry andGiovannoni 2007).
In the pulp, the changes induced by ethylene are not as
remarkable as in the skin (Fig. 3), except for XTH (over 1-h
induction; Fig. 3) and AQUA2 (over 24-h induction;
Fig. 4) that may be part of the expansion response to
ethylene. Indeed, the expansion of pulp tissues is probably
critical in the berry expansion phase, as they represent the
major berry tissue.AQUA2 is probablya goodcandidate to
further study the role of AQUA in expansion and water
exchange of grape berries. Aquaporin expression has
already been observed in grape berries following veraison
(Picaud et al. 2003, Reid et al. 2006), but these studies
focussed on different transcripts than those described inthis paper. The stimulation of AQUA2 by ethylene in skin
tissues reached 300% and was the biggest stimulation
observed for the whole gene set.
XTH mRNAs are present mainly in the skin and
ethylene increases their accumulation. Nunan et al.
(2001) have also observed the presence of other XTH
mRNAs in ripening grape berries and suggested a possible
role for this enzyme in wall modification. In the time–course of developing berries (Fig. 2), the occurrence of
XTH transcripts before others like PME or PG, suggest that
XTH action may prepare the cell wall to further
modifications by PME, PG and others.
PME and PGmight contribute to increase the solubility
of pectic polysaccharides of cell walls observed during
ripening of grape berries (Nunan et al. 1998). PG
transcript accumulations increase at veraison when berryexpansion resumes (Fig. 2). Ethylene stimulates the
accumulation of the PG transcripts, indicating that
ethylene could be one of the signal triggering the berry
expansion. PME transcripts also increased after veraison,
but later than PG (Fig. 2), and in a previous study, the
authors did observe a PME transcript accumulation but no
related increase in PME activity over the second phase of
ripening of grape berries, cv. Muscat Gordo Blanco(Nunan et al. 2001). In addition, the stimulation of PME
by ethylenewas lessmarked, and only in seeds (Figs 3, 4).
Thus, PME seems less critical than PG to the berry
expansion in response to an ethylene stimulus.
CS was marginally induced as the berry expansion
resumed (Fig. 2) and was also stimulated by ethylene in
the skin tissues (Fig. 3). This enzyme is known to be
critical in cell wall expansion, as a sustained cellulosesynthesis is then necessary. There is not a lot of data
regarding ethylene and cellulose synthesis. Luo et al.
(2007) reported recently that inhibition of ethylene
perception by 1-MCP retarded the cellulose accumula-
tion in bamboo shoots.
Nunan et al. (1998) have shown that the first major
change of the cell wall composition during grape berry
ripeningwas a decrease in galactose/galactan content. Thisdecrease was related to b-galactosidase activities, which
increased dramatically as the berry began to soften. Nunan
et al. (2001) showed that accumulation of b-galactosidase
mRNA was detected in pre-veraison and early post-
veraison grapes. Similarly, Barnavon et al. (2000) showed
that the pattern of a b-gal transcript accumulationwas only
detectable in the early stages of development. In our
Physiol. Plant. 134, 2008 543
microarray experiment, no transcript of b-galactosidase
was detected among the strong changes induced by
ethylene (Table 1), but we found an a-galactosidase in this
category. This was not further developed.
Similarly, in the EX family, the accumulation of EX1
transcripts was high in each expansion phase of the berrydiameter (Fig. 2). The accumulation of EX1 and EX2
transcripts was strongly stimulated by ethylene in the skin
1 h after treatment (Fig. 3). The EX involvement in berry
expansion may be linked to depolymerization of struc-
tural hemicelluloses and polyuronides (Brummell et al.
1999). In the seeds, EX2was inhibited by ethylene, but the
expression of EX1was strongly increased.Whether the EX
produced in the seeds can migrate to the pulp remainsundetermined.
It seems logical that most stimulating effects by
ethylene were observed in the skin tissues after 1 h
(Fig. 3) as they were the first tissues in contact with this
exogenous treatment, even if we used a very low dose of
ethylene. It is worth noting that the recommended rates
for commercial for applications of ethephon (ethylene
precursor) to induce chemical thinning or promoteripening led to spraying very high doses of ethylene
equivalent to more than 1000 ml l21, more than 200-fold
the dose we used here, and at such high doses a di-
minution of berry diameter has often been observed. The
genes whose transcript accumulated markedly in the skin
were PG, both EXs, and AQUA1 & AQUA2, and to some
extent CS. This suggests that the skin loosening necessary
to berry expansion may be controlled at veraison by thecorresponding proteins.
Additionally, we verified that the accumulation of gene
transcripts that was shown to be enhanced by ethylene in
our microarray experiment was also observable by qPCR.
Itwas the case for the geneswe tested, twocupins and one
peroxiredoxin, particularly for one cupin with an
ethylene/control ratio as high as 29. This cupin super-
family encompasses a great number of functions(Dunwell et al. 2001), and we were not sure about their
involvement in cell elongation. Thus, the study was not
further extended with this gene family; however, we now
think it would be worth more experiments. We also
checked the induction of some gene transcripts well
known to respond to ethylene (De Paepe et al. 2004,
Tesniere et al. 2004, Van Zhong and Burns 2003). The
qPCR results showed that it was the case for an ERE-binding protein and other genes like an ACC oxidase, an
alcohol dehydrogenase or a chalcone synthase.
Ethylene has many roles in regulating the plant
phenotype, and its particular role about cell elongation
has been reviewed recently with other hormone inter-
play, such as auxins, giberrellins and brassinosteroids
(Vandenbussche and Van Der Straeten 2007).
Conclusions
Grape berry size and softening are important characters in
the grape production. We observed that low doses of
ethylene application increased the berry diameter at theinception of the ripening stage: veraison. Ethylene did not
affect the berry deformability.
This ethylene effect could be related to changes in
transcript accumulation of XTHs and AQUAs that were
found to accumulate in the pulp of ethylene-treated
berries at higher rates than in controls. The physiological
and biochemical changes in pulp tissues are probably
critical to determine the berry diameter as the pulprepresents a large part of the berry tissues. Our results also
confirmed previous studies regarding the good correla-
tions between berry ripening and the accumulation of
various transcripts of PG, PME, CS and EX. Some of these
enzymes may be involved in the increase of berry
expansion by ethylene, even if their stimulation by
ethylene was mainly observed in the skins, that may be
regarded as less important than pulp tissues to explainvariations in the berry diameter.However, the skin rigidity
could restrict the berry expansion, thus enzyme actions
leading to a higher plasticity of the skin may also be
important in the increase of the berry diameter.
Acknowledgements – The authors thank Sandrine Vialet
(INRA Montpellier) for technical assistance in the microarray
experiment, Thales Barreto (ENSA Toulouse) for technical
assistance with the qPCR experiment and the team of CRGS
platform of the Genopole Toulouse where the qRT-PCR
analyses were performed.
References
Barnavon L, Doco T, Terrier N, Ageorges A, Romieu C,
Pellerin P (2000) Analysis of cell wall neutral sugar
composition, beta-galactosidase activity and a related
cDNA clone throughout the development of Vitis vinifera
grape berries. Plant Physiol Biochem 38: 289–300
Barry CS, Giovannoni JJ (2007) Ethylene and fruit ripening.
J Plant Growth Regul 26: 143–159
Boss PK, Davies C, Robinson SP (1996) Analysis of the
expression of anthocyanin pathway genes in developing
Vitis vinifera 1. cv Shiraz grape berries and the
implications for pathway regulation. Plant Physiol 111:
1059–1066
Brady CJ (1987) Fruit ripening. Ann Rev Plant Physiol 38:
155–178
Brummell DA, Harpster MH (2001) Cell wall metabolism
in fruit softening and quality and its manipulation in
transgenic plants. Plant Mol Biol 47: 311–340
Brummell DA, Harpster MH, Civello PM, Palys JM, Benett AB
(1999) Modification of expansin protein abundance in
544 Physiol. Plant. 134, 2008
tomato fruit alters softening and cell wall polymer
metabolism during ripening. Plant Cell 11:
2203–2216
Chervin C, El-Kereamy A, Roustan JP, Latche A, Lamon J,
Bouzayen M (2004) Ethylene seems required for the berry
development and ripening in grape, a non-climacteric
fruit. Plant Sci 167: 1301–1305
Cho HT, Cosgrove DJ (2004) Expansins as agents in hormone
action. In: Davies PJ (ed) Plant Hormones: Biosynthesis,
Signal Transduction, Action. Springer, Dordrecht, pp
262–281
Coombe BG (1992) Research on development and ripening
of the grape berry. Am J Enol Vitic 43: 101–110
Coombe BG (1995) Adoption of a system for identifying
grapevine growth stages. Aust J Grape Wine Res 1: 104–110
Coombe BG, Hale CR (1973) The hormone content of
ripening grape berries and the effect of growth substance
treatments. Plant Physiol 51: 629–634
Deluc LG, Grimplet J, Wheatley MD, Tillett RL, Quilici DR,
Osborne C, Schooley DA, Schlauch KA, Cushman JC,
Cramer GR (2007) Transcriptomic and metabolite analyses
of Cabernet Sauvignon grape berry development. BMC
Genomics 22: 429
De Paepe A, Vuylsteke M, Van Hummelen P, Zabeau M,
Van Der Straeten D (2004) Transcriptional profiling by
cDNA-AFLP and microarray analysis reveals novel
insights into the early response to ethylene in Arabidopsis.
Plant J 39: 537–559
Dunwell JM, Culham A, Carter CE, Sosa-Aguirre CR,
Goodenough PW (2001) Evolution of functional diversity
in the cupin superfamily. Trends Biochem Sci 26: 740–746
Gibeaut DM, Carpita NC (1994) Biosynthesis of plant cell
wall polysaccharides. FASEB J 8: 904–915
Hayama H, Shimada T, Fujii H, Ito A, Kashimura Y (2006)
Ethylene-regulation of fruit softening and softening-related
genes in peach. J Exp Bot 57: 4071–4077
Ishimaru M, Kobayashi S (2002) Expression of a xyloglucan
endo-transglycosylase gene is closely related to grape
berry softening. Plant Sci 162: 621–628
Katz E, Lagunes PM, Riov J, Weiss D, Goldschmidt EE (2004)
Molecular and physiological evidence suggests the
existence of a system II-like pathway of ethylene
production in non-climacteric citrus fruit. Planta 219:
243–252
Luo ZS, Xu XL, Cai ZZ, Yan M (2007) Effects of ethylene and
1-methylcyclopropene (1-MCP) on lignification of
postharvest bamboo shoot. Food Chem 105: 521–527
Nunan KJ, Davies C, Robinson SP, Fincher GB (2001)
Expression patterns of cell wall-modifying enzymes during
grape berry development. Planta 214: 257–264
Nunan KJ, Sims LM, Bacic A, Robinson SP, Fincher GB
(1998) Changes in cell wall composition during ripening
of grape berries. Plant Physiol 118: 783–792
Picaud S, Becq F, Dedalde champ F, Ageorges A, Delrot S
(2003) Cloning and expression of two plasma membrane
aquaporins expressed during the ripening of grape berry.
Funct Plant Biol 30: 621–630
Pilati S, Perazzolli M, Malossini A, Cestaro A, Dematte L,
Fontana P, Dal Ri A, Viola R, Velasco R, Moser C (2007)
Genome-wide transcriptional analysis of grapevine berry
ripening reveals a set of genes similarly modulated during
three seasons and the occurrence of an oxidative burst at
veraison. BMC Genomics 22: 428
Reid KE, Olsson N, Schlosser J, Peng F, Lund ST (2006) An
optimized grapevine RNA isolation and statistical
determination of reference genes for real-time RT-PCR
during berry development. BMC Plant Biol 6: 27
Sane VA, Chourasia A, Nath P (2005) Softening in mango
(Mangifera indica cv. Dashehari) is correlated with the
expression of an early ethylene responsive, ripening
related expansin gene, MiExpA1. Postharvest Biol Technol
38: 223–230
Seymour GB, Gross KC (1996) Cell wall disassembly and fruit
softening. Postharvest News Info 7: 45N–52N
Smalle J, Haegman M, Kurepa J, Van Montagu M, Van Der
Straeten (1997) Ethylene can stimulate Arabidopsis
hypocotyls elongation in the light. Proc Natl Acad Sci
USA 94: 2756–2761
Terrier N, Glissant D, Grimplet J, Barrieu F, Abbal P, Couture
C, Ageorges A, Atanassova R, Leon C, Renaudin J-P,
Dedaldechamp F, Romieu C, Delrot S, Hamdi S (2005)
Isogene specific oligo arrays reveal multifaceted changes
in gene expression during grape berry (Vitis vinifera L.)
development. Planta 222: 832–847
Tesniere C, Pradal M, El-Kereamy A, Torregrosa L, Chatelet P,
Roustan JP Chervin C (2004) Involvement of ethylene
signalling in a non-climacteric fruit: new elements
regarding the regulation of Adh expression in grapevine.
J Exp Bot 55: 2235–2240
Tian MS, Prakash S, ElgarHJ Young H, Burmeister DM, Ross
GS (2000) Responses of strawberry fruit to
1-methylcyclopropene (1-MCP) and ethylene. Plant
Growth Regul 32: 83–90
Trainotti L, Pavanello A, Casadoro G (2005) Different
ethylene receptors show an increased expression during
the ripening of strawberries: does such an increment imply
a role for ethylene in the ripening of these non-climacteric
fruits?. J Exp Bot 56: 2037–2046
Trivedi PK, Nath P (2004) MaExp1, an ethylene-induced
expansin from ripening banana fruit. Plant Sci 167:
1351–1358
Van Zhong G, Burns JK (2003) Profiling ethylene-regulated
gene expression in Arabidopsis thaliana by microarray
analysis. Plant Mol Biol 53: 117–131
Vandenbussche P, Van Der Straeten D (2007) One for all and
all for one: cross-talk of multiple signals controlling the
plant phenotype. J Plant Growth Regul 26: 178–187
Wang Y, Lu W, Jiang Y, Luo Y, Jiang W, Joyce D (2006)
Expression of ethylene-related expansin genes in
cool-stored ripening banana fruit. Plant Sci 170: 962–967
Physiol. Plant. 134, 2008 545

Waters DLE, Holton TA, Ablett EM, Lee LS, Henry RJ (2005)
cDNAsmicroarray analysis of developing grape (Vitis vinifera
cv. Shiraz) berry skin. Funct Integr Genomics 5: 40–58
Supporting information
Additional Supporting Information may be found in the
online version of this article:
Table S1. List of primers used to control the induction
by ethylene of a series of genes known to respond to this
hormone.
Table S2. Experimental design and hybridization result
log2 transformed and normalized.
Table S3. List of genes for which transcript accu-
mulation is significantly affected by ethylene, analysis
performed using microarrays, with gene ontology
annotation.Please note: Wiley-Blackwell is not responsible for the
content or functionality of any supporting materials
supplied by the authors. Any queries (other than missing
material) should be directed to the corresponding author
for the article.
Edited by D. Van Der Straeten
546 Physiol. Plant. 134, 2008
Copyright © 2022 FDOKUMEN