A genetic analysis of seed and berry weight in grapevine
14
A genetic analysis of seed and berry weight in grapevine J.A. Cabezas, M.T. Cervera, L. Ruiz-Garcı ´a, J. Carren ˜ o, and J.M. Martı´nez-Zapater Abstract: Fruit size and seedlessness are highly relevant traits in many fruit crop species, and both are primary targets of breeding programs for table grapes. In this work we performed a quantitative genetic analysis of size and seedlessness in an F 1 segregating population derived from the cross between a classical seeded (Vitis vinifera L. ‘Dominga’) and a newly bred seedless (‘Autumn Seedless’) cultivar. Fruit size was scored as berry weight (BW), and for seedlessness we consid- ered both seed fresh weight (SFW) and the number of seeds and seed traces (SN) per berry. Quantitative trait loci (QTL) analysis of BW detected 3 QTLs affecting this trait and accounting for up to 67% of the total phenotypic variance. QTL analysis for seedlessness detected 3 QTLs affecting SN (explaining up to 35% of total variance) and 6 affecting SFW (ex- plaining up to 90% of total variance). Among them, a major effect QTL explained almost half of the phenotypic variation for SFW. Comparative analysis of QTLs for these traits reduced the number of grapevine genomic regions involved, one of them being a major effect QTL for seedlessness. Association analyses showed that microsatellite locus VMC7F2, closely linked to this QTL, is a useful marker for selection of seedlessnes. Key words: Vitis, table grape, genetic mapping, QTL mapping, berry size, seedlessness, seed number. Re ´sume ´: La taille du fruit et l’absence de pe ´pins sont des caracte `res reve ˆtant un grand inte ´re ˆt chez plusieurs espe `ces frui- tie `res et les deux font l’objet d’efforts dans le cadre de programmes de se ´lection du raisin de table. Dans ce travail, les au- teurs ont re ´alise ´ une e ´tude ge ´ne ´tique quantitative de la taille de fruits et de l’absence de pe ´pins chez une population F 1 en se ´gre ´gation de ´rive ´e du croisement entre un cultivar classique a ` pe ´pins (‘Dominga’) et un nouveau cultivar sans pe ´pins (‘Autumn Seedless’). La taille des fruits a e ´te ´ mesure ´e en de ´terminant la masse des baies, tandis que pour les pe ´pins, les auteurs ont mesure ´ tant la masse fraı ˆche des pe ´pins (SFW) que le nombre de pe ´pins ou de traces de pe ´pins (SN) par baie. Une analyse QTL de la masse des baies a de ´tecte ´ 3 QTL affectant ce caracte `re et expliquant jusqu’a ` 67 % de la variance phe ´notypique totale. L’analyse QTL pour les pe ´pins a de ´cele ´ 3 QTL influenc ¸ant le nombre de pe ´pins (expliquant jusqu’a ` 35 % de la variance totale) et 6 QTL affectant la masse fraı ˆche des pe ´pins (expliquant jusqu’a ` 90 % de la variance totale). Parmi ceux-ci, un QTL majeur expliquait presque la moitie ´ de la variation phe ´notypique pour le SFW. Une analyse com- pare ´e des QTL pour ces caracte `res a permis de re ´duire le nombre de re ´gions ge ´nomiques implique ´es chez la vigne, l’une ce celles-ci e ´tant un QTL majeur pour l’absence de pe ´pins. Des analyses d’association ont montre ´ que le locus microsatel- lite VMC7F2, e ´troitement lie ´a ` ce QTL, constitue un marqueur utile pour se ´lectionner l’absence de pe ´pins. Mots cle ´s : Vitis, raisin de table, cartographie ge ´ne ´tique, cartographie QTL, taille des baies, absence de pe ´pins, nombre de graines. [Traduit par la Re ´daction] Introduction Large fruit size and reduced seed number and size are major goals in the genetic improvement of fruit crop species (Varoquaux et al. 2000). In table grape, seedlessness is one of the most appreciated quality traits. Most breeding pro- grams have focused on the generation of new table grape cultivars combining seedlessness with other berry quality traits, such as large size, muscat flavour, or crispiness (Loomis and Weinberger 1979). Two different types of seedlessness have been observed among grape genetic re- sources: parthenocarpy and stenospermocarpy (Stout 1936). Parthenocarpy, or fruit development in the absence of polli- nation, yields small berries that completely lack seeds, such as ‘Corinto’ and related cultivars, mainly used for the pro- duction of seedless raisins (Ledbetter and Ramming 1989). In stenospermocarpy, pollination takes place, but seed devel- Received 9 June 2006. Accepted 14 September 2006. Published on the NRC Research Press Web site at http://genome.nrc.ca on 27 February 2007. Corresponding Editor: J.P. Gustafson. J.A. Cabezas and J.M. Martı ´nez-Zapater. 1 Departamento de Gene ´tica Molecular de Plantas, Centro Nacional de Biotecnologı ´a, Consejo Superior de Investigaciones Cientı ´ficas (CSIC), C/ Darwin 3, 28049 Madrid, Spain. M.T. Cervera. Centro de Investigacio ´n Forestal, Insitituto Nacional de Investigacio ´n y Tecnologı ´a Agraria y Alimentaria (INIA), Ctra. de A Corun ˜a Km 7, 28040 Madrid, Spain. L. Ruiz-Garcı ´a and J. Carren ˜o. Instituto Murciano de Investigacio ´n y Desarrollo Agrario, Instituto Murciano de Investigacio ´n y Desarrollo Agrario y Alimentario (IMIDA), La Alberca, 30150 Murcia, Spain. 1 Corresponding author (e-mail: [email protected]). 1572 Genome 49: 1572–1585 (2006) doi:10.1139/G06-122 # 2006 NRC Canada
-
Upload
independent -
Category
Documents
-
view
0 -
download
0
Transcript of A genetic analysis of seed and berry weight in grapevine

A genetic analysis of seed and berry weight ingrapevine
J.A. Cabezas, M.T. Cervera, L. Ruiz-Garcıa, J. Carreno, and J.M. Martınez-Zapater
Abstract: Fruit size and seedlessness are highly relevant traits in many fruit crop species, and both are primary targets ofbreeding programs for table grapes. In this work we performed a quantitative genetic analysis of size and seedlessness inan F1 segregating population derived from the cross between a classical seeded (Vitis vinifera L. ‘Dominga’) and a newlybred seedless (‘Autumn Seedless’) cultivar. Fruit size was scored as berry weight (BW), and for seedlessness we consid-ered both seed fresh weight (SFW) and the number of seeds and seed traces (SN) per berry. Quantitative trait loci (QTL)analysis of BW detected 3 QTLs affecting this trait and accounting for up to 67% of the total phenotypic variance. QTLanalysis for seedlessness detected 3 QTLs affecting SN (explaining up to 35% of total variance) and 6 affecting SFW (ex-plaining up to 90% of total variance). Among them, a major effect QTL explained almost half of the phenotypic variationfor SFW. Comparative analysis of QTLs for these traits reduced the number of grapevine genomic regions involved, oneof them being a major effect QTL for seedlessness. Association analyses showed that microsatellite locus VMC7F2,closely linked to this QTL, is a useful marker for selection of seedlessnes.
Key words: Vitis, table grape, genetic mapping, QTL mapping, berry size, seedlessness, seed number.
Resume : La taille du fruit et l’absence de pepins sont des caracteres revetant un grand interet chez plusieurs especes frui-tieres et les deux font l’objet d’efforts dans le cadre de programmes de selection du raisin de table. Dans ce travail, les au-teurs ont realise une etude genetique quantitative de la taille de fruits et de l’absence de pepins chez une population F1 ensegregation derivee du croisement entre un cultivar classique a pepins (‘Dominga’) et un nouveau cultivar sans pepins(‘Autumn Seedless’). La taille des fruits a ete mesuree en determinant la masse des baies, tandis que pour les pepins, lesauteurs ont mesure tant la masse fraıche des pepins (SFW) que le nombre de pepins ou de traces de pepins (SN) par baie.Une analyse QTL de la masse des baies a detecte 3 QTL affectant ce caractere et expliquant jusqu’a 67 % de la variancephenotypique totale. L’analyse QTL pour les pepins a decele 3 QTL influencant le nombre de pepins (expliquant jusqu’a35 % de la variance totale) et 6 QTL affectant la masse fraıche des pepins (expliquant jusqu’a 90 % de la variance totale).Parmi ceux-ci, un QTL majeur expliquait presque la moitie de la variation phenotypique pour le SFW. Une analyse com-paree des QTL pour ces caracteres a permis de reduire le nombre de regions genomiques impliquees chez la vigne, l’unece celles-ci etant un QTL majeur pour l’absence de pepins. Des analyses d’association ont montre que le locus microsatel-lite VMC7F2, etroitement lie a ce QTL, constitue un marqueur utile pour selectionner l’absence de pepins.
Mots cles : Vitis, raisin de table, cartographie genetique, cartographie QTL, taille des baies, absence de pepins, nombre degraines.
[Traduit par la Redaction]
Introduction
Large fruit size and reduced seed number and size aremajor goals in the genetic improvement of fruit crop species(Varoquaux et al. 2000). In table grape, seedlessness is oneof the most appreciated quality traits. Most breeding pro-grams have focused on the generation of new table grapecultivars combining seedlessness with other berry qualitytraits, such as large size, muscat flavour, or crispiness(Loomis and Weinberger 1979). Two different types ofseedlessness have been observed among grape genetic re-sources: parthenocarpy and stenospermocarpy (Stout 1936).Parthenocarpy, or fruit development in the absence of polli-nation, yields small berries that completely lack seeds, suchas ‘Corinto’ and related cultivars, mainly used for the pro-duction of seedless raisins (Ledbetter and Ramming 1989).In stenospermocarpy, pollination takes place, but seed devel-
Received 9 June 2006. Accepted 14 September 2006. Publishedon the NRC Research Press Web site at http://genome.nrc.ca on27 February 2007.
Corresponding Editor: J.P. Gustafson.
J.A. Cabezas and J.M. Martınez-Zapater.1 Departamento deGenetica Molecular de Plantas, Centro Nacional deBiotecnologıa, Consejo Superior de Investigaciones Cientıficas(CSIC), C/ Darwin 3, 28049 Madrid, Spain.M.T. Cervera. Centro de Investigacion Forestal, InsititutoNacional de Investigacion y Tecnologıa Agraria y Alimentaria(INIA), Ctra. de A Coruna Km 7, 28040 Madrid, Spain.L. Ruiz-Garcıa and J. Carreno. Instituto Murciano deInvestigacion y Desarrollo Agrario, Instituto Murciano deInvestigacion y Desarrollo Agrario y Alimentario (IMIDA), LaAlberca, 30150 Murcia, Spain.
1Corresponding author (e-mail: [email protected]).
1572
Genome 49: 1572–1585 (2006) doi:10.1139/G06-122 # 2006 NRC Canada

opment fails because of early degeneration of endosperm(Ledbetter and Ramming 1989). Thus, stenospermocarpiccultivars are not strictly seedless but contain seminal rudi-ments or seed traces of different sizes bearing viable em-bryos that can be germinated by in vitro culture techniques(Cain et al. 1983). Several grape cultivars, such as ‘Muscatof Alexandria’, occasionally produce stenospermocarpic ber-ries (Winkler et al. 1974). However, a stable stenospermo-carpy phenotype is found in only a few ancient orientalcultivars known as ‘Kishmish’ and derived cultivars. Amongthem, the white ‘Kishmish’, also known as ‘Sultanina’ or‘Thomson Seedless’ (Dangl et al. 2001), has been the mainsource of seedlessness in table grape breeding programs(Adam-Blondon et al. 2001). Unfortunately, as in other fruitcrop species (Crane 1965), in grapevine there is a direct re-lation between seed number and berry size (Coombe 1973)that results in an undesired negative correlation betweenseedlessness and berry size (Fanizza et al. 2005; Wei et al.2002). This correlation likely results from the fact that gib-berellins produced by seeds are required to promote berrygrowth during late berry developmental stages (Coombe1960; Perez et al. 2000). Identification of the genetic deter-minants responsible for seedlessness and berry size couldprovide alternatives to dissociate this negative correlation,as well as closely linked molecular markers to assist breed-ing programs.
Stenospermocarpy is a quantitative trait. All degrees ofseed development can be observed in seedless cultivarsand in progenies segregating for this trait. Qualitative anal-yses of stenospermocarpy in different progenies have ledto different hypothesis explaining its genetic control(Bouquet and Danglot 1996). Analysis of the progeny of 2partially seedless grape genotypes led to a genetic modelin which seedlessness would be controlled by recessive al-leles at 3 independent loci regulated by a dominant alleleat a single locus inhibiting the development of the seed(Bouquet and Danglot 1996). This locus was later namedas SdI for seed development inhibitor (Lahogue et al.1998). Studies focused on the identification of markerslinked to seedlessness using bulked segregant analysis(BSA; Michelmore et al. 1991) have identified markerslinked to this putative SdI locus in specific segregatingprogenies (Adam-Blondon et al. 2001; Lahogue et al.1998; Mejıa and Hinrichsen 2003; Striem et al. 1996).However, their usefulness was reduced when tested in ad-ditional segregating progenies (Adam-Blondon et al. 2001;Mejıa and Hinrichsen 2003).
The large availability of molecular markers for grape ge-nome analysis has opened up the possibility of performingquantitative genetic analyses of traits such as berry weightand seedlessness. Nevertheless, the reduced population sizesand the limitations posed by the 2-way pseudo-testcrossmapping strategy (Grattapaglia and Sederoff 1994), com-monly used to build maps in highly heterozygous species us-ing F1 progenies, only allow detection of quantitative traitloci (QTLs) with large phenotypic effects. Several geneticmaps of different grape cultivars and Vitis species havebeen built in recent years using these strategies (Adam-Blondon et al. 2004; Dalbo et al. 2000; Doligez et al. 2002;Doucleff et al. 2004; Fischer et al. 2004; Grando et al. 2003;Lodhi et al. 1995; Riaz et al. 2003), and preliminary results
of QTL detection for berry size and seedlessness have beengenerated (Doligez et al. 2002; Fanizza et al. 2005; Fischeret al. 2004). Doligez et al. (2002) showed the existence of 1major effect QTL for seedlessness, explaining up to 49% ofthe total phenotypic variance for seed fresh weight (SFW) ina controlled cross between 2 partially seedless varieties.This QTL likely corresponds to the SdI locus in the Bouquetand Danglot (1996) model. Unfortunately, in this work thelinkage group (LG) involved did not include any marker incommon with other available Vitis genetic maps allowing itsidentification. QTLs for berry size and seed number weredetected colocalizing with SdI in the same study. AdditionalQTLs with small effects were also found for berry weight,seed number, and seed dry weight but only in one of the 3analyzed seasons. The genetic control of berry size has alsobeen analyzed in 2 additional segregating progenies devel-oped for the genetic analysis of disease resistances in winecultivars (Fischer et al. 2004) and fruit yield components intable grapes (Fanizza et al. 2005). These studies reported theidentification of additional QTLs for berry size on differentlinkage groups.
To further investigate the complex genetic control ofseedlessness and berry size in table grape, we have analyzeda different progeny derived from a seeded (‘Dominga’) anda seedless (‘Autumn Seedless’) cultivar. For this purpose weconstructed parental and consensus genetic maps, mainlybased on amplified fragment length polymorphism (AFLP)and microsatellite markers, and performed QTL analyses ofseed weight, seed number, and berry weight. Our resultsconfirm the existence of a major effect QTL affecting bothseed and berry weight on LG18. In addition, we identifynew QTLs accounting for berry size, seed weight, and seednumber in grape. Finally, we show the usefulness of anLG18 microsatellite locus, VMC7F2, as a marker for seed-lessness breeding in table grape.
Materials and methods
Mapping populationThe F1 segregating population used for the genetic analy-
ses was derived from controlled crosses between cultivars‘Dominga’ (female progenitor) and ‘Autumn Seedless’(male progenitor) performed in 1988 and 1989. ‘Dominga’is a seeded cultivar of unknown origin cultivated in the re-gion of Murcia (Spain). ‘Autumn Seedless’ is a seedlessbred cultivar derived from the cross between cultivar‘Calmeria’ and a hybrid progeny of ‘Sultanina’ and ‘Muscatof Alexandria’ (Vitis International Variety Catalogue; http://www.genres.de/idb/vitis/vitis.htm). Cultivar ‘Calmeria’, pre-viously considered to be the result of open pollination ofcultivar ‘Aledo’ (Vitis International Variety Catalogue;http://www.genres.de/idb/vitis/vitis.htm) is likely an F1 prog-eny of ‘Aledo’ and ‘Sultanina’ according to microsatellitegenotyping (Ibanez et al. personal communication, 2005).The mapping population consisted of 118 hybrid plants andrepresentative plants of both progenitors. All of them weregrown in the same field and on their own roots. Vine androw spacing were 2.5 and 1 m, respectively, with an east–west orientation. The vines were supported on overhead ten-done trellis (parral) and pruned to 2 canes with 10–12 nodes.Irrigation (5500 m3/ha per year) and fertilization regimes
Cabezas et al. 1573
# 2006 NRC Canada

were determined largely by grower experience. Fertilizationwas uniformly performed across all blocks and included120 U of N per hectare and year (U/ha yearly), 80 U/hayearly of P2O5, 180 U/ha yearly of K2O, 30 U/ha yearly ofMgO, and 50 U/ha yearly of CaO. Oligoelements were sup-plied at 1.5, 2.5, and 5 g/plant yearly of Mn, Zn, and Fechelates with 16%, 16%, and 6% richness, respectively.This population was genotyped and phenotyped for seedand berry traits.
Marker analysisTotal DNA was isolated from young frozen leaves using
the procedure described by Dellaporta et al. (1983) with ex-traction buffer supplemented with 1% polyvinylpirrolidoneto reduce polyphenols (Lodhi et al. 1994). Parents and map-ping population, all 118 progeny individuals, were geno-typed using AFLP, selective amplification of microsatellitepolymorphic loci (SAMPL), sequence-specific amplifiedpolymorphisms (S-SAP), and microsatellite and sequence-characterized amplified region (SCAR) markers.
AFLP procedures were performed following the protocoldescribed by Vos et al. (1995) with slight modifications(Cervera et al. 1998). Primer combinations were selected onthe basis of the total number of polymorphic fragments am-plified on a sample with both parents and 10 offspring indi-viduals. Eighteen primer combinations were used forgenotyping the parents and the whole progeny. SAMPLmarkers (Witsenboer et al. 1997) were generated using thesame AFLP protocol but with selective primer combinationsof 1 AFLP primer and 1 microsatellite-based primer (basedon tandem repeats and including a 3’ or 5’ anchor sequence).Sixteen primer combinations were selected for genotypingparents and progeny. Finally, for 2 S-SAP reactions (Waughet al. 1997) a modified AFLP protocol was used in whichselective primer combinations included an AFLP primerand a retrotransposon-based primer. Primer sequences andprimer combinations for all markers are shown in Tables S1and S2 of Supplementary materials.2
For microsatellite analyses both progenitors and 6 prog-eny individuals were first genotyped at 167 microsatelliteloci (primer sequences for most of them are available at theUniSTS database of GeneBank (http://www.ncbi.nlm.nih.gov)) to select useful polymorphisms (Costantini et al., inpress). Ninety-three of them (markers starting with ‘‘VMC’’,‘‘VrZAG’’, ‘‘VVMD’’, and ‘‘VVI’’ in Fig. 1) were selectedfor linkage mapping according to their segregation type. Mi-crosatellite genotyping was carried out using radioactive la-belling of the forward primer with [g33P] followed byseparation of the amplified products on acrylamide gels (6%acrylamide:bisacrylamide 19:1, 1� Tris–borate–EDTA(TBE), and 7.5 mol/L urea) or fluorescence labelling of theforward primers followed by separation of the amplifiedproducts on an ABI-Prism 3700 sequencer (Applied Biosys-tems, Foster City, Calif.). In all cases polymerase chain re-action (PCR) was conducted in a final volume of 10 mLcontaining 20 ng of genomic DNA, 10 mmol/L Tris–HCl(pH 8.3), 2 mmol/L MgCl2, 50 mmol/L KCl, 5% DMSO,
0.2 mmol/L of each deoxynucleoside triphosphate (dNTP),2 mmol of forward primer, 2 mmol of reverse primer, and0.2 U of Taq DNA polymerase (Perkin Elmer, Waltham,Mass.). The amplification program consisted of 1 cycle of30 s at 94 8C, 30 s at (Tm–3) 8C, and 45 s at 72 8C, followedby 14 cycles in which the annealing temperature was de-creased by 0.2 8C/cycle, and then 20 cycles of 30 s at94 8C, 30 s at (Tm–6 8C), and 45 s at 72 8C; there was afinal extension of 5 min at 72 8C. In some cases, microsatel-lite reactions amplified additional fragments. When thesefragments showed clear patterns of Mendelian segregationthey were considered as additional markers in the mappingdata set and named using the microsatellite locus name fol-lowed by ‘‘-FA’’ (fragment associated) and a number.
The mapping population was also genotyped for theSCAR marker SCF27 (Mejıa and Hinrichsen 2003), identi-fied using BSA as being linked to berry seedlessness. PCRwas performed in a final volume of 20 mL containing 20 ngof genomic DNA, 10 mmol/L Tris–HCl (pH 8.3), 2 mmol/LMgCl2, 50 mmol/L KCl, 5% DMSO, 0.2 mmol/L of eachdNTP, 2 mmol of forward primer (5’-CAGGTGGGAGTA-GTGGAATG-3’), 2 mmol of reverse primer (5’-CAGGTG-GGAGTAAGATTTGT-3’), and 0.4 U of Taq DNApolymerase (Perkin Elmer). The amplification program con-sisted of 35 cycles of 30 s at 94 8C, 30s at 55 8C, and 45 sat 72 8C. Amplified fragments were visualized after electro-phoresis on 1.5% agarose gels and 1� TBE buffer.
Phenotypic evaluationNinety of the 118 progeny individuals of the mapping
population bore fruit in at least one of the 3 studied seasons:2002, 2003, and 2004 (from now on, harvests 02, 03, and04, respectively). These plants were evaluated for parame-ters related to berry size and berry seedlessness, but becauseof environmental conditions and disease incidence the num-bers of individuals scored were 89 in 02, 66 in 03, and 65 in04. For each plant we randomly sampled 100 berries from 2or 3 representative ripened clusters. Berry size was scored asthe average weight (BW) and volume (calculated as dis-placed water volume) per berry using the whole set of 100berries. Afterwards, 25 berries of the cluster mix were ran-domly collected to be evaluated for seedlessness. The degreeof seedlessness was scored as the fresh and dry weight oftotal seed content per berry, including completely developedseeds and seed traces. The average number of seeds andseed traces per berry (SN) was also scored. Statistical analy-ses were carried out using the software SPSS v. 12.0 (SASCorporation, Cary, S.C.).
Linkage mappingGenetic maps for ‘Dominga’ and ‘Autumn Seedless’ culti-
vars and a consensus linkage map for the cross were inde-pendently generated using all 118 progeny individuals andthe 2-way pseudo-testcross strategy (Grattapaglia andSederoff 1994). The mapping software Joinmap v. 3.0 (VanOoijen and Voorrips 2001) was used with a cross-pollinationpopulation type. Logarithm of the odds (LOD) and recombi-
2 Supplementary data for this article are available on the Web site or may be purchased from the Depository of Unpublished Data, Docu-ment Delivery, CISTI, National Research Council Canada, Building M-55, 1200 Montreal Rd., Ottawa, ON K1A 0R6, Canada. DUD5121. For more information on obtaining material refer to http://cisti-icist.nrc-cnrc.gc.ca/irm/unpub_eshtml.
1574 Genome Vol. 49, 2006
# 2006 NRC Canada

nation frequency thresholds were fixed at 3.5 and 0.3, respec-tively, to assign markers to LGs and establish marker order.Map distances were estimated using the Kosambi map func-tion (Kosambi 1944). For QTL mapping, framework cultivarmaps (not shown) and a cross consensus map were also devel-oped using only markers that were evenly distributed alongLGs and fully informative when possible (segregation typesabxac, abxcd, and abxaa for ‘Dominga’ and abxac, abxcd,and aaxab for ‘Autumn Seedless’). Partially informativemarkers were only included in gaps longer than 15 cM whenno other marker was available. Framework cultivar mapswere developed with Joinmap v. 3.0 using the double haploidpopulation type (Van Ooijen and Voorrips 2001). Numberingof LG was performed according to Riaz et al. (2003) andAdam-Blondon et al. (2004). Observed genome size (Gob)was calculated for each linkage map as the sum of all LGsizes. Estimated genome size (Ge) was calculated accordingto method 3 of Chakravarti (Hulbert et al. 1988). Observedmap coverage is the quotient of the observed and estimatedgenome sizes (Gob/Ge).
QTL analysisQTL detection was carried out using the framework maps
of each progenitor and the consensus frame map. QTL map-ping was performed using MapQTL v. 4.0 (Van Ooijen et al.2002) software and 3 different methods as described in thereference manual (http://www.mapqtl.nl): Kruskal Wallisnonparametric test (Lehmann 1975), interval mapping(Lander and Botstein 1989), and multiple QTL mapping(Jansen and Stam 1994). The results derived from the finalmultiple QTL mapping (MQM) model are shown. Bothgenome-wide and linkage-group-wide LOD thresholds corre-sponding to a = 0.05 were used for QTL detection. LODthresholds were estimated with the permutation test imple-mented in MapQTL using 10 000 permutations. Only QTLswith LOD values higher than genome-wide thresholds orLOD values higher than LG thresholds in more than 1 grow-ing season (Lander and Kruglyak 1995) were considered.Two LOD support intervals were established as approximate95% QTL confidence intervals (Van Ooijen 1992). Additiveeffect (the effect of substituting 1 parental allele for the other)and percentage of phenotypic variance explained by eachQTL, as well as total phenotypic variance explained by allthe QTLs, were estimated from the MQM model. Dominancerelations among alleles was estimated by studying the pheno-
typic averages of genotypic classes. Two-way analysis of var-iance (ANOVA) was performed using the statistics softwareSPSS v. 12.0 (SAS Corp.) to test possible interactions amongthe identified QTLs; for this analysis the markers selected ascofactors in the QTL mapping were used as fixed factors.
Results
Mapping data setThe final mapping data set for ‘Dominga’ and ‘Autumn
Seedless’ included a total of 595 molecular markers, ofwhich 75% allowed discrimination between maternal(‘Dominga’) and paternal (‘Autumn Seedless’) inherited al-leles (completely informative markers: segregation types ab-xaa, aaxab, abxcd, and abxac) (Table 1). Fifty-one markersof the mapping data set (9%) showed deviations from theexpected Mendelian segregations at P < 0.01 (28 in ‘Dom-inga’ (6.8%) and 40 in ‘Autumn Seedless’ (10.1%)). The ba-sic linkage maps were constructed using 93 microsatelliteloci (Table 1) selected to cover all linkage groups accordingto their position in other Vitis genetic maps (Adam-Blondonet al. 2004; Doligez et al. 2002; Doucleff et al. 2004;Grando et al. 2003) and their segregation in this population.Amplification of 8 of the microsatellite markers generatedcomplex patterns. The primer pair used for microsatelliteVMC1E11 amplified 2 different loci, named VMC1E11-Iand VMC1E11-II in Fig. 1. Furthermore, amplification of 6microsatellite loci yielded 17 additional segregating frag-ments (fragments associated with the amplification of micro-satellites (FA-SSRs)). Six microsatellites amplified a total of14 FA-SSR fragments that were used as dominant markersin the linkage analysis (Table 1). Eight of those markersmapped in positions linked to the original microsatellite lo-cus. Finally, amplification of VVMD30 generated a complexprofile that could not be interpreted, and the 3 segregatingfragments were handled as 3 independent FA-SSR markers.
Basic microsatellite maps were saturated with 484 segre-gating AFLP, SAMPL, and S-SAP markers and 1 SCARmarker (Table 1). Of these techniques, SAMPL was themost efficient in the detection of polymorphic segregatingmarkers, with an average of 17 markers per reaction (vs 11for AFLPs and 9 for S-SAPs). Only S-SAP markers follow-ing Mendelian segregation were considered in the linkageanalyses. Many additional S-SAP-amplified polymorphicfragments did not fit the expected segregation ratios, and
Table 1. Markers used in the linkage analysis.
‘Dominga’ (,) ‘Autumn Seedless’ (<)
abxaa abxab abxac abxcd Total aaxab abxab abxac abxcd Total Total
AFLP 72 55 127. 76 55. 131. 203.SAMPL 96 77 173. 90 77. 167. 263.S-SAP 9 6 15. 3 6. 9. 18.SSR 17 9 37 21 84. 9 9. 37 21 76. 93.FA-SSR 5 4 9. 8 4. 12. 17.SCAR 1 1. 1. 1. 1.Total 199 152 37 21 409. 186 152. 37 21 396. 595.
Note: Markers segregating 1:1 allowed the study of linkage relations only in ‘Dominga’ (abxaa) or ‘Autumn Seedless’ (aaxab).Markers segregating 3:1 (abxab dominant markers), 1:2:1 (abxab codominant markers), and 1:1:1:1 (abxcd and abxac markers) al-lowed the study of linkage relations in both progenitors. Partially informative markers (abxab) are indicated in italics.
Cabezas et al. 1575
# 2006 NRC Canada

Fig
.1.
Gen
etic
map
s.L
inka
gem
aps
of‘D
omin
ga’
(D),
‘Aut
umn
Seed
less
’(A
S)an
dth
ecr
oss
cons
ensu
s(C
)ar
esh
own
with
empt
y,gr
ey,
and
blac
kba
rs,
resp
ectiv
ely.
Part
ially
info
rmat
ive
(seg
rega
tion
type
abxa
b)an
dco
mpl
etel
yin
form
ativ
em
arke
rs(t
here
mai
ning
ones
)ar
ein
dica
ted
inno
rmal
and
bold
type
,re
spec
tive
ly.
Mar
ker
nam
esen
ding
in‘‘-
D’’
or‘‘-
AS’
’co
uld
bem
appe
don
lyin
‘Dom
inga
’(s
egre
gatio
nty
peab
xaa)
or‘A
utum
nSe
edle
ss’
(aax
ab),
resp
ecti
vely
.M
arke
rssh
owin
gdi
stor
ted
segr
egat
ion
ratio
s(P
>0.
01)
are
indi
cate
din
italic
s.R
elev
ant
QT
Ls
(in
bold
inT
able
2)ar
esh
own
for
berr
yw
eigh
t(B
W;
blac
kba
ckgr
ound
)se
ednu
mbe
r(S
N;
grey
back
grou
nd),
and
seed
fres
hw
eigh
t(S
FW;
whi
teba
ckgr
ound
).O
nelo
gari
thim
ofth
eod
ds(L
OD
)an
d2
LO
Dco
nfid
ence
inte
rval
sof
QT
Ls
are
indi
cate
dw
ithbo
xes
and
lines
,re
spec
tivel
y.
1576 Genome Vol. 49, 2006
# 2006 NRC Canada

Fig
.1
(con
tinu
ed).
Cabezas et al. 1577
# 2006 NRC Canada

several S-SAPs observed in the progeny were not found inthe progenitors. These observations suggested the existenceof chimaerism for some of the detected S-SAP markers.
Genetic mapsFigure 1 shows the linkage maps of progenitor cultivars
as well as the consensus framework map. The completelinkage map of ‘Dominga’ consisted of 351 molecularmarkers distributed in 19 LG (in agreement with the n = 19of V. vinifera) and covered 1173 cM, with an estimated sizeof 1461 cM and an observed coverage of 80%. Eleven of the409 markers of the complete data set for ‘Dominga’ couldnot be assigned to any LG, and 47 were discarded becausetheir inclusion in the linkage maps led to inconsistencies inmarker order. The linkage map of ‘Dominga’ included only3 intervals longer than 20 cM. Out of 24 markers with dis-torted segregation, 10 could not be accurately assigned orpositioned in the map, and the remaining 14 appeared to bedistributed in different LGs, with no clusters defining dis-torted regions.
The complete linkage map of ‘Autumn Seedless’ con-sisted of 329 molecular markers grouped in 19 LG and hadan observed size of 1131 cM, which represents a 71% cov-erage of the estimated 1602 cM size. Seven of the 396markers of the complete data set for ‘Autumn Seedless’could not be assigned to any LG, and 60 were discarded be-cause their inclusion in the linkage maps led to inconsisten-ces in marker order. The linkage map of ‘Autumn Seedless’included only 2 intervals longer than 20 cM. The microsatel-lite marker VMC8H10, showing distorted segregations andsignificant linkage with markers in LG13 and LG18, wasexcluded from this map. Only 26 out of the 40 markerswith distorted segregations could be positioned in the map,half of them in LG18.
Microsatellites shared with previously developed Vitislinkage maps (Adam-Blondon et al. 2004; Doligez et al.2002; Doucleff et al. 2004; Fischer et al. 2004; Grando etal. 2003; Riaz et al. 2003) allowed assignment of the 19LGs identified in ‘Dominga’. However, LG6 could not beidentified in ‘Autumn Seedless’, since all 14 microsatelliteswith known position in this LG were homozygous in thisprogenitor. The only unassigned LG of ‘Autumn Seedless’(LG20 in Fig. 1) did not include any marker allowing itscomparison with ‘Dominga’ or with any of the available Vi-tis genetic maps. A consensus framework map for the crosswas constructed for the 18 common LGs in both parentalmaps (Fig. 1) using preferentially codominant markers witheven and accurate positions in the parental maps. This con-sensus map included a total of 189 markers, 68 of thembeing microsatellites, of which only 14 were partially infor-mative. The consensus map had an observed size of1303 cM, with no intervals higher than 20 cM and an esti-mated coverage of 80%.
Phenotypic dataThe 118 progeny individuals used to develop the linkage
maps were evaluated for seedlessness and berry size over 3consecutive years. The number of plants producing berriesduring the 3 analyzed seasons (02, 03, and 04) varied from65 to 89 depending on the year, probably as a result of envi-ronmental conditions. Phenotypic frequency distributions for
Fig
.1
(con
clud
ed).
1578 Genome Vol. 49, 2006
# 2006 NRC Canada

season 2002 are shown in Fig. 2. Seedlessness was measuredscoring 2 variables: the average fresh weight of seeds plusseed traces per berry (SFW) and the average number ofseeds plus seed traces per berry (SN). The average dryweight of seeds plus seed traces per berry was also scored;however, since the weight of fresh and dried seed washighly correlated over the 3 seasons (0.90 < r < 0.95; P <0.01), we only report the SFW results. SFW values fitted anormal distribution for the 3 studied seasons (P = 0.02, 0.75,and 0.26 in 02, 03 and 04, respectively), showing significantcorrelations between years (r > 0.59). The observed SN dis-tributions were normal (P > 0.4), although they showedtransgressive segregations in both directions. However, therewas a very low correlation between the values obtained forseed number in the analyzed 3 seasons (0.21 < r < 0.31).Regarding berry size, both measurements, BW and berryvolume, were highly correlated (0.90 < r < 0.95; P < 0.01),and therefore only BW results are shown. BW values fittednormal distributions in the 3 analyzed seasons (P > 0.5),showing transgressive phenotypes, especially for lowerweight values. Berry fresh weight was correlated betweenseasons (0.595 < r < 0.684, P < 0.01), as well as being cor-related with SFW over the 3 seasons (0.46 < r < 0.53; P <0.01) but not with SN.
QTL analysis of seedlessness and fruit sizeThree QTL analyses were performed for each trait: these
were 1 per progenitor, using framework maps derived fromthe complete maps of ‘Dominga’ and ‘Autumn Seedless’(data not shown), and a third using the consensus frameworkmap. QTLs identified in each map and season are shown inTable 2. Twenty-two QTLs were detected for the 3 traits an-alyzed over the 3 considered seasons (Table 2). Fourteen ofthem showed LOD scores between the whole genome andthe LG estimated thresholds and were observed in a singleseason. Although they are reported in Table 2, they wereconsidered only as exploratory information and have notbeen included in Fig. 1. In a comparison of the parental andconsensus maps, differences in the percentage of explainedphenotypic variance were found for several QTLs. Thesedifferences could be related to the limitations of the struc-ture and size of the analyzed progeny but also to the exis-tence of different allelic interactions. QTLs only detectedon the consensus map suggest the presence of a QTL in het-erozygosity in both progenitors whose effect is only re-
vealed in progeny individuals with specific alleliccombinations (Hayashi and Awata 2004).
For SFW, 6 QTLs were considered (SFW1, SFW3,SFW10, SFW14, SFW18a, and SFW18b) out of the 14 iden-tified in different seasons (Table 2, Fig. 1). A QTL withlarge effect in all 3 seasons was found in the seedless pro-genitor map (‘Autumn Seedless’), in agreement with pre-vious results (Doligez et al. 2002). This QTL, SFW18a, waslocated in LG18 and explained between 45% and 47% of to-tal variance for SFW. Besides SFW18a, another QTL,SFW1, was detected in the ‘Autumn Seedless’ map, inLG1, season 03; this explained 15% of total phenotypic var-iance. Four QTLs were detected on the consensus map. Twoof them were located on LG18: 1 colocating with SFW18a,the major QTL identified in ‘Autumn Seedless’ (41%–63%of total variance), and SFW18b, which had a lower pheno-typic effect (12%–25%) and was detected in 2 different sea-sons in the central region of LG18. QTLs at LG18 had nooverlapping 2 LOD confidence intervals (Fig. 1). The re-maining QTLs on the consensus map were SFW1, in LG1,in season 02, colocated with the QTL observed in the LG1of the ‘Autumn Seedless’ map (12%) and SFW10, in LG10,in seasons 03 and 04, explaining 16% and 33% of the totalvariance, respectively.
In the ‘Dominga’ framework map only 1 relevant QTLwas detected (SFW14), in seasons 03 and 04, explaining be-tween 8% and 17% of total variance for this trait. A putativeQTL was also detected in 1 season in ‘Dominga’ on theSFW18b region, explaining a percentage of the total var-iance similar to that of the SFW18b QTL found in the con-sensus map. For each identified QTL, dominance relationsamong alleles were estimated using the phenotypic averagesof genotypic classes. This study suggested a dominant be-haviour for the ‘Autumn Seedless’ allele identified leadingto decreases in SFW at SFW18a. In addition, alleles leadingto decreases in SFW, possibly recessives, were identified in‘Autumn Seedless’ at SFW1, SFW3, SW10, SFW14, andSFW18b, and in ‘Dominga’ at SFW3, SFW10, SFW14, andSFW18b. A possible codominant allele reducing SFW wasalso detected in ‘Autumn Seedless’ at SFW18b.
For SN per berry, 3 QTLs were considered (SN4, SN14,and SN18) out of the 8 identified (Table 2, Fig. 1). SN4was detected only in the ‘Dominga’ map; it explained be-tween 8% and 12% of the total variance, with a likely dom-inant allele leading to a reduction in SN. SN18 was detected
Fig. 2. Phenotypic frequency distributions for seed and berry traits in 2002. Trait values observed in progenitor cultivars are indicated by D(‘Dominga’) and AS (‘Autumn Seedless’).
Cabezas et al. 1579
# 2006 NRC Canada
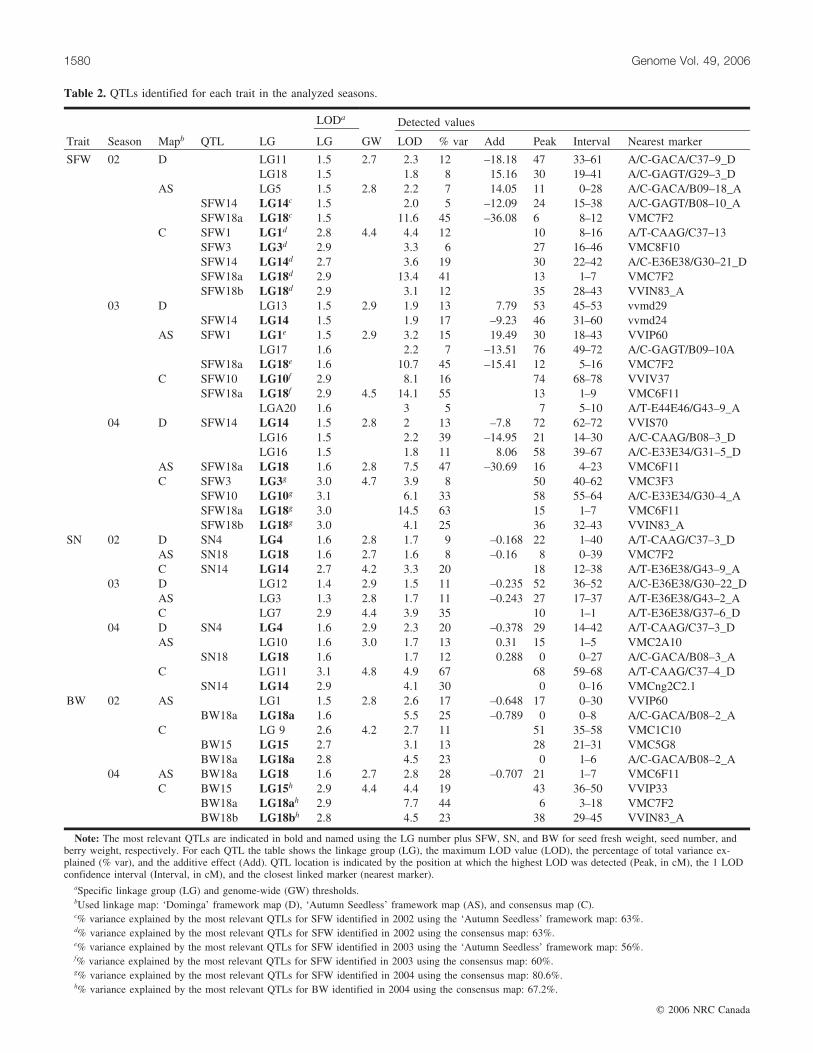
Table 2. QTLs identified for each trait in the analyzed seasons.
LODa Detected values
Trait Season Mapb QTL LG LG GW LOD % var Add Peak Interval Nearest marker
SFW 02 D LG11 1.5 2.7 2.3 12. –18.18 47. 33.–61 A/C-GACA/C37–9_DLG18 1.5 1.8 8. 15.16 30. 19.–41 A/C-GAGT/G29–3_D
AS LG5 1.5 2.8 2.2 7. 14.05 11. 0.–28 A/C-GACA/B09–18_ASFW14 LG14c 1.5 2.0 5. –12.09 24. 15.–38 A/C-GAGT/B08–10_ASFW18a LG18c 1.5 11.6 45. –36.08 6. 8.–12 VMC7F2
C SFW1 LG1d 2.8 4.4 4.4 12. 10. 8.–16 A/T-CAAG/C37–13SFW3 LG3d 2.9 3.3 6. 27. 16.–46 VMC8F10SFW14 LG14d 2.7 3.6 19. 30. 22.–42 A/C-E36E38/G30–21_DSFW18a LG18d 2.9 13.4 41. 13. 1.–7 VMC7F2SFW18b LG18d 2.9 3.1 12. 35. 28.–43 VVIN83_A
03 D LG13 1.5 2.9 1.9 13. 7.79 53. 45.–53 vvmd29SFW14 LG14 1.5 1.9 17. –9.23 46. 31.–60 vvmd24
AS SFW1 LG1e 1.5 2.9 3.2 15. 19.49 30. 18.–43 VVIP60LG17 1.6 2.2 7. –13.51 76. 49.–72 A/C-GAGT/B09–10A
SFW18a LG18e 1.6 10.7 45.. –15.41 12. 5.–16 VMC7F2C SFW10 LG10f 2.9 8.1 16. 74. 68.–78 VVIV37
SFW18a LG18f 2.9 4.5 14.1 55. 13. 1.–9 VMC6F11LGA20 1.6 3 5. 7. 5.–10 A/T-E44E46/G43–9_A
04 D SFW14 LG14 1.5 2.8 2 13. –7.8 72. 62.–72 VVIS70LG16 1.5 2.2 39. –14.95 21. 14.–30 A/C-CAAG/B08–3_DLG16 1.5 1.8 11. 8.06 58. 39.–67 A/C-E33E34/G31–5_D
AS SFW18a LG18 1.6 2.8 7.5 47. –30.69 16. 4.–23 VMC6F11C SFW3 LG3g 3.0 4.7 3.9 8. 50. 40.–62 VMC3F3
SFW10 LG10g 3.1 6.1 33. 58. 55.–64 A/C-E33E34/G30–4_ASFW18a LG18g 3.0 14.5 63. 15. 1.–7 VMC6F11SFW18b LG18g 3.0 4.1 25. 36. 32.–43 VVIN83_A
SN 02 D SN4 LG4 1.6 2.8 1.7 9. –0.168 22. 1.–40 A/T-CAAG/C37–3_DAS SN18 LG18 1.6 2.7 1.6 8. –0.16 8. 0.–39 VMC7F2C SN14 LG14 2.7 4.2 3.3 20. 18. 12.–38 A/T-E36E38/G43–9_A
03 D LG12 1.4 2.9 1.5 11. –0.235 52. 36.–52 A/C-E36E38/G30–22_DAS LG3 1.3 2.8 1.7 11. –0.243 27. 17.–37 A/T-E36E38/G43–2_AC LG7 2.9 4.4 3.9 35. 10. 1.–1 A/T-E36E38/G37–6_D
04 D SN4 LG4 1.6 2.9 2.3 20. –0.378 29. 14.–42 A/T-CAAG/C37–3_DAS LG10 1.6 3.0 1.7 13. 0.31 15. 1.–5 VMC2A10
SN18 LG18 1.6 1.7 12. 0.288 0. 0.–27 A/C-GACA/B08–3_AC LG11 3.1 4.8 4.9 67. 68. 59.–68 A/T-CAAG/C37–4_D
SN14 LG14 2.9 4.1 30. 0. 0.–16 VMCng2C2.1BW 02 AS LG1 1.5 2.8 2.6 17. –0.648 17. 0.–30 VVIP60
BW18a LG18a 1.6 5.5 25. –0.789 0. 0.–8 A/C-GACA/B08–2_AC LG 9 2.6 4.2 2.7 11. 51. 35.–58 VMC1C10
BW15 LG15 2.7 3.1 13. 28. 21.–31 VMC5G8BW18a LG18a 2.8 4.5 23. 0. 1.–6 A/C-GACA/B08–2_A
04 AS BW18a LG18 1.6 2.7 2.8 28. –0.707 21. 1.–7 VMC6F11C BW15 LG15h 2.9 4.4 4.4 19. 43.. 36.–50 VVIP33
BW18a LG18ah 2.9 7.7 44. 6. 3.–18 VMC7F2BW18b LG18bh 2.8 4.5 23. 38. 29.–45 VVIN83_A
Note: The most relevant QTLs are indicated in bold and named using the LG number plus SFW, SN, and BW for seed fresh weight, seed number, andberry weight, respectively. For each QTL the table shows the linkage group (LG), the maximum LOD value (LOD), the percentage of total variance ex-plained (% var), and the additive effect (Add). QTL location is indicated by the position at which the highest LOD was detected (Peak, in cM), the 1 LODconfidence interval (Interval, in cM), and the closest linked marker (nearest marker).
aSpecific linkage group (LG) and genome-wide (GW) thresholds.bUsed linkage map: ‘Dominga’ framework map (D), ‘Autumn Seedless’ framework map (AS), and consensus map (C).c% variance explained by the most relevant QTLs for SFW identified in 2002 using the ‘Autumn Seedless’ framework map: 63%.d% variance explained by the most relevant QTLs for SFW identified in 2002 using the consensus map: 63%.e% variance explained by the most relevant QTLs for SFW identified in 2003 using the ‘Autumn Seedless’ framework map: 56%.f% variance explained by the most relevant QTLs for SFW identified in 2003 using the consensus map: 60%.g% variance explained by the most relevant QTLs for SFW identified in 2004 using the consensus map: 80.6%.h% variance explained by the most relevant QTLs for BW identified in 2004 using the consensus map: 67.2%.
1580 Genome Vol. 49, 2006
# 2006 NRC Canada

only in the ‘Autumn Seedless’ map and explained between7% and 20% of the total variance, with variable effects de-pending on the season. This QTL colocalized with SFW18a,responsible for a strong decrease in SFW. Finally, SN14 wasonly detected on the consensus framework map and ex-plained between 19% and 29% of the total variance. ThisQTL colocalized with SFW14 in the ‘Dominga’ frameworkmap. The dominance relation between alleles at SN14 andSN18 could not be determined.
For BW 3 QTLs were considered (BW15, BW18a, andBW18b) out of the 6 identified (Table 2, Fig. 1). No QTLswere detected in season 03. QTL BW18a was detected inthe upper part of LG18 of ‘Autumn Seedless’ and explainedbetween 22% and 25% of the total variance. It was also de-tected in the consensus framework map, explaining between23% and 44% of the variance, with a dominant ‘AutumnSeedless’ allele leading to decreases in BW. BW18a colo-calized with SFW18a and SN18. The 2 additional QTLs,BW18b and BW15, were detected in the consensus frame-work map. BW18b, colocalized with SFW18b, showed nooverlapping 2 LOD confidence intervals with BW18a andexplained 23% of the total variance. For this QTL, possiblerecessive alleles leading to decreases in BW were found inboth progenitors, as well as a possible codominant allele in‘Autumn Seedless’. BW15, in LG15, explained between13% and 19% of total variance. Dominance relations amongalleles could not be determined for this QTL
Seedlessness-associated molecular markersSince SFW18a explained a large percentage of total phe-
notypic variance (41%–62%) for SFW independently of theseason (Table 2), it was a good candidate to test linkedmarkers in table grape breeding. Two closely linked micro-satellite loci, both with segregation type abxac, were ini-tially selected as possible markers: VMC7F2 (Pellerone etal. 2001), with genotype 200:204 in ‘Dominga’ and 198:200in ‘Autumn Seedless’, and VMC6F11 (Arroyo-Garcıa andMartınez-Zapater 2004), null allele:159 in ‘Dominga’ andnull allele:149 in ‘Autumn Seedless’ (Table 3). One-wayANOVA for these loci identified an ‘Autumn Seedless’dominant allele for seedlessness segregating in the F1 prog-eny. This allele led to an average decrease in SFW of up to68 mg (Table 3). The allele was in coupling phase with the198 bp allele at the VMC7F2 locus and the ‘Autumn Seed-less’ null allele at VMC6F11. Significant segregation distor-tions were observed for most markers located in thisgenomic region of ‘Autumn Seedless’ against individualscarrying the seedlessness allele. For example, VMC7F2 andVMC6F11 displayed segregation ratios of 1.5:1 and 1.7:1,
respectively, versus the expected 1:1 (P < 0.05 and P <0.005, respectively).
The efficacy of these markers for seedlessness marker-assisted breeding was tested by studying the fit betweengenotypes and phenotypes in the segregating progeny and ina collection of seeded and seedless cultivars. Classificationof progeny plants in seedless (SFW per berry < 15 mg), par-tially seedless (15 mg < SFW < 55 mg), and seeded (SFW >55 mg) showed that most seedless plants (92%, 83%, and100% in seasons 02, 03, and 04, respectively) and most par-tially seedless plants (93% in 02 and 100% in 03 and 04)carry the 198 bp VMC7F2 allele. On the other hand, only asmall percentage of seeded plants carry this allele (4%,13%, and 6% in seasons 02, 03, and 04, respectively). The198 bp VMC7F2 and the null VMC6F11 ‘Autumn Seedless’allele were found to be significantly associated with seed-lessness (w2 = 13.70 and 13.93, respectively, P £ 0.001). Un-fortunately, the null nature of the VMC6F11 allele limits itsusefulness. A highly significant association between the198 bp VMC7F2 allele and seedlessness was also observedin a collection of 46 seeded and seedless cultivars of tablegrape (w2 = 36.63, P £ 0.001). All seedless cultivars carriedthe 198 bp allele, whereas only 2 seeded cultivars (‘Muscatof Alexandria’ and its descendant ‘Dona Maria’ (Galet2000)) carried a 198 bp allele at this locus (Table 4).
Discussion
Linkage mapsLinkage maps constructed for ‘Dominga’ and ‘Autumn
Seedless’ were in the range of other Vitis published linkagemaps (Adam-Blondon et al. 2004; Doligez et al. 2002;Doucleff et al. 2004) with estimated coverages among thehighest reported. Comparison of common microsatellite lociamong different linkage maps (Adam-Blondon et al. 2004;Doligez et al. 2002; Doucleff et al. 2004; Fischer et al.2004; Grando et al. 2003; Riaz et al. 2003) also showed astrong conservation of marker order with only minorchanges detected. Although both progenitors showed similarheterozygosity levels, in the range of grape cultivars (Adam-Blondon et al. 2004; Riaz et al. 2003), there were importantdifferences in the heterozygosity shown by different LGs. Inthe extreme case, LG6 in ‘Autumn Seedless’ was homozy-gous for all 14 microsatellite loci tested. Consequently, LG6is not represented in the genetic map of ‘Autumn Seedless’,although the only unassigned LG of ‘Autumn Seedless’ (LGAS20) could correspond to 1 end of its LG6. Given the cur-rently available information on the pedigree of this cultivar(see Material and Methods) it is highly likely that both LG6copies in ‘Autumn Seedless’ derive from ‘Sultanina’.
Table 3. Allele contribution to SFW at locus SFW18a.
VMC7F2 VMC6F11
‘Dominga’ ‘Autumn Seedless’ ‘Dominga’ ‘Autumn Seedless’
Harvest 204 bp 200 bp 198 bp 200 bp Null 159 bp Null 149 bp
2002 57.6 57.8 29.1 96.6 57.3 52.9 24.6 97.62003 68.9 78.1 38.5 86.2 78.5 72.7 44.3 85.52004 47.8 54.2 19.9 82.2 51.2 56.3 23.3 84.2
Note: The table shows, for each season, the average SFW per berry (mg) of progeny individuals car-rying each parental allele. Alleles are indicated in base pairs (null allele means lack of amplification).
Cabezas et al. 1581
# 2006 NRC Canada

The percentage of fully informative markers showing dis-torted segregation ratios (P < 0.05, 5.1% for ‘Dominga’ and10.1% for ‘Autumn Seedless’) was higher than expected bychance but similar to what has been observed in otherV. vinifera segregating progenies (ranging from 6% to 13%(Riaz et al. 2003; Adam-Blondon et al. 2004)). The highestmarker distortions in the ‘Autumn Seedless’ map were asso-ciated with the presence of the main effect allele for seed-lessness at SFW18a. Either this locus or a linked one onLG18 could reduce gamete or embryo viability leading to areduced number of individuals with the QTL allele responsi-ble for seedlessness. Since this distortion has not been re-ported in similar studies using other progenies segregatingfor seedlessness (Doligez et al. 2002), we believe that itdoes not result exclusively from the effect of SFW18a.
Genetic analysis of stenospermocarpic seedlessnessFrom an organoleptic point of view, stenospermocarpic
seedlessness is influenced by seed hardiness, seed number,and even features of the berry flesh (Ledbetter and Shonnard1991). Because of that, the genetic analysis of stenospermo-carpic seedlessness in table grape takes into consideration 2components, the SFW and the SN. This analysis detected amajor effect QTL and 5 smaller effect QTLs affecting SFW.‘Autumn Seedless’ alleles reducing SFW were identified inall of them. In addition, ‘Dominga’ alleles reducing SFWwere identified in 4 of them (SFW3, SFW10, SFW14, andSFW18b). Among them, a dominant ‘Autumn Seedless’ al-lele at SFW18a decreased SFW per berry by 70 mg on aver-age. The remaining alleles decreasing SFW are likelyrecessives. The existence of ‘Autumn Seedless’ recessive al-
leles and ‘Dominga’ alleles reducing SFW could explain thetransgressive phenotypes observed in the F1 progeny. Twoout of the 6 QTLs identified in this progeny (SFW18a andSFW18b) had previously been detected in progeny derivedfrom 2 partially seedless genotypes (Doligez et al. 2002).However, detection of SFW18b could not be confirmed be-cause of the overlapping confidence intervals among bothQTLs. Our results are in agreement with the previously pro-posed model for stenospermocarpic genetic control (Bouquetand Danglot 1996) regarding the existence of a major regu-latory locus, SdI, which should correspond with SFW18a.However, the number of modifier loci involved in the ge-netic control of stenospermocarpic seedlessness seems to bevariable in different progenies.
With respect to the SN per berry, this trait is controlledby at least 3 QTLs: SN4, SN14, and SN18. SN reduction ispromoted by a dominant ‘Dominga’ allele at SN4 and differ-ent parental allelic combinations at SN14, although the al-lelic dominance relation could not be determined in the lastcase. The opposite effect of QTL SN18 in seasons 02 and 04suggests interaction of this QTL with the environment,although the existence of more than 1 QTL for this trait inthis region could be also responsible for the observed effecteach year. A QTL for SN was also detected by Doligez etal. (2002) in a position similar to that of SN18, with severalLOD peaks although with overlapping intervals, and show-ing similar season-dependent effects. These results couldpoint to the existence of several linked QTLs.
SN14 and SN18 QTLs colocated with SFW QTLs(SFW14 and SFW18a/SFW18b, respectively). AlthoughSN18 overlaps with the 2 QTLs for SFW at LG18, the codo-
Table 4. Analysis of association between genotype and seedlessness at locusVMC7F2 in table grape.
Seedless varieties VMC7F2 Seeded varieties VMC7F2
‘Alvina’ 198: 200 ‘Calmerıa’ 200: 200‘Autumn Seedless’ 198: 200 ‘Cardinal’ 200: 200‘Blush Seedless’ 198: 200 ‘Christmas Rose’ 200: 200‘Centennial Seedless’ 198: 200 ‘Italia’ 200: 200‘Danuta’ 198: 200 ‘Matilde’ 200: 200‘Emerald Seedless’ 198: 200 ‘Dominga’ 200: 204‘Emperatriz’ 198: 200 ‘Dona Maria’ 198: 204‘Fantasy Seedless’ 198: 200 ‘Muscat of Alexandria’ 198: 206‘Flame Seedless’ 198: 200 ‘Red Globe’ 200: 200‘Madina’ 198: 200 ‘Dattier of Beyrouth’ 200: 204‘Moscatuel’ 198: 200 ‘Exotic’ 200: 204‘Perlette’ 198: 200 ‘Ohanez’ 200: 204‘Perlona’ 198: 200 ‘Aledo’ 200: 206‘Ruby Seedless’ 198: 200 ‘Alfonso Lavallee’ 200: 206‘Sultana Crimson’ 198: 200 ‘Early Muscat’ 200: 206‘Superior Seedless’ 198: 200 ‘Gold’ 200: 206‘Sultanina’ 198: 200 ‘Michaele Palieri’ 200: 206‘Black Seedless’ 198: 202 ‘Muscat of Hamburg’ 200: 206‘Rutilia’ 198: 204 ‘Black Rose’ 204: 206‘Dawn Seedless’ 198: 206‘Pasiga’ 198: 206‘Sultana Moscata’ 198: 206‘Marroo Seedless’ 198: 210
Note: Alleles are indicated in base pairs.
1582 Genome Vol. 49, 2006
# 2006 NRC Canada

minant behaviour of SN18 alleles suggests its relation withSFW18b. However, further research is required to testwhether these overlapping QTLs result from the pleiotropiceffect of the same genes. It seems reasonable that genes in-volved in embryo and (or) seed development could affectSN. Alternatively, it is likely that the genetic control of SNhas an effect on seed weight. In addition, QTL SN4, havingan effect on SN but not on SFW, suggests the existence ofmechanisms regulating SN independently of the final weightof berry seeds.
Genetic control of BWAt least 3 loci (BW15, BW18a, and BW18b) were re-
sponsible for the variation in BW in the analyzed progeny.A dominant allele decreasing BW was identified at BW18ain ‘Autumn Seedless’. This allele is in coupling phase withthe main effect allele for seedlessness of SFW18a. A morecomplex situation was found in BW18b and BW15. InBW18b a codominant allele of ‘Autumn Seedless’, in phasewith the main effect allele for seedlessness of SFW18a, in-creases BW, whereas 2 recessive alleles, 1 in each progeni-tor, seem to reduce BW.
In grapevine, as in other fruit species, there is a negativecorrelation of berry size with seedlessness (Fanizza et al.2005; Wei et al. 2002) and a positive correlation with SN(Coombe 1973). QTLs for BW at LG18 could result frompleiotropic effects of seedlessness-related QTLs in this LG.Both BW18a and BW18b QTLs were also detected byDoligez et al. (2002) colocating with the QTLs for SFW.As well, Fanizza et al. (2005) detected QTLs for BW atLG18 and LG4 (in a region similar to that of the QTL forSN4 identified in our study) in ‘Big Perlon’, the seedlessprogenitor of their segregating progeny. These results mightbe due to the existence of either pleiotropic effects of a sin-gle QTL or the existence of closely linked QTLs in these re-gions. Pleiotropic effect seems the most likely hypothesisbecause of the known relation between the gibberellins pro-duced by seeds and berry development (Coombe 1960;Perez et al. 2000). Additionally, several QTLs have beenshown to have an effect on BW without affecting seedless-ness. This is the case in BW15, identified in this progeny,and the QTL identified by Doligez et al. (2002) in LG11.Furthermore, QTLs affecting BW at LG5 and LG13, de-tected not only in table grape cultivars (Fanizza et al. 2005)but also in wine cultivars (Fischer et al. 2004), could alsobehave in this way. Thus, it seems that in grapevine therecould be at least 4 genomic regions (LG5, LG11, LG13,and LG15) affecting BW independently of the presence ofseeds.
Analysis of genotype and seedlessness associationSeedlessness is a primordial trait in table grape, and the
use of its marker-based selection could improve the effi-ciency of breeding programs. Since SFW18a consistentlyexplains more than half of the total variance for that trait indifferent seasons in at least 2 progenies, it could be a goodcandidate for marker-assisted breeding. In fact, with the useof BSA strategies several RAPD markers linked to seedless-ness have been identified (Adam-Blondon et al. 2001;Lahogue et al. 1998; Mejıa and Hinrichsen 2003; Striem etal. 1996), some of them linked to this chromosomal region.
However, their dominant behaviour and (or) the existence ofnull alleles (Adam-Blondon et al. 2001; Mejıa andHinrichsen 2003) have limited their general use. In thiswork we have identified microsatellite markers closelylinked to the locus SdI and detected a strong association be-tween specific alleles at loci VMC7F2 and VMC6F11 andseedlessness (Table 3). On the basis of our results, the per-centage of false positives (seeded hybrids identified as seed-less) expected in the analysis of progenies derived from‘Autumn Seedless’ would be 4% using VMC7F2 and 6% us-ing VMC6F11. The percentage of false negatives (seedlesshybrids discarded because they were genotypically consid-ered as seeded) would be 13% and 11%, respectively. More-over, since the donor parent of seedlessness for most of thecurrently available seedless varieties has been ‘Sultanina’ orderivative hybrids, there is a close association between thosemarkers and seedlessness in table grape (Table 4).
Conclusion
Conservatively, we detected 12 QTLs responsible for thevariation in seedlessness and berry weight in the‘Dominga’ � ‘Autumn Seedless’ F1 progeny. ComparativeQTL mapping allowed us to reduce the number of involvedgenomic regions to 8. Among them, 2 linked regions onLG18 showed effects on all 3 traits considered (SFW, SN,and BW), one of them being a major effect QTL. VMC7F2microsatellite, close to this QTL, was shown to be a usefultool for seedlessness breeding. Another genomic region, onLG14, also showed effects on at least 2 traits (SFW andSN). Finally, 5 other regions showed effects on a specifictrait in the studied progeny: 3 genomic regions, at LGs 1, 3,and 10, on SFW; 1 genomic region, at LG4, on SN; and 1genomic region, at LG15, on BW. Further work will be re-quired to narrow down these regions and to identify the spe-cific gene sequences involved.
AcknowledgementsThe authors would like to thank the partners of the
MASTER project for their gracious exchange of informa-tion, Julie Vogel for kindly providing the SAMPL primerssequences, and Carlos Alonso Blanco for critical reading ofthe manuscript. This research was funded by the EuropeanUnion project ICA4-CT-2001-10065. J.A.C. was funded bya predoctoral fellowship from INIA (Instituto Nacional deInvestigaciones Agrarias y Agroalimentarias).
ReferencesAdam-Blondon, A.F., Lahogue-Esnault, F., Bouquet, A., Boursi-
quot, J.M., and This, P. 2001. Usefulness of two SCAR markersfor marker-assisted selection of seedless grapevine cultivars. Vi-tis, 40: 147–155.
Adam-Blondon, A.F., Roux, C., Claux, D., Butterlin, G., Merdino-glu, D., and This, P. 2004. Mapping 245 SSR markers on theVitis vinifera genome: a tool for grape genetics. Theor. Appl.Genet. 109: 1017–1027. doi:10.1007/s00122-004-1704-y.PMID:15184982.
Arroyo-Garcıa, R., and Martınez Zapater, J.M. 2004. Developmentand characterization of new microsatellite markers for grape. Vi-tis, 43: 174–178.
Cabezas et al. 1583
# 2006 NRC Canada

Bouquet, A., and Danglot, Y. 1996. Inheritance of seedlessness ingrapevine (Vitis vinifera L). Vitis, 35: 35–42.
Cain, D.W., Emershad, R.L., and Tarailo, R.E. 1983. In ovulo em-bryo culture and seedling development of seeded and seedlessgrapes. Vitis, 22: 9–14.
Cervera, M.T., Cabezas, J.A., Sancha, J.C., Martinez de Toda, F.,and Martınez-Zapater, J.M. 1998. Application of AFLPs to thecharacterization of grapevine Vitis vinifera L. genetic resources.A case study with accessions from Rioja (Spain). Theor. Appl.Genet. 97: 51–59. doi:10.1007/s001220050866.
Coombe, B.G. 1960. Relationship of growth development tochanges in sugar, auxins and gibberellins in fruits of seeded andseedless varieties of Vitis vinifera. Plant Physiol. 35: 241–250.PMID:16655336.
Coombe, B.G. 1973. The regulation and development of the grapeberry. Acta Hortic. 34: 261–272.
Costantini, L., Grando, M.S., Feingold, S., Ulanovsky, S., Mejıa, N.,Hinrichsen, P., et al. 2007. Generation of a common set of mappingmarkers to assist table grape breeding. Am. J. Enol. Vitic. In press.
Crane, J.C. 1965. The chemical induction of parthenocarpy in theCalimyrna fig and its physiological significance. Plant Physiol.40: 606–610. PMID:16656134.
Dalbo, M.A., Ye, G.N., Weeden, N.F., Steinkellner, H., Sefc, K.M.,and Reisch, B. 2000. A gene controlling sex in grapevinesplaced on a molecular marker-based genetic map. Genome, 43:333–340. doi:10.1139/gen-43-2-333. PMID:10791822.
Dangl, G.S., Mendum, M.L., Prins, B.H., Walker, M.A., Meredith,C.P., and Simon, C.J. 2001. Simple sequence repeat analysis ofa clonally propagated species: a tool for managing a grapegermplasm collection. Genome, 44: 432–438. PMID:11444702.
Dellaporta, S.L., Wood, J., and Hicks, J.B. 1983. A plant DNAminipreparation: version II. Plant Mol. Biol. Rep. 1: 19–21.
Doligez, A., Bouquet, A., Danglot, Y., Lahogue, F., Riaz, S., Mer-edith, C.P., et al. 2002. Genetic mapping of grapevine (Vitisvinifera L.) applied to the detection of QTLs for seedlessnessand berry weight. Theor. Appl. Genet. 105: 780–795.PMID:12582493.
Doucleff, M., Jin, Y., Gao, F., Riaz, S., Krivanek, A.F., andWalker, M.A. 2004. A genetic linkage map of grape, utilizingVitis rupestris and Vitis arizonica. Theor. Appl. Genet. 109:1178–1187. doi:10.1007/s00122-004-1728-3. PMID:15292989.
Fanizza, G., Lamaj, F., Costantini, L., Chaabane, R., and Grando,M.S. 2005. QTL analysis for fruit yield components in tablegrapes (Vitis vinifera). Theor. Appl. Genet. 111: 658–664.doi:10.1007/s00122-005-2016-6. PMID:15995866.
Fischer, B.M., Salakhutdinov, I., Akkurt, M., Eibach, R., Edwards,K.J., Topfer, R., and Zyprian, E.M. 2004. Quantitative trait lo-cus analysis of fungal disease resistance factors on a molecularmap of grapevine. Theor. Appl. Genet. 108: 501–515. doi:10.1007/s00122-003-1445-3. PMID:14574452.
Galet, P. 2000. Dictionnaire encyclopedique des cepages. Hachette,Paris.
Grando, M.S., Bellin, D., Edwards, K.J., Pozzi, C., Stefanini, M.,and Velasco, R. 2003. Molecular linkage maps of Vitis viniferaL., and Vitis riparia Mchx. Theor. Appl. Genet. 106: 1213–1224.PMID:12748772.
Grattapaglia, D., and Sederoff, R. 1994. Genetic linkage maps ofEucalyptus grandis and Eucalyptus urophylla using a pseudo-testcross: mapping strategy and RAPD markers. Genetics, 137:1121–1137. PMID:7982566.
Hayashi, T., and Awata, T. 2004. Efficient method for analysis ofQTLs using F1 progenies in an outcrossing species. Genetica,122: 173–183. doi:10.1023/B:GENE.0000041001.81514.1f.PMID:15609575.
Hulbert, S.H., Ilott, T.W., Legg, E.J., Lincoln, S.E., and Lander,E.S. 1988. Genetic analysis of the fungus, Bremia lactucaeusing restriction fragment length polymorphisms. Genetics, 120:947–958. PMID:2906309.
Jansen, R.C., and Stam, P. 1994. High resolution of quantitativetraits into multiple loci via interval mapping. Genetics, 136:1447–1455. PMID:8013917.
Kosambi, D. 1944. The estimation of map distance from recombi-nation values. Ann. Eugen. 12: 172–175.
Lahogue, F., This, P., and Bouquet, A. 1998. Identification of a co-dominant scar marker linked to the seedlessness character ingrapevine. Theor. Appl. Genet. 97: 950–959. doi:10.1007/s001220050976.
Lander, E., and Kruglyak, L. 1995. Genetic dissection of complextraits: guidelines for interpreting and reporting linkage results. Nat.Genet. 11: 241–247. doi:10.1038/ng1195-241. PMID:7581446.
Lander, E.S., and Botstein, D. 1989. Mapping Mendelian factorsunderlying quantitative traits using RFLP linkage maps. Genet-ics, 121: 185–199. PMID:2563713.
Ledbetter, C.A., and Ramming, D.W. 1989. Seedlessness in grapes.Hortic. Rev. 11: 159–184.
Ledbetter, C.A., and Shonnard, C.B. 1991. Berry and seed charac-teristics associated with stenospermocarpy in vinifera grapes. J.Hortic. Sci. 66: 247–252.
Lehmann, E.L. 1975. Nonparametrics: statistical methods based onranks. Holden-Day, San Fransico, Calif.
Lodhi, M.A., Ye, G.N., Weeden, N.F., and Reisch, B.I. 1994. Asimple and efficient method for DNA extraction from grapevinecultivars and Vitis species. Plant Mol. Biol. Rep. 12: 6–13.
Lodhi, M.A., Daly, M.J., Ye, G.N., Weeden, N.F., and Reisch, B.I.1995. A molecular marker based linkage map of Vitis. Genome,38: 786–794. PMID:7672609.
Loomis, N.H., and Weinberger, J.H. 1979. Inheritance studies ofseedlessness in grapes. J. Am. Soc. Hortic. Sci. 104: 181–184.
Mejıa, N., and Hinrichsen, P. 2003. A new, highly assertive SCARmarker potentially useful to assist selection for seedlessness intable grape breeding. In Proceedings of the 8th InternationalConference on Grape Genetics and Breeding (2002), Kecskemet,Hungary. Edited by E. Hadju and E. Borbas. Published by ISHS,Leuven, Belgium. Vol. 1. pp. 559–564.
Michelmore, R.W., Paran, I., and Kesseli, R.V. 1991. Identificationof markers linked to disease-resistance genes by bulked segre-gant analysis: a rapid method to detect markers in specific geno-mic regions using segregating populations. Proc. Natl. Acad.Sci. U.S.A. 88: 9828–9832. doi:10.1073/pnas.88.21.9828.PMID:1682921.
Pellerone, F.I., Edwards, K.J., and Thomas, M.R. 2001. Grapevinemicrosatellite repeats: isolation, characterization and use forgenotyping of grape germplasm from Southern Italy. Vitis, 40:179–186.
Perez, F.J., Viani, C., and Retamales, J. 2000. Bioactive gibberellinsin seeded and seedless grapes: identification and changes in con-tent during berry development. Am. J. Enol. Vitic. 51: 315–318.
Riaz, S., Dangl, G.S., Edwards, K.J., and Meredith, C.P. 2003. Amicrosatellite marker based framework linkage map of Vitis vi-nifera L. Theor. Appl. Genet. 108: 864–872. PMID:14605808.
Stout, A.B. 1936. Seedlessness in grapes. Agr. Expt. Sta., Geneva,Tech. Bull., N.Y. pp. 1–68.
Striem, M.J., Ben-Hayyim, G., and Spiegel-Roy, P. 1996. Identify-ing molecular genetic markers associated with seedlessness ingrape. J. Am. Soc. Hortic. Sci. 121: 758–763.
Van Ooijen, J.W. 1992. Accuracy of mapping quantitative trait lociin autogamous species. Theor. Appl. Genet. 84: 803–811.
Van Ooijen, J.W., and Voorrips, R.E. 2001. JoinMap1 3.0, soft-
1584 Genome Vol. 49, 2006
# 2006 NRC Canada

ware for the calculation of genetic linkage maps [computer pro-gram]. Plant Research International, Wageningen, Netherlands.
Van Ooijen, J.W., Boer, M.P., Jansen, R.C., and Maliepaard, C.2002. MapQTL1 4.0, software for the calculation of QTL posi-tions on genetic maps [computer program]. Plant Research Inter-national, Wageningen, Netherlands.
Varoquaux, F., Blanvillain, R., Delseny, M., and Gallois, P. 2000.Less is better: new approaches for seedless fruit production.Trends Biotechnol. 18: 233–242. doi:10.1016/S0167-7799(00)01448-7. PMID:10802558.
Vos, P., Hogers, P., Bleeker, M., Reijans, M., van de Lee, T.,Hornes, M., et al. 1995. AFLP: a new technique for DNA fin-gerprinting. Nucleic Acids Res. 23: 4407–4414. PMID:7501463.
Waugh, R., McLean, K., Flavell, A.J., Pearce, S.R., Kumar, A.,Thomas, B.B.T., and Powell, W. 1997. Genetic distribution of
Bare-1-like retrotransposable elements in the barley genomerevealed by sequence-specific amplification polymorphisms(S-SAP). Mol. Gen. Genet. 253: 687–694. PMID:9079879.
Wei, X., Sykes, S.R., and Clingeleffer, P.R. 2002. An investigationto estimate genetic parameters in CSIRO’s table grape breedingprogram. 2. Quality characteristics. Euphytica, 128: 343–351.doi:10.1023/A:1021288618316.
Winkler, A.J., Cook, J.A., Liewer, W.M., and Lider, L.A. 1974.The grape flower and berry set. In General viticulture. Editedby A.J. Winker. University of California Press, Berkeley.pp. 111–138.
Witsenboer, H., Vogel, J., and Michelmore, R.W. 1997. Identifica-tion, genetic localization, and allelic diversity of selectively am-plified microsatellite polymorphic loci in lettuce and wildrelatives (Lactuca spp.). Genome, 40: 923–936.
Cabezas et al. 1585
# 2006 NRC Canada