The Success of Deconstruction: Derrida, Rorty, Gasché, Bennington & the Quasi-Trasncendental
Upload
khangminh22Category
view
0download
0
Investigating grape berry cell wall deconstruction by hydrolytic
enzymes
by
(Anscha) Johanna Jacoba Zietsman
Dissertation presented for the degree of
Doctor of Philosophy (Agricultural Sciences)
at
Stellenbosch University Institute for Wine Biotechnology, Faculty of AgriSciences
Supervisor: Prof Melané A Vivier Co-supervisor: Dr John P Moore
March 2015

Declaration
By submitting this dissertation electronically, I declare that the entirety of the work contained
therein is my own, original work, that I am the sole author thereof (save to the extent explicitly
otherwise stated) that reproduction and publication thereof by Stellenbosch University will not
infringe any third party rights and that I have not previously in its entirety or in part submitted it
for obtaining any qualification.
Date: 15 December 2014
Copyright © 2015 Stellenbosch University All rights reserved
Stellenbosch University https://scholar.sun.ac.za

Summary
Maceration enzymes for the wine industry are preparations containing mainly pectinases,
cellulases and hemicellulases, used during wine making to degrade the berry cell walls and
release polyphenolic and aroma molecules to increase wine quality. These types of enzymes
are also used for the harvesting of revenue-generating molecules from pomace (skins, pulp and
seeds from grape processing waste), or as processing aids when used in the production of
bioethanol.
Grape berry cell walls are recalcitrant towards degradation, therefore knowledge about their
structures and compositions, as well as how the application of enzymes modify these structures
is essential in order to optimise these processes. The aim of this study was to extend current
knowledge by using a mixture of existing and novel methodologies to study grape berry cell
walls by focusing on the profiles of polymers present in the walls.
Cell wall profiling techniques used in this study include the Comprehensive Microarray
Polymer Profiling (CoMPP) method that employs monoclonal antibodies and Carbohydrate
Binding Modules (CBM) which specifically recognise the polymers in the plant cell wall. With
this method we measured the abundance of specific polymers and traced the fluctuation in their
levels of abundance as influenced by external factors such as enzyme hydrolysis. The CoMPP
method was coupled with monosaccharide profile analysis by GC-MS to determine the building
blocks of the cell wall polymers, as well as with Infrared Spectroscopy to monitor the changes in
the bulk chemistry profile. Data sets generated by the cell wall profiling methods were analysed
with uni- and multivariate statistical methods to detect the major patterns in the data.
This study highlighted the cell wall differences on the polymer level, in the berry skin cells of
Pinotage grapes at different ripeness levels and how it changes during a standard wine
fermentation, leading to the release of homogalacturonans and the exposing of arabinogalactan
proteins. When maceration enzymes were added, further depectination was evident and the
enzymes unravelled the cell wall of the ripe grapes. In overripe grapes no additional
degradation could be observed due to maceration enzyme actions, presumably indicating that
the endogenous grape enzymes already caused extensive degradation.
When purified enzymes were incubated under buffered conditions with isolated skin cell
walls from Pinotage grapes or with Chardonnay grape pomace, different levels of enzymatic
hydrolysis were observed and defined. The sequence in which cell wall polymers were
extracted, and the influence of specific enzymes in facilitating the extraction process, provided
important information on the accessibility of specific cell wall polymers. Synergistic action
between, for example an endo-polygalacturonase (EPG) and an endo-glucanase (EG) was
demonstrated with CoMPP.
This EPG and EG synergism was also demonstrated with a yeast strain (a Saccharomyces
paradoxus x S. cerevisiae hybrid) fermented in a buffered pomace suspension. This yeast strain
has a native EPG and was engineered to also express a recombinant EG from a genome
integrated cassette. The cell walls isolated from the pomace after fermentation were unravelled
and depectination took place, as evident from CoMPP data.
The cell wall profiling techniques used in this study were proven to be fast and sensitive. It
provided insights into the structure of grape cell walls and was used to evaluate the changes
due to ripening, fermentation, enzymatic hydrolysis and a heat pre-processing treatment. In
addition to the knowledge gained, we also demonstrated that these techniques can be used to
evaluate different enzymes and enzyme combinations as well as the potential of
microorganisms to degrade grape tissue.
Stellenbosch University https://scholar.sun.ac.za

Opsomming
Maserasie ensieme vir die wynindustrie is ensiem mengsels wat hoofsaaklik pektinases,
sellulases en hemisellulases bevat en word tydens wynbereiding gebruik om die druifkorrel se
selwand af te breek, die polifenole en aroma molekules vry te stel en sodoende die wyn
kwaliteit te verbeter. Hierdie soort ensieme word ook gebruik om inkomste-genererende
molekules vanuit druiweprosesserings afval (doppe, pulp en pitte) te isoleer, en ook as
prosesserings hulpmiddels in die produksie van bioetanol.
Druifkorrel selwande is weerstandig teen ensiem afbraak en daarom is kennis oor die
struktuur en samestelling van die selwand, asook hoe die selwand strukture deur die toediening
van ensieme verander word noodsaaklik om sodoende hierdie prosesse te optimaliseer. Die
doel van hierdie studie was om die huidige kennis uit te brei deur bestaande asook nuwe
metodes te gebruik om die druifkorrel selwand te bestudeer met die fokus op die polimeerprofiel
van die selwande.
Selwand karakteriserings tegnieke wat in hierdie studie gebruik is sluit in die
Comprehensive Microarray Polymer Profiling (CoMPP) metode wat monoklonale
teenliggaampies en koolhidraat bindende modules (Carbohydrate binding modules, CBMs) wat
spesifiek die selwandpolimere van die plant selwand herken, gebruik. Met hierdie metode het
ons die vlakke van spesifieke polimere gemeet asook die skommeling in hulle vlakke soos dit
beïnvloed is deur eksterne faktore soos ensiem hidroliese. Die CoMPP metode is tesame met
monosakkaried profiel analise, met behulp van GC-MS, wat die boublokke van die selwand
polimere bepaal, asook infrarooi spektroskopie om die veranderinge in die oorhoofse chemiese
profiel te bepaal, gebruik. Datastelle wat met die selwand karakteriserings tegnieke gegenereer
is, is ontleed met een- en multiveranderlike statistiese metodes om die hoof tendense in die
data op te spoor.
Hierdie studie het die selwand verskille, op die polimeervlak, van Pinotage druiwe
uitgelig. Verskillende rypheidsgrade asook hoe dit verander tydens ‘n standaard
wynfermentasie is gevolg. Laasgenoemde het die vrystelling van homogalakturonaan en die
ontbloting van arabinogalaktoproteïene tot gevolg gehad. Met die byvoeging van maserasie
ensieme was dit duidelik dat addisionele pektienverwydering plaasgevind het en dat die
ensieme die selwand van die ryp druiwe ontrafel het. In oorryp druiwe was daar geen
addisionele selwand afbreking sigbaar as gevolg van die aksie van maserasie ensieme nie, wat
moontlik aandui dat die inherente druif ensieme reeds uitgebreide selwand afbraak versoorsaak
het.
Wanneer gesuiwerde ensieme met geïsoleerde selwande van Pinotage druiwedoppe en
met Chardonnay druiweprosesserings afval geïnkubeer is onder gebufferde kondisies, is
verskillende vlakke van ensiematiese hidroliese waargeneem en geklassifiseer. Die volgorde
waarin die selwand polimere geëkstraheer is, asook die invloed van spesifieke ensieme in die
bevordering van die ekstraksie proses, het belangrike inligting verskaf oor die toeganglikheid
van spesifieke selwand polimere. Sinergistiese aksie tussen, byvoorbeeld ‘n endo-
poligalakturonase (EPG) en ‘n endo-glukanase (EG) is geidentifiseer met behulp van die
CoMPP data.
Hierdie EPG en EG sinergisme is ook geïllustreer met ‘n gisras (‘n Saccharomyces
paradoxus x S. cerevisiae hibried) wat in ‘n gebufferde druifprosesserings afval suspensie
gefermenteer het. Hierdie gisras het ‘n endogene EPG en is ontwerp om ook ‘n rekombinante
EG uit te druk vanaf ‘n genoom geïntegreerde kasset. Die selwande van die
Stellenbosch University https://scholar.sun.ac.za

druiweprosesserings afval wat na die fermentasie geïsoleer is, was ontrafel en
pektienverwydering het plaasgevind, soos bevestig met CoMPP data.
In hierdie studie is bewys dat die selwand karakteriserings tegnieke vinnig en sensitief
is. Dit het insigte verskaf oor die struktuur van die druifselwand en is gebruik om die
veranderinge as gevolg van rypheidsverskille, wynfermentasie, ensiem hidroliese en hitte
prosessering te evalueer. Buiten die bydraes tot kennis oor hierdie onderwerpe, is die
bruikbaarheid van hierdie tegnieke ook aangetoon, veral in die evaluasie van verskillende
ensieme en ensiemkombinasies, asook mikroörganismes vir die afbraak van druifweefsel.
Stellenbosch University https://scholar.sun.ac.za

This dissertation is dedicated to
my parents
Stellenbosch University https://scholar.sun.ac.za

Biographical sketch
Anscha Zietsman (nee Visser) was born in Stellenbosch on 26 August 1972. She matriculated in 1990 at High School Stellenbosch and enrolled for a BSc(Agric) in Food Science in 1991 at Stellenbosch University. Her BSc(Agric) Food Science degree was completed in 1994 and she received her HonsBScAgric degree in Microbiology in 1995. She enrolled for a MSc (Agric) degree in Microbiology in 1996 and this degree was obtained in 1999. She worked at the Department of Microbiology, Stellenbosch University for 5 years and is currently employed at the Institute for Wine Biotechnology at the same university.
Stellenbosch University https://scholar.sun.ac.za

Acknowledgements
I wish to express my sincere gratitude and appreciation to the following persons and institutions:
Wine industry network of expertise and technology (Winetech)
Technology and Human Resources for Industry Programme (THRIP)
Institute for Wine Biotechnology (IWBT), Stellenbosch University
National Research Fund (NRF).
My supervisor Prof Melané Vivier and co-supervisor Dr John Moore
Karin Vergeer
My friends and colleagues at IWBT
My friends and family
My best friend and husband, Hans-Jurie
Stellenbosch University https://scholar.sun.ac.za
Preface
This dissertation is presented as a compilation of six chapters. Chapter 3 was accepted for
publication in the Journal of Agricultural and Food Chemistry and Chapter 4 will be submitted to
Carbohydrate Polymers. Chapter 5 was written according to the style of the journal Applied and
Environmental Microbiology.
Chapter 1 General Introduction and project aims
Chapter 2 Literature review
Investigating grape berry cell wall deconstruction by hydrolytic enzymes
Chapter 3 Research results
Following the compositional changes of fresh grape skin cell walls during the
fermentation process in the presence and absence of maceration enzymes
Chapter 4 Research results
Unravelling grape skin and pomace cell walls with enzymes and heat
pretreatment
Chapter 5 Research results
Commercial wine yeast strains expressing a polygalacturonase and
glucanase unravel the cell walls of Chardonnay grape pomace
Chapter 6 General discussion and conclusion
Stellenbosch University https://scholar.sun.ac.za
Table of Contents
CHAPTER 1 General introduction and project aims 1
1.1 Specific aims and objectives of this study 2
1.1.1 Cell wall analysis of the skin of ripe Pinotage berries, before and after
enzyme treatments. 2
1.1.2 The effect of heat and enzyme treatment on the cell walls of Chardonnay
pomace 3
1.1.3 Cell wall analysis of Chardonnay pomace fermented with a hydrolytic
enzyme producing yeast 3
1.2 Reference 4 4
CHAPTER 2 Investigating grape berry cell wall deconstruction by hydrolytic enzymes 7
2.1 Maceration 7
2.1.1 The use of maceration enzymes in wine production 8
2.1.1.1 Enzyme effect on wine colour and polyphenolic composition 10
2.1.1.2 Enzyme effect on the polysaccharide composition of wine 11
2.1.1.3 Inconsistent results and side effects ascribed to the use of maceration
enzyme preparations 12
2.2 Grape pomace valorisation 14
2.2.1 The use of enzymes in pomace valorisation 16
2.2.2 Factors that influence the effectiveness of enzymatic hydrolysis of pomace 16
2.3 Investigating the grape berry cell wall structure 18
2.3.1 An introduction to plant cell walls 18
2.3.1.1 Cellulose-hemicellulose network 18
2.3.1.2 Pectin network 19
2.3.1.3 The proteins of the cell wall 21
2.3.1.4 Cutin and lignin 22
2.3.1.5 Models of the primary cell walls of plants 23
2.3.2 The grape berry cell wall 25
2.3.2.1 The cell wall of the mesocarp (pulp) 25
2.3.2.2 The pericarp (skin) and the cell wall so the skin cells 25
2.3.2.3 The cutin layer of the grape berry 26
2.3.3 The changes in the cell wall of the grape berry during ripening 27
2.3.4 The factors affecting the extractability of polyphenols from the grape skin 28
Stellenbosch University https://scholar.sun.ac.za

2.4 Investigating the cell wall degradation by enzymes 31
2.4.1 Investigating the cell wall degradation by maceration enzymes in wine 31
2.4.2 Investigating the changes in the pomace cell wall due to enzyme treatment 31
2.5 Concluding remarks 32
2.6 References 33
CHAPTER 3 Research results: Following the compositional changes of fresh grape skin cell
walls during fermentation in the presence and absence of maceration enzymes 45
CHAPTER 4 Research results: Unravelling grape skin and pomace cell walls with enzymes and
heat pretreatment 75
CHAPTER 5 Research results: Commercial wine yeast strains expressing a polygalacturonase
and glucanase unravel the cell walls of Chardonnay grape pomace 112
CHAPTER 6 General discussion and conclusion 141
6.1 Grape berry cell wall changes during a maceration enzyme assisted red
wine fermentation 141
6.2 Cell wall changes in grape pomace during heat treatment and
enzymatic hydrolysis 143
6.3 Hydrolytic enzymes produced by yeast strains modify the cell wall
composition of Chardonnay pomace 144
6.4 The cell wall profiling techniques 145
6.5 Investigations for the future 147
6.6 References 148
Stellenbosch University https://scholar.sun.ac.za

Chapter 1
Introduction and project aims
Stellenbosch University https://scholar.sun.ac.za

1
1. General introduction and project aims
Grapes are commercially important fruits that are used in the international wine, table and dried
grape industries. In addition to the direct uses of grapes as products, the grape berry and in
particular the grape berry skin is also a valuable source of vitamins, minerals, carbohydrates,
fibers and polyphenolic compounds (1, 2). Berry development progresses through a double
sigmoidal growth pattern from fruit set until ripeness (3). The accumulation and degradation of
sugars and organic acids, polyphenolic substances, such as anthocyanins, as well as volatile
aroma compounds, such as monoterpenes, follow specific developmental patterns, that can
also be influenced by environmental conditions (4–8). These compounds contribute to the
aroma, flavour, colour, bitterness and astringency of wine (8). Per grape berry we find 50 – 60%
[w/w] of the aroma compounds and 20-30% [w/w] of the phenolics in the grape berry skin cells
while the seeds contain 60% of the [w/w] phenolics (1, 9). During the fermentation of wine the
organic acids, ethanol and sulfur present in the must can all contribute to the extraction of
aroma and polyphenolic compounds (10–12) from the berry cells. In red wine fermentations,
skin contact is important to promote the extraction of these compounds into the wine, thus
improving the overall quality of the wine (8). In white wine production the grapes are usually
pressed and removed before fermentation resulting in limited skin contact and less extraction of
skin compounds.
The main waste product of the wine industry is the pomace (pressed red and white grape skins
and seeds). Since polyphenolic compounds also exhibit many biological activities and health
promoting properties, they are extracted from grapes or grape pomace to be used in the food,
pharmaceutical and skin care industries (2). Grape pomace also has the potential to serve as a
source of fermentable sugars in the production of second generation bioethanol (13).
The grape berry cell wall forms the natural barrier preventing the polyphenols from being
extracted during wine fermentation or pomace valorisation (14). The cell walls of skins are
thicker than that of the pulp cells and the polysaccharide composition was estimated to be (in
mol%) 57-62 homogalacturonan, 6-14 cellulose, 10-11 xyloglucan, 4.5-5 rhamnogalacturonan-I,
3.5-4 rhamnogalacturonan-II, 3 arabinogalactan and 0.5-1 mannans (15). The cell walls also
contain cell wall proteins.
Enzymes are used in both wine preparation and grape pomace valorisation to enhance the
extraction of the compounds of interest (phenolic and aroma compounds), or the degradation of
the cell wall polysaccharides into fermentable sugars for the production of bio-ethanol (16, 17).
Based on what is known about berry cell walls, pectinase, cellulase and hemicellulose enzymes
are typically used to unravel the cell walls.
Stellenbosch University https://scholar.sun.ac.za

2
In order to optimize the enzymatic hydrolysis of grape tissue many studies are investigating
grape cell wall composition and how this vary between grape cultivars in terms of recalcitrance
towards degradation (18, 19). Other topics of study involve the type and composition of the
enzyme preparations and how well the enzyme activities match the grape cell wall components
as well as determining the optimal enzyme-substrate ratio and other conditions such as pH,
temperature and duration of the contact time (20). Treatment processes, used either during
wine fermentation (e.g. punching down, grape freezing) or prior to grape pomace valorisation
(e.g. milling or heat pretreatment) can alter the grape cell wall structure and can be advantages
to the enzymatic hydrolysis process (10, 21, 22). The berry ripeness level has an influence on
the cell wall composition and the cell wall pectin and hemicellulose polymers are degraded by
endogenous grape enzymes during ripening. The ripeness level thus, also determines the ease
of polyphenol extractability (23–25).
All these previous studies judged the extent of enzymatic degradation by measuring the
properties of the end product (e.g. colour of the wine) or the compounds released from the
grape tissue (26–29). Some studies investigated the cell wall residue after enzymatic hydrolysis
by measuring the monosaccharide composition (30). They are then able to infer the levels of the
polysaccharides that were present and the changes that happened during a specific treatment
(15). None of these studies measured the changes on a polymer level.
1.1 Specific aims and objectives of the study
This study focuses on the analysis of the berry cell wall and particularly evaluates the impact of
enzymatic hydrolysis on this matrix by profiling and quantifying the cell wall polymers pre-and
post-hydrolysis. Cell wall profiling methods that include Comprehensive Microarray Polymer
Profiling (CoMPP) (31), monosaccharide compositional analysis (32) and Infrared spectroscopy
(FT-IR) (33) will be used to study cell walls and their hydrolysis on a polymer level. These
methods have been tested, optimized and successfully applied on grape matrices in our
laboratory (34, 35).
Ripe berry skins and freshly pressed grape pomace will be used as matrices. The berry skins
will be analysed to understand the compositional and structural barriers presented by the skin
cell wall during red wine fermentations on grape skins, and how enzymes will act on it. The
pomace will be used to simulate the unraveling of this matrix by enzymes. The following
experiments were planned:
1.1.1 Cell wall analysis of the skin of ripe Pinotage berries, before and after enzyme
treatments.
Stellenbosch University https://scholar.sun.ac.za

3
Vitis vinifera cv. Pinotage is a locally bred cultivar with Pinot noir and Cinsaut as parents and
has a tough, thick skin (36) with a high polyphenolic content. The skin cell wall composition of
this cultivar will be studied at two different ripeness levels to see if the cell wall modifications
during ripening are similar to other grape cultivars. Information on the modifications that happen
in the skin cell wall polymers during a standard red wine fermentation with and without the
presence of commercial maceration enzymes will be provided by this study and we will discuss
the influence of the grape ripeness level on the results. In order to compare how hydrolytic
enzymes targeting cell wall polymers will perform under ideal conditions we will incubate
isolated cell walls from Pinotage skin with different purified enzymes in buffered conditions at
temperatures close to optimum for the enzymes. Under these circumstances we want to
investigate to what extent the degradation will proceed and how a specific enzyme or
combinations of enzymes change the cell wall polymer profile.
1.1.2 The effect of heat and enzyme treatment on the cell walls of Chardonnay pomace
This study will furthermore focus on the grape pomace cell wall structure of just-pressed
Chardonnay grapes and determine the polymer and monosaccharide profile of this matrix.
Processing techniques used in pomace valorisation will be investigated to determine how it
modifies the cell wall composition. Towards this goal we will subject the pomace to a heat
pretreatment step and investigate cell wall composition before and after the treatment. The
pretreated pomace will then be used as substrate for enzymatic hydrolysis by commercial
enzyme preparations to measure the cell wall modifications caused by different enzyme
combinations and incubation conditions. These results will be compare to the changes caused
by purified enzymes with the goal to link specific enzyme activities with specific cell wall
modifications.
1.1.3 Cell wall analysis of Chardonnay pomace fermented with a hydrolytic enzyme
producing yeast
In a final experiment we aim to determine if CoMPP cell wall analysis can be used as a tool to
determine the potential of enzyme producing yeast strains to degrade the grape cell wall.
Towards this goal we will modify a commercial wine strain that produces a native endo-
polygalacturonase by introducing a genome integrated expression cassette coding for an endo-
glucanase. This engineered strain as well as the appropriate control strains will be tested for
the production of the recombinant enzyme and will also be used in fermentations with
Chardonnay pomace as substrate. The pomace suspension will be buffered to provide optimum
Stellenbosch University https://scholar.sun.ac.za

4
pH conditions for both enzymes and the cell walls of the pomace will be analysed after the
fermentation.
The cell wall profiling methods that will be used generate large and complex sets of data. To
facilitate the extraction of meaningful information from the data sets it require the use of
multivariate projection methods such as principle component analysis (PCA) to show the main
patterns and correlations within the data. With the CoMPP method we should be able to directly
measure the abundance of cell wall polymers and determine the influence of the different
enzymatic treatment. This will be the first study that will use CoMPP to determine the level of
cell wall degradation in grape tissue.
1.3 References
1. Gomez E, Martinez A, Laencina J. 1994. Localization of free and bound aromatic compounds among skin , juice and pulp fractions of some grape varieties. Vitis 4:1–4.
2. Xia E-Q, Deng G-F, Guo Y-J, Li H-B. 2010. Biological activities of polyphenols from grapes. Int. J. Mol. Sci. 11:622–46.
3. Coombe BG, McCarthy MG. 2000. Dynamics of grape berry growth and physiology of ripening. Aust. J. Grape Wine Res. 6:131–135.
4. González-Barreiro C, Rial-Otero R, Cancho-Grande B, Simal-Gándara J. 2015. Wine aroma compounds in grapes: a critical review. Crit. Rev. Food Sci. Nutr. 55:202–18.
5. Adams DO. 2006. Phenolics and ripening in grape berries. Am. J. Enol. Vitic. 57:249–256.
6. Fournand D, Vicens A, Sidhoum L, Souquet J-M, Moutounet M, Cheynier V. 2006. Accumulation and extractability of grape skin tannins and anthocyanins at different advanced physiological stages. J. Agric. Food Chem. 54:7331–8.
7. Kennedy J. 2008. Grape and wine phenolics: Observations and recent findings. Cienc. e Investig. Agrar. 35:107–120.
8. Garrido J, Borges F. 2013. Wine and grape polyphenols — A chemical perspective. Food Res. Int. 54:1844–1858.
9. Teixeira A, Eiras-Dias J, Castellarin SD, Gerós H. 2013. Berry phenolics of grapevine under challenging environments. Int. J. Mol. Sci. 14:18711–39.
10. Sacchi KL, Bisson LF, Adams DO. 2005. A review of the effect of winemaking techniques on phenolic extraction in red wines. Am. J. Enol. Vitic. 56:197–206.
11. González-Neves G, Gil G, Ferrer M, Charamelo D, Balado J, Bochicchio R, Gatto G, Tessore A. 2010. Prediction of the colour and polyphenolic composition of the young red wines from the phenolic potential of the grapes. Int. J. Food Sci. Technol. 45:1843–1851.
12. Jarvis MC. 2011. Plant cell walls: Supramolecular assemblies. Food Hydrocoll. 25:257–262.
13. Rodríguez LA, Toro ME, Vazquez F, Correa-Daneri ML, Gouiric SC, Vallejo MD. 2010. Bioethanol production from grape and sugar beet pomaces by solid-state fermentation. Int. J. Hydrogen Energy 35:5914–5917.
Stellenbosch University https://scholar.sun.ac.za

5
14. Bautista-Ortin AB, Martinez-Cutillas A, Ros-Garcia JM, Lopez-Roca JM, Gomez-Plaza E. 2005. Improving colour extraction and stability in red wines: the use of maceration enzymes and enological tannins. Int. J. Food Sci. Technol. 40:867–878.
15. Arnous A, Meyer AS. 2009. Quantitative prediction of cell wall polysaccharide composition in grape (Vitis vinifera L.) and apple (Malus domestica) skins from acid hydrolysis monosaccharide profiles. J. Agric. Food Chem. 57:3611–9.
16. Van Rensburg P, Pretorius IS. 2000. Enzymes in winemaking : harnessing natural catalysts for efficient biotransformations - A review. South African J. Enol. Vitic. 21:52–73.
17. Arnous A. 2009. P.hD. thesis. Technical University of Denmark, Lynby, Denmark. Enzymatic release of phenolics from fruit skins – with grape as the main model.
18. Ortega-Regules A, Romero-Cascales I, Ros-García JM, López-Roca JM, Gómez-Plaza E. 2006. A first approach towards the relationship between grape skin cell-wall composition and anthocyanin extractability. Anal. Chim. Acta 563:26–32.
19. Hernández-Hierro JM, Quijada-Morín N, Martínez-Lapuente L, Guadalupe Z, Ayestarán B, Rivas-Gonzalo JC, Escribano-Bailón MT. 2014. Relationship between skin cell wall composition and anthocyanin extractability of Vitis vinifera L. cv. Tempranillo at different grape ripeness degree. Food Chem. 146:41–7.
20. Kammerer D, Claus A, Scieber A, Carle R. 2005. A novel process for the recovery of polyphenols from grape ( Vitis vinifera L .) pomace. Food Chem. Toxicol. 70:157–163.
21. Maier T, Göppert A, Kammerer DR, Schieber A, Carle R. 2007. Optimization of a process for enzyme-assisted pigment extraction from grape (Vitis vinifera L.) pomace. Eur. Food Res. Technol. 227:267–275.
22. Rio-Segade S, Torchio F, Giacosa S, Aimonino DR, Gay P, Lambri M, Dordoni R, Gerbi V, Rolle L. 2014. Impact of several pre-treatments on the extraction of phenolic compounds in winegrape varieties with different anthocyanin profiles and skin mechanical properties. J. Agric. Food Chem. 62:8437–8451.
23. Bindon KA, Bacic A, Kennedy JA. 2012. Tissue-specific and developmental modifications of grape cell walls influence the adsorption of proanthocyanidins. J. Agric. Food Chem. 60:9249–9260.
24. Gil M, Kontoudakis N, González E, Esteruelas M, Fort F, Canals JM, Zamora F. 2012. Influence of grape maturity and maceration length on color, polyphenolic composition, and polysaccharide content of Cabernet Sauvignon and Tempranillo wines. J. Agric. Food Chem. 60:7988–8001.
25. Río Segade S, Soto Vázquez E, Díaz Losada E. 2008. Influence of ripeness grade on accumulation and extractability of grape skin anthocyanins in different cultivars. J. Food Compos. Anal. 21:599–607.
26. Ortega-Heras M, Pérez-Magariño S, González-Sanjosé ML. 2012. Comparative study of the use of maceration enzymes and cold pre-fermentative maceration on phenolic and anthocyanic composition and colour of a Mencía red wine. LWT - Food Sci. Technol. 48:1–8.
27. Doco T, Williams P, Cheynier V. 2007. Effect of flash release and pectinolytic enzyme treatments on wine polysaccharide composition. J. Agric. Food Chem. 55:6643–9.
28. Ortega-Regules A, Ros-García JM, Bautista-Ortín AB, López-Roca JM, Gómez-Plaza E. 2008. Differences in morphology and composition of skin and pulp cell walls from grapes (Vitis vinifera L.): technological implications. Eur. Food Res. Technol. 227:223–231.
Stellenbosch University https://scholar.sun.ac.za

6
29. Chamorro S, Viveros A, Alvarez I, Vega E, Brenes A. 2012. Changes in polyphenol and polysaccharide content of grape seed extract and grape pomace after enzymatic treatment. Food Chem. 133:308–314.
30. Romero-Cascales I, Ros-García JM, López-Roca JM, Gómez-Plaza E. 2012. The effect of a commercial pectolytic enzyme on grape skin cell wall degradation and colour evolution during the maceration process. Food Chem. 130:626–631.
31. Moller I, Sørensen I, Bernal AJ, Blaukopf C, Lee K, Øbro J, Pettolino F, Roberts A, Mikkelsen JD, Knox JP, Bacic A, Willats WGT. 2007. High-throughput mapping of cell-wall polymers within and between plants using novel microarrays. Plant J. 50:1118–28.
32. York WS, Darvill AG, L MM, Stevenson TT, Albersheim P. 1985. Isolation and characterization of plant cell walls and cell wall components. Methods Enzymol. 2:3–40.
33. Kacurakova M, Capek P, Sasinkova V, Wellner N, Ebringerova A, Kac M. 2000. FT-IR study of plant cell wall model compounds : pectic polysaccharides and hemicelluloses. Carbohydr. Polym. 43:195–203.
34. Moore JP, Fangel JU, Willats WGT, Vivier MA. 2014. Pectic-β(1,4)-galactan, extensin and arabinogalactan-protein epitopes differentiate ripening stages in wine and table grape cell walls. Ann. Bot. 114:1279–1294.
35. Nguema-Ona E, Moore JP, Fagerström A, Fangel JU, Willats WGT, Hugo A, Vivier MA. 2012. Profiling the main cell wall polysaccharides of tobacco leaves using high-throughput and fractionation techniques. Carbohydr. Polym. 88:939–949.
36. Goussard PG. 2008. Grape cultivars for wine production in South Africa. Cheviot Publishing, Cape Town.
Stellenbosch University https://scholar.sun.ac.za

Chapter 2
Literature review
Investigating grape berry cell wall deconstruction by hydrolytic enzymes
Stellenbosch University https://scholar.sun.ac.za

7
Investigating grape berry cell wall deconstruction by
hydrolytic enzymes
Enzyme assisted grape maceration and valorisation of pomace waste
Wine maceration is the process where the grapes are soaked in the juice (steeping liquid) to
make it softer or penetrable with the consequential leaching of aroma precursors and molecules
collectively known as polyphenols from the vacuoles of the skin and the pulp cells of the grape
berry into the must (1). These aroma as well as the polyphenol compounds are valuable
because of their contribution towards wine flavour, colour, health properties and overall quality
(2). Thus, it follows that by disrupting the cell wall and releasing the contents of the cells, it will
lead to an increase in juice yield and a higher concentrations of aroma precursors and
polyphenols in the final product. The disruption of the grape berry cell wall structure can be
achieved by the application of heat, chemicals, physical methods (e.g. crushing) and cell wall
disrupting enzymes (3).
Grape pomace valorisation is similar to maceration because both processes involve the
disruption of the cell walls in the grape berry. Valorisation of grape pomace can entail the
release of valuable compounds (mostly polyphenols) located in the cell vacuole or bound to the
cell wall, or it can be the complete hydrolysis of the cell wall in order to liberate the
monosaccharides (4). These monosaccharides then serve as a fermentable carbon source in
bioethanol production. As with maceration, the pomace valorisation process can be enhanced
by mechanical methods or with enzymes. Pretreatment with for example steam, acid or alkali
selectively removes different components from the tissue and makes the residue more
accessible for enzymes (5, 6). The enzymes unravel the cell wall polysaccharides and this may
enhance the extraction of polyphenols. For the complete reduction of the cell walls to
monosaccharides, both acid and enzymatic hydrolysis can be used.
2.1 Maceration
Maceration of white grape cultivars falls outside the scope of this thesis and will not be
discussed. Maceration with red wine production usually takes 3 to 5 days to allow for the
extraction of enough aroma and colour compounds (anthocyanins) as well as tannins from the
skins. Longer maceration periods can lead to the extraction of the harsher seed tannins as well
as some off flavours (2). Factors that increase the permeability of the cells and membranes of
the grape are the alcohol content, sulfur dioxide as well as the heat generated in the
Stellenbosch University https://scholar.sun.ac.za

8
fermentation (3). To ensure good contact between skins and juice during maceration the skin
cap that forms on top of the must is punched down several times per day or the juice/must is
pumped over the skin cap. Some cultivars are recalcitrant towards releasing sufficient amounts
of polyphenols during maceration and techniques were developed to improve their maceration
success. One of these, cold maceration, is a pre-fermentative technique often used with
cultivars such as Pinot Noir (7) . With cold maceration, the crushed grapes are left to macerate
for 3 to 4 days at temperatures between 4 and 15C. This process enhances colour density and
flavor complexity and differential aroma profiles can be obtained depending on the chosen
maceration temperature (8). However, the colour enhancement is not always permanent and
after a relatively short storage period, the cold maceration wines sometimes have the same
colour density values as the wines prepared with standard methods (3, 9, 10). Maceration
conducted at elevated temperatures will increase the extractability of phenolics as the
permeability of the grape berry membranes would be increased (11). This principle is applied in
a process called thermovinification, but it can lead to the formation of volatile acids or oxidized
off-flavours (12). As a non-thermal option, pulsed electric field treatment, has been studied in
recent years as a way to enhance phenolic extraction (13, 14). With optimized pulsed electric
field parameters, it is possible to modify the organization of the berry skin cell wall polymers,
which increases the extraction rate of anthocyanins and other phenols and enhance the sensory
attributes of the wine.
Sacchi et al. (3) reviewed a number of specialized maceration techniques and concluded that
higher fermentation temperatures, thermovinification, must freezing (ice particles rupture cell
walls and membranes), saigneé (decreasing the juice to skins ratio by removing some of the
juice early on), the use of pectolytic enzymes and an extended maceration period will all
increase the phenolic concentration of finished wines. An increase in sulfur dioxide levels
(higher levels than what is normally used) and cold maceration prior to inoculation do not
increase phenolic concentration although there is sometimes a non-permanent effect. Finally,
techniques and operational methods such as carbonic maceration (whole bunch fermentation of
uncrushed grapes under CO2), the employment of specific wine yeast strains and the use of
different skin and juice mixing practices produced variable results, which are dependent on the
grape variety that was used.
2.1.1 The use of maceration enzymes in wine production
Enzymes can enhance and accelerate the maceration process by breaking down the cell walls
and membranes in the berry, weakening or destroying the boundary that is retaining the aroma
and phenolic molecules from the must (15–17). These enzymes can originate from the grape
tissue or from the microorganisms present on the grapes, in the vineyard or the cellar
equipment (18). However, the extent of the hydrolysis performed by these endogenous
Stellenbosch University https://scholar.sun.ac.za

9
microbial or grape derived enzymes are not usually sufficient to make an impact on the
properties of the resulting wine since the must conditions are not optimal for their activity. In the
must the enzymes can be inhibited by the high sugar concentration, the low pH and low
fermenting temperatures, and it can be inhibited by ethanol, sulfur dioxide, tannins and
bentonite. Thus, enzymes, which are not adversely affected by the conditions prevalent in
fermenting must are added to enhance the extraction of aroma, colour and other phenolic
compounds during maceration (19, 20). Commercial maceration enzymes are extracts from
Aspergillus niger and Trichoderma species grown under specific conditions in order to produce
specific enzymes. The Organisation International de la Vigne et du Vin (OIV) stipulates that only
these species may be used for isolation of wine enzymes due to their GRAS (generally
regarded as safe) status. Pectin degrading enzymes have been used since the 1970s in wine
fermentations (19). Although maceration enzyme mixes consist primarily of pectinases there are
always a wide variety of other additional enzymes present such as cellulases, hemicellulases,
esterases, -glucosidases etc. (21, 22). These additional activities can have a positive or
negative effect as discussed in section 2.1.1.3. Studies (21, 23, 24) showed that by combining
pectinases with cellulases, the synergistic effect of these enzymes ensures a more complete
breakdown of cell walls from both grape and apple tissues. An overview of the enzymes that are
used in the wine industry is shown in Table 1 [adapted from (25)].
Table 1: Enzyme families and enzymes commonly used in the wine industry (25)
Enzyme family Enzymes Commercial wine enzyme examples
-Glucanases exo--1,3-glucanase, endo-1,3-1,4-glucanase, Lallzyme MMX™ (Lallemand), Depectil Elevage (Martin Vialatte),
endo--1,4-glucananse Glucanex 200 G (Lamothe-Abiet)
Pectinases Pectate lyase,
endo-Polygalacturonase, Lallzyme C™ (Lallemand), Rapidase® CB (DSM), Rapidase® Vinosuper (DSM),
Rapidase X-Press L (DSM), Depectil Clarification (Martin Vialatte),
Ultrazym Premium (Lamothe-Abiet)
Pectin lyase, Rapidase X-Press L (DSM)
Pectin methyl esterase, Rapidase Vinosuper (DSM)
Galactanase, Lallzyme EX™ (Lallemand)
Rhamnosidase, Lallzyme BETA™ (Lallemand)
Rhamnogalacturonase Rapidase Expression (DSM)
Rapidase X-Press L (DSM)
Hemicellulases Arabinase Rapidase Expression (DSM)
Arabinofuranosidase RapidaseX-Press L (DSM)
Stellenbosch University https://scholar.sun.ac.za

10
2.1.1.1 Enzyme effect on wine colour and polyphenolic composition
In general enzyme treated wines result in a higher amount of total phenolic compounds (16, 26)
being extracted which can improve overall wine quality (27). The polyphenols are important
components of wine. Anthocyanins are the colour pigments of red wine and hydroxycinnamic
acids, flavonols and tannins are colour enhancing and stabilizing factors. Catechins and tannins
contribute to the complexity, astringency and mouth feel of the wine. The phenolics may also
have health promoting qualities (28). The grape skin contains 20 – 30% (w/w) and the seed 60
% (w/w) (29) of the phenolic compounds of the grape berry (Fig. 1). However, skin phenolics are
favoured by winemakers because they result in wines that are less bitter and astringent (30).
This is linked to the type and mean degree of polymerization of the proanthocyanidins that are
found in the seeds and skins (31).
Wine made from riper grapes generally contains more skin than seed proanthocyanidins (32)
because the extraction of seed tannins happens more regularly in the period before the seeds
reach phenolic ripeness, before the outer layer of the seed dehydrates and becomes hard (33).
Enzymes can unfortunately also modify the tannin composition and there is more than one
study showing that enzymes can increase the tannin extraction from specifically the seeds (34–
36). Tannin extraction from seeds will be enhanced even further in the presence of ethanol
since ethanol helps to solubilize the cell wall components of seeds (37).
Figure 1: The structure of the grape berry and the distribution of the phenolic compounds (29, 38).
Stellenbosch University https://scholar.sun.ac.za

11
However, if maceration enzymes extract predominantly skin phenolic compounds it can result in
a wine with improved mouth feel (30). Furthermore, free and glycosidically bound flavour
compounds of wine made from Bobal grapes (from the Utiel-Requena region of Spain) were
increased by using a yeast that expressed an endo-glucanase and an endo-xylanase enzyme
during the maceration period (39). A similar result was seen by a Saccharomyces cerevisiae x
S. paradoxus hybrid yeast strain that produces an endo-polygalacturonase (40). Finally, Salinas
et al. (41) observed an increase in ester content and stabilization in the evolution of terpenols
such as linalool, geraniol and nerolidol, when using enzymes for phenolic and aroma extraction
in Rosé wine preparation.
2.1.1.2 Enzyme effect on the polysaccharide composition of wine.
Wine polysaccharides play important roles during wine production as they can prevent haze
formation (42), stabilize flavour (43), colour and foam in effervescent wines, but they can also
cause filtration problems (44). Vidal et al. (45) showed that polysaccharides, similar to
polyphenols, contribute towards the body, mouth feel, bitterness and astringency of wine. They
isolated a neutral polysaccharide fraction from wine consisting of type II arabinogalactan-
proteins (AGPs), originating from grape cell walls, and mannoproteins originating from yeast cell
walls and demonstrated that this fraction contributes to the ‘fullness’ sensation of wine. The
second acidic fraction, containing rhamnogalacturonan-II (RG-II), significantly decreased the
astringency of wine. Rhamnogalacturonan-I (RG-I) was also detected, but constituted only 4 %
off all the polysaccharides found in wine (46) and was associated with xyloglucan-like
polysaccharides. This contributed to early evidence suggesting cross-links between pectic
polymers and xyloglucans. Ayestarán et al. (47) used size exclusion chromatography and
monosaccharide analysis (GC-MS) and followed the wine polysaccharide profile throughout the
wine making process. The early stages of fermentation are characterized by the release of low
molecular weight AGPs followed by RG-II from the grape tissue into the fermenting wine. The
RG-II are mostly dimers but some RG-I monomers and small quantities of homogalacturonan
(HG) were also detected. In the later stages of the fermentation, there was an increase in larger
AGP molecules as well as yeast mannoproteins released from the yeast cell walls. At the end of
alcoholic fermentation and during malolactic fermentation, the larger AGPs as well as some
mannoproteins precipitated but the levels of the latter stayed constant because it was
presumably replenished from the yeast cell walls in the lees. Furthermore, the levels of the wine
polysaccharides stayed relatively stable during oak and bottle aging. Apolinar-Valiente et al.
(48) showed that terroir might have an influence on the RG-II concentration of wine which might
be linked to the availability of micronutrients such as Boron in the different soils.
A few studies investigated how the use of maceration enzymes alters the polysaccharides and
oligosaccharides found in wine. Ayestarán et al. (47) showed that the use of commercial
Stellenbosch University https://scholar.sun.ac.za

12
enzymes increased the arabinogalactan, AGPs and RG-II levels in wine from Tempranillo
grapes in comparison to the control wines, but it had no effect on yeast mannoproteins. In
contrast Ducasse et al. (49) showed a decrease in the amount of AGPs and arabinans in Merlot
wine that was treated with enzymes. They also saw and increase in RG-II and lower molecular
weight products. The latter can be the degradation products from the AGP and arabinans and
might indicate that more extensive enzyme hydrolysis took place than in the first study. In
another study Ducasse et al. (50) compared the oligosaccharides of Merlot wines that were
prepared with and without the addition of commercial enzyme preparations and found that the
enzymes demethylated and hydrolysed HG and cleaved the RG-I backbone, releasing RG-I with
neutral side chains attached. Doco et al. (51) showed that pectinolytic enzyme treatment are
responsible for the removal of the terminal arabinose unit from AGPs.
2.1.1.3 Inconsistent results and side effects ascribed to the use of maceration enzyme
preparations
Numerous studies on how maceration enzymes change wine properties have been done over
the last 40 years (15–17, 26, 49, 52). The reason for the continued interest in the topic from a
commercial and scientific point of view is that the results achieved by using enzymes for wine
preparation are not consistent. Several studies have shown that the enzymes had no
observable/detectable effect (15, 16, 52) or improved some but not all of the wine properties
and sometimes the effects were not long lasting (9, 10).
The inconsistencies have traditionally been attributed to impurities or side-activities present in
the enzyme preparations. The OIV recommends that detrimental side activities should be
absent in commercial enzyme preparations and all enzymatic activities and their activity levels
should be declared on the label (Resolution OIV/OENO 365 (2009), International Oenological
Codex) (www.oiv.int). Studies investigating the specific enzymatic activities present in
maceration enzyme preparations (21, 22) revealed that most of the preparations have the same
types of activities present, but the levels of specific activities varies between different
preparations and preparations that are marketed for specific applications do not always have
the optimal enzymatic profile. Additionally all the preparations included unwanted activities or
side activities such as -glucosidases, cinnamoyl esterase (only a problem in white wine) and
esterases, although at different concentrations. Few of these so-called side activities were
sufficiently characterized and described on the product labels as required by the OIV.
The presence of -glucosidases in enzyme preparations is problematic because it can remove
the glycosyl moiety from anthocyanins rendering a colourless molecule and can thus result in a
red wine with a low colour intensity (53). In white wine it can liberate non-volatile flavour
compounds from their glycosides and improve the sensory profile (54). Esterases can hydrolyse
Stellenbosch University https://scholar.sun.ac.za

13
both the wine esters responsible for the fruity and floral like aromas but they also hydrolyse
ethyl acetate and long-chain fatty acid esters, which have solvent and soap-like aromas (55).
Thus, whether the presence of esterases in a maceration enzyme preparation is positive or
negative depends on the specificity of those enzymes. Proteases are regarded as a side or
secondary activity but protease action may contribute positively towards wine fermentations by
reducing filtration and clarification problems (56) and enriching the assimilable nitrogen content
of must, benefitting the fermentation microbes (57). Proteases can degrade the proteins from
the grape cell membrane and the vacuole membrane to facilitate the release of phenolic
compounds but protease activity was not found in any of the maceration enzyme preparations
tested by Romero-Cascales et al. (21). In contrast, Fia et al. (22) found proteases in all 21
maceration enzyme preparations tested on bovine serum albumin but under winemaking
conditions, the protease activities were 10 to 20% reduced.
Besides side activities, many other factors that might be the cause for inconsistent successes
with enzymes have been investigated. All factors that can influence the composition of the berry
cell wall can have an influence on the success of the enzymatic hydrolysis. These factors
include the skin thickness [some cultivars are known to have thick skins e.g. Pinotage and
Monastrell (58)], cell wall porosity as well as the relative abundance of the different components
(pectins, celluloses and hemicelluloses) and how that matches up with the activity profile of the
maceration enzyme preparation (pectinases:cellulases:hemicellulases). The composition of the
cell wall is dependent on the tissue type (skin or pulp), cultivar (59), the ripeness stage (60), the
vintage (which depend largely on the climatic properties) (9, 34) and the vineyard practices that
was followed and the geographical orientation of the vineyard. Other factors that may influence
the enzyme success are inhibiting substances that may be present in the must (high tannin or
alcohol concentrations), the residual activity of the enzymes at winemaking conditions or the
enzyme to substrate ratio (16, 61).
A side effect associated with the use of maceration enzymes is the production of methanol.
Pectinmethylesterase is responsible for the de-esterification of pectin to pectate with the release
of methanol (62). During maceration, we thus see the formation of methanol because of the
action of this enzyme whether is it the endogenous grape enzyme or a part of a commercial
preparation. The high activity of the commercial enzyme preparations results in higher levels of
methanol being produced in wines treated with pectinolytic enzymes (63). Methanol is toxic to
humans with the oral lethal dose at 340 mg/kg body weight and the limit for methanol is set at
150 mg/l in white and rosé wines and 300 mg/l for red wines (64). Gnekow and Ough (62)
reported white wine methanol levels between 20 to 32 mg/l and red wines between 48 and 135
mg/l when there was no addition of pectinolytic enzymes. When enzymes were added, the
levels increased to a maximum of 73 mg/l in white wines and 140 mg/l in red wines. Most
Stellenbosch University https://scholar.sun.ac.za

14
studies show that when pectinolytic enzymes are added at the recommended dosages the final
methanol concentration is still far from the maximum allowable concentration, but there are
exceptions. For example, one of the enzymes tested by Romero-Cascales et al. (21) increased
the methanol concentration from 152 mg/l to 338 mg/l.
We have summarized the use of maceration enzymes, and how they affect the properties of the
wine. In the next section we will focus on one of the waste products of the wine making process,
the grape pomace. Pomace is the grape skins, stalks and seeds that remain after both the red
and white wine making process. The global wine industry is moving towards using more
sustainable practices and therefore the development of methods to extract value from waste is
an area of great importance. Enzymes are one of the central tools used in the upcycling of this
waste product.
2.2 Grape pomace valorisation
The different types of waste originating from the wine production process include wastewater,
pomace (skins and seeds), filter cakes, lees and wine (65). Recycling the waste generated by
the wine industry and harvesting from it substances of value is a common practice in most major
wine producing countries. Traditionally most skins, seeds and stalks were used as animal
fodder and as composting material (66). However, because of the low pH of pomace (3.5 – 3.8)
the composting rate is slow if not supplemented with lime or other feed stocks. This
supplementation increases the pH to create a suitable environment for compost microbes,
which prefer a pH of 6.2. Furthermore the high lignin present in the seeds and stalks (17 to
35%) can limit decomposition and wet piles (>60% moisture) may continue to ferment and
produce acetic acid resulting in poor quality compost. As fodder, pomace on its own is not
considered to be of high value although the animals find it extremely palatable once the tartaric
acid has been removed. The high amounts of tannin found in specifically red grape pomace,
results in protein binding and indigestibility in bovines (67).
Large quantities of pomace are generated each year: In 2012, the production of wine in South
African resulted in 213 000 tonnes of pomace (according to SAWIS
[http://www.sawis.co.za/info/download/Book_2013_eng_web.pdf] and worldwide the number
was 5.3 million tonnes. It is clear that if all of this ends up as landfill it will have dire
environmental consequences. Fortunately, pomace (and some of the other winery waste
products) can be processed and valorized (4). In South Africa, the company Brenn-O-Kem
processes 35 000 tonnes of pomace and wine lees annually into products such as grape spirits,
grape seed extract and cream of tartar (68). Grape seed oil pressed or chemically removed
from the grape seeds (65) has a burn point at 216C, is used for food preparation and is rich in
Stellenbosch University https://scholar.sun.ac.za

15
omega-6 fatty acids (linoleic acid) and other polyunsaturated fats. Because of its high
antioxidant concentration the oil is also incorporated into skin therapy products.
Figure 2: Products derived from grape pomace and yeast lees. (SCP, single cell protein). Adapted from
(65).
The residue that remains after the oil extraction is the so-called press cake, a source of
antioxidants, antimicrobials and phytochemicals that can be incorporated into pesticides, food
additives, antibacterial ointments and serves as UV protectant in sunscreens. Grappa is a
distilled spirits that can be produced from grape pomace (skins, seeds and stalks) and
originated in Italy (2). Furthermore, tartaric acid can be isolated from the pomace (50 – 75kg/t)
as well as the lees (100 – 150kg/t) (65). Valuable polyphenols and triterpenic acids can be
extracted from grape skins and these molecules are used in the pharmaceutical, cosmetic and
nutritional industries (69). Other products that can be isolated from the lees and the pomace are
shown in Figure 2. After extraction of the molecules from the grape pomace, the remaining
fibrous material, (i.e. the cell walls of the cells in the grape pulp and skin), can be used in a
biomass power plant to produce electric or thermal energy or it can be saccharified with
enzymes and fermented to bioethanol.
Pomace
Animal feeds, silages Dried feedstuffs
Grape seeds
Anthocyanins Tannins (E163) Colourants Bioenergy
Biogas
Compost
Fermentation medium (yeast, fungi, bacteria)
SCP, citric acid, gluconic acid, carotenoids, xanthan, enzymes, bacterial celluloses etc.
Alcoholic beverages Biofuel
Yeast lees
Tartaric acid >100 – 150kg/t
Pigments from red lees 12kg/t
Ethanol
Food and feed supplements
-1,3-glucans Yeast cell walls 6 – 12% of dry weight
Stellenbosch University https://scholar.sun.ac.za

16
2.2.1 The use of enzymes in pomace valorisation
The following paragraphs will focus on the role that enzymes play in the extraction of valuable
molecules from the pomace as well as the enzymatic hydrolysis of grape cell wall
polysaccharides as preparation for bioethanol fermentations.
The phenolic composition of grapes and thus pomace is dependent on many factors e.g. the
soil, geographical characteristics, weather conditions, maturity at harvest and the grape variety
(27, 70). Furthermore, the phenolic concentration (content/composition) depends on the types
of tissues included (skins, seeds and stalks) and whether the pomace were collected before or
after alcoholic fermentation (70–72). The phenolic compounds are bound to the polysaccharides
of the cell walls, either with hydrophobic interactions or hydrogen or covalent bonds and they
can be found within cell vacuoles (73). Acidified alcohol, sulfited water or organic solvents are
commonly used for the extraction of polyphenols from pomace (28, 74) but the sulfite can be
seen as an allergen risk in the downstream products and the use of large amounts of organic
solvents is environmentally unfriendly. In an effort to reduce or eliminate the use of organic
solvents and SO2 other methods using microwaves, ultrasound or cell wall degrading enzymes
have been developed (28). The advantages of hydrolytic enzymes are that they deliver a more
stable bioactive product at lower temperatures and pressure and with a lower impact on the
environment. Furthermore, some studies showed that enzymes decrease the molecular weight
of phenolics which can improve the ease of absorption (bioavailability) of these molecules in
the human gut (75, 76).
Enzymes are also invaluable for the production of monosaccharides from plant material that
serves as a fermentable carbohydrate source for yeast in bioethanol production. Established
bioethanol production processes using lignocellulosic biomass as starter material usually
consist of five steps: (i) Pretreatment to enhance the enzyme accessibility to cellulose during
hydrolysis, (ii) enzymatic hydrolysis of cell wall polysaccharides (iii) fermentation of sugars to
ethanol (iv) separation of lignin residue and (v) recovery and purification of ethanol (6). The use
of grape pomace waste in the production of bioethanol has been investigated (65, 69, 77) but
the seasonal availability of pomace, makes it less economically attractive. However, a recent
study (78) showed how fresh and fermented pomace can be preserved and enhanced for
digestibility via the process of ensilage (lactic acid fermentation) which would make pomace
available to use as biomass throughout the year.
2.2.2 Factors that influence the effectiveness of enzymatic hydrolysis of pomace
As was briefly mentioned in the previous paragraph, pomace (when it includes stalks, skins,
some flesh and seeds) as bioethanol biomass, would have to be pretreated to ensure effective
enzymatic hydrolysis (6). The pretreatment is largely necessary to remove and convert the lignin
Stellenbosch University https://scholar.sun.ac.za
17
and hemicellulose matrix that surrounds the cellulose and to decrease the crystallinity of
cellulose. The presence and amount of lignin present in grape skins is a topic with divergent
opinions (see section 2.3.1.4) but it is known that the grape stalks contain 17% (w/w) lignin (79)
which was confirmed by solid state 13C NMR spectroscopy. Grape seeds contain 41% (w %, dry
basis) lignin (80). Besides lignin, cutin might also hinder enzymatic hydrolysis of cell wall
polysaccharides since (81) found a major part of the structural polysaccharides from Touriga
Nacional grape skins embedded in an acid-insoluble cuticular residue.
The different pretreatment processes that are commonly used in the bioethanol industry include
biological (white and soft-rot fungi), physical (milling and extrusion), chemical (alkali, acid,
organic solvents) and physico-chemical (steam explosion, liquid hot water, microwave,
ultrasound) pretreatments which are discussed in detail in (6) and (5). When pomace is used for
the extraction of polyphenols the pre-treatment step usually only involves hot water extraction
(61, 82). In this literature review, we will briefly look at milling and steam pretreatment since
these are the two processes used for enzyme substrate preparation in Chapter 4 and 5 of this
study.
Meyer et al. (23) showed that when the size of the pomace particles are reduced (for example,
with milling) the surface area and enzyme accessibility increase, enhancing the enzymatic
hydrolysis of the pomace cell walls which results in a tenfold increase in the extraction of
polyphenols. During steam treatment of wheat straw part of the hemicelluloses hydrolyse to
form acids which catalyse further hemicellulose hydrolysis (5). This leads to pore formation,
which gives the enzymes better access to the cellulose. Information on the effect of steam
treatment on grape pomace cell walls, which have a much higher pectin content, is not
available. The natural pore size of the grape cell wall is between 4 and 10 kDa (83). This is too
small for most hydrolytic enzymes to enter (84, 85) and emphasizes the importance of
pretreatment processes.
Other factors that can affect the enzyme hydrolysis success in polyphenol extracting processes
are the type of enzyme selected, the enzyme-substrate ratio and the time and temperature of
the reaction. These parameters were all investigated in studies by (23, 61, 75, 82, 86) and in
general a better extraction was observed if a combination of enzymes (for example, pectinolytic
with celluloytic enzymes) were used. Most studies achieved extraction levels and rates similar to
what was achieved with sulfite extraction.
Enzymes are an integral part of the processes discussed above but a major obstacle in the
future development of bioconversion processes of waste is the low efficiency and high cost of
enzymes (87). The high chemical and structural complexity of plant cell wall biomass
Stellenbosch University https://scholar.sun.ac.za

18
contributes to this inefficiency and it has become imperative to determine the limitations of
enzymatic deconstruction and in parallel gain knowledge on the architecture of the plant cell
wall. This is also true for the use of maceration enzymes in the production of red wine and thus
the next section is a short summary of the available knowledge on the plant (dicotyledon) cell
wall followed by the grape berry cell wall. We will also focus on the location of the polyphenols
in the grape berry and the factors that influence the extractability of these compounds. Finally,
we will summarize findings from previous studies that investigated how the grape cell wall was
changed by hydrolytic enzymes.
2.3. Investigating the grape berry cell wall structure
2.3.1 An introduction to plant cell walls
The obvious structural functions of plant cell walls includes being a vital component of the
hydrostatic skeleton of plant tissues and organs; resisting mechanical stress by producing
secondary cell wall layers (e.g. wood in trees) and acting as a physical barrier against biotic and
environmental stresses (88). Apart from these classical roles it has become increasingly
apparent that the cell wall plays a number of dynamic biological roles; including recognition,
signaling and responding (via the cell wall components) to pathogen invasion and
environmental stresses; as well as being an active component in plant growth and development
processes (89, 90). Vitis vinifera is a dicotyledonous angiosperm and therefore further
discussion will be limited to the structure and properties of the cell walls of dicots. Most of the
research in plant cell walls has been performed on Arabidopsis, rice (Oryza sativa L.) and
poplar (Populus).
Three inter-dependent networks form the structure of plant cell walls; these being the cellulose-
hemicellulose (xyloglucan); pectin and protein (glycoprotein and proteoglycan) matrices (91).
Traditionally it has been common practice to consider these as separate components; mainly
due to the classical fractionation methods employed to analyse cell walls from various sources.
However, it has become increasingly appreciated that such separations are rather artificial and
arbitrary, and that in order to fully appreciate the complexity of plant cell walls a more nuanced
understanding of the higher order structure and architecture using more recently developed
techniques is needed.
2.3.1.1 Cellulose-hemicellulose network
Cellulose consist of neutral, unbranched β-1,4-D-glucan chains. Primary cell walls (surrounding
growing and dividing plant cells) contain on average between 20 and 30% cellulose while
secondary cell walls (deposited once the cell has ceased to grow) contain up to 50% (88).
Investigations into the nature of the parenchyma cell wall surface of maize, by using atomic
force microscopy (AFM) and immuno-transmission electron microscopy (TEM), showed that 36
Stellenbosch University https://scholar.sun.ac.za

19
β-D-glucan chains assemble into a cellulose microfibril with hydrogen bonds and van der Waals
forces holding it together (92, 93). Microfibrils made of glucan chains, containing as many as
14 000 glucose units, corresponds to a microfibril length of 7m (94) with a 3 nm diameter (84)
and these microfibrils are arranged 10-20 nm apart. Cellulose has a crystalline core surrounded
by a paracrystalline layer of cellulose and then hemicelluloses. Callose is a -1,3-D-glucan (with
occasional -1,6- linked branches) found in plant cell walls and is usually formed in response to
stress conditions such as wounding or pathogen attack. Callose also accumulates around the
plasmodesmata opening and might regulate the aperture of this intercellular channel (95).
Hemicelluloses are polysaccharides with backbones of β-1,4-linked glucose (Glc), mannose
(Man) or xylose (Xyl) with an equatorial configuration (96). Hemicelluloses include xylans (such
as arabinoxylans and glucuronoarabinoxylans), xyloglucans (composed of mainly Glc, Xyl,
galactose (Gal) and fucose (Fuc)), and β-1,3/1,4-D-glucans (not present in dicotyledons).The
typical distribution of the different hemicelluloses between the primary and secondary cell wall of
dicots are shown in Table 2. Mannans are structurally important but they also serve as storage
polysaccharides (96). Xyloglucans cross-links cellulose microfibrils thus strengthens cell walls
and xyloglucan derived oligosaccharides have diverse functions in the plant cell wall since they
can act as physiological signals (97) and are sometimes implicated in cell adhesion (98).
Table 2: Typical distribution of hemicelluloses in primary and secondary cell walls of dicots (96).
% Hemicellulose polysaccharide in dicot walls (%w/w)
Polysaccharide Primary Secondary
Xyloglucan 20-25 Minor
Glucuronoxylan Absent or minor 20-30
Glucuronoarabinoxylan 5 Absent or minor
Glucomannan 3-5 2-5
Galactoglucomannan Absent or minor 0-3
2.3.1.2 Pectin network
Pectins are galacturonate-rich acidic polysaccharides and represent up to 30% of the cell walls
of dicots (99). The different structural classes of pectic polysaccharides found in plant cells are
homogalacturonan (HG), xylogalacturonan (XGA), apiogalacturonan (AGA) (not found in dicots),
RG-II and RG-I. HG is galacturonic acid (GalA) residues linked together with a -1,4-bond and
they can be methyl-esterified at the C-6 carboxyl and/or acetylated at the O-2 or O-3. HG with a
high degree of methyl esterification is called 'pectin' and HG with low or no methyl esterification
is termed 'pectic acid' (100). The degree of methyl esterification can differ significantly between
plant species and tissue type from which the cell wall was harvested (99). Unmethylated C-6
residues carry a negative charge and if there is a stretch of more than 10 unmethylated C-6
Stellenbosch University https://scholar.sun.ac.za

20
residues present, two HG molecules can form a double helix with Ca2+ forming a bridge
between the molecules. This is referred to as the egg-box model or Ca2+-induced gelling (101).
In contrast, HG with a very high degree of methyl esterification can form a calcium independent
gel. This type of gel forms in water limiting environments with the aid of hydrogen bonds and
hydrophobic interactions (88). The formation of a gel by HG can affect all the polysaccharide
interactions in the cell wall and therefore also the physical and functional properties of the cell
wall. Non-esterified HG is mostly found in the middle lamella and in cell corners while esterified
HG is found throughout the cell wall surrounding the cellulose-hemicellulose network (84). HG
isolated from apples, beet (Beta vulgaris) and citrus showed that HG molecules contained
approximately 72 – 100 galacturonic acid residues (99). The backbone of HG is covalently
linked to RG-I, RG-II and presumably covalently cross-linked to xyloglucan (XyG) (105). HG
substituted with D-xylose residues at C-3 is known as Xylogalacturonan (XGA). RG-II is the
most complex polysaccharide found in the plant cell wall and the complexity of RG-II makes it
resistant to microbial attack (103). RG-II exists in the primary wall as a monomer or a dimer with
a single borate diester cross-link. The dimer contains heavy metals such as Pb2+, Ba2+ and St2+
and it is a major component of wines (up to 100mg/ in red wine) and fruit juices. A stretch of
approximately eight 1,4-linked α-D-GalpA (Galacturonosyluronic acid) residues that is
substituted with up to five side chains (A – E) and comprising 12 different monosaccharides
makes up a typical RG-II monomer (104). There is some variability in the structure across plant
species and recently variation within an individual plant, involving monosaccharide substitution,
chain A methylation and variation in the length of chain B was demonstrated (105). Natural
diversity as well as modifications (dearabinosylation and deacetylation) due to acid treatment
were observed in RG-II that was isolated from wine (106). And finally; RG-I is a family of
structurally similar molecules and has a backbone of repeating units of [-D-GalpA-1,2--L-
Rhap-1,4]n. RG-I has as many as 40 structurally different branches attached to about half of
the rhamnose residues at the C-4 position. These branches contain mainly arabinosyl and
galactosyl residues but fucosyl, glycosyluronic acid and 4-O-methyl glycosyluronic acid residues
can be present in low amounts (88) depending on the source of RG-I .
Concerning the function of the pectic polysaccharides in the cell wall, it has been established
that calcium crosslinking brings together blocks of unmethylesterified HG and this contributes to
the rigidity of the cell wall (99). RG-II borate dimers are also important for cell wall integrity and
is specifically required in the elongation of the pollen tube of Arabidopsis (107). Furthermore,
the HG-calcium complexes and the RG-I side chains mediate cellular adhesion in plant tissues
and plays a central role in the functioning of stomata (108). Pectic oligosaccharides produced
by the action of hydrolytic enzymes secreted by plant pathogens, acts as elicitors that induce
the defense response pathways (109) in plants. The pectin network is extensively modified
Stellenbosch University https://scholar.sun.ac.za

21
during fruit ripening/softening (110) and modifications include solubilization, depolymerization,
loss of neutral side chains and reduction in length of individual pectin chains.
2.3.1.3 The proteins of the cell wall
The plant cell wall contains structural and functional proteins (88). The structural proteins
include the hydroxyproline-rich glycoproteins, the glycine-rich proteins and the proline-rich
proteins. A definitive characteristic of the structural proteins are their repeated sequence motifs
of between 2-16 amino acids, which acts as putative functional domains. These domains in
conjunction with each other can create certain geometrical conformations (helical domains, -
strands and –sheets) or form segments with specific characteristics (hydrophobic, or –phylic,
charged or stiff domains). The hydroxyproline-rich glycoproteins, also known as extensins, have
a basic polypeptide backbone substituted with mono- to tetra-saccharide side-chains of
arabinose (Ara) and Gal (111). Extensins are amphiphilic and can form cross-links in the cell
wall with other proteins. Extensins can also function as intra- and intermolecular cross-linking or
-binding sites and glycosylation domains. In fact, extensins are believed to form a fibrillar
network independent from the cellulosic network and thus, contribute significantly towards cell
wall strength, toughness, flexibility, pore size and hydration (112).
Another family of proteins found in the cell wall is the arabinogalactans (AGP). The
polysaccharide portion of these proteoglycans accounts for more than 90% of the molecule and
it is rich in Gal and Ara (113). The protein portion is rich in hydroxyproline, alanine and serine.
The AGPs have diverse biological roles (114) and have been implicated in many plant growth
and development processes such somatic embryogenesis, root growth and development,
hormone responses, xylem differentiation, signaling, salt tolerance, cell expansion etc. Recently
(115) a very important link was made between AGPs and Ca2+ signaling and the existence of an
AGP-Ca2+ oscillator was proposed which would explain the involvement of AGPs in plant
morphogenesis.
The enzymes located in the cell wall are those that are involved in the cell wall metabolism such
as the endo- and exoglycanases, methyl- and acetyl esterases and the trans-glycosylases
(100). Additionally the cell wall contains enzymes such as peroxidases, that can generate cross-
links between wall polymers (116). Functional but non-enzymatic proteins located in the cell
wall are the lipid transporters, pathogen protectors (such as thionins, glucosidases, chitinases,
polygalacturonase-inhibitors) and expansins, which presumably break hydrogen bonds between
xyloglucan and cellulose, regulating wall expansion in the process (88).
Stellenbosch University https://scholar.sun.ac.za

22
2.3.1.4 Cutin and lignin
The cuticle is the final interface between the plant and the environment and is a non-cellular,
protective layer that consists of cutin bi-polymers with waxes (soluble lipids) embedded in or
deposited on the cutin matrix (117). Cutin is a biopolyester of saturated C16 -hydroxy and
unsaturated C18 hydroxy-epoxy fatty acid monomers and the cutin layer can contain small
amounts of phenolic acids such as ferulic acid. The imbedded cuticular waxes serves as
waterproofing filler in the cutin matrix while those deposited onto the surface form complex
three-dimensional crystalline structures such as platelets, rod lets and tubules. They consist of
long-chain aliphatic compounds, such as very long chain fatty acids (C20 to C34), aldehydes,
primary and secondary alcohols, ketones, alkanes and alkyl esters.
Lignin is a phenolic polymer mainly found in secondary cell walls of plants. Lignin provides the
mechanical strength in plant cell walls that enables trees to grow tall, it is the hydrophobic
water-impermeable surface of xylem cells and it protects the plant against pathogens because
of its high resistance towards microbial decay (88). According to Brummel (118) the cell walls in
the fruit flesh of most species do not have secondary cell walls and have very low levels of
lignin. On the other hand and according to some authors, fruit skins do contain lignin (Table 3).
The amount of lignin in grape skins has been a topic of debate for some time. Some authors
recorded lignin values between 2 and 56% for grape pulp and skin (Table 3). In contrast others
belief that the presence of true lignin in grape skin (or pulp) is highly unlikely (83, 119) or
speculate that the acid insoluble fraction that are traditionally classified as lignin might rather be
cellulose embedded in cuticular waxy material (69). Thus, the high variability in the lignin
concentration recorded in Table 3 is probably due to the variation in analysis methods that were
used and in how the lignin fraction is defined.
Table 3: Lignin content of different fruit skins as percentage of skin weight
Fruit % dry weight of skin Reference
Citrus fruit skins 1.3 – 2.2 (120)
Banana skins 6 -16 (121)
(122)
Apple skin 34 - 39 (123)
Grape skin 40 - 45 (123)
Grape skin 24-56 (124)
Grape skin
Grape pulp
10
2
(125)
Stellenbosch University https://scholar.sun.ac.za

23
2.3.1.5 Models of the primary cell walls of plants
Several models have been proposed over the years in an effort to explain how the cellulose,
hemicellulose, pectin and cell wall proteins fit together in a three dimensional structure while
allowing for plant growth and differentiation (90). Examples of these are the Keegstra (126)
model based on sycamore cell walls. The tethered network model by Fry (127) and Hayashi
(128) cited in Cosgrove (116) (FIG 3 A) with xyloglucan chains that span the gap between
cellulose microfibrils was the standard model with many others proposing variations on this
model. Examples are the multicoat model of (129) (cellulose is coated with successively looser
layers of matrix polysaccharides) and the stratified model (130) (strata of pectic polysaccharides
separate cellulose-xyloglucan layers). Carpita and Gibeaut (131) developed a general model for
flowering plants and for Poaceae and illustrated how these models would accommodate cell
expansion. Somerville (94) published an illustration of a model (Fig. 3 B) based on Vincken
(132) and although this model is not widely accepted (133) it was a good attempt to show the
complexity of the cell wall. In 2012 (98) the tethered network model where xyloglucan is seen as
a gap-spanning, taunt, load bearing feature between cellulose microfibrils, was challenged. An
alternative model proposed regions of xyloglucan-mediated, close contact between cellulose
microfibrils and these regions would then be critical in the regulation of cell wall loosening
during growth. The importance of the cellulose microfibril-xyloglucan network in regulating
expansive growth were confirmed by Yi and Puri (134) using a computational cell wall model
and they suggested that the pectic matrix might also contribute to load-bearing in the plant cell
wall. Tan et al. (135) suggested a new model in which AGPs serve as a cross-linker that
connects pectin and hemicellulose polysaccharides after identifying covalent links between an
arabinoxylan-pectin-AGP complex isolated from Arabidopsis tissue culture.
These models were largely build on evidence of interactions between the different cell wall
polymers. Some of the earlier examples are the interaction between pectins and structural cell
wall proteins (126). This was found when a cell wall fraction isolated after treatment with endo-
polygalacturonase, endo-glucanase and alkali rendered pectic polymers only after protease
hydrolysis. Each individual polysaccharide and glycoprotein of the cell wall is water-soluble
(except cellulose) but when forming part of the cell wall matrix the molecules are cross-linked
into a structure that holds together in an aqueous environment (136). The links can be non-
covalent and thus weak but ensuring strength because of their abundance. Examples are the
hydrogen bonds between hemicelluloses and cellulose, the Ca2+ bridges crosslinking HG and
basic glycoproteins ionically linked to acidic polysaccharides. Covalent links, which are
individually strong but few in numbers, are for example the borate diester cross-links between
RG-II molecules. The interaction between xyloglucan and cellulose has been extensively
studied and the binding capacity depends on the surface area of the cellulose, the degree of
fucosylation of xyloglucan (137) and the source of the xyloglucan (138). It has been proposed
Stellenbosch University https://scholar.sun.ac.za

24
that mannans also cross-link cellulose (139) and it is shielded by HG (140). We have already
mentioned that the backbone of HG is covalently linked and continuous to the backbone of RG-I
and –II (102), and the pectin network can thus be envisioned as a macromolecular structure
with different domains. There are many reports in literature that suggest a stable covalent link
between xyloglucan and HG and/or RG-I (97, 133, 141–143)
Figure 3: (A)The tethered network plant cell wall model proposed by Fry (127) and Hayashi (128) cited in
(116) [figure adapted from (98)]. The figure only shows the cellulose microfibrils cross-linked with
xyloglucan. The space in between is filled up by pectin and structural proteins. (B) Scale cell wall model
by (94) of the Arabidopsis leave with the amount of cellulose reduced to provide more clarity.
The galactan and arabinan side chains of RG-I binds to cellulose but this association is not of
the same strength as between cellulose and xyloglucan (141, 144). Where the xyloglucan-
cellulose association has been described as an ‘entrapment’ the cellulose-arabinan or -galactan
A
B
Stellenbosch University https://scholar.sun.ac.za

25
association is limited to the surface of cellulose. Pectin polymers, in particular -1,4-D-galactan,
-1,5-L-arabinan and arabinogalactan are cross-linked to phenolic compounds (99, 100).
Finally, new evidence of interaction between AGPs and cell wall polymers such as the
previously mentioned arabinoxylan-pectin-AGP complex (135) as well as the AGP31 interaction
with galactan branches of RG-I (145) are showing how these cell wall proteins form part of the
cell wall structure. It was proposed that AGP31 participates in supra-molecular scaffolds that
play a role in cell wall strengthening, specifically in plant organs displaying rapid growth (145).
2.3.2 The grape berry cell wall
2.3.2.1 The cell wall of the mesocarp (pulp)
The cell walls of mesocarp cells of mature grape berries are a maximum of 100 nm thick and
the composition is approximately 90% polysaccharides and 10% proteins (146). The major
polysaccharides are cellulose and galacturonans and there is a definite, observable difference
between firmer and softer grape cultivars. The firmer cultivars have more cellulose, xyloglucans
and hydroxyproline-rich proteins while the softer varieties have cell walls enriched by
polygalacturonans, thus a more extensive pectic matrix (146). Ortega-Regules et al. (147)
determined the sugar composition of the cell walls of both the skin and the pulp cells (of four
different wine grape cultivars) and found that the pulp cell walls had slightly higher fucose (Fuc),
rhamnose (Rha), Xyl and cellulose but lower Ara, Gal, Man and hemicellulosic glucose (Glc)
than the skin cell walls. The uronic acid was about the same in the different tissues but the
degree of methylesterification was lower in the pulp cell walls.
2.3.2.2 The pericarp (skin) and the cell wall of the skin cells
The grape skin constitutes for 5 – 10% of the total dry weight of the grape berry and three layers
can be differentiated (148). On the outside is the cuticle (1 – 4 µm thick) consisting of
hydroxylated fatty acids (cutin) and this is covered by hydrophobic waxes. The cuticle protects
the fruit from fungal infection, dehydration, UV light and physical damage (149). Underneath the
cuticle is the epidermis that consists of one or two layers of cells with moderately thick cell walls
(Fig. 4). Following this is the hypodermis that can have a variable number of cell layers and
forms the border between the pulp and the skin. The number of cell layers in the grape berry
skin and the size of the cells are cultivar-specific (150) as well as the cell wall composition
(147). However, on average the cell wall of the skin cells consist of 30% neutral polysaccharides
(cellulose, xyloglucan, arabinan, galactan, xylan and mannan) and 20% of acidic pectin
components (62% methyl esterified). The remainder consists of approximately 15% insoluble
proanthocyanidins and less than 5% structural proteins (148). Working with the values that they
determined for monosaccharides, Arnous and Meyer (123) used an iterative calculation method
to infer the polysaccharides present in the skin cell walls. With this method they estimated the
polysaccharides to be 57-62 mol % HG, 6-14 mol % cellulose, 10-11 mol % xyloglucan, 7 mol %
Stellenbosch University https://scholar.sun.ac.za

26
arabinan, 4.5-5 mol % RG-I, 3.5 – 4 mol % RG-II, 3 mol % arabinogalactan and 0.5 – 10 mol %
mannans.
Figure 4: The cell layers of the grape berry (151). The bar is 100m.
2.3.2.3 The cutin layer of the grape berry
The grape berry cuticle plays a crucial role in protecting against Botrytis cinerea infection by
being a hydrophobic and chemical barrier (152). However, it is still possible for B. cinerea to
enter through undamaged cuticle presumably by secreting a lipase that hydrolyses long chain
fatty acids. Comménil et al. (153) investigated the development of the cuticle from flowering to
maturity. They reported that the composition of the cuticular waxes changed (the percentage
primary alcohols decreased and the hydrocarbons increased) and that there was an increase in
waxy deposits but a decrease in the cutin content per berry surface unit. The wax surface
morphology at maturity showed cracks, which could be a penetration point for the B. cinerea
conidia. Grape berry wax contains 50-80% (total weight of wax extract) oleanolic acid, which is
a triterpenoid (154). Other triterpenoids present are oleanolic aldehyde, erythrodiol and
phytosterols such as -sitosterol, campesterol, stigmasterol and lanosterol. The high
abundance of these triterpenoids in grape berry waxes can contribute to the health benefits
associated with grape consumption because pharmacological properties such as anticancer,
anti-inflammatory, antidiabetogenic, antimicrobial, cardio protective, anti-HIV and anti-multiple
sclerosis effects has been attributed to tripterpenoids (154). The levels of phytosterols present
Stellenbosch University https://scholar.sun.ac.za

27
in the berry cuticle wax exhibited a fluctuation with ripening by increasing at peak berry maturity
and then decreasing in the last stage of ripening.
2.3.3 The changes in the cell wall of the grape berry during ripening
The development of the grape berry consists of a cell division phase followed by a cell
expansion phase (155). The onset of this second phase, known as veraison, signifies the
initiation of events such as sugar accumulation, a decrease in organic acids, colour
development, berry expansion and softening. Information regarding fruit ripening or softening
is commercially important because it goes hand in hand with the development of flavour and
colour of the fruit and can indicate the point of optimum ripeness (156). In addition, by
preventing excessive ripening/softening the fruit is protected from mechanical damage that will
set it vulnerable for microbial attack. The textural change that takes place during ripening is
partially explained by the changes happening in the cell wall polysaccharides (157). With the
development of the berry, the size and morphology changes are accommodated by a series of
coordinated biochemical reactions. These reactions encompass both the biosynthesis and the
degradation of cell wall components and numerous plant enzymes are involved. Several
reviews (97, 136, 157) discuss in detail the processes and the enzymes responsible but for the
purpose of this literature review we will only focus on the degradation effect that these enzymes
are believed to have on the cell wall components.
In literature, most of the studies investigating the changes during ripening focus on the cell walls
of the mesocarp cells. Nunan et al. (151) studied these cell walls during the different
developmental stages using fluorescent and light microscopy and could not detect a
measurable change in the cell wall thickness. Compositional analysis showed a major decrease
in Gal and galactan content during ripening of the berry, especially the (1,4)-linked
galactopyranose residues of type I arabinogalactan. This could be the result of the grape -
galactosidase activity that was detected (158) throughout all the ripening stages of the berry.
Furthermore, the mRNA for this enzyme was accumulating from pre-veraison until early post-
veraison berries. During ripening there was also a major increase in the solubility of the pectic
polysaccharides (151) which was ascribed by the authors to the detected activity (158) of -
galactosidase, -galactosidase and/or pectin methylesterase. The solubilisation can also be a
result of the action of polygalacturonases and/or pectate lyases but they could not observe
these activities although the genes were actively expressed after veraison. In contrast with other
fruits, grapes showed only a slight decrease (from 58 to 48%) in the degree of
methylesterification in the mesocarp cell wall during ripening. The levels of cell wall-associated
proteins, in particular the hydroxyproline rich proteins, increase during ripening (inferred from
changes in the amino acid profile) while cellulose and xyloglucan levels remained the same with
Stellenbosch University https://scholar.sun.ac.za

28
no increase in solubility. However, Yakushiji and co-workers (159) studied the mesocarp cell
walls of Vitis vinifera L. x V. labrusca L. during veraison and found, in contrast to Nunan (151),
that the cellulose content decreased. They also noted a depolymerization of xyloglucan and
pectic polysaccharides and a general decrease in hemicellulose. Furthermore, Guillaumie et al.
(160) correlated the expression profile of four xyloglucan endotransglycosylases/hydrolyses
from Chardonnay berries with fruit ripening and Moore et al. (60) showed the decrease in
epitope abundance for mAb LM15 (that binds to xyloglucan) as ripening progresses.
Ortega-Regules and co-workers (59) investigated the skin cell from veraison up to technological
maturity (related to the sugar concentration, titratable acidity and pH of the grape juice) . In
contrast with the observations recorded for the pulp cells (151) the Ortega-Regules study
showed with transmission microscopy how the cell walls became thinner as the grapes ripen.
This correlated with the decrease in cell wall material per gram of skin that they were able to
isolate as time progressed through the ripening process. Chemical changes included a
decrease in Gal (similar to the mesocarp cell wall) and a decrease in the degree of pectin
methylation and acetylation. This was true for the cultivars Mourvèdre (Monastrell J), Merlot and
Cabernet Sauvignon while the pectin methylation in Shiraz remained constant. In contrast, a
study by Vicens et al. (161) focusing on the grape skin of Shiraz, measured a decrease in
methylesterification of uronic acid and an increase in the water-soluble fraction. According to
Huang et al. (162), the degradation and consequential loss of polysaccharides in the cell wall
are accompanied by cell wall acidification and the loss of pectin bound calcium.
2.3.4 The factors affecting the extractability of polyphenols from the grape skin
In order to understand every aspect involved in the enzyme assisted maceration step we not
only need to know the composition of the barrier (cell wall) between the phenolic compounds
and the wine must, but we also need to understand how these polyphenols are bound to cell
structures and the factors that influence the ease of extractability of these compounds from the
grape tissue to the must.
The phenolic compounds of grapes that contributes to wine quality are mainly the
hydroxycinnamic acid, anthocyanins and tannins (163). Most of the phenolic compounds of the
grape berry are located (Figure 1) in the hypodermal and epidermal cells of the skin (20 – 30%
w/w) and in the epidermal seed coat (60% w/w) (33, 83, 164). Within these cells, the
anthocyanins are mostly found in the vacuole but some are bound to the cell nucleus or to the
cell wall polymers (73). The vacuole, which can occupy more than 90% of the space in the cell
(164) is surrounded by a tonoplast (vacuolar membrane). Tannins can be free in the vacuole,
bound to the proteins on the inside of the tonoplast, or bound to the cell wall polymers by
Stellenbosch University https://scholar.sun.ac.za

29
glycosidic bonds (165). Flavonols and hydroxybenzoic acids are believed to interact with the cell
wall polysaccharides via hydrophobic interactions or hydrogen bonds (23, 73) and
hydroxycinnamic acids might be esterified to the Ara and Gal molecules of -1,4-D-galactan and
-1,5-L-arabinan side chains of RG-I (166).
Grape proanthocyanidins can bind to a variety of molecules because of the availability of both a
hydrophobic aromatic ring and a hydrophilic hydroxyl group (83). In grape skins, they interact
with proteins via hydrogen bonding as well as hydrophobic interactions and in the same way,
they interact with the hydroxyl groups and glycosidic oxygen atoms of the cell wall
polysaccharides (167). Proanthocyanidins shows a hierarchy of affinity for polysaccharides and
would preferentially bind to pectin, then xyloglucan and lastly to cellulose (168). However, this
hierarchy is also dependent on the accessibility of the polysaccharide-binding site within the cell
wall structure. In apple tissue, the degree of pectin methylation shows a positive correlation
with proanthocyanidin binding while protein content has no influence (169).
The phenolic content of grapes is a factor of the cultivar, the climatic conditions during the
growing season, the terroir, vineyard practices that were followed and the degree of maturation
of the grapes (27). The levels of most phenolic compounds in grape tissue increase during
ripening followed by a slight decline close to, what can be considered as, the overripe stage
(170). The decline is due to their degradation, their bioconversion into other products or their
covalent association with other cellular components. Similarly, anthocyanin synthesis that starts
during veraison, accumulate in the skin cells during ripening and show a slight decrease in
concentration in overripe grape skins (163, 171, 172). Grapes with high levels of polyphenols
do not always deliver wines with high colour intensity or polyphenol content. Even with
extended maceration only a fraction of the total polyphenols present in the grapes, will be
extracted (163). The extraction of polyphenols from the grape berry to the wine is in essence a
diffusion process. Therefore, the extraction depends on the molecular size and the type of
polyphenol, the time and temperature of the extraction process, the concentration gradient, cell
permeability, the composition of the extraction medium (for example ethanol concentration) and
the surface area over the concentration gradient (163). In general, anthocyanins from the skin
are extracted early in the maceration while the tannins are extracted later (173). This is also
linked to the solubility characteristics since anthocyanins can dissolve in aqueous solutions but
tannins need a certain level of ethanol in which to dissolve (15, 174).
The ease of extractability of polyphenols from berry skin differs between cultivars (172, 175) and
according to an extractability index developed by Saint-Criq et al. (1998). A cultivar that is
known to have a high extractability index (not easy to extract) is Monastrell (also known as
Mourvèdre) (147, 175, 176) while cultivars such as Merlot, Shiraz and Cabernet Sauvignon
have a lower extractability index. The berry of Monastrell has a thick and tough skin and the
Stellenbosch University https://scholar.sun.ac.za

30
same description is true for the Pinotage cultivar (58) that was used in Chapter 3 and 4 of this
thesis. In contrast, Chardonnay that was also used in Chapter 4 and 5, has a thin (0.14 mm)
(177) but tough skin (58). The divergence in the extractability indexes was studied by
investigating the properties of the skin and the skin cell walls of a number of cultivars in
conjunction with the maturity level of the grapes. Ortega-Regules and co-workers (176) found
that a low extraction index (easy to extract) was linked to a low concentration of Gal in the cell
wall as well as a low degree of pectin methylation and acetylation. Although these are all typical
characteristics of a cell wall of ripe or mature berries (see ripening section 2.3), they could not
form a direct link between extractability index and ripeness (measured in Brix). This is an
unexpected result because we know (147) that the skin cell wall becomes thinner with ripening
and that thinner skin are associated with a greater release of red pigments (178). However,
other authors (171) showed with Shiraz and with Mencía grapes (178) that the percentage of
free anthocyanins and the tannins that could be extracted from skin remained the same
irrespective of the sugar content of the berry pulp. According to Fournand (171) it is rather the
mean degree of polymerization of the tannins, and to a lesser degree, the galloylation
percentage, which are the determining factors concerning extractability. It is only in the past
three years that researchers started to show a positive link between extractability and ripeness.
For example Hernández-Hierro et al. (179) showed how the extractability is strongly linked to
the ripeness level and went on to confirm this in the cultivar Tempranillo (180). Gil et al. (30)
worked on Cabernet Sauvignon and Tempranillo and investigated both grape ripeness and
maceration length. They found a positive correlation between colour extractability, phenolic
compounds, polysaccharide concentrations in the wine and ripeness. Furthermore, mature
grapes released more proanthocyanidins from skins than from seeds, which contributed
positively towards the sensory attributes of the wine (lower astringency and bitterness). They
observed that with an extended maceration the color and anthocyanin concentration decreased
but polysaccharide and proanthocyanidin concentration still increased along with an increase in
the galloylation percentage, indicating proanthocyanidin extraction from seeds.
In studies done by Bindon et al. (125, 181, 182) it was shown that overripe berries have a
higher cell wall porosity (probably due to pectin degradation) and this corresponded with
enhanced adsorption of high molecular mass tannins and anthocyanins. This led to the
hypothesis that these polyphenols are encapsulated within the pores, where they bind to the cell
wall components and it result in a reduction in the extractability of these tannins during
vinification.
Stellenbosch University https://scholar.sun.ac.za

31
2.4 Investigating the cell wall degradation by enzymes
2.4.1 Investigating the cell wall degradation by maceration enzymes in wine
Evaluating the extent of the cell wall degradation done by hydrolytic enzymes by measuring
polyphenol release (section 2.1.1.1) is an indirect measure and does not tell us how the
enzymes changed the structure of the cell wall. A more direct method is to determine the cell
wall components that are released during enzyme incubation. Arnous and Meyer (183)
measured the monosaccharides released from grape skins treated with a cellulolytic and two
pectinolytic maceration enzymes. Overall, higher levels of monosaccharides were liberated by
the pectinolytic than the cellulolytic enzyme preparations and more monosaccharides were
liberated from Cabernet Sauvignon skins than from Merlot skins. This might be a reflection of
the differences in cell wall composition between cultivars and/or the ease of accessibility (e.g.
pore size) for maceration enzymes to the polysaccharides in the cell wall. Enzymatic
monosaccharide release were 2.8 times lower than what were obtained when hydrolyzing the
cell walls with trifluoroacetic acid which indicated that the cell wall polysaccharides were not
completely degraded during prolonged enzymatic treatment. With this study, they could also
correlate the release of specific polyphenols with specific monosaccharides that gave an
indication of the location and bonding of the polyphenols in the cell walls.
Alternatively, methods that isolate and compare cell walls of grape tissue before and after
maceration enzyme treatment were developed. Romero-Cascales et al. (26) isolated cell wall
material from the pomace of enzyme (pectinase) treated fermentations and determined that
enzymatic hydrolysis renders more cell wall material per gram of tissue. They speculated that
since the cell wall has been partially degraded more of the cell content was extracted during the
fermentation, thus at the end of alcoholic fermentation the ratio of cell wall to tissue is larger for
enzyme treated skins. They also showed that the Ara, Gal, uronic acids and total sugar content
of cell wall was lower for enzyme treated samples. These are typical changes seen during fruit
ripening (146, 151) and indicate the degradation of the pectic polysaccharides of the cell wall.
As a consequence of the reduction in pectin polysaccharides (26) they saw an proportional
increase in Man and Glc content indicating that the hemicellulose remained in the cell wall.
2.4.2 Investigating the changes in the pomace cell wall due to enzyme treatment
Chamorro et al. (75) investigated the monosaccharides released from grape pomace after
treatment with different enzyme preparations as an indication of cell wall degradation but they
did not analyze the actual residual matter. None of the other studies that used enzymes on
grape pomace for either polyphenol extraction of bioethanol production studied the cell wall
residues or the changes that happened to the composition of the cell wall during all the steps
involved. A study by DeMartini et al. (184) investigated the sequence of structural changes that
happened in Populus biomass during hydrothermal pretreatment using Immunolabeling. The
Stellenbosch University https://scholar.sun.ac.za

32
steam treatment disrupted the lignin-polysaccharide interactions, pectins and arabinogalactans
were lost, and this was followed by removal of xylans and xyloglucans. And finally a review by
Paës (87) discussed the use of fluorescent probes to study the deconstruction of biomass but
these technique has not yet been used with grape pomace as subject matter.
2.5 Concluding remarks
Enzymes are essential tools for the processing of grapes and it is important to optimize their use
in order to improve the effectiveness and economic viability of these applications for future use
(87). Many factors are thought to determine the success of enzymatic degradation of the grape
berry cell wall. These factors can be connected to the properties of the enzyme, such as
enzyme type, the enzyme-substrate ratio and hydrolysis conditions (pH, time, temperature). The
studies investigating this are in essence all optimizing experiments because for each enzyme
and enzyme combination and for every type of grape tissue substrate as well as the scale of the
experiment the ideal conditions will be different.
Other factors that can determine the enzyme effectiveness has to do with the grape skin and
the composition of the cell wall of the skin and pulp cells. Many things can influence the
composition of the cell walls and those that are being studied are for example the morphological
differences in the skin and the compositional differences in the cell walls of different cultivars.
There are the so-called recalcitrant cultivars (such as Monastrell) that have a tough, thick skin
and many studies focus on the skin properties of these cultivar as well as the effect that
enzymes have on extracting compounds from the Monastrell skin (6, 48, 175, 176, 185).
However, another important South African grape cultivar, Pinotage, is also known for its tough
and thick skin (58, 186), but there is very little information available on the skin or cell wall
properties of this grape.
For the extraction of molecules from recalcitrant grape cultivars pretreatment steps can be
employed (8, 61, 82, 187, 188). Different pretreatments are being evaluated by measuring the
levels of molecules yielded but very little, if any information is available on how these
pretreatment steps change the grape cell wall. Another factor that has a large influence on the
cell wall properties are the level of maturity/ripeness of the grapes (59, 180, 181). There are
subtle differences detectable in how the composition of the cell wall polymers change during
ripening, between cultivars (59). There is no information available on how the cell wall
properties of Pinotage change during ripening. This grape can sometimes deliver a bitter tasting
wine and it has been speculated that it can be linked to the bitterness in the unripe skin (186).
Thus, it is important to gain more information on this topic. Furthermore, there is also no
Stellenbosch University https://scholar.sun.ac.za

33
information on how the maturity level of grapes, in general, affects the success of maceration
enzymes.
A general theme of all previous investigations looking into enzymatic hydrolysis of grape cell
walls is the measuring of indirect and associated molecules or characteristics, for example
measuring red wine colour, polyphenols or typical cell wall monosaccharides released or
determining the monosaccharide composition in the residual cell wall fragments after enzymatic
hydrolysis. From all these studies, it was only possible to infer the actual polymer changes that
took place in the cell walls due to enzymatic hydrolysis. Therefore, in order to understand what
happens at the cell wall during enzyme assisted wine maceration or the use of hydrolytic
enzymes in the valorisation of grape pomace, a detailed investigation on the grape cell wall
structure is needed at the polymer level.
2.6 References
1. Ribéreau-Gayon P, Dubourdieu D, Doneche B, Lonvaud A. 2006. Handbook of enology, 2nd ed. John Wiley and Sons, Chichester.
2. Jackson RS. 2008. Wine science: Principles and applications, 3rd ed. Academic Press, Inc., San Diego.
3. Sacchi KL, Bisson LF, Adams DO. 2005. A review of the effect of winemaking techniques on phenolic extraction in red wines. Am. J. Enol. Vitic. 56:197–206.
4. Naziri E, Nenadis N, Mantzouridou FT, Tsimidou MZ. 2014. Valorization of the major agrifood industrial by-products and waste from Central Macedonia (Greece) for the recovery of compounds for food applications. Food Res. Int. 65:350–358.
5. Hendriks ATWM, Zeeman G. 2009. Pretreatments to enhance the digestibility of lignocellulosic biomass. Bioresour. Technol. 100:10–8.
6. Alvira P, Tomás-Pejó E, Ballesteros M, Negro MJ. 2010. Pretreatment technologies for an efficient bioethanol production process based on enzymatic hydrolysis: A review. Bioresour. Technol. 101:4851–61.
7. Dambergs R, Sparrow A, Carew A, Scrimgeour N, Wilkes E, Godden P, Herderich M, Johnson D. 2012. Quality in a cool climate – maceration techniques in Pinot Noir production. Wine Vitic. J. 3:18–26.
8. De Beer D, Joubert E, Marais J, Manley M. 2006. Maceration before and during fermentation : Effect on Pinotage wine phenolic composition , total antioxidant capacity and objective colour parameters. South African J. Enol. Vitic. 27:137–150.
9. Ortega-Heras M, Pérez-Magariño S, González-Sanjosé ML. 2012. Comparative study of the use of maceration enzymes and cold pre-fermentative maceration on phenolic and anthocyanic composition and colour of a Mencía red wine. LWT - Food Sci. Technol. 48:1–8.
10. Parley A, Vanhanen L, Heatherbell D. 2001. Effects of pre-fermentation enzyme maceration on extraction and colour stability in Pinot Noir wine. Aust. J. Grape Wine Res. 7:146–152.
Stellenbosch University https://scholar.sun.ac.za
34
11. Koyama K, Goto-Yamamoto N, Hashizume K. 2007. Influence of maceration temperature in red wine vinification on extraction of phenolics from berry skins and seeds of grape (Vitis vinifera). Biosci. Biotechnol. Biochem. 71:958–65.
12. Carranza-Concha J, Del Mar Camacho M, Martinez-Navarrete N. 2012. Effects of blanching on grapes (Vitis Vinifera) and changes during storage in syrup. J. Food Process. Preserv. 36:11–20.
13. Delsart C, Ghidossi R, Poupot C, Cholet C, Grimi N, Vorobiev E, Milisic V, Mietton Peuchot M. 2012. Enhanced extraction of phenolic compounds from Merlot grapes by pulsed electric field treatment. Am. J. Enol. Vitic. 63:205–211.
14. Cholet C, Delsart C, Petrel M, Gontier E, Grimi N, L’Hyvernay A, Ghidossi R, Vorobiev E, Mietton-Peuchot M, Gény L. 2014. Structural and biochemical changes induced by pulsed electric field treatments on Cabernet Sauvignon grape berry skins: impact on cell wall total tannins and polysaccharides. J. Agric. Food Chem. 62:2925–34.
15. Bautista-Ortin AB, Martinez-Cutillas A, Ros-Garcia JM, Lopez-Roca JM, Gomez-Plaza E. 2005. Improving colour extraction and stability in red wines: the use of maceration enzymes and enological tannins. Int. J. Food Sci. Technol. 40:867–878.
16. Revilla I, González-Sanjosé ML. 2002. Multivariate evaluation of changes induced in Red Wine characteristics by the use of extracting agents. J. Agric. Food Chem. 50:4525–4530.
17. Ough CS, Crowell EA. 1979. Pectin-enzyme treatment of white grapes: temperature, variety and skin-contact time factors. Am. J. Enol. Vitic. 30:22–27.
18. Van Rensburg P, Pretorius IS. 2000. Enzymes in winemaking : harnessing natural catalysts for efficient biotransformations - A review. South African J. Enol. Vitic. 21:52–73.
19. Mojsov K. 2013. Use of enzymes in wine making: a review. Int. J. Mark. Technol. 3:112–127.
20. Sieiro C, García-Fraga B, López-Seijas J, Da Silva AF, Villa TG. 2010. Microbial pectic enzymes in the food and wine industry, p. 201–218. In Valdez, B (ed.), Food industrial processes - Methods and Equipment. InTech, Rijeka.
21. Romero-Cascales I, Fernández-Fernández JI, Ros-García JM, López-Roca JM, Gómez-Plaza E. 2008. Characterisation of the main enzymatic activities present in six commercial macerating enzymes and their effects on extracting colour during winemaking of Monastrell grapes. Int. J. Food Sci. Technol. 43:1295–1305.
22. Fia G, Canuti V, Rosi I. 2014. Evaluation of potential side activities of commercial enzyme preparations used in winemaking. Int. J. Food Sci. Technol. 49:1902–1911.
23. Meyer AS, Jepsen SM, Sørensen NS. 1998. Enzymatic release of antioxidants for human low-density lipoprotein from grape pomace. J. Agric. Food Chem. 46:2439–2446.
24. Mehrländer K, Dietrich H, Sembries S, Dongowski G, Will F. 2002. Structural characterization of oligosaccharides and polysaccharides from apple juices produced by enzymatic pomace liquefaction. J. Agric. Food Chem. 50:1230–6.
25. Moore JP, Divol B. 2010. Tracking the carreers of grape and wine polymers using biotechnology and systems biology, p. 387–404. In Bagchi, D, Lau, FC, Ghosh, DK (eds.), Biotechnology in Functional Foods and Nutraceuticals. CRC Press, Boca Raton.
26. Romero-Cascales I, Ros-García JM, López-Roca JM, Gómez-Plaza E. 2012. The effect of a commercial pectolytic enzyme on grape skin cell wall degradation and colour evolution during the maceration process. Food Chem. 130:626–631.
Stellenbosch University https://scholar.sun.ac.za

35
27. Garrido J, Borges F. 2013. Wine and grape polyphenols — A chemical perspective. Food Res. Int. 54:1844–1858.
28. Xia E-Q, Deng G-F, Guo Y-J, Li H-B. 2010. Biological activities of polyphenols from grapes. Int. J. Mol. Sci. 11:622–46.
29. Gomez E, Martinez A, Laencina J. 1994. Localization of free and bound aromatic compounds among skin , juice and pulp fractions of some grape varieties. Vitis 4:1–4.
30. Gil M, Kontoudakis N, González E, Esteruelas M, Fort F, Canals JM, Zamora F. 2012. Influence of grape maturity and maceration length on color, polyphenolic composition, and polysaccharide content of Cabernet Sauvignon and Tempranillo wines. J. Agric. Food Chem. 60:7988–8001.
31. González-Manzano S, Rivas-Gonzalo JC, Santos-Buelga C. 2004. Extraction of flavan-3-ols from grape seed and skin into wine using simulated maceration. Anal. Chim. Acta 513:283–289.
32. Kontoudakis N, Esteruelas M, Fort F, Canals JM, De Freitas V, Zamora F. 2011. Influence of the heterogeneity of grape phenolic maturity on wine composition and quality. Food Chem. 124:767–774.
33. Cadot Y, Miñana-Castelló MT, Chevalier M. 2006. Anatomical, histological, and histochemical changes in grape seeds from Vitis vinifera L. cv Cabernet franc during fruit development. J. Agric. Food Chem. 54:9206–15.
34. Ducasse M-A, Canal-Llauberes R-M, de Lumley M, Williams P, Souquet J-M, Fulcrand H, Doco T, Cheynier V. 2010. Effect of macerating enzyme treatment on the polyphenol and polysaccharide composition of red wines. Food Chem. 118:369–376.
35. Busse-Valverde N, Gómez-Plaza E, López-Roca JM, Gil-Muñoz R, Bautista-Ortín AB. 2011. The extraction of anthocyanins and proanthocyanidins from grapes to wine during fermentative maceration is affected by the enological technique. J. Agric. Food Chem. 59:5450–5.
36. Bautista-Ortín AB, Jiménez-Pascual E, Busse-Valverde N, López-Roca JM, Ros-García JM, Gómez-Plaza E. 2012. Effect of wine maceration enzymes on the extraction of grape seed proanthocyanidins. Food Bioprocess Technol. 6:2207–2212.
37. Sun-Waterhouse D, Luberriaga C, Jin D, Wibisono R, Wadhwa SS, Waterhouse GIN. 2011. Juices, fibres and skin waste extracts from white, pink or red-fleshed apple genotypes as potential food ingredients. Food Bioprocess Technol. 6:377–390.
38. Teixeira A, Eiras-Dias J, Castellarin SD, Gerós H. 2013. Berry phenolics of grapevine under challenging environments. Int. J. Mol. Sci. 14:18711–39.
39. Gil J V, Vallés S. 2001. Effect of macerating enzymes on red wine aroma at laboratory scale: exogenous addition or expression by transgenic wine yeasts. J. Agric. Food Chem. 49:5515–23.
40. Mocke B. 2005. M.Sc thesis.The breeding of yeast strains for novel oenological outcomes. Stellenbosch University. Stellenbosch, South Africa.
41. Salinas MR, Garijo J, Pardo F, Zalacain A, Alonso GL. 2003. Color , polyphenol , and aroma compounds in Rosé wines after prefermentative maceration and enzymatic treatments. Am. J. Enol. Vitic. 54:195–202.
42. Waters EJ, Wallace W, Tate ME, Williams PJ. 1993. Isolation and partial characterization of a natural haze protective factor from wine. J. Agric. Food Chem. 41:724–730.
Stellenbosch University https://scholar.sun.ac.za

36
43. Chalier P, Angot B, Delteil D, Doco T, Gunata Z. 2007. Interactions between aroma compounds and whole mannoprotein isolated from Saccharomyces cerevisiae strains. Food Chem. 100:22–30.
44. Vernhet A, Pellerin P, Belleville M-P, Planque J, Moutounet M. 1999. Relative impact of major wine polysaccharides on the performances of an organic microfiltration membrane. Am. J. Enol. Vitic. 50:51–56.
45. Vidal S, Francis L, Williams P, Kwiatkowski M, Gawel R, Cheynier V, Waters E. 2004. The mouth-feel properties of polysaccharides and anthocyanins in a wine like medium. Food Chem. 85:519–525.
46. Vidal S, Williams P, Doco T, Moutounet M, Pellerin P. 2003. The polysaccharides of red wine: total fractionation and characterization. Carbohydr. Polym. 54:439–447.
47. Ayestarán B, Guadalupe Z, León D. 2004. Quantification of major grape polysaccharides (Tempranillo v.) released by maceration enzymes during the fermentation process. Anal. Chim. Acta 513:29–39.
48. Apolinar-Valiente R, Williams P, Romero-Cascales I, Gómez-Plaza E, López-Roca JM, Ros-García JM, Doco T. 2013. Polysaccharide composition of Monastrell red wines from four different Spanish terroirs: effect of wine-making techniques. J. Agric. Food Chem. 61:2538–47.
49. Ducasse M-A, Williams P, Meudec E, Cheynier V, Doco T. 2010. Isolation of Carignan and Merlot red wine oligosaccharides and their characterization by ESI-MS. Carbohydr. Polym. 79:747–754.
50. Ducasse M-A, Williams P, Canal-Llauberes R-M, Mazerolles G, Cheynier V, Doco T. 2011. Effect of macerating enzymes on the oligosaccharide profiles of Merlot red wines. J. Agric. Food Chem. 59:6558–67.
51. Doco T, Williams P, Cheynier V. 2007. Effect of flash release and pectinolytic enzyme treatments on wine polysaccharide composition. J. Agric. Food Chem. 55:6643–9.
52. Wightman JD, Price SF, Watson BT, Wrolstad R. 1997. Some effects of processing enzymes on anthocyanins and phenolics in Pinot noir and Cabernet Sauvignon wines. Am. J. Enol. Vitic. 48:39–48.
53. Wightman JD, Wrolstad RE. 1996. Beta-glucosidase activity in juice-processing enzymes based on anthocyanin analysis. J. Food Sci. 61:544–548.
54. Rocha SM, Coutinho P, Delgadillo I, Cardoso AD, Coimbra MA. 2005. Effect of enzymatic aroma release on the volatile compounds of white wines presenting different aroma potentials. J. Sci. Food Agric. 85:199–205.
55. Tamborra P, Martino N, Esti M. 2004. Laboratory tests on glycosidase preparations in wine. Anal. Chim. Acta 513:299–303.
56. Van Sluyter SC, Warnock NI, Schmidt S, Anderson P, van Kan JAL, Bacic A, Waters EJ. 2013. Aspartic acid protease from Botrytis cinerea removes haze-forming proteins during white winemaking. J. Agric. Food Chem. 61:9705–11.
57. Swiegers JH, Pretorius IS. 2005. Yeast modulation of wine flavor. Adv. Appl. Microbiol. 57:131–75.
58. Goussard PG. 2008. Grape cultivars for wine production in South Africa. Cheviot Publishing, Cape Town.
Stellenbosch University https://scholar.sun.ac.za

37
59. Ortega-Regules A, Ros-García JM, Bautista-Ortín AB, Lopez-Roca JM, Gomez-Plaza E. 2008. Changes in skin cell wall composition during the maturation of four premium wine grape varieties. J. Sci. Food Agric. 88:420–428.
60. Moore JP, Fangel JU, Willats WGT, Vivier MA. 2014. Pectic-β(1,4)-galactan, extensin and arabinogalactan-protein epitopes differentiate ripening stages in wine and table grape cell walls. Ann. Bot. 114:1279–1294.
61. Kammerer D, Claus A, Scieber A, Carle R. 2005. A novel process for the recovery of polyphenols from grape ( Vitis vinifera L .) pomace. Food Chem. Toxicol. 70:157–163.
62. Gnekow B, Ough CS. 1976. Methanol in wines and musts: source and amounts. Am. J. Enol. Vitic. 27:1–6.
63. Revilla I, Gonzalez-SanJose ML. 1998. Methanol release during fermentation of red grapes treated with pectolytic enzymes. Food Chem. 63:307–312.
64. Hou C-Y, Lin Y-S, Wang YT, Jiang C-M, Lin KT, Wu M-C. 2008. Addition of phenolic acids on the reduction of methanol content in wine. J. Food Sci. 73:C432–7.
65. Nerantzis ET, Tataridis P. 2006. Integrated enology-Utilization of winery by-products into high added value products. J. Food Sci. Technol. 3:1–12.
66. Arvanitoyannis IS, Ladas D, Mavromatis A. 2006. Potential uses and applications of treated wine waste: a review. Int. J. Food Sci. Technol. 41:475–487.
67. Alipour D, Rouzbehan Y. 2010. Effects of several levels of extracted tannin from grape pomace on intestinal digestibility of soybean meal. Livest. Sci. 128:87–91.
68. Green Cape. 2013. Devoloping a business case for sustainable biofuels in south africa: A focus on waste-based bioethanol for fleet transport in the Western Cape.
69. Mendes JAS, Xavier AMRB, Evtuguin D V., Lopes LPC. 2013. Integrated utilization of grape skins from white grape pomaces. Ind. Crops Prod. 49:286–291.
70. Kammerer D, Claus A, Carle R, Schieber A. 2004. Polyphenol screening of pomace from red and white grape varieties (Vitis vinifera L.) by HPLC-DAD-MS/MS. J. Agric. Food Chem. 52:4360–7.
71. Makris DP, Boskou G, Andrikopoulos NK. 2007. Polyphenolic content and in vitro antioxidant characteristics of wine industry and other agri-food solid waste extracts. J. Food Compos. Anal. 20:125–132.
72. De la Cerda-Carrasco A, López-Solís R, Nuñez-Kalasic H, Peña-Neira A, Obreque-Slier E. 2014. Phenolic composition and antioxidant capacity of pomaces from four grape varieties (Vitis vinifera L.). J. Sci. Food Agric.
73. Pinelo M, Arnous A, Meyer AS. 2006. Upgrading of grape skins: Significance of plant cell-wall structural components and extraction techniques for phenol release. Trends Food Sci. Technol. 17:579–590.
74. Brazinha C, Cadima M, Crespo JG. 2014. Optimization of extraction of bioactive compounds from different types of grape pomace produced at wineries and distilleries. J. Food Sci. 79:E1142–9.
75. Chamorro S, Viveros A, Alvarez I, Vega E, Brenes A. 2012. Changes in polyphenol and polysaccharide content of grape seed extract and grape pomace after enzymatic treatment. Food Chem. 133:308–314.
Stellenbosch University https://scholar.sun.ac.za

38
76. Zheng H, Hwang I-W, Chung S-K. 2009. Enhancing polyphenol extraction from unripe apples by carbohydrate-hydrolyzing enzymes. J. Zhejiang Univ. Sci. B 10:912–9.
77. Rodríguez LA, Toro ME, Vazquez F, Correa-Daneri ML, Gouiric SC, Vallejo MD. 2010. Bioethanol production from grape and sugar beet pomaces by solid-state fermentation. Int. J. Hydrogen Energy 35:5914–5917.
78. Zheng Y, Lee C, Yu C, Cheng Y-S, Simmons CW, Zhang R, Jenkins BM, VanderGheynst JS. 2012. Ensilage and bioconversion of grape pomace into fuel ethanol. J. Agric. Food Chem. 60:11128–34.
79. Prozil SO, Evtuguin D V., Lopes LPC. 2012. Chemical composition of grape stalks of Vitis vinifera L. from red grape pomaces. Ind. Crops Prod. 35:178–184.
80. Manara P, Zabaniotou A, Vanderghem C, Richel A. 2014. Lignin extraction from Mediterranean agro-wastes: Impact of pretreatment conditions on lignin chemical structure and thermal degradation behavior. Catal. Today 223:25–34.
81. Mendes JAS, Prozil SO, Evtuguin D V., Lopes LPC. 2013. Towards comprehensive utilization of winemaking residues: Characterization of grape skins from red grape pomaces of variety Touriga Nacional. Ind. Crops Prod. 43:25–32.
82. Maier T, Göppert A, Kammerer DR, Schieber A, Carle R. 2007. Optimization of a process for enzyme-assisted pigment extraction from grape (Vitis vinifera L.) pomace. Eur. Food Res. Technol. 227:267–275.
83. Hanlin RL, Hrmova M, Harbertson JF, Downey MO. 2010. Review: Condensed tannin and grape cell wall interactions and their impact on tannin extractability into wine. Aust. J. Grape Wine Res. 16:173–188.
84. Jarvis MC. 2011. Plant cell walls: Supramolecular assemblies. Food Hydrocoll. 25:257–262.
85. Fleischer A, O’Neill M, Ehwald R. 1999. The pore size of non-graminaceous plant cell walls is rapidly decreased by Borate ester cross-linking of the pectic polysaccharide rhamnogalacturonan II. Plant Physiol. 121:829–838.
86. Xu C, Yagiz Y, Borejsza-Wysocki W, Lu J, Gu L, Ramírez-Rodrigues MM, Marshall MR. 2014. Enzyme release of phenolics from muscadine grape (Vitis rotundifolia Michx.) skins and seeds. Food Chem. 157:20–9.
87. Paës G. 2014. Fluorescent probes for exploring plant cell wall deconstruction: a review. Molecules 19:9380–402.
88. Albersheim P, Darvill A, Roberts K, Sederoff R, Staehelin A. 2010. Plant cell walls (From chemistry to biology). Garland Science, New York.
89. Wolf S, Hématy K, Höfte H. 2012. Growth control and cell wall signaling in plants. Annu. Rev. Plant Biol. 63:381–407.
90. Keegstra K. 2010. Plant cell walls. Plant Physiol. 154:483–6.
91. Brett CT, Waldron KW. 1996. Cell wall architecture and the skeletal role of the cell wall, p. 44–74. In Physiology and biochemistry of plant cell walls, 2nd ed. Chapman & Hall, London.
92. Ding S-Y, Himmel ME. 2006. The maize primary cell wall microfibril: a new model derived from direct visualization. J. Agric. Food Chem. 54:597–606.
Stellenbosch University https://scholar.sun.ac.za

39
93. Himmel M, Ding S, Johnson D, William S, Nimlos M, Brady J, Foust T. 2007. Biomass recalcitrance: engineering plants and enzymes for biofuels production. Science (80-. ). 315:804–807.
94. Somerville C, Bauer S, Brininstool G, Facette M, Hamann T, Milne J, Osborne E, Paredez A, Persson S, Raab T, Vorwerk S, Youngs H. 2004. Toward a systems approach to understanding plant cell walls. Science 306:2206–11.
95. Knox JP, Benitez-Alfonso Y. 2014. Roles and regulation of plant cell walls surrounding plasmodesmata. Curr. Opin. Plant Biol. 22C:93–100.
96. Scheller HV, Ulvskov P. 2010. Hemicelluloses. Annu. Rev. Plant Biol. 61:263–89.
97. Franková L, Fry SC. 2013. Biochemistry and physiological roles of enzymes that “cut and paste” plant cell-wall polysaccharides. J. Exp. Bot. 64:3519–50.
98. Park YB, Cosgrove DJ. 2012. A revised architecture of primary cell walls based on biomechanical changes induced by substrate-specific endoglucanases. Plant Physiol. 158:1933–43.
99. Caffall KH, Mohnen D. 2009. The structure, function, and biosynthesis of plant cell wall pectic polysaccharides. Carbohydr. Res. 344:1879–900.
100. O’Neill M., York W. 2003. The composition and structure of plant primary cell walls, p. 1–44. In Rose, JK. (ed.), The plant cell wall. Annual plant reviews, volume 8. Blackwell Publishing Ltd, Oxford.
101. Yoo S-H, Fishman ML, Savary BJ, Hotchkiss AT. 2003. Monovalent salt-induced gelation of enzymatically deesterified pectin. J. Agric. Food Chem. 51:7410–7.
102. Harholt J, Suttangkakul A, Vibe Scheller H. 2010. Biosynthesis of pectin. Plant Physiol. 153:384–95.
103. Pellerin P, O’Neill MA. 1998. The interaction of the pectic polysaccharide Rhamnogalacturonan II with heavy metals and lanthanides in wines and fruit juices. Analusis 26:32–36.
104. Pérez S, Rodríguez-carvajal MA, Doco T. 2003. A complex plant cell wall polysaccharide : rhamnogalacturonan II . A structure in quest of a function. Biochimie 85:109–121.
105. Pabst M, Fischl RM, Brecker L, Morelle W, Fauland A, Köfeler H, Altmann F, Léonard R. 2013. Rhamnogalacturonan II structure shows variation in the side chains monosaccharide composition and methylation status within and across different plant species. Plant J. 76:61–72.
106. Buffetto F, Ropartz D, Zhang XJ, Gilbert HJ, Guillon F, Ralet M-C. 2014. Recovery and fine structure variability of RGII sub-domains in wine (Vitis vinifera Merlot). Ann. Bot. 114:1327–37.
107. Dumont M, Lehner A, Bouton S, Kiefer-Meyer MC, Voxeur A, Pelloux J, Lerouge P, Mollet J-C. 2014. The cell wall pectic polymer rhamnogalacturonan-II is required for proper pollen tube elongation: implications of a putative sialyltransferase-like protein. Ann. Bot. 114:1177–88.
108. Willats WG, McCartney L, Mackie W, Knox JP. 2001. Pectin: cell biology and prospects for functional analysis. Plant Mol. Biol. 47:9–27.
109. Ferrari S, Galletti R, Denoux C, De Lorenzo G, Ausubel FM, Dewdney J. 2007. Resistance to Botrytis cinerea induced in Arabidopsis by elicitors is independent of salicylic acid, ethylene, or jasmonate signaling but requires PHYTOALEXIN DEFICIENT3. Plant Physiol. 144:367–79.
Stellenbosch University https://scholar.sun.ac.za

40
110. Paniagua C, Posé S, Morris VJ, Kirby AR, Quesada MA, Mercado JA. 2014. Fruit softening and pectin disassembly: an overview of nanostructural pectin modifications assessed by atomic force microscopy. Ann. Bot. 114:1375–83.
111. Lamport DTA, Kieliszewski MJ, Chen Y, Cannon MC. 2011. Role of the extensin superfamily in primary cell wall architecture. Plant Physiol. 156:11–9.
112. Varner JE, Louis S. 1989. Plant Cell Wall Architecture Review 56:231–239.
113. Johnson KL, Jones BJ, Schultz CJ, Bacic A. 2003. Non-enzymatic cell wall (glyco)proteins, p. 111–154. In Rose, KC (ed.), The plant cell wall. Annual plant reviews, volume 8. Blackwell Publishing Ltd, Oxford.
114. Ellis M, Egelund J, Schultz CJ, Bacic A. 2010. Arabinogalactan-proteins: key regulators at the cell surface? Plant Physiol. 153:403–19.
115. Lamport DTA, Varnai P, Seal CE. 2014. Back to the future with the AGP-Ca2+ flux capacitor. Ann. Bot. 114:1069–85.
116. Cosgrove DJ. 2003. Expansion of the plant cell wall, p. 237–263. In Rose, JKC (ed.), The plant cell wall. Annual plant reviews, volume 8. Blackwell Publishing Ltd, Oxford.
117. Bargel H, Koch K, Cerman Z, Neinhuis C. 2006. Evans Review No. 3 : Structure–function relationships of the plant cuticle and cuticular waxes — a smart material? Funct. Plant Biol. 33:893.
118. Brummell DA. 2006. Review : Cell wall disassembly in ripening fruit. Funct. plant Biol. 33:103–119.
119. Moreira N, Pina C, Mendes F, Couto JA, Hogg T, Vasconcelos I. 2011. Volatile compounds contribution of Hanseniaspora guilliermondii and Hanseniaspora uvarum during red wine vinifications. Food Control 22:662–667.
120. Ali J, Abid H, Hussain A. 2010. Study on some macronutrients composition in peels of different citrus fruits grown in NWFP. J. Chem. Soc. Pakistan 32:83–86.
121. Jamal P, Saheed, Olorunnisola K, Alam Z. 2012. Bio-valorization potential of banana peels (Musa sapientum): An overview. Asiaqn J. Biotechnol. 4:1–14.
122. Kirtane RD, Suryawanshi PC, Patil MR, Chaudhari AB, Kothari RM. 2009. Optimization of organic loading rate for different fruit wastes during biomethanization. J. Sci. Ind. Res. 68:252–255.
123. Arnous A, Meyer AS. 2009. Quantitative prediction of cell wall polysaccharide composition in grape (Vitis vinifera L.) and apple (Malus domestica) skins from acid hydrolysis monosaccharide profiles. J. Agric. Food Chem. 57:3611–9.
124. Apolinar-Valiente R, Romero-Cascales I, Gómez-Plaza E, López-Roca JM, Ros-García JM. 2015. The composition of cell walls from grape marcs is affected by grape origin and enological technique. Food Chem. 167:370–7.
125. Bindon KA, Smith PA, Kennedy JA. 2010. Interaction between grape-derived proanthocyanidins and cell wall material. 1. Effect on proanthocyanidin composition and molecular mass. J. Agric. Food Chem. 58:2520–8.
126. Keegstra K, Talmadge KW, Bauer WD, Albersheim P. 1973. The Structure of Plant Cell Walls. Plant Physiol. 51:188–196.
Stellenbosch University https://scholar.sun.ac.za

41
127. Fry SC. 1988. The growing plant cell wall: Chemical and metabolic analysis. Longman Scientific UK Limited, Essex.
128. Hayashi T. 1989. Xyloglucans in the primary cell wall. Annu. Rev. Plant Physiol. Plant Mol. Biol. 40:139–168.
129. Talbott LD, Ray PM. 1992. Molecular size and separability features of pea cell wall polysaccharides : Implications for models of primary wall structure. Plant Physiol. 98:357–368.
130. Ha M-A, Apperley DC, Jarvis MC. 1997. Molecular rigidity in dry and hydrated onion cell walls. Plant Physiol. 115:593–598.
131. Carpita NC, Gibeaut DM. 1993. Structural models of primary cell walls in flowering plants: consistency of molecular structure with the physical properties of the walls during growth. Plant J. 3:1–30.
132. Vincken J, Schols HA, Oomen RJFJ, Mccann MC, Ulvskov P, Voragen AGJ, Visser RGF. 2003. If Homogalacturonan were a side chain of Rhamnogalacturonan I . Implications for cell wall architecture. Plant Physiol. 132:1781–1789.
133. Coenen GJ, Bakx EJ, Verhoef RP, Schols HA, Voragen AGJ. 2007. Identification of the connecting linkage between homo- or xylogalacturonan and rhamnogalacturonan type I. Carbohydr. Polym. 70:224–235.
134. Yi H, Puri VM. 2014. Contributions of the mechanical properties of major structural polysaccharides to the stiffness of a cell wall network model. Am. J. Bot. 101:244–54.
135. Tan L, Eberhard S, Pattathil S, Warder C, Glushka J, Yuan C, Hao Z, Zhu X, Avci U, Miller JS, Baldwin D, Pham C, Orlando R, Darvill A, Hahn MG, Kieliszewski MJ, Mohnen D. 2013. An Arabidopsis cell wall proteoglycan consists of pectin and arabinoxylan covalently linked to an arabinogalactan protein. Plant Cell 25:270–87.
136. Fry S. 2004. Primary cell wall metabolism: tracking the careers of wall polymers in living plant cells. New Phytol. 16:641–675.
137. De Lima DU, Buckeridge MS. 2001. Interaction between cellulose and storage xyloglucans : the influence of the degree of galactosylation. Carbohydr. Polym. 46:157–163.
138. Whitney SEC, WIlson E, Webster J, Bacic A, Reid GJS, Gidley MJ. 2006. Effects of structural variation in xyloglucan polymers on interactions with bacterial cellulose. Am. J. Bot. 93:1402–1414.
139. Whitney SEC, Brigham JE, Darke AH, Reid JSG, Gidley MJ. 1998. Structural aspects of the interaction of mannan-based polysaccharides with bacterial cellulose. Carbohydr. Res. 307:299–309.
140. Marcus SE, Blake AW, Benians TAS, Lee KJD, Poyser C, Donaldson L, Leroux O, Rogowski A, Petersen HL, Boraston A, Gilbert HJ, Willats WGT, Knox JP. 2010. Restricted access of proteins to mannan polysaccharides in intact plant cell walls. Plant J. 64:191–203.
141. Cumming CM, Rizkallah HD, McKendrick KA, Abdel-Massih RM, Baydoun EA-H, Brett CT. 2005. Biosynthesis and cell-wall deposition of a pectin-xyloglucan complex in pea. Planta 222:546–55.
142. Cornuault V, Manfield IW, Ralet M-C, Knox JP. 2014. Epitope detection chromatography: a method to dissect the structural heterogeneity and inter-connections of plant cell-wall matrix glycans. Plant J. 78:715–22.
Stellenbosch University https://scholar.sun.ac.za

42
143. Popper ZA, Fry SC. 2008. Xyloglucan-pectin linkages are formed intra-protoplasmically, contribute to wall-assembly, and remain stable in the cell wall. Planta 227:781–94.
144. Zykwinska A, Thibault J-F, Ralet M-C. 2007. Organization of pectic arabinan and galactan side chains in association with cellulose microfibrils in primary cell walls and related models envisaged. J. Exp. Bot. 58:1795–802.
145. Hijazi M, Roujol D, Nguyen-Kim H, Del Rocio Cisneros Castillo L, Saland E, Jamet E, Albenne C. 2014. Arabinogalactan protein 31 (AGP31), a putative network-forming protein in Arabidopsis thaliana cell walls? Ann. Bot. 114:1087–97.
146. Nunan KJ, Sims IM, Bacic A, Robinson SP, Fincher GB. 1997. Isolation and characterization of cell walls from the mesocarp of mature grape berries ( Vitis vinifera ). Planta 203:93–100.
147. Ortega-Regules A, Ros-García JM, Bautista-Ortín AB, López-Roca JM, Gómez-Plaza E. 2008. Differences in morphology and composition of skin and pulp cell walls from grapes (Vitis vinifera L.): technological implications. Eur. Food Res. Technol. 227:223–231.
148. Lecas M, Brillouet J. 1994. Cell wall composition of grape berry skins. Phytochemistry 35:1241–1243.
149. Rosenquist JK, Morrison JC. 1989. Some factors affecting cuticle and wax accumulation on grape berries. Am. J. Enol. Vitic. 40:241–244.
150. Kök D, Çelik S. 2004. Determination of characteristics of grape berry skin in some table grape cultivars (V. vinifera L.). J. Agron 3:141–146.
151. Nunan K, Sims I, Bacic A. 1998. Changes in cell wall composition during ripening of grape berries. Plant Physiol. 118:783–792.
152. Casado CG, Heredia A. 1999. Structure and dynamics of reconstituted cuticular waxes of grape berry cuticle (Vitis vinifera L.). J. Exp. Bot. 50:175–182.
153. Commenil P, Brunet L, Audran J. 1997. The development of the grape berry cuticle in relation to susceptibility to bunch rot disease. J. Exp. Bot. 48:1599–1607.
154. Szakiel A, Pączkowski C, Pensec F, Bertsch C. 2012. Fruit cuticular waxes as a source of biologically active triterpenoids. Phytochem. Rev.
155. Coombe B. 1973. The regulation of set and development of the grape berry. Acta Hortic. 34:261–273.
156. Bapat V a, Trivedi PK, Ghosh A, Sane V a, Ganapathi TR, Nath P. 2010. Ripening of fleshy fruit: molecular insight and the role of ethylene. Biotechnol. Adv. 28:94–107.
157. Minic Z, Jouanin L. 2006. Plant glycoside hydrolases involved in cell wall polysaccharide degradation. Plant Physiol. Biochem. 44:435–49.
158. Nunan KJ, Davies C, Robinson SP, Fincher GB. 2001. Expression patterns of cell wall-modifying enzymes during grape berry development. Planta 214:257–264.
159. Yakushiji H, Sakurai N, Morinaga K. 2001. Changes in cell-wall polysaccharides from the mesocarp of grape berries during veraison. Physiol. Plant. 111:188–195.
160. Guillaumie S, Fouquet R, Kappel C, Camps C, Terrier N, Moncomble D, Dunlevy JD, Davies C, Boss PK, Delrot S. 2011. Transcriptional analysis of late ripening stages of grapevine berry. BMC Plant Biol. 11:165.
Stellenbosch University https://scholar.sun.ac.za

43
161. Vicens A, Fournand D, Williams P, Sidhoum L, Moutounet M, Doco T. 2009. Changes in polysaccharide and protein composition of cell walls in grape berry skin (Cv. Shiraz) during ripening and over-ripening. J. Agric. Food Chem. 57:2955–60.
162. Huang Q, Fu W-L. 2005. Comparative analysis of the DNA staining efficiencies of different fluorescent dyes in preparative agarose gel electrophoresis. Clin. Chem. Lab. Med. 43:841–2.
163. Kennedy J. 2008. Grape and wine phenolics: Observations and recent findings. Cienc. e Investig. Agrar. 35:107–120.
164. Fontes N, Geros H, Delrot S. 2011. Grape Berry Vacuole: A Complex and Heterogeneous Membrane System Specialized in the Accumulation of Solutes. Am. J. Enol. Vitic. 62:270–278.
165. Joutei KA, Glories Y, Mercier M. 1994. Localisation des tanins dans la pellicule de baie de raisin. Vitis 33:133–138.
166. Iiyama K, Lam TB-T, Stone BA. 1994. Covalent cross-links in the cell wall. Plant Physiol. 104:315–320.
167. Le Bourvellec C, Guyot S, Renard CMGC. 2004. Non-covalent interaction between procyanidins and apple cell wall material: Part I. Effect of some environmental parameters. Biochim. Biophys. Acta 1672:192–202.
168. Ruiz-Garcia Y, Smith PA, Bindon KA. 2014. Selective extraction of polysaccharide affects the adsorption of proanthocyanidin by grape cell walls. Carbohydr. Polym. 114:102–114.
169. Le Bourvellec C, Watrelot AA, Ginies C, Imberty A, Renard CMGC. 2012. Impact of processing on the noncovalent interactions between procyanidin and apple cell wall. J. Agric. Food Chem. 60:9484–94.
170. Adams DO. 2006. Phenolics and ripening in grape berries. Am. J. Enol. Vitic. 57:249–256.
171. Fournand D, Vicens A, Sidhoum L, Souquet J-M, Moutounet M, Cheynier V. 2006. Accumulation and extractability of grape skin tannins and anthocyanins at different advanced physiological stages. J. Agric. Food Chem. 54:7331–8.
172. Río Segade S, Soto Vázquez E, Díaz Losada E. 2008. Influence of ripeness grade on accumulation and extractability of grape skin anthocyanins in different cultivars. J. Food Compos. Anal. 21:599–607.
173. González-Neves G, Gil G, Barreiro L. 2008. Influence of grape variety on the extraction of anthocyanins during the fermentation on skins. Eur. Food Res. Technol. 226:1349–1355.
174. Canals R, Llaudy MC, Valls J, Canals JM, Zamora F. 2005. Influence of ethanol concentration on the extraction of color and phenolic compounds from the skin and seeds of Tempranillo grapes at different stages of ripening. J. Agric. Food Chem. 53:4019–25.
175. Romero-Cascales I, Ortega-Regules A, López-Roca JM, Fernández-Fernández JI, Gómez-Plaza E. 2005. Differences in anthocyanin extractability from grapes to wines according to variety. Am. J. Enol. Vitic. 3:212–219.
176. Ortega-Regules A, Romero-Cascales I, Ros-García JM, López-Roca JM, Gómez-Plaza E. 2006. A first approach towards the relationship between grape skin cell-wall composition and anthocyanin extractability. Anal. Chim. Acta 563:26–32.
177. Serratosa MP, Marquez A, Moyano L, Zea L, Merida J. 2014. Chemical and morphological characterization of Chardonnay and Gewürztraminer grapes and changes during chamber-drying under controlled conditions. Food Chem. 159:128–36.
Stellenbosch University https://scholar.sun.ac.za

44
178. Río Segade S, Giacosa S, Gerbi V, Rolle L. 2011. Berry skin thickness as main texture parameter to predict anthocyanin extractability in winegrapes. LWT - Food Sci. Technol. 44:392–398.
179. Hernández-Hierro JM, Quijada-Morín N, Rivas-Gonzalo JC, Escribano-Bailón MT. 2012. Influence of the physiological stage and the content of soluble solids on the anthocyanin extractability of Vitis vinifera L. cv. Tempranillo grapes. Anal. Chim. Acta 732:26–32.
180. Hernández-Hierro JM, Quijada-Morín N, Martínez-Lapuente L, Guadalupe Z, Ayestarán B, Rivas-Gonzalo JC, Escribano-Bailón MT. 2014. Relationship between skin cell wall composition and anthocyanin extractability of Vitis vinifera L. cv. Tempranillo at different grape ripeness degree. Food Chem. 146:41–7.
181. Bindon KA, Madani SH, Pendleton P, Smith PA, Kennedy JA. 2014. Factors affecting skin tannin extractability in ripening grapes. J. Agric. Food Chem. 62:1130–41.
182. Bindon KA, Bacic A, Kennedy JA. 2012. Tissue-specific and developmental modifications of grape cell walls influence the adsorption of proanthocyanidins. J. Agric. Food Chem. 60:9249–9260.
183. Arnous A, Meyer AS. 2010. Discriminated release of phenolic substances from red wine grape skins (Vitis vinifera L.) by multicomponent enzymes treatment. Biochem. Eng. J. 49:68–77.
184. DeMartini JD, Pattathil S, Avci U, Szekalski K, Mazumder K, Hahn MG, Wyman CE. 2011. Application of monoclonal antibodies to investigate plant cell wall deconstruction for biofuels production. Energy Environ. Sci. 4:4332.
185. Busse-Valverde N, Gómez-Plaza E, López-Roca JM, Gil-Muñoz R, Fernández-Fernández JI, Bautista-Ortín AB. 2010. Effect of different enological practices on skin and seed proanthocyanidins in three varietal wines. J. Agric. Food Chem. 58:11333–9.
186. May PF. 2009. PINOTAGE: Behind the Legends of South Africa’s Own Wine, 1st ed. Inform and Enlighten, St Albans.
187. Rio-Segade S, Torchio F, Giacosa S, Aimonino DR, Gay P, Lambri M, Dordoni R, Gerbi V, Rolle L. 2014. Impact of several pre-treatments on the extraction of phenolic compounds in winegrape varieties with different anthocyanin profiles and skin mechanical properties. J. Agric. Food Chem. 62:8437–8451.
188. Álvarez I, Aleixandre JL, García MJ, Lizama V. 2006. Impact of prefermentative maceration on the phenolic and volatile compounds in Monastrell red wines. Anal. Chim. Acta 563:109–115.
Stellenbosch University https://scholar.sun.ac.za

Chapter 3
Research results
Following the compositional changes of fresh grape skin cell walls during the fermentation
process in the presence and absence of maceration enzymes
This manuscript has been accepted for publication in Journal of Agricultural and Food Chemistry
Stellenbosch University https://scholar.sun.ac.za

45
Following the compositional changes of fresh grape skin cell
walls during the fermentation process in the presence and
absence of maceration enzymes
Anscha J. J. Zietsman1, John P. Moore1, Jonatan U. Fangel2, William G.T. Willats2, Johan
Trygg3, and Melané A. Vivier1*
1. Institute for Wine Biotechnology, Department of Viticulture and Oenology, Faculty of
AgriSciences, Stellenbosch University, Matieland 7602, South Africa
2. Department of Plant and Environmental Sciences, Faculty of Science, University of Copenhagen,
DK-1001, Denmark
3. Computational Life Science Cluster (CLiC), Department of Chemistry, Umeå University, Sweden
ABSTRACT
Cell wall profiling technologies were used to follow compositional changes that occurred in the
skins of grape berries (from two different ripeness levels) during fermentation and enzyme
maceration. Multivariate data analysis showed that the fermentation process yielded cell walls
enriched in hemicellulose components because pectin was solubilized (and removed) with a
reduction as well as exposure of cell wall proteins usually embedded within the cell wall
structure. The addition of enzymes caused even more depectination and the enzymes
unravelled the cell walls enabling better access to, and extraction of, all cell wall polymers.
Overripe grapes had cell walls that were extensively hydrolysed and depolymerized probably by
natural grape tissue ripening enzymes and this enhanced the impact that the maceration
enzymes had on the cell wall monosaccharide profile. The combination of the techniques that
were used is an effective direct measurement of the hydrolysis actions of maceration enzymes
on the cell walls of grape berry skin.
Keywords: Cell Wall, Grape Skin, Maceration Enzymes, Grape Maturity, Multivariate Data
Analysis
Contact information for Corresponding Author
Melané A. Vivier, Institute for Wine Biotechnology, Department of Viticulture and Oenology,
Faculty of AgriSciences, Stellenbosch University, Matieland 7602, South Africa,
Tel. +27 21 808 3773, Fax +27 21 808 3771, [email protected]
Stellenbosch University https://scholar.sun.ac.za

46
INTRODUCTION
The quality of a red wine is determined primarily by the presence and relative abundance of
phenolic and varietal aroma compounds1.Studies investigating the distribution of the aroma and
phenolic compounds between the juice, pulp and skin of the grape berry show that the grape
skin, specifically the skin cell vacuoles, are a primary source of these compounds2–5. During red
wine maceration the cell walls of the grape berry are disrupted and become perforated,
promoting the leaching of aroma and phenolic compounds into the fermenting must6. The
maceration process can be enhanced with the addition of maceration enzymes including
pectinolytic enzymes, hemicellulases and cellulases7.
The efficacy of cell wall hydrolysis by maceration enzyme preparations is often tested by
measuring the indirect consequences of cell wall breakdown. For example the release of total
polyphenols, polysaccharides and specific anthocyanins can be quantified; or the color of the
resulting wine; the free run juice collected at the press; or the free and bonded aroma
compounds of the wine can be measured as an indirect indication of enzyme action8–13. Using
the known plant cell wall polysaccharide molar ratios (e.g. XXXG which has a molar ratio of 3:4
for xylose to glucose) and then combining these reference data with the quantitative data (from
monosaccharide analysis14 ) of samples selected before and after enzyme treatment it is
possible to calculate and predict the composition of the original polymers of the sample and the
changes due to enzyme treatment15. With this approach it was shown15 that maceration
enzymes caused a decrease in arabinose, galactose, uronic acid and total sugar concentration
which suggested that pectin degradation took place, although these polymers were not directly
monitored.
Similar changes (a decrease in galactose, an increase in the water-soluble fraction and de-
esterification of uronic acids) were seen in the grape skin cell wall during grape ripening16,17. In
fruit, cell wall loosening and pectin degradation lead to pore formation18. New studies19,20 have
shown that high cell wall porosity implies an increase in binding sites between cell wall polymers
and polyphenols such as condensed tannins and anthocyanins. Due to the retention of these
polyphenols by cell wall particles, a lower concentration might end up in the wine. Cell wall
porosity can also influence the ability of the maceration enzymes to penetrate the cell wall and
reach their targets 21–23. Thus, both ripening and maceration enzymes might have positive and
negative impacts on wine quality and therefore it is extremely important to understand how both
these concepts influence the cell wall composition and deconstruction.
Our aim with this study was to perform an evaluation of the cell walls of fresh Vitis vinifera cv
Pinotage grape skins, fermented skins and skins macerated with enzymes during fermentation,
Stellenbosch University https://scholar.sun.ac.za

47
by applying cell wall profiling methods that were optimised for grape berries24. Both ripe and
overripe grapes were used in order to investigate the impact of cell wall degradation due to
ripening on these processes. We have applied comprehensive microarray polymer profiling
(CoMPP) to monitor the cell wall polysaccharides and proteins directly by virtue of the presence
of epitopes. This is the first study, to our knowledge, that uses CoMPP to investigate the effect
of maceration enzymes on the cell walls of grape berry skin during wine fermentation. CoMPP
analysis is a semi-quantitative high throughput profiling technique and consists of the sequential
extraction of the pectin (CDTA extract) and hemicellulose (NaOH extract) fractions from cell wall
material25. These fractions are then printed onto nitrocellulose membranes and then probed with
monoclonal antibodies (mAbs) as well as carbohydrate binding modules (CBMs). The data
obtained provides an indication of the relative abundance of specific cell wall polysaccharides in
a sample. The CoMPP data is supported by monosaccharide compositional analysis (GC-MS)
and reflectance spectroscopy (FT-MIR) data. Multivariate data analysis tools were used to
identify the components that characterized the differences in cell walls sourced from the
different treatments. The combination of methods employed are complementary and produced
valuable information on the variation in both the surface polymers as well as the profile of
polymer building blocks present at different ripeness levels, winemaking stages or after
different enzyme treatments.
MATERIALS AND METHODS
Vinification of wine. Vitis vinifera cv Pinotage grapes were sourced from vineyards in the
Boland region of South Africa, during the 2012 and 2013 vintages. Fermentations were done in
triplicate in 2012 and quadruplicate in 2013 in polypropylene buckets with 5 kg de-stemmed and
crushed grapes per bucket (weighed, de-stemmed and crushed individually; one bucket is one
biological repeat). After the grapes were crushed, sodium metabisulfite was added (30 ppm
SO2) and the total acid was adjusted to 6.5 g/L. The yeast strain, Saccharomyces cerevisiae
VIN13 (Anchor Yeast, Johannesburg, South Africa) were rehydrated and inoculated according
to the manufacturer’s recommendations and yeast nutrition was supplemented with Fermaid
KTM (Lallemand, Bellville, South Africa). Where applicable, Rapidase Ex Color, -CB and -
Expression (DSM Food Specialties, Heerlen, The Netherlands) were added to the crushed
grapes at a dosage of 0.03 g/L. The manufacturer of these enzymes declares (Product data
sheets, www.dsm-foodspecialities.com) that all the mixes have primarily pectinolytic activity but
that RapidaseCB has been formulated with enhanced polygalacturonase activity, Rapidase®
Ex Color has additional hemicellulases for optimum grape skin extraction during maceration and
Rapidase® Expression formulations contain arabinases and rhamnogalacturonases.
Fermentations were conducted at 25°C and the grape skin caps were punched down twice
Stellenbosch University https://scholar.sun.ac.za

48
daily. At the end of alcoholic fermentation the wines were pressed and transferred to 4.5 L glass
bottles fitted with fermentation caps. The pomace was stored at 4 C until analysis (up to one
week). Freeze dried Oenococcus oeni, Lalvin VP41 (Lallemand, South Africa), supplemented
with OPTI-MALO-PLUS (Lallemand), was inoculated in the wine to induce malolactic
fermentation (MLF) and the fermentations were incubated at 20C. At the end of MLF the wine
was racked off the lees, sulfited (80 ppm SO2), stabilised at 4°C and then filtered and bottled.
General oenological parameters. Three 50 mL samples of the juice were randomly selected
from the buckets after the grapes were crushed, and analyzed for sugar and acid concentration
using Fourier transform infrared (FT-IR) spectroscopy with a WineScan™ FT120 Basic (FOSS
Analytical,Hillerød, Denmark). The same instrument was used to analyse the pH, volatile acidity,
total acid, glucose + fructose and ethanol of two 50 mL wine samples from each biological
repeat at the end of MLF. The FT-IR scans were done in duplicate per sample (two technical
repeats). Wine samples for color analysis were collected three months after the wines have
been bottled. The pH of all samples was adjusted to 3.5 and the color characteristics were
determined according to Iland et al.26 using a Specord 50 UV/VIS spectrophotometer (Analytik
Jena, Jena, Germany). The analysis was done in triplicate.
Pinotage skin cell wall preparation. For the fresh grape skin samples the grapes were
selected from different harvest crates, from different bunches and from the top, middle and
bottom of a bunch to mimic the variability that is found in a commercial harvest batch. The
berries were frozen and stored at -20C before the skins were obtained by manually peeling the
grapes with a scalpel and flash-freezing the skins in liquid nitrogen. Twenty-one samples of 10 g
each (wet weight) were collected in 2012 and twelve in 2013, kept at -80 C before freeze-
drying. The fermented grape skin samples (with and without enzyme treatment) were collected
at the end of alcoholic fermentation after pressing (at least two samples per biological repeat)
and stored at 4C before excess pulp was removed from the skins with a scalpel and the skins
were freeze-dried. Samples of 10 g (wet weight) were milled and homogenized with a Retsch
MM400 mixer mill (Retsch, Haan, Germany) at a frequency of 30Hz for 30 seconds and the
resulting powder was used for the isolation of the cell walls using the method described by
Ortega-Regules et al. 27 with the following changes. The first acetone step after the buffered
phenol extraction was omitted. Furthermore, after the third acetone wash the alcohol insoluble
residue (AIR) was air-dried and then mixed with a volume of MilliQ water, roughly equal to the
pellet size of the AIR, frozen at -80C and then freeze-dried.
Stellenbosch University https://scholar.sun.ac.za

49
Mid-infrared spectroscopy. AIR isolated from fresh and fermented Pinotage skins (with and
without the addition of maceration enzymes) was analyzed by infrared spectroscopy. The
samples were placed in direct contact with the diamond window and the spectra between 4000
and 600 cm-1 were acquired using a NEXUS 670 (Thermo Scientific, MA, USA) fitted with a
Golden Gate Diamond ATR (attenuated total reflectance). A Geon-KBr beam splitter and
DTGS/Csl detector were used and each sample was scanned 128 times. The FT-MIR spectra
data were filtered with a MSC (multiplicative scatter correction) filter to compensate for light
scattering and differences in the effective path length. The spectra for the fingerprint region
(1400 – 800 cm-1) where every polysaccharide has its own unique pattern, as well as
wavelengths from 1400 up to 1800 cm-1 that conveys information about functional groups 28,29
were compared between treatments. The spectra shown in the results section represent the
average absorbance from at least five AIR samples per treatment. Technical repeats were done
once every tenth scan to control for technical reproducibility.
Monosaccharide analysis of cell wall samples. The monosaccharide composition of the AIR
isolated from the grape skins were analyzed according to the method described in 30 and used
on grape cell walls in 24 including a few modifications. Approximately 5 mg of AIR was
hydrolyzed to monosaccharides using 2M TFA and incubated for 2 hours at 110C30. This was
followed by derivatization to methoxy sugars at 80 C for 16 h. After silylation with HMDS +
TMCS + Pyridine 3:1:9 (Sylon HTP) kit (Sigma-Aldrich, MO, USA) the derivatives were
separated and analyzed in a gas chromatograph, Agilent 6890 N (Agilent Technologies, CA,
USA) coupled to a Agilent 5975 MS mass spectrometer detector, using a polar (95%
dimethylpolysiloxane) ZB-Semivolatiles Guardian (30 m, 0.25 mm ID, 0.25 µm film thickness)
GC column. The oven temperature was maintained at 70 C for 2 min, ramped at 1 C/min to 76
C, then at 8 C/min to 300 C and then held for 5 min. The monosaccharide composition was
expressed as the mole percentage contribution of each monosaccharide in relation to the nine
monosaccharides present. Error bars in the histograms or the standard deviation in the tables
represents the mean of at least three biological samples.
Comprehensive microarray polymer profiling (CoMPP) analysis of cell wall fractions. The
pectin- and hemicellulose-rich fractions of the cell wall samples were sequentially extracted
from 10 mg AIR samples using the solvents CDTA (diamino-cyclo-hexane-tetra-acetic acid) and
NaOH respectively according to the procedure described elsewhere24. Arrays printed with the
different fractions were probed individually with 26 different monoclonal antibodies (mAbs) and
carbohydrate binding modules (CBMs) as previously described25. A mean spot signal was
Stellenbosch University https://scholar.sun.ac.za

50
calculated where after it was normalized to the highest signal (set as 100) in the dataset and a
cut-off value of five was used.
Multivariate and univariate statistics. Univariate statistical analysis were done (ANOVA, with
P = 0.05) under the guidance of the Centre for Statistical Consultation at Stellenbosch
University (Prof Martin Kidd) using Statistica 10 (StatSoft Southern Africa - Analytics, Sandton,
South Africa). Multivariate analysis by means of principle component analysis (PCA)31 and
orthogonal projections to latent structures (OPLS) were performed using SIMCA 13 software
package (Umetrics AB, Umeå, Sweden).
RESULTS AND DISCUSSION
In this study we used Pinotage grapes that were at different ripeness levels as reflected in the
Glucose + Fructose (2012: 227 g/L and 2013: 265 g/L) and total acid (2012: 5.37 g/L and 2013:
4.85 g/L) concentrations of the juice samples (Table S1). According to traditional ripeness
criteria discussed in the supplementary data (S 1.1), the grapes at 22.7 B were considered to
be at optimum ripeness while those at 26.5 B are deemed overripe 32,33. Each year we
compared the cell wall composition of fresh (unfermented) skins with skins that went through an
alcoholic fermentation. Additionally, we investigated the cell walls from fermentations
supplemented with commercial maceration enzymes and compared them to their no-enzyme-
added counterparts to determine the changes due to enzymatic hydrolysis. In order to evaluate
the influence of ripeness levels, we compared the results from the samples over the two years
with each other.
Effect of ripeness level in the fresh grape skin cell walls. The mol% ratio of the nine main
monosaccharides found in grape skin cell walls of Pinotage is shown in Figure 1 and confirms
the abundance (ca. 35 mol%) in galacturonic acid (GalA) as previously shown for grape skin14.
The profile obtained (ca. 20 mol% arabinose [Ara], 15 mol% xylose [Xyl] and galactose [Gal],
and lower than 10 mol% for the other sugars) compared well with other red wine cultivars such
as Cabernet Sauvignon, Merlot and Shiraz 27,34. However, direct comparisons of
monosaccharides levels should be avoided due to different methods (TMS methyl glycosides or
alditol acetates 30) that were used to determine the uronic acids since this influences the relative
molar ratios obtained.
Stellenbosch University https://scholar.sun.ac.za

51
0
10
20
30
40
50
Ara Rha Fuc Xyl GalA Man Gal Glc GlcA
Mo
l %
*
*
*
22.7 B
26.5 B
Figure 1. The monosaccharide composition of cell walls from ripe (22.7 B, 2012) and overripe (26.5 B,
2013) fresh Pinotage grape skin.The bars represent the average of at least 10 biological repeats. The
stars indicate a statistical significant difference for of a specific monosaccharide (T-test, 95% confidence
level) between the two ripeness levels. Ara, arabinose; Rha, rhamnose; Fuc, fucose; Xyl, xylose; GalA,
galacturonic acid; Man, mannose; Gal, galactose; Glc, glucose; GlcA, glucoronic acid.
The abundance of homogalacturonan (HG) in the skin cell walls was confirmed with the CoMPP
analysis, as indicated by the signal values in the heat map (Figure 2, CDTA fraction, fresh
samples). The cell walls also contained high levels of xyloglucan (mAbs LM15 and LM25) and
cellulose (mAb CBM3a), with the latter dissolving along with the hemicellulose fraction (Figure
2, NaOH fraction, fresh samples) which might be a reflection of the known association between
the cellulose and hemicellulose network in plant cell walls35. Both the pectin and the
hemicellulose fraction showed the presence of arabinogalactan proteins (AGPs) and extensins.
-1,5-L-Arabinan and -1,4-D-galactan, probably linked to rhamnogalaturonan I (RG-I), were
found in the hemicellulosic fraction. This corresponded with work done by Zykwinska et al.36 on
alkali extracts from potato and sugar beet cell walls where they observed strong interaction
between arabinan or galactan side chains and the cellulose microfibrils surface and were also
observe in grape tissue24.
Stellenbosch University https://scholar.sun.ac.za

52
Gra
pe
mat
rix
Frac
tio
ns
Trea
tmen
t
HG
wit
h a
low
DE
(mA
b JI
M5)
HG
wit
h a
high
DE
(mA
b JI
M7)
HG
Par
tial
ly m
ethy
lest
erif
ied
(mA
b LM
18)
HG
Par
tial
ly m
ethy
lest
erif
ied
(mA
b LM
19)
HG
Par
tial
ly m
ethy
lest
erif
ied
(mA
b LM
20)
-1
,4-g
alac
tan
(mA
b LM
5)
-1
,5-L
-ara
bina
n (m
Ab
LM6)
Feru
late
d
-1,4
-D-
gala
ctan
(m
Ab
LM9)
Line
aris
ed -
1,5-
L-ar
abin
an (
mA
b LM
13)
Feru
loyl
ate
on a
ny p
olym
er (
mA
b LM
12)
-1
,3-D
-glu
can
(mA
b B
S-40
0-2)
-1
,3-1
,4-D
-glu
can
(mA
b B
S-40
0-3)
-1
,4-D
-(ga
lact
o)(g
luco
)man
an (
mA
b LM
21)
-1
,4-D
-(gl
uco)
man
nan
(mA
b LM
22)
Xylo
gluc
an (
XXXG
mot
if)
(mA
b LM
15)
Xylo
gluc
an (
mA
b LM
25)
-1
,4-D
-xyl
an/a
rabi
noxy
lan
(mA
b LM
11)
Cel
ulos
e (c
ryst
allin
e) (
mA
b C
BM
3a)
Exte
nsin
(m
Ab
LM1)
Exte
nsin
(m
Ab
JIM
19)
Exte
nsin
(m
Ab
JIM
20)
AG
P (m
Ab
JIM
4)
AG
P (m
Ab
JIM
8)
AG
P (m
Ab
JIM
13)
AG
P (m
Ab
LM14
)
AG
P,
-lin
ked
Glc
A (
mA
b LM
2)
Fresh 38 75 24 42 48 0 7 0 0 0 0 0 0 0 0 1 0 0 0 0 0 0 7 16 2 4
Fermented 17 42 14 18 22 0 4 0 0 0 0 0 0 0 0 0 0 0 0 0 0 0 6 15 2 3
ExCol 27 52 19 28 32 0 5 0 0 0 0 0 0 0 0 2 0 0 0 0 0 0 11 20 5 5
Expr 22 48 16 22 25 0 1 0 0 0 0 0 0 0 0 0 0 0 0 0 0 0 7 16 3 3
CB 27 53 19 29 29 0 2 0 0 0 0 0 0 0 0 1 0 0 0 0 0 0 10 18 3 3
Fresh 0 0 0 0 0 8 1 0 0 0 1 0 44 23 86 87 0 81 22 0 18 0 10 24 4 1
Fermented 0 0 0 4 0 9 9 0 0 0 12 0 44 24 68 71 0 65 16 0 11 0 11 24 5 1
ExCol 0 0 1 11 0 16 11 0 0 0 17 1 47 29 76 79 3 72 31 0 23 3 20 36 14 9
Expr 0 0 0 4 0 16 9 0 0 0 19 2 48 28 82 81 5 72 31 0 25 5 24 40 18 11
CB 0 0 0 2 0 16 9 0 0 0 17 0 49 29 83 82 3 73 29 0 23 5 22 39 17 11
Fresh 51 95 42 53 42 0 11 0 0 0 0 0 0 0 0 2 0 0 0 0 0 0 17 25 6 6
Fermented 11 63 11 28 9 0 4 0 0 0 0 0 0 0 0 0 0 0 0 0 0 0 14 22 6 2
ExCol 16 62 15 34 8 0 1 0 0 0 1 0 0 0 0 0 1 0 0 0 0 0 13 21 4 1
Expr 14 58 14 32 4 0 0 0 0 0 1 0 0 0 0 0 0 0 0 0 0 0 14 21 6 0
CB 11 52 12 28 4 0 1 0 0 0 2 0 0 0 0 0 0 0 0 0 0 0 14 21 6 1
Fresh 0 0 0 0 0 10 3 0 0 0 25 0 23 15 54 58 2 51 18 0 9 0 6 14 0 0
Fermented 0 0 0 0 0 6 2 0 0 0 49 0 24 16 48 53 3 47 3 0 0 0 4 11 0 0
ExCol 0 0 0 0 0 4 0 0 0 0 52 0 21 14 45 51 0 48 4 0 2 0 4 11 1 0
Expr 0 0 0 2 0 4 1 0 0 0 58 0 23 14 44 51 1 47 2 0 0 0 4 11 0 0
CB 0 0 0 0 0 3 0 0 0 0 59 0 20 14 44 48 1 45 1 0 0 0 2 10 0 0
0 20 40 60 80 100
26.5
B (
2013
)22
.7
B (
2012
) CD
TAN
aOH
CD
TAN
aOH
Figure 2. Heat map (CoMPP results) showing the relative abundance of the cell wall polysaccharides found in the pectin (CDTA) and hemicellulose (NaOH)
fractions extracted from the cell walls of fresh and fermented (with and w/o maceration enzyme treatment) grape skins. Fresh = extracts from fresh skin cell walls.
Fermented = extracts prepared from the cell walls of skins sampled at the end of alcoholic fermentation (without enzyme addition). ExCol, Expr and CB = the same
as Fermented but with the addition of Rapidase ExColor, Rapidase Expression and Rapidase CB enzymes. Values are the average of at least 3 biological
repeats.
Stellenbosch University https://scholar.sun.ac.za

53
Figure 3. ComPP results showing a PCA score plot (A) and loading plot (B) of the hemicellulose fraction
(NaOH) of cell walls from fresh skins for ripe (22.7 B, 2012, Black circle) and overripe (26.5 B, 2013,
Grey circle) grapes. Subgroups are circled and the variance in the ripe (22.7 B) skin data is highlighted
with an arrow. Xyg, xyloglucan.
Comparing ripe (22.7 B) with overripe (26.5 B) Pinotage skin cell walls (Figure 1) the overripe
samples had significantly (95% confidence level) less Gal (2.9 mol % decrease) and Xyl (2.8
mol % decrease) but more GalA (8.8 mol % increase). The lower percentage contribution of Gal
in the overripe grapes corresponds with what other authors17,24,34 described as typical changes
during fruit and grape berry ripening and is believed to be related to arabinogalactan
B
Xyg & Cellulose
Callose
A
PC1 (84%)
PC
2 (
11%
)
22.7 B 26.5 B
Rip
enes
s va
riab
ility
Stellenbosch University https://scholar.sun.ac.za

54
degradation as fruit softens. The lower mol % of Xyl and Gal in the overripe grapes is
corroborated by the CoMPP analysis (Figure 2, fresh samples and PCA plot of NaOH fraction,
Figure 3 A-B) where a decrease in xyloglucan (mAbs LM15 and LM25) and -1,4-D-
(galacto)(gluco)mannan (mAb LM21) was observed in the skin cell walls of the riper grapes.
This was accompanied by a decrease in cellulose (mAb CBM3a); similar results were seen by
Yakushiji et al.,37 and Vicens et al.17 reported a decrease in Xyl with a concurrent decrease in
xyloglucan during ripening, confirming that not only pectin polysaccharides depolymerize with
fruit ripening, but also hemicelluloses.
There is no consensus yet on the fate of GalA in the grape skin during ripening. According to
the data from Ortega-Regules et al.34 the uronic acid concentration reaches a peak before grape
maturity and then declines (Monastrel and Cabernet Sauvignon grapes), but this was not
confirmed for all the cultivars that were tested (Syrah increased and Merlot decreased with
ripening). The higher levels of GalA found in our overripe grape skins might be due to
mesocarp material that peeled off along with the skin. The higher GalA levels were confirmed
with the CoMPP data (Figure 2 and PCA plot, Figure 4 A-B, CDTA extract) where the overripe
skins were more abundant in HG epitopes (mAbs LM18, LM19, JIM7, and JIM5) than the ripe
skins. Additionally the overripe skins showed more arabinogalacturonan proteins (AGPs) (mAbs
JIM8, JIM13) which corresponded well with the observed accumulation of structural cell wall
proteins during fruit ripening17,38. The overripe samples were more abundant in -1,3-D-glucan
(callose) (NaOH fraction, Figure 3B, PC2 = 11 %) which is typically formed in response to
pathogen-induced stress or wounding39. The overripe and softer grapes were probably more
vulnerable to wounding during the harvest and the peeling of the skins. (The separation of the
22.7 from the 26.5B samples is not dominated by the abundance of mAb BS400-2 (callose) as
suggested by Figure 3, because the overall pattern of a PCA where we excluded this antibody
[results not shown] were unchanged from the PCA in Figure 3).
The PCA plots of the CoMPP data for fresh cell walls sampled from grapes at the two different
ripeness levels (Figure 3A and Figure 4A) showed significant heterogeneity between the
samples within a harvest. This is indicated in the NaOH fraction (Figure 3) by the different
subgroups formed by the 26.5 B samples (circled) as well as a strong spread of the 22.7 B
samples along the second component axis, shown by an arrow. Closer examination of the
CDTA fraction revealed that certain samples from both ripeness levels clustered together
(Figure 4, indicated in a block) because they have an abundance of HG, AGPs and extensins.
These samples thus contained a higher percentage of riper skins than the other samples from
Stellenbosch University https://scholar.sun.ac.za

55
their respective ripeness-level-groups, and demonstrated the heterogeneity found in the grapes
harvested for a standard commercial wine fermentation.
Figure 4. ComPP results showing a PCA score plot (A) and loading plot (B) of the pectin fraction (CDTA)
of cell walls from fresh Pinotage skins at different ripeness levels (22.7 B, 2012, Black circle) and
26.5B, 2013, Grey circle ). Subgroups are encircled and indicate that the separation of the groups is
driven by an abundance in AGPs and HG.
A
HG
AGPs
Xyloglucan
B
Stellenbosch University https://scholar.sun.ac.za

56
Effect of the maceration enzymes on the fermented grape skin cell walls. During the
maceration step of red wine fermentation the ethanol formed, penetrates the berry cell walls and
permeabilize the plasma- and the vacuolar membranes of the cells and serves as an extraction
solvent for a range of molecules including high molecular weight tannins6. Furthermore, pectin
solubilization also occurs during fermentation because organic acids such as malate, citrate and
phytic acids present in grape must, act as chelating agents, removing the calcium ions that form
bridges between HG polymers22. Thus, even with no addition of maceration enzymes, cell wall
modifications probably occur as a consequence of the fermentation process alone.
Figure 5. Mol % changes in the monosaccharide composition of the cell walls extracted from fresh and
fermented Pinotage skins in 2012 and 2013. Significant changes (indicated by stars) brought about by the
fermentation process is an increase in Man and Glc and a slight decrease in Ara (95 % confidence level,
ANOVA). The bars represent the average of at least three biological repeats.
The most marked impact of the fermentation process (Figure 5) was an increase in mannose
(Man) (2.9 mol% in 2012 and 5.3 in 2013) and glucose (Glc) (8.2 mol% in 2012 and 6.8 in 2013)
and a slight decrease in Ara (3.8 mol% in 2012 and 2.7 in 2013). The increase in Glc and Man
is probably due to a reduction in pectin polymers leading to a relative increase in polymers such
as cellulose, mannan and xyloglucan. Although not statistically significant, GalA values showed
a decreasing trend (2.8 mol% in 2012 and 5.6 in 2013, T-test, 90% significance) as a result of
the fermentation. This decrease was also clearly visible in the CoMPP data of Figure S1 A-B.
0
10
20
30
40
50
Ara Rha Fuc Xyl GalA Man Gal Glc GlcA
Mo
l % *
22.7 B, Fresh
22.7 B, Fermented
26.5 B, Fresh
*
*
26.5 B, Fermented
Stellenbosch University https://scholar.sun.ac.za

57
This PCA plot shows the fermented (without enzymes) samples on the left separating from the
fresh, unfermented samples on the right. The separation or variance was due to the abundance
of HG polymers (labelled by mAbs JIM5, JIM7, LM18, LM19 and LM20) in the fresh samples. A
similar analysis with the FT-MIR spectra (Figure 6) also indicated that the fresh skin cell walls
had more pectin (high absorbance at 1095 and 1157 – 1147 cm-1).
Figure 6. FT-MIR spectra of the fresh versus fermented (without enzymes) cell walls at two ripeness
levels. ______ Fresh (22.7B, 2012);_ _ _ _ _Fermented (22.7B, 2012); . ______ Fresh (26.5B, 2013);_
_ _ _ _Fermented (26.5B, 2013). The areas and peaks that represent typical chemical groups found in
plant cell walls are shown on the spectra and in the table. The biggest variations are at wavelengths 1650
and 1550 cm-1
where the cell walls isolated from the fresh skins have a lower absorbance than the
fermented samples indicating that they have less cell wall proteins. Another interesting area is the peak
at 1095 cm-1
that shows that the cell walls isolated from fresh skins have more pectin than the fermented
samples. The spectra represent the average absorbance from at least five AIR samples per treatment.
Another explanation for the elevated Man concentration (Figure 5) of the fermented samples
may be the presence of the wine yeast. Forty percent of the wine yeast cell wall (dry weight)
consists of mannoproteins and 98 % of the sugar in this cell wall component is Man40. Yeast cell
wall debris that sticks to grape skin fragments could possibly end up in the cell wall extracts and
thus inflate the Man values. Similarly, yeast cell wall debris that contains -1,3-D-glucan41 might
also have contributed to the elevation in Glc concentration seen, but a more likely source could
be from callose (-1,3-D-glucan) formation in the fermented grape skins. The formation of
callose in grape berries that are crushed and punched down during the red wine production
Stellenbosch University https://scholar.sun.ac.za

58
process is plausible and CoMPP analysis confirmed the presence of -1,3-D-glucan (mAb BS-
400-2, specific to callose). It is not known whether this mAb will also label -1,3-D-glucan in
yeast cell walls, but from other results by our group (unpublished) we regularly see a signal for
mAb BS-400-2 in grape tissue that did not undergo fermentation.
Finally, the decrease in Ara because of the fermentation process may be attributed to the
release of AGPs and type II arabinogalactans into the fermenting must. These molecules
constitute ca. 40% of the total polysaccharides found in red wine42,43 and Guadalupe and
Ayestarán44 showed the Ara concentration increased to more than 150 mg/L at the end of
alcoholic fermentation. However, the FT-MIR data (Figure 6) showed that the fermented skin
cell walls had more protein (high absorbance at 1650 and 1550 cm-1) than the fresh skins. This
seems to be in contrast to the decrease in Ara and the assumed loss of AGPs, but it needs to
be considered that the monosaccharide analysis measured the total amount of Ara in the
samples, whereas the FT-MIR spectra only “evaluated” the surface or cell wall proteins exposed
after depectination. In general, therefore, we see that the fermentation process caused similar
compositional changes in the skin cell walls of grapes, irrespective of the ripeness level of the
skins. However, the ripeness might have an influence on the magnitude of the changes
observed. This can be seen in Figure 6 at wavelengths 1550 and 1650 cm-1, where the grey
dotted line that represents the fermented samples at 26.5 B showed the largest deviation from
the fresh samples.
Color analysis (results in supplementary section [S 1.2 and Table S1]) on the wine prepared in
this study showed no significant improvement in the color density of the wines produced from
enzyme treated fermentations. To supplement this indirect evaluation of the impact of enzymes,
we were asking the question whether this implies that the maceration enzymes did not alter the
cell walls of the skins. This led to the final investigation of this study where we aimed to
determine how typical, commercial maceration enzymes change the cell walls of grape skins
during fermentation. We therefore compared the samples from the enzyme-free fermentations
with samples from the enzyme-assisted fermentations. The most dominant changes (Figure 7,
95 % confidence level, ANOVA) to the monosaccharide composition of the cell walls brought
about by the enzymes were: (1) an increase in the Man (avg. of 3.7 mol% in 2012 and 4.8 in
2013) and Glc (no significant increase in 2012 and avg. of 4.7 mol% in 2013) and a (2)
decrease in Ara (avg. of 2.3 mol% in 2012 and 2.9 in 2013), Rha (avg. of 0.9 mol% in 2012
and 1.1 in 2013) and GalA (no significant increase in 2012 and an avg. of 9.6 mol% in 2013)
composition. As previously discussed, the relative increase of the cellulose, mannan and
xyloglucan monosaccharides (Man and Glc) is a consequence of the degradation of pectin
Stellenbosch University https://scholar.sun.ac.za

59
polymers (HG and RG) but this time it was due to the hydrolysis and depectination of the cell
wall polysaccharides by the maceration enzymes (enzyme treated values were compared to
control fermentation values). Similarly, the decrease in Ara and Rha is an indication of RG-I,
arabinan and AGP degradation. We thus see the same type of monosaccharide changes
occurring in enzyme-free and enzyme-assisted fermentation, but the enzymes increased the
magnitude of the changes. Maceration enzymes might also introduce additional changes to the
cell wall, such as the proportional decrease in Rha (Figure 7), since a similar decrease was not
observed under enzyme-free conditions (Figure 5).
Figure 7. Mol % changes in the monosaccharide composition of the cell walls from Pinotage skins from
fermented (no enzyme addition) and maceration enzyme treated fermentations at 22.7 and 26.5 B.
Different letters indicate a significant difference for a specific sugar, between the different treatments (95
% confidence level, ANOVA). Fermented stands for cell wall samples from fermentation without enzyme
addition. ExCol, Expr and CB is cell wall samples from fermentation with the addition of Rapidase Ex
Color, Rapidase Expression and Rapidase CB respectively. The values represent the average of three
biological repeats.
Stellenbosch University https://scholar.sun.ac.za

60
On the polymer level (CoMPP data) one would expect to see that maceration enzyme action
lead to a consequential decrease in pectin polymers reflecting the decrease in GalA and Rha
values. (We did in fact note a loss of pectin in the FT-MIR spectra [Figure S2] for the enzyme
treated samples). One would expect depectination to be the most prominent change because
pectinases are the major enzyme activity present in the maceration enzyme preparations that
were used. However, the CoMPP heat map (Figure 2) showed an increase in HG labelling
(CDTA fraction, all HG mAbs) of the enzyme treated skins of 2012 (22.7 B) compared to the
control fermentation skins. Considering that the polymers that were identified in the different
fractions of the CoMPP analysis were those polymers extracted and dissolved in CDTA and
NaOH respectively, we can speculate that the increase in HG was the result of enzyme
hydrolysis that unravelled the cell wall structure. This process allowed more of the HG that is
interspersed with the hemicellulose-cellulose scaffold to move out and dissolve in the CDTA
leading to higher labelling signals. In the overripe grape skins (26.5 B) however, the values
only increased for mAbs JIM5 andLM19 and only for ExCol treated samples. In general, for the
overripe grape skins there was only an initial marked decrease in HG and -1,5-L-arabinan as a
result of the depectination that took place during the standard red wine fermentation (no added
enzymes).
In the hemicellulose fraction of the ripe grapes 2012 (Figure 2) there was an increase in the
dissolved -1,4-D-galactan, mannans (slight), xyloglucans (mAbs LM15 and LM25), cellulose
mAb CBM3a), extensins (mAb JIM20) and AGPs (mAbs JIM4, JIM8, JIM13, LM14 and LM2)
which can all be ascribed to the hydrolysis actions of the enzymes that enhanced the
solubilization of these polymers in the NaOH extract. As with the CDTA fraction, these effects
were not repeated in the NaOH fraction of the overripe grapes. This may indicate that the high
degree of cell wall degradation that took place due to the natural grape ripening processes in
the overripe grapes led to a near complete removal of all easily accessible cell wall polymers
during the fermentation, even in the control fermentation. No significant additional change due
to hydrolysis by the maceration enzymes could be detected in the overripe cell walls. Thus,
quantitatively (monosaccharide data) the maceration enzyme actions have a similar effect than
the natural grape tissue ripening enzymes (depectination) but their mode of action might be
different. The former seems to contribute to an increase in cell wall porosity, which is not seen
with the latter. This might indicate that the plant ripening enzymes act in a block wise fashion
(as seen with plant pectin methyl esterases (pPME)45,46 while the fungal enzymes from
commercial maceration preparations act more randomly (as seen with some fungal pectin
methyl esterases)47. However, the differences observed might just be a factor of the degree of
degradation that has taken place. As hydrolysis time increase (as grapes ripen or longer
incubation with maceration enzymes), the degradation might progress in alternating stages of
Stellenbosch University https://scholar.sun.ac.za

61
depolymerization and diffusion of the resulting oligomers into the surrounding matrix (fermenting
must) and pore formation.
Figure 8. Score (A) and loading (B) plot of a correlation matrix analysis on the monosaccharide
composition of enzyme treated grape skin cell walls compared to samples from the control fermentation
(no enzyme addition, represented by the intersection of the axis) at two different ripeness levels.
Orthogonal projections to latent structures (OPLS) models48 were used to focus more
specifically on the difference between each enzyme treatment effect versus its control. The
resulting six OPLS models (three treatments /vintage) can be summarized by its correlation
Ripeness levels
Fermented
PC1 90%
PC
2 7
%
A
B
Stellenbosch University https://scholar.sun.ac.za

62
loadings. These correlation values of the models were portrayed in principle component
analysis (PCA) plots (Figure 8 for monosaccharides and Figure 9 for CoMPP data). This
showed (Figure 8) that in terms of monosaccharide composition all the enzymes had a similar
effect on the cell wall (all are in the same direction, a distance away from the control samples
represented by the intersection of the axis). However, the 2013 enzyme treated samples were
further removed along the first component axis (PC1 = 90%) than the 2012 samples indicating a
greater impact on monosaccharide composition. This impact is partly due to the hydrolysis by
the commercial maceration enzymes but it is also the result endogenous cell wall enzymes.
The loading plot confirms that the enzyme treated cell walls have a higher proportion of Man
and Glc and lower percentage of Ara, Rha and GalA than the control group. The cell walls
treated with Rapidase CB during 2012 are the main contributors to the variance along the
second component of the model and this variance is driven by a relative abundance of Xyl in the
samples. According to the manufacturer, Rapidase CB has primarily pectinase activity with
enhanced polygalacturonases thus, this unique behaviour could not be connected to a specific
enzyme activity present in Rapidase CB.
On a polymer level (CoMPP data), the correlation values obtained from OPLS models on
individual enzyme treatments versus the enzyme-free fermentation are shown in the PCA plots
of Figure 9. In the analysis of the CDTA fraction (Figure 9A and B) ExCol 2012 and CB 2012
were positively correlated with an abundance in HG (mAbs JIM7 and LM20) in the first
component (PC1 = 68%), and xyloglucan (mAb LM25), -1,5-L-arabinan (mAb LM6) and AGPs
(mAb JIM13, LM14 and LM2) in the second component (PC2 = 26%). Expr 2012 had a positive
correlation with HG labelled by mAbs LM18 and LM19 and JIM5. In 2013, Expr and ExCol
showed a positive correlation with an abundance in HG (mAbs LM19, LM18 and JIM5) (also
seen in heat map, Figure 2), but CB 2013 was not showing the same effect. In the NaOH
fraction (Figure 9C and D) all the enzyme treatments in 2012 correlated positively (PC1 = 82
%), with the abundance in -1,4-galactan (mAb LM5), mannan (mAb LM21 and LM22),
xyloglucan, cellulose and AGP. The opposite was true for all the enzymes in 2013. Thus, the
enzyme action of ExCol 2012, CB 2012, Expr 2013 and ExCol 2013 enhanced extraction of HG
in the CDTA fraction although the effect was much stronger in 2012. In the hemicellulose
fraction, all the enzymes during 2012 enhanced the extraction of hemicelluloses, cellulose and
AGPs while none of the enzyme treatments in 2013 caused any changes.
Stellenbosch University https://scholar.sun.ac.za

63
Figure 9. Score (A) and loading (B) plot of a correlation matrix analysis on the CDTA fraction (CoMPP
data) of enzyme treated grape skin cell walls compared to samples from the control fermentation (no
enzyme addition). Score (C) and loading (D) plot of a correlation matrix analysis on the NaOH fraction
(CoMPP data) of enzyme treated grape skin cell walls compared to samples from the control fermentation
(no enzyme addition). The codes for the epitopes are described in Figure 2. Xyg, xyloglucan.
PC1 68%
PC
2 2
6%
Fermented
A
HG Xyg
Arabinan
B
AGPs
Stellenbosch University https://scholar.sun.ac.za

64
Figure 9 C-D
Taken together, we saw that all enzyme treatments group together in the same direction for
grapes from a specific year, which indicated that they affected the cell walls in a similar
fashion. The ripeness level of grapes had a significant effect on the cell walls of the grape
tissue as a result of the action of the endogenous enzymes. The maceration enzymes
appear to have similar activity profiles than these enzymes, which makes it difficult to
distinguishing between the action of the ripening enzymes and the maceration enzymes.
However, this could also be due to the limitations of the CoMPP technique.
In conclusion, this study shows that depectination and consequential exposure of the
hemicellulose-cellulose framework and proteins of the cell walls in the skin occurs as a
Xyg
Arabinan
Callose
D
PC1 82%
PC
1 1
7%
C
Fermented
Stellenbosch University https://scholar.sun.ac.za

65
consequence of the fermentation (no enzymes) process. With the addition of maceration
enzymes, further depectination takes place and depending on the ripeness level of the
grapes it was possible to infer an unravelling of the cell wall. We were unable to distinguish
between the different maceration enzyme preparations in terms of their specific effects on
the cell walls. Future work could use samples from the same vineyard at different harvest
dates (levels of ripeness) and different concentrations of maceration enzymes to refine the
observations made here. Together with wine colour analysis, it is necessary to look at the
concentration of polyphenols retained in the grape skin tissue after fermentation and
maceration enzyme treatment.
Supporting Information Available: A detailed discussion on the ripeness levels of the grapes, the
FT-IR analysis of the wine as well as the results obtained with the wine color analysis are provided in
the supplementary data. A PCA plot that shows the patterns in the data when comparing fresh and
fermented samples as well as the FT-MIR spectra for the enzyme treated cell walls are also shown.
This material is available free of charge via the Internet at http://pubs.acs.org.
REFERENCES
(1) Garrido, J.; Borges, F. Wine and grape polyphenols — A chemical perspective. Food Res. Int.
2013, 54, 1844–1858.
(2) Pinelo, M.; Arnous, A.; Meyer, A. S. Upgrading of grape skins: Significance of plant cell-wall
structural components and extraction techniques for phenol release. Trends Food Sci.
Technol. 2006, 17, 579–590.
(3) Gomez, E.; Martinez, A.; Laencina, J. Localization of free and bound aromatic compounds
among skin , juice and pulp fractions of some grape varieties. Vitis 1994, 4, 1–4.
(4) Darriet, P.; Thibon, C.; Dubourdieu, D. Aroma and Aroma Precursors in Grape Berry. In The
biochemistry of the grape berry; Geros, H.; Chaves, M. M.; Delrot, S., Eds.; Bentham e Books,
2012; pp. 111–136.
(5) Fontes, N.; Corte-Real, M.; Geros, H. New observations on the integrity, structure, and
physiology of flesh cells from fully ripened grape berry. Am. J. Enol. Vitic. 2011, 62, 279–284.
(6) González-Neves, G.; Gil, G.; Ferrer, M.; Charamelo, D.; Balado, J.; Bochicchio, R.; Gatto, G.;
Tessore, A. Prediction of the colour and polyphenolic composition of the young red wines from
the phenolic potential of the grapes. Int. J. Food Sci. Technol. 2010, 45, 1843–1851.
Stellenbosch University https://scholar.sun.ac.za

66
(7) Jackson, R. S. Wine science: Principles and applications. Wine science: Principles and
applications; 3rd ed.; Academic Press, Inc.: San Diego, 2008.
(8) Ducasse, M.-A.; Canal-Llauberes, R.-M.; de Lumley, M.; Williams, P.; Souquet, J.-M.;
Fulcrand, H.; Doco, T.; Cheynier, V. Effect of macerating enzyme treatment on the polyphenol
and polysaccharide composition of red wines. Food Chem. 2010, 118, 369–376.
(9) Wightman, J. D.; Price, S. F.; Watson, B. T.; Wrolstad, R. . Some effects of processing
enzymes on anthocyanins and phenolics in Pinot noir and Cabernet Sauvignon wines. Am. J.
Enol. Vitic. 1997, 48, 39–48.
(10) Haight, K.; Gump, B. The use of macerating enzymes in grape juice processing. Am. J. Enol.
Vitic. 1994, 45, 113–116.
(11) Busse-Valverde, N.; Gómez-Plaza, E.; López-Roca, J. M.; Gil-Muñoz, R.; Bautista-Ortín, A. B.
The extraction of anthocyanins and proanthocyanidins from grapes to wine during fermentative
maceration is affected by the enological technique. J. Agric. Food Chem. 2011, 59, 5450–
5455.
(12) González-Pombo, P.; Fariña, L.; Carrau, F.; Batista-Viera, F.; Brena, B. M. Aroma
enhancement in wines using co-immobilized Aspergillus niger glycosidases. Food Chem.
2014, 143, 185–191.
(13) Arnous, A.; Meyer, A. S. Discriminated release of phenolic substances from red wine grape
skins (Vitis vinifera L.) by multicomponent enzymes treatment. Biochem. Eng. J. 2010, 49, 68–
77.
(14) Arnous, A.; Meyer, A. S. Quantitative prediction of cell wall polysaccharide composition in
grape (Vitis vinifera L.) and apple (Malus domestica) skins from acid hydrolysis
monosaccharide profiles. J. Agric. Food Chem. 2009, 57, 3611–3619.
(15) Romero-Cascales, I.; Ros-García, J. M.; López-Roca, J. M.; Gómez-Plaza, E. The effect of a
commercial pectolytic enzyme on grape skin cell wall degradation and colour evolution during
the maceration process. Food Chem. 2012, 130, 626–631.
(16) Hernández-Hierro, J. M.; Quijada-Morín, N.; Martínez-Lapuente, L.; Guadalupe, Z.; Ayestarán,
B.; Rivas-Gonzalo, J. C.; Escribano-Bailón, M. T. Relationship between skin cell wall
composition and anthocyanin extractability of Vitis vinifera L. cv. Tempranillo at different grape
ripeness degree. Food Chem. 2014, 146, 41–47.
Stellenbosch University https://scholar.sun.ac.za

67
(17) Vicens, A.; Fournand, D.; Williams, P.; Sidhoum, L.; Moutounet, M.; Doco, T. Changes in
polysaccharide and protein composition of cell walls in grape berry skin (Cv. Shiraz) during
ripening and over-ripening. J. Agric. Food Chem. 2009, 57, 2955–2960.
(18) Brummell, D. A. Review : Cell wall disassembly in ripening fruit. Funct. plant Biol. 2006, 33,
103–119.
(19) Bindon, K. A.; Madani, S. H.; Pendleton, P.; Smith, P. A.; Kennedy, J. A. Factors affecting skin
tannin extractability in ripening grapes. J. Agric. Food Chem. 2014, 62, 1130–1141.
(20) Ruiz-Garcia, Y.; Smith, P. A.; Bindon, K. A. Selective extraction of polysaccharide affects the
adsorption of proanthocyanidin by grape cell walls. Carbohydr. Polym. 2014, 114, 102–114.
(21) Hanlin, R. L.; Hrmova, M.; Harbertson, J. F.; Downey, M. O. Review: Condensed tannin and
grape cell wall interactions and their impact on tannin extractability into wine. Aust. J. Grape
Wine Res. 2010, 16, 173–188.
(22) Jarvis, M. C. Plant cell walls: Supramolecular assemblies. Food Hydrocoll. 2011, 25, 257–262.
(23) Fleischer, A.; O’Neill, M.; Ehwald, R. The pore size of non-graminaceous plant cell walls is
rapidly decreased by Borate ester cross-linking of the pectic polysaccharide
rhamnogalacturonan II. Plant Physiol. 1999, 121, 829–838.
(24) Moore, J. P.; Fangel, J. U.; Willats, W. G. T.; Vivier, M. A. Pectic-β(1,4)-galactan, extensin and
arabinogalactan-protein epitopes differentiate ripening stages in wine and table grape cell
walls. Ann. Bot. 2014, 114, 1279–1294.
(25) Moller, I.; Sørensen, I.; Bernal, A. J.; Blaukopf, C.; Lee, K.; Øbro, J.; Pettolino, F.; Roberts, A.;
Mikkelsen, J. D.; Knox, J. P.; Bacic, A.; Willats, W. G. T. High-throughput mapping of cell-wall
polymers within and between plants using novel microarrays. Plant J. 2007, 50, 1118–1128.
(26) Iland, P. .; Ewart, A.; Sitters, J.; Markides, A.; Bruer, N. Techniques for chemical analysis and
quality monitoring during winemaking. Techniques for chemical analysis and quality monitoring
during winemaking; Patrick Iland Wine Promotions: Campbelltown, Australia, 2000.
(27) Ortega-Regules, A.; Ros-García, J. M.; Bautista-Ortín, A. B.; López-Roca, J. M.; Gómez-
Plaza, E. Differences in morphology and composition of skin and pulp cell walls from grapes
(Vitis vinifera L.): technological implications. Eur. Food Res. Technol. 2008, 227, 223–231.
(28) Szymanska-Chargot, M.; Zdunek, A. Use of FT-IR spectra and PCA to the bulk
characterization of cell wall residues of fruits and vegetables along a fraction process. Food
Biophys. 2013, 8, 29–42.
Stellenbosch University https://scholar.sun.ac.za

68
(29) Kacurakova, M.; Capek, P.; Sasinkova, V.; Wellner, N.; Ebringerova, A.; Kac, M. FT-IR study
of plant cell wall model compounds : pectic polysaccharides and hemicelluloses. Carbohydr.
Polym. 2000, 43, 195–203.
(30) York, W. S.; Darvill, A. G.; L, M. M.; Stevenson, T. T.; Albersheim, P. Isolation and
characterization of plant cell walls and cell wall components. Methods Enzymol. 1985, 2, 3–40.
(31) Jackson, J. E. A User’s Guide to Principal Components. A User’s Guide to Principal
Components; Wiley Series in Probability and Statistics; John Wiley & Sons, Inc.: Hoboken, NJ,
USA, 1991.
(32) Coombe, B. G.; Dundon, R. J.; Short, A. W. S. Indices of sugar-acidity as ripeness criteria for
winegrapes. J. Sci. Food Agric. 1980, 31, 495–502.
(33) Du Plessis, C. . Optimum maturity and quality parameters in grapes: A review. South African J.
Enol. Vitic. 1984, 5.
(34) Ortega-Regules, A.; Ros-García, J. M.; Bautista-Ortín, A. B.; Lopez-Roca, J. M.; Gomez-
Plaza, E. Changes in skin cell wall composition during the maturation of four premium wine
grape varieties. J. Sci. Food Agric. 2008, 88, 420–428.
(35) Hayashi, T. Xyloglucans in the primary cell wall. Annu. Rev. Plant Physiol. Plant Mol. Biol.
1989, 40, 139–168.
(36) Zykwinska, A. Organization of pectic arabinan and galactan side chains in association with
cellulose microfibrils in primary cell walls and related models envisaged. 2007, 58, 1795–1802.
(37) Yakushiji, H.; Sakurai, N.; Morinaga, K. Changes in cell-wall polysaccharides from the
mesocarp of grape berries during veraison. Physiol. Plant. 2001, 111, 188–195.
(38) Huang, X.-M.; Huang, H.-B.; Wang, H.-C. Cell walls of loosening skin in post-veraison grape
berries lose structural polysaccharides and calcium while accumulate structural proteins. Sci.
Hortic. (Amsterdam). 2005, 104, 249–263.
(39) Albersheim, P.; Darvill, A.; Roberts, K.; Sederoff, R.; Staehelin, A. Plant cell walls (From
chemistry to biology). Garland Science: New York, 2010.
(40) Quirós, M.; Morales, P.; Pérez-Través, L.; Barcenilla, J. M.; Gonzalez, R. A new methodology
to determine cell wall mannoprotein content and release in wine yeasts. Food Chem. 2011,
125, 760–766.
Stellenbosch University https://scholar.sun.ac.za

69
(41) Dallies, N.; François, J.; Paquet, V. A new method for quantitative determination of
polysaccharides in the yeast cell wall. Application to the cell wall defective mutants of
Saccharomyces cerevisiae. Yeast 1998, 14, 1297–1306.
(42) Pellerin, P.; Vidal, S.; Williams, P.; Brillouet, J. M. Characterization of five type II
arabinogalactan-protein fractions from red wine of increasing uronic acid content. Carbohydr.
Res. 1995, 277, 135–143.
(43) Vidal, S.; Williams, P.; Doco, T.; Moutounet, M.; Pellerin, P. The polysaccharides of red wine:
total fractionation and characterization. Carbohydr. Polym. 2003, 54, 439–447.
(44) Guadalupe, Z.; Ayestarán, B. Polysaccharide profile and content during the vinification and
aging of Tempranillo red wines. J. Agric. Food Chem. 2007, 55, 10720–10728.
(45) Willats, W. G. T.; Gilmartin, P. M.; Mikkelsen, J. D.; Knox, J. P. Cell wall antibodies without
immunization : generation and use of de-esterified homogalacturonan block-specific antibodies
from a naive phage display library. plant J. 1999, 18, 57–65.
(46) Micheli, F. Pectin methylesterases: cell wall enzymes with important roles in plant physiology.
Trends Plant Sci. 2001, 6, 414–419.
(47) Benen, J. A. E.; Van Alebeek, G. J.; Voragen, A. G. J.; De Vries, R. P.; Visser, J. Pectic
esterases. In Handbook of Food enzymology; Whitaker, J. R.; Voragen, A. G. J.; Wong, D. W.
S., Eds.; Marcel Dekker: New York, 2003; pp. 849–856.
(48) Trygg, J.; Wold, S. Orthogonal projections to latent structures (O-PLS). J. Chemom. 2002, 16,
119–128.
(49) Lu, P.; Hsieh, Y.-L. Cellulose isolation and core–shell nanostructures of cellulose nanocrystals
from Chardonnay grape skins. Carbohydr. Polym. 2012, 87, 2546–2553.
AUTHOR INFORMATION
A. Zietsman collected the data, interpreted the results and drafted the manuscript. J. Moore and M.
Vivier designed the study, helped with data interpretation and preparation of the final document. J.
Fangel and W. Willats did the CoMPP analysis. J. Trygg advised on multivariate data analysis.
Stellenbosch University https://scholar.sun.ac.za

70
Funding
Funding for this study was provided by the Wine industry network of expertise and technology
(Winetech), Technology and Human Resources for Industry Programme (THRIP), Institute for Wine
Biotechnology (IWBT), Stellenbosch University, and the National Research Fund (NRF).
SUPPLEMENTARY DATA
S 1.1 Wine fermentation. Table S1 shows the chemical and color characteristics of the
juice and the wine as determined during the harvest seasons of 2012 and 2013. The
ripeness of the grapes from the two vintages showed a large difference as reflected in the
Glc + Fruc (2012: 227 g/L and 2013: 265 g/L) and total acid (2012: 5.37 g/L and 2013: 4.85
g/L) values of the juice. During the 1980s various publications advised different equations for
determining the optimum ripeness of wine grapes. Using the Coombe et al.1 equation (sugar
concentration [B] x pH2 ) the viticulturist should aim for a value between 200 and 270 while
Du Plessis2 proposed a sugar:acid ratio (B: Total Acid in g/L) of four.
Table S1. Chemical properties of Pinotage juice (before yeast inoculation) and the resulting wine at
the end of alcoholic fermentation for 2012 and 2013. Colour density (420 + 520 nm) was determined
after three months of bottle aging. The values are the average of three biological repeats. Only the
volatile acidity of 2012 showed a statistical significant difference between the values and they were
marked with letters to indicate the differences (unpaired T-test, 95% confidence interval) between
them. Fermented = wine without enzyme addition. ExCol, Expr and CB is wine fermented with the
addition of Rapidase Ex Color, Rapidase Expression and Rapidase CB respectively.
Juice 3.28 ± 0.02 5.37 ± 0.11 227 ± 1.42
Fermented 3.39 ± 0.01 0.43a± 0.03 6.59 ± 0.09 1.30 ± 0.14 14.32 ± 0.12 11.76 ± 1.09
ExCol 3.35 ± 0.04 0.45a± 0.04 6.87 ± 0.29 1.29 ± 0.02 14.07 ± 0.38 12.39 ± 0.65
Expr 3.40 ± 0.02 0.50b± 0.01 6.60 ± 0.14 1.30 ± 0.11 14.15 ± 0.10 12.34 ± 0.68
CB 3.40 ± 0.01 0.47a± 0.03 6.62 ± 0.12 1.28 ± 0.06 14.38 ± 0.19 12.33 ± 0.97
Juice 3.71 ± 0.07 4.85 ± 0.20 265 ± 0.96
Fermented 3.71 ± 0.04 0.24 ± 0.04 4.47 ± 0.19 3.51 ± 0.60 14.55 ± 0.49 9.66 ± 1.74
ExCol 3.63 ± 0.07 0.25 ± 0.02 4.64 ± 0.15 3.12 ± 0.54 13.36 ± 1.60 8.78 ± 1.71
Expr 3.75 ± 0.04 0.32 ± 0.04 4.47 ± 0.16 3.71 ± 0.38 14.21 ± 0.48 9.61 ± 0.71
CB 3.74 ± 0.04 0.32 ± 0.03 4.44 ± 0.10 3.03 ± 0.68 13.93 ± 0.90 9.57 ± 0.72
Colour
density
Ethanol
%
2012
2013
pHVolatile
acidity
Total
Acid (g/L)
Gluc +
Fruc (g/L)
Stellenbosch University https://scholar.sun.ac.za

71
Thus, the Pinotage harvested in 2012 meet the criteria with values of 246 and 4.2
respectively while the 2013 Pinotage would be qualified as overripe. However the current
opinion of the Pinotage association (www.pinotage.co.za; April 2014) of South Africa
recommends a minimum sugar level of 23 B and that the optimum ripeness for the
production of a “fuller style” Pinotage is at sugar levels between 24 and 26 B with the total
acid > 5.5 g/L and pH < 3.7. Both fermentations were fermented dry (< 5 g/L Glc + Fruc)
after five and six days respectively with acceptable (0.3 – 0.6 g/L) volatile acidity levels.
Furthermore, it is clear that the enzyme treatments did not significantly alter the chemical
characteristics (pH, volatile acidity, total acidity, residual sugar and ethanol %) of the wine
compared to the control wine of each vintage.
S 1.2 Wine color results. The wine color characteristics were measured to give an
indication of the amount of anthocyanins that leached from the grape skin cells during the
maceration period. This is an indirect method, in contrast to the other methods used in this
article, with which to determine the extent of the permeabilization that occurred in the grape
skin cell wall as a result of the action of the maceration enzymes. For the analysis the wine
pH was adjusted to pH 3.5 and an excess of acetaldehyde were added to eliminate the
bleaching effect of SO2 after which the absorbance of samples was measured at OD420 and
OD520. The sum of the measurements is the value for the colour density of the wine.
In a study3 where the grape phenolics of Pinotage were compared with four other red
cultivars (Merlot, Shiraz, Cabernet franc and Cabernet Sauvignon), Pinotage had the highest
anthocyanin (mg/g berry) and total phenolics (mg/g berry) content of all five cultivars. When
comparing the modified color densities of the wines from the different cultivars, Pinotage had
the second highest value (11.65) after Shiraz (12.3), placing it in the “deep red” wine color
category. The modified color density of the control wine of 2012 from this study compares
well with the results from Du Toit3 having a modified color density of 11.8, but in 2013 the
value for the control wine was only 9.7. According to Fournand and others4 some cultivars
exhibit a decline in anthocyanin content near or after maturity and this can be ascribed to β-
glycosidase and peroxidase activity.
For both the 2012 and 2013 vintages, treatment with maceration enzymes did not improve
the color density of the resulting wines, with color densities only slightly higher, equal to, or
even lower than the control fermentation. This emphasizes the value of the CoMPP method
that shows the direct impact of the enzymes on the cell wall composition.
Stellenbosch University https://scholar.sun.ac.za

72
Figure S1. CoMPP results showing the effect that the fermentation has on the cell wall composition in
the CDTA fraction;(A) score plot and (B) loading plot. Fresh grape skin cell walls (22.7 B, 2012,
black circle and 26.5B, 2013, grey circle) are compared to fermented (without enzymes) (22.7 B,
2012, black triangle and 26.5B, 2013, grey triangle) cell walls. Xyg, xyloglucan.
HG
Depectination
Xyg, AGPs & Extensins
B
Fresh
Rip
enes
s le
vels
Fermented
PC1 (82%)
A
PC
2 (1
0%
)
Stellenbosch University https://scholar.sun.ac.za

73
Figure S2. The effect of maceration enzymes on the FT-MIR spectra of the skin cell walls. Similarly
to Figure 7 there is an increase in cell wall proteins (exposure on surface of AIR particles) and a
decrease in pectins for enzyme treated skins compared to fermented (without enzyme addition) skins.
The spectra represent the average absorbance from at least five AIR samples per treatment. Control
= Fermented cell wall samples without enzyme addition, ExCol, Expr and CB = Fermented cell wall
samples with the addition of RapidaseExColor, -Expression and –CB respectively, 12 = 2012 and 13
= 2013.
REFERENCES
(1) Coombe, B. G.; Dundon, R. J.; Short, A. W. S. Indices of sugar-acidity as ripeness
criteria for winegrapes. J. Sci. Food Agric. 1980, 31, 495–502.
(2) Du Plessis, C. . Optimum maturity and quality parameters in grapes: A review. South
African J. Enol. Vitic. 1984, 5.
(3) Du Toit, W. Colour and phenolic characteristics of different clones of Pinot noir,
Pinotage, Merlot, Shiraz, Cabernet franc and Cabernet Sauvignon. Wynboer 2008,
September.
Wavenumber cm-1
Stellenbosch University https://scholar.sun.ac.za

74
(4) Fournand, D.; Vicens, A.; Sidhoum, L.; Souquet, J.-M.; Moutounet, M.; Cheynier, V.
Accumulation and extractability of grape skin tannins and anthocyanins at different
advanced physiological stages. J. Agric. Food Chem. 2006, 54, 7331–7338.
Stellenbosch University https://scholar.sun.ac.za

Chapter 4
Research results
Unravelling grape skin and pomace cell walls with enzymes and heat pretreatment
This manuscript will be submitted for publication in the journal Carbohydrate Polymers
Stellenbosch University https://scholar.sun.ac.za

75
Unravelling grape skin and pomace cell walls with enzymes
and heat pretreatment
Anscha J. J. Zietsman1, John P. Moore1, Jonatan U. Fangel2, William G.T. Willats2, Melané A.
Vivier1*
1Institute for Wine Biotechnology, Department of Viticulture and Oenology, Faculty of AgriSciences,
Stellenbosch University, Matieland 7602, South Africa
2Department of Plant and Environmental Sciences, Faculty of Science, University of Copenhagen, DK-
1001, Denmark
Abstract
Enzymes are used as processing aids to facilitate extraction of compounds from grapes and
need to effectively act on the cell walls of berry skin and pulp. Cell walls from fresh, ripe, red
berry skins, as well as crushed berry pomace were hydrolysed with different pure and
commercial enzymes in buffered conditions. Cell wall profiling techniques were used to monitor
the compositional changes in the grape cell wall polymers during enzyme hydrolysis and heat-
pretreatment. Extensive enzymatic hydrolysis, achieved with a mixture of pectinases, cellulase
and hemicellulase enzymes, completely removed or reduced levels of pectin polymers but less
extensive hydrolysis only opened up the cell wall structure and allowed extraction of polymers
from within the cell wall layers. Heat pretreatment had a similar depectination effect but it also
uncovered xylan polymers. The sequence in which cell wall polymers could be extracted and
the role that specific enzymes played in facilitating the extraction enabled us to form a picture of
the accessibility of specific cell wall polymers and demonstrated enzyme synergism.
Keywords: Cell wall polymer, Grape berry, Grape pomace, Enzyme, Pretreatment
Contact information for Corresponding Author
Melané A. Vivier, Institute for Wine Biotechnology, Department of Viticulture and Oenology,
Faculty of AgriSciences, Stellenbosch University, Matieland 7602, South Africa,
Tel. +27 21 808 3773, Fax +27 21 808 3771, [email protected]
Stellenbosch University https://scholar.sun.ac.za

76
1. Introduction
Enzymes are important processing tools when utilizing plant material in the feed and food,
paper and pulp, biofuel or biopharmaceutical industries (Mabee et al., 2010; Sieiro et al., 2010;
Singh et al., 2014). The plant resources either need to be made accessible to extract desired
compounds and/or processed directly to form a product (Alvira et al., 2010; Hendriks et al.,
2009). Typically, the role of the enzymes is to disrupt the cellular structures of the plant material,
specifically acting on the plant cell walls. These are highly complex structurally and chemically,
but also dynamic and under control of both developmental and environmental signals (Keegstra,
2010). This may explain the frequent observation that enzymes used in industries reliant on
plant material, do not always deliver the desired effect, due to inherent batch and/or seasonal
variability of the starting material (Himmel et al., 2007; Ortega-Heras, Pérez-Magariño, &
González-Sanjosé, 2012).
In the wine industry hydrolytic enzymes are used to degrade the grape berry cell walls to
release aromatic and phenolic compounds that are important contributors towards wine quality,
as well as reduce cell wall components such as pectins to aid processing of the wines (Romero-
Cascales, Ros-García, López-Roca, & Gómez-Plaza, 2012). A by-product of the wine-making
process is the pomace, essentially made up of skins with some pulp, seeds and stalks (Yu et
al., 2013). This by-product has several uses and enzymes have the potential to support the
harvesting of revenue-generating compounds (e.g. nutraceuticals, antioxidants) from grape
pomace, or using pomace as biomass (Nerantzis et al., 2006; Rodríguez et al., 2010) in the
production of bioethanol. All these processes could still be significantly improved with more
comprehensive knowledge and understanding of the structure and composition of grape berry
cell walls to select the most appropriate (mixture of) enzymes and the industrial conditions to
favour the desired reaction.
The aim of this study was to evaluate the impact of enzymes on the berry cell wall matrix by
focusing on enzymes as fermentation supplements for quality wine production, as well as
processing aids in pomace “deconstruction”. Factors that can affect the extent of enzyme
hydrolysis of grape tissue, such as the type of enzyme, the enzyme-substrate ratio, the time and
temperature of the reaction, inhibition by the substrate and the incorporation of a pre-treatment
step when processing pomace, are some of the factors that were previously investigated
(Chamorro et al., 2012; Kammerer et al., 2005; Maier et al., 2007; Meyer et al., 1998; Xu et al.,
2014). It was found that commercial wine enzyme preparations (Fia et al., 2014; Romero-
Cascales et al., 2008) that are marketed for specific applications do not always have the optimal
enzymatic profile. Furthermore, grape berry cell walls of certain cultivars (Ortega-Regules et al.,
2008; Xu et al., 2014) are quite recalcitrant to enzyme hydrolysis. Better extraction of
Stellenbosch University https://scholar.sun.ac.za

77
polyphenols are observed if a pretreatment step is included and/or a combination of enzymes is
used (Alvira et al., 2010; Kammerer et al., 2005; Maier et al., 2007). It was previously
speculated that the natural pore size (between 4 and 10 kDa) of the grape cell wall (Hanlin et
al., 2010) excluded most hydrolytic enzymes from entering (Fleischer et al., 1999; Jarvis, 2011)
the cell wall and reaching their targets.
Most studies that investigate the success of enzymes in wine preparation or pomace
processing, focus on measuring the release of the desired compounds (Arnous et al., 2010; Xu
et al., 2014). This is then used to infer information regarding the grape berry cell wall matrix and
its deconstruction, without studying the cell wall residues, or the changes to the composition of
the cell wall. Our study had as focus the grape berry cell wall deconstruction process as
influenced by enzymes and studied the cell wall directly. We investigated the effect of hydrolytic
enzymes (different types and combinations) on isolated cell walls from Pinotage grape skins
and on Chardonnay pomace. Pinotage is a thick-skinned, red wine cultivar with relatively high
levels of polyphenolics (Goussard, 2008; May, 2009) and used for quality wine production. Cell
walls from this cultivar were used to evaluate how enzymes deconstruct berry cell walls under
ideal (temperature and pH) conditions, with potential impacts on quality and wine processing.
The Chardonnay pomace was used to study how the enzymes degrade this matrix and how
autoclaving, as a pretreatment, change the matrix encountered by the enzymes. Chardonnay
has thin berry skins (Goussard, 2008; Serratosa et al., 2014) and the Chardonnay pomace was
derived from just-pressed grapes, as is typical for most white wine fermentations. With this
analysis we aimed to shed light on how enzymes change the cell wall composition on a polymer
level by using established cell wall profiling tools viz. Comprehensive Microarray Polymer
Profiling (CoMPP) coupled with monosaccharide compositional analysis. (Fangel, 2013; Moore
et al., 2014; Nguema-Ona et al., 2012; Pedersen et al., 2012). From our results we could see a
clear distinction between extensive and moderate enzymatic hydrolysis and specific synergistic
relationships between enzymes were detected. We could also document for the first time, to our
knowledge, the cell wall changes that occur in grape tissue due to heat pretreatment, a common
practice in pomace valorisation used to reduce the grape tissue recalcitrance.
2. Materials and methods
2.1 Pinotage skin cell wall preparation.
Vitis vinifera cv Pinotage grapes were harvested in 2012 in the Boland wine producing area of
South Africa. The sugar concentration of the grapes were established to be 22.7 B by using
Fourier transform infrared (FT-IR) spectroscopy with a WineScan™ FT120 Basic (FOSS
Stellenbosch University https://scholar.sun.ac.za

78
Analytical,Hillerød, Denmark). Three random juice samples (50 ml each) were generated from
the harvested grapes and the FT-IR scans were done in duplicate per sample. Berries were
sampled from bunches randomly selected from different harvest crates and the berries were
picked from the top, middle and bottom of a bunch. The grapes were frozen at -20C before the
skins were manually peeled with a scalpel and flash frozen with liquid nitrogen in twenty 10 g
(wet weight) batches. The frozen skins were kept at -80C and then freeze-dried. The freeze-
dried skins were dry milled and homogenized with a Retsch MM400 mixer mill (Retsch,
Germany) at 30 Hz for 30 seconds and from the resulting powder, the cell wall or alcohol
insoluble residue (AIR) was extracted. The AIR extraction method described by Ortega-
Regules et al. (2008) was followed except that the first acetone step after the buffered phenol
extraction was omitted and after the third acetone wash, the AIR was air-dried, mixed with an
equal volume of MilliQ water, frozen at -80C and then freeze-dried and stored until further
analysis.
2.2 Enzymatic hydrolysis of Pinotage AIR using purified enzymes.
A representative sample of AIR was obtained by mixing together 200 mg from each of the
twenty AIR samples. From this pooled sample, 50 mg were used per reaction or biological
repeat. The AIR was suspended in citrate phosphate buffer, pH 5 to form a 7.5 % (w/v)
suspension and sodium azide was added at a final concentration of 0.02 % (w/v). The enzymes
used in the experiment (Pect, EPG, EG, EA and XG) are described in Table 1. A Thermo
Scientific™ Pierce™ BCA™ Protein Assay (Thermo Fisher Scientific Inc., USA) kit was used to
determine the protein concentration of each enzyme. A dosage of 180 U/g dry matter of
pectinase containing enzymes (Pect and EPG) and 40 U/g of all other enzymes (EG, EA and
XG) were added individually or in combinations (EPG-EG; EPG-EG-EA; Pect-XG; Pect-EG).
The reactions, performed in triplicate, were incubated at 40 C for 48 h, where after the residual
solids were washed with sterile distilled water, and finally freeze-dried.
2.3 Chardonnay pomace preparation
Vitis vinifera cv Chardonnay grapes were harvested in the Boland region of South Africa and
the pomace was obtained after the grapes were pressed with a hydraulic press (pressure not
exceeding 1.5 bar). The moisture content of the Chardonnay pomace samples were 97.4 %,
using the method described in (Özcan, 2006). The pomace was thoroughly mixed and randomly
divided into three batches and kept at -20 C until processed for sample preparation.
Stellenbosch University https://scholar.sun.ac.za

79
For analyses, sample preparation entailed manual seed removal and blending of the pomace
with a stick blender. To evaluate the impact of a processing step such as heat pretreatment on
the cell wall profile of pomace, five 10 g (wet weight) samples were freeze-dried and another
five were autoclaved (121C, 15 min, 100 kPa) before freeze-drying. These samples were
stored until AIR isolation. For enzyme analysis the deseeded, and blended pomace pulp was
mixed with a 0.12 M citrate phosphate buffer (pH 5 for purified enzyme analyses and pH 3 for
commercial enzymes) to form a 15 % (wet weight/v) suspension and autoclaved (121C, 15
min, 100 kPa) to inactivate the native grape and microbial enzymes. These suspensions were
then used for the various enzyme treatments described below.
Stellenbosch University https://scholar.sun.ac.za

80
Table 1: Purified and commercial enzymes used in this study.
Pect Sigma-Aldrich Pectinase
EPG Megazyme E-PGALS
EG Megazyme E-CELTR
XG Megazyme E-XEGP Xyloglucan-specific endo-1,4-β-glucanase, recombinant enzyme. 104 U/mg
EA Megazyme E-EARAB 15 U/mg
Cellc Novozymes Celluclast 1.5L
ExCol DSM RapidaseExColor
Expr DSM Rapidase Expression
a Depending on substrate
Pectolytic enzyme with additional hemicellulases, negligible levels of anthocyanases and cinnamyl
esterases.
Pectolytic activities with arabinase and rhamnogalacturonase, negligible levels of cinnamyl esterase.
Cellulase, hydrolysing b-1,4-D-glucosidic linkages.
19 U/mg
Description Declared activity
280 U/mg protein,
polygalacturonic
acid as substrate
19 - 71a U/mg,
assumed 40 U/mg
for this study
Endo-arabinase with α-L-arabinofuranosidase < 0.01% (on beet arabinan); endo-galactanase < 0.01%.
700 EGU/g
(endoglucanase
units)
No information
available
No information
available
Pectolytic enzyme preparation: contains mainly pectintranseliminase, polygalacturonase, pectin esterase
and small amounts of hemicellulases and cellulases.
Endo-polygalacturonase from A. niger , contains minor levels of endo-galactanase, endo-arabinase, pectin
transeliminase, arabinofuranosidase and b-galactosidase activity.
Endo-1,4-b-glucanase with minor levels of endo-1,4-b-xylanase, endo-1,4-b-mannanase, a-glucosidase, b-
glucosidase, b-xylosidase, a- and b-galactosidase, b-mannosidase and a-L-arabinofuranosidase activities.
Co
mm
erc
ial e
nzy
me
sP
uri
fie
d e
nzy
me
sName Supplier Catalogue name
Stellenbosch University https://scholar.sun.ac.za

81
2.4 Enzymatic hydrolysis of Chardonnay pomace with commercial enzymes
The autoclaved pomace suspension in 0.12 M citrate phosphate buffer pH 3 was used. The
commercial enzymes used in the experiment were Celluclast 1.5L, RapidaseExColor and R
apidaseExpression (Table 1). Factorial experimental design (MODDE software, Umetrics,
Sweden) was used to design a preliminary experiment to optimize the pH (pH 3, pH 4.5 or pH
6), temperature (15 C, 32.5 C or 50 C), enzyme loading (25 000 ppm or 50 000 ppm) and
enzyme combinations that gave the best results (measured as level of methanol produced,
results not shown). Other methods to determine the degree of cellulosic biomass degradation,
such as the fluorescent cellulose decay assay by Wischmann et al. (Wischmann et al., 2012)
and the Congo red/polysaccharide complex method by Woods et al. (Wood et al., 1988), were
tried, but gave unreliable/unreproducible results under our conditions. The six conditions that
produced the highest levels of methanol were chosen for the subsequent experiment and the
experimental layout (enzyme combinations and incubation conditions) are shown in Table 2.
Enzymes were filter sterilised (0.25-micron pore size) and added to the suspension and the
different hydrolysis reactions were done in triplicate at 15 or 50 C for 72 h. After enzyme
hydrolysis the supernatant and the residual pellet were separated with centrifugation and frozen
at -20 C until further analyses of supernatants or AIR extraction from the solid residue.
Table 2: Experimental layout of Chardonnay pomace incubated with commercial enzymes. The enzymes
are described in Table 1.
2.5 Characterizing the supernatant of the Chardonnay pomace incubated with commercial
enzymes.
The methanol concentrations and the levels of reducing sugars that were released in the
supernatant of the Chardonnay samples that were incubated with commercial enzymes were
determined according to the GC-FID method described in Louw et al. (2010) and the method
Sample Cellc ExCol Expr C pH
Control15 0 0 0 15 3
ExCol15 0 50000 0 15 3
Expr15 0 0 50000 15 3
Cellc, ExCol, Expr15 50000 50000 50000 15 3
Control50 0 0 0 50 3
Cellc, ExCol50 50000 50000 0 50 3
Cellc, Expr50 50000 0 50000 50 3
ExCol, Expr50 0 50000 50000 50 3
ppm
Stellenbosch University https://scholar.sun.ac.za

82
published by Miller (1959), respectively. The assays were performed in duplicate for each
biological repeat.
2.6 Enzymatic hydrolysis of Chardonnay pomace with purified enzymes
The prepared and autoclaved pomace, suspended in 0.12 M citrate phosphate buffer pH 5 was
used to evaluate the impact of purified enzymes on the cell walls of this matrix. Filter sterilized
purified enzymes (Pect, EPG, EG, EA and XG, Table 1) were added to the suspension
individually or in combinations (EPG-EG; EPG-EG-EA; Pect-XG; Pect-EG). For the pectinase
containing enzymes (Pect and EPG) 180 U/g dry matter was added and 40 U/g of all other
enzymes (EG, EA and XG) were added. The enzyme hydrolysis treatments as well as a control
sample (pomace suspension with no enzyme added) were done in triplicate. After incubation at
40 C for 48 h, the supernatants and residual pellets were separated with centrifugation and the
pellets were freeze-dried and stored at room temperature until further analyses.
2.7 Cell wall isolation from hydrolysed Chardonnay pomace
The freeze-dried pellets containing the solid residues from the enzyme hydrolysis treatments
(both the purified and the commercial enzyme treatments) were milled and homogenized with a
Retsch MM400 mixer mill (Retsch, Germany) at 30 Hz for 30 seconds. The cell walls (AIR) were
isolated from the resulting powder as described in Ortega-Regules et al. (2008) with a few
exceptions: The first acetone step after the buffered phenol extraction was omitted and after the
third acetone wash, the AIR was air-dried, mixed with an equal volume of MilliQ water, frozen at
-80C and then freeze-dried and stored until further analysis.
2.8 Cell wall profiling of AIR samples.
The monosaccharide composition of the AIR isolated, after enzyme hydrolysis, was analysed
following the method of Nguema-Ona et al. (2012) with a few modifications. Briefly, 5 mg of AIR
was hydrolysed to monosaccharides using trifluoroacetic acid (TFA), followed by derivatization
to methoxy sugars at 80 C for 16 h. After silylation with HMDS + TMCS + Pyridine 3:1:9 (Sylon
HTP) kit (Sigma-Aldrich, MO, USA) the derivatives were analysed in a gas chromatograph,
Agilent 6890 N (Agilent Technologies, CA, USA) coupled to a Agilent 5975 MS mass
spectrometer detector, using a polar (95% dimethylpolysiloxane) ZB-Semivolatiles Guardian (30
m, 0.25 mm ID, 0.25 µm film thickness) GC column. The oven temperature was maintained at
70 C for 2 min, ramped at 1 C/min to 76 C, then at 8 C/min to 300 C and then held for
5 min. The monosaccharide composition was expressed as pM/mg AIR. Each biological repeat
Stellenbosch University https://scholar.sun.ac.za

83
was analysed twice and standard deviations in the tables represent the average of three
biological samples.
One sample for each biological repeat (enzyme hydrolysis reaction) was analysed with the
CoMPP technique. CoMPP analysis entails the sequential extracted of the pectin- and
hemicellulose-rich fractions from 10 mg AIR per sample, using the solvents CDTA (diamino-
cyclo-hexane-tetra-acetic acid) and NaOH respectively according to the procedure described in
Moore et al. (2014). Arrays printed with the different fractions were probed individually with 26
different monoclonal antibodies (mAbs) and carbohydrate binding modules (CBMs) as
previously described (Moller et al., 2007). The probes that were used are listed in Table A1 in
the appendix. A mean spot signal was calculated where after it was normalized to the highest
signal (set as 100) in the dataset and a cut-off value of five was used.
2.9 Univariate and multivariate data analysis.
Statistical significant differences in the results were determined by using the unpaired T-Test
(95% confidence level). The patterns within the data were investigated with principle component
analysis (PCA) (Jackson, 1991) and partial least squares projections to latent structures (PLS)
(Eriksson et al., 2013) using SIMCA 13 software (Umetrics, Sweden).
3. RESULTS
3.1 The evaluation and profiling of the hydrolysis of fresh berry cell walls with purified
enzymes by using CoMPP and monosaccharide compositional analyses
The cell walls or AIR isolated from fresh Pinotage grape berry skins sampled at the ripe stage
were incubated with a collection of purified enzymes (Table 1) under buffered conditions
favouring the enzymes (pH 5, 40 C) to evaluate the (maximum) potential and impact of
hydrolysis on this matrix. By using isolated cell walls as substrate, we aimed to eliminate any
potential interfering substances (e.g. high sugar concentrations, phenolics, tannins and organic
acids present in grape juice) and improve the accessibility of enzymes to the target
polysaccharides. The enzymes were chosen to degrade different polysaccharide targets,
namely pectins, celluloses and hemicelluloses and the purified enzyme preparations exhibited
these main activities, although most (except the xyloglucanase) also contained some lesser
side activities (Table 1).
The enzymatically hydrolysed AIR was analysed using CoMPP analysis and the results in the
heat map (Fig. 1) shows the relative abundance of a specific cell wall polysaccharide, depicted
as a percentage of the whole dataset. Overall, the analysis showed that the CDTA fraction of
Stellenbosch University https://scholar.sun.ac.za

84
the control samples (no enzyme added) contained mostly pectin type polymers (Fig. 1), but
there was also xyloglucan (mAb LM25), arabinogalactan proteins (AGPs) and extensins
present, as expected. The second extraction with NaOH dissolved mainly hemicelluloses but
also contained cellulose (mAb CBM3a) and some unbranched RG-I. In all the reactions where
the Pect enzyme was involved (CDTA fraction) there was a drastic decrease in the values for
homogalacturonan (HG) epitopes (mAbs JIM5 and JIM7, LM19 and to a lesser degree LM18)
compared to the control samples. This indicated that the HG polymers were probably degraded
into smaller oligosaccharides, which could diffuse out from within the AIR particles, into the
incubation buffer and were subsequently removed at the end of the enzyme incubation period.
The HG with very low methylesterification, recognized by mAb PAM1, was an exception with the
values staying more or less stable with or without enzyme addition. There was also a complete
removal of rhamnogalacturonan-I (RG-I) (mAbs INRA-RU1 and INRA-RU2) and xyloglucan
(mAb LM25). The presence of xyloglucan (mAb LM25) in the pectin fraction and the
concomitant removal of the xyloglucan and pectin polymers in the Pect treated samples may be
a confirmation of the xyloglucan-pectin association found in grape (Vidal et al., 2003) and other
plant cell walls (Popper et al., 2008).
All the other enzymes (EPG, EG, EA, XG and combination of these) nearly doubled the levels of
HG (specifically mAbs JIM5 and JIM7) that could be extracted with CDTA from the AIR (Fig. 1).
The XG treatment delivered the highest values in HG (mAbs JIM5, JIM7, LM18, and LM19)
compared to the control samples, possibly indicating that the hydrolysis of the xyloglucan that
cross-links the cellulose microfibrils has an influence on the release of polymers from within the
cell wall. The levels of unbranched RG-I (mAbs INRA-RU1 and INRA-RU1), xyloglucan (mAb
LM25) and AGPs (mAb JIM13) were not altered by these enzymes (in contrast with Pect).
Stellenbosch University https://scholar.sun.ac.za

85
HG parti
ally/d
e-est
erified (m
Ab JIM
5)
HG parti
ally est
erifie
d (mAb JI
M7)
HG parti
ally/d
e-est
erified (m
Ab LM18)
HG parti
ally/d
e-est
erified (m
Ab LM19)
HG parti
ally est
erifie
d (mAb LM
20)
HG ±30 co
ntiguous u
n-ME G
alA (m
Ab PAM
1)
HG Ca2+ d
imers
(mAb 2
F4)
RG-I, 6 u
nbranch
ed disa
cch (m
Ab INRA-R
U1)
RG-I, 2 u
nbranch
ed disa
cch (m
Ab INRA-R
U2)
b-1,4
-D-g
alacta
n (mAb LM
5)
a-1
,5-L
-ara
binan (m
Ab LM6)
Linear
ised a
-1,5
-L-a
rabin
an (mAb LM
13)
b-1,4
-D-(g
alacto)(g
luco
)mannan (m
Ab LM21)
b-1,4
-D-(g
luco
)mannan (m
Ab LM22)
b-1,3
-D-g
luca
n (mAb B
S-400-2
)
Xyloglu
can (X
XXG motif
) (m
Ab LM15)
Xyloglu
can (X
LLG o
ligosa
cchar
ide) (
mAb LM
24)
Xyloglu
can (m
Ab LM25)
b-1,4
-D-X
ylan (m
Ab LM10)
b-1,4
-D-X
ylan d
/ara
binoxy
lan (m
Ab LM11)
Celulo
se (c
ryst
allin
e) (m
Ab CBM
3a)
Extensin
(mAb LM
1)
Extensin
(mAb JI
M11)
Extensin
(mAb JI
M20)
AGP (mAb JI
M8)
AGP (mAb JI
M13)
AGP (mAb LM
14)
AGP,b-li
nked G
lcA (m
Ab LM2)
CD
TA
Pect 0 0 10 0 0 9 0 0 0 0 0 0 0 0 0 0 0 0 0 0 0 0 0 0 0 9 0 0
EPG 37 33 41 27 0 7 0 26 8 0 0 0 0 0 0 0 0 11 0 0 0 0 0 6 5 21 0 6
EG 35 34 41 28 0 8 0 25 8 0 0 0 0 0 0 0 0 11 0 0 0 0 0 6 0 21 0 5
EA 27 32 42 25 0 7 0 22 7 0 0 0 0 0 0 0 0 10 0 0 0 0 0 0 0 18 0 0
XG 38 38 47 33 0 7 0 27 11 0 0 0 0 0 0 0 0 14 0 0 0 0 0 0 5 23 0 6
EPG, EG 34 33 38 29 0 7 0 26 9 0 0 0 0 0 0 0 0 11 0 0 0 0 0 0 5 21 0 6
EPG, EG, EA 33 33 37 29 0 6 0 27 11 0 0 0 0 0 0 0 0 12 0 0 0 0 0 0 5 21 0 6
Pect, XG 0 0 13 9 0 7 0 0 0 0 0 0 0 0 0 0 0 0 0 0 0 0 0 0 0 15 0 0
Pect, EG 0 0 9 0 0 7 0 0 0 0 0 0 0 0 0 0 0 0 0 0 0 0 0 0 0 10 0 0
Control 19 10 31 25 0 8 0 26 12 0 0 0 0 0 0 0 0 11 0 0 0 0 0 0 5 21 0 0
Pect 0 0 0 0 0 0 0 0 0 0 0 0 0 0 0 17 0 31 0 0 19 0 0 10 0 0 0 0
EPG 0 0 0 0 0 0 0 7 0 0 0 0 0 0 0 11 0 20 0 0 17 0 0 5 0 0 0 0
EG 0 0 0 0 0 0 0 7 0 0 0 0 0 0 0 37 0 57 0 0 30 0 0 6 0 0 0 0
EA 0 0 0 0 0 0 0 6 0 0 0 0 0 0 0 27 0 47 0 0 25 0 0 5 0 5 0 0
XG 0 0 0 0 0 0 0 8 0 0 0 0 0 0 0 29 0 52 0 0 25 0 0 5 0 5 0 0
EPG, EG 0 0 0 0 0 0 0 8 0 0 0 0 0 0 0 12 0 19 0 0 16 0 0 6 0 5 0 0
EPG, EG, EA 0 0 0 0 0 0 0 6 0 0 0 0 0 0 0 13 0 24 0 0 18 0 0 6 0 0 0 0
Pect, XG 0 0 0 0 0 0 0 0 0 0 0 0 0 0 0 63 6 92 0 0 42 0 0 10 0 0 0 0
Pect, EG 0 0 0 0 0 0 0 0 0 0 0 0 0 0 0 22 0 40 0 0 20 0 0 10 0 0 0 0
Control 0 0 0 0 0 0 0 9 0 0 0 0 0 0 0 47 0 74 0 0 34 0 0 0 0 6 0 0
10 20 30 40 50 60 70 80 90 100un-ME GalA, Unmethethylesterified galacturonic acids
CD
TAN
aOH
Figure 1. CDTA and NaOH fractions extracted from Pinotage skin AIR hydrolysed with pure enzymes, showing the relative abundance of the different epitopes. The boxed sections indicate enzymes that caused extensive enzymatic hydrolysis. Values are the average of three biological samples. The enzymes that were used are described in Table 1 and the monoclonal antibodies are listed in the appendix (Table A1).
Stellenbosch University https://scholar.sun.ac.za

86
Although all of the mAb INRA-RU2 labelled RG-I were removed, either by enzyme hydrolysis or
during CDTA extraction, low quantities of mAb INRA-RU1 labelled RG-I could be extracted with
NaOH (Fig. 1). This is seen in the control as well as the EPG, EG, EA and XG treated .The
major epitopes recognized in the NaOH fraction were xyloglucan (mAbs LM15 and mAbs
LM25), cellulose (mAb CBM3a) and extensins (mAb JIM20). A synergistic relationship was seen
with the Pect-XG combination where the XG enzyme could cause an increase in the extraction
of xyloglucan only when combined with the depectination action of Pect. The other enzymes all
decreased the xyloglucan signals presumably by removing some surface exposed, pectin-
associated xyloglucan due to pectin hydrolysis (EPG, Pect and Pect-EG) or by direct xyloglucan
hydrolysis (XG). All enzyme treatments increased the signal for extensins (mAb JIM20)
compared to the control.
The monosaccharide compositional analysis of the AIR samples after enzyme hydrolysis
revealed some interesting results (Table 3). Compared to the control samples, Pect-XG
hydrolysis led to a decrease (statistically significant, 95 % confidence interval) in Ara while Pect-
XG and Pect-EG decreased the Rha values. This corresponds well with the decrease in
unbranched RG-I and AGPs (CoMPP analysis, Fig. 1) of the Pect enzyme treated samples. In
addition, the Pect and Pect combination treatments caused a decrease in GalA which can be
attributed to depectination and this is confirmed by the decrease in the signal for all the HG
polymers (except mAb PAM1). In contrast, all the other enzymes caused an increase in GalA
monosaccharides. An increase (compared to the control samples) in the monosaccharide
concentration is only possible if we consider that incomplete TFA hydrolysis took place during
the preparation steps prior to GC-MS monosaccharide analysis.
Table 3: Monosaccharide composition of Pinotage AIR treated with different enzymes and enzyme combinations. The values are the averages of three samples. Samples that are statistically different (95 % confidence level) from the control are shaded in grey. Ara, arabinose; Rha, rhamnose; Fuc, fucose; Xyl, xylose; GalA, galacturonic acid; Man, mannose; Gal, galactose; Glc, glucose; GlcA, glucuronic acid.
Ara 52 ± 9 78 ± 28 103 ± 10 71 ± 17 102 ± 7 89 ± 25 56 ± 25 36 ± 10 48 ± 6 73 ± 5
Rha 25 ± 3 37 ± 4 42 ± 3 40 ± 6 42 ± 3 38 ± 6 35 ± 6 21 ± 3 23 ± 2 35 ± 3
Fuc 31 ± 3 28 ± 3 32 ± 2 30 ± 5 31 ± 3 29 ± 5 28 ± 5 26 ± 6 29 ± 3 32 ± 2
Xyl 77 ± 17 64 ± 8 80 ± 5 66 ± 7 79 ± 5 65 ± 20 51 ± 20 52 ± 20 74 ± 15 74 ± 6
GalA 123 ± 22 381 ± 44 440 ± 43 366 ±35 452 ± 33 435 ± 62 294 ± 9 72 ± 22 100 ± 29 226 ± 10
Man 36 ± 5 28 ± 2 34 ± 2 29 ± 2 33 ± 2 29 ± 6 25 ± 6 28 ± 8 34 ± 5 34 ± 1
Gal 39 ± 6 39 ± 5 48 ± 3 40 ± 7 46 ± 2 40 ± 8 33 ± 8 30 ± 11 34 ± 11 45 ± 2
Glc 39 ± 6 32 ± 2 40 ± 2 33 ± 3 38 ± 0 33 ± 7 27 ± 7 31 ± 9 37 ± 4 39 ± 2
GlcA 41 ± 5 88 ± 20 80 ± 7 64 ± 9 91 ± 14 74 ± 41 54 ± 41 30 ± 7 36 ± 3 53 ± 11
Control
pM/mg AIR
Pect EPG EG EA XG Pect EPG+EG+EA Pect+XG Pect+EG
Stellenbosch University https://scholar.sun.ac.za
87
This incomplete acid hydrolysis took place in the control samples but in contrast, the AIR
treated with EPG, EG, EA and XG were already partially hydrolysed or unravelled. This led to a
more complete acid hydrolysis by allowing better access for the TFA, delivering higher
quantities of monosaccharides than the control samples. This unravelling and rendering of
access to the inner cell wall spaces by the action of the EPG, EG, EA and XG enzymes were
also demonstrated with the CoMPP results (Fig. 1). In the case of the Pect treated samples, the
enzymatic hydrolysis already removed a large fraction of the pectin cell wall polymers (HG and
RG-I) and the remaining residue thus contained less GalA. For this to be true we have to
presume that complete acid hydrolysis could take place in the Pect samples by virtue of the
extensive enzymatic degradation/unravelling.
Multivariate data analysis of monosaccharide composition of the samples reveals (PCA plot,
Fig. 2) the Pect treated samples clustering together at the bottom of the plot. The control
samples formed a second group in the middle and the rest of the samples were spread out
along the top half of the plot. The spread of all the samples along the first component axis (PC1
69 %) illustrates the variation in the efficiency of the TFA hydrolysis which led to differences in
the monosaccharide values (pM/mg AIR) recorded. Further analysis (shown in Appendix, Fig.
A1 and A2) using a Partial Least Squared (PLS) (Eriksson et al., 2013) plot (Fig. A1) and
Variable Importance for the Projection (VIP) plot (Fig. A2) showed that Pect treated samples
separated from the other samples due to a scarcity in GalA and Rha.
Stellenbosch University https://scholar.sun.ac.za

88
Figure 2. PCA score (A) and loading (B) plot of monosaccharide analysis on Pinotage AIR treated with
pure enzymes. The enzymes are described in Table 1.
3.2 The evaluation and profiling of the hydrolysis of Chardonnay pomace cell walls with
purified and commercial enzymes by using CoMPP and monosaccharide compositional
analyses.
3.2.1 Autoclaving as a pre-processing step removes pectin and exposes xylan in the cell walls
of Chardonnay pomace
The preparation of the Chardonnay pomace involved an autoclaving step in order to destroy
the endogenous grape tissue enzymes as well as any microbial enzymatic activity present on
the pomace. It also gave us the opportunity to investigate how the autoclaving step, which is to
a certain extent similar to the industrial hot water/steam pre-treatment of lignocellulosic biomass
(Alvira et al., 2010), changes the cell wall polymers. The autoclaving step had a considerable
impact (Fig. 3) on the composition of the cell walls as it removed HG (mAbs JIM5, JIM7, LM18,
B
Incomplete TFA hydrolysis
Complete TFA hydrolysis
Stellenbosch University https://scholar.sun.ac.za

89
LM19, LM20) and uncovered RG-I side chains (mAb LM6) and AGPs (mAbs JIM8 and JIM13) in
the CDTA fraction. In the NaOH fraction it enhanced the extraction of HG (mAbs LM18 and
LM19), RG-I side chains (mAbs LM5 and LM6), mannan (mAb LM21 and LM22) and AGPs
(mAbs JIM8 and JIM13). The most interesting result however, is the high level of xylan polymers
(mAbs LM10 and LM11) extracted from the autoclaved samples (Fig 3, NaOH fraction).
Figure 3. The relative abundance of the cell wall polymers of fresh and autoclaved Chardonnay pomace, demonstrated with CoMPP analysis. The boxed section indicates the exposure of xylan. The values are the averages of five biological repeats.
3.2.2 Investigating the cell wall polymers of Chardonnay pomace, using commercial maceration
enzymes
In this investigation, we incubated autoclaved Chardonnay pomace with commercial enzymes in
order to form a general picture on how these enzymes would change the cell wall polymer
composition. The enzymes used in this experiment are listed in Table 1 and the best enzyme
combinations and loadings as well as the incubation conditions (Table 2) were determined in an
initial multi-factorial designed experiment (Modde software, Umetrics, Sweden) (results not
shown). The Rapidase ExColor (ExCol) and -Expression (Expr) enzymes contained mostly
pectinases and the Celluclast 1.5L (Cellc) degrades b-1,4-D-glucosidic links as found in
cellulose and xyloglucan. After enzymatic hydrolysis the turbidity, pH, methanol concentration
and reducing sugars were measured in the supernatant of the samples and the results are
shown in the appendix (Table A2).
The cell walls were isolated from the residue collected after enzymatic hydrolysis and analysed
with CoMPP (Fig. 4). In the absence of commercial enzymes (control samples) we detected
some HG (mAb JIM7, LM18 and LM19) and unbranched RG-I (mAb INRA-RU1 and INRA-
RU2), b-1,4-D-galactan (mAb LM5), xyloglucan (mAb LM25 only), extensins (mAb JIM20) and
HG par
tially
/de-e
sterif
ied (m
Ab JIM
5)
HG par
tially
este
rified
(mAb JI
M7)
HG par
tially
/de-e
sterif
ied (m
Ab LM18
)
HG par
tially
/de-e
sterif
ied (m
Ab LM19
)
HG par
tially
este
rified
(mAb LM
20)
b-1,4-
D-gala
ctan
(mAb LM
5)
a-1,5-
L-ar
abina
n (mAb LM
6)
b-1,4-
D-(galac
to)(g
luco
)man
nan (m
Ab LM21)
b-1,4-
D-(glu
co)m
annan
(mAb L
M22)
b-1,3-
D-gluc
an (m
Ab BS-
400-2)
Xyloglu
can (X
XXG m
otif) (
mAb L
M15
)
Xyloglu
can (m
Ab LM25)
b-1,4-
D-Xyla
n (mAb LM
10)
b-1,4-
D-Xyla
n d/a
rabino
xylan
(mAb L
M11)
Celulo
se (c
ryst
allin
e) (m
Ab CBM
3a)
Exte
nsin (m
Ab JIM
20)
AGP (m
Ab JIM
8)
AGP (m
Ab JIM
13)
AGP (m
Ab LM14)
AGP, b-
linke
d GlcA
(mAb LM
2)
CD
TA Fresh 15 53 16 40 12 0 9 0 0 0 0 0 0 0 0 0 6 14 0 6
Autoclaved 5 32 8 19 8 0 14 0 0 0 0 0 0 0 0 0 15 22 0 7
Fresh 0 0 0 12 0 8 27 13 0 11 33 37 0 0 30 0 0 9 0 0
Autoclaved 0 0 10 23 0 18 32 24 14 16 37 37 19 25 36 0 5 14 0 0
10 20 30 40 50 60 70 80 90 100
CD
TAN
aOH
Stellenbosch University https://scholar.sun.ac.za

90
AGPs (mAb JIM13, LM14 and LM2) in the CDTA fraction. At 50 C there was slightly less HG
(mAb JIM7), RG-I (mAb INRA-RU1), b-1,4-D-galactan (mAb LM5) and AGPs (mAb JIM13) than
at 15C. This decrease might be due to acidic hydrolysis that took place in the low pH buffer
(pH3) at the higher temperature and corresponds with the decrease in pH seen for these
samples (Table A2). The enzyme action in all samples supplemented with commercial enzymes
and at both temperatures (Fig. 4), reduced all exposed and CDTA-dissolvable pectin or other
polymers that might be associated with pectin, such as xyloglucan. At 50C, all the enzyme
combinations removed virtually all extensins and AGPs too, except those recognized by mAb
JIM13, which were only reduced by half. This was also true for the three-enzyme combination
(Cellc, ExCol, Expr) at 15 C, but Expr at 15 C had no effect while ExCol caused a reduction in
AGPs (mAb JIM8, JIM13 and LM2) and extensins (mAbJIM20).
Stellenbosch University https://scholar.sun.ac.za

91
Figure. 4. CoMPP results of Chardonnay pomace incubated with commercial maceration enzymes. The values are the average of three samples. ExCol,
Rapidase ExColor; Expr, Rapidase Expression; CellC, Celluclast
HG par
tially
/de-
este
rified
(mAb JI
M5)
HG par
tially
est
erifi
ed (m
Ab JIM
7)
HG par
tially
/de-
este
rified
(mAb LM
18)
HG par
tially
/de-
este
rified
(mAb LM
19)
HG par
tially
est
erifi
ed (m
Ab LM
20)
HG ±30
cont
iguous u
n-ME
GalA (m
Ab PAM
1)
HG Ca
2+ dim
ers (
mAb 2
F4)
RG-I, 6
unbra
nched
disacc
h (mAb IN
RA-RU1)
RG-I, 2
unbra
nched
disacc
h (mAb IN
RA-RU2)
b-1,
4-D-g
alac
tan (m
Ab LM5)
a-1,5
-L-ar
abinan
(mAb
LM6)
Linea
riseda-1
,5-L-
arabin
an (m
Ab LM
13)
b-1,
4-D-(g
alact
o)(glu
co)m
annan
(mAb
LM21)
b-1,
4-D-(g
luco
)man
nan (m
Ab LM22
)
b-1,
3-D-g
luca
n (mAb B
S-400
-2)
Xylogl
ucan
(XXX
G motif
) (m
Ab LM15)
Xylogl
ucan
(XLL
G olig
osacc
haride) (
mAb LM
24)
Xylogl
ucan
(mAb LM
25)
b-1,
4-D-X
ylan (m
Ab LM10)
b-1,
4-D-X
ylan d
/ara
binoxy
lan (m
Ab LM11
)
Celulo
se (c
ryst
allin
e) (m
Ab CBM
3a)
Exte
nsin (m
Ab LM1)
Exte
nsin (m
Ab JIM
11)
Exte
nsin (m
Ab JIM
20)
AGP (mAb
JIM8)
AGP (mAb
JIM13)
AGP (mAb
LM14)
AGP, b-li
nked
GlcA (m
Ab LM2)
CD
TA
15
°C
ExCol 0 0 0 0 0 0 0 0 0 0 0 0 0 0 0 0 0 0 0 0 0 0 0 0 8 20 0 0
Expr 0 0 0 0 0 0 0 0 0 0 0 0 0 0 0 0 0 0 0 0 0 0 0 7 14 28 0 6
Cellc, ExCol, Expr 0 0 0 0 0 0 0 0 0 0 0 0 0 0 0 0 0 0 0 0 0 0 0 0 0 16 0 0
Control @ 15 0 19 6 11 0 0 0 21 16 8 0 0 0 0 0 0 0 8 0 0 0 0 0 9 14 27 0 9
Cellc, ExCol 0 0 0 0 0 0 0 0 0 0 0 0 0 0 0 0 0 0 0 0 0 0 0 0 0 20 0 0
Cellc, Expr 0 0 0 0 0 0 0 0 0 0 0 0 0 0 0 0 0 0 0 0 0 0 0 0 0 15 0 0
ExCol, Expr 0 0 0 0 0 0 0 0 0 0 0 0 0 0 0 0 0 0 0 0 0 0 0 0 0 13 0 0
Control @ 50 0 14 9 10 0 0 0 17 13 0 0 0 0 0 6 0 0 7 0 0 0 0 0 9 10 22 0 9
ExCol 0 0 0 0 0 5 0 0 0 0 0 0 21 9 15 78 8 83 0 0 49 0 0 0 0 13 0 0
Expr 0 0 0 7 0 0 0 0 0 0 0 0 21 9 16 84 5 86 0 0 52 0 0 7 6 13 0 0
Cellc, ExCol, Expr 0 0 0 0 0 6 0 0 0 0 0 0 23 10 14 62 9 77 0 9 42 0 0 0 0 11 0 0
Control @ 15 0 0 0 0 0 0 0 11 0 10 0 0 17 10 17 94 0 98 0 0 63 0 0 8 0 13 0 0
Cellc, ExCol 0 0 0 8 0 11 0 0 0 0 0 0 21 9 16 72 6 82 0 6 47 0 0 10 0 14 0 0
Cellc, Expr 0 0 0 0 0 15 0 16 6 0 0 0 19 9 16 80 5 85 0 6 51 0 0 17 0 16 0 0
ExCol, Expr 0 0 0 5 0 5 0 0 0 0 0 0 20 9 13 74 6 82 0 9 47 0 0 9 0 10 0 0
Control @ 50 5 0 0 21 0 0 0 7 0 0 8 0 17 6 14 81 0 89 0 7 53 0 0 6 0 10 0 0
10 20 30 40 50 60 70 80 90 100
Un-ME GalA, Unmethylesterified galacturonic acid; disacch, disaccharides
CD
TA
15
°C5
0°C
NaO
H
15
°C5
0°C
Stellenbosch University https://scholar.sun.ac.za

92
In the NaOH fraction that were extracted from the control samples there were some traces of b-
1,4-D-galactan, a-1, 5-L-arabinan, HG (mAbs JIM5 and LM19) and RG-I (mAb INRA-RU1). With
enzyme treatment (Cellc combinations with ExCol and Expr at 50C), a signal for mAb PAM1
appeared for the first time. In general the enzyme treatment removed HG (mAbs LM19) and the
neutral RG-I side chains (mAb LM5 and LM6) and led to a decrease in the xyloglucan (mAb
LM15 and LM25) and cellulose (mAb CBM3a) (except for Cellc, Expr at 50 C). In contrast, a
weak signal for xyloglucan, labelled by mAb LM24, became visible only after pectin removal by
enzymatic hydrolysis.
Figure 5. PCA score (A) and loading (B) plots of CDTA fraction of Chardonnay pomace treated with
commercial enzymes at 15 and 50C.
In a PCA model (Fig. 5) of the CDTA fraction, the enzyme treated samples all displayed a lower
abundance in RG-I (mAbs INRA-RU1 and INRA-RU2) and HG (mAb JIM7) compared to the
control samples (PC1 83%). Expr and ExCol treated samples at 15 C (encircled with a dashed
A
B
AGPs
RG-I & HG
Stellenbosch University https://scholar.sun.ac.za

93
line) have an abundance in residual AGPs (mAb JIM13 and JIM8) and this drive their separation
(PC2 13 %) from the other enzyme treated samples (encircled with a solid line).
Monosaccharide analysis of the AIR isolated after enzyme treatment of pomace showed that
there were two statistically significant (95% confidence interval) changes: Glc decreased from
51 to 35 pM/mg for the ExCol15 treatment, whereas GalA decreased from 57 to 34 pM/mg for
the ExCol-Expr50 treatment (Table A3). In general the enzyme treated samples had lower
monosaccharide levels than the controls which correspond with their lower levels of polymers
as seen in the CoMPP data (Fig. 4 and Fig. 5).
3.2.3 Investigating the cell wall polymers of Chardonnay pomace, using purified enzymes
Finally, purified enzymes, which have one dominant activity, were incubated with the autoclaved
Chardonnay pomace in an effort to link specific enzyme activities with specific cell wall
modifications. The enzymes were used individually or in combinations, identical to the Pinotage
AIR enzymatic hydrolysis. AIR was isolated from the pomace residues that remained, and the
relative signal strengths obtained for the mAb set are shown in Fig. 6. The extreme
depectination (CoMPP results, CDTA fraction) that took place during the autoclaving step is
demonstrated by the absence of any HG polymers and the low levels of RG-I and RG-I side
chains (mAbs INRA-RU1, INRA-RU2 and LM5) in the control samples. The Pect enzyme as well
as the Pect-XG and -EG combinations removed all unbranched RG-I (both mAbs INRA-RU1
and INRA-RU2) and RG-I side branches (b-1,4-D-galactan), extensins (mAbs JIM11 and 20) ,
AGP mAb JIM8 and reduced the signal for mAb JIM13. The EG on its own and the EPG-EG
combination only caused a reduction of the signals for mAbs INRA-RU1 and -2 (in contrast with
complete removal seen with Pect enzymes), the extensins (mAb JIM20) and AGPs (mAb
JIM13). Curiously, when a third enzyme (EA) was added to the EPG-EG combination there was
no further reduction. In fact, the samples, now, had in most cases the same values as the
control.
Stellenbosch University https://scholar.sun.ac.za

94
HG par
tially
/de-
este
rified
(mAb JI
M5)
HG par
tially
est
erifi
ed (m
Ab JIM
7)
HG par
tially
/de-
este
rified
(mAb LM
18)
HG par
tially
/de-
este
rified
(mAb LM
19)
HG par
tially
est
erifi
ed (m
Ab LM
20)
HG ±30
cont
iguous u
n-ME
GalA (m
Ab PAM
1)
HG Ca
2+ dim
ers (
mAb 2
F4)
RG-I, 6
unbra
nched
disacc
h (mAb IN
RA-RU1)
RG-I, 2
unbra
nched
disacc
h (mAb IN
RA-RU2)
b-1,
4-D-g
alac
tan (m
Ab LM5)
a-1,5
-L-ar
abinan
(mAb
LM6)
Linea
rised
a-1
,5-L-
arabin
an (m
Ab LM
13)
b-1,
4-D-(g
alact
o)(glu
co)m
annan
(mAb
LM21)
b-1,
4-D-(g
luco
)man
nan (m
Ab LM22
)
b-1,
3-D-g
luca
n (mAb B
S-400
-2)
Xylogl
ucan
(XXX
G motif
) (m
Ab LM15)
Xylogl
ucan
(XLL
G olig
osacc
haride) (
mAb LM
24)
Xylogl
ucan
(mAb LM
25)
b-1,
4-D-X
ylan (m
Ab LM10)
b-1,
4-D-X
ylan d
/ara
binoxy
lan (m
Ab LM11
)
Celulo
se (c
ryst
allin
e) (m
Ab CBM
3a)
Exte
nsin (m
Ab LM1)
Exte
nsin (m
Ab JIM
11)
Exte
nsin (m
Ab JIM
20)
AGP (mAb
JIM8)
AGP (mAb
JIM13)
AGP (mAb
LM14)
AGP, b-li
nked
GlcA (m
Ab LM2)
CD
TA
Pect 0 0 0 0 0 0 0 0 0 0 0 0 0 0 0 0 0 0 0 0 0 0 0 0 0 9 0 0
EPG 0 0 0 0 0 0 0 15 13 5 0 0 0 0 6 0 0 8 0 0 0 0 6 12 11 23 0 6
EG 0 0 0 0 0 0 0 10 8 0 0 0 0 0 0 0 0 0 0 0 0 0 0 6 8 18 0 0
EA 0 0 0 0 0 0 0 15 9 0 0 0 0 0 5 0 0 8 0 0 0 0 0 9 7 19 0 0
XG 0 0 0 0 0 0 0 15 14 6 0 0 0 0 0 0 0 7 0 0 0 0 6 12 12 26 0 6
EPG, EG 0 0 0 0 0 0 0 8 8 0 0 0 0 0 0 0 0 17 0 0 0 0 0 0 6 16 0 0
EPG, EG, EA 0 0 0 0 0 0 0 11 10 0 0 0 0 0 5 0 0 6 0 0 0 0 0 9 9 21 0 0
Pect, XG 0 0 0 0 0 0 0 0 0 0 0 0 0 0 0 0 0 0 0 0 0 0 0 0 0 11 0 0
Pect, EG 0 0 0 0 0 0 0 0 0 0 0 0 0 0 0 0 0 0 0 0 0 0 0 0 0 12 0 0
Control 0 0 0 0 0 0 0 15 13 5 0 0 0 0 5 0 0 8 0 0 0 0 5 12 9 22 0 0
Pect 0 0 0 0 0 0 0 0 0 0 0 0 26 9 13 68 13 91 0 15 47 0 0 7 0 10 0 0
EPG 0 0 0 0 0 0 0 9 0 9 0 0 13 0 11 59 9 81 0 10 39 0 0 6 0 9 0 0
EG 0 0 0 0 0 0 0 10 0 10 0 0 24 8 14 69 15 89 0 15 46 0 0 9 5 12 0 0
EA 0 0 0 0 0 0 0 7 0 7 0 0 15 0 12 60 11 85 10 19 43 0 0 6 0 11 0 0
XG 0 0 0 0 0 0 0 11 0 10 0 0 21 0 14 68 12 89 9 14 49 0 0 8 5 12 0 0
EPG, EG 0 0 0 0 0 0 0 15 0 16 0 0 29 10 17 79 16 88 7 14 52 0 0 10 6 14 0 0
EPG, EG, EA 0 0 0 0 0 0 0 8 0 8 0 0 15 0 12 55 13 79 0 12 41 0 0 6 0 10 0 0
Pect, XG 0 0 0 0 0 0 0 0 0 0 0 0 18 6 10 59 11 84 0 12 44 0 0 7 0 9 0 0
Pect, EG 0 0 0 0 0 0 0 0 0 0 0 0 27 8 13 65 15 90 0 15 53 0 0 10 5 11 0 0
Control 0 0 0 0 0 0 0 8 0 7 0 0 14 0 10 55 8 79 9 14 41 0 0 6 0 9 0 0
10 20 30 40 50 60 70 80 90 100
Un-ME GalA, Unmethylesterified galacturonic acid; disacch, disaccharides
CD
TAN
aOH
Figure 6. CoMPP analysis performed on the solid residue after Chardonnay pomace was incubated with purified enzymes. The CDTA and NaOH fraction are shown in the heat map and values are the average of three samples. The boxed sections indicate enzymes that caused extensive hydrolysis. The enzymes that were used are described in Table 1.
Stellenbosch University https://scholar.sun.ac.za
Stellenbosch University https://scholar.sun.ac.za

95
In the NaOH fraction (Fig. 6) the Pect enzymes removed all RG-I (mAb INRA-RU1) and b-1,4-D-
galactan (mAb LM5) while the other enzymes had no effect. The only exception is a slight
increase in the mAb INRA-RU1 and LM5 signals for the EPG-EG treated samples. Most of the
enzymes enhanced the levels of xyloglucan (mAbs LM15, LM24 and LM25) and cellulose (mAb
CMB3a) extraction from Chardonnay pomace (except EPG and EPG-EG-EA). Mannan
extraction (mAb LM21 and LM22) is also increased by Pect, Pect-EG, EG, EPG-EG and XG
treatment.
Table 4: Monosaccharide analysis of the Chardonnay pomace treated with pure enzymes. Shaded values indicate the monosaccharides that is significantly lower (95 % confidence level) than the control sample. Values are the average of three samples. Ara, arabinose; Rha, rhamnose; Fuc, fucose; Xyl, xylose; GalA, galacturonic acid; Man, mannose; Gal, galactose; Glc, glucose; GlcA, glucuronic acid.
In Table 4 the monosaccharide composition of the Chardonnay pomace cell walls only changed
significantly for the Pect treated samples. There was a decrease in Rha (compared to the
control) for all these samples which is similar to the Pinotage AIR results and probably due to
the loss in RG-I seen in the CoMPP results (Fig. 6). There is also a reduction in Xyl (xyloglucan
degradation seen in the CDTA fraction) and GalA (RG-I degradation) for the Pect treated
samples and Gal decreased (mAb LM5 and JIM8 and JIM13 labelling decreased [Fig. 6]) in the
presence of the Pect-XG combination. Overall, we see very high values for Xyl, (111 pM/mg
AIR for the Chardonnay control samples) which corresponds to the presence of signals for
mAbs LM10 and LM11 (Fig. 6, NaOH fraction).
4. Discussion
4.1 Pinotage skin cell wall enzymatic hydrolysis
Wine must and fermentation conditions can be a challenging environment for maceration
enzymes because of the low pH and temperatures, the high sugar concentration as well as the
presence of tannins which can bind and inhibit enzymes (Kennedy, 2008; Sieiro et al., 2010;
Van Rensburg et al., 2000). Previous results from our group (Chapter 3) showed how the grape
skin cell wall was modified during a red wine fermentation with the aid of maceration enzymes.
Results suggested that depectination took place but the major effect of the maceration enzymes
Ara 39 ± 12 43 ± 22 53 ± 2 45 ± 10 51 ± 11 53 ± 5 38 ± 7 46 ± 2 38 ± 7 51 ± 6
Rha 16 ± 1 18 ± 5 21 ± 0 21 ± 2 20 ± 2 20 ± 1 18 ± 2 18 ± 0 16 ± 1 21 ± 1
Fuc 23 ± 5 22 ± 9 26 ± 0 25 ± 2 24 ± 4 25 ± 0 21 ± 3 26 ± 1 22 ± 3 25 ± 1
Xyl 83 ± 11 118 ± 22 115 ± 10 103 ± 32 105 ± 28 108 ± 20 84 ± 19 110 ± 6 89 ± 27 111 ± 11
GalA 22 ± 1 27 ± 11 36 ± 1 32 ± 4 33 ± 5 31 ± 3 30 ± 3 24 ± 5 28 ± 8 35 ± 3
Man 24 ± 4 29 ± 12 30 ± 2 29 ± 3 31 ± 5 33 ± 4 26 ± 5 30 ± 4 27 ± 5 31 ± 1
Gal 30 ± 6 36 ± 20 42 ± 2 40 ± 7 40 ± 9 43 ± 3 35 ± 8 36 ± 0 30 ± 6 42 ± 2
Glc 39 ± 7 50 ± 22 52 ± 4 61 ± 5 56 ± 13 65 ± 13 44 ± 8 51 ± 15 45 ± 12 59 ± 4
GlcA 21 ± 2 22 ± 5 25 ± 3 24 ± 1 23 ± 2 23 ± 22 ± 3 22 ± 2 22 ± 2 26 ± 1
Pect + EG Control
pM/mg AIR
Pect EPG EG EA X EPG + EG EPG + EG + EA Pect + X
Stellenbosch University https://scholar.sun.ac.za

96
was described as a loosening of the cell wall structure. Another important factor that made a
large contribution towards the cell wall changes were the ripeness level of the grapes. Here we
aimed to create the ideal enzyme hydrolysis conditions by using isolated cell walls from grape
skins incubated with single purified enzymes (and combinations of these enzymes), in buffered
conditions close to the optimum temperature and pH of the enzymes. The CoMPP results in
combination with the monosaccharide analysis enabled us to form a picture of the cell walls
(AIR) of Pinotage grape skins in which there were some HG, unbranched RG-I, xyloglucan
(mAb LM25-binding motifs only), AGPs and extensins exposed on the surface of the AIR
particles (no enzyme treatment). During the CDTA extraction, the pectins and associated
compounds are removed from the surface area of the AIR particles. When the extraction was
preceded by enzymatic hydrolysis, the composition of the extracted fraction depended on the
extent of the hydrolysis that took place. Extensive hydrolysis (as seen with Pect treated
samples), removed some AGPs and more or less all pectin polymers except some HG (labelled
by mAbs PAM1, LM18 and LM19) which correlates with the low levels of GalA and Rha
measured in these samples. With less extensive enzyme hydrolysis (EPG, EG, EA, XG and
combinations of these enzymes) some of the bonds between the cell wall polysaccharides were
broken but not enough to allow the complete removal of polymers into the hydrolysis buffer, as
was seen with the Pect enzymes. Instead, it is better described as an “opening up” action, or
unravelling and partial degradation of the AIR structure to allow better access for the CDTA in
the subsequent extraction step to dissolve the pectins (HG extraction is enhanced) from the
surface and sub-surface layers of the particle. This is in contrast with the control samples where
only the outer pectin rich layers were dissolved. This unravelling action is similar to our previous
results (Chapter 3) in the cell walls from Pinotage skins retrieved from fermentations done with
commercial maceration enzymes. The results indicate (Table 3, Fig. 1 and 2) that depectination
by both extreme and mild enzymatic hydrolysis unmasked the core hemicellulose-cellulose
framework and this presumably enabled cellulases and hemicellulases to remove some of the
xyloglucan and cellulose (lower values than the control samples in the NaOH fraction, Fig.1).
This demonstration of the different levels of enzymatic hydrolysis on grape skin cell walls has
not been shown previously and CoMPP is thus an effective method to determine which enzyme
combinations and enzyme types are the most successful for grape tissue degradation.
The Pect-XG combination was the only treatment that increased both mAbs LM15 and LM25
labelling in the NaOH fraction compared to the control (Fig.1). Neither the XG nor the Pect
enzymes on their own could show the same effect, confirming a synergism between the two
enzymes under these conditions and on this substrate. Depectination by Pect probably
facilitated better access for the XG enzyme to its target, leading to xyloglucan hydrolysis and an
increased extraction (with NaOH) of partially degraded xyloglucan from within the
hemicellulose-cellulose structure. We know plant cell wall xyloglucan is shielded by pectin
Stellenbosch University https://scholar.sun.ac.za

97
(Marcus et al., 2008) but this synergistic effect between pectinases and xylanases has not been
shown previously (to our knowledge) in grape tissues and it is the first time that the CoMPP was
used to demonstrate synergism. According to Hu et al. (Hu et al., 2013) synergistic effects are
highly substrate specific which also depend on the substrate preparation, thus this synergism
seen on AIR would not necessarily be observed in fresh grape tissue.
4.2 Chardonnay as a matrix for enzyme hydrolysis
The fresh Chardonnay pomace used in this study consisted of deseeded, pressed berries (skin
and pulp) and the CoMPP data showed (Fig. 3, Fresh) a high abundance of HG as well as
some a-1,5-L-arabinan, and AGPs extracted with CDTA. In the NaOH fraction xyloglucan,
cellulose, mannan and AGPs were extracted as well as HG and RG-I side chains, presumably
associated with the xyloglucan and cellulose. This is comparable to the overall polymer profile
of Pinotage skin (Chapter 3) and whole berries of Crimson Seedless and Cabernet Sauvignon
(Moore et al., 2014).
We included a pre-treatment step (autoclaving) in the analysis of the cell walls of the pomace. In
general, information on the cell wall polymer changes occurring during the pre-treatment of
lignocellulosic biomass is scarce. Previous studies investigated the effect of steam treatment on
wheat straw (Hendriks et al., 2009) and showed that it caused partial hemicellulose hydrolysis
which resulted in acid formation. The acids catalysed further hemicellulose hydrolysis, which led
to the formation of pores, thus enhancing the access of enzymes to the cellulose. Hydrothermal
pretreatment of Populus biomass was shown to initially disrupt the lignin-polysaccharide
interactions, leading to pectins and arabinogalactans being removed, and subsequently also
xylans and xyloglucans (DeMartini et al., 2011) (shown with immunolabeling). The pressurised
heating treatment of the pomace in this study removed a large fraction of the HG (Fig. 3),
presumably from the middle lamella, but also enhanced the extraction of mannan, cellulose and
pectin molecules associated with the hemicellulose-cellulose structure. Additionally, there were
strong signals for xylan labelling mAbs (LM11 and LM10) in the NaOH fraction after the
treatment, also corresponding to the high levels of Xyl found in all the autoclaved Chardonnay
pomace samples (111 -125 pM/mg AIR). The level of xylan polymers in grape tissue (probably
originating from the vascular strands of the berry) have been calculated to be between 3 and 7
mol% of total cell wall polysaccharides (Nunan et al., 1998) and CoMPP data usually displays
no to very low abundance of xylan and arabinoxylan in the NaOH fraction of ripe fresh grapes
(Moore et al., 2014; Chapter 3). The data suggest that this exposure of xylan is an effect
strongly associated with the pre-treatment and not due to enzyme hydrolysis. This base-line
information of the processed pomace is important in the evaluation of the influence of the
commercial and purified enzymes on this matrix.
Stellenbosch University https://scholar.sun.ac.za

98
The commercial enzymes, especially the Cellc-ExCol-Expr (15 C), Cellc-ExCol and ExCol-Expr
(50 C) enzyme combinations made large modifications to the polymers extracted with CDTA,
while there was only slight changes (compared to the control sample) in the NaOH fraction (Fig.
4). Although we would classify this as a strong hydrolysis effect (compared to the other data
sets in this study), there are however, no other published data available (to our knowledge) on
pomace cell wall polymer changes due to commercial enzyme degradation, with which we can
compare our results. The reducing sugar concentration measured in the supernatants of these
enzyme reactions did not increase significantly (Fig. A2) thus, these conditions (enzyme type, -
combination, - loading and incubation conditions) tested here might be suitable for the
extraction of polyphenols from the grape tissue, but would not be sufficient for biomass
saccharification.
These pomace results also provide some interesting data to contribute to the development of an
hypothesis regarding the spatial locations of polymers in grape cells. The CoMPP analyses
showed the processed and enzyme hydrolysed pomace samples to be cleared of HG and RG-I
and most of the AGPs were also removed (Fig. 4). Labelling for HG (mAb PAM1) showed up in
the NaOH fraction and the levels were enhanced after enzyme treatment at 50C. This antibody
bind specifically to blocks of de-esterified HG, which is the result of block wise action of plant
pectin methylesterases (pPME) (Willats et al., 1999). Fungal pectin methylesterases have a
more random action. In Arabidopsis thaliana (Willats et al., 1999) and in carrot parenchyma
cells (Christiaens et al., 2011) these blocks of unesterified HG occur in the cell wall lining the
intercellular spaces. However, from the carrot study, it became clear that when the carrot tissue
was subjected to a blanching treatment (60 C for 48 h), the endogenous pPMEs were
stimulated, leading to blocks of unesterified HG appearing throughout the whole inner face of
the cell wall adjacent to the plasma membrane (Christiaens et al., 2011). This distribution of
unesterified HG seems to be species specific because in broccoli, pPME stimulation only led to
the enhancement of the labelling in the intercellular spaces. This might indicate that in grape the
unesterified HG polymers are also found in the intercellular space between cells because it was
easily extracted (no enzyme action needed) in the CDTA fraction of the Pinotage cell walls
(although only low levels were found). In the Chardonnay pomace this polymer could only be
extracted after enzyme hydrolysis and removal of the CDTA fraction. Our preliminary
interpretation of this result is that during the first few minutes of the pre-processing step, the
pPME was able to de-esterify some of the HG that lines the inner face of the cell wall adjacent
to the plasma membrane. At the end of the autoclaving step, most of the pectin from the
intercellular regions was probably removed, but enzyme hydrolysis exposed this newly
unesterified HG and some of this could be dissolved in the NaOH. It would be interesting to add
Stellenbosch University https://scholar.sun.ac.za

99
immunofluorescence microscopy analysis to the polymer profiling studies to investigate the
validity of our speculations.
With the use of purified enzymes on Chardonnay pomace, different levels of enzyme hydrolysis
were seen. The Pect and Pect enzyme combinations caused the highest level of modifications
which entailed strong depectination coupled with the enhancement of extraction of cellulose and
hemicellulose polymers. EG and the EPG-EG combination caused milder depectination, but
also enhanced the extraction of polymers in the NaOH fraction. The EPG-EG combination was
synergistic: EPG on its own gave similar results than the control samples, but when combined
with EG, more modifications were evident. Interestingly, when a third enzyme (EA) was added,
similar values than the control samples were obtained in this matrix. This was not seen in the
Pinotage AIR hydrolysis and would require further investigation. Synergistic effects between
pectinases and cellulases are well known and has been shown previously in grape tissue
(Kammerer et al., 2005) to deliver the best results for the isolation of polyphenols from grapes.
Successful wine maceration enzyme preparations also usually contain a combination of
pectinase and cellulase activities (Fia et al., 2014).
4.3 General observations of enzyme action on grape cell walls
4.3.1 Influence of the matrix on enzyme hydrolysis
When comparing the extent of the enzymatic hydrolysis by the purified enzymes on the
Pinotage AIR and the Chardonnay pomace it was clear that the latter was more resistant
towards degradation. The matrices were clearly different, both in inherent composition and
preparation: the pomace contained both pulp and skin tissue, whereas the Pinotage analysis
was only on skins; the pomace was not exposed to organic solvents or was not freeze-dried
prior to enzymatic hydrolysis, whereas the Pinotage skin samples were subjected to both. In
apple cell walls, freeze-drying caused the collapse and compaction of the material (Le
Bourvellec et al., 2012). Compared to the Pinotage AIR from skins, the pomace contains
interfering substances (e.g. sugars, organic acids, phenolic compounds) which could have
decreased the activity of the enzymes, or prevented access to the cell wall polymers. Moreover,
the pomace might have contained more cuticular matter than the Pinotage skins. Cuticular
matter can decrease the accessibility of the polysaccharides to enzymes (Mendes, Prozil, et al.,
2013; Mendes, Xavier, et al., 2013). In our study the chloroform wash that is part of the AIR
preparation protocol, could have eliminated some of this cuticular matter from the Pinotage AIR,
favouring enzyme action on this matrix compared to the pomace. In addition, Fangel (Fangel,
2013) reported that the organic solvents used in AIR preparation opens up the cell wall structure
which could have contributed to the Pinotage AIR being an “easier” substrate to hydrolyse than
the Chardonnay pomace.
Stellenbosch University https://scholar.sun.ac.za
100
4.3.2 Enzymatic hydrolysis- and extraction patterns as well as associations between cell wall
polymers, as shown by the CoMPP technique
Despite these differences in the matrix and processing of it (section 4.3.1), some shared
features were observed for both matrices. The labelling patterns observed for xyloglucans were
very interesting. We always (in both the Chardonnay and the Pinotage samples) found low
levels of mAb LM25 in the CDTA fraction, strong signals for LM25 and LM15 in the NaOH
fraction and a weak signal for mAb LM24 in the NaOH fraction that was enhanced by enzyme
treatment. Pedersen et al. (2012) observed with immunofluorescence imaging in tobacco stem
parenchyma cells, that LM15 were predominantly located in the corners of intercellular spaces,
LM24 was found in adhered cell walls between intercellular spaces and LM25 was localized in
the cell walls lining intercellular spaces. Although CoMPP analysis does not show the cellular
location of epitopes we are still tempted to speculate that according to the patterns we observed
and the spatial distribution information from Pedersen (Pedersen et al., 2012) , it is likely that
degradation in our samples initiated in the intercellular triangle (low levels of mAb LM25 in the
CDTA fraction). Once a portion of the pectin polymers has been removed (enzyme action
and/or removal with CDTA), the signal for mAb LM25 increased while a signal for LM15
appeared in the NaOH fraction (depectination spreads to the corners) for the first time, in
combination with a weaker signal for LM24. The appearance of mAb LM24 labelling might
indicate that the individual cells were detaching from each other which has been shown to occur
when vegetables are cooked (Jarvis, 2011). For future work it would be interesting to confirm
our hypothesis by treating grape tissue sections with enzymes and visualise the sequence and
extent of degradation using immunofluorescence microscopy.
The enzyme hydrolysis in combination with the sequential extraction steps, as used in CoMPP
analysis, provide the ability to identify possible associations between the cell wall polymers of
grape berry. For example, AGPs recognized by mAb JIM13 were reduced by Pect action (Fig.
1) and the labelling pattern was similar to mAb INRA-RU1. This can indicate that these AGPs
are bound to pectin polymers [as previously reported in other plants (Hijazi et al., 2014;
Keegstra et al., 1973; Tan et al., 2013)], and subsequently removed during pectin hydrolysis. It
might also just confirm the RG-I hydrolysis because it should be noted that mAb JIM13 showed
cross reactivity with RG-I of sycamore maple (Pattathil et al., 2010). Another example is the
association between the RG-I (specifically mAb INRA-RU1) and xyloglucan (Popper et al.,
2008). In both grape matrices a signal for mAb INRA-RU1 was detectable in the NaOH fraction
(even after enzyme hydrolysis and extraction with CDTA) which was probably due to the
interaction between this RG-I and xyloglucan. Interestingly, the RG-I labelled by mAb INRA-
RU2 I (that has more galactosyl side chains than INRA-RU1 labelled RG-I) were more easily
removed. Furthermore, in the Pinotage AIR the relative abundance of xyloglucan (mAb LM25)
and RG-I (mAbs INRA-RU1 and INRA-RU2) was similarly influenced by the different enzyme
Stellenbosch University https://scholar.sun.ac.za

101
treatments but there was no resemblance between mAb LM25 and HG which is an additional
indication of a xyloglucan-RG-I specific association in grape berry tissue.
It is necessary to mention that the actual values between CoMPP data sets (Fig. 3, 4 and 6)
should not be directly compared since the collection of antibodies used for each data set were
not identical and CoMPP results are not directly comparable across datasets obtained on
different occasions (personal experience).
The CoMPP analyses proved to be a valuable, sensitive and high-throughput method to trace
modifications in the polymers of grape berries cell walls. It highlighted synergism between
different enzymes and gave indications of polymer associations. Furthermore, we could
distinguish between the different levels of enzymatic hydrolysis. Mild degradation was typified
by pore formation, presumably by the partial hydrolysis of pectin polymers, and seen with
CoMPP analysis as an enhancement in the CDTA extraction. As the degradation advanced,
these smaller degradation products were removed during the enzyme hydrolysis step resulting
in a decrease in polymers that could be extracted with CDTA. With moderate degradation the
pores became large enough for the enzymes to penetrate into the cell wall and break up
hemicellulose polymers (xyloglucan and mannan). At first those partially degraded polymers
could only be removed from within the cell wall framework by extraction with NaOH. If however,
the degradation proceeded far enough (pores are large enough or polymer size reduction went
far enough) those partially degraded polymers will diffuse out unassisted during the enzymatic
hydrolysis step. For future work it might be informative to use different enzyme-to-AIR/pomace
ratios to study the effect of enzyme loading and improve the observation of subtle differences.
This study provided us with a completely new method for evaluating different enzymes or
enzyme combinations. This method can also be used to test the effect of enzymes on different
substrates or different incubation conditions and it can be a valuable tool to use not only in the
development of enzyme preparations for the wine and pomace valorisation industries but should
be applicable in any industry where enzymes are used for the degradation of plant tissues.
References
lvira, P., Tomás-Pejó, E., Ballesteros, M., and Negro, M. J. (2010). Pretreatment technologies for an efficient bioethanol production process based on enzymatic hydrolysis: A review. Bioresour. Technol., 101, 4851–61.
Arnous, A., and Meyer, A. S. (2010). Discriminated release of phenolic substances from red wine grape skins (Vitis vinifera L.) by multicomponent enzymes treatment. Biochem. Eng. J., 49, 68–77.
Chamorro, S., Viveros, A., Alvarez, I., Vega, E., and Brenes, A. (2012). Changes in polyphenol and polysaccharide content of grape seed extract and grape pomace after enzymatic treatment. Food Chem., 133, 308–314.
Stellenbosch University https://scholar.sun.ac.za

102
Christiaens, S., Van Buggenhout, S., Ngouémazong, E. D., Vandevenne, E., Fraeye, I., Duvetter, T., Van Loey, A. M., and Hendrickx, M. E. (2011). Anti-homogalacturonan antibodies: A way to explore the effect of processing on pectin in fruits and vegetables?. Food Res. Int., 44, 225–234.
DeMartini, J. D., Pattathil, S., Avci, U., Szekalski, K., Mazumder, K., Hahn, M. G., and Wyman, C. E. (2011). Application of monoclonal antibodies to investigate plant cell wall deconstruction for biofuels production. Energy Environ. Sci., 4, 4332.
Eriksson, L., Byrne, T., Johansson, E., Trygg, J., and Vikström, C. (2013). Multi- and megavariate data analysis. Basic principles and applications (3rd ed.). Malmo: MKS Umetrics AB.
Fangel, J. U. (2013). Ph.D. thesis. Advanced technologies for plant cell wall evolution and diversity. University of Copenhagen, Copenhagen, Denmark.
Fia, G., Canuti, V., and Rosi, I. (2014). Evaluation of potential side activities of commercial enzyme preparations used in winemaking. Int. J. Food Sci. Technol., 49, 1902–1911.
Fleischer, A., O’Neill, M., and Ehwald, R. (1999). The pore size of non-graminaceous plant cell walls is rapidly decreased by Borate ester cross-linking of the pectic polysaccharide rhamnogalacturonan II. Plant Physiol., 121, 829–838.
Goussard, P. G. (2008). Grape cultivars for wine production in South Africa. Cape Town: Cheviot Publishing.
Hanlin, R. L., Hrmova, M., Harbertson, J. F., and Downey, M. O. (2010). Review: Condensed tannin and grape cell wall interactions and their impact on tannin extractability into wine. Aust. J. Grape Wine Res., 16, 173–188.
Hendriks, A. T. W. M., and Zeeman, G. (2009). Pretreatments to enhance the digestibility of lignocellulosic biomass. Bioresour. Technol., 100, 10–8.
Hijazi, M., Roujol, D., Nguyen-Kim, H., Del Rocio Cisneros Castillo, L., Saland, E., Jamet, E., and Albenne, C. (2014). Arabinogalactan protein 31 (AGP31), a putative network-forming protein in Arabidopsis thaliana cell walls?. Ann. Bot., 114, 1087–97.
Himmel, M., Ding, S., Johnson, D., William, S., Nimlos, M., Brady, J., and Foust, T. (2007). Biomass recalcitrance: engineering plants and enzymes for biofuels production. Science, 315, 804–807.
Hu, J., Arantes, V., Pribowo, A., and Saddler, J. N. (2013). The synergistic action of accessory enzymes enhances the hydrolytic potential of a “cellulase mixture” but is highly substrate specific. Biotechnol. Biofuels, 6, 112.
Jackson, J. E. (1991). A User’s Guide to Principal Components. Hoboken, NJ, USA: John Wiley & Sons, Inc.
Jarvis, M. C. (2011). Plant cell walls: Supramolecular assemblies. Food Hydrocoll., 25, 257–262.
Kammerer, D., Claus, A., Scieber, A., and Carle, R. (2005). A novel process for the recovery of polyphenols from grape ( Vitis vinifera L .) pomace. Food Chem. Toxicol., 70, 157–163.
Keegstra, K. (2010). Plant cell walls. Plant Physiol., 154, 483–6.
Keegstra, K., Talmadge, K. W., Bauer, W. D., and Albersheim, P. (1973). The Structure of Plant Cell Walls. Plant Physiol., 51, 188–196.
Kennedy, J. (2008). Grape and wine phenolics: Observations and recent findings. Cienc. e Investig. Agrar., 35, 107–120.
Stellenbosch University https://scholar.sun.ac.za

103
Le Bourvellec, C., Watrelot, A. A., Ginies, C., Imberty, A., and Renard, C. M. G. C. (2012). Impact of processing on the noncovalent interactions between procyanidin and apple cell wall. J. Agric. Food Chem., 60, 9484–94.
Louw, L., Tredoux, A. G. J., Rensburg, P. Van, Kidd, M., Naes, T., and Nieuwoudt, H. H. (2010). Fermentation-derived aroma compounds in varietal young wines from South Africa, 31, 213–225.
Mabee, W. E., and Saddler, J. N. (2010). Bioethanol from lignocellulosics: Status and perspectives in Canada. Bioresour. Technol., 101, 4806–13.
Maier, T., Göppert, A., Kammerer, D. R., Schieber, A., and Carle, R. (2007). Optimization of a process for enzyme-assisted pigment extraction from grape (Vitis vinifera L.) pomace. Eur. Food Res. Technol., 227, 267–275.
Marcus, S. E., Verhertbruggen, Y., Hervé, C., Ordaz-Ortiz, J. J., Farkas, V., Pedersen, H. L., Willats, W. G. T., and Knox, J. P. (2008). Pectic homogalacturonan masks abundant sets of xyloglucan epitopes in plant cell walls. BMC Plant Biol., 8, 60.
May, P. F. (2009). PINOTAGE: Behind the Legends of South Africa’s Own Wine (1st ed.). St Albans: Inform and Enlighten.
Mendes, J. A. S., Prozil, S. O., Evtuguin, D. V., and Lopes, L. P. C. (2013). Towards comprehensive utilization of winemaking residues: Characterization of grape skins from red grape pomaces of variety Touriga Nacional. Ind. Crops Prod., 43, 25–32.
Mendes, J. A. S., Xavier, A. M. R. B., Evtuguin, D. V., and Lopes, L. P. C. (2013). Integrated utilization of grape skins from white grape pomaces. Ind. Crops Prod., 49, 286–291.
Meyer, A. S., Jepsen, S. M., and Sørensen, N. S. (1998). Enzymatic release of antioxidants for human low-density lipoprotein from grape pomace. J. Agric. Food Chem., 46, 2439–2446.
Miller, G. (1959). Use of dinitrosalicylic acid reagent for determination of reducing sugar. Anal. Chem., 31, 426–428.
Moller, I., Sørensen, I., Bernal, A. J., Blaukopf, C., Lee, K., Øbro, J., Pettolino, F., Roberts, A., Mikkelsen, J. D., Knox, J. P., Bacic, A., and Willats, W. G. T. (2007). High-throughput mapping of cell-wall polymers within and between plants using novel microarrays. Plant J., 50, 1118–28.
Moore, J. P., Fangel, J. U., Willats, W. G. T., and Vivier, M. A. (2014). Pectic-β(1,4)-galactan, extensin and arabinogalactan-protein epitopes differentiate ripening stages in wine and table grape cell walls. Ann. Bot., 114, 1279–1294.
Nerantzis, E. T., and Tataridis, P. (2006). Integrated enology-Utilization of winery by-products into high added value products. J. Food Sci. Technol., 3, 1–12.
Nguema-Ona, E., Moore, J. P., Fagerström, A., Fangel, J. U., Willats, W. G. T., Hugo, A., and Vivier, M. a. (2012). Profiling the main cell wall polysaccharides of tobacco leaves using high-throughput and fractionation techniques. Carbohydr. Polym., 88, 939–949.
Nunan, K., Sims, I., and Bacic, A. (1998). Changes in cell wall composition during ripening of grape berries. Plant Physiol., 118, 783–792.
Ortega-Heras, M., Pérez-Magariño, S., and González-Sanjosé, M. L. (2012). Comparative study of the use of maceration enzymes and cold pre-fermentative maceration on phenolic and anthocyanic composition and colour of a Mencía red wine. LWT - Food Sci. Technol., 48, 1–8.
Ortega-Regules, A., Ros-García, J. M., Bautista-Ortín, A. B., López-Roca, J. M., and Gómez-Plaza, E. (2008). Differences in morphology and composition of skin and pulp cell walls from grapes (Vitis vinifera L.): technological implications. Eur. Food Res. Technol., 227, 223–231.
Stellenbosch University https://scholar.sun.ac.za

104
Özcan, E. (2006). Ultrasound assisted extraction of phenolics from grape pomace. M.Sc. thesis: Middle east technical university, Ankara, Turkey.
Pattathil, S., Avci, U., Baldwin, D., Swennes, A. G., McGill, J. a, Popper, Z., Bootten, T., Albert, A., Davis, R. H., Chennareddy, C., Dong, R., O’Shea, B., Rossi, R., Leoff, C., Freshour, G., Narra, R., O’Neil, M., York, W. S., and Hahn, M. G. (2010). A comprehensive toolkit of plant cell wall glycan-directed monoclonal antibodies. Plant Physiol., 153, 514–25.
Pedersen, H. L., Fangel, J. U., McCleary, B., Ruzanski, C., Rydahl, M. G., Ralet, M.-C., Farkas, V., von Schantz, L., Marcus, S. E., Andersen, M. C. F., Field, R., Ohlin, M., Knox, J. P., Clausen, M. H., and Willats, W. G. T. (2012). Versatile high resolution oligosaccharide microarrays for plant glycobiology and cell wall research. J. Biol. Chem., 287, 39429–38.
Popper, Z. A., and Fry, S. C. (2008). Xyloglucan-pectin linkages are formed intra-protoplasmically, contribute to wall-assembly, and remain stable in the cell wall. Planta, 227, 781–94.
Rodríguez, L. A., Toro, M. E., Vazquez, F., Correa-Daneri, M. L., Gouiric, S. C., and Vallejo, M. D. (2010). Bioethanol production from grape and sugar beet pomaces by solid-state fermentation. Int. J. Hydrogen Energy, 35, 5914–5917.
Romero-Cascales, I., Fernández-Fernández, J. I., Ros-García, J. M., López-Roca, J. M., and Gómez-Plaza, E. (2008). Characterisation of the main enzymatic activities present in six commercial macerating enzymes and their effects on extracting colour during winemaking of Monastrell grapes. Int. J. Food Sci. Technol., 43, 1295–1305.
Romero-Cascales, I., Ros-García, J. M., López-Roca, J. M., and Gómez-Plaza, E. (2012). The effect of a commercial pectolytic enzyme on grape skin cell wall degradation and colour evolution during the maceration process. Food Chem., 130, 626–631.
Serratosa, M. P., Marquez, A., Moyano, L., Zea, L., and Merida, J. (2014). Chemical and morphological characterization of Chardonnay and Gewürztraminer grapes and changes during chamber-drying under controlled conditions. Food Chem., 159, 128–36.
Sieiro, C., García-Fraga, B., López-Seijas, J., Da Silva, A. F., and Villa, T. G. (2010). Microbial pectic enzymes in the food and wine industry. Food Ind. Process. - Methods Equip. (pp. 201–218). Rijeka: InTech.
Singh, A. P., and Singh, T. (2014). Biotechnological applications of wood-rotting fungi: A review. Biomass and Bioenergy, 62, 198–206.
Tan, L., Eberhard, S., Pattathil, S., Warder, C., Glushka, J., Yuan, C., Hao, Z., Zhu, X., Avci, U., Miller, J. S., Baldwin, D., Pham, C., Orlando, R., Darvill, A., Hahn, M. G., Kieliszewski, M. J., and Mohnen, D. (2013). An Arabidopsis cell wall proteoglycan consists of pectin and arabinoxylan covalently linked to an arabinogalactan protein. Plant Cell, 25, 270–87.
Van Rensburg, P., and Pretorius, I. S. (2000). Enzymes in Winemaking : Harnessing Natural Catalysts for Efficient Biotransformations - A Review. South African J. Enol. Vitic., 21, 52–73.
Vidal, S., Williams, P., Doco, T., Moutounet, M., and Pellerin, P. (2003). The polysaccharides of red wine: total fractionation and characterization. Carbohydr. Polym., 54, 439–447.
Wischmann, B., Toft, M., Malten, M., and McFarland, K. C. (2012). Biomass conversion determined via fluorescent cellulose decay assay. Methods Enzymol., 510, 19–36.
Wood, P. J., Erfle, J. D., and Teather, R. M. (1988). Use of complex formation between Congo Red and polysaccharides in detection and assay of polysaccharide hydrolases. Methods Enzymol., 160, 59–74.
Stellenbosch University https://scholar.sun.ac.za

105
Xu, C., Yagiz, Y., Borejsza-Wysocki, W., Lu, J., Gu, L., Ramírez-Rodrigues, M. M., and Marshall, M. R. (2014). Enzyme release of phenolics from muscadine grape (Vitis rotundifolia Michx.) skins and seeds. Food Chem., 157, 20–9.
Yu, J., and Ahmedna, M. (2013). Functional components of grape pomace: their composition, biological properties and potential applications. Int. J. Food Sci. Technol., 48, 221–237.
Stellenbosch University https://scholar.sun.ac.za

106
Appendix
Table A1
Monoclonal antibodies and carbohydrate binding module used in this study.
Monoclonal antibody Reference
HG partially/de-esterified (mAb JIM5) (Verhertbruggen et al., 2009)
HG partially esterified (mAb JIM7) (Verhertbruggen et al., 2009)
HG partially/de-esterified (mAb LM18) (Verhertbruggen et al., 2009)
HG partially/de-esterified (mAb LM19) (Verhertbruggen et al., 2009)
HG partially esterified (mAb LM20) (Verhertbruggen et al., 2009)
HG ±30 contiguous unmethylesterified GalAa units (mAb PAM1) (Willats et al., 1999)
HG Ca2+ dimers (mAb 2F4) (Liners et al., 1989)
RG-I, 6 unbranched disaccharide (mAb INRA-RU1) (Ralet et al., 2010)
RG-I, 2 unbranched disaccharide (mAb INRA-RU2) (Ralet et al., 2010)
-1,4-D-galactan (mAb LM5) (Jones et al., 1997)
-1,5-L-arabinan (mAb LM6) (Willats et al., 1998)
Linearised -1,5-L-arabinan (mAb LM13) (Moller et al., 2008)
-1,4-D-(galacto)(gluco)mannan (mAb LM21) (Marcus et al., 2010)
-1,4-D-(gluco)mannan (mAb LM22) (Marcus et al., 2010)
-1,3-D-glucan (mAb BS-400-2) (Moller et al., 2008)
Xyloglucan (XXXG motif) (mAb LM15) (Marcus et al., 2010)
Xyloglucan (XLLG oligosaccharide) (mAb LM24) (Pedersen et al., 2012)
Xyloglucan (mAb LM25) (Pedersen et al., 2012)
-1,4-D-Xylan (mAb LM10) (McCartney et al., 2005)
-1,4-D-Xylan d/arabinoxylan (mAb LM11) (McCartney et al., 2005)
Celulose (crystalline) (mAb CBM3a) (Blake et al., 2006)
Extensin (mAb LM1) (Smallwood et al., 1995)c
Extensin (mAb JIM11) (Smallwood et al., 1994)
Extensin (mAb JIM20) (Smallwood et al., 1994)
AGP (mAb JIM8) (Pennell et al., 1991)
AGP (mAb JIM13) (Yates et al., 1996)
AGP (mAb LM14) (Moller et al., 2008)
AGP,-linked GlcAb (mAb LM2) (Yates et al., 1996)
agalacturonic acid; bGlcA, glucuronic acid; cCited in (Neumetzler et al., 2012)
Stellenbosch University https://scholar.sun.ac.za

107
Figure. A1. PLS score (A) and loading plot (B) of the monosaccharide analysis of Pinotage AIR treated with pure enzymes show the Pect treated samples separating from the other samples due to an abundance of Man, Glc and Xyl and a scarcity of GlcA, Rha and GalA. PLS is a regression technique for modelling the association between two sets of variables and has the ability to analyse noisy, collinear and
incomplete sets of variables (Eriksson et al., 2013).
Figure. A2. VIP plot (Variable Importance for the Projection) is an interpretation tool that summarizes the importance of variables in a PLS model and a VIP value larger than one indicates that a variable has an above average influence on the model. The VIP plot indicated that GalA, followed by Rha and Man were the most important contributors towards the configuration of the samples in the PLS plot.
A
B
Stellenbosch University https://scholar.sun.ac.za

108
Properties of the supernatants of Chardonnay pomace suspensions incubated with
commercial enzymes.
After the autoclaving step, the supernatants of the samples had a turbid appearance indicating
that a high percentage of pectin polymers were released into the buffer. These pectins form
soluble, viscous, colloidal structures that stay in suspension and keep other grape solids in
suspension by electrostatic repulsion between particles (Pinelo et al., 2010). After the
incubation with enzymes, the samples that were incubated at 50 C had absolute clear
supernatants (Table A2).
Table A2
The turbidity, pH, methanol and reducing sugar values of the supernatant of Chardonnay pomace after
incubation with commercial enzymes at 15 and 50 C. The values are the average of three biological
repeats. Different letters per column indicate statistical significant differences (95 % confidence interval).
A plus sign for turbidity means the supernatant had a turbid appearance and a negative sign means the
supernatant was clear. ExCol, RapidaseExColor; Expr, RapidaseExpression; Cellc, Celluclast1.5L
In contrast, all the enzyme treated samples at 15 C were still turbid after incubation, with the
exception of ExCol at 15 C that were slightly less turbid than the rest. This indicates a higher
level of activity for the enzymes at 50 C than at 15 C and that ExCol might have a higher
activity than Expr and Cellc at this low temperature. Table A2 also shows the pH, the methanol
and the reducing sugar levels of the supernatants after enzyme hydrolysis. The pH of the
pomace-in-citrate phosphate buffer suspension was 3.25 after autoclaving. The pH of all the
reactions (including the control) at 50 C decreased to three during the incubation period while
Control @ 15 + + + 3.29a± 0.03 < 45a
± 0 25.26a± 0.85
ExCol + + 3.22b± 0.02 85.71b
±2.4 25.97a± 1.17
Expr + + + 3.22b± 0.03 84.51b
±2.1 26.14a± 1.17
Cellc, ExCol, Expr + + + 3.22a± 0.04 82.17b
±3.9 27.29a± 0.41
Control @ 50 + + + 3.03c± 0.04 < 45a
± 0 26.12a± 0.49
Cellc, ExCol - 2.98c± 0.01 80.22b
±4.5 26.02a± 2.62
Cellc, Expr - 3.00c± 0.04 81.75b
±5.7 25.81a± 1.23
ExCol, Expr - 2.97c± 0.03 81.08b
±5.1 25.51a± 1.41
50
C
Turbidity pH Methanol (mg/mL)Reducing sugar
(mg/mL)
15
C
Stellenbosch University https://scholar.sun.ac.za

109
the pH for the reactions at 15 C were more or less stable. The decrease in pH for the control
(no enzyme added) sample at 50 C can be due to acid hydrolysis at this elevated temperature.
The pH values of the enzyme treated samples at 50 C probably also decreased due to the
release of galacturonic acid during enzyme hydrolysis. The methanol levels increased from
below 45 mg/mL for the control samples (no enzymes), [45 mg/mL is the detection threshold of
the GC-FID method (Louw et al., 2010)] to values between 80 and 82 mg/l for the enzyme
hydrolysed samples incubated at 50 C. For the samples incubated at 15 C, slightly higher
methanol values (82 to 86 mg/l) were produced. Methanol production is the result of the de-
esterification of pectin by pectinmethylesterases present in the commercial enzyme
preparations. In acidic solutions and at low temperature, de-esterification of pectin is the
dominant activity while at high temperature, depolymerization occurs more rapidly (Thakur et
al., 1997). This might explain why the seemingly higher enzyme action at 50 C (clear
supernatant, decrease in pH) does not correspond to the highest methanol concentrations. The
reducing sugar concentration in the supernatants did not increase significantly indicating that
the enzyme hydrolysis did not produce a high number of monosaccharides but rather resulted in
a lower number of large oligosaccharides (i.e. partial degradation of polysaccharides) rendering
fewer reducing sugar ends.
Table A3
Monosaccharide analysis cell walls isolated from Chardonnay pomace that were treated with commercial
enzymes. The values are the average of three samples. All light grey shaded values indicate a decrease
compared to the control sample at that specific temperature with 90 % confidence interval. The dark grey
shaded values are the same but the confidence interval is 95 %.
Ara 32 ± 2 36 ± 7 32 ± 3 44 ± 7 43 ± 7 36 ± 11 36 ± 3 44 ± 5
Rha 16 ± 0 17 ± 3 17 ± 0 22 ± 8 19 ± 1 17 ± 3 17 ± 0 21 ± 1
Fuc 20 ± 2 24 ± 4 18 ± 1 31 ± 13 23 ± 2 22 ± 4 23 ± 1 25 ± 2
Xyl 90 ± 9 103 ± 5 63 ± 16 125 ± 14 113 ± 14 85 ± 31 109 ± 23 116 ± 11
GalA 33 ± 2 41 ± 12 41 ± 3 66 ± 14 40 ± 3 34 ± 9 34 ± 3 57 ± 7
Man 25 ± 1 30 ± 10 25 ± 2 41 ± 10 32 ± 4 27 ± 7 28 ± 2 31 ± 2
Gal 30 ± 3 40 ± 12 28 ± 5 50 ± 9 41 ± 7 34 ± 12 37 ± 4 41 ± 4
Glc 35 ± 0 40 ± 16 35 ± 3 51 ± 6 44 ± 12 38 ± 8 40 ± 4 40 ± 4
GlcA 22 ± 1 27 ± 6 25 ± 3 31 ± 7 27 ± 4 25 ± 3 25 ± 3 28 ± 4
50°C control
pM/mg AIR
15C C
ExCol Expr Cellc + ExCol +
Exp
15°C control Cellc + ExCol Cellc + Expr ExCol + Expr
Stellenbosch University https://scholar.sun.ac.za

110
References
Blake, A. W., McCartney, L., Flint, J. E., Bolam, D. N., Boraston, A. B., Gilbert, H. J., and Knox, J. P. (2006). Understanding the biological rationale for the diversity of cellulose-directed carbohydrate-binding modules in prokaryotic enzymes. J. Biol. Chem., 281, 29321–9.
Eriksson, L., Byrne, T., Johansson, E., Trygg, J., and Vikström, C. (2013). Multi- and megavariate data analysis. Basic principles and applications (3rd ed.). Malmo: MKS Umetrics AB.
Jones, L., Seymour, B., and Knox, J. P. (1997). Localization of pectic galactan in tomato cell walls using a
monoclonal antibody specific to 1,4--D-Galactan. Plant Physiol., 113, 1405–1412.
Liners, F., Letesson, J.-J., Didembourg, C., and Van Cutsem, P. (1989). Monoclonal antibodies against pectin: Recognition of a conformation induced by calcium. Plant Physiol., 91, 1419–1424.
Louw, L., Tredoux, A. G. J., Rensburg, P. Van, Kidd, M., Naes, T., and Nieuwoudt, H. H. (2010). Fermentation-derived aroma compounds in varietal young wines from South Africa, 31, 213–225.
Marcus, S. E., Blake, A. W., Benians, T. A. S., Lee, K. J. D., Poyser, C., Donaldson, L., Leroux, O., Rogowski, A., Petersen, H. L., Boraston, A., Gilbert, H. J., Willats, W. G. T., and Knox, J. P. (2010). Restricted access of proteins to mannan polysaccharides in intact plant cell walls. Plant J., 64, 191–203.
McCartney, L., Marcus, S. E., and Knox, J. P. (2005). Monoclonal antibodies to plant cell wall xylans and arabinoxylans. J. Histochem. Cytochem., 53, 543–6.
Moller, I., Marcus, S. E., Haeger, A., Verhertbruggen, Y., Verhoef, R., Schols, H., Ulvskov, P., Mikkelsen, J. D., Knox, J. P., and Willats, W. (2008). High-throughput screening of monoclonal antibodies against plant cell wall glycans by hierarchical clustering of their carbohydrate microarray binding profiles. Glycoconj. J., 25, 37–48.
Neumetzler, L., Humphrey, T., Lumba, S., Snyder, S., Yeats, T. H., Usadel, B., Vasilevski, A., Patel, J., Rose, J. K. C., Persson, S., and Bonetta, D. (2012). The FRIABLE1 gene product affects cell adhesion in Arabidopsis. PLoS One, 7, e42914.
Pedersen, H. L., Fangel, J. U., McCleary, B., Ruzanski, C., Rydahl, M. G., Ralet, M.-C., Farkas, V., von Schantz, L., Marcus, S. E., Andersen, M. C. F., Field, R., Ohlin, M., Knox, J. P., Clausen, M. H., and Willats, W. G. T. (2012). Versatile high resolution oligosaccharide microarrays for plant glycobiology and cell wall research. J. Biol. Chem., 287, 39429–38.
Pennell, R., Janniche, L., Kjellbom, P., Scofield, G. N., and Peart, J. M. (1991). Developmental regulation of a plasma membrane arabinogalactan protein epitope in oilseed rape. Plant Cell, 3, 1317–1326.
Pinelo, M., Zeuner, B., and Meyer, A. S. (2010). Juice clarification by protease and pectinase treatments indicates new roles of pectin and protein in cherry juice turbidity. Food Bioprod. Process., 88, 259–265.
Ralet, M.-C., Tranquet, O., Poulain, D., Moïse, a, and Guillon, F. (2010). Monoclonal antibodies to rhamnogalacturonan I backbone. Planta, 231, 1373–83.
Smallwood, M., Beven, A., Donovan, N., Neill, S. J., Peart, J., Roberts, K., and Knox, J. P. (1994). Localization of cell wall proteins in relation to the developmental anatomy of the carrot root apex. Plant J., 5, 237–246.
Smallwood, M., Martin, H., and Knox, J. P. (1995). An epitope of rice threonine- and hydroxylproline-rich glycoprotein is common to cell wall hydrophobic plasma-membrane glycoproteins. Planta, 196, 510–522.
Stellenbosch University https://scholar.sun.ac.za

111
Thakur, B. R., Singh, R. K., and Handa, a K. (1997). Chemistry and uses of pectin--a review. Crit. Rev. Food Sci. Nutr., 37, 47–73.
Verhertbruggen, Y., Marcus, S. E., Haeger, A., Ordaz-Ortiz, J. J., and Knox, J. P. (2009). An extended set of monoclonal antibodies to pectic homogalacturonan. Carbohydr. Res., 344, 1858–62.
Willats, W. G. T., Gilmartin, P. M., Mikkelsen, J. D., and Knox, J. P. (1999). Cell wall antibodies without immunization : generation and use of de-esterified homogalacturonan block-specific antibodies from a naive phage display library. plant J., 18, 57–65.
Willats, W. G. T., Marcus, S. E., and Knox, J. P. (1998). Generation of a monoclonal antibody specific to 1,5-a-L-arabinan. Carbohydr. Res., 308, 149–152.
Yates, E. A., Valdor, J. F., Haslam, S. M., Morris, H. R., Dell, A., Mackie, W., and Knox, J. P. (1996). Characterization of carbohydrate structural features recognized by anti-arabinogalactan-protein monoclonal antibodies. Glycobiology, 6, 131–9.
Stellenbosch University https://scholar.sun.ac.za

Chapter 5
Research results
Commercial wine yeast strains expressing a polygalacturonase and glucanase unravel the
cell walls of Chardonnay grape pomace
This manuscript was written in the style of the journal Applied and Environmental Mircobiology
Stellenbosch University https://scholar.sun.ac.za

112
Commercial wine yeast strains expressing a polygalacturonase and
glucanase unravel the cell walls of Chardonnay grape pomace
Anscha J. J. Zietsman1, John P. Moore1, Jonatan U. Fangel2, William G.T. Willats2,
Melané A. Vivier1*
1Institute for Wine Biotechnology, Department of Viticulture and Oenology, Faculty of AgriSciences,
Stellenbosch University, Matieland 7602, South Africa
2Department of Plant and Environmental Sciences, Faculty of Science, University of Copenhagen, DK-
1001, Denmark
Industrial wine yeast strains expressing hydrolytic enzymes were fermented on
Chardonnay pomace in buffered conditions. The enzymes produced were a native
endo-polygalacturonase (EPG) and/or a recombinant endo-glucanase (EG). Analysis
of the cell walls of the grape berry tissue by Comprehensive Microarray Polymer
profiling (CoMPP) analysis at the end of fermentation revealed that the EG alone did
not modify the cell walls but the EPG removed some homogalacturonan. A
recombinant yeast strain expressing both the EPG and the EG during the fermentation
displayed an even more pronounced effect with signs that the cell wall was
unravelled, enabling more polymers such as rhamnogalacturonan-I (RG-I), RG-I side
chains and cell wall proteins to be extracted in a pectin solvent (CDTA). Moreover, a
NaOH extract (for glucan extraction) showed that the yeast expressing both enzymes
could liberate more RG-I and side branches of RG-I during the fermentation. This
provides the first information on the specific polymer changes brought about by a
hydrolytic enzyme producing yeast strain during a fermentation on grape pomace. The
cell wall profiling techniques used in this study is a valuable tool to evaluate the
potential of enzyme producing microorganisms and/or enzymes added to degrade
grape berry (and other plant) cell walls.
Grape processing regularly involves the use of enzymes, whether it is during the production
of wine or with the valorisation of pomace, a waste product of the wine industry. These
enzymes are either commercially produced and added during the production step or they can
originate from the microorganisms (wild or inoculated yeast and bacteria) present in the
fermenting must (1, 2). Microorganisms producing wine processing enzymes during the
normal fermentation process would be highly advantageous as discussed in (3, 4). Many
studies isolate and investigate the natural yeast populations found in the grape and wine
environment (5) in the hope of finding new strains that will be able to conduct the wine
Stellenbosch University https://scholar.sun.ac.za

113
fermentation while contributing towards the production of beneficial enzymes. Similarly,
microorganisms that can hydrolyse polysaccharides of the grape cell walls and promote the
extraction of revenue-generating molecules such as polyphenols from pomace, would reduce
the cost of pomace conversion (6, 7) by eliminating the need for the addition of external
enzymes.
The yeast PR7 is a hybrid between Saccharomyces paradoxus R088 (8), a malic acid
degrading strain with good oenological characteristics, and VIN13 (Anchor yeast, South
Africa), a Saccharomyces cerevisiae commercial wine strain. This interspecies hybrid has
been created at the Institute for Wine Biotechnology (IWBT) at Stellenbosch University (9)
and has been commercialized by Anchor yeast (South Africa) under the trade name Exotics
SPH. S. paradoxus R088 produces an endo-polygalacturonase (PGU1) (9) and PR7
inherited this gene during the hybridization process and displays similar polygalacturonase
(EPG) activity than S. paradoxus R088, on a plate assay (10). The S. paradoxus RO88 Pgu1
enzyme has an optimal temperature of 45C with only 25% residual activity at 25C and the
optimal pH is 5.5 with 43% residual activity at pH3.5 (10).
In previous studies we saw that an EPG enzyme on its own did not change the cell wall
composition of grape pomace (Chapter 4), but when this was combined with an EG a
synergistic (larger than EG alone) cell wall degradation effect was seen. Endo-β-1,4-
glucanases randomly hydrolyzes internal β-1,4-D-glycosidic bonds in cellulose and
xyloglucan, producing oligosaccharides and reducing the polymer length. An endo-glucanase
gene (end1, EC 3.2.1.4) used in this study was obtained (11) from the bacteria Butyrivibrio
fibrisolvens H17c. This bacterium is an important rumen bacterium and was isolated from
the rumen of sheep (12), reindeer and semi-starved Zebu cattle in Kenya (13). The end1
gene codes for a protein (END1) with 547 amino acids residues (11) with the catalytic
domain at the N-terminus and five perfect repeats (PDPTPVD) from amino acid 412 to 447.
Proline rich repeats are characteristic of bacterial cellulases (14) and often constitute the
linker between the cellulose-binding domain and the rest of the protein. Proline rich regions
are also common in cell wall proteins (15) and facilitate binding to other proteins and
polyphenols molecules.
In an article by Van Rensburg et al. (16) the end1 gene was expressed by S. cerevisiae
ISP53, a haploid laboratory strain, together with the pectate lyase and polygalacturonase of
Erwinia chrysanthemi. They found that the END1 secretion was delayed by 24 hours
compared to the two pectinases and ascribed this to the PDPTPVD repeats. The enzyme
activity of END1 was tested on a range of substrates and it was highly active against
carboxymethylcellulose and lichenan which has β1-4 and β1-4; β1-3 linkages respectively. It
Stellenbosch University https://scholar.sun.ac.za
114
showed no activity against laminarin which has only β1-3 linkages, indicating activity specific
for β1-4 linkages. Low activity was also found with the substrates xylan (β1-4) and p-
nitrophenyl-β-D-cellobioside (β1-4), but no glucosidase and xylosidase activity could be
detected. According to (17) this enzyme is irreversibly inactivated when the pH decreases
below 4.5, thus this enzyme would not be active in a grape must matrix where the pH is
usually below 4 (18).
With this study, we asked if the EPG produced by PR7 can degrade or change the
composition of grape berry cell walls under optimal pH conditions. Additionally we wanted to
investigate if the presence of an endo-glucanase would augment the cell wall degrading
effect of the EPG. To this end, we produced a recombinant PR7 strain that expressed a -
1,4-D-glucanase from a genome-integrated cassette. The VIN13 strain was used as a
negative control (no EPG or EG activity) and a VIN13 engineered to express the end1 of
B. fibrisolvens H17c gene (VIN13 END1) was used to demonstrate the effect of the endo-
glucanase activity on its own. The yeast strains were fermented on autoclaved Chardonnay
pomace (deseeded pulp and skins) suspended in a buffer at pH6 to ensure that both the
EPG and EG expressed by the yeast strains would be active and close to their optimum pH.
After the fermentation the cell walls of the Chardonnay pomace were studied with
Comprehensive Microarray Polymer Profiling analysis (19) where monoclonal antibodies and
carbohydrate binding modules that are specific for epitopes on the plant cell wall are used to
indicate the presence and relative abundance of certain cell wall polymers. This technique
was supported by the monosaccharide compositional analysis of the Chardonnay pomace
cell walls, reporting the variation in the single sugar composition of the cell wall due to the
different conditions/treatments in the study. Multivariate data analysis was used to detect and
confirm the major patterns and trends in the data.
MATERIALS AND METHODS
Microbial strains and culture conditions. The sources and relevant genotypes of bacterial
and yeast strains, as well as plasmids used in this study, are listed in Table 1. Escherichia
coli transformants were grown in Luria-Bertani (LB) broth (Biolab) containing 12 g/l tryptone,
12 g/l NaCl and 6 g/l yeast extract supplemented with 100 g/ml ampicillin (Roche) for
plasmid selection. Yeast peptone dextrose (YPD) broth (Biolab) containing 1% yeast extract,
2% peptone and 2% glucose was used for the general culturing of yeast cells. S. cerevisiae
transformants were cultured on yeast extract (YE) plates containing 0.5% yeast extract, 2%
glucose and 3% Pastagar B (Bio-Rad Laboratories) supplemented with 150 μg/ml
phleomycin (Sigma-Aldrich) or 200 μg/ml G418 (geneticin) (Sigma-Aldrich).
Stellenbosch University https://scholar.sun.ac.za

115
DNA manipulations and plasmid construction. Standard methods were used for plasmid
DNA isolation, restriction enzyme digestion, ligation reactions and transformation of E. coli
DH5 (20). All gel isolations of DNA fragments were performed with the Zymoclean DNA
recovery kit (Zymo Research Corp.). TaKaRa ExTaq™ DNA polymerase (TAKARA BIO INC)
was used in polymerase chain reactions (PCR) required for the manipulation of DNA while
GoTaq® DNA Polymerase (Promega corporation) was used for screening and confirmation
PCR reactions.
The primers and the PCR programs used in this study are listed in Table 2. PCR
amplification were performed with a thermo cycler (Hybaid PCR express) and the PCR
product fragments were isolated from an agarose gel, ligated into pGEM®-T Easy and
transformed into E. coli DH5. The integrity of the PCR products and the different clones
were verified by restriction analysis and sequencing (Central Analytical Facility, Stellenbosch
University).
Stellenbosch University https://scholar.sun.ac.za

116
TABLE 1 Strains and plasmids used and created in this study
STRAIN OR PLASMID
DESCRIPTION SOURCE OR REFERENCE
Bacterial strain
E. coli DH5a F’ø 80ΔlacZΔM15Δ(lacZYA-argF)U169 deoR reA1 hsdR17 (rk- mk
+) supE44l
- thi1 gyr A96
relA1/F’proABlaclqZΔM15,zzf::Tn5[Km
r]
aGIBCO-BRL/ Life
Technologies
Plasmids
pGEM®-T Easy ApR
ΔlacZ bPromega Corporation
pUT332 ApR
Tn5 ble (21)
pUG6 ApR
loxP TEF2P kanr TEF2T loxP (22)
pDRIVE ApR
kanrΔlacZ
cQiagen GmbH
pAR5 ApRGt
RLEU2 ADC1P MFa1S end1 TRP5T ADC1P MFa1S pelE TRP5T ADC1P MFa1S peh1 TRP5T (16)
pPOF1 PCR product POF1 cloned into pGEM®-T Easy This study
pPOF1b pPOF1 with the SalI site in the dMCS destroyed and a new SalI site introduced within the POF1 ORF This study
pPOF1b KMX eKanMX
R cloned in the BamHI and SalI sitesof pPOF1b This study
pMPOF1 PCR product MPOF1 cloned into pGEM®-T Easy This study
pMPOF1b pMPOF1 with the SalI site in the MCS destroyed and a new SalI site introduced within the MPOF1 ORF This study
pMPOF1bEND1 pGEM®-T Easy with ADC1P MFa1S end1 TRP5T cloned between MPOF1 homologous flanks This study
Yeast strains
VIN13 Saccharomyces cerevisiae, Commercial diploid strain fAnchor yeast.
V13 KMX VIN13 pof1::KanMXR This study
V13 END1 VIN13 pof1:: ADC1P MFa1S end1 TRP5T This study
PR7 VIN13 x Saccharomyces paradoxus RO88 hybrid (9)
PR7 KMX PR7 pof1::KanMXR This study
PR7 END1 PR7 pof1:: ADC1P MFa1S end1 TRP5T This study
aGIBCO/Bethesda Research Laboratories, Life Technologies Ltd.;
bPromega corporation;
cQIAGEN;
dMSC, Multiple cloning site;
eKanMX
R, geneticin resistance expression
cassette; fAnchor yeast
Stellenbosch University https://scholar.sun.ac.za
Stellenbosch University https://scholar.sun.ac.za

117
Construction of integration cassette POF1-TEF2P-kanr-TEF2T-POF1 (POF1-KMX). Primers
POF1-L and POF1-R (Table 2) were designed to amplify the region from 112 bp on the 5’ side
of the start codon of the POF1 gene, up to 466 bp on the 3’ side of the stop codon. Program 1
(Table 2) were used to obtain the 1302 bp fragment (POF1) which were cloned into pGEM®-T
Easy yielding pPOF1. The SalI site in the multiple cloning site of this plasmid was destroyed by
first cutting with this restriction enzyme and then filling up the 5’ protruding ends with the DNA
Polymerase I (Klenow) Large fragment (Promega Corporation) and then ligating the blunt ends.
The resulting plasmid was named pPOF1a and was further modified by introducing a new SalI
site within the coding sequence of the POF1 gene on the plasmid. This was achieved by using
primers POF1-L and POF1-R and plasmid pMPOF1b (described in the next section) as
template and PCR program 1. The 1270 bp PCR fragment was cloned into pDRIVE forming
plasmid pDRIVE POF1b, whereafter the POF1b fragment (with the SalI site) from pDRIVE
POF1b was isolated by digestion with StuI; this fragment replaced the POF1 fragment (without
the SalI site) in pPOF1a to yield pPOF1b. Finally, the TEF2P kanr TEF2T cassette was isolated
from pUG6 by digesting with XhoI and BglII and this was cloned into the BamHI and SalI sites of
pPOF1b to yield pPOF1b KMX.
TABLE 2 Primers and PCR programs used in this study
Primer name Sequence 5'- 3 Restriction sites included
POF1-L AGGCCTGCCCGGGCACCCATTTTTAAGATTGGTG Stu I, Srf I
POF1-R AGGCCTGCCCGGGCTTGGTGATGTAATAATGTCAAG Stu I, Srf I
POF1-M GTACGGATCCACGTGTCGACTCGTTGGGAAGGAATAAA Bam HI, Sal I
MaxiPOF1-L TCGCGAGCCCGGGCCCATGGATGTTCTATGAATG Nru I, Srf I
MaxiPOF1-R TCGCGAGCCCGGGCCTTACACTCCAGCAAATAATC Nru I, Srf I
exPOF1-L AATAGCCCGACTCCGTAG
ENDSEQ GCCTTCAGCTTCTGTAGACT
PCR program number Amplification cycle*
1 94 °C, 30 s; 53 °C, 30 s; 72 °C, 90 s
2 45 °C, 30 s; 55 °C, 30 s; 72 °C, 140 s
3 94 °C, 30 s; 55 °C, 30 s; 72 °C, 34 s
4 94 °C, 30 s; 52 °C, 30 s; 72 °C, 240 s
5 94 °C, 30 s; 53 °C, 30 s; 72 °C, 150 s
* All PCR programs had an initial denaturation step at 94 °C for 5 min and a final elongation step at 72 °C for 7 min
Construction of integration cassette MPOF1-ADC1P-MFα1s-END1-TRP5T-MPOF1 (MPOF
END1). Primers MaxiPOF1-L and -R (Table 2) were used to amplify the region from 815 bp on
the 5’ side of the start codon of the POF1 coding sequence up to 784 bp 3’ from the stop codon.
Genomic DNA from VIN13 was used as template with PCR program 2 (Table 2). The PCR
Stellenbosch University https://scholar.sun.ac.za

118
product (MPOF1) was cloned into pGEM®-T Easy resulting in pMPOF1. The SalI site of this
plasmid was destroyed in the same way as with pPOF1. This plasmid was called pMPOF1a.
The next step was to introduce a new SalI site within the open reading frame of the POF1 gene
that can serve as a position to introduce the END1 expression cassette. An 846 bp PCR
fragment were produced using pPOF1 as template, primer pair POF1-M and POF1-R and PCR
program 3. This PCR product was cut with restriction enzymes BamHI and SnaBI and ligated
into the corresponding restriction enzyme sites of pMPOF1a, yielding pMPOF1b. The final step
was to isolate the 2820 bp ADC1P-MFα1s-END1-TRP5T fragment from pAR5 (SalI) and clone
this into the newly created SalI site of pMPOF1b to yield pMPOF1bEND1 (Fig.1B).
Yeast transformation. Plasmids pPOF1b KMX and pMPOF1bEND1 were digested with StuI
and SmaI respectively to liberate the integration cassettes from the rest of the plasmids. VIN13
and PR7 were transformed, first with the POF KMX integration cassette (from pPOF1b KMX),
according to the electrophoresis protocol described in (23). However, a few changes were
made: the yeast culture was grown until exponential phase (OD600 = 0.8), the DNA integration
cassette concentration was increased to 4 μg and the regeneration after the electroporation
pulse was done overnight. The integration events were targeted to the POF1 locus by exploiting
the natural yeast homologous recombination system. Putative (V13 KMX and PR7 KMX)
transformants were selected from YE-G418 plates. After confirming the integration event with
PCR (see next section), two transformed yeasts were selected for the next round of
transformations. During this round, the POF-KMX cassette was replaced by the MPOF END1
expression cassette. This was a co-transformation where 100 ng of pUT332 plasmid was added
to the 4 μg MPOF END1 expression cassette DNA. The pUT332 plasmid was used as a
screening tool in order to limit background colonies. Putative transformants were selected from
YE-phleomycin plates and transferred with sterile toothpicks to YE-G418 plates (negative
screen) in order to select colonies whose POF KMX cassette was putatively replaced by the
MPOF END1 cassette.
Verifying the yeast transformants and the position of integration. The integration of the
POF1 KMX cassette into the POF1 locus of the VIN13 and PR7 genome was confirmed by
using primers POF1-L and KanMX-Rp (PCR program 2) on genomic DNA isolated (according to
the protocol by (24)) from colonies growing on YE-G418 plates. After replacing the POF KMX
with MPOF END1 expression cassette, primers END1SEQ and MaxiPOF1-L were used with
PCR program 4, to screen the putative VIN13 END1 and PR7 END1 strains. The presence of a
PCR product of 1971 bp indicated that the POF1 locus was successfully interrupted by the
END1 expression cassette.
The position of the integration event was further investigated by designing a primer, exPOF1-L
that aligns on the yeast genome, 167 bp 5’ from the target for homologous recombination. This
Stellenbosch University https://scholar.sun.ac.za

119
primer was used together with primer ENDSEQ (PCR program 5) to yield a band size of 2138
bp that indicated a successful integration.
By using primers POF1-L and POF1-R and genomic DNA of V13 END1 transformant # 1.8 and
PR7 END1 transformant # 4.7 we could establish whether the integration event happened only
at the one POF1 locus or at both loci of these two diploid yeast strains. A PCR product of 1274
bp would indicate the presence of an undisrupted POF1 locus while a band at 3944 bp would
indicate that the locus was disrupted with the MPOF END1 integration cassette.
Enzyme activity. To confirm that the integrated expression cassettes lead to the production of
an active recombinant β-1,4-glucanase, cells from VIN13 END1 and PR7 END1 colonies were
transferred to carboxymethyl cellulose (CMC) plates (0.5% yeast extract, 2% glucose, 2% agar,
1% CMC) and grown for 3 days at 30C, whereafter the colonies were washed off with sterile
distilled water. The plates were then flooded with 0.1% Congo red for two hours followed by a
de-staining step with 1 M NaCl2. A clear/light yellow zone indicated β-1,4-glucanase activity.
The activity of the native polygalacturonase enzyme of PR7 and PR7 END1 strains was
confirmed with a plate assay previously described in (25).
Curing of the pUT332 plasmid and stability of yeast transformants. The yeast strains were
cultivated in YPD media at 30C for 100 generations. Each day some cells were transferred to
fresh media and the absorbance at OD600 were determined at the end and start of each
subculture in order to calculate the number of generations. At the end of 100 generations the
GMY culture were plated on YPD medium. One hundred randomly selected colonies were
analysed for the presence of the end1 gene. Two different methods were used. Initially, yeast
colonies were dissolved in 5 μL of sterile distilled water and the suspension were transferred to
QIAcard FTA cards (QIAGEN). The cards were prepared as specified by the manufacturer and
used as template in a PCR reaction to detect the presence of the end1 gene using primers
END1SEQ and exPOF1-L as previously described. Additionally the colonies were transferred to
CMC plates and tested for the activity of the β-1,4-glucanase activity as previously described.
Finally, the colonies were tested for sensitivity towards phleomycin by transferring them with
sterile toothpicks to YE-pheomycin plates. If colonies were unable to grow on these plates, it is
an indication that the yeast cells discarded the pUT332 plasmid during the 100 generations that
they were grown under non-selective conditions.
Fermentation on pomace. Vitis vinifera cv Chardonnay grapes were harvested in the Boland
region of South Africa and the pomace was obtained after the grapes were pressed. The
pomace was kept at -20C until processed, which entailed seed removal and blending with a
Stellenbosch University https://scholar.sun.ac.za
120
food processor. The chopped/blended pomace was then suspended as a 15% (w/v, wet weight)
suspension in a 0.12 M citrate phosphate buffer at pH 6 and autoclaved (121C, 15 min, 100
kPa) to sterilize as well as destroy the native grape and microbial enzymes. The yeast strains
(VIN13, V13 END1, PR7 and PR7 END1) were grown in YPD and inoculated at a cell density of
ca. 2.2 x 10⁷ cells/ml into the pomace suspension (determined with plate counts just after
inoculation). The pomace cultures were fitted with fermentation caps and incubated with
shaking at 30C for 144 h. All fermentations were done in quadruplicate and after incubation,
the supernatant and solids were separated by centrifugation and frozen at -20C until further
analysed.
Analysis of the pomace fermentation supernatants. Two samples per biological repeat were
taken one hour after inoculation, at 48 h, 120 h and at 144 h (end of fermentation) in order to
determine the reducing sugars using the method described by Ghose (26). The pH of all the
supernatants (the average of two technical repeats), as well as the viable yeast cell count, was
determined on the final day.
Isolation of cell walls or alcohol insoluble residue (AIR) from pomace solids. The frozen
pomace pellets (representing all the solid material from one biological repeat), collected at the
end of the fermentation, were freeze-dried and then dry milled and homogenized with a Retsch
MM400 mixer mill (Retsch, Germany) at a frequency of 30 Hz for 30 seconds. The resulting
powder was used for the isolation of the cell walls using the method described by Ortega-
Regules et al. (27) with some changes. The first acetone step after the buffered phenol
extraction was omitted. Furthermore, after the third acetone wash the excess acetone was
removed under a slight vacuum and the remaining cell walls or alcohol insoluble residue (AIR)
was then mixed with an equal volume of sterile distilled water, frozen at -80C and then freeze-
dried.
Monosaccharide analysis of cell wall samples. The monosaccharide composition of the AIR
isolated from the pomace was analyzed according to the method described in (28, 29), with
some modifications. Approximately 5 mg of AIR was hydrolyzed (two technical repeats per
biological repeat) to monosaccharides followed by derivatization to methoxy sugars at 80C for
16 h. After silylation with HMDS + TMCS + Pyridine 3:1:9 (Sylon HTP) kit (Supelco, USA) the
derivatives were separated and analyzed in a gas chromatograph, Agilent 6890 N (Agilent, Palo
Alto, CA) coupled to a Agilent 5975 MS mass spectrometer detector, using a polar (95%
dimethylpolysiloxane) ZB-Semivolatiles Guardian (30 m, 0.25 mm ID, 0.25 µm film thickness)
GC column. The oven temperature was maintained at 70C for 2 min, ramped at 1C/min to
76C, then at 8C/min to 300C and then held for 5 min. We expressed the monosaccharide
composition as the mole percentage contribution of each monosaccharide in relation to the nine
Stellenbosch University https://scholar.sun.ac.za

121
common plant cell wall monosaccharides present. Error bars in the histogram represent the
mean of four biological samples.
Comprehensive microarray polymer profiling (CoMPP) analysis of cell wall fractions. One
AIR sample (10 mg) from each biological repeat was weighed off and used for CoMPP analysis.
Sequential extractions, according to the procedure described in Moore et al. (30), were
performed on these 10 mg AIR samples, using the solvents CDTA (diamino-cyclo-hexane-tetra-
acetic acid) and NaOH respectively. CDTA extracts mainly pectin-rich polymers from the cell
wall particles and the second extraction with NaOH extracts all the hemicellulose-rich polymers.
A selection of monoclonal antibodies (mAbs) and carbohydrate binding modules (CBMs) were
chosen to cover the variety of epitopes expected in the grape cell wall. A full list is provided in
the Appendix (Table A1). Arrays printed with the different fractions were probed individually
with the mAbs and CBMs as described in Moller et al. (2007). Each sample was represented by
five microarray spots and a mean spot signal was calculated whereafter it was normalized to the
highest signal (set as 100) in the dataset. A cut-off value of five was imposed on the data.
Multivariate and univariate statistics. Univariate statistical analysis (unpaired T-test, 95%
confidence level) was performed on monosaccharide data. Multivariate analysis by means of
principle component analysis (PCA) (31) was performed using SIMCA 13 software package
(Umetrics AB, Sweden).
RESULTS
Construction of genetically modified yeast. Two integration cassettes were developed for
this study. The one (Fig. 1A) contained the expression cassette that conveys resistance towards
geneticin/G418 (TEFP kanr TEFT) with flanking regions that are homologous to the POF1 locus
on the genome of S. cerevisiae. The second integration cassette (Fig. 1B) contained the
expression cassette for the EG gene (end1) from B. fibrisolvens under control of the
S. cerevisiae ADC1 promoter and MF1 secretion signal. This expression cassette is also
flanked with the POF1 homologous regions of the first integration cassette but the homologous
regions were larger (extended outwards towards the 5’and 3’ ends of the POF1 locus). The
larger homologous region in the MPOF END1 integration cassette was designed to ensure that
the MPOF END1 integration cassette would be able to replace the first integration cassette
(POF KMX) on the yeast genome in two consecutive integration events. With the second
integration, the pUT332 plasmid was co-transformed with the linear MPOF END1 integration
cassette and the putative transformants were plated on YE-phleomycin plates. This ensured
that only colonies that took up foreign DNA (pUT332 and MPOF END1 expression cassette or
just pUT332) would need further screening for EG activity. After curing the yeast of the pUT332
Stellenbosch University https://scholar.sun.ac.za

122
plasmid, this strategy (32) ensured that the final recombinant yeast would have no bacterial
resistance markers or other foreign DNA, except the end1 gene, in its genome.
FIG 1A & B. Schematic presentation of the integration cassettes prepared for the disruption of the POF1
gene on the genome of VIN13 and PR7. The primer alignment positions of POF1-L and –R as well as
MaxiPOF1-L and –R, that were used to amplify the POF1 homologous regions are indicated on the
diagram. Primers that were used to confirm the integration event at the intended position on the genome
(exPOF1-L, MaxiPOF1-L and END1SEQ) are indicated.
VIN13 transformed with the kanr integration cassette delivered more than 200 putative
transformants showing resistance to G418. Genomic DNA of ten of these putative transformants
(randomly chosen) were tested for the presence of the kanr integration cassette with primers
POF1-L and KanMX-Rp, and 9 of the transformants gave the correct PCR product of 2130bp
(Fig. 2A). The first transformant was selected for the subsequent co-transformation with MPOF
END1 and pUT332 and this resulted in 1700 putative transformants. These putative
transformants were screened for restored sensitivity towards G418, which would indicate that
the kanr integration cassette was replaced by the MPOF END1 integration cassette. Eighteen
putative V13 END1 transformants were isolated from the master plates and transferred to CMC
plates to test for end1 enzyme activity. Nine of the eighteen putative V13 END1 transformants
showed EG activity on the CMC plates (data not shown) and from those genomic DNA were
isolated. Primer pair END1SEQ and MPOF-1 was used to test for positive integration events
(Fig. 2B) and a PCR product at 1971bp (indicating the presence of the END1 expression
cassette at the intended position on the yeast genome) was achieved for all of the nine
transformants.
Stellenbosch University https://scholar.sun.ac.za

123
Fig 2 (A) Proof of integration of the kanr integration cassette into the VIN13 genome with ten putative
transformants of V13 KMX. A PCR product of 2130bp with primer pair POF1-L and KanMX-Rp were
obtained for nine of the ten transformants. Genomic DNA of VIN13 (-CV) and MilliQ water (-CW) were
used as a negative control while pPOF1bKMX DNA were used as positive control (+C) for the PCR
reaction. (B) A PCR product of 1971 bp indicated that the correct integration of the END1 integration
cassette took place at the POF1 locus of VIN13. On the gel the V13 END1 yeast transformants were in
lane i, transformant # 1.8; lane ii, 1.26; iii, 29.30; iv, 36.31; v, 45.18; vi, 46.29; vii, 47.1; viii, 52.14; ix, 34.3.
Plasmid pMPOF1bEND1 was used a positive control (+C), and negative controls were VIN13 (-CV) and
V13 KMX (-CKMX). The DNA molecular weight marker was Lambda DNA cut with restriction enzymes
EcoRI and HindIII.
The same procedure for the integration of the END1 integration cassette was followed for the
PR7 yeast strain. Eleven PR7 KMX transformants were obtained and verified with primers
exPOF1-L and KanMX-Rp (PCR product 2297bp) (data not shown). The first positive
transformant (named PR7 KMX # 1) were used in the follow up transformation, which rendered
1800 putative transformants. After screening 520 of these transformants for G418 sensitivity,
eleven did not grow on YE-G418 plates and eight of the eleven gave a PCR product (1971bp)
using the exPOF1-L and ENDSEQ primer pair (Fig. 3). Two transformants (PR7 END1 # 10.10
and 4.17) were tested on CMC plates for endo-glucanase activity and both were positive (Fig.
4). The integration strategy was therefore successful in both the VIN13 and PR7 yeast strains.
+C -C
V +C -C
KMX
8 9 10 -CV
5 6 7 1 2 3 4
-CW
+C
21226 bp
2027 bp
2027 bp 2130 bp
2130 bp
2027 bp
A B
1971 bp
1971 bp
2027 bp
v vi vii i ii iii iv
viii ix
: EcoRI/Hind III
Stellenbosch University https://scholar.sun.ac.za

124
FIG 3 PR7 END1 recombinant transformants identified with PCR using primer pair exPOF1-L and
ENDSEQ. A product of 1971 bp indicates that the END1 integration cassette was integrated at the correct
position on the PR7 genome. Lane i, transformant # 2.31; ii, 3.1; iii, 3.28; iv, 4.17, v, 4.31; vi, 4.40; DNA
molecular weight marker (: EcoRI/HindIII), vii, 4.51; viii, 6.44; ix, 7.17; x, 10.10; xi, 10.19; xii, 10.41. The
transformants that gave the correct PCR product are shown in bold letters. Genomic DNA of PR7 was
used as negative control (-C).
VIN13 and PR7 are both diploid yeast strains (9) which would allow the integration of two copies
of the MPOF END1 integration cassette into the genome of these yeast strains. A PCR reaction
on the genomic DNA of V13 END1 # 1.8 and PR7 END1 # 4.17 with primers POF1-L and
POF1-R yielded PCR products of 3944 bp (data not shown) indicating that both copies of the
POF1 gene were disrupted. The undisrupted POF1 gene would have given a PCR product of
1274 bp.
Activity of the recombinant and native yeast enzymes. After confirmation of the integration
of the MPOF END1 expression cassette into the genomes of VIN13 and PR7 the activity of the
recombinant EG enzyme in the V13 END1 and PR7 END1 strains as well as the native
polygalacturonase strains was tested. Positive (light yellow to clear zones on CMC plates)
zones could be seen (Fig. 4A) for all the VIN13 END1 and PR7 END1 GMY’s (indicating EG
activity) while the untransformed VIN13 and PR7 strains showed no zone. All the PR7 strains
showed clear zones inside a white ring (Fig. 4B) indicating an active native polygalacturonase,
while VIN13 strains gave no clearing zones.
2027bp
1584bp
2027 bp 1584 bp
EcoRI/HindIII
1971 bp
i ii iii iv v vi vii viii ix x xi xii -C
Stellenbosch University https://scholar.sun.ac.za

125
FIG 4A & B. (A) Polygalacturonase activity (clear zones inside white rings) on a polygalacturonic agar
plate and (B) endo--1,4-glucanase activity (light yellow zones) on a CMC agar plate with the yeast
strains used in this study (VIN13, VIN13 END1 # 1.8, PR7, PR7 END1 # 4.7). Other strains that were also
successfully integrated with the MPOF END1cassette (VIN13 END1 # 36.31 and PR7 END1 # 10.10) are
also shown here, but they were not used in the pomace fermentations.
Curing of pUT332 and stability and of the integrated expression cassette. Yeast colonies
harboring the β-1,4-glucanase expression cassette were tested for the stability of the integration
event. The GMY were cultivated for 100 generations whereafter 100 colonies of each strain
were tested by PCR and on activity plates for the presence of the recombinant gene. All strains
showed 100% stability of the integration (data not shown) and the loss of pUT332 were proven
by their inability to grow on agar plates containing phleomycin.
Fermetation on Chardonnay pomace. Transformed yeast strains VIN13 END1 # 1.8 and PR7
END1 # 4.17 (henceforth called VIN13 END1 and PR7 END1) were chosen to use in all
subsequent fermentations on pomace, together with untransfromed VIN13 and PR7. The
reducing sugar in the supernatant of the pomace suspension increased from 22 mg/ml to 25.9
mg/ml during the autoclaving process. The progress of the fermentation was followed by
recording the weight loss (data not shown) and the decrease in reducing sugars on the first day
(an hour after inoculation), after 48 h, 120 h and 144 h (last day) (Fig. 5). All the yeast
fermentations reduced the sugar within 48 h to less than 3 mg/ml and at the end of the
fermentation period (144 h) the reducing sugar concentrations were 1.93 (VIN13), 1.87 (V13
END1), 2.04 (PR7) and (PR7 END1) 2.04 mg/ml repectively.
VIN13
VIN13 END1 #1.8
VIN13 END1 #36.31
PR7 END1 #10.10
PR7 PR7 END1 #4.17
VIN13
VIN13 END1 #1.8
VIN13 END1 #36.31
PR7
PR7 END1 #10.10
PR7 END1 #4.17
B A
Stellenbosch University https://scholar.sun.ac.za

126
FIG 5. Reducing sugars in the supernatant of the fermentations with the yeast strains VIN13, VIN13
END1, PR7 and PR7 END1, with Chardonnay pomace suspension as substrate. The values are the
average of four biological repeats.
The pH of the pomace suspension after autoclaving was 5.7 and this changed to 5.9 in the
control reaction while the pH of the yeast fermentations was stable at 5.7. Thus, the
recombinant EG protein that is irreversibly inactivated at pH values below 4.5 (17) would not
have been negatively affected by pH during the fermentation. The same applies for the native
EPG of PR7 [optimum pH of 5.5 (10)] if we assume that it has the same properties as the EPG
expressed by the parent strain, S. paradoxus RO88.
Analysis of the pomace fermentation residue. In order to determine if the hydrolytic enzymes
(EG and EPG) produced by the yeast strains (V13 END1, PR7 and PR7 END1) changed the
cell wall composition of the pomace, we analysed the AIR isolated from pomace residue at the
end of the fermentations. The results from V13 END1, PR7 and PR7 END1 were compared with
the control fermentation (no yeast present) and the VIN13 fermentation (no EG or EPG activity).
Stellenbosch University https://scholar.sun.ac.za
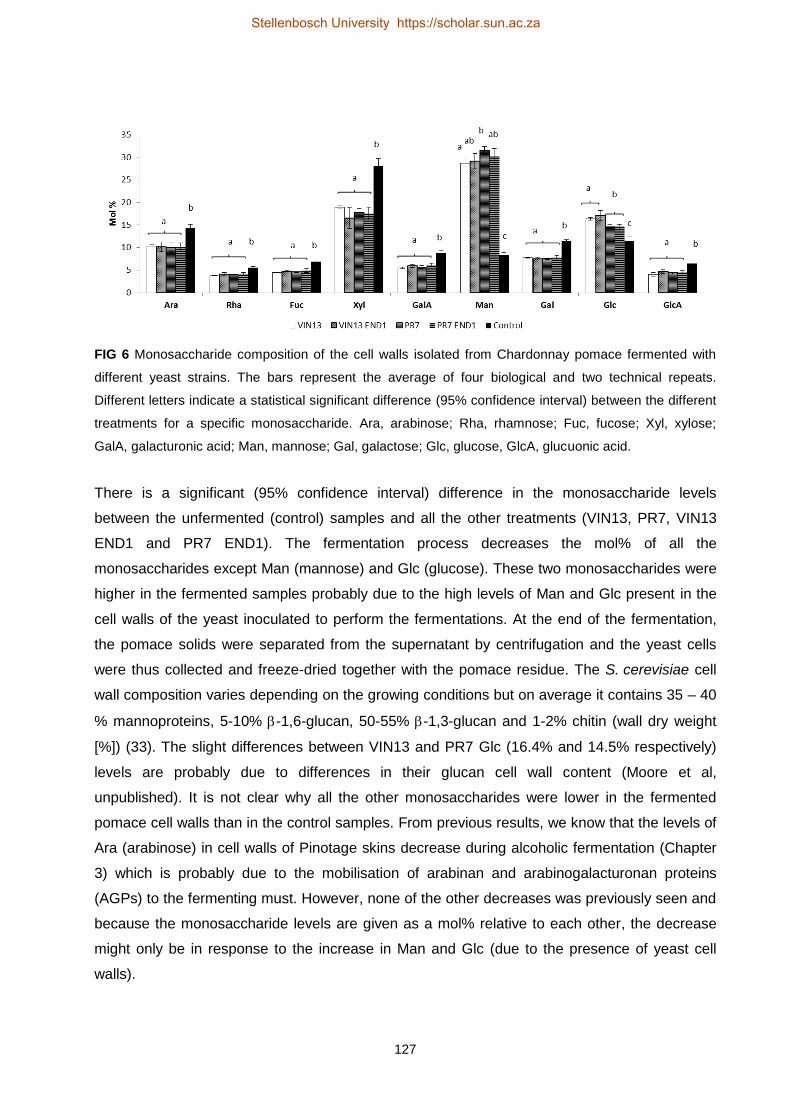
127
FIG 6 Monosaccharide composition of the cell walls isolated from Chardonnay pomace fermented with
different yeast strains. The bars represent the average of four biological and two technical repeats.
Different letters indicate a statistical significant difference (95% confidence interval) between the different
treatments for a specific monosaccharide. Ara, arabinose; Rha, rhamnose; Fuc, fucose; Xyl, xylose;
GalA, galacturonic acid; Man, mannose; Gal, galactose; Glc, glucose, GlcA, glucuonic acid.
There is a significant (95% confidence interval) difference in the monosaccharide levels
between the unfermented (control) samples and all the other treatments (VIN13, PR7, VIN13
END1 and PR7 END1). The fermentation process decreases the mol% of all the
monosaccharides except Man (mannose) and Glc (glucose). These two monosaccharides were
higher in the fermented samples probably due to the high levels of Man and Glc present in the
cell walls of the yeast inoculated to perform the fermentations. At the end of the fermentation,
the pomace solids were separated from the supernatant by centrifugation and the yeast cells
were thus collected and freeze-dried together with the pomace residue. The S. cerevisiae cell
wall composition varies depending on the growing conditions but on average it contains 35 – 40
% mannoproteins, 5-10% -1,6-glucan, 50-55% -1,3-glucan and 1-2% chitin (wall dry weight
[%]) (33). The slight differences between VIN13 and PR7 Glc (16.4% and 14.5% respectively)
levels are probably due to differences in their glucan cell wall content (Moore et al,
unpublished). It is not clear why all the other monosaccharides were lower in the fermented
pomace cell walls than in the control samples. From previous results, we know that the levels of
Ara (arabinose) in cell walls of Pinotage skins decrease during alcoholic fermentation (Chapter
3) which is probably due to the mobilisation of arabinan and arabinogalacturonan proteins
(AGPs) to the fermenting must. However, none of the other decreases was previously seen and
because the monosaccharide levels are given as a mol% relative to each other, the decrease
might only be in response to the increase in Man and Glc (due to the presence of yeast cell
walls).
Stellenbosch University https://scholar.sun.ac.za

128
HG
, lo
w D
E (m
Ab
JIM
5)
HG
, hig
h D
E (m
Ab
JIM
7)
HG
, Par
tial
ly M
E (m
Ab
LM
18
)
HG
, Par
tial
ly M
E (m
Ab
LM
19
)
HG
, Par
tial
ly M
E (m
Ab
LM
20
)
HG
(±
30
co
nti
guo
us
no
n-M
E G
alA
)(m
Ab
PA
M1
)
HG
(C
a2+
dim
ers)
(mA
b 2
F4)
Xyl
oga
lact
uro
nan
(m
Ab
LM
8)
RG
-I (
un
bra
nch
ed, 6
dis
acch
) (m
Ab
INR
A-R
U1
)
RG
-I (
un
bra
nch
ed, 2
dis
acch
) (m
Ab
INR
A-R
U2
)
(1→
4)-
β-D
-gal
acta
n (
mA
b L
M5
)
(1→
5)-
α-L
-ara
bin
an (
mA
b L
M6
)
Lin
eari
sed
(1
→5
)-α
-L-a
rab
inan
(m
Ab
LM
13
)
(1→
4)-
β-D
-(ga
lact
o)(
glu
co)m
ann
an (
mA
b L
M2
1)
(1→
4)-
β-D
-(gl
uco
)man
nan
(m
Ab
LM
22
)
(1→
3)-
β-D
-glu
can
(m
Ab
BS-
40
0-2
)
Xyl
ogl
uca
n (
XX
XG
mo
tif)
(m
Ab
LM
15
)
Xyl
ogl
uca
n (
XLL
G o
ligo
sacc
har
ide)
(m
Ab
LM
24
)
Xyl
ogl
uca
n (
mA
b L
M2
5)
(1→
4)-
β-D
-xyl
an (
mA
b L
M1
0)
(1→
4)-
β-D
-xyl
an/a
rab
ino
xyla
n (
mA
b L
M1
1)
Cel
ulo
se (
crys
talli
ne)
(m
Ab
CB
M3
a)
Exte
nsi
n (
mA
b L
M1
)
Exte
nsi
n (
mA
b J
IM1
1)
Exte
nsi
n (
mA
b J
IM2
0)
AG
P (
mA
b J
IM8
)
AG
P (
mA
b J
IM1
3)
AG
P (
mA
b L
M1
4)
AG
P, β
-lin
ked
Glc
A (
mA
b L
M2
)
VIN13 5 0 9 10 0 0 0 0 47 38 20 14 0 0 0 75 0 0 11 0 0 0 0 21 30 22 46 0 12
VIN13 END1 0 0 9 10 0 0 0 0 43 35 17 11 0 0 0 75 0 0 9 0 0 0 0 17 26 17 39 0 9
PR7 0 0 0 0 0 0 0 0 41 33 19 12 0 0 0 58 0 0 10 0 0 0 0 17 25 19 39 0 9
PR7 END1 0 0 0 0 0 0 0 0 51 43 22 16 0 0 0 74 0 0 14 0 0 0 6 27 37 26 51 0 15
Control 0 0 11 13 0 0 0 0 46 36 16 11 0 0 0 8 0 0 13 0 0 0 0 17 27 22 47 0 12
0 10 20 30 40 50 60 70 80 90 100
The CoMPP data (Fig. 7) analyzing the CDTA (pectin rich) fraction shows that only low levels of
homogalacturonan (HG) (mAbs LM18 and LM19) were still present in the pomace cell walls
after the autoclaving step (control sample). Relative high levels of unbranched
rhamnogalacturonan-I (RG-I) (mAbs INRA-RU1 and INRA-RU2) could be extracted as well as
some RG-I side chains (mAbs LM5 and LM6). The CDTA fraction extracted from the control
samples also contained -1,3- D-glucan (mAb BS-400-2), xyloglucan (mAb LM25), extensins
(mAbs JIM11 and JIM20) and AGPs (mAbs JIM8, JIM13 and LM2). A clear fermentation
response is a high signal for -1,3-D-glucan (mAb BS-400-2) in all the fermented samples. The
BS-400-2 mAb recognize -1,3- D-glucan, also known as callose (a polymer formed in plant
tissue as a response to wounding or pathogen attack), but it also probably recognizes the -1,3-
D-glucan that is part of the yeast cell wall. This corresponds with the high levels of Man and Glc
found with the monosaccharide analysis of the fermented samples.
FIG 7. CoMPP data showing the relative abundance of cell wall polymers that were extracted with CDTA
from AIR. The AIR was isolated from Chardonnay pomace fermented with yeast producing hydrolytic
enzymes (V13 END1, PR7 and PR7 END1, as well as VIN13 as a no-enzyme control). The values are
the average of four biological samples.
The recombinant PR7 END1 yeast strain that produces both a native EPG and a recombinant
EG seems to have an influence on the pomace cell wall composition in the following ways: (1)
There was a decrease in HG (mAbs LM18 and LM19) and this can also be seen for the
untransformed PR7 that only produces an EPG. (2) The PR7 END1 strain caused an increase
in the labelling for unbranched RG-I polymers (mAbs INRA-RU1 and INRA-RU2) (3) and a slight
Stellenbosch University https://scholar.sun.ac.za

129
increase in the RG-I side chains (mAbs LM5 and LM6). (4) Finally, we also saw an increase in
the cell wall proteins for the samples fermented with PR7 END1 (mAbs JIM11, JIM20 and
JIM13). All these changes suggest that cell wall depolymerization took place and the structure
of the cell wall was unravelled which enabled depectination of the HG polymers and enhanced
the solubilization of the other polymers mentioned, into the CDTA extract. The degradation and
disappearance of partially methylesterified HG labelling (mAbs LM18 and LM19) for both PR7
strains might be an indication that this yeast strain has pectinmethylesterase activity in addition
to the EPG activity although there is no evidence for this in literature. The study by Eschstruth
and Divol (10) did not report an increase in methanol concentration for wine fermented by the
PR7 or S. paradoxus R088 strains. Furthermore, it seems that the hydrolysis by the
recombinant EG is making a significant contribution towards the unravelling effect since the PR7
strain without the EG does not show an increase in the labelling for any of the other polymers
besides the HGs. In general, the strong signal for extensins labelled by mAbs JIM11 and JIM20
in all the samples indicates that the pomace is pulp rich and skin cell walls are not dominating
the results (Moore et al., unpublished). Finally, it is also interesting to see the low value
(compared to the other yeast fermented samples) for mAb MS-400-2 in the PR7 samples (Fig.
7), however this was only seen in the CDTA fraction and it is highly unlikely that this is due to
hydrolytic action by PR7.
Multivariate data analysis (SIMCA 13, Umetrics AB, Sweden) (Fig. 8) show that the PR7 END1
samples cluster together and separate from the control samples along the first component axis
(PC1 47%). The separation is driven by an abundance of RG-I side chains, unbranched RG-I
and cell wall proteins in the PR7 END1 samples. PR7 and PR7 END1 separated from the VIN13
and control samples along the second component axis (PC2 13%) because of the abundance in
mAbs LM18 and LM19 in the latter samples. In Fig. 8 the variable mAb BS-400-2 were
excluded in the analysis to see the differences between the samples without the contribution of
(presumably) the yeast cell wall. The exclusion of this variable had very little effect (PC1
changed from 46% to 47% and PC2 were unchanged), and furthermore, the samples and
variables had nearly identical distribution patterns than on the original score and loading plot.
Stellenbosch University https://scholar.sun.ac.za
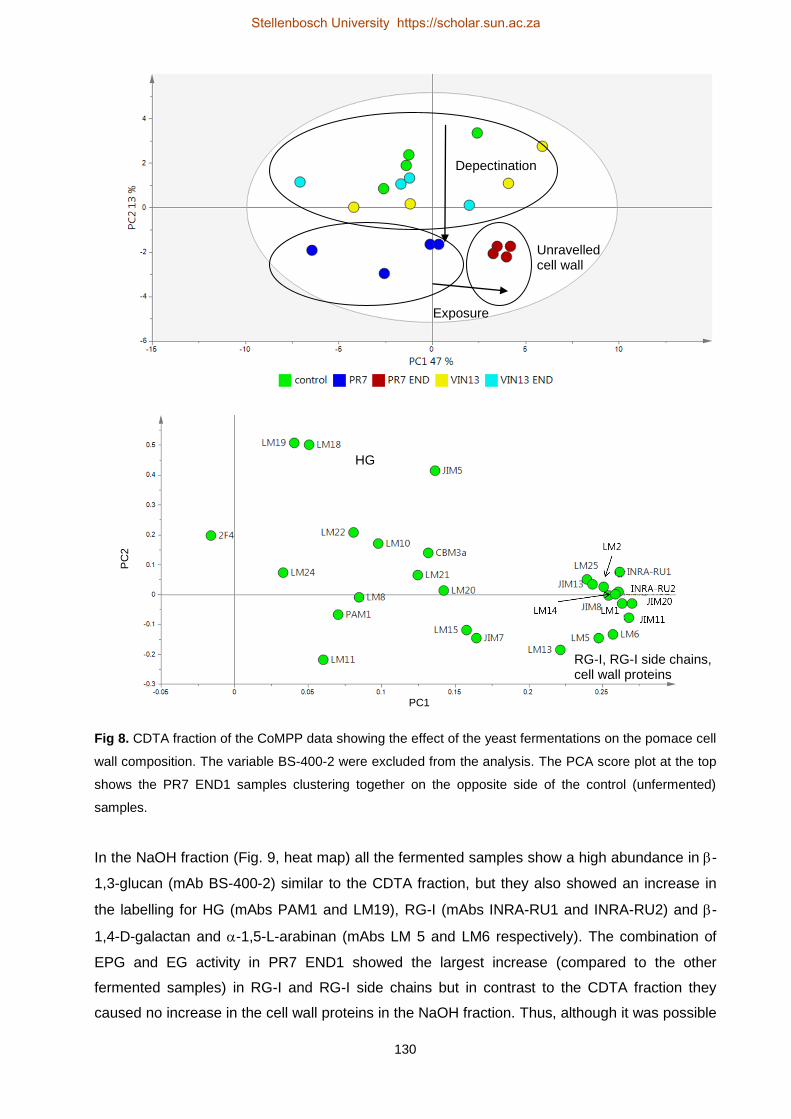
130
Fig 8. CDTA fraction of the CoMPP data showing the effect of the yeast fermentations on the pomace cell
wall composition. The variable BS-400-2 were excluded from the analysis. The PCA score plot at the top
shows the PR7 END1 samples clustering together on the opposite side of the control (unfermented)
samples.
In the NaOH fraction (Fig. 9, heat map) all the fermented samples show a high abundance in -
1,3-glucan (mAb BS-400-2) similar to the CDTA fraction, but they also showed an increase in
the labelling for HG (mAbs PAM1 and LM19), RG-I (mAbs INRA-RU1 and INRA-RU2) and -
1,4-D-galactan and -1,5-L-arabinan (mAbs LM 5 and LM6 respectively). The combination of
EPG and EG activity in PR7 END1 showed the largest increase (compared to the other
fermented samples) in RG-I and RG-I side chains but in contrast to the CDTA fraction they
caused no increase in the cell wall proteins in the NaOH fraction. Thus, although it was possible
Unravelled cell wall
Depectination
Exposure
HG
RG-I, RG-I side chains, cell wall proteins
PC1
PC
2
Stellenbosch University https://scholar.sun.ac.za

131
HG
, lo
w D
E (m
Ab
JIM
5)
HG
, hig
h D
E (m
Ab
JIM
7)
HG
, Par
tial
ly M
E (m
Ab
LM
18
)
HG
, Par
tial
ly M
E (m
Ab
LM
19
)
HG
, Par
tial
ly M
E (m
Ab
LM
20
)
HG
(±
30
co
nti
guo
us
no
n-M
E G
alA
)(m
Ab
PA
M1
)
HG
(C
a2+
dim
ers)
(mA
b 2
F4)
Xyl
oga
lact
uro
nan
(m
Ab
LM
8)
RG
-I (
un
bra
nch
ed, 6
dis
acch
) (m
Ab
INR
A-R
U1
)
RG
-I (
un
bra
nch
ed, 2
dis
acch
) (m
Ab
INR
A-R
U2
)
(1→
4)-
β-D
-gal
acta
n (
mA
b L
M5
)
(1→
5)-
α-L
-ara
bin
an (
mA
b L
M6
)
Lin
eari
sed
(1
→5
)-α
-L-a
rab
inan
(m
Ab
LM
13
)
(1→
4)-
β-D
-(ga
lact
o)(
glu
co)m
ann
an (
mA
b L
M2
1)
(1→
4)-
β-D
-(gl
uco
)man
nan
(m
Ab
LM
22
)
(1→
3)-
β-D
-glu
can
(m
Ab
BS-
40
0-2
)
Xyl
ogl
uca
n (
XX
XG
mo
tif)
(m
Ab
LM
15
)
Xyl
ogl
uca
n (
XLL
G o
ligo
sacc
har
ide)
(m
Ab
LM
24
)
Xyl
ogl
uca
n (
mA
b L
M2
5)
(1→
4)-
β-D
-xyl
an (
mA
b L
M1
0)
(1→
4)-
β-D
-xyl
an/a
rab
ino
xyla
n (
mA
b L
M1
1)
Cel
ulo
se (
crys
talli
ne)
(m
Ab
CB
M3
a)
Exte
nsi
n (
mA
b L
M1
)
Exte
nsi
n (
mA
b J
IM1
1)
Exte
nsi
n (
mA
b J
IM2
0)
AG
P (
mA
b J
IM8
)
AG
P (
mA
b J
IM1
3)
AG
P (
mA
b L
M1
4)
AG
P, β
-lin
ked
Glc
A (
mA
b L
M2
)
VIN13 0 0 0 7 0 8 0 0 32 16 31 15 0 25 15 94 91 0 90 0 0 53 0 0 10 0 14 0 0
VIN13 END1 0 0 0 9 0 8 0 0 25 13 26 14 0 20 13 91 81 0 84 0 0 49 0 0 9 0 12 0 0
PR7 0 0 0 6 0 9 0 0 36 22 33 17 0 20 14 94 84 0 82 0 0 51 0 0 9 0 13 0 0
PR7 END1 0 0 0 10 0 9 0 0 39 24 34 20 0 22 15 96 88 6 88 0 7 52 0 0 11 5 15 0 0
Control 0 0 0 5 0 0 0 0 22 10 25 11 0 20 11 15 86 5 91 7 11 54 0 0 10 0 12 0 0
0 10 20 30 40 50 60 70 80 90 100
to see a difference between PR7 END1 and all the other fermented samples, the effect was less
clear as in the CDTA fraction.
FIG 9. CoMPP data showing the relative abundance of cell wall polymers extracted with NaOH from AIR.
The AIR was isolated from Chardonnay pomace fermented with yeast that produces hydrolytic enzymes
(EPG and/or EG). The values are the average of four biological samples.
A PCA plot (that excludes mAb BS-400-2) confirmed the differences seen in Figure 9 and
showed the PR7 strains located on the opposite side of the plot from the control samples. The
separation was driven by an abundance in RG-I and RG-I side chains. The fermented samples
were separated from the controls because of an abundance in HG (mAb PAM1). Again, the
exclusion of mAb BS-400-2 did not influence the PCA analysis with the general distribution
pattern staying the same and PC1 only changing from 34 to 35% and PC2 from 20 to 18%.
Stellenbosch University https://scholar.sun.ac.za
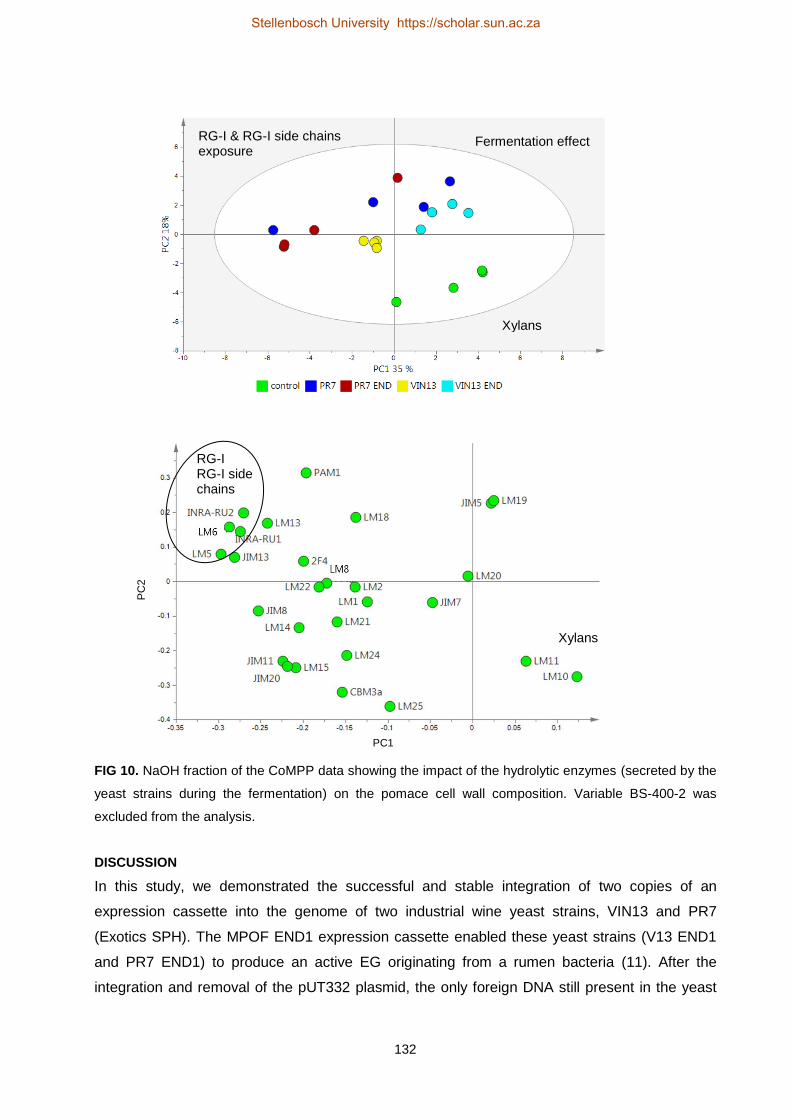
132
FIG 10. NaOH fraction of the CoMPP data showing the impact of the hydrolytic enzymes (secreted by the
yeast strains during the fermentation) on the pomace cell wall composition. Variable BS-400-2 was
excluded from the analysis.
DISCUSSION
In this study, we demonstrated the successful and stable integration of two copies of an
expression cassette into the genome of two industrial wine yeast strains, VIN13 and PR7
(Exotics SPH). The MPOF END1 expression cassette enabled these yeast strains (V13 END1
and PR7 END1) to produce an active EG originating from a rumen bacteria (11). After the
integration and removal of the pUT332 plasmid, the only foreign DNA still present in the yeast
Xylans
Fermentation effect RG-I & RG-I side chains exposure
RG-I RG-I side chains
PC1
PC
2
Xylans
Stellenbosch University https://scholar.sun.ac.za

133
was the end1 gene. The POF1 genome locus (also known as PAD1) was targeted for
integration at position 663 of the open reading frame that has 728 bp.
The recombinant yeast strains showed that an active EG as well an EPG, in the case of PR7
strains, were produced when the yeast were grown on agar plates containing the respective
substrates for the enzymes. These yeast strains were all capable fermenters in a grape pomace
suspension and decreased the reducing sugars within 48 h from 26 mg/ml to 2 mg/ml. No
difference could be observed between the untransformed and the recombinant strains in terms
of fermentation ability.
The VIN13 strain was chosen as a fermentation control that does not secrete any of the
enzymes evaluated in this study. S. cerevisiae produce several extracellular, intracellular and
cell wall bound glucanases (EXG1, BGL1, EXG2, SSG1/SPR1 and BGL2) but they all are -1,3-
specific glucanases and thus inactive towards the -1,4- linked cellulose and xyloglucan of the
grape berry cell wall (34). The VIN13 and VIN13 END1 strains did not alter the cell wall
composition (CoMPP results) apart from the “fermentation” modifications seen for all the
fermented samples. It thus seems that the EG enzyme on its own is not capable of degrading
noticeable amounts of cell wall polymers. Furthermore, the VIN13 strains did not decrease the
mAb BS-400-2 labelling which indicate that none of the enzymes secreted by VIN13 can
degrade this specific polymer or that this polymer were not within reach (shielded by other cell
wall polymers, presumably pectin) of the VIN13 glucanases.
Previous attempts at our Institute (IWBT) to demonstrate the effect of the PR7 EPG activity on
wine characteristics showed an increase in aroma compounds for Shiraz wine produced with
PR7, but a decrease in polyphenol levels (with the exception of quercetin) (10). The authors
speculated that the polyphenols were caught in the thick sediment visible in the PR7 wines. In
other unpublished wine-making trials with PR7 at the IWBT, filter sterilized wine, sampled at the
end of the fermentation gave a positive zone on polygalacturonase activity plate (data not
shown) but no significant increase in colour density or total phenolics, (compared to wine
fermented by the parent strain VIN13) was visible for PR7 (data not shown). It is interesting to
see that despite these previous results, it is still possible to detect the effect of the EPG
hydrolysis on the cell walls of grape berries using CoMPP analysis. However, we have to
consider that the buffered conditions of these fermentations (pH 5.7) in contrast with wine pH (
3.5) might have been crucial to obtain these results.
With the addition of the end1 gene, the resulting PR7 END1 strain shows an enhanced effect
suggesting a synergistic action between the two enzymes. In the samples fermented with PR7
END1, cell wall polymers were unravelled due to presumed partial degradation. This possibly
Stellenbosch University https://scholar.sun.ac.za

134
facilitated better access for the extraction solutions to extract more cell wall polymers that
rendered an enhanced signal for those mAbs. This mild enzyme hydrolysis was thus only
breaking up the cell wall polysaccharides into oligosaccharides that were not small enough to
exit the cell wall environment unless aided by an extraction solvent.
Mild enzyme hydrolysis can in fact cause the development of a more porous cell wall and a
consequential increase in cell wall surface. These are conditions conducive for the increased
binding of proanthocyanidins to the cell wall polymers (35, 36). Thus, when PR7 and PR7 END1
were previously used in wine fermentations the enzymes that were produced might have done
some minor damage to the cell walls of the grape berries. This might have been just enough to
form numerous new pores in the cell wall and proanthocyanidins that were released during the
crushing and fermentation of the grapes would bind to these newly created surface area (36).
This can lead to lower proanthocyanidin concentration in the wine and thus less stabilizing
factors for anthocyanins to bind with and thus a wine with lower colour stability and perhaps
also a lower colour density. Furthermore, in studies done on apple pomace (37) it was found
that if proanthocyanidins absorb to cell walls during mechanical disruption of fruit, limited pectin
depolymerization takes place and low levels of polysaccharide polymers can be extracted from
the tissue. They speculated that the presence of the proanthocyanidins restricted the access of
polysaccharide degrading enzymes to the cell wall polymers. These authors also saw an
increase in pectins that were extracted in the NaOH fraction of apple pomace and they
associated this with the proanthocyanidins bound to the cell wall polymers (37). This
corresponded with our results where the composition of the NaOH extracts was dominated by
pectin polymers (RG-I and RG-I side chains). PR7 END1 samples showed the largest increase
in these polymers and extracted HG (mAb LM19) which can substantiate the pore forming
activity of this yeast.
It would be interesting to determine the extent of the role that the buffered conditions played in
the results that were obtained. Furthermore, if polyphenols are retained in porous grape cell
walls, it is crucial to determine if there is a critical level of enzyme hydrolysis which will ensure
the release of these compounds instead of forming new bonds with cell wall polymers. However,
since there is resistance against the use of genetically engineered microorganisms in wine
preparation, these or similarly adapted yeast strains might rather found an application in the
pomace valorisation industry where the pH can easily be adjusted if needed. Alternatively,
another endo-glucanase with a suitable optimum pH can be integrated into the yeast genome.
The cell wall profiling methods (CoMPP and monosaccharide analysis) used in this study
enabled us to show for the first time, how hydrolytic enzymes produced by fermenting yeast
strains modify the cell walls of grape berries and will be a very valuable tool for the evaluation of
Stellenbosch University https://scholar.sun.ac.za

135
the capacity of any microorganism, isolated or engineered, to change the plant cell wall
composition.
References
1. Ciani M, Comitini F. 2010. Non-Saccharomyces wine yeasts have a promising role in biotechnological approaches to winemaking. Ann. Microbiol. 61:25–32.
2. Sumby KM, Grbin PR, Jiranek V. 2010. Microbial modulation of aromatic esters in wine: Current knowledge and future prospects. Food Chem. 121:1–16.
3. Sieiro C, García-Fraga B, López-Seijas J, Da Silva AF, Villa TG. 2010. Microbial pectic enzymes in the food and wine industry, p. 201–218. In Valdez, B (ed.), Food industrial processes - Methods and Equipment. InTech, Rijeka.
4. Cordente AG, Curtin CD, Varela C, Pretorius IS. 2012. Flavour-active wine yeasts. Appl. Microbiol. Biotechnol. 96:601–18.
5. Barata a, Malfeito-Ferreira M, Loureiro V. 2012. The microbial ecology of wine grape berries. Int. J. Food Microbiol. 153:243–59.
6. Karpe A V., Beale DJ, Harding IH, Palombo EA. 2014. Optimization of degradation of winery-derived biomass waste by Ascomycetes. J. Chem. Technol. Biotechnol. DOI 10.1002/jctb.4486
7. Jin B, Kelly JM. 2009. Wine Industry Residues, p. 293–311. In Biotechnology for agro-industrial residues utilisation. Springer Netherlands.
8. Redzepovic S, Orlic S, Majdak a., Kozina B, Volschenk H, Viljoen-Bloom M. 2003. Differential malic acid degradation by selected strains of Saccharomyces during alcoholic fermentation. Int. J. Food Microbiol. 83:49–61.
9. Mocke B. 2005. M.Sc. thesis The breeding of yeast strains for novel oenological outcomes. Stellenbosch University, Stellenbosch, South Africa.
10. Eschstruth A, Divol B. 2011. Comparative characterization of endo-polygalacturonase (Pgu1) from Saccharomyces cerevisiae and Saccharomyces paradoxus under winemaking conditions. Appl. Microbiol. Biotechnol. 91:623–34.
11. Berger E, Jones W, Jones D, Woods D. 1989. Cloning and sequencing of an endoglucanase (end1) gene from Butyrivibrio fibrisolvens H17c. Mol. Gen. Genet. 219:193–198.
12. Hespell RB, Wolf R, Bothast RJ. 1987. Fermentation of xylans by Butyrivibrio fibrisolvens and other ruminal bacteria. Appl. Environ. Microbiol. 53:2849–53.
13. Orpin CG, Mathiesen SD, Greenwood Y, Blix AS. 1985. Seasonal changes in the ruminal microflora of the high-arctic Svalbard reindeer (Rangifer tarandus platyrhynchus). Appl. Environ. Microbiol. 50:144–51.
14. Gilkes NR, Henrissat B, Kilburn DG, Miller RC, Warren R a. 1991. Domains in microbial -1, 4-glycanases: sequence conservation, function, and enzyme families. Microbiol. Rev. 55:303–15.
15. Williamson MP. 1994. The structure and function of proline-rich regions in proteins 260:249–260.
Stellenbosch University https://scholar.sun.ac.za

136
16. Van Rensburg, P., Van Zyl., W.H. Pretorius IS. 1994. Expression of the Butyrivibrio fibrisolvens
endo--1,4-glucanase gene together with the Erwinia pectate lyase and polygalacturonase genes in Saccharomyces cerevisiae. Curr. Genet. 27:17–22.
17. Scheirlinck T, Meutter J De, Arnaut G, Joos H, Claeyssens M, Michiels F. 1990. Cloning and expression of cellulase and xylanase genes in Lactobacillus plantarum. Appl. Microbiol. Biotechnol. 33:534–541.
18. Jackson RS. 2008. Wine science: Principles and applications, 3rd ed. Academic Press, Inc., San Diego.
19. Moller I, Sørensen I, Bernal AJ, Blaukopf C, Lee K, Øbro J, Pettolino F, Roberts A, Mikkelsen JD, Knox JP, Bacic A, Willats WGT. 2007. High-throughput mapping of cell-wall polymers within and between plants using novel microarrays. Plant J. 50:1118–28.
20. Sambrook J, Fritsch E., Maniatis T. 1989. Molecular cloning: a laboratory manual, 2nd ed. Cold Spring harbour laboratories, New York.
21. Gatignol A, Dassain M, Tiraby G. 1990. Cloning of Saccharomyces cerevisiae promoters using a probe vector based on phleomycin resistance. Gene 91:35–41.
22. Güldener U, Heck S, Fielder T, Beinhauer J, Hegemann JH. 1996. A new efficient gene disruption cassette for repeated use in budding yeast. Nucleic Acids Res. 24:2519–24.
23. Volschenk H, Viljoen-Bloom M, Van Staden J, Husnik J, Van Vuuren HJJ. 2004. Genetic engineering of an industrial strain of Saccharomyces cerevisiae for L-malic acid degradation via an efficient malo-ethanolic pathway. South African J. Enol. Vitic. 25:63–73.
24. Hoffman CS, Winston F. 1987. A ten-minute DNA preparation from yeast efficiently releases autonomous plasmids for trausformation of Escherichia coli. Gene 51:267–272.
25. Louw C, Young PR, van Rensburg P, Divol B. 2010. Epigenetic regulation of PGU1 transcription in Saccharomyces cerevisiae. FEMS Yeast Res. 10:158–67.
26. Ghose TK. 1987. Measurement of cellulase activities. Pure Appl. Chem. 59:257–268.
27. Ortega-Regules A, Ros-García JM, Bautista-Ortín AB, López-Roca JM, Gómez-Plaza E. 2008. Differences in morphology and composition of skin and pulp cell walls from grapes (Vitis vinifera L.): technological implications. Eur. Food Res. Technol. 227:223–231.
28. York WS, Darvill AG, L MM, Stevenson TT, Albersheim P. 1985. Isolation and characterization of plant cell walls and cell wall components. Methods Enzymol. 2:3–40.
29. Nguema-Ona E, Moore JP, Fagerström A, Fangel JU, Willats WGT, Hugo A, Vivier MA. 2012. Profiling the main cell wall polysaccharides of tobacco leaves using high-throughput and fractionation techniques. Carbohydr. Polym. 88:939–949.
30. Moore JP, Fangel JU, Willats WGT, Vivier MA. 2014. Pectic-β(1,4)-galactan, extensin and arabinogalactan-protein epitopes differentiate ripening stages in wine and table grape cell walls. Ann. Bot. 114:1279–1294.
31. Jackson JE. 1991. A User’s Guide to Principal Components. John Wiley & Sons, Inc., Hoboken, NJ, USA.
32. Puig S, Ramon D, Perez-Ortin, José E. 1998. Optimized method to obtain stable food-safe recombinant wine yeast strains. J. Agric. Food Chem. 8561:1689–1693.
33. Klis FM, Mol P, Hellingwerf K, Brul S. 2002. Dynamics of cell wall structure in Saccharomyces cerevisiae. FEMS Microbiol. Rev. 26:239–256.
Stellenbosch University https://scholar.sun.ac.za

137
34. Van Rensburg P, Van Zyl WH, Pretorius IS. 1998. Engineering yeast for efficient cellulose degradation. Yeast 14:67–76.
35. Le Bourvellec C, Guyot S, Renard CMGC. 2004. Non-covalent interaction between procyanidins and apple cell wall material: Part I. Effect of some environmental parameters. Biochim. Biophys. Acta 1672:192–202.
36. Ruiz-Garcia Y, Smith PA, Bindon KA. 2014. Selective extraction of polysaccharide affects the adsorption of proanthocyanidin by grape cell walls. Carbohydr. Polym. 114:102–114.
37. Le Bourvellec C, Guyot S, Renard CMGC. 2009. Interactions between apple (Malus x domestica Borkh.) polyphenols and cell walls modulate the extractability of polysaccharides. Carbohydr. Polym. 75:251–261.
Stellenbosch University https://scholar.sun.ac.za

138
Supplementary data
TABLE S1: Monoclonal antibodies (mAbs) and carbohydrate binding modules (CBMs) used in this study.
Monoclonal antibody Reference
HG partially/de-esterified (mAb JIM5) (1)
HG partially esterified (mAb JIM7) (1)
HG partially/de-esterified (mAb LM18) (1)
HG partially/de-esterified (mAb LM19) (1)
HG partially esterified (mAb LM20) (1)
HG ±30 contiguous unmethylesterified GalAa units (mAb PAM1) (2)
HG Ca2+ dimers (mAb 2F4) (3)
RG-I, 6 unbranched disaccharide (mAb INRA-RU1) (4)
RG-I, 2 unbranched disaccharide (mAb INRA-RU2) (4)
-1,4-D-galactan (mAb LM5) (5)
-1,5-L-arabinan (mAb LM6) (6)
Linearised -1,5-L-arabinan (mAb LM13) (7)
-1,4-D-(galacto)(gluco)mannan (mAb LM21) (8)
-1,4-D-(gluco)mannan (mAb LM22) (8)
-1,3-D-glucan (mAb BS-400-2) (7)
Xyloglucan (XXXG motif) (mAb LM15) (8)
Xyloglucan (XLLG oligosaccharide) (mAb LM24) (9)
Xyloglucan (mAb LM25) (9)
-1,4-D-Xylan (mAb LM10) (10)
-1,4-D-Xylan d/arabinoxylan (mAb LM11) (10)
Celulose (crystalline) (mAb CBM3a) (11)
Extensin (mAb LM1) (12)c
Extensin (mAb JIM11) (13)
Extensin (mAb JIM20) (13)
AGP (mAb JIM8) (14)
AGP (mAb JIM13) (15)
AGP (mAb LM14) (7)
AGP,-linked GlcAb (mAb LM2) (15)
agalacturonic acid;
bGlcA, glucuronic acid;
cCited in (16)
Stellenbosch University https://scholar.sun.ac.za

139
References
1. Verhertbruggen Y, Marcus SE, Haeger A, Ordaz-Ortiz JJ, Knox JP. 2009. An extended set of monoclonal antibodies to pectic homogalacturonan. Carbohydr. Res. 344:1858–62.
2. Willats WGT, Gilmartin PM, Mikkelsen JD, Knox JP. 1999. Cell wall antibodies without immunization : generation and use of de-esterified homogalacturonan block-specific antibodies from a naive phage display library. plant J. 18:57–65.
3. Liners F, Letesson J-J, Didembourg C, Van Cutsem P. 1989. Monoclonal antibodies against pectin: Recognition of a conformation induced by Calcium. Plant Physiol. 91:1419–1424.
4. Ralet M-C, Tranquet O, Poulain D, Moïse a, Guillon F. 2010. Monoclonal antibodies to rhamnogalacturonan I backbone. Planta 231:1373–83.
5. Jones L, Seymour B, Knox JP. 1997. Localization of pectic galactan in tomato cell walls using a
monoclonal antibody specific to 1,4--D-Galactan. Plant Physiol. 113:1405–1412.
6. Willats WGT, Marcus SE, Knox JP. 1998. Generation of a monoclonal antibody specific to 1,5-a-L-arabinan. Carbohydr. Res. 308:149–152.
7. Moller I, Marcus SE, Haeger A, Verhertbruggen Y, Verhoef R, Schols H, Ulvskov P, Mikkelsen JD, Knox JP, Willats W. 2008. High-throughput screening of monoclonal antibodies against plant cell wall glycans by hierarchical clustering of their carbohydrate microarray binding profiles. Glycoconj. J. 25:37–48.
8. Marcus SE, Blake AW, Benians TAS, Lee KJD, Poyser C, Donaldson L, Leroux O, Rogowski A, Petersen HL, Boraston A, Gilbert HJ, Willats WGT, Knox JP. 2010. Restricted access of proteins to mannan polysaccharides in intact plant cell walls. Plant J. 64:191–203.
9. Pedersen HL, Fangel JU, McCleary B, Ruzanski C, Rydahl MG, Ralet M-C, Farkas V, von Schantz L, Marcus SE, Andersen MCF, Field R, Ohlin M, Knox JP, Clausen MH, Willats WGT. 2012. Versatile high resolution oligosaccharide microarrays for plant glycobiology and cell wall research. J. Biol. Chem. 287:39429–38.
10. McCartney L, Marcus SE, Knox JP. 2005. Monoclonal antibodies to plant cell wall xylans and arabinoxylans. J. Histochem. Cytochem. 53:543–6.
11. Blake AW, McCartney L, Flint JE, Bolam DN, Boraston AB, Gilbert HJ, Knox JP. 2006. Understanding the biological rationale for the diversity of cellulose-directed carbohydrate-binding modules in prokaryotic enzymes. J. Biol. Chem. 281:29321–9.
12. Smallwood M, Martin H, Knox JP. 1995. An epitope of rice threonine- and hydroxylproline-rich glycoprotein is common to cell wall hydrophobic plasma-membrane glycoproteins. Planta 196:510–522.
13. Smallwood M, Beven A, Donovan N, Neill SJ, Peart J, Roberts K, Knox JP. 1994. Localization of cell wall proteins in relation to the developmental anatomy of the carrot root apex. Plant J. 5:237–246.
14. Pennell R, Janniche L, Kjellbom P, Scofield GN, Peart JM. 1991. Developmental regulation of a plasma membrane arabinogalactan protein epitope in oilseed rape. Plant Cell 3:1317–1326.
Stellenbosch University https://scholar.sun.ac.za

140
15. Yates EA, Valdor JF, Haslam SM, Morris HR, Dell A, Mackie W, Knox JP. 1996. Characterization of carbohydrate structural features recognized by anti-arabinogalactan-protein monoclonal antibodies. Glycobiology 6:131–9.
16. Neumetzler L, Humphrey T, Lumba S, Snyder S, Yeats TH, Usadel B, Vasilevski A, Patel J, Rose JKC, Persson S, Bonetta D. 2012. The FRIABLE1 gene product affects cell adhesion in Arabidopsis. PLoS One 7:e42914.
Stellenbosch University https://scholar.sun.ac.za

Chapter 6
General discussion and conclusions
Stellenbosch University https://scholar.sun.ac.za
141
6. General discussion and conclusion
This study contributed many new insights on the grape berry cell wall of two different grape
cultivars. The cell wall profiling techniques that were used revealed, on a polymer level, how the
grape berry cell wall changes during different grape processing procedures and highlighted the
variance between grape skins at two different ripeness levels. This study laid the groundwork
for new applications for the cell wall profiling techniques in the grape and enzyme industries.
6.1 Grape berry cell wall changes during a maceration enzyme assisted red wine
fermentation
We investigated for the first time the cell wall composition of Vitis vinifera cv Pinotage, a cultivar
which is known for its thick and tough skin. The monosaccharide profile of the Pinotage skin cell
wall was similar to other cultivars with a high abundance of galacturonic acid followed by
arabinose, xylose and galactose (1). Also, on the polymer level there were strong signals with
cell wall probes that recognize homogalactoronan (HG), xyloglucan and cellulose. Thus we
could not identify, with the methods that we used, any major difference or unique feature of the
thick Pinotage skin. It would be interesting to compare the morphology of the Pinotage skin with
other cultivars by means of optical microscopy as was done for Monastrell grapes (1).
Furthermore, we should determine and compare the cell wall material per gram of skin of
Pinotage with other cultivars to determine if the thick skin is linked to the amount of cell wall
material. When the cell wall composition for the different ripeness levels was compared, some
of the major changes that have previously been reported in grapes and other fruit during
ripening such as the decrease in xylose and galactose and in xyloglucan, mannan and cellulose
and an increase in arabinogalactan proteins were confirmed (2–6) in Pinotage skins. With
multivariate statistical techniques we showed the high variability in ripeness levels found in the
berries of a standard harvest batch and it seems that the heterogeneity decreased as the
ripeness level increased. The riper berries also had elevated levels of callose which indicated
that they were more susceptible to physical damage during the harvest and wine making
procedures.
With this study we were also able to document for the first time the cell wall changes that
happen in the skin cells of grapes during a standard red wine fermentation (in the absence of
maceration enzymes). We saw that the fermentation process removes the HG from the cell wall
samples and that cell wall proteins were exposed and some were also released into the must.
These changes were presumably fermentation related and are mediated by the ethanol,
organic acids and other metabolites in the must that acts on the permeabilization, solubilization
and extraction of the cell membrane, cell wall macromolecules and calcium ions respectively (7,
Stellenbosch University https://scholar.sun.ac.za

142
8). When maceration enzymes were added to the fermentation we saw that even more pectin
polymers were removed (decrease in galacturonic acid and HG labelling) but this was
accompanied by an enhancement in the extraction of both pectin, hemicellulose and cellulose
polymers which can indicate that pores were formed in the cell wall and that partially hydrolysed
polymers were extracted from within the cell wall structure. An additional reduction in rhamnose
(Rha) levels in the cell walls, indicated degradation by the maceration enzymes of presumably,
rhamnogalacturonan I (RG-I). Unfortunately the mAbs for RG-I (INRA-RU1 and INRA-RU2)
were not part of the antibody set that was used in this experiment, thus we could not confirm
this on a polymer level. We were unable to differentiate between the three commercial
maceration enzyme preparations that were used in the Pinotage fermentations in terms of their
effect on the composition of the cell wall polymers but some preparations does seem to cause
more extensive degradation than others. When the experiment was repeated with overripe
grapes the effects of the maceration enzymes were insignificant (no additional loss of polymers
or increase in pore formation /enhancement of extraction due to enzyme action). It seems that
the endogenous grape enzymes involved in metabolic changes during ripening facilitated the
removal of a large fraction of the cell wall polymers presumably by degradation. These
degraded polymers were then easily removed during the fermentation, even in the control
fermentation where no maceration enzymes were added. This information can be valuable for
wine makers to prevent the unnecessary addition of enzymes to grapes of a certain ripeness
level.
This first examination of enzyme hydrolysis on grape tissue generated new questions such as:
(i) to what extent are the grape must environment (low pH and temperature and tannins)
inhibiting the enzymes, and (ii) can the cell wall profiling methods be used to link specific
enzymatic activities with specific cell wall changes? Thus, purified enzymes and different
combinations of these purified enzymes were incubated with isolated Pinotage skin cell walls in
close to optimal conditions for the enzymes, with regards to their temperature and pH optima.
The results showed distinct differences in terms of the extent of enzymatic hydrolysis that took
place depending on the enzyme(s) that were added. When an enzyme called “Pectinase” (Pect
in Chapter 4) which is a combination of pectolytic activities (pectintranseliminase,
polygalacturonase and pectin esterase) was used separately or in combination with an endo-
glucanase extensive hydrolysis was seen with drastic depectination as well as a reduction in the
hemicellulose and cellulose polymers. Less extensive hydrolysis was seen when an endo-
polygalacturonase, endo-glucanase, endo-arabinase, xyloglucanase or a combination of these
enzymes were used. This moderate response was typified by the partial degradation of HG
polymers which enhanced their extraction into the CDTA fraction accompanied by a decrease in
the xyloglucan and cellulose polymers that could be extracted in the NaOH fraction. This
corresponds to what we classify as pore formation. Furthermore, the combination of the strong
Stellenbosch University https://scholar.sun.ac.za

143
pectolytic activities along with a xyloglucanase (Pect-XG) led to a very clear increase in the
xyloglucan and cellulose that could be extracted which was not seen when either of these
enzymes acted solo. This illustrates that a certain level of depectination is first needed before
the xyloglucanase can reach its target and commence with hydrolysis. According to the
manufacturer the XG is a endo-1,4--glucanase with specificity towards xyloglucan. This
specific type of enzyme or the combination with pectinases has not been reported to be present
in wine maceration enzyme preparations (9, 10). This enhanced extraction was perhaps only
possible under the ideal experimental conditions that were used but it is still an interesting
enzyme combination for further investigation.
6.2 Cell wall changes in grape pomace during heat treatment and enzymatic hydrolysis
Besides their application in the maceration step of wine making, enzymes are also used in
processing pomace (pressed grape skin and pulp), a waste product of the wine making industry,
for the isolation of revenue generating molecules that can be reemployed in the
biopharmaceutical and food industries (11). Pomace also have the potential to be used for the
production of second generation biofuel (12). To manage the recalcitrance of pomace towards
enzymatic degradation it is common practice to include a pretreatment step before enzymatic
hydrolysis (13). In our study we investigated how the polymers in the cell wall of grape tissue
change during a pressurized heating (autoclave) step and this generated the first grape cell wall
data, to our knowledge, on the influence of this pretreatment. With autoclaving the cell wall
structure was opened up and a fraction of the HG was removed, while the extraction of all other
pectin, hemicellulose, cellulose and cell wall protein polymers were enhanced. Additionally the
autoclaving process exposed xylan polymers which led to the enhanced extraction of this
polymer in the NaOH fraction.
The autoclaved pomace was incubated with a selection of commercial enzyme preparations in
buffered conditions. The enzyme combinations, pH and temperature conditions were optimized
in a preliminary experiment. We saw that extensive hydrolysis took place when a combination of
enzyme activities (pectinases, cellulases and hemicellulases) were present and a higher
temperature enhanced the hydrolysis. However, this degradation did not increase the levels of
reducing sugars that were liberated into the buffer indicating that the cell wall polymers were
only partially degraded. Thus, this enzymatic hydrolysis would perhaps be sufficient to liberate
polyphenols from the grape tissue, but it would probably not generate single fermentable sugars
if the aim was to saccharify the pomace in preparation for the fermentation to biofuel. However,
the optimization of a saccharification process is complex and depends on many aspect related
to the substrate composition but is also dependent on the type of pretreatment used, the
enzyme dosage and efficiency of the enzyme (14). This study demonstrated that the methods
Stellenbosch University https://scholar.sun.ac.za
144
that we used to study the cell wall can be valuable tools to evaluate the efficiency of different
enzyme preparations but also to determine the efficiency of pretreatments steps.
The pomace hydrolysis with commercial enzymes showed the combined effect of a mixture of
enzymes. To learn more about the action of specific enzymes on the pomace cell wall the
pomace was hydrolyzed with individual purified enzymes and combinations of these enzymes.
Similarly to what we saw with the isolated Pinotage skin cell walls, different levels of enzymatic
hydrolysis were visible and the Pect enzyme and combinations with this enzyme showed the
highest degree of hydrolysis. A clear synergistic effect was seen between an endo-
polygalacturonase (EPG) and an endo-glucanase (EG), with this combination of enzymes
causing more extensive cell wall polymer modifications than when either of the enzymes was
used on their own. In literature the combined hydrolysis effect of pectinases and cellulases does
not always result in an increase in polyphenol release from grape tissue (15) but other factors
such as high temperature during extraction can degrade the polyphenolics (16). If the only
measure of the extent of enzymatic plant cell wall degradation is linked to polyphenolic yield,
this will not give a true reflection of the efficacy of the enzymes that was used. The synergistic
effect observed in our study corresponds with work by Kammerer et al. and Maier et al. (17, 18)
but our method could pin point the effect of the enzymes on the cell wall polymer level.
The overall extraction patterns that we observed for the mAbs that recognize the xyloglucan
epitopes and how this pattern was influenced by different enzymes in the CoMPP results gave
us clues to speculate about the sequence in which the enzymatic degradation took place. Our
speculation was also based on previous work done by Pedersen et al. (19) that showed
differential labelling for xyloglucan in tobacco stem cells. We think that the hydrolysis initiates or
occurs more regularly in the intercellular triangle and then moves into the corners of this area
and finally spreads to the area between two adjacent cells. We also saw similarity in the
extraction and degradation patterns of RG-I and xyloglucan (recognized by mAb LM25), while
there were no resemblance between RG-I and HG hydrolysis- or extraction patterns which
might indicate a specific association between this xyloglucan epitope and RG-I polymers.
6.3 Hydrolytic enzymes produced by yeast strains modify the cell wall composition of
Chardonnay pomace
With the information gained on grape pomace cell wall polymers and their modifications during
autoclaving and enzymatic hydrolysis, and with the demonstration of the synergism between the
EPG and EG, we embarked on our final experiment. A wine yeast strain, PR7 (known as
Exotics SPH Anchor yeast, South Africa), which is a hybrid between Saccharomyces paradoxus
RO88 and VIN13 (Saccharomyces cerevisiae commercial wine yeast strain) that produced an
EPG (native) were transformed with an genome integrating cassette that expresses an EG. This
Stellenbosch University https://scholar.sun.ac.za

145
yeast, called PR7 END1, produced the enzymes while using grape pomace as fermentation
substrate and the changes in the pomace cell wall polymers were monitored. This experiment
was set up to simulate to a certain degree what would happen if such a yeast strain are to be
used in a wine fermentation or in a pomace valorisation effort. Different yeast strains were used
and developed: PR7 that has the native EPG, PR7 END1 that expresses both the EPG and a
recombinant EG, VIN13, which was used as a control strain that produced none of these
enzymes and finally VIN13 END1 that produced the recombinant EG. The yeast strains were all
able to reduce the reducing sugar concentrations to approximately 2 mg/ml within 48 h and with
the CoMPP results we saw that the PR7 strain removed some HG from the grape cell walls.
When both enzymes were present (PR7 END1) there was a decrease in HG but also an
increase in the extraction of other pectin polymers (RG-I and RG-I side branches) and cell wall
proteins (AGPs). This is a strong indication that the synergistic effect of the two enzymes
expressed by the yeast (PR7 END1) has an unravelling effect on the cell wall of grape berries.
This effect is quite mild in comparison to what was seen in the other experiments where we
used commercial or purified enzymes probably due to low levels of enzyme produced by the
strains. However, this proofs that recombinant strains have the potential to be used in wine
making and valorisation processes, at least under ideal conditions. The cell wall profiling
techniques enabled us to determine the extent of hydrolysis or modifications that did happen
and it is thus a useful method for future optimizations of engineered microorganisms.
6.4 The cell wall profiling techniques
The Comprehensive Microarray Polymer Profiling (CoMPP) method that was extensively used
in this study (Chapters 3 – 5), has many advantages: It uses monoclonal antibodies and
carbohydrate binding modules that are specific for cell wall polymers and CoMPP is thus very
specific and sensitive (20). It is an in situ method, but has the high-throughput advantage of
microarrays and providing a profile. Isolated cell walls are first extracted with diamino-cyclo-
hexane-tetra-acetic acid (CDTA) which solubilize pectins and any polymer that are strongly
bonded or associated with pectins. After the first extraction, the residue is treated with 4 M
NaOH that destroys hydrogen bonds and thus releases hemicelluloses. This fraction also
contains other polymers that have a strong association with hemicelluloses. Thus, CoMPP give
information about the actual carbohydrate structure, but furthermore, CoMPP can tell us about
possible associations between different polymers when materials are co-extracted during the
analysis procedures.
CoMPP results are however not fully quantitative because different probes bind with different
avidities to their respective epitopes, but it is still extremely useful in comparing plant cell walls
from different plant organs, from tissues differentially treated, or from tissues at different time
Stellenbosch University https://scholar.sun.ac.za

146
points (2, 20, 21). There are however, a few things to take into consideration when using this
technique. Firstly, CoMPP results are influenced by the preparation method used during cell
wall extraction and this should be considered carefully before commencing with an experiment
(22). In general better results or more epitopes are detected when including a
methanol/chloroform and acetone washing step after the ethanol wash. The
methanol/chloroform solvent seems to loosen up the cell wall structure which gives better
access to enzymes and/or solvents used in subsequent steps. One should also remember that
there is a possibility that epitopes can be modified during the extraction or they may be masked
by structural features (20). We saw that it is not possible to directly compare CoMPP results if
the sets of antibodies that were used are not identical or if the analysis was not done as a single
batch. We were also not able to distinguish clearly between the changes made by the different
maceration enzyme preparations or distinguish between the action of the endogenous grape
ripening enzymes and maceration enzymes added. This may be due to CoMPP that is not
quantitative and high standard deviations for the signal strength of a mAb are sometimes visible
between biological repeats. It is therefore important to have sufficient biological repeats
(preferably five). Finally, there is the possibility of cross-reactivity of mAb JIM13 with RG-I and
CBM3a carbohydrate binding module binds to crystalline cellulose (23), but were detected in the
NaOH fraction (also previously seen by (21)). It is possible that mAb CBM3a might show some
cross-reactivity with xyloglucan (personal communication with Dr J. Fangel) and this would
correspond with the similar patterns observed for mAbs CBM3a, LM15 and LM25 for all
treatments and matrices in this study. These matters as well as the possible recognition of yeast
cell wall -1,3-D-glucan by mAb BS-400-2 needs to be clarified specifically in the grape tissue
matrix.
The data generated with CoMPP were supported by monosaccharide analysis and FT-IR
absorption spectra of the isolated AIR particles. With monosaccharide analysis the AIR was
degraded by trifluoroacetic acid (TFA), then derivatized to methoxy sugars followed by silylation
(24). The derivatives were separated and analyzed in a gas chromatograph, enabling us to
measure the quantities of the nine major single sugars that form the building blocks of the plant
cell wall polysaccharides. We did detect evidence of incomplete TFA hydrolysis which showed
that sample preparation methods could still be optimized further; on the positive side the
incomplete TFA hydrolysis contributed towards the evidence for pore formation due to enzyme
hydrolysis. The monosaccharide profiles provided a rough overview of polymers present while
FT-IR provided the adsorption profile of all the chemical components present in the sample,
thus not only carbohydrates but also proteins, lipids and polyphenolics. This provides a very
complex picture and it is often difficult to interpret because of overlapping peaks and shifts in
the spectral frequency due to interaction between different molecules present in the sample
(25). However, the method was helpful in our study to detect the major differences between
Stellenbosch University https://scholar.sun.ac.za

147
treatments with regards to cell wall proteins and pectin concentration. Another advantage of FT-
IR is that no additional sample preparation is needed, thus any treatment that can introduced
undesired structural changes can be avoided (26). Multivariate data analysis was successfully
used to detect patterns in the data sets.
6.5. Investigations for the future
In general these cell wall profiling methods has provided us with novel insights into the cell wall
of the grape berry rendering indirect polymer visualization which is an advantage over all the
other methods that was used to study the grape berry cell wall until now. With the knowledge
gained on the restrictions of these methods we would be able to tweak future experimental
layouts and the potential is there to learn much more. Furthermore, if more mAbs and cell wall
binding modules with known specificities could be added to the collection that can be used in
CoMPP analysis, it would open up new sections or show new dynamics of the cell wall.
It would be interesting to investigate the grape ripening changes and the influence that it has on
the cell wall and the enzymes used for grape processing. We could optimize this experiment by
selecting grapes from the same vineyard at few different time points, spanning the period from
before harvest up to the overripe stage. The different parameters that can be monitored are the
different ripeness stages and the effect of the fermentation process (with and w/o enzymes) on
the grape berry cell wall. This method will enable us to rule out other factors that could have had
an influence on the cell wall such as different vineyard practices and growing conditions. It
would also be interesting to test different maceration enzyme concentrations in a fermentation in
order to establish if the pore forming effect is coupled to low enzyme concentrations. Ideally the
concentrations of polyphenols that are released at all stages should be monitored in order to
determine how pore formation influences the possible absorption of these compounds onto the
grape tissues.
Furthermore, in order to advance the process of elucidating the connection between specific
enzyme activities and specific cell wall changes we should continue to use isolated cell walls
(AIR) as substrate for this type of experiment (ruling out interfering substances), but by using
different enzyme to substrate ratios we might be able to also observe the subtle cell wall
modifications caused by the enzymes. The set of enzymes and combinations of enzymes tested
can also be expanded and optimized. Finally, it would be interesting to test our hypothesis
regarding the spatial distribution and hydrolysis sequence of the unmethylesteified HG
Stellenbosch University https://scholar.sun.ac.za
148
recognized by mAbs PAM1 and xyloglucan recognized by mAbs LM15 and LM24 with
immunofluorescence microscopy.
6.6 References
1. Ortega-Regules A, Ros-García JM, Bautista-Ortín AB, López-Roca JM, Gómez-Plaza E. 2008. Differences in morphology and composition of skin and pulp cell walls from grapes (Vitis vinifera L.): technological implications. Eur. Food Res. Technol. 227:223–231.
2. Moore JP, Fangel JU, Willats WGT, Vivier MA. 2014. Pectic-β(1,4)-galactan, extensin and arabinogalactan-protein epitopes differentiate ripening stages in wine and table grape cell walls. Ann. Bot. 114:1279–1294.
3. Ortega-Regules A, Ros-García JM, Bautista-Ortín AB, Lopez-Roca JM, Gomez-Plaza E. 2008. Changes in skin cell wall composition during the maturation of four premium wine grape varieties. J. Sci. Food Agric. 88:420–428.
4. Vicens A, Fournand D, Williams P, Sidhoum L, Moutounet M, Doco T. 2009. Changes in polysaccharide and protein composition of cell walls in grape berry skin (Cv. Shiraz) during ripening and over-ripening. J. Agric. Food Chem. 57:2955–60.
5. Yakushiji H, Sakurai N, Morinaga K. 2001. Changes in cell-wall polysaccharides from the mesocarp of grape berries during veraison. Physiol. Plant. 111:188–195.
6. Huang X-M, Huang H-B, Wang H-C. 2005. Cell walls of loosening skin in post-veraison grape berries lose structural polysaccharides and calcium while accumulate structural proteins. Sci. Hortic. (Amsterdam). 104:249–263.
7. González-Neves G, Gil G, Ferrer M, Charamelo D, Balado J, Bochicchio R, Gatto G, Tessore A. 2010. Prediction of the colour and polyphenolic composition of the young red wines from the phenolic potential of the grapes. Int. J. Food Sci. Technol. 45:1843–1851.
8. Jarvis MC. 2011. Plant cell walls: Supramolecular assemblies. Food Hydrocoll. 25:257–262.
9. Fia G, Canuti V, Rosi I. 2014. Evaluation of potential side activities of commercial enzyme preparations used in winemaking. Int. J. Food Sci. Technol. 49:1902–1911.
10. Romero-Cascales I, Fernández-Fernández JI, Ros-García JM, López-Roca JM, Gómez-Plaza E. 2008. Characterisation of the main enzymatic activities present in six commercial macerating enzymes and their effects on extracting colour during winemaking of Monastrell grapes. Int. J. Food Sci. Technol. 43:1295–1305.
11. Arvanitoyannis IS, Ladas D, Mavromatis A. 2006. Potential uses and applications of treated wine waste: a review. Int. J. Food Sci. Technol. 41:475–487.
Stellenbosch University https://scholar.sun.ac.za

149
12. Rodríguez LA, Toro ME, Vazquez F, Correa-Daneri ML, Gouiric SC, Vallejo MD. 2010. Bioethanol production from grape and sugar beet pomaces by solid-state fermentation. Int. J. Hydrogen Energy 35:5914–5917.
13. Hendriks ATWM, Zeeman G. 2009. Pretreatments to enhance the digestibility of lignocellulosic biomass. Bioresour. Technol. 100:10–8.
14. Alvira P, Tomás-Pejó E, Ballesteros M, Negro MJ. 2010. Pretreatment technologies for an efficient bioethanol production process based on enzymatic hydrolysis: A review. Bioresour. Technol. 101:4851–61.
15. Chamorro S, Viveros A, Alvarez I, Vega E, Brenes A. 2012. Changes in polyphenol and polysaccharide content of grape seed extract and grape pomace after enzymatic treatment. Food Chem. 133:308–314.
16. Xu C, Yagiz Y, Borejsza-Wysocki W, Lu J, Gu L, Ramírez-Rodrigues MM, Marshall MR. 2014. Enzyme release of phenolics from muscadine grape (Vitis rotundifolia Michx.) skins and seeds. Food Chem. 157:20–9.
17. Maier T, Göppert A, Kammerer DR, Schieber A, Carle R. 2007. Optimization of a process for enzyme-assisted pigment extraction from grape (Vitis vinifera L.) pomace. Eur. Food Res. Technol. 227:267–275.
18. Kammerer D, Claus A, Scieber A, Carle R. 2005. A novel process for the recovery of polyphenols from grape ( Vitis vinifera L .) pomace. Food Chem. Toxicol. 70:157–163.
19. Pedersen HL, Fangel JU, McCleary B, Ruzanski C, Rydahl MG, Ralet M-C, Farkas V, von Schantz L, Marcus SE, Andersen MCF, Field R, Ohlin M, Knox JP, Clausen MH, Willats WGT. 2012. Versatile high resolution oligosaccharide microarrays for plant glycobiology and cell wall research. J. Biol. Chem. 287:39429–38.
20. Moller I, Sørensen I, Bernal AJ, Blaukopf C, Lee K, Øbro J, Pettolino F, Roberts A, Mikkelsen JD, Knox JP, Bacic A, Willats WGT. 2007. High-throughput mapping of cell-wall polymers within and between plants using novel microarrays. Plant J. 50:1118–28.
21. Alonso-Simón A, Kristensen JB, Obro J, Felby C, Willats WGT, Jørgensen H. 2010. High-throughput microarray profiling of cell wall polymers during hydrothermal pre-treatment of wheat straw. Biotechnol. Bioeng. 105:509–14.
22. Fangel JU. 2013. P.hD. thesis. Advanced technologies for plant cell wall evolution and diversity. University of Copenhagen.Copenhagen, Denmark.
23. Blake AW, McCartney L, Flint JE, Bolam DN, Boraston AB, Gilbert HJ, Knox JP. 2006. Understanding the biological rationale for the diversity of cellulose-directed carbohydrate-binding modules in prokaryotic enzymes. J. Biol. Chem. 281:29321–9.
24. York WS, Darvill AG, L MM, Stevenson TT, Albersheim P. 1985. Isolation and characterization of plant cell walls and cell wall components. Methods Enzymol. 2:3–40.
25. Mouille G, Robin S, Lecomte M, Pagant S, Höfte H. 2003. Classification and identification of Arabidopsis cell wall mutants using Fourier-Transform InfraRed (FT-IR) microspectroscopy. Plant J. 35:393–404.
Stellenbosch University https://scholar.sun.ac.za

150
26. Kačuráková M, Capek P, Sasinková V, Wellner N, Ebringerová A. 2000. FT-IR study of plant cell wall model compounds : pectic polysaccharides and hemicelluloses. Carbohydr. Polym. 43:195–203.
Stellenbosch University https://scholar.sun.ac.za
Copyright © 2022 FDOKUMEN