an economic and financial deconstruction of the commodity ...
313
AN ECONOMIC AND FINANCIAL DECONSTRUCTION OF THE COMMODITY STREAMING BUSINESS MODEL by Daniel Victor DiFilippo A thesis submitted to the Robert M. Buchan Department of Mining In conformity with the requirements for the degree of Master of Applied Science Queen’s University Kingston, Ontario, Canada January 2015 Copyright © Daniel Victor DiFilippo, 2015
-
Upload
khangminh22 -
Category
Documents
-
view
2 -
download
0
Transcript of an economic and financial deconstruction of the commodity ...
AN ECONOMIC AND FINANCIAL DECONSTRUCTION OF THE COMMODITY
STREAMING BUSINESS MODEL
by
Daniel Victor DiFilippo
A thesis submitted to the Robert M. Buchan Department of Mining
In conformity with the requirements for
the degree of Master of Applied Science
Queen’s University
Kingston, Ontario, Canada
January 2015
Copyright © Daniel Victor DiFilippo, 2015
ii
Abstract
The objective of this thesis is to evaluate the viability of the commodity streaming business model, both
as a standalone enterprise and as a financing service for exploration and mining companies. A silver
streaming company, Silver Wheaton, was chosen as the subject of a case study to accomplish this and
nine silver streams that it acquired in its first eight years from 2004-2012 were analysed and evaluated.
Using publicly available technical data, cash flow models were developed for all of the mines and
development projects with which Silver Wheaton made agreements during this time period. Subsets of
these cash flows were isolated to represent the positions of both Silver Wheaton and its operating partners
in each transaction. The Capital Asset Pricing Model and its associated economic metrics were employed
and calculated for all of the isolated stream cash flow models to evaluate the expected financial gain or
loss to each party for every deal.
Cash flow models were developed using two silver price series; one conservative and one bullish price
series. These were compiled through the aggregation of price forecasting data from mining equity
research reports published in the months leading up to each transaction.
It was found that the business model resulted in poor financial outcomes for Silver Wheaton and excellent
financial outcomes for its operating partners in over 50% of the transactions it concluded, when evaluated
at conservative silver prices. Conversely, when evaluated at bullish silver prices it resulted in excellent
financial outcomes for Silver Wheaton and extremely poor financial outcomes for its operating partners in
every instance.
iii
Given that today silver is produced primarily as a by-product to gold and base metals, the business model
has a uniquely large target market when focusing on silver and has been replicated to varying degrees of
success by other companies, both with silver and other commodities. It provides a viable alternative to
traditional financing avenues for exploration and mining companies during all periods of the mining
business cycle and is positioned to grow in significance as a form of mine and project financing.

iv
Acknowledgements
The success of this thesis and associated studies has been achieved with the help and guidance of many
individuals.
Firstly, I would like to thank my two supervisors, Professors Jim Martin and Jeffrey Davidson, for their
invaluable advice, guidance, criticism, and encouragement throughout the development of this thesis’
concept and writing. Special thanks is due to Prof. Davidson for his patience throughout the writing and
re-writing process; without his sound understanding of academic writing I surely would not have
improved this document to a satisfactory calibre.
I would like to thank Dundee Capital Markets and those with whom I worked in Fall 2011: Bob Sangha,
Sandeep Singh, Brad Ralph, and particularly Stanley Iu, Michael Spencer, Alexandra Cowie, and Olga
Ivleva. The experience and guidance I received during my time as a mining investment banking intern
were integral to my understanding of how financial and economic concepts are practically employed
during transactional and enterprise analysis and evaluation in the mining capital markets.
Thank you to my parents, David and Mary Jo, for their constant support and guidance throughout my
schooling and life. Special thanks is due to my father for his interest in Silver Wheaton and its operating
model when I was a young undergraduate student; his fascination with the metal streaming concept
became mine, as well.
Finally, thank you to my fiancée, Catherine. Her love, support, and belief in me and my abilities have
been deeply motivating throughout this academic journey and beyond.
v
Table of Contents
Abstract ......................................................................................................................................................... ii
Acknowledgements ...................................................................................................................................... iv
Table of Contents .......................................................................................................................................... v
List of Figures ............................................................................................................................................ xiv
List of Tables .............................................................................................................................................. xv
List of Abbreviations .............................................................................................................................. xxvii
Chapter 1 ....................................................................................................................................................... 1
Introduction ................................................................................................................................................... 1
Chapter 2 ....................................................................................................................................................... 6
The Silver Streaming Model as exemplified by Silver Wheaton .................................................................. 6
2.1 Problem statement ......................................................................................................................... 9
2.2 Scope ........................................................................................................................................... 10
2.3 Thesis organization ..................................................................................................................... 11
Chapter 3 ..................................................................................................................................................... 14
Basic Concepts in Project Evaluation: A Review of Relevant Concepts and Literature ............................ 14
3.1 Basic concepts in project evaluation ........................................................................................... 14
3.1.1 The cash flow concept ......................................................................................................... 14
3.1.2 Discounted cash flows ........................................................................................................ 15
3.1.3 Capital Asset Pricing Model and beta factors ..................................................................... 17
3.1.4 Economic evaluation metrics .............................................................................................. 19
vi
3.1.5 Minimum acceptable rate of return and discount date selection ......................................... 20
3.1.6 Inflation ............................................................................................................................... 22
3.1.7 Consensus price estimate methodology in mining finance ................................................. 23
Chapter 4 ..................................................................................................................................................... 26
Application of Concepts to the Evaluation of the Silver Streaming Business Model ................................. 26
4.1 Methodology and research plan .................................................................................................. 26
4.1.1 Data sources ........................................................................................................................ 26
4.1.2 Case study: Silver Wheaton Corp. and its operating partners ............................................. 27
4.1.3 Selection of streams to be evaluated ................................................................................... 28
4.1.4 Explanation of enterprise analysis and silver price stress test ............................................ 30
4.1.5 Analysis of value addition or reduction to development project economics ...................... 31
4.2 Calculation of WACC ................................................................................................................. 31
4.3 Calculation of estimated silver stream cash flows ...................................................................... 33
4.3.1 Calculation of cash flows for mines utilizing silver streams .............................................. 33
4.3.2 Calculation of silver stream cash flows for operating partners ........................................... 36
4.3.3 Calculation of silver stream cash flows for Silver Wheaton ............................................... 36
4.3.4 Treatment of outdated capital and operating cost estimates ............................................... 36
4.3.5 Silver price series used in silver stream cash flow models ................................................. 37
4.4 Limitations and assumptions ....................................................................................................... 39
4.4.1 Sample size ......................................................................................................................... 40
4.4.2 Deterministic cash flow modelling ..................................................................................... 40
vii
4.4.3 Quality of index data used in calculation of corporate WACC ........................................... 41
4.4.4 Calculation method of corporate WACC ............................................................................ 41
4.4.5 Qualitative silver price forecast for 2012+.......................................................................... 41
4.4.6 Escalation of capital and operating costs ............................................................................ 42
4.4.7 Omission of working capital ............................................................................................... 42
4.4.8 Mine closure/ramp-down and metal sales ........................................................................... 42
4.4.9 Treatment of upfront payment ............................................................................................ 43
Chapter 5 ..................................................................................................................................................... 44
Sample Calculation of Discounted Cash Flows for a Silver Stream ........................................................... 44
5.1 Sample calculation of beta and WACC ...................................................................................... 44
5.2 Sample calculation of silver stream cash flow model ................................................................. 51
5.2.1 Calculation of mine cash flow model.................................................................................. 51
5.2.2 Calculation of silver stream cash flows for the stream seller .............................................. 54
5.2.3 Calculation of silver stream cash flows for the stream buyer ............................................. 56
Chapter 6 ..................................................................................................................................................... 57
Commodity and Mining Finance Review ................................................................................................... 57
6.1 Silver commodity review ............................................................................................................ 57
6.1.1 Demand and demand elasticity ........................................................................................... 57
6.1.2 Supply ................................................................................................................................. 63
6.1.3 Relevance to analysis of silver streaming business model .................................................. 65
6.2 Mining finance review ................................................................................................................ 66
viii
Chapter 7 ..................................................................................................................................................... 68
Case Study: Silver Wheaton Perspective .................................................................................................... 68
7.1 Initial financing of Silver Wheaton Corp. ................................................................................... 68
7.2 Results of isolated stream financial analysis ............................................................................... 70
7.2.1 Financial analysis at consensus silver price forecasts ......................................................... 72
7.2.2 Financial analysis at bullish silver price forecasts .............................................................. 74
7.3 Sensitivity analysis ...................................................................................................................... 75
7.4 Estimation of tolerable silver price floors ................................................................................... 80
7.5 Discussion ................................................................................................................................... 82
7.5.1 Base case vs. bullish stream cash flows .............................................................................. 82
7.5.2 Stream life and general comments on portfolio diversity ................................................... 83
7.5.3 Silver purchase agreement terms ........................................................................................ 85
7.5.4 Sustainability of silver streaming business model as an enterprise .................................... 85
7.5.5 Risk mitigation through completion guarantees ................................................................. 85
Chapter 8 ..................................................................................................................................................... 87
Case Study: Silver Wheaton Operating Partner Perspective ....................................................................... 87
8.1 Results of isolated stream financial analysis ............................................................................... 87
8.1.1 Financial analysis at consensus silver prices forecasts ....................................................... 88
8.1.2 Financial analysis at bullish silver price forecasts .............................................................. 89
8.2 Sensitivity analysis ...................................................................................................................... 90
8.3 Value of silver streams to development projects ........................................................................ 93
ix
8.4 Internal drivers for opting for stream financing .......................................................................... 95
8.5 Discussion ................................................................................................................................... 98
8.5.1 Isolated stream economics .................................................................................................. 98
8.5.2 Financial sensitivity of streams to operating partners ......................................................... 99
8.5.3 Sustainability of silver streaming business model as a financing service ......................... 100
Chapter 9 ................................................................................................................................................... 101
Comparison of Silver Streaming to Traditional Financing Methods ........................................................ 101
9.1 Debt financing overview ........................................................................................................... 101
9.2 Equity financing overview ........................................................................................................ 102
9.3 Debt and equity financing in mineral exploration and mining.................................................. 103
9.4 Comparison of silver streaming to debt and equity .................................................................. 105
Chapter 10 ................................................................................................................................................. 108
Conclusions and Discussions .................................................................................................................... 108
10.1 Summary ................................................................................................................................... 108
10.2 Conclusions and general discussion .......................................................................................... 110
10.2.1 Silver streaming as an enterprise....................................................................................... 110
10.2.2 Silver streaming as a quasi-financing service ................................................................... 111
10.2.3 Disproportionate risk profile of silver streaming .............................................................. 111
10.2.4 Potential to stream commodities other than silver ............................................................ 112
10.3 Conditions for the existence of the silver streaming business model ....................................... 114
10.4 Replication of Silver Wheaton experience and potential for new market entrants ................... 115
x
10.5 Risk elements for the silver streaming business model ............................................................ 116
10.6 Future work and recommendations ........................................................................................... 118
10.6.1 Future work ....................................................................................................................... 118
10.6.2 Recommendations ............................................................................................................. 119
Bibliography ............................................................................................................................................. 121
Appendix A ............................................................................................................................................... 140
Data Used in Beta Factor and WACC Calculations.................................................................................. 140
Silver Wheaton Data ............................................................................................................................. 140
Yauliyacu transaction ........................................................................................................................ 140
Stratoni transaction ........................................................................................................................... 142
Penasquito transaction....................................................................................................................... 145
Mineral Park transaction ................................................................................................................... 148
Campo Morado transaction ............................................................................................................... 150
Keno Hill transaction ........................................................................................................................ 152
Pascua-Lama transaction................................................................................................................... 155
Rosemont transaction ........................................................................................................................ 158
Operating Partner Data ......................................................................................................................... 161
Lundin and the Zinkgruvan transaction ............................................................................................ 161
European Goldfields and the Stratoni transaction ............................................................................. 163
Goldcorp and the Penasquito transaction .......................................................................................... 165
Mercator and the Mineral Park transaction ....................................................................................... 168
xi
Farallon and the Campo Morado transaction .................................................................................... 171
Alexco and the Keno Hill transaction ............................................................................................... 173
Barrick and the Pascua-Lama transaction ......................................................................................... 176
Augusta and the Rosemont transaction ............................................................................................. 178
Appendix B ............................................................................................................................................... 182
Cash Flow Models for Silver Streams and Underlying Mines ................................................................. 182
Zinkgruvan ........................................................................................................................................ 182
Yauliyacu .......................................................................................................................................... 186
Stratoni .............................................................................................................................................. 189
Penasquito ......................................................................................................................................... 193
Mineral Park ...................................................................................................................................... 200
Campo Morado ................................................................................................................................. 205
Keno Hill ........................................................................................................................................... 210
Pascua-Lama ..................................................................................................................................... 216
Rosemont .......................................................................................................................................... 222
Appendix C ............................................................................................................................................... 227
Consensus Metal Price Estimates Used in Cash Flow Models ................................................................. 227
Zinkgruvan ............................................................................................................................................ 227
Yauliyacu .............................................................................................................................................. 229
Stratoni .................................................................................................................................................. 232
Penasquito ............................................................................................................................................. 234
xii
Mineral Park.......................................................................................................................................... 236
Campo Morado ..................................................................................................................................... 238
Keno Hill ............................................................................................................................................... 242
Pascua-Lama ......................................................................................................................................... 244
Rosemont .............................................................................................................................................. 246
Appendix D ............................................................................................................................................... 249
Calculation of Silver Wheaton Stream Cash Flows for 2012, Going Forward ......................................... 249
Keno Hill ............................................................................................................................................... 250
Mineral Park.......................................................................................................................................... 251
Zinkgruvan ............................................................................................................................................ 253
San Dimas ............................................................................................................................................. 256
Loma de la Plata.................................................................................................................................... 257
Rosemont .............................................................................................................................................. 259
Yauliyacu .............................................................................................................................................. 261
Cozamin ................................................................................................................................................ 262
Minto ..................................................................................................................................................... 264
Pascua-Lama ......................................................................................................................................... 266
Penasquito ............................................................................................................................................. 269
Stratoni .................................................................................................................................................. 273
Campo Morado ..................................................................................................................................... 273
Neves-Corvo ......................................................................................................................................... 277
xiii
Aljustrel ................................................................................................................................................ 279
Los Filos ............................................................................................................................................... 280
Appendix E ............................................................................................................................................... 282
Pertinent Background Information of Silver Wheaton's Operating Partners ............................................ 282
Lundin Mining .................................................................................................................................. 282
Glencore ............................................................................................................................................ 282
European Goldfields Limited ............................................................................................................ 283
Goldcorp ........................................................................................................................................... 283
Mercator Minerals ............................................................................................................................. 284
Farallon ............................................................................................................................................. 284
Alexco ............................................................................................................................................... 284
Barrick............................................................................................................................................... 285
Augusta ............................................................................................................................................. 285
xiv
List of Figures
Figure 1: Cumulative market capitalization of commodity streaming companies, 2004-2011. Sources:
TSX and SEDAR .......................................................................................................................................... 3
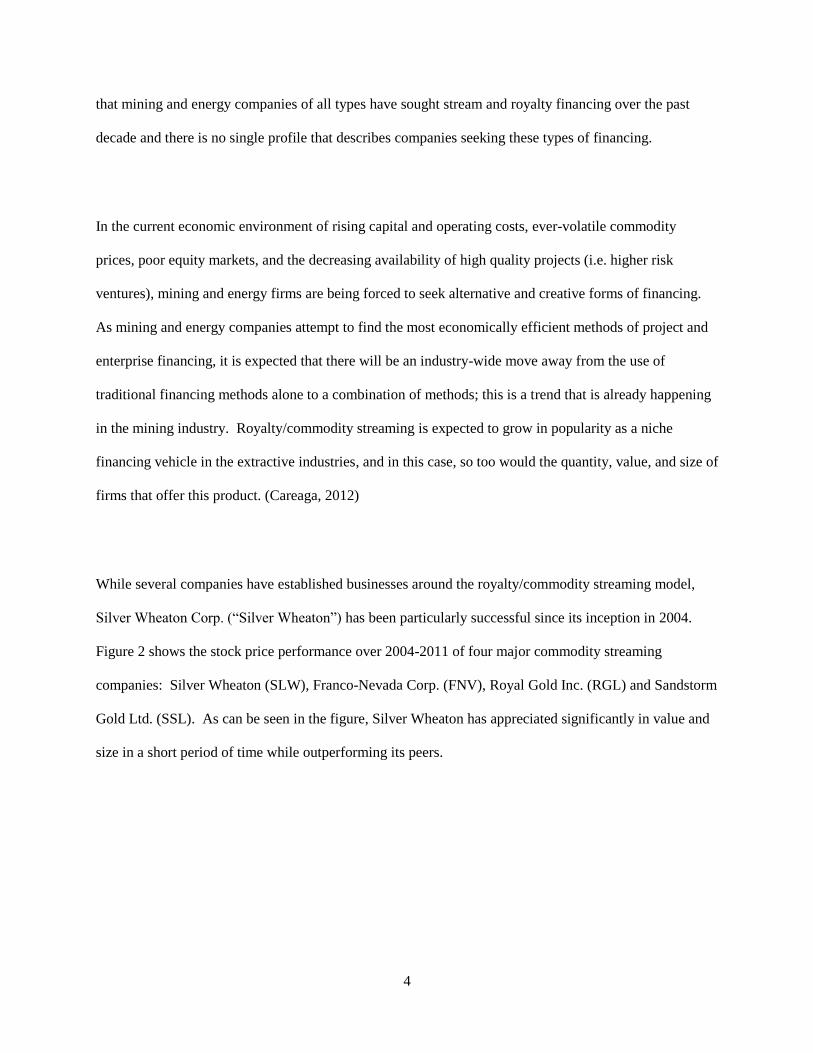
Figure 2: Share price performance of major commodity streaming firms, 2004-2011. Source: TSX .......... 5
Figure 3: Net Present Value at various discount rates ................................................................................ 16
Figure 4: Fabrication demand for silver, 2002-2011. Source: The Silver Institute .................................... 58
Figure 5: Supply and demand of silver, 2002-2011. Source: The Silver Institute ...................................... 59
Figure 6: Real prices of gold and silver, 1980-2011. Source: LBMA ....................................................... 60
Figure 7: Gold to silver price ratio from 1980-2011. Source: LBMA ........................................................ 61
Figure 8: Cumulative investment demand volume vs. value, 2002-2011. Source: The Silver Institute;
Scotia Mocatta ............................................................................................................................................ 62
Figure 9: Total silver mine supply-primary vs. by product output, 2002-2011. Source: Scotia Mocatta .. 64
Figure 10: Silver output by mine type, 2011. Source: The Silver Institute................................................. 65
Figure 11: NPV sensitivity of all analyzed streams to long-term silver price, base case Silver Wheaton
perspective .................................................................................................................................................. 76
Figure 12: NPV sensitivity of all analyzed streams to upfront payment, base case Silver Wheaton
perspective .................................................................................................................................................. 77
Figure 13: NPV sensitivity of all analyzed streams to changes in silver production, base case Silver
Wheaton perspective ................................................................................................................................... 79
Figure 14: NPV sensitivity of all analyzed streams to years of continuous production delay, base case
Silver Wheaton perspective ........................................................................................................................ 80
Figure 15: NPV sensitivity of all analyzed streams to long-term silver price, base case operating partner
perspective .................................................................................................................................................. 91
Figure 16: NPV sensitivity of all analyzed streams to upfront payment, base case operating partner
perspective .................................................................................................................................................. 92
xv
Figure 17: NPV sensitivity of all analyzed streams to changes in silver production, base case operating
partner perspective ...................................................................................................................................... 93
Figure 18: Total value of global mining equity financings (C$ billions), 1999-2012. Source:
PricewaterhouseCoopers ........................................................................................................................... 105
List of Tables
Table 1: Summary of silver stream agreements made by Silver Wheaton Corp. ......................................... 8
Table 2: Consensus silver price estimates for the Pascua-Lama silver stream, US$/oz ............................. 24
Table 3: Silver streams selected for inclusion in Silver Wheaton case study ............................................. 30
Table 4: Summary of consensus commodity price series used in silver stream cash flow models ............ 38
Table 5: Summary of bullish commodity price series used in silver stream cash flow models .................. 38
Table 6: Input data for sample calculation of beta factor ............................................................................ 45
Table 7: Sample calculation of beta factor .................................................................................................. 45
Table 8: Real annual return of S&P/TSX Composite Index, 1988-2007 .................................................... 47
Table 9: Sample calculation of cost of equity capital ................................................................................. 48
Table 10: Sample calculation of WACC ..................................................................................................... 49
Table 11: Example of effective tax rate computation ................................................................................. 50
Table 12: Calculated beta and WACC values for Silver Wheaton and its operating partners at the time of
each deal ..................................................................................................................................................... 50
Table 13: Calculation of expected NSR for Keno Hill polymetallic mine ................................................. 52
Table 14: Calculation of Keno Hill polymetallic mine annual cash flow ................................................... 53
Table 15: Silver stream cash flow calculation for Keno Hill mine, operating partner perspective ............ 55
Table 16: Silver stream cash flow calculation of Keno Hill mine, Silver Wheaton perspective ................ 56
Table 17: Cash flow models for Stratoni silver stream, consensus price scenario ..................................... 70
Table 18: Cash flow models for Stratoni silver stream, bullish price scenario ........................................... 71
xvi
Table 19: Calculation of WACCs used to discount Stratoni silver stream cash flows ............................... 71
Table 20: Summary of key input parameters for the analyses of Silver Wheaton's silver stream deals ..... 72
Table 21: Results of base case silver stream financial analysis, Silver Wheaton perspective .................... 73
Table 22: Results of bullish silver stream financial analysis, Silver Wheaton perspective ........................ 74
Table 23: Summary of base case values used in silver stream sensitivity analyses .................................... 75
Table 24: Minimum tolerable silver price values for Silver Wheaton at various levels of 2012 capital
commitment ................................................................................................................................................ 81
Table 25: Lives of Silver Wheaton streams at deal times ........................................................................... 84
Table 26: Results of base case silver stream financial analysis, operating partner perspective .................. 88
Table 27: Results of bullish case silver stream financial analysis, operating partner perspective .............. 89
Table 28: Summary of base case values used in silver stream sensitivity analyses .................................... 90
Table 29: Effect of silver stream sale on development project economics ................................................. 94
Table 30: Financings and balance sheet condition of operating partner companies surrounding stream
financings .................................................................................................................................................... 96
Table 31: Details of Silver Wheaton-Vale gold purchase agreement, February 28, 2013 ........................ 113
Table 32: Share price and index data used to calculate the Beta factor for Silver Wheaton at the time of
the Yauliyacu stream deal ......................................................................................................................... 140
Table 33: Calculation of Beta factor for Silver Wheaton at the time of the ............................................. 141
Table 34: Market return data used in the calculation of Silver Wheaton Ke at the time of the Yauliyacu
stream deal ................................................................................................................................................ 141
Table 35: Calculation of Silver Wheaton Ke at the time of the Yauliyacu stream deal ............................ 142
Table 36: Calculation of WACC for Silver Wheaton at the time of the Yauliyacu stream deal .............. 142
Table 37: Share price and index data used to calculate the Beta factor for Silver Wheaton at the time of
the Stratoni stream deal ............................................................................................................................. 143
Table 38: Calculation of Beta factor for Silver Wheaton at the time of the ............................................. 143
xvii
Table 39: Market return data used in the calculation of Silver Wheaton Ke at the time of the Stratoni
stream deal ................................................................................................................................................ 144
Table 40: Calculation of Silver Wheaton Ke at the time of the Stratoni stream deal ............................... 144
Table 41: Calculation of WACC for Silver Wheaton at the time of the Stratoni stream deal .................. 145
Table 42: Share price and index data used to calculate the Beta factor for Silver Wheaton at the time of
the Penasquito stream deal ........................................................................................................................ 145
Table 43: Calculation of Silver Wheaton Ke at the time of the Penasquito stream deal ........................... 146
Table 44: Market return data used in the calculation of Silver Wheaton Ke at the time of the Penasquito
stream deal ................................................................................................................................................ 146
Table 45: Calculation of Silver Wheaton Ke at the time of the Penasquito stream deal .......................... 147
Table 46: Calculation of cost of debt, Kd, for Silver Wheaton at the time of the Penasquito stream deal 147
Table 47: Calculation of WACC for Silver Wheaton at the time of the Penasquito stream deal ............. 147
Table 48: Share price and index data used to calculate the Beta factor for Silver Wheaton at the time of
the Mineral Park stream deal .................................................................................................................... 148
Table 49: Calculation of Silver Wheaton Ke at the time of the Mineral Park stream deal ....................... 148
Table 50: Market return data used in the calculation of Silver Wheaton Ke at the time of the Mineral Park
stream deal ................................................................................................................................................ 149
Table 51: Calculation of Silver Wheaton Ke at the time of the Mineral Park stream deal ....................... 149
Table 52: Calculation of WACC for Silver Wheaton at the time of the Mineral Park stream deal .......... 150
Table 53: Share price and index data used to calculate the Beta factor for Silver Wheaton at the time of
the Campo Morado stream deal ................................................................................................................ 150
Table 54: Calculation of Silver Wheaton Ke at the time of the Campo Morado stream deal ................... 151
Table 55: Market return data used in the calculation of Silver Wheaton Ke at the time of the Campo
Morado stream deal ................................................................................................................................... 151
Table 56: Calculation of Silver Wheaton Ke at the time of the Campo Morado stream deal ................... 152
Table 57: Calculation of WACC for Silver Wheaton at the time of the Campo Morado stream deal ...... 152
xviii
Table 58: Share price and index data used to calculate the Beta factor for Silver Wheaton at the time of
the Keno Hill stream deal ......................................................................................................................... 153
Table 59: Calculation of Silver Wheaton Ke at the time of the Keno Hill stream deal ............................. 153
Table 60: Market return data used in the calculation of Silver Wheaton Ke at the time of the Keno Hill
stream deal ................................................................................................................................................ 154
Table 61: Calculation of Silver Wheaton Ke at the time of the Keno Hill stream deal ............................. 154
Table 62: Calculation of cost of debt, Kd, for Silver Wheaton at the time of the Keno Hill stream deal . 155
Table 63: Share price and index data used to calculate the Beta factor for Silver Wheaton at the time of
the Pascua-Lama stream deal .................................................................................................................... 156
Table 64: Calculation of Silver Wheaton Ke at the time of the Pascua-Lama stream deal ....................... 156
Table 65: Market return data used in the calculation of Silver Wheaton Ke at the time of the Pascua-Lama
stream deal ................................................................................................................................................ 157
Table 66: Calculation of Silver Wheaton Ke at the time of the Pascua-Lama stream deal ....................... 157
Table 67: Calculation of WACC for Silver Wheaton at the time of the Pascua-Lama stream deal ......... 158
Table 68: Share price and index data used to calculate the Beta factor for Silver Wheaton at the time of
the Rosemont stream deal ......................................................................................................................... 158
Table 69: Calculation of Silver Wheaton Ke at the time of the Rosemont stream deal ............................ 159
Table 70: Market return data used in the calculation of Silver Wheaton Ke at the time of the Rosemont
stream deal ................................................................................................................................................ 159
Table 71: Calculation of Silver Wheaton Ke at the time of the Rosemont stream deal ............................ 160
Table 72: Calculation of cost of debt, Kd, for Silver Wheaton at the time of the Rosemont stream deal . 160
Table 73: Calculation of WACC for Silver Wheaton at the time of the Rosemont stream deal ............... 160
Table 74: Share price and index data used to calculate the Beta factor for Lundin at the time of the
Zinkgruvan stream deal ............................................................................................................................. 161
Table 75: Calculation of Lundin Ke at the time of the Zinkgruvan stream deal ....................................... 161
xix
Table 76: Market return data used in the calculation of Lundin Ke at the time of the Zinkgruvan stream
deal ............................................................................................................................................................ 162
Table 77: Calculation of Lundin Ke at the time of the Zinkgruvan stream deal ....................................... 162
Table 78: Calculation of WACC for Lundin at the time of the Zinkgruvan stream deal .......................... 163
Table 79: Share price and index data used to calculate the Beta factor for European Goldfields at the time
of the Stratoni stream deal ........................................................................................................................ 163
Table 80: Calculation of European Goldfields Ke at the time of the Stratoni stream deal ........................ 164
Table 81: Market return data used in the calculation of European Goldfields Ke at the time of the Stratoni
stream deal ................................................................................................................................................ 164
Table 82: Calculation of European Goldfields Ke at the time of the Stratoni stream deal ........................ 165
Table 83: Calculation of WACC for European Goldfields at the time of the Stratoni stream deal .......... 165
Table 84: Share price and index data used to calculate the Beta factor for Goldcorp at the time of the
Penasquito stream deal .............................................................................................................................. 166
Table 85: Calculation of Goldcorp Ke at the time of the Penasquito stream deal ..................................... 166
Table 86: Market return data used in the calculation of Goldcorp Ke at the time of the Penasquito stream
deal ............................................................................................................................................................ 167
Table 87: Calculation of Goldcorp Ke at the time of the Penasquito stream deal ..................................... 167
Table 88: Calculation of Goldcorp's cost of debt, Kd, at the time of the Penasquito stream deal ............. 168
Table 89: Calculation of WACC for Goldcorp at the time of the Penasquito stream deal ....................... 168
Table 90: Share price and index data used to calculate the Beta factor for Mercator at the time of the
Mineral Park stream deal .......................................................................................................................... 169
Table 91: Calculation of Mercator Ke at the time of the Mineral Park stream deal .................................. 169
Table 92: Market return data used in the calculation of Mercator Ke at the time of the Mineral Park stream
deal ............................................................................................................................................................ 170
Table 93: Calculation of Mercator Ke at the time of the Mineral Park stream deal .................................. 170
Table 94: Calculation of WACC for Mercator at the time of the Mineral Park stream deal .................... 171

xx
Table 95: Share price and index data used to calculate the Beta factor for Farallon at the time of the
Campo Morado stream deal ...................................................................................................................... 171
Table 96: Calculation of Farallon Ke at the time of the Campo Morado stream deal ............................... 172
Table 97: Market return data used in the calculation of Farallon Ke at the time of the Campo Morado
stream deal ................................................................................................................................................ 172
Table 98: Calculation of Farallon Ke at the time of the Campo Morado stream deal ............................... 173
Table 99: Calculation of WACC for Farallon at the time of the Campo Morado stream deal ................. 173
Table 100: Share price and index data used to calculate the Beta factor for Alexco at the time of the Keno
Hill stream deal ......................................................................................................................................... 174
Table 101: Calculation of Alexco Ke at the time of the Keno Hill stream deal ........................................ 174
Table 102: Market return data used in the calculation of Alexco Ke at the time of the Keno Hill stream
deal ............................................................................................................................................................ 175
Table 103: Calculation of Alexco Ke at the time of the Keno Hill stream deal ........................................ 175
Table 104: Calculation of WACC for Alexco at the time of the Keno Hill stream deal .......................... 176
Table 105: Share price and index data used to calculate the Beta factor for Barrick at the time of the
Pascua-Lama stream deal .......................................................................................................................... 176
Table 106: Calculation of Barrick Ke at the time of the Pascua-Lama stream deal .................................. 177
Table 107: Market return data used in the calculation of Barrick Ke at the time of the Pascua-Lama stream
deal ............................................................................................................................................................ 177
Table 108: Calculation of Barrick Ke at the time of the Pascua-Lama stream deal .................................. 178
Table 109: Calculation of WACC for Barrick at the time of the Pascua-Lama stream deal .................... 178
Table 110: Share price and index data used to calculate the Beta factor for Augusta at the time of the
Rosemont stream deal ............................................................................................................................... 179
Table 111: Calculation of Augusta Ke at the time of the Rosemont stream deal ...................................... 179
Table 112: Market return data used in the calculation of Augusta Ke at the time of the Rosemont stream
deal ............................................................................................................................................................ 180
xxi
Table 113: Calculation of Augusta Ke at the time of the Rosemont stream deal ...................................... 180
Table 114: Calculation of Augusta Kd at the time of the Rosemont stream deal ...................................... 181
Table 115: Calculation of WACC for Augusta at the time of the Rosemont stream deal ........................ 181
Table 116: Silver price assumptions used in the cash flow models for the Zinkgruvan silver stream ..... 183
Table 117: Cash flow model of the Zinkgruvan mine .............................................................................. 184
Table 118: Cash flow model of the Zinkgruvan silver stream, Lundin perspective ................................. 185
Table 119: Cash flow model of the Zinkgruvan silver stream, Silver Wheaton perspective .................... 185
Table 120: Silver price assumptions used in the cash flow models for the Yauliyacu silver stream ........ 186
Table 121: Cash flow model for the Yauliyacu mine ............................................................................... 187
Table 122: Cash flow model for the Yauliyacu silver stream, Glencore perspective ............................... 188
Table 123: Cash flow model for the Yauliyacu silver stream, Silver Wheaton perspective ..................... 188
Table 124: Smelter terms used in the Stratoni mine cash flow model ...................................................... 190
Table 125: Operating costs used in the Stratoni mine cash flow model ................................................... 190
Table 126: European CPI data and resulting growth rates used in the Stratoni capital cost escalation
calculation ................................................................................................................................................. 191
Table 127: Silver price assumptions used in the cash flow models for the Stratoni silver stream ........... 191
Table 128: Cash flow model for the Stratoni mine ................................................................................... 192
Table 129: Cash flow model for the Stratoni silver stream, European Goldfields perspective ................ 193
Table 130: Cash flow model for the Stratoni silver stream, Silver Wheaton perspective ........................ 193
Table 131: Penasquito sulphide ore composition by lithology ................................................................. 194
Table 132: Metal process recovery factors by lithology for Penasquito sulphide ore .............................. 194
Table 133: Weighted average metal process recovery factors for Penasquito sulphide ore ..................... 195
Table 134: Penasquito oxide ore tonnage by type .................................................................................... 195
Table 135: Penasquito oxide ore process recovery factors by ore type .................................................... 195
Table 136: Weighted average process recovery factors for Penasquito oxide ore .................................... 196
Table 137: Life-of-mine operating, shipping, and smelting/refining costs for the Penasquito mine ........ 196
xxii
Table 138: Capital cost estimates for the Penasquito mine ....................................................................... 196
Table 139: U.S. CPI data used in the escalation of capital costs for the Penasquito mine ....................... 197
Table 140: Silver price assumptions used in the cash flow models of the Mineral Park silver stream .... 197
Table 141: Cash flow model for the Penasquito mine .............................................................................. 198
Table 142: Cash flow model for the Penasquito silver stream, Goldcorp perspective ............................. 199
Table 143: Cash flow model for the Penasquito silver stream, Silver Wheaton perspective.................... 199
Table 144: Recovery factors used in the Mineral Park mine cash flow model ......................................... 201
Table 145: Operating cost estimates used in the Mineral Park mine cash flow model ............................. 201
Table 146: CPI data used in the escalation of Mineral Park capital costs ................................................ 202
Table 147: Silver price assumptions used in the cash flow models of the Mineral Park silver stream .... 202
Table 148: Cash flow model for the Mineral Park mine ........................................................................... 203
Table 149: Cash flow model for the Mineral Park silver stream, Mercator perspective .......................... 204
Table 150: Cash flow model for the Mineral Park silver stream, Silver Wheaton perspective ................ 204
Table 151: Average smelter recovery factors for Campo Morado concentrate products ......................... 205
Table 152: Metal refining costs for the Campo Morado project ............................................................... 206
Table 153: Silver price assumptions used in the cash flow models of the Campo Morado silver stream 206
Table 154: Cash flow model for the Campo Morado project ................................................................... 207
Table 155: Cash flow model for the Campo Morado silver stream, Farallon perspective........................ 209
Table 156: Cash flow model for the Campo Morado silver stream, Silver Wheaton perspective ............ 209
Table 157: Metal process recoveries used in the Keno Hill cash flow model .......................................... 210
Table 158: Smelter terms for the Keno Hill mine ..................................................................................... 211
Table 159: Operating cost estimates for the Keno Hill mine .................................................................... 211
Table 160: Estimated metal penalties for the Keno Hill mine concentrate products ................................ 212
Table 161: Silver price assumptions used in the cash flow models of the Keno Hill silver stream ......... 213
Table 162: Cash flow model for the Keno Hill mine ................................................................................ 214
Table 163: Cash flow model for the Keno Hill silver stream, Alexco perspective ................................... 215
xxiii
Table 164: Cash flow model for the Keno Hill silver stream, Silver Wheaton perspective ..................... 215
Table 165: Proven and probable reserves (Mt) for non-refractory ore, Pascua-Lama project .................. 216
Table 166: Given metal process recoveries for Pascua-Lama ore types ................................................... 217
Table 167: Weighted average metal recovery factors for Pascua-Lama oxide ore ................................... 217
Table 168: Estimated smelter terms for Pascua-Lama concentrate at the time of the stream deal with
Silver Wheaton.......................................................................................................................................... 218
Table 169: Estimated LOM operating costs for the Pascua-Lama project ............................................... 218
Table 170: Silver price assumptions used in the cash flow models of the Pascua-Lama silver stream .... 219
Table 171: Cash flow model for Pascua-Lama mine ................................................................................ 220
Table 172: Cash flow model for Pascua-Lama silver stream, Barrick perspective .................................. 221
Table 173: Cash flow model for Pascua-Lama silver stream, Silver Wheaton perspective ..................... 221
Table 174: Smelter terms for the Rosemont project ................................................................................. 223
Table 175: Expected LOM operating costs for the Rosemont project ...................................................... 223
Table 176: Metal price assumptions used in the Rosemont mine and precious metals stream cash flow
calculations ............................................................................................................................................... 224
Table 177: Rosemont project cash flow model ......................................................................................... 225
Table 178: Cash flow model for Rosemont silver stream, Augusta perspective ...................................... 226
Table 179: Cash flow model for the Rosemont silver stream, Silver Wheaton perspective ..................... 226
Table 180: Consensus silver price estimates at the time of the Zinkgruvan silver stream........................ 227
Table 181: Consensus lead price estimates at the time of the Zinkgruvan silver stream .......................... 228
Table 182: Consensus zinc price estimates at the time of the Zinkgruvan silver stream .......................... 229
Table 183: Consensus silver price estimates at the time of the Yauliyacu silver stream .......................... 229
Table 184: Consensus copper price estimates at the time of the Yauliyacu silver stream ........................ 230
Table 185: Consensus lead price estimates at the time of the Yauliyacu silver stream ............................ 231
Table 186: Consensus zinc price estimates at the time of the Yauliyacu silver stream ............................ 231
Table 187: Consensus silver price estimates at the time of the Stratoni silver stream ............................. 232

xxiv
Table 188: Consensus lead price estimates at the time of the Stratoni silver stream ................................ 233
Table 189: Consensus zinc price estimates at the time of the Stratoni silver stream ................................ 233
Table 190: Consensus silver price estimates at the time of the Penasquito silver stream ......................... 234
Table 191: Consensus gold price estimates at the time of the Penasquito silver stream .......................... 235
Table 192: Consensus lead price estimates at the time of the Penasquito silver stream ........................... 235
Table 193: Consensus zinc price estimates at the time of the Penasquito silver stream ........................... 236
Table 194: Consensus silver price estimates at the time of the Mineral Park silver stream ..................... 237
Table 195: Consensus copper price estimates at the time of the Mineral Park silver stream ................... 237
Table 196: Consensus molybdenum price estimates at the time of the Mineral Park silver stream ......... 238
Table 197: Consensus silver price estimates at the time of the Campo Morado silver stream ................. 239
Table 198: Consensus gold price estimates at the time of the Campo Morado silver stream ................... 239
Table 199: Consensus copper price estimates at the time of the Campo Morado silver stream ............... 240
Table 200: Consensus lead price estimates at the time of the Campo Morado silver stream ................... 241
Table 201: Consensus zinc price estimates at the time of the Campo Morado silver stream ................... 241
Table 202: Consensus silver price estimates at the time of the Keno Hill silver stream .......................... 242
Table 203: Consensus lead price estimates at the time of the Keno Hill silver stream............................. 243
Table 204: Consensus zinc price estimates at the time of the Keno Hill silver stream............................. 243
Table 205: Consensus silver price estimates at the time of the Pascua-Lama silver stream ..................... 244
Table 206: Consensus gold price estimates at the time of the Pascua-Lama silver stream ...................... 245
Table 207: Consensus copper price estimates at the time of the Pascua-Lama silver stream ................... 245
Table 208: Consensus silver price estimates at the time of the Rosemont silver stream .......................... 246
Table 209: Consensus gold price estimates at the time of the Rosemont silver stream ............................ 247
Table 210: Consensus copper price estimates at the time of the Rosemont silver stream ........................ 247
Table 211: Consensus molybdenum price estimates at the time of the Rosemont silver stream .............. 248
Table 212: Economic smelter terms for Keno Hill concentrates .............................................................. 250
Table 213: Cash flow model for the Keno Hill mine from 2012 going forward ...................................... 251
xxv
Table 214: Cash flow model for the Mineral Park mine from 2012 going forward ................................. 252
Table 215: Silver mineral reserves by ore type at the Zinkgruvan mine .................................................. 253
Table 216: Silver mineral resources by ore type at the Zinkgruvan mine ................................................ 253
Table 217: Remaining reserves at the Zinkgruvan mine in 2012 ............................................................. 254
Table 218: Ag recovery by ore type at the Zinkgruvan mine ................................................................... 254
Table 219: Cash flow model for Zinkgruvan mine from 2012 going forward ......................................... 255
Table 220: Cash flow model for the San Dimas mine from 2012 going forward ..................................... 256
Table 221: Cash flow model for the planned Loma de La Plata mine ...................................................... 258
Table 222: Economic smelter terms for the Rosemont mine .................................................................... 259
Table 223: Cash flow model for the Rosemont mine from 2012 going forward ...................................... 260
Table 224: Cash flow model for the Yauliyacu mine going forward........................................................ 262
Table 225: Ag recoveries by concentrate type for the Cozamin mine ...................................................... 263
Table 226: Economic smelter terms for the Cozamin mine ...................................................................... 263
Table 227: Cash flow model for the Cozamin mine from 2012 going forward ........................................ 264
Table 228: Metal recovery to concentrate for the Minto mine ................................................................. 265
Table 229: Economic smelter terms for the Minto mine concentrate ....................................................... 265
Table 230: Cash flow model for the Minto mine from 2012 going forward ............................................ 266
Table 231: Cash flow model for the planned Pascua-Lama mine from 2012 going forward ................... 268
Table 232: Ore composition and silver recovery to concentrate at the planned Penasquito mine ............ 269
Table 233: Weighted average silver recovery to concentrate from sulphide ore at the Penasquito mine . 270
Table 234: Silver recovery from oxide ore at the Penasquito mine .......................................................... 270
Table 235: Proven & probable oxide ore reserves at the Penasquito mine ............................................... 270
Table 236: Cash flow model for the Penasquito mine from 2012 going forward ..................................... 272
Table 237: Cash flow model for the Stratoni mine from 2012 going forward .......................................... 273
Table 238: Proven & probable reserves at the planned Campo Morado mine ......................................... 274
Table 239: Measured & indicated resources at the planned Campo Morado mine .................................. 274
xxvi
Table 240: Mill processing rates at the planned Campo Morado mine .................................................... 274
Table 241: Approximate LOM calculation for the planned Campo Morado mine ................................... 275
Table 242: Cash flow model for the planned Campo Morado mine from 2012 going forward ............... 276
Table 243: Proven & probable mineral reserves at the Neves-Corvo mine .............................................. 277
Table 244: Silver recoveries to concentrate at the Neves-Corvo mine ..................................................... 277
Table 245: Cash flow model for the Neves-Corvo mine from 2012 going forward ................................. 278
Table 246: Proven & probable silver reserves at the Aljustrel mine from 2012 going forward ............... 279
Table 247: LOM calculation for the Aljustrel mine.................................................................................. 279
Table 248: Cash flow model for the Aljustrel mine from 2012 going forward ........................................ 280
Table 249: Silver reserves at the Los Filos mine and approximate LOM calculation .............................. 281
Table 250: Cash flow model for the Los Filos mine from 2012 going forward ....................................... 281

xxvii
List of Abbreviations
CAD: Canadian dollars. Currency used in Canada.
CPI: Consumer Price Index.
ETF: exchange-traded fund, a financial security whose value is derived from and meant to replicate that
of an index or physical commodity.
ER: equity research.
FX rate: foreign exchange rate.
FY: fiscal year for a public corporation, generally defined as January 1st to December 31st of a given year.
FYE: fiscal year end. Final day of a defined fiscal year for a public corporation, usually December 31st
of a given year.
H1 or H2: first or second half of a fiscal year, respectively. Refers to the first or last 6 month period of a
fiscal year and typically defined as January 1st to June 30th or July 1st to December 31st, respectively.
IRR: internal rate of return.
LOM: life of mine.
MARR: minimum acceptable rate of return or hurdle rate.
NPV: net present value
NI 43-101: National Instrument 43-101, Standards of Disclosure for Mineral Projects. A code of
guidelines and standards for the reporting of technical and financial data relating to a mineral project that
is owned and operated by a publicly traded corporation in Canada.
NSR: net smelter return.
Operating partner: referred to as OP.
xxviii
PVR: present value ratio.
First, second, third, or fourth quarter of a fiscal year: referred to as Q1, Q2, Q3, and Q4, respectively,
followed by the fiscal year in question (e.g Q1 2010). Generally refers to the following defined periods:
January 1st to March 31st (Q1), April 1st to June 30th (Q2), July 1st to September 30th (Q3), and October 1st
to December 31st (Q4).
SEDAR: System for Electronic Document Analysis and Retrieval. Repository of publicly available
information and data issued by publicly traded corporations in Canada.
SLW: Silver Wheaton Corporation.
TSX: Toronto Stock Exchange. The largest stock exchange in Canada, which lists and trades the largest
proportion of the world’s public mining companies.
TSXV: TSX Venture Exchange. A stock exchange that primarily lists and trades junior companies whose
market capitalization and assets are too small to be listed on the TSX.
USD: United States Dollars. Currency used in the United States of America.
WACC: weighted average cost of capital.
1
Chapter 1
Introduction
“Royalty streaming” or “commodity streaming” is a business model that was first employed by Franco-
Nevada Mining Corporation in 1986. It has become an increasingly important and significant form of
alternate mine financing as well as an accepted and particularly successful method of doing business.
Within the last decade, several companies have emerged whose sole business focus is “commodity
streaming”, with their source of income being the sale of product or receipt of royalties resulting from
these deals. This business model is now being used within both the hard rock mining and hydrocarbon
extraction industries.
The commodity streaming model is simple in nature. A “commodity stream” is effectively an option to
purchase a fixed percentage or volume of a commodity that may be produced in the future from an
exploration property or that is currently being produced by an operating mine. The streaming company
(streaming firm or stream buyer) strikes a deal (commodity stream or commodity purchase agreement)
with a mining/energy exploration or extraction company (miner, operating partner, or stream seller)
exploring for or mining the commodity of interest. The deal always involves an upfront cash payment to
the miner or stream seller which is advanced by the stream buyer. These advance payments have ranged
from the tens to hundreds of millions of dollars. In exchange for advancing money, the stream buyer
receives the right to purchase a percentage of the miner’s production from a particular operation over a set
term and at a pre-established price. The term typically extends over the commercial life of the operation,
and the price ultimately paid to the stream seller or miner (referred to as the “transfer price”) is the lesser
of a pre-established fixed price (e.g. $3.90/oz of silver) or the prevailing spot market price of the
commodity at the time that the option to purchase is exercised. A streaming firm’s operating income is
2
then the difference between the market price of the commodity at the time of sale and the transfer fee it
paid to acquire the commodity, which will either be lower or equal to the market price at the time of
transfer of ownership.
Alternatively, some companies involved in the streaming business have chosen to take a royalty position
or “royalty stream” on all or some of the mine/project’s future profit, instead of holding an option to
purchase the physical commodity at a fixed price. For example, Franco-Nevada Corp. and Royal Gold
Inc. derive the majority of their revenues not from streaming, but from royalties. The royalty, a fixed
percentage, is applied to net revenues, usually the Net Smelter Return (NSR) and would be paid out on an
incremental basis (i.e. semi-annually or annually), although this is not always the case. It is this type of
streaming that Franco-Nevada first employed as a main aspect of its business model in the mid-1980s. It
is worth noting that royalty streams and commodity streams are distinct and separate deal types; the
streaming market was dominated by the former until the early 2000s when the latter began to gain in
popularity.
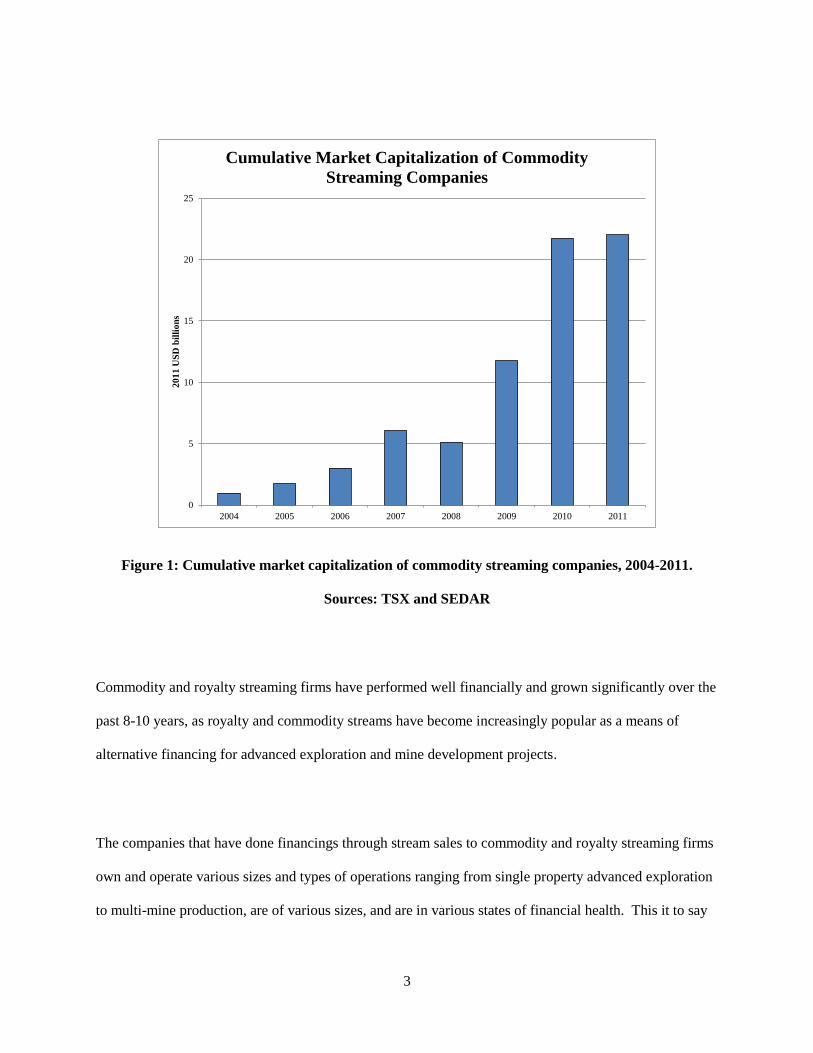
Prior to the early 2000s, there existed only a few companies engaged in royalty/commodity streaming
activities, Franco-Nevada being chief among them (Careaga, 2012). From the years 2004-2012, the
quantity and value of royalty/commodity streaming firms1 and the deals they completed increased
significantly. For illustrative purposes, the cumulative market capitalization of the four major streaming
firms2 from 2004-2011 is presented in Figure 1.
1 Defined as a business entity whose only source of revenue is through royalty and/or commodity streams on hard
rock mining or hydrocarbon extraction operations. 2 Franco-Nevada Corp., Royal Gold Inc, Sandstorm Gold Ltd, and Silver Wheaton Corp.
3
Figure 1: Cumulative market capitalization of commodity streaming companies, 2004-2011.
Sources: TSX and SEDAR
Commodity and royalty streaming firms have performed well financially and grown significantly over the
past 8-10 years, as royalty and commodity streams have become increasingly popular as a means of
alternative financing for advanced exploration and mine development projects.
The companies that have done financings through stream sales to commodity and royalty streaming firms
own and operate various sizes and types of operations ranging from single property advanced exploration
to multi-mine production, are of various sizes, and are in various states of financial health. This it to say
0
5
10
15
20
25
2004 2005 2006 2007 2008 2009 2010 2011
20
11
US
D b
illi
on
s
Cumulative Market Capitalization of Commodity
Streaming Companies
4
that mining and energy companies of all types have sought stream and royalty financing over the past
decade and there is no single profile that describes companies seeking these types of financing.
In the current economic environment of rising capital and operating costs, ever-volatile commodity
prices, poor equity markets, and the decreasing availability of high quality projects (i.e. higher risk
ventures), mining and energy firms are being forced to seek alternative and creative forms of financing.
As mining and energy companies attempt to find the most economically efficient methods of project and
enterprise financing, it is expected that there will be an industry-wide move away from the use of
traditional financing methods alone to a combination of methods; this is a trend that is already happening
in the mining industry. Royalty/commodity streaming is expected to grow in popularity as a niche
financing vehicle in the extractive industries, and in this case, so too would the quantity, value, and size of
firms that offer this product. (Careaga, 2012)
While several companies have established businesses around the royalty/commodity streaming model,
Silver Wheaton Corp. (“Silver Wheaton”) has been particularly successful since its inception in 2004.
Figure 2 shows the stock price performance over 2004-2011 of four major commodity streaming
companies: Silver Wheaton (SLW), Franco-Nevada Corp. (FNV), Royal Gold Inc. (RGL) and Sandstorm
Gold Ltd. (SSL). As can be seen in the figure, Silver Wheaton has appreciated significantly in value and
size in a short period of time while outperforming its peers.
5
-100%
100%
300%
500%
700%
900%
1100%
2003 2004 2005 2006 2007 2008 2009 2010 2011 2012
Sh
are P
ric
e P
erfo
rm
an
ce
SLW
FNV
RGL
SSL
Figure 2: Share price performance of major commodity streaming firms, 2004-2011. Source: TSX
Unlike Franco-Nevada with its asset mix of both royalties and commodity streams, Silver Wheaton has
pioneered the commodity streaming business model specifically and has proven to be the first corporation
to date that has achieved widespread recognition and success solely from stream-derived revenue.
Furthermore, Silver Wheaton has achieved this success by focussing its streams primarily on a single
commodity, silver, with very little exposure to gold. Due to its success, its relative youth, diverse asset
mix (both base metal and gold mines/projects), and the excellent public availability of the necessary and
relevant financial and technical data, Silver Wheaton is used in this thesis as the case study for
understanding the viability of the commodity streaming business model, and evaluating the conditions
necessary for its future sustainability.
6
Chapter 2
The Silver Streaming Model as exemplified by Silver Wheaton
Since its inception in late 2004, Silver Wheaton has grown to a market capitalization of C$11 billion as of
April 14, 20123 (TMX Group Incorporated) through the acquisition of fourteen silver purchase
agreements and two precious metal purchase agreements. While part of Silver Wheaton’s success can be
attributed to the favourable silver price environment of the years 2004-2012, much can also be attributed
to the ability of its management to generate accretive transactions and expand its asset portfolio.
Silver Wheaton Corp. was formally incorporated under the Business Corporations Act (Ontario) on
December 17, 2004, and prior to this, the company operated briefly as Chap Mercantile Inc. In June
2002, a company called Wheaton River Minerals Ltd. purchased the Luismin4 group of mines in Mexico
for approximately US$100 million. The revenue mix from the Luismin mines was split evenly between
gold and silver. Wheaton River was an emerging mid-tier gold producer that was not receiving a
‘precious metal valuation’ by the market due to the company’s copper exposure from their 37.5%
ownership of the Alumbrera mine in Argentina; management and shareholders believed the company to
be undervalued due to this exposure. Thus, several key managers and executives sought to unlock the
value from the significant silver production at the Luismin mines by transferring ownership of it to a
purely precious metals company, Chap Mercantile Inc., which was a spin-off entity that was to eventually
become Silver Wheaton5. In October 2004, Wheaton River entered into a silver purchase agreement with
the newly created Chap Mercantile Inc. whereby Wheaton River sold forward 100% of the silver
3 The cut-off date or end date of analysis in this thesis. 4 At the time of its acquisition, Luismin owned three precious metal mining operations located in Mexico: San
Dimas, La Guitarra, and San Martin. The most significant of the three, San Dimas, was comprised of three operating
mines: the Tayoltita, Santa Rita, and San Antonio mines. 5 Chap Mercantile Inc. changed its name to Silver Wheaton Corp. soon after beginning operation.
7
production from the Luismin mines in exchange for 540 million newly-issued Chap Mercantile shares and
a $36.7 million upfront payment. This afforded Chap Mercantile (effectively, Silver Wheaton) the right
to purchase all silver production from the San Dimas mine (part of the Luismin mines) at a price that was
the lesser of $3.90/oz or the prevailing market price. In April 2005, Goldcorp Inc. acquired Wheaton
River and all of its assets and Silver Wheaton continued to operate as a standalone corporation, using the
same business model that it uses to the present time (Silver Wheaton Corp., 2010a). Silver Wheaton and
the silver streaming business model were not created with the intention of propagating a viable business
but rather as a spin-off entity that was to serve a very specific strategic purpose. With the purchase of
Wheaton River by Goldcorp, Silver Wheaton had to establish its own purpose, identity, and financial
viability as an independent business venture.
Between 2006 and 2012, Silver Wheaton wrote “silver streaming” contracts with 11 additional companies
tied to 18 specific mining and advanced exploration operations. All of Silver Wheaton’s silver purchase
agreements, current as of April 16, 2012, are outlined below, in Table 1.
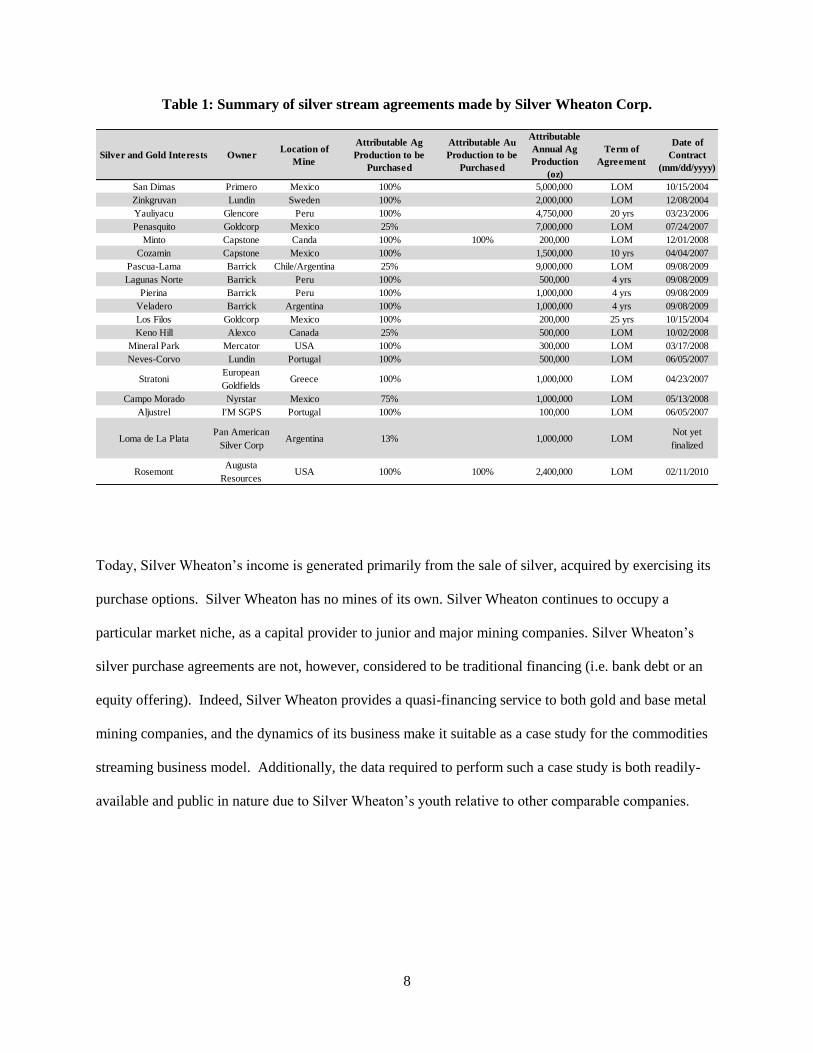
8
Table 1: Summary of silver stream agreements made by Silver Wheaton Corp.
Today, Silver Wheaton’s income is generated primarily from the sale of silver, acquired by exercising its
purchase options. Silver Wheaton has no mines of its own. Silver Wheaton continues to occupy a
particular market niche, as a capital provider to junior and major mining companies. Silver Wheaton’s
silver purchase agreements are not, however, considered to be traditional financing (i.e. bank debt or an
equity offering). Indeed, Silver Wheaton provides a quasi-financing service to both gold and base metal
mining companies, and the dynamics of its business make it suitable as a case study for the commodities
streaming business model. Additionally, the data required to perform such a case study is both readily-
available and public in nature due to Silver Wheaton’s youth relative to other comparable companies.
Silver and Gold Interests OwnerLocation of
Mine
Attributable Ag
Production to be
Purchased
Attributable Au
Production to be
Purchased
Attributable
Annual Ag
Production
(oz)
Term of
Agreement
Date of
Contract
(mm/dd/yyyy)
San Dimas Primero Mexico 100% 5,000,000 LOM 10/15/2004
Zinkgruvan Lundin Sweden 100% 2,000,000 LOM 12/08/2004
Yauliyacu Glencore Peru 100% 4,750,000 20 yrs 03/23/2006
Penasquito Goldcorp Mexico 25% 7,000,000 LOM 07/24/2007
Minto Capstone Canda 100% 100% 200,000 LOM 12/01/2008
Cozamin Capstone Mexico 100% 1,500,000 10 yrs 04/04/2007
Pascua-Lama Barrick Chile/Argentina 25% 9,000,000 LOM 09/08/2009
Lagunas Norte Barrick Peru 100% 500,000 4 yrs 09/08/2009
Pierina Barrick Peru 100% 1,000,000 4 yrs 09/08/2009
Veladero Barrick Argentina 100% 1,000,000 4 yrs 09/08/2009
Los Filos Goldcorp Mexico 100% 200,000 25 yrs 10/15/2004
Keno Hill Alexco Canada 25% 500,000 LOM 10/02/2008
Mineral Park Mercator USA 100% 300,000 LOM 03/17/2008
Neves-Corvo Lundin Portugal 100% 500,000 LOM 06/05/2007
StratoniEuropean
GoldfieldsGreece 100% 1,000,000 LOM 04/23/2007
Campo Morado Nyrstar Mexico 75% 1,000,000 LOM 05/13/2008
Aljustrel I'M SGPS Portugal 100% 100,000 LOM 06/05/2007
Loma de La PlataPan American
Silver CorpArgentina 13% 1,000,000 LOM
Not yet
finalized
RosemontAugusta
ResourcesUSA 100% 100% 2,400,000 LOM 02/11/2010
9
2.1 Problem statement
The questions of why the silver streaming business model has been so successful and whether it is
sustainable remain largely unanswered. Due to its income being generated from silver sales on close to a
100% basis, Silver Wheaton has been examined in the past as if it were identical in nature to a primary
silver mining company. In the mining finance industry, it is consistently compared directly to primary
silver producers on all of its key enterprise and financial metrics. From this superficial perspective, the
successful employment of the silver streaming business model by Silver Wheaton in the past and future
seems to be entirely reliant on the price of silver and silver market fundamentals alone.
In reality, Silver Wheaton’s silver purchase agreements are with mines and mining companies that
produce a variety of primary products: doré, base metal concentrates, and base metal/precious metal
concentrate blends. In fact, Silver Wheaton receives income from only one primary silver mine out of its
entire portfolio of streams. As 70% of global silver production is generated as a by-product of gold or
base metals (Thomson Reuters GFMS, 2012), Silver Wheaton’s ability to generate new business is
therefore largely reliant on its ability to provide value to potential operating partners who produce these
different commodities. However, the subject of the sustainability of Silver Wheaton’s business model is
rarely discussed or analysed in such a way; there is a limited understanding of the drivers behind the
success of a business such as Silver Wheaton’s.
The viability and sustainability of the silver streaming business model appear to be reliant on several
factors, including the state of metal commodity markets, the state of mining equity markets, and the value
that the model can provide to potential operating partners. The streaming business model must be
evaluated as an enterprise in its own right and on its own terms in order to explain its success as a
10
business and as an investment vehicle. Similarly, the value that the streaming model provides to potential
operating partners as a quasi-financing service must be well understood.
This thesis will endeavour to define the conditions and parameters that must exist for both the silver
streaming business model to prosper and for mining companies to pursue stream sales in addition to or
instead of traditional financing methods. To do this, established methods of project and financial
evaluation will be employed to quantify the value-add or value-reduction to each party in typical silver
stream deals, using Silver Wheaton’s silver stream assets as a case study. Since the purpose of the
analysis is to simulate deals that occurred during the time period of 2004-2011, silver price projections at
the time of each deal are used for the base case evaluation. This treatment is meant to simulate as closely
as possible the financial outcomes that the parties to each deal would have forecasted themselves at the
times of the deal-making. A second evaluation is undertaken using a bullish price projection that reflects
actual prices for comparative purposes.
Furthermore, the question of whether the silver streaming business model can be replicated successfully
will be addressed, both as it is and with other commodities. The macroeconomic and microeconomic
conditions that contributed to the success story that is Silver Wheaton Corp. will be examined and
discussed in order to comment on the likelihood of other companies entering the marketplace in the
future.
2.2 Scope
The scope of the analysis in this thesis is limited to the hard rock mines, projects, and companies with
which Silver Wheaton has done business. Analysis and subsequent discussion within this thesis are
11
directed at one example of a commodity streaming business model and should not necessarily be taken as
a method by which all similar business models can be analysed. Several assumptions that are both
financial and technical in nature have been made to facilitate cash flow modelling (see Chapter 4). Where
appropriate, omissions of certain events in Silver Wheaton’s business history have been made to allow for
the direct comparison of silver purchase agreements.
2.3 Thesis organization
The following is a brief summary of the work presented in each chapter of this thesis.
Chapter 3 – Basic Concepts in Project Evaluation
The analysis of Silver Wheaton’s silver streaming business model is undertaken using standard economic
evaluation methods, mainly Discounted Cash Flow (DCF) methods, and associated profitability criteria.
The companies’ minimum acceptable rates of return are set using the Capital Asset Pricing Model
(CAPM). The methods and criteria used are described as they apply to the evaluation of Silver
Wheaton’s silver stream deals from the perspectives of both the seller and buyer of the streaming service.
Consensus commodity price estimates are used for the evaluation; this approach is also explained in
detail. The analysis is undertaken on a constant dollar basis, without considering the effects of inflation.
Other non-conventional economic metrics that are used in the evaluation of the silver stream deals are
also defined and justified.
Chapter 4–Application of Concepts to the Evaluation of the Silver Streaming Business Model
12
A research plan is outlined, in which a brief description of each phase of analysis and its relevance to the
problem statement is provided. Sources of data are identified and the subset of streams included in the
thesis analysis are reviewed. Detailed descriptions for calculation of the Weighted Average Cost of
Capital (WACC) and silver stream cash flow series are provided to establish the thesis methodology.
Lastly, limitations of the methodology and any assumptions are identified.
Chapter 5 – Sample Calculation of Discounted Cash Flows for a Silver Stream
Sample calculations for WACC and silver stream cash flows are reviewed in detail to exhibit the
methodology that was employed using an actual case that is included in the thesis.
Chapter 6 – Commodity and Mining Finance Review
A historical and current discussion of silver market fundamentals is presented, including supply, demand,
and demand elasticity. Aspects of silver economic fundamentals that are particularly relevant to the
discussion of silver streaming are emphasized. A brief review of the state of the mining finance
marketplace is discussed to provide necessary context.
Chapter 7 – Case Study: Silver Wheaton Perspective
Several of Silver Wheaton’s silver purchase agreements are analysed and used as a case study of the
financial success of the silver streaming business model. Silver Wheaton’s stake in each silver stream is
evaluated based on the established criteria. Sensitivity analyses are undertaken to illustrate the sensitivity
of economic outcomes to model input parameters. Lastly, an assessment of the silver price floors that the
silver streaming business model can withstand, using Silver Wheaton as an example, is laid out.
13
Chapter 8 – Case Study: Silver Wheaton Operating Partner Perspective
Several of Silver Wheaton’s silver purchase agreements are analysed and used as case studies of the
financial value that silver streams provide to operating partners. Representative silver streams are
analysed, and results are presented in the form of economic metrics. Using established economic criteria,
the financial success of the operating partner in a silver stream deal is discussed. A sensitivity analysis of
economic outcomes with respect to model input parameters is conducted. A discussion of the motivating
factors for the pursuit of silver stream sales in favour of traditional financing follows.
Chapter 9 – Comparison of Silver Streams to Traditional Financing Methods
A qualitative and quantitative comparison of silver stream sales to debt and equity financing is examined,
in a financial context.
Chapter 10 – Conclusions and Discussions
The final chapter summarizes the research results, discusses the major conclusions garnered from the
research, and recommends future areas of work to further develop thesis concepts and ideas.
14
Chapter 3
Basic Concepts in Project Evaluation: A Review of Relevant Concepts and
Literature
A number of basic concepts that will be applied in this thesis for the evaluation of investment
opportunities are described in this chapter.
3.1 Basic concepts in project evaluation
3.1.1 The cash flow concept
The cash flow for any given time period is the net value of all cash inflows and outflows. Cash inflow is
a positive value that can be produced from three general sources: (1) financing (i.e. the proceeds of a loan
or an equity issuance), (2) operational revenues, or (3) returns on an investment. Cash outflow is a
negative value that can be attributed to two general items: (1) operational expenses/costs and (2)
investment costs.
Generally speaking, the future cash flows of a project or investment opportunity must be estimated and
analyzed in order to evaluate its potential economic viability. The determination of future cash flows
must take into account several factors including but not limited to revenue, direct operating costs, initial
capital expenditures, sustaining and working capital costs, taxation, depreciation, and financing costs.
The forecasting of these items must also take into account the projection of several macroeconomic items
such as the rate of inflation, interest rates, currency exchange rates, and commodity prices.
15
Once the necessary items have been forecasted for a given time period, the cash flow projection can then
be accomplished simply by summing the appropriate positive and negative values for each time increment
within the overall time period of interest. Cash flows are typically calculated on an annual, semi-annual,
or quarterly basis but can be set to any meaningful increment of time for the enterprise in question.
3.1.2 Discounted cash flows
In a discounted cash flow analysis, a discount rate is applied to each element of a cash flow series to
create a common point of reference for the evaluation of the project’s profitability (Doggett, et al., 2009
p. 112). This point of reference is usually time zero or the present. A typical cash flow scenario begins
with one or a series of up-front cash outflows, followed by a longer series of net cash inflows. Each of
the cash flow elements in the series is discounted by the selected interest or discount rate, and the
summation of the discounted cash flow elements is the Net Present Value (NPV) of the cash flow. A
cash flow’s NPV can be calculated using the following formula (see Equation (1) ), where 𝐶𝑛 is the net
cash flow at time period 𝑛, 𝑑 is the discount rate, and 𝑁 is the final time period of the cash flow. An end-
of-year convention on annual cash flows is usually used.
𝑁𝑃𝑉 = ∑𝐶𝑛
(1 + 𝑑)𝑛
𝑁
𝑛=1
(1)
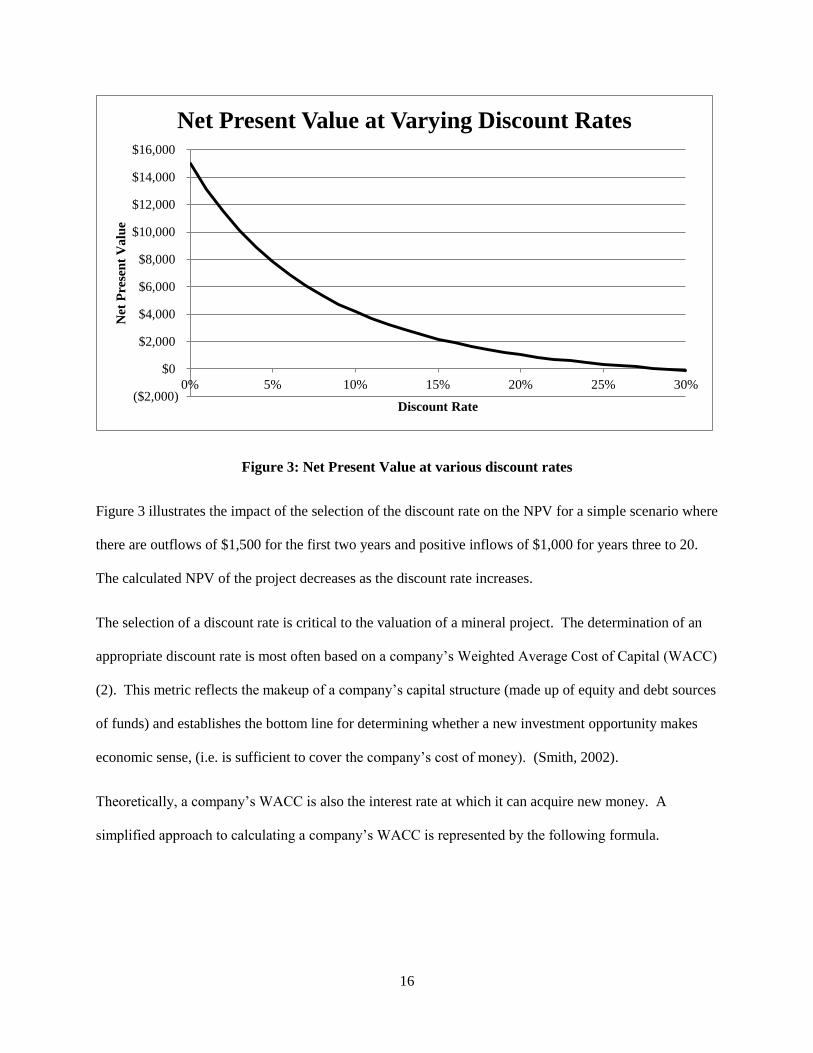
16
Figure 3: Net Present Value at various discount rates
Figure 3 illustrates the impact of the selection of the discount rate on the NPV for a simple scenario where
there are outflows of $1,500 for the first two years and positive inflows of $1,000 for years three to 20.
The calculated NPV of the project decreases as the discount rate increases.
The selection of a discount rate is critical to the valuation of a mineral project. The determination of an
appropriate discount rate is most often based on a company’s Weighted Average Cost of Capital (WACC)
(2). This metric reflects the makeup of a company’s capital structure (made up of equity and debt sources
of funds) and establishes the bottom line for determining whether a new investment opportunity makes
economic sense, (i.e. is sufficient to cover the company’s cost of money). (Smith, 2002).
Theoretically, a company’s WACC is also the interest rate at which it can acquire new money. A
simplified approach to calculating a company’s WACC is represented by the following formula.
($2,000)
$0
$2,000
$4,000
$6,000
$8,000
$10,000
$12,000
$14,000
$16,000
0% 5% 10% 15% 20% 25% 30%
Net
Pre
sen
t V
alu
e
Discount Rate
Net Present Value at Varying Discount Rates
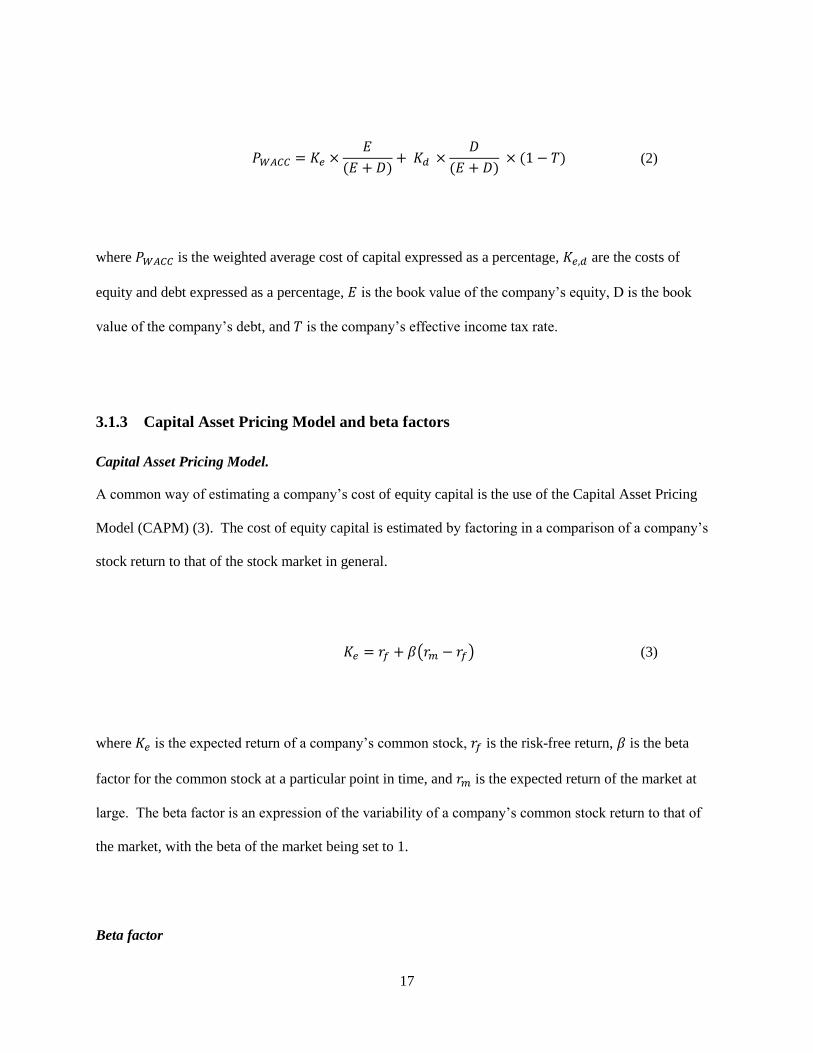
17
𝑃𝑊𝐴𝐶𝐶 = 𝐾𝑒 ×𝐸
(𝐸 + 𝐷)+ 𝐾𝑑 ×
𝐷
(𝐸 + 𝐷) × (1 − 𝑇)
(2)
where 𝑃𝑊𝐴𝐶𝐶 is the weighted average cost of capital expressed as a percentage, 𝐾𝑒,𝑑 are the costs of
equity and debt expressed as a percentage, 𝐸 is the book value of the company’s equity, D is the book
value of the company’s debt, and 𝑇 is the company’s effective income tax rate.
3.1.3 Capital Asset Pricing Model and beta factors
Capital Asset Pricing Model.
A common way of estimating a company’s cost of equity capital is the use of the Capital Asset Pricing
Model (CAPM) (3). The cost of equity capital is estimated by factoring in a comparison of a company’s
stock return to that of the stock market in general.
𝐾𝑒 = 𝑟𝑓 + 𝛽(𝑟𝑚 − 𝑟𝑓)
(3)
where 𝐾𝑒 is the expected return of a company’s common stock, 𝑟𝑓 is the risk-free return, 𝛽 is the beta
factor for the common stock at a particular point in time, and 𝑟𝑚 is the expected return of the market at
large. The beta factor is an expression of the variability of a company’s common stock return to that of
the market, with the beta of the market being set to 1.
Beta factor

18
The beta factor for a given company is expressed in Equation (4), below.
𝛽 =𝐶𝑜𝑣(𝑅𝑐 , 𝑅𝑀)
𝜎2(𝑅𝑀)
(4)
where 𝐶𝑜𝑣(𝑅𝑐 , 𝑅𝑀) is the covariance between the company’s historical return 𝑅𝑐 and that of the market at
large 𝑅𝑀, and 𝜎2(𝑅𝑀) is the variance of the market historical return. In order to carry out this calculation
for a company at a particular point in time, two sets of data must be collected over the same time period:
price history for the stock in question and price (value) history for a representative index of the exchange
on which the stock trades. A sample calculation of the beta factor for Silver Wheaton is available in
Section 5.1.
The calculation of 𝐾𝑒 in Equation (3) then requires the estimation of both 𝑟𝑓 and 𝑟𝑚. For the purpose of
this analysis, the risk-free return will be taken as the 1-year Canadian Federal Treasury Bill rate, as
published on the date of each deal’s announcement. In the absence of a reliable source for consensus
expected market return values, the expected market return will be taken as the real average annual rate of
return of the S&P/TSX Composite Index for a period of at least 20 years prior to each deal’s
announcement.6
6 The S&P/TSX Composite Index was chosen as the representative index for calculation of the market return
because the TSX and TSXV list the majority of the world’s mining and exploration companies (TMX Group
Incorporated).
19
3.1.4 Economic evaluation metrics
In order to evaluate a project’s economic potential, a number of specific metrics are typically calculated,
based on the project cash flow model. The NPV metric presented in Section 3.1.2 is commonly used as a
measure of a mining project’s value and is frequently used for decision-making purposes with regards to a
given project. Using the company’s WACC as the discount rate, the calculated NPV must be greater than
zero for a project to be economically feasible (Doggett, et al., 2009).
Similarly, the internal rate of return (IRR) is a related metric that is frequently used in project economic
analysis. IRR is defined as the effective discount rate, 𝑑, at which the project NPV is equal to zero
(Doggett, et al., 2009 p. 121). It can be thought of as the rate of return on the initial investment that the
project will potentially generate. In practice, a given project rarely achieves its projected IRR. However,
projects with high IRR values are more likely to achieve profitability than those with marginally
acceptable projected rates of return. For a project to be considered worthwhile, its IRR value must exceed
the company’s WACC (see Equation (2) and related discussion, above) (Doggett, et al., 2009).
Logically, it follows that if a project does not generate enough cash flow to cover the cost of the money
invested in the project, then it is not a project that is worth pursuing. Similarly, if a project’s calculated
IRR is less than the prevailing cost of equity or cost of debt available to the company, it is not viable
(Doggett, et al., 2009). Some cash flow series can produce a negative IRR, which can arise when the sum
of the present values of all forecasted cash flows is less than the present value of the initial investment at
time zero. This is a clear indication that the project or investment in question is not economically sound.
Additionally, some cash flow series can produce multiple IRR values when there is more than one change
of sign throughout the series (i.e. change from positive to negative cash flow or vice versa from one time
increment to the next).
20
A third decision-making criterion is sometimes used in the industry. This is the present value ratio (PVR)
which measures the relationship between profit and investment (Doggett, et al., 2009). Defined as the
net present value per unit of investment capital, PVR is best represented by Equation (5) below.
𝑃𝑉𝑅 =
𝑁𝑃𝑉
∑𝐶𝑡
(1 + 𝑑)𝑡𝑝𝑡=0
(5)
where p is the pre-production investment period, 𝐶𝑡 is the absolute value of investment cash flow for a
given pre-production time period (year), and d is the discount rate. The minimum criterion for a project
to be economically feasible is that its PVR is greater than zero (Doggett, et al., 2009). The three metrics
NPV, IRR, and PVR will be used in conjunction to evaluate the investments Silver Wheaton has made in
several of its silver purchase agreements.
3.1.5 Minimum acceptable rate of return and discount date selection
In order to evaluate the viability of a project or investment opportunity, a minimum acceptable rate of
return (MARR) must be established. The MARR is the minimum rate of return at which a business entity
will invest in a project. The MARR for a project can be established in different ways, including by
determination of an arbitrary, desired value. However, more often than not a MARR is determined using
quantitative analysis and qualitative reasoning.
Historically, the MARR for a project/potential investment is chosen with the enterprise’s calculated
WACC value in mind. It is generally accepted that the the enterprise WACC itself may be used as the
MARR, but in many cases the WACC is used as a base value for the MARR to which premiums are
21
added for various risk factors, both external and internal. In this thesis the enterprise WACC of the
project operator will be taken as the MARR for every project both for simplicity and to avoid any
subjectivity (Fraser, et al., 2011).
Once a MARR has been established, the expected return of a project or investment can then be compared
to the MARR to evaluate its economic viability at a basic level. The IRR of the cash flows of a project or
investment is typically compared to the MARR to serve this purpose. Generally speaking: (1) if the IRR
for a project is equal to or greater than the MARR it is considered to be a desirable project; and (2) if the
IRR is less than the MARR it is considered to be undesirable (Fraser, et al., 2011). However, when the
WACC of the enterprise is taken as the MARR for a project with an IRR that is equivalent to the MARR,
the project may be only marginally feasible. This is because the project would generate an expected
return that is equivalent to the cost at which the enterprise can raise capital.
A discount rate must be selected and applied to a forecasted cash flow series in order to calculate the NPV
of the series. In a survey of mineral industry participants conducted circa 2005, Smith (2010) illustrates
that the use of WACC as a method for discount rate selection is considered to be the most important and
commonly used. In this thesis, enterprise WACC at the time of each stream deal will be used as the
discount rate to evaluate the forecasted cash flows and expected financial outcomes of the silver stream to
both Silver Wheaton and the operating partner. A full sample calculation of WACC for Silver Wheaton is
carried out in Section 5.1.
22
3.1.6 Inflation
Inflation is the term used to describe the decrease in the purchasing power of a currency over the course
of time. A cash flow that includes inflation in its computation is deemed to be in “current” dollars, while
a cash flow that does not include inflation in its computation is deemed to be in “constant” or “real”
dollars. (Smith, 1987)
A cash flow calculation that has been completed in constant dollars of the time will retain a constant value
throughout the extent of the cash flow and values can be compared from year to year. Cash flows
computed in current dollars, however, yield values that cannot be compared from year to year as inflation
is included in the cash flow projection, and the final evaluation must be undertaken using an inflation
adjusted discount rate or by deflating current dollar bottom line cash flows using projected inflation rates.
A valuation of a mineral project using the Discounted Cash Flow (DCF) method can be correctly carried
out in constant money terms and without regard to inflation when undertaken on a before-tax basis
(Heath, et al., 1974). When modelling after-tax cash flows, depreciation allowances and tax expenses are
widely accepted to be incurred in current dollars of the time and thus cannot be modelled without
accounting for inflation (Thuesen and Fabrycky , 2001). There are then two acceptable options to
evaluate forward cash flows: (1) perform the analysis on before-tax cash flows; or (2) account for
inflation in the analysis of after-tax cash flows by one of two methods mentioned above (Bilodeau, 2003).
Both after-tax cash flow approaches require the assumption of some forward inflation rate or rates in their
methodologies (Bilodeau, 2003).
Smith (1999) argues that a “bare bones” base case for the valuation of a mineral project is preferable,
whereby constant commodity prices are assumed as well as no debt and zero inflation. This effectively
reduces a project to its essential characteristics and allows it to be more readily compared to other
23
projects. This is an acceptable treatment because it removes assumptions about parameters that have
drastic effects on primary project economic evaluation metrics such as net present value and internal rate
of return.
All DCF analyses carried out in this thesis are carried out on a before-tax basis because the estimation of
future inflation rates requires significant technical expertise, of which the author has none. As such, the
credibility of any such forecasting in this thesis would be minimal, and in any case, any such attempt
would be largely outside the scope of the thesis’ objectives (Gentry and O’Neil, 1984) (Torries, 1998).
3.1.7 Consensus price estimate methodology in mining finance
As part of the process of evaluating a potential deal or agreement, commodity price scenarios for the
purpose of estimating potential revenue flows from an investment must be projected. Oftentimes, a
company will turn to specialist consultants or commission the investment banking services of a financial
firm to assist in investment analysis and deal structuring. With a production schedule in hand (typically
generated as part of the feasibility study process), the price forecasts can be applied to the forecasted
production of all the commodities to be produced to arrive at expected revenue values.
Equity research (ER) departments of financial firms develop commodity price forecasts using generally-
accepted economic modelling practices. When necessary, these forecasts are included in reports on the
equities that a given ER department analyses, follows, and reports on. These sets of price forecasts are
colloquially termed “consensus price estimates” or “street consensus pricing”. On this topic, Sandeep
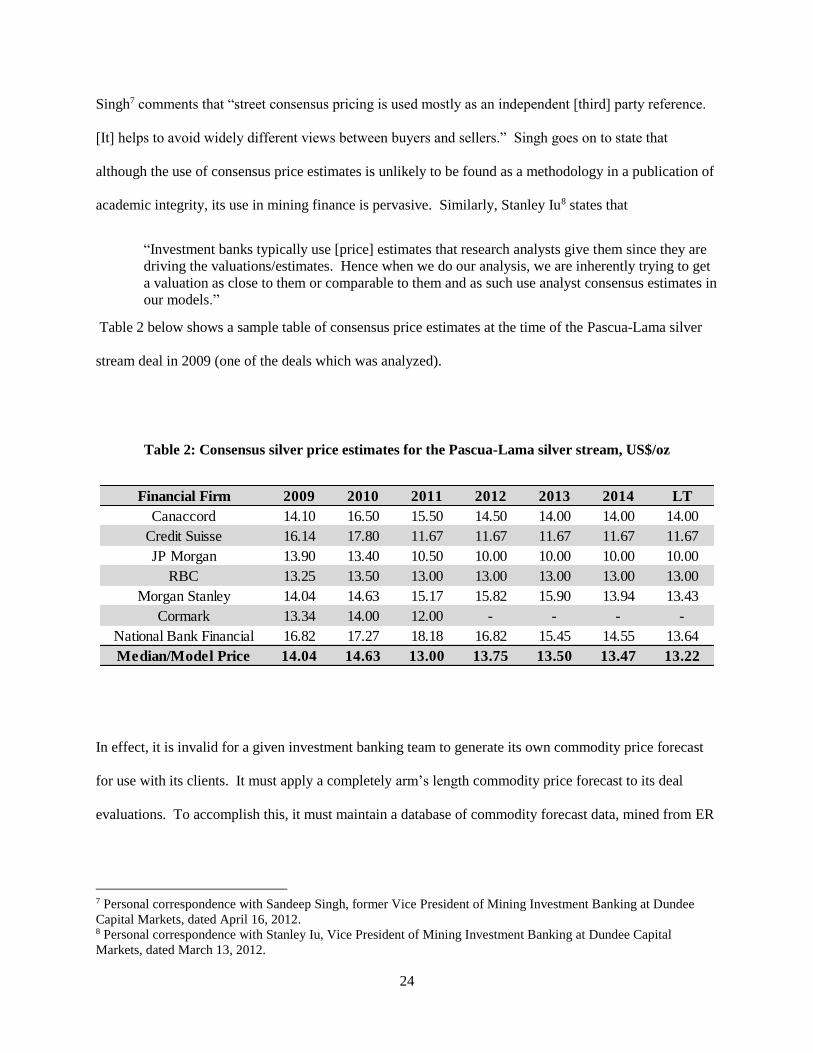
24
Singh7 comments that “street consensus pricing is used mostly as an independent [third] party reference.
[It] helps to avoid widely different views between buyers and sellers.” Singh goes on to state that
although the use of consensus price estimates is unlikely to be found as a methodology in a publication of
academic integrity, its use in mining finance is pervasive. Similarly, Stanley Iu8 states that
“Investment banks typically use [price] estimates that research analysts give them since they are
driving the valuations/estimates. Hence when we do our analysis, we are inherently trying to get
a valuation as close to them or comparable to them and as such use analyst consensus estimates in
our models.”
Table 2 below shows a sample table of consensus price estimates at the time of the Pascua-Lama silver
stream deal in 2009 (one of the deals which was analyzed).
Table 2: Consensus silver price estimates for the Pascua-Lama silver stream, US$/oz
In effect, it is invalid for a given investment banking team to generate its own commodity price forecast
for use with its clients. It must apply a completely arm’s length commodity price forecast to its deal
evaluations. To accomplish this, it must maintain a database of commodity forecast data, mined from ER
7 Personal correspondence with Sandeep Singh, former Vice President of Mining Investment Banking at Dundee
Capital Markets, dated April 16, 2012. 8 Personal correspondence with Stanley Iu, Vice President of Mining Investment Banking at Dundee Capital
Markets, dated March 13, 2012.
Financial Firm 2009 2010 2011 2012 2013 2014 LT
Canaccord 14.10 16.50 15.50 14.50 14.00 14.00 14.00
Credit Suisse 16.14 17.80 11.67 11.67 11.67 11.67 11.67
JP Morgan 13.90 13.40 10.50 10.00 10.00 10.00 10.00
RBC 13.25 13.50 13.00 13.00 13.00 13.00 13.00
Morgan Stanley 14.04 14.63 15.17 15.82 15.90 13.94 13.43
Cormark 13.34 14.00 12.00 - - - -
National Bank Financial 16.82 17.27 18.18 16.82 15.45 14.55 13.64
Median/Model Price 14.04 14.63 13.00 13.75 13.50 13.47 13.22

25
reports that have been published by several different financial firms, and it must also update them on a
continuing basis to account for revised forecasts from any particular ER department.
It should be noted that any forecast is uncertain by definition, and so are all of the forecasted price series
in this thesis.
26
Chapter 4
Application of Concepts to the Evaluation of the Silver Streaming Business
Model
This chapter describes how the concepts reviewed in Chapter 3 were applied to the evaluation of the
silver streaming business model for Silver Wheaton as the stream buyer, and for its client producing
companies as stream sellers.
4.1 Methodology and research plan
The discounted cash flow methodology employed for evaluating the business model required that cash
flows be developed for each mine with which Silver Wheaton entered into a contract, starting from the
points in time when the contracts were finalized. Inflation was assumed to be zero in all cases and all
discounted cash flows were computed in constant U.S. Dollars (USD) of the time of each deal, given that
the functional currency of the company and many of its operating partners is USD.
4.1.1 Data sources
Data was drawn from a number of public sources, including the Silver Institute9 and the United States
Geological Survey (USGS)10, to compile a 10-year historical review of silver supply and demand.
9 The author accessed www.silverinstitute.org/site/ on several occasions from March-December 2012. 10 The author accessed www.minerals.usgs.gov/minerals/pubs/commodity/silver/ in December 2011-January 2012.
27
Historical values for the S&P/TSX Composite Index (S&P/TSX)11 were compiled and used to establish
the market return for beta factor calculations.
Historical stock price data used for beta factor calculations was sourced from the TMX Group12, the
owner and operator of the Toronto Stock Exchange.
Cash flow models in constant dollars for the mines and projects underlying nine of Silver Wheaton’s
stream deals were developed using NI 43-101 compliant technical documentation that is publicly
available on the System for Electronic Document Analysis and Retrieval (SEDAR) of Canada’s Securities
and Exchange Commission13. SEDAR is the online repository for the filing of any material documents of
public companies incorporated in Canada.
Equity research reports from which commodity price data was mined were accessed and downloaded
from Thomson One, a well-known repository of stock market, commodity, and general financial
securities data, news, and research. This service was accessed through the Queen’s University Library
account, which is available for use by all students of the university.
4.1.2 Case study: Silver Wheaton Corp. and its operating partners
The reference point for these cash flow projections was taken to be the point in time at which the deals
were announced in order to simulate the value to each deal participant as closely as possible. From the
full mine cash flow projections, projected silver stream cash flows were isolated. Previously defined
financial and economic evaluation metrics were computed for the isolated stream cash flows, and the
defined criteria were used to evaluate them financially for both Silver Wheaton and its operating partners.
11 Sourced from https://ca.finance.yahoo.com/q/hp?s=%5EGSPTSE, which was accessed multiple times during
April-May 2012. 12 Sourced from www.tmx.com, which was accessed multiple times during May-December 2012. 13 The author accessed www.sedar.com on multiple occasions from March 2012-April 2013.
28
Silver Wheaton’s source financing was reviewed in order to better understand how silver streaming
companies can form. Furthermore, the silver streaming business model was stress-tested14 for silver price
floors by forward modelling Silver Wheaton’s entire silver streams currently in place and establishing
several silver price-to-minimum enterprise IRR relationships. This provided a sense of the extent to
which the silver streaming business model is economically robust. Conclusions were drawn regarding the
business success or lack thereof of the silver streaming business model.
Though the situations of each of Silver Wheaton’s operating partners were all unique at the times of each
stream deal, necessary company background information was summarized and presented to provide
context for and possibly justify the pursuit of stream financing over conventional means. This discussion,
coupled with the aforementioned silver stream financial analysis, was used to draw conclusions on the
value-add to operating partners of the quasi-financing service that the silver streaming business model
provides.
4.1.3 Selection of streams to be evaluated
Silver Wheaton concluded 10 deals organically in the period 2004-2011 but some were excluded from the
thesis analysis for the following reasons:
Differing forms of consideration from Silver Wheaton (e.g. Silver Wheaton common stock in
addition to upfront cash payment);
Obligation for Silver Wheaton to contribute a portion of capital expenditures;
14 A test to establish the lower limits of economic feasibility for an enterprise or investment with respect to one or
multiple economic input parameters.
29
Contract term that is less than the life of mine (LOM).
The San Dimas transaction differed in nature from the typical silver stream contract structure in all of the
above ways partly because it was the deal that effectively created Silver Wheaton and served as the
prototypical silver stream. As such, the San Dimas transaction was excluded for the purpose of silver
stream comparison throughout this thesis. Included in this transaction were silver streams on the San
Dimas and Los Filos mines; both were omitted from the case study. Furthermore, the Cozamin, Minto,
Aljustrel, and Neves-Corvo streams were obtained in the acquisition of Silverstone Resources Inc. in
2009 and do not adhere to the same deal structure as Silver Wheaton’s organically-generated silver
streams. As such, they too were omitted from the case study. The nine stream deals included in the
Silver Wheaton case study are bolded in Table 3 below. Note that the Lagunas Norte, Pierina, and
Veladero silver streams are bolded due to their inclusion in the Pascua-Lama silver purchase agreement.
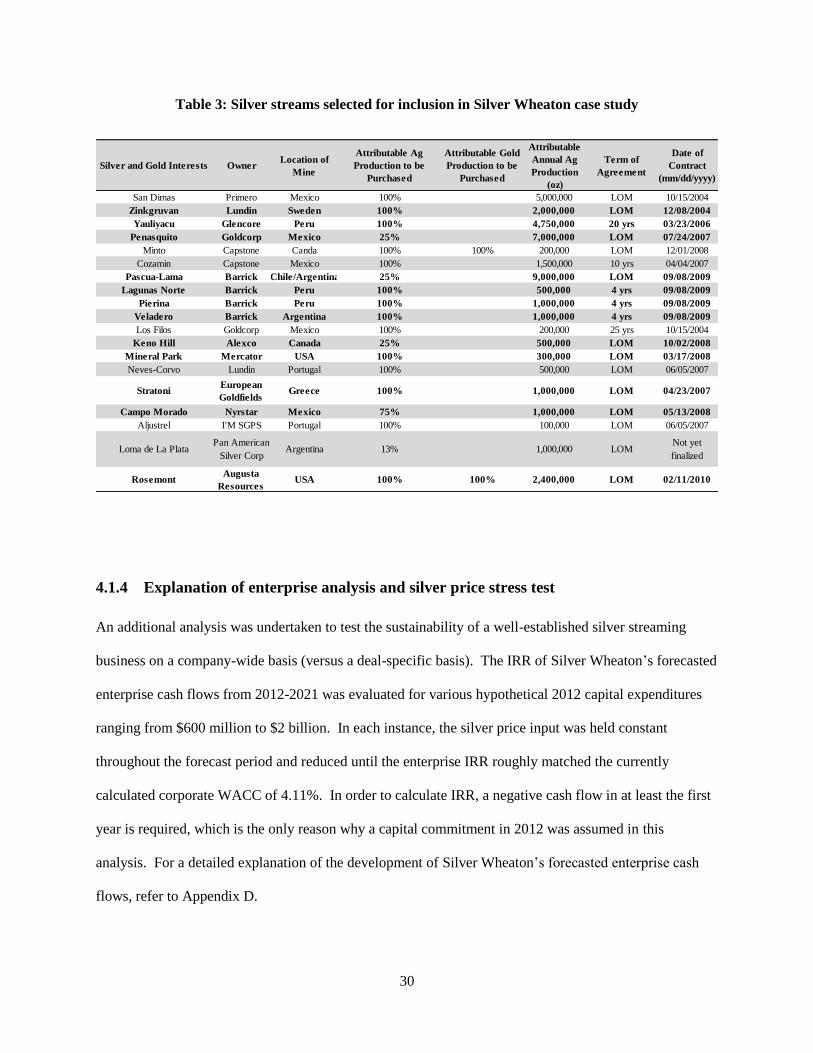
30
Table 3: Silver streams selected for inclusion in Silver Wheaton case study
4.1.4 Explanation of enterprise analysis and silver price stress test
An additional analysis was undertaken to test the sustainability of a well-established silver streaming
business on a company-wide basis (versus a deal-specific basis). The IRR of Silver Wheaton’s forecasted
enterprise cash flows from 2012-2021 was evaluated for various hypothetical 2012 capital expenditures
ranging from $600 million to $2 billion. In each instance, the silver price input was held constant
throughout the forecast period and reduced until the enterprise IRR roughly matched the currently
calculated corporate WACC of 4.11%. In order to calculate IRR, a negative cash flow in at least the first
year is required, which is the only reason why a capital commitment in 2012 was assumed in this
analysis. For a detailed explanation of the development of Silver Wheaton’s forecasted enterprise cash
flows, refer to Appendix D.
Silver and Gold Interests OwnerLocation of
Mine
Attributable Ag
Production to be
Purchased
Attributable Gold
Production to be
Purchased
Attributable
Annual Ag
Production
(oz)
Term of
Agreement
Date of
Contract
(mm/dd/yyyy)
San Dimas Primero Mexico 100% 5,000,000 LOM 10/15/2004
Zinkgruvan Lundin Sweden 100% 2,000,000 LOM 12/08/2004
Yauliyacu Glencore Peru 100% 4,750,000 20 yrs 03/23/2006
Penasquito Goldcorp Mexico 25% 7,000,000 LOM 07/24/2007
Minto Capstone Canda 100% 100% 200,000 LOM 12/01/2008
Cozamin Capstone Mexico 100% 1,500,000 10 yrs 04/04/2007
Pascua-Lama Barrick Chile/Argentina 25% 9,000,000 LOM 09/08/2009
Lagunas Norte Barrick Peru 100% 500,000 4 yrs 09/08/2009
Pierina Barrick Peru 100% 1,000,000 4 yrs 09/08/2009
Veladero Barrick Argentina 100% 1,000,000 4 yrs 09/08/2009
Los Filos Goldcorp Mexico 100% 200,000 25 yrs 10/15/2004
Keno Hill Alexco Canada 25% 500,000 LOM 10/02/2008
Mineral Park Mercator USA 100% 300,000 LOM 03/17/2008
Neves-Corvo Lundin Portugal 100% 500,000 LOM 06/05/2007
StratoniEuropean
GoldfieldsGreece 100% 1,000,000 LOM 04/23/2007
Campo Morado Nyrstar Mexico 75% 1,000,000 LOM 05/13/2008
Aljustrel I'M SGPS Portugal 100% 100,000 LOM 06/05/2007
Loma de La PlataPan American
Silver CorpArgentina 13% 1,000,000 LOM
Not yet
finalized
RosemontAugusta
ResourcesUSA 100% 100% 2,400,000 LOM 02/11/2010
31
4.1.5 Analysis of value addition or reduction to development project economics
Six of the nine silver streams selected for analysis were development projects that were less than five
years from expected commercial production at the time of their respective deals with Silver Wheaton. To
assess the value to the operating partner of the silver stream sale in these cases, an evaluation of the
incremental value added or lost was undertaken. Two cash flow models were created for each project;
one including the silver stream economics, and the other without (i.e. a cash flow model of the expected
standalone mine). The differences in the NPV and IRR values for the two cash flow models were then
computed to evaluate the effect of the silver stream on the development project.
In addition, two extra metrics were computed: percentage of expected construction capital funded and
incremental value lost. The former is simply the proportion of expected construction capital that the
upfront payment represented at the time of the silver stream transaction. The latter is a measure of a
stream sale’s effect on annual metal revenue and is defined by Equation (6), below:
𝐼𝑛𝑐𝑟𝑒𝑚𝑒𝑛𝑡𝑎𝑙 𝑣𝑎𝑙𝑢𝑒 𝑙𝑜𝑠𝑡 =
𝐴𝑣𝑒𝑟𝑎𝑔𝑒 𝑎𝑛𝑛𝑢𝑎𝑙 𝑠𝑖𝑙𝑣𝑒𝑟 𝑟𝑒𝑣𝑒𝑛𝑢𝑒 𝑙𝑜𝑠𝑡 𝑡𝑜 𝑆𝐿𝑊
𝐴𝑣𝑒𝑟𝑎𝑔𝑒 𝑎𝑛𝑛𝑢𝑎𝑙 𝑡𝑜𝑡𝑎𝑙 𝑟𝑒𝑣𝑒𝑛𝑢𝑒 (6)
4.2 Calculation of WACC
Each of Silver Wheaton’s silver purchase agreements were examined as separate transactions. Therefore,
the positions of both the buyer and seller for each transaction needed to be characterized and quantified
(i.e. Silver Wheaton’s position and that of its operating partner). This required that each risk perspective
be simulated as closely as possible to what it would have been for each participant in each transaction at
the relevant points in time. As such, the WACC was separately computed for Silver Wheaton and its
operating partners in each instance and taken as the discount rate for the purpose of evaluating the
“profitability” of the respective participants’ investments in each transaction.
32
Silver Wheaton and the majority of its operating partners are listed on the Toronto Stock Exchange
(TSX). Consequently historical values for the S&P/TSX Composite Index (S&P/TSX) were used to
determine the market return in all of the beta calculations. The respective closing price and value of the
stock and index were taken in monthly intervals for one year prior to the deal’s announcement, with the
last sample being taken from the trading day immediately preceding the deal’s announcement date. The
values of 𝐶𝑜𝑣(𝑅𝑐 , 𝑅𝑀) and 𝜎2(𝑅𝑀) were then computed using functions that are built into Microsoft
Office Excel 2010.
Each respective WACC was then calculated using Equation (2). The values of total equity and total debt
were derived from the balance sheet in the financial statements that were most recent to the deal date. In
the case of Silver Wheaton, its effective tax rate 𝑇 is zero15. However, this is not so for its operating
partners. As some of Silver Wheaton’s operating partners pay taxes in multiple jurisdictions, the effective
corporate tax rate at the time of their deals with Silver Wheaton was estimated using Equation (7) for
simplicity.
𝑇 =𝑎
𝑏
(7)
where 𝑎 is the value for income tax expense and 𝑏 is the value for earnings before tax, both retrieved from
the company financial statements that were most recent to the date that the deal was announced.
Consensus silver price estimates were used for the evaluation of Silver Wheaton’s silver purchase
agreements. The consensus price estimate for any given year was computed as the median of a set of at
least seven estimates from separate firms that were released at most three months prior to the deal date.
15 Although Silver Wheaton is incorporated in Canada, it registers all of its income through a wholly-owned
subsidiary, Silver Wheaton (Caymans) Ltd. As the corporate tax rate in the Cayman Islands is zero, Silver Wheaton
effectively pays no income tax. A description of the legal structure that has allowed this to occur is outside the
scope of this thesis.
33
4.3 Calculation of estimated silver stream cash flows
4.3.1 Calculation of cash flows for mines utilizing silver streams
In order to generate accurate cash flow models for each of the streams of interest, full cash flow models
for the underlying mines were required. The development of mine cash flow models was based on data
derived from NI 43-101 compliant technical reports that were most recent to the date of the completion of
each silver stream deal, readily available on SEDAR. All of Silver Wheaton’s operating partners for the
streams of interest maintain listings on Canadian stock exchanges and thus have documents available on
SEDAR, except for Glencore International AG (Glencore) which was a private company at the time of its
deal with Silver Wheaton16. In three other cases (the Keno Hill, Pascua-Lama, and Penasquito silver
streams), technical reports published from a few days to a few weeks after the deal announcements were
used17. As most of the technical reports sourced in this thesis carried out economic analyses in USD, this
currency convention was maintained in the thesis analyses unless otherwise specified within a technical
report.
The next step in producing accurate cash flows for the streams was retrieving the necessary technical
information and parameters from the technical reports. As Silver Wheaton is in the business of buying
future silver production, the mining assets it targeted for stream deals were either previously operating
mines or development projects with production start-up expected in the near to medium term. As such,
16 In the case of Glencore’s agreement with Silver Wheaton, Glencore was obliged to allow Silver Wheaton to
conduct an independent third party review and prepare an NI 43-101 compliant report to support Silver Wheaton’s
purchase of some silver production from its Yauliyacu mine in Peru. This report was published by Silver Wheaton
after the deal’s announcement but was used in this thesis nonetheless as it represents the only available technical
information for the Yauliyacu mine from the time period of interest. 17 The Keno Hill, Pascua-Lama, and Penasquito silver streams were development projects at the times of the deal
announcements and previously available technical documents for them were outdated. It was assumed that Silver
Wheaton would not have used outdated technical information for the purposes of evaluating ever-changing
development projects and that the technical information released shortly after the deal dates was made available to
Silver Wheaton prior to finalizing the purchase agreements.
34
all of the technical reports that were used contained some form of life of mine (LOM) production/mill
throughput schedule, as well as expected metal mill head grades, metal processing recoveries, product
details (i.e. concentrates and/or doré), and a concentrate tonnage production schedule, if applicable. For
the purpose of this thesis, it was assumed that no closure or production ramp-down would occur for the
entirety of the expected LOM at any mine or project underlying Silver Wheaton’s streams. Furthermore,
it was assumed that all contained metal would be sold in the year in which it was produced. Contained
metal in product was then calculated for each metal produced at the mine on an annual basis using
Equation (8) below.
𝐶𝑜𝑛𝑡𝑎𝑖𝑛𝑒𝑑 𝑀𝑒𝑡𝑎𝑙 = 𝑀𝑇 × 𝐺 × 𝑅 × 𝐶 (8)
where 𝑀𝑇 is ore throughput at the mill, 𝐺 is mill head grade for a given metal, 𝑅 is the process recovery
for a given metal, and 𝐶 is a unit conversion factor. The unit conversion factor was employed for the
purpose of facilitating the calculation of gross revenue further on in the cash flow calculation by
converting the contained metal quantity to the most commonly used pricing unit (typically ounces for
precious metals and pounds for base metals).
Revenue Estimation
Smelter terms and parameters were then retrieved and gathered for application to the gross revenue figure,
to be described below. More often than not and as is typical of smelter contract terms, a deduction from
the total contained metal in a given concentrate product was quoted in the corresponding technical report.
Application of this deduction yields the “payable metal” quantity, which is defined as the quantity of
metal that the smelter will pay the mine for. Two assumptions were made regarding the payable metal
line item:
35
Silver Wheaton’s off-take percentage is based on the quantity of payable metal and not that of
total contained metal;
All refining charges related to a given metal are based on the quantity of payable metal and
not that of total contained metal.
Gross revenue for all metal production was then calculated, simply by multiplying payable metal
quantities contained in product by the commodity price forecast throughout the LOM.
Smelting/treatment, refining, and shipping costs were then applied and deducted from gross revenue, as
detailed in the various technical reports. These parameters were often provided on a ‘per tonne of
concentrate’ or ‘per ounce of precious metal’ basis. This yielded the Net Smelter Revenue (NSR), from
which all further costs were deducted.
Estimation of operating costs
Operating cost parameters were taken from the technical reports and computed based on tonnes milled,
tonnes mined, or both as the given parameters indicated. Capital costs (initial/construction, sustaining,
etc.) were applied and deducted, as taken from the technical reports. Working capital considerations were
not included in the cash flow calculations as these were deemed to be outside the scope of this thesis.
Operating costs were deducted from NSR to yield the operating profit. Finally, any applicable royalties
and capital expenditures were deducted from operating profit to arrive at before-tax net cash flow for the
underlying mine.
36
4.3.2 Calculation of silver stream cash flows for operating partners
Stream cash flows from the operating partner perspective were calculated in this thesis as follows. Cash
in-flow is the upfront payment and any transfer fee received from Silver Wheaton, calculated as described
above. Cash out-flow is silver revenue that is attributable to Silver Wheaton, calculated as described
above. Given that Silver Wheaton’s cash flows are essentially before-tax and in light of the information
presented to avoid the complicating inflation rate issues highlighted in Section 3.1.6, net cash flow for
Silver Wheaton’s operating partners was evaluated on a before-tax basis in this thesis.
4.3.3 Calculation of silver stream cash flows for Silver Wheaton
Stream cash flows from the perspective of Silver Wheaton were calculated in this thesis as follows.
Calculating the cash flow for a given stream began with isolating the payable silver (and in some cases,
gold) quantities produced by the underlying mine that were assigned to Silver Wheaton. This quantity
was multiplied by the silver price forecast and transfer fee to arrive at revenue and operating cost
respectively. Subtracting operating cost from revenue yielded annual operating profit, as previously
mentioned. The upfront capital payment was assumed to have been incurred in the year in which the deal
took place, unless otherwise specified in the stream details. As Silver Wheaton registers all of its profits
through subsidiaries and does not pay any Canadian income tax, the operating profit is effectively the net
cash flow of the silver stream.
4.3.4 Treatment of outdated capital and operating cost estimates
In some cases, the most recent technical reports used to create the cash flow models for each mine were
published greater than one year prior to the date of the stream deal. Cost estimates, both operating and
capital, are generally provided in constant dollars of the time of publication in technical reports. In these
37
cases, it was therefore necessary to adjust the capital and operating cost estimates to constant dollars of
the deal time using the U.S. Consumer Price Index (CPI) and Equation (9) below.
𝐷𝑒𝑎𝑙 𝑡𝑖𝑚𝑒 𝑐𝑜𝑠𝑡 = 𝑂𝑟𝑖𝑔𝑖𝑛𝑎𝑙 𝐶𝑜𝑠𝑡 × (
𝐶𝑃𝐼𝐶𝐶𝑃𝐼𝑃
) (9)
where 𝐶𝑃𝐼𝐶 is the CPI value for the year in which the deal was done and 𝐶𝑃𝐼𝑃 is the CPI value for the
year in which the estimated cost figures were published.
4.3.5 Silver price series used in silver stream cash flow models
As outlined in Section 3.1.7, consensus price estimates were aggregated in this thesis as the “base case”
silver price series and used to evaluate the silver production of several individual mines. To generate
these base case silver price series, several price forecasts in equity research (ER) reports published in nine
different time periods within the three months prior to the date of each silver stream deal were collected.
The median18 was taken from the forecast figures of seven or more separate financial firms to arrive at the
final base case price series for each stream deal. Note that the base case price series used was different
for each deal; this is because equity research departments continually update their price forecast models to
reflect changing global economic conditions. For example, a price forecast published in July 2008 would
be significantly different from one that was published in December 2008; the latest global economic
recession began between those two dates. The purpose of this approach is to simulate as best as possible
the method by which each stream deal would have been evaluated at the time by the market at large; the
use of consensus price estimates achieves this.
18 Due to the relatively small sample sizes, the median was taken instead of the mean to omit the influence of
outlying price estimates.
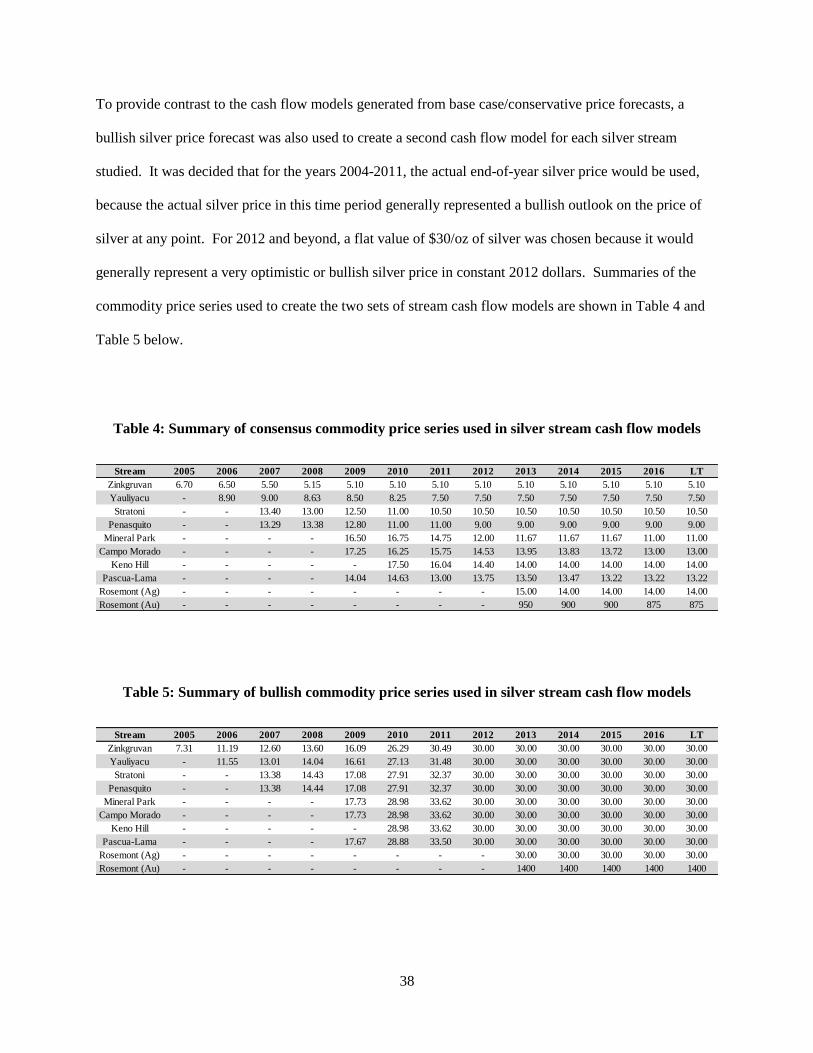
38
To provide contrast to the cash flow models generated from base case/conservative price forecasts, a
bullish silver price forecast was also used to create a second cash flow model for each silver stream
studied. It was decided that for the years 2004-2011, the actual end-of-year silver price would be used,
because the actual silver price in this time period generally represented a bullish outlook on the price of
silver at any point. For 2012 and beyond, a flat value of $30/oz of silver was chosen because it would
generally represent a very optimistic or bullish silver price in constant 2012 dollars. Summaries of the
commodity price series used to create the two sets of stream cash flow models are shown in Table 4 and
Table 5 below.
Table 4: Summary of consensus commodity price series used in silver stream cash flow models
Table 5: Summary of bullish commodity price series used in silver stream cash flow models
Stream 2005 2006 2007 2008 2009 2010 2011 2012 2013 2014 2015 2016 LT
Zinkgruvan 6.70 6.50 5.50 5.15 5.10 5.10 5.10 5.10 5.10 5.10 5.10 5.10 5.10
Yauliyacu - 8.90 9.00 8.63 8.50 8.25 7.50 7.50 7.50 7.50 7.50 7.50 7.50
Stratoni - - 13.40 13.00 12.50 11.00 10.50 10.50 10.50 10.50 10.50 10.50 10.50
Penasquito - - 13.29 13.38 12.80 11.00 11.00 9.00 9.00 9.00 9.00 9.00 9.00
Mineral Park - - - - 16.50 16.75 14.75 12.00 11.67 11.67 11.67 11.00 11.00
Campo Morado - - - - 17.25 16.25 15.75 14.53 13.95 13.83 13.72 13.00 13.00
Keno Hill - - - - - 17.50 16.04 14.40 14.00 14.00 14.00 14.00 14.00
Pascua-Lama - - - - 14.04 14.63 13.00 13.75 13.50 13.47 13.22 13.22 13.22
Rosemont (Ag) - - - - - - - - 15.00 14.00 14.00 14.00 14.00
Rosemont (Au) - - - - - - - - 950 900 900 875 875
Stream 2005 2006 2007 2008 2009 2010 2011 2012 2013 2014 2015 2016 LT
Zinkgruvan 7.31 11.19 12.60 13.60 16.09 26.29 30.49 30.00 30.00 30.00 30.00 30.00 30.00
Yauliyacu - 11.55 13.01 14.04 16.61 27.13 31.48 30.00 30.00 30.00 30.00 30.00 30.00
Stratoni - - 13.38 14.43 17.08 27.91 32.37 30.00 30.00 30.00 30.00 30.00 30.00
Penasquito - - 13.38 14.44 17.08 27.91 32.37 30.00 30.00 30.00 30.00 30.00 30.00
Mineral Park - - - - 17.73 28.98 33.62 30.00 30.00 30.00 30.00 30.00 30.00
Campo Morado - - - - 17.73 28.98 33.62 30.00 30.00 30.00 30.00 30.00 30.00
Keno Hill - - - - - 28.98 33.62 30.00 30.00 30.00 30.00 30.00 30.00
Pascua-Lama - - - - 17.67 28.88 33.50 30.00 30.00 30.00 30.00 30.00 30.00
Rosemont (Ag) - - - - - - - - 30.00 30.00 30.00 30.00 30.00
Rosemont (Au) - - - - - - - - 1400 1400 1400 1400 1400
39
The actual end-of-year values of the partially-realized/bullish silver price series were sourced from the
London Bullion Market Association (LBMA) website. As the LBMA silver prices from 2005-2011 are
quoted in current dollars of these years, this portion of the partially-realized/bullish price series was
required to be converted to constant USD of the years in which each deal was done. This was
accomplished by using U.S. CPI data and Equation (10), below.
𝑃𝑟𝑒𝑎𝑙,𝑦𝑒𝑎𝑟 𝑋 = 𝑃𝑐𝑢𝑟𝑟𝑒𝑛𝑡,𝑦𝑒𝑎𝑟 𝑌 × (𝐶𝑃𝐼𝑦𝑒𝑎𝑟 𝑋
𝐶𝑃𝐼𝑦𝑒𝑎𝑟 𝑌) (10)
where 𝑃𝑟𝑒𝑎𝑙,𝑦𝑒𝑎𝑟 𝑋 is the silver price in constant dollars of year X, 𝑃𝑐𝑢𝑟𝑟𝑒𝑛𝑡,𝑦𝑒𝑎𝑟 𝑌 is the silver price in
current dollars of year Y, 𝐶𝑃𝐼𝑦𝑒𝑎𝑟 𝑋 is the average annual CPI value for year X, and 𝐶𝑃𝐼𝑦𝑒𝑎𝑟 𝑌 is the
average annual CPI value for year Y.
4.4 Limitations and assumptions
Given the ever-changing business marketplace, a cut-off date of April 16, 2012 was applied to the
analysis, that is, no information or actual data available after this date was considered or incorporated into
the evaluation of cash flows or price forecasts. This means that any documents referenced in relevant
discussions will be dated on or prior to the cut-off date. Similarly, any market or global economic events
that are referenced would have taken place on or prior to the cut-off date. This is meant to provide a
“reference point” for discussions and specific financial analyses in this thesis. It should be noted that
some of these discussions and analyses have been written and performed at points in FY 2012 that were
after the cut-off date. Silver Wheaton’s common share price and commodity prices have continued to
trade between the cut-off date and these points in time, effectively adding to portions of the data sets that

40
were meant to be forecasted from the cut-off date, going forward. The author has disregarded this ‘real’
data, so to speak. The data sets in question are forecasted over the course of 10+ years and it is the
author’s belief that this small overlapping time period has no significant impact on the validity of the
analyses or discussions in the thesis.
4.4.1 Sample size
An inherent limitation to the study of Silver Wheaton’s business model is the relatively small sample size
of nine silver purchase agreements to evaluate that are sufficiently comparable. Confidence in the results
of this thesis would be improved given more company history and more silver streams to evaluate. While
nothing can be done to increase the sample size presently, a study of similar scope in another 8-10 years
would likely yield results of higher confidence, assuming Silver Wheaton continues to do deals at the
same rate or greater than that of the past eight years.
4.4.2 Deterministic cash flow modelling
The DCF model used in the analysis is the same type of modelling technique that is typically employed
by mining finance professionals and corporate decision-makers. A potentially better approach to
evaluation termed “real options” was not applied, as it is not widely used in the mining industry.
Traditional DCF models assume a single expected value for every forecasted input parameter, which
results in a final cash flow figure for a given forecasted period or year. Such models do not take into
account the value of future decision-making on the part of a mine operator to optimize cash flow in
response to a change in any of the input parameters that was not forecasted or planned for.
As a result of this limitation, the deterministic cash flow modelling used in this thesis, while widely
employed in the mining industry, may not necessarily represent the optimal analysis approach.
41
4.4.3 Quality of index data used in calculation of corporate WACC
Credible data for historical stock market index values was found to be unavailable in the public domain
with the notable exception of Yahoo! Finance, which was sourced for use in this thesis. Ideally, data
from a more recognized source would be used for the calculation of corporate beta and WACC, and the
unavailability of such a source represents a limitation of this analysis.
4.4.4 Calculation method of corporate WACC
In each instance that a WACC value was calculated for either Silver Wheaton or its operating partners, a
sample size of 12 monthly data points for share price and the S&P/TSX Composite Index were taken for
the calculation of the beta factor. As the calculation of several beta factors was required, this approach
was deemed sufficient for the scope of this thesis. However, this small sample size represents a limitation
to the accuracy of the beta values calculated throughout this document. Ideally, a data set of share prices
and index values taken weekly or daily and spanning several years would be used in the calculation of
beta.
4.4.5 Qualitative silver price forecast for 2012+
The silver price forecasts used to evaluate Silver Wheaton’s production profile from 2012 going forward
were based exclusively on a qualitative consideration of the current supply and demand situation for
silver. No statistical analysis on past silver price data was performed to support the forecasts used,
thereby representing a limitation to the validity of some of the thesis’ findings.
42
4.4.6 Escalation of capital and operating costs
As previously mentioned, in some cases the expected capital and operating costs were escalated to
constant dollars of the deal time using CPI data from the U.S. Bureau of Labor Statistics. Though an
acceptable means of escalating costs for the purposes and scope of this thesis, the CPI tracks the
inflationary changes in the costs of consumer products and is generally not indicative of changes in
producer costs such as energy, labor, and raw goods.
Upon a literature review, the author could not find a consensus regarding a more appropriate index to use
for this purpose. Furthermore, the use of CPI for monetary escalation or de-escalation in mining technical
reports was noted on several occasions in the course of working on this thesis. As such, the use of CPI
was considered to be acceptable.
4.4.7 Omission of working capital
Working capital was not considered in any of the full LOM cash flow models developed for Chapter 5
and Chapter 6, as it is difficult to forecast and deemed to be outside the scope of this thesis.
4.4.8 Mine closure/ramp-down and metal sales
For the purpose of this thesis, it was assumed that no closure or production ramp-down would occur for
the entirety of the expected LOM at any mine or project underlying Silver Wheaton’s streams.
Furthermore, it was assumed that all contained metal would be sold in the year in which it was produced.
43
4.4.9 Treatment of upfront payment
The upfront capital payment was assumed to have been incurred in the year in which the deal took place,
unless otherwise specified in the stream details. Furthermore, it should be noted that not all of Silver
Wheaton’s operating partners have used the entire upfront payment for development of the project under
contract with Silver Wheaton. To maintain consistency in this analysis, it was assumed that in all
instances, the upfront payment was used exclusively for developing the asset meant to produce the
streamed silver.

44
Chapter 5
Sample Calculation of Discounted Cash Flows for a Silver Stream
5.1 Sample calculation of beta and WACC
In order to illustrate the method used for the calculation of beta and WACC values in this thesis, a sample
calculation of the actual WACC value for Silver Wheaton at the time of the Keno Hill silver purchase
agreement is shown below.
To begin with, the closing values of the S&P/TSX Composite Index19 and Silver Wheaton’s share price19
were retrieved for October 1, 2008, the day prior to the deal date, and for 11 days preceding this date in
monthly intervals. Outlined in Table 6, the index and share price values were both normalized20 to the
respective values of the oldest date for which data was collected, which was November 1, 2007 in this
instance.
19 In all instances of beta calculations, these values are sourced from (TMX Group Incorporated). 20 The normalization of a time series to a reference point is standard practice prior to its use in statistical analysis or
computations.
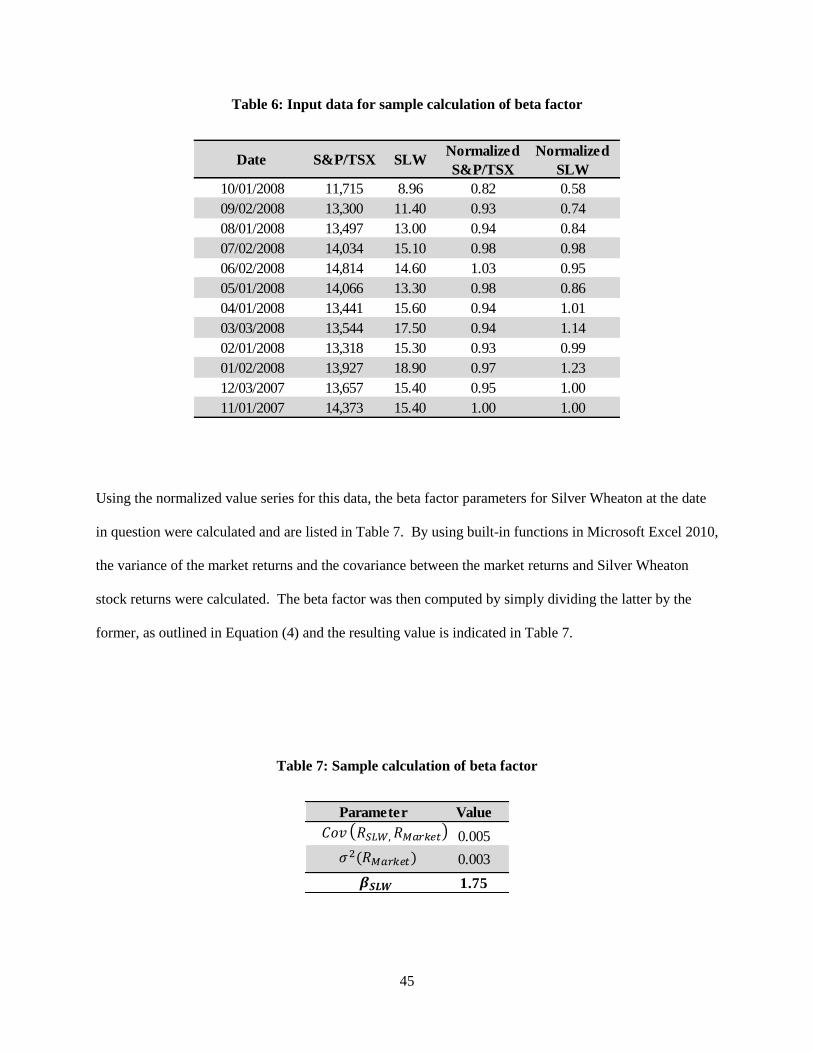
45
Table 6: Input data for sample calculation of beta factor
Using the normalized value series for this data, the beta factor parameters for Silver Wheaton at the date
in question were calculated and are listed in Table 7. By using built-in functions in Microsoft Excel 2010,
the variance of the market returns and the covariance between the market returns and Silver Wheaton
stock returns were calculated. The beta factor was then computed by simply dividing the latter by the
former, as outlined in Equation (4) and the resulting value is indicated in Table 7.
Table 7: Sample calculation of beta factor
Date S&P/TSX SLWNormalized
S&P/TSX
Normalized
SLW
10/01/2008 11,715 8.96 0.82 0.58
09/02/2008 13,300 11.40 0.93 0.74
08/01/2008 13,497 13.00 0.94 0.84
07/02/2008 14,034 15.10 0.98 0.98
06/02/2008 14,814 14.60 1.03 0.95
05/01/2008 14,066 13.30 0.98 0.86
04/01/2008 13,441 15.60 0.94 1.01
03/03/2008 13,544 17.50 0.94 1.14
02/01/2008 13,318 15.30 0.93 0.99
01/02/2008 13,927 18.90 0.97 1.23
12/03/2007 13,657 15.40 0.95 1.00
11/01/2007 14,373 15.40 1.00 1.00
Parameter Value
0.005
0.003
1.75
𝐶𝑜𝑣 𝑅 𝑊, 𝑅𝑀𝑎𝑟 𝑒𝑡
𝜎2(𝑅𝑀𝑎𝑟 𝑒𝑡)
46
The next step in calculating Silver Wheaton’s WACC at this point in time is to determine Silver
Wheaton’s cost of equity capital, Ke. As one of the parameters in the calculation of Ke is the long-term
market return, source data was required to be collected. Given that Silver Wheaton trades on the TSX and
that the TSX lists 58% of the world’s public mining companies (TMX Group Incorporated), the
S&P/TSX Composite Index was used for this purpose as it is considered to be a good indicator for this
particular market. Unfortunately, the TMX Group Incorporated family of websites does not provide free
access to historical index value data. The data for this portion of all WACC calculations was
consequently sourced from (Yahoo! Finance)21. The long-term market return was taken as the real, pre-
tax average annual return of the aforementioned index over a 20-year period prior to the year in which
each silver stream deal took place. Looking at Table 8 below, it can be seen that the real, pre-tax average
annual return of the S&P/TSX Composite Index for this example was calculated to be 6.15%, which was
taken as the long-term market return.
21 No primary source of free index and market data could be found and as a result data from Yahoo! Finance, a
secondary source, was used.
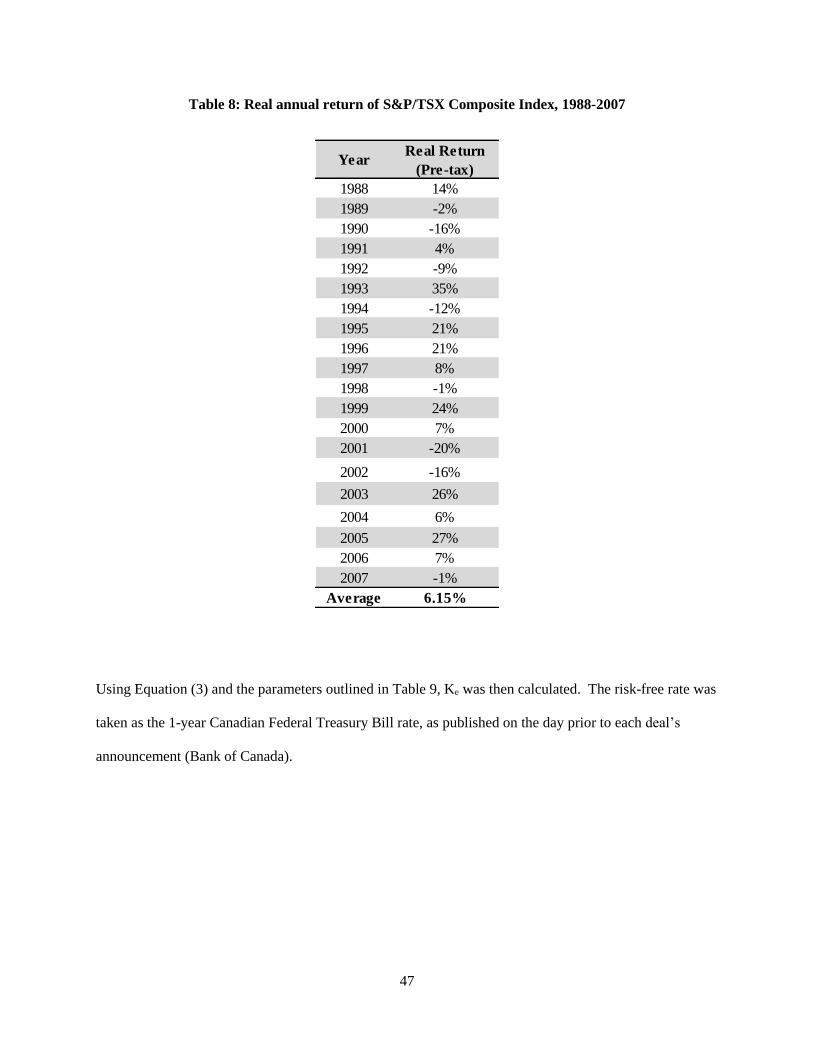
47
Table 8: Real annual return of S&P/TSX Composite Index, 1988-2007
Using Equation (3) and the parameters outlined in Table 9, Ke was then calculated. The risk-free rate was
taken as the 1-year Canadian Federal Treasury Bill rate, as published on the day prior to each deal’s
announcement (Bank of Canada).
YearReal Return
(Pre-tax)
1988 14%
1989 -2%
1990 -16%
1991 4%
1992 -9%
1993 35%
1994 -12%
1995 21%
1996 21%
1997 8%
1998 -1%
1999 24%
2000 7%
2001 -20%
2002 -16%
2003 26%
2004 6%
2005 27%
2006 7%
2007 -1%
Average 6.15%
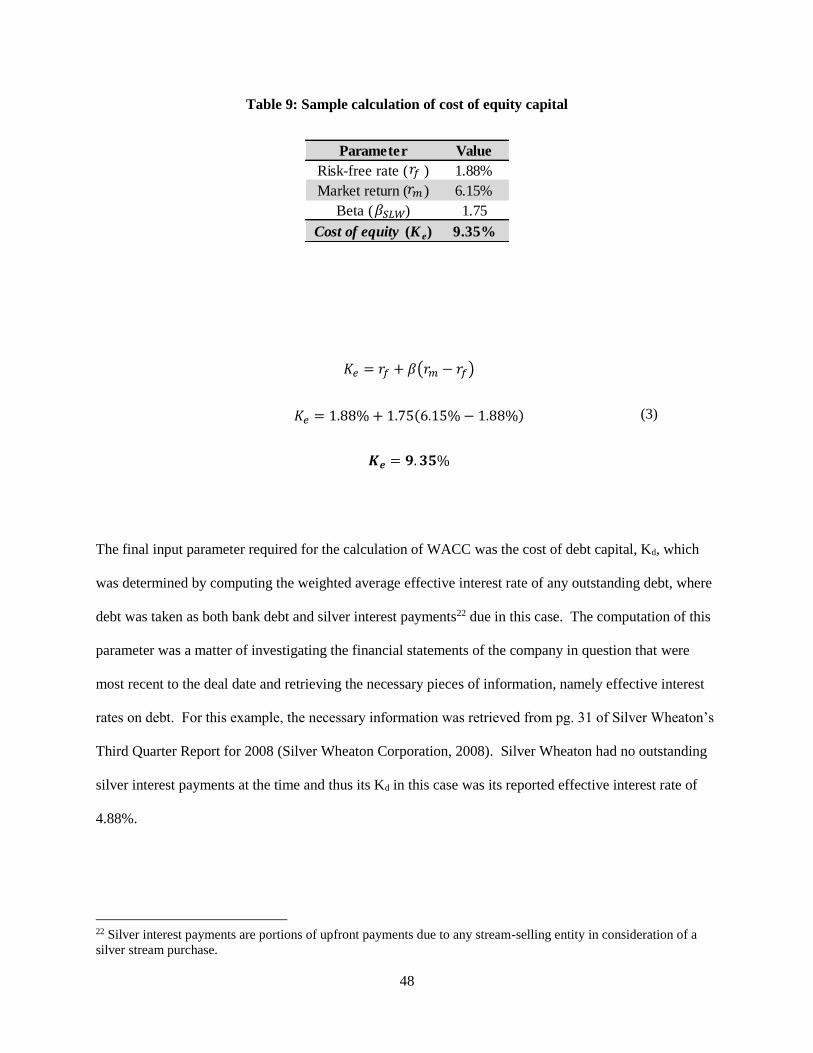
48
Table 9: Sample calculation of cost of equity capital
𝐾𝑒 = 𝑟𝑓 + 𝛽(𝑟𝑚 − 𝑟𝑓)
𝐾𝑒 = 1.88%+ 1.75(6.15%− 1.88%)
𝑲𝒆 = 𝟗. 𝟑𝟓%
(3)
The final input parameter required for the calculation of WACC was the cost of debt capital, Kd, which
was determined by computing the weighted average effective interest rate of any outstanding debt, where
debt was taken as both bank debt and silver interest payments22 due in this case. The computation of this
parameter was a matter of investigating the financial statements of the company in question that were
most recent to the deal date and retrieving the necessary pieces of information, namely effective interest
rates on debt. For this example, the necessary information was retrieved from pg. 31 of Silver Wheaton’s
Third Quarter Report for 2008 (Silver Wheaton Corporation, 2008). Silver Wheaton had no outstanding
silver interest payments at the time and thus its Kd in this case was its reported effective interest rate of
4.88%.
22 Silver interest payments are portions of upfront payments due to any stream-selling entity in consideration of a
silver stream purchase.
Parameter Value
Risk-free rate ( ) 1.88%
Market return ( ) 6.15%
Beta ( ) 1.75
Cost of equity (K e) 9.35%
𝛽 𝑊
𝑟𝑚
𝑟𝑓
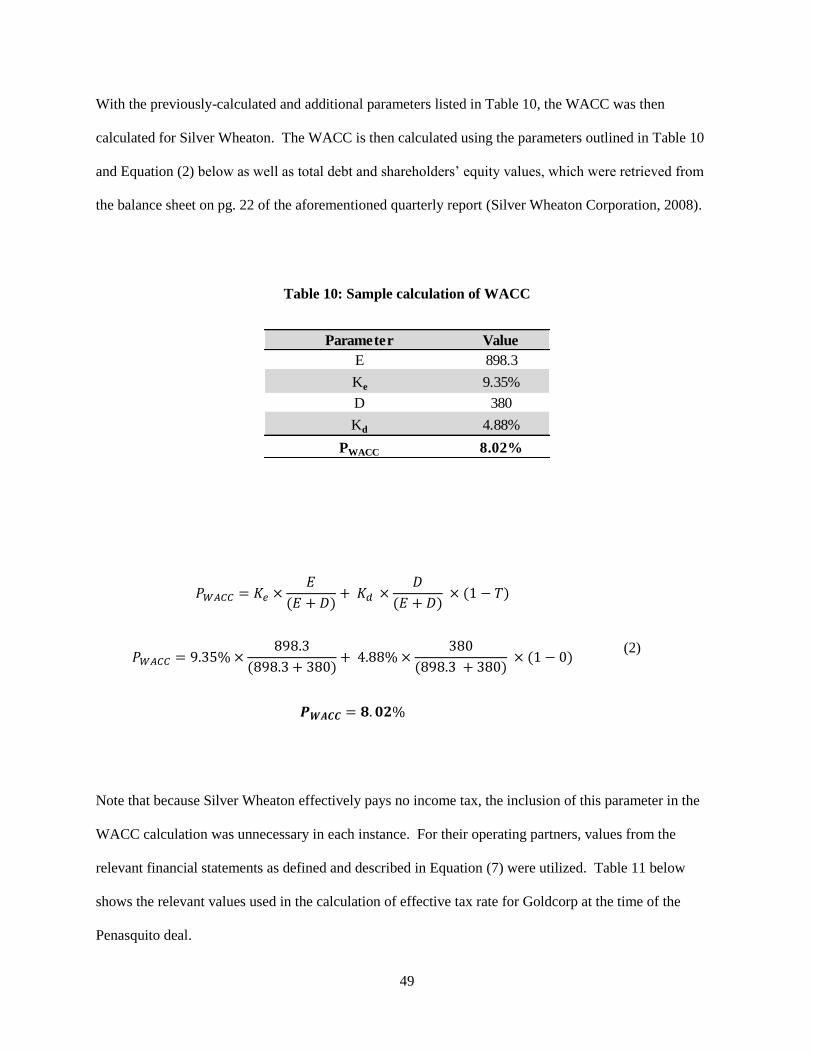
49
With the previously-calculated and additional parameters listed in Table 10, the WACC was then
calculated for Silver Wheaton. The WACC is then calculated using the parameters outlined in Table 10
and Equation (2) below as well as total debt and shareholders’ equity values, which were retrieved from
the balance sheet on pg. 22 of the aforementioned quarterly report (Silver Wheaton Corporation, 2008).
Table 10: Sample calculation of WACC
𝑃𝑊𝐴𝐶𝐶 = 𝐾𝑒 ×𝐸
(𝐸 + 𝐷)+ 𝐾𝑑 ×
𝐷
(𝐸 + 𝐷) × (1 − 𝑇)
𝑃𝑊𝐴𝐶𝐶 = 9.35%×898.3
(898.3 + 380)+ 4.88%×
380
(898.3 + 380) × (1 − 0)
𝑷 𝑨𝑪𝑪 = 𝟖. 𝟎𝟐%
(2)
Note that because Silver Wheaton effectively pays no income tax, the inclusion of this parameter in the
WACC calculation was unnecessary in each instance. For their operating partners, values from the
relevant financial statements as defined and described in Equation (7) were utilized. Table 11 below
shows the relevant values used in the calculation of effective tax rate for Goldcorp at the time of the
Penasquito deal.
Parameter Value
E 898.3
Ke 9.35%
D 380
Kd 4.88%
PWACC 8.02%
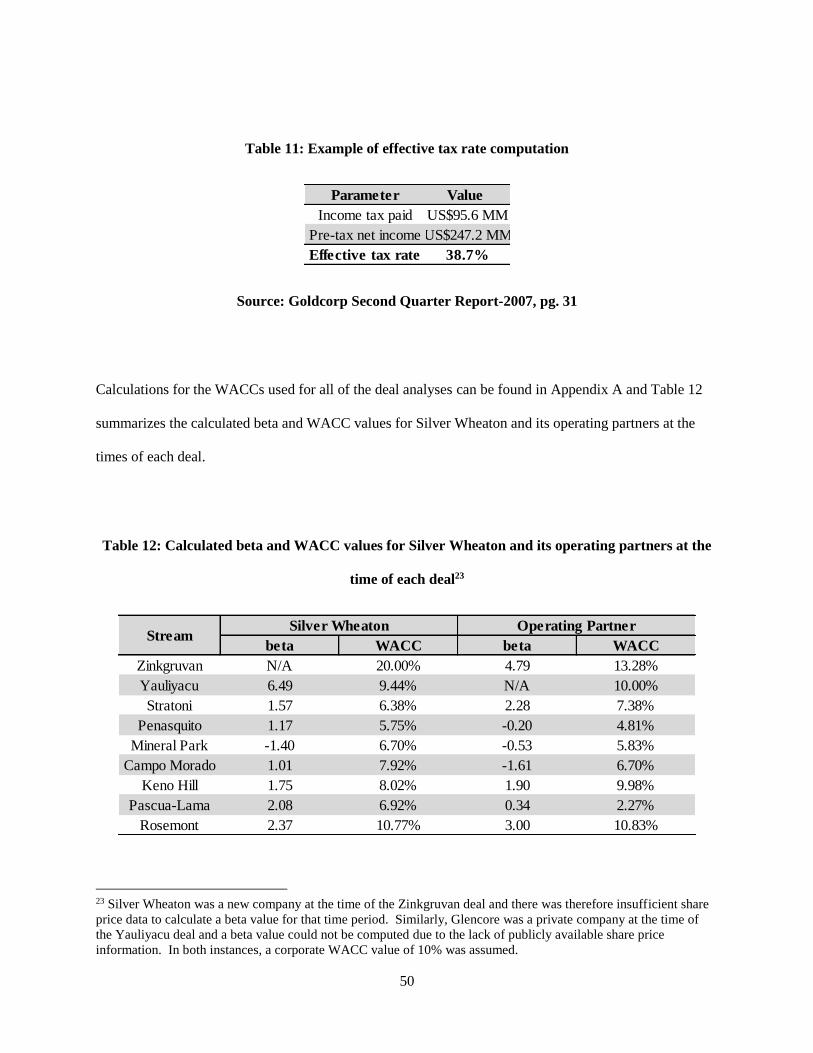
50
Table 11: Example of effective tax rate computation
Source: Goldcorp Second Quarter Report-2007, pg. 31
Calculations for the WACCs used for all of the deal analyses can be found in Appendix A and Table 12
summarizes the calculated beta and WACC values for Silver Wheaton and its operating partners at the
times of each deal.
Table 12: Calculated beta and WACC values for Silver Wheaton and its operating partners at the
time of each deal23
23 Silver Wheaton was a new company at the time of the Zinkgruvan deal and there was therefore insufficient share
price data to calculate a beta value for that time period. Similarly, Glencore was a private company at the time of
the Yauliyacu deal and a beta value could not be computed due to the lack of publicly available share price
information. In both instances, a corporate WACC value of 10% was assumed.
Parameter Value
Income tax paid US$95.6 MM
Pre-tax net income US$247.2 MM
Effective tax rate 38.7%
beta WACC beta WACC
Zinkgruvan N/A 20.00% 4.79 13.28%
Yauliyacu 6.49 9.44% N/A 10.00%
Stratoni 1.57 6.38% 2.28 7.38%
Penasquito 1.17 5.75% -0.20 4.81%
Mineral Park -1.40 6.70% -0.53 5.83%
Campo Morado 1.01 7.92% -1.61 6.70%
Keno Hill 1.75 8.02% 1.90 9.98%
Pascua-Lama 2.08 6.92% 0.34 2.27%
Rosemont 2.37 10.77% 3.00 10.83%
StreamSilver Wheaton Operating Partner
51
5.2 Sample calculation of silver stream cash flow model
For the purpose of this sample calculation, the Keno Hill mine and silver stream were used. Keno Hill is
a poly-metallic project with two concentrate products: a zinc concentrate with minor but material
quantities of silver and a lead/silver concentrate where the majority of the mine’s silver production is
captured.
5.2.1 Calculation of mine cash flow model
The latest technical report regarding this mine, (Keller, et al., 2008), contains a detailed expected
production schedule, inclusive of mill throughput, metal grades, metallurgical recoveries, and concentrate
production tonnage. Furthermore, this technical report contains expected smelter terms, as outlined in the
NSR calculation for this mine, which is presented in Table 13. Forecasted metal prices were consensus
estimates as aggregated at the time that the mine’s owner, Alexco, completed a silver purchase agreement
with Silver Wheaton in late 2008. Using each year’s expected total mill throughput, grades, recoveries,
and Equation (8), both contained and payable lead, zinc, and silver in each concentrate were computed.
From this point, payable metal sales were simply subtracted by all applicable freight, concentrate
treatment, and silver refining charges for each product to arrive at NSR values by concentrate type. The
two were summed to determine the forecasted annual NSR for the mine. Note that the forecasts only
extend to 2014, as the LOM was projected to be five years at the time of the deal.
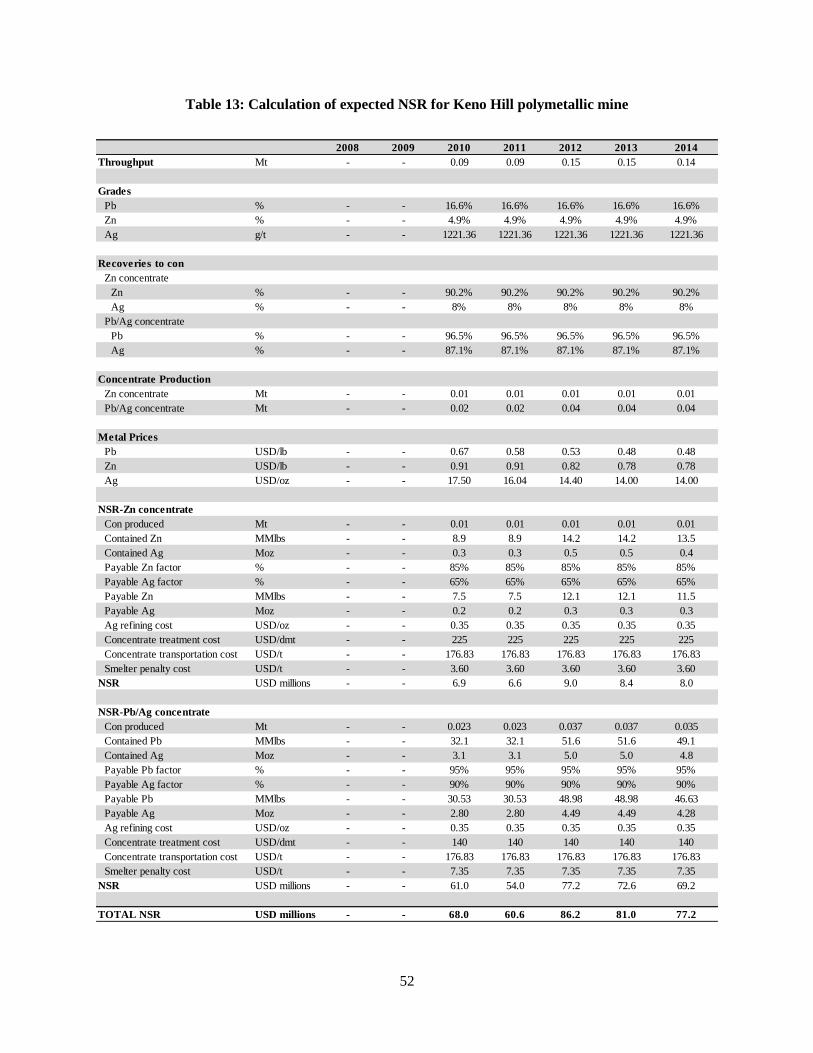
52
Table 13: Calculation of expected NSR for Keno Hill polymetallic mine
2008 2009 2010 2011 2012 2013 2014
Throughput Mt - - 0.09 0.09 0.15 0.15 0.14
Grades
Pb % - - 16.6% 16.6% 16.6% 16.6% 16.6%
Zn % - - 4.9% 4.9% 4.9% 4.9% 4.9%
Ag g/t - - 1221.36 1221.36 1221.36 1221.36 1221.36
Recoveries to con
Zn concentrate
Zn % - - 90.2% 90.2% 90.2% 90.2% 90.2%
Ag % - - 8% 8% 8% 8% 8%
Pb/Ag concentrate
Pb % - - 96.5% 96.5% 96.5% 96.5% 96.5%
Ag % - - 87.1% 87.1% 87.1% 87.1% 87.1%
Concentrate Production
Zn concentrate Mt - - 0.01 0.01 0.01 0.01 0.01
Pb/Ag concentrate Mt - - 0.02 0.02 0.04 0.04 0.04
Metal Prices
Pb USD/lb - - 0.67 0.58 0.53 0.48 0.48
Zn USD/lb - - 0.91 0.91 0.82 0.78 0.78
Ag USD/oz - - 17.50 16.04 14.40 14.00 14.00
NSR-Zn concentrate
Con produced Mt - - 0.01 0.01 0.01 0.01 0.01
Contained Zn MMlbs - - 8.9 8.9 14.2 14.2 13.5
Contained Ag Moz - - 0.3 0.3 0.5 0.5 0.4
Payable Zn factor % - - 85% 85% 85% 85% 85%
Payable Ag factor % - - 65% 65% 65% 65% 65%
Payable Zn MMlbs - - 7.5 7.5 12.1 12.1 11.5
Payable Ag Moz - - 0.2 0.2 0.3 0.3 0.3
Ag refining cost USD/oz - - 0.35 0.35 0.35 0.35 0.35
Concentrate treatment cost USD/dmt - - 225 225 225 225 225
Concentrate transportation cost USD/t - - 176.83 176.83 176.83 176.83 176.83
Smelter penalty cost USD/t - - 3.60 3.60 3.60 3.60 3.60
NSR USD millions - - 6.9 6.6 9.0 8.4 8.0
NSR-Pb/Ag concentrate
Con produced Mt - - 0.023 0.023 0.037 0.037 0.035
Contained Pb MMlbs - - 32.1 32.1 51.6 51.6 49.1
Contained Ag Moz - - 3.1 3.1 5.0 5.0 4.8
Payable Pb factor % - - 95% 95% 95% 95% 95%
Payable Ag factor % - - 90% 90% 90% 90% 90%
Payable Pb MMlbs - - 30.53 30.53 48.98 48.98 46.63
Payable Ag Moz - - 2.80 2.80 4.49 4.49 4.28
Ag refining cost USD/oz - - 0.35 0.35 0.35 0.35 0.35
Concentrate treatment cost USD/dmt - - 140 140 140 140 140
Concentrate transportation cost USD/t - - 176.83 176.83 176.83 176.83 176.83
Smelter penalty cost USD/t - - 7.35 7.35 7.35 7.35 7.35
NSR USD millions - - 61.0 54.0 77.2 72.6 69.2
TOTAL NSR USD millions - - 68.0 60.6 86.2 81.0 77.2
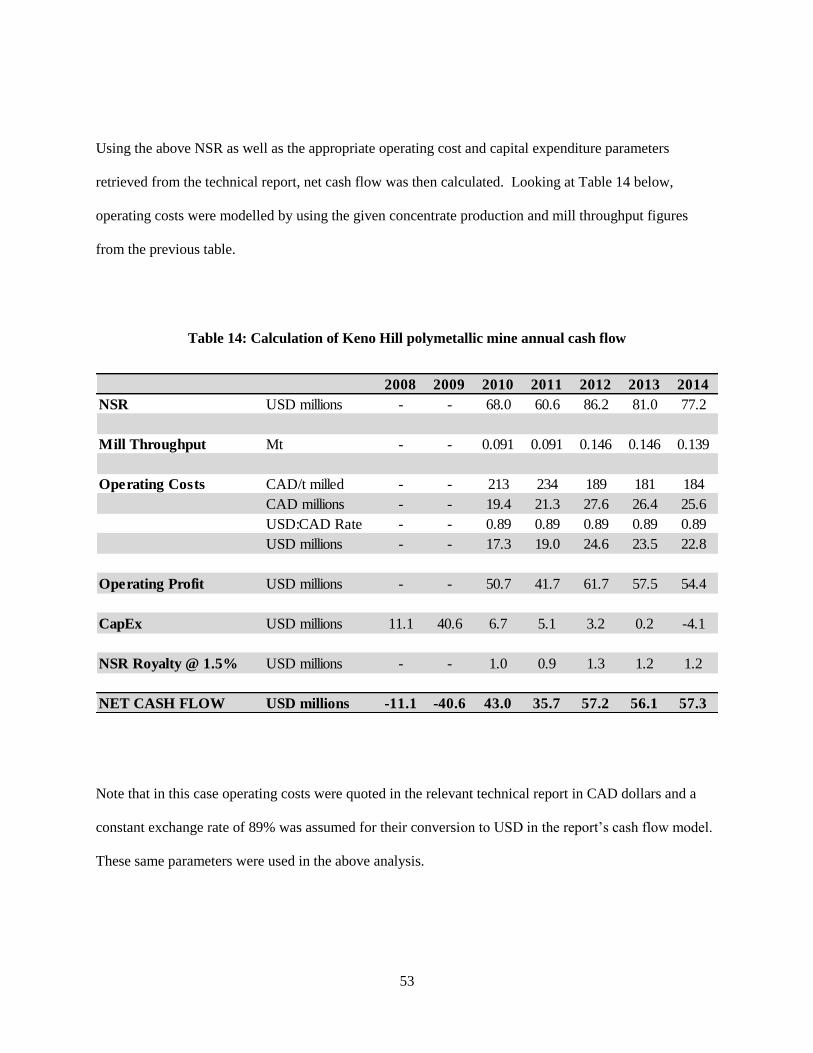
53
Using the above NSR as well as the appropriate operating cost and capital expenditure parameters
retrieved from the technical report, net cash flow was then calculated. Looking at Table 14 below,
operating costs were modelled by using the given concentrate production and mill throughput figures
from the previous table.
Table 14: Calculation of Keno Hill polymetallic mine annual cash flow
Note that in this case operating costs were quoted in the relevant technical report in CAD dollars and a
constant exchange rate of 89% was assumed for their conversion to USD in the report’s cash flow model.
These same parameters were used in the above analysis.
2008 2009 2010 2011 2012 2013 2014
NSR USD millions - - 68.0 60.6 86.2 81.0 77.2
Mill Throughput Mt - - 0.091 0.091 0.146 0.146 0.139
Operating Costs CAD/t milled - - 213 234 189 181 184
CAD millions - - 19.4 21.3 27.6 26.4 25.6
USD:CAD Rate - - 0.89 0.89 0.89 0.89 0.89
USD millions - - 17.3 19.0 24.6 23.5 22.8
Operating Profit USD millions - - 50.7 41.7 61.7 57.5 54.4
CapEx USD millions 11.1 40.6 6.7 5.1 3.2 0.2 -4.1
NSR Royalty @ 1.5% USD millions - - 1.0 0.9 1.3 1.2 1.2
NET CASH FLOW USD millions -11.1 -40.6 43.0 35.7 57.2 56.1 57.3

54
Capital expenditures and the royalty expense were subtracted from operating profit to arrive at net cash
flow for the mine.
5.2.2 Calculation of silver stream cash flows for the stream seller
The silver purchase agreement between Alexco and Silver Wheaton regarding the Keno Hill mine has the
following terms: a capital payment of $57.5 million, a transfer fee of $3.90/oz for silver delivered under
the contract subject to a 1% inflationary adjustment beginning in the third year following the transaction,
and an off-take agreement of 25% of payable silver over the LOM. From Table 13 above, payable silver
quantities and silver price were taken to be used in the silver stream cash flow calculation, which is
outlined below. The isolated stream cash flow from the perspective of the operating partner and mine
owner was then able to be calculated, as outlined in Table 15. Cash in-flow was simply the transfer fee
over the LOM, with the upfront payment being added in the appropriate years. Cash out-flow was the
monetary value of the silver being delivered to Silver Wheaton under the contract; this is effectively the
on-going cost that the operating partner must incur in exchange for the upfront payment.
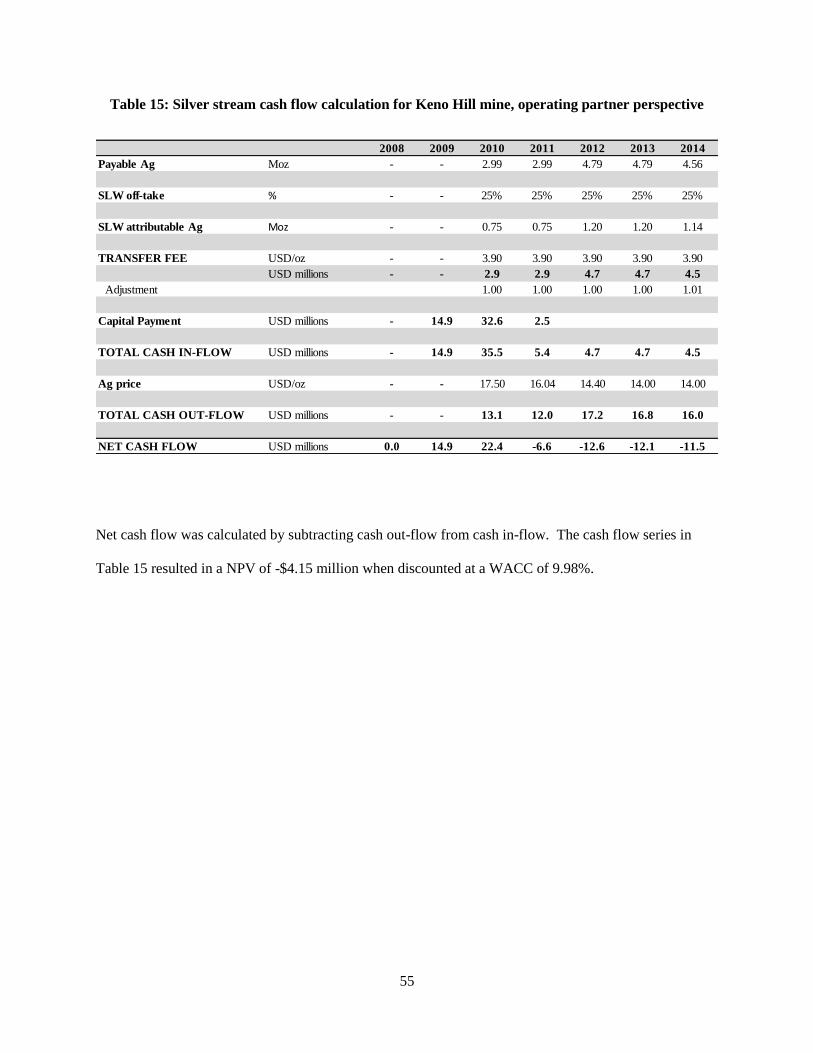
55
Table 15: Silver stream cash flow calculation for Keno Hill mine, operating partner perspective
Net cash flow was calculated by subtracting cash out-flow from cash in-flow. The cash flow series in
Table 15 resulted in a NPV of -$4.15 million when discounted at a WACC of 9.98%.
2008 2009 2010 2011 2012 2013 2014
Payable Ag Moz - - 2.99 2.99 4.79 4.79 4.56
SLW off-take % - - 25% 25% 25% 25% 25%
SLW attributable Ag Moz - - 0.75 0.75 1.20 1.20 1.14
TRANSFER FEE USD/oz - - 3.90 3.90 3.90 3.90 3.90
USD millions - - 2.9 2.9 4.7 4.7 4.5
Adjustment 1.00 1.00 1.00 1.00 1.01
Capital Payment USD millions - 14.9 32.6 2.5
TOTAL CASH IN-FLOW USD millions - 14.9 35.5 5.4 4.7 4.7 4.5
Ag price USD/oz - - 17.50 16.04 14.40 14.00 14.00
TOTAL CASH OUT-FLOW USD millions - - 13.1 12.0 17.2 16.8 16.0
NET CASH FLOW USD millions 0.0 14.9 22.4 -6.6 -12.6 -12.1 -11.5

56
5.2.3 Calculation of silver stream cash flows for the stream buyer
Looking at Table 16, stream revenue was simply calculated using payable silver and the forecasted silver
price assumptions. The total transfer fee was calculated using payable silver and the per ounce, adjusted
transfer fee. The upfront payment by Silver Wheaton was scheduled to occur in three installments as
outlined below. Net cash flow was then computed by subtracting the transfer fee from revenue, less the
upfront payment installments for the years in which they were set to occur. Note that no tax was incurred
due to the fact that Silver Wheaton does not pay any.
Table 16: Silver stream cash flow calculation of Keno Hill mine, Silver Wheaton perspective
The economic evaluation metrics for this cash flow were then able to be computed. When discounted at a
WACC of 8.02%, the NPV of the cash flow series in Table 16 is -$2.9 million, the IRR is 5%, and the
PVR is -0.07.
2008 2009 2010 2011 2012 2013 2014
Payable Ag Moz - - 2.99 2.99 4.79 4.79 4.56
SLW off-take % - - 25% 25% 25% 25% 25%
SLW attributable Ag Moz - - 0.75 0.75 1.20 1.20 1.14
Ag price USD/oz - - 17.50 16.04 14.40 14.00 14.00
REVENUE USD millions - - 13.1 12.0 17.2 16.8 16.0
TRANSFER FEE USD/oz - - 3.90 3.90 3.90 3.90 3.90
USD millions 2.9 2.9 4.7 4.7 4.5
Adjustment 1 1 1 1 1.01
Capital Payment USD millions 14.9 32.6 2.5
NET CASH FLOW USD millions - -14.9 -22.4 6.6 12.6 12.1 11.5
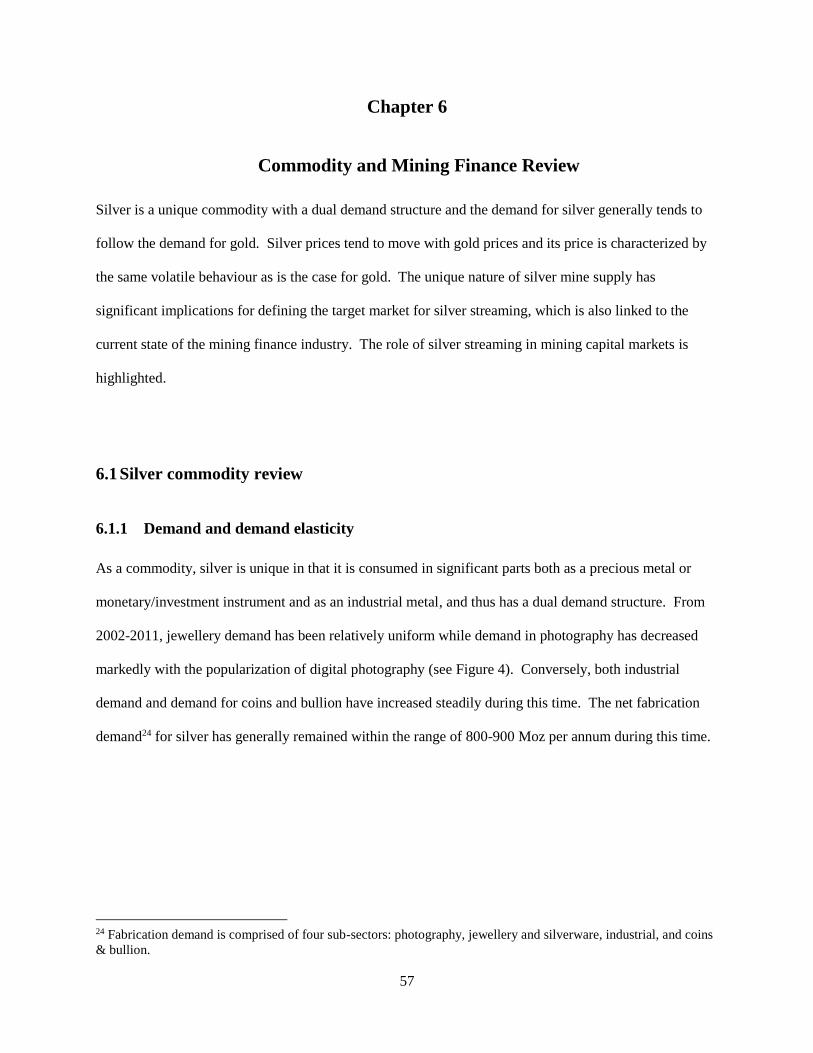
57
Chapter 6
Commodity and Mining Finance Review
Silver is a unique commodity with a dual demand structure and the demand for silver generally tends to
follow the demand for gold. Silver prices tend to move with gold prices and its price is characterized by
the same volatile behaviour as is the case for gold. The unique nature of silver mine supply has
significant implications for defining the target market for silver streaming, which is also linked to the
current state of the mining finance industry. The role of silver streaming in mining capital markets is
highlighted.
6.1 Silver commodity review
6.1.1 Demand and demand elasticity
As a commodity, silver is unique in that it is consumed in significant parts both as a precious metal or
monetary/investment instrument and as an industrial metal, and thus has a dual demand structure. From
2002-2011, jewellery demand has been relatively uniform while demand in photography has decreased
markedly with the popularization of digital photography (see Figure 4). Conversely, both industrial
demand and demand for coins and bullion have increased steadily during this time. The net fabrication
demand24 for silver has generally remained within the range of 800-900 Moz per annum during this time.
24 Fabrication demand is comprised of four sub-sectors: photography, jewellery and silverware, industrial, and coins
& bullion.
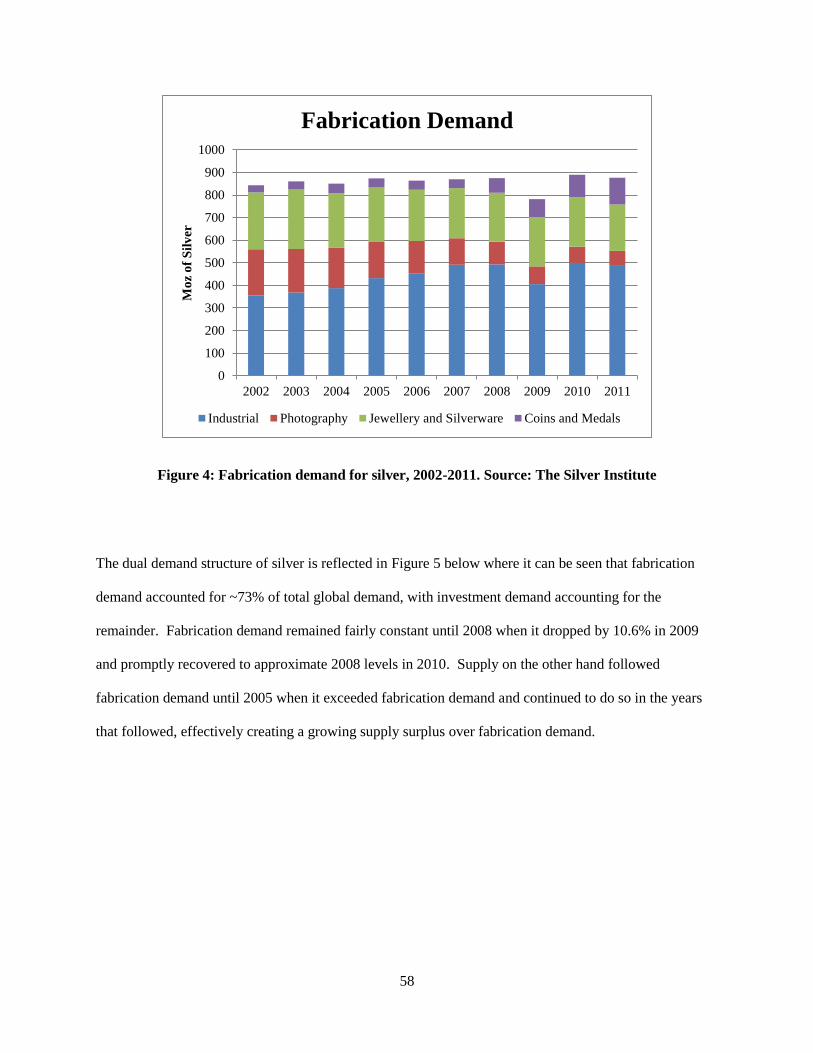
58
Figure 4: Fabrication demand for silver, 2002-2011. Source: The Silver Institute
The dual demand structure of silver is reflected in Figure 5 below where it can be seen that fabrication
demand accounted for ~73% of total global demand, with investment demand accounting for the
remainder. Fabrication demand remained fairly constant until 2008 when it dropped by 10.6% in 2009
and promptly recovered to approximate 2008 levels in 2010. Supply on the other hand followed
fabrication demand until 2005 when it exceeded fabrication demand and continued to do so in the years
that followed, effectively creating a growing supply surplus over fabrication demand.
0
100
200
300
400
500
600
700
800
900
1000
2002 2003 2004 2005 2006 2007 2008 2009 2010 2011
Mo
z o
f S
ilv
er
Fabrication Demand
Industrial Photography Jewellery and Silverware Coins and Medals
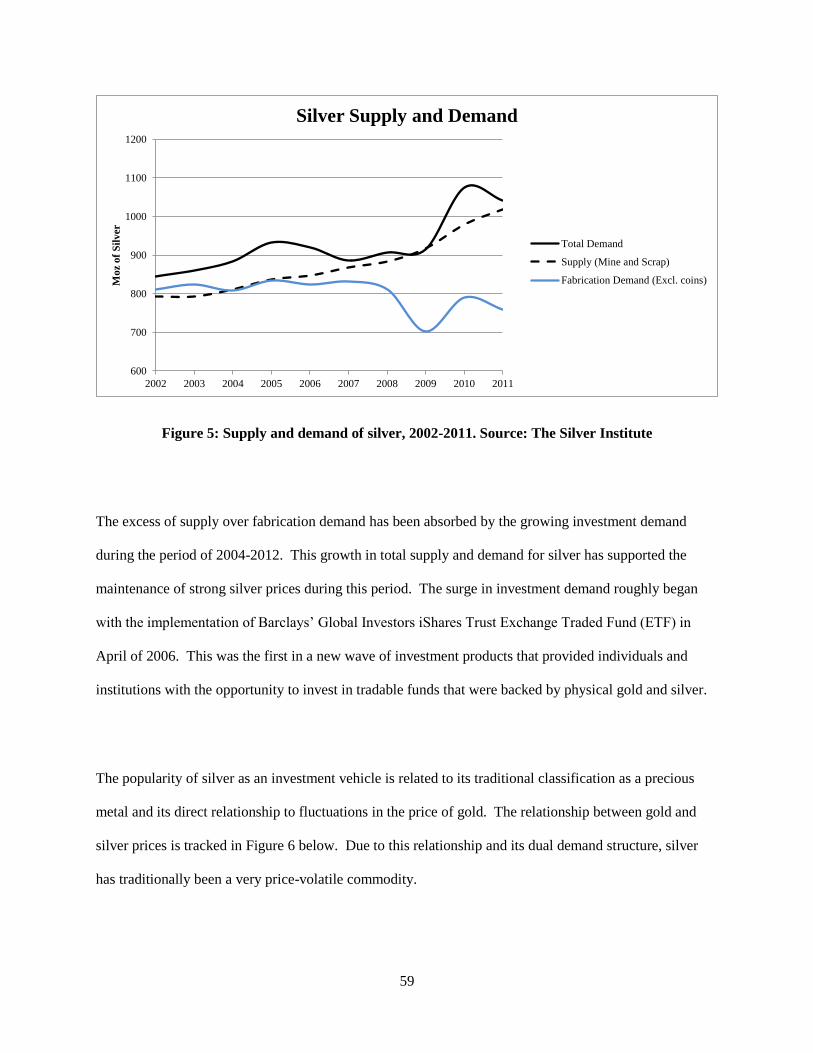
59
Figure 5: Supply and demand of silver, 2002-2011. Source: The Silver Institute
The excess of supply over fabrication demand has been absorbed by the growing investment demand
during the period of 2004-2012. This growth in total supply and demand for silver has supported the
maintenance of strong silver prices during this period. The surge in investment demand roughly began
with the implementation of Barclays’ Global Investors iShares Trust Exchange Traded Fund (ETF) in
April of 2006. This was the first in a new wave of investment products that provided individuals and
institutions with the opportunity to invest in tradable funds that were backed by physical gold and silver.
The popularity of silver as an investment vehicle is related to its traditional classification as a precious
metal and its direct relationship to fluctuations in the price of gold. The relationship between gold and
silver prices is tracked in Figure 6 below. Due to this relationship and its dual demand structure, silver
has traditionally been a very price-volatile commodity.
600
700
800
900
1000
1100
1200
2002 2003 2004 2005 2006 2007 2008 2009 2010 2011
Mo
z o
f S
ilv
erSilver Supply and Demand
Total Demand
Supply (Mine and Scrap)
Fabrication Demand (Excl. coins)
60
Figure 6: Real prices of gold and silver, 1980-2011. Source: LBMA
Conversely, because of its rarity and relatively minimal use in industrial applications, gold has always
existed and still does exist primarily as a store of value. Hence, gold has a one-dimensional demand
structure and its demand is typically inelastic with respect to price. In other words, the demand for gold
in general will be affected minimally by price fluctuations.
Perhaps the best way to describe silver’s demand elasticity is by comparing it to gold, historically. From
Figure 7 below, the fluctuations in the gold/silver ratio exhibit very clearly the relative changes in demand
between each metal across the period presented. Impacts on monetary/investment demand for silver due
to precious metal price movements have historically been much larger than impacts on the demand for
gold, which is exhibited by greater fluctuations in the silver price.
0
10
20
30
40
50
60
70
0
200
400
600
800
1,000
1,200
1,400
1,600
1,800
1980 1985 1990 1995 2000 2005 2010
Sil
ver
Pri
ce (
$/o
z)
Go
ld P
rice
($
/oz)
Gold vs. Silver Price
Gold Silver
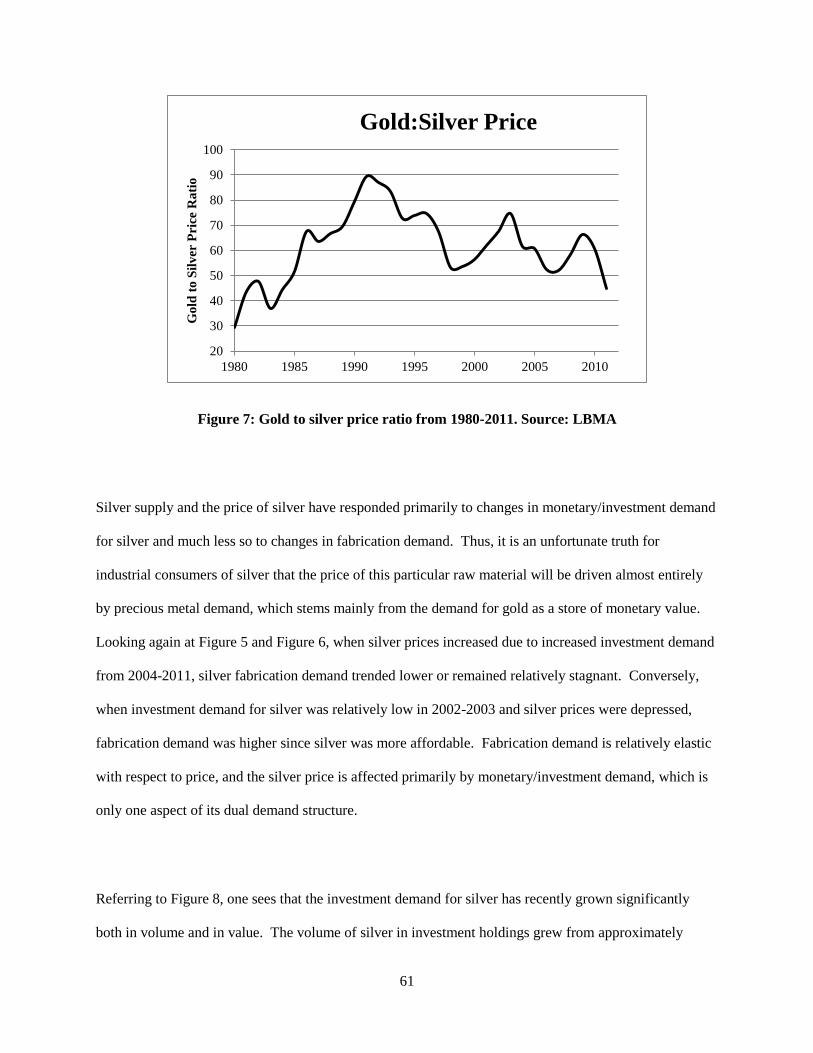
61
Figure 7: Gold to silver price ratio from 1980-2011. Source: LBMA
Silver supply and the price of silver have responded primarily to changes in monetary/investment demand
for silver and much less so to changes in fabrication demand. Thus, it is an unfortunate truth for
industrial consumers of silver that the price of this particular raw material will be driven almost entirely
by precious metal demand, which stems mainly from the demand for gold as a store of monetary value.
Looking again at Figure 5 and Figure 6, when silver prices increased due to increased investment demand
from 2004-2011, silver fabrication demand trended lower or remained relatively stagnant. Conversely,
when investment demand for silver was relatively low in 2002-2003 and silver prices were depressed,
fabrication demand was higher since silver was more affordable. Fabrication demand is relatively elastic
with respect to price, and the silver price is affected primarily by monetary/investment demand, which is
only one aspect of its dual demand structure.
Referring to Figure 8, one sees that the investment demand for silver has recently grown significantly
both in volume and in value. The volume of silver in investment holdings grew from approximately
20
30
40
50
60
70
80
90
100
1980 1985 1990 1995 2000 2005 2010
Go
ld t
o S
ilv
er P
rice
Ra
tio
Gold:Silver Price
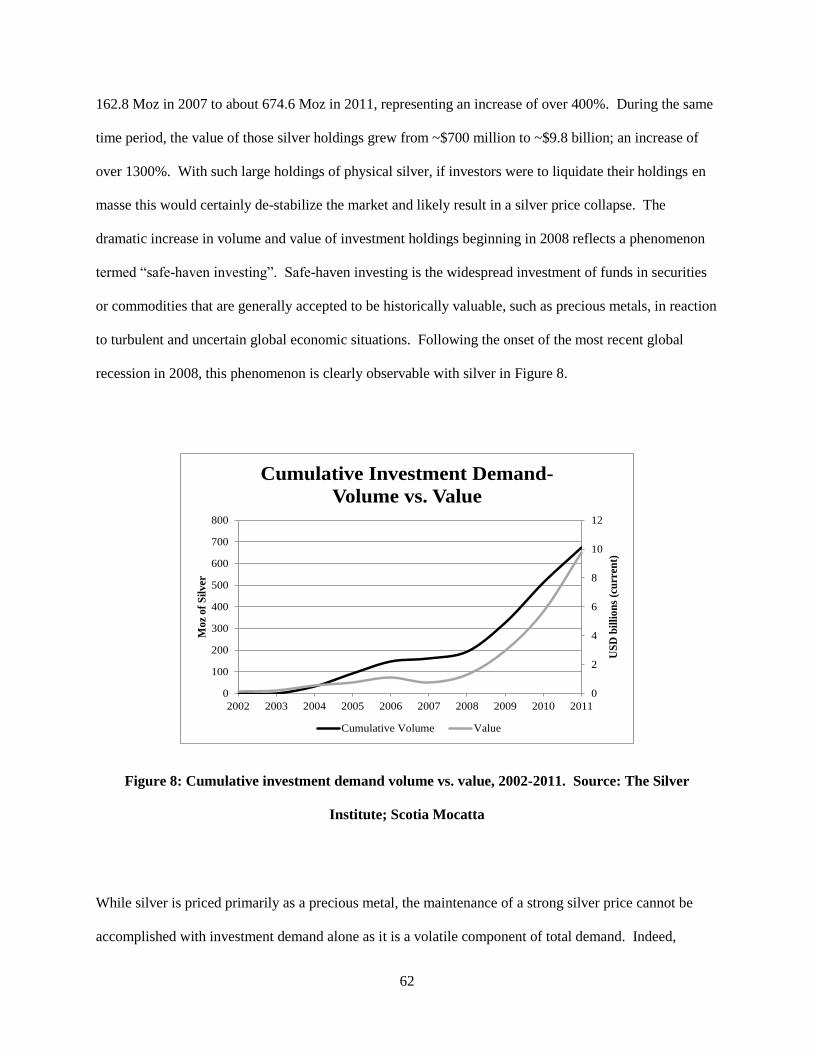
62
162.8 Moz in 2007 to about 674.6 Moz in 2011, representing an increase of over 400%. During the same
time period, the value of those silver holdings grew from ~$700 million to ~$9.8 billion; an increase of
over 1300%. With such large holdings of physical silver, if investors were to liquidate their holdings en
masse this would certainly de-stabilize the market and likely result in a silver price collapse. The
dramatic increase in volume and value of investment holdings beginning in 2008 reflects a phenomenon
termed “safe-haven investing”. Safe-haven investing is the widespread investment of funds in securities
or commodities that are generally accepted to be historically valuable, such as precious metals, in reaction
to turbulent and uncertain global economic situations. Following the onset of the most recent global
recession in 2008, this phenomenon is clearly observable with silver in Figure 8.
Figure 8: Cumulative investment demand volume vs. value, 2002-2011. Source: The Silver
Institute; Scotia Mocatta
While silver is priced primarily as a precious metal, the maintenance of a strong silver price cannot be
accomplished with investment demand alone as it is a volatile component of total demand. Indeed,
0
2
4
6
8
10
12
0
100
200
300
400
500
600
700
800
2002 2003 2004 2005 2006 2007 2008 2009 2010 2011
US
D b
illi
on
s (c
urr
ent)
Mo
z o
f S
ilv
er
Cumulative Investment Demand-
Volume vs. Value
Cumulative Volume Value
63
fabrication demand and its most important sub-sector, industrial demand, are essential to the long-term
maintenance of strong silver prices. Perhaps the most important driver of future fabrication demand is the
various new applications of silver in several industries, namely health, electronics, and renewable energy.
Many of these applications are in the manufacturing of nano-technologies, thus using minute per-unit
amounts of silver. As such, widespread acceptance and use of these products are required before the
impact on silver demand is realized. Other applications of silver such as in plasma displays and as solders
in mobile electronics make use of much more silver but are luxury items whose demand is dependent on
economic recovery. With safe-haven investment demand currently accounting for the growth of supply
and supporting the silver price, growth in demand for these new products is essential to the future stability
and strength of the silver market and prices.
6.1.2 Supply
Silver supply is comprised of two components – (1) mined production, and (2) secondary existing
supplies (recycled metal). The majority of silver supplied by mining operations comes from mines whose
primary product is not silver, but other metals, such as gold and copper. In other words, silver is most
often a secondary product, that is a by-product or co-product of production targeting other commodities.
This is due to its widespread geological occurrence with economic minerals of both gold and base metals.
The significant implication of this is that the majority of mined silver supply is relatively insensitive to
the silver price itself and thus characterized by price inelasticities.
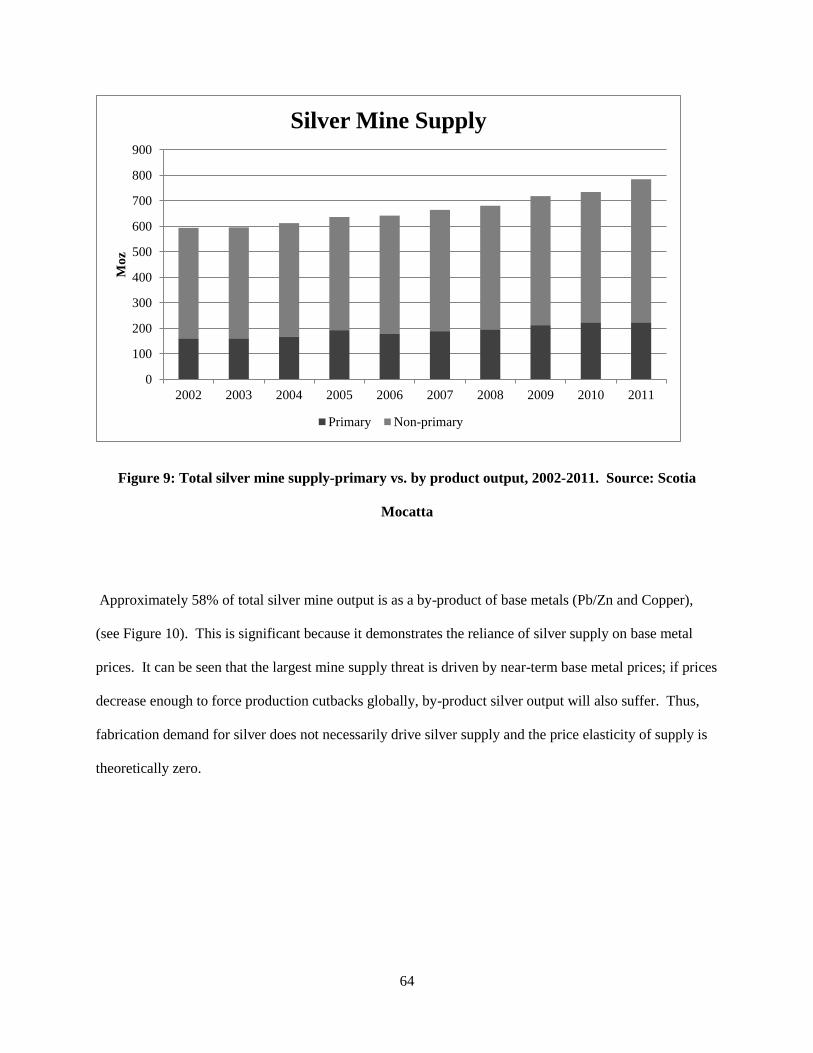
64
Figure 9: Total silver mine supply-primary vs. by product output, 2002-2011. Source: Scotia
Mocatta
Approximately 58% of total silver mine output is as a by-product of base metals (Pb/Zn and Copper),
(see Figure 10). This is significant because it demonstrates the reliance of silver supply on base metal
prices. It can be seen that the largest mine supply threat is driven by near-term base metal prices; if prices
decrease enough to force production cutbacks globally, by-product silver output will also suffer. Thus,
fabrication demand for silver does not necessarily drive silver supply and the price elasticity of supply is
theoretically zero.
0
100
200
300
400
500
600
700
800
900
2002 2003 2004 2005 2006 2007 2008 2009 2010 2011
Mo
zSilver Mine Supply
Primary Non-primary
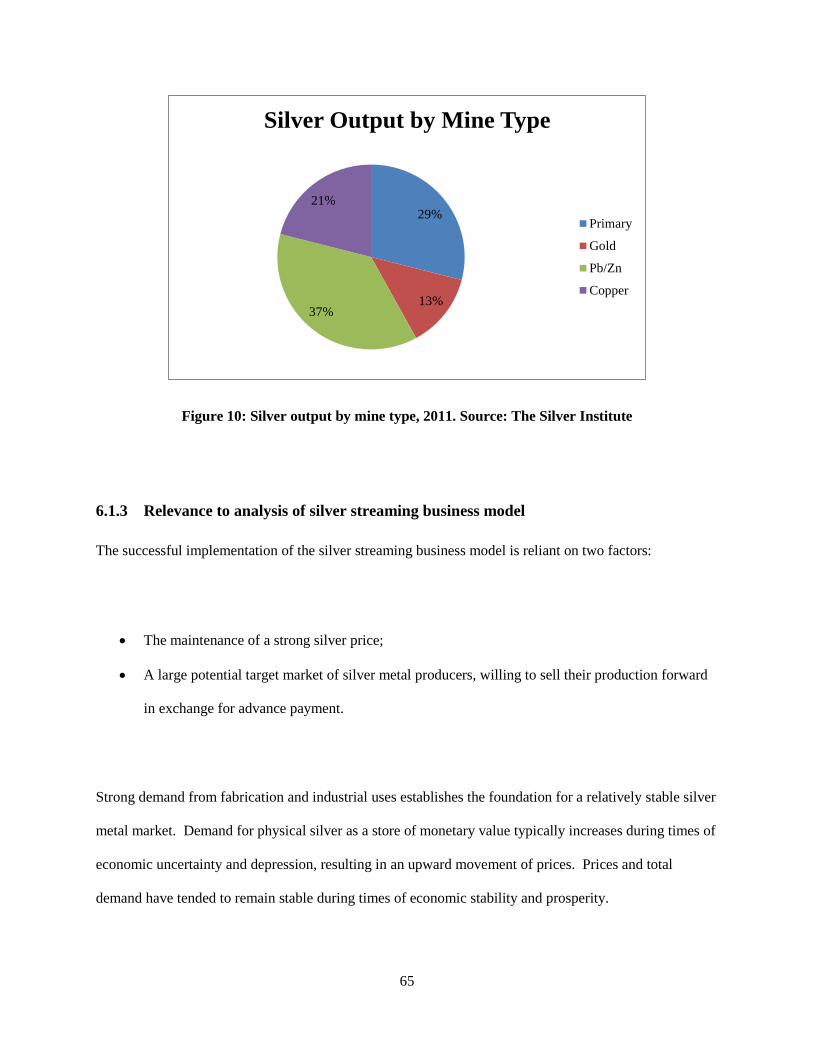
65
Figure 10: Silver output by mine type, 2011. Source: The Silver Institute
6.1.3 Relevance to analysis of silver streaming business model
The successful implementation of the silver streaming business model is reliant on two factors:
The maintenance of a strong silver price;
A large potential target market of silver metal producers, willing to sell their production forward
in exchange for advance payment.
Strong demand from fabrication and industrial uses establishes the foundation for a relatively stable silver
metal market. Demand for physical silver as a store of monetary value typically increases during times of
economic uncertainty and depression, resulting in an upward movement of prices. Prices and total
demand have tended to remain stable during times of economic stability and prosperity.
29%
13%37%
21%
Silver Output by Mine Type
Primary
Gold
Pb/Zn
Copper
66
Today, investment demand, irrespective of emerging new industrial applications, is the main driver
behind an expanding market for physical metal and is the main support for the strong prices currently in
play. New applications of silver can provide a buffer, fill part of the gap which would emerge should
investors sell off significant amounts of their physical silver holdings, and mitigate to some extent the
impact of any declines in investment demand.
On the supply side, since ~70% of silver mine output is as a by-product of other primary commodities, a
large target market of potential clientele exists for silver streaming businesses. The majority of gold and
base metal companies with silver output likely consider silver to be a non-core by-product of the
processes required to extract their primary products. Furthermore, shareholders of gold and base metal
companies are much less likely to object to the forward sale of non-core silver production. Thus, unlike
with other metallic commodities, the majority of mining companies producing silver are probably more
open to exploring such transactions as a means of accessing additional capital.
6.2 Mining finance review
The mining industry is facing a severe shortage of available financing due to several coinciding factors.
To begin with, depressed economic activity has been observed globally over Q1 2012, due primarily to an
economic crisis in Europe and a lacklustre recovery from the recession that began in 2008. This negative
economic outlook is being reflected in generally depressed commodity prices (particularly base metals)
and has direct and negative effects on the valuations of both senior and junior mining companies, alike
(Ernst & Young, 2012). These depressed equity valuations are exacerbated by the widespread perception
that the mining industry is not stable (Global Mining Finance Ltd., 2012). Depressed corporate
valuations are generally not conducive to equity financings, given that completing such transactions at
undervalued stock prices results in undesirable shareholder dilution and is generally viewed negatively by
both stakeholders and the market. Further to this, banks have become increasingly reluctant to lend
67
capital to the mining industry (Turnbull, et al., 2012). This applies particularly to junior mining and
exploration companies, who banks typically view as too risky for their strict risk constraints. All of the
above factors are coinciding at a time when energy prices and the cost of labour are simultaneously
increasing which have led to an increase in overall capital and operating costs (Ernst & Young, 2012).
This upwards capital cost pressure makes mining and exploration companies all the more desperate for
financing as they attempt to bring major and complex development projects into commercial production
and further develop earlier stage exploration projects (Chiu, et al., 2012). In summation, the mining
industry is currently in short supply of financing through traditional means during a notable period of cost
inflation and depressed commodity prices (Ernst & Young, 2012).
The quasi-financing service that the silver streaming business model provides might currently be an
attractive financing option for junior and senior mining companies alike when put into the context of the
current and short term mining finance environment. With the relative unavailability of debt funding and
the significant dilution that equity funding would cause with depressed corporate valuations, selling a
silver stream represents a method of gaining access to capital in a dismal financing environment.
68
Chapter 7
Case Study: Silver Wheaton Perspective
The original seed financing for Silver Wheaton will be reviewed and discussed to demonstrate the method
by which silver streaming businesses can receive initial funding and to explore the rationale of financiers
in providing funding. The results of a financial analysis of a representative set of silver streaming
agreements owned by Silver Wheaton form the basis of a preliminary enterprise analysis of the business
model. A sensitivity analysis highlights the variable factors that affect the value of silver streams the
most. Finally, a simple analysis of Silver Wheaton’s financial future is carried out to ascertain various
silver price floors that the enterprise should be capable of withstanding.
7.1 Initial financing of Silver Wheaton Corp.
Silver Wheaton was originally created as a spinoff business entity from a separate mining company for
the specific strategic purpose of realizing market value from precious metal production that was
previously not being recognized due to the company’s exposure to base metal production. In doing so,
Silver Wheaton undertook its first silver stream agreement with the operator of the San Dimas mine in
2004. This occurred concurrently with a succession of important equity financings. A private placement
was completed in August 2004 for gross proceeds of CAD $70 million followed by a private placement in
November 2004 for gross proceeds of CAD $60.75 million. These financings were followed by a bought
deal in December 2005 which raised another CAD $100 million25 (Silver Wheaton Corp., 2005). The
25 Underwritten by a syndicate led by GMP Securities L.P. and including Scotia Capital Inc., Haywood Securities
Inc. and Fort House Inc. who purchased 15,625,000 units at a price of CAD$6.40 per unit. Each unit was comprised
of one common share and one Series “B” common share purchase warrant; each whole warrant entitled the holder to
purchase one common share at a strike price of CAD$10.00 with an exercise date of December 22, 2010.
69
genesis and inner workings of Silver Wheaton’s initial financing have not been made public and it is not
possible to speculate on the rationale of the underwriter with regard to these initial financings.
Though these equity financings generated a significant amount of seed capital, the capital raised was not
sufficient to underwrite the silver stream purchases that Silver Wheaton put in place over its first 3-4
formative years. Consequently, Silver Wheaton approached the commercial banks and by July 2007 had
secured another USD $500 million in bank credit facilities in the form of a USD $200 million non-
revolving term loan and a USD $300 million revolving term loan from the Bank of Nova Scotia and
BMO Capital Markets who were the co-lead arrangers and administrative agents under the agreement
(Silver Wheaton Corp., 2007).
During this time frame, Silver Wheaton had been working on finalizing a silver purchase agreement with
Goldcorp Inc. for the Penasquito polymetallic project. The deal was consummated on the same day as the
bank credit facilities were announced in July 2007 for the advanced stage development project in Mexico,
which was not yet a producing mine. From 2007-2010, Silver Wheaton was able to arrange deals with
four junior exploration/mining companies, also with no production anticipated for a number of years at
the time the deals were finalized. Junior exploration companies are generally deemed to be too high risk
by commercial banks to qualify for loan capital.
As a start-up company, it would seem that Silver Wheaton should have been regarded by the banks to be
as risky as their junior exploration/mining operating partners, yet banks still saw fit to finance this
company. The explanation for such a discrepancy in risk tolerance can be explained by two primary
factors. The first is that the debt financiers recognized that Silver Wheaton’s management team, largely
composed of former geologists and mining engineers, was experienced enough to properly vet potential
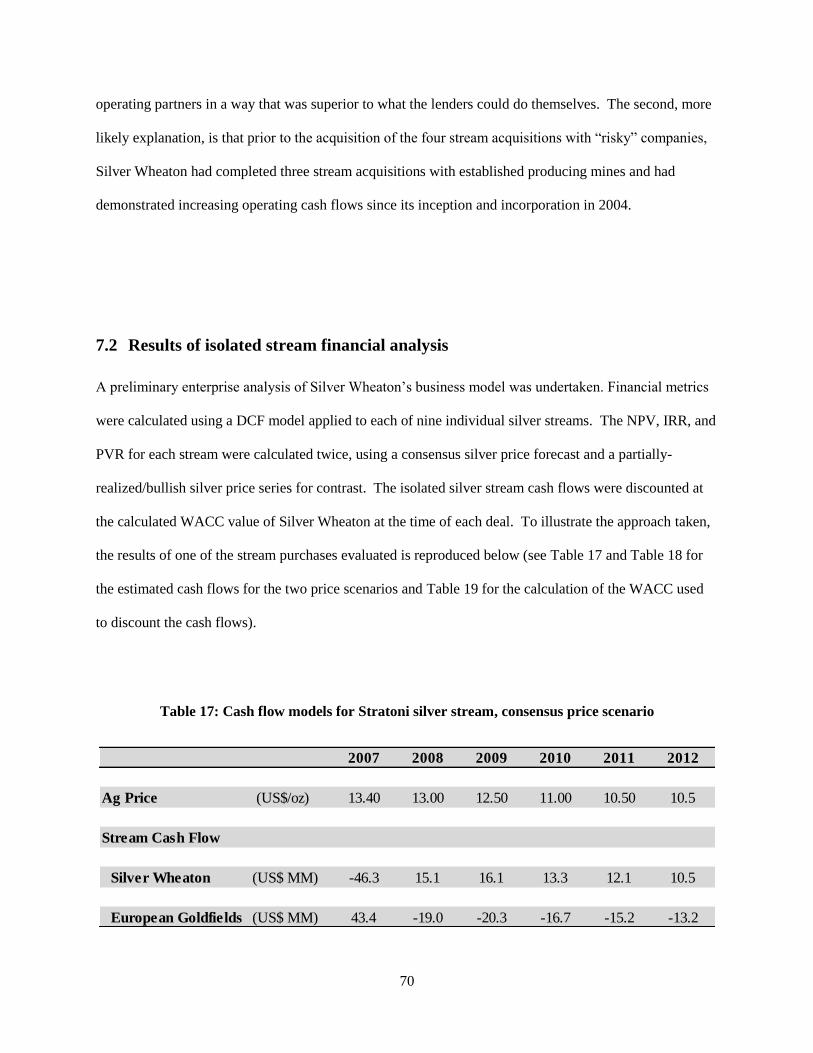
70
operating partners in a way that was superior to what the lenders could do themselves. The second, more
likely explanation, is that prior to the acquisition of the four stream acquisitions with “risky” companies,
Silver Wheaton had completed three stream acquisitions with established producing mines and had
demonstrated increasing operating cash flows since its inception and incorporation in 2004.
7.2 Results of isolated stream financial analysis
A preliminary enterprise analysis of Silver Wheaton’s business model was undertaken. Financial metrics
were calculated using a DCF model applied to each of nine individual silver streams. The NPV, IRR, and
PVR for each stream were calculated twice, using a consensus silver price forecast and a partially-
realized/bullish silver price series for contrast. The isolated silver stream cash flows were discounted at
the calculated WACC value of Silver Wheaton at the time of each deal. To illustrate the approach taken,
the results of one of the stream purchases evaluated is reproduced below (see Table 17 and Table 18 for
the estimated cash flows for the two price scenarios and Table 19 for the calculation of the WACC used
to discount the cash flows).
Table 17: Cash flow models for Stratoni silver stream, consensus price scenario
2007 2008 2009 2010 2011 2012
Ag Price (US$/oz) 13.40 13.00 12.50 11.00 10.50 10.5
Stream Cash Flow
Silver Wheaton (US$ MM) -46.3 15.1 16.1 13.3 12.1 10.5
European Goldfields (US$ MM) 43.4 -19.0 -20.3 -16.7 -15.2 -13.2
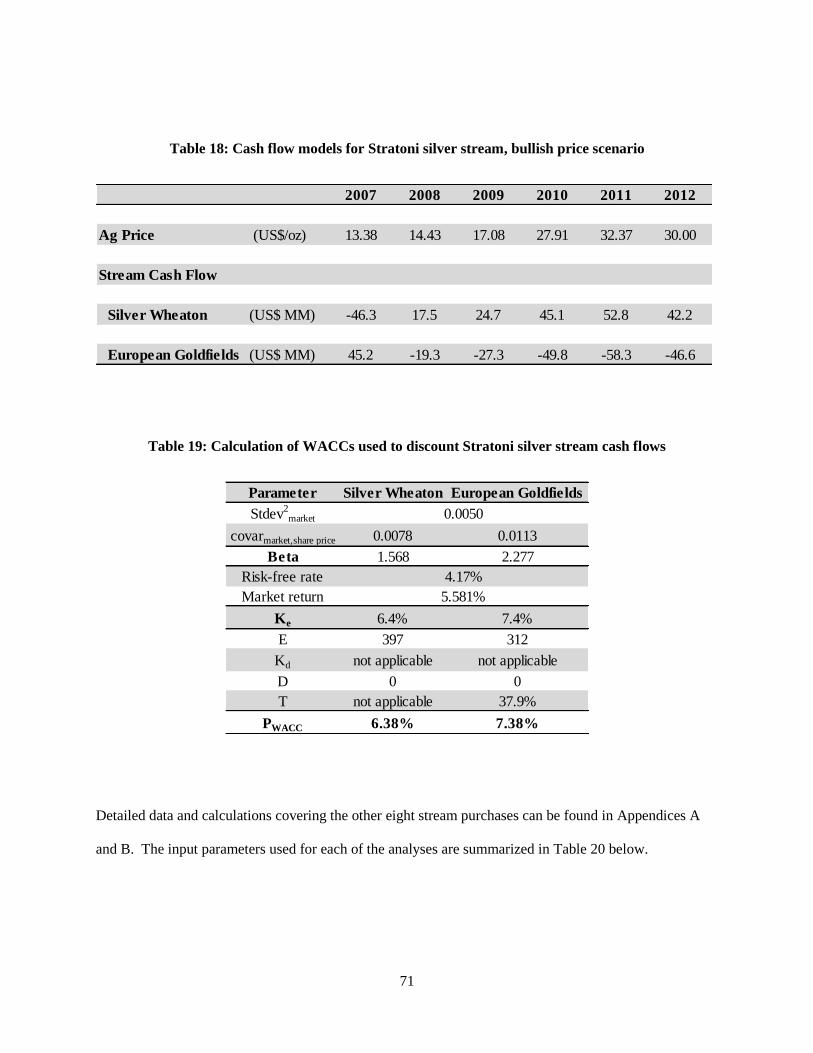
71
Table 18: Cash flow models for Stratoni silver stream, bullish price scenario
Table 19: Calculation of WACCs used to discount Stratoni silver stream cash flows
Detailed data and calculations covering the other eight stream purchases can be found in Appendices A
and B. The input parameters used for each of the analyses are summarized in Table 20 below.
2007 2008 2009 2010 2011 2012
Ag Price (US$/oz) 13.38 14.43 17.08 27.91 32.37 30.00
Stream Cash Flow
Silver Wheaton (US$ MM) -46.3 17.5 24.7 45.1 52.8 42.2
European Goldfields (US$ MM) 45.2 -19.3 -27.3 -49.8 -58.3 -46.6
Parameter Silver Wheaton European Goldfields
Stdev2market
covarmarket,share price 0.0078 0.0113
Beta 1.568 2.277
Risk-free rate
Market return
Ke 6.4% 7.4%
E 397 312
Kd not applicable not applicable
D 0 0
T not applicable 37.9%
PWACC 6.38% 7.38%
5.581%
4.17%
0.0050
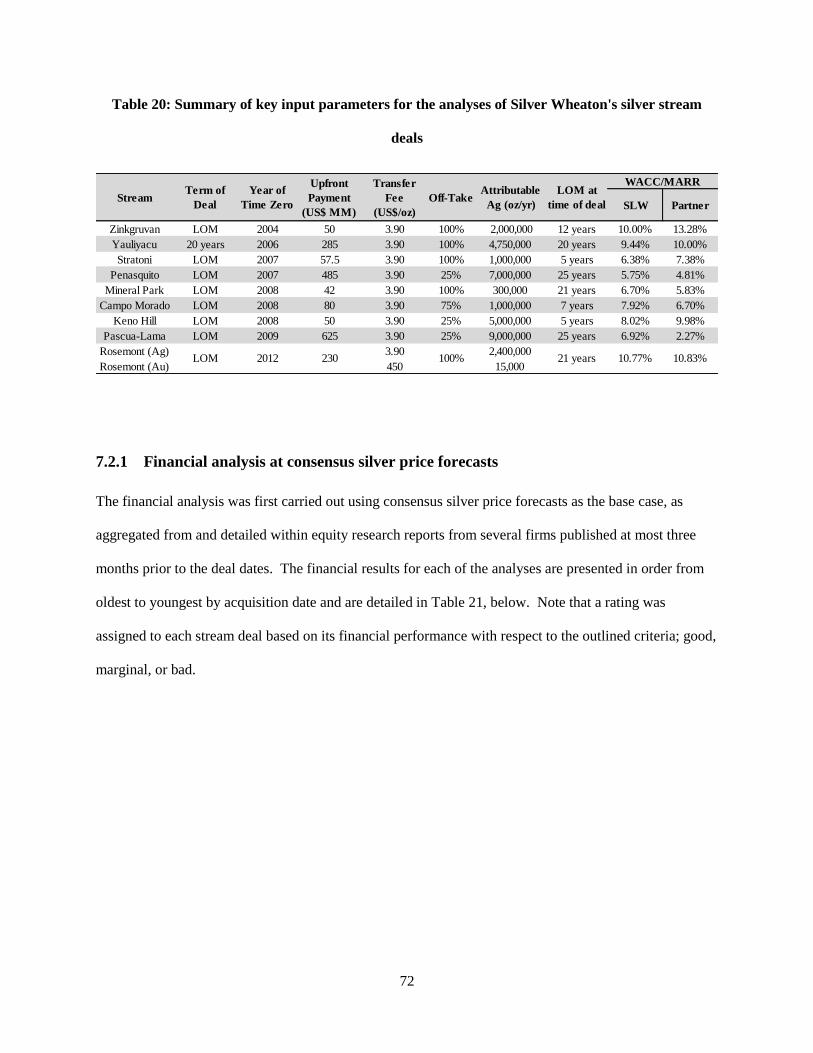
72
Table 20: Summary of key input parameters for the analyses of Silver Wheaton's silver stream
deals
7.2.1 Financial analysis at consensus silver price forecasts
The financial analysis was first carried out using consensus silver price forecasts as the base case, as
aggregated from and detailed within equity research reports from several firms published at most three
months prior to the deal dates. The financial results for each of the analyses are presented in order from
oldest to youngest by acquisition date and are detailed in Table 21, below. Note that a rating was
assigned to each stream deal based on its financial performance with respect to the outlined criteria; good,
marginal, or bad.
SLW Partner
Zinkgruvan LOM 2004 50 3.90 100% 2,000,000 12 years 10.00% 13.28%
Yauliyacu 20 years 2006 285 3.90 100% 4,750,000 20 years 9.44% 10.00%
Stratoni LOM 2007 57.5 3.90 100% 1,000,000 5 years 6.38% 7.38%
Penasquito LOM 2007 485 3.90 25% 7,000,000 25 years 5.75% 4.81%
Mineral Park LOM 2008 42 3.90 100% 300,000 21 years 6.70% 5.83%
Campo Morado LOM 2008 80 3.90 75% 1,000,000 7 years 7.92% 6.70%
Keno Hill LOM 2008 50 3.90 25% 5,000,000 5 years 8.02% 9.98%
Pascua-Lama LOM 2009 625 3.90 25% 9,000,000 25 years 6.92% 2.27%
Rosemont (Ag) 3.90 2,400,000
Rosemont (Au) 450 15,000
Stream
WACC/MARRTerm of
Deal
Year of
Time Zero
Upfront
Payment
(US$ MM)
Transfer
Fee
(US$/oz)
Off-TakeAttributable
Ag (oz/yr)
10.83%10.77%
LOM at
time of deal
LOM 2302012 100% 21 years

73
Table 21: Results of base case silver stream financial analysis, Silver Wheaton perspective
Using the more conservative consensus price series, expected base case financial results for Silver
Wheaton’s silver streams were for the most part found not to be financially positive or profitable. Four of
the nine silver streams yielded positive NPV and PVR values and one of these four, Pascua-Lama, yielded
an IRR value that was equal to Silver Wheaton’s calculated WACC at the time. Three of the four
financially positive streams yielded NPV values that were relatively low. The remaining five silver
streams yielded negative NPV and PVR values, as well as IRR values that were less than calculated
WACC values for the deal times26.
These results suggest that, when evaluated at base case silver prices, the silver streaming business model
produced negative economic results more than 50% of the time. The majority of the streams that are
economically feasible would be expected to generate relatively meagre returns. Particularly disappointing
are the metrics resulting from the significant Pascua-Lama stream, a large scale polymetallic mining
project that, as of the deal date, was expected to deliver an average of ~5.4 Moz per annum to Silver
Wheaton during its estimated commercial life. With a low NPV of USD $14 million and an IRR
26 Recall that a negative IRR value can arise when the NPV is less than the present value of the initial investment.
Stream
NPVWACC
(2011 USD
MM)
IRR PVR WACC Comment
Zinkgruvan -35 -6% -0.59 20% Bad
Yauliyacu -113 2% -0.35 9% Bad
Stratoni 11 15% 0.17 6% Good
Penasquito -98 4% -0.18 6% Bad
Mineral Park 14 12% 0.32 7% Good
Campo Morado -34 -9% -0.42 8% Bad
Keno Hill -3 5% -0.07 8% Bad
Pascua-Lama 14 7% 0.02 7% Marginal
Rosemont 46 14% 0.20 11% Good

74
equivalent to Silver Wheaton’s WACC at the time, the Pascua-Lama stream acquisition barely satisfies
the previously outlined criteria for economic feasibility. Generally, it can be concluded that Silver
Wheaton’s silver streams are not good investments when considered at conservative/base case silver price
scenarios.
7.2.2 Financial analysis at bullish silver price forecasts
For contrast and comparison, the financial analysis was then carried out using bullish/partially-realized
silver price series, as quoted by the LBMA. For an explanation of this price series, refer to Section 0 and
Appendix C. The financial results are presented in Table 22, below.
Table 22: Results of bullish silver stream financial analysis, Silver Wheaton perspective
Using the partially-realized/bullish case silver price series resulted in positive NPV and PVR values, as
well as IRR values that exceed corporate WACC in every case. Of particular interest is the Pascua-Lama
Stream
NPVWACC
(2011 USD
MM)
IRR PVR WACC Comment
Zinkgruvan 56 36% 0.94 20% Good
Yauliyacu 30 12% 0.10 9% Good
Stratoni 104 56% 1.66 6% Good
Penasquito 76 8% 0.15 6% Good
Mineral Park 121 35% 2.70 7% Good
Campo Morado 7 11% 0.08 8% Good
Keno Hill 51 58% 1.12 8% Good
Pascua-Lama 1052 25% 1.87 7% Good
Rosemont 365 33% 1.54 11% Good
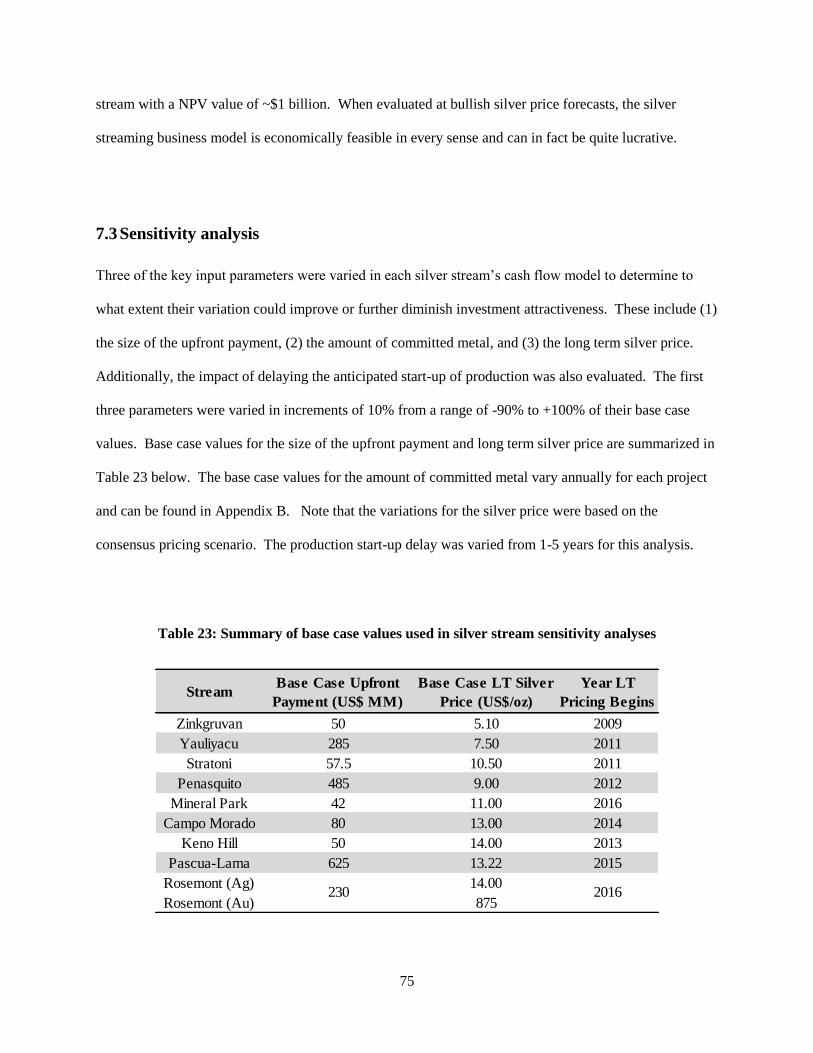
75
stream with a NPV value of ~$1 billion. When evaluated at bullish silver price forecasts, the silver
streaming business model is economically feasible in every sense and can in fact be quite lucrative.
7.3 Sensitivity analysis
Three of the key input parameters were varied in each silver stream’s cash flow model to determine to
what extent their variation could improve or further diminish investment attractiveness. These include (1)
the size of the upfront payment, (2) the amount of committed metal, and (3) the long term silver price.
Additionally, the impact of delaying the anticipated start-up of production was also evaluated. The first
three parameters were varied in increments of 10% from a range of -90% to +100% of their base case
values. Base case values for the size of the upfront payment and long term silver price are summarized in
Table 23 below. The base case values for the amount of committed metal vary annually for each project
and can be found in Appendix B. Note that the variations for the silver price were based on the
consensus pricing scenario. The production start-up delay was varied from 1-5 years for this analysis.
Table 23: Summary of base case values used in silver stream sensitivity analyses
StreamBase Case Upfront
Payment (US$ MM)
Base Case LT Silver
Price (US$/oz)
Year LT
Pricing Begins
Zinkgruvan 50 5.10 2009
Yauliyacu 285 7.50 2011
Stratoni 57.5 10.50 2011
Penasquito 485 9.00 2012
Mineral Park 42 11.00 2016
Campo Morado 80 13.00 2014
Keno Hill 50 14.00 2013
Pascua-Lama 625 13.22 2015
Rosemont (Ag) 14.00
Rosemont (Au) 8752016230
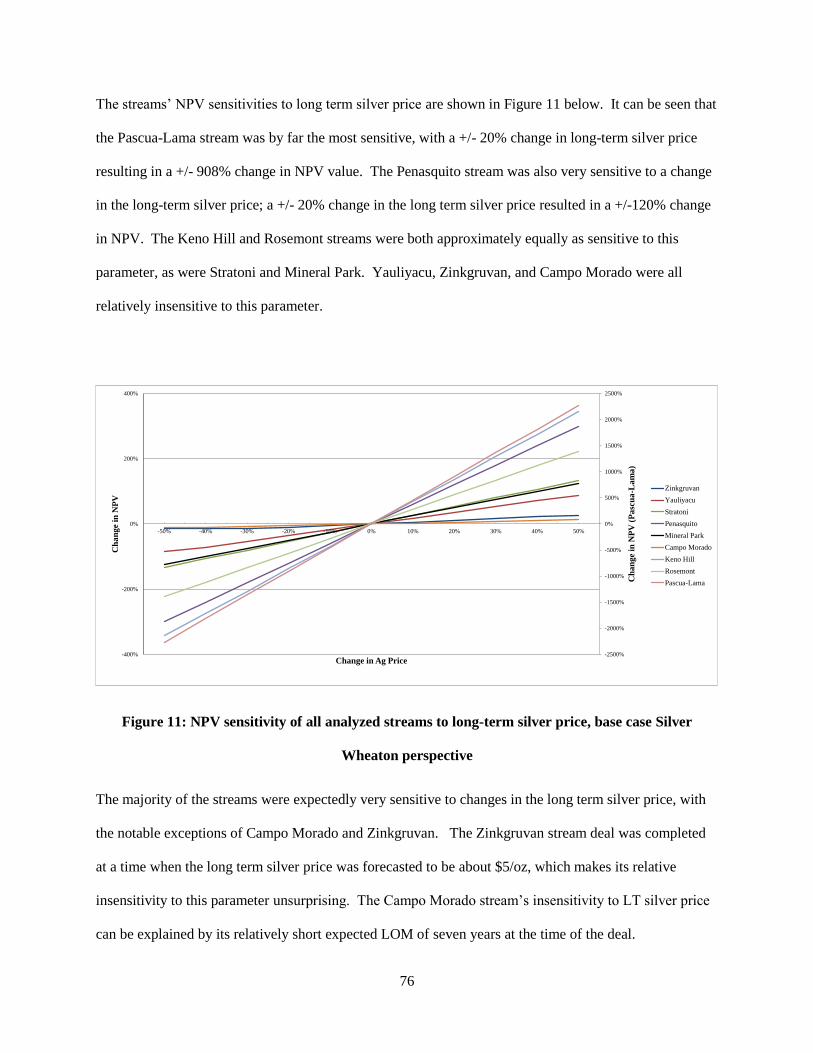
76
The streams’ NPV sensitivities to long term silver price are shown in Figure 11 below. It can be seen that
the Pascua-Lama stream was by far the most sensitive, with a +/- 20% change in long-term silver price
resulting in a +/- 908% change in NPV value. The Penasquito stream was also very sensitive to a change
in the long-term silver price; a +/- 20% change in the long term silver price resulted in a +/-120% change
in NPV. The Keno Hill and Rosemont streams were both approximately equally as sensitive to this
parameter, as were Stratoni and Mineral Park. Yauliyacu, Zinkgruvan, and Campo Morado were all
relatively insensitive to this parameter.
Figure 11: NPV sensitivity of all analyzed streams to long-term silver price, base case Silver
Wheaton perspective
The majority of the streams were expectedly very sensitive to changes in the long term silver price, with
the notable exceptions of Campo Morado and Zinkgruvan. The Zinkgruvan stream deal was completed
at a time when the long term silver price was forecasted to be about $5/oz, which makes its relative
insensitivity to this parameter unsurprising. The Campo Morado stream’s insensitivity to LT silver price
can be explained by its relatively short expected LOM of seven years at the time of the deal.
-2500%
-2000%
-1500%
-1000%
-500%
0%
500%
1000%
1500%
2000%
2500%
-400%
-200%
0%
200%
400%
-50% -40% -30% -20% -10% 0% 10% 20% 30% 40% 50%
Ch
an
ge
in N
PV
(P
asc
ua
-La
ma
)
Ch
an
ge
in N
PV
Change in Ag Price
Zinkgruvan
Yauliyacu
Stratoni
Penasquito
Mineral Park
Campo Morado
Keno Hill
Rosemont
Pascua-Lama
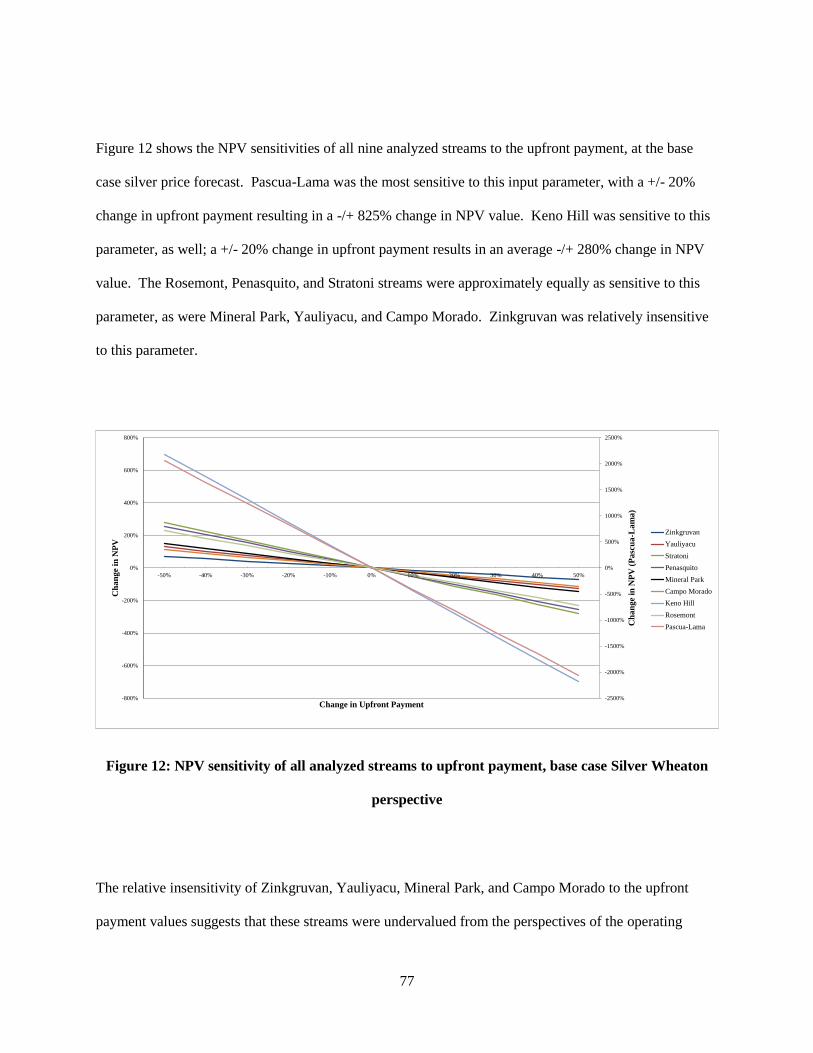
77
Figure 12 shows the NPV sensitivities of all nine analyzed streams to the upfront payment, at the base
case silver price forecast. Pascua-Lama was the most sensitive to this input parameter, with a +/- 20%
change in upfront payment resulting in a -/+ 825% change in NPV value. Keno Hill was sensitive to this
parameter, as well; a +/- 20% change in upfront payment results in an average -/+ 280% change in NPV
value. The Rosemont, Penasquito, and Stratoni streams were approximately equally as sensitive to this
parameter, as were Mineral Park, Yauliyacu, and Campo Morado. Zinkgruvan was relatively insensitive
to this parameter.
Figure 12: NPV sensitivity of all analyzed streams to upfront payment, base case Silver Wheaton
perspective
The relative insensitivity of Zinkgruvan, Yauliyacu, Mineral Park, and Campo Morado to the upfront
payment values suggests that these streams were undervalued from the perspectives of the operating
-2500%
-2000%
-1500%
-1000%
-500%
0%
500%
1000%
1500%
2000%
2500%
-800%
-600%
-400%
-200%
0%
200%
400%
600%
800%
-50% -40% -30% -20% -10% 0% 10% 20% 30% 40% 50%
Ch
an
ge
in N
PV
(P
asc
ua
-La
ma
)
Ch
an
ge
in N
PV
Change in Upfront Payment
Zinkgruvan
Yauliyacu
Stratoni
Penasquito
Mineral Park
Campo Morado
Keno Hill
Rosemont
Pascua-Lama
78
partners and that Silver Wheaton underpaid for the forward silver production in each of these deals. Both
the Zinkgruvan and Yauliyacu streams occurred at times of depressed silver prices, which would partially
justify their owners’ underselling of forward silver production. In contrast, the Campo Morado and
Mineral Park deals occurred during times of rising silver prices. Given that Farallon and Mercator were
junior mining companies looking for financing at the times of each respective deal, it is not necessarily
surprising that they undersold their forward production in exchange for necessary capital that might not
have been readily available to them through traditional means of financing.
Figure 13 shows the NPV sensitivities of all nine streams to changes in silver production27 with all other
parameters held at base case values. As can be seen, the Zinkgruvan, Yauliyacu, and Campo Morado
streams were all relatively insensitive to silver production. Pascua-Lama was the most sensitive stream to
this parameter with a +/-20% change in silver production resulting in a +/-845% change in NPV. The
Keno Hill stream was the next most sensitive to this parameter with a +/-20% change resulting in a +/-
260% change in NPV. The Stratoni and Rosemont streams were only slightly less sensitive to silver
production than Keno Hill, and the Penasquito and Mineral Park streams were approximately equally as
sensitive.
27 Precious metal production for Rosemont.
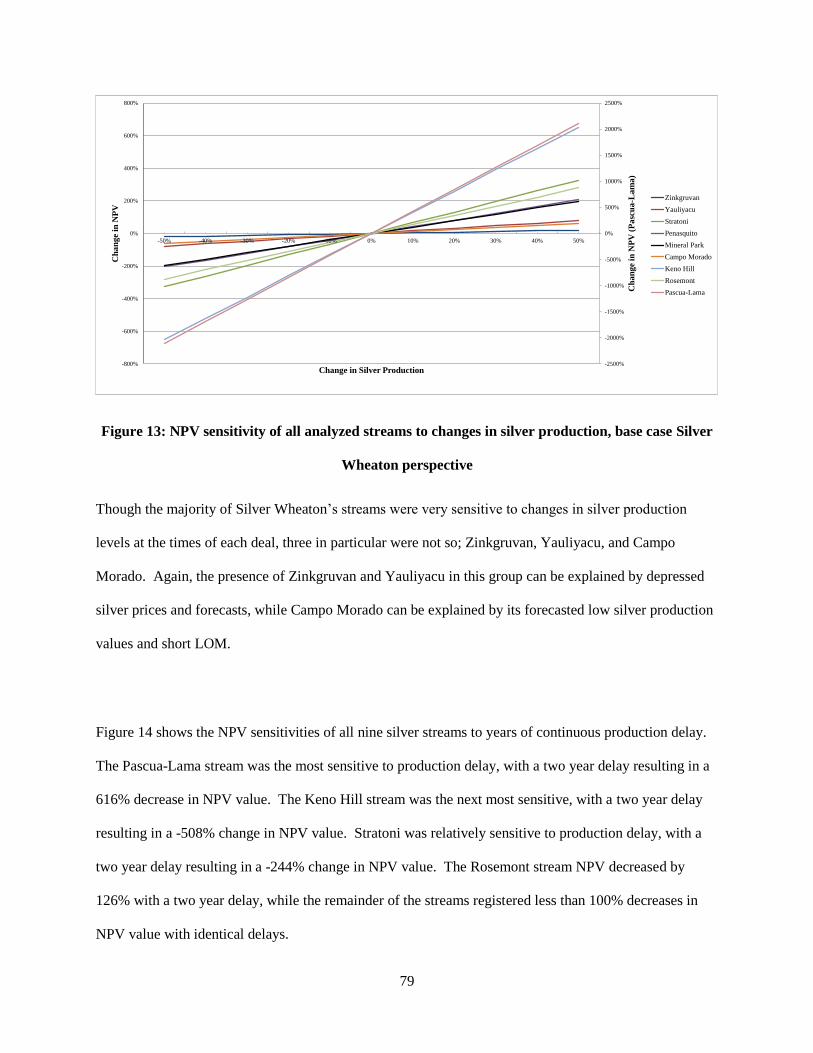
79
Figure 13: NPV sensitivity of all analyzed streams to changes in silver production, base case Silver
Wheaton perspective
Though the majority of Silver Wheaton’s streams were very sensitive to changes in silver production
levels at the times of each deal, three in particular were not so; Zinkgruvan, Yauliyacu, and Campo
Morado. Again, the presence of Zinkgruvan and Yauliyacu in this group can be explained by depressed
silver prices and forecasts, while Campo Morado can be explained by its forecasted low silver production
values and short LOM.
Figure 14 shows the NPV sensitivities of all nine silver streams to years of continuous production delay.
The Pascua-Lama stream was the most sensitive to production delay, with a two year delay resulting in a
616% decrease in NPV value. The Keno Hill stream was the next most sensitive, with a two year delay
resulting in a -508% change in NPV value. Stratoni was relatively sensitive to production delay, with a
two year delay resulting in a -244% change in NPV value. The Rosemont stream NPV decreased by
126% with a two year delay, while the remainder of the streams registered less than 100% decreases in
NPV value with identical delays.
-2500%
-2000%
-1500%
-1000%
-500%
0%
500%
1000%
1500%
2000%
2500%
-800%
-600%
-400%
-200%
0%
200%
400%
600%
800%
-50% -40% -30% -20% -10% 0% 10% 20% 30% 40% 50%
Ch
an
ge
in N
PV
(P
asc
ua
-La
ma
)
Ch
an
ge
in N
PV
Change in Silver Production
Zinkgruvan
Yauliyacu
Stratoni
Penasquito
Mineral Park
Campo Morado
Keno Hill
Rosemont
Pascua-Lama
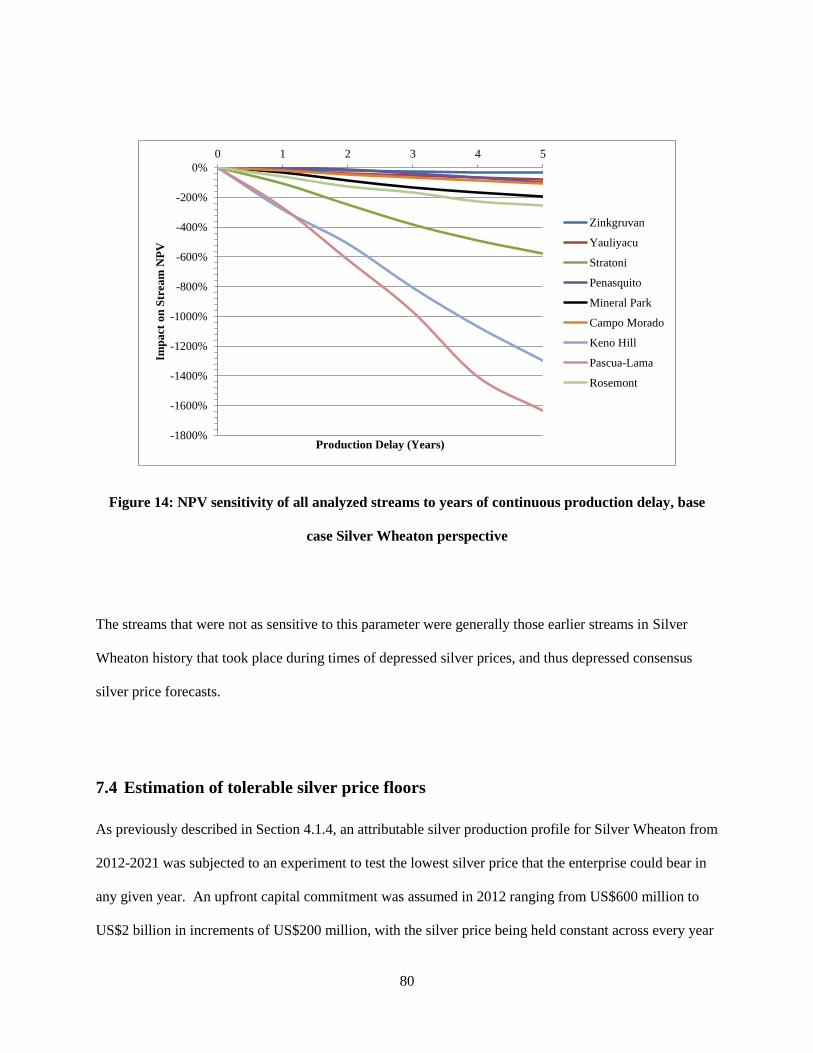
80
Figure 14: NPV sensitivity of all analyzed streams to years of continuous production delay, base
case Silver Wheaton perspective
The streams that were not as sensitive to this parameter were generally those earlier streams in Silver
Wheaton history that took place during times of depressed silver prices, and thus depressed consensus
silver price forecasts.
7.4 Estimation of tolerable silver price floors
As previously described in Section 4.1.4, an attributable silver production profile for Silver Wheaton from
2012-2021 was subjected to an experiment to test the lowest silver price that the enterprise could bear in
any given year. An upfront capital commitment was assumed in 2012 ranging from US$600 million to
US$2 billion in increments of US$200 million, with the silver price being held constant across every year
-1800%
-1600%
-1400%
-1200%
-1000%
-800%
-600%
-400%
-200%
0%
0 1 2 3 4 5Im
pa
ct o
n S
trea
m N
PV
Production Delay (Years)
Zinkgruvan
Yauliyacu
Stratoni
Penasquito
Mineral Park
Campo Morado
Keno Hill
Pascua-Lama
Rosemont
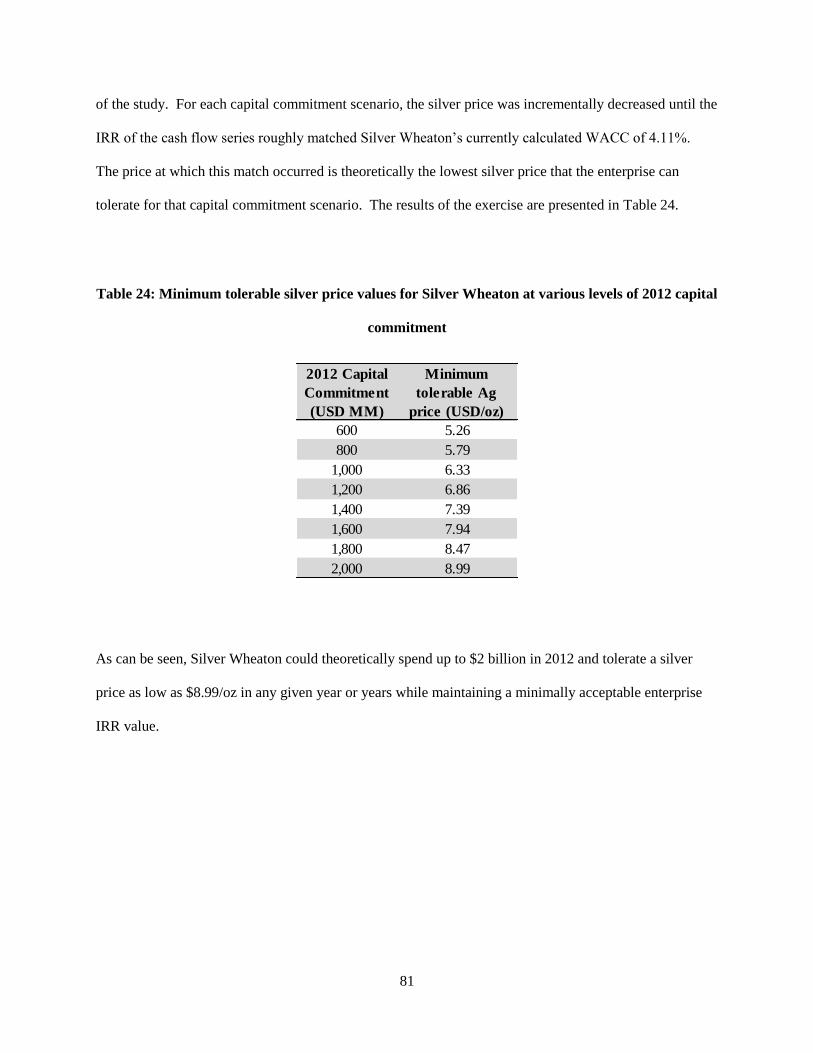
81
of the study. For each capital commitment scenario, the silver price was incrementally decreased until the
IRR of the cash flow series roughly matched Silver Wheaton’s currently calculated WACC of 4.11%.
The price at which this match occurred is theoretically the lowest silver price that the enterprise can
tolerate for that capital commitment scenario. The results of the exercise are presented in Table 24.
Table 24: Minimum tolerable silver price values for Silver Wheaton at various levels of 2012 capital
commitment
As can be seen, Silver Wheaton could theoretically spend up to $2 billion in 2012 and tolerate a silver
price as low as $8.99/oz in any given year or years while maintaining a minimally acceptable enterprise
IRR value.
2012 Capital
Commitment
(USD MM)
Minimum
tolerable Ag
price (USD/oz)
600 5.26
800 5.79
1,000 6.33
1,200 6.86
1,400 7.39
1,600 7.94
1,800 8.47
2,000 8.99
82
7.5 Discussion
7.5.1 Base case vs. bullish stream cash flows
While application of a bullish silver price series yielded the obvious outcome of better stream economics
than using typically conservative consensus price estimates (base case), what is particularly interesting is
the economic marginality of the base case stream economics. Seven of the nine base case stream NPV
values fell within the range of -$50 to $50 million. The majority of Silver Wheaton’s organically-
generated silver streams evaluated at base case consensus pricing turned out to be marginally economic.
Making investments that yield marginal economic returns are not considered to be good business practice.
Shifting to an IRR analysis, of the nine streams, only four generated IRR values that met or exceeded
their respective corporate WACC values at deal time. The average base case stream IRR value of 5% is
almost half as much as the average corporate WACC value of 9%, which does not satisfy the minimum
criteria for investment. Indeed, the highest IRR value across the entire portfolio is from the Stratoni
stream at 15%. This is partially attributable to the fact that the Stratoni stream was already a producing
operation at the time of the deal, thus reducing the typical first year negative cash flow by approximately
19% of what it would have been had Stratoni been a development project with no production from the
start. Clearly, Silver Wheaton’s silver streams are not good investments when considered at
consensus/conservative/base case silver price scenarios. Given that the market at large consistently
forecasted the short term price of silver at values that resulted in marginal economic feasibility for the
majority of Silver Wheaton’s formative investments, it would seem that the decision of Silver Wheaton to
undertake these investments was based on a belief in the robustness of silver’s economic fundamentals in
the medium and long term.
In stark contrast, all of the silver streams evaluated at the partially-realized and/or bullish silver price
series results in excellent project economics by all standards. While this is to be expected based on the
sensitivity analyses presented, all stream economics are exceptionally profitable and deliver excellent

83
value to shareholders under this price scenario. This suggests a business strategy that is almost entirely
reliant on a positive outlook for the long-term silver price. It would seem that Silver Wheaton
management applied a more optimistic price scenario to their evaluation of the different stream purchase
opportunities available to them.
7.5.2 Stream life and general comments on portfolio diversity
As can be seen in the abbreviated Table 25 below (extracted from Table 20), the majority of Silver
Wheaton’s silver streams are with mines or development projects that are expected to have moderately
long or long lives (10+ and 20+ years, respectively). Three had relatively short lives at deal times (less
than 10 years). It is important to note that all evaluation metrics are impacted negatively by a shorter
stream life. With a shorter series of cash flows, there are a lesser number of discounted positive cash
flows to offset the initial negative cash flow(s) due to the upfront payment, which inherently reduces the
NPV, IRR, and PVR values. Conversely, these negative effects on profitability metrics can be offset by
highly favourable off-take agreements at a low transfer price resulting in Silver Wheaton taking a very
large proportion of the mine/project’s silver production, as well as reduced uncertainty regarding silver
price stability due to a shorter time period.

84
Table 25: Lives of Silver Wheaton streams at deal times
Nevertheless, Silver Wheaton did deals with three short life mines/projects that either had a history of
mining/exploration success or significant potential for the addition of reserves, as is the case with Campo
Morado. Incidentally, both Keno Hill and Campo Morado have achieved full commercial production as
of the cut-off date.
Silver Wheaton’s diverse portfolio of mines allows it to spread risk across several ‘calibres’ of operating
partners (i.e. junior, mid-size, and senior mining companies) and across several parts of the mining cycle.
This has resulted in a generally reliable group of assets that can be expected to generate positive cash flow
on an annual basis for the group of investments, so long as the price of silver does not fall below the
transfer fee in any given year. It can thus be concluded that, silver price notwithstanding, Silver Wheaton
has practiced sufficiently good business in its construction of a diverse group of silver purchase
agreements, providing an excellent example of how to manage risk as effectively as possible within the
constraints of the silver streaming business model.
Stream Life at Deal Time
Zinkgruvan 13
Yauliyacu 20
Stratoni 6
Penasquito 26
Mineral Park 25
Campo Morado 7
Keno Hill 5
Pascua-Lama 25
Rosemont 21
85
7.5.3 Silver purchase agreement terms
The terms of the standard silver purchase agreement are extremely conducive to sustained and predictable
positive cash flows, assuming a price of silver that is greater than the transfer fee. Its simplicity allows
for fixed operating costs (i.e. the transfer fee) for the entire life of the agreement, effectively eliminating
one of the two major variables that affect the operating cash flows of traditional business models, with
revenue being the other.
7.5.4 Sustainability of silver streaming business model as an enterprise
Silver Wheaton’s forecasted cash flow model based on their 2012 portfolio of silver streams suggests that
Silver Wheaton can tolerate very low silver prices while still maintaining a minimum enterprise IRR that
is equivalent to current corporate WACC. This suggests that a well-established silver streaming business
is generally sustainable with respect to silver price. Silver Wheaton, with its well-developed and diverse
portfolio of silver streams, has enough producing and near-producing silver streams from mines with a
variety of primary commodity products to sufficiently weather the bottom of a silver price cycle. The
same cannot necessarily be said for a silver streaming business with less total streams, a more limited
variety of primary mine types, less producing streams, or any combination of these factors. Furthermore,
tax analysis was not carried out in the development of the enterprise model as Silver Wheaton does not
currently pay any income tax; an untaxed silver streaming enterprise is unlikely to occur with another
business entity and the introduction of taxation to the model could greatly affect its sustainability.
7.5.5 Risk mitigation through completion guarantees
In some cases, a silver purchase contract can include a provision for the optional repayment of Silver
Wheaton’s upfront capital contribution, specifically in the event of excessive project delay or
86
cancellation. This provision is often termed the “completion guarantee” or “completion test” and often
takes the form of one or more deadlines by which the operating partner must complete a specific
milestone or set of milestones related to project construction or production ramp-up; failure to meet a
deadline would afford Silver Wheaton the right to demand the return of the upfront payment, in part or in
full. As an example, the original Pascua-Lama silver purchase agreement required “Barrick to complete
Pascua-Lama to at least 75% of design capacity by December 31, 2015” (Silver Wheaton Corp., 2013a).
In the event that this condition is not satisfied, Silver Wheaton would be entitled to the repayment of the
initial capital contribution of US$625 million less any silver delivered under the contract28 up to that point
in time. This completion guarantee is not necessarily a part of every silver purchase contract and seems
to be included as a provision in streams with large and complex development projects. Completion
guarantees provide some considerable incentives for an operating partner to build projects as efficiently as
possible and in a timely manner while simultaneously providing Silver Wheaton with significant
insulation to project risk.
28 This is in reference to the silver that has been and is still to be delivered to Silver Wheaton from Barrick’s
Lagunas Norte, Pierina, and Veladero mines until December 31, 2015, as per the original contract.
87
Chapter 8
Case Study: Silver Wheaton Operating Partner Perspective
The purpose of this chapter is to present an analysis of the viability of the silver streaming business model
from the perspective of the stream seller, using a select subset of Silver Wheaton’s operating partners as a
case study. The financial analysis of the nine silver stream agreements allows one to project the value of
the selling decision of the mine explorer/operators. Sensitivity analyses were also applied to demonstrate
the influence that some variable input parameters would have on the financial value of the silver streams
to operating partner companies. Understanding the viability of such arrangements from the perspective of
the stream seller is important for assessing the sustainability of the business model. If it works well for
the sellers, then one might expect this business model to continue to fill a “financing” niche. If it proves
not to be a “win” for the sellers, the client seller base may ultimately dry up. A discussion will ensue
regarding the internal drivers that cause operating partner companies to pursue stream financing in lieu of
traditional financing means. The possibilities for future target markets and operating partner types are
also discussed.
8.1 Results of isolated stream financial analysis
The financial metrics previously outlined were calculated from the DCF models of each of nine individual
silver streams and were evaluated at both a consensus silver price forecast as of the times of each deal and
a partially-realized/bullish silver price series for contrast. The isolated silver stream cash flows were
discounted at the calculated WACC value of each individual operating partner corporation at the time of
each deal. Note that the IRR for each stream deal was omitted due to multiple contradictory results with
respect to calculated NPV. For detailed information regarding the development of isolated silver stream
cash flow models and the calculation of WACC in each instance, refer to Appendix B and Appendix A,
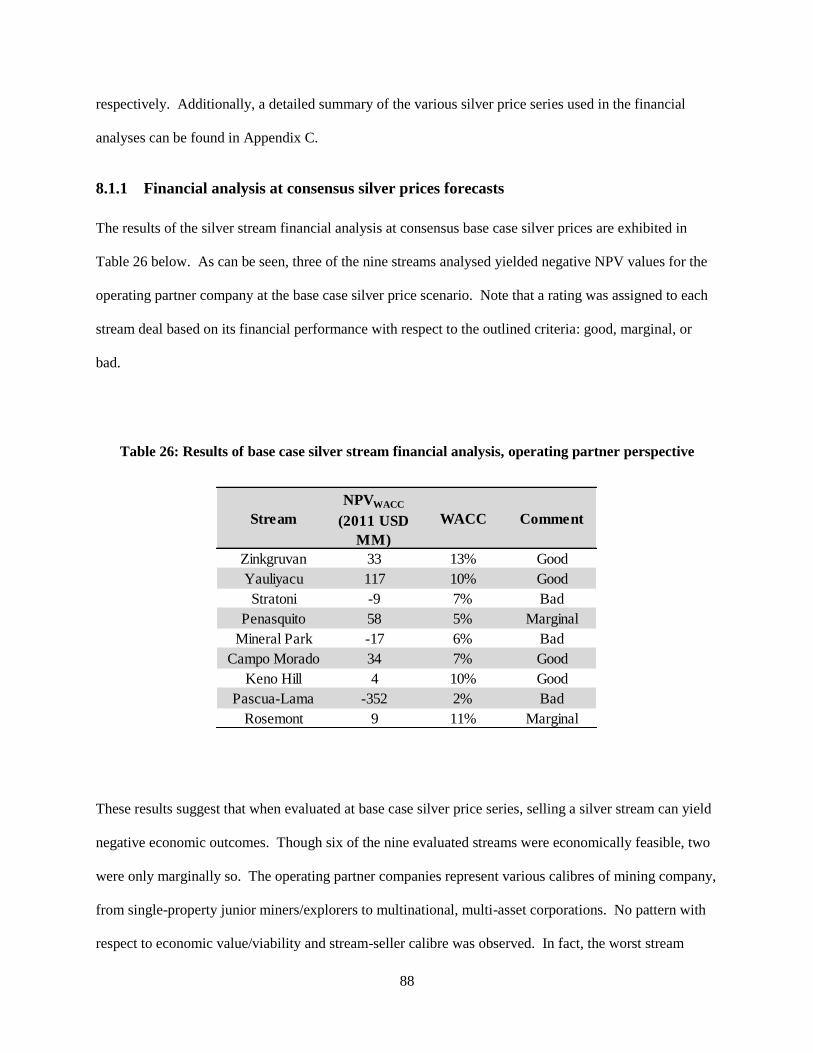
88
respectively. Additionally, a detailed summary of the various silver price series used in the financial
analyses can be found in Appendix C.
8.1.1 Financial analysis at consensus silver prices forecasts
The results of the silver stream financial analysis at consensus base case silver prices are exhibited in
Table 26 below. As can be seen, three of the nine streams analysed yielded negative NPV values for the
operating partner company at the base case silver price scenario. Note that a rating was assigned to each
stream deal based on its financial performance with respect to the outlined criteria: good, marginal, or
bad.
Table 26: Results of base case silver stream financial analysis, operating partner perspective
These results suggest that when evaluated at base case silver price series, selling a silver stream can yield
negative economic outcomes. Though six of the nine evaluated streams were economically feasible, two
were only marginally so. The operating partner companies represent various calibres of mining company,
from single-property junior miners/explorers to multinational, multi-asset corporations. No pattern with
respect to economic value/viability and stream-seller calibre was observed. In fact, the worst stream
Stream
NPVWACC
(2011 USD
MM)
WACC Comment
Zinkgruvan 33 13% Good
Yauliyacu 117 10% Good
Stratoni -9 7% Bad
Penasquito 58 5% Marginal
Mineral Park -17 6% Bad
Campo Morado 34 7% Good
Keno Hill 4 10% Good
Pascua-Lama -352 2% Bad
Rosemont 9 11% Marginal
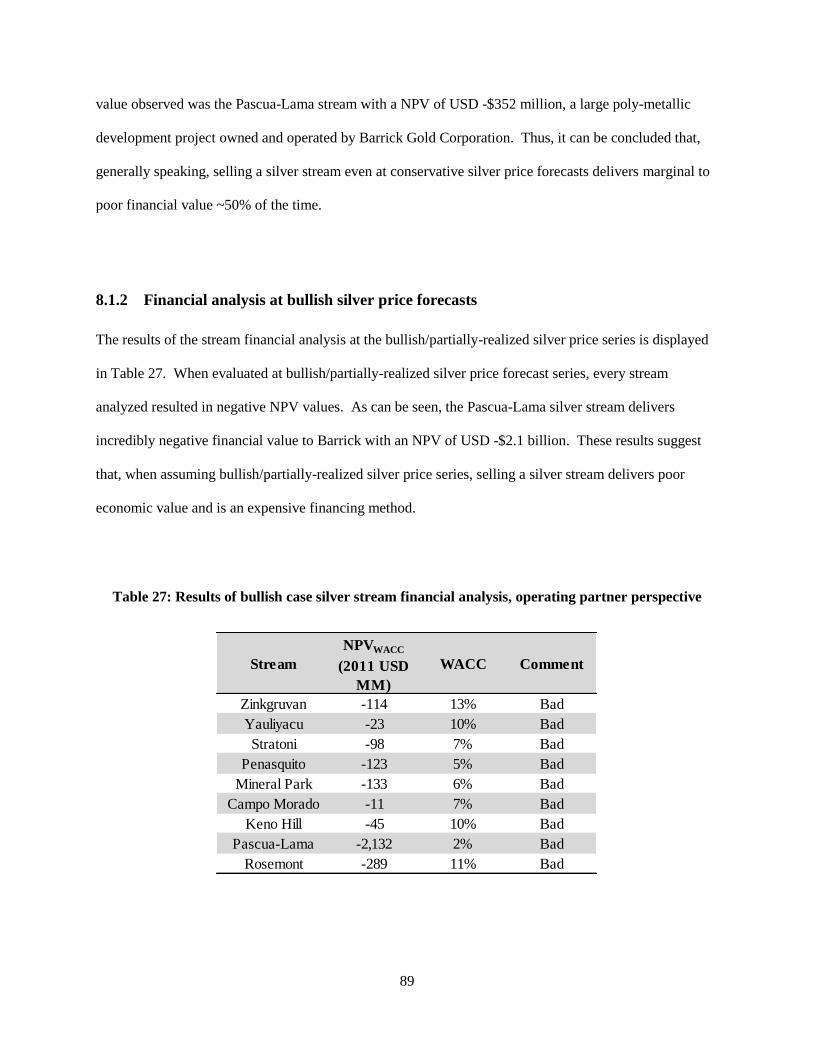
89
value observed was the Pascua-Lama stream with a NPV of USD -$352 million, a large poly-metallic
development project owned and operated by Barrick Gold Corporation. Thus, it can be concluded that,
generally speaking, selling a silver stream even at conservative silver price forecasts delivers marginal to
poor financial value ~50% of the time.
8.1.2 Financial analysis at bullish silver price forecasts
The results of the stream financial analysis at the bullish/partially-realized silver price series is displayed
in Table 27. When evaluated at bullish/partially-realized silver price forecast series, every stream
analyzed resulted in negative NPV values. As can be seen, the Pascua-Lama silver stream delivers
incredibly negative financial value to Barrick with an NPV of USD -$2.1 billion. These results suggest
that, when assuming bullish/partially-realized silver price series, selling a silver stream delivers poor
economic value and is an expensive financing method.
Table 27: Results of bullish case silver stream financial analysis, operating partner perspective
Stream
NPVWACC
(2011 USD
MM)
WACC Comment
Zinkgruvan -114 13% Bad
Yauliyacu -23 10% Bad
Stratoni -98 7% Bad
Penasquito -123 5% Bad
Mineral Park -133 6% Bad
Campo Morado -11 7% Bad
Keno Hill -45 10% Bad
Pascua-Lama -2,132 2% Bad
Rosemont -289 11% Bad
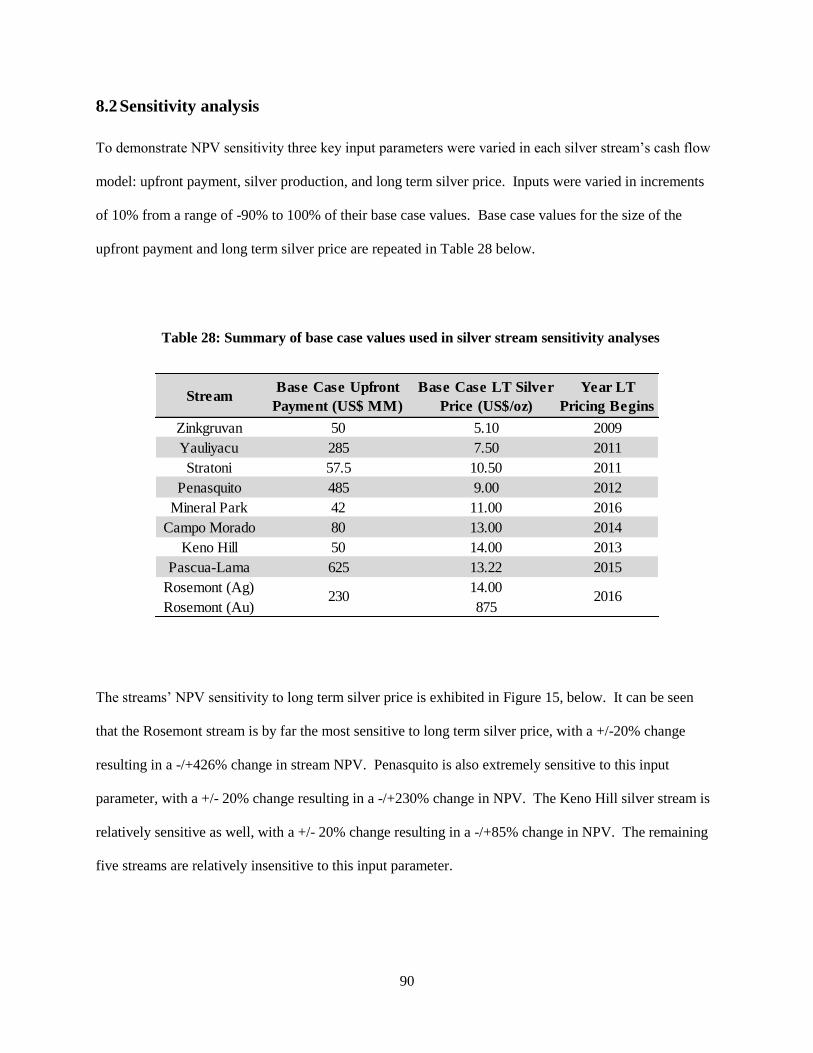
90
8.2 Sensitivity analysis
To demonstrate NPV sensitivity three key input parameters were varied in each silver stream’s cash flow
model: upfront payment, silver production, and long term silver price. Inputs were varied in increments
of 10% from a range of -90% to 100% of their base case values. Base case values for the size of the
upfront payment and long term silver price are repeated in Table 28 below.
Table 28: Summary of base case values used in silver stream sensitivity analyses
The streams’ NPV sensitivity to long term silver price is exhibited in Figure 15, below. It can be seen
that the Rosemont stream is by far the most sensitive to long term silver price, with a +/-20% change
resulting in a -/+426% change in stream NPV. Penasquito is also extremely sensitive to this input
parameter, with a +/- 20% change resulting in a -/+230% change in NPV. The Keno Hill silver stream is
relatively sensitive as well, with a +/- 20% change resulting in a -/+85% change in NPV. The remaining
five streams are relatively insensitive to this input parameter.
StreamBase Case Upfront
Payment (US$ MM)
Base Case LT Silver
Price (US$/oz)
Year LT
Pricing Begins
Zinkgruvan 50 5.10 2009
Yauliyacu 285 7.50 2011
Stratoni 57.5 10.50 2011
Penasquito 485 9.00 2012
Mineral Park 42 11.00 2016
Campo Morado 80 13.00 2014
Keno Hill 50 14.00 2013
Pascua-Lama 625 13.22 2015
Rosemont (Ag) 14.00
Rosemont (Au) 8752016230
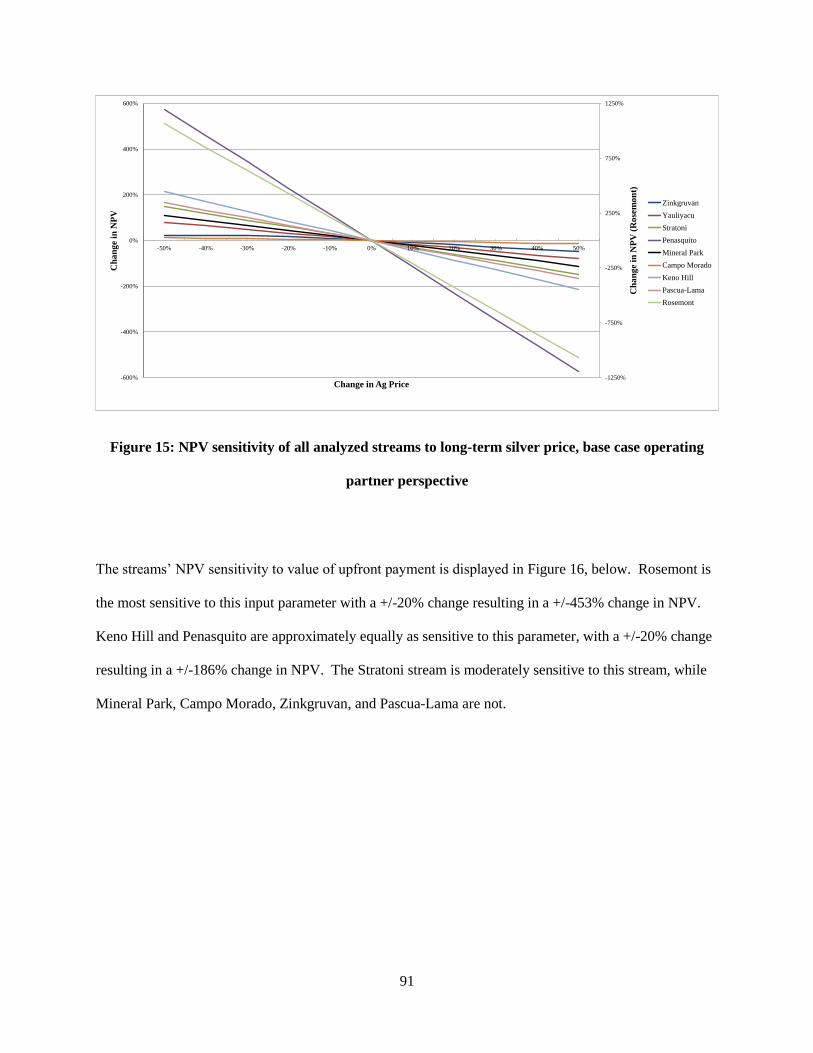
91
Figure 15: NPV sensitivity of all analyzed streams to long-term silver price, base case operating
partner perspective
The streams’ NPV sensitivity to value of upfront payment is displayed in Figure 16, below. Rosemont is
the most sensitive to this input parameter with a +/-20% change resulting in a +/-453% change in NPV.
Keno Hill and Penasquito are approximately equally as sensitive to this parameter, with a +/-20% change
resulting in a +/-186% change in NPV. The Stratoni stream is moderately sensitive to this stream, while
Mineral Park, Campo Morado, Zinkgruvan, and Pascua-Lama are not.
-1250%
-750%
-250%
250%
750%
1250%
-600%
-400%
-200%
0%
200%
400%
600%
-50% -40% -30% -20% -10% 0% 10% 20% 30% 40% 50%
Ch
an
ge
in N
PV
(R
ose
mo
nt)
Ch
an
ge
in N
PV
Change in Ag Price
Zinkgruvan
Yauliyacu
Stratoni
Penasquito
Mineral Park
Campo Morado
Keno Hill
Pascua-Lama
Rosemont
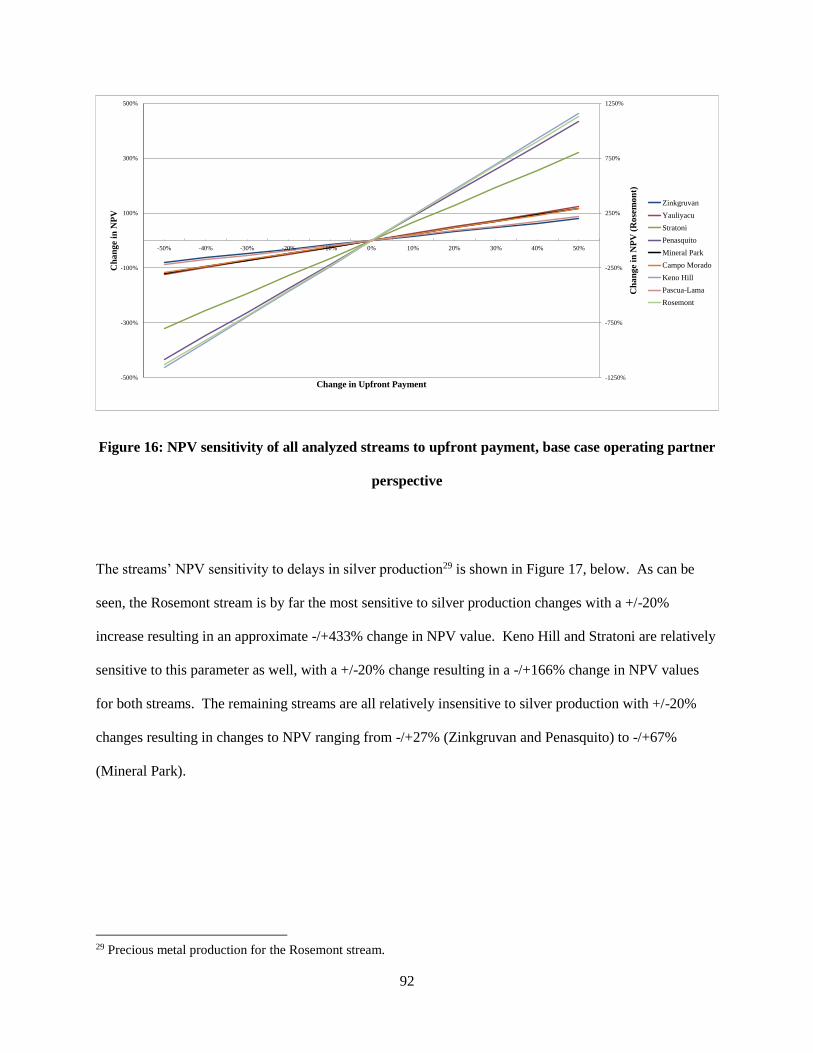
92
Figure 16: NPV sensitivity of all analyzed streams to upfront payment, base case operating partner
perspective
The streams’ NPV sensitivity to delays in silver production29 is shown in Figure 17, below. As can be
seen, the Rosemont stream is by far the most sensitive to silver production changes with a +/-20%
increase resulting in an approximate -/+433% change in NPV value. Keno Hill and Stratoni are relatively
sensitive to this parameter as well, with a +/-20% change resulting in a -/+166% change in NPV values
for both streams. The remaining streams are all relatively insensitive to silver production with +/-20%
changes resulting in changes to NPV ranging from -/+27% (Zinkgruvan and Penasquito) to -/+67%
(Mineral Park).
29 Precious metal production for the Rosemont stream.
-1250%
-750%
-250%
250%
750%
1250%
-500%
-300%
-100%
100%
300%
500%
-50% -40% -30% -20% -10% 0% 10% 20% 30% 40% 50%
Ch
an
ge
in N
PV
(R
ose
mo
nt)
Ch
an
ge
in N
PV
Change in Upfront Payment
Zinkgruvan
Yauliyacu
Stratoni
Penasquito
Mineral Park
Campo Morado
Keno Hill
Pascua-Lama
Rosemont
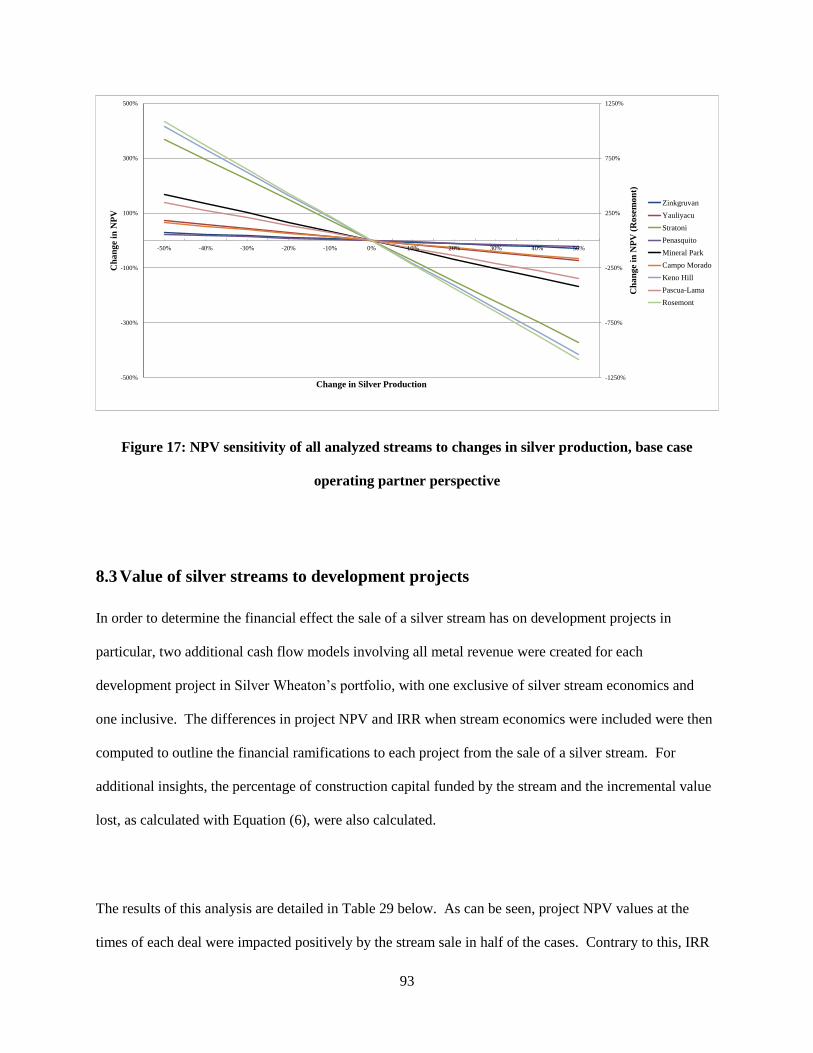
93
Figure 17: NPV sensitivity of all analyzed streams to changes in silver production, base case
operating partner perspective
8.3 Value of silver streams to development projects
In order to determine the financial effect the sale of a silver stream has on development projects in
particular, two additional cash flow models involving all metal revenue were created for each
development project in Silver Wheaton’s portfolio, with one exclusive of silver stream economics and
one inclusive. The differences in project NPV and IRR when stream economics were included were then
computed to outline the financial ramifications to each project from the sale of a silver stream. For
additional insights, the percentage of construction capital funded by the stream and the incremental value
lost, as calculated with Equation (6), were also calculated.
The results of this analysis are detailed in Table 29 below. As can be seen, project NPV values at the
times of each deal were impacted positively by the stream sale in half of the cases. Contrary to this, IRR
-1250%
-750%
-250%
250%
750%
1250%
-500%
-300%
-100%
100%
300%
500%
-50% -40% -30% -20% -10% 0% 10% 20% 30% 40% 50%
Ch
an
ge
in N
PV
(R
ose
mo
nt)
Ch
an
ge
in N
PV
Change in Silver Production
Zinkgruvan
Yauliyacu
Stratoni
Penasquito
Mineral Park
Campo Morado
Keno Hill
Pascua-Lama
Rosemont
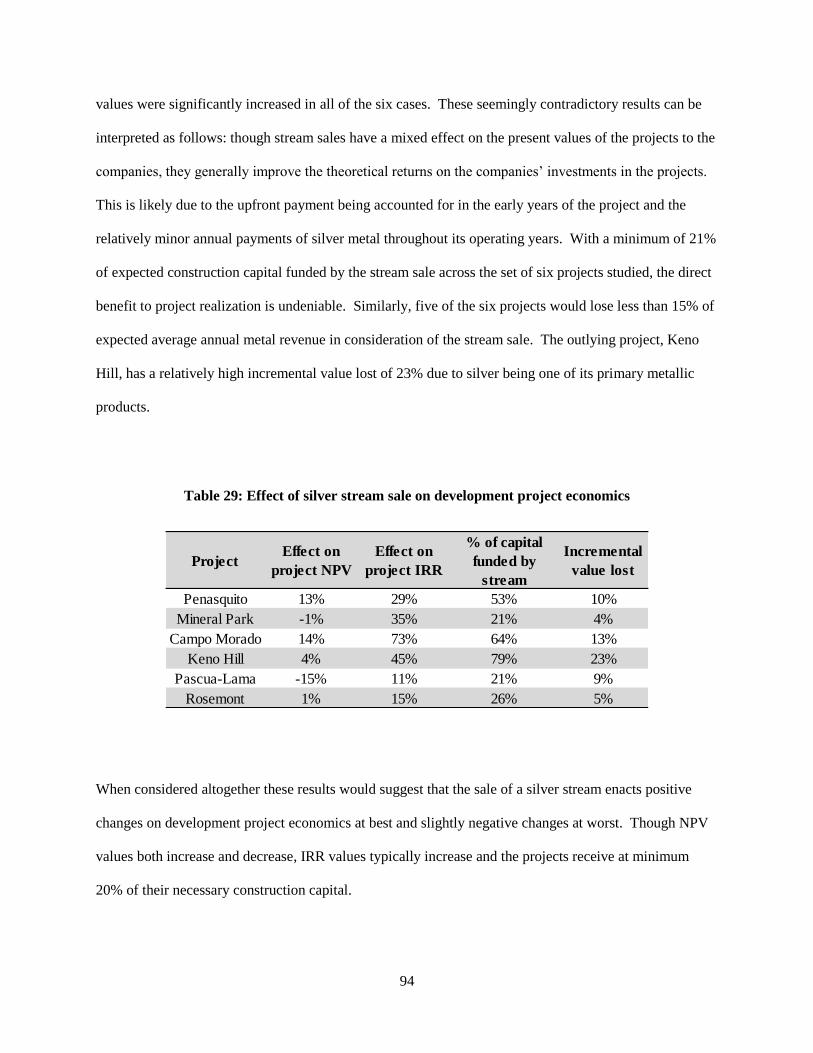
94
values were significantly increased in all of the six cases. These seemingly contradictory results can be
interpreted as follows: though stream sales have a mixed effect on the present values of the projects to the
companies, they generally improve the theoretical returns on the companies’ investments in the projects.
This is likely due to the upfront payment being accounted for in the early years of the project and the
relatively minor annual payments of silver metal throughout its operating years. With a minimum of 21%
of expected construction capital funded by the stream sale across the set of six projects studied, the direct
benefit to project realization is undeniable. Similarly, five of the six projects would lose less than 15% of
expected average annual metal revenue in consideration of the stream sale. The outlying project, Keno
Hill, has a relatively high incremental value lost of 23% due to silver being one of its primary metallic
products.
Table 29: Effect of silver stream sale on development project economics
When considered altogether these results would suggest that the sale of a silver stream enacts positive
changes on development project economics at best and slightly negative changes at worst. Though NPV
values both increase and decrease, IRR values typically increase and the projects receive at minimum
20% of their necessary construction capital.
ProjectEffect on
project NPV
Effect on
project IRR
% of capital
funded by
stream
Incremental
value lost
Penasquito 13% 29% 53% 10%
Mineral Park -1% 35% 21% 4%
Campo Morado 14% 73% 64% 13%
Keno Hill 4% 45% 79% 23%
Pascua-Lama -15% 11% 21% 9%
Rosemont 1% 15% 26% 5%
95
8.4 Internal drivers for opting for stream financing
Objectively, a company would pursue financing through the sale of a silver stream because it either is
unwilling and/or unable to secure debt or equity financing at the time that it requires financing. The
inability to secure debt or equity financing could be a function of the company’s size and position in the
mining business cycle or it could be a function of external macroeconomic factors, such as a global
recession. Further to this, the ability of junior to mid-sized exploration and development companies to
complete debt financings has been hindered by the low tolerance for risk that creditors typically have with
respect to potential debtors. Generally speaking, only well-established mining companies with proven
cash flow bear credit ratings that allow them to secure debt financing on agreeable terms or at all. In
times of economic growth, even the most junior of exploration companies has historically been able to
successfully issue equity and raise capital. However, in times of economic decay when share prices are
generally undervalued, management teams are largely unwilling to issue equity due to the effect that
selling undervalued stock would have on their existing shareholder base.
Conversely, financing by silver stream sale offers some advantages over traditional financing means; the
absences of direct cash liability and shareholder dilution are chief among them. Further to this, stream
financings are generally equally as viable during time periods of both sparse and plentiful mining finance
activity. Finally, the targeting of mining companies with non-core by-product silver by Silver Wheaton30,
results in an agreeable bargain for the stream seller, as it generally does not have to worry about
shareholder backlash for dealing out a primary company product in the transaction.
The rationale behind a management team securing stream financing over another form of financing
cannot definitively be known, unless one were privy to the relevant internal discussions. Nevertheless,
30 Exception: Keno Hill silver stream.

96
educated speculations can be made and a brief study was undertaken to ascertain the potential driving
forces behind each operating partner company deciding to sell a silver stream to Silver Wheaton. A
simple summary of each operating partner’s balance sheet condition and financing history surrounding
each silver stream deal is presented in Table 30 below. Note that the Yauliyacu mine’s owner, Glencore,
was a private company at the time of its stream deal with Silver Wheaton and thus did not publish any
information of substance regarding the deal; it has been omitted from this discussion. For descriptions of
each operating partner’s relevant corporate and financing history, please refer to Appendix E.
Table 30: Financings and balance sheet condition of operating partner companies surrounding
stream financings
As can be seen, every operating partner company completed at least one financing through traditional
means either in the year leading up to or the year following their silver stream sale to Silver Wheaton.
This would support the previously mentioned reasoning that the exhaustion of traditional financing
avenues partially led to the pursuits of stream deals.
Of particular interest are the financing histories of the six junior to intermediate mining companies in this
set (Barrick and Goldcorp being termed ‘senior companies’ for the purpose of this thesis). As can be
Cash (USD MM) Debt (USD MM)
Zinkgruvan- Lundin 25.7 0
Stratoni- European Goldfields 34 0
Penasquito- Goldcorp 282.5 540
Mineral Park- Mercator Minerals 104.5 121.5
Campo Morado- Farallon Resources 15.9 2.5
Keno Hill- Alexco Resources 6.2 0
Pascua-Lama- Barrick ~2,000 ~5,000
Rosemont- Augusta Resources 6.3 45.8
N
Y
Y
Y
Y
Y
Y
Y
N
Y
Y
Financings surrounding stream deal?
Equity DebtStream
Balance sheet condition
Y
Y
Y
Y
Y
97
seen, all of them completed equity financings surrounding their stream deals; the handling of equity at the
junior to intermediate company level requires careful decision-making, given the volatile nature of such
companies’ share prices and the relatively small shareholder base. Further to this, three such companies
(Farallon, Alexco, and Augusta) had extremely low cash positions at the times of their stream deals.
Being that all three companies were in the relatively expensive development stage of their respective
projects, they were likely in dire need of capital at the stream deal times. At the time of its silver stream
sale, Augusta in particular had a debt position that was over seven times more than its meagre cash
position, making it very unlikely that it could successfully sell debt to any lender. For these three junior
companies, it can be postulated that they agreed to stream financing out of desperation; they all had
limited cash positions at times when their other financing avenues were likely exhausted due to recent or
planned financings.
As can be seen, the two senior mining companies, Goldcorp and Barrick, held debt that far exceeded their
cash positions just prior to their deals with Silver Wheaton. While likely able to pursue other financing
means due to their size, the author postulates that the combination of recent or planned financings and
unfavourable balance sheet metrics were driving forces behind their sale of silver streams.
Three silver stream deals took place after the onset of the global recession that began in mid- to late 2008;
Keno Hill, Pascua-Lama, and Rosemont. While the probable rationale behind these deals have already
been outlined, the external macroeconomic factors arising from the recession likely hindered the abilities
and/or willingness of these companies to secure traditional financing. With depressed commodity prices
leading to depressed share prices and company valuations, it may have been difficult for mining
companies of all calibres to issue debt or equity on good terms during this time period. This is especially
true of the two junior companies studied who required capital during this unfortunate time.
98
In summary, it is likely a combination of internal and external factors that drove these mining companies
to make potential or actual financially lopsided stream sales to a stream buyer, Silver Wheaton. The
exhaustion of traditional financing avenues, inability to pursue traditional financing due to company size
and/or balance sheet condition, and depressed equity valuations due to macroeconomic factors likely all
played roles in management teams’ decision to sell silver streams. Perhaps the most interesting
observation of this study is the fact that silver streams were completed with mining companies of various
calibres and sizes both during times of economic growth and recession. This suggests that silver stream
financing can be readily accomplished at all times and does not discriminate based on company valuation.
8.5 Discussion
8.5.1 Isolated stream economics
At base case silver prices, only four silver streams generated non-marginal positive NPV values. Even at
relatively conservative silver price forecasts, it can be seen that silver streams provided marginal value to
Silver Wheaton’s operating partners, if any at all.
At the partially-realized/bullish silver price series, stream NPV values were negative in every instance.
Given these two scenarios, it can then be concluded that when considered as a stand-alone series of cash
flows, silver streams generally do not deliver positive financial value to operating partners.

99
8.5.2 Financial sensitivity of streams to operating partners
As all of the isolated stream cash flows are inversely sensitive to long term silver price (in some cases,
extremely so), operating partner companies cannot have ignored the possibility of a bull market for silver
when considering the stream deals. This would suggest that management teams in every case either had
bearish views on long term silver fundamentals, had decided that upwards price risk was worth the value
of the upfront payment at the time of the deals, or simply viewed non-core and/or by-product silver as an
acceptable loss for upfront funds in each individual situation. As a commodity price forecast is by
definition uncertain, it can be concluded that operating partner management generally viewed silver price
volatility as a tolerable risk that was worth the upfront funds at the time.
The Penasquito, Rosemont, Stratoni, and Keno Hill streams are all relatively sensitive to the upfront
payment. Conversely, the Mineral Park, Pascua-Lama, Zinkgruvan, Yauliyacu, and Stratoni streams are
relatively insensitive to this parameter. This potentially suggests that the operating partners undersold
their forward silver production on the latter five streams.
While the Rosemont, Keno Hill, and Stratoni streams are all relatively sensitive to changes in silver
production, the remainder of the streams are all relatively insensitive to this parameter. This would
suggest that, despite the largely poor financial value to operating partners of isolated streams at the base
case, the majority of stream deals were at the very least economically robust enough to mitigate the
negative financial outcomes of production increases due to the stream contract, from the perspective of
the operating partners.
100
8.5.3 Sustainability of silver streaming business model as a financing service
While the results of this chapter show the relatively poor financial value of selling a silver stream, the
shortcomings of both the debt and equity capital markets have historically created a void that this quasi-
financing service seemingly fills, so to speak. Indeed, the silver streaming business model seems to have
successfully exploited an inefficiency in the capital markets for almost a decade, and it is an inefficiency
for which there is no solution through traditional financing means. As previously mentioned, mining
companies have been willing participants of silver stream agreements during periods of both excellent and
poor capital availability via debt and equity markets. This suggests that the ability to sell a silver stream
is unaffected by macroeconomic factors, corporate valuations, the presence of other attractive financing
options (during boom periods), and commodity markets to a degree.
By its very nature, silver is unique both economically and from a mine production standpoint,
simultaneously making it both a valuable commodity for the stream buyer and an expendable by-product
good that many mining companies (stream sellers) can viably offer as consideration in a deal. While it
can safely be said that a primary gold or base metal producer would likely prefer to fully realize the value
of its by-product silver output, giving up this commodity in exchange for essential project financing
seems to have been an acceptable transaction for the stream sellers that did business with Silver Wheaton
over the past 7-8 years.
In summary, the silver streaming business model offers a quasi-financing service that is sustainable
insofar as silver remains an expendable commodity and traditional financing means cannot compete with
it in terms of availability, impact on corporate capital structure, and impact on corporate finances.
101
Chapter 9
Comparison of Silver Streaming to Traditional Financing Methods
In this chapter the characteristics, advantages, and disadvantages of both debt and equity financing will be
reviewed and compared with selling a silver stream.
9.1 Debt financing overview
Debt financing is essentially the borrowing of money by a borrower from a lender (usually a bank) that is
repaid through loan installments. In exchange for providing access to capital, the borrower must pay an
additional interest rate on the principal amount borrowed from the lender. As well, in the event that the
borrowing entity fails financially, the lender or creditor has claim to the borrower’s assets and typically
has first right to reimbursement in many jurisdictions. The interest rate associated with a given loan is
determined through several factors, including:
The existence or lack of cash flows generated by the borrower and their reliability thereof;
The tangibility of the borrower’s assets;
The type of business the borrower is involved in;
The credit rating of the borrower;
Macroeconomic factors, such as the fluctuation of important interest rates (e.g. LIBOR31,
important national bank benchmark rates)
31 London Interbank Offered Rate: “An interest rate at which banks can borrow funds, in marketable size, from other
banks in the London interbank market…the world’s most widely used benchmark for short-term interest rates.”
(Investopedia)
102
Debt financing offers some well-known advantages. Interest payments on principal loan amounts can be
claimed as tax deductions, effectively aiding a company in servicing its debt. Furthermore, the
obligations of the borrower are limited to the repayment of the principal along with interest; a lender does
not receive any ownership of the borrowing entity in exchange for the loan.
However, debt financing is disadvantageous in some ways. Newer businesses and/or those without well-
established and reliable cash flows might not be able to service their debt and make repayments on the
agreed-upon schedule. This can result in extreme susceptibility to economic recessions when lenders
might demand repayment of principal debt, or interest rate increases might lead to unsustainable debt
servicing. Both of these events can lead to business insolvency. Additionally, accumulation of debt can
result in an increased risk profile for a borrowing entity, which could make raising capital in the future
more difficult.
9.2 Equity financing overview
Equity financing is the receipt of capital in exchange for an ownership position in a company. The
monetary value of a given equity unit of a company is determined by several factors, including:
The size and market positioning of the company;
The existence or lack of cash flows generated by the company and the reliability thereof;
The type of business the company is involved in;
The quantity of any previously existing equity units;
The market value of any previously existing equity units.
103
Equity-holders have particular voting rights regarding certain of the enterprise’s business and internal
activities. The primary advantage of equity financing is that the funds raised from an equity issue are not
subject to repayment. The primary disadvantage is that the ownership of the company is diluted. The
dilution of a company’s equity could eventually lead to a loss of authority or control of the enterprise’s
activities, under specific circumstances.
9.3 Debt and equity financing in mineral exploration and mining
Discovering, proving, and developing a mineral deposit into a mine requires increasing quantities of
capital at each respective stage in the mining business cycle. As a capital intensive industry, both equity
and debt financing are essential to the successful capitalization of a mining enterprise.
However, debt financing is typically only available to a given company once it has reached the feasibility
and pre-development stages of at least one mineral project. In a general sense, banks will only grant the
large loans or credit facilities that mineral project development necessitates to those companies with
proven cash flow or a high probability of near-term cash flow (i.e. companies in the feasibility stage).
Junior exploration companies have little to no tangible assets and no ability to generate cash flow in the
near term. As such, banks will generally not lend to such companies.
Conversely, equity financing is typically available at all stages of the mining business cycle. While
established commercial producers have access to both debt and equity, junior exploration companies can
generally only raise capital through equity financings. As the value of equity is considerably more
volatile than the value of debt, there are certain “windows of opportunity” in which mining companies
can complete equity financings on good terms and when their stock is fairly or overly valued. These
104
windows typically occur during periods of upswing in both commodity price and global economic cycles.
During economic downturns or recessions experienced either globally or by certain influential nations,
investor confidence in the mining industry generally falters and mining equity can become severely
undervalued. During such periods equity financings are rare32. Looking at Figure 18 below, a sharp
decrease in the total value of global mining equity financings occurred from 2011 to the first half of 2012.
The reasons for the rarity of equity financings during periods of depression can vary based on company
type. Generally, junior to senior companies with one or more producing operations are able to
successfully complete equity financings but often choose not to due to undervaluation, while high-risk
exploration ventures with no production and cash flow cannot generate enough investor interest to
complete such financings33.
32 A notable exception to this rule is illustrated by the recent US$3 billion public equity offering of Barrick Gold
Corp., the majority of which is to be used to service short and medium term debt obligations (Barrick Gold Corp.,
2013). Mining firms that are large and influential enough can generate enough investor interest to raise money
through equity sales at all points in the mining cycle. In this instance, Barrick obviously believed that the pros of
servicing debt would outweigh the cons of raising money through the sale of grossly-undervalued stock. 33 No publicly available quantitative data could be found to support this statement.
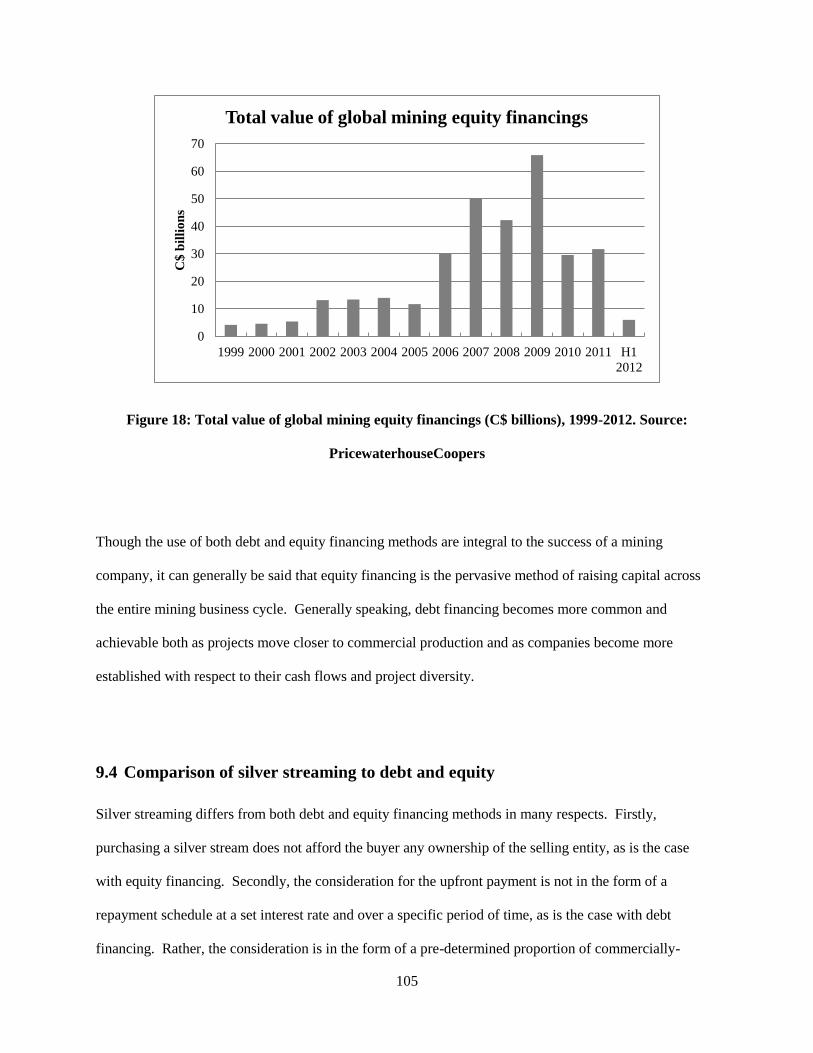
105
Figure 18: Total value of global mining equity financings (C$ billions), 1999-2012. Source:
PricewaterhouseCoopers
Though the use of both debt and equity financing methods are integral to the success of a mining
company, it can generally be said that equity financing is the pervasive method of raising capital across
the entire mining business cycle. Generally speaking, debt financing becomes more common and
achievable both as projects move closer to commercial production and as companies become more
established with respect to their cash flows and project diversity.
9.4 Comparison of silver streaming to debt and equity
Silver streaming differs from both debt and equity financing methods in many respects. Firstly,
purchasing a silver stream does not afford the buyer any ownership of the selling entity, as is the case
with equity financing. Secondly, the consideration for the upfront payment is not in the form of a
repayment schedule at a set interest rate and over a specific period of time, as is the case with debt
financing. Rather, the consideration is in the form of a pre-determined proportion of commercially-
0
10
20
30
40
50
60
70
1999 2000 2001 2002 2003 2004 2005 2006 2007 2008 2009 2010 2011 H1
2012
C$
bil
lio
ns
Total value of global mining equity financings
106
produced silver provided to the buyer, usually for the life of the mine. Therefore, using a silver stream
sale to finance development or plant expansions does not impact a company’s balance sheet as does debt,
nor does it have any effect on the company’s capital structure or ownership as is the case with equity
financing.
Often, the life of a mine as originally planned for is significantly extended based on the addition of future
reserves that the owner delineates with near-mine exploration in the course of mining the original deposit.
This affords the stream buyer rights to any exploration upside and expansion of production capacity that
the stream seller might achieve during the life of the mine. Further to this, the value derived by the
stream buyer in consideration for the upfront payment is directly governed by the price of silver and not
interest rates, thus making the purchase of a silver stream an indirect hedge on silver34. Conversely, if an
operating partner were to go bankrupt or if the mining operation in question should be closed, the silver
stream owner would receive nothing from the operating partner and have the lowest priority claim on its
assets, if any at all.
Financing via silver stream is particularly unique with respect to the temporal diversity with which capital
can be raised using this method. This is to say that silver stream financing has been completed during
upswings and recessions in the mining industry, alike. This is likely due to the fact that the decision to
buy a silver stream from a particular company is not influenced by such factors as credit rating, company
valuation, size of the company, or position in the mining business cycle. Truly, the ability to secure silver
stream financing is dependent on the quality of the mineral project in question and the capability of the
project-owner’s management team to bring it into production (if it is a development project), if given the
necessary capital.
34 While not a direct hedge position on the price of silver as defined by the financial derivatives industry, the success
of a silver stream is entirely dependent on a healthy silver price during at least a portion of its lifetime.
107
Thus, silver streaming, while fundamentally different than debt and equity financing in its core
characteristics, is also fundamentally different with regard to its availability in time and its effect on the
selling company’s balance sheet, capital structure, and ownership structure. It offers a potentially more
expensive alternative to mining and exploration companies that may not be able to secure financing in
other ways; the degree to which it is expensive is entirely dependent on the price of silver. Silver
streaming exploits a niche of the mining finance industry that cannot be addressed by either debt or equity
due to the very nature of these financing methods. Nevertheless, the risks to the operating partners are
straightforward and well-known: potentially giving up more value than the upfront payment is worth
should the price of silver remain high during periods of the contract term.
108
Chapter 10
Conclusions and Discussions
In this thesis generally accepted mineral economic analytical methods were used to evaluate a relatively
new investment and capital funding model, using the silver streams owned by Silver Wheaton Corp. as a
case study. The deals were evaluated from both the perspective of Silver Wheaton, the stream buyer, and
that of its operating partners, the stream sellers. Ten year cash flow forecasts were used to stress test
Silver Wheaton’s financial stability at various silver price forecasts. Internal drivers for opting to finance
via the sale of a stream in lieu of traditional methods were investigated and discussed, from the
perspective of the operating partner. Silver streaming was then qualitatively compared to both debt and
equity financing to provide an understanding of the major differences between these methods. As the
deals selected for evaluation were put in place between 2004 and 2010, with silver producing profiles
extending from 4 to 28 years, silver prices had to be projected to 2036 to enable this predictive evaluation
of the ‘profitability’ of these deals. The specific conclusion reached from the case study analysis is that
the majority of silver streams generated marginal to excellent financial returns to the streaming entity
while generating marginal to poor returns to the operator of the underlying mine, depending on the
forecasted silver price series employed. However, the general conclusion reached regarding the viability
of ‘streaming’ as a business model and mode of alternative mine financing was positive.
10.1 Summary
Silver is a unique commodity with two types of demand: demand as a store of value and demand as an
industrial metal. Further to this, the majority of silver mine supply is generated as a by-product of either
base metal or gold mines. The pricing of silver in the open markets reflects both its supply inventory and
the extent of demand at any given time, the latter of which is robust due to its dual nature.
109
A new type of physical commodity investment vehicle emerged in the early 2000s called metal streaming;
it was applied to silver and gold, and has been used by metal producers to raise funds outside of
conventional financing means. This quasi-financing method involves the sale of a “stream” of future
metal products at a fixed price in exchange for an advance payment.
From the perspective of the stream buyer, the evaluation suggested that when the silver price is
conservative/bearish/low, buying a silver stream is a moderately successful investment at best. When the
silver price is bullish/high, the purchase of a silver stream is an excellent investment. The simple nature
of the silver streaming business model, its relatively low risk profile, exposure to upside exploration
potential, lack of future capital obligations, and essentially fixed operating costs all contribute to optimal
profit margins and investor returns.
However from the perspective of the producers committing future production against capital financing,
the financial returns to operating partners were questionable even with conservative estimates of prices.
Through reviews of the financial situations and recent financings of operating partners surrounding each
stream deal, it was shown that silver stream financing was nevertheless an attractive method for these
companies to raise capital during periods when they could not access or did not want to access capital
through conventional means.
110
10.2 Conclusions and general discussion
10.2.1 Silver streaming as an enterprise
Insofar as the silver price remains relatively strong, the silver streaming business model is an excellent
one. The work presented in this thesis showed very clearly the good return on investment that several
public examples of silver streams provide.
Qualitatively, the ability to fix operating costs at the agreed-upon transfer fee results in an economically
robust business structure with reliable profit margins. Additionally, the lack of any further capital
obligations on the part of the stream seller provides exposure to exploration upside without the burden of
associated costs. The primary risk associated with operating the silver streaming business model is silver
price risk; this one is shared by all entities that produce silver. While the risk that an underlying mine or
project gets shut down or does not reach commercial production is significant, it is presumably mitigated
through careful and objective project selection, due diligence, and by the nature of the silver purchase
agreement in the sense that the upfront capital payment itself contributes to a reduction in the probability
of a production delay or shutdown. Holistically, the silver streaming business model as it exists at the
time of this writing is an objectively good enterprise to operate.
A review of Silver Wheaton’s ample initial financing leads to the conclusion that the ideal strategy for the
successful implementation of the silver streaming business model is to first acquire streams with mines
that have demonstrated silver production in order to generate positive operating cash flows in the
formative years of the business. Not only is this strategy good business sense, but it is likely to
significantly increase the probability of securing financing of any type, both at the inception of the
business and throughout the course of growing it.
111
10.2.2 Silver streaming as a quasi-financing service
As a means of financing, silver streaming was shown to be relatively expensive at both conservative and
bullish silver price forecasts. In this regard, it is a poor financing method on a strict financial basis.
However, selling a silver stream was shown to increase development project IRR values in the majority of
cases studied.
Qualitatively, silver stream financing allows the stream seller to realize present value from non-core by-
product silver production, while preventing both the shareholder dilution and increased financial liability
that equity and debt financing methods introduce. Stream financings were completed in every case
studied at points in time around which other financings by one or both traditional methods were
completed. Furthermore, stream financings were completed by companies of various sizes during both
upswings and downturns in the mining cycle. These two facts would suggest that silver stream financing
is available at times in metal price cycles during which other financing might not be.
10.2.3 Disproportionate risk profile of silver streaming
Silver stream buyers generally benefit financially from silver stream agreements while stream sellers do
not. This can be attributable in large part to the absence of cost escalation in the silver streaming business
model. The standard silver stream contract structure has been established by Silver Wheaton such that the
stream buyer has never been required to assume any direct risk due to cost escalation, as reflected in its
fixed transfer fee. This would suggest that discount rates assigned by analysts to Silver Wheaton’s
corporate and stream valuations would be lower than those if Silver Wheaton were the mine operator,
given its favourable risk profile. Conversely, the operating partner assumes all of the cost escalation risk,
112
which implies that a higher discount rate should be assigned to its stream and corporate valuation than if it
had pursued financing through other means than a silver stream.
Furthermore, Silver Wheaton has been able to successfully mitigate project risk through the inclusion of
completion guarantees in some of its streams with large scale and complex development projects (refer to
Section 7.5.5). Such guarantees almost completely protect Silver Wheaton against project delay or
cancellation, although Silver Wheaton has already once proven to be flexible with respect to project
delay35. Completion guarantees serve to further de-risk the silver streaming model from Silver Wheaton’s
perspective and decrease their exposure to risk relative to that of their operating partners.
The combination of this factor coupled with almost a decade of relatively elevated silver price history will
allow potential operating partners to negotiate silver stream terms such that the risk profiles of the stream
sellers and buyers converge. The author fully expects future silver stream transactions to include upward
revisions to the historical transfer fee and upfront payment levels. Although less likely, other revisions to
future silver streams could include variations of contract term length (i.e. less than the LOM) and lower
off-take percentages for Silver Wheaton.
10.2.4 Potential to stream commodities other than silver
The question of whether the silver streaming business model can be replicated with other commodities to
the same degree of success as silver is a difficult one to answer. Incidentally, approximately two months
prior to this writing Silver Wheaton completed a gold purchase agreement with Vale S.A. (Vale), a multi-
35 In 2013, Silver Wheaton extended the deadline for the completion test at Pascua-Lama on two separate occasions
by a total of two years in response to Barrick’s announced delays at the project (Silver Wheaton Corp., 2013b).
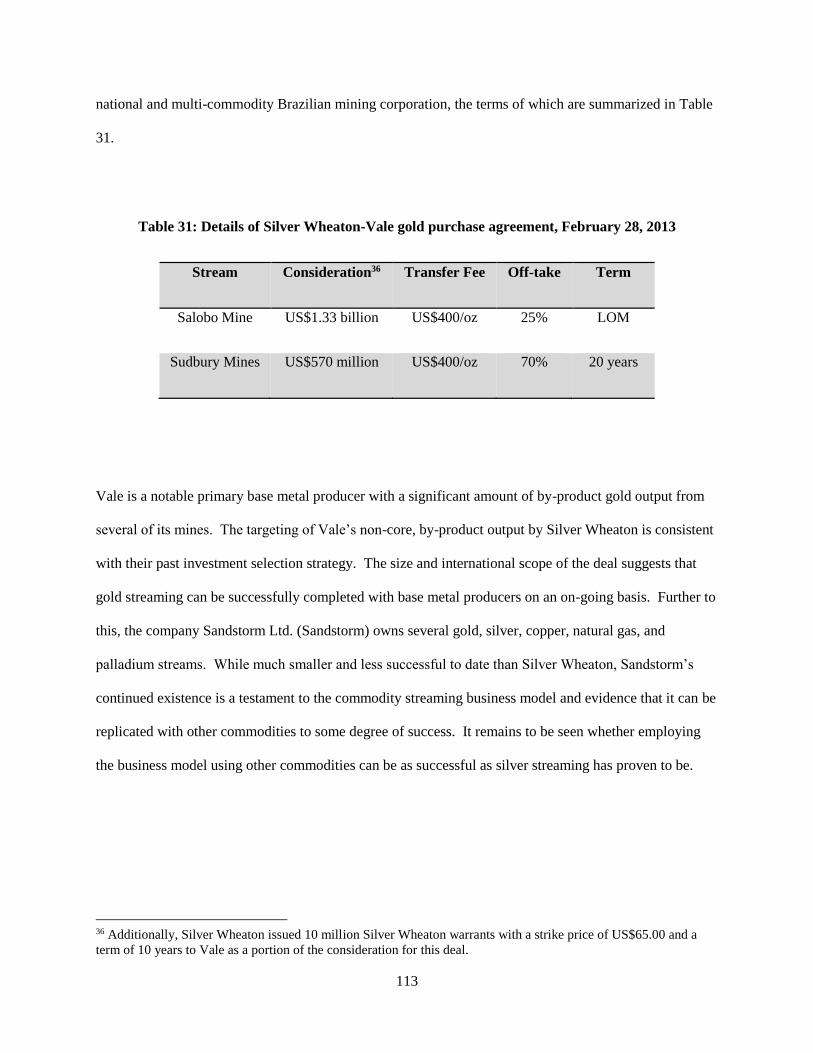
113
national and multi-commodity Brazilian mining corporation, the terms of which are summarized in Table
31.
Table 31: Details of Silver Wheaton-Vale gold purchase agreement, February 28, 2013
Stream Consideration36 Transfer Fee Off-take Term
Salobo Mine US$1.33 billion US$400/oz 25% LOM
Sudbury Mines US$570 million US$400/oz 70% 20 years
Vale is a notable primary base metal producer with a significant amount of by-product gold output from
several of its mines. The targeting of Vale’s non-core, by-product output by Silver Wheaton is consistent
with their past investment selection strategy. The size and international scope of the deal suggests that
gold streaming can be successfully completed with base metal producers on an on-going basis. Further to
this, the company Sandstorm Ltd. (Sandstorm) owns several gold, silver, copper, natural gas, and
palladium streams. While much smaller and less successful to date than Silver Wheaton, Sandstorm’s
continued existence is a testament to the commodity streaming business model and evidence that it can be
replicated with other commodities to some degree of success. It remains to be seen whether employing
the business model using other commodities can be as successful as silver streaming has proven to be.
36 Additionally, Silver Wheaton issued 10 million Silver Wheaton warrants with a strike price of US$65.00 and a
term of 10 years to Vale as a portion of the consideration for this deal.
114
10.3 Conditions for the existence of the silver streaming business model
Although likely not the original intent of the company that founded it, the silver streaming business model
has evolved to become a significant financing option within the Canadian mining finance industry. In this
regard, its core competency is the quasi-financing service it provides to exploration and mining entities.
In the long term, silver streaming can only continue to be a viable enterprise to the extent that corporate
entities continue to sell silver streams as a means of raising capital in lieu of issuing debt or equity. While
commodity prices and macroeconomic factors play important roles in the ebbs and flows of mining
business activity, Silver Wheaton has generated new purchase agreements and produced formidable profit
margins and cash flows through a significant global recession and a period of decreasing commodity
prices. Due to its targeting of a truly unique commodity that is intrinsically linked to several important
primarily-produced metals, the silver streaming business model has proven to provide an attractive
alternative, complement, or supplement to traditional financing methods particularly when their
availability is constrained. A primary condition that governs the existence and success of this business
model is the continued periodic unavailability of both debt and equity financings in the mining business
cycle.
The relatively risky business of hard rock exploration and mining and the volatile nature of various metal
prices have historically resulted in “dead periods” during which companies owning even the best
exploration prospects, development projects, and mines find it difficult to secure financing via debt and
equity. Additionally, during time periods in which capital is abundantly available to exploration and
mining firms, silver stream financings have been completed when debt and equity issues could not be
implemented due to financial and capital structure constraints. It is during such times that the true
strength of the silver streaming business model is exhibited in the service it provides to exploration and
mining corporations: the delivery of cash up front with little to no effect on capital structure or additional
financial liability. These shortages in mining finance have always been present; Silver Wheaton just
115
happened to be the first to employ the business model at the right time and strictly targeted what is
arguably the commodity with the best economic fundamentals to operate this type of enterprise with.
An equally important condition to the viability of this business model is a silver price environment that is
sufficiently high to support a profitable business. While this condition has clearly held true over the past
7-8 years, it is impossible to accurately predict whether this condition will hold at any point in the future.
However, the dual nature of silver demand provides for a theoretically robust commodity price that
should perform reasonably well under conditions of both economic boom and bust, which is presumably
one of the key reasons for targeting silver in this business model.
10.4 Replication of Silver Wheaton experience and potential for new market
entrants
The rise of Silver Wheaton to its current size and degree of success can likely never be replicated again
using the silver streaming business model. Silver Wheaton came into existence just prior to a bull run in
precious and base metal prices that followed nearly a decade of depressed prices and corporate valuations.
The frenzied exploration and mining activity that occurred from roughly 2005 to the end of 2008 provided
the perfect industrial environment for Silver Wheaton to compile a strong portfolio of both producing
assets and promising development projects. The focused strategy of completing stream deals with four
producing mines right from its inception provided the necessary cash flow to support future deals with
non-producing development projects. The continuously rising price of silver during the first seven years
of Silver Wheaton’s existence allowed it to accrue a significant cash position and post excellent profit
margins. Finally, Silver Wheaton’s profits have been virtually un-taxed, a unique situation that likely
would not be replicable by other companies. All of these factors indicate the extreme unlikelihood of any
116
new entrant into the silver streaming market achieving a similar degree of success to that of Silver
Wheaton in as short a time period.
Having said this, the target market for the silver streaming business model is vast and Silver Wheaton is
currently the only publicly-traded silver streaming company in the world that is operating within this
specific market. From this perspective, it is entirely possible for new companies to employ the silver
streaming business model and achieve some success. To do so, any new market entrant would have to
offer similar or better terms in its silver purchase agreements than those offered by Silver Wheaton.
Moreover, any new market entrant would have to be prepared to defend against a takeover attempt by
Silver Wheaton, hostile or otherwise; with its large market capitalization and relatively large pool of cash
and capital resources at its disposal Silver Wheaton is currently well-positioned to absorb any new
competitor. This very situation played out in 2009 when Silverstone Resources Inc., a competing silver
streaming business, was taken over by Silver Wheaton. Nevertheless, the market for buying silver
streams of various sizes and on a global scale is large enough for other companies employing this
business model to come into existence, and the author expects this to be the case over the coming decade.
10.5 Risk elements for the silver streaming business model
There are a number of critical risks that have the potential to affect the future viability of the silver
streaming business model, chief among them being silver price risk. Although the standard silver
purchase agreement affords the stream buyer the right to purchase silver at the lesser of the transfer fee
and the going spot price, an extended depression in the silver price would negatively impact the return on
investment, cash flows, and equity valuation of any silver streaming company. As commodity prices are
naturally volatile, there can be no certainty that the price of silver will remain sufficiently high enough to
support silver streaming firms that are smaller than Silver Wheaton (i.e. less than five producing assets).
117
However, the dual demand structure of silver as both an industrial and precious metal bodes well for the
future stability of its price, as new technologies and industrial uses begin to become widely implemented
in the coming decade.
Silver Wheaton is exposed to the negative effects of potential project delay, project cancellation, mine
shutdown, or the failure of the project’s operator. These kinds of project-specific risks can be mitigated
through careful and objective technical and financial due diligence by Silver Wheaton with respect to
project and operator selection, as well as proper vetting of a potential operator partner’s management and
technical teams.
Another significant risk exposure of the business model is the possibility of silver streaming falling out of
favour with mining companies as an alternative form of financing. Given the disparity in risk that
currently favours the stream buyer in the standard silver purchase agreement, it is not unlikely that mining
companies will demand better terms at some point in the future. Should these demands not be met by
silver streaming companies existing at the time, deal generation could become sparse. In this regard, it is
very likely that silver purchase contract terms will be revised in the future both to reflect this risk
disparity and the current high value of silver. Some probable contract revisions in order of decreasing
likelihood include increased transfer fees, increased capital requirements for upfront payments, and less
off-take for the stream buyer. Similarly, albeit far less likely, silver stream financing could become less
sought after should lenders increase their risk tolerance and begin to provide financing to producers
during periods of upwards cost pressure or poor commodity prices and to riskier junior exploration
companies.
118
A lesser risk to the business model is that enough competing silver streaming companies enter the market
so as to dilute the deal availability, so to speak. Again, the risk disparity that exists in favour of stream
buyers over sellers could potentially allow smaller, less established silver streaming companies to
undercut the market and offer significantly better deal terms than those offered by Silver Wheaton in a
suitably positive silver price environment. While this risk is real, several more companies would first
have to enter the market and establish themselves without being taken over by Silver Wheaton. The
longer that Silver Wheaton is the sole participant in the silver streaming market, the less likely it will be
that one company could successfully enter the market without being acquired, let alone several.
10.6 Future work and recommendations
10.6.1 Future work
Add to data set
The study of Silver Wheaton would greatly benefit from the addition of more organically-generated silver
streams, which presumably will occur over time. A re-visitation of this topic at some point in the future
with a greater sample size of silver streams would certainly add more validity to the results and trends
reported.
Increase accuracy of cash flow models
The modelling of mines/projects underlying silver streams from the operating partner perspective would
be much improved through the additions of detailed working capital, royalty, depreciation, and tax
modelling. Though reasonable assumptions were made to account for these items within the scope of this
thesis, model accuracy would be improved by researching and incorporating them to the best degrees
119
achievable, preferably by an individual or group of individuals who are specifically trained in accounting
practice.
Investigation of effect of taxation
Though not currently exposed to any Canadian income tax on recorded earnings, Silver Wheaton may
very well be in its future. A detailed model of Silver Wheaton, inclusive of forecasted income tax
payable and back-tax liability, would provide an important perspective for investors and ER analysts alike
who wish to understand the effects of such a potential change.
Statistically-derived commodity price forecasts
An ideal report on Silver Wheaton would incorporate statistically-derived price forecasts for all
commodities required. This would provide more validity to forecasted cash flow models.
10.6.2 Recommendations
Published research improvements
Equity research analysts tend to focus on a prescribed set of outputs when evaluating and publishing
reports on public corporations. While these outputs certainly provide for excellent analysis of traditional
businesses, the business of Silver Wheaton is unique and does not necessarily fall into a single category
within which it can be compared to other companies, even other royalty/streaming firms that generate
revenue from multiple commodity types. Due to the non-traditional nature of its services and revenue
source, Silver Wheaton should routinely be compared to royalty/streaming firms, primary silver
producers, and silver ETFs/trusts in any ER report. Furthermore, a brief description of Silver Wheaton’s
primary target market, inclusive of a summary of the prevailing state of the mining finance market, should
120
be regularly included in a discussion of Silver Wheaton’s business to better convey the drivers of this
company’s growth and success.
Monitor Silver Wheaton's proportion of global silver mine output
Currently accounting for 4% of annual global mine output, Silver Wheaton is expecting to increase this
proportion to 6% by FYE 2016. The author believes that Silver Wheaton’s attributable proportion of
global silver mine output will only continue to grow, given its past business success, attractive target
market, and lack of direct competitors. While far from occurring at the present, Silver Wheaton could
potentially account for a significant proportion of silver output from mines at some point in the future and
in doing so corner the silver market. This position should be monitored by national banks, relevant stock
exchanges, the LBMA, and by Silver Wheaton itself, who likely would not intend to profit unduly from
such a position and would likely not want the value of its equity to be affected negatively by such
publicity.
121
Bibliography
Albino George [et al.] Mining Weekly: May 12, 2008 [Report]. - [s.l.] : Macquarie Research, 2008a.
Albino George [et al.] Mining Weekly: September 29, 2008 [Report]. - [s.l.] : Macquarie Research,
2008b.
Albino George [et al.] North American Mining Weekly: September 8, 2009 [Report]. - [s.l.] : Macquarie
Capital Markets Canada Ltd, 2009.
Alexco Resource Corp. Alexco Resource Corp. Management's Discussion and Analysis For the three
month and six month periods ended December 31, 2007 [Report]. - Vancouver : [s.n.], 2008.
Alexco Resource Corp. Alexco Resource Corp. Interim Consolidated Financial Statements for the three
months ended September 30, 2008 [Report]. - Vancouver : [s.n.], 2008.
Augusta Resource Corporation Augusta Resource Corporation Consolidated Financial Statements For
the Years Ended December 31, 2009, 2008, and 2007 [Report]. - Vancouver : [s.n.], 2010.
Bank of Canada Selected treasury bill yields [Online] // Bank of Canada. - May 5, 2012. -
http://www.bankofcanada.ca/rates/interest-rates/t-bill-yields/.
Barnes Greg and To Bonita Daily Letter: Base Metals, October 14, 2004 [Report]. - Toronto :
Canaccord Adams, 2004.
Barnes Greg and To Bonita Base Metals Outlook: April 16, 2007 [Report]. - Toronto : TD Newcrest,
2007a.
Barnes Greg and To Bonita Canadian Mining Equities: Get'em While They Last, July 13, 2007
[Report]. - Toronto : TD Newcrest, 2007b.
Barnes Greg [et al.] The Total Resource: Weekly Update, July 16, 2007 [Report]. - [s.l.] : TD Newcrest,
2007c.
122
Barnes Greg and To Bonita Base Metals Outlook: March 17, 2008 [Report]. - Toronto : TD Newcrest,
2008a.
Barnes Greg [et al.] The Total Resource: Weekly Update, October 2, 2008 [Report]. - Toronto : TD
Newcrest, 2008b.
Barnes Greg [et al.] Base Metals Outlook: February 8, 2010 [Report]. - [s.l.] : TD Newcrest, 2010.
Barrick Gold Corp. Barrick Gold Corp. Second Quarter Report 2009 [Report]. - Toronto : [s.n.], 2009.
Barrick Gold Corp. Pascua-Lama Project Region III, Chile and San Juan Province, Argentina [Report]. -
Toronto : [s.n.], 2011.
Behre Dolbear & Company, Inc. Prefeasibility Study of Olympias, Skouries, and Stratoni Polymetallic
Properties, Greece [Report]. - Denver : European Goldfields Ltd., 2004.
Behre Dolbear International Ltd. Valuation of Hellas Gold SA Mineral Properties, Chalkidiki
Prefecture, Greece [Report]. - London : European Goldfields Ltd., 2004.
Belanger Maryse, Pareja Guillermo and Nahan Peter Penasquito Polymetallic Operation, Zacatecas
State, Mexico NI 43-101 Report [Report]. - Vancouver : Silver Wheaton Corporation, 2010.
Beristain Jorge, Martin David S. and Ortiz Wilfredo Metals in the Americas-Weekly Wrap on Rocks
[Report]. - London : Deutsche Bank, 2010.
Bilodeau Michel Chapter 8 Inflation [Book Section] // Engineering Economy Notes. - Montreal : McGill
University, Department of Mining and Materials Engineering, 2003.
Bryson Robert H [et al.] Penasquito Project Technical Report [Report]. - Vancouver : Goldcorp Inc.,
2007.
Burns Neil and Mah Samuel 2010 Resource and Reserve Update Yauliyacu Mine, Peru [Report]. -
Vancouver : Silver Wheaton Corp., 2011.
123
Butler Steven [et al.] Metals and Mining: Three Positives For The Miners, March 17, 2006 [Report]. -
Toronto : Canaccord Adams, 2006.
Butler Steven and Vinnai John Gold and Precious Metals Weekly: April 16, 2007 [Report]. - [s.l.] :
Canaccord Adams, 2007.
Butler Steven and Vinnai John Gold and Precious Metals Weekly: September 29, 2008 [Report]. -
[s.l.] : Canaccord Adams, 2008.
Butler Steven, Paul Rahul and Ahmed Zainuddin Metals and Mining-Precious Metals and Minerals:
September 8, 2009 [Report]. - [s.l.] : Canaccord Adams, 2009.
Butler Steven, Paul Rahul and Ahmed Zainuddin Metals and Mining-Precious Metals and Minerals,
February 11, 2010 [Report]. - [s.l.] : Canaccord Adams, 2010.
Campbell Craig and Baker Stuart Nonferrous Metals & Mining: November 25, 2004 [Report]. - [s.l.] :
Morgan Stanley, 2004.
Campbell Craig and Judd Cameron Australia Nonferrous Metals & Mining: July 12, 2007 [Report]. -
[s.l.] : Morgan Stanley Research, 2007.
Campbell Craig [et al.] Australian Extractive Industries: Carbon-Cost and Valuation Impacts Coming
Into Focus, September 25, 2008 [Report]. - [s.l.] : Morgan Stanley, 2008.
Careaga Aaron Mineral Royalty Stream Financing [Report]. - Bellingham, WA : Wealthmark LLC.,
2012.
Chiu Cosmos, Chiew Kevin and Cooper Barry Institutional Equity Research Earnings Update: Silver
Wheaton Corp., March 25, 2012 [Report]. - Toronto : CIBC, 2012.
Christie David and Turnbull Trevor Gold-Weekly Outlook:July 23, 2007 [Report]. - [s.l.] : Scotia
Capital, 2007.
124
Christie David and Turnbull Trevor Precious Minerals-Weekly Outlook: March 10, 2008 [Report]. -
[s.l.] : Scotia Capital, 2008a.
Christie David [et al.] Precious Minerals-Weekly Outlook: September 29, 2008 [Report]. - [s.l.] : Scotia
Capital, 2008b.
Christie David, Turnbull Trevor and Gopinathan Indi Precious Minerals-Weekly Outlook: September
8, 2009 [Report]. - Toronto : Scotia Capital, 2009.
Clifford Robert [et al.] Global Mining: Beyond the dreams of avarice. March 22, 2006 [Report]. - [s.l.] :
ABN-AMRO, 2006.
Clifford Rob Metals & Mining: October 1, 2008 [Report]. - London : Deutsche Bank, 2008.
Cooke Allan, Shepherd Steve and Tiwari Abhishek SA Gold Foresight: September 3, 2009 [Report]. -
[s.l.] : J.P. Morgan Securities Inc., 2009.
Cooper Barry and Humphrey Brad Bullion: The Pacifier For Fear And Greed [Report]. - Toronto :
CIBC World Markets, 2006.
Cooper Barry [et al.] CORRECTION: What Happens If Markets Get Real Ugly? [Report]. - [s.l.] :
CIBC World Markets, 2008.
Cooper Barry [et al.] Dissecting Base Metal Contributions In The Gold Sector [Report]. - Toronto :
CIBC World Markets, 2008.
Currie Graeme and Wallis Tony Junior Mining Weekly: November 30, 2004 [Report]. - [s.l.] :
Canaccord Capital, 2004.
Currie Graeme [et al.] Junior Mining Weekly: April 16, 2007 [Report]. - Vancouver : Canaccord
Adams, 2007.
125
Davidson David, Bandrowski Michael and Woolley Jeff Base Metals: Finally...The Buying
Opportunity We Have Been Waiting For. February 10, 2010 [Report]. - [s.l.] : Paradigm Capital, 2010.
De Alba Carlos and Alban-Davies Andrea Latin America Metals & Mining: February 19, 2008
[Report]. - [s.l.] : Morgan Stanley, 2008.
Doerksen Gordon [et al.] Technical Report, Cozamin Mine, Zacatecas, Mexico [Report]. - Vancouver :
Capstone Mining Corp., 2009.
Doggett Michael and Mackenzie Brian W. Mineral Economics [Book]. - 2009. - pp. 111-124.
Durose Michael and Best Kevin Gold-Weekly Outlook: March 13, 2006 [Report]. - [s.l.] : Scotia
Capital, 2006.
Edney Warren [et al.] Mining: Halcyon days for commodities, October 8, 2004 [Report]. - [s.l.] : ABN-
AMRO Equities Australia Limited, 2004.
Edney Warren and Fagan Lyndon Metals & Mining: Higher coal/iron ore price scenario, March 7,
2008 [Report]. - Sydney : ABN-AMRO, 2008.
Elliott Christopher [et al.] Amended NI 43-101 Technical Report, Pascua-Lama Project, Region III,
Chile/San Juan Province, Argentina [Report]. - Vancouver : Silver Wheaton Corporation, 2009.
Ernst & Young Business risks facing mining and metals 2012-2013 [Online] // Mining & Metals. -
2012. - November 12, 2013. - http://www.ey.com/GL/en/Industries/Mining---Metals/Business-risks-
facing-mining-and-metals-2012---2013.
Ernst & Young Capital management and access [Online] // Business risks facing mining and metals
2012-2013. - 2012. - November 12, 2013. - http://www.ey.com/GL/en/Industries/Mining---
Metals/Business-risks-facing-mining-and-metals-2012---2013-8-Capital-management-and-access.
126
Ernst & Young Cost inflation [Online] // Business risks facing mining and metals 2012-2013. - 2012. -
November 12, 2013. - http://www.ey.com/GL/en/Industries/Mining---Metals/Business-risks-facing-
mining-and-metals-2012---2013-4-Cost-inflation.
Esterhuizen Leon, van Graan Arnold and Low Yuen Commodity Assumption Revision: September 2,
2009 [Report]. - [s.l.] : RBC Capital Markets, 2009.
European Goldfields Limited European Goldfields Annual Report 2006 [Report]. - 2006.
European Goldfields Limited European Goldfields Limited Consolidated Financial Statements: First
Quarter 2007 [Report]. - 2007.
Farallon Resources Ltd Farallon Resources Consolidated Financial Statements, Three and Nine Months
Ended March 31, 2008 [Report]. - Vancouver : [s.n.], 2008.
Fitzpatrick Brendan and Young Paul-D Mark to Market: What does Spot say? [Report]. - Sydney :
Deutsche Bank, 2008.
Fitzpatrick Brendan and Young Paul M&M Gold: Gold price pressures already priced into equities,
February 8, 2010 [Report]. - [s.l.] : Deutsche Bank, 2010.
Flores Victor and Wachowiak Nawojka Global Gold Sector: SVM Update, October 25, 2004
[Report]. - [s.l.] : HSBC, 2004.
Forward Patrick Update to Section 7.1.3 of Prefeasibility Study of Olympias, Skouries and Stratoni
Polymetallic Properties, Greece prepared by Behre Dolbear & Company, Inc. dated October 2004
[Report] / European Goldfields Ltd.. - Whitehorse : European Goldfields Ltd., 2007.
Forward Patrick, Francis Antony and Liddell Niel Technical Report on the Stratoni Project [Report]. -
Whitehorse : European Goldfields Ltd., 2010.
127
Fraser Niall M. [et al.] Engineering Economics: Custom Edition for Queen's University [Book]. -
Boston : Pearson Learning Solutions, 2011. - Vol. I.
Gagliano David [et al.] Metals Snapshot: April 20, 2007 [Report]. - [s.l.] : Credit Suisse, 2007a.
Gagliano David, Garchitorena Richard and Profiti Ralph M. Metals Snapshot: July 24, 2007
[Report]. - [s.l.] : Credit Suisse, 2007b.
Gagliano David [et al.] Metals Snapshot: March 14, 2008 [Report]. - [s.l.] : Credit Suisse, 2008a.
Gagliano David [et al.] Metals Snapshot: May 13, 2008 [Report]. - [s.l.] : Credit Suisse, 2008b.
Gagliano David, Wright Sean and Garchitorena Richard Metals Snapshot: October 2, 2008
[Report]. - [s.l.] : Credit Suisse, 2008c.
Gagliano David, Garchitorena Richard and Wright Sean Metals Snapshot: September 8, 2009
[Report]. - [s.l.] : Credit Suisse, 2009.
Gagliano David, Garchitorena Richard and Wright Sean Metals Snapshot: February 11, 2010
[Report]. - [s.l.] : Credit Suisse, 2010.
Gambardella Michael F. and Largey Jeffrey R. Global Metals & Mining Weekly Wrap-Up: November
19, 2004 [Report]. - [s.l.] : JP Morgan, 2004.
Gambardella Michael F., Largey Jeffrey R. and Zibilich Nathan M. Global Metals & Mining:
Weekly Wrap-Up, April 20, 2007 [Report]. - [s.l.] : J.P. Morgan Securities Limited, 2007a.
Gambardella Michael F. [et al.] Global Metals & Mining: July 20, 2007 [Report]. - New York : J.P.
Morgan Securities Inc., 2007b.
Gambardella Michael F. [et al.] Global Metals & Mining: March 14, 2008 [Report]. - [s.l.] : J.P.
Morgan Securities Inc., 2008a.

128
Gambardella Michael [et al.] Global Metals & Mining Weekly Wrap-Up: May 9, 2008 [Book]. - [s.l.] :
JP Morgan, 2008b.
Gardiner Ross, Kelly James E. and George David Mining Diversifieds: March 15, 2006 [Report]. -
[s.l.] : J.P. Morgan Securities Limited, 2006.
Gentry Donald W. and O'Neil Thomas J. Mine Investment Analysis [Journal]. - New York : American
Institute of Mining, Metallurgical, and Petroleum Engineers, Inc., 1984. - pp. 307-308.
George David, Whittall Matthew and Mumme Matt Resources Majors: April 18, 2007 [Report]. -
[s.l.] : J.P. Morgan, 2007.
George David, James Brendan and Zhang Lun Resource Majors: May 5, 2008 [Report]. - [s.l.] : J.P.
Morgan, 2008.
Global Mining Finance Ltd. Global Mining Finance 2012 [Report]. - Toronto : [s.n.], 2012. - p. 32.
Godden Stephen J. [et al.] Technical Report on the January 2010 Mineral Resource and Mineral Reserve
Estimate for G-9 Polymetallic Mine, Campo Morado Project [Report]. - Vancouver : Farallon Mining
Ltd., 2010.
Goldcorp Inc. Goldcorp Second Quarter Report-2007 [Report]. - Vancouver : [s.n.], 2007.
Gordon Deanne and Swartz Jason SA Strategy Spotlight [Report]. - [s.l.] : J.P. Morgan Equities Ltd.,
2007.
Gray Richard [et al.] Mining Stats Weekly: February 9, 2010 [Report]. - [s.l.] : Cormark Securities Inc.,
2010a.
Gray Richard and Jennings Graeme Precious Metals: February 11, 2010 [Report]. - Toronto : Cormark
Securities Inc., 2010b.
Green Steven J. [et al.] Precious Metals Outlook: May 12, 2008 [Report]. - [s.l.] : TD Newcrest, 2008.
129
Green Steve J. [et al.] Precious Metals Outlook: August 31, 2009 [Report]. - Toronto : TD Newcrest,
2009.
Green Steven J. [et al.] Precious Metals Outlook: February 8, 2010 [Report]. - Toronto : TD Newcrest,
2010.
Hackett Damien [et al.] Metals and Mining: Three Positives For The Miners, March 17, 2006 [Report]. -
[s.l.] : Canaccord Adams, 2006.
Hackett Damien [et al.] Global Metals and Mining: July 18, 2007 [Report]. - [s.l.] : Canaccord Adams,
2007.
Hale-Sanders Cliff [et al.] Global Base Metal Equity and Commodity Report Card: October 6, 2004
[Report]. - Toronto : RBC Capital Markets, 2004.
Hale-Sanders Cliff and Tsui Terry K.H. Base Metal Sector Outlook-Q2/2007 Preview-Cash Continues
To Build [Report]. - Toronto : CIBC World Markets, 2007.
Hall Dave, Copland Jim and Wakefield Dana The Golden Eye [Journal]. - [s.l.] : Macquarie First
South Securities, July 24, 2007.
Harris Brendan [et al.] Australian resources: March 5, 2008 [Report]. - [s.l.] : Macquarie Research
Equities, 2008.
Heath K.C.G, Kalcov G.D. and Inns G.S. Treatment of Inflation in Mine Evaluation [Journal]. -
London : Transactions of the Institution of Mining and Metallurgy, 1974. - 806 : Vol. 83. - pp. A20-A33.
Howat Ian and David Shanthu Base Metals & Minerals Weekly: Metal Price Forecast Update-
Estimates and Targets Revised For Some Companies [Report]. - [s.l.] : National Bank Financial, 2004.
Howat Ian and David Shanthu Base Metals & Minerals Weekly [Report]. - Toronto : National Bank
Financial, 2006.
130
Howat Ian and David Shanthu Base Metals & Minerals Weekly: A quiet week as we wait for reporting
season-Metal price forecasts increased [Report]. - Toronto : National Bank Financial, 2007.
Howat Ian, Chu Greg and Szeto Brian How Low Can They Go-An Analytical View on a Weak Price
Environment: January 23, 2008 [Report]. - Toronto : National Bank Financial, 2008a.
Howat Ian, Chu Greg and Szeto Brian Base Metals & Minerals: Metals remain volatile as they gave up
most of last week's gains, March 14, 2008 [Report]. - Toronto : National Bank Financial, 2008b.
Howat Ian, Chu Greg and Szeto Brian Base Metals & Minerals: Sell in May and Go Away-Metals
Jump the Gun and Leave in April, May 2, 2008 [Report]. - Toronto : National Bank Financial, 2008c.
Howat Ian, Chu Greg and Szeto Brian Base Metals & Minerals: Updates to our commodity prices and
company valuations - Timed to coincide with metal sell off! [Report]. - Toronto : National Bank
Financial, 2010.
Humphrey Brad Silver Industrial Demand Update [Report]. - [s.l.] : CIBC World Markets, 2006.
Humphrey Brad [et al.] Precious Metals: February 10, 2010 [Report]. - [s.l.] : Raymond James Ltd.,
2010.
Huss, Conrad; M3 Engineering & Technology Corporation Rosemont Copper Project Updated
Feasibility Study [Report]. - Denver : Augusta Resource Corporation, 2009.
Investopedia Deferred Revenue [Online] // Investopedia. - October 25, 2012. -
http://www.investopedia.com/terms/d/deferredrevenue.asp#axzz2ALDEPtiU.
Jakusconek Tanya, Muir Susan and Santarossa Mark Revised Gold Price Forecast: February 27, 2006
[Report]. - [s.l.] : National Bank Financial, 2006.
Jakusconek Tanya, Hamed Farooq and van Ballegooie Joanne North American Gold Statistics: May
2, 2008 [Report]. - [s.l.] : National Bank Financial, 2008.
131
Jakusconek Tanya, van Ballegooie Joanne and Jee Will North American Gold Statistics: September 1,
2009 [Report]. - [s.l.] : National Bank Financial, 2009.
James Brendan, Behncke Emily and Fitzpatrick Brendan Digging Downunder: March 5, 2008
[Report]. - [s.l.] : Deutsche Bank, 2008.
Jaworski Bart and Sadowski David Uranium Weekly Tracker: September 1, 2009 [Report]. - Toronto :
Raymond James Ltd., 2009.
Kaderavek Joe, Spencer Michael and Finlay Scott Mining Metals Monthly: November 17, 2004
[Report]. - [s.l.] : Deutsche Bank, 2004a.
Kaderavek Joe and Finlay Scott Metals & Mining: December 8, 2004 [Report]. - [s.l.] : Deutsche Bank,
2004b.
Keen Andrew, Stanojevic Nik and Pretorius Lourina Bernstein Metals: Why Decoupling Matters
[Report]. - [s.l.] : Bernstein Research, 2008.
Keller David [et al.] Bellekeno Preliminary Economic Assessment: Technical Report [Report] / SRK
Consulting Inc.. - Vancouver : Alexco Resource Corp., 2008.
Kodatsky Alec [et al.] Scotia Capital Metals & Mining Daily: March 23, 2006 [Report]. - Toronto :
Scotia Capital, 2006.
Lancaster Chris and Staude Miles Diversified Miners: October 18, 2004 [Report]. - [s.l.] : RBC Capital
Markets, 2004.
Lau Pitzi, Laijawala Abhay and Wai Gordon Asian Metals & Mining: December 2, 2004 [Report]. -
Hong Kong; Mumbai : Citigroup Smith Barney, 2004.
Lewis Michael [et al.] Commodities Weekly: April 3, 2007 [Report]. - [s.l.] : Deutsche Bank, 2007.
132
Lundin Mining Corporation Lundin Mining Corporation Interim Report: Nine Months Period Ended
September 30, 2004 [Report]. - Vancouver : [s.n.], 2004.
Lundin Mining Corp. Neves-Corvo, Portugal [Online] // Lundin Mining Corp.. - June 30, 2012. -
October 20, 2012. - http://www.lundinmining.com/s/Neves-Corvo.asp.
M3 Engineering & Technology Corporation Pan American Silver Corp. Navidad Project: Chubut
Province, Argentina: Preliminary Assessment [Report]. - Vancouver : Pan American Silver Corp., 2011.
MacArthur Brian and Lesiak Tony North American Metals, Mining & Gold Weekly: November 1,
2004 [Report]. - Toronto : UBS, 2004.
Macquarie Research The Global Miner: Straits Resources - The tale of the ugly duckling [Report]. -
[s.l.] : Macquarie Research, 2008.
Mak Sarah, Kang Daniel and Pansari Amit China Coal Sector: Defensive plays in a cyclical downturn
[Report]. - Hong Kong : HSBC Global Research, 2008.
Malmstrom Lars, Hedstrom Per and Syme Doug Mineral Reserves and Mineral Resources of the
Zinkgruvan Mine in South-Central Sweden [Report]. - Vancouver : Lundin Mining Corporation, 2008.
Martin David S. and Beristain Jorge Metals in the Americas: Weekly Wrap on Rocks, August 31, 2009
[Report]. - [s.l.] : Deutsche Bank, 2009.
McTaggart Paul and James Alex European mining review: March 14, 2006 [Report]. - [s.l.] : HSBC
Global Research, 2006.
McTaggart Paul and James Alex European miners: April 17, 2007 [Report]. - [s.l.] : HSBC Global
Research, 2007.
McTaggart Paul [et al.] Metals & Mining Chartbook: March 10, 2008 [Report]. - [s.l.] : HSBC Global
Research, 2008a.
133
McTaggart Paul and Banerjee Subhasree European Miners: March 10, 2008 [Report]. - [s.l.] : HSBC
Global Research, 2008b.
McTaggart Paul and Mitra Debal European Miners: European Coal Exposures, April 30, 2008
[Report]. - [s.l.] : HSBC Global Research, 2008c.
Mercator Minerals Ltd. Mercator Minerals Ltd. Consolidated Financial Statements: December 31, 2007
[Report]. - Vancouver : [s.n.], 2007.
Mercator Minerals Ltd. Mercator Minerals Ltd. Consolidated Interim Financial Statements, June 30,
2008 and 2007 [Report]. - Vancouver : [s.n.], 2008. - p. 4.
Mercator Minerals Ltd. Mercator Minerals Reports Record Production for 2011 and Provides 2012
Guidance [Online] // Mercator Minerals Ltd.. - January 16, 2012. - October 17, 2012. -
http://www.mercatorminerals.com/s/NewsReleases.asp?ReportID=501901&_Type=News-
Releases&_Title=Mercator-Minerals-Reports-Record-Production-for-2011-and-Provides-2012-Guid....
Mercator Minerals Ltd. Mineral Park Achieves Target Rate under Silver Wheaton Agreement
[Online] // Mercator Minerals Ltd.. - April 5, 2011. - October 8, 2012. -
http://www.mercatorminerals.com/s/NewsReleases.asp?ReportID=490493&_Type=News-
Releases&_Title=Mineral-Park-Achieves-Target-Rate-under-Silver-Wheaton-Agreement.
Moorhead John and Pintar Andrew The Global Miner: ENRC-upgrading to Outperform [Report]. -
London; Sydney : Macquarie Research, 2008.
Nyrstar N.V. Nyrstar 2011 Mineral Resource and Mineral Reserve Statement [Online] // Nyrstar N.V.. -
February 23, 2012. - October 23, 2012. - http://www.nyrstar.com/investors/en/news/Pages/1588402.aspx.
Olson A.E. and Keane Joseph M Preliminary Feasibility Study on Phase I & Phase II Copper-Moly
Milling Expansion: Mineral Park Mine, Mohave County, Arizona [Report]. - Vancouver : Mercator
Minerals Ltd., 2007.

134
Parekh Pinakin and Pal Prit The Lodestone: De-stocking continues-Spot iron ore, steel decline
[Report]. - [s.l.] : J.P. Morgan Securities Inc., 2008.
Parekh Pinakin The Lodestone: September 4, 2009 [Report]. - [s.l.] : J.P. Morgan, 2009.
Parekh Pinakin and Manpuria Neha The Lodestone: Differing trajectories in spot bulks and steel
prices continue [Report]. - [s.l.] : J.P. Morgan Securities Inc., 2010.
Parkinson Ian, Tsui Terry K.H. and Gibson Matthew Base Metals Data Points: September 2, 2009
[Report]. - Toronto : CIBC World Markets, 2009.
Phillips H. Fraser, Kozar Robin and Riff Jamie Global Base Metals & Mining: March 14, 2006
[Report]. - Toronto : RBC Capital Markets, 2006a.
Phillips Fraser, Kozar Robin and Riff Jamie Metal Prospects: Zinc Market Outlook-Q2 2006: March
21, 2006 [Report]. - Toronto : RBC Capital Markets, 2006b.
Phillips Fraser [et al.] Global Mining Trends & Values: April 9, 2007 [Report]. - [s.l.] : RBC Capital
Markets, 2007a.
Phillips Fraser [et al.] Global Mining Trends & Values: July 17, 2007 [Report]. - [s.l.] : RBC Capital
Markets, 2007b.
Phillips Fraser [et al.] Global Mining Trends & Values: March 11, 2008 [Report]. - [s.l.] : RBC Capital
Markets, 2008a.
Phillips Fraser [et al.] Global Mining Trends & Values: May 12, 2008 [Report]. - [s.l.] : Global Mining
Trends & Values, 2008b.
Phillips Fraser [et al.] Global Mining Trends & Values: September 30, 2008 [Report]. - [s.l.] : RBC
Capital Markets, 2008c.
135
Phillips Fraser [et al.] Global Mining Trends & Values: February 5, 2010 [Report]. - [s.l.] : RBC Capital
Markets Inc., 2010.
Profiti Ralph M. and Yew Edward J. Commodity Quarterly [Report]. - Toronto : Credit Suisse, 2010.
Ravi Ephrem [et al.] Mining & Steel-Weekly Heavy Metal #30: September 3, 2009 [Report]. - [s.l.] :
Morgan Stanley Research, 2009.
Ravi Ephrem [et al.] Mining & Steel: Weekly Heavy Metal #50 [Report]. - [s.l.] : Morgan Stanley, 2010.
Rutten Onno, Gouri Jasmit and Terentiew Alex Scotia Capital Metals & Mining Daily: April 23, 2007
[Report]. - Toronto : Scotia Capital, 2007.
Salmon Garnet Copper and Zinc Markets: February 5, 2010 [Report]. - Toronto : Mackie Research
Capital Corporation, 2010.
Scott Cam [et al.] Minto Phase V Preliminary Feasibility Study Technical Report [Report]. - Vancouver :
Minto Explorations Ltd., 2011.
Silver Wheaton Silver Wheaton Transaction Completed [Online] // Silver Wheaton Corp.. - October 15,
2004a. - April 16, 2012. -
http://www.silverwheaton.com/News1/PressReleases/PressReleaseDetails/2004/Silver-Wheaton-
Transaction-Completed/default.aspx.
Silver Wheaton Corp. Silver Wheaton Corp. Annual Report Four Months Ended December 31, 2004
[Report]. - Vancouver : [s.n.], 2004b.
Silver Wheaton Corp. Silver Wheaton Completes C$100 Million Bought Deal [Online] // SEDAR. -
December 22, 2005. - November 13, 2013. -
http://sedar.com/GetFile.do?lang=EN&docClass=8&issuerNo=00009161&fileName=/csfsprod/data83/fili
ngs/01132095/00000001/s%3A%5CAMT%5CSEDAR%5CSLW%5CPressRel%5CPR072507.pdf.
136
Silver Wheaton Corp. Silver Wheaton And Goldcorp Complete Amended Luismin Contract [Online] //
Silver Wheaton Corp.. - March 31, 2006. - April 16, 2012. -
http://www.silverwheaton.com/News1/PressReleases/PressReleaseDetails/2006/Silver-Wheaton-and-
Goldcorp-Complete-Amended-Luismin-Contract/default.aspx.
Silver Wheaton Corp. Silver Wheaton Completes Penasquito Transaction [Online] // SEDAR. - July 25,
2007. - November 13, 2013. -
http://sedar.com/GetFile.do?lang=EN&docClass=8&issuerNo=00009161&fileName=/csfsprod/data83/fili
ngs/01132095/00000001/s%3A%5CAMT%5CSEDAR%5CSLW%5CPressRel%5CPR072507.pdf.
Silver Wheaton Corporation Third Quarter Report [Report]. - Vancouver : [s.n.], 2008.
Silver Wheaton Corp. Annual Information Form For The Year Ended December 31, 2008 [Report]. -
Vancouver : [s.n.], 2009.
Silver Wheaton Corp. The Evolution of Silver Wheaton [Presentation]. - Vancouver : [s.n.], 2010a.
Silver Wheaton Corporation Silver Wheaton 2009 Annual Report [Report]. - Vancouver : [s.n.], 2010b.
Silver Wheaton Corp. Silver Wheaton Finalizes Amended Silver Purchase Agreement in Conjunction
With Goldcorp's Sale Of The San Dimas Mine [Online] // Silver Wheaton Corp.. - August 6, 2010c. -
April 16, 2012. - http://www.silverwheaton.com/News1/PressReleases/PressReleaseDetails/2010/Silver-
Wheaton-finalizes-amended-silver-purchase-agreement-in-conjunction-with-Goldcorps-sale-of-the-San-
Dimas-mine1122499/default.aspx.
Silver Wheaton Corp. Silver Wheaton 2010 Annual Report [Report]. - Vancouver : [s.n.], 2011a.
Silver Wheaton Corp. Reserves & Resources [Online] // Silver Wheaton Corp.. - December 31, 2011b. -
October 15, 2012. - http://www.silverwheaton.com/Investors/ReservesResources/default.aspx.
Silver Wheaton Corp. The High Margin Growth Story [Presentation]. - Vancouver : [s.n.], 2012.
137
Silver Wheaton Corp. Silver Wheaton Provides Update on Pascua-Lama [Online] // Silver Wheaton
Corp.. - July 1, 2013a. - December 10, 2014. - http://www.silverwheaton.com/news1/press-releases/press-
release-details/2013/Silver-Wheaton-provides-update-on-Pascua-Lama/default.aspx.
Silver Wheaton Corp. Silver Wheaton Provides Update on Pascua-Lama and Extends Barrick Silver
Stream Agreements [Online] // Silver Wheaton Corp.. - October 31, 2013b. - December 10, 2014. -
http://www.silverwheaton.com/news1/press-releases/press-release-details/2013/Silver-Wheaton-provides-
update-on-Pascua-Lama-and-extends-Barrick-silver-stream-agreements/default.aspx.
Smith L.D. Inflation in Project Evaluation [Journal]. - Toronto : CIM Bulletin, March 1987. - 899 : Vol.
80. - pp. 129-130.
Smith L.D. The argument for a "bare bones" base case [Journal]. - Toronto : CIM Bulletin, June 1999. -
1031 : Vol. 92. - pp. 143-150.
Smith L.D. Discounted Cash Flow Analysis-Methodology and Discount Rates [Journal]. - Toronto : CIM
Bulletin, June 2002. - 1062 : Vol. 95. - pp. 101-108.
Smith L.D. 2005 Survey of evaluation practices in the mineral industry [Book Section] / book auth.
Society CIM Management & Economics. - Toronto : CIM, 2010.
Smith Lawrence [et al.] Scotia Capital Metals & Mining Daily: March 17, 2008 [Report]. - Toronto :
Scotia Capital, 2008.
Smith Lawrence, Melling Paul and Przybylowski Jackie Scotia Capital Metals & Mining Daily:
February 8, 2010 [Report]. - Toronto : Scotia Capital, 2010.
Spartalis Sophie, Harris Brendan and Moorhead John Global Resources Weekly: July 17, 2007
[Report]. - Sydney : Macquarie Research, 2007.
Spencer Charles C. [et al.] Asian Steel & Materials: Weekly Monitor, September 7, 2009 [Report]. -
[s.l.] : Morgan Stanley, 2009.
138
Spring Velasquez and Watts Gordon Technical Report on the Tayoltita, Santa Rita and San Antonio
Mines, Durango, Mexico for Silver Wheaton Corp. [Report]. - Toronto : Watts, Griffis and McOuat,
2011.
Stein David [et al.] Mining Stats Weekly: September 1, 2009 [Report]. - [s.l.] : Cormark Securities Inc.,
2009.
Stone David M.R., Godden Stephen J. and Gaunt J. David Revised Technical Report on the 2007
Program and Preliminary Assessment of the G-9 Deposit, Campo Morado Project [Report]. - Vancouver :
Farallon Resources Ltd., 2007.
Sullivan John R., MacFarlane Ross G. and Cheeseman Stephen B. A Technical Review of the
Zinkgruvan Mine in South-Central Sweden [Report] / Watts, Griffis and McOuat Limited Consulting
Geologists and Engineers. - Toronto : Lundin Mining Corporation, 2004.
Thomson Reuters GFMS World Silver Survey 2012: A Summary [Report]. - Washington, D.C. : The
Silver Institute, 2012.
Thuesen G. J. and Fabrycky W. J. Inflations And Its Effects On After-tax Flows [Book Section] //
Engineering Economy. - [s.l.] : Prentice Hall, 2001.
TMX Group Incorporated Global Leader in Mining [Online] // TMX Money. - December 10, 2012. -
http://www.tmx.com/en/pdf/Mining_Sector_Sheet.pdf.
TMX Group Incorporated A Capital Opportunity: A Global Market for Mining Companies [Online]. -
December 12, 2014. - http://apps.tmx.com/en/pdf/Mining_Presentation.pdf.
Torries Thomas F. Evaluating Mineral Projects: Applications and Misconceptions [Journal]. - Littleton,
CO : Society for Mining, Metallurgy, and Exploration, Inc., 1998. - pp. 108-109.
Tumazos John C. and Saha Shamit Metals & Mining Quarterly: March 10, 2006 [Report]. - New
York : Prudential Equity Group, LLC, 2006.
139
Turnbull Trevor and Christie David Gold-Weekly Outlook: April 16, 2007 [Report]. - [s.l.] : Scotia
Capital, 2007.
Turnbull Trevor, Johnston Craig and Rabenok Philip Scotiabank Equity Research Daily Edge: April
2, 2012 [Report]. - Toronto : Scotiabank, 2012.
Walker Stephen [et al.] Precious Metals & Minerals: September 6, 2009 [Report]. - [s.l.] : RBC Capital
Markets, 2009.
Wardell Armstrong International Limited Technical Report on the Neves Corvo Mine, Southern
Portugal [Report]. - Vancouver : Silverstone Resources Corporation, 2007.
William Alain, Panicker Surendran and Bonneviot Aurelien Weekly Metal & Mining: September 7,
2009 [Report]. - London : Societe Generale, 2009.
Willis Tama and Rode Johan Digging the Dirt [Report]. - [s.l.] : Deutsche Bank Global Markets
Research, 2007.
Wowkodaw Orest [et al.] Metals and Mining-Base Metals, Uranium and Coal: February 11, 2010
[Report]. - Toronto : Canaccord Adams, 2010.
Yahoo! Finance S&P/TSX Composite Index Historical Prices [Online] // Yahoo! Finance. - December 7,
2012. - http://ca.finance.yahoo.com/q/hp?s=%5EGSPTSE.
Yu Laban [et al.] Diversified miners: January 10, 2008 [Report]. - Hong Kong : Macquarie Research,
2008.
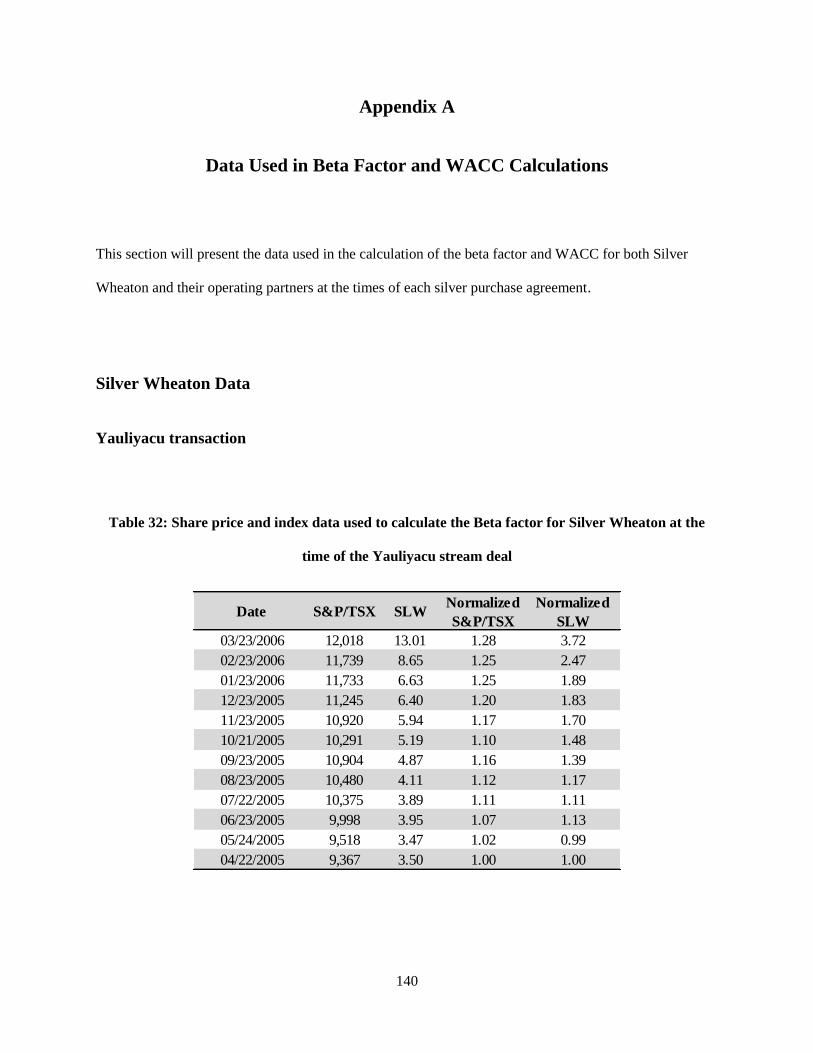
140
Appendix A
Data Used in Beta Factor and WACC Calculations
This section will present the data used in the calculation of the beta factor and WACC for both Silver
Wheaton and their operating partners at the times of each silver purchase agreement.
Silver Wheaton Data
Yauliyacu transaction
Table 32: Share price and index data used to calculate the Beta factor for Silver Wheaton at the
time of the Yauliyacu stream deal
Date S&P/TSX SLWNormalized
S&P/TSX
Normalized
SLW
03/23/2006 12,018 13.01 1.28 3.72
02/23/2006 11,739 8.65 1.25 2.47
01/23/2006 11,733 6.63 1.25 1.89
12/23/2005 11,245 6.40 1.20 1.83
11/23/2005 10,920 5.94 1.17 1.70
10/21/2005 10,291 5.19 1.10 1.48
09/23/2005 10,904 4.87 1.16 1.39
08/23/2005 10,480 4.11 1.12 1.17
07/22/2005 10,375 3.89 1.11 1.11
06/23/2005 9,998 3.95 1.07 1.13
05/24/2005 9,518 3.47 1.02 0.99
04/22/2005 9,367 3.50 1.00 1.00
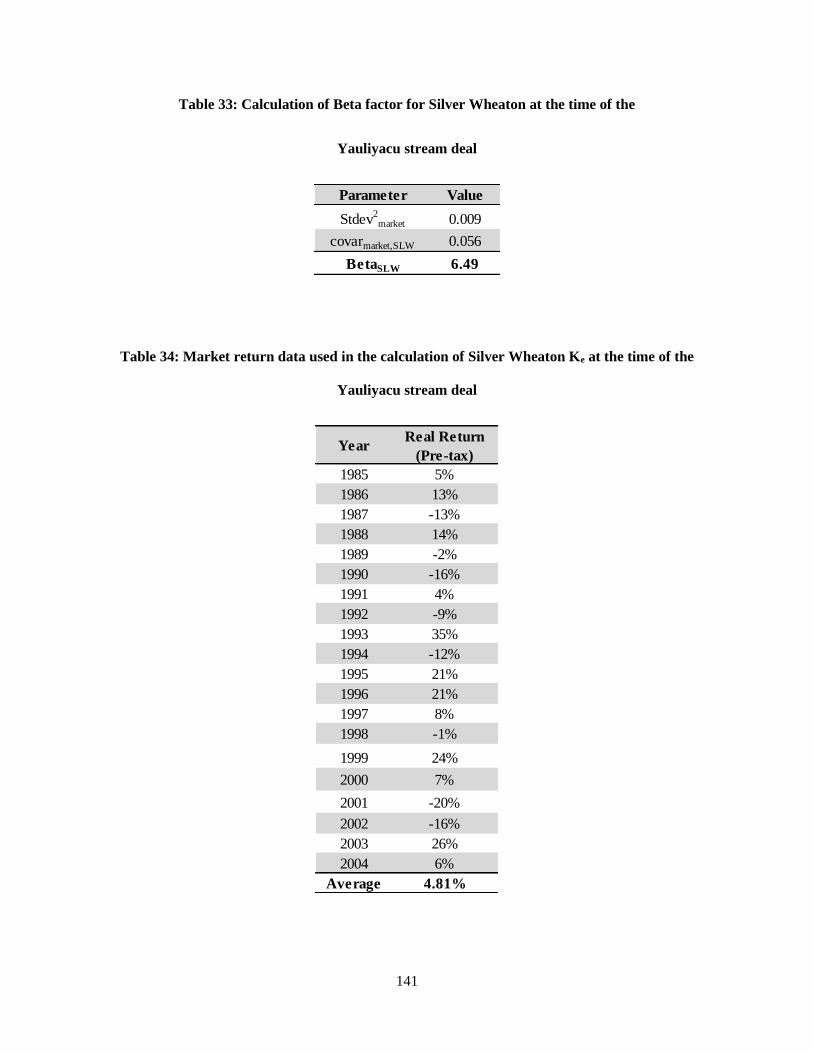
141
Table 33: Calculation of Beta factor for Silver Wheaton at the time of the
Yauliyacu stream deal
Table 34: Market return data used in the calculation of Silver Wheaton Ke at the time of the
Yauliyacu stream deal
Parameter Value
Stdev2market 0.009
covarmarket,SLW 0.056
BetaSLW 6.49
YearReal Return
(Pre-tax)
1985 5%
1986 13%
1987 -13%
1988 14%
1989 -2%
1990 -16%
1991 4%
1992 -9%
1993 35%
1994 -12%
1995 21%
1996 21%
1997 8%
1998 -1%
1999 24%
2000 7%
2001 -20%
2002 -16%
2003 26%
2004 6%
Average 4.81%
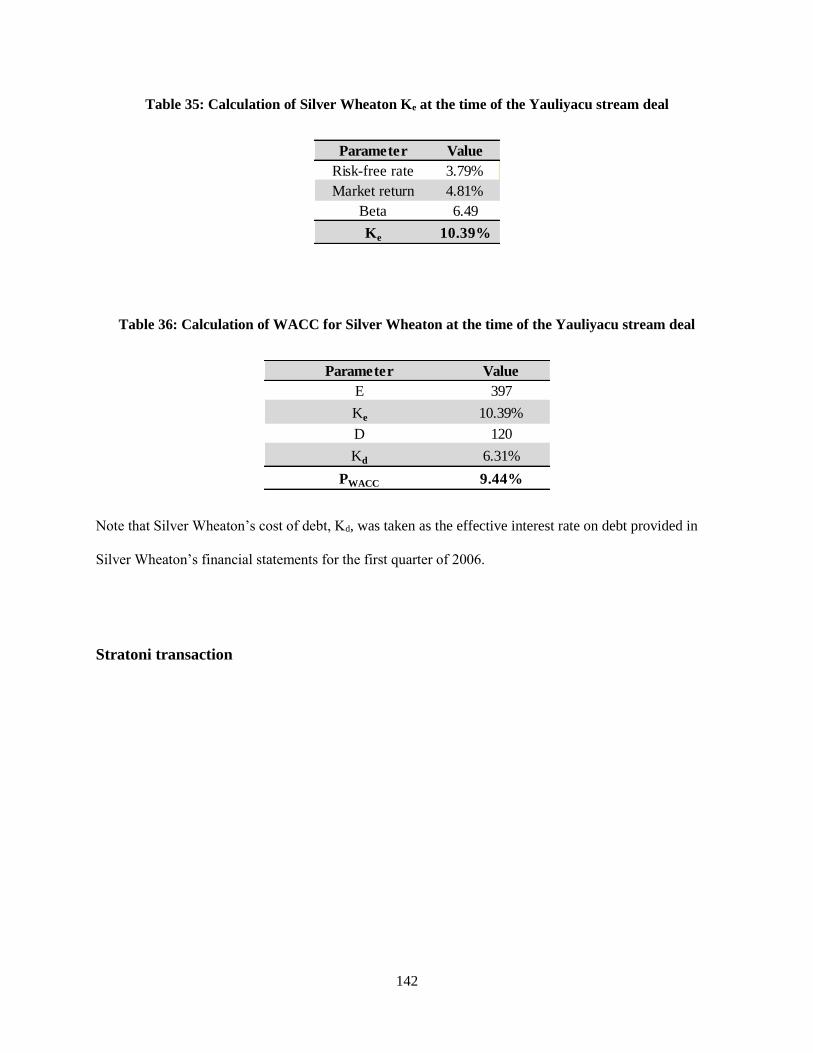
142
Table 35: Calculation of Silver Wheaton Ke at the time of the Yauliyacu stream deal
Table 36: Calculation of WACC for Silver Wheaton at the time of the Yauliyacu stream deal
Note that Silver Wheaton’s cost of debt, Kd, was taken as the effective interest rate on debt provided in
Silver Wheaton’s financial statements for the first quarter of 2006.
Stratoni transaction
Parameter Value
Risk-free rate 3.79%
Market return 4.81%
Beta 6.49
Ke 10.39%
Parameter Value
E 397
Ke 10.39%
D 120
Kd 6.31%
PWACC 9.44%
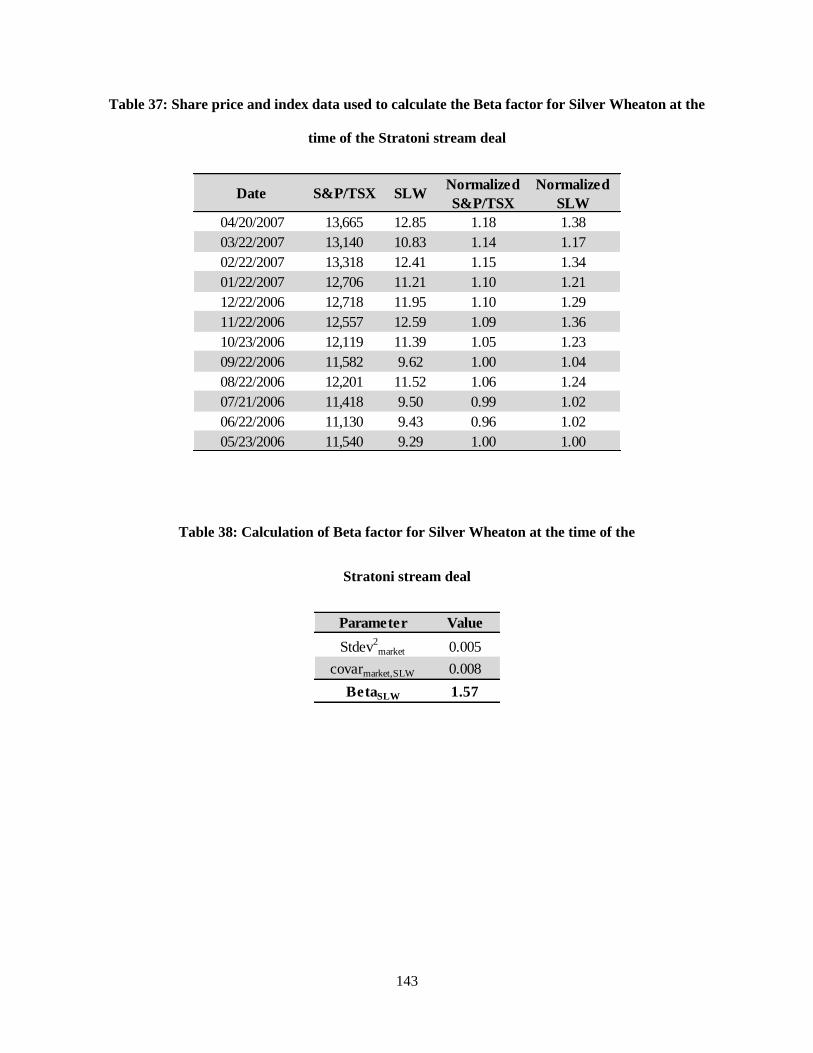
143
Table 37: Share price and index data used to calculate the Beta factor for Silver Wheaton at the
time of the Stratoni stream deal
Table 38: Calculation of Beta factor for Silver Wheaton at the time of the
Stratoni stream deal
Date S&P/TSX SLWNormalized
S&P/TSX
Normalized
SLW
04/20/2007 13,665 12.85 1.18 1.38
03/22/2007 13,140 10.83 1.14 1.17
02/22/2007 13,318 12.41 1.15 1.34
01/22/2007 12,706 11.21 1.10 1.21
12/22/2006 12,718 11.95 1.10 1.29
11/22/2006 12,557 12.59 1.09 1.36
10/23/2006 12,119 11.39 1.05 1.23
09/22/2006 11,582 9.62 1.00 1.04
08/22/2006 12,201 11.52 1.06 1.24
07/21/2006 11,418 9.50 0.99 1.02
06/22/2006 11,130 9.43 0.96 1.02
05/23/2006 11,540 9.29 1.00 1.00
Parameter Value
Stdev2market 0.005
covarmarket,SLW 0.008
BetaSLW 1.57

144
Table 39: Market return data used in the calculation of Silver Wheaton Ke at the time of the
Stratoni stream deal
Table 40: Calculation of Silver Wheaton Ke at the time of the Stratoni stream deal
YearReal Return
(Pre-tax)
1987 -13%
1988 14%
1989 -2%
1990 -16%
1991 4%
1992 -9%
1993 35%
1994 -12%
1995 21%
1996 21%
1997 8%
1998 -1%
1999 24%
2000 7%
2001 -20%
2002 -16%
2003 26%
2004 6%
2005 27%
2006 7%
Average 5.58%
Parameter Value
Risk-free rate 4.17%
Market return 5.58%
Beta 1.57
Ke 6.38%
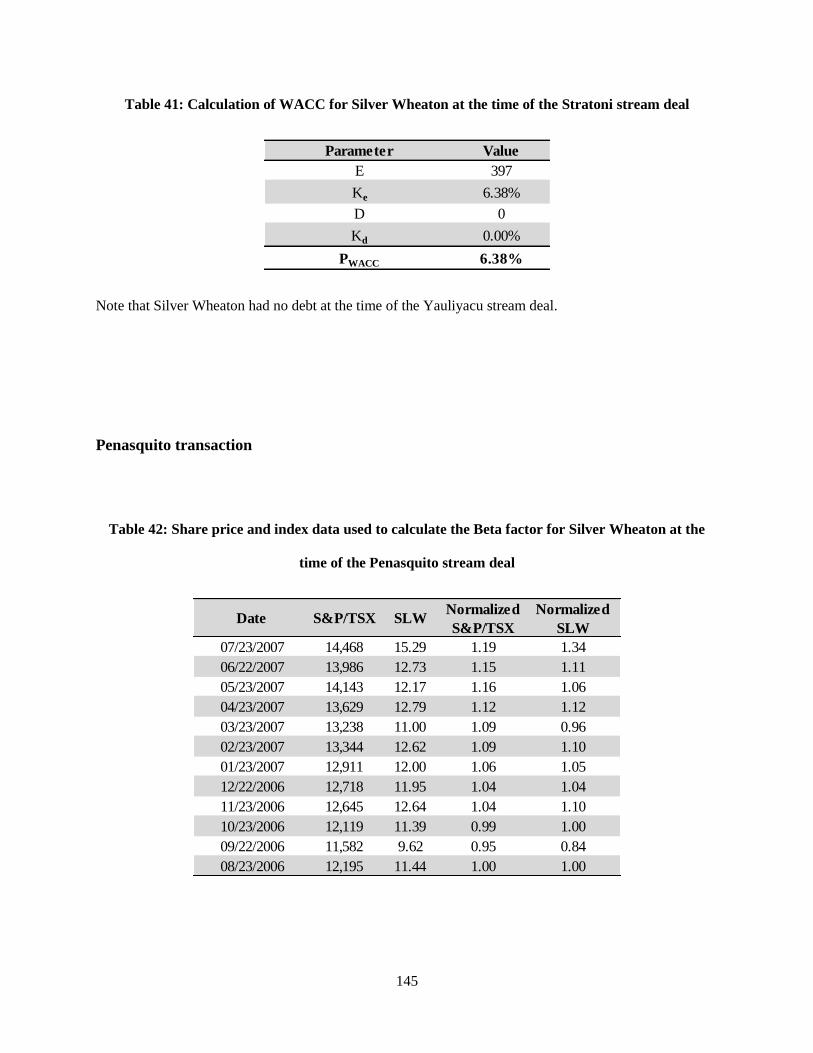
145
Table 41: Calculation of WACC for Silver Wheaton at the time of the Stratoni stream deal
Note that Silver Wheaton had no debt at the time of the Yauliyacu stream deal.
Penasquito transaction
Table 42: Share price and index data used to calculate the Beta factor for Silver Wheaton at the
time of the Penasquito stream deal
Parameter Value
E 397
Ke 6.38%
D 0
Kd 0.00%
PWACC 6.38%
Date S&P/TSX SLWNormalized
S&P/TSX
Normalized
SLW
07/23/2007 14,468 15.29 1.19 1.34
06/22/2007 13,986 12.73 1.15 1.11
05/23/2007 14,143 12.17 1.16 1.06
04/23/2007 13,629 12.79 1.12 1.12
03/23/2007 13,238 11.00 1.09 0.96
02/23/2007 13,344 12.62 1.09 1.10
01/23/2007 12,911 12.00 1.06 1.05
12/22/2006 12,718 11.95 1.04 1.04
11/23/2006 12,645 12.64 1.04 1.10
10/23/2006 12,119 11.39 0.99 1.00
09/22/2006 11,582 9.62 0.95 0.84
08/23/2006 12,195 11.44 1.00 1.00
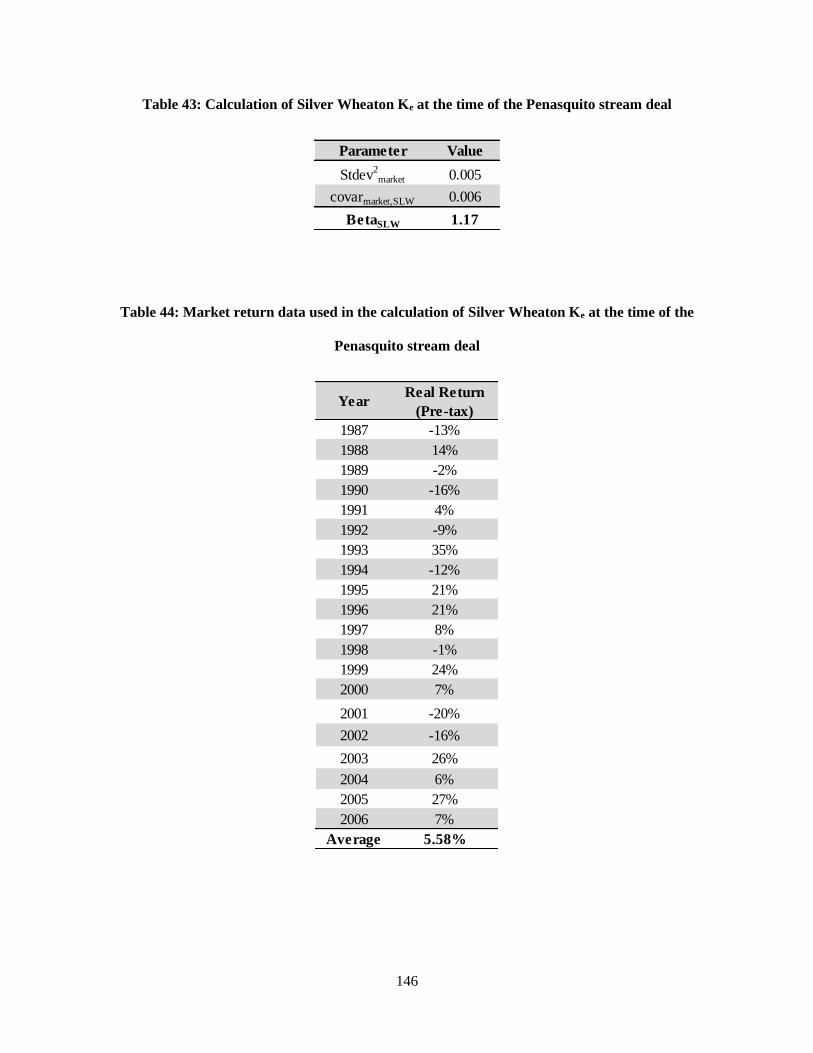
146
Table 43: Calculation of Silver Wheaton Ke at the time of the Penasquito stream deal
Table 44: Market return data used in the calculation of Silver Wheaton Ke at the time of the
Penasquito stream deal
Parameter Value
Stdev2market 0.005
covarmarket,SLW 0.006
BetaSLW 1.17
YearReal Return
(Pre-tax)
1987 -13%
1988 14%
1989 -2%
1990 -16%
1991 4%
1992 -9%
1993 35%
1994 -12%
1995 21%
1996 21%
1997 8%
1998 -1%
1999 24%
2000 7%
2001 -20%
2002 -16%
2003 26%
2004 6%
2005 27%
2006 7%
Average 5.58%
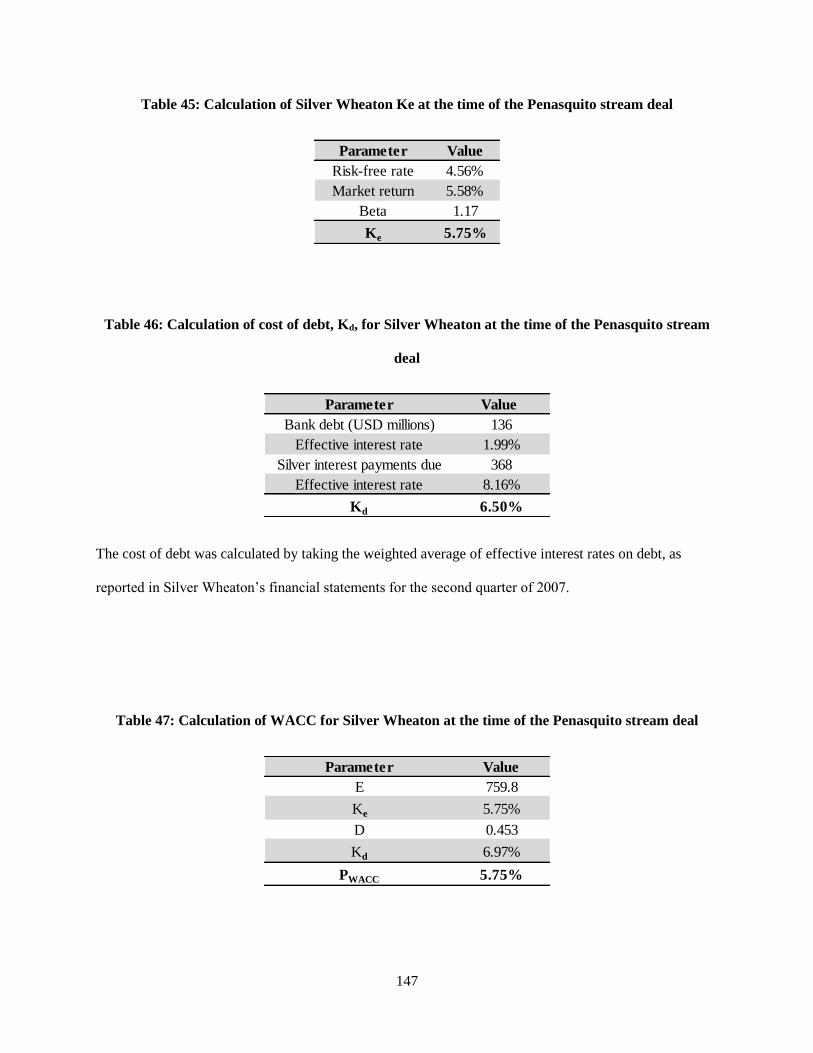
147
Table 45: Calculation of Silver Wheaton Ke at the time of the Penasquito stream deal
Table 46: Calculation of cost of debt, Kd, for Silver Wheaton at the time of the Penasquito stream
deal
The cost of debt was calculated by taking the weighted average of effective interest rates on debt, as
reported in Silver Wheaton’s financial statements for the second quarter of 2007.
Table 47: Calculation of WACC for Silver Wheaton at the time of the Penasquito stream deal
Parameter Value
Risk-free rate 4.56%
Market return 5.58%
Beta 1.17
Ke 5.75%
Parameter Value
Bank debt (USD millions) 136
Effective interest rate 1.99%
Silver interest payments due 368
Effective interest rate 8.16%
Kd 6.50%
Parameter Value
E 759.8
Ke 5.75%
D 0.453
Kd 6.97%
PWACC 5.75%
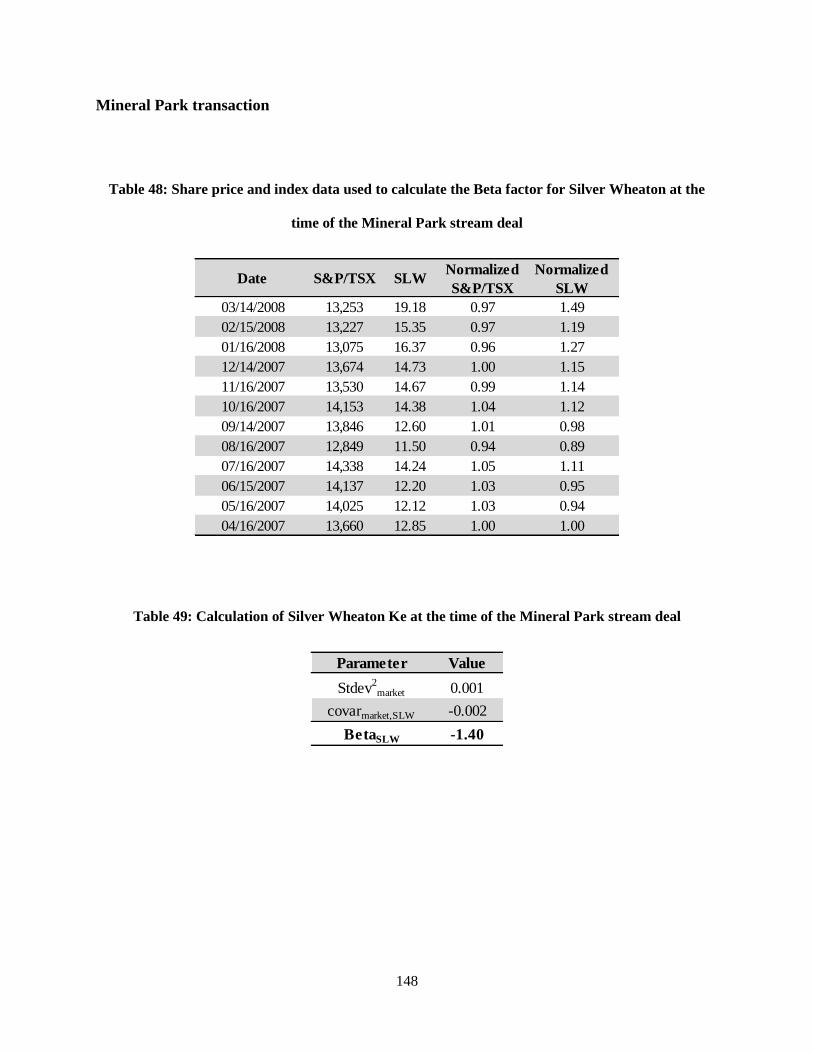
148
Mineral Park transaction
Table 48: Share price and index data used to calculate the Beta factor for Silver Wheaton at the
time of the Mineral Park stream deal
Table 49: Calculation of Silver Wheaton Ke at the time of the Mineral Park stream deal
Date S&P/TSX SLWNormalized
S&P/TSX
Normalized
SLW
03/14/2008 13,253 19.18 0.97 1.49
02/15/2008 13,227 15.35 0.97 1.19
01/16/2008 13,075 16.37 0.96 1.27
12/14/2007 13,674 14.73 1.00 1.15
11/16/2007 13,530 14.67 0.99 1.14
10/16/2007 14,153 14.38 1.04 1.12
09/14/2007 13,846 12.60 1.01 0.98
08/16/2007 12,849 11.50 0.94 0.89
07/16/2007 14,338 14.24 1.05 1.11
06/15/2007 14,137 12.20 1.03 0.95
05/16/2007 14,025 12.12 1.03 0.94
04/16/2007 13,660 12.85 1.00 1.00
Parameter Value
Stdev2market 0.001
covarmarket,SLW -0.002
BetaSLW -1.40
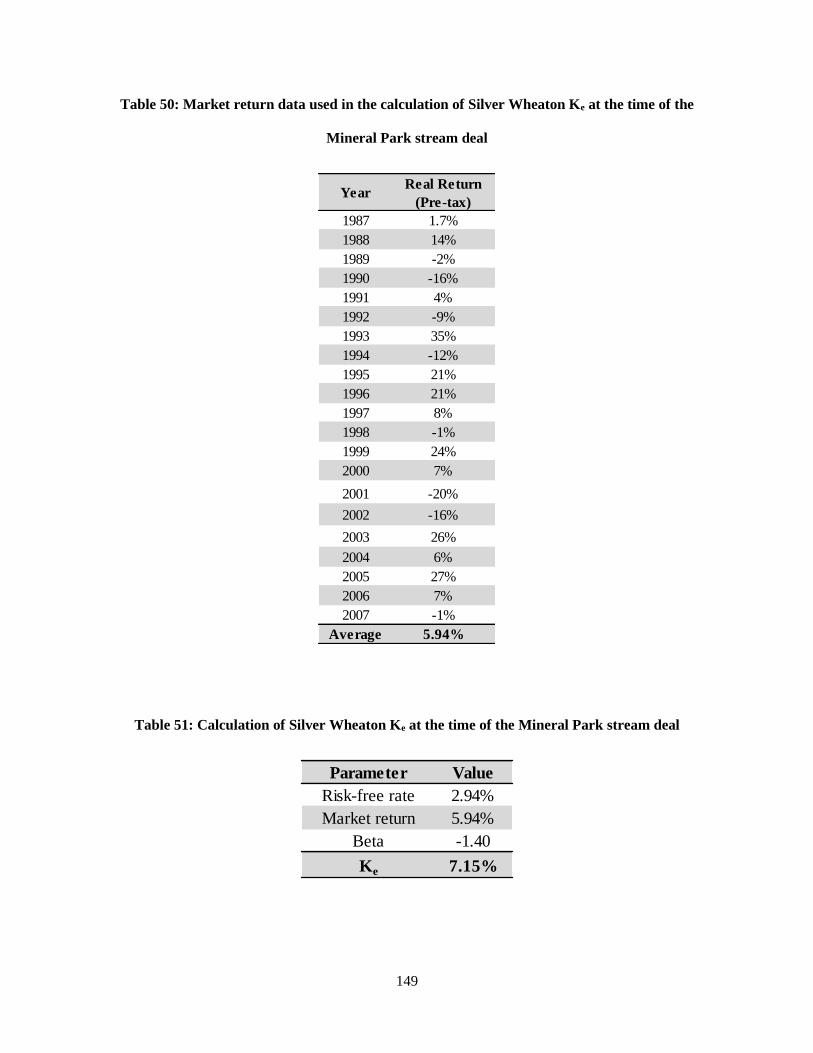
149
Table 50: Market return data used in the calculation of Silver Wheaton Ke at the time of the
Mineral Park stream deal
Table 51: Calculation of Silver Wheaton Ke at the time of the Mineral Park stream deal
YearReal Return
(Pre-tax)
1987 1.7%
1988 14%
1989 -2%
1990 -16%
1991 4%
1992 -9%
1993 35%
1994 -12%
1995 21%
1996 21%
1997 8%
1998 -1%
1999 24%
2000 7%
2001 -20%
2002 -16%
2003 26%
2004 6%
2005 27%
2006 7%
2007 -1%
Average 5.94%
Parameter Value
Risk-free rate 2.94%
Market return 5.94%
Beta -1.40
Ke 7.15%

150
Table 52: Calculation of WACC for Silver Wheaton at the time of the Mineral Park stream deal
The cost of debt for Silver Wheaton at the time of this deal was taken as the total effective interest rate, as
reported in the Silver Wheaton financial statements for the first quarter of 2008.
Campo Morado transaction
Table 53: Share price and index data used to calculate the Beta factor for Silver Wheaton at the
time of the Campo Morado stream deal
Parameter Value
E 814
Ke 7.15%
D 386
Kd 5.74%
PWACC 6.70%
Date S&P/TSX SLWNormalized
S&P/TSX
Normalized
SLW
05/13/2008 14,617 13.99 1.04 1.21
04/14/2008 13,739 16.46 0.98 1.43
03/14/2008 13,253 18.10 0.95 1.57
02/05/2008 12,932 15.13 0.92 1.31
01/16/2008 13,075 16.85 0.93 1.46
12/06/2007 13,850 16.23 0.99 1.41
11/16/2007 13,530 14.80 0.97 1.28
10/09/2007 14,262 14.65 1.02 1.27
09/10/2007 13,625 12.90 0.97 1.12
08/10/2007 13,466 14.19 0.96 1.23
07/12/2007 14,356 14.83 1.03 1.29
06/14/2007 14,002 11.54 1.00 1.00
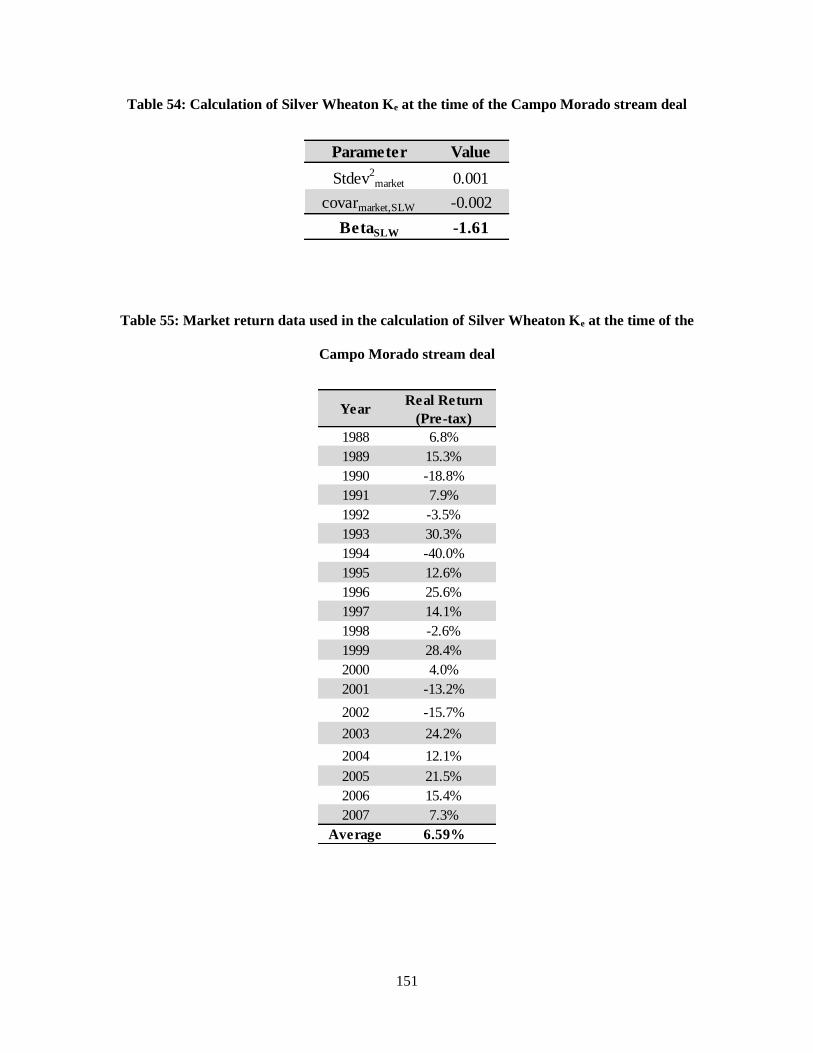
151
Table 54: Calculation of Silver Wheaton Ke at the time of the Campo Morado stream deal
Table 55: Market return data used in the calculation of Silver Wheaton Ke at the time of the
Campo Morado stream deal
Parameter Value
Stdev2market 0.001
covarmarket,SLW -0.002
BetaSLW -1.61
YearReal Return
(Pre-tax)
1988 6.8%
1989 15.3%
1990 -18.8%
1991 7.9%
1992 -3.5%
1993 30.3%
1994 -40.0%
1995 12.6%
1996 25.6%
1997 14.1%
1998 -2.6%
1999 28.4%
2000 4.0%
2001 -13.2%
2002 -15.7%
2003 24.2%
2004 12.1%
2005 21.5%
2006 15.4%
2007 7.3%
Average 6.59%

152
Table 56: Calculation of Silver Wheaton Ke at the time of the Campo Morado stream deal
Table 57: Calculation of WACC for Silver Wheaton at the time of the Campo Morado stream deal
The cost of debt for Silver Wheaton at the time of this deal was taken as the total effective interest rate, as
reported in the Silver Wheaton financial statements for the first quarter of 2008.
Keno Hill transaction
Parameter Value
Risk-free rate 2.71%
Market return 6.59%
Beta -1.61
Ke 8.95%
Parameter Value
E 814.2
Ke 8.95%
D 386.3
Kd 5.74%
PWACC 7.92%
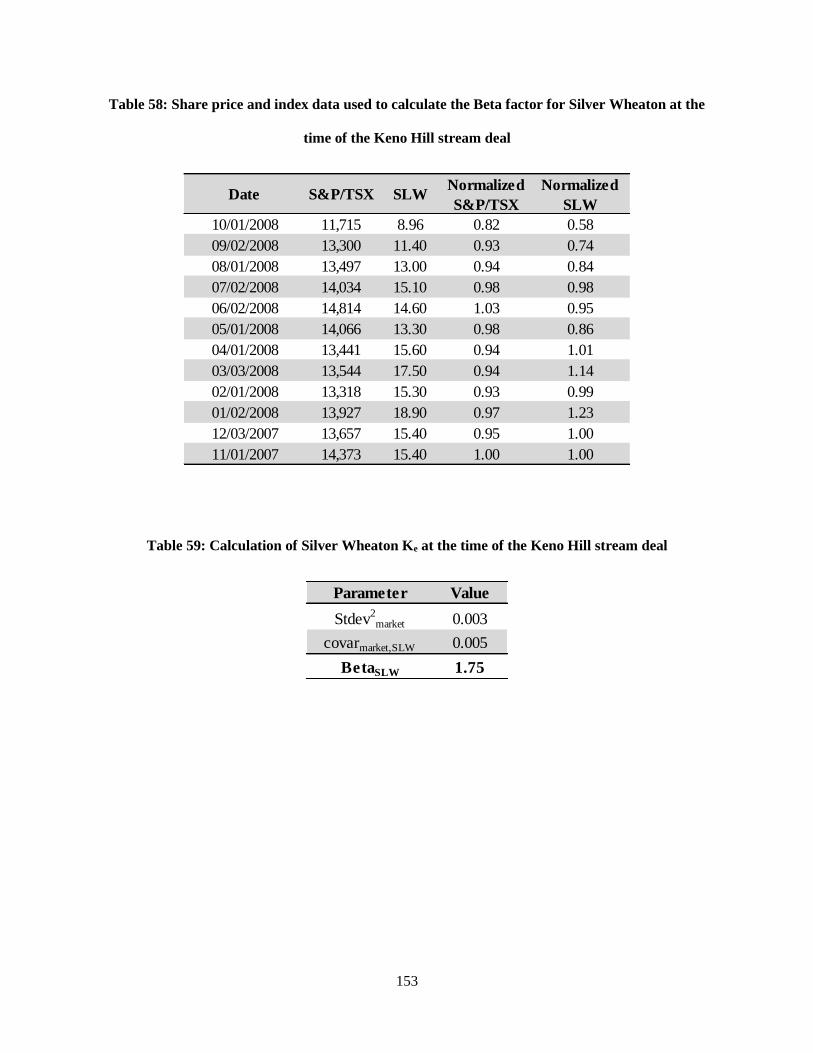
153
Table 58: Share price and index data used to calculate the Beta factor for Silver Wheaton at the
time of the Keno Hill stream deal
Table 59: Calculation of Silver Wheaton Ke at the time of the Keno Hill stream deal
Date S&P/TSX SLWNormalized
S&P/TSX
Normalized
SLW
10/01/2008 11,715 8.96 0.82 0.58
09/02/2008 13,300 11.40 0.93 0.74
08/01/2008 13,497 13.00 0.94 0.84
07/02/2008 14,034 15.10 0.98 0.98
06/02/2008 14,814 14.60 1.03 0.95
05/01/2008 14,066 13.30 0.98 0.86
04/01/2008 13,441 15.60 0.94 1.01
03/03/2008 13,544 17.50 0.94 1.14
02/01/2008 13,318 15.30 0.93 0.99
01/02/2008 13,927 18.90 0.97 1.23
12/03/2007 13,657 15.40 0.95 1.00
11/01/2007 14,373 15.40 1.00 1.00
Parameter Value
Stdev2market 0.003
covarmarket,SLW 0.005
BetaSLW 1.75
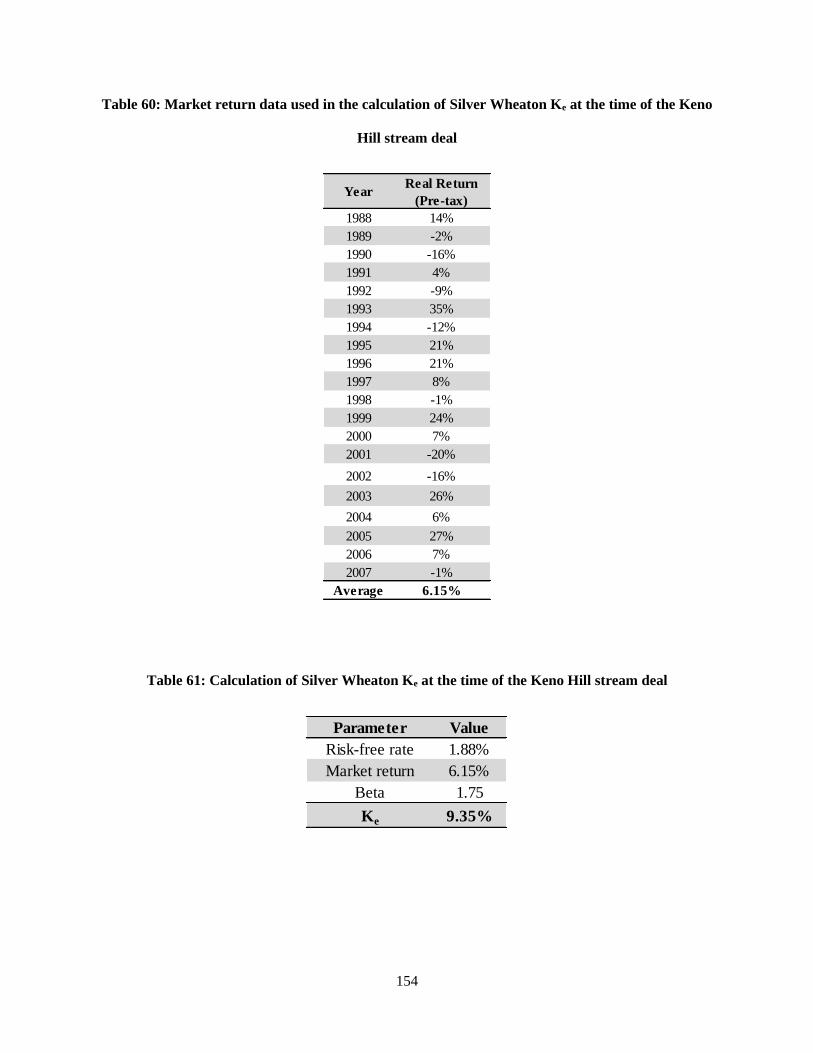
154
Table 60: Market return data used in the calculation of Silver Wheaton Ke at the time of the Keno
Hill stream deal
Table 61: Calculation of Silver Wheaton Ke at the time of the Keno Hill stream deal
YearReal Return
(Pre-tax)
1988 14%
1989 -2%
1990 -16%
1991 4%
1992 -9%
1993 35%
1994 -12%
1995 21%
1996 21%
1997 8%
1998 -1%
1999 24%
2000 7%
2001 -20%
2002 -16%
2003 26%
2004 6%
2005 27%
2006 7%
2007 -1%
Average 6.15%
Parameter Value
Risk-free rate 1.88%
Market return 6.15%
Beta 1.75
Ke 9.35%
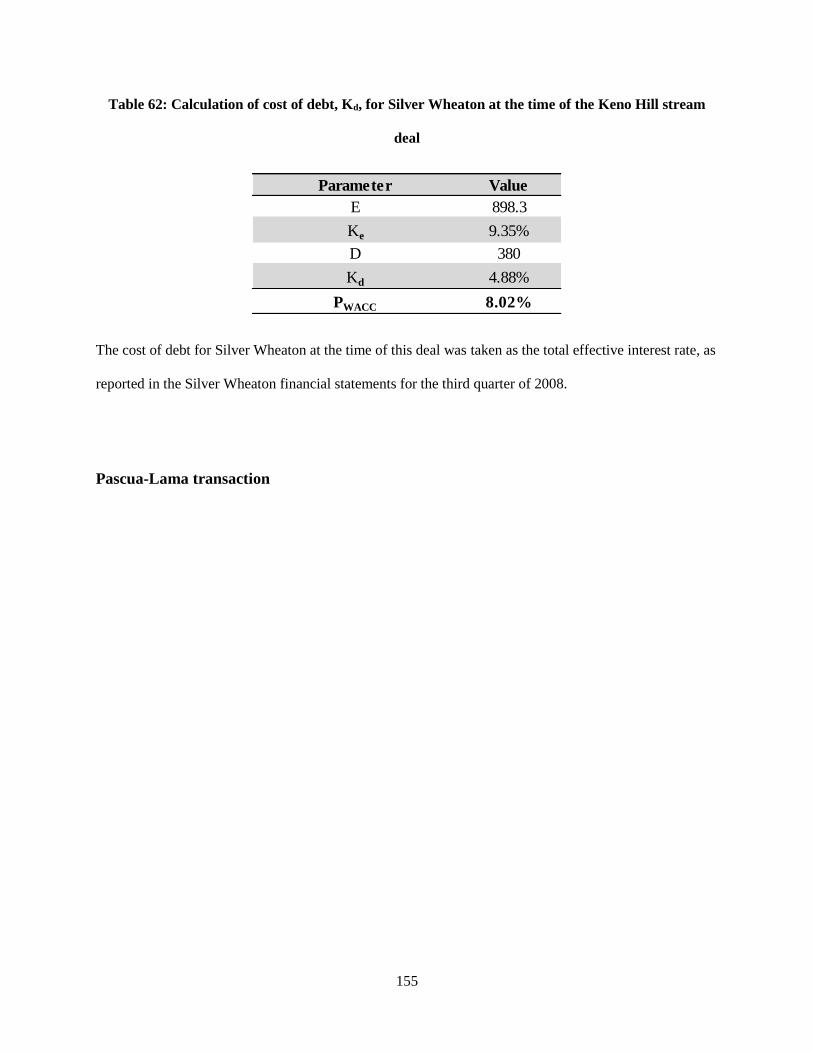
155
Table 62: Calculation of cost of debt, Kd, for Silver Wheaton at the time of the Keno Hill stream
deal
The cost of debt for Silver Wheaton at the time of this deal was taken as the total effective interest rate, as
reported in the Silver Wheaton financial statements for the third quarter of 2008.
Pascua-Lama transaction
Parameter Value
E 898.3
Ke 9.35%
D 380
Kd 4.88%
PWACC 8.02%
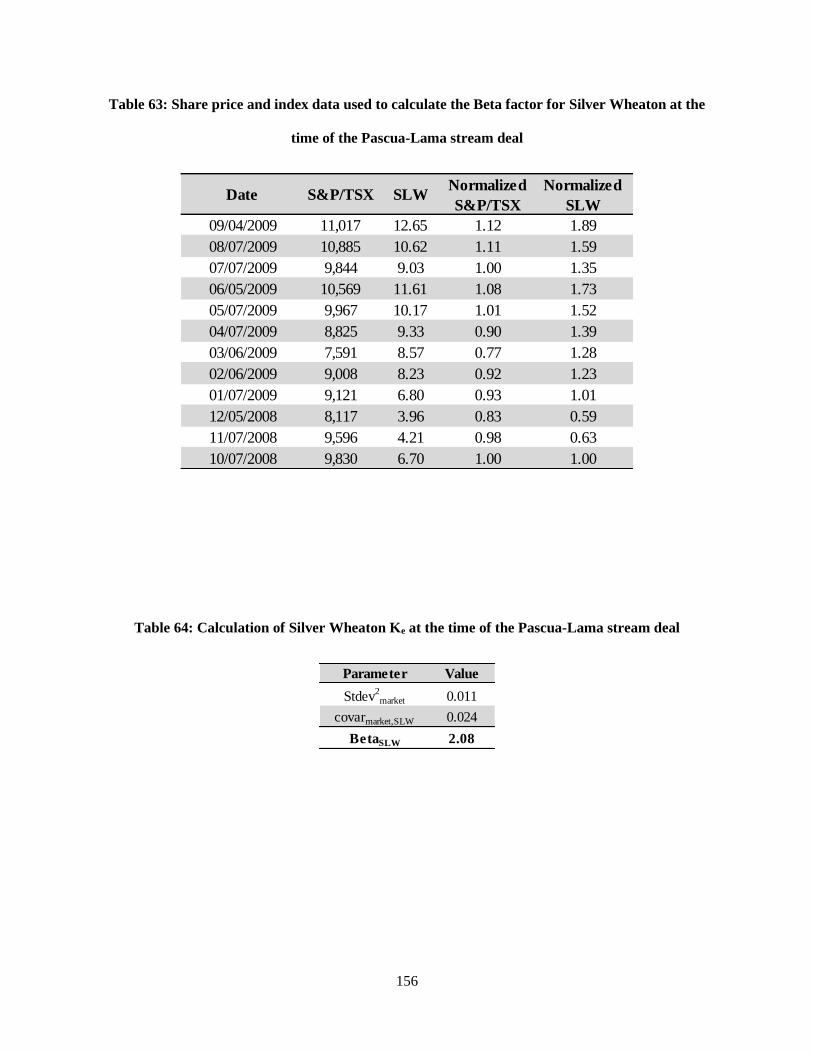
156
Table 63: Share price and index data used to calculate the Beta factor for Silver Wheaton at the
time of the Pascua-Lama stream deal
Table 64: Calculation of Silver Wheaton Ke at the time of the Pascua-Lama stream deal
Date S&P/TSX SLWNormalized
S&P/TSX
Normalized
SLW
09/04/2009 11,017 12.65 1.12 1.89
08/07/2009 10,885 10.62 1.11 1.59
07/07/2009 9,844 9.03 1.00 1.35
06/05/2009 10,569 11.61 1.08 1.73
05/07/2009 9,967 10.17 1.01 1.52
04/07/2009 8,825 9.33 0.90 1.39
03/06/2009 7,591 8.57 0.77 1.28
02/06/2009 9,008 8.23 0.92 1.23
01/07/2009 9,121 6.80 0.93 1.01
12/05/2008 8,117 3.96 0.83 0.59
11/07/2008 9,596 4.21 0.98 0.63
10/07/2008 9,830 6.70 1.00 1.00
Parameter Value
Stdev2market 0.011
covarmarket,SLW 0.024
BetaSLW 2.08
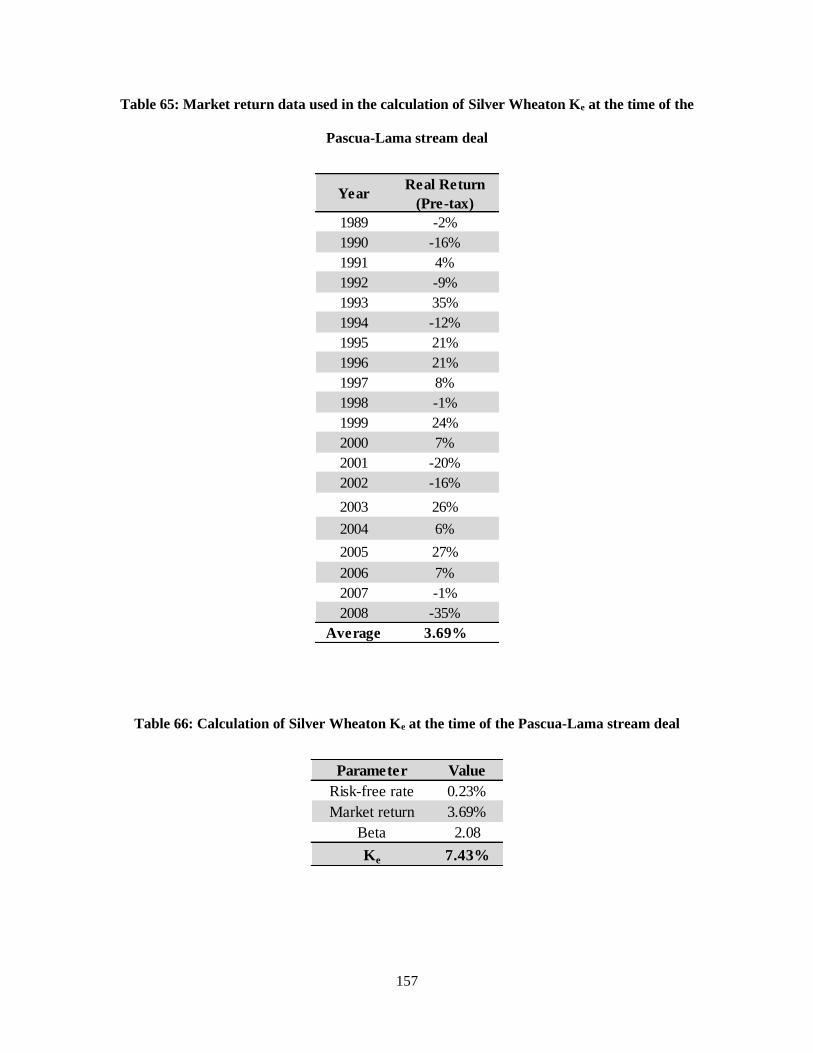
157
Table 65: Market return data used in the calculation of Silver Wheaton Ke at the time of the
Pascua-Lama stream deal
Table 66: Calculation of Silver Wheaton Ke at the time of the Pascua-Lama stream deal
YearReal Return
(Pre-tax)
1989 -2%
1990 -16%
1991 4%
1992 -9%
1993 35%
1994 -12%
1995 21%
1996 21%
1997 8%
1998 -1%
1999 24%
2000 7%
2001 -20%
2002 -16%
2003 26%
2004 6%
2005 27%
2006 7%
2007 -1%
2008 -35%
Average 3.69%
Parameter Value
Risk-free rate 0.23%
Market return 3.69%
Beta 2.08
Ke 7.43%
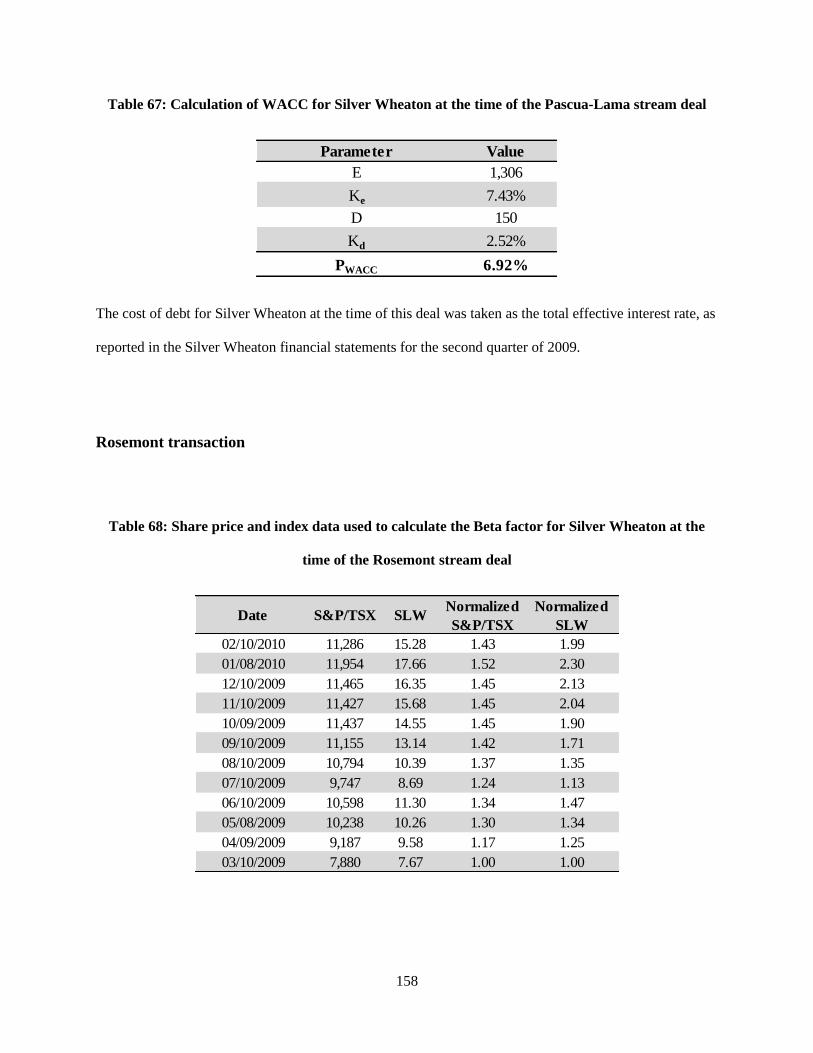
158
Table 67: Calculation of WACC for Silver Wheaton at the time of the Pascua-Lama stream deal
The cost of debt for Silver Wheaton at the time of this deal was taken as the total effective interest rate, as
reported in the Silver Wheaton financial statements for the second quarter of 2009.
Rosemont transaction
Table 68: Share price and index data used to calculate the Beta factor for Silver Wheaton at the
time of the Rosemont stream deal
Parameter Value
E 1,306
Ke 7.43%
D 150
Kd 2.52%
PWACC 6.92%
Date S&P/TSX SLWNormalized
S&P/TSX
Normalized
SLW
02/10/2010 11,286 15.28 1.43 1.99
01/08/2010 11,954 17.66 1.52 2.30
12/10/2009 11,465 16.35 1.45 2.13
11/10/2009 11,427 15.68 1.45 2.04
10/09/2009 11,437 14.55 1.45 1.90
09/10/2009 11,155 13.14 1.42 1.71
08/10/2009 10,794 10.39 1.37 1.35
07/10/2009 9,747 8.69 1.24 1.13
06/10/2009 10,598 11.30 1.34 1.47
05/08/2009 10,238 10.26 1.30 1.34
04/09/2009 9,187 9.58 1.17 1.25
03/10/2009 7,880 7.67 1.00 1.00
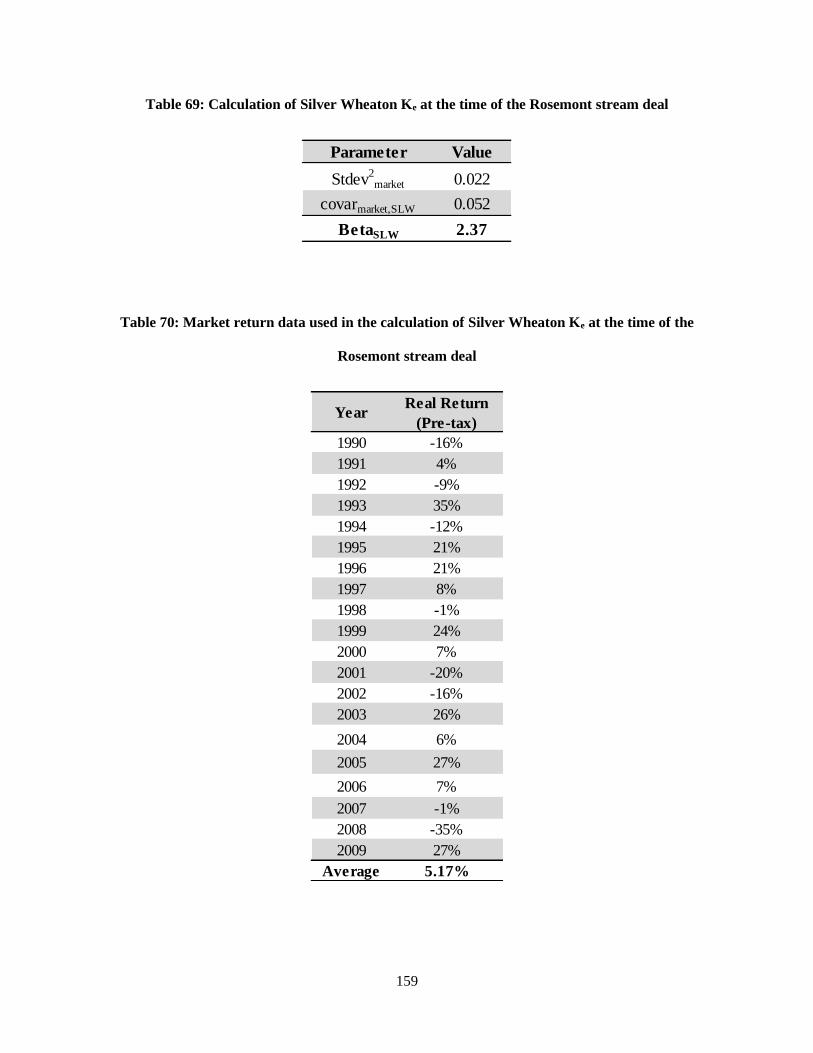
159
Table 69: Calculation of Silver Wheaton Ke at the time of the Rosemont stream deal
Table 70: Market return data used in the calculation of Silver Wheaton Ke at the time of the
Rosemont stream deal
Parameter Value
Stdev2market 0.022
covarmarket,SLW 0.052
BetaSLW 2.37
YearReal Return
(Pre-tax)
1990 -16%
1991 4%
1992 -9%
1993 35%
1994 -12%
1995 21%
1996 21%
1997 8%
1998 -1%
1999 24%
2000 7%
2001 -20%
2002 -16%
2003 26%
2004 6%
2005 27%
2006 7%
2007 -1%
2008 -35%
2009 27%
Average 5.17%
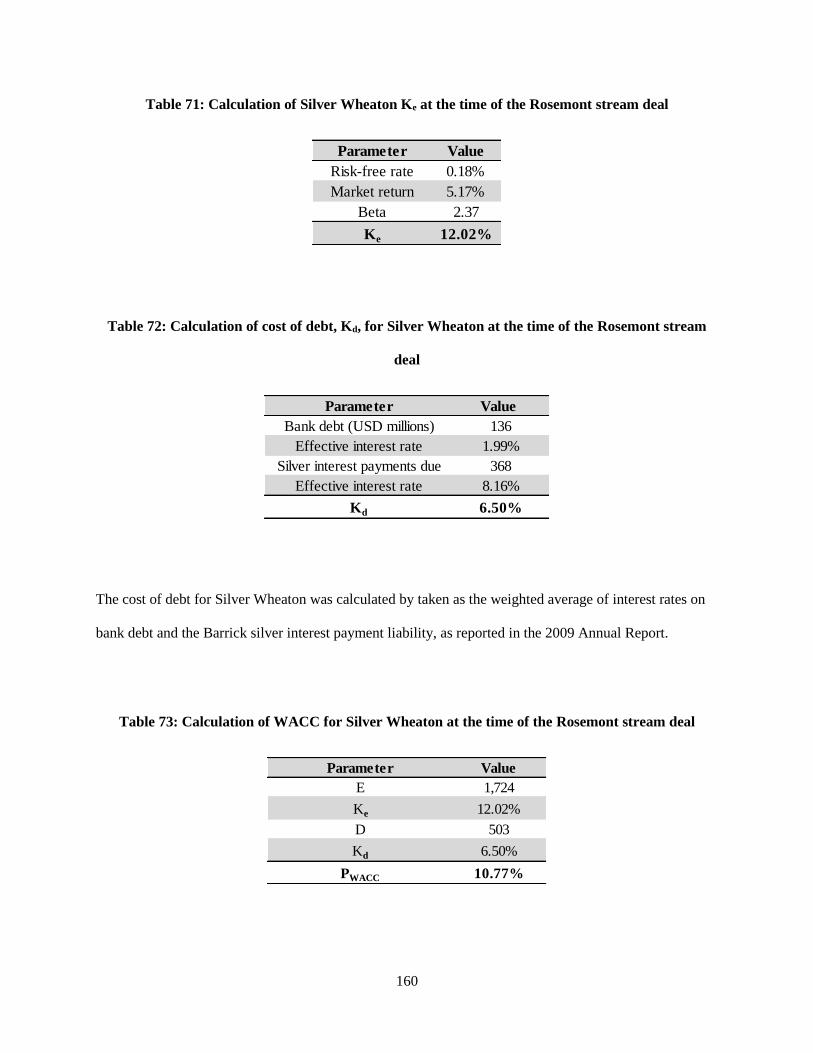
160
Table 71: Calculation of Silver Wheaton Ke at the time of the Rosemont stream deal
Table 72: Calculation of cost of debt, Kd, for Silver Wheaton at the time of the Rosemont stream
deal
The cost of debt for Silver Wheaton was calculated by taken as the weighted average of interest rates on
bank debt and the Barrick silver interest payment liability, as reported in the 2009 Annual Report.
Table 73: Calculation of WACC for Silver Wheaton at the time of the Rosemont stream deal
Parameter Value
Risk-free rate 0.18%
Market return 5.17%
Beta 2.37
Ke 12.02%
Parameter Value
Bank debt (USD millions) 136
Effective interest rate 1.99%
Silver interest payments due 368
Effective interest rate 8.16%
Kd 6.50%
Parameter Value
E 1,724
Ke 12.02%
D 503
Kd 6.50%
PWACC 10.77%
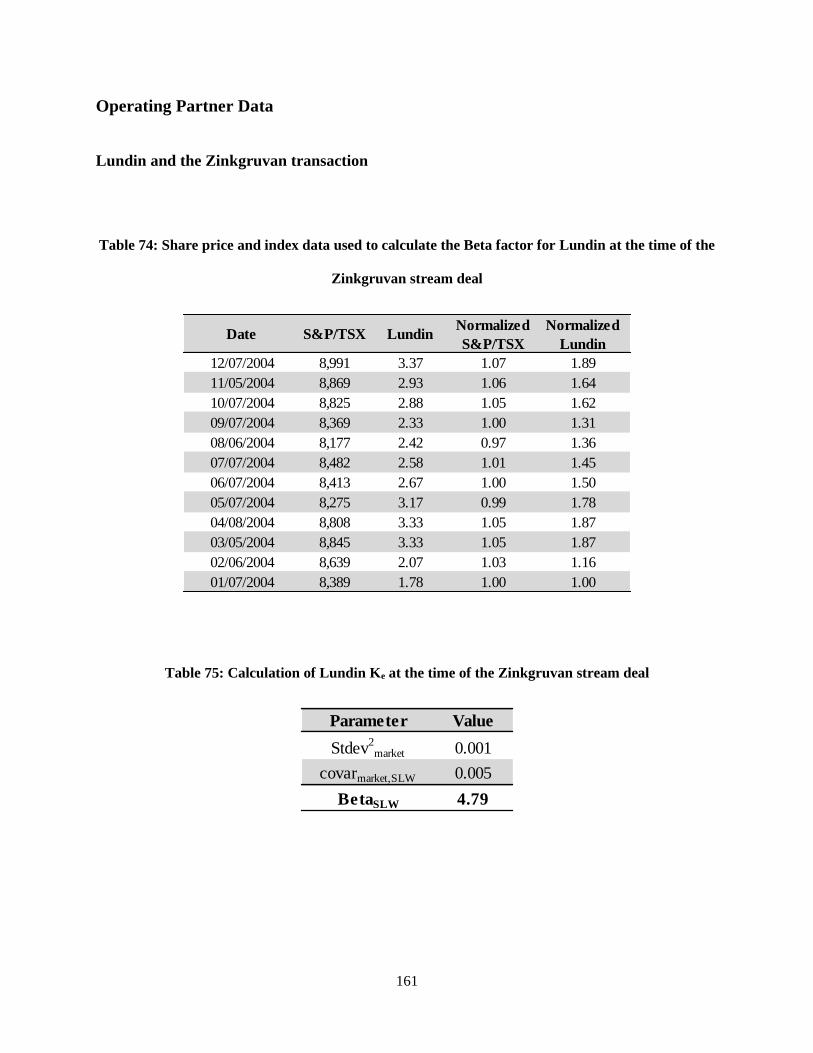
161
Operating Partner Data
Lundin and the Zinkgruvan transaction
Table 74: Share price and index data used to calculate the Beta factor for Lundin at the time of the
Zinkgruvan stream deal
Table 75: Calculation of Lundin Ke at the time of the Zinkgruvan stream deal
Date S&P/TSX LundinNormalized
S&P/TSX
Normalized
Lundin
12/07/2004 8,991 3.37 1.07 1.89
11/05/2004 8,869 2.93 1.06 1.64
10/07/2004 8,825 2.88 1.05 1.62
09/07/2004 8,369 2.33 1.00 1.31
08/06/2004 8,177 2.42 0.97 1.36
07/07/2004 8,482 2.58 1.01 1.45
06/07/2004 8,413 2.67 1.00 1.50
05/07/2004 8,275 3.17 0.99 1.78
04/08/2004 8,808 3.33 1.05 1.87
03/05/2004 8,845 3.33 1.05 1.87
02/06/2004 8,639 2.07 1.03 1.16
01/07/2004 8,389 1.78 1.00 1.00
Parameter Value
Stdev2market 0.001
covarmarket,SLW 0.005
BetaSLW 4.79
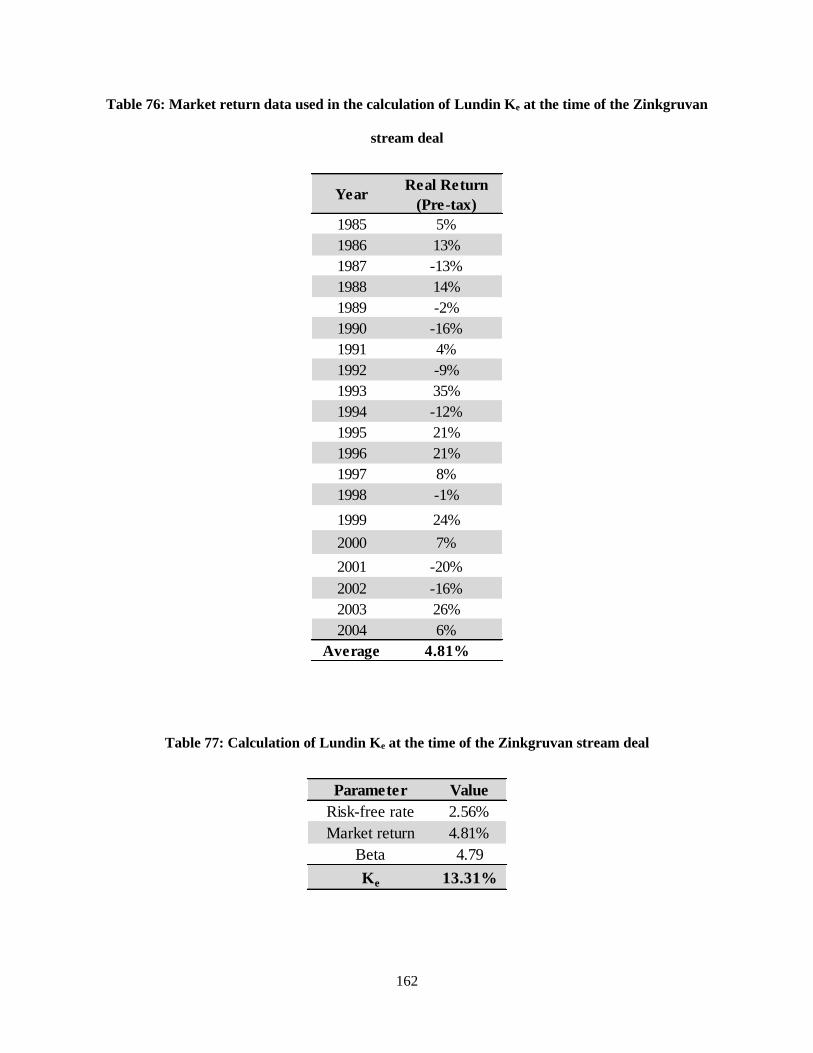
162
Table 76: Market return data used in the calculation of Lundin Ke at the time of the Zinkgruvan
stream deal
Table 77: Calculation of Lundin Ke at the time of the Zinkgruvan stream deal
YearReal Return
(Pre-tax)
1985 5%
1986 13%
1987 -13%
1988 14%
1989 -2%
1990 -16%
1991 4%
1992 -9%
1993 35%
1994 -12%
1995 21%
1996 21%
1997 8%
1998 -1%
1999 24%
2000 7%
2001 -20%
2002 -16%
2003 26%
2004 6%
Average 4.81%
Parameter Value
Risk-free rate 2.56%
Market return 4.81%
Beta 4.79
Ke 13.31%
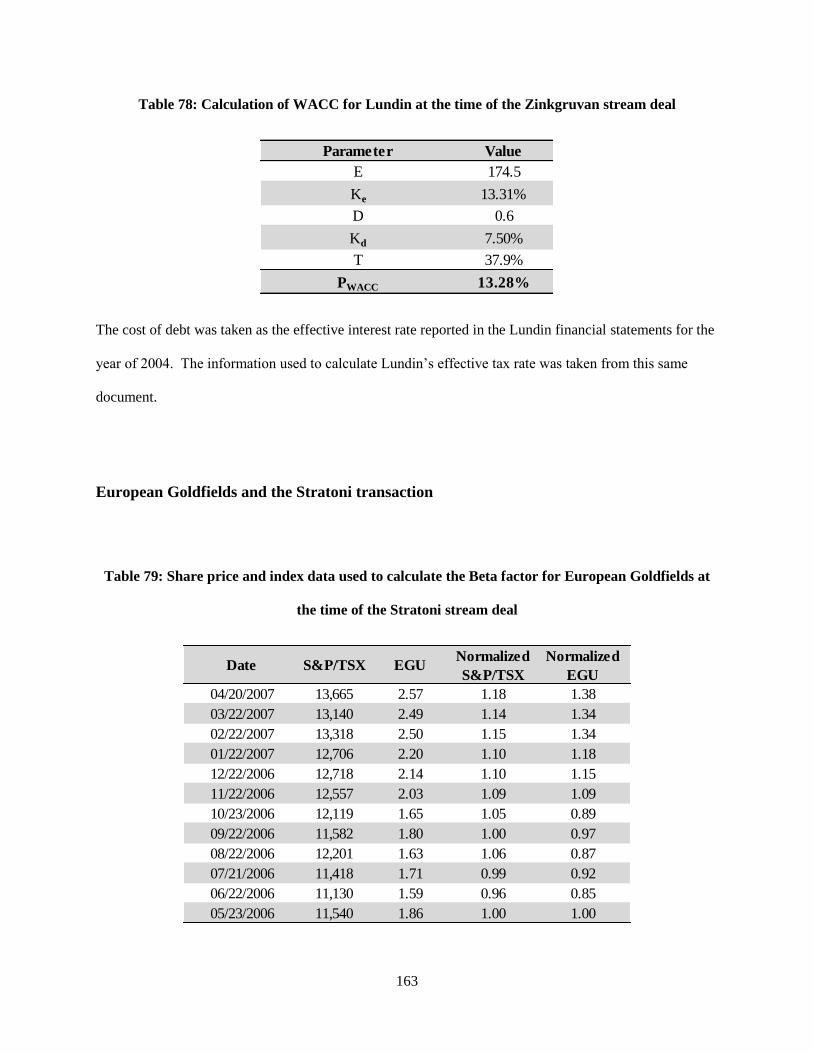
163
Table 78: Calculation of WACC for Lundin at the time of the Zinkgruvan stream deal
The cost of debt was taken as the effective interest rate reported in the Lundin financial statements for the
year of 2004. The information used to calculate Lundin’s effective tax rate was taken from this same
document.
European Goldfields and the Stratoni transaction
Table 79: Share price and index data used to calculate the Beta factor for European Goldfields at
the time of the Stratoni stream deal
Parameter Value
E 174.5
Ke 13.31%
D 0.6
Kd 7.50%
T 37.9%
PWACC 13.28%
Date S&P/TSX EGUNormalized
S&P/TSX
Normalized
EGU
04/20/2007 13,665 2.57 1.18 1.38
03/22/2007 13,140 2.49 1.14 1.34
02/22/2007 13,318 2.50 1.15 1.34
01/22/2007 12,706 2.20 1.10 1.18
12/22/2006 12,718 2.14 1.10 1.15
11/22/2006 12,557 2.03 1.09 1.09
10/23/2006 12,119 1.65 1.05 0.89
09/22/2006 11,582 1.80 1.00 0.97
08/22/2006 12,201 1.63 1.06 0.87
07/21/2006 11,418 1.71 0.99 0.92
06/22/2006 11,130 1.59 0.96 0.85
05/23/2006 11,540 1.86 1.00 1.00
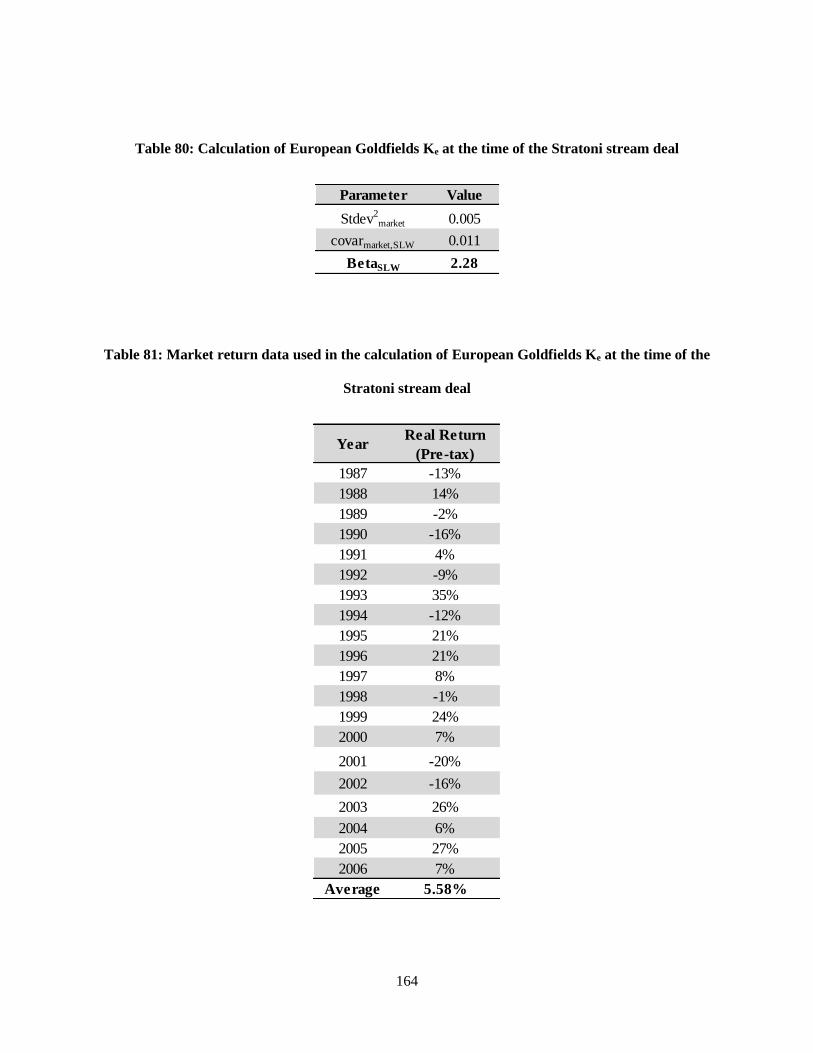
164
Table 80: Calculation of European Goldfields Ke at the time of the Stratoni stream deal
Table 81: Market return data used in the calculation of European Goldfields Ke at the time of the
Stratoni stream deal
Parameter Value
Stdev2market 0.005
covarmarket,SLW 0.011
BetaSLW 2.28
YearReal Return
(Pre-tax)
1987 -13%
1988 14%
1989 -2%
1990 -16%
1991 4%
1992 -9%
1993 35%
1994 -12%
1995 21%
1996 21%
1997 8%
1998 -1%
1999 24%
2000 7%
2001 -20%
2002 -16%
2003 26%
2004 6%
2005 27%
2006 7%
Average 5.58%
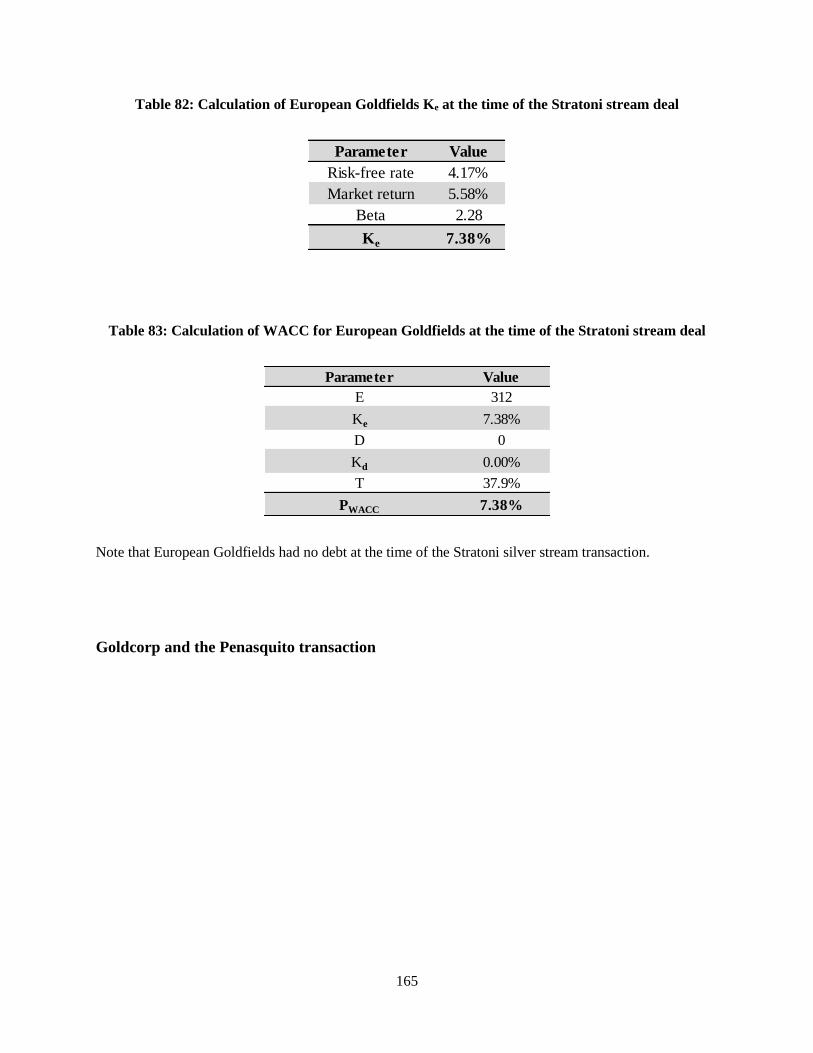
165
Table 82: Calculation of European Goldfields Ke at the time of the Stratoni stream deal
Table 83: Calculation of WACC for European Goldfields at the time of the Stratoni stream deal
Note that European Goldfields had no debt at the time of the Stratoni silver stream transaction.
Goldcorp and the Penasquito transaction
Parameter Value
Risk-free rate 4.17%
Market return 5.58%
Beta 2.28
Ke 7.38%
Parameter Value
E 312
Ke 7.38%
D 0
Kd 0.00%
T 37.9%
PWACC 7.38%

166
Table 84: Share price and index data used to calculate the Beta factor for Goldcorp at the time of
the Penasquito stream deal
Table 85: Calculation of Goldcorp Ke at the time of the Penasquito stream deal
Date S&P/TSX GoldcorpNormalized
S&P/TSX
Normalized
Goldcorp
07/23/2007 14,468 28.20 1.19 0.83
06/22/2007 13,986 26.11 1.15 0.77
05/23/2007 14,143 25.24 1.16 0.75
04/23/2007 13,629 28.51 1.12 0.84
03/23/2007 13,238 28.90 1.09 0.85
02/23/2007 13,344 32.99 1.09 0.98
01/23/2007 12,911 31.64 1.06 0.94
12/22/2006 12,718 31.46 1.04 0.93
11/23/2006 12,645 31.30 1.04 0.93
10/23/2006 12,119 26.14 0.99 0.77
09/22/2006 11,582 25.23 0.95 0.75
08/23/2006 12,195 33.81 1.00 1.00
Parameter Value
Stdev2market 0.005
covarmarket,SLW -0.001
BetaSLW -0.20
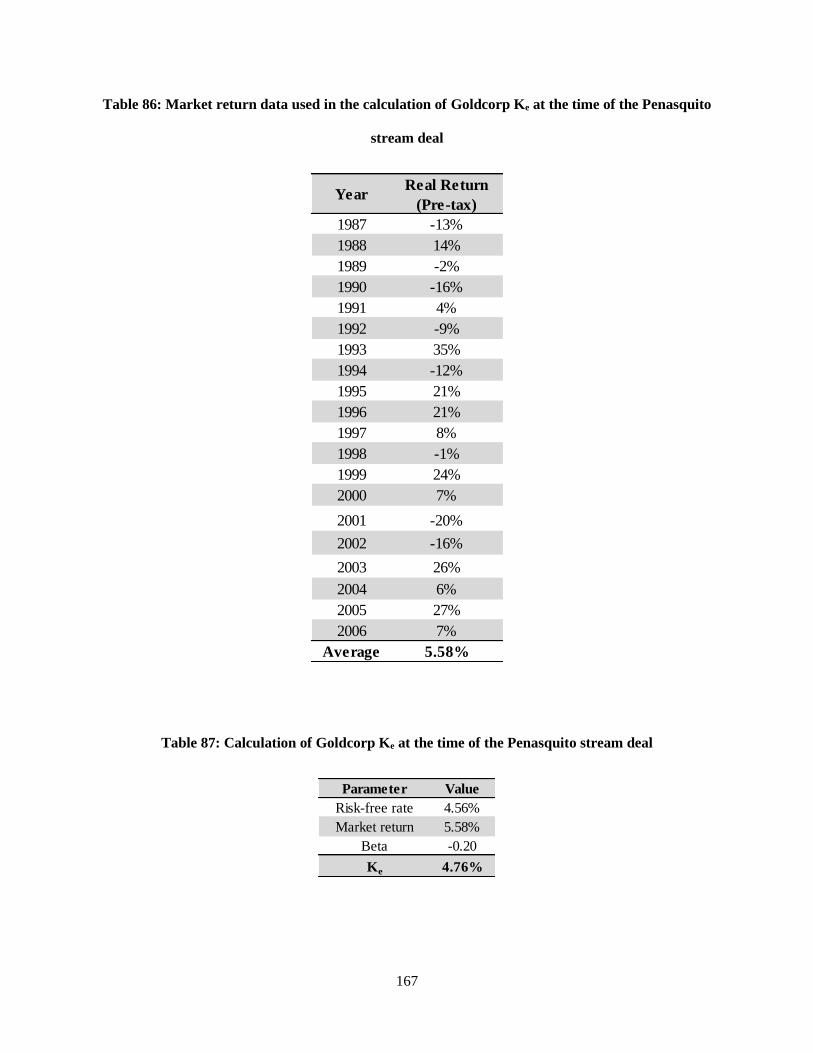
167
Table 86: Market return data used in the calculation of Goldcorp Ke at the time of the Penasquito
stream deal
Table 87: Calculation of Goldcorp Ke at the time of the Penasquito stream deal
YearReal Return
(Pre-tax)
1987 -13%
1988 14%
1989 -2%
1990 -16%
1991 4%
1992 -9%
1993 35%
1994 -12%
1995 21%
1996 21%
1997 8%
1998 -1%
1999 24%
2000 7%
2001 -20%
2002 -16%
2003 26%
2004 6%
2005 27%
2006 7%
Average 5.58%
Parameter Value
Risk-free rate 4.56%
Market return 5.58%
Beta -0.20
Ke 4.76%
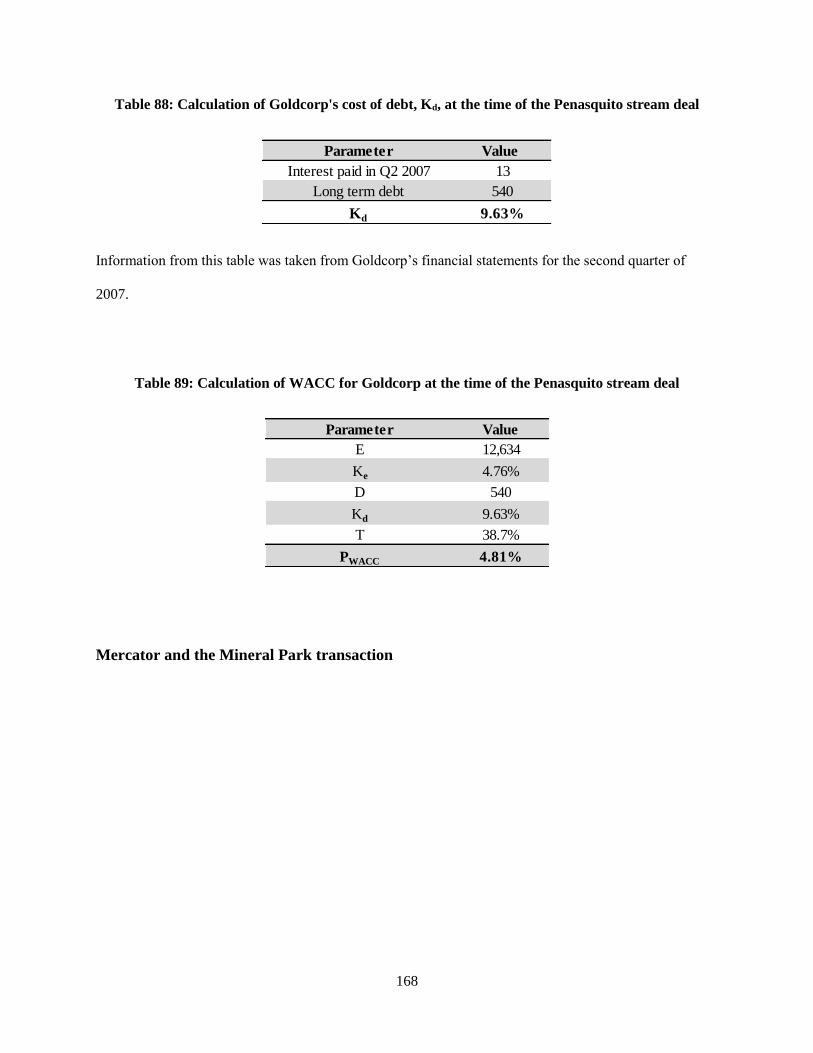
168
Table 88: Calculation of Goldcorp's cost of debt, Kd, at the time of the Penasquito stream deal
Information from this table was taken from Goldcorp’s financial statements for the second quarter of
2007.
Table 89: Calculation of WACC for Goldcorp at the time of the Penasquito stream deal
Mercator and the Mineral Park transaction
Parameter Value
Interest paid in Q2 2007 13
Long term debt 540
Kd 9.63%
Parameter Value
E 12,634
Ke 4.76%
D 540
Kd 9.63%
T 38.7%
PWACC 4.81%
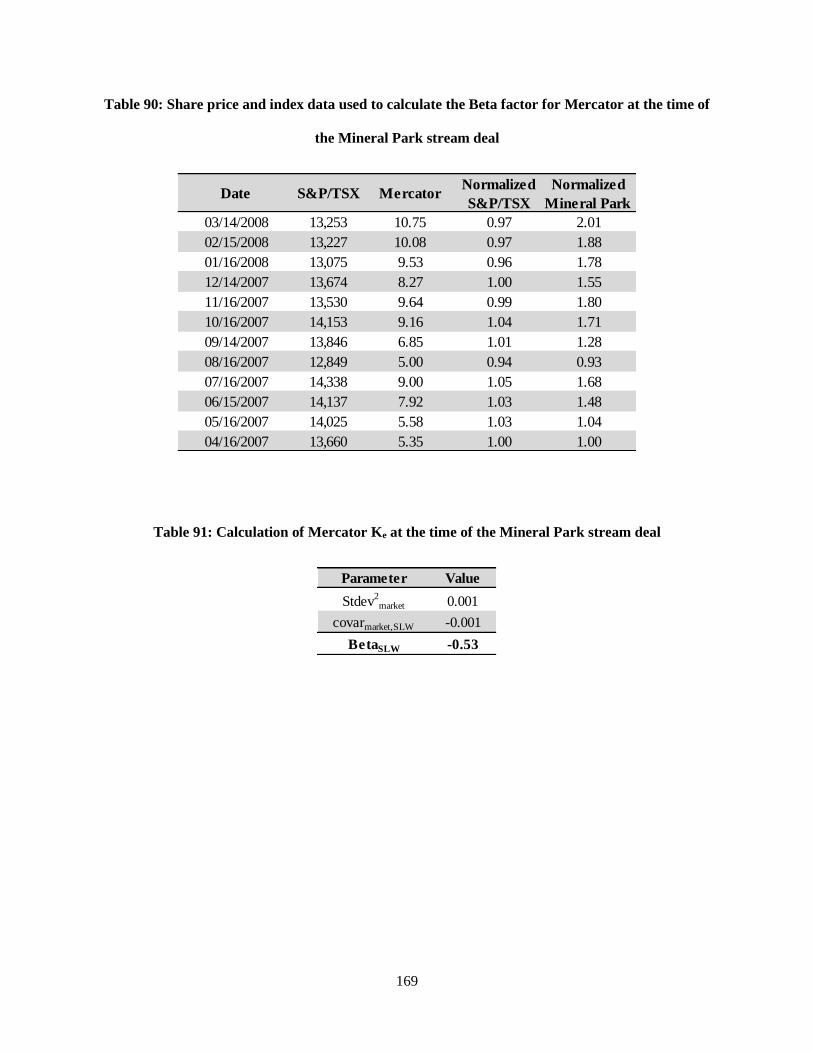
169
Table 90: Share price and index data used to calculate the Beta factor for Mercator at the time of
the Mineral Park stream deal
Table 91: Calculation of Mercator Ke at the time of the Mineral Park stream deal
Date S&P/TSX MercatorNormalized
S&P/TSX
Normalized
Mineral Park
03/14/2008 13,253 10.75 0.97 2.01
02/15/2008 13,227 10.08 0.97 1.88
01/16/2008 13,075 9.53 0.96 1.78
12/14/2007 13,674 8.27 1.00 1.55
11/16/2007 13,530 9.64 0.99 1.80
10/16/2007 14,153 9.16 1.04 1.71
09/14/2007 13,846 6.85 1.01 1.28
08/16/2007 12,849 5.00 0.94 0.93
07/16/2007 14,338 9.00 1.05 1.68
06/15/2007 14,137 7.92 1.03 1.48
05/16/2007 14,025 5.58 1.03 1.04
04/16/2007 13,660 5.35 1.00 1.00
Parameter Value
Stdev2market 0.001
covarmarket,SLW -0.001
BetaSLW -0.53
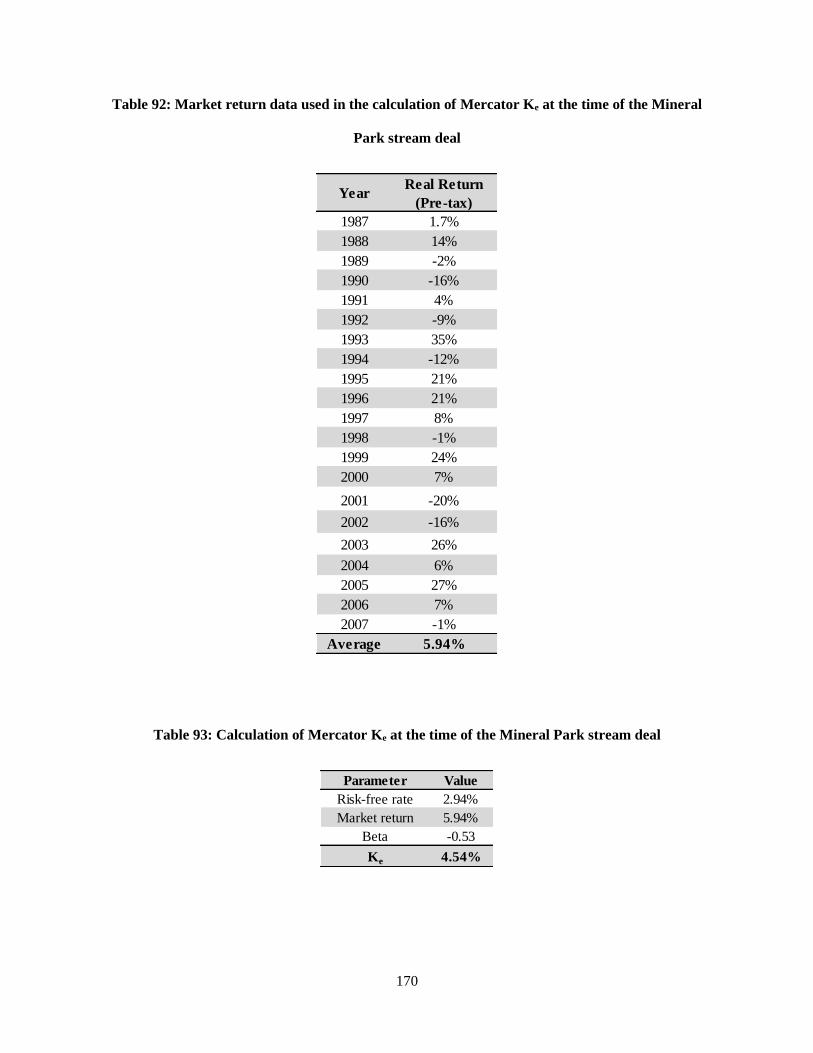
170
Table 92: Market return data used in the calculation of Mercator Ke at the time of the Mineral
Park stream deal
Table 93: Calculation of Mercator Ke at the time of the Mineral Park stream deal
YearReal Return
(Pre-tax)
1987 1.7%
1988 14%
1989 -2%
1990 -16%
1991 4%
1992 -9%
1993 35%
1994 -12%
1995 21%
1996 21%
1997 8%
1998 -1%
1999 24%
2000 7%
2001 -20%
2002 -16%
2003 26%
2004 6%
2005 27%
2006 7%
2007 -1%
Average 5.94%
Parameter Value
Risk-free rate 2.94%
Market return 5.94%
Beta -0.53
Ke 4.54%
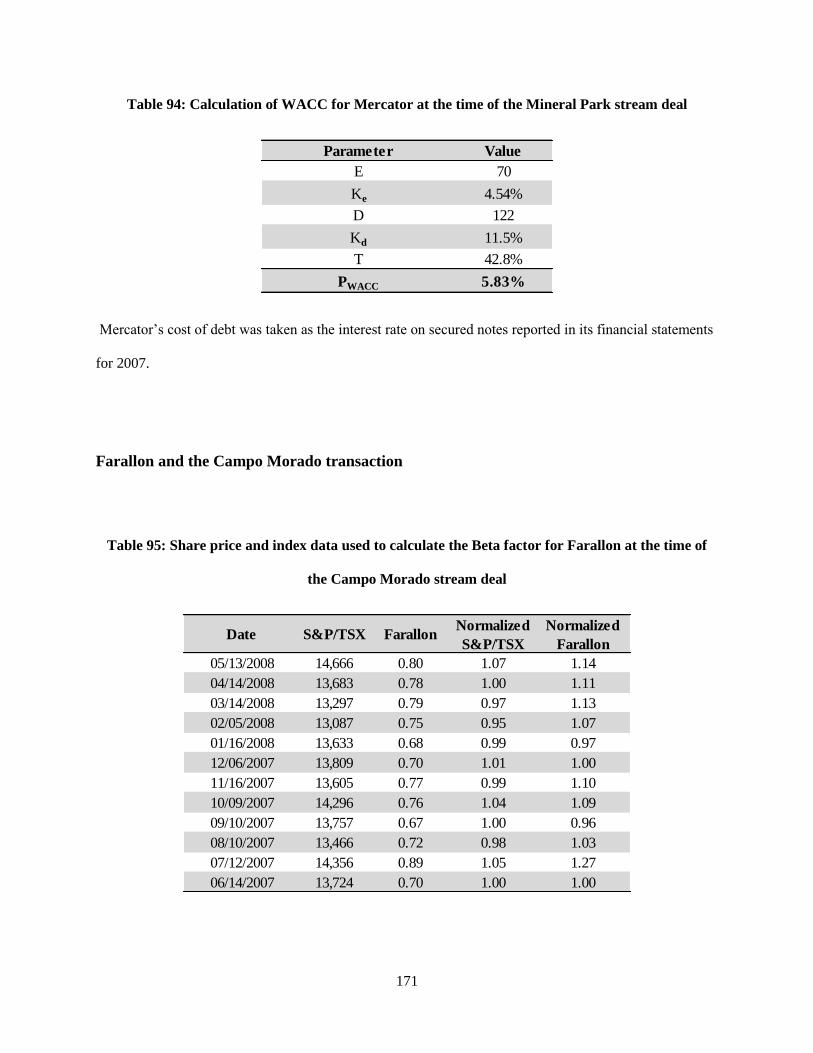
171
Table 94: Calculation of WACC for Mercator at the time of the Mineral Park stream deal
Mercator’s cost of debt was taken as the interest rate on secured notes reported in its financial statements
for 2007.
Farallon and the Campo Morado transaction
Table 95: Share price and index data used to calculate the Beta factor for Farallon at the time of
the Campo Morado stream deal
Parameter Value
E 70
Ke 4.54%
D 122
Kd 11.5%
T 42.8%
PWACC 5.83%
Date S&P/TSX FarallonNormalized
S&P/TSX
Normalized
Farallon
05/13/2008 14,666 0.80 1.07 1.14
04/14/2008 13,683 0.78 1.00 1.11
03/14/2008 13,297 0.79 0.97 1.13
02/05/2008 13,087 0.75 0.95 1.07
01/16/2008 13,633 0.68 0.99 0.97
12/06/2007 13,809 0.70 1.01 1.00
11/16/2007 13,605 0.77 0.99 1.10
10/09/2007 14,296 0.76 1.04 1.09
09/10/2007 13,757 0.67 1.00 0.96
08/10/2007 13,466 0.72 0.98 1.03
07/12/2007 14,356 0.89 1.05 1.27
06/14/2007 13,724 0.70 1.00 1.00
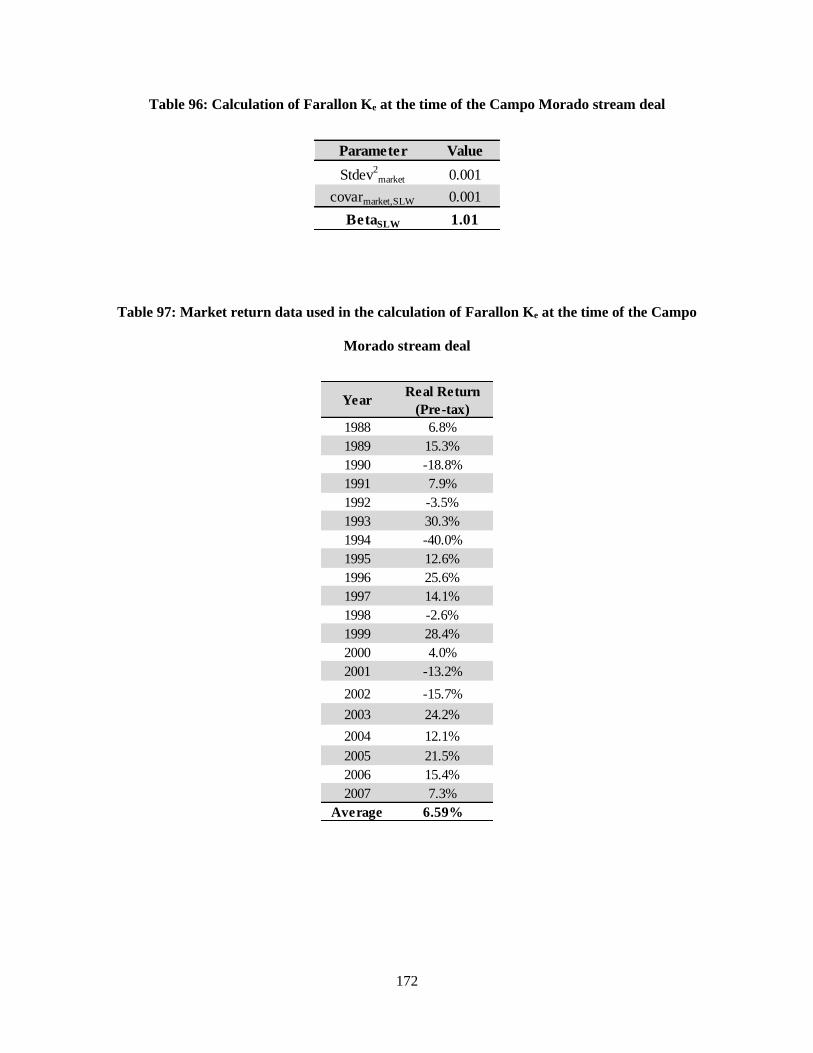
172
Table 96: Calculation of Farallon Ke at the time of the Campo Morado stream deal
Table 97: Market return data used in the calculation of Farallon Ke at the time of the Campo
Morado stream deal
Parameter Value
Stdev2market 0.001
covarmarket,SLW 0.001
BetaSLW 1.01
YearReal Return
(Pre-tax)
1988 6.8%
1989 15.3%
1990 -18.8%
1991 7.9%
1992 -3.5%
1993 30.3%
1994 -40.0%
1995 12.6%
1996 25.6%
1997 14.1%
1998 -2.6%
1999 28.4%
2000 4.0%
2001 -13.2%
2002 -15.7%
2003 24.2%
2004 12.1%
2005 21.5%
2006 15.4%
2007 7.3%
Average 6.59%
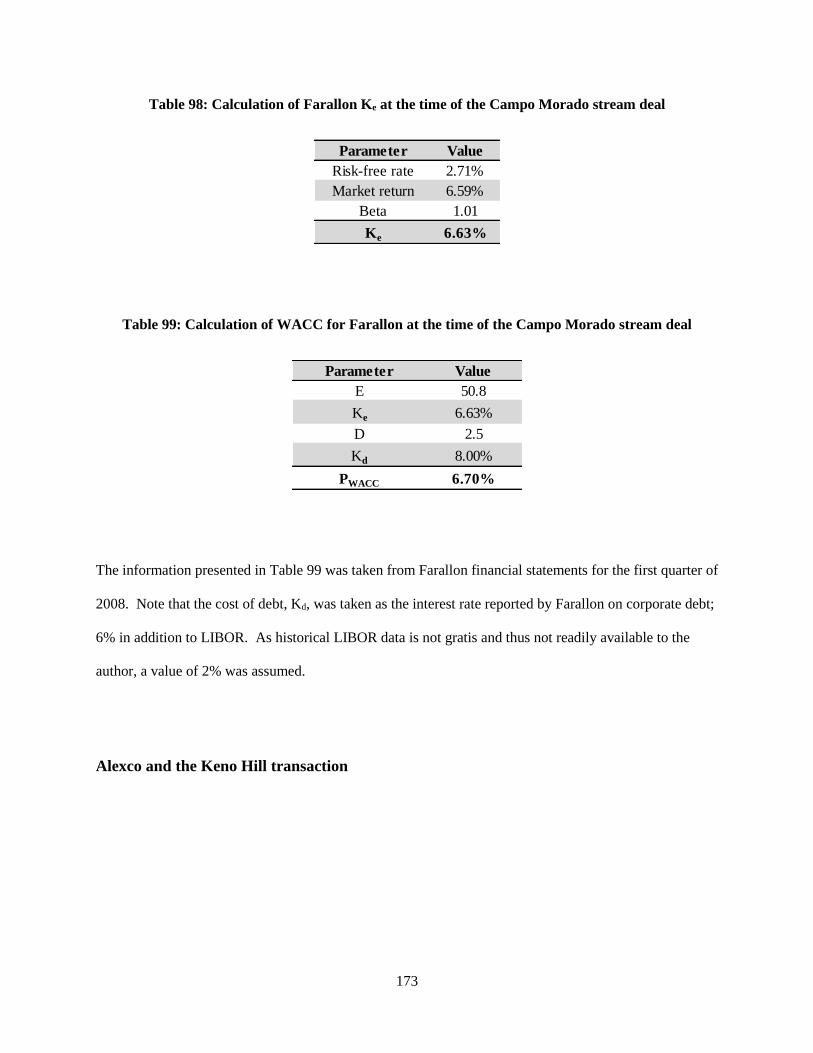
173
Table 98: Calculation of Farallon Ke at the time of the Campo Morado stream deal
Table 99: Calculation of WACC for Farallon at the time of the Campo Morado stream deal
The information presented in Table 99 was taken from Farallon financial statements for the first quarter of
2008. Note that the cost of debt, Kd, was taken as the interest rate reported by Farallon on corporate debt;
6% in addition to LIBOR. As historical LIBOR data is not gratis and thus not readily available to the
author, a value of 2% was assumed.
Alexco and the Keno Hill transaction
Parameter Value
Risk-free rate 2.71%
Market return 6.59%
Beta 1.01
Ke 6.63%
Parameter Value
E 50.8
Ke 6.63%
D 2.5
Kd 8.00%
PWACC 6.70%

174
Table 100: Share price and index data used to calculate the Beta factor for Alexco at the time of the
Keno Hill stream deal
Table 101: Calculation of Alexco Ke at the time of the Keno Hill stream deal
Date S&P/TSX AlexcoNormalized
S&P/TSX
Normalized
Alexco
10/01/2008 11,715 2.00 0.82 0.38
09/02/2008 13,300 2.60 0.93 0.49
08/01/2008 13,497 3.02 0.94 0.57
07/02/2008 14,034 3.29 0.98 0.62
06/02/2008 14,814 3.60 1.03 0.68
05/01/2008 14,066 4.08 0.98 0.77
04/01/2008 13,441 4.18 0.94 0.78
03/03/2008 13,544 4.65 0.94 0.87
02/01/2008 13,318 4.40 0.93 0.83
01/02/2008 13,927 5.20 0.97 0.98
12/03/2007 13,657 4.95 0.95 0.93
11/01/2007 14,373 5.33 1.00 1.00
Parameter Value
Stdev2market 0.003
covarmarket,SLW 0.005
BetaSLW 1.90

175
Table 102: Market return data used in the calculation of Alexco Ke at the time of the Keno Hill
stream deal
Table 103: Calculation of Alexco Ke at the time of the Keno Hill stream deal
YearReal Return
(Pre-tax)
1988 14%
1989 -2%
1990 -16%
1991 4%
1992 -9%
1993 35%
1994 -12%
1995 21%
1996 21%
1997 8%
1998 -1%
1999 24%
2000 7%
2001 -20%
2002 -16%
2003 26%
2004 6%
2005 27%
2006 7%
2007 -1%
Average 6.15%
Parameter Value
Risk-free rate 1.88%
Market return 6.15%
Beta 1.90
Ke 9.98%
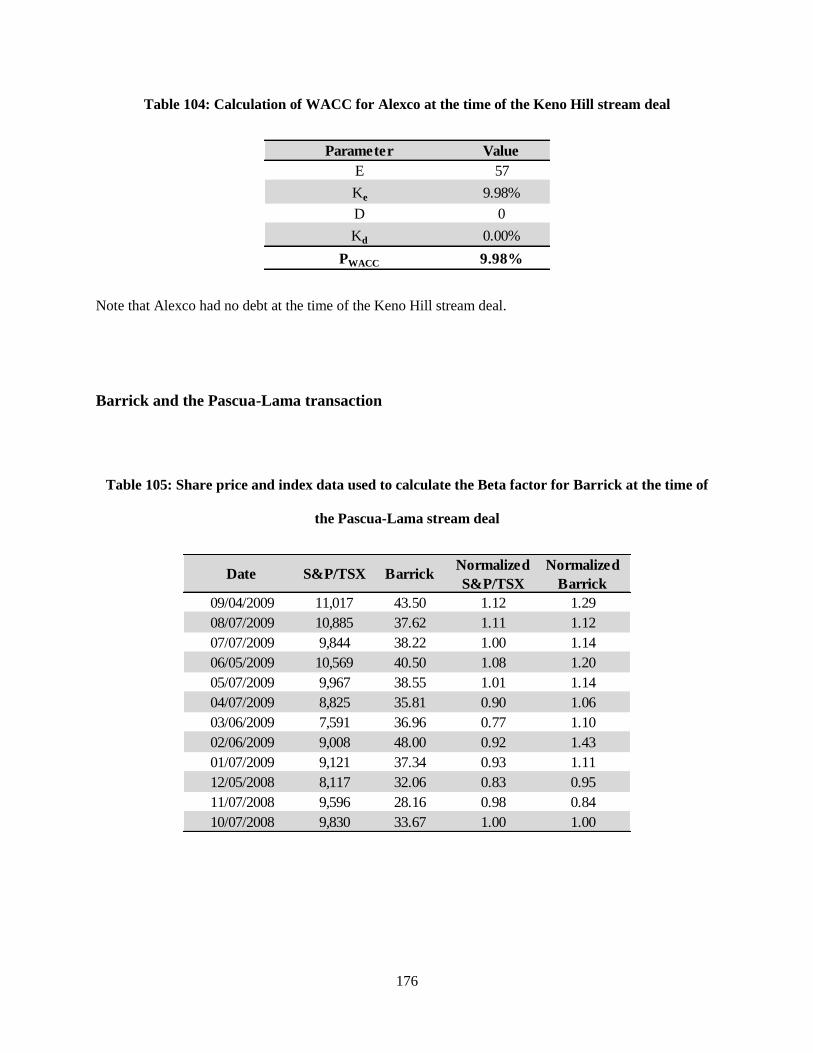
176
Table 104: Calculation of WACC for Alexco at the time of the Keno Hill stream deal
Note that Alexco had no debt at the time of the Keno Hill stream deal.
Barrick and the Pascua-Lama transaction
Table 105: Share price and index data used to calculate the Beta factor for Barrick at the time of
the Pascua-Lama stream deal
Parameter Value
E 57
Ke 9.98%
D 0
Kd 0.00%
PWACC 9.98%
Date S&P/TSX BarrickNormalized
S&P/TSX
Normalized
Barrick
09/04/2009 11,017 43.50 1.12 1.29
08/07/2009 10,885 37.62 1.11 1.12
07/07/2009 9,844 38.22 1.00 1.14
06/05/2009 10,569 40.50 1.08 1.20
05/07/2009 9,967 38.55 1.01 1.14
04/07/2009 8,825 35.81 0.90 1.06
03/06/2009 7,591 36.96 0.77 1.10
02/06/2009 9,008 48.00 0.92 1.43
01/07/2009 9,121 37.34 0.93 1.11
12/05/2008 8,117 32.06 0.83 0.95
11/07/2008 9,596 28.16 0.98 0.84
10/07/2008 9,830 33.67 1.00 1.00
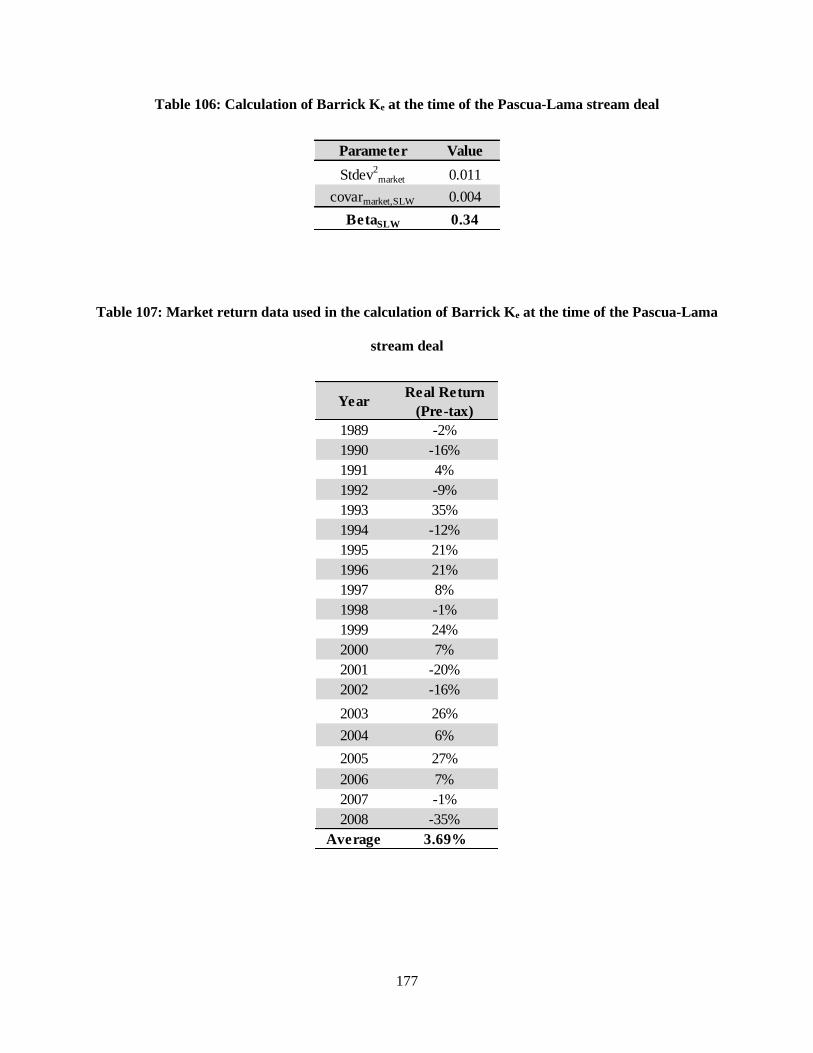
177
Table 106: Calculation of Barrick Ke at the time of the Pascua-Lama stream deal
Table 107: Market return data used in the calculation of Barrick Ke at the time of the Pascua-Lama
stream deal
Parameter Value
Stdev2market 0.011
covarmarket,SLW 0.004
BetaSLW 0.34
YearReal Return
(Pre-tax)
1989 -2%
1990 -16%
1991 4%
1992 -9%
1993 35%
1994 -12%
1995 21%
1996 21%
1997 8%
1998 -1%
1999 24%
2000 7%
2001 -20%
2002 -16%
2003 26%
2004 6%
2005 27%
2006 7%
2007 -1%
2008 -35%
Average 3.69%
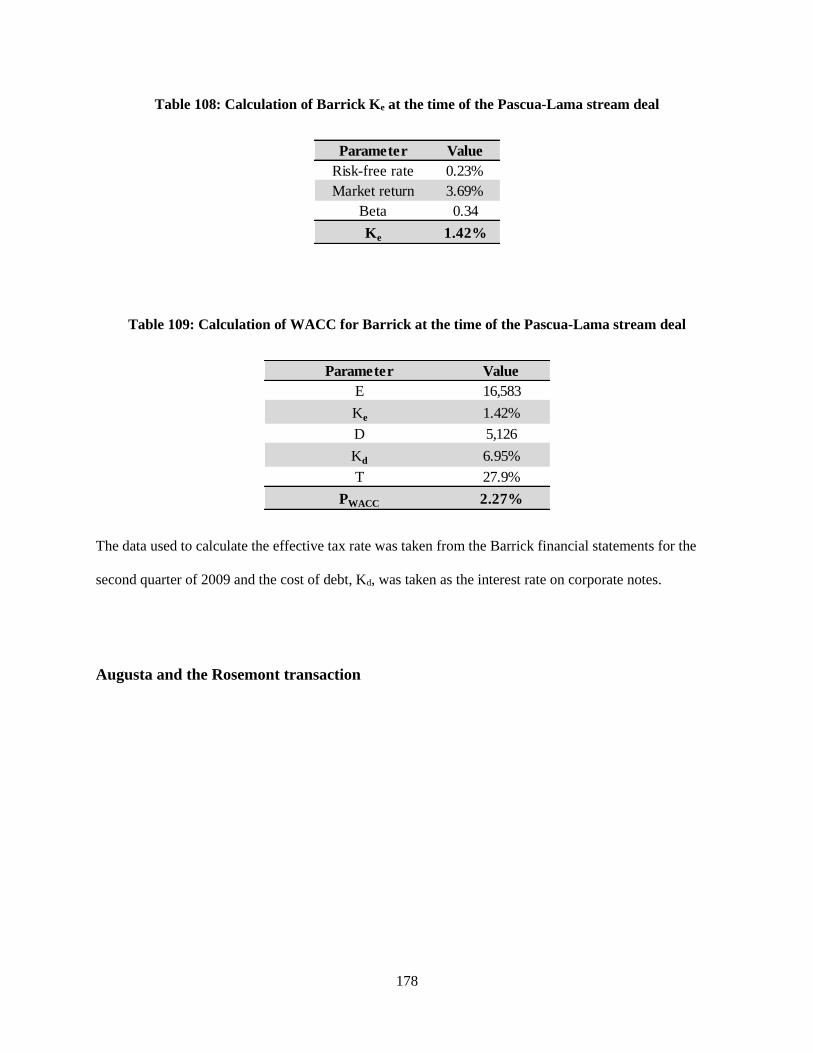
178
Table 108: Calculation of Barrick Ke at the time of the Pascua-Lama stream deal
Table 109: Calculation of WACC for Barrick at the time of the Pascua-Lama stream deal
The data used to calculate the effective tax rate was taken from the Barrick financial statements for the
second quarter of 2009 and the cost of debt, Kd, was taken as the interest rate on corporate notes.
Augusta and the Rosemont transaction
Parameter Value
Risk-free rate 0.23%
Market return 3.69%
Beta 0.34
Ke 1.42%
Parameter Value
E 16,583
Ke 1.42%
D 5,126
Kd 6.95%
T 27.9%
PWACC 2.27%
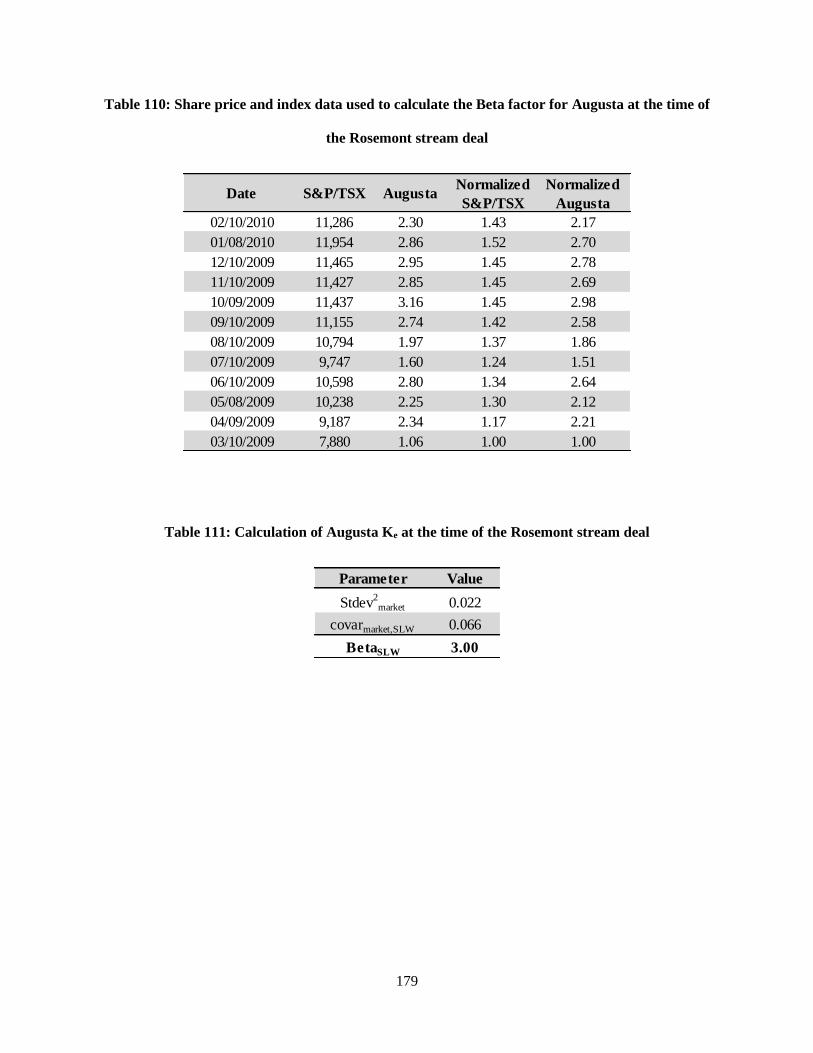
179
Table 110: Share price and index data used to calculate the Beta factor for Augusta at the time of
the Rosemont stream deal
Table 111: Calculation of Augusta Ke at the time of the Rosemont stream deal
Date S&P/TSX AugustaNormalized
S&P/TSX
Normalized
Augusta
02/10/2010 11,286 2.30 1.43 2.17
01/08/2010 11,954 2.86 1.52 2.70
12/10/2009 11,465 2.95 1.45 2.78
11/10/2009 11,427 2.85 1.45 2.69
10/09/2009 11,437 3.16 1.45 2.98
09/10/2009 11,155 2.74 1.42 2.58
08/10/2009 10,794 1.97 1.37 1.86
07/10/2009 9,747 1.60 1.24 1.51
06/10/2009 10,598 2.80 1.34 2.64
05/08/2009 10,238 2.25 1.30 2.12
04/09/2009 9,187 2.34 1.17 2.21
03/10/2009 7,880 1.06 1.00 1.00
Parameter Value
Stdev2market 0.022
covarmarket,SLW 0.066
BetaSLW 3.00
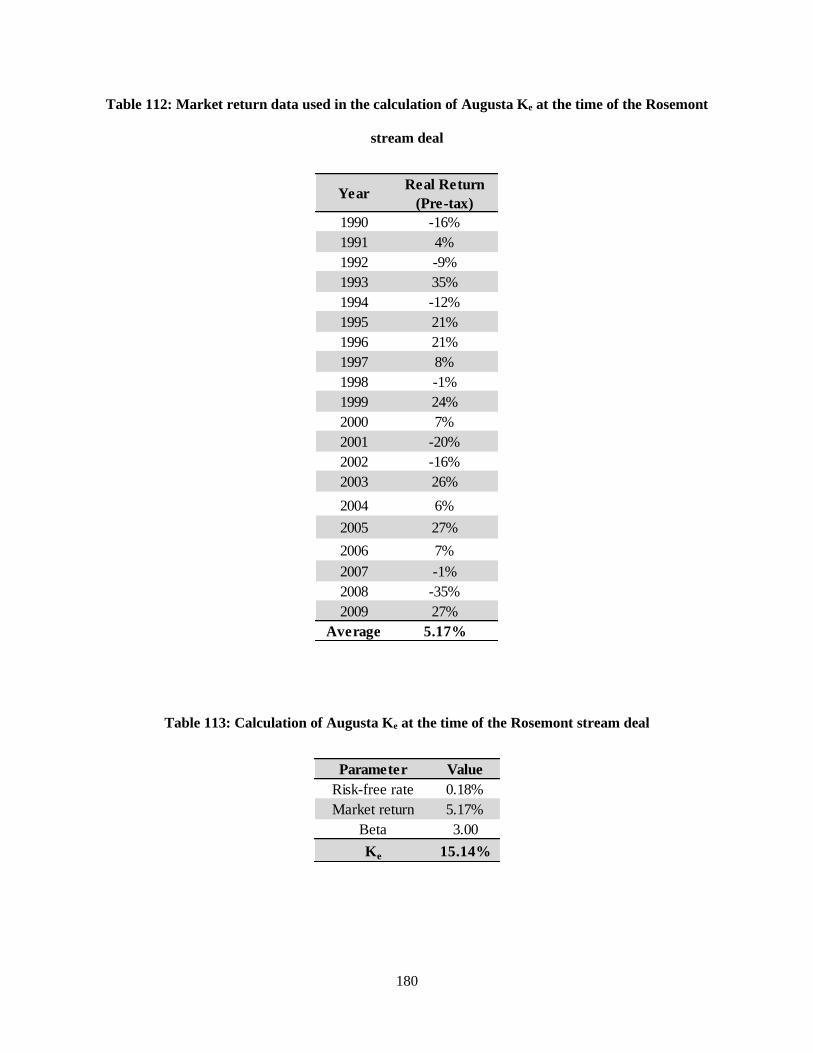
180
Table 112: Market return data used in the calculation of Augusta Ke at the time of the Rosemont
stream deal
Table 113: Calculation of Augusta Ke at the time of the Rosemont stream deal
YearReal Return
(Pre-tax)
1990 -16%
1991 4%
1992 -9%
1993 35%
1994 -12%
1995 21%
1996 21%
1997 8%
1998 -1%
1999 24%
2000 7%
2001 -20%
2002 -16%
2003 26%
2004 6%
2005 27%
2006 7%
2007 -1%
2008 -35%
2009 27%
Average 5.17%
Parameter Value
Risk-free rate 0.18%
Market return 5.17%
Beta 3.00
Ke 15.14%
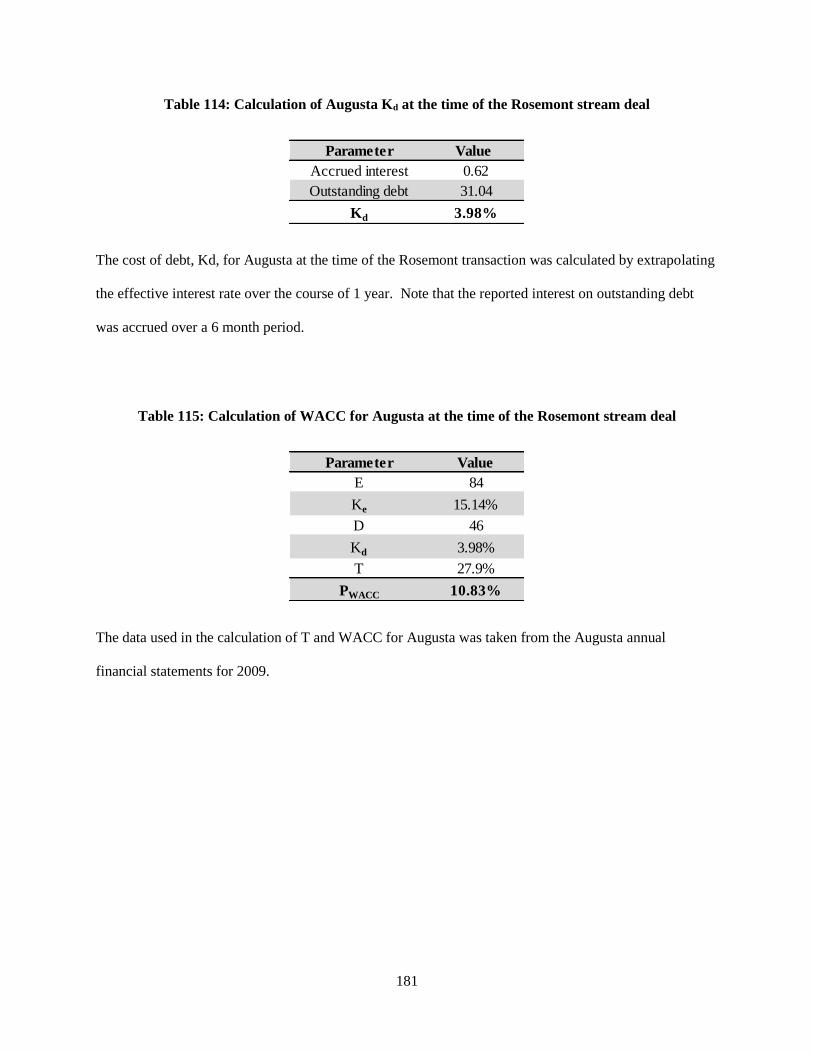
181
Table 114: Calculation of Augusta Kd at the time of the Rosemont stream deal
The cost of debt, Kd, for Augusta at the time of the Rosemont transaction was calculated by extrapolating
the effective interest rate over the course of 1 year. Note that the reported interest on outstanding debt
was accrued over a 6 month period.
Table 115: Calculation of WACC for Augusta at the time of the Rosemont stream deal
The data used in the calculation of T and WACC for Augusta was taken from the Augusta annual
financial statements for 2009.
Parameter Value
Accrued interest 0.62
Outstanding debt 31.04
Kd 3.98%
Parameter Value
E 84
Ke 15.14%
D 46
Kd 3.98%
T 27.9%
PWACC 10.83%
182
Appendix B
Cash Flow Models for Silver Streams and Underlying Mines
This appendix will present the cash flow models that were developed for the silver streams studied and
for their underlying mines, along with any technical and economic assumptions used in their computation.
Note that in every case, silver price assumptions used in the cash flow models were taken as a consensus
of silver price forecasts from several equity research reports (base case) and from the LBMA (partially-
realized/bullish).
Zinkgruvan
A mining, milling, and concentrate production schedule from the relevant technical report was used in the
development of the Zinkgruvan mine cash flow model for the purpose of this thesis (Sullivan, et al., 2004
pp. 103-104).
The following is a description of the smelter terms that were incorporated into the cash flow model for the
Zinkgruvan mine at the time of the silver purchase agreement with Silver Wheaton.
For the mine’s zinc concentrate contract with the smelter (Sullivan, et al., 2004 p. 87):
Pay for the lesser of 85% of contained zinc or a deduction of 8 units;
Treatment charge of US$170/t of concentrate for all years in the model;
Price participation of US$0.15 for each dollar the zinc price is above or below US$1000/t.
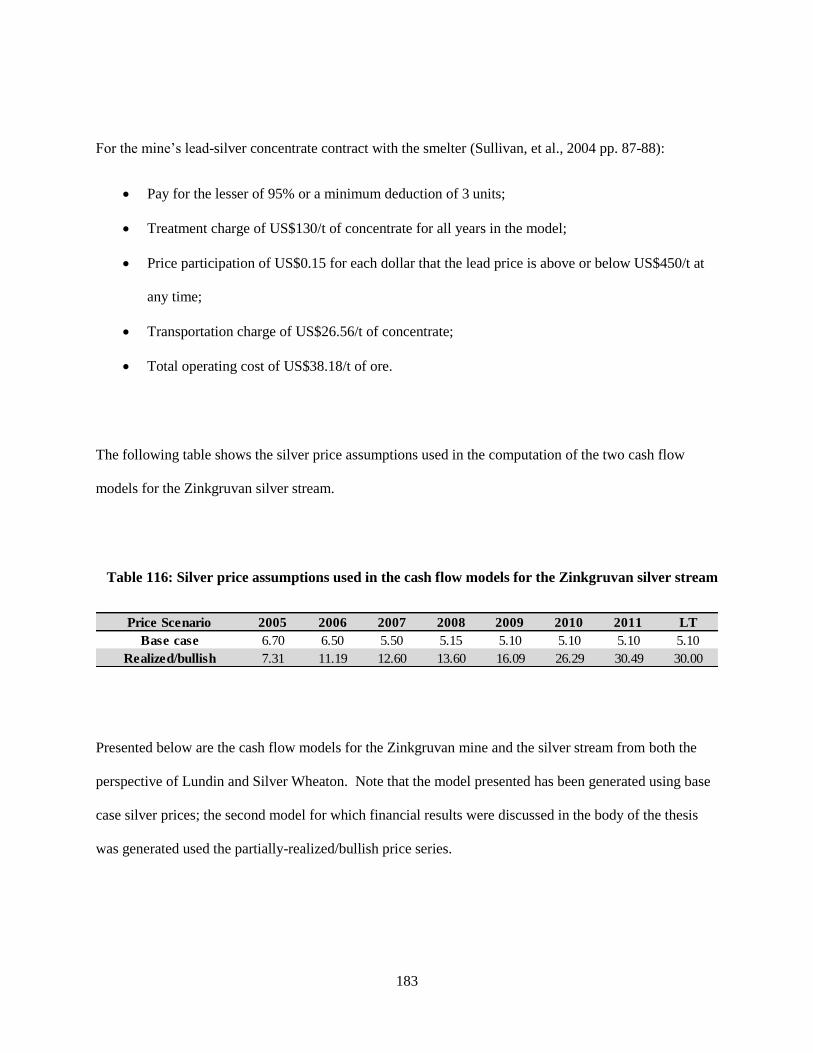
183
For the mine’s lead-silver concentrate contract with the smelter (Sullivan, et al., 2004 pp. 87-88):
Pay for the lesser of 95% or a minimum deduction of 3 units;
Treatment charge of US$130/t of concentrate for all years in the model;
Price participation of US$0.15 for each dollar that the lead price is above or below US$450/t at
any time;
Transportation charge of US$26.56/t of concentrate;
Total operating cost of US$38.18/t of ore.
The following table shows the silver price assumptions used in the computation of the two cash flow
models for the Zinkgruvan silver stream.
Table 116: Silver price assumptions used in the cash flow models for the Zinkgruvan silver stream
Presented below are the cash flow models for the Zinkgruvan mine and the silver stream from both the
perspective of Lundin and Silver Wheaton. Note that the model presented has been generated using base
case silver prices; the second model for which financial results were discussed in the body of the thesis
was generated used the partially-realized/bullish price series.
Price Scenario 2005 2006 2007 2008 2009 2010 2011 LT
Base case 6.70 6.50 5.50 5.15 5.10 5.10 5.10 5.10
Realized/bullish 7.31 11.19 12.60 13.60 16.09 26.29 30.49 30.00
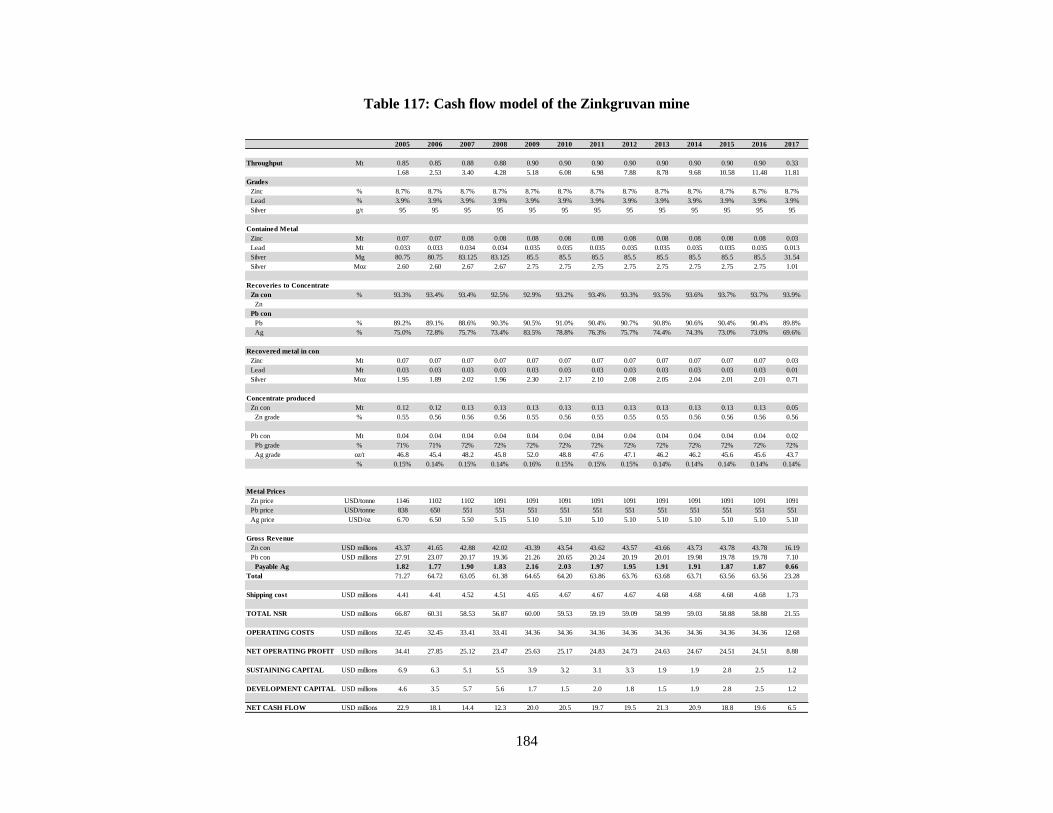
184
Table 117: Cash flow model of the Zinkgruvan mine
2005 2006 2007 2008 2009 2010 2011 2012 2013 2014 2015 2016 2017
Throughput Mt 0.85 0.85 0.88 0.88 0.90 0.90 0.90 0.90 0.90 0.90 0.90 0.90 0.33
1.68 2.53 3.40 4.28 5.18 6.08 6.98 7.88 8.78 9.68 10.58 11.48 11.81
Grades
Zinc % 8.7% 8.7% 8.7% 8.7% 8.7% 8.7% 8.7% 8.7% 8.7% 8.7% 8.7% 8.7% 8.7%
Lead % 3.9% 3.9% 3.9% 3.9% 3.9% 3.9% 3.9% 3.9% 3.9% 3.9% 3.9% 3.9% 3.9%
Silver g/t 95 95 95 95 95 95 95 95 95 95 95 95 95
Contained Metal
Zinc Mt 0.07 0.07 0.08 0.08 0.08 0.08 0.08 0.08 0.08 0.08 0.08 0.08 0.03
Lead Mt 0.033 0.033 0.034 0.034 0.035 0.035 0.035 0.035 0.035 0.035 0.035 0.035 0.013
Silver Mg 80.75 80.75 83.125 83.125 85.5 85.5 85.5 85.5 85.5 85.5 85.5 85.5 31.54
Silver Moz 2.60 2.60 2.67 2.67 2.75 2.75 2.75 2.75 2.75 2.75 2.75 2.75 1.01
Recoveries to Concentrate
Zn con % 93.3% 93.4% 93.4% 92.5% 92.9% 93.2% 93.4% 93.3% 93.5% 93.6% 93.7% 93.7% 93.9%
Zn
Pb con
Pb % 89.2% 89.1% 88.6% 90.3% 90.5% 91.0% 90.4% 90.7% 90.8% 90.6% 90.4% 90.4% 89.8%
Ag % 75.0% 72.8% 75.7% 73.4% 83.5% 78.8% 76.3% 75.7% 74.4% 74.3% 73.0% 73.0% 69.6%
Recovered metal in con
Zinc Mt 0.07 0.07 0.07 0.07 0.07 0.07 0.07 0.07 0.07 0.07 0.07 0.07 0.03
Lead Mt 0.03 0.03 0.03 0.03 0.03 0.03 0.03 0.03 0.03 0.03 0.03 0.03 0.01
Silver Moz 1.95 1.89 2.02 1.96 2.30 2.17 2.10 2.08 2.05 2.04 2.01 2.01 0.71
Concentrate produced
Zn con Mt 0.12 0.12 0.13 0.13 0.13 0.13 0.13 0.13 0.13 0.13 0.13 0.13 0.05
Zn grade % 0.55 0.56 0.56 0.56 0.55 0.56 0.55 0.55 0.55 0.56 0.56 0.56 0.56
Pb con Mt 0.04 0.04 0.04 0.04 0.04 0.04 0.04 0.04 0.04 0.04 0.04 0.04 0.02
Pb grade % 71% 71% 72% 72% 72% 72% 72% 72% 72% 72% 72% 72% 72%
Ag grade oz/t 46.8 45.4 48.2 45.8 52.0 48.8 47.6 47.1 46.2 46.2 45.6 45.6 43.7
% 0.15% 0.14% 0.15% 0.14% 0.16% 0.15% 0.15% 0.15% 0.14% 0.14% 0.14% 0.14% 0.14%
Metal Prices
Zn price USD/tonne 1146 1102 1102 1091 1091 1091 1091 1091 1091 1091 1091 1091 1091
Pb price USD/tonne 838 650 551 551 551 551 551 551 551 551 551 551 551
Ag price USD/oz 6.70 6.50 5.50 5.15 5.10 5.10 5.10 5.10 5.10 5.10 5.10 5.10 5.10
Gross Revenue
Zn con USD millions 43.37 41.65 42.88 42.02 43.39 43.54 43.62 43.57 43.66 43.73 43.78 43.78 16.19
Pb con USD millions 27.91 23.07 20.17 19.36 21.26 20.65 20.24 20.19 20.01 19.98 19.78 19.78 7.10
Payable Ag 1.82 1.77 1.90 1.83 2.16 2.03 1.97 1.95 1.91 1.91 1.87 1.87 0.66
Total 71.27 64.72 63.05 61.38 64.65 64.20 63.86 63.76 63.68 63.71 63.56 63.56 23.28
Shipping cost USD millions 4.41 4.41 4.52 4.51 4.65 4.67 4.67 4.67 4.68 4.68 4.68 4.68 1.73
TOTAL NSR USD millions 66.87 60.31 58.53 56.87 60.00 59.53 59.19 59.09 58.99 59.03 58.88 58.88 21.55
OPERATING COSTS USD millions 32.45 32.45 33.41 33.41 34.36 34.36 34.36 34.36 34.36 34.36 34.36 34.36 12.68
NET OPERATING PROFIT USD millions 34.41 27.85 25.12 23.47 25.63 25.17 24.83 24.73 24.63 24.67 24.51 24.51 8.88
SUSTAINING CAPITAL USD millions 6.9 6.3 5.1 5.5 3.9 3.2 3.1 3.3 1.9 1.9 2.8 2.5 1.2
DEVELOPMENT CAPITAL USD millions 4.6 3.5 5.7 5.6 1.7 1.5 2.0 1.8 1.5 1.9 2.8 2.5 1.2
NET CASH FLOW USD millions 22.9 18.1 14.4 12.3 20.0 20.5 19.7 19.5 21.3 20.9 18.8 19.6 6.5
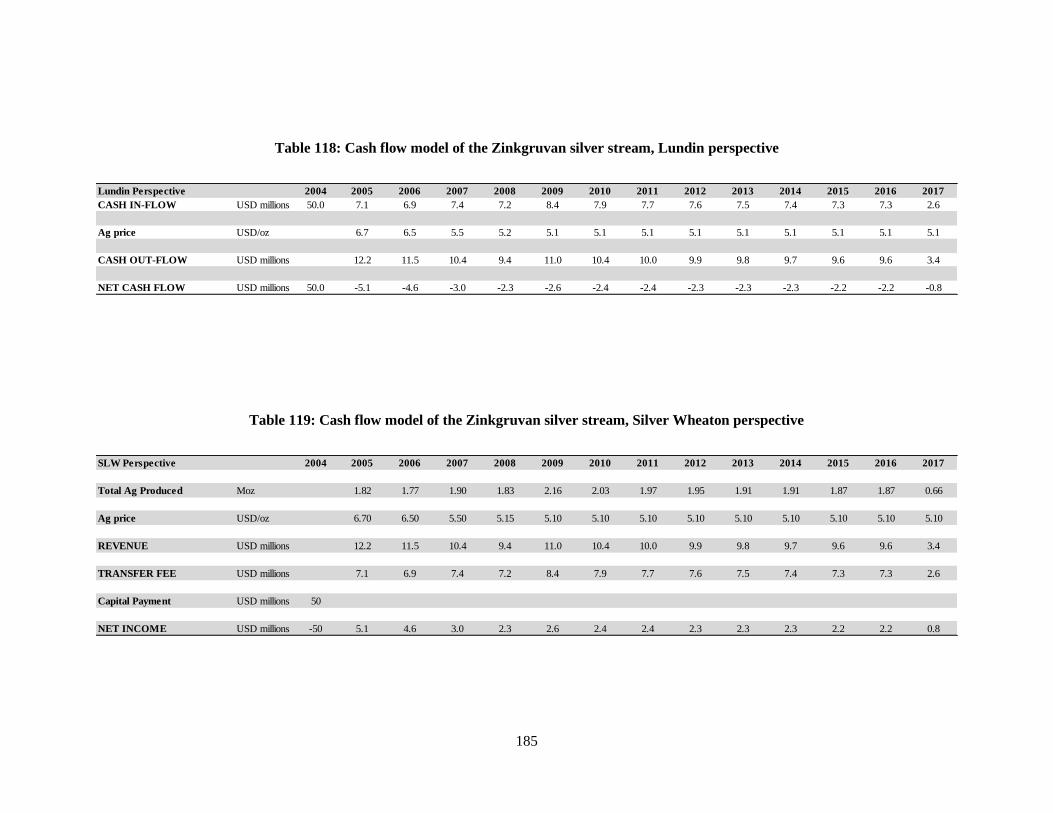
185
Table 118: Cash flow model of the Zinkgruvan silver stream, Lundin perspective
Table 119: Cash flow model of the Zinkgruvan silver stream, Silver Wheaton perspective
Lundin Perspective 2004 2005 2006 2007 2008 2009 2010 2011 2012 2013 2014 2015 2016 2017
CASH IN-FLOW USD millions 50.0 7.1 6.9 7.4 7.2 8.4 7.9 7.7 7.6 7.5 7.4 7.3 7.3 2.6
Ag price USD/oz 6.7 6.5 5.5 5.2 5.1 5.1 5.1 5.1 5.1 5.1 5.1 5.1 5.1
CASH OUT-FLOW USD millions 12.2 11.5 10.4 9.4 11.0 10.4 10.0 9.9 9.8 9.7 9.6 9.6 3.4
NET CASH FLOW USD millions 50.0 -5.1 -4.6 -3.0 -2.3 -2.6 -2.4 -2.4 -2.3 -2.3 -2.3 -2.2 -2.2 -0.8
SLW Perspective 2004 2005 2006 2007 2008 2009 2010 2011 2012 2013 2014 2015 2016 2017
Total Ag Produced Moz 1.82 1.77 1.90 1.83 2.16 2.03 1.97 1.95 1.91 1.91 1.87 1.87 0.66
Ag price USD/oz 6.70 6.50 5.50 5.15 5.10 5.10 5.10 5.10 5.10 5.10 5.10 5.10 5.10
REVENUE USD millions 12.2 11.5 10.4 9.4 11.0 10.4 10.0 9.9 9.8 9.7 9.6 9.6 3.4
TRANSFER FEE USD millions 7.1 6.9 7.4 7.2 8.4 7.9 7.7 7.6 7.5 7.4 7.3 7.3 2.6
Capital Payment USD millions 50
NET INCOME USD millions -50 5.1 4.6 3.0 2.3 2.6 2.4 2.4 2.3 2.3 2.3 2.2 2.2 0.8
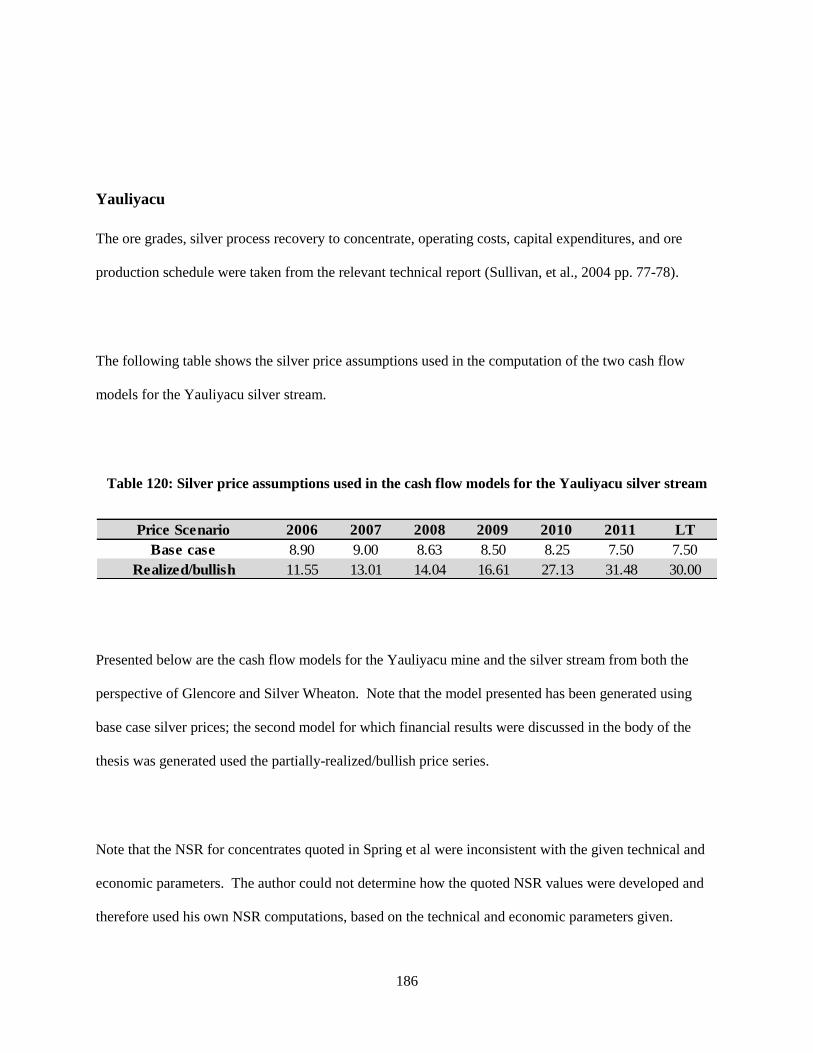
186
Yauliyacu
The ore grades, silver process recovery to concentrate, operating costs, capital expenditures, and ore
production schedule were taken from the relevant technical report (Sullivan, et al., 2004 pp. 77-78).
The following table shows the silver price assumptions used in the computation of the two cash flow
models for the Yauliyacu silver stream.
Table 120: Silver price assumptions used in the cash flow models for the Yauliyacu silver stream
Presented below are the cash flow models for the Yauliyacu mine and the silver stream from both the
perspective of Glencore and Silver Wheaton. Note that the model presented has been generated using
base case silver prices; the second model for which financial results were discussed in the body of the
thesis was generated used the partially-realized/bullish price series.
Note that the NSR for concentrates quoted in Spring et al were inconsistent with the given technical and
economic parameters. The author could not determine how the quoted NSR values were developed and
therefore used his own NSR computations, based on the technical and economic parameters given.
Price Scenario 2006 2007 2008 2009 2010 2011 LT
Base case 8.90 9.00 8.63 8.50 8.25 7.50 7.50
Realized/bullish 11.55 13.01 14.04 16.61 27.13 31.48 30.00
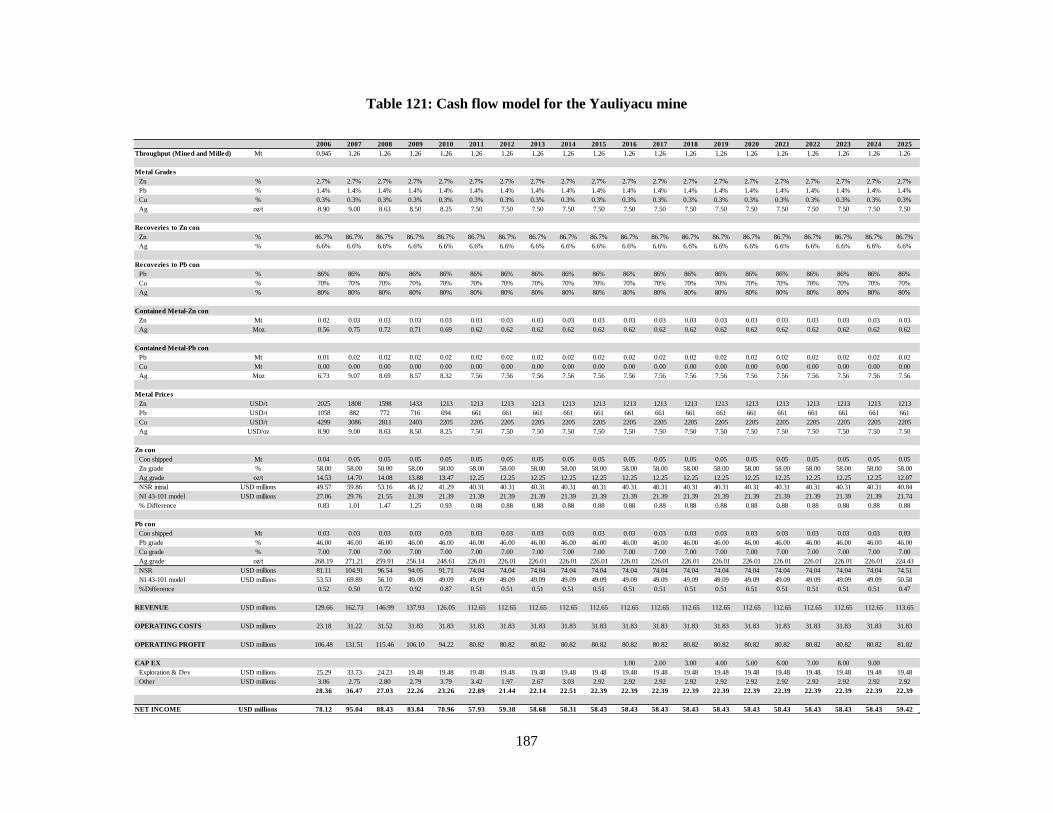
187
Table 121: Cash flow model for the Yauliyacu mine
2006 2007 2008 2009 2010 2011 2012 2013 2014 2015 2016 2017 2018 2019 2020 2021 2022 2023 2024 2025
Throughput (Mined and Milled) Mt 0.945 1.26 1.26 1.26 1.26 1.26 1.26 1.26 1.26 1.26 1.26 1.26 1.26 1.26 1.26 1.26 1.26 1.26 1.26 1.26
Metal Grades
Zn % 2.7% 2.7% 2.7% 2.7% 2.7% 2.7% 2.7% 2.7% 2.7% 2.7% 2.7% 2.7% 2.7% 2.7% 2.7% 2.7% 2.7% 2.7% 2.7% 2.7%
Pb % 1.4% 1.4% 1.4% 1.4% 1.4% 1.4% 1.4% 1.4% 1.4% 1.4% 1.4% 1.4% 1.4% 1.4% 1.4% 1.4% 1.4% 1.4% 1.4% 1.4%
Cu % 0.3% 0.3% 0.3% 0.3% 0.3% 0.3% 0.3% 0.3% 0.3% 0.3% 0.3% 0.3% 0.3% 0.3% 0.3% 0.3% 0.3% 0.3% 0.3% 0.3%
Ag oz/t 8.90 9.00 8.63 8.50 8.25 7.50 7.50 7.50 7.50 7.50 7.50 7.50 7.50 7.50 7.50 7.50 7.50 7.50 7.50 7.50
Recoveries to Zn con
Zn % 86.7% 86.7% 86.7% 86.7% 86.7% 86.7% 86.7% 86.7% 86.7% 86.7% 86.7% 86.7% 86.7% 86.7% 86.7% 86.7% 86.7% 86.7% 86.7% 86.7%
Ag % 6.6% 6.6% 6.6% 6.6% 6.6% 6.6% 6.6% 6.6% 6.6% 6.6% 6.6% 6.6% 6.6% 6.6% 6.6% 6.6% 6.6% 6.6% 6.6% 6.6%
Recoveries to Pb con
Pb % 86% 86% 86% 86% 86% 86% 86% 86% 86% 86% 86% 86% 86% 86% 86% 86% 86% 86% 86% 86%
Cu % 70% 70% 70% 70% 70% 70% 70% 70% 70% 70% 70% 70% 70% 70% 70% 70% 70% 70% 70% 70%
Ag % 80% 80% 80% 80% 80% 80% 80% 80% 80% 80% 80% 80% 80% 80% 80% 80% 80% 80% 80% 80%
Contained Metal-Zn con
Zn Mt 0.02 0.03 0.03 0.03 0.03 0.03 0.03 0.03 0.03 0.03 0.03 0.03 0.03 0.03 0.03 0.03 0.03 0.03 0.03 0.03
Ag Moz 0.56 0.75 0.72 0.71 0.69 0.62 0.62 0.62 0.62 0.62 0.62 0.62 0.62 0.62 0.62 0.62 0.62 0.62 0.62 0.62
Contained Metal-Pb con
Pb Mt 0.01 0.02 0.02 0.02 0.02 0.02 0.02 0.02 0.02 0.02 0.02 0.02 0.02 0.02 0.02 0.02 0.02 0.02 0.02 0.02
Cu Mt 0.00 0.00 0.00 0.00 0.00 0.00 0.00 0.00 0.00 0.00 0.00 0.00 0.00 0.00 0.00 0.00 0.00 0.00 0.00 0.00
Ag Moz 6.73 9.07 8.69 8.57 8.32 7.56 7.56 7.56 7.56 7.56 7.56 7.56 7.56 7.56 7.56 7.56 7.56 7.56 7.56 7.56
Metal Prices
Zn USD/t 2025 1808 1598 1433 1213 1213 1213 1213 1213 1213 1213 1213 1213 1213 1213 1213 1213 1213 1213 1213
Pb USD/t 1058 882 772 716 694 661 661 661 661 661 661 661 661 661 661 661 661 661 661 661
Cu USD/t 4299 3086 2811 2403 2205 2205 2205 2205 2205 2205 2205 2205 2205 2205 2205 2205 2205 2205 2205 2205
Ag USD/oz 8.90 9.00 8.63 8.50 8.25 7.50 7.50 7.50 7.50 7.50 7.50 7.50 7.50 7.50 7.50 7.50 7.50 7.50 7.50 7.50
Zn con
Con shipped Mt 0.04 0.05 0.05 0.05 0.05 0.05 0.05 0.05 0.05 0.05 0.05 0.05 0.05 0.05 0.05 0.05 0.05 0.05 0.05 0.05
Zn grade % 58.00 58.00 58.00 58.00 58.00 58.00 58.00 58.00 58.00 58.00 58.00 58.00 58.00 58.00 58.00 58.00 58.00 58.00 58.00 58.00
Ag grade oz/t 14.53 14.70 14.08 13.88 13.47 12.25 12.25 12.25 12.25 12.25 12.25 12.25 12.25 12.25 12.25 12.25 12.25 12.25 12.25 12.07
NSR initial USD millions 49.57 59.86 53.16 48.12 41.29 40.31 40.31 40.31 40.31 40.31 40.31 40.31 40.31 40.31 40.31 40.31 40.31 40.31 40.31 40.84
NI 43-101 model USD millions 27.06 29.76 21.55 21.39 21.39 21.39 21.39 21.39 21.39 21.39 21.39 21.39 21.39 21.39 21.39 21.39 21.39 21.39 21.39 21.74
% Difference 0.83 1.01 1.47 1.25 0.93 0.88 0.88 0.88 0.88 0.88 0.88 0.88 0.88 0.88 0.88 0.88 0.88 0.88 0.88 0.88
Pb con
Con shipped Mt 0.03 0.03 0.03 0.03 0.03 0.03 0.03 0.03 0.03 0.03 0.03 0.03 0.03 0.03 0.03 0.03 0.03 0.03 0.03 0.03
Pb grade % 46.00 46.00 46.00 46.00 46.00 46.00 46.00 46.00 46.00 46.00 46.00 46.00 46.00 46.00 46.00 46.00 46.00 46.00 46.00 46.00
Cu grade % 7.00 7.00 7.00 7.00 7.00 7.00 7.00 7.00 7.00 7.00 7.00 7.00 7.00 7.00 7.00 7.00 7.00 7.00 7.00 7.00
Ag grade oz/t 268.19 271.21 259.91 256.14 248.61 226.01 226.01 226.01 226.01 226.01 226.01 226.01 226.01 226.01 226.01 226.01 226.01 226.01 226.01 224.43
NSR USD millions 81.11 104.91 96.54 94.05 91.71 74.04 74.04 74.04 74.04 74.04 74.04 74.04 74.04 74.04 74.04 74.04 74.04 74.04 74.04 74.51
NI 43-101 model USD millions 53.53 69.89 56.10 49.09 49.09 49.09 49.09 49.09 49.09 49.09 49.09 49.09 49.09 49.09 49.09 49.09 49.09 49.09 49.09 50.58
%Difference 0.52 0.50 0.72 0.92 0.87 0.51 0.51 0.51 0.51 0.51 0.51 0.51 0.51 0.51 0.51 0.51 0.51 0.51 0.51 0.47
REVENUE USD millions 129.66 162.73 146.99 137.93 126.05 112.65 112.65 112.65 112.65 112.65 112.65 112.65 112.65 112.65 112.65 112.65 112.65 112.65 112.65 113.65
OPERATING COSTS USD millions 23.18 31.22 31.52 31.83 31.83 31.83 31.83 31.83 31.83 31.83 31.83 31.83 31.83 31.83 31.83 31.83 31.83 31.83 31.83 31.83
OPERATING PROFIT USD millions 106.48 131.51 115.46 106.10 94.22 80.82 80.82 80.82 80.82 80.82 80.82 80.82 80.82 80.82 80.82 80.82 80.82 80.82 80.82 81.82
CAP EX 1.00 2.00 3.00 4.00 5.00 6.00 7.00 8.00 9.00
Exploration & Dev USD millions 25.29 33.73 24.23 19.48 19.48 19.48 19.48 19.48 19.48 19.48 19.48 19.48 19.48 19.48 19.48 19.48 19.48 19.48 19.48 19.48
Other USD millions 3.06 2.75 2.80 2.79 3.79 3.42 1.97 2.67 3.03 2.92 2.92 2.92 2.92 2.92 2.92 2.92 2.92 2.92 2.92 2.92
28.36 36.47 27.03 22.26 23.26 22.89 21.44 22.14 22.51 22.39 22.39 22.39 22.39 22.39 22.39 22.39 22.39 22.39 22.39 22.39
NET INCOME USD millions 78.12 95.04 88.43 83.84 70.96 57.93 59.38 58.68 58.31 58.43 58.43 58.43 58.43 58.43 58.43 58.43 58.43 58.43 58.43 59.42
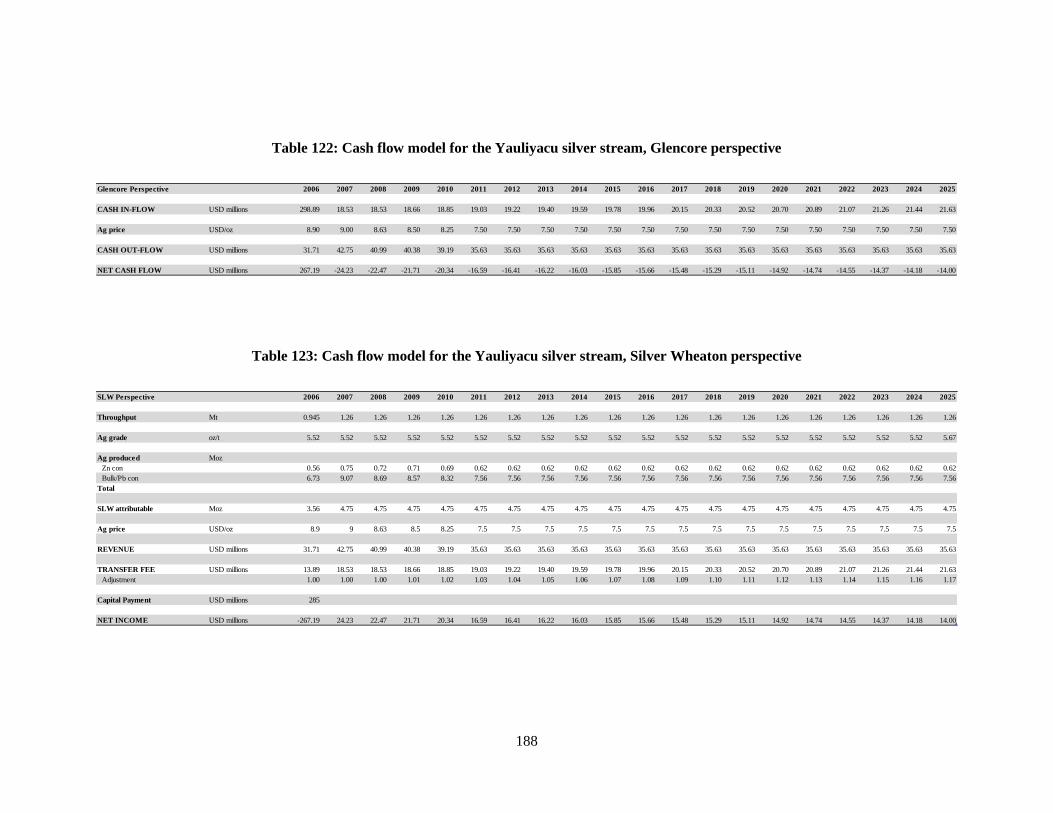
188
Table 122: Cash flow model for the Yauliyacu silver stream, Glencore perspective
Table 123: Cash flow model for the Yauliyacu silver stream, Silver Wheaton perspective
Glencore Perspective 2006 2007 2008 2009 2010 2011 2012 2013 2014 2015 2016 2017 2018 2019 2020 2021 2022 2023 2024 2025
CASH IN-FLOW USD millions 298.89 18.53 18.53 18.66 18.85 19.03 19.22 19.40 19.59 19.78 19.96 20.15 20.33 20.52 20.70 20.89 21.07 21.26 21.44 21.63
Ag price USD/oz 8.90 9.00 8.63 8.50 8.25 7.50 7.50 7.50 7.50 7.50 7.50 7.50 7.50 7.50 7.50 7.50 7.50 7.50 7.50 7.50
CASH OUT-FLOW USD millions 31.71 42.75 40.99 40.38 39.19 35.63 35.63 35.63 35.63 35.63 35.63 35.63 35.63 35.63 35.63 35.63 35.63 35.63 35.63 35.63
NET CASH FLOW USD millions 267.19 -24.23 -22.47 -21.71 -20.34 -16.59 -16.41 -16.22 -16.03 -15.85 -15.66 -15.48 -15.29 -15.11 -14.92 -14.74 -14.55 -14.37 -14.18 -14.00
SLW Perspective 2006 2007 2008 2009 2010 2011 2012 2013 2014 2015 2016 2017 2018 2019 2020 2021 2022 2023 2024 2025
Throughput Mt 0.945 1.26 1.26 1.26 1.26 1.26 1.26 1.26 1.26 1.26 1.26 1.26 1.26 1.26 1.26 1.26 1.26 1.26 1.26 1.26
Ag grade oz/t 5.52 5.52 5.52 5.52 5.52 5.52 5.52 5.52 5.52 5.52 5.52 5.52 5.52 5.52 5.52 5.52 5.52 5.52 5.52 5.67
Ag produced Moz
Zn con 0.56 0.75 0.72 0.71 0.69 0.62 0.62 0.62 0.62 0.62 0.62 0.62 0.62 0.62 0.62 0.62 0.62 0.62 0.62 0.62
Bulk/Pb con 6.73 9.07 8.69 8.57 8.32 7.56 7.56 7.56 7.56 7.56 7.56 7.56 7.56 7.56 7.56 7.56 7.56 7.56 7.56 7.56
Total
SLW attributable Moz 3.56 4.75 4.75 4.75 4.75 4.75 4.75 4.75 4.75 4.75 4.75 4.75 4.75 4.75 4.75 4.75 4.75 4.75 4.75 4.75
Ag price USD/oz 8.9 9 8.63 8.5 8.25 7.5 7.5 7.5 7.5 7.5 7.5 7.5 7.5 7.5 7.5 7.5 7.5 7.5 7.5 7.5
REVENUE USD millions 31.71 42.75 40.99 40.38 39.19 35.63 35.63 35.63 35.63 35.63 35.63 35.63 35.63 35.63 35.63 35.63 35.63 35.63 35.63 35.63
TRANSFER FEE USD millions 13.89 18.53 18.53 18.66 18.85 19.03 19.22 19.40 19.59 19.78 19.96 20.15 20.33 20.52 20.70 20.89 21.07 21.26 21.44 21.63
Adjustment 1.00 1.00 1.00 1.01 1.02 1.03 1.04 1.05 1.06 1.07 1.08 1.09 1.10 1.11 1.12 1.13 1.14 1.15 1.16 1.17
Capital Payment USD millions 285
NET INCOME USD millions -267.19 24.23 22.47 21.71 20.34 16.59 16.41 16.22 16.03 15.85 15.66 15.48 15.29 15.11 14.92 14.74 14.55 14.37 14.18 14.00
189
Stratoni
The Stratoni cash flow calculation was unique in that a full and very detailed valuation/pre-feasibility
study was conducted by Behre Dolbear and published in two separate documents in September and
October 2004, while an update to Stratoni mill throughput and head grade forecasts was published in
February 2007, just prior to completion of the SLW stream deal in April 2007. The February 2007
document is very short and provides no new technical information other than that which was previously
mentioned, as well as no reference to additional reserves or mine life. Thus, the cash flow calculation
was first carried out using the technical information provided in the late 2004 technical documents. A
second, separate cash flow calculation was carried out using the updated throughputs and mill head grades
from the February 2007 document. For this second calculation, it was assumed that all other technical
information not referenced in the February 2007 document remained identical to what was presented in
the previous documents.
As previously stated, a production schedule from the relevant 2007 technical report was used as the basis
for the final Stratoni cash flow model (Forward, 2007 p. 12). As well, process recovery rates used in the
Stratoni cash flow model for zinc, lead, and silver were taken as the weighted average recoveries from
1996-2002 (Behre Dolbear & Company, Inc., 2004 p. 98).
The following tables outline the various economic and technical parameters used in the Stratoni mine
cash flow calculation.
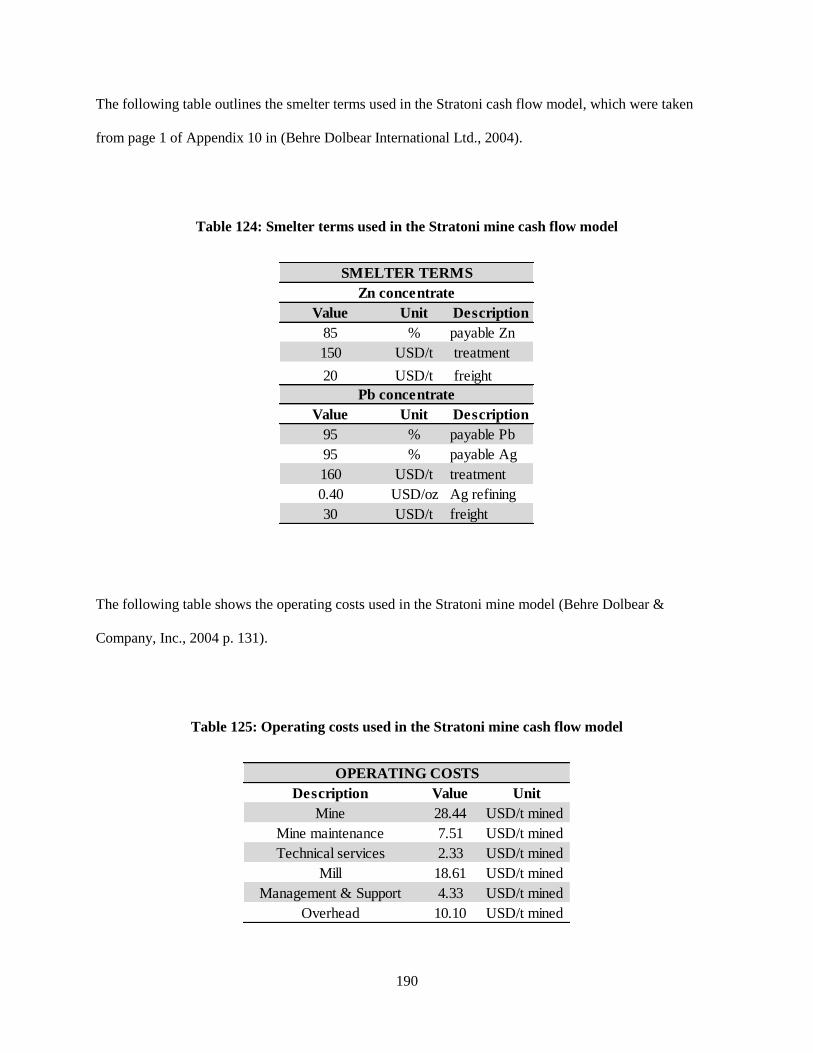
190
The following table outlines the smelter terms used in the Stratoni cash flow model, which were taken
from page 1 of Appendix 10 in (Behre Dolbear International Ltd., 2004).
Table 124: Smelter terms used in the Stratoni mine cash flow model
The following table shows the operating costs used in the Stratoni mine model (Behre Dolbear &
Company, Inc., 2004 p. 131).
Table 125: Operating costs used in the Stratoni mine cash flow model
Value Unit Description
85 % payable Zn
150 USD/t treatment
20 USD/t freight
Value Unit Description
95 % payable Pb
95 % payable Ag
160 USD/t treatment
0.40 USD/oz Ag refining
30 USD/t freight
SMELTER TERMS
Zn concentrate
Pb concentrate
Description Value Unit
Mine 28.44 USD/t mined
Mine maintenance 7.51 USD/t mined
Technical services 2.33 USD/t mined
Mill 18.61 USD/t mined
Management & Support 4.33 USD/t mined
Overhead 10.10 USD/t mined
OPERATING COSTS
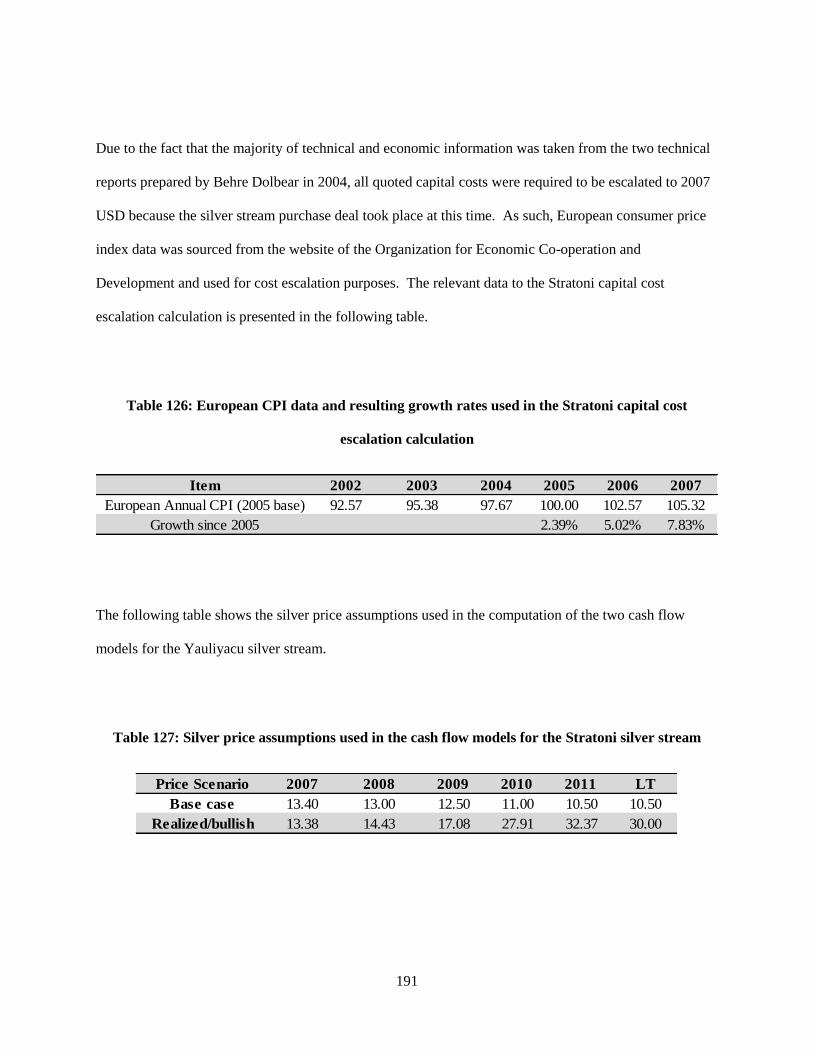
191
Due to the fact that the majority of technical and economic information was taken from the two technical
reports prepared by Behre Dolbear in 2004, all quoted capital costs were required to be escalated to 2007
USD because the silver stream purchase deal took place at this time. As such, European consumer price
index data was sourced from the website of the Organization for Economic Co-operation and
Development and used for cost escalation purposes. The relevant data to the Stratoni capital cost
escalation calculation is presented in the following table.
Table 126: European CPI data and resulting growth rates used in the Stratoni capital cost
escalation calculation
The following table shows the silver price assumptions used in the computation of the two cash flow
models for the Yauliyacu silver stream.
Table 127: Silver price assumptions used in the cash flow models for the Stratoni silver stream
Item 2002 2003 2004 2005 2006 2007
European Annual CPI (2005 base) 92.57 95.38 97.67 100.00 102.57 105.32
Growth since 2005 2.39% 5.02% 7.83%
Price Scenario 2007 2008 2009 2010 2011 LT
Base case 13.40 13.00 12.50 11.00 10.50 10.50
Realized/bullish 13.38 14.43 17.08 27.91 32.37 30.00
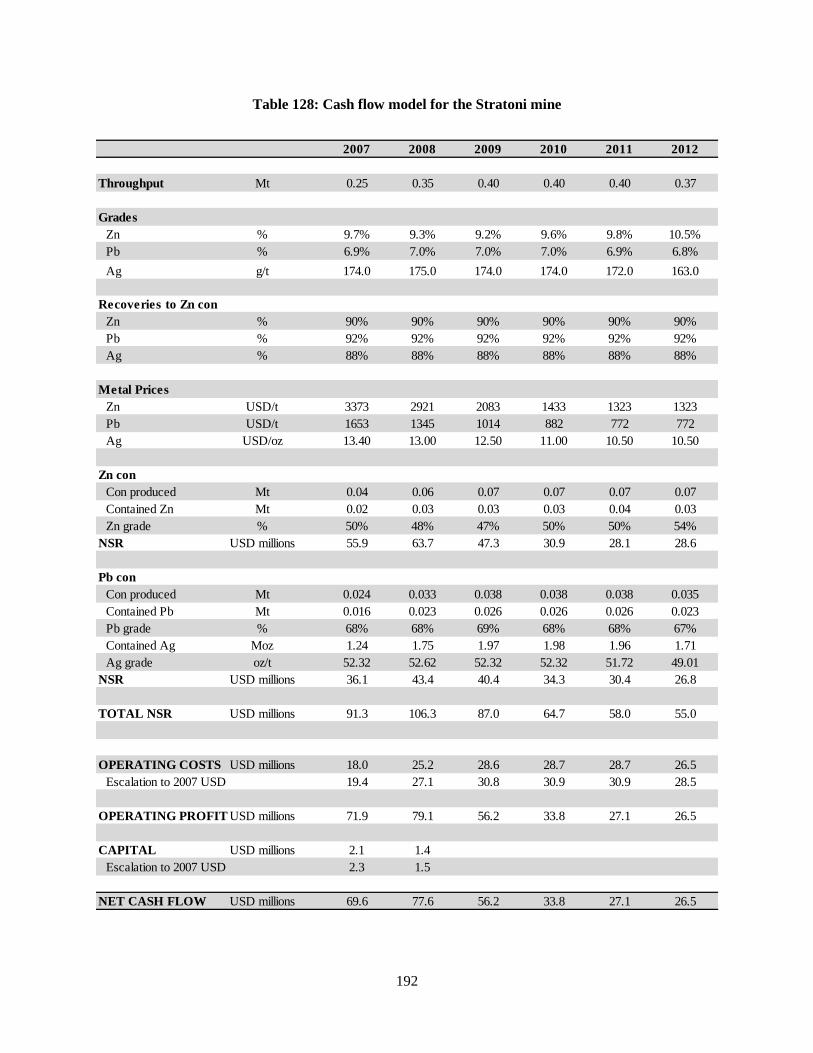
192
Table 128: Cash flow model for the Stratoni mine
2007 2008 2009 2010 2011 2012
Throughput Mt 0.25 0.35 0.40 0.40 0.40 0.37
Grades
Zn % 9.7% 9.3% 9.2% 9.6% 9.8% 10.5%
Pb % 6.9% 7.0% 7.0% 7.0% 6.9% 6.8%
Ag g/t 174.0 175.0 174.0 174.0 172.0 163.0
Recoveries to Zn con
Zn % 90% 90% 90% 90% 90% 90%
Pb % 92% 92% 92% 92% 92% 92%
Ag % 88% 88% 88% 88% 88% 88%
Metal Prices
Zn USD/t 3373 2921 2083 1433 1323 1323
Pb USD/t 1653 1345 1014 882 772 772
Ag USD/oz 13.40 13.00 12.50 11.00 10.50 10.50
Zn con
Con produced Mt 0.04 0.06 0.07 0.07 0.07 0.07
Contained Zn Mt 0.02 0.03 0.03 0.03 0.04 0.03
Zn grade % 50% 48% 47% 50% 50% 54%
NSR USD millions 55.9 63.7 47.3 30.9 28.1 28.6
Pb con
Con produced Mt 0.024 0.033 0.038 0.038 0.038 0.035
Contained Pb Mt 0.016 0.023 0.026 0.026 0.026 0.023
Pb grade % 68% 68% 69% 68% 68% 67%
Contained Ag Moz 1.24 1.75 1.97 1.98 1.96 1.71
Ag grade oz/t 52.32 52.62 52.32 52.32 51.72 49.01
NSR USD millions 36.1 43.4 40.4 34.3 30.4 26.8
TOTAL NSR USD millions 91.3 106.3 87.0 64.7 58.0 55.0
OPERATING COSTS USD millions 18.0 25.2 28.6 28.7 28.7 26.5
Escalation to 2007 USD 19.4 27.1 30.8 30.9 30.9 28.5
OPERATING PROFIT USD millions 71.9 79.1 56.2 33.8 27.1 26.5
CAPITAL USD millions 2.1 1.4
Escalation to 2007 USD 2.3 1.5
NET CASH FLOW USD millions 69.6 77.6 56.2 33.8 27.1 26.5
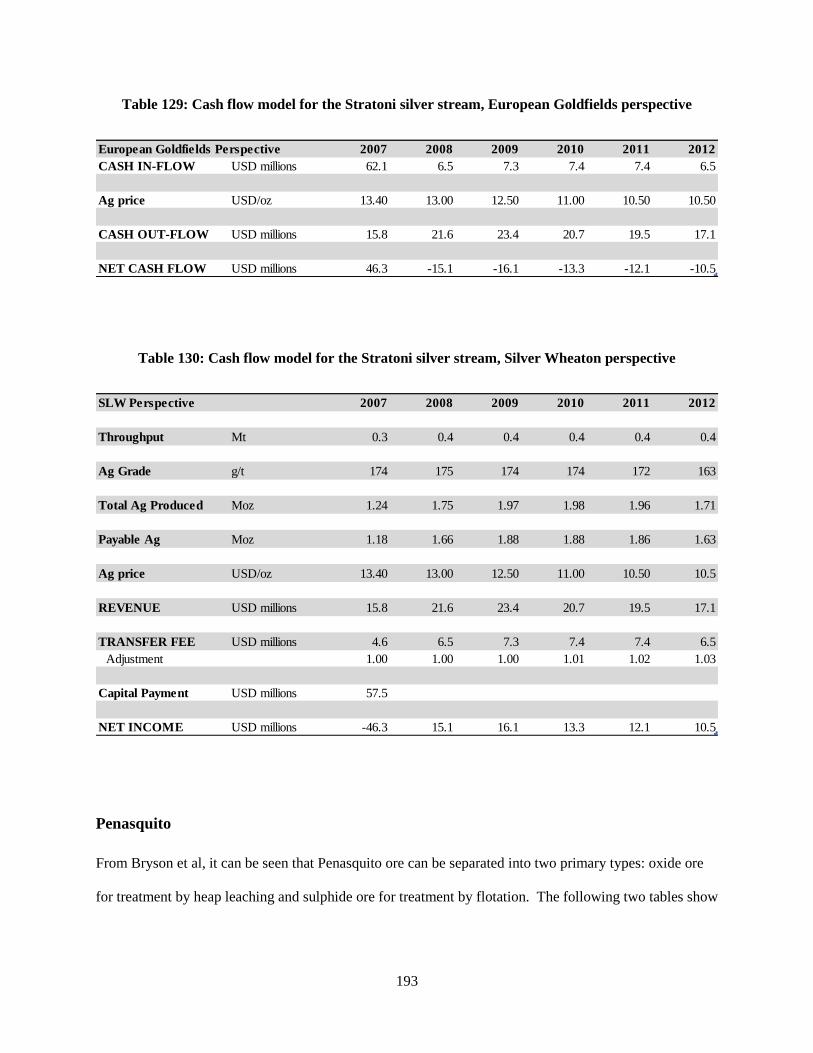
193
Table 129: Cash flow model for the Stratoni silver stream, European Goldfields perspective
Table 130: Cash flow model for the Stratoni silver stream, Silver Wheaton perspective
Penasquito
From Bryson et al, it can be seen that Penasquito ore can be separated into two primary types: oxide ore
for treatment by heap leaching and sulphide ore for treatment by flotation. The following two tables show
European Goldfields Perspective 2007 2008 2009 2010 2011 2012
CASH IN-FLOW USD millions 62.1 6.5 7.3 7.4 7.4 6.5
Ag price USD/oz 13.40 13.00 12.50 11.00 10.50 10.50
CASH OUT-FLOW USD millions 15.8 21.6 23.4 20.7 19.5 17.1
NET CASH FLOW USD millions 46.3 -15.1 -16.1 -13.3 -12.1 -10.5
SLW Perspective 2007 2008 2009 2010 2011 2012
Throughput Mt 0.3 0.4 0.4 0.4 0.4 0.4
Ag Grade g/t 174 175 174 174 172 163
Total Ag Produced Moz 1.24 1.75 1.97 1.98 1.96 1.71
Payable Ag Moz 1.18 1.66 1.88 1.88 1.86 1.63
Ag price USD/oz 13.40 13.00 12.50 11.00 10.50 10.5
REVENUE USD millions 15.8 21.6 23.4 20.7 19.5 17.1
TRANSFER FEE USD millions 4.6 6.5 7.3 7.4 7.4 6.5
Adjustment 1.00 1.00 1.00 1.01 1.02 1.03
Capital Payment USD millions 57.5
NET INCOME USD millions -46.3 15.1 16.1 13.3 12.1 10.5

194
the information given for sulphide ore composition (Bryson, et al., 2007 p. 11) and metal recovery factors
(Bryson, et al., 2007 p. 92).
Table 131: Penasquito sulphide ore composition by lithology
Table 132: Metal process recovery factors by lithology for Penasquito sulphide ore
As no breakdown of sulphide ore feed by lithology was provided anywhere in Bryson et al, weighted
average metal recoveries to concentrate were computed with the given information in Table 131 and
Table 132. Table 133 below shows the result of these calculations, which were ultimately used in the
Penasquito cash flow model.
Breccia Intrusive Sedimentary
61% 6% 33%
Sulphide Ore Composition
Breccia Intrusive Sedimentary Breccia Intrusive Sedimentary
Pb 75% 72% 63% 0% 0% 0%
Zn 0% 0% 0% 75% 60% 60%
Ag 65% 63% 58% 15% 14% 5%
Au 62% 64% 20% 13% 10% 5%
Pb Concentrate Zn Concentrate
SULPHIDE MILL RECOVERIES
Metal
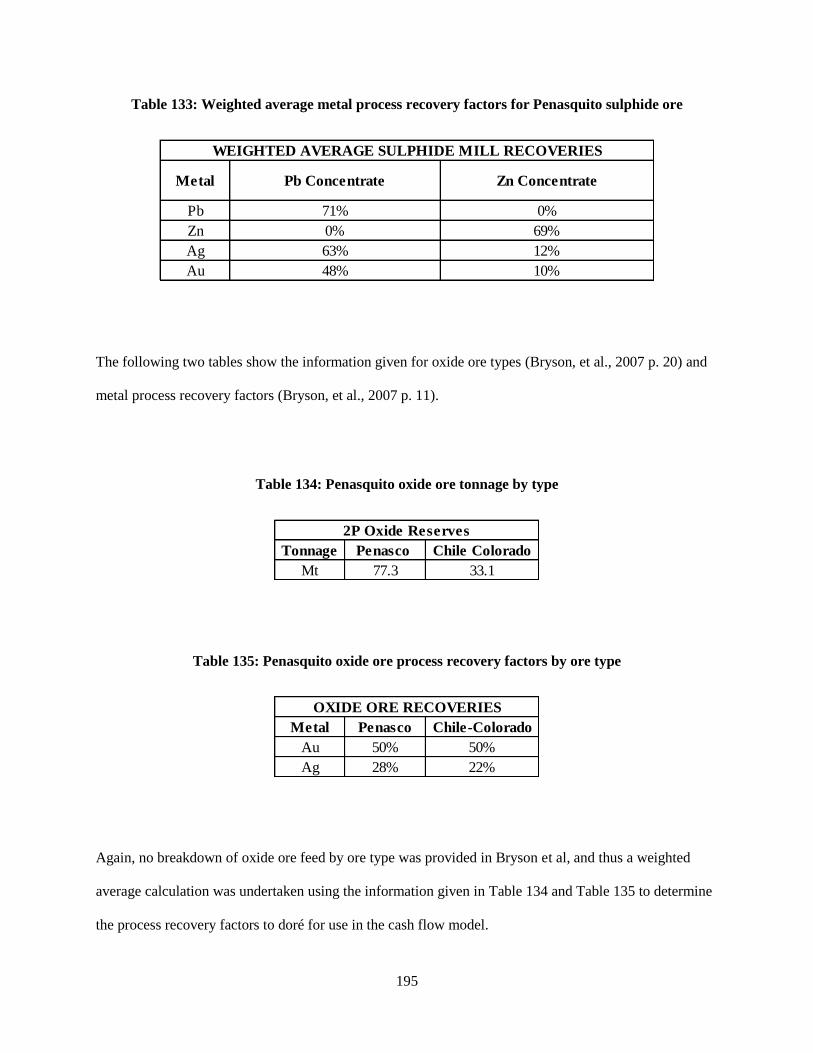
195
Table 133: Weighted average metal process recovery factors for Penasquito sulphide ore
The following two tables show the information given for oxide ore types (Bryson, et al., 2007 p. 20) and
metal process recovery factors (Bryson, et al., 2007 p. 11).
Table 134: Penasquito oxide ore tonnage by type
Table 135: Penasquito oxide ore process recovery factors by ore type
Again, no breakdown of oxide ore feed by ore type was provided in Bryson et al, and thus a weighted
average calculation was undertaken using the information given in Table 134 and Table 135 to determine
the process recovery factors to doré for use in the cash flow model.
Pb
Zn
Ag
Au
WEIGHTED AVERAGE SULPHIDE MILL RECOVERIES
Metal Pb Concentrate Zn Concentrate
48%
63%
0%
71% 0%
10%
12%
69%
Tonnage Penasco Chile Colorado
Mt 77.3 33.1
2P Oxide Reserves
Metal Penasco Chile-Colorado
Au 50% 50%
Ag 28% 22%
OXIDE ORE RECOVERIES
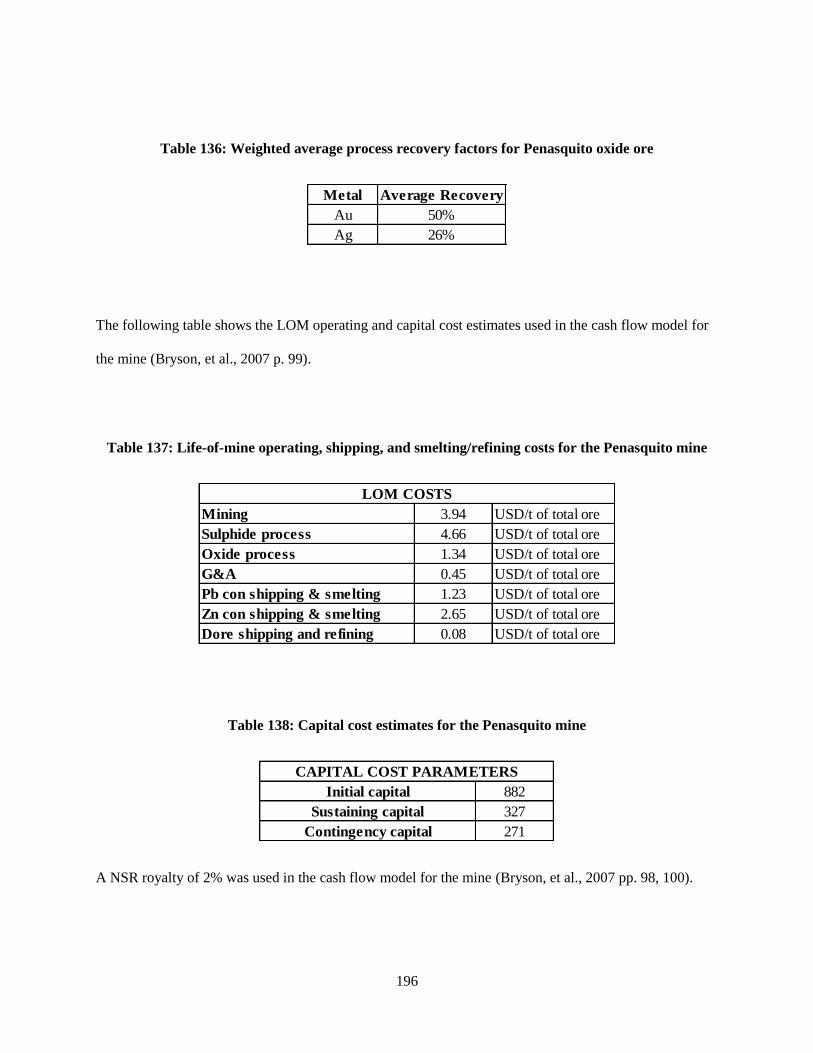
196
Table 136: Weighted average process recovery factors for Penasquito oxide ore
The following table shows the LOM operating and capital cost estimates used in the cash flow model for
the mine (Bryson, et al., 2007 p. 99).
Table 137: Life-of-mine operating, shipping, and smelting/refining costs for the Penasquito mine
Table 138: Capital cost estimates for the Penasquito mine
A NSR royalty of 2% was used in the cash flow model for the mine (Bryson, et al., 2007 pp. 98, 100).
Metal Average Recovery
Au 50%
Ag 26%
3.94 USD/t of total ore
4.66 USD/t of total ore
1.34 USD/t of total ore
0.45 USD/t of total ore
1.23 USD/t of total ore
2.65 USD/t of total ore
0.08 USD/t of total ore
Sulphide process
Mining
LOM COSTS
Dore shipping and refining
Zn con shipping & smelting
Pb con shipping & smelting
G&A
Oxide process
882
327
271
CAPITAL COST PARAMETERS
Contingency capital
Sustaining capital
Initial capital
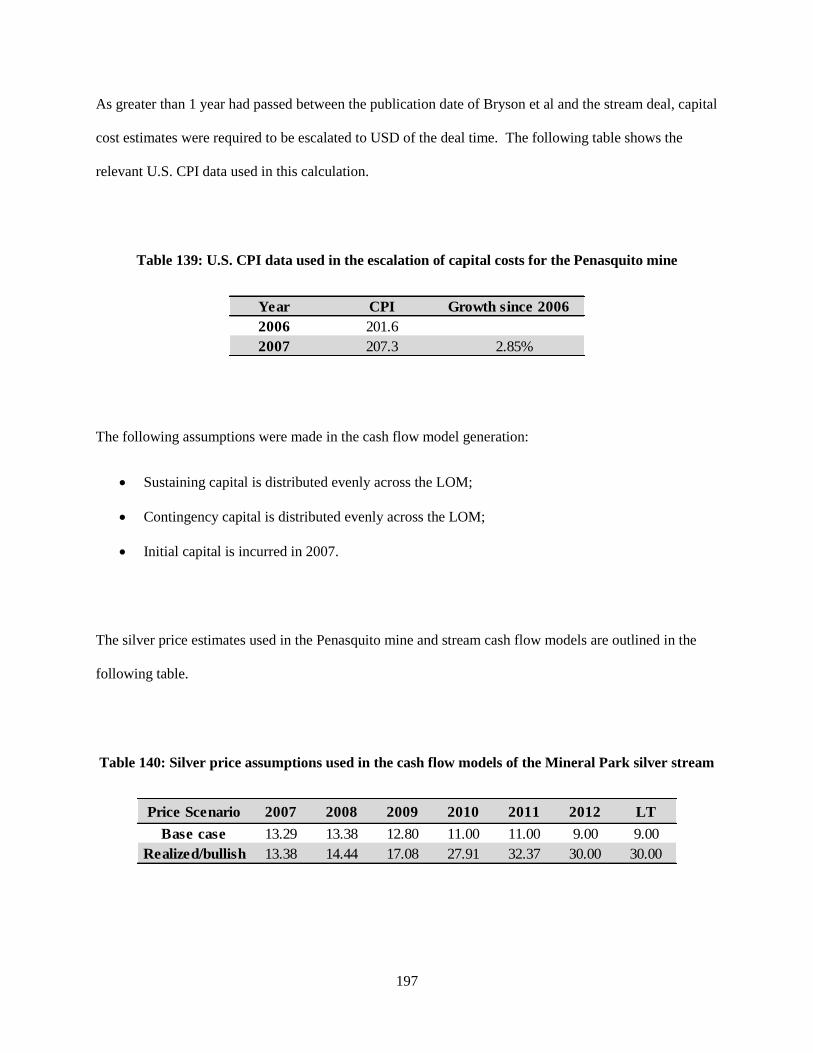
197
As greater than 1 year had passed between the publication date of Bryson et al and the stream deal, capital
cost estimates were required to be escalated to USD of the deal time. The following table shows the
relevant U.S. CPI data used in this calculation.
Table 139: U.S. CPI data used in the escalation of capital costs for the Penasquito mine
The following assumptions were made in the cash flow model generation:
Sustaining capital is distributed evenly across the LOM;
Contingency capital is distributed evenly across the LOM;
Initial capital is incurred in 2007.
The silver price estimates used in the Penasquito mine and stream cash flow models are outlined in the
following table.
Table 140: Silver price assumptions used in the cash flow models of the Mineral Park silver stream
Year CPI Growth since 2006
2006 201.6
2007 207.3 2.85%
Price Scenario 2007 2008 2009 2010 2011 2012 LT
Base case 13.29 13.38 12.80 11.00 11.00 9.00 9.00
Realized/bullish 13.38 14.44 17.08 27.91 32.37 30.00 30.00
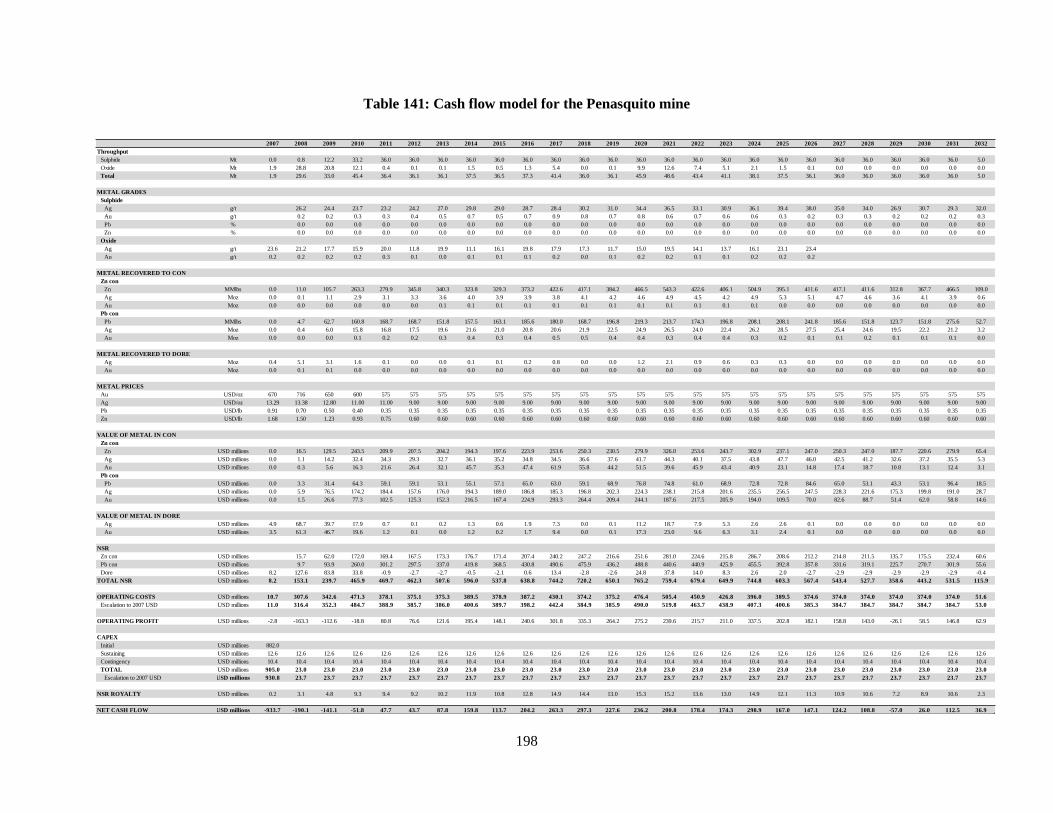
198
Table 141: Cash flow model for the Penasquito mine
2007 2008 2009 2010 2011 2012 2013 2014 2015 2016 2017 2018 2019 2020 2021 2022 2023 2024 2025 2026 2027 2028 2029 2030 2031 2032
Throughput
Sulphide Mt 0.0 0.8 12.2 33.2 36.0 36.0 36.0 36.0 36.0 36.0 36.0 36.0 36.0 36.0 36.0 36.0 36.0 36.0 36.0 36.0 36.0 36.0 36.0 36.0 36.0 5.0
Oxide Mt 1.9 28.8 20.8 12.1 0.4 0.1 0.1 1.5 0.5 1.3 5.4 0.0 0.1 9.9 12.6 7.4 5.1 2.1 1.5 0.1 0.0 0.0 0.0 0.0 0.0 0.0
Total Mt 1.9 29.6 33.0 45.4 36.4 36.1 36.1 37.5 36.5 37.3 41.4 36.0 36.1 45.9 48.6 43.4 41.1 38.1 37.5 36.1 36.0 36.0 36.0 36.0 36.0 5.0
METAL GRADES
Sulphide
Ag g/t 26.2 24.4 23.7 23.2 24.2 27.0 29.8 29.0 28.7 28.4 30.2 31.0 34.4 36.5 33.1 30.9 36.1 39.4 38.0 35.0 34.0 26.9 30.7 29.3 32.0
Au g/t 0.2 0.2 0.3 0.3 0.4 0.5 0.7 0.5 0.7 0.9 0.8 0.7 0.8 0.6 0.7 0.6 0.6 0.3 0.2 0.3 0.3 0.2 0.2 0.2 0.3
Pb % 0.0 0.0 0.0 0.0 0.0 0.0 0.0 0.0 0.0 0.0 0.0 0.0 0.0 0.0 0.0 0.0 0.0 0.0 0.0 0.0 0.0 0.0 0.0 0.0 0.0
Zn % 0.0 0.0 0.0 0.0 0.0 0.0 0.0 0.0 0.0 0.0 0.0 0.0 0.0 0.0 0.0 0.0 0.0 0.0 0.0 0.0 0.0 0.0 0.0 0.0 0.0
Oxide
Ag g/t 23.6 21.2 17.7 15.9 20.0 11.8 19.9 11.1 16.1 19.8 17.9 17.3 11.7 15.0 19.5 14.1 13.7 16.1 23.1 23.4
Au g/t 0.2 0.2 0.2 0.2 0.3 0.1 0.0 0.1 0.1 0.1 0.2 0.0 0.1 0.2 0.2 0.1 0.1 0.2 0.2 0.2
METAL RECOVERED TO CON
Zn con
Zn MMlbs 0.0 11.0 105.7 263.3 279.9 345.8 340.3 323.8 329.3 373.2 422.6 417.1 384.2 466.5 543.3 422.6 406.1 504.9 395.1 411.6 417.1 411.6 312.8 367.7 466.5 109.0
Ag Moz 0.0 0.1 1.1 2.9 3.1 3.3 3.6 4.0 3.9 3.9 3.8 4.1 4.2 4.6 4.9 4.5 4.2 4.9 5.3 5.1 4.7 4.6 3.6 4.1 3.9 0.6
Au Moz 0.0 0.0 0.0 0.0 0.0 0.0 0.1 0.1 0.1 0.1 0.1 0.1 0.1 0.1 0.1 0.1 0.1 0.1 0.0 0.0 0.0 0.0 0.0 0.0 0.0 0.0
Pb con
Pb MMlbs 0.0 4.7 62.7 160.8 168.7 168.7 151.8 157.5 163.1 185.6 180.0 168.7 196.8 219.3 213.7 174.3 196.8 208.1 208.1 241.8 185.6 151.8 123.7 151.8 275.6 52.7
Ag Moz 0.0 0.4 6.0 15.8 16.8 17.5 19.6 21.6 21.0 20.8 20.6 21.9 22.5 24.9 26.5 24.0 22.4 26.2 28.5 27.5 25.4 24.6 19.5 22.2 21.2 3.2
Au Moz 0.0 0.0 0.0 0.1 0.2 0.2 0.3 0.4 0.3 0.4 0.5 0.5 0.4 0.4 0.3 0.4 0.4 0.3 0.2 0.1 0.1 0.2 0.1 0.1 0.1 0.0
METAL RECOVERED TO DORE
Ag Moz 0.4 5.1 3.1 1.6 0.1 0.0 0.0 0.1 0.1 0.2 0.8 0.0 0.0 1.2 2.1 0.9 0.6 0.3 0.3 0.0 0.0 0.0 0.0 0.0 0.0 0.0
Au Moz 0.0 0.1 0.1 0.0 0.0 0.0 0.0 0.0 0.0 0.0 0.0 0.0 0.0 0.0 0.0 0.0 0.0 0.0 0.0 0.0 0.0 0.0 0.0 0.0 0.0 0.0
METAL PRICES
Au USD/oz 670 716 650 600 575 575 575 575 575 575 575 575 575 575 575 575 575 575 575 575 575 575 575 575 575 575
Ag USD/oz 13.29 13.38 12.80 11.00 11.00 9.00 9.00 9.00 9.00 9.00 9.00 9.00 9.00 9.00 9.00 9.00 9.00 9.00 9.00 9.00 9.00 9.00 9.00 9.00 9.00 9.00
Pb USD/lb 0.91 0.70 0.50 0.40 0.35 0.35 0.35 0.35 0.35 0.35 0.35 0.35 0.35 0.35 0.35 0.35 0.35 0.35 0.35 0.35 0.35 0.35 0.35 0.35 0.35 0.35
Zn USD/lb 1.68 1.50 1.23 0.93 0.75 0.60 0.60 0.60 0.60 0.60 0.60 0.60 0.60 0.60 0.60 0.60 0.60 0.60 0.60 0.60 0.60 0.60 0.60 0.60 0.60 0.60
VALUE OF METAL IN CON
Zn con
Zn USD millions 0.0 16.5 129.5 243.5 209.9 207.5 204.2 194.3 197.6 223.9 253.6 250.3 230.5 279.9 326.0 253.6 243.7 302.9 237.1 247.0 250.3 247.0 187.7 220.6 279.9 65.4
Ag USD millions 0.0 1.1 14.2 32.4 34.3 29.3 32.7 36.1 35.2 34.8 34.5 36.6 37.6 41.7 44.3 40.1 37.5 43.8 47.7 46.0 42.5 41.2 32.6 37.2 35.5 5.3
Au USD millions 0.0 0.3 5.6 16.3 21.6 26.4 32.1 45.7 35.3 47.4 61.9 55.8 44.2 51.5 39.6 45.9 43.4 40.9 23.1 14.8 17.4 18.7 10.8 13.1 12.4 3.1
Pb con
Pb USD millions 0.0 3.3 31.4 64.3 59.1 59.1 53.1 55.1 57.1 65.0 63.0 59.1 68.9 76.8 74.8 61.0 68.9 72.8 72.8 84.6 65.0 53.1 43.3 53.1 96.4 18.5
Ag USD millions 0.0 5.9 76.5 174.2 184.4 157.6 176.0 194.3 189.0 186.8 185.3 196.8 202.3 224.3 238.1 215.8 201.6 235.5 256.5 247.5 228.3 221.6 175.3 199.8 191.0 28.7
Au USD millions 0.0 1.5 26.6 77.3 102.5 125.3 152.3 216.5 167.4 224.9 293.3 264.4 209.4 244.1 187.6 217.5 205.9 194.0 109.5 70.0 82.6 88.7 51.4 62.0 58.8 14.6
VALUE OF METAL IN DORE
Ag USD millions 4.9 68.7 39.7 17.9 0.7 0.1 0.2 1.3 0.6 1.9 7.3 0.0 0.1 11.2 18.7 7.9 5.3 2.6 2.6 0.1 0.0 0.0 0.0 0.0 0.0 0.0
Au USD millions 3.5 61.3 46.7 19.6 1.2 0.1 0.0 1.2 0.2 1.7 9.4 0.0 0.1 17.3 23.0 9.6 6.3 3.1 2.4 0.1 0.0 0.0 0.0 0.0 0.0 0.0
NSR
Zn con USD millions 15.7 62.0 172.0 169.4 167.5 173.3 176.7 171.4 207.4 240.2 247.2 216.6 251.6 281.0 224.6 215.8 286.7 208.6 212.2 214.8 211.5 135.7 175.5 232.4 60.6
Pb con USD millions 9.7 93.9 260.0 301.2 297.5 337.0 419.8 368.5 430.8 490.6 475.9 436.2 488.8 440.6 440.9 425.9 455.5 392.8 357.8 331.6 319.1 225.7 270.7 301.9 55.6
Dore USD millions 8.2 127.6 83.8 33.8 -0.9 -2.7 -2.7 -0.5 -2.1 0.6 13.4 -2.8 -2.6 24.8 37.8 14.0 8.3 2.6 2.0 -2.7 -2.9 -2.9 -2.9 -2.9 -2.9 -0.4
TOTAL NSR USD millions 8.2 153.1 239.7 465.9 469.7 462.3 507.6 596.0 537.8 638.8 744.2 720.2 650.1 765.2 759.4 679.4 649.9 744.8 603.3 567.4 543.4 527.7 358.6 443.2 531.5 115.9
OPERATING COSTS USD millions 10.7 307.6 342.6 471.3 378.1 375.1 375.3 389.5 378.9 387.2 430.1 374.2 375.2 476.4 505.4 450.9 426.8 396.0 389.5 374.6 374.0 374.0 374.0 374.0 374.0 51.6
Escalation to 2007 USD USD millions 11.0 316.4 352.3 484.7 388.9 385.7 386.0 400.6 389.7 398.2 442.4 384.9 385.9 490.0 519.8 463.7 438.9 407.3 400.6 385.3 384.7 384.7 384.7 384.7 384.7 53.0
OPERATING PROFIT USD millions -2.8 -163.3 -112.6 -18.8 80.8 76.6 121.6 195.4 148.1 240.6 301.8 335.3 264.2 275.2 239.6 215.7 211.0 337.5 202.8 182.1 158.8 143.0 -26.1 58.5 146.8 62.9
CAPEX
Initial USD millions 882.0
Sustaining USD millions 12.6 12.6 12.6 12.6 12.6 12.6 12.6 12.6 12.6 12.6 12.6 12.6 12.6 12.6 12.6 12.6 12.6 12.6 12.6 12.6 12.6 12.6 12.6 12.6 12.6 12.6
Contingency USD millions 10.4 10.4 10.4 10.4 10.4 10.4 10.4 10.4 10.4 10.4 10.4 10.4 10.4 10.4 10.4 10.4 10.4 10.4 10.4 10.4 10.4 10.4 10.4 10.4 10.4 10.4
TOTAL USD millions 905.0 23.0 23.0 23.0 23.0 23.0 23.0 23.0 23.0 23.0 23.0 23.0 23.0 23.0 23.0 23.0 23.0 23.0 23.0 23.0 23.0 23.0 23.0 23.0 23.0 23.0
Escalation to 2007 USD USD millions 930.8 23.7 23.7 23.7 23.7 23.7 23.7 23.7 23.7 23.7 23.7 23.7 23.7 23.7 23.7 23.7 23.7 23.7 23.7 23.7 23.7 23.7 23.7 23.7 23.7 23.7
NSR ROYALTY USD millions 0.2 3.1 4.8 9.3 9.4 9.2 10.2 11.9 10.8 12.8 14.9 14.4 13.0 15.3 15.2 13.6 13.0 14.9 12.1 11.3 10.9 10.6 7.2 8.9 10.6 2.3
NET CASH FLOW USD millions -933.7 -190.1 -141.1 -51.8 47.7 43.7 87.8 159.8 113.7 204.2 263.3 297.3 227.6 236.2 200.8 178.4 174.3 298.9 167.0 147.1 124.2 108.8 -57.0 26.0 112.5 36.9
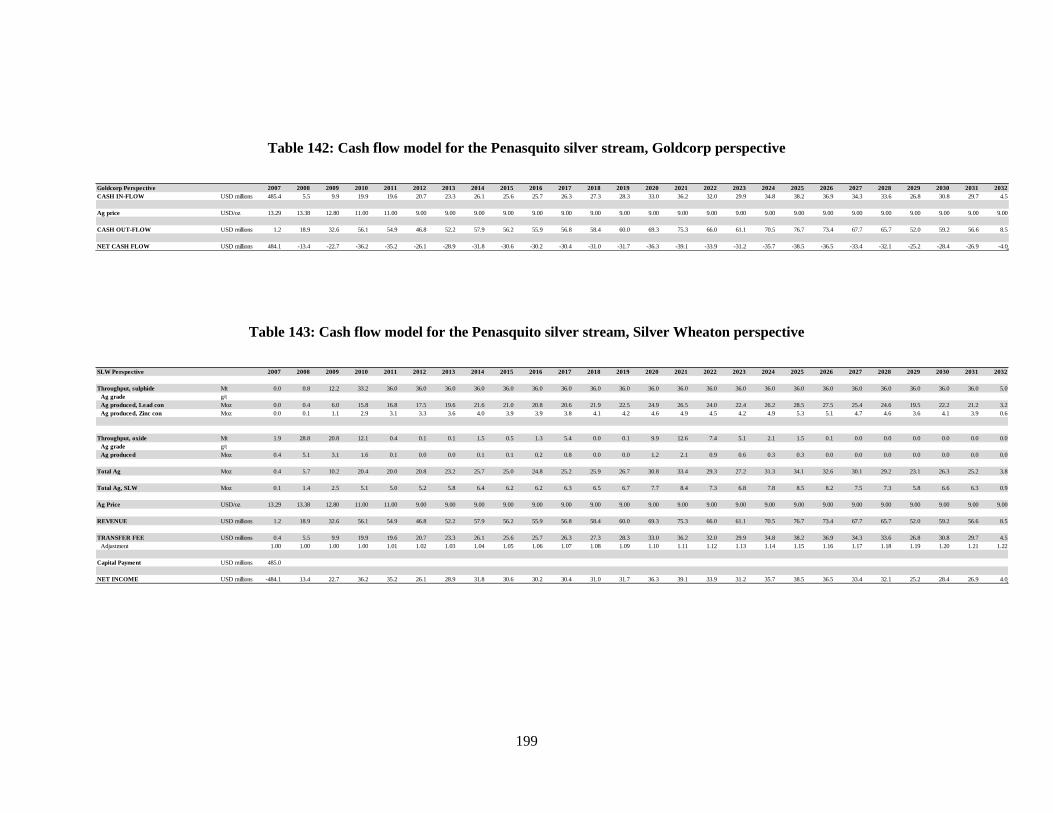
199
Table 142: Cash flow model for the Penasquito silver stream, Goldcorp perspective
Table 143: Cash flow model for the Penasquito silver stream, Silver Wheaton perspective
Goldcorp Perspective 2007 2008 2009 2010 2011 2012 2013 2014 2015 2016 2017 2018 2019 2020 2021 2022 2023 2024 2025 2026 2027 2028 2029 2030 2031 2032
CASH IN-FLOW USD millions 485.4 5.5 9.9 19.9 19.6 20.7 23.3 26.1 25.6 25.7 26.3 27.3 28.3 33.0 36.2 32.0 29.9 34.8 38.2 36.9 34.3 33.6 26.8 30.8 29.7 4.5
Ag price USD/oz 13.29 13.38 12.80 11.00 11.00 9.00 9.00 9.00 9.00 9.00 9.00 9.00 9.00 9.00 9.00 9.00 9.00 9.00 9.00 9.00 9.00 9.00 9.00 9.00 9.00 9.00
CASH OUT-FLOW USD millions 1.2 18.9 32.6 56.1 54.9 46.8 52.2 57.9 56.2 55.9 56.8 58.4 60.0 69.3 75.3 66.0 61.1 70.5 76.7 73.4 67.7 65.7 52.0 59.2 56.6 8.5
NET CASH FLOW USD millions 484.1 -13.4 -22.7 -36.2 -35.2 -26.1 -28.9 -31.8 -30.6 -30.2 -30.4 -31.0 -31.7 -36.3 -39.1 -33.9 -31.2 -35.7 -38.5 -36.5 -33.4 -32.1 -25.2 -28.4 -26.9 -4.0
SLW Perspective 2007 2008 2009 2010 2011 2012 2013 2014 2015 2016 2017 2018 2019 2020 2021 2022 2023 2024 2025 2026 2027 2028 2029 2030 2031 2032
Throughput, sulphide Mt 0.0 0.8 12.2 33.2 36.0 36.0 36.0 36.0 36.0 36.0 36.0 36.0 36.0 36.0 36.0 36.0 36.0 36.0 36.0 36.0 36.0 36.0 36.0 36.0 36.0 5.0
Ag grade g/t
Ag produced, Lead con Moz 0.0 0.4 6.0 15.8 16.8 17.5 19.6 21.6 21.0 20.8 20.6 21.9 22.5 24.9 26.5 24.0 22.4 26.2 28.5 27.5 25.4 24.6 19.5 22.2 21.2 3.2
Ag produced, Zinc con Moz 0.0 0.1 1.1 2.9 3.1 3.3 3.6 4.0 3.9 3.9 3.8 4.1 4.2 4.6 4.9 4.5 4.2 4.9 5.3 5.1 4.7 4.6 3.6 4.1 3.9 0.6
Throughput, oxide Mt 1.9 28.8 20.8 12.1 0.4 0.1 0.1 1.5 0.5 1.3 5.4 0.0 0.1 9.9 12.6 7.4 5.1 2.1 1.5 0.1 0.0 0.0 0.0 0.0 0.0 0.0
Ag grade g/t
Ag produced Moz 0.4 5.1 3.1 1.6 0.1 0.0 0.0 0.1 0.1 0.2 0.8 0.0 0.0 1.2 2.1 0.9 0.6 0.3 0.3 0.0 0.0 0.0 0.0 0.0 0.0 0.0
Total Ag Moz 0.4 5.7 10.2 20.4 20.0 20.8 23.2 25.7 25.0 24.8 25.2 25.9 26.7 30.8 33.4 29.3 27.2 31.3 34.1 32.6 30.1 29.2 23.1 26.3 25.2 3.8
Total Ag, SLW Moz 0.1 1.4 2.5 5.1 5.0 5.2 5.8 6.4 6.2 6.2 6.3 6.5 6.7 7.7 8.4 7.3 6.8 7.8 8.5 8.2 7.5 7.3 5.8 6.6 6.3 0.9
Ag Price USD/oz 13.29 13.38 12.80 11.00 11.00 9.00 9.00 9.00 9.00 9.00 9.00 9.00 9.00 9.00 9.00 9.00 9.00 9.00 9.00 9.00 9.00 9.00 9.00 9.00 9.00 9.00
REVENUE USD millions 1.2 18.9 32.6 56.1 54.9 46.8 52.2 57.9 56.2 55.9 56.8 58.4 60.0 69.3 75.3 66.0 61.1 70.5 76.7 73.4 67.7 65.7 52.0 59.2 56.6 8.5
TRANSFER FEE USD millions 0.4 5.5 9.9 19.9 19.6 20.7 23.3 26.1 25.6 25.7 26.3 27.3 28.3 33.0 36.2 32.0 29.9 34.8 38.2 36.9 34.3 33.6 26.8 30.8 29.7 4.5
Adjustment 1.00 1.00 1.00 1.00 1.01 1.02 1.03 1.04 1.05 1.06 1.07 1.08 1.09 1.10 1.11 1.12 1.13 1.14 1.15 1.16 1.17 1.18 1.19 1.20 1.21 1.22
Capital Payment USD millions 485.0
NET INCOME USD millions -484.1 13.4 22.7 36.2 35.2 26.1 28.9 31.8 30.6 30.2 30.4 31.0 31.7 36.3 39.1 33.9 31.2 35.7 38.5 36.5 33.4 32.1 25.2 28.4 26.9 4.0

200
Mineral Park
All technical parameters were taken from a prefeasibility study prepared by Olson et al in early 2007.
The mine life was expected to be 25 years at the time of the deal and was taken as the life of the silver
stream (Olson, et al., 2007 p. 194). The upfront payment was assumed to have been incurred by SLW in
FY 2008, prior to commencement of silver production at the mine in 2009. The transfer fee adjustment
period was to begin three years after a minimum production target of 35,000 tons per day is reached at the
Mineral Park mill.
On April 5, 2011 Mercator announced that the mill had operated for 30 consecutive days at an average
throughput of 35,238 tons per day, thus satisfying the production target (Mercator Minerals Ltd., 2011).
This indicates that the transfer fee adjustment period would begin in 2014. Although this specific detail
was unknown at the time of the deal, it will be used for the purposes of this calculation. Therefore, an
inflationary adjustment of 1% annually was factored into the calculation of the transfer fee, beginning in
2014.
The following tables show technical parameters taken from Olson et al and used in the Mineral Park mine
cash flow calculation. Freight, shipping, and refining cost estimates were taken from the relevant
technical report (Olson, et al., 2007 pp. 192-193). The LOM ore production, metal grade, and process
recovery schedule in the relevant technical report was used as the basis for the mine cash flow model
(Olson, et al., 2007 pp. 190-191).
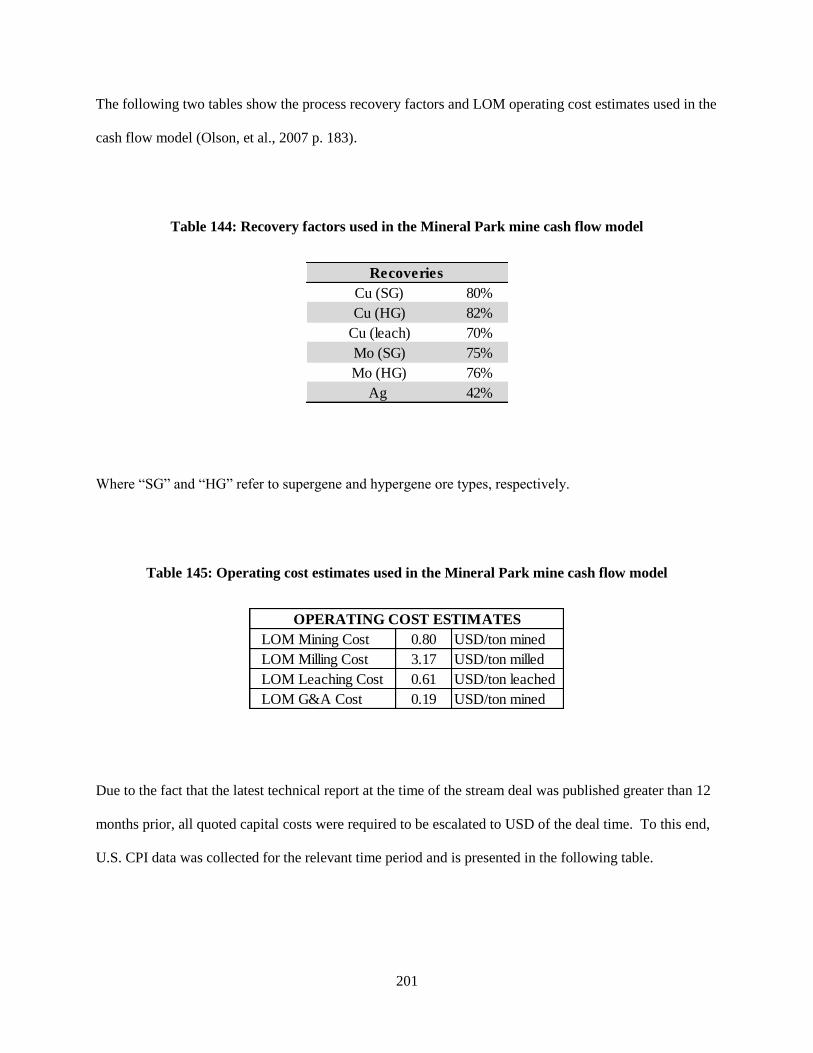
201
The following two tables show the process recovery factors and LOM operating cost estimates used in the
cash flow model (Olson, et al., 2007 p. 183).
Table 144: Recovery factors used in the Mineral Park mine cash flow model
Where “SG” and “HG” refer to supergene and hypergene ore types, respectively.
Table 145: Operating cost estimates used in the Mineral Park mine cash flow model
Due to the fact that the latest technical report at the time of the stream deal was published greater than 12
months prior, all quoted capital costs were required to be escalated to USD of the deal time. To this end,
U.S. CPI data was collected for the relevant time period and is presented in the following table.
Cu (SG) 80%
Cu (HG) 82%
Cu (leach) 70%
Mo (SG) 75%
Mo (HG) 76%
Ag 42%
Recoveries
LOM Mining Cost 0.80 USD/ton mined
LOM Milling Cost 3.17 USD/ton milled
LOM Leaching Cost 0.61 USD/ton leached
LOM G&A Cost 0.19 USD/ton mined
OPERATING COST ESTIMATES
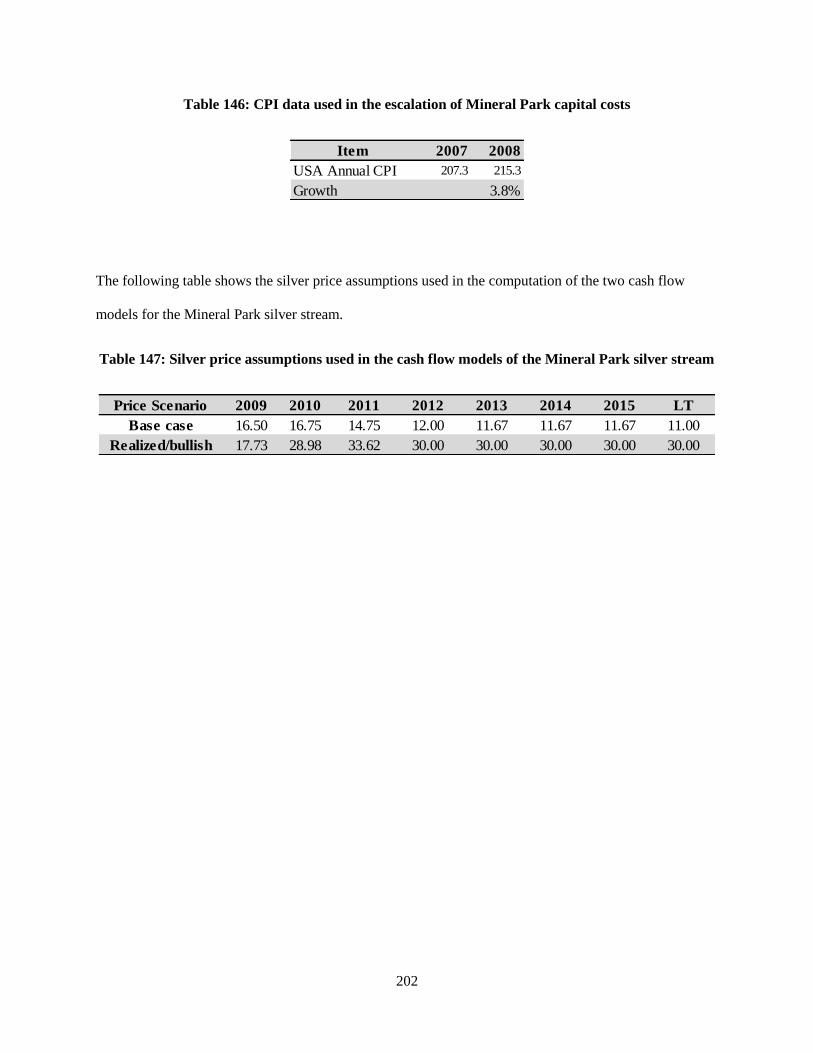
202
Table 146: CPI data used in the escalation of Mineral Park capital costs
The following table shows the silver price assumptions used in the computation of the two cash flow
models for the Mineral Park silver stream.
Table 147: Silver price assumptions used in the cash flow models of the Mineral Park silver stream
Item 2007 2008
USA Annual CPI 207.3 215.3
Growth 3.8%
Price Scenario 2009 2010 2011 2012 2013 2014 2015 LT
Base case 16.50 16.75 14.75 12.00 11.67 11.67 11.67 11.00
Realized/bullish 17.73 28.98 33.62 30.00 30.00 30.00 30.00 30.00
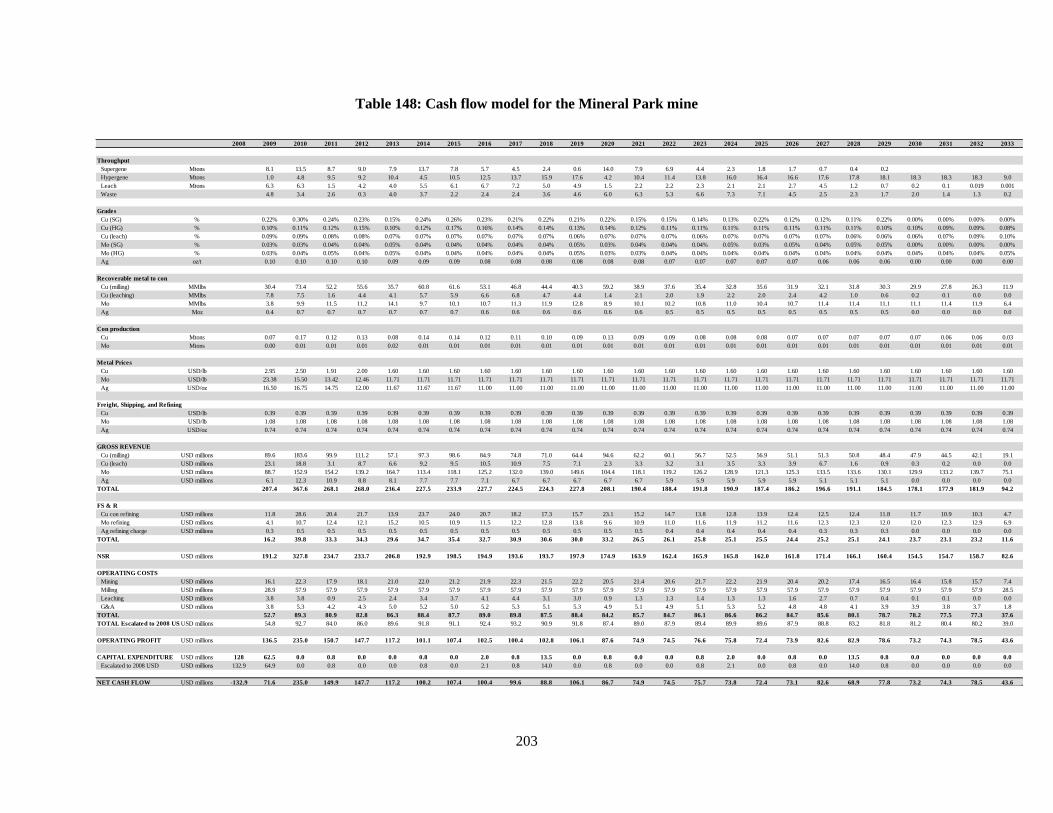
203
Table 148: Cash flow model for the Mineral Park mine
2008 2009 2010 2011 2012 2013 2014 2015 2016 2017 2018 2019 2020 2021 2022 2023 2024 2025 2026 2027 2028 2029 2030 2031 2032 2033
Throughput
Supergene Mtons 8.1 13.5 8.7 9.0 7.9 13.7 7.8 5.7 4.5 2.4 0.6 14.0 7.9 6.9 4.4 2.3 1.8 1.7 0.7 0.4 0.2
Hypergene Mtons 1.0 4.8 9.5 9.2 10.4 4.5 10.5 12.5 13.7 15.9 17.6 4.2 10.4 11.4 13.8 16.0 16.4 16.6 17.6 17.8 18.1 18.3 18.3 18.3 9.0
Leach Mtons 6.3 6.3 1.5 4.2 4.0 5.5 6.1 6.7 7.2 5.0 4.9 1.5 2.2 2.2 2.3 2.1 2.1 2.7 4.5 1.2 0.7 0.2 0.1 0.019 0.001
Waste 4.8 3.4 2.6 0.3 4.0 3.7 2.2 2.4 2.4 3.6 4.6 6.0 6.3 5.3 6.6 7.3 7.1 4.5 2.5 2.3 1.7 2.0 1.4 1.3 0.2
Grades
Cu (SG) % 0.22% 0.30% 0.24% 0.23% 0.15% 0.24% 0.26% 0.23% 0.21% 0.22% 0.21% 0.22% 0.15% 0.15% 0.14% 0.13% 0.22% 0.12% 0.12% 0.11% 0.22% 0.00% 0.00% 0.00% 0.00%
Cu (HG) % 0.10% 0.11% 0.12% 0.15% 0.10% 0.12% 0.17% 0.16% 0.14% 0.14% 0.13% 0.14% 0.12% 0.11% 0.11% 0.11% 0.11% 0.11% 0.11% 0.11% 0.10% 0.10% 0.09% 0.09% 0.08%
Cu (leach) % 0.09% 0.09% 0.08% 0.08% 0.07% 0.07% 0.07% 0.07% 0.07% 0.07% 0.06% 0.07% 0.07% 0.07% 0.06% 0.07% 0.07% 0.07% 0.07% 0.06% 0.06% 0.06% 0.07% 0.09% 0.10%
Mo (SG) % 0.03% 0.03% 0.04% 0.04% 0.05% 0.04% 0.04% 0.04% 0.04% 0.04% 0.05% 0.03% 0.04% 0.04% 0.04% 0.05% 0.03% 0.05% 0.04% 0.05% 0.05% 0.00% 0.00% 0.00% 0.00%
Mo (HG) % 0.03% 0.04% 0.05% 0.04% 0.05% 0.04% 0.04% 0.04% 0.04% 0.04% 0.05% 0.03% 0.03% 0.04% 0.04% 0.04% 0.04% 0.04% 0.04% 0.04% 0.04% 0.04% 0.04% 0.04% 0.05%
Ag oz/t 0.10 0.10 0.10 0.10 0.09 0.09 0.09 0.08 0.08 0.08 0.08 0.08 0.08 0.07 0.07 0.07 0.07 0.07 0.06 0.06 0.06 0.00 0.00 0.00 0.00
Recoverable metal to con
Cu (milling) MMlbs 30.4 73.4 52.2 55.6 35.7 60.8 61.6 53.1 46.8 44.4 40.3 59.2 38.9 37.6 35.4 32.8 35.6 31.9 32.1 31.8 30.3 29.9 27.8 26.3 11.9
Cu (leaching) MMlbs 7.8 7.5 1.6 4.4 4.1 5.7 5.9 6.6 6.8 4.7 4.4 1.4 2.1 2.0 1.9 2.2 2.0 2.4 4.2 1.0 0.6 0.2 0.1 0.0 0.0
Mo MMlbs 3.8 9.9 11.5 11.2 14.1 9.7 10.1 10.7 11.3 11.9 12.8 8.9 10.1 10.2 10.8 11.0 10.4 10.7 11.4 11.4 11.1 11.1 11.4 11.9 6.4
Ag Moz 0.4 0.7 0.7 0.7 0.7 0.7 0.7 0.6 0.6 0.6 0.6 0.6 0.6 0.5 0.5 0.5 0.5 0.5 0.5 0.5 0.5 0.0 0.0 0.0 0.0
Con production
Cu Mtons 0.07 0.17 0.12 0.13 0.08 0.14 0.14 0.12 0.11 0.10 0.09 0.13 0.09 0.09 0.08 0.08 0.08 0.07 0.07 0.07 0.07 0.07 0.06 0.06 0.03
Mo Mtons 0.00 0.01 0.01 0.01 0.02 0.01 0.01 0.01 0.01 0.01 0.01 0.01 0.01 0.01 0.01 0.01 0.01 0.01 0.01 0.01 0.01 0.01 0.01 0.01 0.01
Metal Prices
Cu USD/lb 2.95 2.50 1.91 2.00 1.60 1.60 1.60 1.60 1.60 1.60 1.60 1.60 1.60 1.60 1.60 1.60 1.60 1.60 1.60 1.60 1.60 1.60 1.60 1.60 1.60
Mo USD/lb 23.38 15.50 13.42 12.46 11.71 11.71 11.71 11.71 11.71 11.71 11.71 11.71 11.71 11.71 11.71 11.71 11.71 11.71 11.71 11.71 11.71 11.71 11.71 11.71 11.71
Ag USD/oz 16.50 16.75 14.75 12.00 11.67 11.67 11.67 11.00 11.00 11.00 11.00 11.00 11.00 11.00 11.00 11.00 11.00 11.00 11.00 11.00 11.00 11.00 11.00 11.00 11.00
Freight, Shipping, and Refining
Cu USD/lb 0.39 0.39 0.39 0.39 0.39 0.39 0.39 0.39 0.39 0.39 0.39 0.39 0.39 0.39 0.39 0.39 0.39 0.39 0.39 0.39 0.39 0.39 0.39 0.39 0.39
Mo USD/lb 1.08 1.08 1.08 1.08 1.08 1.08 1.08 1.08 1.08 1.08 1.08 1.08 1.08 1.08 1.08 1.08 1.08 1.08 1.08 1.08 1.08 1.08 1.08 1.08 1.08
Ag USD/oz 0.74 0.74 0.74 0.74 0.74 0.74 0.74 0.74 0.74 0.74 0.74 0.74 0.74 0.74 0.74 0.74 0.74 0.74 0.74 0.74 0.74 0.74 0.74 0.74 0.74
GROSS REVENUE
Cu (milling) USD millions 89.6 183.6 99.9 111.2 57.1 97.3 98.6 84.9 74.8 71.0 64.4 94.6 62.2 60.1 56.7 52.5 56.9 51.1 51.3 50.8 48.4 47.9 44.5 42.1 19.1
Cu (leach) USD millions 23.1 18.8 3.1 8.7 6.6 9.2 9.5 10.5 10.9 7.5 7.1 2.3 3.3 3.2 3.1 3.5 3.3 3.9 6.7 1.6 0.9 0.3 0.2 0.0 0.0
Mo USD millions 88.7 152.9 154.2 139.2 164.7 113.4 118.1 125.2 132.0 139.0 149.6 104.4 118.1 119.2 126.2 128.9 121.3 125.3 133.5 133.6 130.1 129.9 133.2 139.7 75.1
Ag USD millions 6.1 12.3 10.9 8.8 8.1 7.7 7.7 7.1 6.7 6.7 6.7 6.7 6.7 5.9 5.9 5.9 5.9 5.9 5.1 5.1 5.1 0.0 0.0 0.0 0.0
TOTAL 207.4 367.6 268.1 268.0 236.4 227.5 233.9 227.7 224.5 224.3 227.8 208.1 190.4 188.4 191.8 190.9 187.4 186.2 196.6 191.1 184.5 178.1 177.9 181.9 94.2
FS & R
Cu con refining USD millions 11.8 28.6 20.4 21.7 13.9 23.7 24.0 20.7 18.2 17.3 15.7 23.1 15.2 14.7 13.8 12.8 13.9 12.4 12.5 12.4 11.8 11.7 10.9 10.3 4.7
Mo refining USD millions 4.1 10.7 12.4 12.1 15.2 10.5 10.9 11.5 12.2 12.8 13.8 9.6 10.9 11.0 11.6 11.9 11.2 11.6 12.3 12.3 12.0 12.0 12.3 12.9 6.9
Ag refining charge USD millions 0.3 0.5 0.5 0.5 0.5 0.5 0.5 0.5 0.5 0.5 0.5 0.5 0.5 0.4 0.4 0.4 0.4 0.4 0.3 0.3 0.3 0.0 0.0 0.0 0.0
TOTAL 16.2 39.8 33.3 34.3 29.6 34.7 35.4 32.7 30.9 30.6 30.0 33.2 26.5 26.1 25.8 25.1 25.5 24.4 25.2 25.1 24.1 23.7 23.1 23.2 11.6
NSR USD millions 191.2 327.8 234.7 233.7 206.8 192.9 198.5 194.9 193.6 193.7 197.9 174.9 163.9 162.4 165.9 165.8 162.0 161.8 171.4 166.1 160.4 154.5 154.7 158.7 82.6
OPERATING COSTS
Mining USD millions 16.1 22.3 17.9 18.1 21.0 22.0 21.2 21.9 22.3 21.5 22.2 20.5 21.4 20.6 21.7 22.2 21.9 20.4 20.2 17.4 16.5 16.4 15.8 15.7 7.4
Milling USD millions 28.9 57.9 57.9 57.9 57.9 57.9 57.9 57.9 57.9 57.9 57.9 57.9 57.9 57.9 57.9 57.9 57.9 57.9 57.9 57.9 57.9 57.9 57.9 57.9 28.5
Leaching USD millions 3.8 3.8 0.9 2.5 2.4 3.4 3.7 4.1 4.4 3.1 3.0 0.9 1.3 1.3 1.4 1.3 1.3 1.6 2.7 0.7 0.4 0.1 0.1 0.0 0.0
G&A USD millions 3.8 5.3 4.2 4.3 5.0 5.2 5.0 5.2 5.3 5.1 5.3 4.9 5.1 4.9 5.1 5.3 5.2 4.8 4.8 4.1 3.9 3.9 3.8 3.7 1.8
TOTAL 52.7 89.3 80.9 82.8 86.3 88.4 87.7 89.0 89.8 87.5 88.4 84.2 85.7 84.7 86.1 86.6 86.2 84.7 85.6 80.1 78.7 78.2 77.5 77.3 37.6
TOTAL Escalated to 2008 USDUSD millions 54.8 92.7 84.0 86.0 89.6 91.8 91.1 92.4 93.2 90.9 91.8 87.4 89.0 87.9 89.4 89.9 89.6 87.9 88.8 83.2 81.8 81.2 80.4 80.2 39.0
OPERATING PROFIT USD millions 136.5 235.0 150.7 147.7 117.2 101.1 107.4 102.5 100.4 102.8 106.1 87.6 74.9 74.5 76.6 75.8 72.4 73.9 82.6 82.9 78.6 73.2 74.3 78.5 43.6
CAPITAL EXPENDITURE USD millions 128 62.5 0.0 0.8 0.0 0.0 0.8 0.0 2.0 0.8 13.5 0.0 0.8 0.0 0.0 0.8 2.0 0.0 0.8 0.0 13.5 0.8 0.0 0.0 0.0 0.0
Escalated to 2008 USD USD millions 132.9 64.9 0.0 0.8 0.0 0.0 0.8 0.0 2.1 0.8 14.0 0.0 0.8 0.0 0.0 0.8 2.1 0.0 0.8 0.0 14.0 0.8 0.0 0.0 0.0 0.0
NET CASH FLOW USD millions -132.9 71.6 235.0 149.9 147.7 117.2 100.2 107.4 100.4 99.6 88.8 106.1 86.7 74.9 74.5 75.7 73.8 72.4 73.1 82.6 68.9 77.8 73.2 74.3 78.5 43.6
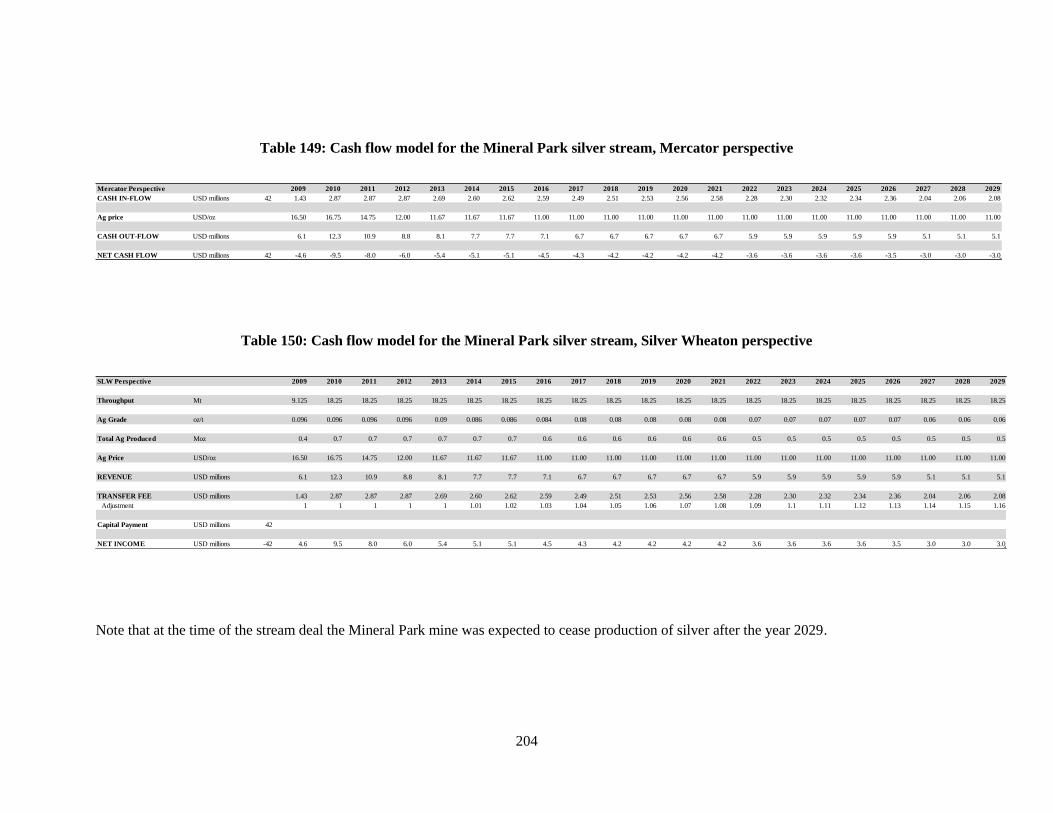
204
Table 149: Cash flow model for the Mineral Park silver stream, Mercator perspective
Table 150: Cash flow model for the Mineral Park silver stream, Silver Wheaton perspective
Note that at the time of the stream deal the Mineral Park mine was expected to cease production of silver after the year 2029.
Mercator Perspective 2009 2010 2011 2012 2013 2014 2015 2016 2017 2018 2019 2020 2021 2022 2023 2024 2025 2026 2027 2028 2029
CASH IN-FLOW USD millions 42 1.43 2.87 2.87 2.87 2.69 2.60 2.62 2.59 2.49 2.51 2.53 2.56 2.58 2.28 2.30 2.32 2.34 2.36 2.04 2.06 2.08
Ag price USD/oz 16.50 16.75 14.75 12.00 11.67 11.67 11.67 11.00 11.00 11.00 11.00 11.00 11.00 11.00 11.00 11.00 11.00 11.00 11.00 11.00 11.00
CASH OUT-FLOW USD millions 6.1 12.3 10.9 8.8 8.1 7.7 7.7 7.1 6.7 6.7 6.7 6.7 6.7 5.9 5.9 5.9 5.9 5.9 5.1 5.1 5.1
NET CASH FLOW USD millions 42 -4.6 -9.5 -8.0 -6.0 -5.4 -5.1 -5.1 -4.5 -4.3 -4.2 -4.2 -4.2 -4.2 -3.6 -3.6 -3.6 -3.6 -3.5 -3.0 -3.0 -3.0
SLW Perspective 2009 2010 2011 2012 2013 2014 2015 2016 2017 2018 2019 2020 2021 2022 2023 2024 2025 2026 2027 2028 2029
Throughput Mt 9.125 18.25 18.25 18.25 18.25 18.25 18.25 18.25 18.25 18.25 18.25 18.25 18.25 18.25 18.25 18.25 18.25 18.25 18.25 18.25 18.25
Ag Grade oz/t 0.096 0.096 0.096 0.096 0.09 0.086 0.086 0.084 0.08 0.08 0.08 0.08 0.08 0.07 0.07 0.07 0.07 0.07 0.06 0.06 0.06
Total Ag Produced Moz 0.4 0.7 0.7 0.7 0.7 0.7 0.7 0.6 0.6 0.6 0.6 0.6 0.6 0.5 0.5 0.5 0.5 0.5 0.5 0.5 0.5
Ag Price USD/oz 16.50 16.75 14.75 12.00 11.67 11.67 11.67 11.00 11.00 11.00 11.00 11.00 11.00 11.00 11.00 11.00 11.00 11.00 11.00 11.00 11.00
REVENUE USD millions 6.1 12.3 10.9 8.8 8.1 7.7 7.7 7.1 6.7 6.7 6.7 6.7 6.7 5.9 5.9 5.9 5.9 5.9 5.1 5.1 5.1
TRANSFER FEE USD millions 1.43 2.87 2.87 2.87 2.69 2.60 2.62 2.59 2.49 2.51 2.53 2.56 2.58 2.28 2.30 2.32 2.34 2.36 2.04 2.06 2.08
Adjustment 1 1 1 1 1 1.01 1.02 1.03 1.04 1.05 1.06 1.07 1.08 1.09 1.1 1.11 1.12 1.13 1.14 1.15 1.16
Capital Payment USD millions 42
NET INCOME USD millions -42 4.6 9.5 8.0 6.0 5.4 5.1 5.1 4.5 4.3 4.2 4.2 4.2 4.2 3.6 3.6 3.6 3.6 3.5 3.0 3.0 3.0
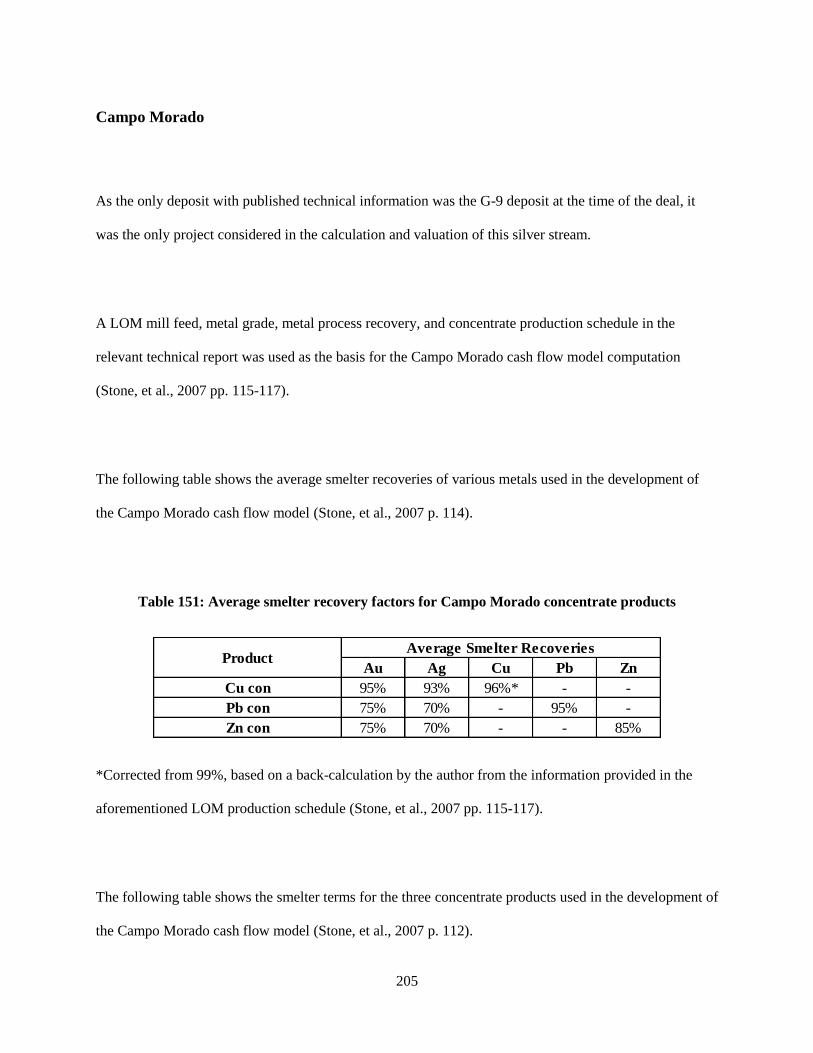
205
Campo Morado
As the only deposit with published technical information was the G-9 deposit at the time of the deal, it
was the only project considered in the calculation and valuation of this silver stream.
A LOM mill feed, metal grade, metal process recovery, and concentrate production schedule in the
relevant technical report was used as the basis for the Campo Morado cash flow model computation
(Stone, et al., 2007 pp. 115-117).
The following table shows the average smelter recoveries of various metals used in the development of
the Campo Morado cash flow model (Stone, et al., 2007 p. 114).
Table 151: Average smelter recovery factors for Campo Morado concentrate products
*Corrected from 99%, based on a back-calculation by the author from the information provided in the
aforementioned LOM production schedule (Stone, et al., 2007 pp. 115-117).
The following table shows the smelter terms for the three concentrate products used in the development of
the Campo Morado cash flow model (Stone, et al., 2007 p. 112).
Au Ag Cu Pb Zn
Cu con 95% 93% 96%* - -
Pb con 75% 70% - 95% -
Zn con 75% 70% - - 85%
ProductAverage Smelter Recoveries
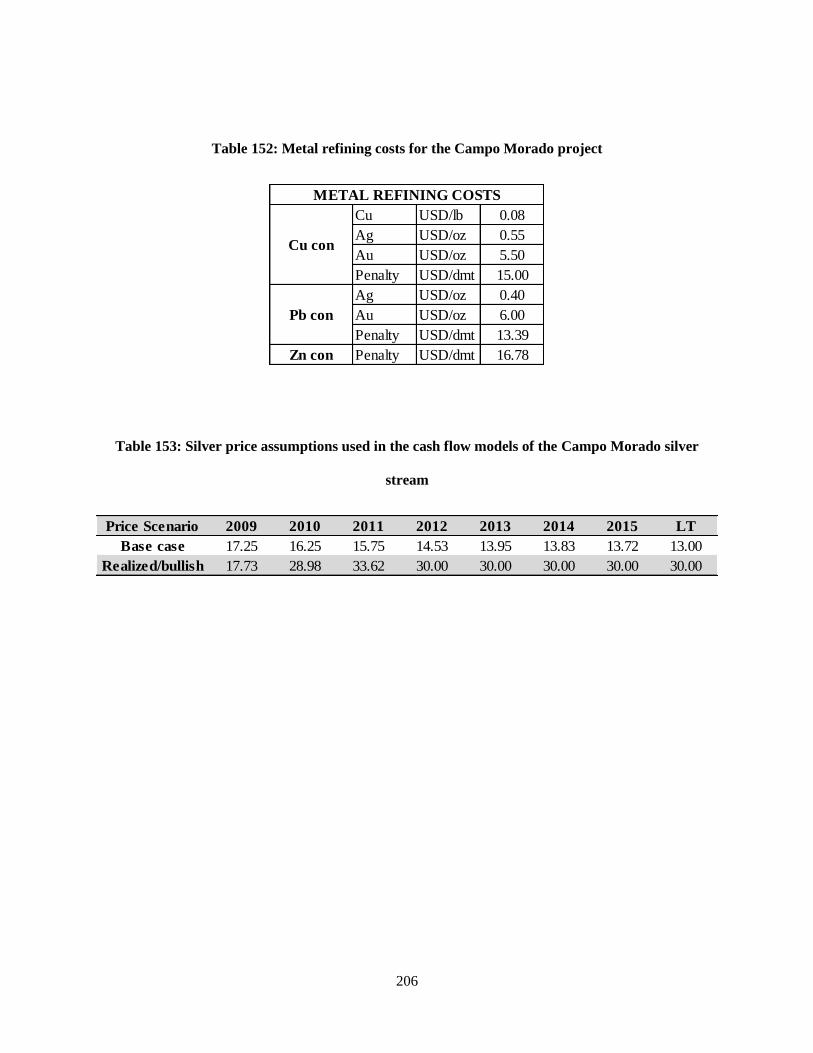
206
Table 152: Metal refining costs for the Campo Morado project
Table 153: Silver price assumptions used in the cash flow models of the Campo Morado silver
stream
Cu USD/lb 0.08
Ag USD/oz 0.55
Au USD/oz 5.50
Penalty USD/dmt 15.00
Ag USD/oz 0.40
Au USD/oz 6.00
Penalty USD/dmt 13.39
Zn con Penalty USD/dmt 16.78
Pb con
Cu con
METAL REFINING COSTS
Price Scenario 2009 2010 2011 2012 2013 2014 2015 LT
Base case 17.25 16.25 15.75 14.53 13.95 13.83 13.72 13.00
Realized/bullish 17.73 28.98 33.62 30.00 30.00 30.00 30.00 30.00
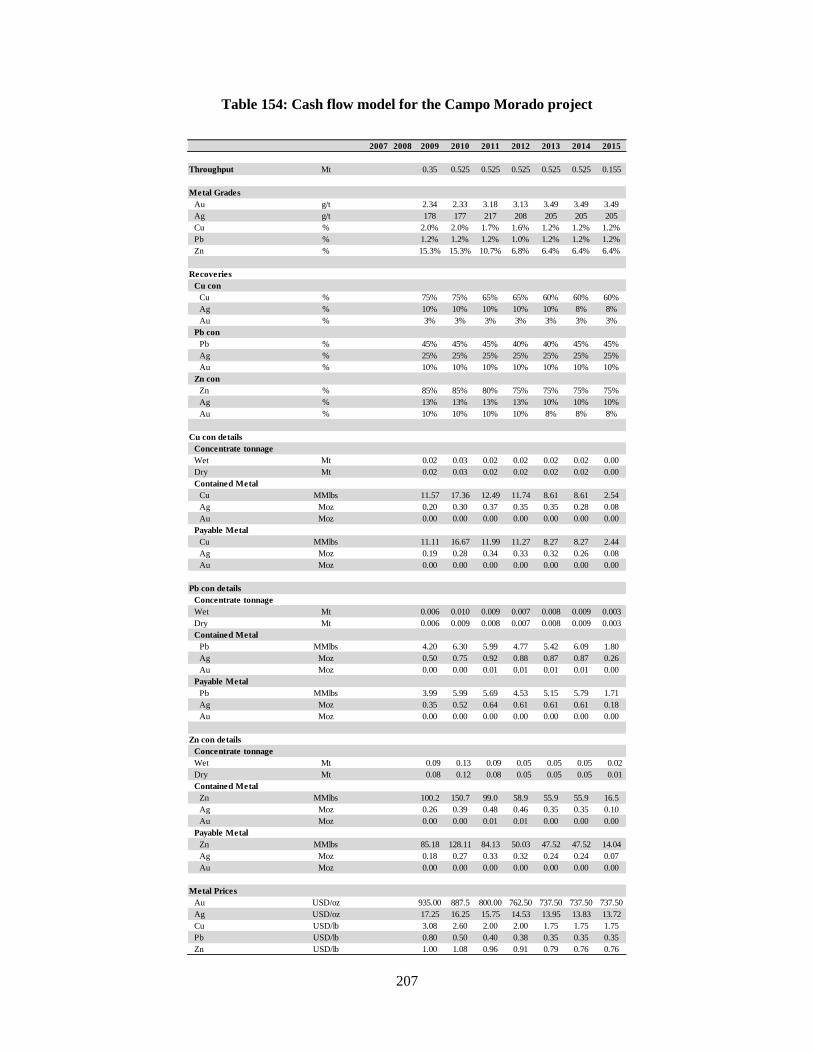
207
Table 154: Cash flow model for the Campo Morado project
2007 2008 2009 2010 2011 2012 2013 2014 2015
Throughput Mt 0.35 0.525 0.525 0.525 0.525 0.525 0.155
Metal Grades
Au g/t 2.34 2.33 3.18 3.13 3.49 3.49 3.49
Ag g/t 178 177 217 208 205 205 205
Cu % 2.0% 2.0% 1.7% 1.6% 1.2% 1.2% 1.2%
Pb % 1.2% 1.2% 1.2% 1.0% 1.2% 1.2% 1.2%
Zn % 15.3% 15.3% 10.7% 6.8% 6.4% 6.4% 6.4%
Recoveries
Cu con
Cu % 75% 75% 65% 65% 60% 60% 60%
Ag % 10% 10% 10% 10% 10% 8% 8%
Au % 3% 3% 3% 3% 3% 3% 3%
Pb con
Pb % 45% 45% 45% 40% 40% 45% 45%
Ag % 25% 25% 25% 25% 25% 25% 25%
Au % 10% 10% 10% 10% 10% 10% 10%
Zn con
Zn % 85% 85% 80% 75% 75% 75% 75%
Ag % 13% 13% 13% 13% 10% 10% 10%
Au % 10% 10% 10% 10% 8% 8% 8%
Cu con details
Concentrate tonnage
Wet Mt 0.02 0.03 0.02 0.02 0.02 0.02 0.00
Dry Mt 0.02 0.03 0.02 0.02 0.02 0.02 0.00
Contained Metal
Cu MMlbs 11.57 17.36 12.49 11.74 8.61 8.61 2.54
Ag Moz 0.20 0.30 0.37 0.35 0.35 0.28 0.08
Au Moz 0.00 0.00 0.00 0.00 0.00 0.00 0.00
Payable Metal
Cu MMlbs 11.11 16.67 11.99 11.27 8.27 8.27 2.44
Ag Moz 0.19 0.28 0.34 0.33 0.32 0.26 0.08
Au Moz 0.00 0.00 0.00 0.00 0.00 0.00 0.00
Pb con details
Concentrate tonnage
Wet Mt 0.006 0.010 0.009 0.007 0.008 0.009 0.003
Dry Mt 0.006 0.009 0.008 0.007 0.008 0.009 0.003
Contained Metal
Pb MMlbs 4.20 6.30 5.99 4.77 5.42 6.09 1.80
Ag Moz 0.50 0.75 0.92 0.88 0.87 0.87 0.26
Au Moz 0.00 0.00 0.01 0.01 0.01 0.01 0.00
Payable Metal
Pb MMlbs 3.99 5.99 5.69 4.53 5.15 5.79 1.71
Ag Moz 0.35 0.52 0.64 0.61 0.61 0.61 0.18
Au Moz 0.00 0.00 0.00 0.00 0.00 0.00 0.00
Zn con details
Concentrate tonnage
Wet Mt 0.09 0.13 0.09 0.05 0.05 0.05 0.02
Dry Mt 0.08 0.12 0.08 0.05 0.05 0.05 0.01
Contained Metal
Zn MMlbs 100.2 150.7 99.0 58.9 55.9 55.9 16.5
Ag Moz 0.26 0.39 0.48 0.46 0.35 0.35 0.10
Au Moz 0.00 0.00 0.01 0.01 0.00 0.00 0.00
Payable Metal
Zn MMlbs 85.18 128.11 84.13 50.03 47.52 47.52 14.04
Ag Moz 0.18 0.27 0.33 0.32 0.24 0.24 0.07
Au Moz 0.00 0.00 0.00 0.00 0.00 0.00 0.00
Metal Prices
Au USD/oz 935.00 887.5 800.00 762.50 737.50 737.50 737.50
Ag USD/oz 17.25 16.25 15.75 14.53 13.95 13.83 13.72
Cu USD/lb 3.08 2.60 2.00 2.00 1.75 1.75 1.75
Pb USD/lb 0.80 0.50 0.40 0.38 0.35 0.35 0.35
Zn USD/lb 1.00 1.08 0.96 0.91 0.79 0.76 0.76
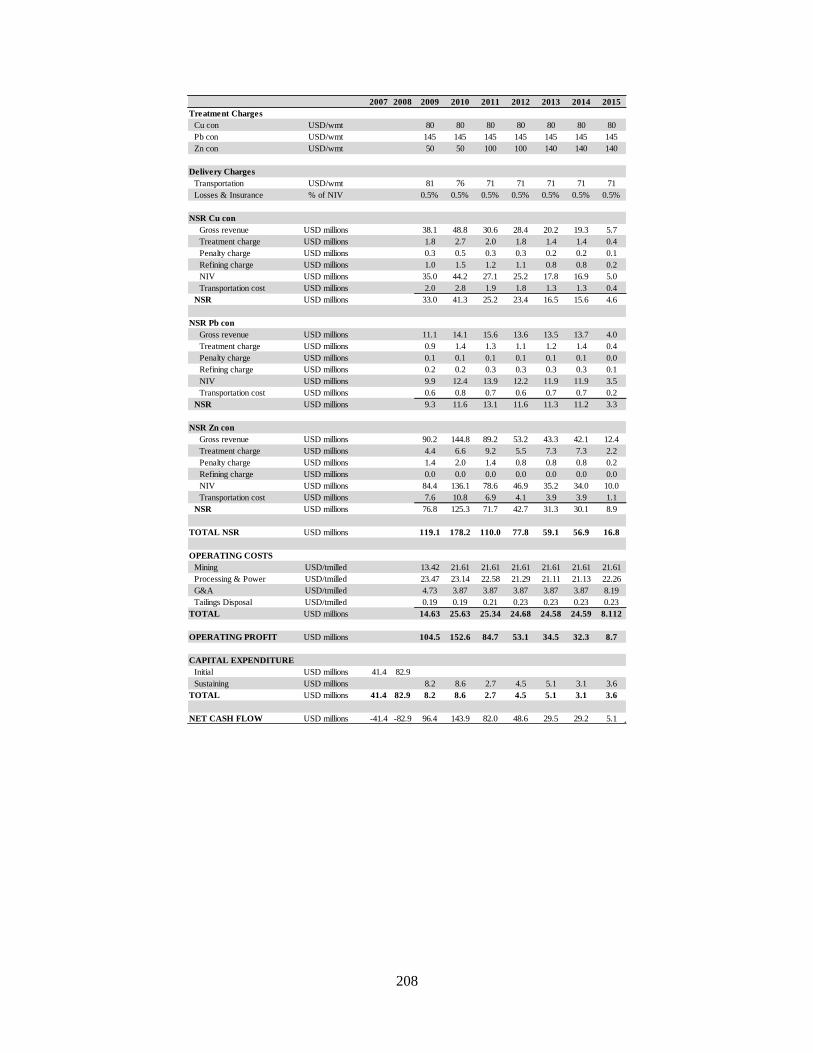
208
2007 2008 2009 2010 2011 2012 2013 2014 2015
Treatment Charges
Cu con USD/wmt 80 80 80 80 80 80 80
Pb con USD/wmt 145 145 145 145 145 145 145
Zn con USD/wmt 50 50 100 100 140 140 140
Delivery Charges
Transportation USD/wmt 81 76 71 71 71 71 71
Losses & Insurance % of NIV 0.5% 0.5% 0.5% 0.5% 0.5% 0.5% 0.5%
NSR Cu con
Gross revenue USD millions 38.1 48.8 30.6 28.4 20.2 19.3 5.7
Treatment charge USD millions 1.8 2.7 2.0 1.8 1.4 1.4 0.4
Penalty charge USD millions 0.3 0.5 0.3 0.3 0.2 0.2 0.1
Refining charge USD millions 1.0 1.5 1.2 1.1 0.8 0.8 0.2
NIV USD millions 35.0 44.2 27.1 25.2 17.8 16.9 5.0
Transportation cost USD millions 2.0 2.8 1.9 1.8 1.3 1.3 0.4
NSR USD millions 33.0 41.3 25.2 23.4 16.5 15.6 4.6
NSR Pb con
Gross revenue USD millions 11.1 14.1 15.6 13.6 13.5 13.7 4.0
Treatment charge USD millions 0.9 1.4 1.3 1.1 1.2 1.4 0.4
Penalty charge USD millions 0.1 0.1 0.1 0.1 0.1 0.1 0.0
Refining charge USD millions 0.2 0.2 0.3 0.3 0.3 0.3 0.1
NIV USD millions 9.9 12.4 13.9 12.2 11.9 11.9 3.5
Transportation cost USD millions 0.6 0.8 0.7 0.6 0.7 0.7 0.2
NSR USD millions 9.3 11.6 13.1 11.6 11.3 11.2 3.3
NSR Zn con
Gross revenue USD millions 90.2 144.8 89.2 53.2 43.3 42.1 12.4
Treatment charge USD millions 4.4 6.6 9.2 5.5 7.3 7.3 2.2
Penalty charge USD millions 1.4 2.0 1.4 0.8 0.8 0.8 0.2
Refining charge USD millions 0.0 0.0 0.0 0.0 0.0 0.0 0.0
NIV USD millions 84.4 136.1 78.6 46.9 35.2 34.0 10.0
Transportation cost USD millions 7.6 10.8 6.9 4.1 3.9 3.9 1.1
NSR USD millions 76.8 125.3 71.7 42.7 31.3 30.1 8.9
TOTAL NSR USD millions 119.1 178.2 110.0 77.8 59.1 56.9 16.8
OPERATING COSTS
Mining USD/tmilled 13.42 21.61 21.61 21.61 21.61 21.61 21.61
Processing & Power USD/tmilled 23.47 23.14 22.58 21.29 21.11 21.13 22.26
G&A USD/tmilled 4.73 3.87 3.87 3.87 3.87 3.87 8.19
Tailings Disposal USD/tmilled 0.19 0.19 0.21 0.23 0.23 0.23 0.23
TOTAL USD millions 14.63 25.63 25.34 24.68 24.58 24.59 8.112
OPERATING PROFIT USD millions 104.5 152.6 84.7 53.1 34.5 32.3 8.7
CAPITAL EXPENDITURE
Initial USD millions 41.4 82.9
Sustaining USD millions 8.2 8.6 2.7 4.5 5.1 3.1 3.6
TOTAL USD millions 41.4 82.9 8.2 8.6 2.7 4.5 5.1 3.1 3.6
NET CASH FLOW USD millions -41.4 -82.9 96.4 143.9 82.0 48.6 29.5 29.2 5.1
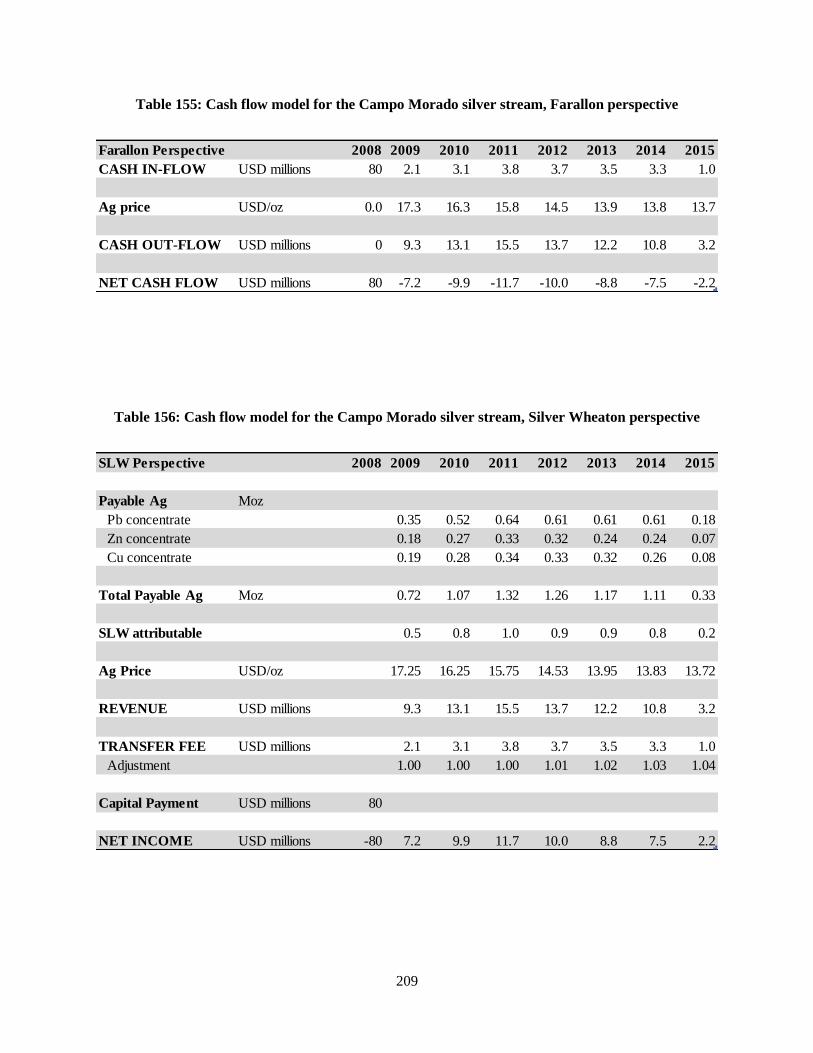
209
Table 155: Cash flow model for the Campo Morado silver stream, Farallon perspective
Table 156: Cash flow model for the Campo Morado silver stream, Silver Wheaton perspective
Farallon Perspective 2008 2009 2010 2011 2012 2013 2014 2015
CASH IN-FLOW USD millions 80 2.1 3.1 3.8 3.7 3.5 3.3 1.0
Ag price USD/oz 0.0 17.3 16.3 15.8 14.5 13.9 13.8 13.7
CASH OUT-FLOW USD millions 0 9.3 13.1 15.5 13.7 12.2 10.8 3.2
NET CASH FLOW USD millions 80 -7.2 -9.9 -11.7 -10.0 -8.8 -7.5 -2.2
SLW Perspective 2008 2009 2010 2011 2012 2013 2014 2015
Payable Ag Moz
Pb concentrate 0.35 0.52 0.64 0.61 0.61 0.61 0.18
Zn concentrate 0.18 0.27 0.33 0.32 0.24 0.24 0.07
Cu concentrate 0.19 0.28 0.34 0.33 0.32 0.26 0.08
Total Payable Ag Moz 0.72 1.07 1.32 1.26 1.17 1.11 0.33
SLW attributable 0.5 0.8 1.0 0.9 0.9 0.8 0.2
Ag Price USD/oz 17.25 16.25 15.75 14.53 13.95 13.83 13.72
REVENUE USD millions 9.3 13.1 15.5 13.7 12.2 10.8 3.2
TRANSFER FEE USD millions 2.1 3.1 3.8 3.7 3.5 3.3 1.0
Adjustment 1.00 1.00 1.00 1.01 1.02 1.03 1.04
Capital Payment USD millions 80
NET INCOME USD millions -80 7.2 9.9 11.7 10.0 8.8 7.5 2.2
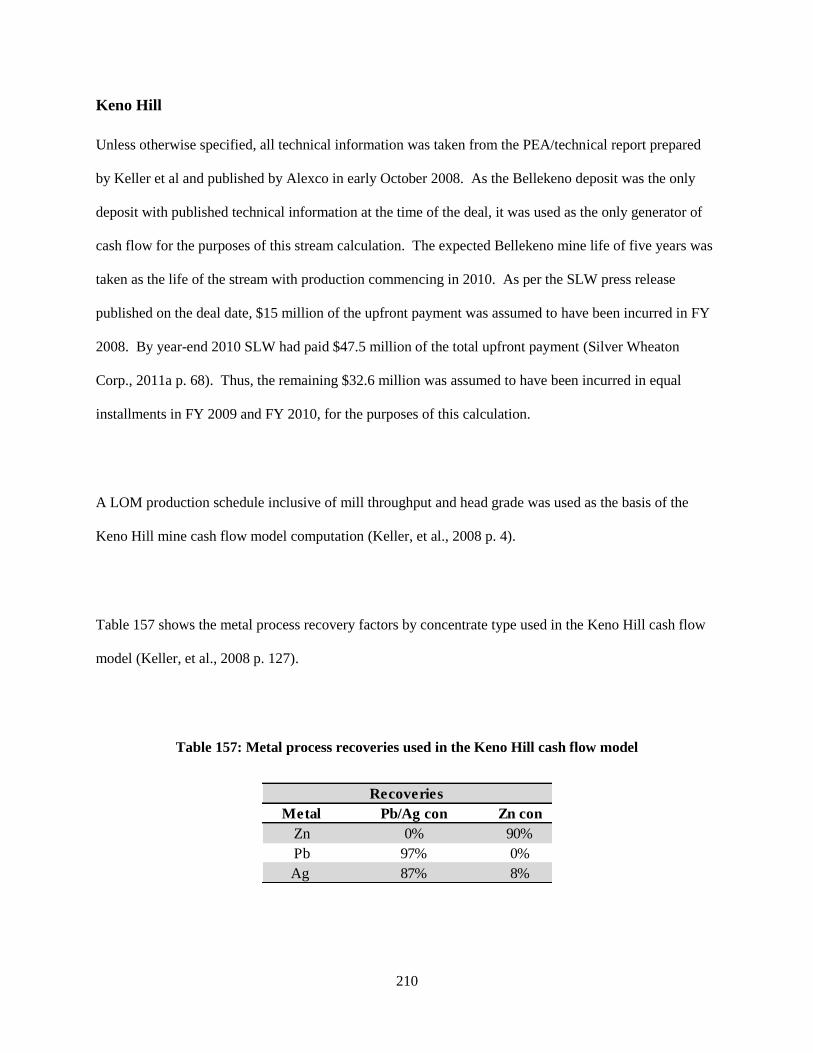
210
Keno Hill
Unless otherwise specified, all technical information was taken from the PEA/technical report prepared
by Keller et al and published by Alexco in early October 2008. As the Bellekeno deposit was the only
deposit with published technical information at the time of the deal, it was used as the only generator of
cash flow for the purposes of this stream calculation. The expected Bellekeno mine life of five years was
taken as the life of the stream with production commencing in 2010. As per the SLW press release
published on the deal date, $15 million of the upfront payment was assumed to have been incurred in FY
2008. By year-end 2010 SLW had paid $47.5 million of the total upfront payment (Silver Wheaton
Corp., 2011a p. 68). Thus, the remaining $32.6 million was assumed to have been incurred in equal
installments in FY 2009 and FY 2010, for the purposes of this calculation.
A LOM production schedule inclusive of mill throughput and head grade was used as the basis of the
Keno Hill mine cash flow model computation (Keller, et al., 2008 p. 4).
Table 157 shows the metal process recovery factors by concentrate type used in the Keno Hill cash flow
model (Keller, et al., 2008 p. 127).
Table 157: Metal process recoveries used in the Keno Hill cash flow model
Metal Pb/Ag con Zn con
Zn 0% 90%
Pb 97% 0%
Ag 87% 8%
Recoveries
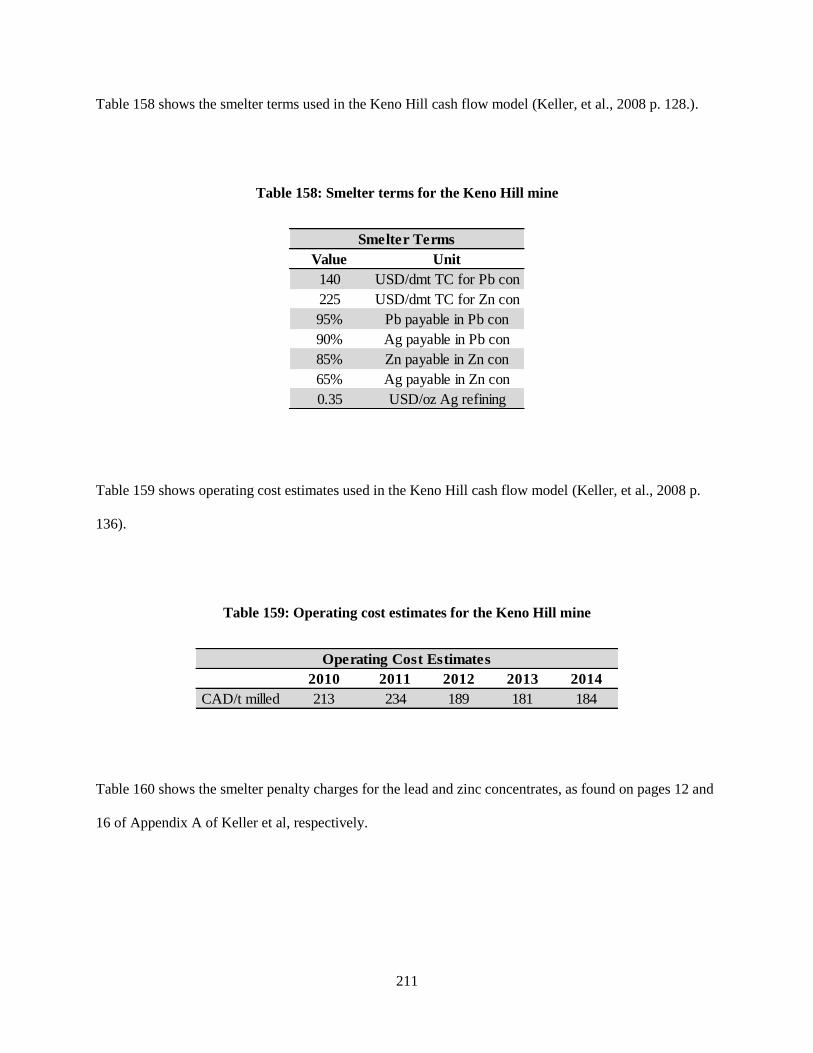
211
Table 158 shows the smelter terms used in the Keno Hill cash flow model (Keller, et al., 2008 p. 128.).
Table 158: Smelter terms for the Keno Hill mine
Table 159 shows operating cost estimates used in the Keno Hill cash flow model (Keller, et al., 2008 p.
136).
Table 159: Operating cost estimates for the Keno Hill mine
Table 160 shows the smelter penalty charges for the lead and zinc concentrates, as found on pages 12 and
16 of Appendix A of Keller et al, respectively.
Value Unit
140 USD/dmt TC for Pb con
225 USD/dmt TC for Zn con
95% Pb payable in Pb con
90% Ag payable in Pb con
85% Zn payable in Zn con
65% Ag payable in Zn con
0.35 USD/oz Ag refining
Smelter Terms
2010 2011 2012 2013 2014
CAD/t milled 213 234 189 181 184
Operating Cost Estimates
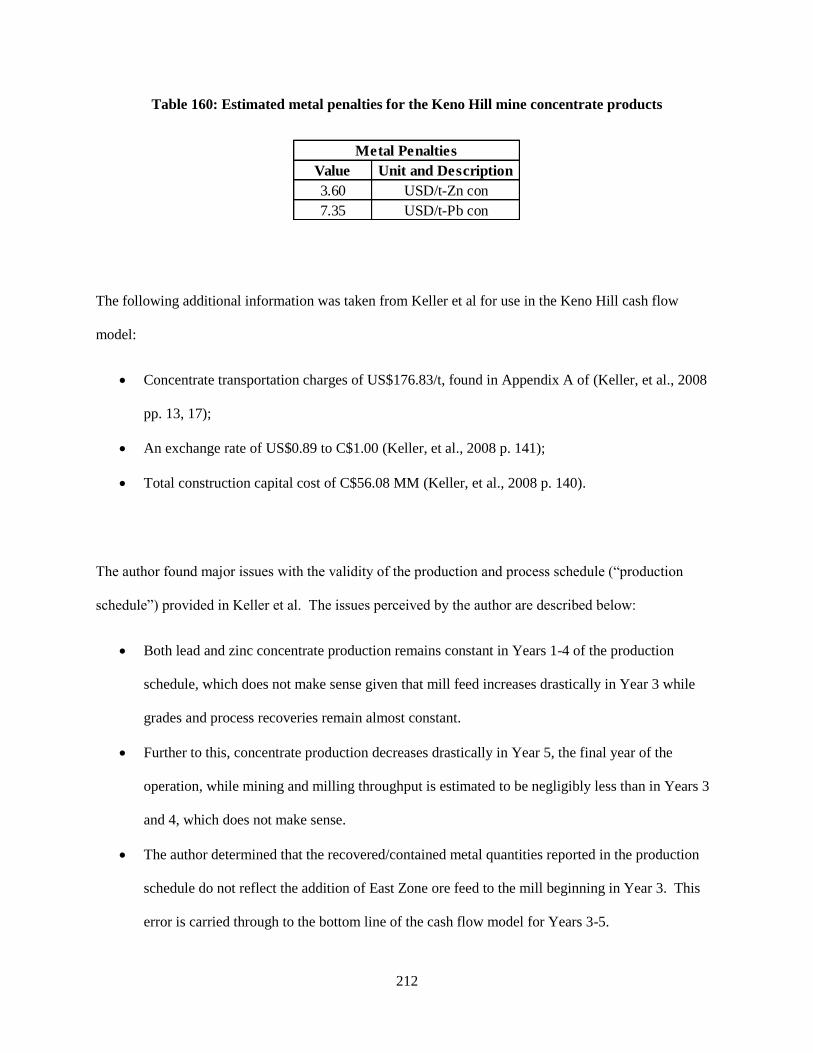
212
Table 160: Estimated metal penalties for the Keno Hill mine concentrate products
The following additional information was taken from Keller et al for use in the Keno Hill cash flow
model:
Concentrate transportation charges of US$176.83/t, found in Appendix A of (Keller, et al., 2008
pp. 13, 17);
An exchange rate of US$0.89 to C$1.00 (Keller, et al., 2008 p. 141);
Total construction capital cost of C$56.08 MM (Keller, et al., 2008 p. 140).
The author found major issues with the validity of the production and process schedule (“production
schedule”) provided in Keller et al. The issues perceived by the author are described below:
Both lead and zinc concentrate production remains constant in Years 1-4 of the production
schedule, which does not make sense given that mill feed increases drastically in Year 3 while
grades and process recoveries remain almost constant.
Further to this, concentrate production decreases drastically in Year 5, the final year of the
operation, while mining and milling throughput is estimated to be negligibly less than in Years 3
and 4, which does not make sense.
The author determined that the recovered/contained metal quantities reported in the production
schedule do not reflect the addition of East Zone ore feed to the mill beginning in Year 3. This
error is carried through to the bottom line of the cash flow model for Years 3-5.
Value Unit and Description
3.60 USD/t-Zn con
7.35 USD/t-Pb con
Metal Penalties
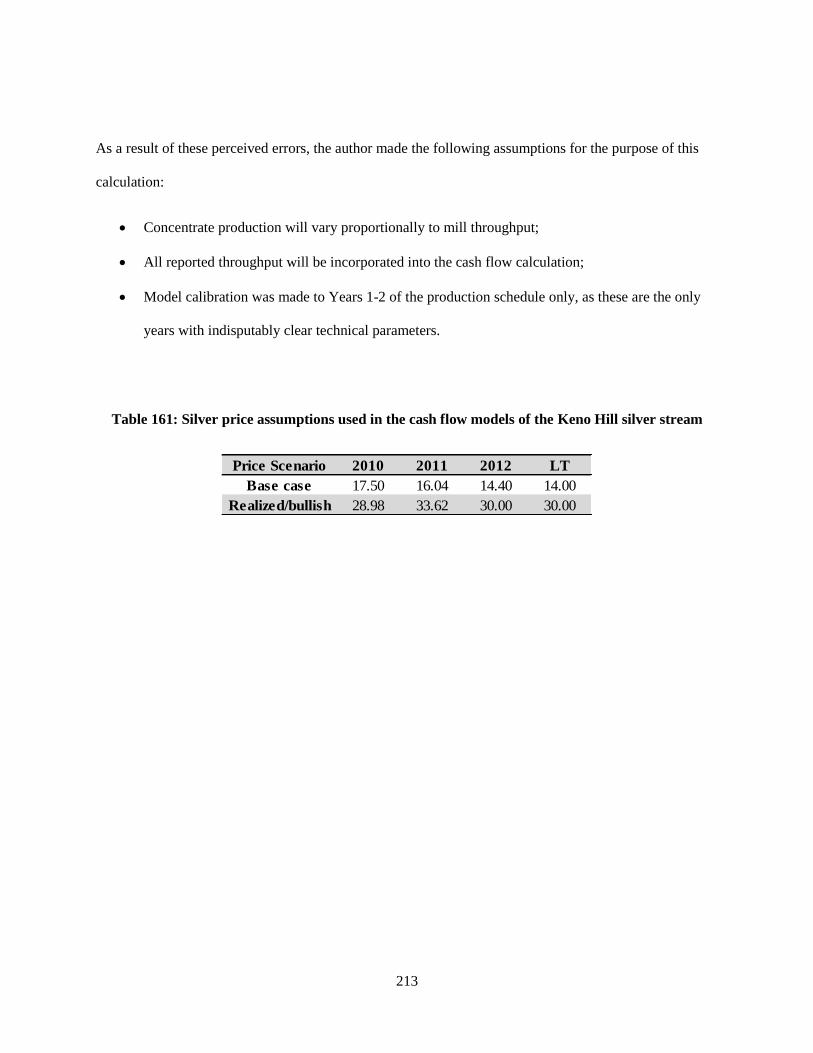
213
As a result of these perceived errors, the author made the following assumptions for the purpose of this
calculation:
Concentrate production will vary proportionally to mill throughput;
All reported throughput will be incorporated into the cash flow calculation;
Model calibration was made to Years 1-2 of the production schedule only, as these are the only
years with indisputably clear technical parameters.
Table 161: Silver price assumptions used in the cash flow models of the Keno Hill silver stream
Price Scenario 2010 2011 2012 LT
Base case 17.50 16.04 14.40 14.00
Realized/bullish 28.98 33.62 30.00 30.00
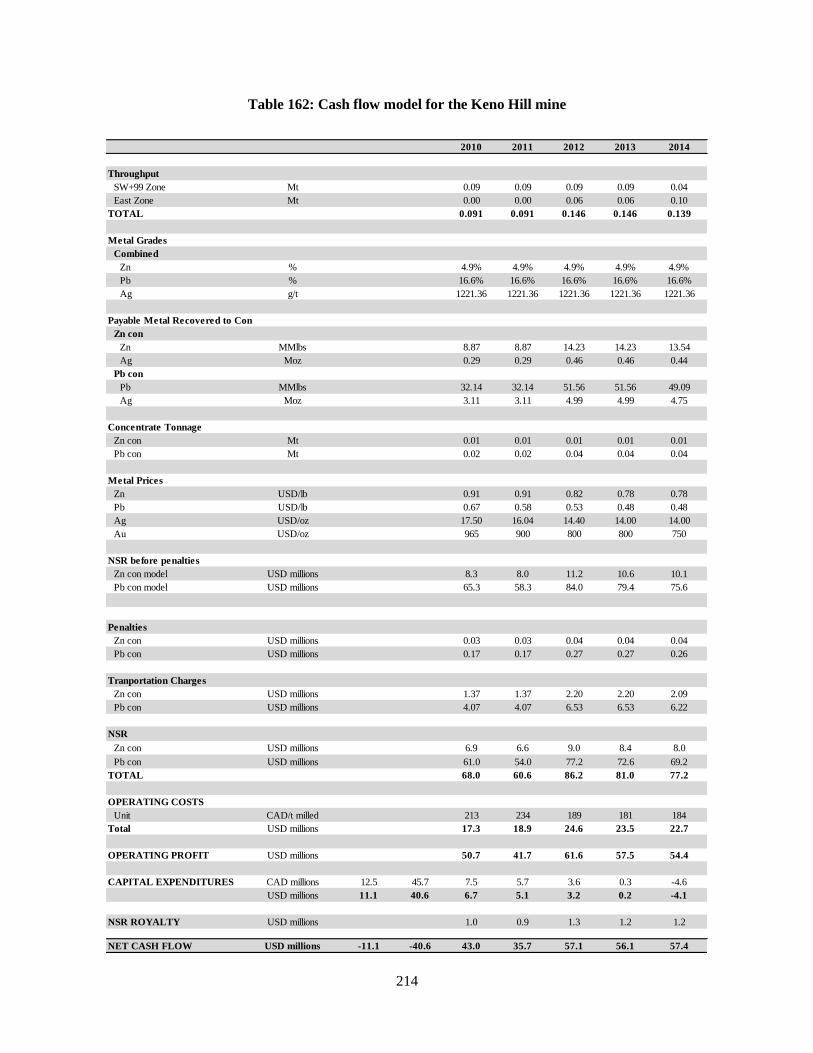
214
Table 162: Cash flow model for the Keno Hill mine
2010 2011 2012 2013 2014
Throughput
SW+99 Zone Mt 0.09 0.09 0.09 0.09 0.04
East Zone Mt 0.00 0.00 0.06 0.06 0.10
TOTAL 0.091 0.091 0.146 0.146 0.139
Metal Grades
Combined
Zn % 4.9% 4.9% 4.9% 4.9% 4.9%
Pb % 16.6% 16.6% 16.6% 16.6% 16.6%
Ag g/t 1221.36 1221.36 1221.36 1221.36 1221.36
Payable Metal Recovered to Con
Zn con
Zn MMlbs 8.87 8.87 14.23 14.23 13.54
Ag Moz 0.29 0.29 0.46 0.46 0.44
Pb con
Pb MMlbs 32.14 32.14 51.56 51.56 49.09
Ag Moz 3.11 3.11 4.99 4.99 4.75
Concentrate Tonnage
Zn con Mt 0.01 0.01 0.01 0.01 0.01
Pb con Mt 0.02 0.02 0.04 0.04 0.04
Metal Prices
Zn USD/lb 0.91 0.91 0.82 0.78 0.78
Pb USD/lb 0.67 0.58 0.53 0.48 0.48
Ag USD/oz 17.50 16.04 14.40 14.00 14.00
Au USD/oz 965 900 800 800 750
NSR before penalties
Zn con model USD millions 8.3 8.0 11.2 10.6 10.1
Pb con model USD millions 65.3 58.3 84.0 79.4 75.6
Penalties
Zn con USD millions 0.03 0.03 0.04 0.04 0.04
Pb con USD millions 0.17 0.17 0.27 0.27 0.26
Tranportation Charges
Zn con USD millions 1.37 1.37 2.20 2.20 2.09
Pb con USD millions 4.07 4.07 6.53 6.53 6.22
NSR
Zn con USD millions 6.9 6.6 9.0 8.4 8.0
Pb con USD millions 61.0 54.0 77.2 72.6 69.2
TOTAL 68.0 60.6 86.2 81.0 77.2
OPERATING COSTS
Unit CAD/t milled 213 234 189 181 184
Total USD millions 17.3 18.9 24.6 23.5 22.7
OPERATING PROFIT USD millions 50.7 41.7 61.6 57.5 54.4
CAPITAL EXPENDITURES CAD millions 12.5 45.7 7.5 5.7 3.6 0.3 -4.6
USD millions 11.1 40.6 6.7 5.1 3.2 0.2 -4.1
NSR ROYALTY USD millions 1.0 0.9 1.3 1.2 1.2
NET CASH FLOW USD millions -11.1 -40.6 43.0 35.7 57.1 56.1 57.4
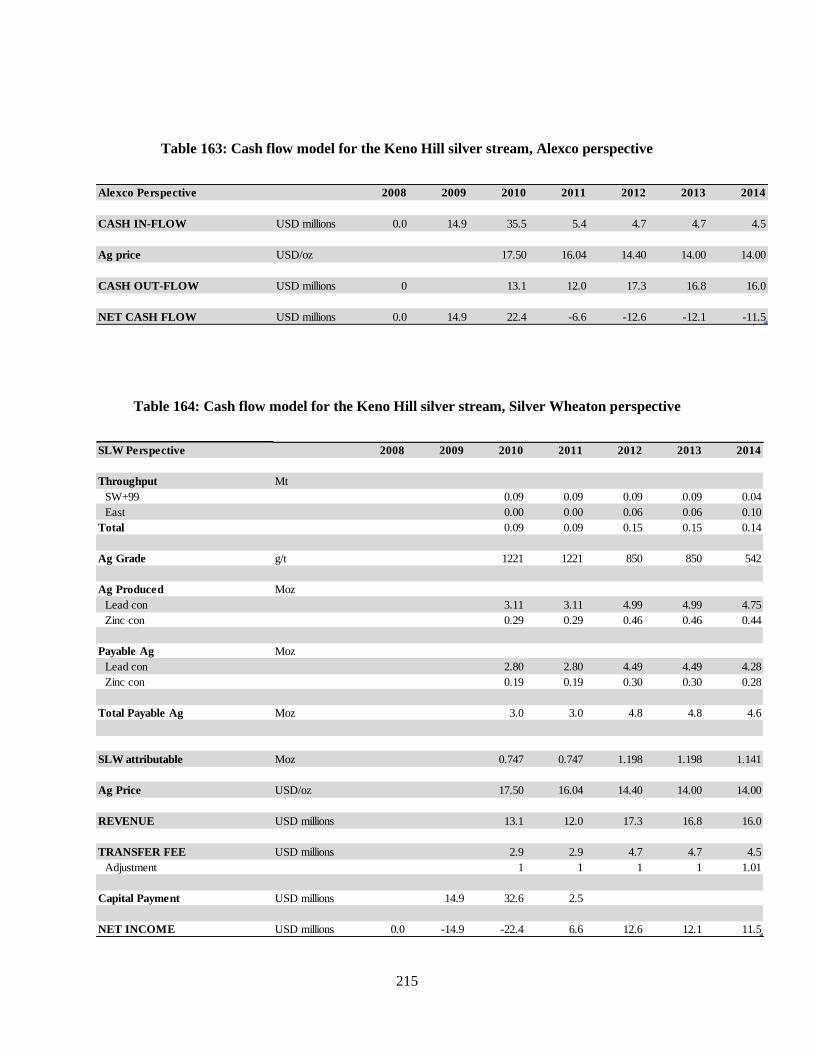
215
Table 163: Cash flow model for the Keno Hill silver stream, Alexco perspective
Table 164: Cash flow model for the Keno Hill silver stream, Silver Wheaton perspective
Alexco Perspective 2008 2009 2010 2011 2012 2013 2014
CASH IN-FLOW USD millions 0.0 14.9 35.5 5.4 4.7 4.7 4.5
Ag price USD/oz 17.50 16.04 14.40 14.00 14.00
CASH OUT-FLOW USD millions 0 13.1 12.0 17.3 16.8 16.0
NET CASH FLOW USD millions 0.0 14.9 22.4 -6.6 -12.6 -12.1 -11.5
SLW Perspective 2008 2009 2010 2011 2012 2013 2014
Throughput Mt
SW+99 0.09 0.09 0.09 0.09 0.04
East 0.00 0.00 0.06 0.06 0.10
Total 0.09 0.09 0.15 0.15 0.14
Ag Grade g/t 1221 1221 850 850 542
Ag Produced Moz
Lead con 3.11 3.11 4.99 4.99 4.75
Zinc con 0.29 0.29 0.46 0.46 0.44
Payable Ag Moz
Lead con 2.80 2.80 4.49 4.49 4.28
Zinc con 0.19 0.19 0.30 0.30 0.28
Total Payable Ag Moz 3.0 3.0 4.8 4.8 4.6
SLW attributable Moz 0.747 0.747 1.198 1.198 1.141
Ag Price USD/oz 17.50 16.04 14.40 14.00 14.00
REVENUE USD millions 13.1 12.0 17.3 16.8 16.0
TRANSFER FEE USD millions 2.9 2.9 4.7 4.7 4.5
Adjustment 1 1 1 1 1.01
Capital Payment USD millions 14.9 32.6 2.5
NET INCOME USD millions 0.0 -14.9 -22.4 6.6 12.6 12.1 11.5
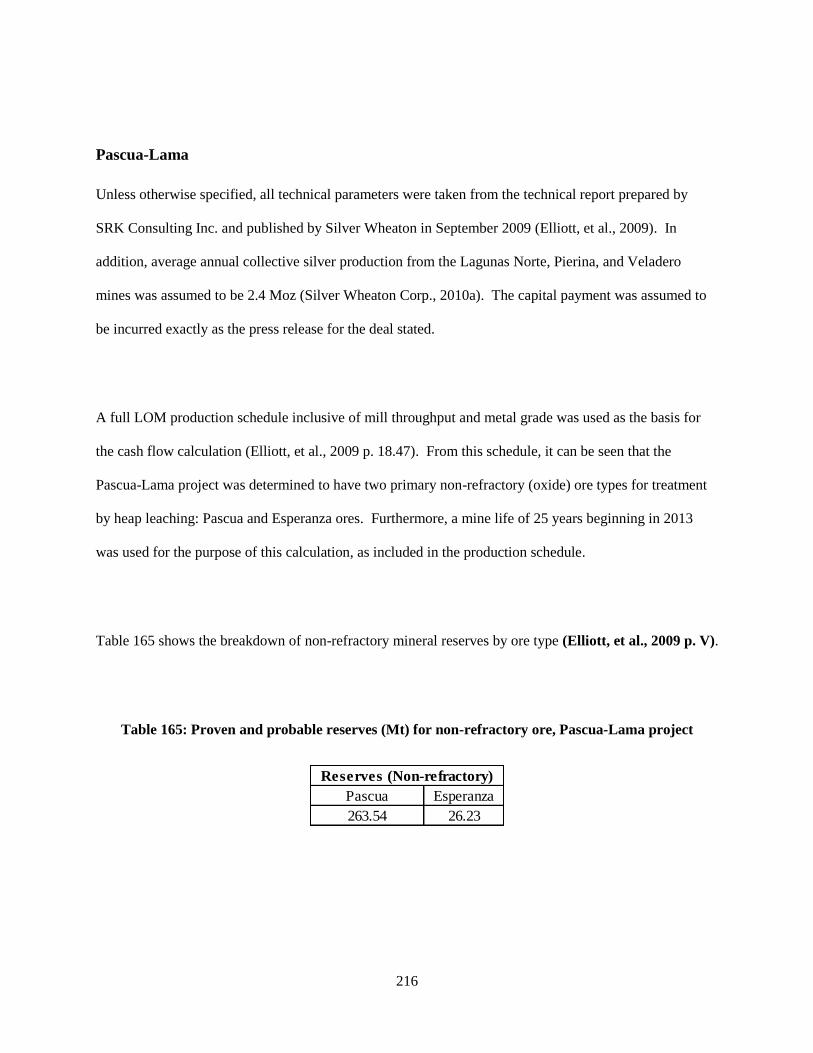
216
Pascua-Lama
Unless otherwise specified, all technical parameters were taken from the technical report prepared by
SRK Consulting Inc. and published by Silver Wheaton in September 2009 (Elliott, et al., 2009). In
addition, average annual collective silver production from the Lagunas Norte, Pierina, and Veladero
mines was assumed to be 2.4 Moz (Silver Wheaton Corp., 2010a). The capital payment was assumed to
be incurred exactly as the press release for the deal stated.
A full LOM production schedule inclusive of mill throughput and metal grade was used as the basis for
the cash flow calculation (Elliott, et al., 2009 p. 18.47). From this schedule, it can be seen that the
Pascua-Lama project was determined to have two primary non-refractory (oxide) ore types for treatment
by heap leaching: Pascua and Esperanza ores. Furthermore, a mine life of 25 years beginning in 2013
was used for the purpose of this calculation, as included in the production schedule.
Table 165 shows the breakdown of non-refractory mineral reserves by ore type (Elliott, et al., 2009 p. V).
Table 165: Proven and probable reserves (Mt) for non-refractory ore, Pascua-Lama project
Pascua Esperanza
263.54 26.23
Reserves (Non-refractory)
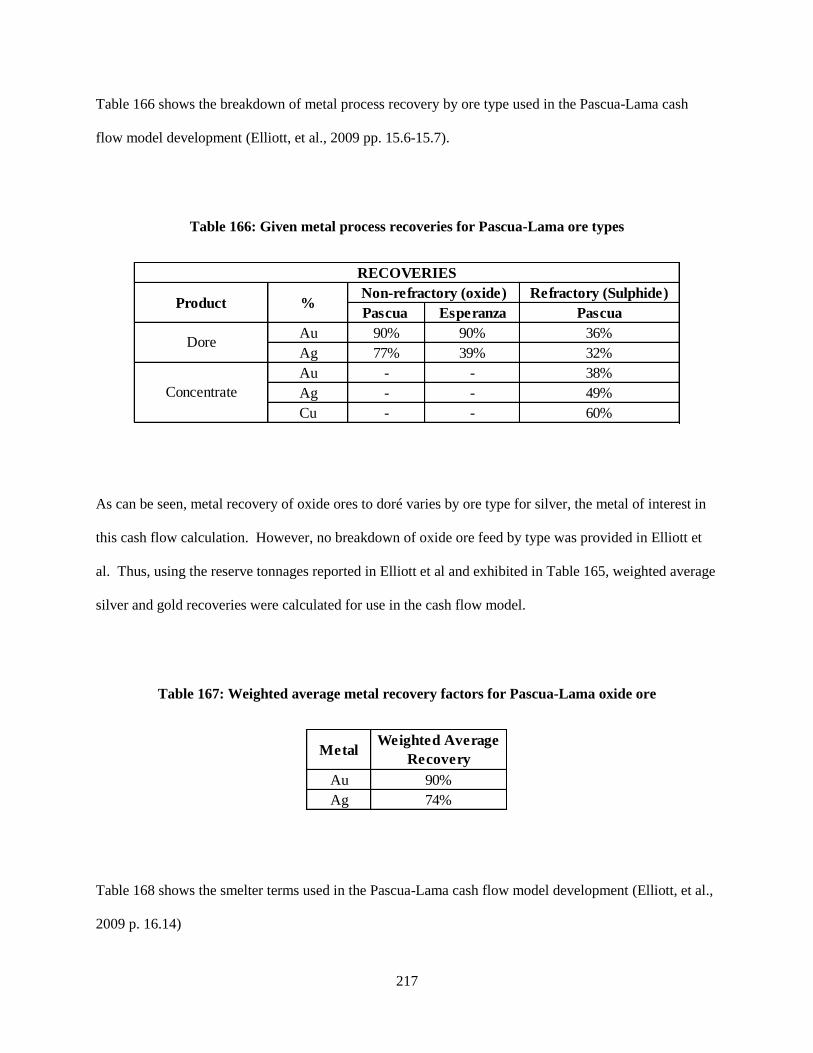
217
Table 166 shows the breakdown of metal process recovery by ore type used in the Pascua-Lama cash
flow model development (Elliott, et al., 2009 pp. 15.6-15.7).
Table 166: Given metal process recoveries for Pascua-Lama ore types
As can be seen, metal recovery of oxide ores to doré varies by ore type for silver, the metal of interest in
this cash flow calculation. However, no breakdown of oxide ore feed by type was provided in Elliott et
al. Thus, using the reserve tonnages reported in Elliott et al and exhibited in Table 165, weighted average
silver and gold recoveries were calculated for use in the cash flow model.
Table 167: Weighted average metal recovery factors for Pascua-Lama oxide ore
Table 168 shows the smelter terms used in the Pascua-Lama cash flow model development (Elliott, et al.,
2009 p. 16.14)
Refractory (Sulphide)
Pascua Esperanza Pascua
Au 90% 90% 36%
Ag 77% 39% 32%
Au - - 38%
Ag - - 49%
Cu - - 60%
Dore
%ProductNon-refractory (oxide)
RECOVERIES
Concentrate
Au 90%
Ag 74%
Weighted Average
RecoveryMetal
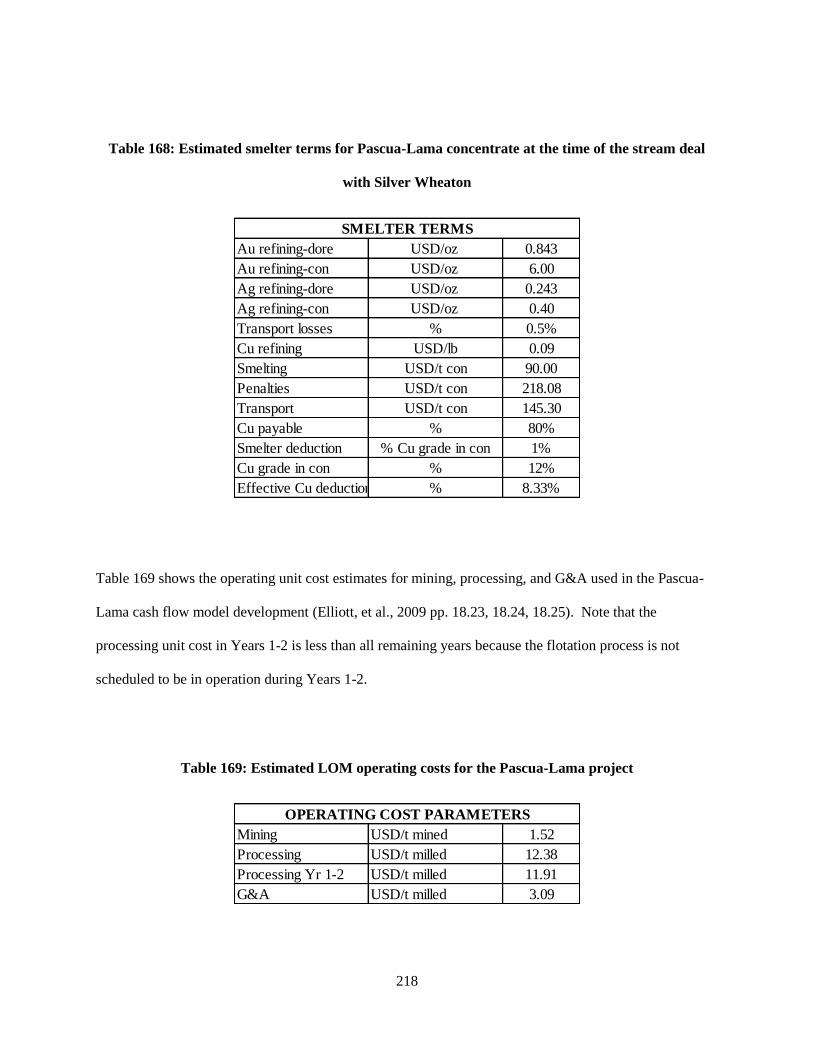
218
Table 168: Estimated smelter terms for Pascua-Lama concentrate at the time of the stream deal
with Silver Wheaton
Table 169 shows the operating unit cost estimates for mining, processing, and G&A used in the Pascua-
Lama cash flow model development (Elliott, et al., 2009 pp. 18.23, 18.24, 18.25). Note that the
processing unit cost in Years 1-2 is less than all remaining years because the flotation process is not
scheduled to be in operation during Years 1-2.
Table 169: Estimated LOM operating costs for the Pascua-Lama project
Au refining-dore USD/oz 0.843
Au refining-con USD/oz 6.00
Ag refining-dore USD/oz 0.243
Ag refining-con USD/oz 0.40
Transport losses % 0.5%
Cu refining USD/lb 0.09
Smelting USD/t con 90.00
Penalties USD/t con 218.08
Transport USD/t con 145.30
Cu payable % 80%
Smelter deduction % Cu grade in con 1%
Cu grade in con % 12%
Effective Cu deduction % 8.33%
SMELTER TERMS
Mining USD/t mined 1.52
Processing USD/t milled 12.38
Processing Yr 1-2 USD/t milled 11.91
G&A USD/t milled 3.09
OPERATING COST PARAMETERS
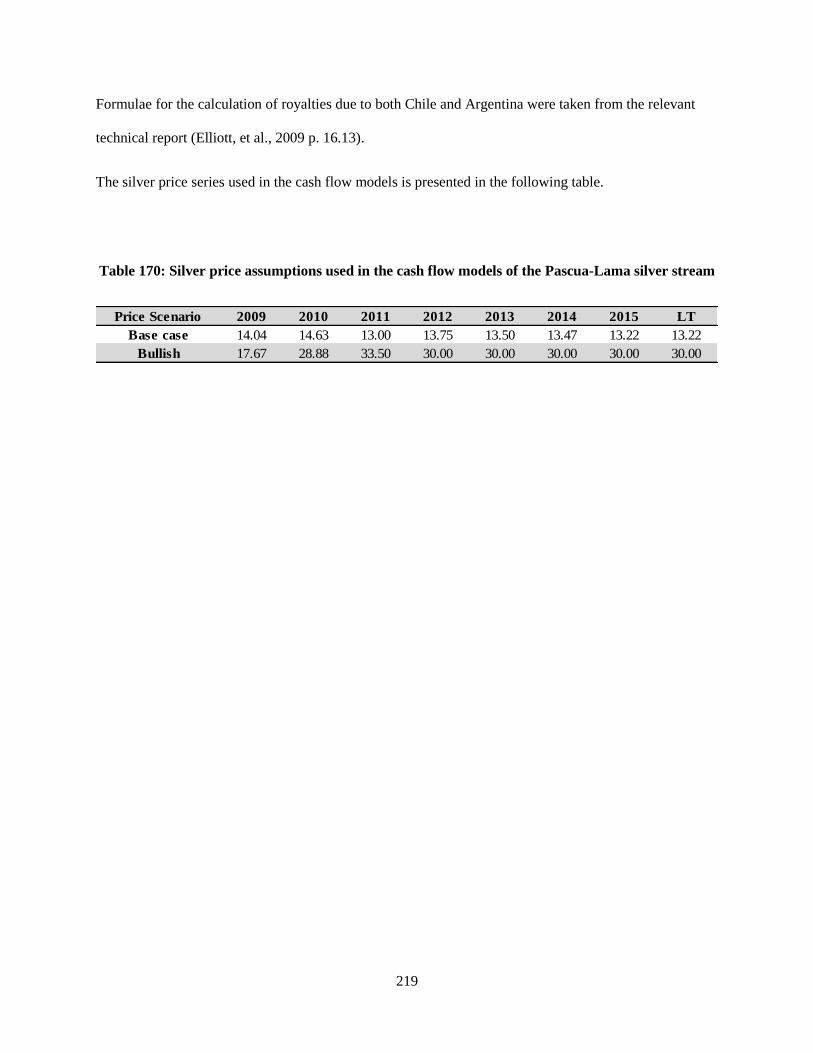
219
Formulae for the calculation of royalties due to both Chile and Argentina were taken from the relevant
technical report (Elliott, et al., 2009 p. 16.13).
The silver price series used in the cash flow models is presented in the following table.
Table 170: Silver price assumptions used in the cash flow models of the Pascua-Lama silver stream
Price Scenario 2009 2010 2011 2012 2013 2014 2015 LT
Base case 14.04 14.63 13.00 13.75 13.50 13.47 13.22 13.22
Bullish 17.67 28.88 33.50 30.00 30.00 30.00 30.00 30.00
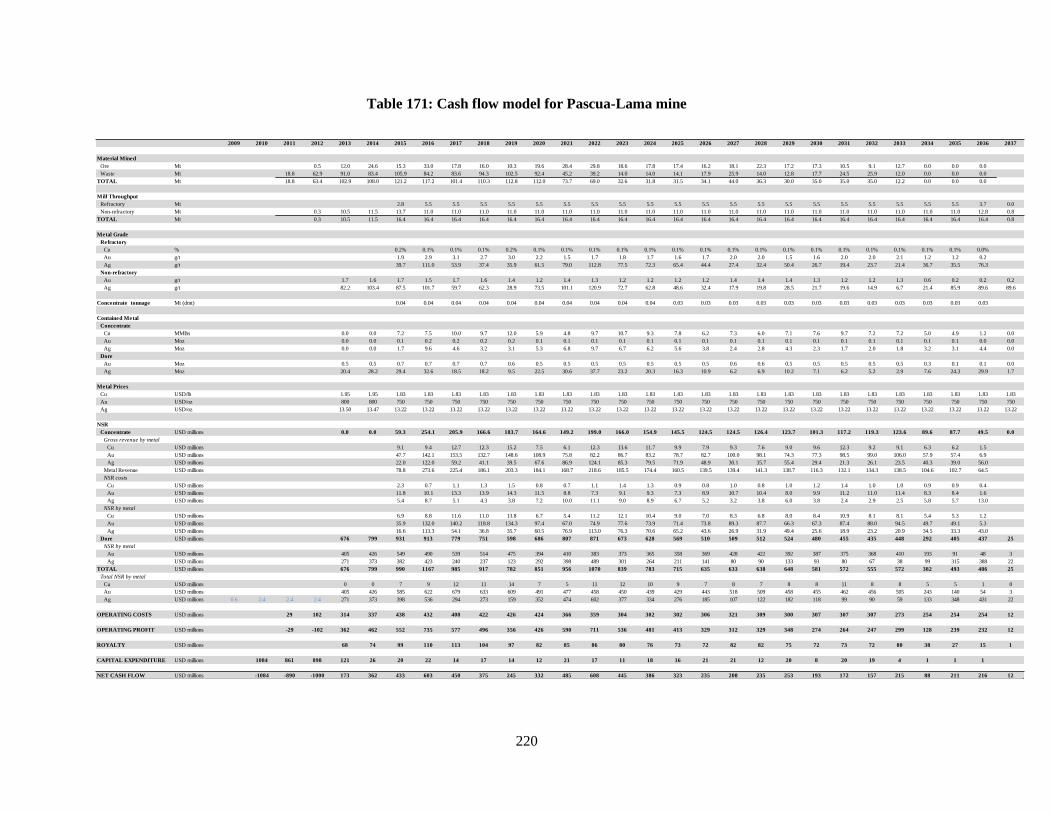
220
Table 171: Cash flow model for Pascua-Lama mine
2009 2010 2011 2012 2013 2014 2015 2016 2017 2018 2019 2020 2021 2022 2023 2024 2025 2026 2027 2028 2029 2030 2031 2032 2033 2034 2035 2036 2037
Material Mined
Ore Mt 0.5 12.0 24.6 15.3 33.0 17.8 16.0 10.3 19.6 28.4 29.8 18.6 17.8 17.4 16.2 18.1 22.3 17.2 17.3 10.5 9.1 12.7 0.0 0.0 0.0
Waste Mt 18.8 62.9 91.0 83.4 105.9 84.2 83.6 94.3 102.5 92.4 45.2 39.2 14.0 14.0 14.1 17.9 25.9 14.0 12.8 17.7 24.5 25.9 12.0 0.0 0.0 0.0
TOTAL Mt 18.8 63.4 102.9 108.0 121.2 117.2 101.4 110.3 112.8 112.0 73.7 69.0 32.6 31.8 31.5 34.1 44.0 36.3 30.0 35.0 35.0 35.0 12.2 0.0 0.0 0.0
Mill Throughput
Refractory Mt 2.8 5.5 5.5 5.5 5.5 5.5 5.5 5.5 5.5 5.5 5.5 5.5 5.5 5.5 5.5 5.5 5.5 5.5 5.5 5.5 5.5 3.7 0.0
Non-refractory Mt 0.3 10.5 11.5 13.7 11.0 11.0 11.0 11.0 11.0 11.0 11.0 11.0 11.0 11.0 11.0 11.0 11.0 11.0 11.0 11.0 11.0 11.0 11.0 11.0 12.8 0.8
TOTAL Mt 0.3 10.5 11.5 16.4 16.4 16.4 16.4 16.4 16.4 16.4 16.4 16.4 16.4 16.4 16.4 16.4 16.4 16.4 16.4 16.4 16.4 16.4 16.4 16.4 16.4 0.8
Metal Grade
Refractory
Cu % 0.2% 0.1% 0.1% 0.1% 0.2% 0.1% 0.1% 0.1% 0.1% 0.1% 0.1% 0.1% 0.1% 0.1% 0.1% 0.1% 0.1% 0.1% 0.1% 0.1% 0.1% 0.0%
Au g/t 1.9 2.9 3.1 2.7 3.0 2.2 1.5 1.7 1.8 1.7 1.6 1.7 2.0 2.0 1.5 1.6 2.0 2.0 2.1 1.2 1.2 0.2
Ag g/t 39.7 111.0 53.9 37.4 35.9 61.5 79.0 112.8 77.5 72.3 65.4 44.4 27.4 32.4 50.4 26.7 19.4 23.7 21.4 36.7 35.5 76.3
Non-refractory
Au g/t 1.7 1.6 1.7 1.5 1.7 1.6 1.4 1.2 1.4 1.3 1.2 1.2 1.2 1.2 1.4 1.4 1.4 1.3 1.2 1.2 1.3 0.6 0.2 0.2 0.2
Ag g/t 82.2 103.4 87.5 101.7 59.7 62.3 28.9 73.5 101.1 120.9 72.7 62.8 48.6 32.4 17.9 19.8 28.5 21.7 19.6 14.9 6.7 21.4 85.9 89.6 89.6
Concentrate tonnage Mt (dmt) 0.04 0.04 0.04 0.04 0.04 0.04 0.04 0.04 0.04 0.04 0.03 0.03 0.03 0.03 0.03 0.03 0.03 0.03 0.03 0.03 0.03 0.03
Contained Metal
Concentrate
Cu MMlbs 0.0 0.0 7.2 7.5 10.0 9.7 12.0 5.9 4.8 9.7 10.7 9.3 7.8 6.2 7.3 6.0 7.1 7.6 9.7 7.2 7.2 5.0 4.9 1.2 0.0
Au Moz 0.0 0.0 0.1 0.2 0.2 0.2 0.2 0.1 0.1 0.1 0.1 0.1 0.1 0.1 0.1 0.1 0.1 0.1 0.1 0.1 0.1 0.1 0.1 0.0 0.0
Ag Moz 0.0 0.0 1.7 9.6 4.6 3.2 3.1 5.3 6.8 9.7 6.7 6.2 5.6 3.8 2.4 2.8 4.3 2.3 1.7 2.0 1.8 3.2 3.1 4.4 0.0
Dore
Au Moz 0.5 0.5 0.7 0.7 0.7 0.7 0.6 0.5 0.5 0.5 0.5 0.5 0.5 0.5 0.6 0.6 0.5 0.5 0.5 0.5 0.5 0.3 0.1 0.1 0.0
Ag Moz 20.4 28.2 29.4 32.6 18.5 18.2 9.5 22.5 30.6 37.7 23.2 20.3 16.3 10.9 6.2 6.9 10.2 7.1 6.2 5.2 2.9 7.6 24.3 29.9 1.7
Metal Prices
Cu USD/lb 1.95 1.95 1.83 1.83 1.83 1.83 1.83 1.83 1.83 1.83 1.83 1.83 1.83 1.83 1.83 1.83 1.83 1.83 1.83 1.83 1.83 1.83 1.83 1.83 1.83
Au USD/oz 800 800 750 750 750 750 750 750 750 750 750 750 750 750 750 750 750 750 750 750 750 750 750 750 750
Ag USD/oz 13.50 13.47 13.22 13.22 13.22 13.22 13.22 13.22 13.22 13.22 13.22 13.22 13.22 13.22 13.22 13.22 13.22 13.22 13.22 13.22 13.22 13.22 13.22 13.22 13.22
NSR
Concentrate USD millions 0.0 0.0 59.3 254.1 205.9 166.6 183.7 164.6 149.2 199.0 166.0 154.9 145.5 124.5 124.5 126.4 123.7 101.3 117.2 119.3 123.6 89.6 87.7 49.5 0.0
Gross revenue by metal
Cu USD millions 9.1 9.4 12.7 12.3 15.2 7.5 6.1 12.3 13.6 11.7 9.9 7.9 9.3 7.6 9.0 9.6 12.3 9.2 9.1 6.3 6.2 1.5
Au USD millions 47.7 142.1 153.5 132.7 148.6 108.9 75.8 82.2 86.7 83.2 78.7 82.7 100.0 98.1 74.3 77.3 98.5 99.0 106.0 57.9 57.4 6.9
Ag USD millions 22.0 122.0 59.2 41.1 39.5 67.6 86.9 124.1 85.3 79.5 71.9 48.9 30.1 35.7 55.4 29.4 21.3 26.1 23.5 40.3 39.0 56.0
Metal Revenue USD millions 78.8 273.6 225.4 186.1 203.3 184.1 168.7 218.6 185.5 174.4 160.5 139.5 139.4 141.3 138.7 116.3 132.1 134.3 138.5 104.6 102.7 64.5
NSR costs
Cu USD millions 2.3 0.7 1.1 1.3 1.5 0.8 0.7 1.1 1.4 1.3 0.9 0.8 1.0 0.8 1.0 1.2 1.4 1.0 1.0 0.9 0.9 0.4
Au USD millions 11.8 10.1 13.3 13.9 14.3 11.5 8.8 7.3 9.1 9.3 7.3 8.9 10.7 10.4 8.0 9.9 11.2 11.0 11.4 8.3 8.4 1.6
Ag USD millions 5.4 8.7 5.1 4.3 3.8 7.2 10.0 11.1 9.0 8.9 6.7 5.2 3.2 3.8 6.0 3.8 2.4 2.9 2.5 5.8 5.7 13.0
NSR by metal
Cu USD millions 6.9 8.8 11.6 11.0 13.8 6.7 5.4 11.2 12.1 10.4 9.0 7.0 8.3 6.8 8.0 8.4 10.9 8.1 8.1 5.4 5.3 1.2
Au USD millions 35.9 132.0 140.2 118.8 134.3 97.4 67.0 74.9 77.6 73.9 71.4 73.8 89.3 87.7 66.3 67.3 87.4 88.0 94.5 49.7 49.1 5.3
Ag USD millions 16.6 113.3 54.1 36.8 35.7 60.5 76.9 113.0 76.3 70.6 65.2 43.6 26.9 31.9 49.4 25.6 18.9 23.2 20.9 34.5 33.3 43.0
Dore USD millions 676 799 931 913 779 751 598 686 807 871 673 628 569 510 509 512 524 480 455 435 448 292 405 437 25
NSR by metal
Au USD millions 405 426 549 490 539 514 475 394 410 383 373 365 358 369 428 422 392 387 375 368 410 193 91 48 3
Ag USD millions 271 373 382 423 240 237 123 292 398 489 301 264 211 141 80 90 133 93 80 67 38 99 315 388 22
TOTAL USD millions 676 799 990 1167 985 917 782 851 956 1070 839 783 715 635 633 638 648 581 572 555 572 382 493 486 25
Total NSR by metal
Cu USD millions 0 0 7 9 12 11 14 7 5 11 12 10 9 7 8 7 8 8 11 8 8 5 5 1 0
Au USD millions 405 426 585 622 679 633 609 491 477 458 450 439 429 443 518 509 458 455 462 456 505 243 140 54 3
Ag USD millions 0.6 2.4 2.4 2.4 271 373 398 536 294 273 159 352 474 602 377 334 276 185 107 122 182 118 99 90 59 133 348 431 22
OPERATING COSTS USD millions 29 102 314 337 438 432 408 422 426 424 366 359 304 302 302 306 321 309 300 307 307 307 273 254 254 254 12
OPERATING PROFIT USD millions -29 -102 362 462 552 735 577 496 356 426 590 711 536 481 413 329 312 329 348 274 264 247 299 128 239 232 12
ROYALTY USD millions 68 74 99 110 113 104 97 82 85 86 80 76 73 72 82 82 75 72 73 72 80 38 27 15 1
CAPITAL EXPENDITURE USD millions 1084 861 898 121 26 20 22 14 17 14 12 21 17 11 18 16 21 21 12 20 8 20 19 4 1 1 1
NET CASH FLOW USD millions -1084 -890 -1000 173 362 433 603 450 375 245 332 485 608 445 386 323 235 208 235 253 193 172 157 215 88 211 216 12

221
Table 172: Cash flow model for Pascua-Lama silver stream, Barrick perspective
Table 173: Cash flow model for Pascua-Lama silver stream, Silver Wheaton perspective
Barrick Perspective 2009 2010 2011 2012 2013 2014 2015 2016 2017 2018 2019 2020 2021 2022 2023 2024 2025 2026 2027 2028 2029 2030 2031 2032 2033 2034 2035 2036 2037
CASH IN-FLOW USD millions 214.8 146.9 146.9 146.9 19.9 27.5 30.4 41.5 23.0 21.6 12.8 28.5 38.7 49.4 31.5 28.2 23.5 15.9 9.3 10.7 16.2 10.6 8.9 8.2 5.5 12.5 32.0 40.5 2.0
Ag price USD/oz 14.04 14.63 13.00 13.75 13.50 13.47 13.22 13.22 13.22 13.22 13.22 13.22 13.22 13.22 13.22 13.22 13.22 13.22 13.22 13.22 13.22 13.22 13.22 13.22 13.22 13.22 13.22 13.22 13.22
CASH OUT-FLOW USD millions 8.4 35.1 31.2 33.0 68.9 94.9 102.9 139.3 76.5 71.0 41.6 91.9 123.8 156.7 98.7 87.8 72.4 48.7 28.3 32.2 48.2 31.2 25.9 23.9 15.8 35.6 90.3 113.5 5.6
NET CASH FLOW USD millions 206.4 111.7 115.7 113.9 -49.0 -67.4 -72.6 -97.8 -53.5 -49.4 -28.9 -63.4 -85.1 -107.2 -67.3 -59.6 -48.9 -32.7 -18.9 -21.5 -32.0 -20.6 -17.0 -15.6 -10.3 -23.1 -58.3 -73.0 -3.6
SLW Perspective 2009 2010 2011 2012 2013 2014 2015 2016 2017 2018 2019 2020 2021 2022 2023 2024 2025 2026 2027 2028 2029 2030 2031 2032 2033 2034 2035 2036 2037
Ag Produced Moz
Concentrate 0.0 0.0 1.7 9.6 4.6 3.2 3.1 5.3 6.8 9.7 6.7 6.2 5.6 3.8 2.4 2.8 4.3 2.3 1.7 2.0 1.8 3.2 3.1 4.4 0.0
Dore 20.4 28.2 29.4 32.6 18.5 18.2 9.5 22.5 30.6 37.7 23.2 20.3 16.3 10.9 6.2 6.9 10.2 7.1 6.2 5.2 2.9 7.6 24.3 29.9 1.7
Total 20.4 28.2 31.1 42.2 23.2 21.5 12.6 27.8 37.5 47.4 29.9 26.6 21.9 14.7 8.6 9.7 14.6 9.4 7.8 7.2 4.8 10.8 27.3 34.3 1.7
SLW attributable Moz 0.6 2.4 2.4 2.4 5.1 7.0 7.8 10.5 5.8 5.4 3.1 7.0 9.4 11.8 7.5 6.6 5.5 3.7 2.1 2.4 3.6 2.4 2.0 1.8 1.2 2.7 6.8 8.6 0.4
Ag Price USD/oz 14.04 14.63 13.00 13.75 13.50 13.47 13.22 13.22 13.22 13.22 13.22 13.22 13.22 13.22 13.22 13.22 13.22 13.22 13.22 13.22 13.22 13.22 13.22 13.22 13.22 13.22 13.22 13.22 13.22
REVENUE USD millions 8.4 35.1 31.2 33.0 68.9 94.9 102.9 139.3 76.5 71.0 41.6 91.9 123.8 156.7 98.7 87.8 72.4 48.7 28.3 32.2 48.2 31.2 25.9 23.9 15.8 35.6 90.3 113.5 5.6
TRANSFER FEE USD millions 2.3 9.4 9.4 9.4 19.9 27.5 30.4 41.5 23.0 21.6 12.8 28.5 38.7 49.4 31.5 28.2 23.5 15.9 9.3 10.7 16.2 10.6 8.9 8.2 5.5 12.5 32.0 40.5 2.0
Adjustment 1.00 1.00 1.00 1.00 1.00 1.00 1.00 1.01 1.02 1.03 1.04 1.05 1.06 1.07 1.08 1.09 1.10 1.11 1.12 1.13 1.14 1.15 1.16 1.17 1.18 1.19 1.20 1.21 1.22
Capital Payment USD millions 212.5 137.5 137.5 137.5
NET INCOME USD millions -206.4 -111.7 -115.7 -113.9 49.0 67.4 72.6 97.8 53.5 49.4 28.9 63.4 85.1 107.2 67.3 59.6 48.9 32.7 18.9 21.5 32.0 20.6 17.0 15.6 10.3 23.1 58.3 73.0 3.6
222
Rosemont
Unless otherwise specified, all technical information was taken from a feasibility study prepared by Huss
of M3 Engineering & Technology Corporation and published by Augusta in early 2009. Therefore, the
capital payment was assumed to have been incurred by Silver Wheaton in FY 2012, prior to the estimated
start date.
A full LOM production schedule inclusive of mill throughput, head grades, and capital cost estimates was
used as the basis for the Rosemont mine cash flow calculation (Huss, Conrad; M3 Engineering &
Technology Corporation, 2009 p. 117). From this production schedule, a mine life of 21 years beginning
in 2013 was taken as the stream life. Although the capital payment was only to be incurred upon receipt
of key permits and a positive construction decision on the part of Augusta, the start year of 2013 indicated
in the aforementioned production schedule would suggest that all of the upfront payment will have been
transferred to Augusta prior to this time.
Table 174 shows the smelter terms used in the Rosemont mine cash flow development (Huss, Conrad; M3
Engineering & Technology Corporation, 2009 p. 108).

223
Table 174: Smelter terms for the Rosemont project
Table 175 shows the operating cost estimates used in the Rosemont mine cash flow development (Huss,
Conrad; M3 Engineering & Technology Corporation, 2009 p. 103).
Table 175: Expected LOM operating costs for the Rosemont project
As well, the following parameters were taken from Huss et al for use in the cash flow model:
A mass recovery factor of 1.83% for the calculation of concentrate tonnage, which was not given
(Huss, Conrad; M3 Engineering & Technology Corporation, 2009 p. 87);
NSR royalty of 3% (Huss, Conrad; M3 Engineering & Technology Corporation, 2009 p. 112);
Treatment charge 50.00 USD/ton
Shipping charge 43.00 USD/ton
Cu payable 96.5% %
Cu refining 0.055 USD/lb
Au payable 90.0% %
Au refining 7.00 USD/oz
Ag payable 90.0% %
Ag refining 0.40 USD/oz
Treatment charge 1.50 USD/lb
SMELTER TERMS
Cu con
Mo con
Mining 0.613 USD/ton mined
Sulphide processing 3.341 USD/ton
Oxide processing 2.061 USD/ton
Supporting-sulphide 0.266 USD/ton
Operating Costs

224
Finally, metal process recovery factors was taken from page 9 of Huss et al for use in the cash flow model
computation.
The gold and silver price series used in the Rosemont cash flow calculation are shown in the following
table.
Table 176: Metal price assumptions used in the Rosemont mine and precious metals stream cash
flow calculations
CommodityPrice
Scenario2013 2014 2015 2016 LT
Silver Base case 15.00 14.00 14.00 14.00 14.00
Silver Bullish 30.00 30.00 30.00 30.00 30.00
Gold Base case 950 900 900 875 875
Gold Bullish 1400 1400 1400 1400 1400
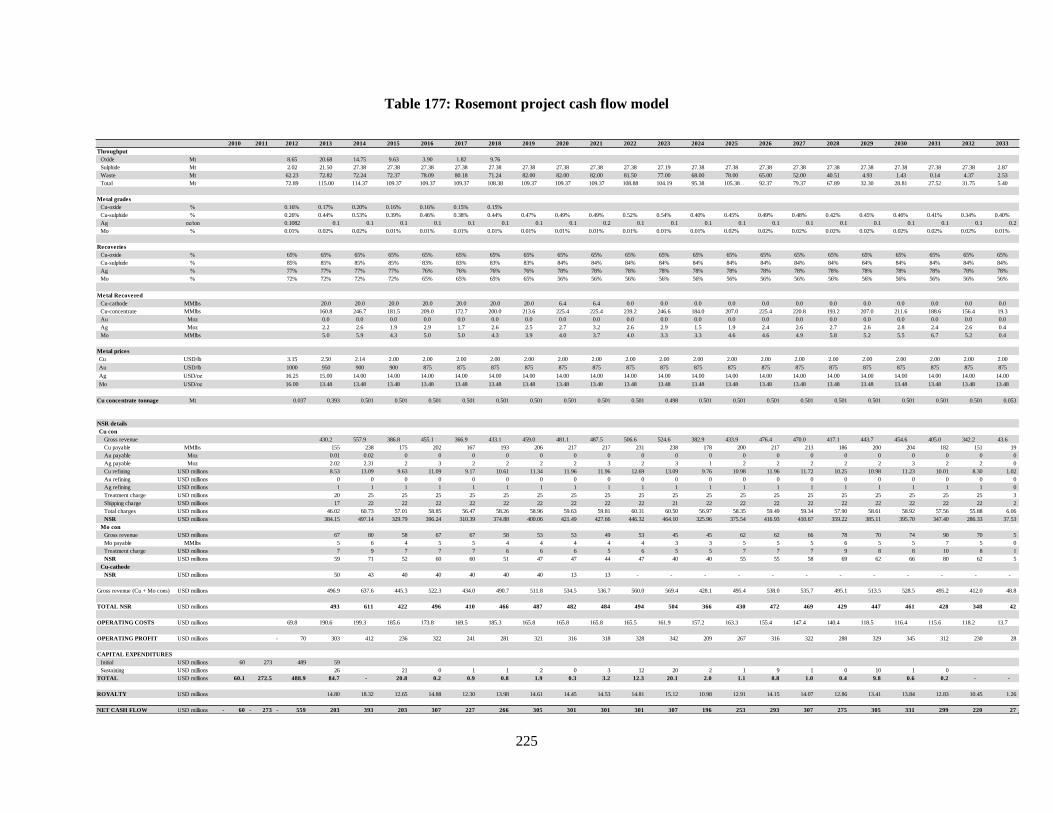
225
Table 177: Rosemont project cash flow model
2010 2011 2012 2013 2014 2015 2016 2017 2018 2019 2020 2021 2022 2023 2024 2025 2026 2027 2028 2029 2030 2031 2032 2033
Throughput
Oxide Mt 8.65 20.68 14.75 9.63 3.90 1.82 9.76
Sulphide Mt 2.02 21.50 27.38 27.38 27.38 27.38 27.38 27.38 27.38 27.38 27.38 27.19 27.38 27.38 27.38 27.38 27.38 27.38 27.38 27.38 27.38 2.87
Waste Mt 62.23 72.82 72.24 72.37 78.09 80.18 71.24 82.00 82.00 82.00 81.50 77.00 68.00 78.00 65.00 52.00 40.51 4.93 1.43 0.14 4.37 2.53
Total Mt 72.89 115.00 114.37 109.37 109.37 109.37 108.38 109.37 109.37 109.37 108.88 104.19 95.38 105.38 92.37 79.37 67.89 32.30 28.81 27.52 31.75 5.40
Metal grades
Cu-oxide % 0.16% 0.17% 0.20% 0.16% 0.16% 0.15% 0.15%
Cu-sulphide % 0.26% 0.44% 0.53% 0.39% 0.46% 0.38% 0.44% 0.47% 0.49% 0.49% 0.52% 0.54% 0.40% 0.45% 0.49% 0.48% 0.42% 0.45% 0.46% 0.41% 0.34% 0.40%
Ag oz/ton 0.1082 0.1 0.1 0.1 0.1 0.1 0.1 0.1 0.1 0.2 0.1 0.1 0.1 0.1 0.1 0.1 0.1 0.1 0.1 0.1 0.1 0.2
Mo % 0.01% 0.02% 0.02% 0.01% 0.01% 0.01% 0.01% 0.01% 0.01% 0.01% 0.01% 0.01% 0.01% 0.02% 0.02% 0.02% 0.02% 0.02% 0.02% 0.02% 0.02% 0.01%
Recoveries
Cu-oxide % 65% 65% 65% 65% 65% 65% 65% 65% 65% 65% 65% 65% 65% 65% 65% 65% 65% 65% 65% 65% 65% 65%
Cu-sulphide % 85% 85% 85% 85% 83% 83% 83% 83% 84% 84% 84% 84% 84% 84% 84% 84% 84% 84% 84% 84% 84% 84%
Ag % 77% 77% 77% 77% 76% 76% 76% 76% 78% 78% 78% 78% 78% 78% 78% 78% 78% 78% 78% 78% 78% 78%
Mo % 72% 72% 72% 72% 65% 65% 65% 65% 56% 56% 56% 56% 56% 56% 56% 56% 56% 56% 56% 56% 56% 56%
Metal Recovered
Cu-cathode MMlbs 20.0 20.0 20.0 20.0 20.0 20.0 20.0 6.4 6.4 0.0 0.0 0.0 0.0 0.0 0.0 0.0 0.0 0.0 0.0 0.0 0.0
Cu-concentrate MMlbs 160.8 246.7 181.5 209.0 172.7 200.0 213.6 225.4 225.4 239.2 246.6 184.0 207.0 225.4 220.8 193.2 207.0 211.6 188.6 156.4 19.3
Au Moz 0.0 0.0 0.0 0.0 0.0 0.0 0.0 0.0 0.0 0.0 0.0 0.0 0.0 0.0 0.0 0.0 0.0 0.0 0.0 0.0 0.0
Ag Moz 2.2 2.6 1.9 2.9 1.7 2.6 2.5 2.7 3.2 2.6 2.9 1.5 1.9 2.4 2.6 2.7 2.6 2.8 2.4 2.6 0.4
Mo MMlbs 5.0 5.9 4.3 5.0 5.0 4.3 3.9 4.0 3.7 4.0 3.3 3.3 4.6 4.6 4.9 5.8 5.2 5.5 6.7 5.2 0.4
Metal prices
Cu USD/lb 3.15 2.50 2.14 2.00 2.00 2.00 2.00 2.00 2.00 2.00 2.00 2.00 2.00 2.00 2.00 2.00 2.00 2.00 2.00 2.00 2.00 2.00
Au USD/lb 1000 950 900 900 875 875 875 875 875 875 875 875 875 875 875 875 875 875 875 875 875 875
Ag USD/oz 16.25 15.00 14.00 14.00 14.00 14.00 14.00 14.00 14.00 14.00 14.00 14.00 14.00 14.00 14.00 14.00 14.00 14.00 14.00 14.00 14.00 14.00
Mo USD/oz 16.00 13.48 13.48 13.48 13.48 13.48 13.48 13.48 13.48 13.48 13.48 13.48 13.48 13.48 13.48 13.48 13.48 13.48 13.48 13.48 13.48 13.48
Cu concentrate tonnage Mt 0.037 0.393 0.501 0.501 0.501 0.501 0.501 0.501 0.501 0.501 0.501 0.498 0.501 0.501 0.501 0.501 0.501 0.501 0.501 0.501 0.501 0.053
NSR details
Cu con
Gross revenue 430.2 557.9 386.8 455.1 366.9 433.1 459.0 481.1 487.5 506.6 524.6 382.9 433.9 476.4 470.0 417.1 443.7 454.6 405.0 342.2 43.6
Cu payable MMlbs 155 238 175 202 167 193 206 217 217 231 238 178 200 217 213 186 200 204 182 151 19
Au payable Moz 0.01 0.02 0 0 0 0 0 0 0 0 0 0 0 0 0 0 0 0 0 0 0
Ag payable Moz 2.02 2.31 2 3 2 2 2 2 3 2 3 1 2 2 2 2 2 3 2 2 0
Cu refining USD millions 8.53 13.09 9.63 11.09 9.17 10.61 11.34 11.96 11.96 12.69 13.09 9.76 10.98 11.96 11.72 10.25 10.98 11.23 10.01 8.30 1.02
Au refining USD millions 0 0 0 0 0 0 0 0 0 0 0 0 0 0 0 0 0 0 0 0 0
Ag refining USD millions 1 1 1 1 1 1 1 1 1 1 1 1 1 1 1 1 1 1 1 1 0
Treatment charge USD millions 20 25 25 25 25 25 25 25 25 25 25 25 25 25 25 25 25 25 25 25 3
Shipping charge USD millions 17 22 22 22 22 22 22 22 22 22 21 22 22 22 22 22 22 22 22 22 2
Total charges USD millions 46.02 60.73 57.01 58.85 56.47 58.26 58.96 59.63 59.81 60.31 60.50 56.97 58.35 59.49 59.34 57.90 58.61 58.92 57.56 55.88 6.06
NSR USD millions 384.15 497.14 329.79 396.24 310.39 374.88 400.06 421.49 427.66 446.32 464.10 325.96 375.54 416.93 410.67 359.22 385.11 395.70 347.40 286.33 37.53
Mo con
Gross revenue USD millions 67 80 58 67 67 58 53 53 49 53 45 45 62 62 66 78 70 74 90 70 5
Mo payable MMlbs 5 6 4 5 5 4 4 4 4 4 3 3 5 5 5 6 5 5 7 5 0
Treatment charge USD millions 7 9 7 7 7 6 6 6 5 6 5 5 7 7 7 9 8 8 10 8 1
NSR USD millions 59 71 52 60 60 51 47 47 44 47 40 40 55 55 58 69 62 66 80 62 5
Cu-cathode
NSR USD millions 50 43 40 40 40 40 40 13 13 - - - - - - - - - - - -
Gross revenue (Cu + Mo cons) USD millions 496.9 637.6 445.3 522.3 434.0 490.7 511.8 534.5 536.7 560.0 569.4 428.1 495.4 538.0 535.7 495.1 513.5 528.5 495.2 412.0 48.8
TOTAL NSR USD millions 493 611 422 496 410 466 487 482 484 494 504 366 430 472 469 429 447 461 428 348 42
OPERATING COSTS USD millions 69.8 190.6 199.3 185.6 173.8 169.5 185.3 165.8 165.8 165.8 165.5 161.9 157.2 163.3 155.4 147.4 140.4 118.5 116.4 115.6 118.2 13.7
OPERATING PROFIT USD millions 70- 303 412 236 322 241 281 321 316 318 328 342 209 267 316 322 288 329 345 312 230 28
CAPITAL EXPENDITURES
Initial USD millions 60 273 489 59
Sustaining USD millions 26 21 0 1 1 2 0 3 12 20 2 1 9 1 0 10 1 0
TOTAL USD millions 60.1 272.5 488.9 84.7 - 20.8 0.2 0.9 0.8 1.9 0.3 3.2 12.3 20.1 2.0 1.1 8.8 1.0 0.4 9.8 0.6 0.2 - -
ROYALTY USD millions 14.80 18.32 12.65 14.88 12.30 13.98 14.61 14.45 14.53 14.81 15.12 10.98 12.91 14.15 14.07 12.86 13.41 13.84 12.83 10.45 1.26
NET CASH FLOW USD millions 60- 273- 559- 203 393 203 307 227 266 305 301 301 301 307 196 253 293 307 275 305 331 299 220 27
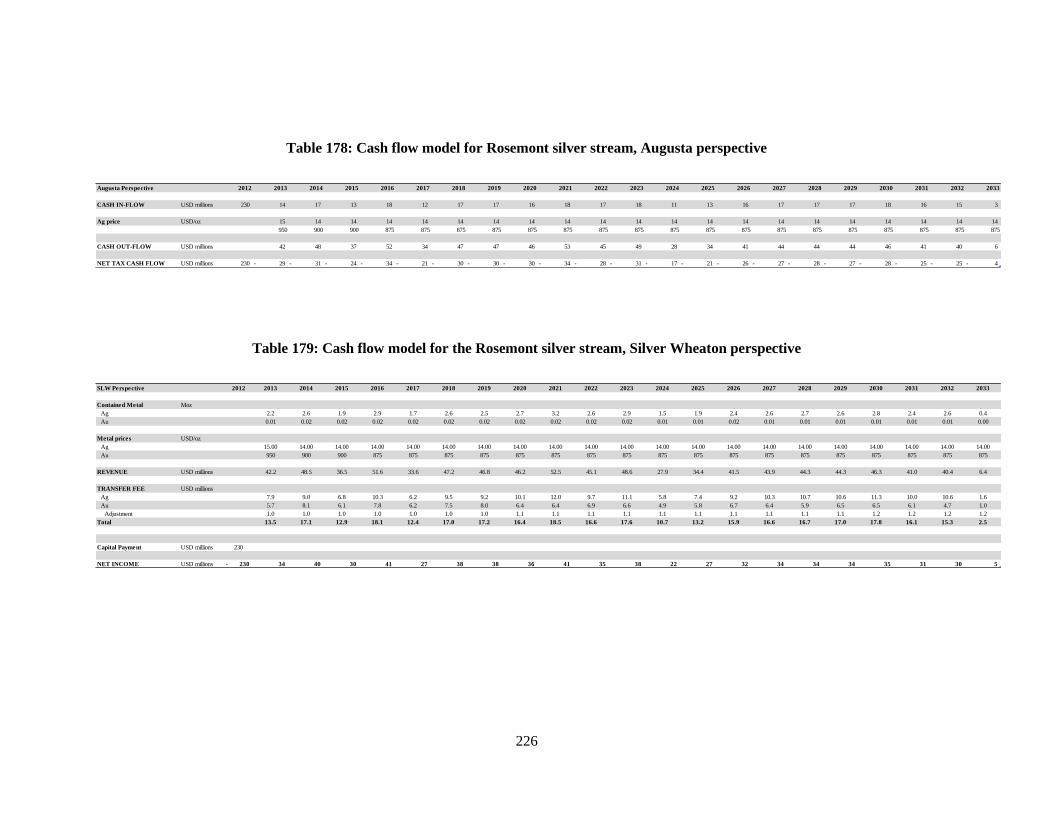
226
Table 178: Cash flow model for Rosemont silver stream, Augusta perspective
Table 179: Cash flow model for the Rosemont silver stream, Silver Wheaton perspective
Augusta Perspective 2012 2013 2014 2015 2016 2017 2018 2019 2020 2021 2022 2023 2024 2025 2026 2027 2028 2029 2030 2031 2032 2033
CASH IN-FLOW USD millions 230 14 17 13 18 12 17 17 16 18 17 18 11 13 16 17 17 17 18 16 15 3
Ag price USD/oz 15 14 14 14 14 14 14 14 14 14 14 14 14 14 14 14 14 14 14 14 14
950 900 900 875 875 875 875 875 875 875 875 875 875 875 875 875 875 875 875 875 875
CASH OUT-FLOW USD millions 42 48 37 52 34 47 47 46 53 45 49 28 34 41 44 44 44 46 41 40 6
NET TAX CASH FLOW USD millions 230 29- 31- 24- 34- 21- 30- 30- 30- 34- 28- 31- 17- 21- 26- 27- 28- 27- 28- 25- 25- 4-
SLW Perspective 2012 2013 2014 2015 2016 2017 2018 2019 2020 2021 2022 2023 2024 2025 2026 2027 2028 2029 2030 2031 2032 2033
Contained Metal Moz
Ag 2.2 2.6 1.9 2.9 1.7 2.6 2.5 2.7 3.2 2.6 2.9 1.5 1.9 2.4 2.6 2.7 2.6 2.8 2.4 2.6 0.4
Au 0.01 0.02 0.02 0.02 0.02 0.02 0.02 0.02 0.02 0.02 0.02 0.01 0.01 0.02 0.01 0.01 0.01 0.01 0.01 0.01 0.00
Metal prices USD/oz
Ag 15.00 14.00 14.00 14.00 14.00 14.00 14.00 14.00 14.00 14.00 14.00 14.00 14.00 14.00 14.00 14.00 14.00 14.00 14.00 14.00 14.00
Au 950 900 900 875 875 875 875 875 875 875 875 875 875 875 875 875 875 875 875 875 875
REVENUE USD millions 42.2 48.5 36.5 51.6 33.6 47.2 46.8 46.2 52.5 45.1 48.6 27.9 34.4 41.5 43.9 44.3 44.3 46.3 41.0 40.4 6.4
TRANSFER FEE USD millions
Ag 7.9 9.0 6.8 10.3 6.2 9.5 9.2 10.1 12.0 9.7 11.1 5.8 7.4 9.2 10.3 10.7 10.6 11.3 10.0 10.6 1.6
Au 5.7 8.1 6.1 7.8 6.2 7.5 8.0 6.4 6.4 6.9 6.6 4.9 5.8 6.7 6.4 5.9 6.5 6.5 6.1 4.7 1.0
Adjustment 1.0 1.0 1.0 1.0 1.0 1.0 1.0 1.1 1.1 1.1 1.1 1.1 1.1 1.1 1.1 1.1 1.1 1.2 1.2 1.2 1.2
Total 13.5 17.1 12.9 18.1 12.4 17.0 17.2 16.4 18.5 16.6 17.6 10.7 13.2 15.9 16.6 16.7 17.0 17.8 16.1 15.3 2.5
Capital Payment USD millions 230
NET INCOME USD millions 230- 34 40 30 41 27 38 38 36 41 35 38 22 27 32 34 34 34 35 31 30 5
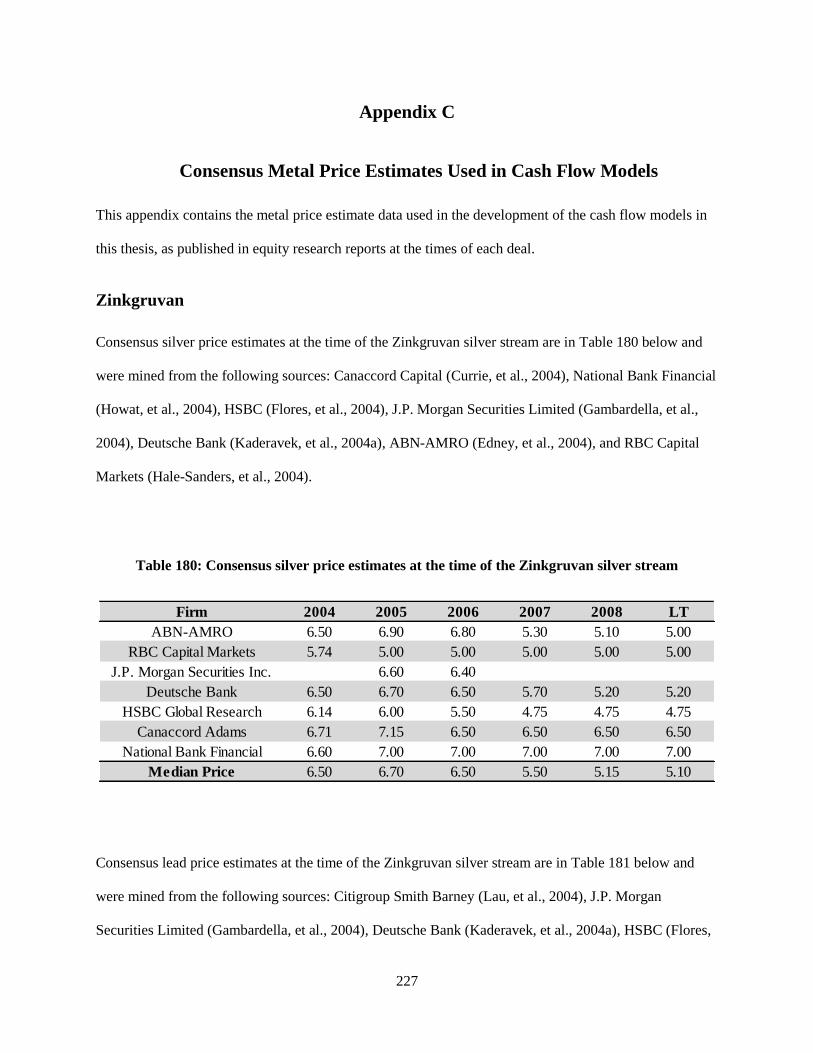
227
Appendix C
Consensus Metal Price Estimates Used in Cash Flow Models
This appendix contains the metal price estimate data used in the development of the cash flow models in
this thesis, as published in equity research reports at the times of each deal.
Zinkgruvan
Consensus silver price estimates at the time of the Zinkgruvan silver stream are in Table 180 below and
were mined from the following sources: Canaccord Capital (Currie, et al., 2004), National Bank Financial
(Howat, et al., 2004), HSBC (Flores, et al., 2004), J.P. Morgan Securities Limited (Gambardella, et al.,
2004), Deutsche Bank (Kaderavek, et al., 2004a), ABN-AMRO (Edney, et al., 2004), and RBC Capital
Markets (Hale-Sanders, et al., 2004).
Table 180: Consensus silver price estimates at the time of the Zinkgruvan silver stream
Consensus lead price estimates at the time of the Zinkgruvan silver stream are in Table 181 below and
were mined from the following sources: Citigroup Smith Barney (Lau, et al., 2004), J.P. Morgan
Securities Limited (Gambardella, et al., 2004), Deutsche Bank (Kaderavek, et al., 2004a), HSBC (Flores,
Firm 2004 2005 2006 2007 2008 LT
ABN-AMRO 6.50 6.90 6.80 5.30 5.10 5.00
RBC Capital Markets 5.74 5.00 5.00 5.00 5.00 5.00
J.P. Morgan Securities Inc. 6.60 6.40
Deutsche Bank 6.50 6.70 6.50 5.70 5.20 5.20
HSBC Global Research 6.14 6.00 5.50 4.75 4.75 4.75
Canaccord Adams 6.71 7.15 6.50 6.50 6.50 6.50
National Bank Financial 6.60 7.00 7.00 7.00 7.00 7.00
Median Price 6.50 6.70 6.50 5.50 5.15 5.10
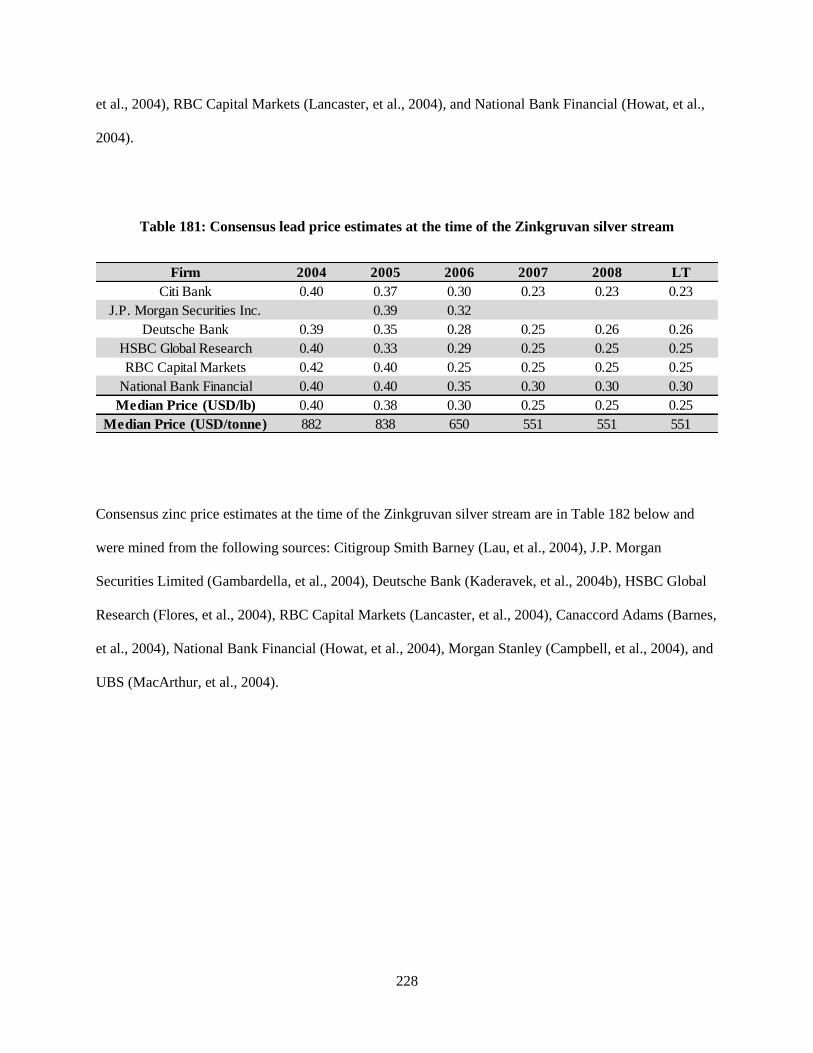
228
et al., 2004), RBC Capital Markets (Lancaster, et al., 2004), and National Bank Financial (Howat, et al.,
2004).
Table 181: Consensus lead price estimates at the time of the Zinkgruvan silver stream
Consensus zinc price estimates at the time of the Zinkgruvan silver stream are in Table 182 below and
were mined from the following sources: Citigroup Smith Barney (Lau, et al., 2004), J.P. Morgan
Securities Limited (Gambardella, et al., 2004), Deutsche Bank (Kaderavek, et al., 2004b), HSBC Global
Research (Flores, et al., 2004), RBC Capital Markets (Lancaster, et al., 2004), Canaccord Adams (Barnes,
et al., 2004), National Bank Financial (Howat, et al., 2004), Morgan Stanley (Campbell, et al., 2004), and
UBS (MacArthur, et al., 2004).
Firm 2004 2005 2006 2007 2008 LT
Citi Bank 0.40 0.37 0.30 0.23 0.23 0.23
J.P. Morgan Securities Inc. 0.39 0.32
Deutsche Bank 0.39 0.35 0.28 0.25 0.26 0.26
HSBC Global Research 0.40 0.33 0.29 0.25 0.25 0.25
RBC Capital Markets 0.42 0.40 0.25 0.25 0.25 0.25
National Bank Financial 0.40 0.40 0.35 0.30 0.30 0.30
Median Price (USD/lb) 0.40 0.38 0.30 0.25 0.25 0.25
Median Price (USD/tonne) 882 838 650 551 551 551
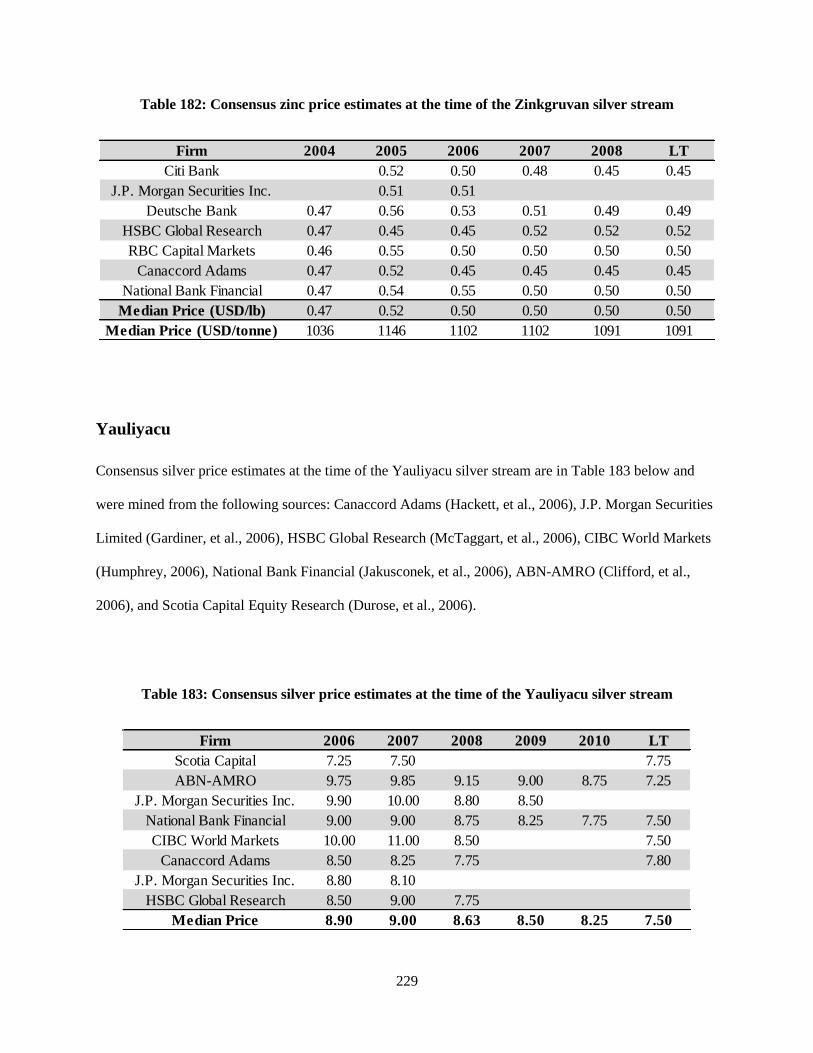
229
Table 182: Consensus zinc price estimates at the time of the Zinkgruvan silver stream
Yauliyacu
Consensus silver price estimates at the time of the Yauliyacu silver stream are in Table 183 below and
were mined from the following sources: Canaccord Adams (Hackett, et al., 2006), J.P. Morgan Securities
Limited (Gardiner, et al., 2006), HSBC Global Research (McTaggart, et al., 2006), CIBC World Markets
(Humphrey, 2006), National Bank Financial (Jakusconek, et al., 2006), ABN-AMRO (Clifford, et al.,
2006), and Scotia Capital Equity Research (Durose, et al., 2006).
Table 183: Consensus silver price estimates at the time of the Yauliyacu silver stream
Firm 2004 2005 2006 2007 2008 LT
Citi Bank 0.52 0.50 0.48 0.45 0.45
J.P. Morgan Securities Inc. 0.51 0.51
Deutsche Bank 0.47 0.56 0.53 0.51 0.49 0.49
HSBC Global Research 0.47 0.45 0.45 0.52 0.52 0.52
RBC Capital Markets 0.46 0.55 0.50 0.50 0.50 0.50
Canaccord Adams 0.47 0.52 0.45 0.45 0.45 0.45
National Bank Financial 0.47 0.54 0.55 0.50 0.50 0.50
Median Price (USD/lb) 0.47 0.52 0.50 0.50 0.50 0.50
Median Price (USD/tonne) 1036 1146 1102 1102 1091 1091
Firm 2006 2007 2008 2009 2010 LT
Scotia Capital 7.25 7.50 7.75
ABN-AMRO 9.75 9.85 9.15 9.00 8.75 7.25
J.P. Morgan Securities Inc. 9.90 10.00 8.80 8.50
National Bank Financial 9.00 9.00 8.75 8.25 7.75 7.50
CIBC World Markets 10.00 11.00 8.50 7.50
Canaccord Adams 8.50 8.25 7.75 7.80
J.P. Morgan Securities Inc. 8.80 8.10
HSBC Global Research 8.50 9.00 7.75
Median Price 8.90 9.00 8.63 8.50 8.25 7.50
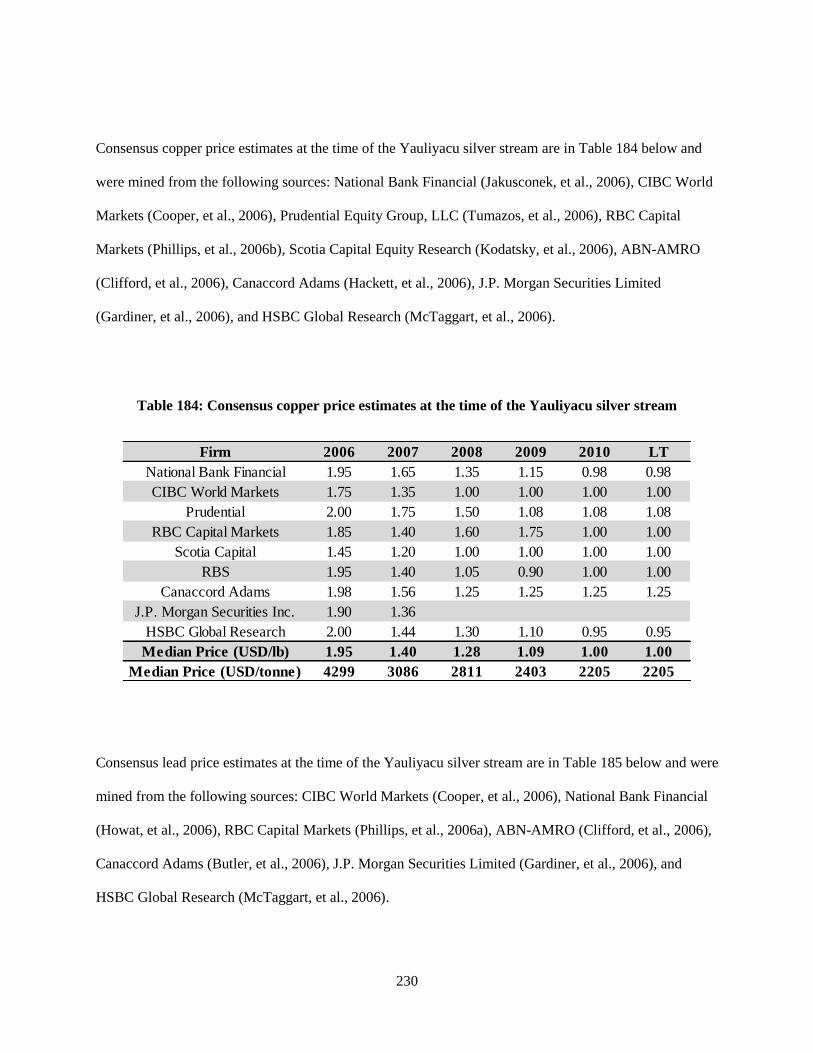
230
Consensus copper price estimates at the time of the Yauliyacu silver stream are in Table 184 below and
were mined from the following sources: National Bank Financial (Jakusconek, et al., 2006), CIBC World
Markets (Cooper, et al., 2006), Prudential Equity Group, LLC (Tumazos, et al., 2006), RBC Capital
Markets (Phillips, et al., 2006b), Scotia Capital Equity Research (Kodatsky, et al., 2006), ABN-AMRO
(Clifford, et al., 2006), Canaccord Adams (Hackett, et al., 2006), J.P. Morgan Securities Limited
(Gardiner, et al., 2006), and HSBC Global Research (McTaggart, et al., 2006).
Table 184: Consensus copper price estimates at the time of the Yauliyacu silver stream
Consensus lead price estimates at the time of the Yauliyacu silver stream are in Table 185 below and were
mined from the following sources: CIBC World Markets (Cooper, et al., 2006), National Bank Financial
(Howat, et al., 2006), RBC Capital Markets (Phillips, et al., 2006a), ABN-AMRO (Clifford, et al., 2006),
Canaccord Adams (Butler, et al., 2006), J.P. Morgan Securities Limited (Gardiner, et al., 2006), and
HSBC Global Research (McTaggart, et al., 2006).
Firm 2006 2007 2008 2009 2010 LT
National Bank Financial 1.95 1.65 1.35 1.15 0.98 0.98
CIBC World Markets 1.75 1.35 1.00 1.00 1.00 1.00
Prudential 2.00 1.75 1.50 1.08 1.08 1.08
RBC Capital Markets 1.85 1.40 1.60 1.75 1.00 1.00
Scotia Capital 1.45 1.20 1.00 1.00 1.00 1.00
RBS 1.95 1.40 1.05 0.90 1.00 1.00
Canaccord Adams 1.98 1.56 1.25 1.25 1.25 1.25
J.P. Morgan Securities Inc. 1.90 1.36
HSBC Global Research 2.00 1.44 1.30 1.10 0.95 0.95
Median Price (USD/lb) 1.95 1.40 1.28 1.09 1.00 1.00
Median Price (USD/tonne) 4299 3086 2811 2403 2205 2205
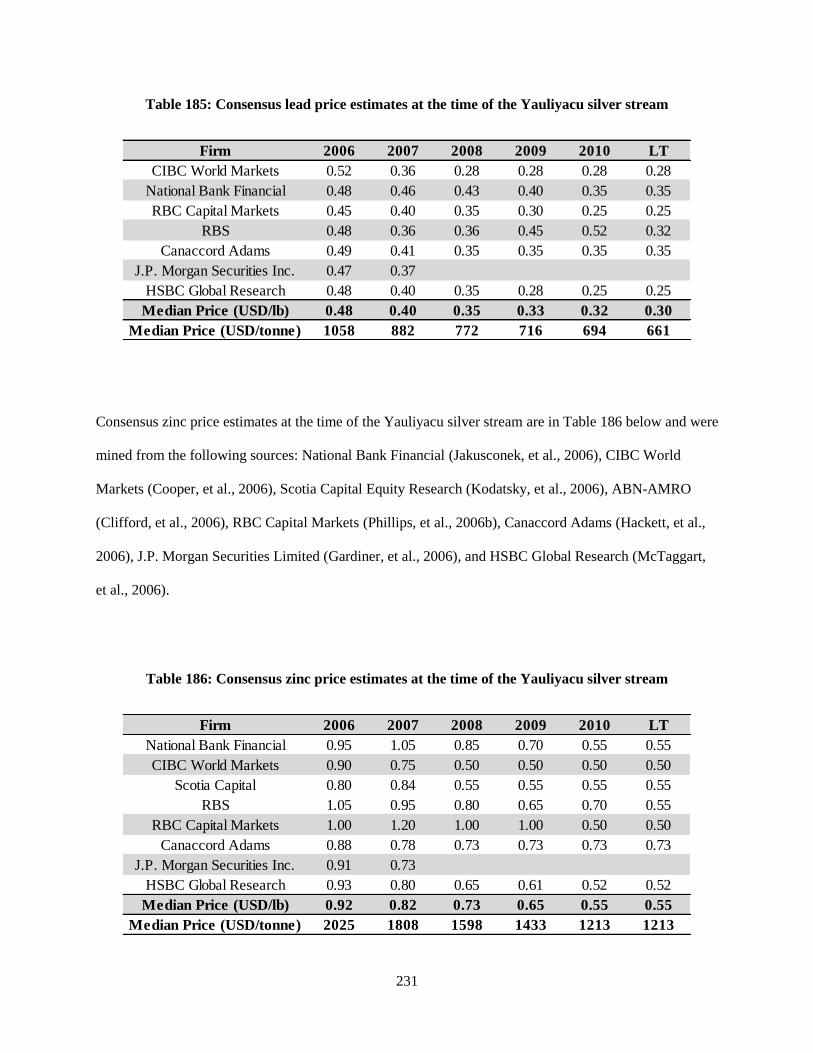
231
Table 185: Consensus lead price estimates at the time of the Yauliyacu silver stream
Consensus zinc price estimates at the time of the Yauliyacu silver stream are in Table 186 below and were
mined from the following sources: National Bank Financial (Jakusconek, et al., 2006), CIBC World
Markets (Cooper, et al., 2006), Scotia Capital Equity Research (Kodatsky, et al., 2006), ABN-AMRO
(Clifford, et al., 2006), RBC Capital Markets (Phillips, et al., 2006b), Canaccord Adams (Hackett, et al.,
2006), J.P. Morgan Securities Limited (Gardiner, et al., 2006), and HSBC Global Research (McTaggart,
et al., 2006).
Table 186: Consensus zinc price estimates at the time of the Yauliyacu silver stream
Firm 2006 2007 2008 2009 2010 LT
CIBC World Markets 0.52 0.36 0.28 0.28 0.28 0.28
National Bank Financial 0.48 0.46 0.43 0.40 0.35 0.35
RBC Capital Markets 0.45 0.40 0.35 0.30 0.25 0.25
RBS 0.48 0.36 0.36 0.45 0.52 0.32
Canaccord Adams 0.49 0.41 0.35 0.35 0.35 0.35
J.P. Morgan Securities Inc. 0.47 0.37
HSBC Global Research 0.48 0.40 0.35 0.28 0.25 0.25
Median Price (USD/lb) 0.48 0.40 0.35 0.33 0.32 0.30
Median Price (USD/tonne) 1058 882 772 716 694 661
Firm 2006 2007 2008 2009 2010 LT
National Bank Financial 0.95 1.05 0.85 0.70 0.55 0.55
CIBC World Markets 0.90 0.75 0.50 0.50 0.50 0.50
Scotia Capital 0.80 0.84 0.55 0.55 0.55 0.55
RBS 1.05 0.95 0.80 0.65 0.70 0.55
RBC Capital Markets 1.00 1.20 1.00 1.00 0.50 0.50
Canaccord Adams 0.88 0.78 0.73 0.73 0.73 0.73
J.P. Morgan Securities Inc. 0.91 0.73
HSBC Global Research 0.93 0.80 0.65 0.61 0.52 0.52
Median Price (USD/lb) 0.92 0.82 0.73 0.65 0.55 0.55
Median Price (USD/tonne) 2025 1808 1598 1433 1213 1213
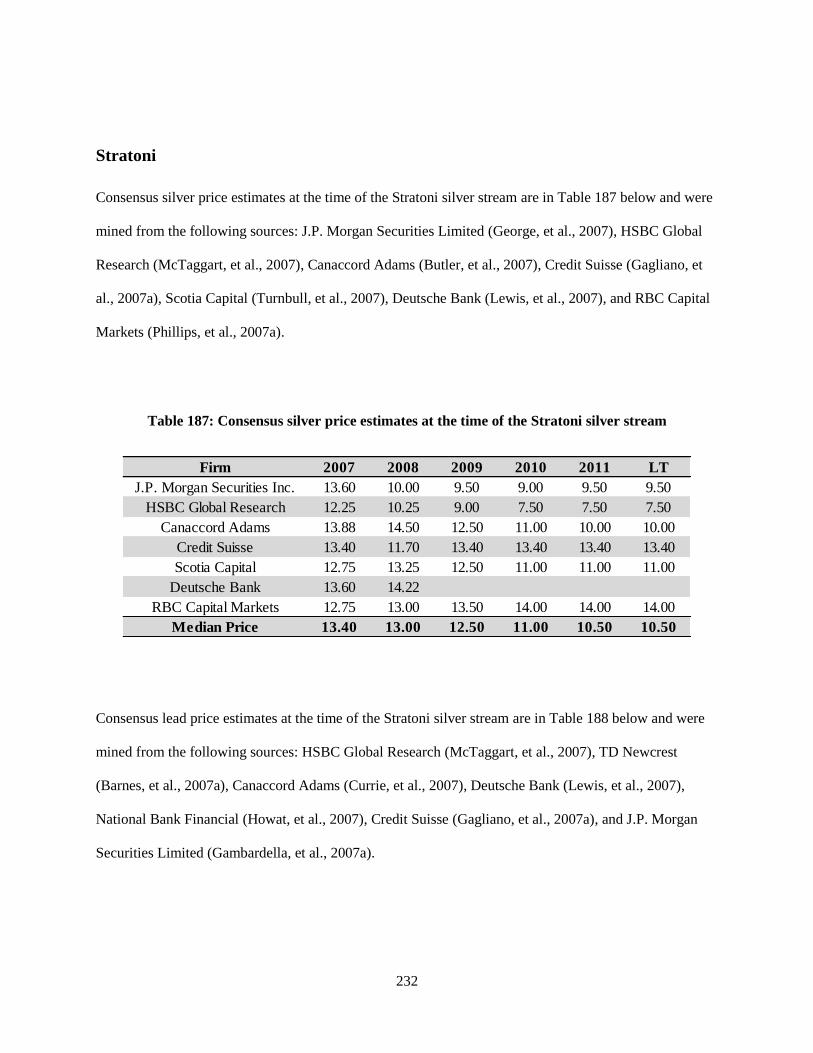
232
Stratoni
Consensus silver price estimates at the time of the Stratoni silver stream are in Table 187 below and were
mined from the following sources: J.P. Morgan Securities Limited (George, et al., 2007), HSBC Global
Research (McTaggart, et al., 2007), Canaccord Adams (Butler, et al., 2007), Credit Suisse (Gagliano, et
al., 2007a), Scotia Capital (Turnbull, et al., 2007), Deutsche Bank (Lewis, et al., 2007), and RBC Capital
Markets (Phillips, et al., 2007a).
Table 187: Consensus silver price estimates at the time of the Stratoni silver stream
Consensus lead price estimates at the time of the Stratoni silver stream are in Table 188 below and were
mined from the following sources: HSBC Global Research (McTaggart, et al., 2007), TD Newcrest
(Barnes, et al., 2007a), Canaccord Adams (Currie, et al., 2007), Deutsche Bank (Lewis, et al., 2007),
National Bank Financial (Howat, et al., 2007), Credit Suisse (Gagliano, et al., 2007a), and J.P. Morgan
Securities Limited (Gambardella, et al., 2007a).
Firm 2007 2008 2009 2010 2011 LT
J.P. Morgan Securities Inc. 13.60 10.00 9.50 9.00 9.50 9.50
HSBC Global Research 12.25 10.25 9.00 7.50 7.50 7.50
Canaccord Adams 13.88 14.50 12.50 11.00 10.00 10.00
Credit Suisse 13.40 11.70 13.40 13.40 13.40 13.40
Scotia Capital 12.75 13.25 12.50 11.00 11.00 11.00
Deutsche Bank 13.60 14.22
RBC Capital Markets 12.75 13.00 13.50 14.00 14.00 14.00
Median Price 13.40 13.00 12.50 11.00 10.50 10.50
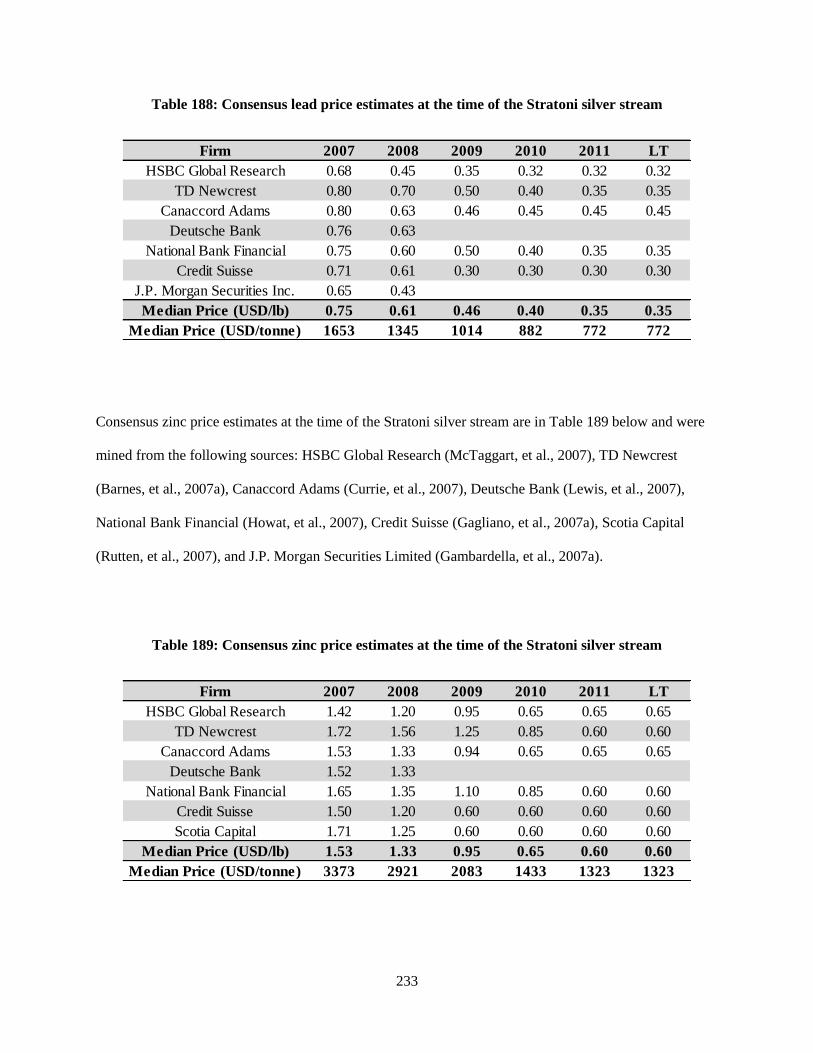
233
Table 188: Consensus lead price estimates at the time of the Stratoni silver stream
Consensus zinc price estimates at the time of the Stratoni silver stream are in Table 189 below and were
mined from the following sources: HSBC Global Research (McTaggart, et al., 2007), TD Newcrest
(Barnes, et al., 2007a), Canaccord Adams (Currie, et al., 2007), Deutsche Bank (Lewis, et al., 2007),
National Bank Financial (Howat, et al., 2007), Credit Suisse (Gagliano, et al., 2007a), Scotia Capital
(Rutten, et al., 2007), and J.P. Morgan Securities Limited (Gambardella, et al., 2007a).
Table 189: Consensus zinc price estimates at the time of the Stratoni silver stream
Firm 2007 2008 2009 2010 2011 LT
HSBC Global Research 0.68 0.45 0.35 0.32 0.32 0.32
TD Newcrest 0.80 0.70 0.50 0.40 0.35 0.35
Canaccord Adams 0.80 0.63 0.46 0.45 0.45 0.45
Deutsche Bank 0.76 0.63
National Bank Financial 0.75 0.60 0.50 0.40 0.35 0.35
Credit Suisse 0.71 0.61 0.30 0.30 0.30 0.30
J.P. Morgan Securities Inc. 0.65 0.43
Median Price (USD/lb) 0.75 0.61 0.46 0.40 0.35 0.35
Median Price (USD/tonne) 1653 1345 1014 882 772 772
Firm 2007 2008 2009 2010 2011 LT
HSBC Global Research 1.42 1.20 0.95 0.65 0.65 0.65
TD Newcrest 1.72 1.56 1.25 0.85 0.60 0.60
Canaccord Adams 1.53 1.33 0.94 0.65 0.65 0.65
Deutsche Bank 1.52 1.33
National Bank Financial 1.65 1.35 1.10 0.85 0.60 0.60
Credit Suisse 1.50 1.20 0.60 0.60 0.60 0.60
Scotia Capital 1.71 1.25 0.60 0.60 0.60 0.60
Median Price (USD/lb) 1.53 1.33 0.95 0.65 0.60 0.60
Median Price (USD/tonne) 3373 2921 2083 1433 1323 1323
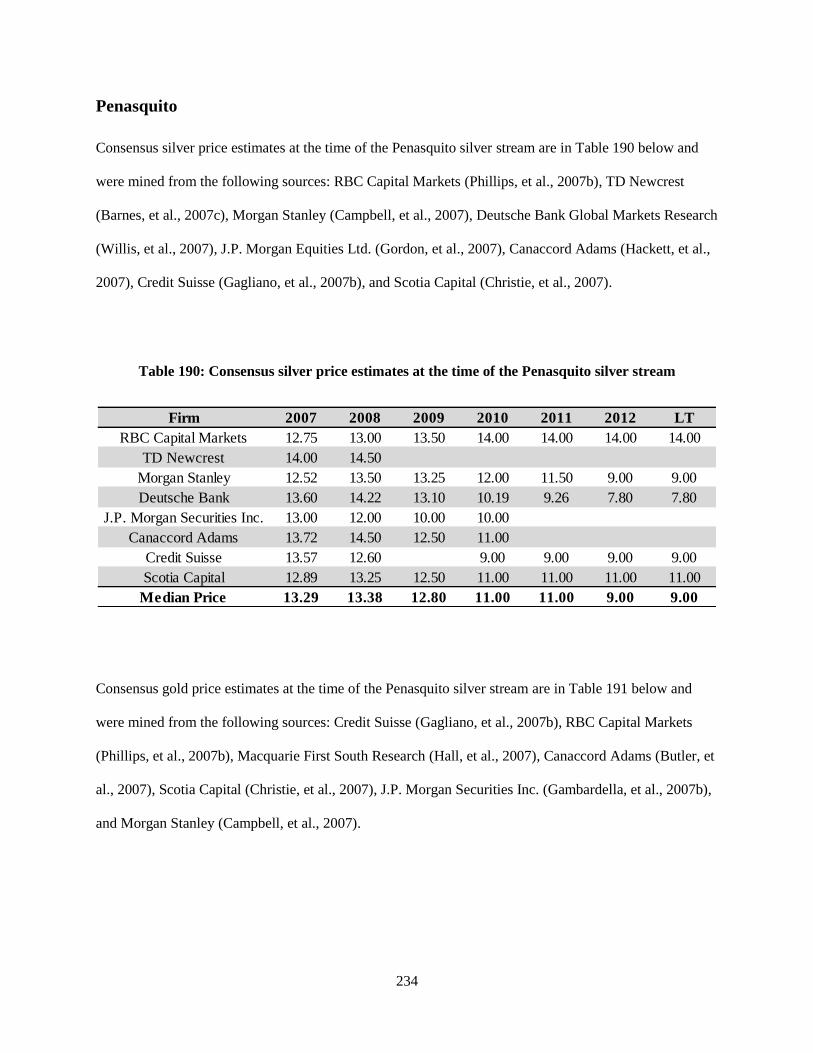
234
Penasquito
Consensus silver price estimates at the time of the Penasquito silver stream are in Table 190 below and
were mined from the following sources: RBC Capital Markets (Phillips, et al., 2007b), TD Newcrest
(Barnes, et al., 2007c), Morgan Stanley (Campbell, et al., 2007), Deutsche Bank Global Markets Research
(Willis, et al., 2007), J.P. Morgan Equities Ltd. (Gordon, et al., 2007), Canaccord Adams (Hackett, et al.,
2007), Credit Suisse (Gagliano, et al., 2007b), and Scotia Capital (Christie, et al., 2007).
Table 190: Consensus silver price estimates at the time of the Penasquito silver stream
Consensus gold price estimates at the time of the Penasquito silver stream are in Table 191 below and
were mined from the following sources: Credit Suisse (Gagliano, et al., 2007b), RBC Capital Markets
(Phillips, et al., 2007b), Macquarie First South Research (Hall, et al., 2007), Canaccord Adams (Butler, et
al., 2007), Scotia Capital (Christie, et al., 2007), J.P. Morgan Securities Inc. (Gambardella, et al., 2007b),
and Morgan Stanley (Campbell, et al., 2007).
Firm 2007 2008 2009 2010 2011 2012 LT
RBC Capital Markets 12.75 13.00 13.50 14.00 14.00 14.00 14.00
TD Newcrest 14.00 14.50
Morgan Stanley 12.52 13.50 13.25 12.00 11.50 9.00 9.00
Deutsche Bank 13.60 14.22 13.10 10.19 9.26 7.80 7.80
J.P. Morgan Securities Inc. 13.00 12.00 10.00 10.00
Canaccord Adams 13.72 14.50 12.50 11.00
Credit Suisse 13.57 12.60 9.00 9.00 9.00 9.00
Scotia Capital 12.89 13.25 12.50 11.00 11.00 11.00 11.00
Median Price 13.29 13.38 12.80 11.00 11.00 9.00 9.00
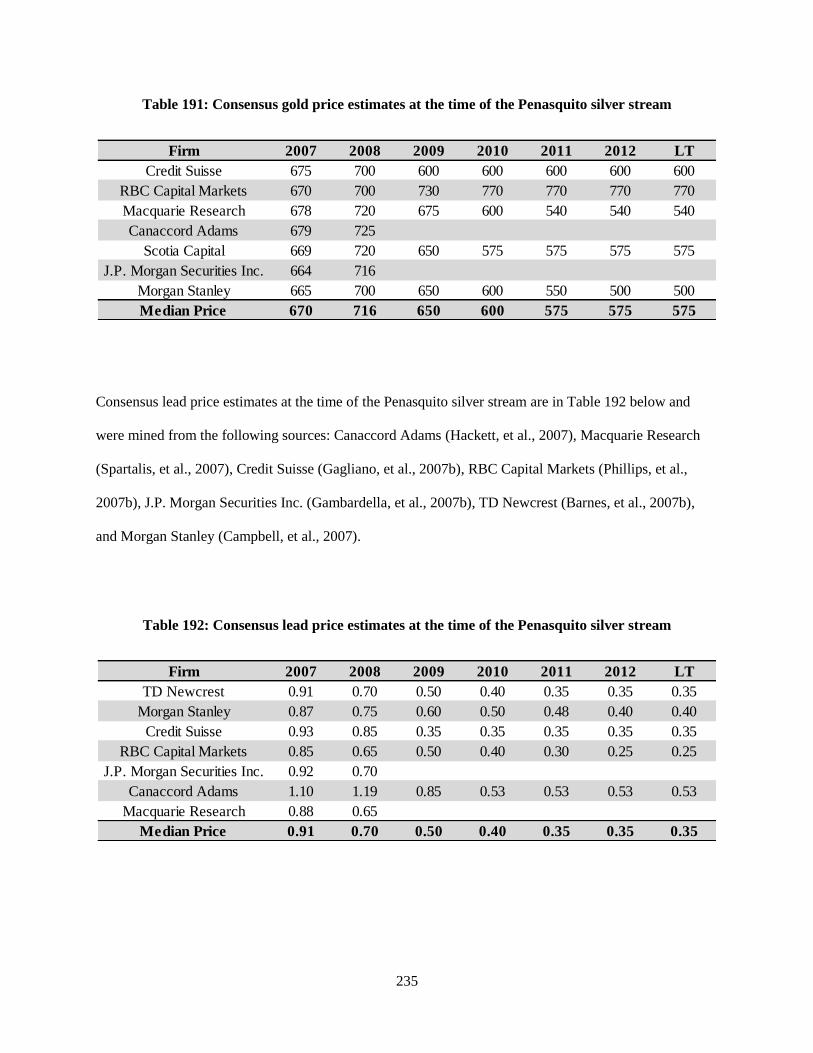
235
Table 191: Consensus gold price estimates at the time of the Penasquito silver stream
Consensus lead price estimates at the time of the Penasquito silver stream are in Table 192 below and
were mined from the following sources: Canaccord Adams (Hackett, et al., 2007), Macquarie Research
(Spartalis, et al., 2007), Credit Suisse (Gagliano, et al., 2007b), RBC Capital Markets (Phillips, et al.,
2007b), J.P. Morgan Securities Inc. (Gambardella, et al., 2007b), TD Newcrest (Barnes, et al., 2007b),
and Morgan Stanley (Campbell, et al., 2007).
Table 192: Consensus lead price estimates at the time of the Penasquito silver stream
Firm 2007 2008 2009 2010 2011 2012 LT
Credit Suisse 675 700 600 600 600 600 600
RBC Capital Markets 670 700 730 770 770 770 770
Macquarie Research 678 720 675 600 540 540 540
Canaccord Adams 679 725
Scotia Capital 669 720 650 575 575 575 575
J.P. Morgan Securities Inc. 664 716
Morgan Stanley 665 700 650 600 550 500 500
Median Price 670 716 650 600 575 575 575
Firm 2007 2008 2009 2010 2011 2012 LT
TD Newcrest 0.91 0.70 0.50 0.40 0.35 0.35 0.35
Morgan Stanley 0.87 0.75 0.60 0.50 0.48 0.40 0.40
Credit Suisse 0.93 0.85 0.35 0.35 0.35 0.35 0.35
RBC Capital Markets 0.85 0.65 0.50 0.40 0.30 0.25 0.25
J.P. Morgan Securities Inc. 0.92 0.70
Canaccord Adams 1.10 1.19 0.85 0.53 0.53 0.53 0.53
Macquarie Research 0.88 0.65
Median Price 0.91 0.70 0.50 0.40 0.35 0.35 0.35

236
Consensus zinc price estimates at the time of the Penasquito silver stream are in Table 193 below and
were mined from the following sources: Canaccord Adams (Hackett, et al., 2007), Macquarie Research
(Spartalis, et al., 2007), CIBC World Markets (Hale-Sanders, et al., 2007), TD Newcrest (Barnes, et al.,
2007b), Morgan Stanley (Campbell, et al., 2007), Credit Suisse (Gagliano, et al., 2007b), Scotia Capital,
(Christie, et al., 2007), RBC Capital Markets (Phillips, et al., 2007b), and J.P. Morgan Securities Inc.
(Gambardella, et al., 2007b).
Table 193: Consensus zinc price estimates at the time of the Penasquito silver stream
Mineral Park
Consensus silver price estimates at the time of the Mineral Park silver stream are in Table 194 below and
were mined from the following sources: Macquarie Research (Harris, et al., 2008), Deutsche Bank
(James, et al., 2008), J.P. Morgan Securities Ltd. (Gambardella, et al., 2008a), RBC Capital Markets
(Phillips, et al., 2008a), Credit Suisse (Gagliano, et al., 2008a), CIBC World Markets (Cooper, et al.,
2008), HSBC Global Research (McTaggart, et al., 2008a), and Scotia Capital (Christie, et al., 2008a).
Firm 2007 2008 2009 2010 2011 2012 LT
Canaccord Adams 1.62 1.41 1.20 1.00 1.00 1.00 1.00
Macquarie Research 1.79 1.30
CIBC World Markets 1.70 1.70
TD Newcrest 1.64 1.50 1.25 0.85 0.60 0.60 0.60
Morgan Stanley 1.65 1.50 1.25 1.00 0.90 0.75 0.75
Credit Suisse 1.56 1.40 0.60 0.60 0.60 0.60 0.60
RBC Capital Markets 1.80 1.70 1.85 1.90 1.90 0.60 0.60
Scotia Capital 2.06 1.56 0.60 0.60 0.60 0.60 0.60
Median Price 1.68 1.50 1.23 0.93 0.75 0.60 0.60
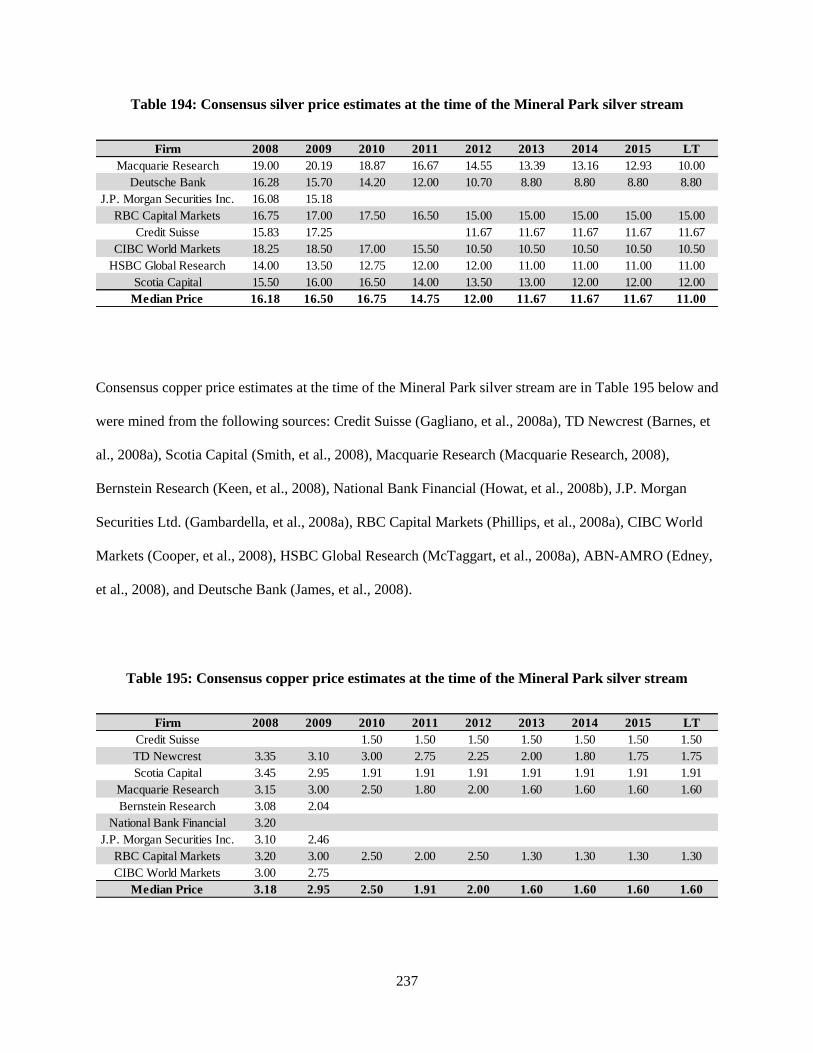
237
Table 194: Consensus silver price estimates at the time of the Mineral Park silver stream
Consensus copper price estimates at the time of the Mineral Park silver stream are in Table 195 below and
were mined from the following sources: Credit Suisse (Gagliano, et al., 2008a), TD Newcrest (Barnes, et
al., 2008a), Scotia Capital (Smith, et al., 2008), Macquarie Research (Macquarie Research, 2008),
Bernstein Research (Keen, et al., 2008), National Bank Financial (Howat, et al., 2008b), J.P. Morgan
Securities Ltd. (Gambardella, et al., 2008a), RBC Capital Markets (Phillips, et al., 2008a), CIBC World
Markets (Cooper, et al., 2008), HSBC Global Research (McTaggart, et al., 2008a), ABN-AMRO (Edney,
et al., 2008), and Deutsche Bank (James, et al., 2008).
Table 195: Consensus copper price estimates at the time of the Mineral Park silver stream
Firm 2008 2009 2010 2011 2012 2013 2014 2015 LT
Macquarie Research 19.00 20.19 18.87 16.67 14.55 13.39 13.16 12.93 10.00
Deutsche Bank 16.28 15.70 14.20 12.00 10.70 8.80 8.80 8.80 8.80
J.P. Morgan Securities Inc. 16.08 15.18
RBC Capital Markets 16.75 17.00 17.50 16.50 15.00 15.00 15.00 15.00 15.00
Credit Suisse 15.83 17.25 11.67 11.67 11.67 11.67 11.67
CIBC World Markets 18.25 18.50 17.00 15.50 10.50 10.50 10.50 10.50 10.50
HSBC Global Research 14.00 13.50 12.75 12.00 12.00 11.00 11.00 11.00 11.00
Scotia Capital 15.50 16.00 16.50 14.00 13.50 13.00 12.00 12.00 12.00
Median Price 16.18 16.50 16.75 14.75 12.00 11.67 11.67 11.67 11.00
Firm 2008 2009 2010 2011 2012 2013 2014 2015 LT
Credit Suisse 1.50 1.50 1.50 1.50 1.50 1.50 1.50
TD Newcrest 3.35 3.10 3.00 2.75 2.25 2.00 1.80 1.75 1.75
Scotia Capital 3.45 2.95 1.91 1.91 1.91 1.91 1.91 1.91 1.91
Macquarie Research 3.15 3.00 2.50 1.80 2.00 1.60 1.60 1.60 1.60
Bernstein Research 3.08 2.04
National Bank Financial 3.20
J.P. Morgan Securities Inc. 3.10 2.46
RBC Capital Markets 3.20 3.00 2.50 2.00 2.50 1.30 1.30 1.30 1.30
CIBC World Markets 3.00 2.75
Median Price 3.18 2.95 2.50 1.91 2.00 1.60 1.60 1.60 1.60
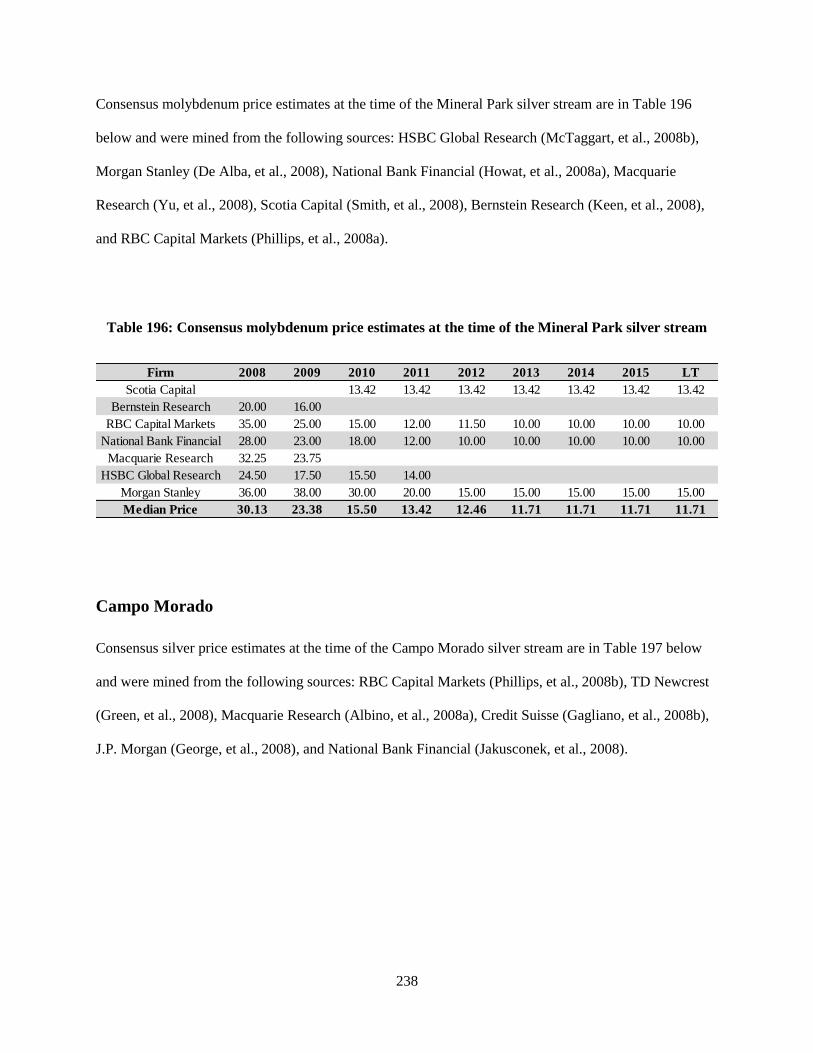
238
Consensus molybdenum price estimates at the time of the Mineral Park silver stream are in Table 196
below and were mined from the following sources: HSBC Global Research (McTaggart, et al., 2008b),
Morgan Stanley (De Alba, et al., 2008), National Bank Financial (Howat, et al., 2008a), Macquarie
Research (Yu, et al., 2008), Scotia Capital (Smith, et al., 2008), Bernstein Research (Keen, et al., 2008),
and RBC Capital Markets (Phillips, et al., 2008a).
Table 196: Consensus molybdenum price estimates at the time of the Mineral Park silver stream
Campo Morado
Consensus silver price estimates at the time of the Campo Morado silver stream are in Table 197 below
and were mined from the following sources: RBC Capital Markets (Phillips, et al., 2008b), TD Newcrest
(Green, et al., 2008), Macquarie Research (Albino, et al., 2008a), Credit Suisse (Gagliano, et al., 2008b),
J.P. Morgan (George, et al., 2008), and National Bank Financial (Jakusconek, et al., 2008).
Firm 2008 2009 2010 2011 2012 2013 2014 2015 LT
Scotia Capital 13.42 13.42 13.42 13.42 13.42 13.42 13.42
Bernstein Research 20.00 16.00
RBC Capital Markets 35.00 25.00 15.00 12.00 11.50 10.00 10.00 10.00 10.00
National Bank Financial 28.00 23.00 18.00 12.00 10.00 10.00 10.00 10.00 10.00
Macquarie Research 32.25 23.75
HSBC Global Research 24.50 17.50 15.50 14.00
Morgan Stanley 36.00 38.00 30.00 20.00 15.00 15.00 15.00 15.00 15.00
Median Price 30.13 23.38 15.50 13.42 12.46 11.71 11.71 11.71 11.71
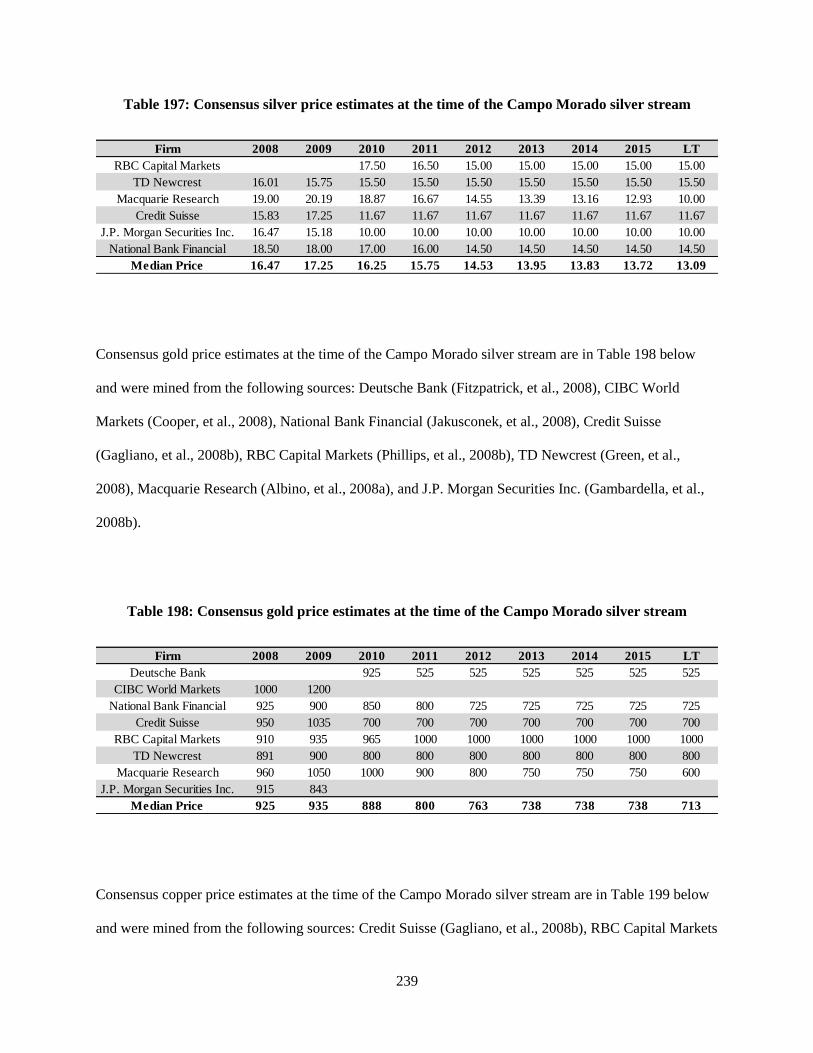
239
Table 197: Consensus silver price estimates at the time of the Campo Morado silver stream
Consensus gold price estimates at the time of the Campo Morado silver stream are in Table 198 below
and were mined from the following sources: Deutsche Bank (Fitzpatrick, et al., 2008), CIBC World
Markets (Cooper, et al., 2008), National Bank Financial (Jakusconek, et al., 2008), Credit Suisse
(Gagliano, et al., 2008b), RBC Capital Markets (Phillips, et al., 2008b), TD Newcrest (Green, et al.,
2008), Macquarie Research (Albino, et al., 2008a), and J.P. Morgan Securities Inc. (Gambardella, et al.,
2008b).
Table 198: Consensus gold price estimates at the time of the Campo Morado silver stream
Consensus copper price estimates at the time of the Campo Morado silver stream are in Table 199 below
and were mined from the following sources: Credit Suisse (Gagliano, et al., 2008b), RBC Capital Markets
Firm 2008 2009 2010 2011 2012 2013 2014 2015 LT
RBC Capital Markets 17.50 16.50 15.00 15.00 15.00 15.00 15.00
TD Newcrest 16.01 15.75 15.50 15.50 15.50 15.50 15.50 15.50 15.50
Macquarie Research 19.00 20.19 18.87 16.67 14.55 13.39 13.16 12.93 10.00
Credit Suisse 15.83 17.25 11.67 11.67 11.67 11.67 11.67 11.67 11.67
J.P. Morgan Securities Inc. 16.47 15.18 10.00 10.00 10.00 10.00 10.00 10.00 10.00
National Bank Financial 18.50 18.00 17.00 16.00 14.50 14.50 14.50 14.50 14.50
Median Price 16.47 17.25 16.25 15.75 14.53 13.95 13.83 13.72 13.09
Firm 2008 2009 2010 2011 2012 2013 2014 2015 LT
Deutsche Bank 925 525 525 525 525 525 525
CIBC World Markets 1000 1200
National Bank Financial 925 900 850 800 725 725 725 725 725
Credit Suisse 950 1035 700 700 700 700 700 700 700
RBC Capital Markets 910 935 965 1000 1000 1000 1000 1000 1000
TD Newcrest 891 900 800 800 800 800 800 800 800
Macquarie Research 960 1050 1000 900 800 750 750 750 600
J.P. Morgan Securities Inc. 915 843
Median Price 925 935 888 800 763 738 738 738 713
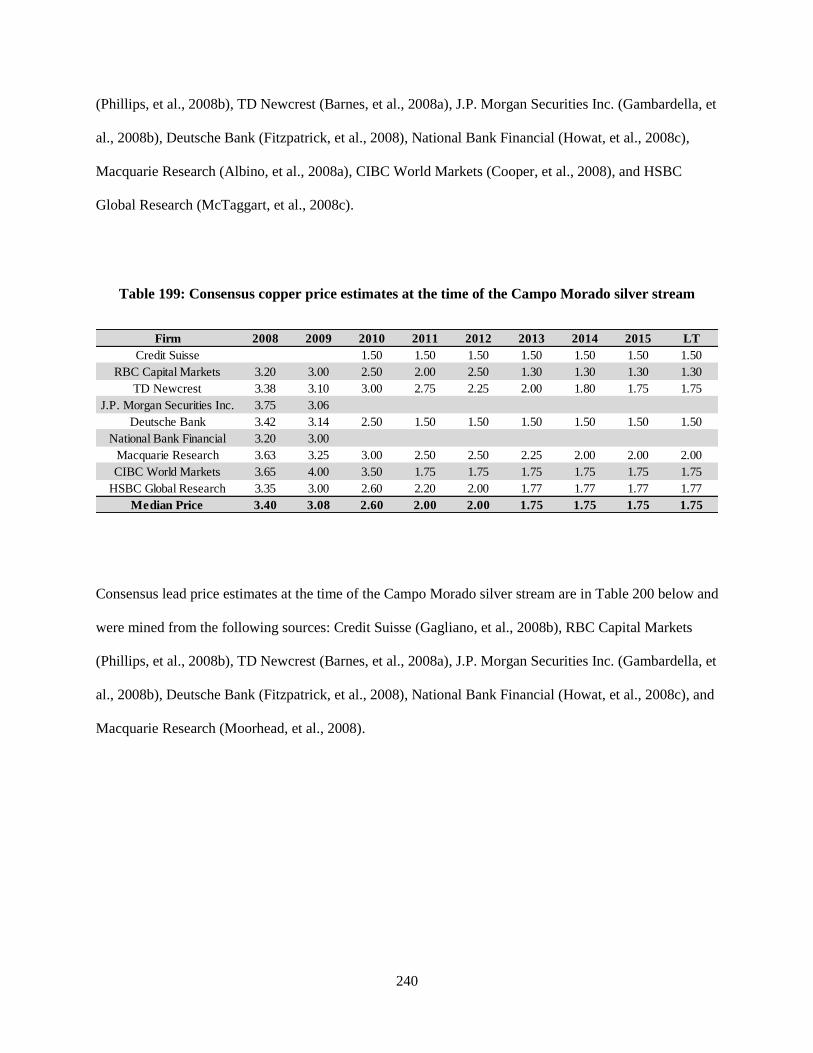
240
(Phillips, et al., 2008b), TD Newcrest (Barnes, et al., 2008a), J.P. Morgan Securities Inc. (Gambardella, et
al., 2008b), Deutsche Bank (Fitzpatrick, et al., 2008), National Bank Financial (Howat, et al., 2008c),
Macquarie Research (Albino, et al., 2008a), CIBC World Markets (Cooper, et al., 2008), and HSBC
Global Research (McTaggart, et al., 2008c).
Table 199: Consensus copper price estimates at the time of the Campo Morado silver stream
Consensus lead price estimates at the time of the Campo Morado silver stream are in Table 200 below and
were mined from the following sources: Credit Suisse (Gagliano, et al., 2008b), RBC Capital Markets
(Phillips, et al., 2008b), TD Newcrest (Barnes, et al., 2008a), J.P. Morgan Securities Inc. (Gambardella, et
al., 2008b), Deutsche Bank (Fitzpatrick, et al., 2008), National Bank Financial (Howat, et al., 2008c), and
Macquarie Research (Moorhead, et al., 2008).
Firm 2008 2009 2010 2011 2012 2013 2014 2015 LT
Credit Suisse 1.50 1.50 1.50 1.50 1.50 1.50 1.50
RBC Capital Markets 3.20 3.00 2.50 2.00 2.50 1.30 1.30 1.30 1.30
TD Newcrest 3.38 3.10 3.00 2.75 2.25 2.00 1.80 1.75 1.75
J.P. Morgan Securities Inc. 3.75 3.06
Deutsche Bank 3.42 3.14 2.50 1.50 1.50 1.50 1.50 1.50 1.50
National Bank Financial 3.20 3.00
Macquarie Research 3.63 3.25 3.00 2.50 2.50 2.25 2.00 2.00 2.00
CIBC World Markets 3.65 4.00 3.50 1.75 1.75 1.75 1.75 1.75 1.75
HSBC Global Research 3.35 3.00 2.60 2.20 2.00 1.77 1.77 1.77 1.77
Median Price 3.40 3.08 2.60 2.00 2.00 1.75 1.75 1.75 1.75
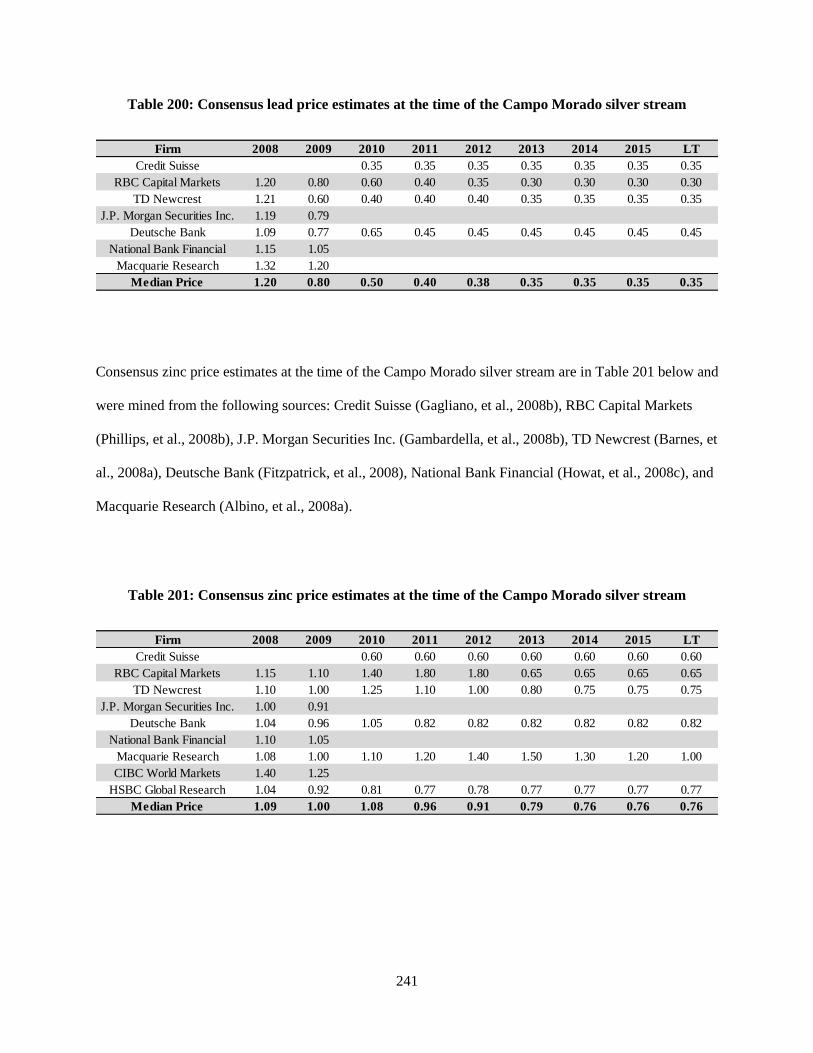
241
Table 200: Consensus lead price estimates at the time of the Campo Morado silver stream
Consensus zinc price estimates at the time of the Campo Morado silver stream are in Table 201 below and
were mined from the following sources: Credit Suisse (Gagliano, et al., 2008b), RBC Capital Markets
(Phillips, et al., 2008b), J.P. Morgan Securities Inc. (Gambardella, et al., 2008b), TD Newcrest (Barnes, et
al., 2008a), Deutsche Bank (Fitzpatrick, et al., 2008), National Bank Financial (Howat, et al., 2008c), and
Macquarie Research (Albino, et al., 2008a).
Table 201: Consensus zinc price estimates at the time of the Campo Morado silver stream
Firm 2008 2009 2010 2011 2012 2013 2014 2015 LT
Credit Suisse 0.35 0.35 0.35 0.35 0.35 0.35 0.35
RBC Capital Markets 1.20 0.80 0.60 0.40 0.35 0.30 0.30 0.30 0.30
TD Newcrest 1.21 0.60 0.40 0.40 0.40 0.35 0.35 0.35 0.35
J.P. Morgan Securities Inc. 1.19 0.79
Deutsche Bank 1.09 0.77 0.65 0.45 0.45 0.45 0.45 0.45 0.45
National Bank Financial 1.15 1.05
Macquarie Research 1.32 1.20
Median Price 1.20 0.80 0.50 0.40 0.38 0.35 0.35 0.35 0.35
Firm 2008 2009 2010 2011 2012 2013 2014 2015 LT
Credit Suisse 0.60 0.60 0.60 0.60 0.60 0.60 0.60
RBC Capital Markets 1.15 1.10 1.40 1.80 1.80 0.65 0.65 0.65 0.65
TD Newcrest 1.10 1.00 1.25 1.10 1.00 0.80 0.75 0.75 0.75
J.P. Morgan Securities Inc. 1.00 0.91
Deutsche Bank 1.04 0.96 1.05 0.82 0.82 0.82 0.82 0.82 0.82
National Bank Financial 1.10 1.05
Macquarie Research 1.08 1.00 1.10 1.20 1.40 1.50 1.30 1.20 1.00
CIBC World Markets 1.40 1.25
HSBC Global Research 1.04 0.92 0.81 0.77 0.78 0.77 0.77 0.77 0.77
Median Price 1.09 1.00 1.08 0.96 0.91 0.79 0.76 0.76 0.76
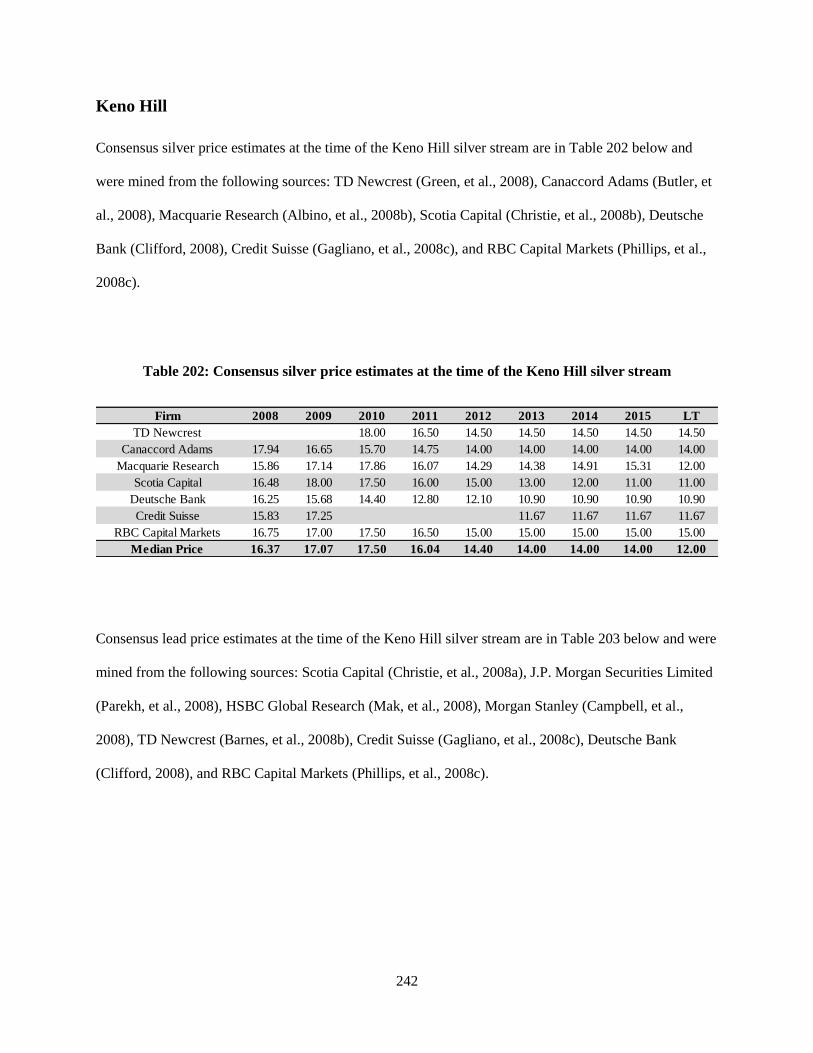
242
Keno Hill
Consensus silver price estimates at the time of the Keno Hill silver stream are in Table 202 below and
were mined from the following sources: TD Newcrest (Green, et al., 2008), Canaccord Adams (Butler, et
al., 2008), Macquarie Research (Albino, et al., 2008b), Scotia Capital (Christie, et al., 2008b), Deutsche
Bank (Clifford, 2008), Credit Suisse (Gagliano, et al., 2008c), and RBC Capital Markets (Phillips, et al.,
2008c).
Table 202: Consensus silver price estimates at the time of the Keno Hill silver stream
Consensus lead price estimates at the time of the Keno Hill silver stream are in Table 203 below and were
mined from the following sources: Scotia Capital (Christie, et al., 2008a), J.P. Morgan Securities Limited
(Parekh, et al., 2008), HSBC Global Research (Mak, et al., 2008), Morgan Stanley (Campbell, et al.,
2008), TD Newcrest (Barnes, et al., 2008b), Credit Suisse (Gagliano, et al., 2008c), Deutsche Bank
(Clifford, 2008), and RBC Capital Markets (Phillips, et al., 2008c).
Firm 2008 2009 2010 2011 2012 2013 2014 2015 LT
TD Newcrest 18.00 16.50 14.50 14.50 14.50 14.50 14.50
Canaccord Adams 17.94 16.65 15.70 14.75 14.00 14.00 14.00 14.00 14.00
Macquarie Research 15.86 17.14 17.86 16.07 14.29 14.38 14.91 15.31 12.00
Scotia Capital 16.48 18.00 17.50 16.00 15.00 13.00 12.00 11.00 11.00
Deutsche Bank 16.25 15.68 14.40 12.80 12.10 10.90 10.90 10.90 10.90
Credit Suisse 15.83 17.25 11.67 11.67 11.67 11.67
RBC Capital Markets 16.75 17.00 17.50 16.50 15.00 15.00 15.00 15.00 15.00
Median Price 16.37 17.07 17.50 16.04 14.40 14.00 14.00 14.00 12.00
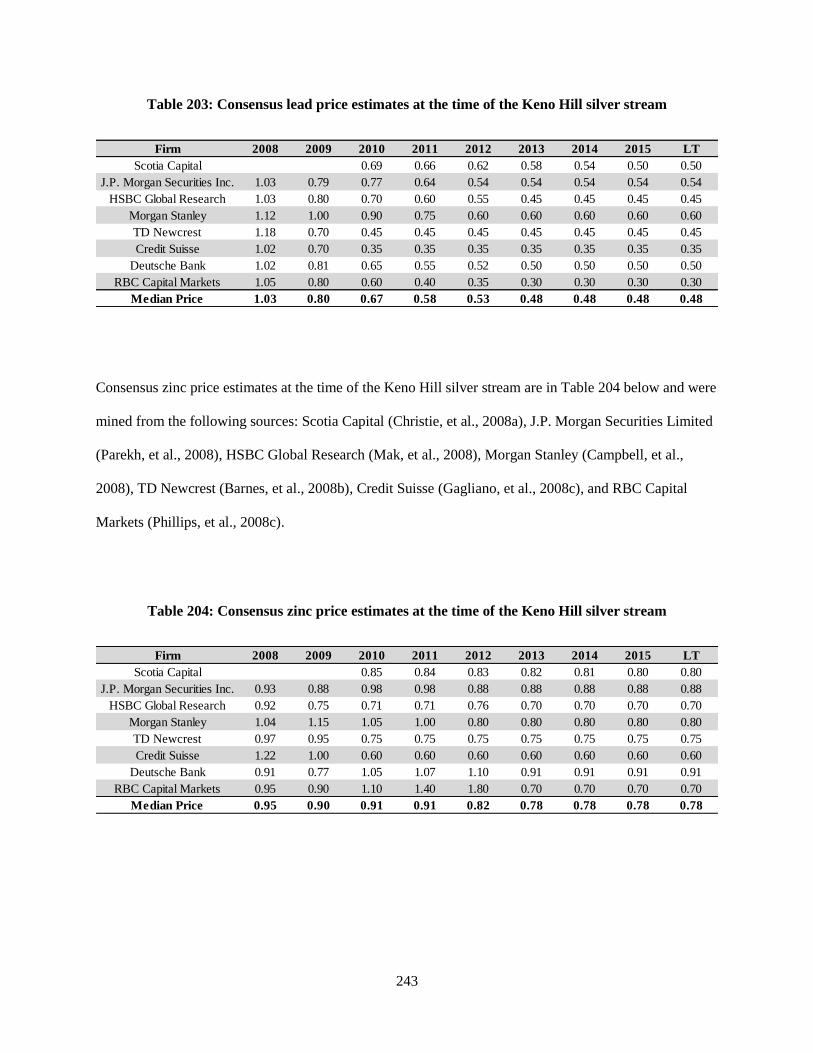
243
Table 203: Consensus lead price estimates at the time of the Keno Hill silver stream
Consensus zinc price estimates at the time of the Keno Hill silver stream are in Table 204 below and were
mined from the following sources: Scotia Capital (Christie, et al., 2008a), J.P. Morgan Securities Limited
(Parekh, et al., 2008), HSBC Global Research (Mak, et al., 2008), Morgan Stanley (Campbell, et al.,
2008), TD Newcrest (Barnes, et al., 2008b), Credit Suisse (Gagliano, et al., 2008c), and RBC Capital
Markets (Phillips, et al., 2008c).
Table 204: Consensus zinc price estimates at the time of the Keno Hill silver stream
Firm 2008 2009 2010 2011 2012 2013 2014 2015 LT
Scotia Capital 0.69 0.66 0.62 0.58 0.54 0.50 0.50
J.P. Morgan Securities Inc. 1.03 0.79 0.77 0.64 0.54 0.54 0.54 0.54 0.54
HSBC Global Research 1.03 0.80 0.70 0.60 0.55 0.45 0.45 0.45 0.45
Morgan Stanley 1.12 1.00 0.90 0.75 0.60 0.60 0.60 0.60 0.60
TD Newcrest 1.18 0.70 0.45 0.45 0.45 0.45 0.45 0.45 0.45
Credit Suisse 1.02 0.70 0.35 0.35 0.35 0.35 0.35 0.35 0.35
Deutsche Bank 1.02 0.81 0.65 0.55 0.52 0.50 0.50 0.50 0.50
RBC Capital Markets 1.05 0.80 0.60 0.40 0.35 0.30 0.30 0.30 0.30
Median Price 1.03 0.80 0.67 0.58 0.53 0.48 0.48 0.48 0.48
Firm 2008 2009 2010 2011 2012 2013 2014 2015 LT
Scotia Capital 0.85 0.84 0.83 0.82 0.81 0.80 0.80
J.P. Morgan Securities Inc. 0.93 0.88 0.98 0.98 0.88 0.88 0.88 0.88 0.88
HSBC Global Research 0.92 0.75 0.71 0.71 0.76 0.70 0.70 0.70 0.70
Morgan Stanley 1.04 1.15 1.05 1.00 0.80 0.80 0.80 0.80 0.80
TD Newcrest 0.97 0.95 0.75 0.75 0.75 0.75 0.75 0.75 0.75
Credit Suisse 1.22 1.00 0.60 0.60 0.60 0.60 0.60 0.60 0.60
Deutsche Bank 0.91 0.77 1.05 1.07 1.10 0.91 0.91 0.91 0.91
RBC Capital Markets 0.95 0.90 1.10 1.40 1.80 0.70 0.70 0.70 0.70
Median Price 0.95 0.90 0.91 0.91 0.82 0.78 0.78 0.78 0.78
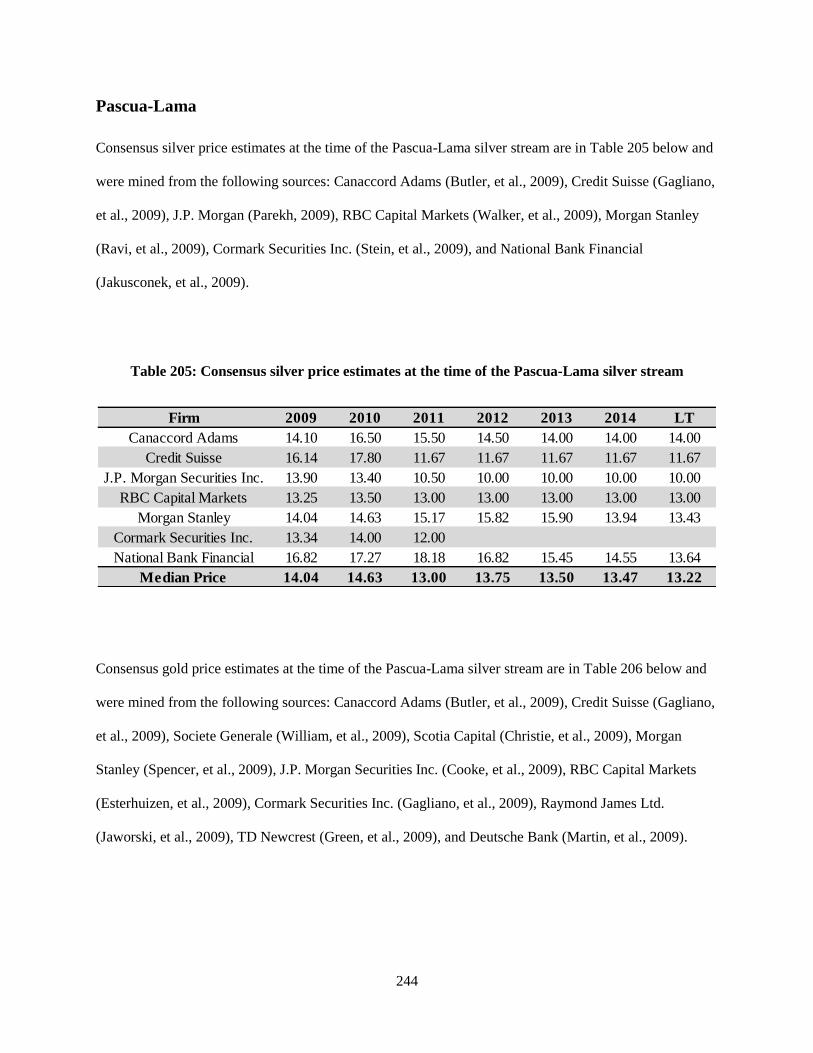
244
Pascua-Lama
Consensus silver price estimates at the time of the Pascua-Lama silver stream are in Table 205 below and
were mined from the following sources: Canaccord Adams (Butler, et al., 2009), Credit Suisse (Gagliano,
et al., 2009), J.P. Morgan (Parekh, 2009), RBC Capital Markets (Walker, et al., 2009), Morgan Stanley
(Ravi, et al., 2009), Cormark Securities Inc. (Stein, et al., 2009), and National Bank Financial
(Jakusconek, et al., 2009).
Table 205: Consensus silver price estimates at the time of the Pascua-Lama silver stream
Consensus gold price estimates at the time of the Pascua-Lama silver stream are in Table 206 below and
were mined from the following sources: Canaccord Adams (Butler, et al., 2009), Credit Suisse (Gagliano,
et al., 2009), Societe Generale (William, et al., 2009), Scotia Capital (Christie, et al., 2009), Morgan
Stanley (Spencer, et al., 2009), J.P. Morgan Securities Inc. (Cooke, et al., 2009), RBC Capital Markets
(Esterhuizen, et al., 2009), Cormark Securities Inc. (Gagliano, et al., 2009), Raymond James Ltd.
(Jaworski, et al., 2009), TD Newcrest (Green, et al., 2009), and Deutsche Bank (Martin, et al., 2009).
Firm 2009 2010 2011 2012 2013 2014 LT
Canaccord Adams 14.10 16.50 15.50 14.50 14.00 14.00 14.00
Credit Suisse 16.14 17.80 11.67 11.67 11.67 11.67 11.67
J.P. Morgan Securities Inc. 13.90 13.40 10.50 10.00 10.00 10.00 10.00
RBC Capital Markets 13.25 13.50 13.00 13.00 13.00 13.00 13.00
Morgan Stanley 14.04 14.63 15.17 15.82 15.90 13.94 13.43
Cormark Securities Inc. 13.34 14.00 12.00
National Bank Financial 16.82 17.27 18.18 16.82 15.45 14.55 13.64
Median Price 14.04 14.63 13.00 13.75 13.50 13.47 13.22
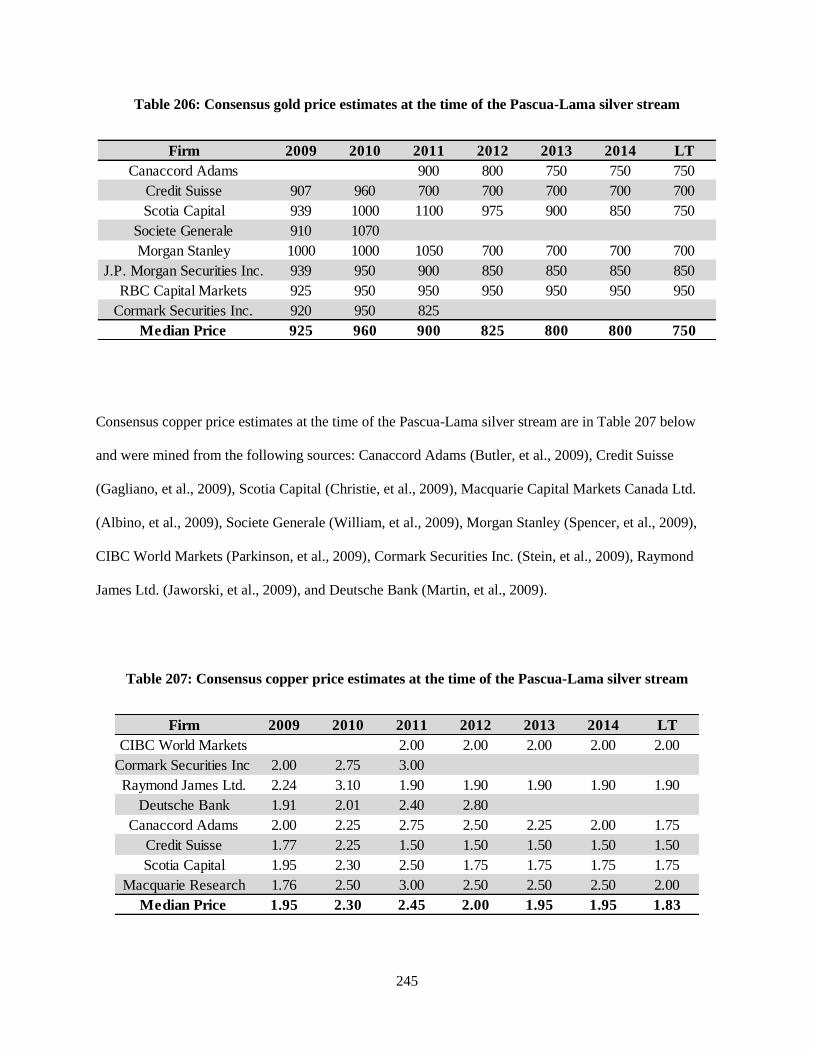
245
Table 206: Consensus gold price estimates at the time of the Pascua-Lama silver stream
Consensus copper price estimates at the time of the Pascua-Lama silver stream are in Table 207 below
and were mined from the following sources: Canaccord Adams (Butler, et al., 2009), Credit Suisse
(Gagliano, et al., 2009), Scotia Capital (Christie, et al., 2009), Macquarie Capital Markets Canada Ltd.
(Albino, et al., 2009), Societe Generale (William, et al., 2009), Morgan Stanley (Spencer, et al., 2009),
CIBC World Markets (Parkinson, et al., 2009), Cormark Securities Inc. (Stein, et al., 2009), Raymond
James Ltd. (Jaworski, et al., 2009), and Deutsche Bank (Martin, et al., 2009).
Table 207: Consensus copper price estimates at the time of the Pascua-Lama silver stream
Firm 2009 2010 2011 2012 2013 2014 LT
Canaccord Adams 900 800 750 750 750
Credit Suisse 907 960 700 700 700 700 700
Scotia Capital 939 1000 1100 975 900 850 750
Societe Generale 910 1070
Morgan Stanley 1000 1000 1050 700 700 700 700
J.P. Morgan Securities Inc. 939 950 900 850 850 850 850
RBC Capital Markets 925 950 950 950 950 950 950
Cormark Securities Inc. 920 950 825
Median Price 925 960 900 825 800 800 750
Firm 2009 2010 2011 2012 2013 2014 LT
CIBC World Markets 2.00 2.00 2.00 2.00 2.00
Cormark Securities Inc. 2.00 2.75 3.00
Raymond James Ltd. 2.24 3.10 1.90 1.90 1.90 1.90 1.90
Deutsche Bank 1.91 2.01 2.40 2.80
Canaccord Adams 2.00 2.25 2.75 2.50 2.25 2.00 1.75
Credit Suisse 1.77 2.25 1.50 1.50 1.50 1.50 1.50
Scotia Capital 1.95 2.30 2.50 1.75 1.75 1.75 1.75
Macquarie Research 1.76 2.50 3.00 2.50 2.50 2.50 2.00
Median Price 1.95 2.30 2.45 2.00 1.95 1.95 1.83
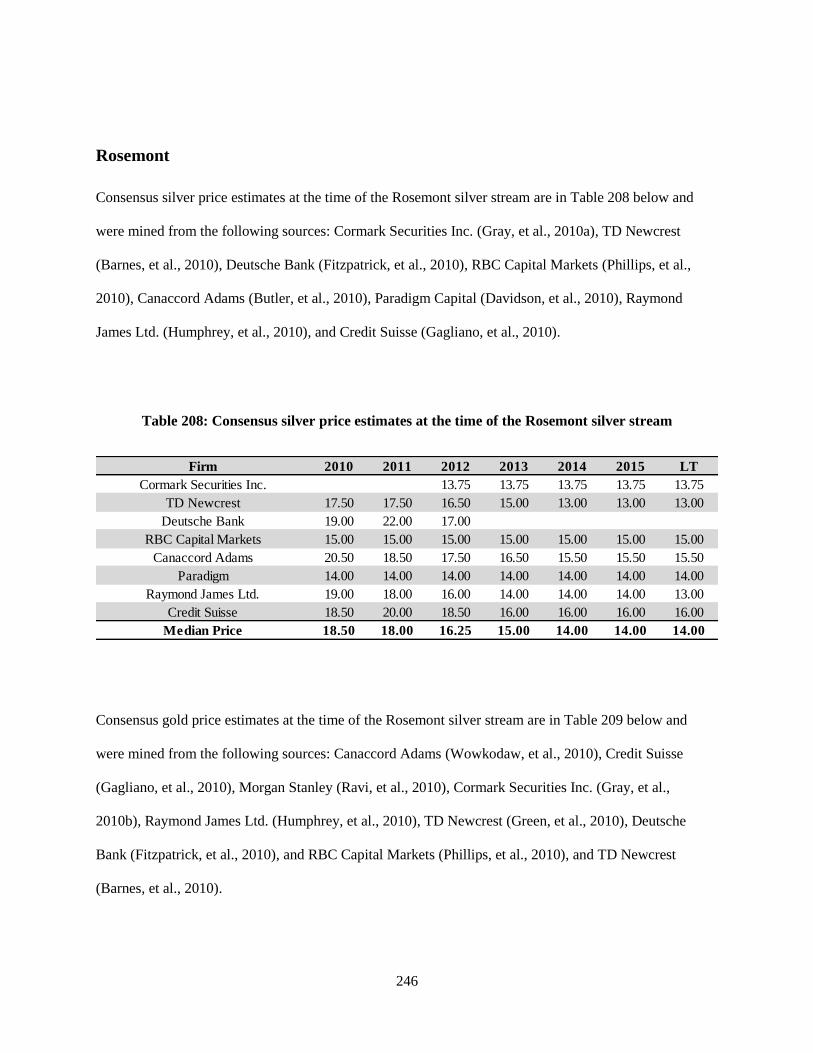
246
Rosemont
Consensus silver price estimates at the time of the Rosemont silver stream are in Table 208 below and
were mined from the following sources: Cormark Securities Inc. (Gray, et al., 2010a), TD Newcrest
(Barnes, et al., 2010), Deutsche Bank (Fitzpatrick, et al., 2010), RBC Capital Markets (Phillips, et al.,
2010), Canaccord Adams (Butler, et al., 2010), Paradigm Capital (Davidson, et al., 2010), Raymond
James Ltd. (Humphrey, et al., 2010), and Credit Suisse (Gagliano, et al., 2010).
Table 208: Consensus silver price estimates at the time of the Rosemont silver stream
Consensus gold price estimates at the time of the Rosemont silver stream are in Table 209 below and
were mined from the following sources: Canaccord Adams (Wowkodaw, et al., 2010), Credit Suisse
(Gagliano, et al., 2010), Morgan Stanley (Ravi, et al., 2010), Cormark Securities Inc. (Gray, et al.,
2010b), Raymond James Ltd. (Humphrey, et al., 2010), TD Newcrest (Green, et al., 2010), Deutsche
Bank (Fitzpatrick, et al., 2010), and RBC Capital Markets (Phillips, et al., 2010), and TD Newcrest
(Barnes, et al., 2010).
Firm 2010 2011 2012 2013 2014 2015 LT
Cormark Securities Inc. 13.75 13.75 13.75 13.75 13.75
TD Newcrest 17.50 17.50 16.50 15.00 13.00 13.00 13.00
Deutsche Bank 19.00 22.00 17.00
RBC Capital Markets 15.00 15.00 15.00 15.00 15.00 15.00 15.00
Canaccord Adams 20.50 18.50 17.50 16.50 15.50 15.50 15.50
Paradigm 14.00 14.00 14.00 14.00 14.00 14.00 14.00
Raymond James Ltd. 19.00 18.00 16.00 14.00 14.00 14.00 13.00
Credit Suisse 18.50 20.00 18.50 16.00 16.00 16.00 16.00
Median Price 18.50 18.00 16.25 15.00 14.00 14.00 14.00
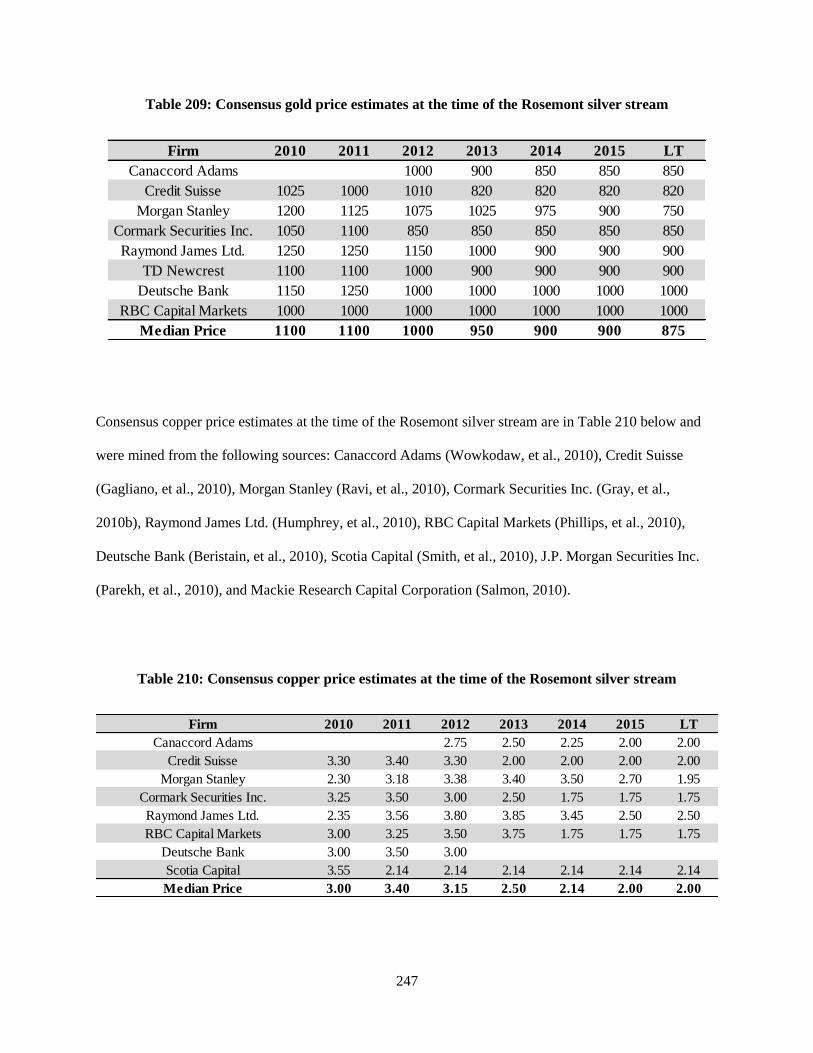
247
Table 209: Consensus gold price estimates at the time of the Rosemont silver stream
Consensus copper price estimates at the time of the Rosemont silver stream are in Table 210 below and
were mined from the following sources: Canaccord Adams (Wowkodaw, et al., 2010), Credit Suisse
(Gagliano, et al., 2010), Morgan Stanley (Ravi, et al., 2010), Cormark Securities Inc. (Gray, et al.,
2010b), Raymond James Ltd. (Humphrey, et al., 2010), RBC Capital Markets (Phillips, et al., 2010),
Deutsche Bank (Beristain, et al., 2010), Scotia Capital (Smith, et al., 2010), J.P. Morgan Securities Inc.
(Parekh, et al., 2010), and Mackie Research Capital Corporation (Salmon, 2010).
Table 210: Consensus copper price estimates at the time of the Rosemont silver stream
Firm 2010 2011 2012 2013 2014 2015 LT
Canaccord Adams 1000 900 850 850 850
Credit Suisse 1025 1000 1010 820 820 820 820
Morgan Stanley 1200 1125 1075 1025 975 900 750
Cormark Securities Inc. 1050 1100 850 850 850 850 850
Raymond James Ltd. 1250 1250 1150 1000 900 900 900
TD Newcrest 1100 1100 1000 900 900 900 900
Deutsche Bank 1150 1250 1000 1000 1000 1000 1000
RBC Capital Markets 1000 1000 1000 1000 1000 1000 1000
Median Price 1100 1100 1000 950 900 900 875
Firm 2010 2011 2012 2013 2014 2015 LT
Canaccord Adams 2.75 2.50 2.25 2.00 2.00
Credit Suisse 3.30 3.40 3.30 2.00 2.00 2.00 2.00
Morgan Stanley 2.30 3.18 3.38 3.40 3.50 2.70 1.95
Cormark Securities Inc. 3.25 3.50 3.00 2.50 1.75 1.75 1.75
Raymond James Ltd. 2.35 3.56 3.80 3.85 3.45 2.50 2.50
RBC Capital Markets 3.00 3.25 3.50 3.75 1.75 1.75 1.75
Deutsche Bank 3.00 3.50 3.00
Scotia Capital 3.55 2.14 2.14 2.14 2.14 2.14 2.14
Median Price 3.00 3.40 3.15 2.50 2.14 2.00 2.00
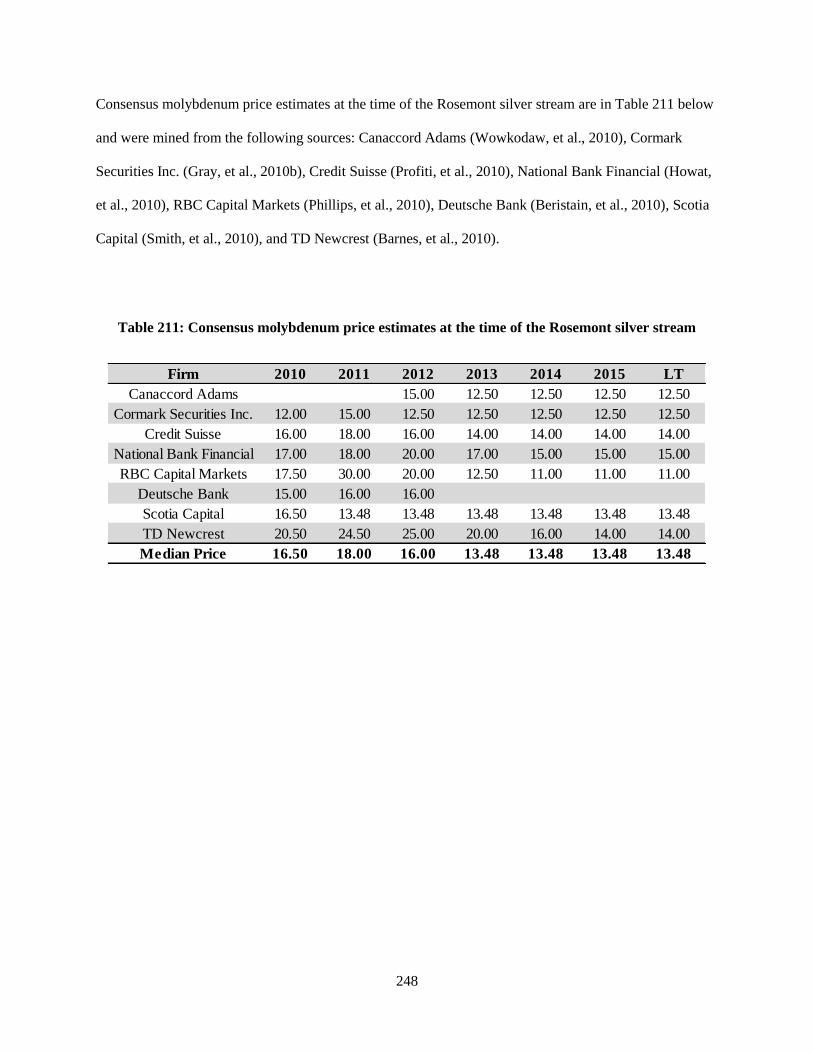
248
Consensus molybdenum price estimates at the time of the Rosemont silver stream are in Table 211 below
and were mined from the following sources: Canaccord Adams (Wowkodaw, et al., 2010), Cormark
Securities Inc. (Gray, et al., 2010b), Credit Suisse (Profiti, et al., 2010), National Bank Financial (Howat,
et al., 2010), RBC Capital Markets (Phillips, et al., 2010), Deutsche Bank (Beristain, et al., 2010), Scotia
Capital (Smith, et al., 2010), and TD Newcrest (Barnes, et al., 2010).
Table 211: Consensus molybdenum price estimates at the time of the Rosemont silver stream
Firm 2010 2011 2012 2013 2014 2015 LT
Canaccord Adams 15.00 12.50 12.50 12.50 12.50
Cormark Securities Inc. 12.00 15.00 12.50 12.50 12.50 12.50 12.50
Credit Suisse 16.00 18.00 16.00 14.00 14.00 14.00 14.00
National Bank Financial 17.00 18.00 20.00 17.00 15.00 15.00 15.00
RBC Capital Markets 17.50 30.00 20.00 12.50 11.00 11.00 11.00
Deutsche Bank 15.00 16.00 16.00
Scotia Capital 16.50 13.48 13.48 13.48 13.48 13.48 13.48
TD Newcrest 20.50 24.50 25.00 20.00 16.00 14.00 14.00
Median Price 16.50 18.00 16.00 13.48 13.48 13.48 13.48
249
Appendix D
Calculation of Silver Wheaton Stream Cash Flows for 2012, Going Forward
Stream cash flows in this chapter have been developed in accordance with the process and procedures that
were previously outlined in Section 4.3 with the exception of two assumptions:
In the event that the latest technical report for any underlying mine/project was published prior to
2010, the latest proven and probable reserve tonnage and grades published on the Silver Wheaton
website (effective date of December 31, 2011) were taken for modelling purposes. Furthermore,
recovery factors and throughputs from the latest technical report were assumed for the purpose of
the cash flow model development. This was the case with three mines in particular; Neves-
Corvo, Aljustrel, and Los Filos.
None of the project/mines underlying Silver Wheaton’s streams will close or ramp down
production within the LOM forecasted in the various technical reports and/or based on respective
proven and probable reserves published by Silver Wheaton.
The following sections will present the cash flow models of each silver stream from 2012 going forward,
as well as their associated input parameters and any assumptions made in their development.
It should be noted that a flat silver price of US$30.00/oz was chosen for 2012 and onwards for the
purpose of presenting these cash flow models. The primary purpose of this appendix is to exhibit the
silver production models that underlie the cash flow models; varying silver price series were applied to
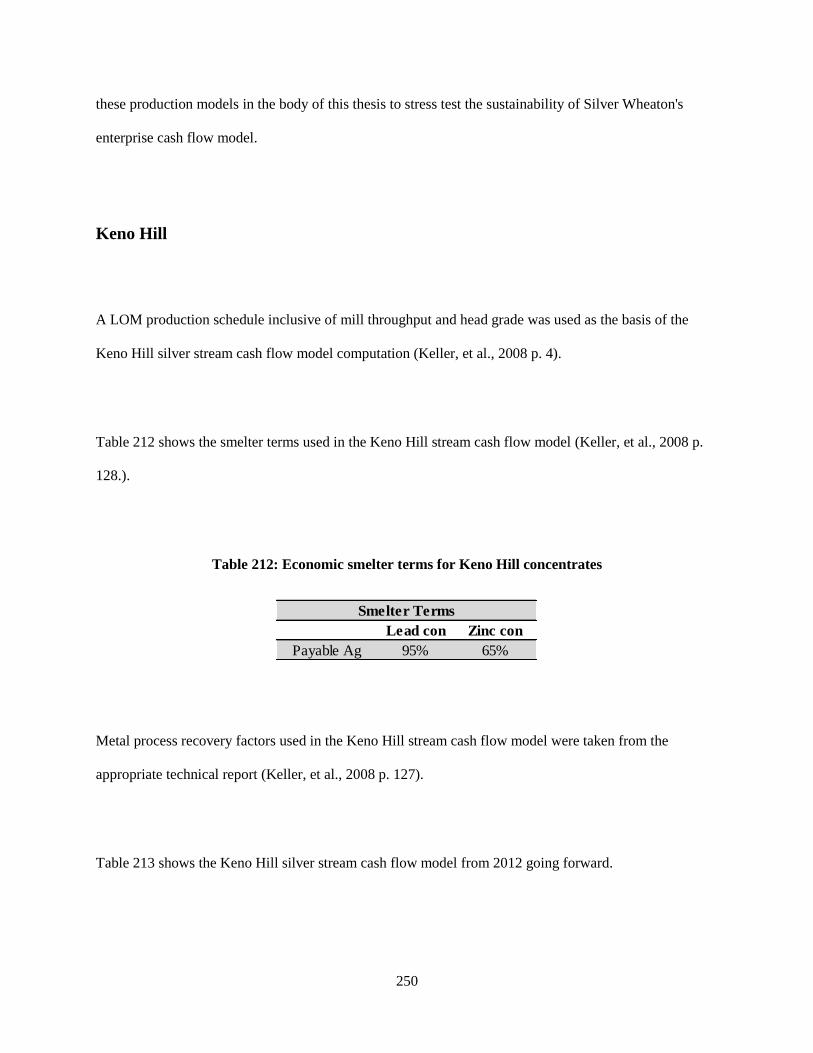
250
these production models in the body of this thesis to stress test the sustainability of Silver Wheaton's
enterprise cash flow model.
Keno Hill
A LOM production schedule inclusive of mill throughput and head grade was used as the basis of the
Keno Hill silver stream cash flow model computation (Keller, et al., 2008 p. 4).
Table 212 shows the smelter terms used in the Keno Hill stream cash flow model (Keller, et al., 2008 p.
128.).
Table 212: Economic smelter terms for Keno Hill concentrates
Metal process recovery factors used in the Keno Hill stream cash flow model were taken from the
appropriate technical report (Keller, et al., 2008 p. 127).
Table 213 shows the Keno Hill silver stream cash flow model from 2012 going forward.
Lead con Zinc con
Payable Ag 95% 65%
Smelter Terms
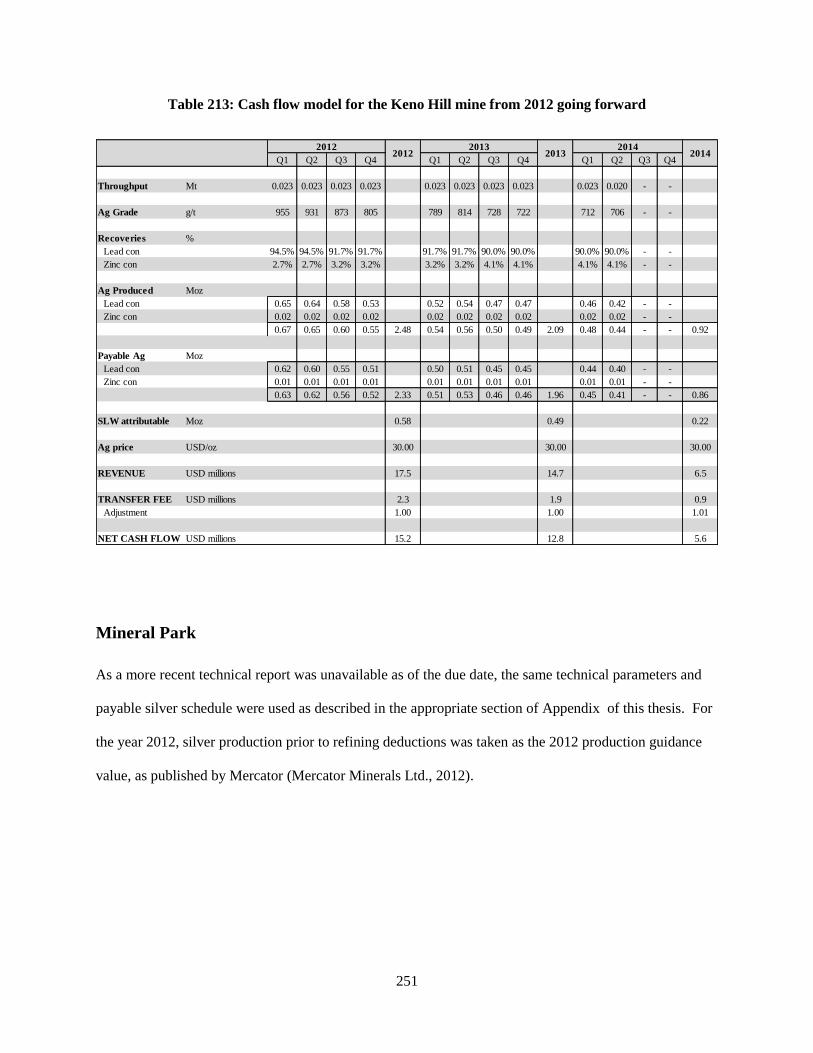
251
Table 213: Cash flow model for the Keno Hill mine from 2012 going forward
Mineral Park
As a more recent technical report was unavailable as of the due date, the same technical parameters and
payable silver schedule were used as described in the appropriate section of Appendix of this thesis. For
the year 2012, silver production prior to refining deductions was taken as the 2012 production guidance
value, as published by Mercator (Mercator Minerals Ltd., 2012).
Q1 Q2 Q3 Q4 Q1 Q2 Q3 Q4 Q1 Q2 Q3 Q4
Throughput Mt 0.023 0.023 0.023 0.023 0.023 0.023 0.023 0.023 0.023 0.020 - -
Ag Grade g/t 955 931 873 805 789 814 728 722 712 706 - -
Recoveries %
Lead con 94.5% 94.5% 91.7% 91.7% 91.7% 91.7% 90.0% 90.0% 90.0% 90.0% - -
Zinc con 2.7% 2.7% 3.2% 3.2% 3.2% 3.2% 4.1% 4.1% 4.1% 4.1% - -
Ag Produced Moz
Lead con 0.65 0.64 0.58 0.53 0.52 0.54 0.47 0.47 0.46 0.42 - -
Zinc con 0.02 0.02 0.02 0.02 0.02 0.02 0.02 0.02 0.02 0.02 - -
0.67 0.65 0.60 0.55 2.48 0.54 0.56 0.50 0.49 2.09 0.48 0.44 - - 0.92
Payable Ag Moz
Lead con 0.62 0.60 0.55 0.51 0.50 0.51 0.45 0.45 0.44 0.40 - -
Zinc con 0.01 0.01 0.01 0.01 0.01 0.01 0.01 0.01 0.01 0.01 - -
0.63 0.62 0.56 0.52 2.33 0.51 0.53 0.46 0.46 1.96 0.45 0.41 - - 0.86
SLW attributable Moz 0.58 0.49 0.22
Ag price USD/oz 30.00 30.00 30.00
REVENUE USD millions 17.5 14.7 6.5
TRANSFER FEE USD millions 2.3 1.9 0.9
Adjustment 1.00 1.00 1.01
NET CASH FLOW USD millions 15.2 12.8 5.6
2013 201420142013
20122012
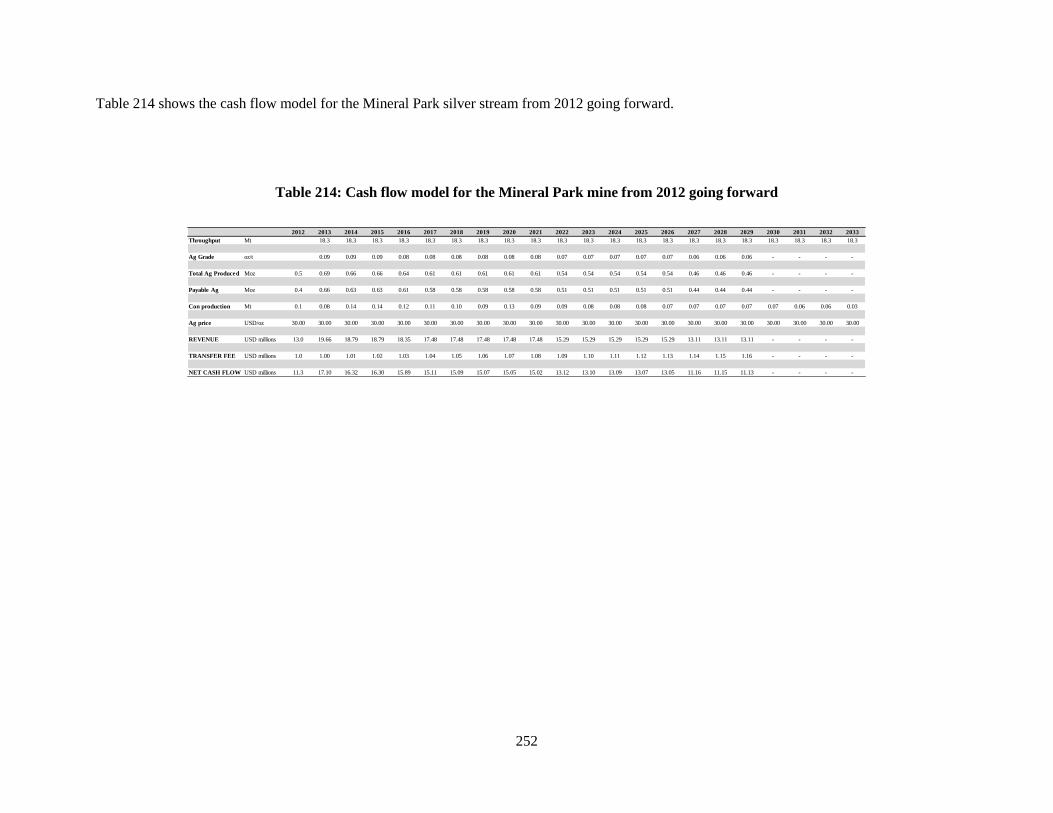
252
Table 214 shows the cash flow model for the Mineral Park silver stream from 2012 going forward.
Table 214: Cash flow model for the Mineral Park mine from 2012 going forward
2012 2013 2014 2015 2016 2017 2018 2019 2020 2021 2022 2023 2024 2025 2026 2027 2028 2029 2030 2031 2032 2033
Throughput Mt 18.3 18.3 18.3 18.3 18.3 18.3 18.3 18.3 18.3 18.3 18.3 18.3 18.3 18.3 18.3 18.3 18.3 18.3 18.3 18.3 18.3
Ag Grade oz/t 0.09 0.09 0.09 0.08 0.08 0.08 0.08 0.08 0.08 0.07 0.07 0.07 0.07 0.07 0.06 0.06 0.06 - - - -
Total Ag Produced Moz 0.5 0.69 0.66 0.66 0.64 0.61 0.61 0.61 0.61 0.61 0.54 0.54 0.54 0.54 0.54 0.46 0.46 0.46 - - - -
Payable Ag Moz 0.4 0.66 0.63 0.63 0.61 0.58 0.58 0.58 0.58 0.58 0.51 0.51 0.51 0.51 0.51 0.44 0.44 0.44 - - - -
Con production Mt 0.1 0.08 0.14 0.14 0.12 0.11 0.10 0.09 0.13 0.09 0.09 0.08 0.08 0.08 0.07 0.07 0.07 0.07 0.07 0.06 0.06 0.03
Ag price USD/oz 30.00 30.00 30.00 30.00 30.00 30.00 30.00 30.00 30.00 30.00 30.00 30.00 30.00 30.00 30.00 30.00 30.00 30.00 30.00 30.00 30.00 30.00
REVENUE USD millions 13.0 19.66 18.79 18.79 18.35 17.48 17.48 17.48 17.48 17.48 15.29 15.29 15.29 15.29 15.29 13.11 13.11 13.11 - - - -
TRANSFER FEE USD millions 1.0 1.00 1.01 1.02 1.03 1.04 1.05 1.06 1.07 1.08 1.09 1.10 1.11 1.12 1.13 1.14 1.15 1.16 - - - -
NET CASH FLOW USD millions 11.3 17.10 16.32 16.30 15.89 15.11 15.09 15.07 15.05 15.02 13.12 13.10 13.09 13.07 13.05 11.16 11.15 11.13 - - - -
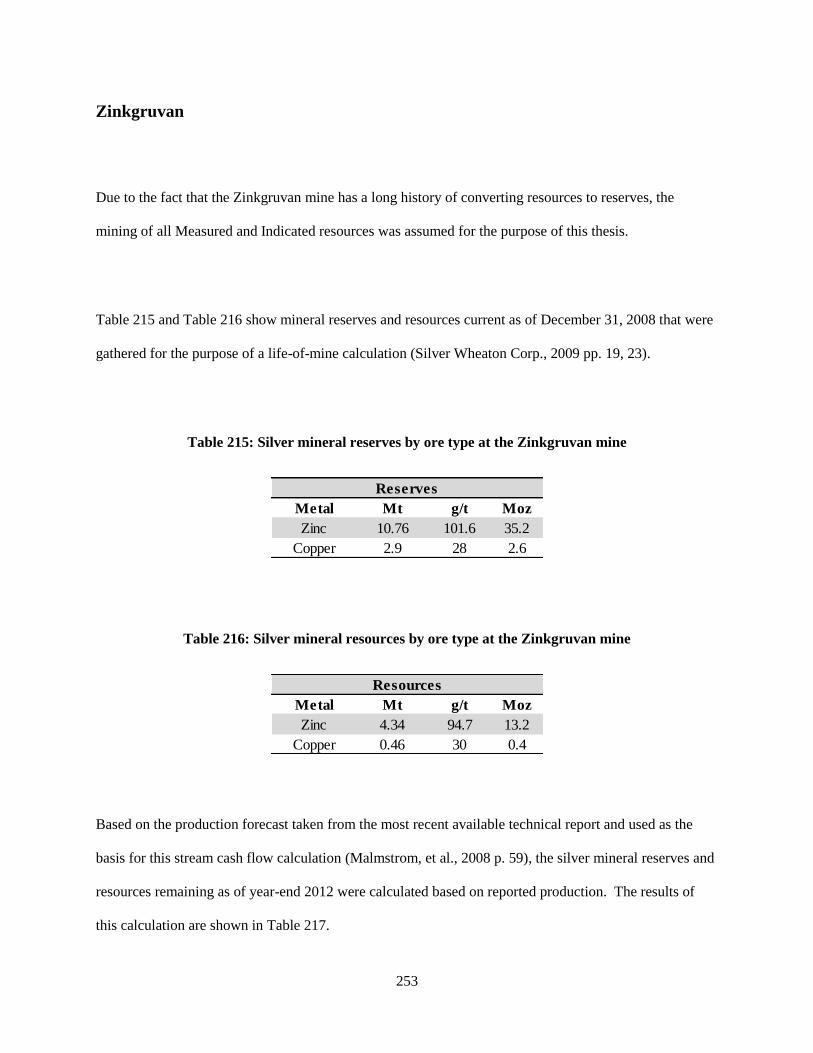
253
Zinkgruvan
Due to the fact that the Zinkgruvan mine has a long history of converting resources to reserves, the
mining of all Measured and Indicated resources was assumed for the purpose of this thesis.
Table 215 and Table 216 show mineral reserves and resources current as of December 31, 2008 that were
gathered for the purpose of a life-of-mine calculation (Silver Wheaton Corp., 2009 pp. 19, 23).
Table 215: Silver mineral reserves by ore type at the Zinkgruvan mine
Table 216: Silver mineral resources by ore type at the Zinkgruvan mine
Based on the production forecast taken from the most recent available technical report and used as the
basis for this stream cash flow calculation (Malmstrom, et al., 2008 p. 59), the silver mineral reserves and
resources remaining as of year-end 2012 were calculated based on reported production. The results of
this calculation are shown in Table 217.
Metal Mt g/t Moz
Zinc 10.76 101.6 35.2
Copper 2.9 28 2.6
Reserves
Metal Mt g/t Moz
Zinc 4.34 94.7 13.2
Copper 0.46 30 0.4
Resources
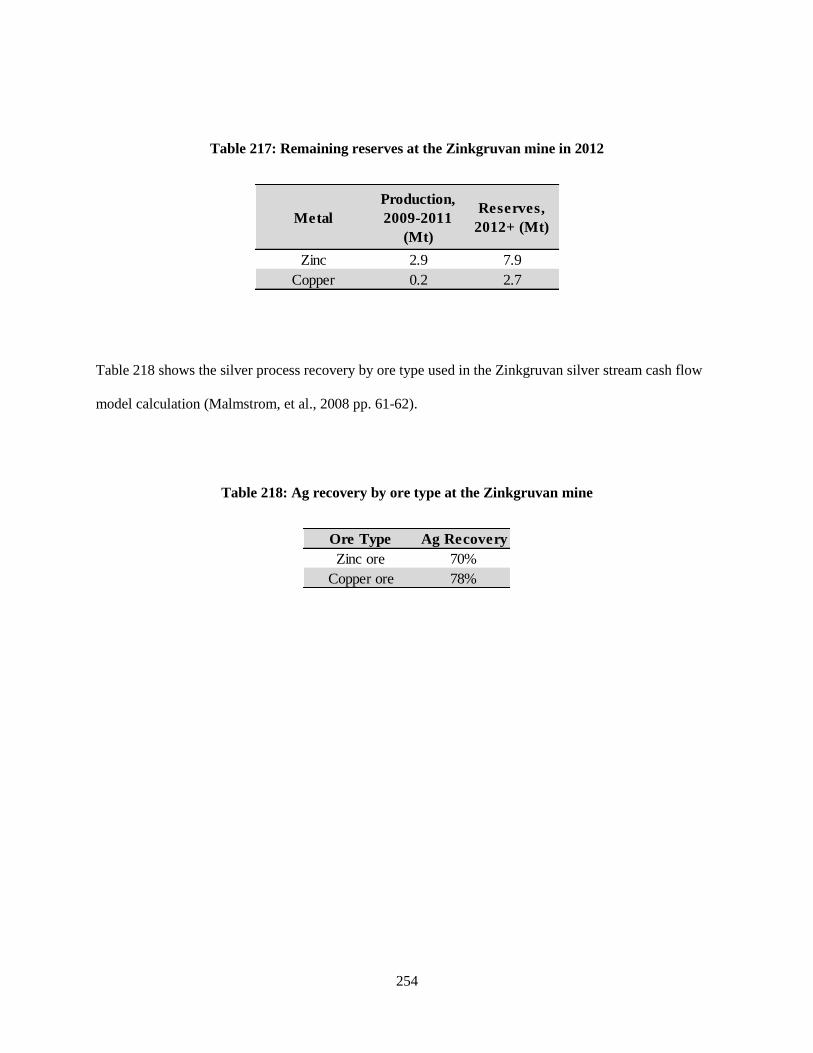
254
Table 217: Remaining reserves at the Zinkgruvan mine in 2012
Table 218 shows the silver process recovery by ore type used in the Zinkgruvan silver stream cash flow
model calculation (Malmstrom, et al., 2008 pp. 61-62).
Table 218: Ag recovery by ore type at the Zinkgruvan mine
Metal
Production,
2009-2011
(Mt)
Reserves,
2012+ (Mt)
Zinc 2.9 7.9
Copper 0.2 2.7
Ore Type Ag Recovery
Zinc ore 70%
Copper ore 78%
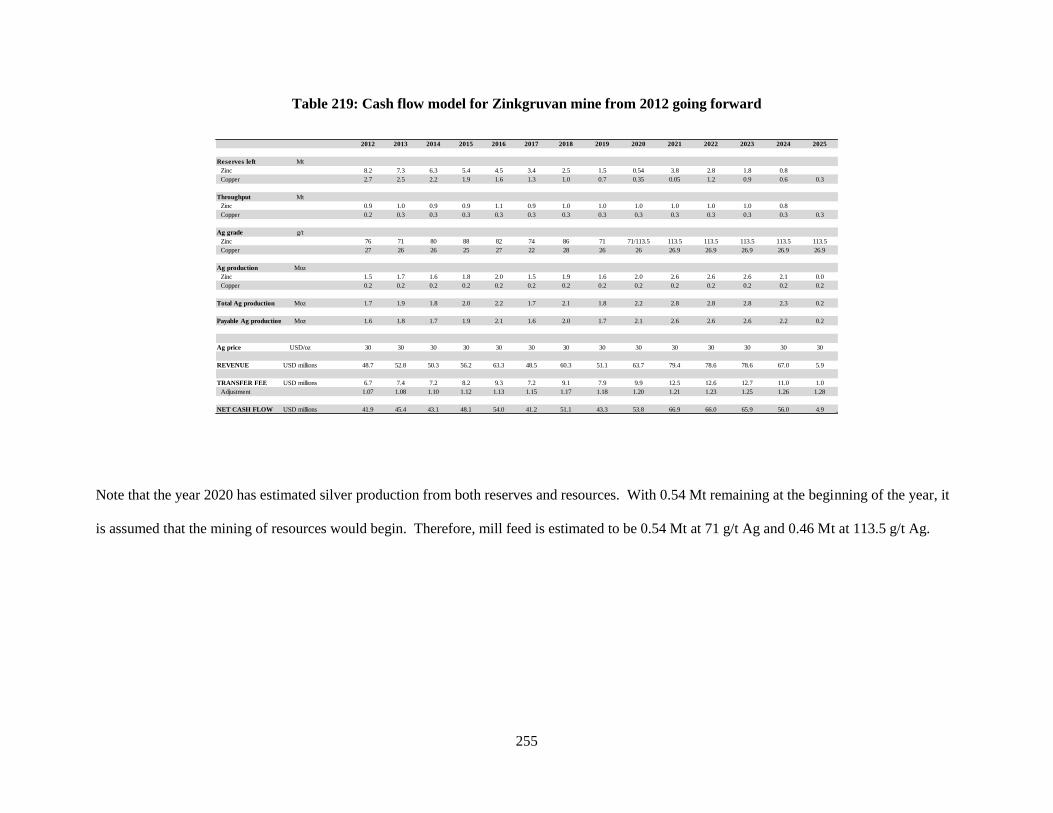
255
Table 219: Cash flow model for Zinkgruvan mine from 2012 going forward
Note that the year 2020 has estimated silver production from both reserves and resources. With 0.54 Mt remaining at the beginning of the year, it
is assumed that the mining of resources would begin. Therefore, mill feed is estimated to be 0.54 Mt at 71 g/t Ag and 0.46 Mt at 113.5 g/t Ag.
2012 2013 2014 2015 2016 2017 2018 2019 2020 2021 2022 2023 2024 2025
Reserves left Mt
Zinc 8.2 7.3 6.3 5.4 4.5 3.4 2.5 1.5 0.54 3.8 2.8 1.8 0.8
Copper 2.7 2.5 2.2 1.9 1.6 1.3 1.0 0.7 0.35 0.05 1.2 0.9 0.6 0.3
Throughput Mt
Zinc 0.9 1.0 0.9 0.9 1.1 0.9 1.0 1.0 1.0 1.0 1.0 1.0 0.8
Copper 0.2 0.3 0.3 0.3 0.3 0.3 0.3 0.3 0.3 0.3 0.3 0.3 0.3 0.3
Ag grade g/t
Zinc 76 71 80 88 82 74 86 71 71/113.5 113.5 113.5 113.5 113.5 113.5
Copper 27 26 26 25 27 22 28 26 26 26.9 26.9 26.9 26.9 26.9
Ag production Moz
Zinc 1.5 1.7 1.6 1.8 2.0 1.5 1.9 1.6 2.0 2.6 2.6 2.6 2.1 0.0
Copper 0.2 0.2 0.2 0.2 0.2 0.2 0.2 0.2 0.2 0.2 0.2 0.2 0.2 0.2
Total Ag production Moz 1.7 1.9 1.8 2.0 2.2 1.7 2.1 1.8 2.2 2.8 2.8 2.8 2.3 0.2
Payable Ag production Moz 1.6 1.8 1.7 1.9 2.1 1.6 2.0 1.7 2.1 2.6 2.6 2.6 2.2 0.2
Ag price USD/oz 30 30 30 30 30 30 30 30 30 30 30 30 30 30
REVENUE USD millions 48.7 52.8 50.3 56.2 63.3 48.5 60.3 51.1 63.7 79.4 78.6 78.6 67.0 5.9
TRANSFER FEE USD millions 6.7 7.4 7.2 8.2 9.3 7.2 9.1 7.9 9.9 12.5 12.6 12.7 11.0 1.0
Adjustment 1.07 1.08 1.10 1.12 1.13 1.15 1.17 1.18 1.20 1.21 1.23 1.25 1.26 1.28
NET CASH FLOW USD millions 41.9 45.4 43.1 48.1 54.0 41.2 51.1 43.3 53.8 66.9 66.0 65.9 56.0 4.9
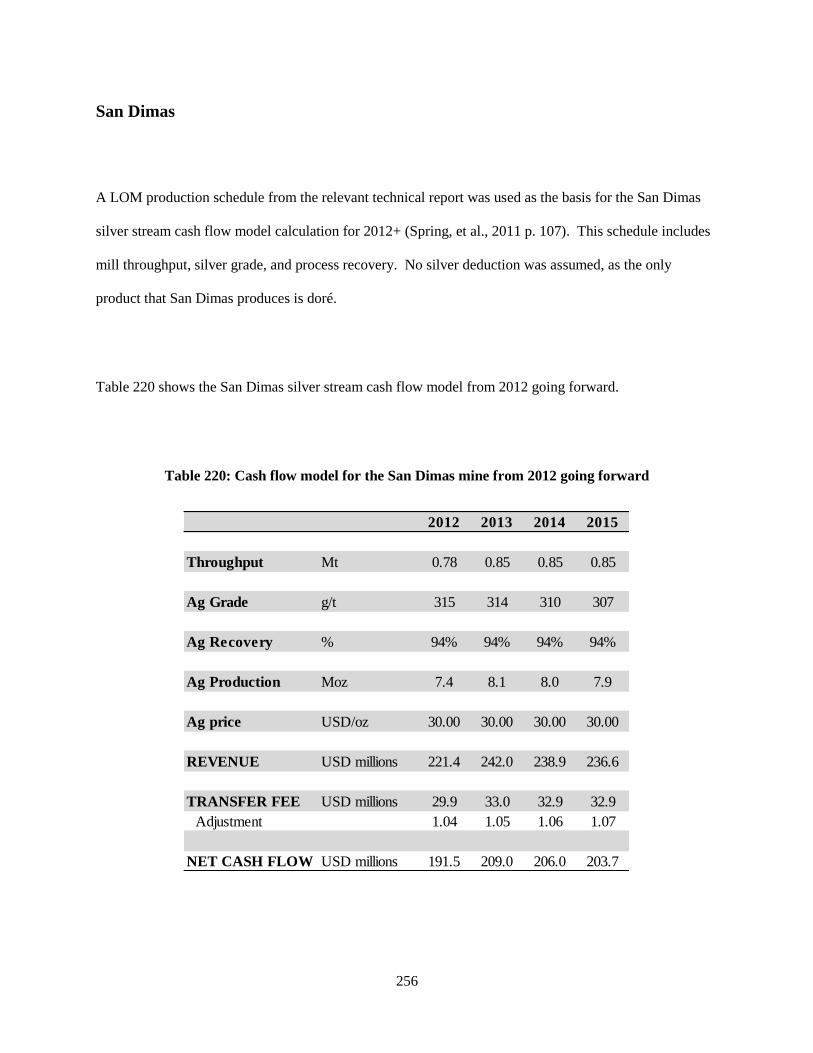
256
San Dimas
A LOM production schedule from the relevant technical report was used as the basis for the San Dimas
silver stream cash flow model calculation for 2012+ (Spring, et al., 2011 p. 107). This schedule includes
mill throughput, silver grade, and process recovery. No silver deduction was assumed, as the only
product that San Dimas produces is doré.
Table 220 shows the San Dimas silver stream cash flow model from 2012 going forward.
Table 220: Cash flow model for the San Dimas mine from 2012 going forward
2012 2013 2014 2015
Throughput Mt 0.78 0.85 0.85 0.85
Ag Grade g/t 315 314 310 307
Ag Recovery % 94% 94% 94% 94%
Ag Production Moz 7.4 8.1 8.0 7.9
Ag price USD/oz 30.00 30.00 30.00 30.00
REVENUE USD millions 221.4 242.0 238.9 236.6
TRANSFER FEE USD millions 29.9 33.0 32.9 32.9
Adjustment 1.04 1.05 1.06 1.07
NET CASH FLOW USD millions 191.5 209.0 206.0 203.7
257
Loma de la Plata
A LOM production schedule was used as the basis for the Loma de La Plata silver stream cash flow
model (M3 Engineering & Technology Corporation, 2011 p. 125). As well, a silver process recovery of
72% was used in this cash flow model (M3 Engineering & Technology Corporation, 2011 p. 69). A
payable silver factor of 96.5% was used, as well (M3 Engineering & Technology Corporation, 2011 p.
154).
The following assumptions were made in the development of the Loma de La Plata stream cash flow
model:
that low grade stockpile is processed and sold in last five years;
that quoted silver grades are from copper-silver ore grades;
that quoted smelter terms applicable to Loma de La Plata are those for the copper-silver
concentrate.
Finally, no concentrate production schedule was published and there was thus no information to base the
silver deduction on. Therefore, no silver deduction was assumed in the model.
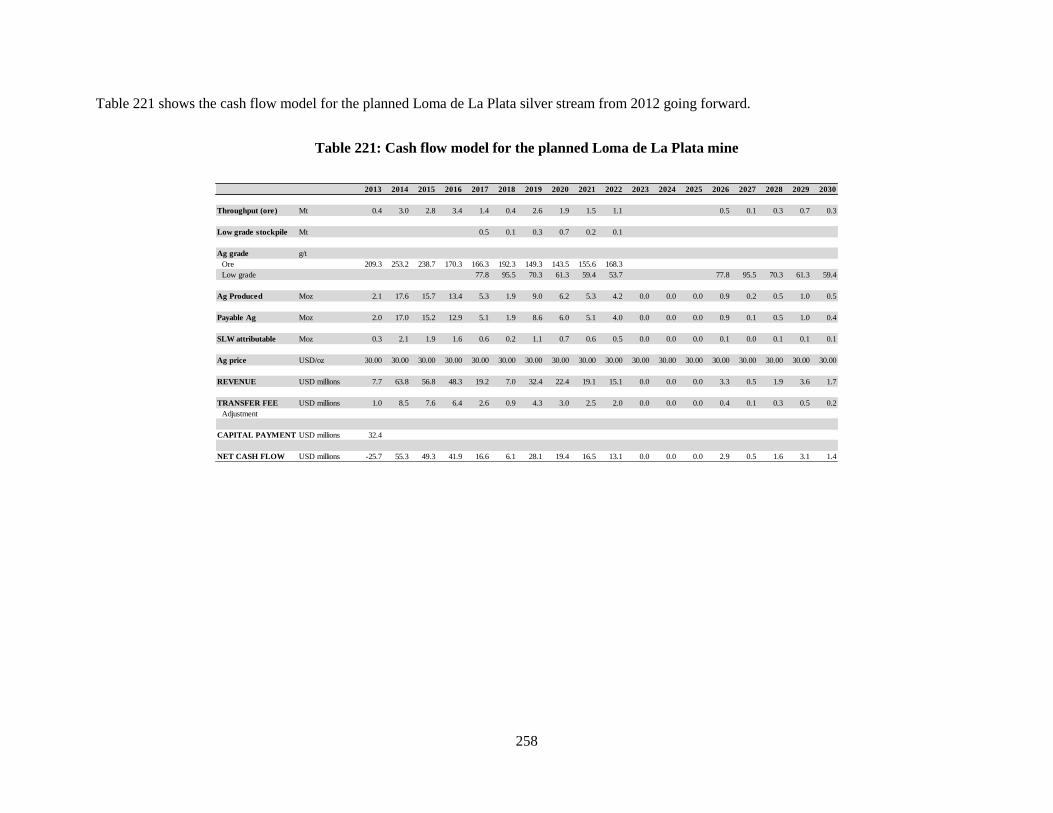
258
Table 221 shows the cash flow model for the planned Loma de La Plata silver stream from 2012 going forward.
Table 221: Cash flow model for the planned Loma de La Plata mine
2013 2014 2015 2016 2017 2018 2019 2020 2021 2022 2023 2024 2025 2026 2027 2028 2029 2030
Throughput (ore) Mt 0.4 3.0 2.8 3.4 1.4 0.4 2.6 1.9 1.5 1.1 0.5 0.1 0.3 0.7 0.3
Low grade stockpile Mt 0.5 0.1 0.3 0.7 0.2 0.1
Ag grade g/t
Ore 209.3 253.2 238.7 170.3 166.3 192.3 149.3 143.5 155.6 168.3
Low grade 77.8 95.5 70.3 61.3 59.4 53.7 77.8 95.5 70.3 61.3 59.4
Ag Produced Moz 2.1 17.6 15.7 13.4 5.3 1.9 9.0 6.2 5.3 4.2 0.0 0.0 0.0 0.9 0.2 0.5 1.0 0.5
Payable Ag Moz 2.0 17.0 15.2 12.9 5.1 1.9 8.6 6.0 5.1 4.0 0.0 0.0 0.0 0.9 0.1 0.5 1.0 0.4
SLW attributable Moz 0.3 2.1 1.9 1.6 0.6 0.2 1.1 0.7 0.6 0.5 0.0 0.0 0.0 0.1 0.0 0.1 0.1 0.1
Ag price USD/oz 30.00 30.00 30.00 30.00 30.00 30.00 30.00 30.00 30.00 30.00 30.00 30.00 30.00 30.00 30.00 30.00 30.00 30.00
REVENUE USD millions 7.7 63.8 56.8 48.3 19.2 7.0 32.4 22.4 19.1 15.1 0.0 0.0 0.0 3.3 0.5 1.9 3.6 1.7
TRANSFER FEE USD millions 1.0 8.5 7.6 6.4 2.6 0.9 4.3 3.0 2.5 2.0 0.0 0.0 0.0 0.4 0.1 0.3 0.5 0.2
Adjustment
CAPITAL PAYMENT USD millions 32.4
NET CASH FLOW USD millions -25.7 55.3 49.3 41.9 16.6 6.1 28.1 19.4 16.5 13.1 0.0 0.0 0.0 2.9 0.5 1.6 3.1 1.4
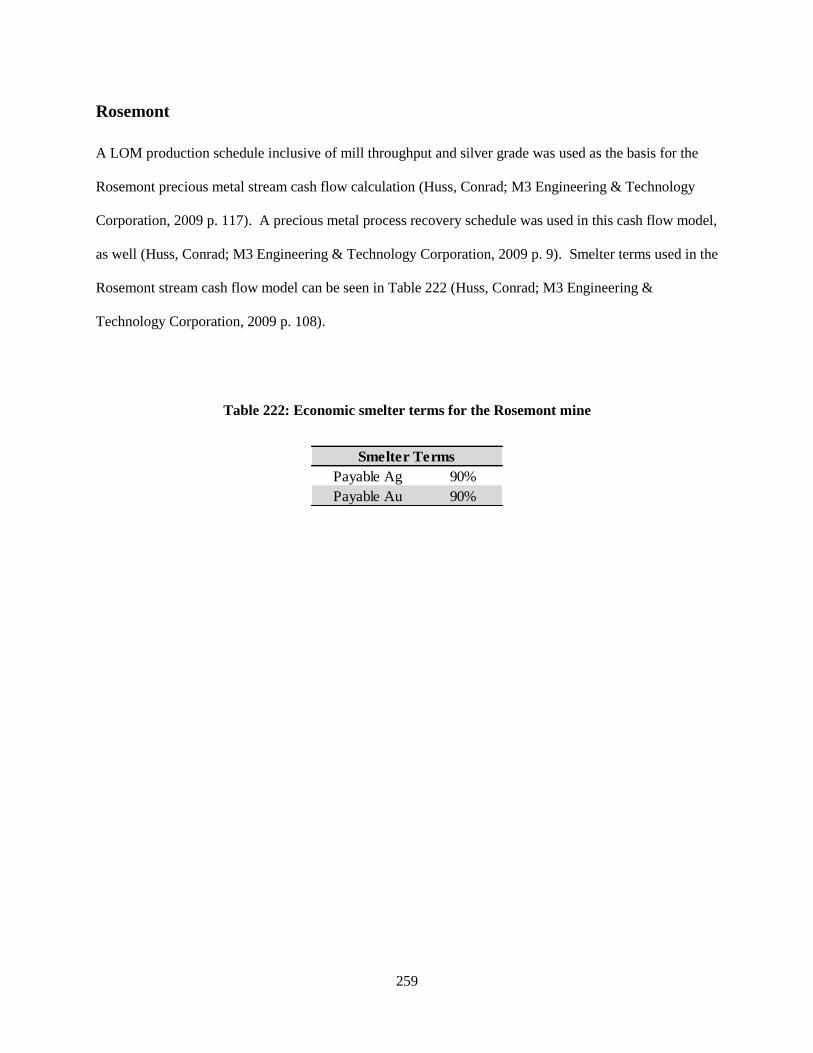
259
Rosemont
A LOM production schedule inclusive of mill throughput and silver grade was used as the basis for the
Rosemont precious metal stream cash flow calculation (Huss, Conrad; M3 Engineering & Technology
Corporation, 2009 p. 117). A precious metal process recovery schedule was used in this cash flow model,
as well (Huss, Conrad; M3 Engineering & Technology Corporation, 2009 p. 9). Smelter terms used in the
Rosemont stream cash flow model can be seen in Table 222 (Huss, Conrad; M3 Engineering &
Technology Corporation, 2009 p. 108).
Table 222: Economic smelter terms for the Rosemont mine
Payable Ag 90%
Payable Au 90%
Smelter Terms
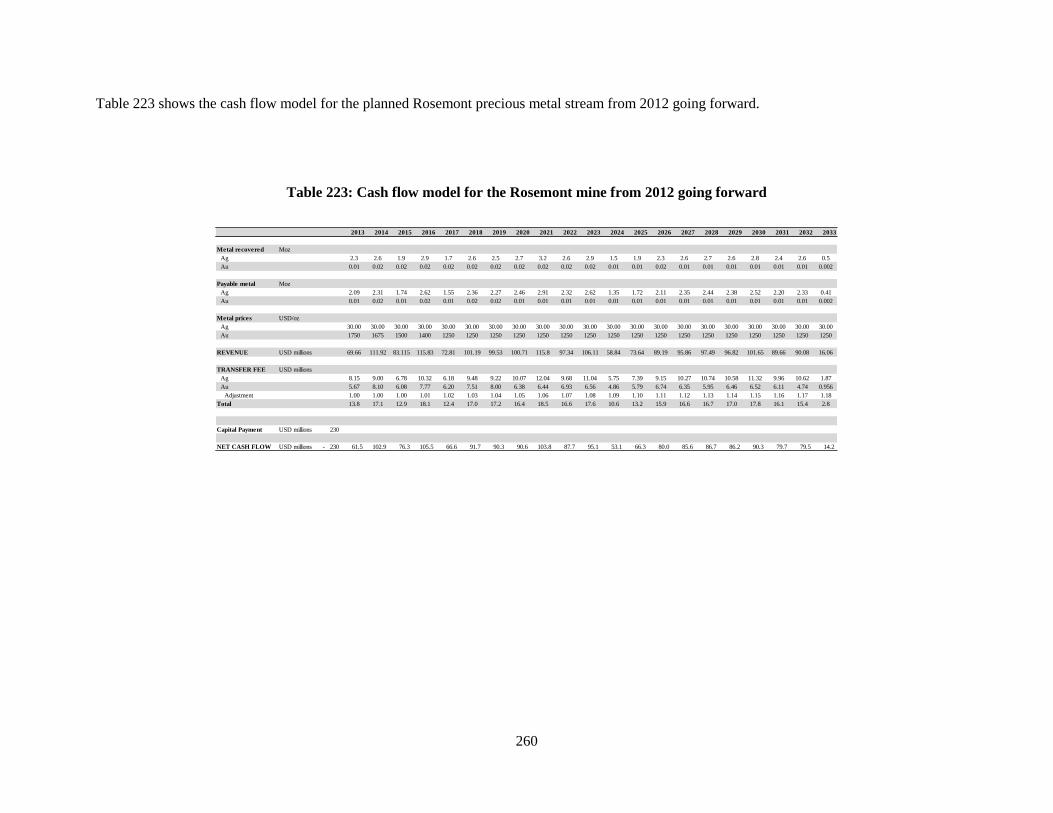
260
Table 223 shows the cash flow model for the planned Rosemont precious metal stream from 2012 going forward.
Table 223: Cash flow model for the Rosemont mine from 2012 going forward
2013 2014 2015 2016 2017 2018 2019 2020 2021 2022 2023 2024 2025 2026 2027 2028 2029 2030 2031 2032 2033
Metal recovered Moz
Ag 2.3 2.6 1.9 2.9 1.7 2.6 2.5 2.7 3.2 2.6 2.9 1.5 1.9 2.3 2.6 2.7 2.6 2.8 2.4 2.6 0.5
Au 0.01 0.02 0.02 0.02 0.02 0.02 0.02 0.02 0.02 0.02 0.02 0.01 0.01 0.02 0.01 0.01 0.01 0.01 0.01 0.01 0.002
Payable metal Moz
Ag 2.09 2.31 1.74 2.62 1.55 2.36 2.27 2.46 2.91 2.32 2.62 1.35 1.72 2.11 2.35 2.44 2.38 2.52 2.20 2.33 0.41
Au 0.01 0.02 0.01 0.02 0.01 0.02 0.02 0.01 0.01 0.01 0.01 0.01 0.01 0.01 0.01 0.01 0.01 0.01 0.01 0.01 0.002
Metal prices USD/oz
Ag 30.00 30.00 30.00 30.00 30.00 30.00 30.00 30.00 30.00 30.00 30.00 30.00 30.00 30.00 30.00 30.00 30.00 30.00 30.00 30.00 30.00
Au 1750 1675 1500 1400 1250 1250 1250 1250 1250 1250 1250 1250 1250 1250 1250 1250 1250 1250 1250 1250 1250
REVENUE USD millions 69.66 111.92 83.115 115.83 72.81 101.19 99.53 100.71 115.8 97.34 106.11 58.84 73.64 89.19 95.86 97.49 96.82 101.65 89.66 90.08 16.06
TRANSFER FEE USD millions
Ag 8.15 9.00 6.78 10.32 6.18 9.48 9.22 10.07 12.04 9.68 11.04 5.75 7.39 9.15 10.27 10.74 10.58 11.32 9.96 10.62 1.87
Au 5.67 8.10 6.08 7.77 6.20 7.51 8.00 6.38 6.44 6.93 6.56 4.86 5.79 6.74 6.35 5.95 6.46 6.52 6.11 4.74 0.956
Adjustment 1.00 1.00 1.00 1.01 1.02 1.03 1.04 1.05 1.06 1.07 1.08 1.09 1.10 1.11 1.12 1.13 1.14 1.15 1.16 1.17 1.18
Total 13.8 17.1 12.9 18.1 12.4 17.0 17.2 16.4 18.5 16.6 17.6 10.6 13.2 15.9 16.6 16.7 17.0 17.8 16.1 15.4 2.8
Capital Payment USD millions 230
NET CASH FLOW USD millions 230- 61.5 102.9 76.3 105.5 66.6 91.7 90.3 90.6 103.8 87.7 95.1 53.1 66.3 80.0 85.6 86.7 86.2 90.3 79.7 79.5 14.2
261
Yauliyacu
A LOM production schedule inclusive of throughput, silver grades, and recoveries to concentrate for the
various ore types was used as the basis for the Yauliyacu silver stream cash flow model (Burns, et al.,
2011 p. 102). Additionally, a payable silver factor of 95% was assumed in this model in the absence of
published data in Burns et al. Table 224 shows the cash flow model for the planned Yauliyacu silver
stream from 2012 going forward.
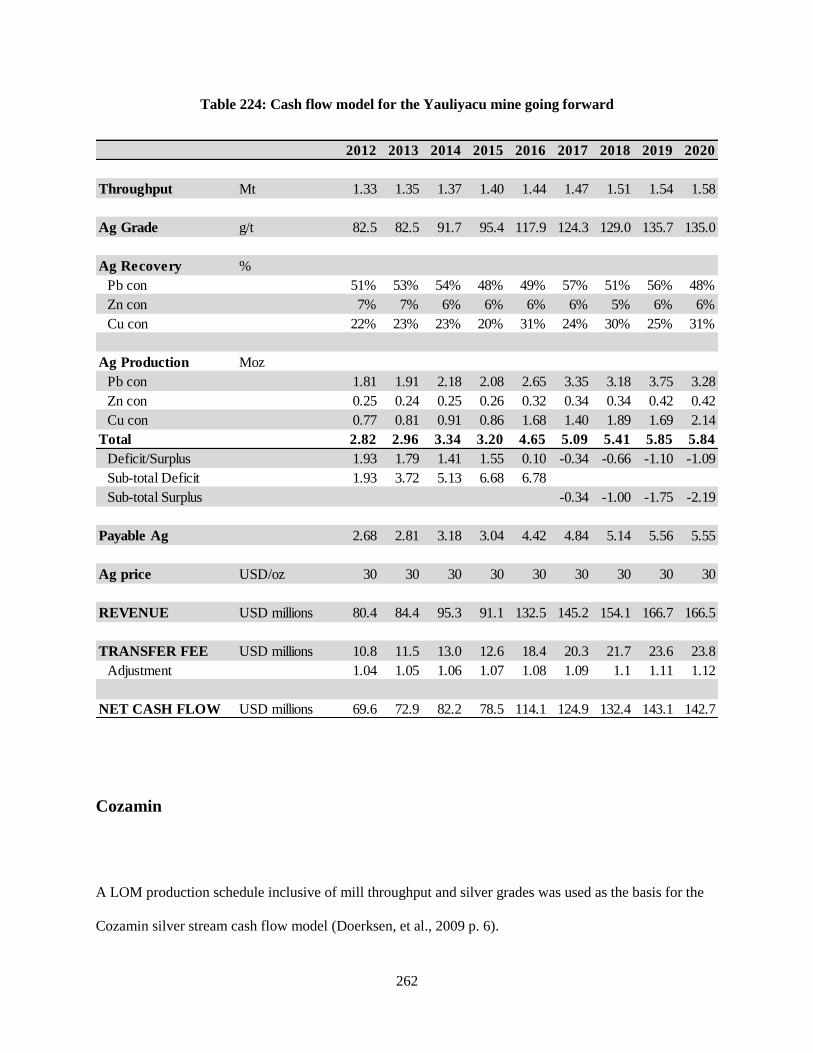
262
Table 224: Cash flow model for the Yauliyacu mine going forward
Cozamin
A LOM production schedule inclusive of mill throughput and silver grades was used as the basis for the
Cozamin silver stream cash flow model (Doerksen, et al., 2009 p. 6).
2012 2013 2014 2015 2016 2017 2018 2019 2020
Throughput Mt 1.33 1.35 1.37 1.40 1.44 1.47 1.51 1.54 1.58
Ag Grade g/t 82.5 82.5 91.7 95.4 117.9 124.3 129.0 135.7 135.0
Ag Recovery %
Pb con 51% 53% 54% 48% 49% 57% 51% 56% 48%
Zn con 7% 7% 6% 6% 6% 6% 5% 6% 6%
Cu con 22% 23% 23% 20% 31% 24% 30% 25% 31%
Ag Production Moz
Pb con 1.81 1.91 2.18 2.08 2.65 3.35 3.18 3.75 3.28
Zn con 0.25 0.24 0.25 0.26 0.32 0.34 0.34 0.42 0.42
Cu con 0.77 0.81 0.91 0.86 1.68 1.40 1.89 1.69 2.14
Total 2.82 2.96 3.34 3.20 4.65 5.09 5.41 5.85 5.84
Deficit/Surplus 1.93 1.79 1.41 1.55 0.10 -0.34 -0.66 -1.10 -1.09
Sub-total Deficit 1.93 3.72 5.13 6.68 6.78
Sub-total Surplus -0.34 -1.00 -1.75 -2.19
Payable Ag 2.68 2.81 3.18 3.04 4.42 4.84 5.14 5.56 5.55
Ag price USD/oz 30 30 30 30 30 30 30 30 30
REVENUE USD millions 80.4 84.4 95.3 91.1 132.5 145.2 154.1 166.7 166.5
TRANSFER FEE USD millions 10.8 11.5 13.0 12.6 18.4 20.3 21.7 23.6 23.8
Adjustment 1.04 1.05 1.06 1.07 1.08 1.09 1.1 1.11 1.12
NET CASH FLOW USD millions 69.6 72.9 82.2 78.5 114.1 124.9 132.4 143.1 142.7
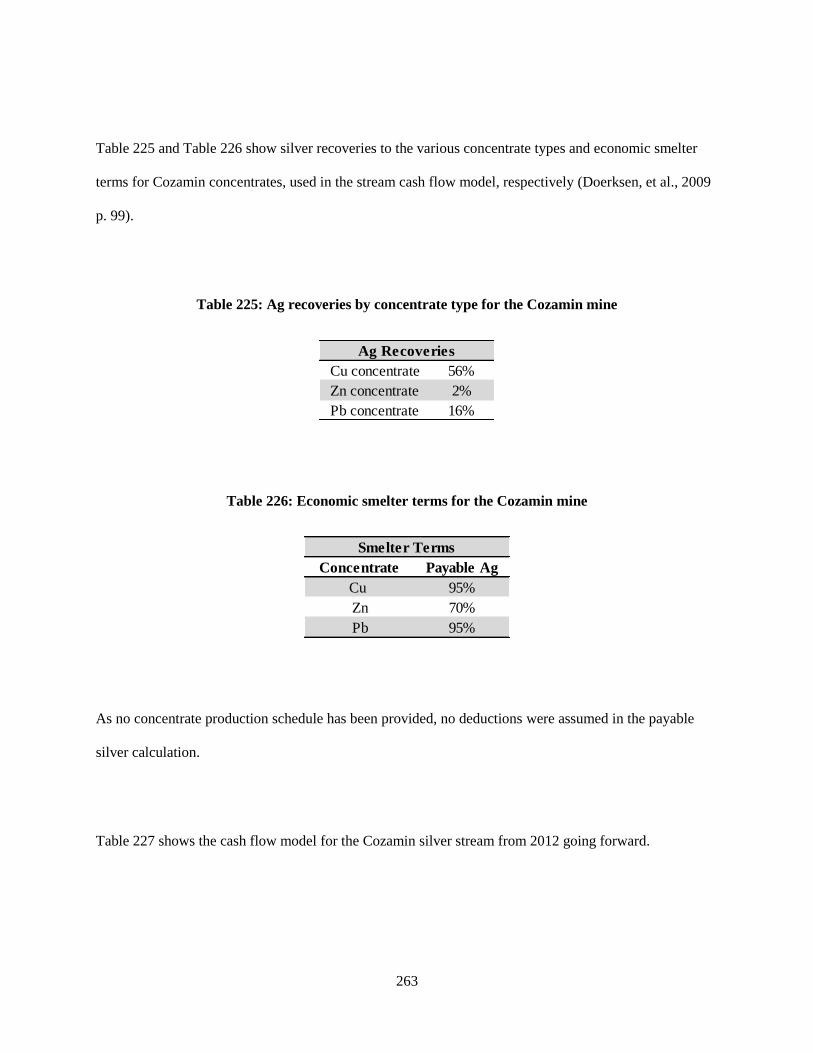
263
Table 225 and Table 226 show silver recoveries to the various concentrate types and economic smelter
terms for Cozamin concentrates, used in the stream cash flow model, respectively (Doerksen, et al., 2009
p. 99).
Table 225: Ag recoveries by concentrate type for the Cozamin mine
Table 226: Economic smelter terms for the Cozamin mine
As no concentrate production schedule has been provided, no deductions were assumed in the payable
silver calculation.
Table 227 shows the cash flow model for the Cozamin silver stream from 2012 going forward.
Cu concentrate 56%
Zn concentrate 2%
Pb concentrate 16%
Ag Recoveries
Concentrate Payable Ag
Cu 95%
Zn 70%
Pb 95%
Smelter Terms
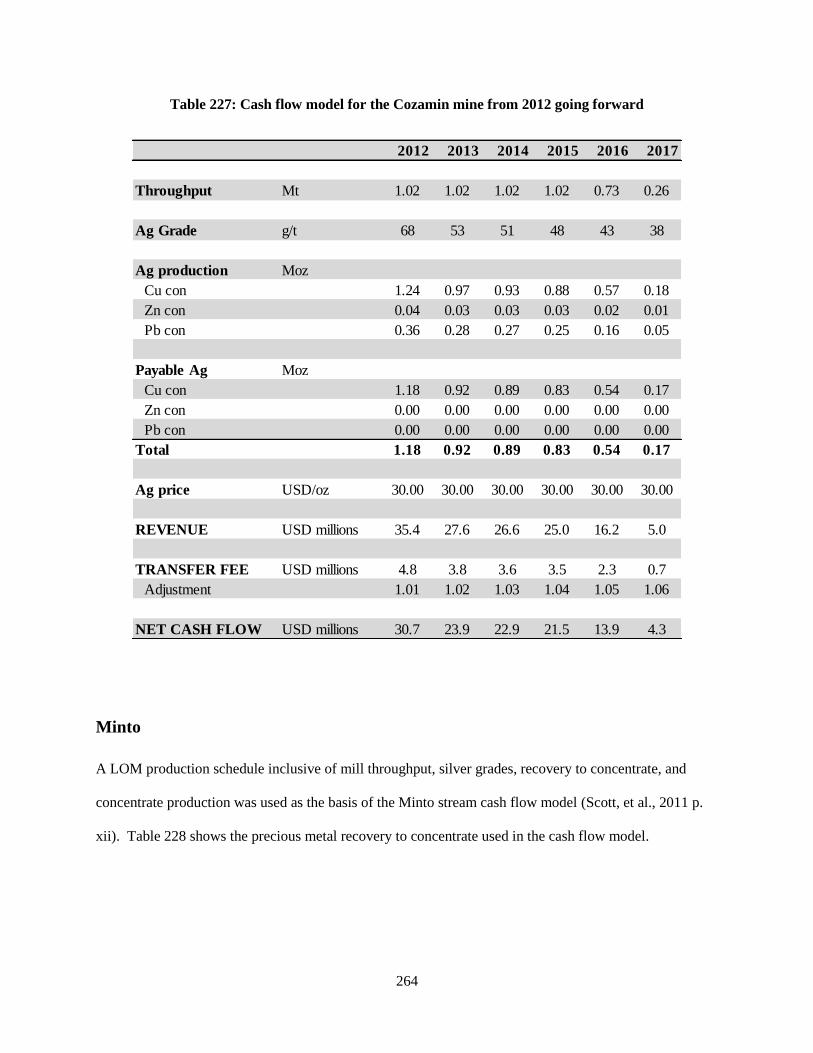
264
Table 227: Cash flow model for the Cozamin mine from 2012 going forward
Minto
A LOM production schedule inclusive of mill throughput, silver grades, recovery to concentrate, and
concentrate production was used as the basis of the Minto stream cash flow model (Scott, et al., 2011 p.
xii). Table 228 shows the precious metal recovery to concentrate used in the cash flow model.
2012 2013 2014 2015 2016 2017
Throughput Mt 1.02 1.02 1.02 1.02 0.73 0.26
Ag Grade g/t 68 53 51 48 43 38
Ag production Moz
Cu con 1.24 0.97 0.93 0.88 0.57 0.18
Zn con 0.04 0.03 0.03 0.03 0.02 0.01
Pb con 0.36 0.28 0.27 0.25 0.16 0.05
Payable Ag Moz
Cu con 1.18 0.92 0.89 0.83 0.54 0.17
Zn con 0.00 0.00 0.00 0.00 0.00 0.00
Pb con 0.00 0.00 0.00 0.00 0.00 0.00
Total 1.18 0.92 0.89 0.83 0.54 0.17
Ag price USD/oz 30.00 30.00 30.00 30.00 30.00 30.00
REVENUE USD millions 35.4 27.6 26.6 25.0 16.2 5.0
TRANSFER FEE USD millions 4.8 3.8 3.6 3.5 2.3 0.7
Adjustment 1.01 1.02 1.03 1.04 1.05 1.06
NET CASH FLOW USD millions 30.7 23.9 22.9 21.5 13.9 4.3

265
Table 228: Metal recovery to concentrate for the Minto mine
Table 229 economic smelter terms used in the Minto precious metal stream cash flow model (Scott, et al.,
2011 p. ix).
Table 229: Economic smelter terms for the Minto mine concentrate
Additionally, the following assumptions were made in the cash flow model development:
payable gold factor of 95%;
and a silver recovery to concentrate of 74%.
Table 230 shows the cash flow model for the Minto precious metal stream from 2012 going forward.
Ag recovery 74%
Au recovery 70%
Recovery to concentrate
Ag deduction 30.00 g/dmt
Smelter Terms
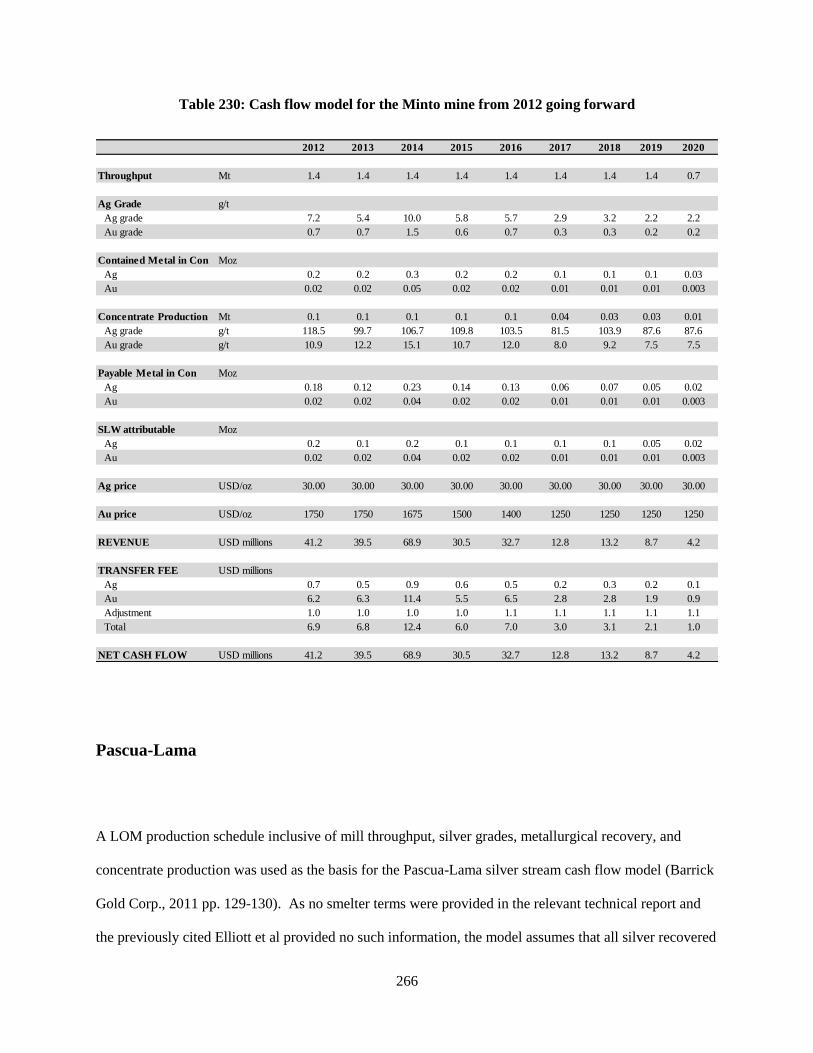
266
Table 230: Cash flow model for the Minto mine from 2012 going forward
Pascua-Lama
A LOM production schedule inclusive of mill throughput, silver grades, metallurgical recovery, and
concentrate production was used as the basis for the Pascua-Lama silver stream cash flow model (Barrick
Gold Corp., 2011 pp. 129-130). As no smelter terms were provided in the relevant technical report and
the previously cited Elliott et al provided no such information, the model assumes that all silver recovered
2012 2013 2014 2015 2016 2017 2018 2019 2020
Throughput Mt 1.4 1.4 1.4 1.4 1.4 1.4 1.4 1.4 0.7
Ag Grade g/t
Ag grade 7.2 5.4 10.0 5.8 5.7 2.9 3.2 2.2 2.2
Au grade 0.7 0.7 1.5 0.6 0.7 0.3 0.3 0.2 0.2
Contained Metal in Con Moz
Ag 0.2 0.2 0.3 0.2 0.2 0.1 0.1 0.1 0.03
Au 0.02 0.02 0.05 0.02 0.02 0.01 0.01 0.01 0.003
Concentrate Production Mt 0.1 0.1 0.1 0.1 0.1 0.04 0.03 0.03 0.01
Ag grade g/t 118.5 99.7 106.7 109.8 103.5 81.5 103.9 87.6 87.6
Au grade g/t 10.9 12.2 15.1 10.7 12.0 8.0 9.2 7.5 7.5
Payable Metal in Con Moz
Ag 0.18 0.12 0.23 0.14 0.13 0.06 0.07 0.05 0.02
Au 0.02 0.02 0.04 0.02 0.02 0.01 0.01 0.01 0.003
SLW attributable Moz
Ag 0.2 0.1 0.2 0.1 0.1 0.1 0.1 0.05 0.02
Au 0.02 0.02 0.04 0.02 0.02 0.01 0.01 0.01 0.003
Ag price USD/oz 30.00 30.00 30.00 30.00 30.00 30.00 30.00 30.00 30.00
Au price USD/oz 1750 1750 1675 1500 1400 1250 1250 1250 1250
REVENUE USD millions 41.2 39.5 68.9 30.5 32.7 12.8 13.2 8.7 4.2
TRANSFER FEE USD millions
Ag 0.7 0.5 0.9 0.6 0.5 0.2 0.3 0.2 0.1
Au 6.2 6.3 11.4 5.5 6.5 2.8 2.8 1.9 0.9
Adjustment 1.0 1.0 1.0 1.0 1.1 1.1 1.1 1.1 1.1
Total 6.9 6.8 12.4 6.0 7.0 3.0 3.1 2.1 1.0
NET CASH FLOW USD millions 41.2 39.5 68.9 30.5 32.7 12.8 13.2 8.7 4.2

267
to concentrate and doré is payable. Note that the attributable silver production figure for 2012 is
composed of the combined production from the Pierina, Veladero, and Lagunas Norte mines in the
absence of commercial production at Pascua-Lama, as per the original silver purchase agreement.
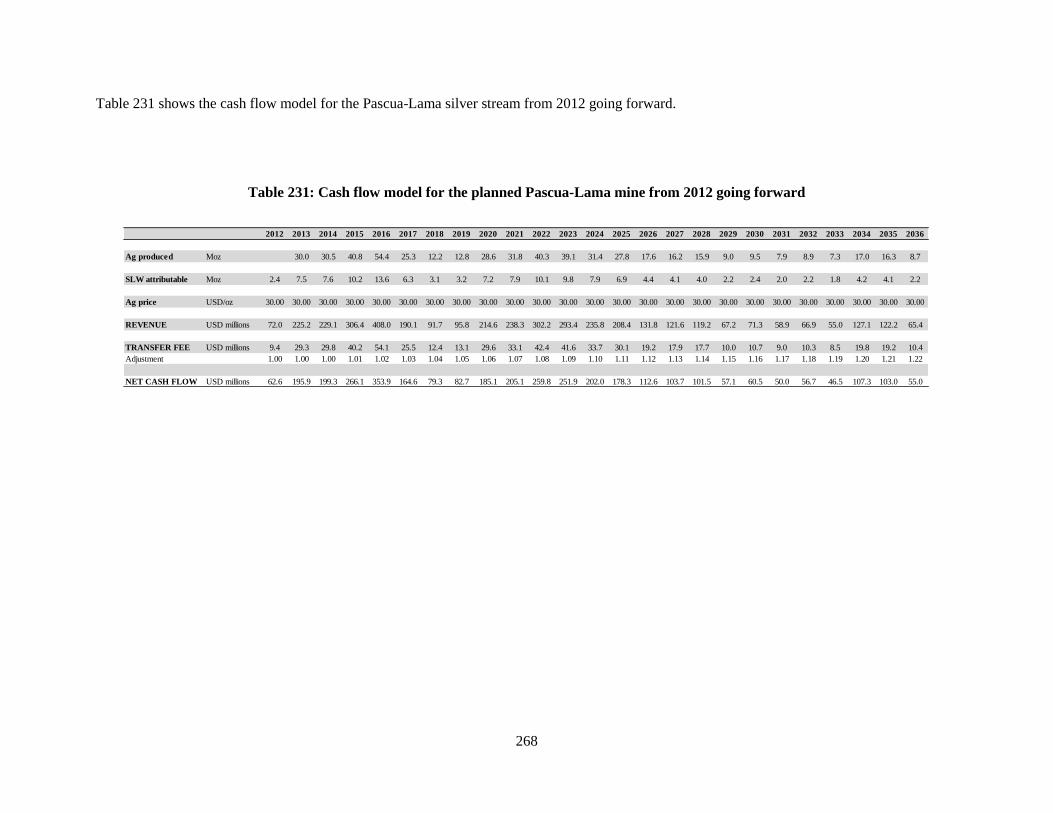
268
Table 231 shows the cash flow model for the Pascua-Lama silver stream from 2012 going forward.
Table 231: Cash flow model for the planned Pascua-Lama mine from 2012 going forward
2012 2013 2014 2015 2016 2017 2018 2019 2020 2021 2022 2023 2024 2025 2026 2027 2028 2029 2030 2031 2032 2033 2034 2035 2036
Ag produced Moz 30.0 30.5 40.8 54.4 25.3 12.2 12.8 28.6 31.8 40.3 39.1 31.4 27.8 17.6 16.2 15.9 9.0 9.5 7.9 8.9 7.3 17.0 16.3 8.7
SLW attributable Moz 2.4 7.5 7.6 10.2 13.6 6.3 3.1 3.2 7.2 7.9 10.1 9.8 7.9 6.9 4.4 4.1 4.0 2.2 2.4 2.0 2.2 1.8 4.2 4.1 2.2
Ag price USD/oz 30.00 30.00 30.00 30.00 30.00 30.00 30.00 30.00 30.00 30.00 30.00 30.00 30.00 30.00 30.00 30.00 30.00 30.00 30.00 30.00 30.00 30.00 30.00 30.00 30.00
REVENUE USD millions 72.0 225.2 229.1 306.4 408.0 190.1 91.7 95.8 214.6 238.3 302.2 293.4 235.8 208.4 131.8 121.6 119.2 67.2 71.3 58.9 66.9 55.0 127.1 122.2 65.4
TRANSFER FEE USD millions 9.4 29.3 29.8 40.2 54.1 25.5 12.4 13.1 29.6 33.1 42.4 41.6 33.7 30.1 19.2 17.9 17.7 10.0 10.7 9.0 10.3 8.5 19.8 19.2 10.4
Adjustment 1.00 1.00 1.00 1.01 1.02 1.03 1.04 1.05 1.06 1.07 1.08 1.09 1.10 1.11 1.12 1.13 1.14 1.15 1.16 1.17 1.18 1.19 1.20 1.21 1.22
NET CASH FLOW USD millions 62.6 195.9 199.3 266.1 353.9 164.6 79.3 82.7 185.1 205.1 259.8 251.9 202.0 178.3 112.6 103.7 101.5 57.1 60.5 50.0 56.7 46.5 107.3 103.0 55.0
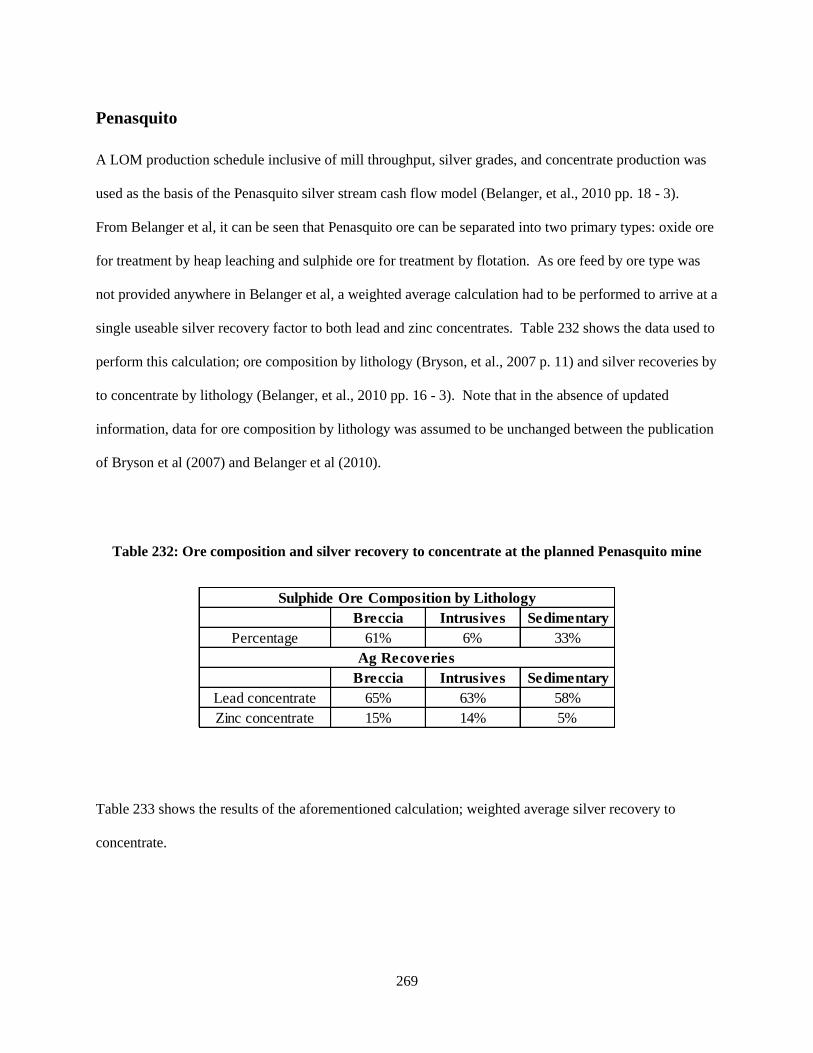
269
Penasquito
A LOM production schedule inclusive of mill throughput, silver grades, and concentrate production was
used as the basis of the Penasquito silver stream cash flow model (Belanger, et al., 2010 pp. 18 - 3).
From Belanger et al, it can be seen that Penasquito ore can be separated into two primary types: oxide ore
for treatment by heap leaching and sulphide ore for treatment by flotation. As ore feed by ore type was
not provided anywhere in Belanger et al, a weighted average calculation had to be performed to arrive at a
single useable silver recovery factor to both lead and zinc concentrates. Table 232 shows the data used to
perform this calculation; ore composition by lithology (Bryson, et al., 2007 p. 11) and silver recoveries by
to concentrate by lithology (Belanger, et al., 2010 pp. 16 - 3). Note that in the absence of updated
information, data for ore composition by lithology was assumed to be unchanged between the publication
of Bryson et al (2007) and Belanger et al (2010).
Table 232: Ore composition and silver recovery to concentrate at the planned Penasquito mine
Table 233 shows the results of the aforementioned calculation; weighted average silver recovery to
concentrate.
Breccia Intrusives Sedimentary
Percentage 61% 6% 33%
Breccia Intrusives Sedimentary
Lead concentrate 65% 63% 58%
Zinc concentrate 15% 14% 5%
Sulphide Ore Composition by Lithology
Ag Recoveries
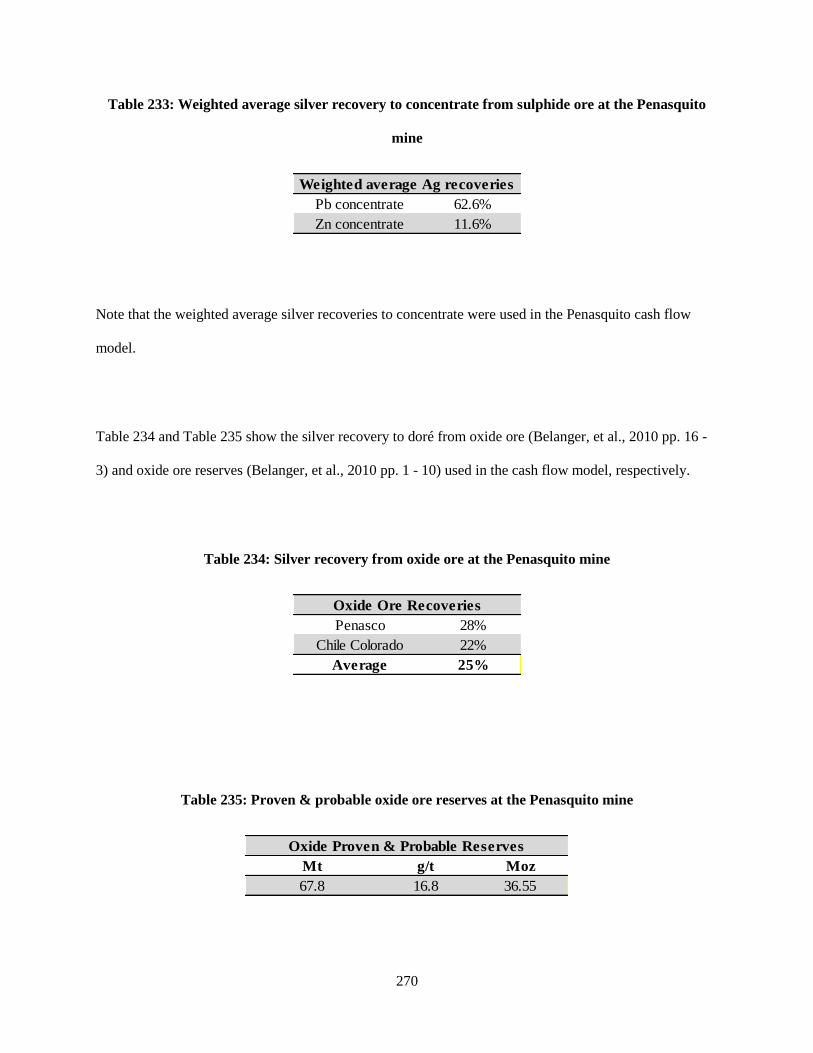
270
Table 233: Weighted average silver recovery to concentrate from sulphide ore at the Penasquito
mine
Note that the weighted average silver recoveries to concentrate were used in the Penasquito cash flow
model.
Table 234 and Table 235 show the silver recovery to doré from oxide ore (Belanger, et al., 2010 pp. 16 -
3) and oxide ore reserves (Belanger, et al., 2010 pp. 1 - 10) used in the cash flow model, respectively.
Table 234: Silver recovery from oxide ore at the Penasquito mine
Table 235: Proven & probable oxide ore reserves at the Penasquito mine
Pb concentrate 62.6%
Zn concentrate 11.6%
Weighted average Ag recoveries
Penasco 28%
Chile Colorado 22%
Average 25%
Oxide Ore Recoveries
Mt g/t Moz
67.8 16.8 36.55
Oxide Proven & Probable Reserves

271
Note that the oxide ore reserves listed above were used to estimate the oxide ore production schedule in
the cash flow model.
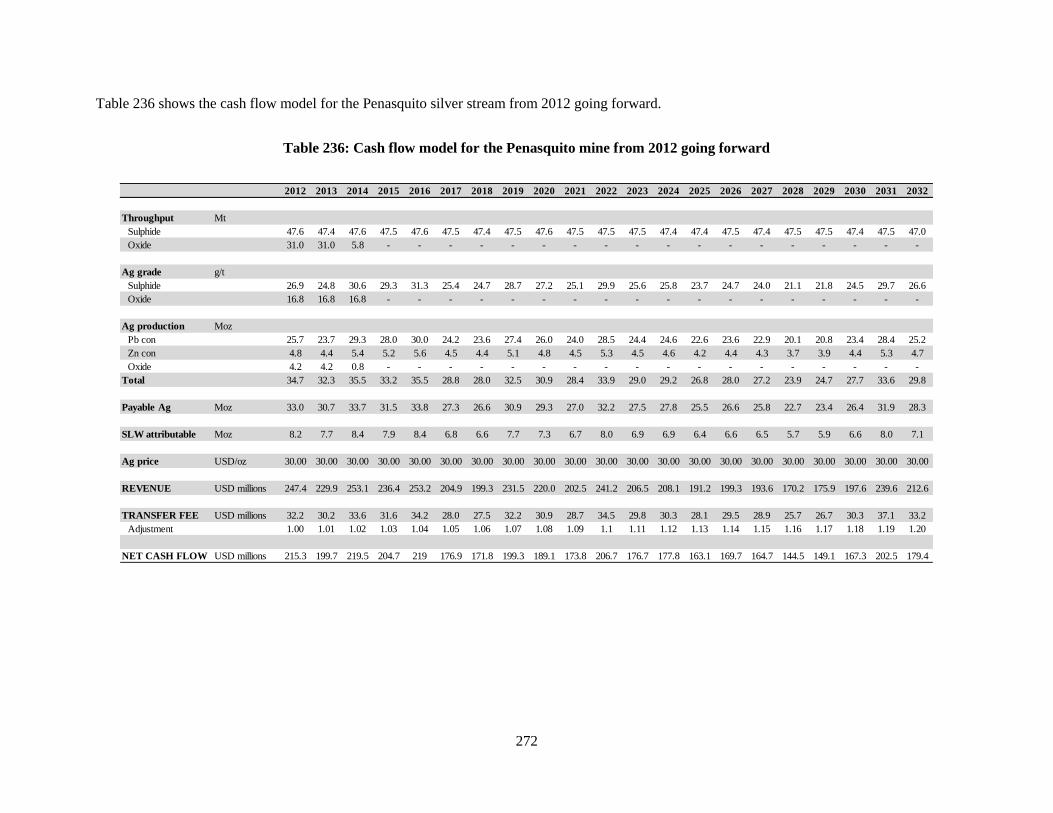
272
Table 236 shows the cash flow model for the Penasquito silver stream from 2012 going forward.
Table 236: Cash flow model for the Penasquito mine from 2012 going forward
2012 2013 2014 2015 2016 2017 2018 2019 2020 2021 2022 2023 2024 2025 2026 2027 2028 2029 2030 2031 2032
Throughput Mt
Sulphide 47.6 47.4 47.6 47.5 47.6 47.5 47.4 47.5 47.6 47.5 47.5 47.5 47.4 47.4 47.5 47.4 47.5 47.5 47.4 47.5 47.0
Oxide 31.0 31.0 5.8 - - - - - - - - - - - - - - - - - -
Ag grade g/t
Sulphide 26.9 24.8 30.6 29.3 31.3 25.4 24.7 28.7 27.2 25.1 29.9 25.6 25.8 23.7 24.7 24.0 21.1 21.8 24.5 29.7 26.6
Oxide 16.8 16.8 16.8 - - - - - - - - - - - - - - - - - -
Ag production Moz
Pb con 25.7 23.7 29.3 28.0 30.0 24.2 23.6 27.4 26.0 24.0 28.5 24.4 24.6 22.6 23.6 22.9 20.1 20.8 23.4 28.4 25.2
Zn con 4.8 4.4 5.4 5.2 5.6 4.5 4.4 5.1 4.8 4.5 5.3 4.5 4.6 4.2 4.4 4.3 3.7 3.9 4.4 5.3 4.7
Oxide 4.2 4.2 0.8 - - - - - - - - - - - - - - - - - -
Total 34.7 32.3 35.5 33.2 35.5 28.8 28.0 32.5 30.9 28.4 33.9 29.0 29.2 26.8 28.0 27.2 23.9 24.7 27.7 33.6 29.8
Payable Ag Moz 33.0 30.7 33.7 31.5 33.8 27.3 26.6 30.9 29.3 27.0 32.2 27.5 27.8 25.5 26.6 25.8 22.7 23.4 26.4 31.9 28.3
SLW attributable Moz 8.2 7.7 8.4 7.9 8.4 6.8 6.6 7.7 7.3 6.7 8.0 6.9 6.9 6.4 6.6 6.5 5.7 5.9 6.6 8.0 7.1
Ag price USD/oz 30.00 30.00 30.00 30.00 30.00 30.00 30.00 30.00 30.00 30.00 30.00 30.00 30.00 30.00 30.00 30.00 30.00 30.00 30.00 30.00 30.00
REVENUE USD millions 247.4 229.9 253.1 236.4 253.2 204.9 199.3 231.5 220.0 202.5 241.2 206.5 208.1 191.2 199.3 193.6 170.2 175.9 197.6 239.6 212.6
TRANSFER FEE USD millions 32.2 30.2 33.6 31.6 34.2 28.0 27.5 32.2 30.9 28.7 34.5 29.8 30.3 28.1 29.5 28.9 25.7 26.7 30.3 37.1 33.2
Adjustment 1.00 1.01 1.02 1.03 1.04 1.05 1.06 1.07 1.08 1.09 1.1 1.11 1.12 1.13 1.14 1.15 1.16 1.17 1.18 1.19 1.20
NET CASH FLOW USD millions 215.3 199.7 219.5 204.7 219 176.9 171.8 199.3 189.1 173.8 206.7 176.7 177.8 163.1 169.7 164.7 144.5 149.1 167.3 202.5 179.4
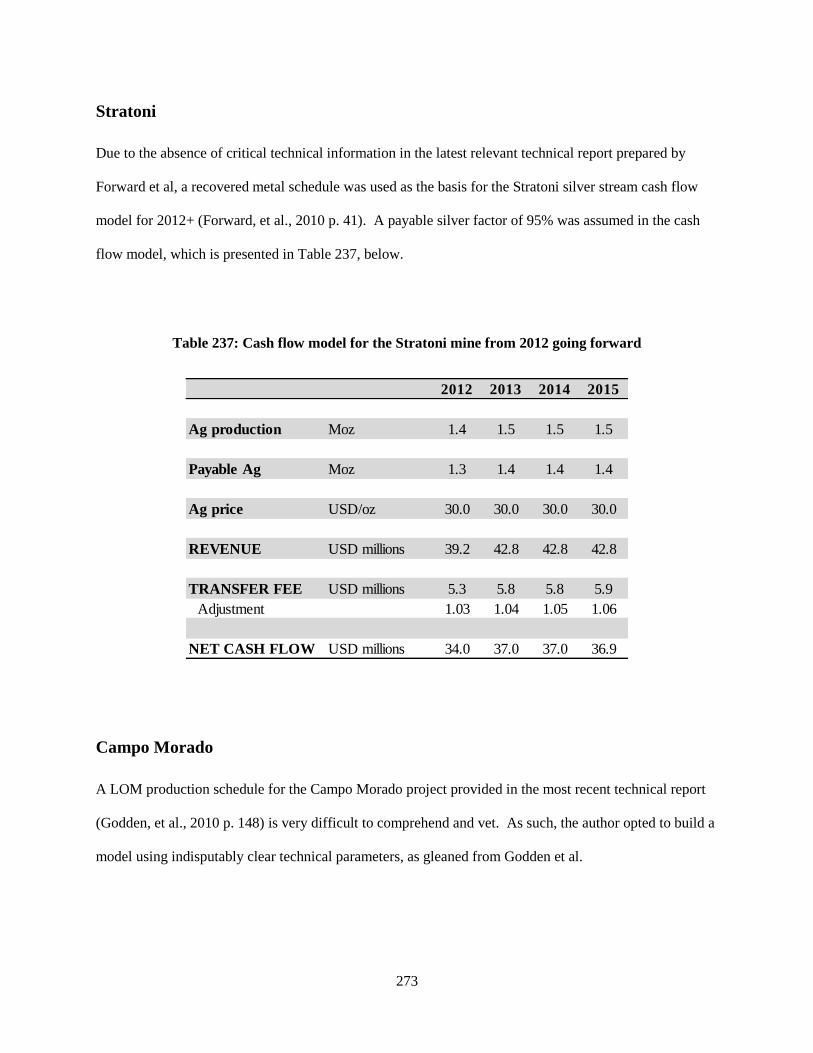
273
Stratoni
Due to the absence of critical technical information in the latest relevant technical report prepared by
Forward et al, a recovered metal schedule was used as the basis for the Stratoni silver stream cash flow
model for 2012+ (Forward, et al., 2010 p. 41). A payable silver factor of 95% was assumed in the cash
flow model, which is presented in Table 237, below.
Table 237: Cash flow model for the Stratoni mine from 2012 going forward
Campo Morado
A LOM production schedule for the Campo Morado project provided in the most recent technical report
(Godden, et al., 2010 p. 148) is very difficult to comprehend and vet. As such, the author opted to build a
model using indisputably clear technical parameters, as gleaned from Godden et al.
2012 2013 2014 2015
Ag production Moz 1.4 1.5 1.5 1.5
Payable Ag Moz 1.3 1.4 1.4 1.4
Ag price USD/oz 30.0 30.0 30.0 30.0
REVENUE USD millions 39.2 42.8 42.8 42.8
TRANSFER FEE USD millions 5.3 5.8 5.8 5.9
Adjustment 1.03 1.04 1.05 1.06
NET CASH FLOW USD millions 34.0 37.0 37.0 36.9
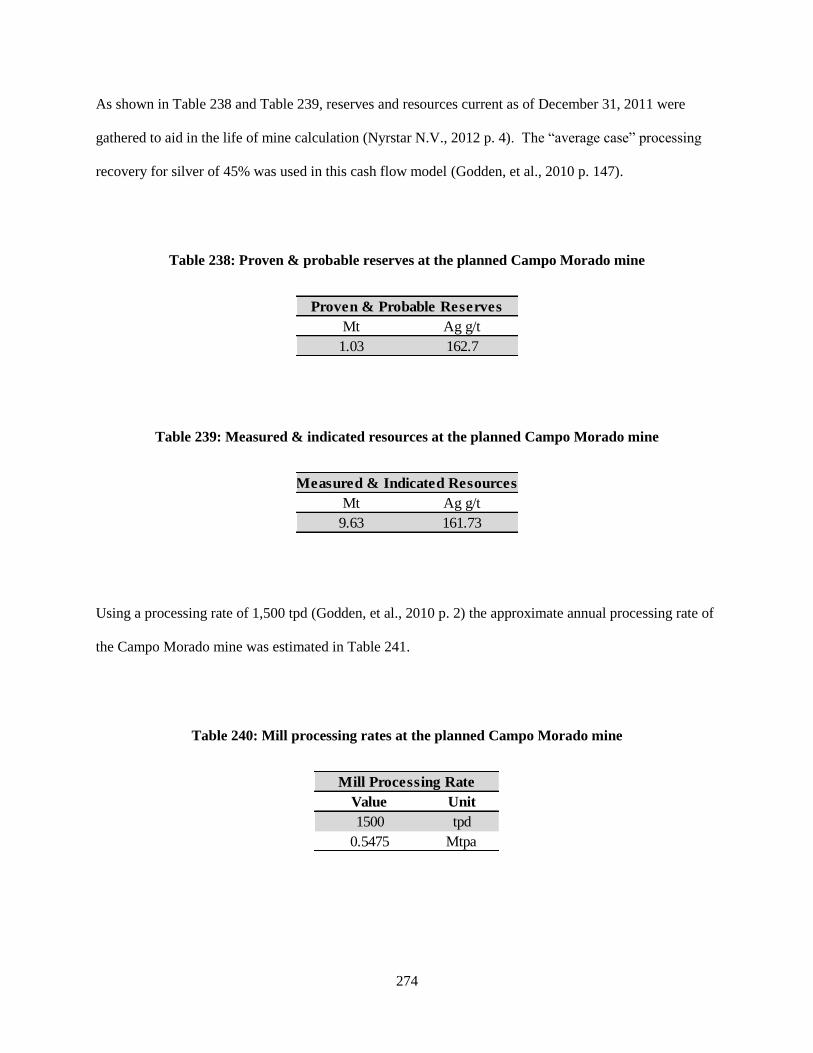
274
As shown in Table 238 and Table 239, reserves and resources current as of December 31, 2011 were
gathered to aid in the life of mine calculation (Nyrstar N.V., 2012 p. 4). The “average case” processing
recovery for silver of 45% was used in this cash flow model (Godden, et al., 2010 p. 147).
Table 238: Proven & probable reserves at the planned Campo Morado mine
Table 239: Measured & indicated resources at the planned Campo Morado mine
Using a processing rate of 1,500 tpd (Godden, et al., 2010 p. 2) the approximate annual processing rate of
the Campo Morado mine was estimated in Table 241.
Table 240: Mill processing rates at the planned Campo Morado mine
Mt Ag g/t
1.03 162.7
Proven & Probable Reserves
Mt Ag g/t
9.63 161.73
Measured & Indicated Resources
Value Unit
1500 tpd
0.5475 Mtpa
Mill Processing Rate

275
Assuming the mining of all resources and reserves, the approximate life of mine for the Campo Morado
mine is shown in Table 241, below.
Table 241: Approximate LOM calculation for the planned Campo Morado mine
The following additional assumptions were made in the development of the Campo Morado silver stream
cash flow model:
smelter terms from Stone et al, as previously outlined in Table 151 and ;
no further production of lead concentrate;
and weighted average silver smelter recovery of 75% for both copper and zinc concentrates.
Reserves &
Resources
Approx. LOM
(years)
10.66 19.47
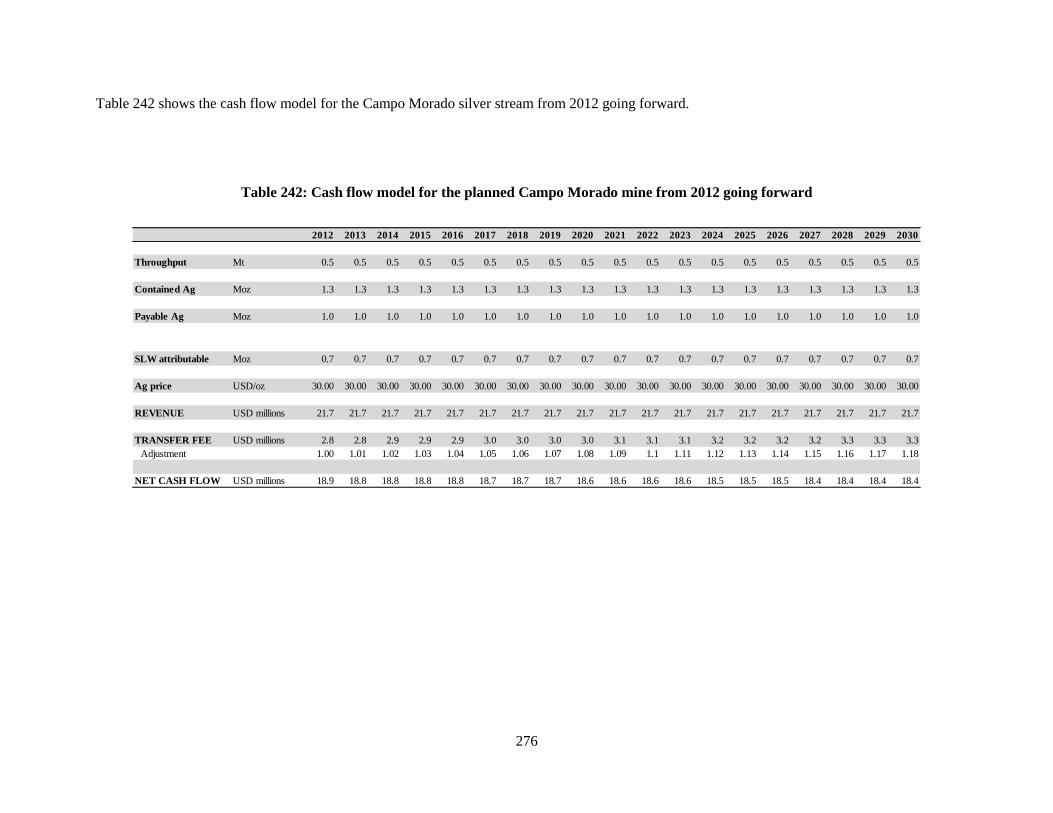
276
Table 242 shows the cash flow model for the Campo Morado silver stream from 2012 going forward.
Table 242: Cash flow model for the planned Campo Morado mine from 2012 going forward
2012 2013 2014 2015 2016 2017 2018 2019 2020 2021 2022 2023 2024 2025 2026 2027 2028 2029 2030
Throughput Mt 0.5 0.5 0.5 0.5 0.5 0.5 0.5 0.5 0.5 0.5 0.5 0.5 0.5 0.5 0.5 0.5 0.5 0.5 0.5
Contained Ag Moz 1.3 1.3 1.3 1.3 1.3 1.3 1.3 1.3 1.3 1.3 1.3 1.3 1.3 1.3 1.3 1.3 1.3 1.3 1.3
Payable Ag Moz 1.0 1.0 1.0 1.0 1.0 1.0 1.0 1.0 1.0 1.0 1.0 1.0 1.0 1.0 1.0 1.0 1.0 1.0 1.0
SLW attributable Moz 0.7 0.7 0.7 0.7 0.7 0.7 0.7 0.7 0.7 0.7 0.7 0.7 0.7 0.7 0.7 0.7 0.7 0.7 0.7
Ag price USD/oz 30.00 30.00 30.00 30.00 30.00 30.00 30.00 30.00 30.00 30.00 30.00 30.00 30.00 30.00 30.00 30.00 30.00 30.00 30.00
REVENUE USD millions 21.7 21.7 21.7 21.7 21.7 21.7 21.7 21.7 21.7 21.7 21.7 21.7 21.7 21.7 21.7 21.7 21.7 21.7 21.7
TRANSFER FEE USD millions 2.8 2.8 2.9 2.9 2.9 3.0 3.0 3.0 3.0 3.1 3.1 3.1 3.2 3.2 3.2 3.2 3.3 3.3 3.3
Adjustment 1.00 1.01 1.02 1.03 1.04 1.05 1.06 1.07 1.08 1.09 1.1 1.11 1.12 1.13 1.14 1.15 1.16 1.17 1.18
NET CASH FLOW USD millions 18.9 18.8 18.8 18.8 18.8 18.7 18.7 18.7 18.6 18.6 18.6 18.6 18.5 18.5 18.5 18.4 18.4 18.4 18.4
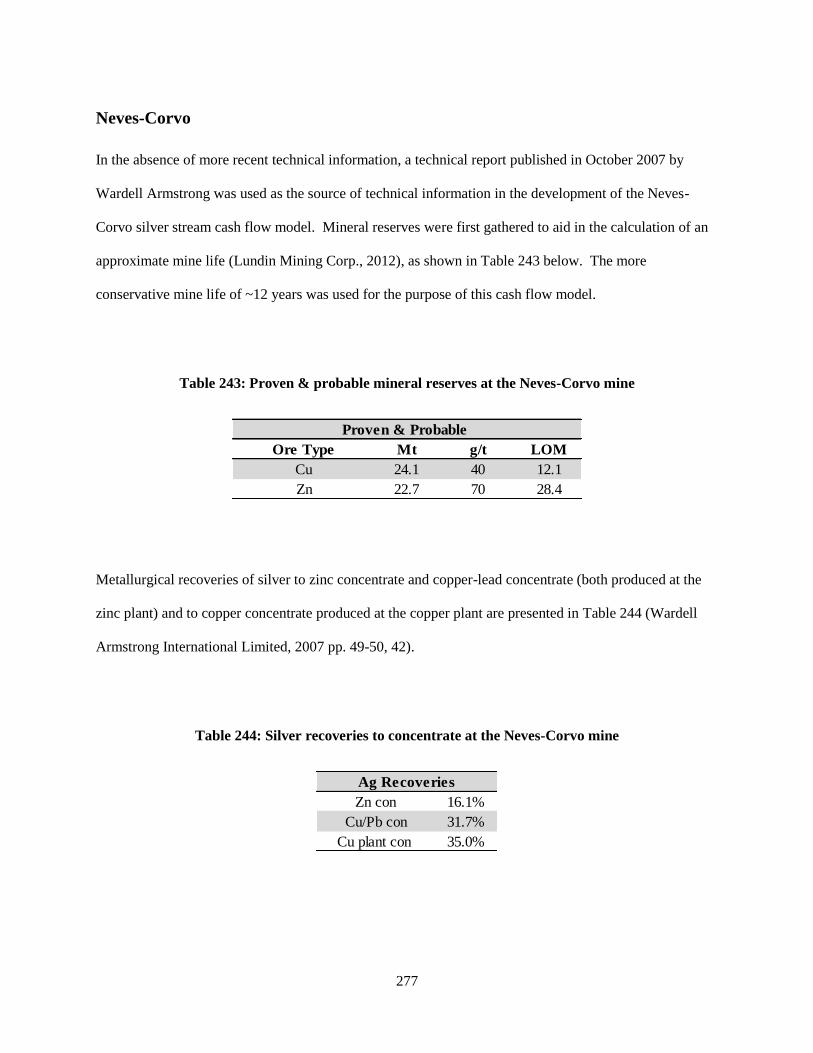
277
Neves-Corvo
In the absence of more recent technical information, a technical report published in October 2007 by
Wardell Armstrong was used as the source of technical information in the development of the Neves-
Corvo silver stream cash flow model. Mineral reserves were first gathered to aid in the calculation of an
approximate mine life (Lundin Mining Corp., 2012), as shown in Table 243 below. The more
conservative mine life of ~12 years was used for the purpose of this cash flow model.
Table 243: Proven & probable mineral reserves at the Neves-Corvo mine
Metallurgical recoveries of silver to zinc concentrate and copper-lead concentrate (both produced at the
zinc plant) and to copper concentrate produced at the copper plant are presented in Table 244 (Wardell
Armstrong International Limited, 2007 pp. 49-50, 42).
Table 244: Silver recoveries to concentrate at the Neves-Corvo mine
Ore Type Mt g/t LOM
Cu 24.1 40 12.1
Zn 22.7 70 28.4
Proven & Probable
Zn con 16.1%
Cu/Pb con 31.7%
Cu plant con 35.0%
Ag Recoveries
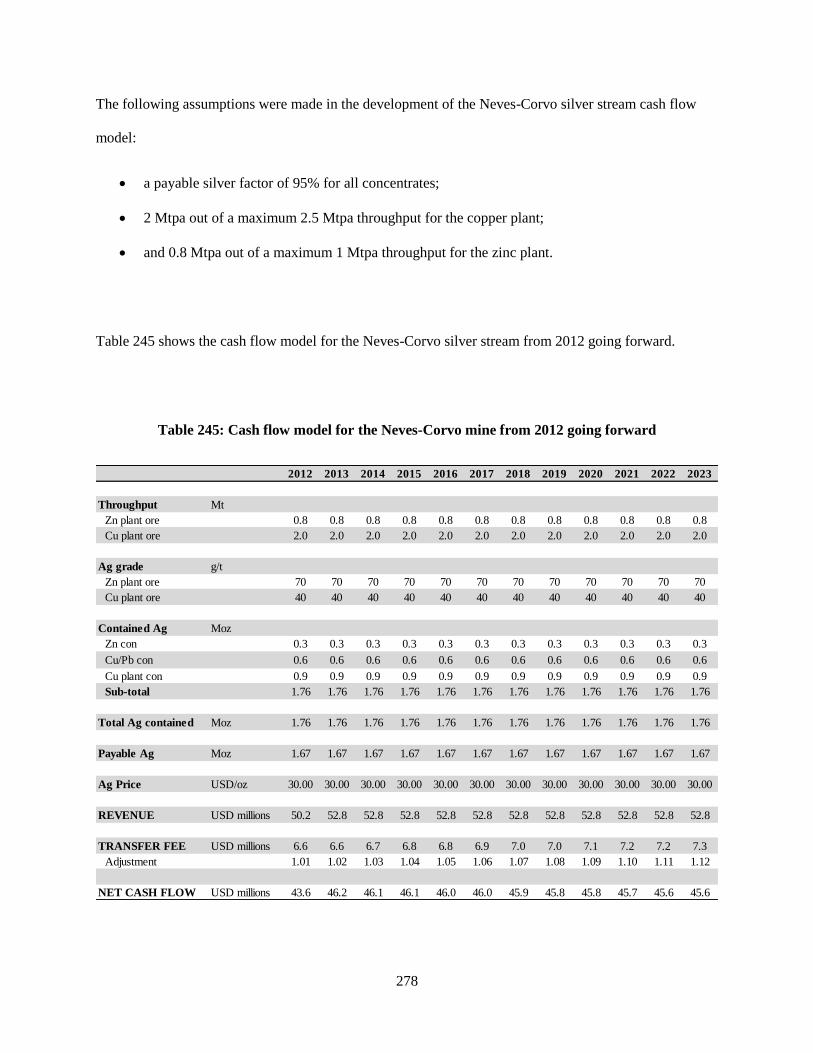
278
The following assumptions were made in the development of the Neves-Corvo silver stream cash flow
model:
a payable silver factor of 95% for all concentrates;
2 Mtpa out of a maximum 2.5 Mtpa throughput for the copper plant;
and 0.8 Mtpa out of a maximum 1 Mtpa throughput for the zinc plant.
Table 245 shows the cash flow model for the Neves-Corvo silver stream from 2012 going forward.
Table 245: Cash flow model for the Neves-Corvo mine from 2012 going forward
2012 2013 2014 2015 2016 2017 2018 2019 2020 2021 2022 2023
Throughput Mt
Zn plant ore 0.8 0.8 0.8 0.8 0.8 0.8 0.8 0.8 0.8 0.8 0.8 0.8
Cu plant ore 2.0 2.0 2.0 2.0 2.0 2.0 2.0 2.0 2.0 2.0 2.0 2.0
Ag grade g/t
Zn plant ore 70 70 70 70 70 70 70 70 70 70 70 70
Cu plant ore 40 40 40 40 40 40 40 40 40 40 40 40
Contained Ag Moz
Zn con 0.3 0.3 0.3 0.3 0.3 0.3 0.3 0.3 0.3 0.3 0.3 0.3
Cu/Pb con 0.6 0.6 0.6 0.6 0.6 0.6 0.6 0.6 0.6 0.6 0.6 0.6
Cu plant con 0.9 0.9 0.9 0.9 0.9 0.9 0.9 0.9 0.9 0.9 0.9 0.9
Sub-total 1.76 1.76 1.76 1.76 1.76 1.76 1.76 1.76 1.76 1.76 1.76 1.76
Total Ag contained Moz 1.76 1.76 1.76 1.76 1.76 1.76 1.76 1.76 1.76 1.76 1.76 1.76
Payable Ag Moz 1.67 1.67 1.67 1.67 1.67 1.67 1.67 1.67 1.67 1.67 1.67 1.67
Ag Price USD/oz 30.00 30.00 30.00 30.00 30.00 30.00 30.00 30.00 30.00 30.00 30.00 30.00
REVENUE USD millions 50.2 52.8 52.8 52.8 52.8 52.8 52.8 52.8 52.8 52.8 52.8 52.8
TRANSFER FEE USD millions 6.6 6.6 6.7 6.8 6.8 6.9 7.0 7.0 7.1 7.2 7.2 7.3
Adjustment 1.01 1.02 1.03 1.04 1.05 1.06 1.07 1.08 1.09 1.10 1.11 1.12
NET CASH FLOW USD millions 43.6 46.2 46.1 46.1 46.0 46.0 45.9 45.8 45.8 45.7 45.6 45.6
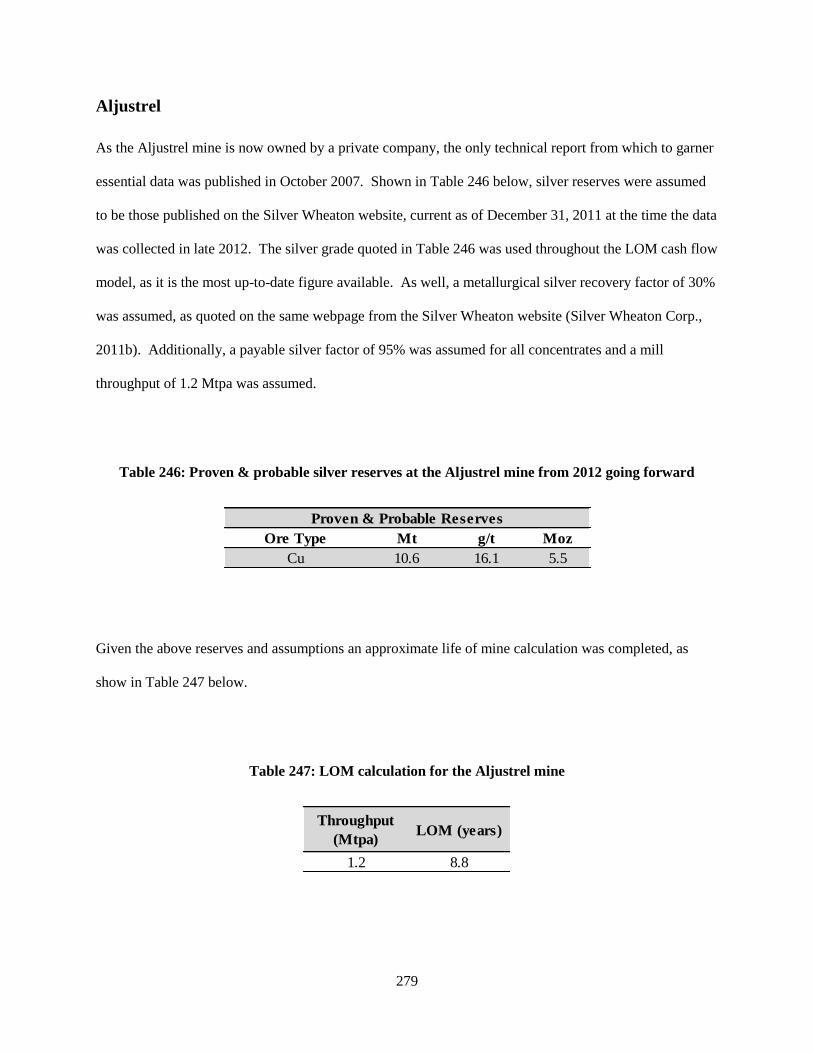
279
Aljustrel
As the Aljustrel mine is now owned by a private company, the only technical report from which to garner
essential data was published in October 2007. Shown in Table 246 below, silver reserves were assumed
to be those published on the Silver Wheaton website, current as of December 31, 2011 at the time the data
was collected in late 2012. The silver grade quoted in Table 246 was used throughout the LOM cash flow
model, as it is the most up-to-date figure available. As well, a metallurgical silver recovery factor of 30%
was assumed, as quoted on the same webpage from the Silver Wheaton website (Silver Wheaton Corp.,
2011b). Additionally, a payable silver factor of 95% was assumed for all concentrates and a mill
throughput of 1.2 Mtpa was assumed.
Table 246: Proven & probable silver reserves at the Aljustrel mine from 2012 going forward
Given the above reserves and assumptions an approximate life of mine calculation was completed, as
show in Table 247 below.
Table 247: LOM calculation for the Aljustrel mine
Ore Type Mt g/t Moz
Cu 10.6 16.1 5.5
Proven & Probable Reserves
Throughput
(Mtpa)LOM (years)
1.2 8.8
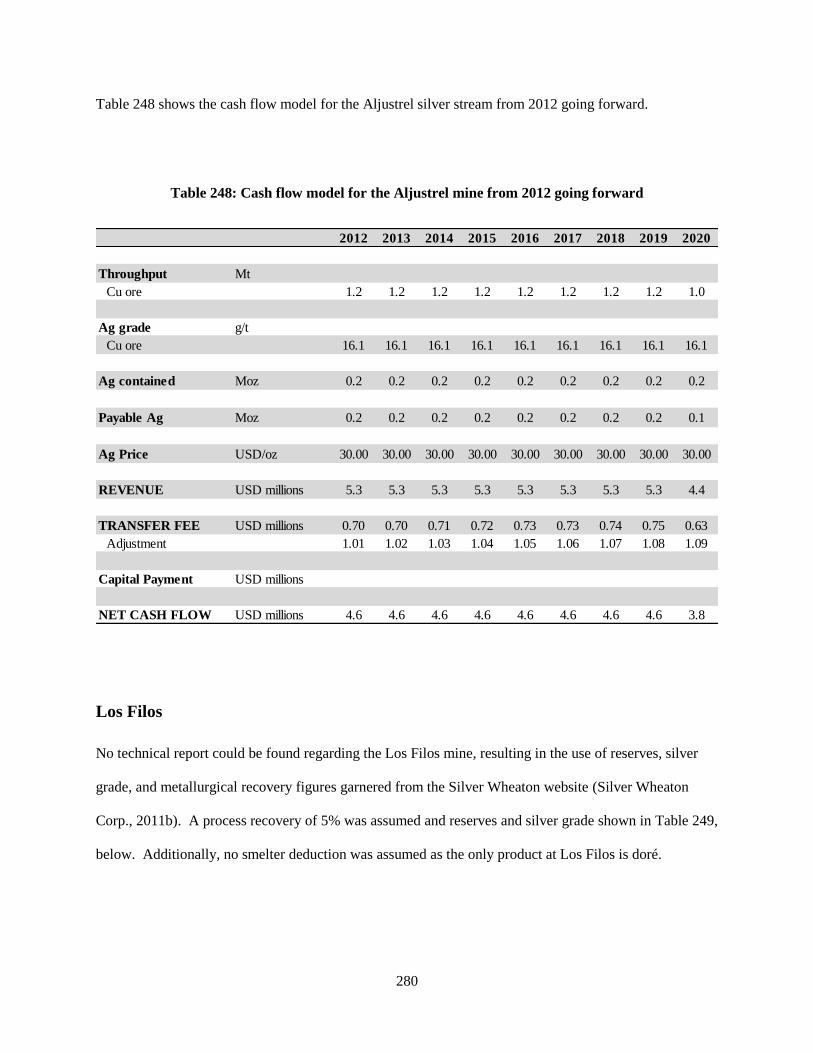
280
Table 248 shows the cash flow model for the Aljustrel silver stream from 2012 going forward.
Table 248: Cash flow model for the Aljustrel mine from 2012 going forward
Los Filos
No technical report could be found regarding the Los Filos mine, resulting in the use of reserves, silver
grade, and metallurgical recovery figures garnered from the Silver Wheaton website (Silver Wheaton
Corp., 2011b). A process recovery of 5% was assumed and reserves and silver grade shown in Table 249,
below. Additionally, no smelter deduction was assumed as the only product at Los Filos is doré.
2012 2013 2014 2015 2016 2017 2018 2019 2020
Throughput Mt
Cu ore 1.2 1.2 1.2 1.2 1.2 1.2 1.2 1.2 1.0
Ag grade g/t
Cu ore 16.1 16.1 16.1 16.1 16.1 16.1 16.1 16.1 16.1
Ag contained Moz 0.2 0.2 0.2 0.2 0.2 0.2 0.2 0.2 0.2
Payable Ag Moz 0.2 0.2 0.2 0.2 0.2 0.2 0.2 0.2 0.1
Ag Price USD/oz 30.00 30.00 30.00 30.00 30.00 30.00 30.00 30.00 30.00
REVENUE USD millions 5.3 5.3 5.3 5.3 5.3 5.3 5.3 5.3 4.4
TRANSFER FEE USD millions 0.70 0.70 0.71 0.72 0.73 0.73 0.74 0.75 0.63
Adjustment 1.01 1.02 1.03 1.04 1.05 1.06 1.07 1.08 1.09
Capital Payment USD millions
NET CASH FLOW USD millions 4.6 4.6 4.6 4.6 4.6 4.6 4.6 4.6 3.8
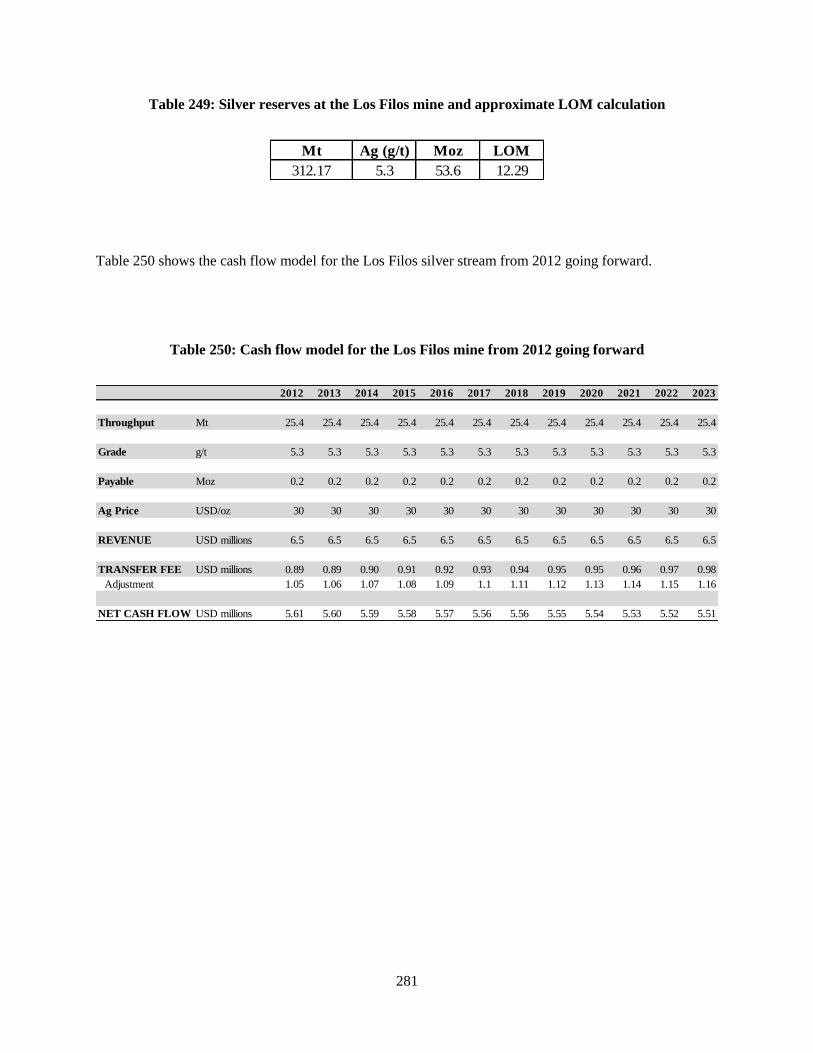
281
Table 249: Silver reserves at the Los Filos mine and approximate LOM calculation
Table 250 shows the cash flow model for the Los Filos silver stream from 2012 going forward.
Table 250: Cash flow model for the Los Filos mine from 2012 going forward
Mt Ag (g/t) Moz LOM
312.17 5.3 53.6 12.29
2012 2013 2014 2015 2016 2017 2018 2019 2020 2021 2022 2023
Throughput Mt 25.4 25.4 25.4 25.4 25.4 25.4 25.4 25.4 25.4 25.4 25.4 25.4
Grade g/t 5.3 5.3 5.3 5.3 5.3 5.3 5.3 5.3 5.3 5.3 5.3 5.3
Payable Moz 0.2 0.2 0.2 0.2 0.2 0.2 0.2 0.2 0.2 0.2 0.2 0.2
Ag Price USD/oz 30 30 30 30 30 30 30 30 30 30 30 30
REVENUE USD millions 6.5 6.5 6.5 6.5 6.5 6.5 6.5 6.5 6.5 6.5 6.5 6.5
TRANSFER FEE USD millions 0.89 0.89 0.90 0.91 0.92 0.93 0.94 0.95 0.95 0.96 0.97 0.98
Adjustment 1.05 1.06 1.07 1.08 1.09 1.1 1.11 1.12 1.13 1.14 1.15 1.16
NET CASH FLOW USD millions 5.61 5.60 5.59 5.58 5.57 5.56 5.56 5.55 5.54 5.53 5.52 5.51
282
Appendix E
Pertinent Background Information of Silver Wheaton's Operating Partners
Lundin Mining
Just prior to the Zinkgruvan silver purchase agreement, Lundin had acquired the Zinkgruvan mine on
June 2, 2004 from Rio Tinto Plc (Rio Tinto) for approximately $100 million. The acquisition was
financed through a public equity offering in Canada and Sweden. At the time, Lundin owned an option
on a separate advanced exploration project, the Norrbotten Gold-Copper Project, as well as a 37%
position in North Atlantic Natural Resources AB (NAN) who owned and operated the producing
Storliden Zinc/Copper Mine (Lundin Mining Corporation, 2004).
At the time of the Zinkgruvan silver purchase agreement, Lundin was a growing junior mining company
that had recently acquired its first producing property while trying to option in to another property
through the spending of exploration money. Lundin had recently issued equity to fund the purchase of the
Zinkgruvan mine, its cash position as of September 30, 2004 (two months before the stream deal) was
$25.7 million37, and it held no debt (Lundin Mining Corporation, 2004).
Glencore
At the time of the Yauliyacu silver purchase agreement, the Yauliyacu mine had been operating
continuously for over 100 years. Glencore was a private company and few details regarding its cash
position or market value were known. As such, there will be no section regarding the impact of this
37 Using an FX rate of 1.26 CAD=1.00 USD for September 30, 2004 (IMF)
283
stream deal on Glencore as a corporation and a corporate WACC of 10% was assumed for the purposes of
this section.
European Goldfields Limited
At the time of the Stratoni silver purchase transaction, EGU had recorded its first earnings period in
company history, generated from Stratoni mine revenue. Production ramp-up at the Stratoni mine was
still underway and was scheduled to continue throughout FY 2007, requiring an undisclosed capital
expenditure. Other development projects operated by EGU at the time were expected to require
approximately $270 million of initial capital, over the course of several years (European Goldfields
Limited, 2006).
At the time of the transaction, EGU had a cash position of approximately $34 million and held no debt.
EGU had not completed any significant financings in the previous year, and had approximately 118
million fully-diluted, in-the-money shares outstanding (European Goldfields Limited, 2007).
Goldcorp
Approximately nine months prior to the Penasquito silver stream transaction, Goldcorp had issued 283.2
million common shares in partial consideration of the purchase of Glamis Gold Ltd. (Glamis), a junior
gold mining company. This transaction partly contributed to Goldcorp’s ascent to the status of a senior
gold producing company. At the time of the silver stream, Goldcorp had a cash position of $282.5
million and held $540 million in long-term debt (Goldcorp Inc., 2007).
284
Mercator Minerals
At the time of the Mineral Park silver stream transaction, Mercator was commercially producing copper
from its leaching and SX/EW operations at Mineral Park. Plans were in place to construct a full sulphide
flotation mill and concentrator. Mercator had completed an equity financing approximately 13 months
prior to the Mineral Park stream deal whereby it issued 8.3 million common shares, increasing its share
base by approximately 13%. At the time of the deal, Mercator had a cash position of $104.5 million and
held a total of approximately $121.5 million in debt, comprised of both equipment loans and secured
notes (Mercator Minerals Ltd., 2007).
Farallon
At the time of the Campo Morado silver stream transaction, Farallon had a cash position of $15.9 million
and held $2.5 million in debt. In January 2008, approximately four months prior to the stream deal,
Farallon completed a prospectus financing and a private placement whereby ~30.7 million and ~8.2
million shares were issued, respectively. This represented a 13.6% increase of its shareholder base at the
beginning of FY 2008. At the time of the deal, Farallon was an exploration company attempting to
develop the Campo Morado property and had no producing operations (Farallon Resources Ltd, 2008).
Alexco
At the time of the deal, Alexco was a junior exploration company with no producing operations and no
income. Alexco had a cash position of $6.2 million38 and held no debt (Alexco Resource Corp., 2008).
In the year preceding the silver purchase transaction, Alexco had issued 1.5 million shares in an equity
financing (Alexco Resource Corp., 2008). Alexco was in the process of advancing the Keno Hill project
38 Using a FX rate of 1.06 CAD=1.00 USD for September 30, 2008 (IMF)
285
to commercial production and was seeking financing during the beginning of the latest global economic
recession.
Barrick
As of the deal date, Barrick was a multi-national, major gold mining corporation with several producing
mines, $2 billion in cash, and $5 billion in debt. With excellent stock liquidity and ~1.1 billion fully-
diluted shares outstanding priced at $42.45 on the deal date, Barrick likely would have been able to easily
raise money through equity offerings (Barrick Gold Corp., 2009).
Augusta
At the time of the Rosemont stream deal, Augusta had no producing operations or income. In the year
prior to the Rosemont deal, Augusta issued a total of approximately 17.6 million common shares in a
private placement and prospectus offering, increasing the previous share base by 20%. Augusta had a
cash position of $6.25 million and held approximately $45.80 million in debt. The Rosemont project was
Augusta’s flagship project and the asset in its portfolio that was the closest to achieving commercial
production (Augusta Resource Corporation, 2010).