STILTS - Starlink Tables Infrastructure Library Tool Set Version 3.4-2 ...
584
STILTS - Starlink Tables Infrastructure Library Tool Set Version 3.4-2 Starlink User Note256 Mark Taylor 15 October 2021 Abstract STILTS is a set of command-line tools for processing tabular data. It has been designed for, but is not restricted to, use on astronomical data such as source catalogues. It contains both generic (format-independent) table processing tools and tools for processing VOTable documents. Facilities offered include crossmatching, format conversion, format validation, column calculation and rearrangement, row selection, sorting, plotting, statistical calculations and metadata display. Calculations on cell data can be performed using a powerful and extensible expression language. The package is written in pure Java and based on STIL, the Starlink Tables Infrastructure Library. This gives it high portability, support for many data formats (including FITS, VOTable, text-based formats and SQL databases), extensibility and scalability. Where possible the tools are written to accept streamed data so the size of tables which can be processed is not limited by available memory. As well as the tutorial and reference information in this document, detailed on-line help is available from the tools themselves. The STILTS application is available under the GNU General Public License (GPL) though most parts of the library code may alternatively be used under the GNU Lesser General Public License (LGPL). Contents Abstract............................................................................................................................................. 1 1 Introduction.................................................................................................................................. 9 2 The stilts command................................................................................................................. 11
-
Upload
khangminh22 -
Category
Documents
-
view
0 -
download
0
Transcript of STILTS - Starlink Tables Infrastructure Library Tool Set Version 3.4-2 ...
STILTS - Starlink Tables Infrastructure Library Tool Set
Version 3.4-2
Starlink User Note256Mark Taylor15 October 2021
Abstract
STILTS is a set of command-line tools for processing tabular data. It has been designed for, but isnot restricted to, use on astronomical data such as source catalogues. It contains both generic(format-independent) table processing tools and tools for processing VOTable documents. Facilitiesoffered include crossmatching, format conversion, format validation, column calculation andrearrangement, row selection, sorting, plotting, statistical calculations and metadata display.Calculations on cell data can be performed using a powerful and extensible expression language.
The package is written in pure Java and based on STIL, the Starlink Tables Infrastructure Library.This gives it high portability, support for many data formats (including FITS, VOTable, text-basedformats and SQL databases), extensibility and scalability. Where possible the tools are written toaccept streamed data so the size of tables which can be processed is not limited by availablememory. As well as the tutorial and reference information in this document, detailed on-line help isavailable from the tools themselves.
The STILTS application is available under the GNU General Public License (GPL) though mostparts of the library code may alternatively be used under the GNU Lesser General Public License(LGPL).
ContentsAbstract............................................................................................................................................. 11 Introduction.................................................................................................................................. 92 The stilts command................................................................................................................. 11
2.1 Stilts flags.................................................................................................................................. 112.2 Task Names............................................................................................................................... 122.3 Task Arguments........................................................................................................................ 132.4 Getting Help.............................................................................................................................. 143 Invocation.................................................................................................................................... 173.1 Class Path.................................................................................................................................. 183.2 Java Flags.................................................................................................................................. 183.3 System Properties...................................................................................................................... 193.4 JDBC Configuration.................................................................................................................. 214 JyStilts - STILTS from Python................................................................................................. 244.1 Running JyStilts........................................................................................................................ 254.2 Table I/O................................................................................................................................... 264.3 Table objects............................................................................................................................. 274.4 Table filter commands (cmd_*)................................................................................................. 294.5 Table output modes (mode_*).................................................................................................... 304.6 Tasks.......................................................................................................................................... 304.7 Calculation Functions................................................................................................................ 315 Table I/O...................................................................................................................................... 325.1 Table Formats............................................................................................................................ 325.1.1 Input Formats......................................................................................................................... 325.1.1.1 fits ..................................................................................................................................... 335.1.1.2 colfits ............................................................................................................................... 345.1.1.3 votable ............................................................................................................................... 345.1.1.4 cdf ....................................................................................................................................... 355.1.1.5 csv ....................................................................................................................................... 355.1.1.6 ecsv ..................................................................................................................................... 375.1.1.7 ascii ................................................................................................................................... 385.1.1.8 ipac ..................................................................................................................................... 395.1.1.9 mrt ....................................................................................................................................... 405.1.1.10 parquet ............................................................................................................................. 415.1.1.11 feather ............................................................................................................................. 425.1.1.12 gbin ................................................................................................................................... 425.1.1.13 tst ..................................................................................................................................... 435.1.1.14 wdc ..................................................................................................................................... 445.1.2 Output Formats....................................................................................................................... 445.1.2.1 fits ..................................................................................................................................... 445.1.2.2 colfits ............................................................................................................................... 455.1.2.3 votable ............................................................................................................................... 465.1.2.4 csv ....................................................................................................................................... 475.1.2.5 ecsv ..................................................................................................................................... 475.1.2.6 ascii ................................................................................................................................... 485.1.2.7 ipac ..................................................................................................................................... 495.1.2.8 parquet ............................................................................................................................... 505.1.2.9 feather ............................................................................................................................... 515.1.2.10 text ................................................................................................................................... 515.1.2.11 html ................................................................................................................................... 515.1.2.12 latex ................................................................................................................................. 525.1.2.13 tst ..................................................................................................................................... 535.1.2.14 mirage ............................................................................................................................... 535.2 Input Locations.......................................................................................................................... 545.3 Input Schemes........................................................................................................................... 555.3.1 skysim .................................................................................................................................... 555.3.2 attractor ...............................................................................................................................565.3.3 jdbc ........................................................................................................................................ 575.3.4 loop ........................................................................................................................................ 58

5.3.5 test ........................................................................................................................................ 585.3.6 class ...................................................................................................................................... 596 Table Pipelines............................................................................................................................ 606.1 Processing Filters...................................................................................................................... 606.1.1 addcol .................................................................................................................................... 616.1.2 addpixsample .........................................................................................................................616.1.3 addresolve .............................................................................................................................626.1.4 addskycoords .........................................................................................................................626.1.5 assert .................................................................................................................................... 636.1.6 badval .................................................................................................................................... 636.1.7 cache ...................................................................................................................................... 636.1.8 check ...................................................................................................................................... 646.1.9 clearparams ...........................................................................................................................646.1.10 collapsecols .......................................................................................................................646.1.11 colmeta ................................................................................................................................ 656.1.12 delcols ................................................................................................................................ 656.1.13 every .................................................................................................................................... 656.1.14 explodeall ...........................................................................................................................656.1.15 explodecols .........................................................................................................................666.1.16 fixcolnames .........................................................................................................................666.1.17 head ...................................................................................................................................... 666.1.18 healpixmeta .........................................................................................................................666.1.19 keepcols ...............................................................................................................................676.1.20 meta ...................................................................................................................................... 676.1.21 progress ...............................................................................................................................686.1.22 random .................................................................................................................................. 686.1.23 randomview ...........................................................................................................................686.1.24 repeat .................................................................................................................................. 696.1.25 replacecol ...........................................................................................................................696.1.26 replaceval ...........................................................................................................................696.1.27 rowrange ...............................................................................................................................696.1.28 select .................................................................................................................................. 706.1.29 seqview ................................................................................................................................ 706.1.30 setparam ...............................................................................................................................706.1.31 sort ...................................................................................................................................... 706.1.32 sorthead ...............................................................................................................................716.1.33 stats .................................................................................................................................... 716.1.34 tablename .............................................................................................................................726.1.35 tail ...................................................................................................................................... 726.1.36 transpose .............................................................................................................................726.1.37 uniq ...................................................................................................................................... 736.2 Specifying a Single Column...................................................................................................... 736.3 Specifying a List of Columns.................................................................................................... 746.4 Output Modes............................................................................................................................ 746.4.1 cgi .......................................................................................................................................... 746.4.2 checksum .................................................................................................................................756.4.3 count ...................................................................................................................................... 756.4.4 discard .................................................................................................................................. 756.4.5 gui .......................................................................................................................................... 756.4.6 meta ........................................................................................................................................ 756.4.7 out .......................................................................................................................................... 766.4.8 plastic .................................................................................................................................. 766.4.9 samp ........................................................................................................................................ 776.4.10 stats .................................................................................................................................... 776.4.11 topcat .................................................................................................................................. 78
6.4.12 tosql .................................................................................................................................... 787 Crossmatching............................................................................................................................ 807.1 Match Criteria........................................................................................................................... 807.1.1 sky: Sky Matching................................................................................................................. 817.1.2 skyerr: Sky Matching with Per-Object Errors...................................................................... 827.1.3 skyellipse: Sky Matching of Elliptical Regions.................................................................. 837.1.4 sky3d: Spherical Polar Matching........................................................................................... 837.1.5 exact: Exact Matching........................................................................................................... 847.1.6 1d, 2d, ...: Isotropic Cartesian Matching................................................................................ 847.1.7 2d_anisotropic, ...: Anisotropic Cartesian Matching........................................................... 857.1.8 2d_cuboid, ...: Cuboid Cartesian Matching........................................................................... 857.1.9 1d_err, 2d_err, ...: Cartesian Matching with Per-Object Errors........................................... 867.1.10 2d_ellipse: Cartesian Matching of Elliptical Regions....................................................... 877.1.11 Custom Matchers.................................................................................................................. 877.1.12 Matcher Combinations......................................................................................................... 877.2 Multi-Object Matches............................................................................................................... 888 Plotting......................................................................................................................................... 908.1 Plot Parameters.......................................................................................................................... 908.1.1 Global Parameters.................................................................................................................. 918.1.2 Layer Parameters.................................................................................................................... 918.1.3 Animation............................................................................................................................... 928.2 Surface Types............................................................................................................................ 938.3 Layer Types............................................................................................................................... 948.3.1 mark ........................................................................................................................................ 948.3.2 size ........................................................................................................................................ 978.3.3 sizexy .................................................................................................................................. 1008.3.4 xyvector ...............................................................................................................................1038.3.5 xyerror ................................................................................................................................ 1068.3.6 xyellipse .............................................................................................................................1108.3.7 xycorr .................................................................................................................................. 1138.3.8 link2 .................................................................................................................................... 1178.3.9 mark2 .................................................................................................................................... 1198.3.10 poly4 .................................................................................................................................. 1228.3.11 mark4 .................................................................................................................................. 1258.3.12 polygon .............................................................................................................................. 1288.3.13 area .................................................................................................................................... 1318.3.14 central .............................................................................................................................. 1358.3.15 lines .................................................................................................................................. 1388.3.16 marks .................................................................................................................................. 1418.3.17 yerrors .............................................................................................................................. 1438.3.18 xyerrors .............................................................................................................................1468.3.19 line .................................................................................................................................... 1498.3.20 linearfit ...........................................................................................................................1528.3.21 label .................................................................................................................................. 1558.3.22 arealabel ...........................................................................................................................1588.3.23 contour .............................................................................................................................. 1628.3.24 grid .................................................................................................................................... 1658.3.25 fill .................................................................................................................................... 1698.3.26 quantile .............................................................................................................................1718.3.27 histogram ...........................................................................................................................1758.3.28 kde ...................................................................................................................................... 1798.3.29 knn ...................................................................................................................................... 1838.3.30 densogram ...........................................................................................................................1888.3.31 gaussian .............................................................................................................................1938.3.32 function .............................................................................................................................196
8.3.33 skyvector ...........................................................................................................................1988.3.34 skyellipse .........................................................................................................................2028.3.35 skycorr .............................................................................................................................. 2068.3.36 skydensity .........................................................................................................................2108.3.37 healpix .............................................................................................................................. 2138.3.38 skygrid .............................................................................................................................. 2168.3.39 xyzvector ...........................................................................................................................2188.3.40 xyzerror .............................................................................................................................2218.3.41 line3d ................................................................................................................................ 2258.3.42 spheregrid .........................................................................................................................2288.3.43 yerror ................................................................................................................................ 2298.3.44 spectrogram .......................................................................................................................2328.4 Shading Modes........................................................................................................................ 2348.4.1 auto ...................................................................................................................................... 2348.4.2 flat ...................................................................................................................................... 2368.4.3 translucent .........................................................................................................................2378.4.4 transparent .........................................................................................................................2388.4.5 density ................................................................................................................................ 2398.4.6 aux ........................................................................................................................................ 2428.4.7 weighted ...............................................................................................................................2448.5 Output Modes.......................................................................................................................... 2458.5.1 swing .................................................................................................................................... 2458.5.2 out ........................................................................................................................................ 2468.5.3 cgi ........................................................................................................................................ 2468.5.4 discard ................................................................................................................................ 2468.5.5 auto ...................................................................................................................................... 2468.6 Export Formats........................................................................................................................ 2469 Old-Style Plotting..................................................................................................................... 2489.1 Parameter Suffixes.................................................................................................................. 24810 Algebraic Expression Syntax................................................................................................. 25110.1 Referencing Column Values................................................................................................. 25110.2 Referencing Parameter Values.............................................................................................. 25210.3 Special Tokens...................................................................................................................... 25310.4 Null Values............................................................................................................................ 25310.5 Operators............................................................................................................................... 25410.6 Functions............................................................................................................................... 25510.6.1 Arithmetic........................................................................................................................... 25510.6.2 Arrays................................................................................................................................. 25910.6.3 Conversions........................................................................................................................ 26810.6.4 CoordsDegrees................................................................................................................... 27310.6.5 CoordsRadians................................................................................................................... 27610.6.6 Coverage............................................................................................................................. 28110.6.7 Distances............................................................................................................................ 28210.6.8 Fluxes................................................................................................................................. 28510.6.9 Formats............................................................................................................................... 28710.6.10 Gaia.................................................................................................................................. 28910.6.11 KCorrections.................................................................................................................... 29710.6.12 Lists.................................................................................................................................. 30110.6.13 Maths................................................................................................................................ 30310.6.14 Shapes............................................................................................................................... 30710.6.15 Sky.................................................................................................................................... 30810.6.16 Strings............................................................................................................................... 31010.6.17 Tilings............................................................................................................................... 31610.6.18 Times................................................................................................................................ 32110.6.19 TrigDegrees...................................................................................................................... 327

10.6.20 URLs................................................................................................................................ 32910.6.21 VO.................................................................................................................................... 33210.7 Examples............................................................................................................................... 33410.8 Advanced Topics................................................................................................................... 33510.8.1 Expression evaluation........................................................................................................ 33610.8.2 Instance Methods................................................................................................................ 33610.8.3 Adding User-Defined Functions........................................................................................ 33611 Server Mode............................................................................................................................ 33811.1 Plot Service........................................................................................................................... 33811.1.1 Usage.................................................................................................................................. 33911.1.2 RESTful API...................................................................................................................... 33911.1.3 Caching and Performance.................................................................................................. 34211.2 Task Service.......................................................................................................................... 34211.3 Form Service......................................................................................................................... 34312 Programmatic Invocation...................................................................................................... 345Appendix A: Commands By Category...................................................................................... 347Appendix B: Command Reference............................................................................................ 349B.1 calc: Evaluates expressions................................................................................................. 349B.2 cdsskymatch: Crossmatches table on sky position against VizieR/SIMBAD table......... 350B.3 cone: Executes a Cone Search-like query........................................................................... 355B.4 coneskymatch: Crossmatches table on sky position against remote cone service............ 358B.5 datalinklint: Validates DataLink documents.................................................................. 366B.6 funcs: Browses functions used by algebraic expression language................................... 369B.7 pixfoot: Generates Multi-Order Coverage maps............................................................. 369B.8 pixsample: Samples from a HEALPix pixel data file........................................................ 371B.9 plot2plane: Draws a plane plot........................................................................................... 376B.10 plot2sky: Draws a sky plot................................................................................................ 387B.11 plot2cube: Draws a cube plot............................................................................................ 398B.12 plot2sphere: Draws a sphere plot..................................................................................... 409B.13 plot2time: Draws a time plot............................................................................................. 419B.14 plot2d: Old-style 2D Scatter Plot...................................................................................... 431B.15 plot3d: Old-style 3D Scatter Plot...................................................................................... 440B.16 plothist: Old-style Histogram.......................................................................................... 449B.17 regquery: Queries the VO registry.................................................................................... 455B.18 server: Runs an HTTP server to perform STILTS commands..................................... 458B.19 sqlclient: Executes SQL statements................................................................................ 459B.20 sqlskymatch: Crossmatches table on sky position against SQL table............................ 461B.21 sqlupdate: Updates values in an SQL table..................................................................... 467B.22 taplint: Tests TAP services.............................................................................................. 468B.23 tapquery: Queries a Table Access Protocol server.......................................................... 473B.24 tapresume: Resumes a previous query to a Table Access Protocol server..................... 478B.25 tapskymatch: Crossmatches table on sky position against TAP table............................ 480B.26 tcat: Concatenates multiple similar tables...................................................................... 486B.27 tcatn: Concatenates multiple tables................................................................................. 491B.28 tcopy: Converts between table formats............................................................................ 494B.29 tcube: Calculates N-dimensional histograms................................................................... 496B.30 tloop: Generates a single-column table from a loop variable........................................ 499B.31 tjoin: Joins multiple tables side-to-side........................................................................... 501B.32 tmatch1: Performs a crossmatch internal to a single table............................................. 504B.33 tmatch2: Crossmatches 2 tables using flexible criteria.................................................... 508B.34 tmatchn: Crossmatches multiple tables using flexible criteria....................................... 514B.35 tmulti: Writes multiple tables to a single container file................................................. 519B.36 tmultin: Writes multiple processed tables to single container file................................. 522B.37 tpipe: Performs pipeline processing on a table............................................................... 524B.38 tskymap: Calculates sky density maps............................................................................... 529
B.39 tskymatch2: Crossmatches 2 tables on sky position......................................................... 534B.40 votcopy: Transforms between VOTable encodings......................................................... 538B.41 votlint: Validates VOTable documents.......................................................................... 541Appendix C: Release Notes......................................................................................................... 546C.1 Acknowledgements............................................................................................................... 546C.2 Version History..................................................................................................................... 546

SUN/256 8
1 Introduction
STILTS provides a number of command-line applications which can be used for manipulatingtabular data. Conceptually it sits between, and uses many of the same classes as, the packages STIL,which is a set of Java APIs providing table-related functionality, and TOPCAT, which is a graphicalapplication providing the user with an interactive platform for exploring one or more tables. Thisdocument is mostly self-contained - it covers some of the same ground as the STIL and TOPCATuser documents (SUN/252 and SUN/253 respectively).
Currently, this package consists of commands in the following categories:
Generic table manipulationtcopy, tpipe, tmulti, tmultin, tcat, tcatn, tloop, tjoin and tcube (see Section 6).
Crossmatchingtmatch1, tmatch2, tmatchn and tskymatch2 (see Section 7).
Plottingplot2plane, plot2sky, plot2cube, plot2sphere and plot2time (also deprecated old-styleplot commands plot2d, plot3d and plothist) (see Section 8).
Sky Pixel Operationstskymap, pixfoot and pixsample.
VOTablevotcopy and votlint.
Virtual Observatory accesscdsskymatch, cone, coneskymatch, tapquery, tapresume, tapskymatch, taplint,datalinklint and regquery.
SQL databasessqlclient, sqlupdate and sqlskymatch.
Miscellaneouscalc (Appendix B.1), funcs (Appendix B.6) and server (Appendix B.18).
See Appendix A for an expanded version of this list.
There are many ways you might want to use these tools; here are a few possibilities:
In conjunction with TOPCATyou can identify a set of processing steps using TOPCAT's interactive graphical facilities, andconstruct a script using the commands provided here which can perform the same steps onmany similar tables without further user intervention.
Format conversionIf you have a separate table processing engine and you want to be able to output the results in asomewhat different form, for instance converting it from FITS to VOTable or fromTABLEDATA-encoded to BINARY-encoded VOTable, or to perform some morescientifically substantial operation such as changing units or coordinate systems, substitutingbad values etc, you can pass the results through one of the tools here. Since on the wholeoperation is streaming, such conversion can easily and efficiently be done on the fly.
Server-side operationsThe tools provided here are suitable for use on servers, either to generate files as part of a webservice (perhaps along the lines of the Format conversion item above) or as configurablecomponents in a server-based workflow system. The server command may help, but is notrequired, for use in these situations.
Quick look
SUN/256 9

You might want to examine the metadata, or a few rows, or a statistical summary of a tablewithout having to load the whole thing into TOPCAT or some other table viewer application.
SUN/256 10
2 The stilts command
All the functions available in this package can be used from a single command, which is usuallyreferred to in this document simply as "stilts". Depending on how you have installed the package,you may just type "stilts", or something like
java -jar some/path/stilts.jar
or
java -classpath topcat-lite.jar uk.ac.starlink.ttools.Stilts
or something else - this is covered in detail in Section 3.
In general, the form of a command is
stilts <stilts-flags> <task-name> <task-args>
The forms of the parts of this command are described in the following subsections, and details ofeach of the available tasks along with their arguments are listed in the command reference(Appendix B) at the end of this document. Some of the commands are highly configurable and havea variety of parameters to define their operation. In many cases however, it's not complicated to usethem. For instance, to convert the data in a FITS table to VOTable format you might write:
stilts tcopy cat.fits cat.vot
2.1 Stilts flags
Some flags are common to all the tasks in the STILTS package, and these are specified after thestilts invocation itself and before the task name. They generally have the same effect regardlessof which task is running. These generic flags are as follows:
-help
Prints a usage message for the stilts command itself and exits. The message contains alisting of all the known tasks.
-version
Prints the STILTS version number and exits.
-verbose
Causes more verbose information to be written during operation. Specifically, what this does isto boost the logging level by one notch. It may be specified multiple times to increaseverbosity further. The flag +verbose can be used to do the opposite (reduce the logging levelby one notch).
-allowunused
Causes unused parameter settings on the command line to be tolerated. Normally, any unusedparameters on the command line cause a usage message to be output and the command to fail,on the assumption that if you've supplied a parameter setting that's not doing anything it isprobably a mistake and you should be given a chance to correct it. But if this flag is set, youjust get a warning through the logging system about any unused parameters, and the commandis executed as if they weren't there.
-prompt
Most of the STILTS commands have a number of parameters which will assume sensibledefaults if you do not give them explicit values on the command line. If you use the -prompt
flag, then you will be prompted for every parameter you have not explicitly specified to giveyou an opportunity to enter a value other than the default.
SUN/256 11

-bench
Outputs the elapsed time taken by the task to standard error on successful completion.
-debug
Sets up output suitable for debugging. The most visible consequence of this is that if an erroroccurs then a full stacktrace is output, rather than just a user-friendly report.
-batch
Some parameters will prompt you for their values, even if they offer legal defaults. If you usethe -batch flag, then you won't be prompted at all.
-memory
Encourages the command to use java heap memory for caching large amounts of data ratherthan using temporary disk files. The default is to use memory for small tables, and disk forlarge ones. This flag is in most cases equivalent to specifying the system property-Dstartable.storage=memory.
-disk
Encourages the command to use temporary files on disk for caching table data. The default isto use memory for small tables, and disk for large ones. Using this flag may help if you arerunning out of memory. This flag is in most cases equivalent to specifying the system property-Dstartable.storage=disk.
-memgui
Displays a graphical window while the command is running which summarises used andavailable heap memory. May be useful for profiling or understanding resource constraints.
-checkversion <vers>
Requires that the version is exactly as given by the string <vers>. If it is not, STILTS will exitwith an error. This can be useful when executing in certain controlled environments to ensurethat the correct version of the application is being picked up.
-stdout <file>
Sends all normal output from the run to the given file. By default this goes to the standardoutput stream. Supplying an empty string or "-" for <file> will restore this default behaviour.
-stderr <file>
Sends all error output from the run to the given file. By default this goes to the standard errorstream. Supplying an empty string or "-" for <file> will restore this default behaviour.
If you are submitting an error report, please include the result of running stilts -version and theoutput of the troublesome command with the -debug flag specified.
2.2 Task Names
The <task-name> part of the command line is the name of one of the tasks listed in Appendix B -currently the available tasks are:
• calc
• cdsskymatch
• cone
• coneskymatch
• datalinklint
• funcs
• pixfoot
• pixsample
• plot2cube
• plot2plane
• plot2sphere
SUN/256 12
• plot2sky
• plot2time
• plot2d
• plot3d
• plothist
• regquery
• server
• sqlclient
• sqlskymatch
• sqlupdate
• taplint
• tapquery
• tapresume
• tapskymatch
• tcat
• tcatn
• tcopy
• tcube
• tjoin
• tloop
• tmatch1
• tmatch2
• tmatchn
• tmulti
• tmultin
• tpipe
• tskymap
• tskymatch2
• votcopy
• votlint
2.3 Task Arguments
The <task-args> part of the command line is a list of parameter assignments, each giving the valueof one of the named parameters belonging to the task which is specified in the <task-name> part.
The general form of each parameter assignment is
<param-name>=<param-value>
If you want to set the parameter to the null value, which is legal for some but not all parameters, usethe special string "null", or just leave the value blank ("<param-name>="). In some cases you canoptionally leave out the <param-name> part of the assignment (i.e. the parameter is positionallydetermined); this is indicated in the task's usage description if the parameter is described like[<param-name>=]<param-value> rather than <param-name>=<param-value>. If the <param-value>
contains spaces or other special characters, then in most cases, such as from the Unix shell, you willhave to quote it somehow. How this is done depends on your platform, but usually surrounding thewhole value in single quotes will do the trick.
Tasks may have many parameters, and you don't have to set all of them explicitly on the comandline. For a parameter which you don't set, two things can happen. In many cases, it will default tosome sensible value. Sometimes however, you may be prompted for the value to use. In the lattercase, a line like this will be written to the terminal:
matcher - Name of matching algorithm [sky]:
SUN/256 13
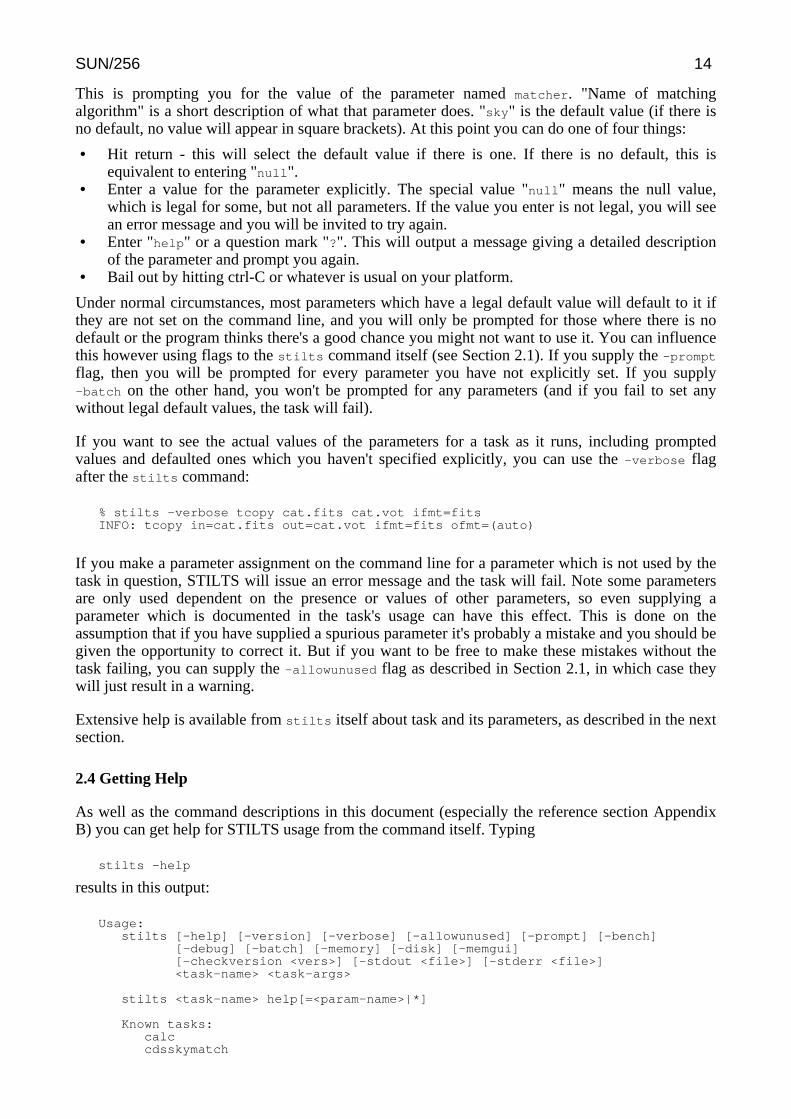
This is prompting you for the value of the parameter named matcher. "Name of matchingalgorithm" is a short description of what that parameter does. "sky" is the default value (if there isno default, no value will appear in square brackets). At this point you can do one of four things:
• Hit return - this will select the default value if there is one. If there is no default, this isequivalent to entering "null".
• Enter a value for the parameter explicitly. The special value "null" means the null value,which is legal for some, but not all parameters. If the value you enter is not legal, you will seean error message and you will be invited to try again.
• Enter "help" or a question mark "?". This will output a message giving a detailed descriptionof the parameter and prompt you again.
• Bail out by hitting ctrl-C or whatever is usual on your platform.
Under normal circumstances, most parameters which have a legal default value will default to it ifthey are not set on the command line, and you will only be prompted for those where there is nodefault or the program thinks there's a good chance you might not want to use it. You can influencethis however using flags to the stilts command itself (see Section 2.1). If you supply the -prompt
flag, then you will be prompted for every parameter you have not explicitly set. If you supply-batch on the other hand, you won't be prompted for any parameters (and if you fail to set anywithout legal default values, the task will fail).
If you want to see the actual values of the parameters for a task as it runs, including promptedvalues and defaulted ones which you haven't specified explicitly, you can use the -verbose flagafter the stilts command:
% stilts -verbose tcopy cat.fits cat.vot ifmt=fitsINFO: tcopy in=cat.fits out=cat.vot ifmt=fits ofmt=(auto)
If you make a parameter assignment on the command line for a parameter which is not used by thetask in question, STILTS will issue an error message and the task will fail. Note some parametersare only used dependent on the presence or values of other parameters, so even supplying aparameter which is documented in the task's usage can have this effect. This is done on theassumption that if you have supplied a spurious parameter it's probably a mistake and you should begiven the opportunity to correct it. But if you want to be free to make these mistakes without thetask failing, you can supply the -allowunused flag as described in Section 2.1, in which case theywill just result in a warning.
Extensive help is available from stilts itself about task and its parameters, as described in the nextsection.
2.4 Getting Help
As well as the command descriptions in this document (especially the reference section AppendixB) you can get help for STILTS usage from the command itself. Typing
stilts -help
results in this output:
Usage:stilts [-help] [-version] [-verbose] [-allowunused] [-prompt] [-bench]
[-debug] [-batch] [-memory] [-disk] [-memgui][-checkversion <vers>] [-stdout <file>] [-stderr <file>]<task-name> <task-args>
stilts <task-name> help[=<param-name>|*]
Known tasks:calccdsskymatch
SUN/256 14
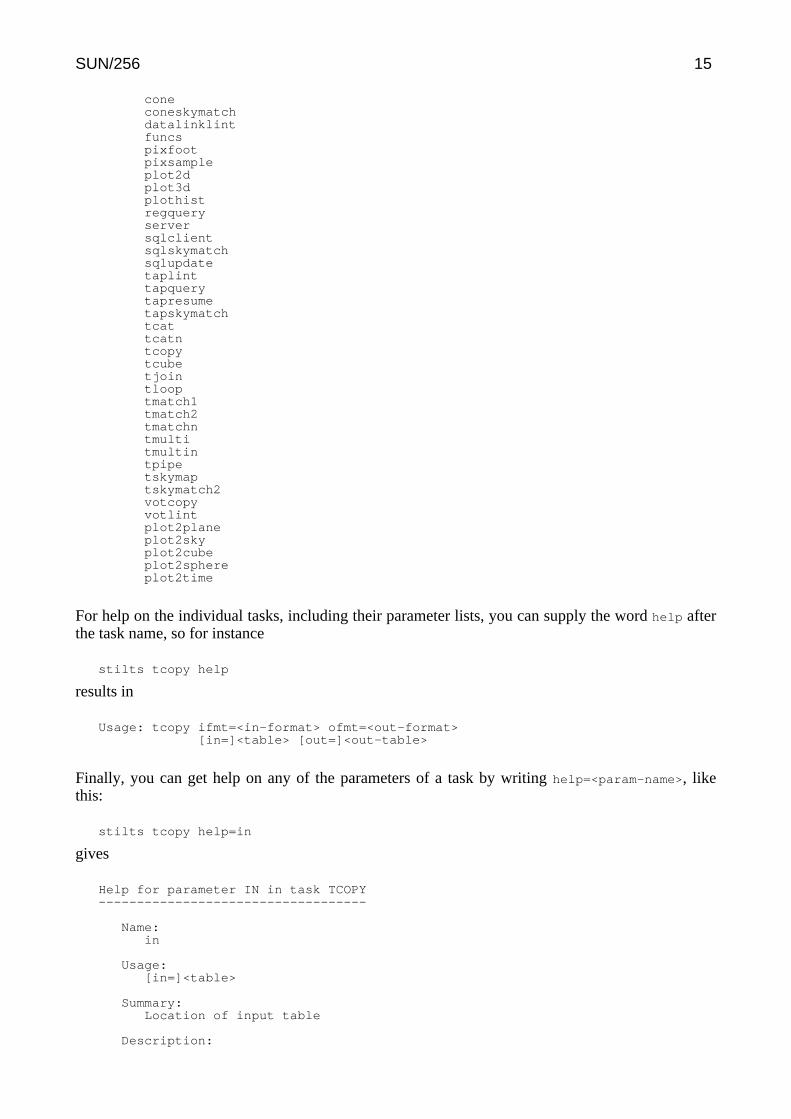
coneconeskymatchdatalinklintfuncspixfootpixsampleplot2dplot3dplothistregqueryserversqlclientsqlskymatchsqlupdatetaplinttapquerytapresumetapskymatchtcattcatntcopytcubetjointlooptmatch1tmatch2tmatchntmultitmultintpipetskymaptskymatch2votcopyvotlintplot2planeplot2skyplot2cubeplot2sphereplot2time
For help on the individual tasks, including their parameter lists, you can supply the word help afterthe task name, so for instance
stilts tcopy help
results in
Usage: tcopy ifmt=<in-format> ofmt=<out-format>[in=]<table> [out=]<out-table>
Finally, you can get help on any of the parameters of a task by writing help=<param-name>, likethis:
stilts tcopy help=in
gives
Help for parameter IN in task TCOPY-----------------------------------
Name:in
Usage:[in=]<table>
Summary:Location of input table
Description:
SUN/256 15

The location of the input table. This may take one of the followingforms:
* A filename.* A URL.* The special value "-", meaning standard input. In this case the
input format must be given explicitly using the ifmt parameter.Note that not all formats can be streamed in this way.
* A scheme specification of the form :<scheme-name>:<scheme-args>.* A system command line with either a "<" character at the start, or
a "|" character at the end ("<syscmd" or "syscmd|"). Thisexecutes the given pipeline and reads from its standard output.This will probably only work on unix-like systems.
In any case, compressed data in one of the supported compressionformats (gzip, Unix compress or bzip2) will be decompressedtransparently.
Type:uk.ac.starlink.table.StarTable
If you use "*" instead of a parameter name in this usage, help for all the parameters will be printed.Note that in most shells you will probably need to quote the asterisk, so you should write
stilts tcopy help='*'
In some cases, as described in Section 2.3, you will be prompted for the value of a parameter with aline something like this:
matcher - Name of matching algorithm [sky]:
In this case, if you enter "help" or a question mark, then the parameter help entry will be printed tothe screen, and the prompt will be repeated.
For more detailed descriptions of the tasks, which includes explanatory comments and examples aswell as the information above, see the full task descriptions in the Command Reference (AppendixB).
SUN/256 16

3 Invocation
There are a number of ways of invoking commands in the stilts application, depending on howyou have installed the package. This section describes how to invoke it from the command line.Other options are using it from Jython (the Java implementation of the Python language) asdescribed in Section 4, invoking it over HTTP as described in Section 11, and invoking it fromwithin a Java application as described in Section 12.
If you're using a Unix-like operating system, the easiest way is to use the stilts script. If you havea full starjava installation it is in the starjava/bin directory. Otherwise you can download itseparately from wherever you got your STILTS installation in the first place, or find it at the top ofthe stilts.jar or topcat-*.jar that contains your STILTS installation, so do something like
unzip stilts.jar stiltschmod +x stilts
to extract it (if you don't have unzip, try jar xvf stilts.jar stilts). stilts is a simple shellscript which just invokes java with the right classpath and the supplied arguments.
To run using the stilts script, first make sure that both the java executable and the stilts scriptitself are on your path, and that the stilts.jar or topcat-*.jar jar file is in the same directory asstilts. Then the form of invocation is:
stilts <java-flags> <stilts-flags> <task-name> <task-args>
A simple example would be:
stilts votcopy format=binary t1.xml t2.xml
in this case, as often, there are no <java-flags> or <stilts-flags>. If you use the -classpath
argument or have a CLASSPATH environment variable set, then classpath elements thus specifiedwill be added to the classpath required to run the command. The examples in the commanddescriptions below use this form for convenience.
If you don't have a Unix-like shell available however, you will need to invoke Java directly with theappropriate classes on your classpath. If you have the file stilts.jar, in most cases you can justwrite:
java <java-flags> -jar stilts.jar <stilts-flags> <task-name> <task-args>
which in practice would look something like
java -jar /some/where/stilts.jar votcopy format=binary t1.xml t2.xml
In the most general case, Java's -jar flag might be no good, for one of the following reasons:
1. You have the classes in some form other than the stilts.jar file (such as topcat-full.jar)2. You need to specify some extra classes on the classpath, which is required e.g. for use with
JDBC (Section 3.4) or if you are extending the commands (Section 10.8.3) using your ownclasses at runtime
In this case, you will need an invocation of this form:
java <java-flags> -classpath <class-path>uk.ac.starlink.ttools.Stilts <stilts-flags> <task-name> <task-args>
The example above in this case would look something like:
java -classpath /some/where/topcat-full.jar uk.ac.starlink.ttools.Stiltsvotcopy format=binary t1.xml t2.xml
SUN/256 17
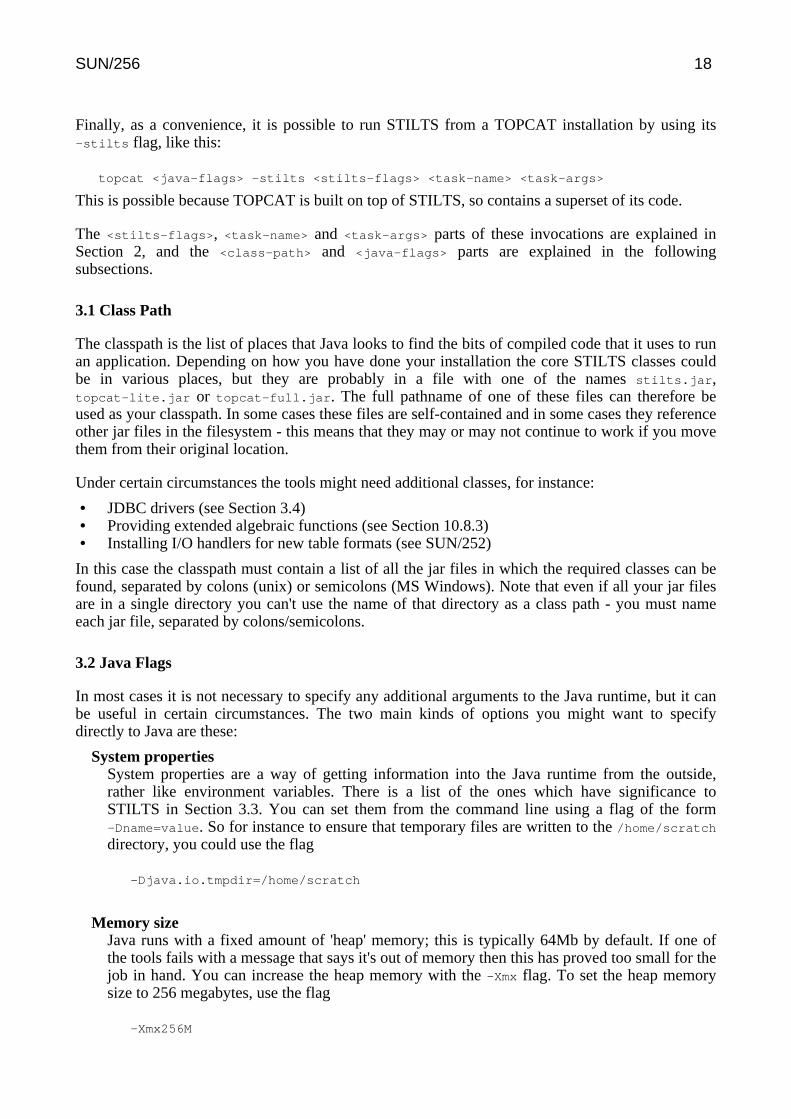
Finally, as a convenience, it is possible to run STILTS from a TOPCAT installation by using its-stilts flag, like this:
topcat <java-flags> -stilts <stilts-flags> <task-name> <task-args>
This is possible because TOPCAT is built on top of STILTS, so contains a superset of its code.
The <stilts-flags>, <task-name> and <task-args> parts of these invocations are explained inSection 2, and the <class-path> and <java-flags> parts are explained in the followingsubsections.
3.1 Class Path
The classpath is the list of places that Java looks to find the bits of compiled code that it uses to runan application. Depending on how you have done your installation the core STILTS classes couldbe in various places, but they are probably in a file with one of the names stilts.jar,topcat-lite.jar or topcat-full.jar. The full pathname of one of these files can therefore beused as your classpath. In some cases these files are self-contained and in some cases they referenceother jar files in the filesystem - this means that they may or may not continue to work if you movethem from their original location.
Under certain circumstances the tools might need additional classes, for instance:
• JDBC drivers (see Section 3.4)• Providing extended algebraic functions (see Section 10.8.3)• Installing I/O handlers for new table formats (see SUN/252)
In this case the classpath must contain a list of all the jar files in which the required classes can befound, separated by colons (unix) or semicolons (MS Windows). Note that even if all your jar filesare in a single directory you can't use the name of that directory as a class path - you must nameeach jar file, separated by colons/semicolons.
3.2 Java Flags
In most cases it is not necessary to specify any additional arguments to the Java runtime, but it canbe useful in certain circumstances. The two main kinds of options you might want to specifydirectly to Java are these:
System propertiesSystem properties are a way of getting information into the Java runtime from the outside,rather like environment variables. There is a list of the ones which have significance toSTILTS in Section 3.3. You can set them from the command line using a flag of the form-Dname=value. So for instance to ensure that temporary files are written to the /home/scratch
directory, you could use the flag
-Djava.io.tmpdir=/home/scratch
Memory sizeJava runs with a fixed amount of 'heap' memory; this is typically 64Mb by default. If one ofthe tools fails with a message that says it's out of memory then this has proved too small for thejob in hand. You can increase the heap memory with the -Xmx flag. To set the heap memorysize to 256 megabytes, use the flag
-Xmx256M
SUN/256 18

(don't forget the 'M' for megabyte). You will probably find performance is dreadful if youspecify a heap size larger than the physical memory of the machine you're running on.
You can specify other options to Java such as tuning and profiling flags etc, but if you want to dothat sort of thing you probably don't need me to tell you about it.
If you are using the stilts command-line script, any flags to it starting -D or -X are passed directlyto the java executable. You can pass other flags to Java with the stilts script's -J flag; forinstance:
stilts -Xmx4M -J-verbose:gc calc 'mjdToIso(0)'
is equivalent to
java -Xmx4M -verbose:gc -jar stilts.jar calc 'mjdToIso(0)'
3.3 System Properties
System properties are a way of getting information into the Java runtime - they are a bit likeenvironment variables. There are two ways to set them when using STILTS: either on the commandline using arguments of the form -Dname=value (see Section 3.2) or in a file in your home directorynamed .starjava.properties, in the form of a name=value line. Thus submitting the flag
-Dvotable.strict=false
on the command line is equivalent to having the following in your .starjava.properties file:
# Force strict interpretation of the VOTable standard.votable.strict=false
The following system properties have special significance to STILTS:
http.proxyHost
Can be used to force HTTP access to go via a named proxy; may be required if you areattempting access to remote data or services from behind a firewall configured to block directHTTP connections. See java documentation for this property for more details.
java.awt.headless
May need to be set to "true" if running the plotting tasks on a headless server. You only needto worry about this if you see error messages complaining about headlessness.
java.io.tmpdir
The directory in which STILTS will write any temporary files it needs. This is usually onlydone if the -disk flag has been specified (see Section 2.1).
java.util.concurrent.ForkJoinPool.common.parallelism
Controls the level of parallelisation done by certain processing, currently mainly visualisation.By default it is typically set to one less than the number of processing cores on the currentmachine. To inhibit parallelisation (e.g. if you suspect that the parallel output is givingdifferent results to sequential processing) you can set this to 1.
jdbc.drivers
Can be set to a (colon-separated) list of JDBC driver classes using which SQL databases canbe accessed (see Section 3.4).
jel.classes
Can be set to a (colon-separated) list of classes containing static methods which defineuser-provided functions for synthetic columns or subsets. (see Section 10.8.3).
SUN/256 19
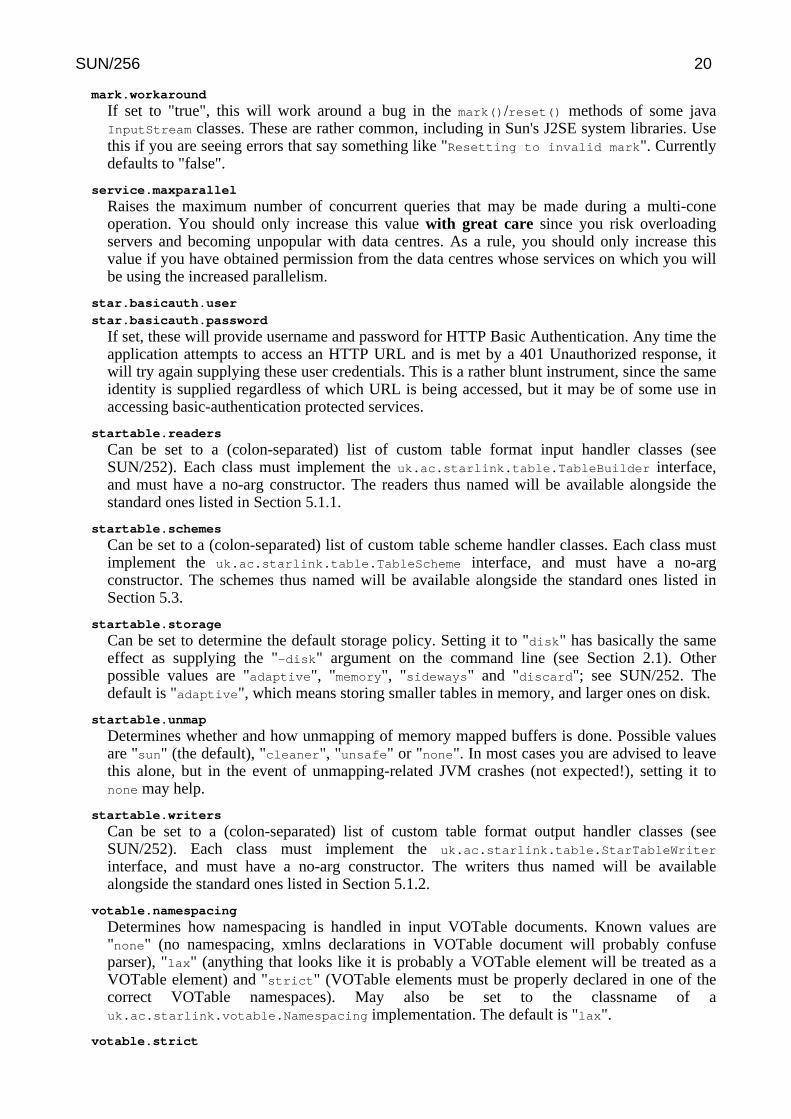
mark.workaround
If set to "true", this will work around a bug in the mark()/reset() methods of some javaInputStream classes. These are rather common, including in Sun's J2SE system libraries. Usethis if you are seeing errors that say something like "Resetting to invalid mark". Currentlydefaults to "false".
service.maxparallel
Raises the maximum number of concurrent queries that may be made during a multi-coneoperation. You should only increase this value with great care since you risk overloadingservers and becoming unpopular with data centres. As a rule, you should only increase thisvalue if you have obtained permission from the data centres whose services on which you willbe using the increased parallelism.
star.basicauth.user
star.basicauth.password
If set, these will provide username and password for HTTP Basic Authentication. Any time theapplication attempts to access an HTTP URL and is met by a 401 Unauthorized response, itwill try again supplying these user credentials. This is a rather blunt instrument, since the sameidentity is supplied regardless of which URL is being accessed, but it may be of some use inaccessing basic-authentication protected services.
startable.readers
Can be set to a (colon-separated) list of custom table format input handler classes (seeSUN/252). Each class must implement the uk.ac.starlink.table.TableBuilder interface,and must have a no-arg constructor. The readers thus named will be available alongside thestandard ones listed in Section 5.1.1.
startable.schemes
Can be set to a (colon-separated) list of custom table scheme handler classes. Each class mustimplement the uk.ac.starlink.table.TableScheme interface, and must have a no-argconstructor. The schemes thus named will be available alongside the standard ones listed inSection 5.3.
startable.storage
Can be set to determine the default storage policy. Setting it to "disk" has basically the sameeffect as supplying the "-disk" argument on the command line (see Section 2.1). Otherpossible values are "adaptive", "memory", "sideways" and "discard"; see SUN/252. Thedefault is "adaptive", which means storing smaller tables in memory, and larger ones on disk.
startable.unmap
Determines whether and how unmapping of memory mapped buffers is done. Possible valuesare "sun" (the default), "cleaner", "unsafe" or "none". In most cases you are advised to leavethis alone, but in the event of unmapping-related JVM crashes (not expected!), setting it tonone may help.
startable.writers
Can be set to a (colon-separated) list of custom table format output handler classes (seeSUN/252). Each class must implement the uk.ac.starlink.table.StarTableWriter
interface, and must have a no-arg constructor. The writers thus named will be availablealongside the standard ones listed in Section 5.1.2.
votable.namespacing
Determines how namespacing is handled in input VOTable documents. Known values are"none" (no namespacing, xmlns declarations in VOTable document will probably confuseparser), "lax" (anything that looks like it is probably a VOTable element will be treated as aVOTable element) and "strict" (VOTable elements must be properly declared in one of thecorrect VOTable namespaces). May also be set to the classname of auk.ac.starlink.votable.Namespacing implementation. The default is "lax".
votable.strict
SUN/256 20
Controls the behaviour when encountering a VOTable FIELD or PARAM element with adatatype attribute of char/unicodeChar, and no arraysize attribute. The VOTable standardsays this indicates a single character, but some VOTables omit arraysize specification byaccident when they intend arraysize="*". If votable.strict is set true, a missing arraysizewill be interpreted as meaning a single character, and if false, it will be interpreted as avariable-length array of characters (a string). The default is true.
votable.version
Selects the version of the VOTable standard which output VOTables will conform to bydefault. May take the values "1.0", "1.1", "1.2", "1.3" or "1.4". By default, version 1.4VOTables are written.
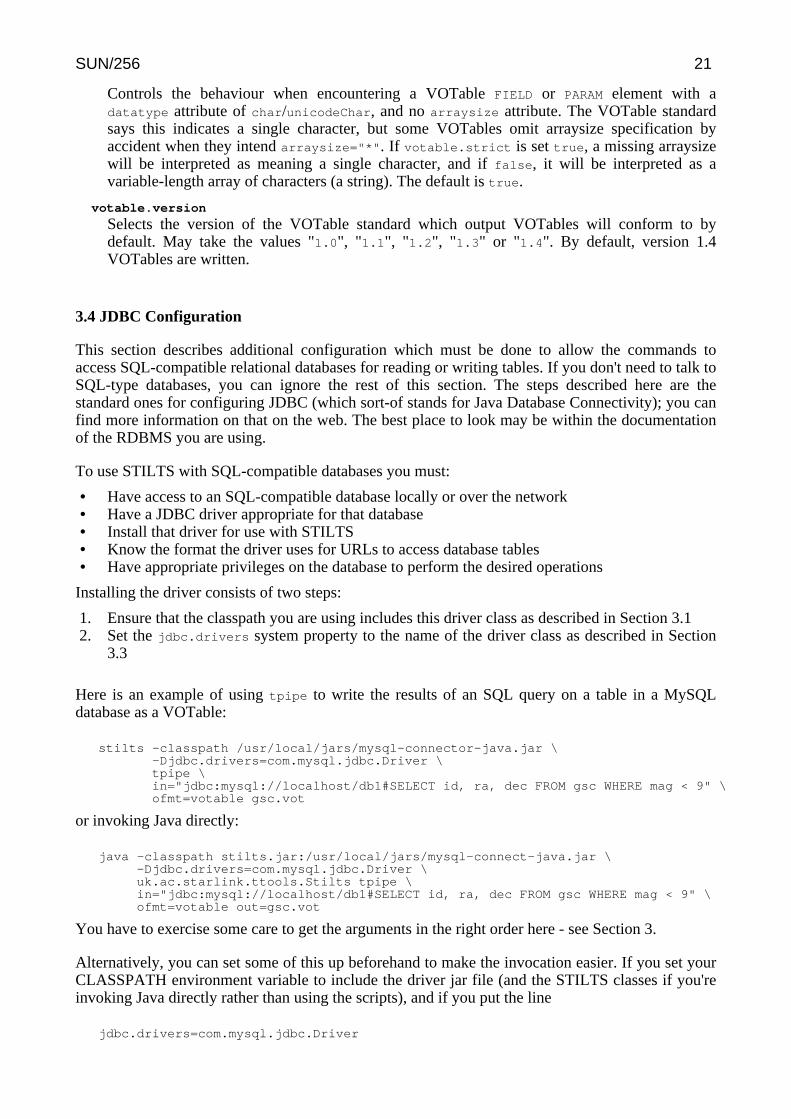
3.4 JDBC Configuration
This section describes additional configuration which must be done to allow the commands toaccess SQL-compatible relational databases for reading or writing tables. If you don't need to talk toSQL-type databases, you can ignore the rest of this section. The steps described here are thestandard ones for configuring JDBC (which sort-of stands for Java Database Connectivity); you canfind more information on that on the web. The best place to look may be within the documentationof the RDBMS you are using.
To use STILTS with SQL-compatible databases you must:
• Have access to an SQL-compatible database locally or over the network• Have a JDBC driver appropriate for that database• Install that driver for use with STILTS• Know the format the driver uses for URLs to access database tables• Have appropriate privileges on the database to perform the desired operations
Installing the driver consists of two steps:
1. Ensure that the classpath you are using includes this driver class as described in Section 3.12. Set the jdbc.drivers system property to the name of the driver class as described in Section
3.3
Here is an example of using tpipe to write the results of an SQL query on a table in a MySQLdatabase as a VOTable:
stilts -classpath /usr/local/jars/mysql-connector-java.jar \-Djdbc.drivers=com.mysql.jdbc.Driver \tpipe \in="jdbc:mysql://localhost/db1#SELECT id, ra, dec FROM gsc WHERE mag < 9" \ofmt=votable gsc.vot
or invoking Java directly:
java -classpath stilts.jar:/usr/local/jars/mysql-connect-java.jar \-Djdbc.drivers=com.mysql.jdbc.Driver \uk.ac.starlink.ttools.Stilts tpipe \in="jdbc:mysql://localhost/db1#SELECT id, ra, dec FROM gsc WHERE mag < 9" \ofmt=votable out=gsc.vot
You have to exercise some care to get the arguments in the right order here - see Section 3.
Alternatively, you can set some of this up beforehand to make the invocation easier. If you set yourCLASSPATH environment variable to include the driver jar file (and the STILTS classes if you'reinvoking Java directly rather than using the scripts), and if you put the line
jdbc.drivers=com.mysql.jdbc.Driver
SUN/256 21
in the .starjava.properties file in your home directory, then you could avoid having to give the-classpath and -Djdbc.drivers flags respectively.
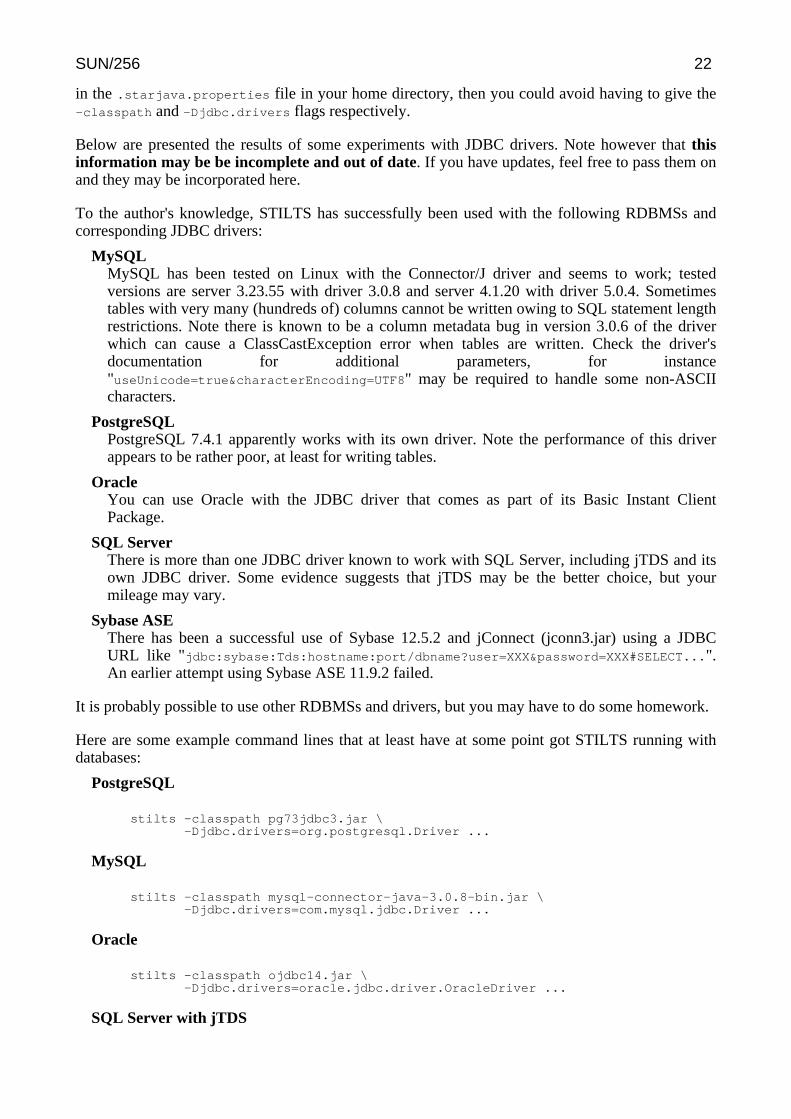
Below are presented the results of some experiments with JDBC drivers. Note however that thisinformation may be be incomplete and out of date. If you have updates, feel free to pass them onand they may be incorporated here.
To the author's knowledge, STILTS has successfully been used with the following RDBMSs andcorresponding JDBC drivers:
MySQLMySQL has been tested on Linux with the Connector/J driver and seems to work; testedversions are server 3.23.55 with driver 3.0.8 and server 4.1.20 with driver 5.0.4. Sometimestables with very many (hundreds of) columns cannot be written owing to SQL statement lengthrestrictions. Note there is known to be a column metadata bug in version 3.0.6 of the driverwhich can cause a ClassCastException error when tables are written. Check the driver'sdocumentation for additional parameters, for instance"useUnicode=true&characterEncoding=UTF8" may be required to handle some non-ASCIIcharacters.
PostgreSQLPostgreSQL 7.4.1 apparently works with its own driver. Note the performance of this driverappears to be rather poor, at least for writing tables.
OracleYou can use Oracle with the JDBC driver that comes as part of its Basic Instant ClientPackage.
SQL ServerThere is more than one JDBC driver known to work with SQL Server, including jTDS and itsown JDBC driver. Some evidence suggests that jTDS may be the better choice, but yourmileage may vary.
Sybase ASEThere has been a successful use of Sybase 12.5.2 and jConnect (jconn3.jar) using a JDBCURL like "jdbc:sybase:Tds:hostname:port/dbname?user=XXX&password=XXX#SELECT...".An earlier attempt using Sybase ASE 11.9.2 failed.
It is probably possible to use other RDBMSs and drivers, but you may have to do some homework.
Here are some example command lines that at least have at some point got STILTS running withdatabases:
PostgreSQL
stilts -classpath pg73jdbc3.jar \-Djdbc.drivers=org.postgresql.Driver ...
MySQL
stilts -classpath mysql-connector-java-3.0.8-bin.jar \-Djdbc.drivers=com.mysql.jdbc.Driver ...
Oracle
stilts -classpath ojdbc14.jar \-Djdbc.drivers=oracle.jdbc.driver.OracleDriver ...
SQL Server with jTDS
SUN/256 22

stilts -classpath jtds-1.1.jar \-Djdbc.drivers=net.sourceforge.jtds.jdbc.Driver ...
SUN/256 23
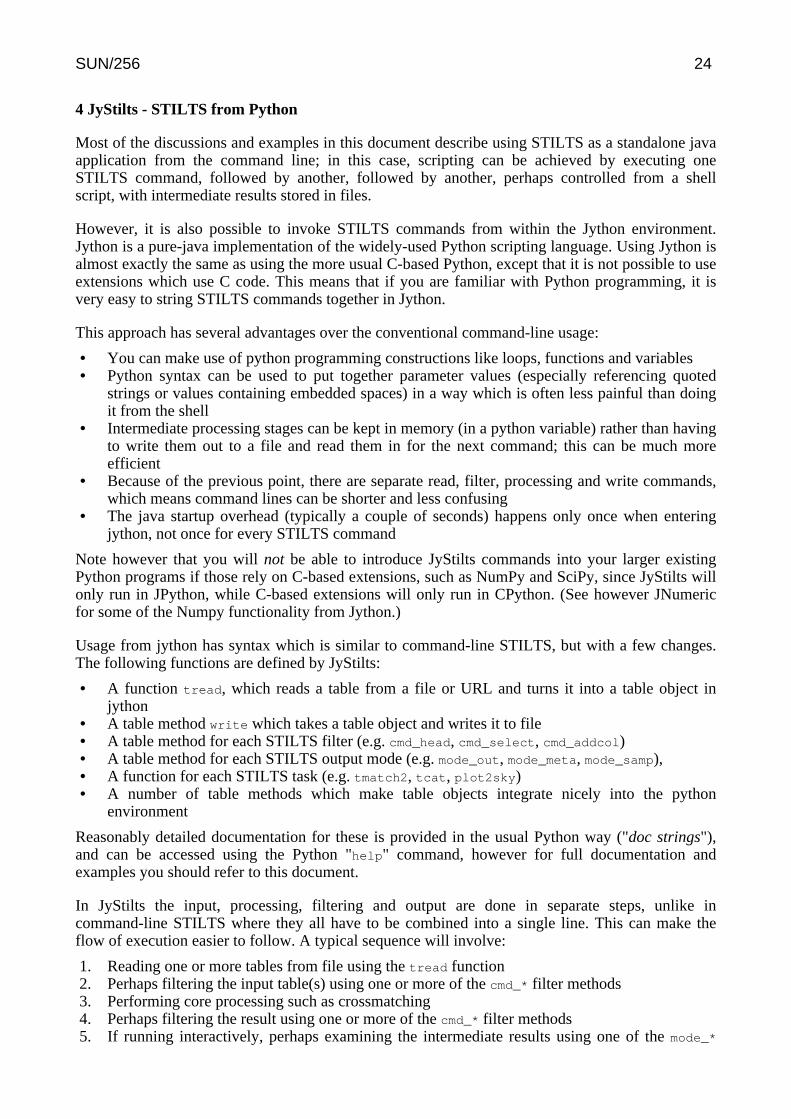
4 JyStilts - STILTS from Python
Most of the discussions and examples in this document describe using STILTS as a standalone javaapplication from the command line; in this case, scripting can be achieved by executing oneSTILTS command, followed by another, followed by another, perhaps controlled from a shellscript, with intermediate results stored in files.
However, it is also possible to invoke STILTS commands from within the Jython environment.Jython is a pure-java implementation of the widely-used Python scripting language. Using Jython isalmost exactly the same as using the more usual C-based Python, except that it is not possible to useextensions which use C code. This means that if you are familiar with Python programming, it isvery easy to string STILTS commands together in Jython.
This approach has several advantages over the conventional command-line usage:
• You can make use of python programming constructions like loops, functions and variables• Python syntax can be used to put together parameter values (especially referencing quoted
strings or values containing embedded spaces) in a way which is often less painful than doingit from the shell
• Intermediate processing stages can be kept in memory (in a python variable) rather than havingto write them out to a file and read them in for the next command; this can be much moreefficient
• Because of the previous point, there are separate read, filter, processing and write commands,which means command lines can be shorter and less confusing
• The java startup overhead (typically a couple of seconds) happens only once when enteringjython, not once for every STILTS command
Note however that you will not be able to introduce JyStilts commands into your larger existingPython programs if those rely on C-based extensions, such as NumPy and SciPy, since JyStilts willonly run in JPython, while C-based extensions will only run in CPython. (See however JNumericfor some of the Numpy functionality from Jython.)
Usage from jython has syntax which is similar to command-line STILTS, but with a few changes.The following functions are defined by JyStilts:
• A function tread, which reads a table from a file or URL and turns it into a table object injython
• A table method write which takes a table object and writes it to file• A table method for each STILTS filter (e.g. cmd_head, cmd_select, cmd_addcol)• A table method for each STILTS output mode (e.g. mode_out, mode_meta, mode_samp),• A function for each STILTS task (e.g. tmatch2, tcat, plot2sky)• A number of table methods which make table objects integrate nicely into the python
environment
Reasonably detailed documentation for these is provided in the usual Python way ("doc strings"),and can be accessed using the Python "help" command, however for full documentation andexamples you should refer to this document.
In JyStilts the input, processing, filtering and output are done in separate steps, unlike incommand-line STILTS where they all have to be combined into a single line. This can make theflow of execution easier to follow. A typical sequence will involve:
1. Reading one or more tables from file using the tread function2. Perhaps filtering the input table(s) using one or more of the cmd_* filter methods3. Performing core processing such as crossmatching4. Perhaps filtering the result using one or more of the cmd_* filter methods5. If running interactively, perhaps examining the intermediate results using one of the mode_*
SUN/256 24

output modes6. Writing the final result to a file using the write method
Here is an example command line invocation for crossmatching two tables:
stilts tskymatch2 in1=survey.fits \icmd1='addskycoords fk4 fk5 RA1950 DEC1950 RA2000 DEC2000' \in2=mycat.csv ifmt2=csv \icmd2='select VMAG>18' \ra1=ALPHA dec1=DELTA ra2=RA2000 dec2=DEC2000 \error=10 join=2not1 \out=matched.fits
and here is what it might look like in JyStilts:
>>> import stilts>>> t1 = stilts.tread('survey.fits')>>> t1 = t1.cmd_addskycoords(t1, 'fk4', 'fk5', 'RA1950', 'DEC1950', 'RA2000', 'DEC2000')>>> t2 = stilts.tread('mycat.csv', 'csv')>>> t2 = t2.cmd_select('VMAG>18')>>> tm = stilts.tskymatch2(in1=t1, in2=t2, ra1='ALPHA', dec1='DELTA',... error=10, join='2not1')>>> tm.write('matched.fits')
When running interactively, it can be convenient to examine the intermediate results beforeprocessing or writing as well, for instance:
>>> tm.mode_count()columns: 19 rows: 2102>>> tm.cmd_keepcols('ID ALPHA DELTA').cmd_head(4).write()+--------+---------------+-----------+| ID | ALPHA | DELTA |+--------+---------------+-----------+| 262 | 149.82439 | -0.11249 || 263 | 150.14438 | -0.11785 || 265 | 149.92944 | -0.11667 || 273 | 149.93185 | -0.12566 |+--------+---------------+-----------+
More detail about how to run JyStilts and its usage is given in the following subsections.
4.1 Running JyStilts
The easiest way to run JyStilts is to download the standalone jystilts.jar file from the STILTSweb page, and simply run
java -jar jystilts.jar
This file includes jython itself and all the STILTS and JyStilts classes. To use the JyStiltscommands, you will need to import the stilts module using a line like "import stilts" from Jythonin the usual Python way.
Alternatively, you can run JyStilts from an existing Jython installation using just the stilts.jar
file. First, make sure that Jython is installed; it is available from http://www.jython.org/, and comesas a self-installing jar file. JyStilts has been tested, and appears to work, on versions 2.5.0 and 2.5.1;it's recommended to use the latest version if you don't have some reason to use one of the others.Some earlier versions of JyStilts worked with jython 2.2.1, but that no longer seems to be the case;it might be possible to reinstate this if there is some pressing need.
To use JyStilts, you then just need to start jython with the stilts.jar file on your classpath, forinstance like this:
SUN/256 25
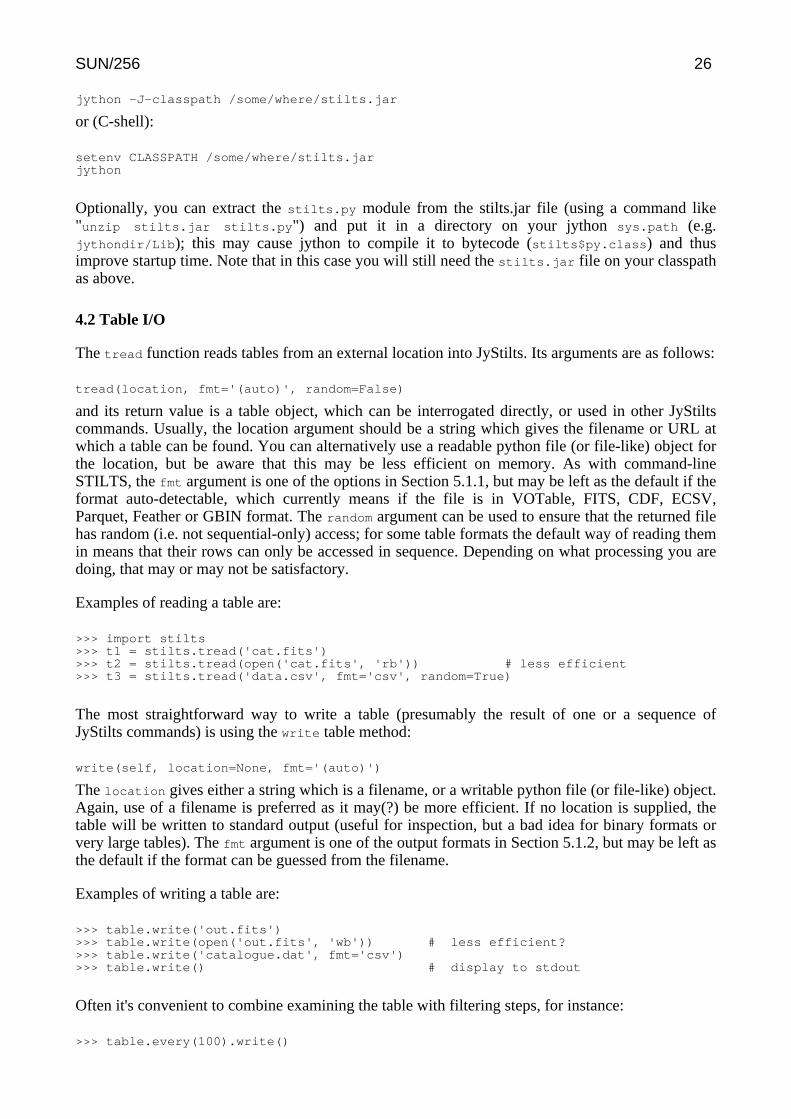
jython -J-classpath /some/where/stilts.jar
or (C-shell):
setenv CLASSPATH /some/where/stilts.jarjython
Optionally, you can extract the stilts.py module from the stilts.jar file (using a command like"unzip stilts.jar stilts.py") and put it in a directory on your jython sys.path (e.g.jythondir/Lib); this may cause jython to compile it to bytecode (stilts$py.class) and thusimprove startup time. Note that in this case you will still need the stilts.jar file on your classpathas above.
4.2 Table I/O
The tread function reads tables from an external location into JyStilts. Its arguments are as follows:
tread(location, fmt='(auto)', random=False)
and its return value is a table object, which can be interrogated directly, or used in other JyStiltscommands. Usually, the location argument should be a string which gives the filename or URL atwhich a table can be found. You can alternatively use a readable python file (or file-like) object forthe location, but be aware that this may be less efficient on memory. As with command-lineSTILTS, the fmt argument is one of the options in Section 5.1.1, but may be left as the default if theformat auto-detectable, which currently means if the file is in VOTable, FITS, CDF, ECSV,Parquet, Feather or GBIN format. The random argument can be used to ensure that the returned filehas random (i.e. not sequential-only) access; for some table formats the default way of reading themin means that their rows can only be accessed in sequence. Depending on what processing you aredoing, that may or may not be satisfactory.
Examples of reading a table are:
>>> import stilts>>> t1 = stilts.tread('cat.fits')>>> t2 = stilts.tread(open('cat.fits', 'rb')) # less efficient>>> t3 = stilts.tread('data.csv', fmt='csv', random=True)
The most straightforward way to write a table (presumably the result of one or a sequence ofJyStilts commands) is using the write table method:
write(self, location=None, fmt='(auto)')
The location gives either a string which is a filename, or a writable python file (or file-like) object.Again, use of a filename is preferred as it may(?) be more efficient. If no location is supplied, thetable will be written to standard output (useful for inspection, but a bad idea for binary formats orvery large tables). The fmt argument is one of the output formats in Section 5.1.2, but may be left asthe default if the format can be guessed from the filename.
Examples of writing a table are:
>>> table.write('out.fits')>>> table.write(open('out.fits', 'wb')) # less efficient?>>> table.write('catalogue.dat', fmt='csv')>>> table.write() # display to stdout
Often it's convenient to combine examining the table with filtering steps, for instance:
>>> table.every(100).write()
SUN/256 26
would write only every hundredth row, and
>>> (table.cmd_sorthead(10, 'BMAG')... .cmd_select('!NULL_VMAG')... .cmd_keepcols('BMAG VMAG')... .write())
would write only the BMAG and VMAG columns for the ten rows in which VMAG is non-nullwith the lowest BMAG values.
You can also read and write multiple tables, if you use a table format for which that is appropriate.This generally means FITS (which can store tables in multiple extensions) or VOTable (which canstore multiple TABLE elements in one document). This is done using the treads and twrites
functions. The functions look like this:
treads(location, fmt='(auto)', random=False)twrites(tables, location=None, fmt='(auto)')
These are similar to the tread and twrite functions, except that treads returns a list of tablesrather than a single table, and twrites's tables argument is an iterable over tables rather than asingle table. Here is an example of reading multiple tables from a multi-extension FITS file,counting the rows in each, and then writing them out to a multi-TABLE VOTable file:
import stiltstables = stilts.treads('multi.fits')print([t.getRowCount() for t in tables])stilts.twrites(tables, 'multi.vot', fmt='votable')
4.3 Table objects
The tables read by the tread function and produced by operating on them within JyStilts have anumber of methods defined on them. These are explained below.
First, a number of special methods are defined which allow a table to behave in python like asequence of rows:
__iter__
This special method means that the table can be treated as an iterable, so that for instance "forrow in table:" will iterate over all rows.
__len__ (random-access tables only)This special method means that you can use the expression "len(table)" to count the numberof rows. This method is not available for tables with sequential access only.
__getitem__ (random-access tables only)Returns a row at a given index in the table. This special method means that you can useindexing expressions like "table[3]" or table[0:10] to obtain the row or rows correspondingto a given row index or slice. This method is not available for tables with sequential accessonly.
__add__, __mul__, __rmul__These special methods allow the addition and multiplication operators "+" and and "*" to beused with the sense of concatenation. Thus "table1+table2" will produce a new table with therows of table1 followed by the rows of table2. Note this will only work if both tables havecompatible columns. Similarly "table*3" would produce a table like table but with all itsrows repeated three times.
In all of these cases, each row object that is accessed is a tuple of the column values for that row ofthe table. The tuple items (table cells) may be accessed using a key which is a numeric index or
SUN/256 27
slice in the usual way, or with a key which is a column name, or one of the ColumnInfo objectsreturned by columns().
Sometimes, the result of a table operation will be a table which does not have random access. Forsuch tables you can iterate over the rows, but not get their row values by indexing.Non-random-access tables are also peculiar in that getRowCount returns a negative value. To take atable which may not have random access and make it capable of random access, use the random
filter: "table=table.cmd_random()".
To a large extent it is possible to duplicate the functions of the various STILTS commands bywriting your own python code based on these python-friendly table access methods. Note howeverthat such python-based processing is likely to be much slower than the STILTS equivalents. Ifperformance is important to you, you should try in most cases to use the various cmd_* commandsetc for table processing.
Second, some additional utility methods are defined:
count_rows()
Returns the number of rows in the table in the most efficient way possible. If the table israndom-access or otherwise knows its row count without further calculation, that value isreturned. Otherwise, the rows are iterated over without reading, which may take some time butshould be much more efficient than iterating over the table as an iterable, since the row celldata itself is not retrieved.
columns()
Returns a tuple of the column descriptors for the table. Each item in the tuple is an instance ofthe ColumnInfo class; useful methods include getName(), getUnitString(), getUCD().str(column) will return its name.
coldata(key)
Returns a sequence of the values for the given column. The sequence will have the samenumber of elements as the number of rows in the table. The key argument may be either aninteger column index (if negative, counts backwards from the end), or the column name or infoobject. The returned value will always be iterable (has __iter__), but will only be indexable(has __len__ and __getitem__) if the table is random access.
parameters()
Returns a name to value mapping of the table parameters (per-table metadata). This does notinclude all the available information about those parameters, for instance unit and UCDinformation is not included. For more detailed information, use the StarTable methods. Notethat as currently implemented, changing the values in the returned mapping will not change theactual table parameter values.
write(location=None, fmt=None)
Outputs the table. The optional location argument gives a filename or writable file object,and the optional fmt argument gives a format, one of the options listed in Section 5.1.1. Iflocation is not supplied, output is to standard output, so in an interactive session it will beprinted to the terminal. If fmt is not supplied, an attempt will be made to guess a suitableformat based on the location.
Third, a set of cmd_* methods corresponding to the STILTS filters are available; these are describedin Section 4.4.
Fourth, a set of mode_* methods corresponding to the STILTS output modes are available; these aredescribed in Section 4.5.
Finally, tables are also instances of the StarTable interface defined by STIL, which is the table I/O
SUN/256 28
layer underlying STILTS. The full documentation can be found in the user manual and javadocs onthe STIL page, and all the java methods can be used from JyStilts, but in most cases there are morepythonic equivalents provided, as described above.
Here are some examples of these methods in use:
>>> import stilts>>> xsc = stilts.tread('/data/table/2mass_xsc.xml') # read table>>> xsc.mode_count() # show rows/column countcolumns: 6 rows: 1646844>>> print xsc.columns() # full info on columns(id(String), ra(Double)/degrees, dec(Double)/degrees, jmag(Double)/mag, hmag(Double)/mag, kmag(Double)/mag)>>> print [str(col) for col in xsc.columns()] # column names only['id', 'ra', 'dec', 'jmag', 'hmag', 'kmag']>>> row = xsc[1000000] # examine millionth row>>> print row(u'19433000+4003190', 295.875, 40.055286, 14.449, 13.906, 13.374)>>> print row[0] # cell by index19433000+4003190>>> print row['ra'], row['dec'] # cells by col name295.875 40.055286>>> print len(xsc) # count rows, maybe slow1646844>>> print xsc.count_rows() # count rows efficiently1646844L>>> print (xsc+xsc).count_rows() # concatenate3293688L>>> print (xsc*10000).count_rows()16468440000L>>> for row in xsc: # select rows using python commands... if row[4] - row[3] > 3.0:... print row[0]...11165243+292550920491597+511908904330238+085810101182715-101324811244075+5218078>>> # same thing using stilts (50x faster)>>> (xsc.cmd_select('hmag - jmag > 3.0')... .cmd_keepcols('id')... .write())+------------------+| id |+------------------+| 11165243+2925509 || 20491597+5119089 || 04330238+0858101 || 01182715-1013248 || 11244075+5218078 |+------------------+
The following are all ways to obtain the value of a given cell in the table from the previousexample.
xsc.getCell(99, 0)xsc[99][0]xsc[99]['id']xsc.coldata(0)[99]xsc.coldata('id')[99]
Some of these methods may be more efficient than others. Note that none of these methods willwork if the table has sequential-only access.
4.4 Table filter commands (cmd_*)
The STILTS table filters documented in Section 6.1 are available in JyStilts as table methods whichstart with the "cmd_" prefix. The return value when calling the method on a table object is another
SUN/256 29
table object. The arguments, which are the same as those required for the command-line version, aresupplied as a list of unnamed arguments of the cmd_* function. In general the arguments are strings,but numbers are accepted where appropriate. Use the python help command to see the usage ofeach method.
So, to use the tail filter to select only the last ten lines of a table, you can write:
table.cmd_tail(10)
To set units of "Hz" for some columns using the colmeta filter write:
table.cmd_colmeta('-units', 'Hz', 'AFREQ BFREQ CFREQ')
Note that where a filter argument is a space-separated list it must appear as a single argument in thefilter invocation, just as in command-line STILTS.
The filter commands are also available as module functions. This means that
stilts.cmd_head(table, 10)
and
table.cmd_head(10)
have exactly the same meaning. It's a matter of taste which you prefer.
4.5 Table output modes (mode_*)
The STILTS table output modes documented in Section 6.4 are available in JyStilts as tablemethods which start with the "mode_" prefix. These methods have no return value, but causesomething to happen, in some cases output to be written to standard output. Some of these methodshave named arguments, others have no arguments. Use the python help command to see the usageof each method.
These methods are straightforward to use. The following example calculates statistics for a tableand writes the results to standard output:
>>> table.mode_stats()
and this one attempts to send the table via the SAMP communications protocol to a runninginstance of TOPCAT:
>>> table.mode_samp(client='topcat')
The output modes are also available as module functions. This means that
stilts.mode_samp(table, client='topcat')
and
table.mode_samp(client='topcat)
have exactly the same meaning. It's a matter of taste which you prefer.
4.6 Tasks
The STILTS tasks documented in Appendix B can be used under their usual names if they areimported from the stilts module. STILTS parameters as are supplied as named arguments of thepython functions. In general they are either table objects for table input parameters or strings, but in
SUN/256 30
some cases python arrays are accepted, and numbers may be used where appropriate. The STILTSinput format (ifmt, istream), filter (cmd/icmd/ocmd) and output mode (omode) parameters are notused however; instead perform filtering directly on the table inputs and outputs using the pythoncmd_* and mode_* table methods or functions.
Here is an example of concatenating two similar tables together and writing the result:
>>> from stilts import tread, tcat>>> t1 = tread('data1.csv', fmt='csv')>>> t2 = tread('data2.csv', fmt='csv')>>> t12 = tcat([t1,t2], seqcol='seq')>>> t12.write('t12.csv', fmt='csv')
Note that for those tasks which have a parameter named "in" in command-line STILTS, it has beenrenamed as "in_" for the python version, to avoid a name clash with the python reserved word. Inmost cases, the in parameter is the first, mandatory parameter in any case, and so can be referencedby position as in the previous example (we could have written "tcat(in_=[t1,t2])" instead).
4.7 Calculation Functions
The various functions from the expression language listed in Section 10.6 are available directlyfrom JyStilts. Each of the subsections in that section is a class in the stilts module namespace,with unbound functions representing the functions.
This means you can use them like this:
>>> import stilts>>> print stilts.Times.mjdToIso(54292)2007-07-11T00:00:00
or like this:
>>> from stilts import CoordsDegrees>>> dist = CoordsDegrees.skyDistanceDegrees(ra1, dec1, ra2, dec2)
SUN/256 31

5 Table I/O
Most of the tools in this package either read one or more tables as input, or write one or more tablesas output, or both. This section explains what kind of tables the tools can read and write, and howyou tell them where to find the tables to operate on.
In most cases input and output table specifications are given by parameters with the followingnames (or similar ones):
in
Location of the input table; usually a filename or URL, but maybe some other source of data(see Section 5.2) or a scheme specification (see Section 5.3)
ifmt
Format of the input table, as listed in Section 5.1.1, or blank for automatic format detectionbased on input content or name (but ignored for scheme specifications)
out
Destination of the output table; usually a filename or "-"/blank for standard output
ofmt
Format of the output table as listed in Section 5.1.2, or blank for automatic format detectionbased on output filename
5.1 Table Formats
The generic table commands in STILTS (currently tpipe, tcopy, tmulti, tmultin, tcat, tcatn,tloop, tjoin, tcube, tmatch1, tmatch2, tmatchn, tskymap, tskymatch2, pixfoot, pixsample,plot2cube, plot2plane, plot2sky, plot2sphere, plot2time, plot2d, plot3d, plothist,cdsskymatch, cone, coneskymatch, sqlskymatch, tapquery, tapresume, tapskymatch andregquery) have no native format for table storage, they can process data in a number of formatsequally well. STIL has its own model of what a table consists of, which is basically:
• Some per-table metadata (parameters)• A number of columns• Some per-column metadata• A number of rows, each containing one entry per column
Some table formats have better facilities for storing this sort of thing than others, and whenperforming conversions STILTS does its best to translate between them, but it can't perform theimpossible: for instance there is nowhere in a Comma-Separated Values file to store descriptions ofcolumn units, so these will be lost when converting from VOTable to CSV formats.
The formats the package knows about are dependent on the input and output handlers currentlyinstalled. The ones installed by default are listed in the following subsections. More may be addedin the future, and it is possible to install new ones at runtime - see the STIL documentation fordetails.
Some formats can be used to hold multiple tables in a single file, and others can only hold a singletable per file.
5.1.1 Input Formats
Some of the tools in this package ask you to specify the format of input tables using the ifmt (or asimilarly named) parameter. For some file formats (e.g. FITS, VOTable, CDF), the format can beautomatically determined by looking at the file content, regardless of filename; for others (e.g. CSV
SUN/256 32
files with a ".csv" extension), STILTS may be able to use the filename as a hint to guess the format(the details of these rules are given in the format-specific subsections below). Otherwise, you haveto supply the format using the ifmt parameter. It is always safe to specify the format explicitly; thiswill be slightly more efficient than auto-determination, and may lead to more helpful errormessages in the case that the table can't be read correctly.
The available input formats are described in the following subsections. It is also possible to add newformats at runtime using the startable.readers system property, or by setting the format to theclassname of a uk.ac.starlink.table.TableBuilder class.
5.1.1.1 fits
FITS is a very well-established format for storage of astronomical table or image data (seehttps://fits.gsfc.nasa.gov/). This reader can read tables stored in binary (XTENSION='BINTABLE') andASCII (XTENSION='TABLE') table extensions; any image data is ignored. Currently, binary tableextensions are read much more efficiently than ASCII ones.
When a table is stored in a BINTABLE extension in an uncompressed FITS file on disk, the table is'mapped' into memory; this generally means very fast loading and low memory usage. FITS tablesare thus usually efficient to use.
Limited support is provided for the semi-standard HEALPix-FITS convention; such informationabout HEALPix level and coordinate system is read and made available for application usage anduser examination.
A private convention is used to support encoding of tables with more than 999 columns (notpossible in standard FITS); this was discussed on the FITSBITS mailing list in July 2017 in thethread BINTABLE convention for >999 columns.
Header cards in the table's HDU header will be made available as table parameters. Only headercards which are not used to specify the table format itself are visible as parameters (e.g. NAXIS,TTYPE* etc cards are not). HISTORY and COMMENT cards are run together as one multi-linevalue.
Any 64-bit integer column with a non-zero integer offset (TFORMn='K', TSCALn=1, TZEROn<>0) isrepresented in the read table as Strings giving the decimal integer value, since no numeric type inJava is capable of representing the whole range of possible inputs. Such columns are mostcommonly seen representing unsigned long values.
Where a multi-extension FITS file contains more than one table, a single table may be specifiedusing the position indicator, which may take one of the following forms:
• The numeric index of the HDU. The first extension (first HDU after the primary HDU) isnumbered 1. Thus in a compressed FITS table named "spec23.fits.gz" with one primaryHDU and two BINTABLE extensions, you would view the first one using the name"spec23.fits.gz" or "spec23.fits.gz#1" and the second one using the name"spec23.fits.gz#2". The suffix "#0" is never used for a legal FITS file, since the primaryHDU cannot contain a table.
• The name of the extension. This is the value of the EXTNAME header in the HDU, oralternatively the value of EXTNAME followed by "-" followed by the value of EXTVER. Thisfollows the recommendation in the FITS standard that EXTNAME and EXTVER headers can beused to identify an HDU. So in a multi-extension FITS file "cat.fits" where a table extensionhas EXTNAME='UV_DATA' and EXTVER=3, it could be referenced as "cat.fits#UV_DATA" or"cat.fits#UV_DATA-3". Matching of these names is case-insensitive.
Files in this format may contain multiple tables; depending on the context, either one or all tables
SUN/256 33
will be read. Where only one table is required, either the first one in the file is used, or the requiredone can be specified after the "#" character at the end of the filename.
This format can be automatically identified by its content so you do not need to specify the formatexplicitly when reading FITS tables, regardless of the filename.
There are actually two FITS input handlers, fits-basic and fits-plus. The fits-basic handlerextracts standard column metadata from FITS headers of the HDU in which the table is found,while the fits-plus handler reads column and table metadata from VOTable content stored in theprimary HDU of the multi-extension FITS file. FITS-plus is a private convention effectivelydefined by the corresponding output handler; it allows de/serialization of much richer metadata thancan be stored in standard FITS headers when the FITS file is read by fits-plus-aware readers, thoughother readers can understand the unenhanced FITS file perfectly well. It is normally not necessaryto worry about this distinction; STILTS will determine whether a FITS file is FITS-plus or notbased on its content and use the appropriate handler, but if you want to force the reader to use orignore the enriched header, you can explicitly specify an input format of "fits-plus" or"fits-basic".
5.1.1.2 colfits
As well as normal binary and ASCII FITS tables, STIL supports FITS files which contain tabulardata stored in column-oriented format. This means that the table is stored in a BINTABLEextension HDU, but that BINTABLE has a single row, with each cell of that row holding a wholecolumn's worth of data. The final (slowest-varying) dimension of each of these cells (declared viathe TDIMn headers) is the same for every column, namely, the number of rows in the table that isrepresented. The point of this is that all the cells for each column are stored contiguously, which forvery large, and especially very wide tables means that certain access patterns (basically, ones whichaccess only a small proportion of the columns in a table) can be much more efficient since theyrequire less I/O overhead in reading data blocks.
Such tables are perfectly legal FITS files, but general-purpose FITS software may not recognisethem as multi-row tables in the usual way. This format is mostly intended for the case where youhave a large table in some other format (possibly the result of an SQL query) and you wish to cacheit in a way which can be read efficiently by a STIL-based application.
For performance reasons, it is advisable to access colfits files uncompressed on disk. Reading themfrom a remote URL, or in gzipped form, may be rather slow (in earlier versions it was not supportedat all).
This format can be automatically identified by its content so you do not need to specify the formatexplicitly when reading colfits-basic tables, regardless of the filename.
Like the normal (row-oriented) FITS handler, two variants are supported: with (colfits-plus) orwithout (colfits-basic) metadata stored as a VOTable byte array in the primary HDU.
5.1.1.3 votable
VOTable is an XML-based format for tabular data endorsed by the International VirtualObservatory Alliance; while the tabular data which can be encoded is by design close to what FITSallows, it provides for much richer encoding of structure and metadata. Most of the table dataexchanged by VO services is in VOTable format, and it can be used for local table storage as well.
Any table which conforms to the VOTable 1.0, 1.1, 1.2, 1.3 or 1.4 specifications can be read. Thisincludes all the defined cell data serializations; cell data may be included in-line as XML elements(TABLEDATA serialization), included/referenced as a FITS table (FITS serialization), or
SUN/256 34

included/referenced as a raw binary stream (BINARY or BINARY2 serialization). The handler doesnot attempt to be fussy about input VOTable documents, and it will have a good go at readingVOTables which violate the standards in various ways.
Much, but not all, of the metadata contained in a VOTable document is retained when the table isread in. The attributes unit, ucd, xtype and utype, and the elements COOSYS, TIMESYS andDESCRIPTION attached to table columns or parameters, are read and may be used by the applicationas appropriate or examined by the user. However, information encoded in the hierarchical structureof the VOTable document, including GROUP structure, is not currently retained when a VOTable isread.
VOTable documents may contain more than one actual table (TABLE element). To specify a specificsingle table, the table position indicator is given by the zero-based index of the TABLE element in abreadth-first search. Here is an example VOTable document:
<VOTABLE><RESOURCE>
<TABLE name="Star Catalogue"> ... </TABLE><TABLE name="Galaxy Catalogue"> ... </TABLE>
</RESOURCE></VOTABLE>
If this is available in a file named "cats.xml" then the two tables could be named as "cats.xml#0"and "cats.xml#1" respectively.
Files in this format may contain multiple tables; depending on the context, either one or all tableswill be read. Where only one table is required, either the first one in the file is used, or the requiredone can be specified after the "#" character at the end of the filename.
This format can be automatically identified by its content so you do not need to specify the formatexplicitly when reading VOTable tables, regardless of the filename.
5.1.1.4 cdf
NASA's Common Data Format, described at http://cdf.gsfc.nasa.gov/, is a binary format for storingself-described data. It is typically used to store tabular data for subject areas like space and solarphysics.
This format can be automatically identified by its content so you do not need to specify the formatexplicitly when reading CDF tables, regardless of the filename.
5.1.1.5 csv
Comma-separated value ("CSV") format is a common semi-standard text-based format in whichfields are delimited by commas. Spreadsheets and databases are often able to export data in somevariant of it. The intention is to read tables in the version of the format spoken by MS Excelamongst other applications, though the documentation on which it was based was not obtaineddirectly from Microsoft.
The rules for data which it understands are as follows:
• Each row must have the same number of comma-separated fields.• Whitespace (space or tab) adjacent to a comma is ignored.• Adjacent commas, or a comma at the start or end of a line (whitespace apart) indicates a null
field.• Lines are terminated by any sequence of carriage-return or newline characters ('\r' or '\n') (a
corollary of this is that blank lines are ignored).
SUN/256 35

• Cells may be enclosed in double quotes; quoted values may contain linebreaks (or any othercharacter); a double quote character within a quoted value is represented by two adjacentdouble quotes.
• The first line may be a header line containing column names rather than a row of data. Exactlythe same syntactic rules are followed for such a row as for data rows.
Note that you can not use a "#" character (or anything else) to introduce "comment" lines.
Because the CSV format contains no metadata beyond column names, the handler is forced to guessthe datatype of the values in each column. It does this by reading the whole file through once andguessing on the basis of what it has seen (though see the maxSample configuration option). This hasthe disadvantages:
• Sometimes it guesses a different type than what you want (e.g. 32-bit integer rather than 64-bitinteger)
• It's slow to read.
This means that CSV is not generally recommended if you can use another format instead. If you'restuck with a large CSV file that's misbehaving or slow to use, one possibility is to turn it into anECSV file file by adding some header lines by hand.
The handler behaviour may be modified by specifying one or more comma-separated name=valueconfiguration options in parentheses after the handler name, e.g."csv(maxSample=100000,header=true)". The following options are available:
maxSample = <int>
Controls how many rows of the input file are sampled to determine column datatypes. Whenreading CSV files, since no type information is present in the input file, the handler has to lookat the column data to see what type of value appears to be present in each column, before evenstarting to read the data in. By default it goes through the whole table when doing this, whichcan be time-consuming for large tables. If this value is set, it limits the number of rows that aresampled in this data characterisation pass, which can reduce read time substantially. However,if values near the end of the table differ in apparent type from those near the start, it can alsoresult in getting the datatypes wrong.
header = true|false|null
Indicates whether the input CSV file contains the optional one-line header giving columnnames. Options are:
• true: the first line is a header line containing column names• false: all lines are data lines, and column names will be assigned automatically• null: a guess will be made about whether the first line is a header or not depending on
what it looks like
The default value is null (auto-determination). This usually works OK, but can get intotrouble if all the columns look like string values.
This format cannot be automatically identified by its content, so in general it is necessary to specifythat a table is in CSV format when reading it. However, if the input file has the extension ".csv"(case insensitive) an attempt will be made to read it using this format.
An example looks like this:
RECNO,SPECIES,NAME,LEGS,HEIGHT,MAMMAL1,pig,Pigling Bland,4,0.8,true2,cow,Daisy,4,2.0,true3,goldfish,Dobbin,,0.05,false4,ant,,6,0.001,false5,ant,,6,0.001,false6,queen ant,Ma'am,6,0.002,false
SUN/256 36
7,human,Mark,2,1.8,true
See also ECSV as a format which is similar and capable of storing more metadata.
5.1.1.6 ecsv
The Enhanced Character Separated Values format was developed within the Astropy project and isdescribed in Astropy APE6 (DOI). It is composed of a YAML header followed by a CSV-likebody, and is intended to be a human-readable and maybe even human-writable format with richmetadata. Most of the useful per-column and per-table metadata is preserved when de/serializing tothis format. The version supported by this reader is currently ECSV 1.0.
There are various ways to format the YAML header, but a simple example of an ECSV file lookslike this:
# %ECSV 1.0# ---# delimiter: ','# datatype: [# { name: index, datatype: int32 },# { name: Species, datatype: string },# { name: Name, datatype: string },# { name: Legs, datatype: int32 },# { name: Height, datatype: float64, unit: m },# { name: Mammal, datatype: bool },# ]index,Species,Name,Legs,Height,Mammal1,pig,Bland,4,,True2,cow,Daisy,4,2,True3,goldfish,Dobbin,,0.05,False4,ant,,6,0.001,False5,ant,,6,0.001,False6,human,Mark,2,1.9,True
If you follow this pattern, it's possible to write your own ECSV files by taking an existing CSV fileand decorating it with a header that gives column datatypes, and possibly other metadata such asunits. This allows you to force the datatype of given columns (the CSV reader guesses datatypebased on content, but can get it wrong) and it can also be read much more efficiently than a CSVfile and its format can be detected automatically.
The header information can be provided either in the ECSV file itself, or alongside a plain CSV filefrom a separate source referenced using the header configuration option. In Gaia EDR3 forinstance, the ECSV headers are supplied alongside the CSV files available for raw download of alltables in the Gaia source catalogue, so e.g. STILTS can read one of the gaia_source CSV files withfull metadata as follows:
stilts tpipeifmt='ecsv(header=http://cdn.gea.esac.esa.int/Gaia/gedr3/ECSV_headers/gaia_source.header)'in=http://cdn.gea.esac.esa.int/Gaia/gedr3/gaia_source/GaiaSource_000000-003111.csv.gz
The ECSV datatypes that work well with this reader are bool, int8, int16, int32, int64, float32,float64 and string. Array-valued columns are also supported with some restrictions. Followingthe ECSV 1.0 specification, columns representing arrays of the supported datatypes can be read, ascolumns with datatype: string and a suitable subtype, e.g. "int32[<dims>]" or"float64[<dims>]". Fixed-length arrays (e.g. subtype: int32[3,10]) and 1-dimensionalvariable-length arrays (e.g. subtype: float64[null]) are supported; however variable-lengtharrays with more than one dimension (e.g. subtype: int32[4,null]) cannot be represented, andare read in as string values. Null elements of array-valued cells are not supported; they are read asNaNs for floating point data, and as zero/false for integer/boolean data. ECSV 1.0, required to workwith array-valued columns, is supported by Astropy v4.3 and later.
SUN/256 37
The handler behaviour may be modified by specifying one or more comma-separated name=valueconfiguration options in parentheses after the handler name, e.g."ecsv(colcheck=FAIL,header=http://cdn.gea.esac.esa.int/Gaia/gedr3/ECSV_headers/gaia_source.header)".The following options are available:
colcheck = IGNORE|WARN|FAIL
Determines the action taken if the columns named in the YAML header differ from thecolumns named in the first line of the CSV part of the file.
header = <filename-or-url>
Location of a file containing a header to be applied to the start of the input file. By using thisyou can apply your own ECSV-format metadata to plain CSV files.
This format can be automatically identified by its content so you do not need to specify the formatexplicitly when reading ECSV tables, regardless of the filename.
5.1.1.7 ascii
In many cases tables are stored in some sort of unstructured plain text format, with cells separatedby spaces or some other delimiters. There is a wide variety of such formats depending on whatdelimiters are used, how columns are identified, whether blank values are permitted and so on. It isimpossible to cope with them all, but the ASCII handler attempts to make a good guess about howto interpret a given ASCII file as a table, which in many cases is successful. In particular, if you justhave columns of numbers separated by something that looks like spaces, you should be just fine.
Here are the detailed rules for how the ASCII-format tables are interpreted:
• Bytes in the file are interpreted as ASCII characters• Each table row is represented by a single line of text• Lines are terminated by one or more contiguous line termination characters: line feed (0x0A)
or carriage return (0x0D)• Within a line, fields are separated by one or more whitespace characters: space (" ") or tab
(0x09)• A field is either an unquoted sequence of non-whitespace characters, or a sequence of
non-newline characters between matching single (') or double (") quote characters - spaces aretherefore allowed in quoted fields
• Within a quoted field, whitespace characters are permitted and are treated literally• Within a quoted field, any character preceded by a backslash character ("\") is treated literally.
This allows quote characters to appear within a quoted string.• An empty quoted string (two adjacent quotes) or the string "null" (unquoted) represents the
null value• All data lines must contain the same number of fields (this is the number of columns in the
table)• The data type of a column is guessed according to the fields that appear in the table. If all the
fields in one column can be parsed as integers (or null values), then that column will turn intoan integer-type column. The types that are tried, in order of preference, are: Boolean, ShortInteger, Long, Float, Double, String
• Some special values are permitted for floating point columns: NaN for not-a-number, which istreated the same as a null value for most purposes, and Infinity or inf for infinity (with orwithout a preceding +/- sign). These values are matched case-insensitively.
• Empty lines are ignored• Anything after a hash character "#" (except one in a quoted string) on a line is ignored as far as
table data goes; any line which starts with a "!" is also ignored. However, lines which startwith a "#" or "!" at the start of the table (before any data lines) will be interpreted as metadataas follows:
SUN/256 38
• The last "#"/"!"-starting line before the first data line may contain the column names. If ithas the same number of fields as there are columns in the table, each field will be taken tobe the title of the corresponding column. Otherwise, it will be taken as a normal commentline.
• Any comment lines before the first data line not covered by the above will beconcatenated to form the "description" parameter of the table.
If the list of rules above looks frightening, don't worry, in many cases it ought to make sense of atable without you having to read the small print. Here is an example of a suitable ASCII-formattable:
## Here is a list of some animals.## RECNO SPECIES NAME LEGS HEIGHT/m1 pig "Pigling Bland" 4 0.82 cow Daisy 4 23 goldfish Dobbin "" 0.054 ant "" 6 0.0015 ant "" 6 0.0016 ant '' 6 0.0017 "queen ant" 'Ma\'am' 6 2e-38 human "Mark" 2 1.8
In this case it will identify the following columns:
Name Type---- ----RECNO ShortSPECIES StringNAME StringLEGS ShortHEIGHT/m Float
It will also use the text "Here is a list of some animals" as the Description parameter of thetable. Without any of the comment lines, it would still interpret the table, but the columns would begiven the names col1..col5.
The handler behaviour may be modified by specifying one or more comma-separated name=valueconfiguration options in parentheses after the handler name, e.g. "ascii(maxSample=5000)". Thefollowing options are available:
maxSample = <int>
Controls how many rows of the input file are sampled to determine column datatypes. Whenreading ASCII files, since no type information is present in the input file, the handler has tolook at the column data to see what type of value appears to be present in each column, beforeeven starting to read the data in. By default it goes through the whole table when doing this,which can be time-consuming for large tables. If this value is set, it limits the number of rowsthat are sampled in this data characterisation pass, which can reduce read time substantially.However, if values near the end of the table differ in apparent type from those near the start, itcan also result in getting the datatypes wrong.
This format cannot be automatically identified by its content, so in general it is necessary to specifythat a table is in ASCII format when reading it. However, if the input file has the extension ".txt"(case insensitive) an attempt will be made to read it using this format.
5.1.1.8 ipac
CalTech's Infrared Processing and Analysis Center use a text-based format for storage of tabulardata, defined at http://irsa.ipac.caltech.edu/applications/DDGEN/Doc/ipac_tbl.html. Tables can
SUN/256 39
store column name, type, units and null values, as well as table parameters.
This format cannot be automatically identified by its content, so in general it is necessary to specifythat a table is in IPAC format when reading it. However, if the input file has the extension ".tbl" or".ipac" (case insensitive) an attempt will be made to read it using this format.
An example looks like this:
\Table name = "animals.vot"\Description = "Some animals"\Author = "Mark Taylor"| RECNO | SPECIES | NAME | LEGS | HEIGHT | MAMMAL || int | char | char | int | double | char || | | | | m | || null | null | null | null | null | null |1 pig Pigling Bland 4 0.8 true2 cow Daisy 4 2.0 true3 goldfish Dobbin null 0.05 false4 ant null 6 0.001 false5 ant null 6 0.001 false6 queen ant Ma'am 6 0.002 false7 human Mark 2 1.8 true
5.1.1.9 mrt
The so-called "Machine-Readable Table" format is used by AAS journals, and based on the formatof readMe files used by the CDS. There is some documentation athttps://journals.aas.org/mrt-standards/, which mostly builds on documentation athttp://vizier.u-strasbg.fr/doc/catstd.htx, but the format is in fact quite poorly specified, so this inputhandler was largely developed on a best-efforts basis by looking at MRT tables actually in use byAAS, and with assistance from AAS staff. As such, it's not guaranteed to succeed in reading allMRT files out there, but it will try its best.
It only attempts to read MRT files themselves, there is currently no capability to read VizieR datatables which provide the header and formatted data in separate files; however, if a table is present inVizieR, there will be options to download it in more widely used formats that can be used instead.
An example looks like this:
Title: A search for multi-planet systems with TESS using a BayesianN-body retrieval and machine learning
Author: Pearson K.A.Table: Stellar Parameters================================================================================Byte-by-byte Description of file: ajab4e1ct2_mrt.txt--------------------------------------------------------------------------------
Bytes Format Units Label Explanations--------------------------------------------------------------------------------
1- 9 I9 --- ID TESS Input Catalog identifier11- 15 F5.2 mag Tmag Apparent TESS band magnitude17- 21 F5.3 solRad R* Stellar radius23- 26 I4 K Teff Effective temperature28- 32 F5.3 [cm/s2] log(g) log surface gravity34- 38 F5.2 [Sun] [Fe/H] Metallicity40- 44 F5.3 --- u1 Linear Limb Darkening46- 50 F5.3 --- u2 Quadratic Limb Darkening
--------------------------------------------------------------------------------231663901 12.35 0.860 5600 4.489 0.00 0.439 0.138149603524 9.72 1.280 6280 4.321 0.24 0.409 0.140336732616 11.46 1.400 6351 4.229 0.00 0.398 0.140231670397 9.85 2.070 6036 3.934 0.00 0.438 0.117...
The handler behaviour may be modified by specifying one or more comma-separated name=value
SUN/256 40
configuration options in parentheses after the handler name, e.g."mrt(checkmagic=false,errmode=FAIL)". The following options are available:
checkmagic = true|false
Determines whether an initial test is made to see whether the file looks like MRT beforeattempting to read it as one; the test is that it starts with the string "Title: ". Setting this trueis generally a good idea to avoid attempting to parse non-MRT files, but you can set it false toattempt to read an MRT file that starts with the wrong sequence.
errmode = IGNORE|WARN|FAIL
Indicates what action should be taken if formatting errors are detected in the file at read time.
This format can be automatically identified by its content so you do not need to specify the formatexplicitly when reading MRT tables, regardless of the filename.
5.1.1.10 parquet
Parquet is a columnar format developed within the Apache project. Data is compressed on disk andread into memory before use.
This input handler will read columns representing scalars, strings and one-dimensional arrays of thesame. It is not capable of reading multi-dimensional arrays, more complex nested data structures, orsome more exotic data types like 96-bit integers. If such columns are encountered in an input file, awarning will be emitted through the logging system and the column will not appear in the readtable. Support may be introduced for some additional types if there is demand.
At present, only very limited metadata is read. Parquet does not seem(?) to have any standardformat for per-column metadata, so the only information read about each column apart from itsdatatype is its name.
Depending on the way that the table is accessed, the reader tries to take advantage of the columnand row block structure of parquet files to read the data in parallel where possible.
Parquet support is currently somewhat experimental.
Note:
The parquet I/O handlers require large external libraries, which are not always bundled withthe library/application software because of their size. In some configurations, parquetsupport may not be present, and attempts to read or write parquet files will result in amessage like:
Parquet-mr libraries not available
If you can supply the relevant libaries on the classpath at runtime, the parquet support willwork. At time of writing, the required libraries are included in the topcat-extra.jar
monolithic jar file; they can also be found in the starjava github repository(https://github.com/Starlink/starjava/tree/master/parquet/src/lib, use parquet-mr-stil.jar
and its dependencies), or you can acquire them from the Parquet MR package. Thesearrangements may be revised in future releases, for instance if parquet usage becomes moremainstream. The required dependencies are those of the Parquet MR submoduleparquet-cli, in particular the files parquet-cli-1.11.1.jar,parquet-column-1.11.1.jar, parquet-common-1.11.1.jar,parquet-encoding-1.11.1.jar, parquet-format-structures-1.11.1.jar,parquet-hadoop-1.11.1-noshaded.jar, parquet-jackson-1.11.1.jar,commons-collections-3.2.2.jar, commons-configuration-1.6.jar,
SUN/256 41
commons-lang-2.6.jar, failureaccess-1.0.1.jar, guava-27.0.1-jre.jar,hadoop-auth-2.7.3.jar, hadoop-common-2.7.3.jar, log4j-1.2.17.jar,slf4j-api-1.7.22.jar, slf4j-log4j12-1.7.22.jar, snappy-java-1.1.7.3.jar.
The handler behaviour may be modified by specifying one or more comma-separated name=valueconfiguration options in parentheses after the handler name, e.g."parquet(cachecols=true,nThread=4)". The following options are available:
cachecols = true|false|null
Forces whether to read all the column data at table load time. If true, then when the table isloaded, all data is read by column into local scratch disk files, which is generally the fastestway to ingest all the data. If false, the table rows are read as required, and possibly cachedusing the normal STIL mechanisms. If null (the default), the decision is taken automaticallybased on available information.
nThread = <int>
Sets the number of read threads used for concurrently reading table columns if the columns arecached at load time - see the cachecols option. If the value is <=0 (the default), a value ischosen based on the number of apparently available processors.
This format can be automatically identified by its content so you do not need to specify the formatexplicitly when reading parquet tables, regardless of the filename.
5.1.1.11 feather
The Feather file format is a column-oriented binary disk-based format based on Apache Arrow andsupported by (at least) Python, R and Julia. Some description of it is available athttps://github.com/wesm/feather and https://blog.rstudio.com/2016/03/29/feather/. It can be used forlarge datasets, but it does not support array-valued columns. It can be a useful format to use forexchanging data with R, for which FITS I/O is reported to be slow.
At present CATEGORY type columns are not supported, and metadata associated with TIME,DATE and TIMESTAMP columns is not retrieved.
This format can be automatically identified by its content so you do not need to specify the formatexplicitly when reading feather tables, regardless of the filename.
5.1.1.12 gbin
GBIN format is a special-interest file format used within DPAC, the Data Processing and AnalysisConsortium working on data from the Gaia astrometry satellite. It is based on java serialization, andin all of its various forms has the peculiarity that you only stand any chance of decoding it if youhave the Gaia data model classes on your java classpath at runtime. Since the set of relevant classesis very large, and also depends on what version of the data model your GBIN file corresponds to,those classes will not be packaged with this software, so some additional setup is required to readGBIN files.
As well as the data model classes, you must provide on the runtime classpath the GaiaTools classesrequired for GBIN reading. The table input handler accesses these by reflection, to avoid anadditional large library dependency for a rather niche requirement. It is likely that since you have tosupply the required data model classes you will also have the required GaiaTools classes to hand aswell, so this shouldn't constitute much of an additional burden for usage.
In practice, if you have a jar file or files for pretty much any java library or application which iscapable of reading a given GBIN file, just adding it or them to the classpath at runtime when using
SUN/256 42
this input handler ought to do the trick. Examples of such jar files are theMDBExplorerStandalone.jar file available from https://gaia.esac.esa.int/mdbexp/, or thegbcat.jar file you can build from the CU9/software/gbcat/ directory in the DPAC subversionrepository.
The GBIN format doesn't really store tables, it stores arrays of java objects, so the input handler hasto make some decisions about how to flatten these into table rows.
In its simplest form, the handler basically looks for public instance methods of the form getXxx()
and uses the Xxx as column names. If the corresponding values are themselves objects with suitablegetter methods, those objects are added as new columns instead. This more or less follows thepractice of the gbcat (gaia.cu1.tools.util.GbinInterogator) tool. Method names are sortedalphabetically. Arrays of complex objects are not handled well, and various other things may trip itup. See the source code (e.g. uk.ac.starlink.gbin.GbinTableProfile) for more details.
If the object types stored in the GBIN file are known to the special metadata-bearing classgaia.cu9.tools.documentationexport.MetadataReader and its dependencies, and if that class ison the runtime classpath, then the handler will be able to extract additional metadata as available,including standardised column names, table and column descriptions, and UCDs. An example of ajar file containing this metadata class alongside data model classes isGaiaDataLibs-18.3.1-r515078.jar. Note however at time of writing there are some deficiencieswith this metadata extraction functionality related to unresolved issues in the upstream gaia classlibraries and the relevant interface control document (GAIA-C9-SP-UB-XL-034-01, "External DataCentres ICD"). Currently columns appear in the output table in a more or less random order, unitsand Utypes are not extracted, and using the GBIN reader tends to cause a 700kbyte file "temp.xml"to be written in the current directory. If the upstream issues are fixed, this behaviour may improve.
Note that support for GBIN files is somewhat experimental. Please contact the author (who is not aGBIN expert) if it doesn't seem to be working properly or you think it should do things differently.
This format can be automatically identified by its content so you do not need to specify the formatexplicitly when reading GBIN tables, regardless of the filename.
Example: Suppose you have the MDBExplorerStandalone.jar file containing the data modelclasses, you can read GBIN files by starting STILTS like this:
stilts -classpath MDBExplorerStandalone.jar ...
or like this:
java -classpath stilts.jar:MDBExplorerStandalone.jar uk.ac.starlink.ttools.Stilts ...
5.1.1.13 tst
Tab-Separated Table, or TST, is a text-based table format used by a number of astronomical toolsincluding Starlink's GAIA and ESO's SkyCat on which it is based. A definition of the format can befound in Starlink Software Note 75. The implementation here ignores all comment lines: specialcomments such as the "#column-units:" are not processed.
An example looks like this:
Simple TST example; stellar photometry catalogue.
A.C. Davenhall (Edinburgh) 26/7/00.
Catalogue of U,B,V colours.UBV photometry from Mount Pumpkin Observatory,
SUN/256 43

see Sage, Rosemary and Thyme (1988).
# Start of parameter definitions.EQUINOX: J2000.0EPOCH: J1996.35
id_col: -1ra_col: 0dec_col: 1
# End of parameter definitions.ra<tab>dec<tab>V<tab>B_V<tab>U_B--<tab>---<tab>-<tab>---<tab>---5:09:08.7<tab> -8:45:15<tab> 4.27<tab> -0.19<tab> -0.905:07:50.9<tab> -5:05:11<tab> 2.79<tab> +0.13<tab> +0.105:01:26.3<tab> -7:10:26<tab> 4.81<tab> -0.19<tab> -0.745:17:36.3<tab> -6:50:40<tab> 3.60<tab> -0.11<tab> -0.47[EOD]
This format cannot be automatically identified by its content, so in general it is necessary to specifythat a table is in TST format when reading it.
5.1.1.14 wdc
Some support is provided for files produced by the World Data Centre for Solar Terrestrial Physics.The format itself apparently has no name, but files in this format look something like the following:
Column formats and units - (Fixed format columns which are single space separated.)------------------------Datetime (YYYY mm dd HHMMSS) %4d %2d %2d %6d -
%1saa index - 3-HOURLY (Provisional) %3d nT
2000 01 01 000000 672000 01 01 030000 32
...
Support for this (obsolete?) format may not be very complete or robust.
This format cannot be automatically identified by its content, so in general it is necessary to specifythat a table is in WDC format when reading it.
5.1.2 Output Formats
Some of the tools ask you to specify the format of output tables using the ofmt parameter. Theoutput formats described below are supported; in some cases there are variants or options for thebasic formats as documented. If you don't specify an output format explicitly, STILTS will try toguess what format to write based on the output filename; the details of those rules are alsodocumented below.
It is also possible to add new formats at runtime using the startable.writers system property, orby setting the format to the classname of a uk.ac.starlink.table.StarTableWriter class.
5.1.2.1 fits
FITS is a very well-established format for storage of astronomical table or image data (seehttps://fits.gsfc.nasa.gov/). This writer stores tables in a FITS file consisting of two HDUs(Header+Data Units): a Primary HDU as required by the FITS standard, and a single extension oftype BINTABLE containing the table data.
There are a few variants of this format:
SUN/256 44
fits-plusThe primary HDU contains an array of bytes which stores the full table metadata as the text ofa VOTable document, along with headers that mark this has been done. Most FITS tablereaders will ignore this altogether and treat the file just as if it contained only the table. Whenit is re-read by this or compatible applications however, they can read out the metadata andmake it available for use. In this way you can store your data in the efficient and widelyportable FITS format without losing the additional metadata such as table parameters, columnUCDs, lengthy column descriptions etc that may be attached to the table.
fits-basicThe primary HDU contains only very minimal headers and no data.
fits-varBehaves like fits-basic, but columns containing variable-length numeric array data arestored using the P and Q formats where appropriate, rather than padding smaller arrays to thesize of the largest. This can make for more compact storage of variable-length array-valuedcolumn data but may also result in tables less suitable for streaming.
fits-healpixUsed for storing HEALPix pixel data in a way that conforms to the HEALPix-FITSserialization convention. In most ways it behaves the same as fits-basic, but it will rearrangeand rename columns as required to follow the convention, and it will fail if the table does notcontain the required HEALPix metadata (STIL_HPX_* parameters).
The default output format is fits-plus; in general you don't need to worry about this, it just givesyou some hidden benefits over fits-basic.
A private convention is used where required to support encoding of tables with more than 999columns (not possible in standard FITS); this was discussed on the FITSBITS mailing list in July2017 in the thread BINTABLE convention for >999 columns. If software unaware of thisconvention (e.g. CFITSIO) is used to read such tables, it will only see the first 998 columns writtenas intended, plus a column 999 containing an undescribed byte buffer.
The handler behaviour may be modified by specifying one or more comma-separated name=valueconfiguration options in parentheses after the handler name, e.g. "fits-plus(date=true)". Thefollowing options are available:
date = true|false
If true, the DATE-HDU header is filled in with the current date; otherwise it is not included.
Multiple tables may be written to a single output file using this format.
If no output format is explicitly chosen, writing to a filename with the extension ".fit", ".fits" or".fts" (case insensitive) will select fits-plus format for output.
For column-oriented FITS table output, see Section 5.1.2.2.
5.1.2.2 colfits
Column-oriented FITS output consists of a FITS file containing two HDUs (Header+Data Units); aprimary one (required by the FITS standard) and a single extension of type BINTABLE containingthe table data. Unlike normal FITS format however, this table consists of a single row in which eachcell holds the data for an entire column.
This can be a more efficient format to work with when dealing with very large, and especially verywide, tables. The benefits are greatest when the file size exceeds the amount of available physicalmemory and operations are required which scan through the table using only a few of the columns
SUN/256 45
(many common operations, for instance plotting two columns against each other, fall into thiscategory). The overhead for reading and writing this format is somewhat higher than for normalFITS however, and other applications may not be able to work with it (though it is a legal FITSfile), so in most cases normal FITS is a more suitable choice.
There are two variants of this format:
colfits-plusThe primary HDU contains an array of bytes which stores the table metadata in VOTableformat.
colfits-basicThe primary HDU contains no data.
The handler behaviour may be modified by specifying one or more comma-separated name=valueconfiguration options in parentheses after the handler name, e.g. "colfits-plus(date=true)". Thefollowing options are available:
date = true|false
If true, the DATE-HDU header is filled in with the current date; otherwise it is not included.
Multiple tables may be written to a single output file using this format.
If no output format is explicitly chosen, writing to a filename with the extension ".colfits" (caseinsensitive) will select colfits-plus format for output.
For normal (row-oriented) FITS output, see Section 5.1.2.1.
5.1.2.3 votable
VOTable is an XML-based format for tabular data endorsed by the International VirtualObservatory Alliance and defined in the VOTable Recommendation. While the tabular data whichcan be encoded is by design close to what FITS allows, it provides for much richer encoding ofstructure and metadata. Most of the table data exchanged by VO services is in VOTable format, butit can be used for local table storage as well.
When a table is saved to VOTable format, a document conforming to the VOTable specificationcontaining a single TABLE element within a single RESOURCE element is written. Where thetable contains such information (often obtained by reading an input VOTable), column and tablemetadata will be written out as appropriate to the attributes unit, ucd, xtype and utype, and theelements COOSYS, TIMESYS and DESCRIPTION attached to table columns or parameters.
There are various ways that a VOTable can be written; by default the output serialization format isTABLEDATA and the VOTable format version is 1.4, or a value controlled by thevotable.version system property. However, configuration options are available to adjust thesedefaults.
The handler behaviour may be modified by specifying one or more comma-separated name=valueconfiguration options in parentheses after the handler name, e.g."votable(version=V14,format=TABLEDATA)". The following options are available:
version = V10|V11|V12|V13|V14
Gives the version of the VOTable format which will be used when writing the VOTable. "V10"is version 1.0 etc.
format = TABLEDATA|BINARY|BINARY2|FITS
SUN/256 46
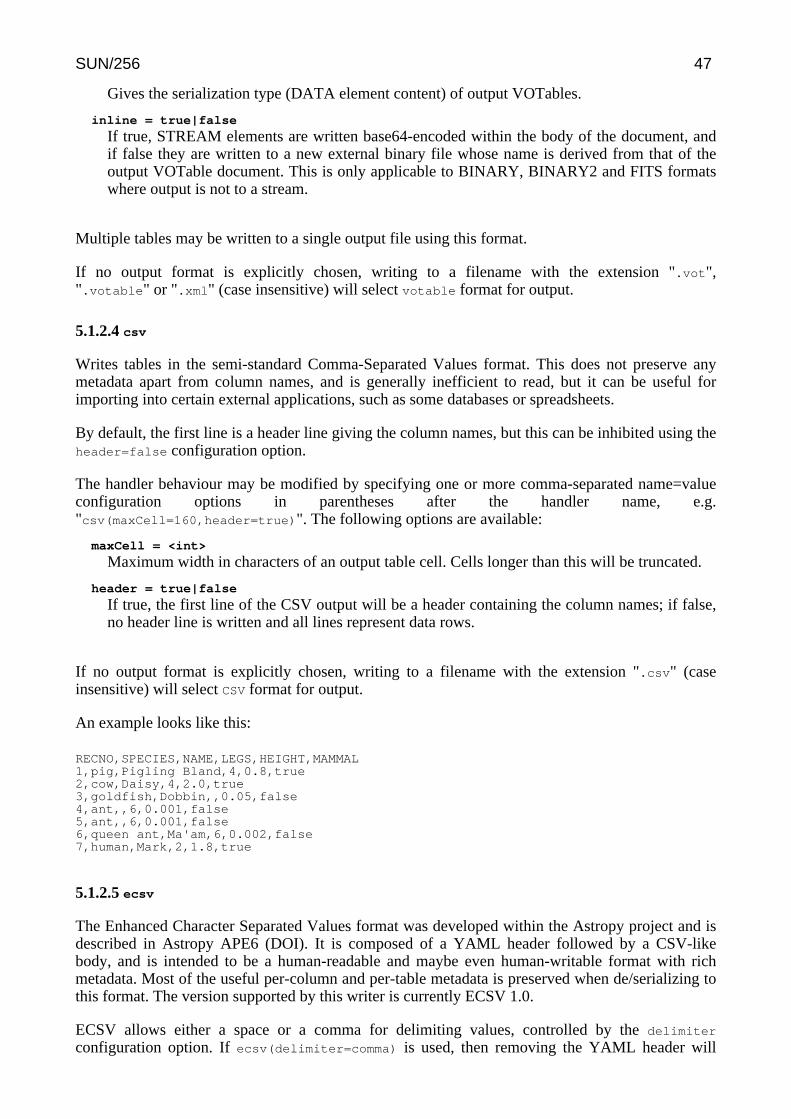
Gives the serialization type (DATA element content) of output VOTables.
inline = true|false
If true, STREAM elements are written base64-encoded within the body of the document, andif false they are written to a new external binary file whose name is derived from that of theoutput VOTable document. This is only applicable to BINARY, BINARY2 and FITS formatswhere output is not to a stream.
Multiple tables may be written to a single output file using this format.
If no output format is explicitly chosen, writing to a filename with the extension ".vot",".votable" or ".xml" (case insensitive) will select votable format for output.
5.1.2.4 csv
Writes tables in the semi-standard Comma-Separated Values format. This does not preserve anymetadata apart from column names, and is generally inefficient to read, but it can be useful forimporting into certain external applications, such as some databases or spreadsheets.
By default, the first line is a header line giving the column names, but this can be inhibited using theheader=false configuration option.
The handler behaviour may be modified by specifying one or more comma-separated name=valueconfiguration options in parentheses after the handler name, e.g."csv(maxCell=160,header=true)". The following options are available:
maxCell = <int>
Maximum width in characters of an output table cell. Cells longer than this will be truncated.
header = true|false
If true, the first line of the CSV output will be a header containing the column names; if false,no header line is written and all lines represent data rows.
If no output format is explicitly chosen, writing to a filename with the extension ".csv" (caseinsensitive) will select CSV format for output.
An example looks like this:
RECNO,SPECIES,NAME,LEGS,HEIGHT,MAMMAL1,pig,Pigling Bland,4,0.8,true2,cow,Daisy,4,2.0,true3,goldfish,Dobbin,,0.05,false4,ant,,6,0.001,false5,ant,,6,0.001,false6,queen ant,Ma'am,6,0.002,false7,human,Mark,2,1.8,true
5.1.2.5 ecsv
The Enhanced Character Separated Values format was developed within the Astropy project and isdescribed in Astropy APE6 (DOI). It is composed of a YAML header followed by a CSV-likebody, and is intended to be a human-readable and maybe even human-writable format with richmetadata. Most of the useful per-column and per-table metadata is preserved when de/serializing tothis format. The version supported by this writer is currently ECSV 1.0.
ECSV allows either a space or a comma for delimiting values, controlled by the delimiter
configuration option. If ecsv(delimiter=comma) is used, then removing the YAML header will
SUN/256 47
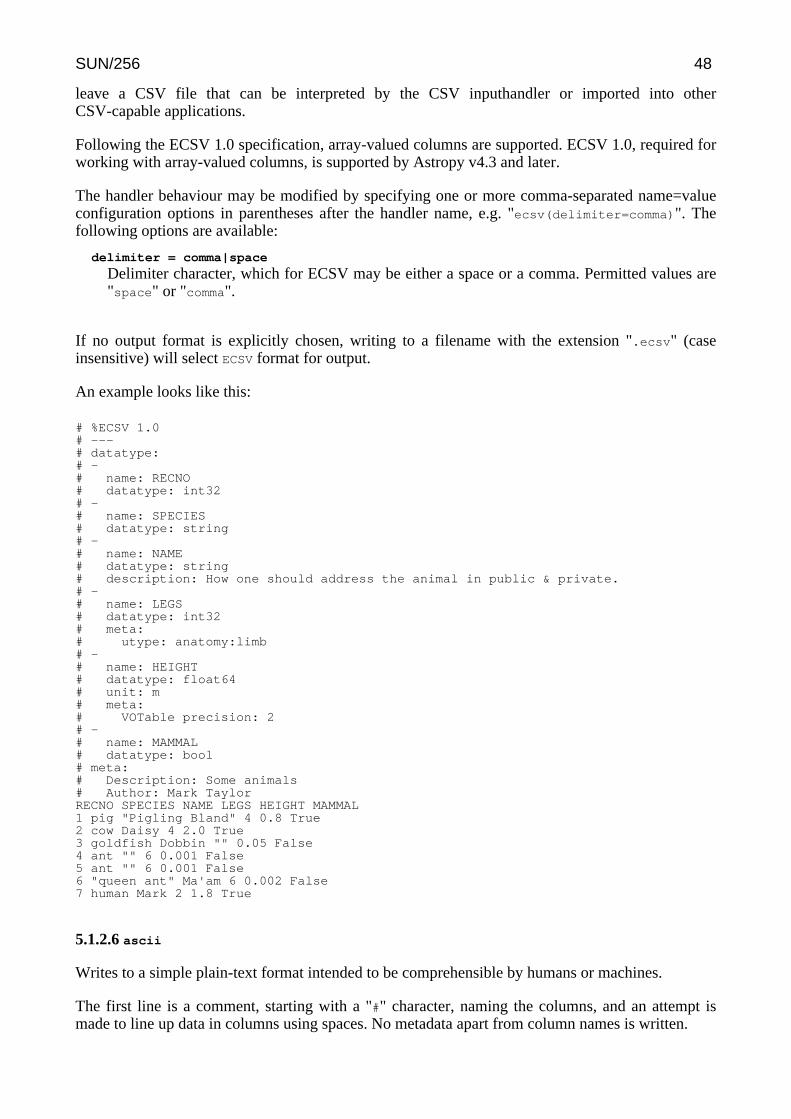
leave a CSV file that can be interpreted by the CSV inputhandler or imported into otherCSV-capable applications.
Following the ECSV 1.0 specification, array-valued columns are supported. ECSV 1.0, required forworking with array-valued columns, is supported by Astropy v4.3 and later.
The handler behaviour may be modified by specifying one or more comma-separated name=valueconfiguration options in parentheses after the handler name, e.g. "ecsv(delimiter=comma)". Thefollowing options are available:
delimiter = comma|space
Delimiter character, which for ECSV may be either a space or a comma. Permitted values are"space" or "comma".
If no output format is explicitly chosen, writing to a filename with the extension ".ecsv" (caseinsensitive) will select ECSV format for output.
An example looks like this:
# %ECSV 1.0# ---# datatype:# -# name: RECNO# datatype: int32# -# name: SPECIES# datatype: string# -# name: NAME# datatype: string# description: How one should address the animal in public & private.# -# name: LEGS# datatype: int32# meta:# utype: anatomy:limb# -# name: HEIGHT# datatype: float64# unit: m# meta:# VOTable precision: 2# -# name: MAMMAL# datatype: bool# meta:# Description: Some animals# Author: Mark TaylorRECNO SPECIES NAME LEGS HEIGHT MAMMAL1 pig "Pigling Bland" 4 0.8 True2 cow Daisy 4 2.0 True3 goldfish Dobbin "" 0.05 False4 ant "" 6 0.001 False5 ant "" 6 0.001 False6 "queen ant" Ma'am 6 0.002 False7 human Mark 2 1.8 True
5.1.2.6 ascii
Writes to a simple plain-text format intended to be comprehensible by humans or machines.
The first line is a comment, starting with a "#" character, naming the columns, and an attempt ismade to line up data in columns using spaces. No metadata apart from column names is written.
SUN/256 48
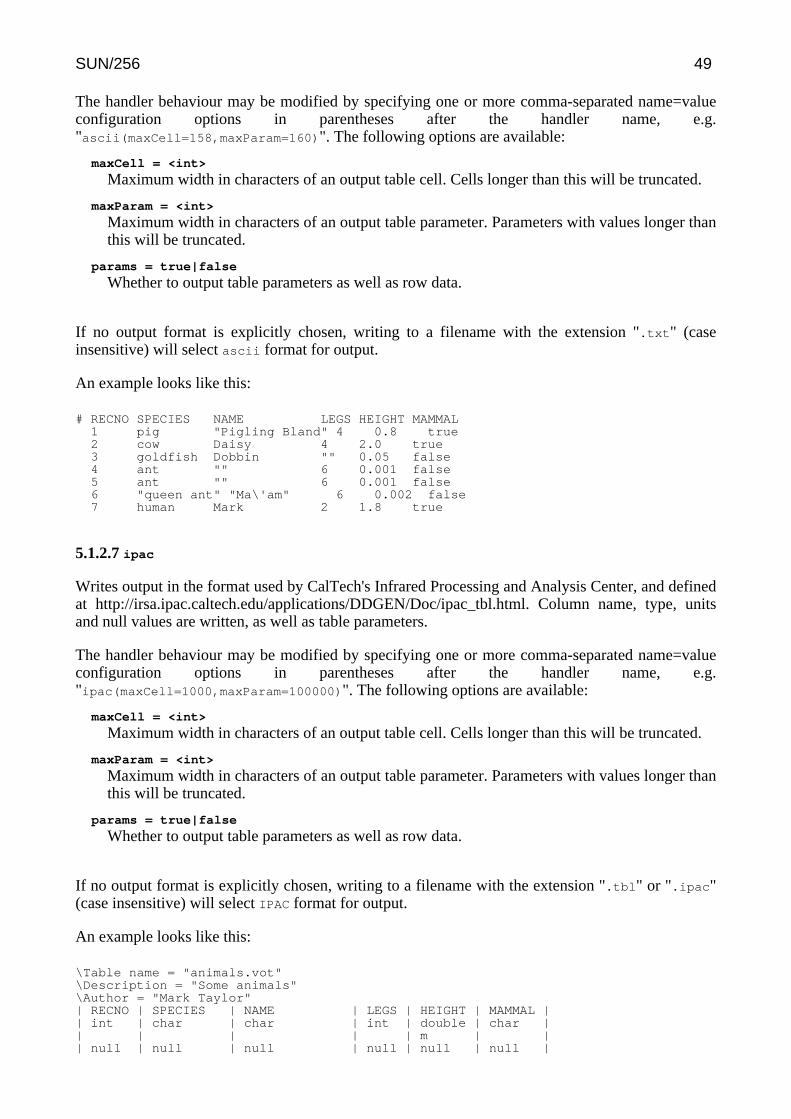
The handler behaviour may be modified by specifying one or more comma-separated name=valueconfiguration options in parentheses after the handler name, e.g."ascii(maxCell=158,maxParam=160)". The following options are available:
maxCell = <int>
Maximum width in characters of an output table cell. Cells longer than this will be truncated.
maxParam = <int>
Maximum width in characters of an output table parameter. Parameters with values longer thanthis will be truncated.
params = true|false
Whether to output table parameters as well as row data.
If no output format is explicitly chosen, writing to a filename with the extension ".txt" (caseinsensitive) will select ascii format for output.
An example looks like this:
# RECNO SPECIES NAME LEGS HEIGHT MAMMAL1 pig "Pigling Bland" 4 0.8 true2 cow Daisy 4 2.0 true3 goldfish Dobbin "" 0.05 false4 ant "" 6 0.001 false5 ant "" 6 0.001 false6 "queen ant" "Ma\'am" 6 0.002 false7 human Mark 2 1.8 true
5.1.2.7 ipac
Writes output in the format used by CalTech's Infrared Processing and Analysis Center, and definedat http://irsa.ipac.caltech.edu/applications/DDGEN/Doc/ipac_tbl.html. Column name, type, unitsand null values are written, as well as table parameters.
The handler behaviour may be modified by specifying one or more comma-separated name=valueconfiguration options in parentheses after the handler name, e.g."ipac(maxCell=1000,maxParam=100000)". The following options are available:
maxCell = <int>
Maximum width in characters of an output table cell. Cells longer than this will be truncated.
maxParam = <int>
Maximum width in characters of an output table parameter. Parameters with values longer thanthis will be truncated.
params = true|false
Whether to output table parameters as well as row data.
If no output format is explicitly chosen, writing to a filename with the extension ".tbl" or ".ipac"(case insensitive) will select IPAC format for output.
An example looks like this:
\Table name = "animals.vot"\Description = "Some animals"\Author = "Mark Taylor"| RECNO | SPECIES | NAME | LEGS | HEIGHT | MAMMAL || int | char | char | int | double | char || | | | | m | || null | null | null | null | null | null |
SUN/256 49
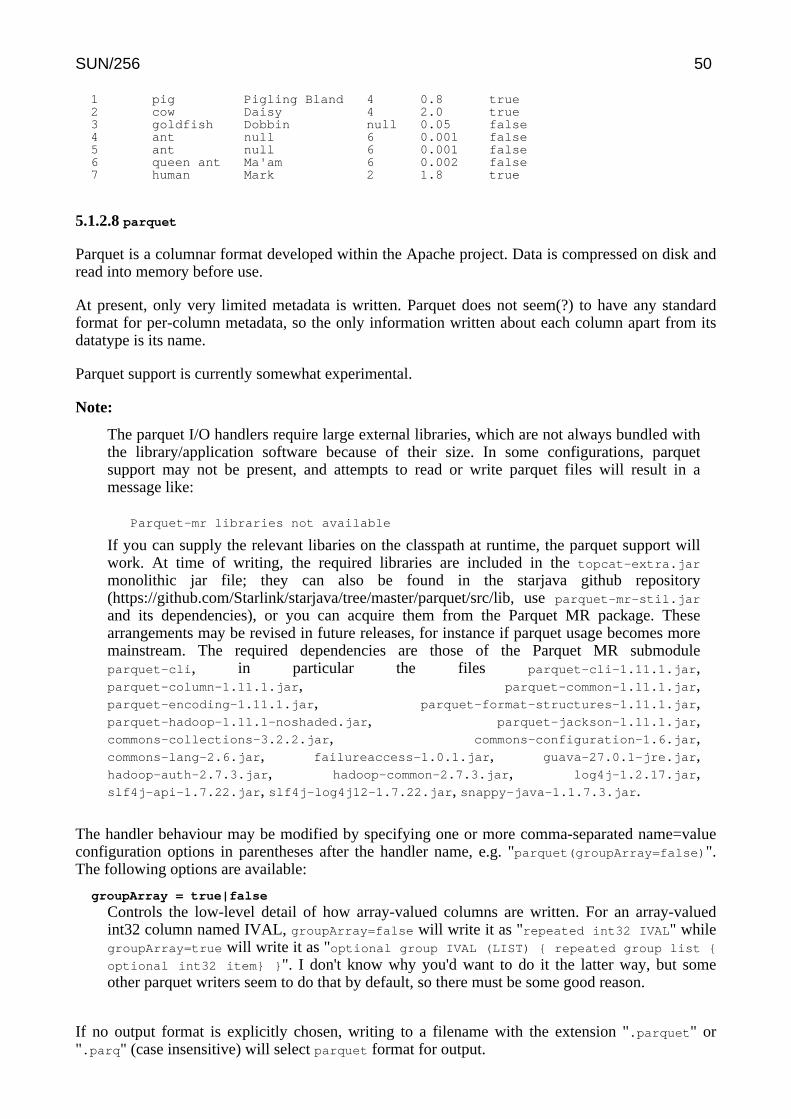
1 pig Pigling Bland 4 0.8 true2 cow Daisy 4 2.0 true3 goldfish Dobbin null 0.05 false4 ant null 6 0.001 false5 ant null 6 0.001 false6 queen ant Ma'am 6 0.002 false7 human Mark 2 1.8 true
5.1.2.8 parquet
Parquet is a columnar format developed within the Apache project. Data is compressed on disk andread into memory before use.
At present, only very limited metadata is written. Parquet does not seem(?) to have any standardformat for per-column metadata, so the only information written about each column apart from itsdatatype is its name.
Parquet support is currently somewhat experimental.
Note:
The parquet I/O handlers require large external libraries, which are not always bundled withthe library/application software because of their size. In some configurations, parquetsupport may not be present, and attempts to read or write parquet files will result in amessage like:
Parquet-mr libraries not available
If you can supply the relevant libaries on the classpath at runtime, the parquet support willwork. At time of writing, the required libraries are included in the topcat-extra.jar
monolithic jar file; they can also be found in the starjava github repository(https://github.com/Starlink/starjava/tree/master/parquet/src/lib, use parquet-mr-stil.jar
and its dependencies), or you can acquire them from the Parquet MR package. Thesearrangements may be revised in future releases, for instance if parquet usage becomes moremainstream. The required dependencies are those of the Parquet MR submoduleparquet-cli, in particular the files parquet-cli-1.11.1.jar,parquet-column-1.11.1.jar, parquet-common-1.11.1.jar,parquet-encoding-1.11.1.jar, parquet-format-structures-1.11.1.jar,parquet-hadoop-1.11.1-noshaded.jar, parquet-jackson-1.11.1.jar,commons-collections-3.2.2.jar, commons-configuration-1.6.jar,commons-lang-2.6.jar, failureaccess-1.0.1.jar, guava-27.0.1-jre.jar,hadoop-auth-2.7.3.jar, hadoop-common-2.7.3.jar, log4j-1.2.17.jar,slf4j-api-1.7.22.jar, slf4j-log4j12-1.7.22.jar, snappy-java-1.1.7.3.jar.
The handler behaviour may be modified by specifying one or more comma-separated name=valueconfiguration options in parentheses after the handler name, e.g. "parquet(groupArray=false)".The following options are available:
groupArray = true|false
Controls the low-level detail of how array-valued columns are written. For an array-valuedint32 column named IVAL, groupArray=false will write it as "repeated int32 IVAL" whilegroupArray=true will write it as "optional group IVAL (LIST) { repeated group list {
optional int32 item} }". I don't know why you'd want to do it the latter way, but someother parquet writers seem to do that by default, so there must be some good reason.
If no output format is explicitly chosen, writing to a filename with the extension ".parquet" or".parq" (case insensitive) will select parquet format for output.
SUN/256 50

5.1.2.9 feather
The Feather file format is a column-oriented binary disk-based format based on Apache Arrow andsupported by (at least) Python, R and Julia. Some description of it is available athttps://github.com/wesm/feather and https://blog.rstudio.com/2016/03/29/feather/. It can be used forlarge datasets, but it does not support array-valued columns. It can be a useful format to use forexchanging data with R, for which FITS I/O is reported to be slow.
This writer is somewhat experimental; please report problems if you encounter them.
If no output format is explicitly chosen, writing to a filename with the extension ".fea" or".feather" (case insensitive) will select feather format for output.
5.1.2.10 text
Writes tables in a simple text-based format designed to be read by humans. No reader exists for thisformat.
The handler behaviour may be modified by specifying one or more comma-separated name=valueconfiguration options in parentheses after the handler name, e.g."text(maxCell=40,maxParam=160)". The following options are available:
maxCell = <int>
Maximum width in characters of an output table cell. Cells longer than this will be truncated.
maxParam = <int>
Maximum width in characters of an output table parameter. Parameters with values longer thanthis will be truncated.
params = true|false
Whether to output table parameters as well as row data.
Multiple tables may be written to a single output file using this format.
An example looks like this:
Table name: animals.votDescription: Some animalsAuthor: Mark Taylor+-------+-----------+---------------+------+--------+--------+| RECNO | SPECIES | NAME | LEGS | HEIGHT | MAMMAL |+-------+-----------+---------------+------+--------+--------+| 1 | pig | Pigling Bland | 4 | 0.8 | true || 2 | cow | Daisy | 4 | 2.0 | true || 3 | goldfish | Dobbin | | 0.05 | false || 4 | ant | | 6 | 0.001 | false || 5 | ant | | 6 | 0.001 | false || 6 | queen ant | Ma'am | 6 | 0.002 | false || 7 | human | Mark | 2 | 1.8 | true |+-------+-----------+---------------+------+--------+--------+
5.1.2.11 html
Writes a basic HTML TABLE element suitable for use as a web page or for insertion into one.
The handler behaviour may be modified by specifying one or more comma-separated name=valueconfiguration options in parentheses after the handler name, e.g."html(maxCell=200,standalone=false)". The following options are available:
SUN/256 51

maxCell = <int>
Maximum width in characters of an output table cell. Cells longer than this will be truncated.
standalone = true|false
If true, the output is a freestanding HTML document complete with HTML, HEAD andBODY tags. If false, the output is just a TABLE element.
Multiple tables may be written to a single output file using this format.
If no output format is explicitly chosen, writing to a filename with the extension ".html" or ".htm"(case insensitive) will select HTML format for output.
An example looks like this:
<TABLE BORDER='1'><CAPTION><STRONG>animals.vot</STRONG></CAPTION><THEAD><TR> <TH>RECNO</TH> <TH>SPECIES</TH> <TH>NAME</TH> <TH>LEGS</TH> <TH>HEIGHT</TH> <TH>MAMMAL</TH></TR><TR> <TH> </TH> <TH> </TH> <TH> </TH> <TH> </TH> <TH>(m)</TH> <TH> </TH></TR><TR><TD colspan='6'></TD></TR></THEAD><TBODY><TR> <TD>1</TD> <TD>pig</TD> <TD>Pigling Bland</TD> <TD>4</TD> <TD>0.8</TD> <TD>true</TD></TR><TR> <TD>2</TD> <TD>cow</TD> <TD>Daisy</TD> <TD>4</TD> <TD>2.0</TD> <TD>true</TD></TR><TR> <TD>3</TD> <TD>goldfish</TD> <TD>Dobbin</TD> <TD> </TD> <TD>0.05</TD> <TD>false</TD></TR><TR> <TD>4</TD> <TD>ant</TD> <TD> </TD> <TD>6</TD> <TD>0.001</TD> <TD>false</TD></TR><TR> <TD>5</TD> <TD>ant</TD> <TD> </TD> <TD>6</TD> <TD>0.001</TD> <TD>false</TD></TR><TR> <TD>6</TD> <TD>queen ant</TD> <TD>Ma'am</TD> <TD>6</TD> <TD>0.002</TD> <TD>false</TD></TR><TR> <TD>7</TD> <TD>human</TD> <TD>Mark</TD> <TD>2</TD> <TD>1.8</TD> <TD>true</TD></TR></TBODY></TABLE>
5.1.2.12 latex
Writes a table as a LaTeX tabular environment, suitable for insertion into a document intended forpublication. This is only likely to be useful for fairly small tables.
The handler behaviour may be modified by specifying one or more comma-separated name=valueconfiguration options in parentheses after the handler name, e.g. "latex(standalone=false)". Thefollowing options are available:
standalone = true|false
If true, the output is a freestanding LaTeX document consisting of a tabular environmentwithin a table within a document. If false, the output is just a tabular environment.
If no output format is explicitly chosen, writing to a filename with the extension ".tex" (caseinsensitive) will select LaTeX format for output.
An example looks like this:
\begin{tabular}{|r|l|l|r|r|l|}\hline\multicolumn{1}{|c|}{RECNO} &\multicolumn{1}{c|}{SPECIES} &\multicolumn{1}{c|}{NAME} &\multicolumn{1}{c|}{LEGS} &\multicolumn{1}{c|}{HEIGHT} &\multicolumn{1}{c|}{MAMMAL} \\
\hline1 & pig & Pigling Bland & 4 & 0.8 & true\\2 & cow & Daisy & 4 & 2.0 & true\\3 & goldfish & Dobbin & & 0.05 & false\\
SUN/256 52
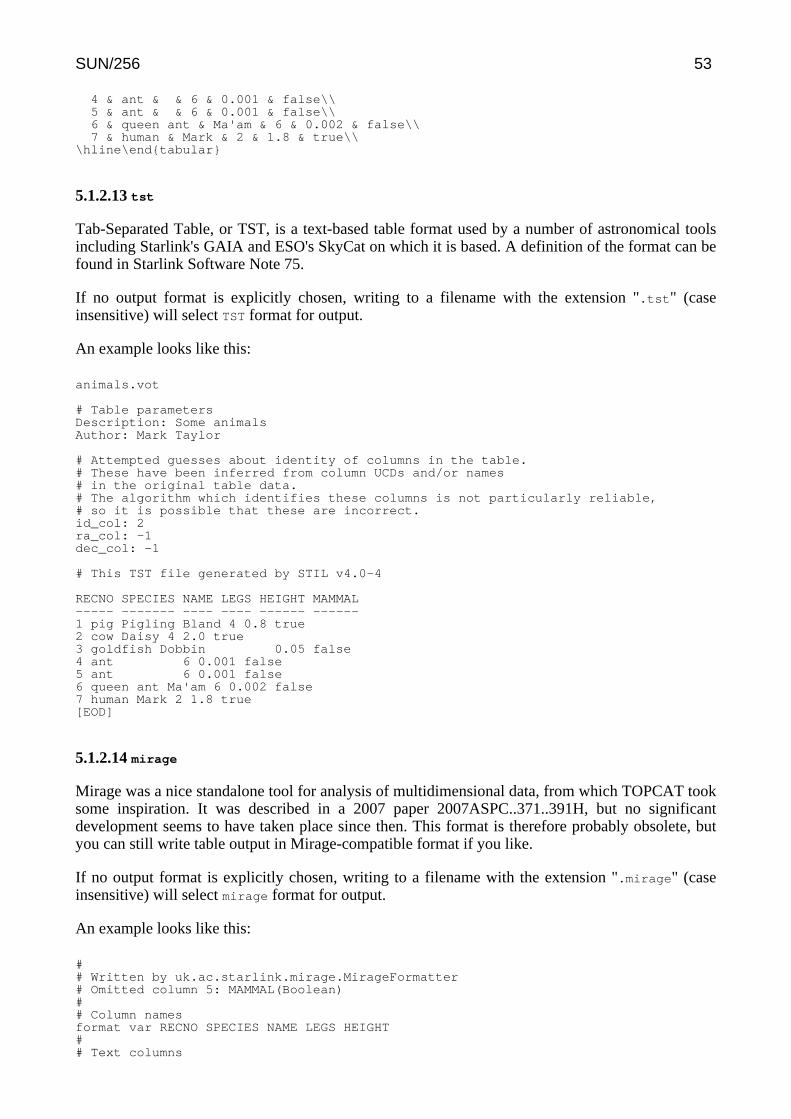
4 & ant & & 6 & 0.001 & false\\5 & ant & & 6 & 0.001 & false\\6 & queen ant & Ma'am & 6 & 0.002 & false\\7 & human & Mark & 2 & 1.8 & true\\
\hline\end{tabular}
5.1.2.13 tst
Tab-Separated Table, or TST, is a text-based table format used by a number of astronomical toolsincluding Starlink's GAIA and ESO's SkyCat on which it is based. A definition of the format can befound in Starlink Software Note 75.
If no output format is explicitly chosen, writing to a filename with the extension ".tst" (caseinsensitive) will select TST format for output.
An example looks like this:
animals.vot
# Table parametersDescription: Some animalsAuthor: Mark Taylor
# Attempted guesses about identity of columns in the table.# These have been inferred from column UCDs and/or names# in the original table data.# The algorithm which identifies these columns is not particularly reliable,# so it is possible that these are incorrect.id_col: 2ra_col: -1dec_col: -1
# This TST file generated by STIL v4.0-4
RECNO SPECIES NAME LEGS HEIGHT MAMMAL----- ------- ---- ---- ------ ------1 pig Pigling Bland 4 0.8 true2 cow Daisy 4 2.0 true3 goldfish Dobbin 0.05 false4 ant 6 0.001 false5 ant 6 0.001 false6 queen ant Ma'am 6 0.002 false7 human Mark 2 1.8 true[EOD]
5.1.2.14 mirage
Mirage was a nice standalone tool for analysis of multidimensional data, from which TOPCAT tooksome inspiration. It was described in a 2007 paper 2007ASPC..371..391H, but no significantdevelopment seems to have taken place since then. This format is therefore probably obsolete, butyou can still write table output in Mirage-compatible format if you like.
If no output format is explicitly chosen, writing to a filename with the extension ".mirage" (caseinsensitive) will select mirage format for output.
An example looks like this:
## Written by uk.ac.starlink.mirage.MirageFormatter# Omitted column 5: MAMMAL(Boolean)## Column namesformat var RECNO SPECIES NAME LEGS HEIGHT## Text columns
SUN/256 53

format text SPECIESformat text NAME## Table data1 pig Pigling_Bland 4 0.82 cow Daisy 4 2.03 goldfish Dobbin <blank> 0.054 ant <blank> 6 0.0015 ant <blank> 6 0.0016 queen_ant Ma'am 6 0.0027 human Mark 2 1.8
5.2 Input Locations
The location of a serialized input table, usually given using the in parameter or similar, may begiven in one of the forms listed below.
FilenameVery often, you will simply specify a filename as location, and the tool will just read from it inthe usual way.
URLTables can be read from URLs directly. Some non-standard URL protocols are supported aswell as the usual ones. The list is:
http:
Read from HTTP resources.
https:
Read from HTTPS resources.
ftp:
Read from anonymous FTP resources.
file:
Read from local files, using the syntax file:///path/to/file. This is similar tospecifying the filename directly, but there is a difference: using this form forces reads tobe sequential rather than random access, which may allow you to experience a differentset of performance characteristics and bugs.
jar:
Specialised protocol for looking inside Java Archive files - see JarURLConnectiondocumentation.
myspace:
(Obsolete?) Accesses files in the AstroGrid "MySpace" virtual file store. These URLslook something like "myspace:/survey/iras_psc.xml", and can access files in themyspace are that the user is currently logged into. These URLs can be used for both inputand output of tables. To use them you must have an AstroGrid account and the AstroGridWorkBench or similar must be running; if you're not currently logged in a dialogue willpop up to ask you for name and password.
ivo:
(Obsolete?) Understands ivo-type URLs which signify files in the AstroGrid "MySpace"virtual file store. These URLs look something like"ivo://uk.ac.le.star/filemanager#node-2583". These URLs can be used for bothinput and output of tables. To use them you must have an AstroGrid account and theAstroGrid WorkBench or similar must be running; if you're not currently logged in adialogue will pop up to ask you for name and password.
jdbc:
JDBC URLs may be used, but they don't work in the same way as the others listed here,since they do not reference an input byte stream. See instead Section 5.3.3.
SUN/256 54
Minus sign ("-")The special location "-" (minus sign) indicates standard input. This allows you to use STILTScommands in a normal Unix pipeline.
System command ("< syscmd" or "syscmd |")If the location starts with a "<" character or ends with a "|" character, the rest of the string istaken as a command line to be executed by the system shell. For instance a location like "<catheader.txt data.txt" (or equivalently "cat header.txt data.txt|") could be used toprepend a header line to an ASCII data file before it is passed to the STILTS ASCII-formatinput handler. Note this syntax will probably only work on Unix-like systems.
In any of these cases, for input locations compression is taken care of automatically. That meansthat you can give the filename or URL of a file which is compressed using gzip, bzip2 or Unixcompress and the program will uncompress it on the fly.
For file formats that can contain multiple tables, the one required, if it's not the first in the file, cangenerally be specified by a position indicator string appended to the basic location following a "#".For instance "cat.fits#3" references HDU 3 in a multi-extension FITS file. The details of this syntaxdepend on the file format, and are given in the relevant subsection of Section 5.1.1.
Note that tables can also be supplied from non-serialized sources, as described in Input Schemes.
5.3 Input Schemes
As well as being able to load tables from external data streams, STILTS offers a way to specifytables that do not correspond to a stream of bytes. These may be defined programmatically orinteract with external services in some way that is not as straightforward as decoding a stream ofbytes.
Such tables are defined using different schemes, and scheme specifications may be used in the sameplaces as input table names, for instance as the value of the in parameter in tpipe and othercommands. If an input location parameter (in) uses a scheme specification, the corresponding inputformat parameter (ifmt) is ignored.
The form of a scheme specification is:
:<scheme-name>:<scheme-specific-part>
so that for instance "in=:loop:10" specifies a 10-row single-column table, as described by the loopscheme documentation below. For an example of using such tables, you can try running for instance
stilts plot2plane in=:attractor:1e7,clifford layer1=mark shading1=density densemap1=plasma x1=x y1=y
The following subsections describe all the schemes that are available by default. It is also possibleto add new schemes at runtime by using the startable.schemes system property.
5.3.1 skysim
Usage: :skysim:<nrow>
Generates a simulated all-sky star catalogue with a specified number of rows. This is intended toprovide crude test catalogues when no suitable real dataset of the required size is available. In thecurrent implementation the row count, which may be given in integer or exponential notation, is theonly parameter, so the specification ":skysim:5e6" would give a 5 million-row simulated
SUN/256 55
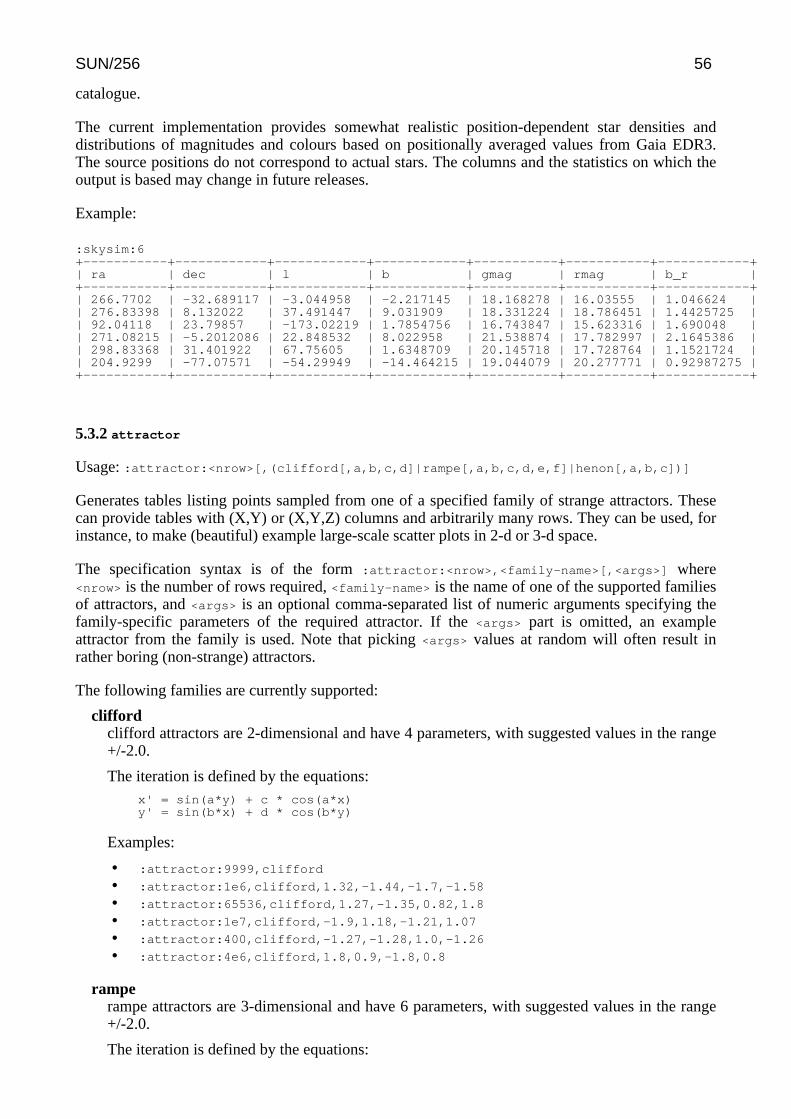
catalogue.
The current implementation provides somewhat realistic position-dependent star densities anddistributions of magnitudes and colours based on positionally averaged values from Gaia EDR3.The source positions do not correspond to actual stars. The columns and the statistics on which theoutput is based may change in future releases.
Example:
:skysim:6+-----------+------------+------------+------------+-----------+-----------+------------+| ra | dec | l | b | gmag | rmag | b_r |+-----------+------------+------------+------------+-----------+-----------+------------+| 266.7702 | -32.689117 | -3.044958 | -2.217145 | 18.168278 | 16.03555 | 1.046624 || 276.83398 | 8.132022 | 37.491447 | 9.031909 | 18.331224 | 18.786451 | 1.4425725 || 92.04118 | 23.79857 | -173.02219 | 1.7854756 | 16.743847 | 15.623316 | 1.690048 || 271.08215 | -5.2012086 | 22.848532 | 8.022958 | 21.538874 | 17.782997 | 2.1645386 || 298.83368 | 31.401922 | 67.75605 | 1.6348709 | 20.145718 | 17.728764 | 1.1521724 || 204.9299 | -77.07571 | -54.29949 | -14.464215 | 19.044079 | 20.277771 | 0.92987275 |+-----------+------------+------------+------------+-----------+-----------+------------+
5.3.2 attractor
Usage: :attractor:<nrow>[,(clifford[,a,b,c,d]|rampe[,a,b,c,d,e,f]|henon[,a,b,c])]
Generates tables listing points sampled from one of a specified family of strange attractors. Thesecan provide tables with (X,Y) or (X,Y,Z) columns and arbitrarily many rows. They can be used, forinstance, to make (beautiful) example large-scale scatter plots in 2-d or 3-d space.
The specification syntax is of the form :attractor:<nrow>,<family-name>[,<args>] where<nrow> is the number of rows required, <family-name> is the name of one of the supported familiesof attractors, and <args> is an optional comma-separated list of numeric arguments specifying thefamily-specific parameters of the required attractor. If the <args> part is omitted, an exampleattractor from the family is used. Note that picking <args> values at random will often result inrather boring (non-strange) attractors.
The following families are currently supported:
cliffordclifford attractors are 2-dimensional and have 4 parameters, with suggested values in the range+/-2.0.
The iteration is defined by the equations:x' = sin(a*y) + c * cos(a*x)y' = sin(b*x) + d * cos(b*y)
Examples:
• :attractor:9999,clifford
• :attractor:1e6,clifford,1.32,-1.44,-1.7,-1.58
• :attractor:65536,clifford,1.27,-1.35,0.82,1.8
• :attractor:1e7,clifford,-1.9,1.18,-1.21,1.07
• :attractor:400,clifford,-1.27,-1.28,1.0,-1.26
• :attractor:4e6,clifford,1.8,0.9,-1.8,0.8
ramperampe attractors are 3-dimensional and have 6 parameters, with suggested values in the range+/-2.0.
The iteration is defined by the equations:
SUN/256 56
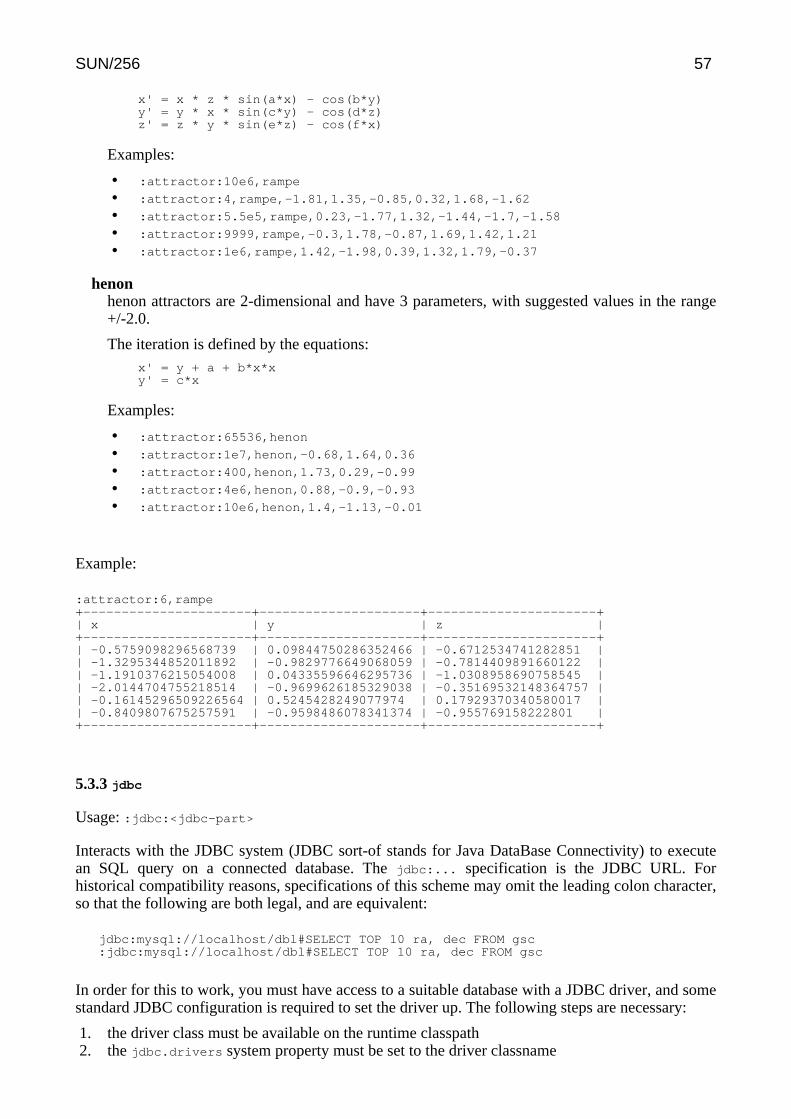
x' = x * z * sin(a*x) - cos(b*y)y' = y * x * sin(c*y) - cos(d*z)z' = z * y * sin(e*z) - cos(f*x)
Examples:
• :attractor:10e6,rampe
• :attractor:4,rampe,-1.81,1.35,-0.85,0.32,1.68,-1.62
• :attractor:5.5e5,rampe,0.23,-1.77,1.32,-1.44,-1.7,-1.58
• :attractor:9999,rampe,-0.3,1.78,-0.87,1.69,1.42,1.21
• :attractor:1e6,rampe,1.42,-1.98,0.39,1.32,1.79,-0.37
henonhenon attractors are 2-dimensional and have 3 parameters, with suggested values in the range+/-2.0.
The iteration is defined by the equations:x' = y + a + b*x*xy' = c*x
Examples:
• :attractor:65536,henon
• :attractor:1e7,henon,-0.68,1.64,0.36
• :attractor:400,henon,1.73,0.29,-0.99
• :attractor:4e6,henon,0.88,-0.9,-0.93
• :attractor:10e6,henon,1.4,-1.13,-0.01
Example:
:attractor:6,rampe+----------------------+---------------------+----------------------+| x | y | z |+----------------------+---------------------+----------------------+| -0.5759098296568739 | 0.09844750286352466 | -0.6712534741282851 || -1.3295344852011892 | -0.9829776649068059 | -0.7814409891660122 || -1.1910376215054008 | 0.04335596646295736 | -1.0308958690758545 || -2.0144704755218514 | -0.9699626185329038 | -0.35169532148364757 || -0.16145296509226564 | 0.5245428249077974 | 0.17929370340580017 || -0.8409807675257591 | -0.9598486078341374 | -0.955769158222801 |+----------------------+---------------------+----------------------+
5.3.3 jdbc
Usage: :jdbc:<jdbc-part>
Interacts with the JDBC system (JDBC sort-of stands for Java DataBase Connectivity) to executean SQL query on a connected database. The jdbc:... specification is the JDBC URL. Forhistorical compatibility reasons, specifications of this scheme may omit the leading colon character,so that the following are both legal, and are equivalent:
jdbc:mysql://localhost/dbl#SELECT TOP 10 ra, dec FROM gsc:jdbc:mysql://localhost/dbl#SELECT TOP 10 ra, dec FROM gsc
In order for this to work, you must have access to a suitable database with a JDBC driver, and somestandard JDBC configuration is required to set the driver up. The following steps are necessary:
1. the driver class must be available on the runtime classpath2. the jdbc.drivers system property must be set to the driver classname
SUN/256 57
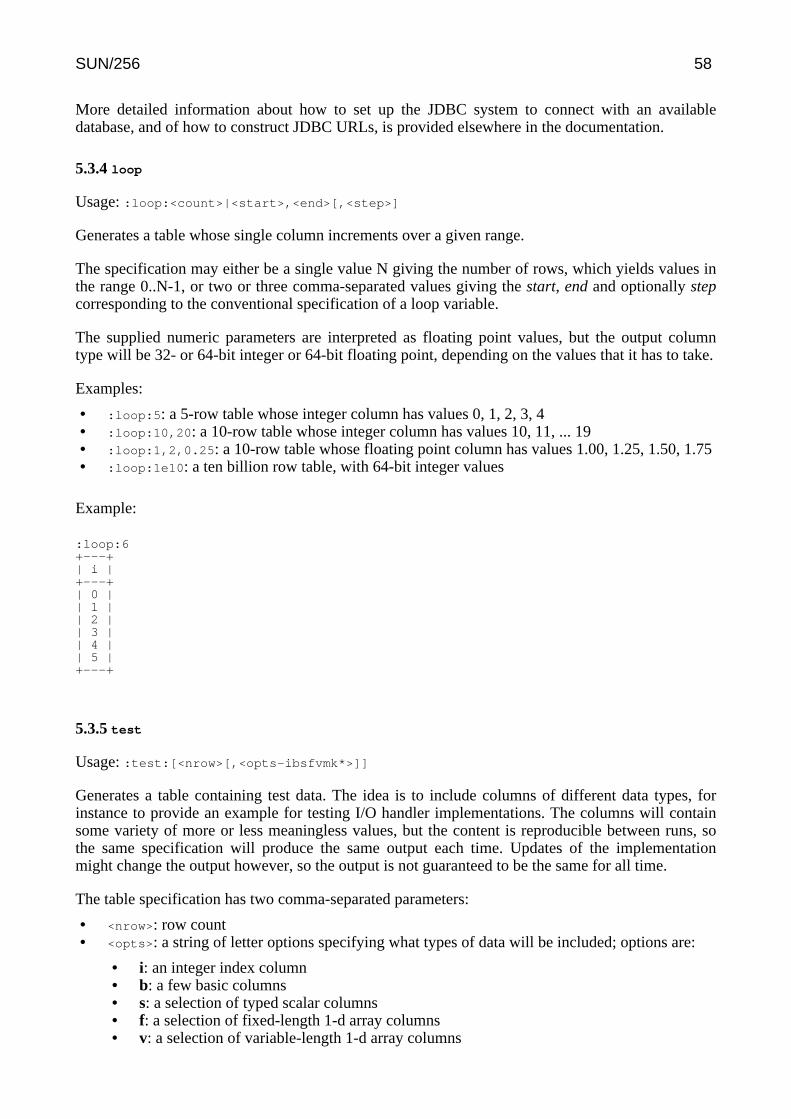
More detailed information about how to set up the JDBC system to connect with an availabledatabase, and of how to construct JDBC URLs, is provided elsewhere in the documentation.
5.3.4 loop
Usage: :loop:<count>|<start>,<end>[,<step>]
Generates a table whose single column increments over a given range.
The specification may either be a single value N giving the number of rows, which yields values inthe range 0..N-1, or two or three comma-separated values giving the start, end and optionally stepcorresponding to the conventional specification of a loop variable.
The supplied numeric parameters are interpreted as floating point values, but the output columntype will be 32- or 64-bit integer or 64-bit floating point, depending on the values that it has to take.
Examples:
• :loop:5: a 5-row table whose integer column has values 0, 1, 2, 3, 4• :loop:10,20: a 10-row table whose integer column has values 10, 11, ... 19• :loop:1,2,0.25: a 10-row table whose floating point column has values 1.00, 1.25, 1.50, 1.75• :loop:1e10: a ten billion row table, with 64-bit integer values
Example:
:loop:6+---+| i |+---+| 0 || 1 || 2 || 3 || 4 || 5 |+---+
5.3.5 test
Usage: :test:[<nrow>[,<opts-ibsfvmk*>]]
Generates a table containing test data. The idea is to include columns of different data types, forinstance to provide an example for testing I/O handler implementations. The columns will containsome variety of more or less meaningless values, but the content is reproducible between runs, sothe same specification will produce the same output each time. Updates of the implementationmight change the output however, so the output is not guaranteed to be the same for all time.
The table specification has two comma-separated parameters:
• <nrow>: row count• <opts>: a string of letter options specifying what types of data will be included; options are:
• i: an integer index column• b: a few basic columns• s: a selection of typed scalar columns• f: a selection of fixed-length 1-d array columns• v: a selection of variable-length 1-d array columns
SUN/256 58

• m: a selection of multi-dimensional array columns• k: almost a thousand columns• *: equivalent to all of the above
If <opts> and/or <nrow> are omitted, some default values are used.
Example:
:test:10,is+---------+--------+---------+-------+--------+---------+----------+----------------+-----------+| i_index | s_byte | s_short | s_int | s_long | s_float | s_double | s_string | s_boolean |+---------+--------+---------+-------+--------+---------+----------+----------------+-----------+| 0 | 0 | 0 | 0 | 0 | 0.0 | 0.0 | zero | false || 1 | | 1 | 1 | 1 | 1.0 | 1.0 | one | true || 2 | 2 | | 2 | 2 | 2.0 | 2.0 | two | false || 3 | 3 | 3 | | 3 | 3.0 | 3.0 | three | true || 4 | 4 | 4 | 4 | | 4.0 | 4.0 | four | false || 5 | 5 | 5 | 5 | 5 | | 5.0 | five | true || 6 | 6 | 6 | 6 | 6 | 6.0 | | six | false || 7 | 7 | 7 | 7 | 7 | 7.0 | 7.0 | | true || 8 | 8 | 8 | 8 | 8 | 8.0 | 8.0 | ' "\""' ; '&<> | || 9 | 9 | 9 | 9 | 9 | | | | true |+---------+--------+---------+-------+--------+---------+----------+----------------+-----------+
5.3.6 class
Usage: :class:<TableScheme-classname>:<scheme-spec>
Uses an instance of a named class that implements the uk.ac.starlink.table.TableScheme
interface and that has a no-arg constructor. Arguments to be passed to an instance of the namedclass are appended after a colon following the classname.
For example, the specification ":class:uk.ac.starlink.table.LoopTableScheme:10" wouldreturn a table constructed by the code new
uk.ac.starlink.table.LoopTableScheme().createTable("10").
Example:
:class:uk.ac.starlink.table.LoopTableScheme:5+---+| i |+---+| 0 || 1 || 2 || 3 || 4 |+---+
SUN/256 59
6 Table Pipelines
Several of the tasks available in STILTS take one or more input tables, do something or other withthem, and produce one or more output tables. This is a pretty obvious way to go about things, and inthe most straightforward case that's exactly what happens: you name one or more input tables,specify the processing parameters, and name an output table; the task then reads the input tablesfrom disk, does the processing and writes the output table to disk.
However, many of the tasks in STILTS allow you to do pre-processing of the input tables before themain job, post-processing of the output table after the main job, and to decide what happens to thefinal tabular result, without any intermediate storage of the data. Examples of the kind ofpre-processing you might want to do are to rearrange the columns so that they have the right unitsfor the main task, or replace 'magic' values such as -999 with genuine blank values; the kind ofpost-processing you might want to do is to sort the rows in the output table or delete some of thecolumns you're not interested in. As for the destination of the final table, you might want to write itto disk, but equally you might not want to store it anywhere, but only be interested in counting thenumber of rows, or seeing the minima/maxima of a few of the columns, or you might want to sendit straight to TOPCAT or some other table viewing application for interactive analysis.
Clearly, you could achieve the same effect by running multiple applications: preprocess youroriginal input tables to write intermediate files on disk, run the main processing application whichreads those files from disk and writes a new output file, run another application to postprocess theoutput file and write a new final output file, and finally do something with this such as counting therows in it or viewing it in TOPCAT. However, by doing it all within a single task instead, nointermediate results have to be stored, and the whole sequence can be very much more efficient.You can think of this (if it helps) like a Unix pipeline, except what is being streamed from the startto the end of the pipe is not bytes, but table metadata and data. In most cases, the table data isstreamed through the pipeline a row at a time, meaning that the amount of memory required is small(though in some cases, for instance row sorting and crossmatching, this is not possible).
Tasks which allow this pre/post-processing, or "filtering", have parameters with names like "cmd"which you use to specify processing steps. Tasks with multiple input tables (tmatch2, tskymatch2,tcatn, tjoin) may have parameters named icmd1, icmd2, ... for preprocessing the different inputtables and ocmd for postprocessing the output table. tpipe does nothing except filtering, so there isno distinction between pre- and post-processing, and its filter parameter is just named cmd. tpipeadditionally has a script parameter which allows you to use a text file to write the commands in, toprevent the command line getting too long. In both cases there is a parameter named omode whichdefines the "output mode", that is, what happens to the post-processed output table that comes outof the end of the pipeline.
Section 6.1 lists the processing steps available, and explains how to use them, Section 6.2 andSection 6.3 describe the syntax used in some of these filter commands for specifying columns, andSection 6.4 describes the available output modes. See the examples in the command reference, andparticularly the tpipe examples (Appendix B.37.2), for some examples putting all this together.
6.1 Processing Filters
This section lists the filter commands which can be used for table pipeline processing, inconjunction with cmd- or script-type parameters.
You can string as many of these together as you like. On the command line, you can repeat the cmd
(or icmd1, or ocmd...) parameter multiple times, or use one cmd parameter and separate differentfilter specifiers with semicolons (";"). The effect is the same.
It's important to note that each command in the sequence of processing steps acts on the table at that
SUN/256 60
point in the sequence. Thus either of the two identical invocations:
stilts tpipe cmd='delcols 1; delcols 1; delcols 1'stilts tpipe cmd='delcols 1' cmd='delcols 1' cmd='delcols 1'
has the same effect as
stilts tpipe cmd='delcols "1 2 3"'
since in the first case the columns are shifted left after each one is deleted, so the table seen by eachstep has one fewer column than the one before. Note also the use of quotes in the latter of theexamples above, which is necessary so that the <colid-list> of the delcols command isinterpreted as one argument not three separate words.
The available filters are described in the following subsections.
6.1.1 addcol
Usage:addcol [-after <col-id> | -before <col-id>]
[-units <units>] [-ucd <ucd>] [-utype <utype>] [-desc <descrip>][-shape <n>[,<n>...][,*]] [-elsize <n>]<col-name> <expr>
Add a new column called <col-name> defined by the algebraic expression <expr>. By default thenew column appears after the last column of the table, but you can position it either before or after aspecified column using the -before or -after flags respectively.
The -units, -ucd, -utype and -desc flags can be used to define textual metadata values for the newcolumn.
The -shape flag can also be used, but is intended only for array-valued columns, e.g. -shape 3,3 todeclare a 3x3 array. The final entry only in the shape list may be a "*" character to indicateunknown extent. Array values with no specified shape effectively have a shape of "*". The -elsize
flag may be used to specify the length of fixed length strings; use with non-string columns is notrecommended.
Syntax for the <expr> and <col-id> arguments is described in the manual.
6.1.2 addpixsample
Usage:addpixsample [-radius <expr-rad>] [-systems <in-sys> <pix-sys>]
<expr-lon> <expr-lat> <healpix-file>
Samples pixel data from an all-sky image file in HEALPix format. The <healpix-file> argumentmust be the filename of a table containing HEALPix pixel data. The URL of such a file can be usedinstead, but local files are likely to be more efficient.
The <expr-lon> and <expr-lat> arguments give expressions for the longitude and latitude indegrees for each row of the input table; this is usually just the column names. The long/lat mustusually be in the same coordinate system as that used for the HEALPix data, so if the one is ingalactic coordinates the other must be as well. If this is not the case, use the -systems flag to givethe input long/lat and healpix data coordinate system names respectively. The available coordinatesystem names are:
• icrs: ICRS (Right Ascension, Declination)
SUN/256 61
• fk5: FK5 J2000.0 (Right Ascension, Declination)• fk4: FK4 B1950.0 (Right Ascension, Declination)• galactic: IAU 1958 Galactic (Longitude, Latitude)• supergalactic: de Vaucouleurs Supergalactic (Longitude, Latitude)• ecliptic: Ecliptic (Longitude, Latitude)
The <expr-rad>, if present, is a constant or expression giving the radius in degrees over whichpixels will be averaged to obtain the result values. Note that this averaging is somewhatapproximate; pixels partly covered by the specified disc are weighted the same as those fullycovered. If no radius is specified, the value of the pixel covering the central position will be used.
The <healpix-file> file is a table with one row per HEALPix pixel and one or more columnsrepresenting pixel data. A new column will be added to the output table corresponding to each ofthese pixel columns. This type of data is available in FITS tables for a number of all-sky data sets,particularly from the LAMBDA (http://lambda.gsfc.nasa.gov/) archive; see for instance the page onforeground products (including dust emission, reddening etc) or WMAP 7 year data. If the filenamegiven does not appear to point to a file of the appropriate format, an error will result. Note theLAMBDA files mostly (all?) use galactic coordinates, so coordinate conversion using the -systems
flag may be appropriate, see above.
Syntax for the <expr-lon> , <expr-lat> and <expr-rad> arguments is described in the manual.
This filter is somewhat experimental, and its usage may be changed or replaced in a future version.
Note: you may prefer to use the pixsample command instead.
6.1.3 addresolve
Usage:addresolve <col-id-objname> <col-name-ra> <col-name-dec>
Performs name resolution on the string-valued column <col-id-objname> and appends two newcolumns <col-name-ra> and <col-name-dec> containing the resolved Right Ascension andDeclination in degrees.
Syntax for the <col-id-objname> argument is described in Section 6.2.
UCDs are added to the new columns in a way which tries to be consistent with any UCDs alreadyexisting in the table.
Since this filter works by interrogating a remote service, it will obviously be slow. The currentimplementation is experimental; it may be replaced in a future release by some way of doing thesame thing (perhaps a new STILTS task) which is able to work more efficiently by dispatchingmultiple concurrent requests.
This is currently implemented using the Simbad service operated by CDS.
6.1.4 addskycoords
Usage:addskycoords [-epoch <expr>] [-inunit deg|rad|sex] [-outunit deg|rad|sex]
<insys> <outsys> <col-id1> <col-id2> <col-name1> <col-name2>
Add new columns to the table representing position on the sky. The values are determined by
SUN/256 62

converting a sky position whose coordinates are contained in existing columns. The <col-id>
arguments give identifiers for the two input coordinate columns in the coordinate system named by<insys>, and the <col-name> arguments name the two new columns, which will be in thecoordinate system named by <outsys>. The <insys> and <outsys> coordinate system specifiers areone of
• icrs: ICRS (Right Ascension, Declination)• fk5: FK5 J2000.0 (Right Ascension, Declination)• fk4: FK4 B1950.0 (Right Ascension, Declination)• galactic: IAU 1958 Galactic (Longitude, Latitude)• supergalactic: de Vaucouleurs Supergalactic (Longitude, Latitude)• ecliptic: Ecliptic (Longitude, Latitude)
The -inunit and -outunit flags may be used to indicate the units of the existing coordinates andthe units for the new coordinates respectively; use one of degrees, radians or sexagesimal (maybe abbreviated), otherwise degrees will be assumed. For sexagesimal, the two correspondingcolumns must be string-valued in forms like hh:mm:ss.s and dd:mm:ss.s respectively.
For certain conversions, the value specified by the -epoch flag is of significance. Where significantits value defaults to 2000.0.
Syntax for the <expr> , <col-id1> and <col-id2> arguments is described in the manual.
6.1.5 assert
Usage:assert <expr>
Check that a boolean expression is true for each row. If the expression <expr> does not evaluatetrue for any row of the table, execution terminates with an error. As long as no error occurs, theoutput table is identical to the input one.
The exception generated by an assertion violation is of classuk.ac.starlink.ttools.filter.AssertException although that is not usually obvious if you arerunning from the shell in the usual way.
Syntax for the <expr> argument is described in Section 10.
6.1.6 badval
Usage:badval <bad-val> <colid-list>
For each column specified in <colid-list> any occurrence of the value <bad-val> is replaced by ablank entry.
Syntax for the <colid-list> argument is described in Section 6.3.
6.1.7 cache
Usage:cache
SUN/256 63

Stores in memory or on disk a temporary copy of the table at this point in the pipeline. This canprovide improvements in efficiency if there is an expensive step upstream and a step which requiresmore than one read of the data downstream. If you see an error like "Can't re-read data from stream"then adding this step near the start of the filters might help.
The output table contains no code-level reference to the input table, so this filter can also be usefulwhen managing tables that have become deeply nested as the result of successively applying manySTILTS operations.
The result of this filter is guaranteed to be random-access.
See also the random filter, which caches only when the input table is not random-access.
6.1.8 check
Usage:check
Runs checks on the table at the indicated point in the processing pipeline. This is strictly adebugging measure, and may be time-consuming for large tables.
6.1.9 clearparams
Usage:clearparams <pname> ...
Clears the value of one or more named parameters. Each of the <pname> values supplied may beeither a parameter name or a simple wildcard expression matching parameter names. Currently theonly wildcarding is a "*" to match any sequence of characters. clearparams * will clear all theparameters in the table.
It is not an error to supply <pname>s which do not exist in the table - these have no effect.
6.1.10 collapsecols
Usage:collapsecols [-[no]keepscalars] <array-colname> <col-id0> <ncol>
Adds a new array-valued column by using the values from a specified range of scalar columns asarray elements. The new column is named <array-colname>, and produced from the sequence of<ncol> scalar columns starting with <col-id0>.
The array type of the output column is determined by the type of the first input column(<col-id0>). If it is of type Double, the output array column will be a double[] array, and similarlyfor types Long, Integer, Float and Boolean. Other integer types are currently mapped to int[],and object types, e.g. String, to the corresponding array type. Array elements for null or mistypedinput values are mapped to NaN for floating point types, but note that they currently just turn intozeros for integer array types and false for boolean.
By default the scalar columns that have been used are removed from the output table and the newcolumn replaces them at the same position. However, if you supply the -keepscalars flag they willbe retained alongside the new array column (the new column will appear just after the run of scalarcolumns).
SUN/256 64
This filter does the opposite of explodecols.
Syntax for the <col-id0> argument is described in Section 6.2.
6.1.11 colmeta
Usage:colmeta [-name <name>] [-units <units>] [-ucd <ucd>] [-utype <utype>]
[-desc <descrip>] [-shape <n>[,<n>...][,*]] [-elsize <n>]<colid-list>
Modifies the metadata of one or more columns. Some or all of the name, units, ucd, utype,description, shape and elementsize of the column(s), identified by <colid-list> can be set byusing some or all of the listed flags. Typically, <colid-list> will simply be the name of a singlecolumn.
The -name, -units, -ucd, -utype and -desc flags just take textual arguments. The -shape flag canalso be used, but is intended only for array-valued columns, e.g. -shape 3,3 to declare a 3x3 array.The final entry only in the shape list may be a "*" character to indicate unknown extent. Arrayvalues with no specified shape effectively have a shape of "*". The -elsize flag may be used tospecify the length of fixed length strings; use with non-string columns is not recommended.
Syntax for the <colid-list> argument is described in Section 6.3.
6.1.12 delcols
Usage:delcols <colid-list>
Delete the specified columns. The same column may harmlessly be specified more than once.
Syntax for the <colid-list> argument is described in Section 6.3.
6.1.13 every
Usage:every [-exact|-approx] <step>
Include only every <step>'th row in the result, starting with the first row. The optional-approx/-exact argument controls whether the selection needs to be exact; in some cases anapproximate calculation can take advantage of parallelism where an exact one cannot.
6.1.14 explodeall
Usage:explodeall [-ifndim <ndim>] [-ifshape <dims>]
Replaces any columns which is an N-element arrays with N scalar columns. Only columns withfixed array sizes are affected. The action can be restricted to only columns of a certain shape usingthe flags.
If the -ifndim flag is used, then only columns of dimensionality <ndim> will be exploded. <ndim>may be 1, 2, ....
SUN/256 65
If the -ifshape flag is used, then only columns with a specific shape will be exploded; <dims> is aspace- or comma-separated list of dimension extents, with the most rapidly-varying first, e.g. '2 5'to explode all 2 x 5 element array columns.
6.1.15 explodecols
Usage:explodecols <colid-list>
Takes a list of specified columns which represent N-element arrays and replaces each one with Nscalar columns. Each of the columns specified by <colid-list> must have a fixed-length arraytype, though not all the arrays need to have the same number of elements.
This filter does the opposite of collapsecols.
Syntax for the <colid-list> argument is described in Section 6.3.
6.1.16 fixcolnames
Usage:fixcolnames
Renames all columns and parameters in the input table so that they have names which haveconvenient syntax for STILTS. For the most part this means replacing spaces and othernon-alphanumeric characters with underscores. This is a convenience which lets you use columnnames in algebraic expressions and other STILTS syntax.
6.1.17 head
Usage:head <nrows>
Include only the first <nrows> rows of the table. If the table has fewer than <nrows> rows then itwill be unchanged.
6.1.18 healpixmeta
Usage:healpixmeta [-level <n>] [-implicit|-column <col-id>] [-csys C|G|E] [-nested|-ring]
Adjusts the table metadata items that describe how HEALPix pixel data is encoded in the table.
Zero or more of the following flags may be supplied:
• -level <n>: Defines the HEALPix level; the sky is split into 12*4^n pixels. This quantity isequal to logarithm base 2 of NSIDE.
• -implicit: Declares that pixel indices are implicit, so that row i represents HEALPix pixelindex i. The table should have 12*4^level rows in this case. Not to be used with -column.
• -column <col-id>: Declares that the column identified contains the (0-based) HEALPix pixelindex. Not to be used with -implicit.
• -csys C|G|E: Declares the sky coordinate system to which the HEALPix pixels apply:Celestial(=equatorial), Galactic or Ecliptic. Some applications assume Galactic if this is not
SUN/256 66
specified.• -nested: Declares that the NESTED ordering scheme is in use. Not to be used with -ring.• -ring: Declares that the RING ordering scheme is in use. Not to be used with -nested.
The effect of this filter is to write, or overwrite, certain special table parameters (per-table metadata)that STIL uses to describe how HEALPix pixel information is encoded in a table, specifically theHEALPix level, the column containing pixel index, the ordering scheme, and the sky coordinatesystem. Adding these parameters doesn't do anything on its own, but some of the STIL I/O handlersrecognise these parameters, and they affect how the table will be formatted for output. In particular,if you set these parameters and then output to FITS format, the output table will contain headersdefined by the HEALPix-FITS serialization format which is understood by several otherapplications to describe HEALPix maps. If you write to VOTable format, the metadata will only berecognised by other STIL-based applications but it means that if you, e.g., load the table intoTOPCAT and then write it out again as FITS, the HEALPix information should be preserved.
When writing tables marked up like this to FITS, you have two options. If you write to one of the"normal" FITS formats (e.g. fits, fits-basic) then suitable headers will be added; in this case ifan explicit pixel index column is used it must be the first column, and should be named "PIXEL".This may be enough for other applications to recognise the HEALPix metadata. However, if youuse the special fits-healpix format more efforts will be made to conform to the HEALPix-FITSconvention, for instance moving and renaming the explicit pixel index column if required.
The table parameters affected by this filter are: STIL_HPX_LEVEL, STIL_HPX_ISNEST,STIL_HPX_COLNAME, STIL_HPX_CSYS. Note these are not defined by any standard, they are definedand used only by STILTS and related applications (TOPCAT).
Syntax for the <col-id> argument is described in Section 6.2.
6.1.19 keepcols
Usage:keepcols <colid-list>
Select the columns from the input table which will be included in the output table. The output tablewill include only those columns listed in <colid-list>, in that order. The same column may belisted more than once, in which case it will appear in the output table more than once.
Syntax for the <colid-list> argument is described in Section 6.3.
6.1.20 meta
Usage:meta [<item> ...]
Provides information about the metadata for each column. This filter turns the table sideways, sothat each row of the output corresponds to a column of the input. The columns of the output tablecontain metadata items such as column name, units, UCD etc corresponding to each column of theinput table.
By default the output table contains columns for all metadata items for which any of the columnshave non-blank values.
However, the output may be customised by supplying one or more <item> headings, in which caseexactly those columns will appear, regardless of whether they have entries. It is not an error to
SUN/256 67
specify an item for which no metadata exists in any of the columns (such entries will result inempty columns).
Some of the metadata items commonly found are:
• Index: Position of column in table• Name: Column name• Class: Data type of objects in column• Shape: Shape of array values• ElSize: Size of each element in column (mostly useful for strings)• Units: Unit string• Description: Description of data in the column• UCD: Unified Content Descriptor• Utype: Type in data model• Xtype: Extended data type• CoosysSystem: Sky coordinate system name from COOSYS• CoosysEpoch: Sky epoch from COOSYS• CoosysEquinox: Sky equinox from COOSYS• TimesysTimeorigin: Time origin from TIMESYS• TimesysTimescale: Timescale from TIMESYS• TimesysRefposition: Ref position from TIMESYS• STIL_HPX_LEVEL: Level of HEALPix pixels contained in the table (nside=2^level)• STIL_HPX_ISNEST: True for NEST indexation scheme, False for RING• STIL_HPX_COLNAME: Name of the table column containing HEALPix index; null value or empty
string indicates implicit• STIL_HPX_CSYS: 'C'=celestial/equatorial, 'G'=galactic, 'E'=ecliptic
Any table parameters of the input table are propagated to the output one.
6.1.21 progress
Usage:progress
Monitors progress by displaying the number of rows processed so far on the terminal (standarderror). This number is updated every second or thereabouts; if all the processing is done in under asecond you may not see any output. If the total number of rows in the table is known, an ASCII-artprogress bar is updated, otherwise just the number of rows seen so far is written.
Note under some circumstances progress may appear to complete before the actual work of the taskis done since part of the processing involves slurping up the whole table to provide random accesson it. In this case, applying the cache upstream may help.
6.1.22 random
Usage:random
Ensures that random access is available on this table. If the table currently has random access, it hasno effect. If only sequential access is available, the table is cached so that downstream steps will seethe cached, hence random-access, copy.
6.1.23 randomview
SUN/256 68

Usage:randomview
Ensures that steps downstream only use random access methods for table access. If the table issequential only, this will result in an error. Only useful for debugging.
6.1.24 repeat
Usage:repeat [-row|-table] <count>
Repeats the rows of a table multiple times to produce a longer table. The output table will have<count> times as many rows as the input table.
The optional flag determines the sequence of the output rows. If <count>=2 and there are threerows, the output sequence will be 112233 for -row and 123123 for -table. The default behaviour iscurrently -table.
The <count> value will usually be a constant integer value, but it can be an expression evaluated inthe context of the table.
6.1.25 replacecol
Usage:replacecol [-name <name>] [-units <units>] [-ucd <ucd>] [-utype <utype>]
[-desc <descrip>]<col-id> <expr>
Replaces the content of a column with the value of an algebraic expression. The old values arediscarded in favour of the result of evaluating <expr>. You can specify the metadata for the newcolumn using the -name, -units, -ucd, -utype and -desc flags; for any of these items which you donot specify, they will take the values from the column being replaced.
It is legal to reference the replaced column in the expression, so for example "replacecol pixsize
pixsize*2" just multiplies the values in column pixsize by 2.
Syntax for the <col-id> and <expr> arguments is described in the manual.
6.1.26 replaceval
Usage:replaceval <old-val> <new-val> <colid-list>
For each column specified in <colid-list> any instance of <old-val> is replaced by <new-val>.The value string 'null' can be used for either <old-value> or <new-value> to indicate a blank value(but see also the badval filter).
Syntax for the <colid-list> argument is described in Section 6.3.
6.1.27 rowrange
Usage:
SUN/256 69
rowrange <first> <last>|+<count>
Includes only rows in a given range. The range can either be supplied as "<first> <last>", whererow indices are inclusive, or "<first> +<count>". In either case, the first row is numbered 1.
Thus, to get the first hundred rows, use either "rowrange 1 100" or "rowrange 1 +100" and to getthe second hundred, either "rowrange 101 200" or "rowrange 101 +100"
6.1.28 select
Usage:select <expr>
Include in the output table only rows for which the expression <expr> evaluates to true. <expr>must be an expression which evaluates to a boolean value (true/false).
Syntax for the <expr> argument is described in Section 10.
6.1.29 seqview
Usage:seqview
Ensures that steps downstream see the table as sequential access. Any attempts at random accesswill fail. Only useful for debugging.
6.1.30 setparam
Usage:setparam [-type byte|short|int|long|float|double|boolean|string]
[-desc <descrip>] [-unit <units>] [-ucd <ucd>] [-utype <utype>]<pname> <pexpr>
Sets a named parameter in the table to a given value. The parameter named <pname> is set to thevalue <pexpr>, which may be a literal value or an expression involving mathematical operationsand other parameter names (using the param$<name> syntax). By default, the data type of theparameter is determined by the type of the supplied expression, but this can be overridden using the-type flag. The parameter description, units, UCD and Utype attributes may optionally be set usingthe other flags.
6.1.31 sort
Usage:sort [-down] [-nullsfirst] [-[no]parallel] <key-list>
Sorts the table according to the value of one or more algebraic expressions. The sort keyexpressions appear, as separate (space-separated) words, in <key-list>; sorting is done on the firstexpression first, but if that results in a tie then the second one is used, and so on.
Each expression must evaluate to a type that it makes sense to sort, for instance numeric. If the-down flag is used, the sort order is descending rather than ascending.
SUN/256 70
Blank entries are by default considered to come at the end of the collation sequence, but if the-nullsfirst flag is given then they are considered to come at the start instead.
By default, sorting is done sequentially for small tables and in parallel for large tables, but this canbe controlled with the -parallel or -noparallel flag.
Syntax for the <key-list> argument is described in Section 10.
6.1.32 sorthead
Usage:sorthead [-tail] [-down] [-nullsfirst] <nrows> <key-list>
Performs a sort on the table according to the value of one or more algebraic expressions, retainingonly <nrows> rows at the head of the resulting sorted table. The sort key expressions appear, asseparate (space-separated) words, in <key-list>; sorting is done on the first expression first, but ifthat results in a tie then the second one is used, and so on. Each expression must evaluate to a typethat it makes sense to sort, for instance numeric.
If the -tail flag is used, then the last <nrows> rows rather than the first ones are retained.
If the -down flag is used the sort order is descending rather than ascending.
Blank entries are by default considered to come at the end of the collation sequence, but if the-nullsfirst flag is given then they are considered to come at the start instead.
This filter is functionally equivalent to using sort followed by head, but it can be done in one passand is usually cheaper on memory and faster, as long as <nrows> is significantly lower than the sizeof the table.
Syntax for the <key-list> argument is described in Section 10.
6.1.33 stats
Usage:stats [-[no]parallel] [-qapprox|-qexact] [<item> ...]
Calculates statistics on the data in the table. This filter turns the table sideways, so that each row ofthe output corresponds to a column of the input. The columns of the output table contain statisticalitems such as mean, standard deviation etc corresponding to each column of the input table.
By default the output table contains columns for the following items:
• Name: Column name• Mean: Average• StDev: Population Standard deviation• Minimum: Numeric minimum• Maximum: Numeric maximum• NGood: Number of non-blank cells
However, the output may be customised by supplying one or more <item> headings. These may beselected from the above as well as the following:
• NBad: Number of blank cells• Variance: Population Variance
SUN/256 71
• SampStDev: Sample Standard Deviation• SampVariance: Sample Variance• MedAbsDev: Median Absolute Deviation• ScMedAbsDev: Median Absolute Deviation * 1.4826• Skew: Gamma 1 skewness measure• Kurtosis: Gamma 2 peakedness measure• Sum: Sum of values• MinPos: Row index of numeric minimum• MaxPos: Row index of numeric maximum• Cardinality: Number of distinct values in column; values >100 ignored• Median: Middle value in sequence• Quartile1: First quartile• Quartile2: Second quartile• Quartile3: Third quartile
Additionally, the form "Q.nn" may be used to represent the quantile corresponding to the proportion0.nn, e.g.:
• Q.25: First quartile• Q.625: Fifth octile
Any parameters of the input table are propagated to the output one.
The -qapprox or -qexact flag controls how quantiles are calculated. With -qexact they arecalculated exactly, but this requires memory usage scaling with the number of rows. If the -qapprox
flag is supplied, an method is used which is typically slower and produces only approximate values,but which will work in fixed memory and so can be used for arbitrarily large tables. By default,exact calculation is used. These flags are ignored if neither quantiles nor the MAD are beingcalculated
The -noparallel flag may be supplied to inhibit multi-threaded statistics accumulation.Calculation is done in parallel by default if multi-threaded hardware is available, and it's usuallyfaster.
6.1.34 tablename
Usage:tablename <name>
Sets the table's name attribute to the given string.
6.1.35 tail
Usage:tail <nrows>
Include only the last <nrows> rows of the table. If the table has fewer than <nrows> rows then it willbe unchanged.
6.1.36 transpose
Usage:transpose [-namecol <col-id>]
SUN/256 72

Transposes the input table so that columns become rows and vice versa. The -namecol flag can beused to specify a column in the input table which will provide the column names for the outputtable. The first column of the output table will contain the column names of the input table.
Syntax for the <col-id> argument is described in Section 6.2.
6.1.37 uniq
Usage:uniq [-count] [<colid-list>]
Eliminates adjacent rows which have the same values. If used with no arguments, then any rowwhich has identical values to its predecessor is removed.
If the <colid-list> parameter is given then only the values in the specified columns must be equalin order for the row to be removed.
If the -count flag is given, then an additional column with the name DupCount will be prepended tothe table giving a count of the number of duplicated input rows represented by each output row. Aunique row has a DupCount value of 1.
Syntax for the <colid-list> argument is described in Section 6.3.
6.2 Specifying a Single Column
If an argument is specified in the help text for a command with the symbol <col-id> it means youmust give a string which identifies one of the existing columns in a table.
There are several ways you can specify a column in this context:
Column NameThe name of the column may be used if it contains no spaces and doesn't start with a minuscharacter ('-'). It is usually matched case insensitively. If multiple columns have the samename, the first one that matches is selected.
Column Index or $IDThe index of the column may always be used; this is a useful fallback if the column name isn'tsuitable for some reason. The first column is '1', the second is '2' and so on. You mayalternatively use the forms '$1', '$2' etc.
Tip: if counting which column has which index is giving you a headache, running tpipe withomode=meta or omode=stats on the table may help.
Column ucd$ specifierIf the column has a Unified Content Descriptor (this will usually only be the case for VOTableor possibly FITS format tables) you can refer to it using an identifier of the form"ucd$<ucd-spec>". Depending on the version of UCD scheme used, UCDs can contain variouspunctuation marks such as underscores, semicolons and dots; for the purpose of this syntaxthese should all be represented as underscores ("_"). So to identify a column which has theUCD "phot.mag;em.opt.R", you should use the identifier "ucd$phot_mag_em_opt_r".Matching is not case-sensitive. Futhermore, a trailing underscore acts as a wildcard, so that theabove column could also be referenced using the identifier "ucd$phot_mag_". If multiplecolumns have UCDs which match the given identifer, the first one will be used.
Column utype$ specifierIf the column has a Utype (this will usually only be the case for VOTable or possibly FITSformat tables) you can refer to it using an identifier of the form "utype$<utype-spec>".
SUN/256 73

Utypes may contain various punctuation marks such as colons and dots; for the purpose of thissyntax these should all be represented as underscores ("_"). So to identify a column which hasthe Utype "ssa:Access.Format", you should use the identifier "utype$ssa_Access_format".Matching is not case-sensitive. If multiple columns have Utypes which match the givenidentifier, the first one will be used.
6.3 Specifying a List of Columns
If an argument is specified in the help text for a command with the symbol <colid-list> it meansyou must give a string which identifies a list of zero, one or more of the existing columns in a table.The string you specify is a separated into separate tokens by whitespace, which means that you willnormally have to surround it in single or double quotes to ensure that it is treated as a singleargument and not several of them.
Each token in the <colid-list> string may be one of the following:
Column NameThe name of a column may be used if it contains no spaces and doesn't start with a minuscharacter ('-'). It is usually matched case insensitively. If multiple columns have the samename, the first one that matches is selected.
Column Index or $IDThe index of the column may always be used; this is a useful fallback if the column name isn'tsuitable for some reason. The first column is '1', the second is '2' and so on. You mayalternatively use the forms '$1', '$2' etc.
Tip: if counting which column has which index is giving you a headache, running tpipe withomode=meta or omode=stats on the table may help.
Wildcard ExpressionYou can use a simple form of wildcard expression which expands to any columns in the tablewhose names match the pattern. Currently, the only special character is an asterisk '*' whichmatches any sequence of characters. To match an unknown sequence at the start or end of thestring an asterisk must be given explicitly. Other than that, matching is usually caseinsensitive. The order of the expanded list is the same as the order in which the columnsappear in the table.
Thus "col*" will match columns named col1, Column2 and COL_1024, but not decOld. "*MAG*"will match columns named magnitude, ABS_MAG_U and JMAG. "*" on its own expands to a list ofall the columns of the table in order.
Specifying a list which contains a given column more than once is not usually an error, but whateffect it has depends on the function you are executing.
6.4 Output Modes
This section lists the output modes which can be used as the value of the omode parameter of tpipeand other commands. Typically, having produced a result table by pipeline processing an input one,you will write it out by specifying omode=out (or not using the omode parameter at all - out is thedefault). However, you can do other things such as calculate statistics, display metadata, etc. Insome of these cases, additional parameters are required. The different output modes, with theirassociated parameters, are described in the following subsections.
6.4.1 cgi
SUN/256 74
Usage:omode=cgi ofmt=<out-format>
Writes a table to standard output in a way suitable for use as output from a CGI (Common GatewayInterface) program. This is very much like out mode but a short CGI header giving the MIMEContent-Type is prepended to the output
Additional parameters for this output mode are:
ofmt = <out-format> (String)Specifies the format in which the output table will be written (one of the ones in Section 5.1.2 -matching is case-insensitive and you can use just the first few letters).
[Default: votable]
6.4.2 checksum
Usage:omode=checksum
Calculates a checksum from all the data in the table. The checksum is written to standard output inhexadecimal; row and column counts are also written.
If two tables have the same checksum it is extremely likely that they contain the same cell data. Ifthey have a different checksum, their cell data differs. By default, the checksum implementationuses Adler32, which is fast but not cryptographically secure.
6.4.3 count
Usage:omode=count
Counts the number of rows and columns and writes the result to standard output.
6.4.4 discard
Usage:omode=discard
Reads all the data in the table in sequential mode and discards it. May be useful in conjunction withthe assert filter.
6.4.5 gui
Usage:omode=gui
Displays the table in a scrollable window.
6.4.6 meta
SUN/256 75
Usage:omode=meta
Prints the table metadata to standard output. The name and type etc of each column is tabulated, andtable parameters are also shown.
See the meta filter for more flexible output of table metadata.
6.4.7 out
Usage:omode=out out=<out-table> ofmt=<out-format>
Writes a new table.
Additional parameters for this output mode are:
out = <out-table> (TableConsumer)The location of the output table. This is usually a filename to write to. If it is equal to thespecial value "-" (the default) the output table will be written to standard output.
[Default: -]
ofmt = <out-format> (String)Specifies the format in which the output table will be written (one of the ones in Section 5.1.2 -matching is case-insensitive and you can use just the first few letters). If it has the specialvalue "(auto)" (the default), then the output filename will be examined to try to guess whatsort of file is required usually by looking at the extension. If it's not obvious from the filenamewhat output format is intended, an error will result.
[Default: (auto)]
6.4.8 plastic
Usage:omode=plastic transport=string|file client=<app-name>
Broadcasts the table to any registered Plastic-aware applications. PLASTIC, the PLatform forAStronomical Tool InterConnection, is a tool interoperability protocol. A Plastic hub must berunning in order for this to work.
Additional parameters for this output mode are:
transport = string|file (String)Determines the method (PLASTIC message) used to perform the PLASTIC communication.The choices are
• string: VOTable serialized as a string and passed as a call parameter(ivo://votech.org/votable/load). Not suitable for very large files.
• file: VOTable written to a temporary file and the filename passed as a call parameter(ivo://votech.org/votable/loadFromURL). The file ought to be deleted once it has beenloaded. Not suitable for inter-machine communication.
If no value is set (null) then a decision will be taken based on the apparent size of the table.
client = <app-name> (String)
SUN/256 76
Gives the name of a PLASTIC listener application which is to receive the broadcast table. If anon-null value is given, then only the first registered application which reports its applicationname as that value will receive the message. If no value is supplied, the broadcast will be to alllistening applications.
6.4.9 samp
Usage:omode=samp format=<value> client=<name-or-id>
Sends the table to registered SAMP-aware applications subscribed to a suitable table load MType.SAMP, the Simple Application Messaging Protocol, is a tool interoperability protocol. A SAMPHub must be running for this to work.
Additional parameters for this output mode are:
format = <value> (String[])Gives one or more table format types for attempting the table transmission over SAMP. Ifmultiple values are supplied, they should be separated by spaces. Each value supplied for thisparameter corresponds to a different MType which may be used for the transmission. If asingle value is used, a SAMP broadcast will be used. If multiple values are used, eachregistered client will be interrogated to see whether it subscribes to the corresponding MTypesin order; the first one to which it is subscribed will be used to send the table. The standardoptions are
• votable: use MType table.load.votable
• fits: use MType table.load.fits
If any other string is used which corresponds to one of STILTS's known table output formats,an attempt will be made to use an ad-hoc MType of the form table.load.format.
[Default: votable fits]
client = <name-or-id> (String)Identifies a registered SAMP client which is to receive the table. Either the client ID or the(case-insensitive) application name may be used. If a non-null value is given, then the tablewill be sent to only the first client with the given name or ID. If no value is supplied the tablewill be sent to all suitably subscribed clients.
6.4.10 stats
Usage:omode=stats
Calculates and displays univariate statistics for each of the numeric columns in the table. Thefollowing entries are shown for each column as appropriate:
• mean• population standard deviation• minimum• maximum• number of non-null entries
See the stats filter for more flexible statistical calculations.
SUN/256 77

6.4.11 topcat
Usage:omode=topcat
Attempts to display the output table directly in TOPCAT. If a TOPCAT instance is already runningon the local host, an attempt will be made to open the table in that. A variety of mechanisms areused to attempt communication with an existing TOPCAT instance. In order:
1. SAMP using existing hub (TOPCAT v3.4+ only, requires SAMP hub to be running)2. PLASTIC using existing hub (requires PLASTIC hub to be running)3. SOAP (requires TOPCAT to run with somewhat deprecated -soap flag, may be limitations on
table size)4. SAMP using internal, short-lived hub (TOPCAT v3.4+ only, running hub not required, but
may be slow. It's better to start an external hub, e.g. topcat -exthub)
Failing that, an attempt will be made to launch a new TOPCAT instance for display. This onlyworks if the TOPCAT classes are on the class path.
If large tables are involved, starting TOPCAT with the -disk flag is probably a good idea.
6.4.12 tosql
Usage:omode=tosql protocol=<jdbc-protocol> host=<value> db=<db-name>
dbtable=<table-name> write=create|dropcreate|appenduser=<username> password=<passwd>
Writes a new table to an SQL database. You need the appropriate JDBC drivers and-Djdbc.drivers set as usual (see Section 3.4).
Additional parameters for this output mode are:
protocol = <jdbc-protocol> (String)The driver-specific sub-protocol specifier for the JDBC connection. For MySQL's Connector/Jdriver, this is mysql, and for PostgreSQL's driver it is postgresql. For other drivers, you mayhave to consult the driver documentation.
host = <value> (String)The host which is acting as a database server.
[Default: localhost]
db = <db-name> (String)The name of the database on the server into which the new table will be written.
The value of this parameter forms the last part of the JDBC connection URL. That means thatfor some JDBC drivers, you can append parameter specifications to it to affect the way theconnection is made to the database, e.g. "db=some_db?useSSL=false" for MySQL'sConnector/J.
dbtable = <table-name> (String)The name of the table which will be written to the database.
write = create|dropcreate|append (WriteMode)Controls how the values are written to a table in the database. The options are:
• create: Creates a new table before writing. It is an error if a table of the same namealready exists.
SUN/256 78
• dropcreate: Creates a new database table before writing. If a table of the same namealready exists, it is dropped first.
• append: Appends to an existing table. An error results if the named table has the wrongstructure (number or types of columns) for the data being written.
[Default: create]
user = <username> (String)User name for the SQL connection to the database.
[Default: mbt]
password = <passwd> (String)Password for the SQL connection to the database.
SUN/256 79

7 Crossmatching
STILTS offers flexible and efficient facilities for crossmatching tables. Crossmatching isidentifying different rows, which may be in the same or different tables, that refer to the same item.In an astronomical context such an item is usually, though not necessarily, an astronomical sourceor object. This operation corresponds to what in database terminology is called a join.
There are various complexities to specifying such a match. In the first place you have to definewhat is the condition that must be satisfied for two rows to be considered matching. In the secondplace you must decide what happens if, for a given row, more than one match can be found. Finally,you have to decide what to do having worked out what the matched rows are; the result willgenerally be presented as a new output table, but there are various choices about what columns androws it will consist of. Some of these issues are discussed in this section, and others in the referencesections on the tools themselves in Appendix B.
Matching can in general be a computationally intensive process. The algorithm used by the tmatch*
tasks in STILTS, except in pathological cases, scales as O(N log(N)) or thereabouts, where N is thetotal number of rows in all the tables being matched. No preparation (such as sorting) is required onthe tables prior to invoking the matching operation. It is reasonably fast; for instance an RA, Decpositional match of two 105-row catalogues takes of the order of 60 seconds on current (2005laptop) hardware. Attempting matches with large tables can lead to running out of memory; thecalculation just mentioned required a java heap size of around 200Mb (-Xmx200M).
In the current release of STILTS the following tasks are provided for crossmatching between localtables:
tmatch2
Generic crossmatching between two tables.
tskymatch2
Crossmatching between two tables where the matching criterion is a fixed separation on thesky. This is simply a stripped-down version of tmatch2 provided for convenience when thefull generality is not required.
tmatch1
Generic crossmatching internal to a single table. The basic task this performs is to identifygroups of rows within a single table which match each other.
tmatchn
Generic crossmatching between multiple (>2) tables.
tjoin
Trivial join operation between multiple tables in which no row re-ordering is required. Thisbarely warrants the term "crossmatch" and the concepts explained in the rest of this section arenot relevant to it.
7.1 Match Criteria
Determining whether one row represents the same item as another is done by comparing the valuesin certain of their columns to see if they are the same or similar. The most common astronomicalcase is to say that two rows match if their celestial coordinates (right ascension and declination) arewithin a given small radius of each other on the sky. There are other possibilities; for instance thecoordinates to compare may be in a Cartesian space, or have a higher (or lower) dimensionality thantwo, or the match may be exact rather than within an error radius....
If you just need to match two tables according to sky position with fixed errors you are
SUN/256 80
recommended to use the simplified tskymatch2 task. For other cases, this section describes how tospecify much more flexible match criteria for use with tmatch1, tmatch2 or tmatchn by setting thefollowing parameters:
matcher
Name of the match criteria type.
params
Fixed value(s) giving the parameters of the match (typically an error radius). If more than onevalue is required, the values should be separated by spaces.
values*
Expressions to be compared between rows. This will typically contain the names of one ormore columns, but each element may be an algebraic expression (see Section 10) rather thanjust a column name if required. If more than one value is required, the values should beseparated by spaces. There is one of these parameters for each table taking part in the match,so for tmatch2 you must specify both values1 and values2.
tuning
Fixed value(s) supplying tuning parameters for the match algorithm. If there is more than onevalue, they should be separated by spaces. This value will have a sensible default, so you donot need to supply it, but providing adjusted values may make your match run faster or requireless memory (or the reverse). Adjusting tuning parameters will not change the result of anymatch, only the resources required to run it. Looking at the progress output of a match willindicate what tuning values have been used; adjusting the value a bit up or down is a good wayto experiment.
For example, suppose we wish to locate objects in two tables which are within 3 arcseconds of eachother on the sky. One table has columns RA and DEC which give coordinates in degrees, and theother has columns RArad and DECrad which give coordinates in radians. These are the argumentswhich would be used to tell tmatch2 what the match criteria are:
matcher=skyparams=3values1='RA DEC'values2='radiansToDegrees(RArad) radiansToDegrees(DECrad)'
It is clearly important that corresponding values are comparable (in the same units) between thetables being matched, and in geometrically sensitive cases such as matching on the sky, it'simportant that they are the units expected by the matcher as well. To determine what those units are,either consult the roster below, or run the following command:
stilts tmatch2 help=matcher
which will tell you about all the known matchers and their associated params, values* and tuning
parameters.
The following subsections list the basic matcher types and the requirements of their associatedparams, values* and tuning parameters. The units of the required values are given wheresignificant.
7.1.1 sky: Sky Matching
matcher=sky values*='<ra/degrees> <dec/degrees>'params='<max-error/arcsec>'tuning='<healpix-k>'
values*:
SUN/256 81
• ra/degrees: Right Ascension• dec/degrees: Declination
params:
• max-error/arcsec: Maximum separation along a great circle
tuning:
• healpix-k: Controls sky pixel size. Legal range 0 - 29. 0 is 60deg, 20 is 0.2".
The sky matcher compares positions on the celestial sphere with a fixed error radius. Rows areconsidered to match when the two (ra, dec) positions are within max-error arcseconds of eachother along a great circle.
In fact this matching is not restricted to equatorial coordinates - the ra and dec parameters mayrepresent any longitude-like and latitude-like coordinates in degrees, since the spherical geometryfor the matching is unchanged under such transformations.
7.1.2 skyerr: Sky Matching with Per-Object Errors
matcher=skyerr values*='<ra/degrees> <dec/degrees> <error/arcsec>'params='<scale/arcsec>'tuning='<healpix-k>'
values*:
• ra/degrees: Right Ascension• dec/degrees: Declination• error/arcsec: Per-object error radius along a great circle
params:
• scale/arcsec: Rough average of per-object error distance; just used for tuning toset default pixel size
tuning:
• healpix-k: Controls sky pixel size. Legal range 0 - 29. 0 is 60deg, 20 is 0.2".
The skyerr matcher compares positions on the celestial sphere using error radii which can bedifferent for each row. Rows are considered to match when the separation between the two ra, decpositions is no larger than the sum of the two per-row error values.
The scale parameter should be a rough average value of the error distances. It is used only to set asensible default for healpix-k tuning parameter, and its value does not affect the result. If you sethealpix-k directly, its value is ignored.
As with sky matching, other longitude/latitude coordinate pairs may be used in place of rightascension and declination.
Note: the semantics of this matcher have changed slightly at version 2.4 of STILTS. In earlierversions the single parameter was named max-error and provided an additional constraint on themaximum accepted separation between matched objects. For most uses, the old and new behaviours
SUN/256 82
are expected to give the same results, but in cases of difference, the new behaviour is more likelywhat you want.
7.1.3 skyellipse: Sky Matching of Elliptical Regions
matcher=skyellipse values*='<ra/degrees> <dec/degrees> <primary-radius/arcsec><secondary-radius/arcsec><position-angle/degrees>'
params='<scale/arcsec>'tuning='<healpix-k>'
values*:
• ra/degrees: Right ascension of centre• dec/degrees: Declination of centre• primary-radius/arcsec: Length of ellipse semi-major axis• secondary-radius/arcsec: Length of ellipse semi-minor axis• position-angle/degrees: Position angle - measured from north pole to primary
axis, in direction of positive RA
params:
• scale/arcsec: Rough average of ellipse major radius; just used for tuning to setdefault pixel size
tuning:
• healpix-k: Controls sky pixel size. Legal range 0 - 29. 0 is 60deg, 20 is 0.2".
The skyellipse matcher compares elliptical regions on the sky for overlap. Each row has toprovide five values, giving the centre, the major and minor radii, and the position angle of anellipse. Rows are considered to match if there is any overlap between the ellipses. The goodness ofmatch is a normalised generalisation of the symmetrical case used by the skyerr matcher, in whichthe best possible match is two concentric ellipses, and the worst allowable match is when thecircumferences just touch.
The calculations are approximate since in some cases they rely on projecting the ellipses onto aCartesian tangent plane before evaluating the match, so for larger ellipses the criterion will be lessexact. For objects the size of most observed stars or galaxies, this approximation is not expected tobe problematic.
The scale parameter must be supplied, and should be a rough average value of the major radii. it isused only to set a sensible default for the healpix-k tuning parameter, and its value does not affectthe result. If you set healpix-k directly, the value of scale is ignored.
7.1.4 sky3d: Spherical Polar Matching
matcher=sky3d values*='<ra/degrees> <dec/degrees> <distance>'params='<error/units of distance>'tuning='<bin-factor>'
values*:
• ra/degrees: Right Ascension• dec/degrees: Declination• distance: Distance from origin
SUN/256 83
params:
• error/units of distance: Maximum Cartesian separation for match
tuning:
• bin-factor: Scaling factor to adjust bin size; larger values mean larger bins
The sky3d matcher compares positions in the volume of the sky taking account of distance from theobserver. The position in three-dimensional space is calculated for each row using the ra, dec anddistance as spherical polar coordinates, where distance is the distance from the observer alongthe line of sight. Rows are considered to match when their positions in this space are within error
units of each other. The units of error are the same as those of distance.
As with sky matching, other longitude/latitude coordinate pairs may be used in place of rightascension and declination.
7.1.5 exact: Exact Matching
matcher=exact values*='<matched-value>'
values*:
• matched-value: Value for exact match
The exact matcher compares arbitrary key values for exact equality. Rows are considered to matchonly if the values in their matched-value columns are exactly the same. These values can bestrings, numbers, or anything else. A blank value never matches, not even with another blank one.Since the params parameter holds no values, it does not have to be specified. Note that the valuesmust also be of the same type, so for instance a Long (64-bit) integer value will not match anInteger (32-bit) value.
7.1.6 1d, 2d, ...: Isotropic Cartesian Matching
matcher=1d values*='<x>'params='<error>'tuning='<bin-factor>'
values*:
• x: Cartesian co-ordinate #1
params:
• error: Maximum Cartesian separation for match
tuning:
• bin-factor: Scaling factor to adjust bin size; larger values mean larger bins
matcher=2d values*='<x> <y>'params='<error>'
SUN/256 84
tuning='<bin-factor>'
values*:
• x: Cartesian co-ordinate #1• y: Cartesian co-ordinate #2
params:
• error: Maximum Cartesian separation for match
tuning:
• bin-factor: Scaling factor to adjust bin size; larger values mean larger bins
The 1d matcher compares positions in 1-dimensional Cartesian space. Rows are considered tomatch if their x column values differ by no more than error.
The 2d matcher compares postions in 2-dimensional Cartesian space. Rows are considered to matchif the difference in their (x,y) positions reckoned using Pythagoras is less than error.
Matching in any number of Cartesian dimensions can be done by extending this syntax in theobvious way.
7.1.7 2d_anisotropic, ...: Anisotropic Cartesian Matching
matcher=2d_anisotropic values*='<x> <y>'params='<error-in-x> <error-in-y>'tuning='<bin-factor>'
values*:
• x: Cartesian co-ordinate #1• y: Cartesian co-ordinate #2
params:
• error-in-x: Axis length of error ellipse in Cartesian co-ordinate #1 direction• error-in-y: Axis length of error ellipse in Cartesian co-ordinate #2 direction
tuning:
• bin-factor: Scaling factor to adjust bin size; larger values mean larger bins
The 2d_anisotropic matcher compares positions in 2-dimensional Cartesian space using ananisotropic metric. Rows are considered to match if their (x,y) positions fall within an error ellipsewith axis lengths error-in-x, error-in-y of each other. This kind of match will typically be usedfor non-'spatial' spaces, for instance (magnitude,redshift) space, in which the metrics along differentaxes are not related to each other.
Matching in any number of dimensions of Cartesian space using an anisotropic metric can be doneby extending this syntax in the obvious way.
7.1.8 2d_cuboid, ...: Cuboid Cartesian Matching
SUN/256 85
matcher=2d_cuboid values*='<x> <y>'params='<error-in-x> <error-in-y>'tuning='<bin-factor>'
values*:
• x: Cartesian co-ordinate #1• y: Cartesian co-ordinate #2
params:
• error-in-x: Half length of cuboid in Cartesian co-ordinate #1 direction• error-in-y: Half length of cuboid in Cartesian co-ordinate #2 direction
tuning:
• bin-factor: Scaling factor to adjust bin size; larger values mean larger bins
The 2d_cuboid matcher compares positions in 2-dimensional Cartesian space in cuboidal cells.Rows are considered to match if their (x,y) positions fall within an error cuboid with half-axislengths error-in-x, error-in-y of each other. This kind of match is suitable for grouping itemsinto pixels, though it's not a very efficient way of doing that.
Matching in any number of dimensions using N-dimensional hyper-cuboids can be done byextending this syntax in the obvious way.
7.1.9 1d_err, 2d_err, ...: Cartesian Matching with Per-Object Errors
matcher=2d_err values*='<x> <y> <error>'params='<scale>'tuning='<bin-factor>'
values*:
• x: Cartesian co-ordinate #1• y: Cartesian co-ordinate #2• error: Per-object error radius
params:
• scale: Rough average of per-object error distance; just used for tuning inconjunction with bin factor
tuning:
• bin-factor: Scaling factor to adjust bin size; larger values mean larger bins
The 1d_err, 2d_err, ... matchers compare positions in N-dimensional Cartesian space like the 1d,2d matchers described in Section 7.1.6, except that the match radius can be different for each row.Rows are considered to match when the separation reckoned by Pythagoras between the x, y, ...positions is no larger than the sum of the two per-row error values. Matching in any number ofCartesian dimensions can be done by extending this syntax in the obvious way.
The scale parameter must be supplied, and should be approximately the characteristic size of theper-object error values. In conjunction with the bin-factor tuning parameter its value affects the
SUN/256 86
performance of the match, but not the result.
7.1.10 2d_ellipse: Cartesian Matching of Elliptical Regions
matcher=2d_ellipse values*='<x> <y> <primary-radius> <secondary-radius><orientation-angle/degrees>'
params='<scale>'tuning='<bin-factor>'
values*:
• x: X coordinate of centre• y: Y coordinate of centre• primary-radius: Length of ellipse semi-major axis• secondary-radius: Length of ellipse semi-minor axis• orientation-angle/degrees: Angle from X axis towards Y axis of semi-major
axis
params:
• scale: Rough average of per-object error distance; just used for tuning inconjunction with bin factor
tuning:
• bin-factor: Scaling factor to adjust bin size; larger values mean larger bins
The 2d_ellipse matcher compares elliptical regions in a 2d plane for overlap. Each row has tospecify five values, giving the centre, the major and minor radii, and the orientation angle of anellipse. Rows are considered to match if there is any overlap between the ellipses. The goodness ofmatch is a normalised generalisation of the symmetrical case used by the isotropic matcher, inwhich the best possible match is two concentric ellipses, and the worst allowable match is when thecircumferences just touch.
Note the orientation angle is measured anticlockwise from the horizontal, unlike the position angleused by the skyellipse matcher.
The scale parameter must be supplied, and should be approximately the characteristic size of theper-object major radius. In conjunction with the bin-factor tuning parameter its value affects theperformance of the match, but not the result.
7.1.11 Custom Matchers
For advanced users, it is possible to supply the name of a class on the classpath which implementsthe uk.ac.starlink.table.join.MatchEngine interface and which has a no-arg constructor. Thisallows java programmers to write their own matchers using any match criteria and binningalgorithms they choose.
7.1.12 Matcher Combinations
In addition to the matching criteria listed in the previous subsections, you can build your own bycombining any of these. To do this, take the two (or more) matchers that you want to use, andseparate their names with a "+" character. The values* parameters of the combined matcher shouldthen hold the concatenation of the values* entries of the constituent matchers, and the same for theparams parameter.
SUN/256 87
So for instance the matcher "sky+1d" could be used with the following syntax:matcher=sky+1d values*='<ra/degrees> <dec/degrees> <x>'
params='<max-error/arcsec> <error>'tuning='<healpix-k> <bin-factor>'
values*:
• ra/degrees: Right Ascension• dec/degrees: Declination• x: Cartesian co-ordinate #1
params:
• max-error/arcsec: Maximum separation along a great circle• error: Maximum Cartesian separation for match
tuning:
• healpix-k: Controls sky pixel size. Legal range 0 - 29. 0 is 60deg, 20 is 0.2".• bin-factor: Scaling factor to adjust bin size; larger values mean larger bins
This would compare positions on the sky with an additional scalar constraint. Rows are consideredto match if both their ra, dec positions are within max-error arcseconds of each other along a greatcircle (as for matcher=sky) and their x values differ by no more than error (as for matcher=1d).
This example might be used for instance to identify objects from two catalogues which are within acouple of arcseconds and also 0.5 blue magnitudes of each other. Rolling your own matchers in thisway can give you quite flexible match constraints.
When identifying the closest match (e.g. find=best1 in tmatch2) the "distance" measure isobtained by scaling the distances from each of the constituent matchers and adding these scaleddistances in quadrature, so that each element of the matcher has approximately equal weight.Scaling is generally done using the maximum permissible match radius (or equivalent), so thedistance measure looks something like d = sqrt([d
A/max(d
A)]2 + [d
B/max(d
B)]2). However the
details are a bit dependent on which matchers you are combining.
Note that in STILTS v3.0-9 and earlier, a linear unscaled distance measure was used here instead,which did not give very meaningful Best match results.
7.2 Multi-Object Matches
The generic matching in STILTS is determined by specified match criteria, as described in Section7.1. These criteria give conditions for whether two items (table rows) count as matched with eachother. In the case of a pair match, as provided by tmatch2, it is clear how this is to be interpreted.
However, some of the matching tasks (tmatchn in group mode and tmatch1) search for matchgroups which may have more than two members. This section explains precisely how STILTSapplies the pair-wise matching criteria it is given to identifying multi-object groups.
In a multi-object match context, the matcher identifies a matched group as the largest possiblegroup of objects in which each is linked by a pair match to any other object in the group - it is agroup of "friends of friends". Formally, the set of matched groups is a set of disjoint graphs whosenodes are input table rows and whose edges are successful pair matches, where no successful pairmatch exists between nodes in different elements of that set. Thus the set has a minimal number ofelements, and each of its elements is a matched group of maximal size. The important point to noteis that for any particular pair in a matched group, there is no guarantee that the two objects match
SUN/256 88
each other, only that you can hop from one to the other via pairs which do match.
So in the case of a multi-object sky match on a field which is very crowded compared to thespecified error radius, it is quite possible for all the objects in the input table(s) to end up as part ofthe same large matching group. Results at or near this percolation threshold are (a) probably notuseful and (b) likely to take a long time to run. Some care should therefore be exercised whenspecifying match criteria in multi-object match contexts.
SUN/256 89

8 Plotting
As of version 3.0 (October 2014), STILTS offers plotting commands corresponding to thenew-style plots in version 4 of the TOPCAT application. The commands are currently:
• plot2plane (Appendix B.9): Draws a plane plot• plot2sky (Appendix B.10): Draws a sky plot• plot2cube (Appendix B.11): Draws a cube plot• plot2sphere (Appendix B.12): Draws a sphere plot• plot2time (Appendix B.13): Draws a time plot
(In previous versions the less capable commands plot2d, plot3d and plothist were available -these are now deprecated, but described in Section 9).
These commands all have a similar structure. The plot surface, or geometry of the plot, is definedby which command you use (for instance, if you want to plot longitude/latitude data on the celestialsphere, use plot2sky). Content is added to the plot by specifying zero or more plot layers, asdescribed in Section 8.3 below. Section 8.4 describes the shading modes which affect howcolouring is performed for some of the layer types. Once a plot has been specified, it can bedisplayed on the screen or exported in some way according to a selected output mode (Section 8.5)and perhaps export format (Section 8.6). Plots displayed to the screen are by default "live" - theycan be resized and navigated around (pan, zoom, rotate, ...) using the mouse in the same way as in aTOPCAT window.
These commands allow you to make all the plots that can be produced with TOPCAT, in somecases with more flexibility in configuration. Unlike TOPCAT, the size of table you can plot is notlimited by the size of table you can load into the application. In most cases, STILTS will generateplots from arbitrarily large data sets with fixed (and modest) memory requirements. Performance isof course highly dependent on the details of the plot, but for instance an all-sky density plot for 2billion points can be produced in the order of 30 minutes.
8.1 Plot Parameters
The plotting commands offer a great deal of control over what is plotted and how it is represented,and thus unavoidably have lots of parameters. When looking at the command documentation inAppendix B the Usage sections may look rather daunting. However, the discussion below and theExamples sections should help. Generating a simple plot is straightforward and can be done withonly four or five parameters; if you want to represent more complicated data or have specificpreferences for appearance then you can consult the documentation for the additional options.
As a simple example, if a file "cat.fits" contains the columns RMAG and BMAG for red and bluemagnitudes, you can draw a two-dimensional colour-magnitude scatter plot with the command:
stilts plot2plane layer_1=mark in_1=cat.fits x_1=BMAG-RMAG y_1=BMAG
Since an output file is not specified, the plot is shown in a window on the screen. This plot windowis "live" - you can resize the window, or pan and zoom around it using the same mouse controls asin TOPCAT. To send the output to a PNG file, do instead:
stilts plot2plane layer_1=mark in_1=cat.fits x_1=BMAG-RMAG y_1=BMAG out=fig.png
We can adjust the plot by inverting the Y axis so it increases downwards instead of upwards:
stilts plot2planeyflip=truelayer_1=mark in_1=cat.fits x_1=BMAG-RMAG y_1=BMAG
SUN/256 90
The parameters of the plot now fall into two groups. Global parameters, without suffixes, makeglobal adjustments to the plot. In this example yflip=true inverts the Y axis. Layer parameters,with suffixes, are introduced by a layer parameter and grouped together by a given suffix. Eachlayer group defines a plot layer with content to be drawn on the plot surface. In this case the layer isof type mark (draw markers) and the suffix is "_1". Global and Layer parameters are describedseparately in the following subsections.
8.1.1 Global Parameters
The global plot parameters are documented in the usage sections of the various plot commands (e.g.Appendix B.9.1). They deal with things like positioning the plot axes, fixing the data bounds,selecting font types and sizes, adjusting grids and tickmarks, configuring how interactive navigationworks, managing data storage, and so on. They are all optional, since they all have sensible defaults,for instance data bounds will be determined from the supplied data if they are not given explicitly.
8.1.2 Layer Parameters
The layer parameters come in groups, each specifying the details of one plot layer. Each layer typehas its own list of parameters. A plot layer is introduced on the command line with a parameter ofthe form
layer<suffix>=<layer-type>
and any other parameters with the same <suffix> are considered to apply to the same layer. In thebasic example we considered:
stilts plot2plane layer_1=mark in_1=cat.fits x_1=BMAG-RMAG y_1=BMAG
the suffix is "_1" and the layer type associated with it is mark (plotting markers to make a scatterplot). The different layer types are documented in Section 8.3, and each has its own set ofparameters, some of which are mandatory and some which are optional with sensible defaults. Inthe documentation, the suffix is represented as "N". For instance the mark layer type requires you tospecify an input table (inN) and point positions (xN and yN). Since the suffix we have used in theexample for the layerN parameter is "_1", we have written in_1, x_1 and y_1. The mark layer hassome optional style parameters as well, so we could adjust the plot's appearance by addingshape_1=cross size_1=4 color_1=blue.
You can have as many layers as you like (even none), so we could overplot two datasets fromdifferent input files like this:
stilts plot2planelayer_1=mark in_1=cat1.fits x_1=BMAG-RMAG y_1=BMAG color_1=magenta size_1=5layer_2=mark in_2=cat2.fits x_2=mag_b-mag_r y_2=mag_b color_2=cyan size_2=5
We have assigned different colours to the different layers and boosted the marker size to 5 pixels.
As a convenience, if the same value is used for all the layers, you can omit the suffix. So to avoidhaving to specify the same markers size for both layers, you can write instead:
stilts plot2planesize=5layer_1=mark in_1=cat1.fits x_1=BMAG-RMAG y_1=BMAG color_1=magentalayer_2=mark in_2=cat2.fits x_2=mag_b-mag_r y_2=mag_b color_2=teal
Although the size parameter no longer has an explicit suffix, it's still a layer parameter, it justapplies to multiple layers. This shorthand works for all layer parameters. Here is another examplewhich also shows how you can use the icmdN parameter to pre-process input data prior toperforming the plot. Here, we make two different selections of the input rows to plot two differentdata sets.
SUN/256 91
stilts plot2planein=cat.fits x=BMAG-RMAG y=BMAGlayer_1=mark icmd_1='select vel<1000' color_1=bluelayer_2=mark icmd_2='select vel>=1000' color_2=red
The input tables and data values are the same for both datasets, so we can just supply the parametersin, x and y, rather than in_1, in_2 etc.
Any string can be used as a suffix, including the empty string (though an empty string can causeconfusion if there are multiple layers). The suffixing is also slightly more sophisticated thandescribed above; to find parameters relating to a layer with a given suffix, the parameter looks firstusing the whole suffix, and strips single characters off it until it has none left. So if a layer isintroduced with the parameter layer_ab, you can give the marker shape using any of the parametersshape_ab, shape_a, shape_ or shape. If more than one of these is present, the first one in that listwill be used (the order in which they appear on the command line is not significant). This can beused to group sets of layers.
By default, if multiple layers are specified, they are plotted in the order in which the introducinglayerN parameters appear on the command line. This may be relevant, since layers plotted latersometimes obscure ones plotted earlier. You can alter the order of plotting with the seq (global)parameter, which is a comma-separated list of layer suffixes giving the sequence in which layersshould be plotted. So adding "seq=_2,_1" would cause layer _2 to be plotted before layer _1,instead of the other way round.
By default, if more than one layer is plotted, a legend will appear labelling the datasets. The datasetlabels appearing in the legend are by default the layer suffixes specified on the command line.However, the labels can be given explicitly with the legendN parameter, so for instance in theexample above leglabel_1=Slow leglabel_2=Fast would adjust the legend accordingly. Legendappearance and positioning can be adjusted by various leg* global parameters.
8.1.3 Animation
The plotting commands can be used to produce animations. This is done by supplying an animationcontrol table using the animate parameter (which has associated afmt and acmd parameters forspecifying its file format and applying filters). One output image is produced for each row of thecontrol table. The columns of the table have names which correspond to plot command parameters,and for each row, the basic plot command is executed with the parameters on the command linesupplied or replaced by those from the table. This is most commonly used for providing a movie ofthe kind of navigation you can do interactively with the mouse, but other applications are possible.
For instance, given the following animation control table with the name "bounds.txt", in ASCIIformat:
# xmax ymax4.0 2.03.0 1.52.0 1.01.0 0.5
then this command:
stilts plot2plane xmin=0 ymin=0layer_1=mark in_1=gums_smc.fits x_1=ag y_1=avanimate=bounds.txt afmt=ascii
would produce a 4-frame animation zooming in towards the origin.
If output is to the screen (omode=swing, the default) the animation can be seen directly. If it is to anoutput file (omode=out) then a number of output files is written with sequence numbers, so adding
SUN/256 92
the parameter "out=x.png" to the above command would produce 4 files, x-1.png, x-2.png,x-3.png and x-4.png. Padding zeros are used to keep the files in alphanumeric sequence, so forinstance in a 500-frame animation the first one would be named x-001.png. STILTS does notactually turn these files into a single animated output file, but you can use other tools to do this, forinstance using ImageMagick:
convert x-*.png xmovie.gif
or ffmpeg:
ffmpeg -i 'x-%03d.png' -framerate 15 -pix_fmt yuv420p xmovie.webm
You can create the animation control table any way you like, but you may find the tloop commandconvenient. For instance the above table can be written like this:
stilts tloop xmax 4 0 -1 ocmd='addcol ymax xmax*0.5' ofmt=ascii out=bounds.txt
Alternatively, you can generate a table like this inline using the loop scheme. A commonrequirement is to produce an animation of rotating a 3-d plot, here's an example of how to do that:
stilts plot2sphere layer_1=mark in_1=hip_main.fits lon_1=radeg lat_1=dedeg r_1=plx \animate=:loop:15,375,2 acmd='colmeta -name phi $1'
The phi parameter controls the angle from which the 3D plot is viewed, and here it is incrementedby 2 degrees for each frame. The same thing would work for plot2cube as well as plot2sphere.
Note that producing animations in this way is usually much more efficient than writing a shell scriptwhich invokes STILTS multiple times. The plot commands also employ multi-threading whenanimating to output files, so should make efficient use of multi-core machines (though currentlyanimations to the screen are not multi-threaded).
8.2 Surface Types
The different plot2* commands correspond to different plot surface geometries. The differentcommands come with their own specific axis configuration parameters. Some of the plot layer typesare specific to certain surface types. When supplying data from input tables to plot layers, thecoordinate values you need to supply (and hence the corresponding parameter names) aredetermined not by the layer type, but by the surface type. For instance, point positions for layer Non a 2-d Cartesian surface (plot2plane command) are given using parameters xN and yN, but whenplotting to the celestial sphere (plot2sky command) you supply lonN and latN).
The following list summarises the available surface types and their corresponding positionalcoordinates.
Plane (plot2plane)2-dimensional Cartesian axes. Positional coordinates are supplied as x, y pairs. Note that thiscommand can also be used to draw histograms.
Sky (plot2sky)Celestial sphere. Positional coordinates are supplied as lon, lat pairs, giving longitude andlatitude in decimal degrees. A number of different projections are available, and conversionbetween different celestial coordinate systems can also be performed. You could use it forother spherical coordinate systems too (like the surface of a planet).
Cube (plot2cube)3-dimensional Cartesian axes. Positional coordinates are supplied as x, y, z triples.
Sphere (plot2sphere)3-dimensional isotropic space with spherical polar coordinates. Positional coordinates are
SUN/256 93
supplied as lon, lat, r triples, giving longitude and latitude in decimal degrees, and radius inan arbitrary unit. The plotting surface (space) is similar to Cube, except that the unit distance isalways the same in all three directions.
Time (plot2time)2-dimensional axes, but the horizontal axis represents time. The axis may be labelled invarious ways (ISO-8601 dates, decimal year, MJD etc). Positional coordinates are supplied ast, y pairs. Time can be represented in input data in various ways; if sufficient metadata isprovided in the input format the epoch can be determined automatically, otherwise it may benecessary to specify the time representation being used.
8.3 Layer Types
The different plot layers and how to configure them with parameters is given in the followingsubsections. The layers which may be plotted on a particular surface depend on the plot geometry,so not all of these are available for every plot command.
8.3.1 mark
Plots a marker of fixed size and shape at each position.
Usage Overview:
layerN=mark shapeN=filled_circle|open_circle|... sizeN=<pixels>shadingN=auto|flat|translucent|transparent|density|aux|weighted <shade-paramsN><pos-coord-paramsN> inN=<table> ifmtN=<in-format>istreamN=true|false icmdN=<cmds>
All the parameters listed here affect only the relevant layer, identified by the suffix N.
Positional Coordinate Parameters:The positional coordinates <pos-coord-paramsN> give a position for each row of the inputtable. Their form depends on the plot geometry, i.e. which plotting command is used. For aplane plot (plot2plane) the parameters would be xN and yN. The coordinate parameter valuesare in all cases strings interpreted as numeric expressions based on column names. These canbe column names, fixed values or algebraic expressions as described in Section 10.
Example:
SUN/256 94
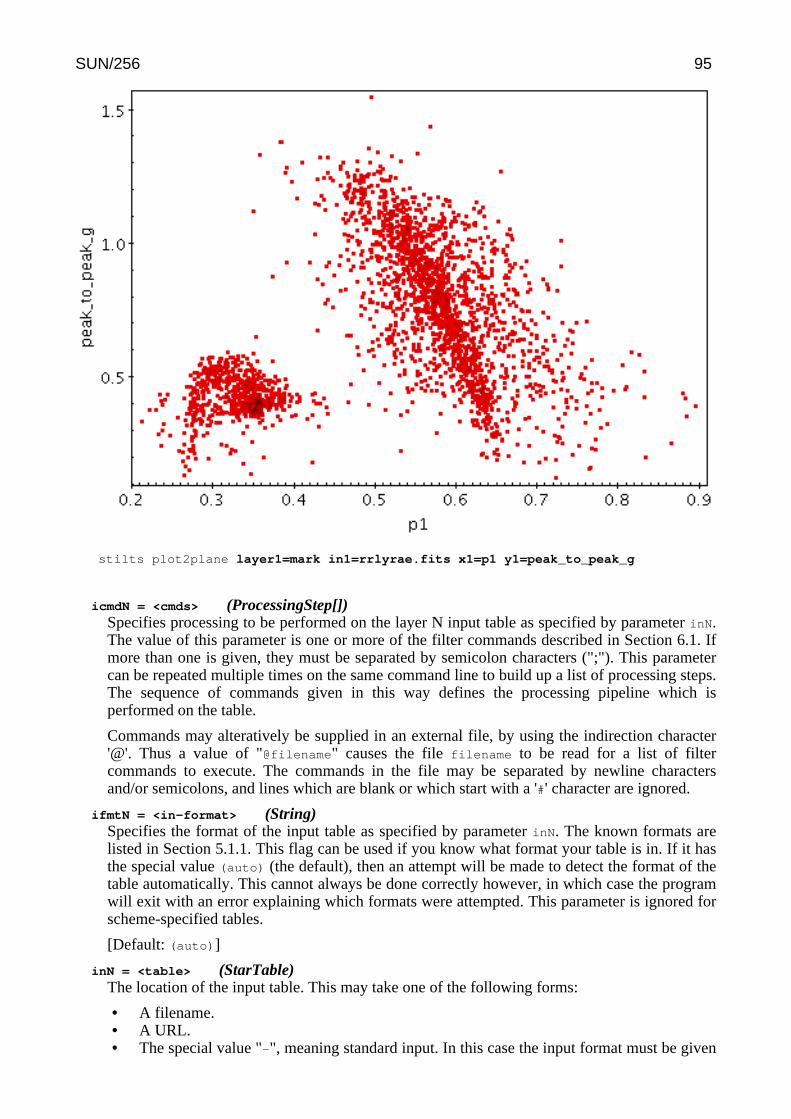
stilts plot2plane layer1=mark in1=rrlyrae.fits x1=p1 y1=peak_to_peak_g
icmdN = <cmds> (ProcessingStep[])Specifies processing to be performed on the layer N input table as specified by parameter inN.The value of this parameter is one or more of the filter commands described in Section 6.1. Ifmore than one is given, they must be separated by semicolon characters (";"). This parametercan be repeated multiple times on the same command line to build up a list of processing steps.The sequence of commands given in this way defines the processing pipeline which isperformed on the table.
Commands may alteratively be supplied in an external file, by using the indirection character'@'. Thus a value of "@filename" causes the file filename to be read for a list of filtercommands to execute. The commands in the file may be separated by newline charactersand/or semicolons, and lines which are blank or which start with a '#' character are ignored.
ifmtN = <in-format> (String)Specifies the format of the input table as specified by parameter inN. The known formats arelisted in Section 5.1.1. This flag can be used if you know what format your table is in. If it hasthe special value (auto) (the default), then an attempt will be made to detect the format of thetable automatically. This cannot always be done correctly however, in which case the programwill exit with an error explaining which formats were attempted. This parameter is ignored forscheme-specified tables.
[Default: (auto)]
inN = <table> (StarTable)The location of the input table. This may take one of the following forms:
• A filename.• A URL.• The special value "-", meaning standard input. In this case the input format must be given
SUN/256 95
explicitly using the ifmtN parameter. Note that not all formats can be streamed in thisway.
• A scheme specification of the form :<scheme-name>:<scheme-args>.• A system command line with either a "<" character at the start, or a "|" character at the
end ("<syscmd" or "syscmd|"). This executes the given pipeline and reads from itsstandard output. This will probably only work on unix-like systems.
In any case, compressed data in one of the supported compression formats (gzip, Unixcompress or bzip2) will be decompressed transparently.
istreamN = true|false (Boolean)If set true, the input table specified by the inN parameter will be read as a stream. It isnecessary to give the ifmtN parameter in this case. Depending on the required operations andprocessing mode, this may cause the read to fail (sometimes it is necessary to read the tablemore than once). It is not normally necessary to set this flag; in most cases the data will bestreamed automatically if that is the best thing to do. However it can sometimes result in lessresource usage when processing large files in certain formats (such as VOTable). Thisparameter is ignored for scheme-specified tables.
[Default: false]
shadingN = auto|flat|translucent|transparent|density|aux|weighted <shade-paramsN>
(ShapeMode)Determines how plotted objects in layer N are coloured. This may be influenced by how manyobjects are plotted over each other as well as the values of other parameters. Available options(Section 8.4) are:
• auto (Section 8.4.1)
• flat (Section 8.4.2)
• translucent (Section 8.4.3)
• transparent (Section 8.4.4)
• density (Section 8.4.5)
• aux (Section 8.4.6)
• weighted (Section 8.4.7)
Each of these options comes with its own set of parameters to specify the details of howcolouring is done.
[Default: auto]
shapeN = filled_circle|open_circle|... (MarkerShape)Sets the shape of markers that are plotted at each position of the scatter plot.
The available options are:
• filled_circle
• open_circle
• cross
• x
• open_square
• open_diamond
• open_triangle_up
• open_triangle_down
• fat_circle
• fat_cross
• fat_x
• fat_square
• fat_diamond
• fat_triangle_up
• fat_triangle_up
• filled_square
SUN/256 96
• filled_diamond
• filled_triangle_up
• filled_triangle_down
[Default: filled_circle]
sizeN = <pixels> (Integer)Size of the scatter plot markers. The unit is pixels, in most cases the marker is approximatelytwice the size of the supplied value.
[Default: 1]
8.3.2 size
Plots a marker of fixed shape but variable size at each position. The size is determined by anadditional input data value.
The actual size of the markers depends on the setting of the autoscale parameter. If autoscaling isoff, then the basic size of each marker is the input data value in units of pixels. If autoscaling is on,then the data values are gathered for all the currently visible points, and a scaling factor is appliedso that the largest ones will be a sensible size (a few tens of pixels). This basic size can be furtheradjusted with the scale factor.
Currently data values of zero always correspond to marker size of zero, negative data values are notrepresented, and the mapping is linear. An absolute maximum of 100 pixels is also imposed onmarker sizes. Other options may be introduced in future.
Note: for marker sizes that correspond to data values in data coordinates, you may find Errorplotting more appropriate.
Usage Overview:
layerN=size shapeN=filled_circle|open_circle|... scaleN=<factor>autoscaleN=true|falseshadingN=auto|flat|translucent|transparent|density|aux|weighted <shade-paramsN><pos-coord-paramsN> sizeN=<num-expr> inN=<table>ifmtN=<in-format> istreamN=true|false icmdN=<cmds>
All the parameters listed here affect only the relevant layer, identified by the suffix N.
Positional Coordinate Parameters:The positional coordinates <pos-coord-paramsN> give a position for each row of the inputtable. Their form depends on the plot geometry, i.e. which plotting command is used. For aplane plot (plot2plane) the parameters would be xN and yN. The coordinate parameter valuesare in all cases strings interpreted as numeric expressions based on column names. These canbe column names, fixed values or algebraic expressions as described in Section 10.
Example:
SUN/256 97
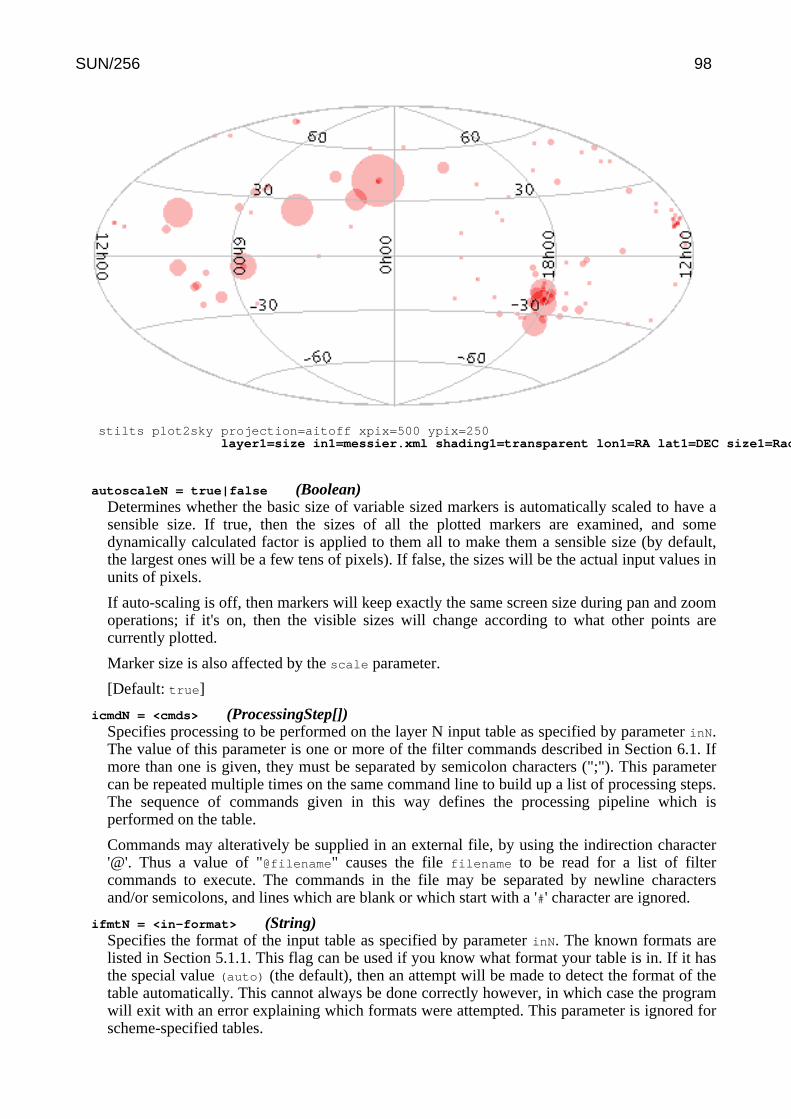
stilts plot2sky projection=aitoff xpix=500 ypix=250layer1=size in1=messier.xml shading1=transparent lon1=RA lat1=DEC size1=Radius
autoscaleN = true|false (Boolean)Determines whether the basic size of variable sized markers is automatically scaled to have asensible size. If true, then the sizes of all the plotted markers are examined, and somedynamically calculated factor is applied to them all to make them a sensible size (by default,the largest ones will be a few tens of pixels). If false, the sizes will be the actual input values inunits of pixels.
If auto-scaling is off, then markers will keep exactly the same screen size during pan and zoomoperations; if it's on, then the visible sizes will change according to what other points arecurrently plotted.
Marker size is also affected by the scale parameter.
[Default: true]
icmdN = <cmds> (ProcessingStep[])Specifies processing to be performed on the layer N input table as specified by parameter inN.The value of this parameter is one or more of the filter commands described in Section 6.1. Ifmore than one is given, they must be separated by semicolon characters (";"). This parametercan be repeated multiple times on the same command line to build up a list of processing steps.The sequence of commands given in this way defines the processing pipeline which isperformed on the table.
Commands may alteratively be supplied in an external file, by using the indirection character'@'. Thus a value of "@filename" causes the file filename to be read for a list of filtercommands to execute. The commands in the file may be separated by newline charactersand/or semicolons, and lines which are blank or which start with a '#' character are ignored.
ifmtN = <in-format> (String)Specifies the format of the input table as specified by parameter inN. The known formats arelisted in Section 5.1.1. This flag can be used if you know what format your table is in. If it hasthe special value (auto) (the default), then an attempt will be made to detect the format of thetable automatically. This cannot always be done correctly however, in which case the programwill exit with an error explaining which formats were attempted. This parameter is ignored forscheme-specified tables.
SUN/256 98

[Default: (auto)]
inN = <table> (StarTable)The location of the input table. This may take one of the following forms:
• A filename.• A URL.• The special value "-", meaning standard input. In this case the input format must be given
explicitly using the ifmtN parameter. Note that not all formats can be streamed in thisway.
• A scheme specification of the form :<scheme-name>:<scheme-args>.• A system command line with either a "<" character at the start, or a "|" character at the
end ("<syscmd" or "syscmd|"). This executes the given pipeline and reads from itsstandard output. This will probably only work on unix-like systems.
In any case, compressed data in one of the supported compression formats (gzip, Unixcompress or bzip2) will be decompressed transparently.
istreamN = true|false (Boolean)If set true, the input table specified by the inN parameter will be read as a stream. It isnecessary to give the ifmtN parameter in this case. Depending on the required operations andprocessing mode, this may cause the read to fail (sometimes it is necessary to read the tablemore than once). It is not normally necessary to set this flag; in most cases the data will bestreamed automatically if that is the best thing to do. However it can sometimes result in lessresource usage when processing large files in certain formats (such as VOTable). Thisparameter is ignored for scheme-specified tables.
[Default: false]
scaleN = <factor> (Double)Scales the size of variable-sized markers. The default is 1, smaller or larger values multiply thevisible sizes accordingly.
[Default: 1]
shadingN = auto|flat|translucent|transparent|density|aux|weighted <shade-paramsN>
(ShapeMode)Determines how plotted objects in layer N are coloured. This may be influenced by how manyobjects are plotted over each other as well as the values of other parameters. Available options(Section 8.4) are:
• auto (Section 8.4.1)
• flat (Section 8.4.2)
• translucent (Section 8.4.3)
• transparent (Section 8.4.4)
• density (Section 8.4.5)
• aux (Section 8.4.6)
• weighted (Section 8.4.7)
Each of these options comes with its own set of parameters to specify the details of howcolouring is done.
[Default: auto]
shapeN = filled_circle|open_circle|... (MarkerShape)Sets the shape of markers that are plotted at each position of the scatter plot.
The available options are:
• filled_circle
• open_circle
• cross
• x
SUN/256 99

• open_square
• open_diamond
• open_triangle_up
• open_triangle_down
• fat_circle
• fat_cross
• fat_x
• fat_square
• fat_diamond
• fat_triangle_up
• fat_triangle_up
• filled_square
• filled_diamond
• filled_triangle_up
• filled_triangle_down
[Default: filled_circle]
sizeN = <num-expr> (String)Size to draw each sized marker. Units are pixels unless auto-scaling is in effect, in which caseunits are arbitrary. The plotted size is also affected by the scale value.
The value is a numeric algebraic expression based on column names as described in Section10.
8.3.3 sizexy
Plots a shaped marker with variable horizontal and vertical extents at each position. The X and Ydimensions are determined by two additional input data values.
The actual size of the markers depends on the setting of the autoscale parameter. If autoscaling isoff, the basic dimensions of each marker are given by the input data values in units of pixels. Ifautoscaling is on, the data values are gathered for all the currently visible points, and scaling factorsare applied so that the largest ones will be a sensible size (a few tens of pixels). This autoscalinghappens independently for the X and Y directions. The basic sizes can be further adjusted with thescale factor.
Currently data values of zero always correspond to marker dimension of zero, negative data valuesare not represented, and the mapping is linear. An absolute maximum of 100 pixels is also imposedon marker sizes. Other options may be introduced in future.
Note: for marker sizes that correspond to data values in data coordinates, you may find Errorplotting more appropriate.
Usage Overview:
layerN=sizexy shapeN=open_rectangle|open_triangle|... thickN=<int-value>scaleN=<factor> autoscaleN=true|falseshadingN=auto|flat|translucent|transparent|density|aux|weighted <shade-paramsN><pos-coord-paramsN> xsizeN=<num-expr> ysizeN=<num-expr>inN=<table> ifmtN=<in-format> istreamN=true|false icmdN=<cmds>
All the parameters listed here affect only the relevant layer, identified by the suffix N.
Positional Coordinate Parameters:The positional coordinates <pos-coord-paramsN> give a position for each row of the input
SUN/256 100

table. Their form depends on the plot geometry, i.e. which plotting command is used. For aplane plot (plot2plane) the parameters would be xN and yN. The coordinate parameter valuesare in all cases strings interpreted as numeric expressions based on column names. These canbe column names, fixed values or algebraic expressions as described in Section 10.
Example:
stilts plot2plane layer1=sizexy in1=dr5qso.fits shape1=filled_rectanglex1=psfmag_u-psfmag_g y1=psfmag_r-psfmag_z xsize1=exp(psfmag_g) ysize1=exp(psfmag_r)xmin=-3 xmax=1 ymin=1 ymax=3.2
autoscaleN = true|false (Boolean)Determines whether the basic size of variable sized markers is automatically scaled to have asensible size. If true, then the sizes of all the plotted markers are examined, and somedynamically calculated factor is applied to them all to make them a sensible size (by default,the largest ones will be a few tens of pixels). If false, the sizes will be the actual input values inunits of pixels.
If auto-scaling is off, then markers will keep exactly the same screen size during pan and zoomoperations; if it's on, then the visible sizes will change according to what other points arecurrently plotted.
Marker size is also affected by the scale parameter.
[Default: true]
icmdN = <cmds> (ProcessingStep[])Specifies processing to be performed on the layer N input table as specified by parameter inN.The value of this parameter is one or more of the filter commands described in Section 6.1. Ifmore than one is given, they must be separated by semicolon characters (";"). This parameter
SUN/256 101

can be repeated multiple times on the same command line to build up a list of processing steps.The sequence of commands given in this way defines the processing pipeline which isperformed on the table.
Commands may alteratively be supplied in an external file, by using the indirection character'@'. Thus a value of "@filename" causes the file filename to be read for a list of filtercommands to execute. The commands in the file may be separated by newline charactersand/or semicolons, and lines which are blank or which start with a '#' character are ignored.
ifmtN = <in-format> (String)Specifies the format of the input table as specified by parameter inN. The known formats arelisted in Section 5.1.1. This flag can be used if you know what format your table is in. If it hasthe special value (auto) (the default), then an attempt will be made to detect the format of thetable automatically. This cannot always be done correctly however, in which case the programwill exit with an error explaining which formats were attempted. This parameter is ignored forscheme-specified tables.
[Default: (auto)]
inN = <table> (StarTable)The location of the input table. This may take one of the following forms:
• A filename.• A URL.• The special value "-", meaning standard input. In this case the input format must be given
explicitly using the ifmtN parameter. Note that not all formats can be streamed in thisway.
• A scheme specification of the form :<scheme-name>:<scheme-args>.• A system command line with either a "<" character at the start, or a "|" character at the
end ("<syscmd" or "syscmd|"). This executes the given pipeline and reads from itsstandard output. This will probably only work on unix-like systems.
In any case, compressed data in one of the supported compression formats (gzip, Unixcompress or bzip2) will be decompressed transparently.
istreamN = true|false (Boolean)If set true, the input table specified by the inN parameter will be read as a stream. It isnecessary to give the ifmtN parameter in this case. Depending on the required operations andprocessing mode, this may cause the read to fail (sometimes it is necessary to read the tablemore than once). It is not normally necessary to set this flag; in most cases the data will bestreamed automatically if that is the best thing to do. However it can sometimes result in lessresource usage when processing large files in certain formats (such as VOTable). Thisparameter is ignored for scheme-specified tables.
[Default: false]
scaleN = <factor> (Double)Scales the size of variable-sized markers. The default is 1, smaller or larger values multiply thevisible sizes accordingly.
[Default: 1]
shadingN = auto|flat|translucent|transparent|density|aux|weighted <shade-paramsN>
(ShapeMode)Determines how plotted objects in layer N are coloured. This may be influenced by how manyobjects are plotted over each other as well as the values of other parameters. Available options(Section 8.4) are:
• auto (Section 8.4.1)
• flat (Section 8.4.2)
• translucent (Section 8.4.3)
• transparent (Section 8.4.4)
SUN/256 102

• density (Section 8.4.5)
• aux (Section 8.4.6)
• weighted (Section 8.4.7)
Each of these options comes with its own set of parameters to specify the details of howcolouring is done.
[Default: auto]
shapeN = open_rectangle|open_triangle|... (BasicXYShape)The available options are:
• open_rectangle
• open_triangle
• open_triangle_down
• open_diamond
• open_ellipse
• filled_rectangle
• filled_triangle
• filled_triangle_down
• filled_diamond
• filled_ellipse
[Default: open_rectangle]
thickN = <int-value> (Integer)Controls the line thickness used when drawing shapes. Zero, the default value, means a1-pixel-wide line is used. Larger values make drawn lines thicker, but note changing this valuewill not affect all shapes, for instance filled rectangles contain no line drawings.
[Default: 0]
xsizeN = <num-expr> (String)Horizontal extent of each marker. Units are pixels unless auto-scaling is in effect, in whichcase units are arbitrary.
The value is a numeric algebraic expression based on column names as described in Section10.
ysizeN = <num-expr> (String)Vertical extent of each marker. Units are pixels unless auto-scaling is in effect, in which caseunits are arbitrary.
The value is a numeric algebraic expression based on column names as described in Section10.
8.3.4 xyvector
Plots directed lines from the data position given delta values for the coordinates. The plottedmarkers are typically little arrows, but there are other options.
In some cases the supplied data values give the actual extents in data coordinates for the plottedvectors but sometimes the data is on a different scale or in different units to the positionalcoordinates. As a convenience for this case, the plotter can optionally scale the magnitudes of allthe vectors to make them a reasonable size on the plot, so by default the largest ones are a few tensof pixels long. This auto-scaling is turned off by default, but it can be activated with the autoscale
option. Whether autoscaling is on or off, the scale option can be used to apply a fixed scalingfactor.
Usage Overview:
SUN/256 103
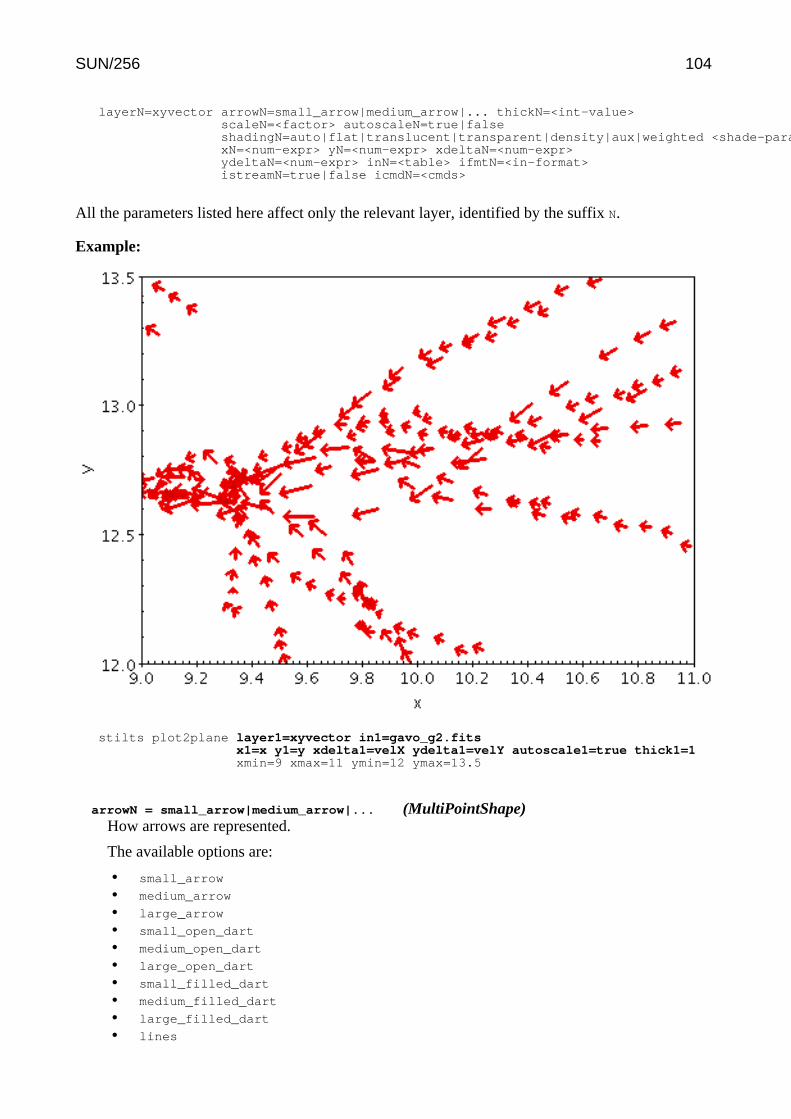
layerN=xyvector arrowN=small_arrow|medium_arrow|... thickN=<int-value>scaleN=<factor> autoscaleN=true|falseshadingN=auto|flat|translucent|transparent|density|aux|weighted <shade-paramsN>xN=<num-expr> yN=<num-expr> xdeltaN=<num-expr>ydeltaN=<num-expr> inN=<table> ifmtN=<in-format>istreamN=true|false icmdN=<cmds>
All the parameters listed here affect only the relevant layer, identified by the suffix N.
Example:
stilts plot2plane layer1=xyvector in1=gavo_g2.fitsx1=x y1=y xdelta1=velX ydelta1=velY autoscale1=true thick1=1xmin=9 xmax=11 ymin=12 ymax=13.5
arrowN = small_arrow|medium_arrow|... (MultiPointShape)How arrows are represented.
The available options are:
• small_arrow
• medium_arrow
• large_arrow
• small_open_dart
• medium_open_dart
• large_open_dart
• small_filled_dart
• medium_filled_dart
• large_filled_dart
• lines
SUN/256 104

• capped_lines
[Default: small_arrow]
autoscaleN = true|false (Boolean)Determines whether the default size of variable-sized markers like vectors and ellipses areautomatically scaled to have a sensible size. If true, then the sizes of all the plotted markers areexamined, and some dynamically calculated factor is applied to them all to make them asensible size (by default, the largest ones will be a few tens of pixels). If false, the sizes will bethe actual input values interpreted in data coordinates.
If auto-scaling is on, then markers will keep approximately the same screen size during zoomoperations; if it's off, they will keep the same size in data coordinates.
Marker size is also affected by the scale parameter.
[Default: false]
icmdN = <cmds> (ProcessingStep[])Specifies processing to be performed on the layer N input table as specified by parameter inN.The value of this parameter is one or more of the filter commands described in Section 6.1. Ifmore than one is given, they must be separated by semicolon characters (";"). This parametercan be repeated multiple times on the same command line to build up a list of processing steps.The sequence of commands given in this way defines the processing pipeline which isperformed on the table.
Commands may alteratively be supplied in an external file, by using the indirection character'@'. Thus a value of "@filename" causes the file filename to be read for a list of filtercommands to execute. The commands in the file may be separated by newline charactersand/or semicolons, and lines which are blank or which start with a '#' character are ignored.
ifmtN = <in-format> (String)Specifies the format of the input table as specified by parameter inN. The known formats arelisted in Section 5.1.1. This flag can be used if you know what format your table is in. If it hasthe special value (auto) (the default), then an attempt will be made to detect the format of thetable automatically. This cannot always be done correctly however, in which case the programwill exit with an error explaining which formats were attempted. This parameter is ignored forscheme-specified tables.
[Default: (auto)]
inN = <table> (StarTable)The location of the input table. This may take one of the following forms:
• A filename.• A URL.• The special value "-", meaning standard input. In this case the input format must be given
explicitly using the ifmtN parameter. Note that not all formats can be streamed in thisway.
• A scheme specification of the form :<scheme-name>:<scheme-args>.• A system command line with either a "<" character at the start, or a "|" character at the
end ("<syscmd" or "syscmd|"). This executes the given pipeline and reads from itsstandard output. This will probably only work on unix-like systems.
In any case, compressed data in one of the supported compression formats (gzip, Unixcompress or bzip2) will be decompressed transparently.
istreamN = true|false (Boolean)If set true, the input table specified by the inN parameter will be read as a stream. It isnecessary to give the ifmtN parameter in this case. Depending on the required operations andprocessing mode, this may cause the read to fail (sometimes it is necessary to read the tablemore than once). It is not normally necessary to set this flag; in most cases the data will be
SUN/256 105
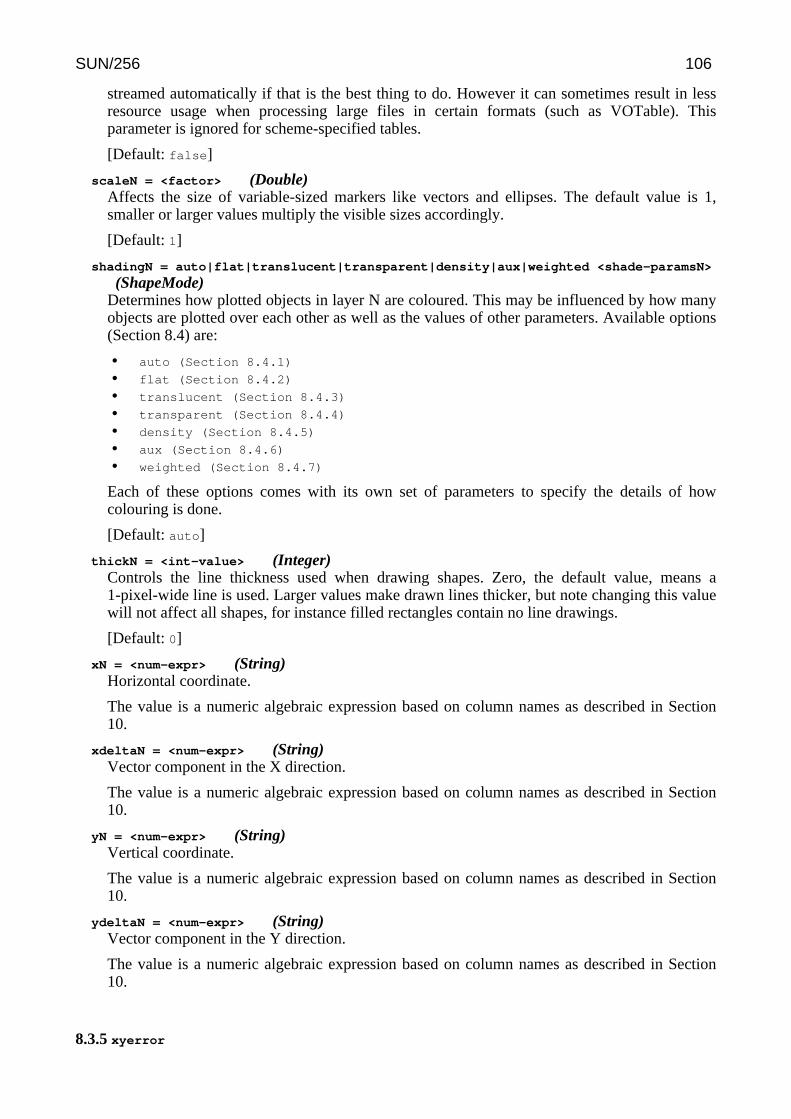
streamed automatically if that is the best thing to do. However it can sometimes result in lessresource usage when processing large files in certain formats (such as VOTable). Thisparameter is ignored for scheme-specified tables.
[Default: false]
scaleN = <factor> (Double)Affects the size of variable-sized markers like vectors and ellipses. The default value is 1,smaller or larger values multiply the visible sizes accordingly.
[Default: 1]
shadingN = auto|flat|translucent|transparent|density|aux|weighted <shade-paramsN>
(ShapeMode)Determines how plotted objects in layer N are coloured. This may be influenced by how manyobjects are plotted over each other as well as the values of other parameters. Available options(Section 8.4) are:
• auto (Section 8.4.1)
• flat (Section 8.4.2)
• translucent (Section 8.4.3)
• transparent (Section 8.4.4)
• density (Section 8.4.5)
• aux (Section 8.4.6)
• weighted (Section 8.4.7)
Each of these options comes with its own set of parameters to specify the details of howcolouring is done.
[Default: auto]
thickN = <int-value> (Integer)Controls the line thickness used when drawing shapes. Zero, the default value, means a1-pixel-wide line is used. Larger values make drawn lines thicker, but note changing this valuewill not affect all shapes, for instance filled rectangles contain no line drawings.
[Default: 0]
xN = <num-expr> (String)Horizontal coordinate.
The value is a numeric algebraic expression based on column names as described in Section10.
xdeltaN = <num-expr> (String)Vector component in the X direction.
The value is a numeric algebraic expression based on column names as described in Section10.
yN = <num-expr> (String)Vertical coordinate.
The value is a numeric algebraic expression based on column names as described in Section10.
ydeltaN = <num-expr> (String)Vector component in the Y direction.
The value is a numeric algebraic expression based on column names as described in Section10.
8.3.5 xyerror
SUN/256 106
Plots symmetric or asymmetric error bars in some or all of the plot dimensions. The shape of theerror "bars" is quite configurable, including (for 2-d and 3-d errors) ellipses, rectangles etc alignedwith the axes.
Usage Overview:
layerN=xyerror errorbarN=none|lines|capped_lines|... thickN=<int-value>shadingN=auto|flat|translucent|transparent|density|aux|weighted <shade-paramsN>xN=<num-expr> yN=<num-expr> xerrhiN=<num-expr>xerrloN=<num-expr> yerrhiN=<num-expr> yerrloN=<num-expr>inN=<table> ifmtN=<in-format> istreamN=true|falseicmdN=<cmds>
All the parameters listed here affect only the relevant layer, identified by the suffix N.
Example:
stilts plot2plane in=J_MNRAS_440_1571.vot x=S500 y=S160layer1=mark size1=5 shape1=fat_circlelayer2=xyerror xerrhi2=e_S500 yerrhi2=e_S160 errorbar2=capped_lines thick2=1xlog=true ylog=true shading=flat xmin=0.012 xmax=1 ymin=0.01 ymax=10
errorbarN = none|lines|capped_lines|... (MultiPointShape)How errorbars are represented.
The available options are:
• none
• lines
• capped_lines
• caps
SUN/256 107
• arrows
• ellipse
• crosshair_ellipse
• rectangle
• crosshair_rectangle
• filled_ellipse
• filled_rectangle
[Default: lines]
icmdN = <cmds> (ProcessingStep[])Specifies processing to be performed on the layer N input table as specified by parameter inN.The value of this parameter is one or more of the filter commands described in Section 6.1. Ifmore than one is given, they must be separated by semicolon characters (";"). This parametercan be repeated multiple times on the same command line to build up a list of processing steps.The sequence of commands given in this way defines the processing pipeline which isperformed on the table.
Commands may alteratively be supplied in an external file, by using the indirection character'@'. Thus a value of "@filename" causes the file filename to be read for a list of filtercommands to execute. The commands in the file may be separated by newline charactersand/or semicolons, and lines which are blank or which start with a '#' character are ignored.
ifmtN = <in-format> (String)Specifies the format of the input table as specified by parameter inN. The known formats arelisted in Section 5.1.1. This flag can be used if you know what format your table is in. If it hasthe special value (auto) (the default), then an attempt will be made to detect the format of thetable automatically. This cannot always be done correctly however, in which case the programwill exit with an error explaining which formats were attempted. This parameter is ignored forscheme-specified tables.
[Default: (auto)]
inN = <table> (StarTable)The location of the input table. This may take one of the following forms:
• A filename.• A URL.• The special value "-", meaning standard input. In this case the input format must be given
explicitly using the ifmtN parameter. Note that not all formats can be streamed in thisway.
• A scheme specification of the form :<scheme-name>:<scheme-args>.• A system command line with either a "<" character at the start, or a "|" character at the
end ("<syscmd" or "syscmd|"). This executes the given pipeline and reads from itsstandard output. This will probably only work on unix-like systems.
In any case, compressed data in one of the supported compression formats (gzip, Unixcompress or bzip2) will be decompressed transparently.
istreamN = true|false (Boolean)If set true, the input table specified by the inN parameter will be read as a stream. It isnecessary to give the ifmtN parameter in this case. Depending on the required operations andprocessing mode, this may cause the read to fail (sometimes it is necessary to read the tablemore than once). It is not normally necessary to set this flag; in most cases the data will bestreamed automatically if that is the best thing to do. However it can sometimes result in lessresource usage when processing large files in certain formats (such as VOTable). Thisparameter is ignored for scheme-specified tables.
[Default: false]
shadingN = auto|flat|translucent|transparent|density|aux|weighted <shade-paramsN>
SUN/256 108
(ShapeMode)Determines how plotted objects in layer N are coloured. This may be influenced by how manyobjects are plotted over each other as well as the values of other parameters. Available options(Section 8.4) are:
• auto (Section 8.4.1)
• flat (Section 8.4.2)
• translucent (Section 8.4.3)
• transparent (Section 8.4.4)
• density (Section 8.4.5)
• aux (Section 8.4.6)
• weighted (Section 8.4.7)
Each of these options comes with its own set of parameters to specify the details of howcolouring is done.
[Default: auto]
thickN = <int-value> (Integer)Controls the line thickness used when drawing shapes. Zero, the default value, means a1-pixel-wide line is used. Larger values make drawn lines thicker, but note changing this valuewill not affect all shapes, for instance filled rectangles contain no line drawings.
[Default: 0]
xN = <num-expr> (String)Horizontal coordinate.
The value is a numeric algebraic expression based on column names as described in Section10.
xerrhiN = <num-expr> (String)Error in the X coordinate in the positive direction. If no corresponding negative error value issupplied, then this value is also used in the negative direction, i.e. in that case errors areassumed to be symmetric.
The value is a numeric algebraic expression based on column names as described in Section10.
xerrloN = <num-expr> (String)Error in the X coordinate in the negative direction. If left blank, it is assumed to take the samevalue as the positive error.
The value is a numeric algebraic expression based on column names as described in Section10.
yN = <num-expr> (String)Vertical coordinate.
The value is a numeric algebraic expression based on column names as described in Section10.
yerrhiN = <num-expr> (String)Error in the Y coordinate in the positive direction. If no corresponding negative error value issupplied, then this value is also used in the negative direction, i.e. in that case errors areassumed to be symmetric.
The value is a numeric algebraic expression based on column names as described in Section10.
yerrloN = <num-expr> (String)Error in the Y coordinate in the negative direction. If left blank, it is assumed to take the samevalue as the positive error.
SUN/256 109
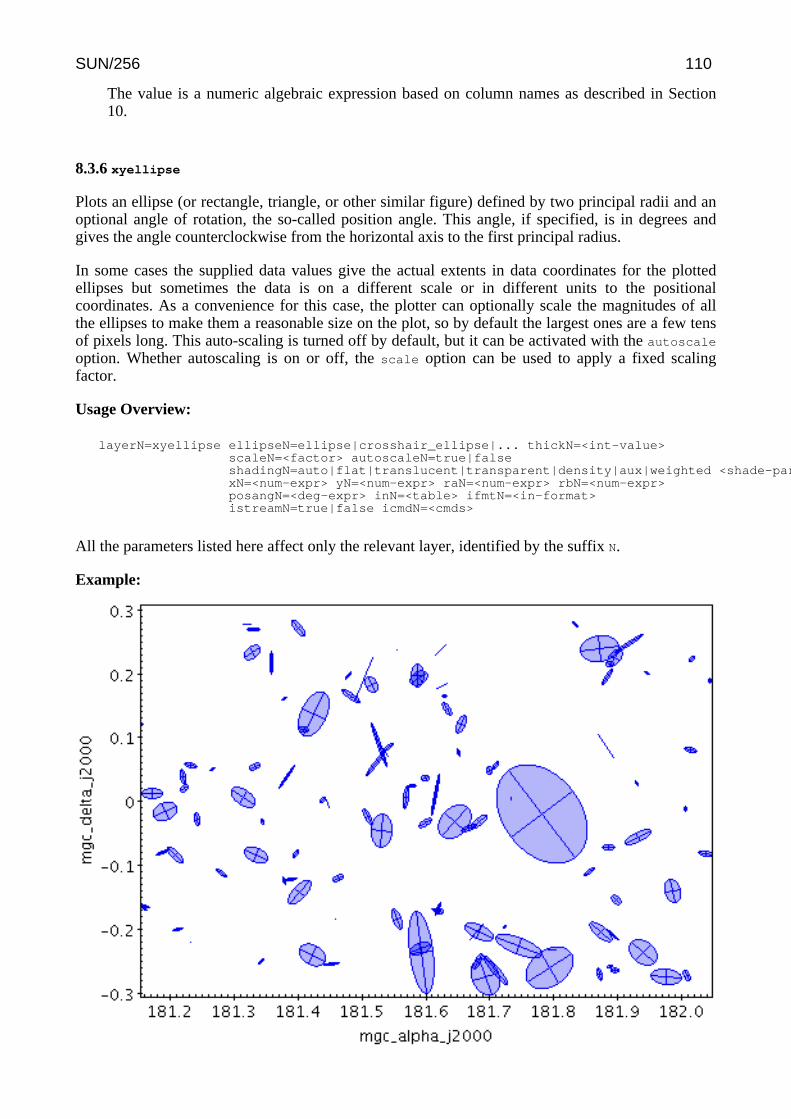
The value is a numeric algebraic expression based on column names as described in Section10.
8.3.6 xyellipse
Plots an ellipse (or rectangle, triangle, or other similar figure) defined by two principal radii and anoptional angle of rotation, the so-called position angle. This angle, if specified, is in degrees andgives the angle counterclockwise from the horizontal axis to the first principal radius.
In some cases the supplied data values give the actual extents in data coordinates for the plottedellipses but sometimes the data is on a different scale or in different units to the positionalcoordinates. As a convenience for this case, the plotter can optionally scale the magnitudes of allthe ellipses to make them a reasonable size on the plot, so by default the largest ones are a few tensof pixels long. This auto-scaling is turned off by default, but it can be activated with the autoscale
option. Whether autoscaling is on or off, the scale option can be used to apply a fixed scalingfactor.
Usage Overview:
layerN=xyellipse ellipseN=ellipse|crosshair_ellipse|... thickN=<int-value>scaleN=<factor> autoscaleN=true|falseshadingN=auto|flat|translucent|transparent|density|aux|weighted <shade-paramsN>xN=<num-expr> yN=<num-expr> raN=<num-expr> rbN=<num-expr>posangN=<deg-expr> inN=<table> ifmtN=<in-format>istreamN=true|false icmdN=<cmds>
All the parameters listed here affect only the relevant layer, identified by the suffix N.
Example:
SUN/256 110
stilts plot2plane in=mgc_ok.fits x=mgc_alpha_j2000 y=mgc_delta_j2000ra=bulge_re/3600. rb=bulge_re*bulge_e/3600. posang=bulge_paautoscale=false scale=10 color=bluelayer1=xyellipse ellipse1=filled_ellipse shading1=transparent opaque1=4layer2=xyellipse ellipse2=crosshair_ellipseaspect=1 xmin=181.3 xmax=181.9
autoscaleN = true|false (Boolean)Determines whether the default size of variable-sized markers like vectors and ellipses areautomatically scaled to have a sensible size. If true, then the sizes of all the plotted markers areexamined, and some dynamically calculated factor is applied to them all to make them asensible size (by default, the largest ones will be a few tens of pixels). If false, the sizes will bethe actual input values interpreted in data coordinates.
If auto-scaling is on, then markers will keep approximately the same screen size during zoomoperations; if it's off, they will keep the same size in data coordinates.
Marker size is also affected by the scale parameter.
[Default: false]
ellipseN = ellipse|crosshair_ellipse|... (MultiPointShape)How ellipses are represented.
The available options are:
• ellipse
• crosshair_ellipse
• filled_ellipse
• rectangle
• crosshair_rectangle
• filled_rectangle
• open_triangle
• filled_triangle
• lines
• capped_lines
• arrows
[Default: ellipse]
icmdN = <cmds> (ProcessingStep[])Specifies processing to be performed on the layer N input table as specified by parameter inN.The value of this parameter is one or more of the filter commands described in Section 6.1. Ifmore than one is given, they must be separated by semicolon characters (";"). This parametercan be repeated multiple times on the same command line to build up a list of processing steps.The sequence of commands given in this way defines the processing pipeline which isperformed on the table.
Commands may alteratively be supplied in an external file, by using the indirection character'@'. Thus a value of "@filename" causes the file filename to be read for a list of filtercommands to execute. The commands in the file may be separated by newline charactersand/or semicolons, and lines which are blank or which start with a '#' character are ignored.
ifmtN = <in-format> (String)Specifies the format of the input table as specified by parameter inN. The known formats arelisted in Section 5.1.1. This flag can be used if you know what format your table is in. If it hasthe special value (auto) (the default), then an attempt will be made to detect the format of thetable automatically. This cannot always be done correctly however, in which case the programwill exit with an error explaining which formats were attempted. This parameter is ignored forscheme-specified tables.
SUN/256 111
[Default: (auto)]
inN = <table> (StarTable)The location of the input table. This may take one of the following forms:
• A filename.• A URL.• The special value "-", meaning standard input. In this case the input format must be given
explicitly using the ifmtN parameter. Note that not all formats can be streamed in thisway.
• A scheme specification of the form :<scheme-name>:<scheme-args>.• A system command line with either a "<" character at the start, or a "|" character at the
end ("<syscmd" or "syscmd|"). This executes the given pipeline and reads from itsstandard output. This will probably only work on unix-like systems.
In any case, compressed data in one of the supported compression formats (gzip, Unixcompress or bzip2) will be decompressed transparently.
istreamN = true|false (Boolean)If set true, the input table specified by the inN parameter will be read as a stream. It isnecessary to give the ifmtN parameter in this case. Depending on the required operations andprocessing mode, this may cause the read to fail (sometimes it is necessary to read the tablemore than once). It is not normally necessary to set this flag; in most cases the data will bestreamed automatically if that is the best thing to do. However it can sometimes result in lessresource usage when processing large files in certain formats (such as VOTable). Thisparameter is ignored for scheme-specified tables.
[Default: false]
posangN = <deg-expr> (String)Orientation of the ellipse. The value is the angle in degrees from the X axis towards the Y axisof the first principal axis of the ellipse.
The value is a numeric algebraic expression based on column names as described in Section10.
raN = <num-expr> (String)Ellipse first principal radius.
The value is a numeric algebraic expression based on column names as described in Section10.
rbN = <num-expr> (String)Ellipse second principal radius. If this value is blank, the two radii will be assumed equal, i.e.the ellipses will be circles.
The value is a numeric algebraic expression based on column names as described in Section10.
scaleN = <factor> (Double)Affects the size of variable-sized markers like vectors and ellipses. The default value is 1,smaller or larger values multiply the visible sizes accordingly.
[Default: 1]
shadingN = auto|flat|translucent|transparent|density|aux|weighted <shade-paramsN>
(ShapeMode)Determines how plotted objects in layer N are coloured. This may be influenced by how manyobjects are plotted over each other as well as the values of other parameters. Available options(Section 8.4) are:
• auto (Section 8.4.1)
• flat (Section 8.4.2)
SUN/256 112
• translucent (Section 8.4.3)
• transparent (Section 8.4.4)
• density (Section 8.4.5)
• aux (Section 8.4.6)
• weighted (Section 8.4.7)
Each of these options comes with its own set of parameters to specify the details of howcolouring is done.
[Default: auto]
thickN = <int-value> (Integer)Controls the line thickness used when drawing shapes. Zero, the default value, means a1-pixel-wide line is used. Larger values make drawn lines thicker, but note changing this valuewill not affect all shapes, for instance filled rectangles contain no line drawings.
[Default: 0]
xN = <num-expr> (String)Horizontal coordinate.
The value is a numeric algebraic expression based on column names as described in Section10.
yN = <num-expr> (String)Vertical coordinate.
The value is a numeric algebraic expression based on column names as described in Section10.
8.3.7 xycorr
Plots an error ellipse (or rectangle or other similar figure) defined by errors in the X and Ydirections, and a correlation between the two errors.
The supplied correlation is a dimensionless value in the range -1..+1 and is equal to the covariancedivided by the product of the X and Y errors. The covariance matrix is thus:
[ xerr*xerr xerr*yerr*xycorr ][ xerr*yerr*xycorr yerr*yerr ]
In some cases the supplied data values give the actual extents in data coordinates for the plottedellipses but sometimes the data is on a different scale or in different units to the positionalcoordinates. As a convenience for this case, the plotter can optionally scale the magnitudes of allthe ellipses to make them a reasonable size on the plot, so by default the largest ones are a few tensof pixels long. This auto-scaling is turned off by default, but it can be activated with the autoscale
option. Whether autoscaling is on or off, the scale option can be used to apply a fixed scalingfactor.
This plot type is suitable for use with the <x>_error and <x>_<y>_corr columns in the Gaia sourcecatalogue.
Usage Overview:
layerN=xycorr ellipseN=ellipse|crosshair_ellipse|... thickN=<int-value>scaleN=<factor> autoscaleN=true|falseshadingN=auto|flat|translucent|transparent|density|aux|weighted <shade-paramsN>xN=<num-expr> yN=<num-expr> xerrN=<num-expr> yerrN=<num-expr>xycorrN=<num-expr> inN=<table> ifmtN=<in-format>istreamN=true|false icmdN=<cmds>
SUN/256 113
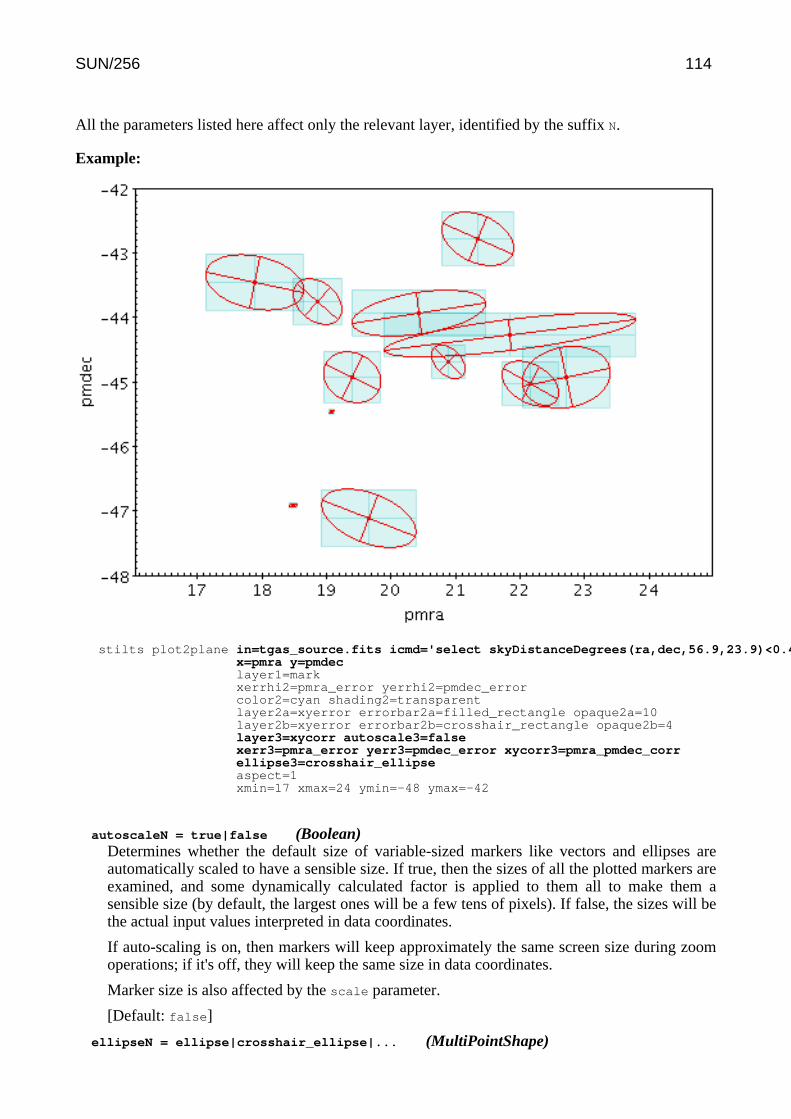
All the parameters listed here affect only the relevant layer, identified by the suffix N.
Example:
stilts plot2plane in=tgas_source.fits icmd='select skyDistanceDegrees(ra,dec,56.9,23.9)<0.4'x=pmra y=pmdeclayer1=markxerrhi2=pmra_error yerrhi2=pmdec_errorcolor2=cyan shading2=transparentlayer2a=xyerror errorbar2a=filled_rectangle opaque2a=10layer2b=xyerror errorbar2b=crosshair_rectangle opaque2b=4layer3=xycorr autoscale3=falsexerr3=pmra_error yerr3=pmdec_error xycorr3=pmra_pmdec_correllipse3=crosshair_ellipseaspect=1xmin=17 xmax=24 ymin=-48 ymax=-42
autoscaleN = true|false (Boolean)Determines whether the default size of variable-sized markers like vectors and ellipses areautomatically scaled to have a sensible size. If true, then the sizes of all the plotted markers areexamined, and some dynamically calculated factor is applied to them all to make them asensible size (by default, the largest ones will be a few tens of pixels). If false, the sizes will bethe actual input values interpreted in data coordinates.
If auto-scaling is on, then markers will keep approximately the same screen size during zoomoperations; if it's off, they will keep the same size in data coordinates.
Marker size is also affected by the scale parameter.
[Default: false]
ellipseN = ellipse|crosshair_ellipse|... (MultiPointShape)
SUN/256 114
How ellipses are represented.
The available options are:
• ellipse
• crosshair_ellipse
• filled_ellipse
• rectangle
• crosshair_rectangle
• filled_rectangle
• open_triangle
• filled_triangle
• lines
• capped_lines
• arrows
[Default: ellipse]
icmdN = <cmds> (ProcessingStep[])Specifies processing to be performed on the layer N input table as specified by parameter inN.The value of this parameter is one or more of the filter commands described in Section 6.1. Ifmore than one is given, they must be separated by semicolon characters (";"). This parametercan be repeated multiple times on the same command line to build up a list of processing steps.The sequence of commands given in this way defines the processing pipeline which isperformed on the table.
Commands may alteratively be supplied in an external file, by using the indirection character'@'. Thus a value of "@filename" causes the file filename to be read for a list of filtercommands to execute. The commands in the file may be separated by newline charactersand/or semicolons, and lines which are blank or which start with a '#' character are ignored.
ifmtN = <in-format> (String)Specifies the format of the input table as specified by parameter inN. The known formats arelisted in Section 5.1.1. This flag can be used if you know what format your table is in. If it hasthe special value (auto) (the default), then an attempt will be made to detect the format of thetable automatically. This cannot always be done correctly however, in which case the programwill exit with an error explaining which formats were attempted. This parameter is ignored forscheme-specified tables.
[Default: (auto)]
inN = <table> (StarTable)The location of the input table. This may take one of the following forms:
• A filename.• A URL.• The special value "-", meaning standard input. In this case the input format must be given
explicitly using the ifmtN parameter. Note that not all formats can be streamed in thisway.
• A scheme specification of the form :<scheme-name>:<scheme-args>.• A system command line with either a "<" character at the start, or a "|" character at the
end ("<syscmd" or "syscmd|"). This executes the given pipeline and reads from itsstandard output. This will probably only work on unix-like systems.
In any case, compressed data in one of the supported compression formats (gzip, Unixcompress or bzip2) will be decompressed transparently.
istreamN = true|false (Boolean)If set true, the input table specified by the inN parameter will be read as a stream. It isnecessary to give the ifmtN parameter in this case. Depending on the required operations andprocessing mode, this may cause the read to fail (sometimes it is necessary to read the table
SUN/256 115
more than once). It is not normally necessary to set this flag; in most cases the data will bestreamed automatically if that is the best thing to do. However it can sometimes result in lessresource usage when processing large files in certain formats (such as VOTable). Thisparameter is ignored for scheme-specified tables.
[Default: false]
scaleN = <factor> (Double)Affects the size of variable-sized markers like vectors and ellipses. The default value is 1,smaller or larger values multiply the visible sizes accordingly.
[Default: 1]
shadingN = auto|flat|translucent|transparent|density|aux|weighted <shade-paramsN>
(ShapeMode)Determines how plotted objects in layer N are coloured. This may be influenced by how manyobjects are plotted over each other as well as the values of other parameters. Available options(Section 8.4) are:
• auto (Section 8.4.1)
• flat (Section 8.4.2)
• translucent (Section 8.4.3)
• transparent (Section 8.4.4)
• density (Section 8.4.5)
• aux (Section 8.4.6)
• weighted (Section 8.4.7)
Each of these options comes with its own set of parameters to specify the details of howcolouring is done.
[Default: auto]
thickN = <int-value> (Integer)Controls the line thickness used when drawing shapes. Zero, the default value, means a1-pixel-wide line is used. Larger values make drawn lines thicker, but note changing this valuewill not affect all shapes, for instance filled rectangles contain no line drawings.
[Default: 0]
xN = <num-expr> (String)Horizontal coordinate.
The value is a numeric algebraic expression based on column names as described in Section10.
xerrN = <num-expr> (String)Error in the X coordinate.
The value is a numeric algebraic expression based on column names as described in Section10.
xycorrN = <num-expr> (String)Correlation beteween the errors in the X and Y directions. This is a dimensionless quantity inthe range -1..+1, and is equivalent to the covariance divided by the product of the X and Yerror values themselves. It corresponds to the *_corr values supplied in the Gaia sourcecatalogue.
The value is a numeric algebraic expression based on column names as described in Section10.
yN = <num-expr> (String)Vertical coordinate.
The value is a numeric algebraic expression based on column names as described in Section
SUN/256 116
10.
yerrN = <num-expr> (String)Error in the Y coordinate.
The value is a numeric algebraic expression based on column names as described in Section10.
8.3.8 link2
Plots a line linking two positions from the same input table row.
Usage Overview:
layerN=link2 thickN=<int-value>shadingN=auto|flat|translucent|transparent|density|aux|weighted <shade-paramsN><pos-coord-params1N> <pos-coord-params2N> inN=<table>ifmtN=<in-format> istreamN=true|false icmdN=<cmds>
All the parameters listed here affect only the relevant layer, identified by the suffix N.
Positional Coordinate Parameters:The positional coordinates <pos-coord-params1N> , <pos-coord-params2N> give 2 positionsfor each row of the input table. Their form depends on the plot geometry, i.e. which plottingcommand is used. For a plane plot (plot2plane) the parameters would be x1N, y1N, x2N andy2N. The coordinate parameter values are in all cases strings interpreted as numeric expressionsbased on column names. These can be column names, fixed values or algebraic expressions asdescribed in Section 10.
Example:
SUN/256 117
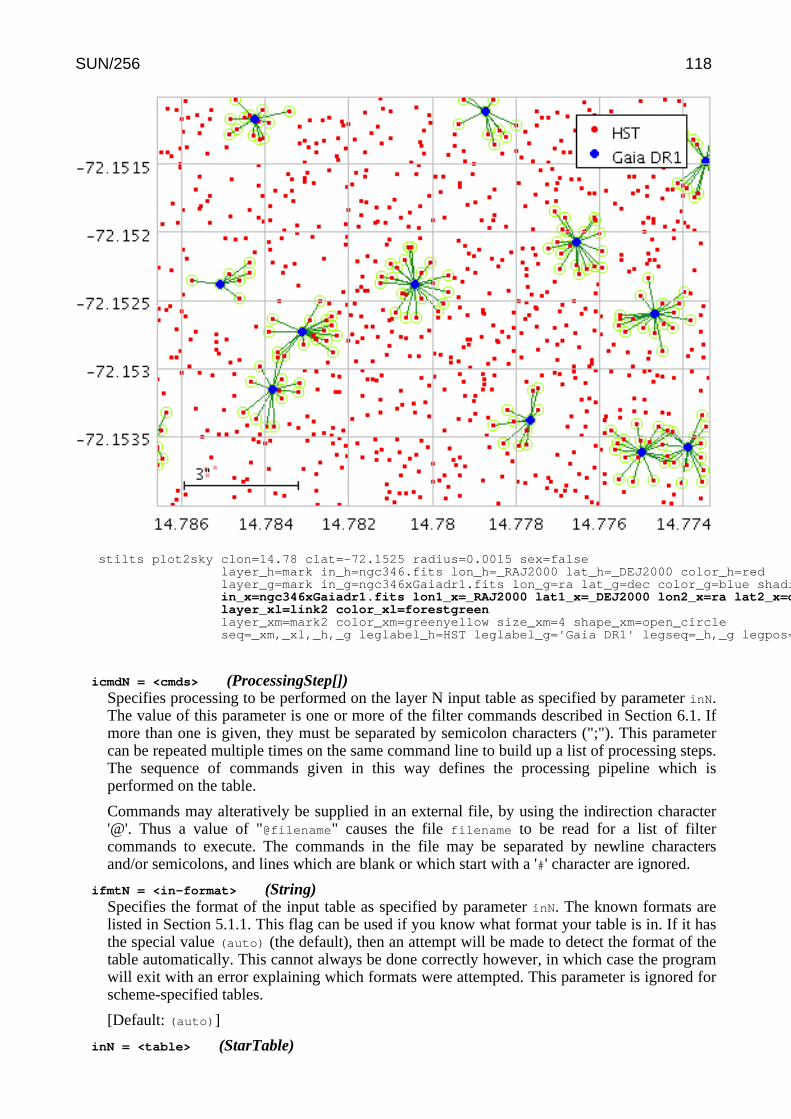
stilts plot2sky clon=14.78 clat=-72.1525 radius=0.0015 sex=falselayer_h=mark in_h=ngc346.fits lon_h=_RAJ2000 lat_h=_DEJ2000 color_h=redlayer_g=mark in_g=ngc346xGaiadr1.fits lon_g=ra lat_g=dec color_g=blue shading_g=flat size_g=3in_x=ngc346xGaiadr1.fits lon1_x=_RAJ2000 lat1_x=_DEJ2000 lon2_x=ra lat2_x=dec shading_x=flatlayer_xl=link2 color_xl=forestgreenlayer_xm=mark2 color_xm=greenyellow size_xm=4 shape_xm=open_circleseq=_xm,_xl,_h,_g leglabel_h=HST leglabel_g='Gaia DR1' legseq=_h,_g legpos=0.95,0.95
icmdN = <cmds> (ProcessingStep[])Specifies processing to be performed on the layer N input table as specified by parameter inN.The value of this parameter is one or more of the filter commands described in Section 6.1. Ifmore than one is given, they must be separated by semicolon characters (";"). This parametercan be repeated multiple times on the same command line to build up a list of processing steps.The sequence of commands given in this way defines the processing pipeline which isperformed on the table.
Commands may alteratively be supplied in an external file, by using the indirection character'@'. Thus a value of "@filename" causes the file filename to be read for a list of filtercommands to execute. The commands in the file may be separated by newline charactersand/or semicolons, and lines which are blank or which start with a '#' character are ignored.
ifmtN = <in-format> (String)Specifies the format of the input table as specified by parameter inN. The known formats arelisted in Section 5.1.1. This flag can be used if you know what format your table is in. If it hasthe special value (auto) (the default), then an attempt will be made to detect the format of thetable automatically. This cannot always be done correctly however, in which case the programwill exit with an error explaining which formats were attempted. This parameter is ignored forscheme-specified tables.
[Default: (auto)]
inN = <table> (StarTable)
SUN/256 118
The location of the input table. This may take one of the following forms:
• A filename.• A URL.• The special value "-", meaning standard input. In this case the input format must be given
explicitly using the ifmtN parameter. Note that not all formats can be streamed in thisway.
• A scheme specification of the form :<scheme-name>:<scheme-args>.• A system command line with either a "<" character at the start, or a "|" character at the
end ("<syscmd" or "syscmd|"). This executes the given pipeline and reads from itsstandard output. This will probably only work on unix-like systems.
In any case, compressed data in one of the supported compression formats (gzip, Unixcompress or bzip2) will be decompressed transparently.
istreamN = true|false (Boolean)If set true, the input table specified by the inN parameter will be read as a stream. It isnecessary to give the ifmtN parameter in this case. Depending on the required operations andprocessing mode, this may cause the read to fail (sometimes it is necessary to read the tablemore than once). It is not normally necessary to set this flag; in most cases the data will bestreamed automatically if that is the best thing to do. However it can sometimes result in lessresource usage when processing large files in certain formats (such as VOTable). Thisparameter is ignored for scheme-specified tables.
[Default: false]
shadingN = auto|flat|translucent|transparent|density|aux|weighted <shade-paramsN>
(ShapeMode)Determines how plotted objects in layer N are coloured. This may be influenced by how manyobjects are plotted over each other as well as the values of other parameters. Available options(Section 8.4) are:
• auto (Section 8.4.1)
• flat (Section 8.4.2)
• translucent (Section 8.4.3)
• transparent (Section 8.4.4)
• density (Section 8.4.5)
• aux (Section 8.4.6)
• weighted (Section 8.4.7)
Each of these options comes with its own set of parameters to specify the details of howcolouring is done.
[Default: auto]
thickN = <int-value> (Integer)Controls the line thickness used when drawing point-to-point links. Zero, the default value,means a 1-pixel-wide line is used, and larger values make drawn lines thicker.
[Default: 0]
8.3.9 mark2
Plots 2 similar markers of fixed size and shape representing 2 separate positions from the sameinput table row. This is a convenience option that can be used with other plot layers based on 2positions.
Usage Overview:
layerN=mark2 shapeN=filled_circle|open_circle|... sizeN=<pixels>
SUN/256 119

shadingN=auto|flat|translucent|transparent|density|aux|weighted <shade-paramsN><pos-coord-params1N> <pos-coord-params2N> inN=<table>ifmtN=<in-format> istreamN=true|false icmdN=<cmds>
All the parameters listed here affect only the relevant layer, identified by the suffix N.
Positional Coordinate Parameters:The positional coordinates <pos-coord-params1N> , <pos-coord-params2N> give 2 positionsfor each row of the input table. Their form depends on the plot geometry, i.e. which plottingcommand is used. For a plane plot (plot2plane) the parameters would be x1N, y1N, x2N andy2N. The coordinate parameter values are in all cases strings interpreted as numeric expressionsbased on column names. These can be column names, fixed values or algebraic expressions asdescribed in Section 10.
Example:
stilts plot2sky clon=14.78 clat=-72.1525 radius=0.0015 sex=falselayer_h=mark in_h=ngc346.fits lon_h=_RAJ2000 lat_h=_DEJ2000 color_h=redlayer_g=mark in_g=ngc346xGaiadr1.fits lon_g=ra lat_g=dec color_g=blue shading_g=flat size_g=3in_x=ngc346xGaiadr1.fits lon1_x=_RAJ2000 lat1_x=_DEJ2000 lon2_x=ra lat2_x=dec shading_x=flatlayer_xl=link2 color_xl=greenyellowlayer_xm=mark2 color_xm=forestgreen size_xm=4 shape_xm=open_circleseq=_xm,_xl,_h,_g leglabel_h=HST leglabel_g='Gaia DR1' legseq=_h,_g legpos=0.95,0.95
icmdN = <cmds> (ProcessingStep[])Specifies processing to be performed on the layer N input table as specified by parameter inN.The value of this parameter is one or more of the filter commands described in Section 6.1. Ifmore than one is given, they must be separated by semicolon characters (";"). This parametercan be repeated multiple times on the same command line to build up a list of processing steps.
SUN/256 120
The sequence of commands given in this way defines the processing pipeline which isperformed on the table.
Commands may alteratively be supplied in an external file, by using the indirection character'@'. Thus a value of "@filename" causes the file filename to be read for a list of filtercommands to execute. The commands in the file may be separated by newline charactersand/or semicolons, and lines which are blank or which start with a '#' character are ignored.
ifmtN = <in-format> (String)Specifies the format of the input table as specified by parameter inN. The known formats arelisted in Section 5.1.1. This flag can be used if you know what format your table is in. If it hasthe special value (auto) (the default), then an attempt will be made to detect the format of thetable automatically. This cannot always be done correctly however, in which case the programwill exit with an error explaining which formats were attempted. This parameter is ignored forscheme-specified tables.
[Default: (auto)]
inN = <table> (StarTable)The location of the input table. This may take one of the following forms:
• A filename.• A URL.• The special value "-", meaning standard input. In this case the input format must be given
explicitly using the ifmtN parameter. Note that not all formats can be streamed in thisway.
• A scheme specification of the form :<scheme-name>:<scheme-args>.• A system command line with either a "<" character at the start, or a "|" character at the
end ("<syscmd" or "syscmd|"). This executes the given pipeline and reads from itsstandard output. This will probably only work on unix-like systems.
In any case, compressed data in one of the supported compression formats (gzip, Unixcompress or bzip2) will be decompressed transparently.
istreamN = true|false (Boolean)If set true, the input table specified by the inN parameter will be read as a stream. It isnecessary to give the ifmtN parameter in this case. Depending on the required operations andprocessing mode, this may cause the read to fail (sometimes it is necessary to read the tablemore than once). It is not normally necessary to set this flag; in most cases the data will bestreamed automatically if that is the best thing to do. However it can sometimes result in lessresource usage when processing large files in certain formats (such as VOTable). Thisparameter is ignored for scheme-specified tables.
[Default: false]
shadingN = auto|flat|translucent|transparent|density|aux|weighted <shade-paramsN>
(ShapeMode)Determines how plotted objects in layer N are coloured. This may be influenced by how manyobjects are plotted over each other as well as the values of other parameters. Available options(Section 8.4) are:
• auto (Section 8.4.1)
• flat (Section 8.4.2)
• translucent (Section 8.4.3)
• transparent (Section 8.4.4)
• density (Section 8.4.5)
• aux (Section 8.4.6)
• weighted (Section 8.4.7)
Each of these options comes with its own set of parameters to specify the details of howcolouring is done.
SUN/256 121
[Default: auto]
shapeN = filled_circle|open_circle|... (MarkerShape)Sets the shape of markers that are plotted at each position of the scatter plot.
The available options are:
• filled_circle
• open_circle
• cross
• x
• open_square
• open_diamond
• open_triangle_up
• open_triangle_down
• fat_circle
• fat_cross
• fat_x
• fat_square
• fat_diamond
• fat_triangle_up
• fat_triangle_up
• filled_square
• filled_diamond
• filled_triangle_up
• filled_triangle_down
[Default: filled_circle]
sizeN = <pixels> (Integer)Size of the scatter plot markers. The unit is pixels, in most cases the marker is approximatelytwice the size of the supplied value.
[Default: 1]
8.3.10 poly4
Draws a closed quadrilateral given the coordinates of its vertices supplied as 4 separate positions.The way that the polygon is drawn (outline, fill etc) is determined using the polymode option.
Polygons smaller than a configurable threshold size in pixels are by default represented by areplacement marker, so the position of even a very small polygon is still visible on the screen.
Usage Overview:
layerN=poly4 polymodeN=outline|border|fill|cross|star thickN=<int-value>minsizeN=<pixels> minshapeN=filled_circle|open_circle|...shadingN=auto|flat|translucent|transparent|density|aux|weighted <shade-paramsN><pos-coord-params1N> <pos-coord-params2N> <pos-coord-params3N><pos-coord-params4N> inN=<table> ifmtN=<in-format>istreamN=true|false icmdN=<cmds>
All the parameters listed here affect only the relevant layer, identified by the suffix N.
Positional Coordinate Parameters:The positional coordinates <pos-coord-params1N> , <pos-coord-params2N> ,<pos-coord-params3N> , <pos-coord-params4N> give 4 positions for each row of the inputtable. Their form depends on the plot geometry, i.e. which plotting command is used. For a
SUN/256 122

plane plot (plot2plane) the parameters would be x1N, y1N, x2N, y2N, x3N, y3N, x4N and y4N.The coordinate parameter values are in all cases strings interpreted as numeric expressionsbased on column names. These can be column names, fixed values or algebraic expressions asdescribed in Section 10.
Example:
stilts plot2sky in=big_tab_VIR_VIS_CSA_public.fits icmd='every 32'lon1=LON_CORNER_1 lat1=LAT_CORNER_1lon2=LON_CORNER_2 lat2=LAT_CORNER_2lon3=LON_CORNER_3 lat3=LAT_CORNER_3lon4=LON_CORNER_4 lat4=LAT_CORNER_4aux=RADIUSlayer_o=poly4 polymode_o=outline shading_o=auxlayer_f=poly4 polymode_f=fill shading_f=aux opaque_f=4auxmap=rainbow auxvisible=false xpix=300 ypix=300 labelpos=none
icmdN = <cmds> (ProcessingStep[])Specifies processing to be performed on the layer N input table as specified by parameter inN.The value of this parameter is one or more of the filter commands described in Section 6.1. Ifmore than one is given, they must be separated by semicolon characters (";"). This parametercan be repeated multiple times on the same command line to build up a list of processing steps.The sequence of commands given in this way defines the processing pipeline which isperformed on the table.
Commands may alteratively be supplied in an external file, by using the indirection character'@'. Thus a value of "@filename" causes the file filename to be read for a list of filtercommands to execute. The commands in the file may be separated by newline charactersand/or semicolons, and lines which are blank or which start with a '#' character are ignored.
ifmtN = <in-format> (String)Specifies the format of the input table as specified by parameter inN. The known formats arelisted in Section 5.1.1. This flag can be used if you know what format your table is in. If it hasthe special value (auto) (the default), then an attempt will be made to detect the format of the
SUN/256 123
table automatically. This cannot always be done correctly however, in which case the programwill exit with an error explaining which formats were attempted. This parameter is ignored forscheme-specified tables.
[Default: (auto)]
inN = <table> (StarTable)The location of the input table. This may take one of the following forms:
• A filename.• A URL.• The special value "-", meaning standard input. In this case the input format must be given
explicitly using the ifmtN parameter. Note that not all formats can be streamed in thisway.
• A scheme specification of the form :<scheme-name>:<scheme-args>.• A system command line with either a "<" character at the start, or a "|" character at the
end ("<syscmd" or "syscmd|"). This executes the given pipeline and reads from itsstandard output. This will probably only work on unix-like systems.
In any case, compressed data in one of the supported compression formats (gzip, Unixcompress or bzip2) will be decompressed transparently.
istreamN = true|false (Boolean)If set true, the input table specified by the inN parameter will be read as a stream. It isnecessary to give the ifmtN parameter in this case. Depending on the required operations andprocessing mode, this may cause the read to fail (sometimes it is necessary to read the tablemore than once). It is not normally necessary to set this flag; in most cases the data will bestreamed automatically if that is the best thing to do. However it can sometimes result in lessresource usage when processing large files in certain formats (such as VOTable). Thisparameter is ignored for scheme-specified tables.
[Default: false]
minshapeN = filled_circle|open_circle|... (MarkerShape)Defines the shape of markers plotted instead of the actual polygon shape, for polygons that aresmaller than the size threshold defined by minsize.
The available options are:
• filled_circle
• open_circle
• cross
• x
• open_square
• open_diamond
• open_triangle_up
• open_triangle_down
• fat_circle
• fat_cross
• fat_x
• fat_square
• fat_diamond
• fat_triangle_up
• fat_triangle_up
• filled_square
• filled_diamond
• filled_triangle_up
• filled_triangle_down
[Default: x]
SUN/256 124
minsizeN = <pixels> (Integer)Defines a threshold size in pixels below which, instead of the polygon defined by the otherparameters, a replacement marker will be painted instead. If this is set to zero, then only theshape itself will be plotted, but if it is small it may appear as only a single pixel. By setting alarger value, you can ensure that the position of even small polygons is easily visible, at theexpense of giving them an artificial shape and size. This value also defines the size of thereplacement markers.
[Default: 1]
polymodeN = outline|border|fill|cross|star (PolygonShape)Polygon drawing mode. Different options are available, including drawing an outline round theedge and filling the interior with colour.
The available options are:
• outline: draws a line round the outside of the polygon• border: draws a line butting up to the outside of the polygon; may look better for adjacent
shapes, but more expensive to draw• fill: fills the interior of the polygon• cross: draws a line round the outside of the polygon and lines between all the vertices• star: draws a line round the outside of the polygon and lines from the nominal center to
each vertex
[Default: outline]
shadingN = auto|flat|translucent|transparent|density|aux|weighted <shade-paramsN>
(ShapeMode)Determines how plotted objects in layer N are coloured. This may be influenced by how manyobjects are plotted over each other as well as the values of other parameters. Available options(Section 8.4) are:
• auto (Section 8.4.1)
• flat (Section 8.4.2)
• translucent (Section 8.4.3)
• transparent (Section 8.4.4)
• density (Section 8.4.5)
• aux (Section 8.4.6)
• weighted (Section 8.4.7)
Each of these options comes with its own set of parameters to specify the details of howcolouring is done.
[Default: auto]
thickN = <int-value> (Integer)Controls the line thickness used when drawing polygons. Zero, the default value, means a1-pixel-wide line is used. Larger values make drawn lines thicker, but note changing this valuewill not affect all shapes, for instance filled polygons contain no line drawings.
[Default: 0]
8.3.11 mark4
Plots 4 similar markers of fixed size and shape representing 4 separate positions from the sameinput table row. This is a convenience option that can be used with other plot layers based on 4positions.
Usage Overview:
SUN/256 125

layerN=mark4 shapeN=filled_circle|open_circle|... sizeN=<pixels>shadingN=auto|flat|translucent|transparent|density|aux|weighted <shade-paramsN><pos-coord-params1N> <pos-coord-params2N> <pos-coord-params3N><pos-coord-params4N> inN=<table> ifmtN=<in-format>istreamN=true|false icmdN=<cmds>
All the parameters listed here affect only the relevant layer, identified by the suffix N.
Positional Coordinate Parameters:The positional coordinates <pos-coord-params1N> , <pos-coord-params2N> ,<pos-coord-params3N> , <pos-coord-params4N> give 4 positions for each row of the inputtable. Their form depends on the plot geometry, i.e. which plotting command is used. For aplane plot (plot2plane) the parameters would be x1N, y1N, x2N, y2N, x3N, y3N, x4N and y4N.The coordinate parameter values are in all cases strings interpreted as numeric expressionsbased on column names. These can be column names, fixed values or algebraic expressions asdescribed in Section 10.
Example:
stilts plot2plane in=big_tab_VIR_VIS_CSA_public.fitsicmd='select IOF_055<0.005'icmd='select lon_center>250&&lon_center<300&&lat_center>-65&&lat_center<-16'x1=LON_CORNER_1 y1=LAT_CORNER_1x2=LON_CORNER_2 y2=LAT_CORNER_2x3=LON_CORNER_3 y3=LAT_CORNER_3x4=LON_CORNER_4 y4=LAT_CORNER_4layer_q=poly4 polymode_q=fill shading_q=transparent opaque_q=4layer_m=mark4 color_m=404040 shape_m=open_circle size_m=3
SUN/256 126
icmdN = <cmds> (ProcessingStep[])Specifies processing to be performed on the layer N input table as specified by parameter inN.The value of this parameter is one or more of the filter commands described in Section 6.1. Ifmore than one is given, they must be separated by semicolon characters (";"). This parametercan be repeated multiple times on the same command line to build up a list of processing steps.The sequence of commands given in this way defines the processing pipeline which isperformed on the table.
Commands may alteratively be supplied in an external file, by using the indirection character'@'. Thus a value of "@filename" causes the file filename to be read for a list of filtercommands to execute. The commands in the file may be separated by newline charactersand/or semicolons, and lines which are blank or which start with a '#' character are ignored.
ifmtN = <in-format> (String)Specifies the format of the input table as specified by parameter inN. The known formats arelisted in Section 5.1.1. This flag can be used if you know what format your table is in. If it hasthe special value (auto) (the default), then an attempt will be made to detect the format of thetable automatically. This cannot always be done correctly however, in which case the programwill exit with an error explaining which formats were attempted. This parameter is ignored forscheme-specified tables.
[Default: (auto)]
inN = <table> (StarTable)The location of the input table. This may take one of the following forms:
• A filename.• A URL.• The special value "-", meaning standard input. In this case the input format must be given
explicitly using the ifmtN parameter. Note that not all formats can be streamed in thisway.
• A scheme specification of the form :<scheme-name>:<scheme-args>.• A system command line with either a "<" character at the start, or a "|" character at the
end ("<syscmd" or "syscmd|"). This executes the given pipeline and reads from itsstandard output. This will probably only work on unix-like systems.
In any case, compressed data in one of the supported compression formats (gzip, Unixcompress or bzip2) will be decompressed transparently.
istreamN = true|false (Boolean)If set true, the input table specified by the inN parameter will be read as a stream. It isnecessary to give the ifmtN parameter in this case. Depending on the required operations andprocessing mode, this may cause the read to fail (sometimes it is necessary to read the tablemore than once). It is not normally necessary to set this flag; in most cases the data will bestreamed automatically if that is the best thing to do. However it can sometimes result in lessresource usage when processing large files in certain formats (such as VOTable). Thisparameter is ignored for scheme-specified tables.
[Default: false]
shadingN = auto|flat|translucent|transparent|density|aux|weighted <shade-paramsN>
(ShapeMode)Determines how plotted objects in layer N are coloured. This may be influenced by how manyobjects are plotted over each other as well as the values of other parameters. Available options(Section 8.4) are:
• auto (Section 8.4.1)
• flat (Section 8.4.2)
• translucent (Section 8.4.3)
• transparent (Section 8.4.4)
• density (Section 8.4.5)
SUN/256 127
• aux (Section 8.4.6)
• weighted (Section 8.4.7)
Each of these options comes with its own set of parameters to specify the details of howcolouring is done.
[Default: auto]
shapeN = filled_circle|open_circle|... (MarkerShape)Sets the shape of markers that are plotted at each position of the scatter plot.
The available options are:
• filled_circle
• open_circle
• cross
• x
• open_square
• open_diamond
• open_triangle_up
• open_triangle_down
• fat_circle
• fat_cross
• fat_x
• fat_square
• fat_diamond
• fat_triangle_up
• fat_triangle_up
• filled_square
• filled_diamond
• filled_triangle_up
• filled_triangle_down
[Default: filled_circle]
sizeN = <pixels> (Integer)Size of the scatter plot markers. The unit is pixels, in most cases the marker is approximatelytwice the size of the supplied value.
[Default: 1]
8.3.12 polygon
Draws a closed polygon given an array of coordinates that define its vertices. In fact this plotrequires the position of the first vertex supplied as a positional value in the usual way (e.g. X and Y
coordinates) and the second, third etc vertices supplied as an array using the otherpoints
parameter.
Invocation might therefore look like "xN=x1 yN=y1 otherpointsN=array(x2,y2, x3,y3,
x4,y4)".
Usage Overview:
layerN=polygon useposN=true|false polymodeN=outline|border|fill|cross|starthickN=<int-value>shadingN=auto|flat|translucent|transparent|density|aux|weighted <shade-paramsN><pos-coord-paramsN> otherpointsN=<array-expr> inN=<table>ifmtN=<in-format> istreamN=true|false icmdN=<cmds>
SUN/256 128
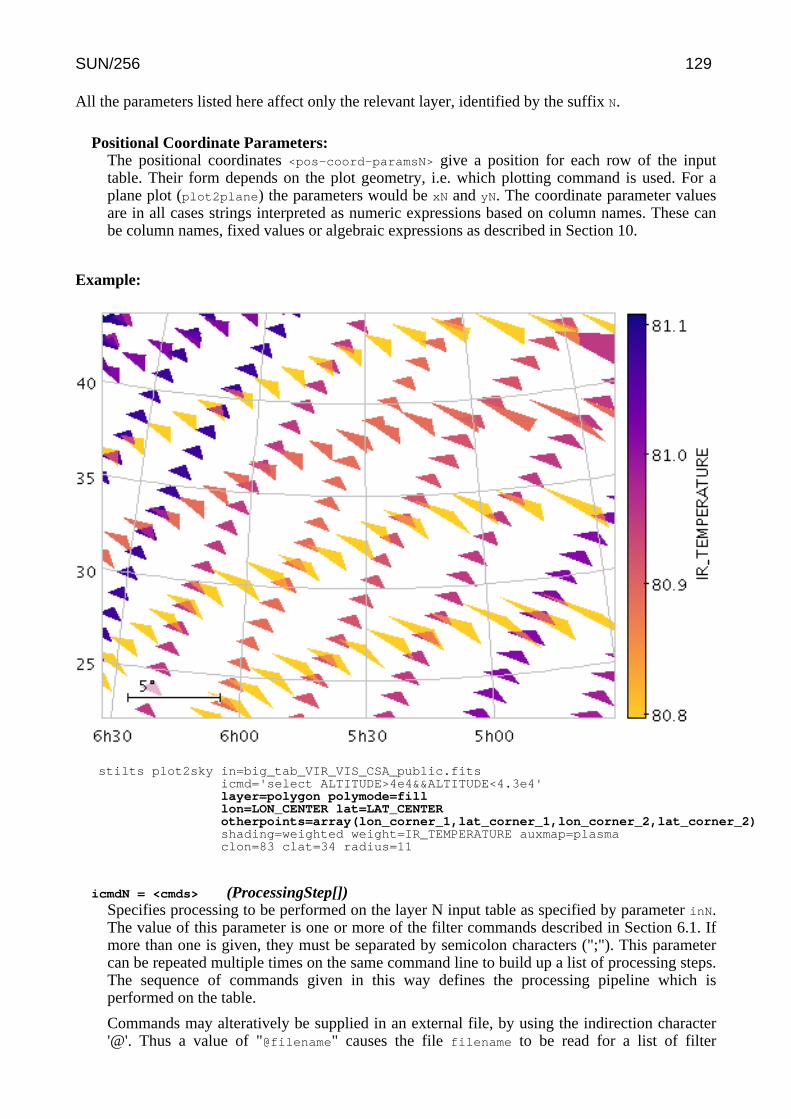
All the parameters listed here affect only the relevant layer, identified by the suffix N.
Positional Coordinate Parameters:The positional coordinates <pos-coord-paramsN> give a position for each row of the inputtable. Their form depends on the plot geometry, i.e. which plotting command is used. For aplane plot (plot2plane) the parameters would be xN and yN. The coordinate parameter valuesare in all cases strings interpreted as numeric expressions based on column names. These canbe column names, fixed values or algebraic expressions as described in Section 10.
Example:
stilts plot2sky in=big_tab_VIR_VIS_CSA_public.fitsicmd='select ALTITUDE>4e4&&ALTITUDE<4.3e4'layer=polygon polymode=filllon=LON_CENTER lat=LAT_CENTERotherpoints=array(lon_corner_1,lat_corner_1,lon_corner_2,lat_corner_2)shading=weighted weight=IR_TEMPERATURE auxmap=plasmaclon=83 clat=34 radius=11
icmdN = <cmds> (ProcessingStep[])Specifies processing to be performed on the layer N input table as specified by parameter inN.The value of this parameter is one or more of the filter commands described in Section 6.1. Ifmore than one is given, they must be separated by semicolon characters (";"). This parametercan be repeated multiple times on the same command line to build up a list of processing steps.The sequence of commands given in this way defines the processing pipeline which isperformed on the table.
Commands may alteratively be supplied in an external file, by using the indirection character'@'. Thus a value of "@filename" causes the file filename to be read for a list of filter
SUN/256 129
commands to execute. The commands in the file may be separated by newline charactersand/or semicolons, and lines which are blank or which start with a '#' character are ignored.
ifmtN = <in-format> (String)Specifies the format of the input table as specified by parameter inN. The known formats arelisted in Section 5.1.1. This flag can be used if you know what format your table is in. If it hasthe special value (auto) (the default), then an attempt will be made to detect the format of thetable automatically. This cannot always be done correctly however, in which case the programwill exit with an error explaining which formats were attempted. This parameter is ignored forscheme-specified tables.
[Default: (auto)]
inN = <table> (StarTable)The location of the input table. This may take one of the following forms:
• A filename.• A URL.• The special value "-", meaning standard input. In this case the input format must be given
explicitly using the ifmtN parameter. Note that not all formats can be streamed in thisway.
• A scheme specification of the form :<scheme-name>:<scheme-args>.• A system command line with either a "<" character at the start, or a "|" character at the
end ("<syscmd" or "syscmd|"). This executes the given pipeline and reads from itsstandard output. This will probably only work on unix-like systems.
In any case, compressed data in one of the supported compression formats (gzip, Unixcompress or bzip2) will be decompressed transparently.
istreamN = true|false (Boolean)If set true, the input table specified by the inN parameter will be read as a stream. It isnecessary to give the ifmtN parameter in this case. Depending on the required operations andprocessing mode, this may cause the read to fail (sometimes it is necessary to read the tablemore than once). It is not normally necessary to set this flag; in most cases the data will bestreamed automatically if that is the best thing to do. However it can sometimes result in lessresource usage when processing large files in certain formats (such as VOTable). Thisparameter is ignored for scheme-specified tables.
[Default: false]
otherpointsN = <array-expr> (String)Array of coordinates giving the points of the vertices defining the polygon to be drawn. Thesecoordinates are given as an interleaved array by this parameter, e.g. (x1,y1, x2,y2, y3,y3). Thebasic position for the row being plotted either is or is not included as the first vertex, accordingto the setting of the usepos parameter.
Some expression language functions that can be useful when specifying this parameter arearray() and parseDoubles().
The value is an array-valued algebraic expression based on column names as described inSection 10. Some of the functions in the Arrays class may be useful here.
polymodeN = outline|border|fill|cross|star (PolygonShape)Polygon drawing mode. Different options are available, including drawing an outline round theedge and filling the interior with colour.
The available options are:
• outline: draws a line round the outside of the polygon• border: draws a line butting up to the outside of the polygon; may look better for adjacent
shapes, but more expensive to draw• fill: fills the interior of the polygon
SUN/256 130
• cross: draws a line round the outside of the polygon and lines between all the vertices• star: draws a line round the outside of the polygon and lines from the nominal center to
each vertex
[Default: outline]
shadingN = auto|flat|translucent|transparent|density|aux|weighted <shade-paramsN>
(ShapeMode)Determines how plotted objects in layer N are coloured. This may be influenced by how manyobjects are plotted over each other as well as the values of other parameters. Available options(Section 8.4) are:
• auto (Section 8.4.1)
• flat (Section 8.4.2)
• translucent (Section 8.4.3)
• transparent (Section 8.4.4)
• density (Section 8.4.5)
• aux (Section 8.4.6)
• weighted (Section 8.4.7)
Each of these options comes with its own set of parameters to specify the details of howcolouring is done.
[Default: auto]
thickN = <int-value> (Integer)Controls the line thickness used when drawing polygons. Zero, the default value, means a1-pixel-wide line is used. Larger values make drawn lines thicker, but note changing this valuewill not affect all shapes, for instance filled polygons contain no line drawings.
[Default: 0]
useposN = true|false (Boolean)Determines whether the basic positional coordinates are included as one of the polygonvertices or not. The polygon has N+1 vertices if true, or N vertices if false, where N is thenumber of vertices supplied by the array coordinate. If false, the basic position is ignored forthe purposes of drawing the polygon.
[Default: true]
8.3.13 area
Plots a region on the plotting surface specified by a string or array of numbers. The area may bespecified as an STC-S string (as for example in an ObsCore or EPN-TAP s_region column) orusing an array of numbers representing a polygon, circle or point as flagged using theDALI/VOTable extended type (xtype) marker, or as an ASCII-encoded MOC.
Areas smaller than a configurable threshold size in pixels are by default represented by areplacement marker, so the position of even a very small area is still visible on the screen.
This plot type is generally intended for displaying relatively small shapes such as instrumentfootprints. It can be used for areas that are larger as well, but there may be issues with use, forinstance auto-determination of the initial plot region may not work so well, and the rendering ofshapes that are large relative to the sky may be inaccurate. These issues may be addressed in futurereleases.
Usage Overview:
layerN=area polymodeN=outline|border|fill|cross|star thickN=<int-value>
SUN/256 131
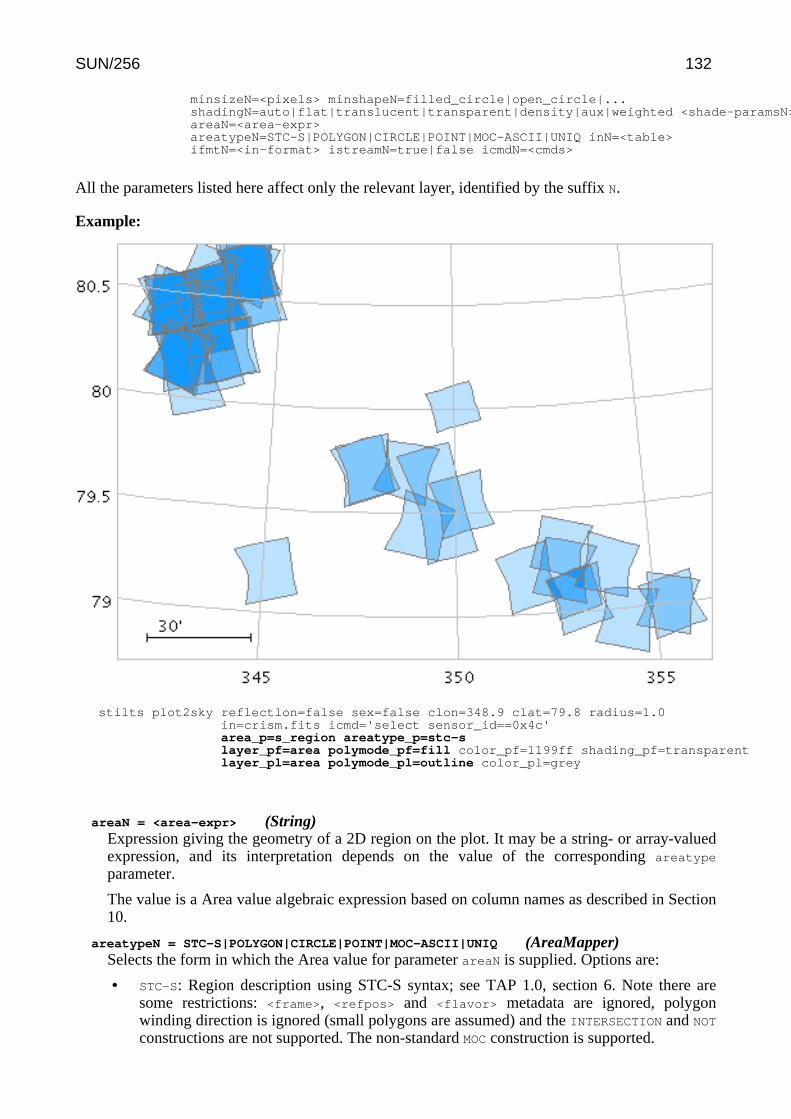
minsizeN=<pixels> minshapeN=filled_circle|open_circle|...shadingN=auto|flat|translucent|transparent|density|aux|weighted <shade-paramsN>areaN=<area-expr>areatypeN=STC-S|POLYGON|CIRCLE|POINT|MOC-ASCII|UNIQ inN=<table>ifmtN=<in-format> istreamN=true|false icmdN=<cmds>
All the parameters listed here affect only the relevant layer, identified by the suffix N.
Example:
stilts plot2sky reflectlon=false sex=false clon=348.9 clat=79.8 radius=1.0in=crism.fits icmd='select sensor_id==0x4c'area_p=s_region areatype_p=stc-slayer_pf=area polymode_pf=fill color_pf=1199ff shading_pf=transparentlayer_pl=area polymode_pl=outline color_pl=grey
areaN = <area-expr> (String)Expression giving the geometry of a 2D region on the plot. It may be a string- or array-valuedexpression, and its interpretation depends on the value of the corresponding areatype
parameter.
The value is a Area value algebraic expression based on column names as described in Section10.
areatypeN = STC-S|POLYGON|CIRCLE|POINT|MOC-ASCII|UNIQ (AreaMapper)Selects the form in which the Area value for parameter areaN is supplied. Options are:
• STC-S: Region description using STC-S syntax; see TAP 1.0, section 6. Note there aresome restrictions: <frame>, <refpos> and <flavor> metadata are ignored, polygonwinding direction is ignored (small polygons are assumed) and the INTERSECTION and NOT
constructions are not supported. The non-standard MOC construction is supported.
SUN/256 132
• POLYGON: 2n-element array (x1,y1, x2,y2,...); a NaN,NaN pair can be used to delimit distinctpolygons.
• CIRCLE: 3-element array (x,y,r)• POINT: 2-element array (x,y)• MOC-ASCII: Region description using ASCII MOC syntax; see MOC 1.1 2.3.2. Note there
are currently a few issues with MOC plotting, especially for large pixels.• UNIQ: Region description representing a single HEALPix cell as defined by an UNIQ
value, see MOC 1.1 sec 2.3.1.
If left blank, a guess will be taken depending on the data type of the value supplied for theareaN value.
icmdN = <cmds> (ProcessingStep[])Specifies processing to be performed on the layer N input table as specified by parameter inN.The value of this parameter is one or more of the filter commands described in Section 6.1. Ifmore than one is given, they must be separated by semicolon characters (";"). This parametercan be repeated multiple times on the same command line to build up a list of processing steps.The sequence of commands given in this way defines the processing pipeline which isperformed on the table.
Commands may alteratively be supplied in an external file, by using the indirection character'@'. Thus a value of "@filename" causes the file filename to be read for a list of filtercommands to execute. The commands in the file may be separated by newline charactersand/or semicolons, and lines which are blank or which start with a '#' character are ignored.
ifmtN = <in-format> (String)Specifies the format of the input table as specified by parameter inN. The known formats arelisted in Section 5.1.1. This flag can be used if you know what format your table is in. If it hasthe special value (auto) (the default), then an attempt will be made to detect the format of thetable automatically. This cannot always be done correctly however, in which case the programwill exit with an error explaining which formats were attempted. This parameter is ignored forscheme-specified tables.
[Default: (auto)]
inN = <table> (StarTable)The location of the input table. This may take one of the following forms:
• A filename.• A URL.• The special value "-", meaning standard input. In this case the input format must be given
explicitly using the ifmtN parameter. Note that not all formats can be streamed in thisway.
• A scheme specification of the form :<scheme-name>:<scheme-args>.• A system command line with either a "<" character at the start, or a "|" character at the
end ("<syscmd" or "syscmd|"). This executes the given pipeline and reads from itsstandard output. This will probably only work on unix-like systems.
In any case, compressed data in one of the supported compression formats (gzip, Unixcompress or bzip2) will be decompressed transparently.
istreamN = true|false (Boolean)If set true, the input table specified by the inN parameter will be read as a stream. It isnecessary to give the ifmtN parameter in this case. Depending on the required operations andprocessing mode, this may cause the read to fail (sometimes it is necessary to read the tablemore than once). It is not normally necessary to set this flag; in most cases the data will bestreamed automatically if that is the best thing to do. However it can sometimes result in lessresource usage when processing large files in certain formats (such as VOTable). Thisparameter is ignored for scheme-specified tables.
[Default: false]
SUN/256 133
minshapeN = filled_circle|open_circle|... (MarkerShape)Defines the shape of markers plotted instead of the actual polygon shape, for polygons that aresmaller than the size threshold defined by minsize.
The available options are:
• filled_circle
• open_circle
• cross
• x
• open_square
• open_diamond
• open_triangle_up
• open_triangle_down
• fat_circle
• fat_cross
• fat_x
• fat_square
• fat_diamond
• fat_triangle_up
• fat_triangle_up
• filled_square
• filled_diamond
• filled_triangle_up
• filled_triangle_down
[Default: x]
minsizeN = <pixels> (Integer)Defines a threshold size in pixels below which, instead of the polygon defined by the otherparameters, a replacement marker will be painted instead. If this is set to zero, then only theshape itself will be plotted, but if it is small it may appear as only a single pixel. By setting alarger value, you can ensure that the position of even small polygons is easily visible, at theexpense of giving them an artificial shape and size. This value also defines the size of thereplacement markers.
[Default: 1]
polymodeN = outline|border|fill|cross|star (PolygonShape)Polygon drawing mode. Different options are available, including drawing an outline round theedge and filling the interior with colour.
The available options are:
• outline: draws a line round the outside of the polygon• border: draws a line butting up to the outside of the polygon; may look better for adjacent
shapes, but more expensive to draw• fill: fills the interior of the polygon• cross: draws a line round the outside of the polygon and lines between all the vertices• star: draws a line round the outside of the polygon and lines from the nominal center to
each vertex
[Default: outline]
shadingN = auto|flat|translucent|transparent|density|aux|weighted <shade-paramsN>
(ShapeMode)Determines how plotted objects in layer N are coloured. This may be influenced by how manyobjects are plotted over each other as well as the values of other parameters. Available options(Section 8.4) are:
SUN/256 134
• auto (Section 8.4.1)
• flat (Section 8.4.2)
• translucent (Section 8.4.3)
• transparent (Section 8.4.4)
• density (Section 8.4.5)
• aux (Section 8.4.6)
• weighted (Section 8.4.7)
Each of these options comes with its own set of parameters to specify the details of howcolouring is done.
[Default: auto]
thickN = <int-value> (Integer)Controls the line thickness used when drawing polygons. Zero, the default value, means a1-pixel-wide line is used. Larger values make drawn lines thicker, but note changing this valuewill not affect all shapes, for instance filled polygons contain no line drawings.
[Default: 0]
8.3.14 central
Plots the nominal central point of an area. This appears just like a normal marker plot, but can beused when the available geometry information is an area description (such as an STC-S string or anarray of polygon vertices) rather than coordinate values such as an X,Y pair. The position plotted isthe nominal center of the shape as determined by the plotting code; that may or may not correspondto the actual center.
Usage Overview:
layerN=central shapeN=filled_circle|open_circle|... sizeN=<pixels>shadingN=auto|flat|translucent|transparent|density|aux|weighted <shade-paramsN>areaN=<area-expr>areatypeN=STC-S|POLYGON|CIRCLE|POINT|MOC-ASCII|UNIQinN=<table> ifmtN=<in-format> istreamN=true|falseicmdN=<cmds>
All the parameters listed here affect only the relevant layer, identified by the suffix N.
Example:
SUN/256 135
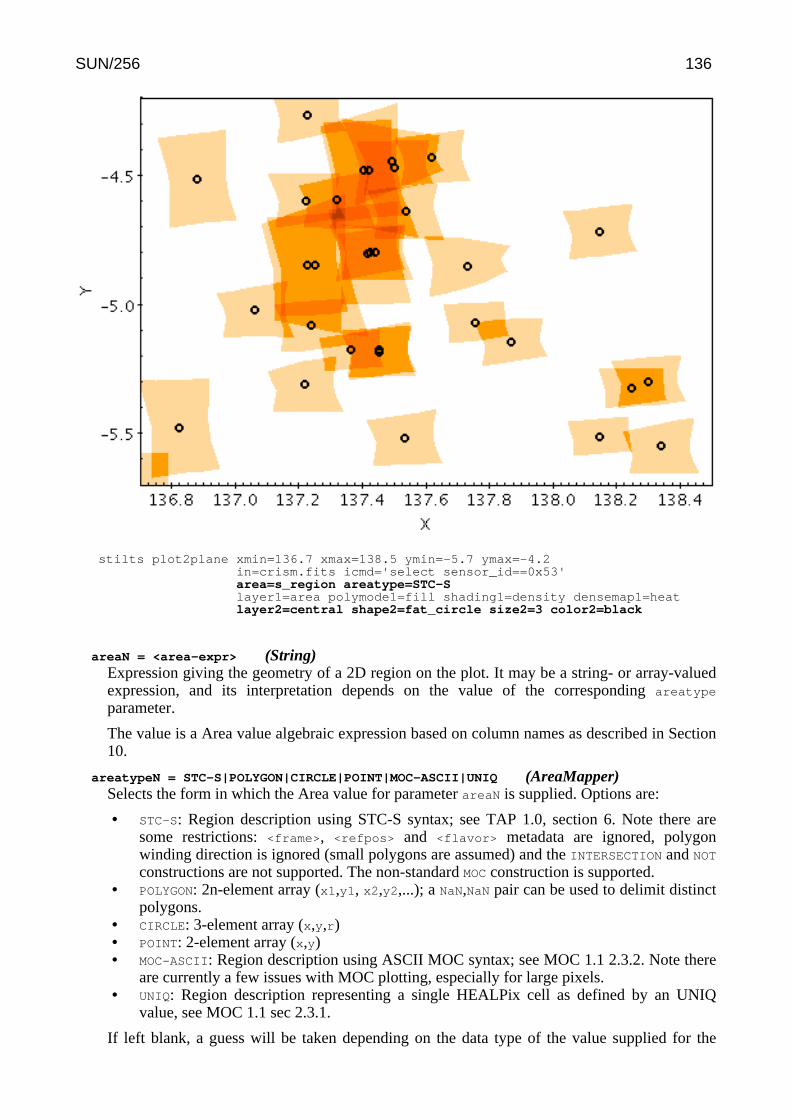
stilts plot2plane xmin=136.7 xmax=138.5 ymin=-5.7 ymax=-4.2in=crism.fits icmd='select sensor_id==0x53'area=s_region areatype=STC-Slayer1=area polymode1=fill shading1=density densemap1=heatlayer2=central shape2=fat_circle size2=3 color2=black
areaN = <area-expr> (String)Expression giving the geometry of a 2D region on the plot. It may be a string- or array-valuedexpression, and its interpretation depends on the value of the corresponding areatype
parameter.
The value is a Area value algebraic expression based on column names as described in Section10.
areatypeN = STC-S|POLYGON|CIRCLE|POINT|MOC-ASCII|UNIQ (AreaMapper)Selects the form in which the Area value for parameter areaN is supplied. Options are:
• STC-S: Region description using STC-S syntax; see TAP 1.0, section 6. Note there aresome restrictions: <frame>, <refpos> and <flavor> metadata are ignored, polygonwinding direction is ignored (small polygons are assumed) and the INTERSECTION and NOT
constructions are not supported. The non-standard MOC construction is supported.• POLYGON: 2n-element array (x1,y1, x2,y2,...); a NaN,NaN pair can be used to delimit distinct
polygons.• CIRCLE: 3-element array (x,y,r)• POINT: 2-element array (x,y)• MOC-ASCII: Region description using ASCII MOC syntax; see MOC 1.1 2.3.2. Note there
are currently a few issues with MOC plotting, especially for large pixels.• UNIQ: Region description representing a single HEALPix cell as defined by an UNIQ
value, see MOC 1.1 sec 2.3.1.
If left blank, a guess will be taken depending on the data type of the value supplied for the
SUN/256 136
areaN value.
icmdN = <cmds> (ProcessingStep[])Specifies processing to be performed on the layer N input table as specified by parameter inN.The value of this parameter is one or more of the filter commands described in Section 6.1. Ifmore than one is given, they must be separated by semicolon characters (";"). This parametercan be repeated multiple times on the same command line to build up a list of processing steps.The sequence of commands given in this way defines the processing pipeline which isperformed on the table.
Commands may alteratively be supplied in an external file, by using the indirection character'@'. Thus a value of "@filename" causes the file filename to be read for a list of filtercommands to execute. The commands in the file may be separated by newline charactersand/or semicolons, and lines which are blank or which start with a '#' character are ignored.
ifmtN = <in-format> (String)Specifies the format of the input table as specified by parameter inN. The known formats arelisted in Section 5.1.1. This flag can be used if you know what format your table is in. If it hasthe special value (auto) (the default), then an attempt will be made to detect the format of thetable automatically. This cannot always be done correctly however, in which case the programwill exit with an error explaining which formats were attempted. This parameter is ignored forscheme-specified tables.
[Default: (auto)]
inN = <table> (StarTable)The location of the input table. This may take one of the following forms:
• A filename.• A URL.• The special value "-", meaning standard input. In this case the input format must be given
explicitly using the ifmtN parameter. Note that not all formats can be streamed in thisway.
• A scheme specification of the form :<scheme-name>:<scheme-args>.• A system command line with either a "<" character at the start, or a "|" character at the
end ("<syscmd" or "syscmd|"). This executes the given pipeline and reads from itsstandard output. This will probably only work on unix-like systems.
In any case, compressed data in one of the supported compression formats (gzip, Unixcompress or bzip2) will be decompressed transparently.
istreamN = true|false (Boolean)If set true, the input table specified by the inN parameter will be read as a stream. It isnecessary to give the ifmtN parameter in this case. Depending on the required operations andprocessing mode, this may cause the read to fail (sometimes it is necessary to read the tablemore than once). It is not normally necessary to set this flag; in most cases the data will bestreamed automatically if that is the best thing to do. However it can sometimes result in lessresource usage when processing large files in certain formats (such as VOTable). Thisparameter is ignored for scheme-specified tables.
[Default: false]
shadingN = auto|flat|translucent|transparent|density|aux|weighted <shade-paramsN>
(ShapeMode)Determines how plotted objects in layer N are coloured. This may be influenced by how manyobjects are plotted over each other as well as the values of other parameters. Available options(Section 8.4) are:
• auto (Section 8.4.1)
• flat (Section 8.4.2)
• translucent (Section 8.4.3)
SUN/256 137
• transparent (Section 8.4.4)
• density (Section 8.4.5)
• aux (Section 8.4.6)
• weighted (Section 8.4.7)
Each of these options comes with its own set of parameters to specify the details of howcolouring is done.
[Default: auto]
shapeN = filled_circle|open_circle|... (MarkerShape)Sets the shape of markers that are plotted at each position of the scatter plot.
The available options are:
• filled_circle
• open_circle
• cross
• x
• open_square
• open_diamond
• open_triangle_up
• open_triangle_down
• fat_circle
• fat_cross
• fat_x
• fat_square
• fat_diamond
• fat_triangle_up
• fat_triangle_up
• filled_square
• filled_diamond
• filled_triangle_up
• filled_triangle_down
[Default: filled_circle]
sizeN = <pixels> (Integer)Size of the scatter plot markers. The unit is pixels, in most cases the marker is approximatelytwice the size of the supplied value.
[Default: 1]
8.3.15 lines
Plots an N-segment line for each input row, with the X and Y coordinate arrays each supplied by anN-element array value.
Usage Overview:
layerN=lines thickN=<pixels> dashN=dot|dash|...|<a,b,...>antialiasN=true|falseshadingN=auto|flat|translucent|transparent|density|aux|weighted <shade-paramsN>xsN=<array-expr> ysN=<array-expr> inN=<table> ifmtN=<in-format>istreamN=true|false icmdN=<cmds>
All the parameters listed here affect only the relevant layer, identified by the suffix N.
Example:
SUN/256 138
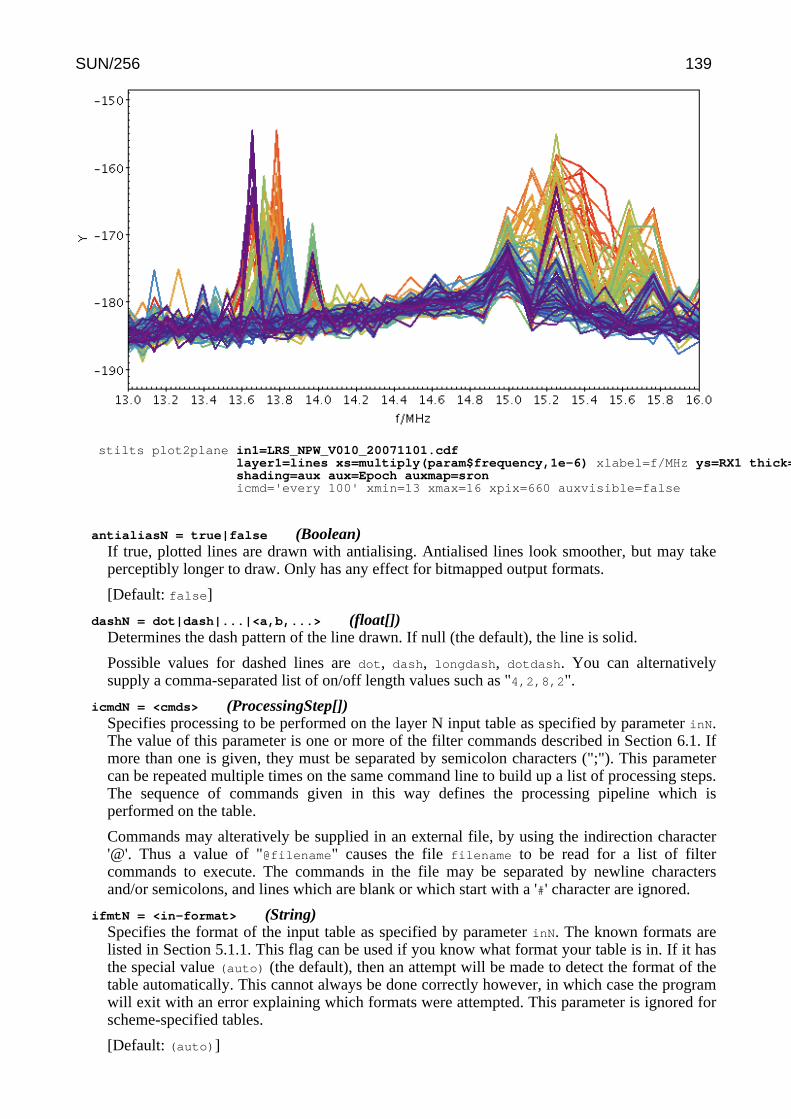
stilts plot2plane in1=LRS_NPW_V010_20071101.cdflayer1=lines xs=multiply(param$frequency,1e-6) xlabel=f/MHz ys=RX1 thick=2shading=aux aux=Epoch auxmap=sronicmd='every 100' xmin=13 xmax=16 xpix=660 auxvisible=false
antialiasN = true|false (Boolean)If true, plotted lines are drawn with antialising. Antialised lines look smoother, but may takeperceptibly longer to draw. Only has any effect for bitmapped output formats.
[Default: false]
dashN = dot|dash|...|<a,b,...> (float[])Determines the dash pattern of the line drawn. If null (the default), the line is solid.
Possible values for dashed lines are dot, dash, longdash, dotdash. You can alternativelysupply a comma-separated list of on/off length values such as "4,2,8,2".
icmdN = <cmds> (ProcessingStep[])Specifies processing to be performed on the layer N input table as specified by parameter inN.The value of this parameter is one or more of the filter commands described in Section 6.1. Ifmore than one is given, they must be separated by semicolon characters (";"). This parametercan be repeated multiple times on the same command line to build up a list of processing steps.The sequence of commands given in this way defines the processing pipeline which isperformed on the table.
Commands may alteratively be supplied in an external file, by using the indirection character'@'. Thus a value of "@filename" causes the file filename to be read for a list of filtercommands to execute. The commands in the file may be separated by newline charactersand/or semicolons, and lines which are blank or which start with a '#' character are ignored.
ifmtN = <in-format> (String)Specifies the format of the input table as specified by parameter inN. The known formats arelisted in Section 5.1.1. This flag can be used if you know what format your table is in. If it hasthe special value (auto) (the default), then an attempt will be made to detect the format of thetable automatically. This cannot always be done correctly however, in which case the programwill exit with an error explaining which formats were attempted. This parameter is ignored forscheme-specified tables.
[Default: (auto)]
SUN/256 139

inN = <table> (StarTable)The location of the input table. This may take one of the following forms:
• A filename.• A URL.• The special value "-", meaning standard input. In this case the input format must be given
explicitly using the ifmtN parameter. Note that not all formats can be streamed in thisway.
• A scheme specification of the form :<scheme-name>:<scheme-args>.• A system command line with either a "<" character at the start, or a "|" character at the
end ("<syscmd" or "syscmd|"). This executes the given pipeline and reads from itsstandard output. This will probably only work on unix-like systems.
In any case, compressed data in one of the supported compression formats (gzip, Unixcompress or bzip2) will be decompressed transparently.
istreamN = true|false (Boolean)If set true, the input table specified by the inN parameter will be read as a stream. It isnecessary to give the ifmtN parameter in this case. Depending on the required operations andprocessing mode, this may cause the read to fail (sometimes it is necessary to read the tablemore than once). It is not normally necessary to set this flag; in most cases the data will bestreamed automatically if that is the best thing to do. However it can sometimes result in lessresource usage when processing large files in certain formats (such as VOTable). Thisparameter is ignored for scheme-specified tables.
[Default: false]
shadingN = auto|flat|translucent|transparent|density|aux|weighted <shade-paramsN>
(ShapeMode)Determines how plotted objects in layer N are coloured. This may be influenced by how manyobjects are plotted over each other as well as the values of other parameters. Available options(Section 8.4) are:
• auto (Section 8.4.1)
• flat (Section 8.4.2)
• translucent (Section 8.4.3)
• transparent (Section 8.4.4)
• density (Section 8.4.5)
• aux (Section 8.4.6)
• weighted (Section 8.4.7)
Each of these options comes with its own set of parameters to specify the details of howcolouring is done.
[Default: auto]
thickN = <pixels> (Integer)Thickness of plotted line in pixels.
[Default: 1]
xsN = <array-expr> (String)Array giving the X coordinate array for each line.
The value is an array-valued algebraic expression based on column names as described inSection 10. Some of the functions in the Arrays class may be useful here.
ysN = <array-expr> (String)Array giving the Y coordinate array for each line.
The value is an array-valued algebraic expression based on column names as described inSection 10. Some of the functions in the Arrays class may be useful here.
SUN/256 140
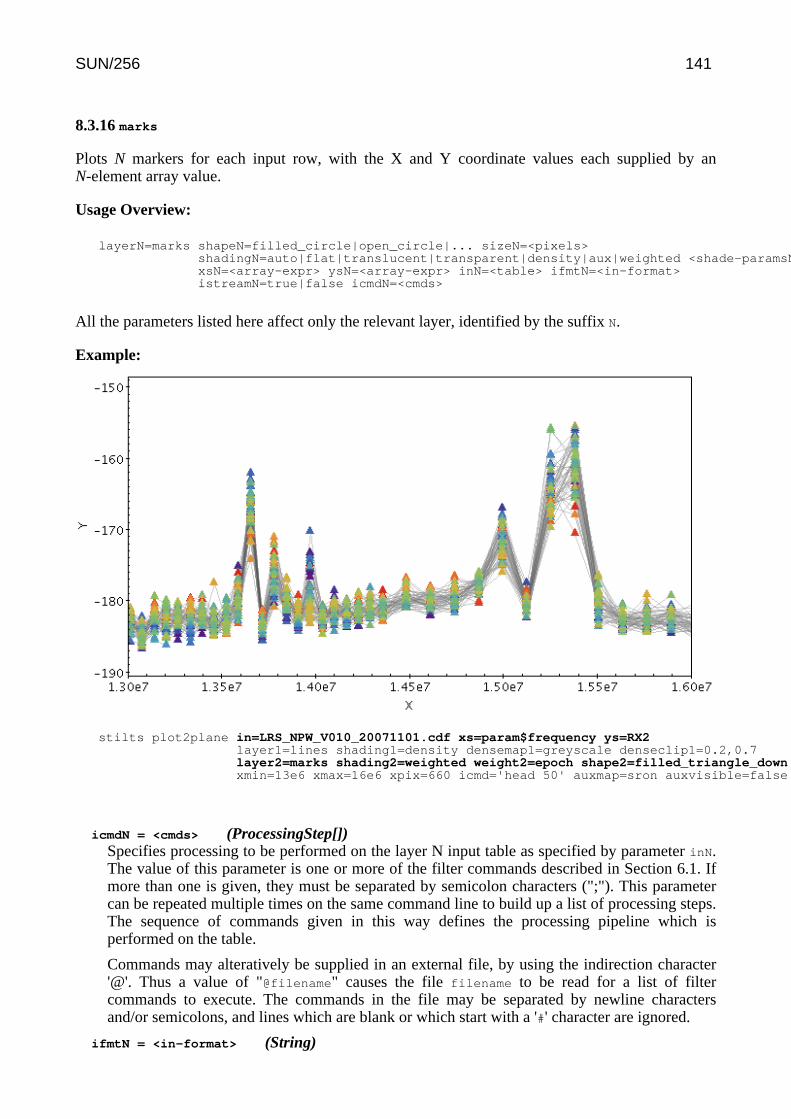
8.3.16 marks
Plots N markers for each input row, with the X and Y coordinate values each supplied by anN-element array value.
Usage Overview:
layerN=marks shapeN=filled_circle|open_circle|... sizeN=<pixels>shadingN=auto|flat|translucent|transparent|density|aux|weighted <shade-paramsN>xsN=<array-expr> ysN=<array-expr> inN=<table> ifmtN=<in-format>istreamN=true|false icmdN=<cmds>
All the parameters listed here affect only the relevant layer, identified by the suffix N.
Example:
stilts plot2plane in=LRS_NPW_V010_20071101.cdf xs=param$frequency ys=RX2layer1=lines shading1=density densemap1=greyscale denseclip1=0.2,0.7layer2=marks shading2=weighted weight2=epoch shape2=filled_triangle_down size2=4xmin=13e6 xmax=16e6 xpix=660 icmd='head 50' auxmap=sron auxvisible=false
icmdN = <cmds> (ProcessingStep[])Specifies processing to be performed on the layer N input table as specified by parameter inN.The value of this parameter is one or more of the filter commands described in Section 6.1. Ifmore than one is given, they must be separated by semicolon characters (";"). This parametercan be repeated multiple times on the same command line to build up a list of processing steps.The sequence of commands given in this way defines the processing pipeline which isperformed on the table.
Commands may alteratively be supplied in an external file, by using the indirection character'@'. Thus a value of "@filename" causes the file filename to be read for a list of filtercommands to execute. The commands in the file may be separated by newline charactersand/or semicolons, and lines which are blank or which start with a '#' character are ignored.
ifmtN = <in-format> (String)
SUN/256 141
Specifies the format of the input table as specified by parameter inN. The known formats arelisted in Section 5.1.1. This flag can be used if you know what format your table is in. If it hasthe special value (auto) (the default), then an attempt will be made to detect the format of thetable automatically. This cannot always be done correctly however, in which case the programwill exit with an error explaining which formats were attempted. This parameter is ignored forscheme-specified tables.
[Default: (auto)]
inN = <table> (StarTable)The location of the input table. This may take one of the following forms:
• A filename.• A URL.• The special value "-", meaning standard input. In this case the input format must be given
explicitly using the ifmtN parameter. Note that not all formats can be streamed in thisway.
• A scheme specification of the form :<scheme-name>:<scheme-args>.• A system command line with either a "<" character at the start, or a "|" character at the
end ("<syscmd" or "syscmd|"). This executes the given pipeline and reads from itsstandard output. This will probably only work on unix-like systems.
In any case, compressed data in one of the supported compression formats (gzip, Unixcompress or bzip2) will be decompressed transparently.
istreamN = true|false (Boolean)If set true, the input table specified by the inN parameter will be read as a stream. It isnecessary to give the ifmtN parameter in this case. Depending on the required operations andprocessing mode, this may cause the read to fail (sometimes it is necessary to read the tablemore than once). It is not normally necessary to set this flag; in most cases the data will bestreamed automatically if that is the best thing to do. However it can sometimes result in lessresource usage when processing large files in certain formats (such as VOTable). Thisparameter is ignored for scheme-specified tables.
[Default: false]
shadingN = auto|flat|translucent|transparent|density|aux|weighted <shade-paramsN>
(ShapeMode)Determines how plotted objects in layer N are coloured. This may be influenced by how manyobjects are plotted over each other as well as the values of other parameters. Available options(Section 8.4) are:
• auto (Section 8.4.1)
• flat (Section 8.4.2)
• translucent (Section 8.4.3)
• transparent (Section 8.4.4)
• density (Section 8.4.5)
• aux (Section 8.4.6)
• weighted (Section 8.4.7)
Each of these options comes with its own set of parameters to specify the details of howcolouring is done.
[Default: auto]
shapeN = filled_circle|open_circle|... (MarkerShape)Sets the shape of markers that are plotted at each position of the scatter plot.
The available options are:
• filled_circle
• open_circle
SUN/256 142
• cross
• x
• open_square
• open_diamond
• open_triangle_up
• open_triangle_down
• fat_circle
• fat_cross
• fat_x
• fat_square
• fat_diamond
• fat_triangle_up
• fat_triangle_up
• filled_square
• filled_diamond
• filled_triangle_up
• filled_triangle_down
[Default: filled_circle]
sizeN = <pixels> (Integer)Size of the scatter plot markers. The unit is pixels, in most cases the marker is approximatelytwice the size of the supplied value.
[Default: 1]
xsN = <array-expr> (String)Array giving the X coordinate array for each line.
The value is an array-valued algebraic expression based on column names as described inSection 10. Some of the functions in the Arrays class may be useful here.
ysN = <array-expr> (String)Array giving the Y coordinate array for each line.
The value is an array-valued algebraic expression based on column names as described inSection 10. Some of the functions in the Arrays class may be useful here.
8.3.17 yerrors
Plots N error bars in the Y direction for each input row, with the X, Y and error bar extents eachsupplied by N-element array values.
Usage Overview:
layerN=yerrors errorbarN=none|lines|capped_lines|caps|arrowsthickN=<int-value>shadingN=auto|flat|translucent|transparent|density|aux|weighted <shade-paramsN>xsN=<array-expr> ysN=<array-expr> yerrhisN=<array-expr>yerrlosN=<array-expr> inN=<table> ifmtN=<in-format>istreamN=true|false icmdN=<cmds>
All the parameters listed here affect only the relevant layer, identified by the suffix N.
Example:
SUN/256 143
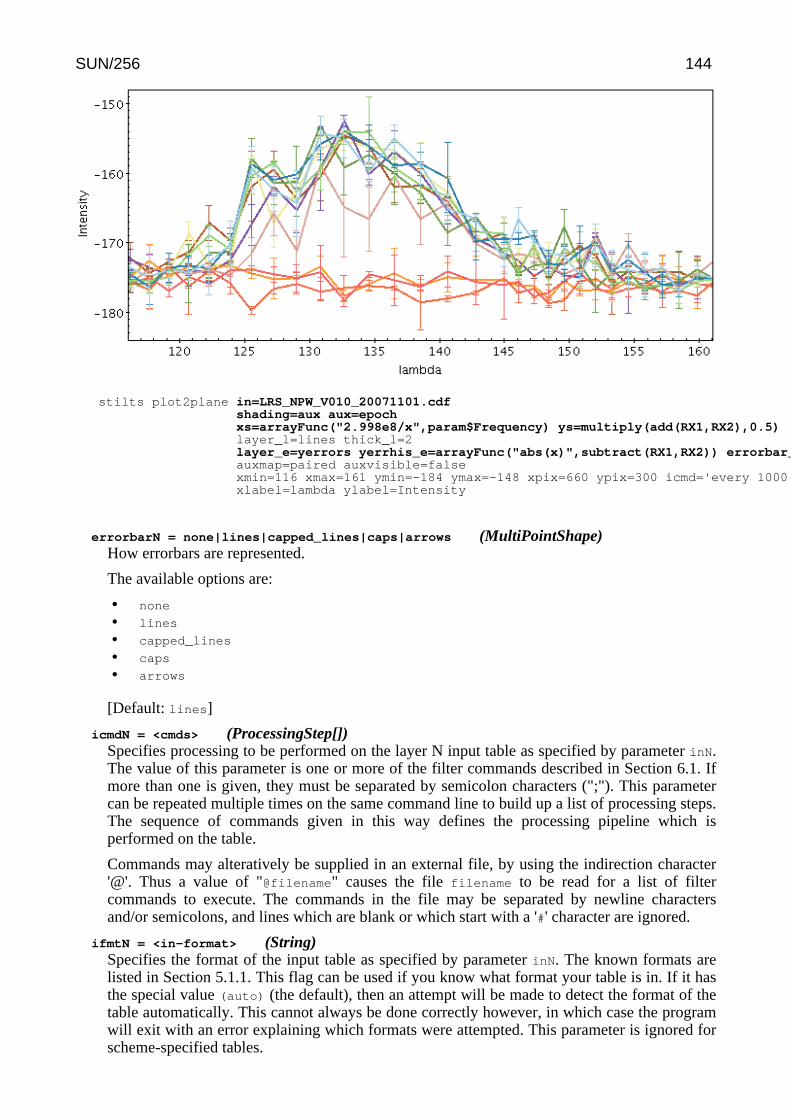
stilts plot2plane in=LRS_NPW_V010_20071101.cdfshading=aux aux=epochxs=arrayFunc("2.998e8/x",param$Frequency) ys=multiply(add(RX1,RX2),0.5)layer_l=lines thick_l=2layer_e=yerrors yerrhis_e=arrayFunc("abs(x)",subtract(RX1,RX2)) errorbar_e=capped_linesauxmap=paired auxvisible=falsexmin=116 xmax=161 ymin=-184 ymax=-148 xpix=660 ypix=300 icmd='every 1000'xlabel=lambda ylabel=Intensity
errorbarN = none|lines|capped_lines|caps|arrows (MultiPointShape)How errorbars are represented.
The available options are:
• none
• lines
• capped_lines
• caps
• arrows
[Default: lines]
icmdN = <cmds> (ProcessingStep[])Specifies processing to be performed on the layer N input table as specified by parameter inN.The value of this parameter is one or more of the filter commands described in Section 6.1. Ifmore than one is given, they must be separated by semicolon characters (";"). This parametercan be repeated multiple times on the same command line to build up a list of processing steps.The sequence of commands given in this way defines the processing pipeline which isperformed on the table.
Commands may alteratively be supplied in an external file, by using the indirection character'@'. Thus a value of "@filename" causes the file filename to be read for a list of filtercommands to execute. The commands in the file may be separated by newline charactersand/or semicolons, and lines which are blank or which start with a '#' character are ignored.
ifmtN = <in-format> (String)Specifies the format of the input table as specified by parameter inN. The known formats arelisted in Section 5.1.1. This flag can be used if you know what format your table is in. If it hasthe special value (auto) (the default), then an attempt will be made to detect the format of thetable automatically. This cannot always be done correctly however, in which case the programwill exit with an error explaining which formats were attempted. This parameter is ignored forscheme-specified tables.
SUN/256 144
[Default: (auto)]
inN = <table> (StarTable)The location of the input table. This may take one of the following forms:
• A filename.• A URL.• The special value "-", meaning standard input. In this case the input format must be given
explicitly using the ifmtN parameter. Note that not all formats can be streamed in thisway.
• A scheme specification of the form :<scheme-name>:<scheme-args>.• A system command line with either a "<" character at the start, or a "|" character at the
end ("<syscmd" or "syscmd|"). This executes the given pipeline and reads from itsstandard output. This will probably only work on unix-like systems.
In any case, compressed data in one of the supported compression formats (gzip, Unixcompress or bzip2) will be decompressed transparently.
istreamN = true|false (Boolean)If set true, the input table specified by the inN parameter will be read as a stream. It isnecessary to give the ifmtN parameter in this case. Depending on the required operations andprocessing mode, this may cause the read to fail (sometimes it is necessary to read the tablemore than once). It is not normally necessary to set this flag; in most cases the data will bestreamed automatically if that is the best thing to do. However it can sometimes result in lessresource usage when processing large files in certain formats (such as VOTable). Thisparameter is ignored for scheme-specified tables.
[Default: false]
shadingN = auto|flat|translucent|transparent|density|aux|weighted <shade-paramsN>
(ShapeMode)Determines how plotted objects in layer N are coloured. This may be influenced by how manyobjects are plotted over each other as well as the values of other parameters. Available options(Section 8.4) are:
• auto (Section 8.4.1)
• flat (Section 8.4.2)
• translucent (Section 8.4.3)
• transparent (Section 8.4.4)
• density (Section 8.4.5)
• aux (Section 8.4.6)
• weighted (Section 8.4.7)
Each of these options comes with its own set of parameters to specify the details of howcolouring is done.
[Default: auto]
thickN = <int-value> (Integer)Controls the line thickness used when drawing shapes. Zero, the default value, means a1-pixel-wide line is used. Larger values make drawn lines thicker, but note changing this valuewill not affect all shapes, for instance filled rectangles contain no line drawings.
[Default: 0]
xsN = <array-expr> (String)Array giving the X coordinate array for each line.
The value is an array-valued algebraic expression based on column names as described inSection 10. Some of the functions in the Arrays class may be useful here.
yerrhisN = <array-expr> (String)Array of errors in the Y coordinates in the positive direction. If no corresponding negative
SUN/256 145
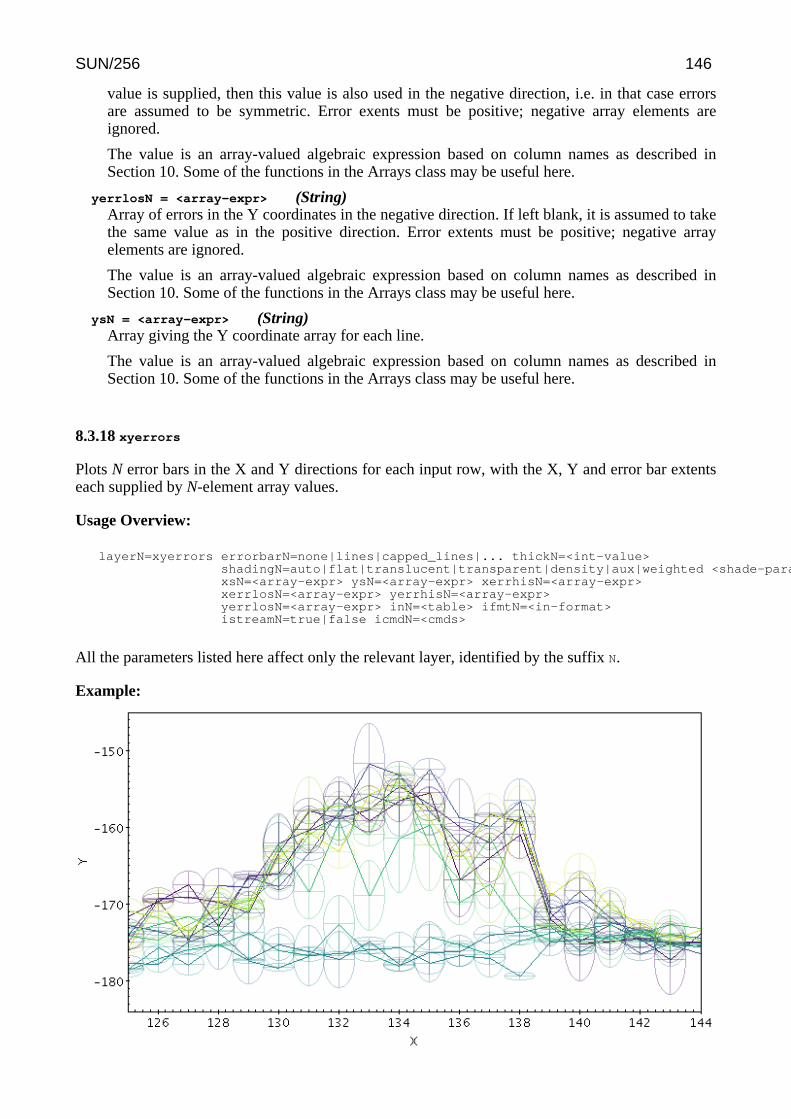
value is supplied, then this value is also used in the negative direction, i.e. in that case errorsare assumed to be symmetric. Error exents must be positive; negative array elements areignored.
The value is an array-valued algebraic expression based on column names as described inSection 10. Some of the functions in the Arrays class may be useful here.
yerrlosN = <array-expr> (String)Array of errors in the Y coordinates in the negative direction. If left blank, it is assumed to takethe same value as in the positive direction. Error extents must be positive; negative arrayelements are ignored.
The value is an array-valued algebraic expression based on column names as described inSection 10. Some of the functions in the Arrays class may be useful here.
ysN = <array-expr> (String)Array giving the Y coordinate array for each line.
The value is an array-valued algebraic expression based on column names as described inSection 10. Some of the functions in the Arrays class may be useful here.
8.3.18 xyerrors
Plots N error bars in the X and Y directions for each input row, with the X, Y and error bar extentseach supplied by N-element array values.
Usage Overview:
layerN=xyerrors errorbarN=none|lines|capped_lines|... thickN=<int-value>shadingN=auto|flat|translucent|transparent|density|aux|weighted <shade-paramsN>xsN=<array-expr> ysN=<array-expr> xerrhisN=<array-expr>xerrlosN=<array-expr> yerrhisN=<array-expr>yerrlosN=<array-expr> inN=<table> ifmtN=<in-format>istreamN=true|false icmdN=<cmds>
All the parameters listed here affect only the relevant layer, identified by the suffix N.
Example:
SUN/256 146
stilts plot2plane in=LRS_NPW_V010_20071101.cdf xs=sequence(512) ys=RX1shading=aux aux=epochlayer_l=lines opaque_l=1layer_xy=xyerrors opaque_xy=3.3 errorbar_xy=crosshair_ellipsexerrhis_xy=constant(512,0.5) yerrhis_xy=arrayFunc("abs(x)",subtract(RX1,RX2))xmin=125 xmax=144 ymin=-184 ymax=-145 xpix=660 icmd='every 1000'auxmap=viridis auxvisible=false
errorbarN = none|lines|capped_lines|... (MultiPointShape)How errorbars are represented.
The available options are:
• none
• lines
• capped_lines
• caps
• arrows
• ellipse
• crosshair_ellipse
• rectangle
• crosshair_rectangle
• filled_ellipse
• filled_rectangle
[Default: lines]
icmdN = <cmds> (ProcessingStep[])Specifies processing to be performed on the layer N input table as specified by parameter inN.The value of this parameter is one or more of the filter commands described in Section 6.1. Ifmore than one is given, they must be separated by semicolon characters (";"). This parametercan be repeated multiple times on the same command line to build up a list of processing steps.The sequence of commands given in this way defines the processing pipeline which isperformed on the table.
Commands may alteratively be supplied in an external file, by using the indirection character'@'. Thus a value of "@filename" causes the file filename to be read for a list of filtercommands to execute. The commands in the file may be separated by newline charactersand/or semicolons, and lines which are blank or which start with a '#' character are ignored.
ifmtN = <in-format> (String)Specifies the format of the input table as specified by parameter inN. The known formats arelisted in Section 5.1.1. This flag can be used if you know what format your table is in. If it hasthe special value (auto) (the default), then an attempt will be made to detect the format of thetable automatically. This cannot always be done correctly however, in which case the programwill exit with an error explaining which formats were attempted. This parameter is ignored forscheme-specified tables.
[Default: (auto)]
inN = <table> (StarTable)The location of the input table. This may take one of the following forms:
• A filename.• A URL.• The special value "-", meaning standard input. In this case the input format must be given
explicitly using the ifmtN parameter. Note that not all formats can be streamed in thisway.
• A scheme specification of the form :<scheme-name>:<scheme-args>.• A system command line with either a "<" character at the start, or a "|" character at the
SUN/256 147
end ("<syscmd" or "syscmd|"). This executes the given pipeline and reads from itsstandard output. This will probably only work on unix-like systems.
In any case, compressed data in one of the supported compression formats (gzip, Unixcompress or bzip2) will be decompressed transparently.
istreamN = true|false (Boolean)If set true, the input table specified by the inN parameter will be read as a stream. It isnecessary to give the ifmtN parameter in this case. Depending on the required operations andprocessing mode, this may cause the read to fail (sometimes it is necessary to read the tablemore than once). It is not normally necessary to set this flag; in most cases the data will bestreamed automatically if that is the best thing to do. However it can sometimes result in lessresource usage when processing large files in certain formats (such as VOTable). Thisparameter is ignored for scheme-specified tables.
[Default: false]
shadingN = auto|flat|translucent|transparent|density|aux|weighted <shade-paramsN>
(ShapeMode)Determines how plotted objects in layer N are coloured. This may be influenced by how manyobjects are plotted over each other as well as the values of other parameters. Available options(Section 8.4) are:
• auto (Section 8.4.1)
• flat (Section 8.4.2)
• translucent (Section 8.4.3)
• transparent (Section 8.4.4)
• density (Section 8.4.5)
• aux (Section 8.4.6)
• weighted (Section 8.4.7)
Each of these options comes with its own set of parameters to specify the details of howcolouring is done.
[Default: auto]
thickN = <int-value> (Integer)Controls the line thickness used when drawing shapes. Zero, the default value, means a1-pixel-wide line is used. Larger values make drawn lines thicker, but note changing this valuewill not affect all shapes, for instance filled rectangles contain no line drawings.
[Default: 0]
xerrhisN = <array-expr> (String)Array of errors in the X coordinates in the positive direction. If no corresponding negativevalue is supplied, then this value is also used in the negative direction, i.e. in that case errorsare assumed to be symmetric. Error exents must be positive; negative array elements areignored.
The value is an array-valued algebraic expression based on column names as described inSection 10. Some of the functions in the Arrays class may be useful here.
xerrlosN = <array-expr> (String)Array of errors in the X coordinates in the negative direction. If left blank, it is assumed to takethe same value as in the positive direction. Error extents must be positive; negative arrayelements are ignored.
The value is an array-valued algebraic expression based on column names as described inSection 10. Some of the functions in the Arrays class may be useful here.
xsN = <array-expr> (String)Array giving the X coordinate array for each line.
SUN/256 148
The value is an array-valued algebraic expression based on column names as described inSection 10. Some of the functions in the Arrays class may be useful here.
yerrhisN = <array-expr> (String)Array of errors in the Y coordinates in the positive direction. If no corresponding negativevalue is supplied, then this value is also used in the negative direction, i.e. in that case errorsare assumed to be symmetric. Error exents must be positive; negative array elements areignored.
The value is an array-valued algebraic expression based on column names as described inSection 10. Some of the functions in the Arrays class may be useful here.
yerrlosN = <array-expr> (String)Array of errors in the Y coordinates in the negative direction. If left blank, it is assumed to takethe same value as in the positive direction. Error extents must be positive; negative arrayelements are ignored.
The value is an array-valued algebraic expression based on column names as described inSection 10. Some of the functions in the Arrays class may be useful here.
ysN = <array-expr> (String)Array giving the Y coordinate array for each line.
The value is an array-valued algebraic expression based on column names as described inSection 10. Some of the functions in the Arrays class may be useful here.
8.3.19 line
Plots a point-to-point line joining up the positions of data points. There are additional options topre-sort the points according to their order on the X or Y axis (using the sortaxis value), and tovary the colour of the line along its length (using the aux value).
The options for controlling the Aux colour map are controlled at the level of the plot itself, ratherthan by per-layer configuration.
Usage Overview:
layerN=line colorN=<rrggbb>|red|blue|... thickN=<pixels>dashN=dot|dash|...|<a,b,...> sortaxisN=[X|Y]antialiasN=true|false auxnullcolorN=<rrggbb>|red|blue|...<pos-coord-paramsN> auxN=<num-expr> inN=<table>ifmtN=<in-format> istreamN=true|false icmdN=<cmds>
All the parameters listed here affect only the relevant layer, identified by the suffix N.
Positional Coordinate Parameters:The positional coordinates <pos-coord-paramsN> give a position for each row of the inputtable. Their form depends on the plot geometry, i.e. which plotting command is used. For aplane plot (plot2plane) the parameters would be xN and yN. The coordinate parameter valuesare in all cases strings interpreted as numeric expressions based on column names. These canbe column names, fixed values or algebraic expressions as described in Section 10.
Example:
SUN/256 149
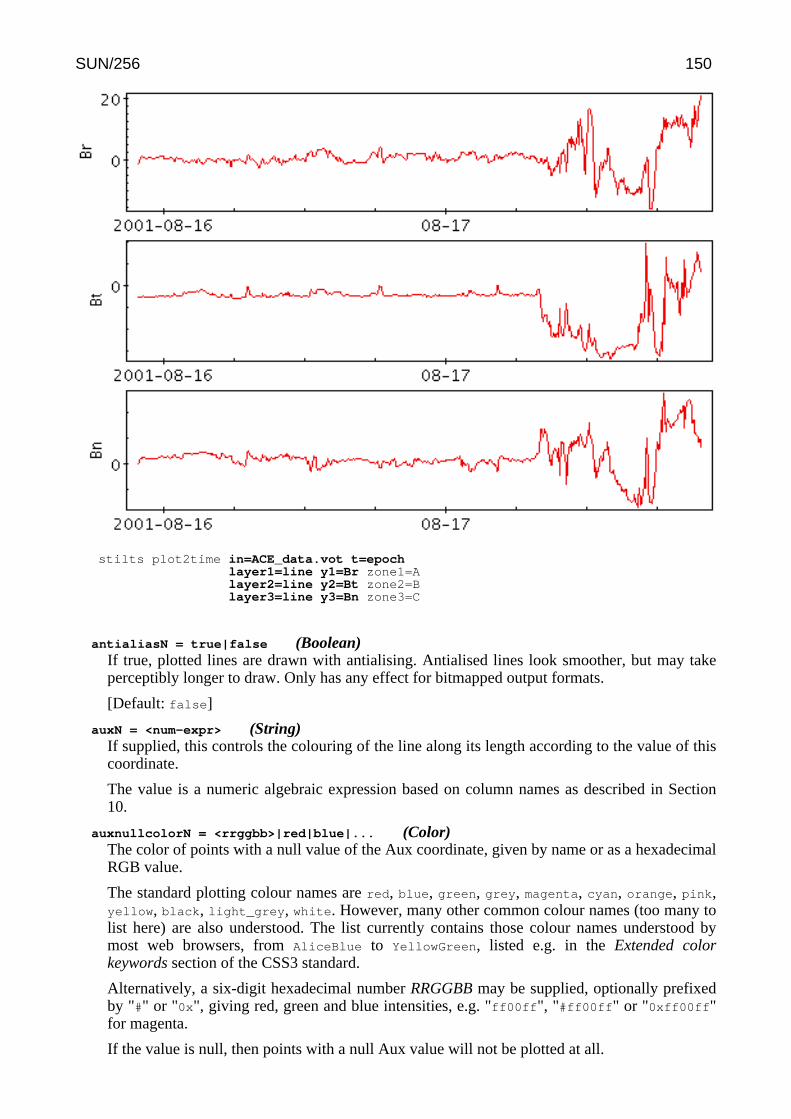
stilts plot2time in=ACE_data.vot t=epochlayer1=line y1=Br zone1=Alayer2=line y2=Bt zone2=Blayer3=line y3=Bn zone3=C
antialiasN = true|false (Boolean)If true, plotted lines are drawn with antialising. Antialised lines look smoother, but may takeperceptibly longer to draw. Only has any effect for bitmapped output formats.
[Default: false]
auxN = <num-expr> (String)If supplied, this controls the colouring of the line along its length according to the value of thiscoordinate.
The value is a numeric algebraic expression based on column names as described in Section10.
auxnullcolorN = <rrggbb>|red|blue|... (Color)The color of points with a null value of the Aux coordinate, given by name or as a hexadecimalRGB value.
The standard plotting colour names are red, blue, green, grey, magenta, cyan, orange, pink,yellow, black, light_grey, white. However, many other common colour names (too many tolist here) are also understood. The list currently contains those colour names understood bymost web browsers, from AliceBlue to YellowGreen, listed e.g. in the Extended colorkeywords section of the CSS3 standard.
Alternatively, a six-digit hexadecimal number RRGGBB may be supplied, optionally prefixedby "#" or "0x", giving red, green and blue intensities, e.g. "ff00ff", "#ff00ff" or "0xff00ff"for magenta.
If the value is null, then points with a null Aux value will not be plotted at all.
SUN/256 150
[Default: grey]
colorN = <rrggbb>|red|blue|... (Color)The color of plotted data, given by name or as a hexadecimal RGB value.
The standard plotting colour names are red, blue, green, grey, magenta, cyan, orange, pink,yellow, black, light_grey, white. However, many other common colour names (too many tolist here) are also understood. The list currently contains those colour names understood bymost web browsers, from AliceBlue to YellowGreen, listed e.g. in the Extended colorkeywords section of the CSS3 standard.
Alternatively, a six-digit hexadecimal number RRGGBB may be supplied, optionally prefixedby "#" or "0x", giving red, green and blue intensities, e.g. "ff00ff", "#ff00ff" or "0xff00ff"for magenta.
[Default: red]
dashN = dot|dash|...|<a,b,...> (float[])Determines the dash pattern of the line drawn. If null (the default), the line is solid.
Possible values for dashed lines are dot, dash, longdash, dotdash. You can alternativelysupply a comma-separated list of on/off length values such as "4,2,8,2".
icmdN = <cmds> (ProcessingStep[])Specifies processing to be performed on the layer N input table as specified by parameter inN.The value of this parameter is one or more of the filter commands described in Section 6.1. Ifmore than one is given, they must be separated by semicolon characters (";"). This parametercan be repeated multiple times on the same command line to build up a list of processing steps.The sequence of commands given in this way defines the processing pipeline which isperformed on the table.
Commands may alteratively be supplied in an external file, by using the indirection character'@'. Thus a value of "@filename" causes the file filename to be read for a list of filtercommands to execute. The commands in the file may be separated by newline charactersand/or semicolons, and lines which are blank or which start with a '#' character are ignored.
ifmtN = <in-format> (String)Specifies the format of the input table as specified by parameter inN. The known formats arelisted in Section 5.1.1. This flag can be used if you know what format your table is in. If it hasthe special value (auto) (the default), then an attempt will be made to detect the format of thetable automatically. This cannot always be done correctly however, in which case the programwill exit with an error explaining which formats were attempted. This parameter is ignored forscheme-specified tables.
[Default: (auto)]
inN = <table> (StarTable)The location of the input table. This may take one of the following forms:
• A filename.• A URL.• The special value "-", meaning standard input. In this case the input format must be given
explicitly using the ifmtN parameter. Note that not all formats can be streamed in thisway.
• A scheme specification of the form :<scheme-name>:<scheme-args>.• A system command line with either a "<" character at the start, or a "|" character at the
end ("<syscmd" or "syscmd|"). This executes the given pipeline and reads from itsstandard output. This will probably only work on unix-like systems.
In any case, compressed data in one of the supported compression formats (gzip, Unixcompress or bzip2) will be decompressed transparently.
istreamN = true|false (Boolean)
SUN/256 151
If set true, the input table specified by the inN parameter will be read as a stream. It isnecessary to give the ifmtN parameter in this case. Depending on the required operations andprocessing mode, this may cause the read to fail (sometimes it is necessary to read the tablemore than once). It is not normally necessary to set this flag; in most cases the data will bestreamed automatically if that is the best thing to do. However it can sometimes result in lessresource usage when processing large files in certain formats (such as VOTable). Thisparameter is ignored for scheme-specified tables.
[Default: false]
sortaxisN = [X|Y] (AxisOpt)May be set to "X" or "Y" to ensure that the points are plotted in ascending order of thecorresponding coordinate. This will ensure that the plotted line resembles a function of thecorresponding coordinate rather than a scribble. The default (null) value causes the points to bejoined in the sequence in which they appear in the table. If the points already appear in thetable sorted according to the corresponding coordinate, this option has no visible effect, thoughit may slow things down.
[Default: None]
thickN = <pixels> (Integer)Thickness of plotted line in pixels.
[Default: 1]
8.3.20 linearfit
Plots a line of best fit for the data points.
Usage Overview:
layerN=linearfit colorN=<rrggbb>|red|blue|... thickN=<pixels>dashN=dot|dash|...|<a,b,...> antialiasN=true|false<pos-coord-paramsN> weightN=<num-expr> inN=<table>ifmtN=<in-format> istreamN=true|false icmdN=<cmds>
All the parameters listed here affect only the relevant layer, identified by the suffix N.
Positional Coordinate Parameters:The positional coordinates <pos-coord-paramsN> give a position for each row of the inputtable. Their form depends on the plot geometry, i.e. which plotting command is used. For aplane plot (plot2plane) the parameters would be xN and yN. The coordinate parameter valuesare in all cases strings interpreted as numeric expressions based on column names. These canbe column names, fixed values or algebraic expressions as described in Section 10.
Example:
SUN/256 152
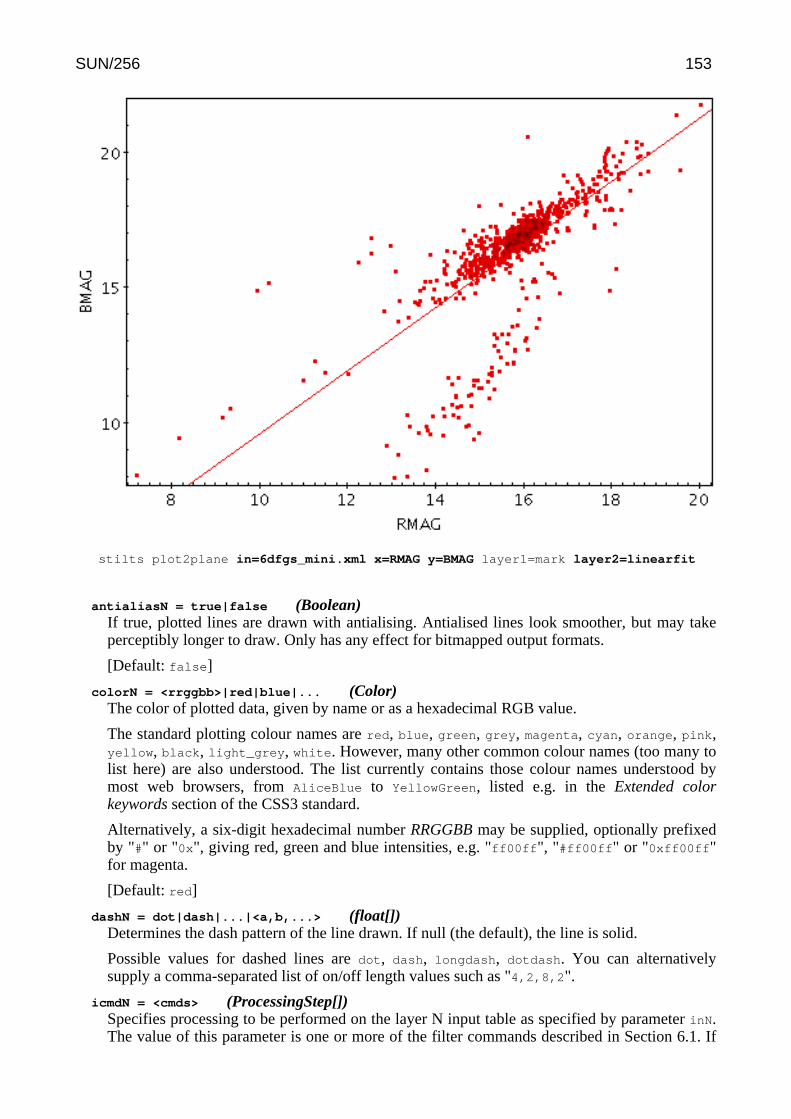
stilts plot2plane in=6dfgs_mini.xml x=RMAG y=BMAG layer1=mark layer2=linearfit
antialiasN = true|false (Boolean)If true, plotted lines are drawn with antialising. Antialised lines look smoother, but may takeperceptibly longer to draw. Only has any effect for bitmapped output formats.
[Default: false]
colorN = <rrggbb>|red|blue|... (Color)The color of plotted data, given by name or as a hexadecimal RGB value.
The standard plotting colour names are red, blue, green, grey, magenta, cyan, orange, pink,yellow, black, light_grey, white. However, many other common colour names (too many tolist here) are also understood. The list currently contains those colour names understood bymost web browsers, from AliceBlue to YellowGreen, listed e.g. in the Extended colorkeywords section of the CSS3 standard.
Alternatively, a six-digit hexadecimal number RRGGBB may be supplied, optionally prefixedby "#" or "0x", giving red, green and blue intensities, e.g. "ff00ff", "#ff00ff" or "0xff00ff"for magenta.
[Default: red]
dashN = dot|dash|...|<a,b,...> (float[])Determines the dash pattern of the line drawn. If null (the default), the line is solid.
Possible values for dashed lines are dot, dash, longdash, dotdash. You can alternativelysupply a comma-separated list of on/off length values such as "4,2,8,2".
icmdN = <cmds> (ProcessingStep[])Specifies processing to be performed on the layer N input table as specified by parameter inN.The value of this parameter is one or more of the filter commands described in Section 6.1. If
SUN/256 153
more than one is given, they must be separated by semicolon characters (";"). This parametercan be repeated multiple times on the same command line to build up a list of processing steps.The sequence of commands given in this way defines the processing pipeline which isperformed on the table.
Commands may alteratively be supplied in an external file, by using the indirection character'@'. Thus a value of "@filename" causes the file filename to be read for a list of filtercommands to execute. The commands in the file may be separated by newline charactersand/or semicolons, and lines which are blank or which start with a '#' character are ignored.
ifmtN = <in-format> (String)Specifies the format of the input table as specified by parameter inN. The known formats arelisted in Section 5.1.1. This flag can be used if you know what format your table is in. If it hasthe special value (auto) (the default), then an attempt will be made to detect the format of thetable automatically. This cannot always be done correctly however, in which case the programwill exit with an error explaining which formats were attempted. This parameter is ignored forscheme-specified tables.
[Default: (auto)]
inN = <table> (StarTable)The location of the input table. This may take one of the following forms:
• A filename.• A URL.• The special value "-", meaning standard input. In this case the input format must be given
explicitly using the ifmtN parameter. Note that not all formats can be streamed in thisway.
• A scheme specification of the form :<scheme-name>:<scheme-args>.• A system command line with either a "<" character at the start, or a "|" character at the
end ("<syscmd" or "syscmd|"). This executes the given pipeline and reads from itsstandard output. This will probably only work on unix-like systems.
In any case, compressed data in one of the supported compression formats (gzip, Unixcompress or bzip2) will be decompressed transparently.
istreamN = true|false (Boolean)If set true, the input table specified by the inN parameter will be read as a stream. It isnecessary to give the ifmtN parameter in this case. Depending on the required operations andprocessing mode, this may cause the read to fail (sometimes it is necessary to read the tablemore than once). It is not normally necessary to set this flag; in most cases the data will bestreamed automatically if that is the best thing to do. However it can sometimes result in lessresource usage when processing large files in certain formats (such as VOTable). Thisparameter is ignored for scheme-specified tables.
[Default: false]
thickN = <pixels> (Integer)Thickness of plotted line in pixels.
[Default: 1]
weightN = <num-expr> (String)The weight associated with each data point for fitting purposes. This is used for calculating thecoefficients of the line of best fit, and the correlation coefficient. If no coordinate is supplied,all points are assumed to have equal weight (1). Otherwise, any point with a null weight valueis assigned a weight of zero, i.e. ignored.
Given certain assumptions about independence of samples, a suitable value for the weight maybe 1/(err*err), if err is the measurement error for each Y value.
The value is a numeric algebraic expression based on column names as described in Section
SUN/256 154
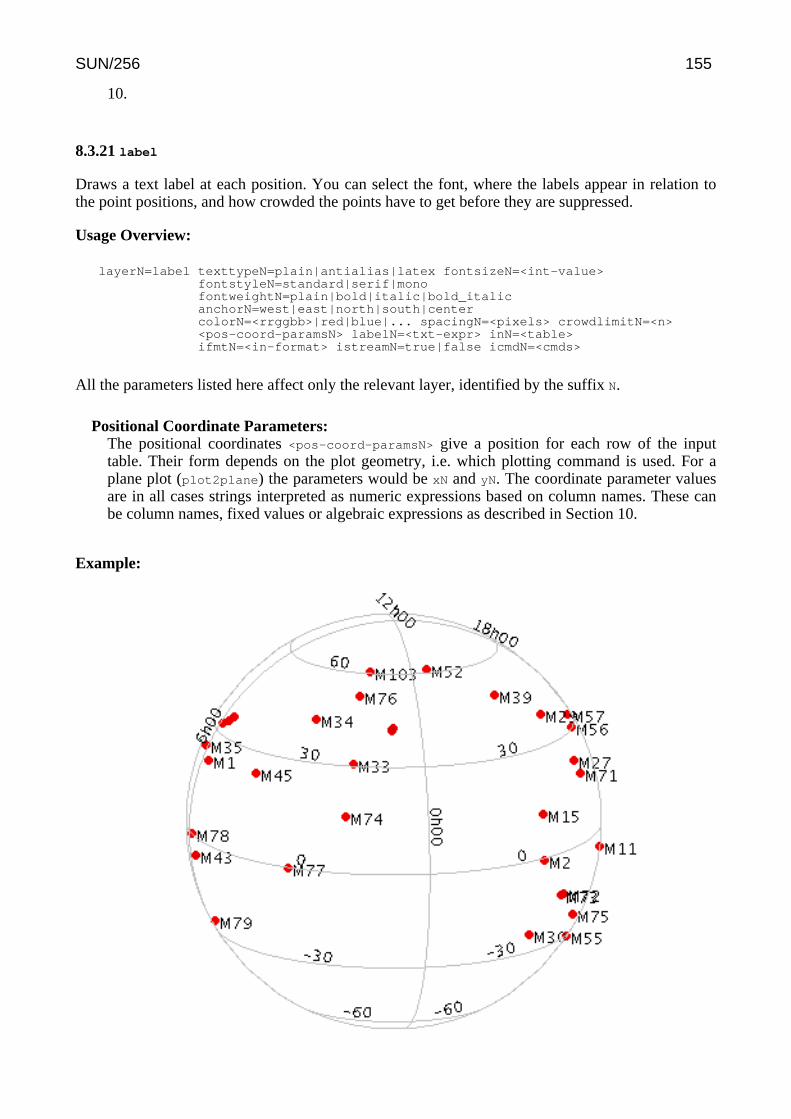
10.
8.3.21 label
Draws a text label at each position. You can select the font, where the labels appear in relation tothe point positions, and how crowded the points have to get before they are suppressed.
Usage Overview:
layerN=label texttypeN=plain|antialias|latex fontsizeN=<int-value>fontstyleN=standard|serif|monofontweightN=plain|bold|italic|bold_italicanchorN=west|east|north|south|centercolorN=<rrggbb>|red|blue|... spacingN=<pixels> crowdlimitN=<n><pos-coord-paramsN> labelN=<txt-expr> inN=<table>ifmtN=<in-format> istreamN=true|false icmdN=<cmds>
All the parameters listed here affect only the relevant layer, identified by the suffix N.
Positional Coordinate Parameters:The positional coordinates <pos-coord-paramsN> give a position for each row of the inputtable. Their form depends on the plot geometry, i.e. which plotting command is used. For aplane plot (plot2plane) the parameters would be xN and yN. The coordinate parameter valuesare in all cases strings interpreted as numeric expressions based on column names. These canbe column names, fixed values or algebraic expressions as described in Section 10.
Example:
SUN/256 155
stilts plot2sky in=messier.xml lon=RA lat=DEClayer1=mark size1=3layer2=label label2=NAME color2=black
anchorN = west|east|north|south|center (Anchor)Determines where the text appears in relation to the plotted points. Values are points of thecompass.
The available options are:
• west
• east
• north
• south
• center
[Default: west]
colorN = <rrggbb>|red|blue|... (Color)The color of plotted data, given by name or as a hexadecimal RGB value.
The standard plotting colour names are red, blue, green, grey, magenta, cyan, orange, pink,yellow, black, light_grey, white. However, many other common colour names (too many tolist here) are also understood. The list currently contains those colour names understood bymost web browsers, from AliceBlue to YellowGreen, listed e.g. in the Extended colorkeywords section of the CSS3 standard.
Alternatively, a six-digit hexadecimal number RRGGBB may be supplied, optionally prefixedby "#" or "0x", giving red, green and blue intensities, e.g. "ff00ff", "#ff00ff" or "0xff00ff"for magenta.
[Default: red]
crowdlimitN = <n> (Integer)Sets the maximum number of labels in a label group. This many labels can appear closelyspaced without being affected by the label spacing parameter.
It is useful for instance if you are looking at pairs of points, which will always be closetogether; if you set this value to 2, an isolated pair of labels can be seen, but if it's 1 then theywill only be plotted when they are distant from each other, which may only happen at veryhigh magnifications.
[Default: 2]
fontsizeN = <int-value> (Integer)Size of the text font in points.
[Default: 12]
fontstyleN = standard|serif|mono (FontType)Font style for text.
The available options are:
• standard
• serif
• mono
[Default: standard]
fontweightN = plain|bold|italic|bold_italic (FontWeight)Font weight for text.
The available options are:
SUN/256 156
• plain
• bold
• italic
• bold_italic
[Default: plain]
icmdN = <cmds> (ProcessingStep[])Specifies processing to be performed on the layer N input table as specified by parameter inN.The value of this parameter is one or more of the filter commands described in Section 6.1. Ifmore than one is given, they must be separated by semicolon characters (";"). This parametercan be repeated multiple times on the same command line to build up a list of processing steps.The sequence of commands given in this way defines the processing pipeline which isperformed on the table.
Commands may alteratively be supplied in an external file, by using the indirection character'@'. Thus a value of "@filename" causes the file filename to be read for a list of filtercommands to execute. The commands in the file may be separated by newline charactersand/or semicolons, and lines which are blank or which start with a '#' character are ignored.
ifmtN = <in-format> (String)Specifies the format of the input table as specified by parameter inN. The known formats arelisted in Section 5.1.1. This flag can be used if you know what format your table is in. If it hasthe special value (auto) (the default), then an attempt will be made to detect the format of thetable automatically. This cannot always be done correctly however, in which case the programwill exit with an error explaining which formats were attempted. This parameter is ignored forscheme-specified tables.
[Default: (auto)]
inN = <table> (StarTable)The location of the input table. This may take one of the following forms:
• A filename.• A URL.• The special value "-", meaning standard input. In this case the input format must be given
explicitly using the ifmtN parameter. Note that not all formats can be streamed in thisway.
• A scheme specification of the form :<scheme-name>:<scheme-args>.• A system command line with either a "<" character at the start, or a "|" character at the
end ("<syscmd" or "syscmd|"). This executes the given pipeline and reads from itsstandard output. This will probably only work on unix-like systems.
In any case, compressed data in one of the supported compression formats (gzip, Unixcompress or bzip2) will be decompressed transparently.
istreamN = true|false (Boolean)If set true, the input table specified by the inN parameter will be read as a stream. It isnecessary to give the ifmtN parameter in this case. Depending on the required operations andprocessing mode, this may cause the read to fail (sometimes it is necessary to read the tablemore than once). It is not normally necessary to set this flag; in most cases the data will bestreamed automatically if that is the best thing to do. However it can sometimes result in lessresource usage when processing large files in certain formats (such as VOTable). Thisparameter is ignored for scheme-specified tables.
[Default: false]
labelN = <txt-expr> (String)Column or expression giving the text of the label to be written near the position being labelled.Label values may be of any type (string or numeric)
SUN/256 157
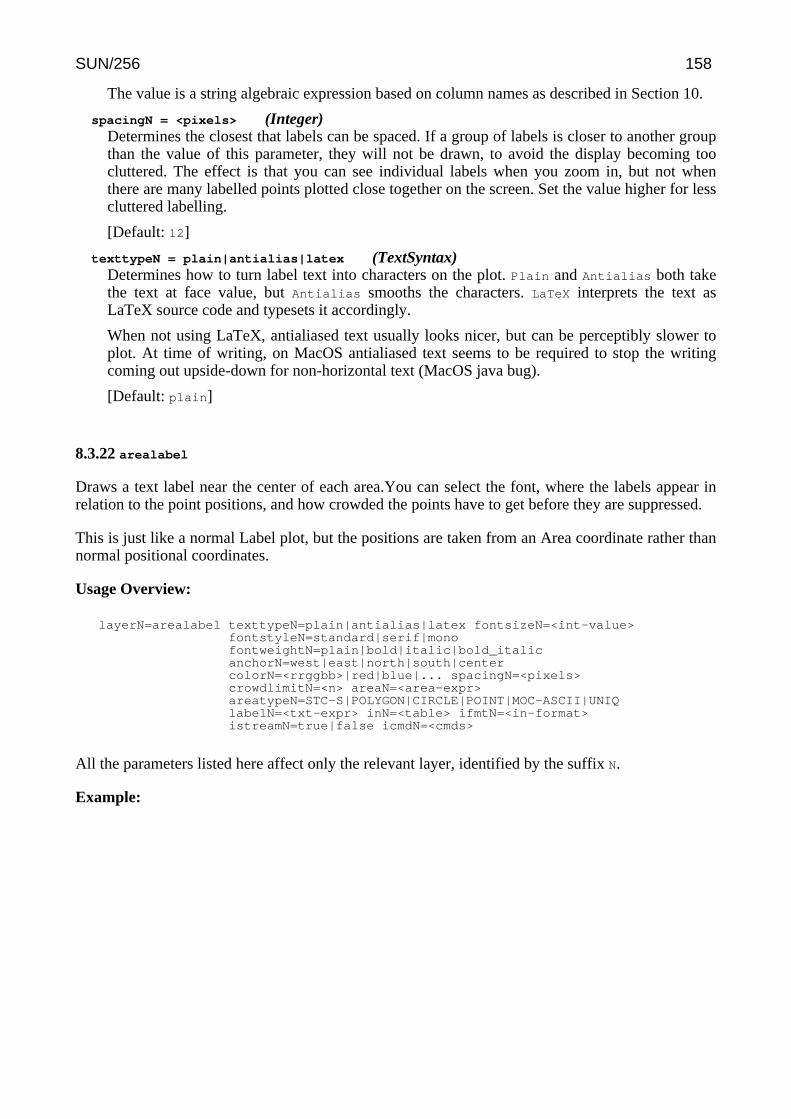
The value is a string algebraic expression based on column names as described in Section 10.
spacingN = <pixels> (Integer)Determines the closest that labels can be spaced. If a group of labels is closer to another groupthan the value of this parameter, they will not be drawn, to avoid the display becoming toocluttered. The effect is that you can see individual labels when you zoom in, but not whenthere are many labelled points plotted close together on the screen. Set the value higher for lesscluttered labelling.
[Default: 12]
texttypeN = plain|antialias|latex (TextSyntax)Determines how to turn label text into characters on the plot. Plain and Antialias both takethe text at face value, but Antialias smooths the characters. LaTeX interprets the text asLaTeX source code and typesets it accordingly.
When not using LaTeX, antialiased text usually looks nicer, but can be perceptibly slower toplot. At time of writing, on MacOS antialiased text seems to be required to stop the writingcoming out upside-down for non-horizontal text (MacOS java bug).
[Default: plain]
8.3.22 arealabel
Draws a text label near the center of each area.You can select the font, where the labels appear inrelation to the point positions, and how crowded the points have to get before they are suppressed.
This is just like a normal Label plot, but the positions are taken from an Area coordinate rather thannormal positional coordinates.
Usage Overview:
layerN=arealabel texttypeN=plain|antialias|latex fontsizeN=<int-value>fontstyleN=standard|serif|monofontweightN=plain|bold|italic|bold_italicanchorN=west|east|north|south|centercolorN=<rrggbb>|red|blue|... spacingN=<pixels>crowdlimitN=<n> areaN=<area-expr>areatypeN=STC-S|POLYGON|CIRCLE|POINT|MOC-ASCII|UNIQlabelN=<txt-expr> inN=<table> ifmtN=<in-format>istreamN=true|false icmdN=<cmds>
All the parameters listed here affect only the relevant layer, identified by the suffix N.
Example:
SUN/256 158
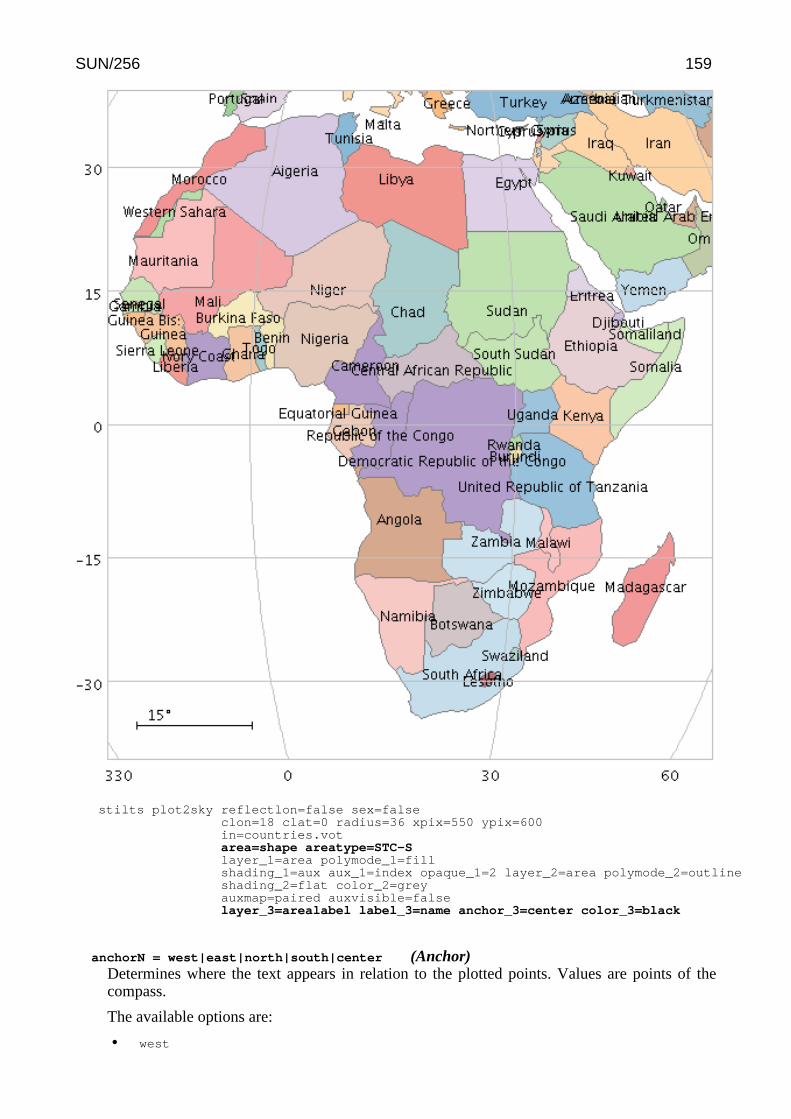
stilts plot2sky reflectlon=false sex=falseclon=18 clat=0 radius=36 xpix=550 ypix=600in=countries.votarea=shape areatype=STC-Slayer_1=area polymode_1=fillshading_1=aux aux_1=index opaque_1=2 layer_2=area polymode_2=outlineshading_2=flat color_2=greyauxmap=paired auxvisible=falselayer_3=arealabel label_3=name anchor_3=center color_3=black
anchorN = west|east|north|south|center (Anchor)Determines where the text appears in relation to the plotted points. Values are points of thecompass.
The available options are:
• west
SUN/256 159
• east
• north
• south
• center
[Default: west]
areaN = <area-expr> (String)Expression giving the geometry of a 2D region on the plot. It may be a string- or array-valuedexpression, and its interpretation depends on the value of the corresponding areatype
parameter.
The value is a Area value algebraic expression based on column names as described in Section10.
areatypeN = STC-S|POLYGON|CIRCLE|POINT|MOC-ASCII|UNIQ (AreaMapper)Selects the form in which the Area value for parameter areaN is supplied. Options are:
• STC-S: Region description using STC-S syntax; see TAP 1.0, section 6. Note there aresome restrictions: <frame>, <refpos> and <flavor> metadata are ignored, polygonwinding direction is ignored (small polygons are assumed) and the INTERSECTION and NOT
constructions are not supported. The non-standard MOC construction is supported.• POLYGON: 2n-element array (x1,y1, x2,y2,...); a NaN,NaN pair can be used to delimit distinct
polygons.• CIRCLE: 3-element array (x,y,r)• POINT: 2-element array (x,y)• MOC-ASCII: Region description using ASCII MOC syntax; see MOC 1.1 2.3.2. Note there
are currently a few issues with MOC plotting, especially for large pixels.• UNIQ: Region description representing a single HEALPix cell as defined by an UNIQ
value, see MOC 1.1 sec 2.3.1.
If left blank, a guess will be taken depending on the data type of the value supplied for theareaN value.
colorN = <rrggbb>|red|blue|... (Color)The color of plotted data, given by name or as a hexadecimal RGB value.
The standard plotting colour names are red, blue, green, grey, magenta, cyan, orange, pink,yellow, black, light_grey, white. However, many other common colour names (too many tolist here) are also understood. The list currently contains those colour names understood bymost web browsers, from AliceBlue to YellowGreen, listed e.g. in the Extended colorkeywords section of the CSS3 standard.
Alternatively, a six-digit hexadecimal number RRGGBB may be supplied, optionally prefixedby "#" or "0x", giving red, green and blue intensities, e.g. "ff00ff", "#ff00ff" or "0xff00ff"for magenta.
[Default: red]
crowdlimitN = <n> (Integer)Sets the maximum number of labels in a label group. This many labels can appear closelyspaced without being affected by the label spacing parameter.
It is useful for instance if you are looking at pairs of points, which will always be closetogether; if you set this value to 2, an isolated pair of labels can be seen, but if it's 1 then theywill only be plotted when they are distant from each other, which may only happen at veryhigh magnifications.
[Default: 2]
fontsizeN = <int-value> (Integer)Size of the text font in points.
SUN/256 160
[Default: 12]
fontstyleN = standard|serif|mono (FontType)Font style for text.
The available options are:
• standard
• serif
• mono
[Default: standard]
fontweightN = plain|bold|italic|bold_italic (FontWeight)Font weight for text.
The available options are:
• plain
• bold
• italic
• bold_italic
[Default: plain]
icmdN = <cmds> (ProcessingStep[])Specifies processing to be performed on the layer N input table as specified by parameter inN.The value of this parameter is one or more of the filter commands described in Section 6.1. Ifmore than one is given, they must be separated by semicolon characters (";"). This parametercan be repeated multiple times on the same command line to build up a list of processing steps.The sequence of commands given in this way defines the processing pipeline which isperformed on the table.
Commands may alteratively be supplied in an external file, by using the indirection character'@'. Thus a value of "@filename" causes the file filename to be read for a list of filtercommands to execute. The commands in the file may be separated by newline charactersand/or semicolons, and lines which are blank or which start with a '#' character are ignored.
ifmtN = <in-format> (String)Specifies the format of the input table as specified by parameter inN. The known formats arelisted in Section 5.1.1. This flag can be used if you know what format your table is in. If it hasthe special value (auto) (the default), then an attempt will be made to detect the format of thetable automatically. This cannot always be done correctly however, in which case the programwill exit with an error explaining which formats were attempted. This parameter is ignored forscheme-specified tables.
[Default: (auto)]
inN = <table> (StarTable)The location of the input table. This may take one of the following forms:
• A filename.• A URL.• The special value "-", meaning standard input. In this case the input format must be given
explicitly using the ifmtN parameter. Note that not all formats can be streamed in thisway.
• A scheme specification of the form :<scheme-name>:<scheme-args>.• A system command line with either a "<" character at the start, or a "|" character at the
end ("<syscmd" or "syscmd|"). This executes the given pipeline and reads from itsstandard output. This will probably only work on unix-like systems.
In any case, compressed data in one of the supported compression formats (gzip, Unix
SUN/256 161

compress or bzip2) will be decompressed transparently.
istreamN = true|false (Boolean)If set true, the input table specified by the inN parameter will be read as a stream. It isnecessary to give the ifmtN parameter in this case. Depending on the required operations andprocessing mode, this may cause the read to fail (sometimes it is necessary to read the tablemore than once). It is not normally necessary to set this flag; in most cases the data will bestreamed automatically if that is the best thing to do. However it can sometimes result in lessresource usage when processing large files in certain formats (such as VOTable). Thisparameter is ignored for scheme-specified tables.
[Default: false]
labelN = <txt-expr> (String)Column or expression giving the text of the label to be written near the position being labelled.Label values may be of any type (string or numeric)
The value is a string algebraic expression based on column names as described in Section 10.
spacingN = <pixels> (Integer)Determines the closest that labels can be spaced. If a group of labels is closer to another groupthan the value of this parameter, they will not be drawn, to avoid the display becoming toocluttered. The effect is that you can see individual labels when you zoom in, but not whenthere are many labelled points plotted close together on the screen. Set the value higher for lesscluttered labelling.
[Default: 12]
texttypeN = plain|antialias|latex (TextSyntax)Determines how to turn label text into characters on the plot. Plain and Antialias both takethe text at face value, but Antialias smooths the characters. LaTeX interprets the text asLaTeX source code and typesets it accordingly.
When not using LaTeX, antialiased text usually looks nicer, but can be perceptibly slower toplot. At time of writing, on MacOS antialiased text seems to be required to stop the writingcoming out upside-down for non-horizontal text (MacOS java bug).
[Default: plain]
8.3.23 contour
Plots position density contours. This provides another way (alongside the auto, density andweighted shading modes) to visualise the characteristics of overdense regions in a crowded plot. It'snot very useful if you just have a few points.
A weighting may optionally be applied to the quantity being contoured. To do this, provide anon-blank value for the weight coordinate, and use the combine parameter to define how theweights are combined (sum, mean, etc).
The contours are currently drawn as pixels rather than lines so they don't look very beautiful inexported vector output formats (PDF, PostScript). This may be improved in the future.
Usage Overview:
layerN=contour colorN=<rrggbb>|red|blue|...combineN=sum|mean|median|stdev|min|max|countnlevelN=<int-value> smoothN=<pixels> thickN=<pixels>scalingN=linear|log|equal zeroN=<number> <pos-coord-paramsN>weightN=<num-expr> inN=<table> ifmtN=<in-format>istreamN=true|false icmdN=<cmds>
SUN/256 162
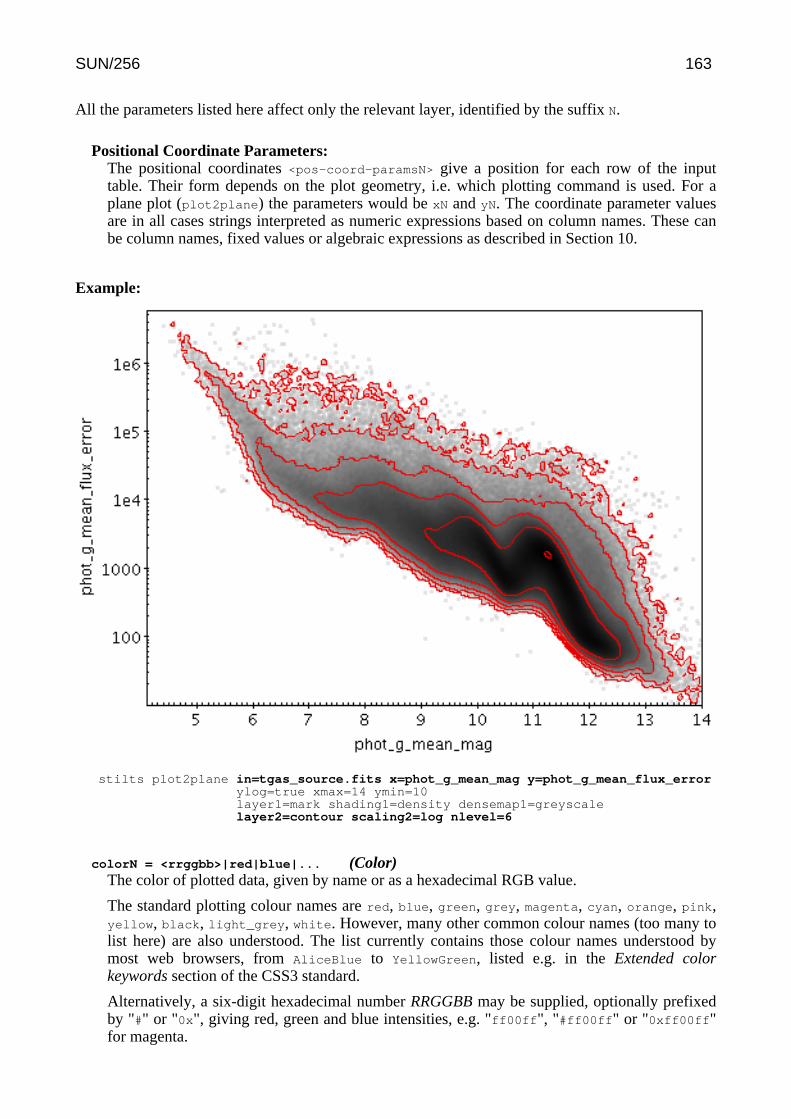
All the parameters listed here affect only the relevant layer, identified by the suffix N.
Positional Coordinate Parameters:The positional coordinates <pos-coord-paramsN> give a position for each row of the inputtable. Their form depends on the plot geometry, i.e. which plotting command is used. For aplane plot (plot2plane) the parameters would be xN and yN. The coordinate parameter valuesare in all cases strings interpreted as numeric expressions based on column names. These canbe column names, fixed values or algebraic expressions as described in Section 10.
Example:
stilts plot2plane in=tgas_source.fits x=phot_g_mean_mag y=phot_g_mean_flux_errorylog=true xmax=14 ymin=10layer1=mark shading1=density densemap1=greyscalelayer2=contour scaling2=log nlevel=6
colorN = <rrggbb>|red|blue|... (Color)The color of plotted data, given by name or as a hexadecimal RGB value.
The standard plotting colour names are red, blue, green, grey, magenta, cyan, orange, pink,yellow, black, light_grey, white. However, many other common colour names (too many tolist here) are also understood. The list currently contains those colour names understood bymost web browsers, from AliceBlue to YellowGreen, listed e.g. in the Extended colorkeywords section of the CSS3 standard.
Alternatively, a six-digit hexadecimal number RRGGBB may be supplied, optionally prefixedby "#" or "0x", giving red, green and blue intensities, e.g. "ff00ff", "#ff00ff" or "0xff00ff"for magenta.
SUN/256 163

[Default: red]
combineN = sum|mean|median|stdev|min|max|count (Combiner)Defines the way that the weight values are combined when generating the value grid for whichthe contours will be plotted. If a weighting is supplied, the most useful values are mean whichtraces the mean values of a quantity and sum which traces the weighted sum. Other values suchas median are of dubious validity because of the way that the smoothing is done.
This value is ignored if the weighting coordinate weight is not set.
The available options are:
• sum: the sum of all the combined values per bin• mean: the mean of the combined values• median: the median of the combined values (may be slow)• stdev: the sample standard deviation of the combined values• min: the minimum of all the combined values• max: the maximum of all the combined values• count: the number of non-blank values per bin (weight is ignored)
[Default: sum]
icmdN = <cmds> (ProcessingStep[])Specifies processing to be performed on the layer N input table as specified by parameter inN.The value of this parameter is one or more of the filter commands described in Section 6.1. Ifmore than one is given, they must be separated by semicolon characters (";"). This parametercan be repeated multiple times on the same command line to build up a list of processing steps.The sequence of commands given in this way defines the processing pipeline which isperformed on the table.
Commands may alteratively be supplied in an external file, by using the indirection character'@'. Thus a value of "@filename" causes the file filename to be read for a list of filtercommands to execute. The commands in the file may be separated by newline charactersand/or semicolons, and lines which are blank or which start with a '#' character are ignored.
ifmtN = <in-format> (String)Specifies the format of the input table as specified by parameter inN. The known formats arelisted in Section 5.1.1. This flag can be used if you know what format your table is in. If it hasthe special value (auto) (the default), then an attempt will be made to detect the format of thetable automatically. This cannot always be done correctly however, in which case the programwill exit with an error explaining which formats were attempted. This parameter is ignored forscheme-specified tables.
[Default: (auto)]
inN = <table> (StarTable)The location of the input table. This may take one of the following forms:
• A filename.• A URL.• The special value "-", meaning standard input. In this case the input format must be given
explicitly using the ifmtN parameter. Note that not all formats can be streamed in thisway.
• A scheme specification of the form :<scheme-name>:<scheme-args>.• A system command line with either a "<" character at the start, or a "|" character at the
end ("<syscmd" or "syscmd|"). This executes the given pipeline and reads from itsstandard output. This will probably only work on unix-like systems.
In any case, compressed data in one of the supported compression formats (gzip, Unixcompress or bzip2) will be decompressed transparently.
istreamN = true|false (Boolean)
SUN/256 164

If set true, the input table specified by the inN parameter will be read as a stream. It isnecessary to give the ifmtN parameter in this case. Depending on the required operations andprocessing mode, this may cause the read to fail (sometimes it is necessary to read the tablemore than once). It is not normally necessary to set this flag; in most cases the data will bestreamed automatically if that is the best thing to do. However it can sometimes result in lessresource usage when processing large files in certain formats (such as VOTable). Thisparameter is ignored for scheme-specified tables.
[Default: false]
nlevelN = <int-value> (Integer)Number of countour lines drawn. In fact, this is an upper limit; if there is not enough variationin the plot's density, then fewer contour lines will be drawn.
[Default: 5]
scalingN = linear|log|equal (LevelMode)How the smoothed density is treated before contour levels are determined.
The available options are:
• linear: levels are equally spaced• log: level logarithms are equally spaced• equal: levels are spaced to provide equal-area inter-contour regions
[Default: linear]
smoothN = <pixels> (Integer)The linear size of the smoothing kernel applied to the density before performing the contourdetermination. If set too low the contours will be too crinkly, and if too high they will losedefinition. Smoothing currently uses an approximately Gaussian kernel for extensivecombination modes (count, sum) or a circular top hat for intensive modes (weighted mean).
[Default: 5]
thickN = <pixels> (Integer)Thickness of plotted line in pixels.
[Default: 1]
weightN = <num-expr> (String)Weighting of data points. If supplied, each point contributes a value to the histogram equal tothe data value multiplied by this coordinate. If not supplied, the effect is the same as supplyinga fixed value of one.
The value is a numeric algebraic expression based on column names as described in Section10.
zeroN = <number> (Double)Determines the level at which the first contour (and hence all the others, which are separatedfrom it by a fixed amount) are drawn.
[Default: 1]
8.3.24 grid
Plots 2-d data aggregated into rectangular cells. You can optionally use a weighting for the points,and you can configure how the values are combined to produce the output pixel values (colours).You can use this plotter in various ways, including as a 2-d histogram or weighted density map, orto plot gridded data.
The X and Y dimensions of the grid cells (or equivalently histogram bins) can be configured either
SUN/256 165
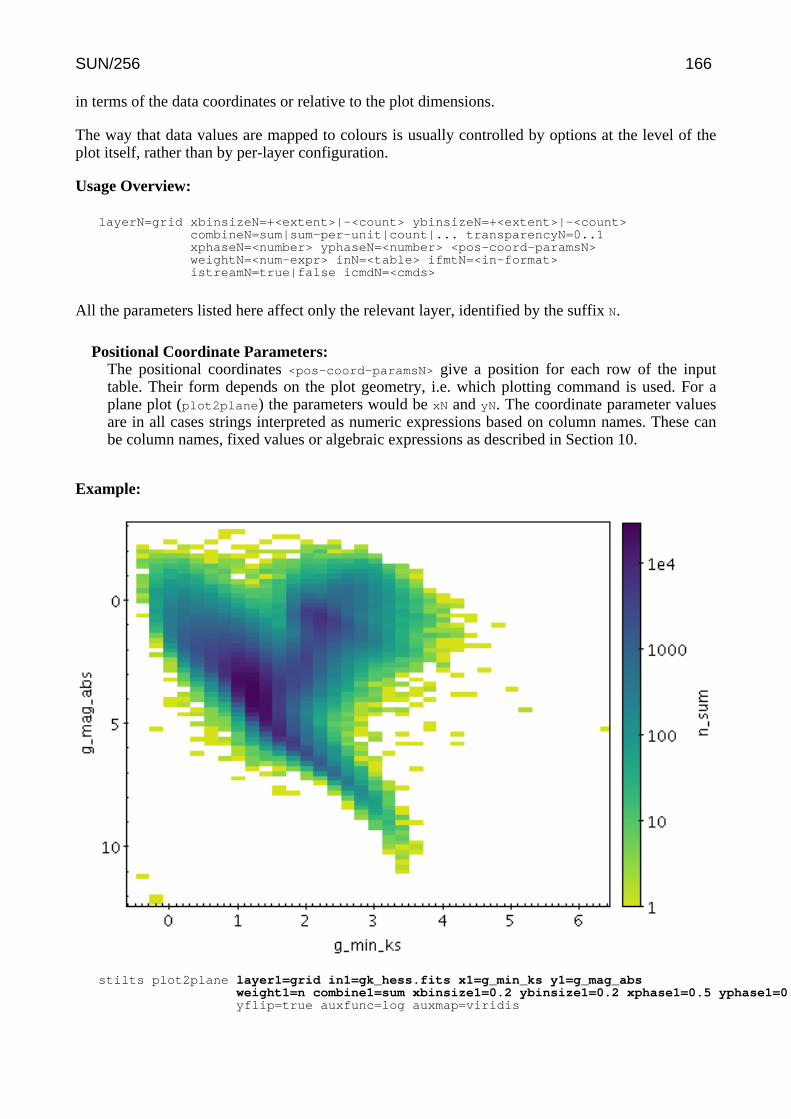
in terms of the data coordinates or relative to the plot dimensions.
The way that data values are mapped to colours is usually controlled by options at the level of theplot itself, rather than by per-layer configuration.
Usage Overview:
layerN=grid xbinsizeN=+<extent>|-<count> ybinsizeN=+<extent>|-<count>combineN=sum|sum-per-unit|count|... transparencyN=0..1xphaseN=<number> yphaseN=<number> <pos-coord-paramsN>weightN=<num-expr> inN=<table> ifmtN=<in-format>istreamN=true|false icmdN=<cmds>
All the parameters listed here affect only the relevant layer, identified by the suffix N.
Positional Coordinate Parameters:The positional coordinates <pos-coord-paramsN> give a position for each row of the inputtable. Their form depends on the plot geometry, i.e. which plotting command is used. For aplane plot (plot2plane) the parameters would be xN and yN. The coordinate parameter valuesare in all cases strings interpreted as numeric expressions based on column names. These canbe column names, fixed values or algebraic expressions as described in Section 10.
Example:
stilts plot2plane layer1=grid in1=gk_hess.fits x1=g_min_ks y1=g_mag_absweight1=n combine1=sum xbinsize1=0.2 ybinsize1=0.2 xphase1=0.5 yphase1=0.5yflip=true auxfunc=log auxmap=viridis
SUN/256 166

combineN = sum|sum-per-unit|count|... (Combiner)Defines how values contributing to the same grid cell are combined together to produce thevalue assigned to that cell, and hence its colour. The combined values are the weights, but ifthe weight coordinate is left blank, a weighting of unity is assumed.
The available options are:
• sum: the sum of all the combined values per bin• sum-per-unit: the sum of all the combined values per unit of bin size• count: the number of non-blank values per bin (weight is ignored)• count-per-unit: the number of non-blank values per unit of bin size (weight is ignored)• mean: the mean of the combined values• median: the median of the combined values (may be slow)• min: the minimum of all the combined values• max: the maximum of all the combined values• stdev: the sample standard deviation of the combined values• hit: 1 if any values present, NaN otherwise (weight is ignored)
[Default: mean]
icmdN = <cmds> (ProcessingStep[])Specifies processing to be performed on the layer N input table as specified by parameter inN.The value of this parameter is one or more of the filter commands described in Section 6.1. Ifmore than one is given, they must be separated by semicolon characters (";"). This parametercan be repeated multiple times on the same command line to build up a list of processing steps.The sequence of commands given in this way defines the processing pipeline which isperformed on the table.
Commands may alteratively be supplied in an external file, by using the indirection character'@'. Thus a value of "@filename" causes the file filename to be read for a list of filtercommands to execute. The commands in the file may be separated by newline charactersand/or semicolons, and lines which are blank or which start with a '#' character are ignored.
ifmtN = <in-format> (String)Specifies the format of the input table as specified by parameter inN. The known formats arelisted in Section 5.1.1. This flag can be used if you know what format your table is in. If it hasthe special value (auto) (the default), then an attempt will be made to detect the format of thetable automatically. This cannot always be done correctly however, in which case the programwill exit with an error explaining which formats were attempted. This parameter is ignored forscheme-specified tables.
[Default: (auto)]
inN = <table> (StarTable)The location of the input table. This may take one of the following forms:
• A filename.• A URL.• The special value "-", meaning standard input. In this case the input format must be given
explicitly using the ifmtN parameter. Note that not all formats can be streamed in thisway.
• A scheme specification of the form :<scheme-name>:<scheme-args>.• A system command line with either a "<" character at the start, or a "|" character at the
end ("<syscmd" or "syscmd|"). This executes the given pipeline and reads from itsstandard output. This will probably only work on unix-like systems.
In any case, compressed data in one of the supported compression formats (gzip, Unixcompress or bzip2) will be decompressed transparently.
istreamN = true|false (Boolean)If set true, the input table specified by the inN parameter will be read as a stream. It is
SUN/256 167

necessary to give the ifmtN parameter in this case. Depending on the required operations andprocessing mode, this may cause the read to fail (sometimes it is necessary to read the tablemore than once). It is not normally necessary to set this flag; in most cases the data will bestreamed automatically if that is the best thing to do. However it can sometimes result in lessresource usage when processing large files in certain formats (such as VOTable). Thisparameter is ignored for scheme-specified tables.
[Default: false]
transparencyN = 0..1 (Double)Transparency with which components are plotted, in the range 0 (opaque) to 1 (invisible). Thevalue is 1-alpha.
[Default: 0]
weightN = <num-expr> (String)Weighting of data points. If supplied, each point contributes a value to the histogram equal tothe data value multiplied by this coordinate. If not supplied, the effect is the same as supplyinga fixed value of one.
The value is a numeric algebraic expression based on column names as described in Section10.
xbinsizeN = +<extent>|-<count> (BinSizer)Configures the extent of the density grid bins on the X axis.
If the supplied value is a positive number it is interpreted as a fixed size in data coordinates (ifthe X axis is logarithmic, the value is a fixed factor). If it is a negative number, then it will beinterpreted as the approximate number of bins to display across the plot in the X direction(though an attempt is made to use only round numbers for bin sizes).
When setting this value graphically, you can use either the slider to adjust the bin count or thenumeric entry field to fix the bin size.
[Default: -30]
xphaseN = <number> (Double)Controls where the zero point on the X axis is set. For instance if your bin size is 1, this valuecontrols whether bin boundaries are at 0, 1, 2, .. or 0.5, 1.5, 2.5, ... etc.
A value of 0 (or any integer) will result in a bin boundary at X=0 (linear X axis) or X=1(logarithmic X axis). A fractional value will give a bin boundary at that value multiplied by thebin width.
[Default: 0]
ybinsizeN = +<extent>|-<count> (BinSizer)Configures the extent of the density grid bins on the Y axis.
If the supplied value is a positive number it is interpreted as a fixed size in data coordinates (ifthe Y axis is logarithmic, the value is a fixed factor). If it is a negative number, then it will beinterpreted as the approximate number of bins to display across the plot in the Y direction(though an attempt is made to use only round numbers for bin sizes).
When setting this value graphically, you can use either the slider to adjust the bin count or thenumeric entry field to fix the bin size.
[Default: -30]
yphaseN = <number> (Double)Controls where the zero point on the Y axis is set. For instance if your bin size is 1, this valuecontrols whether bin boundaries are at 0, 1, 2, .. or 0.5, 1.5, 2.5, ... etc.
A value of 0 (or any integer) will result in a bin boundary at X=0 (linear X axis) or X=1(logarithmic X axis). A fractional value will give a bin boundary at that value multiplied by the
SUN/256 168
bin width.
[Default: 0]
8.3.25 fill
If a two-dimensional dataset represents a single-valued function, this plotter will fill the areaunderneath the function's curve with a solid colour. Parts of the surface which would only bepartially covered (because of rapid function variation within the width of a single pixel) arerepresented using appropriate alpha-blending. The filled area may alternatively be that above thecurve or to its left or right.
One example of its use is to reconstruct the appearance of a histogram plot from a set of histogrambins. For X,Y data which is not single-valued, the result may not be very useful.
Usage Overview:
layerN=fill colorN=<rrggbb>|red|blue|... transparencyN=0..1horizontalN=true|false positiveN=true|false <pos-coord-paramsN>inN=<table> ifmtN=<in-format> istreamN=true|false icmdN=<cmds>
All the parameters listed here affect only the relevant layer, identified by the suffix N.
Positional Coordinate Parameters:The positional coordinates <pos-coord-paramsN> give a position for each row of the inputtable. Their form depends on the plot geometry, i.e. which plotting command is used. For aplane plot (plot2plane) the parameters would be xN and yN. The coordinate parameter valuesare in all cases strings interpreted as numeric expressions based on column names. These canbe column names, fixed values or algebraic expressions as described in Section 10.
Example:
SUN/256 169
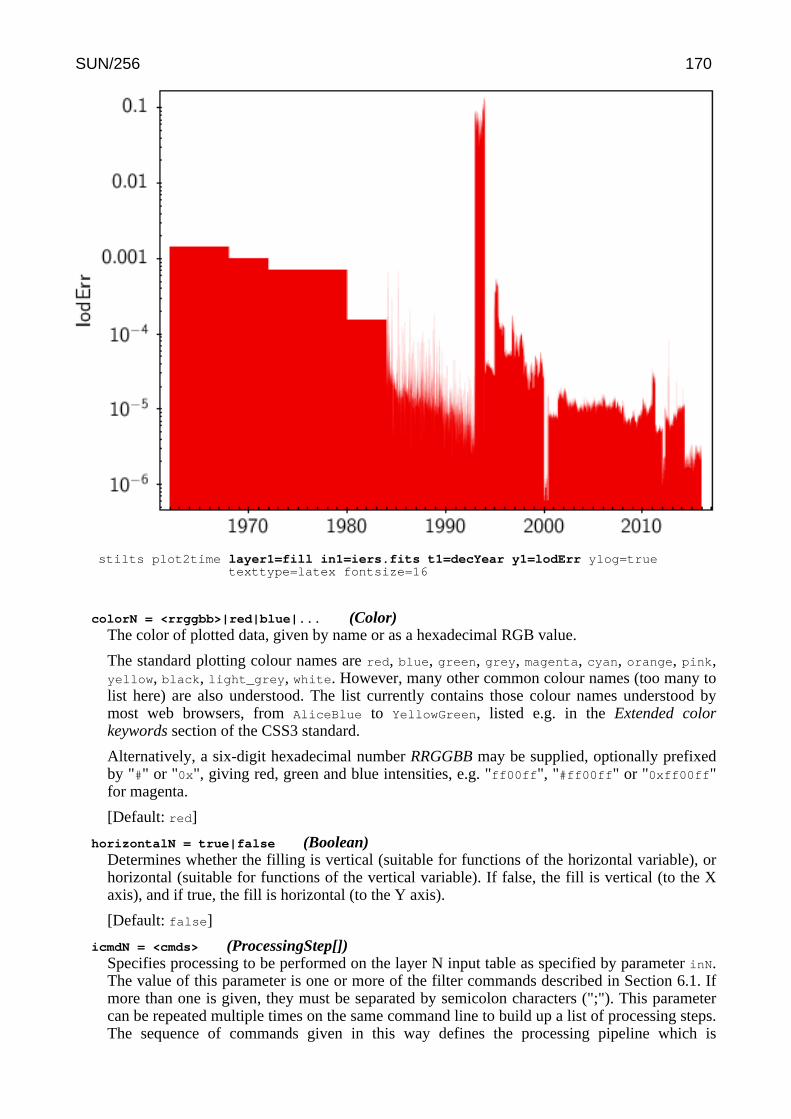
stilts plot2time layer1=fill in1=iers.fits t1=decYear y1=lodErr ylog=truetexttype=latex fontsize=16
colorN = <rrggbb>|red|blue|... (Color)The color of plotted data, given by name or as a hexadecimal RGB value.
The standard plotting colour names are red, blue, green, grey, magenta, cyan, orange, pink,yellow, black, light_grey, white. However, many other common colour names (too many tolist here) are also understood. The list currently contains those colour names understood bymost web browsers, from AliceBlue to YellowGreen, listed e.g. in the Extended colorkeywords section of the CSS3 standard.
Alternatively, a six-digit hexadecimal number RRGGBB may be supplied, optionally prefixedby "#" or "0x", giving red, green and blue intensities, e.g. "ff00ff", "#ff00ff" or "0xff00ff"for magenta.
[Default: red]
horizontalN = true|false (Boolean)Determines whether the filling is vertical (suitable for functions of the horizontal variable), orhorizontal (suitable for functions of the vertical variable). If false, the fill is vertical (to the Xaxis), and if true, the fill is horizontal (to the Y axis).
[Default: false]
icmdN = <cmds> (ProcessingStep[])Specifies processing to be performed on the layer N input table as specified by parameter inN.The value of this parameter is one or more of the filter commands described in Section 6.1. Ifmore than one is given, they must be separated by semicolon characters (";"). This parametercan be repeated multiple times on the same command line to build up a list of processing steps.The sequence of commands given in this way defines the processing pipeline which is
SUN/256 170
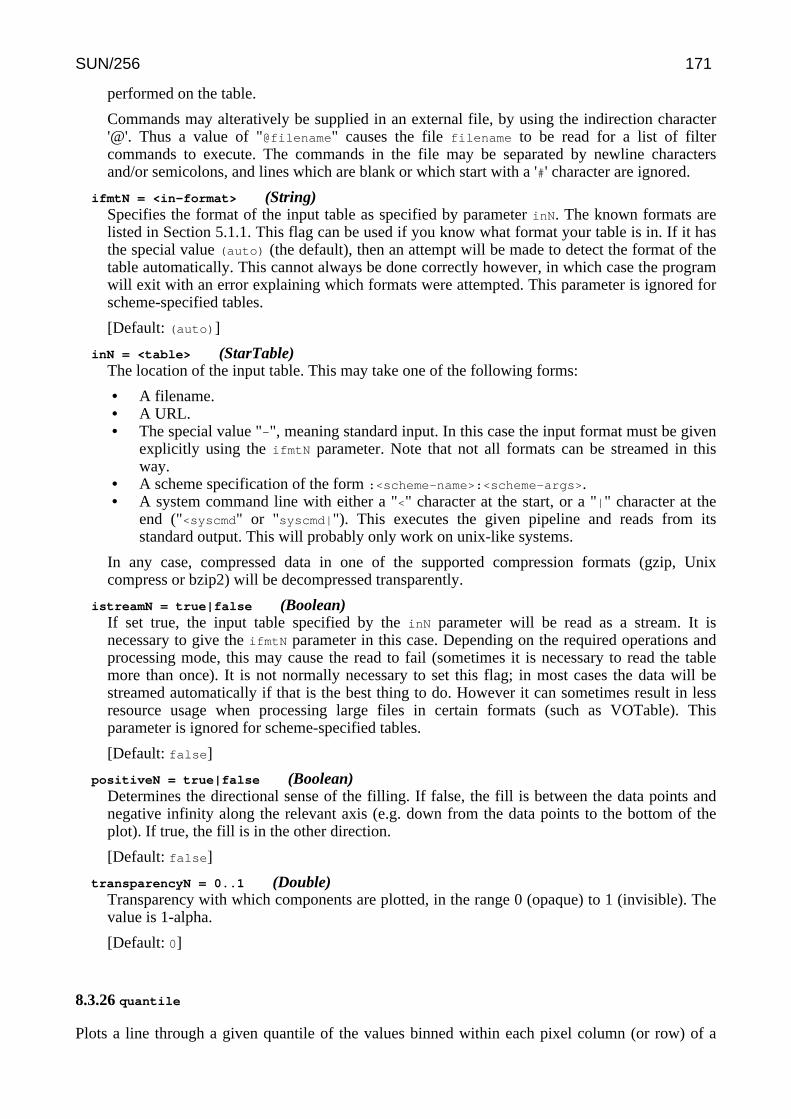
performed on the table.
Commands may alteratively be supplied in an external file, by using the indirection character'@'. Thus a value of "@filename" causes the file filename to be read for a list of filtercommands to execute. The commands in the file may be separated by newline charactersand/or semicolons, and lines which are blank or which start with a '#' character are ignored.
ifmtN = <in-format> (String)Specifies the format of the input table as specified by parameter inN. The known formats arelisted in Section 5.1.1. This flag can be used if you know what format your table is in. If it hasthe special value (auto) (the default), then an attempt will be made to detect the format of thetable automatically. This cannot always be done correctly however, in which case the programwill exit with an error explaining which formats were attempted. This parameter is ignored forscheme-specified tables.
[Default: (auto)]
inN = <table> (StarTable)The location of the input table. This may take one of the following forms:
• A filename.• A URL.• The special value "-", meaning standard input. In this case the input format must be given
explicitly using the ifmtN parameter. Note that not all formats can be streamed in thisway.
• A scheme specification of the form :<scheme-name>:<scheme-args>.• A system command line with either a "<" character at the start, or a "|" character at the
end ("<syscmd" or "syscmd|"). This executes the given pipeline and reads from itsstandard output. This will probably only work on unix-like systems.
In any case, compressed data in one of the supported compression formats (gzip, Unixcompress or bzip2) will be decompressed transparently.
istreamN = true|false (Boolean)If set true, the input table specified by the inN parameter will be read as a stream. It isnecessary to give the ifmtN parameter in this case. Depending on the required operations andprocessing mode, this may cause the read to fail (sometimes it is necessary to read the tablemore than once). It is not normally necessary to set this flag; in most cases the data will bestreamed automatically if that is the best thing to do. However it can sometimes result in lessresource usage when processing large files in certain formats (such as VOTable). Thisparameter is ignored for scheme-specified tables.
[Default: false]
positiveN = true|false (Boolean)Determines the directional sense of the filling. If false, the fill is between the data points andnegative infinity along the relevant axis (e.g. down from the data points to the bottom of theplot). If true, the fill is in the other direction.
[Default: false]
transparencyN = 0..1 (Double)Transparency with which components are plotted, in the range 0 (opaque) to 1 (invisible). Thevalue is 1-alpha.
[Default: 0]
8.3.26 quantile
Plots a line through a given quantile of the values binned within each pixel column (or row) of a
SUN/256 171
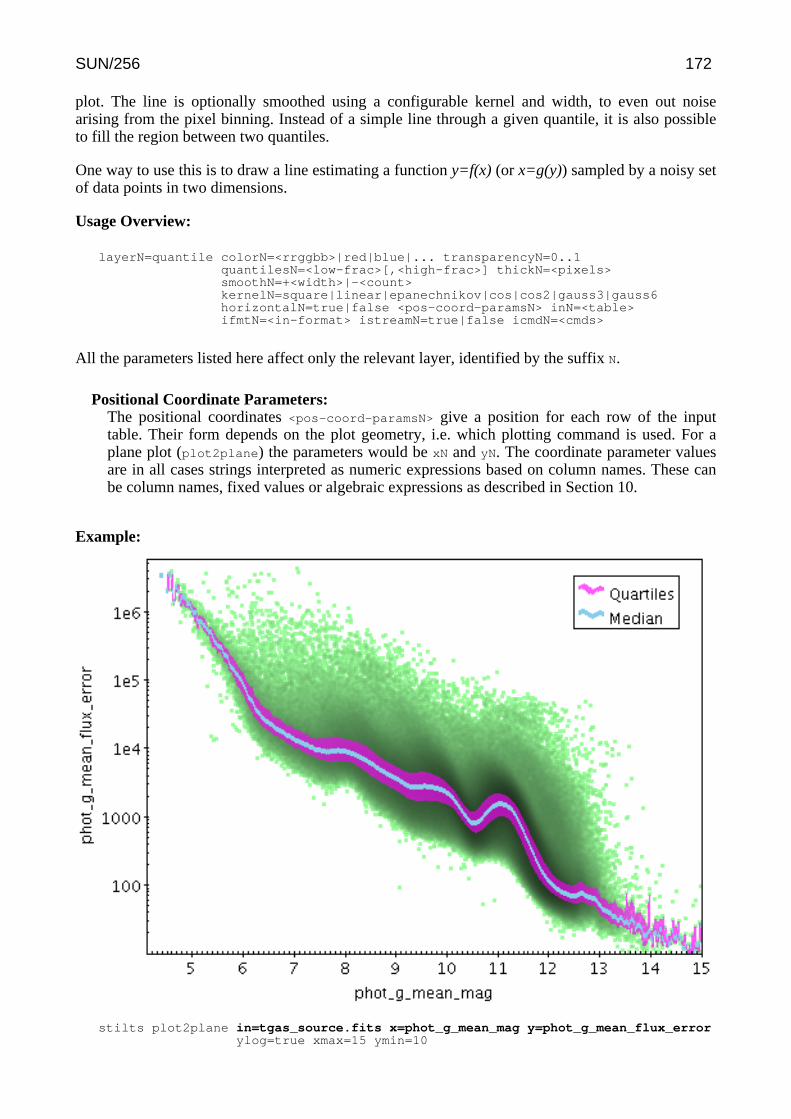
plot. The line is optionally smoothed using a configurable kernel and width, to even out noisearising from the pixel binning. Instead of a simple line through a given quantile, it is also possibleto fill the region between two quantiles.
One way to use this is to draw a line estimating a function y=f(x) (or x=g(y)) sampled by a noisy setof data points in two dimensions.
Usage Overview:
layerN=quantile colorN=<rrggbb>|red|blue|... transparencyN=0..1quantilesN=<low-frac>[,<high-frac>] thickN=<pixels>smoothN=+<width>|-<count>kernelN=square|linear|epanechnikov|cos|cos2|gauss3|gauss6horizontalN=true|false <pos-coord-paramsN> inN=<table>ifmtN=<in-format> istreamN=true|false icmdN=<cmds>
All the parameters listed here affect only the relevant layer, identified by the suffix N.
Positional Coordinate Parameters:The positional coordinates <pos-coord-paramsN> give a position for each row of the inputtable. Their form depends on the plot geometry, i.e. which plotting command is used. For aplane plot (plot2plane) the parameters would be xN and yN. The coordinate parameter valuesare in all cases strings interpreted as numeric expressions based on column names. These canbe column names, fixed values or algebraic expressions as described in Section 10.
Example:
stilts plot2plane in=tgas_source.fits x=phot_g_mean_mag y=phot_g_mean_flux_errorylog=true xmax=15 ymin=10
SUN/256 172
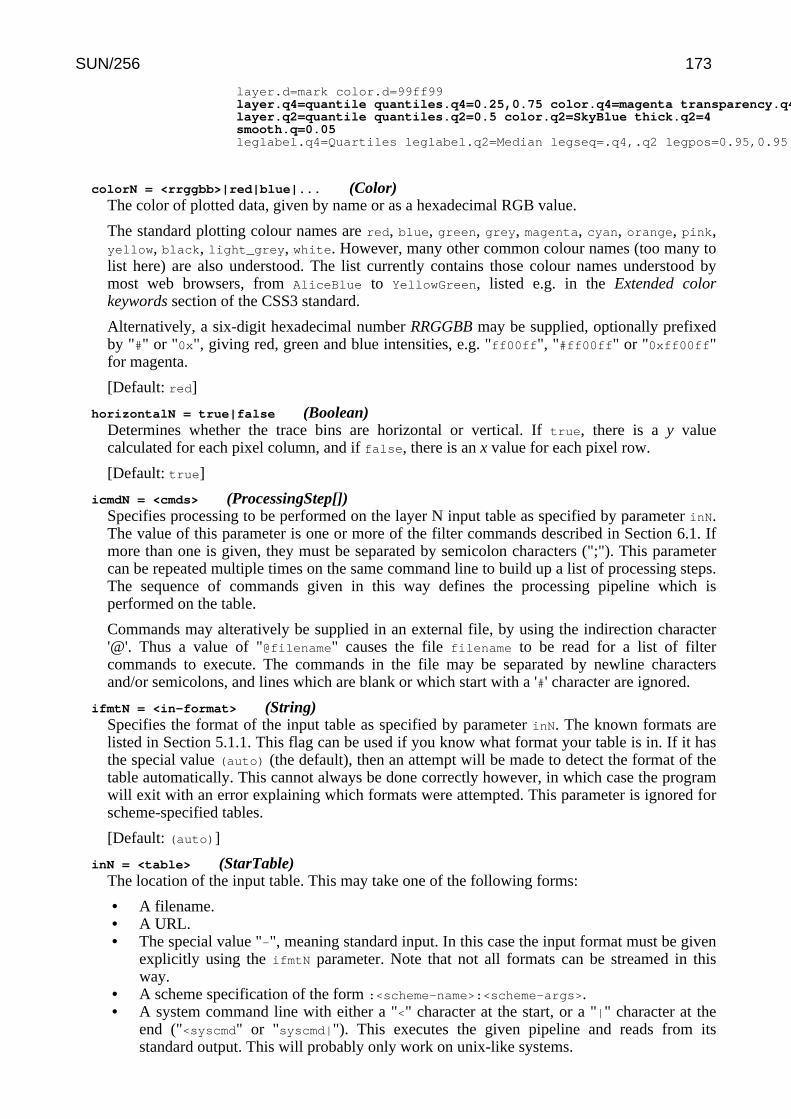
layer.d=mark color.d=99ff99layer.q4=quantile quantiles.q4=0.25,0.75 color.q4=magenta transparency.q4=0.35layer.q2=quantile quantiles.q2=0.5 color.q2=SkyBlue thick.q2=4smooth.q=0.05leglabel.q4=Quartiles leglabel.q2=Median legseq=.q4,.q2 legpos=0.95,0.95
colorN = <rrggbb>|red|blue|... (Color)The color of plotted data, given by name or as a hexadecimal RGB value.
The standard plotting colour names are red, blue, green, grey, magenta, cyan, orange, pink,yellow, black, light_grey, white. However, many other common colour names (too many tolist here) are also understood. The list currently contains those colour names understood bymost web browsers, from AliceBlue to YellowGreen, listed e.g. in the Extended colorkeywords section of the CSS3 standard.
Alternatively, a six-digit hexadecimal number RRGGBB may be supplied, optionally prefixedby "#" or "0x", giving red, green and blue intensities, e.g. "ff00ff", "#ff00ff" or "0xff00ff"for magenta.
[Default: red]
horizontalN = true|false (Boolean)Determines whether the trace bins are horizontal or vertical. If true, there is a y valuecalculated for each pixel column, and if false, there is an x value for each pixel row.
[Default: true]
icmdN = <cmds> (ProcessingStep[])Specifies processing to be performed on the layer N input table as specified by parameter inN.The value of this parameter is one or more of the filter commands described in Section 6.1. Ifmore than one is given, they must be separated by semicolon characters (";"). This parametercan be repeated multiple times on the same command line to build up a list of processing steps.The sequence of commands given in this way defines the processing pipeline which isperformed on the table.
Commands may alteratively be supplied in an external file, by using the indirection character'@'. Thus a value of "@filename" causes the file filename to be read for a list of filtercommands to execute. The commands in the file may be separated by newline charactersand/or semicolons, and lines which are blank or which start with a '#' character are ignored.
ifmtN = <in-format> (String)Specifies the format of the input table as specified by parameter inN. The known formats arelisted in Section 5.1.1. This flag can be used if you know what format your table is in. If it hasthe special value (auto) (the default), then an attempt will be made to detect the format of thetable automatically. This cannot always be done correctly however, in which case the programwill exit with an error explaining which formats were attempted. This parameter is ignored forscheme-specified tables.
[Default: (auto)]
inN = <table> (StarTable)The location of the input table. This may take one of the following forms:
• A filename.• A URL.• The special value "-", meaning standard input. In this case the input format must be given
explicitly using the ifmtN parameter. Note that not all formats can be streamed in thisway.
• A scheme specification of the form :<scheme-name>:<scheme-args>.• A system command line with either a "<" character at the start, or a "|" character at the
end ("<syscmd" or "syscmd|"). This executes the given pipeline and reads from itsstandard output. This will probably only work on unix-like systems.
SUN/256 173
In any case, compressed data in one of the supported compression formats (gzip, Unixcompress or bzip2) will be decompressed transparently.
istreamN = true|false (Boolean)If set true, the input table specified by the inN parameter will be read as a stream. It isnecessary to give the ifmtN parameter in this case. Depending on the required operations andprocessing mode, this may cause the read to fail (sometimes it is necessary to read the tablemore than once). It is not normally necessary to set this flag; in most cases the data will bestreamed automatically if that is the best thing to do. However it can sometimes result in lessresource usage when processing large files in certain formats (such as VOTable). Thisparameter is ignored for scheme-specified tables.
[Default: false]
kernelN = square|linear|epanechnikov|cos|cos2|gauss3|gauss6 (Kernel1dShape)The functional form of the smoothing kernel. The functions listed refer to the unscaled shape;all kernels are normalised to give a total area of unity.
The available options are:
• square: Uniform value: f(x)=1, |x|=0..1• linear: Triangle: f(x)=1-|x|, |x|=0..1• epanechnikov: Parabola: f(x)=1-x*x, |x|=0..1• cos: Cosine: f(x)=cos(x*pi/2), |x|=0..1• cos2: Cosine squared: f(x)=cos^2(x*pi/2), |x|=0..1• gauss3: Gaussian truncated at 3.0 sigma: f(x)=exp(-x*x/2), |x|=0..3• gauss6: Gaussian truncated at 6.0 sigma: f(x)=exp(-x*x/2), |x|=0..6
[Default: epanechnikov]
quantilesN = <low-frac>[,<high-frac>] (Subrange)Defines the quantile or quantile range of values that should be marked in each pixel column (orrow). The value may be a single number in the range 0..1 indicating the quantile which shouldbe marked. Alternatively, it may be a pair of numbers, each in the range 0..1, separated bycommas (<lo>,<hi>) indicating two quantile lines bounding an area to be filled. A pair ofequal values "a,a" is equivalent to the single value "a". The default is 0.5, which means tomark the median value in each column, and could equivalently be specified 0.5,0.5.
[Default: 0.5]
smoothN = +<width>|-<count> (BinSizer)Configures the smoothing width. This is the characteristic width of the kernel function to beconvolved with the density in one dimension to smooth the quantile function.
If the supplied value is a positive number it is interpreted as a fixed width in the datacoordinates of the X axis (if the X axis is logarithmic, the value is a fixed factor). If it is anegative number, then it will be interpreted as the approximate number of smooothing widthsthat fit in the width of the visible plot (i.e. plot width / smoothing width). If the value is zero,no smoothing is applied.
When setting this value graphically, you can use either the slider to adjust the bin count or thenumeric entry field to fix the bin width.
[Default: 0]
thickN = <pixels> (Integer)Sets the minimum extent of the markers that are plotted in each pixel column (or row) toindicate the designated value range. If the range is zero sized (quantiles specifies a singlevalue rather than a pair) this will give the actual thickness of the plotted line. If the range isnon-zero however, the line may be thicker than this in places according to the quantilepositions.
SUN/256 174
[Default: 3]
transparencyN = 0..1 (Double)Transparency with which components are plotted, in the range 0 (opaque) to 1 (invisible). Thevalue is 1-alpha.
[Default: 0]
8.3.27 histogram
Plots a histogram.
Bin heights may optionally be weighted by the values of some additional coordinate, supplied usingthe weight parameter. In this case you can choose how these weights are combined in each binusing the combine parameter.
Various options are provided for configuring how the bar heights are calculated, but note that not allcombinations of the available parameters will necessarily lead to meaningful visualisations.
Usage Overview:
layerN=histogram colorN=<rrggbb>|red|blue|... transparencyN=0..1binsizeN=+<width>|-<count> phaseN=<number>combineN=sum|sum-per-unit|count|...cumulativeN=none|forward|reversenormaliseN=none|area|unit|maximum|heightbarformN=open|filled|semi_filled|steps|semi_steps|spikesthickN=<pixels> dashN=dot|dash|...|<a,b,...> xN=<num-expr>weightN=<num-expr> inN=<table> ifmtN=<in-format>istreamN=true|false icmdN=<cmds>
All the parameters listed here affect only the relevant layer, identified by the suffix N.
Example:
SUN/256 175
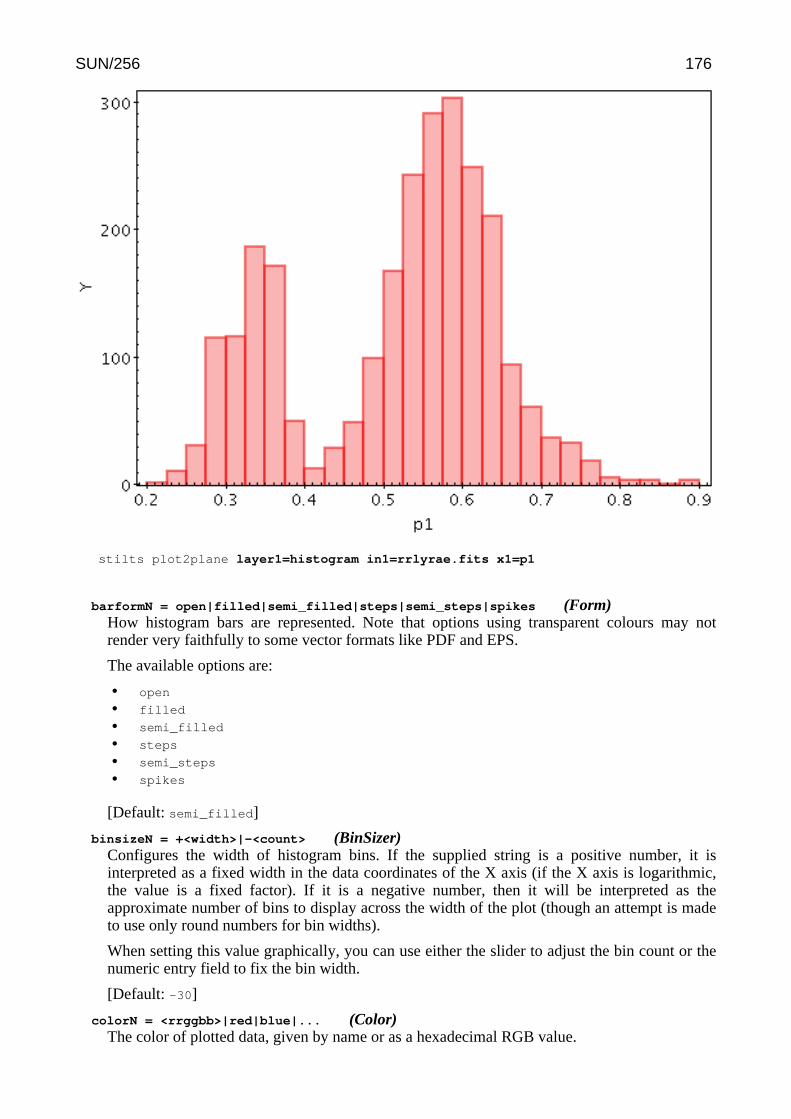
stilts plot2plane layer1=histogram in1=rrlyrae.fits x1=p1
barformN = open|filled|semi_filled|steps|semi_steps|spikes (Form)How histogram bars are represented. Note that options using transparent colours may notrender very faithfully to some vector formats like PDF and EPS.
The available options are:
• open
• filled
• semi_filled
• steps
• semi_steps
• spikes
[Default: semi_filled]
binsizeN = +<width>|-<count> (BinSizer)Configures the width of histogram bins. If the supplied string is a positive number, it isinterpreted as a fixed width in the data coordinates of the X axis (if the X axis is logarithmic,the value is a fixed factor). If it is a negative number, then it will be interpreted as theapproximate number of bins to display across the width of the plot (though an attempt is madeto use only round numbers for bin widths).
When setting this value graphically, you can use either the slider to adjust the bin count or thenumeric entry field to fix the bin width.
[Default: -30]
colorN = <rrggbb>|red|blue|... (Color)The color of plotted data, given by name or as a hexadecimal RGB value.
SUN/256 176
The standard plotting colour names are red, blue, green, grey, magenta, cyan, orange, pink,yellow, black, light_grey, white. However, many other common colour names (too many tolist here) are also understood. The list currently contains those colour names understood bymost web browsers, from AliceBlue to YellowGreen, listed e.g. in the Extended colorkeywords section of the CSS3 standard.
Alternatively, a six-digit hexadecimal number RRGGBB may be supplied, optionally prefixedby "#" or "0x", giving red, green and blue intensities, e.g. "ff00ff", "#ff00ff" or "0xff00ff"for magenta.
[Default: red]
combineN = sum|sum-per-unit|count|... (Combiner)Defines how values contributing to the same bin are combined together to produce the valueassigned to that bin, and hence its height. The combined values are those given by the weight
coordinate, but if no weight is supplied, a weighting of unity is assumed.
The available options are:
• sum: the sum of all the combined values per bin• sum-per-unit: the sum of all the combined values per unit of bin size• count: the number of non-blank values per bin (weight is ignored)• count-per-unit: the number of non-blank values per unit of bin size (weight is ignored)• mean: the mean of the combined values• median: the median of the combined values (may be slow)• min: the minimum of all the combined values• max: the maximum of all the combined values• stdev: the sample standard deviation of the combined values• hit: 1 if any values present, NaN otherwise (weight is ignored)
[Default: sum]
cumulativeN = none|forward|reverse (Cumulation)If set to forward/reverse the histogram bars plotted are calculated cumulatively; each binincludes the counts from all previous bins working up/down the independent axis.
Note that setting cumulative plotting may not make much sense with some other parametervalues, for instance averaging aggregation modes.
For reasons of backward compatibility, the values true and false may be used as aliases forforward and none.
The available options are:
• none: The value plotted for each bin uses the samples accumulated in that bin.• forward: The value plotted for each bin uses the samples accumulated all the way from
negative infinity to that bin.• reverse: The value plotted for each bin uses the samples accumulated all the way from
positive infinity to that bin.
[Default: none]
dashN = dot|dash|...|<a,b,...> (float[])Determines the dash pattern of the line drawn. If null (the default), the line is solid.
Possible values for dashed lines are dot, dash, longdash, dotdash. You can alternativelysupply a comma-separated list of on/off length values such as "4,2,8,2".
icmdN = <cmds> (ProcessingStep[])Specifies processing to be performed on the layer N input table as specified by parameter inN.The value of this parameter is one or more of the filter commands described in Section 6.1. Ifmore than one is given, they must be separated by semicolon characters (";"). This parameter
SUN/256 177
can be repeated multiple times on the same command line to build up a list of processing steps.The sequence of commands given in this way defines the processing pipeline which isperformed on the table.
Commands may alteratively be supplied in an external file, by using the indirection character'@'. Thus a value of "@filename" causes the file filename to be read for a list of filtercommands to execute. The commands in the file may be separated by newline charactersand/or semicolons, and lines which are blank or which start with a '#' character are ignored.
ifmtN = <in-format> (String)Specifies the format of the input table as specified by parameter inN. The known formats arelisted in Section 5.1.1. This flag can be used if you know what format your table is in. If it hasthe special value (auto) (the default), then an attempt will be made to detect the format of thetable automatically. This cannot always be done correctly however, in which case the programwill exit with an error explaining which formats were attempted. This parameter is ignored forscheme-specified tables.
[Default: (auto)]
inN = <table> (StarTable)The location of the input table. This may take one of the following forms:
• A filename.• A URL.• The special value "-", meaning standard input. In this case the input format must be given
explicitly using the ifmtN parameter. Note that not all formats can be streamed in thisway.
• A scheme specification of the form :<scheme-name>:<scheme-args>.• A system command line with either a "<" character at the start, or a "|" character at the
end ("<syscmd" or "syscmd|"). This executes the given pipeline and reads from itsstandard output. This will probably only work on unix-like systems.
In any case, compressed data in one of the supported compression formats (gzip, Unixcompress or bzip2) will be decompressed transparently.
istreamN = true|false (Boolean)If set true, the input table specified by the inN parameter will be read as a stream. It isnecessary to give the ifmtN parameter in this case. Depending on the required operations andprocessing mode, this may cause the read to fail (sometimes it is necessary to read the tablemore than once). It is not normally necessary to set this flag; in most cases the data will bestreamed automatically if that is the best thing to do. However it can sometimes result in lessresource usage when processing large files in certain formats (such as VOTable). Thisparameter is ignored for scheme-specified tables.
[Default: false]
normaliseN = none|area|unit|maximum|height (Normalisation)Defines how, if at all, the bars of histogram-like plots are normalised or otherwise scaledvertically.
Note that some of the normalisation options may not make much sense with some otherparameter values, for instance averaging aggregation modes.
The available options are:
• none: No normalisation is performed.• area: The total area of histogram bars is normalised to unity. For cumulative plots, this
behaves like height.• unit: Histogram bars are scaled by the inverse of the bin width in data units. For
cumulative plots, this behaves like none.• maximum: The height of the tallest histogram bar is normalised to unity. For cumulative
plots, this behaves like height.
SUN/256 178
• height: The total height of histogram bars is normalised to unity.
[Default: none]
phaseN = <number> (Double)Controls where the horizontal zero point for binning is set. For instance if your bin size is 1,this value controls whether bin boundaries are at 0, 1, 2, .. or 0.5, 1.5, 2.5, ... etc.
A value of 0 (or any integer) will result in a bin boundary at X=0 (linear X axis) or X=1(logarithmic X axis). A fractional value will give a bin boundary at that value multiplied by thebin width.
[Default: 0]
thickN = <pixels> (Integer)Thickness of plotted line in pixels.
[Default: 2]
transparencyN = 0..1 (Double)Transparency with which components are plotted, in the range 0 (opaque) to 1 (invisible). Thevalue is 1-alpha.
[Default: 0]
weightN = <num-expr> (String)Weighting of data points. If supplied, each point contributes a value to the histogram equal tothe data value multiplied by this coordinate. If not supplied, the effect is the same as supplyinga fixed value of one.
The value is a numeric algebraic expression based on column names as described in Section10.
xN = <num-expr> (String)Horizontal coordinate.
The value is a numeric algebraic expression based on column names as described in Section10.
8.3.28 kde
Plots a Discrete Kernel Density Estimate giving a smoothed frequency of data values along thehorizontal axis, using a fixed-width smoothing kernel. This is a generalisation of a histogram inwhich the bins are always 1 pixel wide, and a smoothing kernel is applied to each bin. The widthand shape of the kernel may be varied.
This is suitable for cases where the division into discrete bins done by a normal histogram isunnecessary or troublesome.
Note this is not a true Kernel Density Estimate, since, for performance reasons, the smoothing isapplied to the (pixel-width) bins rather than to each data sample. The deviation from a true KDEcaused by this quantisation will be at the pixel level, hence in most cases not visually apparent.
A weighting may be applied to the calculated levels by supplying the weight coordinate. In thiscase you can choose how these weights are aggregated in each pixel bin using the combine
parameter. The result is something like a smoothed version of the corresponding weightedhistogram. Note that some combinations of the available parameters (e.g. a normalised cumulativemedian-aggregated KDE) may not make much visual sense.
Usage Overview:
SUN/256 179
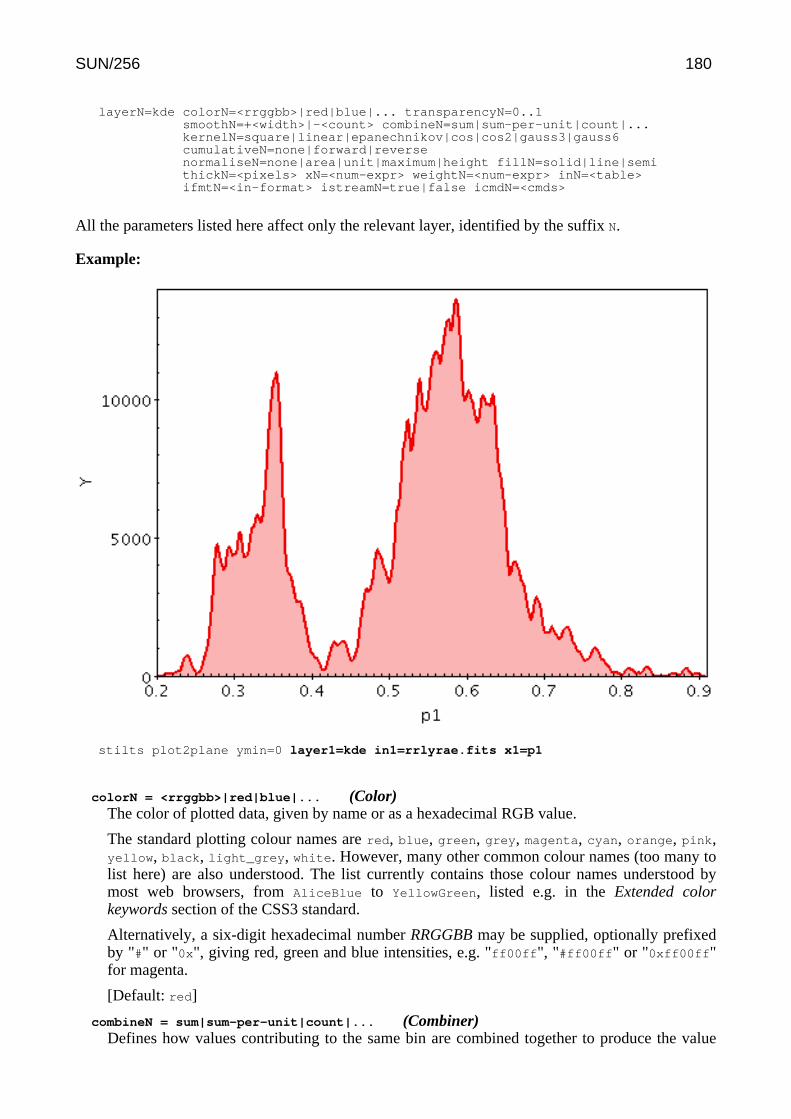
layerN=kde colorN=<rrggbb>|red|blue|... transparencyN=0..1smoothN=+<width>|-<count> combineN=sum|sum-per-unit|count|...kernelN=square|linear|epanechnikov|cos|cos2|gauss3|gauss6cumulativeN=none|forward|reversenormaliseN=none|area|unit|maximum|height fillN=solid|line|semithickN=<pixels> xN=<num-expr> weightN=<num-expr> inN=<table>ifmtN=<in-format> istreamN=true|false icmdN=<cmds>
All the parameters listed here affect only the relevant layer, identified by the suffix N.
Example:
stilts plot2plane ymin=0 layer1=kde in1=rrlyrae.fits x1=p1
colorN = <rrggbb>|red|blue|... (Color)The color of plotted data, given by name or as a hexadecimal RGB value.
The standard plotting colour names are red, blue, green, grey, magenta, cyan, orange, pink,yellow, black, light_grey, white. However, many other common colour names (too many tolist here) are also understood. The list currently contains those colour names understood bymost web browsers, from AliceBlue to YellowGreen, listed e.g. in the Extended colorkeywords section of the CSS3 standard.
Alternatively, a six-digit hexadecimal number RRGGBB may be supplied, optionally prefixedby "#" or "0x", giving red, green and blue intensities, e.g. "ff00ff", "#ff00ff" or "0xff00ff"for magenta.
[Default: red]
combineN = sum|sum-per-unit|count|... (Combiner)Defines how values contributing to the same bin are combined together to produce the value
SUN/256 180
assigned to that bin, and hence its height. The bins in this case are 1-pixel wide, so lack muchphysical significance. This means that while some combination modes, such as sum-per-unit
and mean make sense, others such as sum do not.
The combined values are those given by the weight coordinate, but if no weight is supplied, aweighting of unity is assumed.
The available options are:
• sum: the sum of all the combined values per bin• sum-per-unit: the sum of all the combined values per unit of bin size• count: the number of non-blank values per bin (weight is ignored)• count-per-unit: the number of non-blank values per unit of bin size (weight is ignored)• mean: the mean of the combined values• median: the median of the combined values (may be slow)• min: the minimum of all the combined values• max: the maximum of all the combined values• stdev: the sample standard deviation of the combined values• hit: 1 if any values present, NaN otherwise (weight is ignored)
[Default: sum-per-unit]
cumulativeN = none|forward|reverse (Cumulation)If set to forward/reverse the histogram bars plotted are calculated cumulatively; each binincludes the counts from all previous bins working up/down the independent axis.
Note that setting cumulative plotting may not make much sense with some other parametervalues, for instance averaging aggregation modes.
For reasons of backward compatibility, the values true and false may be used as aliases forforward and none.
The available options are:
• none: The value plotted for each bin uses the samples accumulated in that bin.• forward: The value plotted for each bin uses the samples accumulated all the way from
negative infinity to that bin.• reverse: The value plotted for each bin uses the samples accumulated all the way from
positive infinity to that bin.
[Default: none]
fillN = solid|line|semi (FillMode)How the density function is represented.
The available options are:
• solid: area between level and axis is filled with solid colour• line: level is marked by a wiggly line• semi: level is marked by a wiggly line, and area below it is filled with a transparent colour
[Default: semi]
icmdN = <cmds> (ProcessingStep[])Specifies processing to be performed on the layer N input table as specified by parameter inN.The value of this parameter is one or more of the filter commands described in Section 6.1. Ifmore than one is given, they must be separated by semicolon characters (";"). This parametercan be repeated multiple times on the same command line to build up a list of processing steps.The sequence of commands given in this way defines the processing pipeline which isperformed on the table.
Commands may alteratively be supplied in an external file, by using the indirection character
SUN/256 181
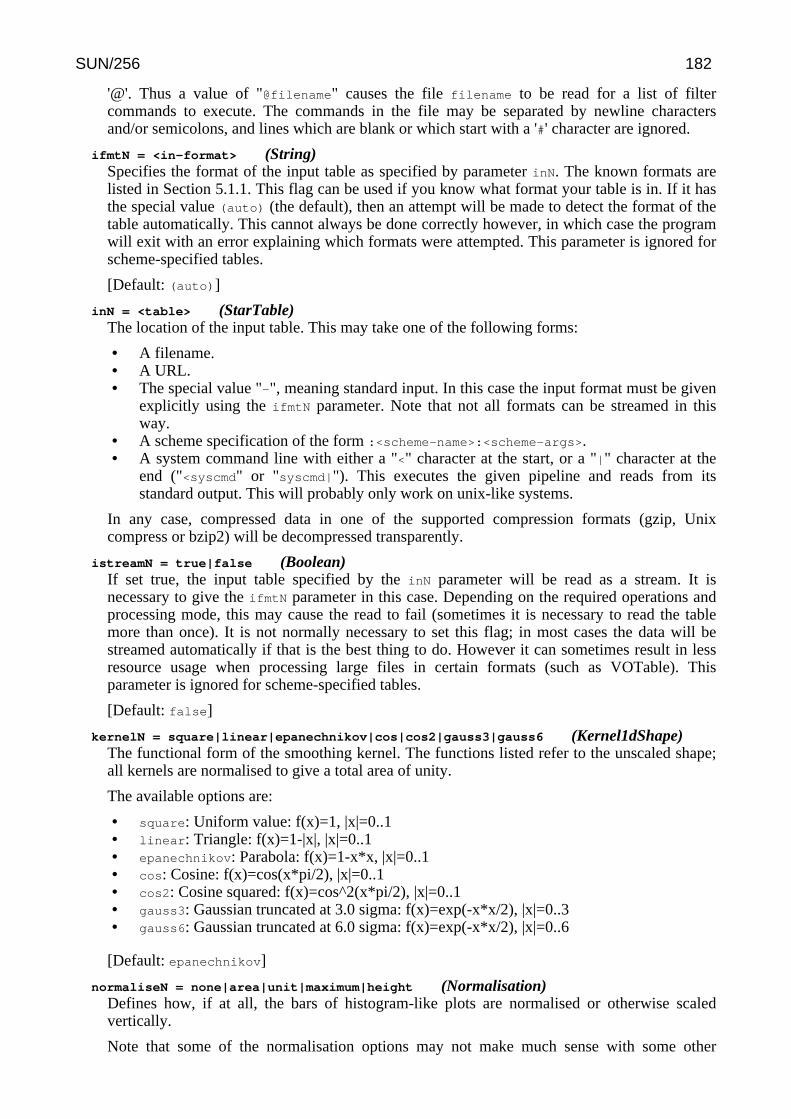
'@'. Thus a value of "@filename" causes the file filename to be read for a list of filtercommands to execute. The commands in the file may be separated by newline charactersand/or semicolons, and lines which are blank or which start with a '#' character are ignored.
ifmtN = <in-format> (String)Specifies the format of the input table as specified by parameter inN. The known formats arelisted in Section 5.1.1. This flag can be used if you know what format your table is in. If it hasthe special value (auto) (the default), then an attempt will be made to detect the format of thetable automatically. This cannot always be done correctly however, in which case the programwill exit with an error explaining which formats were attempted. This parameter is ignored forscheme-specified tables.
[Default: (auto)]
inN = <table> (StarTable)The location of the input table. This may take one of the following forms:
• A filename.• A URL.• The special value "-", meaning standard input. In this case the input format must be given
explicitly using the ifmtN parameter. Note that not all formats can be streamed in thisway.
• A scheme specification of the form :<scheme-name>:<scheme-args>.• A system command line with either a "<" character at the start, or a "|" character at the
end ("<syscmd" or "syscmd|"). This executes the given pipeline and reads from itsstandard output. This will probably only work on unix-like systems.
In any case, compressed data in one of the supported compression formats (gzip, Unixcompress or bzip2) will be decompressed transparently.
istreamN = true|false (Boolean)If set true, the input table specified by the inN parameter will be read as a stream. It isnecessary to give the ifmtN parameter in this case. Depending on the required operations andprocessing mode, this may cause the read to fail (sometimes it is necessary to read the tablemore than once). It is not normally necessary to set this flag; in most cases the data will bestreamed automatically if that is the best thing to do. However it can sometimes result in lessresource usage when processing large files in certain formats (such as VOTable). Thisparameter is ignored for scheme-specified tables.
[Default: false]
kernelN = square|linear|epanechnikov|cos|cos2|gauss3|gauss6 (Kernel1dShape)The functional form of the smoothing kernel. The functions listed refer to the unscaled shape;all kernels are normalised to give a total area of unity.
The available options are:
• square: Uniform value: f(x)=1, |x|=0..1• linear: Triangle: f(x)=1-|x|, |x|=0..1• epanechnikov: Parabola: f(x)=1-x*x, |x|=0..1• cos: Cosine: f(x)=cos(x*pi/2), |x|=0..1• cos2: Cosine squared: f(x)=cos^2(x*pi/2), |x|=0..1• gauss3: Gaussian truncated at 3.0 sigma: f(x)=exp(-x*x/2), |x|=0..3• gauss6: Gaussian truncated at 6.0 sigma: f(x)=exp(-x*x/2), |x|=0..6
[Default: epanechnikov]
normaliseN = none|area|unit|maximum|height (Normalisation)Defines how, if at all, the bars of histogram-like plots are normalised or otherwise scaledvertically.
Note that some of the normalisation options may not make much sense with some other
SUN/256 182
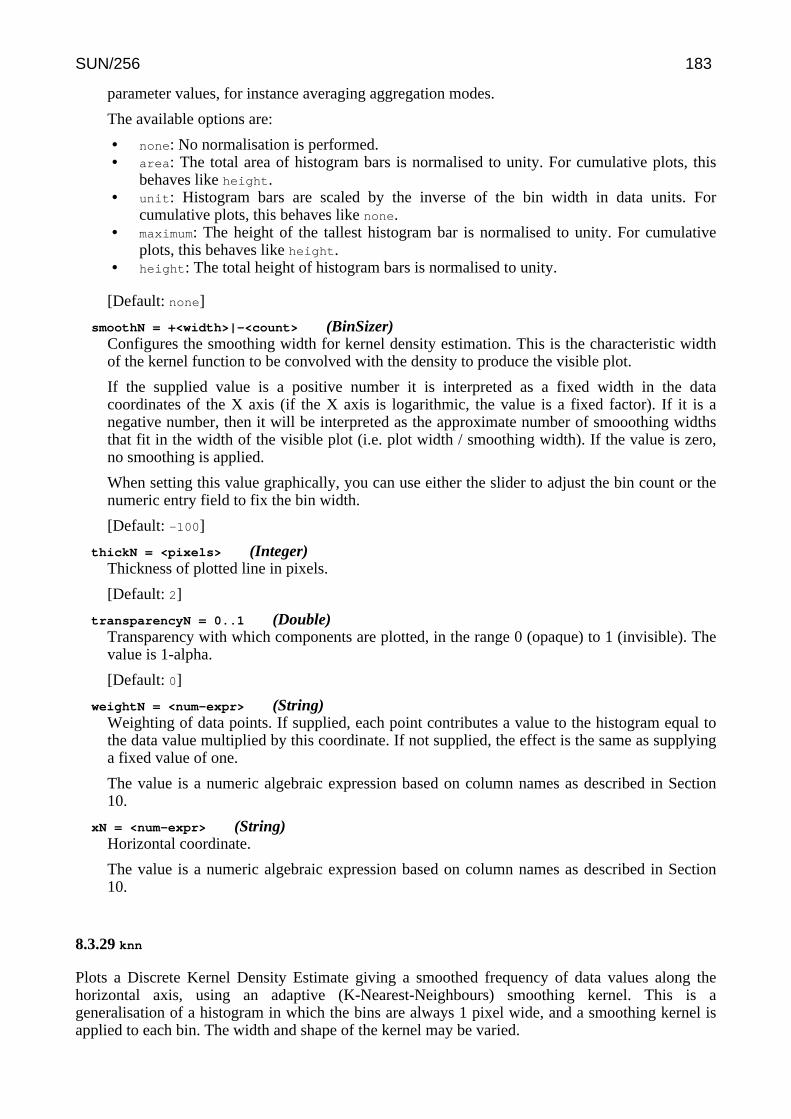
parameter values, for instance averaging aggregation modes.
The available options are:
• none: No normalisation is performed.• area: The total area of histogram bars is normalised to unity. For cumulative plots, this
behaves like height.• unit: Histogram bars are scaled by the inverse of the bin width in data units. For
cumulative plots, this behaves like none.• maximum: The height of the tallest histogram bar is normalised to unity. For cumulative
plots, this behaves like height.• height: The total height of histogram bars is normalised to unity.
[Default: none]
smoothN = +<width>|-<count> (BinSizer)Configures the smoothing width for kernel density estimation. This is the characteristic widthof the kernel function to be convolved with the density to produce the visible plot.
If the supplied value is a positive number it is interpreted as a fixed width in the datacoordinates of the X axis (if the X axis is logarithmic, the value is a fixed factor). If it is anegative number, then it will be interpreted as the approximate number of smooothing widthsthat fit in the width of the visible plot (i.e. plot width / smoothing width). If the value is zero,no smoothing is applied.
When setting this value graphically, you can use either the slider to adjust the bin count or thenumeric entry field to fix the bin width.
[Default: -100]
thickN = <pixels> (Integer)Thickness of plotted line in pixels.
[Default: 2]
transparencyN = 0..1 (Double)Transparency with which components are plotted, in the range 0 (opaque) to 1 (invisible). Thevalue is 1-alpha.
[Default: 0]
weightN = <num-expr> (String)Weighting of data points. If supplied, each point contributes a value to the histogram equal tothe data value multiplied by this coordinate. If not supplied, the effect is the same as supplyinga fixed value of one.
The value is a numeric algebraic expression based on column names as described in Section10.
xN = <num-expr> (String)Horizontal coordinate.
The value is a numeric algebraic expression based on column names as described in Section10.
8.3.29 knn
Plots a Discrete Kernel Density Estimate giving a smoothed frequency of data values along thehorizontal axis, using an adaptive (K-Nearest-Neighbours) smoothing kernel. This is ageneralisation of a histogram in which the bins are always 1 pixel wide, and a smoothing kernel isapplied to each bin. The width and shape of the kernel may be varied.
SUN/256 183

The K-Nearest-Neighbour figure gives the number of points in each direction to determine thewidth of the smoothing kernel for smoothing each bin. Upper and lower limits for the kernel widthare also supplied; if the upper and lower limits are equal, this is equivalent to a fixed-width kernel.
Note this is not a true Kernel Density Estimate, since, for performance reasons, the smoothing isapplied to the (pixel-width) bins rather than to each data sample. The deviation from a true KDEcaused by this quantisation will be at the pixel level, hence in most cases not visually apparent.
Usage Overview:
layerN=knn colorN=<rrggbb>|red|blue|... transparencyN=0..1 knnN=<number>symmetricN=true|false minsmoothN=+<width>|-<count>maxsmoothN=+<width>|-<count>kernelN=square|linear|epanechnikov|cos|cos2|gauss3|gauss6cumulativeN=none|forward|reversenormaliseN=none|area|unit|maximum|height fillN=solid|line|semithickN=<pixels> xN=<num-expr> weightN=<num-expr> inN=<table>ifmtN=<in-format> istreamN=true|false icmdN=<cmds>
All the parameters listed here affect only the relevant layer, identified by the suffix N.
Example:
stilts plot2plane layer1=knn in1=rrlyrae.fits x1=p1
colorN = <rrggbb>|red|blue|... (Color)The color of plotted data, given by name or as a hexadecimal RGB value.
The standard plotting colour names are red, blue, green, grey, magenta, cyan, orange, pink,yellow, black, light_grey, white. However, many other common colour names (too many tolist here) are also understood. The list currently contains those colour names understood by
SUN/256 184
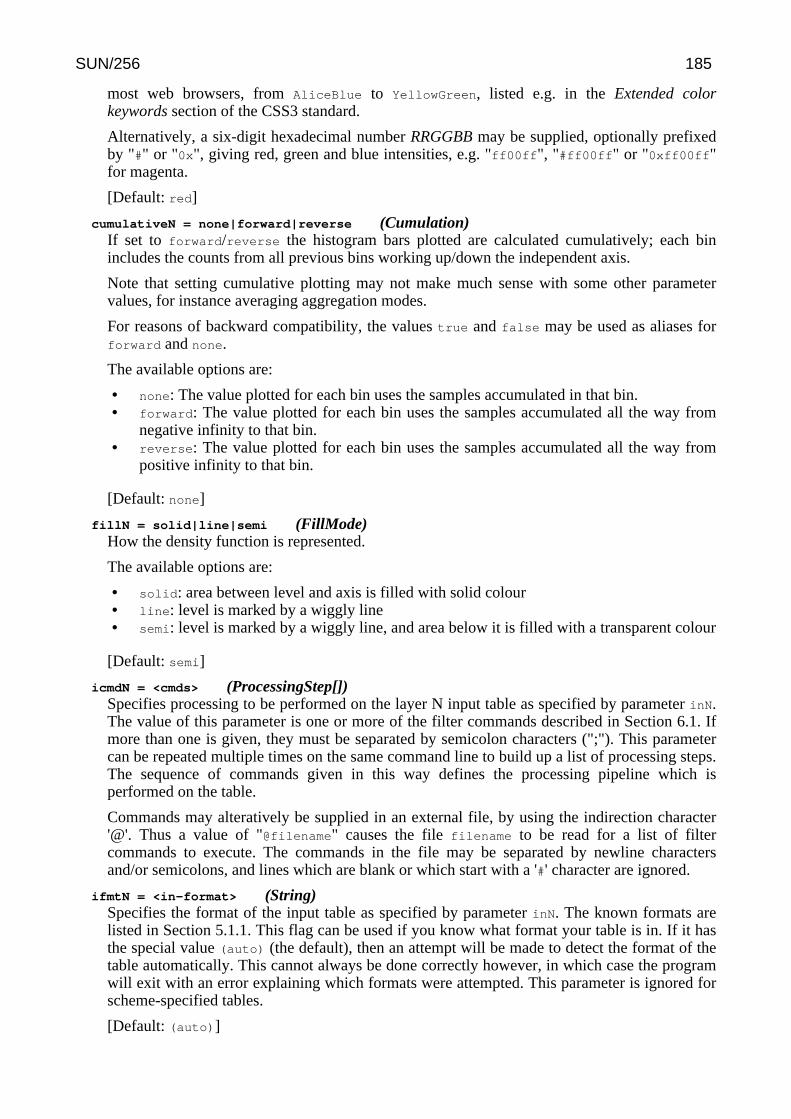
most web browsers, from AliceBlue to YellowGreen, listed e.g. in the Extended colorkeywords section of the CSS3 standard.
Alternatively, a six-digit hexadecimal number RRGGBB may be supplied, optionally prefixedby "#" or "0x", giving red, green and blue intensities, e.g. "ff00ff", "#ff00ff" or "0xff00ff"for magenta.
[Default: red]
cumulativeN = none|forward|reverse (Cumulation)If set to forward/reverse the histogram bars plotted are calculated cumulatively; each binincludes the counts from all previous bins working up/down the independent axis.
Note that setting cumulative plotting may not make much sense with some other parametervalues, for instance averaging aggregation modes.
For reasons of backward compatibility, the values true and false may be used as aliases forforward and none.
The available options are:
• none: The value plotted for each bin uses the samples accumulated in that bin.• forward: The value plotted for each bin uses the samples accumulated all the way from
negative infinity to that bin.• reverse: The value plotted for each bin uses the samples accumulated all the way from
positive infinity to that bin.
[Default: none]
fillN = solid|line|semi (FillMode)How the density function is represented.
The available options are:
• solid: area between level and axis is filled with solid colour• line: level is marked by a wiggly line• semi: level is marked by a wiggly line, and area below it is filled with a transparent colour
[Default: semi]
icmdN = <cmds> (ProcessingStep[])Specifies processing to be performed on the layer N input table as specified by parameter inN.The value of this parameter is one or more of the filter commands described in Section 6.1. Ifmore than one is given, they must be separated by semicolon characters (";"). This parametercan be repeated multiple times on the same command line to build up a list of processing steps.The sequence of commands given in this way defines the processing pipeline which isperformed on the table.
Commands may alteratively be supplied in an external file, by using the indirection character'@'. Thus a value of "@filename" causes the file filename to be read for a list of filtercommands to execute. The commands in the file may be separated by newline charactersand/or semicolons, and lines which are blank or which start with a '#' character are ignored.
ifmtN = <in-format> (String)Specifies the format of the input table as specified by parameter inN. The known formats arelisted in Section 5.1.1. This flag can be used if you know what format your table is in. If it hasthe special value (auto) (the default), then an attempt will be made to detect the format of thetable automatically. This cannot always be done correctly however, in which case the programwill exit with an error explaining which formats were attempted. This parameter is ignored forscheme-specified tables.
[Default: (auto)]
SUN/256 185
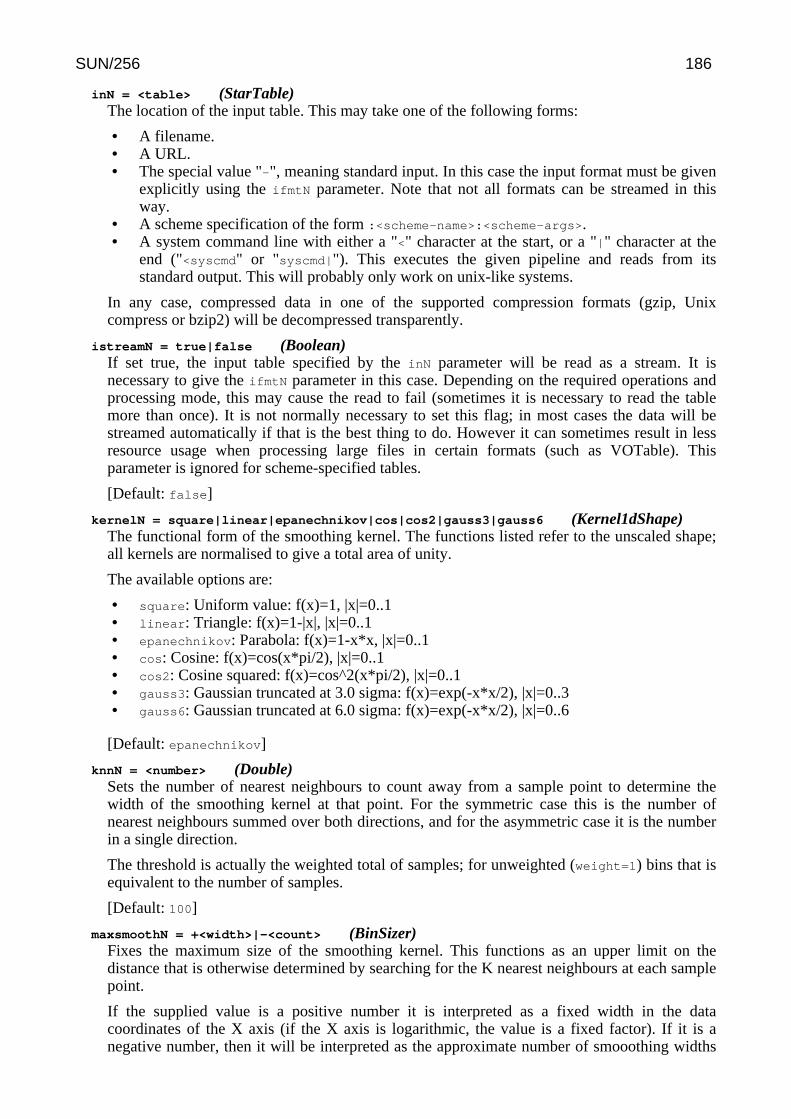
inN = <table> (StarTable)The location of the input table. This may take one of the following forms:
• A filename.• A URL.• The special value "-", meaning standard input. In this case the input format must be given
explicitly using the ifmtN parameter. Note that not all formats can be streamed in thisway.
• A scheme specification of the form :<scheme-name>:<scheme-args>.• A system command line with either a "<" character at the start, or a "|" character at the
end ("<syscmd" or "syscmd|"). This executes the given pipeline and reads from itsstandard output. This will probably only work on unix-like systems.
In any case, compressed data in one of the supported compression formats (gzip, Unixcompress or bzip2) will be decompressed transparently.
istreamN = true|false (Boolean)If set true, the input table specified by the inN parameter will be read as a stream. It isnecessary to give the ifmtN parameter in this case. Depending on the required operations andprocessing mode, this may cause the read to fail (sometimes it is necessary to read the tablemore than once). It is not normally necessary to set this flag; in most cases the data will bestreamed automatically if that is the best thing to do. However it can sometimes result in lessresource usage when processing large files in certain formats (such as VOTable). Thisparameter is ignored for scheme-specified tables.
[Default: false]
kernelN = square|linear|epanechnikov|cos|cos2|gauss3|gauss6 (Kernel1dShape)The functional form of the smoothing kernel. The functions listed refer to the unscaled shape;all kernels are normalised to give a total area of unity.
The available options are:
• square: Uniform value: f(x)=1, |x|=0..1• linear: Triangle: f(x)=1-|x|, |x|=0..1• epanechnikov: Parabola: f(x)=1-x*x, |x|=0..1• cos: Cosine: f(x)=cos(x*pi/2), |x|=0..1• cos2: Cosine squared: f(x)=cos^2(x*pi/2), |x|=0..1• gauss3: Gaussian truncated at 3.0 sigma: f(x)=exp(-x*x/2), |x|=0..3• gauss6: Gaussian truncated at 6.0 sigma: f(x)=exp(-x*x/2), |x|=0..6
[Default: epanechnikov]
knnN = <number> (Double)Sets the number of nearest neighbours to count away from a sample point to determine thewidth of the smoothing kernel at that point. For the symmetric case this is the number ofnearest neighbours summed over both directions, and for the asymmetric case it is the numberin a single direction.
The threshold is actually the weighted total of samples; for unweighted (weight=1) bins that isequivalent to the number of samples.
[Default: 100]
maxsmoothN = +<width>|-<count> (BinSizer)Fixes the maximum size of the smoothing kernel. This functions as an upper limit on thedistance that is otherwise determined by searching for the K nearest neighbours at each samplepoint.
If the supplied value is a positive number it is interpreted as a fixed width in the datacoordinates of the X axis (if the X axis is logarithmic, the value is a fixed factor). If it is anegative number, then it will be interpreted as the approximate number of smooothing widths
SUN/256 186
that fit in the width of the visible plot (i.e. plot width / smoothing width). If the value is zero,no smoothing is applied.
When setting this value graphically, you can use either the slider to adjust the bin count or thenumeric entry field to fix the bin width.
[Default: -100]
minsmoothN = +<width>|-<count> (BinSizer)Fixes the minimum size of the smoothing kernel. This functions as a lower limit on thedistance that is otherwise determined by searching for the K nearest neighbours at each samplepoint.
If the supplied value is a positive number it is interpreted as a fixed width in the datacoordinates of the X axis (if the X axis is logarithmic, the value is a fixed factor). If it is anegative number, then it will be interpreted as the approximate number of smooothing widthsthat fit in the width of the visible plot (i.e. plot width / smoothing width). If the value is zero,no smoothing is applied.
When setting this value graphically, you can use either the slider to adjust the bin count or thenumeric entry field to fix the bin width.
[Default: 0]
normaliseN = none|area|unit|maximum|height (Normalisation)Defines how, if at all, the bars of histogram-like plots are normalised or otherwise scaledvertically.
Note that some of the normalisation options may not make much sense with some otherparameter values, for instance averaging aggregation modes.
The available options are:
• none: No normalisation is performed.• area: The total area of histogram bars is normalised to unity. For cumulative plots, this
behaves like height.• unit: Histogram bars are scaled by the inverse of the bin width in data units. For
cumulative plots, this behaves like none.• maximum: The height of the tallest histogram bar is normalised to unity. For cumulative
plots, this behaves like height.• height: The total height of histogram bars is normalised to unity.
[Default: none]
symmetricN = true|false (Boolean)If true, the nearest neigbour search is carried out in both directions, and the kernel issymmetric. If false, the nearest neigbour search is carried out separately in the positive andnegative directions, and the kernel width is accordingly different in the positive and negativedirections.
[Default: true]
thickN = <pixels> (Integer)Thickness of plotted line in pixels.
[Default: 2]
transparencyN = 0..1 (Double)Transparency with which components are plotted, in the range 0 (opaque) to 1 (invisible). Thevalue is 1-alpha.
[Default: 0]
weightN = <num-expr> (String)
SUN/256 187
Weighting of data points. If supplied, each point contributes a value to the histogram equal tothe data value multiplied by this coordinate. If not supplied, the effect is the same as supplyinga fixed value of one.
The value is a numeric algebraic expression based on column names as described in Section10.
xN = <num-expr> (String)Horizontal coordinate.
The value is a numeric algebraic expression based on column names as described in Section10.
8.3.30 densogram
Represents smoothed density of data values along the horizontal axis using a colourmap. This islike a Kernel Density Estimate (smoothed histogram with bins 1 pixel wide), but instead ofrepresenting the data extent vertically as bars or a line, values are represented by a fixed-sizepixel-width column of a colour from a colour map. A smoothing kernel, whose width and shapemay be varied, is applied to each data point.
A weighting may be applied to the calculated levels by supplying the weight coordinate. In thiscase you can choose how these weights are aggregated in each pixel bin using the combine
parameter. The result is something like a smoothed version of the corresponding weightedhistogram. Note that some combinations of the available parameters (e.g. a normalised cumulativemedian-aggregated KDE) may not make much visual sense.
This is a rather unconventional way to represent density data, and this plotting mode is probably notvery useful. But hey, nobody's forcing you to use it.
Usage Overview:
layerN=densogram colorN=<rrggbb>|red|blue|... smoothN=+<width>|-<count>kernelN=square|linear|epanechnikov|cos|cos2|gauss3|gauss6densemapN=<map-name>|<color>-<color>[-<color>...]denseclipN=<lo>,<hi> denseflipN=true|falsedensequantN=<number> densesubN=<lo>,<hi>densefuncN=log|linear|histogram|histolog|sqrt|square|acos|coscumulativeN=none|forward|reverse sizeN=<pixels>posN=<fraction> xN=<num-expr> weightN=<num-expr>inN=<table> ifmtN=<in-format> istreamN=true|falseicmdN=<cmds>
All the parameters listed here affect only the relevant layer, identified by the suffix N.
Example:
SUN/256 188
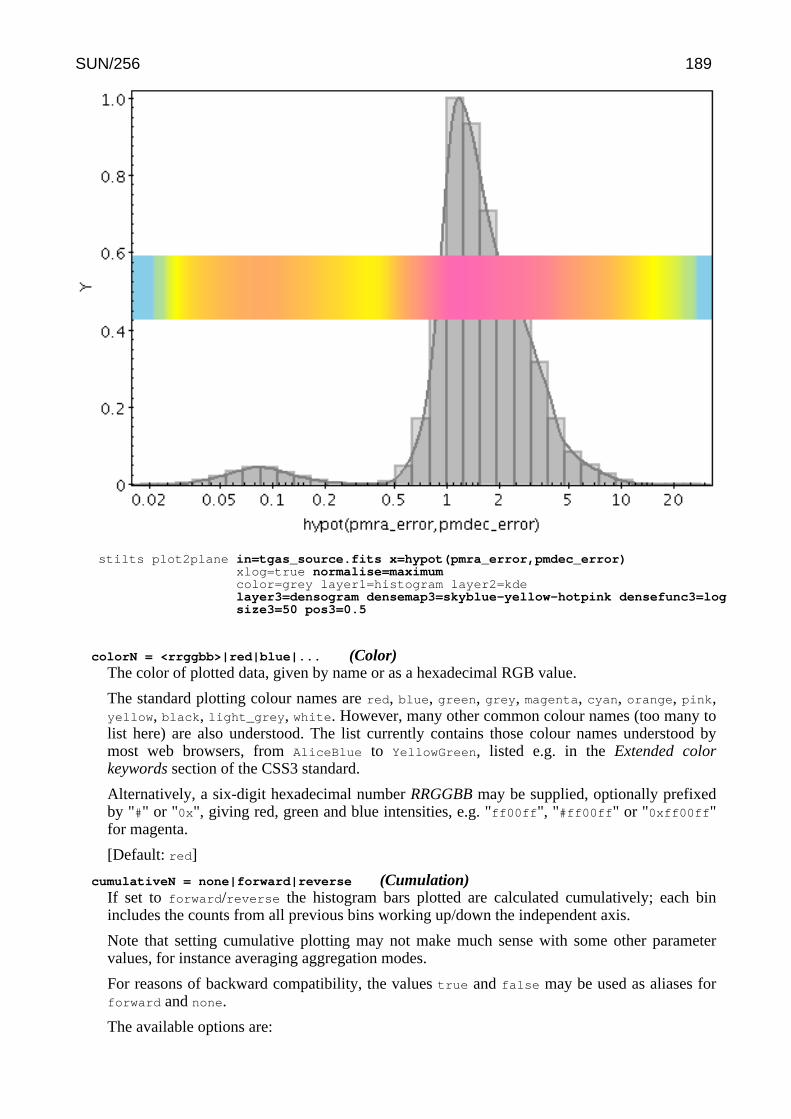
stilts plot2plane in=tgas_source.fits x=hypot(pmra_error,pmdec_error)xlog=true normalise=maximumcolor=grey layer1=histogram layer2=kdelayer3=densogram densemap3=skyblue-yellow-hotpink densefunc3=logsize3=50 pos3=0.5
colorN = <rrggbb>|red|blue|... (Color)The color of plotted data, given by name or as a hexadecimal RGB value.
The standard plotting colour names are red, blue, green, grey, magenta, cyan, orange, pink,yellow, black, light_grey, white. However, many other common colour names (too many tolist here) are also understood. The list currently contains those colour names understood bymost web browsers, from AliceBlue to YellowGreen, listed e.g. in the Extended colorkeywords section of the CSS3 standard.
Alternatively, a six-digit hexadecimal number RRGGBB may be supplied, optionally prefixedby "#" or "0x", giving red, green and blue intensities, e.g. "ff00ff", "#ff00ff" or "0xff00ff"for magenta.
[Default: red]
cumulativeN = none|forward|reverse (Cumulation)If set to forward/reverse the histogram bars plotted are calculated cumulatively; each binincludes the counts from all previous bins working up/down the independent axis.
Note that setting cumulative plotting may not make much sense with some other parametervalues, for instance averaging aggregation modes.
For reasons of backward compatibility, the values true and false may be used as aliases forforward and none.
The available options are:
SUN/256 189
• none: The value plotted for each bin uses the samples accumulated in that bin.• forward: The value plotted for each bin uses the samples accumulated all the way from
negative infinity to that bin.• reverse: The value plotted for each bin uses the samples accumulated all the way from
positive infinity to that bin.
[Default: none]
denseclipN = <lo>,<hi> (Subrange)Defines a subrange of the colour ramp to be used for Density shading. The value is specified asa (low,high) comma-separated pair of two numbers between 0 and 1.
If the full range 0,1 is used, the whole range of colours specified by the selected shader will beused. But if for instance a value of 0,0.5 is given, only those colours at the left hand end of theramp will be seen.
If the null (default) value is chosen, a default clip will be used. This generally covers most orall of the range 0-1 but for colour maps which fade to white, a small proportion of the lowerend may be excluded, to ensure that all the colours are visually distinguishable from a whitebackground. This default is usually a good idea if the colour map is being used with somethinglike a scatter plot, where markers are plotted against a white background. However, forsomething like a density map when the whole plotting area is tiled with colours from the map,it may be better to supply the whole range 0,1 explicitly.
denseflipN = true|false (Boolean)If true, the colour map on the Density axis will be reversed.
[Default: false]
densefuncN = log|linear|histogram|histolog|sqrt|square|acos|cos (Scaling)Defines the way that values in the Density range are mapped to the selected colour ramp.
The available options are:
• log: Logarithmic scaling• linear: Linear scaling• histogram: Scaling follows data distribution, with linear axis• histolog: Scaling follows data distribution, with logarithmic axis• sqrt: Square root scaling• square: Square scaling• acos: Arccos Scaling• cos: Cos Scaling
For all these options, the full range of data values is used, and displayed on the colour bar ifapplicable (though it can be restricted using the densesub option) The Linear, Log, Square andSqrt options just apply the named function to the full data range. The histogram options on theother hand use a scaling function that corresponds to the actual distribution of the data, so thatthere are about the same number of points (or pixels, or whatever is being scaled) of eachcolour. The histogram options are somewhat more expensive, but can be a good choice if youare exploring data whose distribution is unknown or not well-behaved over its min-max range.The Histogram and HistoLog options both assign the colours in the same way, but theydisplay the colour ramp with linear or logarithmic annotation respectively; the HistoLog
option also ignores non-positive values.
[Default: linear]
densemapN = <map-name>|<color>-<color>[-<color>...] (Shader)Color map used for Density axis shading.
A mixed bag of colour ramps are available: inferno, magma, plasma, viridis, cividis,cubehelix, sron, rainbow, rainbow2, rainbow3, pastel, accent, gnuplot, gnuplot2,
SUN/256 190

, set1, paired, hotcold, rdbu, piyg, brbg, cyan-magenta, red-blue, brg, heat, cold, light,greyscale, colour, standard, bugn, bupu, orrd, pubu, purd, huecl, hue, intensity, rgb_red,rgb_green, rgb_blue, hsv_h, hsv_s, hsv_v, yuv_y, yuv_u, yuv_v, scale_hsv_s, scale_hsv_v,scale_yuv_y, mask, blacker, whiter, transparency. Note: many of these, includingrainbow-like ones, are frowned upon by the visualisation community.
You can also construct your own custom colour map by giving a sequence of colour namesseparated by minus sign ("-") characters. In this case the ramp is a linear interpolation betweeneach pair of colours named, using the same syntax as when specifying a colour value. So forinstance "yellow-hotpink-#0000ff" would shade from yellow via hot pink to blue.
[Default: inferno]
densequantN = <number> (Double)Allows the colour map used for the Density axis to be quantised. If an integer value N ischosen then the colour map will be viewed as N discrete evenly-spaced levels, so that only Ndifferent colours will appear in the plot. This can be used to generate a contour-like effect, andmay make it easier to trace the boundaries of regions of interest by eye.
If left blank, the colour map is nominally continuous (though in practice it may be quantised toa medium-sized number like 256).
densesubN = <lo>,<hi> (Subrange)Defines a normalised adjustment to the data range of the Density axis. The value may bespecified as a comma-separated pair of two numbers, giving the lower and upper bounds of therange of of interest respectively. This sub-range is applied to the data range that wouldotherwise be used, either automatically calculated or explicitly supplied; zero corresponds tothe lower bound and one to the upper.
The default value "0,1" therefore has no effect. The range could be restricted to its lower halfwith the value 0,0.5.
[Default: 0,1]
icmdN = <cmds> (ProcessingStep[])Specifies processing to be performed on the layer N input table as specified by parameter inN.The value of this parameter is one or more of the filter commands described in Section 6.1. Ifmore than one is given, they must be separated by semicolon characters (";"). This parametercan be repeated multiple times on the same command line to build up a list of processing steps.The sequence of commands given in this way defines the processing pipeline which isperformed on the table.
Commands may alteratively be supplied in an external file, by using the indirection character'@'. Thus a value of "@filename" causes the file filename to be read for a list of filtercommands to execute. The commands in the file may be separated by newline charactersand/or semicolons, and lines which are blank or which start with a '#' character are ignored.
ifmtN = <in-format> (String)Specifies the format of the input table as specified by parameter inN. The known formats arelisted in Section 5.1.1. This flag can be used if you know what format your table is in. If it hasthe special value (auto) (the default), then an attempt will be made to detect the format of thetable automatically. This cannot always be done correctly however, in which case the programwill exit with an error explaining which formats were attempted. This parameter is ignored forscheme-specified tables.
[Default: (auto)]
inN = <table> (StarTable)The location of the input table. This may take one of the following forms:
• A filename.• A URL.
SUN/256 191
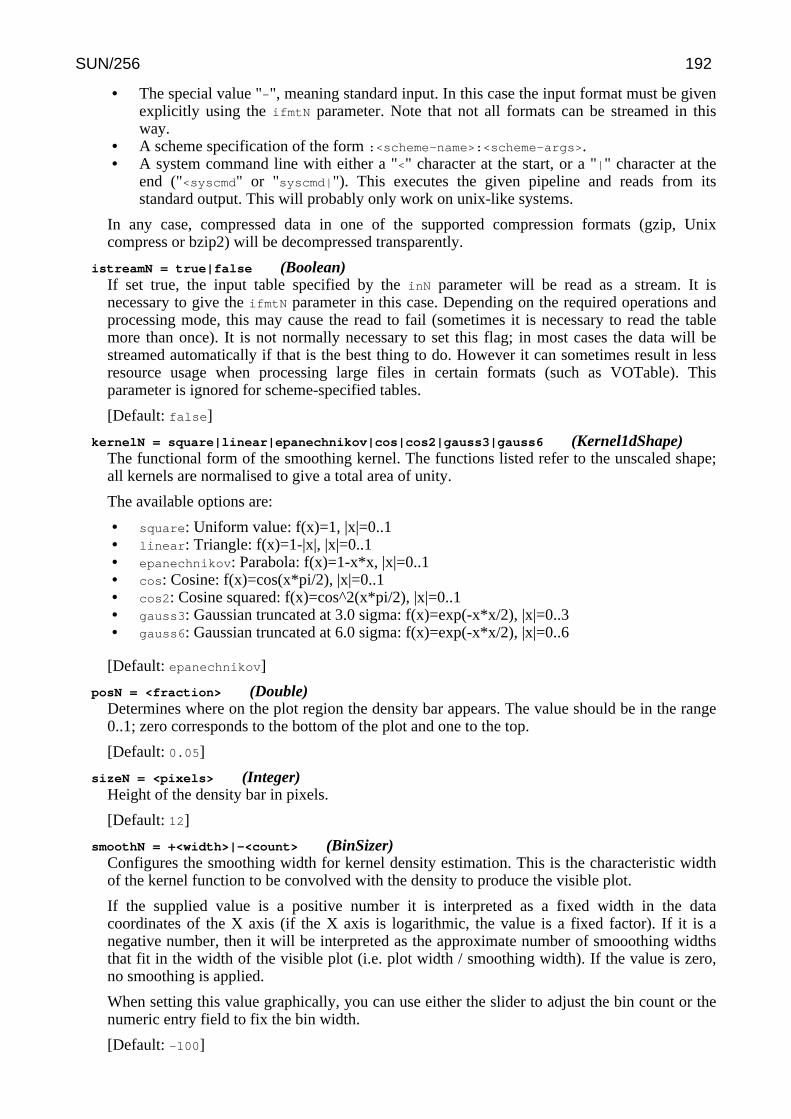
• The special value "-", meaning standard input. In this case the input format must be givenexplicitly using the ifmtN parameter. Note that not all formats can be streamed in thisway.
• A scheme specification of the form :<scheme-name>:<scheme-args>.• A system command line with either a "<" character at the start, or a "|" character at the
end ("<syscmd" or "syscmd|"). This executes the given pipeline and reads from itsstandard output. This will probably only work on unix-like systems.
In any case, compressed data in one of the supported compression formats (gzip, Unixcompress or bzip2) will be decompressed transparently.
istreamN = true|false (Boolean)If set true, the input table specified by the inN parameter will be read as a stream. It isnecessary to give the ifmtN parameter in this case. Depending on the required operations andprocessing mode, this may cause the read to fail (sometimes it is necessary to read the tablemore than once). It is not normally necessary to set this flag; in most cases the data will bestreamed automatically if that is the best thing to do. However it can sometimes result in lessresource usage when processing large files in certain formats (such as VOTable). Thisparameter is ignored for scheme-specified tables.
[Default: false]
kernelN = square|linear|epanechnikov|cos|cos2|gauss3|gauss6 (Kernel1dShape)The functional form of the smoothing kernel. The functions listed refer to the unscaled shape;all kernels are normalised to give a total area of unity.
The available options are:
• square: Uniform value: f(x)=1, |x|=0..1• linear: Triangle: f(x)=1-|x|, |x|=0..1• epanechnikov: Parabola: f(x)=1-x*x, |x|=0..1• cos: Cosine: f(x)=cos(x*pi/2), |x|=0..1• cos2: Cosine squared: f(x)=cos^2(x*pi/2), |x|=0..1• gauss3: Gaussian truncated at 3.0 sigma: f(x)=exp(-x*x/2), |x|=0..3• gauss6: Gaussian truncated at 6.0 sigma: f(x)=exp(-x*x/2), |x|=0..6
[Default: epanechnikov]
posN = <fraction> (Double)Determines where on the plot region the density bar appears. The value should be in the range0..1; zero corresponds to the bottom of the plot and one to the top.
[Default: 0.05]
sizeN = <pixels> (Integer)Height of the density bar in pixels.
[Default: 12]
smoothN = +<width>|-<count> (BinSizer)Configures the smoothing width for kernel density estimation. This is the characteristic widthof the kernel function to be convolved with the density to produce the visible plot.
If the supplied value is a positive number it is interpreted as a fixed width in the datacoordinates of the X axis (if the X axis is logarithmic, the value is a fixed factor). If it is anegative number, then it will be interpreted as the approximate number of smooothing widthsthat fit in the width of the visible plot (i.e. plot width / smoothing width). If the value is zero,no smoothing is applied.
When setting this value graphically, you can use either the slider to adjust the bin count or thenumeric entry field to fix the bin width.
[Default: -100]
SUN/256 192
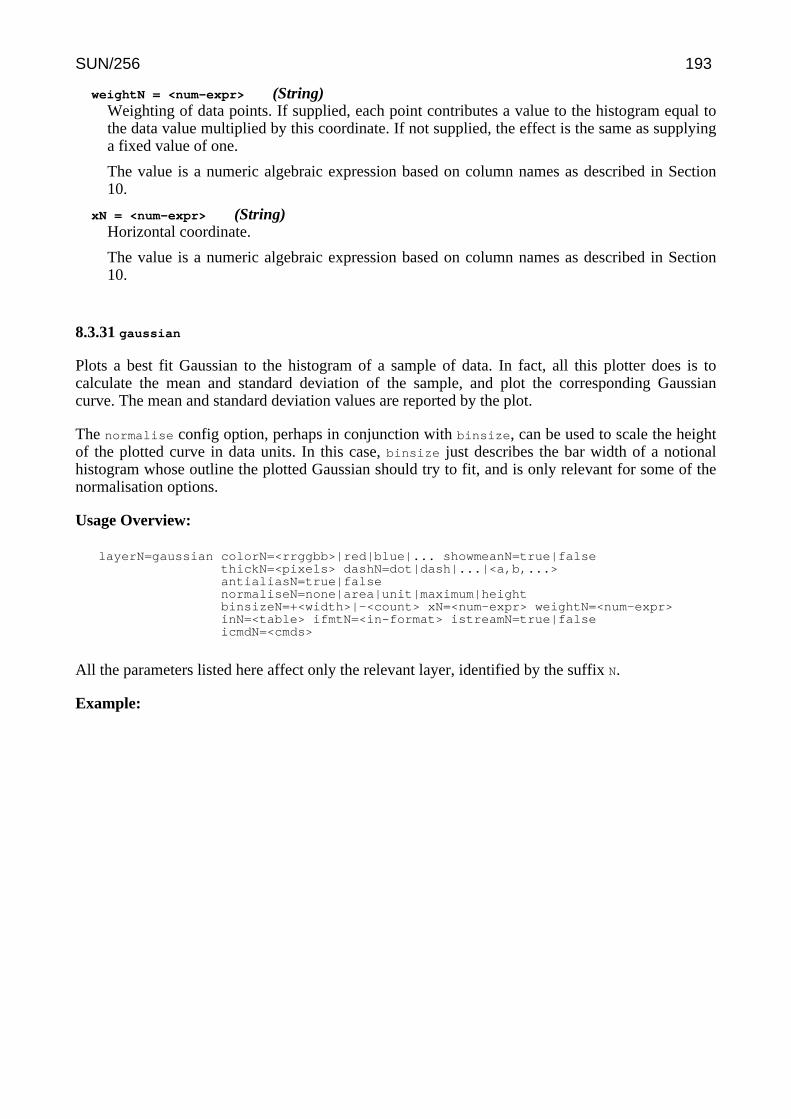
weightN = <num-expr> (String)Weighting of data points. If supplied, each point contributes a value to the histogram equal tothe data value multiplied by this coordinate. If not supplied, the effect is the same as supplyinga fixed value of one.
The value is a numeric algebraic expression based on column names as described in Section10.
xN = <num-expr> (String)Horizontal coordinate.
The value is a numeric algebraic expression based on column names as described in Section10.
8.3.31 gaussian
Plots a best fit Gaussian to the histogram of a sample of data. In fact, all this plotter does is tocalculate the mean and standard deviation of the sample, and plot the corresponding Gaussiancurve. The mean and standard deviation values are reported by the plot.
The normalise config option, perhaps in conjunction with binsize, can be used to scale the heightof the plotted curve in data units. In this case, binsize just describes the bar width of a notionalhistogram whose outline the plotted Gaussian should try to fit, and is only relevant for some of thenormalisation options.
Usage Overview:
layerN=gaussian colorN=<rrggbb>|red|blue|... showmeanN=true|falsethickN=<pixels> dashN=dot|dash|...|<a,b,...>antialiasN=true|falsenormaliseN=none|area|unit|maximum|heightbinsizeN=+<width>|-<count> xN=<num-expr> weightN=<num-expr>inN=<table> ifmtN=<in-format> istreamN=true|falseicmdN=<cmds>
All the parameters listed here affect only the relevant layer, identified by the suffix N.
Example:
SUN/256 193

stilts plot2plane in=mgc_ok.fits x=mgc_dc_sblayer1=histogram color1=greenlayer2=gaussian color2=grey thick2=3ymax=1200
antialiasN = true|false (Boolean)If true, plotted lines are drawn with antialising. Antialised lines look smoother, but may takeperceptibly longer to draw. Only has any effect for bitmapped output formats.
[Default: false]
binsizeN = +<width>|-<count> (BinSizer)Configures the width of histogram bins. If the supplied string is a positive number, it isinterpreted as a fixed width in the data coordinates of the X axis (if the X axis is logarithmic,the value is a fixed factor). If it is a negative number, then it will be interpreted as theapproximate number of bins to display across the width of the plot (though an attempt is madeto use only round numbers for bin widths).
When setting this value graphically, you can use either the slider to adjust the bin count or thenumeric entry field to fix the bin width.
[Default: -30]
colorN = <rrggbb>|red|blue|... (Color)The color of plotted data, given by name or as a hexadecimal RGB value.
The standard plotting colour names are red, blue, green, grey, magenta, cyan, orange, pink,yellow, black, light_grey, white. However, many other common colour names (too many tolist here) are also understood. The list currently contains those colour names understood bymost web browsers, from AliceBlue to YellowGreen, listed e.g. in the Extended colorkeywords section of the CSS3 standard.
Alternatively, a six-digit hexadecimal number RRGGBB may be supplied, optionally prefixed
SUN/256 194
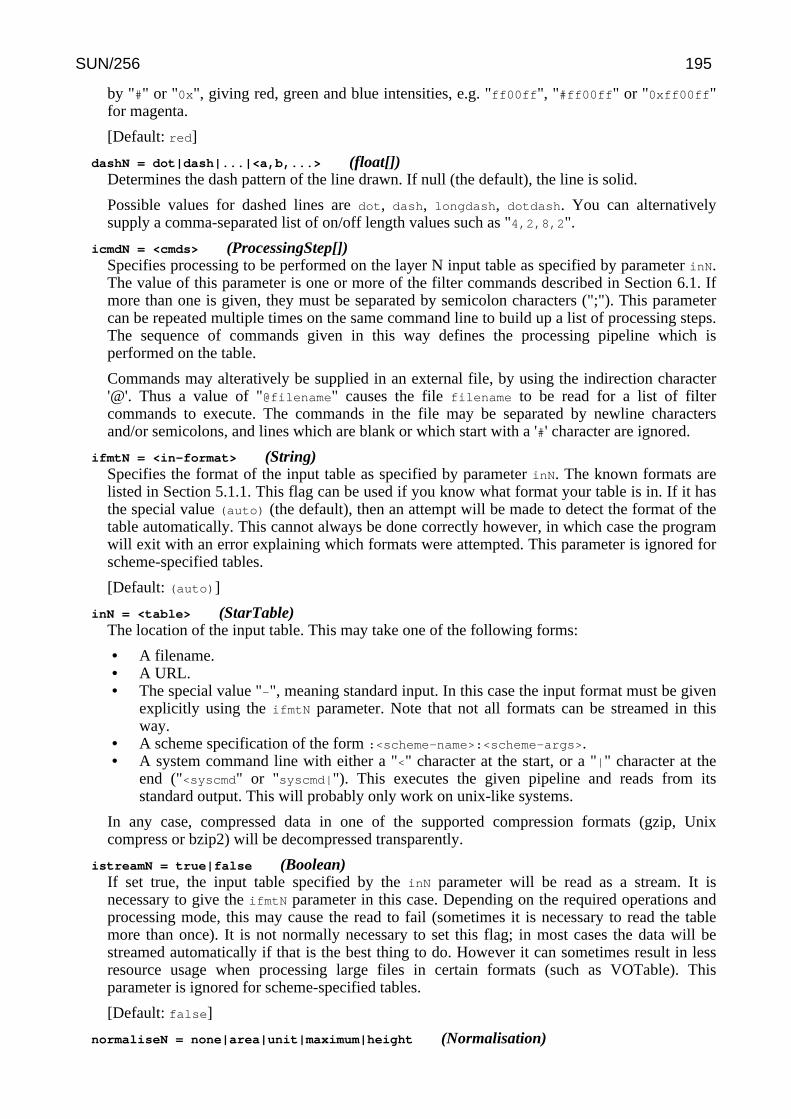
by "#" or "0x", giving red, green and blue intensities, e.g. "ff00ff", "#ff00ff" or "0xff00ff"for magenta.
[Default: red]
dashN = dot|dash|...|<a,b,...> (float[])Determines the dash pattern of the line drawn. If null (the default), the line is solid.
Possible values for dashed lines are dot, dash, longdash, dotdash. You can alternativelysupply a comma-separated list of on/off length values such as "4,2,8,2".
icmdN = <cmds> (ProcessingStep[])Specifies processing to be performed on the layer N input table as specified by parameter inN.The value of this parameter is one or more of the filter commands described in Section 6.1. Ifmore than one is given, they must be separated by semicolon characters (";"). This parametercan be repeated multiple times on the same command line to build up a list of processing steps.The sequence of commands given in this way defines the processing pipeline which isperformed on the table.
Commands may alteratively be supplied in an external file, by using the indirection character'@'. Thus a value of "@filename" causes the file filename to be read for a list of filtercommands to execute. The commands in the file may be separated by newline charactersand/or semicolons, and lines which are blank or which start with a '#' character are ignored.
ifmtN = <in-format> (String)Specifies the format of the input table as specified by parameter inN. The known formats arelisted in Section 5.1.1. This flag can be used if you know what format your table is in. If it hasthe special value (auto) (the default), then an attempt will be made to detect the format of thetable automatically. This cannot always be done correctly however, in which case the programwill exit with an error explaining which formats were attempted. This parameter is ignored forscheme-specified tables.
[Default: (auto)]
inN = <table> (StarTable)The location of the input table. This may take one of the following forms:
• A filename.• A URL.• The special value "-", meaning standard input. In this case the input format must be given
explicitly using the ifmtN parameter. Note that not all formats can be streamed in thisway.
• A scheme specification of the form :<scheme-name>:<scheme-args>.• A system command line with either a "<" character at the start, or a "|" character at the
end ("<syscmd" or "syscmd|"). This executes the given pipeline and reads from itsstandard output. This will probably only work on unix-like systems.
In any case, compressed data in one of the supported compression formats (gzip, Unixcompress or bzip2) will be decompressed transparently.
istreamN = true|false (Boolean)If set true, the input table specified by the inN parameter will be read as a stream. It isnecessary to give the ifmtN parameter in this case. Depending on the required operations andprocessing mode, this may cause the read to fail (sometimes it is necessary to read the tablemore than once). It is not normally necessary to set this flag; in most cases the data will bestreamed automatically if that is the best thing to do. However it can sometimes result in lessresource usage when processing large files in certain formats (such as VOTable). Thisparameter is ignored for scheme-specified tables.
[Default: false]
normaliseN = none|area|unit|maximum|height (Normalisation)
SUN/256 195
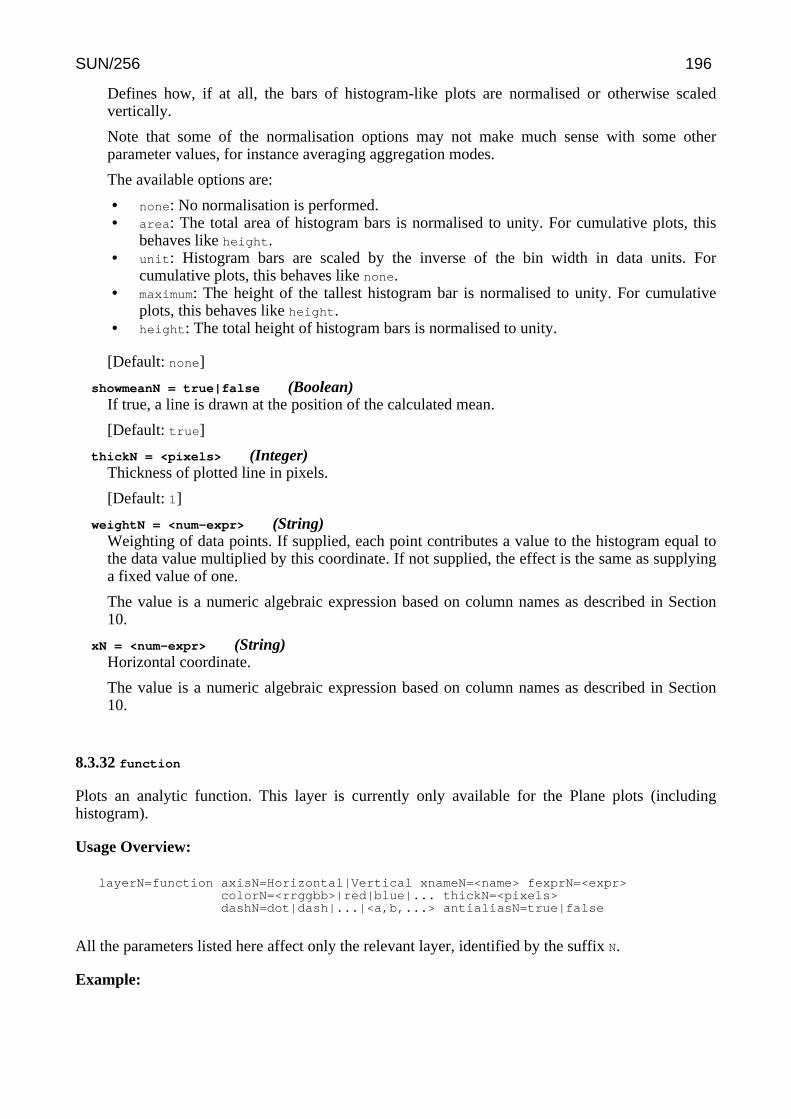
Defines how, if at all, the bars of histogram-like plots are normalised or otherwise scaledvertically.
Note that some of the normalisation options may not make much sense with some otherparameter values, for instance averaging aggregation modes.
The available options are:
• none: No normalisation is performed.• area: The total area of histogram bars is normalised to unity. For cumulative plots, this
behaves like height.• unit: Histogram bars are scaled by the inverse of the bin width in data units. For
cumulative plots, this behaves like none.• maximum: The height of the tallest histogram bar is normalised to unity. For cumulative
plots, this behaves like height.• height: The total height of histogram bars is normalised to unity.
[Default: none]
showmeanN = true|false (Boolean)If true, a line is drawn at the position of the calculated mean.
[Default: true]
thickN = <pixels> (Integer)Thickness of plotted line in pixels.
[Default: 1]
weightN = <num-expr> (String)Weighting of data points. If supplied, each point contributes a value to the histogram equal tothe data value multiplied by this coordinate. If not supplied, the effect is the same as supplyinga fixed value of one.
The value is a numeric algebraic expression based on column names as described in Section10.
xN = <num-expr> (String)Horizontal coordinate.
The value is a numeric algebraic expression based on column names as described in Section10.
8.3.32 function
Plots an analytic function. This layer is currently only available for the Plane plots (includinghistogram).
Usage Overview:
layerN=function axisN=Horizontal|Vertical xnameN=<name> fexprN=<expr>colorN=<rrggbb>|red|blue|... thickN=<pixels>dashN=dot|dash|...|<a,b,...> antialiasN=true|false
All the parameters listed here affect only the relevant layer, identified by the suffix N.
Example:
SUN/256 196
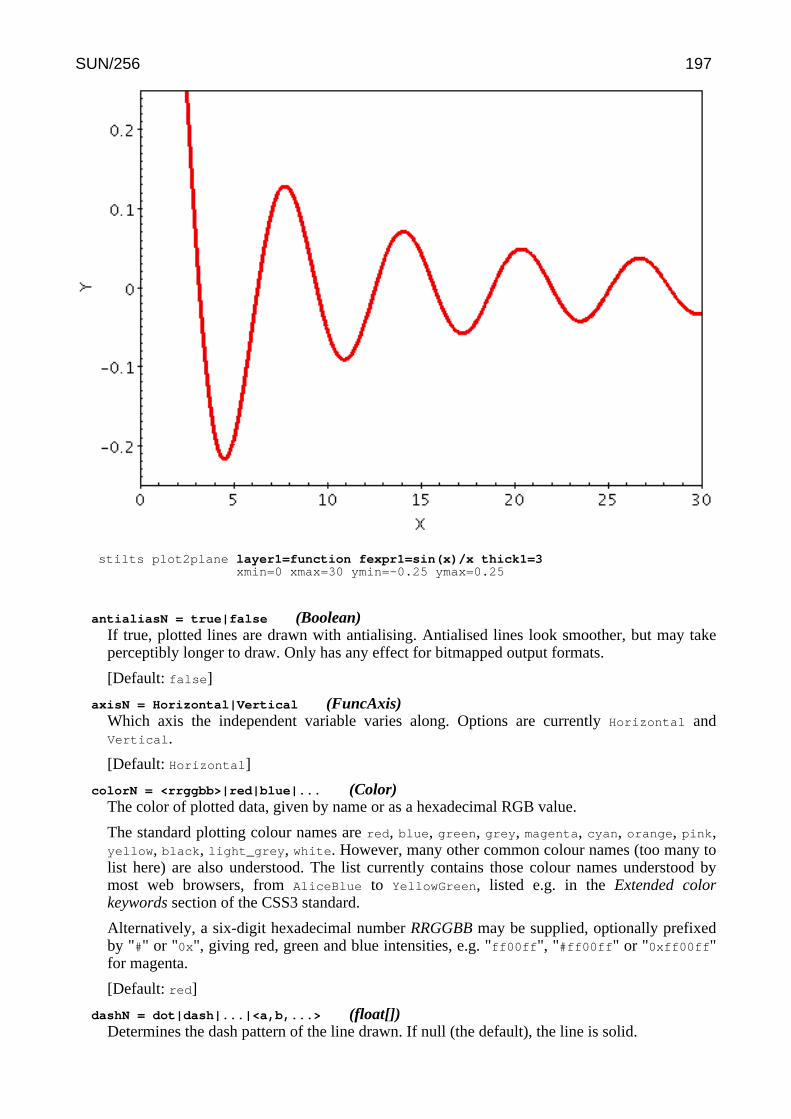
stilts plot2plane layer1=function fexpr1=sin(x)/x thick1=3xmin=0 xmax=30 ymin=-0.25 ymax=0.25
antialiasN = true|false (Boolean)If true, plotted lines are drawn with antialising. Antialised lines look smoother, but may takeperceptibly longer to draw. Only has any effect for bitmapped output formats.
[Default: false]
axisN = Horizontal|Vertical (FuncAxis)Which axis the independent variable varies along. Options are currently Horizontal andVertical.
[Default: Horizontal]
colorN = <rrggbb>|red|blue|... (Color)The color of plotted data, given by name or as a hexadecimal RGB value.
The standard plotting colour names are red, blue, green, grey, magenta, cyan, orange, pink,yellow, black, light_grey, white. However, many other common colour names (too many tolist here) are also understood. The list currently contains those colour names understood bymost web browsers, from AliceBlue to YellowGreen, listed e.g. in the Extended colorkeywords section of the CSS3 standard.
Alternatively, a six-digit hexadecimal number RRGGBB may be supplied, optionally prefixedby "#" or "0x", giving red, green and blue intensities, e.g. "ff00ff", "#ff00ff" or "0xff00ff"for magenta.
[Default: red]
dashN = dot|dash|...|<a,b,...> (float[])Determines the dash pattern of the line drawn. If null (the default), the line is solid.
SUN/256 197
Possible values for dashed lines are dot, dash, longdash, dotdash. You can alternativelysupply a comma-separated list of on/off length values such as "4,2,8,2".
fexprN = <expr> (String)An expression using TOPCAT's expression language in terms of the independent variable todefine the function. This expression must be standalone - it cannot reference any tables.
thickN = <pixels> (Integer)Thickness of plotted line in pixels.
[Default: 1]
xnameN = <name> (String)Name of the independent variable for use in the function expression. This is typically x for ahorizontal independent variable and y for a vertical independent variable, but any string that isa legal expression language identifier (starts with a letter, continues with letters, numbers,underscores) can be used.
[Default: x]
8.3.33 skyvector
Plots directed lines from the data position given delta values for the coordinates The plottedmarkers are typically little arrows, but there are other options.
The dimensions of the plotted vectors are given by the dlon and dlat coordinates. The units ofthese values are specified using the unit option. If only the relative rather than the absolute sizesare required on the plot, or if the units are not known, the special value unit=scaled may be used;this applies a non-physical scaling factor to make the vectors appear at some reasonable size in theplot. When unit=scaled vectors will keep approximately the same screen size during zoomoperations; when one of the angular units is chosen, they will keep the same size in datacoordinates.
Additionally, the scale option may be used to scale all the plotted vectors by a given factor to makethem all larger or smaller.
Usage Overview:
layerN=skyvector arrowN=small_arrow|medium_arrow|... thickN=<int-value>unitN=scaled|radian|degree|minute|arcsec|mas|uasscaleN=<number>shadingN=auto|flat|translucent|transparent|density|aux|weighted <shade-paramsN>lonN=<deg-expr> latN=<deg-expr> dlonN=<num-expr>dlatN=<num-expr> inN=<table> ifmtN=<in-format>istreamN=true|false icmdN=<cmds>
All the parameters listed here affect only the relevant layer, identified by the suffix N.
Example:
SUN/256 198
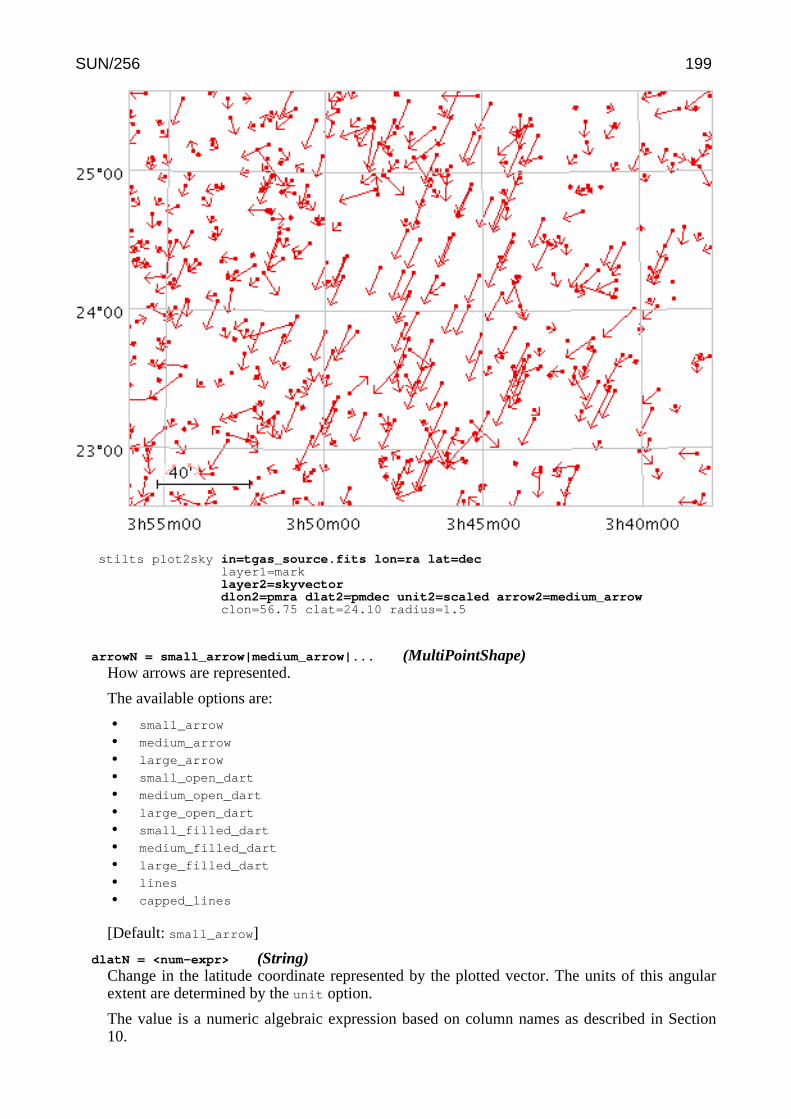
stilts plot2sky in=tgas_source.fits lon=ra lat=declayer1=marklayer2=skyvectordlon2=pmra dlat2=pmdec unit2=scaled arrow2=medium_arrowclon=56.75 clat=24.10 radius=1.5
arrowN = small_arrow|medium_arrow|... (MultiPointShape)How arrows are represented.
The available options are:
• small_arrow
• medium_arrow
• large_arrow
• small_open_dart
• medium_open_dart
• large_open_dart
• small_filled_dart
• medium_filled_dart
• large_filled_dart
• lines
• capped_lines
[Default: small_arrow]
dlatN = <num-expr> (String)Change in the latitude coordinate represented by the plotted vector. The units of this angularextent are determined by the unit option.
The value is a numeric algebraic expression based on column names as described in Section10.
SUN/256 199
dlonN = <num-expr> (String)Change in the longitude coordinate represented by the plotted vector. The supplied value isconsidered to be premultiplied by cos(Latitude). The units of this angular extent aredetermined by the unit option.
The value is a numeric algebraic expression based on column names as described in Section10.
icmdN = <cmds> (ProcessingStep[])Specifies processing to be performed on the layer N input table as specified by parameter inN.The value of this parameter is one or more of the filter commands described in Section 6.1. Ifmore than one is given, they must be separated by semicolon characters (";"). This parametercan be repeated multiple times on the same command line to build up a list of processing steps.The sequence of commands given in this way defines the processing pipeline which isperformed on the table.
Commands may alteratively be supplied in an external file, by using the indirection character'@'. Thus a value of "@filename" causes the file filename to be read for a list of filtercommands to execute. The commands in the file may be separated by newline charactersand/or semicolons, and lines which are blank or which start with a '#' character are ignored.
ifmtN = <in-format> (String)Specifies the format of the input table as specified by parameter inN. The known formats arelisted in Section 5.1.1. This flag can be used if you know what format your table is in. If it hasthe special value (auto) (the default), then an attempt will be made to detect the format of thetable automatically. This cannot always be done correctly however, in which case the programwill exit with an error explaining which formats were attempted. This parameter is ignored forscheme-specified tables.
[Default: (auto)]
inN = <table> (StarTable)The location of the input table. This may take one of the following forms:
• A filename.• A URL.• The special value "-", meaning standard input. In this case the input format must be given
explicitly using the ifmtN parameter. Note that not all formats can be streamed in thisway.
• A scheme specification of the form :<scheme-name>:<scheme-args>.• A system command line with either a "<" character at the start, or a "|" character at the
end ("<syscmd" or "syscmd|"). This executes the given pipeline and reads from itsstandard output. This will probably only work on unix-like systems.
In any case, compressed data in one of the supported compression formats (gzip, Unixcompress or bzip2) will be decompressed transparently.
istreamN = true|false (Boolean)If set true, the input table specified by the inN parameter will be read as a stream. It isnecessary to give the ifmtN parameter in this case. Depending on the required operations andprocessing mode, this may cause the read to fail (sometimes it is necessary to read the tablemore than once). It is not normally necessary to set this flag; in most cases the data will bestreamed automatically if that is the best thing to do. However it can sometimes result in lessresource usage when processing large files in certain formats (such as VOTable). Thisparameter is ignored for scheme-specified tables.
[Default: false]
latN = <deg-expr> (String)Latitude in decimal degrees.
The value is a numeric algebraic expression based on column names as described in Section
SUN/256 200

10.
lonN = <deg-expr> (String)Longitude in decimal degrees.
The value is a numeric algebraic expression based on column names as described in Section10.
scaleN = <number> (Double)Scales the size of variable-sized markers like vectors and ellipses. The default value is 1,smaller or larger values multiply the visible sizes accordingly.
The main purpose of this option is to tweak the visible sizes of the plotted markers for bettervisibility. The unit option is more convenient to account for the units in which the angularextent coordinates are supplied. If the markers are supposed to be plotted with their absoluteangular extents visible, this option should be set to its default value of 1.
[Default: 1]
shadingN = auto|flat|translucent|transparent|density|aux|weighted <shade-paramsN>
(ShapeMode)Determines how plotted objects in layer N are coloured. This may be influenced by how manyobjects are plotted over each other as well as the values of other parameters. Available options(Section 8.4) are:
• auto (Section 8.4.1)
• flat (Section 8.4.2)
• translucent (Section 8.4.3)
• transparent (Section 8.4.4)
• density (Section 8.4.5)
• aux (Section 8.4.6)
• weighted (Section 8.4.7)
Each of these options comes with its own set of parameters to specify the details of howcolouring is done.
[Default: auto]
thickN = <int-value> (Integer)Controls the line thickness used when drawing shapes. Zero, the default value, means a1-pixel-wide line is used. Larger values make drawn lines thicker, but note changing this valuewill not affect all shapes, for instance filled rectangles contain no line drawings.
[Default: 0]
unitN = scaled|radian|degree|minute|arcsec|mas|uas (AngleUnit)Defines the units in which the angular extents are specified. Options are degrees, arcsecondsetc. If the special value scaled is given then a non-physical scaling is applied to the inputvalues to make the the largest markers appear at a reasonable size (a few tens of pixels) in theplot.
Note that the actual plotted size of the markers can also be scaled using the scale option; thesetwo work together to determine the actual plotted sizes.
The available options are:
• scaled: a non-physical scaling is applied based on the size of values present• radian: radians• degree: degrees• minute: arcminutes• arcsec: arcseconds• mas: milli-arcseconds• uas: micro-arcseconds
SUN/256 201
[Default: degree]
8.3.34 skyellipse
Plots an ellipse (or rectangle, triangle, or other similar figure) defined by two principal radii and anoptional angle of rotation, the so-called position angle. This angle, if specified, is in degrees andgives the angle from the North pole towards the direction of increasing longitude on the longitudeaxis.
The dimensions of the plotted ellipses are given by the ra and rb coordinates. The units of thesevalues are specified using the unit option. If only the relative rather than the absolute sizes arerequired on the plot, or if the units are not known, the special value unit=scaled may be used; thisapplies a non-physical scaling factor to make the ellipses appear at some reasonable size in the plot.When unit=scaled ellipses will keep approximately the same screen size during zoom operations;when one of the angular units is chosen, they will keep the same size in data coordinates.
Additionally, the scale option may be used to scale all the plotted ellipses by a given factor tomake them all larger or smaller.
Usage Overview:
layerN=skyellipse ellipseN=ellipse|crosshair_ellipse|... thickN=<int-value>unitN=scaled|radian|degree|minute|arcsec|mas|uasscaleN=<number>shadingN=auto|flat|translucent|transparent|density|aux|weighted <shade-paramsN>lonN=<deg-expr> latN=<deg-expr> raN=<num-expr>rbN=<num-expr> posangN=<deg-expr> inN=<table>ifmtN=<in-format> istreamN=true|false icmdN=<cmds>
All the parameters listed here affect only the relevant layer, identified by the suffix N.
Example:
SUN/256 202
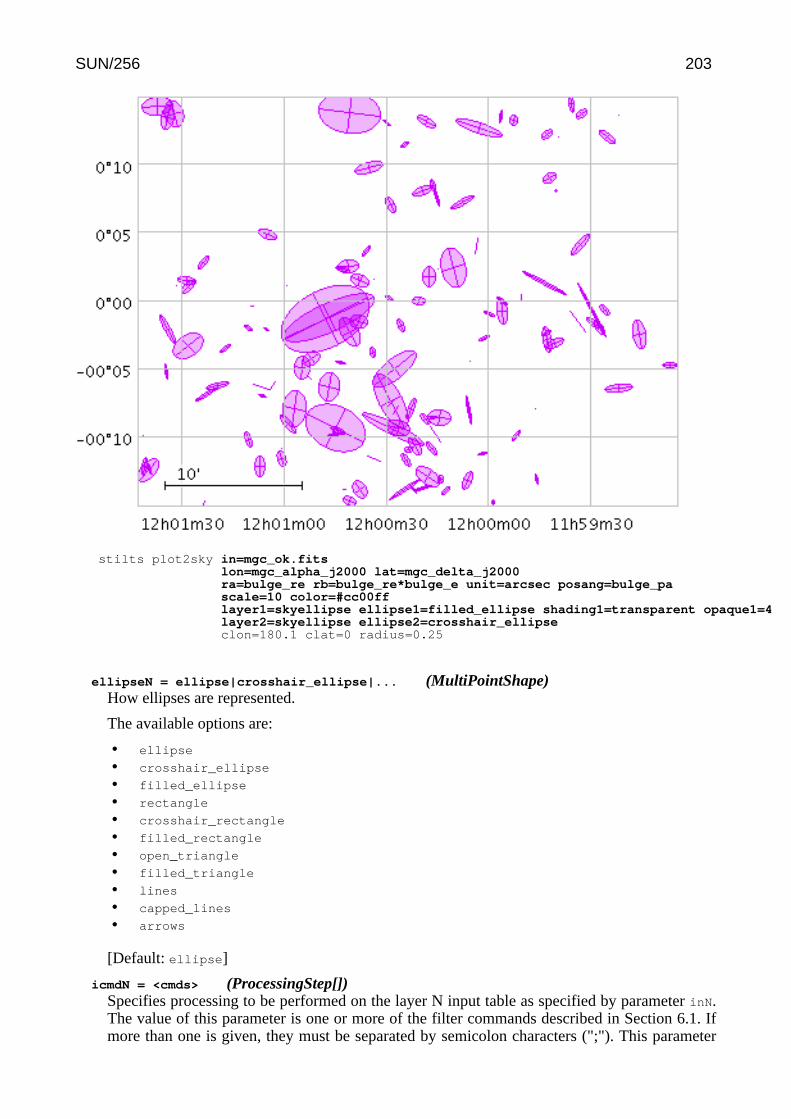
stilts plot2sky in=mgc_ok.fitslon=mgc_alpha_j2000 lat=mgc_delta_j2000ra=bulge_re rb=bulge_re*bulge_e unit=arcsec posang=bulge_pascale=10 color=#cc00fflayer1=skyellipse ellipse1=filled_ellipse shading1=transparent opaque1=4layer2=skyellipse ellipse2=crosshair_ellipseclon=180.1 clat=0 radius=0.25
ellipseN = ellipse|crosshair_ellipse|... (MultiPointShape)How ellipses are represented.
The available options are:
• ellipse
• crosshair_ellipse
• filled_ellipse
• rectangle
• crosshair_rectangle
• filled_rectangle
• open_triangle
• filled_triangle
• lines
• capped_lines
• arrows
[Default: ellipse]
icmdN = <cmds> (ProcessingStep[])Specifies processing to be performed on the layer N input table as specified by parameter inN.The value of this parameter is one or more of the filter commands described in Section 6.1. Ifmore than one is given, they must be separated by semicolon characters (";"). This parameter
SUN/256 203
can be repeated multiple times on the same command line to build up a list of processing steps.The sequence of commands given in this way defines the processing pipeline which isperformed on the table.
Commands may alteratively be supplied in an external file, by using the indirection character'@'. Thus a value of "@filename" causes the file filename to be read for a list of filtercommands to execute. The commands in the file may be separated by newline charactersand/or semicolons, and lines which are blank or which start with a '#' character are ignored.
ifmtN = <in-format> (String)Specifies the format of the input table as specified by parameter inN. The known formats arelisted in Section 5.1.1. This flag can be used if you know what format your table is in. If it hasthe special value (auto) (the default), then an attempt will be made to detect the format of thetable automatically. This cannot always be done correctly however, in which case the programwill exit with an error explaining which formats were attempted. This parameter is ignored forscheme-specified tables.
[Default: (auto)]
inN = <table> (StarTable)The location of the input table. This may take one of the following forms:
• A filename.• A URL.• The special value "-", meaning standard input. In this case the input format must be given
explicitly using the ifmtN parameter. Note that not all formats can be streamed in thisway.
• A scheme specification of the form :<scheme-name>:<scheme-args>.• A system command line with either a "<" character at the start, or a "|" character at the
end ("<syscmd" or "syscmd|"). This executes the given pipeline and reads from itsstandard output. This will probably only work on unix-like systems.
In any case, compressed data in one of the supported compression formats (gzip, Unixcompress or bzip2) will be decompressed transparently.
istreamN = true|false (Boolean)If set true, the input table specified by the inN parameter will be read as a stream. It isnecessary to give the ifmtN parameter in this case. Depending on the required operations andprocessing mode, this may cause the read to fail (sometimes it is necessary to read the tablemore than once). It is not normally necessary to set this flag; in most cases the data will bestreamed automatically if that is the best thing to do. However it can sometimes result in lessresource usage when processing large files in certain formats (such as VOTable). Thisparameter is ignored for scheme-specified tables.
[Default: false]
latN = <deg-expr> (String)Latitude in decimal degrees.
The value is a numeric algebraic expression based on column names as described in Section10.
lonN = <deg-expr> (String)Longitude in decimal degrees.
The value is a numeric algebraic expression based on column names as described in Section10.
posangN = <deg-expr> (String)Orientation of the ellipse. The value is the angle in degrees from the North pole to the primaryaxis of the ellipse in the direction of increasing longitude.
The value is a numeric algebraic expression based on column names as described in Section
SUN/256 204

10.
raN = <num-expr> (String)Ellipse first principal radius. The units of this angular extent are determined by the unit
option.
The value is a numeric algebraic expression based on column names as described in Section10.
rbN = <num-expr> (String)Ellipse second principal radius. The units of this angular extent are determined by the unit
option. If this value is blank, the two radii will be assumed equal, i.e. the ellipses will becircles.
The value is a numeric algebraic expression based on column names as described in Section10.
scaleN = <number> (Double)Scales the size of variable-sized markers like vectors and ellipses. The default value is 1,smaller or larger values multiply the visible sizes accordingly.
The main purpose of this option is to tweak the visible sizes of the plotted markers for bettervisibility. The unit option is more convenient to account for the units in which the angularextent coordinates are supplied. If the markers are supposed to be plotted with their absoluteangular extents visible, this option should be set to its default value of 1.
[Default: 1]
shadingN = auto|flat|translucent|transparent|density|aux|weighted <shade-paramsN>
(ShapeMode)Determines how plotted objects in layer N are coloured. This may be influenced by how manyobjects are plotted over each other as well as the values of other parameters. Available options(Section 8.4) are:
• auto (Section 8.4.1)
• flat (Section 8.4.2)
• translucent (Section 8.4.3)
• transparent (Section 8.4.4)
• density (Section 8.4.5)
• aux (Section 8.4.6)
• weighted (Section 8.4.7)
Each of these options comes with its own set of parameters to specify the details of howcolouring is done.
[Default: auto]
thickN = <int-value> (Integer)Controls the line thickness used when drawing shapes. Zero, the default value, means a1-pixel-wide line is used. Larger values make drawn lines thicker, but note changing this valuewill not affect all shapes, for instance filled rectangles contain no line drawings.
[Default: 0]
unitN = scaled|radian|degree|minute|arcsec|mas|uas (AngleUnit)Defines the units in which the angular extents are specified. Options are degrees, arcsecondsetc. If the special value scaled is given then a non-physical scaling is applied to the inputvalues to make the the largest markers appear at a reasonable size (a few tens of pixels) in theplot.
Note that the actual plotted size of the markers can also be scaled using the scale option; thesetwo work together to determine the actual plotted sizes.
The available options are:
SUN/256 205

• scaled: a non-physical scaling is applied based on the size of values present• radian: radians• degree: degrees• minute: arcminutes• arcsec: arcseconds• mas: milli-arcseconds• uas: micro-arcseconds
[Default: degree]
8.3.35 skycorr
Plots an error ellipse (or rectangle or other similar figure) on the sky defined by errors in thelongitude and latitude directions, and a correlation between the two errors.
The error in longitude is considered to be premultiplied by the cosine of the latitude, i.e. both errorscorrespond to angular distances along a great circle.
The supplied correlation is a dimensionless value in the range -1..+1 and is equal to the covariancedivided by the product of the lon and lat errors. The covariance matrix is thus:
[ lonerr*lonerr lonerr*laterr*corr ][ lonerr*laterr*corr laterr*laterr ]
The dimensions of the plotted ellipses are given by the lonerr and laterr coordinates. The units ofthese values are specified using the unit option. If only the relative rather than the absolute sizesare required on the plot, or if the units are not known, the special value unit=scaled may be used;this applies a non-physical scaling factor to make the ellipses appear at some reasonable size in theplot. When unit=scaled ellipses will keep approximately the same screen size during zoomoperations; when one of the angular units is chosen, they will keep the same size in datacoordinates.
Additionally, the scale option may be used to scale all the plotted ellipses by a given factor tomake them all larger or smaller.
This plot type is suitable for use with the ra_error, dec_error and ra_dec_corr columns in theGaia source catalogue. Note that Gaia positional errors are generally quoted in milli-arcseconds, soyou should set unit=mas. Note also that in most plots Gaia positional errors are much too small tosee!
Usage Overview:
layerN=skycorr ellipseN=ellipse|crosshair_ellipse|... thickN=<int-value>unitN=scaled|radian|degree|minute|arcsec|mas|uasscaleN=<number>shadingN=auto|flat|translucent|transparent|density|aux|weighted <shade-paramsN>lonN=<deg-expr> latN=<deg-expr> lonerrN=<num-expr>laterrN=<num-expr> corrN=<num-expr> inN=<table>ifmtN=<in-format> istreamN=true|false icmdN=<cmds>
All the parameters listed here affect only the relevant layer, identified by the suffix N.
Example:
SUN/256 206
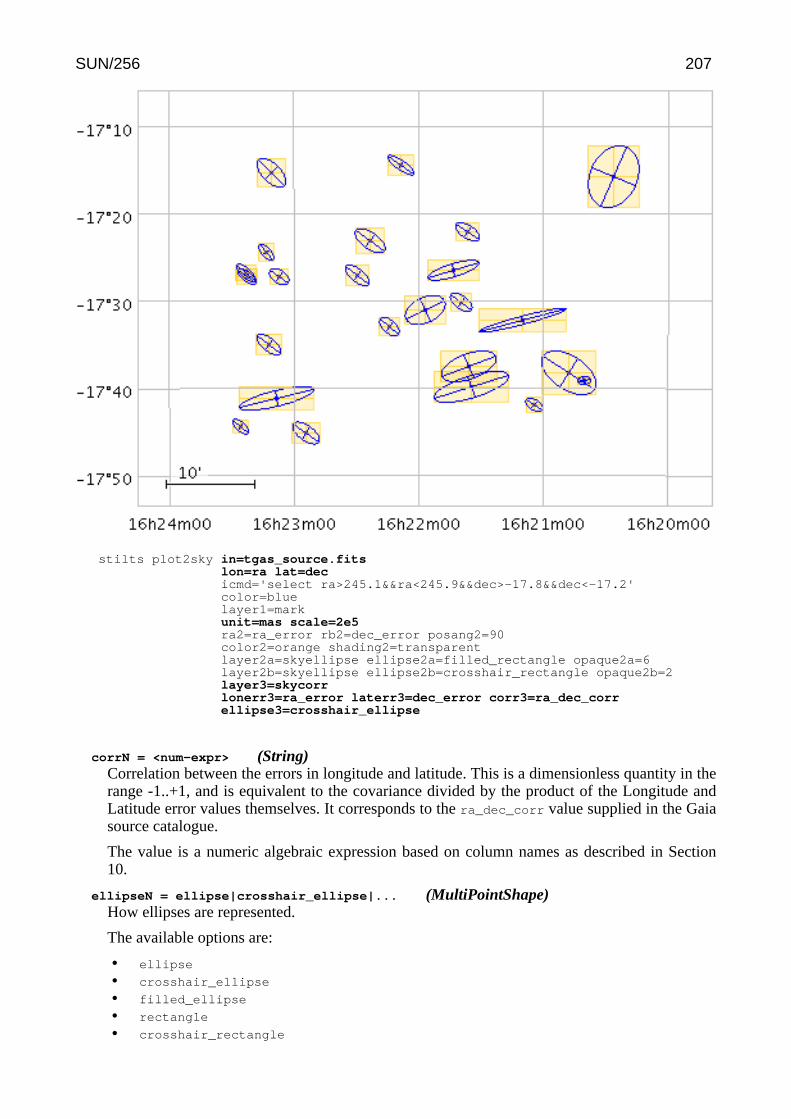
stilts plot2sky in=tgas_source.fitslon=ra lat=decicmd='select ra>245.1&&ra<245.9&&dec>-17.8&&dec<-17.2'color=bluelayer1=markunit=mas scale=2e5ra2=ra_error rb2=dec_error posang2=90color2=orange shading2=transparentlayer2a=skyellipse ellipse2a=filled_rectangle opaque2a=6layer2b=skyellipse ellipse2b=crosshair_rectangle opaque2b=2layer3=skycorrlonerr3=ra_error laterr3=dec_error corr3=ra_dec_correllipse3=crosshair_ellipse
corrN = <num-expr> (String)Correlation between the errors in longitude and latitude. This is a dimensionless quantity in therange -1..+1, and is equivalent to the covariance divided by the product of the Longitude andLatitude error values themselves. It corresponds to the ra_dec_corr value supplied in the Gaiasource catalogue.
The value is a numeric algebraic expression based on column names as described in Section10.
ellipseN = ellipse|crosshair_ellipse|... (MultiPointShape)How ellipses are represented.
The available options are:
• ellipse
• crosshair_ellipse
• filled_ellipse
• rectangle
• crosshair_rectangle
SUN/256 207
• filled_rectangle
• open_triangle
• filled_triangle
• lines
• capped_lines
• arrows
[Default: ellipse]
icmdN = <cmds> (ProcessingStep[])Specifies processing to be performed on the layer N input table as specified by parameter inN.The value of this parameter is one or more of the filter commands described in Section 6.1. Ifmore than one is given, they must be separated by semicolon characters (";"). This parametercan be repeated multiple times on the same command line to build up a list of processing steps.The sequence of commands given in this way defines the processing pipeline which isperformed on the table.
Commands may alteratively be supplied in an external file, by using the indirection character'@'. Thus a value of "@filename" causes the file filename to be read for a list of filtercommands to execute. The commands in the file may be separated by newline charactersand/or semicolons, and lines which are blank or which start with a '#' character are ignored.
ifmtN = <in-format> (String)Specifies the format of the input table as specified by parameter inN. The known formats arelisted in Section 5.1.1. This flag can be used if you know what format your table is in. If it hasthe special value (auto) (the default), then an attempt will be made to detect the format of thetable automatically. This cannot always be done correctly however, in which case the programwill exit with an error explaining which formats were attempted. This parameter is ignored forscheme-specified tables.
[Default: (auto)]
inN = <table> (StarTable)The location of the input table. This may take one of the following forms:
• A filename.• A URL.• The special value "-", meaning standard input. In this case the input format must be given
explicitly using the ifmtN parameter. Note that not all formats can be streamed in thisway.
• A scheme specification of the form :<scheme-name>:<scheme-args>.• A system command line with either a "<" character at the start, or a "|" character at the
end ("<syscmd" or "syscmd|"). This executes the given pipeline and reads from itsstandard output. This will probably only work on unix-like systems.
In any case, compressed data in one of the supported compression formats (gzip, Unixcompress or bzip2) will be decompressed transparently.
istreamN = true|false (Boolean)If set true, the input table specified by the inN parameter will be read as a stream. It isnecessary to give the ifmtN parameter in this case. Depending on the required operations andprocessing mode, this may cause the read to fail (sometimes it is necessary to read the tablemore than once). It is not normally necessary to set this flag; in most cases the data will bestreamed automatically if that is the best thing to do. However it can sometimes result in lessresource usage when processing large files in certain formats (such as VOTable). Thisparameter is ignored for scheme-specified tables.
[Default: false]
latN = <deg-expr> (String)Latitude in decimal degrees.
SUN/256 208
The value is a numeric algebraic expression based on column names as described in Section10.
laterrN = <num-expr> (String)Error in the latitude coordinate. The units of this angular extent are determined by the unit
option.
The value is a numeric algebraic expression based on column names as described in Section10.
lonN = <deg-expr> (String)Longitude in decimal degrees.
The value is a numeric algebraic expression based on column names as described in Section10.
lonerrN = <num-expr> (String)Error in the longitude coordinate. The supplied value is considered to be premultiplied bycos(Latitude). The units of this angular extent are determined by the unit option.
The value is a numeric algebraic expression based on column names as described in Section10.
scaleN = <number> (Double)Scales the size of variable-sized markers like vectors and ellipses. The default value is 1,smaller or larger values multiply the visible sizes accordingly.
The main purpose of this option is to tweak the visible sizes of the plotted markers for bettervisibility. The unit option is more convenient to account for the units in which the angularextent coordinates are supplied. If the markers are supposed to be plotted with their absoluteangular extents visible, this option should be set to its default value of 1.
[Default: 1]
shadingN = auto|flat|translucent|transparent|density|aux|weighted <shade-paramsN>
(ShapeMode)Determines how plotted objects in layer N are coloured. This may be influenced by how manyobjects are plotted over each other as well as the values of other parameters. Available options(Section 8.4) are:
• auto (Section 8.4.1)
• flat (Section 8.4.2)
• translucent (Section 8.4.3)
• transparent (Section 8.4.4)
• density (Section 8.4.5)
• aux (Section 8.4.6)
• weighted (Section 8.4.7)
Each of these options comes with its own set of parameters to specify the details of howcolouring is done.
[Default: auto]
thickN = <int-value> (Integer)Controls the line thickness used when drawing shapes. Zero, the default value, means a1-pixel-wide line is used. Larger values make drawn lines thicker, but note changing this valuewill not affect all shapes, for instance filled rectangles contain no line drawings.
[Default: 0]
unitN = scaled|radian|degree|minute|arcsec|mas|uas (AngleUnit)Defines the units in which the angular extents are specified. Options are degrees, arcsecondsetc. If the special value scaled is given then a non-physical scaling is applied to the inputvalues to make the the largest markers appear at a reasonable size (a few tens of pixels) in the
SUN/256 209
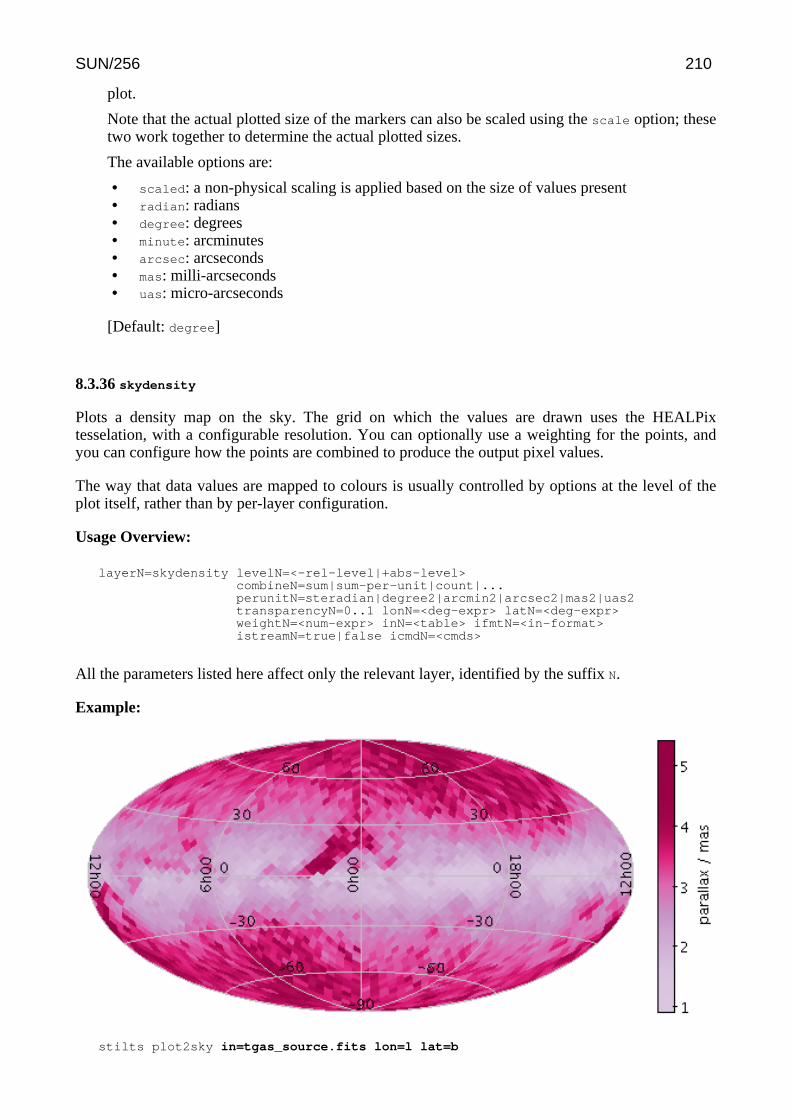
plot.
Note that the actual plotted size of the markers can also be scaled using the scale option; thesetwo work together to determine the actual plotted sizes.
The available options are:
• scaled: a non-physical scaling is applied based on the size of values present• radian: radians• degree: degrees• minute: arcminutes• arcsec: arcseconds• mas: milli-arcseconds• uas: micro-arcseconds
[Default: degree]
8.3.36 skydensity
Plots a density map on the sky. The grid on which the values are drawn uses the HEALPixtesselation, with a configurable resolution. You can optionally use a weighting for the points, andyou can configure how the points are combined to produce the output pixel values.
The way that data values are mapped to colours is usually controlled by options at the level of theplot itself, rather than by per-layer configuration.
Usage Overview:
layerN=skydensity levelN=<-rel-level|+abs-level>combineN=sum|sum-per-unit|count|...perunitN=steradian|degree2|arcmin2|arcsec2|mas2|uas2transparencyN=0..1 lonN=<deg-expr> latN=<deg-expr>weightN=<num-expr> inN=<table> ifmtN=<in-format>istreamN=true|false icmdN=<cmds>
All the parameters listed here affect only the relevant layer, identified by the suffix N.
Example:
stilts plot2sky in=tgas_source.fits lon=l lat=b
SUN/256 210

layer1=skydensity weight1=parallax combine1=mean level1=4projection=aitoff auxmap=PuRd auxfunc=histogramxpix=540 ypix=250
combineN = sum|sum-per-unit|count|... (Combiner)Defines how values contributing to the same density map bin are combined together toproduce the value assigned to that bin, and hence its colour. The combined values are theweights, but if the weight is left blank, a weighting of unity is assumed.
For density-like values (count-per-unit, sum-per-unit) the scaling is additionally influencedby the perunit parameter.
The available options are:
• sum: the sum of all the combined values per bin• sum-per-unit: the sum of all the combined values per unit of bin size• count: the number of non-blank values per bin (weight is ignored)• count-per-unit: the number of non-blank values per unit of bin size (weight is ignored)• mean: the mean of the combined values• median: the median of the combined values (may be slow)• min: the minimum of all the combined values• max: the maximum of all the combined values• stdev: the sample standard deviation of the combined values• hit: 1 if any values present, NaN otherwise (weight is ignored)
[Default: sum-per-unit]
icmdN = <cmds> (ProcessingStep[])Specifies processing to be performed on the layer N input table as specified by parameter inN.The value of this parameter is one or more of the filter commands described in Section 6.1. Ifmore than one is given, they must be separated by semicolon characters (";"). This parametercan be repeated multiple times on the same command line to build up a list of processing steps.The sequence of commands given in this way defines the processing pipeline which isperformed on the table.
Commands may alteratively be supplied in an external file, by using the indirection character'@'. Thus a value of "@filename" causes the file filename to be read for a list of filtercommands to execute. The commands in the file may be separated by newline charactersand/or semicolons, and lines which are blank or which start with a '#' character are ignored.
ifmtN = <in-format> (String)Specifies the format of the input table as specified by parameter inN. The known formats arelisted in Section 5.1.1. This flag can be used if you know what format your table is in. If it hasthe special value (auto) (the default), then an attempt will be made to detect the format of thetable automatically. This cannot always be done correctly however, in which case the programwill exit with an error explaining which formats were attempted. This parameter is ignored forscheme-specified tables.
[Default: (auto)]
inN = <table> (StarTable)The location of the input table. This may take one of the following forms:
• A filename.• A URL.• The special value "-", meaning standard input. In this case the input format must be given
explicitly using the ifmtN parameter. Note that not all formats can be streamed in thisway.
• A scheme specification of the form :<scheme-name>:<scheme-args>.• A system command line with either a "<" character at the start, or a "|" character at the
SUN/256 211

end ("<syscmd" or "syscmd|"). This executes the given pipeline and reads from itsstandard output. This will probably only work on unix-like systems.
In any case, compressed data in one of the supported compression formats (gzip, Unixcompress or bzip2) will be decompressed transparently.
istreamN = true|false (Boolean)If set true, the input table specified by the inN parameter will be read as a stream. It isnecessary to give the ifmtN parameter in this case. Depending on the required operations andprocessing mode, this may cause the read to fail (sometimes it is necessary to read the tablemore than once). It is not normally necessary to set this flag; in most cases the data will bestreamed automatically if that is the best thing to do. However it can sometimes result in lessresource usage when processing large files in certain formats (such as VOTable). Thisparameter is ignored for scheme-specified tables.
[Default: false]
latN = <deg-expr> (String)Latitude in decimal degrees.
The value is a numeric algebraic expression based on column names as described in Section10.
levelN = <-rel-level|+abs-level> (Integer)Determines the HEALPix level of pixels which are averaged over to calculate density.
If the supplied value is a non-negative integer, it gives the absolute level to use; at level 0 thereare 12 pixels on the sky, and the count multiplies by 4 for each increment.
If the value is negative, it represents a relative level; it is approximately the (negative) numberof screen pixels along one side of a HEALPix sky pixel. In this case the actual HEALPix levelwill depend on the current zoom.
[Default: -3]
lonN = <deg-expr> (String)Longitude in decimal degrees.
The value is a numeric algebraic expression based on column names as described in Section10.
perunitN = steradian|degree2|arcmin2|arcsec2|mas2|uas2 (SolidAngleUnit)Defines the unit of sky area used for scaling density-like combinations (e.g.combine=count-per-unit or sum-per-unit). If the Combination mode is calculating valuesper unit area, this configures the area scale in question. For non-density-like combinationmodes (e.g. combine=sum or mean) it has no effect.
The available options are:
• steradian: (180/Pi)^2 deg^2• degree2: square degrees• arcmin2: square arcminute, (1/60)^2 deg^2• arcsec2: square arcsecond, (1/3600)^2 deg^2• mas2: square milliarcsecond, (.001/3600)^2 deg^2• uas2: square microarcsecond, (1e-6/3600)^2 deg^2
[Default: degree2]
transparencyN = 0..1 (Double)Transparency with which components are plotted, in the range 0 (opaque) to 1 (invisible). Thevalue is 1-alpha.
[Default: 0]
SUN/256 212
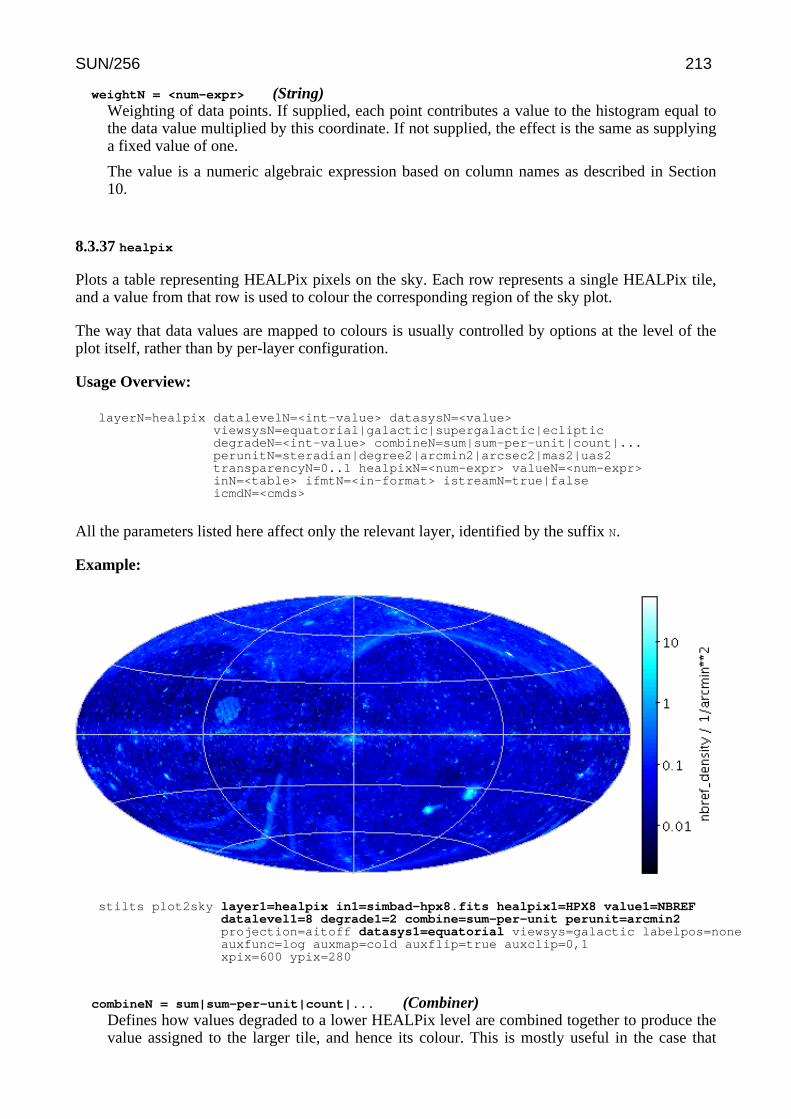
weightN = <num-expr> (String)Weighting of data points. If supplied, each point contributes a value to the histogram equal tothe data value multiplied by this coordinate. If not supplied, the effect is the same as supplyinga fixed value of one.
The value is a numeric algebraic expression based on column names as described in Section10.
8.3.37 healpix
Plots a table representing HEALPix pixels on the sky. Each row represents a single HEALPix tile,and a value from that row is used to colour the corresponding region of the sky plot.
The way that data values are mapped to colours is usually controlled by options at the level of theplot itself, rather than by per-layer configuration.
Usage Overview:
layerN=healpix datalevelN=<int-value> datasysN=<value>viewsysN=equatorial|galactic|supergalactic|eclipticdegradeN=<int-value> combineN=sum|sum-per-unit|count|...perunitN=steradian|degree2|arcmin2|arcsec2|mas2|uas2transparencyN=0..1 healpixN=<num-expr> valueN=<num-expr>inN=<table> ifmtN=<in-format> istreamN=true|falseicmdN=<cmds>
All the parameters listed here affect only the relevant layer, identified by the suffix N.
Example:
stilts plot2sky layer1=healpix in1=simbad-hpx8.fits healpix1=HPX8 value1=NBREFdatalevel1=8 degrade1=2 combine=sum-per-unit perunit=arcmin2projection=aitoff datasys1=equatorial viewsys=galactic labelpos=noneauxfunc=log auxmap=cold auxflip=true auxclip=0,1xpix=600 ypix=280
combineN = sum|sum-per-unit|count|... (Combiner)Defines how values degraded to a lower HEALPix level are combined together to produce thevalue assigned to the larger tile, and hence its colour. This is mostly useful in the case that
SUN/256 213
degrade>0.
For density-like values (count-per-unit, sum-per-unit) the scaling is additionally influencedby the perunit parameter.
The available options are:
• sum: the sum of all the combined values per bin• sum-per-unit: the sum of all the combined values per unit of bin size• count: the number of non-blank values per bin (weight is ignored)• count-per-unit: the number of non-blank values per unit of bin size (weight is ignored)• mean: the mean of the combined values• median: the median of the combined values (may be slow)• min: the minimum of all the combined values• max: the maximum of all the combined values• stdev: the sample standard deviation of the combined values• hit: 1 if any values present, NaN otherwise (weight is ignored)
[Default: mean]
datalevelN = <int-value> (Integer)HEALPix level of the (implicit or explicit) tile indices. Legal values are between 0 (12 pixels)and 29 (3458764513820540928 pixels). If a negative value is supplied (the default), then anattempt is made to determine the correct level from the data.
[Default: -1]
datasysN = <value> (SkySys)The sky coordinate system to which the HEALPix grid used by the input pixel file refers.
[Default: equatorial]
degradeN = <int-value> (Integer)Allows the HEALPix grid to be drawn at a less detailed level than the level at which the inputdata are supplied. A value of zero (the default) means that the HEALPix tiles are painted withthe same resolution as the input data, but a higher value will degrade resolution of the plottiles; each plotted tile will correspond to 4^degrade input tiles. The way that values arecombined within each painted tile is controlled by the combine value.
[Default: 0]
healpixN = <num-expr> (String)HEALPix index indicating the sky position of the tile whose value is plotted. If not supplied,the assumption is that the supplied table contains one row for each HEALPix tile at a givenlevel, in ascending order.
The value is a numeric algebraic expression based on column names as described in Section10.
icmdN = <cmds> (ProcessingStep[])Specifies processing to be performed on the layer N input table as specified by parameter inN.The value of this parameter is one or more of the filter commands described in Section 6.1. Ifmore than one is given, they must be separated by semicolon characters (";"). This parametercan be repeated multiple times on the same command line to build up a list of processing steps.The sequence of commands given in this way defines the processing pipeline which isperformed on the table.
Commands may alteratively be supplied in an external file, by using the indirection character'@'. Thus a value of "@filename" causes the file filename to be read for a list of filtercommands to execute. The commands in the file may be separated by newline charactersand/or semicolons, and lines which are blank or which start with a '#' character are ignored.
ifmtN = <in-format> (String)
SUN/256 214
Specifies the format of the input table as specified by parameter inN. The known formats arelisted in Section 5.1.1. This flag can be used if you know what format your table is in. If it hasthe special value (auto) (the default), then an attempt will be made to detect the format of thetable automatically. This cannot always be done correctly however, in which case the programwill exit with an error explaining which formats were attempted. This parameter is ignored forscheme-specified tables.
[Default: (auto)]
inN = <table> (StarTable)The location of the input table. This may take one of the following forms:
• A filename.• A URL.• The special value "-", meaning standard input. In this case the input format must be given
explicitly using the ifmtN parameter. Note that not all formats can be streamed in thisway.
• A scheme specification of the form :<scheme-name>:<scheme-args>.• A system command line with either a "<" character at the start, or a "|" character at the
end ("<syscmd" or "syscmd|"). This executes the given pipeline and reads from itsstandard output. This will probably only work on unix-like systems.
In any case, compressed data in one of the supported compression formats (gzip, Unixcompress or bzip2) will be decompressed transparently.
istreamN = true|false (Boolean)If set true, the input table specified by the inN parameter will be read as a stream. It isnecessary to give the ifmtN parameter in this case. Depending on the required operations andprocessing mode, this may cause the read to fail (sometimes it is necessary to read the tablemore than once). It is not normally necessary to set this flag; in most cases the data will bestreamed automatically if that is the best thing to do. However it can sometimes result in lessresource usage when processing large files in certain formats (such as VOTable). Thisparameter is ignored for scheme-specified tables.
[Default: false]
perunitN = steradian|degree2|arcmin2|arcsec2|mas2|uas2 (SolidAngleUnit)Defines the unit of sky area used for scaling density-like combinations (e.g.combine=count-per-unit or sum-per-unit). If the Combination mode is calculating valuesper unit area, this configures the area scale in question. For non-density-like combinationmodes (e.g. combine=sum or mean) it has no effect.
The available options are:
• steradian: (180/Pi)^2 deg^2• degree2: square degrees• arcmin2: square arcminute, (1/60)^2 deg^2• arcsec2: square arcsecond, (1/3600)^2 deg^2• mas2: square milliarcsecond, (.001/3600)^2 deg^2• uas2: square microarcsecond, (1e-6/3600)^2 deg^2
[Default: degree2]
transparencyN = 0..1 (Double)Transparency with which components are plotted, in the range 0 (opaque) to 1 (invisible). Thevalue is 1-alpha.
[Default: 0]
valueN = <num-expr> (String)Value of HEALPix tile, determining the colour which will be plotted.
SUN/256 215
The value is a numeric algebraic expression based on column names as described in Section10.
viewsysN = equatorial|galactic|supergalactic|ecliptic (SkySys)The sky coordinate system used for the generated plot.
Choice of this value goes along with the data coordinate system that may be specified for plotlayers. If unspecified, a generic longitude/latitude system is used, and all lon/lat coordinates inthe plotted data layers are assumed to be in the same system. If a value is supplied for thisparameter, then a sky system must (implicitly or explicitly) be supplied for each data layer, andthe coordinates are converted from data to view system before being plotted.
The available options are:
• equatorial: J2000 equatorial system• galactic: IAU 1958 galactic system• supergalactic: De Vaucouleurs supergalactic system• ecliptic: ecliptic system based on conversion at 2000.0
[Default: equatorial]
8.3.38 skygrid
Plots an additional axis grid on the celestial sphere. This can be overlaid on the default sky axis gridso that axes for multiple sky coordinate systems are simultaneously visible. The plots are donerelative to the View sky system (viewsys parameter) defined for the plot as a whole.
Note that some of the configuration items for this plotter, such as grid line antialiasing and thedecimal/sexagesimal flag, are inherited from the values set for the main sky plot grid.
Usage Overview:
layerN=skygrid gridsysN=equatorial|galactic|supergalactic|eclipticgridcolorN=<rrggbb>|red|blue|... transparencyN=0..1labelposN=Internal|None loncrowdN=<number> latcrowdN=<number>
All the parameters listed here affect only the relevant layer, identified by the suffix N.
Example:
SUN/256 216
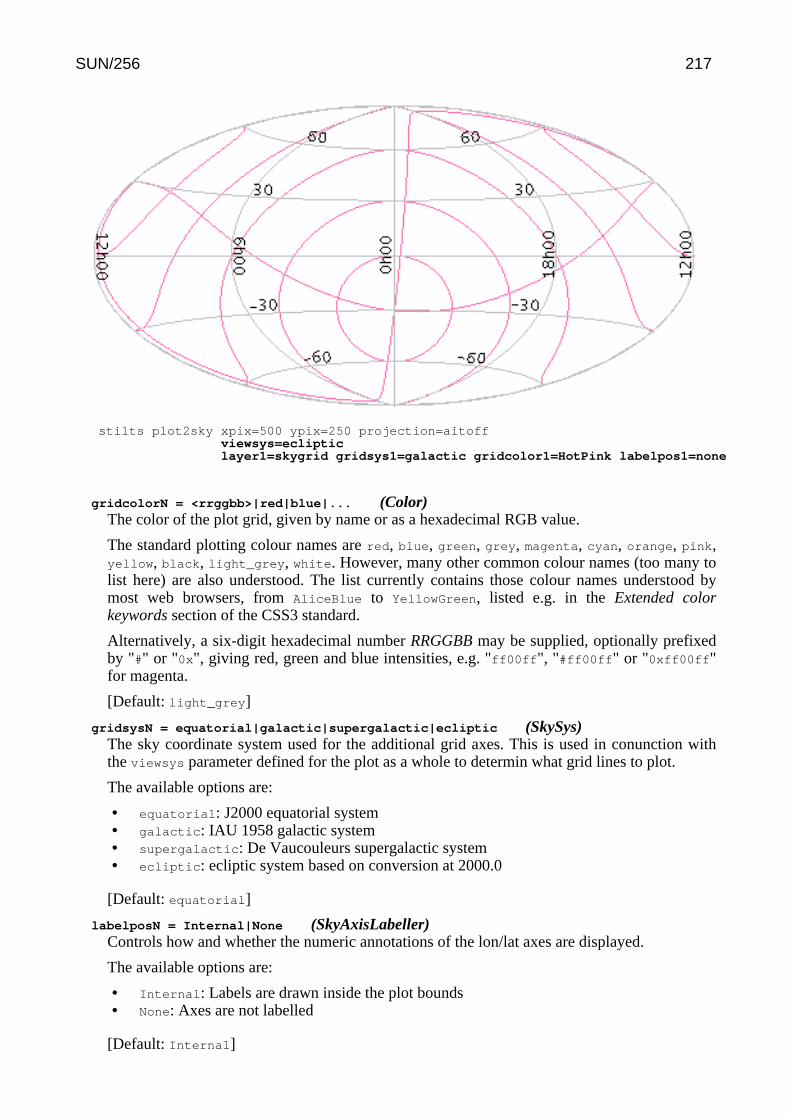
stilts plot2sky xpix=500 ypix=250 projection=aitoffviewsys=eclipticlayer1=skygrid gridsys1=galactic gridcolor1=HotPink labelpos1=none
gridcolorN = <rrggbb>|red|blue|... (Color)The color of the plot grid, given by name or as a hexadecimal RGB value.
The standard plotting colour names are red, blue, green, grey, magenta, cyan, orange, pink,yellow, black, light_grey, white. However, many other common colour names (too many tolist here) are also understood. The list currently contains those colour names understood bymost web browsers, from AliceBlue to YellowGreen, listed e.g. in the Extended colorkeywords section of the CSS3 standard.
Alternatively, a six-digit hexadecimal number RRGGBB may be supplied, optionally prefixedby "#" or "0x", giving red, green and blue intensities, e.g. "ff00ff", "#ff00ff" or "0xff00ff"for magenta.
[Default: light_grey]
gridsysN = equatorial|galactic|supergalactic|ecliptic (SkySys)The sky coordinate system used for the additional grid axes. This is used in conunction withthe viewsys parameter defined for the plot as a whole to determin what grid lines to plot.
The available options are:
• equatorial: J2000 equatorial system• galactic: IAU 1958 galactic system• supergalactic: De Vaucouleurs supergalactic system• ecliptic: ecliptic system based on conversion at 2000.0
[Default: equatorial]
labelposN = Internal|None (SkyAxisLabeller)Controls how and whether the numeric annotations of the lon/lat axes are displayed.
The available options are:
• Internal: Labels are drawn inside the plot bounds• None: Axes are not labelled
[Default: Internal]
SUN/256 217
latcrowdN = <number> (Double)Determines how closely sky latitude grid lines (parallels) are spaced. The default value is 1,meaning normal crowding. Larger values result in more grid lines, and smaller values in fewergrid lines.
[Default: 1]
loncrowdN = <number> (Double)Determines how closely sky longitude grid lines (meridians) are spaced. The default value is 1,meaning normal crowding. Larger values result in more grid lines, and smaller values in fewergrid lines.
[Default: 1]
transparencyN = 0..1 (Double)Transparency with which components are plotted, in the range 0 (opaque) to 1 (invisible). Thevalue is 1-alpha.
[Default: 0]
8.3.39 xyzvector
Plots directed lines from the data position given delta values for the coordinates. The plottedmarkers are typically little arrows, but there are other options.
In some cases the supplied data values give the actual extents in data coordinates for the plottedvectors but sometimes the data is on a different scale or in different units to the positionalcoordinates. As a convenience for this case, the plotter can optionally scale the magnitudes of allthe vectors to make them a reasonable size on the plot, so by default the largest ones are a few tensof pixels long. This auto-scaling is turned off by default, but it can be activated with the autoscale
option. Whether autoscaling is on or off, the scale option can be used to apply a fixed scalingfactor.
Usage Overview:
layerN=xyzvector arrowN=small_arrow|medium_arrow|... thickN=<int-value>scaleN=<factor> autoscaleN=true|falseshadingN=flat|translucent|transparent|density|aux|weighted <shade-paramsN>xN=<num-expr> yN=<num-expr> zN=<num-expr>xdeltaN=<num-expr> ydeltaN=<num-expr> zdeltaN=<num-expr>inN=<table> ifmtN=<in-format> istreamN=true|falseicmdN=<cmds>
All the parameters listed here affect only the relevant layer, identified by the suffix N.
Example:
SUN/256 218

stilts plot2cube in=gavo_g2.fitsx=x y=y z=z xdelta=velX ydelta=velY zdelta=velZ autoscale=truecolor=BlueViolet scale=1.5layer1=xyzvector shading1=transparent opaque1=5 arrow1=medium_filled_dartlayer2=xyzvector shading2=flat arrow2=medium_open_dartxmin=6 xmax=7.5 ymin=12.5 ymax=13.5 zmin=19 zmax=21.5
arrowN = small_arrow|medium_arrow|... (MultiPointShape)How arrows are represented.
The available options are:
• small_arrow
• medium_arrow
• large_arrow
• small_open_dart
• medium_open_dart
• large_open_dart
• small_filled_dart
• medium_filled_dart
• large_filled_dart
• lines
• capped_lines
[Default: small_arrow]
autoscaleN = true|false (Boolean)Determines whether the default size of variable-sized markers like vectors and ellipses areautomatically scaled to have a sensible size. If true, then the sizes of all the plotted markers areexamined, and some dynamically calculated factor is applied to them all to make them asensible size (by default, the largest ones will be a few tens of pixels). If false, the sizes will be
SUN/256 219
the actual input values interpreted in data coordinates.
If auto-scaling is on, then markers will keep approximately the same screen size during zoomoperations; if it's off, they will keep the same size in data coordinates.
Marker size is also affected by the scale parameter.
[Default: false]
icmdN = <cmds> (ProcessingStep[])Specifies processing to be performed on the layer N input table as specified by parameter inN.The value of this parameter is one or more of the filter commands described in Section 6.1. Ifmore than one is given, they must be separated by semicolon characters (";"). This parametercan be repeated multiple times on the same command line to build up a list of processing steps.The sequence of commands given in this way defines the processing pipeline which isperformed on the table.
Commands may alteratively be supplied in an external file, by using the indirection character'@'. Thus a value of "@filename" causes the file filename to be read for a list of filtercommands to execute. The commands in the file may be separated by newline charactersand/or semicolons, and lines which are blank or which start with a '#' character are ignored.
ifmtN = <in-format> (String)Specifies the format of the input table as specified by parameter inN. The known formats arelisted in Section 5.1.1. This flag can be used if you know what format your table is in. If it hasthe special value (auto) (the default), then an attempt will be made to detect the format of thetable automatically. This cannot always be done correctly however, in which case the programwill exit with an error explaining which formats were attempted. This parameter is ignored forscheme-specified tables.
[Default: (auto)]
inN = <table> (StarTable)The location of the input table. This may take one of the following forms:
• A filename.• A URL.• The special value "-", meaning standard input. In this case the input format must be given
explicitly using the ifmtN parameter. Note that not all formats can be streamed in thisway.
• A scheme specification of the form :<scheme-name>:<scheme-args>.• A system command line with either a "<" character at the start, or a "|" character at the
end ("<syscmd" or "syscmd|"). This executes the given pipeline and reads from itsstandard output. This will probably only work on unix-like systems.
In any case, compressed data in one of the supported compression formats (gzip, Unixcompress or bzip2) will be decompressed transparently.
istreamN = true|false (Boolean)If set true, the input table specified by the inN parameter will be read as a stream. It isnecessary to give the ifmtN parameter in this case. Depending on the required operations andprocessing mode, this may cause the read to fail (sometimes it is necessary to read the tablemore than once). It is not normally necessary to set this flag; in most cases the data will bestreamed automatically if that is the best thing to do. However it can sometimes result in lessresource usage when processing large files in certain formats (such as VOTable). Thisparameter is ignored for scheme-specified tables.
[Default: false]
scaleN = <factor> (Double)Affects the size of variable-sized markers like vectors and ellipses. The default value is 1,smaller or larger values multiply the visible sizes accordingly.
SUN/256 220
[Default: 1]
shadingN = flat|translucent|transparent|density|aux|weighted <shade-paramsN>
(ShapeMode)Determines how plotted objects in layer N are coloured. This may be influenced by how manyobjects are plotted over each other as well as the values of other parameters. Available options(Section 8.4) are:
• flat (Section 8.4.2)
• translucent (Section 8.4.3)
• transparent (Section 8.4.4)
• density (Section 8.4.5)
• aux (Section 8.4.6)
• weighted (Section 8.4.7)
Each of these options comes with its own set of parameters to specify the details of howcolouring is done.
[Default: flat]
thickN = <int-value> (Integer)Controls the line thickness used when drawing shapes. Zero, the default value, means a1-pixel-wide line is used. Larger values make drawn lines thicker, but note changing this valuewill not affect all shapes, for instance filled rectangles contain no line drawings.
[Default: 0]
xN = <num-expr> (String)X coordinate.
The value is a numeric algebraic expression based on column names as described in Section10.
xdeltaN = <num-expr> (String)Vector component in the X direction.
The value is a numeric algebraic expression based on column names as described in Section10.
yN = <num-expr> (String)Y coordinate.
The value is a numeric algebraic expression based on column names as described in Section10.
ydeltaN = <num-expr> (String)Vector component in the Y direction.
The value is a numeric algebraic expression based on column names as described in Section10.
zN = <num-expr> (String)Z coordinate.
The value is a numeric algebraic expression based on column names as described in Section10.
zdeltaN = <num-expr> (String)Vector component in the Z direction.
The value is a numeric algebraic expression based on column names as described in Section10.
8.3.40 xyzerror
SUN/256 221

Plots symmetric or asymmetric error bars in some or all of the plot dimensions. The shape of theerror "bars" is quite configurable, including (for 2-d and 3-d errors) ellipses, rectangles etc alignedwith the axes.
Usage Overview:
layerN=xyzerror errorbarN=none|lines|capped_lines|... thickN=<int-value>shadingN=flat|translucent|transparent|density|aux|weighted <shade-paramsN>xN=<num-expr> yN=<num-expr> zN=<num-expr> xerrhiN=<num-expr>xerrloN=<num-expr> yerrhiN=<num-expr> yerrloN=<num-expr>zerrhiN=<num-expr> zerrloN=<num-expr> inN=<table>ifmtN=<in-format> istreamN=true|false icmdN=<cmds>
All the parameters listed here affect only the relevant layer, identified by the suffix N.
Example:
stilts plot2cube in=dr5qso.fits icmd='select morphology==1'x=psfmag_g xerrhi=psfmagerr_gy=psfmag_r yerrhi=psfmagerr_rz=psfmag_u zerrhi=psfmagerr_ulayer1=marklayer2=xyzerror errorbar2=cuboidshading=transparent opaque=3xmin=17.5 xmax=18 ymin=17.3 ymax=17.7 zmin=17.4 zmax=18.2
errorbarN = none|lines|capped_lines|... (MultiPointShape)How errorbars are represented.
The available options are:
• none
SUN/256 222
• lines
• capped_lines
• caps
• arrows
• cuboid
• ellipse
• crosshair_ellipse
• rectangle
• crosshair_rectangle
• filled_ellipse
• filled_rectangle
[Default: lines]
icmdN = <cmds> (ProcessingStep[])Specifies processing to be performed on the layer N input table as specified by parameter inN.The value of this parameter is one or more of the filter commands described in Section 6.1. Ifmore than one is given, they must be separated by semicolon characters (";"). This parametercan be repeated multiple times on the same command line to build up a list of processing steps.The sequence of commands given in this way defines the processing pipeline which isperformed on the table.
Commands may alteratively be supplied in an external file, by using the indirection character'@'. Thus a value of "@filename" causes the file filename to be read for a list of filtercommands to execute. The commands in the file may be separated by newline charactersand/or semicolons, and lines which are blank or which start with a '#' character are ignored.
ifmtN = <in-format> (String)Specifies the format of the input table as specified by parameter inN. The known formats arelisted in Section 5.1.1. This flag can be used if you know what format your table is in. If it hasthe special value (auto) (the default), then an attempt will be made to detect the format of thetable automatically. This cannot always be done correctly however, in which case the programwill exit with an error explaining which formats were attempted. This parameter is ignored forscheme-specified tables.
[Default: (auto)]
inN = <table> (StarTable)The location of the input table. This may take one of the following forms:
• A filename.• A URL.• The special value "-", meaning standard input. In this case the input format must be given
explicitly using the ifmtN parameter. Note that not all formats can be streamed in thisway.
• A scheme specification of the form :<scheme-name>:<scheme-args>.• A system command line with either a "<" character at the start, or a "|" character at the
end ("<syscmd" or "syscmd|"). This executes the given pipeline and reads from itsstandard output. This will probably only work on unix-like systems.
In any case, compressed data in one of the supported compression formats (gzip, Unixcompress or bzip2) will be decompressed transparently.
istreamN = true|false (Boolean)If set true, the input table specified by the inN parameter will be read as a stream. It isnecessary to give the ifmtN parameter in this case. Depending on the required operations andprocessing mode, this may cause the read to fail (sometimes it is necessary to read the tablemore than once). It is not normally necessary to set this flag; in most cases the data will bestreamed automatically if that is the best thing to do. However it can sometimes result in lessresource usage when processing large files in certain formats (such as VOTable). This
SUN/256 223

parameter is ignored for scheme-specified tables.
[Default: false]
shadingN = flat|translucent|transparent|density|aux|weighted <shade-paramsN>
(ShapeMode)Determines how plotted objects in layer N are coloured. This may be influenced by how manyobjects are plotted over each other as well as the values of other parameters. Available options(Section 8.4) are:
• flat (Section 8.4.2)
• translucent (Section 8.4.3)
• transparent (Section 8.4.4)
• density (Section 8.4.5)
• aux (Section 8.4.6)
• weighted (Section 8.4.7)
Each of these options comes with its own set of parameters to specify the details of howcolouring is done.
[Default: flat]
thickN = <int-value> (Integer)Controls the line thickness used when drawing shapes. Zero, the default value, means a1-pixel-wide line is used. Larger values make drawn lines thicker, but note changing this valuewill not affect all shapes, for instance filled rectangles contain no line drawings.
[Default: 0]
xN = <num-expr> (String)X coordinate.
The value is a numeric algebraic expression based on column names as described in Section10.
xerrhiN = <num-expr> (String)Error in the X coordinate in the positive direction. If no corresponding negative error value issupplied, then this value is also used in the negative direction, i.e. in that case errors areassumed to be symmetric.
The value is a numeric algebraic expression based on column names as described in Section10.
xerrloN = <num-expr> (String)Error in the X coordinate in the negative direction. If left blank, it is assumed to take the samevalue as the positive error.
The value is a numeric algebraic expression based on column names as described in Section10.
yN = <num-expr> (String)Y coordinate.
The value is a numeric algebraic expression based on column names as described in Section10.
yerrhiN = <num-expr> (String)Error in the Y coordinate in the positive direction. If no corresponding negative error value issupplied, then this value is also used in the negative direction, i.e. in that case errors areassumed to be symmetric.
The value is a numeric algebraic expression based on column names as described in Section10.
yerrloN = <num-expr> (String)
SUN/256 224
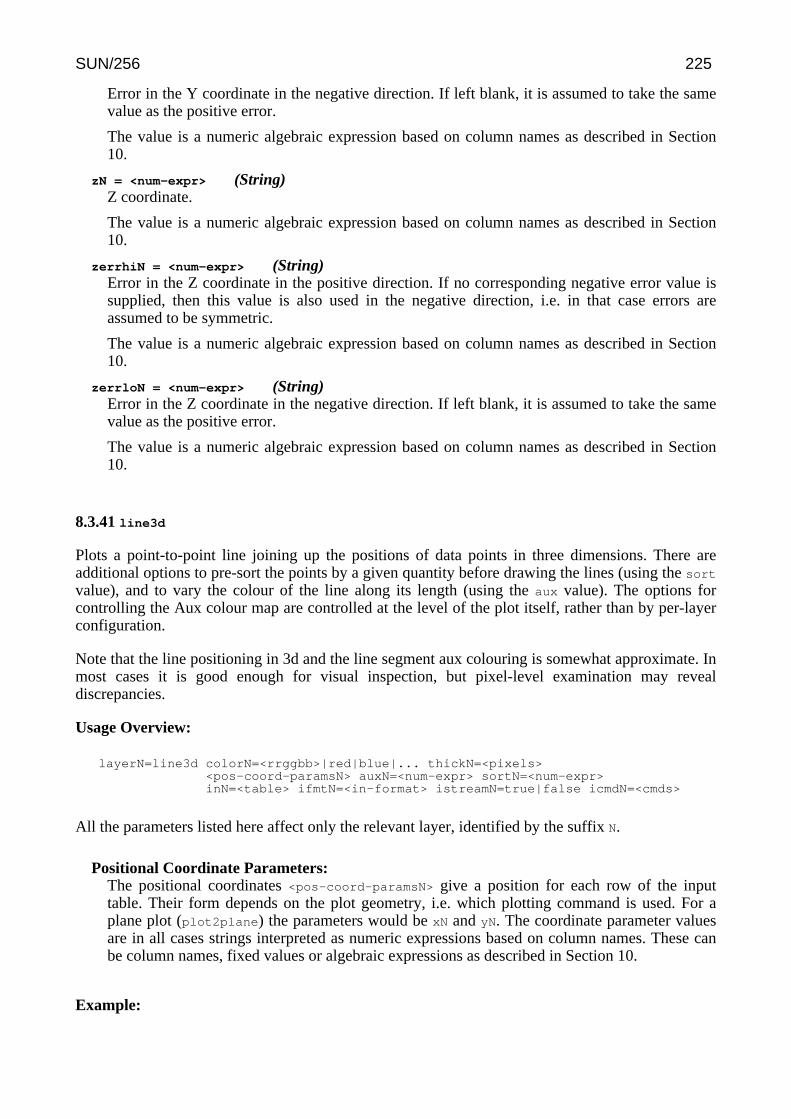
Error in the Y coordinate in the negative direction. If left blank, it is assumed to take the samevalue as the positive error.
The value is a numeric algebraic expression based on column names as described in Section10.
zN = <num-expr> (String)Z coordinate.
The value is a numeric algebraic expression based on column names as described in Section10.
zerrhiN = <num-expr> (String)Error in the Z coordinate in the positive direction. If no corresponding negative error value issupplied, then this value is also used in the negative direction, i.e. in that case errors areassumed to be symmetric.
The value is a numeric algebraic expression based on column names as described in Section10.
zerrloN = <num-expr> (String)Error in the Z coordinate in the negative direction. If left blank, it is assumed to take the samevalue as the positive error.
The value is a numeric algebraic expression based on column names as described in Section10.
8.3.41 line3d
Plots a point-to-point line joining up the positions of data points in three dimensions. There areadditional options to pre-sort the points by a given quantity before drawing the lines (using the sort
value), and to vary the colour of the line along its length (using the aux value). The options forcontrolling the Aux colour map are controlled at the level of the plot itself, rather than by per-layerconfiguration.
Note that the line positioning in 3d and the line segment aux colouring is somewhat approximate. Inmost cases it is good enough for visual inspection, but pixel-level examination may revealdiscrepancies.
Usage Overview:
layerN=line3d colorN=<rrggbb>|red|blue|... thickN=<pixels><pos-coord-paramsN> auxN=<num-expr> sortN=<num-expr>inN=<table> ifmtN=<in-format> istreamN=true|false icmdN=<cmds>
All the parameters listed here affect only the relevant layer, identified by the suffix N.
Positional Coordinate Parameters:The positional coordinates <pos-coord-paramsN> give a position for each row of the inputtable. Their form depends on the plot geometry, i.e. which plotting command is used. For aplane plot (plot2plane) the parameters would be xN and yN. The coordinate parameter valuesare in all cases strings interpreted as numeric expressions based on column names. These canbe column names, fixed values or algebraic expressions as described in Section 10.
Example:
SUN/256 225
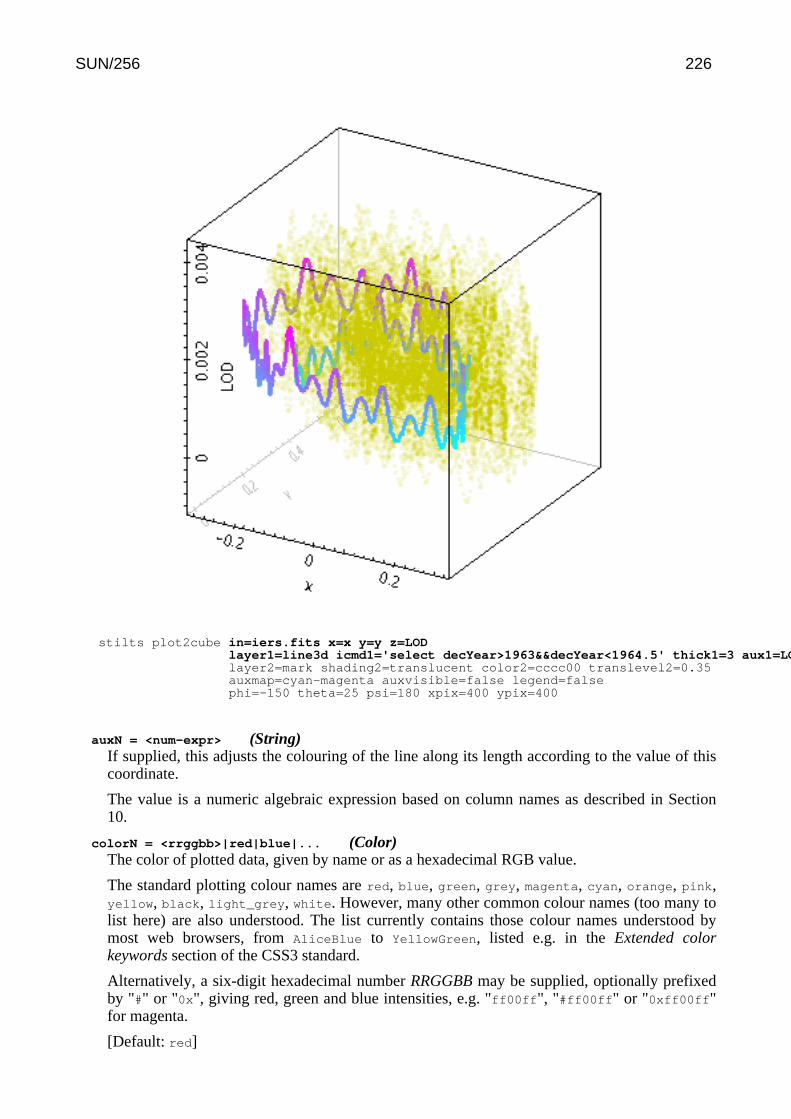
stilts plot2cube in=iers.fits x=x y=y z=LODlayer1=line3d icmd1='select decYear>1963&&decYear<1964.5' thick1=3 aux1=LODlayer2=mark shading2=translucent color2=cccc00 translevel2=0.35auxmap=cyan-magenta auxvisible=false legend=falsephi=-150 theta=25 psi=180 xpix=400 ypix=400
auxN = <num-expr> (String)If supplied, this adjusts the colouring of the line along its length according to the value of thiscoordinate.
The value is a numeric algebraic expression based on column names as described in Section10.
colorN = <rrggbb>|red|blue|... (Color)The color of plotted data, given by name or as a hexadecimal RGB value.
The standard plotting colour names are red, blue, green, grey, magenta, cyan, orange, pink,yellow, black, light_grey, white. However, many other common colour names (too many tolist here) are also understood. The list currently contains those colour names understood bymost web browsers, from AliceBlue to YellowGreen, listed e.g. in the Extended colorkeywords section of the CSS3 standard.
Alternatively, a six-digit hexadecimal number RRGGBB may be supplied, optionally prefixedby "#" or "0x", giving red, green and blue intensities, e.g. "ff00ff", "#ff00ff" or "0xff00ff"for magenta.
[Default: red]
SUN/256 226
icmdN = <cmds> (ProcessingStep[])Specifies processing to be performed on the layer N input table as specified by parameter inN.The value of this parameter is one or more of the filter commands described in Section 6.1. Ifmore than one is given, they must be separated by semicolon characters (";"). This parametercan be repeated multiple times on the same command line to build up a list of processing steps.The sequence of commands given in this way defines the processing pipeline which isperformed on the table.
Commands may alteratively be supplied in an external file, by using the indirection character'@'. Thus a value of "@filename" causes the file filename to be read for a list of filtercommands to execute. The commands in the file may be separated by newline charactersand/or semicolons, and lines which are blank or which start with a '#' character are ignored.
ifmtN = <in-format> (String)Specifies the format of the input table as specified by parameter inN. The known formats arelisted in Section 5.1.1. This flag can be used if you know what format your table is in. If it hasthe special value (auto) (the default), then an attempt will be made to detect the format of thetable automatically. This cannot always be done correctly however, in which case the programwill exit with an error explaining which formats were attempted. This parameter is ignored forscheme-specified tables.
[Default: (auto)]
inN = <table> (StarTable)The location of the input table. This may take one of the following forms:
• A filename.• A URL.• The special value "-", meaning standard input. In this case the input format must be given
explicitly using the ifmtN parameter. Note that not all formats can be streamed in thisway.
• A scheme specification of the form :<scheme-name>:<scheme-args>.• A system command line with either a "<" character at the start, or a "|" character at the
end ("<syscmd" or "syscmd|"). This executes the given pipeline and reads from itsstandard output. This will probably only work on unix-like systems.
In any case, compressed data in one of the supported compression formats (gzip, Unixcompress or bzip2) will be decompressed transparently.
istreamN = true|false (Boolean)If set true, the input table specified by the inN parameter will be read as a stream. It isnecessary to give the ifmtN parameter in this case. Depending on the required operations andprocessing mode, this may cause the read to fail (sometimes it is necessary to read the tablemore than once). It is not normally necessary to set this flag; in most cases the data will bestreamed automatically if that is the best thing to do. However it can sometimes result in lessresource usage when processing large files in certain formats (such as VOTable). Thisparameter is ignored for scheme-specified tables.
[Default: false]
sortN = <num-expr> (String)If supplied, this gives a value to define in what order points are joined together. If no value isgiven, the natural order is used, i.e. the sequence of rows in the table.
Note that if the required order is in fact the natural order of the table, it is better to leave thisvalue blank, since sorting is a potentially expensive step.
The value is a numeric algebraic expression based on column names as described in Section10.
thickN = <pixels> (Integer)Thickness of plotted line in pixels.
SUN/256 227
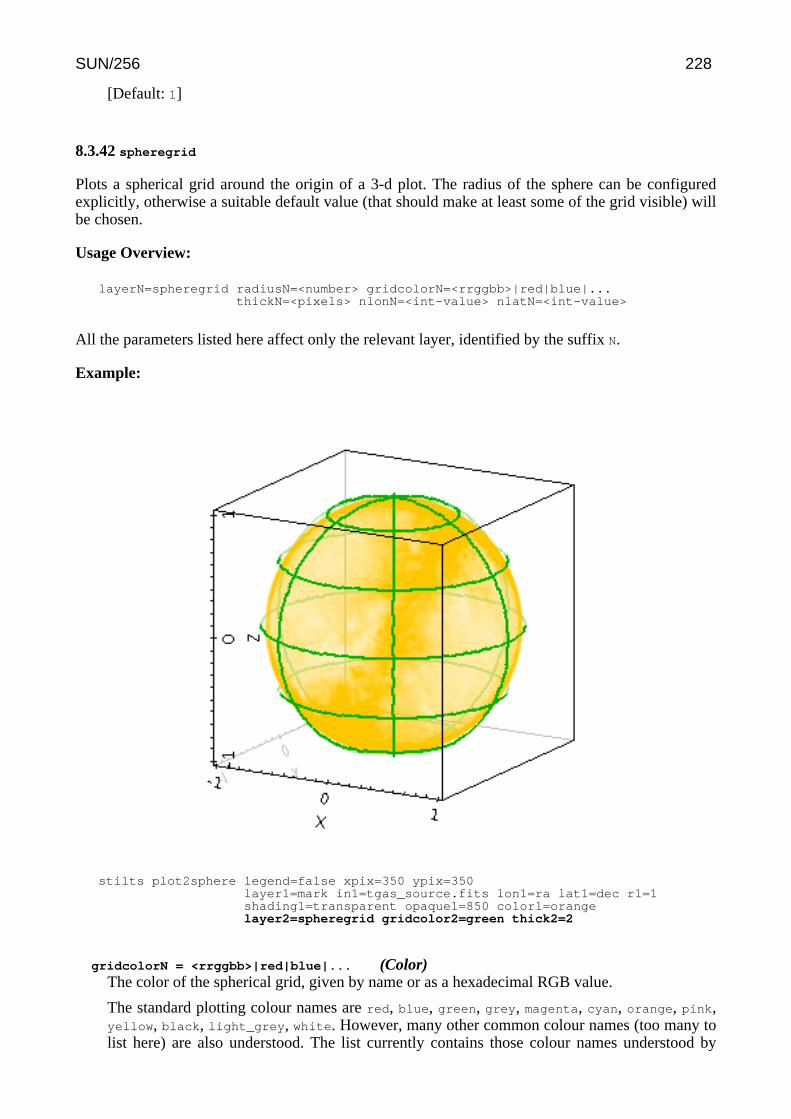
[Default: 1]
8.3.42 spheregrid
Plots a spherical grid around the origin of a 3-d plot. The radius of the sphere can be configuredexplicitly, otherwise a suitable default value (that should make at least some of the grid visible) willbe chosen.
Usage Overview:
layerN=spheregrid radiusN=<number> gridcolorN=<rrggbb>|red|blue|...thickN=<pixels> nlonN=<int-value> nlatN=<int-value>
All the parameters listed here affect only the relevant layer, identified by the suffix N.
Example:
stilts plot2sphere legend=false xpix=350 ypix=350layer1=mark in1=tgas_source.fits lon1=ra lat1=dec r1=1shading1=transparent opaque1=850 color1=orangelayer2=spheregrid gridcolor2=green thick2=2
gridcolorN = <rrggbb>|red|blue|... (Color)The color of the spherical grid, given by name or as a hexadecimal RGB value.
The standard plotting colour names are red, blue, green, grey, magenta, cyan, orange, pink,yellow, black, light_grey, white. However, many other common colour names (too many tolist here) are also understood. The list currently contains those colour names understood by
SUN/256 228
most web browsers, from AliceBlue to YellowGreen, listed e.g. in the Extended colorkeywords section of the CSS3 standard.
Alternatively, a six-digit hexadecimal number RRGGBB may be supplied, optionally prefixedby "#" or "0x", giving red, green and blue intensities, e.g. "ff00ff", "#ff00ff" or "0xff00ff"for magenta.
[Default: grey]
nlatN = <int-value> (Integer)Number of latitude lines to plot both above and below the equator in the spherical grid. Avalue of zero plots just the equator, and negative values plot no parallels at all.
[Default: 2]
nlonN = <int-value> (Integer)Number of longitude great circles to plot in the spherical grid. Since each great circle joins thepoles in two hemispheres, this value is half the number of meridians to be drawn.
[Default: 3]
radiusN = <number> (Double)Defines the radius of the spherical grid that is drawn around the origin. Positive values give theradius in data units, negative values provide a multiplier for the default radius which is chosenon the basis of the currently visible volume.
[Default: -1]
thickN = <pixels> (Integer)Thickness of plotted line in pixels.
[Default: 1]
8.3.43 yerror
Plots symmetric or asymmetric error bars in the Y direction.
Usage Overview:
layerN=yerror errorbarN=none|lines|capped_lines|caps|arrowsthickN=<int-value> shadingN=flat <shade-paramsN>tN=<time-expr> ttypeN=DecYear|MJD|JD|Unix|Iso8601yN=<num-expr> yerrhiN=<num-expr> yerrloN=<num-expr>inN=<table> ifmtN=<in-format> istreamN=true|false icmdN=<cmds>
All the parameters listed here affect only the relevant layer, identified by the suffix N.
Example:
SUN/256 229
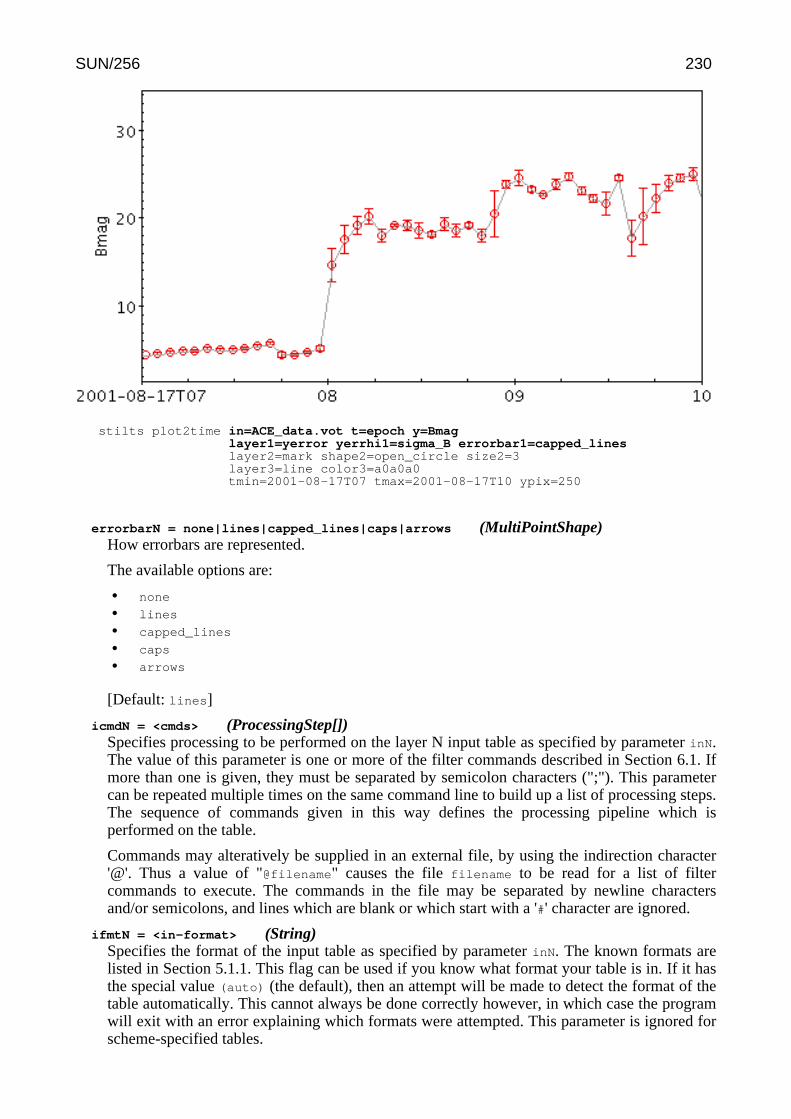
stilts plot2time in=ACE_data.vot t=epoch y=Bmaglayer1=yerror yerrhi1=sigma_B errorbar1=capped_lineslayer2=mark shape2=open_circle size2=3layer3=line color3=a0a0a0tmin=2001-08-17T07 tmax=2001-08-17T10 ypix=250
errorbarN = none|lines|capped_lines|caps|arrows (MultiPointShape)How errorbars are represented.
The available options are:
• none
• lines
• capped_lines
• caps
• arrows
[Default: lines]
icmdN = <cmds> (ProcessingStep[])Specifies processing to be performed on the layer N input table as specified by parameter inN.The value of this parameter is one or more of the filter commands described in Section 6.1. Ifmore than one is given, they must be separated by semicolon characters (";"). This parametercan be repeated multiple times on the same command line to build up a list of processing steps.The sequence of commands given in this way defines the processing pipeline which isperformed on the table.
Commands may alteratively be supplied in an external file, by using the indirection character'@'. Thus a value of "@filename" causes the file filename to be read for a list of filtercommands to execute. The commands in the file may be separated by newline charactersand/or semicolons, and lines which are blank or which start with a '#' character are ignored.
ifmtN = <in-format> (String)Specifies the format of the input table as specified by parameter inN. The known formats arelisted in Section 5.1.1. This flag can be used if you know what format your table is in. If it hasthe special value (auto) (the default), then an attempt will be made to detect the format of thetable automatically. This cannot always be done correctly however, in which case the programwill exit with an error explaining which formats were attempted. This parameter is ignored forscheme-specified tables.
SUN/256 230
[Default: (auto)]
inN = <table> (StarTable)The location of the input table. This may take one of the following forms:
• A filename.• A URL.• The special value "-", meaning standard input. In this case the input format must be given
explicitly using the ifmtN parameter. Note that not all formats can be streamed in thisway.
• A scheme specification of the form :<scheme-name>:<scheme-args>.• A system command line with either a "<" character at the start, or a "|" character at the
end ("<syscmd" or "syscmd|"). This executes the given pipeline and reads from itsstandard output. This will probably only work on unix-like systems.
In any case, compressed data in one of the supported compression formats (gzip, Unixcompress or bzip2) will be decompressed transparently.
istreamN = true|false (Boolean)If set true, the input table specified by the inN parameter will be read as a stream. It isnecessary to give the ifmtN parameter in this case. Depending on the required operations andprocessing mode, this may cause the read to fail (sometimes it is necessary to read the tablemore than once). It is not normally necessary to set this flag; in most cases the data will bestreamed automatically if that is the best thing to do. However it can sometimes result in lessresource usage when processing large files in certain formats (such as VOTable). Thisparameter is ignored for scheme-specified tables.
[Default: false]
shadingN = flat <shade-paramsN> (ShapeMode)Determines how plotted objects in layer N are coloured. This may be influenced by how manyobjects are plotted over each other as well as the values of other parameters. Available options(Section 8.4) are:
• flat (Section 8.4.2)
Each of these options comes with its own set of parameters to specify the details of howcolouring is done.
[Default: flat]
tN = <time-expr> (String)Time coordinate.
The value is a Time value algebraic expression based on column names as described in Section10.
thickN = <int-value> (Integer)Controls the line thickness used when drawing shapes. Zero, the default value, means a1-pixel-wide line is used. Larger values make drawn lines thicker, but note changing this valuewill not affect all shapes, for instance filled rectangles contain no line drawings.
[Default: 0]
ttypeN = DecYear|MJD|JD|Unix|Iso8601 (TimeMapper)Selects the form in which the Time value for parameter tN is supplied. Options are:
• DecYear: Years since 0 AD• MJD: Modified Julian Date• JD: Julian Day• Unix: Seconds since midnight 1 Jan 1970• Iso8601: ISO 8601 string
If left blank, a guess will be taken depending on the data type of the value supplied for the tN
SUN/256 231
value.
yN = <num-expr> (String)Vertical coordinate.
The value is a numeric algebraic expression based on column names as described in Section10.
yerrhiN = <num-expr> (String)Error in the Y coordinate in the positive direction. If no corresponding negative error value issupplied, then this value is also used in the negative direction, i.e. in that case errors areassumed to be symmetric.
The value is a numeric algebraic expression based on column names as described in Section10.
yerrloN = <num-expr> (String)Error in the Y coordinate in the negative direction. If left blank, it is assumed to take the samevalue as the positive error.
The value is a numeric algebraic expression based on column names as described in Section10.
8.3.44 spectrogram
Plots spectrograms. A spectrogram is a sequence of spectra plotted as vertical 1-d images, each oneplotted at a different horizontal coordinate.
This specialised layer is only available for time plots.
The way that data values are mapped to colours is usually controlled by options at the level of theplot itself, rather than by per-layer configuration.
Usage Overview:
layerN=spectrogram tN=<time-expr> ttypeN=DecYear|MJD|JD|Unix|Iso8601spectrumN=<array-expr> twidthN=<num-expr> inN=<table>ifmtN=<in-format> istreamN=true|false icmdN=<cmds>
All the parameters listed here affect only the relevant layer, identified by the suffix N.
Example:
SUN/256 232
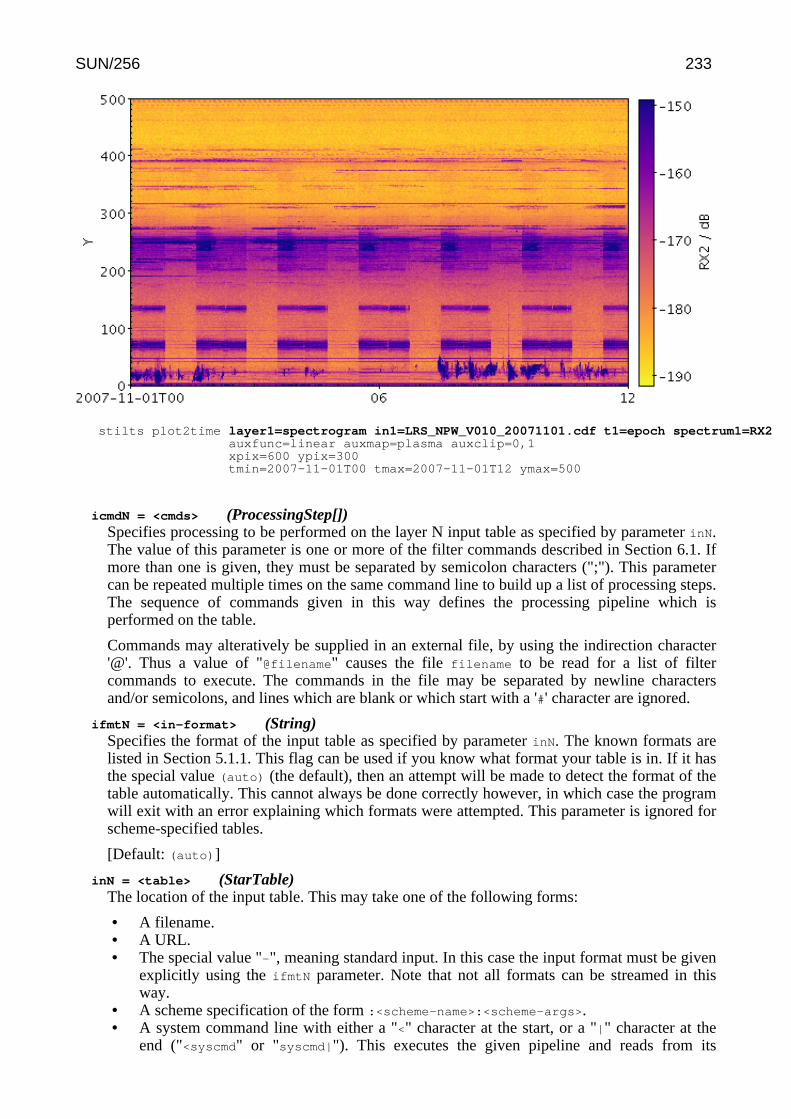
stilts plot2time layer1=spectrogram in1=LRS_NPW_V010_20071101.cdf t1=epoch spectrum1=RX2auxfunc=linear auxmap=plasma auxclip=0,1xpix=600 ypix=300tmin=2007-11-01T00 tmax=2007-11-01T12 ymax=500
icmdN = <cmds> (ProcessingStep[])Specifies processing to be performed on the layer N input table as specified by parameter inN.The value of this parameter is one or more of the filter commands described in Section 6.1. Ifmore than one is given, they must be separated by semicolon characters (";"). This parametercan be repeated multiple times on the same command line to build up a list of processing steps.The sequence of commands given in this way defines the processing pipeline which isperformed on the table.
Commands may alteratively be supplied in an external file, by using the indirection character'@'. Thus a value of "@filename" causes the file filename to be read for a list of filtercommands to execute. The commands in the file may be separated by newline charactersand/or semicolons, and lines which are blank or which start with a '#' character are ignored.
ifmtN = <in-format> (String)Specifies the format of the input table as specified by parameter inN. The known formats arelisted in Section 5.1.1. This flag can be used if you know what format your table is in. If it hasthe special value (auto) (the default), then an attempt will be made to detect the format of thetable automatically. This cannot always be done correctly however, in which case the programwill exit with an error explaining which formats were attempted. This parameter is ignored forscheme-specified tables.
[Default: (auto)]
inN = <table> (StarTable)The location of the input table. This may take one of the following forms:
• A filename.• A URL.• The special value "-", meaning standard input. In this case the input format must be given
explicitly using the ifmtN parameter. Note that not all formats can be streamed in thisway.
• A scheme specification of the form :<scheme-name>:<scheme-args>.• A system command line with either a "<" character at the start, or a "|" character at the
end ("<syscmd" or "syscmd|"). This executes the given pipeline and reads from its
SUN/256 233

standard output. This will probably only work on unix-like systems.
In any case, compressed data in one of the supported compression formats (gzip, Unixcompress or bzip2) will be decompressed transparently.
istreamN = true|false (Boolean)If set true, the input table specified by the inN parameter will be read as a stream. It isnecessary to give the ifmtN parameter in this case. Depending on the required operations andprocessing mode, this may cause the read to fail (sometimes it is necessary to read the tablemore than once). It is not normally necessary to set this flag; in most cases the data will bestreamed automatically if that is the best thing to do. However it can sometimes result in lessresource usage when processing large files in certain formats (such as VOTable). Thisparameter is ignored for scheme-specified tables.
[Default: false]
spectrumN = <array-expr> (String)Provides an array of spectral samples at each data point. The value must be a numeric array(e.g. the value of an array-valued column).
The value is an array-valued algebraic expression based on column names as described inSection 10. Some of the functions in the Arrays class may be useful here.
tN = <time-expr> (String)Time coordinate.
The value is a Time value algebraic expression based on column names as described in Section10.
ttypeN = DecYear|MJD|JD|Unix|Iso8601 (TimeMapper)Selects the form in which the Time value for parameter tN is supplied. Options are:
• DecYear: Years since 0 AD• MJD: Modified Julian Date• JD: Julian Day• Unix: Seconds since midnight 1 Jan 1970• Iso8601: ISO 8601 string
If left blank, a guess will be taken depending on the data type of the value supplied for the tN
value.
twidthN = <num-expr> (String)Range on the Time axis over which the spectrum is plotted. If no value is supplied, an attemptwill be made to determine it automatically by looking at the spacing of the Time coordinatesplotted in the spectrogram.
The value is a numeric algebraic expression based on column names as described in Section10.
8.4 Shading Modes
Some plot layer types have an associated shading parameter which determines how plotted markersare coloured. This is independent of the marker shapes (which may be points, vectors, ellipses, ...)but may be affected by how many markers are plotted on top of each other, additional input tablevalues, selected colour maps etc. For the simplest shading types (e.g. flat) it's just a case ofchoosing a colour, but the more complex ones have several associated parameters.
The various shading types and their usages are described in the following subsections.
8.4.1 auto
SUN/256 234
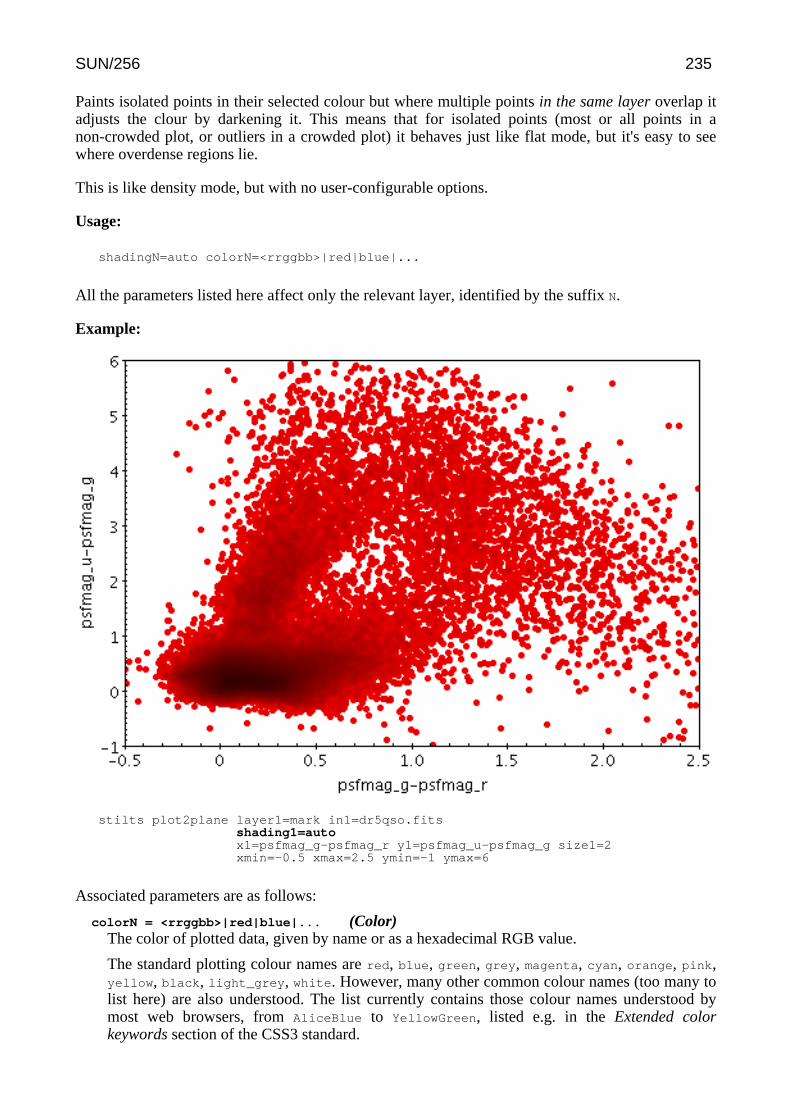
Paints isolated points in their selected colour but where multiple points in the same layer overlap itadjusts the clour by darkening it. This means that for isolated points (most or all points in anon-crowded plot, or outliers in a crowded plot) it behaves just like flat mode, but it's easy to seewhere overdense regions lie.
This is like density mode, but with no user-configurable options.
Usage:
shadingN=auto colorN=<rrggbb>|red|blue|...
All the parameters listed here affect only the relevant layer, identified by the suffix N.
Example:
stilts plot2plane layer1=mark in1=dr5qso.fitsshading1=autox1=psfmag_g-psfmag_r y1=psfmag_u-psfmag_g size1=2xmin=-0.5 xmax=2.5 ymin=-1 ymax=6
Associated parameters are as follows:
colorN = <rrggbb>|red|blue|... (Color)The color of plotted data, given by name or as a hexadecimal RGB value.
The standard plotting colour names are red, blue, green, grey, magenta, cyan, orange, pink,yellow, black, light_grey, white. However, many other common colour names (too many tolist here) are also understood. The list currently contains those colour names understood bymost web browsers, from AliceBlue to YellowGreen, listed e.g. in the Extended colorkeywords section of the CSS3 standard.
SUN/256 235
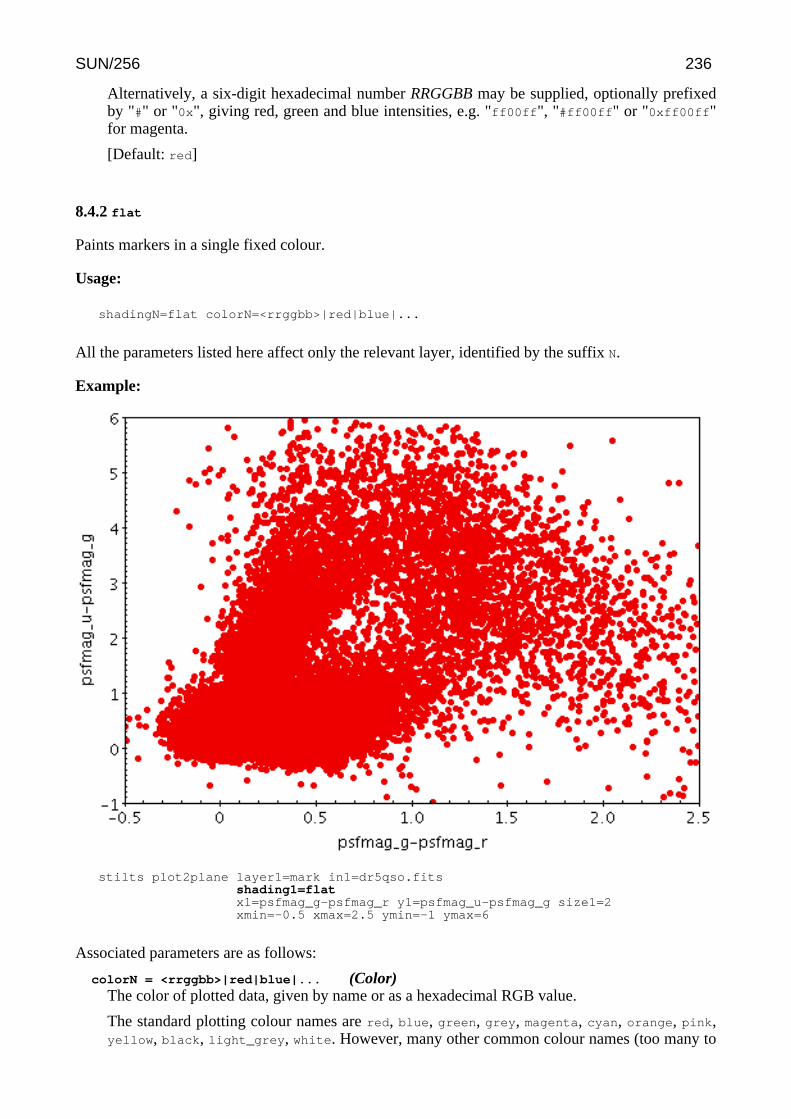
Alternatively, a six-digit hexadecimal number RRGGBB may be supplied, optionally prefixedby "#" or "0x", giving red, green and blue intensities, e.g. "ff00ff", "#ff00ff" or "0xff00ff"for magenta.
[Default: red]
8.4.2 flat
Paints markers in a single fixed colour.
Usage:
shadingN=flat colorN=<rrggbb>|red|blue|...
All the parameters listed here affect only the relevant layer, identified by the suffix N.
Example:
stilts plot2plane layer1=mark in1=dr5qso.fitsshading1=flatx1=psfmag_g-psfmag_r y1=psfmag_u-psfmag_g size1=2xmin=-0.5 xmax=2.5 ymin=-1 ymax=6
Associated parameters are as follows:
colorN = <rrggbb>|red|blue|... (Color)The color of plotted data, given by name or as a hexadecimal RGB value.
The standard plotting colour names are red, blue, green, grey, magenta, cyan, orange, pink,yellow, black, light_grey, white. However, many other common colour names (too many to
SUN/256 236

list here) are also understood. The list currently contains those colour names understood bymost web browsers, from AliceBlue to YellowGreen, listed e.g. in the Extended colorkeywords section of the CSS3 standard.
Alternatively, a six-digit hexadecimal number RRGGBB may be supplied, optionally prefixedby "#" or "0x", giving red, green and blue intensities, e.g. "ff00ff", "#ff00ff" or "0xff00ff"for magenta.
[Default: red]
8.4.3 translucent
Paints markers in a transparent version of their selected colour. The degree of transparency isdetermined by how many points are plotted on top of each other and by the transparency level.Unlike transparent mode, the transparency varies according to the average point density in the plot,so leaving the setting the same as you zoom in and out usually has a sensible effect.
Usage:
shadingN=translucent colorN=<rrggbb>|red|blue|... translevelN=<number>
All the parameters listed here affect only the relevant layer, identified by the suffix N.
Example:
stilts plot2plane layer1=mark in1=dr5qso.fitsshading1=translucentx1=psfmag_g-psfmag_r y1=psfmag_u-psfmag_g size1=2xmin=-0.5 xmax=2.5 ymin=-1 ymax=6
SUN/256 237
Associated parameters are as follows:
colorN = <rrggbb>|red|blue|... (Color)The color of plotted data, given by name or as a hexadecimal RGB value.
The standard plotting colour names are red, blue, green, grey, magenta, cyan, orange, pink,yellow, black, light_grey, white. However, many other common colour names (too many tolist here) are also understood. The list currently contains those colour names understood bymost web browsers, from AliceBlue to YellowGreen, listed e.g. in the Extended colorkeywords section of the CSS3 standard.
Alternatively, a six-digit hexadecimal number RRGGBB may be supplied, optionally prefixedby "#" or "0x", giving red, green and blue intensities, e.g. "ff00ff", "#ff00ff" or "0xff00ff"for magenta.
[Default: red]
translevelN = <number> (Double)Sets the level of automatically controlled transparency. The higher this value the moretransparent points are. Exactly how transparent points are depends on how many are currentlybeing plotted on top of each other and the value of this parameter. The idea is that you can setit to some fixed value, and then get something which looks similarly transparent while youzoom in and out.
[Default: 0.1]
8.4.4 transparent
Paints markers in a transparent version of their selected colour. The degree of transparency isdetermined by how many points are plotted on top of each other and by the opaque limit. Theopaque limit fixes how many points must be plotted on top of each other to completely obscure thebackground. This is set to a fixed value, so a transparent level that works well for a crowded region(or low magnification) may not work so well for a sparse region (or when zoomed in).
Usage:
shadingN=transparent colorN=<rrggbb>|red|blue|... opaqueN=<number>
All the parameters listed here affect only the relevant layer, identified by the suffix N.
Example:
SUN/256 238
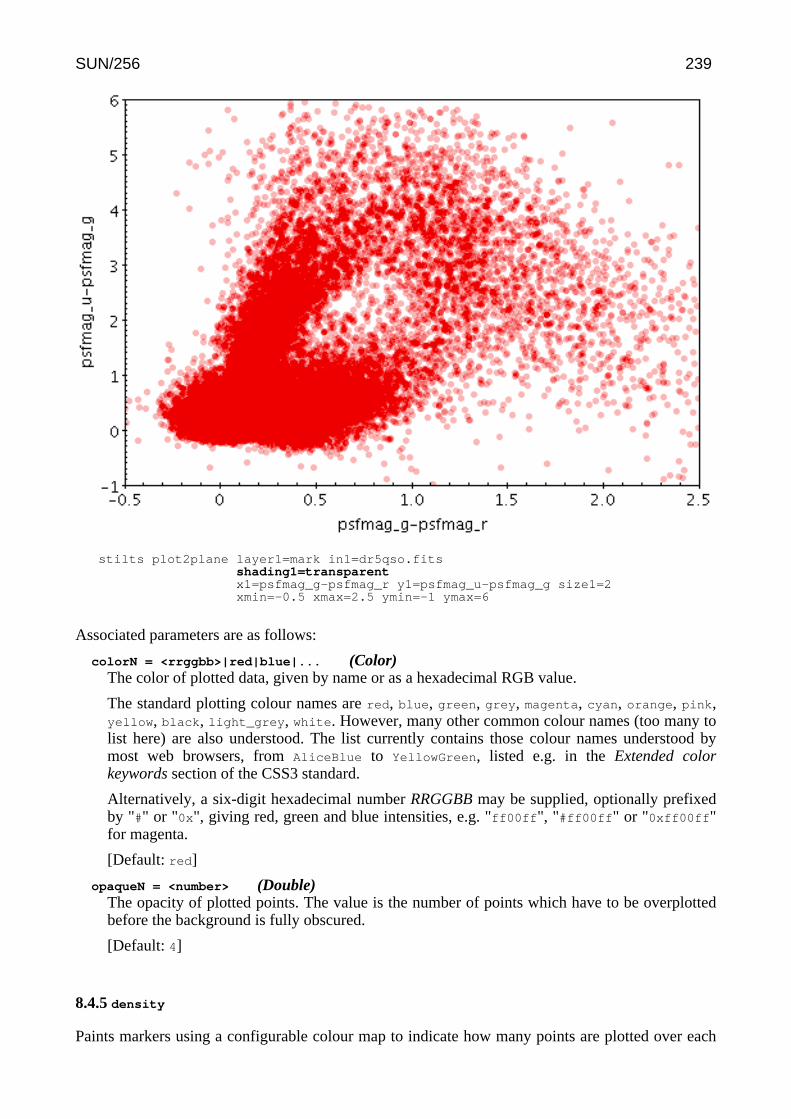
stilts plot2plane layer1=mark in1=dr5qso.fitsshading1=transparentx1=psfmag_g-psfmag_r y1=psfmag_u-psfmag_g size1=2xmin=-0.5 xmax=2.5 ymin=-1 ymax=6
Associated parameters are as follows:
colorN = <rrggbb>|red|blue|... (Color)The color of plotted data, given by name or as a hexadecimal RGB value.
The standard plotting colour names are red, blue, green, grey, magenta, cyan, orange, pink,yellow, black, light_grey, white. However, many other common colour names (too many tolist here) are also understood. The list currently contains those colour names understood bymost web browsers, from AliceBlue to YellowGreen, listed e.g. in the Extended colorkeywords section of the CSS3 standard.
Alternatively, a six-digit hexadecimal number RRGGBB may be supplied, optionally prefixedby "#" or "0x", giving red, green and blue intensities, e.g. "ff00ff", "#ff00ff" or "0xff00ff"for magenta.
[Default: red]
opaqueN = <number> (Double)The opacity of plotted points. The value is the number of points which have to be overplottedbefore the background is fully obscured.
[Default: 4]
8.4.5 density
Paints markers using a configurable colour map to indicate how many points are plotted over each
SUN/256 239
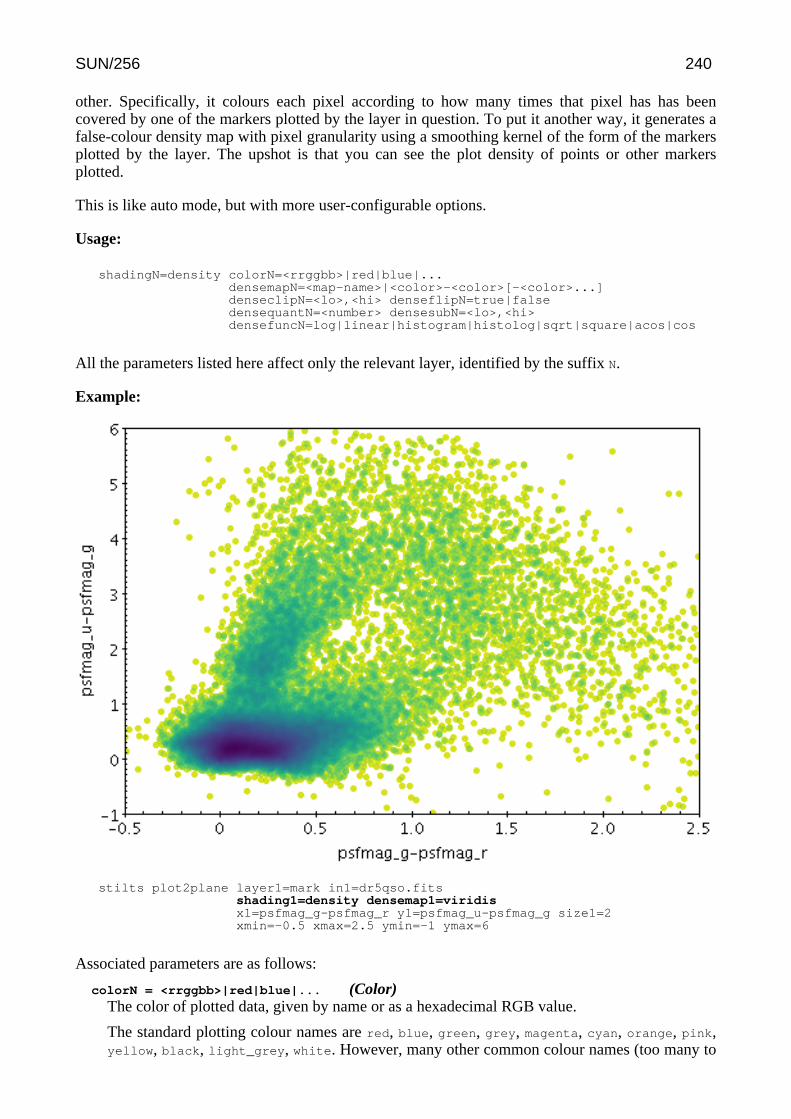
other. Specifically, it colours each pixel according to how many times that pixel has has beencovered by one of the markers plotted by the layer in question. To put it another way, it generates afalse-colour density map with pixel granularity using a smoothing kernel of the form of the markersplotted by the layer. The upshot is that you can see the plot density of points or other markersplotted.
This is like auto mode, but with more user-configurable options.
Usage:
shadingN=density colorN=<rrggbb>|red|blue|...densemapN=<map-name>|<color>-<color>[-<color>...]denseclipN=<lo>,<hi> denseflipN=true|falsedensequantN=<number> densesubN=<lo>,<hi>densefuncN=log|linear|histogram|histolog|sqrt|square|acos|cos
All the parameters listed here affect only the relevant layer, identified by the suffix N.
Example:
stilts plot2plane layer1=mark in1=dr5qso.fitsshading1=density densemap1=viridisx1=psfmag_g-psfmag_r y1=psfmag_u-psfmag_g size1=2xmin=-0.5 xmax=2.5 ymin=-1 ymax=6
Associated parameters are as follows:
colorN = <rrggbb>|red|blue|... (Color)The color of plotted data, given by name or as a hexadecimal RGB value.
The standard plotting colour names are red, blue, green, grey, magenta, cyan, orange, pink,yellow, black, light_grey, white. However, many other common colour names (too many to
SUN/256 240
list here) are also understood. The list currently contains those colour names understood bymost web browsers, from AliceBlue to YellowGreen, listed e.g. in the Extended colorkeywords section of the CSS3 standard.
Alternatively, a six-digit hexadecimal number RRGGBB may be supplied, optionally prefixedby "#" or "0x", giving red, green and blue intensities, e.g. "ff00ff", "#ff00ff" or "0xff00ff"for magenta.
[Default: red]
denseclipN = <lo>,<hi> (Subrange)Defines a subrange of the colour ramp to be used for Density shading. The value is specified asa (low,high) comma-separated pair of two numbers between 0 and 1.
If the full range 0,1 is used, the whole range of colours specified by the selected shader will beused. But if for instance a value of 0,0.5 is given, only those colours at the left hand end of theramp will be seen.
If the null (default) value is chosen, a default clip will be used. This generally covers most orall of the range 0-1 but for colour maps which fade to white, a small proportion of the lowerend may be excluded, to ensure that all the colours are visually distinguishable from a whitebackground. This default is usually a good idea if the colour map is being used with somethinglike a scatter plot, where markers are plotted against a white background. However, forsomething like a density map when the whole plotting area is tiled with colours from the map,it may be better to supply the whole range 0,1 explicitly.
denseflipN = true|false (Boolean)If true, the colour map on the Density axis will be reversed.
[Default: false]
densefuncN = log|linear|histogram|histolog|sqrt|square|acos|cos (Scaling)Defines the way that values in the Density range are mapped to the selected colour ramp.
The available options are:
• log: Logarithmic scaling• linear: Linear scaling• histogram: Scaling follows data distribution, with linear axis• histolog: Scaling follows data distribution, with logarithmic axis• sqrt: Square root scaling• square: Square scaling• acos: Arccos Scaling• cos: Cos Scaling
For all these options, the full range of data values is used, and displayed on the colour bar ifapplicable (though it can be restricted using the densesub option) The Linear, Log, Square andSqrt options just apply the named function to the full data range. The histogram options on theother hand use a scaling function that corresponds to the actual distribution of the data, so thatthere are about the same number of points (or pixels, or whatever is being scaled) of eachcolour. The histogram options are somewhat more expensive, but can be a good choice if youare exploring data whose distribution is unknown or not well-behaved over its min-max range.The Histogram and HistoLog options both assign the colours in the same way, but theydisplay the colour ramp with linear or logarithmic annotation respectively; the HistoLog
option also ignores non-positive values.
[Default: log]
densemapN = <map-name>|<color>-<color>[-<color>...] (Shader)Color map used for Density axis shading.
A mixed bag of colour ramps are available: blacker, whiter, inferno, magma, plasma,
SUN/256 241
viridis, cividis, cubehelix, sron, rainbow, rainbow2, rainbow3, pastel, accent, gnuplot,gnuplot2, specxby, set1, paired, hotcold, rdbu, piyg, brbg, cyan-magenta, red-blue, brg,heat, cold, light, greyscale, colour, standard, bugn, bupu, orrd, pubu, purd, huecl, hue,intensity, rgb_red, rgb_green, rgb_blue, hsv_h, hsv_s, hsv_v, yuv_y, yuv_u, yuv_v,scale_hsv_s, scale_hsv_v, scale_yuv_y. Note: many of these, including rainbow-like ones,are frowned upon by the visualisation community.
You can also construct your own custom colour map by giving a sequence of colour namesseparated by minus sign ("-") characters. In this case the ramp is a linear interpolation betweeneach pair of colours named, using the same syntax as when specifying a colour value. So forinstance "yellow-hotpink-#0000ff" would shade from yellow via hot pink to blue.
[Default: blacker]
densequantN = <number> (Double)Allows the colour map used for the Density axis to be quantised. If an integer value N ischosen then the colour map will be viewed as N discrete evenly-spaced levels, so that only Ndifferent colours will appear in the plot. This can be used to generate a contour-like effect, andmay make it easier to trace the boundaries of regions of interest by eye.
If left blank, the colour map is nominally continuous (though in practice it may be quantised toa medium-sized number like 256).
densesubN = <lo>,<hi> (Subrange)Defines a normalised adjustment to the data range of the Density axis. The value may bespecified as a comma-separated pair of two numbers, giving the lower and upper bounds of therange of of interest respectively. This sub-range is applied to the data range that wouldotherwise be used, either automatically calculated or explicitly supplied; zero corresponds tothe lower bound and one to the upper.
The default value "0,1" therefore has no effect. The range could be restricted to its lower halfwith the value 0,0.5.
[Default: 0,1]
8.4.6 aux
Paints markers in a colour determined by the value of an additional data coordinate. The markercolours then represent an additional dimension of the plot. You can also adjust the transparency ofthe colours used. The way that data values are mapped to colours is usually controlled by options atthe level of the plot itself, rather than by per-layer configuration.
Usage:
shadingN=aux auxN=<num-expr> auxnullcolorN=<rrggbb>|red|blue|...opaqueN=<number>
All the parameters listed here affect only the relevant layer, identified by the suffix N.
Example:
SUN/256 242
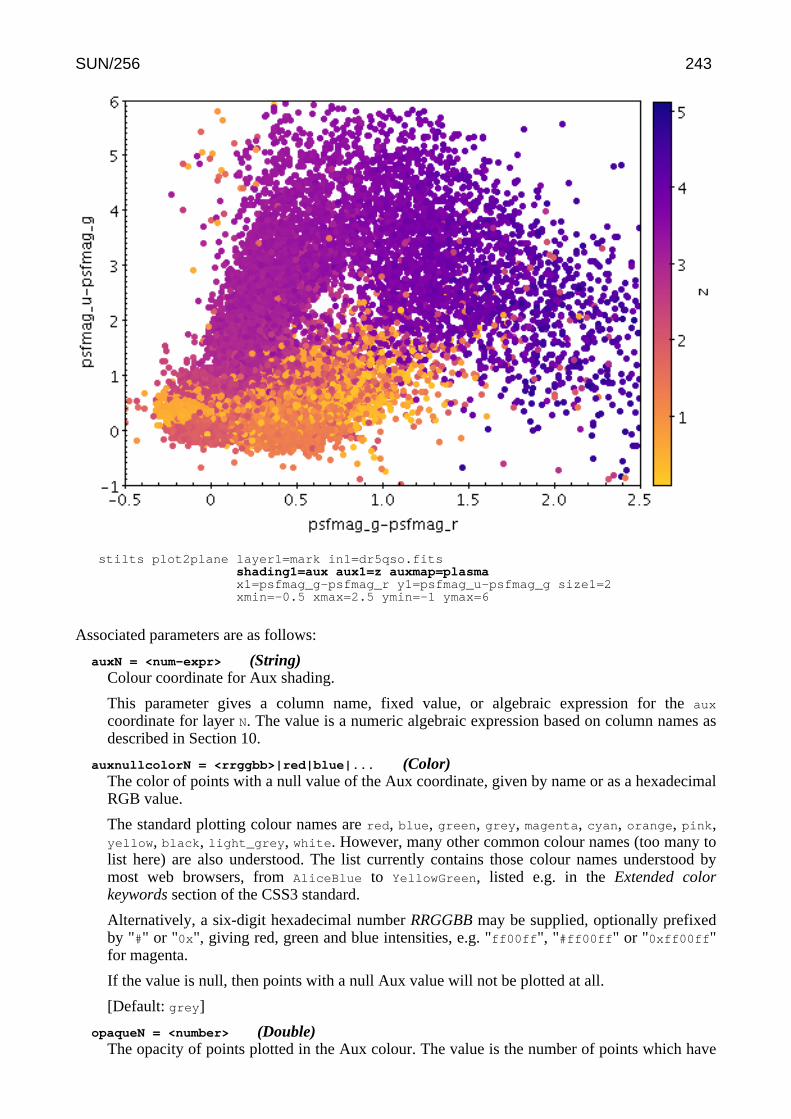
stilts plot2plane layer1=mark in1=dr5qso.fitsshading1=aux aux1=z auxmap=plasmax1=psfmag_g-psfmag_r y1=psfmag_u-psfmag_g size1=2xmin=-0.5 xmax=2.5 ymin=-1 ymax=6
Associated parameters are as follows:
auxN = <num-expr> (String)Colour coordinate for Aux shading.
This parameter gives a column name, fixed value, or algebraic expression for the aux
coordinate for layer N. The value is a numeric algebraic expression based on column names asdescribed in Section 10.
auxnullcolorN = <rrggbb>|red|blue|... (Color)The color of points with a null value of the Aux coordinate, given by name or as a hexadecimalRGB value.
The standard plotting colour names are red, blue, green, grey, magenta, cyan, orange, pink,yellow, black, light_grey, white. However, many other common colour names (too many tolist here) are also understood. The list currently contains those colour names understood bymost web browsers, from AliceBlue to YellowGreen, listed e.g. in the Extended colorkeywords section of the CSS3 standard.
Alternatively, a six-digit hexadecimal number RRGGBB may be supplied, optionally prefixedby "#" or "0x", giving red, green and blue intensities, e.g. "ff00ff", "#ff00ff" or "0xff00ff"for magenta.
If the value is null, then points with a null Aux value will not be plotted at all.
[Default: grey]
opaqueN = <number> (Double)The opacity of points plotted in the Aux colour. The value is the number of points which have
SUN/256 243
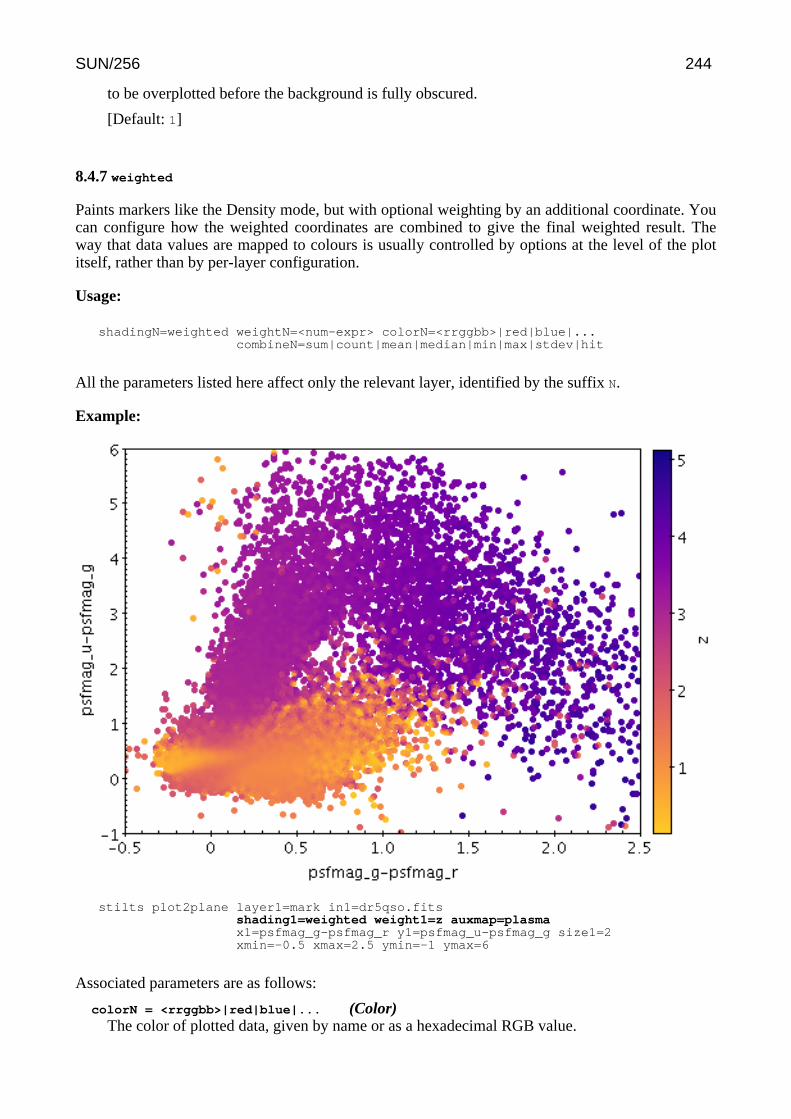
to be overplotted before the background is fully obscured.
[Default: 1]
8.4.7 weighted
Paints markers like the Density mode, but with optional weighting by an additional coordinate. Youcan configure how the weighted coordinates are combined to give the final weighted result. Theway that data values are mapped to colours is usually controlled by options at the level of the plotitself, rather than by per-layer configuration.
Usage:
shadingN=weighted weightN=<num-expr> colorN=<rrggbb>|red|blue|...combineN=sum|count|mean|median|min|max|stdev|hit
All the parameters listed here affect only the relevant layer, identified by the suffix N.
Example:
stilts plot2plane layer1=mark in1=dr5qso.fitsshading1=weighted weight1=z auxmap=plasmax1=psfmag_g-psfmag_r y1=psfmag_u-psfmag_g size1=2xmin=-0.5 xmax=2.5 ymin=-1 ymax=6
Associated parameters are as follows:
colorN = <rrggbb>|red|blue|... (Color)The color of plotted data, given by name or as a hexadecimal RGB value.
SUN/256 244

The standard plotting colour names are red, blue, green, grey, magenta, cyan, orange, pink,yellow, black, light_grey, white. However, many other common colour names (too many tolist here) are also understood. The list currently contains those colour names understood bymost web browsers, from AliceBlue to YellowGreen, listed e.g. in the Extended colorkeywords section of the CSS3 standard.
Alternatively, a six-digit hexadecimal number RRGGBB may be supplied, optionally prefixedby "#" or "0x", giving red, green and blue intensities, e.g. "ff00ff", "#ff00ff" or "0xff00ff"for magenta.
[Default: red]
combineN = sum|count|mean|median|min|max|stdev|hit (Combiner)Defines how values contributing to the same pixel are combined together to produce the valueassigned to that pixel (and hence its colour).
When a weight is in use, mean or sum are typically sensible choices. If there is no weight (apure density map) then count is usually better, but in that case it may make more sense (it ismore efficient) to use one of the other shading modes instead.
The available options are:
• sum: the sum of all the combined values per bin• count: the number of non-blank values per bin (weight is ignored)• mean: the mean of the combined values• median: the median of the combined values (may be slow)• min: the minimum of all the combined values• max: the maximum of all the combined values• stdev: the sample standard deviation of the combined values• hit: 1 if any values present, NaN otherwise (weight is ignored)
[Default: mean]
weightN = <num-expr> (String)Weight coordinate for weighted density shading.
This parameter gives a column name, fixed value, or algebraic expression for the weight
coordinate for layer N. The value is a numeric algebraic expression based on column names asdescribed in Section 10.
8.5 Output Modes
The plots generated by the plotting commands can be used in various different ways. One thing youmight want to do is to write the output to a file in a given graphics format (out); another is topreview it directly on the screen (swing). By default one or other of these will happen depending onwhether you specify an output file. However there are other possibilities; these are listed in thefollowing subsections.
Except for display to the screen, these modes should work happily on a headless machine (one withno graphics display, as may be the case for a web server). When running headless, you may find itnecessary to set the java system property "java.awt.headless" to true - see Section 3.3.
The default output mode is auto, which means that output is to a file if an output file is specified, orto the screen if it is not. So in most cases you don't need to specify the omode parameter explicitly.
8.5.1 swing
Usage:
SUN/256 245

omode=swing
Plot will be displayed in a window on the screen. This plot is "live"; it can be resized and (exceptfor old-style plots) navigated around with mouse actions in the same way as plots in TOPCAT.
8.5.2 out
Usage:omode=out out=<out-file> ofmt=png|png-transp|gif|jpeg|pdf|svg|eps|eps-gzip
Plot will be written to a file given by out using the graphics format given by ofmt.
8.5.3 cgi
Usage:omode=cgi ofmt=png|png-transp|gif|jpeg|pdf|svg|eps|eps-gzip
Plot will be written in a way suitable for CGI use direct from a web server. The output is in thegraphics format given by ofmt, preceded by a suitable "Content-type" declaration.
8.5.4 discard
Usage:omode=discard
Plot is drawn, but discarded. There is no output.
8.5.5 auto
Usage:omode=auto [out=<out-file>]
Behaves as swing or out mode depending on presence of out parameter
8.6 Export Formats
Several of the plot output modes write the plot in some graphics format or other. When selecting anoutput format it is important to understand the distinction between bitmapped and vector formats;basically bitmapped formats represent the image as a grid of finite-sized pixels while vector formatsnotionally draw smooth lines. Bitmapped formats are fine for a computer screen, but for highquality paper printouts you will want a vector format. You can convert from vector to bitmappedbut not (usefully) in the other direction. There are a couple of subtleties to this distinction specificto STILTS graphical output as discussed below.
The following formats are the available values for the ofmt parameter of the various plotcommands:
png
PNG format. This is a flexible bitmapped format providing transparency and an unlimitednumber of colours with good lossless compression. It is widely supported by non-ancientbrowsers and other image viewers, and is generally recommended for bitmapped output.
SUN/256 246

gif
GIF format. This is a bitmapped format providing transparency and lossless compression. Thenumber of colours is limited to 255 however, so if you are using auxiliary axes (colourvariation to represent higher dimensionality) or other plot features which use a wide range ofcolours you may see image degradation. It has long been widely supported by browsers andother image viewers.
jpeg
JPEG format. This is a bitmapped format with lossy compression intended primarily forphotographs. Transparency is not supported, and although there is no limit on the maximumnumber of colours, its lossiness means that plots generated using it generally look a bitsmudged.
Portable Document Format. This is the format which can be read by Adobe's Acrobat Reader.It is a widely portable vector format, and is suitable for printing at high resolution, eitherstandalone or imported into some other presentation format. However, there are a couple ofcaveats when it comes to using it with STILTS plots.
1. If used to plot a very large number of points, the output PDF file can get quite large,though it's much better than for eps output (see below).
2. For certain colour shading options (auto, density, and in some circumstancestransparency), the body of the plot will be drawn as a bitmap rather than vector graphics.This is sometimes a blessing in disguise since with very large numbers of points a vectorPDF file could get unmanageably large in any case. In this case the interior of the plotwill be pixellated. The axes and annotations outside of the plot will still be drawn invector format however.
svg
Scalable Vector Graphics. This is an XML-based vector graphics format developed for displayin web pages, and defined by the W3C. This exporter can generate OutOfMemoryErrors ifasked to generate a large output file.
eps
Encapsulated Postscript. This is a vector format which is suitable for printing at high resolutioneither standalone or imported into some other presentation format (you may need to convert itvia PDF depending on the intended destination). However, there are a couple of caveats whenit comes to using it with STILTS plots.
1. Unfortunately the postscript driver used by STILTS is not very efficient and can result inlarge, sometimes very large, postscript output files. This is likely to be a problem for plotswith a large number of non-transparent points. For this reason eps-gzip or pdf may be abetter choice.
2. Postscript has no support for partial transparency, so if plots are drawn with partiallytransparent points (common for very large data sets) the only way they can be rendered isby drawing the body of the plot as a bitmap rather than as vector graphics. This issometimes a blessing in disguise since with very large numbers of points a vectorpostscript file would likely be unmanageably large in any case. So if there is anytransparency in the plot, the interior of the plot will be pixellated. The axes andannotations outside of the plot will still be drawn in vector format however.
eps-gzip
Just like the eps format above except that the output is automatically compressed using theGZIP format as it is written. Postscript compresses well (typically a factor of 5-10).
SUN/256 247
9 Old-Style Plotting
This section describes deprecated commands. For recommended plotting commands, see Section 8.
From version 2.0 (October 2008), STILTS incorporated three table plotting commands:
• plot2d: Old-style 2D Scatter Plot• plot3d: Old-style 3D Scatter Plot• plothist: Old-style Histogram
These provided command-line access to some, though not all, of the plotting capabilities offered byTOPCAT.
Since version 3.0 (October 2014), these commands are deprecated in favour of the more powerfulones described in Section 8. The rest of this section describes some aspects of the deprecatedcommands for the benefit of legacy code. The output modes and formats are the same in old- andnew-style plots, and are discussed in Section 8.5 and Section 8.6. The handling of parameters andsuffixes for these commands is not quite the same as for new-style plots, and is documented in thenext subsection.
As a simple example, if a file "cat.fits" contains the columns RMAG and BMAG for red and bluemagnitudes, you can draw a two-dimensional colour-magnitude scatter plot with the command:
stilts plot2d in=cat.fits xdata=BMAG-RMAG ydata=BMAG
Since an output file is not specified, the plot is shown on the screen for convenience. To send theoutput to a PNG file, do instead:
stilts plot2d in=cat.fits xdata=BMAG-RMAG ydata=BMAG out=plot.png ofmt=png
in some cases (including the above), the ofmt parameter is not required since STILTS may be ableto guess the format from the output file name. Various other options for output and graphics formatsare described in Section 8.5 and Section 8.6
Some of the parameters use suffixes to define data sets and therefore behave a bit differently fromthe parameters elsewhere in STILTS - a discussion of these is given in the following subsection.Some other plotting-specific topics are also discussed below.
9.1 Parameter Suffixes
This section describes deprecated commands. For recommended plotting commands, see Section 8.
Some of the parameters for the plotting tasks behave a little bit differently to other parameters inSTILTS, in order to accommodate related sets of values. If you look at the usage of one of theplotting commands, for instance in Appendix B.14.1, you will see that a number of the parametershave the suffixes "N" or "NS". These suffixes can be substituted with any convenient string toidentify parameters which relate to the same input datasets or subsets. Specifically:
Suffix "N":Denotes an input dataset. At least the inN parameter must be given to identify the source of thedata; any other parameters with the same value of the N suffix relate to that dataset. A datasethere refers to a particular set of plot data from a table; in most cases each input tablecorresponds to a different dataset, though two datasets may correspond to different sets ofcolumns from the same table.
Suffix "NS":Denotes a particular subset of the rows in dataset N. At least the subsetNS parameter must begiven to identify the expression by which the subset is defined; any other parameters with the
SUN/256 248
same value of the NS suffix relate to that subset.
Some examples will help to illustrate. The following will generate a Cartesian plot of catalogueposition from a single dataset:
stilts plot2d in=gals.fits xdata=RA ydata=DEC
In this case the N suffix is present on each of the parameters in, xdata and ydata, but is equal to theempty string, hence invisible. This is perfectly legal, and convenient when only a single table is inuse. If we wish to overplot two datasets however, the dataset suffixes (or one of them at least) haveto be made explicit so that different ones can be used, for instance:
stilts plot2d in1=gals.fits xdata1=RA ydata1=DECin2=stars.fits xdata2=RAJ2000 ydata2=DEJ2000
The suffix values "1" and "2" are quite arbitrary and can be chosen as convenient, so the followingwould do exactly the same as the previous example:
stilts plot2d in_GAL=gals.fits xdata_GAL=RA ydata_GAL=DECin_STAR=stars.fits xdata_STAR=RAJ2000 ydata_STAR=DEJ2000
The other parameters which have the N suffix apply only to the matching dataset, so for instance thefollowing:
stilts plot2d in1=gals.fits xdata1=RA ydata1=DEC txtlabel1=NGC_IDin2=stars.fits xdata2=RAJ2000 ydata2=DEJ2000
would draw text labels adjacent to the points from only the gals.fits file giving the contents of itsNGC_ID column.
The NS suffix identifies distinct row subsets within the same or different datasets. A subset isdefined by supplying a boolean inclusion expression (each row is included only if the expressionevaluates true for that row) as the value of a subsetNS parameter. If, as in all the examples we haveseen so far, no subsetNS parameter is supplied for a given dataset, then it is treated as a specialcase, as if a single subset with a name equal to the empty string (S="") containing all rows has beenspecified. So our earlier simple example:
stilts plot2d in=gals.fits xdata=RA ydata=DEC
is equivalent to
stilts plot2d in=gals.fits xdata=RA ydata=DEC subset=true
If we wish to split the plotted points into two sets based on their R-B colours, we can writesomething like:
stilts plot2d in=gals.fits xdata=RA ydata=DECsubsetX='RMAG-BMAG>0' subsetY='RMAG-BMAG<=0'
This will generate a plot with two subsets shown using different colours and/or plotting symbols.These colours and symbols are selected automatically. More control over the appearance can beexercised by setting values for some of the other parameters with NS suffixes, for instance
stilts plot2d in=gals.fits xdata=RA ydata=DECsubset_A='RMAG-BMAG>0' colour_A=bluesubset_B='RMAG-BMAG<=0' colour_B=red
Again, the suffix strings can be chosen to have any value as convenient.
The dataset- and subset-specific parameters must be put together if there are multiple datasets withmultiple subsets to plot simultaneously, for instance:
SUN/256 249
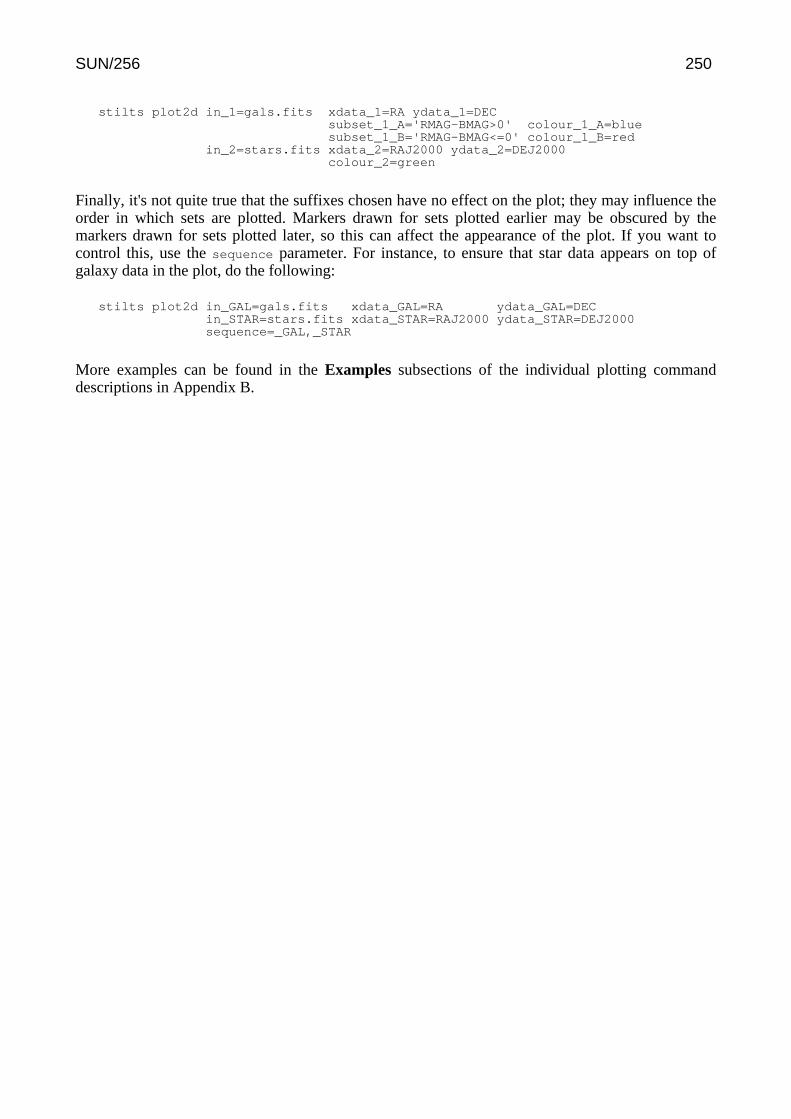
stilts plot2d in_1=gals.fits xdata_1=RA ydata_1=DECsubset_1_A='RMAG-BMAG>0' colour_1_A=bluesubset_1_B='RMAG-BMAG<=0' colour_1_B=red
in_2=stars.fits xdata_2=RAJ2000 ydata_2=DEJ2000colour_2=green
Finally, it's not quite true that the suffixes chosen have no effect on the plot; they may influence theorder in which sets are plotted. Markers drawn for sets plotted earlier may be obscured by themarkers drawn for sets plotted later, so this can affect the appearance of the plot. If you want tocontrol this, use the sequence parameter. For instance, to ensure that star data appears on top ofgalaxy data in the plot, do the following:
stilts plot2d in_GAL=gals.fits xdata_GAL=RA ydata_GAL=DECin_STAR=stars.fits xdata_STAR=RAJ2000 ydata_STAR=DEJ2000sequence=_GAL,_STAR
More examples can be found in the Examples subsections of the individual plotting commanddescriptions in Appendix B.
SUN/256 250
10 Algebraic Expression Syntax
Many of the STILTS commands allow you to use algebraic expressions based on table columnswhen doing things like making row selections, defining new columns, selecting values to plot ormatch, and so on. In these cases you are defining an expression which has a value in each row as afunction of the values in the existing columns in that row. This is a powerful feature which permitsyou to manipulate and select table data in very flexible ways. The syntax for entering theseexpressions is explained in this section.
What you write are actually expressions in the Java language, which are compiled into Javabytecode before evaluation. However, this does not mean that you need to be a Java programmer towrite them. The syntax is pretty similar to C, but even if you've never programmed in C mostsimple things, and many complicated ones, are quite intutitive.
The following explanation gives some guidance and examples for writing these expressions.Unfortunately a complete tutorial on writing Java expressions is beyond the scope of this document,but it should provide enough information for even a novice to write useful expressions.
The expressions that you can write are basically any function of all the column values which applyto a given row; the function result can then be used where STILTS needs a per-row value, forinstance to define a new column. If the built-in operators and functions are not sufficient, or it'sunwieldy to express your function in one line of code, it is possible to add new functions by writingyour own classes - see Section 10.8.3.
Note that since these algebraic expressions often contain spaces, you may need to enclose them insingle or double quotes so that they don't get confused with other parts of the command string.
Note: if Java is running in an environment with certain security restrictions (a security managerwhich does not permit creation of custom class loaders) then algebraic expressions won't work atall. It's not particularly likely that security restrictions will be in place if you are running from thecommand line though.
10.1 Referencing Column Values
To create a useful expression which can be evaluated for each row in a table, you will have to referto cells in different columns of that row. You can do this in several ways:
By NameThe Name of the column may be used if it is unique (no other column in the table has the samename) and if it has a suitable form. This means that it must have the form of a Java variable -basically starting with a letter and continuing with letters, numbers, underscores and currencysymbols. In particular it cannot contain spaces, commas, parentheses etc.
As a special case, if an expression contains just a single column name, rather than some morecomplicated expression, then any column name may be used, even one containingnon-alphanumeric characters.
Column names are treated case-insensitively.
By $IDThe "$ID" identifier of the column may always be used to refer to it; this is a useful fallback ifthe column name isn't suitable for some reason (for instance it contains spaces or is notunique). This is just a "$" sign followed by the column index - the first column is $1.
By ucd$ specifierIf the column has a Unified Content Descriptor (this will usually only be the case for VOTableor possibly FITS format tables) you can refer to it using an identifier of the form
SUN/256 251
ucd$<ucd-spec>". Depending on the version of UCD scheme used, UCDs can contain variouspunctuation marks such as underscores, semicolons and dots; for the purpose of this syntaxthese should all be represented as underscores ("_"). So to identify a column which has theUCD "phot.mag;em.opt.R", you should use the identifier "ucd$phot_mag_em_opt_r".Matching is not case-sensitive. Futhermore, a trailing underscore acts as a wildcard, so that theabove column could also be referenced using the identifier "ucd$phot_mag_". If multiplecolumns have UCDs which match the given identifer, the first one will be used.
Note that the same syntax can be used for referencing table parameters (see the next section);columns take preference so if a column and a parameter both match the requested UCD, thecolumn value will be used.
By utype$ specifierIf the column has a Utype (this will usually only be the case for VOTable or possibly FITSformat tables) you can refer to it using an identifier of the form "utype$<utype-spec>".Utypes can contain various punctuation marks such as colons and dots; for the purpose of thissyntax these should all be represented as underscores ("_"). So to identify a column which hasthe Utype "ssa:Access.Format", you should use the identifier "utype$ssa_Access_Format".Matching is not case-sensitive. If multiple columns have Utypes which match the givenidentifier, the first one will be used.
Note that the same syntax can be used for referencing table parameters (see the next section);columns take preference so if a column and a parameter both match the requested Utype, thecolumn value will be used.
With the Object$ prefixIf a column is referenced with the prefix "Object$" before its identifier (e.g. "Object$BMAG"for a column named BMAG) the result will be the column value as a java Object. Without thatprefix, numeric columns are evaluated as java primitives. In most cases, you don't want to dothis, since it means that you can't use the value in arithmetic expressions. However, if you needthe value to be passed to a (possibly user-defined) method, and you need that method to beinvoked even when the value is null, you have to do it like this. Null-valued primitivesotherwise cause expression evaluation to abort.
The value of the variables so referenced will be a primitive (boolean, byte, short, char, int, long,float, double) if the column contains one of the corresponding types. Otherwise it will be an Objectof the type held by the column, for instance a String. In practice this means: you can write the nameof a column, and it will evaluate to the numeric (or string) value that that column contains in eachrow. You can then use this in normal algebraic expressions such as "B_MAG-U_MAG" as you'd expect.
10.2 Referencing Parameter Values
Some tables have constant values associated with them; these may represent such things as theepoch at which observations were taken, the name of the catalogue, an angular resolution associatedwith all observations, or any number of other things. Such constants are known as table parameters(not to be confused with parameters passed to STILTS commands) and can be thought of as extracolumns which have the same value for every row. The values of such parameters can be referencedin STILTS algebraic expressions as follows:
param$nameIf the parameter name has a suitable form (starting with a letter and continuing with letters ornumbers) it can be referenced by prefixing that name with the string param$.
ucd$ucd-specIf the parameter has a Unified Content Descriptor it can be referenced by prefixing the UCDspecifier with the string ucd$. Any punctuation marks in the UCD should be replaced byunderscores, and a trailing underscore is interpreted as a wildcard. See Section 10.1 for more
SUN/256 252
discussion.
utype$utype-specIf the parameter has a Utype, it can be referenced by prefixing the Utype specifier with thestring utype$. Any punctuation marks in the Utype should be replaced by underscores. SeeSection 10.1 for more discussion.
Note that if a parameter has a name in an unsuitable form (e.g. containing spaces) and has no UCDthen it cannot be referenced in an expression. One possible workaround for that is to use thefixcolnames filter.
10.3 Special Tokens
There are a few pseudo-variables which have special functions in the expression language. Thefollowing specials are column-like, in that they have a different value for each row:
$index or $0The value of this is the current row number (the first row is 1). Note that this value is a long
(8-byte integer); when using it in certain expressions you may find it necessary to convert it toan int (4-byte integer) using the toInteger() function. The deprecated alias "INDEX" mayalso be used.
$randomEvaluates to a double-precision random number 0<=x<1 with a value which is fixed for a givenrow in this expression. The quality of the random numbers may not be particularly good. Thedeprecated alias "RANDOM" may also be used.
The following specials are parameter-like, in that their value is not sensitive to the row:
$ncolThe number of columns in the table.
$nrowThe number of rows in the table. Note in some cases this is not known (e.g. if the table is beingstreamed), in which case the value of this variable is null. Note also that this value is a long
(8-byte integer); when using it in certain expressions you may find it necessary to convert it toan int (4-byte integer) using the toInteger() function.
10.4 Null Values
When no special steps are taken, if a null value (blank cell) is encountered in evaluating anexpression (usually because one of the columns it relies on has a null value in the row in question)then the result of the expression is also null.
It is possible to exercise more control than this, but it requires a little bit of care, because theexpressions work in terms of primitive values (numeric or boolean ones) which don't in generalhave a defined null value. The name "null" in expressions gives you the java null reference, butthis cannot be matched against a primitive value or used as the return value of a primitiveexpression.
For most purposes, the following two tips should enable you to work with null values:
Testing for nullTo test whether a column contains a null value, prepend the string "NULL_" (use upper case) tothe column name or $ID. This will yield a boolean value which is true if the column contains ablank, and false otherwise.
SUN/256 253
Returning nullTo return a null value from a numeric expression, use the name "NULL" (upper case). To returna null value from a non-numeric expression (e.g. a String column) use the name "null" (lowercase).
Null values are often used in conjunction with the conditional operator, "? :"; the expression
test ? tval : fval
returns the value tval if the boolean expression test evaluates true, or fval if test evaluates false.So for instance the following expression:
Vmag == -99 ? NULL : Vmag
can be used to define a new column which has the same value as the Vmag column for most values,but if Vmag has the "magic" value -99 the new column will contain a blank. The opposite trick(substituting a blank value with a magic one) can be done like this:
NULL_Vmag ? -99 : Vmag
Some more examples are given in Section 10.7.
10.5 Operators
The operators are pretty much the same as in the C language. The common ones are:
Arithmetic
+ (add)- (subtract)* (multiply)/ (divide)% (modulus)
Boolean
! (not)&& (and)|| (or)^ (exclusive-or)== (numeric identity)!= (numeric non-identity)< (less than)> (greater than)<= (less than or equal)>= (greater than or equal)
Bitwise
& (and)| (or)^ (exclusive-or)<< (left shift)>> (right shift)>>> (logical right shift)
Numeric Typecasts
(byte) (numeric -> signed byte)(short) (numeric -> 2-byte integer)
SUN/256 254
(int) (numeric -> 4-byte integer)(long) (numeric -> 8-byte integer)(float) (numeric -> 4-type floating point)(double) (numeric -> 8-byte floating point)
Note you may find the Maths (Section 10.6.13) conversion functions more convenient fornumeric conversions than these.
Other
+ (string concatenation)[] (array dereferencing - first element is zero)?: (conditional switch)instanceof (class membership)
10.6 Functions
Many functions are available for use within your expressions, covering standard mathematical andtrigonometric functions, arithmetic utility functions, type conversions, and some more specialisedastronomical ones. You can use them in just the way you'd expect, by using the function name(unlike column names, this is case-sensitive) followed by comma-separated arguments in brackets,so
max(IMAG,JMAG)
will give you the larger of the values in the columns IMAG and JMAG, and so on.
The functions available for use by default are listed by class in the following subsections with theirarguments and short descriptions. The funcs command provides another way to browse thesefunction descriptions online.
10.6.1 Arithmetic
Standard arithmetic functions including things like rounding, sign manipulation, andmaximum/minimum functions. Phase folding operations, and a convenient form of the modulusoperation on which they are based, are also provided.
roundUp( x )
Rounds a value up to an integer value. Formally, returns the smallest (closest to negativeinfinity) integer value that is not less than the argument.
• Parameters:
• x (floating point): a value.
• Return value
• (integer): x rounded up
roundDown( x )
Rounds a value down to an integer value. Formally, returns the largest (closest to positiveinfinity) integer value that is not greater than the argument.
• Parameters:
• x (floating point): a value
• Return value
SUN/256 255

• (integer): x rounded down
round( x )
Rounds a value to the nearest integer. Formally, returns the integer that is closest in value tothe argument. If two integers are equally close, the result is the even one.
• Parameters:
• x (floating point): a floating point value.
• Return value
• (integer): x rounded to the nearest integer
roundDecimal( x, dp )
Rounds a value to a given number of decimal places. The result is a float (32-bit floatingpoint value), so this is only suitable for relatively low-precision values. It's intended fortruncating the number of apparent significant figures represented by a value which you knowhas been obtained by combining other values of limited precision. For more control, see thefunctions in the Formats class.
• Parameters:
• x (floating point): a floating point value• dp (integer): number of decimal places (digits after the decimal point) to retain
• Return value
• (floating point): floating point value close to x but with a limited apparent precision
• Example:
• roundDecimal(PI,2) = 3.14f
abs( x )
Returns the absolute value of an integer value. If the argument is not negative, the argument isreturned. If the argument is negative, the negation of the argument is returned.
• Parameters:
• x (integer): the argument whose absolute value is to be determined
• Return value
• (integer): the absolute value of the argument.
abs( x )
Returns the absolute value of a floating point value. If the argument is not negative, theargument is returned. If the argument is negative, the negation of the argument is returned.
• Parameters:
• x (floating point): the argument whose absolute value is to be determined
• Return value
• (floating point): the absolute value of the argument.
max( a, b )
Returns the greater of two integer values. If the arguments have the same value, the result isthat same value.
SUN/256 256
Multiple-argument maximum functions are also provided in the Arrays and Lists packages.
• Parameters:
• a (integer): an argument.• b (integer): another argument.
• Return value
• (integer): the larger of a and b.
maxNaN( a, b )
Returns the greater of two floating point values. If the arguments have the same value, theresult is that same value. If either value is blank, then the result is blank.
• Parameters:
• a (floating point): an argument.• b (floating point): another argument.
• Return value
• (floating point): the larger of a and b.
maxReal( a, b )
Returns the greater of two floating point values, ignoring blanks. If the arguments have thesame value, the result is that same value. If one argument is blank, the result is the other one. Ifboth arguments are blank, the result is blank.
Multiple-argument maximum functions are also provided in the Arrays and Lists packages.
• Parameters:
• a (floating point): an argument• b (floating point): another argument
• Return value
• (floating point): the larger non-blank value of a and b
min( a, b )
Returns the smaller of two integer values. If the arguments have the same value, the result isthat same value.
Multiple-argument minimum functions are also provided in the Arrays and Lists packages.
• Parameters:
• a (integer): an argument.• b (integer): another argument.
• Return value
• (integer): the smaller of a and b.
minNaN( a, b )
Returns the smaller of two floating point values. If the arguments have the same value, theresult is that same value. If either value is blank, then the result is blank.
• Parameters:
• a (floating point): an argument.
SUN/256 257
• b (floating point): another argument.
• Return value
• (floating point): the smaller of a and b.
minReal( a, b )
Returns the smaller of two floating point values, ignoring blanks. If the arguments have thesame value, the result is that same value. If one argument is blank, the result is the other one. Ifboth arguments are blank, the result is blank.
Multiple-argument minimum functions are also provided in the Arrays and Lists packages.
• Parameters:
• a (floating point): an argument• b (floating point): another argument
• Return value
• (floating point): the larger non-blank value of a and b
mod( a, b )
Returns the non-negative remainder of a/b. This is a modulo operation, but differs from theexpression a%b in that the answer is always >=0 (as long as b is not zero).
• Parameters:
• a (floating point): dividend• b (floating point): divisor
• Return value
• (floating point): non-negative remainder when dividing a by b
• Examples:
• modulo(14, 5) = 4
• modulo(-14, 5) = 1
• modulo(2.75, 0.5) = 0.25
phase( t, period )
Returns the phase of a value within a period.
For positive period, the returned value is in the range [0,1).
• Parameters:
• t (floating point): value• period (floating point): folding period
• Return value
• (floating point): mod(t,period)/period
• Examples:
• phase(7, 4) = 0.75
• phase(-1000.5, 2.5) = 0.8
• phase(-3300, 33) = 0
phase( t, period, t0 )
Returns the phase of an offset value within a period. The reference value t0 corresponds to
SUN/256 258

phase zero.
For positive period, the returned value is in the range [0,1).
• Parameters:
• t (floating point): value• period (floating point): folding period• t0 (floating point): reference value, corresponding to phase zero
• Return value
• (floating point): phase(t-t0, period)
• Examples:
• phase(5003,100,0) = 0.03
• phase(5003,100,2) = 0.01
• phase(5003,100,4) = 0.99
phase( t, period, t0, phase0 )
Returns the offset phase of an offset value within a period. The reference value t0 correspondsto integer phase value, and the phase offset phase0 determines the starting value for the phaserange.
For positive period, the returned value is in the range [phase0,phase0+1).
• Parameters:
• t (floating point): value• period (floating point): folding period• t0 (floating point): reference value, corresponding to phase zero• phase0 (floating point): offset for phase
• Return value
• (floating point): offset phase
• Examples:
• phase(23,10,1,99) = 99.2
• phase(8.6125,0.2,0.0125,-0.3) = 0
• phase(8.6125,0.2,0.1125,-0.7) = -0.5
10.6.2 Arrays
Functions which operate on array-valued cells. The array parameters of these functions can only beused on values which are already arrays (usually, numeric arrays). In most cases that means onvalues in table columns which are declared as array-valued. FITS and VOTable tables can havecolumns which contain array values, but other formats such as CSV cannot.
If you want to calculate aggregating functions like sum, min, max etc on multiple values which arenot part of an array, it's easier to use the functions from the Lists class.
Note that none of these functions will calculate statistical functions over a whole column of a table.
The functions fall into a number of categories:
• Aggregating operations, which map an array value to a scalar, including size, count,countTrue, maximum, minimum, sum, mean, median, quantile, stdev, variance, join.
SUN/256 259

• Operations on one or more arrays which produce array results, including add, subtract,multiply, divide, reciprocal, condition, slice, pick. Mostly these work on any numericarray type and return floating point (double precision) values, but some of them (slice, pick)have variants for different array types.
• The function array, which lets you assemble a floating point array value from a list of scalarnumbers. There are variants (intArray, stringArray) for some different array types.
sum( array )
Returns the sum of all the non-blank elements in the array. If array is not a numeric array,null is returned.
• Parameters:
• array (Object): array of numbers
• Return value
• (floating point): sum of all the numeric values in array
mean( array )
Returns the mean of all the non-blank elements in the array. If array is not a numeric array,null is returned.
• Parameters:
• array (Object): array of numbers
• Return value
• (floating point): mean of all the numeric values in array
variance( array )
Returns the population variance of all the non-blank elements in the array. If array is not anumeric array, null is returned.
• Parameters:
• array (Object): array of numbers
• Return value
• (floating point): variance of the numeric values in array
stdev( array )
Returns the population standard deviation of all the non-blank elements in the array. If arrayis not a numeric array, null is returned.
• Parameters:
• array (Object): array of numbers
• Return value
• (floating point): standard deviation of the numeric values in array
minimum( array )
Returns the smallest of the non-blank elements in the array. If array is not a numeric array,null is returned.
• Parameters:
SUN/256 260
• array (Object): array of numbers
• Return value
• (floating point): minimum of the numeric values in array
maximum( array )
Returns the largest of the non-blank elements in the array. If array is not a numeric array,null is returned.
• Parameters:
• array (Object): array of numbers
• Return value
• (floating point): maximum of the numeric values in array
median( array )
Returns the median of the non-blank elements in the array. If array is not a numeric array,null is returned.
• Parameters:
• array (Object): array of numbers
• Return value
• (floating point): median of the numeric values in array
quantile( array, quant )
Returns a quantile value of the non-blank elements in the array. Which quantile is determinedby the quant value; values of 0, 0.5 and 1 give the minimum, median and maximumrespectively. A value of 0.99 would give the 99th percentile.
• Parameters:
• array (Object): array of numbers• quant (floating point): number in the range 0-1 deterining which quantile to
calculate
• Return value
• (floating point): quantile corresponding to quant
size( array )
Returns the number of elements in the array. If array is not an array, zero is returned.
• Parameters:
• array (Object): array
• Return value
• (integer): size of array
count( array )
Returns the number of non-blank elements in the array. If array is not an array, zero isreturned.
• Parameters:
SUN/256 261
• array (Object): array (may or may not be numeric)
• Return value
• (integer): number of non-blank elements in array
countTrue( array )
Returns the number of true elements in an array of boolean values.
• Parameters:
• array (array of boolean): array of true/false values
• Return value
• (integer): number of true values in array
join( array, joiner )
Returns a string composed of concatenating all the elements of an array, separated by a joinerstring. If array is not an array, null is returned.
• Parameters:
• array (Object): array of numbers or strings• joiner (String): text string to interpose between adjacent elements
• Return value
• (String): string composed of array elements separated by joiner strings
• Example:
• join(array(1.5,2.1,-3.9), "; ") = "1.5; 2.1; -3.9"
add( array1, array2 )
Returns the result of adding two numeric arrays element by element. Both arrays must benumeric, and the arrays must have the same length. If either of those conditions is not true,null is returned. The types of the arrays do not need to be the same, so for example it ispermitted to add an integer array to a floating point array.
• Parameters:
• array1 (Object): first array of numeric values• array2 (Object): second array of numeric values
• Return value
• (array of floating point): element-by-element sum of array1 and array2, the samelength as the input arrays
• Example:
• add(array(1,2,3), array(0.1,0.2,0.3)) = [1.1, 2.2, 3.3]
add( array, constant )
Returns the result of adding a constant value to every element of a numeric array. If thesupplied array argument is not a numeric array, null is returned.
• Parameters:
• array (Object): array input• constant (floating point): value to add to each array element
SUN/256 262
• Return value
• (array of floating point): array output, the same length as the array parameter
• Example:
• add(array(1,2,3), 10) = [11,12,13]
subtract( array1, array2 )
Returns the result of subtracting one numeric array from the other element by element. Botharrays must be numeric, and the arrays must have the same length. If either of those conditionsis not true, null is returned. The types of the arrays do not need to be the same, so for exampleit is permitted to subtract an integer array from a floating point array.
• Parameters:
• array1 (Object): first array of numeric values• array2 (Object): second array of numeric values
• Return value
• (array of floating point): element-by-element difference of array1 and array2, thesame length as the input arrays
• Example:
• subtract(array(1,2,3), array(0.1,0.2,0.3)) = [0.9, 1.8, 2.7]
multiply( array1, array2 )
Returns the result of multiplying two numeric arrays element by element. Both arrays must benumeric, and the arrays must have the same length. If either of those conditions is not true,null is returned. The types of the arrays do not need to be the same, so for example it ispermitted to multiply an integer array by a floating point array.
• Parameters:
• array1 (Object): first array of numeric values• array2 (Object): second array of numeric values
• Return value
• (array of floating point): element-by-element product of array1 and array2, thesame length as the input arrays
• Example:
• multiply(array(1,2,3), array(2,4,6)) = [2, 8, 18]
multiply( array, constant )
Returns the result of multiplying every element of a numeric array by a constant value. If thesupplied array argument is not a numeric array, null is returned.
• Parameters:
• array (Object): array input• constant (floating point): value by which to multiply each array element
• Return value
• (array of floating point): array output, the same length as the array parameter
• Example:
• multiply(array(1,2,3), 2) = [2, 4, 6]
SUN/256 263
divide( array1, array2 )
Returns the result of dividing two numeric arrays element by element. Both arrays must benumeric, and the arrays must have the same length. If either of those conditions is not true,null is returned. The types of the arrays do not need to be the same, so for example it ispermitted to divide an integer array by a floating point array.
• Parameters:
• array1 (Object): array of numerator values (numeric)• array2 (Object): array of denominator values (numeric)
• Return value
• (array of floating point): element-by-element result of array1[i]/array2[i] thesame length as the input arrays
• Example:
• divide(array(0,9,4), array(1,3,8)) = [0, 3, 0.5]
reciprocal( array )
Returns the result of taking the reciprocal of every element of a numeric array. If the suppliedarray argument is not a numeric array, null is returned.
• Parameters:
• array (Object): array input
• Return value
• (array of floating point): array output, the same length as the array parameter
• Example:
• reciprocal(array(1,2,0.25) = [1, 0.5, 4]
condition( flagArray, trueValue, falseValue )
Maps a boolean array to a numeric array by using supplied numeric values to represent trueand false values from the input array.
This has the same effect as applying the expression outArray[i] = flagArray[i] ?
trueValue : falseValue.
• Parameters:
• flagArray (array of boolean): array of boolean values• trueValue (floating point): output value corresponding to an input true value• falseValue (floating point): output value corresponding to an input false value
• Return value
• (array of floating point): output numeric array, same length as flagArray
• Example:
• condition([true, false, true], 1, 0) = [1, 0, 1]
constant( n, value )
Returns a fixed-size array filled with a given constant value.
Note: This documents the double-precision version of the routine. Corresponding routinesexist for other data types (float, long, int, short, byte).
SUN/256 264

• Parameters:
• n (integer): size of output array• value (floating point): value of every element in the output array
• Return value
• (array of floating point): n-element array with every element set to value
• Example:
• constant(5, 23.5) = [23.5, 23.5, 23.5, 23.5, 23.5]
slice( array, i0, i1 )
Returns a sub-sequence of values from a given array.
The semantics are like python array slicing, though both limits have to be specified: the outputarray contains the sequence of elements in the input array from i0 (inclusive) to i1 (exclusive).If a negative value is given in either case, it is added to the length of the input array, so that -1indicates the last element of the input array. The indices are capped at 0 and the input arraylength respectively, so a large positive value may be used to indicate the end of the array. If theend index is less than or equal to the start index, a zero-length array is returned.
Note: This documents the double-precision version of the routine. Corresponding routinesexist for other data types (float, long, int, short, byte, String, Object).
• Parameters:
• array (array of floating point): input array• i0 (integer): index of first element, inclusive (may be negative to count back from
the end)• i1 (integer): index of the last element, exclusive (may be negative to count back
from the end)
• Return value
• (array of floating point): array giving the sequence of elements specified by i0 andi1
• Examples:
• slice(array(10,11,12,13), 0, 3) = [10, 11, 12]
• slice(array(10,11,12,13), -2, 999) = [12, 13]
pick( array, indices, ... )
Returns a selection of elements from a given array.
The output array consists of one element selected from the input array for each of the suppliedindex values. If a negative value is supplied for an index value, it is added to the input arraylength, so that -1 indicates the last element of the input array. If the input array is null, null isreturned. If any of the index values is out of the range of the extent of the input array, an errorresults.
Note: This documents the double-precision version of the routine. Corresponding routinesexist for other data types (float, long, int, short, byte, String, Object).
• Parameters:
• array (array of floating point): input array• indices (integer, one or more): one or more index into the input array (may be
negative to count back from the end)
• Return value
SUN/256 265
• (array of floating point): array giving the elements specified by indices
• Examples:
• pick(array(10,11,12,13), 0, 3) = [10, 13]
• pick(array(10,11,12,13), -1, -2, -3) = [13, 12, 11]
arrayFunc( expr, inArray )
Returns a floating-point array resulting from applying a given function expressionelement-by-element to an input array. The output array is the same length as the input array.
The supplied expression can use the variable "x" to refer to the corresponding element of theinput array, and "i" to refer to its (zero-based) index. The various functions and operators fromthe expression language can all be used, but it is currently not possible to reference other tablecolumn values.
If there is an error in the expression, a blank value (not an array) will be returned.
• Parameters:
• expr (String): expression mapping input to output array values• inArray (Object): input array
• Return value
• (array of floating point): floating point array with the same number of elements asinArray, or null for a bad expr
• Examples:
• arrayFunc("3*x",array(0,1,2,3,NaN)) = [0, 3, 6, 9, NaN]
• arrayFunc("pow(2,i)+x", array(0.5,0.5,0.5,0.5)) = [1.5, 2.5, 4.5, 8.5]
intArrayFunc( expr, inArray )
Returns an integer array resulting from applying a given function expressionelement-by-element to an input array. The output array is the same length as the input array.
The supplied expression can use the variable "x" to refer to the corresponding element of theinput array, and "i" to refer to its (zero-based) index. The various functions and operators fromthe expression language can all be used, but it is currently not possible to reference other tablecolumn values.
If there is an error in the expression, a blank value (not an array) will be returned.
• Parameters:
• expr (String): expression mapping input to output array values• inArray (Object): input array
• Return value
• (array of integer): floating point array with the same number of elements asinArray, or null for a bad expr
• Example:
• intArrayFunc("-x",sequence(5)) = [0, -1, -2, -3, -4]
indexOf( array, item )
Returns the position in a supplied array at which a given item appears. The result iszero-based, so if the supplied item is the first entry in the array, the return value will be zero.
If the item does not appear in the array, -1 is returned. If it appears multiple times, the index of
SUN/256 266

its first appearance is returned.
If indexOf(array, item)==n, then array[n] is equal to item.
Note: This documents the Object version of the routine. Corresponding routines exist for otherdata types (double, float, long, int, short).
• Parameters:
• array (array of Object): array which may contain the supplied item• item (Object): entry to look for in the array
• Return value
• (integer): the index of item in array, or -1
• Examples:
• indexOf(stringArray("QSO", "BCG", "SNR"), "BCG") = 1
• indexOf(stringArray("QSO", "BCG", "SNR"), "TLA") = -1
sequence( n )
Returns an integer array of a given length with the values 0, 1, 2, ....
• Parameters:
• n (integer): length of array
• Return value
• (array of integer): n-element array, (0, 1, 2, ... n-1)
• Example:
• sequence(4) = (0, 1, 2, 3)
array( values, ... )
Returns a floating point numeric array built from the given arguments.
• Parameters:
• values (floating point, one or more): one or more array elements
• Return value
• (array of floating point): array
intArray( values, ... )
Returns an integer numeric array built from the given arguments.
• Parameters:
• values (integer, one or more): one or more array elements
• Return value
• (array of integer): array
stringArray( values, ... )
Returns a String array built from the given arguments.
• Parameters:
• values (String, one or more): one or more array elements
SUN/256 267
• Return value
• (array of String): array
10.6.3 Conversions
Functions for converting between strings and numeric values.
toString( fpVal )
Turns a numeric value into a string.
• Parameters:
• fpVal (floating point): floating point numeric value
• Return value
• (String): a string representation of fpVal
toString( intVal )
Turns an integer numeric value into a string.
• Parameters:
• intVal (long integer): integer numeric value
• Return value
• (String): a string representation of intVal
toString( charVal )
Turns a single character value into a string.
• Parameters:
• charVal (char): character numeric value
• Return value
• (String): a string representation of charVal
toString( byteVal )
Turns a byte value into a string.
• Parameters:
• byteVal (byte): byte numeric value
• Return value
• (String): a string representation of byteVal
toString( booleanVal )
Turns a boolean value into a string.
• Parameters:
• booleanVal (boolean): boolean value (true or false)
• Return value
SUN/256 268
• (String): a string representation of booleanVal ("true" or "false")
toString( objVal )
Turns any object value into a string. As applied to existing string values this isn't really useful,but it means that you can apply toString to any object value without knowing its type and geta useful return from it.
• Parameters:
• objVal (Object): non-primitive value
• Return value
• (String): a string representation of objVal
parseByte( str )
Attempts to interpret a string as a byte (8-bit signed integer) value. If the input string can't beinterpreted in this way, a blank value will result.
• Parameters:
• str (String): string containing numeric representation
• Return value
• (byte): byte value of str
parseShort( str )
Attempts to interpret a string as a short (16-bit signed integer) value. If the input string can't beinterpreted in this way, a blank value will result.
• Parameters:
• str (String): string containing numeric representation
• Return value
• (short integer): byte value of str
parseInt( str )
Attempts to interpret a string as an int (32-bit signed integer) value. If the input string can't beinterpreted in this way, a blank value will result.
• Parameters:
• str (String): string containing numeric representation
• Return value
• (integer): byte value of str
parseLong( str )
Attempts to interpret a string as a long (64-bit signed integer) value. If the input string can't beinterpreted in this way, a blank value will result.
• Parameters:
• str (String): string containing numeric representation
• Return value
• (long integer): byte value of str
SUN/256 269
parseFloat( str )
Attempts to interpret a string as a float (32-bit floating point) value. If the input string can't beinterpreted in this way, a blank value will result.
• Parameters:
• str (String): string containing numeric representation
• Return value
• (floating point): byte value of str
parseDouble( str )
Attempts to interpret a string as a double (64-bit signed integer) value. If the input string can'tbe interpreted in this way, a blank value will result.
• Parameters:
• str (String): string containing numeric representation
• Return value
• (floating point): byte value of str
parseBigInteger( str )
Attempts to interpret a string as a "BigInteger" value. This can be used for working with stringrepresentations of integers that can't be stored as an unsigned 64-bit value.
The result is a BigInteger object, which can't be used in normal numeric expressions, but hasa number of methods defined on it for comparison, arithmetic, bit manipulation etc. See thejava.math.BigInteger (https://docs.oracle.com/javase/8/docs/api/java/math/BigInteger.html)javadocs for details.
• Parameters:
• str (String): string containing numeric representation
• Return value
• (BigInteger): BigInteger value of str
• Examples:
• parseBigInteger("-20000000000000000023").doubleValue() = -2e19
• parseBigInteger("18446744073709551616").testBit(64) = true
parseBigDecimal( str )
Attempts to interpret a string as a "BigDecimal" value. This can be used for working withstring representations of non-integer values that require more precision or range than ispossible in a 64-bit IEEE-754 double precision variable.
The result is a BigDecimal object, which can't be used in normal numeric expressions, but hasa number of methods defined on it for comparison, arithmetic, bit manipulation etc. See thejava.math.BigDecimal (https://docs.oracle.com/javase/8/docs/api/java/math/BigDecimal.html)javadocs for details.
• Parameters:
• str (String): string contining numeric representation
• Return value
SUN/256 270
• (BigDecimal): BigDecimal value of str
• Example:
• parseBigDecimal("101").compareTo(parseBigDecimal("102")) = -1
parseInts( str )
Attempts to interpret a string as an array of integer values. An ad-hoc algorithm is used thattries to extract a list of integers from a string; a comma- or space-separated list of integervalues will work, and other formats may or may not.
The details of this function's behaviour may change in future releases.
• Parameters:
• str (String): string containing a list of integer values
• Return value
• (array of integer): array of integer values
• Examples:
• parseInts("9 8 -23") = [9, 8, -23]
• parseInts("tiddly-pom") = []
parseDoubles( str )
Attempts to interpret a string as an array of floating point values. An ad-hoc algorithm is usedthat tries to extract a list of numeric values from a string; a comma- or space-separated list offloating point values will work, and other formats may or may not.
This function can be used as a hacky way to extract the numeric values from an STC-S (forinstance ObsCore/EPNcore s_region) string.
The details of this function's behaviour may change in future releases.
• Parameters:
• str (String): string containing a list of floating point values
• Return value
• (array of floating point): array of floating point values
• Examples:
• parseDoubles("1.3, 99e1, NaN, -23") = [1.3, 990.0, NaN, -23.0]
• parseDoubles("Polygon ICRS 0.8 2.1 9.0 2.1 6.2 8.6") = [0.8, 2.1, 9.0,
2.1, 6.2, 8.6]
• parseDoubles("La la la") = []
toByte( value )
Attempts to convert the numeric argument to a byte (8-bit signed integer) result. If it is out ofrange, a blank value will result.
• Parameters:
• value (floating point): numeric value for conversion
• Return value
• (byte): value converted to type byte
toShort( value )
SUN/256 271

Attempts to convert the numeric argument to a short (16-bit signed integer) result. If it is out ofrange, a blank value will result.
• Parameters:
• value (floating point): numeric value for conversion
• Return value
• (short integer): value converted to type short
toInteger( value )
Attempts to convert the numeric argument to an int (32-bit signed integer) result. If it is out ofrange, a blank value will result.
• Parameters:
• value (floating point): numeric value for conversion
• Return value
• (integer): value converted to type int
toLong( value )
Attempts to convert the numeric argument to a long (64-bit signed integer) result. If it is out ofrange, a blank value will result.
• Parameters:
• value (floating point): numeric value for conversion
• Return value
• (long integer): value converted to type long
toFloat( value )
Attempts to convert the numeric argument to a float (32-bit floating point) result. If it is out ofrange, a blank value will result.
• Parameters:
• value (floating point): numeric value for conversion
• Return value
• (floating point): value converted to type float
toDouble( value )
Converts the numeric argument to a double (64-bit signed integer) result.
• Parameters:
• value (floating point): numeric value for conversion
• Return value
• (floating point): value converted to type double
toHex( value )
Converts the integer argument to hexadecimal form.
• Parameters:
SUN/256 272

• value (long integer): integer value
• Return value
• (String): hexadecimal representation of value
• Example:
• toHex(42) = "2a"
fromHex( hexVal )
Converts a string representing a hexadecimal number to its integer value.
• Parameters:
• hexVal (String): hexadecimal representation of value
• Return value
• (integer): integer value represented by hexVal
• Example:
• fromHex("2a") = 42
10.6.4 CoordsDegrees
Functions for angle transformations and manipulations, with angles generally in degrees. Inparticular, methods for translating between degrees and HH:MM:SS.S or DDD:MM:SS.S typesexagesimal representations are provided.
degreesToDms( deg )
Converts an angle in degrees to a formatted degrees:minutes:seconds string. No fractional partof the seconds field is given.
• Parameters:
• deg (floating point): angle in degrees
• Return value
• (String): DMS-format string representing deg
degreesToDms( deg, secFig )
Converts an angle in degrees to a formatted degrees:minutes:seconds string with a givennumber of decimal places in the seconds field.
• Parameters:
• deg (floating point): angle in degrees• secFig (integer): number of decimal places in the seconds field
• Return value
• (String): DMS-format string representing deg
degreesToHms( deg )
Converts an angle in degrees to a formatted hours:minutes:seconds string. No fractional part ofthe seconds field is given.
SUN/256 273
• Parameters:
• deg (floating point): angle in degrees
• Return value
• (String): HMS-format string representing deg
degreesToHms( deg, secFig )
Converts an angle in degrees to a formatted hours:minutes:seconds string with a given numberof decimal places in the seconds field.
• Parameters:
• deg (floating point): angle in degrees• secFig (integer): number of decimal places in the seconds field
• Return value
• (String): HMS-format string representing deg
dmsToDegrees( dms )
Converts a formatted degrees:minutes:seconds string to an angle in degrees. Delimiters may becolon, space, characters dm[s], or some others. Additional spaces and leading +/- arepermitted. The :seconds part is optional.
• Parameters:
• dms (String): formatted DMS string
• Return value
• (floating point): angle in degrees specified by dms
hmsToDegrees( hms )
Converts a formatted hours:minutes:seconds string to an angle in degrees. Delimiters may becolon, space, characters hm[s], or some others. Additional spaces and leading +/- arepermitted. The :seconds part is optional.
• Parameters:
• hms (String): formatted HMS string
• Return value
• (floating point): angle in degrees specified by hms
dmsToDegrees( deg, min, sec )
Converts degrees, minutes, seconds to an angle in degrees.
In conversions of this type, one has to be careful to get the sign right in converting angleswhich are between 0 and -1 degrees. This routine uses the sign bit of the deg argument, takingcare to distinguish between +0 and -0 (their internal representations are different for floatingpoint values). It is illegal for the min or sec arguments to be negative.
• Parameters:
• deg (floating point): degrees part of angle• min (floating point): minutes part of angle• sec (floating point): seconds part of angle
• Return value
SUN/256 274
• (floating point): specified angle in degrees
hmsToDegrees( hour, min, sec )
Converts hours, minutes, seconds to an angle in degrees.
In conversions of this type, one has to be careful to get the sign right in converting angleswhich are between 0 and -1 hours. This routine uses the sign bit of the hour argument, takingcare to distinguish between +0 and -0 (their internal representations are different for floatingpoint values).
• Parameters:
• hour (floating point): degrees part of angle• min (floating point): minutes part of angle• sec (floating point): seconds part of angle
• Return value
• (floating point): specified angle in degrees
skyDistanceDegrees( ra1, dec1, ra2, dec2 )
Calculates the separation (distance around a great circle) of two points on the sky in degrees.
• Parameters:
• ra1 (floating point): right ascension of point 1 in degrees• dec1 (floating point): declination of point 1 in degrees• ra2 (floating point): right ascension of point 2 in degrees• dec2 (floating point): declination of point 2 in degrees
• Return value
• (floating point): angular distance between point 1 and point 2 in degrees
posAngDegrees( ra1, dec1, ra2, dec2 )
Calculates the position angle between two points on the sky in degrees. The result is in therange +/-180. If point 2 is due east of point 1, the result is +90. Zero is returned if the pointsare coincident.
• Parameters:
• ra1 (floating point): right ascension of point 1 in degrees• dec1 (floating point): declination of point 1 in degrees• ra2 (floating point): right ascension of point 2 in degrees• dec2 (floating point): declination of point 2 in degrees
• Return value
• (floating point): bearing in degrees of point 2 from point 1.
polarDistanceDegrees( ra1, dec1, radius1, ra2, dec2, radius2 )
Calculates the distance in three dimensional space between two points specified in sphericalpolar coordinates.
• Parameters:
• ra1 (floating point): right ascension of point 1 in degrees• dec1 (floating point): declination of point1 in degrees• radius1 (floating point): distance from origin of point1• ra2 (floating point): right ascension of point 2 in degrees
SUN/256 275
• dec2 (floating point): declination of point2 in degrees• radius2 (floating point): distance from origin of point2
• Return value
• (floating point): the linear distance between point1 and point2; units are as forradius1 and radius2
10.6.5 CoordsRadians
Functions for angle transformations and manipulations, based on radians rather than degrees. Inparticular, methods for translating between radians and HH:MM:SS.S or DDD:MM:SS.S typesexagesimal representations are provided.
radiansToDms( rad )
Converts an angle in radians to a formatted degrees:minutes:seconds string. No fractional partof the seconds field is given.
• Parameters:
• rad (floating point): angle in radians
• Return value
• (String): DMS-format string representing rad
radiansToDms( rad, secFig )
Converts an angle in radians to a formatted degrees:minutes:seconds string with a givennumber of decimal places in the seconds field.
• Parameters:
• rad (floating point): angle in radians• secFig (integer): number of decimal places in the seconds field
• Return value
• (String): DMS-format string representing rad
radiansToHms( rad )
Converts an angle in radians to a formatted hours:minutes:seconds string. No fractional part ofthe seconds field is given.
• Parameters:
• rad (floating point): angle in radians
• Return value
• (String): HMS-format string representing rad
radiansToHms( rad, secFig )
Converts an angle in radians to a formatted hours:minutes:seconds string with a given numberof decimal places in the seconds field.
• Parameters:
• rad (floating point): angle in radians
SUN/256 276
• secFig (integer): number of decimal places in the seconds field
• Return value
• (String): HMS-format string representing rad
dmsToRadians( dms )
Converts a formatted degrees:minutes:seconds string to an angle in radians. Delimiters may becolon, space, characters dm[s], or some others. Additional spaces and leading +/- arepermitted. The :seconds part is optional.
• Parameters:
• dms (String): formatted DMS string
• Return value
• (floating point): angle in radians specified by dms
hmsToRadians( hms )
Converts a formatted hours:minutes:seconds string to an angle in radians. Delimiters may becolon, space, characters hm[s], or some others. Additional spaces and leading +/- arepermitted. The :seconds part is optional.
• Parameters:
• hms (String): formatted HMS string
• Return value
• (floating point): angle in radians specified by hms
dmsToRadians( deg, min, sec )
Converts degrees, minutes, seconds to an angle in radians.
In conversions of this type, one has to be careful to get the sign right in converting angleswhich are between 0 and -1 degrees. This routine uses the sign bit of the deg argument, takingcare to distinguish between +0 and -0 (their internal representations are different for floatingpoint values). It is illegal for the min or sec arguments to be negative.
• Parameters:
• deg (floating point): degrees part of angle• min (floating point): minutes part of angle• sec (floating point): seconds part of angle
• Return value
• (floating point): specified angle in radians
hmsToRadians( hour, min, sec )
Converts hours, minutes, seconds to an angle in radians.
In conversions of this type, one has to be careful to get the sign right in converting angleswhich are between 0 and -1 hours. This routine uses the sign bit of the hour argument, takingcare to distinguish between +0 and -0 (their internal representations are different for floatingpoint values).
• Parameters:
• hour (floating point): degrees part of angle• min (floating point): minutes part of angle
SUN/256 277

• sec (floating point): seconds part of angle
• Return value
• (floating point): specified angle in radians
skyDistanceRadians( ra1, dec1, ra2, dec2 )
Calculates the separation (distance around a great circle) of two points on the sky in radians.
• Parameters:
• ra1 (floating point): right ascension of point 1 in radians• dec1 (floating point): declination of point 1 in radians• ra2 (floating point): right ascension of point 2 in radians• dec2 (floating point): declination of point 2 in radians
• Return value
• (floating point): angular distance between point 1 and point 2 in radians
posAngRadians( ra1, dec1, ra2, dec2 )
Calculates the position angle between two points on the sky in radians. The result is in therange +/-pi. If point 2 is due east of point 1, the result is +pi/2. Zero is returned if the points arecoincident.
• Parameters:
• ra1 (floating point): right ascension of point 1 in radians• dec1 (floating point): declination of point 1 in radians• ra2 (floating point): right ascension of point 2 in radians• dec2 (floating point): declination of point 2 in radians
• Return value
• (floating point): bearing in radians of point 2 from point 1
polarDistanceRadians( ra1, dec1, radius1, ra2, dec2, radius2 )
Calculates the distance in three dimensional space between two points specified in sphericalpolar coordinates.
• Parameters:
• ra1 (floating point): right ascension of point 1 in radians• dec1 (floating point): declination of point1 in radians• radius1 (floating point): distance from origin of point1• ra2 (floating point): right ascension of point 2 in radians• dec2 (floating point): declination of point2 in radians• radius2 (floating point): distance from origin of point2
• Return value
• (floating point): the linear distance between point1 and point2; units are as forradius1 and radius2
hoursToRadians( hours )
Converts hours to radians.
• Parameters:
• hours (floating point): angle in hours
SUN/256 278
• Return value
• (floating point): angle in radians
degreesToRadians( deg )
Converts degrees to radians.
• Parameters:
• deg (floating point): angle in degrees
• Return value
• (floating point): angle in radians
radiansToDegrees( rad )
Converts radians to degrees.
• Parameters:
• rad (floating point): angle in radians
• Return value
• (floating point): angle in degrees
raFK4toFK5radians( raFK4, decFK4 )
Converts a B1950.0 FK4 position to J2000.0 FK5 at an epoch of B1950.0 yielding RightAscension. This assumes zero proper motion in the FK5 frame.
• Parameters:
• raFK4 (floating point): right ascension in B1950.0 FK4 system (radians)• decFK4 (floating point): declination in B1950.0 FK4 system (radians)
• Return value
• (floating point): right ascension in J2000.0 FK5 system (radians)
decFK4toFK5radians( raFK4, decFK4 )
Converts a B1950.0 FK4 position to J2000.0 FK5 at an epoch of B1950.0 yielding DeclinationThis assumes zero proper motion in the FK5 frame.
• Parameters:
• raFK4 (floating point): right ascension in B1950.0 FK4 system (radians)• decFK4 (floating point): declination in B1950.0 FK4 system (radians)
• Return value
• (floating point): declination in J2000.0 FK5 system (radians)
raFK5toFK4radians( raFK5, decFK5 )
Converts a J2000.0 FK5 position to B1950.0 FK4 at an epoch of B1950.0 yieldingDeclination. This assumes zero proper motion, parallax and radial velocity in the FK5 frame.
• Parameters:
• raFK5 (floating point): right ascension in J2000.0 FK5 system (radians)• decFK5 (floating point): declination in J2000.0 FK5 system (radians)
• Return value
SUN/256 279
• (floating point): right ascension in the FK4 system (radians)
decFK5toFK4radians( raFK5, decFK5 )
Converts a J2000.0 FK5 position to B1950.0 FK4 at an epoch of B1950.0 yieldingDeclination. This assumes zero proper motion, parallax and radial velocity in the FK5 frame.
• Parameters:
• raFK5 (floating point): right ascension in J2000.0 FK5 system (radians)• decFK5 (floating point): declination in J2000.0 FK5 system (radians)
• Return value
• (floating point): right ascension in the FK4 system (radians)
raFK4toFK5Radians( raFK4, decFK4, bepoch )
Converts a B1950.0 FK4 position to J2000.0 FK5 yielding Right Ascension. This assumeszero proper motion in the FK5 frame. The bepoch parameter is the epoch at which the positionin the FK4 frame was determined.
• Parameters:
• raFK4 (floating point): right ascension in B1950.0 FK4 system (radians)• decFK4 (floating point): declination in B1950.0 FK4 system (radians)• bepoch (floating point): Besselian epoch
• Return value
• (floating point): right ascension in J2000.0 FK5 system (radians)
decFK4toFK5Radians( raFK4, decFK4, bepoch )
Converts a B1950.0 FK4 position to J2000.0 FK5 yielding Declination. This assumes zeroproper motion in the FK5 frame. The bepoch parameter is the epoch at which the position inthe FK4 frame was determined.
• Parameters:
• raFK4 (floating point): right ascension in B1950.0 FK4 system (radians)• decFK4 (floating point): declination in B1950.0 FK4 system (radians)• bepoch (floating point): Besselian epoch
• Return value
• (floating point): declination in J2000.0 FK5 system (radians)
raFK5toFK4Radians( raFK5, decFK5, bepoch )
Converts a J2000.0 FK5 position to B1950.0 FK4 yielding Declination. This assumes zeroproper motion, parallax and radial velocity in the FK5 frame.
• Parameters:
• raFK5 (floating point): right ascension in J2000.0 FK5 system (radians)• decFK5 (floating point): declination in J2000.0 FK5 system (radians)• bepoch (floating point): Besselian epoch
• Return value
• (floating point): right ascension in the FK4 system (radians)
decFK5toFK4Radians( raFK5, decFK5, bepoch )
SUN/256 280
Converts a J2000.0 FK5 position to B1950.0 FK4 yielding Declination. This assumes zeroproper motion, parallax and radial velocity in the FK5 frame.
• Parameters:
• raFK5 (floating point): right ascension in J2000.0 FK5 system (radians)• decFK5 (floating point): declination in J2000.0 FK5 system (radians)• bepoch (floating point): Besselian epoch
• Return value
• (floating point): right ascension in the FK4 system (radians)
DEGREE_RADIANS
The size of one degree in radians.
HOUR_RADIANS
The size of one hour of right ascension in radians.
ARC_MINUTE_RADIANS
The size of one arcminute in radians.
ARC_SECOND_RADIANS
The size of one arcsecond in radians.
10.6.6 Coverage
Functions related to coverage and footprints.
One coverage standard is Multi-Order Coverage maps, described athttp://www.ivoa.net/Documents/MOC/ (http://www.ivoa.net/Documents/MOC/). MOC positionsare always defined in ICRS equatorial coordinates.
MOC locations may be given as either the filename or the URL of a MOC FITS file. Alternatively,they may be the identifier of a VizieR table, for instance "V/139/sdss9" (SDSS DR9). A list of allthe MOCs available from VizieR can currently be found athttp://alasky.u-strasbg.fr/footprints/tables/vizier/ (http://alasky.u-strasbg.fr/footprints/tables/vizier/).You can search for VizieR table identifiers from the VizieR web page (http://vizier.u-strasbg.fr/(http://vizier.u-strasbg.fr/)); note you must use the table identifier (like "V/139/sdss9") and not thecatalogue identifier (like "V/139").
inMoc( mocLocation, ra, dec )
Indicates whether a given sky position falls strictly within a given MOC (Multi-OrderCoverage map). If the given mocLocation value does not represent a MOC (for instance no fileexists or the file is not in MOC format) a warning will be issued the first time it's referenced,and the result will be false.
• Parameters:
• mocLocation (String): location of a FITS MOC file: a filename, a URL, or a VizieRtable name
• ra (floating point): ICRS right ascension in degrees
SUN/256 281

• dec (floating point): ICRS declination in degrees
• Return value
• (boolean): true iff the given position falls within the given MOC
nearMoc( mocLocation, ra, dec, distanceDeg )
Indicates whether a given sky position either falls within, or is within a certain distance of theedge of, a given MOC (Multi-Order Coverage map). If the given mocLocation value does notrepresent a MOC (for instance no file exists or the file is not in MOC format) a warning will beissued the first time it's referenced, and the result will be false.
• Parameters:
• mocLocation (String): location of a FITS MOC file: a filename, a URL, or a VizieRtable name
• ra (floating point): ICRS right ascension in degrees• dec (floating point): ICRS declination in degrees• distanceDeg (floating point): permitted distance from MOC boundary in degrees
• Return value
• (boolean): true iff the given position is within distance degrees of the given MOC
10.6.7 Distances
Functions for converting between different measures of cosmological distance.
The following parameters are used:
• z: redshift• H0: Hubble constant in km/sec/Mpc (example value ~70)• omegaM: Density ratio of the universe (example value 0.3)• omegaLambda: Normalised cosmological constant (example value 0.7)
For a flat universe, omegaM+omegaLambda=1
The terms and formulae used here are taken from the paper by D.W.Hogg, Distance measures incosmology, astro-ph/9905116 (http://arxiv.org/abs/astro-ph/9905116) v4 (2000).
MpcToM( distMpc )
Converts from MegaParsecs to metres.
• Parameters:
• distMpc (floating point): distance in Mpc
• Return value
• (floating point): distance in m
mToMpc( distM )
Converts from metres to MegaParsecs.
• Parameters:
• distM (floating point): distance in m
SUN/256 282
• Return value
• (floating point): distance in Mpc
zToDist( z )
Quick and dirty function for converting from redshift to distance.
Warning: this makes some reasonable assumptions about the cosmology and returns theluminosity distance. It is only intended for approximate use. If you care about the details, useone of the more specific functions here.
• Parameters:
• z (floating point): redshift
• Return value
• (floating point): some distance measure in Mpc
zToAge( z )
Quick and dirty function for converting from redshift to time.
Warning: this makes some reasonable assumptions about the cosmology. It is only intendedfor approximate use. If you care about the details use one of the more specific functions here.
• Parameters:
• z (floating point): redshift
• Return value
• (floating point): 'age' of photons from redshift z in Gyr
comovingDistanceL( z, H0, omegaM, omegaLambda )
Line-of-sight comoving distance.
• Parameters:
• z (floating point): redshift• H0 (floating point): Hubble constant in km/sec/Mpc• omegaM (floating point): density ratio of the universe• omegaLambda (floating point): normalised cosmological constant
• Return value
• (floating point): line-of-sight comoving distance in Mpc
comovingDistanceT( z, H0, omegaM, omegaLambda )
Transverse comoving distance.
• Parameters:
• z (floating point): redshift• H0 (floating point): Hubble constant in km/sec/Mpc• omegaM (floating point): density ratio of the universe• omegaLambda (floating point): normalised cosmological constant
• Return value
• (floating point): transverse comoving distance in Mpc
angularDiameterDistance( z, H0, omegaM, omegaLambda )
SUN/256 283
Angular diameter distance.
• Parameters:
• z (floating point): redshift• H0 (floating point): Hubble constant in km/sec/Mpc• omegaM (floating point): density ratio of the universe• omegaLambda (floating point): normalised cosmological constant
• Return value
• (floating point): angular diameter distance in Mpc
luminosityDistance( z, H0, omegaM, omegaLambda )
Luminosity distance.
• Parameters:
• z (floating point): redshift• H0 (floating point): Hubble constant in km/sec/Mpc• omegaM (floating point): density ratio of the universe• omegaLambda (floating point): normalised cosmological constant
• Return value
• (floating point): luminosity distance in Mpc
lookbackTime( z, H0, omegaM, omegaLambda )
Lookback time. This returns the difference between the age of the universe at time ofobservation (now) and the age of the universe at the time when photons of redshift z wereemitted.
• Parameters:
• z (floating point): redshift• H0 (floating point): Hubble constant in km/sec/Mpc• omegaM (floating point): density ratio of the universe• omegaLambda (floating point): normalised cosmological constant
• Return value
• (floating point): lookback time in Gyr
comovingVolume( z, H0, omegaM, omegaLambda )
Comoving volume. This returns the all-sky total comoving volume out to a given redshift z.
• Parameters:
• z (floating point): redshift• H0 (floating point): Hubble constant in km/sec/Mpc• omegaM (floating point): density ratio of the universe• omegaLambda (floating point): normalised cosmological constant
• Return value
• (floating point): comoving volume in Gpc3
SPEED_OF_LIGHT
Speed of light in m/s.
SUN/256 284
METRE_PER_PARSEC
Number of metres in a parsec.
SEC_PER_YEAR
Number of seconds in a year.
10.6.8 Fluxes
Functions for conversion between flux and magnitude values. Functions are provided forconversion between flux in Janskys and AB magnitudes.
Some constants for approximate conversions between different magnitude scales are also provided:
• Constants JOHNSON_AB_*, for Johnson <-> AB magnitude conversions, from Frei and Gunn,Astronomical Journal 108, 1476 (1994), Table 2 (1994AJ....108.1476F(http://adsabs.harvard.edu/abs/1994AJ....108.1476F)).
• Constants VEGA_AB_*, for Vega <-> AB magnitude conversions, from Blanton et al.,Astronomical Journal 129, 2562 (2005), Eqs. (5) (2005AJ....129.2562B(http://adsabs.harvard.edu/abs/2005AJ....129.2562B)).
abToJansky( magAB )
Converts AB magnitude to flux in Jansky.
F/Jy=10(23-(AB+48.6)/2.5)
• Parameters:
• magAB (floating point): AB magnitude value
• Return value
• (floating point): equivalent flux in Jansky
janskyToAb( fluxJansky )
Converts flux in Jansky to AB magnitude.
AB=2.5*(23-log10
(F/Jy))-48.6
• Parameters:
• fluxJansky (floating point): flux in Jansky
• Return value
• (floating point): equivalent AB magnitude
luminosityToFlux( lumin, dist )
Converts luminosity to flux given a luminosity distance.
F=lumin/(4 x Pi x dist2)
• Parameters:
• lumin (floating point): luminosity• dist (floating point): luminosity distance
• Return value
SUN/256 285
• (floating point): equivalent flux
fluxToLuminosity( flux, dist )
Converts flux to luminosity given a luminosity distance.
lumin=(4 x Pi x dist2) F
• Parameters:
• flux (floating point): flux• dist (floating point): luminosity distance
• Return value
• (floating point): equivalent luminosity
JOHNSON_AB_V
Approximate offset between Johnson and AB magnitudes in V band.V
J~=V
AB+JOHNSON_AB_V.
JOHNSON_AB_B
Approximate offset between Johnson and AB magnitudes in B band.B
J~=B
AB+JOHNSON_AB_B.
JOHNSON_AB_Bj
Approximate offset between Johnson and AB magnitudes in Bj band.Bj
J~=Bj
AB+JOHNSON_AB_Bj.
JOHNSON_AB_R
Approximate offset between Johnson and AB magnitudes in R band.R
J~=R
AB+JOHNSON_AB_R.
JOHNSON_AB_I
Approximate offset between Johnson and AB magnitudes in I band. IJ~=I
AB+JOHNSON_AB_I.
JOHNSON_AB_g
Approximate offset between Johnson and AB magnitudes in g band. gJ~=g
AB+JOHNSON_AB_g.
JOHNSON_AB_r
Approximate offset between Johnson and AB magnitudes in r band. rJ~=r
AB+JOHNSON_AB_r.
JOHNSON_AB_i
Approximate offset between Johnson and AB magnitudes in i band. iJ~=i
AB+JOHNSON_AB_i.
JOHNSON_AB_Rc
Approximate offset between Johnson and AB magnitudes in Rc band.Rc
J~=Rc
AB+JOHNSON_AB_Rc.
JOHNSON_AB_Ic
SUN/256 286

Approximate offset between Johnson and AB magnitudes in Ic band.Ic
J~=Ic
AB+JOHNSON_AB_Ic.
JOHNSON_AB_uPrime
Offset between Johnson and AB magnitudes in u' band (zero).u'
J=u'
AB+JOHNSON_AB_uPrime=u'
AB.
JOHNSON_AB_gPrime
Offset between Johnson and AB magnitudes in g' band (zero).g'
J=g'
AB+JOHNSON_AB_gPrime=g'
AB.
JOHNSON_AB_rPrime
Offset between Johnson and AB magnitudes in r' band (zero).r'
J=r'
AB+JOHNSON_AB_rPrime=r'AB.
JOHNSON_AB_iPrime
Offset between Johnson and AB magnitudes in i' band (zero).i'
J=i'
AB+JOHNSON_AB_iPrime=i'AB.
JOHNSON_AB_zPrime
Offset between Johnson and AB magnitudes in z' band (zero).z'
J=z'
AB+JOHNSON_AB_zPrime=z'
AB.
VEGA_AB_J
Approximate offset between Vega (as in 2MASS) and AB magnitudes in J band.JVega
~=JAB
+VEGA_AB_J.
VEGA_AB_H
Approximate offset between Vega (as in 2MASS) and AB magnitudes in H band.H
Vega~=HAB+VEGA_AB_H.
VEGA_AB_K
Approximate offset between Vega (as in 2MASS) and AB magnitudes in K band.K
Vega~=KAB+VEGA_AB_K.
10.6.9 Formats
Functions for formatting numeric values.
formatDecimal( value, dp )
Turns a floating point value into a string with a given number of decimal places using standardsettings.
• Parameters:
• value (floating point): value to format
SUN/256 287
• dp (integer): number of decimal places (digits after the decmal point)
• Return value
• (String): formatted string
• Examples:
• formatDecimal(PI,0) = "3."
• formatDecimal(0,10) = ".0000000000"
• formatDecimal(E*10,3) = "27.183"
formatDecimalLocal( value, dp )
Turns a floating point value into a string using current locale settings. For instance if languageis set to French, decimal points will be represented as a comma "," instead of a full stop ".".Otherwise behaves the same as the corresponding formatDecimal function.
• Parameters:
• value (floating point): value to format• dp (integer): number of decimal places (digits after the decmal point)
• Return value
• (String): formatted string
• Examples:
• formatDecimal(PI,0) = "3,"
• formatDecimal(0,10) = ",0000000000"
• formatDecimal(E*10,3) = "27,183"
formatDecimal( value, format )
Turns a floating point value into a formatted string using standard settings. The format stringis as defined by Java's java.text.DecimalFormat
(http://docs.oracle.com/javase/6/docs/api/java/text/DecimalFormat.html) class.
• Parameters:
• value (floating point): value to format• format (String): format specifier
• Return value
• (String): formatted string
• Examples:
• formatDecimal(99, "#.000") = "99.000"
• formatDecimal(PI, "+0.##;-0.##") = "+3.14"
formatDecimalLocal( value, format )
Turns a floating point value into a formatted string using current locale settings. For instance iflanguage is set to French, decimal points will be represented as a comma "," instead of a fullstop ".". Otherwise behaves the same as the corresponding formatDecimal function.
• Parameters:
• value (floating point): value to format• format (String): format specifier
• Return value
• (String): formatted string
SUN/256 288
• Examples:
• formatDecimal(99, "#.000") = "99,000"
• formatDecimal(PI, "+0.##;-0.##") = "+3,14"
10.6.10 Gaia
Functions related to astrometry suitable for use with data from the Gaia astrometry mission.
The methods here are not specific to the Gaia mission, but the parameters of the functions and theirunits are specified in a form that is convenient for use with Gaia data, in particular the gaia_source
catalogue available from http://gea.esac.esa.int/archive/ (http://gea.esac.esa.int/archive/) and copiesor mirrors.
There are currently three main sets of functions here:
• position and velocity vector calculation and manipulation• distance estimation from parallaxes• astrometry propagation to different epochs
Position and velocity vectors
Functions are provided for converting the astrometric parameters contained in the Gaia catalogue toICRS Cartesian position (XYZ) and velocity (UVW) vectors. Functions are also provided toconvert these vectors between ICRS and Galactic or Ecliptic coordinates. The calculations are fairlystraightforward, and follow the equations laid out in section 1.5.6 of The Hipparcos and TychoCatalogues, ESA SP-1200 (https://www.cosmos.esa.int/web/hipparcos/catalogues) (1997) and alsosection 3.1.7 of the Gaia DR2 documentation(http://gea.esac.esa.int/archive/documentation/GDR2/) (2018).
These functions will often be combined; for instance to calculate the position and velocity ingalactic coordinates from Gaia catalogue values, the following expressions may be useful:
xyz_gal = icrsToGal(astromXYZ(ra,dec,parallax))uvw_gal = icrsToGal(astromUVW(array(ra,dec,parallax,pmra,pmdec,radial_velocity)))
though note that these particular examples simply invert parallax to provide distance estimates,which is not generally valid. Note also that these functions do not attempt to correct for solarmotion. Such adjustments should be carried out by hand on the results of these functions if they arerequired.
Functions for calculating errors on the Cartesian components based on the error and correlationquantities from the Gaia catalogue are not currently provided. They would require fairlycomplicated invocations. If there is demand they may be implemented in the future.
Distance estimation
Gaia measures parallaxes, but some scientific use cases require the radial distance instead. Whiledistance in parsec is in principle the reciprocal of parallax in arcsec, in the presence ofnon-negligable errors on measured parallax, this inversion does not give a good estimate ofdistance. A thorough discussion of this topic and approaches to estimating distances for Gaia-likedata can be found in the papers
• C.A.L.Bailer-Jones, "Estimating distances from parallaxes", PASP 127, p994 (2015)2015PASP..127..994B (http://adsabs.harvard.edu/abs/2015PASP..127..994B)
SUN/256 289
• T.L.Astraatmadja and C.A.L.Bailer-Jones, "Estimating Distances from Parallaxes. II.Performance of Bayesian Distance Estimators on a Gaia-like Catalogue", ApJ 832, a137(2016) 2016ApJ...832..137A (http://adsabs.harvard.edu/abs/2016ApJ...832..137A)
• X.Luri et al., "Gaia Data Release 2: Using Gaia Parallaxes", A&A in press (2018)arXiv:1804.09376 (https://arxiv.org/abs/1804.09376)
The functions provided here correspond to calculations from Astraatmadja & Bailer-Jones,"Estimating Distances from Parallaxes. III. Distances of Two Million Stars in the Gaia DR1Catalogue", ApJ 833, a119 (2016) 2016ApJ...833..119A(http://adsabs.harvard.edu/abs/2016ApJ...833..119A) based on the Exponentially DecreasingSpace Density prior defined therein. This implementation was written with reference to the Javaimplementation by Enrique Utrilla (DPAC).
These functions are parameterised by a length scale L that defines the exponential decay (the modeof the prior PDF is at r=2L). Some value for this length scale, specified in parsec, must be suppliedto the functions as the lpc parameter.
Note that the values provided by these functions do not match those from the paper Bailer-Jones etal. "Estimating Distances from Parallaxes IV: Distances to 1.33 Billion stars in Gaia Data Release2", accepted for AJ (2018) arXiv:1804.10121 (https://arxiv.org/abs/1804.10121). The calculationsof that paper differ from the ones presented here in several ways: it uses a galactic model for thedirection-dependent length scale not currently available here, it pre-applies a parallax correction of-0.029mas, and it uses different uncertainty measures and in some cases (bimodal PDF) a differentbest distance estimator.
Epoch Propagation
The Gaia source catalogue provides, for at least some sources, the six-parameter astrometricsolution (Right Ascension, Declination, Parallax, Proper motion in RA and Dec, and RadialVelocity), along with errors on these values and correlations between these errors. While a crudeestimate of the position at an earlier or later epoch than that of the measurement can be made bymultiplying the proper motion components by epoch difference and adding to the measuredposition, a more careful treatment is required for accurate propagation between epochs of theastrometric parameters, and if required their errors and correlations. The expressions for this are setout in section 1.5.5 (Volume 1) of The Hipparcos and Tycho Catalogues, ESA SP-1200(https://www.cosmos.esa.int/web/hipparcos/catalogues) (1997) (but see below), and the code isbased on an implementation by Alexey Butkevich and Daniel Michalik (DPAC). A correction isapplied to the SP-1200 treatment of radial velocity uncertainty following Michalik et al. 20142014A&A...571A..85M (http://ukads.nottingham.ac.uk/abs/2014A%26A...571A..85M) because oftheir better handling of small radial velocities or parallaxes.
The calculations give the same results, though not exactly in the same form, as the epochpropagation functions available in the Gaia archive service.
polarXYZ( phi, theta, r )
Converts from spherical polar to Cartesian coordinates.
• Parameters:
• phi (floating point): longitude in degrees• theta (floating point): latitude in degrees• r (floating point): radial distance
• Return value
• (array of floating point): 3-element vector giving Cartesian coordinates
SUN/256 290

• Examples:
• polarXYZ(ra, dec, distance_estimate)
• polarXYZ(l, b, 3262./parallax) - calculates vector components in units of lightyear in the galactic system, on the assumption that distance is the inverse of parallax
astromXYZ( ra, dec, parallax )
Calculates Cartesian components of position from RA, Declination and parallax. This is aconvenience function, equivalent to:
polarXYZ(ra, dec, 1000./parallax)
Note that this performs distance scaling using a simple inversion of parallax, which is not ingeneral reliable for parallaxes with non-negligable errors. Use at your own risk.
• Parameters:
• ra (floating point): Right Ascension in degrees• dec (floating point): Declination in degrees• parallax (floating point): parallax in mas
• Return value
• (array of floating point): 3-element vector giving equatorial space coordinates inparsec
• Examples:
• astromXYZ(ra, dec, parallax)
• icrsToGal(astromXYZ(ra, dec, parallax))
icrsToGal( xyz )
Converts a 3-element vector representing ICRS (equatorial) coordinates to galacticcoordinates. This can be used with position or velocity vectors.
The input vector is multiplied by the matrix AG', given in Eq. 3.61 of the Gaia DR2documentation, following Eq. 1.5.13 of the Hipparcos catalogue.
The output coordinate system is right-handed, with the three components positive in thedirections of the Galactic center, Galactic rotation, and the North Galactic Pole respectively.
• Parameters:
• xyz (array of floating point): 3-element vector giving ICRS Cartesian components
• Return value
• (array of floating point): 3-element vector giving Galactic Cartesian components
• Example:
• icrsToGal(polarXYZ(ra, dec, distance))
galToIcrs( xyz )
Converts a 3-element vector representing galactic coordinates to ICRS (equatorial)coordinates. This can be used with position or velocity vectors.
The input vector is multiplied by the matrix AG , given in Eq. 3.61 of the Gaia DR2documentation, following Eq. 1.5.13 of the Hipparcos catalogue.
The input coordinate system is right-handed, with the three components positive in thedirections of the Galactic center, Galactic rotation, and the North Galactic Pole respectively.
SUN/256 291

• Parameters:
• xyz (array of floating point): 3-element vector giving Galactic Cartesian components
• Return value
• (array of floating point): 3-element vector giving ICRS Cartesian components
• Example:
• galToIcrs(polarXYZ(l, b, distance))
icrsToEcl( xyz )
Converts a 3-element vector representing ICRS (equatorial) coordinates to ecliptic coordinates.This can be used with position or velocity vectors.
The transformation corresponds to that between the coordinates (ra,dec) and(ecl_lon,ecl_lat) in the Gaia source catalogue (DR2).
• Parameters:
• xyz (array of floating point): 3-element vector giving ICRS Cartesian components
• Return value
• (array of floating point): 3-element vector giving ecliptic Cartesian components
• Example:
• icrsToEcl(polarXYZ(ra, dec, distance))
eclToIcrs( xyz )
Converts a 3-element vector representing ecliptic coordinates to ICRS (equatorial) coordinates.This can be used with position or velocity vectors.
The transformation corresponds to that between the coordinates (ecl_lon,ecl_lat) and(ra,dec) in the Gaia source catalogue (DR2).
• Parameters:
• xyz (array of floating point): 3-element vector giving ecliptic Cartesian coordinates
• Return value
• (array of floating point): 3-element vector giving ICRS Cartesian coordinates
• Example:
• eclToIcrs(polarXYZ(ecl_lon, ecl_lat, distance))
astromUVW( astrom6 )
Calculates Cartesian components of velocity from quantities available in the Gaia sourcecatalogue. The output is in the same coordinate system as the inputs, that is ICRS for thecorrespondingly-named Gaia quantities.
The input astrometry parameters are represented by a 6-element array, with the followingelements:
index gaia_source name unit description----- ---------------- ---- -----------0: ra deg right ascension1: dec deg declination2: parallax mas parallax3: pmra mas/yr proper motion in ra * cos(dec)4: pmdec mas/yr proper motion in dec5: radial_velocity km/s barycentric radial velocity
SUN/256 292
The units used by this function are the units used in the gaia_source table.
This convenience function just invokes the 7-argument astromUVW function using the invertedparallax for the radial distance, and without invoking the Doppler correction. It is exactlyequivalent to:
astromUVW(a[0], a[1], a[3], a[4], a[5], 1000./a[2], false)
Note this naive inversion of parallax to estimate distance is not in general reliable forparallaxes with non-negligable errors.
• Parameters:
• astrom6 (array of floating point): vector of 6 astrometric parameters as provided bythe Gaia source catalogue
• Return value
• (array of floating point): 3-element vector giving equatorial velocity components inkm/s
• Examples:
• astromUVW(array(ra, dec, parallax, pmra, pmdec, radial_velocity))
• icrsToGal(astromUVW(array(ra, dec, parallax, pmra, pmdec,
radial_velocity)))
astromUVW( ra, dec, pmra, pmdec, radial_velocity, r_parsec, useDoppler )
Calculates Cartesian components of velocity from the observed position and proper motion,radial velocity and radial distance, with optional light-time correction. The output is in thesame coordinate system as the inputs, that is ICRS for the correspondingly-named Gaiaquantities.
The radial distance must be supplied using the r_parsec parameter. A naive estimate fromquantities in the Gaia source catalogue may be made with the expression 1000./parallax,though note that this simple inversion of parallax is not in general reliable for parallaxes withnon-negligable errors.
The calculations are fairly straightforward, following Eq. 1.5.74 from the Hipparcos catalogue.A (usually small) Doppler factor accounting for light-time effects can also optionally beapplied. The effect of this is to multiply the returned vector by a factor of1/(1-radial_velocity/c), as discussed in Eq. 1.2.21 of the Hipparcos catalogue.
Note that no attempt is made to adjust for solar motion.
• Parameters:
• ra (floating point): Right Ascension in degrees• dec (floating point): Declination in degrees• pmra (floating point): proper motion in RA * cos(dec) in mas/yr• pmdec (floating point): proper motion in declination in mas/yr• radial_velocity (floating point): radial velocity in km/s• r_parsec (floating point): radial distance in parsec• useDoppler (boolean): whether to apply the Doppler factor to account for light-time
effects
• Return value
• (array of floating point): 3-element vector giving equatorial velocity components inkm/s
SUN/256 293
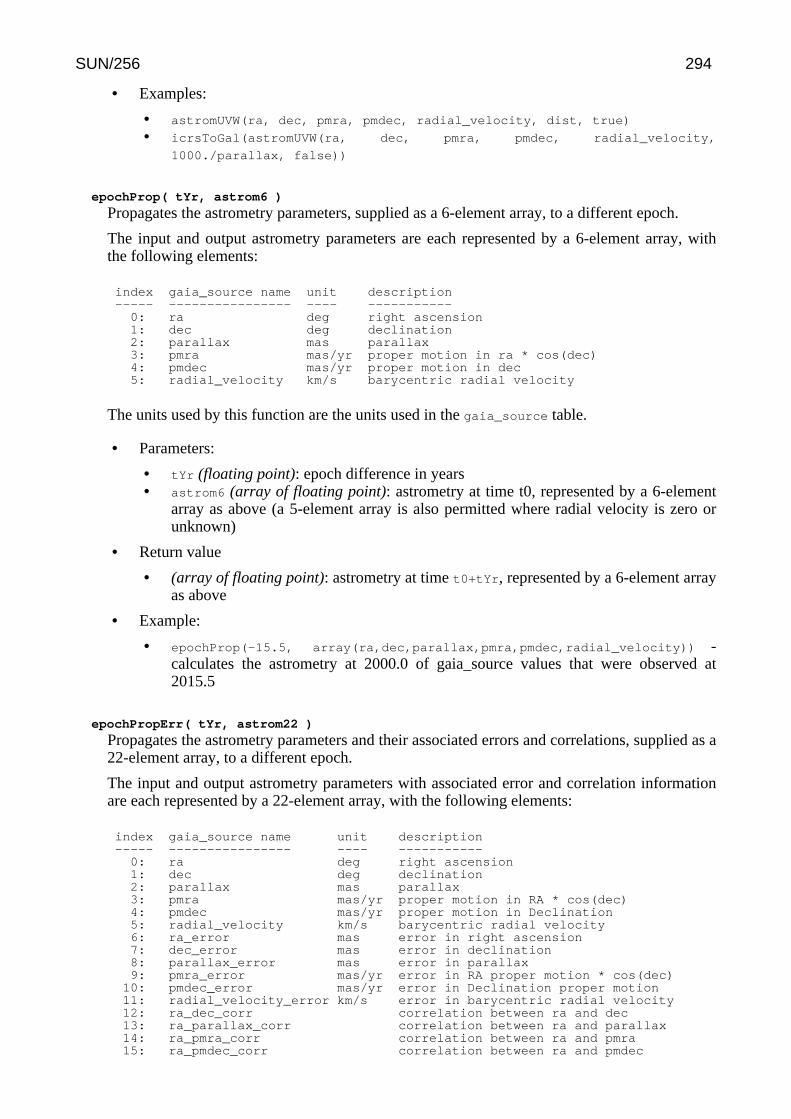
• Examples:
• astromUVW(ra, dec, pmra, pmdec, radial_velocity, dist, true)
• icrsToGal(astromUVW(ra, dec, pmra, pmdec, radial_velocity,
1000./parallax, false))
epochProp( tYr, astrom6 )
Propagates the astrometry parameters, supplied as a 6-element array, to a different epoch.
The input and output astrometry parameters are each represented by a 6-element array, withthe following elements:
index gaia_source name unit description----- ---------------- ---- -----------0: ra deg right ascension1: dec deg declination2: parallax mas parallax3: pmra mas/yr proper motion in ra * cos(dec)4: pmdec mas/yr proper motion in dec5: radial_velocity km/s barycentric radial velocity
The units used by this function are the units used in the gaia_source table.
• Parameters:
• tYr (floating point): epoch difference in years• astrom6 (array of floating point): astrometry at time t0, represented by a 6-element
array as above (a 5-element array is also permitted where radial velocity is zero orunknown)
• Return value
• (array of floating point): astrometry at time t0+tYr, represented by a 6-element arrayas above
• Example:
• epochProp(-15.5, array(ra,dec,parallax,pmra,pmdec,radial_velocity)) -calculates the astrometry at 2000.0 of gaia_source values that were observed at2015.5
epochPropErr( tYr, astrom22 )
Propagates the astrometry parameters and their associated errors and correlations, supplied as a22-element array, to a different epoch.
The input and output astrometry parameters with associated error and correlation informationare each represented by a 22-element array, with the following elements:
index gaia_source name unit description----- ---------------- ---- -----------0: ra deg right ascension1: dec deg declination2: parallax mas parallax3: pmra mas/yr proper motion in RA * cos(dec)4: pmdec mas/yr proper motion in Declination5: radial_velocity km/s barycentric radial velocity6: ra_error mas error in right ascension7: dec_error mas error in declination8: parallax_error mas error in parallax9: pmra_error mas/yr error in RA proper motion * cos(dec)
10: pmdec_error mas/yr error in Declination proper motion11: radial_velocity_error km/s error in barycentric radial velocity12: ra_dec_corr correlation between ra and dec13: ra_parallax_corr correlation between ra and parallax14: ra_pmra_corr correlation between ra and pmra15: ra_pmdec_corr correlation between ra and pmdec
SUN/256 294
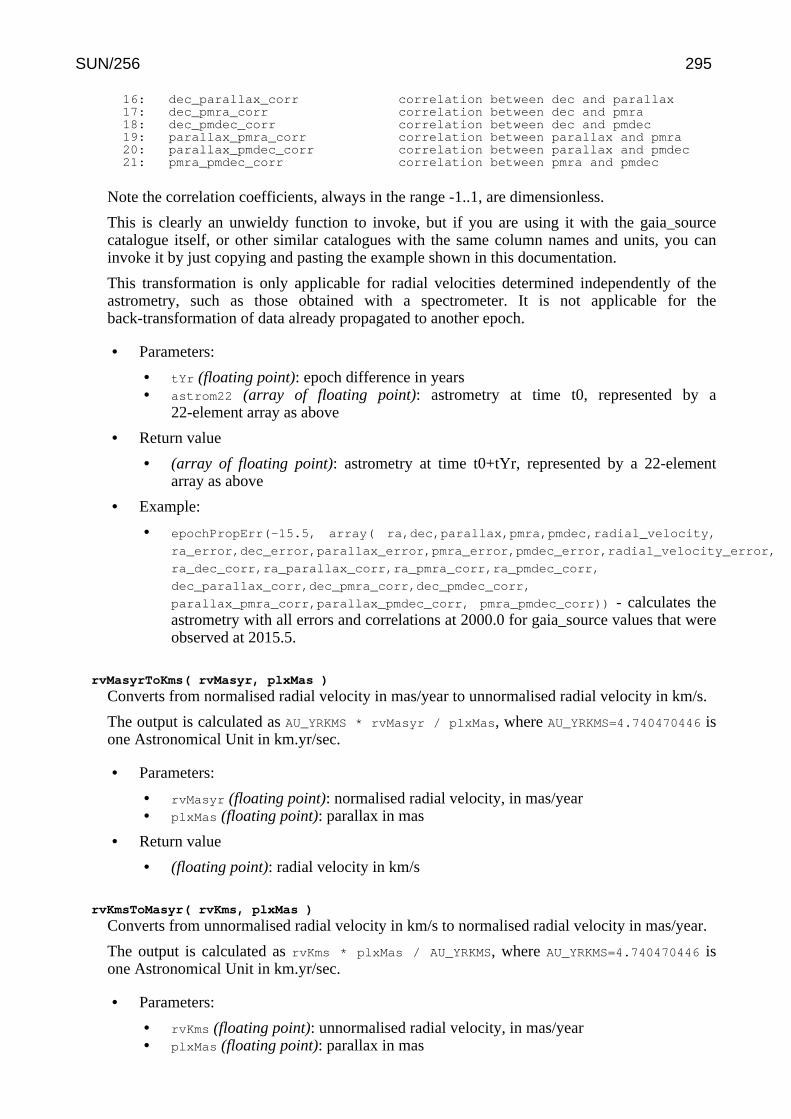
16: dec_parallax_corr correlation between dec and parallax17: dec_pmra_corr correlation between dec and pmra18: dec_pmdec_corr correlation between dec and pmdec19: parallax_pmra_corr correlation between parallax and pmra20: parallax_pmdec_corr correlation between parallax and pmdec21: pmra_pmdec_corr correlation between pmra and pmdec
Note the correlation coefficients, always in the range -1..1, are dimensionless.
This is clearly an unwieldy function to invoke, but if you are using it with the gaia_sourcecatalogue itself, or other similar catalogues with the same column names and units, you caninvoke it by just copying and pasting the example shown in this documentation.
This transformation is only applicable for radial velocities determined independently of theastrometry, such as those obtained with a spectrometer. It is not applicable for theback-transformation of data already propagated to another epoch.
• Parameters:
• tYr (floating point): epoch difference in years• astrom22 (array of floating point): astrometry at time t0, represented by a
22-element array as above
• Return value
• (array of floating point): astrometry at time t0+tYr, represented by a 22-elementarray as above
• Example:
• epochPropErr(-15.5, array( ra,dec,parallax,pmra,pmdec,radial_velocity,
ra_error,dec_error,parallax_error,pmra_error,pmdec_error,radial_velocity_error,
ra_dec_corr,ra_parallax_corr,ra_pmra_corr,ra_pmdec_corr,
dec_parallax_corr,dec_pmra_corr,dec_pmdec_corr,
parallax_pmra_corr,parallax_pmdec_corr, pmra_pmdec_corr)) - calculates theastrometry with all errors and correlations at 2000.0 for gaia_source values that wereobserved at 2015.5.
rvMasyrToKms( rvMasyr, plxMas )
Converts from normalised radial velocity in mas/year to unnormalised radial velocity in km/s.
The output is calculated as AU_YRKMS * rvMasyr / plxMas, where AU_YRKMS=4.740470446 isone Astronomical Unit in km.yr/sec.
• Parameters:
• rvMasyr (floating point): normalised radial velocity, in mas/year• plxMas (floating point): parallax in mas
• Return value
• (floating point): radial velocity in km/s
rvKmsToMasyr( rvKms, plxMas )
Converts from unnormalised radial velocity in km/s to normalised radial velocity in mas/year.
The output is calculated as rvKms * plxMas / AU_YRKMS, where AU_YRKMS=4.740470446 isone Astronomical Unit in km.yr/sec.
• Parameters:
• rvKms (floating point): unnormalised radial velocity, in mas/year• plxMas (floating point): parallax in mas
SUN/256 295

• Return value
• (floating point): radial velocity in mas/year
distanceEstimateEdsd( plxMas, plxErrorMas, lPc )
Best estimate of distance using the Exponentially Decreasing Space Density prior. Thisestimate is provided by the mode of the PDF.
• Parameters:
• plxMas (floating point): parallax in mas• plxErrorMas (floating point): parallax error in mas• lPc (floating point): length scale in parsec
• Return value
• (floating point): best distance estimate in parsec
distanceBoundsEdsd( plxMas, plxErrorMas, lPc )
Calculates the 5th and 95th percentile confidence intervals on the distance estimate using theExponentially Decreasing Space Density prior.
Note this function has to numerically integrate the PDF to determine quantile values, so it isrelatively slow.
• Parameters:
• plxMas (floating point): parallax in mas• plxErrorMas (floating point): parallax error in mas• lPc (floating point): length scale in parsec
• Return value
• (array of floating point): 2-element array giving the 5th and 95th percentiles inparsec of the EDSD distance PDF
distanceQuantilesEdsd( plxMas, plxErrorMas, lPc, qpoints, ... )
Calculates arbitrary quantiles for the distance estimate using the Exponentially DecreasingSpace Density prior.
Note this function has to numerically integrate the PDF to determine quantile values, so it isrelatively slow.
• Parameters:
• plxMas (floating point): parallax in mas• plxErrorMas (floating point): parallax error in mas• lPc (floating point): length scale in parsec• qpoints (floating point, one or more): one or more required quantile cut points, each
in the range 0..1
• Return value
• (array of floating point): array with one element for each of the supplied qpoints
giving the corresponding distance in parsec
• Examples:
• distanceQuantilesEdsd(parallax, parallax_error, 1350, 0.5)[0] calculatesthe median of the EDSD distance PDF using a length scale of 1.35kpc
• distanceQuantilesEdsd(parallax, parallax_error, 3000, 0.01, 0.99)
returns a 2-element array giving the 1st and 99th percentile of the distance estimate
SUN/256 296
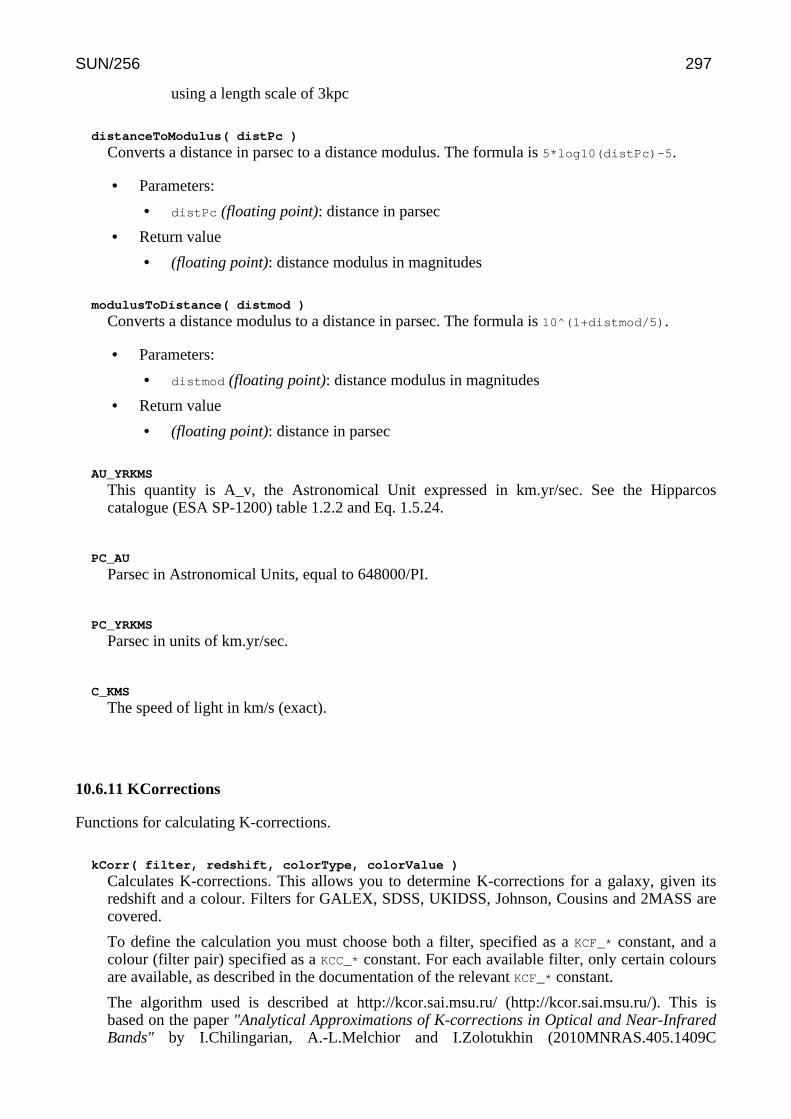
using a length scale of 3kpc
distanceToModulus( distPc )
Converts a distance in parsec to a distance modulus. The formula is 5*log10(distPc)-5.
• Parameters:
• distPc (floating point): distance in parsec
• Return value
• (floating point): distance modulus in magnitudes
modulusToDistance( distmod )
Converts a distance modulus to a distance in parsec. The formula is 10^(1+distmod/5).
• Parameters:
• distmod (floating point): distance modulus in magnitudes
• Return value
• (floating point): distance in parsec
AU_YRKMS
This quantity is A_v, the Astronomical Unit expressed in km.yr/sec. See the Hipparcoscatalogue (ESA SP-1200) table 1.2.2 and Eq. 1.5.24.
PC_AU
Parsec in Astronomical Units, equal to 648000/PI.
PC_YRKMS
Parsec in units of km.yr/sec.
C_KMS
The speed of light in km/s (exact).
10.6.11 KCorrections
Functions for calculating K-corrections.
kCorr( filter, redshift, colorType, colorValue )
Calculates K-corrections. This allows you to determine K-corrections for a galaxy, given itsredshift and a colour. Filters for GALEX, SDSS, UKIDSS, Johnson, Cousins and 2MASS arecovered.
To define the calculation you must choose both a filter, specified as a KCF_* constant, and acolour (filter pair) specified as a KCC_* constant. For each available filter, only certain coloursare available, as described in the documentation of the relevant KCF_* constant.
The algorithm used is described at http://kcor.sai.msu.ru/ (http://kcor.sai.msu.ru/). This isbased on the paper "Analytical Approximations of K-corrections in Optical and Near-InfraredBands" by I.Chilingarian, A.-L.Melchior and I.Zolotukhin (2010MNRAS.405.1409C
SUN/256 297
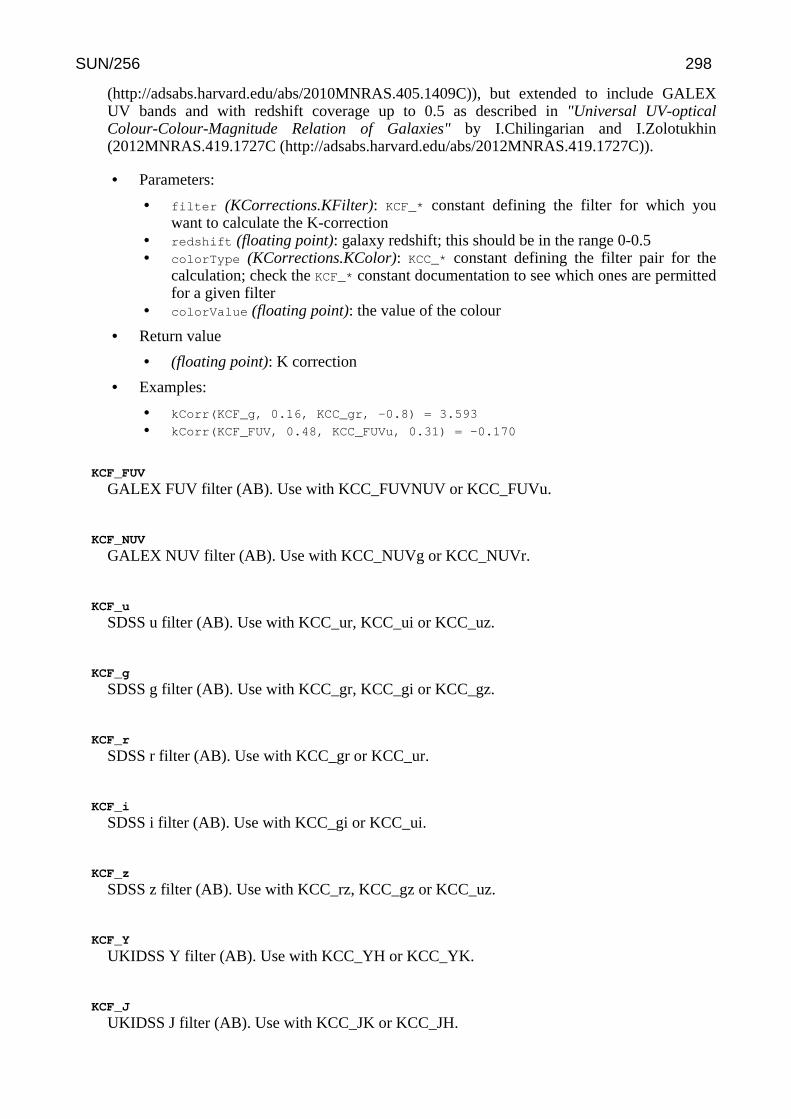
(http://adsabs.harvard.edu/abs/2010MNRAS.405.1409C)), but extended to include GALEXUV bands and with redshift coverage up to 0.5 as described in "Universal UV-opticalColour-Colour-Magnitude Relation of Galaxies" by I.Chilingarian and I.Zolotukhin(2012MNRAS.419.1727C (http://adsabs.harvard.edu/abs/2012MNRAS.419.1727C)).
• Parameters:
• filter (KCorrections.KFilter): KCF_* constant defining the filter for which youwant to calculate the K-correction
• redshift (floating point): galaxy redshift; this should be in the range 0-0.5• colorType (KCorrections.KColor): KCC_* constant defining the filter pair for the
calculation; check the KCF_* constant documentation to see which ones are permittedfor a given filter
• colorValue (floating point): the value of the colour
• Return value
• (floating point): K correction
• Examples:
• kCorr(KCF_g, 0.16, KCC_gr, -0.8) = 3.593
• kCorr(KCF_FUV, 0.48, KCC_FUVu, 0.31) = -0.170
KCF_FUV
GALEX FUV filter (AB). Use with KCC_FUVNUV or KCC_FUVu.
KCF_NUV
GALEX NUV filter (AB). Use with KCC_NUVg or KCC_NUVr.
KCF_u
SDSS u filter (AB). Use with KCC_ur, KCC_ui or KCC_uz.
KCF_g
SDSS g filter (AB). Use with KCC_gr, KCC_gi or KCC_gz.
KCF_r
SDSS r filter (AB). Use with KCC_gr or KCC_ur.
KCF_i
SDSS i filter (AB). Use with KCC_gi or KCC_ui.
KCF_z
SDSS z filter (AB). Use with KCC_rz, KCC_gz or KCC_uz.
KCF_Y
UKIDSS Y filter (AB). Use with KCC_YH or KCC_YK.
KCF_J
UKIDSS J filter (AB). Use with KCC_JK or KCC_JH.
SUN/256 298

KCF_H
UKIDSS H filter (AB). Use with KCC_HK or KCC_JH.
KCF_K
UKIDSS K filter (AB). Use with KCC_JK or KCC_HK.
KCF_U
Johnson U filter (Vega). Use with KCC_URc.
KCF_B
Johnson B filter (Vega). Use with KCC_BRc or KCC_BIc.
KCF_V
Johnson V filter (Vega). Use with KCC_VIc or KCC_VRc.
KCF_Rc
Cousins Rc filter (Vega). Use with KCC_BRc or KCC_VRc.
KCF_Ic
Cousins Ic filter (Vega). Use with KCC_VIc.
KCF_J2
2MASS J filter (Vega). Use with KCC_J2Ks2 or KCC_J2H2.
KCF_H2
2MASS H filter (Vega). Use with KCC_H2Ks2 or KCC_J2H2.
KCF_Ks2
2MASS Ks filter (Vega). Use with KCC_J2Ks2 or KCC_H2Ks2.
KCC_BIc
Johnson B - Cousins Ic colour.
KCC_BRc
Johnson B - Cousins Rc colour.
KCC_FUVNUV
GALEX FUV - NUV colour.
KCC_FUVu
GALEX FUV - SDSS u colour.
KCC_gi
SUN/256 299
SDSS g - i colour.
KCC_gr
SDSS g - r colour.
KCC_gz
SDSS g - z colour.
KCC_H2Ks2
2MASS H - Ks colour.
KCC_HK
UKIDSS H - K colour.
KCC_J2H2
2MASS J - H colour.
KCC_J2Ks2
2MASS J - Ks colour.
KCC_JH
UKIDSS J - H colour.
KCC_JK
UKIDSS J - K colour.
KCC_NUVg
GALEX NUV - SDSS g colour.
KCC_NUVr
GALEX NUV - SDSS r colour.
KCC_rz
SDSS r - SDSS z colour.
KCC_ui
SDSS u - SDSS i colour.
KCC_URc
Johnson U - Cousins Rc colour.
KCC_ur
SDSS u - r colour.
SUN/256 300
KCC_uz
SDSS u - z colour.
KCC_VIc
Johnson V - Cousins Ic colour.
KCC_VRc
Johnson V - Cousins Rc colour.
KCC_YH
UKIDSS Y - H colour.
KCC_YK
UKIDSS Y - K colour.
10.6.12 Lists
Functions which operate on lists of values.
Some of these resemble similar functions in the Arrays class, and in some cases areinterchangeable, but these are easier to use on non-array values because you don't have to explicitlywrap up lists of arguments as an array. However, for implementation reasons, most of the functionsdefined here can be used on values which are already double[] arrays (for instance array-valuedcolumns) rather than as comma-separated lists of floating point values.
sum( values, ... )
Returns the sum of all the non-blank supplied arguments.
• Parameters:
• values (floating point, one or more): one or more numeric values
• Return value
• (floating point): sum of values
• Examples:
• sum(1, 3, 99) = 103
• sum(1, 3, NaN) = 4
mean( values, ... )
Returns the mean of all the non-blank supplied arguments.
• Parameters:
• values (floating point, one or more): one or more numeric values
• Return value
• (floating point): mean of values
SUN/256 301
• Examples:
• mean(2, 4, 6, 8) = 5
• mean(100.5, 99.5, NaN) = 100
variance( values, ... )
Returns the population variance of the non-blank supplied arguments.
• Parameters:
• values (floating point, one or more): one or more numeric values
• Return value
• (floating point): population variance of values
• Examples:
• variance(0, 3, 4, 3, 0) = 2.8
• variance(0, 3, NaN, 3, NaN) = 2
stdev( values, ... )
Returns the population standard deviation of the non-blank supplied arguments.
• Parameters:
• values (floating point, one or more): one or more numeric values
• Return value
• (floating point): population standard deviation of values
• Example:
• stdev(-3, -2, 0, 0, 1, 2, 3, 4, 5, 6) = 2.8
min( values, ... )
Returns the minimum of all the non-blank supplied arguments.
• Parameters:
• values (floating point, one or more): one or more numeric values
• Return value
• (floating point): minimum of values
• Example:
• min(20, 25, -50, NaN, 101) = -50
max( values, ... )
Returns the maximum of all the non-blank supplied arguments.
• Parameters:
• values (floating point, one or more): one or more numeric values
• Return value
• (floating point): maximum of values
• Example:
• max(20, 25, -50, NaN, 101) = 101
SUN/256 302
median( values, ... )
Returns the median of all the non-blank supplied arguments.
• Parameters:
• values (floating point, one or more): one or more numeric values
• Return value
• (floating point): median of values
• Example:
• median(-100000, 5, 6, 7, 8) = 6
countTrue( values, ... )
Returns the number of true values in a list of boolean arguments. Note if any of the values areblank, the result may be blank as well.
• Parameters:
• values (boolean, one or more): one or more true/false values
• Return value
• (integer): number of elements of values that are true
• Example:
• countTrue(false, false, true, false, true) = 2
10.6.13 Maths
Standard mathematical and trigonometric functions. Trigonometric functions work with angles inradians.
sin( theta )
Sine of an angle.
• Parameters:
• theta (floating point): an angle, in radians.
• Return value
• (floating point): the sine of the argument.
cos( theta )
Cosine of an angle.
• Parameters:
• theta (floating point): an angle, in radians.
• Return value
• (floating point): the cosine of the argument.
tan( theta )
Tangent of an angle.
SUN/256 303
• Parameters:
• theta (floating point): an angle, in radians.
• Return value
• (floating point): the tangent of the argument.
asin( x )
Arc sine of an angle. The result is in the range of -pi/2 through pi/2.
• Parameters:
• x (floating point): the value whose arc sine is to be returned.
• Return value
• (floating point): the arc sine of the argument (radians)
acos( x )
Arc cosine of an angle. The result is in the range of 0.0 through pi.
• Parameters:
• x (floating point): the value whose arc cosine is to be returned.
• Return value
• (floating point): the arc cosine of the argument (radians)
atan( x )
Arc tangent of an angle. The result is in the range of -pi/2 through pi/2.
• Parameters:
• x (floating point): the value whose arc tangent is to be returned.
• Return value
• (floating point): the arc tangent of the argument (radians)
ln( x )
Natural logarithm.
• Parameters:
• x (floating point): argument
• Return value
• (floating point): loge(x)
exp( x )
Euler's number e raised to a power.
• Parameters:
• x (floating point): the exponent to raise e to.
• Return value
• (floating point): the value e x, where e is the base of the natural logarithms.
SUN/256 304
log10( x )
Logarithm to base 10.
• Parameters:
• x (floating point): argument
• Return value
• (floating point): log10
(x)
exp10( x )
Power of 10. This convenience function is identical to pow(10,x).
• Parameters:
• x (floating point): argument
• Return value
• (floating point): 10x
sqrt( x )
Square root. The result is correctly rounded and positive.
• Parameters:
• x (floating point): a value.
• Return value
• (floating point): the positive square root of x. If the argument is NaN or less thanzero, the result is NaN.
square( x )
Raise to the power 2.
• Parameters:
• x (floating point): a value
• Return value
• (floating point): x * x
hypot( xs, ... )
Returns the square root of the sum of squares of its arguments. In the 2-argument case, doing itlike this may avoid intermediate overflow or underflow.
• Parameters:
• xs (floating point, one or more): one or more numeric values
• Return value
• (floating point): sqare root of sum of squares of arguments
• Examples:
• hypot(3,4) = 5
• hypot(2,2,2,2) = 4
atan2( y, x )
SUN/256 305
Converts rectangular coordinates (x,y) to polar (r,theta). This method computes the phasetheta by computing an arc tangent of y/x in the range of -pi to pi.
• Parameters:
• y (floating point): the ordinate coordinate• x (floating point): the abscissa coordinate
• Return value
• (floating point): the theta component (radians) of the point (r,theta) in polarcoordinates that corresponds to the point (x,y) in Cartesian coordinates.
pow( a, b )
Exponentiation. The result is the value of the first argument raised to the power of the secondargument.
• Parameters:
• a (floating point): the base.• b (floating point): the exponent.
• Return value
• (floating point): the value ab .
sinh( x )
Hyperbolic sine.
• Parameters:
• x (floating point): parameter
• Return value
• (floating point): result
cosh( x )
Hyperbolic cosine.
• Parameters:
• x (floating point): parameter
• Return value
• (floating point): result
tanh( x )
Hyperbolic tangent.
• Parameters:
• x (floating point): parameter
• Return value
• (floating point): result
asinh( x )
Inverse hyperbolic sine.
SUN/256 306

• Parameters:
• x (floating point): parameter
• Return value
• (floating point): result
acosh( x )
Inverse hyperbolic cosine.
• Parameters:
• x (floating point): parameter
• Return value
• (floating point): result
atanh( x )
Inverse hyperbolic tangent.
• Parameters:
• x (floating point): parameter
• Return value
• (floating point): result
E
Euler's number e, the base of natural logarithms.
PI
Pi, the ratio of the circumference of a circle to its diameter.
Infinity
Positive infinite floating point value.
NaN
Not-a-Number floating point value. Use with care; arithmetic and logical operations behave instrange ways near NaN (for instance, NaN!=NaN). For most purposes this is equivalent to theblank value.
RANDOM
Evaluates to a random number in the range 0<=x<1. This is different for each cell of the table.The quality of the randomness may not be particularly good.
10.6.14 Shapes
Functions useful for working with shapes in the (X, Y) plane.
polyLine( x, xys, ... )
SUN/256 307
Function of x defined by straight line segments between a specified list of vertices. Thevertices are specified as a sequence of X
i, Y
ipairs, for which the X
ivalues must be monotonic.
The line segment at each end of the specified point sequence is considered to be extended toinfinity. If only two points are specified, this is the equation of a straight line between thosepoints. As a special case, if only one point is specified, the line is considered to be a horizontalline (equal to the sole specified Y
icoordinate for all x).
By reversing the Xi
and Yi
values, this function can equally be used to represent a functionX(y) rather than Y(x).
If the number of coordinates is odd, or the Xi
values are not monotonic, behaviour isundefined.
• Parameters:
• x (floating point): X value at which function is to be evaluated• xys (floating point, one or more): 2N arguments (x1, y1, x2, y2, ..., xN, yN) giving
vertices of an N-point line with monotonically increasing or decreasing X values
• Return value
• (floating point): Y coordinate of poly-line for specified x
• Example:
• polyLine(5, 0,0, 2,2) = 5
isInside( x, y, xys, ... )
Indicates whether a given test point is inside a polygon defined by specified list of vertices.The vertices are specified as a sequence of X
i, Y
ipairs.
If the number of coordinates is odd, the behaviour is not defined.
• Parameters:
• x (floating point): X coordinate of test point• y (floating point): Y coordinate of test point• xys (floating point, one or more): 2N arguments (x1, y1, x2, y2, ..., xN, yN) giving
vertices of an N-sided polygon
• Return value
• (boolean): true iff test point is inside, or on the border of, the polygon
• Examples:
• isInside(0.5,0.5, 0,0, 0,1, 1,1, 1,0) = true
• isInside(0,0, array(10,20, 20,20, 20,10)) = false
10.6.15 Sky
Functions useful for working with shapes on a sphere. All angles are expressed in degrees.
skyDistance( lon1, lat1, lon2, lat2 )
Calculates the separation (distance around a great circle) of two points on the sky in degrees.
This function is identical to skyDistanceDegrees in class CoordsDegrees.
• Parameters:
• lon1 (floating point): point 1 longitude in degrees
SUN/256 308
• lat1 (floating point): point 1 latitude in degrees• lon2 (floating point): point 2 longitude in degrees• lat2 (floating point): point 2 latitude in degrees
• Return value
• (floating point): angular distance between point 1 and point 2 in degrees
midLon( lon1, lon2 )
Determines the longitude mid-way between two given longitudes. In most cases this is just themean of the two values, but this function copes correctly with the case where the given valuesstraddle the lon=0 line.
• Parameters:
• lon1 (floating point): first longitude in degrees• lon2 (floating point): second longitude in degrees
• Return value
• (floating point): longitude midway between the given values
• Examples:
• midLon(204.0, 203.5) = 203.75
• midLon(2, 359) = 0.5
midLat( lat1, lat2 )
Determines the latitude midway between two given latitudes. This simply returns the mean ofthe two values, but is supplied for convenience to use alongside the midLon function.
• Parameters:
• lat1 (floating point): first latitude in degrees• lat2 (floating point): second latitude in degrees
• Return value
• (floating point): latitude midway between the given values
• Example:
• midLat(23.5, 24.0) = 23.75
inSkyPolygon( lon0, lat0, lonLats, ... )
Tests whether a given sky position is inside the polygon defined by a given set of vertices. Thebounding lines of the polygon are the minor arcs of great circles between adjacent vertices,with an extra line assumed between the first and last supplied vertex. The interior of thepolygon is defined to be the smaller of the two regions separated by the boundary. The verticesare specified as a sequence of lon
i, lat
ipairs.
The implementation of this point-in-polygon function is mostly correct, but may not bebulletproof. It ought to work for relatively small regions anywhere on the sky, but for instanceit may get the sense wrong for regions that extend to cover both poles.
• Parameters:
• lon0 (floating point): test point latitude in degrees• lat0 (floating point): test point longitude in degrees• lonLats (floating point, one or more): 2N arguments (lon1, lat1, lon2, lat2, ...,
lonN, latN) giving (longitude, latitude) vertices of an N-sided polygon in degrees
SUN/256 309

• Return value
• (boolean): true iff test point is inside, or on the border of, the polygon
10.6.16 Strings
String manipulation and query functions.
concat( strings, ... )
Concatenates multiple values into a string. In some cases the same effect can be achieved bywriting s1+s2+..., but this method makes sure that values are converted to strings, with theblank value invisible.
• Parameters:
• strings (Object, one or more): one or more strings
• Return value
• (String): concatenation of input strings, without separators
• Examples:
• concat("blue", "moon") = "bluemoon"
• concat("1", 2, 3, "4") = "1234"
• concat("Astro", null, "Physics") = "AstroPhysics"
join( separator, words, ... )
Joins multiple values into a string, with a given separator between each pair.
• Parameters:
• separator (String): string to insert between adjacent words• words (Object, one or more): one or more values to join
• Return value
• (String): input values joined together with separator
• Examples:
• join("<->", "alpha", "beta", "gamma") = "alpha<->beta<->gamma"
• join(" ", 1, "brown", "mouse") = "1 brown mouse"
equals( s1, s2 )
Determines whether two strings are equal. Note you should use this function instead of s1==s2,which can (for technical reasons) return false even if the strings are the same.
• Parameters:
• s1 (String): first string• s2 (String): second string
• Return value
• (boolean): true if s1 and s2 are both blank, or have the same content
equalsIgnoreCase( s1, s2 )
Determines whether two strings are equal apart from possible upper/lower case distinctions.
SUN/256 310

• Parameters:
• s1 (String): first string• s2 (String): second string
• Return value
• (boolean): true if s1 and s2 are both blank, or have the same content apart from casefolding
• Examples:
• equalsIgnoreCase("Cygnus", "CYGNUS") = true
• equalsIgnoreCase("Cygnus", "Andromeda") = false
startsWith( whole, start )
Determines whether a string starts with a certain substring.
• Parameters:
• whole (String): the string to test• start (String): the sequence that may appear at the start of whole
• Return value
• (boolean): true if the first few characters of whole are the same as start
• Example:
• startsWith("CYGNUS X-1", "CYG") = true
endsWith( whole, end )
Determines whether a string ends with a certain substring.
• Parameters:
• whole (String): the string to test• end (String): the sequence that may appear at the end of whole
• Return value
• (boolean): true if the last few characters of whole are the same as end
• Example:
• endsWith("M32", "32") = true
contains( whole, sub )
Determines whether a string contains a given substring.
• Parameters:
• whole (String): the string to test• sub (String): the sequence that may appear within whole
• Return value
• (boolean): true if the sequence sub appears within whole
• Example:
• contains("Vizier", "izi") = true
length( str )
SUN/256 311
Returns the length of a string in characters.
• Parameters:
• str (String): string
• Return value
• (integer): number of characters in str
• Example:
• length("M34") = 3
split( words )
Splits a string into an array of space-separated words. One or more spaces separates each wordfrom the next. Leading and trailing spaces are ignored.
The result is an array of strings, and if you want to use the individual elements you need to usesquare-bracket indexing, with [0] representing the first object
• Parameters:
• words (String): string with embedded spaces delimiting the words
• Return value
• (array of String): array of the separate words; you can extract the individual wordsfrom the result using square bracket indexing
• Examples:
• split("211:54:01 +29:33:41") gives a 2-element array, first element is"211:54:01" and second element is "+29:33:41".
• split(" cat dog cow ")[1] = "dog"
split( words, regex )
Splits a string into an array of words separated by a given regular expression.
The result is an array of strings, and if you want to use the individual elements you need to usesquare-bracket indexing, with [0] representing the first object
• Parameters:
• words (String): string with multiple parts• regex (String): regular expression delimiting the different words in the words
parameter
• Return value
• (array of String): array of the separate words; you can extract the individual wordsfrom the result using square bracket indexing
• Examples:
• split("cat, dog, cow", ", *") gives a 3-element string array.• split("23.0, 45.92", ", ")[0] = "23.0"
• parseDouble(split("23.0, 45.92", ", ")[0]) = 23
matches( str, regex )
Tests whether a string matches a given regular expression.
• Parameters:
SUN/256 312

• str (String): string to test• regex (String): regular expression string
• Return value
• (boolean): true if regex matches str anywhere
• Example:
• matches("Hubble", "ub") = true
matchGroup( str, regex )
Returns the first grouped expression matched in a string defined by a regular expression. Agrouped expression is one enclosed in parentheses.
• Parameters:
• str (String): string to match against• regex (String): regular expression containing a grouped section
• Return value
• (String): contents of the matched group (or null, if regex didn't match str)
• Example:
• matchGroup("NGC28948b","NGC([0-9]*)") = "28948"
replaceFirst( str, regex, replacement )
Replaces the first occurrence of a regular expression in a string with a different substringvalue.
• Parameters:
• str (String): string to manipulate• regex (String): regular expression to match in str
• replacement (String): replacement string
• Return value
• (String): same as str, but with the first match (if any) of regex replaced byreplacement
• Example:
• replaceFirst("Messier 61", "Messier ", "M-") = "M-61"
replaceAll( str, regex, replacement )
Replaces all occurrences of a regular expression in a string with a different substring value.
• Parameters:
• str (String): string to manipulate• regex (String): regular expression to match in str
• replacement (String): replacement string
• Return value
• (String): same as str, but with all matches of regex replaced by replacement
• Example:
• replaceAll("1-2--3---4","--*","x") = "1x2x3x4"
SUN/256 313

substring( str, startIndex )
Returns the last part of a given string. The substring begins with the character at the specifiedindex and extends to the end of this string.
• Parameters:
• str (String): the input string• startIndex (integer): the beginning index, inclusive
• Return value
• (String): last part of str, omitting the first startIndex characters
• Example:
• substring("Galaxy", 2) = "laxy"
substring( str, startIndex, endIndex )
Returns a substring of a given string. The substring begins with the character at startIndexand continues to the character at index endIndex-1 Thus the length of the substring isendIndex-startIndex.
• Parameters:
• str (String): the input string• startIndex (integer): the beginning index, inclusive• endIndex (integer): the end index, inclusive
• Return value
• (String): substring of str
• Example:
• substring("Galaxy", 2, 5) = "lax"
toUpperCase( str )
Returns an uppercased version of a string.
• Parameters:
• str (String): input string
• Return value
• (String): uppercased version of str
• Example:
• toUpperCase("Universe") = "UNIVERSE"
toLowerCase( str )
Returns an lowercased version of a string.
• Parameters:
• str (String): input string
• Return value
• (String): lowercased version of str
• Example:
• toLowerCase("Universe") = "universe"
SUN/256 314

trim( str )
Trims whitespace from both ends of a string.
• Parameters:
• str (String): input string
• Return value
• (String): str with any spaces trimmed from start and finish
• Examples:
• trim(" some text ") = "some text"
• trim("some text") = "some text"
padWithZeros( value, ndigit )
Takes an integer argument and returns a string representing the same numeric value butpadded with leading zeros to a specified length.
• Parameters:
• value (long integer): numeric value to pad• ndigit (integer): the number of digits in the resulting string
• Return value
• (String): a string evaluating to the same as value with at least ndigit characters
• Example:
• padWithZeros(23,5) = "00023"
desigToRa( designation )
Attempts to determine the ICRS Right Ascension from an IAU-style designation such as"2MASS J04355524+1630331" following the specifications in the documenthttps://cdsweb.u-strasbg.fr/Dic/iau-spec.html (https://cdsweb.u-strasbg.fr/Dic/iau-spec.html).
Note: this function should be used with considerable care. Such designators are intended forobject identification and not for communicating sky positions, so that the resulting positionsare likely to lack precision, and may be inaccurate. If positional information is available fromother sources, it should almost certainly be used instead. But if there's no other choice, thismay be used as a fallback.
Note also that a designator with no coordsystem-specific flag character (a leading "J", "B" or"G") is considered to be B1950, not J2000.
• Parameters:
• designation (String): designation string in IAU format
• Return value
• (floating point): ICRS right ascension in degreees, or blank if no position can bedecoded
• Examples:
• desigToRa("2MASS J04355524+1630331") = 60.98016
• desigToRa("PSR J120000.0+450000.0") = 180
• desigToDec("PSR B120000.0+450000.0") = 180.639096
• desigToRa("PN G001.2-00.3") = 267.403
• desigToRa("NGC 4993") = NaN
SUN/256 315
desigToDec( designation )
Attempts to determine the ICRS Declination from an IAU-style designation such as "2MASSJ04355524+1630331" following the specifications in the documenthttps://cdsweb.u-strasbg.fr/Dic/iau-spec.html (https://cdsweb.u-strasbg.fr/Dic/iau-spec.html).
Note: this function should be used with considerable care. Such designators are intended forobject identification and not for communicating sky positions, so that the resulting positionsare likely to lack precision, and may be inaccurate. If positional information is available fromother sources, it should almost certainly be used instead. But if there's no other choice, thismay be used as a fallback.
Note also that a designator with no coordsystem-specific flag character (a leading "J", "B" or"G") is considered to be B1950, not J2000.
• Parameters:
• designation (String): designation string in IAU format
• Return value
• (floating point): ICRS declination in degrees, or blank if no position can be decoded
• Examples:
• desigToDec("2MASS J04355524+1630331") = 16.50919
• desigToDec("PSR J120000.0+450000.0") = 45
• desigToDec("PSR B120000.0+450000.0") = 44.72167
• desigToDec("PN G001.2-00.3") = -28.06457
• desigToDec("NGC 4993") = NaN
desigToIcrs( designation )
Attempts to decode an IAU-style designation such as "2MASS J04355524+1630331" todetermine its sky position, following the specifications in the documenthttps://cdsweb.u-strasbg.fr/Dic/iau-spec.html (https://cdsweb.u-strasbg.fr/Dic/iau-spec.html).
Obviously, this only works where the sequence part of the designation takes one of the familyof coordinate-based forms.
Note: this function should be used with considerable care. Such designators are intended forobject identification and not for communicating sky positions, so that the resulting positionsare likely to lack precision, and may be inaccurate. If positional information is available fromother sources, it should almost certainly be used instead. But if there's no other choice, thismay be used as a fallback.
Note also that a designator with no coordsystem-specific flag character (a leading "J", "B" or"G") is considered to be B1950, not J2000.
• Parameters:
• designation (String): designation string in IAU format
• Return value
• (array of floating point): 2-element array giving ICRS (RA,Dec) in degrees, or nullif no position can be decoded
10.6.17 Tilings
Pixel tiling functions for the celestial sphere.
SUN/256 316
The k parameter for the HEALPix functions is the HEALPix order, which can be in the range0<=k<=29. This is the logarithm to base 2 of the HEALPix NSIDE parameter. At order k, there are12*4^k pixels on the sphere.
htmIndex( level, lon, lat )
Gives the HTM (Hierachical Triangular Mesh) pixel index for a given sky position.
• Parameters:
• level (integer): HTM level• lon (floating point): longitude in degrees• lat (floating point): latitude in degrees
• Return value
• (long integer): pixel index
• See Also:
• HTM web site
healpixNestIndex( k, lon, lat )
Gives the pixel index for a given sky position in the HEALPix NEST scheme.
• Parameters:
• k (integer): HEALPix order (0..29)• lon (floating point): longitude in degrees• lat (floating point): latitude in degrees
• Return value
• (long integer): pixel index
• See Also:
• HEALPix web site
healpixRingIndex( k, lon, lat )
Gives the pixel index for a given sky position in the HEALPix RING scheme.
• Parameters:
• k (integer): HEALPix order (0..29)• lon (floating point): longitude in degrees• lat (floating point): latitude in degrees
• Return value
• (long integer): pixel index
• See Also:
• HEALPix web site
healpixNestLon( k, index )
Returns the longitude of the approximate center of the tile with a given index in the HEALPixNEST scheme.
Note: the index parameter is 0-based, unlike the table row index special token $index (a.k.a.$0), which is 1-based. So if the HEALpix index is implicitly determined by the table row, thevalue $index-1 should be used.
SUN/256 317
• Parameters:
• k (integer): HEALPix order (0..29)• index (long integer): healpix index
• Return value
• (floating point): longitude in degrees
• See Also:
• HEALPix web site
healpixNestLat( k, index )
Returns the latitude of the approximate center of the tile with a given index in the HEALPixNEST scheme.
Note: the index parameter is 0-based, unlike the table row index special token $index (a.k.a.$0), which is 1-based. So if the HEALpix index is implicitly determined by the table row, thevalue $index-1 should be used.
• Parameters:
• k (integer): HEALPix order (0..29)• index (long integer): healpix index
• Return value
• (floating point): latitude in degrees
• See Also:
• HEALPix web site
healpixRingLon( k, index )
Returns the longitude of the approximate center of the tile with a given index in the HEALPixRING scheme.
Note: the index parameter is 0-based, unlike the table row index special token $index (a.k.a.$0), which is 1-based. So if the HEALpix index is implicitly determined by the table row, thevalue $index-1 should be used.
• Parameters:
• k (integer): HEALPix order (0..29)• index (long integer): healpix index
• Return value
• (floating point): longitude in degrees
• See Also:
• HEALPix web site
healpixRingLat( k, index )
Returns the latitude of the approximate center of the tile with a given index in the HEALPixRING scheme.
Note: the index parameter is 0-based, unlike the table row index special token $index (a.k.a.$0), which is 1-based. So if the HEALpix index is implicitly determined by the table row, thevalue $index-1 should be used.
• Parameters:
SUN/256 318
• k (integer): HEALPix order (0..29)• index (long integer): healpix index
• Return value
• (floating point): latitude in degrees
• See Also:
• HEALPix web site
healpixNestToRing( k, nestIndex )
Converts a healpix tile index from the NEST to the RING scheme at a given order.
Note: the nestIndex parameter is 0-based, unlike the table row index special token $index
(a.k.a. $0), which is 1-based. So if the HEALpix index is implicitly determined by the tablerow, the value $index-1 should be used.
• Parameters:
• k (integer): HEALPix order (0..29)• nestIndex (long integer): pixel index in NEST scheme
• Return value
• (long integer): pixel index in RING scheme
• See Also:
• HEALPix web site
healpixRingToNest( k, ringIndex )
Converts a healpix tile index from the RING to the NEST scheme at a given order.
Note: the ringIndex parameter is 0-based, unlike the table row index special token $index
(a.k.a. $0), which is 1-based. So if the HEALpix index is implicitly determined by the tablerow, the value $index-1 should be used.
• Parameters:
• k (integer): HEALPix order (0..29)• ringIndex (long integer): pixel index in RING scheme
• Return value
• (long integer): pixel index in NEST scheme
• See Also:
• HEALPix web site
healpixK( pixelsize )
Gives the HEALPix resolution parameter suitable for a given pixel size. This k value (alsovariously known as order, level, depth) is the logarithm to base 2 of the Nside parameter.
• Parameters:
• pixelsize (floating point): pixel size in degrees
• Return value
• (integer): HEALPix order k
• See Also:
• HEALPix web site
SUN/256 319
healpixResolution( k )
Gives the approximate resolution in degrees for a given HEALPix resolution parameter k Thisk value is the logarithm to base 2 of the Nside parameter.
• Parameters:
• k (integer): HEALPix order (0..29)
• Return value
• (floating point): approximate angular resolution in degrees
healpixSteradians( k )
Returns the solid angle in steradians of each HEALPix pixel at a given order.
• Parameters:
• k (integer): HEALPix order (0..29)
• Return value
• (floating point): pixel size in steradians
• Examples:
• healpixSteradians(5) = 0.0010226538585904274
• 4*PI/healpixSteradians(0) = 12.0
healpixSqdeg( k )
Returns the solid angle in square degrees of each HEALPix pixel at a given order.
• Parameters:
• k (integer): HEALPix order (0..29)
• Return value
• (floating point): pixel size in steradians
• Examples:
• healpixSqdeg(5) = 3.357174580844667
• round(12 * healpixSqdeg(0)) = 41253
steradiansToSqdeg( sr )
Converts a solid angle from steradians to square degrees.
The unit sphere is 4*PI steradians = 360*360/PI square degrees.
• Parameters:
• sr (floating point): quantity in steradians
• Return value
• (floating point): quantity in sqare degrees
• Example:
• round(steradiansToSqdeg(4*PI)) = 41253
sqdegToSteradians( sqdeg )
Converts a solid angle from square degrees to steradians.
SUN/256 320
The unit sphere is 4*PI steradians = 360*360/PI square degrees.
• Parameters:
• sqdeg (floating point): quantity in square degrees
• Return value
• (floating point): quantity in steradians
• Example:
• round(sqdegToSteradians(41253)/PI) = 4
htmLevel( pixelsize )
Gives the HTM level parameter suitable for a given pixel size.
• Parameters:
• pixelsize (floating point): required resolution in degrees
• Return value
• (integer): HTM level parameter
htmResolution( level )
Gives the approximate resolution in degrees for a given HTM depth level.
• Parameters:
• level (integer): HTM depth
• Return value
• (floating point): approximate angular resolution in degrees
SQDEG
Solid angle in steradians corresponding to 1 square degree.
10.6.18 Times
Functions for conversion of time values between various forms. The forms used are
Modified Julian Date (MJD)A continuous measure in days since midnight at the start of 17 November 1858. Based onUTC.
Julian Day (JD)MJD plus a fixed offset of 2400000.5. The number of days since the notional creation of theuniverse, midday on 1 Jan 4713 BC.
ISO 8601A string representation of the form yyyy-mm-ddThh:mm:ss.s, where the T is a literal character(a space character may be used instead). Based on UTC.
Julian EpochA continuous measure based on a Julian year of exactly 365.25 days. For approximatepurposes this resembles the fractional number of years AD represented by the date. Sometimes(but not here) represented by prefixing a 'J'; J2000.0 is defined as 2000 January 1.5 in the TTtimescale.
SUN/256 321
Besselian EpochA continuous measure based on a tropical year of about 365.2422 days. For approximatepurposes this resembles the fractional number of years AD represented by the date. Sometimes(but not here) represented by prefixing a 'B'.
Decimal YearFractional number of years AD represented by the date. 2000.0, or equivalently1999.99recurring, is midnight at the start of the first of January 2000. Because of leap years,the size of a unit depends on what year it is in.
Therefore midday on the 25th of October 2004 is 2004-10-25T12:00:00 in ISO 8601 format,53303.5 as an MJD value, 2004.81588 as a Julian Epoch and 2004.81726 as a Besselian Epoch.
Currently this implementation cannot be relied upon to better than a millisecond.
isoToMjd( isoDate )
Converts an ISO8601 date string to Modified Julian Date. The basic format of the isoDate
argument is yyyy-mm-ddThh:mm:ss.s, though some deviations from this form are permitted:
• The 'T' which separates date from time can be replaced by a space• The seconds, minutes and/or hours can be omitted• The decimal part of the seconds can be any length, and is optional• A 'Z' (which indicates UTC) may be appended to the time
Some legal examples are therefore: "1994-12-21T14:18:23.2", "1968-01-14", and"2112-05-25 16:45Z".
• Parameters:
• isoDate (String): date in ISO 8601 format
• Return value
• (floating point): modified Julian date corresponding to isoDate
• Examples:
• isoToMjd("2004-10-25T18:00:00") = 53303.75
• isoToMjd("1970-01-01") = 40587.0
dateToMjd( year, month, day, hour, min, sec )
Converts a calendar date and time to Modified Julian Date.
• Parameters:
• year (integer): year AD• month (integer): index of month; January is 1, December is 12• day (integer): day of month (the first day is 1)• hour (integer): hour (0-23)• min (integer): minute (0-59)• sec (floating point): second (0<=sec<60)
• Return value
• (floating point): modified Julian date corresponding to arguments
• Example:
• dateToMjd(1999, 12, 31, 23, 59, 59.) = 51543.99998
dateToMjd( year, month, day )
SUN/256 322

Converts a calendar date to Modified Julian Date.
• Parameters:
• year (integer): year AD• month (integer): index of month; January is 1, December is 12• day (integer): day of month (the first day is 1)
• Return value
• (floating point): modified Julian date corresponding to 00:00:00 of the date specifiedby the arguments
• Example:
• dateToMjd(1999, 12, 31) = 51543.0
decYearToMjd( decYear )
Converts a Decimal Year to a Modified Julian Date.
• Parameters:
• decYear (floating point): decimal year
• Return value
• (floating point): modified Julian Date
• Example:
• decYearToMjd(2000.0) = 51544.0
isoToUnixSec( isoDate )
Converts an ISO8601 date string to seconds since 1970-01-01. The basic format of theisoDate argument is yyyy-mm-ddThh:mm:ss.s, though some deviations from this form arepermitted:
• The 'T' which separates date from time can be replaced by a space• The seconds, minutes and/or hours can be omitted• The decimal part of the seconds can be any length, and is optional• A 'Z' (which indicates UTC) may be appended to the time
Some legal examples are therefore: "1994-12-21T14:18:23.2", "1968-01-14", and"2112-05-25 16:45Z".
• Parameters:
• isoDate (String): date in ISO 8601 format
• Return value
• (floating point): seconds since the Unix epoch
• Examples:
• isoToUnixSec("2004-10-25T18:00:00") = 1098727200
• isoToMjd("1970-01-01") = 0
decYearToUnixSec( decYear )
Converts a Decimal Year to seconds since 1970-01-01.
• Parameters:
• decYear (floating point): decimal year
SUN/256 323

• Return value
• (floating point): seconds since the Unix epoch
• Examples:
• decYearToUnixSec(2000.0) = 946684800
• decYearToUnixSec(1970) = 0
mjdToUnixSec( mjd )
Converts a Modified Julian Date to seconds since 1970-01-01.
• Parameters:
• mjd (floating point): modified Julian date
• Return value
• (floating point): seconds since the Unix epoch
jdToUnixSec( jd )
Converts a Julian day to seconds since 1970-01-01.
• Parameters:
• jd (floating point): Julian day
• Return value
• (floating point): seconds since the Unix epoch
mjdToIso( mjd )
Converts a Modified Julian Date value to an ISO 8601-format date-time string. The outputformat is yyyy-mm-ddThh:mm:ss. If the result predates the Common Era, the string "(BCE)" isprepended.
• Parameters:
• mjd (floating point): modified Julian date
• Return value
• (String): ISO 8601 format date corresponding to mjd
• Example:
• mjdToIso(53551.72917) = "2005-06-30T17:30:00"
mjdToDate( mjd )
Converts a Modified Julian Date value to an ISO 8601-format date string. The output format isyyyy-mm-dd. If the result predates the Common Era, the string "(BCE)" is prepended.
• Parameters:
• mjd (floating point): modified Julian date
• Return value
• (String): ISO 8601 format date corresponding to mjd
• Example:
• mjdToDate(53551.72917) = "2005-06-30"
SUN/256 324

mjdToTime( mjd )
Converts a Modified Julian Date value to an ISO 8601-format time-only string. The outputformat is hh:mm:ss.
• Parameters:
• mjd (floating point): modified Julian date
• Return value
• (String): ISO 8601 format time corresponding to mjd
• Example:
• mjdToTime(53551.72917) = "17:30:00"
mjdToDecYear( mjd )
Converts a Modified Julian Date to Decimal Year.
• Parameters:
• mjd (floating point): modified Julian Date
• Return value
• (floating point): decimal year
• Example:
• mjdToDecYear(0.0) = 1858.87671
formatMjd( mjd, format )
Converts a Modified Julian Date value to a date using a customisable date format. The formatis as defined by the java.text.SimpleDateFormat
(http://docs.oracle.com/javase/6/docs/api/java/text/SimpleDateFormat.html) class. The defaultoutput corresponds to the string "yyyy-MM-dd'T'HH:mm:ss"
Note that the output from certain formatting characters (such as MMM for month, EEE for day ofweek) is dependent on your locale (system language settings). The output time zone howeveralways corresponds to UTC.
• Parameters:
• mjd (floating point): modified Julian date• format (String): formatting patttern
• Return value
• (String): custom formatted time corresponding to mjd
• Examples:
• formatMjd(50000.3, "EEE dd, MMM, yy") = "Tue 10 Oct, 95"
• formatMjd(50000.1234, "'time 'H:mm:ss.SSS") = "time 2:57:41.760"
jdToMjd( jd )
Converts a Julian Day to Modified Julian Date. The calculation is simply jd-2400000.5.
• Parameters:
• jd (floating point): Julian day number
• Return value
SUN/256 325
• (floating point): MJD value
mjdToJd( mjd )
Converts a Modified Julian Date to Julian Day. The calculation is simply jd+2400000.5.
• Parameters:
• mjd (floating point): MJD value
• Return value
• (floating point): Julian day number
mjdToJulian( mjd )
Converts a Modified Julian Date to Julian Epoch. For approximate purposes, the result of thisroutine consists of an integral part which gives the year AD and a fractional part whichrepresents the distance through that year, so that for instance 2000.5 is approximately 1 July2000.
• Parameters:
• mjd (floating point): modified Julian date
• Return value
• (floating point): Julian epoch
• Example:
• mjdToJulian(0.0) = 1858.87885
julianToMjd( julianEpoch )
Converts a Julian Epoch to Modified Julian Date. For approximate purposes, the argument ofthis routine consists of an integral part which gives the year AD and a fractional part whichrepresents the distance through that year, so that for instance 2000.5 is approximately 1 July2000.
• Parameters:
• julianEpoch (floating point): Julian epoch
• Return value
• (floating point): modified Julian date
• Example:
• julianToMjd(2000.0) = 51544.5
mjdToBesselian( mjd )
Converts Modified Julian Date to Besselian Epoch. For approximate purposes, the result ofthis routine consists of an integral part which gives the year AD and a fractional part whichrepresents the distance through that year, so that for instance 1950.5 is approximately 1 July1950.
• Parameters:
• mjd (floating point): modified Julian date
• Return value
• (floating point): Besselian epoch
SUN/256 326

• Example:
• mjdToBesselian(0.0) = 1858.87711
besselianToMjd( besselianEpoch )
Converts Besselian Epoch to Modified Julian Date. For approximate purposes, the argument ofthis routine consists of an integral part which gives the year AD and a fractional part whichrepresents the distance through that year, so that for instance 1950.5 is approximately 1 July1950.
• Parameters:
• besselianEpoch (floating point): Besselian epoch
• Return value
• (floating point): modified Julian date
• Example:
• besselianToMjd(1950.0) = 33281.92346
unixMillisToMjd( unixMillis )
Converts from milliseconds since the Unix epoch (1970-01-01T00:00:00) to a modified Juliandate value
• Parameters:
• unixMillis (long integer): milliseconds since the Unix epoch
• Return value
• (floating point): modified Julian date
mjdToUnixMillis( mjd )
Converts from modified Julian date to milliseconds since the Unix epoch(1970-01-01T00:00:00).
• Parameters:
• mjd (floating point): modified Julian date
• Return value
• (long integer): milliseconds since the Unix epoch
MJD_OFFSET
JD value for MJD = 0 (=2400000.5).
10.6.19 TrigDegrees
Standard trigonometric functions with angles in degrees.
sinDeg( theta )
Sine of an angle.
• Parameters:
SUN/256 327
• theta (floating point): an angle, in degrees
• Return value
• (floating point): the sine of the argument
cosDeg( theta )
Cosine of an angle.
• Parameters:
• theta (floating point): an angle, in degrees
• Return value
• (floating point): the cosine of the argument
tanDeg( theta )
Tangent of an angle.
• Parameters:
• theta (floating point): an angle, in degrees
• Return value
• (floating point): the tangent of the argument.
asinDeg( x )
Arc sine. The result is in the range of -90 through 90.
• Parameters:
• x (floating point): the value whose arc sine is to be returned.
• Return value
• (floating point): the arc sine of the argument in degrees
acosDeg( x )
Arc cosine. The result is in the range of 0.0 through 180.
• Parameters:
• x (floating point): the value whose arc cosine is to be returned.
• Return value
• (floating point): the arc cosine of the argument in degrees
atanDeg( x )
Arc tangent. The result is in the range of -90 through 90.
• Parameters:
• x (floating point): the value whose arc tangent is to be returned.
• Return value
• (floating point): the arc tangent of the argument in degrees
atan2Deg( y, x )
Converts rectangular coordinates (x,y) to polar (r,theta). This method computes the phase
SUN/256 328
theta by computing an arc tangent of y/x in the range of -180 to 180.
• Parameters:
• y (floating point): the ordinate coordinate• x (floating point): the abscissa coordinate
• Return value
• (floating point): the theta component in degrees of the point (r,theta) in polarcoordinates that corresponds to the point (x,y) in Cartesian coordinates.
10.6.20 URLs
Functions that construct URLs for external services. Most of the functions here just do stringmanipulation to build up URL strings, using knowledge of the parameters required for variousservices.
urlEncode( txt )
Performs necessary quoting of a string for it to be included safely in the data part of a URL.Alphanumeric characters and the characters underscore ("_"), minus sign ("-"), period (".")and tilde ("~") are passed through unchanged, and any other 7-bit ASCII character isrepresented by a percent sign ("%") followed by its 2-digit hexadecimal code. Characters withvalues of 128 or greater are simply dropped.
• Parameters:
• txt (String): input (unencoded) string
• Return value
• (String): output (encoded) string
• Example:
• urlEncode("RR Lyr") = "RR%20Lyr"
• See Also:
• RFC 3986
urlDecode( txt )
Reverses the quoting performed by urlEncode. Percent-encoded sequences (%xx) are replacedby the ASCII character with the hexadecimal code xx.
• Parameters:
• txt (String): input (encoded) string
• Return value
• (String): output (unencoded) string
• Example:
• urlDecode("RR%20Lyr") = "RR Lyr"
• See Also:
• RFC 3986
SUN/256 329
paramsUrl( baseUrl, nameValuePairs, ... )
Builds a query-type URL string given a base URL and a list of name, value pairs.
The parameters are encoded on the command line according to the"application/x-www-form-urlencoded" convention, which appends a "?" to the base URL,and then adds name=value pairs separated by "&" characters, with percent-encoding ofnon-URL-friendly characters. This format is used by many services that require a list ofparameters to be conveyed on the URL.
• Parameters:
• baseUrl (String): basic URL (may or may not already contain a "?")• nameValuePairs (String, one or more): an even number of arguments (or an
even-length string array) giving parametername1,value1,name2,value2,...nameN,valueN
• Return value
• (String): form-encoded URL
• Example:
• paramsUrl("http://x.org/", "a", "1", "b", "two", "c", "3&4") =
"http://x.org/?a=1&b=two&c=3%264"
bibcodeUrl( bibcode )
Maps a bibcode to the URL that will display the relevant entry in ADS(https://ui.adsabs.harvard.edu/). If the supplied string does not appear to be a bibcode, null willbe returned.
If the supplied string appears to be a bibcode, it just prepends the string"https://ui.adsabs.harvard.edu/abs/" and performs any character escaping that isrequired.
• Parameters:
• bibcode (String): ADS-style bibcode string
• Return value
• (String): display URL pointing at bibcode record, or null if it doesn't look like abibcode
• Example:
• bibcodeUrl("2018A&A...616A...2L") =
"https://ui.adsabs.harvard.edu/abs/2018A%26A...616A...2L"
• See Also:
• http://adsabs.harvard.edu/abs_doc/help_pages/data.html
doiUrl( doi )
Maps a DOI (Digital Object Identifier) to its dislay URL. If the supplied string does not appearto be a DOI, null will be returned.
If the supplied string appears to be a DOI, it strips any "doi:" prefix if present, prepends thestring "https://doi.org/", and performs any character escaping that is required.
• Parameters:
• doi (String): DOI string, with or without "doi:" prefix
• Return value
SUN/256 330
• (String): display URL pointing at DOI content, or null if it doesn't look like a DOI
• Example:
• doiUrl("10.3390/informatics4030018") =
"https://doi.org/10.3390/informatics4030018"
• See Also:
• https://www.doi.org/
arxivUrl( arxivId )
Maps an arXiv identifier to the URL that will display its arXiv (https://arxiv.org/) web page. Ifthe supplied string does not appear to be an arXiv identifier, null will be returned.
If the supplied string appears to be an arXiv identifier, it strips any "arXiv: prefix andprepends the string "https://arxiv.org/abs/".
• Parameters:
• arxivId (String): arXiv identifier, with or without "arXiv:" prefix
• Return value
• (String): display URL pointing at bibcode record, or null if it doesn't look like abibcode
• Example:
• arxivUrl("arXiv:1804.09379") = "https://arxiv.org/abs/1804.09381"
• See Also:
• https://arxiv.org/help/arxiv_identifier
simbadUrl( sourceId )
Maps a source identifier to the URL of its SIMBAD (http://simbad.u-strasbg.fr/simbad/) webpage. SIMBAD is the astronomical source information service run by the Centre de Donnéesastronomiques de Strasbourg.
The string "http://simbad.u-strasbg.fr/simbad/sim-id?Ident=" is prepended to the givenid string, and any necessary character escaping is applied. No attempt is made to validatewhether the supplied string is a real source identifier, so there is no guarantee that the returnedURL will contain actual results.
• Parameters:
• sourceId (String): free text assumed to represent a source identifier known bySIMBAD
• Return value
• (String): URL of the Simbad web page describing the identified source
• Example:
• simbadUrl("Beta Pictoris") =
"http://simbad.u-strasbg.fr/simbad/sim-id?Ident=Beta%20Pictoris"
nedUrl( sourceId )
Maps a source identifier to the URL of its NED (http://ned.ipac.caltech.edu/) web page. NEDis the NASA/IPAC Extragalactic Database.
The string "http://ned.ipac.caltech.edu/byname?objname=" is prepended to the given idstring, and any necessary character escaping is applied. No attempt is made to validate whether
SUN/256 331
the supplied string is a real source identifier, so there is no guarantee that the returned URLwill contain actual results.
• Parameters:
• sourceId (String): free text assumed to represent a source identifier known by NED
• Return value
• (String): URL of the NED web page describing the identified source
• Example:
• nedUrl("NGC 3952") =
"http://ned.ipac.caltech.edu/byname?objname=NGC%203952"
hips2fitsUrl( hipsId, fmt, raDeg, decDeg, fovDeg, npix )
Returns the URL of a cutout from the Hips2Fits service operated by CDS. The result will bethe URL of a FITS or image file resampled to order from one of the HiPS surveys available atCDS.
This function requests a square cutout using the SIN projection, which is suitable for smallcutouts. If the details of this function don't suit your purposes, you can construct the URLyourself.
• Parameters:
• hipsId (String): identifier or partial identifier for the HiPS survey• fmt (String): required output format, for instance "fits", "png", "jpg"• raDeg (floating point): central Right Ascension (longitude) in degrees• decDeg (floating point): central Declination (latitude) in degrees• fovDeg (floating point): field of view; extent of the cutout in degrees• npix (integer): extent of the cutout in pixels (width=height=npix)
• Return value
• (String): URL of the required cutout
• See Also:
• http://alasky.u-strasbg.fr/hips-image-services/hips2fits
10.6.21 VO
Virtual Observatory-specific functions. Some of these are for rather technical purposes.
The UCD parsing functions are based on Grégory Mantelet's library Ucidy(https://github.com/gmantele/ucidy) corresponding to UCD1+ 1.4(https://www.ivoa.net/documents/UCD1+/20210616/), and the VOUnit parsing functions are basedon Norman Gray's library Unity (http://www.astro.gla.ac.uk/users/norman/ivoa/unity/)corresponding to VOUnits 1.0 (https://www.ivoa.net/documents/VOUnits/20140523/).
ucdStatus( ucd )
Returns a token string giving the category of UCD compliance. UCD1+, UCD1 and SIAv1("VOX:")-style UCDs are recognised.
Possible return values are currently:
• "OK": conforms to UCD1+ standard• "UCD1": looks like a UCD1
SUN/256 332
• "VOX": is in VOX: namespace introduced by SIAv1• "BAD_SYNTAX": not a UCD1 and cannot be parsed according to UCD1+• "BAD_SEQUENCE": UCD words violate UCD1+ sequence rules• "UNKNOWN_WORD": follows UCD1+ syntax rules but contains non-UCD1+ atom• "NAMESPACE": follows UCD1+ syntax but contains atoms in non-standard namespace• "DEPRECATED": contains deprecated UCD1+ words
In the case of non-compliant values, more information can be found using the ucdMessage
function.
• Parameters:
• ucd (String): UCD string
• Return value
• (String): "OK" for conformant UCD1+, otherwise some other value
ucdMessage( ucd )
Returns a human-readable message associated with the parsing of a UCD. This is expected tobe empty for a fully compliant UCD, and may contain error messages or advice otherwise.
• Parameters:
• ucd (String): UCD value
• Return value
• (String): message text
vounitStatus( unit )
Returns a token string giving the category of VOUnits compliance.
Possible return values are currently:
• "OK": conforms to VOUnits syntax• "UNKNOWN_UNIT": parsed as VOUnit but contains unknown base unit(s)• "BAD_SYNTAX": cannot be parsed as VOUnit syntax• "PARSE_ERROR": unexpected error during parsing• "USAGE": violates VOUnit usage constraints• "WHITESPACE": legal VOUnit except that it contains whitespace, which is not allowed
by VOUnits
In the case of non-compliant values, more information can be found using the vounitMessage
function.
• Parameters:
• unit (String): unit string
• Return value
• (String): "OK" for conformant VOUnits, otherwise some other value
vounitMessage( unit )
Returns a human-readable message associated with the parsing of a unit string. This isexpected to be empty for a string fully compliant with VOUnits, and may contain errormessages or additional information otherwise.
• Parameters:
SUN/256 333

• unit (String): unit string
• Return value
• (String): message text
10.7 Examples
Here are some examples for defining new columns; the expressions below could appear as the<expr> in a tpipe addcol or sortexpr command).
Average
(first + second) * 0.5
Square root
sqrt(variance)
Angle conversion
radiansToDegrees(DEC_radians)degreesToRadians(RA_degrees)
Conversion from string to number
parseInt($12)parseDouble(ident)
Conversion from number to string
toString(index)
Conversion between numeric types
toShort(obs_type)toDouble(range)
or
(short) obs_type(double) range
Conversion from sexagesimal to degrees
hmsToDegrees(RA1950)dmsToDegrees(decDeg,decMin,decSec)
Conversion from degrees to sexagesimal
degreesToDms($3)degreesToHms(RA,2)
Outlier clipping
min(1000, max(value, 0))
Converting a magic value to null
SUN/256 334

jmag == 9999 ? NULL : jmag
Converting a null value to a magic one
NULL_jmag ? 9999 : jmag
Taking the third scalar element from an array-valued column
psfCounts[2]
Converting spectral type to numeric value (e.g. "L3.5" -> 23.5, "M7" -> 17)
"MLT".indexOf(spType.charAt(0)) * 10 + parseDouble(substring(spType,1)) + 10
Note this uses a couple of Java String instance methods (Section 10.8.2) which are notexplicitly documented in this section.
Here are some examples of boolean expressions that could be used for row selection (appearing in atpipe select command)
Within a numeric range
RA > 100 && RA < 120 && Dec > 75 && Dec < 85
Within a circle
$2*$2 + $3*$3 < 1skyDistanceDegrees(ra0,dec0,hmsToDegrees(RA),dmsToDegrees(DEC))<15./3600.
First 100 rows
index <= 100
(though you could use tpipe cmd='head 100' instead)
Every tenth row
index % 10 == 0
(though you could use tpipe cmd='every 10' instead)
String equality/matching
equals(SECTOR, "ZZ9 Plural Z Alpha")equalsIgnoreCase(SECTOR, "zz9 plural z alpha")startsWith(SECTOR, "ZZ")contains(ph_qual, "U")
String regular expression matching
matches(SECTOR, "[XYZ] Alpha")
Test for non-blank value
! NULL_ellipticity
10.8 Advanced Topics
This section contains some notes on getting the most out of the algebraic expressions facility. Ifyou're not a Java programmer, some of the following may be a bit daunting - read on at your own
SUN/256 335

risk!
10.8.1 Expression evaluation
This note provides a bit more detail for Java programmers on what is going on here; it describeshow the use of functions in STILTS algebraic expressions relates to normal Java code.
The expressions which you write are compiled to Java bytecode when you enter them (if there is a'compilation error' it will be reported straight away). The functions listed in the previoussubsections are all the public static methods of the classes which are made available by default.The classes listed are all in the package uk.ac.starlink.ttools.func. However, the public staticmethods are all imported into an anonymous namespace for bytecode compilation, so that you write(sqrt(x,y) and not Maths.sqrt(x,y). The same happens to other classes that are imported (whichcan be in any package or none) - their public static methods all go into the anonymous namespace.Thus, method name clashes are a possibility.
This cleverness is all made possible by the rather wonderful JEL(http://www.gnu.org/software/jel/).
10.8.2 Instance Methods
There is another category of functions which can be used apart from those listed in Section 10.6.These are called, in Java/object-oriented parlance, "instance methods" and represent functions thatcan be executed on an object.
It is possible to invoke any of its public instance methods on any object (though not on primitivevalues - numeric and boolean ones). The syntax is that you place a "." followed by the methodinvocation after the object you want to invoke the method on, hence NAME.substring(3) instead ofsubstring(NAME,3). If you know what you're doing, feel free to go ahead and do this. However,most of the instance methods you're likely to want to use have equivalents in the normal functionslisted in the previous section, so unless you're a Java programmer or feeling adventurous, you maybe best off ignoring this feature.
10.8.3 Adding User-Defined Functions
The functions provided by default for use with algebraic expressions, while powerful, may notprovide all the operations you need. For this reason, it is possible to write your own extensions tothe expression language. In this way you can specify abritrarily complicated functions. Notehowever that this will only allow you to define new columns or subsets where each cell is afunction only of the other cells in the same row - it will not allow values in one row to be functionsof values in another.
In order to do this, you have to write and compile a (probably short) program in the Java language.A full discussion of how to go about this is beyond the scope of this document, so if you are new toJava and/or programming you may need to find a friendly local programmer to assist (or mail theauthor). The following explanation is aimed at Java programmers, but may not be incomprehensibleto non-specialists.
The steps you need to follow are:
1. Write and compile a class containing one or more static public methods representing thefunction(s) required
2. Make this class available on the application's classpath at runtime as described in Section 3.13. Specify the class's name to the application, as the value of the jel.classes system property
(colon-separated if there are several) as described in Section 3.3
SUN/256 336
Any public static methods defined in the classes thus specified will then be available for use. Theyshould be defined to take and return the relevant primitive or Object types for the function required.For instance a class written as follows would define a three-value average:
public class AuxFuncs {public static double average3(double x, double y, double z) {
return (x + y + z) / 3.0;}
}
and the command
stilts tpipe cmd='addcol AVERAGE "average3($1,$2,$3)"'
would add a new column named AVERAGE giving the average of the first three existing columns.Exactly how you would build this is dependent on your system, but it might involve doingsomething like the following:
1. Writing a file named AuxFuncs.java containing the above code2. Compiling it using a command like "javac AuxFuncs.java"3. Running tpipe using the flags "stilts -classpath . -Djel.classes=AuxFuncs tpipe"
Note that (in versions later than STILTS 3.0-6) variable-length argument lists are supported wherethe final declared argument is an array, so for instance a method declared like:
public static double sum(double[] values) {double total = 0;for (int i = 0; i < values.length; i++) {
total += values[i];}return total;
}
can be invoked like "sum(UMAG,GMAG,RMAG,IMAG,ZMAG)". The alternative form "double...values" can be used in the declaration with identical effect.
SUN/256 337

11 Server Mode
STILTS is generally run by issuing commands from some kind of command line. However,facilities are also included to run it as a service, accepting commands via HTTP. The basicimplementation of this is in the form of some Servlet implementations that can be run in a servletcontainer. At present the following servlets are provided:
• PlotServlet
• TaskServlet
• FormServlet
In order to run them there are a few options:
STILTS server commandThe simplest is to use the STILTS server command. If you run this, the services will start upimmediately and print information about the base URL. Some configuration of availablefunctions and data access is offered by the command line parameters. This command is a thinwrapper around the Jetty servlet engine which is included in the STILTS distribution.
Deploy in a servlet containerFor more control you can deploy the servlet or servlets you want to run in a servlet containerof your choice, for instance Tomcat. The servlets can be configured by setting contextparameters in a web.xml file in the usual way; look at the StiltsContext class to see theavailable configuration parameters.
DockerIn the case of the plot server, a Docker container has been provided for convenience. At timeof writing this is available, with some more discussion about how to deploy it, athttps://hub.docker.com/r/mbtaylor/plotserv.
In all cases, look at the base URL of the running service for more information and usage examples.For instance if the server is running at the default base URL, then pointing your browser at
http://localhost:2112/stilts/
will show you links to documentation for the available services.
The different services are described further in the following subsections.
Note: The server command and associated servlet code are somewhat experimental. If you haverequirements which are not currently provided, please contact the author for discussion.
11.1 Plot Service
The plot server supports interactive plots that can be viewed and navigated using HTTP requests. Aplot is specified with a URL, corresponding to an invocation of one of the plot2* commands, thatspecifies a plot, and uses a service API that can be used by client-side javascript to display andupdate a plot image in response to user navigation actions such as mouse drag and wheel gestures.The effect is of an interactive plot in a web browser that can be navigated with the mouse in exactlythe same way as a STILTS or TOPCAT interactive plot.
To see this in action, run
% stilts server
point your browser at the URL displayed and follow the links to see some interactive plots.
SUN/256 338
The following subsections give some more details about how this works and how it can be used.
11.1.1 Usage
The best way to see how the plot service can be used is to run the service (most simply by executingstilts server), and look at the running plot examples, along with their HTML source code,served from the server endpoint.
However this section gives a brief independent overview of how the service can be used. ThePlotServlet itself exposes a RESTful API as described in Section 11.1.2. This offers the servicesrequired for client HTML/JavaScript code running in a browser to set up a plot based on server-side(or at least server-accessible) table data, and to make updates to it following user activity likemouse gestures.
A basic client JavaScript library named plot2Lib.js, that facilitates this plot setup is included withSTILTS; it can be found in the stilts.jar file at uk/ac/starlink/ttools/server/plot2Lib.js,and is available from the running server at <plot-service-base>/plot2Lib.js. It exports somevariables in the plot2 namespace; see comments in the file itself for documentation of how to useit. A minimal web page using this to present an interactive plot might look like:
<html><script src="plot2Lib.js"></script><script>
var serverUrl = "http://localhost:2112/stilts/plot/";onload = function() {
var plotTxt = plot2.wordsToPlotTxt(["plot2sky","layer1=mark","in1=/data/catalogue.fits","lon1=RA","lat1=DEC"
]);var plotNode = plot2.createPlotNode(serverUrl, plotTxt);document.getElementsByTagName("body")[0].appendChild(plotNode);
};</script></html>
In this case the data file "/data/catalogue.fits" has to be available to the servlet; how this isarranged depends on the way the service is deployed.
JavaScript clients don't have to use the plot2Lib.js library; it's also possible to write custom codethat talks to the RESTful API described in Section 11.1.2.
11.1.2 RESTful API
This section details the endpoints supported by the plot servlet; it is not required reading for thosewho want to use the supplied plot2Lib.js JavaScript library, but may be of interest to those whowant to write their own JavaScript clients.
General URL Syntax
The plot service accepts URLs of the form
<base-url>/<action-type>/<plot-spec>[?<session-id>&<arg-list>]
These parts are expanded as follows:
<action-type>
The action type string determines the kind of request, and is one of the strings "html", "state",
SUN/256 339

"imgsrc", "position", "count", "row"; see below for details.
<plot-spec>
The plot specification is an ampersand-separated STILTS plot command string; the form is"<command-name>&<arg-name>=<value>&<arg-name>=<value>..." for instance"plot2sky&layer1=mark&in1=stars.vot&lon1=ra&lat1=dec". See STILTS plottingdocumentation in Section 8 for command syntax. Note that although this part contains&-separated name=value pairs which are syntactically application/x-www-form-urlencoded
it is part of the URI path and not a URI query string since it does not come after a questionmark ('?') and it cannot be supplied by POSTing parameters.
<session-id>
The session identifier is of the form "sessionId=<unique-string>" and it serves to maintainthe state of the plot between requests (so that for instance a navigation action starts from wherethe last one left off). The <unique-string> string is chosen by the client; any string value ispermitted, but it's up to the client to pick something that is unlikely to be chosen by otherunrelated clients on the same or different machines. Incorporating a high-resolution timestampis a good bet. In case of a collision, confusing results may ensue, but it's probably notnecessary to resort to cryptographic-grade hashing. This part is not necessary for the "html"
<action-type>.
<arg-list>
A list of zero or more ampersand-separated "<name>=<value>" parameters, specific to the<action-type>; see below for details.
The [?<session-id>&<arg-list>] part of the URL is an application/x-www-form-urlencoded
query-string, and may be supplied as a POST body rather than as part of the GET query if preferred.Note that does not apply to the <plot-spec> part, which is in RFC3986 terms part of the path andnot part of the query.
Available Action Types
The options for the various different values of the <action-type> string, with their associatedparameters and response values, are as follows:
html
Returns a new standalone HTML page containing the interactive plot specified by the suppliedplot specification. Note this does not require a session ID to be supplied, and it has noparameters. This action is easy to use, but not very flexible.
state
Returns a JSON structure giving the image and/or image annotations for the current state of thesession. The session state may be updated by supplying navigation parameters, as follows:
• navigate=reset: reset the plot to initial state• navigate=resize&size=width,height: resize the plot to width x height pixels• navigate=click&pos=x,y&ibutton=1|2|3: emulate TOPCAT click on plot at graphics
position x,y• navigate=drag&origin=x0,y0&pos=x1,y1&ibutton=1|2|3: emulate TOPCAT
continuing drag from start graphics position x0,y0 to x1,y1• navigate=drag&origin=x0,y0&pos=x1,y1&ibutton=1|2|3&end=true: emulate TOPCAT
end-drag from start graphics position x0,y0 to x1,y1• navigate=wheel&pos=x,y&wheelrot=nstep: emulate TOPCAT mouse wheel at graphics
position x,y• navigate=none: no change to last position
The members of the returned structure are:
SUN/256 340
imgSrc (present if plot has changed since last request):Contains a data: URL suitable for use as the content of an IMG/@src attribute to displaythe current state of the plot
staticSvg (present if there are static decorations):SVG content, suitable as the content of an SVG node, giving decorations to superimposeover the plot image.
transientSvg (present if there are transient decorations):SVG content, suitable as the content of an SVG node, giving decorations to superimposeover the plot image representing a navigation action. Such decorations should only bedisplayed for a short time (e.g. 0.5 second).
bounds (present for planar and cubic plots):A 2- or 3-element array of (lower,upper) data bound pairs giving the extent of the currentplot.
imgsrc
Returns image data suitable for reference by an IMG/@src attribute value for the current state ofthe session. The session state may be updated by supplying navigation parameters as follows:
• navigate=reset: reset the plot to initial state• navigate=resize&size=width,height: resize the plot to width x height pixels• navigate=click&pos=x,y&ibutton=1|2|3: emulate TOPCAT click on plot at graphics
position x,y• navigate=drag&origin=x0,y0&pos=x1,y1&ibutton=1|2|3: emulate TOPCAT
continuing drag from start graphics position x0,y0 to x1,y1• navigate=drag&origin=x0,y0&pos=x1,y1&ibutton=1|2|3&end=true: emulate TOPCAT
end-drag from start graphics position x0,y0 to x1,y1• navigate=wheel&pos=x,y&wheelrot=nstep: emulate TOPCAT mouse wheel at graphics
position x,y• navigate=none: no change to last position
The response MIME type can be influenced by the ofmt parameter in the <plot-spec> or theformat parameter in the <arg-list>. In case of disagreement, the latter takes precedence. Theavailable options are "png", "png-transp", "gif", "jpeg", "pdf", "svg", "eps", "eps-gzip".
position
Provides a service to convert a position in plot graphics coordinates to data coordinates. Therequest must have a pos argument giving the graphics position in the form x,y (e.g."pos=203,144"), and the response will be a JSON structure with the following members:
dataPos:On success, contains data coordinates as a numeric array.
txtPos:On success, contains data coordinates as a formatted string.
message:Textual indication of conversion status. It will be "ok" on success, but may have someother value, such as "out of plot bounds", on failure.
count
Returns the number of points currently visible in this plot. Note that determining this valuedoes take some computation (it's not free). The output is a plain text decimal value; it can alsobe interpreted as JSON.
row
Services a request for row information, at or near a submitted graphics position on the plot.
SUN/256 341
The request must have a pos argument giving the graphics position in the form x,y (e.g."pos=203,144"),
The output is a JSON array of objects; there is one array element for each table represented,and each such element is a column-name->column-value map for the row indicated. If thesubmitted point is not near any plotted points, the result will therefore be an empty array.
This API is subject to extension or modification in future releases.
11.1.3 Caching and Performance
The plot servlet requires some temporary disk storage for caching images and prepared coordinatedata to improve performance when updating plots during visualisation sequences. Servletconfiguration options are available to manage usage of these resources.
When first requested to make a plot, it works out what coordinate data will be required, reads thisfrom the input table, and writes it to cache in an efficient binary storage format. This may be simplya copy of columns from the input table, or may require some computation, for instance if the plottedquantity is the result of an expression in the expression language, or if the coordinates are longitudeand latitude (in which case they are converted to unit vector components). This coordinate cachepreparation requires a scan of the input table which is in the current implementationsingle-threaded, so may be time-consuming for very large tables.
Once the coordinate data is in cache, the cache rather than the input table is used for subsequentplots; that includes both derived replots resulting from user navigation and completely separateplots that happen to require the same row/column data. Plots from cache are in most casesmulti-threaded, so can be quite rapid even for large datasets depending on server configuration andload.
When the plot is first made, the initial (pre-navigation) plotted image is also stored in a cache, sothat if other HTTP clients request the same plot they can receive the initial image without furtherdata access or computation.
By default, the directory used for caching is the value of the java.io.tmpdir system property,which is typically /tmp on Unix systems. The directory used for caching can be changed bymodifying this system property, or caching can be configured with the servlet context parameterscontrolled by the StiltsContext class.
When cache storage gets full, older items are dropped in the usual way. There is no doubt scope forimprovement of the existing cache management; the details may be refined in future releases.
11.2 Task Service
This servlet allows execution of a single STILTS command by making an HTTP request with thecommand name and parameters, rather than by presenting them on the command line. You mightwant to run this service if you are providing a web service to external users which is able to accessfiles residing on the server, for instance generating static table plots (though see the Plot service formore sophisticated server-side visualisation) or row selections on the fly. This can be done withoutthe server mode, for instance by invoking the stilts script or java from a CGI script to serve eachrequest, but using server mode has two advantages: first it provides correct output HTTP headerssuch as Content-Type, and secondly it avoids the Java startup overheads for each invocation.
The URLs accepted by the service are of the form
<task-base-url>/<task-name>?<arg-name>=<arg-value>&<arg-name>=<arg-value>...
SUN/256 342

The <task-name> is one of the STILTS command names as listed in Appendix B, and the<arg-name>=<arg-value> pairs are the parameter settings for that command; the parameter settingsare syntactically an application/x-www-form-urlencoded query string. These parameters may besupplied as a POST body rather than as part of a GET query if preferred, though since the taskinvocation will normally be idempotent, GET may be more respectable.
The HTTP response depends on the behaviour of the task in question. If the task is one that outputsa table or sequence of tables, such as tpipe or tmatch2, the HTTP response will be the serializedform of the table in an appropriate format. By default that is currently VOTable (Content-Type"application/x-votable+xml"), but that can be altered by supplying the appropriate output formatparameter, e.g. "ofmt=fits". Plotting commands return an image in a default graphics format; againthe output format can be controlled using command paramters in the same way as on the commandline. Output for some other commands such as calc may just be plain text.
Here are some example invocations, assuming the default server base URL ofhttp://localhost:2112/stilts/:
http://localhost:2112/stilts/
Returns an HTML page giving version information and some links to example usages of theserver.
http://localhost:2112/stilts/task/tpipe
Returns an HTML page giving usage instructions for the tpipe task.
http://localhost:2112/stilts/task/calc?expression=21%2b2
Invokes the calc task to return a document containing the text "23". Note that the plus ("+")sign in the expression has to be encoded using the sequence "%2b" since "+" has a specialsignificance in query URLs - see for instance sec 2.2 of RFC 1738.
http://localhost:2112/stilts/task/plot2plane?in=/data/table1.vot&layer1=mark&x1=RMAG&y1=BMAG
Invokes the plot2d task to return a magnitude-magnitude diagram of the named server-sidefile as an image, probably an image/png (but see the Plot Service if you want interactive plots).
http://localhost:2112/stilts/task/tcopy?in=/data/cat.fits&ofmt=ecsv
Invokes the tcopy task to return a translation of the named server-side FITS file to ECSVformat.
Note that in the current form of this service no great attention has been paid to security, so it may bepossible for clients to read and write files and expend significant system resources by makingcertain requests to the server. Anyone exposing this service directly to external clients should bearthis in mind.
11.3 Form Service
The Form service is more or less obsolete; it really just gives an example of how to set up anHTML Form to invoke one of the STILTS commands using the Task Service.
The content served gives provides a couple of examples of an HTML form that can invoke plottingusing the Task Service. The output graphics use the old-style plot commands rather than the muchmore capable plot2* plotting, and are not interactive; for much improved server-side visualisastion,
SUN/256 343

see Section 11.1.
SUN/256 344
12 Programmatic Invocation
The STILTS package provides some capabilities, for instance plotting, that might be useful as partof other Java applications. The code that forms STILTS is fully documented at the API level; thereare comprehensive javadocs throughout for the uk.ac.starlink.ttools package, its subpackages,and most of the other classes in the uk.ac.starlink tree on which it relies. Anybody is welcome touse these classes at their own risk, but the code does not form a stable API intended for public use:the javadocs are not distributed as part of the package (though you may be able to find them here),tutorial documentation is not provided, and there is no commitment to API stability betweenreleases.
With this in mind, there are facilities for invoking the STILTS commands programmatically fromthird-party java code. Of course it is possible to do this by just calling the static main(String[])
method of the application Main-Class (Stilts) but we document here how it can be done in a waywhich allows more control, using the uk.ac.starlink.task parameter handling framework.
Each of the STILTS tasks listed in Appendix B is represented by a class implementing the Task
interface; these all have no-arg constructors. To run it, you need to create an instance of the class,pass it an Environment object which can acquire values for parameters by name, and then executeit. The MapEnvironment class, based on a Map containing name/value pairs, is provided for thispurpose. As well as managing parameter values, MapEnvironment captures table and text output ina way that lets you retrieve it after the task has executed. Here is a simple example for invoking thecalc task to perform a simple calcation:
MapEnvironment env = new MapEnvironment();env.setValue( "expression", "sqrt(3*3+4*4)" );Task calcTask = new uk.ac.starlink.ttools.task.Calc();calcTask.createExecutable( env ).execute();String result = env.getOutputText();
The execution corresponds exactly to the command-line:
stilts calc expression="sqrt(3*3+4*4)"
The Usage section for the calc task notes that the corresponding Task subclass is Calc.
Also in the usage section, each parameter reports the data type that it may take, and objects of thistype may be used as the parameter value passed in the MapEnvironment as an alternative to passingstring values. For the case of the input table parameters, this is StarTable, so in a task like tpipe(TablePipe), if you want to read a file "data.fits", you can either write
env.setValue( "in", "data.fits" );
or
StarTable table = new StarTableFactory().readStarTable( "data.fits" );env.setValue( "in", table );
That doesn't buy you much, but the table could equally be obtained from any other source,including being a user-defined iterable over existing data structures. See SUN/252 for moreinformation on StarTable handling.
For some short examples of programs which invoke STILTS tasks in this way, see the source codeof some of the examples in the uk.ac.starlink.ttools.example directory: Calculator andHead10.
Some commands provide additional methods for use with parameter-based invocation. In particularthe plotting commands can be used to create JComponent objects that can be incorporated into anexisting GUI. A working example of this can be found in the source code for the example
SUN/256 345
EnvPlanePlotter class. For some more tutorial introductions to using the plotting classesprogrammatically, see also the example classes SinePlot, ApiPlanePlotter, and BasicPlotGui in thesame place.
SUN/256 346

A Commands By Category
This section lists the commands available broken down by the category of function they provide.Some commands appear in more than one category. Detailed descriptions and examples for eachcommand can be found in Appendix B.
Format conversion:
• tcopy (Appendix B.28): Converts between table formats• votcopy (Appendix B.40): Transforms between VOTable encodings
See also Section 5.
Generic table manipulation:
• tcopy (Appendix B.28): Converts between table formats• tpipe (Appendix B.37): Performs pipeline processing on a table• tmulti (Appendix B.35): Writes multiple tables to a single container file• tmultin (Appendix B.36): Writes multiple processed tables to single container file• tcat (Appendix B.26): Concatenates multiple similar tables• tcatn (Appendix B.27): Concatenates multiple tables• tloop (Appendix B.30): Generates a single-column table from a loop variable• tjoin (Appendix B.31): Joins multiple tables side-to-side• tcube (Appendix B.29): Calculates N-dimensional histograms
See also Section 6.
Crossmatching:
• tmatch1 (Appendix B.32): Performs a crossmatch internal to a single table• tmatch2 (Appendix B.33): Crossmatches 2 tables using flexible criteria• tmatchn (Appendix B.34): Crossmatches multiple tables using flexible criteria• tskymatch2 (Appendix B.39): Crossmatches 2 tables on sky position• cdsskymatch (Appendix B.2): Crossmatches table on sky position against
VizieR/SIMBAD table• coneskymatch (Appendix B.4): Crossmatches table on sky position against remote cone
service• sqlskymatch (Appendix B.20): Crossmatches table on sky position against SQL table
See also Section 7.
Plotting:
• plot2plane (Appendix B.9): Draws a plane plot• plot2sky (Appendix B.10): Draws a sky plot• plot2cube (Appendix B.11): Draws a cube plot• plot2sphere (Appendix B.12): Draws a sphere plot• plot2time (Appendix B.13): Draws a time plot• plot2d (Appendix B.14) (deprecated): Old-style 2D Scatter Plot• plot3d (Appendix B.15) (deprecated): Old-style 3D Scatter Plot• plothist (Appendix B.16) (deprecated): Old-style Histogram
See also Section 9.
Sky Pixel Operations:
• tskymap (Appendix B.38): Calculates sky density maps• pixfoot (Appendix B.7): Generates Multi-Order Coverage maps• pixsample (Appendix B.8): Samples from a HEALPix pixel data file
VOTables:
• votcopy (Appendix B.40): Transforms between VOTable encodings
SUN/256 347
• votlint (Appendix B.41): Validates VOTable documents
Virtual Observatory service access:
• cdsskymatch (Appendix B.2): Crossmatches table on sky position againstVizieR/SIMBAD table
• cone (Appendix B.3): Executes a Cone Search-like query• coneskymatch (Appendix B.4): Crossmatches table on sky position against remote cone
service• tapskymatch (Appendix B.25): Crossmatches table on sky position against TAP table• tapquery (Appendix B.23): Queries a Table Access Protocol server• tapresume (Appendix B.24): Resumes a previous query to a Table Access Protocol server• taplint (Appendix B.22): Tests TAP services• datalinklint (Appendix B.5): Validates DataLink documents• regquery (Appendix B.17): Queries the VO registry
SQL Database access:
• sqlclient (Appendix B.19): Executes SQL statements• sqlupdate (Appendix B.21): Updates values in an SQL table• sqlskymatch (Appendix B.20): Crossmatches table on sky position against SQL table
Miscellaneous:
• server (Appendix B.18): Runs an HTTP server to perform STILTS commands• calc (Appendix B.1): Evaluates expressions• funcs (Appendix B.6): Browses functions used by algebraic expression language
SUN/256 348
B Command Reference
This appendix provides the reference documentation for the commands in the package. For eachone a description of its purpose, a list of its command-line arguments, and some examples aregiven.
B.1 calc: Evaluates expressions
calc is a very simple utility for evaluating expressions. It uses the same expression evaluator as isused in tpipe and the other generic table tasks for things like creating new columns, so it can beused as a quick test to see what expressions work, or in order to evaluate expressions using thevarious algebraic functions documented in Section 10.6. Since usually no table is involved, youcan't refer to column names in the expressions. It has one mandatory parameter, the expression toevaluate, and writes the result to the screen.
B.1.1 Usage
The usage of calc is
stilts <stilts-flags> calc table=<table>[expression=]<expr>
If you don't have the stilts script installed, write "java -jar stilts.jar" instead of "stilts" -see Section 3. The available <stilts-flags> are listed in Section 2.1. For programmaticinvocation, the Task class for this command is uk.ac.starlink.ttools.task.Calc.
Parameter values are assigned on the command line as explained in Section 2.3. They are asfollows:
expression = <expr> (String)An expression to evaluate. The functions in Section 10.6 can be used.
table = <table> (StarTable)A table which provides the context within which expression is evaluated. This parameter isoptional, and will usually not be required; its only purpose is to allow use of constantexpressions (table parameters) associated with the table. These can be referenced usingidentifiers of the form param$*, ucd$* or utype$* - see Section 10.2 for more detail.
B.1.2 Examples
Here are some examples of using calc:
stilts calc 1+2
Calculates one plus two. Writes "3" to standard output.
stilts calc 'isoToMjd("2005-12-25T00:00:00")'
Works out the Modified Julian Day corresponding to Christmas 2005. The output is "53729.0".
stilts calc 'param$author' table=catalogue.xml
In this case the expression is evaluated in the context of the supplied table, which means thatthe table's parameters can be referenced in the expression. This example just outputs the valueof the table parameter named "author".
SUN/256 349
B.2 cdsskymatch: Crossmatches table on sky position against VizieR/SIMBAD table
cdsskymatch uses the CDS X-Match service to join a local table to one of the tables hosted by theCentre de Données astronomiques de Strasbourg. This includes all of the VizieR tables and theSIMBAD database. The service is very fast, and in most cases it is the best way to match a localtable against a large external table hosted by a service. It is almost certainly much better than usingconeskymatch, though it is less flexible than TAP (see the tapquery task for flexible access to TAPservices, and tapskymatch for positional matches).
The local table is uploaded to the X-Match service in chunks, and the matches for each chunk areretrieved in turn and eventually stitched together to form the final result. The tool only uploads skyposition and an identifier for each row of the input table, but all columns of the input table arereinstated in the result for reference.
For a better understanding of the details of how this service operates, including exactly whatcoordinates are matched against the uploaded positions (roughly: integrated to J2000 using propermotions if available) and what columns are included in the output (roughly: a subset of the mostcommonly used columns), please consult the service documentation.
Acknowledgement: CDS note that if the use of the X-Match service is useful to your research, theywould appreciate the following acknowledgement:
"This research made use of the cross-match service provided by CDS, Strasbourg."
B.2.1 Usage
The usage of cdsskymatch is
stilts <stilts-flags> cdsskymatch ifmt=<in-format> istream=true|falseicmd=<cmds> ocmd=<cmds>omode=out|meta|stats|count|checksum|cgi|discard|topcat|samp|plastic|tosql|guiout=<out-table> ofmt=<out-format>ra=<expr> dec=<expr>radius=<value/arcsec> cdstable=<value>find=all|best|best-remote|each|each-distblocksize=<int-value> maxrec=<int-value>compress=true|falseserviceurl=<url-value> usemoc=true|falsepresort=true|false fixcols=none|dups|allsuffixin=<label> suffixremote=<label>[in=]<table>
If you don't have the stilts script installed, write "java -jar stilts.jar" instead of "stilts" -see Section 3. The available <stilts-flags> are listed in Section 2.1. For programmaticinvocation, the Task class for this command isuk.ac.starlink.ttools.task.CdsUploadSkyMatch.
Parameter values are assigned on the command line as explained in Section 2.3. They are asfollows:
blocksize = <int-value> (Integer)The CDS Xmatch service operates limits on the maximum number of rows that can beuploaded and the maximum number of rows that is returned as a result from a single query. Inthe case of large input tables, they are broken down into smaller blocks, and one request is sentto the external service for each block. This parameter controls the number of rows in eachblock. For an input table with fewer rows than this value, the whole thing is done as a singlerequest.
SUN/256 350

At time of writing, the maximum upload size is 100Mb (about 3Mrow; this does not depend onthe width of your table), and the maximum return size is 2Mrow.
Large blocksizes tend to be good (up to a point) for reducing the total amount of time a largexmatch operation takes, but they can make it harder to see the job progressing. There is alsothe danger (for ALL-type find modes) of exceeding the return size limit, which will result intruncation of the returned result.
[Default: 50000]
cdstable = <value> (String)Identifier of the table from the CDS crossmatch service that is to be matched against the localtable. This identifier may be the standard VizieR identifier (e.g. "II/246/out" for the 2MASSPoint Source Catalogue) or "simbad" to indicate SIMBAD data.
See for instance the TAPVizieR table searching facility athttp://tapvizier.u-strasbg.fr/adql/ to find VizieR catalogue identifiers.
compress = true|false (Boolean)If true, the service is requested to provide HTTP-level compression for the response stream(Accept-Encoding header is set to "gzip", see RFC 2616). This does not guarantee thatcompression will happen but if the service honours this request it may result in a smalleramount of network traffic at the expense of more processing on the server and client.
[Default: true]
dec = <expr> (String)Declination in degrees in the ICRS coordinate system for the position of each row of the inputtable. This may simply be a column name, or it may be an algebraic expression calculatedfrom columns as explained in Section 10. If left blank, an attempt is made to guess fromUCDs, column names and unit annotations what expression to use.
find = all|best|best-remote|each|each-dist (UserFindMode)Determines which pair matches are included in the result.
• all: All matches• best: Matched rows, best remote row for each input row• best-remote: Matched rows, best input row for each remote row• each: One row per input row, contains best remote match or blank• each-dist: One row per input row, column giving distance only for best match
Note only the all mode is symmetric between the two tables.
Note also that there is a bug in best-remote matching. If the match is done in multipleblocks, it's possible for a remote table row to appear matched against one local table row peruploaded block, rather than just once for the whole result. If you're worried about that, setblocksize >= rowCount. This may be fixed in a future release.
[Default: all]
fixcols = none|dups|all (Fixer)Determines how input columns are renamed before use in the output table. The choices are:
• none: columns are not renamed• dups: columns which would otherwise have duplicate names in the output will be
renamed to indicate which table they came from• all: all columns will be renamed to indicate which table they came from
If columns are renamed, the new ones are determined by suffix* parameters.
[Default: dups]
icmd = <cmds> (ProcessingStep[])Specifies processing to be performed on the input table as specified by parameter in, before
SUN/256 351
any other processing has taken place. The value of this parameter is one or more of the filtercommands described in Section 6.1. If more than one is given, they must be separated bysemicolon characters (";"). This parameter can be repeated multiple times on the samecommand line to build up a list of processing steps. The sequence of commands given in thisway defines the processing pipeline which is performed on the table.
Commands may alteratively be supplied in an external file, by using the indirection character'@'. Thus a value of "@filename" causes the file filename to be read for a list of filtercommands to execute. The commands in the file may be separated by newline charactersand/or semicolons, and lines which are blank or which start with a '#' character are ignored.
ifmt = <in-format> (String)Specifies the format of the input table as specified by parameter in. The known formats arelisted in Section 5.1.1. This flag can be used if you know what format your table is in. If it hasthe special value (auto) (the default), then an attempt will be made to detect the format of thetable automatically. This cannot always be done correctly however, in which case the programwill exit with an error explaining which formats were attempted. This parameter is ignored forscheme-specified tables.
[Default: (auto)]
in = <table> (StarTable)The location of the input table. This may take one of the following forms:
• A filename.• A URL.• The special value "-", meaning standard input. In this case the input format must be given
explicitly using the ifmt parameter. Note that not all formats can be streamed in this way.• A scheme specification of the form :<scheme-name>:<scheme-args>.• A system command line with either a "<" character at the start, or a "|" character at the
end ("<syscmd" or "syscmd|"). This executes the given pipeline and reads from itsstandard output. This will probably only work on unix-like systems.
In any case, compressed data in one of the supported compression formats (gzip, Unixcompress or bzip2) will be decompressed transparently.
istream = true|false (Boolean)If set true, the input table specified by the in parameter will be read as a stream. It is necessaryto give the ifmt parameter in this case. Depending on the required operations and processingmode, this may cause the read to fail (sometimes it is necessary to read the table more thanonce). It is not normally necessary to set this flag; in most cases the data will be streamedautomatically if that is the best thing to do. However it can sometimes result in less resourceusage when processing large files in certain formats (such as VOTable). This parameter isignored for scheme-specified tables.
[Default: false]
maxrec = <int-value> (Integer)Limit to the number of rows resulting from this operation. If the value is negative (the default)no limit is imposed. Note however that there can be truncation of the result if the number ofrecords returned from a single chunk exceeds the service hard limit (2,000,000 at time ofwriting).
[Default: -1]
ocmd = <cmds> (ProcessingStep[])Specifies processing to be performed on the output table, after all other processing has takenplace. The value of this parameter is one or more of the filter commands described in Section6.1. If more than one is given, they must be separated by semicolon characters (";"). Thisparameter can be repeated multiple times on the same command line to build up a list ofprocessing steps. The sequence of commands given in this way defines the processing pipeline
SUN/256 352
which is performed on the table.
Commands may alteratively be supplied in an external file, by using the indirection character'@'. Thus a value of "@filename" causes the file filename to be read for a list of filtercommands to execute. The commands in the file may be separated by newline charactersand/or semicolons, and lines which are blank or which start with a '#' character are ignored.
ofmt = <out-format> (String)Specifies the format in which the output table will be written (one of the ones in Section 5.1.2 -matching is case-insensitive and you can use just the first few letters). If it has the specialvalue "(auto)" (the default), then the output filename will be examined to try to guess whatsort of file is required usually by looking at the extension. If it's not obvious from the filenamewhat output format is intended, an error will result.
This parameter must only be given if omode has its default value of "out".
[Default: (auto)]
omode = out|meta|stats|count|checksum|cgi|discard|topcat|samp|plastic|tosql|gui
(ProcessingMode)The mode in which the result table will be output. The default mode is out, which means thatthe result will be written as a new table to disk or elsewhere, as determined by the out andofmt parameters. However, there are other possibilities, which correspond to uses to which atable can be put other than outputting it, such as displaying metadata, calculating statistics, orpopulating a table in an SQL database. For some values of this parameter, additionalparameters (<mode-args>) are required to determine the exact behaviour.
Possible values are
• out
• meta
• stats
• count
• checksum
• cgi
• discard
• topcat
• samp
• plastic
• tosql
• gui
Use the help=omode flag or see Section 6.4 for more information.
[Default: out]
out = <out-table> (TableConsumer)The location of the output table. This is usually a filename to write to. If it is equal to thespecial value "-" (the default) the output table will be written to standard output.
This parameter must only be given if omode has its default value of "out".
[Default: -]
presort = true|false (Boolean)If true, the rows are sorted by HEALPix index before they are uploaded to the CDS X-Matchservice. If the match is done in multiple blocks, this may improve efficiency, since whenmatching against a large remote catalogue the X-Match service likes to process requests inwhich sources are grouped into a small region rather than scattered all over the sky.
Note this will have a couple of other side effects that may be undesirable: it will read all theinput rows into the task at once, which may make it harder to assess progress, and it will affectthe order of the rows in the output table.
SUN/256 353
It is probably only worth setting true for rather large (multi-million-row?) multi-blockmatches, where both local and remote catalogues are spread over a significant fraction of thesky. But feel free to experiment.
[Default: false]
ra = <expr> (String)Right ascension in degrees in the ICRS coordinate system for the position of each row of theinput table. This may simply be a column name, or it may be an algebraic expressioncalculated from columns as explained in Section 10. If left blank, an attempt is made to guessfrom UCDs, column names and unit annotations what expression to use.
radius = <value/arcsec> (Double)Maximum distance from the local table (ra,dec) position at which counterparts from the remotetable will be identified. This is a fixed value given in arcseconds, and must be in the range[0,180] (this limit is currently enforced by the CDS Xmatch service).
serviceurl = <url-value> (URL)The URL at which the CDS Xmatch service can be found. Normally this should not be alteredfrom the default, but if other implementations of the same service are known, this parametercan be used to access them.
[Default: http://cdsxmatch.u-strasbg.fr/xmatch/api/v1/sync]
suffixin = <label> (String)If the fixcols parameter is set so that input columns are renamed for insertion into the outputtable, this parameter determines how the renaming is done. It gives a suffix which is appendedto all renamed columns from the input table.
[Default: _in]
suffixremote = <label> (String)If the fixcols parameter is set so that input columns are renamed for insertion into the outputtable, this parameter determines how the renaming is done. It gives a suffix which is appendedto all renamed columns from the CDS result table.
[Default: _cds]
usemoc = true|false (Boolean)If true, first acquire a MOC coverage map from CDS, and use that to pre-filter rows beforeuploading them for matching. This should improve efficiency, but have no effect on the result.
[Default: true]
B.2.2 Examples
Here are some examples of cdsskymatch:
stilts cdsskymatch cdstable=II/246/out find=allin=dr5qso.fits ra=RA dec=DEC radius=1 out=qso_2mass.fits
Matches a local catalogue dr5qso.fits against the VizieR table II/246/out (the 2MASSPoint Source Catalogue). The search radius is 1 arcsecond, and all 2MASS sources within theradius of each input source are returned.
stilts cdsskymatch cdstable=simbad find=bestin=sources.txt ifmt=ascii ra=RAJ2000 dec=DEJ2000 radius=8.5blocksize=1000 icmd=progress omode=topcat
This finds the closest object in the SIMBAD database within 8.5 arcsec for each row of aninput ASCII table. Uploads are done in blocks of 1,000 rows at a time, and progress is
SUN/256 354
displayed on the console. When the match is complete, the result is sent directly to a runninginstance of TOPCAT.
stilts cdsskymatch in=3XMM_DR4cat_slim_v1.0.fitsicmd='select "SC_POSERR < 1 && SC_EXTENT == 0"'cdstable=B/mk/mktypesra=SC_RA dec=SC_DEC radius=1.5find=best suffixin=_XMM suffixremote=_MK fixcols=allocmd='select startsWith(spType_MK,\"G\")'out=xmm_gtype.fits
This locates XMM-Newton point-like sources identified as being of spectral type G. It uses the3XMM-DR4 XMM-Newton serendipitous source catalogue as input. The icmd filter selectsthe objects in that catalogue with well-defined point-like positions. It then matches them withSkiff's MK spectral classification catalogue (B/mk/mktypes in VizieR) and finally filters theresult to include only those sources identified as being of spectral type G. Thanks to AdaNebot (CDS) for this example.
B.3 cone: Executes a Cone Search-like query
cone is a utility to execute one of the "Simple" positional DAL query operations on a remote server:Simple Cone Search, Simple Image Access (SIA) or Simple Spectral Access (SSA). The job it doesis not very complicated: given a base URL for a service of one of these types and values for thecentral position and radius required, it assembles the query URL in the form required for therelevant protocol, retrieves the result of the query, and turns it into a table which can be operated onwith the usual STILTS pipeline operations.
B.3.1 Usage
The usage of cone is
stilts <stilts-flags> cone serviceurl=<url-value> lon=<degrees>lat=<degrees> radius=<degrees>skysys=icrs|fk5|fk4|galactic|supergalactic|eclipticservicetype=cone|ssa|sia1|sia2|sia verb=1|2|3compress=true|false dataformat=<value>ocmd=<cmds>omode=out|meta|stats|count|checksum|cgi|discard|topcat|samp|plastic|tosql|guiout=<out-table> ofmt=<out-format>
If you don't have the stilts script installed, write "java -jar stilts.jar" instead of "stilts" -see Section 3. The available <stilts-flags> are listed in Section 2.1. For programmaticinvocation, the Task class for this command is uk.ac.starlink.ttools.task.TableCone.
Parameter values are assigned on the command line as explained in Section 2.3. They are asfollows:
compress = true|false (Boolean)If true, the service is requested to provide HTTP-level compression for the response stream(Accept-Encoding header is set to "gzip", see RFC 2616). This does not guarantee thatcompression will happen but if the service honours this request it may result in a smalleramount of network traffic at the expense of more processing on the server and client.
[Default: true]
dataformat = <value> (String)Indicates the format of data objects described in the returned table. The meaning of this isdependent on the value of the servicetype parameter:
• servicetype=cone: not used
SUN/256 355

• servicetype=ssa: gives the MIME type of spectra referenced in the output table, alsospecial values "votable", "fits", "compliant", "graphic", "all", and others (value ofthe SSA FORMAT parameter).
• servicetype=sia1: gives the MIME type required for images/resources referenced in theoutput table, corresponding to the SIA FORMAT parameter. The special values"GRAPHIC" (all graphics formats) and "ALL" (no restriction) as defined by SIAv1 are alsopermissible. For SIA version 1 only, this defaults to"image/fits".
• servicetype=sia2: gives the MIME type required for images/resources referenced in theoutput table, corresponding to the SIA FORMAT parameter. The special values"GRAPHIC" (all graphics formats) and "ALL" (no restriction) as defined by SIAv1 are alsopermissible.
• servicetype=sia: gives the MIME type required for images/resources referenced in theoutput table, corresponding to the SIA FORMAT parameter. The special values"GRAPHIC" (all graphics formats) and "ALL" (no restriction) as defined by SIAv1 are alsopermissible. For SIA version 1 only, this defaults to"image/fits".
lat = <degrees> (Double)Central latitude position for cone search. By default this is the Declination, but depending onthe value of the skysys parameter it may be in a different sky system.
lon = <degrees> (Double)Central longitude position for cone search. By default this is the Right Ascension, butdepending on the value of the skysys parameter it may be in a different sky system.
ocmd = <cmds> (ProcessingStep[])Specifies processing to be performed on the output table, after all other processing has takenplace. The value of this parameter is one or more of the filter commands described in Section6.1. If more than one is given, they must be separated by semicolon characters (";"). Thisparameter can be repeated multiple times on the same command line to build up a list ofprocessing steps. The sequence of commands given in this way defines the processing pipelinewhich is performed on the table.
Commands may alteratively be supplied in an external file, by using the indirection character'@'. Thus a value of "@filename" causes the file filename to be read for a list of filtercommands to execute. The commands in the file may be separated by newline charactersand/or semicolons, and lines which are blank or which start with a '#' character are ignored.
ofmt = <out-format> (String)Specifies the format in which the output table will be written (one of the ones in Section 5.1.2 -matching is case-insensitive and you can use just the first few letters). If it has the specialvalue "(auto)" (the default), then the output filename will be examined to try to guess whatsort of file is required usually by looking at the extension. If it's not obvious from the filenamewhat output format is intended, an error will result.
This parameter must only be given if omode has its default value of "out".
[Default: (auto)]
omode = out|meta|stats|count|checksum|cgi|discard|topcat|samp|plastic|tosql|gui
(ProcessingMode)The mode in which the result table will be output. The default mode is out, which means thatthe result will be written as a new table to disk or elsewhere, as determined by the out andofmt parameters. However, there are other possibilities, which correspond to uses to which atable can be put other than outputting it, such as displaying metadata, calculating statistics, orpopulating a table in an SQL database. For some values of this parameter, additionalparameters (<mode-args>) are required to determine the exact behaviour.
Possible values are
• out
SUN/256 356

• meta
• stats
• count
• checksum
• cgi
• discard
• topcat
• samp
• plastic
• tosql
• gui
Use the help=omode flag or see Section 6.4 for more information.
[Default: out]
out = <out-table> (TableConsumer)The location of the output table. This is usually a filename to write to. If it is equal to thespecial value "-" (the default) the output table will be written to standard output.
This parameter must only be given if omode has its default value of "out".
[Default: -]
radius = <degrees> (Double)Search radius in degrees.
servicetype = cone|ssa|sia1|sia2|sia (ServiceType)Selects the type of data access service to contact. Most commonly this will be the Cone Searchservice itself, but there are one or two other possibilities:
• cone: Cone Search protocol - returns a table of objects found near each location. SeeCone Search standard.
• ssa: Simple Spectral Access protocol - returns a table of spectra near each location. SeeSSA standard.
• sia1: Simple Image Access protocol version 1 - returns a table of images near eachlocation. See SIA 1.0 standard.
• sia2: Simple Image Access protocol version 2 - returns a table of images near eachlocation. See SIA 2.0 standard.
• sia: alias for sia1
[Default: cone]
serviceurl = <url-value> (URL)The base part of a URL which defines the query to be made. Additional parameters will beappended to this using CGI syntax ("name=value", separated by '&' characters). If this valuedoes not end in either a '?' or a '&', one will be added as appropriate.
skysys = icrs|fk5|fk4|galactic|supergalactic|ecliptic (SkySystem)Sky coordinate system used to interpret the lon and lat parameters. If the value is ICRS (thedefault) the provided values are assumed to be Right Ascension and Declination and are sentunchanged; for other values they will be converted from the named system into RA and Decfirst.
[Default: icrs]
verb = 1|2|3 (String)Verbosity level of the tables returned by the query service. A value of 1 indicates the bareminimum and 3 indicates all available information.
SUN/256 357

B.3.2 Examples
Here are some examples of cone:
stilts cone serviceurl=http://gaia.ari.uni-heidelberg.de/cone/searchlon=56.75 lat=24.12 radius=0.8out=pleiades.fits
Queries the ARI-Gaia cone search service for sources within 0.8 of the given sky position, andwrites the result to a file.
stilts cone serviceurl=http://gaia.ari.uni-heidelberg.de/cone/searchlon=56.75 lat=24.12 radius=0.8verb=1ocmd='sorthead 10 phot_g_mean_mag'ocmd='keepcols "source_id ra dec phot_g_mean_mag"'
This does the same basic query as the previous example, but post-processes the result so that alimited amount of data (source identifier, position and magnitude) for only the ten brightestsources is written to the console. Since most of the columns are discarded, we specify verb=1
which indicates to the service that only a minimal column set is required in the query result.
stilts -verbosecone servicetype=ssa serviceurl='http://archive.eso.org/ssap'
lon=0 lat=90 radius=1.0 skysys=galacticomode=count
Queries the ESO Simple Spectral Access service for spectra within one degree of the northerngalactic pole. The omode=count parameter means that it just counts the rows and columns andprints the numbers to the console. The -verbose flag means that (amongst other things) thefull URL that the command used to make the query will be logged to the console.
B.4 coneskymatch: Crossmatches table on sky position against remote cone service
Note: this command is very inefficient for large tables, and in most cases cdsskymatch ortapskymatch provide better alternatives.
coneskymatch is a utility which performs a cone search-like query to a remote server for each rowof an input table. Each of these queries returns a table with one row for each item held by the serverin the region of sky represented by the input row. The results of all the queries are thenconcatenated into one big output table which is the output of this command.
The type of virtual observatory service queried is determined by the servicetype parameter.Typically it will be a Cone Search service, which queries a remote catalogue for astronomicalobjects or sources in a particular region. However, you can also query Simple Image Access andSimple Spectral Access services in just the same way, to return tables of available image andspectral resources in the relevant regions.
The identity of the server to query is given by the serviceurl parameter. Some advice about howto locate URLs for suitable services is given in Appendix B.4.3.
The effect of this command is like doing a positional crossmatch where one of the catalogues islocal and the other is remote and exposes its data via a cone search/SIA/SSA service. Because ofboth the network communication and the necessarily naive crossmatching algorithm (which scaleslinearly with the size of the local catalogue) however, it is only suitable if the local catalogue has areasonably small number of rows, unless you are prepared to wait a long time.
SUN/256 358
The parallel parameter allows you to perform multiple cone searches concurrently, so that insteadof completing the first cone search, then the second, then the third, the program can be executing anumber of them at once. This can speed up operation considerably, especially in the face of networklatency, but beware that submitting a very large number of queries simultaneously to the sameserver may overload it, resulting in some combination of failed queries, ultimately slower runtimes,and unpopularity with server admins. Best to start with a low parallelism and cautiously increase itto see whether there are gains in performance.
Note that when running, coneskymatch can generate a lot of WARNING messages. Most of theseare complaining about badly formed VOTables being returned from the cone search services.STILTS does its best to work out what the service responses mean in this case, and usually makes agood enough job of it.
Note: this task was known as multicone in its experimental form in STILTS v1.2 and v1.3.
B.4.1 Usage
The usage of coneskymatch is
stilts <stilts-flags> coneskymatch ifmt=<in-format> istream=true|falseicmd=<cmds> ocmd=<cmds>omode=out|meta|stats|count|checksum|cgi|discard|topcat|samp|plastic|tosql|guiout=<out-table> ofmt=<out-format>ra=<expr> dec=<expr> sr=<expr/deg>find=best|all|each usefoot=true|falsefootnside=<int-value>copycols=<colid-list>scorecol=<col-name> parallel=<n>erract=abort|ignore|retry|retry<n>ostream=true|false fixcols=none|dups|allsuffix0=<label> suffix1=<label>servicetype=cone|ssa|sia1|sia2|siaserviceurl=<url-value> verb=1|2|3dataformat=<value> emptyok=true|falsecompress=true|false[in=]<table>
If you don't have the stilts script installed, write "java -jar stilts.jar" instead of "stilts" -see Section 3. The available <stilts-flags> are listed in Section 2.1. For programmaticinvocation, the Task class for this command is uk.ac.starlink.ttools.task.MultiCone.
Parameter values are assigned on the command line as explained in Section 2.3. They are asfollows:
compress = true|false (Boolean)If true, the service is requested to provide HTTP-level compression for the response stream(Accept-Encoding header is set to "gzip", see RFC 2616). This does not guarantee thatcompression will happen but if the service honours this request it may result in a smalleramount of network traffic at the expense of more processing on the server and client.
[Default: true]
copycols = <colid-list> (String)List of columns from the input table which are to be copied to the output table. Each columnidentified here will be prepended to the columns of the combined output table, and its value foreach row taken from the input table row which provided the parameters of the query whichproduced it. See Section 6.3 for list syntax. The default setting is "*", which means that allcolumns from the input table are included in the output.
[Default: *]
dataformat = <value> (String)
SUN/256 359
Indicates the format of data objects described in the returned table. The meaning of this isdependent on the value of the servicetype parameter:
• servicetype=cone: not used• servicetype=ssa: gives the MIME type of spectra referenced in the output table, also
special values "votable", "fits", "compliant", "graphic", "all", and others (value ofthe SSA FORMAT parameter).
• servicetype=sia1: gives the MIME type required for images/resources referenced in theoutput table, corresponding to the SIA FORMAT parameter. The special values"GRAPHIC" (all graphics formats) and "ALL" (no restriction) as defined by SIAv1 are alsopermissible. For SIA version 1 only, this defaults to "image/fits".
• servicetype=sia2: gives the MIME type required for images/resources referenced in theoutput table, corresponding to the SIA FORMAT parameter. The special values"GRAPHIC" (all graphics formats) and "ALL" (no restriction) as defined by SIAv1 are alsopermissible.
• servicetype=sia: gives the MIME type required for images/resources referenced in theoutput table, corresponding to the SIA FORMAT parameter. The special values"GRAPHIC" (all graphics formats) and "ALL" (no restriction) as defined by SIAv1 are alsopermissible. For SIA version 1 only, this defaults to "image/fits".
dec = <expr> (String)Declination in degrees in the ICRS coordinate system for the position of each row of the inputtable. This may simply be a column name, or it may be an algebraic expression calculatedfrom columns as explained in Section 10. If left blank, an attempt is made to guess fromUCDs, column names and unit annotations what expression to use.
emptyok = true|false (Boolean)Whether the table metadata which is returned from a search result with zero rows is to bebelieved. According to the spirit, though not the letter, of the cone search standard, a conesearch service which returns no data ought nevertheless to return the correct column headings.Unfortunately this is not always the case. If this parameter is set true, it is assumed that theservice behaves properly in this respect; if it does not an error may result. In that case, set thisparameter false. A consequence of setting it false is that in the event of no results beingreturned, the task will return no table at all, rather than an empty one.
[Default: true]
erract = abort|ignore|retry|retry<n> (ConeErrorPolicy)Determines what will happen if any of the individual cone search requests fails. By default thetask aborts. That may be the best thing to do, but for unreliable or poorly implemented servicesyou may find that some searches fail and others succeed so it can be best to continue operationin the face of a few failures. The options are:
• abort: Failure of any query terminates the task.• ignore: Failure of a query is treated the same as a query which returns no rows.• retry: Failed queries are retried until they succeed; an increasing delay is introduced for
each failure. Use with care - if the failure is for some good, or at least reproducible reasonthis could prevent the task from ever completing.
• retry<n>: Failed queries are retried at most a fixed number <n> of times; an increasingdelay is introduced for each failure. If failures persist the task terminates.
[Default: abort]
find = best|all|each (String)Determines which matches are retained.
• best: Only the matching query table row closest to the input table row will be output.Input table rows with no matches will be omitted. (Note this corresponds to the best1
option in the pair matching commands, and best1 is a permitted alias).
SUN/256 360
• all: All query table rows which match the input table row will be output. Input table rowswith no matches will be omitted.
• each: There will be one output table row for each input table row. If matches are found,the closest one from the query table will be output, and in the case of no matches, thequery table columns will be blank.
[Default: all]
fixcols = none|dups|all (Fixer)Determines how input columns are renamed before use in the output table. The choices are:
• none: columns are not renamed• dups: columns which would otherwise have duplicate names in the output will be
renamed to indicate which table they came from• all: all columns will be renamed to indicate which table they came from
If columns are renamed, the new ones are determined by suffix* parameters.
[Default: dups]
footnside = <int-value> (Integer)Determines the HEALPix Nside parameter for use with the MOC footprint service. This tuningparameter determines the resolution of the footprint if available. Larger values give betterresolution, hence a better chance of avoiding unnecessary queries, but processing them takeslonger and retrieving and storing them is more expensive.
The value must be a power of 2, and at the time of writing, the MOC service will not supplyfootprints at resolutions greater than nside=512, so it should be <=512.
Only used if usefoot=true.
icmd = <cmds> (ProcessingStep[])Specifies processing to be performed on the input table as specified by parameter in, beforeany other processing has taken place. The value of this parameter is one or more of the filtercommands described in Section 6.1. If more than one is given, they must be separated bysemicolon characters (";"). This parameter can be repeated multiple times on the samecommand line to build up a list of processing steps. The sequence of commands given in thisway defines the processing pipeline which is performed on the table.
Commands may alteratively be supplied in an external file, by using the indirection character'@'. Thus a value of "@filename" causes the file filename to be read for a list of filtercommands to execute. The commands in the file may be separated by newline charactersand/or semicolons, and lines which are blank or which start with a '#' character are ignored.
ifmt = <in-format> (String)Specifies the format of the input table as specified by parameter in. The known formats arelisted in Section 5.1.1. This flag can be used if you know what format your table is in. If it hasthe special value (auto) (the default), then an attempt will be made to detect the format of thetable automatically. This cannot always be done correctly however, in which case the programwill exit with an error explaining which formats were attempted. This parameter is ignored forscheme-specified tables.
[Default: (auto)]
in = <table> (StarTable)The location of the input table. This may take one of the following forms:
• A filename.• A URL.• The special value "-", meaning standard input. In this case the input format must be given
explicitly using the ifmt parameter. Note that not all formats can be streamed in this way.• A scheme specification of the form :<scheme-name>:<scheme-args>.
SUN/256 361

• A system command line with either a "<" character at the start, or a "|" character at theend ("<syscmd" or "syscmd|"). This executes the given pipeline and reads from itsstandard output. This will probably only work on unix-like systems.
In any case, compressed data in one of the supported compression formats (gzip, Unixcompress or bzip2) will be decompressed transparently.
istream = true|false (Boolean)If set true, the input table specified by the in parameter will be read as a stream. It is necessaryto give the ifmt parameter in this case. Depending on the required operations and processingmode, this may cause the read to fail (sometimes it is necessary to read the table more thanonce). It is not normally necessary to set this flag; in most cases the data will be streamedautomatically if that is the best thing to do. However it can sometimes result in less resourceusage when processing large files in certain formats (such as VOTable). This parameter isignored for scheme-specified tables.
[Default: false]
ocmd = <cmds> (ProcessingStep[])Specifies processing to be performed on the output table, after all other processing has takenplace. The value of this parameter is one or more of the filter commands described in Section6.1. If more than one is given, they must be separated by semicolon characters (";"). Thisparameter can be repeated multiple times on the same command line to build up a list ofprocessing steps. The sequence of commands given in this way defines the processing pipelinewhich is performed on the table.
Commands may alteratively be supplied in an external file, by using the indirection character'@'. Thus a value of "@filename" causes the file filename to be read for a list of filtercommands to execute. The commands in the file may be separated by newline charactersand/or semicolons, and lines which are blank or which start with a '#' character are ignored.
ofmt = <out-format> (String)Specifies the format in which the output table will be written (one of the ones in Section 5.1.2 -matching is case-insensitive and you can use just the first few letters). If it has the specialvalue "(auto)" (the default), then the output filename will be examined to try to guess whatsort of file is required usually by looking at the extension. If it's not obvious from the filenamewhat output format is intended, an error will result.
This parameter must only be given if omode has its default value of "out".
[Default: (auto)]
omode = out|meta|stats|count|checksum|cgi|discard|topcat|samp|plastic|tosql|gui
(ProcessingMode)The mode in which the result table will be output. The default mode is out, which means thatthe result will be written as a new table to disk or elsewhere, as determined by the out andofmt parameters. However, there are other possibilities, which correspond to uses to which atable can be put other than outputting it, such as displaying metadata, calculating statistics, orpopulating a table in an SQL database. For some values of this parameter, additionalparameters (<mode-args>) are required to determine the exact behaviour.
Possible values are
• out
• meta
• stats
• count
• checksum
• cgi
• discard
• topcat
SUN/256 362

• samp
• plastic
• tosql
• gui
Use the help=omode flag or see Section 6.4 for more information.
[Default: out]
ostream = true|false (Boolean)If set true, this will cause the operation to stream on output, so that the output table is built upas the results are obtained from the cone search service. The disadvantage of this is that someoutput modes and formats need multiple passes through the data to work, so depending on theoutput destination, the operation may fail if this is set. Use with care (or be prepared for theoperation to fail).
[Default: false]
out = <out-table> (TableConsumer)The location of the output table. This is usually a filename to write to. If it is equal to thespecial value "-" (the default) the output table will be written to standard output.
This parameter must only be given if omode has its default value of "out".
[Default: -]
parallel = <n> (Integer)Allows multiple cone searches to be performed concurrently. If set to the default value, 1, thecone query corresponding to the first row of the input table will be dispatched, when that iscompleted the query corresponding to the second row will be dispatched, and so on. If set to<n>, then queries will be overlapped in such a way that up to approximately <n> may berunning at any one time.
Whether increasing <n> is a good idea, and what might be a sensible maximum value, dependson the characteristics of the service being queried. In particular, setting it to too large a numbermay overload the service resulting in some combination of failed queries, ultimately slowerruntimes, and unpopularity with server admins.
The maximum value permitted for this parameter by default is 5. This limit may be raised byuse of the service.maxparallel system property but use that option with great care since youmay overload services and make yourself unpopular with data centre admins. As a rule, youshould only increase this value if you have obtained permission from the data centres whoseservices on which you will be using the increased parallelism.
[Default: 1]
ra = <expr> (String)Right ascension in degrees in the ICRS coordinate system for the position of each row of theinput table. This may simply be a column name, or it may be an algebraic expressioncalculated from columns as explained in Section 10. If left blank, an attempt is made to guessfrom UCDs, column names and unit annotations what expression to use.
scorecol = <col-name> (String)Gives the name of a column in the output table to contain the distance between the requestedcentral position and the actual position of the returned row. The distance returned is an angulardistance in degrees. If a null value is chosen, no distance column will appear in the outputtable.
[Default: Separation]
servicetype = cone|ssa|sia1|sia2|sia (ServiceType)Selects the type of data access service to contact. Most commonly this will be the Cone Searchservice itself, but there are one or two other possibilities:
SUN/256 363
• cone: Cone Search protocol - returns a table of objects found near each location. SeeCone Search standard.
• ssa: Simple Spectral Access protocol - returns a table of spectra near each location. SeeSSA standard.
• sia1: Simple Image Access protocol version 1 - returns a table of images near eachlocation. See SIA 1.0 standard.
• sia2: Simple Image Access protocol version 2 - returns a table of images near eachlocation. See SIA 2.0 standard.
• sia: alias for sia1
[Default: cone]
serviceurl = <url-value> (URL)The base part of a URL which defines the queries to be made. Additional parameters will beappended to this using CGI syntax ("name=value", separated by '&' characters). If this valuedoes not end in either a '?' or a '&', one will be added as appropriate.
See Appendix B.4.3 for discussion of how to locate service URLs corresponding to givendatasets.
sr = <expr/deg> (String)Expression which evaluates to the search radius in degrees for the request at each row of theinput table. This will often be a constant numerical value, but may be the name or ID of acolumn in the input table, or a function involving one.
suffix0 = <label> (String)If the fixcols parameter is set so that input columns are renamed for insertion into the outputtable, this parameter determines how the renaming is done. It gives a suffix which is appendedto all renamed columns from the input table.
[Default: _0]
suffix1 = <label> (String)If the fixcols parameter is set so that input columns are renamed for insertion into the outputtable, this parameter determines how the renaming is done. It gives a suffix which is appendedto all renamed columns from the cone result table.
[Default: _1]
usefoot = true|false (Boolean)Determines whether an attempt will be made to restrict searches in accordance with availablefootprint information. If this is set true, then before any of the per-row queries are performed,an attempt may be made to acquire footprint information about the servce. If such informationcan be obtained, then queries which fall outside the footprint, and hence which are known toyield no results, are skipped. This can speed up the search considerably.
Currently, the only footprints available are those provided by the CDS MOC (Multi-OrderCoverage map) service, which covers VizieR and a few other cone search services.
[Default: true]
verb = 1|2|3 (String)Verbosity level of the tables returned by the query service. A value of 1 indicates the bareminimum and 3 indicates all available information.
B.4.2 Examples
Here are some examples of coneskymatch:
stilts coneskymatch serviceurl=http://archive.stsci.edu/hst/search.php \
SUN/256 364
in=messier.xml sr=0.05 out=matches.xml
This queries the HST cone search service from Space Telescope for records within .05 degreesof each Messier object contained in a local VOTable messier.xml. The sky positions in theinput catalogue are guessed from the available table metadata. The result is written to a newVOTable, matches.xml. Since the servicetype parameter is not given, the default (conesearch) service type is assumed.
stilts coneskymatchservicetype=sia \serviceurl=http://irsa.ipac.caltech.edu/cgi-bin/2MASS/IM/nph-im_sia?type=ql&ds=asky \in=messier.xml ra=RA dec=DEC \dataformat=image/fits \out=fitsimages.xml
This is similar to the previous example, but instead of querying an HST cone search server forcatalogue objects near the input table positions, it queries a 2MASS Simple Image Access(SIA) server for images. It also explicitly names the columns holding the J2000 positions ofreach record in the input catalogue as RA and DEC. The search radius parameter (sr) is not sethere; for SIA queries the default search radius is zero, which has the special meaning ofincluding any image which covers the requested position. Setting dataformat=image/fits
(which is the default) requests only records describing FITS-format images to be returned;setting it to an empty value might return other formats such as JPEG too.
stilts coneskymatch \serviceurl='http://www.nofs.navy.mil/cgi-bin/vo_cone.cgi?CAT=NOMAD' \in=vizier.xml#7 \icmd='addskycoords -inunit sex fk4 fk5 RAB1950 DEB1950 RAJ2000 DEJ2000' \icmd='progress'ra=RAJ2000 dec=DEJ2000 sr=0.01 \ocmd='replacecol -units deg RA hmsToDegrees(RA[0],RA[1],RA[2])' \ocmd='replacecol -units deg DEC dmsToDegrees(DEC[0],DEC[1],DEC[2])' \omode=topcat
In this example some pre-processing of the input catalogue and post-processing of the outputcatalogue is performed as well as the multiple cone search itself.
The input catalogue, which is the 8th TABLE element in a VOTable file, contains skypositions in sexagesimal FK4 (B1950) coordinates. The icmd=addskycoords... parameterspecifies a filter which will add new columns in FK5 (J2000) degrees, which are what theconeskymatch command requires. The icmd=progress parameter specifies a filter which willwrite progress information to the terminal so you can see how the queries are progressing.
The NOMAD service specified by the serviceurl parameter used here happens to returnresults with the RA/DEC columns represented in a rather eccentric format, namely 3-elementfloating point arrays representing (hours,minutes,seconds)/(degrees,minutes,seconds). The twoocmd=replacecol... filters replace the values of these columns with the scalar equivalents indegrees. Finally, the omode=topcat parameter causes the result table to be loaded directly intoTOPCAT (if it is available).
stilts coneskymatch serviceurl='http://archive.stsci.edu/iue/search.php?' \in=queries.txt ifmt=ascii \ra='$1' dec='$2' \sr='$3' copycols='$4' \out=found.fits
Here the input is a plain text table with four unnamed columns, giving in order the rightascension, declination, positional error and name of target objects. The command carries out acone search to the named service for each one. Note in this case the search radius (srparameter) is taken from the table and so varies for each query. The copycols parameter hasthe value '$4', which means that the value of the fourth column of the input table will beprepended to each row of the output table for which it is responsible. Output is to a FITS table.
SUN/256 365
B.4.3 Locating Cone Query Service URLs
To use the coneskymatch command you need the service URL (also known as the base URL oraccess URL) of a cone search, SIA or SSA service to use. If you know one of these representing aservice that you wish to use, you can use it directly.
If you don't, you will need to find the URL from somewhere. It is the job of the Virtual ObservatoryRegistry to keep a record of where you can find various astronomical services, so this is where youshould look.
There are various ways you can interrogate the registry; the easiest is probably to use a graphicalregistry search tool. One such tool is AstroGrid's VOExplorer, which allows you to performsophisticated searches for cone search, SIA or SSA services. Another option is to use TOPCAT; theCone Search, SIA and SSA load dialogues allow you to search the registry for these services priorto performing a query; you can just use the registry part and cut'n'paste the URL which is shown.
Other registry querying tools are available, including STILTS's regquery (Appendix B.17)command. See that section of the manual for details, but for instance to locate registered ConeSearch services which have something to do with SDSS data, you could execute the following:
stilts regquery query="capability/@standardID = 'ivo://ivoa.net/std/ConeSearch' and title like '%SDSS%'" \ocmd="keepcols 'shortName AccessUrl'" \ofmt=ascii
Writing just query="capability/@standardID = 'ivo://ivoa.net/std/ConeSearch'" with nofurther qualification would give you all registered cone search services.
B.5 datalinklint: Validates DataLink documents
datalinklint runs a series of tests on a VOTable that is supposed to conform to the{links}-response format defined in the IVOA DataLink specification, and reports the results. This isnot likely to be of use to normal users, it is intended for people developing or operatingDataLink-compliant services to assess correctness, perhaps with a view to improving compliance.
To run it, you point it at the URL or filename of a VOTable of interest, and it runs various tests onit and reports them to standard output. Only the input table itself, and if the input location usesHTTP the HTTP headers, are tested, this validator does not inspect any other resources. As well asvalidation checks, some reporting of the table's content (such as a summary of the link defined byeach row and a listing of the defined service descriptors) is provided as INFO-level output forconvenience. This can be suppressed if preferred by use of the report parameter.
This operates in much the same way as the taplint command, and the output has a similar format,though unlike taplint this command does not divide the testing up into stages. Each report line isof the form:
T-MMMMxN aaaaa...
where the parts have the following meanings:
• T: Report type, one of E(rror), W(arning), I(nfo), S(ummary), F(ailure). See the documentationof the report parameter for further description of what these mean. The report parameter canbe used to suppress some of these; only E indicates actual service compliance errors, butincluding the others may make it easier to see what's going on.
• MMMM: Message label, which is always the same for messages generated by the same test, isusually different for messages generated by different tests, and may be somewhat mnemonic.
• x: Continuation indicator, either "-" or "+". In most cases it is "-", indicating the first line of a
SUN/256 366
message, but multi-line messages (rare) use "-" for the first line and "+" for any continuationlines.
• N: Sequence number, which is 1 for the first time message T-MMMM is reported, and increases byone for each subsequent appearance. After a certain maximum (determined by the maxrepeat
parameter) additional reports with the same code are no longer output individually, but asummary of the number of reports so discarded is written at the end of the section with thecharacter "x" instead of the sequence number. This behaviour prevents the output beingswamped by multiple reports of the same issue. If the maxrepeat parameter is increased above9, more than one digit will be used here (so e.g. for maxrepeat=999, the format would be NNN
not N).• aaaaa...: Message text, a free text description of what is being reported.
If you don't like that format, others may be selected using the format parameter, which currentlyalso supports JSON. For more flexible interaction with the output you can invoke taplint
programmatically and supply your own OutputReporter instance.
As with any validator, this command does not guarantee to pick up everything wrong with theindicated VOTable, but it tries as hard as it can to check against the rules set out in the DataLinkspecification and other related documents as appropriate. A non-exhaustive list of the items checkedis:
• VOTable validation à la votlint
• Correct RESOURCE structure of VOTable document• All required columns are present with mandated metadata• Each row contains one of access_url, service_def, error_message• Service descriptors correctly specified and referenced• Syntax of error_message column values• Syntax of content_type column values• Syntax of semantics column values• Reported HTTP content-type, if applicable• Correct serialization (TABLEDATA) is used• DALI error-response checking, if applicable
At present no checking is performed on the link targets; tests are confined to the presenteddocument itself.
HTTP connections made by this validator are flagged in the User-Agent field with the token"(IVOA-test)".
B.5.1 Usage
The usage of datalinklint is
stilts <stilts-flags> datalinklint format=text|json report=[EWISF]+maxrepeat=<int-value>truncate=<int-value> debug=true|false[votable=]<filename>|<URL>|-
If you don't have the stilts script installed, write "java -jar stilts.jar" instead of "stilts" -see Section 3. The available <stilts-flags> are listed in Section 2.1. For programmaticinvocation, the Task class for this command is uk.ac.starlink.ttools.task.DatalinkLint.
Parameter values are assigned on the command line as explained in Section 2.3. They are asfollows:
debug = true|false (Boolean)If true, debugging output including stack traces will be output along with the normal validation
SUN/256 367
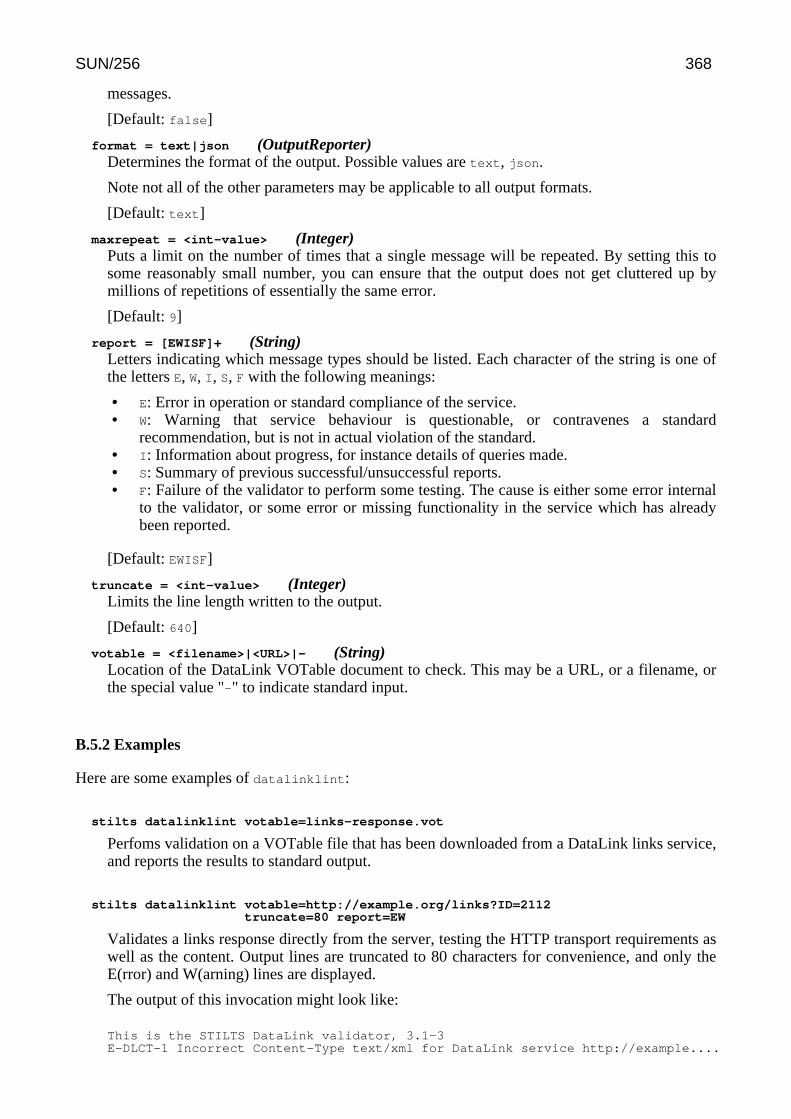
messages.
[Default: false]
format = text|json (OutputReporter)Determines the format of the output. Possible values are text, json.
Note not all of the other parameters may be applicable to all output formats.
[Default: text]
maxrepeat = <int-value> (Integer)Puts a limit on the number of times that a single message will be repeated. By setting this tosome reasonably small number, you can ensure that the output does not get cluttered up bymillions of repetitions of essentially the same error.
[Default: 9]
report = [EWISF]+ (String)Letters indicating which message types should be listed. Each character of the string is one ofthe letters E, W, I, S, F with the following meanings:
• E: Error in operation or standard compliance of the service.• W: Warning that service behaviour is questionable, or contravenes a standard
recommendation, but is not in actual violation of the standard.• I: Information about progress, for instance details of queries made.• S: Summary of previous successful/unsuccessful reports.• F: Failure of the validator to perform some testing. The cause is either some error internal
to the validator, or some error or missing functionality in the service which has alreadybeen reported.
[Default: EWISF]
truncate = <int-value> (Integer)Limits the line length written to the output.
[Default: 640]
votable = <filename>|<URL>|- (String)Location of the DataLink VOTable document to check. This may be a URL, or a filename, orthe special value "-" to indicate standard input.
B.5.2 Examples
Here are some examples of datalinklint:
stilts datalinklint votable=links-response.vot
Perfoms validation on a VOTable file that has been downloaded from a DataLink links service,and reports the results to standard output.
stilts datalinklint votable=http://example.org/links?ID=2112truncate=80 report=EW
Validates a links response directly from the server, testing the HTTP transport requirements aswell as the content. Output lines are truncated to 80 characters for convenience, and only theE(rror) and W(arning) lines are displayed.
The output of this invocation might look like:
This is the STILTS DataLink validator, 3.1-3E-DLCT-1 Incorrect Content-Type text/xml for DataLink service http://example....
SUN/256 368
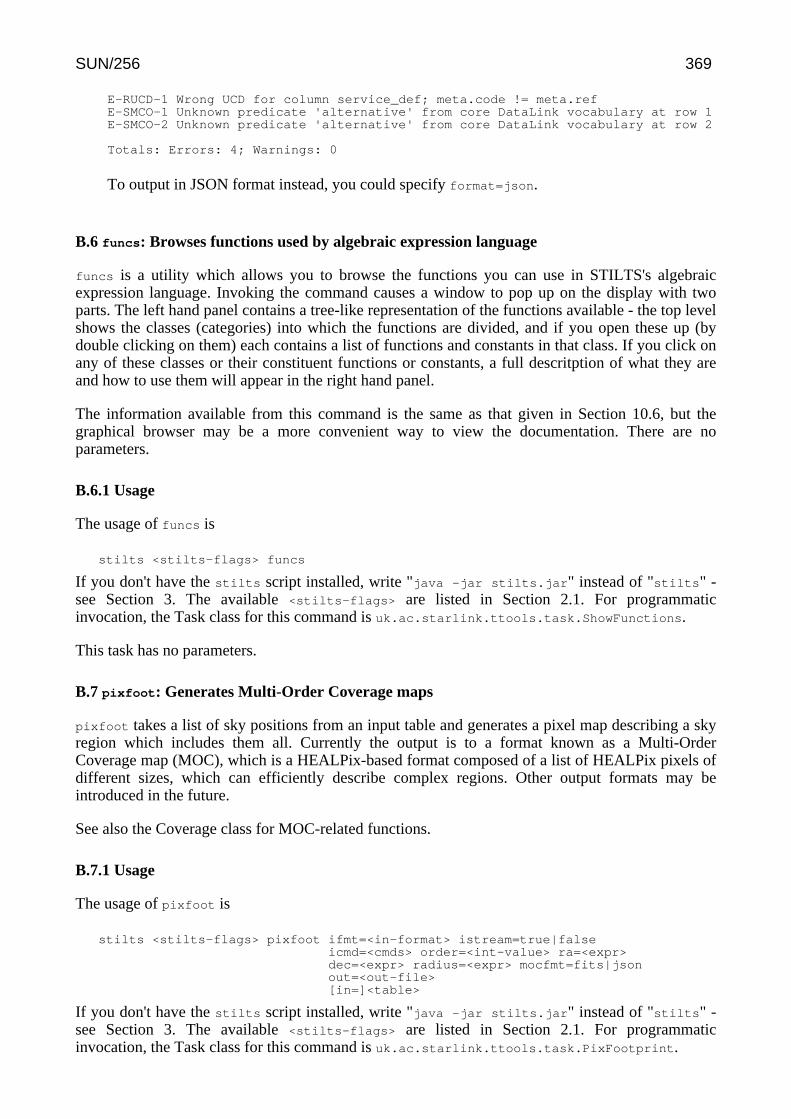
E-RUCD-1 Wrong UCD for column service_def; meta.code != meta.refE-SMCO-1 Unknown predicate 'alternative' from core DataLink vocabulary at row 1E-SMCO-2 Unknown predicate 'alternative' from core DataLink vocabulary at row 2
Totals: Errors: 4; Warnings: 0
To output in JSON format instead, you could specify format=json.
B.6 funcs: Browses functions used by algebraic expression language
funcs is a utility which allows you to browse the functions you can use in STILTS's algebraicexpression language. Invoking the command causes a window to pop up on the display with twoparts. The left hand panel contains a tree-like representation of the functions available - the top levelshows the classes (categories) into which the functions are divided, and if you open these up (bydouble clicking on them) each contains a list of functions and constants in that class. If you click onany of these classes or their constituent functions or constants, a full descritption of what they areand how to use them will appear in the right hand panel.
The information available from this command is the same as that given in Section 10.6, but thegraphical browser may be a more convenient way to view the documentation. There are noparameters.
B.6.1 Usage
The usage of funcs is
stilts <stilts-flags> funcs
If you don't have the stilts script installed, write "java -jar stilts.jar" instead of "stilts" -see Section 3. The available <stilts-flags> are listed in Section 2.1. For programmaticinvocation, the Task class for this command is uk.ac.starlink.ttools.task.ShowFunctions.
This task has no parameters.
B.7 pixfoot: Generates Multi-Order Coverage maps
pixfoot takes a list of sky positions from an input table and generates a pixel map describing a skyregion which includes them all. Currently the output is to a format known as a Multi-OrderCoverage map (MOC), which is a HEALPix-based format composed of a list of HEALPix pixels ofdifferent sizes, which can efficiently describe complex regions. Other output formats may beintroduced in the future.
See also the Coverage class for MOC-related functions.
B.7.1 Usage
The usage of pixfoot is
stilts <stilts-flags> pixfoot ifmt=<in-format> istream=true|falseicmd=<cmds> order=<int-value> ra=<expr>dec=<expr> radius=<expr> mocfmt=fits|jsonout=<out-file>[in=]<table>
If you don't have the stilts script installed, write "java -jar stilts.jar" instead of "stilts" -see Section 3. The available <stilts-flags> are listed in Section 2.1. For programmaticinvocation, the Task class for this command is uk.ac.starlink.ttools.task.PixFootprint.
SUN/256 369
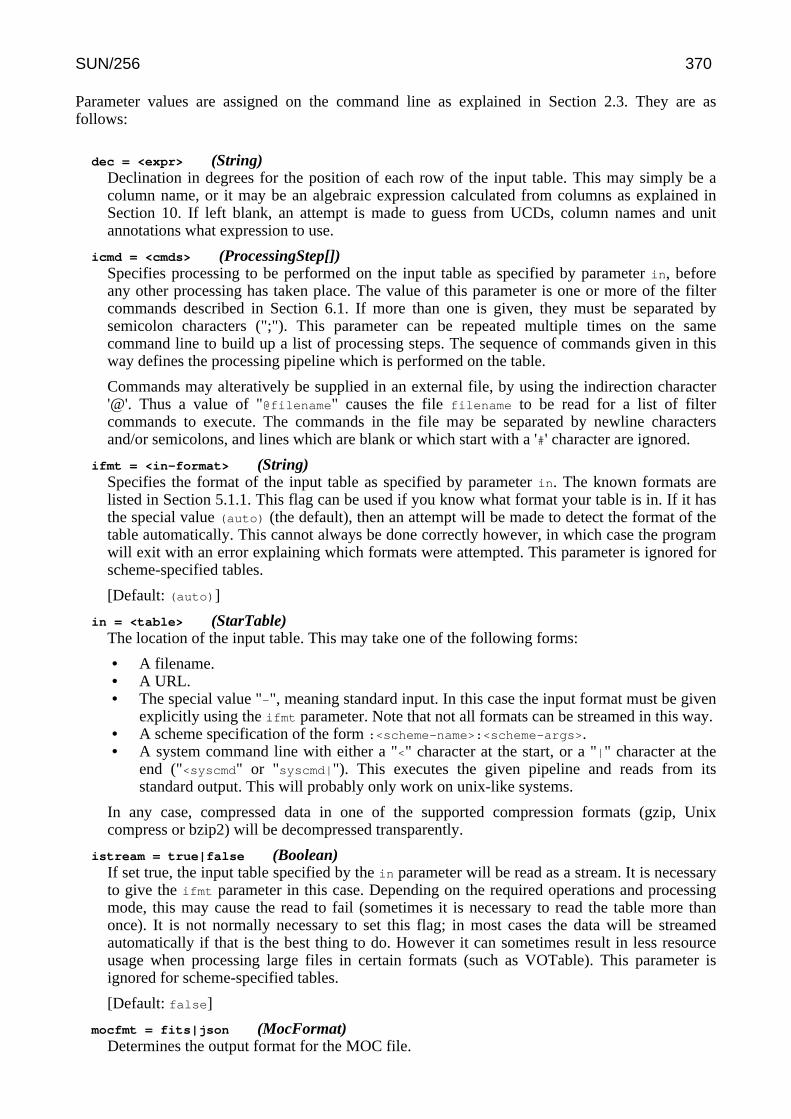
Parameter values are assigned on the command line as explained in Section 2.3. They are asfollows:
dec = <expr> (String)Declination in degrees for the position of each row of the input table. This may simply be acolumn name, or it may be an algebraic expression calculated from columns as explained inSection 10. If left blank, an attempt is made to guess from UCDs, column names and unitannotations what expression to use.
icmd = <cmds> (ProcessingStep[])Specifies processing to be performed on the input table as specified by parameter in, beforeany other processing has taken place. The value of this parameter is one or more of the filtercommands described in Section 6.1. If more than one is given, they must be separated bysemicolon characters (";"). This parameter can be repeated multiple times on the samecommand line to build up a list of processing steps. The sequence of commands given in thisway defines the processing pipeline which is performed on the table.
Commands may alteratively be supplied in an external file, by using the indirection character'@'. Thus a value of "@filename" causes the file filename to be read for a list of filtercommands to execute. The commands in the file may be separated by newline charactersand/or semicolons, and lines which are blank or which start with a '#' character are ignored.
ifmt = <in-format> (String)Specifies the format of the input table as specified by parameter in. The known formats arelisted in Section 5.1.1. This flag can be used if you know what format your table is in. If it hasthe special value (auto) (the default), then an attempt will be made to detect the format of thetable automatically. This cannot always be done correctly however, in which case the programwill exit with an error explaining which formats were attempted. This parameter is ignored forscheme-specified tables.
[Default: (auto)]
in = <table> (StarTable)The location of the input table. This may take one of the following forms:
• A filename.• A URL.• The special value "-", meaning standard input. In this case the input format must be given
explicitly using the ifmt parameter. Note that not all formats can be streamed in this way.• A scheme specification of the form :<scheme-name>:<scheme-args>.• A system command line with either a "<" character at the start, or a "|" character at the
end ("<syscmd" or "syscmd|"). This executes the given pipeline and reads from itsstandard output. This will probably only work on unix-like systems.
In any case, compressed data in one of the supported compression formats (gzip, Unixcompress or bzip2) will be decompressed transparently.
istream = true|false (Boolean)If set true, the input table specified by the in parameter will be read as a stream. It is necessaryto give the ifmt parameter in this case. Depending on the required operations and processingmode, this may cause the read to fail (sometimes it is necessary to read the table more thanonce). It is not normally necessary to set this flag; in most cases the data will be streamedautomatically if that is the best thing to do. However it can sometimes result in less resourceusage when processing large files in certain formats (such as VOTable). This parameter isignored for scheme-specified tables.
[Default: false]
mocfmt = fits|json (MocFormat)Determines the output format for the MOC file.
SUN/256 370
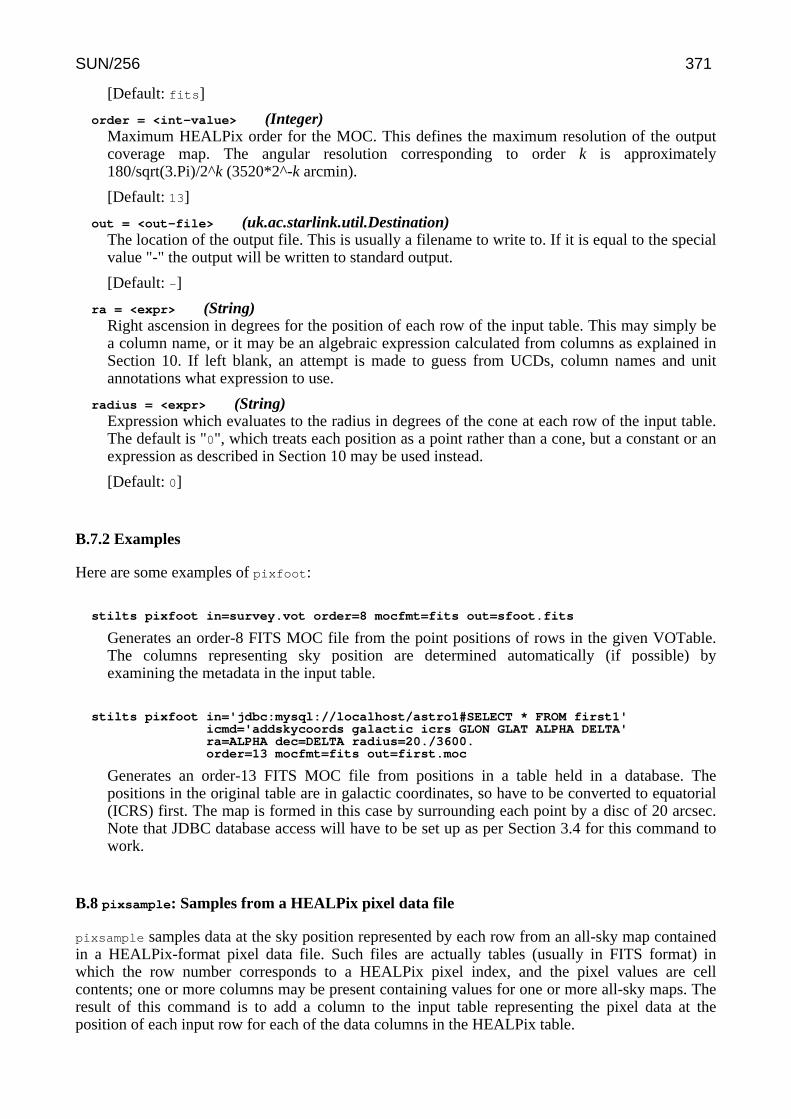
[Default: fits]
order = <int-value> (Integer)Maximum HEALPix order for the MOC. This defines the maximum resolution of the outputcoverage map. The angular resolution corresponding to order k is approximately180/sqrt(3.Pi)/2^k (3520*2^-k arcmin).
[Default: 13]
out = <out-file> (uk.ac.starlink.util.Destination)The location of the output file. This is usually a filename to write to. If it is equal to the specialvalue "-" the output will be written to standard output.
[Default: -]
ra = <expr> (String)Right ascension in degrees for the position of each row of the input table. This may simply bea column name, or it may be an algebraic expression calculated from columns as explained inSection 10. If left blank, an attempt is made to guess from UCDs, column names and unitannotations what expression to use.
radius = <expr> (String)Expression which evaluates to the radius in degrees of the cone at each row of the input table.The default is "0", which treats each position as a point rather than a cone, but a constant or anexpression as described in Section 10 may be used instead.
[Default: 0]
B.7.2 Examples
Here are some examples of pixfoot:
stilts pixfoot in=survey.vot order=8 mocfmt=fits out=sfoot.fits
Generates an order-8 FITS MOC file from the point positions of rows in the given VOTable.The columns representing sky position are determined automatically (if possible) byexamining the metadata in the input table.
stilts pixfoot in='jdbc:mysql://localhost/astro1#SELECT * FROM first1'icmd='addskycoords galactic icrs GLON GLAT ALPHA DELTA'ra=ALPHA dec=DELTA radius=20./3600.order=13 mocfmt=fits out=first.moc
Generates an order-13 FITS MOC file from positions in a table held in a database. Thepositions in the original table are in galactic coordinates, so have to be converted to equatorial(ICRS) first. The map is formed in this case by surrounding each point by a disc of 20 arcsec.Note that JDBC database access will have to be set up as per Section 3.4 for this command towork.
B.8 pixsample: Samples from a HEALPix pixel data file
pixsample samples data at the sky position represented by each row from an all-sky map containedin a HEALPix-format pixel data file. Such files are actually tables (usually in FITS format) inwhich the row number corresponds to a HEALPix pixel index, and the pixel values are cellcontents; one or more columns may be present containing values for one or more all-sky maps. Theresult of this command is to add a column to the input table representing the pixel data at theposition of each input row for each of the data columns in the HEALPix table.
SUN/256 371
This command does not attempt to convert between coordinate systems except as instructed, so it isimportant to know what coordinate system the HEALPix file is in, and ensure that the coordinatessupplied from the input table match this. You may need to examine the documentation or headers ofthe HEALPix file in question to find out. See the Examples section for some examples.
There is a choice of how the sampling is done; the simplest way is just to use the value of the pixelcovering the indicated position. An alternative is to average over a disc of given radius (perhaps afunction of the input row). Other options (e.g. max/min) could easily be added.
Although HEALPix is not a common format for storing image data in general, it is used for storinga number of important all-sky data sets such as the WMAP results and Schlegel dust maps. TheNASA LAMBDA (http://lambda.gsfc.nasa.gov/) (Legacy Archive for Microwave Background DataAnalysis) archive has a number of maps in a suitable format, including foreground data likepredicted reddening as well as CMB maps.
Note at present this command only supports all-sky, not partial, HEALPix maps. Partial mapsupport may be added at some point in the future if there is demand.
B.8.1 Usage
The usage of pixsample is
stilts <stilts-flags> pixsample in=<table> ifmt=<in-format> icmd=<cmds>pixdata=<pix-table> pfmt=<in-format>pcmd=<cmds> ocmd=<cmds>omode=out|meta|stats|count|checksum|cgi|discard|topcat|samp|plastic|tosql|guiout=<out-table> ofmt=<out-format>pixorder=nested|ring|(auto) stat=point|meanlon=<expr> lat=<expr>insys=icrs|fk5|fk4|galactic|supergalactic|eclipticpixsys=icrs|fk5|fk4|galactic|supergalactic|eclipticradius=<expr>
If you don't have the stilts script installed, write "java -jar stilts.jar" instead of "stilts" -see Section 3. The available <stilts-flags> are listed in Section 2.1. For programmaticinvocation, the Task class for this command is uk.ac.starlink.ttools.task.PixSample.
Parameter values are assigned on the command line as explained in Section 2.3. They are asfollows:
icmd = <cmds> (ProcessingStep[])Specifies processing to be performed on the input table as specified by parameter in, beforeany other processing has taken place. The value of this parameter is one or more of the filtercommands described in Section 6.1. If more than one is given, they must be separated bysemicolon characters (";"). This parameter can be repeated multiple times on the samecommand line to build up a list of processing steps. The sequence of commands given in thisway defines the processing pipeline which is performed on the table.
Commands may alteratively be supplied in an external file, by using the indirection character'@'. Thus a value of "@filename" causes the file filename to be read for a list of filtercommands to execute. The commands in the file may be separated by newline charactersand/or semicolons, and lines which are blank or which start with a '#' character are ignored.
ifmt = <in-format> (String)Specifies the format of the input table as specified by parameter in. The known formats arelisted in Section 5.1.1. This flag can be used if you know what format your table is in. If it hasthe special value (auto) (the default), then an attempt will be made to detect the format of thetable automatically. This cannot always be done correctly however, in which case the programwill exit with an error explaining which formats were attempted. This parameter is ignored for
SUN/256 372
scheme-specified tables.
[Default: (auto)]
in = <table> (StarTable)The location of the input table. This may take one of the following forms:
• A filename.• A URL.• The special value "-", meaning standard input. In this case the input format must be given
explicitly using the ifmt parameter. Note that not all formats can be streamed in this way.• A scheme specification of the form :<scheme-name>:<scheme-args>.• A system command line with either a "<" character at the start, or a "|" character at the
end ("<syscmd" or "syscmd|"). This executes the given pipeline and reads from itsstandard output. This will probably only work on unix-like systems.
In any case, compressed data in one of the supported compression formats (gzip, Unixcompress or bzip2) will be decompressed transparently.
insys = icrs|fk5|fk4|galactic|supergalactic|ecliptic (SkySystem)Specifies the sky coordinate system in which sample positions are provided by the lon/latparameters. If the sample positions are given in the same coordinate system as that given bythe pixel data table, both the insys and pixsys parameters may be set null.
The available coordinate systems are:
• icrs: ICRS (Right Ascension, Declination)• fk5: FK5 J2000.0 (Right Ascension, Declination)• fk4: FK4 B1950.0 (Right Ascension, Declination)• galactic: IAU 1958 Galactic (Longitude, Latitude)• supergalactic: de Vaucouleurs Supergalactic (Longitude, Latitude)• ecliptic: Ecliptic (Longitude, Latitude)
lat = <expr> (String)Expression which evaluates to the latitude coordinate in degrees in the input table at whichpositions are to be sampled from the pixel data table. This will usually be the name or ID of acolumn in the input table, or an expression involving one. If this coordinate does not match thecoordinate system used by the pixel data table, both coordinate systems must be set using theinsys and pixsys parameters.
lon = <expr> (String)Expression which evaluates to the longitude coordinate in degrees in the input table at whichpositions are to be sampled from the pixel data table. This will usually be the name or ID of acolumn in the input table, or an expression involving one. If this coordinate does not match thecoordinate system used by the pixel data table, both coordinate systems must be set using theinsys and pixsys parameters.
ocmd = <cmds> (ProcessingStep[])Specifies processing to be performed on the output table, after all other processing has takenplace. The value of this parameter is one or more of the filter commands described in Section6.1. If more than one is given, they must be separated by semicolon characters (";"). Thisparameter can be repeated multiple times on the same command line to build up a list ofprocessing steps. The sequence of commands given in this way defines the processing pipelinewhich is performed on the table.
Commands may alteratively be supplied in an external file, by using the indirection character'@'. Thus a value of "@filename" causes the file filename to be read for a list of filtercommands to execute. The commands in the file may be separated by newline charactersand/or semicolons, and lines which are blank or which start with a '#' character are ignored.
ofmt = <out-format> (String)
SUN/256 373
Specifies the format in which the output table will be written (one of the ones in Section 5.1.2 -matching is case-insensitive and you can use just the first few letters). If it has the specialvalue "(auto)" (the default), then the output filename will be examined to try to guess whatsort of file is required usually by looking at the extension. If it's not obvious from the filenamewhat output format is intended, an error will result.
This parameter must only be given if omode has its default value of "out".
[Default: (auto)]
omode = out|meta|stats|count|checksum|cgi|discard|topcat|samp|plastic|tosql|gui
(ProcessingMode)The mode in which the result table will be output. The default mode is out, which means thatthe result will be written as a new table to disk or elsewhere, as determined by the out andofmt parameters. However, there are other possibilities, which correspond to uses to which atable can be put other than outputting it, such as displaying metadata, calculating statistics, orpopulating a table in an SQL database. For some values of this parameter, additionalparameters (<mode-args>) are required to determine the exact behaviour.
Possible values are
• out
• meta
• stats
• count
• checksum
• cgi
• discard
• topcat
• samp
• plastic
• tosql
• gui
Use the help=omode flag or see Section 6.4 for more information.
[Default: out]
out = <out-table> (TableConsumer)The location of the output table. This is usually a filename to write to. If it is equal to thespecial value "-" (the default) the output table will be written to standard output.
This parameter must only be given if omode has its default value of "out".
[Default: -]
pcmd = <cmds> (ProcessingStep[])Specifies processing to be performed on pixel data table as specified by parameter pixdata,before any other processing has taken place. The value of this parameter is one or more of thefilter commands described in Section 6.1. If more than one is given, they must be separated bysemicolon characters (";"). This parameter can be repeated multiple times on the samecommand line to build up a list of processing steps. The sequence of commands given in thisway defines the processing pipeline which is performed on the table.
Commands may alteratively be supplied in an external file, by using the indirection character'@'. Thus a value of "@filename" causes the file filename to be read for a list of filtercommands to execute. The commands in the file may be separated by newline charactersand/or semicolons, and lines which are blank or which start with a '#' character are ignored.
pfmt = <in-format> (String)File format for the HEALPix pixel data table. This is usually, but not necessarily, FITS.
[Default: (auto)]
SUN/256 374
pixdata = <pix-table> (StarTable)The location of the table containing the pixel data. The data must be in the form of a HEALPixtable, with one pixel per row in HEALPix order. These files are typically, but not necessarily,FITS tables. A filename or URL may be used, but a local file will be more efficient.
Some HEALPix format FITS tables seem to have rows which contain 1024-element arrays ofpixels instead of single pixel values. This (rather perverse?) format is not currently supportedhere, but if there is demand support could be added.
pixorder = nested|ring|(auto) (HealpixScheme)Selects the pixel ordering scheme used by the pixel data file. There are two different ways ofordering pixels in a HEALPix file, "ring" and "nested", and the sampler needs to know whichone is in use. If you know which is in use, choose the appropriate value for this parameter; if(auto) is used it will attempt to work it out from headers in the file (the ORDERING header).If no reliable ordering scheme can be determined, the command will fail with an error.
[Default: (auto)]
pixsys = icrs|fk5|fk4|galactic|supergalactic|ecliptic (SkySystem)Specifies the sky coordinate system used for the HEALPix data in the pixdata file. If thesample positions are given in the same coordinate system as that given by the pixel data table,both the insys and pixsys parameters may be set null.
The available coordinate systems are:
• icrs: ICRS (Right Ascension, Declination)• fk5: FK5 J2000.0 (Right Ascension, Declination)• fk4: FK4 B1950.0 (Right Ascension, Declination)• galactic: IAU 1958 Galactic (Longitude, Latitude)• supergalactic: de Vaucouleurs Supergalactic (Longitude, Latitude)• ecliptic: Ecliptic (Longitude, Latitude)
radius = <expr> (String)Determines the radius in degrees over which pixels will be sampled to generate the outputstatistic in accordance with the value of the stat parameter. This will typically be a constantvalue, but it may be an algebraic expression based on columns from the input table.
Not used if stat=point.
stat = point|mean (StatMode)Determines how the pixel values will be sampled to generate an output value. The options are:
• point: Uses the value at the pixel covering the supplied position. In this case the radius
parameter is not used.• mean: Averages the values over all the pixels within a radius given by the radius
parameter. This averaging is somewhat approximate; all pixels which are mostly withinthe radius are averaged with equal weights.
[Default: point]
B.8.2 Examples
Here are some examples of pixsample:
stilts pixsample in=szdata.fits pixdata=wmap_ilc_7yr_v4.fitslat=GAL_LAT lon=GAL_LON pcmd='keepcols TEMPERATURE'out=szdata_cmb.fits
Samples from a HEALPix file containing WMAP data are added to an input file szdata.fits,giving an output file szdata_cmb.fits which is the same but with an additional column
SUN/256 375
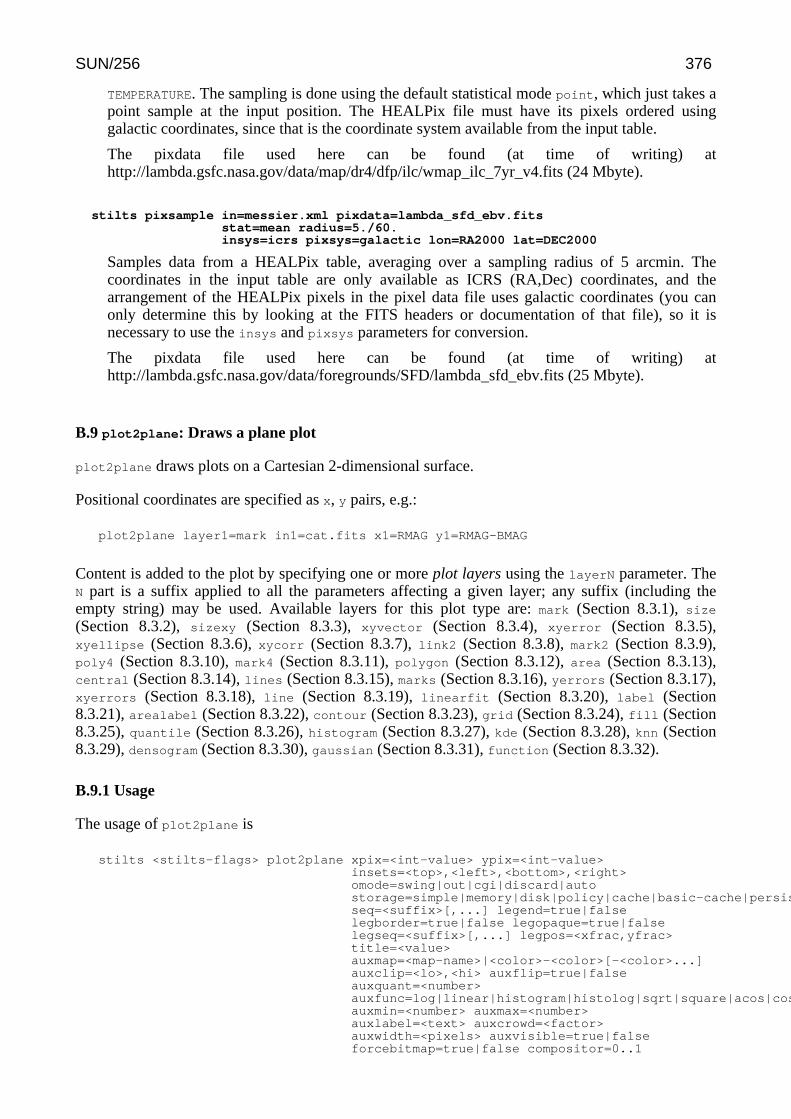
TEMPERATURE. The sampling is done using the default statistical mode point, which just takes apoint sample at the input position. The HEALPix file must have its pixels ordered usinggalactic coordinates, since that is the coordinate system available from the input table.
The pixdata file used here can be found (at time of writing) athttp://lambda.gsfc.nasa.gov/data/map/dr4/dfp/ilc/wmap_ilc_7yr_v4.fits (24 Mbyte).
stilts pixsample in=messier.xml pixdata=lambda_sfd_ebv.fitsstat=mean radius=5./60.insys=icrs pixsys=galactic lon=RA2000 lat=DEC2000
Samples data from a HEALPix table, averaging over a sampling radius of 5 arcmin. Thecoordinates in the input table are only available as ICRS (RA,Dec) coordinates, and thearrangement of the HEALPix pixels in the pixel data file uses galactic coordinates (you canonly determine this by looking at the FITS headers or documentation of that file), so it isnecessary to use the insys and pixsys parameters for conversion.
The pixdata file used here can be found (at time of writing) athttp://lambda.gsfc.nasa.gov/data/foregrounds/SFD/lambda_sfd_ebv.fits (25 Mbyte).
B.9 plot2plane: Draws a plane plot
plot2plane draws plots on a Cartesian 2-dimensional surface.
Positional coordinates are specified as x, y pairs, e.g.:
plot2plane layer1=mark in1=cat.fits x1=RMAG y1=RMAG-BMAG
Content is added to the plot by specifying one or more plot layers using the layerN parameter. TheN part is a suffix applied to all the parameters affecting a given layer; any suffix (including theempty string) may be used. Available layers for this plot type are: mark (Section 8.3.1), size
(Section 8.3.2), sizexy (Section 8.3.3), xyvector (Section 8.3.4), xyerror (Section 8.3.5),xyellipse (Section 8.3.6), xycorr (Section 8.3.7), link2 (Section 8.3.8), mark2 (Section 8.3.9),poly4 (Section 8.3.10), mark4 (Section 8.3.11), polygon (Section 8.3.12), area (Section 8.3.13),central (Section 8.3.14), lines (Section 8.3.15), marks (Section 8.3.16), yerrors (Section 8.3.17),xyerrors (Section 8.3.18), line (Section 8.3.19), linearfit (Section 8.3.20), label (Section8.3.21), arealabel (Section 8.3.22), contour (Section 8.3.23), grid (Section 8.3.24), fill (Section8.3.25), quantile (Section 8.3.26), histogram (Section 8.3.27), kde (Section 8.3.28), knn (Section8.3.29), densogram (Section 8.3.30), gaussian (Section 8.3.31), function (Section 8.3.32).
B.9.1 Usage
The usage of plot2plane is
stilts <stilts-flags> plot2plane xpix=<int-value> ypix=<int-value>insets=<top>,<left>,<bottom>,<right>omode=swing|out|cgi|discard|autostorage=simple|memory|disk|policy|cache|basic-cache|persistent|parallelseq=<suffix>[,...] legend=true|falselegborder=true|false legopaque=true|falselegseq=<suffix>[,...] legpos=<xfrac,yfrac>title=<value>auxmap=<map-name>|<color>-<color>[-<color>...]auxclip=<lo>,<hi> auxflip=true|falseauxquant=<number>auxfunc=log|linear|histogram|histolog|sqrt|square|acos|cosauxmin=<number> auxmax=<number>auxlabel=<text> auxcrowd=<factor>auxwidth=<pixels> auxvisible=true|falseforcebitmap=true|false compositor=0..1
SUN/256 376
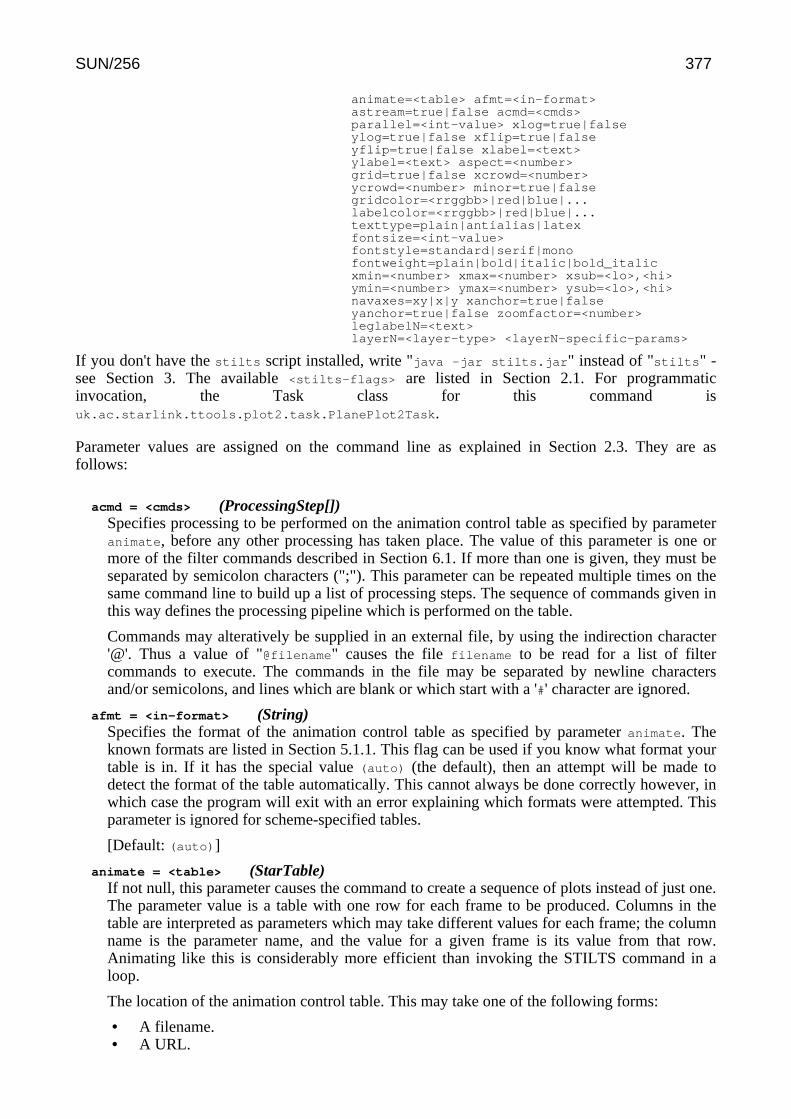
animate=<table> afmt=<in-format>astream=true|false acmd=<cmds>parallel=<int-value> xlog=true|falseylog=true|false xflip=true|falseyflip=true|false xlabel=<text>ylabel=<text> aspect=<number>grid=true|false xcrowd=<number>ycrowd=<number> minor=true|falsegridcolor=<rrggbb>|red|blue|...labelcolor=<rrggbb>|red|blue|...texttype=plain|antialias|latexfontsize=<int-value>fontstyle=standard|serif|monofontweight=plain|bold|italic|bold_italicxmin=<number> xmax=<number> xsub=<lo>,<hi>ymin=<number> ymax=<number> ysub=<lo>,<hi>navaxes=xy|x|y xanchor=true|falseyanchor=true|false zoomfactor=<number>leglabelN=<text>layerN=<layer-type> <layerN-specific-params>
If you don't have the stilts script installed, write "java -jar stilts.jar" instead of "stilts" -see Section 3. The available <stilts-flags> are listed in Section 2.1. For programmaticinvocation, the Task class for this command isuk.ac.starlink.ttools.plot2.task.PlanePlot2Task.
Parameter values are assigned on the command line as explained in Section 2.3. They are asfollows:
acmd = <cmds> (ProcessingStep[])Specifies processing to be performed on the animation control table as specified by parameteranimate, before any other processing has taken place. The value of this parameter is one ormore of the filter commands described in Section 6.1. If more than one is given, they must beseparated by semicolon characters (";"). This parameter can be repeated multiple times on thesame command line to build up a list of processing steps. The sequence of commands given inthis way defines the processing pipeline which is performed on the table.
Commands may alteratively be supplied in an external file, by using the indirection character'@'. Thus a value of "@filename" causes the file filename to be read for a list of filtercommands to execute. The commands in the file may be separated by newline charactersand/or semicolons, and lines which are blank or which start with a '#' character are ignored.
afmt = <in-format> (String)Specifies the format of the animation control table as specified by parameter animate. Theknown formats are listed in Section 5.1.1. This flag can be used if you know what format yourtable is in. If it has the special value (auto) (the default), then an attempt will be made todetect the format of the table automatically. This cannot always be done correctly however, inwhich case the program will exit with an error explaining which formats were attempted. Thisparameter is ignored for scheme-specified tables.
[Default: (auto)]
animate = <table> (StarTable)If not null, this parameter causes the command to create a sequence of plots instead of just one.The parameter value is a table with one row for each frame to be produced. Columns in thetable are interpreted as parameters which may take different values for each frame; the columnname is the parameter name, and the value for a given frame is its value from that row.Animating like this is considerably more efficient than invoking the STILTS command in aloop.
The location of the animation control table. This may take one of the following forms:
• A filename.• A URL.
SUN/256 377
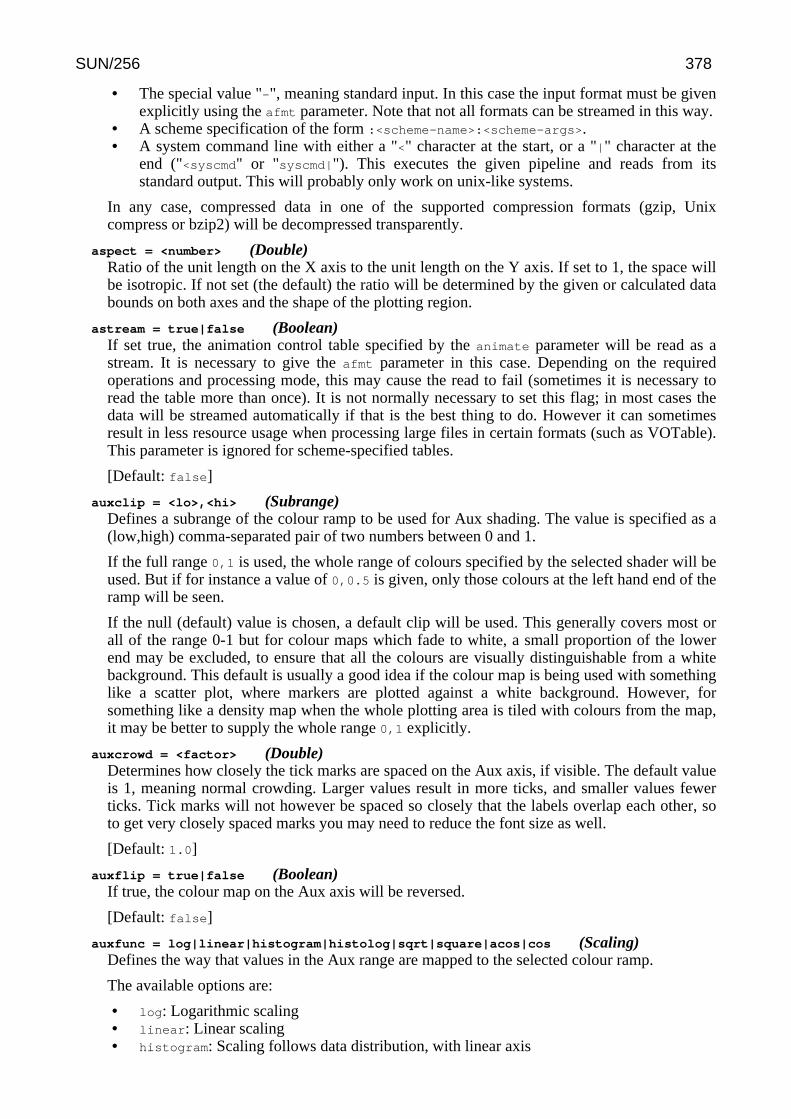
• The special value "-", meaning standard input. In this case the input format must be givenexplicitly using the afmt parameter. Note that not all formats can be streamed in this way.
• A scheme specification of the form :<scheme-name>:<scheme-args>.• A system command line with either a "<" character at the start, or a "|" character at the
end ("<syscmd" or "syscmd|"). This executes the given pipeline and reads from itsstandard output. This will probably only work on unix-like systems.
In any case, compressed data in one of the supported compression formats (gzip, Unixcompress or bzip2) will be decompressed transparently.
aspect = <number> (Double)Ratio of the unit length on the X axis to the unit length on the Y axis. If set to 1, the space willbe isotropic. If not set (the default) the ratio will be determined by the given or calculated databounds on both axes and the shape of the plotting region.
astream = true|false (Boolean)If set true, the animation control table specified by the animate parameter will be read as astream. It is necessary to give the afmt parameter in this case. Depending on the requiredoperations and processing mode, this may cause the read to fail (sometimes it is necessary toread the table more than once). It is not normally necessary to set this flag; in most cases thedata will be streamed automatically if that is the best thing to do. However it can sometimesresult in less resource usage when processing large files in certain formats (such as VOTable).This parameter is ignored for scheme-specified tables.
[Default: false]
auxclip = <lo>,<hi> (Subrange)Defines a subrange of the colour ramp to be used for Aux shading. The value is specified as a(low,high) comma-separated pair of two numbers between 0 and 1.
If the full range 0,1 is used, the whole range of colours specified by the selected shader will beused. But if for instance a value of 0,0.5 is given, only those colours at the left hand end of theramp will be seen.
If the null (default) value is chosen, a default clip will be used. This generally covers most orall of the range 0-1 but for colour maps which fade to white, a small proportion of the lowerend may be excluded, to ensure that all the colours are visually distinguishable from a whitebackground. This default is usually a good idea if the colour map is being used with somethinglike a scatter plot, where markers are plotted against a white background. However, forsomething like a density map when the whole plotting area is tiled with colours from the map,it may be better to supply the whole range 0,1 explicitly.
auxcrowd = <factor> (Double)Determines how closely the tick marks are spaced on the Aux axis, if visible. The default valueis 1, meaning normal crowding. Larger values result in more ticks, and smaller values fewerticks. Tick marks will not however be spaced so closely that the labels overlap each other, soto get very closely spaced marks you may need to reduce the font size as well.
[Default: 1.0]
auxflip = true|false (Boolean)If true, the colour map on the Aux axis will be reversed.
[Default: false]
auxfunc = log|linear|histogram|histolog|sqrt|square|acos|cos (Scaling)Defines the way that values in the Aux range are mapped to the selected colour ramp.
The available options are:
• log: Logarithmic scaling• linear: Linear scaling• histogram: Scaling follows data distribution, with linear axis
SUN/256 378

• histolog: Scaling follows data distribution, with logarithmic axis• sqrt: Square root scaling• square: Square scaling• acos: Arccos Scaling• cos: Cos Scaling
For all these options, the full range of data values is used, and displayed on the colour bar ifapplicable. The Linear, Log, Square and Sqrt options just apply the named function to the fulldata range. The histogram options on the other hand use a scaling function that corresponds tothe actual distribution of the data, so that there are about the same number of points (or pixels,or whatever is being scaled) of each colour. The histogram options are somewhat moreexpensive, but can be a good choice if you are exploring data whose distribution is unknown ornot well-behaved over its min-max range. The Histogram and HistoLog options both assignthe colours in the same way, but they display the colour ramp with linear or logarithmicannotation respectively; the HistoLog option also ignores non-positive values.
[Default: linear]
auxlabel = <text> (String)Sets the label used to annotate the aux axis, if it is visible.
auxmap = <map-name>|<color>-<color>[-<color>...] (Shader)Color map used for Aux axis shading.
A mixed bag of colour ramps are available: inferno, magma, plasma, viridis, cividis,cubehelix, sron, rainbow, rainbow2, rainbow3, pastel, accent, gnuplot, gnuplot2,specxby, set1, paired, hotcold, rdbu, piyg, brbg, cyan-magenta, red-blue, brg, heat, cold,light, greyscale, colour, standard, bugn, bupu, orrd, pubu, purd, huecl, hue, intensity,rgb_red, rgb_green, rgb_blue, hsv_h, hsv_s, hsv_v, yuv_y, yuv_u, yuv_v, scale_hsv_s,scale_hsv_v, scale_yuv_y, mask, blacker, whiter, transparency. Note: many of these,including rainbow-like ones, are frowned upon by the visualisation community.
You can also construct your own custom colour map by giving a sequence of colour namesseparated by minus sign ("-") characters. In this case the ramp is a linear interpolation betweeneach pair of colours named, using the same syntax as when specifying a colour value. So forinstance "yellow-hotpink-#0000ff" would shade from yellow via hot pink to blue.
[Default: inferno]
auxmax = <number> (Double)Maximum value of the data coordinate on the Aux axis. This sets the value before anysubranging is applied. If not supplied, the value is determined from the plotted data.
auxmin = <number> (Double)Minimum value of the data coordinate on the Aux axis. This sets the value before anysubranging is applied. If not supplied, the value is determined from the plotted data.
auxquant = <number> (Double)Allows the colour map used for the Aux axis to be quantised. If an integer value N is chosenthen the colour map will be viewed as N discrete evenly-spaced levels, so that only N differentcolours will appear in the plot. This can be used to generate a contour-like effect, and maymake it easier to trace the boundaries of regions of interest by eye.
If left blank, the colour map is nominally continuous (though in practice it may be quantised toa medium-sized number like 256).
auxvisible = true|false (Boolean)Determines whether the aux axis colour ramp is displayed alongside the plot.
If not supplied (the default), the aux axis will be visible when aux shading is used in any of theplotted layers.
SUN/256 379
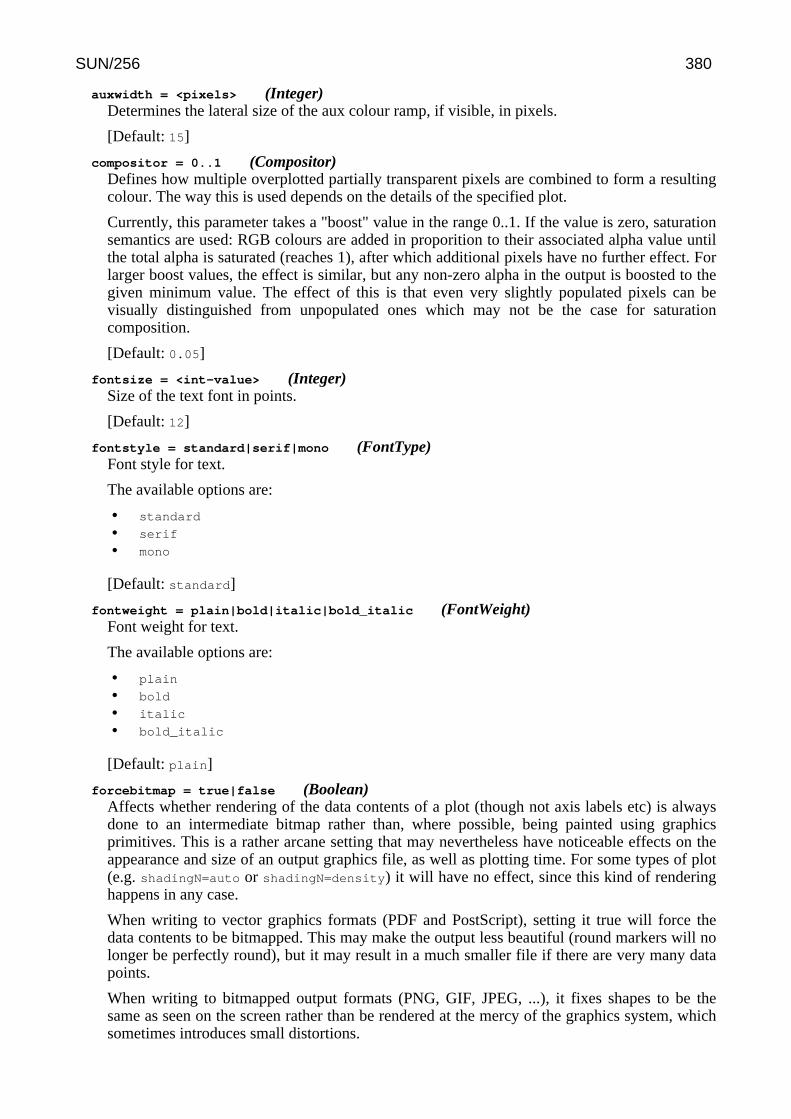
auxwidth = <pixels> (Integer)Determines the lateral size of the aux colour ramp, if visible, in pixels.
[Default: 15]
compositor = 0..1 (Compositor)Defines how multiple overplotted partially transparent pixels are combined to form a resultingcolour. The way this is used depends on the details of the specified plot.
Currently, this parameter takes a "boost" value in the range 0..1. If the value is zero, saturationsemantics are used: RGB colours are added in proporition to their associated alpha value untilthe total alpha is saturated (reaches 1), after which additional pixels have no further effect. Forlarger boost values, the effect is similar, but any non-zero alpha in the output is boosted to thegiven minimum value. The effect of this is that even very slightly populated pixels can bevisually distinguished from unpopulated ones which may not be the case for saturationcomposition.
[Default: 0.05]
fontsize = <int-value> (Integer)Size of the text font in points.
[Default: 12]
fontstyle = standard|serif|mono (FontType)Font style for text.
The available options are:
• standard
• serif
• mono
[Default: standard]
fontweight = plain|bold|italic|bold_italic (FontWeight)Font weight for text.
The available options are:
• plain
• bold
• italic
• bold_italic
[Default: plain]
forcebitmap = true|false (Boolean)Affects whether rendering of the data contents of a plot (though not axis labels etc) is alwaysdone to an intermediate bitmap rather than, where possible, being painted using graphicsprimitives. This is a rather arcane setting that may nevertheless have noticeable effects on theappearance and size of an output graphics file, as well as plotting time. For some types of plot(e.g. shadingN=auto or shadingN=density) it will have no effect, since this kind of renderinghappens in any case.
When writing to vector graphics formats (PDF and PostScript), setting it true will force thedata contents to be bitmapped. This may make the output less beautiful (round markers will nolonger be perfectly round), but it may result in a much smaller file if there are very many datapoints.
When writing to bitmapped output formats (PNG, GIF, JPEG, ...), it fixes shapes to be thesame as seen on the screen rather than be rendered at the mercy of the graphics system, whichsometimes introduces small distortions.
SUN/256 380
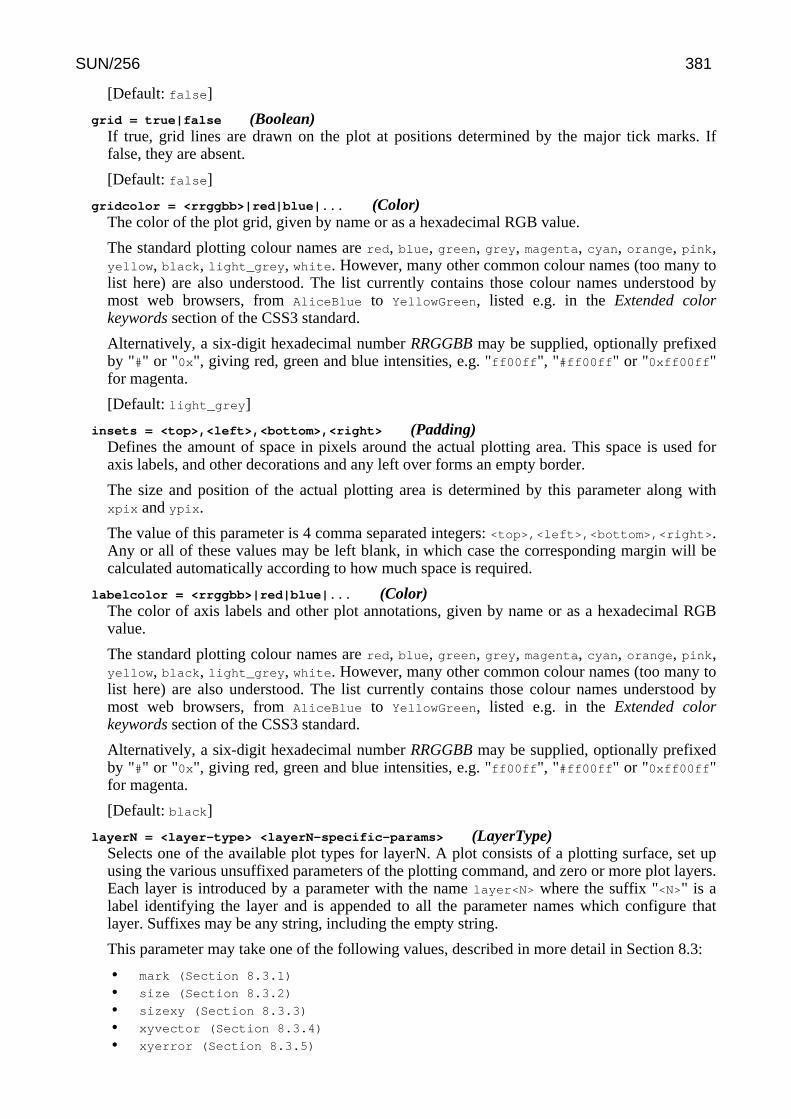
[Default: false]
grid = true|false (Boolean)If true, grid lines are drawn on the plot at positions determined by the major tick marks. Iffalse, they are absent.
[Default: false]
gridcolor = <rrggbb>|red|blue|... (Color)The color of the plot grid, given by name or as a hexadecimal RGB value.
The standard plotting colour names are red, blue, green, grey, magenta, cyan, orange, pink,yellow, black, light_grey, white. However, many other common colour names (too many tolist here) are also understood. The list currently contains those colour names understood bymost web browsers, from AliceBlue to YellowGreen, listed e.g. in the Extended colorkeywords section of the CSS3 standard.
Alternatively, a six-digit hexadecimal number RRGGBB may be supplied, optionally prefixedby "#" or "0x", giving red, green and blue intensities, e.g. "ff00ff", "#ff00ff" or "0xff00ff"for magenta.
[Default: light_grey]
insets = <top>,<left>,<bottom>,<right> (Padding)Defines the amount of space in pixels around the actual plotting area. This space is used foraxis labels, and other decorations and any left over forms an empty border.
The size and position of the actual plotting area is determined by this parameter along withxpix and ypix.
The value of this parameter is 4 comma separated integers: <top>,<left>,<bottom>,<right>.Any or all of these values may be left blank, in which case the corresponding margin will becalculated automatically according to how much space is required.
labelcolor = <rrggbb>|red|blue|... (Color)The color of axis labels and other plot annotations, given by name or as a hexadecimal RGBvalue.
The standard plotting colour names are red, blue, green, grey, magenta, cyan, orange, pink,yellow, black, light_grey, white. However, many other common colour names (too many tolist here) are also understood. The list currently contains those colour names understood bymost web browsers, from AliceBlue to YellowGreen, listed e.g. in the Extended colorkeywords section of the CSS3 standard.
Alternatively, a six-digit hexadecimal number RRGGBB may be supplied, optionally prefixedby "#" or "0x", giving red, green and blue intensities, e.g. "ff00ff", "#ff00ff" or "0xff00ff"for magenta.
[Default: black]
layerN = <layer-type> <layerN-specific-params> (LayerType)Selects one of the available plot types for layerN. A plot consists of a plotting surface, set upusing the various unsuffixed parameters of the plotting command, and zero or more plot layers.Each layer is introduced by a parameter with the name layer<N> where the suffix "<N>" is alabel identifying the layer and is appended to all the parameter names which configure thatlayer. Suffixes may be any string, including the empty string.
This parameter may take one of the following values, described in more detail in Section 8.3:
• mark (Section 8.3.1)
• size (Section 8.3.2)
• sizexy (Section 8.3.3)
• xyvector (Section 8.3.4)
• xyerror (Section 8.3.5)
SUN/256 381

• xyellipse (Section 8.3.6)
• xycorr (Section 8.3.7)
• link2 (Section 8.3.8)
• mark2 (Section 8.3.9)
• poly4 (Section 8.3.10)
• mark4 (Section 8.3.11)
• polygon (Section 8.3.12)
• area (Section 8.3.13)
• central (Section 8.3.14)
• lines (Section 8.3.15)
• marks (Section 8.3.16)
• yerrors (Section 8.3.17)
• xyerrors (Section 8.3.18)
• line (Section 8.3.19)
• linearfit (Section 8.3.20)
• label (Section 8.3.21)
• arealabel (Section 8.3.22)
• contour (Section 8.3.23)
• grid (Section 8.3.24)
• fill (Section 8.3.25)
• quantile (Section 8.3.26)
• histogram (Section 8.3.27)
• kde (Section 8.3.28)
• knn (Section 8.3.29)
• densogram (Section 8.3.30)
• gaussian (Section 8.3.31)
• function (Section 8.3.32)
Each of these layer types comes with a list of type-specific parameters to define the details ofthat layer, including some or all of the following groups:
• input table parameters (e.g. inN, icmdN)• coordinate params referring to input table columns (e.g. xN, yN)• layer style parameters (e.g. shadingN, colorN)
Every parameter notionally carries the same suffix N. However, if the suffix is not present, theapplication will try looking for a parameter with the same name with no suffix instead. In thisway, if several layers have the same value for a given parameter (for instance input table), youcan supply it using one unsuffixed parameter to save having to supply several parameters withthe same value but different suffixes.
legborder = true|false (Boolean)If true, a line border is drawn around the legend.
[Default: true]
legend = true|false (Boolean)Whether to draw a legend or not. If no value is supplied, the decision is made automatically: alegend is drawn only if it would have more than one entry.
leglabelN = <text> (String)Sets the presentation label for the layer with a given suffix. This is the text which is displayedin the legend, if present. Multiple layers may use the same label, in which case they will becombined to form a single legend entry.
If no value is supplied (the default), the suffix itself is used as the label.
legopaque = true|false (Boolean)If true, the background of the legend is opaque, and the legend obscures any plot components
SUN/256 382
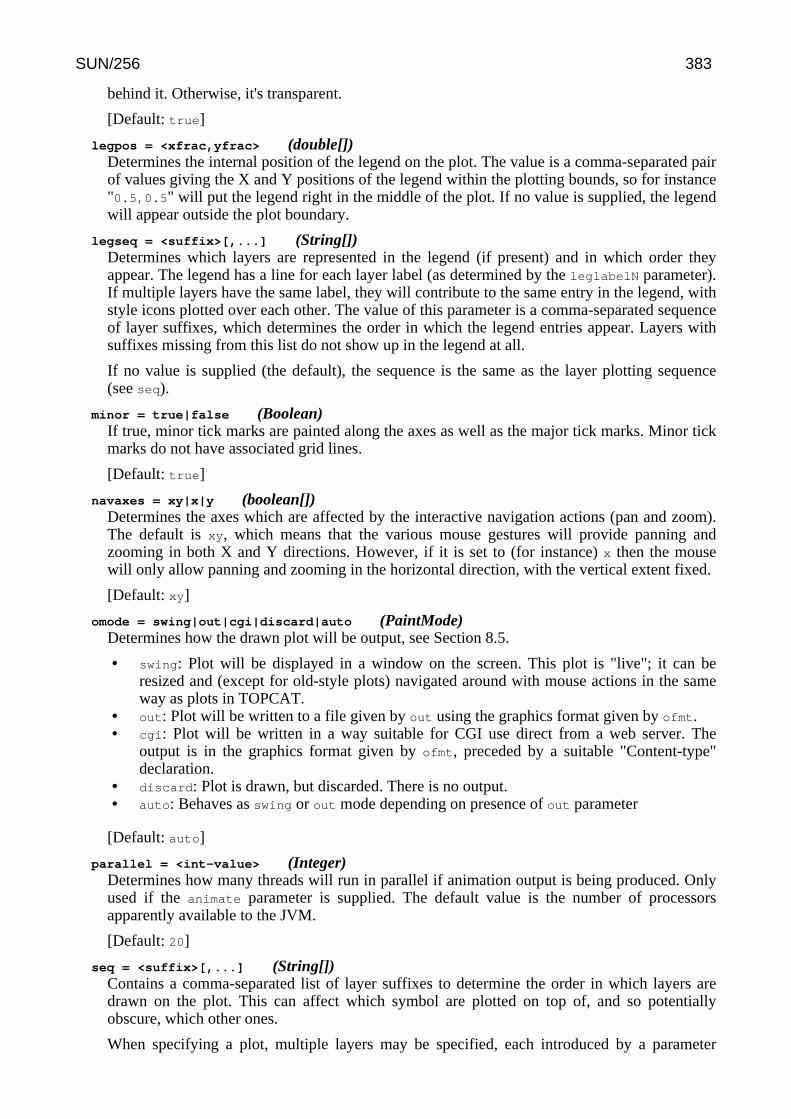
behind it. Otherwise, it's transparent.
[Default: true]
legpos = <xfrac,yfrac> (double[])Determines the internal position of the legend on the plot. The value is a comma-separated pairof values giving the X and Y positions of the legend within the plotting bounds, so for instance"0.5,0.5" will put the legend right in the middle of the plot. If no value is supplied, the legendwill appear outside the plot boundary.
legseq = <suffix>[,...] (String[])Determines which layers are represented in the legend (if present) and in which order theyappear. The legend has a line for each layer label (as determined by the leglabelN parameter).If multiple layers have the same label, they will contribute to the same entry in the legend, withstyle icons plotted over each other. The value of this parameter is a comma-separated sequenceof layer suffixes, which determines the order in which the legend entries appear. Layers withsuffixes missing from this list do not show up in the legend at all.
If no value is supplied (the default), the sequence is the same as the layer plotting sequence(see seq).
minor = true|false (Boolean)If true, minor tick marks are painted along the axes as well as the major tick marks. Minor tickmarks do not have associated grid lines.
[Default: true]
navaxes = xy|x|y (boolean[])Determines the axes which are affected by the interactive navigation actions (pan and zoom).The default is xy, which means that the various mouse gestures will provide panning andzooming in both X and Y directions. However, if it is set to (for instance) x then the mousewill only allow panning and zooming in the horizontal direction, with the vertical extent fixed.
[Default: xy]
omode = swing|out|cgi|discard|auto (PaintMode)Determines how the drawn plot will be output, see Section 8.5.
• swing: Plot will be displayed in a window on the screen. This plot is "live"; it can beresized and (except for old-style plots) navigated around with mouse actions in the sameway as plots in TOPCAT.
• out: Plot will be written to a file given by out using the graphics format given by ofmt.• cgi: Plot will be written in a way suitable for CGI use direct from a web server. The
output is in the graphics format given by ofmt, preceded by a suitable "Content-type"declaration.
• discard: Plot is drawn, but discarded. There is no output.• auto: Behaves as swing or out mode depending on presence of out parameter
[Default: auto]
parallel = <int-value> (Integer)Determines how many threads will run in parallel if animation output is being produced. Onlyused if the animate parameter is supplied. The default value is the number of processorsapparently available to the JVM.
[Default: 20]
seq = <suffix>[,...] (String[])Contains a comma-separated list of layer suffixes to determine the order in which layers aredrawn on the plot. This can affect which symbol are plotted on top of, and so potentiallyobscure, which other ones.
When specifying a plot, multiple layers may be specified, each introduced by a parameter
SUN/256 383

layer<N>, where <N> is a different (arbitrary) suffix labelling the layer, and is appended to allthe parameters specific to defining that layer.
By default the layers are drawn on the plot in the order in which the layer* parameters appearon the command line. However if this parameter is specified, each comma-separated element isinterpreted as a layer suffix, giving the ordered list of layers to plot. Every element of the listmust be a suffix with a corresponding layer parameter, but missing or repeated elements areallowed.
storage = simple|memory|disk|policy|cache|basic-cache|persistent|parallel
(DataStoreFactory)Determines the way that data is accessed when constructing the plot. There are two mainoptions, cached or not. If no caching is used then rows are read sequentially from the specifiedinput table(s) every time they are required. This generally requires a small resource footprint(though that can depend on how the table is specified) and makes sense if the data only needsto be scanned once or perhaps if the table is very large. If caching is used then the requireddata is read once from the specified input table(s), then prepared and cached before anyplotting is performed, and plots are done using this cached data. This may use a significantamount of storage for large tables but it's usually more sensible (faster) if the data will need tobe scanned multiple times. There are various options for cache storage.
The options are:
• simple: no caching, data read directly from input table• memory: cached to memory; OutOfMemoryError possible for very large plots• disk: cached to disk• policy: cached using application-wide default storage policy, which is usually adaptive
(memory/disk hybrid)• persistent: cached to persistent files on disk, in the system temporary directory (defined
by system property java.io.tmpdir). If this is used, plot data will be stored on disk in away that means they can be re-used between STILTS invocations, so data preparation canbe avoided on subsequent runs. Note however it can leave potentially large files in yourtemporary directory.
• cache: synonym for memory (backward compatibility)• basic-cache: dumber version of memory (no optimisation for constant-valued columns)• parallel: experimental version of memory-based cache that reads into the cache in
parallel for large files. This will make the plot faster to prepare, but interaction is a bitslower and sequence-dependent attributes of the plot may not come out right. Thisexperimental option may be withdrawn or modified in future releases.
The default value is memory if a live plot is being generated (omode=swing), since in that casethe plot needs to be redrawn every time the user performs plot navigation actions or resizes thewindow, or if animations are being produced. Otherwise (e.g. output to a graphics file) thedefault is simple.
[Default: simple]
texttype = plain|antialias|latex (TextSyntax)Determines how to turn label text into characters on the plot. Plain and Antialias both takethe text at face value, but Antialias smooths the characters. LaTeX interprets the text asLaTeX source code and typesets it accordingly.
When not using LaTeX, antialiased text usually looks nicer, but can be perceptibly slower toplot. At time of writing, on MacOS antialiased text seems to be required to stop the writingcoming out upside-down for non-horizontal text (MacOS java bug).
[Default: plain]
title = <value> (String)Text of a title to be displayed at the top of the plot. If null, the default, no title is shown and
SUN/256 384

there's more space for the graphics.
xanchor = true|false (Boolean)If true, then zoom actions will work in such a way that the zero point on the X axis stays in thesame position on the plot.
[Default: false]
xcrowd = <number> (Double)Determines how closely the tick marks are spaced on the X axis. The default value is 1,meaning normal crowding. Larger values result in more ticks, and smaller values fewer ticks.Tick marks will not however be spaced so closely that the labels overlap each other, so to getvery closely spaced marks you may need to reduce the font size as well.
[Default: 1]
xflip = true|false (Boolean)If true, the scale on the X axis will increase in the opposite sense from usual (e.g. right to leftrather than left to right).
[Default: false]
xlabel = <text> (String)Gives a label to be used for annotating axis X A default value based on the plotted data will beused if no value is supplied.
[Default: X]
xlog = true|false (Boolean)If false (the default), the scale on the X axis is linear, if true it is logarithmic.
[Default: false]
xmax = <number> (Double)Maximum value of the data coordinate on the X axis. This sets the value before anysubranging is applied. If not supplied, the value is determined from the plotted data.
xmin = <number> (Double)Minimum value of the data coordinate on the X axis. This sets the value before any subrangingis applied. If not supplied, the value is determined from the plotted data.
xpix = <int-value> (Integer)Size of the output image in the X direction in pixels. This includes space for any axis labels,padding and other decoration outside the plot area itself. See also insets.
[Default: 500]
xsub = <lo>,<hi> (Subrange)Defines a normalised adjustment to the data range of the X axis. The value may be specified asa comma-separated pair of two numbers, giving the lower and upper bounds of the range of ofinterest respectively. This sub-range is applied to the data range that would otherwise be used,either automatically calculated or explicitly supplied; zero corresponds to the lower bound andone to the upper.
The default value "0,1" therefore has no effect. The range could be restricted to its lower halfwith the value 0,0.5.
[Default: 0,1]
yanchor = true|false (Boolean)If true, then zoom actions will work in such a way that the zero point on the Y axis stays in thesame position on the plot.
[Default: false]
ycrowd = <number> (Double)
SUN/256 385
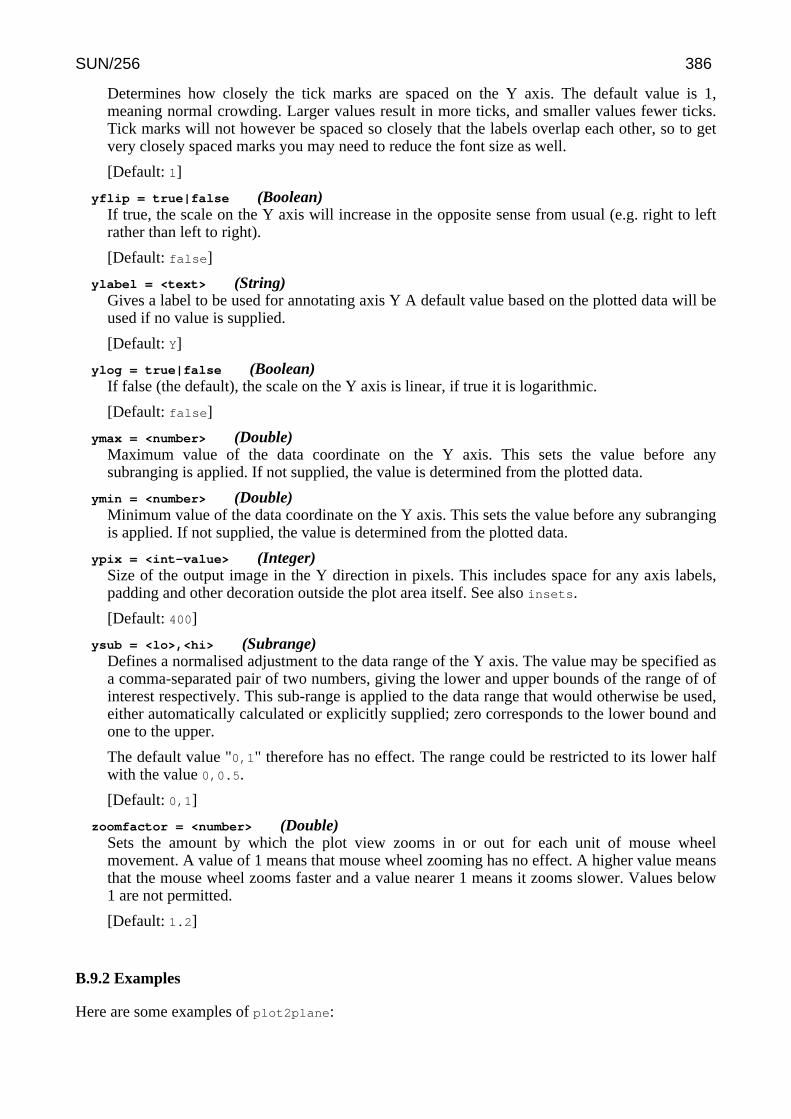
Determines how closely the tick marks are spaced on the Y axis. The default value is 1,meaning normal crowding. Larger values result in more ticks, and smaller values fewer ticks.Tick marks will not however be spaced so closely that the labels overlap each other, so to getvery closely spaced marks you may need to reduce the font size as well.
[Default: 1]
yflip = true|false (Boolean)If true, the scale on the Y axis will increase in the opposite sense from usual (e.g. right to leftrather than left to right).
[Default: false]
ylabel = <text> (String)Gives a label to be used for annotating axis Y A default value based on the plotted data will beused if no value is supplied.
[Default: Y]
ylog = true|false (Boolean)If false (the default), the scale on the Y axis is linear, if true it is logarithmic.
[Default: false]
ymax = <number> (Double)Maximum value of the data coordinate on the Y axis. This sets the value before anysubranging is applied. If not supplied, the value is determined from the plotted data.
ymin = <number> (Double)Minimum value of the data coordinate on the Y axis. This sets the value before any subrangingis applied. If not supplied, the value is determined from the plotted data.
ypix = <int-value> (Integer)Size of the output image in the Y direction in pixels. This includes space for any axis labels,padding and other decoration outside the plot area itself. See also insets.
[Default: 400]
ysub = <lo>,<hi> (Subrange)Defines a normalised adjustment to the data range of the Y axis. The value may be specified asa comma-separated pair of two numbers, giving the lower and upper bounds of the range of ofinterest respectively. This sub-range is applied to the data range that would otherwise be used,either automatically calculated or explicitly supplied; zero corresponds to the lower bound andone to the upper.
The default value "0,1" therefore has no effect. The range could be restricted to its lower halfwith the value 0,0.5.
[Default: 0,1]
zoomfactor = <number> (Double)Sets the amount by which the plot view zooms in or out for each unit of mouse wheelmovement. A value of 1 means that mouse wheel zooming has no effect. A higher value meansthat the mouse wheel zooms faster and a value nearer 1 means it zooms slower. Values below1 are not permitted.
[Default: 1.2]
B.9.2 Examples
Here are some examples of plot2plane:
SUN/256 386

stilts plot2plane yflip=true layer_1=mark in_1=cat.fits x_1=BMAG-RMAG y_1=BMAG
This is a colour-magnitude diagram where the input table has columns named RMAG andBMAG. The Y axis is inverted so that the magnitude values increase downwards not up. Theplot is displayed in a window on the screen, and may be panned and zoomed with the mouse.
stilts plot2plane layer=histogram in=hip_main.fits x=plx xlog=truexlabel=Parallax ylabel=
Plots a histogram of parallaxes for Hipparcos data, with a logarithmic X axis. The axes arelabelled explicitly, with an empty string in the case of the Y axis.
stilts plot2plane xpix=600 ypix=500in=gavo_g2.fits x=X y=Yshading=aux aux='atan2(vely,velx)' auxmap=hue auxvisible=falselayer_m=mark shape_m=cross size_m=4layer_v=xyvector xdelta_v=velx ydelta_v=vely scale_v=2out=velocities.pdf
Two layers are plotted, point markers representing position (4 pixels radius, shaped likecrosses) and vectors representing velocity. Both markers and vectors are coloured according tothe direction (arctan(vely/velx)) of the arrows, so it's easy to see points moving in similardirections; the "hue" colour map is good for this, since it's periodic, so values of +Pi and -Pihave the same colour. Since it's not very revealing in this case, display of the aux axis colourramp beside the plot has been turned off. Since the X and Y coordinates and the colouring iscommon to both layers, the relevant parameters can given without suffixes to avoid having torepeat them. Output is to a PDF file.
stilts plot2plane xmin=0 xmax=6.283 ymin=-1 ymax=1 xlabel=Timelayer=function axis=horizontal xname=time fexpr='sin(time)'dash=3,2 thick=4 color=ee6aa7
Plots a sine curve to the screen. Initially the view is of one period, but you can pan and zoominteractively to see any range. The line is plotted in hot pink, four pixels wide, with a customdash pattern. Since the function layer type has no data coordinates, no input table is required.The layer suffix here is the empty string; since there's only one layer, it doesn't cause anyproblems.
stilts plot2plane ylog=true xflip=true xmin=-5.2 xmax=3.8 ymin=250 ymax=3.5e5in1=6dfgs_E7.fits x1=bmag-rmag y1=vellayer1a=mark color1a=cyanlayer1b=contour color1b=yellow smooth1b=9 scaling1b=loglayer1c=mark icmd1c='every 35;select star'
shape1c=filled_triangle_down size1c=5 color1c=redshading1c=transparent opaque1c=3
layer2=function fexpr2='exp(x*2+12)' color2=black antialias2=truedash2=dash thick2=3
leglabel1a=Population leglabel1c=Sample legpos=.95,.95 legseq=1a,1cfontsize=16 texttype=latex ylabel="v\,/\,km.s^{-1}" xlabel=colour
There are four layers: 1a, 1b and 1c use the same positional data from the same input file, sothe positional coordinates common to them are given the suffix "1". Layer "2" is unrelated, andhas no input data, since it's just an analytic function. The legend is positioned to taste, and itscontent is manipulated so that only datasets 1a and 1c are described, and they are given customnames (the default would be their suffix names).
B.10 plot2sky: Draws a sky plot
plot2sky draws plots on the celestial sphere. This can be represented in a number of ways,controlled by the projection parameter; by default the view is of a rotatable sphere seen from theoutside (which approximates to a tangent projection for small regions of the sky), but Aitoff and
SUN/256 387
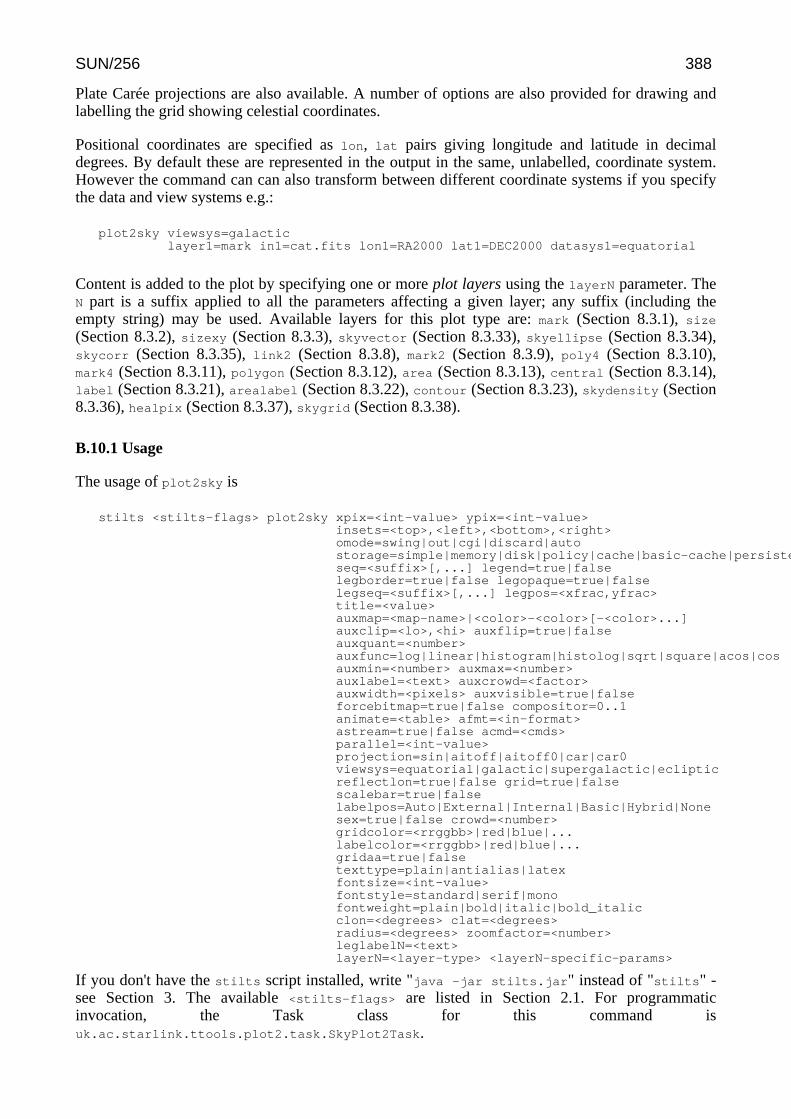
Plate Carée projections are also available. A number of options are also provided for drawing andlabelling the grid showing celestial coordinates.
Positional coordinates are specified as lon, lat pairs giving longitude and latitude in decimaldegrees. By default these are represented in the output in the same, unlabelled, coordinate system.However the command can can also transform between different coordinate systems if you specifythe data and view systems e.g.:
plot2sky viewsys=galacticlayer1=mark in1=cat.fits lon1=RA2000 lat1=DEC2000 datasys1=equatorial
Content is added to the plot by specifying one or more plot layers using the layerN parameter. TheN part is a suffix applied to all the parameters affecting a given layer; any suffix (including theempty string) may be used. Available layers for this plot type are: mark (Section 8.3.1), size
(Section 8.3.2), sizexy (Section 8.3.3), skyvector (Section 8.3.33), skyellipse (Section 8.3.34),skycorr (Section 8.3.35), link2 (Section 8.3.8), mark2 (Section 8.3.9), poly4 (Section 8.3.10),mark4 (Section 8.3.11), polygon (Section 8.3.12), area (Section 8.3.13), central (Section 8.3.14),label (Section 8.3.21), arealabel (Section 8.3.22), contour (Section 8.3.23), skydensity (Section8.3.36), healpix (Section 8.3.37), skygrid (Section 8.3.38).
B.10.1 Usage
The usage of plot2sky is
stilts <stilts-flags> plot2sky xpix=<int-value> ypix=<int-value>insets=<top>,<left>,<bottom>,<right>omode=swing|out|cgi|discard|autostorage=simple|memory|disk|policy|cache|basic-cache|persistent|parallelseq=<suffix>[,...] legend=true|falselegborder=true|false legopaque=true|falselegseq=<suffix>[,...] legpos=<xfrac,yfrac>title=<value>auxmap=<map-name>|<color>-<color>[-<color>...]auxclip=<lo>,<hi> auxflip=true|falseauxquant=<number>auxfunc=log|linear|histogram|histolog|sqrt|square|acos|cosauxmin=<number> auxmax=<number>auxlabel=<text> auxcrowd=<factor>auxwidth=<pixels> auxvisible=true|falseforcebitmap=true|false compositor=0..1animate=<table> afmt=<in-format>astream=true|false acmd=<cmds>parallel=<int-value>projection=sin|aitoff|aitoff0|car|car0viewsys=equatorial|galactic|supergalactic|eclipticreflectlon=true|false grid=true|falsescalebar=true|falselabelpos=Auto|External|Internal|Basic|Hybrid|Nonesex=true|false crowd=<number>gridcolor=<rrggbb>|red|blue|...labelcolor=<rrggbb>|red|blue|...gridaa=true|falsetexttype=plain|antialias|latexfontsize=<int-value>fontstyle=standard|serif|monofontweight=plain|bold|italic|bold_italicclon=<degrees> clat=<degrees>radius=<degrees> zoomfactor=<number>leglabelN=<text>layerN=<layer-type> <layerN-specific-params>
If you don't have the stilts script installed, write "java -jar stilts.jar" instead of "stilts" -see Section 3. The available <stilts-flags> are listed in Section 2.1. For programmaticinvocation, the Task class for this command isuk.ac.starlink.ttools.plot2.task.SkyPlot2Task.
SUN/256 388
Parameter values are assigned on the command line as explained in Section 2.3. They are asfollows:
acmd = <cmds> (ProcessingStep[])Specifies processing to be performed on the animation control table as specified by parameteranimate, before any other processing has taken place. The value of this parameter is one ormore of the filter commands described in Section 6.1. If more than one is given, they must beseparated by semicolon characters (";"). This parameter can be repeated multiple times on thesame command line to build up a list of processing steps. The sequence of commands given inthis way defines the processing pipeline which is performed on the table.
Commands may alteratively be supplied in an external file, by using the indirection character'@'. Thus a value of "@filename" causes the file filename to be read for a list of filtercommands to execute. The commands in the file may be separated by newline charactersand/or semicolons, and lines which are blank or which start with a '#' character are ignored.
afmt = <in-format> (String)Specifies the format of the animation control table as specified by parameter animate. Theknown formats are listed in Section 5.1.1. This flag can be used if you know what format yourtable is in. If it has the special value (auto) (the default), then an attempt will be made todetect the format of the table automatically. This cannot always be done correctly however, inwhich case the program will exit with an error explaining which formats were attempted. Thisparameter is ignored for scheme-specified tables.
[Default: (auto)]
animate = <table> (StarTable)If not null, this parameter causes the command to create a sequence of plots instead of just one.The parameter value is a table with one row for each frame to be produced. Columns in thetable are interpreted as parameters which may take different values for each frame; the columnname is the parameter name, and the value for a given frame is its value from that row.Animating like this is considerably more efficient than invoking the STILTS command in aloop.
The location of the animation control table. This may take one of the following forms:
• A filename.• A URL.• The special value "-", meaning standard input. In this case the input format must be given
explicitly using the afmt parameter. Note that not all formats can be streamed in this way.• A scheme specification of the form :<scheme-name>:<scheme-args>.• A system command line with either a "<" character at the start, or a "|" character at the
end ("<syscmd" or "syscmd|"). This executes the given pipeline and reads from itsstandard output. This will probably only work on unix-like systems.
In any case, compressed data in one of the supported compression formats (gzip, Unixcompress or bzip2) will be decompressed transparently.
astream = true|false (Boolean)If set true, the animation control table specified by the animate parameter will be read as astream. It is necessary to give the afmt parameter in this case. Depending on the requiredoperations and processing mode, this may cause the read to fail (sometimes it is necessary toread the table more than once). It is not normally necessary to set this flag; in most cases thedata will be streamed automatically if that is the best thing to do. However it can sometimesresult in less resource usage when processing large files in certain formats (such as VOTable).This parameter is ignored for scheme-specified tables.
[Default: false]
auxclip = <lo>,<hi> (Subrange)
SUN/256 389
Defines a subrange of the colour ramp to be used for Aux shading. The value is specified as a(low,high) comma-separated pair of two numbers between 0 and 1.
If the full range 0,1 is used, the whole range of colours specified by the selected shader will beused. But if for instance a value of 0,0.5 is given, only those colours at the left hand end of theramp will be seen.
If the null (default) value is chosen, a default clip will be used. This generally covers most orall of the range 0-1 but for colour maps which fade to white, a small proportion of the lowerend may be excluded, to ensure that all the colours are visually distinguishable from a whitebackground. This default is usually a good idea if the colour map is being used with somethinglike a scatter plot, where markers are plotted against a white background. However, forsomething like a density map when the whole plotting area is tiled with colours from the map,it may be better to supply the whole range 0,1 explicitly.
auxcrowd = <factor> (Double)Determines how closely the tick marks are spaced on the Aux axis, if visible. The default valueis 1, meaning normal crowding. Larger values result in more ticks, and smaller values fewerticks. Tick marks will not however be spaced so closely that the labels overlap each other, soto get very closely spaced marks you may need to reduce the font size as well.
[Default: 1.0]
auxflip = true|false (Boolean)If true, the colour map on the Aux axis will be reversed.
[Default: false]
auxfunc = log|linear|histogram|histolog|sqrt|square|acos|cos (Scaling)Defines the way that values in the Aux range are mapped to the selected colour ramp.
The available options are:
• log: Logarithmic scaling• linear: Linear scaling• histogram: Scaling follows data distribution, with linear axis• histolog: Scaling follows data distribution, with logarithmic axis• sqrt: Square root scaling• square: Square scaling• acos: Arccos Scaling• cos: Cos Scaling
For all these options, the full range of data values is used, and displayed on the colour bar ifapplicable. The Linear, Log, Square and Sqrt options just apply the named function to the fulldata range. The histogram options on the other hand use a scaling function that corresponds tothe actual distribution of the data, so that there are about the same number of points (or pixels,or whatever is being scaled) of each colour. The histogram options are somewhat moreexpensive, but can be a good choice if you are exploring data whose distribution is unknown ornot well-behaved over its min-max range. The Histogram and HistoLog options both assignthe colours in the same way, but they display the colour ramp with linear or logarithmicannotation respectively; the HistoLog option also ignores non-positive values.
[Default: linear]
auxlabel = <text> (String)Sets the label used to annotate the aux axis, if it is visible.
auxmap = <map-name>|<color>-<color>[-<color>...] (Shader)Color map used for Aux axis shading.
A mixed bag of colour ramps are available: inferno, magma, plasma, viridis, cividis,cubehelix, sron, rainbow, rainbow2, rainbow3, pastel, accent, gnuplot, gnuplot2,
SUN/256 390
, set1, paired, hotcold, rdbu, piyg, brbg, cyan-magenta, red-blue, brg, heat, cold, light,greyscale, colour, standard, bugn, bupu, orrd, pubu, purd, huecl, hue, intensity, rgb_red,rgb_green, rgb_blue, hsv_h, hsv_s, hsv_v, yuv_y, yuv_u, yuv_v, scale_hsv_s, scale_hsv_v,scale_yuv_y, mask, blacker, whiter, transparency. Note: many of these, includingrainbow-like ones, are frowned upon by the visualisation community.
You can also construct your own custom colour map by giving a sequence of colour namesseparated by minus sign ("-") characters. In this case the ramp is a linear interpolation betweeneach pair of colours named, using the same syntax as when specifying a colour value. So forinstance "yellow-hotpink-#0000ff" would shade from yellow via hot pink to blue.
[Default: inferno]
auxmax = <number> (Double)Maximum value of the data coordinate on the Aux axis. This sets the value before anysubranging is applied. If not supplied, the value is determined from the plotted data.
auxmin = <number> (Double)Minimum value of the data coordinate on the Aux axis. This sets the value before anysubranging is applied. If not supplied, the value is determined from the plotted data.
auxquant = <number> (Double)Allows the colour map used for the Aux axis to be quantised. If an integer value N is chosenthen the colour map will be viewed as N discrete evenly-spaced levels, so that only N differentcolours will appear in the plot. This can be used to generate a contour-like effect, and maymake it easier to trace the boundaries of regions of interest by eye.
If left blank, the colour map is nominally continuous (though in practice it may be quantised toa medium-sized number like 256).
auxvisible = true|false (Boolean)Determines whether the aux axis colour ramp is displayed alongside the plot.
If not supplied (the default), the aux axis will be visible when aux shading is used in any of theplotted layers.
auxwidth = <pixels> (Integer)Determines the lateral size of the aux colour ramp, if visible, in pixels.
[Default: 15]
clat = <degrees> (Double)Latitude of the central position of the plot in decimal degrees. Use with clon and radius. If thecenter is not specified, the field of view is determined from the data.
clon = <degrees> (Double)Longitude of the central position of the plot in decimal degrees. Use with clat and radius. Ifthe center is not specified, the field of view is determined from the data.
compositor = 0..1 (Compositor)Defines how multiple overplotted partially transparent pixels are combined to form a resultingcolour. The way this is used depends on the details of the specified plot.
Currently, this parameter takes a "boost" value in the range 0..1. If the value is zero, saturationsemantics are used: RGB colours are added in proporition to their associated alpha value untilthe total alpha is saturated (reaches 1), after which additional pixels have no further effect. Forlarger boost values, the effect is similar, but any non-zero alpha in the output is boosted to thegiven minimum value. The effect of this is that even very slightly populated pixels can bevisually distinguished from unpopulated ones which may not be the case for saturationcomposition.
[Default: 0.05]
crowd = <number> (Double)
SUN/256 391
Determines how closely sky grid lines are spaced. The default value is 1, meaning normalcrowding. Larger values result in more grid lines, and smaller values in fewer grid lines.
[Default: 1]
fontsize = <int-value> (Integer)Size of the text font in points.
[Default: 12]
fontstyle = standard|serif|mono (FontType)Font style for text.
The available options are:
• standard
• serif
• mono
[Default: standard]
fontweight = plain|bold|italic|bold_italic (FontWeight)Font weight for text.
The available options are:
• plain
• bold
• italic
• bold_italic
[Default: plain]
forcebitmap = true|false (Boolean)Affects whether rendering of the data contents of a plot (though not axis labels etc) is alwaysdone to an intermediate bitmap rather than, where possible, being painted using graphicsprimitives. This is a rather arcane setting that may nevertheless have noticeable effects on theappearance and size of an output graphics file, as well as plotting time. For some types of plot(e.g. shadingN=auto or shadingN=density) it will have no effect, since this kind of renderinghappens in any case.
When writing to vector graphics formats (PDF and PostScript), setting it true will force thedata contents to be bitmapped. This may make the output less beautiful (round markers will nolonger be perfectly round), but it may result in a much smaller file if there are very many datapoints.
When writing to bitmapped output formats (PNG, GIF, JPEG, ...), it fixes shapes to be thesame as seen on the screen rather than be rendered at the mercy of the graphics system, whichsometimes introduces small distortions.
[Default: false]
grid = true|false (Boolean)If true, sky coordinate grid lines are drawn on the plot. If false, they are absent.
[Default: true]
gridaa = true|false (Boolean)If true, grid lines are drawn with antialiasing. Antialiased lines look smoother, but may takeperceptibly longer to draw. Only has any effect for bitmapped output formats.
[Default: false]
gridcolor = <rrggbb>|red|blue|... (Color)The color of the plot grid, given by name or as a hexadecimal RGB value.
SUN/256 392
The standard plotting colour names are red, blue, green, grey, magenta, cyan, orange, pink,yellow, black, light_grey, white. However, many other common colour names (too many tolist here) are also understood. The list currently contains those colour names understood bymost web browsers, from AliceBlue to YellowGreen, listed e.g. in the Extended colorkeywords section of the CSS3 standard.
Alternatively, a six-digit hexadecimal number RRGGBB may be supplied, optionally prefixedby "#" or "0x", giving red, green and blue intensities, e.g. "ff00ff", "#ff00ff" or "0xff00ff"for magenta.
[Default: light_grey]
insets = <top>,<left>,<bottom>,<right> (Padding)Defines the amount of space in pixels around the actual plotting area. This space is used foraxis labels, and other decorations and any left over forms an empty border.
The size and position of the actual plotting area is determined by this parameter along withxpix and ypix.
The value of this parameter is 4 comma separated integers: <top>,<left>,<bottom>,<right>.Any or all of these values may be left blank, in which case the corresponding margin will becalculated automatically according to how much space is required.
labelcolor = <rrggbb>|red|blue|... (Color)The color of axis labels and other plot annotations, given by name or as a hexadecimal RGBvalue.
The standard plotting colour names are red, blue, green, grey, magenta, cyan, orange, pink,yellow, black, light_grey, white. However, many other common colour names (too many tolist here) are also understood. The list currently contains those colour names understood bymost web browsers, from AliceBlue to YellowGreen, listed e.g. in the Extended colorkeywords section of the CSS3 standard.
Alternatively, a six-digit hexadecimal number RRGGBB may be supplied, optionally prefixedby "#" or "0x", giving red, green and blue intensities, e.g. "ff00ff", "#ff00ff" or "0xff00ff"for magenta.
[Default: black]
labelpos = Auto|External|Internal|Basic|Hybrid|None (SkyAxisLabeller)Controls whether and where the numeric annotations of the lon/lat axes are displayed. Thedefault option Auto usually does the sensible thing, but other options exist to force labellinginternally or externally to the plot region, or to remove numeric labels altogether.
The available options are:
• Auto: Uses External or Internal policy according to whether the sky fills the plotbounds or not
• External: Labels are drawn outside the plot bounds• Internal: Labels are drawn inside the plot bounds• Basic: Labels are drawn somewhere near the grid line• Hybrid: Grid lines are labelled outside the plot bounds where possible, but inside if they
would otherwise be invisible• None: Axes are not labelled
[Default: Auto]
layerN = <layer-type> <layerN-specific-params> (LayerType)Selects one of the available plot types for layerN. A plot consists of a plotting surface, set upusing the various unsuffixed parameters of the plotting command, and zero or more plot layers.Each layer is introduced by a parameter with the name layer<N> where the suffix "<N>" is alabel identifying the layer and is appended to all the parameter names which configure that
SUN/256 393

layer. Suffixes may be any string, including the empty string.
This parameter may take one of the following values, described in more detail in Section 8.3:
• mark (Section 8.3.1)
• size (Section 8.3.2)
• sizexy (Section 8.3.3)
• skyvector (Section 8.3.33)
• skyellipse (Section 8.3.34)
• skycorr (Section 8.3.35)
• link2 (Section 8.3.8)
• mark2 (Section 8.3.9)
• poly4 (Section 8.3.10)
• mark4 (Section 8.3.11)
• polygon (Section 8.3.12)
• area (Section 8.3.13)
• central (Section 8.3.14)
• label (Section 8.3.21)
• arealabel (Section 8.3.22)
• contour (Section 8.3.23)
• skydensity (Section 8.3.36)
• healpix (Section 8.3.37)
• skygrid (Section 8.3.38)
Each of these layer types comes with a list of type-specific parameters to define the details ofthat layer, including some or all of the following groups:
• input table parameters (e.g. inN, icmdN)• coordinate params referring to input table columns (e.g. xN, yN)• layer style parameters (e.g. shadingN, colorN)
Every parameter notionally carries the same suffix N. However, if the suffix is not present, theapplication will try looking for a parameter with the same name with no suffix instead. In thisway, if several layers have the same value for a given parameter (for instance input table), youcan supply it using one unsuffixed parameter to save having to supply several parameters withthe same value but different suffixes.
legborder = true|false (Boolean)If true, a line border is drawn around the legend.
[Default: true]
legend = true|false (Boolean)Whether to draw a legend or not. If no value is supplied, the decision is made automatically: alegend is drawn only if it would have more than one entry.
leglabelN = <text> (String)Sets the presentation label for the layer with a given suffix. This is the text which is displayedin the legend, if present. Multiple layers may use the same label, in which case they will becombined to form a single legend entry.
If no value is supplied (the default), the suffix itself is used as the label.
legopaque = true|false (Boolean)If true, the background of the legend is opaque, and the legend obscures any plot componentsbehind it. Otherwise, it's transparent.
[Default: true]
legpos = <xfrac,yfrac> (double[])Determines the internal position of the legend on the plot. The value is a comma-separated pair
SUN/256 394
of values giving the X and Y positions of the legend within the plotting bounds, so for instance"0.5,0.5" will put the legend right in the middle of the plot. If no value is supplied, the legendwill appear outside the plot boundary.
legseq = <suffix>[,...] (String[])Determines which layers are represented in the legend (if present) and in which order theyappear. The legend has a line for each layer label (as determined by the leglabelN parameter).If multiple layers have the same label, they will contribute to the same entry in the legend, withstyle icons plotted over each other. The value of this parameter is a comma-separated sequenceof layer suffixes, which determines the order in which the legend entries appear. Layers withsuffixes missing from this list do not show up in the legend at all.
If no value is supplied (the default), the sequence is the same as the layer plotting sequence(see seq).
omode = swing|out|cgi|discard|auto (PaintMode)Determines how the drawn plot will be output, see Section 8.5.
• swing: Plot will be displayed in a window on the screen. This plot is "live"; it can beresized and (except for old-style plots) navigated around with mouse actions in the sameway as plots in TOPCAT.
• out: Plot will be written to a file given by out using the graphics format given by ofmt.• cgi: Plot will be written in a way suitable for CGI use direct from a web server. The
output is in the graphics format given by ofmt, preceded by a suitable "Content-type"declaration.
• discard: Plot is drawn, but discarded. There is no output.• auto: Behaves as swing or out mode depending on presence of out parameter
[Default: auto]
parallel = <int-value> (Integer)Determines how many threads will run in parallel if animation output is being produced. Onlyused if the animate parameter is supplied. The default value is the number of processorsapparently available to the JVM.
[Default: 20]
projection = sin|aitoff|aitoff0|car|car0 (Projection)Sky projection used to display the plot.
The available options are:
• sin: rotatable sphere• aitoff: Aitoff projection with lon=0 at center• aitoff0: Aitoff projection with lon=180 at center• car: Plate Carree projection (lon/lat on Cartesian axes) with lon=0 at center• car0: Plate Carree Projection (lon/lat on Cartesian axes) with lon=180 at center
[Default: sin]
radius = <degrees> (Double)Approximate radius of the plot field of view in degrees. Only used if clon and clat are alsospecified.
[Default: 1]
reflectlon = true|false (Boolean)Whether to invert the celestial sphere by displaying the longitude axis increasing right-to-leftrather than left-to-right. It is conventional to display the celestial sphere in this way becausethat's what it looks like from the earth, so the default is true. Set it false to see the sphere fromthe outside.
SUN/256 395
[Default: true]
scalebar = true|false (Boolean)If true, a small bar is drawn near the bottom left of the plot annotated with a distance indegrees, arc minutes or arc seconds, to make it easier to determine the size of features on theplot by eye.
[Default: true]
seq = <suffix>[,...] (String[])Contains a comma-separated list of layer suffixes to determine the order in which layers aredrawn on the plot. This can affect which symbol are plotted on top of, and so potentiallyobscure, which other ones.
When specifying a plot, multiple layers may be specified, each introduced by a parameterlayer<N>, where <N> is a different (arbitrary) suffix labelling the layer, and is appended to allthe parameters specific to defining that layer.
By default the layers are drawn on the plot in the order in which the layer* parameters appearon the command line. However if this parameter is specified, each comma-separated element isinterpreted as a layer suffix, giving the ordered list of layers to plot. Every element of the listmust be a suffix with a corresponding layer parameter, but missing or repeated elements areallowed.
sex = true|false (Boolean)If true, grid line labels are written in sexagesimal notation, if false in decimal degrees.
[Default: true]
storage = simple|memory|disk|policy|cache|basic-cache|persistent|parallel
(DataStoreFactory)Determines the way that data is accessed when constructing the plot. There are two mainoptions, cached or not. If no caching is used then rows are read sequentially from the specifiedinput table(s) every time they are required. This generally requires a small resource footprint(though that can depend on how the table is specified) and makes sense if the data only needsto be scanned once or perhaps if the table is very large. If caching is used then the requireddata is read once from the specified input table(s), then prepared and cached before anyplotting is performed, and plots are done using this cached data. This may use a significantamount of storage for large tables but it's usually more sensible (faster) if the data will need tobe scanned multiple times. There are various options for cache storage.
The options are:
• simple: no caching, data read directly from input table• memory: cached to memory; OutOfMemoryError possible for very large plots• disk: cached to disk• policy: cached using application-wide default storage policy, which is usually adaptive
(memory/disk hybrid)• persistent: cached to persistent files on disk, in the system temporary directory (defined
by system property java.io.tmpdir). If this is used, plot data will be stored on disk in away that means they can be re-used between STILTS invocations, so data preparation canbe avoided on subsequent runs. Note however it can leave potentially large files in yourtemporary directory.
• cache: synonym for memory (backward compatibility)• basic-cache: dumber version of memory (no optimisation for constant-valued columns)• parallel: experimental version of memory-based cache that reads into the cache in
parallel for large files. This will make the plot faster to prepare, but interaction is a bitslower and sequence-dependent attributes of the plot may not come out right. Thisexperimental option may be withdrawn or modified in future releases.
The default value is memory if a live plot is being generated (omode=swing), since in that case
SUN/256 396
the plot needs to be redrawn every time the user performs plot navigation actions or resizes thewindow, or if animations are being produced. Otherwise (e.g. output to a graphics file) thedefault is simple.
[Default: simple]
texttype = plain|antialias|latex (TextSyntax)Determines how to turn label text into characters on the plot. Plain and Antialias both takethe text at face value, but Antialias smooths the characters. LaTeX interprets the text asLaTeX source code and typesets it accordingly.
When not using LaTeX, antialiased text usually looks nicer, but can be perceptibly slower toplot. At time of writing, on MacOS antialiased text seems to be required to stop the writingcoming out upside-down for non-horizontal text (MacOS java bug).
[Default: plain]
title = <value> (String)Text of a title to be displayed at the top of the plot. If null, the default, no title is shown andthere's more space for the graphics.
viewsys = equatorial|galactic|supergalactic|ecliptic (SkySys)The sky coordinate system used for the generated plot.
Choice of this value goes along with the data coordinate system that may be specified for plotlayers. If unspecified, a generic longitude/latitude system is used, and all lon/lat coordinates inthe plotted data layers are assumed to be in the same system. If a value is supplied for thisparameter, then a sky system must (implicitly or explicitly) be supplied for each data layer, andthe coordinates are converted from data to view system before being plotted.
The available options are:
• equatorial: J2000 equatorial system• galactic: IAU 1958 galactic system• supergalactic: De Vaucouleurs supergalactic system• ecliptic: ecliptic system based on conversion at 2000.0
xpix = <int-value> (Integer)Size of the output image in the X direction in pixels. This includes space for any axis labels,padding and other decoration outside the plot area itself. See also insets.
[Default: 500]
ypix = <int-value> (Integer)Size of the output image in the Y direction in pixels. This includes space for any axis labels,padding and other decoration outside the plot area itself. See also insets.
[Default: 400]
zoomfactor = <number> (Double)Sets the amount by which the plot view zooms in or out for each unit of mouse wheelmovement. A value of 1 means that mouse wheel zooming has no effect. A higher value meansthat the mouse wheel zooms faster and a value nearer 1 means it zooms slower. Values below1 are not permitted.
[Default: 1.2]
B.10.2 Examples
Here are some examples of plot2sky:
SUN/256 397
stilts plot2sky in=messier.xml lon=RA lat=DEClayer.pos=mark size.pos=4layer.txt=label label.txt=Name color.txt=slategrey
Plots the positions of all the Messier objects on the sky, with text labels giving their objectnames. This displays a sphere on the screen that you can rotate/zoom using the mouse.
stilts plot2sky projection=aitoffxpix=600 ypix=300gridcolour=green labelcolour=blackfontsize=10 gridaa=true texttype=antialiassex=true crowd=4
This just plots a celestial coordinate grid with no data. Various options are tweaked to adjustthe appearance of the grid.
stilts plot2sky xpix=1000 ypix=500 fontsize=18 crowd=2projection=aitoff viewsys=galacticlayer1=mark size1=0shading1=density densemap1=gnuplot2 densefunc1=logdensesub1=0.5,.95 denseclip1=0.02,1in1=gums_mw_all.fitslon1=alpha lat1=delta datasys1=equatorialicmd1=progress out=mw.pdf
Makes an all-sky plot using an Aitoff projection into galactic coordinates of a large dataset.Density shading means that the colour at each point is dependent on how many points areplotted; the density colour map has been fine-tuned here to get a specific visual effect. The skycoordinates in the input file (alpha and delta) are equatorial, but these are transformed togalactic coordinates for plotting. The progress filter applied to the input table displays aprogress indicator on the console to see how far it's got. The result is written to a PDF file.
This command was used to plot the GUMS-10 MW dataset, a simulation of the milky waystars seen by the Gaia satellite; The 2.1 billion row plot took about 45 minutes.
B.11 plot2cube: Draws a cube plot
plot2cube draws plots in a Cartesian 3-dimensional space. The plotting volume is a cube, which isviewed from the outside and usually bounded by an annotated wire frame.
Positional coordinates are specified as x, y, z triples, e.g.:
plot2cube layer1=mark in1=sim.fits x1=XPOS y1=YPOS z1=ZPOS
Content is added to the plot by specifying one or more plot layers using the layerN parameter. TheN part is a suffix applied to all the parameters affecting a given layer; any suffix (including theempty string) may be used. Available layers for this plot type are: mark (Section 8.3.1), size
(Section 8.3.2), sizexy (Section 8.3.3), xyzvector (Section 8.3.39), xyzerror (Section 8.3.40),link2 (Section 8.3.8), mark2 (Section 8.3.9), poly4 (Section 8.3.10), mark4 (Section 8.3.11),polygon (Section 8.3.12), label (Section 8.3.21), line3d (Section 8.3.41), contour (Section8.3.23), spheregrid (Section 8.3.42).
B.11.1 Usage
The usage of plot2cube is
stilts <stilts-flags> plot2cube xpix=<int-value> ypix=<int-value>insets=<top>,<left>,<bottom>,<right>omode=swing|out|cgi|discard|autostorage=simple|memory|disk|policy|cache|basic-cache|persistent|parallel
SUN/256 398
seq=<suffix>[,...] legend=true|falselegborder=true|false legopaque=true|falselegseq=<suffix>[,...] legpos=<xfrac,yfrac>title=<value>auxmap=<map-name>|<color>-<color>[-<color>...]auxclip=<lo>,<hi> auxflip=true|falseauxquant=<number>auxfunc=log|linear|histogram|histolog|sqrt|square|acos|cosauxmin=<number> auxmax=<number>auxlabel=<text> auxcrowd=<factor>auxwidth=<pixels> auxvisible=true|falseforcebitmap=true|false compositor=0..1animate=<table> afmt=<in-format>astream=true|false acmd=<cmds>parallel=<int-value> xlog=true|falseylog=true|false zlog=true|falsexflip=true|false yflip=true|falsezflip=true|false xlabel=<text>ylabel=<text> zlabel=<text> xcrowd=<number>ycrowd=<number> zcrowd=<number>frame=true|false minor=true|falsegridaa=true|falsetexttype=plain|antialias|latexfontsize=<int-value>fontstyle=standard|serif|monofontweight=plain|bold|italic|bold_italicxmin=<number> xmax=<number> xsub=<lo>,<hi>ymin=<number> ymax=<number> ysub=<lo>,<hi>zmin=<number> zmax=<number> zsub=<lo>,<hi>phi=<degrees> theta=<degrees> psi=<degrees>zoom=<factor> xoff=<pixels> yoff=<pixels>zoomaxes=[[x][y][z]] zoomfactor=<number>leglabelN=<text>layerN=<layer-type> <layerN-specific-params>
If you don't have the stilts script installed, write "java -jar stilts.jar" instead of "stilts" -see Section 3. The available <stilts-flags> are listed in Section 2.1. For programmaticinvocation, the Task class for this command isuk.ac.starlink.ttools.plot2.task.CubePlot2Task.
Parameter values are assigned on the command line as explained in Section 2.3. They are asfollows:
acmd = <cmds> (ProcessingStep[])Specifies processing to be performed on the animation control table as specified by parameteranimate, before any other processing has taken place. The value of this parameter is one ormore of the filter commands described in Section 6.1. If more than one is given, they must beseparated by semicolon characters (";"). This parameter can be repeated multiple times on thesame command line to build up a list of processing steps. The sequence of commands given inthis way defines the processing pipeline which is performed on the table.
Commands may alteratively be supplied in an external file, by using the indirection character'@'. Thus a value of "@filename" causes the file filename to be read for a list of filtercommands to execute. The commands in the file may be separated by newline charactersand/or semicolons, and lines which are blank or which start with a '#' character are ignored.
afmt = <in-format> (String)Specifies the format of the animation control table as specified by parameter animate. Theknown formats are listed in Section 5.1.1. This flag can be used if you know what format yourtable is in. If it has the special value (auto) (the default), then an attempt will be made todetect the format of the table automatically. This cannot always be done correctly however, inwhich case the program will exit with an error explaining which formats were attempted. Thisparameter is ignored for scheme-specified tables.
[Default: (auto)]
animate = <table> (StarTable)
SUN/256 399

If not null, this parameter causes the command to create a sequence of plots instead of just one.The parameter value is a table with one row for each frame to be produced. Columns in thetable are interpreted as parameters which may take different values for each frame; the columnname is the parameter name, and the value for a given frame is its value from that row.Animating like this is considerably more efficient than invoking the STILTS command in aloop.
The location of the animation control table. This may take one of the following forms:
• A filename.• A URL.• The special value "-", meaning standard input. In this case the input format must be given
explicitly using the afmt parameter. Note that not all formats can be streamed in this way.• A scheme specification of the form :<scheme-name>:<scheme-args>.• A system command line with either a "<" character at the start, or a "|" character at the
end ("<syscmd" or "syscmd|"). This executes the given pipeline and reads from itsstandard output. This will probably only work on unix-like systems.
In any case, compressed data in one of the supported compression formats (gzip, Unixcompress or bzip2) will be decompressed transparently.
astream = true|false (Boolean)If set true, the animation control table specified by the animate parameter will be read as astream. It is necessary to give the afmt parameter in this case. Depending on the requiredoperations and processing mode, this may cause the read to fail (sometimes it is necessary toread the table more than once). It is not normally necessary to set this flag; in most cases thedata will be streamed automatically if that is the best thing to do. However it can sometimesresult in less resource usage when processing large files in certain formats (such as VOTable).This parameter is ignored for scheme-specified tables.
[Default: false]
auxclip = <lo>,<hi> (Subrange)Defines a subrange of the colour ramp to be used for Aux shading. The value is specified as a(low,high) comma-separated pair of two numbers between 0 and 1.
If the full range 0,1 is used, the whole range of colours specified by the selected shader will beused. But if for instance a value of 0,0.5 is given, only those colours at the left hand end of theramp will be seen.
If the null (default) value is chosen, a default clip will be used. This generally covers most orall of the range 0-1 but for colour maps which fade to white, a small proportion of the lowerend may be excluded, to ensure that all the colours are visually distinguishable from a whitebackground. This default is usually a good idea if the colour map is being used with somethinglike a scatter plot, where markers are plotted against a white background. However, forsomething like a density map when the whole plotting area is tiled with colours from the map,it may be better to supply the whole range 0,1 explicitly.
auxcrowd = <factor> (Double)Determines how closely the tick marks are spaced on the Aux axis, if visible. The default valueis 1, meaning normal crowding. Larger values result in more ticks, and smaller values fewerticks. Tick marks will not however be spaced so closely that the labels overlap each other, soto get very closely spaced marks you may need to reduce the font size as well.
[Default: 1.0]
auxflip = true|false (Boolean)If true, the colour map on the Aux axis will be reversed.
[Default: false]
auxfunc = log|linear|histogram|histolog|sqrt|square|acos|cos (Scaling)
SUN/256 400
Defines the way that values in the Aux range are mapped to the selected colour ramp.
The available options are:
• log: Logarithmic scaling• linear: Linear scaling• histogram: Scaling follows data distribution, with linear axis• histolog: Scaling follows data distribution, with logarithmic axis• sqrt: Square root scaling• square: Square scaling• acos: Arccos Scaling• cos: Cos Scaling
For all these options, the full range of data values is used, and displayed on the colour bar ifapplicable. The Linear, Log, Square and Sqrt options just apply the named function to the fulldata range. The histogram options on the other hand use a scaling function that corresponds tothe actual distribution of the data, so that there are about the same number of points (or pixels,or whatever is being scaled) of each colour. The histogram options are somewhat moreexpensive, but can be a good choice if you are exploring data whose distribution is unknown ornot well-behaved over its min-max range. The Histogram and HistoLog options both assignthe colours in the same way, but they display the colour ramp with linear or logarithmicannotation respectively; the HistoLog option also ignores non-positive values.
[Default: linear]
auxlabel = <text> (String)Sets the label used to annotate the aux axis, if it is visible.
auxmap = <map-name>|<color>-<color>[-<color>...] (Shader)Color map used for Aux axis shading.
A mixed bag of colour ramps are available: inferno, magma, plasma, viridis, cividis,cubehelix, sron, rainbow, rainbow2, rainbow3, pastel, accent, gnuplot, gnuplot2,specxby, set1, paired, hotcold, rdbu, piyg, brbg, cyan-magenta, red-blue, brg, heat, cold,light, greyscale, colour, standard, bugn, bupu, orrd, pubu, purd, huecl, hue, intensity,rgb_red, rgb_green, rgb_blue, hsv_h, hsv_s, hsv_v, yuv_y, yuv_u, yuv_v, scale_hsv_s,scale_hsv_v, scale_yuv_y, mask, blacker, whiter, transparency. Note: many of these,including rainbow-like ones, are frowned upon by the visualisation community.
You can also construct your own custom colour map by giving a sequence of colour namesseparated by minus sign ("-") characters. In this case the ramp is a linear interpolation betweeneach pair of colours named, using the same syntax as when specifying a colour value. So forinstance "yellow-hotpink-#0000ff" would shade from yellow via hot pink to blue.
[Default: inferno]
auxmax = <number> (Double)Maximum value of the data coordinate on the Aux axis. This sets the value before anysubranging is applied. If not supplied, the value is determined from the plotted data.
auxmin = <number> (Double)Minimum value of the data coordinate on the Aux axis. This sets the value before anysubranging is applied. If not supplied, the value is determined from the plotted data.
auxquant = <number> (Double)Allows the colour map used for the Aux axis to be quantised. If an integer value N is chosenthen the colour map will be viewed as N discrete evenly-spaced levels, so that only N differentcolours will appear in the plot. This can be used to generate a contour-like effect, and maymake it easier to trace the boundaries of regions of interest by eye.
If left blank, the colour map is nominally continuous (though in practice it may be quantised toa medium-sized number like 256).
SUN/256 401

auxvisible = true|false (Boolean)Determines whether the aux axis colour ramp is displayed alongside the plot.
If not supplied (the default), the aux axis will be visible when aux shading is used in any of theplotted layers.
auxwidth = <pixels> (Integer)Determines the lateral size of the aux colour ramp, if visible, in pixels.
[Default: 15]
compositor = 0..1 (Compositor)Defines how multiple overplotted partially transparent pixels are combined to form a resultingcolour. The way this is used depends on the details of the specified plot.
Currently, this parameter takes a "boost" value in the range 0..1. If the value is zero, saturationsemantics are used: RGB colours are added in proporition to their associated alpha value untilthe total alpha is saturated (reaches 1), after which additional pixels have no further effect. Forlarger boost values, the effect is similar, but any non-zero alpha in the output is boosted to thegiven minimum value. The effect of this is that even very slightly populated pixels can bevisually distinguished from unpopulated ones which may not be the case for saturationcomposition.
[Default: 0.05]
fontsize = <int-value> (Integer)Size of the text font in points.
[Default: 12]
fontstyle = standard|serif|mono (FontType)Font style for text.
The available options are:
• standard
• serif
• mono
[Default: standard]
fontweight = plain|bold|italic|bold_italic (FontWeight)Font weight for text.
The available options are:
• plain
• bold
• italic
• bold_italic
[Default: plain]
forcebitmap = true|false (Boolean)Affects whether rendering of the data contents of a plot (though not axis labels etc) is alwaysdone to an intermediate bitmap rather than, where possible, being painted using graphicsprimitives. This is a rather arcane setting that may nevertheless have noticeable effects on theappearance and size of an output graphics file, as well as plotting time. For some types of plot(e.g. shadingN=auto or shadingN=density) it will have no effect, since this kind of renderinghappens in any case.
When writing to vector graphics formats (PDF and PostScript), setting it true will force thedata contents to be bitmapped. This may make the output less beautiful (round markers will nolonger be perfectly round), but it may result in a much smaller file if there are very many data
SUN/256 402

points.
When writing to bitmapped output formats (PNG, GIF, JPEG, ...), it fixes shapes to be thesame as seen on the screen rather than be rendered at the mercy of the graphics system, whichsometimes introduces small distortions.
[Default: false]
frame = true|false (Boolean)If true, a cube wire frame with labelled axes is drawn to indicate the limits of the plotted 3Dregion. If false, no wire frame and no axes are drawn.
[Default: true]
gridaa = true|false (Boolean)If true, grid lines are drawn with antialiasing. Antialiased lines look smoother, but may takeperceptibly longer to draw. Only has any effect for bitmapped output formats.
[Default: false]
insets = <top>,<left>,<bottom>,<right> (Padding)Defines the amount of space in pixels around the actual plotting area. This space is used foraxis labels, and other decorations and any left over forms an empty border.
The size and position of the actual plotting area is determined by this parameter along withxpix and ypix.
The value of this parameter is 4 comma separated integers: <top>,<left>,<bottom>,<right>.Any or all of these values may be left blank, in which case the corresponding margin will becalculated automatically according to how much space is required.
layerN = <layer-type> <layerN-specific-params> (LayerType)Selects one of the available plot types for layerN. A plot consists of a plotting surface, set upusing the various unsuffixed parameters of the plotting command, and zero or more plot layers.Each layer is introduced by a parameter with the name layer<N> where the suffix "<N>" is alabel identifying the layer and is appended to all the parameter names which configure thatlayer. Suffixes may be any string, including the empty string.
This parameter may take one of the following values, described in more detail in Section 8.3:
• mark (Section 8.3.1)
• size (Section 8.3.2)
• sizexy (Section 8.3.3)
• xyzvector (Section 8.3.39)
• xyzerror (Section 8.3.40)
• link2 (Section 8.3.8)
• mark2 (Section 8.3.9)
• poly4 (Section 8.3.10)
• mark4 (Section 8.3.11)
• polygon (Section 8.3.12)
• label (Section 8.3.21)
• line3d (Section 8.3.41)
• contour (Section 8.3.23)
• spheregrid (Section 8.3.42)
Each of these layer types comes with a list of type-specific parameters to define the details ofthat layer, including some or all of the following groups:
• input table parameters (e.g. inN, icmdN)• coordinate params referring to input table columns (e.g. xN, yN)• layer style parameters (e.g. shadingN, colorN)
SUN/256 403
Every parameter notionally carries the same suffix N. However, if the suffix is not present, theapplication will try looking for a parameter with the same name with no suffix instead. In thisway, if several layers have the same value for a given parameter (for instance input table), youcan supply it using one unsuffixed parameter to save having to supply several parameters withthe same value but different suffixes.
legborder = true|false (Boolean)If true, a line border is drawn around the legend.
[Default: true]
legend = true|false (Boolean)Whether to draw a legend or not. If no value is supplied, the decision is made automatically: alegend is drawn only if it would have more than one entry.
leglabelN = <text> (String)Sets the presentation label for the layer with a given suffix. This is the text which is displayedin the legend, if present. Multiple layers may use the same label, in which case they will becombined to form a single legend entry.
If no value is supplied (the default), the suffix itself is used as the label.
legopaque = true|false (Boolean)If true, the background of the legend is opaque, and the legend obscures any plot componentsbehind it. Otherwise, it's transparent.
[Default: true]
legpos = <xfrac,yfrac> (double[])Determines the internal position of the legend on the plot. The value is a comma-separated pairof values giving the X and Y positions of the legend within the plotting bounds, so for instance"0.5,0.5" will put the legend right in the middle of the plot. If no value is supplied, the legendwill appear outside the plot boundary.
legseq = <suffix>[,...] (String[])Determines which layers are represented in the legend (if present) and in which order theyappear. The legend has a line for each layer label (as determined by the leglabelN parameter).If multiple layers have the same label, they will contribute to the same entry in the legend, withstyle icons plotted over each other. The value of this parameter is a comma-separated sequenceof layer suffixes, which determines the order in which the legend entries appear. Layers withsuffixes missing from this list do not show up in the legend at all.
If no value is supplied (the default), the sequence is the same as the layer plotting sequence(see seq).
minor = true|false (Boolean)If true, minor tick marks are painted along the axes as well as the major tick marks. Minor tickmarks do not have associated grid lines.
[Default: true]
omode = swing|out|cgi|discard|auto (PaintMode)Determines how the drawn plot will be output, see Section 8.5.
• swing: Plot will be displayed in a window on the screen. This plot is "live"; it can beresized and (except for old-style plots) navigated around with mouse actions in the sameway as plots in TOPCAT.
• out: Plot will be written to a file given by out using the graphics format given by ofmt.• cgi: Plot will be written in a way suitable for CGI use direct from a web server. The
output is in the graphics format given by ofmt, preceded by a suitable "Content-type"declaration.
• discard: Plot is drawn, but discarded. There is no output.• auto: Behaves as swing or out mode depending on presence of out parameter
SUN/256 404
[Default: auto]
parallel = <int-value> (Integer)Determines how many threads will run in parallel if animation output is being produced. Onlyused if the animate parameter is supplied. The default value is the number of processorsapparently available to the JVM.
[Default: 20]
phi = <degrees> (Double)First of the Euler angles, in the ZXZ sequence, defining the rotation of the plotted 3d space.Units are degrees. This is the rotation around the initial Z axis applied before the plot isviewed.
[Default: 30]
psi = <degrees> (Double)Second of the Euler angles, in the ZXZ sequence, defining the rotation of the plotted 3d space.Units are degrees.
[Default: 0]
seq = <suffix>[,...] (String[])Contains a comma-separated list of layer suffixes to determine the order in which layers aredrawn on the plot. This can affect which symbol are plotted on top of, and so potentiallyobscure, which other ones.
When specifying a plot, multiple layers may be specified, each introduced by a parameterlayer<N>, where <N> is a different (arbitrary) suffix labelling the layer, and is appended to allthe parameters specific to defining that layer.
By default the layers are drawn on the plot in the order in which the layer* parameters appearon the command line. However if this parameter is specified, each comma-separated element isinterpreted as a layer suffix, giving the ordered list of layers to plot. Every element of the listmust be a suffix with a corresponding layer parameter, but missing or repeated elements areallowed.
storage = simple|memory|disk|policy|cache|basic-cache|persistent|parallel
(DataStoreFactory)Determines the way that data is accessed when constructing the plot. There are two mainoptions, cached or not. If no caching is used then rows are read sequentially from the specifiedinput table(s) every time they are required. This generally requires a small resource footprint(though that can depend on how the table is specified) and makes sense if the data only needsto be scanned once or perhaps if the table is very large. If caching is used then the requireddata is read once from the specified input table(s), then prepared and cached before anyplotting is performed, and plots are done using this cached data. This may use a significantamount of storage for large tables but it's usually more sensible (faster) if the data will need tobe scanned multiple times. There are various options for cache storage.
The options are:
• simple: no caching, data read directly from input table• memory: cached to memory; OutOfMemoryError possible for very large plots• disk: cached to disk• policy: cached using application-wide default storage policy, which is usually adaptive
(memory/disk hybrid)• persistent: cached to persistent files on disk, in the system temporary directory (defined
by system property java.io.tmpdir). If this is used, plot data will be stored on disk in away that means they can be re-used between STILTS invocations, so data preparation canbe avoided on subsequent runs. Note however it can leave potentially large files in yourtemporary directory.
SUN/256 405
• cache: synonym for memory (backward compatibility)• basic-cache: dumber version of memory (no optimisation for constant-valued columns)• parallel: experimental version of memory-based cache that reads into the cache in
parallel for large files. This will make the plot faster to prepare, but interaction is a bitslower and sequence-dependent attributes of the plot may not come out right. Thisexperimental option may be withdrawn or modified in future releases.
The default value is memory if a live plot is being generated (omode=swing), since in that casethe plot needs to be redrawn every time the user performs plot navigation actions or resizes thewindow, or if animations are being produced. Otherwise (e.g. output to a graphics file) thedefault is simple.
[Default: simple]
texttype = plain|antialias|latex (TextSyntax)Determines how to turn label text into characters on the plot. Plain and Antialias both takethe text at face value, but Antialias smooths the characters. LaTeX interprets the text asLaTeX source code and typesets it accordingly.
When not using LaTeX, antialiased text usually looks nicer, but can be perceptibly slower toplot. At time of writing, on MacOS antialiased text seems to be required to stop the writingcoming out upside-down for non-horizontal text (MacOS java bug).
[Default: plain]
theta = <degrees> (Double)Second of the Euler angles, in the ZXZ sequence, defining the rotation of the plotted 3d space.Units are degrees. This is the rotation towards the viewer.
[Default: -15]
title = <value> (String)Text of a title to be displayed at the top of the plot. If null, the default, no title is shown andthere's more space for the graphics.
xcrowd = <number> (Double)Determines how closely the tick marks are spaced on the X axis. The default value is 1,meaning normal crowding. Larger values result in more ticks, and smaller values fewer ticks.Tick marks will not however be spaced so closely that the labels overlap each other, so to getvery closely spaced marks you may need to reduce the font size as well.
[Default: 1]
xflip = true|false (Boolean)If true, the scale on the X axis will increase in the opposite sense from usual (e.g. right to leftrather than left to right).
[Default: false]
xlabel = <text> (String)Gives a label to be used for annotating axis X A default value based on the plotted data will beused if no value is supplied.
[Default: X]
xlog = true|false (Boolean)If false (the default), the scale on the X axis is linear, if true it is logarithmic.
[Default: false]
xmax = <number> (Double)Maximum value of the data coordinate on the X axis. This sets the value before anysubranging is applied. If not supplied, the value is determined from the plotted data.
xmin = <number> (Double)
SUN/256 406
Minimum value of the data coordinate on the X axis. This sets the value before any subrangingis applied. If not supplied, the value is determined from the plotted data.
xoff = <pixels> (Double)Shifts the whole plot within the plotting region by the given number of pixels in the horizontaldirection.
[Default: 0]
xpix = <int-value> (Integer)Size of the output image in the X direction in pixels. This includes space for any axis labels,padding and other decoration outside the plot area itself. See also insets.
[Default: 500]
xsub = <lo>,<hi> (Subrange)Defines a normalised adjustment to the data range of the X axis. The value may be specified asa comma-separated pair of two numbers, giving the lower and upper bounds of the range of ofinterest respectively. This sub-range is applied to the data range that would otherwise be used,either automatically calculated or explicitly supplied; zero corresponds to the lower bound andone to the upper.
The default value "0,1" therefore has no effect. The range could be restricted to its lower halfwith the value 0,0.5.
[Default: 0,1]
ycrowd = <number> (Double)Determines how closely the tick marks are spaced on the Y axis. The default value is 1,meaning normal crowding. Larger values result in more ticks, and smaller values fewer ticks.Tick marks will not however be spaced so closely that the labels overlap each other, so to getvery closely spaced marks you may need to reduce the font size as well.
[Default: 1]
yflip = true|false (Boolean)If true, the scale on the Y axis will increase in the opposite sense from usual (e.g. right to leftrather than left to right).
[Default: false]
ylabel = <text> (String)Gives a label to be used for annotating axis Y A default value based on the plotted data will beused if no value is supplied.
[Default: Y]
ylog = true|false (Boolean)If false (the default), the scale on the Y axis is linear, if true it is logarithmic.
[Default: false]
ymax = <number> (Double)Maximum value of the data coordinate on the Y axis. This sets the value before anysubranging is applied. If not supplied, the value is determined from the plotted data.
ymin = <number> (Double)Minimum value of the data coordinate on the Y axis. This sets the value before any subrangingis applied. If not supplied, the value is determined from the plotted data.
yoff = <pixels> (Double)Shifts the whole plot within the plotting region by the given number of pixels in the verticaldirection.
[Default: 0]
SUN/256 407
ypix = <int-value> (Integer)Size of the output image in the Y direction in pixels. This includes space for any axis labels,padding and other decoration outside the plot area itself. See also insets.
[Default: 400]
ysub = <lo>,<hi> (Subrange)Defines a normalised adjustment to the data range of the Y axis. The value may be specified asa comma-separated pair of two numbers, giving the lower and upper bounds of the range of ofinterest respectively. This sub-range is applied to the data range that would otherwise be used,either automatically calculated or explicitly supplied; zero corresponds to the lower bound andone to the upper.
The default value "0,1" therefore has no effect. The range could be restricted to its lower halfwith the value 0,0.5.
[Default: 0,1]
zcrowd = <number> (Double)Determines how closely the tick marks are spaced on the Z axis. The default value is 1,meaning normal crowding. Larger values result in more ticks, and smaller values fewer ticks.Tick marks will not however be spaced so closely that the labels overlap each other, so to getvery closely spaced marks you may need to reduce the font size as well.
[Default: 1]
zflip = true|false (Boolean)If true, the scale on the Z axis will increase in the opposite sense from usual (e.g. right to leftrather than left to right).
[Default: false]
zlabel = <text> (String)Gives a label to be used for annotating axis Z A default value based on the plotted data will beused if no value is supplied.
[Default: Z]
zlog = true|false (Boolean)If false (the default), the scale on the Z axis is linear, if true it is logarithmic.
[Default: false]
zmax = <number> (Double)Maximum value of the data coordinate on the Z axis. This sets the value before any subrangingis applied. If not supplied, the value is determined from the plotted data.
zmin = <number> (Double)Minimum value of the data coordinate on the Z axis. This sets the value before any subrangingis applied. If not supplied, the value is determined from the plotted data.
zoom = <factor> (Double)Sets the magnification factor at which the the plotted 3D region itself is viewed, withoutaffecting its contents. The default value is 1, which means the cube fits into the plotting spacehowever it is rotated. Much higher zoom factors will result in parts of the plotting region andaxes being drawn outside of the plotting region (so invisible).
[Default: 1]
zoomaxes = [[x][y][z]] (boolean[])Determines which axes are affected by zoom navigation actions.
If no value is supplied (the default), the mouse wheel zooms around the center of the cube, andright-button (or CTRL-) drag zooms in the two dimensions most closely aligned with the planeof the screen, with the reference position set by the initial position of the mouse.
SUN/256 408
If this value is set (legal values are x, y, z, xy, yz, xz and xyz) then all zoom operations arearound the cube center and affect the axes named.
zoomfactor = <number> (Double)Sets the amount by which the plot view zooms in or out for each unit of mouse wheelmovement. A value of 1 means that mouse wheel zooming has no effect. A higher value meansthat the mouse wheel zooms faster and a value nearer 1 means it zooms slower. Values below1 are not permitted.
[Default: 1.2]
zsub = <lo>,<hi> (Subrange)Defines a normalised adjustment to the data range of the Z axis. The value may be specified asa comma-separated pair of two numbers, giving the lower and upper bounds of the range of ofinterest respectively. This sub-range is applied to the data range that would otherwise be used,either automatically calculated or explicitly supplied; zero corresponds to the lower bound andone to the upper.
The default value "0,1" therefore has no effect. The range could be restricted to its lower halfwith the value 0,0.5.
[Default: 0,1]
B.11.2 Examples
Some examples of plot2cube are shown below. See Section 8.1.3 for some examples of producinganimations, for instance of a rotating cube.
stilts plot2cube
Just displays a unit cube wireframe in a window. You can rotate it with the mouse.
stilts plot2cube layer.1=mark in.1=sim.fits x.1=x y.1=y z.1=zshading.1=density densemap.1=pastel
Plots markers with x,y,z positions on the screen. You can rotate, zoom and pan the cube on thewindow this produces. Density shading is used, which means you can see the lines of sightalong which most objects fall, though single points are still visible. Density shading is usuallya good choice if there is just one dataset, though it can get confusing with more than one.
stilts plot2cube in=gavo_g2.fitsx=X y=Y z=Zshading=aux aux=HALOID opaque=2.5 auxmap=red-bluelayer_m=mark shape_m=open_circle size_m=2layer_v=xyzvector xdelta_v=velX ydelta_v=velY zdelta_v=velZ
Plots points in three dimensions with little arrows representing velocity as well as positionmarkers; layer _m draws the markers and layer _v draws the arrows. Points and vectors arecoloured according to the HALOID data value. The positional coordinates (x, y, z) and theshading options are common to both layers, so they can be specified without a prefix.
B.12 plot2sphere: Draws a sphere plot
plot2sphere draws plots in an isotropic 3-dimensional space using spherical polar coordinates. Theplotting volume is a cube, which is viewed from the outside and usually bounded by a wire frameannotated by Cartesian coordinates. This viewing cube is not necessarily centered on the coordinateorigin.
SUN/256 409
This plotting geometry is like that used by plot2cube, but the coordinate unit size is always thesame in the three dimensions, and the coordinates are specified differently.
Positional coordinates are specified as lon, lat, r triples, e.g.:
plot2sphere layer1=mark in1=survey.fits lon1=RA lat1=DEC r1=REDSHIFT
Content is added to the plot by specifying one or more plot layers using the layerN parameter. TheN part is a suffix applied to all the parameters affecting a given layer; any suffix (including theempty string) may be used. Available layers for this plot type are: mark (Section 8.3.1), size
(Section 8.3.2), sizexy (Section 8.3.3), link2 (Section 8.3.8), mark2 (Section 8.3.9), poly4 (Section8.3.10), mark4 (Section 8.3.11), polygon (Section 8.3.12), area (Section 8.3.13), central (Section8.3.14), label (Section 8.3.21), arealabel (Section 8.3.22), line3d (Section 8.3.41), contour
(Section 8.3.23), spheregrid (Section 8.3.42).
B.12.1 Usage
The usage of plot2sphere is
stilts <stilts-flags> plot2sphere xpix=<int-value> ypix=<int-value>insets=<top>,<left>,<bottom>,<right>omode=swing|out|cgi|discard|autostorage=simple|memory|disk|policy|cache|basic-cache|persistent|parallelseq=<suffix>[,...] legend=true|falselegborder=true|false legopaque=true|falselegseq=<suffix>[,...]legpos=<xfrac,yfrac> title=<value>auxmap=<map-name>|<color>-<color>[-<color>...]auxclip=<lo>,<hi> auxflip=true|falseauxquant=<number>auxfunc=log|linear|histogram|histolog|sqrt|square|acos|cosauxmin=<number> auxmax=<number>auxlabel=<text> auxcrowd=<factor>auxwidth=<pixels> auxvisible=true|falseforcebitmap=true|false compositor=0..1animate=<table> afmt=<in-format>astream=true|false acmd=<cmds>parallel=<int-value> crowd=<number>frame=true|false minor=true|falsegridaa=true|falsetexttype=plain|antialias|latexfontsize=<int-value>fontstyle=standard|serif|monofontweight=plain|bold|italic|bold_italiccx=<number> cy=<number> cz=<number>scale=<number> phi=<degrees>theta=<degrees> psi=<degrees>zoom=<factor> xoff=<pixels> yoff=<pixels>zoomfactor=<number> leglabelN=<text>layerN=<layer-type> <layerN-specific-params>
If you don't have the stilts script installed, write "java -jar stilts.jar" instead of "stilts" -see Section 3. The available <stilts-flags> are listed in Section 2.1. For programmaticinvocation, the Task class for this command isuk.ac.starlink.ttools.plot2.task.SpherePlot2Task.
Parameter values are assigned on the command line as explained in Section 2.3. They are asfollows:
acmd = <cmds> (ProcessingStep[])Specifies processing to be performed on the animation control table as specified by parameteranimate, before any other processing has taken place. The value of this parameter is one ormore of the filter commands described in Section 6.1. If more than one is given, they must be
SUN/256 410

separated by semicolon characters (";"). This parameter can be repeated multiple times on thesame command line to build up a list of processing steps. The sequence of commands given inthis way defines the processing pipeline which is performed on the table.
Commands may alteratively be supplied in an external file, by using the indirection character'@'. Thus a value of "@filename" causes the file filename to be read for a list of filtercommands to execute. The commands in the file may be separated by newline charactersand/or semicolons, and lines which are blank or which start with a '#' character are ignored.
afmt = <in-format> (String)Specifies the format of the animation control table as specified by parameter animate. Theknown formats are listed in Section 5.1.1. This flag can be used if you know what format yourtable is in. If it has the special value (auto) (the default), then an attempt will be made todetect the format of the table automatically. This cannot always be done correctly however, inwhich case the program will exit with an error explaining which formats were attempted. Thisparameter is ignored for scheme-specified tables.
[Default: (auto)]
animate = <table> (StarTable)If not null, this parameter causes the command to create a sequence of plots instead of just one.The parameter value is a table with one row for each frame to be produced. Columns in thetable are interpreted as parameters which may take different values for each frame; the columnname is the parameter name, and the value for a given frame is its value from that row.Animating like this is considerably more efficient than invoking the STILTS command in aloop.
The location of the animation control table. This may take one of the following forms:
• A filename.• A URL.• The special value "-", meaning standard input. In this case the input format must be given
explicitly using the afmt parameter. Note that not all formats can be streamed in this way.• A scheme specification of the form :<scheme-name>:<scheme-args>.• A system command line with either a "<" character at the start, or a "|" character at the
end ("<syscmd" or "syscmd|"). This executes the given pipeline and reads from itsstandard output. This will probably only work on unix-like systems.
In any case, compressed data in one of the supported compression formats (gzip, Unixcompress or bzip2) will be decompressed transparently.
astream = true|false (Boolean)If set true, the animation control table specified by the animate parameter will be read as astream. It is necessary to give the afmt parameter in this case. Depending on the requiredoperations and processing mode, this may cause the read to fail (sometimes it is necessary toread the table more than once). It is not normally necessary to set this flag; in most cases thedata will be streamed automatically if that is the best thing to do. However it can sometimesresult in less resource usage when processing large files in certain formats (such as VOTable).This parameter is ignored for scheme-specified tables.
[Default: false]
auxclip = <lo>,<hi> (Subrange)Defines a subrange of the colour ramp to be used for Aux shading. The value is specified as a(low,high) comma-separated pair of two numbers between 0 and 1.
If the full range 0,1 is used, the whole range of colours specified by the selected shader will beused. But if for instance a value of 0,0.5 is given, only those colours at the left hand end of theramp will be seen.
If the null (default) value is chosen, a default clip will be used. This generally covers most orall of the range 0-1 but for colour maps which fade to white, a small proportion of the lower
SUN/256 411
end may be excluded, to ensure that all the colours are visually distinguishable from a whitebackground. This default is usually a good idea if the colour map is being used with somethinglike a scatter plot, where markers are plotted against a white background. However, forsomething like a density map when the whole plotting area is tiled with colours from the map,it may be better to supply the whole range 0,1 explicitly.
auxcrowd = <factor> (Double)Determines how closely the tick marks are spaced on the Aux axis, if visible. The default valueis 1, meaning normal crowding. Larger values result in more ticks, and smaller values fewerticks. Tick marks will not however be spaced so closely that the labels overlap each other, soto get very closely spaced marks you may need to reduce the font size as well.
[Default: 1.0]
auxflip = true|false (Boolean)If true, the colour map on the Aux axis will be reversed.
[Default: false]
auxfunc = log|linear|histogram|histolog|sqrt|square|acos|cos (Scaling)Defines the way that values in the Aux range are mapped to the selected colour ramp.
The available options are:
• log: Logarithmic scaling• linear: Linear scaling• histogram: Scaling follows data distribution, with linear axis• histolog: Scaling follows data distribution, with logarithmic axis• sqrt: Square root scaling• square: Square scaling• acos: Arccos Scaling• cos: Cos Scaling
For all these options, the full range of data values is used, and displayed on the colour bar ifapplicable. The Linear, Log, Square and Sqrt options just apply the named function to the fulldata range. The histogram options on the other hand use a scaling function that corresponds tothe actual distribution of the data, so that there are about the same number of points (or pixels,or whatever is being scaled) of each colour. The histogram options are somewhat moreexpensive, but can be a good choice if you are exploring data whose distribution is unknown ornot well-behaved over its min-max range. The Histogram and HistoLog options both assignthe colours in the same way, but they display the colour ramp with linear or logarithmicannotation respectively; the HistoLog option also ignores non-positive values.
[Default: linear]
auxlabel = <text> (String)Sets the label used to annotate the aux axis, if it is visible.
auxmap = <map-name>|<color>-<color>[-<color>...] (Shader)Color map used for Aux axis shading.
A mixed bag of colour ramps are available: inferno, magma, plasma, viridis, cividis,cubehelix, sron, rainbow, rainbow2, rainbow3, pastel, accent, gnuplot, gnuplot2,specxby, set1, paired, hotcold, rdbu, piyg, brbg, cyan-magenta, red-blue, brg, heat, cold,light, greyscale, colour, standard, bugn, bupu, orrd, pubu, purd, huecl, hue, intensity,rgb_red, rgb_green, rgb_blue, hsv_h, hsv_s, hsv_v, yuv_y, yuv_u, yuv_v, scale_hsv_s,scale_hsv_v, scale_yuv_y, mask, blacker, whiter, transparency. Note: many of these,including rainbow-like ones, are frowned upon by the visualisation community.
You can also construct your own custom colour map by giving a sequence of colour namesseparated by minus sign ("-") characters. In this case the ramp is a linear interpolation betweeneach pair of colours named, using the same syntax as when specifying a colour value. So for
SUN/256 412
instance "yellow-hotpink-#0000ff" would shade from yellow via hot pink to blue.
[Default: inferno]
auxmax = <number> (Double)Maximum value of the data coordinate on the Aux axis. This sets the value before anysubranging is applied. If not supplied, the value is determined from the plotted data.
auxmin = <number> (Double)Minimum value of the data coordinate on the Aux axis. This sets the value before anysubranging is applied. If not supplied, the value is determined from the plotted data.
auxquant = <number> (Double)Allows the colour map used for the Aux axis to be quantised. If an integer value N is chosenthen the colour map will be viewed as N discrete evenly-spaced levels, so that only N differentcolours will appear in the plot. This can be used to generate a contour-like effect, and maymake it easier to trace the boundaries of regions of interest by eye.
If left blank, the colour map is nominally continuous (though in practice it may be quantised toa medium-sized number like 256).
auxvisible = true|false (Boolean)Determines whether the aux axis colour ramp is displayed alongside the plot.
If not supplied (the default), the aux axis will be visible when aux shading is used in any of theplotted layers.
auxwidth = <pixels> (Integer)Determines the lateral size of the aux colour ramp, if visible, in pixels.
[Default: 15]
compositor = 0..1 (Compositor)Defines how multiple overplotted partially transparent pixels are combined to form a resultingcolour. The way this is used depends on the details of the specified plot.
Currently, this parameter takes a "boost" value in the range 0..1. If the value is zero, saturationsemantics are used: RGB colours are added in proporition to their associated alpha value untilthe total alpha is saturated (reaches 1), after which additional pixels have no further effect. Forlarger boost values, the effect is similar, but any non-zero alpha in the output is boosted to thegiven minimum value. The effect of this is that even very slightly populated pixels can bevisually distinguished from unpopulated ones which may not be the case for saturationcomposition.
[Default: 0.05]
crowd = <number> (Double)Determines how closely tick marks are spaced on the wire frame axes. The default value is 1,meaning normal crowding. Larger values result in more grid lines, and smaller values in fewergrid lines.
[Default: 1]
cx = <number> (Double)Gives the central coordinate in the X dimension. This will be determined from the data range ifnot supplied.
cy = <number> (Double)Gives the central coordinate in the Y dimension. This will be determined from the data range ifnot supplied.
cz = <number> (Double)Gives the central coordinate in the Z dimension. This will be determined from the data range ifnot supplied.
SUN/256 413
fontsize = <int-value> (Integer)Size of the text font in points.
[Default: 12]
fontstyle = standard|serif|mono (FontType)Font style for text.
The available options are:
• standard
• serif
• mono
[Default: standard]
fontweight = plain|bold|italic|bold_italic (FontWeight)Font weight for text.
The available options are:
• plain
• bold
• italic
• bold_italic
[Default: plain]
forcebitmap = true|false (Boolean)Affects whether rendering of the data contents of a plot (though not axis labels etc) is alwaysdone to an intermediate bitmap rather than, where possible, being painted using graphicsprimitives. This is a rather arcane setting that may nevertheless have noticeable effects on theappearance and size of an output graphics file, as well as plotting time. For some types of plot(e.g. shadingN=auto or shadingN=density) it will have no effect, since this kind of renderinghappens in any case.
When writing to vector graphics formats (PDF and PostScript), setting it true will force thedata contents to be bitmapped. This may make the output less beautiful (round markers will nolonger be perfectly round), but it may result in a much smaller file if there are very many datapoints.
When writing to bitmapped output formats (PNG, GIF, JPEG, ...), it fixes shapes to be thesame as seen on the screen rather than be rendered at the mercy of the graphics system, whichsometimes introduces small distortions.
[Default: false]
frame = true|false (Boolean)If true, a cube wire frame with labelled axes is drawn to indicate the limits of the plotted 3Dregion. If false, no wire frame and no axes are drawn.
[Default: true]
gridaa = true|false (Boolean)If true, grid lines are drawn with antialiasing. Antialiased lines look smoother, but may takeperceptibly longer to draw. Only has any effect for bitmapped output formats.
[Default: false]
insets = <top>,<left>,<bottom>,<right> (Padding)Defines the amount of space in pixels around the actual plotting area. This space is used foraxis labels, and other decorations and any left over forms an empty border.
The size and position of the actual plotting area is determined by this parameter along withxpix and ypix.
SUN/256 414
The value of this parameter is 4 comma separated integers: <top>,<left>,<bottom>,<right>.Any or all of these values may be left blank, in which case the corresponding margin will becalculated automatically according to how much space is required.
layerN = <layer-type> <layerN-specific-params> (LayerType)Selects one of the available plot types for layerN. A plot consists of a plotting surface, set upusing the various unsuffixed parameters of the plotting command, and zero or more plot layers.Each layer is introduced by a parameter with the name layer<N> where the suffix "<N>" is alabel identifying the layer and is appended to all the parameter names which configure thatlayer. Suffixes may be any string, including the empty string.
This parameter may take one of the following values, described in more detail in Section 8.3:
• mark (Section 8.3.1)
• size (Section 8.3.2)
• sizexy (Section 8.3.3)
• link2 (Section 8.3.8)
• mark2 (Section 8.3.9)
• poly4 (Section 8.3.10)
• mark4 (Section 8.3.11)
• polygon (Section 8.3.12)
• area (Section 8.3.13)
• central (Section 8.3.14)
• label (Section 8.3.21)
• arealabel (Section 8.3.22)
• line3d (Section 8.3.41)
• contour (Section 8.3.23)
• spheregrid (Section 8.3.42)
Each of these layer types comes with a list of type-specific parameters to define the details ofthat layer, including some or all of the following groups:
• input table parameters (e.g. inN, icmdN)• coordinate params referring to input table columns (e.g. xN, yN)• layer style parameters (e.g. shadingN, colorN)
Every parameter notionally carries the same suffix N. However, if the suffix is not present, theapplication will try looking for a parameter with the same name with no suffix instead. In thisway, if several layers have the same value for a given parameter (for instance input table), youcan supply it using one unsuffixed parameter to save having to supply several parameters withthe same value but different suffixes.
legborder = true|false (Boolean)If true, a line border is drawn around the legend.
[Default: true]
legend = true|false (Boolean)Whether to draw a legend or not. If no value is supplied, the decision is made automatically: alegend is drawn only if it would have more than one entry.
leglabelN = <text> (String)Sets the presentation label for the layer with a given suffix. This is the text which is displayedin the legend, if present. Multiple layers may use the same label, in which case they will becombined to form a single legend entry.
If no value is supplied (the default), the suffix itself is used as the label.
legopaque = true|false (Boolean)If true, the background of the legend is opaque, and the legend obscures any plot componentsbehind it. Otherwise, it's transparent.
SUN/256 415
[Default: true]
legpos = <xfrac,yfrac> (double[])Determines the internal position of the legend on the plot. The value is a comma-separated pairof values giving the X and Y positions of the legend within the plotting bounds, so for instance"0.5,0.5" will put the legend right in the middle of the plot. If no value is supplied, the legendwill appear outside the plot boundary.
legseq = <suffix>[,...] (String[])Determines which layers are represented in the legend (if present) and in which order theyappear. The legend has a line for each layer label (as determined by the leglabelN parameter).If multiple layers have the same label, they will contribute to the same entry in the legend, withstyle icons plotted over each other. The value of this parameter is a comma-separated sequenceof layer suffixes, which determines the order in which the legend entries appear. Layers withsuffixes missing from this list do not show up in the legend at all.
If no value is supplied (the default), the sequence is the same as the layer plotting sequence(see seq).
minor = true|false (Boolean)If true, minor tick marks are painted along the axes as well as the major tick marks. Minor tickmarks do not have associated grid lines.
[Default: true]
omode = swing|out|cgi|discard|auto (PaintMode)Determines how the drawn plot will be output, see Section 8.5.
• swing: Plot will be displayed in a window on the screen. This plot is "live"; it can beresized and (except for old-style plots) navigated around with mouse actions in the sameway as plots in TOPCAT.
• out: Plot will be written to a file given by out using the graphics format given by ofmt.• cgi: Plot will be written in a way suitable for CGI use direct from a web server. The
output is in the graphics format given by ofmt, preceded by a suitable "Content-type"declaration.
• discard: Plot is drawn, but discarded. There is no output.• auto: Behaves as swing or out mode depending on presence of out parameter
[Default: auto]
parallel = <int-value> (Integer)Determines how many threads will run in parallel if animation output is being produced. Onlyused if the animate parameter is supplied. The default value is the number of processorsapparently available to the JVM.
[Default: 20]
phi = <degrees> (Double)First of the Euler angles, in the ZXZ sequence, defining the rotation of the plotted 3d space.Units are degrees. This is the rotation around the initial Z axis applied before the plot isviewed.
[Default: 30]
psi = <degrees> (Double)Second of the Euler angles, in the ZXZ sequence, defining the rotation of the plotted 3d space.Units are degrees.
[Default: 0]
scale = <number> (Double)The length of the cube sides in data coordinates. This will be determined from the data range ifnot supplied.
SUN/256 416
seq = <suffix>[,...] (String[])Contains a comma-separated list of layer suffixes to determine the order in which layers aredrawn on the plot. This can affect which symbol are plotted on top of, and so potentiallyobscure, which other ones.
When specifying a plot, multiple layers may be specified, each introduced by a parameterlayer<N>, where <N> is a different (arbitrary) suffix labelling the layer, and is appended to allthe parameters specific to defining that layer.
By default the layers are drawn on the plot in the order in which the layer* parameters appearon the command line. However if this parameter is specified, each comma-separated element isinterpreted as a layer suffix, giving the ordered list of layers to plot. Every element of the listmust be a suffix with a corresponding layer parameter, but missing or repeated elements areallowed.
storage = simple|memory|disk|policy|cache|basic-cache|persistent|parallel
(DataStoreFactory)Determines the way that data is accessed when constructing the plot. There are two mainoptions, cached or not. If no caching is used then rows are read sequentially from the specifiedinput table(s) every time they are required. This generally requires a small resource footprint(though that can depend on how the table is specified) and makes sense if the data only needsto be scanned once or perhaps if the table is very large. If caching is used then the requireddata is read once from the specified input table(s), then prepared and cached before anyplotting is performed, and plots are done using this cached data. This may use a significantamount of storage for large tables but it's usually more sensible (faster) if the data will need tobe scanned multiple times. There are various options for cache storage.
The options are:
• simple: no caching, data read directly from input table• memory: cached to memory; OutOfMemoryError possible for very large plots• disk: cached to disk• policy: cached using application-wide default storage policy, which is usually adaptive
(memory/disk hybrid)• persistent: cached to persistent files on disk, in the system temporary directory (defined
by system property java.io.tmpdir). If this is used, plot data will be stored on disk in away that means they can be re-used between STILTS invocations, so data preparation canbe avoided on subsequent runs. Note however it can leave potentially large files in yourtemporary directory.
• cache: synonym for memory (backward compatibility)• basic-cache: dumber version of memory (no optimisation for constant-valued columns)• parallel: experimental version of memory-based cache that reads into the cache in
parallel for large files. This will make the plot faster to prepare, but interaction is a bitslower and sequence-dependent attributes of the plot may not come out right. Thisexperimental option may be withdrawn or modified in future releases.
The default value is memory if a live plot is being generated (omode=swing), since in that casethe plot needs to be redrawn every time the user performs plot navigation actions or resizes thewindow, or if animations are being produced. Otherwise (e.g. output to a graphics file) thedefault is simple.
[Default: simple]
texttype = plain|antialias|latex (TextSyntax)Determines how to turn label text into characters on the plot. Plain and Antialias both takethe text at face value, but Antialias smooths the characters. LaTeX interprets the text asLaTeX source code and typesets it accordingly.
When not using LaTeX, antialiased text usually looks nicer, but can be perceptibly slower toplot. At time of writing, on MacOS antialiased text seems to be required to stop the writing
SUN/256 417
coming out upside-down for non-horizontal text (MacOS java bug).
[Default: plain]
theta = <degrees> (Double)Second of the Euler angles, in the ZXZ sequence, defining the rotation of the plotted 3d space.Units are degrees. This is the rotation towards the viewer.
[Default: -15]
title = <value> (String)Text of a title to be displayed at the top of the plot. If null, the default, no title is shown andthere's more space for the graphics.
xoff = <pixels> (Double)Shifts the whole plot within the plotting region by the given number of pixels in the horizontaldirection.
[Default: 0]
xpix = <int-value> (Integer)Size of the output image in the X direction in pixels. This includes space for any axis labels,padding and other decoration outside the plot area itself. See also insets.
[Default: 500]
yoff = <pixels> (Double)Shifts the whole plot within the plotting region by the given number of pixels in the verticaldirection.
[Default: 0]
ypix = <int-value> (Integer)Size of the output image in the Y direction in pixels. This includes space for any axis labels,padding and other decoration outside the plot area itself. See also insets.
[Default: 400]
zoom = <factor> (Double)Sets the magnification factor at which the the plotted 3D region itself is viewed, withoutaffecting its contents. The default value is 1, which means the cube fits into the plotting spacehowever it is rotated. Much higher zoom factors will result in parts of the plotting region andaxes being drawn outside of the plotting region (so invisible).
[Default: 1]
zoomfactor = <number> (Double)Sets the amount by which the plot view zooms in or out for each unit of mouse wheelmovement. A value of 1 means that mouse wheel zooming has no effect. A higher value meansthat the mouse wheel zooms faster and a value nearer 1 means it zooms slower. Values below1 are not permitted.
[Default: 1.2]
B.12.2 Examples
Some examples of plot2cube are shown below. See Section 8.1.3 for some examples of producinganimations, for instance of a rotating cube.
stilts plot2sphere in=hip_main.fits lon=radeg lat=dedeg r=plxlayer1=mark shading1=density densemap1=cyan-magenta
Plots points with RA, Dec and parallax coordinates in 3D. Density shading is used, which
SUN/256 418

means you can see the lines of sight along which most objects fall, though single points arestill visible. Density shading is usually a good choice if there is just one dataset, though it canget confusing with more than one.
stilts plot2sphere in=hip_main.fits lon=radeg lat=dedeg r=plxlayer1=mark shading1=density densemap1=cyan-magentacx=0 cy=0 cz=0 scale=38 texttype=antialias gridaa=true
The same as the previous example but with some more configuration of the axes. The dataorigin is placed at the centre of the visible cube (this is the position around which the cube willrotate when you drag the mouse), and the size of the cube sides in data coordinates is setexplicitly.
B.13 plot2time: Draws a time plot
plot2time draws plots where the horizontal axis represents time. The time axis can be labelled invarious different ways including MJD, decimal year and ISO-8601 form.
Positional coordinates are specified as t, y pairs, with an optional ttype specifier to indicate howthe input value is to be interpreted, e.g.:
plot2time in1=series.fits layer1=line t1=EPOCH ttype1=MJD y1=ENERGY
Time values can be represented in various ways in input data, for instance as Julian Day, ModifiedJulian Date, decimal years since 0AD, Unix seconds, ISO-8601, or variants of some of the abovewith additional offsets. In some cases the input format contains enough metadata to determine howthe values should be mapped to a common timescale (so for instance they can be plotted as MJD orYear/Month/Day), and in other cases they do not. For example CDF files and VOTable 1.4 fileswith TIMESYS markup contain sufficient metadata, and text inputs using the ISO-8601 format canusually be identified and understood, but there's no way to tell automatically whether a numericcolumn in a CSV file represents MJD, seconds since a known epoch, decimal years, or anythingelse. For this reason the ttypeN parameter is provided for all the layer types with a tN coordinate, asfollows:
ttypeN = DecYear|MJD|JD|Unix|Iso8601 (TimeMapper)Selects the form in which the Time value for parameter tN is supplied. Options are:
• DecYear: Years since 0 AD• MJD: Modified Julian Date• JD: Julian Day• Unix: Seconds since midnight 1 Jan 1970• Iso8601: ISO 8601 string
If left blank, a guess will be taken depending on the data type of the value supplied for the tN
value.
This command, unlike the other plot2* commands at time of writing, can be used to drawmulti-zone plots. These are plots with different panels stacked vertically so that different datasetscan share the same horizontal (time) axis, but have separate vertical axes, colour maps, legends etc.The horizontal axes are always synchronized between zones. This is currently controlled with thezoneN parameter. For any layer with a layer suffix N, you can specify a zone identifier as anarbitrary string, Z, by supplying the parameter zoneN=Z. Layers with the same value of zoneN areplotted in the same zone, and layers with different values are plotted in different zones. If no zoneN
is given, the layer is assigned to a single (unnamed) zone, so with no zone parameters specified allplots appear in a single zone. Parameters specific to a given zone can then be suffixed with the same
SUN/256 419
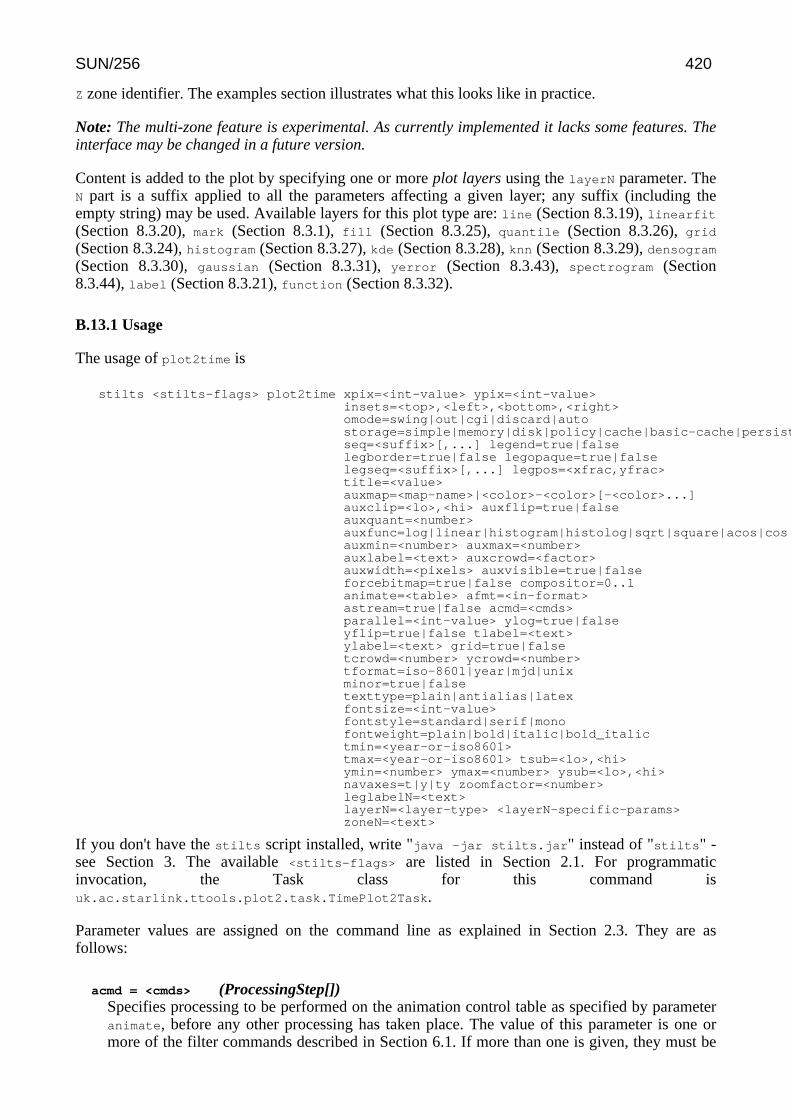
Z zone identifier. The examples section illustrates what this looks like in practice.
Note: The multi-zone feature is experimental. As currently implemented it lacks some features. Theinterface may be changed in a future version.
Content is added to the plot by specifying one or more plot layers using the layerN parameter. TheN part is a suffix applied to all the parameters affecting a given layer; any suffix (including theempty string) may be used. Available layers for this plot type are: line (Section 8.3.19), linearfit(Section 8.3.20), mark (Section 8.3.1), fill (Section 8.3.25), quantile (Section 8.3.26), grid
(Section 8.3.24), histogram (Section 8.3.27), kde (Section 8.3.28), knn (Section 8.3.29), densogram(Section 8.3.30), gaussian (Section 8.3.31), yerror (Section 8.3.43), spectrogram (Section8.3.44), label (Section 8.3.21), function (Section 8.3.32).
B.13.1 Usage
The usage of plot2time is
stilts <stilts-flags> plot2time xpix=<int-value> ypix=<int-value>insets=<top>,<left>,<bottom>,<right>omode=swing|out|cgi|discard|autostorage=simple|memory|disk|policy|cache|basic-cache|persistent|parallelseq=<suffix>[,...] legend=true|falselegborder=true|false legopaque=true|falselegseq=<suffix>[,...] legpos=<xfrac,yfrac>title=<value>auxmap=<map-name>|<color>-<color>[-<color>...]auxclip=<lo>,<hi> auxflip=true|falseauxquant=<number>auxfunc=log|linear|histogram|histolog|sqrt|square|acos|cosauxmin=<number> auxmax=<number>auxlabel=<text> auxcrowd=<factor>auxwidth=<pixels> auxvisible=true|falseforcebitmap=true|false compositor=0..1animate=<table> afmt=<in-format>astream=true|false acmd=<cmds>parallel=<int-value> ylog=true|falseyflip=true|false tlabel=<text>ylabel=<text> grid=true|falsetcrowd=<number> ycrowd=<number>tformat=iso-8601|year|mjd|unixminor=true|falsetexttype=plain|antialias|latexfontsize=<int-value>fontstyle=standard|serif|monofontweight=plain|bold|italic|bold_italictmin=<year-or-iso8601>tmax=<year-or-iso8601> tsub=<lo>,<hi>ymin=<number> ymax=<number> ysub=<lo>,<hi>navaxes=t|y|ty zoomfactor=<number>leglabelN=<text>layerN=<layer-type> <layerN-specific-params>zoneN=<text>
If you don't have the stilts script installed, write "java -jar stilts.jar" instead of "stilts" -see Section 3. The available <stilts-flags> are listed in Section 2.1. For programmaticinvocation, the Task class for this command isuk.ac.starlink.ttools.plot2.task.TimePlot2Task.
Parameter values are assigned on the command line as explained in Section 2.3. They are asfollows:
acmd = <cmds> (ProcessingStep[])Specifies processing to be performed on the animation control table as specified by parameteranimate, before any other processing has taken place. The value of this parameter is one ormore of the filter commands described in Section 6.1. If more than one is given, they must be
SUN/256 420
separated by semicolon characters (";"). This parameter can be repeated multiple times on thesame command line to build up a list of processing steps. The sequence of commands given inthis way defines the processing pipeline which is performed on the table.
Commands may alteratively be supplied in an external file, by using the indirection character'@'. Thus a value of "@filename" causes the file filename to be read for a list of filtercommands to execute. The commands in the file may be separated by newline charactersand/or semicolons, and lines which are blank or which start with a '#' character are ignored.
afmt = <in-format> (String)Specifies the format of the animation control table as specified by parameter animate. Theknown formats are listed in Section 5.1.1. This flag can be used if you know what format yourtable is in. If it has the special value (auto) (the default), then an attempt will be made todetect the format of the table automatically. This cannot always be done correctly however, inwhich case the program will exit with an error explaining which formats were attempted. Thisparameter is ignored for scheme-specified tables.
[Default: (auto)]
animate = <table> (StarTable)If not null, this parameter causes the command to create a sequence of plots instead of just one.The parameter value is a table with one row for each frame to be produced. Columns in thetable are interpreted as parameters which may take different values for each frame; the columnname is the parameter name, and the value for a given frame is its value from that row.Animating like this is considerably more efficient than invoking the STILTS command in aloop.
The location of the animation control table. This may take one of the following forms:
• A filename.• A URL.• The special value "-", meaning standard input. In this case the input format must be given
explicitly using the afmt parameter. Note that not all formats can be streamed in this way.• A scheme specification of the form :<scheme-name>:<scheme-args>.• A system command line with either a "<" character at the start, or a "|" character at the
end ("<syscmd" or "syscmd|"). This executes the given pipeline and reads from itsstandard output. This will probably only work on unix-like systems.
In any case, compressed data in one of the supported compression formats (gzip, Unixcompress or bzip2) will be decompressed transparently.
astream = true|false (Boolean)If set true, the animation control table specified by the animate parameter will be read as astream. It is necessary to give the afmt parameter in this case. Depending on the requiredoperations and processing mode, this may cause the read to fail (sometimes it is necessary toread the table more than once). It is not normally necessary to set this flag; in most cases thedata will be streamed automatically if that is the best thing to do. However it can sometimesresult in less resource usage when processing large files in certain formats (such as VOTable).This parameter is ignored for scheme-specified tables.
[Default: false]
auxclip = <lo>,<hi> (Subrange)Defines a subrange of the colour ramp to be used for Aux shading. The value is specified as a(low,high) comma-separated pair of two numbers between 0 and 1.
If the full range 0,1 is used, the whole range of colours specified by the selected shader will beused. But if for instance a value of 0,0.5 is given, only those colours at the left hand end of theramp will be seen.
If the null (default) value is chosen, a default clip will be used. This generally covers most orall of the range 0-1 but for colour maps which fade to white, a small proportion of the lower
SUN/256 421
end may be excluded, to ensure that all the colours are visually distinguishable from a whitebackground. This default is usually a good idea if the colour map is being used with somethinglike a scatter plot, where markers are plotted against a white background. However, forsomething like a density map when the whole plotting area is tiled with colours from the map,it may be better to supply the whole range 0,1 explicitly.
If a zone suffix is appended to the parameter name, only that zone is affected, e.g. auxclipZaffects only zone Z.
auxcrowd = <factor> (Double)Determines how closely the tick marks are spaced on the Aux axis, if visible. The default valueis 1, meaning normal crowding. Larger values result in more ticks, and smaller values fewerticks. Tick marks will not however be spaced so closely that the labels overlap each other, soto get very closely spaced marks you may need to reduce the font size as well.
If a zone suffix is appended to the parameter name, only that zone is affected, e.g. auxcrowdZaffects only zone Z.
[Default: 1.0]
auxflip = true|false (Boolean)If true, the colour map on the Aux axis will be reversed.
If a zone suffix is appended to the parameter name, only that zone is affected, e.g. auxflipZaffects only zone Z.
[Default: false]
auxfunc = log|linear|histogram|histolog|sqrt|square|acos|cos (Scaling)Defines the way that values in the Aux range are mapped to the selected colour ramp.
The available options are:
• log: Logarithmic scaling• linear: Linear scaling• histogram: Scaling follows data distribution, with linear axis• histolog: Scaling follows data distribution, with logarithmic axis• sqrt: Square root scaling• square: Square scaling• acos: Arccos Scaling• cos: Cos Scaling
For all these options, the full range of data values is used, and displayed on the colour bar ifapplicable. The Linear, Log, Square and Sqrt options just apply the named function to the fulldata range. The histogram options on the other hand use a scaling function that corresponds tothe actual distribution of the data, so that there are about the same number of points (or pixels,or whatever is being scaled) of each colour. The histogram options are somewhat moreexpensive, but can be a good choice if you are exploring data whose distribution is unknown ornot well-behaved over its min-max range. The Histogram and HistoLog options both assignthe colours in the same way, but they display the colour ramp with linear or logarithmicannotation respectively; the HistoLog option also ignores non-positive values.
If a zone suffix is appended to the parameter name, only that zone is affected, e.g. auxfuncZaffects only zone Z.
[Default: linear]
auxlabel = <text> (String)Sets the label used to annotate the aux axis, if it is visible.
If a zone suffix is appended to the parameter name, only that zone is affected, e.g. auxlabelZaffects only zone Z.
SUN/256 422
auxmap = <map-name>|<color>-<color>[-<color>...] (Shader)Color map used for Aux axis shading.
A mixed bag of colour ramps are available: inferno, magma, plasma, viridis, cividis,cubehelix, sron, rainbow, rainbow2, rainbow3, pastel, accent, gnuplot, gnuplot2,specxby, set1, paired, hotcold, rdbu, piyg, brbg, cyan-magenta, red-blue, brg, heat, cold,light, greyscale, colour, standard, bugn, bupu, orrd, pubu, purd, huecl, hue, intensity,rgb_red, rgb_green, rgb_blue, hsv_h, hsv_s, hsv_v, yuv_y, yuv_u, yuv_v, scale_hsv_s,scale_hsv_v, scale_yuv_y, mask, blacker, whiter, transparency. Note: many of these,including rainbow-like ones, are frowned upon by the visualisation community.
You can also construct your own custom colour map by giving a sequence of colour namesseparated by minus sign ("-") characters. In this case the ramp is a linear interpolation betweeneach pair of colours named, using the same syntax as when specifying a colour value. So forinstance "yellow-hotpink-#0000ff" would shade from yellow via hot pink to blue.
If a zone suffix is appended to the parameter name, only that zone is affected, e.g. auxmapZaffects only zone Z.
[Default: inferno]
auxmax = <number> (Double)Maximum value of the data coordinate on the Aux axis. This sets the value before anysubranging is applied. If not supplied, the value is determined from the plotted data.
If a zone suffix is appended to the parameter name, only that zone is affected, e.g. auxmaxZaffects only zone Z.
auxmin = <number> (Double)Minimum value of the data coordinate on the Aux axis. This sets the value before anysubranging is applied. If not supplied, the value is determined from the plotted data.
If a zone suffix is appended to the parameter name, only that zone is affected, e.g. auxminZaffects only zone Z.
auxquant = <number> (Double)Allows the colour map used for the Aux axis to be quantised. If an integer value N is chosenthen the colour map will be viewed as N discrete evenly-spaced levels, so that only N differentcolours will appear in the plot. This can be used to generate a contour-like effect, and maymake it easier to trace the boundaries of regions of interest by eye.
If left blank, the colour map is nominally continuous (though in practice it may be quantised toa medium-sized number like 256).
If a zone suffix is appended to the parameter name, only that zone is affected, e.g. auxquantZaffects only zone Z.
auxvisible = true|false (Boolean)Determines whether the aux axis colour ramp is displayed alongside the plot.
If not supplied (the default), the aux axis will be visible when aux shading is used in any of theplotted layers.
If a zone suffix is appended to the parameter name, only that zone is affected, e.g.auxvisibleZ affects only zone Z.
auxwidth = <pixels> (Integer)Determines the lateral size of the aux colour ramp, if visible, in pixels.
If a zone suffix is appended to the parameter name, only that zone is affected, e.g. auxwidthZaffects only zone Z.
[Default: 15]
compositor = 0..1 (Compositor)
SUN/256 423
Defines how multiple overplotted partially transparent pixels are combined to form a resultingcolour. The way this is used depends on the details of the specified plot.
Currently, this parameter takes a "boost" value in the range 0..1. If the value is zero, saturationsemantics are used: RGB colours are added in proporition to their associated alpha value untilthe total alpha is saturated (reaches 1), after which additional pixels have no further effect. Forlarger boost values, the effect is similar, but any non-zero alpha in the output is boosted to thegiven minimum value. The effect of this is that even very slightly populated pixels can bevisually distinguished from unpopulated ones which may not be the case for saturationcomposition.
[Default: 0.05]
fontsize = <int-value> (Integer)Size of the text font in points.
If a zone suffix is appended to the parameter name, only that zone is affected, e.g. fontsizeZaffects only zone Z.
[Default: 12]
fontstyle = standard|serif|mono (FontType)Font style for text.
The available options are:
• standard
• serif
• mono
If a zone suffix is appended to the parameter name, only that zone is affected, e.g. fontstyleZaffects only zone Z.
[Default: standard]
fontweight = plain|bold|italic|bold_italic (FontWeight)Font weight for text.
The available options are:
• plain
• bold
• italic
• bold_italic
If a zone suffix is appended to the parameter name, only that zone is affected, e.g.fontweightZ affects only zone Z.
[Default: plain]
forcebitmap = true|false (Boolean)Affects whether rendering of the data contents of a plot (though not axis labels etc) is alwaysdone to an intermediate bitmap rather than, where possible, being painted using graphicsprimitives. This is a rather arcane setting that may nevertheless have noticeable effects on theappearance and size of an output graphics file, as well as plotting time. For some types of plot(e.g. shadingN=auto or shadingN=density) it will have no effect, since this kind of renderinghappens in any case.
When writing to vector graphics formats (PDF and PostScript), setting it true will force thedata contents to be bitmapped. This may make the output less beautiful (round markers will nolonger be perfectly round), but it may result in a much smaller file if there are very many datapoints.
When writing to bitmapped output formats (PNG, GIF, JPEG, ...), it fixes shapes to be the
SUN/256 424

same as seen on the screen rather than be rendered at the mercy of the graphics system, whichsometimes introduces small distortions.
[Default: false]
grid = true|false (Boolean)If true, grid lines are drawn on the plot at positions determined by the major tick marks. Iffalse, they are absent.
If a zone suffix is appended to the parameter name, only that zone is affected, e.g. gridZ
affects only zone Z.
[Default: false]
insets = <top>,<left>,<bottom>,<right> (Padding)Defines the amount of space in pixels around the actual plotting area. This space is used foraxis labels, and other decorations and any left over forms an empty border.
The size and position of the actual plotting area is determined by this parameter along withxpix and ypix.
The value of this parameter is 4 comma separated integers: <top>,<left>,<bottom>,<right>.Any or all of these values may be left blank, in which case the corresponding margin will becalculated automatically according to how much space is required.
layerN = <layer-type> <layerN-specific-params> (LayerType)Selects one of the available plot types for layerN. A plot consists of a plotting surface, set upusing the various unsuffixed parameters of the plotting command, and zero or more plot layers.Each layer is introduced by a parameter with the name layer<N> where the suffix "<N>" is alabel identifying the layer and is appended to all the parameter names which configure thatlayer. Suffixes may be any string, including the empty string.
This parameter may take one of the following values, described in more detail in Section 8.3:
• line (Section 8.3.19)
• linearfit (Section 8.3.20)
• mark (Section 8.3.1)
• fill (Section 8.3.25)
• quantile (Section 8.3.26)
• grid (Section 8.3.24)
• histogram (Section 8.3.27)
• kde (Section 8.3.28)
• knn (Section 8.3.29)
• densogram (Section 8.3.30)
• gaussian (Section 8.3.31)
• yerror (Section 8.3.43)
• spectrogram (Section 8.3.44)
• label (Section 8.3.21)
• function (Section 8.3.32)
Each of these layer types comes with a list of type-specific parameters to define the details ofthat layer, including some or all of the following groups:
• input table parameters (e.g. inN, icmdN)• coordinate params referring to input table columns (e.g. xN, yN)• layer style parameters (e.g. shadingN, colorN)
Every parameter notionally carries the same suffix N. However, if the suffix is not present, theapplication will try looking for a parameter with the same name with no suffix instead. In thisway, if several layers have the same value for a given parameter (for instance input table), youcan supply it using one unsuffixed parameter to save having to supply several parameters with
SUN/256 425
the same value but different suffixes.
legborder = true|false (Boolean)If true, a line border is drawn around the legend.
[Default: true]
legend = true|false (Boolean)Whether to draw a legend or not. If no value is supplied, the decision is made automatically: alegend is drawn only if it would have more than one entry.
leglabelN = <text> (String)Sets the presentation label for the layer with a given suffix. This is the text which is displayedin the legend, if present. Multiple layers may use the same label, in which case they will becombined to form a single legend entry.
If no value is supplied (the default), the suffix itself is used as the label.
legopaque = true|false (Boolean)If true, the background of the legend is opaque, and the legend obscures any plot componentsbehind it. Otherwise, it's transparent.
[Default: true]
legpos = <xfrac,yfrac> (double[])Determines the internal position of the legend on the plot. The value is a comma-separated pairof values giving the X and Y positions of the legend within the plotting bounds, so for instance"0.5,0.5" will put the legend right in the middle of the plot. If no value is supplied, the legendwill appear outside the plot boundary.
If a zone suffix is appended to the parameter name, only that zone is affected, e.g. legposZaffects only zone Z.
legseq = <suffix>[,...] (String[])Determines which layers are represented in the legend (if present) and in which order theyappear. The legend has a line for each layer label (as determined by the leglabelN parameter).If multiple layers have the same label, they will contribute to the same entry in the legend, withstyle icons plotted over each other. The value of this parameter is a comma-separated sequenceof layer suffixes, which determines the order in which the legend entries appear. Layers withsuffixes missing from this list do not show up in the legend at all.
If no value is supplied (the default), the sequence is the same as the layer plotting sequence(see seq).
minor = true|false (Boolean)If true, minor tick marks are painted along the axes as well as the major tick marks. Minor tickmarks do not have associated grid lines.
If a zone suffix is appended to the parameter name, only that zone is affected, e.g. minorZaffects only zone Z.
[Default: true]
navaxes = t|y|ty (boolean[])Determines the axes which are affected by the interactive navigation actions (pan and zoom).The default is t which means that the various mouse gestures will provide panning andzooming in the Time direction only. However, if it is set to ty mouse actions will affect boththe horizontal and vertical axes.
[Default: t]
omode = swing|out|cgi|discard|auto (PaintMode)Determines how the drawn plot will be output, see Section 8.5.
• swing: Plot will be displayed in a window on the screen. This plot is "live"; it can be
SUN/256 426
resized and (except for old-style plots) navigated around with mouse actions in the sameway as plots in TOPCAT.
• out: Plot will be written to a file given by out using the graphics format given by ofmt.• cgi: Plot will be written in a way suitable for CGI use direct from a web server. The
output is in the graphics format given by ofmt, preceded by a suitable "Content-type"declaration.
• discard: Plot is drawn, but discarded. There is no output.• auto: Behaves as swing or out mode depending on presence of out parameter
[Default: auto]
parallel = <int-value> (Integer)Determines how many threads will run in parallel if animation output is being produced. Onlyused if the animate parameter is supplied. The default value is the number of processorsapparently available to the JVM.
[Default: 20]
seq = <suffix>[,...] (String[])Contains a comma-separated list of layer suffixes to determine the order in which layers aredrawn on the plot. This can affect which symbol are plotted on top of, and so potentiallyobscure, which other ones.
When specifying a plot, multiple layers may be specified, each introduced by a parameterlayer<N>, where <N> is a different (arbitrary) suffix labelling the layer, and is appended to allthe parameters specific to defining that layer.
By default the layers are drawn on the plot in the order in which the layer* parameters appearon the command line. However if this parameter is specified, each comma-separated element isinterpreted as a layer suffix, giving the ordered list of layers to plot. Every element of the listmust be a suffix with a corresponding layer parameter, but missing or repeated elements areallowed.
storage = simple|memory|disk|policy|cache|basic-cache|persistent|parallel
(DataStoreFactory)Determines the way that data is accessed when constructing the plot. There are two mainoptions, cached or not. If no caching is used then rows are read sequentially from the specifiedinput table(s) every time they are required. This generally requires a small resource footprint(though that can depend on how the table is specified) and makes sense if the data only needsto be scanned once or perhaps if the table is very large. If caching is used then the requireddata is read once from the specified input table(s), then prepared and cached before anyplotting is performed, and plots are done using this cached data. This may use a significantamount of storage for large tables but it's usually more sensible (faster) if the data will need tobe scanned multiple times. There are various options for cache storage.
The options are:
• simple: no caching, data read directly from input table• memory: cached to memory; OutOfMemoryError possible for very large plots• disk: cached to disk• policy: cached using application-wide default storage policy, which is usually adaptive
(memory/disk hybrid)• persistent: cached to persistent files on disk, in the system temporary directory (defined
by system property java.io.tmpdir). If this is used, plot data will be stored on disk in away that means they can be re-used between STILTS invocations, so data preparation canbe avoided on subsequent runs. Note however it can leave potentially large files in yourtemporary directory.
• cache: synonym for memory (backward compatibility)• basic-cache: dumber version of memory (no optimisation for constant-valued columns)• parallel: experimental version of memory-based cache that reads into the cache in
SUN/256 427
parallel for large files. This will make the plot faster to prepare, but interaction is a bitslower and sequence-dependent attributes of the plot may not come out right. Thisexperimental option may be withdrawn or modified in future releases.
The default value is memory if a live plot is being generated (omode=swing), since in that casethe plot needs to be redrawn every time the user performs plot navigation actions or resizes thewindow, or if animations are being produced. Otherwise (e.g. output to a graphics file) thedefault is simple.
[Default: simple]
tcrowd = <number> (Double)Determines how closely the tick marks are spaced on the Time axis. The default value is 1,meaning normal crowding. Larger values result in more ticks, and smaller values fewer ticks.Tick marks will not however be spaced so closely that the labels overlap each other, so to getvery closely spaced marks you may need to reduce the font size as well.
If a zone suffix is appended to the parameter name, only that zone is affected, e.g. tcrowdZaffects only zone Z.
[Default: 1]
texttype = plain|antialias|latex (TextSyntax)Determines how to turn label text into characters on the plot. Plain and Antialias both takethe text at face value, but Antialias smooths the characters. LaTeX interprets the text asLaTeX source code and typesets it accordingly.
When not using LaTeX, antialiased text usually looks nicer, but can be perceptibly slower toplot. At time of writing, on MacOS antialiased text seems to be required to stop the writingcoming out upside-down for non-horizontal text (MacOS java bug).
If a zone suffix is appended to the parameter name, only that zone is affected, e.g. texttypeZaffects only zone Z.
[Default: plain]
tformat = iso-8601|year|mjd|unix (TimeFormat)Selects the way in which time values are represented when using them to label the time axis.
The available options are:
• iso-8601: ISO 8601 date, of the form yyyy-mm-ddThh:mm:ss.s (e.g. "2012-03-13T04")• year: Decimal year (e.g. "2012.197")• mjd: Modified Julian Date (e.g. "55999.2")• unix: Seconds since midnight of 1 Jan 1970 (e.g. "1331613420")
If a zone suffix is appended to the parameter name, only that zone is affected, e.g. tformatZaffects only zone Z.
[Default: iso-8601]
title = <value> (String)Text of a title to be displayed at the top of the plot. If null, the default, no title is shown andthere's more space for the graphics.
If a zone suffix is appended to the parameter name, only that zone is affected, e.g. titleZaffects only zone Z.
tlabel = <text> (String)Gives a label to be used for annotating the Time axis. If not supplied no label will be drawn.
If a zone suffix is appended to the parameter name, only that zone is affected, e.g. tlabelZaffects only zone Z.
tmax = <year-or-iso8601> (Double)
SUN/256 428
Maximum value of the time coordinate plotted. This sets the value before any subranging isapplied. If not supplied, the value is determined from the plotted data.
The value may be set with a string that can be interpreted as a decimal year (e.g. "2007.521")or an ISO-8601 string (e.g. "2007-07-10T03:57:36", "2007-07-10T03" or "2007-07-10").Note however that the numeric value of this configuration item if accessed programmatically isseconds since 1 Jan 1970.
If a zone suffix is appended to the parameter name, only that zone is affected, e.g. tmaxZ
affects only zone Z.
tmin = <year-or-iso8601> (Double)Minimum value of the time coordinate plotted. This sets the value before any subranging isapplied. If not supplied, the value is determined from the plotted data.
The value may be set with a string that can be interpreted as a decimal year (e.g. "2007.521")or an ISO-8601 string (e.g. "2007-07-10T03:57:36", "2007-07-10T03" or "2007-07-10").Note however that the numeric value of this configuration item if accessed programmatically isseconds since 1 Jan 1970.
If a zone suffix is appended to the parameter name, only that zone is affected, e.g. tminZ
affects only zone Z.
tsub = <lo>,<hi> (Subrange)Defines a normalised adjustment to the data range of the Time axis. The value may bespecified as a comma-separated pair of two numbers, giving the lower and upper bounds of therange of of interest respectively. This sub-range is applied to the data range that wouldotherwise be used, either automatically calculated or explicitly supplied; zero corresponds tothe lower bound and one to the upper.
The default value "0,1" therefore has no effect. The range could be restricted to its lower halfwith the value 0,0.5.
If a zone suffix is appended to the parameter name, only that zone is affected, e.g. tsubZ
affects only zone Z.
[Default: 0,1]
xpix = <int-value> (Integer)Size of the output image in the X direction in pixels. This includes space for any axis labels,padding and other decoration outside the plot area itself. See also insets.
[Default: 500]
ycrowd = <number> (Double)Determines how closely the tick marks are spaced on the Y axis. The default value is 1,meaning normal crowding. Larger values result in more ticks, and smaller values fewer ticks.Tick marks will not however be spaced so closely that the labels overlap each other, so to getvery closely spaced marks you may need to reduce the font size as well.
If a zone suffix is appended to the parameter name, only that zone is affected, e.g. ycrowdZaffects only zone Z.
[Default: 1]
yflip = true|false (Boolean)If true, the scale on the Y axis will increase in the opposite sense from usual (e.g. right to leftrather than left to right).
If a zone suffix is appended to the parameter name, only that zone is affected, e.g. yflipZaffects only zone Z.
[Default: false]
ylabel = <text> (String)
SUN/256 429
Gives a label to be used for annotating axis Y A default value based on the plotted data will beused if no value is supplied.
If a zone suffix is appended to the parameter name, only that zone is affected, e.g. ylabelZaffects only zone Z.
[Default: Y]
ylog = true|false (Boolean)If false (the default), the scale on the Y axis is linear, if true it is logarithmic.
If a zone suffix is appended to the parameter name, only that zone is affected, e.g. ylogZ
affects only zone Z.
[Default: false]
ymax = <number> (Double)Maximum value of the data coordinate on the Y axis. This sets the value before anysubranging is applied. If not supplied, the value is determined from the plotted data.
If a zone suffix is appended to the parameter name, only that zone is affected, e.g. ymaxZ
affects only zone Z.
ymin = <number> (Double)Minimum value of the data coordinate on the Y axis. This sets the value before any subrangingis applied. If not supplied, the value is determined from the plotted data.
If a zone suffix is appended to the parameter name, only that zone is affected, e.g. yminZ
affects only zone Z.
ypix = <int-value> (Integer)Size of the output image in the Y direction in pixels. This includes space for any axis labels,padding and other decoration outside the plot area itself. See also insets.
[Default: 400]
ysub = <lo>,<hi> (Subrange)Defines a normalised adjustment to the data range of the Y axis. The value may be specified asa comma-separated pair of two numbers, giving the lower and upper bounds of the range of ofinterest respectively. This sub-range is applied to the data range that would otherwise be used,either automatically calculated or explicitly supplied; zero corresponds to the lower bound andone to the upper.
The default value "0,1" therefore has no effect. The range could be restricted to its lower halfwith the value 0,0.5.
If a zone suffix is appended to the parameter name, only that zone is affected, e.g. ysubZ
affects only zone Z.
[Default: 0,1]
zoneN = <text> (String)Defines which plot zone the layer with suffix N will appear in. This only makes sense formulti-zone plots. The actual value of the parameter is not significant, it just serves as a label,but different layers will end up in the same plot zone if they give the same values for thisparameter.
zoomfactor = <number> (Double)Sets the amount by which the plot view zooms in or out for each unit of mouse wheelmovement. A value of 1 means that mouse wheel zooming has no effect. A higher value meansthat the mouse wheel zooms faster and a value nearer 1 means it zooms slower. Values below1 are not permitted.
[Default: 1.2]
SUN/256 430

B.13.2 Examples
Here are some examples of plot2time:
stilts plot2time xpix=1000 ypix=300in=ACE_data.vot t=epochlayer.r=line y.r=Br color.r=greylayer.t=line y.t=Bt color.t=cyanlayer.n=line y.n=Bn color.n=pink
Three time series are plotted on the same axes as lines in different colours. In this case we trustthe markup in the VOTable input to describe the format of the epoch column.
stilts plot2time xpix=1000 ypix=1000in=ACE_data.vot t=fp_year ttype=decyearlayer.r=line y.r=Br zone.r=ZRlayer.t=line y.t=Bt zone.t=ZTlayer.n=line y.n=Bn zone.n=ZNtitleZR="Br" titleZT="Bt" titleZN="Bn"
The same data is plotted as in the previous example, but in this case each line is drawn in adifferent panel (zone), stacked vertically. The default colour is used for each line. Each plot isgiven a different title; note the title parameter suffixes refer to the zone identifiers not thelayer identifiers. The time coordinate in this case is supplied as a decimal year column whichdoes not have sufficient metadata to identify it as such, so we specify the time format explicitlyas decyear.
stilts plot2time tmin=2007-06-07T02:40 tmax=2007-06-07T06:20 tformat=mjdin=STEREO_STA_L1_SEPT_20070607_V05.cdf t=epoch_nsylabel=Channellayer_3=spectrogram spectrum_3=Spec_0_NSauxmap=accent auxfunc=log
Plots a spectrogram from a CDF file. The range along the horizontal axis is specified explicitlyusing ISO-8601 date strings, but it is labelled in Modified Julian Date.
stilts plot2time in=STEREO_STA_L1_SEPT_20070607_V05.cdf t=epoch_nslayer_1=spectrogram spectrum_1=spec_0_ns zone_1=Alayer_2=spectrogram spectrum_2=spec_0_e zone_2=Blayer_3=line y_3='mean(spec_0_ns)' color_3=plum zone_3=Clayer_4=line y_4='mean(spec_0_e)' color_4=skyblue zone_4=CylogC=trueauxfunc=sqrt auxmapA=viridis auxmapB=magma
This is a 3-zone plot; zones A and B each contains a spectrogram (layers _1 and _2), and zone C
contains two line plots (layers _3 and _4). The Y axis is set to logarithmic for zone C only. Thecolour ramps are configured with aux* parameters; the stretch function is set to sqrt for allzones, and the colour map is set to different values for zones A and B.
B.14 plot2d: Old-style 2D Scatter Plot
This section describes a deprecated command. It still works, but you are advised to use the morecapable plot2plane instead.
plot2d performs two-dimensional scatter plots, sending the output to a graphical display or writingit to a file in some vector or bitmapped graphics format. You need to supply it with values for oneor more X and Y datasets, in terms of table columns, and it will generate a plot with a point for eachrow. There are many options available to configure the detailed appearance of the plot, but in itssimplest form invocation is quite straightforward. See Section 9 for more discussion on use of the
SUN/256 431
plotting commands.
B.14.1 Usage
The usage of plot2d is
stilts <stilts-flags> plot2d xpix=<int-value> ypix=<int-value>font=dialog|serif|... fontsize=<int-value>fontstyle=plain|bold|italic|bold-italiclegend=true|false title=<value>omode=swing|out|cgi|discard|autoout=<out-file>ofmt=png|png-transp|gif|jpeg|pdf|svg|eps|eps-gzipinN=<table> ifmtN=<in-format>istreamN=true|false cmdN=<cmds> xdataN=<expr>ydataN=<expr> auxdataN=<expr>xlo=<float-value> ylo=<float-value>auxlo=<float-value> xhi=<float-value>yhi=<float-value> auxhi=<float-value>xlog=true|false ylog=true|falseauxlog=true|false xflip=true|falseyflip=true|false auxflip=true|falsexlabel=<value> ylabel=<value> auxlabel=<value>xerrorN=<expr>|[<lo-expr>],[<hi-expr>]yerrorN=<expr>|[<lo-expr>],[<hi-expr>]auxshader=rainbow|pastel|... txtlabelN=<value>subsetNS=<expr> nameNS=<value>colourNS=<rrggbb>|red|blue|...shapeNS=filled_circle|open_circle|...sizeNS=<int-value> transparencyNS=<int-value>lineNS=DotToDot|LinearRegressionlinewidthNS=<int-value>dashNS=dot|dash|...|<a,b,...>hideNS=true|falseerrstyleNS=lines|capped_lines|...grid=true|false antialias=true|falsesequence=<suffix>,<suffix>,...
If you don't have the stilts script installed, write "java -jar stilts.jar" instead of "stilts" -see Section 3. The available <stilts-flags> are listed in Section 2.1. For programmaticinvocation, the Task class for this command is uk.ac.starlink.ttools.task.TablePlot2D.
Parameter values are assigned on the command line as explained in Section 2.3. They are asfollows:
antialias = true|false (Boolean)Controls whether lines are drawn using antialiasing, where applicable. If lines are drawn to abitmapped-type graphics output format setting this parameter to true smooths the lines out byusing gradations of colour for diagonal lines, and setting it false simply sets each pixel in theline to on or off. For vector-type graphics output formats, or for cases in which no diagonallines are drawn, the setting of this parameter has no effect. Setting it true may slow the plotdown slightly.
[Default: true]
auxdataN = <expr> (String)Gives a column name or expression for the aux axis data for table N. The expression is anumeric algebraic expression based on column names as described in Section 10
auxflip = true|false (Boolean)If set true, the scale on the aux axis will increase in the opposite sense from usual (e.g. right toleft rather than left to right).
[Default: false]
auxhi = <float-value> (Double)
SUN/256 432

The upper limit for the plotted aux axis. If not set, a value will be chosen which is high enoughto accommodate all the data.
auxlabel = <value> (String)Specifies a label to be used for annotating axis aux. A default values based on the plotted datawill be used if no value is supplied for this parameter.
auxlo = <float-value> (Double)The lower limit for the plotted aux axis. If not set, a value will be chosen which is low enoughto accommodate all the data.
auxlog = true|false (Boolean)If false (the default), the scale on the aux axis is linear; if true it is logarithmic.
[Default: false]
auxshader = rainbow|pastel|... (Shader)Determines how data from auxiliary axes will be displayed. Generally this is some kind ofcolour ramp. These are the available colour fixing options:
• rainbow
• pastel
• standard
• heat
• colour
• hue
• greyscale
• red-blue
and these are the available colour modifying options:
• hsv_h
• hsv_s
• hsv_v
• intensity
• rgb_red
• rgb_green
• rgb_blue
• yuv_y
• yuv_u
• yuv_v
• transparency
[Default: rainbow]
cmdN = <cmds> (ProcessingStep[])Specifies processing to be performed on the table. The value of this parameter is one or moreof the filter commands described in Section 6.1. If more than one is given, they must beseparated by semicolon characters (";"). This parameter can be repeated multiple times on thesame command line to build up a list of processing steps. The sequence of commands given inthis way defines the processing pipeline which is performed on the table.
Commands may alteratively be supplied in an external file, by using the indirection character'@'. Thus a value of "@filename" causes the file filename to be read for a list of filtercommands to execute. The commands in the file may be separated by newline charactersand/or semicolons, and lines which are blank or which start with a '#' character are ignored.
colourNS = <rrggbb>|red|blue|... (Color)Defines the colour of markers plotted. The value may be a 6-digit hexadecimal number givingred, green and blue intensities, e.g. "ff00ff" for magenta. Alternatively it may be the name ofone of the pre-defined colours. These are currently red, blue, green, grey, magenta, cyan,
SUN/256 433

orange, pink, yellow, black and white.
For most purposes, either the American or the British spelling is accepted for this parametername.
dashNS = dot|dash|...|<a,b,...> (float[])Defines the dash style for any lines drawn in data set NS To generate a dashed line the valuemay be one of the named dash types:
• dot
• dash
• longdash
• dotdash
or may be a comma-separated string of on/off length values such as "4,2,8,2". A null valueindicates a solid line.
Only has an effect if the lineNS parameter is set to draw lines.
errstyleNS = lines|capped_lines|... (ErrorRenderer)Defines the way in which error bars (or ellipses, or...) will be represented for data set NS iferrors are being displayed. The following options are available:
• none
• lines
• capped_lines
• caps
• arrows
• ellipse
• crosshair_ellipse
• rectangle
• crosshair_rectangle
• filled_ellipse
• filled_rectangle
[Default: lines]
font = dialog|serif|... (String)Determines the font that will be used for textual annotation of the plot, including axes etc. Atleast the following fonts will be available:
• serif
• sansserif
• monospaced
• dialog
• dialoginput
as well as a range of system-dependent fonts, possibly including
• aakar
• abyssinica_sil
• ani
• anjalioldlipi
• bitstream_charter
• c059
• century_schoolbook_l
• chandas
• chilanka
• courier
• courier_10_pitch
• d050000l
SUN/256 434
• dejavu_sans
• dejavu_sans_mono
• dejavu_serif
• dingbats
• droid_sans_fallback
• dyuthi
• freemono
• freesans
• freeserif
• gargi
• garuda
• gayathri
• ...
[Default: dialog]
fontsize = <int-value> (Integer)Sets the font size used for plot annotations.
[Default: 12]
fontstyle = plain|bold|italic|bold-italic (Integer)Gives a style in which the font is to be applied for plot annotations. Options are plain, bold,italic and bold-italic.
[Default: plain]
grid = true|false (Boolean)If true, grid lines are drawn on the plot. If false, they are absent.
[Default: true]
hideNS = true|false (Boolean)Indicates whether the actual markers plotted for each point should be hidden. Normally this isfalse, but you may want to set it to true if the point positions are being revealed in some otherway, for instance by error markers or lines drawn between them.
[Default: false]
ifmtN = <in-format> (String)Specifies the format of the input table as specified by parameter inN. The known formats arelisted in Section 5.1.1. This flag can be used if you know what format your table is in. If it hasthe special value (auto) (the default), then an attempt will be made to detect the format of thetable automatically. This cannot always be done correctly however, in which case the programwill exit with an error explaining which formats were attempted. This parameter is ignored forscheme-specified tables.
[Default: (auto)]
inN = <table> (StarTable)The location of the input table. This may take one of the following forms:
• A filename.• A URL.• The special value "-", meaning standard input. In this case the input format must be given
explicitly using the ifmtN parameter. Note that not all formats can be streamed in thisway.
• A scheme specification of the form :<scheme-name>:<scheme-args>.• A system command line with either a "<" character at the start, or a "|" character at the
end ("<syscmd" or "syscmd|"). This executes the given pipeline and reads from itsstandard output. This will probably only work on unix-like systems.
SUN/256 435
In any case, compressed data in one of the supported compression formats (gzip, Unixcompress or bzip2) will be decompressed transparently.
istreamN = true|false (Boolean)If set true, the input table specified by the inN parameter will be read as a stream. It isnecessary to give the ifmtN parameter in this case. Depending on the required operations andprocessing mode, this may cause the read to fail (sometimes it is necessary to read the tablemore than once). It is not normally necessary to set this flag; in most cases the data will bestreamed automatically if that is the best thing to do. However it can sometimes result in lessresource usage when processing large files in certain formats (such as VOTable). Thisparameter is ignored for scheme-specified tables.
[Default: false]
legend = true|false (Boolean)Determines whether a legend showing which plotting style is used for each data set. Defaultsto true if there is more than one set, false otherwise.
lineNS = DotToDot|LinearRegression (Line)Determines what line if any will be plotted along with the data points. The options are:
• null: No line is plotted.• DotToDot: Each point is joined to the next one in sequence by a straight line.• LinearRegression: A linear regression line is plotted based on all the points which are
visible in the plot. Note that the regression coefficients take no account of points out ofthe visible range.
linewidthNS = <int-value> (Integer)Sets the line width in pixels for any lines drawn in data set NS.
Only has an effect if the lineNS parameter is set to draw lines.
[Default: 1]
nameNS = <value> (String)Provides a name to use for a subset with the symbolic label NS. This name will be used fordisplay in the legend, if one is displayed.
ofmt = png|png-transp|gif|jpeg|pdf|svg|eps|eps-gzip (GraphicExporter)Graphics format in which the plot is written to the output file, see Section 8.6. One of:
• png: PNG• png-transp: PNG with transparent background• gif: GIF• jpeg: JPEG• pdf: Portable Document Format• svg: Scalable Vector Graphics• eps: Encapsulated PostScript• eps-gzip: Gzipped Encapsulated PostScript
May default to a sensible value depending on the filename given by out.
omode = swing|out|cgi|discard|auto (PaintMode)Determines how the drawn plot will be output, see Section 8.5.
• swing: Plot will be displayed in a window on the screen. This plot is "live"; it can beresized and (except for old-style plots) navigated around with mouse actions in the sameway as plots in TOPCAT.
• out: Plot will be written to a file given by out using the graphics format given by ofmt.• cgi: Plot will be written in a way suitable for CGI use direct from a web server. The
output is in the graphics format given by ofmt, preceded by a suitable "Content-type"declaration.
SUN/256 436

• discard: Plot is drawn, but discarded. There is no output.• auto: Behaves as swing or out mode depending on presence of out parameter
[Default: auto]
out = <out-file> (uk.ac.starlink.util.Destination)The location of the output file. This is usually a filename to write to. If it is equal to the specialvalue "-" the output will be written to standard output.
sequence = <suffix>,<suffix>,... (String[])Can be used to control the sequence in which different datasets and subsets are plotted. Thiswill affect which symbols are plotted on top of, and so potentially obscure, which other ones.The value of this parameter is a comma-separated list of the "NS" suffixes which appear on theparameters which apply to subsets. The sets which are named will be plotted in order, so thefirst-named one will be at the bottom (most likely to be obscured). Note that if this parameteris supplied, then only those sets which are named will be plotted, so this parameter may also beused to restrict which plots appear (though it may not be the most efficient way of doing this).If no explicit value is supplied for this parameter, sets will be plotted in some sequencedecided by STILTS (probably alphabetic by suffix).
shapeNS = filled_circle|open_circle|... (MarkShape)Defines the shapes for the markers that are plotted in data set NS. The following shapes areavailable:
• filled_circle
• open_circle
• cross
• x
• open_square
• open_diamond
• open_triangle_up
• open_triangle_down
• filled_square
• filled_diamond
• filled_triangle_up
• filled_triangle_down
sizeNS = <int-value> (Integer)Defines the marker size in pixels for markers plotted in data set NS. If the value is negative, anattempt will be made to use a suitable size according to how many points there are to beplotted.
[Default: -1]
subsetNS = <expr> (String)Gives the selection criterion for the subset labelled "NS". This is a boolean expression whichmay be the name of a boolean-valued column or any other boolean-valued expression. Rowsfor which the expression evaluates true will be included in the subset, and those for which itevaluates false will not.
title = <value> (String)A one-line title to display at the top of the plot.
transparencyNS = <int-value> (Integer)Determines the transparency of plotted markers for data set NS. A value of <n> means thatopacity is only achieved (the background is only blotted out) when <n> pixels of this colourhave been plotted on top of each other.
The minimum value is 1, which means opaque markers.
txtlabelN = <value> (String)
SUN/256 437
Gives an expression which will label each plotted point. If given, the text (or number) resultingfrom evaluating the expression will be written near each point which is plotted.
xdataN = <expr> (String)Gives a column name or expression for the x axis data for table N. The expression is a numericalgebraic expression based on column names as described in Section 10
xerrorN = <expr>|[<lo-expr>],[<hi-expr>] (String)Gives expressions for the errors on X coordinates for table N. The following forms arepermitted:
• <expr>: symmetric error value• <lo-expr>,<hi-expr>:distinct lower and upper error values• <lo-expr>,: lower error value only• ,<hi-expr>: upper error value only• null: no errors
The expression in each case is a numeric algebraic expression based on column names asdescribed in Section 10.
xflip = true|false (Boolean)If set true, the scale on the x axis will increase in the opposite sense from usual (e.g. right toleft rather than left to right).
[Default: false]
xhi = <float-value> (Double)The upper limit for the plotted x axis. If not set, a value will be chosen which is high enough toaccommodate all the data.
xlabel = <value> (String)Specifies a label to be used for annotating axis x. A default values based on the plotted datawill be used if no value is supplied for this parameter.
xlo = <float-value> (Double)The lower limit for the plotted x axis. If not set, a value will be chosen which is low enough toaccommodate all the data.
xlog = true|false (Boolean)If false (the default), the scale on the x axis is linear; if true it is logarithmic.
[Default: false]
xpix = <int-value> (Integer)The width of the output graphic in pixels.
[Default: 400]
ydataN = <expr> (String)Gives a column name or expression for the y axis data for table N. The expression is a numericalgebraic expression based on column names as described in Section 10
yerrorN = <expr>|[<lo-expr>],[<hi-expr>] (String)Gives expressions for the errors on Y coordinates for table N. The following forms arepermitted:
• <expr>: symmetric error value• <lo-expr>,<hi-expr>:distinct lower and upper error values• <lo-expr>,: lower error value only• ,<hi-expr>: upper error value only• null: no errors
The expression in each case is a numeric algebraic expression based on column names asdescribed in Section 10.
SUN/256 438

yflip = true|false (Boolean)If set true, the scale on the y axis will increase in the opposite sense from usual (e.g. right toleft rather than left to right).
[Default: false]
yhi = <float-value> (Double)The upper limit for the plotted y axis. If not set, a value will be chosen which is high enough toaccommodate all the data.
ylabel = <value> (String)Specifies a label to be used for annotating axis y. A default values based on the plotted datawill be used if no value is supplied for this parameter.
ylo = <float-value> (Double)The lower limit for the plotted y axis. If not set, a value will be chosen which is low enough toaccommodate all the data.
ylog = true|false (Boolean)If false (the default), the scale on the y axis is linear; if true it is logarithmic.
[Default: false]
ypix = <int-value> (Integer)The height of the output graphic in pixels.
[Default: 300]
B.14.2 Examples
Here are some examples of plot2d in use:
stilts plot2d in=cat.xml xdata=RMAG-BMAG ydata=BMAG
Plots a colour-magnitude diagram. Since no omode or out value has been specified, the plot isposted directly to the graphics display for inspection. By adding the parameterout=xyplot.eps the plot could be written to an Encapsulated Postscript file instead.
The generated plot is here.
stilts plot2d in=6dfgs_mini.xml xdata=RMAG-BMAG ydata=BMAGsubset1=SGFLAG==1 name1=galaxy colour1=blue shape1=open_circlesubset2=SGFLAG==2 name2=star colour2=e010f0 shape2=x size2=3xlo=-1 xhi=4.5 ylo=10 yhi=20 xpix=500 ypix=250out=xyplot2.png
Plots a colour-magnitude diagram with multiple subsets. The subsets are labelled "1" and "2"with separate sets of parameters applying to each. The selections for the sets are given by thesubset* parameters; set 1 is those rows with the SGFLAG column equal to 1 and set 2 is thoserows with the SGFLAG column equal to 2. The boundaries of the plot in data coordinates areset explicitly rather than being determined from the data (this is faster) and the plot size inpixels is also set explicitly rather than taking the default values. Output is to a PNG file.
The generated plot is here.
stilts plot2d in1=iras_psc.fits cmd1='addskycoords fk5 galactic RA DEC GLON GLAT'xdata1=GLON ydata1=GLATauxdata1=FNU_100 auxlog=true auxflip=true size1=0 transparency1=3in2=messier.xml cmd2='addskycoords fk5 galactic RA DEC GLON GLAT'xdata2=GLON ydata2=GLATtxtlabel2=RADIUS>16?("M"+ID):"" cmd2='addcol SIZE sqrt(RADIUS/2)'xerror2=SIZE yerror2=SIZEsubset2a=true hide2a=true colour2a=black errstyle2a=ellipse
SUN/256 439

subset2b=true hide2b=true colour2b=black errstyle2b=filled_ellipsetransparency2b=6
xlabel='Galactic Longitude' ylabel='Galactic Latitude' title='The Sky'legend=false grid=false fontsize=12 fontstyle=bold-italicxlo=0 xhi=360 ylo=-90 yhi=+90 xpix=600 ypix=300out=skyplot.png
You can do quite complicated things.
The generated plot is here.
B.15 plot3d: Old-style 3D Scatter Plot
This section describes a deprecated command. It still works, but you are advised to use the morecapable plot2cube or plot2sphere instead.
plot3d performs three-dimensional scatter plots, sending the output to a graphical display orwriting it to a file in some vector or bitmapped graphics format. You need to supply it with valuesfor one or more X, Y and Z datasets, in terms of table columns, and it will generate a plot with apoint for each row. There are many options available to configure the detailed appearance of theplot, but in its simplest form invocation is quite straightforward. See Section 9 for more discussionon use of the plotting commands.
B.15.1 Usage
The usage of plot3d is
stilts <stilts-flags> plot3d xpix=<int-value> ypix=<int-value>font=dialog|serif|... fontsize=<int-value>fontstyle=plain|bold|italic|bold-italiclegend=true|false title=<value>omode=swing|out|cgi|discard|autoout=<out-file>ofmt=png|png-transp|gif|jpeg|pdf|svg|eps|eps-gzipinN=<table> ifmtN=<in-format>istreamN=true|false cmdN=<cmds> xdataN=<expr>ydataN=<expr> zdataN=<expr> auxdataN=<expr>xlo=<float-value> ylo=<float-value>zlo=<float-value> auxlo=<float-value>xhi=<float-value> yhi=<float-value>zhi=<float-value> auxhi=<float-value>xlog=true|false ylog=true|falsezlog=true|false auxlog=true|falsexflip=true|false yflip=true|falsezflip=true|false auxflip=true|falsexlabel=<value> ylabel=<value> zlabel=<value>auxlabel=<value>xerrorN=<expr>|[<lo-expr>],[<hi-expr>]yerrorN=<expr>|[<lo-expr>],[<hi-expr>]zerrorN=<expr>|[<lo-expr>],[<hi-expr>]auxshader=rainbow|pastel|... txtlabelN=<value>subsetNS=<expr> nameNS=<value>colourNS=<rrggbb>|red|blue|...shapeNS=filled_circle|open_circle|...sizeNS=<int-value> transparencyNS=<int-value>lineNS=DotToDot|LinearRegressionlinewidthNS=<int-value>dashNS=dot|dash|...|<a,b,...>hideNS=true|falseerrstyleNS=lines|capped_lines|...grid=true|false antialias=true|falsesequence=<suffix>,<suffix>,...fog=<float-value> phi=<float-value>theta=<float-value>
If you don't have the stilts script installed, write "java -jar stilts.jar" instead of "stilts" -see Section 3. The available <stilts-flags> are listed in Section 2.1. For programmatic
SUN/256 440
invocation, the Task class for this command is uk.ac.starlink.ttools.task.TablePlot3D.
Parameter values are assigned on the command line as explained in Section 2.3. They are asfollows:
antialias = true|false (Boolean)Controls whether lines are drawn using antialiasing, where applicable. If lines are drawn to abitmapped-type graphics output format setting this parameter to true smooths the lines out byusing gradations of colour for diagonal lines, and setting it false simply sets each pixel in theline to on or off. For vector-type graphics output formats, or for cases in which no diagonallines are drawn, the setting of this parameter has no effect. Setting it true may slow the plotdown slightly.
[Default: true]
auxdataN = <expr> (String)Gives a column name or expression for the aux axis data for table N. The expression is anumeric algebraic expression based on column names as described in Section 10
auxflip = true|false (Boolean)If set true, the scale on the aux axis will increase in the opposite sense from usual (e.g. right toleft rather than left to right).
[Default: false]
auxhi = <float-value> (Double)The upper limit for the plotted aux axis. If not set, a value will be chosen which is high enoughto accommodate all the data.
auxlabel = <value> (String)Specifies a label to be used for annotating axis aux. A default values based on the plotted datawill be used if no value is supplied for this parameter.
auxlo = <float-value> (Double)The lower limit for the plotted aux axis. If not set, a value will be chosen which is low enoughto accommodate all the data.
auxlog = true|false (Boolean)If false (the default), the scale on the aux axis is linear; if true it is logarithmic.
[Default: false]
auxshader = rainbow|pastel|... (Shader)Determines how data from auxiliary axes will be displayed. Generally this is some kind ofcolour ramp. These are the available colour fixing options:
• rainbow
• pastel
• standard
• heat
• colour
• hue
• greyscale
• red-blue
and these are the available colour modifying options:
• hsv_h
• hsv_s
• hsv_v
• intensity
• rgb_red
SUN/256 441
• rgb_green
• rgb_blue
• yuv_y
• yuv_u
• yuv_v
• transparency
[Default: rainbow]
cmdN = <cmds> (ProcessingStep[])Specifies processing to be performed on the table. The value of this parameter is one or moreof the filter commands described in Section 6.1. If more than one is given, they must beseparated by semicolon characters (";"). This parameter can be repeated multiple times on thesame command line to build up a list of processing steps. The sequence of commands given inthis way defines the processing pipeline which is performed on the table.
Commands may alteratively be supplied in an external file, by using the indirection character'@'. Thus a value of "@filename" causes the file filename to be read for a list of filtercommands to execute. The commands in the file may be separated by newline charactersand/or semicolons, and lines which are blank or which start with a '#' character are ignored.
colourNS = <rrggbb>|red|blue|... (Color)Defines the colour of markers plotted. The value may be a 6-digit hexadecimal number givingred, green and blue intensities, e.g. "ff00ff" for magenta. Alternatively it may be the name ofone of the pre-defined colours. These are currently red, blue, green, grey, magenta, cyan,orange, pink, yellow, black and white.
For most purposes, either the American or the British spelling is accepted for this parametername.
dashNS = dot|dash|...|<a,b,...> (float[])Defines the dash style for any lines drawn in data set NS To generate a dashed line the valuemay be one of the named dash types:
• dot
• dash
• longdash
• dotdash
or may be a comma-separated string of on/off length values such as "4,2,8,2". A null valueindicates a solid line.
Only has an effect if the lineNS parameter is set to draw lines.
errstyleNS = lines|capped_lines|... (ErrorRenderer)Defines the way in which error bars (or ellipses, or...) will be represented for data set NS iferrors are being displayed. The following options are available:
• none
• lines
• capped_lines
• caps
• arrows
• cuboid
• ellipse
• crosshair_ellipse
• rectangle
• crosshair_rectangle
• filled_ellipse
• filled_rectangle
SUN/256 442
[Default: lines]
fog = <float-value> (Double)Sets the level of fogging used to provide a visual indication of depth. Object plotted furtheraway from the viewer appear more washed-out by a white fog. The default value gives a bit offogging; increase it to make the fog thicker, or set to zero if no fogging is required.
[Default: 1.0]
font = dialog|serif|... (String)Determines the font that will be used for textual annotation of the plot, including axes etc. Atleast the following fonts will be available:
• serif
• sansserif
• monospaced
• dialog
• dialoginput
as well as a range of system-dependent fonts, possibly including
• aakar
• abyssinica_sil
• ani
• anjalioldlipi
• bitstream_charter
• c059
• century_schoolbook_l
• chandas
• chilanka
• courier
• courier_10_pitch
• d050000l
• dejavu_sans
• dejavu_sans_mono
• dejavu_serif
• dingbats
• droid_sans_fallback
• dyuthi
• freemono
• freesans
• freeserif
• gargi
• garuda
• gayathri
• ...
[Default: dialog]
fontsize = <int-value> (Integer)Sets the font size used for plot annotations.
[Default: 12]
fontstyle = plain|bold|italic|bold-italic (Integer)Gives a style in which the font is to be applied for plot annotations. Options are plain, bold,italic and bold-italic.
[Default: plain]
grid = true|false (Boolean)
SUN/256 443
If true, grid lines are drawn on the plot. If false, they are absent.
[Default: true]
hideNS = true|false (Boolean)Indicates whether the actual markers plotted for each point should be hidden. Normally this isfalse, but you may want to set it to true if the point positions are being revealed in some otherway, for instance by error markers or lines drawn between them.
[Default: false]
ifmtN = <in-format> (String)Specifies the format of the input table as specified by parameter inN. The known formats arelisted in Section 5.1.1. This flag can be used if you know what format your table is in. If it hasthe special value (auto) (the default), then an attempt will be made to detect the format of thetable automatically. This cannot always be done correctly however, in which case the programwill exit with an error explaining which formats were attempted. This parameter is ignored forscheme-specified tables.
[Default: (auto)]
inN = <table> (StarTable)The location of the input table. This may take one of the following forms:
• A filename.• A URL.• The special value "-", meaning standard input. In this case the input format must be given
explicitly using the ifmtN parameter. Note that not all formats can be streamed in thisway.
• A scheme specification of the form :<scheme-name>:<scheme-args>.• A system command line with either a "<" character at the start, or a "|" character at the
end ("<syscmd" or "syscmd|"). This executes the given pipeline and reads from itsstandard output. This will probably only work on unix-like systems.
In any case, compressed data in one of the supported compression formats (gzip, Unixcompress or bzip2) will be decompressed transparently.
istreamN = true|false (Boolean)If set true, the input table specified by the inN parameter will be read as a stream. It isnecessary to give the ifmtN parameter in this case. Depending on the required operations andprocessing mode, this may cause the read to fail (sometimes it is necessary to read the tablemore than once). It is not normally necessary to set this flag; in most cases the data will bestreamed automatically if that is the best thing to do. However it can sometimes result in lessresource usage when processing large files in certain formats (such as VOTable). Thisparameter is ignored for scheme-specified tables.
[Default: false]
legend = true|false (Boolean)Determines whether a legend showing which plotting style is used for each data set. Defaultsto true if there is more than one set, false otherwise.
lineNS = DotToDot|LinearRegression (Line)Determines what line if any will be plotted along with the data points. The options are:
• null: No line is plotted.• DotToDot: Each point is joined to the next one in sequence by a straight line.• LinearRegression: A linear regression line is plotted based on all the points which are
visible in the plot. Note that the regression coefficients take no account of points out ofthe visible range.
linewidthNS = <int-value> (Integer)
SUN/256 444
Sets the line width in pixels for any lines drawn in data set NS.
Only has an effect if the lineNS parameter is set to draw lines.
[Default: 1]
nameNS = <value> (String)Provides a name to use for a subset with the symbolic label NS. This name will be used fordisplay in the legend, if one is displayed.
ofmt = png|png-transp|gif|jpeg|pdf|svg|eps|eps-gzip (GraphicExporter)Graphics format in which the plot is written to the output file, see Section 8.6. One of:
• png: PNG• png-transp: PNG with transparent background• gif: GIF• jpeg: JPEG• pdf: Portable Document Format• svg: Scalable Vector Graphics• eps: Encapsulated PostScript• eps-gzip: Gzipped Encapsulated PostScript
May default to a sensible value depending on the filename given by out.
omode = swing|out|cgi|discard|auto (PaintMode)Determines how the drawn plot will be output, see Section 8.5.
• swing: Plot will be displayed in a window on the screen. This plot is "live"; it can beresized and (except for old-style plots) navigated around with mouse actions in the sameway as plots in TOPCAT.
• out: Plot will be written to a file given by out using the graphics format given by ofmt.• cgi: Plot will be written in a way suitable for CGI use direct from a web server. The
output is in the graphics format given by ofmt, preceded by a suitable "Content-type"declaration.
• discard: Plot is drawn, but discarded. There is no output.• auto: Behaves as swing or out mode depending on presence of out parameter
[Default: auto]
out = <out-file> (uk.ac.starlink.util.Destination)The location of the output file. This is usually a filename to write to. If it is equal to the specialvalue "-" the output will be written to standard output.
phi = <float-value> (Double)Angle in degrees through which the 3D plot is rotated abound the Z axis prior to drawing.
[Default: 30.0]
sequence = <suffix>,<suffix>,... (String[])Can be used to control the sequence in which different datasets and subsets are plotted. Thiswill affect which symbols are plotted on top of, and so potentially obscure, which other ones.The value of this parameter is a comma-separated list of the "NS" suffixes which appear on theparameters which apply to subsets. The sets which are named will be plotted in order, so thefirst-named one will be at the bottom (most likely to be obscured). Note that if this parameteris supplied, then only those sets which are named will be plotted, so this parameter may also beused to restrict which plots appear (though it may not be the most efficient way of doing this).If no explicit value is supplied for this parameter, sets will be plotted in some sequencedecided by STILTS (probably alphabetic by suffix).
shapeNS = filled_circle|open_circle|... (MarkShape)Defines the shapes for the markers that are plotted in data set NS. The following shapes areavailable:
SUN/256 445

• filled_circle
• open_circle
• cross
• x
• open_square
• open_diamond
• open_triangle_up
• open_triangle_down
• filled_square
• filled_diamond
• filled_triangle_up
• filled_triangle_down
sizeNS = <int-value> (Integer)Defines the marker size in pixels for markers plotted in data set NS. If the value is negative, anattempt will be made to use a suitable size according to how many points there are to beplotted.
[Default: -1]
subsetNS = <expr> (String)Gives the selection criterion for the subset labelled "NS". This is a boolean expression whichmay be the name of a boolean-valued column or any other boolean-valued expression. Rowsfor which the expression evaluates true will be included in the subset, and those for which itevaluates false will not.
theta = <float-value> (Double)Angle in degrees through which the 3D plot is rotated towards the viewer (i.e. about thehorizontal axis of the viewing plane) prior to drawing.
[Default: 15.0]
title = <value> (String)A one-line title to display at the top of the plot.
transparencyNS = <int-value> (Integer)Determines the transparency of plotted markers for data set NS. A value of <n> means thatopacity is only achieved (the background is only blotted out) when <n> pixels of this colourhave been plotted on top of each other.
The minimum value is 1, which means opaque markers.
txtlabelN = <value> (String)Gives an expression which will label each plotted point. If given, the text (or number) resultingfrom evaluating the expression will be written near each point which is plotted.
xdataN = <expr> (String)Gives a column name or expression for the x axis data for table N. The expression is a numericalgebraic expression based on column names as described in Section 10
xerrorN = <expr>|[<lo-expr>],[<hi-expr>] (String)Gives expressions for the errors on X coordinates for table N. The following forms arepermitted:
• <expr>: symmetric error value• <lo-expr>,<hi-expr>:distinct lower and upper error values• <lo-expr>,: lower error value only• ,<hi-expr>: upper error value only• null: no errors
The expression in each case is a numeric algebraic expression based on column names asdescribed in Section 10.
SUN/256 446
xflip = true|false (Boolean)If set true, the scale on the x axis will increase in the opposite sense from usual (e.g. right toleft rather than left to right).
[Default: false]
xhi = <float-value> (Double)The upper limit for the plotted x axis. If not set, a value will be chosen which is high enough toaccommodate all the data.
xlabel = <value> (String)Specifies a label to be used for annotating axis x. A default values based on the plotted datawill be used if no value is supplied for this parameter.
xlo = <float-value> (Double)The lower limit for the plotted x axis. If not set, a value will be chosen which is low enough toaccommodate all the data.
xlog = true|false (Boolean)If false (the default), the scale on the x axis is linear; if true it is logarithmic.
[Default: false]
xpix = <int-value> (Integer)The width of the output graphic in pixels.
[Default: 300]
ydataN = <expr> (String)Gives a column name or expression for the y axis data for table N. The expression is a numericalgebraic expression based on column names as described in Section 10
yerrorN = <expr>|[<lo-expr>],[<hi-expr>] (String)Gives expressions for the errors on Y coordinates for table N. The following forms arepermitted:
• <expr>: symmetric error value• <lo-expr>,<hi-expr>:distinct lower and upper error values• <lo-expr>,: lower error value only• ,<hi-expr>: upper error value only• null: no errors
The expression in each case is a numeric algebraic expression based on column names asdescribed in Section 10.
yflip = true|false (Boolean)If set true, the scale on the y axis will increase in the opposite sense from usual (e.g. right toleft rather than left to right).
[Default: false]
yhi = <float-value> (Double)The upper limit for the plotted y axis. If not set, a value will be chosen which is high enough toaccommodate all the data.
ylabel = <value> (String)Specifies a label to be used for annotating axis y. A default values based on the plotted datawill be used if no value is supplied for this parameter.
ylo = <float-value> (Double)The lower limit for the plotted y axis. If not set, a value will be chosen which is low enough toaccommodate all the data.
ylog = true|false (Boolean)If false (the default), the scale on the y axis is linear; if true it is logarithmic.
SUN/256 447

[Default: false]
ypix = <int-value> (Integer)The height of the output graphic in pixels.
[Default: 300]
zdataN = <expr> (String)Gives a column name or expression for the z axis data for table N. The expression is a numericalgebraic expression based on column names as described in Section 10
zerrorN = <expr>|[<lo-expr>],[<hi-expr>] (String)Gives expressions for the errors on Z coordinates for table N. The following forms arepermitted:
• <expr>: symmetric error value• <lo-expr>,<hi-expr>:distinct lower and upper error values• <lo-expr>,: lower error value only• ,<hi-expr>: upper error value only• null: no errors
The expression in each case is a numeric algebraic expression based on column names asdescribed in Section 10.
zflip = true|false (Boolean)If set true, the scale on the z axis will increase in the opposite sense from usual (e.g. right toleft rather than left to right).
[Default: false]
zhi = <float-value> (Double)The upper limit for the plotted z axis. If not set, a value will be chosen which is high enough toaccommodate all the data.
zlabel = <value> (String)Specifies a label to be used for annotating axis z. A default values based on the plotted datawill be used if no value is supplied for this parameter.
zlo = <float-value> (Double)The lower limit for the plotted z axis. If not set, a value will be chosen which is low enough toaccommodate all the data.
zlog = true|false (Boolean)If false (the default), the scale on the z axis is linear; if true it is logarithmic.
[Default: false]
B.15.2 Examples
Here are some examples of plot3d in use:
stilts plot3d in=cat.xml xdata=RMAG ydata=BMAG zdata=VEL zlog=true
Plots a 3-d scatter plot of red magnitude vs. blue magnitude vs. velocity; the velocity is plottedon a logarithmic scale. Since no omode or out value has been specified, the plot is posteddirectly to the graphics display for inspection. By adding the parameter out=xyplot.eps theplot could be written to an Encapsulated Postscript file instead.
The generated plot is here.
stilts plot3d in=sim1.fits xdata=x ydata=y zdata=zcmd='addcol vel "sqrt(velx*velx+vely*vely+velz*velz)"' auxdata=vel auxlog=true
SUN/256 448

xpix=500 ypix=400 phi=50 theta=10 out=cube.jpeg
Plots the x, y, z positions of particles from a file containing the result of a simulation run. Herean auxiliary axis is used to colour-code the points according their velocity. This is done byintroducing a new vel column to the table using the addcol filter command, so that the vel
column can be used as the value for the auxdata parameter. Alternatively, the given expressionfor the velocity could have been used directly as the value of the auxdata parameter.
Additionally, the phi and theta parameters are given to adjust the orientation of the cube.
The generated plot is here.
B.16 plothist: Old-style Histogram
This section describes a deprecated command. It still works, but you are advised to use the morecapable plot2plane instead.
plothist performs histogram plots, sending the output to a graphical display or writing it to a filein some vector or bitmapped graphics format. You need to supply it with values for one or moresets of X values, in terms of table columns, and it will bin the data and draw bars appropriately. Plotbounds, bin widths etc may be supplied expliicitly, but will be calculated from the data and set fromdefaults as appropriate otherwise. There are many options available to configure the detailedappearance of the plot, but in its simplest form invocation is quite straightforward. See Section 9 formore discussion on use of the plotting commands.
B.16.1 Usage
The usage of plothist is
stilts <stilts-flags> plothist xpix=<int-value> ypix=<int-value>font=dialog|serif|... fontsize=<int-value>fontstyle=plain|bold|italic|bold-italiclegend=true|false title=<value>omode=swing|out|cgi|discard|autoout=<out-file>ofmt=png|png-transp|gif|jpeg|pdf|svg|eps|eps-gzipinN=<table> ifmtN=<in-format>istreamN=true|false cmdN=<cmds>xdataN=<expr> xlo=<float-value>xhi=<float-value> xlog=true|falsexflip=true|false xlabel=<value>subsetNS=<expr> nameNS=<value>colourNS=<rrggbb>|red|blue|...barstyleNS=fill|open|...linewidthNS=<int-value>dashNS=dot|dash|...|<a,b,...>grid=true|false antialias=true|falsesequence=<suffix>,<suffix>,...ylo=<float-value> yhi=<float-value>ylog=true|false ylabel=<value>weightN=<value> binwidth=<float-value>norm=true|false cumulative=true|falsebinbase=<float-value>
If you don't have the stilts script installed, write "java -jar stilts.jar" instead of "stilts" -see Section 3. The available <stilts-flags> are listed in Section 2.1. For programmaticinvocation, the Task class for this command is uk.ac.starlink.ttools.task.TableHistogram.
Parameter values are assigned on the command line as explained in Section 2.3. They are asfollows:
antialias = true|false (Boolean)
SUN/256 449
Controls whether lines are drawn using antialiasing, where applicable. If lines are drawn to abitmapped-type graphics output format setting this parameter to true smooths the lines out byusing gradations of colour for diagonal lines, and setting it false simply sets each pixel in theline to on or off. For vector-type graphics output formats, or for cases in which no diagonallines are drawn, the setting of this parameter has no effect. Setting it true may slow the plotdown slightly.
[Default: true]
barstyleNS = fill|open|... (BarShape)Defines how histogram bars will be drawn for dataset NS. The options are:
• fill
• open
• tops
• semi
• semitops
• spikes
• fillover
• openover
[Default: fill]
binbase = <float-value> (Double)Adjusts the offset of the bins. By default zero (or one for logarithmic X axis) is a boundarybetween bins; other boundaries are defined by this and the bin width. If this value is adjusted,the lower bound of one of the bins will be set to this value, so all the bins move along by thecorresponding distance.
[Default: 0.0]
binwidth = <float-value> (Double)Defines the width on the X axis of histogram bins. If the X axis is logarithmic, then this is amultiplicative value.
cmdN = <cmds> (ProcessingStep[])Specifies processing to be performed on the table. The value of this parameter is one or moreof the filter commands described in Section 6.1. If more than one is given, they must beseparated by semicolon characters (";"). This parameter can be repeated multiple times on thesame command line to build up a list of processing steps. The sequence of commands given inthis way defines the processing pipeline which is performed on the table.
Commands may alteratively be supplied in an external file, by using the indirection character'@'. Thus a value of "@filename" causes the file filename to be read for a list of filtercommands to execute. The commands in the file may be separated by newline charactersand/or semicolons, and lines which are blank or which start with a '#' character are ignored.
colourNS = <rrggbb>|red|blue|... (Color)Defines the colour of bars plotted for data set NS. The value may be a 6-digit hexadecimalnumber giving red, green and blue intensities, e.g. "ff00ff" for magenta. Alternatively it maybe the name of one of the pre-defined colours. These are currently red, blue, green, grey,magenta, cyan, orange, pink, yellow, black and white.
For most purposes, either the American or the British spelling is accepted for this parametername.
cumulative = true|false (Boolean)Determines whether historams are cumulative. When false (the default), the height of each baris determined by counting the number of points which fall into the range on the X axis that itcovers. When true, the height is determined by counting all the points between negativeinfinity and the upper bound of the range on the X axis that it covers.
SUN/256 450

[Default: false]
dashNS = dot|dash|...|<a,b,...> (float[])Defines the dashing pattern for lines drawn for dataset NS. To generate a dashed line the valuemay be one of the named dash types:
• dot
• dash
• longdash
• dotdash
or may be a comma-separated string of on/off length values such as "4,2,8,2". A null valueindicates a solid line. Only certain bar styles are affected by the dash pattern.
font = dialog|serif|... (String)Determines the font that will be used for textual annotation of the plot, including axes etc. Atleast the following fonts will be available:
• serif
• sansserif
• monospaced
• dialog
• dialoginput
as well as a range of system-dependent fonts, possibly including
• aakar
• abyssinica_sil
• ani
• anjalioldlipi
• bitstream_charter
• c059
• century_schoolbook_l
• chandas
• chilanka
• courier
• courier_10_pitch
• d050000l
• dejavu_sans
• dejavu_sans_mono
• dejavu_serif
• dingbats
• droid_sans_fallback
• dyuthi
• freemono
• freesans
• freeserif
• gargi
• garuda
• gayathri
• ...
[Default: dialog]
fontsize = <int-value> (Integer)Sets the font size used for plot annotations.
[Default: 12]
fontstyle = plain|bold|italic|bold-italic (Integer)Gives a style in which the font is to be applied for plot annotations. Options are plain, bold,
SUN/256 451
italic and bold-italic.
[Default: plain]
grid = true|false (Boolean)If true, grid lines are drawn on the plot. If false, they are absent.
[Default: true]
ifmtN = <in-format> (String)Specifies the format of the input table as specified by parameter inN. The known formats arelisted in Section 5.1.1. This flag can be used if you know what format your table is in. If it hasthe special value (auto) (the default), then an attempt will be made to detect the format of thetable automatically. This cannot always be done correctly however, in which case the programwill exit with an error explaining which formats were attempted. This parameter is ignored forscheme-specified tables.
[Default: (auto)]
inN = <table> (StarTable)The location of the input table. This may take one of the following forms:
• A filename.• A URL.• The special value "-", meaning standard input. In this case the input format must be given
explicitly using the ifmtN parameter. Note that not all formats can be streamed in thisway.
• A scheme specification of the form :<scheme-name>:<scheme-args>.• A system command line with either a "<" character at the start, or a "|" character at the
end ("<syscmd" or "syscmd|"). This executes the given pipeline and reads from itsstandard output. This will probably only work on unix-like systems.
In any case, compressed data in one of the supported compression formats (gzip, Unixcompress or bzip2) will be decompressed transparently.
istreamN = true|false (Boolean)If set true, the input table specified by the inN parameter will be read as a stream. It isnecessary to give the ifmtN parameter in this case. Depending on the required operations andprocessing mode, this may cause the read to fail (sometimes it is necessary to read the tablemore than once). It is not normally necessary to set this flag; in most cases the data will bestreamed automatically if that is the best thing to do. However it can sometimes result in lessresource usage when processing large files in certain formats (such as VOTable). Thisparameter is ignored for scheme-specified tables.
[Default: false]
legend = true|false (Boolean)Determines whether a legend showing which plotting style is used for each data set. Defaultsto true if there is more than one set, false otherwise.
linewidthNS = <int-value> (Integer)Defines the line width for lines drawn as part of the bars for dataset NS. Only certain bar stylesare affected by the line width.
[Default: 2]
nameNS = <value> (String)Provides a name to use for a subset with the symbolic label NS. This name will be used fordisplay in the legend, if one is displayed.
norm = true|false (Boolean)Determines whether bin counts are normalised. If true, histogram bars are scaled such thatsummed height of all bars over the whole dataset is equal to one. Otherwise (the default), no
SUN/256 452

scaling is done.
[Default: false]
ofmt = png|png-transp|gif|jpeg|pdf|svg|eps|eps-gzip (GraphicExporter)Graphics format in which the plot is written to the output file, see Section 8.6. One of:
• png: PNG• png-transp: PNG with transparent background• gif: GIF• jpeg: JPEG• pdf: Portable Document Format• svg: Scalable Vector Graphics• eps: Encapsulated PostScript• eps-gzip: Gzipped Encapsulated PostScript
May default to a sensible value depending on the filename given by out.
omode = swing|out|cgi|discard|auto (PaintMode)Determines how the drawn plot will be output, see Section 8.5.
• swing: Plot will be displayed in a window on the screen. This plot is "live"; it can beresized and (except for old-style plots) navigated around with mouse actions in the sameway as plots in TOPCAT.
• out: Plot will be written to a file given by out using the graphics format given by ofmt.• cgi: Plot will be written in a way suitable for CGI use direct from a web server. The
output is in the graphics format given by ofmt, preceded by a suitable "Content-type"declaration.
• discard: Plot is drawn, but discarded. There is no output.• auto: Behaves as swing or out mode depending on presence of out parameter
[Default: auto]
out = <out-file> (uk.ac.starlink.util.Destination)The location of the output file. This is usually a filename to write to. If it is equal to the specialvalue "-" the output will be written to standard output.
sequence = <suffix>,<suffix>,... (String[])Can be used to control the sequence in which different datasets and subsets are plotted. Thiswill affect which symbols are plotted on top of, and so potentially obscure, which other ones.The value of this parameter is a comma-separated list of the "NS" suffixes which appear on theparameters which apply to subsets. The sets which are named will be plotted in order, so thefirst-named one will be at the bottom (most likely to be obscured). Note that if this parameteris supplied, then only those sets which are named will be plotted, so this parameter may also beused to restrict which plots appear (though it may not be the most efficient way of doing this).If no explicit value is supplied for this parameter, sets will be plotted in some sequencedecided by STILTS (probably alphabetic by suffix).
subsetNS = <expr> (String)Gives the selection criterion for the subset labelled "NS". This is a boolean expression whichmay be the name of a boolean-valued column or any other boolean-valued expression. Rowsfor which the expression evaluates true will be included in the subset, and those for which itevaluates false will not.
title = <value> (String)A one-line title to display at the top of the plot.
weightN = <value> (String)Defines a weighting for each point accumulated to determine the height of plotted bars. If thisparameter has a value other than 1 (the default) then instead of simply accumulating thenumber of points per bin to determine bar height, the bar height will be the sum over the
SUN/256 453

weighting expression for the points in each bin. Note that with weighting, the figure drawn isno longer strictly speaking a histogram.
When weighted, bars can be of negative height. An anomaly of the plot as currentlyimplemented is that the Y axis never descends below zero, so any such bars are currentlyinvisible. This may be amended in a future release (contact the author to lobby for such anamendment).
[Default: 1]
xdataN = <expr> (String)Gives a column name or expression for the x axis data for table N. The expression is a numericalgebraic expression based on column names as described in Section 10
xflip = true|false (Boolean)If set true, the scale on the x axis will increase in the opposite sense from usual (e.g. right toleft rather than left to right).
[Default: false]
xhi = <float-value> (Double)The upper limit for the plotted x axis. If not set, a value will be chosen which is high enough toaccommodate all the data.
xlabel = <value> (String)Specifies a label to be used for annotating axis x. A default values based on the plotted datawill be used if no value is supplied for this parameter.
xlo = <float-value> (Double)The lower limit for the plotted x axis. If not set, a value will be chosen which is low enough toaccommodate all the data.
xlog = true|false (Boolean)If false (the default), the scale on the x axis is linear; if true it is logarithmic.
[Default: false]
xpix = <int-value> (Integer)The width of the output graphic in pixels.
[Default: 400]
yhi = <float-value> (Double)Upper bound for Y axis. Autogenerated from the data if not supplied.
ylabel = <value> (String)Specifies a label for annotating the vertical axis. A default value based on the type ofhistogram will be used if no value is supplied for this parameter.
[Default: Count]
ylo = <float-value> (Double)Lower bound for Y axis.
[Default: 0.0]
ylog = true|false (Boolean)Whether to use a logarithmic scale for the Y axis.
[Default: false]
ypix = <int-value> (Integer)The height of the output graphic in pixels.
[Default: 300]
SUN/256 454
B.16.2 Examples
Here are some examples of plothist in use:
stilts plothist in=cat.xml xdata=RMAG-BMAG
Plots a histogram of the R-B colour. The plot is displayed directly on the screen.
The generated plot is here.
stilts plothist in=cat.xml xdata=RMAG-BMAG ofmt=eps-gzip out=hist.eps.gz
Makes the same plot as the previous example, but writes it to a gzipped encapsulated postscriptfile instead of displaying it on the screen.
The generated plot is here.
stilts plothist inJ=2mass_xsc.fits xdataJ=j_m_k20fe barstyleJ=topsinH=2mass_xsc.fits xdataH=h_m_k20fe barstyleH=topsinK=2mass_xsc.fits xdataK=k_m_k20fe barstyleK=topsbinwidth=0.1 xlo=12 xhi=16 xflip=true xlabel=Magnitude xpix=500out=2mass.png
Overplots histograms of three different columns from the same input table. These are treated asthree separate datasets which all happen to use the same input file. The different datasets arelabelled "J", "H" and "K" so these suffixes appear on all the dataset-dependent parameterswhich are supplied. The binwidth and X range are specified explicitly rather than leaving themto be chosen automatically by examining the data.
The generated plot is here.
B.17 regquery: Queries the VO registry
regquery submits a query to the Virtual Observatory registry and returns the result as a tablecontaining all the records which match the condition specified. The resulting table can be writtenout in any of the supported formats or otherwise processed in the usual ways. Making use of thiscommand requires an understanding of the VOResource schema.
It is important to note that the results of this command give a very much flattened and incompleteview of the results of a full registry query. That is because the contents of an IVOA Registry (seethe IVOA Resource Metadata and VOResource documents for more detail) are hierarchical andcannot be faithfully represented in a simple tabular structure. Other superior registry search clientsexist; this command is just useful for viewing the results in a rather simplified way which can berepresented as a table.
B.17.1 Usage
The usage of regquery is
stilts <stilts-flags> regquery query=<value> regurl=<url-value>soapout=<out-file> ocmd=<cmds>omode=out|meta|stats|count|checksum|cgi|discard|topcat|samp|plastic|tosql|guiout=<out-table> ofmt=<out-format>
If you don't have the stilts script installed, write "java -jar stilts.jar" instead of "stilts" -see Section 3. The available <stilts-flags> are listed in Section 2.1. For programmaticinvocation, the Task class for this command is uk.ac.starlink.ttools.task.RegQuery.
SUN/256 455
Parameter values are assigned on the command line as explained in Section 2.3. They are asfollows:
ocmd = <cmds> (ProcessingStep[])Specifies processing to be performed on the output table, after all other processing has takenplace. The value of this parameter is one or more of the filter commands described in Section6.1. If more than one is given, they must be separated by semicolon characters (";"). Thisparameter can be repeated multiple times on the same command line to build up a list ofprocessing steps. The sequence of commands given in this way defines the processing pipelinewhich is performed on the table.
Commands may alteratively be supplied in an external file, by using the indirection character'@'. Thus a value of "@filename" causes the file filename to be read for a list of filtercommands to execute. The commands in the file may be separated by newline charactersand/or semicolons, and lines which are blank or which start with a '#' character are ignored.
ofmt = <out-format> (String)Specifies the format in which the output table will be written (one of the ones in Section 5.1.2 -matching is case-insensitive and you can use just the first few letters). If it has the specialvalue "(auto)" (the default), then the output filename will be examined to try to guess whatsort of file is required usually by looking at the extension. If it's not obvious from the filenamewhat output format is intended, an error will result.
This parameter must only be given if omode has its default value of "out".
[Default: (auto)]
omode = out|meta|stats|count|checksum|cgi|discard|topcat|samp|plastic|tosql|gui
(ProcessingMode)The mode in which the result table will be output. The default mode is out, which means thatthe result will be written as a new table to disk or elsewhere, as determined by the out andofmt parameters. However, there are other possibilities, which correspond to uses to which atable can be put other than outputting it, such as displaying metadata, calculating statistics, orpopulating a table in an SQL database. For some values of this parameter, additionalparameters (<mode-args>) are required to determine the exact behaviour.
Possible values are
• out
• meta
• stats
• count
• checksum
• cgi
• discard
• topcat
• samp
• plastic
• tosql
• gui
Use the help=omode flag or see Section 6.4 for more information.
[Default: out]
out = <out-table> (TableConsumer)The location of the output table. This is usually a filename to write to. If it is equal to thespecial value "-" (the default) the output table will be written to standard output.
This parameter must only be given if omode has its default value of "out".
SUN/256 456
[Default: -]
query = <value> (String)Text of an ADQL WHERE clause targeted at the VOResource 1.0 schema defining whichresource records you wish to retrieve from the registry. Some examples are:
• @xsi:type like '%Organisation%'
• capability/@standardID = 'ivo://ivoa.net/std/ConeSearch' and title like
'%SDSS%'
• curation/publisher like 'CDS%' and title like '%galax%'
A full description of ADQL syntax and of the VOResource schema is well beyond the scope ofthis documentation, but in general you want to use <field-name> like '<value>' where '%' isa wildcard character. Logical operators and and or and parentheses can be used to group andcombine expressions. To work out the various <field-name>s you need to look at theVOResource 1.0 schema.
regurl = <url-value> (URL)The URL of a SOAP endpoint which provides a VOResource1.0 IVOA registry service. Someknown suitable registry endpoints at time of writing are
• http://registry.astrogrid.org/astrogrid-registry/services/RegistryQueryv1_0
• http://registry.euro-vo.org/services/RegistrySearch
• http://vao.stsci.edu/directory/ristandardservice.asmx
[Default:http://registry.astrogrid.org/astrogrid-registry/services/RegistryQueryv1_0]
soapout = <out-file> (uk.ac.starlink.util.Destination)If set to a non-null value, this gives the destination for the text of the request and responseSOAP messages. The special value "-" indicates standard output.
B.17.2 Examples
Here are some examples of regquery:
stilts regquery query="title like '%IRAS%'" ofmt=ascii out=iras.txt
Retrieves all the records in the registry whose title field contain the string "IRAS". The '%'characters function as wildcards for the ADQL like operator. The output is written to a localASCII table which can be examined later.
stilts regquery query="capability/@standardID = 'ivo://ivoa.net/std/ConeSearch'and curation/@publisher like '%astrogrid%'"
omode=count
Searches for all resources which offer a cone search service and are published by AstroGrid. Inthis case the records are not stored, but the omode=count output mode counts the rows. Thistherefore tells you how many AstroGrid cone search services are in the registry.
stilts regquery query="capability/@standardID = 'ivo://ivoa.net/std/SSA'"ocmd="keepcols 'identifier accessUrl'"ofmt=ascii out=-
Queries the registry for all Simple Spectral Access services. The keepcols filter takes theresult and throws away all the columns except for identifier and accessUrl, and these arewritten to the terminal int ASCII format.
SUN/256 457
B.18 server: Runs an HTTP server to perform STILTS commands
server runs an HTTP server which makes various elements of STILTS functionality available asHTTP services, so that they can be run by local or remote clients making HTTP requests rather thanfrom the more usual command line interface.
When you run server it will start up a server which runs until it is interrupted, and write to standardoutput the base URL at which it can be accessed, for instance "http://localhost:2112/stilts/".If you point your browser here you will see some examples (hyperlinks to service requests) of howto use the server.
See Section 11 for more discussion of the server functionality available.
Note: The server command and associated servlet code are somewhat experimental. If you haverequirements which are not currently provided, please contact the author for discussion.
B.18.1 Usage
The usage of server is
stilts <stilts-flags> server port=<int-value> basepath=<value>tasks=<task-name> ...tablefactory=file|dirs:...|locator:...
If you don't have the stilts script installed, write "java -jar stilts.jar" instead of "stilts" -see Section 3. The available <stilts-flags> are listed in Section 2.1. For programmaticinvocation, the Task class for this command is uk.ac.starlink.ttools.task.StiltsServer.
Parameter values are assigned on the command line as explained in Section 2.3. They are asfollows:
basepath = <value> (String)Base path on the server at which request URLs are rooted. The default is /stilts, whichmeans that for instance requests to execute task plot2d should be directed to the URLhttp://host:portnum/stilts/task/plot2d?name=value&name=value...
[Default: /stilts]
port = <int-value> (Integer)Port number on which the server should run.
[Default: 2112]
tablefactory = file|dirs:...|locator:... (StarTableFactory)This parameter determines how input table names (typically the in parameter of tableprocessing commands) are used to acquire references to actual table data. The defaultbehaviour is for input table names to be treated as filenames, in conjunction with some filetype parameter. While this is usually sensible for local use, in server situations it may beinappropriate, since you don't want external users to have read access to your entire filesystem.
This parameter gives options for alternative ways of mapping table names to table data items.The currently available options are:
• file: default behaviour - names are treated as filenames• dirs:<dir>:<dir>:...: following the "dirs:" prefix a list of directories is specified
which will be searched for the file named. Note that the directory separator characterdiffers between operating systems; it is a colon (":") for Unix-like OSs and a semi-colon(";") for MS Windows. If a given name is identical to the path-less filename in one of the<dir> directories, that file is used as the referenced table. File type information is ignored
SUN/256 458

in this case, so the files must be one of the types which STILTS can autodetect, currentlyFITS or VOTable (FITS is more efficient). By using this option, clients can be restrictedto using a fixed set of tables in a restricted part of the server's file system.
• locator:<class-name>: the <class-name> must be the name of a Java class on theclasspath which implements the interface uk.ac.starlink.ttools.task.TableLocator
and which has a no-arg constructor. An instance of this class will be used to resolvenames to tables.
The usage and functionality of this parameter is experimental, and may change significantly infuture releases.
[Default: file]
tasks = <task-name> ... (String)Gives a space-separated list of tasks which will be provided by the relevant endpoints of therunning server. If the value is null then all tasks will be available. However, some tasks don'tmake a lot of sense to run from the server, so the default value is a somewhat restricted list. Ifthe server is being exposed to external users, you might also want to reduce the list for securityreasons. If you don't want any tasks made available, for instance if you want to run the plotservice only, you can set this to the empty string.
[Default: calc cdsskymatch cone coneskymatch datalinklint pixfoot pixsample
plot2d plot3d plothist regquery sqlclient sqlskymatch sqlupdate taplint
tapquery tapresume tapskymatch tcat tcatn tcopy tcube tjoin tloop tmatch1
tmatch2 tmatchn tmulti tmultin tpipe tskymap tskymatch2 votcopy votlint
plot2plane plot2sky plot2cube plot2sphere plot2time]
B.18.2 Examples
Here are some examples of running the server command:
stilts server
Starts a server on the default port until it is interrupted. Most tasks are available in servermode. A message will be printed on standard output indicating the base URL at which it maybe accessed, for instance "http://localhost:2112/stilts/".
stilts server port=2100 basepath=tableserv
Starts a server running on port 2100 with a given URL. The URL at which, for instance, theplot2d task can be executed will be "http:// host :2100/tableserv/task/plot2d"
stilts server tasks="plot2d plothist"
Starts a server with a restricted list of tasks available. Only the plotting tasks plot2d andplothist will be available for execution by clients.
B.19 sqlclient: Executes SQL statements
sqlclient is a simple command-line client for use with SQL databases. One or more SQLstatements can be supplied using the sql parameter. The result of each statement may be one ormore update counts (for update-type statements) or tables (for query-type statements). Tables willbe written to standard output in a format given by the ofmt parameter. Update results and timinginformation will be written to standard error.
SUN/256 459
In most cases, you will find life easier if you use either the database's own command-line or GUIclient, or, if you require STILTS-type format conversion or post-processing, a jdbc:-format URLfor the in parameter of the tpipe or tcopy commands (see Section 3.4 for more explanation of thelatter). However, this command enables you to submit multiple queries over the same JDBCconnection, including ones which do not generate a tabular result. It may be useful if acommand-line client is not available to you for the database you are using.
This command can only be used if you have access to an SQL database via JDBC. The details ofhow to configure a JDBC connection to a database are discussed in Section 3.4 - obviously you willneed a database to connect to and appropriate permissions on it as well as the relevant drivers.
This command is experimental, and it may be enhanced, renamed or withdrawn in future releases.
B.19.1 Usage
The usage of sqlclient is
stilts <stilts-flags> sqlclient db=<jdbc-url> user=<value> password=<value>sql=<sql> ofmt=<out-format>
If you don't have the stilts script installed, write "java -jar stilts.jar" instead of "stilts" -see Section 3. The available <stilts-flags> are listed in Section 2.1. For programmaticinvocation, the Task class for this command is uk.ac.starlink.ttools.task.SqlClient.
Parameter values are assigned on the command line as explained in Section 2.3. They are asfollows:
db = <jdbc-url> (Connection)URL which defines a connection to a database. This has the formjdbc:<subprotocol>:<subname> - the details are database- and driver-dependent. ConsultSun's JDBC documentation and that for the particular JDBC driver you are using for details.Note that the relevant driver class will need to be on your classpath and referenced in thejdbc.drivers system property as well for the connection to be made.
ofmt = <out-format> (String)Specifies the format in which the output table will be written (one of the ones in Section 5.1.2 -matching is case-insensitive and you can use just the first few letters). If it has the specialvalue "(auto)" (the default), then the output filename will be examined to try to guess whatsort of file is required usually by looking at the extension. If it's not obvious from the filenamewhat output format is intended, an error will result.
[Default: text]
password = <value> (String)Password for logging in to SQL database.
sql = <sql> (String)Text of an SQL statement for execution. This parameter may be repeated, or statements maybe separated by semicolon (";") characters.
user = <value> (String)User name for logging in to SQL database. Defaults to the current username.
[Default: mbt]
B.19.2 Examples
SUN/256 460
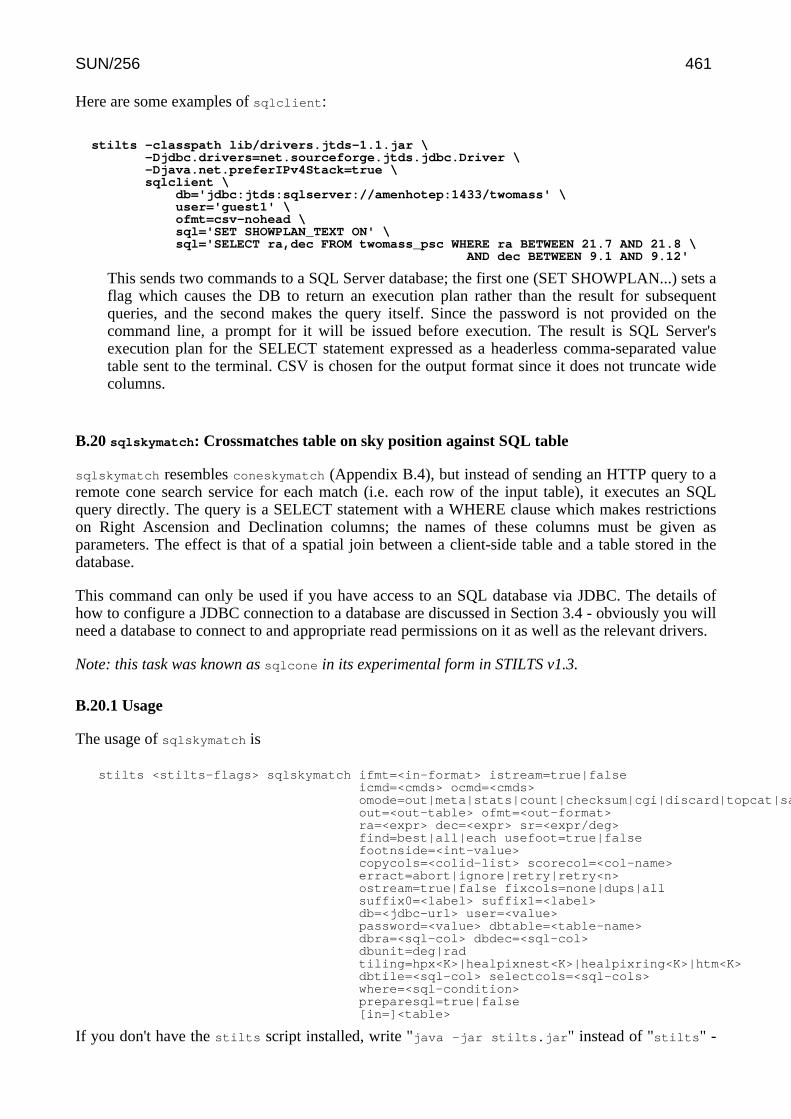
Here are some examples of sqlclient:
stilts -classpath lib/drivers.jtds-1.1.jar \-Djdbc.drivers=net.sourceforge.jtds.jdbc.Driver \-Djava.net.preferIPv4Stack=true \sqlclient \
db='jdbc:jtds:sqlserver://amenhotep:1433/twomass' \user='guest1' \ofmt=csv-nohead \sql='SET SHOWPLAN_TEXT ON' \sql='SELECT ra,dec FROM twomass_psc WHERE ra BETWEEN 21.7 AND 21.8 \
AND dec BETWEEN 9.1 AND 9.12'
This sends two commands to a SQL Server database; the first one (SET SHOWPLAN...) sets aflag which causes the DB to return an execution plan rather than the result for subsequentqueries, and the second makes the query itself. Since the password is not provided on thecommand line, a prompt for it will be issued before execution. The result is SQL Server'sexecution plan for the SELECT statement expressed as a headerless comma-separated valuetable sent to the terminal. CSV is chosen for the output format since it does not truncate widecolumns.
B.20 sqlskymatch: Crossmatches table on sky position against SQL table
sqlskymatch resembles coneskymatch (Appendix B.4), but instead of sending an HTTP query to aremote cone search service for each match (i.e. each row of the input table), it executes an SQLquery directly. The query is a SELECT statement with a WHERE clause which makes restrictionson Right Ascension and Declination columns; the names of these columns must be given asparameters. The effect is that of a spatial join between a client-side table and a table stored in thedatabase.
This command can only be used if you have access to an SQL database via JDBC. The details ofhow to configure a JDBC connection to a database are discussed in Section 3.4 - obviously you willneed a database to connect to and appropriate read permissions on it as well as the relevant drivers.
Note: this task was known as sqlcone in its experimental form in STILTS v1.3.
B.20.1 Usage
The usage of sqlskymatch is
stilts <stilts-flags> sqlskymatch ifmt=<in-format> istream=true|falseicmd=<cmds> ocmd=<cmds>omode=out|meta|stats|count|checksum|cgi|discard|topcat|samp|plastic|tosql|guiout=<out-table> ofmt=<out-format>ra=<expr> dec=<expr> sr=<expr/deg>find=best|all|each usefoot=true|falsefootnside=<int-value>copycols=<colid-list> scorecol=<col-name>erract=abort|ignore|retry|retry<n>ostream=true|false fixcols=none|dups|allsuffix0=<label> suffix1=<label>db=<jdbc-url> user=<value>password=<value> dbtable=<table-name>dbra=<sql-col> dbdec=<sql-col>dbunit=deg|radtiling=hpx<K>|healpixnest<K>|healpixring<K>|htm<K>dbtile=<sql-col> selectcols=<sql-cols>where=<sql-condition>preparesql=true|false[in=]<table>
If you don't have the stilts script installed, write "java -jar stilts.jar" instead of "stilts" -
SUN/256 461
see Section 3. The available <stilts-flags> are listed in Section 2.1. For programmaticinvocation, the Task class for this command is uk.ac.starlink.ttools.task.SqlCone.
Parameter values are assigned on the command line as explained in Section 2.3. They are asfollows:
copycols = <colid-list> (String)List of columns from the input table which are to be copied to the output table. Each columnidentified here will be prepended to the columns of the combined output table, and its value foreach row taken from the input table row which provided the parameters of the query whichproduced it. See Section 6.3 for list syntax. The default setting is "*", which means that allcolumns from the input table are included in the output.
[Default: *]
db = <jdbc-url> (Connection)URL which defines a connection to a database. This has the formjdbc:<subprotocol>:<subname> - the details are database- and driver-dependent. ConsultSun's JDBC documentation and that for the particular JDBC driver you are using for details.Note that the relevant driver class will need to be on your classpath and referenced in thejdbc.drivers system property as well for the connection to be made.
dbdec = <sql-col> (String)The name of a column in the SQL database table dbtable which gives the declination. Unitsare given by dbunit.
dbra = <sql-col> (String)The name of a column in the SQL database table dbtable which gives the right ascension.Units are given by dbunit.
dbtable = <table-name> (String)The name of the table in the SQL database which provides the remote data.
dbtile = <sql-col> (String)The name of a column in the SQL database table dbtable which contains a sky tiling pixelindex. The tiling scheme is given by the tiling parameter. Use of a tiling column is optional,but if present (and if the column is indexed in the database table) it may serve to speed upsearches. Set to null if the database table contains no tiling column or if you do not wish to useone.
dbunit = deg|rad (AngleUnits)Units of the right ascension and declination columns identified in the database table. May beeither deg[rees] (the default) or rad[ians].
[Default: deg]
dec = <expr> (String)Declination in degrees in the coordinate system for the position of each row of the input table.This may simply be a column name, or it may be an algebraic expression calculated fromcolumns as explained in Section 10. If left blank, an attempt is made to guess from UCDs,column names and unit annotations what expression to use.
erract = abort|ignore|retry|retry<n> (ConeErrorPolicy)Determines what will happen if any of the individual cone search requests fails. By default thetask aborts. That may be the best thing to do, but for unreliable or poorly implemented servicesyou may find that some searches fail and others succeed so it can be best to continue operationin the face of a few failures. The options are:
• abort: Failure of any query terminates the task.• ignore: Failure of a query is treated the same as a query which returns no rows.• retry: Failed queries are retried until they succeed; an increasing delay is introduced for
SUN/256 462
each failure. Use with care - if the failure is for some good, or at least reproducible reasonthis could prevent the task from ever completing.
• retry<n>: Failed queries are retried at most a fixed number <n> of times; an increasingdelay is introduced for each failure. If failures persist the task terminates.
[Default: abort]
find = best|all|each (String)Determines which matches are retained.
• best: Only the matching query table row closest to the input table row will be output.Input table rows with no matches will be omitted. (Note this corresponds to the best1
option in the pair matching commands, and best1 is a permitted alias).• all: All query table rows which match the input table row will be output. Input table rows
with no matches will be omitted.• each: There will be one output table row for each input table row. If matches are found,
the closest one from the query table will be output, and in the case of no matches, thequery table columns will be blank.
[Default: all]
fixcols = none|dups|all (Fixer)Determines how input columns are renamed before use in the output table. The choices are:
• none: columns are not renamed• dups: columns which would otherwise have duplicate names in the output will be
renamed to indicate which table they came from• all: all columns will be renamed to indicate which table they came from
If columns are renamed, the new ones are determined by suffix* parameters.
[Default: dups]
footnside = <int-value> (Integer)Determines the HEALPix Nside parameter for use with the MOC footprint service. This tuningparameter determines the resolution of the footprint if available. Larger values give betterresolution, hence a better chance of avoiding unnecessary queries, but processing them takeslonger and retrieving and storing them is more expensive.
The value must be a power of 2, and at the time of writing, the MOC service will not supplyfootprints at resolutions greater than nside=512, so it should be <=512.
Only used if usefoot=true.
icmd = <cmds> (ProcessingStep[])Specifies processing to be performed on the input table as specified by parameter in, beforeany other processing has taken place. The value of this parameter is one or more of the filtercommands described in Section 6.1. If more than one is given, they must be separated bysemicolon characters (";"). This parameter can be repeated multiple times on the samecommand line to build up a list of processing steps. The sequence of commands given in thisway defines the processing pipeline which is performed on the table.
Commands may alteratively be supplied in an external file, by using the indirection character'@'. Thus a value of "@filename" causes the file filename to be read for a list of filtercommands to execute. The commands in the file may be separated by newline charactersand/or semicolons, and lines which are blank or which start with a '#' character are ignored.
ifmt = <in-format> (String)Specifies the format of the input table as specified by parameter in. The known formats arelisted in Section 5.1.1. This flag can be used if you know what format your table is in. If it hasthe special value (auto) (the default), then an attempt will be made to detect the format of thetable automatically. This cannot always be done correctly however, in which case the program
SUN/256 463
will exit with an error explaining which formats were attempted. This parameter is ignored forscheme-specified tables.
[Default: (auto)]
in = <table> (StarTable)The location of the input table. This may take one of the following forms:
• A filename.• A URL.• The special value "-", meaning standard input. In this case the input format must be given
explicitly using the ifmt parameter. Note that not all formats can be streamed in this way.• A scheme specification of the form :<scheme-name>:<scheme-args>.• A system command line with either a "<" character at the start, or a "|" character at the
end ("<syscmd" or "syscmd|"). This executes the given pipeline and reads from itsstandard output. This will probably only work on unix-like systems.
In any case, compressed data in one of the supported compression formats (gzip, Unixcompress or bzip2) will be decompressed transparently.
istream = true|false (Boolean)If set true, the input table specified by the in parameter will be read as a stream. It is necessaryto give the ifmt parameter in this case. Depending on the required operations and processingmode, this may cause the read to fail (sometimes it is necessary to read the table more thanonce). It is not normally necessary to set this flag; in most cases the data will be streamedautomatically if that is the best thing to do. However it can sometimes result in less resourceusage when processing large files in certain formats (such as VOTable). This parameter isignored for scheme-specified tables.
[Default: false]
ocmd = <cmds> (ProcessingStep[])Specifies processing to be performed on the output table, after all other processing has takenplace. The value of this parameter is one or more of the filter commands described in Section6.1. If more than one is given, they must be separated by semicolon characters (";"). Thisparameter can be repeated multiple times on the same command line to build up a list ofprocessing steps. The sequence of commands given in this way defines the processing pipelinewhich is performed on the table.
Commands may alteratively be supplied in an external file, by using the indirection character'@'. Thus a value of "@filename" causes the file filename to be read for a list of filtercommands to execute. The commands in the file may be separated by newline charactersand/or semicolons, and lines which are blank or which start with a '#' character are ignored.
ofmt = <out-format> (String)Specifies the format in which the output table will be written (one of the ones in Section 5.1.2 -matching is case-insensitive and you can use just the first few letters). If it has the specialvalue "(auto)" (the default), then the output filename will be examined to try to guess whatsort of file is required usually by looking at the extension. If it's not obvious from the filenamewhat output format is intended, an error will result.
This parameter must only be given if omode has its default value of "out".
[Default: (auto)]
omode = out|meta|stats|count|checksum|cgi|discard|topcat|samp|plastic|tosql|gui
(ProcessingMode)The mode in which the result table will be output. The default mode is out, which means thatthe result will be written as a new table to disk or elsewhere, as determined by the out andofmt parameters. However, there are other possibilities, which correspond to uses to which atable can be put other than outputting it, such as displaying metadata, calculating statistics, orpopulating a table in an SQL database. For some values of this parameter, additional
SUN/256 464

parameters (<mode-args>) are required to determine the exact behaviour.
Possible values are
• out
• meta
• stats
• count
• checksum
• cgi
• discard
• topcat
• samp
• plastic
• tosql
• gui
Use the help=omode flag or see Section 6.4 for more information.
[Default: out]
ostream = true|false (Boolean)If set true, this will cause the operation to stream on output, so that the output table is built upas the results are obtained from the cone search service. The disadvantage of this is that someoutput modes and formats need multiple passes through the data to work, so depending on theoutput destination, the operation may fail if this is set. Use with care (or be prepared for theoperation to fail).
[Default: false]
out = <out-table> (TableConsumer)The location of the output table. This is usually a filename to write to. If it is equal to thespecial value "-" (the default) the output table will be written to standard output.
This parameter must only be given if omode has its default value of "out".
[Default: -]
password = <value> (String)Password for logging in to SQL database.
preparesql = true|false (Boolean)If true, the JDBC connection will use PreparedStatements for the SQL SELECTs otherwise itwill use simple Statements. This is a tuning parameter and affects only performance. On somedatabase/driver combinations it's a lot faster set false (the default); on others it may be faster,who knows?
[Default: false]
ra = <expr> (String)Right ascension in degrees in the coordinate system for the position of each row of the inputtable. This may simply be a column name, or it may be an algebraic expression calculatedfrom columns as explained in Section 10. If left blank, an attempt is made to guess fromUCDs, column names and unit annotations what expression to use.
scorecol = <col-name> (String)Gives the name of a column in the output table to contain the distance between the requestedcentral position and the actual position of the returned row. The distance returned is an angulardistance in degrees. If a null value is chosen, no distance column will appear in the outputtable.
[Default: Separation]
selectcols = <sql-cols> (String)
SUN/256 465

An SQL expression for the list of columns to be selected from the table in the database. Avalue of "*" retrieves all columns.
[Default: *]
sr = <expr/deg> (String)Expression which evaluates to the search radius in degrees for the request at each row of theinput table. This will often be a constant numerical value, but may be the name or ID of acolumn in the input table, or a function involving one.
suffix0 = <label> (String)If the fixcols parameter is set so that input columns are renamed for insertion into the outputtable, this parameter determines how the renaming is done. It gives a suffix which is appendedto all renamed columns from the input table.
[Default: _0]
suffix1 = <label> (String)If the fixcols parameter is set so that input columns are renamed for insertion into the outputtable, this parameter determines how the renaming is done. It gives a suffix which is appendedto all renamed columns from the cone result table.
[Default: _1]
tiling = hpx<K>|healpixnest<K>|healpixring<K>|htm<K> (SkyTiling)Describes the sky tiling scheme that is in use. One of the following values may be used:
• hpxK: alias for healpixnestK• healpixnestK: HEALPix using the Nest scheme at order K• healpixringK: HEALPix using the Ring scheme at order K• htmK: Hierarchical Triangular Mesh at level K
So for instance hpx5 or healpixnest5 would both indicate the HEALPix NEST tiling schemeat order 5.
At level K, there are 12*4^K HEALPix pixels, or 8*4^K HTM pixels on the sky. Moreinformation about these tiling schemes can be found at the HEALPix and HTM web sites.
usefoot = true|false (Boolean)Determines whether an attempt will be made to restrict searches in accordance with availablefootprint information. If this is set true, then before any of the per-row queries are performed,an attempt may be made to acquire footprint information about the servce. If such informationcan be obtained, then queries which fall outside the footprint, and hence which are known toyield no results, are skipped. This can speed up the search considerably.
Currently, the only footprints available are those provided by the CDS MOC (Multi-OrderCoverage map) service, which covers VizieR and a few other cone search services.
[Default: true]
user = <value> (String)User name for logging in to SQL database. Defaults to the current username.
[Default: mbt]
where = <sql-condition> (String)An SQL expression further limiting the rows to be selected from the database. This will becombined with the constraints on position implied by the cone search centres and radii. Thevalue of this parameter should just be a condition, it should not contain the WHERE keyword. Anull value indicates no additional criteria.
B.20.2 Examples
SUN/256 466
Here are some examples of sqlskymatch:
stilts -classpath lib/drivers/mysql-connector-java.jar \-Djdbc.drivers=com.mysql.jdbc.Driversqlskymatch in=messier.xml ra=RA dec=DEC sr=0.05 \
db='jdbc:mysql://localhost/ASTRO1' user=mbt \dbtable=FIRST dbra=_RA2000 dbdec=_DE2000 \out=matches.xml
This performs a series of SELECT statements on the table FIRST in the local MySQL databaseASTRO1 to identify database objects in the region of each object represented in the VOTablemessier.xml. The result, a join between the Messier and FIRST tables, is output as a VOTablecalled matches.xml. In this case a password has not been supplied on the command line, so ifone is required it will be prompted for on the console.
B.21 sqlupdate: Updates values in an SQL table
sqlupdate updates values in an existing table in an SQL database. The rows to update are specified,as a normal SELECT statement, using the select parameter. Each column to update, and the valueto write to it, are given using the assign parameter.
Why not just use the database's own UPDATE statement? In most cases, that would be a muchbetter idea. However, using sqlupdate you can write values using STILTS's expression language(Section 10), and hence take advantage of its various functions, without having to embed them intothe database. SQL column names can be used as variables in these expressions, in the same waythat table column names are used as variables in other commands such as tpipe.
This command can only be used if you have access to an SQL database via JDBC. The details ofhow to configure a JDBC connection to a database are discussed in Section 3.4 - obviously you willneed a database to connect to and appropriate write permissions on it as well as the relevant drivers.
This is a somewhat specialised command, and several (database/driver-specific) things can gowrong with it. If you do not have a fairly good understanding of the database with which you areusing it then you may run into problems (but then you'd be unlikely to have the permissions to dothe updates in any case).
B.21.1 Usage
The usage of sqlupdate is
stilts <stilts-flags> sqlupdate db=<jdbc-url> user=<value> password=<value>select=<select-stmt> assign=<col>=<expr>progress=true|false
If you don't have the stilts script installed, write "java -jar stilts.jar" instead of "stilts" -see Section 3. The available <stilts-flags> are listed in Section 2.1. For programmaticinvocation, the Task class for this command is uk.ac.starlink.ttools.task.SqlUpdate.
Parameter values are assigned on the command line as explained in Section 2.3. They are asfollows:
assign = <col>=<expr> (Assignment[])Assigns new values for a given column. The assignment is made in the form<colname>=<expr> where <colname> is the name of a column in the SQL table and <expr> isthe text of an expression using STILTS's expression language, as described in Section 10. SQLtable column names or $ID identifiers may be used as variables in the usual way.
SUN/256 467
This parameter may be supplied more than once to effect multiple assignments, or multipleassignments may be made by separating them with semicolons in the value of this parameter.
db = <jdbc-url> (Connection)URL which defines a connection to a database. This has the formjdbc:<subprotocol>:<subname> - the details are database- and driver-dependent. ConsultSun's JDBC documentation and that for the particular JDBC driver you are using for details.Note that the relevant driver class will need to be on your classpath and referenced in thejdbc.drivers system property as well for the connection to be made.
password = <value> (String)Password for logging in to SQL database.
progress = true|false (Boolean)If true, a spinner will be drawn on standard error which shows how many rows have beenupdated so far.
[Default: true]
select = <select-stmt> (String)Gives the full text (including "SELECT") of the SELECT statement to identify which rowsundergo updates.
user = <value> (String)User name for logging in to SQL database. Defaults to the current username.
[Default: mbt]
B.21.2 Examples
Here are some examples of sqlupdate:
stilts -classpath lib/drivers/mysql-connector-java.jar \-Djdbc.drivers=com.mysql.jdbc.Driver \sqlupdate db='jdbc:mysql://localhost/RADIO' user=rootselect='SELECT * from FIRST" \assign='HTMID=htmIndex(20,POS_EQ_RA,POS_EQ_DEC)'
Fills in the HTMID column of a table called FIRST in the local MySQL database RADIO,using HTM pixel indices based on the existing right ascension and declination columns in thattable. The HTMID column must exist prior to executing this command.
B.22 taplint: Tests TAP services
taplint runs a series of tests on a Table Access Protocol (TAP) service and reports the results.Unlike most of the other tools in this package it is not likely to be of use to normal users; itsintended use is for people developing or operating TAP services to assess their services, perhapswith a view to improving compliance.
Testing takes place in a number of stages; it is possible to choose which stages are run in by usingthe stages parameter. The default output (format=text) is line-based text to standard output, andeach report line is of the (fairly greppable) form:
T-SSS-MMMMxN aaaaa...
where the parts have the following meanings:
• T: Report type, one of E(rror), W(arning), I(nfo), S(ummary), F(ailure). See the documentationof the report parameter for further description of what these mean. The report parameter can
SUN/256 468
be used to suppress some of these; only E indicates actual service compliance errors, butincluding the others may make it easier to see what's going on.
• SSS: Stage abbreviation, as used in the stages parameter. The stages parameter can be used toselect which stages are run.
• MMMM: Message label, which is always the same for messages generated by the same test, isusually different for messages generated by different tests, and may be somewhat mnemonic.
• x: Continuation indicator, either "-" or "+". In most cases it is "-", indicating the first line of amessage, but multi-line messages (rare) use "-" for the first line and "+" for any continuationlines.
• N: Sequence number, which is 1 for the first time message T-SSS-MMMM is reported, andincreases by one for each subsequent appearance. After a certain maximum (determined by themaxrepeat parameter) additional reports with the same code are no longer output individually,but a summary of the number of reports so discarded is written at the end of the section withthe character "x" instead of the sequence number. This behaviour prevents the output beingswamped by multiple reports of the same issue. If the maxrepeat parameter is increased above9, more than one digit will be used here (so e.g. for maxrepeat=999, the format would be NNN
not N).• aaaaa...: Message text, a free text description of what is being reported.
If you don't like that format, others may be selected using the format parameter, which currentlyalso supports JSON. For more flexible interaction with the output you can invoke taplint
programmatically and supply your own OutputReporter instance.
TAP is a complicated beast, referencing many standards (including TAP, UWS, VODataService,ADQL, VOResource, VOSI, TAPRegExt, DALI, ObsCore, ObsLocTAP, EPN-TAP, VOTable,UCD, VOUnits, SSO, SoftID, HTTP, RDFa Lite), and it is hard to write a validator which iscomprehensive, especially one which can provide useful output for services with a range ofcompliance levels. This tool tries to make a wide range of tests, but does not claim to becomprehensive. An idea of what tests it does perform can be gained from the stages listed in thedescription of the stages parameter. It does make a fairly good job of checking that declaredmetadata is consistent and matches the data actually returned from queries, it tests job submission inmost of the various ways permitted by the TAP standard, and it checks all returned VOTables byeffectively running them through votlint. Things it does not test much include complex ADQLqueries, coordinate/STC-related data types, queries in non-ADQL languages, and serviceregistration.
HTTP connections made by this validator are flagged in the User-Agent field with the token"(IVOA-test)".
B.22.1 Usage
The usage of taplint is
stilts <stilts-flags> taplint stages=[+/-]XXX ... maxtable=<int-value>format=text|json report=[EWISF]+maxrepeat=<int-value> truncate=<int-value>debug=true|false interface=tap1.0|tap1.1|capsyncurl=<url-value> asyncurl=<url-value>tablesurl=<url-value>capabilitiesurl=<url-value>availabilityurl=<url-value>examplesurl=<url-value>[tapurl=]<url-value>
If you don't have the stilts script installed, write "java -jar stilts.jar" instead of "stilts" -see Section 3. The available <stilts-flags> are listed in Section 2.1. For programmaticinvocation, the Task class for this command is uk.ac.starlink.ttools.task.TapLint.
SUN/256 469
Parameter values are assigned on the command line as explained in Section 2.3. They are asfollows:
asyncurl = <url-value> (URL)Sets the URL to use for the async endpoint of the TAP service. The default value would be<tapurl>/async, but it may be influenced by the chosen interface value, and it can befurther overridden by setting this value.
availabilityurl = <url-value> (URL)Sets the URL to use for the availability endpoint of the TAP service. The default value wouldbe <tapurl>/availability, but it may be influenced by the chosen interface value, and itcan be further overridden by setting this value.
capabilitiesurl = <url-value> (URL)Sets the URL to use for the capabilities endpoint of the TAP service. The default value wouldbe <tapurl>/capabilities, but it may be influenced by the chosen interface value, and itcan be further overridden by setting this value.
debug = true|false (Boolean)If true, debugging output including stack traces will be output along with the normal validationmessages.
[Default: false]
examplesurl = <url-value> (URL)Sets the URL to use for the examples endpoint of the TAP service. The default value would be<tapurl>/examples, but it may be influenced by the chosen interface value, and it can befurther overridden by setting this value.
format = text|json (OutputReporter)Determines the format of the output. Possible values are text, json.
Note not all of the other parameters may be applicable to all output formats.
[Default: text]
interface = tap1.0|tap1.1|cap (String)Defines how the service endpoints and the version of the TAP protocol to use for queries isdetermined. This may take one of the following (case-insensitive) values:
• TAP1.0: The standard TAP endpoints are used, without examining the service'scapabilities document. The service is queried using version 1.0 of the TAP protocol.
• TAP1.1: The standard TAP endpoints are used, without examining the service'scapabilities document. The service is queried using version 1.1 of the TAP protocol.
• cap: The service's capabilities document is examined, and the endpoints listed there areused.
The capabilities document, if used, is read from tapurl/capabilities unless thecapabilitiesurl parameter is defined, in which case that is used.
The baseline value of all the TAP service endpoints (sync, async, tables, capabilities,examples) are determined by this parameter, but each of those endpoint values may beoverridden individually by other endpoint-specific parameters (syncurl, asyncurl, tablesurl,capabilitiesurl, availabilityurl, examplesurl)
For default (unauthenticated) access, the default value is usually suitable.
[Default: cap]
maxrepeat = <int-value> (Integer)Puts a limit on the number of times that a single message will be repeated. By setting this tosome reasonably small number, you can ensure that the output does not get cluttered up by
SUN/256 470
millions of repetitions of essentially the same error.
[Default: 9]
maxtable = <int-value> (Integer)Limits the number of tables from the service that will be tested. Currently, this only affectsstage MDQ. If the value is left blank (the default), or if it is larger than the number of tablesactually present in the service, it will have no effect.
report = [EWISF]+ (String)Letters indicating which message types should be listed. Each character of the string is one ofthe letters E, W, I, S, F with the following meanings:
• E: Error in operation or standard compliance of the service.• W: Warning that service behaviour is questionable, or contravenes a standard
recommendation, but is not in actual violation of the standard.• I: Information about progress, for instance details of queries made.• S: Summary of previous successful/unsuccessful reports.• F: Failure of the validator to perform some testing. The cause is either some error internal
to the validator, or some error or missing functionality in the service which has alreadybeen reported.
[Default: EWISF]
stages = [+/-]XXX ... (String[])Determines the validation stages which the validator will peform. Each stage is represented bya short code, as follows:
• TMV: Validate table metadata against XML schema• TME: Check content of tables metadata from /tables• TMS: Check content of tables metadata from TAP_SCHEMA• TMC: Compare table metadata from /tables and TAP_SCHEMA• UUC: Check column units and UCDs are legal• CPV: Validate capabilities against XML schema• CAP: Check TAP and TAPRegExt content of capabilities document• AVV: Validate availability against XML schema• QGE: Make ADQL queries in sync GET mode• QPO: Make ADQL queries in sync POST mode• QAS: Make ADQL queries in async mode• UWS: Test asynchronous UWS/TAP behaviour• MDQ: Check table query result columns against declared metadata• OBS: Test implementation of ObsCore Data Model• LOC: Test implementation of ObsLocTAP Data Model• EPN: Test implementation of EPN-TAP tables (off)• UPL: Make queries with table uploads• EXA: Check content of examples document
This parameter can specify what stages to run in the following ways:
• if left blank, the default list of stages (which is most or all of them) will be run• if the value is a space-separated list of three-letter codes, it lists the stages that will be run• if the value is a space separated list of three-letter codes preceded by a "+" or "-"
character, the named stages will be removed or added to the default list
So "TME CAP" will run only Table Metadata and Capability stages, while "-EXA -UPL" will runall the default stages apart from Examples and Upload. The order in which stages are listed isnot significant.
Note that removing some stages may affect the operation of others; for instance table metadatais acquired from the metadata stages, and avoiding those will mean that later stages which use
SUN/256 471
the table metadata to pose queries will not be able to do so with knowledge of the databaseschema.
syncurl = <url-value> (URL)Sets the URL to use for the sync endpoint of the TAP service. The default value would be<tapurl>/sync, but it may be influenced by the chosen interface value, and it can be furtheroverridden by setting this value.
tablesurl = <url-value> (URL)Sets the URL to use for the tables endpoint of the TAP service. The default value would be<tapurl>/tables, but it may be influenced by the chosen interface value, and it can befurther overridden by setting this value.
tapurl = <url-value> (URL)The base URL of a Table Access Protocol service. This is the bare URL without a trailing"/[a]sync".
In the usual case, the default values of the various endpoints (sync and async querysubmission, tables metadata, service-provided examples etc) use this URL as a parent andappend standard sub-paths.
In some cases however, determination of the endpoints is more complicated, as determined bythe interface parameter which may cause endpoints to be read from the capabilitiesdocument at tapurl/capabilities, and by other endpoint-specific parameters (syncurl,asyncurl, tablesurl, capabilitiesurl, availabilityurl, examplesurl) for fine tuning.
truncate = <int-value> (Integer)Limits the line length written to the output.
[Default: 640]
B.22.2 Examples
Here are some examples of taplint:
stilts taplint http://dc.g-vo.org/tap
Performs a default validation run against the TAP service based at the given URL.
stilts taplint tapurl=http://gaia.esac.esa.int/tap-server/tapexamplesurl=file://localhost/tmp/examples.xmlstages='TME CAP EXA'
Executes the EXAmples stage against the GACS TAP service at ESAC. Most of the serviceendpoints (tables, capabilities, availability etc) are found at their default locations relative tothe given tapurl. However, the Examples document is loaded instead from the local file at theURL that has been specified by the examplesurl parameter. This makes is possible to test anon-deployed examples document against a deployed TAP service. It may also be used ifcertain capabilities have been deployed at non-default locations to satisfy multiple securitymodels or for other reasons. You can play similar tricks with the other *url parameters likecapabilitiesurl and tablesurl, as listed in the documentation.
The TME (table metadata) and CAP (service capabilities) stages have been executed along withEXA, since taplint needs to pick up the metadata and capabilities in order to be able to do someof the checks on the examples it finds. If those stage names are not included in the stages
parameter, the output will include some messages noting that fact, and the tests will be lessrigorous.
stilts taplint tapurl=http://example.com/tap
SUN/256 472

report=EW stages='TMS UWS' truncate=80 maxrepeat=4
A validation run is done against the named TAP service. Only Error and Warning typemessages are output, only two validation stages are performed, lines are truncated to amaximum of 80 characters, and each message is repeated a maximum of 4 times. Aninvocation like this may be suitable if you find the default operation too verbose.
The output of this invocation might look like this:
Section TMS: Check content of tables metadata from TAP_SCHEMAE-TMS-CINT-1 Column principal in TAP_SCHEMA.columns has wrong type char not intE-TMS-CINT-2 Column std in TAP_SCHEMA.columns has wrong type char not intW-TMS-CLUN-1 Unused entry in TAP_SCHEMA.columns table: ivoa.obscore
Section UWS: Test asynchronous UWS/TAP behaviourE-UWS-GMIM-1 Incorrect Content-Type text/xml != text/plain for http://exampl....E-UWS-GMIM-2 Incorrect Content-Type text/xml != text/plain for http://exampl....E-UWS-GMIM-3 Incorrect Content-Type text/xml != text/plain for http://exampl....E-UWS-GMIM-4 Incorrect Content-Type text/xml != text/plain for http://exampl....E-UWS-GMIM-x (3 more)
Totals: Errors: 9; Warnings: 1
B.23 tapquery: Queries a Table Access Protocol server
tapquery can query remote databases using the Table Access Protocol (TAP) services bysubmitting Astronomical Data Query Language queries to them and retrieving the results. TAP andADQL are Virtual Observatory protocols.
Queries can be submitted in either synchronous or asynchronous mode, as determined by the sync
parameter. In asynchronous mode, if the query has not been deleted by the time the command exits(see the delete parameter), the result can be picked up at a later stage using the tapresume
command. Table uploads are supported, so it is possible (if the service supports this functionality),to upload a local table to the remote database, perform a query involving it, such as a join with aremote table of some sort, and receive the result. This powerful facility gives you crossmatchesbetween local and remote tables.
This command does not provide any facility for querying the service for either table or capabilitymetadata, so you will need to know about the service capabilities and database structure from someother source (possibly TOPCAT).
Note: this command has been introduced at STILTS version 2.3, at which time most available TAPservices are quite new and may not fully conform to the standards, and usage patterns are stillsettling down. For this reason you may find that some TAP services do not behave quite asexpected; it is also possible that in future versions the command behaviour or parameters willchange in line with changing service profiles or in the light of user experience.
B.23.1 Usage
The usage of tapquery is
stilts <stilts-flags> tapquery nupload=<count> ufmtN=<in-format>uploadN=<tableN> ucmdN=<cmds> ocmd=<cmds>omode=out|meta|stats|count|checksum|cgi|discard|topcat|samp|plastic|tosql|guiout=<out-table> ofmt=<out-format>upnameN=<adql-identifier> tapurl=<url-value>interface=tap1.0|tap1.1|capadql=<query-text> parse=true|falsesync=true|false maxrec=<nrow>destruction=<iso8601>
SUN/256 473
executionduration=<seconds>compress=true|falseupvotformat=TABLEDATA|BINARY|BINARY2language=<lang-name> poll=<millisec>progress=true|falsedelete=finished|never|always|now
If you don't have the stilts script installed, write "java -jar stilts.jar" instead of "stilts" -see Section 3. The available <stilts-flags> are listed in Section 2.1. For programmaticinvocation, the Task class for this command is uk.ac.starlink.ttools.task.TapQuerier.
Parameter values are assigned on the command line as explained in Section 2.3. They are asfollows:
adql = <query-text> (String)Astronomical Data Query Language string specifying the TAP query to execute. ADQL/Sresembles SQL, so this string will likely start with "SELECT".
compress = true|false (Boolean)If true, the service is requested to provide HTTP-level compression for the response stream(Accept-Encoding header is set to "gzip", see RFC 2616). This does not guarantee thatcompression will happen but if the service honours this request it may result in a smalleramount of network traffic at the expense of more processing on the server and client.
[Default: true]
delete = finished|never|always|now (DeleteMode)Determines under what circumstances the UWS job is to be deleted from the server when itsdata is no longer required. If it is not deleted, then the job is left on the TAP server and it canbe accessed via the normal UWS REST endpoints or using tapresume until it is destroyed bythe server.
Possible values:
• finished: delete only if the job finished, successfully or not• never: do not delete• always: delete on command exit• now: delete and return immediately
[Default: finished]
destruction = <iso8601> (String)Posts an updated value of the UWS DESTRUCTION parameter to the query job before itstarts. This only makes sense for asynchronous jobs (sync=false).
The supplied value should be an ISO-8601-like string, giving the new requested jobdestruction time. The service is not obliged to honour this request. See UWS v1.0, sec 2.2.3.3.
executionduration = <seconds> (Long)Posts an updated value of the UWS EXECUTIONDURATION parameter to the query jobbefore it starts. This only makes sense for asynchronous jobs (sync=false).
The supplied value is an integer giving the maximum number of wall-clock seconds for whichthe job is permitted to execute before being forcibly terminated. A value of zero indicatesunlimited duration. The service is not obliged to honour this request. See UWS v1.0, sec2.2.3.4.
interface = tap1.0|tap1.1|cap (String)Defines how the service endpoints and the version of the TAP protocol to use for queries isdetermined. This may take one of the following (case-insensitive) values:
• TAP1.0: The standard TAP endpoints are used, without examining the service'scapabilities document. The service is queried using version 1.0 of the TAP protocol.
SUN/256 474
• TAP1.1: The standard TAP endpoints are used, without examining the service'scapabilities document. The service is queried using version 1.1 of the TAP protocol.
• cap: The service's capabilities document is examined, and the endpoints listed there areused.
The capabilities document, if used, is read from tapurl/capabilities unless thecapabilitiesurl parameter is defined, in which case that is used.
The baseline value of all the TAP service endpoints (sync, async, tables, capabilities,examples) are determined by this parameter, but each of those endpoint values may beoverridden individually by other endpoint-specific parameters (syncurl, asyncurl, tablesurl,capabilitiesurl, availabilityurl, examplesurl)
For default (unauthenticated) access, the default value is usually suitable.
[Default: tap1.0]
language = <lang-name> (String)Language to use for the ADQL-like query. This will usually be "ADQL" (the default), but maybe set to some other value supported by the service, for instance a variant indicating a differentADQL version. Note that at present, setting it to "PQL" is not sufficient to submit a PQLquery.
[Default: ADQL]
maxrec = <nrow> (Long)Sets the requested maximum row count for the result of the query. The service is not obliged torespect this, but in the case that it has a default maximum record count, setting this value mayraise the limit. If no value is set, the service's default policy will be used.
nupload = <count> (Integer)The number of upload tables for this task. For each of the upload tables N there will beassociated parameters ufmtN, uploadN and ucmdN.
[Default: 0]
ocmd = <cmds> (ProcessingStep[])Specifies processing to be performed on the output table, after all other processing has takenplace. The value of this parameter is one or more of the filter commands described in Section6.1. If more than one is given, they must be separated by semicolon characters (";"). Thisparameter can be repeated multiple times on the same command line to build up a list ofprocessing steps. The sequence of commands given in this way defines the processing pipelinewhich is performed on the table.
Commands may alteratively be supplied in an external file, by using the indirection character'@'. Thus a value of "@filename" causes the file filename to be read for a list of filtercommands to execute. The commands in the file may be separated by newline charactersand/or semicolons, and lines which are blank or which start with a '#' character are ignored.
ofmt = <out-format> (String)Specifies the format in which the output table will be written (one of the ones in Section 5.1.2 -matching is case-insensitive and you can use just the first few letters). If it has the specialvalue "(auto)" (the default), then the output filename will be examined to try to guess whatsort of file is required usually by looking at the extension. If it's not obvious from the filenamewhat output format is intended, an error will result.
This parameter must only be given if omode has its default value of "out".
[Default: (auto)]
omode = out|meta|stats|count|checksum|cgi|discard|topcat|samp|plastic|tosql|gui
(ProcessingMode)The mode in which the result table will be output. The default mode is out, which means that
SUN/256 475

the result will be written as a new table to disk or elsewhere, as determined by the out andofmt parameters. However, there are other possibilities, which correspond to uses to which atable can be put other than outputting it, such as displaying metadata, calculating statistics, orpopulating a table in an SQL database. For some values of this parameter, additionalparameters (<mode-args>) are required to determine the exact behaviour.
Possible values are
• out
• meta
• stats
• count
• checksum
• cgi
• discard
• topcat
• samp
• plastic
• tosql
• gui
Use the help=omode flag or see Section 6.4 for more information.
[Default: out]
out = <out-table> (TableConsumer)The location of the output table. This is usually a filename to write to. If it is equal to thespecial value "-" (the default) the output table will be written to standard output.
This parameter must only be given if omode has its default value of "out".
[Default: -]
parse = true|false (Boolean)Determines whether an attempt will be made to check the syntax of the ADQL prior tosubmitting the query. If this is set true, and if a syntax error is found, the task will fail with anerror before any attempt is made to submit the query.
[Default: false]
poll = <millisec> (Integer)Interval to wait between polling attempts, in milliseconds. Asynchronous TAP queries canonly find out when they are complete by repeatedly polling the server to find out the job'sstatus. This parameter allows you to set how often that happens. Attempts to set it too low(<50) will be rejected on the assumption that you're thinking in seconds.
[Default: 5000]
progress = true|false (Boolean)If this parameter is set true, progress of the job is reported to standard output as it happens.
[Default: true]
sync = true|false (Boolean)Determines whether the TAP query is submitted in synchronous or asynchronous mode.Synchronous (true) means that the result is retrieved over the same HTTP connection that thequery is submitted from. This is uncomplicated, but means if the query takes a long time itmay time out and the results will be lost. Asynchronous (false) means that the job is queuedand results may be retrieved later. Normally this command does the necessary waiting aroundand recovery of the result, though with appropriate settings you can get tapresume to pick it upfor you later instead. In most cases false (the default) is preferred.
[Default: false]
SUN/256 476
tapurl = <url-value> (URL)The base URL of a Table Access Protocol service. This is the bare URL without a trailing"/[a]sync".
In the usual case, the default values of the various endpoints (sync and async querysubmission, tables metadata, service-provided examples etc) use this URL as a parent andappend standard sub-paths.
In some cases however, determination of the endpoints is more complicated, as determined bythe interface parameter which may cause endpoints to be read from the capabilitiesdocument at tapurl/capabilities, and by other endpoint-specific parameters (syncurl,asyncurl, tablesurl, capabilitiesurl, availabilityurl, examplesurl) for fine tuning.
ucmdN = <cmds> (ProcessingStep[])Specifies processing to be performed on upload table #N as specified by parameter uploadN,before any other processing has taken place. The value of this parameter is one or more of thefilter commands described in Section 6.1. If more than one is given, they must be separated bysemicolon characters (";"). This parameter can be repeated multiple times on the samecommand line to build up a list of processing steps. The sequence of commands given in thisway defines the processing pipeline which is performed on the table.
Commands may alteratively be supplied in an external file, by using the indirection character'@'. Thus a value of "@filename" causes the file filename to be read for a list of filtercommands to execute. The commands in the file may be separated by newline charactersand/or semicolons, and lines which are blank or which start with a '#' character are ignored.
ufmtN = <in-format> (String)Specifies the format of upload table #N as specified by parameter uploadN. The knownformats are listed in Section 5.1.1. This flag can be used if you know what format your table isin. If it has the special value (auto) (the default), then an attempt will be made to detect theformat of the table automatically. This cannot always be done correctly however, in whichcase the program will exit with an error explaining which formats were attempted. Thisparameter is ignored for scheme-specified tables.
[Default: (auto)]
uploadN = <tableN> (StarTable)The location of upload table #N. This may take one of the following forms:
• A filename.• A URL.• The special value "-", meaning standard input. In this case the input format must be given
explicitly using the ufmtN parameter. Note that not all formats can be streamed in thisway.
• A scheme specification of the form :<scheme-name>:<scheme-args>.• A system command line with either a "<" character at the start, or a "|" character at the
end ("<syscmd" or "syscmd|"). This executes the given pipeline and reads from itsstandard output. This will probably only work on unix-like systems.
In any case, compressed data in one of the supported compression formats (gzip, Unixcompress or bzip2) will be decompressed transparently.
upnameN = <adql-identifier> (String)Identifier to use in server-side expressions for uploaded table #N. In ADQL expressions, thetable should be referred to as "TAP_UPLOAD.<label>".
The value must syntactically be an ADQL identifier ([A-Za-z][A-Za-z0-9_]*).
[Default: upN]
upvotformat = TABLEDATA|BINARY|BINARY2 (uk.ac.starlink.votable.VOTableWriter)Determines how any uploaded tables will be serialized for transmission to the TAP server. The
SUN/256 477
supplied string is the name of one of the defined VOTable serialization formats. The choiceshouldn't affect any results, though it may affect required bandwidth, and some services may(though should not) have non-standard requirements for serialization format.
[Default: TABLEDATA]
B.23.2 Examples
Here are some examples of tapquery:
stilts tapquery tapurl='http://dc.zah.uni-heidelberg.de/__system__/tap/run/tap'adql='SELECT TOP 1000 * FROM ppmxl.main'out=ppmxl.fits
Executes the given ADQL query on the service referenced by the URL and writes the result toa FITS file.
stilts tapquerytapurl='http://dc.zah.uni-heidelberg.de/__system__/tap/run/tap'adql="SELECT *
FROM twomass.data AS tJOIN TAP_UPLOAD.up1 AS sON 1=CONTAINS(POINT('ICRS', t.RAJ2000, t.DEJ2000),
CIRCLE('ICRS', s.ra2000, s.dec2000, 5./3600.))"nupload=1 upload1=6dfgs_E7.fits ucmd1='select BMAG-RMAG<0'maxrec=20000ocmd='tablename 2mass_x_6df' omode=topcat
The local table 6dfgs_E7 is filtered to contain only rather blue objects, and the resultingselection is uploaded to the TAP server. A positional crossmatch with 5 arcsec tolerance isthen performed on the server between this uploaded table and the twomass.data table held bythe service. The adjusted maxrec parameter ensures that the result will not be artificiallytruncated to shorter than 20000 rows (assuming the service limits permit this). When the resultis received, it is loaded directly into TOPCAT with the name "2mass_x_6df".
B.24 tapresume: Resumes a previous query to a Table Access Protocol server
tapresume can resume monitoring and data retrieval from an asynchronous Table Access Protocolquery which has already been submitted. TAP is a Virtual Observatory protocol. Such apre-existing query may have been submitted by the tapquery command or by some completelydifferent mechanism. It essentially does the same job as tapquery but without the job submissionstage. It waits until the query has completed, and then retrieves the table result and processes it inaccordance with the supplied parameters. The query may or may not be deleted from the server aspart of the operation.
B.24.1 Usage
The usage of tapresume is
stilts <stilts-flags> tapresume joburl=<url-value> compress=true|falsepoll=<millisec> progress=true|falsedelete=finished|never|always|nowocmd=<cmds>omode=out|meta|stats|count|checksum|cgi|discard|topcat|samp|plastic|tosql|guiout=<out-table> ofmt=<out-format>
If you don't have the stilts script installed, write "java -jar stilts.jar" instead of "stilts" -see Section 3. The available <stilts-flags> are listed in Section 2.1. For programmaticinvocation, the Task class for this command is uk.ac.starlink.ttools.task.TapResume.
SUN/256 478

Parameter values are assigned on the command line as explained in Section 2.3. They are asfollows:
compress = true|false (Boolean)If true, the service is requested to provide HTTP-level compression for the response stream(Accept-Encoding header is set to "gzip", see RFC 2616). This does not guarantee thatcompression will happen but if the service honours this request it may result in a smalleramount of network traffic at the expense of more processing on the server and client.
[Default: true]
delete = finished|never|always|now (DeleteMode)Determines under what circumstances the UWS job is to be deleted from the server when itsdata is no longer required. If it is not deleted, then the job is left on the TAP server and it canbe accessed via the normal UWS REST endpoints or using tapresume until it is destroyed bythe server.
Possible values:
• finished: delete only if the job finished, successfully or not• never: do not delete• always: delete on command exit• now: delete and return immediately
[Default: finished]
joburl = <url-value> (URL)The URL of a job created by submission of a TAP query which was created earlier and has notyet been deleted (by the client) or destroyed (by the server). This will usually be of the form<tap-url>/async/<job-id>. You can also find out, and possibly retrieve results from the jobby pointing a web browser at this URL.
ocmd = <cmds> (ProcessingStep[])Specifies processing to be performed on the output table, after all other processing has takenplace. The value of this parameter is one or more of the filter commands described in Section6.1. If more than one is given, they must be separated by semicolon characters (";"). Thisparameter can be repeated multiple times on the same command line to build up a list ofprocessing steps. The sequence of commands given in this way defines the processing pipelinewhich is performed on the table.
Commands may alteratively be supplied in an external file, by using the indirection character'@'. Thus a value of "@filename" causes the file filename to be read for a list of filtercommands to execute. The commands in the file may be separated by newline charactersand/or semicolons, and lines which are blank or which start with a '#' character are ignored.
ofmt = <out-format> (String)Specifies the format in which the output table will be written (one of the ones in Section 5.1.2 -matching is case-insensitive and you can use just the first few letters). If it has the specialvalue "(auto)" (the default), then the output filename will be examined to try to guess whatsort of file is required usually by looking at the extension. If it's not obvious from the filenamewhat output format is intended, an error will result.
This parameter must only be given if omode has its default value of "out".
[Default: (auto)]
omode = out|meta|stats|count|checksum|cgi|discard|topcat|samp|plastic|tosql|gui
(ProcessingMode)The mode in which the result table will be output. The default mode is out, which means thatthe result will be written as a new table to disk or elsewhere, as determined by the out and
SUN/256 479
ofmt parameters. However, there are other possibilities, which correspond to uses to which atable can be put other than outputting it, such as displaying metadata, calculating statistics, orpopulating a table in an SQL database. For some values of this parameter, additionalparameters (<mode-args>) are required to determine the exact behaviour.
Possible values are
• out
• meta
• stats
• count
• checksum
• cgi
• discard
• topcat
• samp
• plastic
• tosql
• gui
Use the help=omode flag or see Section 6.4 for more information.
[Default: out]
out = <out-table> (TableConsumer)The location of the output table. This is usually a filename to write to. If it is equal to thespecial value "-" (the default) the output table will be written to standard output.
This parameter must only be given if omode has its default value of "out".
[Default: -]
poll = <millisec> (Integer)Interval to wait between polling attempts, in milliseconds. Asynchronous TAP queries canonly find out when they are complete by repeatedly polling the server to find out the job'sstatus. This parameter allows you to set how often that happens. Attempts to set it too low(<50) will be rejected on the assumption that you're thinking in seconds.
[Default: 5000]
progress = true|false (Boolean)If this parameter is set true, progress of the job is reported to standard output as it happens.
[Default: true]
B.24.2 Examples
Here are some examples of tapresume:
stilts tapresume joburl='http://dc.zah.uni-heidelberg.de/__system__/tap/run/tap/async/d4ENGR'out=result.csv ofmt=csv
Resumes waiting for the output of a query on a job with ID d4ENGR which was previouslystarted on the GAVO TAP server. When it has completed the output table will be written as acomma-separated value file.
B.25 tapskymatch: Crossmatches table on sky position against TAP table
tapskymatch allows you to perform a positional crossmatch of a local table with one held in a
SUN/256 480
remote TAP service, as long as that TAP supports upload queries. This task does three main jobs.First, it prepares the ADQL queries and TAP negotiations for you so that you don't need toremember the syntax for performing positional crossmatches against a TAP service. Second, itorganises data transfer so that only those columns required (basically the positional ones) aretransmitted to and from the service, to save on bandwidth. And third it divides the job up intochunks, so that the TAP service only has to perform a manageable-sized query at a time. If the jobis large this chunking can be useful to monitor progress of the job, and it also allows you to performa match which would otherwise hit the upload or output limits imposed by the service.
The positional match may be done in any spherical coordinate system, it's up to the user to ensurethat the same coordinates are provided for the local and remote tables.
Note that cdsskymatch provides similar functionality by accessing a different external service,which is usually much faster; if the table you wish to match is part of the VizieR database, you maywish to use that command instead.
B.25.1 Usage
The usage of tapskymatch is
stilts <stilts-flags> tapskymatch ifmt=<in-format> istream=true|falseicmd=<cmds> ocmd=<cmds>omode=out|meta|stats|count|checksum|cgi|discard|topcat|samp|plastic|tosql|guiout=<out-table> ofmt=<out-format>inlon=<expr/deg> inlat=<expr/deg>tapurl=<url-value>interface=tap1.0|tap1.1|captaptable=<name> taplon=<column>taplat=<column> tapcols=<colname,...>sr=<expr/deg>find=all|best|each|each-distblocksize=<int-value> maxrec=<int-value>sync=true|false blockmaxrec=<nrow>compress=true|false fixcols=none|dups|allsuffixin=<label> suffixremote=<label>[in=]<table>
If you don't have the stilts script installed, write "java -jar stilts.jar" instead of "stilts" -see Section 3. The available <stilts-flags> are listed in Section 2.1. For programmaticinvocation, the Task class for this command isuk.ac.starlink.ttools.task.TapUploadSkyMatch.
Parameter values are assigned on the command line as explained in Section 2.3. They are asfollows:
blockmaxrec = <nrow> (Long)Sets the MAXREC parameter passed to the TAP service for each uploaded block. This allowsyou to request that the service overrides its default limit for the number of rows output from asingle query. The service may still impose some "hard" limit beyond which the output rowcount cannot be increased.
Note this differs from the maxrec parameter, which gives the maximum total number of rowsto be returned from this command.
blocksize = <int-value> (Integer)The number of rows uploaded in each TAP query. TAP services may have limits on thenumber of rows in a table uploaded for matching. This command can therefore break up inputtables into blocks and make a number of individual TAP queries to generate the result. Thisparameter controls the maximum number of rows uploaded in each individual request. For aninput table with fewer rows than this value, the whole thing is done as a single query.
SUN/256 481
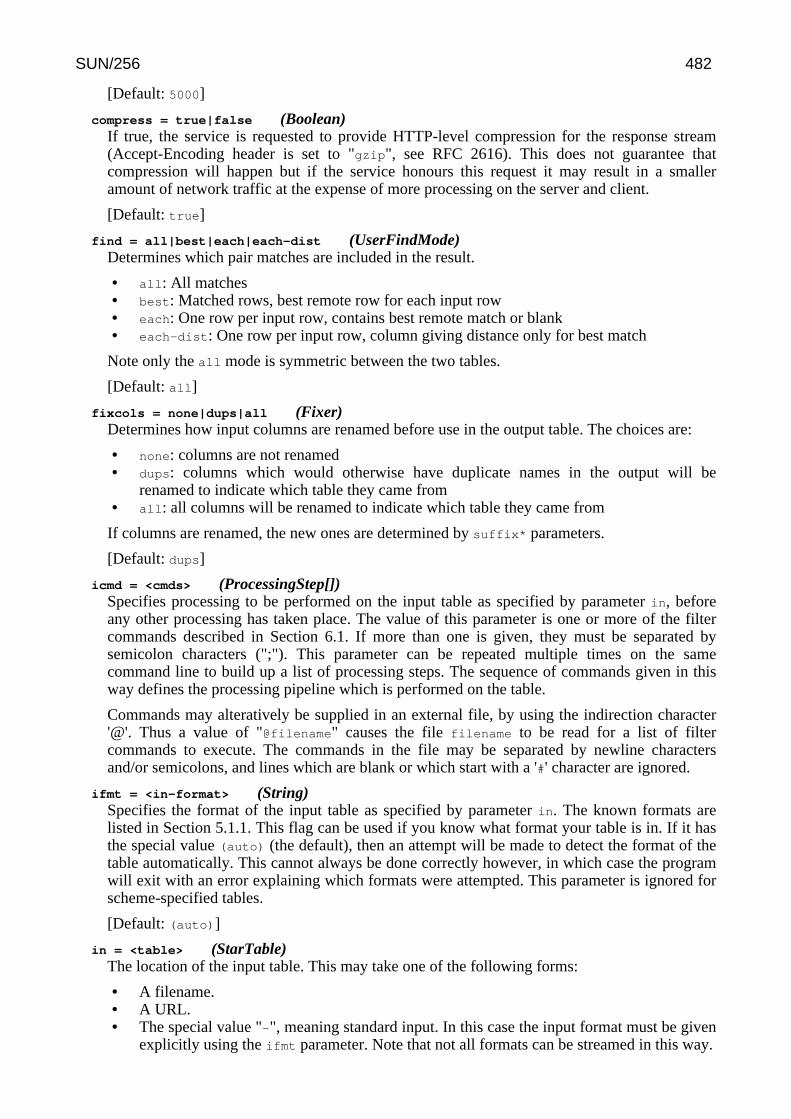
[Default: 5000]
compress = true|false (Boolean)If true, the service is requested to provide HTTP-level compression for the response stream(Accept-Encoding header is set to "gzip", see RFC 2616). This does not guarantee thatcompression will happen but if the service honours this request it may result in a smalleramount of network traffic at the expense of more processing on the server and client.
[Default: true]
find = all|best|each|each-dist (UserFindMode)Determines which pair matches are included in the result.
• all: All matches• best: Matched rows, best remote row for each input row• each: One row per input row, contains best remote match or blank• each-dist: One row per input row, column giving distance only for best match
Note only the all mode is symmetric between the two tables.
[Default: all]
fixcols = none|dups|all (Fixer)Determines how input columns are renamed before use in the output table. The choices are:
• none: columns are not renamed• dups: columns which would otherwise have duplicate names in the output will be
renamed to indicate which table they came from• all: all columns will be renamed to indicate which table they came from
If columns are renamed, the new ones are determined by suffix* parameters.
[Default: dups]
icmd = <cmds> (ProcessingStep[])Specifies processing to be performed on the input table as specified by parameter in, beforeany other processing has taken place. The value of this parameter is one or more of the filtercommands described in Section 6.1. If more than one is given, they must be separated bysemicolon characters (";"). This parameter can be repeated multiple times on the samecommand line to build up a list of processing steps. The sequence of commands given in thisway defines the processing pipeline which is performed on the table.
Commands may alteratively be supplied in an external file, by using the indirection character'@'. Thus a value of "@filename" causes the file filename to be read for a list of filtercommands to execute. The commands in the file may be separated by newline charactersand/or semicolons, and lines which are blank or which start with a '#' character are ignored.
ifmt = <in-format> (String)Specifies the format of the input table as specified by parameter in. The known formats arelisted in Section 5.1.1. This flag can be used if you know what format your table is in. If it hasthe special value (auto) (the default), then an attempt will be made to detect the format of thetable automatically. This cannot always be done correctly however, in which case the programwill exit with an error explaining which formats were attempted. This parameter is ignored forscheme-specified tables.
[Default: (auto)]
in = <table> (StarTable)The location of the input table. This may take one of the following forms:
• A filename.• A URL.• The special value "-", meaning standard input. In this case the input format must be given
explicitly using the ifmt parameter. Note that not all formats can be streamed in this way.
SUN/256 482

• A scheme specification of the form :<scheme-name>:<scheme-args>.• A system command line with either a "<" character at the start, or a "|" character at the
end ("<syscmd" or "syscmd|"). This executes the given pipeline and reads from itsstandard output. This will probably only work on unix-like systems.
In any case, compressed data in one of the supported compression formats (gzip, Unixcompress or bzip2) will be decompressed transparently.
inlat = <expr/deg> (String)Longitude in degrees for the position of each row in the input table. This may simply be acolumn name, or it may be an algebraic expression as explained in Section 10. The coordinatesystem must match that used for the coordinates in the remote table.
inlon = <expr/deg> (String)Longitude in degrees for the position of each row in the input table. This may simply be acolumn name, or it may be an algebraic expression as explained in Section 10. The coordinatesystem must match that used for the coordinates in the remote table.
interface = tap1.0|tap1.1|cap (String)Defines how the service endpoints and the version of the TAP protocol to use for queries isdetermined. This may take one of the following (case-insensitive) values:
• TAP1.0: The standard TAP endpoints are used, without examining the service'scapabilities document. The service is queried using version 1.0 of the TAP protocol.
• TAP1.1: The standard TAP endpoints are used, without examining the service'scapabilities document. The service is queried using version 1.1 of the TAP protocol.
• cap: The service's capabilities document is examined, and the endpoints listed there areused.
The capabilities document, if used, is read from tapurl/capabilities unless thecapabilitiesurl parameter is defined, in which case that is used.
The baseline value of all the TAP service endpoints (sync, async, tables, capabilities,examples) are determined by this parameter, but each of those endpoint values may beoverridden individually by other endpoint-specific parameters (syncurl, asyncurl, tablesurl,capabilitiesurl, availabilityurl, examplesurl)
For default (unauthenticated) access, the default value is usually suitable.
[Default: tap1.0]
istream = true|false (Boolean)If set true, the input table specified by the in parameter will be read as a stream. It is necessaryto give the ifmt parameter in this case. Depending on the required operations and processingmode, this may cause the read to fail (sometimes it is necessary to read the table more thanonce). It is not normally necessary to set this flag; in most cases the data will be streamedautomatically if that is the best thing to do. However it can sometimes result in less resourceusage when processing large files in certain formats (such as VOTable). This parameter isignored for scheme-specified tables.
[Default: false]
maxrec = <int-value> (Integer)Limit to the number of rows resulting from this operation. If the value is negative (the default)no limit is imposed. Note however that there can be truncation of the result if the number ofrecords returned from a single chunk exceeds limits imposed by the service.
[Default: -1]
ocmd = <cmds> (ProcessingStep[])Specifies processing to be performed on the output table, after all other processing has takenplace. The value of this parameter is one or more of the filter commands described in Section
SUN/256 483
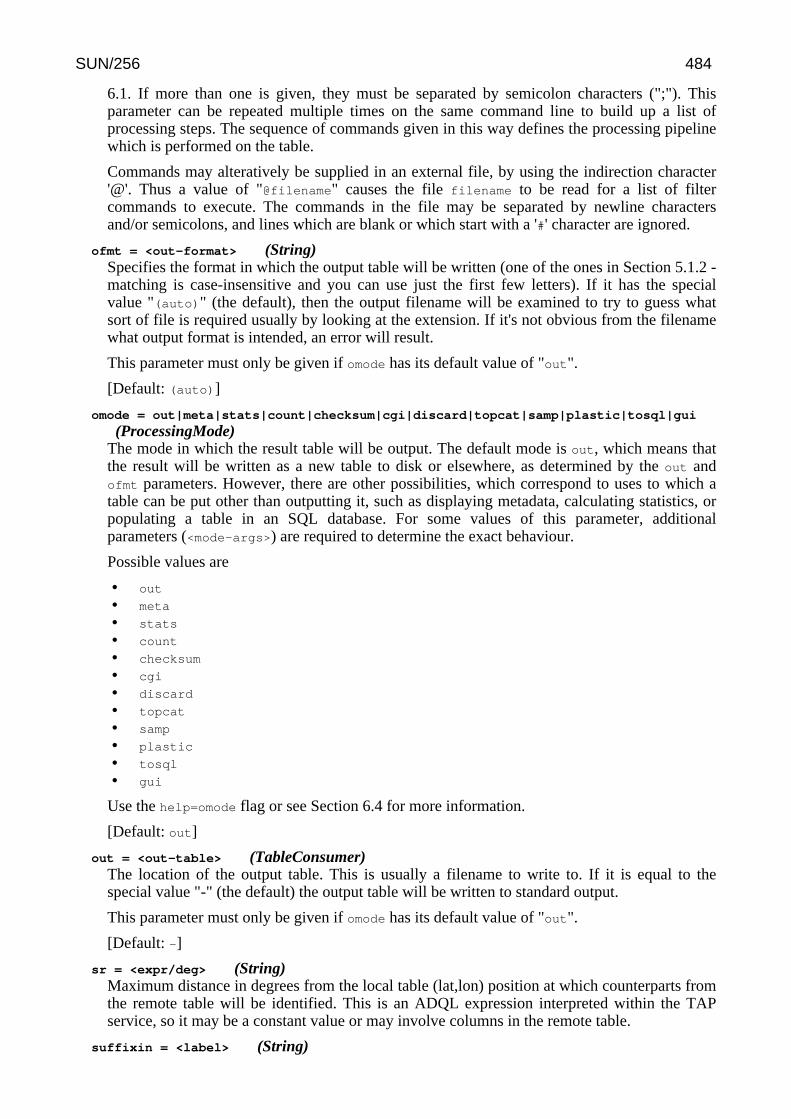
6.1. If more than one is given, they must be separated by semicolon characters (";"). Thisparameter can be repeated multiple times on the same command line to build up a list ofprocessing steps. The sequence of commands given in this way defines the processing pipelinewhich is performed on the table.
Commands may alteratively be supplied in an external file, by using the indirection character'@'. Thus a value of "@filename" causes the file filename to be read for a list of filtercommands to execute. The commands in the file may be separated by newline charactersand/or semicolons, and lines which are blank or which start with a '#' character are ignored.
ofmt = <out-format> (String)Specifies the format in which the output table will be written (one of the ones in Section 5.1.2 -matching is case-insensitive and you can use just the first few letters). If it has the specialvalue "(auto)" (the default), then the output filename will be examined to try to guess whatsort of file is required usually by looking at the extension. If it's not obvious from the filenamewhat output format is intended, an error will result.
This parameter must only be given if omode has its default value of "out".
[Default: (auto)]
omode = out|meta|stats|count|checksum|cgi|discard|topcat|samp|plastic|tosql|gui
(ProcessingMode)The mode in which the result table will be output. The default mode is out, which means thatthe result will be written as a new table to disk or elsewhere, as determined by the out andofmt parameters. However, there are other possibilities, which correspond to uses to which atable can be put other than outputting it, such as displaying metadata, calculating statistics, orpopulating a table in an SQL database. For some values of this parameter, additionalparameters (<mode-args>) are required to determine the exact behaviour.
Possible values are
• out
• meta
• stats
• count
• checksum
• cgi
• discard
• topcat
• samp
• plastic
• tosql
• gui
Use the help=omode flag or see Section 6.4 for more information.
[Default: out]
out = <out-table> (TableConsumer)The location of the output table. This is usually a filename to write to. If it is equal to thespecial value "-" (the default) the output table will be written to standard output.
This parameter must only be given if omode has its default value of "out".
[Default: -]
sr = <expr/deg> (String)Maximum distance in degrees from the local table (lat,lon) position at which counterparts fromthe remote table will be identified. This is an ADQL expression interpreted within the TAPservice, so it may be a constant value or may involve columns in the remote table.
suffixin = <label> (String)
SUN/256 484
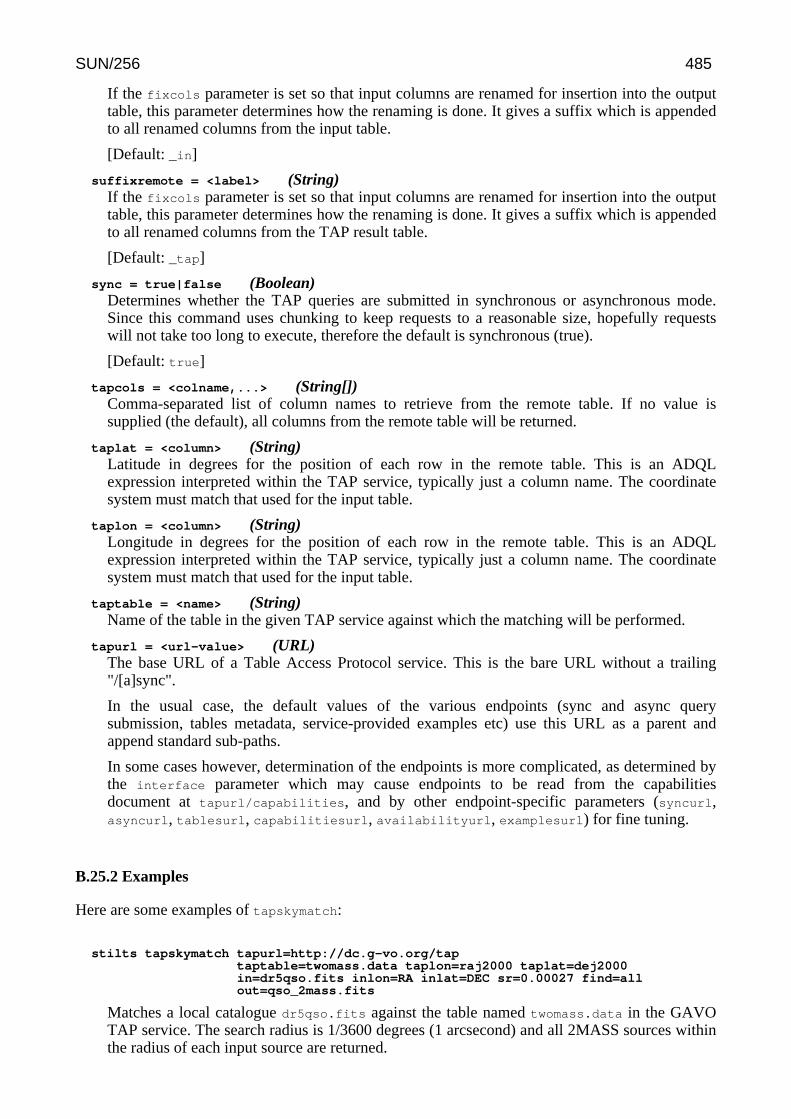
If the fixcols parameter is set so that input columns are renamed for insertion into the outputtable, this parameter determines how the renaming is done. It gives a suffix which is appendedto all renamed columns from the input table.
[Default: _in]
suffixremote = <label> (String)If the fixcols parameter is set so that input columns are renamed for insertion into the outputtable, this parameter determines how the renaming is done. It gives a suffix which is appendedto all renamed columns from the TAP result table.
[Default: _tap]
sync = true|false (Boolean)Determines whether the TAP queries are submitted in synchronous or asynchronous mode.Since this command uses chunking to keep requests to a reasonable size, hopefully requestswill not take too long to execute, therefore the default is synchronous (true).
[Default: true]
tapcols = <colname,...> (String[])Comma-separated list of column names to retrieve from the remote table. If no value issupplied (the default), all columns from the remote table will be returned.
taplat = <column> (String)Latitude in degrees for the position of each row in the remote table. This is an ADQLexpression interpreted within the TAP service, typically just a column name. The coordinatesystem must match that used for the input table.
taplon = <column> (String)Longitude in degrees for the position of each row in the remote table. This is an ADQLexpression interpreted within the TAP service, typically just a column name. The coordinatesystem must match that used for the input table.
taptable = <name> (String)Name of the table in the given TAP service against which the matching will be performed.
tapurl = <url-value> (URL)The base URL of a Table Access Protocol service. This is the bare URL without a trailing"/[a]sync".
In the usual case, the default values of the various endpoints (sync and async querysubmission, tables metadata, service-provided examples etc) use this URL as a parent andappend standard sub-paths.
In some cases however, determination of the endpoints is more complicated, as determined bythe interface parameter which may cause endpoints to be read from the capabilitiesdocument at tapurl/capabilities, and by other endpoint-specific parameters (syncurl,asyncurl, tablesurl, capabilitiesurl, availabilityurl, examplesurl) for fine tuning.
B.25.2 Examples
Here are some examples of tapskymatch:
stilts tapskymatch tapurl=http://dc.g-vo.org/taptaptable=twomass.data taplon=raj2000 taplat=dej2000in=dr5qso.fits inlon=RA inlat=DEC sr=0.00027 find=allout=qso_2mass.fits
Matches a local catalogue dr5qso.fits against the table named twomass.data in the GAVOTAP service. The search radius is 1/3600 degrees (1 arcsecond) and all 2MASS sources withinthe radius of each input source are returned.
SUN/256 485
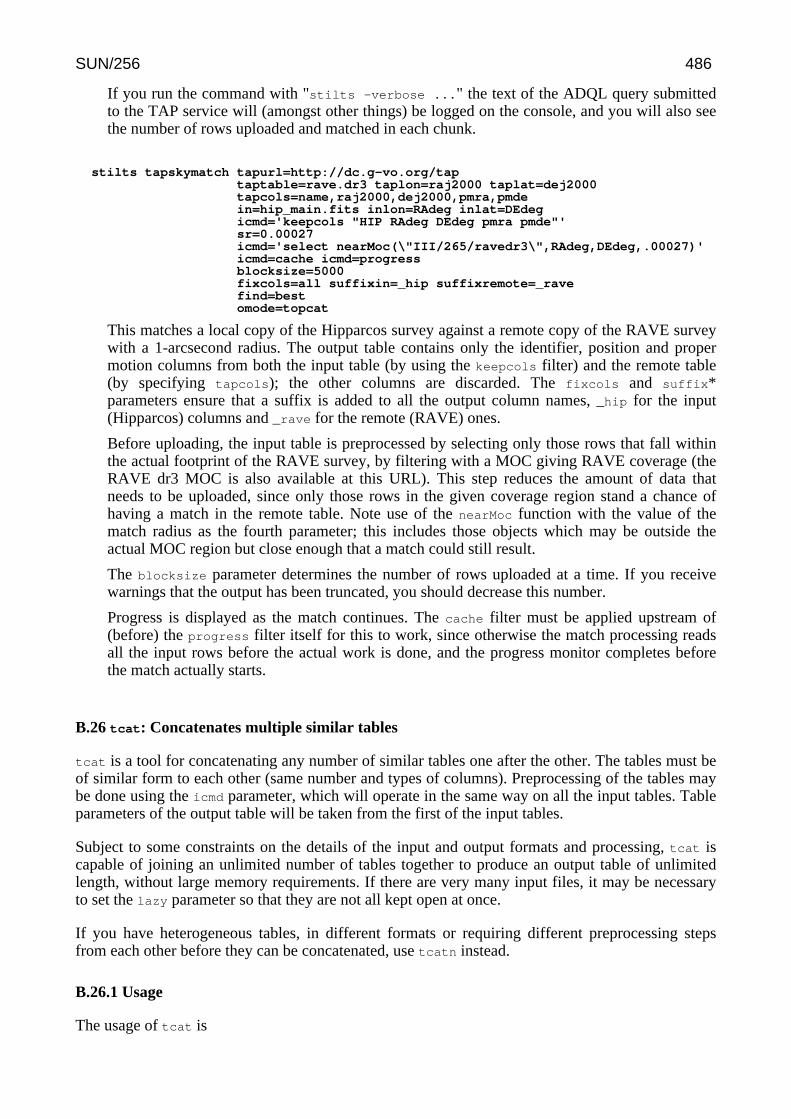
If you run the command with "stilts -verbose ..." the text of the ADQL query submittedto the TAP service will (amongst other things) be logged on the console, and you will also seethe number of rows uploaded and matched in each chunk.
stilts tapskymatch tapurl=http://dc.g-vo.org/taptaptable=rave.dr3 taplon=raj2000 taplat=dej2000tapcols=name,raj2000,dej2000,pmra,pmdein=hip_main.fits inlon=RAdeg inlat=DEdegicmd='keepcols "HIP RAdeg DEdeg pmra pmde"'sr=0.00027icmd='select nearMoc(\"III/265/ravedr3\",RAdeg,DEdeg,.00027)'icmd=cache icmd=progressblocksize=5000fixcols=all suffixin=_hip suffixremote=_ravefind=bestomode=topcat
This matches a local copy of the Hipparcos survey against a remote copy of the RAVE surveywith a 1-arcsecond radius. The output table contains only the identifier, position and propermotion columns from both the input table (by using the keepcols filter) and the remote table(by specifying tapcols); the other columns are discarded. The fixcols and suffix*parameters ensure that a suffix is added to all the output column names, _hip for the input(Hipparcos) columns and _rave for the remote (RAVE) ones.
Before uploading, the input table is preprocessed by selecting only those rows that fall withinthe actual footprint of the RAVE survey, by filtering with a MOC giving RAVE coverage (theRAVE dr3 MOC is also available at this URL). This step reduces the amount of data thatneeds to be uploaded, since only those rows in the given coverage region stand a chance ofhaving a match in the remote table. Note use of the nearMoc function with the value of thematch radius as the fourth parameter; this includes those objects which may be outside theactual MOC region but close enough that a match could still result.
The blocksize parameter determines the number of rows uploaded at a time. If you receivewarnings that the output has been truncated, you should decrease this number.
Progress is displayed as the match continues. The cache filter must be applied upstream of(before) the progress filter itself for this to work, since otherwise the match processing readsall the input rows before the actual work is done, and the progress monitor completes beforethe match actually starts.
B.26 tcat: Concatenates multiple similar tables
tcat is a tool for concatenating any number of similar tables one after the other. The tables must beof similar form to each other (same number and types of columns). Preprocessing of the tables maybe done using the icmd parameter, which will operate in the same way on all the input tables. Tableparameters of the output table will be taken from the first of the input tables.
Subject to some constraints on the details of the input and output formats and processing, tcat iscapable of joining an unlimited number of tables together to produce an output table of unlimitedlength, without large memory requirements. If there are very many input files, it may be necessaryto set the lazy parameter so that they are not all kept open at once.
If you have heterogeneous tables, in different formats or requiring different preprocessing stepsfrom each other before they can be concatenated, use tcatn instead.
B.26.1 Usage
The usage of tcat is
SUN/256 486

stilts <stilts-flags> tcat in=<table> [<table> ...] ifmt=<in-format>multi=true|false istream=true|false icmd=<cmds>ocmd=<cmds>omode=out|meta|stats|count|checksum|cgi|discard|topcat|samp|plastic|tosql|guiout=<out-table> ofmt=<out-format>seqcol=<colname> loccol=<colname>uloccol=<colname> lazy=true|falsecountrows=true|false
If you don't have the stilts script installed, write "java -jar stilts.jar" instead of "stilts" -see Section 3. The available <stilts-flags> are listed in Section 2.1. For programmaticinvocation, the Task class for this command is uk.ac.starlink.ttools.task.TableCat.
Parameter values are assigned on the command line as explained in Section 2.3. They are asfollows:
countrows = true|false (Boolean)Whether to count the rows in the table before starting the output. This is essentially a tuningparameter - if writing to an output format which requires the number of rows up front (such asnormal FITS) it may result in skipping the number of passes through the input files requiredfor processing. Unless you have a good understanding of the internals of the software, yourbest bet for working out whether to set this true or false is to try it both ways
[Default: false]
icmd = <cmds> (ProcessingStep[])Specifies processing to be performed on each input table as specified by parameter in, beforeany other processing has taken place. The value of this parameter is one or more of the filtercommands described in Section 6.1. If more than one is given, they must be separated bysemicolon characters (";"). This parameter can be repeated multiple times on the samecommand line to build up a list of processing steps. The sequence of commands given in thisway defines the processing pipeline which is performed on the table.
Commands may alteratively be supplied in an external file, by using the indirection character'@'. Thus a value of "@filename" causes the file filename to be read for a list of filtercommands to execute. The commands in the file may be separated by newline charactersand/or semicolons, and lines which are blank or which start with a '#' character are ignored.
ifmt = <in-format> (String)Specifies the format of the input table as specified by parameter in. The known formats arelisted in Section 5.1.1. This flag can be used if you know what format your table is in. If it hasthe special value (auto) (the default), then an attempt will be made to detect the format of thetable automatically. This cannot always be done correctly however, in which case the programwill exit with an error explaining which formats were attempted. This parameter is ignored forscheme-specified tables.
The same format parameter applies to all the tables specified by in.
[Default: (auto)]
in = <table> [<table> ...] (TableProducer[])Locations of the input tables. Either specify the parameter multiple times, or supply the inputtables as a space-separated list within a single use.
The following table location forms are allowed:
• A filename.• A URL.• The special value "-", meaning standard input. In this case the input format must be given
explicitly using the ifmt parameter. Note that not all formats can be streamed in this way.• A scheme specification of the form :<scheme-name>:<scheme-args>.• A system command line with either a "<" character at the start, or a "|" character at the
SUN/256 487
end ("<syscmd" or "syscmd|"). This executes the given pipeline and reads from itsstandard output. This will probably only work on unix-like systems.
Compression in any of the supported compression formats (Unix compress, gzip or bzip2) isexpanded automatically.
A list of input table locations may be given in an external file by using the indirction character'@'. Thus "in=@filename" causes the file filename to be read for a list of input table locations.The locations in the file should each be on a separate line.
istream = true|false (Boolean)If set true, the input table specified by the in parameter will be read as a stream. It is necessaryto give the ifmt parameter in this case. Depending on the required operations and processingmode, this may cause the read to fail (sometimes it is necessary to read the table more thanonce). It is not normally necessary to set this flag; in most cases the data will be streamedautomatically if that is the best thing to do. However it can sometimes result in less resourceusage when processing large files in certain formats (such as VOTable). This parameter isignored for scheme-specified tables.
The same streaming flag applies to all the tables specified by in.
[Default: false]
lazy = true|false (Boolean)Whether to perform table resolution lazily. If true, each table is only accessed when the timecomes to add its rows to the output; if false, then all the tables are accessed up front. This ismostly a tuning parameter, and on the whole it doesn't matter much how it is set, but forjoining an enormous number of tables setting it true may avoid running out of resources.
[Default: false]
loccol = <colname> (String)Name of a column to be added to the output table which will contain the location (as specifiedin the input parameter(s)) of the input table from which each row originated.
multi = true|false (Boolean)Determines whether all tables, or just the first one, from input table files will be used. If setfalse, then just the first table from each file named by in will be used. If true, then all tablespresent in those input files will be used. This only has an effect for file formats which arecapable of containing more than one table, which effectively means FITS and VOTable andtheir variants.
[Default: false]
ocmd = <cmds> (ProcessingStep[])Specifies processing to be performed on the output table, after all other processing has takenplace. The value of this parameter is one or more of the filter commands described in Section6.1. If more than one is given, they must be separated by semicolon characters (";"). Thisparameter can be repeated multiple times on the same command line to build up a list ofprocessing steps. The sequence of commands given in this way defines the processing pipelinewhich is performed on the table.
Commands may alteratively be supplied in an external file, by using the indirection character'@'. Thus a value of "@filename" causes the file filename to be read for a list of filtercommands to execute. The commands in the file may be separated by newline charactersand/or semicolons, and lines which are blank or which start with a '#' character are ignored.
ofmt = <out-format> (String)Specifies the format in which the output table will be written (one of the ones in Section 5.1.2 -matching is case-insensitive and you can use just the first few letters). If it has the specialvalue "(auto)" (the default), then the output filename will be examined to try to guess whatsort of file is required usually by looking at the extension. If it's not obvious from the filename
SUN/256 488
what output format is intended, an error will result.
This parameter must only be given if omode has its default value of "out".
[Default: (auto)]
omode = out|meta|stats|count|checksum|cgi|discard|topcat|samp|plastic|tosql|gui
(ProcessingMode)The mode in which the result table will be output. The default mode is out, which means thatthe result will be written as a new table to disk or elsewhere, as determined by the out andofmt parameters. However, there are other possibilities, which correspond to uses to which atable can be put other than outputting it, such as displaying metadata, calculating statistics, orpopulating a table in an SQL database. For some values of this parameter, additionalparameters (<mode-args>) are required to determine the exact behaviour.
Possible values are
• out
• meta
• stats
• count
• checksum
• cgi
• discard
• topcat
• samp
• plastic
• tosql
• gui
Use the help=omode flag or see Section 6.4 for more information.
[Default: out]
out = <out-table> (TableConsumer)The location of the output table. This is usually a filename to write to. If it is equal to thespecial value "-" (the default) the output table will be written to standard output.
This parameter must only be given if omode has its default value of "out".
[Default: -]
seqcol = <colname> (String)Name of a column to be added to the output table which will contain the sequence number ofthe input table from which each row originated. This column will contain 1 for the rows fromthe first concatenated table, 2 for the second, and so on.
uloccol = <colname> (String)Name of a column to be added to the output table which will contain the unique part of thelocation (as specified in the input parameter(s)) of the input table from which each roworiginated. If not null, parameters will also be added to the output table giving the pre- andpost-fix string common to all the locations. For example, if the input tables are"/data/cat_a1.fits" and "/data/cat_b2.fits" then the output table will contain a new column<colname> which takes the value "a1" for rows from the first table and "b2" for rows from thesecond, and new parameters "<colname>_prefix" and "<colname>_postfix" with the values"/data/cat_" and ".fits" respectively.
B.26.2 Examples
Here are some examples of tcat:
SUN/256 489
stilts tcat ifmt=ascii in=t1.txt in=t2.txt in=t3.txt out=table.txt
Concatenates the three named ASCII format tables to produce an output table. All three musthave compatible numbers and types of columns.
stilts tcat ifmt=ascii in="t1.txt t2.txt t3.txt" out=table.txt
Has exactly the same effect as the previous example.
stilts tcat ifmt=ascii [email protected] out=table.txt
This will have the same effect as the previous two examples if a file name "inlist.lis" in thecurrent directory contains three lines, "t1.txt", "t2.txt" and "t3.txt".
stilts tcat [email protected] out=gaia_source.colfitslazy=true countrows=true
Concatenates the contents of all the files listed in "infits.lis" to one large output colfits file. Thelazy=true is a good idea if there is a large number of input files listed.
stilts tcat in=r368776.fits#1 in=r368776#2 in=r368776.fits#3 in=r368776.fits#4out=r368776_all.fits
Concatenates the contents of four tables (the first four extension HDUs) from amulti-extension FITS file to produce a single FITS table. Many Unix shells (csh, bash) willallow you to list the input files using the following shorthand: "in=r368776.fits#{1,2,3,4}".
stilts tcat in=r368776.fits multi=true out=r368776_all.fits
Concatenates all the tables in the named file together. Setting multi=true means that insteadof picking the first table from each named in table, all tables will be selected. So, if the inputFITS file in this example has just four table HDUs, then this example does exactly the same asthe previous one, but with less typing. The same thing works with multi-TABLE VOTabledocuments, but most other file formats (CSV etc) do not have the facility for storing multipletables in a single file.
stilts tcat in=r368776.fits multi=true out=r368776_all.fitsicmd=progress seqcol=ID
Does the same as the previous example with a couple of additions. Firstly, progress througheach of the input files will be reported to the console. Secondly, an additional column "ID" willbe appended to the output which contains 1 for all the rows from the first input table, 2 for therows from the second one and so on.
stilts tcat in='rA.csv rB.csv rC.csv' ifmt=csv \icmd='keepcols "RA DEC FLUX"' icmd='sorthead 10 FLUX' \ocmd='sort FLUX'
Takes the 10 rows with highest FLUX values from each of three input tables (incomma-separated value format) and joins them together to produce a 30-row output table. Thisis then sorted in FLUX order, and the resulting table is output to the console in text format.Only the columns RA, DEC and FLUX are output; any other columns are discarded. The inputtables don't need to have identical forms to each other, but each must have at least an RA, DECand FLUX column.
stilts tcat in=vizier.xml multi=trueicmd='keepcols "ucd$RECORD ucd$POS_EQ_RA_MAIN ucd$POS_EQ_DEC_MAIN"'uloccol=TID out=all.csv
SUN/256 490

This processes a VOTable file which may have multiple TABLEs in it, but for which each ofthe tables is known to have columns with the UCDs RECORD, POS_EQ_RA_MAIN andPOS_EQ_DEC_MAIN (this is typical of VOTables retrieved from CDS's VizieR service). Itretains only those columns from each table and writes the result as a single concatenated tableto a CSV file.
B.27 tcatn: Concatenates multiple tables
tcatn is a tool for concatenating a number of tables one after the other. Each table can bemanipulated separately prior to the concatenatation. If you have two tables T1 and T2 whichcontain similar columns, and you want to treat them as a single table, you can use tcatn to producea new table whose metadata (row headings etc) comes from T1 and whose data consists of all therows of T1 followed by all the rows of T2.
For this concatenation to make sense, each column of T1 must be compatible with thecorresponding column of T2 - they must have compatible types and, presumably, meanings. If thisis not the case for the tables that you wish to concatenate, for instance the columns are in differentorders, or the units differ between a column in T1 and its opposite number in T2, you can use theicmd1 and/or icmd2 parameters to manipulate the input tables so that the column sequences arecompatible. See Appendix B.27.2 for some examples.
If the tables are similar to each other (same format, same columns, same preprocessing stagesrequired if any), you may find it easier to use tcat instead.
B.27.1 Usage
The usage of tcatn is
stilts <stilts-flags> tcatn nin=<count> ifmtN=<in-format> inN=<tableN>icmdN=<cmds> ocmd=<cmds>omode=out|meta|stats|count|checksum|cgi|discard|topcat|samp|plastic|tosql|guiout=<out-table> ofmt=<out-format>seqcol=<colname> loccol=<colname>uloccol=<colname> countrows=true|false
If you don't have the stilts script installed, write "java -jar stilts.jar" instead of "stilts" -see Section 3. The available <stilts-flags> are listed in Section 2.1. For programmaticinvocation, the Task class for this command is uk.ac.starlink.ttools.task.TableCatN.
Parameter values are assigned on the command line as explained in Section 2.3. They are asfollows:
countrows = true|false (Boolean)Whether to count the rows in the table before starting the output. This is essentially a tuningparameter - if writing to an output format which requires the number of rows up front (such asnormal FITS) it may result in skipping the number of passes through the input files requiredfor processing. Unless you have a good understanding of the internals of the software, yourbest bet for working out whether to set this true or false is to try it both ways
[Default: false]
icmdN = <cmds> (ProcessingStep[])Specifies processing to be performed on input table #N as specified by parameter inN, beforeany other processing has taken place. The value of this parameter is one or more of the filtercommands described in Section 6.1. If more than one is given, they must be separated bysemicolon characters (";"). This parameter can be repeated multiple times on the samecommand line to build up a list of processing steps. The sequence of commands given in this
SUN/256 491
way defines the processing pipeline which is performed on the table.
Commands may alteratively be supplied in an external file, by using the indirection character'@'. Thus a value of "@filename" causes the file filename to be read for a list of filtercommands to execute. The commands in the file may be separated by newline charactersand/or semicolons, and lines which are blank or which start with a '#' character are ignored.
ifmtN = <in-format> (String)Specifies the format of input table #N as specified by parameter inN. The known formats arelisted in Section 5.1.1. This flag can be used if you know what format your table is in. If it hasthe special value (auto) (the default), then an attempt will be made to detect the format of thetable automatically. This cannot always be done correctly however, in which case the programwill exit with an error explaining which formats were attempted. This parameter is ignored forscheme-specified tables.
[Default: (auto)]
inN = <tableN> (StarTable)The location of input table #N. This may take one of the following forms:
• A filename.• A URL.• The special value "-", meaning standard input. In this case the input format must be given
explicitly using the ifmtN parameter. Note that not all formats can be streamed in thisway.
• A scheme specification of the form :<scheme-name>:<scheme-args>.• A system command line with either a "<" character at the start, or a "|" character at the
end ("<syscmd" or "syscmd|"). This executes the given pipeline and reads from itsstandard output. This will probably only work on unix-like systems.
In any case, compressed data in one of the supported compression formats (gzip, Unixcompress or bzip2) will be decompressed transparently.
loccol = <colname> (String)Name of a column to be added to the output table which will contain the location (as specifiedin the input parameter(s)) of the input table from which each row originated.
nin = <count> (Integer)The number of input tables for this task. For each of the input tables N there will be associatedparameters ifmtN, inN and icmdN.
ocmd = <cmds> (ProcessingStep[])Specifies processing to be performed on the output table, after all other processing has takenplace. The value of this parameter is one or more of the filter commands described in Section6.1. If more than one is given, they must be separated by semicolon characters (";"). Thisparameter can be repeated multiple times on the same command line to build up a list ofprocessing steps. The sequence of commands given in this way defines the processing pipelinewhich is performed on the table.
Commands may alteratively be supplied in an external file, by using the indirection character'@'. Thus a value of "@filename" causes the file filename to be read for a list of filtercommands to execute. The commands in the file may be separated by newline charactersand/or semicolons, and lines which are blank or which start with a '#' character are ignored.
ofmt = <out-format> (String)Specifies the format in which the output table will be written (one of the ones in Section 5.1.2 -matching is case-insensitive and you can use just the first few letters). If it has the specialvalue "(auto)" (the default), then the output filename will be examined to try to guess whatsort of file is required usually by looking at the extension. If it's not obvious from the filenamewhat output format is intended, an error will result.
This parameter must only be given if omode has its default value of "out".
SUN/256 492
[Default: (auto)]
omode = out|meta|stats|count|checksum|cgi|discard|topcat|samp|plastic|tosql|gui
(ProcessingMode)The mode in which the result table will be output. The default mode is out, which means thatthe result will be written as a new table to disk or elsewhere, as determined by the out andofmt parameters. However, there are other possibilities, which correspond to uses to which atable can be put other than outputting it, such as displaying metadata, calculating statistics, orpopulating a table in an SQL database. For some values of this parameter, additionalparameters (<mode-args>) are required to determine the exact behaviour.
Possible values are
• out
• meta
• stats
• count
• checksum
• cgi
• discard
• topcat
• samp
• plastic
• tosql
• gui
Use the help=omode flag or see Section 6.4 for more information.
[Default: out]
out = <out-table> (TableConsumer)The location of the output table. This is usually a filename to write to. If it is equal to thespecial value "-" (the default) the output table will be written to standard output.
This parameter must only be given if omode has its default value of "out".
[Default: -]
seqcol = <colname> (String)Name of a column to be added to the output table which will contain the sequence number ofthe input table from which each row originated. This column will contain 1 for the rows fromthe first concatenated table, 2 for the second, and so on.
uloccol = <colname> (String)Name of a column to be added to the output table which will contain the unique part of thelocation (as specified in the input parameter(s)) of the input table from which each roworiginated. If not null, parameters will also be added to the output table giving the pre- andpost-fix string common to all the locations. For example, if the input tables are"/data/cat_a1.fits" and "/data/cat_b2.fits" then the output table will contain a new column<colname> which takes the value "a1" for rows from the first table and "b2" for rows from thesecond, and new parameters "<colname>_prefix" and "<colname>_postfix" with the values"/data/cat_" and ".fits" respectively.
B.27.2 Examples
Here are some examples of tcatn:
stilts tcatn nin=2 in1=obs1.fits in2=obs2.fits out=combined.fits
Concatenates two similar observation catalogues to form a combined one. In this case, both
SUN/256 493

input and output tables are FITS files.
stilts tcatn nin=3 omode=stats in1=obs1.txt ifmt1=asciiin2=obs2.xml ifmt2=votablein3=obs3.fit ifmt3=fits
Three catalogues with similar forms but in different data formats are joined. Instead of writingthe result to an output file, the resulting joined catalogue is examined to calculate its statistics,which are written to standard output.
stilts tcatn nin=2 in1=survey.vot.gz ifmt2=csv in2=more_data.csvicmd1='addskycoords fk5 galactic RA2000 DEC2000 GLON GLAT' \icmd1='keepcols "OBJ_ID GLON GLAT"' \icmd2='keepcols "ident gal_long gal_lat"' \loccol=FILENAMEomode=topcat
In this case we are trying to concatenate results from two tables which are quite dissimilar toeach other. In the first place, one is a VOTable (no ifmt1 parameter is required sinceVOTables can be detected automatically), and the other is a comma-separated-values file (forwhich the ifmt2=csv parameter must be given). In the second place, the column structure ofthe two tables may be quite different. By pre-processing the two tables using the icmd1 &icmd2 parameters, we produce in each case an input table which consists of three columns ofcompatible types and meanings: an integer identifier and floating point galactic longitude andlatitude coordinates. The second table contains such columns to start with, but the first tablerequires an initial step to convert FK5 J2000.0 coordinates to galactic ones. tcatn joins thetwo doctored tables together, to produce a table which contains only these three columns, withall the rows from both input tables, and sends the result directly to a new or running instance ofTOPCAT. An additional column named FILENAME is appended to the table before sendingit; this contains "survey.vot.gz" for all the columns from the first table and "more_data.csv" forall the columns from the second one.
B.28 tcopy: Converts between table formats
tcopy is a table copying tool. It simply copies a table from one place to another, but since you canspecify the input and output formats as desired, it works as a converter from any of the supportedinput formats (Section 5.1.1) to any of the supported output formats (Section 5.1.2).
tcopy is just a stripped-down version of tpipe - it doesn't do anything that tpipe can't, but theusage is slightly simplified. It is provided as a drop-in replacement for the old tablecopy
(uk.ac.starlink.table.TableCopy) tool which was supplied with earlier versions of STIL andTOPCAT - it has the same arguments and behaviour as tablecopy, but is implemented somewhatdifferently and will in some cases be more efficient.
B.28.1 Usage
The usage of tcopy is
stilts <stilts-flags> tcopy ifmt=<in-format> ofmt=<out-format>[in=]<table> [out=]<out-table>
If you don't have the stilts script installed, write "java -jar stilts.jar" instead of "stilts" -see Section 3. The available <stilts-flags> are listed in Section 2.1. For programmaticinvocation, the Task class for this command is uk.ac.starlink.ttools.task.TableCopy.
Parameter values are assigned on the command line as explained in Section 2.3. They are asfollows:
SUN/256 494
ifmt = <in-format> (String)Specifies the format of the input table as specified by parameter in. The known formats arelisted in Section 5.1.1. This flag can be used if you know what format your table is in. If it hasthe special value (auto) (the default), then an attempt will be made to detect the format of thetable automatically. This cannot always be done correctly however, in which case the programwill exit with an error explaining which formats were attempted. This parameter is ignored forscheme-specified tables.
[Default: (auto)]
in = <table> (StarTable)The location of the input table. This may take one of the following forms:
• A filename.• A URL.• The special value "-", meaning standard input. In this case the input format must be given
explicitly using the ifmt parameter. Note that not all formats can be streamed in this way.• A scheme specification of the form :<scheme-name>:<scheme-args>.• A system command line with either a "<" character at the start, or a "|" character at the
end ("<syscmd" or "syscmd|"). This executes the given pipeline and reads from itsstandard output. This will probably only work on unix-like systems.
In any case, compressed data in one of the supported compression formats (gzip, Unixcompress or bzip2) will be decompressed transparently.
ofmt = <out-format> (String)Specifies the format in which the output table will be written (one of the ones in Section 5.1.2 -matching is case-insensitive and you can use just the first few letters). If it has the specialvalue "(auto)" (the default), then the output filename will be examined to try to guess whatsort of file is required usually by looking at the extension. If it's not obvious from the filenamewhat output format is intended, an error will result.
[Default: (auto)]
out = <out-table> (TableConsumer)The location of the output table. This is usually a filename to write to. If it is equal to thespecial value "-" (the default) the output table will be written to standard output.
[Default: -]
B.28.2 Examples
Here are some examples of tcopy in use:
stilts tcopy stars.fits stars.xml
Copies a FITS table to a VOTable. Since no input format is specified, the format isautomatically detected (FITS is one of the formats for which this is possible). Since no outputformat is specified, the stars.xml filename is examined to make a guess at the kind of outputto write: the .xml ending is taken to mean a TABLEDATA-encoded VOTable.
stilts tcopy stars.fits stars.xml ifmt=fits ofmt=votable
Does the same as the previous example, but the input and output formats have been specifiedexplicitly.
stilts tcopy ofmt=text http://remote.host/data/vizer.xml.gz#4 -
SUN/256 495
Prints the contents of a remote, compressed VOTable to the terminal in a human-readableform. The #4 at the end of the URL indicates that the data from the fifth TABLE element in theremote document are to be used. The gzip compression of the table is taken care ofautomatically.
stilts tcopy ifmt=csv ofmt=latex spec.csv
Converts a comma-separated values file to a LaTeX table environment, writing the result tostandard output.
stilts -classpath /usr/local/jars/pg73jdbc3.jar \-Djdbc.drivers=org.postgresql.Driver \tcopy in="jdbc:postgresql://localhost/imsim#SELECT ra, dec, Imag FROM dqc" \
ofmt=fits wfslist.cat
Makes an SQL query on a PostgreSQL database and writes the results to a FITS file. Thewhole command is shown here, to show that the classpath is augmented to include thePostgreSQL driver class, and the driver class is named using the jdbc.drivers systemproperty. As you can see, using SQL from Java is a bit fiddly, and there are other ways toperform this setup than on the command line - see Section 3.4 and tpipe's omode=tosql outputmode.
B.29 tcube: Calculates N-dimensional histograms
tcube constructs an N-dimensional histogram, or density map, from N columns of an input table,and writes it out as an N-dimensional data cube. The parameters you supply define which Nnumeric columns of the input table you want to use and the dimensions (bounds and pixel sizes) ofthe output grid, as well as any weighting to be applied to each point and how the weightedquantities in a single bin are to be aggregated together. Each table row then defines a point inN-dimensional space. The program goes through each row, and if the point that row defines fallswithin the bounds of the output grid you have defined, associates the weight value with the relevantpixel in the output grid. When all the input values have been processed, the weights in each pixelare aggregated according to the requested combination method.
The resulting N-dimensional array, whose pixel values represent an aggregation of the rowsassociated with that region of the N-dimensional space, is then written out as a FITS file. In onedimension, this gives you a normal histogram of a given variable. In two dimensions it mighttypically be used to plot the density or weighted density on the sky of objects from a catalogue.
As with some of the other generic table commands, you can perform extensive pre-processing onthe input table by use of the icmd parameter before the actual cube counts are calculated.
B.29.1 Usage
The usage of tcube is
stilts <stilts-flags> tcube cols=<expr> ... ... ifmt=<in-format>istream=true|false icmd=<cmds>bounds=[<lo>]:[<hi>] ... binsizes=<size> ...nbins=<num> ...combine=sum|sum-per-unit|count|count-per-unit|mean|median|min|max|stdev|hitout=<out-file>otype=byte|short|int|long|float|doublescale=<expr>[in=]<table>
If you don't have the stilts script installed, write "java -jar stilts.jar" instead of "stilts" -see Section 3. The available <stilts-flags> are listed in Section 2.1. For programmatic
SUN/256 496
invocation, the Task class for this command is uk.ac.starlink.ttools.task.TableCube.
Parameter values are assigned on the command line as explained in Section 2.3. They are asfollows:
binsizes = <size> ... (String[])Gives the extent of of the data bins (cube pixels) in each dimension in data coordinates. Theform of the value is a space-separated list of values, giving a list of extents for the first, second,... dimension. Either this parameter or the nbins parameter must be supplied.
bounds = [<lo>]:[<hi>] ... (String[])Gives the bounds for each dimension of the cube in data coordinates. The form of the value isa space-separated list of words, each giving an optional lower bound, then a colon, then anoptional upper bound, for instance "1:100 0:20" to represent a range for two-dimensionaloutput between 1 and 100 of the first coordinate (table column) and between 0 and 20 for thesecond. Either or both numbers may be omitted to indicate that the bounds should bedetermined automatically by assessing the range of the data in the table. A null value for theparameter indicates that all bounds should be determined automatically for all the dimensions.
If any of the bounds need to be determined automatically in this way, two passes through thedata will be required, the first to determine bounds and the second to populate the cube.
cols = <expr> ... ... (String[])Columns to use for this task. One or more <expr> elements, separated by spaces, should begiven. Each one represents a numeric value from the table, provided as a column name oralgebraic expression.
The number of columns listed in the value of this parameter defines the dimensionality of theoutput data cube.
combine = sum|sum-per-unit|count|count-per-unit|mean|median|min|max|stdev|hit
(Combiner)Defines how values contributing to the same density map bin are combined together toproduce the value assigned to that bin. Possible values are:
• sum: the sum of all the combined values per bin• sum-per-unit: the sum of all the combined values per unit of bin size• count: the number of non-blank values per bin (weight is ignored)• count-per-unit: the number of non-blank values per unit of bin size (weight is ignored)• mean: the mean of the combined values• median: the median of the combined values (may be slow)• min: the minimum of all the combined values• max: the maximum of all the combined values• stdev: the sample standard deviation of the combined values• hit: 1 if any values present, NaN otherwise (weight is ignored)
[Default: sum]
icmd = <cmds> (ProcessingStep[])Specifies processing to be performed on the input table as specified by parameter in, beforeany other processing has taken place. The value of this parameter is one or more of the filtercommands described in Section 6.1. If more than one is given, they must be separated bysemicolon characters (";"). This parameter can be repeated multiple times on the samecommand line to build up a list of processing steps. The sequence of commands given in thisway defines the processing pipeline which is performed on the table.
Commands may alteratively be supplied in an external file, by using the indirection character'@'. Thus a value of "@filename" causes the file filename to be read for a list of filtercommands to execute. The commands in the file may be separated by newline characters
SUN/256 497
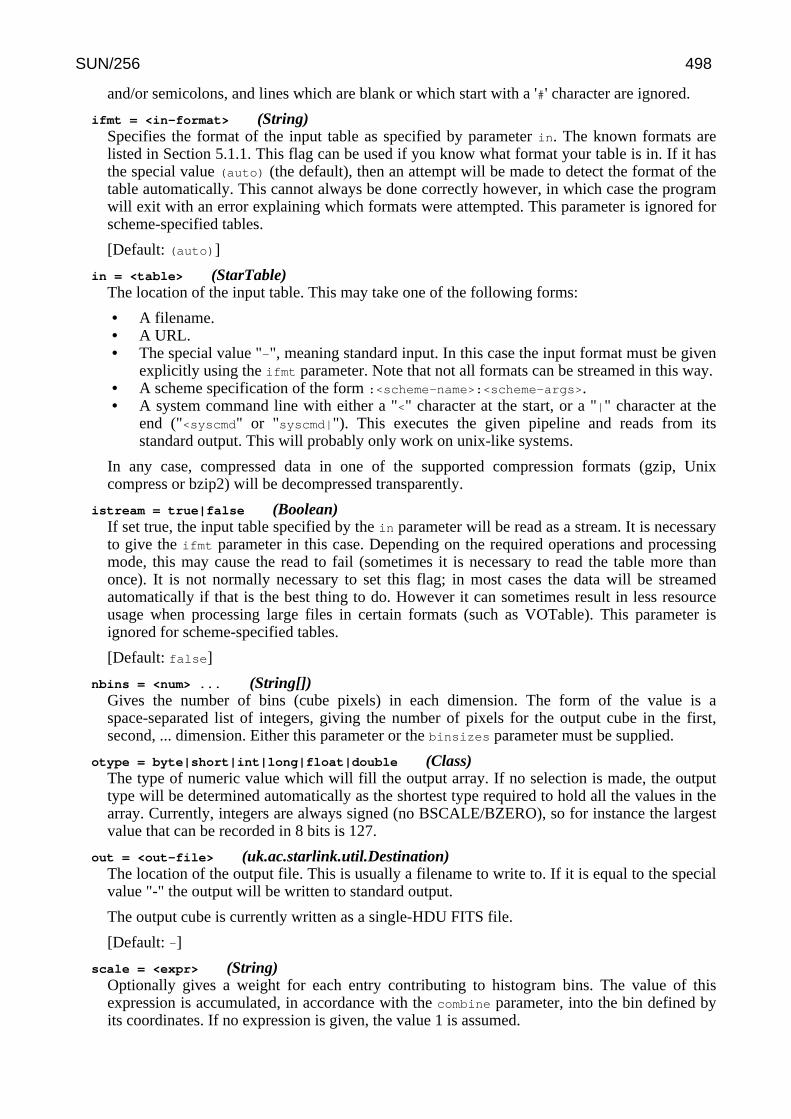
and/or semicolons, and lines which are blank or which start with a '#' character are ignored.
ifmt = <in-format> (String)Specifies the format of the input table as specified by parameter in. The known formats arelisted in Section 5.1.1. This flag can be used if you know what format your table is in. If it hasthe special value (auto) (the default), then an attempt will be made to detect the format of thetable automatically. This cannot always be done correctly however, in which case the programwill exit with an error explaining which formats were attempted. This parameter is ignored forscheme-specified tables.
[Default: (auto)]
in = <table> (StarTable)The location of the input table. This may take one of the following forms:
• A filename.• A URL.• The special value "-", meaning standard input. In this case the input format must be given
explicitly using the ifmt parameter. Note that not all formats can be streamed in this way.• A scheme specification of the form :<scheme-name>:<scheme-args>.• A system command line with either a "<" character at the start, or a "|" character at the
end ("<syscmd" or "syscmd|"). This executes the given pipeline and reads from itsstandard output. This will probably only work on unix-like systems.
In any case, compressed data in one of the supported compression formats (gzip, Unixcompress or bzip2) will be decompressed transparently.
istream = true|false (Boolean)If set true, the input table specified by the in parameter will be read as a stream. It is necessaryto give the ifmt parameter in this case. Depending on the required operations and processingmode, this may cause the read to fail (sometimes it is necessary to read the table more thanonce). It is not normally necessary to set this flag; in most cases the data will be streamedautomatically if that is the best thing to do. However it can sometimes result in less resourceusage when processing large files in certain formats (such as VOTable). This parameter isignored for scheme-specified tables.
[Default: false]
nbins = <num> ... (String[])Gives the number of bins (cube pixels) in each dimension. The form of the value is aspace-separated list of integers, giving the number of pixels for the output cube in the first,second, ... dimension. Either this parameter or the binsizes parameter must be supplied.
otype = byte|short|int|long|float|double (Class)The type of numeric value which will fill the output array. If no selection is made, the outputtype will be determined automatically as the shortest type required to hold all the values in thearray. Currently, integers are always signed (no BSCALE/BZERO), so for instance the largestvalue that can be recorded in 8 bits is 127.
out = <out-file> (uk.ac.starlink.util.Destination)The location of the output file. This is usually a filename to write to. If it is equal to the specialvalue "-" the output will be written to standard output.
The output cube is currently written as a single-HDU FITS file.
[Default: -]
scale = <expr> (String)Optionally gives a weight for each entry contributing to histogram bins. The value of thisexpression is accumulated, in accordance with the combine parameter, into the bin defined byits coordinates. If no expression is given, the value 1 is assumed.
SUN/256 498
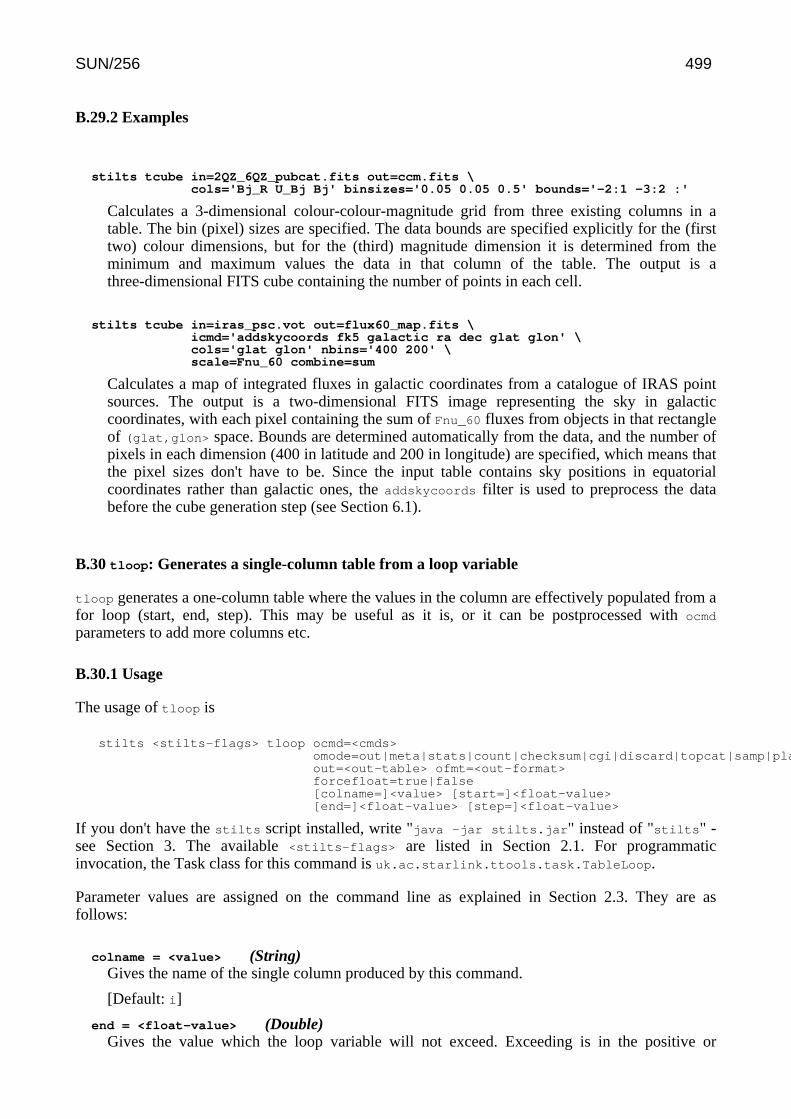
B.29.2 Examples
stilts tcube in=2QZ_6QZ_pubcat.fits out=ccm.fits \cols='Bj_R U_Bj Bj' binsizes='0.05 0.05 0.5' bounds='-2:1 -3:2 :'
Calculates a 3-dimensional colour-colour-magnitude grid from three existing columns in atable. The bin (pixel) sizes are specified. The data bounds are specified explicitly for the (firsttwo) colour dimensions, but for the (third) magnitude dimension it is determined from theminimum and maximum values the data in that column of the table. The output is athree-dimensional FITS cube containing the number of points in each cell.
stilts tcube in=iras_psc.vot out=flux60_map.fits \icmd='addskycoords fk5 galactic ra dec glat glon' \cols='glat glon' nbins='400 200' \scale=Fnu_60 combine=sum
Calculates a map of integrated fluxes in galactic coordinates from a catalogue of IRAS pointsources. The output is a two-dimensional FITS image representing the sky in galacticcoordinates, with each pixel containing the sum of Fnu_60 fluxes from objects in that rectangleof (glat,glon> space. Bounds are determined automatically from the data, and the number ofpixels in each dimension (400 in latitude and 200 in longitude) are specified, which means thatthe pixel sizes don't have to be. Since the input table contains sky positions in equatorialcoordinates rather than galactic ones, the addskycoords filter is used to preprocess the databefore the cube generation step (see Section 6.1).
B.30 tloop: Generates a single-column table from a loop variable
tloop generates a one-column table where the values in the column are effectively populated from afor loop (start, end, step). This may be useful as it is, or it can be postprocessed with ocmd
parameters to add more columns etc.
B.30.1 Usage
The usage of tloop is
stilts <stilts-flags> tloop ocmd=<cmds>omode=out|meta|stats|count|checksum|cgi|discard|topcat|samp|plastic|tosql|guiout=<out-table> ofmt=<out-format>forcefloat=true|false[colname=]<value> [start=]<float-value>[end=]<float-value> [step=]<float-value>
If you don't have the stilts script installed, write "java -jar stilts.jar" instead of "stilts" -see Section 3. The available <stilts-flags> are listed in Section 2.1. For programmaticinvocation, the Task class for this command is uk.ac.starlink.ttools.task.TableLoop.
Parameter values are assigned on the command line as explained in Section 2.3. They are asfollows:
colname = <value> (String)Gives the name of the single column produced by this command.
[Default: i]
end = <float-value> (Double)Gives the value which the loop variable will not exceed. Exceeding is in the positive or
SUN/256 499
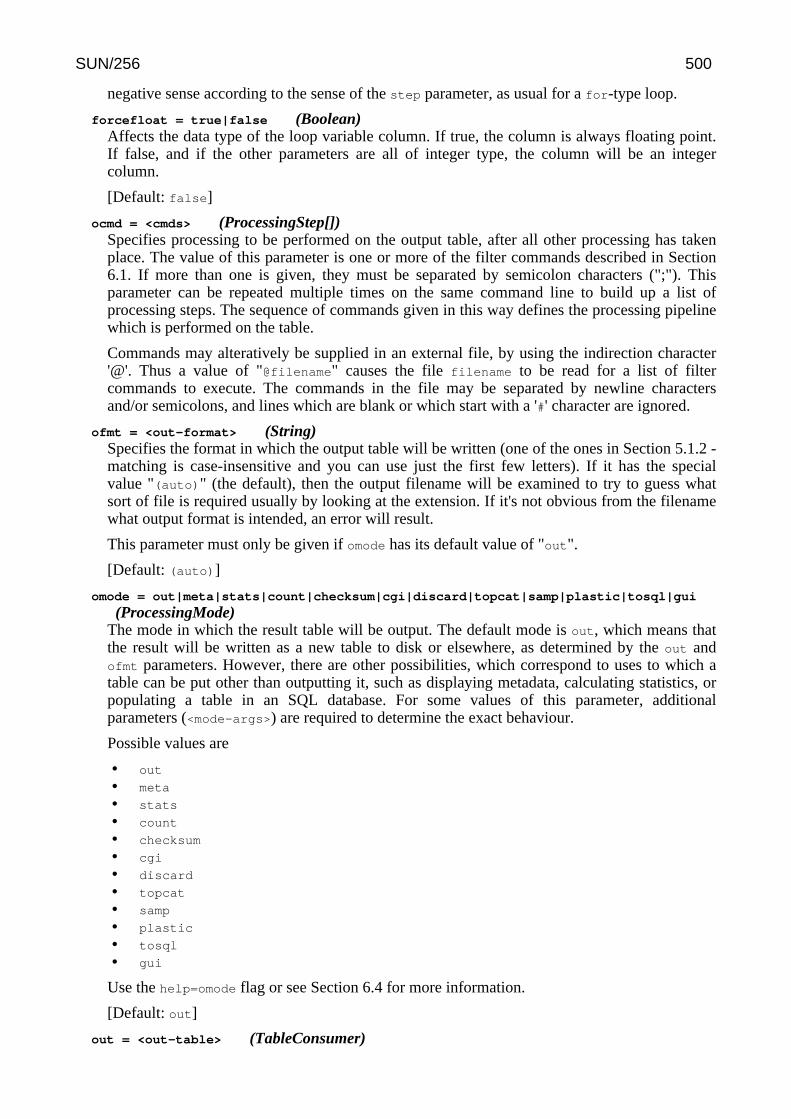
negative sense according to the sense of the step parameter, as usual for a for-type loop.
forcefloat = true|false (Boolean)Affects the data type of the loop variable column. If true, the column is always floating point.If false, and if the other parameters are all of integer type, the column will be an integercolumn.
[Default: false]
ocmd = <cmds> (ProcessingStep[])Specifies processing to be performed on the output table, after all other processing has takenplace. The value of this parameter is one or more of the filter commands described in Section6.1. If more than one is given, they must be separated by semicolon characters (";"). Thisparameter can be repeated multiple times on the same command line to build up a list ofprocessing steps. The sequence of commands given in this way defines the processing pipelinewhich is performed on the table.
Commands may alteratively be supplied in an external file, by using the indirection character'@'. Thus a value of "@filename" causes the file filename to be read for a list of filtercommands to execute. The commands in the file may be separated by newline charactersand/or semicolons, and lines which are blank or which start with a '#' character are ignored.
ofmt = <out-format> (String)Specifies the format in which the output table will be written (one of the ones in Section 5.1.2 -matching is case-insensitive and you can use just the first few letters). If it has the specialvalue "(auto)" (the default), then the output filename will be examined to try to guess whatsort of file is required usually by looking at the extension. If it's not obvious from the filenamewhat output format is intended, an error will result.
This parameter must only be given if omode has its default value of "out".
[Default: (auto)]
omode = out|meta|stats|count|checksum|cgi|discard|topcat|samp|plastic|tosql|gui
(ProcessingMode)The mode in which the result table will be output. The default mode is out, which means thatthe result will be written as a new table to disk or elsewhere, as determined by the out andofmt parameters. However, there are other possibilities, which correspond to uses to which atable can be put other than outputting it, such as displaying metadata, calculating statistics, orpopulating a table in an SQL database. For some values of this parameter, additionalparameters (<mode-args>) are required to determine the exact behaviour.
Possible values are
• out
• meta
• stats
• count
• checksum
• cgi
• discard
• topcat
• samp
• plastic
• tosql
• gui
Use the help=omode flag or see Section 6.4 for more information.
[Default: out]
out = <out-table> (TableConsumer)
SUN/256 500
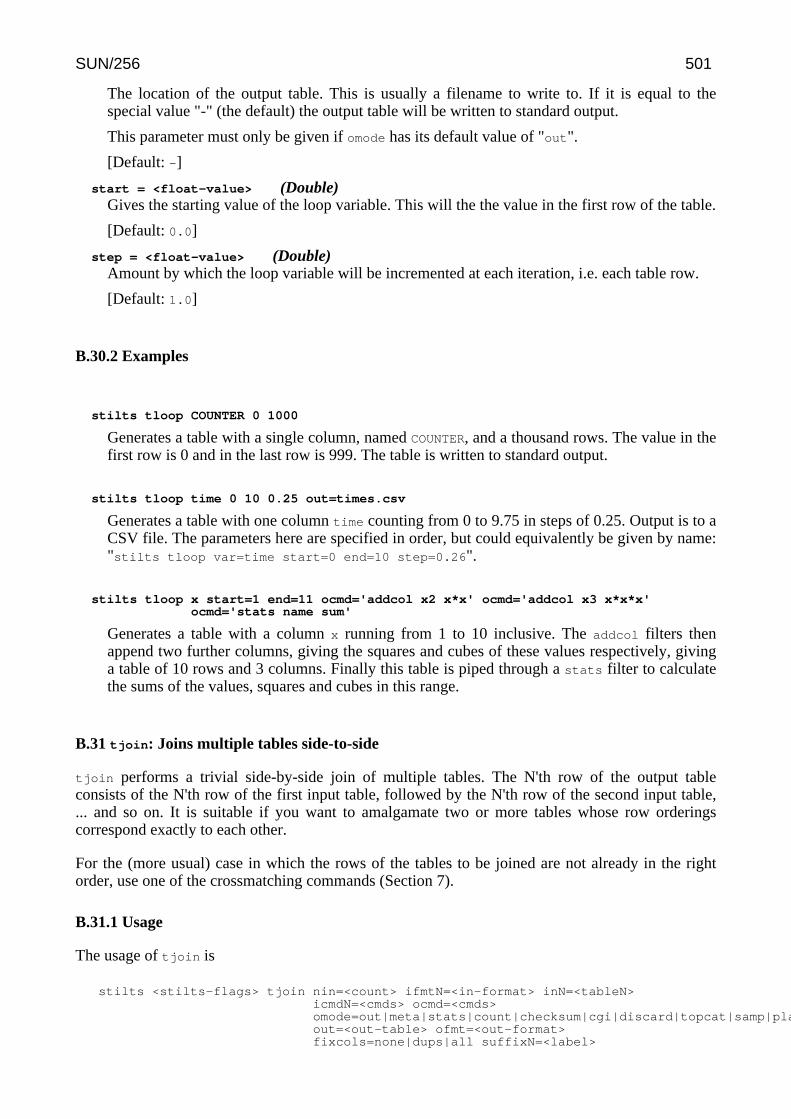
The location of the output table. This is usually a filename to write to. If it is equal to thespecial value "-" (the default) the output table will be written to standard output.
This parameter must only be given if omode has its default value of "out".
[Default: -]
start = <float-value> (Double)Gives the starting value of the loop variable. This will the the value in the first row of the table.
[Default: 0.0]
step = <float-value> (Double)Amount by which the loop variable will be incremented at each iteration, i.e. each table row.
[Default: 1.0]
B.30.2 Examples
stilts tloop COUNTER 0 1000
Generates a table with a single column, named COUNTER, and a thousand rows. The value in thefirst row is 0 and in the last row is 999. The table is written to standard output.
stilts tloop time 0 10 0.25 out=times.csv
Generates a table with one column time counting from 0 to 9.75 in steps of 0.25. Output is to aCSV file. The parameters here are specified in order, but could equivalently be given by name:"stilts tloop var=time start=0 end=10 step=0.26".
stilts tloop x start=1 end=11 ocmd='addcol x2 x*x' ocmd='addcol x3 x*x*x'ocmd='stats name sum'
Generates a table with a column x running from 1 to 10 inclusive. The addcol filters thenappend two further columns, giving the squares and cubes of these values respectively, givinga table of 10 rows and 3 columns. Finally this table is piped through a stats filter to calculatethe sums of the values, squares and cubes in this range.
B.31 tjoin: Joins multiple tables side-to-side
tjoin performs a trivial side-by-side join of multiple tables. The N'th row of the output tableconsists of the N'th row of the first input table, followed by the N'th row of the second input table,... and so on. It is suitable if you want to amalgamate two or more tables whose row orderingscorrespond exactly to each other.
For the (more usual) case in which the rows of the tables to be joined are not already in the rightorder, use one of the crossmatching commands (Section 7).
B.31.1 Usage
The usage of tjoin is
stilts <stilts-flags> tjoin nin=<count> ifmtN=<in-format> inN=<tableN>icmdN=<cmds> ocmd=<cmds>omode=out|meta|stats|count|checksum|cgi|discard|topcat|samp|plastic|tosql|guiout=<out-table> ofmt=<out-format>fixcols=none|dups|all suffixN=<label>
SUN/256 501
If you don't have the stilts script installed, write "java -jar stilts.jar" instead of "stilts" -see Section 3. The available <stilts-flags> are listed in Section 2.1. For programmaticinvocation, the Task class for this command is uk.ac.starlink.ttools.task.TableJoinN.
Parameter values are assigned on the command line as explained in Section 2.3. They are asfollows:
fixcols = none|dups|all (Fixer)Determines how input columns are renamed before use in the output table. The choices are:
• none: columns are not renamed• dups: columns which would otherwise have duplicate names in the output will be
renamed to indicate which table they came from• all: all columns will be renamed to indicate which table they came from
If columns are renamed, the new ones are determined by suffix* parameters.
[Default: dups]
icmdN = <cmds> (ProcessingStep[])Specifies processing to be performed on input table #N as specified by parameter inN, beforeany other processing has taken place. The value of this parameter is one or more of the filtercommands described in Section 6.1. If more than one is given, they must be separated bysemicolon characters (";"). This parameter can be repeated multiple times on the samecommand line to build up a list of processing steps. The sequence of commands given in thisway defines the processing pipeline which is performed on the table.
Commands may alteratively be supplied in an external file, by using the indirection character'@'. Thus a value of "@filename" causes the file filename to be read for a list of filtercommands to execute. The commands in the file may be separated by newline charactersand/or semicolons, and lines which are blank or which start with a '#' character are ignored.
ifmtN = <in-format> (String)Specifies the format of input table #N as specified by parameter inN. The known formats arelisted in Section 5.1.1. This flag can be used if you know what format your table is in. If it hasthe special value (auto) (the default), then an attempt will be made to detect the format of thetable automatically. This cannot always be done correctly however, in which case the programwill exit with an error explaining which formats were attempted. This parameter is ignored forscheme-specified tables.
[Default: (auto)]
inN = <tableN> (StarTable)The location of input table #N. This may take one of the following forms:
• A filename.• A URL.• The special value "-", meaning standard input. In this case the input format must be given
explicitly using the ifmtN parameter. Note that not all formats can be streamed in thisway.
• A scheme specification of the form :<scheme-name>:<scheme-args>.• A system command line with either a "<" character at the start, or a "|" character at the
end ("<syscmd" or "syscmd|"). This executes the given pipeline and reads from itsstandard output. This will probably only work on unix-like systems.
In any case, compressed data in one of the supported compression formats (gzip, Unixcompress or bzip2) will be decompressed transparently.
nin = <count> (Integer)The number of input tables for this task. For each of the input tables N there will be associated
SUN/256 502

parameters ifmtN, inN and icmdN.
ocmd = <cmds> (ProcessingStep[])Specifies processing to be performed on the output table, after all other processing has takenplace. The value of this parameter is one or more of the filter commands described in Section6.1. If more than one is given, they must be separated by semicolon characters (";"). Thisparameter can be repeated multiple times on the same command line to build up a list ofprocessing steps. The sequence of commands given in this way defines the processing pipelinewhich is performed on the table.
Commands may alteratively be supplied in an external file, by using the indirection character'@'. Thus a value of "@filename" causes the file filename to be read for a list of filtercommands to execute. The commands in the file may be separated by newline charactersand/or semicolons, and lines which are blank or which start with a '#' character are ignored.
ofmt = <out-format> (String)Specifies the format in which the output table will be written (one of the ones in Section 5.1.2 -matching is case-insensitive and you can use just the first few letters). If it has the specialvalue "(auto)" (the default), then the output filename will be examined to try to guess whatsort of file is required usually by looking at the extension. If it's not obvious from the filenamewhat output format is intended, an error will result.
This parameter must only be given if omode has its default value of "out".
[Default: (auto)]
omode = out|meta|stats|count|checksum|cgi|discard|topcat|samp|plastic|tosql|gui
(ProcessingMode)The mode in which the result table will be output. The default mode is out, which means thatthe result will be written as a new table to disk or elsewhere, as determined by the out andofmt parameters. However, there are other possibilities, which correspond to uses to which atable can be put other than outputting it, such as displaying metadata, calculating statistics, orpopulating a table in an SQL database. For some values of this parameter, additionalparameters (<mode-args>) are required to determine the exact behaviour.
Possible values are
• out
• meta
• stats
• count
• checksum
• cgi
• discard
• topcat
• samp
• plastic
• tosql
• gui
Use the help=omode flag or see Section 6.4 for more information.
[Default: out]
out = <out-table> (TableConsumer)The location of the output table. This is usually a filename to write to. If it is equal to thespecial value "-" (the default) the output table will be written to standard output.
This parameter must only be given if omode has its default value of "out".
[Default: -]
suffixN = <label> (String)
SUN/256 503

If the fixcols parameter is set so that input columns are renamed for insertion into the outputtable, this parameter determines how the renaming is done. It gives a suffix which is appendedto all renamed columns from table N.
[Default: _N]
B.31.2 Examples
Here are some examples of using tjoin:
stilts tjoin nin=2 in1=positions.fit in2=fluxes.fits out=combined.fits
Takes two input FITS files and sticks them together side by side, writing the result as a thirdFITS file. The output will have the same number of rows as each of the input catalogues, and anumber of columns equal to the sum of those in the two input catalogues.
stilts tjoin nin=3 fixcols=all \ifmt1=ascii in1=t1.txt suffix1=_T1 \ifmt2=ascii in2=t2.txt suffix2=_T2 \ifmt3=ascii in3=t3.txt suffix3=_T3 \ocmd='select FLAG_T1==0' \omode=stats
This joins three ascii tables together. Each column of the output table is renamed by appendinga string to it ("_T1" for the first table, "_T2" for the second...). Only those rows of the outputfor which the FLAG column in the first input table, and hence the FLAG_T1 column in theoutput table, have the value zero are selected. Statistics are calculated for all the columns ofthese selected rows, and written to the output.
B.32 tmatch1: Performs a crossmatch internal to a single table
tmatch1 performs efficient and flexible crossmatching between the rows of a single table. It canmatch rows on the basis of their relative position in the sky, or alternatively using many othercriteria such as separation in in some isotropic or anisotropic Cartesian space, identity of a keyvalue, or some combination of these; the full range of match criteria is dicussed in Section 7.1.
The basic task performed by the intra-table matcher is to identify groups of rows within the tablewhich match each other. See Section 7.2 for an explanation of exactly what consitutes a matchgroup. The result of identifying these groups is expressed as an output table in one of a variety ofways, specified by the action parameter. These options include marking group membership inadded columns and eliminating some or all rows which form part of a match group.
B.32.1 Usage
The usage of tmatch1 is
stilts <stilts-flags> tmatch1 matcher=<matcher-name> params=<match-params>tuning=<tuning-params> values=<expr-list>action=identify|keep0|keep1|wide2|wideNprogress=none|log|profile ifmt=<in-format>istream=true|false icmd=<cmds> ocmd=<cmds>omode=out|meta|stats|count|checksum|cgi|discard|topcat|samp|plastic|tosql|guiout=<out-table> ofmt=<out-format>[in=]<table>
If you don't have the stilts script installed, write "java -jar stilts.jar" instead of "stilts" -see Section 3. The available <stilts-flags> are listed in Section 2.1. For programmaticinvocation, the Task class for this command is uk.ac.starlink.ttools.task.TableMatch1.
SUN/256 504
Parameter values are assigned on the command line as explained in Section 2.3. They are asfollows:
action = identify|keep0|keep1|wide2|wideN (Match1Type)Determines the form of the table which will be output as a result of the internal match.
• identify: The output table is the same as the input table except that it contains twoadditional columns, GroupID and GroupSize, following the input columns. Each group ofrows which matched is assigned a unique integer, recorded in the GroupID column, andthe size of each group is recorded in the GroupSize column. Rows which don't match anyothers (singles) have null values in both these columns.
• keep0: The result is a new table containing only "single" rows, that is ones which don'tmatch any other rows in the table. Any other rows are thrown out.
• keep1: The result is a new table in which only one row (the first in the input table order)from each group of matching ones is retained. A subsequent intra-table match with thesame criteria would therefore show no matches.
• wideN: The result is a new "wide" table consisting of matched rows in the input tablestacked next to each other. Only groups of exactly N rows in the input table are used toform the output table; each row of the output table consists of the columns of the firstgroup member, followed by the columns of the second group member and so on. Theoutput table therefore has N times as many columns as the input table. The column namesin the new table have _1, _2, ... appended to them to avoid duplication.
[Default: identify]
icmd = <cmds> (ProcessingStep[])Specifies processing to be performed on the input table as specified by parameter in, beforeany other processing has taken place. The value of this parameter is one or more of the filtercommands described in Section 6.1. If more than one is given, they must be separated bysemicolon characters (";"). This parameter can be repeated multiple times on the samecommand line to build up a list of processing steps. The sequence of commands given in thisway defines the processing pipeline which is performed on the table.
Commands may alteratively be supplied in an external file, by using the indirection character'@'. Thus a value of "@filename" causes the file filename to be read for a list of filtercommands to execute. The commands in the file may be separated by newline charactersand/or semicolons, and lines which are blank or which start with a '#' character are ignored.
ifmt = <in-format> (String)Specifies the format of the input table as specified by parameter in. The known formats arelisted in Section 5.1.1. This flag can be used if you know what format your table is in. If it hasthe special value (auto) (the default), then an attempt will be made to detect the format of thetable automatically. This cannot always be done correctly however, in which case the programwill exit with an error explaining which formats were attempted. This parameter is ignored forscheme-specified tables.
[Default: (auto)]
in = <table> (StarTable)The location of the input table. This may take one of the following forms:
• A filename.• A URL.• The special value "-", meaning standard input. In this case the input format must be given
explicitly using the ifmt parameter. Note that not all formats can be streamed in this way.• A scheme specification of the form :<scheme-name>:<scheme-args>.• A system command line with either a "<" character at the start, or a "|" character at the
end ("<syscmd" or "syscmd|"). This executes the given pipeline and reads from its
SUN/256 505
standard output. This will probably only work on unix-like systems.
In any case, compressed data in one of the supported compression formats (gzip, Unixcompress or bzip2) will be decompressed transparently.
istream = true|false (Boolean)If set true, the input table specified by the in parameter will be read as a stream. It is necessaryto give the ifmt parameter in this case. Depending on the required operations and processingmode, this may cause the read to fail (sometimes it is necessary to read the table more thanonce). It is not normally necessary to set this flag; in most cases the data will be streamedautomatically if that is the best thing to do. However it can sometimes result in less resourceusage when processing large files in certain formats (such as VOTable). This parameter isignored for scheme-specified tables.
[Default: false]
matcher = <matcher-name> (MatchEngine)Defines the nature of the matching that will be performed. Depending on the name supplied,this may be positional matching using celestial or Cartesian coordinates, exact matching on thevalue of a string column, or other things. A list and explanation of the available matchingalgorithms is given in Section 7.1. The value supplied for this parameter determines themeanings of the values required by the params, values* and tuning parameter(s).
[Default: sky]
ocmd = <cmds> (ProcessingStep[])Specifies processing to be performed on the output table, after all other processing has takenplace. The value of this parameter is one or more of the filter commands described in Section6.1. If more than one is given, they must be separated by semicolon characters (";"). Thisparameter can be repeated multiple times on the same command line to build up a list ofprocessing steps. The sequence of commands given in this way defines the processing pipelinewhich is performed on the table.
Commands may alteratively be supplied in an external file, by using the indirection character'@'. Thus a value of "@filename" causes the file filename to be read for a list of filtercommands to execute. The commands in the file may be separated by newline charactersand/or semicolons, and lines which are blank or which start with a '#' character are ignored.
ofmt = <out-format> (String)Specifies the format in which the output table will be written (one of the ones in Section 5.1.2 -matching is case-insensitive and you can use just the first few letters). If it has the specialvalue "(auto)" (the default), then the output filename will be examined to try to guess whatsort of file is required usually by looking at the extension. If it's not obvious from the filenamewhat output format is intended, an error will result.
This parameter must only be given if omode has its default value of "out".
[Default: (auto)]
omode = out|meta|stats|count|checksum|cgi|discard|topcat|samp|plastic|tosql|gui
(ProcessingMode)The mode in which the result table will be output. The default mode is out, which means thatthe result will be written as a new table to disk or elsewhere, as determined by the out andofmt parameters. However, there are other possibilities, which correspond to uses to which atable can be put other than outputting it, such as displaying metadata, calculating statistics, orpopulating a table in an SQL database. For some values of this parameter, additionalparameters (<mode-args>) are required to determine the exact behaviour.
Possible values are
• out
• meta
SUN/256 506
• stats
• count
• checksum
• cgi
• discard
• topcat
• samp
• plastic
• tosql
• gui
Use the help=omode flag or see Section 6.4 for more information.
[Default: out]
out = <out-table> (TableConsumer)The location of the output table. This is usually a filename to write to. If it is equal to thespecial value "-" (the default) the output table will be written to standard output.
This parameter must only be given if omode has its default value of "out".
[Default: -]
params = <match-params> (String[])Determines the parameters of this match. This is typically one or more tolerances such as errorradii. It may contain zero or more values; the values that are required depend on the matchtype selected by the matcher parameter. If it contains multiple values, they must be separatedby spaces; values which contain a space can be 'quoted' or "quoted".
progress = none|log|profile (String)Determines whether information on progress of the match should be output to the standarderror stream as it progresses. For lengthy matches this is a useful reassurance and can giveguidance about how much longer it will take. It can also be useful as a performance diagnostic.
The options are:
• none: no progress is shown• log: progress information is shown• profile: progress information and limited time/memory profiling information are shown
[Default: log]
tuning = <tuning-params> (String[])Tuning values for the matching process, if appropriate. It may contain zero or more values; thevalues that are permitted depend on the match type selected by the matcher parameter. If itcontains multiple values, they must be separated by spaces; values which contain a space canbe 'quoted' or "quoted". If this optional parameter is not supplied, sensible defaults will bechosen.
values = <expr-list> (String[])Defines the values from the input table which are used to determine whether a match hasoccurred. These will typically be coordinate values such as RA and Dec and perhaps someper-row error values as well, though exactly what values are required is determined by the kindof match as determined by matcher. Depending on the kind of match, the number and type ofthe values required will be different. Multiple values should be separated by whitespace; ifwhitespace occurs within a single value it must be 'quoted' or "quoted". Elements of theexpression list are commonly just column names, but may be algebraic expressions calculatedfrom zero or more columns as explained in Section 10.
B.32.2 Examples
SUN/256 507
Here are some examples of using tmatch1:
stilts tmatch1 matcher=sky values="RA2000 DE2000" params=20 \action=keep0 in=crowded.vot out=sparse.vot
Copies an input catalogue "crowded.vot" to an output catalogue "sparse.vot", but omitting anyobjects (rows) which are within 20 arcsec of other objects. The output catalogue will containno near neighbours.
stilts tmatch1 matcher=skyerr values="RA2000 DE2000 RADIUS*4" params=40 \action=keep0 in=crowded.vot out=sparse.vot
This is similar to the previous example, but uses the skyerr matcher which determines theproximity threshold on a row-by-row basis from values in the table - in this case 4 times thevalue of the RADIUS column (this value must be in arc seconds). The params=40 value doesnot affect the result, but it gives the algorithm an idea of the rough scale of object separation.
stilts tmatch1 matcher=3d values="XPIX YPIX ZPIX" params=10 action=identify \in=state.fit ocmd='select GroupSize>3' out=groups3+.fit
Uses the "3d" matcher to identify groups of objects in terms of their proximity in a3-dimensional Cartesian space, with positions given by the XPIX, YPIX and ZPIX columns inthe input table. The action=identify parameter means that the input table is written out withthe same rows, but with additional columns indicating which rows are associated with eachother. One of these columns, "GroupSize" gives the number of objects in each group. Thepostprocessing filter ocmd='select GroupSize>3' selects only those rows which are part ofgroups of three objects or larger; singletons and pairs are discarded before writing the outputfile.
stilts tmatch1 matcher=sky values="ra dec" params=3 action=wide2 \ocmd='keepcols "id_1 ra_1 dec_1 id_2 ra_2 dec_2"'in=galaxy.fits out=binaries.txt ofmt=ascii
Identifies pairs of objects within 3 arcsec of each other from an input catalogue. Singles, andgroups of three or more, will be discarded. The output table generated is a double-widthversion of the input table with pairs of objects next to each other on the same row. Here, theocmd post-processing filter discards all of the columns except the identifiers and sky positionsfor each object. The output is to a text file.
B.33 tmatch2: Crossmatches 2 tables using flexible criteria
tmatch2 is an efficient and highly configurable tool for crossmatching pairs of tables. It can matchrows between tables on the basis of their relative position in the sky, or alternatively using manyother criteria such as separation in some isotropic or anisotropic Cartesian space, identity of a keyvalue, or some combination of these; the full range of match criteria is discussed in Section 7.1.You can choose whether you want to identify all the matches or only the closest, and what form theoutput table takes, for instance matched rows only, or all rows from one or both tables, or only theunmatched rows.
If you simply want to match two tables based on sky position with a fixed maximum separation,you may find the tskymatch2 command easier to use.
Note: the duptag1 and duptag2 parameters have been replaced at version 1.4 by suffix1 andsuffix2 for consistency with other table join tasks.
B.33.1 Usage
SUN/256 508
The usage of tmatch2 is
stilts <stilts-flags> tmatch2 ifmt1=<in-format> ifmt2=<in-format>icmd1=<cmds> icmd2=<cmds> ocmd=<cmds>omode=out|meta|stats|count|checksum|cgi|discard|topcat|samp|plastic|tosql|guiout=<out-table> ofmt=<out-format>matcher=<matcher-name> values1=<expr-list>values2=<expr-list> params=<match-params>tuning=<tuning-params>join=1and2|1or2|all1|all2|1not2|2not1|1xor2find=all|best|best1|best2fixcols=none|dups|all suffix1=<label>suffix2=<label> scorecol=<col-name>progress=none|log|profile[in1=]<table1> [in2=]<table2>
If you don't have the stilts script installed, write "java -jar stilts.jar" instead of "stilts" -see Section 3. The available <stilts-flags> are listed in Section 2.1. For programmaticinvocation, the Task class for this command is uk.ac.starlink.ttools.task.TableMatch2.
Parameter values are assigned on the command line as explained in Section 2.3. They are asfollows:
find = all|best|best1|best2 (PairMode)Determines what happens when a row in one table can be matched by more than one row inthe other table. The options are:
• all: All matches. Every match between the two tables is included in the result. Rowsfrom both of the input tables may appear multiple times in the result.
• best: Best match, symmetric. The best pairs are selected in a way which treats the twotables symmetrically. Any input row which appears in one result pair is disqualified fromappearing in any other result pair, so each row from both input tables will appear in atmost one row in the result.
• best1: Best match for each Table 1 row. For each row in table 1, only the best matchfrom table 2 will appear in the result. Each row from table 1 will appear a maximum ofonce in the result, but rows from table 2 may appear multiple times.
• best2: Best match for each Table 2 row. For each row in table 2, only the best matchfrom table 1 will appear in the result. Each row from table 2 will appear a maximum ofonce in the result, but rows from table 1 may appear multiple times.
The differences between best, best1 and best2 are a bit subtle. In cases where it's obviouswhich object in each table is the best match for which object in the other, choosing betwenthese options will not affect the result. However, in crowded fields (where the distancebetween objects within one or both tables is typically similar to or smaller than the specifiedmatch radius) it will make a difference. In this case one of the asymmetric options (best1 orbest2) is usually more appropriate than best, but you'll have to think about which of themsuits your requirements. The performance (time and memory usage) of the match may alsodiffer between these options, especially if one table is much bigger than the other.
[Default: best]
fixcols = none|dups|all (Fixer)Determines how input columns are renamed before use in the output table. The choices are:
• none: columns are not renamed• dups: columns which would otherwise have duplicate names in the output will be
renamed to indicate which table they came from• all: all columns will be renamed to indicate which table they came from
If columns are renamed, the new ones are determined by suffix* parameters.
[Default: dups]
SUN/256 509
icmd1 = <cmds> (ProcessingStep[])Specifies processing to be performed on the first input table as specified by parameter in1,before any other processing has taken place. The value of this parameter is one or more of thefilter commands described in Section 6.1. If more than one is given, they must be separated bysemicolon characters (";"). This parameter can be repeated multiple times on the samecommand line to build up a list of processing steps. The sequence of commands given in thisway defines the processing pipeline which is performed on the table.
Commands may alteratively be supplied in an external file, by using the indirection character'@'. Thus a value of "@filename" causes the file filename to be read for a list of filtercommands to execute. The commands in the file may be separated by newline charactersand/or semicolons, and lines which are blank or which start with a '#' character are ignored.
icmd2 = <cmds> (ProcessingStep[])Specifies processing to be performed on the second input table as specified by parameter in2,before any other processing has taken place. The value of this parameter is one or more of thefilter commands described in Section 6.1. If more than one is given, they must be separated bysemicolon characters (";"). This parameter can be repeated multiple times on the samecommand line to build up a list of processing steps. The sequence of commands given in thisway defines the processing pipeline which is performed on the table.
Commands may alteratively be supplied in an external file, by using the indirection character'@'. Thus a value of "@filename" causes the file filename to be read for a list of filtercommands to execute. The commands in the file may be separated by newline charactersand/or semicolons, and lines which are blank or which start with a '#' character are ignored.
ifmt1 = <in-format> (String)Specifies the format of the first input table as specified by parameter in1. The known formatsare listed in Section 5.1.1. This flag can be used if you know what format your table is in. If ithas the special value (auto) (the default), then an attempt will be made to detect the format ofthe table automatically. This cannot always be done correctly however, in which case theprogram will exit with an error explaining which formats were attempted. This parameter isignored for scheme-specified tables.
[Default: (auto)]
ifmt2 = <in-format> (String)Specifies the format of the second input table as specified by parameter in2. The knownformats are listed in Section 5.1.1. This flag can be used if you know what format your table isin. If it has the special value (auto) (the default), then an attempt will be made to detect theformat of the table automatically. This cannot always be done correctly however, in whichcase the program will exit with an error explaining which formats were attempted. Thisparameter is ignored for scheme-specified tables.
[Default: (auto)]
in1 = <table1> (StarTable)The location of the first input table. This may take one of the following forms:
• A filename.• A URL.• The special value "-", meaning standard input. In this case the input format must be given
explicitly using the ifmt1 parameter. Note that not all formats can be streamed in thisway.
• A scheme specification of the form :<scheme-name>:<scheme-args>.• A system command line with either a "<" character at the start, or a "|" character at the
end ("<syscmd" or "syscmd|"). This executes the given pipeline and reads from itsstandard output. This will probably only work on unix-like systems.
In any case, compressed data in one of the supported compression formats (gzip, Unixcompress or bzip2) will be decompressed transparently.
SUN/256 510
in2 = <table2> (StarTable)The location of the second input table. This may take one of the following forms:
• A filename.• A URL.• The special value "-", meaning standard input. In this case the input format must be given
explicitly using the ifmt2 parameter. Note that not all formats can be streamed in thisway.
• A scheme specification of the form :<scheme-name>:<scheme-args>.• A system command line with either a "<" character at the start, or a "|" character at the
end ("<syscmd" or "syscmd|"). This executes the given pipeline and reads from itsstandard output. This will probably only work on unix-like systems.
In any case, compressed data in one of the supported compression formats (gzip, Unixcompress or bzip2) will be decompressed transparently.
join = 1and2|1or2|all1|all2|1not2|2not1|1xor2 (JoinType)Determines which rows are included in the output table. The matching algorithm determineswhich of the rows from the first table correspond to which rows from the second. Thisparameter determines what to do with that information. Perhaps the most obvious thing is towrite out a table containing only rows which correspond to a row in both of the two inputtables. However, you may also want to see the unmatched rows from one or both input tables,or rows present in one table but unmatched in the other, or other possibilities. The options are:
• 1and2: An output row for each row represented in both input tables (INNER JOIN)• 1or2: An output row for each row represented in either or both of the input tables (FULL
OUTER JOIN)• all1: An output row for each matched or unmatched row in table 1 (LEFT OUTER
JOIN)• all2: An output row for each matched or unmatched row in table 2 (RIGHT OUTER
JOIN)• 1not2: An output row only for rows which appear in the first table but are not matched in
the second table• 2not1: An output row only for rows which appear in the second table but are not matched
in the first table• 1xor2: An output row only for rows represented in one of the input tables but not the
other one
[Default: 1and2]
matcher = <matcher-name> (MatchEngine)Defines the nature of the matching that will be performed. Depending on the name supplied,this may be positional matching using celestial or Cartesian coordinates, exact matching on thevalue of a string column, or other things. A list and explanation of the available matchingalgorithms is given in Section 7.1. The value supplied for this parameter determines themeanings of the values required by the params, values* and tuning parameter(s).
[Default: sky]
ocmd = <cmds> (ProcessingStep[])Specifies processing to be performed on the output table, after all other processing has takenplace. The value of this parameter is one or more of the filter commands described in Section6.1. If more than one is given, they must be separated by semicolon characters (";"). Thisparameter can be repeated multiple times on the same command line to build up a list ofprocessing steps. The sequence of commands given in this way defines the processing pipelinewhich is performed on the table.
Commands may alteratively be supplied in an external file, by using the indirection character'@'. Thus a value of "@filename" causes the file filename to be read for a list of filtercommands to execute. The commands in the file may be separated by newline characters
SUN/256 511

and/or semicolons, and lines which are blank or which start with a '#' character are ignored.
ofmt = <out-format> (String)Specifies the format in which the output table will be written (one of the ones in Section 5.1.2 -matching is case-insensitive and you can use just the first few letters). If it has the specialvalue "(auto)" (the default), then the output filename will be examined to try to guess whatsort of file is required usually by looking at the extension. If it's not obvious from the filenamewhat output format is intended, an error will result.
This parameter must only be given if omode has its default value of "out".
[Default: (auto)]
omode = out|meta|stats|count|checksum|cgi|discard|topcat|samp|plastic|tosql|gui
(ProcessingMode)The mode in which the result table will be output. The default mode is out, which means thatthe result will be written as a new table to disk or elsewhere, as determined by the out andofmt parameters. However, there are other possibilities, which correspond to uses to which atable can be put other than outputting it, such as displaying metadata, calculating statistics, orpopulating a table in an SQL database. For some values of this parameter, additionalparameters (<mode-args>) are required to determine the exact behaviour.
Possible values are
• out
• meta
• stats
• count
• checksum
• cgi
• discard
• topcat
• samp
• plastic
• tosql
• gui
Use the help=omode flag or see Section 6.4 for more information.
[Default: out]
out = <out-table> (TableConsumer)The location of the output table. This is usually a filename to write to. If it is equal to thespecial value "-" (the default) the output table will be written to standard output.
This parameter must only be given if omode has its default value of "out".
[Default: -]
params = <match-params> (String[])Determines the parameters of this match. This is typically one or more tolerances such as errorradii. It may contain zero or more values; the values that are required depend on the matchtype selected by the matcher parameter. If it contains multiple values, they must be separatedby spaces; values which contain a space can be 'quoted' or "quoted".
progress = none|log|profile (String)Determines whether information on progress of the match should be output to the standarderror stream as it progresses. For lengthy matches this is a useful reassurance and can giveguidance about how much longer it will take. It can also be useful as a performance diagnostic.
The options are:
• none: no progress is shown
SUN/256 512
• log: progress information is shown• profile: progress information and limited time/memory profiling information are shown
[Default: log]
scorecol = <col-name> (String)Gives the name of a column in the output table to contain the "match score" for each pairwisematch. The meaning of this column is dependent on the chosen matcher, but it typicallyrepresents a distance of some kind between the two matching points. If a null value is chosen,no score column will be inserted in the output table. The default value of this parameterdepends on matcher.
[Default: Score]
suffix1 = <label> (String)If the fixcols parameter is set so that input columns are renamed for insertion into the outputtable, this parameter determines how the renaming is done. It gives a suffix which is appendedto all renamed columns from table 1.
[Default: _1]
suffix2 = <label> (String)If the fixcols parameter is set so that input columns are renamed for insertion into the outputtable, this parameter determines how the renaming is done. It gives a suffix which is appendedto all renamed columns from table 2.
[Default: _2]
tuning = <tuning-params> (String[])Tuning values for the matching process, if appropriate. It may contain zero or more values; thevalues that are permitted depend on the match type selected by the matcher parameter. If itcontains multiple values, they must be separated by spaces; values which contain a space canbe 'quoted' or "quoted". If this optional parameter is not supplied, sensible defaults will bechosen.
values1 = <expr-list> (String[])Defines the values from table 1 which are used to determine whether a match has occurred.These will typically be coordinate values such as RA and Dec and perhaps some per-row errorvalues as well, though exactly what values are required is determined by the kind of match asdetermined by matcher. Depending on the kind of match, the number and type of the valuesrequired will be different. Multiple values should be separated by whitespace; if whitespaceoccurs within a single value it must be 'quoted' or "quoted". Elements of the expression list arecommonly just column names, but may be algebraic expressions calculated from zero or morecolumns as explained in Section 10.
values2 = <expr-list> (String[])Defines the values from table 2 which are used to determine whether a match has occurred.These will typically be coordinate values such as RA and Dec and perhaps some per-row errorvalues as well, though exactly what values are required is determined by the kind of match asdetermined by matcher. Depending on the kind of match, the number and type of the valuesrequired will be different. Multiple values should be separated by whitespace; if whitespaceoccurs within a single value it must be 'quoted' or "quoted". Elements of the expression list arecommonly just column names, but may be algebraic expressions calculated from zero or morecolumns as explained in Section 10.
B.33.2 Examples
Here are some examples of using tmatch2:
SUN/256 513
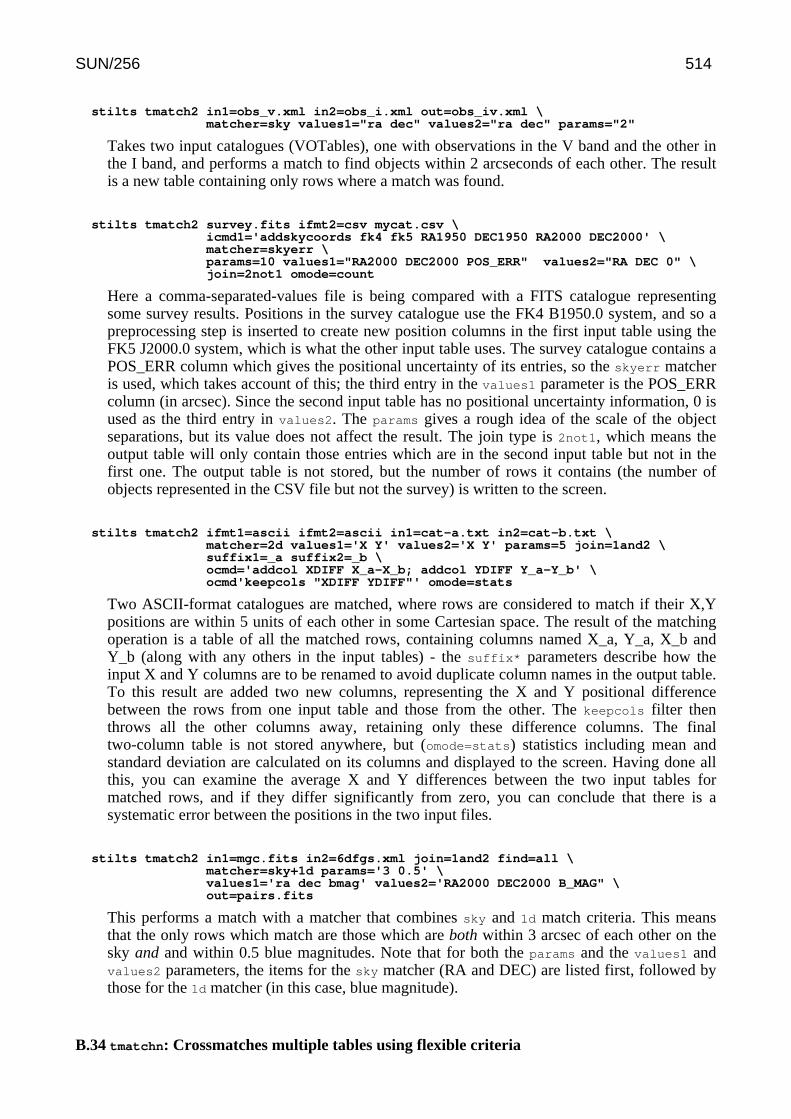
stilts tmatch2 in1=obs_v.xml in2=obs_i.xml out=obs_iv.xml \matcher=sky values1="ra dec" values2="ra dec" params="2"
Takes two input catalogues (VOTables), one with observations in the V band and the other inthe I band, and performs a match to find objects within 2 arcseconds of each other. The resultis a new table containing only rows where a match was found.
stilts tmatch2 survey.fits ifmt2=csv mycat.csv \icmd1='addskycoords fk4 fk5 RA1950 DEC1950 RA2000 DEC2000' \matcher=skyerr \params=10 values1="RA2000 DEC2000 POS_ERR" values2="RA DEC 0" \join=2not1 omode=count
Here a comma-separated-values file is being compared with a FITS catalogue representingsome survey results. Positions in the survey catalogue use the FK4 B1950.0 system, and so apreprocessing step is inserted to create new position columns in the first input table using theFK5 J2000.0 system, which is what the other input table uses. The survey catalogue contains aPOS_ERR column which gives the positional uncertainty of its entries, so the skyerr matcheris used, which takes account of this; the third entry in the values1 parameter is the POS_ERRcolumn (in arcsec). Since the second input table has no positional uncertainty information, 0 isused as the third entry in values2. The params gives a rough idea of the scale of the objectseparations, but its value does not affect the result. The join type is 2not1, which means theoutput table will only contain those entries which are in the second input table but not in thefirst one. The output table is not stored, but the number of rows it contains (the number ofobjects represented in the CSV file but not the survey) is written to the screen.
stilts tmatch2 ifmt1=ascii ifmt2=ascii in1=cat-a.txt in2=cat-b.txt \matcher=2d values1='X Y' values2='X Y' params=5 join=1and2 \suffix1=_a suffix2=_b \ocmd='addcol XDIFF X_a-X_b; addcol YDIFF Y_a-Y_b' \ocmd'keepcols "XDIFF YDIFF"' omode=stats
Two ASCII-format catalogues are matched, where rows are considered to match if their X,Ypositions are within 5 units of each other in some Cartesian space. The result of the matchingoperation is a table of all the matched rows, containing columns named X_a, Y_a, X_b andY_b (along with any others in the input tables) - the suffix* parameters describe how theinput X and Y columns are to be renamed to avoid duplicate column names in the output table.To this result are added two new columns, representing the X and Y positional differencebetween the rows from one input table and those from the other. The keepcols filter thenthrows all the other columns away, retaining only these difference columns. The finaltwo-column table is not stored anywhere, but (omode=stats) statistics including mean andstandard deviation are calculated on its columns and displayed to the screen. Having done allthis, you can examine the average X and Y differences between the two input tables formatched rows, and if they differ significantly from zero, you can conclude that there is asystematic error between the positions in the two input files.
stilts tmatch2 in1=mgc.fits in2=6dfgs.xml join=1and2 find=all \matcher=sky+1d params='3 0.5' \values1='ra dec bmag' values2='RA2000 DEC2000 B_MAG" \out=pairs.fits
This performs a match with a matcher that combines sky and 1d match criteria. This meansthat the only rows which match are those which are both within 3 arcsec of each other on thesky and and within 0.5 blue magnitudes. Note that for both the params and the values1 andvalues2 parameters, the items for the sky matcher (RA and DEC) are listed first, followed bythose for the 1d matcher (in this case, blue magnitude).
B.34 tmatchn: Crossmatches multiple tables using flexible criteria
SUN/256 514

tmatchn performs efficient and flexible crossmatching between multiple tables. It can match rowson the basis of their relative position in the sky, or alternatively using many other criteria such asseparation in in some isotropic or anisotropic Cartesian space, identity of a key value, or somecombination of these; the full range of match criteria is dicussed in Section 7.1.
Since the match criteria define what counts as a match between two objects, it is not immediatelyobvious what is meant by a multi-table match. In fact the command can work in one of two distinctmodes, controlled by the multimode parameter. In pairs mode, one table (by default the first inputtable) is designated the reference table, and pair matches between each of the other tables and thatone are identified. In group mode groups of objects from all the input tables are identified, asdiscussed in Section 7.2. Currently, in both cases an output matched row cannot contain more thanone object from each input table. Options for output of multiple rows per input table per match maybe forthcoming in future releases if there is demand.
tmatchn is intended for use with more than two input tables - see tmatch1 and tmatch2 for 1- and2-table crossmatching respectively.
B.34.1 Usage
The usage of tmatchn is
stilts <stilts-flags> tmatchn nin=<count> ifmtN=<in-format> inN=<tableN>icmdN=<cmds> ocmd=<cmds>omode=out|meta|stats|count|checksum|cgi|discard|topcat|samp|plastic|tosql|guiout=<out-table> ofmt=<out-format>multimode=pairs|group iref=<table-index>matcher=<matcher-name> params=<match-params>tuning=<tuning-params> valuesN=<expr-list>joinN=default|match|nomatch|alwaysfixcols=none|dups|all suffixN=<label>progress=none|log|profile
If you don't have the stilts script installed, write "java -jar stilts.jar" instead of "stilts" -see Section 3. The available <stilts-flags> are listed in Section 2.1. For programmaticinvocation, the Task class for this command is uk.ac.starlink.ttools.task.TableMatchN.
Parameter values are assigned on the command line as explained in Section 2.3. They are asfollows:
fixcols = none|dups|all (Fixer)Determines how input columns are renamed before use in the output table. The choices are:
• none: columns are not renamed• dups: columns which would otherwise have duplicate names in the output will be
renamed to indicate which table they came from• all: all columns will be renamed to indicate which table they came from
If columns are renamed, the new ones are determined by suffix* parameters.
[Default: dups]
icmdN = <cmds> (ProcessingStep[])Specifies processing to be performed on input table #N as specified by parameter inN, beforeany other processing has taken place. The value of this parameter is one or more of the filtercommands described in Section 6.1. If more than one is given, they must be separated bysemicolon characters (";"). This parameter can be repeated multiple times on the samecommand line to build up a list of processing steps. The sequence of commands given in thisway defines the processing pipeline which is performed on the table.
Commands may alteratively be supplied in an external file, by using the indirection character
SUN/256 515
'@'. Thus a value of "@filename" causes the file filename to be read for a list of filtercommands to execute. The commands in the file may be separated by newline charactersand/or semicolons, and lines which are blank or which start with a '#' character are ignored.
ifmtN = <in-format> (String)Specifies the format of input table #N as specified by parameter inN. The known formats arelisted in Section 5.1.1. This flag can be used if you know what format your table is in. If it hasthe special value (auto) (the default), then an attempt will be made to detect the format of thetable automatically. This cannot always be done correctly however, in which case the programwill exit with an error explaining which formats were attempted. This parameter is ignored forscheme-specified tables.
[Default: (auto)]
inN = <tableN> (StarTable)The location of input table #N. This may take one of the following forms:
• A filename.• A URL.• The special value "-", meaning standard input. In this case the input format must be given
explicitly using the ifmtN parameter. Note that not all formats can be streamed in thisway.
• A scheme specification of the form :<scheme-name>:<scheme-args>.• A system command line with either a "<" character at the start, or a "|" character at the
end ("<syscmd" or "syscmd|"). This executes the given pipeline and reads from itsstandard output. This will probably only work on unix-like systems.
In any case, compressed data in one of the supported compression formats (gzip, Unixcompress or bzip2) will be decompressed transparently.
iref = <table-index> (Integer)If multimode=pairs this parameter gives the index of the table in the input table list which isto serve as the reference table (the one which must be matched by other tables). Ignored inother modes.
Row ordering in the output table is usually tidiest if the default setting of 1 is used (i.e. if thefirst input table is used as the reference table).
[Default: 1]
joinN = default|match|nomatch|always (MultiJoinType)Determines which rows from input table N are included in the output table. The matchingalgorithm determines which of the rows in each of the input tables correspond to which rowsin the other input tables, and this parameter determines what to do with that information.
The default behaviour is that a row will appear in the output table if it represents a match ofrows from two or more of the input tables. This can be altered on a per-input-table basishowever by choosing one of the non-default options below:
• match: Rows are included only if they contain an entry from input table N.• nomatch: Rows are included only if they do not contain an entry from input table N.• always: Rows are included if they contain an entry from input table N (overrides any
match and nomatch settings of other tables).• default: Input table N has no special effect on whether rows are included.
[Default: default]
matcher = <matcher-name> (MatchEngine)Defines the nature of the matching that will be performed. Depending on the name supplied,this may be positional matching using celestial or Cartesian coordinates, exact matching on thevalue of a string column, or other things. A list and explanation of the available matchingalgorithms is given in Section 7.1. The value supplied for this parameter determines the
SUN/256 516
meanings of the values required by the params, values* and tuning parameter(s).
[Default: sky]
multimode = pairs|group (String)Defines what is meant by a multi-table match. There are two possibilities:
• pairs: Each output row corresponds to a single row of the reference table (see parameteriref) and contains entries from other tables which are pair matches to that. If a referencetable row matches multiple rows from one of the other tables, only the best one isincluded.
• group: Each output row corresponds to a group of entries from the input tables which aremutually linked by pair matches between them. This means that although you can getfrom any entry to any other entry via one or more pair matches, there is no guarantee thatany entry is a pair match with any other entry. No table has privileged status in this case.If there are multiple entries from a given table in the match group, an arbitrary one ischosen for inclusion (there is no unique way to select the best). See Section 7.2 for morediscussion.
Note that which rows actually appear in the output is also influenced by the joinN parameter.
[Default: pairs]
nin = <count> (Integer)The number of input tables for this task. For each of the input tables N there will be associatedparameters ifmtN, inN and icmdN.
ocmd = <cmds> (ProcessingStep[])Specifies processing to be performed on the output table, after all other processing has takenplace. The value of this parameter is one or more of the filter commands described in Section6.1. If more than one is given, they must be separated by semicolon characters (";"). Thisparameter can be repeated multiple times on the same command line to build up a list ofprocessing steps. The sequence of commands given in this way defines the processing pipelinewhich is performed on the table.
Commands may alteratively be supplied in an external file, by using the indirection character'@'. Thus a value of "@filename" causes the file filename to be read for a list of filtercommands to execute. The commands in the file may be separated by newline charactersand/or semicolons, and lines which are blank or which start with a '#' character are ignored.
ofmt = <out-format> (String)Specifies the format in which the output table will be written (one of the ones in Section 5.1.2 -matching is case-insensitive and you can use just the first few letters). If it has the specialvalue "(auto)" (the default), then the output filename will be examined to try to guess whatsort of file is required usually by looking at the extension. If it's not obvious from the filenamewhat output format is intended, an error will result.
This parameter must only be given if omode has its default value of "out".
[Default: (auto)]
omode = out|meta|stats|count|checksum|cgi|discard|topcat|samp|plastic|tosql|gui
(ProcessingMode)The mode in which the result table will be output. The default mode is out, which means thatthe result will be written as a new table to disk or elsewhere, as determined by the out andofmt parameters. However, there are other possibilities, which correspond to uses to which atable can be put other than outputting it, such as displaying metadata, calculating statistics, orpopulating a table in an SQL database. For some values of this parameter, additionalparameters (<mode-args>) are required to determine the exact behaviour.
Possible values are
• out
SUN/256 517
• meta
• stats
• count
• checksum
• cgi
• discard
• topcat
• samp
• plastic
• tosql
• gui
Use the help=omode flag or see Section 6.4 for more information.
[Default: out]
out = <out-table> (TableConsumer)The location of the output table. This is usually a filename to write to. If it is equal to thespecial value "-" (the default) the output table will be written to standard output.
This parameter must only be given if omode has its default value of "out".
[Default: -]
params = <match-params> (String[])Determines the parameters of this match. This is typically one or more tolerances such as errorradii. It may contain zero or more values; the values that are required depend on the matchtype selected by the matcher parameter. If it contains multiple values, they must be separatedby spaces; values which contain a space can be 'quoted' or "quoted".
progress = none|log|profile (String)Determines whether information on progress of the match should be output to the standarderror stream as it progresses. For lengthy matches this is a useful reassurance and can giveguidance about how much longer it will take. It can also be useful as a performance diagnostic.
The options are:
• none: no progress is shown• log: progress information is shown• profile: progress information and limited time/memory profiling information are shown
[Default: log]
suffixN = <label> (String)If the fixcols parameter is set so that input columns are renamed for insertion into the outputtable, this parameter determines how the renaming is done. It gives a suffix which is appendedto all renamed columns from table N.
[Default: _N]
tuning = <tuning-params> (String[])Tuning values for the matching process, if appropriate. It may contain zero or more values; thevalues that are permitted depend on the match type selected by the matcher parameter. If itcontains multiple values, they must be separated by spaces; values which contain a space canbe 'quoted' or "quoted". If this optional parameter is not supplied, sensible defaults will bechosen.
valuesN = <expr-list> (String[])Defines the values from table N which are used to determine whether a match has occurred.These will typically be coordinate values such as RA and Dec and perhaps some per-row errorvalues as well, though exactly what values are required is determined by the kind of match asdetermined by matcher. Depending on the kind of match, the number and type of the values
SUN/256 518
required will be different. Multiple values should be separated by whitespace; if whitespaceoccurs within a single value it must be 'quoted' or "quoted". Elements of the expression list arecommonly just column names, but may be algebraic expressions calculated from zero or morecolumns as explained in Section 10.
B.34.2 Examples
Here are some examples of using tmatchn:
stilts tmatchn multimode=pairs nin=4 matcher=sky params=5 \in1=transients.txt ifmt1=ascii values1='alpha delta' \in2=2mass_virgo.fits values2='ra2000 dec2000' \in3=sdss_virgo.fits values3='ra dec' \in4=first_virgo.fits values4='pos_eq_ra pos_eq_dec' \out=matches.xml ofmt=votable-binary
Compares a text-format table "transients.txt" against each of three other catalogues coveringthe same region of sky, and outputs a table which contains a row for each row of"transients.txt" which matches (is within 5 arcsec) of an object in any of the other tables.
stilts tmatchn multimode=pairs nin=4 matcher=sky params=5 \in1=transients.txt ifmt1=ascii suffix1='_t' values1='alpha delta' \in2=2mass_virgo.fits suffix2='_2mass' values2='ra2000 dec2000' \in3=sdss_virgo.fits suffix3='_sdss' values3='ra dec' \in4=first_virgo.fits suffix4='_first' values4='pos_eq_ra pos_eq_dec' \fixcols=all join1=always \ocmd='keepcols "*_t designation_2mass SDSSName_sdss id_field_first"' \out=matches.xml ofmt=votable-binary
Similar to the previous example but with some doctoring of what the output table will looklike. The fixcols=all and suffixN assignments mean that all the columns from the inputtables will be renamed for output by adding the given suffixes. The keepcols filter applied tothe output table throws out all the columns except the ones from the reference table (*_t) andone column from each of the other table giving object identifiers. This output table willprobably be easier to read (though contain less information) than that from the previousexample). Additionally, the join1=always assignment means that the output table will haveone row for each row of the reference table (transients.txt), even if no matches are found for it.
stilts tmatchn multimode=group nin=3 matcher=skyerr params=8 \in1=Hband.fits values1='RA DEC SEEING*2' \in2=Jband.fits values2='RA DEC SEEING*2' \in3=Kband.fits values3='RA DEC SEEING*2' \omode=topcat
Performs a group-mode match. There is no reference table, so that an output row will result foreach object which is represented in any two of the input catalogues. The match takes accountof per-object errors equivalent to twice the recorded seeing, which is in the region of 8 arcsec.Note that this may not operate as expected if the catalogues contain multiple distinct objectstoo close (in comparison to the declared separation) to each other. The resulting matched tableis sent directly to TOPCAT (if available).
B.35 tmulti: Writes multiple tables to a single container file
tmulti takes multiple input tables and writes them as separate tables to a single output containerfile. The container file must be of some format which can contain more than one table, for instancea FITS file (which can contain multiple extensions) or a VOTable document (which can containmultiple TABLE elements). Filtering may be performed on the tables prior to writing them. It is notnecessary that all the tables are similar (e.g. that they all have the same type and number of
SUN/256 519
columns), but the same processing commands will be applied to all of them. For more individualcontrol, use the tmultin task.
B.35.1 Usage
The usage of tmulti is
stilts <stilts-flags> tmulti in=<table> [<table> ...] ifmt=<in-format>multi=true|false istream=true|falseicmd=<cmds> out=<out-file> ofmt=<out-format>
If you don't have the stilts script installed, write "java -jar stilts.jar" instead of "stilts" -see Section 3. The available <stilts-flags> are listed in Section 2.1. For programmaticinvocation, the Task class for this command is uk.ac.starlink.ttools.task.MultiCopy.
Parameter values are assigned on the command line as explained in Section 2.3. They are asfollows:
icmd = <cmds> (ProcessingStep[])Specifies processing to be performed on each input table as specified by parameter in, beforeany other processing has taken place. The value of this parameter is one or more of the filtercommands described in Section 6.1. If more than one is given, they must be separated bysemicolon characters (";"). This parameter can be repeated multiple times on the samecommand line to build up a list of processing steps. The sequence of commands given in thisway defines the processing pipeline which is performed on the table.
Commands may alteratively be supplied in an external file, by using the indirection character'@'. Thus a value of "@filename" causes the file filename to be read for a list of filtercommands to execute. The commands in the file may be separated by newline charactersand/or semicolons, and lines which are blank or which start with a '#' character are ignored.
ifmt = <in-format> (String)Specifies the format of the input table as specified by parameter in. The known formats arelisted in Section 5.1.1. This flag can be used if you know what format your table is in. If it hasthe special value (auto) (the default), then an attempt will be made to detect the format of thetable automatically. This cannot always be done correctly however, in which case the programwill exit with an error explaining which formats were attempted. This parameter is ignored forscheme-specified tables.
The same format parameter applies to all the tables specified by in.
[Default: (auto)]
in = <table> [<table> ...] (TableProducer[])Locations of the input tables. Either specify the parameter multiple times, or supply the inputtables as a space-separated list within a single use.
The following table location forms are allowed:
• A filename.• A URL.• The special value "-", meaning standard input. In this case the input format must be given
explicitly using the ifmt parameter. Note that not all formats can be streamed in this way.• A scheme specification of the form :<scheme-name>:<scheme-args>.• A system command line with either a "<" character at the start, or a "|" character at the
end ("<syscmd" or "syscmd|"). This executes the given pipeline and reads from itsstandard output. This will probably only work on unix-like systems.
Compression in any of the supported compression formats (Unix compress, gzip or bzip2) isexpanded automatically.
SUN/256 520
A list of input table locations may be given in an external file by using the indirction character'@'. Thus "in=@filename" causes the file filename to be read for a list of input table locations.The locations in the file should each be on a separate line.
istream = true|false (Boolean)If set true, the input table specified by the in parameter will be read as a stream. It is necessaryto give the ifmt parameter in this case. Depending on the required operations and processingmode, this may cause the read to fail (sometimes it is necessary to read the table more thanonce). It is not normally necessary to set this flag; in most cases the data will be streamedautomatically if that is the best thing to do. However it can sometimes result in less resourceusage when processing large files in certain formats (such as VOTable). This parameter isignored for scheme-specified tables.
The same streaming flag applies to all the tables specified by in.
[Default: false]
multi = true|false (Boolean)Determines whether all tables, or just the first one, from input table files will be used. If setfalse, then just the first table from each file named by in will be used. If true, then all tablespresent in those input files will be used. This only has an effect for file formats which arecapable of containing more than one table, which effectively means FITS and VOTable andtheir variants.
[Default: false]
ofmt = <out-format> (String)Specifies the format in which the output tables will be written (one of the ones in Section 5.1.2- matching is case-insensitive and you can use just the first few letters). If it has the specialvalue "(auto)" (the default), then the output filename will be examined to try to guess whatsort of file is required usually by looking at the extension. If it's not obvious from the filenamewhat output format is intended, an error will result.
Not all output formats are capable of writing multiple tables; if you choose one that is not, anerror will result.
[Default: (auto)]
out = <out-file> (uk.ac.starlink.util.Destination)The location of the output file. This is usually a filename to write to. If it is equal to the specialvalue "-" the output will be written to standard output.
[Default: -]
B.35.2 Examples
Here are some examples of using tmulti:
stilts tmulti ifmt=ascii in=t1.txt in=t2.txt in=t3.txtofmt=fits out=tables.fits
Takes the three named ASCII format tables and writes them into a multi-extension FITS file,as three separate BINTABLE HDUs. These tables do not need to be of the same shape orotherwise similar.
stilts tmulti ifmt=ascii in="t1.txt t2.txt t3.txt"ofmt=fits out=tables.fits
Does exactly the same as the previous example.
SUN/256 521
stilts tmulti ifmt=ascii [email protected]=fits out=tables.fits
This will have the same effect as the previous two examples if a file name "inlist.lis" in thecurrent directory contains three lines, "t1.txt", "t2.txt" and "t3.txt".
stilts tmulti in=extract.fits multi=true out=extract.vot
This takes the table extensions from a multi-extension FITS file and writes them out as amulti-TABLE VOTable document. The multi=true setting is required, since this means thatall the tables from the input file are used as input; if it was set false, only the first table HDUfrom the input file would be used.
stilts tmulti in=extract.fits multi=true out=extract.voticmd='badval -999 *MAG'
Does the same as the previous example, but additionally replaces with a blank valueoccurrences of the value "-999" in columns whose name ends with "MAG" in any of the inputtables before copying them.
B.36 tmultin: Writes multiple processed tables to single container file
tmultin takes multiple input tables and writes them to a single output container file. The containerfile must be of some format which can contain more than one table, for instance a FITS file (whichcan contain multiple extensions) or a VOTable document (which can contain multiple TABLEelements). Individual filtering may be performed on the tables prior to writing them, and theirformats may be specified individually. If you want to apply the same pre-processing to all the inputtables, you may find the tmulti command more convenient.
B.36.1 Usage
The usage of tmultin is
stilts <stilts-flags> tmultin nin=<count> ifmtN=<in-format> inN=<tableN>icmdN=<cmds> out=<out-file> ofmt=<out-format>
If you don't have the stilts script installed, write "java -jar stilts.jar" instead of "stilts" -see Section 3. The available <stilts-flags> are listed in Section 2.1. For programmaticinvocation, the Task class for this command is uk.ac.starlink.ttools.task.MultiCopyN.
Parameter values are assigned on the command line as explained in Section 2.3. They are asfollows:
icmdN = <cmds> (ProcessingStep[])Specifies processing to be performed on input table #N as specified by parameter inN, beforeany other processing has taken place. The value of this parameter is one or more of the filtercommands described in Section 6.1. If more than one is given, they must be separated bysemicolon characters (";"). This parameter can be repeated multiple times on the samecommand line to build up a list of processing steps. The sequence of commands given in thisway defines the processing pipeline which is performed on the table.
Commands may alteratively be supplied in an external file, by using the indirection character'@'. Thus a value of "@filename" causes the file filename to be read for a list of filtercommands to execute. The commands in the file may be separated by newline charactersand/or semicolons, and lines which are blank or which start with a '#' character are ignored.
ifmtN = <in-format> (String)
SUN/256 522
Specifies the format of input table #N as specified by parameter inN. The known formats arelisted in Section 5.1.1. This flag can be used if you know what format your table is in. If it hasthe special value (auto) (the default), then an attempt will be made to detect the format of thetable automatically. This cannot always be done correctly however, in which case the programwill exit with an error explaining which formats were attempted. This parameter is ignored forscheme-specified tables.
[Default: (auto)]
inN = <tableN> (StarTable)The location of input table #N. This may take one of the following forms:
• A filename.• A URL.• The special value "-", meaning standard input. In this case the input format must be given
explicitly using the ifmtN parameter. Note that not all formats can be streamed in thisway.
• A scheme specification of the form :<scheme-name>:<scheme-args>.• A system command line with either a "<" character at the start, or a "|" character at the
end ("<syscmd" or "syscmd|"). This executes the given pipeline and reads from itsstandard output. This will probably only work on unix-like systems.
In any case, compressed data in one of the supported compression formats (gzip, Unixcompress or bzip2) will be decompressed transparently.
nin = <count> (Integer)The number of input tables for this task. For each of the input tables N there will be associatedparameters ifmtN, inN and icmdN.
ofmt = <out-format> (String)Specifies the format in which the output tables will be written (one of the ones in Section 5.1.2- matching is case-insensitive and you can use just the first few letters). If it has the specialvalue "(auto)" (the default), then the output filename will be examined to try to guess whatsort of file is required usually by looking at the extension. If it's not obvious from the filenamewhat output format is intended, an error will result.
Not all output formats are capable of writing multiple tables; if you choose one that is not, anerror will result.
[Default: (auto)]
out = <out-file> (uk.ac.starlink.util.Destination)The location of the output file. This is usually a filename to write to. If it is equal to the specialvalue "-" the output will be written to standard output.
[Default: -]
B.36.2 Examples
Here are some examples of using tmultin:
stilts tmultin nin=3 in1=t1.xml ifmt1=votablein2=t2.fit ifmt2=fitsin3=t3.txt ifmt3=asciiout=tables.fits
Takes three input tables in different formats, and writes them out as a single multi-extensionFITS file.
stilts tmultin nin=3 in1=data.fits icmd1='every 10; head 100'
SUN/256 523
in2=data.fits icmd2='every 100; head 100'in3=data.fits icmd3='every 1000; head 100'out=samples.xml ofmt=votable
Writes three hundred-row tables as separate TABLE elements in a single output VOTabledocument. Each of the output tables is a sample from the same input table, but sampleddifferently; the first is every tenth row, the second every hundredth, and the third everythousandth.
B.37 tpipe: Performs pipeline processing on a table
tpipe performs all kinds of general purpose manipulations which take one table as input. It isextremely flexible, and can do the following things amongst others:
• calculate statistics• display metadata• select rows in various ways, including algebraically• define new columns as algebraic functions of old ones• delete or rearrange columns• sort rows• convert between table formats
and combine these operations. You can think of it as a supercharged table copying tool.
The basic operation of tpipe is that it reads an input table, performs zero or more processing stepson it, and then does something with the output. There are therefore three classes of things you needto tell it when it runs:
Input table locationSpecified by the in, ifmt and istream parameters.
Processing stepsEither provide a string giving steps as the value of one or more cmd parameters, or the name ofa file containing the steps using the script parameter. The steps that you can perform aredescribed in Section 6.1.
Output table destinationWhat happens to the output table is determined by the value of the omode parameter. Bydefault, omode=out, in which case the table is written to a new table file in a format determinedby ofmt. However, you can do other things with the result such as calculate the per-columnstatistics (omode=stats), view only the table and column metadata (omode=meta), display itdirectly in TOPCAT (omode=topcat) etc.
See Section 6 for a more detailed explanation of these ideas.
The parameters mentioned above are listed in detail in the next section.
B.37.1 Usage
The usage of tpipe is
stilts <stilts-flags> tpipe ifmt=<in-format> istream=true|false cmd=<cmds>omode=out|meta|stats|count|checksum|cgi|discard|topcat|samp|plastic|tosql|guiout=<out-table> ofmt=<out-format>[in=]<table>
If you don't have the stilts script installed, write "java -jar stilts.jar" instead of "stilts" -see Section 3. The available <stilts-flags> are listed in Section 2.1. For programmaticinvocation, the Task class for this command is uk.ac.starlink.ttools.task.TablePipe.
SUN/256 524
Parameter values are assigned on the command line as explained in Section 2.3. They are asfollows:
cmd = <cmds> (ProcessingStep[])Specifies processing to be performed on the input table as specified by parameter in, beforeany other processing has taken place. The value of this parameter is one or more of the filtercommands described in Section 6.1. If more than one is given, they must be separated bysemicolon characters (";"). This parameter can be repeated multiple times on the samecommand line to build up a list of processing steps. The sequence of commands given in thisway defines the processing pipeline which is performed on the table.
Commands may alteratively be supplied in an external file, by using the indirection character'@'. Thus a value of "@filename" causes the file filename to be read for a list of filtercommands to execute. The commands in the file may be separated by newline charactersand/or semicolons, and lines which are blank or which start with a '#' character are ignored.
ifmt = <in-format> (String)Specifies the format of the input table as specified by parameter in. The known formats arelisted in Section 5.1.1. This flag can be used if you know what format your table is in. If it hasthe special value (auto) (the default), then an attempt will be made to detect the format of thetable automatically. This cannot always be done correctly however, in which case the programwill exit with an error explaining which formats were attempted. This parameter is ignored forscheme-specified tables.
[Default: (auto)]
in = <table> (StarTable)The location of the input table. This may take one of the following forms:
• A filename.• A URL.• The special value "-", meaning standard input. In this case the input format must be given
explicitly using the ifmt parameter. Note that not all formats can be streamed in this way.• A scheme specification of the form :<scheme-name>:<scheme-args>.• A system command line with either a "<" character at the start, or a "|" character at the
end ("<syscmd" or "syscmd|"). This executes the given pipeline and reads from itsstandard output. This will probably only work on unix-like systems.
In any case, compressed data in one of the supported compression formats (gzip, Unixcompress or bzip2) will be decompressed transparently.
istream = true|false (Boolean)If set true, the input table specified by the in parameter will be read as a stream. It is necessaryto give the ifmt parameter in this case. Depending on the required operations and processingmode, this may cause the read to fail (sometimes it is necessary to read the table more thanonce). It is not normally necessary to set this flag; in most cases the data will be streamedautomatically if that is the best thing to do. However it can sometimes result in less resourceusage when processing large files in certain formats (such as VOTable). This parameter isignored for scheme-specified tables.
[Default: false]
ofmt = <out-format> (String)Specifies the format in which the output table will be written (one of the ones in Section 5.1.2 -matching is case-insensitive and you can use just the first few letters). If it has the specialvalue "(auto)" (the default), then the output filename will be examined to try to guess whatsort of file is required usually by looking at the extension. If it's not obvious from the filenamewhat output format is intended, an error will result.
This parameter must only be given if omode has its default value of "out".
SUN/256 525
[Default: (auto)]
omode = out|meta|stats|count|checksum|cgi|discard|topcat|samp|plastic|tosql|gui
(ProcessingMode)The mode in which the result table will be output. The default mode is out, which means thatthe result will be written as a new table to disk or elsewhere, as determined by the out andofmt parameters. However, there are other possibilities, which correspond to uses to which atable can be put other than outputting it, such as displaying metadata, calculating statistics, orpopulating a table in an SQL database. For some values of this parameter, additionalparameters (<mode-args>) are required to determine the exact behaviour.
Possible values are
• out
• meta
• stats
• count
• checksum
• cgi
• discard
• topcat
• samp
• plastic
• tosql
• gui
Use the help=omode flag or see Section 6.4 for more information.
[Default: out]
out = <out-table> (TableConsumer)The location of the output table. This is usually a filename to write to. If it is equal to thespecial value "-" (the default) the output table will be written to standard output.
This parameter must only be given if omode has its default value of "out".
[Default: -]
B.37.2 Examples
Here are some examples of tpipe in use with explanations of what's going on. For simplicity theseexamples assume that you have the stilts script installed and are using a Unix-like shell; seeSection 3 for an explanation of how to invoke the command if you just have the Java classes.
stilts tpipe cat.fits
Writes a FITS table to standard output in human-readable form. Since no mode specifier isgiven, omode=out is assumed, and output is to standard output in text format.
stilts tpipe cmd='head 5' cat.fits.gz
Does the same as the last example, but with one processing step: only the first five rows of thetable are output. In this case, the input file is compressed using gzip - this is automaticallydetected.
stilts tpipe ifmt=csv xxx.csv \cmd='keepcols "index ra dec"' \omode=out ofmt=fits xxx.fits
SUN/256 526
Reads from a comma-separated values file, writes to a FITS file, and discards all columns inthe input table apart from INDEX, RA and DEC. Note the quoting in the cmd argument: theouter quotes are so that the argument of the cmd parameter itself (keepcols "index ra dec")is not split up by spaces (to protect it from the shell), and the inner quotes are to keep thecolid-list argument of the keepcols command together.
stilts tpipe ifmt=votable \cmd='addcol IV_SUM "(IMAG+VMAG)"' \cmd='addcol IV_DIFF "(IMAG-VMAG)"' \cmd='delcols "IMAG VMAG"' \omode=out ofmt=votable \
< tab1.vot \> tab2.vot
Replaces two columns by their sum and difference in a VOTable. Since neither the in nor outparameters have been specified, the input and output are actually byte streams on standardinput and standard output of the tpipe command in this case. The processing steps first add acolumn representing the sum, then add a column representing the difference, then delete theoriginal columns.
stilts tpipe cmd='addskycoords -inunit sex fk5 gal \RA2000 DEC2000 GAL_LONG GAL_LAT' \
6dfgs.fits 6dfgs+gal.fits
Adds columns giving galactic coordinates to a table. Both input and output tables are FITSfiles. The galactic coordinates, stored in new columns named GAL_LONG and GAL_LAT,are calculated from FK5 J2000.0 coordinates given in the existing columns named RA2000and DEC2000. The input (FK5) coordinates are represented as sexagesimal strings (hh:mm:ss,dd:mm:ss), and the output ones are numeric degrees.
stilts -disk tpipe 2dfgrs_ngp.fits \cmd='keepcols "SEQNUM AREA ECCENT"' \cmd='sort -down AREA' \cmd='head 20'
Displays selected columns for the 20 rows with largest values in the AREA column of a FITStable. First the columns of interest are selected, then the rows are sorted into descending orderby the value of the AREA column, then the first 20 rows of the resulting table are selected, andthe result is written to standard output. Since a sort is being performed here, it's not possible todo all the processing a row at a time, since all the AREA values must be available forcomparison during the sort. Two things are done here to accommodate this fact: first thecolumn selection is done before the sort, so that it's only a 3-column table which needs to beavailable for random access, reducing the temporary storage required. Secondly the -disk flagis supplied, which means that temporary disk files rather than memory will be used for cachingtable data.
stilts tpipe 2dfgrs_ngp.fits \cmd='keepcols "SEQNUM AREA ECCENT"' \cmd='sorthead -down 20 AREA'
Has exactly the same effect as the previous example. However, the algorithm used by thesorthead filter is in most cases faster and cheaper on memory (only 20 rows ever have to bestored in this case), so this is generally a better approach than combining the sort and head
filters.
stilts tpipe omode=meta [email protected] http://archive.org/data/survey.vot.Z
Outputs column and table metadata about a table. In this case the table is a compressedVOTable at the end of a URL. Processing is performed according to the commands contained
SUN/256 527
in a file named "commands.lis" in the current directory.
stilts tpipe in=survey.fitscmd='select "skyDistanceDegrees(hmsToDegrees(RA),dmsToDegrees(DEC), \
hmsToDegrees(2,28,11),dmsToDegrees(-6,49,45)) \< 5./60."' \
omode=count
Counts the number of rows within a given 5 arcmin cone of sky in a FITS table. TheskyDistanceDegrees function is an expression which calculates the distance between theposition specified in a row (as given by its RA and DEC columns) and a given point on the sky(here, 02:28:11,-06:49:45). Since skyDistanceDegrees's arguments and return value are indecimal degrees, some conversions are required: the RA and DEC columns are sexagesimalstrings which are converted using the hmsToDegrees and dmsToDegrees functions respectively.Different versions of these functions (ones which take numeric arguments) are used to convertthe coordinates of the fixed point to degrees. The result is compared to a constant expressionrepresenting 5 arcminutes in degrees. Any rows of the input table for which this comparison istrue are included in the output. An alternative function, skyDistanceRadians which works inradians, is also available. These functions and constants used here are described in detail inSection 10.6.4 and Section 10.6.5.
stilts tpipe ifmt=ascii survey.txt \cmd='select "OBJTYPE == 3 && Z > 0.15"' \cmd='keepcols "IMAG JMAG KMAG"' \omode=stats
Calculate statistics on the I, J and K magnitudes of selected objects from a catalogue. Onlythose rows with the given OBJTYPE and in the given Z range are included. The minimum,maximum, mean, standard deviation etc of the IMAG, JMAG and KMAG columns will bewritten to standard output.
stilts -classpath lib/drivers/mysql-connector-java.jar \-Djdbc.drivers=com.mysql.jdbc.Driver \tpipe in=x.fits cmd="explodeall" omode=tosql \
protocol=mysql host=localhost db=ASTRO1 dbtable=TABLEX \write=dropcreate user=mbt
Writes a FITS table to an SQL table, converting array-valued columns to scalar ones. To makethe SQL connection work properly, the classpath is augmented to include the path of theMySQL JDBC driver and the jdbc.drivers system property is set to the JDBC driver classname. The output will be written as a new table named TABLEX in the MySQL databasenamed ASTRO1 on a MySQL server on the local host. The password, if required, will beprompted for, as would any of the other required parameters if they had not been given on thecommand line. Any existing table in ASTRO1 with the name TABLEX is overwritten. Theonly processing done here is by the explodeall command, which takes any columns whichhave fixed-size array values and replaces them in the output with multiple scalar columns.
java -classpath stilts.jar:lib/drivers/mysql-connector-java.jar-Djdbc.drivers=com.mysql.jdbc.Driver \uk.ac.starlink.ttools.Stilts \tpipe in=x.fits \
cmd=explodeall \omode=out \out="jdbc:mysql://localhost/ASTRO1?user=mbt#TABLEX"
This does exactly the same as the previous example, but achieves it in a slightly different way.In the first place, java is invoked directly with the necessary flags rather than getting thestilts script to do it. Note that you cannot use java's -jar flag in this case, because doing itlike that would not permit access to the additional classes that contain the JDBC driver. In thesecond place we use omode=out rather than omode=tosql. For this we need to supply an out
value which encodes the information about the SQL connection and table in a special
SUN/256 528
URL-like format. As you can see, this is a bit arcane, which is why the omode=tosql mode canbe a help.
stilts tpipe USNOB.FITS cmd='every 1000000' omode=stats
Calculates statistics on a selection of the rows in a catalogue, and writes the result to theterminal. In this example, every millionth row is sampled.
B.38 tskymap: Calculates sky density maps
tskymap calculates a weighted density map (or, to put it another way, a histogram) on the sky fromcolumns of an input table. The sky is divided up into some discrete set of tiles according to aspecified tessellation scheme (currently HEALPix or HTM are supported), and the requiredquantities are aggregated into bins corresponding to these tiles. The output table has a columngiving the pixel index identifying each tile, plus one or more columns each representing anaggregation of a quantity from the input table.
By default the number of rows from the input table falling within each tile is included as the firstcolumn in the output table. But by specifying the cols and combine parameters you can add morecolumns giving the sum, mean, median or other statistics of input table columns or expressions aswell.
The output table can then, for instance, be plotted using plot2sky's healpix layer type (though analternative is to do that plot directly using a skydensity layer).
In the case of HEALPix tiling, the result can also be output in a FITS file suitable for use byexternal applications that understand the semi-standard FITS-Healpix convention. Note in this case,for maximum compatibility, the fits-healpix output format should in general be used.
B.38.1 Usage
The usage of tskymap is
stilts <stilts-flags> tskymap ifmt=<in-format> istream=true|falseicmd=<cmds> ocmd=<cmds>omode=out|meta|stats|count|checksum|cgi|discard|topcat|samp|plastic|tosql|guiout=<out-table> ofmt=<out-format>lon=<expr/deg> lat=<expr/deg>tiling=hpx<K>|healpixnest<K>|healpixring<K>|htm<K>count=true|false cols=<expr> ...combine=sum|sum-per-unit|count|count-per-unit|mean|median|min|max|stdev|hitperunit=steradian|degree2|arcmin2|arcsec2|mas2|uas2complete=true|false[in=]<table>
If you don't have the stilts script installed, write "java -jar stilts.jar" instead of "stilts" -see Section 3. The available <stilts-flags> are listed in Section 2.1. For programmaticinvocation, the Task class for this command is uk.ac.starlink.ttools.task.SkyDensityMap.
Parameter values are assigned on the command line as explained in Section 2.3. They are asfollows:
cols = <expr> ... (String[])Selects the columns to be aggregated into bins. The value is a space-separated list of items,where each item may be either a column name or an expression using the expression language.The output table will have one column for each of the items in this list.
combine = sum|sum-per-unit|count|count-per-unit|mean|median|min|max|stdev|hit
SUN/256 529
(Combiner)Defines how values contributing to the same density map bin are combined together toproduce the value assigned to that bin. Possible values are:
• sum: the sum of all the combined values per bin• sum-per-unit: the sum of all the combined values per unit of bin size• count: the number of non-blank values per bin (weight is ignored)• count-per-unit: the number of non-blank values per unit of bin size (weight is ignored)• mean: the mean of the combined values• median: the median of the combined values (may be slow)• min: the minimum of all the combined values• max: the maximum of all the combined values• stdev: the sample standard deviation of the combined values• hit: 1 if any values present, NaN otherwise (weight is ignored)
For density-like values (count-per-unit, sum-per-unit) the scaling is additionally influencedby the perunit parameter.
[Default: mean]
complete = true|false (Boolean)Determines whether the output table contains a row for every pixel in the tiling, or only therows for pixels in which some of the input data fell.
The value of this parameter may affect performance as well as output. If you know that mostpixels on the sky will be covered, it's probably a good idea to set this true, and if you know thatonly a small patch of sky will be covered, it's better to set it false.
[Default: false]
count = true|false (Boolean)Controls whether a COUNT column is added to the output table along with any other columnsthat may have been requested. If included, this reports the number of rows from the input tablethat fell within the corresponding bin.
[Default: true]
icmd = <cmds> (ProcessingStep[])Specifies processing to be performed on the input table as specified by parameter in, beforeany other processing has taken place. The value of this parameter is one or more of the filtercommands described in Section 6.1. If more than one is given, they must be separated bysemicolon characters (";"). This parameter can be repeated multiple times on the samecommand line to build up a list of processing steps. The sequence of commands given in thisway defines the processing pipeline which is performed on the table.
Commands may alteratively be supplied in an external file, by using the indirection character'@'. Thus a value of "@filename" causes the file filename to be read for a list of filtercommands to execute. The commands in the file may be separated by newline charactersand/or semicolons, and lines which are blank or which start with a '#' character are ignored.
ifmt = <in-format> (String)Specifies the format of the input table as specified by parameter in. The known formats arelisted in Section 5.1.1. This flag can be used if you know what format your table is in. If it hasthe special value (auto) (the default), then an attempt will be made to detect the format of thetable automatically. This cannot always be done correctly however, in which case the programwill exit with an error explaining which formats were attempted. This parameter is ignored forscheme-specified tables.
[Default: (auto)]
in = <table> (StarTable)The location of the input table. This may take one of the following forms:
SUN/256 530
• A filename.• A URL.• The special value "-", meaning standard input. In this case the input format must be given
explicitly using the ifmt parameter. Note that not all formats can be streamed in this way.• A scheme specification of the form :<scheme-name>:<scheme-args>.• A system command line with either a "<" character at the start, or a "|" character at the
end ("<syscmd" or "syscmd|"). This executes the given pipeline and reads from itsstandard output. This will probably only work on unix-like systems.
In any case, compressed data in one of the supported compression formats (gzip, Unixcompress or bzip2) will be decompressed transparently.
istream = true|false (Boolean)If set true, the input table specified by the in parameter will be read as a stream. It is necessaryto give the ifmt parameter in this case. Depending on the required operations and processingmode, this may cause the read to fail (sometimes it is necessary to read the table more thanonce). It is not normally necessary to set this flag; in most cases the data will be streamedautomatically if that is the best thing to do. However it can sometimes result in less resourceusage when processing large files in certain formats (such as VOTable). This parameter isignored for scheme-specified tables.
[Default: false]
lat = <expr/deg> (String)Latitude in degrees for the position of each row in the input table. This may simply be acolumn name, or it may be an algebraic expression as explained in Section 10. The sky systemused here will determine the grid on which the output map is built.
lon = <expr/deg> (String)Longitude in degrees for the position of each row in the input table. This may simply be acolumn name, or it may be an algebraic expression as explained in Section 10. The sky systemused here will determine the grid on which the output map is built.
ocmd = <cmds> (ProcessingStep[])Specifies processing to be performed on the output table, after all other processing has takenplace. The value of this parameter is one or more of the filter commands described in Section6.1. If more than one is given, they must be separated by semicolon characters (";"). Thisparameter can be repeated multiple times on the same command line to build up a list ofprocessing steps. The sequence of commands given in this way defines the processing pipelinewhich is performed on the table.
Commands may alteratively be supplied in an external file, by using the indirection character'@'. Thus a value of "@filename" causes the file filename to be read for a list of filtercommands to execute. The commands in the file may be separated by newline charactersand/or semicolons, and lines which are blank or which start with a '#' character are ignored.
ofmt = <out-format> (String)Specifies the format in which the output table will be written (one of the ones in Section 5.1.2 -matching is case-insensitive and you can use just the first few letters). If it has the specialvalue "(auto)" (the default), then the output filename will be examined to try to guess whatsort of file is required usually by looking at the extension. If it's not obvious from the filenamewhat output format is intended, an error will result.
This parameter must only be given if omode has its default value of "out".
[Default: (auto)]
omode = out|meta|stats|count|checksum|cgi|discard|topcat|samp|plastic|tosql|gui
(ProcessingMode)The mode in which the result table will be output. The default mode is out, which means thatthe result will be written as a new table to disk or elsewhere, as determined by the out and
SUN/256 531
ofmt parameters. However, there are other possibilities, which correspond to uses to which atable can be put other than outputting it, such as displaying metadata, calculating statistics, orpopulating a table in an SQL database. For some values of this parameter, additionalparameters (<mode-args>) are required to determine the exact behaviour.
Possible values are
• out
• meta
• stats
• count
• checksum
• cgi
• discard
• topcat
• samp
• plastic
• tosql
• gui
Use the help=omode flag or see Section 6.4 for more information.
[Default: out]
out = <out-table> (TableConsumer)The location of the output table. This is usually a filename to write to. If it is equal to thespecial value "-" (the default) the output table will be written to standard output.
This parameter must only be given if omode has its default value of "out".
[Default: -]
perunit = steradian|degree2|arcmin2|arcsec2|mas2|uas2 (SolidAngleUnit)Defines the unit of sky area used for scaling density-like combinations (e.g.combine=count-per-unit or sum-per-unit). If the combination mode is calculating valuesper unit area this configures the area scale in question. For non-density-like combinationmodes (e.g. combine=sum or mean) it has no effect.
Possible values are:
• steradian: steradian• degree2: square degree• arcmin2: square arcminute• arcsec2: square arcsecond• mas2: square milliarcsec• uas2: square microarcsec
[Default: degree2]
tiling = hpx<K>|healpixnest<K>|healpixring<K>|htm<K> (SkyTiling)Describes the sky tiling scheme that is in use. One of the following values may be used:
• hpxK: alias for healpixnestK• healpixnestK: HEALPix using the Nest scheme at order K• healpixringK: HEALPix using the Ring scheme at order K• htmK: Hierarchical Triangular Mesh at level K
So for instance hpx5 or healpixnest5 would both indicate the HEALPix NEST tiling schemeat order 5.
At level K, there are 12*4^K HEALPix pixels, or 8*4^K HTM pixels on the sky. Moreinformation about these tiling schemes can be found at the HEALPix and HTM web sites.
SUN/256 532
[Default: hpx5]
B.38.2 Examples
Here are some examples of using tskymap:
stilts tskymap in=iras_psc.fits lon=RA lat=DEC out=iras_map.csv
Writes a table representing a density map of IRAS point sources on the sky. The output is a2-column CSV file: the first column is pixel index, and the second column is the number ofrows in the input table whose (RA,DEC) positions fall within that pixel. The default tiling isused (currently level 5 HEALPix, which has 12288 pixels).
stilts tskymap in=iras_psc.fits lon=RA lat=DEC tiling=hpx6ocmd='healpixmeta -csys C'ofmt=fits-healpix out=iras_map.fits
This does a similar job to the previous example, but explicitly requests HEALPix level 6 tiling,and outputs to a FITS variant that other applications such as Aladin understand as containing aHEALPix map. The output format is specified with ofmt=fits-healpix, which writes a FITSfile following the HEALPix-FITS convention. An additional filter "healpixmeta -csys C" isalso supplied here: this indicates that the HEALPix pixels in the output file are to beconsidered in the Celestial (=equatorial) sky system. If this is not done, Aladin assumes thecoordinate system to be Galactic and will align the results incorrectly on the sky.
stilts tskymap in=2mpz.fits icmd='addskycoords fk5 galactic ra dec glon glat'lon=glon lat=glat tiling=hpx6cols='jCorr-hCorr hCorr-kCorr jCorr-kCorr' combine=mediancount=falsecomplete=trueout=2mpzColors.fits
Writes a table with columns giving median J-H, H-K and J-K colours, but no source countcolumn, from the sources in the file 2mpz.fits, aggregated over each tile of a level 6 HEALPixgrid. The input table has equatorial coordinates, but the addskycoords filter has been used sothat the grid is laid on the sky with galactic coordinates. Setting complete=true guaranteesthat a row is written to the output file for every sky pixel, including empty ones. Note in thiscase that the output format is not specified explicitly, so it will be inferred from the filename,to be "normal" FITS, rather than healpix-fits. The output data will still be present, butexternal applications may not automatically identify the pixel column.
stilts tskymap in=tgas_source.fits tiling=hpx7 lon=l lat=b count=falsecols=phot_g_n_obs combine=sum-per-unit perunit=arcmin2ofmt=fits-healpix ocmd='healpixmeta -csys G'out=obs-density.fits
Calculates a level-7 HEALPix map where each cell contains the local number of observationsper square arcminute, as determined by summing all the phot_g_n_obs values from the inputtable that fall into each tile and applying a suitable scaling factor. The grid coordinate systemis explicitly labelled as Galactic.
stilts tskymap in=gums_lmc.fits lon=alpha lat=deltatiling=hpx14 complete=false omode=count
This prepares a source count map at healpix level 14 (3 billion pixels) from the given inputtable. Since complete=false, only rows for non-empty pixels are included in the output table.Then, since the output mode is count, these rows are just counted, discarding the pixelsthemselves, giving the number of level-14 healpix pixels touched by the sources in this input
SUN/256 533
file. Note this is not necessarily the most efficient way to calculate coverage information.
B.39 tskymatch2: Crossmatches 2 tables on sky position
tskymatch2 performs a crossmatch of two tables based on the proximity of sky positions. Youspecify the columns or expressions giving right ascension and declination in degrees for each inputtable, and a maximum permissible separation in arcseconds, and the resulting joined table is output.
If you omit expressions for the RA and Dec, an attempt is made to identify the columns to use usingcolumn Unified Content Descriptors (UCDs) or names. First columns bearing appropriate UCD1 orUCD1+ values (POS_EQ_RA, POS_EQ_RA_MAIN, pos.eq.ra or pos.eq.ra;meta.main and theirequivalents for declination) are sought. If these cannot be found, columns named something like"RA" or "RA2000" are sought. If either is found, the column units are consulted and radian->degreeconversions are performed if necessary (degrees are assumed if no unit value is given). If nothinglikely can be found, then the command will fail with an error message. This search logic is intendedas a convenience only; it is somewhat ad hoc and subject to change. To make sure that the correctangle values are being used, specify the ra and dec position parameters explicitly.
tskymatch2 is simply a cut-down version, provided for convenience, of the more general matchingtask tmatch2. If you want more match options or otherwise more configurability, you can probablyfind it by using tmatch2.
B.39.1 Usage
The usage of tskymatch2 is
stilts <stilts-flags> tskymatch2 ifmt1=<in-format> ifmt2=<in-format>omode=out|meta|stats|count|checksum|cgi|discard|topcat|samp|plastic|tosql|guiout=<out-table> ofmt=<out-format>ra1=<expr> dec1=<expr> ra2=<expr>dec2=<expr> error=<value/arcsec>tuning=<healpix-k>join=1and2|1or2|all1|all2|1not2|2not1|1xor2find=all|best|best1|best2[in1=]<table1> [in2=]<table2>
If you don't have the stilts script installed, write "java -jar stilts.jar" instead of "stilts" -see Section 3. The available <stilts-flags> are listed in Section 2.1. For programmaticinvocation, the Task class for this command is uk.ac.starlink.ttools.task.SkyMatch2.
Parameter values are assigned on the command line as explained in Section 2.3. They are asfollows:
dec1 = <expr> (String)Declination in degrees for the position of each row of table 1. This may simply be a columnname, or it may be an algebraic expression calculated from columns as explained in Section10. If left blank, an attempt is made to guess from UCDs, column names and unit annotationswhat expression to use.
dec2 = <expr> (String)Declination in degrees for the position of each row of table 2. This may simply be a columnname, or it may be an algebraic expression calculated from columns as explained in Section10. If left blank, an attempt is made to guess from UCDs, column names and unit annotationswhat expression to use.
error = <value/arcsec> (Double)The maximum separation permitted between two objects for them to count as a match. Unitsare arc seconds.
SUN/256 534

find = all|best|best1|best2 (PairMode)Determines what happens when a row in one table can be matched by more than one row inthe other table. The options are:
• all: All matches. Every match between the two tables is included in the result. Rowsfrom both of the input tables may appear multiple times in the result.
• best: Best match, symmetric. The best pairs are selected in a way which treats the twotables symmetrically. Any input row which appears in one result pair is disqualified fromappearing in any other result pair, so each row from both input tables will appear in atmost one row in the result.
• best1: Best match for each Table 1 row. For each row in table 1, only the best matchfrom table 2 will appear in the result. Each row from table 1 will appear a maximum ofonce in the result, but rows from table 2 may appear multiple times.
• best2: Best match for each Table 2 row. For each row in table 2, only the best matchfrom table 1 will appear in the result. Each row from table 2 will appear a maximum ofonce in the result, but rows from table 1 may appear multiple times.
The differences between best, best1 and best2 are a bit subtle. In cases where it's obviouswhich object in each table is the best match for which object in the other, choosing betwenthese options will not affect the result. However, in crowded fields (where the distancebetween objects within one or both tables is typically similar to or smaller than the specifiedmatch radius) it will make a difference. In this case one of the asymmetric options (best1 orbest2) is usually more appropriate than best, but you'll have to think about which of themsuits your requirements. The performance (time and memory usage) of the match may alsodiffer between these options, especially if one table is much bigger than the other.
[Default: best]
ifmt1 = <in-format> (String)Specifies the format of the first input table as specified by parameter in1. The known formatsare listed in Section 5.1.1. This flag can be used if you know what format your table is in. If ithas the special value (auto) (the default), then an attempt will be made to detect the format ofthe table automatically. This cannot always be done correctly however, in which case theprogram will exit with an error explaining which formats were attempted. This parameter isignored for scheme-specified tables.
[Default: (auto)]
ifmt2 = <in-format> (String)Specifies the format of the second input table as specified by parameter in2. The knownformats are listed in Section 5.1.1. This flag can be used if you know what format your table isin. If it has the special value (auto) (the default), then an attempt will be made to detect theformat of the table automatically. This cannot always be done correctly however, in whichcase the program will exit with an error explaining which formats were attempted. Thisparameter is ignored for scheme-specified tables.
[Default: (auto)]
in1 = <table1> (StarTable)The location of the first input table. This may take one of the following forms:
• A filename.• A URL.• The special value "-", meaning standard input. In this case the input format must be given
explicitly using the ifmt1 parameter. Note that not all formats can be streamed in thisway.
• A scheme specification of the form :<scheme-name>:<scheme-args>.• A system command line with either a "<" character at the start, or a "|" character at the
end ("<syscmd" or "syscmd|"). This executes the given pipeline and reads from itsstandard output. This will probably only work on unix-like systems.
SUN/256 535
In any case, compressed data in one of the supported compression formats (gzip, Unixcompress or bzip2) will be decompressed transparently.
in2 = <table2> (StarTable)The location of the second input table. This may take one of the following forms:
• A filename.• A URL.• The special value "-", meaning standard input. In this case the input format must be given
explicitly using the ifmt2 parameter. Note that not all formats can be streamed in thisway.
• A scheme specification of the form :<scheme-name>:<scheme-args>.• A system command line with either a "<" character at the start, or a "|" character at the
end ("<syscmd" or "syscmd|"). This executes the given pipeline and reads from itsstandard output. This will probably only work on unix-like systems.
In any case, compressed data in one of the supported compression formats (gzip, Unixcompress or bzip2) will be decompressed transparently.
join = 1and2|1or2|all1|all2|1not2|2not1|1xor2 (JoinType)Determines which rows are included in the output table. The matching algorithm determineswhich of the rows from the first table correspond to which rows from the second. Thisparameter determines what to do with that information. Perhaps the most obvious thing is towrite out a table containing only rows which correspond to a row in both of the two inputtables. However, you may also want to see the unmatched rows from one or both input tables,or rows present in one table but unmatched in the other, or other possibilities. The options are:
• 1and2: An output row for each row represented in both input tables (INNER JOIN)• 1or2: An output row for each row represented in either or both of the input tables (FULL
OUTER JOIN)• all1: An output row for each matched or unmatched row in table 1 (LEFT OUTER
JOIN)• all2: An output row for each matched or unmatched row in table 2 (RIGHT OUTER
JOIN)• 1not2: An output row only for rows which appear in the first table but are not matched in
the second table• 2not1: An output row only for rows which appear in the second table but are not matched
in the first table• 1xor2: An output row only for rows represented in one of the input tables but not the
other one
[Default: 1and2]
ofmt = <out-format> (String)Specifies the format in which the output table will be written (one of the ones in Section 5.1.2 -matching is case-insensitive and you can use just the first few letters). If it has the specialvalue "(auto)" (the default), then the output filename will be examined to try to guess whatsort of file is required usually by looking at the extension. If it's not obvious from the filenamewhat output format is intended, an error will result.
This parameter must only be given if omode has its default value of "out".
[Default: (auto)]
omode = out|meta|stats|count|checksum|cgi|discard|topcat|samp|plastic|tosql|gui
(ProcessingMode)The mode in which the result table will be output. The default mode is out, which means thatthe result will be written as a new table to disk or elsewhere, as determined by the out andofmt parameters. However, there are other possibilities, which correspond to uses to which atable can be put other than outputting it, such as displaying metadata, calculating statistics, or
SUN/256 536
populating a table in an SQL database. For some values of this parameter, additionalparameters (<mode-args>) are required to determine the exact behaviour.
Possible values are
• out
• meta
• stats
• count
• checksum
• cgi
• discard
• topcat
• samp
• plastic
• tosql
• gui
Use the help=omode flag or see Section 6.4 for more information.
[Default: out]
out = <out-table> (TableConsumer)The location of the output table. This is usually a filename to write to. If it is equal to thespecial value "-" (the default) the output table will be written to standard output.
This parameter must only be given if omode has its default value of "out".
[Default: -]
ra1 = <expr> (String)Right ascension in degrees for the position of each row of table 1. This may simply be acolumn name, or it may be an algebraic expression calculated from columns as explained inSection 10. If left blank, an attempt is made to guess from UCDs, column names and unitannotations what expression to use.
ra2 = <expr> (String)Right ascension in degrees for the position of each row of table 2. This may simply be acolumn name, or it may be an algebraic expression calculated from columns as explained inSection 10. If left blank, an attempt is made to guess from UCDs, column names and unitannotations what expression to use.
tuning = <healpix-k> (Integer)Tuning parameter that controls the pixel size used when binning the rows. The legal range isfrom 0 (corresponding to pixel size of about 60 degrees) to 20 (about 0.2 arcsec). The value ofthis parameter will not affect the result but may affect the performance in terms of CPU andmemory resources required. A default value will be chosen based on the size of the error
parameter, but it may be possible to improve performance by adjusting the default value. Thevalue used can be seen by examining the progress output. If your match is taking a long timeor is failing from lack of memory it may be worth trying different values for this parameter.
B.39.2 Examples
Here are some examples of using tskymatch2:
stilts tskymatch2 in1=obs_v.xml in2=obs_i.xml out=obs_iv.xml \ra1=OBS_RA dec1=OBS_DEC ra2=OBS_RA dec2=OBS_DEC error=2
Takes two input catalogues (VOTables), one with observations in the V band and the other inthe I band, and performs a match to find objects within 2 arcseconds of each other. The result
SUN/256 537
is a new VOTable containing only rows where a match was found.
stilts tskymatch2 in1=obs_v.xml in2=obs_i.xml out=obs_iv.xml \error=2
This is the same as the previous example but without explicit specification of the sky positioncolumns in either table. It will work only if those columns are identified with appropriateUCDs, for instance pos.eq.ra;meta.main and pos.eq.dec:meta.main. If no suitable UCDsare in place this invocation will fail with an error.
stilts tskymatch2 in1=virgo1.txt ifmt1=ascii in2=mgc.fits \ra1='radiansToDegrees(raRad)' dec1='radiansToDegrees(deRad)' \ra2=MGC_ALPHA_J2000 dec2=MGC_DELTA_J2000 \error=10 join=2not1 omode=count
Object positions in the text file virgo1.txt are compared to those in the FITS file mgc.fits. Theangles have been recorded in the text file in radians, so they are converted to degrees herebefore use. Use of the join=2not1 parameter causes the command to identify all the objects inthe first list which do not have counterparts within 10 arcsec in the second list. The number ofsuch objects found is simply output to the terminal.
B.40 votcopy: Transforms between VOTable encodings
The VOTable standard provides for three basic encodings of the actual data within each table:TABLEDATA, BINARY and FITS. TABLEDATA is a pure-XML encoding, which is relativelyeasy for humans to read and write. However, it is verbose and not very efficient for transmissionand processing, for which reason the more compact BINARY format has been defined. FITS formatshares the advantages of BINARY, but is more likely to be used where a VOTable is providingmetadata 'decoration' for an existing FITS table. In addition, the BINARY and FITS encodings maycarry their data either inline (as the base64-encoded text content of a STREAM element) or externally(referenced by a STREAM element's href attribute).
These different formats have their different advantages and disadvantages. Since, to some extent,programmers are humans too, much existing VOTable software deals in TABLEDATA format eventhough it may not be the most efficient way to proceed. Conversely, you might wish to examine thecontents of a BINARY-encoded table without use of any software more specialised than a texteditor. So there are times when it is desirable to convert from one of these encodings to another.
votcopy is a tool which translates between these encodings while making a minimum of otherchanges to the VOTable document. The processing may result in some changes to lexical detailssuch as whitespace in start tags, but the element structure is not modified. Unlike tpipe it does notimpose STIL's model of what constitutes a table on the data between reading it in and writing it out,so subtleties dependent on the exact structure of the VOTable document will not be mangled. Theonly important changes should be the contents of DATA elements in the document.
B.40.1 Usage
The usage of votcopy is
stilts <stilts-flags> votcopy version=1.0|1.1|1.2|1.3|1.4charset=<xml-encoding> cache=true|falsehref=true|false nomagic=true|falsebase=<location>[in=]<location> [out=]<location>[format=]TABLEDATA|BINARY|BINARY2|FITS
If you don't have the stilts script installed, write "java -jar stilts.jar" instead of "stilts" -see Section 3. The available <stilts-flags> are listed in Section 2.1. For programmatic
SUN/256 538
invocation, the Task class for this command is uk.ac.starlink.ttools.task.VotCopy.
Parameter values are assigned on the command line as explained in Section 2.3. They are asfollows:
base = <location> (String)Determines the name of external output files written when the href flag is true. Normally theseare given names based on the name of the output file. But if this flag is given, the names willbe based on the <location> string. This flag is compulsory if href is true and out=- (output isto standard out), since in this case there is no default base name to use.
cache = true|false (Boolean)Determines whether the input tables are read into a cache prior to being written out. Thedefault is selected automatically depending on the input table; so you should normally leavethis flag alone.
charset = <xml-encoding> (Charset)Selects the Unicode encoding used for the output XML. The available options are dependenton your JVM, use help=charset for a full listing. Setting the value null will use the JVM'ssystem default.
[Default: UTF-8]
format = TABLEDATA|BINARY|BINARY2|FITS (uk.ac.starlink.votable.DataFormat)Determines the encoding format of the table data in the output document. If null is selected,then the tables will be data-less (will contain no DATA element), leaving only the documentstructure. Data-less tables are legal VOTable elements.
The BINARY2 format is only available for version=1.3
[Default: TABLEDATA]
href = true|false (Boolean)In the case of BINARY or FITS encoding, this determines whether the STREAM elementsoutput will contain their data inline or externally. If set false, the output document will beself-contained, with STREAM data inline as base64-encoded characters. If true, then for eachTABLE in the document the binary data will be written to a separate file and referenced by anhref attribute on the corresponding STREAM element. The name of these files is usuallydetermined by the name of the main output file; but see also the base flag.
in = <location> (String)Location of the input VOTable. May be a URL, filename, or "-" to indicate standard input. Theinput table may be compressed using one of the known compression formats (Unix compress,gzip or bzip2).
[Default: -]
nomagic = true|false (Boolean)Eliminate the null attributes of VALUES elements where they are no longer required. InVOTable versions <=1.2, the only way to specify null values for integer-type scalar columnswas to use the null attribute of the VALUES element to indicate an in-band magic valuerepresenting null. From VOTable v1.3, null values can be represented using empty <TD>
elements or flagged specially in BINARY2 streams. In these cases, it is recommended (thoughnot required) not to use the VALUES/null mechanism.
If this parameter is set true, then any VALUES/null attributes will be removed in VOTable 1.3BINARY2 or TABLEDATA output. If this results in an empty VALUES element, it too will beremoved.
This parameter is ignored if the output VOTable version is lower than 1.3 or ifformat=BINARY/FITS.
SUN/256 539
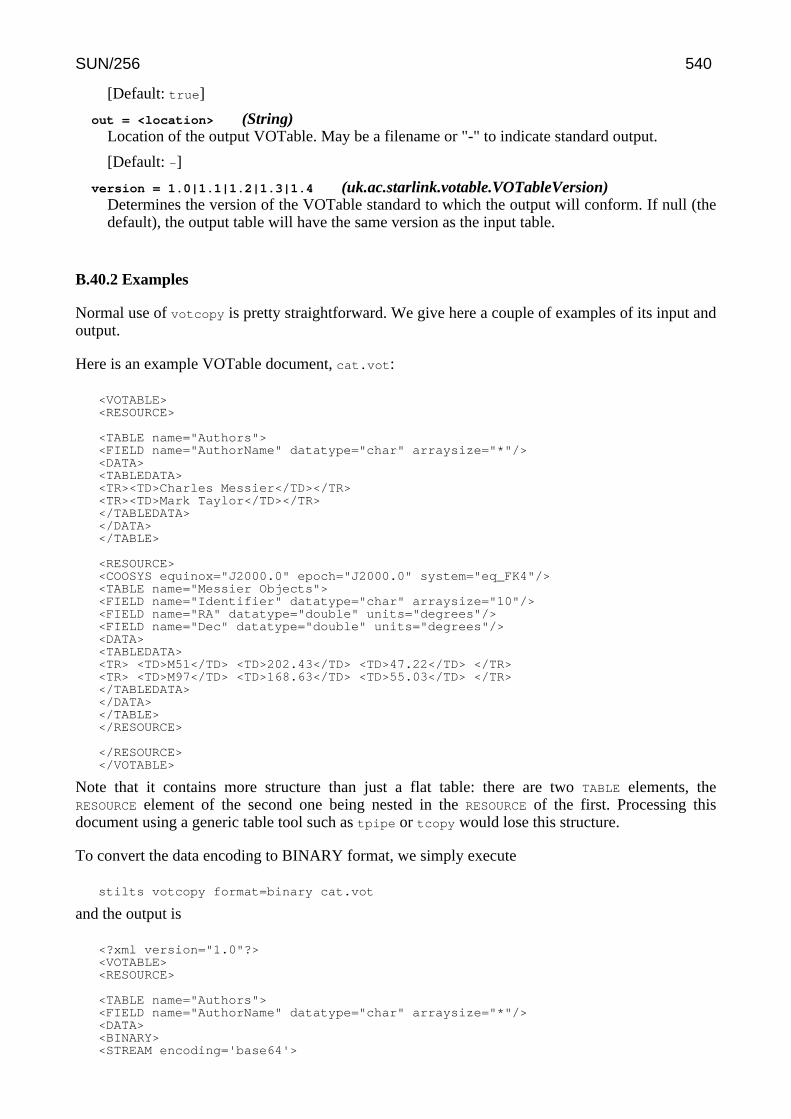
[Default: true]
out = <location> (String)Location of the output VOTable. May be a filename or "-" to indicate standard output.
[Default: -]
version = 1.0|1.1|1.2|1.3|1.4 (uk.ac.starlink.votable.VOTableVersion)Determines the version of the VOTable standard to which the output will conform. If null (thedefault), the output table will have the same version as the input table.
B.40.2 Examples
Normal use of votcopy is pretty straightforward. We give here a couple of examples of its input andoutput.
Here is an example VOTable document, cat.vot:
<VOTABLE><RESOURCE>
<TABLE name="Authors"><FIELD name="AuthorName" datatype="char" arraysize="*"/><DATA><TABLEDATA><TR><TD>Charles Messier</TD></TR><TR><TD>Mark Taylor</TD></TR></TABLEDATA></DATA></TABLE>
<RESOURCE><COOSYS equinox="J2000.0" epoch="J2000.0" system="eq_FK4"/><TABLE name="Messier Objects"><FIELD name="Identifier" datatype="char" arraysize="10"/><FIELD name="RA" datatype="double" units="degrees"/><FIELD name="Dec" datatype="double" units="degrees"/><DATA><TABLEDATA><TR> <TD>M51</TD> <TD>202.43</TD> <TD>47.22</TD> </TR><TR> <TD>M97</TD> <TD>168.63</TD> <TD>55.03</TD> </TR></TABLEDATA></DATA></TABLE></RESOURCE>
</RESOURCE></VOTABLE>
Note that it contains more structure than just a flat table: there are two TABLE elements, theRESOURCE element of the second one being nested in the RESOURCE of the first. Processing thisdocument using a generic table tool such as tpipe or tcopy would lose this structure.
To convert the data encoding to BINARY format, we simply execute
stilts votcopy format=binary cat.vot
and the output is
<?xml version="1.0"?><VOTABLE><RESOURCE>
<TABLE name="Authors"><FIELD name="AuthorName" datatype="char" arraysize="*"/><DATA><BINARY><STREAM encoding='base64'>
SUN/256 540

AAAAD0NoYXJsZXMgTWVzc2llcgAAAAtNYXJrIFRheWxvcg==</STREAM></BINARY></DATA></TABLE>
<RESOURCE><COOSYS equinox="J2000.0" epoch="J2000.0" system="eq_FK4"/><TABLE name="Messier Objects"><FIELD name="Identifier" datatype="char" arraysize="10"/><FIELD name="RA" datatype="double" units="degrees"/><FIELD name="Dec" datatype="double" units="degrees"/><DATA><BINARY><STREAM encoding='base64'>TTUxAAAAAAAAAEBpTcKPXCj2QEecKPXCj1xNOTcAAAAAAAAAQGUUKPXCj1xAS4PXCj1wpA==</STREAM></BINARY></DATA></TABLE></RESOURCE>
</RESOURCE></VOTABLE>
Note that both tables in the document have been translated to BINARY format. The basic structureof the document is unchanged: the only differences are within the DATA elements. If we ran
stilts votcopy format=tabledata
on either this output or the original input then the output would be identical (apart perhaps fromwhitespace) to the input table, since the data are originally in TABLEDATA format.
To generate a VOTable document with the data in external files, the href parameter is used. Wewill output in FITS format this time. Executing:
stilts votcopy format=fits href=true cat.vot fcat.vot
writes the following to the file fcat.vot:
...<DATA><FITS><STREAM href="fcat-1.fits"/></FITS></DATA>...<DATA><FITS><STREAM href="fcat-2.fits"/></FITS></DATA>...
(the unchanged parts of the document have been skipped here for brevity). The actual data arewritten in two additional files in the same directory as the output file, fcat-1.fits andfcat-2.fits. These filenames are based on the main output filename, but can be altered using thebase flag if required. Note this has also given you FITS binary table versions of all the tables in theinput VOTable document, which can be operated on by normal FITS-aware software quiteseparately from the VOTable if required.
B.41 votlint: Validates VOTable documents
The VOTable standard, while not hugely complicated, has a number of subtleties and it's notdifficult to produce VOTable documents which violate it in various ways. In some cases the errorsare small and a parser is likely to process the document without noticing the trouble. In other cases,the errors are so serious that it's hard for any software to make sense of it. In many cases in
SUN/256 541

between, different software will react in different ways, in the worst case appearing to parse aVOTable but in fact understanding the wrong data.
votlint is a program which can check a VOTable document and spot places where it does notconform to the VOTable standard, or places which look like they may not mean what the authorintended. It is meant for use in two main scenarios:
1. For authors of VOTables and VOTable-producing software, to check that the documents theyproduce are legal and problem-free.
2. For users of VOTables (including authors of VOTable-processing software) who are havingproblems with one and want to know whether it is the data or the software at fault.
Validating a VOTable document against the VOTable schema or DTD of course goes a long waytowards checking a VOTable document for errors, but it by no means does the whole job, simplybecause the schema/DTD specification languages don't have the facilities to understand the datastructure of a VOTable document. For instance the VOTable schema will allow any plain textcontent in a TD element, but whether this makes sense in a VOTable depends on the datatype
attribute of the corresponding FIELD element. There are many other examples. votlint tackles thisby parsing the VOTable document in a way which understands its structure and assessing thecontent as critically as it can. For any incorrect or questionable content it finds, it will output a shortmessage describing the problem and giving its location in the document. What you do with thisinformation is then up to you.
Using votlint is very straightforward. The votable argument gives the location (filename or URL)of a VOTable document. Otherwise, the document will be read from standard input. Error andwarning messages will be written on standard output. Each message is prefixed with the location atwhich the error was found (if possible the line and column are shown, though this is dependent onyour JVM's default XML parser). If multiple instances of the same problem are found, by defaultonly a few repeats of the message are reported; this can be controlled with the maxrepeat
parameter. The processing is SAX-based, so arbitrarily long tables can be processed without heavymemory use.
votlint can't guarantee to pick up every possible error in a VOTable document, but it ought to pickup many of the most serious errors that are commonly made in authoring VOTables.
Note: votlint's handling of XML namespaces seems to be somewhat dependent on the XMLparser in use. As far as I can see, Crimson (the default in many JREs) works for any namespacearrangements, but Xerces seems to have problems when validating documents which usenamespace prefixes. Not sure about other parsers. This probably won't cause you trouble, but if itdoes you may need to set validate=false to work around it. Contact the author if this seems to bea serious issue for you.
B.41.1 Usage
The usage of votlint is
stilts <stilts-flags> votlint ucd=true|false unit=true|falsemaxrepeat=<int-value> validate=true|falseversion=1.0|1.1|1.2|1.3|1.4 out=<location>[votable=]<location>
If you don't have the stilts script installed, write "java -jar stilts.jar" instead of "stilts" -see Section 3. The available <stilts-flags> are listed in Section 2.1. For programmaticinvocation, the Task class for this command is uk.ac.starlink.ttools.task.VotLint.
Parameter values are assigned on the command line as explained in Section 2.3. They are as
SUN/256 542
follows:
maxrepeat = <int-value> (Integer)Puts a limit on the number of times that the same issue will be reported. With this set to arelatively small number, the output is not cluttered with many repetitions of the same problem.
[Default: 4]
out = <location> (uk.ac.starlink.util.Destination)Destination file for output messages. May be a filename or "-" to indicate standard output.
[Default: -]
ucd = true|false (Boolean)If true, the ucd attributes on FIELD and PARAM elements etc are checked for conformanceagainst the UCD1+ standard or a list of known UCD1 terms.
[Default: true]
unit = true|false (Boolean)If true, the unit attributes on FIELD and PARAM elements are checked for conformanceagainst the VOUnits standard; if false, no such checks are made.
The VOTable 1.4 standard recommends use of VOUnits, though there are someinconsistencies in the text on this topic. Earlier VOTable versions refer to a different (CDS)unit syntax, which is not checked by votlint. So by default unit syntax is checked when theVOTable is 1.4 or greater, and not for earlier versions, but that can be overridden by giving atrue or false value for this parameter.
The wording of the VOTable and VOUnit standards do not strictly require use of VOUnitsyntax even at VOTable 1.4, so failed checks result in Warning rather than Error reports.
validate = true|false (Boolean)Whether to validate the input document aganist the VOTable DTD. If true (the default), then aswell as votlint's own checks, it is validated against an appropriate version of the VOTableDTD which picks up such things as the presence of unknown elements and attributes, elementsin the wrong place, and so on. Sometimes however, particularly when XML namespaces areinvolved, the validator can get confused and may produce a lot of spurious errors. Setting thisflag false prevents this validation step so that only votlint's own checks are performed. In thiscase many violations of the VOTable standard concerning document structure will gounnoticed.
[Default: true]
version = 1.0|1.1|1.2|1.3|1.4 (uk.ac.starlink.votable.VOTableVersion)Selects the version of the VOTable standard which the input table is supposed to exemplify.The version may also be specified within the document using the "version" attribute of thedocument's VOTABLE element; if it is and it conflicts with the value specified by this flag, awarning is issued.
If no value is provided for this parameter (the default), the version will be determined from theVOTable itself.
votable = <location> (InputStream)Location of the VOTable to be checked. This may be a filename, URL or "-" (the default), toindicate standard input. The input may be compressed using one of the known compressionformats (Unix compress, gzip or bzip2).
B.41.2 Items Checked
SUN/256 543

Votlint checks that the XML input is well-formed, and, unless the valid=false parameter issupplied, that it validates against the 1.0 DTD or 1.1, 1.2, 1.3 or 1.4 schema as appropriate. Some ofthe validity checks are also done by votlint internally, so that some validity-type errors may giverise to more than one warning. In general, the program errs on the side of verbosity.
In addition to these checks, the following checks are carried out, and lead to ERROR reports ifviolations are found:
• TD contents incompatible datatype/arraysize attributes declared in FIELD
• BINARY/BINARY2 data streams which don't match metadata declared in FIELD
• PARAM values incompatible with declared datatype/arraysize• Meaningless arraysize declarations• Array-valued TD elements with the wrong number of elements• Array-valued PARAM values with the wrong number of elements• nrows attribute on TABLE element different from the number of rows actually in the table• VOTABLE version attribute is unknown• ref attributes without matching ID elements elsewhere in the document• Same ID attribute value on multiple elements.• Attributes defined by external vocabularies have permitted values; hard-coded lists of known
permitted values are stored internally, but the external vocabularies are consulted if necessaryto check for values added after build time (currently only applies to TIMESYS attributes).
• Values marked by xtype values as defined in DALI are checked for formal compliance withDALI requirements.
Additionally, the following conditions, which are not actually forbidden by the VOTable standard,will generate WARNING reports. Some of these may result from harmless constructions, but it iswise at least to take a look at the input which caused them:
• Wrong number of TD elements in row of TABLEDATA table• Mismatch between VOTable and FITS column metadata for FITS data encoding• TABLE with no FIELD elements• Use of deprecated attributes• FIELD or PARAM elements with datatype of either char or unicodeChar and undeclared
arraysize - this is a common error which can result in ignoring all but the first character in TD
elements from a column• ref attributes which reference other elements by ID where the reference makes no, or
questionable sense (e.g. FIELDref references FIELD in a different table)• Multiple sibling elements (such as FIELDs, though not INFOs) with the same name attributes• TIMESYS elements never referenced.• ucd attribute values are not legal UCD1+ strings (if parameter ucd=true)• unit attribute values are not legal VOUnit strings (if parameter unit=true)
B.41.3 Examples
Here is a brief example of running votlint against a (very short) imperfect VOTable document. Ifthe document looks like this:
<VOTABLE version="1.1"><RESOURCE><TABLE nrows="2"><FIELD name="Identifier" datatype="char"/><FIELD name="RA" datatype="double"/><FIELD name="Dec" datatype="double"/><DESCRIPTION>A very small table</DESCRIPTION><DATA><TABLEDATA><TR><TD>Fomalhaut</TD>
SUN/256 544
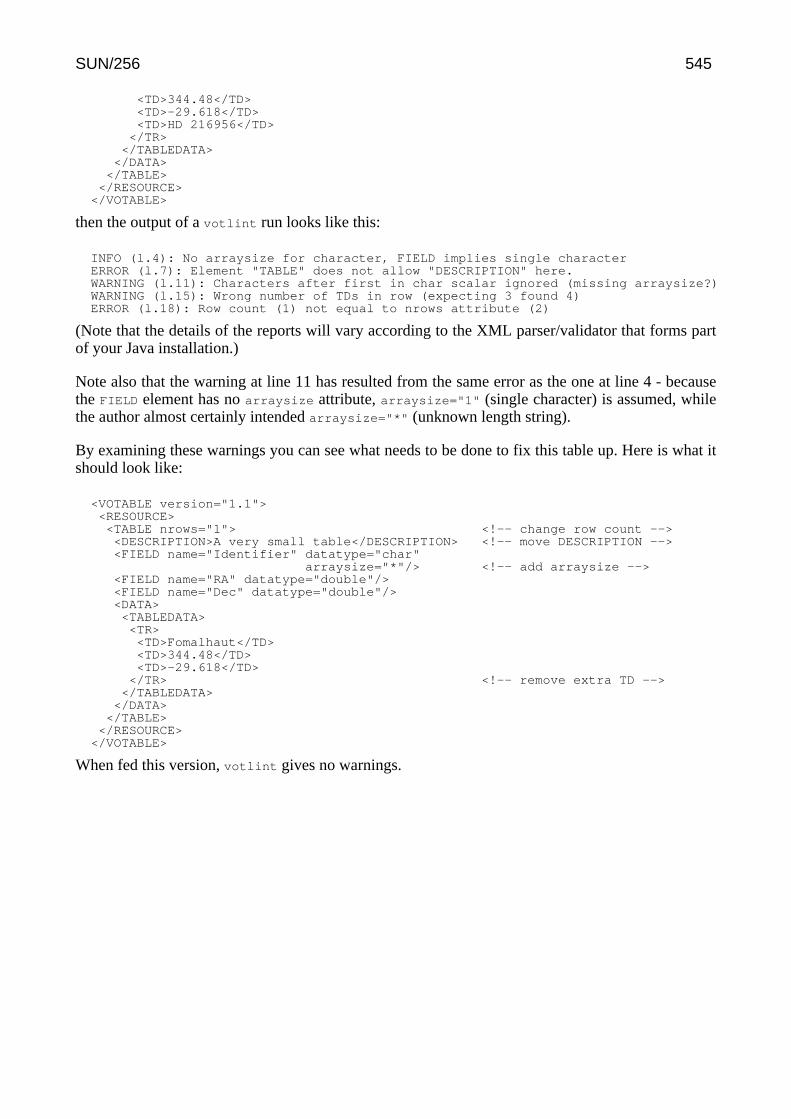
<TD>344.48</TD><TD>-29.618</TD><TD>HD 216956</TD>
</TR></TABLEDATA>
</DATA></TABLE>
</RESOURCE></VOTABLE>
then the output of a votlint run looks like this:
INFO (l.4): No arraysize for character, FIELD implies single characterERROR (l.7): Element "TABLE" does not allow "DESCRIPTION" here.WARNING (l.11): Characters after first in char scalar ignored (missing arraysize?)WARNING (l.15): Wrong number of TDs in row (expecting 3 found 4)ERROR (l.18): Row count (1) not equal to nrows attribute (2)
(Note that the details of the reports will vary according to the XML parser/validator that forms partof your Java installation.)
Note also that the warning at line 11 has resulted from the same error as the one at line 4 - becausethe FIELD element has no arraysize attribute, arraysize="1" (single character) is assumed, whilethe author almost certainly intended arraysize="*" (unknown length string).
By examining these warnings you can see what needs to be done to fix this table up. Here is what itshould look like:
<VOTABLE version="1.1"><RESOURCE><TABLE nrows="1"> <!-- change row count --><DESCRIPTION>A very small table</DESCRIPTION> <!-- move DESCRIPTION --><FIELD name="Identifier" datatype="char"
arraysize="*"/> <!-- add arraysize --><FIELD name="RA" datatype="double"/><FIELD name="Dec" datatype="double"/><DATA><TABLEDATA><TR><TD>Fomalhaut</TD><TD>344.48</TD><TD>-29.618</TD>
</TR> <!-- remove extra TD --></TABLEDATA>
</DATA></TABLE>
</RESOURCE></VOTABLE>
When fed this version, votlint gives no warnings.
SUN/256 545
C Release Notes
This is STILTS, Starlink Tables Infrastructure Library Tool Set. It is a collection of non-GUIutilites for general purpose table manipulation.
AuthorMark Taylor (Bristol University)
WWWhttp://www.starlink.ac.uk/stilts/
User comments, suggestions, requests and bug reports to the above address are welcomed.
C.1 Acknowledgements
The initial development of STILTS was done under the UK's Starlink project (1980-2005, R.I.P.).Since then it has been supported by grant PP/D002486/1 from the UK's Particle Physics andAstronomy Research Council, the VOTech project (from EU FP6), the AstroGrid project (fromPPARC/STFC), the AIDA project (from EU FP7), grants ST/H008470/1, ST/I00176X/1,ST/J001414/1, ST/L002388/1, ST/M000907/1, ST/R000700/1 and ST/S001980/1 from the UK'sScience and Technology Facilities Council (STFC), the GAVO project (BMBFBewilligungsnummer 05A08VHA), the European Space Agency, and the EU FP7-2013-Spaceproject GENIUS. All of this support is gratefully acknowledged.
Apart from the excellent Java 2 Standard Edition itself, the following external libraries provideimportant parts of STILTS's functionality:
• JEL (GNU) for algebraic expression evaluation• cds-healpix-java (CDS) for HEALPix manipulation• iText (1T3XT BVBA) for PDF output• JFreeSVG for SVG output• EPSGraphics2D (Jibble) for encapsulated postscript output• MOC (CDS) for Multi-Order Coverage map manipulation• ADQL (CDS) for ADQL parsing in TAP query preparation• nom.tam.fits (NASA) for parts of FITS I/O• Skyview in a Jar (NASA) for sky axis drawing• JLaTeXMath (Scilab) for LaTeX typesetting in plots• GifEncoder (Acme) for GIF output• HTM (Sloan Digital Sky Survey) for HTM-based celestial sphere row matching (now
deprecated within STILTS)
Thanks in particular to Nickolai Kouropatkine and Chris Stoughton of Fermilab for writing thePixTools specially for use in STIL.
Many people have contributed ideas and advice to the development of STILTS and its relatedproducts. A list of some of them can be found in the TOPCAT user document, SUN/253.
If you use this software in published work, the following citation would be appreciated:
2006ASPC..351..666T: M. B. Taylor, "STILTS - A Package for Command-Line Processingof Tabular Data", in Astronomical Data Analysis Software and Systems XV, eds. C. Gabrielet al., ASP Conf. Ser. 351, p. 666 (2006)
C.2 Version History
SUN/256 546
Releases to date have been as follows:
Version 0.1b (29 April 2005)First public release
Version 0.2b (30 June 2005)
• Added Times func class for MJD-ISO8601 time conversions.• Fixed bug when doing NULL_ test expressions on first column in table.
Version 1.0b (30 September 2005)This is the first non-experimental release of STILTS, and it incorporates major changes andbackward incompatibilities since version 0.2b.
Parameter systemThe parameter system has undergone a complete rewrite; there is now only a singlecommand "stilts", invoked using the stilts script or the stilts.jar jar file, and thevarious tasks are named as subsequent arguments on the command line. Commandarguments are supplied after that. The new invocation syntax is described in detailelsewhere in this document. As well as invocation features such as improved on-line help,optional prompting, parameter defaulting, and more uniform access to common features,this will make it more straightforward to wrap these tasks for use in non-command-lineenvironments, such as behind a SOAP or CORBA interface, or in a CEA-like executionenvironment.
CrossmatchingA new command tmatch2 has been introduced. This provides flexible and efficientcrossmatching between two input tables. Future releases will provide commands forintra-table and multi-table matching.
ConcatentationA new command tcat has been introduced, which allows two tables to be glued togethertop-to-bottom. This is currently working but very rudimentary - improvements will beforthcoming in future releases.
CalculatorA new utility command calc has been introduced, which performs one-line expressionevaluations from the command line.
Pipeline filtersThe following new filter commands for use in tpipe and other commands have beenintroduced:
• addskycoords: calculates new celestial coordinate pair from existing ones (FK4,FK5, ecliptic, galactic, supergalactic)
• replacecol: replaces column data, using existing metadata• badval: replaces given 'magic' value with null• replaceval: replaces given 'magic' value with any specified value• tablename: edits table name• explodecols and explodecols commands replace explode
The new stream parameter of tpipe now allows you to write filter commands in anexternal file, to facilitate more manageable command lines.
Wildarding for column specification is now allowed for some filter commands.
Algebraic functions
• New functions for converting time values between different coordinate systems(Modified Julian Date, ISO-8601, Julian Epoch and Besselian Epoch).
• New RANDOM special function.
SUN/256 547
DocumentationSUN/256 has undergone many changes. Much of the tool documentation is nowautomatically generated from the code itself, which goes a long way to ensuring that thedocumentation is correct with respect to the current state of the code.
Version 1.0-1b (7 October 2005)Fixed jar file manifest bug which prevented working on Java 1.5
Version 1.1 (10 May 2006)A number of new features and capabilities have been introduced:
tcube CommandThe new tcube (Appendix B.29) command calculates N-dimensional histograms (densitymaps) from N columns of an input table and writes the result to a FITS file.
Processing FiltersThe following new filters have been added:
• stats filter provides the same information as the old stats output mode, but allowsmuch more flexible use of the results. It can also calculate many new quantities,including quantiles, skew and kurtosis.
• meta filter provides the same information as the old meta output mode, but allowsmuch more flexible use of the results.
• assert filter provides in-pipeline logical assertions.• uniq filter collapses multiple adjacent identical or similar rows.• sorthead filter provides a (usually) more efficient method of doing what you could
previously do by combining sort and head filters.• colmeta filter adds/modifies metadata for selected columns.• check filter checks table in stream - for debugging purposes only.
Additionally usage of the sort filter has been changed so that it can now do everythingthat sortexpr used to be able to do; sortexpr is now withdrawn.
Output ModesThe following new output modes have been introduced:
• plastic mode broadcasts the table to one or all registered PLASTIC listeners.• cgi mode writes the table to standard output in a form suitable for output from a CGI
script.• discard mode throws away the table.
and usage of the following has been modified:
• topcat mode now attempts to use PLASTIC (amongst other methods) to contactTOPCAT.
• stats and meta modes are mildly deprecated in favour of the corresponding newfilters (see above).
Other new features
• New IPAC table format input handler added.• New csv-noheader format variant output handler added.• roundDecimal and formatDecimal functions introduced for more control over visual
appearance of numeric values.• Experimental facilities for automatically generating a CEA application description
file.
Bug fixes and minor improvements
• Now copes with 'K'-format FITS binary table columns (64-bit integers).
SUN/256 548
• Improved, though still imperfect, retention of table-wide metadata in VOTables.• Distinctions between null and false values in boolean columns are handled more
carefully for FITS and VOTable files.• Efficiency improvement when writing FITS-plus format (now only requires a
maximum of two passes rather than three of the input rows).• Added the mark.workaround system property which can optionally work around a
bug in some input streams ("Resetting to invalid mark" errors).• Fixed a bug in Cartesian matching which failed to match if the required error in any
dimension was zero.• Fixed erroneous reports about unknown ucd and utype attributes of TABLE element
in votlint.• When joining tables, column name comparison to determine whether deduplication
is required is now case-insensitive.• Error message improved when no automatic format detection is attempted for
streamed tables.• Setting istream=true is now less likely to cause a "Can't re-read stream" error.
Version 1.2 (7 July 2006)
Column-oriented StorageNew features for permitting column-oriented storage (colfits format, newstartable.storage policy "sideways") have been introduced. These can provideconsiderable efficiency improvements for certain tasks when working with very large(and especially wide) tables.
New VO commandsAdded two new commands for querying Virtual Observatory services:
• multicone - Makes multiple cone search queries to the same service• regquery - Queries the VO registry
These tasks are experimental and may be modified or renamed in future releases.
Other items
• transpose filter added.• Added flux conversion functions (Jansky<->magnitude).• ISO-8601 strings now permit times of 24:00:00 as they should.
Version 1.2-1 (3 August 2006)
• Tab-Separated Table (TST) format now supported for reading and writing.• New setparam and clearparams filters.• Added ICRS coordinate system for addskycoords.• TUCDnn header cards now used in FITS files to transmit UCDs (non-standard
mechanism).• Efficiency improvements for column-oriented access.
Version 1.3 (5 October 2006)
Table ConcatenationThe old tcat command has been replaced by more capable tcat and tcatn commands.Between them these provide concatenation of an unlimited number of homogeneous orheterogeneous input tables. Additional columns may be added to indicate which of theinput tables given output rows originated from.
Parameter value indirectionCertain parameters (in in tcat, cmd and friends) may now be specified in the form"@filename". This indicates that the value for the parameter is to be obtained by reading
SUN/256 549

it from the named file. This is useful if a very long value is required for the parameter inquestion. The script parameter of tpipe has therefore been withdrawn, since it did justthe same thing.
MySpace accessDirect access to the MySpace virtual file system is now provided by use of ivo:- ormyspace:-type URLs.
Conversion functions
• Time conversion functions between MJD and Decimal Year have been added(Section 10.6.18).
• toHex and fromHex numeric conversion functions have been added (Section 10.6.3).
Documentation improvements
• The HTML version of SUN/256 now uses CSS to provide better highlighting ofcommands etc.
• The Output Modes and Processing Filter sections are now split into subsections tomake the table of contents clearer.
• The Command Reference section now has only one level of subsection listed in thetable of contents to make it clearer.
Other new features and improvements
• Added -J flag to stilts script for passing flags directly to Java.• Added new out parameter to votlint.• Added -ifndim and -ifshape flags to explodeall filter.• The exact match mode in tmatch2 now copes with array-valued columns.• Added force parameter to multicone task as a workaround for some broken
services.• Added Sample (as opposed to Population) Standard Deviation/Variance calculation
options to the stats filter.• Improved CEA description file output - now contains details of all tasks rather than
just a few, as well as various improvements in documentation etc.
Bug fixes
• Fixed erroneous complaints from votlint about utype attribute on RESOURCEelements.
• Fixed a couple of minor crossmatching bugs (which wouldn't have affected results).
Version 1.3-1 (Starlink Hokulei release)
• New command tjoin introduced.• Output to MySpace can now be streamed, if running under J2SE1.5 or later.• Slight changes to parameters for votlint and votcopy.• Fixed bug in handling of single quotes in FITS file metadata.• Added -bench flag to stilts command.• Various scalability improvements for use with very large (Tb?) files.• Improved efficiency for text and ascii output formats (now one-pass not two-pass).• Improved CEA app-description file, including especially option lists for things like input
and output formats.• Added README.cea file to distribution.• Fixed problem which could mis-report VOTable out of memory errors as Broken Pipe.• Added Vega<->AB magnitude conversion constants to Fluxes functions.• Added duptag parameters to tmatch2 task for customised renaming of columns with
duplicated names.
SUN/256 550
• Added hyperbolic trig functions to Maths class (sinh, cosh, tanh and inverses).• Added cosmology distance calculations in class Distances.• Added funcs task, a browser for expression language function documentation.• Added -checkversion to list of stilts flags.
Version 1.3-2 (6 July 2007)
• Added optional table parameter to calc command (for access to table parameters).• Can use table parameter names in expressions using param$ notation (Section 10.2).• Can reference columns/parameters by UCD by using ucd$ notation in expressions
(Section 10.1) and as column identifiers (Section 6.2).• Improved deduplication of column names when joining tables.• Fix error in output of FITS table TNULL n header cards - write them as numeric not string
values.• Improve error message for broken CSV files.• Modified JDBC handling so that MySQL and PostgreSQL do not run out of heap memory
when streaming large datasets for input. Think I've done the same for SQL Server, butthis is not tested.
• Improve error reporting in the presence of a deficient JVM (such as GNU gcj).• Add locale-specific formatDecimalLocal functions in class Formats.• Add fluxToLuminosity and luminosityToFlux functions in class Fluxes.• Fix bug which was causing NullPointerExceptions in the transpose filter.
Version 1.3-3 (4 Sep 2007)
• Experimental, and currently undocumented, sqlcone task introduced, along with someclasses in package uk.ac.starlink.ttools.cone designed for library use by AstroGridDSA code.
• CEA description of tmatch2 params parameter now has minoccurs=0, since that can betrue for exact matches.
Version 1.3-4 (10 Sep 2007)
• Fixed VotCopy bug.
Version 1.3-5 (30 Oct 2007)
• Added -stdout and -stderr flags to stilts command.• Some bugs fixed in generation of CEA app-description.xml file.• Documentation provided for sqlcone command.• Fixed error in fluxToLuminosity function.
Version 1.4 (6 December 2007)
Table joinsThis version provides more cross matching functionality. Added to the existing tmatch2
command are new tasks:
• tskymatch2: stripped down version of tmatch2 for ease of use when matching withsky coordinates.
• tmatch1: internal matcher, finds groups of objects within a table.• tmatchn: finds group or multiple-pair matches between multiple (>2) tables.
Two tasks have been renamed for improved clarity and consistency:
• multicone is now named coneskymatch
• sqlcone is now named sqlskymatch
There has also been some enhancement and rationalisation of parameters for all table jointools (tmatch* as well as tjoin, coneskymatch and sqlskymatch):
SUN/256 551

• All table join commands now use similar fixcols and suffix* parameters to controlrenaming of duplicated columns in output tables (note this replaces the old duptag*
parameters in tmatch2).• Crossmatching tasks have a new progress parameter which allows you to configure
whether progress is reported to the console.• The copycols parameter of coneskymatch and sqlskymatch now defaults to "*"
(include all columns from input table in the output).
Section 7 of the manual has been somewhat rearranged and improved.
Other enhancements
• FITS reader now imports table HDU header cards as table parameters.• CeaWriter can now output CEA service definition XML config file as well as
app-description file (experimental - may be withdrawn).
Bug fixes
• Embedded spaces in output ASCII format table column names are now substitutedwith underscores.
• Fix a bug which caused an infinite number of dots to be printed when attempting acrossmatch with an empty input table.
• Corrected votlint handling of TABLEDATA-type multi-dimensionalchar/unicodeChar arrays. These are now split up into strings by counting charactersrather than using whitespace delimiters. I think it's doing the right thing now.
Version 1.4-1 (28 January 2008)
New RDBMS-related features
• New command sqlclient, which is a general JDBC-based SQL command-lineclient.
• New command sqlupdate, which allows updates to existing rows in SQL tables.• Some changes to tosql output mode:
• choice of options for how to write to the database output table, controlled bynew associated parameter write (can be create, dropcreate or append)
• associated parameter newtable renamed dbtable
• associated parameter database renamed db for consistency with othercommands
Local and service-based matching command enhancements
• New parameter scorecol added to tmatch2, coneskymatch and sqlskymatch
commands, which controls adding a new column to match output tables containing agoodness-of-match value.
• New parameter parallel added to coneskymatch task which allows multiple conesearches to be carried out in parallel.
• New parameter erract added to coneskymatch which controls response to isolatedfailures in individual cone search queries.
General improvements
• Improved error reporting (reasons for errors are now reported even without the-debug flag).
• Add new help option help='*' which prints help for all parameters of a task at once.• Added (mostly undocumented) +verbose flag for reducing verbosity level.• Minor improvements to CEA app-description.• Downgraded from WARNING to INFO log messages about the (extremely
SUN/256 552
common) VOTable syntax error of omitting a FIELD/PARAM element's datatype
attribute.
Version 1.4-2 (26 March 2008)
Minor enhancements:
• Add progress parameter to tmatchn.• Add emptyok parameter to coneskymatch.
Bugfixes:
• Fixed pair matching performance bug (slower if tables were not given in the rightorder) introduced at v1.4.
• Fixed null handling error in calc task.• Fixed error in stats filter cardinality value calculation.• Fixed minor bugs in suffix addition for matching commands fixcols.• Removed unformatted XML output in stats filter usage message.• Try to avoid exponential format in cone search URLs (some endpoints seem to
require fixed point format).• Minor CEA fixes.
Version 2.0b (23 October 2008)This version contains two new major items, plotting and server mode. Both work, but aremissing desirable features and have not had extensive testing in the field, so should beconsidered experimental at this stage.
PlottingTwo table plotting commands are now provided:
• plot2d: Old-style 2D Scatter Plot• plot3d: Old-style 3D Scatter Plot• plothist: Old-style Histogram
See also the new Plotting (Section 9) section in the manual.
Server/Servlet ModeA new command server is provided which allows STILTS commands to be executed viaHTTP. One purpose of this is to facilitate server-side use of the plotting commandsco-located with data to generate on-the-fly graphical summaries of server-held datasets.
Smaller enhancements and bugfixes
• Efficiency improvements (~25%? in both CPU time and memory usage) forHEALPix-based sky crossmatching (thanks to Nikolay Kouropatkine at Fermilab fora new version of the PixTools library).
• New class Arrays added to algebraic functions.• New Appendix Commands by Category (Appendix A) added to manual.• Add minReal and maxReal functions (max/min ignoring blank values) in class
Arithmetic.• Sexagesimal field identification for ASCII input files is less stringent (now permits
minutes or seconds equal to 60).• Minor CEA fixes.• HEALPix bug fix (PixTools bug fix update).• Fix bug in use of tcat's loccol parameter.
Version 2.0-1 (23 December 2008)
SUN/256 553

• Can reference columns/parameters by Utype by using utype$ notation in expressions(Section 10.1) and as column identifiers (Section 6.2).
• Non-alphanumeric column names may now be used for algebraic expressions in thespecial case that the expression is just the value of a single column.
• regquery command has changed in implementation, data access, and output format. Itnow queries VOResource1.0 registries rather than the very out of date registry protocolwhich was used in earlier versions.
Version 2.0-2 (9 January 2009)
• Added new samp output mode which passes the generated table to clients using theSAMP protocol.
• Updated the topcat output mode to use SAMP as one way of communicating with arunning TOPCAT.
• -version flag now reports starjava subversion revision as well as other items.
Version 2.0-3 (27 March 2009)
• Fits BINTABLE TZERO/TSCAL value reading improvements:
• Columns with integer TZERO values now read as integers rather than floating pointvalues where possible. This includes unsigned longs ('K'), which were previouslyrepresented as doubles with lost precision. Unsigned longs which are too largehowever (>263) are read as nulls.
• Byte-valued columns can now be written out by fits-basic output handler assigned byte values (TFORM=B,TZERO=-128) rather than signed shorts(TFORM=I).
• More comprehensive testing.• Fixed bug in calculating value scaled double ('D') values.• Fixed bug in typing value for scaled float ('E') arrays.• Fixed bug which caused registry queries (regquery) to fail for Java 1.6.
• Fix minor bugs in detail of votlint's validation tests (VOTABLE element content model,INFO and PARAM and FIELD required attributes).
• Report application name and version in User-Agent header of outgoing HTTP requests.• The fixed length Substring Array Convention for string arrays (TFORMnn=rAw) is now
understood for FITS binary tables.• Minor SAMP bugs fixed (JSAMP upgraded to 0.3-1).
Version 2.0-4 (17 July 2009)
• Work around J2SE mark/reset bug when loading table direct from URL.• Produce null rather than nonsense results from sky coordinate conversions with
unphysical latitudes (addskycoords filter).• Produce null rather than questionable results from sexagesimal conversions with
mins/secs out of range.• Fix two bugs in votcopy: XML processing instructions garbled on output, and pathnames
in base parameters inappropriately flattened in hrefs attribute values.
Version 2.0-5 (2 Oct 2009)
• VOTable 1.2 supported.• votlint can now validate VOTable documents following the (provisional, 2009-09-29
PR) VOTable 1.2 standard.• Namespacing of VOTable documents made more intelligent, and configurable using the
votable.namespacing system property.• votlint now checks that the correct XML namespaces are in use.• Be more careful in XML, including VOTable, output; fix VOTable output encoding to be
UTF-8, and ensure no illegal XML characters are written.
SUN/256 554
• HTML table output is now HTML 4.01 by default (includes THEAD and TBODY tags).• parse* string->numeric conversion functions now cope with leading or trailing
whitespace.• Work around illegally truncated type declarations in IPAC tables.• Fix a bug which caused the first table in a multi-table file (FITS or VOTable) to be used
in streaming mode, even if a subsequent one was requested.• Bug fixed in crossmatching output: entries which should have been null were sometimes
written as non-null (typically large negative numbers) in FITS and in non-TABLEDATAVOTable output. This affected cells in otherwise non-nullable columns where the entirerow was absent. The previous behaviour is not likely to have been mistaken for genuineresults.
Version 2.1 (6 November 2009)
• coneskymatch can now match using SIA and SSA services as alternatives to Cone Searchones (see its new servicetype parameter).
• Fixed an obscure bug which could under rare circumstances cause truncation of stringswith leading/trailing whitespace read from text-format files.
• A new startable.storage policy "adaptive" is now the default. This should meanrunning out of memory less often. The old behaviour can be restored by giving the new-memory command line flag.
Note that the STIL API used by this release has changed in some backwardly incompatibleways, and may change further. If you're using STILTS as a library rather than an applicationyou might want to wait for a later release when the API has settled down.
Version 2.1-1 (21 December 2009)
• Plotting commands can now output to PDF as well as existing graphics formats.• New filter fixcolnames.• Fixed internationalisation bug which could cause coneskymatch to fail in locales that use
"," for a decimal point.• Significant performance improvements related to the case of VOTable documents
containing many tables.
Version 2.1-2 (24 March 2010)
• JyStilts introduced. This is a jython (i.e. Python, though not CPython) interface to theSTILTS commands. It is believed to be fully working, but somewhat experimental -feedback is encouraged.
• Considerable performance and scalability improvements to the crossmatching commands(tmatch1, tmatch2, tmatchn and tskymatch2). For several common regimes, usingdefault settings, memory use has been decreased by a factor of about 5, and CPU timereduced by a factor of about 3.
• Add optional tuning parameters to crossmatch commands (parameter tuning for tmatch1,tmatch2 and tmatchn, and parameter healpixk for tskymatch2). Experimentation withthese can lead to significant performance improvements for given matches.
• Fixed a crossmatch bug; it was giving a possibility of suboptimal "find=best" matchassignments when pair matching in crowded fields. Crossmatch results thus may differbetween earlier versions and this one. Both are reasonable, but the newer behaviour ismore correct. In non-crowded fields, there should be no change.
• Further performance improvement for VOTable documents with very many TABLEs.• Memory management adjusted further - default (Adaptive) storage policy now uses direct
allocation (=malloc()) for intermediate-sized buffers to avoid running out of java heapspace.
• New option "find=each" for coneskymatch and sqlskymatch commands. This allowsyou to get an output table with exactly one row for each row of the input table.
• New flag -memgui to monitor memory usage during runs.
SUN/256 555
• Add new filter rowrange.• Add new functions to Arrays: array functions for constructing arrays, and new
aggregating functions median and quantile.• Syntax of the crossmatching commands' progress parameter has changed; it now has an
additional option which will write limited profiling information as well as logging as thematch progresses.
• Add ylabel parameter to plothist command.• The random and sequential filters have been renamed randomview and seqview
respectively. This provides a better idea of what they do. Since they are only useful fordebugging, it is unlikely that this will break anyone's existing code.
• New filter random introduced which converts tables to random-access if necessary.• Document previously undocumented legend parameter to plotting commands.• Matching commands matcher parameters can now accept classnames of MatchEngine
implementation classes as an option.• Classes are now distributed as a zip of jars (stilts_jars.zip) as an alternative to the
monolithic jar file (stilts.jar). This may be more appropriate for those using STILTSclasses in a framework that contains other third party class libraries.
• Adjusted the way that data types are read from JDBC databases. Date, Time andTimestamp typed columns will now be converted to Strings which means they can bewritten to most output formats (previously they were omitted from output tables).
• STILTS no longer attempts to communicate with TOPCAT using SOAP. TOPCAT'sSOAP interface has been deprecated since v2.1 (2006), so this isn't likely to cause trouble,and it permits removal of SOAP (Axis) classes from the application jar file, savingseveral megabytes and reducing potential version clash problems.
• Fix bug in code for handling very large mapped FITS files. This was causing fatal readerrors in some cases.
Version 2.2 (6 August 2010)New capabilities for multi-table I/O have been introduced:
• New multi-table output tasks tmulti and tmultin. These currently just copy multipleinput tables to a single multi-table container file (e.g. Multi-Extension FITS ormulti-TABLE VOTable). Future releases may generalise the output of multi-tableprocessing.
• New multi parameter introduced for tcat and tmulti tasks to pick up all tables in amulti-table container file.
• New JyStilts functions treads and twrites for multi-table I/O.
There are some additional enhancements:
• Added experimental name-resolution filter addresolve; this currently uses Sesame.• Added filter repeat, which repeats table rows a given number of times.
And a number of bug fixes:
• Recognise unofficial column type "long" in IPAC format tables.• Better behaviour (warn + failover) when attempting to read large files on 32-bit OS or
JVM.• Efficiency warning now issued for large compressed FITS files.• Upgraded PixTools HEALPix library to 2010/02/09 version. This fixes a bug that could
theoretically cause deficient crossmatch results, though I haven't managed to producesuch errors.
• Fixed bug in TST table output.• Fixed bug in FITS-plus metadata output (table parameters were getting lost).• Corrected literature references in Fluxes conversion class documentation (thanks to
Mattia Vaccari).• Fixed bug in CSV file parsing that could ignore header row in absence of non-numeric
columns.
SUN/256 556
• Shape and ElSize metadata items now correctly reported by meta filter.• Fixed JyStilts bug when supplying an empty string for a parameter value.
Finally, from this release STILTS requires version 1.5 (a.k.a. 5.0) of the Java J2SE RuntimeEnvironment; it will no longer run on version 1.4, which is now very old. I don't expect this tocause compatibility issues for anyone, but I'm interested to hear if that's not the case.
Version 2.2-1 (23 December 2010)
• Storage management improvements; removed restriction on large (>2Gb) non-FITSdatasets in some circumstances.
• Efficiency improvement in sequential mapped access to large FITS files.• Fix so FITS tables >2Gb can provide random access in 32-bit mode (though slower than
64-bit).• FITS files now store table names in EXTNAME (and possibly EXTVAR) header cards.• Window placement for the few GUI tasks should now behave a bit more like platform
norms, rather than sitting in the top left hand corner.• HTML table output now writes cell contents which look like URLs in HTML <A> tags.• Basic authorization (http://user:pass@host/path) on table URLs handled.• Fixed file pointer int overflow bug in FITS MultiMappedFiles.
Version 2.3 (9 May 2011)
TAPThe new commands tapquery and tapresume have been introduced. These providesupport for the Table Access Protocol (TAP), and allow freeform queries in an SQL-likelanguage to be made to remote databases.
Minor enhancements
• Random Groups HDUs are now tolerated, though not interpreted, within FITS files.• Added soapout parameter to regquery command.• Added count, variance and stdev functions to Arrays.• Upgrade to JSAMP v1.2.• Improve text rendering in funcs window display.• Attempt case-sensitive matching before case-insensitive for column names.• Fix replaceval filter to work with Infinities.
Bug fixes and workarounds
• JDBC table input handler now effectively downcasts BigInteger/BigDecimal types toLong/Double. The PostgreSQL JDBC driver seems to use the Big* types routinelyfor numeric values (which I don't think it used to do).
• Add workaround for J2SE bug #4795134, which could cause errors when readingcompressed FITS files.
• Fix FITS character handling bug which could cause corrupted FITS files on output inpresence of non-ASCII characters.
• Fix (some) JDBC connection leaks.• Add missing parameters dashNS and linewidthNS to plot2d task.
Version 2.3-1 (30 June 2011)
• Added new command taplint. This is a validator for TAP (Table Access Protocol)services. It is only likely to be useful to people developing or operating TAP services.
• ASCII table parsers now understand python-friendly nan and inf representations.• Added new constants to expression language Infinity and NaN.• Fixed a significant bug in sky crossmatching. If all points in a table were on one side of
the RA=0 line, but the error radius extended across that line, matches on the other side
SUN/256 557

could be missed. Matches could also be missed if different tables used differentconventional ranges for RA (e.g. -180..180 in one case and 0..360 in another). This fixmay in some, but not most, cases result in slower matching than previously.
• Fixed coneskymatch cone search verbosity parameter so that VERB=3 is not erroneouslyignored.
Version 2.4 (27 October 2011)
Crossmatching:
• Two new asymmetric match options best1 and best2 have been added for the find
parameter in the pair matching commands tmatch2 and tskymatch2. Theycorrespond to finding the best match in table B for each row in table A, and incrowded fields often provide more intuitive semantics than the previous symmetricbest option (in non-crowded fields there is generally no difference). This replicatesthe matching performed by some other tools, including Aladin.
• New matchers have been added to permit matching of general elliptical, rather thanjust circular, regions in both planar and sky coordinates; see 2d_ellipse, andskyellipse.
• Another new matcher is available for dealing with per-object errors in Cartesiancoordinates (previously per-object errors could only be handled in sky coords); see Nd_err.
• Semantics of the skyerr matcher have changed slightly.
Expression language functions:
• Algebraic functions involving angles are now mostly available using degrees as wellas radians. The Coords class has been replaced by CoordsDegrees andCoordsRadians classes providing sky coordinate functions, and a new classTrigDegrees provides normal degree-based trigonometric functions alongside theradian-based versions in Maths. Some of the old function names have changed tomake clear that they use radians and not degrees. This change should be much moreconvenient in most cases; sorry it's taken so long to get round to.
• Add new join function is added to the Arrays class to combine all the elements of anarray into a string.
taplint:There are several bugfixes and changes related to the TAP validator tool taplint, mostlythanks to bug reports etc from the TAP community:
• Improve test logic for record limiting queries.• Errors no longer reported (e.g. E-Qxx-CNAM) for unexpected TAP_SCHEMA table
column ordering (when running query stage but no metadata acquisition stages).• Add new stage MDQ, which checks query result columns for all tables against
declared metadata.• Add check of versioned and unversioned LANG variants.• Now uses corrected upload ID (ivo://ivoa.net/std/TAPRegExt#upload-*) as per
most recent TAPRegExt draft.
Bug fixes and minor enhancements:
• Add parameter parse to tapquery command, allowing pre-send syntax checking ofsubmitted ADQL.
• Add experimental system properties star.basicauth.user andstar.basicauth.password.
• Improve resilience of coneskymatch in the presence of unreliable or inconsistentDAL services.
• A PARAMref element with no referent in a VOTable no longer causes an uncaught
SUN/256 558

NullPointerException.
Version 2.5 (28 March 2013)
New coverage-related functionality:
• Add new command pixsample which can sample pixel data from HEALPix tablefiles (useful for things like Schlegel dust extinction). Also addpixsample filter,which does the same job.
• Add new command pixfoot which can generate MOC (Multi-Order Coverage)maps.
• Add MOC-based coverage filter to coneskymatch when using some Cone Searchservices (mostly VizieR). This uses the Multi-Order Coverage map service operatedby CDS. It can make VizieR multi-cone queries much faster by not doing conesearches that are outside the coverage region of the catalogue in question.
• Add new class Coverage to the expression language containing MOC-relatedfunctions (currently, just inMoc).
Other new capabilities:
• Add IPAC table output format.• Add new class KCorrections to the expression language, containing a method for
calculating K-corrections following the method of Chilingarian and Zolotukhin.• You can now reference tables in multi-extension FITS files by name (EXTNAME or
EXTNAME-EXTVER) as an alternative to by HDU index.
VOTable enhancements:
• VOTable input, output and validation are now supported for version 1.3 of theVOTable standard.
• The version of the VOTable format used for VOTable output can now be selected,by using the system property votable.version. Output version is VOTable 1.2 bydefault.
• votlint has been changed so that it handles different VOTable versions morecapably. Versions 1.1+ are now validated against a schema (which is how thoseversions are defined) rather than against a DTD hacked to do the same job as theschema. VOTable 1.3 validation is now provided.
• The votcopy command has a new version parameter to control output version, anda new nomagic parameter to control whether VALUES/null attributes are removedwhere appropriate.
• Infinite floating point values are now correctly encoded in VOTable output("+Inf"/"-Inf", not "Infinity"/"-Infinity" as in previous versions).
• votlint is now stricter about floating point TD element contents.• VOTable output no longer writes the schemaLocation attribute by default.
Other enhancements:
• Add new function hypot (=sqrt(x*x+y*y)) to the Maths class in expression language.• Add new split functions for string splitting to the Strings class in expression
language.• Add -utype flags for addcol, replacecol, colmeta and setparam filters, and utype
option for meta filter.• Some changes to the toString function: it now works on non-numeric values, gives
the right answer for Long integers and character values, and returns a blank valuerather than the string "null" or "NaN" for blank inputs.
• Sexagesimal to numeric angle conversion functions now permit the seconds part ofthe sexagesimal string to be missing.
SUN/256 559
• Changes to the IPAC format definition are accommodated: the "long"/"l" type,which is apparently now official, no longer generates a warning, and headers maynow use minus signs instead of whitespace.
• Add OBS stage (ObsTAP validation) to taplint.• Add more checks to CAP stage of taplint. Declared languages (including features)
and output formats are now checked.• Tidy up error reporting a bit (fewer duplicate nested messages reported).• PNG graphics output no longer has transparent background.• Issue a warning for high values of coneskymatch parallel parameter.• Upgrade JSAMP library to version 1.3-3.• Upgrade Grégory Mantelet's ADQL library to version 1.1.
Bug fixes:
• Fix serious and long-standing bug (bad TZERO header, causes subsequent reads tofail) for FITS output of boolean array columns.
• Fix small but genuine sky matching bug. The effect was that near the poles matchesnear the specified threshold could be missed. The bug was in the PixTools library,fixed at the 2012-07-28 release.
• Fix bug in tmatchn group mode which could result in output rows with columnsfrom only a single table, i.e. not representing an inter-table match, even whenjoin*=default.
• Fix bug which failed when attempting to read FITS files with complex arraycolumns (TFORMn=rC/rM).
• Fix failure when caching very large sequential tables.• Fix bug in replacecol and replaceval filters which could cause truncation of
strings in FITS and possibly VOTable output when the new value was longer thanthe previously declared maximum length.
• Fix tcat, tcatn so that in most cases output column metadata is compatible with allinput tables, not just the first one in terms of nullability, array shape etc.
• Adjust SQL writer to avoid a type error for MySQL.• Fix bug in HMS sexagesimal formatting: minus sign was omitted from negative
angles. Now the output is forced positive.• Cope with 1-column CSV files.• Use the correct form "rows"/"bytes" rather than "row"/"byte" for TAP capability
unit values.• Fix error bar rendering bug which could result in diagonal lines being offset near the
edge of plots.
Version 2.5-1 (1 July 2013)
New functionality
• Add read-only support for CDF (NASA Common Data Format) files.• Add Median Absolute Deviation calculation (MedAbsDev and ScMedAbsDev) options
to stats filter.• Improved handling of HTTP basic authorization. 401s now generate a useful
message about the star.basicauth.* system properties if they have not been set up.
Bug fixes and minor enhancements
• Fix CSV regression bug introduced at v2.5 - CSV files now work again withMSDOS-style line breaks.
• Fixed FITS output bug which could result in badly-formed string-valued headercards (no closing quote).
• Source code is now managed by git and not subversion. The format of the "Starjavarevision" string reported by the -version flag has changed accordingly.
SUN/256 560
• Output mode meta now copes better with array-valued table parameters.• Implemented fixes to reduce the chance of users inadvertently overloading external
Cone/SIA/SSA services with multicone-like queries. First, fix it so that abandonedqueries are properly terminated, rather than continuing to hit the server untilcompletion or JVM shutdown. Second, implement a sensible default maximum valuefor the parallel parameter of skyconematch (though this may be adjusted with asystem property).
• Quoting behaviour has changed when generating SQL to write to RDBMS tables.This ought to reduce problems related to mixed-case identifiers. However, it ispossible that it could lead to unforseen new anomalies.
• More toString overloads - now works for byte and boolean values too.
Version 2.5-2 (7 March 2014)
• Add some more colour maps.• Fix some broken and misdocumented non-table-output JyStilts commands (tcube,
pixfoot).• Fix bug which prevented access to long integer array elements from expression language.• The Exact matcher now considers scalar numeric values equal if they have the same
numeric value; they are no longer required to have the same type.• Fixed a registry client bug which means that the regquery command can now
successfully talk to the NVO/VAO/STSci registry. That has been broken since mid-2010.• Add new command tloop for generating single-column tables from a numeric loop
variable.• taplint now checks for the right ObsCore ID, though still recognises the wrong one (got
from TAPRegExt), and warns if found.• Fix TST input handler so TST files with fewer than 3 columns can be read.• Add Nd_cuboid matcher option to match commands.
Version 2.5-3 (4 July 2014)
New and improved functionality:
• Add new command cdsskymatch. In most cases (for querying tables that can befound in VizieR) this can and should be used instead of coneskymatch - it's muchfaster.
• Commands coneskymatch, sqlskymatch and pixfoot will now guess RA/Deccolumns if relevant parameters are left blank.
• Added new graphics output format png-transp to generate PNG files withtransparent backgrounds.
• Upgraded Gregory Mantelet's ADQL library to version 1.2. Better ADQL parsing.
Improvements and adjustments to taplint:
• Rework taplint API to facilitate static acquisition of report codes duringprogrammatic use. A few error codes have changed.
• Add new "duff query" test to taplint.• Avoid taplint MDQ stage data type mismatch error report for BOOLEAN/boolean
declared/returned data.• taplint now takes steps to ensure that TAP_SCHEMA column list query is not
truncated.• taplint now flags absence of ObsCore table with I[nfo] not F[ailure] status.• Change the implementation of taplint stages which perform validation against
XSD schemas. Schemas from external namespaces may now be imported and used.The CPV stage, which was previously broken and disabled by default, is now fixedand enabled by default. Known/expected schemas are stored locally, and a warningis reported if external ones are used. Schema validation seems remarkably
SUN/256 561
complicated, so it's possible there are still errors in this implementation - if yoususpect so, please report it.
• Add missing geometric reserved words to ADQL reserved word list. This fixes someproblems with column names like "DISTANCE" in taplint tests.
• Fixed some bugs related to TAP table uploads. In particular these could causeincorrect table upload error reports in taplint.
Version 3.0 (3 October 2014)
New plotting commands:A set of new plotting commands are provided which give comprehensive access to all thenew-style visualisation capabilities available in TOPCAT v4. These commands aredocumented in Section 8. These commands, and the underlying visualisation facilities, areconsiderably more capable than the, now deprecated, old-style plot commands plot2d,plot3d and plothist.
Programmatic invocation:Programmatic invocation of STILTS tasks from third-party java code is now officiallysanctioned and documented in the new Section 12. To support this changes have beenmade to the parameter system (Parameter class now supports generics) and there aresome visible changes to the user documentation as well (parameters now report their datatype, and tasks report their classname). Normal (e.g. command-line) usage should notundergo any changes, but a fair bit of UI code has changed, so unexpected problems arepossible.
Other items:
• Add new output mode gui, which displays the table data in a scrollable window onthe screen.
• Add new -allowunused flag to the stilts command. If this is set, then unusedparameter settings on the command line just result in a warning, not failure of thecommand.
• Attempting to write FITS tables with >999 columns now fails with a more helpfulerror message.
• Improved Unicode handling in VOTables. Fixed a serious bug in votcopy thatgenerated unreadable output to BINARY or BINARY2 serialization if anynon-empty column had datatype="unicodeChar". Also improved behaviour whencopying between tables with unicodeChar columns; these are usually preserved now,rather than being squashed to datatype char. Some lurking Unicode-related issuesremain.
• The TAP client now tolerates whitespace around UWS status codes.• taplint: downgrade unknown post-table QUERY_STATUS value message from
Error to Warning.
Version 3.0-1 (13 November 2014)
New functionality:
• Add (experimental) read-only support for Gaia/DPAC GBIN format.• Add new task tapskymatch.• Functions in class Coverage adjusted: new function nearMoc, and MOC can be
identified by VizieR table IDs as well as by filename/URL.• For repeat filter, add -row|-table flags to control sequence of output rows.• For setparam and repeat filters, allow use of an algebraic expression for values, not
just a literal value.• Add special values $ncol and $nrow to the expression language to refer to the
column and row counts in a table. The special variable index is also deprecated in
SUN/256 562
favour of $index or $0.
Bugfixes and minor improvements:
• Add some more colour maps for aux/density shading.• Fix stilts invocation script to pick up classes from stilts.jar in script directory
in preference to other places (e.g. topcat-full.jar).• Fix taplint to permit application/xml not just text/xml content-type where
appropriate (UWS stage).• Fix taplint so it doesn't warn (W-TMV-UNSC) about unknown VOSITables
schema.• Fix taplint so that unicodeChar matches CHAR/VARCHAR in the same way as
char for column type declaration purposes.• Fix taplint so that capabilities document can have TAPRegExt dataModel ivo-id
elements with xs:anyURI rather than vr:IdentifierURI (only a warning is issued inthe latter case), in anticipation of TAPRegExt-1.0 Erratum #1.
• Adjust taplint to handle adql:TIMESTAMP columns more carefully on upload andretrieval.
• Update JSAMP to v1.3.5.
Version 3.0-2 (6 February 2015)
Plotting enhancements:
• Linear fitting of points is now available using the linearfit layer type for plot2plane.Points may be weighted.
• You can add titles to plots using the new title parameter.• New plot layer type sizexy allows plotting (optionally autoscaled) markers with
horizontal and vertical extents independently determined by input data.• More flexibility when assigning colour maps, in aux and density shading modes, and
spectrogram layer. New parameters *func allow assignment of different data->rampmapping functions (sqrt and square as well as linear and logarithmic), and newparameters *quant allow quantisation of the colour map to discrete levels.
• Replace maxsizeN parameter with autoscaleN for size plot layer type. You can nowoptionally turn off autoscaling and specify marker size in pixels instead.
• Add auxcrowd parameter to plot2 tasks to influence tick crowding on aux axis colourramp. Also adjust default to use fewer ticks.
• Add some "dart" options (fixed-base open or filled triangles) for plotting vectors (seearrowN parameter in layers like xyvector).
• Add some "triangle" options (variable-base open or filled triangles) for plottingellipses (see ellipseN parameter in layers like xyellipse).
• Histogram normalisation option adjusted so that total area under bars, rather thantotal height of bars, is fixed.
• The PlotDisplay class that forms the result of plot2 commands can now havePointSelectionListeners registered on it. This lets you determine what point auser has clicked on if you're using the plotting classes from third party java code.
FITS I/O:
• Reworked part of the FITS table input implementation, in particular adjusting theway memory mapping is done to reduce resource requirements on some platforms. Ifyou notice any difference, it should be reduced virtual and perhaps resident memoryusage, and some (~10%?) performance improvements, when reading largeFITS/colfits files. If you were previously having problems with large memoryallocations leading to disk thrashing and system lockup when scanning files largerthan RAM (this didn't happen on all OSes), these will hopefully have gone away.However, please report anything that appears to be working worse than before, or
SUN/256 563

continued memory usage issues.• Colfits files can now be accessed from streams, not just uncompressed disk files
(though that's not necessarily a good idea).
Bugfixes and workarounds:
• Fixed a query bug (missing REQUEST=queryData parameter) in the multi-SSA mode(servicetype=ssa) of coneskymatch. This long-standing bug would have stoppedthis command working at all with well-behaved SSA services.
• Fixed error in fits-var output (PCOUNT header card did not include block alignmentgap).
• Graphics coordinates are now calculated in floating point rather than as integers.This fixes problems that could cause scaled vectors, ellipses etc to be drawn withshapes or orientations badly wrong due to rounding errors. It also improves plottingof analytic functions, especially to vector contexts (PDF/EPS).
• Fix some problems to do with zooming to very large/small plot axis ranges.• Hide error bars (etc) that would extend to negative values on logarithmic axes;
previously they were being drawn in anomalous places.• Fix NullPointerException bug when null value was supplied to multi-word
parameter (e.g. tcube).• Fix Aux axis positioning for 3D plots so that the numeric labels don't get snipped off
at top and bottom.• Add a hack that allows LDAC FITS tables to be treated sensibly in
auto-format-detection mode.• Make VOTable handling more robust against unknown (illegal) datatypes.• Add missing parameters auxmax, auxmin to plotting task documentation.
Version 3.0-3 (14 April 2015)
• New System Command option for input table syntax; you can now use "<syscmd" or"syscmd|" to supply input byte streams from Un*x pipelines.
• Add new Kernel Density Estimate plot layer types kde, knn and densogram forplot2plane.
• More histogram normalisation options provided. Instead of just true/false, thenormalisation parameter of the histogram layer now has the options none, height, areaand maximum. This allows both the area normalisation introduced in v3.0-2, and the heightnormalisation used in earlier versions which it replaced.
• More histogram bar style options provided; the histogram barform parameter nowprovides the options semi_filled (the new default) and semi_steps. These give outlinedpartially transparent bars, which make it much easier to see what's going on inmulti-dataset histograms. Note semi_steps does not currently export very nicely toPDF/EPS. Similar options are also available in the new KDE plots.
• Column data read in as unsigned bytes will now be written out as unsigned bytes wherethe output format permits; previously they were forced to 16-bit signed integers. Thisaffects FITS, VOTable and CDF I/O handlers.
• Add count_rows() method to JyStilts table objects, which for non-random tables may bemuch more efficient than len().
• Be less strict about recognising colfits files (tolerate implicit TDIMn headers).• taplint is now aware of, and performs some checks related to, schema-level table
metadata declared by TAP services.• Work round FITS read bug that could cause problems for VOTables using inline FITS
serialization, and possibly elsewhere.• Fix bug that caused trouble when auto-ranging a plot with a single sky position.
Version 3.0-4 (17 August 2015)
SUN/256 564
Bugfixes (some significant):
• Fix a serious bug in processing of FITS bit vector (TFORMn='rX') columns. Valuesread from these columns are presented as a boolean[] array. In all previous versionsof STIL the bits have appeared in that array in the wrong sequence (LSB..MSB perbyte rather than the other way round). Apologies to anyone who may have gotincorrect science results from this error in the past, and thanks to Paul Price forhelping to diagnose it.
• Fix a less serious bug with TFORMn='rX' processing; attempting to read asingle-element bit vector column (TFORMn=1X or X) previously resulted in an errormaking the file unreadable. Values read from such columns are now presented asBoolean scalars.
• Fix a VOTable reading bug relating to bit vector data (datatype="bit") appearingin BINARY/BINARY2 serializations. This one was more obvious, it would usuallygenerate an error when attempting to read the file.
• Fix serious bug in time conversion for CDF TIME_TT2000 data types.• Fix a bug in votcopy that converted columns from datatype unsignedByte to short
when transforming. Since v3.0-3 this is no longer necessary. In the case ofconverting to a binary serialization, since v3.0-3 this was causing it to generateunreadable VOTable output.
• Fix a bug in votcopy that failed to handle columns with datatype bit. In the case ofconverting to a binary serialization, these were in all previous versions generatingunreadable VOTable output. Now they convert them to columns with datatypeboolean (not perfect, but better).
• Fix skyvector bug: dlat and dlon values were being used the wrong way round.• Upgrade JEL to v2.0.2. Fixes problem with evaluating void-typed expressions, and
possibly some other obscure bugs.• Some taplint bug fixes.
Behaviour changes:
• Changes to the way that TAP service table/column name reports are interpreted (toconform to original intention of TAP standard). Taplint now checks thattable/column names from TAP_SCHEMA and /tables endpoint areregular-or-delimited-identifiers, but no longer submits example queries usingsupplied column names wrapped in additional quotes.
• Modify the heuristics that determine whether the first row of a CSV file is a header.
Enhancements (mostly minor):
• Added some functions to the Arrays class that return array-valued results fromarray-valued parameters: add, subtract, multiply, divide, reciprocal, condition.
• Improve error reporting in the face of non-VOTable TAP error responses. In manycases this makes it much easier to see what's going wrong with a TAP query.
• As a diagnostic tool, when making TAP queries, a log message giving a roughlyequivalent curl(1) command is now issued at the CONFIG level (visible using flags-verbose -verbose).
• New taplint parameter maxtable limits the number of tables tested in the stage thatqueries data from each individual table (MDQ). May be useful for very large services.
• New tapquery parameter upvotformat to determine what VOTable serializationvariant is used to transmit uploaded tables to the TAP server. Previously uploadswere always BINARY which ought to work, but the parameter now defaults toTABLEDATA, since some services (e.g. CADC) currently fail with binary uploads.
• Minor improvement to version reporting (reports java specification version, nolonger issues warning for absent revision string).
• Update JCDF library to v1.1 (minor changes to do with leap seconds).
SUN/256 565

Version 3.0-5 (22 October 2015)
• Fix error reporting bug when a non-VOTable response is received from a TAP service.• Upgrade to JCDF v1.2 - fixes a bug when reading large (multi-2Gb) CDF files.• Added source code for an example basic GUI plot application,
uk.ac.starlink.ttools.example.BasicPlotGui.• The expression language has a new way of referring to a column; if you use the form
"Object$ <column-id>" you get the value as an Object not a primitive. This is aspecial-interest measure for user-defined functions that need to see null numeric values.
• Adjust GBIN input handler: avoid descending into Class-typed members of gbin listobjects, and add logging for object->column translations.
Version 3.0-6 (27 November 2015)
Crossmatching bug fixFix a long-standing crossmatch bug relating to range restriction during pre-processing.This could have caused missed associations (but not false positives) near the edge ofcoverage regions when using per-row errors, if the scale of the errors differed (especiallydiffered significantly) between the matched tables. It affected matcher values of<n>-d_err, skyerr, 2d_ellipse and skyellipse only. Thanks to Grant Kennedy (IoA)for reporting this bug.
Density plotsSome more options for making weighted density plots have been added. Since v3.0 theDensity shading mode has let you see the density of plotted points, but this lacked somefeatures. Three new ways to do density plots are added; these all give you the option ofweighting by an additional coordinate (like the Aux mode), choosing the combinationmethod (mean, median, sum, max, ...), and displaying the quantitative value-colourmapping on the shared colour ramp (previously aux axis) beside the plot. The new densityplots are:
• Weighted shading mode, using shaped marker kernels on the screen pixel grid,available for all plot types
• SkyDensity layer, using HEALPix bins on the celestial sphere, for the Sky plot• Density layer (later obsoleted by Grid layer), using square N*N screen pixel bins,
for the Plane plot
The details are somewhat experimental and may undergo some adjustments in futurereleases (feedback welcome).
Colour mapsThere are various changes affecting selection and display of colour maps used for densityand aux axis shading:
• The default colour map for Aux mode, and other layers using the shared colour map,is no longer Rainbow! It's Inferno. Rainbow colour maps are much hated byvisualisation experts. Of course you can still choose Rainbow if you like.
• Add some new colour maps: Viridis, Inferno, Magma and Plasma from Matplotlib1.5, the SRON rainbow variant developed by Paul Tol, some diverging maps(HotCold, RdBu, PiYG, BrBG) and a qualitative constant chroma/luminance mapHueCL.
• The options for Density and Aux shading are now mostly the same as each otherexcept where there's good reason to differ. Previously they were different inhaphazard ways.
• An attempt is made to give the default form of each colour map a sensible name,without leading minus signs.
• Fix it so that the whole range of each map is distinguishable from white. This is agood idea when you're plotting symbols on a white background, which is common in
SUN/256 566

stilts. Perhaps there are cases it's not such a good idea; if you think so, complain andI may change it back.
• Try to fix it so that all the colour maps go in the same direction (light->dark) whereapplicable.
• Throw out a couple of particularly useless colour maps.• Colour map ramp display is now different for non-absolute maps; their effect is
shown on a selection of base colours, not just for one base colour.
Minor items
• Try harder to identify epoch columns (suitable for time plot), in particular look forVOTable xtype of JD or MJD, and units of year.
• Add some functions to the Tilings class to do with solid angles (healpixSqdeg,healpixSteradians, steradiansToSqdeg, sqdegToSteradians, SQDEG).
• Fix plot bug; titles were painted in white for pixel output formats.• Rationalise plot report logging. Some more diagnostic information about plots is
now logged at the INFO level (visible if topcat is run with the -verbose flag).
Version 3.0-7 (10 June 2016)
Expression LanguageThe JEL library underlying the expression language parser has been upgraded to v2.1.1(thanks to Konstantin Metlov), now supporting variable-length argument lists amongother things. This allows the following improvements:
• New functions that support any number of arguments are provided: array, intArray,stringArray in class Arrays; concat, join in class Strings; and sum, mean,variance, stdev, min, max, median, countTrue in new class Lists.
• Some old lists of similarly-named functions with fixed numbers of arguments havebeen replaced by single functions that take an arbitrary number of arguments (e.g.array(x1), array(x1,x2), ... array(x1,x2,x3,x4,x5,x6,x7,x8) replaced byarray(values...)).
• The 2-argument min/max functions in class Arithmetic have been renamedminNaN/maxNaN to avoid confusion, but in most cases existing expressions involvingmin/max will work as before.
• Some functions that used to require string arguments will now auto-convert numerictypes (e.g. concat(toString(RA),";",toString(DEC)) can now be writtenconcat(RA,";",DEC)).
• You can now implement user-defined functions with variable numbers of arguments.• Writing large (>=2**31) literal integers used to fail with an inscrutable error
message. Now the message tells you to append the "L" character.
Time plotsThe plot2time command has been enhanced so that it can make multi-zone plots -multiple plots stacked vertically that share the same horizontal (time) axis but haveindependent vertical axes. The time plot itself and this multi-zone feature are currentlyexperimental; in future versions they may be improved or changed, and the multi-zonefeature may be extended to other plot types. Some other changes and fixes have gonealong with this:
• A few API changes have been made to support multi-zone plots, includinggeneralising the NavigationListener interface and rearranging some PlotDisplay
and AbstractPlot2Task constructor/factory method arguments. For single-zoneplots the changes are not very substantial. This only affects you if you are using theSTILTS classes as a java plotting library. If that applies to you and you have troubleupgrading, I'm happy to provide assistance.
• plot2time now supports shading modes (shadingN and associated parameters).
SUN/256 567
• The spectrogram layer now uses the (per-plot, or more precisely now per-zone) Auxcolour map rather than a layer-specific colour map. This means that the colour rampis displayed alongside the plot, but also that some parameters have been renamed(e.g. auxmapZ replaces spectromapN, where Z is an optional zone suffix and N is anoptional layer suffix).
• The function layer type now works in the time plot, rather than throwing an error.However, it doesn't work very well, since the time coordinate is in unix secondsrather than something more user-friendly.
• Fixed a serious bug in ISO-8601 axis labelling. In some cases axis labels were beingdrawn at positions badly different from the correct position.
Miscellaneous enhancements and changes
• This and subsequent releases target Java SE 6, so will no longer run under the (nowvery ancient) Java 5 runtime.
• Provide more careful documentation of licensing arrangements. The distributedLICENSE.txt file notes that the starjava code is LGPL, and documents licenses foreach third-party dependency.
• Add Fill layer type for Plane and Time plots.• tapquery and tapresume now use blocking HTTP requests rather than repeated polls
to wait for asynchronous TAP job completion from services that declare themselvesUWS 1.1 compliant.
• Add new parameters executionduration and destruction to tapquery command.These let you request resource limit adjustments when submitting an asynchronousTAP job.
• Improve sky plot border painting.• Clean up noisy Cubehelix colour map.• New function countTrue in class Arrays.• New stage EXA for taplint checks TAP /examples endpoint. Note the details of the
examples format are still under discussion, (this version targetsWD-DALI-1.1-20160415 & WD-TAP-1.1-20160428, somewhat informed byTAPNotes-2013-12-13), so the details may change in future.
• taplint now validates ObsCore 1.1 where declared alongside ObsCore 1.0.Currently uses PR-ObsCore-v1.1-20160330.
• The taplint API has changed slightly: the class that used to be Reporter is nowcalled TextOutputReporter. If you are using taplint programmatically you may needto make small changes. This results from some refactoring that makes it easier tocustomise taplint output.
• Replaced opaque config option with transparency for plane and sky density plots.• Changed implementation of GIF exporter for plots, from Acme to ImageIO.
Shouldn't be any noticable difference. Acme encoding dependency removed.
Bug fixes
• Fix bug in cumulative histogram calculation.• Fix read failure for FITS files with non-blank TDIM for zero-length columns.• Fix bugs that led to timezone-dependent results when reading ISO-8601 or decimal
year time columns.• Fix numeric field truncation bug in LaTeX table output.• Fix some parameter handling errors in coneskymatch.• Fix NullPointerException bug for disjoint regions in some cases in tmatchn.
Version 3.0-8 (13 September 2016)
• New task tskymap lets you generate all-sky density maps (e.g. HEALPix) from an inputtable.
SUN/256 568
• New plot layer type healpix can plot all-sky maps from HEALPix map tables (e.g. asgenerated by tskymap).
• Add some HEALPix-related functions to the Tilings class: conversions from pixel indexto sky position and conversions between ring and nested schemes.
• Subrange-typed plot command parameters like plot2plane's auxclip now have a defaultvalue of null. This uses a default clip, which avoids very light colours. Explicitlysupplying a subrange value (e.g. "0,1") can now use the whole range; previously the verylight colours were inaccessible.
• The GBIN input handler can now pick up more metadata from the classpath. For suitabletables, metadata included in datamodel classes if present can be interrogated to providetable and column descriptions and UCDs. There are still some deficiencies of thisfunctionality (no column order, utypes and units missing, large file "temp.xml" written tocurrent directory) dependent on issues in the upstream Gaia libraries and ICD.
• Add parameters tablesurl, examplesurl etc to task taplint, so you can specify customlocations for different TAP endpoints rather than have them fixed at their defaultlocations hanging off the base service URL. Ditto for the tasks tapquery andtapskymatch, though in these cases the extra parameters are (since currently ratherspecial interest) largely undocumented.
• Fix taplint behaviour in absence of a /tables endpoint (404 now gives a Warning not anError).
• taplint ObsTAP validation updated to PR-ObsCore-v1.1-20160709.• Fix bug that caused read failures for large (>0.5Gb) FITS files outside of the current
directory on 32-bit JVMs. This was a regression bug since v3.0-2.• Fix long-standing bug that failed to release file descriptors when opening FITS tables
(could cause an error if very many FITS files were opened).
Version 3.0-9 (23 September 2016)
• Fix aux ranging bug in some plot types (SkyDensity, Healpix, Density, Weighted) thatused an aux data range too small to show colour variations when auxfunc=log andnegative data values were present.
• Improved performance (better memory use, faster) of some plot types (SkyDensity,Healpix, Density, Weighted).
• Fix JyStilts bug that could cause the same data to be used for different tables specified ina single plot.
Version 3.1 (8 March 2017)
Plotting improvements
• Improved documentation of plot layer types and shading modes in the user document- each option now has an example graphic and the text of the command thatgenerates it.
• New layer type grid, to plot a 2-d weighted histogram. This replaces the density
layer, which has been withdrawn (grid can do all the same things and more, exceptspecify bin size in screen pixels).
• New plot layer type quantile, which can (e.g.) plot median lines through noisy data.• New plot layer type gaussian, for Gaussian fits to histograms.• Histogram-like layer types are now available from the plot2time command as well as
from plot2plane, so you can now plot histograms with a temporal horizontal axis.• New normalisation (scaling) option unit for histogram, KDE, and KNN plots.• New normalisation (scaling) options per_day etc for histogram, KDE and KNN
layers when used from the plot2time command.• Colour names recognised by the plot2* command *color parameters now include
the (140) CSS-like colours alongside the dozen standard plotting colours.• Plot commands insets parameter now lets you specify margins round plots using
any combination of <top>,<left>,<bottom>,<right>, rather than requiring all
SUN/256 569
values or none.• Add new parameter auxwidth to plot2 commands, to control colour ramp lateral
dimension in pixels.• Modify plan caching arrangements for STILTS plots. This results in much better
interactive performance (navigation etc) for some plot layer types plotted to thescreen. There are also some minor API changes to a few of the plot2 utility classes,which now provide more flexibility for caching.
• Various tweaks to the details of how plots are positioned on the screen or in outputgraphics files.
Miscellaneous enhancements
• Fixed the match score (distance measure) for combined matchers. Previously, thescore was a linear sum of the unscaled distances for the constituent matchers, whichmeant a Best match was pretty meaningless. Now, it adds scaled distances inquadrature, so Best matching should give you a somewhat sensible result.
• The skyerr and nd_err matchers now report output separations as scaled(dimensionless) values rather than in physical units; this means the results are morecomparable, so Best matches will make more sense.
• taplint can now optionally write its output in JSON format (see format parameter).• Update taplint OBS stage for PR-ObsCore-v1.1-20160923.• The Maths function hypot now takes an arbitrary number of arguments (instead of
exactly two).• Add blockmaxrec parameter to tapskymatch, and improve warning text in case of
result truncations.• Improve tapquery/tapresume behaviour when monitoring async jobs; if the service
goes down, the application will wait for it to come back rather than bailing out.• Options for MOC output format (mocfmt parameter in pixfoot command) have
changed; option ascii is replaced by json. The old ASCII format was slightlybroken JSON in any case.
• MOC library upgraded to v4.6 (from v3.3). Improved MOC output.• Update JCDF library to v1.2-2 (2017-01-01 leap second).
Bug fixes
• Fix KDE/KNN plotting bug that could get scaling badly wrong for normalisedcumulative plots.
• Fix some regression bugs relating to plot2 command insets parameter, presentsince v3.0-6.
• Remove spurious padding from EPS graphics output.• Fix small bug in plot2plane/plot2time label painting; horizontal axis label was
sometimes off the bottom of the plot by a few pixels.• Fix subpixel offset of colour ramp frame in PDF/PostScript graphics output.
Version 3.1-1 (29 September 2017)
New functionality
• New plot layer types xycorr and skycorr for error ellipses rotated as specified byGaia-style correlation values.
• New plot layer type skygrid can draw multiple sky system coordinate axis grids onsky plot.
• Colour map parameters (auxmap, densemapN etc) for the plotting commands will nowaccept custom colour maps that interpolate between a list of named colours, e.g."HotPink-yellow-SkyBlue".
• New position angle calculation functions posAngRadians and posAngDegrees addedto expression language.
SUN/256 570

Table I/O changes
• It is now possible to write and re-read tables with >999 columns to FITS or colfitsformat. The new limit is 2^31 columns. This uses a non-standard convention;software that is not aware of the convention (e.g. CFITSIO or earlier STILTSversions) will only be able to use the first 998 columns of tables written in this way.
• For VOTable columns that reference COOSYS elements, the relevant information isnow accessible as column auxiliary metadata (CoosysSystem, CoosysEpoch,CoosysEquinox) e.g. using the meta filter.
• Any columns referencing COOSYS elements read from VOTable-based formats(VOTable or FITS-plus) will now be written out to VOTable-based formats withequivalent COOSYS references included. Currently not table parameters though.
• The default version for output VOTables is now VOTable 1.3. New output formatsvotable-binary2-inline and votable-binary2-href are now offered alongsidethe five previously available VOTable variants.
• Slight changes to the FITS-plus output handler VOTable formatting in the primaryHDU; now uses default output VOTable version rather than VOTable 1.1.
• FITS keywords using the ESO HIERARCH convention can now be read as tableparameters rather than ignored when reading FITS tables.
Minor behaviour changes
• The charset parameter of votcopy now defaults to UTF-8 rather than the systemdefault.
• Replace parameter autoscale with unit in skyvector and skyellipse plot layers.• Change autoscaling defaults for plot layer types xyvector, xyzvector, skyvector,
xyellipse, skyellipse; autoscaling is now turned off by default. Apologies for thischange to behaviour, but it's better for consistency with new layer types xycorr andskycorr, and presents less danger of misinterpreted plots.
• Taplint: downgrade type mismatch error E_QTYP to warning W_QTYP in view ofTAP-1.0 Erratum #3.
• The COOSYS element is now passed without a deprecation warning in VOTable 1.3documents by the taplint and votlint validators, in view of VOTable-1.3 Erratum#1. The warning is still issued for VOTable 1.2 documents, but the text is toneddown.
• Taplint no longer issues a warning about DataModel references that do not match thevr:IdentifierURI type; this follows TAPRegExt Erratum #1.
• Modify taplint Examples document @vocab attribute testing in the light of DALI1.1.
Bug fixes
• Update PixTools (HEALPix) library to 2017-09-06 version(https://github.com/kuropat/eag-HEALPix, 447a7be073876dba32). This fixes a bugin healpixRingIndex that could give the wrong value for small values of longitudenear zero in the equatorial region. It seems possible that this might have led to veryinfrequent missed associations when crossmatching in these regions, but tests appearto indicate that no such errors would actually have resulted.
• Long fields (>10240 characters) in output CSV files are no longer truncated.• Fix misfeature in skyvector and skyellipse plot layers; these now preserve orientation
on the sky even when viewsys differs from datasys. Previously thedlat/dlon/posang parameters were always interpreted in the view, rather than thedata, sky coordinate system.
• Fix bug in plot title placement.• Fix filename generation error for plotting command animation output (wrong
number of digits if frame count was an exact power of 10).
SUN/256 571
Version 3.1-2 (7 November 2017)
New expression language functions
• New functions desigTo* for extracting positions from IAU-style object designations(like 2MASS J04355524+1630331) - use with care.
• New functions polarDistanceDegrees and polarDistanceRadians; these calculatethe distance in 3d space between two positions specified in spherical polarcoordinates.
• New functions phase to help with phase folding given a known period. A newmodulus function mod, whose output is always positive (unlike the % operator) is alsoadded.
Bug fixes and workarounds
• Upgrade JEL to v2.1.2: now you can use functions in the expression language thathave the same name as table columns.
• Add fix to discard on read any VOTable/FITS-plus table parameters with names"uk.ac.starlink.topcat.plot2.TopcatLayer*". These useless items were addedin potentially large numbers when saving plotted tables from TOPCAT v4.5(TOPCAT bug). A null tpipe operation at this version will therefore purge theseitems.
• Fix plot bug that sometimes caused error bars to come out very small whenexporting to a graphics file. This was a regression bug (present in v3.1-1 but notv3.1).
• Fix another tiny error bar plotting bug too.• Small taplint update; required UCD for obs_publisher_did/publisher_id changed
to match REC-ObsCore-1.1 (even though it's an illegal UCD1+).
Version 3.1-3 (24 April 2018)
New Functionality
• New DataLink validator task datalinklint.• Add class Gaia to the expression language. This contains functions for estimating
distances from parallaxes and propagating astrometric parameters and errors todifferent epochs. The functions are not specific to data from the Gaia astrometrysatellite, but are presented in a form convenient for use with the Gaia DR2 sourcecatalogue.
• New array manipulation functions slice and pick added to class Arrays.• New utility function square added to class Maths.• The addcol and colmeta filters now accept -shape and -elsize flags for defining
array and string shape/extent column metadata.• DataLink-style service descriptor RESOURCEs in input VOTables (and FITS-plus
tables) now appear as table parameters.
Plotting Enhancements
• Various improvements to the Contour plotter. You can now contour quantitiesweighted by a given coordinate, rather than just point density. The smoothing fromweighted point samples to the grid being contoured can be performed using sum,mean and other combination methods, it now uses a Gaussian kernel rather than asquare top hat, and performance is considerably improved especially at largesmoothing widths. The contour levels used are now reported, so can be seen byspecifying the -verbose flag. The contours are now plotted correctly right up to theedge of the visible plot, and various bugs have been fixed.
SUN/256 572
• The histogram plotter now has a combine parameter (sum, mean, median, min, max,stdev, etc) for weighted histograms. This means that you can plot e.g. the meanvalue of a given quantity per interval on the X axis rather than just the summedquantity. A corresponding (though somewhat less well-defined) option is alsoprovided for the kde and densogram plotters.
• The combine parameter that configures how values are binned in varioushistogram-like plots (skydensity, healpix) grid, and since this version also contour,histogram, kde) now has two new options, sum-per-unit and count-per-unit.These work like the existing sum and count options, but scale the combined valuesby the relevant unit (e.g. X axis unit or solid angle). Where these units are physical, aperunit parameter is also provided for scaling in convenient units: second, day, yearetc for time (plot2time), and square degree, arcminute, arcecond etc for solid angle(skydensity, healpix). In some cases, the combine default values have changed.
• The same new combine/perunit options are also added to the tskymap command.• The linearfit layer type is now available for plot2time as well as plot2plane.
Minor behaviour changes
• votlint no longer considers an integer- or array-typed PARAM element with attributevalue="" to be an error.
• votlint no longer Warns about PARAM/@ref->FIELD/@ID references, since this usagepattern is now found in DataLink Service Descriptors.
• The IPAC table reader now matches data type specifications case-insensitively.• Improvements in documentation of the expression language functions: in the
Function documentation section classes are now listed in alphabetical order, andexamples are included in some cases. Some readability improvements have also beenmade in the function browser displayed by the funcs command.
Bugfixes
• taplint's VOTable validation now includes XML schema/DTD validation as well asthe custom VOTable checks. It was always supposed to do this, but it seems that itdidn't, at least in recent versions.
• Update JCDF to v1.2-3; fixes some CDF reading bugs.• Prevent coneskymatch from sending cone search queries with sr=NaN.• Minor fix in taplint OBS stage; ObsCore v1.1 s_region UCD is
pos.outline;obs.field, not phys.outline;obs.field (a relic fromPR-ObsCore-1.1-20161004).
Version 3.1-4 (18 May 2018)Bugfixes and minor enhancements:
• Add new option delete=now to tapresume, which lets you delete a TAP async job. Alsoadd a message to tapquery inviting the user to delete interrupted jobs in this way.
• Upgrade Grégory Mantelet's ADQL parsing library to v1.4.• VOTable output tweaked: single quotes now used for attribute values if attribute contains
double quotes.• Fix bug in tapquery and tapresume that caused a result read failure for result VOTables
longer than 2Gb.• Fix range bug; caused plot failure when plotting very large values with no variation (e.g.
gaia_source solution_id).
Version 3.1-5 (2 November 2018)
Plotting:
• New spheregrid plot layer, for plotting a spherical net around the origin, added to
SUN/256 573
plot2cube and plot2sphere.• New line3d plot layer, for plotting lines joining points in 3d, added to plot2cube and
plot2sphere.• New sortaxis parameter, for joining out-of-sequence points, added to line plot
layer.• Replace skygrid plot layer parameter crowd with two parameters, loncrowd and
latcrowd, so you can control grid line spacing for meridians and parallelsindependently. Note this is a backwardly-incompatible change, so could breakexisting scripts. This change may have introduced slight changes to sky axis grid linespacing at low crowding levels.
• Contour level calculations improved; in some cases this previously didn't work wellat low point density, resulting in missing contours. The meaning of the zero
parameter has also changed slightly, it now defaults to 1 and is not phase folded.• Sphere plot now centers axes on zero if the center would otherwise be near zero.• Address long-standing plot auto-ranging issue; when auto-ranging resulted in the
bottom X limit or right-hand Y limit being exactly equal to zero, the correspondingzero-valued results were not plotted. Auto-ranging has been slightly adjusted toavoid that. This results in pixel-level changes to plot appearance in some cases; thesecan be avoided by explicitly setting xmax/ymin etc.
Expression Language:
• New functions in class Gaia: polarXYZ, astromXYZ, astromUVW, icrsToGal,galToIcrs, icrsToEcl, eclToIcrs. These can calculate Cartesian position andvelocity components from (e.g. Gaia) astrometric parameters.
• New Shapes class added for working with polygons in the X,Y plane; has functionsisInside and polyLine.
• Rearrange expression language documentation slightly: there is a new section listingSpecial Tokens. This includes "$random", which was previously undocumented andnamed "RANDOM".
• New functions urlEncode and urlDecode added to class Strings.• New convenience function exp10 in class Maths.
Validators:
• Improvements to taplint UWS stage: now validates job documents against UWSschema, tests uws:job/@version attribute, and does improved and version-sensitive(UWS v1.0/v1.1) validation of UWS timestamps. Also does more complete deletionof submitted jobs.
• taplint schema validation now takes account of VOTable 1.3 Erratum #2 -FIELD/@precision attribute values "F0"/"E0" are now permitted.
• The VOTable validator in votlint and taplint no longer complains about multipleINFO elements in the same scope sharing the same name attribute.
• Minor improvements to datalinklint error reporting.
Miscellaneous Enhancements:
• New collapsecols filter added, to convert a run of adjacent scalar columns into anarray column (the opposite of explodecols).
Minor enhancements and behaviour changes:
• GBIN read fix to work around changed behaviour in recent GaiaTools (versions19.4.*, >=20.1.0 and >=21.0.0) that caused GBIN table reading to fail.
• Fix some additional commands (votcopy, votlint, datalinklint) so they followHTTP 3xx redirects automatically in more cases when given a URL for input. MostSTILTS commands already do this.
• Introduce a couple of measures to reduce the likelihood of unintentional service
SUN/256 574
overload from coneskymatch and friends: add a progressively increasing delay forerract=retry* error handling modes, and decrease the soft maximum for theparallel parameter to 5 (from 10).
• Slight improvements to the JDBC Configuration section of this manual.• Small change to MOC handling that might possibly avoid some network-related
performance issues.
Bugfixes:
• Fix function plot layer so that NaN values are omitted rather than interpolated.• The stilts startup script now correctly follows symlinks on some OSes where it
didn't work before (including OSX). It also looks for jar files to use in slightlydifferent places on OS X.
Version 3.1-6 (9 May 2019)
Plotting enhancements
• Introduced new colour scaling options histogram and histolog for the parametersauxfunc, densefunc etc in plot2plane and the other plotting commands. This canmake it much easier to see structure in quantities that do not vary smoothly over theirmin-max range.
• New plot layer types poly4, mark4, polygon introduced for drawing outline or filledquadrilaterals and other polygons in all plot types.
• The line plot layer now has an aux parameter that can vary the colour of the linealong its length according to some third quantity.
• plot2sky now by default draws a small scale bar at the bottom left corner of the plot,indicating the scale in degrees, minutes or seconds. It can be switched off using thenew scalebar parameter.
• New option Car0 for the plot2sky projection parameter; this is like Car (PlateCarrée) but has longitude=0 at the left/right edge rather than the center of the plot.
• The healpix plot layer can now plot HEALPix levels up to 20 (previously themaximum was 13). Also, autoranging now works, so if a plot is made of a HEALPixfile covering part of the sky, the sky view is centered on it in the same way as formarker plots. Memory management is improved for fairly large maps.
HEALPix-FITS supportVarious changes introduced to support the semi-standard HEALPix-FITS serializationconvention. Available information about HEALPix encoding (level, index column,ordering scheme, coord sys) can now be stored in custom table parameters (of the formSTIL_HPX_*), and is used by FITS output handlers to insert the relevant FITS headers.The existing FITS handlers do this where it's not disruptive, and the new fits-healpixoutput handler will additionally move and rename columns if required. This metadata isround-tripped by FITS and VOTable I/O handlers. It is added automatically by thetskymap command, and can be manipulated by hand using the new healpixmeta filter.FITS support is not perfect: the BAD_DATA FITS keyword is ignored, and the 1024-elementarray-valued column variant is not understood.
VOTable 1.4 supportSupport has been introduced for version 1.4 of the VOTable format and its new TIMESYS
element.
• votlint (and hence taplint) now supports Version 1.4 VOTables: the 1.4 schemais used for XSD validation, and the TIMESYS element is checked for attributecontent and suitable referencing.
• For VOTable columns that reference TIMESYS elements, the relevant information isnow accessible as column auxiliary metadata (TimesysTimeorigin,
SUN/256 575
TimesysTimescale, TimesysRefposition) e.g. using the meta filter.• Any columns referencing TIMESYS elements read from VOTable-based formats
(VOTable or FITS-plus) can now be written out to VOTable-based formats withequivalent TIMESYS references included, so TIMESYS round-tripping for columnsworks; however this will only be done if the VOTable output format is set to version1.4. By default (at least as long as 1.4 is not finalised) the output version is 1.3. Toenable this TIMESYS output, set the system property -Dvotable.version=1.4.Currently this TIMESYS output works only for table columns (FIELDs) notparameters (PARAMs).
• The timeoffset attribute of a TIMESYS element referenced by a VOTable columnis used to make sense of column data when interpreting it as an absolute time.Currently, the only use of this is in time plots.
This VOTable 1.4 support has resulted in some minor related behaviour changes:
• FIELD/@ref attributes are no longer imported as "VOTable ref" column auxmetadata items, since they often interfere with TIMESYS references. Doing this wasprobably always a bad idea since the referencing is not kept track of within theapplication, so withdrawing this functionality makes sense, but beware that it mightchange or break some existing behaviour.
• votlint modifications above may now interrogate external vocabulary resourcesduring validation, meaning that external network connections may be made duringvalidation, which didn't happen in previous versions.
Other enhancements
• New functions indexOf in class Arrays to find position of a given value in an array.• New functions parseDoubles and parseInts in class Conversions for extracting
array values from strings (experimental).• Fix expression compilation so that $ID column references referring to nonexistent
columns are rejected at compile time rather than causing trouble during evaluation.• The validator tasks taplint and datalinklint now insert the token
"(IVOA-validate)" into the User-Agent header of all HTTP requests they make, forconvenience of services that want to identify validators. This is a conventiondiscussed within the IVOA Operations IG.
Bug and misfeature fixes
• Improve colour ramp quantisation (plot parameters auxquant etc); the full colorrange is now included.
• Use period not comma as decimal separator for non-sexagesimal plot2sky axislabels regardless of Locale; also avoid trailing comma sometimes erroneouslypresent.
• Fix bug/misfeature in CDF table parameter construction: CDF global attributes wereignored (with a "WARNING: Omitting complicated global attribute" message) ifthey contained any null entries. Now such entries are just ignored and the tableparameter is constructed from the global attribute using the non-null entries.
• Fix some bugs relating to plotting values close to the limits of the double precisionrange.
• Fix a problem with the link2 plot layers on sky plots with Aitoff/Car projections thatcaused short lines that should span the antimeridian to appear as long lines crossingthe whole sky. Such links are now just not drawn.
• Fix misleading error message about seq parameter for underconfigured plot layers inplot2* commands.
Version 3.2 (18 November 2019)
SUN/256 576

Runtime environment: Java 8From this release, STILTS requires Java 8 (a.k.a. Java 1.8) or greater to run, rather thanJava 6 as for previous releases. Java 8 has been around since 2014, so it should beavailable on all but very ancient platforms. If execution fails with ajava.lang.UnsupportedClassVersionError then you need to upgrade.
New or enhanced functionality:
• New cone command to execute simple spatial DAL queries (Cone Search, SIA,SSA).
• Most plot layer types, though not the intial data preparation, will now run in parallelfor large datasets. When using one of the plot2* commands interactively(omode=swing), this should make interacting with slow plots faster on multi-coremachines. (In rare cases this multi-threading might cause problems with memoryusage; it can be effectively turned off if required by using the system propertyjava.util.concurrent.ForkJoinPool.common.parallelism.)
• New class URLs contains expression language utility functions for constructingcertain service URLs: hips2fitsUrl, bibcodeUrl, doiUrl, arxivUrl, simbadUrl
and nedUrl. Existing functions urlEncode and urlDecode have been moved to URLs
from class Strings.• New functions parseBigInteger and parseBigDecimal in class Conversions.• Add new parameter usepos to polygon plot layer, to toggle inclusion of reference
position in polygon vertex list.• Add parameter interface added to TAP query tasks tapquery, tapskymatch and
taplint. This can control how TAP version is determined.• Modified behaviour for offset (e.g. unsigned) longs in FITS files. 64-bit integer
columns (TFORMn='K') with non-zero integer offsets (TSCALn=1, TZEROn<>0) are nowrepresented internally as Strings; previously they were represented as Long integers,but values out of the possible range appeared as null (with a warning written throughthe logging system). Such columns are most commonly seen representing unsignedlong values. If written back out to FITS, the offset long value will be reinstated, butother output formats cannot encode unsigned longs, so they will stay as strings.
Minor enhancements and behaviour changes:
• VOTable output now writes VOTable version 1.4 by default (was 1.3).• Modified plot legend display so that small markers are displayed a bit bigger in the
legend than on the plot for readability.• Add new colour map Cividis.• Permit FITS and VOTable files with zero-length string columns. Previously all-null
or zero-length string columns were sometimes forced to single-character values.• Update mapped file unmapping implementation to work for java9+.• Updated taplint OBS stage according to ObsCore-1.1 Erratum #1 (corrected
UCDs). No code changes required for ObsCore-1.1 Erratum #2.• More taplint tests added for TAP 1.1-style capabilities document.• Taplint now recognises ADQL 2.1 language features (as listed in
PR-ADQL-2.1-20180112), avoiding some E_KEYX errors.• VOResource validation in taplint now uses VOResource v1.1 not v1.0. Erratum #1
(multiple security methods) has been applied.• Some taplint enhancements: add some new general tests, and some only used when
testing TAP 1.1 services.• Adopt VOTable-1.3 Erratum #3 in votlint; arraysize="1" now provokes a
Warning.• Updates to meta filter documentation.• Minor changes to behaviour when querying TAP 1.1 services (REQUEST parameter
is omitted).• JSAMP to version 1.3.7.
SUN/256 577
Bugfixes:
• Fix regression issues introduced at v3.1-6 relating to pixsample command; it nowreads HEALPix metadata from headers correctly again.
• Avoid sometimes losing precision when reading ASCII/CSV values in the range+/-(1e-45..1e-38).
• Fix plot axis ranging bug: padding was not always applied properly for logarithmicaxes.
• JEL bug fix update, to avoid unwanted debugging output for String function nullreturns.
Version 3.2-1 (5 June 2020)
File Formats:
• The ECSV (Enhanced Character Separated Values) storage format is now supportedfor input and output.
• The Feather storage format is now supported for input and output.
Performance:A number of implementation changes have been made which may improve performance,particularly for crossmatching (typical improvements for large sky crossmatches are afactor of 2, though YMMV). These should have no effect on the results, but if anybodynotices crossmatching behaviour which is changed since previous versions or otherwisesuspicious, please report it.
• The HEALPix implementation has been replaced; all HEALPix manipulation is nowdone using the excellent cds-healpix-java library written by François-Xavier Pineaufrom CDS, which speeds up sky crossmatching considerably. Many thanks toFrançois-Xavier and to CDS for providing this library and for assistance with its use;thanks also to Nikolay Kuropatkin from FermiLab whose PixTools library servedthis purpose in STILTS up till now.
• Rows are now binned during crossmatches using a HashSet rather than a TreeSet.• Evaluations of the arcsin function in Sky matches now use the (Apache via
cds-healpix) FastMath implementation rather than the standard J2SE version.• Performance is improved when reading long String values from FITS files.
Plot commands:
• The new layer types area, central and arealabel can be used for plotting regiondata supplied as area coordinates in the form of STC-S (e.g. fromObsCore/EPN-TAP s_region), DALI polygon/circle/point, or (ASCII) MOCcolumns. These layers are available from the plot2plane, plot2sky andplot2sphere commands.
• The plot2time command has been improved, and is no longer consideredexperimental. A new ttypeN parameter is added, which allows you to explicitlydefine (as MJD, JD, ISO-8601 etc) how input values are mapped to time. If no suchmapping is specified or can be guessed from the input metadata, time values are nowinterpreted by default as MJD rather than (as previously) Unix seconds.
• Provide more options for the shapeN parameter of the plot mark layer type:fat_circle, fat_cross etc using thicker lines.
• Add line thickness parameter thick to contour plot.• Plot storage parameter has new options disk, policy and persistent. These allow
off-heap plot data caching, so that interactive plots for very large data sets may bemade without running of of memory. The persistent option additionally means thatresults of expensive data read operations can be cached between invocations.
• The line layer's sortaxisN parameter now accepts the option time rather than X (or
SUN/256 578
Y) when used with plot2time.• Improved plot axis labelling in LaTeX mode, e.g. in LaTeX write "3x106" not "3e6".• Add new option anchorN=center to the label plot layer.• Add parameters minsize and minshape to poly4 plot layer type.• Improve accuracy when drawing large HEALPix tile boundaries in some cases for
skydensity and healpix sky plot layers.
Other minor enhancements:
• Basic support for SIA version 2 as well as version 1 in cone and coneskymatch
commands (new option servicetype=sia2).• Add new conversion functions *ToUnixSec to Times class.• Add new functions midLon and midLat to Sky class.• Slightly improve sampling accuracy of pixsample output.
Bug and misfeature fixes:
• Fix bug in SkyGrid plot layer that made it ignore the viewsys parameter, alwaysassuming equatorial so plotting the wrong grid lines for non-equatorial view skysystems. Note this bug applied only to STILTS, not TOPCAT.
• Fix regression bug since last release that refused to make dataless plots.• Fix polygon plots in plot2sphere - this combination was failing to plot anything,
now it works.• FITS ASCII table extensions with TFORM values of In are now treated as 64-bit
integers for n>=10 rather than n>10.• Modify taplint processing of QUERY_STATUS declarations; overflow may now be
declared before, as well as after, the table.• Slightly improve plot axis labelling for small numbers; remove unnecessary decimal
point in scientific notation in some cases.
Version 3.2-2 (24 August 2020)
New Functionality:
• SVG (Scalable Vector Graphics) is now one of the supported graphic output formatsfor plot export.
Bugfixes and minor enhancements:
• Fix Healpix trouble at large angles, e.g. sky crossmatch failure with match radius >6degrees.
• Fix ECSV output bug: encoding was incorrect for metadata scalars with certainnon-alphanumeric first characters, leading to invalid YAML.
• Votlint now warns about use of vocabulary terms marked as preliminary ordeprecated as well as unknown ones (although currently no such terms exist inrelevant vocabularies).
• Remove some unhelpful per-column metadata items from ECSV output.• Improve seeding of the expression language $random special value; it should now be
less dependent on JVM details.• TAP curl(1) equivalent logging flag error fixed (write --compressed not
--compress).
Version 3.3 (23 October 2020)
Plot serverA plot server has been added that can serve interactive plots in web applications forserver-side tables. Documentation for the server command has been mostly moved into
SUN/256 579
new Server Mode section.
Bug fixes
• Upgrade cds-healpix-java library to v0.28_1; avoid occasional sky crossmatchfailures (termination with error).
• Fix minor plotting bug that could cause white points to be invisible.
Version 3.4 (11 January 2021)In this version, the table handling library STIL has been upgraded to v4.0, which enables someenhancements including multithreading and new I/O handler features.
Notable new functionality:
• Auto file format detection now examines filenames to help guess format; this meansthat e.g. for CSV files named with the ".csv" extension, it is no longer necessary tospecify ifmt=csv.
• Several operations can now run in parallel, so should execute faster for large datasetson multi-core machines. Parallelised operations are the output modes stats and count,the filters stats and sort, and the task tskymap. The stats and sort filters have-[no]parallel flags that can be used to select between sequential and parallelexecution. Parallel data caching for plots is also available using thestorage=parallel option, but this is currently experimental and not generallyrecommended. Future releases will parallelise other operations, including matching.
• I/O handlers can now in some cases take parenthesised options, e.g.ofmt=votable(version=V12,format=BINARY). For examples see individual handlerdocumentation, e.g. the VOTable output handler and ECSV input handler.
• Scheme specifiers can now be used to specify input tables, to read tables not basedon external files. Options currently provided include simple sequence, simulated skyand strange attractor data.
• Improved documentation of I/O formats in this document: full docs are nowprovided in Section 5.1 for all formats rather than summaries with pointers toSUN/253. The Table I/O section has been somewhat reorganised and tidied up.
Minor enhancements:
• When the stats filter calculates quantiles, the -qapprox flag can be supplied to use an(approximate) algorithm that will not run out of memory.
• Add combine parameter to tcube, so it can produce generalised weighted maps.• Add new options acos and cos for colour scaling options auxfunc, densefunc etc;
these provide linear-like stretch functions with steeper/flatter ends, which may beuseful for shading by quantities with most variation near to/far from the middle ofthe range.
• The progress filter no longer slows down pipelines to any noticeable extent.• COOSYS and TIMESYS attributes are now preserved during VOTable I/O for table
PARAMs (as well as for FIELDs, which was already the case).• Tidy up open files in the table concatenation command tcat; with lazy=true it
should no longer fail with "Too many open files".• The every filter has a new -exact|-approx flag; -approx may be required for
certain operations to run in parallel.• Slightly improved documentation for cdsskymatch.
Bugfixes:
• Fix bug that could give unhelpful table load error message for very short non-FITSfiles.
• Fix broken example in tmatchn documentation.• Fix taplint to cope with VOSI1.1 detail=min-style response from /tables
SUN/256 580
endpoint; avoid spurious E-TMC-CM21/E-TMC-FM21 errors.• Cope better with infinite values in aux plot coordinates.• Fix histogram ranging bug (plot failure under certain circumstances).• Upgrade JEL to v2.1.2: bugfix plus some efficiency improvements in object
creation.• Avoid inserting NULL_VALUE custom metadata entries into ECSV output.• Make taplint changes for later edits to ObsCore-1.1 Erratum #1
(dataproduct_type and dataproduct_subtype UCDs are now meta.code.class).
Version 3.4-1 (10 June 2021)
File formats:
• Apache Parquet format is now supported for input and output (note not available inall configurations).
• AAS Machine-Readable Table (MRT) format is now supported for input.• ECSV format input and output handlers are upgraded to version 1.0 of the ECSV
format, meaning they can now read and write array-valued columns.• Add configuration option header for CSV input handler, to indicate whether header
line is present.• Add configuration option maxSample for CSV and ASCII input handlers to reduce
2-pass read time.• Variable-length array-valued columns in FITS tables (P/Q descriptors) can now be
read even in compressed or streamed input.
Other new functionality:
• Add new plot layers to plot2plane for plotting data (such as spectra or time series) inarray-valued columns: lines, marks, yerrors and xyerrors.
• Add new functions to class Arrays for working with array values: arrayFunc,intArrayFunc, sequence, constant.
• Add new table scheme test.• The cumulative option in histogram-like plots can now take the values
none/forward/reverse, not just true/false.• Introduce the aitoff0 option alongside aitoff as a value for the plot2sky
projection parameter. In the same way as car/car0, this gives an Aitoff projectionbut with the longitude=0 line at the left/right edge instead of the center.
• Modify tcube so that it accepts expression language expressions rather than justcolumn name/ID values for the cols and scale parameters.
Taplint changes:
• Add new taplint stage LOC, for ObsLocTAP validation. This release validates againstthe draft standard version PR-ObsLocTAP-20210609.
• Taplint stage TMV now validates against (a pre-REC version of) version 1.2 of theVODataService schema instead of version 1.1.
• Downgrade taplint report for accepting unknown LANG from E_DSUC to W_OLNG.• Relax taplint timestamp upload round-tripping requirements; folding
adql:TIMESTAMP->timestamp no longer provokes error E-UPL-TMCX.• Relax some taplint type checking for TAP_SCHEMA columns of TAP 1.0 services
(see TAP 1.0 Erratum #3); report E-TMS-TSCT is downgraded to W-TMS-TSCT.• Taplint W_EXVC TOPCAT compatibility warnings are downgraded to I_EXVT.
Minor enhancements and workarounds:
• The fits-var output handler now avoids use of the THEAP keyword (no pre-heap gapis written). Heap padding is legal FITS, but bugs in other FITS software mean that
SUN/256 581
some third party components (including fverify in FTOOLS e.g. v3.14-3.50) haveproblems with such files.
• Fix server to work with scheme-specified tables having a non-default tablefactoryparameter.
• JDBC output no longer attempts to create VARCHAR(0) columns.• Output of cache filter now retains no reference to input table, so it can be used to
manage deeply nested tables in (Jy)STILTS pipelines.• JyStilts now has access to the same table schemes as STILTS.• Collapse whitespace in some table metadata description items in output form meta
filter and output mode. This prevents unwanted linebreaks as well as tidyingwhitespace-formatted values.
• Space-delimited ECSV files now write empty fields quoted.• Unknown or unsupported column datatype values in ECSV files are now treated like
string rather than causing table read failure.• Empty strings in FITS 1-character columns are now returned as blank values rather
than ASCII NUL ('\0').• Undersized, including zero-length, strings written to FITS columns are now by
default terminated with an ASCII NUL rather than in some cases padded withspaces.
Bugfixes:
• Fix regression bug in previous release (v3.4) that broke use of jdbc: URLs.• Fix regression bug in previous release (v3.4) affecting text, ascii and ipac output
formats, that could cause cached table output (e.g. from filters cache or random) tocontain many repeated copies of the same row.
• Upgrade cds-healpix-java library to v0.29.3; this avoids occasional sky crossmatchfailures (termination with error) introduced at STILTS v3.2-1.
• Fix bug in addcol filter that could evaluate the row index ($index/$0) incorrectlyduring parallel processing.
• Fix plot2sky bug that got clon/clat positioning wrong for some projections such asCAR0.
• Fix issue with cumulative histograms; bars beyond the last sample are now displayedwith total value not zero.
• Fix bugs that meant writing long (>2Gb) fits-var files could outputincorrect/corrupted FITS.
• Fix long-standing file caching bug; mostly seemed to affect large (>2Gb) streams.• Fix documentation bug in cone; output parameters out, ofmt, ocmd and omode are
now listed.• Fix optional argument processing bug in JyStilts (optional named arguments like
start in tloop were being ignored).• Fix tcube bug that caused problems with some input filter (icmd) processing.• Fix long-standing logic error in ASCII/CSV input handler that could misidentify
column types and cause read failures.• Fix failure when trying to plot with auxfunc=histogram and explicitly set
auxmin/auxmax bounds outside of data range.• FITS TZERO headers are now written correctly with numeric values rather than
string values.
Version 3.4-2 (15 October 2021)
Taplint and Votlint changes:
• New stage UUC added to taplint. This checks units (against the VOUnits standard)and UCDs (against the UCD1+ standard and legacy UCD1 list).
• New stage EPN added to taplint. This checks EPN-TAP (*.epn_core) tables against
SUN/256 582
some version of EPN-TAP 2.0 (currently PR-EPNTAP-2.0-20211012). SinceEPN-TAP is still in draft at time of writing, this stage is not currently run by default.
• Modify taplint stages parameter usage; you can now add and remove stagesindividually using +XXX/-XXX syntax.
• Taplint now does a better job of categorising VOTable parse errors, so multiplerepeats of similar messages can be avoided. Ad-hoc VOTable error codes havechanged from "VOxx" to "Yxxx".
• Votlint, hence also taplint, now checks values in FIELD/PARAMs marked withxtype attributes for conformance to rules from DALI 1.1 sec 3.3.
• Taplint MDQ stage now reports mismatches between declared and result Units, UCDs,Xtypes, and Utypes as well as datatypes.
• Taplint and datalinklint now identify themselves as validators using the User-Agent
token "(IVOA-test)" rather than "(IVOA-validate)" as before; this follows thepublished content of the SoftID-1.0 IVOA Note.
• Taplint now examines the service Server header and tries to check it for VOcomponent identification as recommended by SoftID.
• Votlint now has a maxrepeat parameter like taplint (previously the repeat countwas hard-wired to 4).
• Votlint now does a better job of identifying similar errors, so output suppressingrepeated messages can be more compact. Suppression of repeated messages isreported.
• Votlint now optionally checks the content of unit and ucd attributes, checkingagainst the VOUnits and UCD1+/UCD1 standards respectively.
• Distinguish votlint reports for recognised and unrecognised (e.g. VODML)elements in foreign XML namespaces.
• Add timestamp line at start of taplint output.
Other new functionality:
• A new parameter thick has been added to several plot layer types to enable linesthicker than a single pixel when drawing error bars, arrows, outlines, pair links etc:xyvector, xyerror, sizexy, xyellipse, xycorr, link2, poly4, polygon, area,yerrors, xyerrors, skyvector, skyellipse, skycorr, xyzvector, xyzerror,yerror.
• New functions in class VO to check syntax of UCD and VOUnit strings.• New areatype value UNIQ for plotting single HEALPix tiles e.g. from MOC files in
area (and similar) layer type.• New checksum table output mode.• Add Julian Day manipulation functions jdToMjd and mjdToJd to class Times.
Minor enhancements and behaviour changes:
• The fast parameter has been withdrawn from polygon-plotting plot types area,polygon, poly4; the shape-filling algorithm has been improved, and it's no longernecessary to choose between speed and accuracy.
• Replace the julianToUnixSec function in class Times, which didn't do what it said itdid, with jdToUnixSec.
• The mjdToIso and mjdToDate functions in class Times now prepend the string"(BCE)" to dates before the Common Era.
• Guess meaning for some non-standard COORDSYS values in HEALPix-FITS files,e.g. allow "GALACTIC" instead of "G".
• Revert to sequential processing in some cases for HEALPix plot layer to reduceresource usage.
• Columns that are all blank in ASCII-like tables (CSV, ASCII, TST) are nowinterpreted as type String not boolean.
• Files compressed using multi-stream bzip2 compression (e.g. pbzip2 output) are
SUN/256 583
now supported alongside single-stream bzip2.
Bugfixes:
• Fix serious threading bug that could return nonsense values from fixed-length stringfields during parallel processing, for instance statistics calculation, of large cached orrandomised tables.
• Upgrade of cds-healpix-java library to v0.30.2; this fixes some HEALPix cellplotting bugs.
• Fix aux ranging bug that meant auxmax without auxmin was not honoured in plotcommands. This was a regression bug introduced at v3.1-5.
SUN/256 584