Statistics of Income. - Internal Revenue Service
102
Statistics of Income. Individual IncomeTax Rates,- 1982 Taxpayers Classiffed,by Sex F139 Fiduciary Income, -Tax~ Returns,-,-A 982 - F61. Environmental Taxes, .1981-83 091 Crude Oil Windfall - Profit Tax, -Second Quarter 1984 Selected: Statistical Series,,1970-85 Publication 1136 (Rev. 4-85)
-
Upload
khangminh22 -
Category
Documents
-
view
0 -
download
0
Transcript of Statistics of Income. - Internal Revenue Service

Statistics of Income.
Individual IncomeTax Rates,- 1982
Taxpayers Classiffed,by Sex
F139 Fiduciary Income, -Tax~ Returns,-,-A 982 -
F61. Environmental Taxes, .1981-83
091 Crude Oil Windfall - Profit Tax, -Second Quarter 1984
Selected:Statistical Series,,1970-85
Publication 1136 (Rev. 4-85)

6
Statistics of Income
01 BULLETIN
Department of the TreasuryInternal Revenue Service
Roscoe L. Egger, Jr.Commissioner
M. Eddie HeironimusAssociate Commissioner(Data Processing)
Stanley GoldbergAssistant Commissioner(Returns and Information Processing)
Fritz Scheuren - -Director, Statistics of Income Division
Robert A. WilsonChief, Coordination ahd Publications
Staff
Publication 1136 (Rev. 4-85)
The SOI Bulletin provides the earliest published annual financial statisticsfrom various types of tax and information returns filed with the InternalRevenue Service. It also includes information from periodic or specialanalytical studies of particular interest to tax administrators. In addition,historical data are provided for selected types of taxpayers, as well as thegross internal revenue collections and other tax related items.
Information on the availability of additional unpublished data concerningthe topics in this issue may be obtained by writing to the Statistics of IncomeDivision, D:R:S, Internal Revenue Service, Washington, DC 20224.
In addition, special Statistics of Income tabulations based on income taxreturns can be produced upon request on a reimbursable basis. Requestsfor this service should be addressed to the Director, Statistics of IncomeDivision, at the address shown above.
Ralph B. Bristol, Jr., Chief, Tax Statistics, Office of Tax Analysis, providedoverall policy review and comments. Cecelia Hilgert was the technical editorof the publication. Clementine Brittain and Cathy Robinson provided editorialassistance and copy preparation.
Suggested Citation
Internal Revenue ServiceStatistics of Income Bulletin,Spring 1985 1Washington, D.C. 1985
For sale by the Superintendent of Documents,U.S. Government Printing Office,
Aon-~~~~~~~,FAV'asll I I ngton~,DAG-.-2vMt Z-
q
COMMISSIONER OF INTERNAL REVENUE
Washington, DC 20224
April 17, 1985
The Honorable James A. Baker, IIIThe Secretary of the TreasuryWashington, DC 20220
Dear Mr. Secretary:
I am transmitting the Spring 1985 issue of the Statistics of Income
Bulletin. This report has been produced in accordance with the mandate of
section 6108 of the Internal Revenue Code which requires the preparation and
publication of statistics reasonably available with respect to the operation
of the internal revenue laws. Presented in this issue are recent financial
and tax data obtained from tax returns and associated supporting schedules.
With kind regards,
Sincerely,
-"'~40'~fZ,-,
Department of the Treasury Internal Revenue Service
Articles in Preparation forUpcoming Issues
- Taxpayer Usage.of Forms. 10.40, 1,04,OA, and 1040EZ,Sole.. Proprietorship Returns, 1983Partnership Returns, 1983Sales of Capital Assets, 1981Individual Income Tax Data Classified by Occupation of.Taxpa~yerTaxpayers Age 65 or Over, 1982Nonresident Alien Income and Tax Withheld, 1983
NOTE TO USERS: Please take time to completethe survey form at the back of this publication.No postage or envelope is required. Your inputwill help us- to be more, responsive to, theinformation needs of bur users. Thank you for
,..your cooperation.
I
For sale by the Superintendent of Documents, U.S. Government Printing OfficeWashington. D.C. 20402

Subscription Order Form DepartmentNo. 39-FF
Mail thisform to: Superintendent of Documents, U.S. Government Printing Office, Department No. 39-FF, Washington, D.C. 20402
P-1--4 i~ It M checkCredit Card Orders Only
0 money order, or charge to myDeposit Account No.
I I I I I TTI -11Order No.
VISA
master charge
OLa charges
CreditCard No.
Fill in the boxes below.
111111111111111M
Expiration DateMonth/Year
Please enter my subscription to the Statistics of Income Bulletinat $20.00 per year ($25.00 for other than U.S. mailing).
Company or personal name
111 111111111111-1 111 1Additional address/attention line
Street address
City State ZIP Code
I I I I I I I I I I I I I I I I I I I I I I I I I I I I I I
(or Country)
I I I I I I I I I I I I I I I I I I I I I I I I I I I I I
PLEASE PRINT OR TYPE
For Office Use OnlyQuantity Charges
......... Enclosed ...............
.... I .... To be mailed ...........
......... Subscriptions ...........
Postage ...........................
Foreign handling .................
MMOB ...........................
OPNR ...........................
.......... UPNS
.......... Discount
.......... Refund
-----------------------------------------------------------------
Subscription Information
Title: Statistics of Income Bulletin Issued: Quarterly
Subscription Price:
Single Copy Price:
Available From:
$20.00 domestic, $25.00 foreign
$5.50 domestic, $6.88 foreign
Superintendent of DocumentsU.S. Government Printing OfficeDepartment 39-FFWashington, D.C. 20402(Subscription order form above) i
-------------------------------------------------------------------
Change of Address Form forStatistics of Income
01 BULLETINMail this form to: New Address, Superintendent of Documents, U.S. Government Printing Office, Washington, D.C. 20402
Company or personal name
Additional address /attent ion line
I I I I I I I I I I I I I I I I I I I I I I I I I I I I I IStreet address
11 1 1 1 1 1 1 1 1 1 1 1 1 1 1 1 1 1 1 1 1 1 1 1 1 1 1 Li
City State ZIP Code
I it-1-111 11 111111 111 11 1 1 1 1 1 1 1 1 1(or Country)
I I
Attach last subscriptionlabel here.
PLEASE PRINT OR TYPE
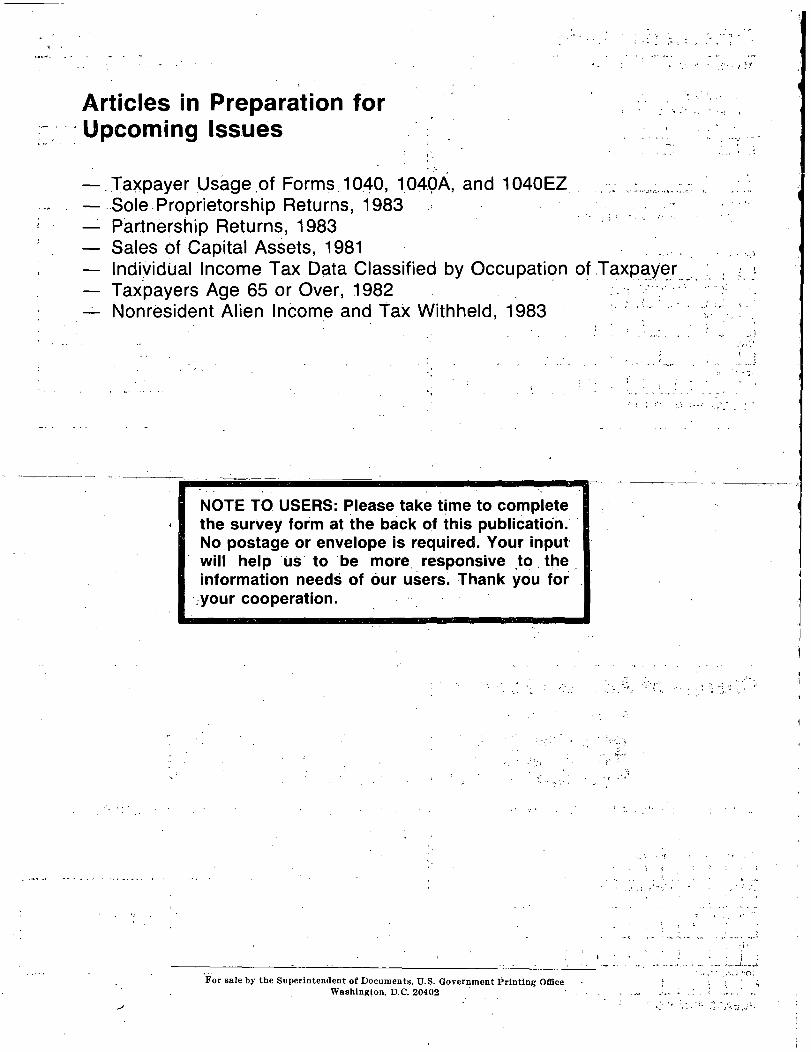
Contents
Individual Income Tax Rates, 1982 .......................................By Dan HolikReflecting lower tax rates, the average income tax reported per return decreased by $99 to$3,604 for Tax Year 1982.
Taxpayers Classified by Sex ............................................By Patricia A. Crabbe and Elizabeth L. GrossStatistics prepared from individual income tax returns indicated that in the late 1970's it firstbecame more likely for both husbands and wives to be wage-earners; for Tax Year 1979, 53percent of all joint returns with salaries and wages had incomes from two earners.
Fiduciary Income Tax Returns, 1982 ......................................By Gary J. EstepFor 1982, approximately 2 million estates and trusts reported an estimated $37 billion in totalincome.
Page
I
13
39
Environmental Taxes: Superfund and Hazardous Waste, 1981-83 .............. 61By Rashida BelalThrough 1983, a total of $678 million in environmental taxes has been reported for the fundsestablished under the Comprehensive Environmental Response, Compensation, and LiabilityAct of 1980.
Crude Oil Windfall Profit Tax, Second Quarter 1984 ......................... 69By Ed ChungFor the second quarter of 1984, the windfall profit tax liability after adjustments was $2.3billion, a decline of 6 percent from the previous quarter.
Selected Statistical Series .............................................. 77
Append ix-General Description of SOI Sample Procedures and Data Limitations 93
Cumulative Index of Previously Published SOI Bulletin Articles ............ Back Cover

Individual Income Tax Rates, 1982By Dan Holik*
The Economic Recovery Tax Act of 1981 broughtabout significant changes in the computation ofboth adjusted gross income (AGI) and tax for1982. The deduction for a married couple whenboth work was introduced, and the eligibilityrequirements for individual retirement arrange-ments (IRA's) were expanded. More importantly,all the tax rate schedules were revised. Mosttax rates were cut by about 10 percent fromtheir 1()80 levels, and the top rate was loweredto 50 percent [1]. The average total incometax reported per return for Tax Year 1982 was$3,604, a $99 decrease from Tax Year 1981, asshown in Figure A.
Reflecting both inflation and real economicgrowth, the adjusted gross income reported ontaxable returns [21 rose by $82.6 billion (4.8ercent) from Tax Year 1981 to Tax Year 198231. However, the AGI class of the median
taxable return remained the same as for TaxYear 1981--between $17,000 and $19,000.
Total numberof returns
Figure A.--Taxable Returns: Adjusted Gross Income, Total Income Tax, Average Total Income Tax, andAverage Tax Rate, 1979-1982
Tax Year
1979 ....................1980 ....................1981 ....................1982 ....................
Tax Year
0 )
92,694,30293,902,46995,396,12395,337,432
Taxablereturns
The average tax rate on all taxable returnsfell from 16.5 percent of AGI for 1981 to 15.4percent for 1982. The average tax rate on themedian class of returns fell from 12.1 percentto 11 .1 percent [4]. For further informationon the number of returns, income tax, andaverage tax by size of AGI, see Table 3 of theSelected Statistical Series.
CALCULATION OF TAXES FOR 1982
For Tax Year 1982, taxpayers used one of fourdifferent tax rate schedules F51, depending onthe taxpayer's filing stitus. There wereseparate schedules for: married persons filingjoint returns (and those claiming survivingspouse status); a married person filing a returnseparately from his or her spouse; individualsqualifying as heads of households; and singleindividuals. Each of these rate schedulescontained rates ranging from 0 through 50percent.
(2) 1
Nontaxablereturns
(3)
Adjusted grossincome (billions)
(4)
20,999,31919,996,22518,671,39918,302,132
71,694,98373,906,24476,724,72477,035,300
Total incometax (billions)
1979 ............................1980 ............................1981 ............................1982 ............................
(5)
$214250284278
(6)
$2,9923,3873,7033,604
$1,4021,5561,7211,804
Averagetax rate
(7)
15.3%16.116.515.4
NOTE: The average total income tax per return and average tax rate were calculated before rounding.
Average total income tax(dollars per return)
*Individual Returns Analysis Section. Prepared under the direction ofDavid Paris, Chief. 1

2 Individual Income Tax Rates, 1982
The application of different tax rates from atax rate schedule to a particular return isillustrated by the example presented in FigureB, which shows how tax was calculated for 1982for a typical married couple filing a joint'return havi ng an adjusted gross i ncome of$21,025. Taxpayers who filed joint returns forTax Year 1982 had a tax rate of zero percentapplied to the first $3,400 of income subjectto tax, a rate of 12 percent appl ied to thenext $2,100, a- rate of 14 percent applied tothe.next $2,100, and so forth. '
Figure, B.--Calculation of Tax, Joint Return, WithIncome Subject to Tax at Regular Rates, 1982' -
Adjusted gross income ................... $21,025Exemption amount (2 X $1,000) -2,000Income subject to tax .................. $19,025
Derivation of Tax Computedfrom Tax Rate Schedule Y:
First $3,400 taxed at 0% .... $0Next $2,100 taxed at 12% ...... 252Next $2,100 taxed at 14% .............. 294Next $4,300 taxed at 16% - ............ 688Next $4,100 taxed,at 19% .............. 779Next $3,b25 taxed at 22% .............. 666
Tax ................................. $2,679
To simplify tax computation and reduce . errors,taxpayers having less than $50,000- of incomesubject to tax and who did not "income average"were required to use the 1982 Tax Table todetermine tax instead of using Tax Rate ScheduleY. According to the 1982 Tax Table, the tax formarried taxpayers filing a joint return with$19,025 of income was $2,679. The tax as -shownin the tax table is equal to the tax on the.mid-point of the bracket, as calculated from- theappropriate tax rate schedule
'rounded to the
nearest whole dollar'. In this example, the taxWas computed on the midpoint ($19,025) of the$19,000 to $19,050 bracket.
The regular and income averaging methods oftax 'computation Were the only methods of tax
-computation available for Tax Year 1982 [51.Choice of the income averaging computationpermitted part of an unusually large amount ofincome for 1982 to 'be taxed at lower rates,thus resulting in a lower amount
'of tax due.
than would have resulted if taxpayers hadcomputed. their tax 'using. the regular method.-if the income av
.eraging computation was, -used,
the income tax before credits had to be computedfrom- the tax rate schedules rather than the TaxTables.
Marginal Tax Rates
As shown in Figure B, a particular return canhave portions of income taxed at different
rates. However, each return has only onemarginal tax rate, which is the highest taxrate applied to that return. In Figure B, thetaxpayers had portions of income taxed at sixtax rates ranging from 0 percent to 22.percent.The ma'rginal tax rate is the hi.ghest' rate used,in this instance 22 percent.
Marginal tax rate data for Tax Year*1982 arepresented in Tables 1 and 2 [6]. Returns areclassified by two different methods in Table 1.In. columns 1 through 9, a return is classifiedby the marginal or highest rate. For example,Tabl e 1 . 1 i ne 11 , col umn * 1 , shows that therewere 5,855,086 returns for which the marginaltax rate was 25 percent, while columns 5 and 6show that, for those returns, the amount of taxgen
.erated at the 12 percent through '25 percent
rates totaled $20.1 billion and the amount oftax generated solely at the marginal rate of 25percent totaled $3.1 billion. (Note: Dollaramounts presented in this section and in thetables have been rounded during Processing.)* Incolumns 10 through 1.2, a return is classified byeach rate that generated a tax. For example,1 i ne 11 , col umns 10, 11 , and .1 2, shows that22,051,871 returns had income taxed at a, 25percent rate; $83 billion of this income wa'staxed at the 25 percent rate, and $20.7 billion
--of-i;ncome-tax--wa s--gene rated- at-the-25-perc-enttax rate,, respectively.
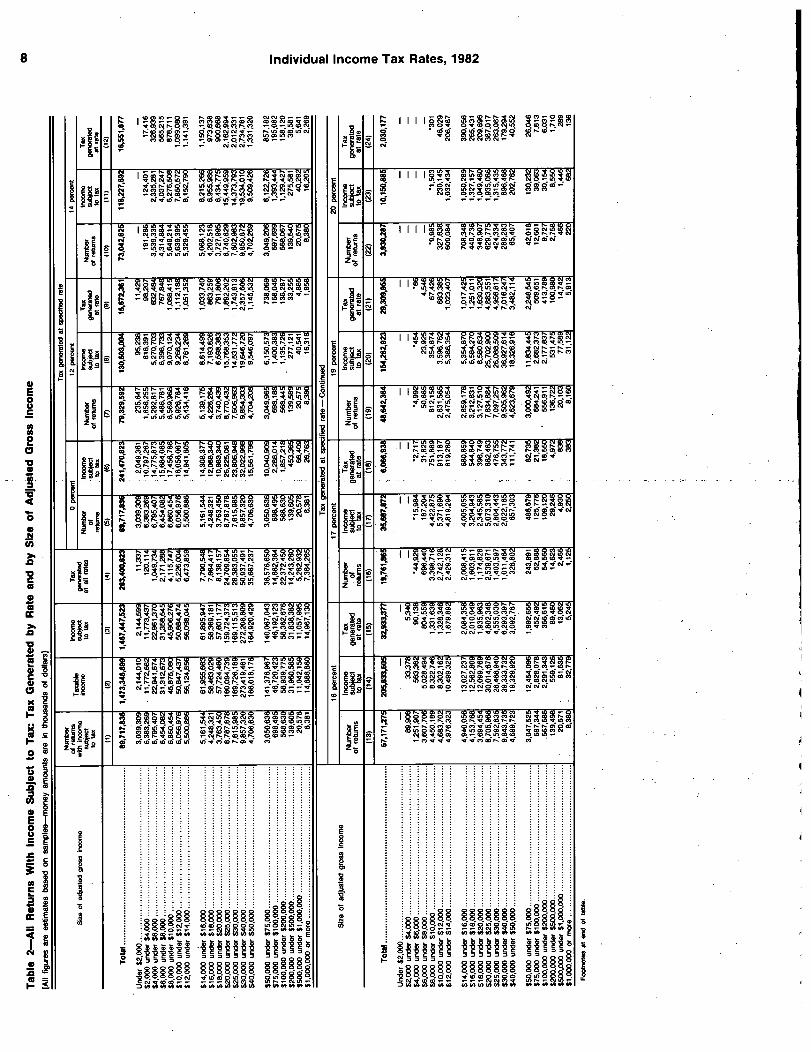
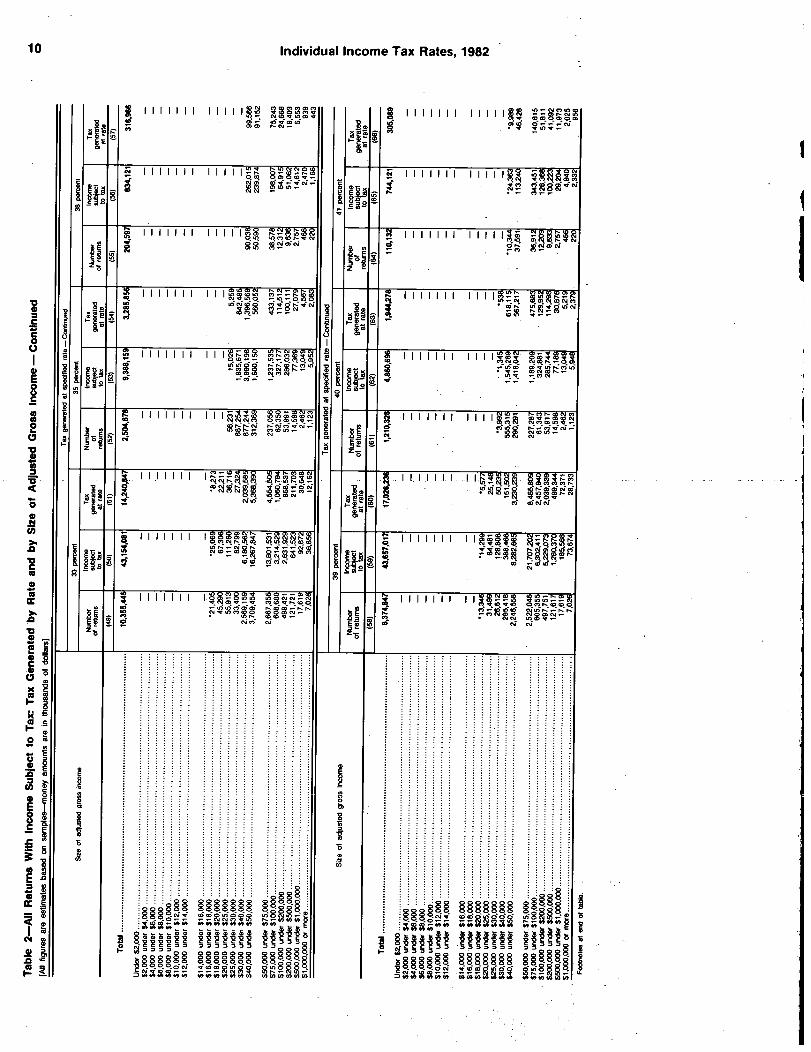
- The amount of tax generated for each- specifictax rate ranging from 12 to 50 percent, as wellas. the corresponding number of returns and theamount of income subject: to tax, are presentedin Table 2. These data are classifted by sizeof- adjusted gross income (AGI). For example,line 9, columns 1 , 7, 8 and 9, show that of the5,161,544 returns with an AGI between $14,000and $16,000 and income subject to tax for TaxYear 1982, 5,139,175 returns had a-portion- oftheir income taxed at -the 12 percent rate.These.-5,139,175 returns had $8.6 billion ofincome subject to tax. and generated $1.0billion of tax at the 12 percent rate.
D6finitibns
Individual income tax concepts are complex,a9d complete definitions of all tax conceptsare-beyond the scope of this article. Extensivedefinitions of the technical terms used in thisarticle and tables--for example, income subject6 tax, tax generated and income averaging' maybe found in the Statistics of Income--i982,.Indiv idual . Income Tax Returns. Ine followingI ist presents Brief dFf-i-n-ft-ions of the majortax concepts discussed in this article.
.Adjusted Gross Income. --Adjusted gross income(AGI) was computed by subtracting statutoryadjustments from total income recognized underthe tax code.
~Total Income Tax.--Total income tax was thesum. of incomF-tax after credits and the addi-
1
I
Individual Income Tax Rates, 1982
ti onal tax for tax preferences (minimum andalternative minimum taxes).
Average Tax Rate.--The average tax rate pre-sented in thTs-article was the ratio of totalincome tax to adjusted gross income.
Marginal Tax Rate.--The marginal tax rate wasthe highest tax-rate applied to a portion ofincome from a return.
Income Subject To Tax.--For taxpayers usingthe regular tax computat on method, income sub-ject to tax was identical to "taxable income"(adjusted gross income less the personal exemp-tion amount and excess itemized deductions).For taxpayers using the income averagingmethod, income subject to tax was speciallycomputed for the statistics by imputing incomefrom the tax reported.
Tax Generated.--Tax generated was the taxcomputed from the tax rate schedules on taxtables on the amount of income subject to tax.For most returns (those Without one of the"taxes from special computations"), tax gen-erated equalled income tax before credits.
DATA SOURCES AND LIMITATIONS
These statistics are based on a sample ofindividual income tax returns, Forms 1040,1040A, and 1040EZ, filed for Tax Year 1982.Returns in the sample were stratified based -onthe presence or absence of Schedule C, Profit(or Loss) from Business or Profession; statefor which filed; adjusted gross income ordeficit, or largest of selected sources ofincome or loss; and size of business plus farmreceipts. Returns were selected at ratesranging from 0.05 percent to 100 percent,resulting in 88,277 returns being selected froma population of 95,608,582.
As the data presented in this article areestimates based on a sample of documents filedwith the Internal Revenue Service, they aresubject to sampling, as well as nonsampling,error. To make proper use of the statisticaldata provided, one must know the magnitude ofthe potential sampling error.
The following table presentsapproximatecoefficients of variation (CV's) for frequency
estimates. The approximate CV's shown here areintended only as a general indication of thereliability of the data.
For a number other than those shown, thecorresponding CV's can be estimated by inter-polation.
ApproximateNumber of Returns Coefficient of Variation
12,478,000 0.021,996,500 0.05499,100 0.10124,800 0.2055,500 0.3020,000 0.50
The reliability of estimates based on samples,the use of coefficients of variation for evalu-ating the precision of sample estimates, andnonsampling error considerations are discussedin the Appendix.
NOTES AND RFFERENCES
[11 For further information on tax law changesfor 1982, see the Statistics of Income--1982 Individual Incomi-Ti-x R-efurn-s.
[21 A return was considered to be taxable if"total income tax" (the sum of income taxafter credits and additional tax for taxpreferences) was present.
[31 Adjusted gross income (AGI) reported ontaxable returns rose by 4.8 percent eventhough total statutory adjustments used toreduce AGI, as reported on taxable returns,increased by 111 percent from $29.1 billionfor Tax Year 1981 to $61.4 billion for 1982.The increase in total statutory adjustmentsto income reflected, in part, the introduc-tion of the deduction for a married couplewhen both work and the expansion of theeligibility requirements for IRA's.
[41 Individual income tax rate data for 1983will be released in a forthcoming Statisticsof Income Supplemental Report.
[51 In addition, certain income and deductionitems, "tax preferences," were givenspecial treatment in the computation oftax, and were subject to the alternativeminimum and minimum taxes instead of taxescomputed from the tax rate schedules. ForTax Year 1982, the minimum tax was a 15-percent tax imposed on certain "tax prefer-ences," while the alternative minimum taxwas imposed on "alternative minimum taxableincome" at three rates (0, 10, and 20percent).
[61 Tables 1 and 2 use the concept of incomesubject to tax, and include returns withthe regular or the income averaging taxcomputation. For returns with the regularmethod of tax computation, income subject

Individual Income Tax Rates, 1982
to tax was the amount taxpayers applied totax tables or the tax rate schedules' todetermine tax generated. Income averagingreturns are - shown in the same manner asrefurns with the regular tax computation,except that an imputed income subject totax is used in determining the marginal taxrate.
Tables 1 and 2 do not include any taxattributable to the minimum tax or thealternative minimum tax. These taxes werecomputed on a different base. For furtherinformation on the minimum and alternativeminimum taxes, see the Statistics of.Income--1982 Individual Income Tax Returns.

§R,%4N w io wo ct vW c". . . . . . . . tooo%NGNod o ~: §22maN NSG INmw w q o Cli "Id cf z.~.Sda ec;~:7 - ;&N &16 we~;N
a
I is. A..... ..... ..8pi -~!~ - -4 0 ~- -v - ~e
w osic"im 8~ m V;;~:§. . . . . . . . . . .no ~t ctwoMEN PS29 NST MH 4 V &18k S HEN't R . I RcinNaga - - - - - - - -
q' R F4 2
mo 461IR 3 1q . Cli No Nm- Z 12. a A CvI MEI-P IRS
;.;Ci,:d f,6a Cr I7.z d C!oN o- mmNNw- V-NN
C4,q R C1 C'! q m 1-t Ci 1i m IQ64 m 1: 6 6 6
q N qq 'R C! o q Q 'R c~ m rl~ qNq q NC2 V w C6NNm
t.e MH R §;mz IN 9 'S § S N, 1211. . . . . . . . . . . . . . . ..t -1 ciV m %1m UN F E REM E 19% Ir
;&Ugci I%m4 v d 6
N N m v CIF 6 c6 C6 ~6
cl IL N . . . N. . . . . . . .H HN:;§ F8-8'4 N§'41Mct oNN7- N so N~eNN N N
NS ;w; ~ Dv; E 2 NS 9- E 16~;c-;mgg gqdc;Cf d,6gge ggg
--wN-mt~G;: UWE !0'F.:~;c6cs; 6 ~ 4 ~: dC4 Ld.~ a~:d
. . . . . . C4 dg~:CMgg
6~:99K 9,i a a ~z KN N -!9 C2
t q ...NS N N
Cli N., N-, G, a `t . R I lq~ n
N pf ge,:,z - - - - - - - - - m ~?-Nvo 4~82o SIMI
. I . . . . . . . MIN .66gag!REM R 2 11 MR SR ~v: -Ir s PtI1. . .dd Ld d m w mNo N w N m - M
1111'6 iffli 111Z I ZE 11E
1 kI I II I
F4 oN IN FM 9 ;; Nm mm IM 29 A q :;3 1v 2
Individual Income Tax Rates, 1982
fp
lie
ZE
~i CIL
Cli . . .N
FSLl
4
a
a
Imul I I t~ 1 0 1 c%
le m a ,RM 1 8 1 1w 12at ~ia
qR a 21
I N C~S 16 ~d a 1: 9 9 9HNC1ct q ck R 16 d d N-f
m N t 14 qd 6 C6 Ui N
NN. I q G9 1 P,I . tN 6 ~6 16 ..m
I I I I I I I R I low I I Nimck IRN N.
Roaa d r NoN
K& F4 'NS
ct8 oN I a3 9 4 li~tgf
; PIZ. N 1 2o N'~t
m N": ct
cr w NIN N
o
Vo1 1 Vo I I I lo, I I a
Il cli
9
q
!2. N. IliN 2
F4 Iq
I'm
N
I w NOS?-q Ci
E
I 1 11111 111
$3 ow ~N 2a FS ;; Nm om Im 29
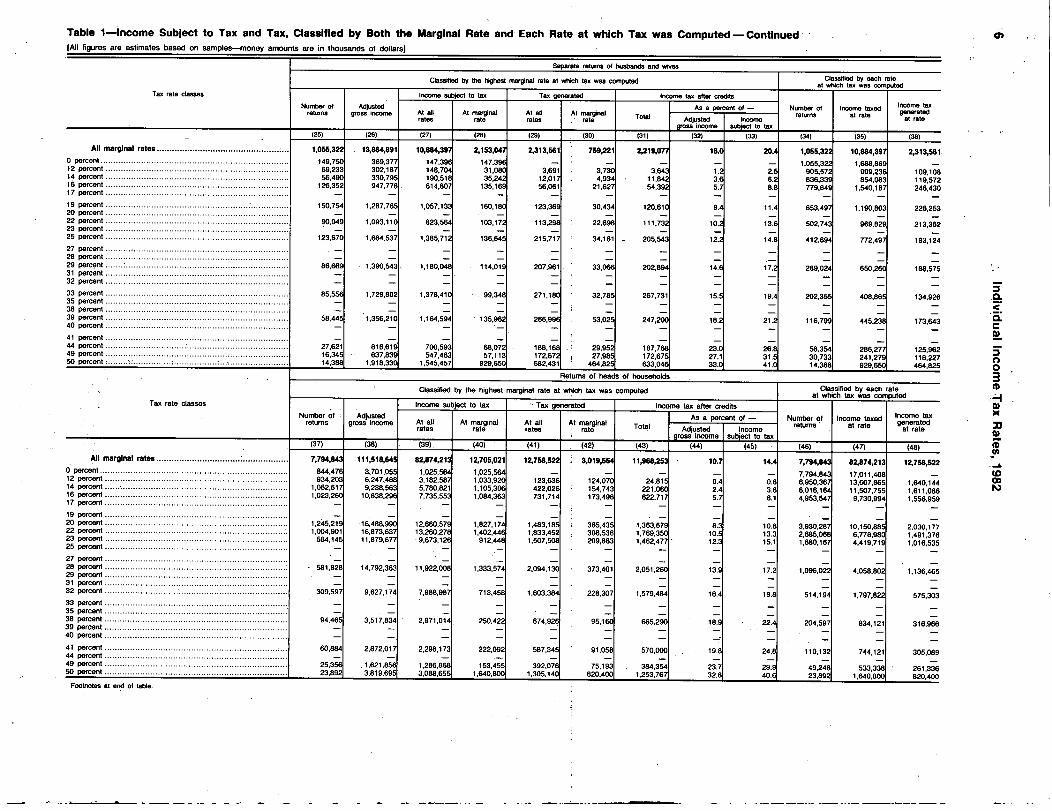
Table I-Income Subject to Tax and Tax, Classified by Both the Marginal Rate and Each Rate' at which Tax was Computed -Continued[All figures are estimates based on samples--money amounts are in thousands of dollars)
All marginal rates ....................................................
0 percent ..........................................................................
12 parc nt ........................................................................
1 4 percent ...... .................................................................16 percent ........................................................................c17 per eni ........................................................................
19 perc nt ........................................................................20 percent ........................................................................22 percent ....................................................... ...........nt23 pe a ........................................................................25 percent ........................................................................
27 pe ant ........................................................................28 percent ........................................................................29 percent ........................................................................31 percent ........................................................................32 percent ........................................................................
33 perc:nt ........................................................................35 perc
nt........................................................................
38 percent ........................................................................39 percent ........................................................................40 percent ........................................................................
41 percent ........................................................................44 percent ........................................................................49 perc nt ........................................................................50 percent ........................................................................
Tax rate classes
All marginal rates ................................................ z ...
0 percent ..........................................................................pis
12 percent ........................................................................
14 rcent ........................................................................I perc nt16 percent ........................................................................7 a ........................................................................
19 percent ........................................................ : ...............20 percent ........................................................................22 percent ........................................................................23 perc nt ........................................................................25 percent ............................................................ ...........
27 percent .......... I .............................................................2 perc n ........................................................................2: Pcsn't ....... : ................................................................31 percent ........................................................................32 percent ........................................................................
33 percent ........................................................................35 per an ........................................................................8 percent ........................................................................3
39
percent........................................................................
40 percent ........................................................................
41 percent ........................................................................44 percn ... ....t49 perc I
........... *'*** ................................. .................. *50 percent .......... ........... ..................... ~ .......................
Footnotes at " of table.
Tax rate classes
Number ofretums
(25)
1,055,322
149,75069.23356,490
126.352
150.754
-
(37)
?0,044
'7:12
86,ft
85,556q
58,44$
-27,62116,34514,388
Number ofreturns
-
7,794,84~
=:47
1,062,61711,023,260
245 ~_Ii11: 004
029,141584
581.1~2f
30
94.461
60,6
Adjustedgross income
(26)
13,111",8911
369,377302,187330,795947,778
1,287.765
1,093.17(
1,390,543
1,729,802-
1,356,210-
816,11E637
1.918
Adjustedgross income
(38)
111,518,645
:~7 5.11:4.' ' 06 47
9,238,56310,838.296
6'488116::73:1 671, 79,6_1
14,792,~63
-9,627,174
--
3,517.834-
At allratft
(27)
At allrates
Separate returns of husbands and wim
Classified by the highest marginal rate at which tax was computed
1~ subject to tax
110,88,11,397
147,396148,704190,518614,807
1,057.133
-
823,564-
1,385,712
1,180.
1,378,41
--11,164,59
-
-700,~9354 7463
1.545:457
Income subject to tax
(39) 1 (40)
82,874,211 12,705,021
1:1.2~1:51 '5:=3 1 1:0'33
85.7 21 1,105,306537.7 1,084,363
2 5113:2.:27, 9,673,121
11,922.
007,988,
IT--
2,971
.07--
2,298,13
286
1
ia&_:088:65
At marginalrate
(28)
2,153,04~1
471:33
461
160,18Q
-
103,1721-
136,64$
114,019
9!9,3
135,962
68.0721357
929:6
At marginala
1,827,1741.402446
912:448
-1,333,574-
-713,450-
--250.42~
-
222,092~
315 :~5641, 0
At allrates
(29)
2,313,561
At allrates
(41)
Tax generated
3,~9111
123.369
113,298-
215,717-
207,961
271,18~
gl_~
188172:67682,4311
Tax generated
IZ758,52A
-f4. 2f731,71
1:4 311 :4US3 1'3
1, 8507,50_~
2,094,130
-
-
-1,603,384
---674,92~
-
587,345~
9 -3 2:07~1. '4305
IAt marginal
rate
1
At marginalrate
(30)
(42)
759,221
379 3.643:.4,7. 11840
21
30.4341 120,610
22,6981 11 1,~30
34.1611 205,543
33,0"
32,785
53,02.5-
292798
464,82~
Classified by the highest marginal rate at which tax was computedI
3,019,664
7~"":0743I173,49
361:4313209.863
373,401-
228,307--
95,160---
-
91,058
75 3'20,
4t
Total
(31)
2,219,077
(43)
--
Total
ncome tax after credits
202.894
267,731
247,200-
187:172 7633,E
Returns of heads of households
11,968,25$
14 15'~J:
622,7$
Income tax after credits
1361 79:637
11,462.477
2,051,26C
-1,579,484
--665,290-
57:,:.
3
4~
8253,761,
As a percent of -Adjustedss; ircot
(32)
23:.([2733.~1
As a percent ofAdjusted
gross income(44)
10.7
12:15.
1'0~3S
12.3-
13.9-
-16.4
---18.9-
--23.19-
32.
Incomissubject to tax
(33)
055,32~
1
051122
-90':~7
3.- 6-. 83r77
9'
11.1 653.49
3. 502,74_
-
-_I
-'2. 412.694
14.: 11] 289,02~
15.1 19.4 202,3:5:1
-18.1 21.1 11 6.7!~
2613-141.
Incomesubject to tax
(45)
14*3.,
30-~113.'~5'11D.15.
1 7.2--
19.8
--22.4-
24,:840.
--
Number ofreturns
(34)
(46)
58,3~~730
14:388
Number ofreturns
7:7794:8
7695 36
0:1
60164,953.54
3.1.305:21:680.16
811
Classifiet! by each rateat which tax was computed
Classified by each ratet which tax was computed
1.096,021
-514.1 9,1~-
--204,597-
-
110,132~
49 2J2
Irioorrie taxedat rate
(35)
1,190,803
969,829--772.497
650,260
(47)
408,865
445,230-
-286,27712412791929:65;
8 IsrateIncome taxed ',-nm. cxat rate Iat rate
82,874213oij:.1,
8'j
.0
,136':.;:7' 5
9,730.994
986:77.:"" "84,419.8719
4.058,802
--1.797,822
--834,121-
-
744,121
-3,338~640,800
Income taxgenerated
at rate
(36)
2,313,561
(48)
109,108119,572246.430
226,253
-
213,362-
193,124
186.575
134,926
173,643-
-125.962118,227464.825
IZ758,522
1.640,1441,611,0861,556.959
2:030
:177
14913761,016.535
1,136,465--
575,303
--316,966-
-
305,089
261,336820,400

Table i-4ncome Subject to Tax and Tax, Classified by Both the Marginal Rate and Each Rate at which Tax was Computed - Continued(All figures are estimates based on samples--money amounts are in thousands of dollars)
Returns of single persons
Classified by the highest rnarginal rate at which tax was computed Classified by each rateat which tax was computed
Tax rate classes Income sub#W to tax Tax generated Inoom tax after creditsNumber of
rehimsAdjusted
ross incorne At all At mar inal At all At lAs a percent of - Nundw of 1~ taxed Inoom tax
t dgrates
grate rates
marginarate Total Ad-ted -I
retums at rate genera eat rate
gross income tax(49) (50) (51) (52) (53) (54) (55) (56) (57) (58) (59) (60)
All marginal rates .................................................... 36,M,087 428,669,127 362,11KIIII 56,195,166 611,649,"S 15,096,899 W,957,430 14.2 1&0 36,808,087 36ZI68,119 61,649,"g0 percent .......................................................................... 6,775,048 15.950,301 7,769,211 7769,21 -
-167 ( ) 36 808 087 76 845 20012 percent ........................................................................
14 percent3,175,7382 5
12,559.914 9.015,631 1:711,4 203,861 205,372 198.672 1.6 2.2, ,
30,033,039. ,
31,254.465 3,750,536........................................................................16 percent
, 50,"44 544 992
13,033.2953
9,906,926 1,235,489 508,321 172,968 496.829 3.8 5.0 26,857.301 25,542,346 3.575,928........................................................................17 percent
, ,3 709 59
0,458,554 24,569,457 4,571,564 1,965,473 731.450 1,924,893 6.3 7.8 24,306,857 46,071,480 7,371.437........................................................................ , , 4 32,772,733 27,695.120 3,583,330 2,862,724 609,166 2,826,557 8.6 10.2 19,761,865 35.687.872 6,066,93819 percent ........................................................................20 percent ........................................................................
3.436,777-
37,844.218-
32,922,663-
3,711,077-
3,961.374-
705,105-
3.928,524-
10.4-
11.9 16.052,271 32,726.714 6,218.07622 percent ........................................................................23 percent
2,609.057
2 275 42035,160.043 30,826.090 2.648.346 4,194.868 582,636 4,167,037 11.9
-13.5
-12,615,494
-23,661,864
-5,205.610........................................................................
25 percent ........................................................................, ,
-35,647,519
-31,621,337
-2.268,419
-4,723,239
-521,73C
-4,698,175
-13.2-
14.9-
10,006,437-
18,503,554-
4,255,818-
27 percent ........................................................................28 percent ........................................................................
2.417,982-
44.901,468-
39,900,449-
3,630,748-
6,612,941-
980.302-
6.567,977-
14.6 16.5 7,731,017 20.632,460 5,570.76429 percent ........................................................................ - - - - - - -
--
- - - -
31 percent ........................................................................32 percent ........................................................................
2,808.357-
66,057,175-
58.122,938-
7,010,841-
11,141.727-
2,173.361-
11,049,074-
16.7-
-19.0-
-5,313.035
-
-20,285,634
-
-6,288,547
-33 percent ........................................................................ - - -
- --
35 percent ........................................................................ 1,294,350 37,725.706 33,390,646 2,973,421 7,300,782 1,040,697 7 214 454 -19 1 21 2 504 678- -9 388 159 3 -285 8538 percent ........................................................................ - - - - - -, ,
-. .. , , , . . , 6
39 percent ........................................................................ - - - - - -- - - - -
40 percent ........................................................................ 503,840 18,067,474 15,626,902 1,116,31C 3.818,018 "6.524 3,801 94-
21.0
-24.3
1
-1,210.328
-4,860,696
-1,944.278
41 percent ........................................................................ - - - - - -44 percent ........................................................................49 percent ...........................................................
** ...........
336,956 14,384,872-
12,405.244-
915,045-
3.371,697-
402,620-
]3'~322.17
-23.1
-
26.. 706,488- -3,649,582 -1,605,81650 percent ..................... .................................................. 369.532 34,105,8541 28,385,485 13,049.933 10,984,423 6.524,967
10,760,95
-31.6 37.9- 369,532 -13,049.933 6,524,967-4 'Less than 0.05 percentNOTE: Detail may not add to total because of rounding.
-4
1 Individual Income Tax Rates, 1982
a '- (5 c ~, C c V!c! Pl0
NNR--mT o -2112~c
160,I I I I-0q~t t 1 l ~ ~ !
2 l 8
~R R 1
1 !R
t
1 e j; q
16
UM:L
m o - olm. w aN cr
RNN"-
p
w cli R,-,q k -R t2%
i S .4
'c! 'q E HHUM F
c; Mr g~:dgfga cogo-
L . . . . . . . . I .cr
N vi q Ct . . .MoNSNANvIS-2-ol
..'09.6 AE Now v -
z o Z-6
2e . . . oso. ;~i IN4 POR & N~:4969V G 'Mol wo
-9292. 9 N6 ZGgivew V§V8,!.ia
lq N N v~ ~6 ci
Z
k RkR cR N A R R cl cl Pl~ 11L Iq E IoN 2v os 90 i OR 4 ImR~
-.....
N '99.99.
199 Of 9 ma2 ,4.w w
6 cli Ld ;Q6.6 'Ni
H. ~2cIL R 1% It
"AAME IFINH8 H, 8 1 Iss zg"M a lUUMNoo Na
-r aciZ
.F ga§ o- mv,MR1~~! 88.
91 s,69d-m
7 i dee ; 6 e 6dz ; E e N N . . . . . ."mm-mv.m
Z-6- . ~ w L - c a zz~
Na -MISWU
c6
lWHIP
,
I oNov,gff,,:9i9 ~w
go.V;;G V~
m-.- ool PIN :1;lag..I
18
gMM AM q
d N -.
qqvN-o 2- ~
swoRo O. . . ck
A& HMT~ Z "q ct . . . . . I
I. . I L1 "Z RIMHc~
poolX F 48 0 w 'Z?2 A, NoUSH cwi ~i ~4 3 8"z .
R-, 00U.~~ 9N o w lW8:~ ~ --, -~ k I " gw~!Moo'ck Nv os~?PRISI ct 12,92Iq cl
MN4w.v
Hvoe~w INS~N-voN9 -:Nv.w
t .-ogns." I
. - LI N
.6NN ,
I'm 9v R clF~oMN2 A
- - - - - -- -
c!
- - L
a"IN,Iq
`
q13~klqkq v..465fs 0:9 N o o; ci;g
12UHNUUN- I - IN oN. HUHNNH MWa P~%jNiciL,6~9IP% c'! q
Lod gv~jcR r% r% ct cl 9 99 i 99
Ros~'.Vtg6f
2mv .- - - 8, t
2mv2slg. . . . . .E
MH- - -GIs
MAVUN~VaONME
-oN,NmR w
g m,-no H~id l7 c;,e ~6 6 -.i "i'i
*
....... .......M
§ ----- -UPNI:f ~R 2 o- ---~; 6s
- 15.~ E
,T22 J 1111 .2 113 228 T1 33 ..... M-
~ HUNdcj 16.69. dg
A
4
I

Table 2-All Returns With income Subject to Tax: Tax Generated by Rate and by Size of Adjusted Gross Income- Continued
[All figures are estimates based on samples-money amounts are in thousands of dollars]
22 percent
Numberof returns
(25)
3,0334:81,236956 1:13::3
9
Incomesubjectto tax
126)
:1757:72122
2.24412.9:273J
Taxgrmerated
at rate(27)
2,674:711607260493,708120,841
17,6737,103
Tarr genenirted at specified rate-Continued
23 percentNumber
ofturns(28)
Income,subjectto tax
(29)
Taxgerierated
at rate(30)
42,659,0561 1133,356,64~ - 29,338,40 11,686,60~ 22,923,271 5,272,35M 22,051,8711 82,963,851 20,740,96M 7,731,011 20,632,46~
- - - - - - - - - -- - - - - - - - - -- - - - - - - - - -- - - - - - - - - -
;6 430 *2 68 5911 - - -- - -
-
3 6:965 1.7:6480 41 L2- -
- '31.392 *21,740 -5,435 -
2.134,420 2,390,765 525, 85.725 7.442 1,712 68,878 98,353 24,588 -81
0 1 ";72,507.336 4.561,948 1.003,629 1,709,498 1,686,810 387,966 64,152 115,871 28,968 .16:372,044.938 4,238,338 932,434 1,613,953 2,973,632 683,935 42,925 90.218 22,555 1 , 6"
,:2'1 1'
2 4:.~q 3362, 1; 1:1.536:1 1 2:11: 17:123 6
1
~r703
30
~83710'
1:40241 70 2:441:419,74:3
1:16
1 ..2 107 32:5 7'6 3:9 5 294 57 332:67021 1 . 1 ~745:22331 J.2 9351
0 -1
0 ~5~. 0 3:17,273,7031 25,436.79 5596 437. 52 12 1 75.8541
374 11 4 3:2503~1:7:4 Is
1
4 1:7 9553 :303 4 3690.1 1; a 1 32952101 1:
69,700,28Eq 37,741,83 83032
12
:4 :~.1 : 7 094.96 3 .02 33 003::'3 741 4.633:77414,673,6041 18.803,09 4136,681 388,191 885,37 20363 4,253,29 18,535.0 321,695 1.026,94
2837564,0317,37
2,931,341
1722'":33214
3
3
.7'47:'39
"7N
25 percent
Numberof returns
(31)
2,7413'1616:11
500Z121,
1767:0
Incomesubjectto tax
(32)
111:" 3332 711'2:132,,195:6595333
Taxgeneratedat rate
(33)
2,9915:13,67548:418~2133
179:2 216:
Numberof returns
(34)
2461:13~2..
1 033,4:3
24641 123
27 percent
Incomesubjectto tax(35)
773:,17~12001763:715
473
Size of adjusted gross mcome
Total ......................................................................
Under $2,000 .....................................................................$2,000 under S4,000 ...........................................................S4,ODO under $6.000 ...........................................................$6,000 under $8,000 ...........................................................$8,000 under $10,000 .........................................................$10.000 under $12,000 ........................................................$12.000 under $14,000 ........................................................
$14,DOO under $16,000 ........................................................$16,000 under $18,000 ........................................................$18,000 under $20,000 ........................................................
........$20,000 under $25.000 ............................. I ..................$25000 under $30:000 ........................................................
0. un$3 000 der $40000 ........................................................$40000 under $50,000 ........................................................
$50,000 under $75,000 ........................................................$75,000 under $100,000 ......................................................$100 000 under $200,000 .....................................................200 000 under $500,DOO .....................................................$ :
$500,ODO under $1,ODO,000 ..................................................
1,000,000 or more ............................................................$
Size of adjusted gross income
Total ......................................................................
Under $2,000 .....* ................... *'*** ..................................$2 ODO under $4, ...........................................................
$4:ODO under $6000..... ......................................................S6,000 under $8:000 ..........................................................$6 000 under $10,000 .........................................................
$ 16,000 und
r$12000 ........................................................
$12.001 under$,
4:000 ........................................................
$14000 under $16000 ........................................................$16:000 under $
18:000 ........................................................
$18,000 under $20,000 ........................................................
.................................$20000 underr $25,000 .......................$25:00.uncle S30,000 ........................................................
$30 ODO under $40,000 ........................................................S40 ODO under $50,000 ..................................................... -
$50000 under $75,000 ...................................................... .der $100,000 ......................................................$75:000 n
$100000 under $200.000 .....................................................$200 000 und r $500,000 .....................................................
00 000 under $1,000.000 ..................................................................................................$1,000,000 or more ...
Foomotes at end of table.
Twgen adwat
at rate(36)
5,570,764
'2,155289.2391'.9 0:4 21. S
1,172.746862.450277,276
201:72548. 4
1 146'
172:6 72,129
970
28 percent
Num- aof retum
(37)
1,096,022
:114'1
43 1
":I117 1127
65,068
41,6357 7422012,
601
2
757
9
Incomea b1Vu0
(38)
4,068,80Z
1
1
54.:
10437'1:42336,380
216 13J5:874,65 41
1 1661
Taxenerated9 at rate
(39)
11,1136,46~
1 .3. ITE53,593
402,94383,99_~a94,18$
6170",:4.:l
1441
0409
69
29 percent
Numberof
returns
(40)
16,196,785
'20,2~j
37~3673
1678
671
163,2r4:2
11, 195 316,648,834,163,4991
2.7230:12~14~6149964512
1
1 2~
Inoomea biru
(41)
69,018,41$
--8,446
'7:80174
9,
459916
1:731 '0~.il!])
24,931,2-21,208,M~7
134:2126: 4,23
a2,63789.2:2
81~57
Tax generated at specified rate - Continued
Taxan9 terateda rate
(42)
20,OJS,34Q
--2.440
132
1:73'
4233746:903
437,8997,230,0676,150,563
4.13473:141,679764
9186:226 31510 88
31 percent
Nu barmof returns
(43)
5,313,036
-
2212 070:395651:334,
992.317.
24612611:6.7
1301,4:.3
2,46411,123
IncometbCVsu
(44)
20,285,634
-76996757415.3
6,192,2304,988,0101,673,286
1,263 6,31:1a3217:31.517
73130565952
Taxonerated9 at
rate
(45)
6,288,547
-23:8691666480919,5911
1:546,283518,719
3112 7::10
8239:09'.
4,0461,8451
Numberof returns
(46)
514,19#
151,503233,940
59.768
402 212 196 7
75702:4220
32 percentInqqmesubto(47)
1,797,822
-4,535,283,077886,743278,931
209 191F,:6
2.
51071,114:6
24701110
Taxan rated9aterate
(48)
-
-
575,303
-1.451
90,585283,75889,258
67:.1:702
344r1 ':64 7
790373
10
jig2
E
Ha
L
2z
G
FjUme
X
cl
m-
N q "t AiN-~! q q q *q 'tI~:!. -
U, _Z'
N-'!.
16 Ili c6 'N_Nm
g 2, 0, 0. -Vci mv
gg g ; ign :.H§-Ff de g c g g
a V~ . . . .
§ dcq "i'deg g cr q g,688§I NDo ;; o
Individual Income Tax Rates, 1982
jigzo
Elsa
V
Ee=Z-6
gig
EeZ-5
o
9
E7
Cr
OL'Kg4d.;c'f
IMr-we, 1;
cr S!q K g'i crF3-
iq .
kciggggiS k1ci .....
a N.021111111
4W I
lo .7.= . . .WH'WUH
12V :!!R'c2§oH I;; IDUASS"" """ 22 H;8a i

Table 2-All Rotuma With Income Subject to Tax: Tax Generated by Rate and by Size of Adjusted Gross Income-Continued[All figures am estimates, based on samples-irriciney arnotints are in thousands of dollars]
Tax generated at specified rate-Con5mied
Size of adjusted ross moome,44 paMent 49 poMM so Percentg
NumberOf returns
Iric;omesublect
TUgenerated Number
Of rehims
Iricomesublect
TUgerierated Number
Of returns
rx*rrie
=
Taxgenerated
to tax at rate to tax at rate ..(67) (68) (69) (70) (71) (72) (73) (74) (75)
Total .............................................................................................................. 3,%4,S42 29,01Z757 IZ765,613 1,304,904 21,36Z750 10,467,748 940,745 63,169,077 31,584,536
Under $2,000 ............................................................................................................. - -S2,000 under $4,ODD ................................................................................................... - - -$4,000 under $6,000 ................................................................................................... - - -$6,000 under $8.000 ................................................................................................... - - -$8.000 under $10,000 .................................................................................................. - - -$10,DDD under $12,000 ................................................................................................ - - -$12,000 under $14,000 ................................................................................................ - - -
$14.000 under $16.000 ................................................................................................ - - -$16.000 under $18,000 ................................................................................................ - - -$18,000 under SM,000 ................................................................................................ - - -S20.000 under $25,000 ................................................................................................ - - -$25.DDO under $30,000 ................................................................................................ 18.297 15,903 6.997 - - -$30,000 under $40,000 ................................................................................................ 149.564 331,779 145,983 '14,403 '36,793 '18 029 - - -$40.000 under $50,000 ................................................................................................ 259,273 1,002,048 440,901 '962 -9,787
,47,566 104.858 52,429
$50,000 under $75,000 ................................................................................................ 1,583,832 10,151,241 4,466,546 105,851 776,660 380,563 198,722 1 894 603 947 302$76.000 under $100.000 ............................................................................................... 644,038 8.074,908 3,552,959 470,727 5,488,192 2,689,214 96,692
, ,1 980 021
,990 011$100.000 under $200,000 ............................................................................................. 545,561 7247723
' '31188.998 484,381 11,317,969 5.545,805 432.
, ,14 111124
,7 347 912
$200,000 under $500,000 ............................................................................................. 135,781 1 815 8331 798.
9
123 32~ 3,098,707 1,518,366 136.3:20 7":0
Ol
, ,10 375 507
$500.000 under $1,000.000 ........................................................................................... 20,oi~ 266.3451 117 1919
1801 453,347 222,140 1I
9 430 64. ,
4 715 320$1,DDO,ODO or more ..........................................................
I
............... 8,14q 106.970 n,4 :~
- 181,2961 88,8351 35. , , ,
7,156,058Tstimutte should be used with caution because of the small number of sample ratums ort hich it is based.NOTE: DOW my rot add to total because of roundirig.
Taxpayers Classified by SexBy Patricia A. Crabbe and Elizabeth L. Gross*
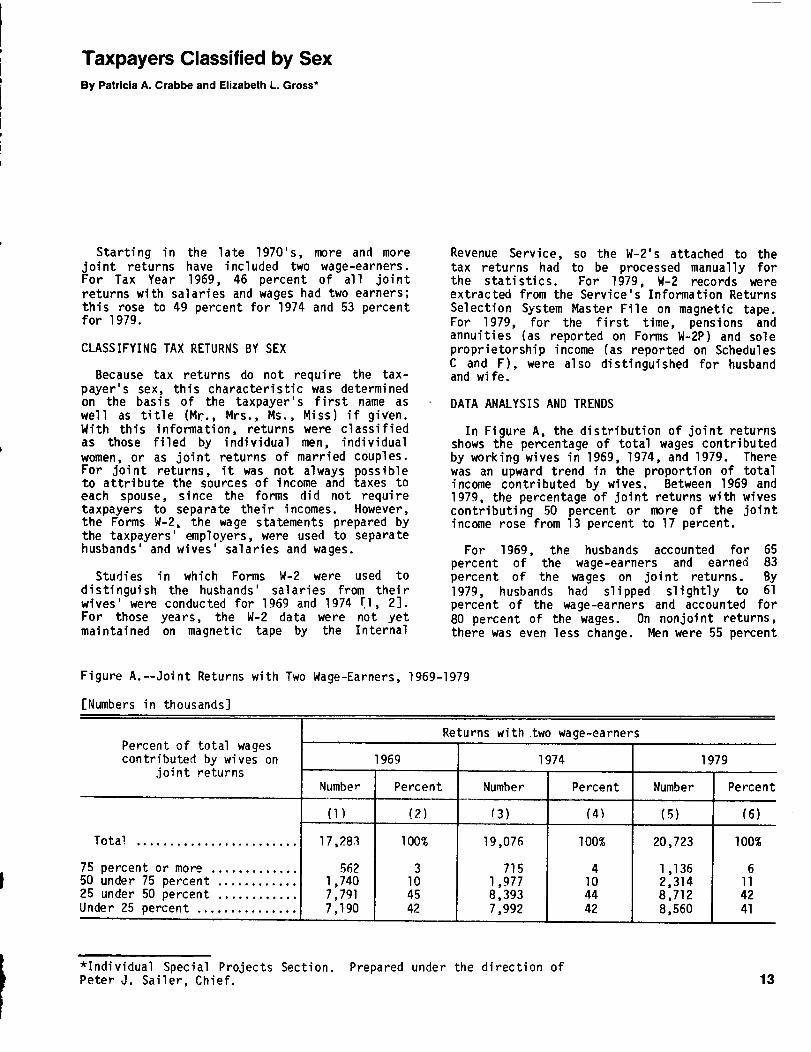
Starting in the late 1970's, more and morejoint returns have included two wage-earners.For Tax Year 1969, 46 percent of all jointreturns with salaries and wages had two earners;this rose to 49 percent for 1974 and 53 percentfor 1979.
CLASSIFYING TAX RETURNS BY SEX
Because tax returns do not require the tax-payer's sex, this characteristic was determinedon the basis of the taxpayer's first name aswell as title (Mr., Mrs., Ms., Miss) if given.With this information, returns were classifiedas those filed by individual men, individualwomen, or as joint returns of married couples.For joint returns, it was not always possibleto attribute the sources of income and taxes toeach spouse, since the forms did not requiretaxpayers to separate their incomes. However,the Forms W-2, the wage statements prepared bythe taxpayers' employers, were used to separatehusbands' and wives' salaries and wages.
Studies in which Forms W-2 were used todistinguish the husbands' salaries from theirwives' were conducted for 1969 and 1974 ~1, 21.For those years, the W-2 data were not yetmaintained on magnetic tape by the Internal
Revenue Service, so the W-2's attached to thetax returns had to be processed manually forthe statistics. For 1979, W-2 records wereextracted from the Service's Information ReturnsSelection System Master File on magnetic tape.For 1979, for the first time, pensions andannuities (as reported on Forms W-2P) and soleproprietorship income (as reported on SchedulesC and F), were also distinguished for husbandand wife.
DATA ANALYSIS AND TRENDS
In Figure A, the distribution of joint returnsshows the percentage of total wages contributedby working wives in 1969, 1974, and 1979. Therewas an upward trend in the proportion of totalincome contributed by wives. Between 1969 and1979, the percentage of joint returns with wivescontributing 50 percent or more of the jointincome rose from 13 percent to 17 percent.
For 1969, the husbands accounted for 65percent of the wage-earners and earned 83percent of the wages on joint returns. By1979, husbands had slipped slightly to 61percent of the wage-earners and accounted for80 percent of the wages. On nonjoint returns,there was even less change. Men were 55 percent
Figure A.--Joint Returns with Two Wage-Earners, 1969-1979
[Numbers in thousands]
Percent of total wagescontributed by wives on
joint returns
Total ........................
75 percent or more .............50 under 75 percent ............25 under 50 percent ............Under 25 percent ...............
Number
0 )
17,283
5621,7407,7917,190
1969
Percent
(2)
100%
3104542
Returns with.two wage-earners
1974
Number
(3)
19,076
7151,9778,3937,992
Percent
(4)
100%
4104442
Number
(5)
20,723
1 1362,3148,7128,560
1979
Percent
(6)
100%
6114241
*Individual Special Projects Section. Prepared under the direction ofPeter J. Sailer, Chief. 13
I
14 Taxpayers Classified by Sex
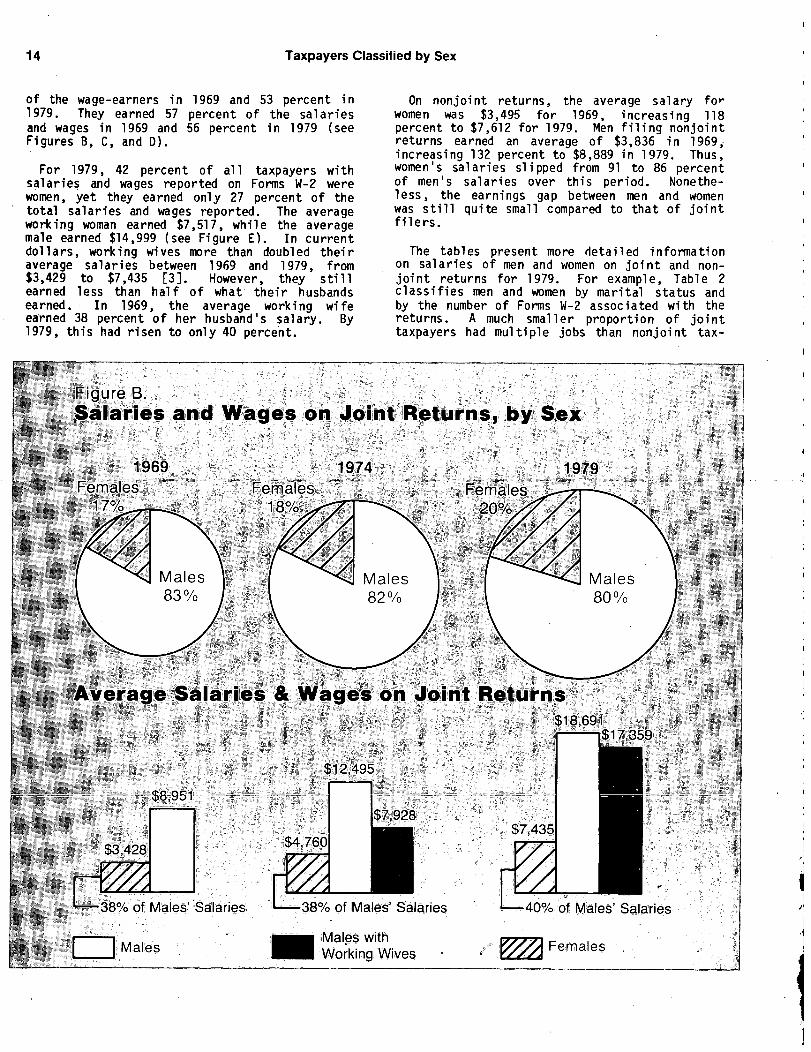
of the wage-earners in 1969 and 53 percent in1979. They earned 57 percent of the salariesand wages in 1969 and 56 percent in 1979 (seeFigures B, C, and D).
For 1979, 42 percent of all taxpayers withsalaries and wages reported on Foms W-2 werewomen, yet they earned only 27 percent of thetotal salaries and wages reported. The averageworking woman earned $7,517, while the averagemale earned $14,999 (see Figure E). In currentdollars, working wives more than doubled theiraverage salaries between 1969 and 1979, from$3,429 to $7,435 [3]. However, they stillearned less than half of what their husbandsearned. In 1969, the average working wifeearned 38 percent of her husband's salary. By1979, this had risen to only 40 percent.
Figure B.
I
On nonjoint returns, the average salary forwomen was $3,495 for 1969, increasing 118percent to $7,612 for 1979. Men filing nonjointreturns earned an average of $3,836 in 1969iinicreasing 132 percent to $8,889 in 1979. Thus,women's salaries slipped from 91 to 86 percentof men's salaries over this period. Nonethe-less, the earnings gap between men and womenwas still quite small compared to that of jointfilers.
The tables present more detailed informationon salaries of men and women on joint and non-joint returns for 1979. For example, Table 2classifies men and women by marital status andby the number of Forms W-2 associated with thereturns. A much smaller proportion of jointtaxpayers had multiple jobs than nonjoint tax-
Salaries and Wages on Joint Returns, by Sex
I
$12,495
$7,435
i
$7,928
$4,760
38% of Males' Salaries
Males withWorking. Wives
Females
Males82%
Males80%
aries & Wages on Joint Returns$18,691F----l$ 7,359
40% of Males' Salaries

Taxpayers Classified by Sex
1974
Figure C.
Salaries and Wages on Nonjoint Returns, by Sex
1969
$8.888
I
Average Salaries & Wages on Nonjoint Returns
$3,495 $3,836
91 % of Males' Salaries
Males
$4,827
n5.633
15
1979
86% of Males' Salaries
Females
payers. On joint returns, 75 percent of hus-bands filed only one W-2 while 78 percent ofthe wives filed one W-2. Among nonjoint filers,59 percent of the men filed only one W-2, while64 percent of the women filed one W-2. Whilethe presence of multiple Forms W-2 simply meansthat the taxpayer worked at more than one jobduring the course of the year, it is notpossible to determine from the return whetherthis means that the taxpayer changed jobs orworked on multiple jobs concurrently.
In addition to salaries, the "earned incomes"of men and women, as shown on tax returns,differ. Earned income was compiled by summingthe Form W-2 salary and wage data with nonfarmsole proprietorship and farm sole proprietorshipincome or loss reported on Schedules C and F,respectively; on joint returns, this was doneseparately for each spouse ~41. In the case ofjoint returns, if only one name was shown atthe top of the Schedule C or F, all income or
1 86% of Males' Salaries
loss from the schedule was attributed to thattaxpayer. If both names were shown, the incomeor loss was divided equally between the two.
Earned income figures show the same patternsas salary and wage data. Among joint returnfilers, women accounted for only 19 percent ofearned income (as opposed to 20 percent ofsalaries). Among filers of nonjoint returns,women earned 43 percent of the total earnedincome and 43 percent of total salaries.
For the purposes of these tabulations,adjusted gross income and total income tax werealso divided between male and female taxpayers.Since these amounts were not shown separatelyfor the husband and the wife on a joint return,there was no way of estimating separate marginaltax rates. For purposes of estimating the taxof each spouse separately, the ratio of theearned incomes of each was used to allocate theadjusted gross income and total income tax.

16
Figure D.--All Returns of Taxpayers by Sex: Selected Income Items and Total-Income Tax, 1979
Adjusted gross income
(1)
All returns, total ................Filed by'men ....................Filed by women ..................
Joint returns, total ...............Filed by men ....................Filed by women ...................
Nonjoint returns, total ...........Filed by men .....................Filed by women ................
Taxpayers Classified by Sex
Number oftaxpayers
118,546,20267,745,48050,800,722
70,707,04143,184,71427,522,327
47,839,16124,560,76623,278,395
Amount(thousands)
(2)
$1 465,394,5301 077 117,361
388,277,169
1 048,174,7831850,401,610197,773,173
417,219,748226,715,751190,503,996
Salaries and wagesfrom Form W-2
All returns, total ................Filed by men ....................Filed by women ..................
.Number ofreturns
__ --(-5)-- --
81,695,10659,100,52143,317,220
Amount(thousands)
- (6)--
$1,212,059,280886,442,684325,616,596
Joint returns, total ...............Filed by men ....................Filed by women ..................
Nonjoint returns, total ...........Filed by men ......................Filed by women ..................
39,378,35136,837,81523,263,171
42,316,75522,26?,70620,054,049
861,502,353688,541,476172,960,876
350,556,928197,901,207152,655,720
Earne
Number ofreturns
(3)
85,261,05063,131,07244,846',275
41,810,76940,108,47824,418,588
43,450,28123,022,59420,427,687
Total i
Number oftaxpayers
- - -+fl-
92,231,81355,132,77937,099,034
59,540,74737,632,59421,908,153
32,691,06617,500,185
\~l 5,190,881
d i ncome
Amountfthousands)
(4)
$1,270,868,756939,861,92 9331,006,82-7
912,133,598735,909,732176,223,866
358,735,158203,952,197154,782,961
ncome tax
Amount(thousands)
$214,494,519164,036,16550,458,354
161 081 1951132,793,78828,287,407
53,413,32431,242,37722,170,947
'On joint returns, AGI and total tax were divided between the two taxpayers based on the ratio oftheir earned income.
Information provided on joint returns for1979 shows that women had just 19 percent ofthe combined adjusted gross income (AGI), whileon nonjoint returns, women reported 46 percentof total AGI. Overall, women comprised 43percent of the taxpayers with AGI, but accountedfor only 27 percent of the total adjusted grossincome E51.
As might he expected from the income datacited above, the total income tax for men washigher than that for women for TY 1979. Mencontributed 76 percent of total taxes. Onjoint returns, men accounted for 82 percent ofthe taxes. Even on -nonjoint- returns, mencontributed .58 percent of the total. Sincewomen, on the average, earned less than men,their incomes generally were taxed at lowerrates; thus, the average rate (total tax as apercentage of adjusted gross income) was 15,percent for men and 13 percent for women.
Tax returns reveal relatively little aboutthe cause of discrepancies between men's andwomen's incomes and their taxes, especiallysince not all income or expense items areseparable on joint returns. One factor, thatwill be the subject of future Statistics ofIncome Bulletin articles, is occuFa'tion. womentend to entrated in occupations such asnursing, teaching, and secretarial or clericalwork, where the average annual wage is rela-tively low [6]. It should be noted, however,that the discrepancies between men's and women'sincome on nonjoint returns were relatively small
'when compared with those on joint returns.Unmarried women earn more than married womenon the average, whereas married men earn muchmore than unmarried men. One possible explan~ation for this discrepancy is that many marriedwomen in the labor force are working only part-time. According to the Bureau of Labor Statis-
-tics, 25 percent of married working women volun-
I

Taxpayers Classified by Sex
Figure E.--Returns with Salaries and Wages Reported on FormsW-2: Total and Average Salaries andWages by Marital Status and Sex of Taxpayers, 1969-1979
1979
17
Marital status Number ofSalaries and wages
reported on Form W-2 Averageand sex returns (thousands) sa 1 a ry
(2) (3)
All returns, total ........................... 81,695,106 $1,212,059,280 $14,836Men ........................................ 59,100,521 886,442,684 14,999Women ...................................... 43,317,220 325,616,596 7,517
Joint returns, total ......................... 39,378,351 861,502,353 21,878Husbands ................................... 36,837,815 688,541,476 18,691Wives ...................................... 23,263,171 172,960,876 7,435
Nonjoint returns, total ...................... 42,316,755 350,556,928 8,284Men ........................................ 22,262,706 197,901,207 8,889Women ...................................... 20$054,049 152,655,720 1 7,612
1974
Salaries and wagesMarital status Number of reported on Form W-2 Average
and sex returns (thousands) salary
(4) (5) (6)
All returns, total ........................... 73,775,~78 $742,005,222 $10,058Men ........................................ 55,016,332 560,787,885 10,193Women ...................................... 37,835,394 181,217,337 4,790
Joint returns, total ......................... 38,978,471 559,136,495 14,345Husbands ................................... 36,557,491 4.96,793,677 12,4()5Wives ...................................... 21,497,128 102,342,818 4,761
Nonjoint returns, total ...................... 34,797,107 182,868,728 5,255Men ........................................ 18,458,841 103,994,208 5,634Women .............. . ....... . .............. 16,338,266 78,874,519 4,828
1969
Salaries and wagesMarital status Number of reported on Form W-2 Average
and sex returns (thousands) salary
(7) (8) (9)
All returns, total ........................... 66,700,995 $492,389,227 $7,382Men ........................................ 51,707,592 380,762,675 7,364Women ...................................... 32,301,390 111,626,905 3,456
Joint returns, total ......................... 37,544,308 385,004,721 10,255Husbands ................................... 35,659,287 319,197,087 8,951Wives ...................................... 19,193,008 652807,986 3,429
Nonjoint returns, total ...................... 29,156,687 107,384,506 3,683Men ........................................ 16,048,305 61,565,587 3,836Women ......................................
113,108,382
145,818,919
13,495

18 Taxpayers Classified by Sex
tarily worked part-time in 1979, as comparedwith 4 percent of married men [7). Presumably,the married women chose to work part-time sothey could devote time to family. responsibili-ties.
PENSIONS AND ANNUITIES
Figure F indicates that 72 percent of thetotal pensions and annuities reported on FormsW-2P for 1979 were reported by- men, and 28percent were reported by women. On
*joint
returns, the husbands* received 83 percent ofthe pensions whi
.le the wives received only 17
percent (see Table 1). However, on nonjointreturns with Forms W-2P, the women received 61percent of the pensions and annuities while
.the
men received only 39 percent. This is notsurprising since women generally live longerthan men and receive survivors' benefits.
The amounts of pensions and annuitiesreported. on Form W-2P were greater. than thoseshown on the corresponding -tax
Ireturns (see
Figure F). The difference is partly attribu-
Total
---Figure.-F.--Returns-with-Pensions-and-Annuities-Reported*on-Form 1040-and - on -Form -W-2P-:-- Pens ions-and-Annui t ies-and Income Tax--------Withheld, by Sex of Taxpayer and Size of Adjusted Gross Income
[All figures are estimates based on sampies--data are in thousands]
Total pensions and annuities'
Size of'adjusted gross income
Total ....................Under $5,000 ...............$5,000 under $10,000 .......$10,000 under $15,000 ......$15,000 under $20
'000 ......
$20,000 or more ............
Reported on Form 10402
Number ofreturns Amount
W
7,157,348. 892,2682,082,7671,310 587908:530
1,963,196
(2)
$40,976,1702,425,8968,600,1027,540,8016,155,923
16,253,448.
Number ofreturns Amount
"3
7,559,0731,063,5392,181,7511,384,510
935,8911,993,382
Reported on Form W-2P
Number ofreturns
"5
5,196,452645,041
1,418,906955,080674,106
1,503,319
Male
Amount
W
$31,248,8892,190,179-5,994,0835,444,2464,586,63913,033,742
Fe ale
Number ofreturns
M
3,006,813453,907938,969564,108370,025679,804
Amount
(8)
$12,366,424996,902-
3,083,8662,654,7101,822,1W3,808,794
Income tax withheld from Forin W-2P
Size of,adjusted gross inc-ome
Total
Number ofreturns
19A
Total ..................... * .........................Under $5,000 ........................................$5,000 under $10,000 ................................$10,000 under $15,000 ..............................$15.000 under $20,000 ...............................$20,000 or more ....................................
2,008,19983,894
433,919394,402310,058785,926
tabl e to the fact that certain disabilityretirement incomes for taxpayers under the. ageof 65 were appropriately reported as salariesand wages on Form 1040, not as income frompensions and annuities. In addition, sometaxpayers may have misrepdrted pensions ..andannuities as salaries and wages rsi.
SUMMARY
Income tax return data of men and women forTax Years 1969,- 1974. and 1979 show a slighttrend towards equalization. There was a gradualincrease in the number of working wives on jointreturns. On nonjoint returns, 47 percen
't
*of the
wage-earners were female in 1979, up only 2 per-cent from 1969. The average salary of-women asa group edged slightly closer to that
*of men..
There is movement, however slight, toward equal-ity of pay between the sexes. Even for 1.979,however, 48 percent of all wives who wereincluded on joint return
.s reported no salary
and wage income and 25 percent earned less than$6,032, which is the salary one would. receivefor a full-time job at the minimum wage.
L4)
$43,615,3113,187,0819,077,9498,098,9566,408,790
16,842,535
Amount
(10)
$1,972,79423o593
181,526275,920314,589
1,177,166
Male
Number ofreturns
(11)
1,600,20854,681
290,655301,073254,724699,075
Amount
L12)
$1,631,36517,693
128,636193,455240,969
1,050,612
Fema
Number ofreturns
(13)
491,19829,405
150,263104,96175,300
131,269
Amount
( 14
$341,4285,900
52,89082,46473,620~
126,554
)
'This amount.includes nontaxable pensions and annuities of 1,875,508.2The difference is largely attributable to the fact that certain disability retirement incomes for taxpayers under the age of65 are to be shown as-salaries and wages on Form 1040, not.pensions and annuities income., In addition, it-is known that some..taxpayers misreport pensions and annuities income as salaries and wages.'NOTE: Detail may not add to total because of rounding.

Taxpayers Classified by Sex 19
DEFINITIONS
Definitions for most of the items shown inthe following tabulations can be found in theannual Statistics of Income--Individual IncomeTax Returns reports-. Those that cannot bi-T-o-u-n-ffthere are defined in the following paragraphs.
FICA Tax Withheld.--This is the amount paidor withheld in accordance with the FederalInsurance Contributions Act (FICA) for aFederal system of old age, survivors, disa-bility, and hospital insurance benefits. Thissystem is financed through social securitytaxes. These taxes are levied on both employersand employees; however, the amount shown inthese tabulations is strictly the amount paidby employees. Employers withhold these taxesfrom wages in much the same way as they withholdincome tax, except that no "withholding allow-ances" are permitted for social security taxes.The amount is computed on total wages paid; thetax rate for 1979 was 6.13 percent, limited tothe first $22,900 of wages paid each employeeduring the calendar year.
Form W-2, Wage and Tax Statement, 1979.--Thistorm was completed Sy- em pI oyer-s--To-r eachemployee from whom income tax or social securitytax was withheld, or income tax would have beenwithheld if the employee had not claimed morethan one withholding exemption. The form pro-vided the employer identification number andthe employee s social security number. TheForm W-2 also showed total wages and other com-pensation paid, whether they were subject towithholding; the amounts deducted for incometax and social security tax, including hospitalinsurance; and the total amount of advance"earned income credit" payments.
Form W-2P, Statement for Recipients of Peri-od-ic-Wn-n-FiYies, Pensions-'Retirement Pay -6-r-711WPayments. --TKi-s form is used to report periodicretirement plan distributions such as pensions;retirement or retainer pay; annuities under com-mercial, individually-purchased contracts; andpayments from individual retirement arrangement;(IRA's).
Number of Taxpayers. --Three counts of indi-,vidua s occur in this report: those based onnumber of returns, those based on number oftaxpayers (husband and wife), and those basedon the number of personal exemptions claimed.On a joint return, data may be shown for twotaxpayers. To the extent that both the husbandand the wife each reported a given item (e.g.,salaries and wages), the return would be countedtwice in the corresponding "number of taxpayers"column, and only once in a "number of returns"column.
Schedule C and F Net Income Subject to the-Em loyment Tax.--This amount was compute'dSel f Lm~ 0
y 1Nb -1 1-ii-g-WoFe- proprietorship i ncome (as
defined in this section) to $22,900 minus anysalaries and wages subject to the FICA tax foreach taxpayer.
Sole Proprietorship Income.--Shown are theneTfe7 amounts of protits less loss as reportedon Schedule C (nonfarm sole proprietorships)and Schedule F (fann sole proprietorships), forthe taxpayer whose name appeared as proprietor.On a joint return, if both names were listed onthe Schedule C or F, the income or loss amountfrom that schedule was divided equally betweenthe two spouses.
DATA SOURCES AND LIMITATIONS
These statistics are based on a sample ofindividual income tax returns, Forms 1040 and1040A, filed for Tax Year 1979. Returns in thesample were stratified based on the presence orabsence of Schedule C, Profit (or Loss) fromBusiness or Profession; state in which filed;adjusted gross income (or deficit), or larg~stof selected sources of income or loss; and sizeof business plus farm receipts. For 1979,returns were selected from the sample stratausing the last four digits of the socialsecurity number at rates ranging from 0.05percent to 100 percent, determined by thestratum into which the return fell. There were203,605 returns in the Tax Year 1979 sample,designated from a total population of92,774,844.
Because the data presented in this articleare estimates based on a sample of documentsfiled with the Internal Revenue Service, theyare subject to sampling, as well as nonsampling,error. For proper use of the statistical dataprovided, the magnitude of the potential sam-pling error must be known. Figure G presentsapproximate coefficients of variation (CV's)for frequency estimates only. The approximateCV's shown here are intended only as a generalindication of the data reliability. For anumber other than one shown in the table, thecorresponding CV can be estimated by inter-polation. The reliability of estimates basedon samples and the use of coefficients ofvariation in evaluating the precision of sampleestimates are discussed in the Appendix.
A number of factors contributed to nonsamplingerror. First, determining the sex of taxpayersmay have posed problems for the coders. The sexclassification was based on information providedon the returns that may have been incomplete orinaccurate. A second source of nonsamplingerror involves the matching of social securitynumbers with Form W-2 information. Incorrectnumbers may have led to false matches or falsenonmatches. A third possible source of erroris that, at the time of the match, not all W-2information for 1979 had been put on magnetictape.

20 Taxpayers Classified by Sex
Figure G.--Estimated Number of Returns for Selected Upper Limit Coefficients of Variation by Size of AdjustedGross Income or Deficit
Size of adjusted gross income or deficit
Coefficient ofvariation (C.V.)
(percent)
I
Under.$10,0001
(1)8,160,000
1,365,600
326,400
81,600
36j600
26,600
13,100
$10,000under
$15,000
(2)
5,117,900
818,900
204,700
51,200
22,700
16,700
89200
$15,000under
$20,000
(3).
4,701,500
752,200
188,100
47,000
20,900
15,400
7,500
$20,000under
$30,000
(4)
3,556,900
569,100
142,300
35.600
15,800
11,600
5,700
$30,000under
$50,000
(5)
3,309,000
529,400
132,400
33,100
14,700
10,800
5,300
$50,000under
$100,000
(6)
1,914,000
306,2DO
76,6DO
19,100
8,500
6,3DO
3,100
$100,000under
$200,000
(7)
509,500
81,500
.20,400
5,100
2,300
1,700
800
$200,000under
$500,000
(8)
111,200
17,800
4,400
1,100
500
400
200
$500,000and over
(9)
4J CL
4J W
CD 04J C CAWr=
0 4J4AW
This column should'be used for estimated number of returns not classified by adjusted gross income or deficit.NOTE: This table is applicable to frequencies only and not to estimated amounts.
In cases of missing information, if the sta--tistical--edi-tor noted -there-- was--a_W-m-2 form--present with the Form 1040,, but none was foundin the match, the missing 'data were imputed.Since the total salary amount for the Form 1040data was imputed.. it Js possible that theimputed amounts wOr'e too high;' certain types ofsalaries (e.g., directors' fees) are not gen-erally included on.the Forms W-2.
NOTES AND REFERENCES
[11 U.S. Department of the Treasury, InternalRevenue Service,'Statistics of Income--1969,-Individual-Income Tax Returns.
[2.1 U. S. Department of the Treasury, InternalRevenue Service', Statistics_.of Income--1974,Individual Income-7-ax-Te-f-urns.
[31 Much of the increase in the average salarywas attributable to inflation. The ConsumerPrice Index rose from 109.8 in 1969 to 217.4in 1979 (1967 .= lOO). Using this index todeflate the 1979 figure, the rise from 1969to 1979 in terms of- 1969 dollars was from$3,428 to $3,755, or,an average of only onepercent per year.
[41 "Earned income" 'excludes income from part-nerships, as well' as fees paid to fiduci-aries, dir6ctors, or fee-'basis -state andlocal government employees, because suchincome was not ~designated on joint returnsas earned by the husband or by the wife.
[51 On joint retUens, 'AGI and total tax we'redivided between the two taxpayers based onthe ratio of their.earned incomes.
[61 Crabbe, Patricia, Sailer, Peter, and Kilss,Beth-,-- -"-Ta xp aye r__Da ta .-Used-to- Study--Wa gePatterns by Sex and Occupation: 1969, 1974and 1979," 1984 American StatisticalAssociation Pro-c-e-e-d-ings, SocTaT__STa7i-sTics5e`cion.
7.1 U.S. Department of Labor, Burea u of LaborStatistics, Current Population Survey BaseTables--12 Month Aver-a-g-e-s-,-Te-ce-m-E5-r-Tg7g.-In add.ition-, 4 _perc__e_nT-6T__m_a_r_r-1e_T women2 percent of married men worked part-time"for economic reasons," i.e., involuntarily.
[81 U.S. Department of the Treasury, InternalRevenue Service, Income Tax ComplianceResearch--Es tima tes for 1973 T981, ff._~_.Government Printing ___MT1c_e__,__-T983-381-544:1056. Discrepancies between thesalaries and wages reported on Forms 1040and Forms W-2 salaries and wages identifiedin this special report are due to noncompli-ance with tax laws. The compliance levelfor 1979 was almost 90 percent as estimated'from the voluntary reporting percentages(VRP) of individual filers and nonfilers.Voluntary reporting percentages relateamounts voluntarily reported to amountswhich should have been reported. Salariesand wages had a VRP of 94.4, while pensionsand annuities had a VRP of 85.0 . Noncompli-ance may be due to a number of factorsincluding understating or not reportingincome.

Table 1.-Returns with Earned Income and Returns with Pensions: Selected Items by Sex of Taxpayer and Size of Adjusted Gross Income(All figures are estimates based on samples-money amounts are in thousands of dollars)
All returnsEarned income Retur a with Form W-2, wage and tax statement
Size of adjusted gross income Number of Adjusted grossincome less
Total Reported for men Reported for womenSalaries and wages from the tax
return Salaries and wages from Form W-2returns
deficit Number
of
I Amount Number oI Amount
Number ofAmount Numb r of
Total Reported for man
;
returns
return.
returns returns ereturns Amount Number of
returns AmountNumber
ofreturns Amount
2 (4) (5) (6) (7) (8) (9) (10) (11) (12) (13) (14)All returns, total . . . . . . . . . . . . . . . . . . 88,830,133 1,413,9318,211 85,261,050 1,270,866,756 63,131,072 939,861,929 44,846,275 331,006,827 81,695,106 1,211,494,120 81,695,106 1,212,059,280 59,100,521 886,442.684
Under $2,000 . . . . . . . . . . . . . . . . . . . 7.804,296 42.616 7,658,219 5.189,996 4,205.672 976,922 3,632,737 4,213,074 7,140.247 9,745,876 7,140,247 10,678.662 7413 575 6 075 652$2.000 under S4,000 . . . . . . . . . . . . . . . 8,083,865 23,98~4,244 7.830,954 22,157.929 4,357,040 12,012,027 3,704,049 10.145.903 7,489,631 21,733,935 7,489,631 21,732,740
. .4 068 178
, ,11 734 380$4,000 under $6.000 . . . . . . . . . . . . . . . 7,462,654 37,402,867 6.891,064 31,974,181 3,974,402 17,823,646 3,291,742 14,150,535 6,536,071 31,650,724 6,536,071 30,828,488
, ,3 639 737
, ,16 947 813$6,000 under $8,000 . . . . . . . . . . . . . . . 7,878,112 54,975,361 7,247.438 47,259,370 4,312,195 26.521,199 3,618,667 20,738.171 6,954.476 46,757,903 6.954.476 45,661,974
,.7943 996
, .14025 372$8,000 under $10,000 . . . . . . . . . . . . . . 6,935,814 62,307,958 6,474,450 56.338,885 3,970,266 31,034,145 3,304,750 25,304,740 6,194.731 53,656,274 6,194,731 54,425,280
,.3 660 513
, ,29 362 229$10,000 under $12,000 . . . . . . . . . . . . . 5.937,041 65.167.311 5,598,039 57,568.071 3,656.360 34,451,688 2,841,126 23,116,383 5.384,607 56.839,852 5,384,607 55,554,096
, .3,400,419
. ,32,721.648
$12,000 under $14,000 . . . . . . . . . . . . . 5.436,292 70,558,623 5,176,918 63,035,306 3,732,087 40,724,206 2,615,854 22,311,100 5,004.813 62,134.157 5.004.813 60.929 691 3 502 833 38 843 599$14,000 under $16.DOO . . . . . . . . . . . . .
000 under $18 000$164,864,9634 442 999
72,920.44375 5
4,678,932 70,558,495 3,678.164 45,617,250 2,392,669 24,941,246 4,521,396 65,031,082 4,521.396,
68,100,399, ,
3.462,369. ,
43,375.951, . . . . . . . . . . . . .,8 000
. , ,4 1,318 4,294,164 68,087.940 3,593.664 49,988,674 2.171,332 18.099,267 4,147,469 67,678,911 4.147,469 65,810,034 3,397.123 47,906,699$1 , under $20.000 . . . . . . . . . . . . . 4,275,616 81,182,792 4,170,100 74,902,311 3,655;825 56.575,113 2,197,996 18,327,197 4,050,584 73,467,661 4,050,584 72,459,147 3.490.374 54 376 446$20,000 under $25,ODO . . . . . . . . . . . . . 8,843,524 197,751,366 8.674.029 186.138,145 8,013,684 146,093,855 4,799,623 40,044,290 8,417,890 179.425,190 8,417,890 180,144,169 7 668 049,,
140 676 610$25.000 under S30,000 . . . . . . . . . . . . . 6,196,288 169,289,733 6.080.935 156,769,094 5,805,727 123,665,555 3,806,094 33,103,539 5,917,444 152,930,939 5,917,444 151,250,187, ,
5.579,860, ,
118,735,706S30,000 under $50,000 . . . . . . . . . . . . . 8.473,268 310,588,498 8,340,446 286.898,912 8.103.655 225,306,600 5,500,195 61,592,312 8.006.607 268,953,480 8,006,607 270.656,152 7 675 495 210 471 957$50,000 under $100,000 . . . . . . . . . . . . . 1.782,130 115.915.864 1,743,482 99,229,235 1,684,412 86,973,578 831,891 12.255,657 1.568.730 81,222,805 1,568,730 85.025 439
..1 473 524
. ,73 624 416$100,000 under $200,000 . . . . . . . . . . . . 329,010 43.218.505 320,537 30,214,864 309,422 28,299,321 112,219 1.915,543 286.968 26.907,727 286.968
,26.093 934
, ,273 024
, ,24 383 434$200.000 under $500,000 . . . . . . . . . . . . 72,229 20,365,748 69,852 11,004.790 67,598 10,453,760 21,825 551,030 63,198 10,259,394 63,198
,9 837 689
,60 886
, ,9 354 710$500,000 under $1,000,000 . . . . . . . . . . . 8,857 5,879,584 8,433 2,134,503 8,011 2,018,085 2,566 116,418 7,532 1.974,901 7,532
, ,1 843 491
,7 192
, .1 747 317$1,000,000 or more. . . . . . . . . . . . . . . . 3,175 7,020,614 3.058 1,406,728 2,888 1,326,306 940 80,423 2,712 1,123,309 2,712
, ,1,027,708
,2.576
. ,963.745
All returns, summary:
Under $5,000 . . . . . . . . . . . . . . . . . . . 19,532.638 40.303,07
5
8 7650If '
1
1 .171.0031
4 10,487,851 20,649,135 8,952,560 20,521,867 17,827,918 45,291,482 17,827,918 45 724 533 9 566 955 25 421105$5,000 under $10,000 . . . . . . . . . . . . . . 18.632,103 138.324,7381
S:7:22 5751 '
112 749.359 10,331,724 67,718,803 8,599,385 54,030,556 16,487,238 118,253,231 16,487,238, ,
117 602 611, ,
9 539 842, .
64 155 026$10,000 under $15,000 . . . . . . . . . . . . . 13,8711,138 171,951,335 13,175,906 1 155,409,195 9259591'
97629095 6672335 57780099 12709979 151277969* 1
2709979
, ,
'50,027,735
, ,1 8 661 542
, .92 896 884$15,000 under $20.000 . . . . . . . . . . . . . 11,085,773 193,329,152 10,742.247 1 178,742,928 9 056:509 129:727:835 5:546:642 49:015:093 10:398:890 173:873 693 1 10:3..:.9. 1 172,825 632
, ,1 8 591 576
, ,124 327 459
1$20.000 or more . . . . . . . . . . . . . . . . .. 25.708.481 870.029.911 25,240,7721
1773,796.271 23:995,397 624,137,060 15,075,353 1 149,65 722.797:
,25,878,769
, ,1 22,740,606
, ,579,957,893
All retums--Conbnued
Returns with Form W-2, wage and tax statement-Continued
Size of adjusted gross incomeSalaries and wages from Form
-.W-2-Continued Income tax withheld from Form W-2 Social Security (FICA) taxes withheld
Reported for women Total Reported for men Reported for women Total Reported for men Reported for womanNumber of
t Amount Number ofAmount
Number of Amount Number o
I Amour*Number of
Amount Number of A tNumber ofre urns
- returns - returns returns returns ieturns moun returns Amount
(15) (16) (17) (18) (19) (20) (21) (22) (23) (24) (25) (26) (271 (28)All returns, total . . . . . . . . . . . . . . . . . . 43,317,220 325,616,596 78,967,665 198,417,508 56,872,225 152,357,561 41,040,052 46,059,947 69,462,288 49,770,691 48,270,842 36,041,339 34,489,525 13,729,352
Under $2,000 . . . . . . . . . . . . . . . . . . .000 under $4$2 000
3,491.0973 603 932
4,603,DO9 6.622,894 898,372 3,459.239 544.648 3,214,705 353,724 6,017,197 489,525 3,125,053 271,686 2,945,500 217,839. , . . . . . . . . . . . . . . .$4.000 under $6,000 . . . . . . . . . . . . . . .
, ,3,192,709
9,998,36013,880,675
7,DO5.9036,152,398
1.899,4353,062,836
3.797.4683,389,291
1,073,4321 760 734
3,331,1182 972 839
826,0041 302 103
6.621,8877555 945
1,123,4091 608 280
3.573,6763 190 685
597,473870 571
3.168,4787612 214
525,935737 709$6,000 under $8,000 . . . . . . . . . . . . . . . 3,528,622 20,521,602 6,695,275 5,031,782 3.796,815
, ,2,824,815
, ,3,348.913
. ,2,206,967
. .6,D49,159
. ,2,370.166
, .3.488 062
,1 353 970
. .2 968 672
,1 016 196S8,000 under $10,000 . . . . . . . . . . . . . .
$10 000 under $12 0003,211,3772 755 718
25,063,05122 832 448
5,992,8045 229 665
6,686,5967 238 987
3,458,3253 248 555
3,519,391 3,070.790 3.167,205 5,239,461 2.585.612,
3,106,584. ,
1.490.366. ,
2.638,464, ,
1,095,246. , . . . . . . . . . . . . . . , . , , , . , . , 4.188,653 2.634.838 3,050.334 4,505,581 2,701,010 2,819,907 1,623,780 2,246,943 1.077,230$12,DW under $14,000 . . . . . . . . . . . . . 2,542,622 22,086.093 4,891,526 8,332.190 3,375,753 5,189.830 2,421,230 3,142,360 4,150,875 2,883,007 2,882,395 1 900 097 2 010 084 982 910$14,000 under $16,000 . . . . . . . . . . . . .$16 000 under $18 000
2,314,9522 090 638
24,724,"817 90
4,419,042 9,889,653 3,343,806 6,144,084 2,207,731 3,745,569 3.773,565 2,994,006 2,844,381, ,
2,089,528. .
1,845.491,
904.478, , . . . . . . . . . . . . .$18 000 d $20 000
, , , 3,334 4,086.085 9,763,127 3,304,294 7,077,942 1,977,196 2,685,185 3.439,656 3,067.348 2,736.770 2,279,327 1,624.812 788,021. un er , . . . . . . . . . . . . .$20 000
2,107,901 18,082,700 3.993,995 11,040,863 3,421,725 8,321,283 2,006,755 2,719,580 3,343.163 3.261,286 2,767,990 2,549,400 1,608.365 711 886. under $25,000 . . . . . . . . . . . . . 4,619,285 39,467,559 8,330,381 28,796,474 7,546,573 22.888,888 4.401,623 5,907,586 7,075.743 7,883,434 5,997,909 6,281,966 3 542 663.
1 601 469$25.000 under $30,000 . . . . . . . . . . . . . 3,667,079 32,514,481 5,852.697 25,503,008 5,500,635 20,701.926 3,513,573 4.801,081 5.099.507 6.509.880 4,396.417 5.157,875, ,
2.772.696, .
1,352,005S30.000 under $50,000 . . . . . . . . . . . . .$50,000 under $100.000 . . . . . . . . . . . . .
5,307,451762 024
60.1 B4,19511 401 023
7,878,9391 487 007
50,048,07019 346 572
7,527,2421 390 837
40,528,95717 234 312
5.130,709704 383
9.519,1132 112 260
6,750,3291 322 275
9.736.886 5,841.127 7,449,407 3.739,586 2,287,479$100,000 under $200,000 . . . . . . . . . . . .
.99,964
, ,1.710,500
, ,263,213
, ,7.078,640
, ,248,712
, ,6,718,504
,85,620
, ,360.136
, ,253,679
2,026,248410,549
1,199.270239 169
1.664.681355 782
523,21476 299
361,56754 768$200,000 under $500,000 . . . . . . . . . . . . 18,982 482.979 56,883 2,968,415 54.490 2,847.273 15,756 121,142 55,603 102,613
,53.193
,90 022
. ,14 945
,12 591
$5W,000 under $1,000,000 . . . . . . . . . . . 2,114 96,175 6,565 547,114 6,272 622,119 1,689 24.996 6,430 12,945 6,134,
11,423,
1 568,
1 521$1,000.000 or more. . . . . . . . . . . . . . . . 753 63,963 2,293 285,374 2,193 270,771 584 14,603 2,233 4,487 2,120 3,983.531
.5134
All returns, summarf.
Under $5,000 . . . . . . . . . . . . . . . . . . .$5 000 under $10 OW
8,656.2458 37 92
20,619.112 16.618,034 4,058,996 8,886,074 22751443 5'9':'47 1 14721' 7 ' 3431" 42 "2 3 "'
242
1.235,347 7,459,480 1,066.514. , . . . . . . . . . . . . . .$10,ODO under $15,000 . . . . . . . . . . . . .
, 1.46,473,626
,447,58557,130,851
,851.24012,391,256
.520,02620,351461
015,064832
3454
17 :7: 37. 4-2 314 5741
.:~7 53 66 176 440
: 141:2817 966 887
::2583.1410 603 0141
:: 7 15 . .1 307 084 692
1-62M 2919
3-348,719
4 72 5657,022,8485 92 6
2,526,411
$15.000 under $20,000 . . . . . . . . . . . . . 3 5" 'M
4 1 3498' ;
1 012291057 2 1 9113:359 :7.:369
1
. .8,537,2181
. ,5,071,310
, ,7376,1411
, ,8,609,8261
, ,7,821,965 1
, .1
. , 084 143 087
2,512,1273971 952$20,000 or more . . . . . . . . . . . . . . . . .
114.477652
:9 :.0 1145 2 5
3 . 8 ,2 7797 4 ~1311,712,7501 13,853,937 22:860,9171 20,565,7991 26,687,043 i
1 16 1.2 1'o 7, , ,5A71,903
XV
(A
00)ICA(A
CD0617
(DX

Table I -Returns with Earned Income and Returns with Pensions: Selected Items by Sex of Taxpayer and Size of Adjusted Gross Income-Continued,(All figures are estimates based on samples-money amounts are in thousands of dollarsk
Size of adjusted gross income
All returns, total . . . . . . . . . . . . . . . . . .Under $2,000 . . . . . . ... . . . . . . . . . . .$2,000 under $4,000 . . . . . . . . . . . . . . .$4,000 under $6,000 . . . . . . . . . . . . . . .$6.000 under S8,000 . . . . . . . . . . . . . . .$8,000 under $10,000 . . . . . . . . . . . . .$10,000 under $12,000 . . . . . . . . . . . . .$12,000 under $14,000 . . . . . . . . . . . . .$14,000 under $16,000 . . . . . . . . . . . . .$16,000 under $18,000 . . . . . . . . . . . . .$18,000 under $20,000 . . . . . . . . . . . . .$20,000 under $25,000 . . . . ... . . . . . . .$25,000 under $30,000 . . . . . . . . . . . . .$30,000 under $50,000 . . . . . . . . . . . . .$50,000 under $100,000 . . . . . . . . . . . . .$100,000 under $200,000 . . . . . . . . . . . .$200,000 under $500,000 . . . . . . . . . . . .$500,000 under $1,000,000 . . . . . . . . . . .$1,000,000 or more . . . . . . . . . . . . . . . .
All returns, summary:
Under $5,000 . . . . . . . . . . . . . . . . . . .$5,000 under $10,000 . . . . . . . . . . . . . .$10,000 under $15,000 . . . . . . . . . . . . .$15,000 under $20,000 . . . . . . . . . . . . .20.000 or more . . . . . . . . . . . . . . . . .
Size of adjusted gross income
All returns, total . . . . . . . . . . . . . . . . . .
Under $2,000 . . . . . . . . . . . . . . . . . . .$2,000 under $4,000 . . . . . . . . . . . . . . .$4,000 under $6,000 . . . . . . . . . . . . . . .$6,0130 under $8,000 . . . . . . . . . . . . . . .$8.000 under $10,000 . . . . . . . . . . . . . .$10,000 under $12,000 . . . . . . . . . . . . .
$12,000 under $14,000 . . . . . . . . . . . . .$14,000 under $16,000 . . . . . . . . . . . . .$16,000 under $18,000 . . . . . . . . . . . . .$18,000 under $20,000 . . . . . . . . . . . . .$20,000 under $25,000 . . . . . . . . . . . . .$25,000 under $30,000 . . . . . . . . . . . . .$30,000 under $50,000 . . . . . . . . . . . . .$50,000 under $100,000 . . . . . . . . . . . . .$100,000 under $200,000 . . . . . . . . . . . .$200,000 under $500,000 . . . . . . . . . . . .$500.000 under $1,000,000 . . . . . . . . . . .$1,000,000 or more . . . . . . . . . . . . .
All returns, summary:Under $5,000 . . . . . . . . . . . . . . . . . . .$5,000 under $10,000 . . . . . . . . . . . . . .$10,000 under $15,000 . . . . . . . . . . . . .$15,000 under $20,000 . . . . . . . . . . . . .20,000 or more . . . . . . . . . . . . . . . . .
Footnote(s) at end of table.
Pensions and annuities from thetax return
Number ofreturns
(291
7,559,073-230,142
434,529850,451966,340763,828625,905535,168432,966400,615325.747636.441455.685684,982174.115
30,8747,7121,151
422
1,063,5392,181,7511,384,510
935,8911,993,382
Amount
(30)
39,214,051465,009793,222
2,407,3863,648,9813,290.0043,150,7872,877,0882,639,7002,591,4971,981,9544,222,3183,447,4505,430,1631,762,597
347,514117,74128,02512,613
2,269,5118,335,0927,303,3625,937,664
15,368,4221
TotalNumber of
returns(31)
7,S59,073230.142434,529850,451966,340763.828625,905535,1 68432,966400,615325.747638,441455,685684,982174,115
30,8747,7121.151
422
1,063,5392,181,7511,384,510
935,8911,993,3821
Amount
(32)
43,615,311798,568
1,149,6932,799,5854.031,1633,486,0203.451,656
3.206.3962,877,2382.757.0682.215,3884.661,6173.722,4856.047,7791.881,679
361,594124,267
29,63313.281
3,187,0819.077,9498,098,9566,408,790
16,842,5351
All returns-ConfinuedReturns with Form W-2P, pension, annuity, and retirement pay statement
Pensions and annuities from Form W-2P
Reported for menNumber of
returnsL331
5,196,452149,170250,441506,548642,256515,532406,609372,777316,478298,476234,846492,149336,246510,454134,21323,1055,950
878324
645,0411.418,906
955,080674,106
1,503,3191
Amount
(34)
31,248,889611,859759,010
1,757,5152.695,4882,360,3902,232,794
2,154,9592,024,7482,027,1961,591,1883,633,4632,845,0034,657,6221,487,020
276,173101,709
22,69110,059
2,190.1795,994.0835,444.2464,586,639
13,033,7421
Reported for womenNumber of
returns
(35)
3,00681388:435
198,468388,404401,567316,002275,738
215,488167,224144,127131,556214,556157,012~35,268
58,84311,093
2,522'; 3781 132
I41338
909 :9679564.108370.025679,804
Amount
(36)
12,366,422186,708390.684
1.042.0701.335.6751,125,6301,218,862
1,051,438852.491729,872624,200
1.028,354877,482
1,390,157394,659
85,42022,558
6,9423,222
'023,90'8'3:8662,654,7101,822,15213,808,794
TotalNumber of
returnsJ371
2,008,19916,80821,864
112,532199,082167,527165,528
148,926152,305129,378108,323250.261199,122276,02654,6344.716
98213748
133.1394433.919394.402310.058785,926
Amount
(38)
1,972,7934,9652,978
32,751B4,89679,53098,791
114,260133,182130,831113,445272,726252,133496,993134,064
14.6544,5311,723
343
23,593181,526275,920314,589
1,177,166
Income tax withheld from Form W-2P. Reported for man
Numberofreturns
(39)
1,600,M89,327
11,50473,4DO
131,328119,777129,036
109,801118,554105,204
93,202215,457178,020253.350
47,5093.822
76810841
54,681290,655301.073254.724699,0751
Amount
140)
1,631,3653,4841.000
25.00459,16957,67373,204
78,37487.908
101,00193,938
227,423231,897453,537117,952
13.9883.7731,720
321
17,693128,636193,455240,969
1,050,6121
Reported for womenNumber
ofreturns(41)
491,1987.673
-10,36039,13271,50351,00043,674
42,02342.41DO26,13226,03245.69532.86941.5829.7091,130
247298
29,405150.263104,961
75,300131,2691
(42)
Amount
341,4281,481
-1,9787,747
25,72721.85725.58735.88645,27429.83119,50745,30320,23643,45616.112
666757
321
5,90052.89082,46473,620
126,554
Number ofreturns
(43)
43,669,316
773.135965,681
1,452,4132,102,4212,294,7522,311,323
2,609,8842,705,5892,841,8313,049,2897,152,5105,484,660
7,892,9831,651,907
304,48365,978
7,7492,728
23768695:211:5336,268,3737,249,543
22-5629-98
Adjusted grossincome less
deficit
(44)
1,023,088,680
-6,090,2762,960,295
~ 7,365,47214,761,56420,669.65525.455,055
33,957,12940,612,17548,342.70157,940,627
160,301,366149,998,053289,667.393107,537,88740,000.83218,575,232
5,135,5285,897,994
-25429839,921:00878,960,799
127.346,888777-11-4 284
Earned income
TotalNumber of
returns
L451
41,810,769
705,936857,140
1,266,5591,784,9112,036,4242,135,421
2,464,0322,591,6982,754,6002,977,9637,030.6065,410,5447,798,9801,623,715
297,99464,172
7,4372,637
2123,8174:527,1535,883,4937,040,221
22,236,085
Amount
A46A
912,133,598
-2,369,5522.489.1665,722,395
11,405,76816,821,93621,445,705
29,564,89936,481,77443,335,59253,117,010
148.140,213140,041,897270,507,352
93,613,23028,383,07810,282,060
1,906,1531.244.924
2.304.46631,765,24668.251,943
115,69:,.036694,118,906
Reported for menNumber of
returns
t47)
40,108,478
620,938727,944
1,080,2611,569,8671,835,3521,990,042
2,327,1972,484,1042,667,7032,907,8996,903,7985,337,0997,697,6441,593,291
292,22863,179
7,3202,6`12
1,824,2684,010,0945,542,8116,834,134
21,897,171
Amount
481735,909,732
-2,781.7271,665.3724,105,4948,328,301
12,697.23616,809,112
23,180,29028,549,21534,826,95642.938,014
120.039,704111,619.012212,137.162
82,258,39926,729,4919,790.4101,821,4331.195,859
484,84423,529,83153,488,73792,814,850
565,591,471
Joint returns
Reported for womenNumber of
returns
L49j11
24,418,588
265,188359.331561,378898,468
1,001,6381,04
f"826
1,307.8581,499,4951,557,7291,753,7854.266.0863.604.3315,364,740
803,245106.870
20,5642,261
795
863,4102,222,5933,096,7024,066,991
14,168,892
Amount
L501
176,223,866
412,175823,795
1,616,9013,077,4674,124,7004,636,593
6.384.6097,932,5598.508.636
10,178,99628,100,50928,422,88558,370,18911,354,831
1,653,588491,650
84,72049.064
1,819,6228,235,415
14,763.20622,878,186
128,527,4361
Salaries and wages from the taxreturn
Number ofreturns
(51)
39,378,351
435.498704,289
1,063,2671.593,304~1.857,2141,985,342
2,334,0932,464,7862,641,8532,889,1146,817,5045,274,1207,513,7001,468,646
268,01156,476
6,7562,378
1,600,9014,052,6715,537,5206,777,668
21,409,591
Amount
(52)
865,303,235
2.112,9752,273,3635.047.352
10,379.22715,584.09820.394.113
28,593.88835,115.45542.765.23252,310,834
146,143,526136.647,924253,708,584
76,537,89525,326,374
9,589,5331,785,523
987,341
6,310,31929,086,69665,683,534
113,495,987650,726,6981
Returns with Form W-2, wage and tax statement
Salaries and wages from Form W-2
TotalNumber of
returns
L53139,378,351
435,498704,289
1,063,2671,593,3041,857,2141,985.342
2,334,0932,464,7862,641.8532,889,1146,817,5045,274,1207,513,7001,468,646
268.01158,476
6.7562,378
1,600,9014,052,6715.537,5206,777,668
21,409,5911
Amount
(54)
861,502,353
2,192.6772,460,1875,152,844
10,379,53615.623,18420,026,890
27,909.65534.433.07941,481,88451,109,868
142,970.988135,129,295255,861,632
80,422,96424,570,367
9,195,7891,669,274
912,241
6,605,12129,203,30764,140,198
110,821,178650,732,548
ReportedNumber of
returnsA5 51
36,837,815
317,465563,813845,443
1.321.2971,593.3371.775.560
2,125,2922.290,3122,497,4622,763,6876.587.8405.130,6617,304,7551,396,650258,360
56,9386,6082,335
1,249,8003.391,5555.023,1526,429.161
20,744,1471
Amount
(56)
for men
688,541,476
1,555.4611.654.7053.603,1657.368.560
11.570.79215.473,022
21.607,89326,624,47033,073,33141,064,812
115,246,447107,128,652198,531,354
69,763,81723,065,027
8,755,9931,590,741
863,236
4.624.76821,127,91549,617.43588,226.093
524.945.266
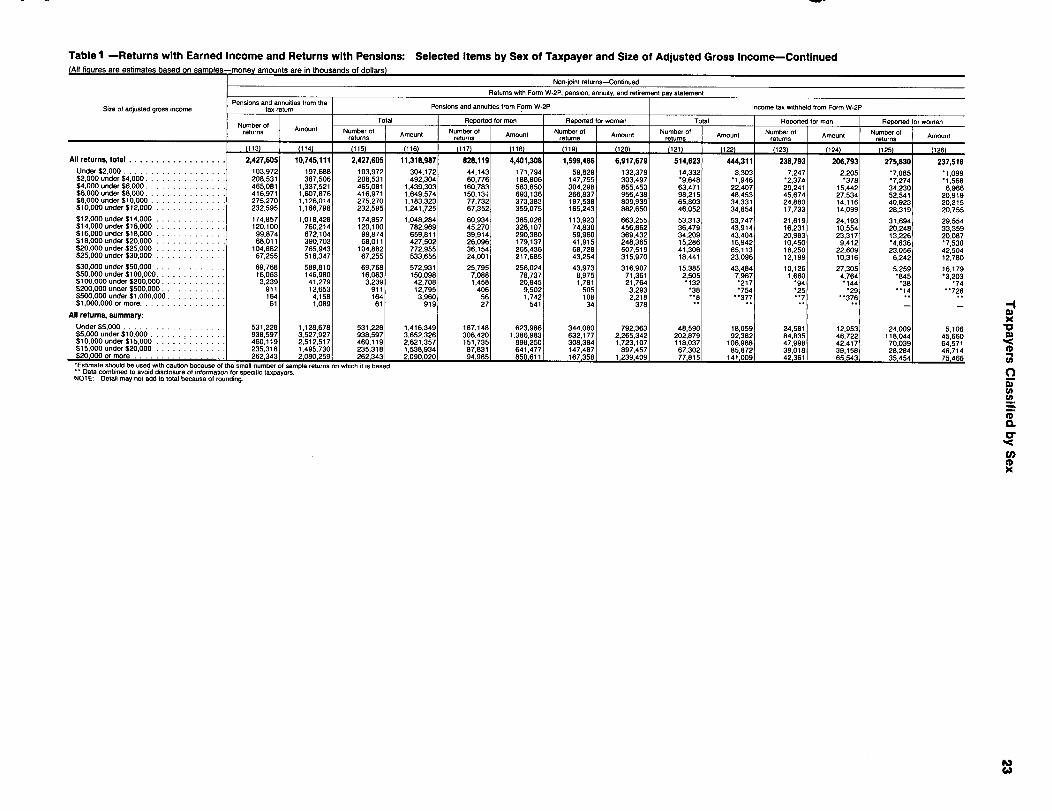
Table I -Returns with Earned Income and Returns with Pensions: Selected Items by Sex of Taxpayer and Size of Adjusted Gross Income-Continued(All figures are estimates based on samples-money amounts are in thousands of dollars)
Non-joint returns-Continued
Returns with Form W-2P, pension. annuity. and retirement pay statement
Size of adjusted gross incomePensions and annuities from the
tax return Pensions and annuities from Form W-2P Income tax withheld from Form W-2P
N b fTotal Reported for men Reported for women Total Reported for men Reported for woman
um er oreturns
Amount Number of Amo nt Number of Amount
Number ofAmount Number o
f Amount Number 0f
Am t Number ofAreturns returns - -returns returns returns
ounreturns mount
(113) (114) (115) (116) (117) (118) (119) (120) (121) (122) IIL3L (124) (125) 1126)
All returns, total . . . . . . . . . . . . . . . . . . 2,427,605 10,745,111 2,427,605 11,318,987 828,119 4,401,308 1,699,486 6,917,679 514,623 444,311
___ _
238,793 206,793 275,830 237,518Under $2,000 . . . . . . . . . . . . . . . . . . . 103,972 197,688 103,972 304,172 44,143 171,794 59,829 132,378 14.332 3,303 7,247 2,205 -1,099$2,000 under $4,000 . . . . . . . . . . . . . . . 208,531 387,506 208.531 492,304 60,776 188,806 147,755 303.497 -1,946 -2,374 -7,274 -1.568$4,000 under $6,000 . . . . . . . . . . . . . . . 465,081 1,337,521 465.081 1,439,303 160.783 583,850 304,298 855,453 63,471 22,407 29,241 15,442 34,230 6.966$6,000 under $8,000 . . . . . . . . . . . . . . . 416.971 1,607,876 416.971 1,649,574 150,134 693.136 266,837 956,438 98,215 48,453 45,674 27,534 52,541 20,919$8,000 under $10,000 . . . . . . . . . . . . . . 275,270 1,126,014 275,270 1,183,323 77,732 373,383 197,538 809.939 65,803 34,331 24,880 14.116 40,923 20,215$10,000 under $12,000 . . . . . . . . . . . . . 232,595 1,166,798 232,595 1,241,725 67,352 359,075 165.243 882,650 46,052 34,854 17,733 14,099 28,319 20,755$12,000 under $14,000 . . . . . . . . . . . . . 174,857 1,018,428 174,857 1,048,284 60,934 385,028 113.923 663,255 53,313 53,747 21,619 24,193 31,694 29,554$14,000 under $16,000 . . . . . . . . . . . . . 120,100 760,214 120,100 782.969 45,270 326,107 74.830 456,862 36,479 43,914 16,231 10.554 20,248 33,359$16,000 under $18,000 . . . . . . . . . . . . . 99,874 672,104 99,874 659.811 39,914 290,380 59,960 369,432 34,209 43,404 20.983 23,317 13.226 20,087$18,000 under $20,000 . . . . . . . . . . . . . 68,011 390.703 68,011 427,502 26.096 179,137 41,915 248,365 15,286 16,942 10,450 9,412 -7,530$20,000 under $25,000 . . . . . . . . . . . . . 104.882 765,943 104.882 772,955 36.154 265,436 68,728 507,519 41,306 65,113 18,250 22,609 23,056 42,504$25,000 under $30,000 . . . . . . . . . . . . . 67,255 518,347 67,255 533,655 24,001 217,685 43,254 315,970 18,441 23,096 12,199 10,316 6,242 12,780$30,000 under $50,000 . . . . . . . . . . . . . 69,768 589.810 69,768 572,931 25,795 256,024 43.973 316,907 15,385 43,484 10.126 27,305 5,259 16,179$50.000 under $100,000. . . . . . . . . . . . . 16,063 146.980 16,063 150,098 7,088 78,737 8,975 71.361 2,505 7,667 1,660 4,764 -3,203$100,000 under $200,000 . . . . . . . . . . . . 3,239 41,279 3.239 42,708 1,458 20,945 1,781 21.764 '38S200,000 under $500,000
. . . . . . .911 12,653 911 12,795 406 9,502 505 3,293 "72
$500.000 under $1,000,006 164 4,158 164 3,960 56 1,742 108 2.218$1,000,000 or more. . . . . . . . . . . . . . . . 61 1,089 61 919 27 541 34 378 - -
All retums, summary:
Under $5,000 . . . . . . . . . . . . . . . . . . . 531,228 1.128.678 531,228 1,416,349 187,148 623,986 344080 792,363 48,590 18,059 24,581 12,953 24,009 5,106$5.000 under $10,000 . . . . . . . . . . . . . . 938.597 3,527,927 938,597 3 612 326 420
3061,386,983 2:17763 65,34222 202,879 92.382 84,835 46,722 118,044 45,660
$10,000 under $15,000 . . . . . . . . . . . . . 460119 2512517 460119: 1:~
262~F,7
151
735: 898,250 308 438
1723.107 118,037 106.988 4 '799
'
42 41 7 71 039 64,571$15,000 under $20,000 . . . . . . . . . . . . . 235:318
11:495:730
1
235:318 1,538,934 87,831 641,477
:
147487
8
97,457 67,302 851872 1 6:013 8: . 15
39.:2
2 46,714$20,000 or more . . . . . . . . . . . . . . . . . 262,343 2,080,25 262,343 2,090,020 94,985, 850,611, 167 835
12
39.409 77815, 141009 4 2,36 1 65 75,466:~stimate should be used with caution because of the small number of sample returns on which it is based.
Data combined to amd disclosure of information for specific taxpayers.NOTE: DeuW may not add to total because of rounding.

Table 11~.-Returns with Earned Income and Returns with Pensions: Selected Items by Sex of Taxpayer and Size of Adjusted Gross Income-Continued
(All figures are estimates based on samples--money amounts are in thousands of dollars) I. Joint returns-Continued
Returns with Form W-2. wage and tax statement-Continued
Sao of adjusted gross incomefrom Form
"-vV=u9dIIncome tax withheld from Form W-2 Social Security (FICA) taxes withheld
Reported for women Total Reported! for man Reported for women Total Reported for men Reported for women
Number ofAmount
Number ofAmount
Number ofAmount
Nmt Of Amount Number of
AnXKmtNumber of
AmountNumber of
Amountreturns returns returns r ,, returns returns -. returns
(57) (58) (59) (60) (61) (62) (63) (64) (651 166) (67) 168) (69) [70)
All relums, total . . . . . . . . . . . . . . . . . . 23,263,171 172,960,876 37,974,983 142,130,625 35,215,044 116,700,730 21,704,651 23,429,095 33,914,018 34,143,140 29,096,335 26,861,142 18,115,762 7,281,998
Under $2,000 . . . . . . . . . . . . . . . . . . . 210,458 637,216 313,912 194,813 212,651 136,983 152,311 57,831 324,154 80.251 206.566 53,470 170.944 26,780$2.000 under $4.000 . . . . . . . . . . . . . . . 322.965 805,482 585,145 169,437 456,674 108,843 251,154 60.593 575,049 109.572 425.341 70.640 269.975 38,932$4,000 under $6.000 . . . . . . . . . . . . . . . 514.199 1,549,679 900,663 373.768 687,693 252,162 422,702 121,606 886,557 253,997 651,520 164,967 430,991 89,030S6,000 under $8.000 ............... 842,947 3,010,976 1,436,989 830,507 1,167.962 593,058 719,480 237.448 1,384,893 510,968 1,087,548 366,535 704.920 144,433$8,000 under $10,000 .............. 941.036 4,052,392 1,720,068 1,441,517 1.428,915 1,057,931 827,464 383,586 1,592.116 779.729 1,289.134 580.981 808.569 198,748$10,000 under $12.000 ............. 981.312 4,553,869 1,879,221 1,983,627 1.644,975 1,548,506 887.974 435,121 1,708,651 973,716 1,423,117 746.263 846.803 227,453
$12,000 under $14,000 ............. 1,249,443 6,301,762 2,251,872 3,040,941 2.009,370 2,386,643 1,147,959 654.299 2,022,567 1,343.092 1,730,054 1,047,255 1,034,117 295,838$14,ODO under $16,000 ............. 1,430.399 7,808,609 2,391,107 4.096.760 2,193,542 3,232,469 1.330,060 864,311 2,156.593 1,656,914 1.877.755 1,285.629 1.195,145 371,285$16.000 under $18,000 . . . . . . . . . . . . . 1.484.683 8,408,552 2,591,273 5,275.308 2,409,258 4,315,984 1.377,420 959.324 2,288,406 1.968,804 2,010.853 1,577.384 1,199,479 391,420$18,000 under $20,000 ............. 1,673,118 10,045,056 2,839,914 6.905.403 2,698,614 5,724,222 1,575,785 1,181,181 2,507,815 2,389,260 2,201.506 1,934,968 1.339.501 454.292$20.000 under $25,000 ............. 4099,108
~27,724,541 6,741,254 21,013.021 6,471,451 17,554,602 3,887,618 3,458.219 5,919.877 6.505,239 5.184,994 5.279.488 3,199,712 1,225,751
S25,000 under $30.000 ............. i .472,954 28,000,643 5,217,342 21,905,039 5,053,843 18.104.088 3.325,010 3,800,951 4,625,583 5,884,010 4.039.893 4,679.495 2.655.296 1,204,515
$30,000 under $50,000 ............. 5,185,284 57,330,278 7,401,989 46,531.985 7.165.298 37.684,401 5,015,703 847,584 6,384,759 9.270,845 5,550.604 7,064.225 3.664.539 2.206,620$50,000 under $1 D0,000 ............. 738,814 10,659,147 1,396,569 18,174.513 1,320,156 16245,199 684,626 1:929,3114 1,240,021 1,917,059 1,133.870 1,574.916 5D6.360 342,143$100.000 under $200,000 ............ 95.671 1.505,340 246,786 6,664.148 235,807 6:362,629 82,098 301,519 237,472 387,369 226.169 336,392 73,092 50,978$200,000 under $500,000 ............ 18,208 439,796 52,900 2,784,526 51.078 2,676,617 15,185 107,909 51,710 96,396 49.861 84,429 14,384 11.967$500.000 under $1.000,000 ........... 1,922 78,533 5,952 495,622 5,777 475,872 1,571 19750 5,813 11,888 5631 10511 1,454 1,377$1,1300,000 or more................ 660 49,005 2,027 249,669 1,980 240,319 63
19:351 1,982 4.031 1:919 3:595 481 436
All retums, summary:
Under $5.000 ................... 746383 1980353 1285414 498 226 970,893 342,615 567,080 155,611 1,278.101 280.137 909.977 186.707 619.475 93,430$5.000 under $10,000 .............. 2 5
088:075:392 3:671:363 1 2,511:816 2.983,002 1,806363 1806031 705,453 3,484,668 1,454 2750132 049886 1 765924 404,494
$10,000 under $15,DDO ............. 13 5572: 14,522.763 53 8 71 1 4
6917778 4,735,499 5,438:844 2~6)2:20419
1,478,935 4,799,758 3,111:2831 4:077:597 1 2 412:4761 2:472:6841 698,808$15,000 under S20,000 ............. 3,879.398 22,595,086 6:635:21 3 14:384:280
16,220,260 11,768,
981
13626,9941 2,615,300 5,884.274 52205021 5.165,688 1 4:179,023 1 3,142,3611 1,041,479
$20,000 or more ................. 1 13,612,621
1
125,787,283 21,064,819 117,818,524 20,305,390 1 99,343.9 IL71597 18.467.217 24:076 837 16,192,941 19,033,051 1 10,115,3181 5,043,767
Joint retums-Continuod
Returns with Form W-2P, pension, annuity, and retirement pay statement
Size of adjusted gross incomePensions and annuities from the
tax returnPensions and annuities from Form W-2P Income tax withheld from Form W-2P
Total Reported for man Reported for woman Total Reported for man Reported for womenNumber of
returnsAmount INumber o Amount
Number of AmountNumber of
AmountNumber o
IAmount
Number ofAmount
Number of Amountreturns returns returns returns returns retumL
(71) (72) (73) (74) (75) (76) (77) (78) [79) (80) (82)
.
(63) (84)
All retums, total .................. 5,131,468 28,468,941 5,131,468 - 32,M,324 4,368,333 26,047,581 1,407,327 5,446,743 1,493,576 1,526,462 1,361,415
1
11,424,02 215,368 103,910
Under $2,000 ................... 126,170 267,322 126,170 494,396 105.027 440,065 28,606 54,331 2,476 1,662 2,080 1.280 588 382S2,000 under $4,000 ............... 225,998 405,716 225.998 657,390 189,665 570,203 50,713 87,186 12,216 1,032 -9.130 3,086 410$4,000 under $6,000 ............... 385,370 1,069,864 385.370 1,360,282 345.765 1,173,666 84.106 186,617 49.061 10,343 44,159 . 9.562 4,902 781$6,000 under $8,ODO ............... 549,369 2,041,105 549,369 2,381,589 492,122 2,002,353 134,730 379.237 100,867 36,442 85,654 31,634 18,962 4,806$8,000 under $10.000 .............. 488,558 2,163,990 488,558 2,302,698 437,800 1,987,007 118,464 315,691 101,724 45,199 94,897 43.556 10,077 1,643$10,000 under $12,000 .............. 393,310 1,983,990 393,310 2,209,930 339.257 1,873,719 110.495 336,212 119,476 63,937 111,303 59,105 15,355 4,831
$12,000 under $14,ODO .............. 360,311 1,858,660 360,311 2,158,112 311,843 1,769,930 101,565 388,182 95,613 60.512 88,182 54,181 10,329 6,332$14.000 under $16,DDO ............. 312,866 1,879,485 312,866 2,094,269 271,208 1,698,640 92,394 395,629 115,826 89,268 102,323 77,353 22,152 11,915$16,DDO under $18,000 ............. 300,741 1,919,393 300,741 2,097,257 258,562 1,736,816 84,167 360,440 95,169 87.427 84,221 77,684 12,906 9,743$18,DOO under $20.000 ............. 257,736 1,591,251 257,736 1,787,886 208,750 1,412,051 89,641 375,835 93,037 96,503 82,752 84,526 21.196 11,977S20,000 under $25.000 ............. 533,559 3,456,375 533,559 3,888,862 455,995 3,368,027 145.828 520,835 208.955 207.613 197.207 204,814 22.639 2.799$25.000 under S30,000 ............. 388,430 2,929,104 388,430 3,188,830 312.245 2,627,319 113,758 561,511 180,681 229,038 165,821 221,582 26,627 7,456
$30,000 under $50,ODO ........... 615,214 4,840,352 615,214 5.474.846 484,659 4,401.599 191,295 1,073,250 260,641 453,508 243,224 426,231 36,323 27,277$50,000 under $100,DOO ............. 158,052 1,615,616 158,052 1,731,582 127.125 1,408,283 49,868 323,298 52,129 126,096 45,849 113,1188 8.864 12,909$100,000 under $200,000 ............ 27,635 306,235 27,635 318,885 21,647 255,229 ~9,312 63,657 4,584 14,436 3,728 13,844 1.092 592S200,000 under $500,000 ............ 6,801 105,088 6.801 111,473 5,544 92.208 2,017 19.265 944 3.777 743 3,744 234 32$500,000 under $1,000,000 ........... 987 23,867 987 25.673 822 20,949 1 270 4.724 130 1,366 102 1,364 28 2$1,000,ODO or more................ 361 11,525 361 12,362 297 9,518 1 98 2,844 47 323 40 302 6 21
An returns, summarr. IUnder $5,000 ................... 532,311 1,140,833 532,311 1,770.731 457,893 1,566.193 109,827 204,538 35.304 5,533 30,100 4.739 5,396 794$5.000 under $10.000 .............. 1,243,154 . 4,807,165 .1,243.154 5.425.623 1,112,486 4,607.1 DO 306.792 818,523 231.040 89.144 205,820 81,914 32.219 7,230$10,000 under $15.000 ............. 924,391 4,790,845 924391 5477598 803345 4.545.995 255724 931603 276365 168932 253075 151039 34922 17893$15,DDO under $20,000 ............. 7009571 4A411 i934 700:573
14:869:856
1586:275 3,945,161 222:538 924:695
1 1242:756 1 228:717 215:706 201:811
147:016 26:906
1$20.000 or more . . ~ ............. 1.731039 , 3 2fifl
163 1.7 1,408,334 12,183,131, 512,446 2. 569,38411 708,111 1 1,036,157, 656,714 9 51,088Footnote(s) at and of table.
I
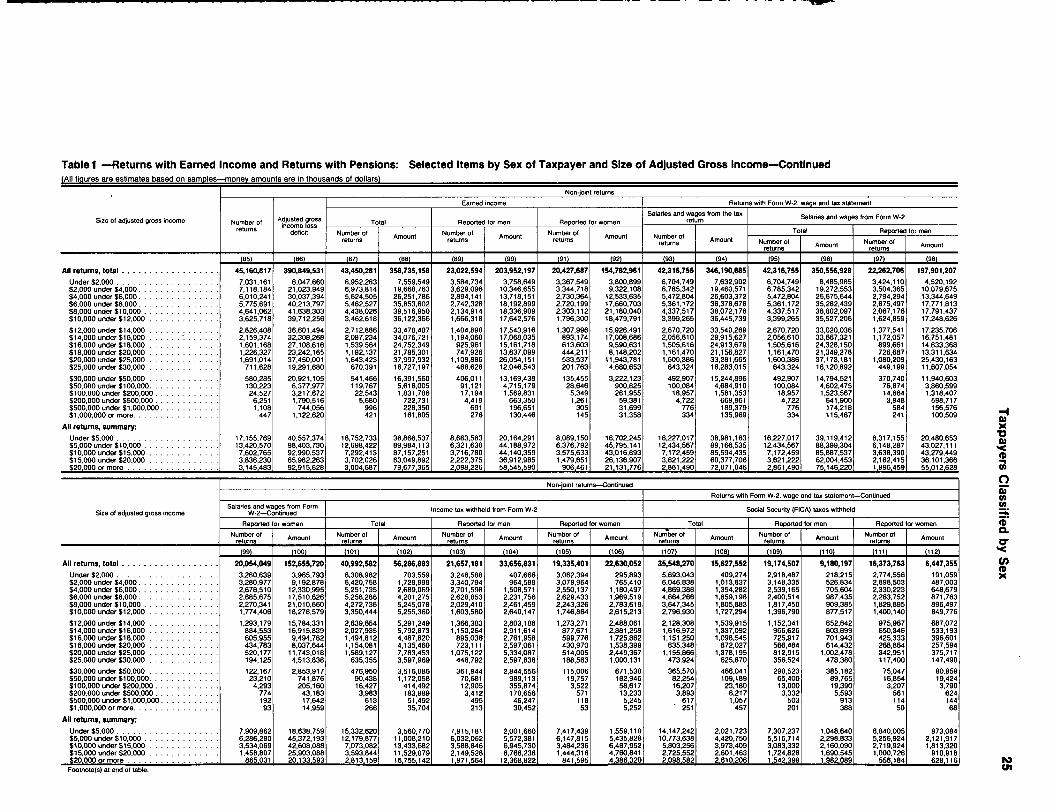
Table 1 -Returns with Earned Income and Returns with Pensions: Selected Items by Sex of Taxpayer and Size of Adjusted Gross Income-Continued(All figures are estimates based on samples-money amounts are in thousands of dollars)
Non-joint returns
Earned income Return s with Form W-2, wage and tax statement
Size of adjusted gross income Number ofAdjusted gross
Total Reported for men Reported for womenSalaries and wages from the tax
returnSalaries and wages from Form W-2
returnsincome low
deficit Number of Number of Number oI
Total Reported for menreturns
Amountreturns
Amountreturns
Amount Number ofreturns Amount Number
of Anno ntNumber o
I Amountreturns returns
(88) (89) (90) (91) (92) 93 (941 (96) 97
All returns, total . . . . . . . . . . . . . . . . . . 45,160,817 390,849,531 43,460,281 358,735,168 23,022,594 203,952,197 20,427,687 154,782,961 42,316,755 346,190,885 42,316,755
1
350,556,928 22,262,706
ri
197,901,207
Under $2,000 . . . . . . . . . . . . . . . . . . . 7.031,161 6,047,660 6,952,283 7,559,549 3,584,734 3,758,649 3,367,549 3,800,899 6,704,749 7,632,902 6,704,749 8,485,985 3.424,110 4,520,192$2,000 under $4,000 . . . . . . . . . . . . . . . 7,118,184 21,023,949 6,973,814 19,668,763 3,629,096 10,346,655 3,344,718 9.322.108 6,785,342 19,460.571 6,785,342 19,272,553 3,504,365 10,079,675$4,000 under $6,000 . . . . . . . . . . . . . . 6.010,241 30.037,394 5,624,505 26,251,786 2,894,141 13,718.151 2,730,364 12,533,635 5,472,804 26,603,372 5,472,804 25,675,644 2,794,294 13,344,649$6,000 under $8,000 . . . . . . . . . . . . . . . 5,775,691 40.213.797 5,462,527 35,853,602 2,742,328 18,192,899 2,720,199 17,660,703 5,361,172 36,378,676 5,361,172 35,282,439 2,675,497 17,771,813$8,000 under $10,000 . . . . . . . . . . . . . . 4.641,062 41,638,303 4,438,026 39,516,950 2,134,914 18,336,909 2,303,112 21,180,040 4,337,517 38,072,176 4, 337,517 38,802,097 2 067,176 17,791,437$10,000 under $12,000 . . . . . . . . . . . . . 3,625,718 39,712,256 3,462,618 36,122,366 1,666,318 17,642,576 1,796,300 18,479,791 3,399,265 36,445,739 3,399,265 35,527,206 1,624,859 17,248,626
$12,000 under $14.000 . . . . . . . . . . . . . 2,826,408 36,601,494 2,712,886 33,470,407 1,404,890 17,543,916 1,307,996 15,926,491 2,670,720 33,540,269 2,670,720 33,020,036 1,377,541 17,235,706$14,DOO under $16.000 . . . . . . . . . . . . . 2.159.374 32,308,268 2,087,234 34,076,721 1,194,060 17,068,035 893,174 17,008,686 2,056,610 29,915,627 2,056,610 33,667,321 1,172,057 16,751,481$16.000 under $18.000 . . . . . . . . . . . . . 1.601,168 27,108,616 1,539,564 24.752,349 925,961 15;161,718 613,603 9,590.631 1,505,616 24.913.679 1,505.616 24.328.150 899,661 14,833,368$18,000 under $20,000 . . . . . . . . . . . . . 1,226,327 23,242,165 1,192,137 21,785,301 747.926 13,637,099 444,211 8,148.202 1,161.470 21,156,827 1,161,470 21,349,278 726.687 13,311,634$20,000 under $25,000 . . . . . . . . . . . . . 1,691,014 37,450,001 1,643,423 37,997,932 1,109.886 26,054.151 533,537 11.943.781 1,600,386 33,281,665 1.600,386 37,173,181 1,080,209 25,430,163$25,000 under $30,000 . . . . . . . . . . . . . 711,628 19,291,680 670,391 16,727,197 468,628 12,046,543 201,763 4,680.653 643,324 16,283,015 643,324 16,120,892 449,199 11,607,054
$30,000 under $50,000 . . . . . . . . . . . . . 580.285 20,921,105 541,466 16,391,560 406,011 13,169.438 135,455 3.222,123 492,907 15,244,896 492,907 14,794,521 370,740 11,940,603$50,GOO under $100,000 . . . . . . . . . . . . . 130,223 8,377,977 119,767 5,616,005 91,121 4,715,179 28,646 900.825 100,084 4,684,910 100,084 4,602,475 76,874 3,860,599S100.000 under $200,000 . . . . . . . . . . . . 24,527 3,217,672 22,543 1,831,786 17.194 1,569,831 5,349 261,955 18,957 1,581,353 18,957 1,523,567 14,664 1,318,407S200,000 under $500,000 . . . . . . . . . . . . 6,251 1,790,516 5,680 722,731 4,419 663,350 1,261 59,381 4,722 669,861 4,722 641,900 3,948 598,717$500,000 under $1,000,000 . . . . . . . . . . . 1.108 744,056 996 228,350 691 196,651 305 31,699 776 189,379 776 174,218 584 156,576$1,000,000 or more. . . . . . . . . . . . . . . . 447 1,122,620 421 161,805 276 130,446 145 31,358 334 135,969 334 115,467 241 100,509
All returns, summary:
Under $5,000 . . . . . . . . . . . . . . . . . . . 17,155,769 40,557,374 16,752.733 38.866.537 8,663.583 20,164,291 8,089,150 18,702,245 16,227,017 38,981,163 16,227,017 39,119,412 8,317,155 20.480,653$5,000 under $10,000 . . . . . . . . . . . . . . 13,420,570 98,403,730 12,698,422 89,984,113 6,321,630 44,188,972 6,376,792 45,795,141 12,434,567 89,`166,535 12,434,567 88,399,304 6,148,287 43,027,111$10,000 under $15,000 . . . . . . . . . . . . . 7,602,765 92,990,537 7292.413 87.157,251 3,716,780 44,140,359 3,575,633 43,016,893 7,172,459 85,594,435 7,172,459 85,887,537 3,638, 43279,449$15,000 under $20,000 . . . . . . . . . . . . . 3,836,230 65,982,263 3:702,0261 63,049,892 2,222.375 36,9121985 1,479,6511 261136907 3621 222
1 160377706
1 131621.222 1 62,004,453 , 2,162,41 36:101,366
$20.000 or more . . . . . . . . . . . . . . . 3,145.483. 92,915,628 3.004,6871 79,677.365. 2.098.226. 58,545590, 906,461 21
13 1:776 1 2 861 490 72 071 0461 2,861,490 1 75,146,220 1 11~996~45 55,012.628
Non-joint returns-Continued
Returns with Form W-2, wage and tax statement--Confinued
Size of adjusted gross incomeSalaries and wages from Form
W-2-Continued Income tax withheld from Form W-2 Social Secunty (FICA) taxes withheld
Reported for women Total Reported for men Reported for women Total Reported for men Reported for women
Number ofAmount
Number ofAmount
Number oI Amount
Number oI Amount
NuAberof Amount
Number ofAmount
Number ofAmountreturns returns returns returns returns returns returns
(99) (100) (101) (102) (103) (104) (105) (106) (107) (108) (109) (1 i0j, (111) (112)
All retums, total . . . . . . . . . . . . . . . . . . 20,054,049 152,655,720 40,992,582 56,286,883 21,657,181 33,656,831 19,335,401 22,630,052 35,548,270 15,627,552 19,174,507 9,1180,197 16,373,763 6,447,355
Under $2,000 . . . . . . . . . . . . . . . . . . . 3,280.639 3,965,793 6,308.982 703,559 3,246,588 407,666 3,062,394 295,893 5,693,043 409,274 2,918,487 218,215 2,774,556 191,059$2,000 under $4,000 . . . . . . . . . . . . . . . 3,280,977 9,192,878 6,420.758 1.729,999 3,340,794 964.589 3,079.964 765,410 6,046,838 1,013,837 3,148,335 526,834 2,898.503 487,003S4,000 under $6.000 . . . . . . . . . . . . . . . 2,678,510 12,330,995 5,251,735 2,689,069 2,701,598 1,508,571 2,550,137 1,180,497 4.869,388 1,354.282 2.539.165 705,604 2,330.223 648,679$6,000 under $8,000 . . . . . . . . . . . . . . . 2,685.675 17,510,626 5,258.286 4,201,275 2.628,853 2.231,756 2.629.433 1,969,519 4.664.266 1.859,198 2,400,514 987,435 2,263.752 871,763$8,000 under $10,000 . . . . . . . . . . . . . . 2,270,341 21,010,660 4,272,736 5,245,078 2,029,410 2,461,459 2,243,326 2,783,619 3,647.345 1.805.883 1.817.450 909,385 1,829,895 896,497$10,000 under $12.000 . . . . . . . . . . . . . 1,774,406 18,278,579 3,350,444 5,255,360 1,603,580 2,640,147 1,746,864 2,615,213 2,796,930 1.727.294 1,396,790 877,517 1,400,`140 849,776
$12,000 under $14.000 . . . . . . . . . . . . . 1,293,179 15,784,331 2,639,654 5,291,249 1,366,383 2,803,188 1,273.271 2,488.061 2.128,308 1,539,915 1.152,341 852,842 975.967 687,072$14,000 under $16,000 . . . . . . . . . . . . . 884,553 16,915,839 2,027.935 5,792,873 1,150,264 2,911,614 877,671 2,881,258 1.616,972 1.337,092 966,626 803,899 650,346 533,193S16.000 under $18.000 . . . . . . . . . . . . . 605.955 9,494,782 1,494,812 4,487,820 895,036 2,761,958 599,776 1,725,862 1.151,250 1.098.545 725,917 701,943 425,333 396,601$18.000 under $20,000 . . . . . . . . . . . . . 434,783 8,037,644 1,154,081 4,135,460 723,111 2,597,061 430,970 1,538,399 835,348 872.027 566,484 614,432 268,864 257,594$20.000 under $25,000 . . . . . . . . . . . . . 520.177 11,743,018 1,589,127 7,783,453 1,075,122 5,334,087 514,005 2,449,367 1,155.866 1,378,195 812.915 1,002,478 342,951 375,717$25,000 under $30.000 . . . . . . . . . . . . . 194.125 4,513,838 635,355 3,597,969 446,792 2,597,838 188,563 1,000.131 473,924 625,870 356,524 478,380 117,400 147,490
$30.000 under $50.000 . . . . . . . . . . . . . 122,167 2,853,917 476,950 3,516,086 361,944 2,844,556 115,006 671.530 365,570 466,041 290,523 385,182 75,047 80,859$50,000 under $100,000 . . . . . . . . . . . . . 23,210 741,876 90,438 1,172,058 70,681 989,113 19,757 182,946 82,254 109,189 65,400 89.765 16,854 19,424$100,000 under $200,000 . . . . . . . . . . . . 4,293 205,160 16,427 414,492 12,905 355,874 3,522 58.617 16,207 23,180 13,000 19.390 3,207 3,790$200,000 under $500.000 . . . . . . . . . . . . 774 43,183 3,983 183,889 3,412 170,656 571 13.233 3,893 6,217 3,332 5,593 561 624$500,000 under $1,000,000 . . . . . . . . . . . 192 17,642 613 51,492 495 46,247 118 5,245 617 1,057 503 913 114 144$1,000,000 or more. . . . . . . . . . . . . . . . 93 14.959 266 35,704 213 30,452 53 5,252 251 457 201 388 50 68
All retums, summary:
Under $5,000 . . . . . . . . . . . . . . . . . . . 7,909,862 18,638,759 15,332,620 3560770 7,915,181 2,001,66 417,439
'
1,559,110 14,147,242 2,021,723 7,307,237 1 640 6,840,005 973,084$5,000 under $10.000 . . . . . . . . . . . . . . 6,286,280 45.372,193 12,179,877 11:008:2
106,032.062 5,572,381 6.147.815 5,435,828 10,773,638 4,420,750 5,516,714 2: 98:833 5256924 2121917
$10,000 under $15,000 . . . . . . . . . . . . . 3534069 42608088 7073082 V 3,588.846 457309
1
3484236 6487952 5803256 3973409 3083332 2160090 2:719:924 1:813:320$15,000 under $20,000 . . . . . . . . . . . . . 1:458:807 1 25:903:088 1 3 593:844 1
12,149.5281 68:2386:7 1:444:3161 4 760:841 1 2:725:552 1 2:601:463 1:724:826
11690545: :
11
,000,726 910,918
$20.000 or more . . . . . . . . . . . . . . . . .. 865,031 1 20,133,593,
1 2813,159 11 1,971,564 12,368,8 841,5951 4,386,320 1 2,098,5821 2,610,206 82,089 556,184 628.116Footriote(s) at end of table. full

Table 2.-Returns with Salaries and Wages Reported on Form W-2: Number of Taxpayers by Number of Forms W-2 and Size of Adjusted Gross Income(All finures are estimates based on samples-monev amounts are in thousands of dollars) I
Size of adjusted gross income
All returns, total .....................................Under $2,060 ......................................$2.000 under $4,000 ..................................S4,000 under $6.000 ..................................$6,000 under $8,000 ..................................$8,000 under $10,000 .................................$10,000 under $12,000.................................$12,000 under $14,000.................................$14.DOO under $16,000.................................$16,000 under $18,000.................................$18.000 under $20,000.................................$20,000 under $25,000.................................$25,000 under $30,000.................................$30,000 under $50,000.................................$50.000 under $100,000 ................................$100,DDO under $200,000 ...............................$200,000 under $500,000 ...............................$500,000 under $1,000,000 ..............................$1,000,000 or more ...................................
All returns, summary:Under $5,000 ......................................$5,000 under $10,000 .................................$10,000 under $15,000.................................$15,000 under $20,000.................................20.000 or more . . . . . . . . . . . . . . . . . . . . . . . . . . . . . . . . . . . .
Size of adjusted gross income
All returns, total ......................................Under $2.000 .......................................$2,000 under $4,000 ...................................S4,000 under $6,000 ..................................$6,000 under S8,000 ..................................$8,000 under $10,000 .................................$10.000 under $12,000..................................$12,000 under $14,000.................................$14.000 under $16,000 .................................$16,000 under $18,000 .................................$18,000 under $20,000.................................$20.000 under $25,000.................................$25.000 under $30,000.................................$30,000 under $50,000.................................$50,000 under $100,000 ............ I ...................$100.000 under $200,000 ...............................$200,000 under $5DO,000 ...............................$500,000 under $1,DDO,DDO ..............................$1,000,000 or more...................................
All returns, summary.,Under $5.000 ......................................$5,000 under $10.000 .................................$10,000 under $15,000........................ ........$15,000 under $20,000.................................$20.000 or more ...... ...... ..............
All returns with Form W-2
Number ofreturns
t2l QJ1,212,059,280
10.678.66221,732,74030,828,48845.661,97454,425,28055,554,09660.929,69168.100,39965.810,03472,459,147
180,144,169151,250.187270.656,152
85.025,43926,093.934
9,837.6891,843,4911,027,708
Number. ofForms W-2
Salaries andwages
III81,695,1067,140,2477,489.6316,536,0716,954,4766,194.7315,384,6075,004,8134,521,3964,147,4694.050,5848,417,8905,917,4448,006,6071,568,730
286,96863,19875322:712
17,827,91816,487,23812,709.97910,398,89024,271,061
152,490,24012,019,26515,116.28512,885,21412,839,44510,942,4969,098,5238,710,3128.342,8747,494,7267,615,753
16,236,16911,826,48716,010,8072,742,503
473,335114,88815418
5:740
33,528,85530.273,85022,031,24019,230,94847, 25,3471
45,724,533117,602.611150,027,735172,825.632725,878,769
Number ofreturns
L4122,262,7063,424,1103;504.3652,794,2942,675,4972.067,1761.624,8591,377,5411,172,057
899,661726,687
1,080,209449,199370,740
76,87414,664
3,948584241
8,317,1556,148,2873,638,3902,162,4151.996-459
Total[Number ofForms W-2
15L-38,409,1235,867.1197,337,9475,578,5434,922.6383,601,5202,556,6492,03~1.1071,661.6911,246,474
979,67311,414,6501
587,965~491,2081,101,530
19,7776,0561,097
479
16,045,53311,262,2345,487,8682,990,7262,622,762
Non-joint returns filed by men-ContinuedWith four Forms W-2
Number ofreturns
(13)906,531134,899259,032180,304119,262
88,66444,89021,01719,58011,826
9,4809,806
-3,7052,984
758*174
12122
7
Salaries and-ages
(14)5,584,088
300,162821,399914,444802,824801,206479,700263,506289,766197,778176,603212,151136,95586,79741,393
'13,01929,924
9,2257,238
495,749286,412
71,57035,22317,577
1,588,0772,051,957
835,394571,959536,701
With We or more Forms W-2Number of
returns(16) (17)
4,830.35220 1,399709,236726,972863,239574,516376,913283,595240,508124,420167,383242.355*75,992
'136,09641,26312,42520,18415,51716,338
I1,270.4741,804,8118
775,204417,616
Number ofForms W-2
, Salaries and___wag"
If 51739,639
95,741206,053146,750119,262
62,63334,22921,32515,5788,5309,588
12,061*2,8DO-3,929
8551351083517
380,528249,91163,02326,22719,940
4,448,583555.692
1,234,122844,445702,216330,318238.676158,280105,468
60,57156,75691,747
*20,541'37,921
9,695923793273146
2,236,1201,430,673
439,961179,790162,039 562,1711
Salaries andwall"
6(6)197,901,207
4,520,19210,079,67513,344,64917.771,81317,791.43717.248,62617,235,70616,751,48114,833,36813,311,63425,430,16311,607,05411,940,6033,860,5991,318,407
598,717156,576100.509
20,480,65343.027.11143,279,44936,101,36655,012,6281
Number ofreturns1"8
20,054,0493,280,6393,280,9772,678,5102,685,6752,270,3411,774,4061,293,179
884,553605,955434,783520,177194,125122,167
23,2104,293
77419293
7,909,8626,286,2803,534,0691,458,807
865,0311
Non-joint returns filed by menWith we Form W-2
Number ofreturns
71E13,067,299
1,960,2101,524,5501,309,3351.445,8561,150,7791,062,415
958,674850.058660,645555,573858.535355,598296,485
63,95511,310
2,812364145
Salaries andwaties
(0)131,363,097
2,212,0634,078,8696,128,2109,377,7969,756,737
11,187,21211,897,26811,980,99010,761,38310,159,02220.634,7959,040.5589,528.1583,129,699
988,869385,263
80,02636,179
4,105,4323,285,2982,472,DDO1,615,3651 58-9204
TotalNumber ofForms W-2
(19)31,890,4295,424,4876,357,2934,988.5084,262.9553,341,0322,410,3221.701.3131,101,869
746,448522,553625,557218,150144,29628,169
5,8821,133
309153
14,340,81210,033,4634.687.2721.795.2331~023~649
8,777,63422,776,04129,243.88826,741,98743,823,547
With two Forms W-2Number of
returns[a
41,854,6801,198,8512.961,7243,614,3234,561,4864.604.5114.008.6923.794,9933.415.0793,086,1932,325,2083,768,8281,727,9201,832,686
523.368235,797131,925
33,44729,650
5,380,624888,159
1,001,043770,168675,833529.533373,977296,490232,678178,026126.714174,27764,28257,1609,0702,287
75411756
Salaries andwao"001
2,285,3531,579,383
805,764402,121308,0031
5.837.39511,103,499
9,695,4736.934.6928,283,6211
Nonjoint returns filed by women
Salaries and--wages
(20)152,655,720
3,965,7939,192,878
12,330,99517,510,62621,010,66018,278,57915.784,33116,915,839
9,494,7828,037,644
11,743,0184.513.8382,853,917
741,876205,160
43,18317.64214,959
With one Form W-2Number of
returns(21)
12,810,6931,953.46011,549,9701,391,6181,722,1071,554,1161,314,741
999,508721,817493,614370,265433,809173.148108,059
20.0023,669
56914972
18,638,75945,372.19342.608.08825.903.08820-133-593
4,157,3864,013,8852,694,9591,204.986
739-477
Salaries and"OoS
(22)110,167,496
2.015.0134,190.2546,166,139
11,199,77814,919,83413.393.90712,059,16114,552.6647,672,1866,878,6569,901,2053,957,2322.453,613
619,393152,59323.1106,4696,289
8,709,53129,781.48632,761,89921.794.67417-119-905
With threeNumber of
returnsLI-112,166,623
345,101513.687387,737315,284235,567109,34880,03554,16340,63425,33225,53022,81410,182
2.2367581534616
1.050,093747.283226,033
83,47961,735
orms W-2Salaries and
--!222L.-(12)
14,268,989607,717
1,508,4471,960,7002,166,4682,054,4671,196,109
996.343825.138663.595483,418572,033625,629354,866124,67768,29731,42018,36211.104
3,007,0725,290,7272.729.4911,435,1121.806.588
With two Forms W-2Number of
returns12314,440,619
797,896930.980710,245616.587472,485336.806209,643123.330
88.46251,38370,81219,6429.6152.184
386136
1710
Salaries and
(24)27,811,11,6131,064,2532,647,7973,322,7374.036,1944.050,3803,589,1602.656.0301,781,5121,429,164
924,6061,478,011
535.219242.163
90,54334,96813,297
3,138420
2,114,3351.413,858
611,603198,021102,802
5,314,6049,806,7587.163.9203,216,5712.397.760
Foutnote(s) at end of table.

Table 2.-Returns with Salaries and Wages Reported on Form W-2: Number of Taxpayers by Number of Forms W-2 and Size of Adjusted Gross Income-Continued(All figures are estimates based-Onsamples-morel amounts are in thousands of dQuarsl
Non-joint returns filed by women--Continued Joint returns ith Forms W-2 for husbands
Size of adjusted grow income With three Forms W-2 With four orms W-2 With five or more Forms W-2 Total With one Form W-2 for husbandsNumber of Salaries and Number of Salaries and Number of Number of Salaries and Number of Number of Sa nd Number of Salaries and
returns ___.&2gas returns __.&2&es returns Forms W-2 ---.:2&es returns Forms W-2=
returns asMtL((25) (26) (27) (28) (29) 130) (31) (32) (33) 434)
-
135)
___ _
(36)All returns, total . . . . . . . . . . . . . . . . . . . . . . . . . . . . . . . . . . . . . 1,711,781 9,290,229 691,940 3,268,718 399,016 2,286,395 2,029,665 36,837,815 61,680,783 688,541,476 27,640,547 53Z498,ew
Under S2.000 . . . . . . . . . . . . . . . . . . . . . . . . . . . . . . . . . . . . . . 337,820 563,963 124,593 214,508 66,870 363,403 108,056 317.465 454,019 1.555,461 234,096 1,117,783$2,000 under $4,000 . . . . . . . . . . . . . . . . . . . . . . . . . . . . . . . . . . 461,175 1,326,976 214,759 638,690 124,093 702,802 389,161 563,813 958,334 1,654,705 361,829 1.020,859$4.000 under $6.000 . . . . . . . . . . . . . . . . . . . . . . . . . . . . . . . . . . 318,801 1,508,046 165,647 801,221 92,199 557,409 532,852 845,443 1.603,170 3.603,165 527.680 2.089,759$6,000 undei $8,000 . . . . . . . . . . . . . . . . . . . . . . . . . . . . . . . . . . 197,493 1.316,140 83,876 518,359 65,612 379,691 440,155 1,321.297 2,368,115 7,368,560 823,498 4,306,037$8,000 under $1O,ODO . . . . . . . . . . . . . . . . . . . . . . . . . . . . . . . . . 168.354 1.392,977 51,330 438,747 24,056 131.564 208.721 1,593,337 2,600,128 11,570.792 1,036,650 7,393,479$10,000 under $12,000. . . . . . . . . . . . . . . . . . . . . . . . . . . . . . . . . 87,377 933,757 23,182 249,007 12,300 67.110 112,728 1,775,560 2.731,567 15.473,022 1.214,955 10.622,267
$12,000 under $14,000. . . . . . . . . . . . . . . . . . . . . . . . . . . . . . . . . 62,412 809,196 15,775 191,954 -5,841 '32,183 *67,990 2,125,292 3,199,511 21.607,893 1,464,749 14.687,479$14.000 under $16,000. . . . . . . . . . . . . . . . . . . . . . . . . . . . . . . . . 28,928 442,442 *6.776 '95,449 *3,702 '19,504 '43,773 2,290,312 3,517,139 26,624.470 1,553,743 18,145.450S16,000 under sle,ooo. . . . . . . . . . . . . . . . . . . . . . . . . . . . . . . . . 20,674 335,041 *2.849 '50,922 -7,470 2.497,462 3.541,103 33,073,331 1,845,599 24.450,136$18,000 under $20,000. . . . . . . . . . . . . . . . . . . . . . . . . . . . . . . . . 8.602 153,082 -1,721 *30,968 -2,812 '16.832 *50,333 2.763,687 3,845,732 41.064,812 2.053,615 30,858,127$20,000 under $25.000. . . . . . . . . . . . . . . . . . . . . . . . . . . . . . . . . 13,709 315,732 -1,326 *31.988 -3,693 '16,083 6,587,840 8,917,230 115,246,447 5,041,942 88.319,716$25,000 under $30,000. . . . . . . . . . . . . . . . . . . . . . . . . . . . . . . . . -1,148 '15.542 - -2,274 *5.845 5,130,661 6,609,875 107,128,652 4,081,214 83.782,337$30,000 under $50,000. . . . . . . . . . . . . . . . . . . . . . . . . . . . . . . . . 4,283 147,026 - 0 -4,158 '11,115 7,304,755 9.154,318 198,531,354 5.990.719 163.338,152$50.000 under $100,000 . . . . . . . . . . . . . . . . . . . . . . . . . . . . . . . . '864 *22,004
..99 **4,957 *63 -5,237 1,396,650 1.744,955 69,763,817 1,159.025 57.657,791$100.000 under $200.000 . . . . . . . . . . . . . . . . . . . . . . . . . . . . . . . -2,495 -1,184 '14,844 258,360 334,865 23,065,027 205,129 17,624,660$200,0M under $500,000 . . . . . . . . . . . . . . . . . . . . . . . . . . . . . . . 42 2,147 - *27 -4,629 56,938 85,133 8.755,993 40,252 5,802,515$500.DDO under $1,000,000 . . . . . . . . . . . . . . . . . . . . . . . . . . . . . . 13 2,873 "1,94
1!7 63 3,217 6,608 11,418 1,590,741 4,349 893,493
$1,000.000 or more . . . . . . . . . . . . . . . . . . . . . . . . . . . . . . . . . . . 3 791.
7 48 7,455 2,335 4,171 863,236 1,503 388,759All returns, summary:
Under $5.000 . . . . . . . . . . . . . . . . . . . . . . . . . . . . . . . . . . . . . . 983,616 2,669,703 421,652 1,203,194 232,873 1,317,300 741,726 1,249,800 2,135,599 4,624,768 824,453 2,915,833$5.000 under $10,000 . . . . . . . . . . . . . . . . . . . . . . . . . . . . . . . . . 500.027 3.438,399 218,553 1,408,331 139,957 817.569 937,219 3,391.555 5,848,167 21,127.915 2,159,300 13,012.085$10,000 under $15,000. . . . . . . . . . . . . . . . . . . . . . . . . . . . . . . .
.167650 2019288
'
41 4822. 8 141!
99293 180718 5'023152 76533
2949617.435 3,432,7731 33,683.677
$15.000 under S20,000. . . . . . . . . . . . . . . . . . . . . . . . . . . . . . . . . 40:3431
654:229 8:58711
136:0381
:6 870 38:828
1-
. 101:575
16,i29:161
19:181:723
188:226,093 4,699,8881 65,079,7B3
. . . . . . . . . . . . . . . . . .. 20,145 508,609 1,432 38
1.11 20 A.
147 26 5 16,524,133 1 417,807,423
Joint returns with Forms W-2 for husbands-Continued Joint returns vAth Forms W-2 for ives
Size of adjusted gross income With Wo Forms W-2 for husbands With three Forms W-2 forhusbands With four Forms W-2 for husbands With five or more Forms W-2 for husbands Total
Number of Salaries and Number of Salaries and Number of Salaries and Number of Number of Salaries and Number of Number of Salaries andreturns __Xj2L9_ returns ___&g&es returns as__22L returns Forms W-2 returns Forms W-2
XMM(37) (38) (39) (40) (41)
_ _
(42) (43) (44) (45)-
(46) (47)_ _
(48)
All returns, total . . . . . . . . . . . . . . . . . . . . . . . . . . . . . . . . . . . . . 6,165,521 109,402,101 1,815,448 29,906,928 652,657 9,219,022 563,642 3,652,222 7,515,625 23,263,171 30,519,905 17Z960,876
Under $2,000 . . . . . . . . . . . . . . . . . . . . . . . . . . . . . . . . . . . . . . 55,803 298,659 14.764 84,430 4,859 34,029 7,943 44,589 20.561 210,458 273,640 637,216$2,000 under S4.000 . . . . . . . . . . . . . . . . . . . . . . . . . . . . . . . . . . 112,194 351,610 44.382 116,372 19.863 75.532 25,545 159,519 90,332 322,955 462,711 805,482$4,000 under $6,000 . . . . . . . . . . . . . . . . . . . . . . . . . . . . . . . . . . 133,158 559,704 82.449 419,113 39,051 185,475 63,105 405,623 349.115 514,199 714.993 1,549,679$6.000 under $8.000 . . . . . . . . . . . . . . . . . . . . . . . . . . . . . . . . . . 246,675 1,487,695 113,388 710,012 62.640 375,732 75.096 460,543 489,083 842.947 1.285,737 3,010.976$8.000 under $10.000 . . . . . . . . . . . . . . . . . . . . . . . . . . . . . . . . . 298.580 2.247.083 166,006 1,242,136 45,444 314,765 46.657 286,524 373,329 941,036 1,399,816 4.052,392$10,000 under $12,000. . . . . . . . . . . . . . . . . . . . . . . . . . . . . . . . . 338.055 2,861,647 122,604 1,102,869 62,425 554,218 37,521 222,990 332,021 981,312 1,399,985 4,553,869
$12,000 under $14,000 . . . . . . . . . . . . . . . . . . . . . . . . . . . . . . . . . 428,129 4,477,774 133.646 1,390,889 56.855 639,246 41,913 250,146 412,504 1,249,443 1.775,381 6.301,762$14,000 under $16,000. . . . . . . . . . . . . . . . . . . . . . . . . . . . . . . . . 458,906 5,307,630 161,876 1.813,093 68.103 769,725 47,684 287,544 588,572 1,430,399 2.062,175 7.808,609$16,000 under $18,000. . . . . . . . . . . . . . . . . . . . . . . . . . . . . . . . . 442,199 5,852.386 132,513 1.758,276 40.079 523,354 37.072 253,251 489,180 1.484,683 1,960,701 8.408,552$18,000 under $20,000. . . . . . . . . . . . . . . . . . . . . . . . . . . . . . . . . 500,063 7.261,293 128,571 1.860,109 49.890 670,845 31,548 206.718 414,437 1.673,118 2,267,795 10,045.056$20.000 under $25.000. . . . . . . . . . . . . . . . . . . . . . . . . . . . . . . . . 1,099,876 19,143,720 295,854 5,247,926 83,832 1,431,004 66,336 452,646 1,104,081 4,099,108 5,278,732 27,724,541$25.000 under $30,000. . . . . . . . . . . . . . . . . . . . . . . . . . . . . . . . . 793,489 16,324.390 168,431 5,176,117 56,782 1.213,070 30,745 209.262 632,738 3,472,954 4,410,497 28,000.643$30,000 under $50,000. . . . . . . . . . . . . . . . . . . . . . . . . . . . . . . . . 1,016,704 27,107,602 203,521 5,452,041 50.776 1,393.233 43,035 316,524 1.240,325 5,185,284 6,220.985 57.330,278$50,000 under $100,000 . . . . . . . . . . . . . . . . . . . . . . . . . . . . . . . . 188.284 9,511,649 35,079 1,798,678 8,020 439,983 6.242 72,045 355.715 738,814 867.849 10,659,147$100,000 under $200,000 . . . . . . . . . . . . . . . . . . . . . . . . . . . . . . . 40,568 4,090,629 8,328 888,345 2,613 260,775 1,722 13,164 200,618 95,671 112,811 1,505,340$200.000 under $500,000 . . . . . . . . . . . . . . . . . . . . . . . . . . . . . . . 11,036 1,912,954 3,422 604,070 1,124 218,227 1.104 8,047 218,227 18,208 22.566 439,796$500,000 under $1,000,000 . . . . . . . . . . . . . . . . . . . . . . . . . . . . . . 1,323 384363 458 146.925 210 70,290 268 2.209 95,670 1,922 2.594 78,533$1,000.000 or mom . . . . . . . . . . . . . . . . . . . . . . . . . . . . . . . . . . . 479 221:312 156 94,528 91 49.520 106 878 109,117 660 937 49,005
All returns, summary:
Under $5,DDO . . . . . . . . . . . . . . . . . . . . . . . . . . . . . . . . . . . . . . 230,819 901,847 90.735 336,756 31 141 173 11 64,648 420.723 296,478 746,3153 1,DD6,911 1.980,353$5,000 under $10.000 . . . . . . . . . . . . . . . . . . . . . . . . . . . . . . . . . 615.591 4,042,905 330,254 2.235,306
2:71213
.11: 679153,698 936,075 1,025,941 2.085,212 3,129,986 8.075,392
$10,000 under $15,000. . . . . . . . . . . . . . . . . . . . . . . . . . . . . . . . 955609
9.927,088 344,169 3443168 is 96005 578,349 957,875 2939557 4202771 14522,763. . . . . . . . . . . . . . .$15,DOO under $20.000. . . . . . . . . . . . . . . . . :792 J1 171 15.833,643
,335,041 4:482:067
112 99:733
1642,300 1,278,8401
13:879:398 5:263:266 22595,086
S20.000 or more . . . . . . . . . . .. . . 1 3:151.7591 78,696,618 715.249 9,408,630 1 20 149,558 1 1,074J75 1 3,956,492
213.61 .621
1
6,916,971 125,787,283ootriote(s) at end of table.

Table 2 -Returns with Salaries and Wages Reported on Form W-2: Number of Taxpayers by Number of Forms W-2 and Size of Adjusted Gross Income-Continued
(All fioures are estimates based on sannoles-money amounts are in thousands of-dollars)Joint returns Wth Forms W-2 for wives-Continued
Si f d d inWith one Form W-2 for wives With two Forms W-2 for wtvas With three Forms W-2 for wives With four Forms W-2 for wives With five or more Forms W-2 for wives
ze o a juste grow come _Nu
.mber of Salaries and Number of Salaries and Numbaot
w
SaLanes and Number of Salanes and Number of Number of SaLanes andreturns waaes returns wades
~returns wages returns 5 returns Forms W-2 a
(49) (50) (61) (52) 53 (54) (55) (56) (57) (58) ---agL-
All returns, total . . . . . . . . . . . . . . . . . . . . . . . . . . . . . . . . . . . . . . . . . . . . . . . 18,078,053 141,086,341 3,830,989 23,986~776 959,228 5,676,436 256,658 075,819 136,243 667,558 833,503
Under $2,000 . . . . . . . . . . . . . . . . . . . . . . . . . . . . . . . . . . . . . . . . . . . . . . . . 166,247 484,714 31,891 1191285 9,770 26,406 .5" 3.468 *1.962 '11,949 -3,343
$2,000 under S4.DOO . . . . . . . . . . . . . . . . . . . . . . . . . . . . . . . . . . . . . . . . . . . . 232.674 605.622 59.DO3 158~013 22,312 23.829 -4,233 -6,570 -4,733 '28.163 '11,449
$4,000 under $6,000 . . . . . . . . . . . . . . . . . . . . . . . . . . . . . . . . . . . . . . . . . . . . 389,788 1,088,221 79.699 286,695 28,142 111,349 12,037 45,354 '33,233 18,060
$6,000 under $8,000 . . . . . . . . . . . . . . . . . . . . . . . . . . . . . . . . . . . . . . . . . . . . 591,277 2,152,108 146,311 476~390 62,905 203,635 26,663 102,211 15,791 :106,471 76,632$8,000 under $10.000 . . . . . . . . . . . . . . . . . . . . . . . . . . . . . . . . . . . . . . . . . . . 640,667 2,919.521 204,971 751 A48 56,522 232,872 25,598 92.101 '13.278 '77.249 *56,250$10,DDO under SIZOOO . . . . . . . . . . . . . . . . . . . . . . . . . . . . . . . . . . . . . . . . . . 687,372 3,235,717 217.357 931 ~872 56,572 289,736 11,066 51.138 8,945 63,919 45,406
$1 2,000 under $14.000 . . . . . . . . . . . . . . . . . . . . . . . . . . . . . . . . . . . . . . . . . . 893,490 4,762,369 247,198 1.060,530 70,772 284,196 23,629 100,912 14,354 80,663 93,754
$14,000 under $16,000 . . . . . . . . . . . . . . . . . . . . . . . . . . . . . . . . . . . . . . . . . . 1.019,202 5.712,752 280,609 1,438,755 84,282 413,615 28.414 149,529 17,892 115,253 93,957
$16,000 under $18.000 . . . . . . . . . . . . . . . . . . . . . . . . . . . . . . . . . . . . . . . . . . 1,126.763 6,638,606 272,069 1,329,434 69.307 367,746 12,549 47,575 -3,995 -31,683 '25.191
$18,000 under $20,000 . . . . . . . . . . . . . . . . . . . . . . . . . . . . . . . . . . . . . . . . . . 1,248,790 7,735,991 299,672 1,630,912 93,817 535,083 18,591 80,385 12,248 63.846 62,685S20,ODO under $25.000 . . . . . . . . . . . . . . . . . . . . . . . . . . . . . . . . . . . . . . . . . . 3,179.009 21,895,413 729,023 4.683,768 147,431 890.514 33,951 183,735 9,694 63,580 71,111
$25,000 under $30,000 . . . . . . . . . . . . . . . . . . . . . . . . . . . . . . . . . . . . . . . . . . 2,769,018 22,914,736 544,199 3,902~1249 110,462 868.170 32,291 222,146 16.984 92,531 93,343
$30Z under $50,000 . . . . . . . . . . . . . . . . .. . . . . . . . . . . . . . . . . . . . . . . . . . 4,395,524227637
49,930,0759 300 429
621,73484 786
5,807.1651 148 885
133,28911 917
1,242,565139 482
25,3372873
229,03141 796
9.4001 597
80.77812 151
121,44228 555$50. under $100,000 . . . . . . . . . . . . . . . . . . . . . . . . . . . . . . . . . . . . . . . . .
$100,000 under $200,000 . . . . . . . . . . . . . . . . . . . . . . . . . . . . . . . . . . . . . . . . .
,83,259
, ,1,280,383
,10,325
. ,186,764
,1,209
,18.806
,269
,3,927
.609
,4,199
,15,459
$200,DDO under $500,DOO . . . . . . . . . . . . . . . . . . . . . . . . . . . . . . . . . . . . . . . . . 15,619 349.2B4 1,862 58,562 433 19,153 123 3,526 171 1.432 9,271
$500,ODO under $1,000.000 . . . . . . . . . . . . . . . . . . . . . . . . . . . . . . . . . . . . . . . . 1,580 53,055 219 12.180 63 5,139 24 3.067 36 291 5.093$1,000,DOO or more . . . . . . . . . . . . . . . . . . . . . . . . . . . . . . . . . . . . . . . . . . . . 547 27,345 61 3,670 23 . 6,140 8 9,349 21 167 2,501
All.returns, summary: a
Under $5,000 . . . . . . . . . . . . . . . . . . . . . . . . . . . . . . . . . . . . . . . . . . . . . . . . 568,439 1,477,864 122,598 374,248 42.105 98.103 6J46 13,552 7,095 42,377 16.587$5,000 under $10,000 . . . . . . . . . . . . . . . . . . . . . . . . . . . . . . . . . . . . . . . . . . . 1,452,214 5,772,323 399,277 1,417,781 137.546 499,988 62,973 1 236,152 33,202 214,688 149.148
$10,000 under $15,000 . . . . . . . . . . . . . . . . . . . . . . . . . . . . . . . . . . . . . . . . . . 2.077 59 3
2910 11 27
607,952 2,600297 171 Ifil 71112 90:3 49773 1 224.256 1 32,058 195,194,077
$15,000 under $20,000 . . . . . . . . . . . . . . . . . . . . . . . . . . . . . . . . . . . . . . . . . . :2,.97:02 4 07:1 17: 314 2 708,9531
3.791:206 203:5691
1097:474 44:476
11 205,283 1 25,376 , 159,72 2
161 6.9
$20,000 or more . . . . . . . . . . . . . . . . . . . . ... . . . . . . . . . . . . . 11,081,783 105,750,719 1.992,209 15,803,244 404,827
:3
189 696,577 1 38~512 1 255.12 346,775
:Fstima'e should be used with caution because of the small number of sarnple returns on which R is based.D. combined to avoid disclosure of information for specific taxpayers.
NOTE: Detail my not add to total because of rounding.

W;~ggjcIMO
;;f± (± z0. TOM" TstOSINAT ran!!Tz
0§19 -§ 00 S.t
0 c cZZ..;mamaMOOM""'Rmamma,Skit gi R 5R 5R
K a .0R qR IV-
...gamOw
.... c c......mammag,R R R R iR
Z,"
c.a 'aR R R 0; L
..... ... 0 wzz,; !! T919.... I wM---
.. ........
..........
oHU
. .8 .......- - - : : :
....: : : :
.... ...... . ...... ......... ...... ........ ..... .
......... ..... .
....
. . . ........ . . . . .
..... .
. ....
.................
.
..... .
ME ......... ......
N."Wo Ttwwww w 0 N "WMM
!VTPM. P ~3;gpp p
mWiM . Ni:w., 0I No.WN8!9"I~glw
.0~ 0 =wo NMHO ol i
wNwN4 0
,§c w,!!s
ppw- omwTMww mr2 Es
. 'N .Iw w "4 N
T. ?t. - -1449S , I.NNow
jw~-momww Nb,-.-8-2-tR-- 2
F
WNN'M= 88:3W4 rs -M
ng--
t:Ts~:~§
om
- ngnp. 8--- ----- -
.. . ...... .....
m os IQ .88o,2 ".wwoo~2 M8 S
P
------ ----- ---"WE
"Sow 8 Otir 'm !!w'" w w 'Now ~Nw-
"wI Mcl, ol
w..
MIRo. TgTtwo Swo w
mN.~.88
wl
N. No 8 w ol
ST .. 8
S-98c,
a §Q3w
GooWN 9TSIM9 t!Nlgw.
Ttg- 48-41

30 Taxpayers Classified by Sex
Table 4.-Joint Returns with Earned Income: Number of Returns by Size of Husband's and by Size of. Wife's Earned IncomeNumber of returns by size of wife's earned inc~ome
Size of Husband's earned uicome Number of No earned $1 under S1 000 $1.000 S2.000 under $3.0010 under S4,000 uncle, S5,000 under S6.000 underreturns Mome
.$3,000 -S4.000 S5.000 - $6,000 $7,000
(1) (2) (3) (4) (5) (6) (7) (8) (9)
All returns, total . . . . . . . . . . . . . . . . . . . . . . . 41,204,874 17,333,155 2,965,875 1,986,344 1,823,506 .. 1,641,049 1,542,193 1,575,094 1,727,214
No earned income . . . . . . . . . . . . . . . . . . . . . . . . . . 1.895,187 - 161.059 113,797 144,950 109,013 110,535 132,719 142,679$1 under S1.000 . . . . . . . . . . . . . . . . . . . . . . . . . . . 1,031,233 475,750 71,866 33,364 34.827 48,231 38,187 43,751 42.883$1,000 under $2.000 . . . . . . . . . . . . . . . . . . . . . . . . . 836,912 378,212 64,547 49.957 41,621 30.074 26,874 33,164 42.821$2,000 under $3,000 . . . . . . . . . . . . . . . . . . . . . . . . . 835,242 395,114 55.717 55.273 33.837 39.013 28,661 29.664 30,864$3.000 under $4.000 . . . . . . . . . . . . . . . . . . . . . . . . . 896,804 435,300 58,701 49,422 34,387 41,670 36,810 16,572 25,548
S4,000 under $5.000 . . . . . . . . . . . . . . . . . . . . . . . . . 973,381 459.144 87,411 40,807 31.693 37.403 36,866 44.607 433DOS5,000 under $6.000 . . . . . . . . . . . . . . . . . . . . . . . . 815,468 331,887 88,507 49.140 25,613 32,284 22,720 41,526 37.646S6,000 under $7,000 . . . . . . . . . . . . . . . . . . . . . . . . . 1,033.911 425.303 95.293 55,641 61.110 47,516 37.086 53,826 56,704$7,000 under $8,000 . . . . . . . . . . . . . . . . . . . . . . . . . 1,172,569 500.885 95,178 63,143 60,636 43.239 47.101 56,455 64,095$8.000 under $9.ODO ......................... 1;170,370 486,251 84,074 66,062 65,315 66,113 51.812 51,437 61.936S9,000 under $10,000 ........................ 1.309.758 514,349 102,400 67,280 56,434 60,551 43,931 60,646 89.618
$10,DOO under $15,000 ....................... 7.590,135 ~.849,853 510,202 356,664 324,654 311.555 341.395 342.620 389,368$15.000 under $20.000 ............ ........... 7761,044 3,069,369 494 241 370,992 367,841 329,882 270,609 274,782 300,281.$20,000 under $50,000 ....................... 12:739.158 6,223,823
:91 .4 44 580,698 51 2 1 420,210 431,5251 376,503 383.586
$50,000 under $100,000 ....................... 920,021
628,0591 43,631,2
2911
1
2 :40.21 425 15,0251 1113
2'11 2
$100.000 or more. . .. . . . ......... 223,681 1 159,8561 7,5211 4:992 3,8861 2:870 1 3,056:9 ~
12 3~
304
Number of returns by size of vvife's earned income-C~onfinuedSize of Husbantd's earned income S7,000 under $8.000 under S9.ODO under $10,000 under $15.000 under S20,000 under $50.000 under $100,000 or
$8,000 $9,000 $10,1)00 $15,000 $20,000 $50,000 S100,000 -=_0(10) 1) (12) (13) (14) (15) (16) (17)
All returns, total . . . . . . . . . . . . . . ... . . . . . . . . . . . . . . . . . . 1,549,875 1,272,325 4,199,189 1,529,777 700,693 19,280 7,249
No earned i come . . . . . . . . . . . . . . . . . . . . . . . . . . . . . . . . . . . . 120,880 108,435 103,197 368,401 162,490 109,933 5,670 1,429$1 under $1,000 . . . . . . . . . . . . . . . . . . . . . . . . . . . . . . . . . . . . . 33,093 18,629 29,617 82.473 44,602 33,449 257 254$1,000 under $2.ODO . . . . . . . . . . . . . . . . . . . . . . . . . . . . . . . . . . 26.893 19,274 16,017 69,809 19,314 - 18,025 -7$2.000 under $3.000 . . . . . . . . . . . . . . . . . . . . . . . . . . . . . . . . . . 25,247 22,880 17,923 60,217 27,579 13,105$3.ODO under $4,000 .................................. 32,075 24,152 23,290 80,186 23,015 15.473
S4,000 under $5,000 .................................. 40,266 25.439 18,715 65,423 28,448 13,111$5.000 under $6,ODO .................................. 31,701 45,983 15,827 62,963 15,508 12,759$6,000 under $7,000 .................................. 52,662 23,595 25,402 63,873 23,164 12,636$7,000 under $8,000 ................................... 55,678 32,176 85,072 26,110 9,129$8,000 under $9,000 .................................. 45,871 44.168 38,527 77,575 22,275 8,705 220 '29$9.0D0 under. $1 O.DOO .................................. 63,883 50,144 43.538 117,766 28,728 10,320 148
$10,000 under $15.ODO ................................ 372,040 368,905 305,499 820,209 224,558 71.149 1,282 182$15,000 under $20.000 ................................. 309,775 282,598 269,733 993.510 330,117 94,826 1,082 823$20,DOO under S50,000 ................................. 325,752 1 352,557 1 3 19,129 1 1,196.257 52 4 677 2 4 2
'4:3,601 1.198
$50,0W under $100,000 ................................ 11060 10,7701
01516 4518483 :
1 245. 1 2 6 :
29 3,8141 1 366$100,000 or more ........... ........... 2:999
12,342
11860
19607 2,199
1,312
'Estimate should be used with mution because of the small number of sample returns on hich it is based.NOTE: Detail may not add to total because of rounding.
I

Taxpayers Classified by Sex
Table 5 .-Joint Returns: Husband's Wages as a Percent of Total Form W-2 Wages, by Size of Adjusted Gross Income(All fiffures are estimates based on samples-money amounts are in thousands of dollars)
31
All joint returns Returns with age exemptions
Size of adjusted grow income Numbw of
Adjusted gross Salaries andNumber of
Adjusted gros Salaries and
returnsincome
law wagesfrom Total income tax
returns income less,
wages ro. Total inconte taxdeficit Form W-2 deficit Form W-2
(1) (21 (3) (4) (5) (6) (7)
All Adjusted Gross Income Classes
Joint returns, total . . . . . . . . . . . . . . . . . . . . . . . . . . . . . . . . . . . 44,855,141 1,048,174,783 861,502,353 161,081,195 4,933,570 88,903,440 26,872,065 15,419,495
Joint returns with salaries and wages from Form W-2, total . . . . . . . . . . . . 39.378,351 950,367,569 861,502,353 145,269,565 2.402,951 48.201.257 26,872,865 9,197,981
Husband's wages as a percent of total Form W-2 wages:
Zero . . . . . . . . . . . . . . . . . . . . . . . . . . . . . . . . . . . . . . . . . . . 2.540,536 41,051,808 21,818,775 5,180,431 680,083 9.116,107 5,055,394 1,057,862Under 10 percent . . . . . . . . . . . . . . . . . . . . . . . . . . . . . . . . . . . 529,987 10,112,135 8.492,329 1,291.074 54,859 1,064,163 675,210 153,82110 under 25 percent . . . . . . . . . . . . . . . . . . . . . . . . . . . . . . . . . 605,852 10,709,304 8,215,812 1,292,610 56,953 945,418 686,041 125,75725 under 50 percent . . . . . . . . . . . . . . . . . . . . . . . . . . . . . . . . . 2,314,498 51,608.102 48,046,257 7,113,568 115.104 1.996,276 1.468,518 269,15450 under 75 percent . . . . . . . . . . . . . . . . . . . . . . . . . . . . . . . . . 8,712,055 230,953,047 226,801.303 34,562.235 128,888 3,415,627 2,494,023 674.75475 under 95 percent . . . . . . . . . . . . . . . . . . . . . . . . . . . . . . . . . 6,395,211 164,381,578 157,647,710 24,868.697 89,750 2,776,013 1,966,982 686,81295 under 100 percent . . . . . . . . . . . . . . . . . . . . . . . . . . . . . . . . . 2,165,032 56,778,288 61,639,825 9,076,759 34.061 1,273.031 792.449 383.312100 percent . . . . . . . . . . . . . . . . . . . . . . . . . . . . . . . . . . . . . . 16,115,180 384,773,307 328.840.342 61,884.191 1,243,253 27,614,622 13,735,247 5,846,510
Under $5,000
Joint returns, total . . . . . . . . . . . . . . . . . . . . . . . . . . . . . . . . . . . 2,564,514 -593,249 6,605,121 70,072 764,839 1,615,290 1,051,446 10,365
Joint returns with salaries and wages from Form W-2, total . . . . . . . . . . . . 1,600,901 940,163 6,605,121 42.332 358.386 906.048 1,051.446 2.848
Husband's wages as a percent of total Form W-2 wages:
Zero . . . . . . . . . . . . . . . . . . . . . . . . . . . . . . . . . . . . . . . . . . . 351,101 277.160 1,181,099 1.667 116,916 344.560 380,977 100Under 10 percent . . . . . . . . . . . . . . . . . . . . . . . . . . . . . . . . . . . 32,059 -31.894 160,172 190 1,717 -1,593 12,57310 under 25 percent . . . . . . . . . . . . . . . . . . . . . . . . . . . . . . . . . 41.375 56,354 173,292 31 7,243 21,080 17,87825 under 50 percent . . . . . . . . . . . . . . . . . . . . . . . . . . . . . . . . . 70,573 68,597 342,629 206 4,403 14,051 28,43650 under 75 percent . . . . . . . . . . . . . . . . . . . . . . . . . . . . . . . . . 95,221 77.074 553,875 2.203 7,324 1,250 36,130 31675 under 95 percent . . . . . . . . . . . . . . . . . . . . . . . . . . . . . . . . . 109,665 66,325 660,937 3,411 10,941 22,669 31,300 10195 under 100 percent . . . . . . . . . . . . . . . . . . . . . . . . . . . . . . . . . 46,389 14,768 323,874 2.284 3,281 8.651 13,844100 percent . . . . . . . . . . . . . . . . . . . . . . . . . . . . . . . . . . . . . . 854,518 411,778 3.209,243 32.341 206,561 495,381 530,308 2,331
$5,000 under $10,000
Joint returns, total . . . . . . . . . . . . . . . . . . . . . . . . . . . . . . . . . . . 5,477,986 411,111M,1155 29,203,307 728,534 1,478,567 11,008,181 3,090,121 154,236
Joint returns with salaries and wages from Form W-2, total . . . . . . . . . . . . 4,052,671 31,261,151 29,203,307 564,324 638.836 4.699,371 3.090.121 70,508
Husband's wages as a percent of total Form W-2 wages:
Zero . . . . . . . . . . . . . . . . . . . . . . . . . . . . . . . . . . . . . . . . . . . 661.116 4,949,049 3.881,730 91,448 229,197 1,690,872 1,176.596 27.873Under 10 percent . . . . . . . . . . . . . . . . . . . . . . . . . . . . . . . . . . . 110,276 826,878 803,649 12,312 14.342 102,544 81.356 87810 under 25 percent . . . . . . . . . . . . . . . . . . . . . . . . . . . . . . . . . 119,117 947,786 928.727 24,948 15.223 117,657 106,661 2,26725 under 50 percent . . . . . . . . . . . . . . . . . . . . . . . . . . . . . . . . . 227,887 1,752,597 1,778.889 35,139 25.636 188,594 148,915 3,79150 under 75 percent . . . . . . . . . . . . . . . . . . . . . . . . . . . . . . . . . 338.147 2.688,605 2,829,759 58.195 19,364 146,901 133,258 3,01675 under 95 percent . . . . . . . . . . . . . . . . . . . . . . . . . . . . . . . . . 436.698 3,419,077 3,660,811 69,486 18,111 129,191 103,954 1.59095 under 100 percent . . . . . . . . . . . . . . . . . . . . . . . . . . . . . . . . . 191,971 1,498,473 1,545,416 24,630 10.041 71,925 56.222 1.123100 percent . . . . . . . . . . . . . . . . . . . . . . . . . . . . . . . . . . . . . . 1,967,459 15.178,687 13,774,326 248.165 306.922 2,251.686 1,283,158 29,972
$10JM under $15,0D0
Joint returns, total . . . . . . . . . . . . . . . . . . . . . . . . . . . . . . . . . . . 6,466,232 81,411,705 64,140,198 5,183,258 921,483 11,348,643 3,391,045 694,440
Joint returns with salaries and wages from Form W-2, total . . . . . . . . . . . . 5,537,520 69,958,333 64,140.198 4,553.289 441,413 5,437,263 3,391,045 349,582
Husband's wages as a percent at total Form W-2 wages:
Zero . . . . . . . . . . . . . . . . . . . . . . . . . . . . . . . . . . . . . . . . . . . 514,368 6,428,006 4,365,998 410.774 142,548 1.762,452 1,127,780 116,105Under 10 percent . . . . . . . . . . . . . . . . . . . . . . . . . . . . . . . . . . . 102,179 1,274,966 1,005,090 80.844 10,418 123,728 97,590 7,69910 under 25 percent . . . . . . . . . . . . . . . . . . . . . . . . . . . . . . . . . 129,054 1,639,257 1,411,993 115,030 8,452 107,145 83,105 6,73025 under 50 percent . . . . . . . . . . . . . . . . . . . . . . . . . . . . . . . . . 397,659 5,063,425 4,889,931 365,736 34,047 430,857 340,755 30,65050 under 75 percent . . . . . . . . . . . . . . . . . . . . . . . . . . . . . . . . . 736,643 9,478,041 9,696,731 665,327 17,081 207,484 150,941 12,61175 under 95 percent . . . . . . . . . . . . . . . . . . . . . . . . . . . . . . . . . 766,767 9,758,941 9.810,000 641,361 8,311 102,537 87,461 5.93795 under 100 percent . . . . . . . . . . . . . . . . . . . . . . . . . . . . . . . . . 292,887 3.768,837 3.733,314 249,850 3,664 45,938 34.284 3,2471 DO percent . . . . . . . . . . . . . . . . . . . . . . . . . . . . . . . . . . . . . . 2,597,963 32,546,860 29.227
,141 2,024,367 216,892 2,657,123 1.469,129 166,604
$15,000 or more
Joint returns, total . . . . . . . . . . . . . . . . . . . . . . . . . . . . . . . . . . . 30,346,409 925,450,171 761,553,727 155,M,330 1,768,691 64,931,325 19,340,253 14,570,454
Joint returns with salaries and wages from Form W-2, total . . . . . . . . . . . . 28,187,259 848,207,922 761,553,727 140,109,621 964,316 37,158,574 19,340,253 8.775,042
Husband's wages as a percent of total Form W-2 wages:
Zero . . . . . . . . . . . . . . . . . . . . . . . . . . . . . . . . . . . . . . . . . . . 1.013,951 29,397,593 12,389,948 4,676,542 191,422 5,318.222 2,370,041 913,783Under 10 percent . . . . . . . . . . . . . . . . . . . . . . . . . . . . . . . . . . . 285,473 8,042,185 6,523,418 1,197,728 28.382 839.484 483,692 145.24410 under 25 percent . . . . . . . . . . . . . . . . . . . . . . . . . . . . . . . . . 316,306 8,065,907 5,701.799 1.152.600 26,035 699,537 478,396 116,76025 under 50 percent . . . . . . . . . . . . . . . . . . . . . . . . . . . . . . . . . 1,618,379 44,723,483 .41,034.808 6,712,487 51,018 1,362,774 950,412 234,71350 under 75 percent . . . . . . . . . . . . . . . . . . . . . . . . . . . . . . . . . 7,542,044 218,709,327 213,720,938 33,836,510 85.119 3,059.992 2,173,693 658.81275 under 95 percent . . . . . . . . . . . . . . . . . . . . . . . . . . . . . . . . 5,082,081 151,137,235 143,515,962 24,154.439 52,387 2,521,616 1,743,267 679,18495 under 100 percent . . . . . . . . . . . . . . . . . . . . . . . . . . . . . . . . . 1,633,785 51,496,211 56,037.221 8,799,996 17,075 1.146,5171 100:M 1 378.943100 percent . . . . . . . . . . . . . . . . . . . . . . . . . . . . . . . . . . . . . .. 10,695.2401 336,635.9,81 282.629,632, 59,579,318, 512.8781
043222.21
0. S2:6~'25.647.603
01-ess than 500.NOTE: Detail may not add to total because of rounding.
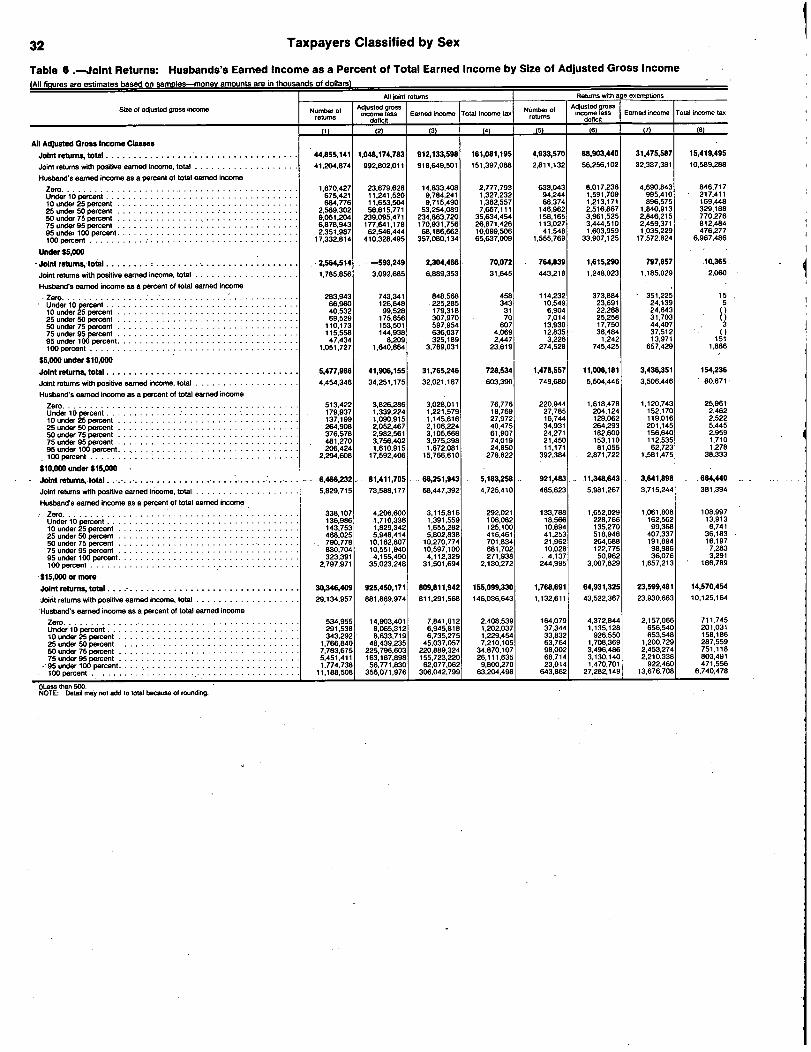
32 Taxpayers Classified by Sex
Table 6 .-Joint Returns: Husbands's Earned Income as a Percent of Total Earned Income by Size of Adjusted Gross Income
fAll finures are estimates based on samoles--monev amounts are in thousands of dollars)All joint returns Returns with a ge exemptions
Size of adjusted gross inoome Nurnow of Adjusted grossincome tess
IEamed incorne Total tnoorne tax
Number ofAdjusted grow
mcorne Is Eamed incorne Total income taxreturns defidt
returns defidt
(2) (3) (4) (5) (6) (7)
Ali Adjusted Gross Income Cluses
Joint returns, total . . . . . . . . . . . . . . . ... . . . . . . . . . . . . . . . . . . ",855,141 1,048,174,783 912,133,598 161,081,195 4,933,570 88,903,440 31,475,567 15,419,495
Joint returns with positive earned income. total ................... 41.204.874 992.802,011 918.649.501 151,397,088 2.811,132 56.256.102 32,337.381 10.589,288
Husband's earned income as a percent of total earned income
Zero..................... ...................... 1,670.427 23.679,628 14,833.408 2,777,793 633,043 8,017,236 4.690,843 846,717Under 10 percent ................................... 675,421 11,241,520 9.784,241 1,327.232 94,244 1.591,709 995.410 217,411
10 under 25 percent ................................ - 664,776 11.653,504 9,715,490 1.382.557 68.374 1,213,171 896,575 169,44825 under 50 percent ................................. 2.569,302 56,615,771 53,254.089 7.667,111 146,962 2,516.867 1,840,913 329.1 11850 under 75 percent . . . . . . . . . . . . . . . . . . . . . . . . . . . . . . . . . 9,061.204 239,095.471 234,863,720 35,634,454 158,165 3.961,525 2,846,215 770,27675 under 95 percent ................................. 6,878.943 177,641,178 170.931,756 26,871.426 113,027 3,444,510 2,459,371 812.484
95 under 100 percent................................. 2,351.987 62,546,444 68.186,662 10.099.506 41.548 1.603,959 1.035,229 476.277100 percent ...................................... 17,332,814 410,328,495 357,080,134 65,637,009 1.555.769 33,907,125 17,572,824 6,967,486
Under $5,000
Joint returns, total ........ ; .......................... -2,564,514 -593,249 2,304,466 - 70,072 764,839 1,615,290 797,857 10,365
Joint returns with positive earned income, total ................... 1,785,856 3,092.685 6,889.353 31,645 443,218 1,248.023 1.185.029 2,060
Husband's earned income as a percent of total earned income
Zero............................................ 283,943 743,341 848.568 458 114,232 373,884-
351,225 15Under 10 percent ................................... 66,960 126,648 .225,285 343 10.549 23,691 24,139 510 under 25 percent ................................. 40.532 99,528 179,318 31 6,904 22,2B8 24,643
25 under 50 percent ................................. 69.529 175.656 307,970 70 7,014 25,258 31,70350 under 75 percent . . . . . . . . . . . . . . . . . . . . . . . . . . . . . . . . . 110,173 153,501 597,954 607 13.930 17,750 44,407 375 under 95 percent . . . . . . . . . . . . . . . . . . . . . . . . . . . . . . . . . 115,558 144,938 636,037 4,069 12,835 38,484 37,512 )95 under 100 percent................................. 47,434 8,209 325,189 2,447 3,226 1.242 13,971 151100 percent ...............
.......... ........1,051,727 1,640.864 3,769,031 23,619 274,528 745,425 657,429 1.886
$5,000 under $10,000
Joint returns, total ................................... 5,477,986 41,906,155 31,765,246 728,534 1,478,657 11,008,181 3,436,351 154,236
Joint returns with positive earned income, total ................... 4,454,346 34,251,175 32,021.187 603,390 749,r.80 5,504,446 3,506,446 80,671
Husband's earned income as a percent of total earned income
Zero............................................ 513,422 3,826,286 3,028,011 76,776 220.944 1,618,478 1,120,743 25,961Under 10 percent .................................... 179,937 1,339,224 1,221,579 18,769 27.785 204,124 152,170 2,46210 under 25 percent ................................. 137,199 1,090,915 1.145,616 27,972 16,744 129,062 119,016 2,52225 under 50 percent ................................. 264.908 2,052,467 2,106,224 40,475 34,931 264,293 201,145 5,44550 under 75 percent ................................. 376,578 2,982,561 3.105,668 61,907 24,271 182,600 156.640 2,95975 under 95 percent ................................. 481,270 3.756,402 3,975,398 74,019 21,450 153,110 112,535 1,71095 under 100 percent................................. 206,424 1,610,915 1,672,081 24,850 11,171 81,055 62,723 1,278100 percent ........... : .......................... 2,294,608 17,592,406 15,766,610 278,622 392,384 - 2,871.722 1,581,475 38,333
$10,000 under $15,000
-Joint retunns, total . _. ~- a_. - ;-_. ~ ~. -- -I
--.
- . 6,,M,232 - -81,411,705 68,251,943 -5,193,258 -921,483 - -11,348,643 3,641,898 684,440
Joint returns YAM positive earned income, total .................... 5,829.715 73,588,177 68.447,392 4,725.410 485,623 5,981,267 3,715,244 381.394
Husband's earned income as a percent of total earned income
Zero............................................ 338,107 4.206.600 3,115,816 292,021 133,788 1,652,029 1.061,808 108,997
Under 10 percent ................................... 136,986 1,710,336 1,391.559 106,082 18,566 228,766 162.562 13,91310 under 25 percent .................................. 143,753 1,829,342 1,655,282 125,100 10,894 135,270 99,368 8,741
25 under 50 percent ................................. 468.025 5,948,414 5,802,838 416,461 41,253 518.948 407.337 36,18350 under 75 percent . . . . . . . . . . . . . . . . . . . . . . . . . . . . . . . . . 790,778 10,162,807 10,270,774 701,834 21,962 264,688 191,894 16,19775 under 95 percent ................................. 830,704 10,551,940 10,597,100 681,702 10,028 122,775 98,986 7,28395 under 1 DO percent................................. 323,391 4,155,490 4,112,329 271,938 4,137 50,962 36,076 3,291100 percent ...................................... 2.797,971 35,023,248 31,501,694 2,130.272 244,995 3.007.829 1,657,213 186,789
$15,000 or more
Joint retunns. total .................................... 30,346,409 925,460,171 809,811,942 156,01109,330 1,768,691 64,931,325 23,5",481 14,570,454
Joint returns with positive earned income, total ................... 29,134,957 881,869.974 811,291,568 146,036.643 1,132,611 43,522,367 23,930.663 10,125.164
Husband's earned income as a percent of total earned income
Zero........................................... 534,955 14,903,401 7,841,012 2,408,539 - 164,079 4,372,844 2,157,066 711,745Under 10 percent ................................... 291,538 8,065,312 6,945, 1 1 02,037 37,344 1,135,128 656,540 201,03110 under 25 percent ................................. 343,292 8,633,719 6.735. 75 1: 29,454 33,832 926,550 653.548 158,18625 under 50 percent ................................. 1.766,840 48,439,235 45,037,057 7,210,105 63,764 1,708.369 1,200,729 287,55950 under 75 percent ................................. 7.783,675 225,796,603 220,889,324 34.870,107 98,002 3,496.486 2,453,274 751,11875 under 95 percent ................................. 5,451,411 163.187,898 155,723,220 26,111,635 68,714 3,130,140 2,210,338 803,491
.'95 under 100 percent.................................1 774 738 83077156
62,077,062 9,800,270 23,014 1.470,701 922,460 471,556- 100 percent ....................................... : :11 1. 50. :91 :0356 71 76 306.042,799 63,204.496 643,862 27,282.149 13,676,708 6,740,478
OLess than SM.NOTE: Detail my riot add to total because of rotinding.
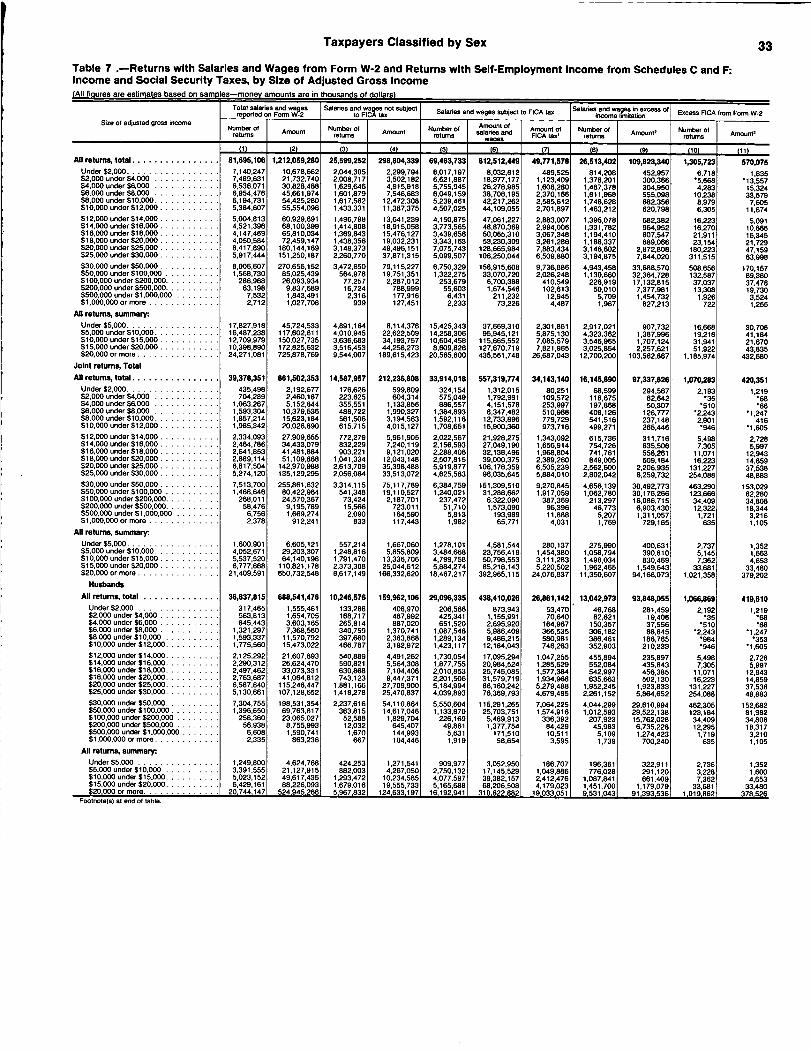
Taxpayers Classified by Sex
Table 7 .-Returns with Salaries and Wages from Form W-2 and Returns with Self-Employment Income from Schedules C and F:Income and Social Security Taxes, by Size of Adjusted Gross Income(All figures are estimates based on samples-money mounts are in thousands of dollars)
33
Total salaries and wagesre ad on Form W.2
Salaries and wartsto
FIC aTt subject Salaries and wages subject to FICA tax Salaries, ar%w znxcass ofeactaExcess FICA from Form W-2
Size of adjusted grossincome Number
of Amount Number oI Amount
Number of Amount of- rd
Amount of Number oI
Ammu t2 a`~=O' -~M'returns returns return = FICA tax' return r ,
--.W- (2) (3) (4) (5) (6) (7).
(8) (9) (10) 0 1)All returns, total . . . . . . . . . . . . . . . . 81,695,106 1,212,059,280 25,599,252 298,804,339 69,463,733 812,512,449 49,"1,578 26,513,402 109,823,340 1,305,723 570,075
Under $2,000 . . . . . . . . . . . . . . . . . 7,140,247 10.678,662 2,044,305 2,299,794 6,017.197 8,032,812 489.525 814,208 452,957 6,718 1,835$2,000 under $4,000 . . . . . . . . . . . . 7,489,631 21.732.740 2,008,717 3,502,182 6,621,887 18,377,177 1.123,409 1,378,201 300,366 -5,668 -13,557$4,000 under $6,000 . . . . . . . . . . . . 6,536.071 30,828,488 1,629,646 4,915,918 5,755,945 26,278,985 1,608,280 1,487,378 304,950 4,283 15,324$6,000 under $8,000 . . . . . . . . . . . . 6,954,476 45.661,974 1,601,879 7,546,683 6,049.159 38,708,195 2,370,166 1,81 l'9M 555,098 10,238 33,579$8,000 under $10,000 . . . . . . . . . . . . 6,194,731 54,425.280 1,617,562 12.472,308 5,239,461 42,217,262 2,585,612 1,748,628 682,356 8,979 7.605$10,000 under $12,DDO . . . . . . . . . . . 5,384.607 55.554.096 1,433,331 11.387,375 4,507,025 44,109,055 2,701,897 1,463,212 620,798 6,305 11,674$12,000 under $14,DDO . . . . . . . . . . . 5,004,813 60,929.691 1,496,798 13,641.239 4,150,875 47,061,227 2,883,007 1,395,078 682,382 16,223 5,091$14,000 under $16,DDO ........... 4,521,396 68,100,399 1.414,808 18,915,058 3,773,565 48,870,369 2,994,006 1,331,782 964,952 16,270 10.666$16,000 under $1 8,ODO ........... 4,147,469 65.810,034 1,369,843 15.476,127 3,439,656 50,065,310 3,067,348 1,194,410 807,547 21,911 16.345$18,000 under $20,DDO ........... 4,050.584 72,459.147 1,438,356 19,032.231 3,343,163 53,230,309 3,261,286 1,188,337 889.066 23,154 21.729$20,000 under $25,DDO ........... 8,417,890 180,144,169 3.148,373 49,496,151 7,075,743 128,665,984 7,883,434 3,146,602 2,872,808 180,223 47,159$25,000 under S30,ODO . . . . . . . . . . . 5,917,444 151,250,187 2,260,770 37,871,315 5,099,507 106,250,0" 6,509,880 3,194,875 7,844,020 311,515 63.998$30,000 under $50,000 ........... 8,006.607 270,656,152 3.472,650 79,115,227 6,750,329 158,915,608 9,736,886 4,943,458 33,688,570 508,656 170,157$50,000 under $100,1300 .......... 1,568,730 85.025,439 564,978 19,751,351 1,322,275 33,070,720 2.026,248 1,130,660 32,364,728 132,587 89,380$100,000 under $200,000.......... 286,968 26,093.934 77,257 2,287,012 253,679 6,700,3B8 410,549 226,919 17,132,815 37,037 37,478$200,000 under $500,000 .......... 63,198 9.837,689 16,724 788,999 55,603 1,674,546 102,613 50,010 7,377,981 13,308 19,730$500,000 under $1,000,000 ........ 7,532 1.843,491 2,316 177,916 6,431 211,232 12,945 5,709 1,454,732 1.926 3,524$1,ODO,000 or more ............. 2,712 1,027,708 939 127,451 2,233 73,226 4,487 1,967 827,213 722 1,255
All returns, summary:
Under $5,000 ................. 17,827,918 45,724,533 4,891,164 8,114,376 15,425,343 37,669,310 2,301,861 2,917,021 907,732 16,668 30,706$5,000 under $10,DDO............ 16.487,238 117,602,611 4.010,945 22,622,509 14,258,306 95,945,121 5,875,130 4,323,362 1,387,996 19,218 41,184$10,000 under $15,000 ........... 12,709,979 150,027,735 3,636.683 34,193,757 10,604,458 115,665,562 7,085,579 3,546,965 1,707,124 31,941 21.670$15.000 under $20,DDO ........... 10,398,890 172,825,632 3,516,453 44,258,273 8,609,826 127,670,719 7,821,965 3,025,854 2,257,621 51,922 43,835$20,000 or more ............... 24.271,081 725.878,769 9.544,007 189,615,423 20,565,800 435,561,748 26,687,043 12,700.200 103,562,867 1,185,974 432,680
Joint returns, Total
All returns, total................ 39,378,351 861,502,353 14,587,957 212,236,808 33,914,010 557,319,774 34,143,140 16,145,890 97,337,626 1,070,283 420,351Under $2,000................. 435,498 2.192,677 176,626 599,809 324,154 1,312,015 80,251 68,599 294,667 2,193 1,219$2,000 under S4,000 . . . . . . . . . . . . 704.289 2,460,187 223,625 604,314 575,049 1,792,991 109,572 118,675 82,642 '68$4,000 under $6,000 ............ 1,063.267 5,152,844 355,551 1,133,856 886.557 4,151,578 253,997 197,868 50,307 '510
.66$6,000 under $8,000 ............ 1,593,304 10,379,536 488,722 1,990,327 1,384,893 8,347,482 510,968 408,126 126.777 -2,243 -1,247$8,000 under $10,000 ............ 1,857,214 15.623.184 561,506 3,194.563 1,592,116 12,733,896 779,729 541,516 237,148 2,901 416$10,000 under $12,000 ........... 1,985,342 20,026.890 615,715 4.015,127 1,708,651 15,900,360 973,716 499,271 265,446 -1,605$12,000 under $14.000 ........... 2,334,093 27.909,655 772,279 5,961,905 2,022,567 21,928,275 1,343,092 615,736 311,716 5,498 2,728$14,ODO under $16,000 ........... 2,464,786 34.433.079 832,229 7,240,119 2,156,593 27,049,190 1,656,914 754,726 635,506 7,305 5,997$16,ODO under $18,000 ........... 2,641,853 41,481,884 903,221 9,121,020 2,288,406 32,138,496 1,968,804 741,761 558,261 11,071 12.943$18,000 under $20.000 ........... 2,889,114 51,109,868 1.041,334 12,043,148 2,507.815 39,DOO,375 2,389,260 949,005 609.184 16,223 14,859$20,000 under $25.000 ........... 6,817.504 142,970,988 2.613,709 35,398,488 5,919.877 106,176,359 6,505,239 2,562,6DO 2,206,935 131,227 37,538$25,000 under $30.000 ........... 5,274,120 135,129.295 2,056,064 33,513,072 4,625,583 96,035,645 5.884,010 2,802,042 6,259,732 254,088 48,883S30,000 under $50.000 ........... 7,513.700 255,861,632 3.314,115 75,117,789 6,384.759 151,309,510 9,270,B45 4,656,139 30,492,773 463,290 153,029$50,000 under $100,000 .......... 1,468,646 80,422,964 541,348 19,110,527 1,240,021 31,288,662 1,917,059 1,G62,780 30,176,266 123,666 82,280$100,000 under $200,000.......... 268,011 24.570.367 73,424 2.187,701 237,472 6,322,090 387,369 213,297 16,086,715 34,409 34,808$200,000 under $500,000 .......... 58,476 9.195,789 15,566 723,011 51,710 1,573,090 96,396 46,773 6,903,430 12,322 18,344$500.ODO under $1,000.000 ........ 6.756 1,669,274 2,090 164,590 5,813 193,989 11,888 5,207 1,311,057 1,721 3,216$1,000,DDO or more ............. 2.378 912,241 833 117,443 1.982 65,771 4,031 1.769 729,165 635 1,105
All returns, summary:
Under $5,000 ................. 1,600.901 6,605.121 557,214 1.667,060 1,278,101 4,581,544 280.137 275,990 400,631 2,737 1,352$5,000 under $10.000 ............ 4,052.671 29,203,307 1.248,816 5,855,809 3,484.668 23,756,419 1,454,380 1,058,794 390.810 5,145 1,663$10,000 under $15,000 ........... 5,537.520 64.140,198 1,791,470 13,336,706 4,799.758 50,798,553 3,111,283 1.498,034 830,469 7,362 4,653$15,000 under $20,000 ........... 6,777,668 110.821.178 2,373,308 25,044,612 5,884,274 85,218,143 5,220,502 1,962,465 1,549,643 33,681 33,480$20,000 or more............... 21,409,591 650,732.548 8,617,149 166,332,620 18,467,217 392,965,115 24.076,837 11,350,607 94,166,073 1.021,358 379,202Husbands
All returns, total .............. 36,837,815 686,541,476 10,246,576 159,962,106 29,096,335 438,410,026 26,861,142 13,042,973 93,848,055 1,066,969 419,610Under $2.000 ............... 317,465 1,555.461 133,286 408,970 206.566 873,943 53,470 46,768 281,459 2,192 1,219$2,000 under $4,000 ........... 563.813 1,654,705 168,717 487,992 425,341 1,165,991 70,640 82,621 19,406 '68$4,000 under $6,000 ........... 845.443 3,603,165 265,814 887,020 651,520 2,695,920 164.967 150,357 37,556 W$6,000 under $8,000 ........... 1,321,297 7,368,560 340,759 1,370,741 1,087,548 5,986,409 366,535 306,182 88,845 -2,243$8,000 under $10,000 .......... 1,593,337 11,570,792 397,680 2,383,868 1,289,134 9,486,215 580,981 386.461 186,765$10,000 under $12,000 .......... 1,775,560 15,473.022 466,787 3,182,972 1,423,117 12,184.043 746,263 352,903 210,233 -1,605$12,000 under $14,000 .......... 2,125,292 21,607.893 540,889 4,491,262 1.730,054 17,095.294 1,047,255 455.894 235,897 5,498 2,728$14,000 under $16,000 .......... 2,290,312 26.624.470 590,821 5,564,308 1,877.755 20,984,524 1.285,629 552,084 435,843 7,305 5,997$16,000 under $18,000 . . . . . . . . . . 2,497,462 33,073,331 630,868 7.104,406 2,010,853 25.745,085 1,577.384 542,997 456,385 11,071 12,943$18,000 under $20,000 ........ . 2,763,687 41,064.812 743.123 9,447,371 2.201,506 31,579.719 1,934,968 635,663 502.130 16,223 14,859$20,000 under $25,000 .......... 6,587.840 115.246,447 1,881,166 27.709,900 5,184,994 86,160.242 5,279,488 1,952,245 1,923,833 131,227 37,538$25.000 under S30,000 .......... 5,130.661 107,128,652 1,418.278 25,470,837 4,039,893 76,369,793 4,679,495 2,261,152 5,864,652 254,088 48,883$30,000 under $50,000 .......... 7,304,755 198,531.354 2,237,616 54.110,864 5,550,604 115,291,265 7,064,225 4,044,299 29,610,994 462,305 152,682$50,000 under $100,000 ......... 1,396.650 69,763,817 363,815 14,617,046 1,133,870 25.703,751 1,574,916 1,012,593 29,522,138 123,184 81.982$100.000 under $200,000 ........ 258,360 23,065.027 52,588 1,829,704 226,169 5,489,913 336,392 207,923 15,762,028 34,409 34,808$200,000 under $500.000 ........ 56,938 8.755,993 12,032 645,407 49.861 1,377.754 84,429 45,983 6,735.228 12,295 18,317$500,000 under $1.000,000 ....... 6.608 1,590,741 1,670 144,993 5,631 171,510 10,511 5,109 1,274,423 1,719 3,210$1,000,000 or more ..... ...... 2,335 863,236 667 104,446 1,919 58,654 3,595 1,739 700,240 635 1,105
All returns, summary:
Under $5,000 ............... 1,249' 00
14 2 7'6 4
424,253 1.271541909 9 7 7
3,052,950 186,707 196,361 322,911 2,736 1,352$5,000 under $10,000 ..........
13,39 :5 55 21 :1 2 7:915 882.003
504,267:0 :2.7,10 1 3 2 17,145,529 1,049,886 776,028 291,120 3,228 1,600
$10,000 under $15,000 .......... 5,023152 49617435 2934721
023451
39382157 2412476 1087841 661,409 7.362 4,653$15,000 under $20,000 .......... 6,429:161 88:226:093
1 11 :679:016 19:555:7 68:206:508 4:179:023
1:451:700
11.179PO79 33!681 33,480
$20.000 or more.............. 20.744,1471 524,945,266 ;.967,832, 124,633.1 310,622,882 19,033,051
.
531,0439. 91,393536, ,J..19S62
378,526ootnote(s) at end of
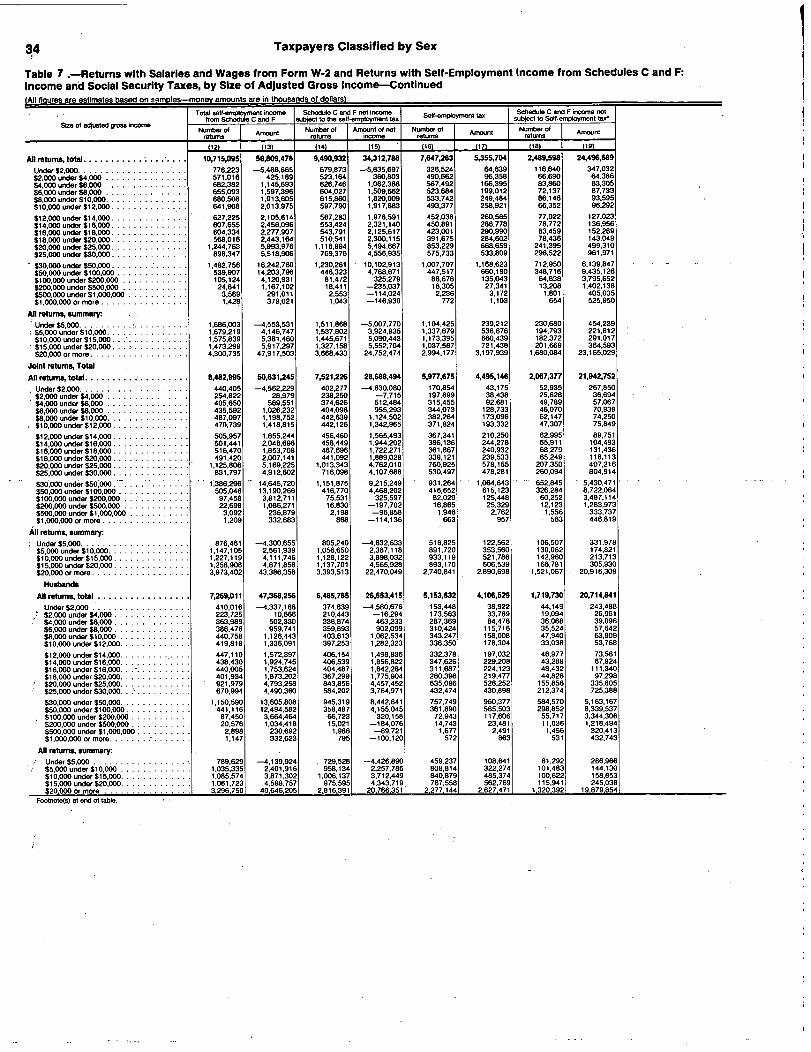
34 Taxpayers Classified by Sex
Table 7 .-Returns with Salaries and Wages from Form W-2 and Returns with Self-Employment Income from Schedules C and F:Income and Social Security Taxes, by Size of Adjusted Gross Income-Continued(All figures are estimates based on aRmDies--monev amounts are in incrusancis or aoijarsi -
TOW SM= or"O127
ScheduleC
F not inixinie Self_e~t taxSchedule C and F wiccme rw)t
from C subpact to the self-a~nt tax subject to Self mptoyinant tax-Size of adjusted gross =orne
Number Of Armiunt Number of Arriotint of not Nuffe" Of ntN.Mber of I
Airicoritreb.1-3 returns i~ rehirns retum
(13) 14 (15) 16 (17) (18) (19)
Ail returns, total ..................... 10,715,095
1
58,80,476 9,490,932
r%
34,312,786 7,647,263
1
5,355,704 Z489,598 24,496,689
Under $2.000 776,223 -5,488,665 679.873 -5,835,697 326.524 64,639 116,640 347,032
$2.000 undw 571,016 425,189 523,164 360.803 490,662 96,358 66,690 64,386
S4,000 under S8,ODO . . . . . . . . . . . . . . . 682,382 1,145.693 626,746 1.062.388 567,492 166,395 83,860 83,305
$6,000 under $8.000 . . . . . . . . . . . . . . . 655,093 1.597,396 604,027 1,509,662 523.684 199,012 72.137 87,733
$8,000 under $10,000 ............... 680.508 1.913,605 615,860 1,820,009 533,742 249,484 86.146 93,595
$10.000 under $12,000 .............. 641.908 2.013,975 597.790 1,917.683 493,377 258,921 66,352 96,292
$12,000 under $14.000 ............... 627,225 2,105,614 567.283 1,978,591 452,038 260,585 77.022 127,023
$14,000 under $16,000 .............. 607,655 2,458.096 553.424 2,321,140 450,891 286.778 78,772 136,956
$16,DDO under $18,000 . . . . . . . . . . . . . . 604,334 2,277.907 543,791 2,125,617 423,001 290.990 83,459 152.289
$18.000 under $20.ODO .............. 568,016 2.443,164 510,541 2,300,115 391,675 284.602 78.436 143,049
$20,000 under $25.000 .............. 1,244.763 5.993,976 1,110,994 5,494,667 853.229 668,659 241,395 499,310
$25.000 under $30.000 .............. 898.347 5.518,906 769,376 4,556.935 575.733 533,809 296,522 961,971
$30,000 under $50,000 ............... 1,482,756 16,242,760 1,230.261 10,102,913 1.007,707 1,168,623 712,950 6,139,847
$50,000 under $100,000 ............. 539,907 14,203,796 446,323 4,768.671 447,517 660.190 348,716 9,435.126
$100,000 under S200.000 ............ 105,124 4,120,931 81,472 325,279 88,678 135.043 64,838 3,795.652
$M,000 under $500.00D ............ 24,841 1,167.102 18,411 -235,037 18,305 27,341 13,208 1.402.138
$500,000 under $I.ODD.000 ........... 3,569 291,011 2,553 -114,024 2.236 3,172 1,801 405,035
$1.000.000 or more . . . . . . . . . . . . . . . . 1.428 379,021 1.D43 -146.930 772 1,103 654 525,950
An returns, summarr.
Under $5,000.......... :.......... 1,686,003 -4,553,531 1,511.868 -5,007,770 1.104.425 239,212 230.680 454,239
$5,000 under $10,000 ............... 1,679,219 4,146,747 1,537,802 3,924,935 1.337,679 536,676 194.793 221.812
$10,000 under $15.000 ............... 1,575,839 5,381,460 1,445,671 5,090,443 1,173,395 660,439 182,372 291,017
$15,000 under $20.000 ... .......... 1.473,299 5,917.297 1,327,158 5,552,704 1,037,587 721,438 201,669 364.593
$20,000 or more .................. 4,300,735 47.917,503 3,668,433 24,752,474 2,994,177 3,197,939 1.680,084 23.165,029
Joint returns, Total
Ali returns, total................... 8,482,"S 50,631,245 7,521,226 28,688,494 5,977,675 4,495,146 2,067,377 21,942,752
Under $2,000.................... 440,405 -4,562,229 402.277 -4.830,080 170,854 43.175 52,935 267,850
$2,000 under S4,000 ............... 254,822 28,979 238,250 -7,715 197,899 38,438 25,628 36,694
$4,ODO under $6.000 ............... 405,650 569,551 374,626 512,484 315,455 92,681 49,789 57,067
$6,000 under $8,000 ............... 435,592 1,026,232 404,098 955,293 344,073 128,733 46,070 70,939
$8,000 under $10,1300 ............... 487,097 1,198.752 442,639 1,124.502 382,264 173.096 62,147 74,250
$10.000 under $12.000 .............. 470,739 1,418.815 442,126 1,342.965 371,824 193,332 47,307 75,849
$12.000 under $14,ODO .............. 505,957 1,655,244 456,460 1,565,493 367,341 210,250 62.995 89,751
$14,000 under $16.000 .............. 501,441 2,048,696 458,449 1.944,202 386,136 244,278 65,911 104,493
$16,000 under $18,000 .............. 516,470 1,853,708 467,696 1,722,271 361,867 240,932 68,279 131,436
$18,000 under $20,000 .............. 491,420 2,007,1411 441,092 1,889,028 339,121 239,533 65,249 118,113
$20.000 under $25,000 ...............
1,125,806 5,169,225 1.013,343 4,762,010 760,925 578,155 207,350 407,216
S25.000 under $30,000 .............. 831,797 4,912.602 716,098 4,107.688 530,497 478,281 260.094 804,914
$M,001) under $50.ODO_ 7. 7. _1.386.2~96 14,645,720 1.151.875 9,215,249 931-.264 -1,064,643 -652.845 -5,430.471
$50,000 under $100,DOO ............. 505.046 13,190,266 416,770 4,468,202 416.652 615,123 326,284 8.722,064
$100,000 under $200,ODO ............ 97,458 3,812,711 75,531 325,597 82,029 125,448 60,252 3,487,114
$200,000 under $500,000 ............ 22,698 1,086,271 16,830 -197,702 16,865 25.329 12,123 1,283,973
$500.000 under $1,000,000 ........... 3,092 236,879 2,198 -96,858 1,946 2.762 1,556 333,737
$1,000,000 or more ................ 1,209 332,683 868 -114,136 663 957 563 446.819
ill returns, summary:
Under $5,000.................... 876,461 -4,3DO,655 805,240 -4,632,633 518,825 122,562 106,507 331,978
$5,000 under $10,000 ............... 1,147,105 2,561,939 1,056,650 2,387,118 891,720 353.560 130,062 174,821
$110.000 under $15,000 .............. 1,227.119 ' 4,111,746 1.128,122 3,898,032 933,119 521.786 142,960 213,713
$15,000 under $20.ODO .............. 1258908 4871858 1,137,701 4,565,928 893,170 606,539 166,781 305.930
$20,000 or more .................. 3:973:402 43:386:358 3,393,513 22,470.049 2.740,841 2,890,698 1,521.067 20,916,309
Husbands
All returns, total ................. 7,269,011 47,368,256 6,485,785 26,653,415 S,153,632 4,106,529 1,719,730 20,714,841
Under SZODO .................. 410.016 --4,337,188 374,B39 -4,580,676 153,448 38,922 44,149 243,488
$2,ODO under S4,000 .............. 223,725 10.666 210,443 -16,294 173,563 33,789 19,094 26,961
$4,000 under $6,000 .............. 363,989 502,330 338,874 463,233 287,369 84,478 36,068 39,096
$6,000 under $8,000 .............. 386.476 959,741 359,893 902.099 310,424 115.716 35.524 57,642
$8,000 under $10,000 ............. 440,758 1,126,443 403,613 1.062,534 343,247 158,008 47,940 63,909
$10,000 under $12,000............. 419,818 1,336,091 397,253 1,282,323 336,350 178,304 33,038 53.768
$12,000 under $14.ODO............. 447.110 1,572,397 406,154 1,498,836 332,378 197.032 46,977 73,561
$14.DDO under $16,000............. 438,430 1,924.745 406,539 1,856,822 347,626 229,208 43,288 67,924
$16.0W under $18.000.............. 440,005 1.753,624 404,487 1,642,284 311,687 224,123 48,432 111,340
$18,000 under $20,000............. 401,934 1.873,202 367.299 1,775,904 280,396 219,477 44.828 97,298
$20.000 under $25,000............. 921,979 4,793,258 843,856 4.457,452 635,096 526,252 155,856 335,805
$25,000 under S30,000... .......... 670,994 4,490,360 584,202 3.764,971 432,474 430,898 212.374 725.388
$30,DDO under $50,000............. 1,150,590 13,605.808 945,319 8,442,641 757,749 960,377 584,570 5,163,167
$50,000 under $100,000 ............ 441,116 12,494,582 358,487 4,155.045 361,890 565,503 298,852 8,339.537
$100,000 under $200,000 ........... 87,450 3,664,464 66.723 320.158 72.943 117.606 55,717 3,344,306
$200,000 under $500,000 ........... 20,576 1,034,418 15.021 -184,076 14.743 23.481 11,036 1,218,494
$500.000 under $1,ODO,000 .......... 2,898 230,692 1,988 --89,721 1,677 2,491 1.456 320,413
$1,000,000 or more....... : ....... 1,147 332,623 795 -100,120 572 863 531 432,743
All returns, summary.
Under $5,000 ................. 789,629 -4,139.924 729,528 -4,426.890 459237 108,641 81,292 286,966
$5,000 under $10,000 ............. 1.035,335 2.401,916 958,134 2,257.786 808:814 322 274 4831
0'
144,130
$10,000 under $15,000 ............. 1.085,574 871 30231.006.137 3,712,449 840,879
:
'M 374
:
too622 158.853
$15,000 under $20,000....... 1 061 j723:
4 588:757
1
975,595
1
!343 719
4
767.558 562 769 115 94
1
245,038
$20,000 or more
:23 .
750,
40646,205 2816391
:
0
7.
3512 2 277,144 ~2E
1
19,879,854 ,
Footnote(s) at end of table.
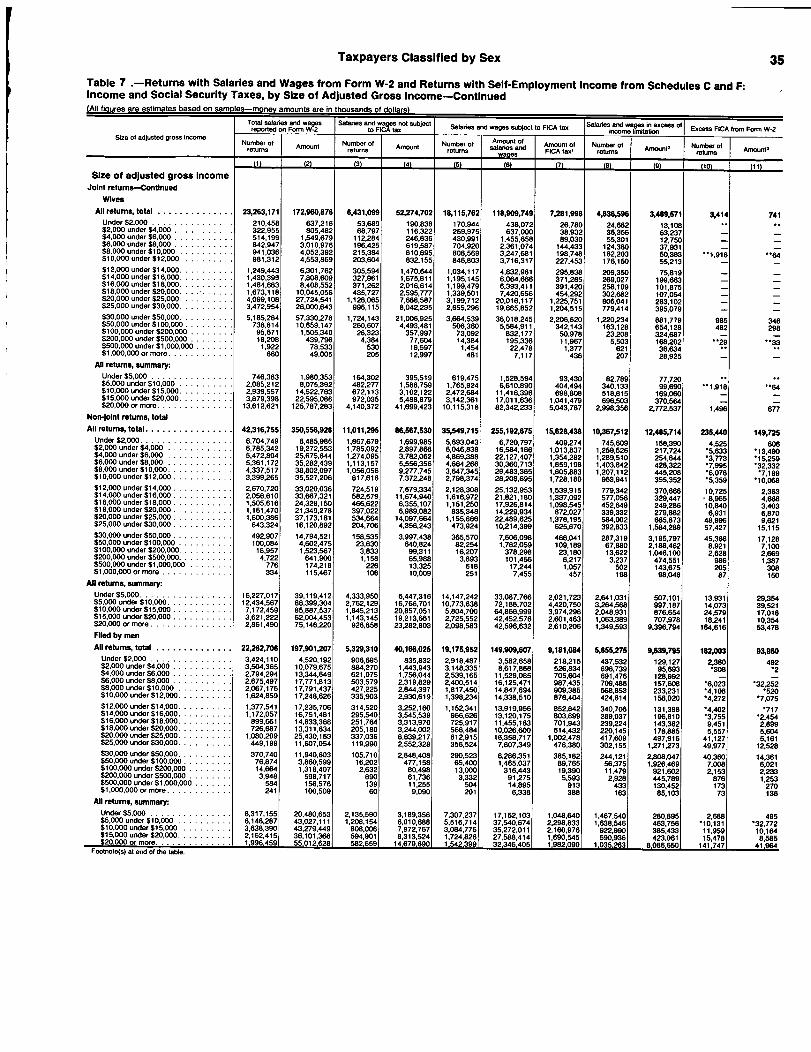
Taxpayers Classified by Sex
Table 7 .-Returns with Salaries and Wages from Form W-2 and Returns with Self-Employment Income from Schedules C and F:Income and Social Security Taxes, by Size of Adjusted Gross Income-Continued
35
Total salaries S=~a?es Salaries and ars rt subjectSalenss and wages Subject to FICA tax Salaive%an~wages=cess Of
E FICA f F W2
reported onF W F
toIC a re mr
xceis rom orm -2Size of adjusted gross income
Number ofr t
Amount Number ofAmount Number of
Amount ofsa a nd
Amount of Number ofAmount2 Number of
A M3e urns returns returns ~r..:FICA tax' returns returns mou
(1) t2) (3) (4) (53 (6) (7) (9)
Size of adjusted gross IncomeJoint retums-Continued
Wives
All returns, total . . . . . . . . . . . . . . 23,263,171 172,960,876 6,431,M 5Z274,702 18,115,762 118,909,749 7,281,998 4,636,596 3,489,571 3,414 741Under $2,000 . . . . . . . . . . . . . . . 210,458 637,216 53.689 190,838 170,944 438,072 26,780 24,682 13 108$2.000 under $4.000 ........... 322,955 805,482 68,797 116,322 269,975 637,000 38,932 36,356
,63 237S4,000 under $6,000 ........... 514.199 1.549,679 112,284 246,836 430,991 1,455.658 89,030 55,301
,12 750
$6,000 under S8,000 ........... 842,947 3.010,976 196,425 619,587 704,920 2,361,074 144,433 124,380,
37 931S8,000 under $10,000 . . . . . . . . . . 941,036 4,052,392 215,384 810,695 808,569 3,247.681 198,748 182,203
,50,383 --1 918
$10,000 under $12,000 . . . . . . . . . . 981,312 4,553,869 203,604 832,155 846,803 3.716,317 227,453 176.150 55,213,
$1 2,000 under $14,DOO.......... 1,249,443 6,301,762 305,594 1,470,644 1,034,117 4,832,981 295,838 209,350 75 819$14,000 under $16,000 .......... 1,430,399 7,808.609 327,961 1,675.811 1,195,145 6,064.666 371.285 269,027,
199 663$16.000 under $18,DOO.......... 1,484,683 8,408,552 371,262 2,016,614 1,199,479 6,393,411 391,420 258,109
.101 875
$18,000 under $20,000.......... 1,673.118 10,045,056 435,727 2,595,777 1,339,501 7,420,656 454,292 302,682.
107 054$20,000 under $25,000 .......... 4,099,108 27,724,541 1.128,065 7,688.587 3,199.712 20.016,117 1,225,751 806,041
,283 102
$25,000 under $30,000 .......... 3,472.954 28,000,643 996,115 8,042.235 2,655,296 19.665.852 1,204,515 779,414,
395,079 -$30.000 under $50,000 .......... 5,185,284 57,330.278 1,724,143 21.006,925 3,664,539 36,018,245 2,206.620 1.220.234 881 779 985 346$50,000 under $100.000 . . . . . . . . . 738.814 10,659,147 260,607 4,493,481 506,360 5,584,911 342,143 163,128
,654 128 482 298
$100,000 under $200,000 ........ 95,671 1,505,340 26,323 357,997 73,092 832.177 50,978 23,208,
324,687 - -$200,000 under $500,000 ........ 18,208 439,796 4,384 77,604 14,384 195,336 11,967 5,503 168 202 -3$500.000 under $1,000,DOO ....... 1,922 78,533 530 19,597 1.454 22,478 1,377 621
,36 634
$1,000,000 or more............ 660 49.005 205 12.997 481 7.117 436 207.
28.925All returns, summary.
Under $5,000 ............... 746,383 1,980,353 164,302 395.519 619,475 1,528,594 93.430 82,789 77 720$5,000 under $10,000 .......... 2,085,212 8,075.392 482,277 1,588.759 1,765,924 6,610,890 404,494 340,133
.99.690 -.1 918 ..64$10.000 under $15,DOO.......... 2,939,557 14,522,763 672,113 3,102,122 2,472,6B4 11,416,396 698,808 518,815 169 060
,-
$15.000 under $20,000.......... 3,879,398 22,595,086 972,035 5,488,879 3,142,361 17.011,636 1,041,479 696,503,
370 564 - -$20,000 or more.............. 13,612,621 125.787,283 4.140,372 41,699,423 10,115,318 82,342,233 5,043,787 2.998.356
,2.772,537 1.496 677
Nonjoint retums, total
All returns, total................ 42,316,755 350,556,928 11,011,295 86,S67,530 35,549,715 25S, 192,675 15,628,438 10,367,512 12,485,714 235,440 149,725Under $2,000................. 6,704,749 8,485.985 1,867,679 1,699.985 5,693,043 6,720,797 409,274 745,609 158.390 4 525 606$2.000 under $4,000 ............ 6,785,342 19,272.553 1,785,092 2,897.868 6,046,838 16,584,186 1,013,837 1,259,526 217.724
,'S 633 '13 490
$4.000 under $6,000 ............ 5,472,804 25,675,644 1,274,095 3,782,062 4,869,388 22,127,407 1.354,282 1,289,510 254,644.
-3.773.
'15 259$6,000 under S8,000 ............ 5,361,172 35,282,439 1,113,157 5,556,356 4,664,266 30,360,713 1,859,198 1,403,842 428,322 -7,995.
'32 332$8,000 under $10,000 ............ 4,337,517 38,802,097 1.056,056 9.277,745 3,647,345 29,483,365 1,805,883 1,207,112 445,208 *6 078
,-7 189
$10,000 under $12,000 . . . . . . . . . . . 3,399,265 35,527,206 817,616 7,372,248 2,798,374 28,208,695 1,728,180 963,941 355,352,
*5,359,
'10.068$12,000 under $14,000 ........... 2,670,720 33.020,036 724,519 7,679,334 2,128.308 25,132.953 1,539,915 779,342 370,666 10 725 2 363$14,000 under $16,000 ........... 2,056.610 33,667,321 582,579 11,674,940 1.616.972 21,821,180 1,337,092 577.056 329."7
,- 8 965
.4 668$16,000 under $18,000 ........... 1,505,616 24,328,150 466,622 6,355,107 1,151.250 17,926,814 1,098,545 452,649 249,286
,10,840
,3 403
$18,000 under $20,000 ........... 1,161,470 21,349,278 397,022 6,989,082 835,348 14,229,934 872,027 339.332 279,882 6,931,
6 870$20,000 under $25,000 ........... 1,600,386 37.173,181 534.664 14,097.664 1,155.866 22,489,625 1,378.195 584,D02 665.873 48 996,
9 621$25,000 under $30.000 ........... 643,324 16,120,892 204,706 4,358,243 473,924 10,214,399 625,870 392,833 1,584,289,
57,427,
15,115$30,000 under $50,000 ........... 492,907 14,794,521 158.535 3,997.438 365,570 7,606,098 466.041 267,319 3,195,797 45 366 17 128$50.000 under $100.000 .......... 100,084 4,602,475 23,630 640,824 82,254 1,782,059 109,189 67,880 2 188 462
,8 921
,7 100
$100.000 under $200,DDO .......... 18,957 1,523,567 3,833 99,311 16.207 378,298 23,180 13,622, ,
1,046,100,
2 628.
2 669$200,000 under $500,DOO.......... 4,722 641,900 1,158 65,988 3,893 101.456 6,217 3,237 474,551,986
,1 387
$500.000 under $1,ODO,000 ........ 776 174,218 226 13,325 618 17,244 1,057 502 143 675 205,308$1,000,000 or more ............. 334 115,467 106 10,009 251 7.455 457 198
,98,048 87 150
All returns, summary.
Under $5,000 ............. ... 16,227,017 39.119,412 4.333,950 6,"7,316 14,147,242 33,087,766 2,021,723 2,641,031 507,101 13 931 29 354$5,DDO under $10.000 ............ 12,434,567 88,399.304 2,762,129 16,766.701 10,773,638 72,188.702 4,420.750 3,264,568 997,187
,14 073
,39 521
$10.000 under $15,000 ........... 7,172,459 85,887,537 1,845.213 20,857.051 5,8U.700 64,866,999 3,974,296 2.048,931 876 664,
24 579,
17 018$15,000 under $20,000 ........... 3,621,222 62,004,453 1,143,145 19,213,661 2,725,552 42,452,576 2.601,463 1,063,389
,707,978
,18 241
,10 354$20,000 or more ............... 2,861,490 75,146,220 926.858 23.282,803 2.098,583 42,596,632 2,610.206 1,349,593 9,396.794
,164.616
,53,478
Filed by men
All returns, total .............. 22,262,706 197,901,207 5,329,310 40,166,025 19,175,952 149,909,607 9,181,094 5,655,275 9,639,795 182,003 93,980Under $2,000 ............... 3,424.110 4,520,192 906,695 835.832 2.918,487 3,582,658 218,215 437,532 129 127 2 380 492$2.ODO under S4,000 ........... 3,UM,365 10,079,675 884,270 1,443,943 3,148,335 8,617,868 526,834 698,739
,95 693
,'308 -2
$4,000 under $6.000 ........... 2,794,294 13,344,649 621,975 1,756,044 2,539,165 11.529,085 705,604 691,476,
128 992 - -$6,000 under $8.000 ........... 2,675.497 17,771,813 603,579 2,319.829 2,400,514 16,125,471 987,435 709,486
,157 608 -6 023 *32 252
$8,000 under $10,000 .......... 2,067.176 17,791,437 427,225 2,844,397 1,817,450 14.847,694 909,385 568,853,
233,231,
-4 108.'520
$10,000 under $12,000.......... 1,624.859 17,248,626 335,903 2,930,619 1,398,234 14.338.510 878,404 424.814 158,020.
-4,272 -7,075$12,000 under $14,000.......... 1,377.541 17,235,706 314,520 3.252,160 1,152,341 13,919,956 852,842 340,706 131.398 *4 402$14,000 under $16,000 .......... 1,172,057 16.751,481 295,540 3.545,539 966,626 13,120,175 803,899 289,037 196,810
,-3 755 -2 454$16,000 under $18,000 .......... 899,661 14,833,368 251,764 3.313,970 725,917 11,455,183 701,943 239,224 143 382
,9 451
,2 899
$18,000 under $20,000.......... 726,687 13,311,634 205,180 3.244,002 566,484 10,026,600 614,432 220,145,
178 885.5575
,5 604
$20,000 under $25,000.......... 1,080,209 25,430,163 337,036 8.639,217 812,915 16,358,717 1,002,478 417,609,
497 916.
41 127,
5 161$25,000 under $30,000 . . . . . . . . . . 449,199 11,607,054 119,990 2,552.328 356,524 7,807,349 478,380 302.155
.1,271.273
,49.977
,12,528
S30.DOO under $50,000 .......... 370.740 11.940,603 105,710 2,648.408 290.523 6,286,351 385,182 244,121 2 808 047 40 360 14 361$50.000 under $100,000 ......... 76,874 3,860,599 16,202 477,158 65,400 1,465,037 89,765 56,375
, ,1.926 469
.7 008
.6 021
$100,000 under $200,000 ........ 14,664 1,318,407 2,632 80,498 13,000 316,443 19.390 11,479,
921,602,
2 153,
2 233$200.000 under $500,000 ........ 3,948 598,717 890 61,736 3.332 91,275 5,593 2.928 "5,789
,876
,1 253
$500,000 under $I.DOO,000 ....... 584 156,576 139 11,255 504 14,895 913 433 130 452 173.270$1,000,000 or more ............ 241 100,509 9,090 201 6.338 388 163
,85,103 73 136
All retums, summary:
Under $5,000 ............... 8,317,155 20,480653 2.135,590 3.189,356 7,307,237 17,162,103 1,048,640 467 5401 280 895 2 688 495$5,000 under $10,000 .......... 6,148,287 43,027:111 1,208,154 6,010,688 5,516,714 37,540,674 2,298,833:546
1:638,
463 756,
*10 131 '32 772$10,000 under $15.000 .......... 3,638,390 43,279449 808.006 7972767 3084776 35,272,011 2,160,976 922,9901
,385 4331
.
'110:164
$15,000 under $20,1~O 2 162141 5 3%101 31 8 313:5241
1:724:8261
27,588,414 1,690.545 590,9361,
423.0611 M1 :4.1 7. 8 585$20,000 or more.
1:9 ,96 4F9 55 12,628 582,659
14,679,690 1,542,399 _ 32.346.405 1.982 090 1.035,2631 8,086,6501 14
,

36 Taxpayers Classified by Sex
Table 7 .-Returns with Salaries and.Wages from ForOn W-2 and Returns with Self-Employment Income from Schedules C and F:Income and Social Security Taxes, by Size of Adjusted Gross Income-Continued(All fioures are estimates based on samples-monev amounts are in thousands of dollars)
Total sell I=O
t koomeOel
SchedLde C and F mt uxome Self-empWyment tax Schad Is C andu
F income notfrom U and F subject to the self-err~ent tax subject to Self-e mploymarri ta.'
Size of adjusted gross irx*m Number of Amcxt Number of "M of net Numberof Arr~nt Number
of A~ntreturns ratums 1~me sret-
~
returns
12 (13) (14) (1 5)
1
(17) 18
Size of adjusted gross Income'
I P
Joint retums--Continued
t
wives
All returns, total ................. 2,033,763 3,262,989 1,657,991 2,035,079 1,072,646 388,617 455,660 1,227,910
Under $2,000 ................. 69,471 -225.042 59,458 -249,404 24,609 4,253 10,613 24,362$2,000 under $4,000 .... ......... 50,315 18,313 41,897 8,580 30,878 4,649 9,074 9,733$4,000 under $6,000 .............. 70,521 67.221 57,401 49,251 41,468 8,202 17,107 17,970$6,000 under $8,000 .............. 79,975 66,491 68,358 53,194 46,285 13,016 13,283 13,297$8.000 under $10,ODO ............. 92,798 72,308 78,870 61,968 53,777 15.088 16,711 10.341$10,000 under $12,DDO. . . . . . . . . . . . . 95,030 82,724 78,845 .60,642 51,927 15,028 17.905 22.082
$12,000 under $14,000. .......... 100,809 82,847 80,984 66,658 52,585 13,218 20,783 16,190$14,000 under $16,000............. 113,185 123,950 89,946 87,380 60,273 15,070 26,682 36,570$16,000 under $18,000............ : . 127,378 100,084 108.392 79,988 63,644 16,810 22,118 20,096$1 8,ODO under $20.DDO............. 134,712 133,939 112,073 113,125 73,806 20.056 25,133 20,814S20,0DO under $25,000.............. 322,062 375,968 269,192 304,557 167,330 51.903 60,671 71,410$25,000 under $30.000 ............. 250,111 422,242 196,409 342,716 120,602 47,383 62,955 79.526
$30.000 under $50,000 .............. 387,399 1,039.912 311,012 772,607 204,942 104.266 100,539 267,304$50.000 under $100.000 ............ 115,216 695.6S4 87,503 313,157 66,804 49,620 42,445 382,528$1 00,ODO under $200,000 ........... 19,564 148,248 14.129 5,439 10,887 7,842 7,543 142,808$2DO,DDO under $500,000 ........... 4,414 51,854 2,953 -13,626 2,408 1,847 1,802 65.479$500,000 under $1.000.000 . . . . . . . . . . 575 6.196 406 -7,138 308 272 216 13.324$1,000,ODO or more . . . . . . . . . . . . . . . 228 60 163 -14,017 113 94 80 14,076
All returns, summary:-Under $5.000 ................... 156,816 -160,731 130,336 -205,743 81,558 13,921 30,981 45.012$5,ODO under $10,000 ............. 206,264 160,023 175.648 129,332 115,459 31,286 35,807 30,691$10,000 under $15,000 ............. 251,804 240,444 206.030 185,584 133,888 36,413 51.423 54,860$15.000 under $20,000............. 319.310 283,101 264.210 222,209 168,347 43,770 61,198 60,892$20.000 or more ............. 1,099,569 2,740.153 881,767 1,703,698 573,394 263,227 276,251 1,036,456
Nowlolnt returns, total
All returns, total................... 2,232,100 8,176,230 1,969,706 5,624,292 1,669,688 860,558 422,221 2,553,938
Under $2,000.................... 335,818 -926,436 277.596 -1,005,617 155.670 21,463 63.705 79,181SZODO under $4,000 ............... 316.194 396,210 284.914 368,518 292,763 57,920 41,062 27,692$4,000 under $6,000 ............... 276,732 576,142 252,120 549,904 252,037 73,715 34,071 26,238$6,000 under $8.000 ............... 219,501 571,164 199,929 554,369 179,611 70,280 26,067 16,794WPM under $10.000 ............... 193,411 714,853 173,221 695,507 151,478 76,388 23,999 19,346
_$10.DDO under $12,DDO.. -171,169 595,161 -155,6164 _5T4.71 8 _121.553 65.589 19,045 20,4~43
$12,000 under $14,DDO .............. 121.268 450,370 110,823 413,098 84,697 50.335 14,027 37,273$14,000 under $16.000 .............. 106,214 409,400 94,975 376,938 64,755 42,500 12,861 32,462$16,000 under $18,000 .............. 87,864 424,199 76,095 403,346 61,134 50,058 15,180 20,853$18,000 under $20.000.............. 76,596 436,023 69,449 411,087 52,554 45,069 13,187 24,936$20,000 under $25,000 .............. 118,957 824,751 105,651 732,657 92,304 90,504 34,045 92,094$25,000 under S30,000 .............. 66.550 6D6,305 53,278 449.248 45,236 55,527 36,428 157,057
$30,000 under $50,DDO .............. 96,460 1,597,040 78,386 B87,664 76,443 103,980 60,105 709,376$50,000 under $100,000 ............. 34,861 1,013,530 29,553 3DO,469 30,865 45,068 22,432 713,061$100,000 under $200,000 . . . . . . . . . . . . 7,666 308,219 5,941 -319 6,649 9,595 4,586 308,538$200.000 under $500,000 ............ 2,143 80,830 1,581 -37,335 1,440 2,012 1,085 118,165$500,ODO under $1,000,000 ........... 477 54,132 355 -17,166 290 409 245 71,298$1,000,000 or more ................ 219 46,337 175 -32,793 109 146 91 79,131
All returns, summarr.
Under $5,000* * ........
809,542 -252,876 706,628 -375,137 585.600 116,650 124,173 122,261$5,000 under 66,66o 532,114 1,584.808 481,152 1,537,818 "5,959 183,116 64,731 46,990
. .$10,000 under $15,666 348.720 1.269.714 317,549 1.192.410 240,276 138,652 39,412 77,304$15,000 under $20,000 .............. 214,391 1,045,439 189.457 986,776 144,417 114,899 34,888 58,663$20,ODO or more................... 327,333 4,531,145 274.920 2,282,425 253,336 307,241 159,017 2,248,720
Filed by men
All returns, total ................. 1,491,501 6,050,989 1,339,207 4,017,417 1,147,289 638,155 275,5`11 2,033,572
Under $2,ODO .................. 220,672 -761.542 188,175 -824,118 97,936 16,221 36,851 62,576$2,000 under $4,000 .............. 208,488 266,980 190,107 246.015 202,641 42,290 24,536 20,965$4,000 under $6.000 .............. 183,172 373,503 168.114 353,530 164,317 50,565 21,803 19,973$6,000 under $8,000 .............. 143,590 421,086 133,981 408,236 132,953 52,690 14,891 12,850$8,000 under $10,000 ............. 126,495 545,472 117,705 528,993 108,133 57,543 11,544 16,479$10,000 under $12,000............. 103.471 393,950 97,459 382,094 79.915 45,944 9,136 11,856
$12,000 under $14,ODO ............. 78.762 308,211 72,753 273,391 53,772 33,361 9,181 34,819$14,000 under $16,000 ............. 72,996 316,553 66,146 292,593 45,184 32,474 8.165 23,960$16,000 under $18,000 ............. 63,008 328,350 56,405 312.834 43,289 38,684 9,468 15,516$18,000 under $20,000............. 49,885 325,465 45,320 307,122 35,383 33,038 9,671 18.343$20,000 under $25.000 ............. 85.274 623,988 77,168 554,495 65,152 68,196 24,083 69,493$25,000 under $30,000 ............. 49,242 439,490 39,087 325,508 33,481 42,214 27,196 113,981
$30,000 under $50,000 ............. 72.164 1,228,835 58,709 671,014 56,405 80,599 46,111 557,821$50,000 under $100,000 ............ 26,405 854.580 22,257 247,360 22,663 35.190 18,058 607,220$100,000 under $2DO.000 .... ....... 5,927 251,424 4.465 -935 4.960 7,516 3,751 252,359$200,000 under $500.000 ........... 1,514 64,633 1',045 -28.786 883 1,315 849 93,419$500.000 under $1,000,000 .......... 304 40,075 211 -9,782 162 237 159 49,857$1,000,000 or more............... 132 29,938 100 -22,149 60 77 58 52,086 1
All returns, summary:
Under $5,000 .................. 537,842 -316 362 478,588 -411,224 395623 85075 73927 94862$5,000 under $10,000 ............. 344,575
:1,161
861319,494 1. 123
220310:357 134:235 35:698 37:980
$10,000 under $15.000............. 218,621 860 :203.913,'02: 93
1
1.
,990
1
95..5 21,816
~
58,316$1 5,DOO under $20.000....... ..... 149,501 811 134.170 765,443 102.553 88,496 23,805 46,177$20.DDO or more ......... : ..... . 240,962 3,532 203,042 1,736,7 183,7 235,345 120,265 1 ~796,236
Footnote(s) at arid of table.
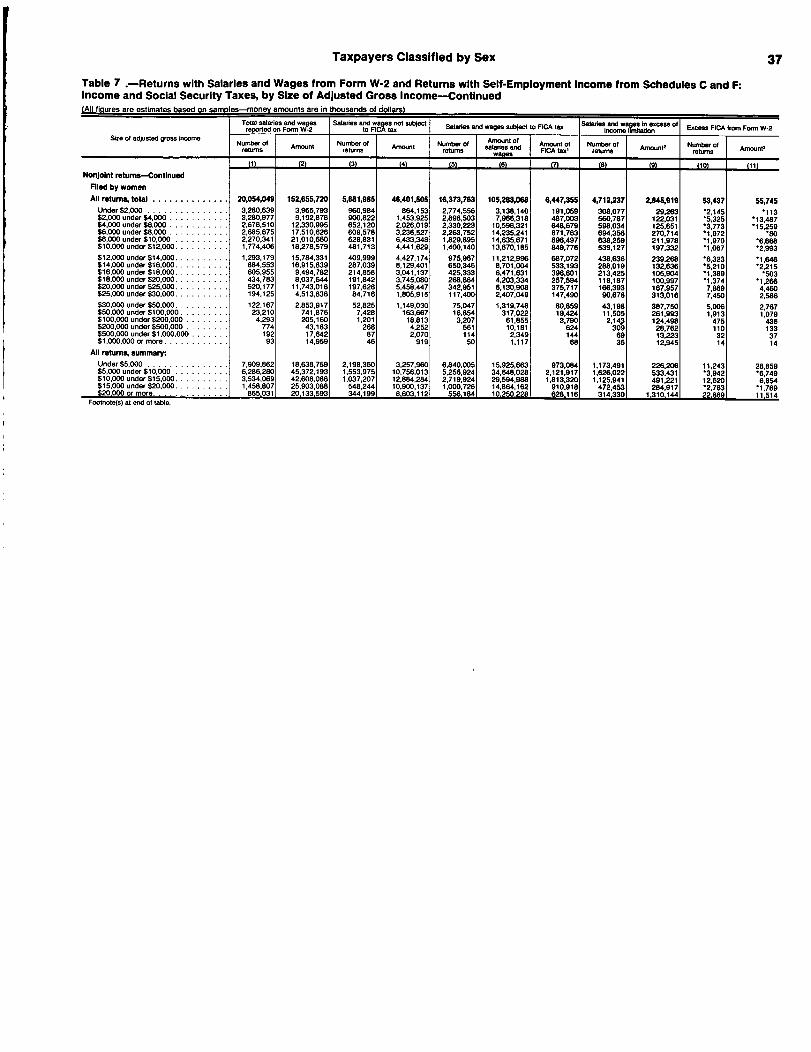
Taxpayers Classifled by Sex
Table 7 .-Returns with Salaries and Wages from Form W-2 and Returns with Self-Employment Income from Schedules C and F:Income and Social Security Taxes, by Size of Adjusted Gross Income-Continued
37
(All figures are estimates based on SaMDles-monev amounts are in thousands of dollars'
Total salariesreported on Mwwo??
Sale- and , -1to"=" Salaries and vrages viubject to FICA tax sa~-~w.*,?,-.=-of E..FlCAfromFormW-2
Size of adjusted grossi .mcomeNumber of Amount Number of Amount Number of Amount of
sa nd Amou ofe ,nNumber of Amount- Number of Amount-retums returns retums = t 'FICA returns retums
(2) (3) (4) (5) (6) (8) (9) (10) (1Nonjoint rOtums-Continued
Filed by women
All returns, total . . . . . . . . . . . . . . 20,054,049 152,655,720 5,681,985 46,401,506 16,373,763 105,283,068 6,447,355 4,712,237 2,845,919 53,437 55,745Under $2,000 ............... 3,280.639 3,965,793 960,984 864,153 2.774,556 3,138.140 191,059 308,077 29.263 -2,145$2,DOO under $4,000 ........... 3,280,977 9,192,878 900.822 1,453,925 2.898,503 7,966,318 487,003 560,787 122,031 -5,325 -13.487$4,000 under $6,000 ........... 2,678.510 12.330.995 652,120 2,026.019 2,330,223 10,598,321 648,679 598,034 125,651 -3,773 -15.259$6,DOO under $8,000 . . . . . . . . . . . 2,685.675 17,510,626 609,578 3,236.527 2.263,752 14,235,241 871.763 694.356 270,714 -1,972 .80S8.000 under $10,000 .......... 2,270,341 21,010,660 628,831 6,433,348 1,829,895 14,635,671 896,497 638,259 211,978 -1,970$10,000 under $12.000.......... 1,774,406 18.278,579 481,713 4,441.629 1,400,140 13.870,185 849,776 539,127 197,332 -1,087 -2,993$1 2,000 under $14.000.......... 1,293,179 15,784,331 409,999 4,427.174 975,967 11,212,996 687,072 438,636 239,268 -6,323 -1,646$14,000 under $16,000 .......... 884.553 16,915,839 287,039 8,129.401 650.346 8.701.OD4 533,193 288,019 132,636 -5,210 -2.215$16,000 under $18,000 .......... 605,955 9,494,782 214,858 3,041,137 425,333 6,471,631 396,601 213.425 105,904 *1,389 *503$18,000 under $20,000.......... 434,783 8.037,644 191,842 3,745.080 268,864 4,203,334 257.594 119,187 100.997 -1,374 -1,266$20,000 under $25,000 .......... 520.177 11,743.018 197,628 5,458.447 342,951 6,130,908 375,717 166,393 167.957 7,869 4,460$25,000 under $30.000 . . . . . . . . . . 194,125 4,513,838 84,716 1,805,915 117,400 2,407,049 147,490 90,678 313,016 7,450 2.586$30.000 under $50,000 .......... 122.167 2,853,917 52,825 1,149,030 75.047 1.319,748 80.859 43.198 387,750 5,006 2,767$50,000 under $100,000 ......... 23,210 741,876 7,428 163,667 16.854 317,022 19,424 11,505 261,993 1,913 1.079$1 DO,000 under $2GO,000 ........ 4,293 205.160 1,201 18.813 3,207 61.855 3.790 2,14.3 124.498 475 436$200,000 under $500,000 ........ 774 43,183 268 4,252 561 10,181 624 309 28.762 110 133$500,000 under $1,000.000 ....... 192 17,642 87 2,070 114 2,349 144 69 13,223 32 37$1,000,000 or more............ 93 14.959 46 919 so 1,117 68 35 12,945 14 14
All returns, summary:Under $5,000 ............... 7,909,862 18.638.759 2,198,360 3,257.960 6,840,005 15.925,663 973,084 1,173,491 226 1 ! 1 2431 ?8,859$5,ODO under $10,000 .......... 6,286,280 45,372.193 1,553,975 10,756.013 5,256,924 34,648,028 2,121,917 1 1022 533:01
3:2 6,749
$10,000 under $15,000 .......... 3,534,069 42,608,088 1,037,207 12,884.284 2,719,924 29,594,988 1,813.320: :1125
,
~
49'.221 !2,620 6,854
$15,000 under $20,DOO.......... 1,458.807 25,903,088 548,244 10,900,137 1.000,726 14,864,162 910.9181
472,4531
284,9171
2,763.
1.769S20.DOO or more............... 865,031, 20.133.593. 344.199. 8,603,112 556J84 10.250.228, 628,116 314,330 1,310,144 22,869 11,514
oomole(s) at end of table.
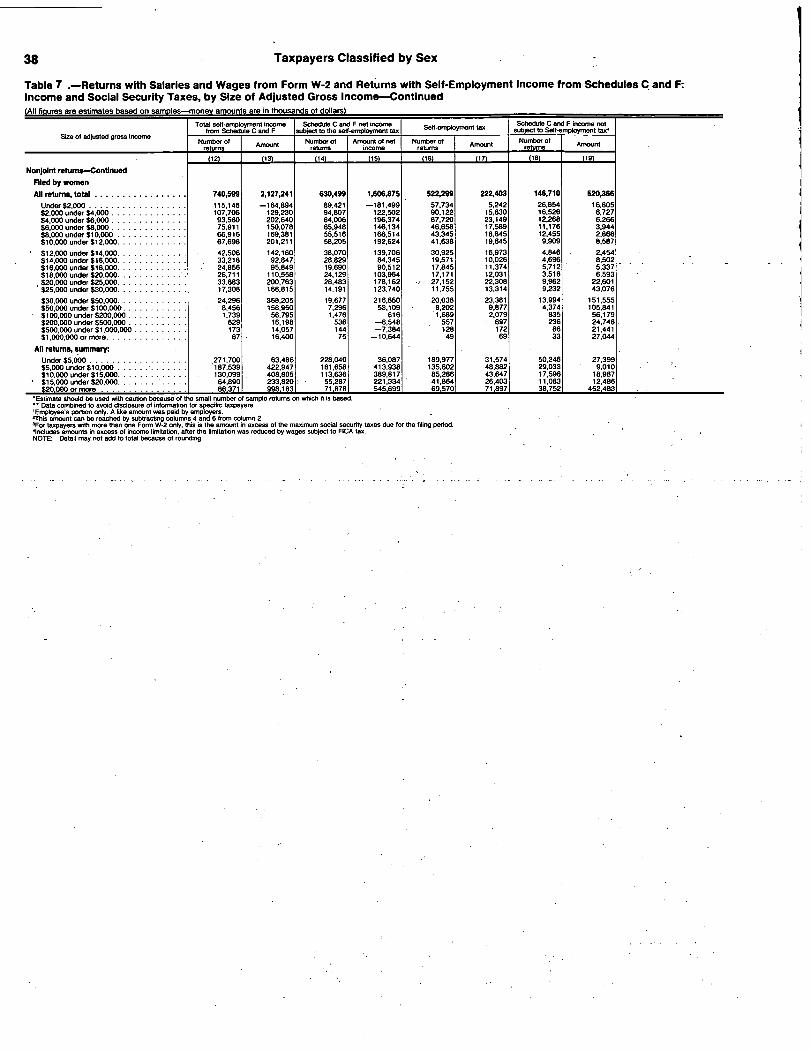
I
38 Taxpayers Classified by Sex
Table 7 .-Returns with Salaries and Wages from Form W-2 and Returns with Self-Employment Income from Schedules C. and F:Income and Social Security Taxes, by Size of Adjusted Gross Income-Continued(All ficlures are estimates based on samoles-monev amounts are in thousands of dollars)
Total self-employment moome Schedule C F nel moome Seff-emplo ment taxSchedule C and F income not
from Sched uleC
and F subject to theself
-emptoyment taxy subject to Self-e mployment face
Size of adjusted gross incomeNumber of Amount Number of Amount of not Number of Amount
Number
ofAmount
reftam; refung mcome returns returns
(13)
_
(141 151 (16) (17) (181 (19)
Nonjoint retums-Continued
r
___ __
Filed by women
All returns, total ................. 740,5" 2,127,241 630,499 1,606,875 522,299 222,403 146,710 520,366
Under $2.000 . . . . . . . . . . . . . . . . . . 115,146 -164,894 89.421 -181,499 57.734 5,242 26,854 16,605
szooo under $4,000 .............. l 07,706 129,230 94,807 122.502 90,122 15.630 16,526 6.727
$4.000 under $6,000 . . . . . . . . . . . . . . 93,560 202,640 84.006 196,374 87,720 23,149 12.268 6.266
$6.000 under $8.000 . . . . . . . . . . . . . . 75,911 150,078 65,948 146,134 46.658 17,589 11,176 3.944
S8.000 under $10.000 . . . . . . . . . . . . . 66.916 169,381 55,516 166,514 43,345 18,845 12.455 2,866
$10,000 under $12,000. . . . . . . . . . . . . 67.698 201,211 58,205 192,624 41,638 19,645 9,909 8,587
$12,000 under $14,DOO. . . . . . . . . . . . . 42,506 142,160 38,070 139,706 30,925 16,973 4,846 2,454
$14,000 under $16.000............. 33,218 92,847 28,829 84,345 19,571 10,026 4,696 8,502
$16,000 under $18,000............. 24,856 95,849 19,690 90,512 17,845 11.374 5,712 5.337
$18,000 under $20.000. . . . . . . . . . . . . 26.711 110,558 24,129 103,964 17,171 12,031 3,516 6,593$20,000 under $25.000............. 33.683 200,763 28,483 178.162 27,152 22,308 9.962 22,601
$25.DOO under S30,000............. 17.308 166,815 14,191 123.740 11,755 13,314 9.232 43,076
$30,ODO under $50.000............. 24.296 368,205 19,677 216,650 20.038 23,381 13,994 151.555
$50,000 under $100,000 ............ 8,456 158,950 7,296 53,109 9,877 4,374 105,841
$1 00,ODO under $200,000 ........... 1,739 56,795 1.476 616 1,689 2,079 835 56,179$200,000 under $SW.000 ........... 629 16.198 536 -8,548 557 697 236 24,746 ,
$5DO,000 under $1.000,DOO .......... 173 14.057 144 -7,384 128 172 86 21,441
$1,000,000 or more............... 87 16,400 75 -10.6" 49 69 33 27,044
All returns, summary:Under $5,000 .................. ~271,700 63,486 228,040 36 087
779 94 '31,574 50,246 27.399
$5.DD0 under $10.000 .............. 187.539 422,947 161,658:
41393.
:1 5.23 418,8132 29033 9,010S10.000 under $15,000 ............. 130,099 408,805 113,636 389.
.17 .5,286
~
43,647 17:596 18,987$15,000 under $20,000............. 64,890 233,820 55.287 221,334 41,WA
126,403 11.083 12,486
$20,000 or more ................ . 86,371 998.183 71 ~878 545,699 69,570 71.897 38,752 452.483:~stirnate should be used with caution because of the small number of sample returns on which it is based.
Data combined to avoid disclosure of information for specific taxpayers.'Employee's portion only. A like amount Was paid by employers.zThis amount can be reached by subtracting columns 4 and 6 from column 2.3For taxpayers with more than one Form W-2 only, this is the amount in excess of the maximum social security taxes due for the filing period..Includes amounts in excess of income limitation, after the limitation was reduced by wages subject to FICA tax.NOTE: Detail may not add to total because of rounding.
I

Fiduciary Income Tax Returns, 1982By Gary J. Estep*
For 1982, approximately 2 million estates andtrusts reported an estimated $37 billion in"total income." Of these 2 million returns,only an estimated 601,000 (or 30 percent), with$20 billion in income were taxable. This tax-able group reported $2.6 billion in income tax.
While estates and trusts accounted for only$7.4 billion of taxable net income and $2.6billion in tax liability (less than 1 percentof that which was reported by individual tax-payers), administrators of estates and trustsalso distributed $19.6 billion to beneficiaries,much of which became taxable on individuals'returns. Only $5.7 billion was reported onindividual returns as "estate or trust income"Ell. Most of the remaining $13.9 billion ofdistributions by estates and trusts was "passedthrough" to individuals as dividends or capitalgains and reported as such on their individualincome tax returns.
Fiduciary returns (Forms 1041) are filed forthree types of entities: estates (created asthe result of the death of an individual),bankruptcy estates (created as the result of anindividual debtor filing for bankruptcy underchapter 7 --r 11 of the Bankruptcy Code), andtrusts (created as the result of specificplanning during the lifetime of an individual).As will be explained in greater detail below,"testamentary trusts," while planned during theindividual's lifetime, do not come into beinguntil that individual is deceased. The"fiduciary" is the person or institution thathas power and control over the property and isholding it for the benefit of another person(s).
For the Tax Year 1982 statistics, fiduciaryreturns were classified as generation-skipping,family estate, testamentary and grantor-typetrusts. Grantor-type trusts permitted theindividual creating the trust (the "grantor")
Figure A.--Number of Estates and Trusts, Income and Tax
FAll figures are estimates based on samples--money amounts are in thoijsands of dollarsl
Item
Number of estates and trusts .................Estates ....................................Trusts .....................................
Taxable, total ...............................Estates ....................................Trusts .....................................
Total income (less loss) .....................
Taxable income ...............................
Total tax ....................................
1974
336,475921 641
403,886139,963263,923
$13,737,886
2,403,040
835,575
19821
1 631 6AO422,734
1,208,911
597,100168,441428,659
$39,410,572 2
7,353,461
2,617,771
Percent increase
29.725.631.2
47.820.362.4
186.9
206.0
213.3
'Grantor trusts are excluded from 1982 to make the data comparable to 1974.'Total income (less loss) as defined for 1982 was $36,677,858 billion. Total income (less loss)includes the net rent and royalty income instead of the gross. The 1982 figure in this table hasbeen adjusted to show gross rent and royalty for the purpose of comparing the total income (lessloss) for the two years.
*Individual Special Projects Section. Prepared under the direction ofPeter Sailer, Chief. Special thanks to Bruce Gardner, Tax Forms Develop-ment Branch, Internal Revenue Service, for his review of the manuscript. 39
40 Fiduciary Income Tax Returns, 1982
or the party under the grantor's control(nonadverse party) to retain control over theproperty for a given period or. until his or herdeath. However, since grantor trusts were notincluded in the statistics published by theInternal Revenue Service for earlier years(most recently for Tax Year 1974), they areomitted from the following table and also fromthe analysis to facilitate comparisons ofcurrent and prior-year data. A separateanalysis of grantor trusts is included in thesection titled "Types of Trusts."
Number of returns
Number of estates 1974 1982
Total .................... 336,475 4229734Taxable .. 139,869 168,441Percent ta;a,b,l*e* 41.6 39.8
Number of trusts
Total .................... 921,641 1,208,911Taxable 263,228 428,659Percent 28.6 35.5
HIGHLIGHTS OF THE DATA
The number of taxable trusts increased 62percent over 1074, ~ while the total number ofall trusts ncreased by only 31 percent. Theincrease in taxable trusts probably resultedfrom an increased usage of complex trusts (seetypes of tru5ts), which individual taxpayersmay have created to shelter more of theirincome during a period of rapid inflation andconcurrent tax "bracket creep."
. Between 1 974 and 1982, the number of returnsfiled for complex trusts increased 46 percent,as compared to a 21-percent increase in returnsfiled for simple trusts (see types of trusts)and a 26-percent increase in returns filed forestates. The nontaxable trusts, most of whichwere simple trusts, increased only 18 percent.
Total income as reported by fiduciaries forestates and trusts rose by $26 bil-lion (or by187 percent) between 1974 and 1982, while thenumber of estates and trusts rose by 373,000(or 30 percent). The rise in "estate and trust"income was greater than the rise in individual"adjusted gross.income" (which rose 105 percent)[2, 31. The increase in estate and trust incomewas due to the fact that most of the incomereported on fiduciary returns is unearnedincome. Seventy-seven percent of estate andtrust income comes . from interest, dividends,and gains from the sale of capital assets.When these sources of income are considered,the rise in individual income (232 percentincrease) was greater than the rise in estate
and trust income (198 percent increase). Thisrise in estate and trust income can also beattributed to the steady increase of fiduciaryincome tax returns filed between 1974 and 1982.Tables in this article present some of thedetails on the income, credits, and deductionsreported on these returns.
Comparisons of Financial Data
Despite a substantial decrease in the taxrates for 1982, the total tax for all fiduciaryreturns
-filed more than tripled (largely
accounted for by the 30-percent increase in thenumber of returns filed). For 1974, only 532estates and trusts had a total income [41 of $1million or more (with an average of $2.5 millionper return) [5]. For 1982, 2,762 estates andtrusts had total income of $1 million or more(with an average of $3 million per return).Despite the rise in the average- total income,the average tax liability remained about thesame ($400,000 per return). Tax reductionsenacted by the Economic Recovery Tax Act of1981 (ERTA) appeared to be the major factor inthe tax liability for these returns not rising.In contrast, the average tax for returns withtotal income under $1 million almost doubled
--($l-,700.-to-$3.,,100.)-.-----
Total Income
There was a notable shift in the compositionof total income over the period 1974-82, withthe proportion attributable to interest risingfrom 23.9 percent ($3.3 billion)- for 1974 to31.0 percent ($12.2 billion) for 1982, and theproportion attributable to dividends fallingfrom 35.3 percent ($4.8 billion) to 22.1 percent($8.7 billion) for the same period. No doubtrising interest rates over the period contri-buted to the shift, both directly (by increasingthe income from existing interest-bearingaccounts) and indirectly (by encouraging ashift in holdings to interest-bearing assets).
Capital Gains
Another source of income that increased inrelation to total income was net gains fromsales of capital assets, which accounted for15.4 percent of the total for 1974 and 24.4percent for 1982. While capital gains. werefully includable in total income, a proportionwas deducted in the computation of taxableincome. For 1982, if the gain on the trans-action was a long-term capital gain, that is, again arising from the sale or exchange ofcapital assets held by the fiduciary for atleast one year, 60 percent of the gain, wasdeductfble in arriving at taxable income. Therules for the computation of the capital- gainsdeduction were substantially different for TaxYear 1974, when the assets had to be held onlyfor 6 months with half of the long-term gainbeing taxable.
I

Fiduciary Income Tax Returns, 1982 41
Figure B.Major Sources of Income - Percent of Total- 1974 and 1982
1974
1982
last day of the year following that year as paidin the earlier year. In other words, thefiduciary can elect to treat a contributionactually paid within one taxable year as paidwithin the preceding taxable year. This allowsthe fiduciary to tailor the amount contributedwith precise knowledge of the income for theyear for which the contribution is being
Gross deducted [6].Rentsand
claimed as a charitaule deduCLTon on rorms 1041accounted for an estimated 4 percent of totaldeductions, slightly lower than reported for1974.
-To make data comparable between 1974 and 1982,depreciation, depletions and other expenses were GENERAL INFORMATION ON FIDUCIARY RETURNSadded to the 1982 figures. . ....... .
Taxable Income
Taxable i ncome (total i ncome reduced byallowable deductions) for 1982 was just over $7billion, or 20 percent of total income. Thislow ratio reflects the conduit nature of theestate or trust, where generally only the
income received, but not distributed, duringthe year is taxable. For all fiduciary returnsfiled for Tax Year 1982, tritsts accounted for70.9 percent of the taxable income and 73percent of the total tax liability.
Distributions
The i ncome distribution deduction is theamount that the estate or trust can deduct foramounts paid, credited, or required to bedistributed to the beneficiaries. The deductionis limited to the "distributable net income" of
Dividends the estate or trust.
The percentage of estates and trusts withdistributions to beneficiaries remainedrelatively constant between 1974 and 1982, 63.4and 61.8, respectively. Likewise, distributionsto beneficiaries accounted for 58.2 percent oftotal deductions for 1974 and 61 .6 percent for1982.
Charitable Contributions
Estates and trusts can generally deduct fromgross income the amounts that they pay forcharitable purposes. Some estates and trustscan also deduct amounts they set aside forcharitable purposes, even if they don't actuallypay those amounts currently. Amounts paid forcharitable purposes are deductible for the yearpaid, however, the fiduciary is allowed to elect
Sales of to treat a contribution which is paid after theCapital Assets close of a taxable year and on or before the
Royaltiesl/ For 1982, charitable contributions that were
A fiduciary files a Form 1041 as an incometax return to report the income of the estateor trust and the tax (if any) it must pay, ifits gross income is $600 or more, or if one ofits beneficiaries is a nonresident alien. Afiduciary also files a Form 1041 to show theamount of income distributed or distributableto the beneficiaries that must be accountedfor, in the case of individuals, on theirindividual income tax returns. The Form 1041is also used as a transmittal form for Form1040 if the fidiciary is filing for the estateof an individual involved in hankruptcy

42 Fiduciary Income Tax Returns, 1982
proceedings under chapter 7 or 11 of theBankruptcy Code when the estate* has grossincome for the tax year of $2,700 or more.(See the section on bankruptcy estate later inthis article.) Schedule K-1 of Form 1041 showseach beneficiary's share of income, deductions,credits and "tax preference" items of theestate or trust.
The Form 1041 is due by the 15th day of thefourth month following the close of the taxyear of the estate or trust. As a rule, alldistributions (other than tax-exempt gi-fts- orbequests) from the estates or trusts to thebeneficiaries are deductible by the fiduciaryand taxable to the beneficiary. In general ,the taxable income of any kind of property heldin trust is computed and taxed in the samemanner as. an individual filing under themarried-filing-separately rates.
jh!~_ Purpose of A Trust
An individual establishes a trust by statinghis or her intention, usually in a formaldocument somewhat like a will , or in a clauseof the will itself. The grantor who establishesthe trust sets aside part.or all of his or her
,personal- wealth-to-fund-the- trust.- -He -or -she-appoints a trustee (fiduciary) to manage thetrust funds and states the duties and privilegesof the trustee. He or she may even outline asuccession of trustees and names the individualsor organizations who are to receive benefitsfrom the trust. A grantor, in establishing atritst, is often motivated by a desire to controlthe distribution of his or her wealth
'or to
relieve himself or herself of the burden ofmanaging capital. Another considerationgrantors have for estWishing a trust is toremove a portion of their income being taxed ata high rate and shift the income to be taxed atthe trust's or beneficiaries' tax rates, bothof which are presumably lower. Generally,personal trusts are established for specificpurposes. The purposes of some trusts ares
,omewhat publ ic in nature, such as to support
charities or to provide scholarships.
Split-interest trusts that have bothcharitable and noncharitable benefici-aries arenonexempt trusts. Typically, there is acharitable and noncharitable interest created.The. noncharitable interest is subject to incomeand gift tax or to the estate tax, dependingupon the order of succession of the interests.For 1979 (the most current year of availableSOI data on split-interest trusts), there were13,743 split-interest trusts with total assetsof $2.5 billion and charitable contributions of$61 million E7, 8, 91.
Trusts taxed under the fiduciary income taxlaws are those established by individuals andnot the other legal devices that are alsocalled trusts. Trusts taxable as corporations,
common trust funds, and tax-exempt (charitableand similar) trusts are not treated as trustssubject to the fiduciary income tax.
TYPES OF TRUSTS
Simple Trust
A simple trust is a trust that, in general ,distributes its entire current income to thebeneficiaries during ' the year the income isreceived, in accordance with either thegoverning instrument or local law, and it doesnot make charitable contributions. A smallnumber of trusts do not have income todistribute, or in some cases the character ofthe income is such that it is not required tobe currently distributed. A trust can be asimple trust in one year and a complex trustthe next year. Data for simple trusts areshown below for 1974 and 1982.
Simple trusts 1974 1982
[Money'amounts are in millions of dollars]
Number of simple trusts ...... 545,556 677,454-Total-i ncome--(-l ess- Toss-) .. ... .... -$6-,594- $1-7-,964--Number with taxable income ... 62,036 127,969Taxable income ............... $414 $1,590
.Complex Trust
A trust will - be complex in either of thefollowing two events: (a) it distributes tothe beneficiaries a portion of the trust corpusor W it accumulates income (regardless of thefact that during the taxable year it also dis-tributes a. portion of current-year income). Asimple trust becomes a complex trust when itbegins to distribute its corpus. For example,a trust cannot,be simple in a year of partialliquidation or the year of its termination.Data for complex trusts are shown in thefollowing table.
Complex trusts 1974 1982
[Money amounts are in millions of dollars]
Number of*1compl ex trusts ..... 376,085 555,716Total income (less loss) ..... $3,701 $12,004Number with taxable income ... 201,674 305,990Taxable income ................ $1,066 $3,647
Grantor Type Trusts
Grantors who desire to split their incomewith a family member, or otherwise to relievethemselves of liability for taxes on incomefrom
'certain property, may do so by conveying
the property in trust for the family member.This is particularly desirable if the familymember is a minor child or one to whom thegrantor does not wish to entrust property at

Fiduciary Income Tax Returns, 1982
the time. The grantor may thus avoid tax onpart of his or her income, subject to thegeneral requirement that he or she must in facttransfer income-producing property, rather thanjust income.
To the extent the grantor retains controlover property, the income is taxable to him orher and is not shown on the Form 1041. (Thismay happen even if the income goes to someother person he or she is legally obligated tosupport.) One example of a grantor trust isthe "family estate trust," a trust to which anindividual transfers his or her personal assetsand right to income in exchange for the bene-ficial enjoyment of such assets and compensa-tion.
As can be seen from the following table, for1982 the vast majority of grantor trusts didnot show any income. These Forms 1041 werefiled strictly for information purposes, andthe actual income amounts appeared on thegrantors' Forms 1040. Of the $501 million ofincome reported on Forms 1041, $413 million (or82 percent) was passed on to beneficiaries andtaxed to them. The amounts that were taxableto the trust were the gains from sales ofproperty and any amounts added to the corpuswhen the grantor did not have any futureinterest in the corpus.
Grantor trusts Total Taxabl
[Money amounts are in millions of dollars]
Number of returns ........... 377,572 4,015Returns with no totalincome ................... 363,893 0
Total income:Number of returns ......... 13,679 4,015Amount ................... 501 78
Interest:Number of returns ..... 10,821 3,186Amount ............... 340 19
Sales of capital assets,net gain:
Number of returns ..... 2,984 1,510Amount ............... 62 27
Distributions to beneficiaries:Number of returns ......... 10,704 1,595Amount ................... 413 27
Total tax:Number of returns ......... 4,015 4,015Amount ................... 8 8
43
Generation-Skipping Trusts
A generation-skipping trust is a trust thatprovides for benefits to pass to two or moregenerations that are younger than the generationof the grantor of the trust. These trusts aresubject to a generation-skipping transfer tax,but this tax is not imposed on the outrighttransfer of property to a person who is in ageneration younger than the transferor's. Noseparate data were compiled for these trusts.
Inter Vivos Trusts or Testamentary Trusts
Inter vivos trusts are those created whilethe grantor is living. Testamentary trusts arethose established under the terms of thegrantor's will to take effect at the time ofhis or her death. For 1974, trusts were classi-fied as inter vivos or testamentary accordingto the answer given by the fiduciary to aquestion on the first page of the Form 1041 .Returns for fiduciaries not answering thisquestion were included in the classification"Inter Vivos or Testamentary Trust NotSpecified" 151. For 1982, trusts wereclassified as generation-skipping, grantortype, family estate and testamentary trusts.
BANKRUPTCY ESTATES
This new taxable entity was first used forbankruptcy cases commencing on or after March25, 1981 . If an individual debtor files forbankruptcy under chapter 7 (based on liqui-dation) or chapter 11 (reorganization) of theBankruptcy Code, a separate "estate" is createdconsisting of property that belonged to thedebtor before the filing date. The estate ismanaged by a trustee for the benefit of anycreditors, and it may produce its own income aswell as incur its own expenses. The creationof a separate bankruptcy estate gives the indi-vidual debtor a "fresh start." If wages areearned or property is bought by the individualafter the bankruptcy case has begun, it belongsto him or her and does not become a part of thebankruptcy estate.
The fiduciary filing for the estate of anindividual in bankruptcy proceedings uses Form1041 as a transmittal form for Form 1040. Thetax is figured on the Form 1040 the same way asfor a married person filing separately, thenthe Form 1040 is attached to the Form 1041where the fiduciary will fill in the identifi-cation area, enter the tax due (if any), signand date.
For 1982, an estimated 6,176 bankruptcyestates were filed; 1,597 of these returnsaccounted for $3.7 million of tax due at timeof filing. These data are included in table 1"Estates."

44 Fiduciary Income Tax Returns,1982
SUMMARY,
Stati s tics for Tax Year 1974--the lastprevious year for which IRS published data fromForms 1041 --and 1982 - show three major changesJn fiduciary returns. Taxable trusts increasedat more than twice the rate of-nontaxable trusts(62.4 ,percent, and 18.5 percent, respectively).Complex-trusts increased at more than'twice therate of simple trusts (46.1 percent and 20.8percent, respectively). Interest income showeda_ larger increase than any other s6urce~ ofincome, -becoming the'dominant. source of incomeon fiduciary returns (31.0 percent of totalincomel.
.The -first -two developments are obviouslyrelated, since only complex trusts can betaxable. Al I - the income. of a simple trust ispassed on currently to its beneficiaries andbecomes' taxable (if at al-l') to them. One ofthe purposes of these, trusts appears to be thetransf.
-er, of a portion of the grantor's income,
which. would otherwise: be' taxed at a highmarginal rate, to a trust, where at least someof. the, transferred income will be taxed atlower rates.
.Distributable Net Income;--The distributablenet income consisted of Iff-e-same items of -grossincome and- deduction th at make up the taxableincome of the e~state or trust.- There are,however, important modifications, defined inSection 643(a)(1) through M of the InternalRevenue. Code, that -include. the~ deduction for,distribution, deduction for ~personal exemption,capital gains and losses., extraordinary divi-dends and - taxable sto ,ck dividends', -tax-exemptinterest, income, of~ a foreign trust, anddividends or interest.
Personal Trust.--A trust,set up to benefit aninTi~vidual or-a grou
Ip of individuals by a
person, the grantor not being 4 beneficiary.
Exemption.--Each estate in--th.e. process ofsett-Fe-ment was entitled to an annual exemptionof $600. Trust instruments: that ..require. alli.ncome to, be distri buted currently., regardlessof whether the trust is s
-imple- or complex, . was
allowed to deduct $300. .'For example, a simpletrust that distributed corpus and; was, there-fore, considered to be a complex trust for thatyear
'was still entitled to a $300 exemption.
When the trust. instrument, did not require thatall . income must be distributed currently, i.t
--As-far -as-can- be-dete~rmi-ned-the predominance- __ wa-s-- al I owed on -Many - returns- had.of interest as-'the major source of income forestates and trusts Was a reflection of the risein interes t rates between 1974 and 1982. Ashift in investments occurred' as administratorsof estates and trusts decided to take 'advantageof rising interest rates. Interest-bearingaccounts and certificates *were . one of ' the mostattractive investment opportunities in 1982.
DEFINITIONS
Brief. definitions of some of the terms usedin the tables are provided.
Total D6ductions.--This was the sum of allM7~owable -&e-ductions: interest paid, - taxespaid, charitable deductions, deduction fordistributions to beneficiaries, interestexclusion, long-term capital gain deduction,the exemption, fiduciary fees, preparer fees,and any other qualifying deduction.
Other Deductions. --Other deductions includedthe divi-d-Wd-exclusion and estate tax deduc-tions., Estate tax deductions resulted whenincome was received on behalf of a decedentwhich that decedent had earned (but notreceived) during his or 'her lifetime. Suchamounts were added to the total value of the
.estate (and thus subjected to the estate tax)and also added to the estate's taxable income(and thus subjected to the fiduciary incometax). However, the additional estate tax whichresulted from this income could be deducted incomputing the fiduciary's taxable income.
a, reduced amount of exemption . or none at . al Isince prev-ious deduction-of expenses had e
'limi-
nated, or nearly eliminated, total income andhad made them already nontaxable.' If finaldistribution of assets had been made.during theyear,
'all income to the est.at.e:o~ trust had to
be reported as distributed to beneficiaries;for these 'returns the , exemption , served nopurpose and was not'reported as a result.
N*onadverse .' Party.. --Any person Who 'had no
benetic-1-a-1----interest, or whose' beneficialinterest was not substantial, or whose interest,while beneficial and substantial , w
*ould not be
adversely affected by the exercise of his orher power with regard to the trust.
SOURCES OF DATA AND METHOD OFESTIMATION
For the 1982 fiduciary report., a stratifiedrandom sample was computer- selected from theForm 1041 , U.S. Fiduciary Income -Tax Returns,filed during 1983. All Form 1041 returns, with.the exception of amended and tentative returns,were stratified into sample classes on the basisof income, return typeand taxability or non.tax-ability of the return. The returns were thenselected at' rates ranging
.from 0.24 percent to
100 percent, yielding a sample of 71,139 returnsfrom an estimated population of 2,009,216.
In contrast to earlier years, no specialstatistical editing or keying of the data fo
*r
Tax Year 1982 was performed. Rather, data forthe returns selected for the sample were

Fiduciary Income Tax Returns, 1982 45
obtained from information transcribed for taxadministration purposes onto the IRS BusinessMaster File system (BMF). Before this wasdone, a sample of Tax Year 1981 Forms 1041 waspulled, and the line-by-line entries shown onthe tax return were compared with entriesrecorded on the BMF. In general, the majordifference was that specific deduction itemswere sometimes classified in "other incomedeductions"; however for tax administrationpurposes this had no effect on the verificationof tax.
COEFFICIENTS OF VARIATION
As the data presented in this article areestimates based on a sample of documents filedwith the Internal Revenue Service, they aresubject to sampling, as well as nonsampling,errors. To use the statistical data properly,the magnitude of the sampling errors must beknown. Coefficients of variation (CV's)computed from the sample are used to measurethe magnitude of the sampling errors.
The following table presents approximate CV'sfor frequency estimates. The approximate CV'sshown here are intended only as a general indi-cation of the reliability of the data. Fornumbers of fiduciaries other than those shownbelow, the corresponding CV's can be estimatedby interpolation.
The reliability of estimates based on samplesand the use of coefficients of variation forevaluating the precision of sample estimatesare discussed in the Appendix.
Estimated ApproximateNumber of Returns Coefficient of Variation7-,476-,600 U1
~9,100 .0514,800 .103,700 .201,600 .30
900 .40600 .50
NOTES AND REFERENCES
[11 U.S. Department of the Treasury, InternalRevenue Service, Statistics of Income--1982, Individual Income Tax Returns, p. 2.
[21 See Paris, David, and Hilgert, Cecelia,"70th Year of Individual Income and Tax
Statistics, 1913-1982," Statistics ofIncome Bulletin, Winter 198-3-8T, for amore complete discussion of individualincome trends.
E3_1 U.S. Department of the Treasury, InternalRevenue Service, Statistics of Income--1974, Corporation ome Tax Returns, p.4, and also Statistici-of Income BUTT-etin,Fall 1984, p.__f9_.
[41 For 1974, total income (less loss) includedgross rent and royalties. For 1982, totalincome included net rent and royalties.The 1982 figure has been adjusted by usinggross rent and royalty for of comparingtotal income (less loss) for the 2 years.
[51 U.S. Department of the Treasury, InternalRevenue Service, Statistics of Income--1974, Fiduciary Income Tax Fe-f-urns.Selected fiduciary data are als a-M-6Tefor earlier years -- 1918, 1926-50, 1954,1956, 1958, 1960, 1962, 1965 and 1970.
r.61 Research Institute of America, Inc.,Federal Tax Coordinator 2d, Washington,
[71 Petska, Thomas B., "Charitable Trusts: AnIRS Examination of Nonexempt PhilanthropicOrganizations," Statistics of Income andRel ated Admi n i sf-ra-f1-ve Record Re s ii'FEF71983, pp. f59-1b4.
[81 Petska, Thomas B., "An Examination ofPrivate Foundations for 1979," Statisticsof Income Bulletin, Fall 1982, pp-.9-30.
[91 Petska, Thomas B., and Skelly, Daniel,"Private Foundations, Federal Tax Law, andPhilanthropic Activity: An IRS Perspec-tive," 1981 American Statistical Associ-ation Proceedings, Se c0-on arn__S urveyVe-s-ear-5 Methods, pp. 651-b55.
[101 Bentz, Mary F., "Estate Tax Returns, 1983,"Statistics of Income Bulletin, Fall 1984,pp. 17777.
[11.1 Federal Financial Institutions ExaminationCouncil , Trust Assets of Banks and TrustCompanies= 1983, Washington, D.C. Thisannual repoFt-is conducted by the Board ofGovernors of the Federal Reserve System,Federal Deposit Insurance Corporation, andOffice of the Comptroller of the Currency.

ITable i. - Estates-Sources of Income and Loss, Deductions, Taxable Income and Tax Item
Is, by Size of Total Income
(All figures are estimates based on samples - money amounts are in thousands of dollars)
Sources of income and loss
Total Diyid.nds before Interest Ifeceived Partnerships Other estates or trusts Computalion of fonts and royaltiesNumber of income exclusions
S- of total income estates (less Gross rentsdeficit) Number of Amount Number of Amount
Number ofAmount
Number ofAmount Number of
,estate
sestate estates estates
estatesAmount
6) (2) (3) (4) (Ed (6) (7) (8) (9) (10) fit) (12)
ll estates, total .............................................................. 422,734 7,126,213 f8O,700 1,239,717 349,110 2,846,718 22,211 200,198 7,758 53,374 77,370 902,207
No total income ............................................................. 46,383 -145,600 4,066 3,061 9,488 25,771 1,520 -20,434 293 473 8,207 69,947
Sl under S1.000 .......................... 62.852 31,215 16,548 6.747 52,769 29,391 310 75 310 141 9.225 19,568:S1.000 under $2.000 ............................ _ ........................ 43,810 65,447 13,596 10,804 38,375 48,178 766 -1.519 787 608 4,912 19,595
.S2.000 under $3.000__ .................. .......... 35.302 86,449 13,472 15,612 31,508 61,490 783 4,043 310 829 6,114 22.871S3,000 under S4.000 ............................................. __ .... _ 23,066 80,400 9,523 15,576 20,737 52.414 528 218 355 4.300 15,167$4.000 under S5.000 ...... ....... ....... .............. 21.231 95,585 9,066 19,302 19,481 65.192 913 1,953 163 363 3,648 18,929
S5,000 under S7. 000 ~ ~ ~ ............ ........ ___ .......... 33,360 198,222 16,200 39.029 30,026 124,266 1,119 1,012 410 1.227 5.944 32,612S7.000 under S10,000 __ ............ ............................. 34,992 294,473 18,937 58,289 32,584 179,829 1,830 2,496 985 2.943 6.114 38,331S10.000 under S15,000 ............. .......... ... ____ .............. 33,236 409,106 19,394 88.577 30,577 226,903 2,250 6,385 844 3,169 6,129 51,223S15.000 under S25.000 ...................................... _ ... _ ....... 35,935 693,807 22.607 138,410 33,668 381,126 2.548 8,000 1,108 5.406 8,068 90,924$25.000 under S50.000 ......... _ ................................. _ ...... 29,354 1.019.866 20,356 212,597 27,70C 470.094 4,052 28,682 1,240 8.112 7.210 123.257
S50.000 under S100.000 ...... .............. 13,884 960,667 9,922 178,094 13,306 393,810 2,747 30.817 555 8,853 4.097 104,460S100,000 under S200,000 ..... _ ...... ................................. 5,708 774,715 4,229 143,009 5,402 243,504 1,544 18,830 311 7,643 2,024 70.60CS200,000 under S500,000 ~ ........ __ ............................. 2,570 764,504 1.945 118,829 2,470 205,446 854 33,346 156 6,292 944 96.508S500.000 under S1.000,000 .... ......................................... 624 430,481 501 60,357 600 102,295 256 22,528 43 3,473 250 42,767S1.000,000 or more .............................. ___ ................... 426 1,366,875 339 131,424 419
1237,008 192 62,854 24 3,487 185 85.446
Taxable estates, total ....................................................... 168,441 4,576,923 89,956 768,746 153,375 1,619,174 13,002 163,178 4,195 29,737 34.885 537,774
S1 under S1.000 ....... .............. ......................... 6,559 5,053 1.600 1,280 5,415 3,574 163 75 163 106 1,018 5,017S1.000 under S2,000__ ............... ......................... 16,627 24,507 5,427 5,429 14,123 16,648 272 8 54 90 1.579 4,691$2.000 under S3,000 ....... ................ ......................... 14,035 34,92 5,357 6,331 12,347 23,456 490 276 163 280 2,689 13.882S3.000 under S4.000 ............................. _ ....................... 11.635 40,459 4,247 6,778 9,892 25,844 381 963 218 355 2.395 10.137S4,000 under S5,000 ................................... __ .............. 9,746 43,687 4,083 9,512 8,874 27,988 327 727 163 363 1,742 8.63G
$5.000 under $7,000 ........... ........................... 16,263 97,055 7,503 18.019 14,395 ou.j- 585 -225 242 544 3,111 16,46~$7.000 under S10,000 .................................... __ ........... 17,860 149,722 9,771 28.743 16,753 93,265 761 1,328 484 1.599 3,212 1 7.27ES10.000 under S15.000 ... ____ ......... ...................... ___ 19,201 235,570 11,827 51,910 17,742 129.822 1.384 3,602 277 840 3,629 28.474$15,000 under $25,000......... ............ .............................. 21.723 420,789 14.034 84,395 20,383 225,530 1.671 7,863 777 3,893 5.472 63, 1 O~S25,000 under $50,000 .................................................... 19,110 662,507 14,051 145,046 18,350 298,766 2.694 15,803 893 5.035 4,860 86.071
S50,000 under S100,000 .............. ___ ............................ 9,240 641,604 6,986 128,950 8.922 249,276 2,069 22,195 390 5.148 2,735 71,18E$100.000 under S200,000 ...................... ......................... 3,978 541,387 3.085 100,457 3.775 163.085 1.210 10.662 213 5,140 1,477 48,50-,S200,000 under S500,000 ............. _ ......__ ..................... 1,746 520,975 1,395 83.125 1,700 124,340 658 25,356 ill 4,488 658 76.22E$500,000 under S1,000,000 ............. .................... 434 299,625 359 41,113 424 65,646 193 16.889 32 1,470 182 33,97-,S1,000,000 or more ........................... 284 859,057 229 57,659 279
i111,544 144 57,656 14 383 127 54,121
Nontaxable estates, total .................................................. 254,293 2,549,291 90,744 470,970 195,735 1,227,544 9,208 37,019 3,563 23,637 42,485 364.4X
No total income ............................................................. 46,383 -145,600 4,066 3,061 9,48~ 25,771 1,520 -20,434 293 473 8,207 69,941
Sl under S1,000 __ ........ .............................. ...... ___ 56,293 26.162 14,948 5,467 47,35~ 25,818 147 C) 147 33 8,207 14,551S1,000 under $2.000 ......... _ ... ................ ................. 27,183 40,940 8,169 5,375 24,252 31,530 494 - 1,527 733 518 3,333 14,90,S2,000 under S3,000 .................. ....................... 21.267 51,524 8,115 9,282 19,160 38.035 293 3,767 147 549 3.425 8.98;S3,000 under S4.000 .... ......................... ........................ 11,431 39,940 5.276 8,798 10,845 26,571 147 167 - - 1,905 5.03(S4,000 under S5,000 ....................................................... 11,485 . 51,899 4,983 9,790 10,606 37,204 586 1,226 - - 1.905 10.29(
$5.000 under $7,000 .................. ................ 17,097 101,167 8,696 21,010 15,631 63,874 533 1.236 168 683 2,833 16,14(S7.000 under S10,000 ................ .......... _ .................. 17,132 144,751 9,165 29.547 15,831 86,564 1,069 1.168 501 1,344 2,902 21.05!S10,000 under S15,000 .................................... ___ ... ___. 14,035 173,537 7,566 36,667 12,835 97.081 866 2,783 568 2.329 2,500 22,74~S15,000, under S25.000 ........................................... ..... _ 14,212 273,018 8.573 54,015 13,285 155.597 877 137 331 1,513 2.596 27.82S25,000 under S50,000 .................................................... 10,244 357,359 6,305 67,551 9,351 171,328 1,357 12,880 348 3,078 2,350 37,18(
S50,000 under S100,000 ..... ......... .......... 4,645 319.064 2,936 49,1441
4,384 144,534 678 8.622 165'
3,705 1.362 33,27!S100.000 under S200,000 _ ........................ 1,730 233,328 1,144 42.552 1,627 80,419 334 8.169 98 2,503 547 22,09:S200.000 under $500.000 ......... ................... 824 243,529 550 35,704 770 81,106 196 7,991 44 1,803 286 20,28:S500.000 under S1,000,000 .............................................. 190 130,856 142 19,243 176 36,649
~
64
~
5.639 2,003 69 B.MS1,000,000 or more .............................................. 1421 507,818 109 73,765 139 .125.463 49 5,198 3 105 58
A
31,32~
AllbCn
Foolhole(s) at end of table.

Table 1. - Estates-Sources of Income and Loss, Deductions, Taxable Income and Tax Items, by Size of Total Income - Continued(All figures are estimates based on samples - money amounts are in thousands of dollars)
Sources of income and loss-Continued
Size of t tal inc meComputation of rents and royalties-Continued Net rents and royalties Business and farm Sales of capital assets:
net gaino o
Gross royalties Depreciation and depletions Other expenses
Number of Amount Numberof Amount
Number of Amount
m er oestates Amount
Number ofestates
Amount Number ofestates Amount
estates estates estates(13) (14) (15) (16) (17) (18) (19) (20) (21) (22) (23) (24)
All estates, total .............................................................. 25,597 525,080 47,051 261,372 70,997 592,959 89,148 572,954 18,057 151,605 87,807 1,878,038No total income ............................................................. 879 221 6,741 35,959 9,672 84,694 10,259 -50,484 2,985 -25,912 1,520 3,068$1 under $1,000 ............................................................ 2,253 1,232 4,372 8,766 7,303 13,707 9.371 -1,673 767 426 2,525 973$1.000 under $2,000 ....................................................... 1,587 1,348 2,081 5,035 4,749 13,055 5,369 2,853 1,206 -14 5,117 4.271S2,000 under $3,000 ..................................................... _ 1,478 2,633 3.174 4,904 5,381 19.084 6,114 1,516 838 661 4,271 3,404$3,000 under S4,000 ....................................................... 1,457 4,012 2,164 4,390 3,496 8,161 4,920 6,628 674 -770 3,539 5,238S4.000 under $5,000 ....................................................... 1,366 3,046 2,261 6,146 3,522 10,284 4.468 5,545 729 -84 4,012 5,056$5,000 under $7,000 ....................................................... 1,627 4,591 3,400 9,508 5,126 13,975 6,860 13,719 1,094 2,782 5,939 14,010$7.000 under $10,000 ... ................................................. 2,136 8,938 3,297 10,003 5,166 18,191 6,990 19,075 1,499 3,342 8,218 21.322S10,000 under S15.000 .................................................... 2,242 10,469 3,660 13,461 5,453 21,499 7,455 26,733 1,741 7,211 10,646 43,757S15.000 under $25,000 ..................................................... 3,076 24,245 5.043 20,120 7,260 40,737 9.507 54,311 2,084 13,681 13,065 75,259$25,000 under S50,000 .................................................... 3.059 46,205 5,110 30,202 6,449 54,780 8,450 84,480 2,034 22,294 14,304 161,742
$50,000-under S100,000 .................................................. 2,070 61,404 3,050 25,361 3,932 63,189 4,991 77,314 1,047 10,556 8,182 217.390$100,000 under $200,000 ............... .......................... 1,284 85,053 1,601 21,704 2,036 40,297 2.576 93,651 736 12,127 3,825 212,285$200,000 under $500,000 ................................................ 697 97,309 753 22,544 993 80,635 1,242 90,637 396 18,042 1,798 246,613$500,000 under $1,000.000 ... .......................................... 203 56,377 208 16,458 270 35.083 337 47,603 106 11,698 489 165,804S1,000,000 or more ........ ............................................... 162 117,996 134 26,812 190 75,587 240 101,045 102 75,566 358 695.846
Taxable estates, total ....................................................... 13,319 338,556 23,814 149,841 31,684 328,471 40,323 398,017 8,993 127,810 49,061 1,275,805S1 under $1,000 ............................................................ 54 551 854 2,887 854 2,982 1,018 -301 54 -119 473 282S1,000 under $2.000 ....................................................... 708 909 708 1,487 1,416 2,666 1,742 1,447 327 202 1.453 538S2.000 under $3,000 ...................................... ................ 691 1,127 1,508 3,405 2,488 9,426 2,689 2,179 545 309 1.780 1,184$3.000 under $4,000 ................................. - ................... 871 3,744 1,578 2,715 2,177 5,737 2,722 5,429 381 -778 1,634 2,111S4,000 under $5.000 ....................................................... 653 1,956 1,089 2,060 1,470 4,377 2,124 4.159 436 -6 1,906 1,747$5.000 under $7,000 ...................... ... __ ...................... 828 3,065 1,833 4.662 2,626 7,104 3.560 7,765 761 2,486 2,906 5,115S7.000 under $10,000 ...................................................... 1,102 4,327 1,863 4,830 2,730 7,507 3,590 9,267 966 3,025 4,217 10,017$10,000 under S15,000 ................................... - .............. 1,176 7,628 2,594 8,525 3.387 11.221 4,356 16,355 1,141 6,040 5,843 23,311S15,000 under $25.000 ................ ................................... 2,083 16,068 3,670 14.824 5,025 28,164 6.331 36,182 1,273 8,170 8,001 44,258S25,000 under S50,000 .................. .............................. 2,050 27,144 3,686 24,130 4,265 36,514 5,736 52,571 1,405 15,465 10,100 109,291$50.000 under $100,000 .............................. ................... 1,413 40,153 2,306 20,179 2,714 47,054 3,319 44,105 697 9,332 5,941 152,144$100,000 under S200.000 .............................................. _ 952 61,891 1,264 17,038 1,504 28,237 1,868 65,122 584 9,163 2,833 151,746S200.000 under 5500,000 ........... ........ _ .......................... 487 67,566 599 18,106 705 64,819 866 60,866 282 10,013 1,348 181,541S500,000 under S1,000,000 ............................... .............. 144 41,678 163 13,734 194 28,740 241 33,181 73 7,570 369 122,588S1,000,000 or more ........................................................ 107 60,751 98 11,259 129 43,923 162 59,690 67 56,939 256 469,932
Nontaxable estates, total .................................................. 12,278 186,524 23,237 111,531 39,313 264,488 48,825 174,937 9,064 23,795 38,746 602,232No total income ............................................................. 879 221 6,741 35,959 9,672 84,694 10,259 -50,484 2,985 -25,912 1,520 3,068S1 under S1,000 .............. _.. .... .................................... 2,198 681 3,517 5,879 6,448 10,725 8,353 - 1,372 733 546 2,052 691S1,000 under $2,000 .................................... .......... 879 440 1,373 3,548 3,333 10,390 3,626 1,406 879 -215 3,664 3,732S2,000 under $3.000 ................... ................................... 787 1,506 1,667 1,499 2,893 9,658 3,425 -663 293 352 2,491 2,220$3,000 under S4.000 ....................................................... 586 269 586 1,676 1,319 2,424 2,198 1,199 293 8 1,905 3,128$4,000 under S5,000 ....................................................... 733 1,090 1,172 4,086 2,052 5,907 2,345 1,387 293 -78 2,106 3,309S5,000 under $7,000.. ................................. I ................... 800 1,526 1,567 4,846 2,500 6,871 3,299 5,955 333 296 3.033 8.894S7.000 under S10,000 ... ........................................ 1,034 4,611 1,434 5,173 2,436 10,685 3,401 9,808 533 317 4.000 11.305S10,000 under $15,000 .................................................... 1,066 2,841 1,066 4,935 2,066 10,277 3,100 10,377 600 1,171 4.802 20.446S15,000 under $25,000 .................................................... 993 8.177 1,374 5,296 2,234 12,572 3,176 18,129 811 5,510 5,064 31,000S25,000 under S50,000 ......................................... .......... 1,010 19,062 6,072 2,185 18,266 2,714 31,910 621 6 8291 4 0412 52,451$50,000 under $100,000....... .............................. __ ... 657 21.251 744 5,182 1,218 16,135 1,672 33,208 350
~ 224
1
'~24,
65,246S100.000 under S200,000 ....................................... ...... _ 332 23162 337 4666 532 2061
1708 28529 52 2,965 992 60.540
S200.000 under $500,000 ................................................ 209 29~744 155 4:437 288 15:816 376 29:771 13 8,029 4'0
67,072S500,000 under S1,000.000 .............................. ............... 60 14,700 44 2,724 76 6,343 96 14,423 32 4,12
~
43.216S1,000,000 or more ......................................... _ ....... 55 57,245 36 15,553 621 31,6641 78 41,355 34
1
8,62 225.914
See footnote at end of table.

Table 1. - Estates-Sources of Income and Loss, Deductions, Taxable Income and Tax ItemIS, by Size of Total Income- Continued
(All figures are estimates based on samples - money amounts are in thousands of dollars)
Sources at income and loss-Contin6ed Total deductions Type at deduclion
Sales of canot
pital assetsloss
Sales of property other than capital assetsI
Other sources Interest paid
Net gain N.C lossNumber at
estates AmountN b tNumber of
estate.s Amount Number
ofestatesAmount Number a
statesAmount
Number ofestates
Amount um er aestates
Amount
(25) (26) (27) (28) (29) (30) (31) (32) (33) (34) (35) (36)
All estates, total .............................................................. 29,751 54,558 3,654 15,473 3,522 37,804 47,588 260,489 401,125 5,912,331 63,371 313,005
No total income ............................................................. 3,957 13,329 348 764 1,905 30,003 1,466 -38,574 26,249 129,025 3,040 20,033
Sl under S1.000 ............................................................ 2,784 5,110 - - 147 310 2.617 555 62,341 129,716 4.945 2.477
S1.060 under S2,000 ....................................................... 2.190 2,129 402 466 14 132 3.396 2,061 43,701 117,250 3J62 3.830S2.000 under $3.000 .... ...................... _ ........................ 2,119 3.861 - - - - 2,810 2,755 35,139 111,925 3.639 4.289S3.000 under S4,000 .................... ................... ....... 1,952 2428 402 265 -i - 2.864 1,991 23,066 80,941 2,684 4.818: :S4.000 under'S5,000 ....................... ..............
.1.093 1:777 - log 149 2.136 185 21.013 84,337 3,103 1,585
S5.000 under S7.000 ..................... _._ ... ......................... 2,062 2.460 262 184 lot 122 3,84g 4.575 33,187 185,117 4.834 11.741
S7.000 under S10.000 ................... ............ _._ ............... 3.102 .4,408 274 578 405 785 4,610 11.792 34,888 234,478 5,721 10.013
S10,000 under S15.000 .......................... ..................... 3,045 5.389 373 168 35 45 4,805 11.638 33,132 317,244 6.005 13.824
$15,000 under S25,000 ............................... __ ... ........... 3.060 4,847 430 963 215 1,256 5,755 22,753 35.902 449,487 7,805 22.765
S25.000 under S50.000 .............. ___ ............................... 2.497 4,403 446 1.847 149 1,302 6,086 35,722 29,305 676,355 8.682 31,818
S50,000 under $100.000 ............................... ...... ...... . 1,243 2,720 292 1,456i
112 315 3,968 45,412 13,874 681,147 5.176 40,378
Sloo.000 under S200,000 ..... ...................... ........ 1,135 260 2.247 100 1,966 1,787 44*517 5,708 558,378 2,607 40.051
S200.000 under S500,000 ....................... ............. 190 441 153 3.163 54 702 975 41.275 2,570 636.666 1,329 39,900S500,000 under S 1,000,000 ......................................... 32 74 35 719 '24 517 275 16,593 624 343,354 356 20,410S1,000,000 or more ....................... ...... ......................... 17 46 37 2,652 20 201 169 57,240 426 1,176,910 283 45.073
Taxable estates, total ....................................................... 13,576 20,152 1,809 9,883 810 4,705 U,580 209,423 166,966 2,443,626 27,813 156,239
Sl under $1.000 ............................................................ - - --1
- 272 155 6,048 3,785 109 2
S1.000 under S2.000 .................. .................................... 817 821 109 18 - 1,198 949 16,518 13.427 817 108:S2,000 under S3,000 ....... .............................. ................ 653 641 -
I1.290 1,552 13,872 15.271 708 346
S3,000 under S4.000 ................ .............. ................. ...... 926 1.229 109 13 -1- 1,399 974 11,635 16.580 926 409
S4.000 under S5,000 ........................... ...................... 653 1,144 - - 109 149 762 489 9,528 15,423 1,198 594
S5,000 under $7,000 ............................... ...... ........... 796 708 69 37 35 4 2,116 3,634 16,090 32.734 1,969 1,031
STOOO under $10,000 .................................. ........ 2,001 2,746 208 529 170 350 2,310 5.046 17,756 51,955 2,387 2,136
$10,000 under S15.000 .................................................... 2.145 2,845 173 101 35 45 2,705 6,478 19,098 77,961 2,906 5,360
S15.000 under S25.000 .................................................... 2.216 3,455 231 774 149 246 3.422 13,425 21,690 143,695 4,365 8,949
$25,000 under S50,000 .................................................... 1.851 3,148 347 1,173 83 1,099 3,885 23,605 19.061 267,518 5,571 17,043
$50,000 under S100,000 ............................. .................... 964 1,937 215 1.062 82 100 2,828 31,427 9.229 327,843 3,494 21,963S100.000 under S200,000 ................................................ 359 1,024 lB2 .1,184 80 1,811 1.377 37,662 3.978 312,709 1,912 23,832$200,000 under S500,000 ............................... ___ ........ 157 358 110 2,040 39 495 696 30,058 1,746 ~46,060 976 26,604S500,000 under $1,000,000 __ ................ ................ ... _. 25 61 26 543 16 249 195 10,934 434 207,181 267 15.341$1,000,000 or more ........................................................ 13 34 30 2,409 13 -156 126 43,035 284 611,484 209 32.522
Nontaxable estates, total .................................................. 16,175 34,406 1,844 5,590 2,712 33,099 23,007 51,066 234,159 3,468,705 35,558 156,767
No total income ............................................................. 3,957 13,329 348 764 1,905I
I
30,003 1,466 -38,574 26,249 129,025 3,040 20,033
Sl under $1,000..............
2,784 5.110 - - 147 310 2,345 400 56,293 125,931 4,836 2,47E
S1.000 under S2,000 ....................................................... 1,373 1,308 293 448 147 132 2.198 1,112 27,183 103,823 2,345 3,722$2.000 under S3,000 ................................ _ ... .............. 1,466 3,220 - - -
;- 1,520 1,203 21,267 96,654 2,931 3.94'
S3,000 under $4,000 ................ ............................. 1,026 .1,199 293 252 1.466 1,017 11,431 64.361 1,759 4,4019S4,600 under $5,000.. .................................. ....... 440 633 - 1,373 -304 11,485 68,913 1,905 99,
S5,000 under $7,000 ..................... .................... 1,266 1,752 133 147 6, - 1,732 941 17.097 152.383 2,865 10,71CSTOOO under $10,000 .......................... ............... 1,101 1,662 67 50 234 435 2,300 6,746 17.132 182,524 3,334 7.87~S10,000 under $15,000 ....... _ ...................................... .... got 2,544 200 66 2,100 5,161 14,035 239.283 3,100 8,46E
S15,000 under S25,000 ................... _ .............................. 844 1,392 199 189 66 1,010 2,334 9,326 14,212 305,792 .3.440 13,81E
S25,000 under $50.000 .................................................... 645 1,255 99 673 66 203 2.201 12,117 10,244 408,837 3,111 14,77E
S50.060 under S100.000 ...... ........................................ 280 783 77 394 30 215 1,140 13,985 4,645 353,304 1,682 18.4 1 E
S100,000 under S200,000 ................................................ 49111 7' 1.
063 20 155 410 6,854 1,730 245.670 695 16.2 1 ~
S200.000 under $500,000 .... ........................................... 33 83 42 f,124 5 .207 280 11,218 824 290,606 353 13.29E$500
'000 under S1,000,000 ... ........................................... -6 1 .8
~176
'1 267 80 5,659 190 136,173 89 5.07C
$1,000,000 or more .............................................. -4 1 -7 243 -7 45 63 14,205 142 565,426 74 '12,551
See footnote at end of table,
I

Table 1. - Estates-Sources of Income and Loss, Deductions, Taxable Income and Tax Items, by Size of Total Income - Continued
(All figures are estimates based on samples - money amounts are in thousands of dollars)
Type of deduction-Continued
Taxes Charitable contribut,ons Rduciary fees Attorney, accountant Dslnbut,on to Long-term captaland tax preparer fees beneliciaries ga.rr
Number ofAmount
Number ofAmount
Numberof
AmountNumber of
AmountNumber at
Amount Number of
Amo ntestates estates estates estates estates estates
(37) (38) (39) (40) (41) (42) (43) (44) (45) (46) (47) (48)
All estates, total .............................................................. 150,426 236,510 19,263 658,788 82,959 268,404 190,297 524,861 144,322 2,443,251 57,439 778,010
No total income ............................................................. 5,477 7,845 1,026 273 4,103 4,738 12,712 28,800 6,888 31,670 934 530
Sl under S1,000 ................................ __ ................ 13,257 6,081 1.612 15,802 12,289 14,033 24.266 33.460 15.974 20,597 1,227 207S1.000 under S2.000 _ ~ ~ ~ ..................... ................... 11.453 5.764 934 11,490 6,934 13,216 18,521 29,012 14,195 21.400 2,647 1,533S2.000 under S3,000 ..... ___ ..................................... 10.829 6.211 1,428 1,567 7.772 14,055 16,733 28,334 11,096 30.379 2,333 1,188S3,000 under S4,000 ...... ........ ........................................ 8.647 4,693 1,097 1,802 4.899 4.897 11,549 15,680 6,260 14.196 2.714 2,739S4,000 under S5.000 ........ ................................. - _ 8,501 4,610 310 850 4,606 10.483 10,426 21,094 7,269 23,393 1,927 1,102
S5,000 under STOOO .......... ....................................... 14,259 10.983 1,479 9,206 7,904 20,152 17,597 43,129 11,464 45,572 3,996 5,310S7.000 under $10,000 ........ ...................................... 15,307 10,303 1,894 11,547 8,722 25,276 17,414 45.890 14,315 84,352 4,432 7,482S10.000 uride, $15,000 ........................... ........................ 14,373 13.887 1,726 39,352 7,180 21,028 16,451 46,558 13,349 115,183 6,622 15,729S15.000 under S25.000....... ................................ .... __ ... 17,266 21,851 2,499 27,817 7,456 27.408 17,148 52,345 15,686 215,367 8,614 27.945S25.000 under S50,000. ......................... __ ............... __ 16,239 28,504 2,184 60,920 6.004 30.655 14,885 59,020 14,260 323.519 10,647 67,433
S50,000 under S100,000 ............... .................................. 8.58C 26,161 1,640 65,785 2,960 23.529 7,239 43,047 7,680 343,108 6,241 89,204S100,000 under S200,000 ................................... 3,749 20.285 777 42,285 1,282 16.300 3,290 27,805 3,474 278,631 3,007 89,773S200,000 under S500,000 ............................ 1,738 23,091 420 61,339 598 14.180 1,449 22.907 1,692 294.930 1,417 100.680S500.000 under S1,000,000 ....___ ................................. 439 10,889 129 35,997 154 6,296 373 11,733 439 164,795 394 71.815S1,000,000 or more .... ...................................... ............. 313 35.352 110 272,757 93 22,159 244 15,848 283 436,160 289 295,340
Taxable estates, total ....................................................... 70,361 132,121 5,662 82,764 22,038 70,374 64,650 148,089 25,561 873,415 43,718 676,497
Sl under $1,000 ....... __ ........ ........... ....... ............... - 800 61 - - 218 10 708 81 147 136 54 2S1,000 under S2.000 ............ __ ........................ - ... ........ 3,539 686 54 12 926 191 3,904 996 419 307 1,035 245$2.000 under S3.000 .............. _ .... ................................ 3,740 1,040 109 12 1,709 740 3,288 1,261 984 1,610 1,307 528S3,000 under S4,000_.._ .......................................... 3,957 1,425 218 26 1,089 499 5,101 3,047 691 969 1.688 1,356$4.000 under S5.000--_ ................. ............... 3,812 2,357 163 157 1,035 566 3,484 2,235 327 584 1.634 982
$5.000 under S7.000-__ ............... .............................. 6.362 3,862 346 466 1,972 1,974 6,398 6.060 1,203 2,784 2,560 2,596$7.000 under S10.000 -, ............. .............. 7,943 4,895 761 989 2,722 4.155 7,249 10.668 1,885 7,114 3.563 4.943S10,000 under S15,000 ........... ......... ........................ 8,541 7.418 726 1.799 3,113 5.535 7.651 9,922 2,350 13,894 5,119 12,479S15,000 under S25,000... .............. .................... 10,449 11,407 1,026 2,541 3,108 7.425 9.208 19,054 4,184 38,272 7.191 24,095S25,000 under S50,00O..... ...................... __ ................ 10,695 16,234 876 4,617 3,240 11.391 9.324 25,365 5,720 91.798 9,257 59,342
S50,000 under S100,000 ........................ ......................... 5,943 16.360 665 6,838 1.588 11,679 4.670 21,073 4,003 132,500 5,689 81.998S100,000 under S200,000 .... ......................... ..... ___ 2,747 13,196 421 8,739 813 9.304 2.249 16,657 2,082 127,226 2,728 84.218S200,000 under S500.000 ................................................ 1,281 14,288 191 9,810 356 7,004 985 13,950 1,084 150,813 1,291 94.034S500,000 under S1,000.000 ~ ...... ... - ..... 328 6,642 61 5,655 93 3.840 264 8.102 301 88,739 354 66,561S1,000,000 or more ............ ............................ 223 32,249 44 41,102 58 6,063 168 9,616 184 216,669 250 243,118
Nontaxable estates, total .................................................. 80,064 104,389 13,601 576,024 60,920 198,030 125,647 376,773 118,761 1,569,836 13,721 101,512
No total income ............................................................. 5,477 7,845 1,026 273 4,103 4,738 12,712 28,800 6,888 31,670 934 530
S1 under $1,000 .................... _ ...................................... 12,457 6,020 1.612 15.802 12,072 14,023 23,558 33,379 15,827 20,461 1,172 205S1.000 under S2,000 .................. __ ........ ...................... 7,914 5,077 879 11.478 6.009 13,024 14,617 28,016 13,776 21.093 1.612 1,287S2.000 under S3.000 ~ ~ ~ ~ - ~ ............... ........... 7,089 5,172 1,319 1.555 6.063 13.315 13,445 27,072 10,112 28,769 1,026 660S3,000 under S4.000.. ~ ................................ ................... 4,690 3,267 879 1.777 3,810 4,398 6,448 12,833 5,569 13,227 1,026 1,383S4.000 under $5.000 ................ __ ........ ................... 4,690 2,253 147 692 3,572 9,917 6,942 18,859 6,942 22,809 293 120
S5,000 undo, S7.000 ............................. .................. 7,897 7,122 1.133 8.740 5,933 18,178 11,199 37,069 10,261 42,788 1.436 2,713S7.000 under S10,000 __ ........... ............ ....... 7,364 5.408 1,133 10,558 5.999 21,121 10,165 35,222 12.430 77,238 869 2.540S10.000 undo, S15,000 .............. ___ ... ........................... 5,831 6,469 999 37,553 4,067 15,494 8,800 36,636 10,999 101.289 1,503 3,249S15,000 under $25,000 .............. ..................................... 6,816 10,444 1,473 25,275 4,348 19,983 7,940 33,291 11,502 177,095 1.423 3.850S25,000 under S50,00O........... ......................................... 5.544 12.270 1.307 56,303 2,764 19.264 5,561 33,654 8,540 231,721 1.390 8,091
S50,000 under S100,000 ....................... ........... 2,637 9,8 1 975 58,948 1.313. 1 1 8501 2,569 21,974 3,677 210 086 1 512, 7 206$100.000 under S200,000 __ .......................................... 1,002 7,089 356 33.546
6~4
:~'96 71,042 11,148 1,392
1:15
405 279 :5555
S200.000 under $500,000 ........ ................... 457 8,803 M~ 51,529 242 7,176 464 8,957 608 144.117 12 5 6 647S500,000 under $1,000,000 .......................... 110 4,2
~
30,342 62~
42, 56 109 3,631 138 76.056
~ 04
1 5: 254
$1,000,000 or ore .............. __ ... .................................. 90 3.1 231,654 35 16,096 76 6,233 99 219.490 39 52,222
Sce footnote at end of table

Table 1. - Estates-Sources of Income and Loss, Deductions, Taxable Income and Tax Items, by Size of Total Income - Continued'(All figures are estimates based on samples - money amounts are in thousands of dollars)
Type of cl,~J.cfion-Coru.... d Taxable income In om.taxbolou, crudits
E.e.pbon Other nComdeductionse
Other dd.chonsNumber of Number of
Number of Amount Amount Amountstates Amount states Amount
estates 1
(49) (50) (51) (52) (53) 1 (54) (55) (56)All estates, total ........................................................................................................................... 251,484 1151,~116 392,698 .145,310 168,420 - 2,1411,0711 168,420 707,052No total income .......................................................................................................................... 10,020 6,012 27,105 2,019S1 under $1.000 ............... .....................................................
. . ......... :........................ 30.689 18'?71 14.384 4,405 6,559 1,268 6 559 152S1,000 under S2,000.. .............................................................. 25,902 4:115 99 3510 6.68
1.11.100
,6 682
11 341S2.000 under S3.000... .............................................................
.. ....... ... ... . .19,483
":6 2 ~0158 3291 4.091 19.658
.4.0901
.2 504S3.000 under S4,000 .............. .................................................
.....15,964 9,562 19,764 2,590 11.635 23,879 11 635
.3 205
S4.000 under S5.000 ........................................................... _ ....................................................... 13,104 7,862 12.305 1,052 9.746 28,263,
9,746,
3.964S5,000 under S7,000 ................................................. .............................................. __ ................ 21.301 12.674 22,853 3,472 16,263 64.322 16 263 9 595SU00 under $10.000 ............................ I ........ b-- ......... : .... w ............. ... I .............. ............. ;....... 23.170 13,785 21:739 4,060 17,860 t 97.768
,17.860
.15 935
S10.000 under S15,000 .......................................... : ............................................... ...................... 23.736 14,067 23.443 14,167 19,236 157.830 19 236,32429
S15.000 under S25.000 ............................... ........................................... ..................................... 26,242 16,190 26,995 10,793 21,723 277,341.
21 723,
63 961S25,000 under S50.000 ........................ ............................................................................... 22,801 14,011 40,231 20,161 19,127 395,627,
19.127,
118,347S50.000 under S 100,000 ................................................................... ...................................... 11.258 6,889 23.793 19,215 9,157 315,318 1579 115 725S100.000 under S200.000 ................................................................ ............................................ 4 790
,
'02.863 25,158 15.216 3,913 230.514
,3 913
,16796S200.000 under $500,000 ............................................. ...........................................................
:2,128 .1,306 60.946 17,381 1,720 177,492
,1.720
.80 173S500,000 under SI.000,000 ...................................... __ .......................................................... ...... 531 317 13,370 7.729 431 92,931 431
,44 243SI.000.000 or more ........... .................................................................................. _ ..................... 3:66 217 37.756 16,248 278 247.760 278
.122.414
Taxable estates, total ....................................................................................................................
1
158
'
461 94,i105
~
124,831 84,207 168,147 2,139,348 168,147 706,544Sl under S1,000 ............................................... .......................................................................... 5,520 3,280 82 133 6,559
1268 6 559 152
S1,000 under $2.000 ................................... _ .................................................... ......................... 15,718 9,367 718 774 16,627 11:081.
1.6 6271 3
39S2,000 under S3.000 ............... .......................... .................................. ..................................... 12,578 7,458 1,124 1,097 14.035 19,654
,14.035
.
5042S3,000 under S4,000 .............................................................................. ..................................... 10,835 6,484 1,584 780 11.635 23,879 11 635
,3 205$4,000 under MMO....................... ............................................... ..................... ..................... 9,092 5,~55 1.813 680 9.746 28,263
.9,746
,3,964
$5,000 under S7.000 .............................................................................................................. ..... 15,233 9,104 3.116 1,716 16,263 64.322 16 263 9 595$7,000 under S10.000 ....... ........................:........................................... .................................... 16,769 10.004 4.738 2,282 17,860 97.768
,17 860
.15 935S10,000 under S15,000 ................................. ................................................ __ ......................... 18.267 10.922 6.964 3,664 19,201 157,608
,19 201
.29 288S15.000 under S25.000 ............................. ................................ ....... ....................................... 20.764 12,410 12.175 7,339 21,706 277,172
,21 706
.63 929S25,000 under S50.000.. .............................. _ ......................................... ................................ 18,415 10.974
118.509 12,161 19,061 395,351
,19,061
.118,304
S50.000 under S100.000 .................. ........ ...................... .........................................................
,-5,527 4,944 14,924 9, 137 3 15.010 9 137 115 623S100,000 under S200,000 .............................. ................ _ ................................................ _ ... ...... 3:89 1 2,326
5,855
11.343
9
3, 033
2 0,449,
3 903.15796S200,000 under $500.000 .............................................. _ ............................................................ 1,699 1,053 17,246 11.253 1,706 176,922
,1 706
,79 929S500,000 under S1,000.000 ............... _ ......................................................... _ .......... ................... 424 253 7,268 4,777 429 92.842
,429
,44 206SI.000.000 or more ............. ................. .................................................................... ......... 277 i
165 18,697 11.283 278 247,760 276
,122,414
Nontaxable estates, total ............................................................................................................... 93,023 56,411 267,867 61,103 273 1,723 273 507No total income .......................................................................................................................... 10,020 6,012 27,105 2,019 - - - -Sl under $1,000 _ .................. ................................................................................................... 25,169 14,991 14,302 4,272 - - - -S1,000 under S2,000 .................................................................................................................... 10,183 6j 10 11,280 2,735 54 19 54 2$2,000 under $3,000 .................................................................................................................... 6,905 4,234 9,734 2,194 54 4 54 (1)$3,000 under S4.000 ....................................... ................................. ..................................... .... 5,129 3.078 18,180 1 810 - - -S4,000 under S5,000 ........................................................................................................ ........... 4,011 2,407 10,493
.372 - - -
-
-S5.000 under S7.000 ............. ....................................................................... ... ..... __ .......... 6,068
I3,570 19.737 1 757 - - - -
$7,000 under S10,000 ........ .......................... .............................................................................. 6.402 3,781 17,001.
1,778 - - - -S10,000 under $15,000 .................................. ............ _ ............................... ......... ................... 5,469 3,144 16,480 10504 35 222 35 36S15.000 under $25,000 .............................................................................. .................................. 5,478 3.~79 14,820 3:455 17 168 17 32S25,000 under S50,000 ................................................................................................................. 4,386 3,037 21,722 8,000 66 66 43S50,000 under $100.000 ................... ........................................... ........................................... 2.279 1.~62 8,849 4,291 20 309 20 102S100.000 under S200.000 ........... .......................................................... .................................... -900 537 9,302 3,873 10 65S200,000 under S500,000 .................... _ ...................................................................................... 428 253 43,699 6,128
.16 .4
6$500,000 under S1,000,000 ~ ..................................................... .............. ............... __ ........ 107 64 6.102 2 951 C I VS1,000,000 or more ........................ _ .......................................................................................... 89 52 19.060.
4.965
See fo6t..le at end of table.
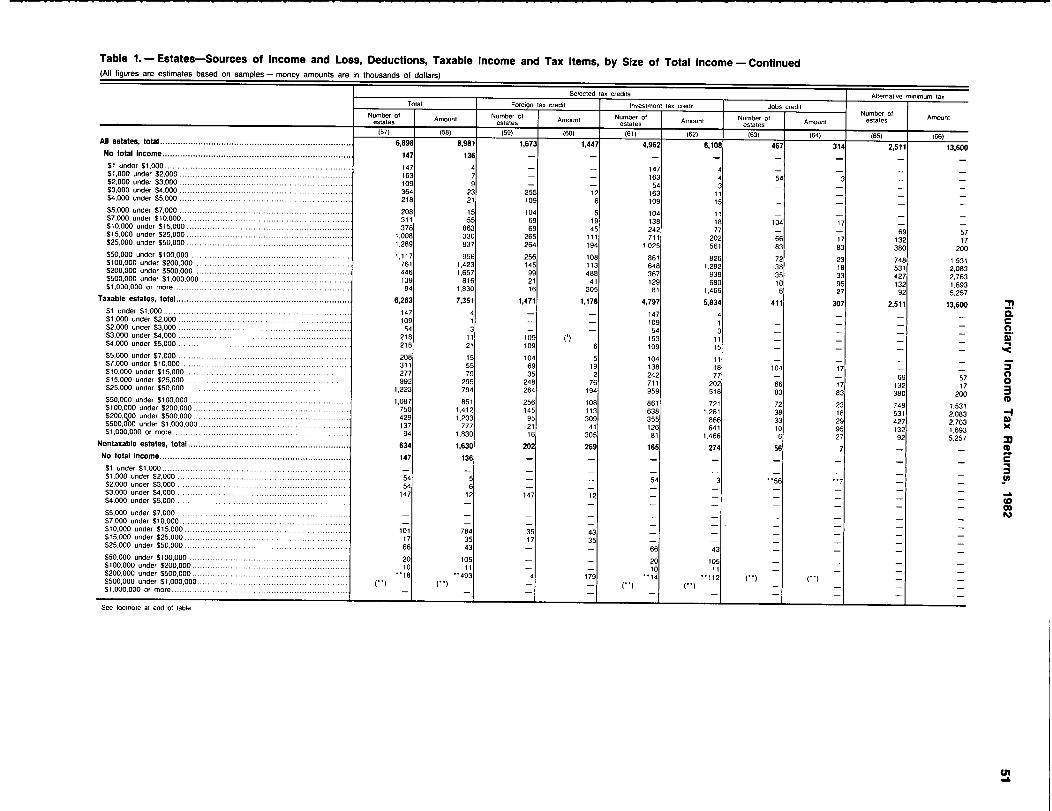
Table 1. - Estates-Sources of Income and Loss, Deductions, Taxable Income and Tax Items, by Size of Total Income - Continued(All figures are estimates based on samples - money amounts are in thousands of dollars)
Selected tax credits Alternative minimum laxT at Foreign tax credit Investmen tax credit Jobs credit
Number ofAmount Number of Amount Number of Amount Number of
ANumber of
estates Amountestates estates
sestate estates mount
(57) (58) (59) (60) (61) (62) (63) (64) (65) (66)All estates, total ........................................................................... 6,8i8 8,981 1,673 1,447 4,962 6,108 467
---314 2,511
.13,600
No total Income .......................................................................... 147 136 - - - - - - - -$I under S1,000 ......................................................................... 147 4 - - 147 4 - -$1,000 under $2.000 ................................................................... 163 7 - - 163 4 54 3S2,000 under $3,000 ................................................................... 109 9 - - 54$3,000 under $4,000 ................................................................... 364 23 255 12 163$4,000 under S5,000 ................................................................... 218 21 109 6 109 15S5,000 under $7,000 ................................................................... 208 15 104 5 104 11 - -$7,000 under $10,000 .................................................................. 311 55 69 19 138 18 104 17 -S10.000 under S15,000 ............... ....................... ........................ 378 863 69 45 242 77 -
-
$15,000 under S25,000 ......... ...................................................... 1,008 330 265 ill 711 202 66-17
613
57
17S25,000 under S50,000 ................................................................ 1,289 837 264 194 1,025 561 83 83 380 200
S50.000 under S100,000 .............................................................. 1,117 956 256 108 881 826 72 23 748 1 531S100,000 under $200,000 ........ ....................................... ............ 761 1,423 145 113 648 1,292 38 18 531,
2 083S200,000 under S500,000 ............................................................. 446 1,657 99 488 367 938 35 33 427,
2 763S500,000 under S1,000.000 ................ _ ......................... ............... 139 816 21 41 129 680 10 95 132,
1 693$1,000,000 or more .......... ................................................ I ......... 94 1.830 16 305 81 1,466 6 27 92,
5,257raffable estates, total .................................................................... 6,263 7,351 1,471 1,178 4,797 5,834 411 307 2,511
1"'00
S1 under S1.000 .......... _ .............................................................. 147 4 - - 147 4 - -S1,000 under $2,000 ................ ................. ................... ........ 109 1 109 1
- -
S2,000 under $3,000 .............................................. .................... 54 3 - - 54 3S3,000 under S4,000 ....................... .................. _ ...................... 218 11 109 (1) 163 11S4.000 under $5,000 ................................................................... 218 21 109 6 109 15S5,000 under $7,000 ................................................................... 208 15 104 5 104 11S7,000 under $10.000 .................................................................. 311 55 69 19 138 18 104 17 -S10,000 under S15,000 ........................................................... _.. 277 79 35 2 242 77 -
-
S15,000 under $25,000 ................................................................ 992 295 248 76 711 202 66-17
69132
57S25.000 under $50.000 ...................... ....... ................................. 1,223 794 264 194 959 518 83 83 380 1
7200
S50,000 under S100,000 .................................................... _ 1,097 851 256 108 861 721 72 23 748 1 531S100.000 under S200,000 ............... ............................................. 750 lA12 145 113 638 1,281 38 18 531,
2 083S200,ROO under S500.000 ........................... .................. .............. 429 1.203 95 309 355 866 33 29 427.7632S500,000 under $1.000,000 ............ .......... ................................... 137 777 21 41 126 641 10 95 132
,1 693S1,000,000 or more ............... .............. _ ... _ ........... _ ................ 94 1,830 16 305 81 1,466 6 27 92
,5,257
ilontaxable estates, total ............................................................... 634 1,630 202 269 165 274 56 7 - -No total income .......................................................................... 147 136 - - - - - -Sl under $1.000 .................. _ .................. ................................S1,000 under $2,000 ................................................................... 54 5 54 3 "56$2,000 under S3,000 ........................................... ....................... 54 6 - - - -S3,000 under $4,000 ................................................................... 147 12 147 12
-
S4,000 under $5,000 ....... ........................................................... - - - -
S5.000 under $7,000 _ .... ............................................................S7,000 under S10.000 ....... .............. __ .............. .................S10,000 under $15,000 ......................................... ...................... 101 784 35 43S15,000 under S25.000 ................................................................ 17 35 17 35 - - -S25,000 under $50,000 ............................ ................................... 66 43 - - 66 43 -
--
--
--
S50.000 under S100,000 ........................................... __ ............... 20 105 20 105 - -S100,000 under $200,000 ............................................................. 10 11 - -
'0 11 -
-
- -
S200,000 under $500.000 ............................................................. ..184 179 14 **112 V
- -
S500,000 under S1,000,000 ........................................................... CS1,000.000 or more ....................... ............................................. - V
e footnote at end of table.

I
table 1. - Estates-Sources of Income and Loss, Deductions, Taxable Income and Tax Items, by Size of Total Income- Continued
(All figures are estimates based on samples - money amounts are in thousands oi dollars)
Total tax Other creditsT credits andlotactral"It`a"x previously
Tax due at timeof filing
Overpaymentpaid and withhold
Number ofAmount
Number of AmountNumber at
AmountNumber of
AmountNumber of Amount
state, estates estates estates estates
(67) (68) (69) (70)1 (71) (72) (73) (74) (75) (76)
All estates, total ........................................................................... 168,441 712,821 5,206
F
1 9,387 16,419 99,016 163,282 630,463 7,567 16,658
No total income ............................................ ~.: ........................... - - 348 1 23 348 23 - - 348 23
000 ......... ..... I ... ... ...............................S1 under S1 6559 149-
-1255 273 6,450 144 255 267
,000 _ ......___ ....... ___ .... __ ........... ........000 under S2S1 16~627
1,337109 39 545 176 16,192
1.299436 138
,,S2,000 under $3,000 ........... ... :~ .............. ....... 14,035 2,501 -
I - 821 418 13,763 2,441 712 358:_
000 under $4,000 ................ 1 ..................................................S3 11,635 3,194 381 257 490 289 11,362 3,116 272 211,
$4,000 under S5.000 .. ............. ........... 9,746 3,944 109 - 1 136 436 427 9,365 3,738 381 - 222
ooo under STOOD .............. ...... .........§9 16.263 9.580 205 897 537 15,813 9,206 516 163,
undo, S10.000- ...... .............ST000 17,860 _375 .130 1.368 1,507 17,551 15.449 607 1.076,
S0 000 under S15.000 ..... ... _ ....... 19,201 29.266 41~3 371 1,751 2,117 18.613 27,953 852 805,000 under S25 000 ........S 15 21,723 63,652 761 718 2,596 5,322 20,979 59,566 926 1.237
,,S25.000 under S50,000 19.110 117,711 744 817 2,794 12.497 18.300 107,676 1,058 2.461
S50.000 under sio6,ooo .......................... ... ... ........ ........ 9,240 116,318 7h 25;.l
977.
12,323 8,861 106.244 542 2,248S100000
under S200.000 ...... ...................... 3,978 96,828 527 .682 1,190 14,709 3,695 84,579 397 2,460"
000; under S500.000 ..................... ...... I ................S200 1,746 81,489 309 1 1.109 634 13,895 1,641 70.029 183 2,435,
..... .....000 under $1.000,000... ........ ...........$500 434 45.130 90.1
417 182 6,915 410 39,225 44 1,010:.S1,000,000 or more .................. ............ ....... 284 125,841 65 2,474 136 27.587 267 99,799 38 1,545
Taxable estates,.,toial ................................. .............. _ .................. 168,441 712,821 4,1081
7,19 13,736 92,796 163,282 630,463 4,883 10,438
000 .................... ................... .........S1 under S1 6,559 149 --I
109 53 6,450 144 109 47,.
.........000 under S2.000 .............. ...... __ ...................... ...S1 16,627 1,337 109 .39 545 176 16,192 1,299 436 138.000 under $3,000 ....... _ ....... .... ......$2 14,035 2,501
-381 180 13.763 2,441 272 120
.000 under S4.000 .......... - ...... ____ ___ ... _ ...................S3 11,635 3.194 381 257 490 289 11.362 3,116 272 211
.$4.000 under S5.000 .... ....... ................ 9,746 3,944 109 136 436 427 9,365 3,738 381 222
000 ........................................ ...... ......000 under S7$5 16,263 9,580 138 85 830 533 15.813 9,206 450 158..000 under S10.000 ............................................S7 17,860 15,880 309 117 1,035 593 17,551 15.449 274 162.
000 .............................. _ ......000 under S15S10 19,201 29.266 346 307 1.418 1,736 18,613 27,953 519 423,.000 ............... ......... _ ..................... ........000 under S25S15 21,723 63,652 661 693 2,314 4.875 20,979 59,566 645 789..
$25,000 under $50,000.. ..... ............................................... 19,110 117,711 612 768 2,496 12,111 18,300 107,676 760 2,075
S50.000 under S 100:000 .............................................................. 9,240 116,318 636 873 1.773 11,565 8.881 106.244 338 1.490
000 under $200.000 ................... .......... ..............................$100 3,976 96.828 439 1 1,408 1.077 14,197 3,695 84.579 283 1,948,000 under $500,000 ..................... ....................S200 1,746 81,489 249 764 554 12,880 1,641 70.029 103 1.420
.S500,000 under $1,000,000, ............ ......... 434 45.130 75 299 163 6,637 410 39.225 24 732
S1.000.000 or more ............................................ -- ... 284 125,841 45 1,448 115 -26.543 267 99,799 16 501
Nontaxable estates, total ............................................................... - - 1,097 2,194 2,683 6,220 - 2,683 6,220
No total income .......................................................................... 348 23 348 23 348 23
S1 under $1.000 .................... _ .......... _ ........................ - 147 220 147 220
S1,000 under S1,000 : ........... .................................. -440
-239
-440
-239
S2,000 under S3,000 ..... .................. : ..................... ...........
S3,000 under S4,000 ... .......... ...... .......S4,000 under S5,000 ....................... ........... - - - - -
S5,000 under $7,000 ........................ .......................................... 67 4 67 4 - 67 4
$7,000 under S10,000 ... ............ ............................... 67 13 333 914 - 333 914
$10,000 under S15,0110 ........... .............. ......... ......... 67 64 333 381 - 333 381
000 under S25,000 .................. - ....... ......................S15 99 25 281 448 - 281 448,
S25,000 under S50,000 ............ ........................................ ....... 132 49 298 385 - 298 365
$50,000 under $100.000 ...................... ........... ................. 136 252 204 758 - 204 758
S100,000 under S200,000 ........... ....... __ ............. .................... 88 275 113 512 - 113 512
000 under $500,000 ........................ .......... ..............S200 60 345 80 1,015 80 1,015,000 under $1,000,000 ............... ..................... ...............S500 14 118 19 277 19 277
,S1,000,000 or more .............. ...................................................... 20
11 1.026 21 1,043 21 1,043
*Estimate should be used with caution because of the small number of sample returns on which it was based.
"Data combined to avoid disclosure of information for specific taxpayers.
(')Less than S500.NOTE: Detail may not add to total because of rounding.

Table 2. - Trusts-Sources of Income and Loss, Deductions, Taxable Income and Tax Items, by Size of Total Income
(All figures are estimates based on samples- money amounts are in thousands of dollars)
Sources of income and loss
Number ofTotal
ricomeDividends beforee~clusions Interest received Partnerships Other estates or trusts Gompulation of rents and royalties
trusts (lessdeficit) f N f f
Gross rentsNumber o Amount umber o Amount Number o Amount Number of Amount
trusts trusts trusts trusts Number .1Amount
trusts(2) (3) (4) (5) (6) (7) (8) (9) (10) (1 1) (12)
All trusts, total ................................................................ 1,586,482 30,053,710 767,249 7,517,364 1,007,882 9,718,369 129,612 705,405 37,278 430,214
_
131,175 2,312,669
No total income ............................................................. 429,977 -155,848 5,295 10,203 11,970 15,664 9,606 -155,487 586 -79 6,481 127,503
SI under SI,000 ............ ............. ........ . ......... 156,442 71,418 69,562 24,474 122,835 44,452 9,496 1,734 1.586 398 9,241 20,467SI,000 under S2.000 ....................................................... 113,552 168,607 59.385 52,285 92,515 98,258 8,948 6.574 632
i 1886 6,743 21.344
S2,000 under S3.000 ......... .... _ ........ _ ... ................... 90,319 226,074 52.319 70,462 75.552 122.363 6,252 7,181 907 2.900 8,534 33.889S3,000 under $4.000 .............. ................ ....................... 68,622 238,793 44,238 79,234 58.500 119.978 6,371 8,293 1,012 1,895 5,758 25,476S4.000 under S5.000 .............. ........................................ 66,243 298,063 43,301 94,396 56,171 152,571 6,466 14,510 1,803 3.220 5.559 26,617
S5,000 under S7.000, .......... ____ .................................. 104,847 623,179 69,511 190,447 90,388 314,637 11,012 31,323 2.260 6.361 12.422 66.146S7.000 under S10,000 ........... ....... ...................... 114,993 963,443 82.457 312,904 102,100 465,250 10,389 33,613 3,203 8,848 12,938 98.440S10.000 under S15,000 ......................... _ .... .... .............. 122,468 1,500,353 94,750 508,981 109.931 686,285 13,090 50,198 4,528 19,997 13.459 133,232S15.000 under S25.000 ............ __ ...................... 123,249 2,381,300 96,563 790,723 111.277 959.069 15,266 98,325 6,503 43.612 16,264 264.101S25,000 under S50.000 ............. ......................... 102,716 3,559,435 82,056 1,172,692 92,909 1,183,580 15,112 140.608 6,332 67,588 16.457 411,805
S50,000 under S100,000 .................. ......................... 50,600 3,495,745 38,444 1,043,630 45,397 1,017,110 9,068 133,771 3,334 60,333 9,616 387,336S100,000 under $200,000 . .......... __-- ..... - 23,606 3,238,346 16.808 860,491 21.290 978,907 4,499 105,042 1.435 55,689 4.286 247,122S200,000 under S500,000 ................................ ___ ........ 12.943 3,904.270 8,695 859,717 11,657 1,200,636 2,676 77.310 806 64,351 2,419 216,564S500.000 under S1.000,000 .............................................. 3,515 2.414.462 2,297 447,164 3,200 693,289 777 61.975 200 37,206 593 88.424SI.000.000 or more ... ........................... ........................ 2,389 7,126.068 1.569 999,561 2,190 1,666.322 582 90.437 152 57,010 407 144,202
Taxable trusts, total ......................................................... 432,674 15,488,442 300,766 3,520,860 382,917 2,980,827 62,544 497,266 19,707 253,842 48,449 922,336
No total income ............................................................. 60 -3,246 - - 60 1 60 -5,459 - - - -
$1 under S1.000 __ ....................... __ ......... ................. 47.348 24.591 19,561 7,196 38,846 15,428 3.646 1.051 562 266 2,325 4,466SI.000 under S2
.000 ............................................. 41.473 61.132 21,946 17,974 35,304 34,689 3.142 2,795 391 413 2,413 6.047
S2,000 under S3.000 .............................................. _ ....... 27.655 68.988 15,458 19,001 23,282 34,929 3.116 4,276 734 859 2,384 9.677S3,000 under S4.000 ............. 21,663 75.880 13,135 19,076 18.691 38,578 2,881 5,601 566 1.310 1.942 6.320S4.000 under S5.000 ................................... ................... 19,355 86,225 12,257 22,774 16,645 41,651 3,064 5,975 622 1,192 1.586 8.817
S5,000 under S7.000 .................... ......... ____ ................ 33,199 197,841 22,141 54,309 28.752 85,388 5,104 15,024 1,293 3,473 4,623 19,954S7,000 under S10.000 ............... ... __ ........... ....... 35.914 302,649 26,030 86,945 32,452 126,530 4,539 16,728 1,467 5.177 3.923 24,808$10.000 under S15,000 .......................... .... _ ..... ...... ..... 45.931 565,338 36,159 173,297 41.414 218,468 6,848 24,861 2,382 11,548 4.904 47,338S15.000 under S25,000... .......................... 52,783 1.026,787 42,743 292,019 48.208 354,753 8,234 50,086 3,481 26.610 6,548 92,802S25.000 under S50,00O.... .................................... 54.387 1,906,542 45,760 544,041 50.290 560,003 9,457 81.560 4,014 43,508 7,778 184,907
S50,000 under S100.000 .................................................. 28,891 1,988,389 24,780 561,061 26,541 449,070 5,928 72,788 2,317 35,929 5.203 174,113S100,000 under S200.000 ... ............................................. 13,499 1,851,773 11,606 504,084 12,485 333.148 3.326 71.386 1,027 33,040 2.525 118,036S200.000 under S500,000 ~ ............................. .... 7,164 2,147,975 6,251 490,448 6,623 285,902 2,074 48,131 579 42,207 1'608 107,510S500,000 under $1,000,000 ................................ _ ...... ..... 1,985 1,365,502 1,717 260,558 1,837 132.624 612 38.011 155 25,255 402 48,695SI.000.000 or more ............ _ ....................... 1,367 3,822,076 1,201 468,077 1,287 269.664 493 64.452 119 23,057 286 66,846
Nontaxable trusts, total .................................................... 1,153,808 14,565,268 466,483 3,996,504 624,966 6,737,542 67,068 208,139 17,571 176,372 82,725 1,390,333
No total income ............................................................. 429,917 -152,602 5,295 10,203 11,910 15,663 9,546 -150,028 586 -79 6,481 127,503
S1 under $1.000 .. ................. ... ................... 109,094 46.826 49,981 17,278 83,990 29,024 5,850 682 1,024 132 6.916 16,000S1,000 under S2
,000 ....................................................... 72,079 107,475 37,439 34,311 57,210 63,569 5,806 3.778 1,241 474 4.330 13,297
S2,000 under S3.000 ... .................................................. 62,665 157,086 36,861 51,461 52,270 87,433 3,136 2,905 1,173 2,041 6.149 24,212S3,000 under S4,000 ............................................... __ ... 46.959 162.913 31,103 60,159 39,609 81,400 3.490 2,693 446 585 3,816 19,156S4,000 under S5,000 ...................................... ............ 46,889 211.838 31,044 71,622 39,526 110.921 3,382 8,535 1,181 2,028 3,973 17,800
S5.000 under SUM_ ... .......................... .......... 71,648 425,339 47,369 136,139 61,636 229,249 5,909 16.299 967 2,888 7,800 46,192ST000 under S10.000 ..................................... 79.079 660.794 56,427 225,959 69,648 338,719 5,850 16,886 1,736 3.671 9,015 73.632S10,000 under S15.000 ................................................ 76.537 935,015 58,591 335,684 68,517 467,817 6,242 25.336 2.147 8,449 8,554 85,894S15,000 under S25,000... ................................................. 70,466 1,354,514 53,820 498.703 63,069 604,315 7,031 48,239 3,022 17,002 9.716 171.300S25.000 under S50,000 .............................................. ..... 48.329 1.652,893 36.295 628,651 42,619 623,576 5,655 59,048 2,318 24.080 8.679 226.898
S50.000 under S100.000 ...... ..................... 21,709 1,507,356 13,664 482.569 18,856 568,040 3,141 60,983 1,017 24,404 4.412 213,223S100.000 under S200,000 ................................................ 10,107 1,386,573 5,202 356,407 8,805 645.758 1,173 33,655 408 22,649 1,761 129,087S200,000 under S500.000 ~. .............................................. 5.778 1,756,295 2,444 369,269 5.034 914,734 602 29,178 227 22,145 810 109,054S500,000 under SI.000,000 .............................................. 1,529
1048,960 580 186,606 1,364 560,664 166 23,964 44 11.951 192 39,730
S1,000,000 or more ................ 1,022 3,303,993 368 531.484 903 1,396,658 89 25,985 33 33,953 121 77,356
Foolnot- at i,nd of table.
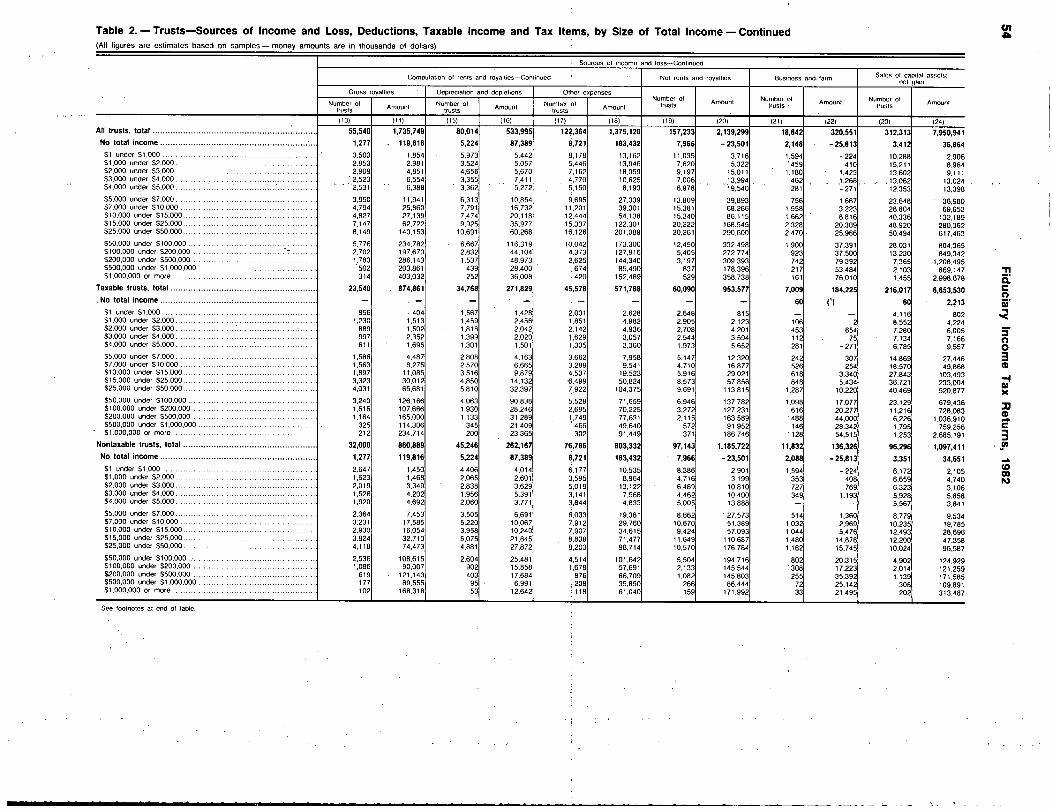
II
Table 2~ - Trusts-Sources of Income and Loss, Deductions, Taxable Income and Tax, Items, by Size of Total Income- Continued(All figures are estimates based on samples - money amounts are in thousands of dollars) I
Sources of income and loss-Continued
Computation of rents and royallics-Cont,nued Net rents and royalties Business and- farm Sales of capital asset.:net gain
Gross royalties Depreciation and depletions Other expenses
Number of AmountNumber of mount
ANumber of
AmountNumber of
trusts Amount Number oftrusts
Amount Numb., oftrusts
Amounttrusts trusts trusts
(13) (14) (15) (16) (17) (18) (19) (20) (21) (22) (23) (24)All trusts, total ................................................................ 55,540 1,735,749 80,014 533,995 122,364 1,375,120 157,233 2,139,299 18,842 320,551 312,313 7,95Y941No total income .......................................................... 1,277 119,816 5,224 87,389 8,721 183,432 7,966 -23,501 2,148 -25,813 3,412 36,864Sl under S1,000 ...................................................... ..... 3,503 1.854 5,973 5,442 8,178 13,162 11,035 3,716 1,594 -224 10,288 2,906S1,000 under $2,000 ................................ __ .......... - ..... 2,853 2.981 3,524 5,057 5.446 13,946 7.620 5,322 '459 410 15,211 8,964$2.000 under S3.000 ~ ............ ....................... ................. 2,909 4,851 4,656 5,670 7,162 18.059 9,197 15.011 1,180 1.423 13,602 9.111S3,000 under S4.000 ..................... .....................
.2,523 6,554 3,355 7,411 4,770 10,625 7,006 13,994 462 .1,268 , .13.062 13.024
S4,000 under $5.000 .............. .. ...... ............. 2,531 6,388 3,362 5,272 6.15o 8,193 6,978 19,540 281 -271 12,353 13,398S5,000 under S7,000 ... ........................ 3.950 11,941 6,313 10,854 9,695 27,339 13,809 39,893 756 1,667 23,648 36.980S7.000 under $10,000 ...... ............ ..................... 4,794 25,860 7,791 16,732 11,201 39,301 15,381 68,266 1.558 3,223 28,804 69.653$10.000 under S15,000.. .................................................. 4.827 27,139 7,474 20,118 12.444 54,138 15,340 86,115 1,662 8,816 40,336 132,189S15.000 under S25,000 .................... .............. ............ 7,147 62,722 9.925 35,977 15,337 122,301 20,222 168.545 2,328 20,309 48.920 280,362S25,000 under S50.000 .................... _ ........ ............ 8,149 140,153 10,691 60,268 16,126 201,089 20,261 290.600 2,470 25,966 50,494 617,463
S50,000 under S100.000 .................. .............. ............ 5,776 234,782 6,667 116,319 100421
73.300 12,450 332498 1,900 37.391 28,031 804,365S100.000 under S200,000 ....... __ ... __ ........ ......... 7 .......... 2,702 197,673 2,832 44,104 ~:373 127,91 5,405 272:774 923 37.500 13,230 849,342S200.000 under S500.000 ...................... _ ... .................... 1.783 286,143 1,537 48,973 2,625 144.340 3.197 309,393 742 79.392 7,365 1,208.495S500,000 under S1,000,000 __ ........................................ 502 203,861 439 28,400 674 85,490 837 178,396 217 53,484 2.103 869,147S1,000,000 or more ................................... - .................. 314 403,032 252 36,008 420 152.489 529 358,738 161 76.010 1,455 2,998,678
Taxable trusts, total ......................................................... 23,540 874,861 34,768 271,829 45578 571,788 60,090 953,577 7,009 184,225 216,017 6,853,530.No total income ............................................................. - - 60 60 2,213
$1 under S1.000 ...... ......................... - .................. 856 404 1,567 1,428 2,001 2,628 2,648 815 - 4,116 802S1.000 under S2,000 .......................... ................ ........... 1,230 1,513 1.459 2,456 1,851 4.982 2,905 2,123 106 2 8,552 4,224S2,000 under S3,000 .............................. ............ ...... 889 1,502 1.818 2,042 2,142 4.936 2.708 4,201 453 654 7,280 6,005S3,000 under $4.000 .......................... - .... .................. 997 2,352 1,399 2,020 1,629 3,057 2.544 3,594 112 75 7.134 7,166S4,000 under $5,000 ..................... ................................. 611 1,696 1,301 1.501 1
t'305 3,360 1,973 5.652 281 -271 6,785 9,557
S5,000 under S7,000 .............................. .................... 1,586 4,487 2,808 4,163 3,662 7,958 5.147 12.320 242 307 14.869 27,446$7,000 under S10.000 ........... ...... .................... 1,563 8,275 2.570 6,665 3,288 9.541 4,710 16,877 526 254 18.570 49,868S10.000 under $15,000 ........................... ........................ 1,897 11,085 3.516 9,879 4,537 19,523 5,916 29,021 618 3.340 27,843 103,493S15,000 under $25,000 .................................................... 3,323 30,012 4,850 14,132 6.499 50,824 8,573 57,858 848 5.434 36,721 233,004$25.000 under $50,000 .......... ... I............. 4,031 65,681 5,810 32,397 7,922 104,375 9,691 113,815 1,287 10,220 40.469 520,877
S50.000 under S100.000 ..................... __ ......................... 3,240 126,166 4.063 90,838 5,528 71,659 6,946 137,782 1.098 17,077 23,129 679,436S100.000 under $200,000 ............. __ ....................... - ..... 1,616 107,666 1,930 28.246 2,695 70,225 3,272 127,231 616 20,277 11.216 728,083S200,000 under $500,000 ................. __ .......................... 1,164 165,000 1.133 31,289 1,749 77,631 2.115 163,589 488 44.000 6,226 1.036,910$500,000 under $1,000,000 _ ....... .................................. _ 325 114,306 345 21,409 '466 49,640 572 91.952 146 28.342 1.795 759 256$1.000,000 or more ........................................................ 212 234.714 200 23.365 1302 91,449 371 186.746 128 54,515 1.253
,2,685,191
Nontaxable trusts, total .................................................... 32,000 860,889 45,246 262,167 76786
I
803,332 97,143 1,185,722 11,832 136,326 96,296 1,097,411No total income ............................................................. 1,277 119,816 5,224 87,389 8,721 183,432 7,966 -23,501 2,088 -25,813 3,351 34,651Sl under S1,000 ............................................................ 2,647 1,450 4,406 4,014 6,177 10,535 8,386 2.901 1,594 -224 6.172 2,105S1,000 under S2,000 ..................................... ................. 1,623 1,468 2.065 2,601 3,595 8,964 4,716 3,199 353 408 6,659 4.740S2,000 under S3,000 ............... ..... .................... 2,019 3,349 2,838 3,629 5,019 13,122 6,489 10,810 727 769 6.323 3,106S3,000 under S4,000 .................................. ................ 1,526 4.202 1.956 5,391 3,141 7,568 4,462 10,400 349 1.193 5,928 5,858$4,000 under S5,000 ....................................................... 1,920 4,692 2.060 3,771 3,844 4,833 5,005 13,888 - - 5,567 3,841
S5,000 under S7,000 .......................... __ ........................ 2,364 7,453 3,505 6,691 6,033 19,381 8.662 27,573 514 1,360 8,779 9,534S7.000 under $10.000 ..................................................... 3231 17,585 5.220 10,067 7,,912 29,760 10.670 51,389 1,032 2.969 10,235 19,785S10.000 under $15.000 .............. __ ... ............................ 2,930 16,054 3,958 10,240 7,907 34,615 9,424 57,093 1,044 5.476 12,493 28,696S15.000 under $25,000 .................... ................... 3.824 32,710 5,075 21,845 8,838 71,477 11.649 110,687 1.480 14.876 12.200 47.358S25,000 under $50,000 .................................................... 4,118 74,473 4,881 27,872 8,203 96,714 10,570 176,784 1,182 15.745 10,024 96,587S50.000 under $100,000 .................................................. 2.536 108,615 2,604 25,481 4,514 101,642 5.504 194,716 802 20,315 4.902 124.929S100,000 under $200.000 ............. ..................... 1,086 90,007 902 15,858 1,678 57,691 2,133 145,544 308 17,223 2,014 121,259S200,000 under S500.000 ..................... ................ 619 121,143 403 17,684 1876 66,709 1,082 145,803 255 35,392 1,139 171,585S500,000 under $1,000,000 ................... - ........................ 177 89,555 95 6,991 1208 35,650 266 86,444 72 25.142 306 109
'891
Sl..000.000
-or more ........................................................ 102 168,318 53 12.642 1118, 61,0401 159 171,992 33 21.
495
12021 313,487
See footnotes at end of table.

Table 2.- Trusts-Sources of Income and Loss, Deductions, Taxable Income and Tax Items, by Size of Total Income -~- Continued(All figures are estimates based on samples - money amounts are in thousands of dollars)
Sources of income and loss-Continued Total de ductions Type of deductionSales of capital assets
net loss Sales of property other than capital assets Other sources Interest paid
Number ofNet gain Net loss Number of
Amounttr t Amount Number f N
-- Number ofAmount
trustsNumber ofus s o Amount umber of
Amount trusts trustsAmount
-trusts
-trusts
(25) (76) (27) (28) (29) (30) (31) (32) (33) (34) (35) (36)All trusts, total ................................................................ 70,328 87,282 6,170 45,396 4,002 6,268 87,034 1,319,685 1,181,330 25,698,238 83,474 595,942No total income ............................................................. 3,352 8,144 839 4,179 883 260 2,493 -9,473 26,073 152,568 3,637 20,792$1 under $1,000 ............................................................S1.000 under S2,000 .........................................
12,3685 876
6,8424 501
-
56
-
4438 65
"5,788 868 155,867 89,593 4,421 2.615..............
S2.000 under $3,000 ......... ............. - ............... - ............
5 289,
5 112 229 4614956
17 3,669 421 113,336 143,566 3,856 1.769$3,000 under $4,000 ...................... ............... ................
,3,258
,2,962 406 630 112
C182
4,4914,280
2,6893 622
90,20656268
204,493208 940
3.8243 590
3.136$4,000 under S5.000.. ~ .................................................... 4.688 4,102 265 233 112 8 4.267
,4,575
,66,243
,258,372
.3,112
4.4082,785
$5,000 under S7,000 ........... ...........................................$7 000 under S10 000
5,8585 985
5,9817 13
381 334 174 20 6,862 7,536 104,777 544,401 6,330 10,690, . ................ ............................... --S10,000 under $15,000 .......................... ................. .......
.7 055
, 19 929
557525
6551 158
281383
759 7,877 8,920 114,928 850,999 7,291 12,207S15,000 under $25,000 ................. - ............ - .................
,6,481
,10,349 544
,804 396
224430
9,23211 439
16,76630 325
122,398123 23
1,288,584 9.387 17,553$25,000 under S50,000 .......................... - ....................... 5,929 10,341 818 4.890 338 975
.12,043
,67 360
, 3102 684
2,035,8842 956 024
10.59011 954
35,443
$50,000 under S100,000 ............................................. ....S100 000 under S200 000
2,558 4,985 711 3,960 312 273 7,425
,
67,940
,
50,580
, ,
2.905,579
.
7,558
58,956
78 829, , .......................... ................ --S200,000 under S500,000 .................................... ...........
998495
2,3742 152
369277
4,9155 046
193118
789 3,764 76,846 23,601 2.701,388 4,308.
88,530S500,000 under S1,000,000 .............................................. 84
,1,381 98
.2 923 44
714338
2,242697
102.788 12,942 3,310,290 2,432 101.018$1.000,000 or more ........................................................ 55 999 96
,15,618 12 1,215 465
72,595865 907
3,5132 386
2,021,9976 025 560
726458
42,340114
Taxable trusts, total ......................................................... 38,214 44,219 3,167 28,753 1,670 -2,404 40,777
,
262,160
,
431,425
, ,
10,275,919 41,607
,871
228,406No total income ............................................................. - - - - - - - - 60 1,730 60 283S1 under $1.000 ............................................................S1,000 under S2,000 ................................
4.5578243
1,2072762
-
56-4
- 1,279 240 46,773 10,585 876 32- ... .................S2,000 under S3,000 .................................. - .......... ....
,2,604
,1,726 229 46
-56
- 1.9061 066
1.185 41,257 19,491 1.213 241S3,000 under S4.000 .......... - .......................................... 2,073 1,641 112 211 56 164
.2,465
7432 076
27,54121 602
23,77030 822
2,0736341
7711 08S4,000 under $5,000 ........ .... __ ............. ........................ 1,989 1,281 60 37 112 8 1,158
,947
,19,355
,34,608
,1,446
, 61,340
S5,000 under $7,000 ............... - .......... __ .............. - ....S7 000 under $10 000
3,731 4,256 245 284 174 20 2,801 3,566 33,129 89.195 3,113 2 936. , ........................................... ..........$10,000 under S15.000. ..................... .............................
3,2194 055
4,0595 422
350175
616271
210105
316 3,218 4,028 35,849 160,384 3,198,
3,906S15,000 under S25.000 ....................................................
.4,488
,7,041 312 577 231
17303
4,2808245
6.47713 788
45,861 329,336 4,562 6,979$25.000 under $50,000. ................................................... 4,334 8,015 621 4,003 206 266
,7,149
.36.793
52,76754,356
637,5071,245,975
5,6497,373
14.92329,397
S50,000 untler S100,000 ............. - .... ___ .........................S100 000 under $200 000
1,975837
3,9172 099
429 1,401 239 142 4,779 37,903 28,871 1,362,868 5,136 36,665, , .............. - ..... ...... ...................S200.000 under S500,000 ................................................ 415
,984
237188
3.3043 757
14890
428 2,577 33,745 13,494 1.273,193 2,801 37,218S500,000 under S1,000,000 ........................................... - 69 179 73
,2 176 35
409 1,507 34.417 7,163 1,504.767 1,617 39.552$1.000,000 or more ................. ...................................... 45 115 80
,12 068 7
3237
468 27.826 1,983 956,922 496 19,642, 300 58.426 1.364 2,594,765 359 33,4364ontaxable trusts, total .................................................... 32,114 43,063 3,002 16,642 2,332 3,865 46,257 1,057,525 749,904 15,422,319 41,867 367,536No total income ............................................................. 3,352 8,144 839 4,179 883 260 2,493 -9,473 26,013 150,838 3,577 20,509Sl under S1.000 ............................................................S1,000 under S2,000 ......................................................
7,8122 052
5.6352 225
- - 438 65 4,509 628 109,094 79,008 3,545 2.583.S2,000 under S3,000 .......................................................
,2 686
,3 385 - -
149 17 1,763 -764 72,079 124,075 2,643 1,526S3.000 under S4,000 .......... ......... ...... _ ... _ .............. _ ...
,1,185
,1 321 293 419
-56
-18
3,425 1,946 62,665 180,723 1,751 2,365S4,000 under S5.000 .............. ...... ............... ................. 2,699
,2,821 205 197 - -
1,8153,109
1,5463,628
46,95946 889
178,119223 764
1,9561 666
3,3221 445
S5,000 under S7.000 .......................................................S7 000 under S10 000
2,126 1,725 136 51 - - 4,060 3,971
,
71,648
,
455,206
,
3 217
,
7 753, , ...... - ............................................S10.000 under S15,000.... ............. ............................... -
2,7653 000
3,0724 507
207350
39888
71 443 4,659 4,893 79,079 690,615,
4,093,
6,301S15,000 under S25,000 ...... ............. ................... -
,1,993
,3,307 232 228
278165
207127
4,9515 615
10,28916 537
76,53770 466
959,248 4,824 10.575S25,000 under $50.000... ........ ....... - ...... ..... __ .......... ... 1,596 2,326 197 887 131 709
,4,894
,30,567
,48,329
1,398,3771,710,049
4,9414,580
20,52029 559
S50.000 under $100.000 ..................................................
$100 000 under S200 000582161
1.068 282 2,560 72 130 2.646 30,037 21 7'
7.142"
1 42 221
,
42.163, , ......................... ......................
S200,000 under S500,000 - ....... ........ ......... . 802751671
13189
1,6111
46 361 1,1874'
lot
:07
~ ~ 142 94
1: 0ft5 51,312. ................
S500,000 under S1,000.000 ........... ............. 15.
1 202 24,288747
~89
~
30 735 '311:370
~
5778 523'05'
815 61,467S1,000.000 or more ..... ................................................
.884 16 3 550 -5
15 228 44,769 1:529:0
1 :065 15 229 22,698,
1'
208 166 807,481 1,022 3,430,795 99 81.435
e

Table 2.- Trusts-Sources of Income and Loss, Deductions, Taxable Income and Tax Items, by Size of Total Income - Continued
(All figures are estimates based on samples - money amounts are in thousands of dollars)
Type of deduclion-Confinued
Taxes Charitable contribu!ionst
Fiduciary feesAll mey. accountant
oD, Mbut.on 10
oLonq.lcrm capital
I and la. prepare, fees n.f.-n-b gain
Number of AmountNumber
ofAmount
Numb.,of~ Amount
Number of Amount Number or Amount Number of Amounttruststrusts trusts trusts trusis trusts
(37) (38) (39) (40) (41) 1 (42) (43) (44) (45) (46) (47) (48)
All trusts, total ................................................................ 361,057 512,760 36,770 757,370 611 ~761 908,874 375,300 240,422 874,581 17,141,999 248,198 4,039,93i
No total income ............................................................. 4,435 4,440 1,698 707 3~1108 2,559 4,942 3,980 4,405 44,719 2,673 20,298
51 under S1,000 _ ... ................................... ....... - 19,603 3,784 2.437 1,040 62~308 13,351 33,492 7,246 73,671 32.653 7.161 979S1.000 under S2.000 .......... ____ ..... .......... ................ 24,071 4,262 2,517 2.560 47'141 12,810 29.938 5.517 71,655 89.280 10,810 2,990S2.000 under S3,000 .......... .................. ............. _ 22,875 3,550 3,090 3.549 41!569 16.456 24,821 4,472 65,900 138.364 10.175 3,739S3.000 under S4.000 .............. __ ................... ................. 19,728 4.200 2,292 3.762 32,201 13.665 20,184 5.549 51,208 148,757 9,287 5,454S4.000 under S5.000_ ...................................... 20.333 5.642 1.128 1,982 35:770
117.613 18,658 7,024 52,374 196,403 9,604 5,657
$5.000 under $7,000 ... ___ ................. .............. ... 32,094 14.451 2,069 6,508 58,566 36.556 34,652 10,356 83,332 408,497 17,789 14,914
S7.000 under $10,000 ............ I ............ ......... 38.638 17,134 2.660 10,385 67!651 61,437 40,683 14,055 96,694 662,260 22,269 29,093~
$10.000 under S15.000 .................................................... 44.637 23.778 3.936 25.254 73,556 83,321 41,343 17,498 103,003 1,006,931 31.590 58,418S15,000 under S25,000 .................................................... 48,682 37.509 3,688 32,281 74!516 123,423 47,246 28,277 105,417 1,563,927 39,785 129,887S25.000 under S50.000 ............................. ....... ...... ... 44,639 60.046 4,848 65,994 63,168 167,761 42.283 37,700 87,445 2,135,973 42,345 300.304
S50,000 under $100.000 ............................... .................. 22,947 59.313 3,072 86,654 29!746 124,627 20.420 28.455 43.087 2,025,211 23.797 389.468SiOO.000 under S200,000 ...................................... ____ 10,368 56,702 1.817 118,067 13,100 84.103 9,308 22,262 20,219 1,797.716 11,389 427.322S200,000 under S500,000 ~ ........ .......... .............. 5,433 62,778 965 117,818 6!584 69,938 4,969 22,066 11,166 2,186,324 6,398 610,758S500.000 under S1.000,000 _ .... ............ ... _ ........ 1.548 48.585 306 82,945 11667 33,663 1,403 10.577 2,989 1.261,159 1,846 446,070S1.000.000 or more ...................... _ ............................... 1,026 106.586 247 197,861 009 47.592 957 15,389 2,015 3,443,805 1,278 1,594,580
Taxable trusts, total ......................................................... 194,937 308,596 9,658 171,536 212,830 379,553 152,097 102,172 219,104 4,719,786 198,671 3,901,716
.......................................... ........No total income 60 9 60
6
60 1,327..........
Sl under S1.000 . ........ .............. ........ 8.026 205 113 29 14,254 1,205 9,659 592 2.874 1,052 3,190 352S1,000 under $2,000 ... ............... ........................ 12,552 797 56 (1) 15086 3,055 10,562 1,086 6,793 4,746 6,585 1,699S2,000 under S3.000 ~ ...... .......... ................ 10,226 1,114 609 207 10,114 3.355 8.114 1,025 7.059 8,199 6.423 3.062S3,000 under S4,000 ..... .............. .......................... 9,156 1.330 626 248 7,203 2,479 7,004 1,399 8,177 16.107 5,849 3,630S4,000 under S5,000 ................ ...................................... 8,182 1,385 393 129 8~431 3,749 5,921 1,124 7,634 17,458 5,728 4,451
S5,000 under STOOO ....................................................... 16,058 3,723 454 259 141892 8,581 11,810 2,809 14,801 47,757 13.119 13,712S7.000 under $10,000 .................... _.. _.. _ ...................... 17,831 4,895 359 384 19.086 13.271 13,693 3,919 20,856 96,810 17,068 26.049S10.000 under $15,000 ......................................... .......... 23,724 10,871 1,276 2.862 2l 25,530 16,710 5.728 29.506 205,512 25,513 54,683S15.000 under S25,000 .......................... _ _ .... _ .......... 28,090 17,530 1,056 3,163 31,345 45,391 21.374 10,866 37,571 393,287 34,276 125,163S25,000 urider-S50.000 ... ......................................... 30,063 34,335 1,919 10,749 A436 74,431 23,117 16,213 41,590 745.572 38,743 290.926
S50.000 under S100.000 ............ ..................................... 16,779 38,387 .1.215 14,216 181. 005 65.475 12,703 16.134 22.938 768.545 22.286 379.819S100,000 under S200.000 ................................................ 7.840 35,690 811 27,521 8,321 49.104 6,217 12,833 10.820 649,675 10.811 413.512S200,000 under S500.000 ............ ........ ... _ ................... 4,280 43,842 417 25.023 4~346 39,585 3,505 12.873 5,828 698,074 6,045 589,466S500.000 under S1,000.000 _ ........................ .................. 1,222 29,365 152 19,088 1~151 19,091 1,004 6,512 1,582 384.635 1,752 434.162S1,000,000 or more ................................................... 847 85,119 143 67,652 1816 25,250 704 9,057 1,076 682,357 1.223 1.559.702
Nontaxable trusts, total .................................................... 166,120 204,164 27,112 585,834 -398,931 529,321 223,204 138,250 655,476 12,422,212 49,527 138,217
No total income ............................................................. 4,375 4,431 1,638 701 3,108 2,559 4,942 3,980 4,405 44,719 2,613 18,971
Sl under $1,000 .................................................... 11,577 3,579 2,325 1.011 48,054 12,146 23,833 6,654 70,796 31,602 3,971 628..........................S1,000 under S2.000 ............................ 11,519 3,466 2,461 2.560 31.955 9,755 19.375 4,431 64.862 84.534 4,225 1,291:
S2,000 under $3.000 ................................. : ..................... 12,649 2,436 2,482 3,342 31~456 13,100 16,707 3,447 58,842 130,165 3,752 677S3,000 under $4,000 ....................................................... 10,572 2,870 1,667 3,514 24~997 11,186 13,179 4.149 43,031 132,650 3.438 1.82~S4.000 under S5,006 ....................... _ ...... ............. ... 12,151 4,257 735 1,853 27,339 13,864 12,737 5,900 44.740 178,945 3,877 1,205
S5,000 under STOOG ......... ............................................. 16,036 10,728 1,616 6,249 461,674 27,974 22,842 7,546 66,531 360.740 4.670 1,203S7.000 under S10,000 .................... ................................ 20.807 12.240 2,301 10,001 48.565 48,166 26,990 10,136 75,839 565.469 5,200 3,044S10,000 under $15,000 ............................................... .... 20.913 12,907 2,659 22,392 47,312 57,791 24.633 11,770 73,497 801,419 6.076 3,734
S15,000 under S25,000 .................................................... 20,593 19,979 2.632 29.119 43,171 78,032 25,872 17,41) 67,846 1,170,640 5,509 4,725
S25,000 under $50,000 ..................................................... 14,576 25,711 2.929 55,245 29,732 93,330 19,;66 21,487 45.855 1 390 401' 3,601 9,379
S50,000 under $100,000 ................................................... 6,168 20,926 1,857 72,438 11,740 59.152 7. 18 12321 ~..149 1.2156,666 5,
2 9,649
S100,000 under S200,000 ................................................. 2,528 21,012 1,005 90,546 4,779 34,999 3,092 9:429 9,399
"48.040
57~ 13,810
S200,000 under $500,000 ................................................. 1,152 18,935 548 92,795 2,239 30,353 1,465 9192 5.338
1,488.250j
354 21.292S500,000 under $1,000,000 ............................................... 325 19,220 155 63,857 1516 14,572 399 4:064 1.407
ff76,524
94 11,908$1,000,000 or more ......................................................... 179 21,467 104 130,209
1293 22.342 254 6332 939
2,761.447
56 34,878
See footnotes at end of table.
I

Table 2. - Trusts-Sources of Income and Loss, Deductions, Taxable Income and Tax Items, by Size of Total Income - Continued(All figures are estimates based on samples - money amounts are in thousands of dollars)
Type of deduchon-Confinued Taxable income Incometax before credits
Exempiton Otherincomededuction Other deductions
Number of Number ofNumber of trusts Amount trusts Amounts
trusts Amount Amount Amount
(49) (50) (51) (52) (53) (54) (55) (56)All trusts, total ............................................................................................................................. 860,489 176,501 951,25i 373,299 434,542 5,241,40i 434,542 1,894,491No total income .......................................................................................................................... 18,~94 2,687 43,155 9,244 - - - -Sl under S1.000 ......... ......... _ ... ......................... .......................................................... 107,856 17,070 7,288 3,566 47,950 14,135 47 950 1 697$1.000 under S2.000 ................ .................................................... ................................... 78.296 13,941 4.179 6,255 41,906 42,030
,41,906
,5 176
S2.000 under S3.000 .............. ____ ... ._._ ............................................... 61,623 11.794 14,997 4.435 27,944 45,414 27 944,
5 916S3.000 under S4,000. ..................... .............................. ......... _._ ........... ___ ................ 47,279 10.180 7,595 5,503 21,863 45,263
.21,863
,6 213S4.000 under S5.000. .......................... _ .......... ............ ........................................ 46,271 9,649 8,472 3.139 19.555 52,394 19.555
,7,419
S5.000 under S7.000 ~ .... ...................................... ................................................... 75,883 15,747 20,196 6,485 33,620 110,302 33 620 45616S7.000 under S10.000 ___ .......................................... ... ................ I ..... ... -__. 84,610 18,938 18,556 6,912 36,052 443,374
,36 052
,04923
S10.000 under $15.000 ... ___ .......... .... .............................. I ~ .... .................. ....... 91.656 20.398 25,327 10,105 45,896 236,361.
45 896,
42 395S15.000 under $25.000 ................................................................................................................. 94.653 21,513 31,323 32,293 52,835 390.049
~52 835
,82 336
S25.000 under $50.000 ....... ....... .._ ................ ............................................. ... _ .... _ .................. 83,212 18.151 8Z005 29,126 54.405 661,969,
54,405.
175,212S50.000 under $100.000 ........... .................................................... __ ........... 39,663 9,024 76,342 27,652 28.691 629.944 28 691 206 892S100.000 under $200.000 ............................................................................................................. 17,675 4,136 72.809 29,730 13,392 579,575
.13 392
,228 693S200.000 under S500.000 _ ........ ......................................................................................... ___ 9,315 2.237 105.266 32,074 7.102 648,027
,7 102
.288 881S500.000 under S1.000.000........ .......... __ .................................................................................... 2,519 657 84,596 11.433 1,975 412,079
.1,975
,195 981S1.000.000 or more .... .................................. ................................ .. _ 1,684 378 349.148 155.347 1,356 1,230.493 1.356
,608.173
Taxable trusts, total ...................................................................................................................... 415,913 68,109 314,060 82,106 431,913 5,232,560 431,913 1,892,232No total income .......................................................................................................................... - - 105 - - - -S1 under $1.000 .................. ...... ....... I ...... --- ........... - .... ---' ............ 45,231 5,052 269 1,799 47,348 14,007 47 348 1 682S1.000 under S2.000.. . I ... ~ - I ~ .... .... ......... -- ..... ........................ I ... ... 1.11 ...... 39,523 4,631 907 2,328 41,473 41.641
.41 473
,5 129
S2.000 under $3.000 ...................................... .................... ........................................ 26,740 3.327 938 1,772 27,655 45.218.
27,655.
5 892S3.000 under S4. 000.. .. ........................................ _ .............................. _ .... .................. 20,238 2,862 664 1.150 21,663 45,058 21 663
,6 188S4.000 under S 5, 000 .. ~ ~ ~. _ _ ~ ............. .................................................. ___ ......................... 18,411 2.657 1,043 1,266 19,355 51,617
,19,355
,7,307
S5.000 under ST000 ....... ..... .__ ............................................... .............................. 31,781 4.755 2,408 2,253 33.199 108,645 33 199 16 211S7.000 under S10.000 .................... ............................... . ........... __ _ ......................... ___ ... 34,278 5,728 3,089 2,331 35.914 142,264.
35 914,
22 858S10.000 under S15.000 ... ......................... . ......... .___ . .... ................... ................................ 43.448 7,727 6.149 3,293 45.896 236.361.
45 896,
42 395S15.000 under $25.000 ............... ................. ___ .......... ..... ........... ...................................... 51,195 10,125 9,997 7,060 52.734 389,510.
52 734,
82 219S25.000 under S50.000 ....... ........................................................... I ..................... 53,274 10,436 24~830 9,082 54,239 661,342
.54.239
,175,110
S50.000 under S100,000 .... __ .............................................................. ............................ 28;232 5,598 30,151 7,874 28.641 629,425 64128 206 759S100.000 under S200,000 _._ ................................................................... __ ....... .... _ ................. 13,229 2.806 36,348 8,478 13,387 579,514,
13 387,
228 681S200.000 under S500,000 .... _ ... ____ ........ _ ... ........................... __ ........... _ ........... .............. 7,031 1.639 45,555 9.147 7,088 647,497,
7 088.
288 667$500.000 under S1,000.000 ........................................................ ........................................ _ ....... 1,960 490 39,802 4,164 1,967 409,970.
1 967,
194 961S1.000.000 or more ............. ___ ... ____ ........................................ __ .................. __ ............... 1,342 276 111,805 20,108 1,355 1,230,492,
1,355.
608,173Nontaxable trusts, total ................................................................................................................. 444,576 108,392 637,195 291,193 2,629 8,847 2,629 2,259No total income .......................................................................................................................... 18,294 2,687 43,044 9,244 - - - -S1 under $1.000 .... .................................................... ............................................................... 62,625 12,019 7,019 1,767 602 12B 602 15S1.000 under S2,000___ .................... _ ......................................................... ....................... __ 38,773 9,310 3,272 3.927 434 389 434 47S2.000 under S3,000 ........... __ ...... .............. ....................................... __ ... ..... ....... 1 34,884 8,467 14,060 2.663 289 196 289 24S3.000 under S4,000 ........... ... .......... ___ ........................... .... .................... 27.041 7.319 6,931 4,353 201 205 201 2654.000 under S5.000 .............................. ... 111.1 .......... ............ .... 27,860 6.992 7,430 1,873 201 777 201 112S5.000 under STOOD ~ ...................................... ................. ...... ---11111 ........ 44.102 10,991 17.788 4,232 420 1,657 420 246S7.000 under S10.000 ___ ...... ............... .... .1 11 -1 ....... 11 ... 1-111 .......... 50.333 13.210 15,467 4,581 138 1.110 138 192$10.000 under S15.000..,...,. .... .......................... .................... ................................. _._' 48.208 12,671 19.178 6 811 - -
- -S15.000 under S25.000. ........... _ .. ........................................................................................... 43,458 11,388 21,326
,25.233 101 539 101 117S25.000 under S50.000 ...... .............................................................. ............................ 29,938 7,715 57,176 20.044 166 627 166 102
S50.000 under S100,000. 111-1-- ....... ~. ~.. 1. 1 ................... - ......... ---- _- ....... ... ... ....... 11,430 3.426 46,191 19,778 50 519 50 133S100.000 under S200.000 , ........................ __ ...... ___ .................... ......................................... 4,446 1.330 36,463 21,252 5 61 5 12S200.000 under S500.000 ~ ............... ...... ...... . ............ .............. . ......... ..... _ .......... 2,284 598 59,711 22,926 13 530 3 214S500,000 under S 1.000,000 . ~ .... _.__ ............. __ ......... .......................................... __ ........ 559 167 44.795 7,269 ..9
10.!
9 1 020S 1.000.000 or more .. ~ ~ _ ~ ~ ~ ~ ~ ....................... ................................ ... ___ . ............. ... .............. 341 102
It237.344 135,239 C *) I* *)
.C')
See footnotes at end of tal,re

ITable 2. - Trusts-Sources of Income and Loss, Deductions, Taxable Income and Tax Items, by Size of Total Income - Continued
(All figures are estimates based on samples- money amounts are in thousands of dollars) I
Selected tax credits Alternative m1mmilm tax
Total Foreign tax credit j ln~cslmo tax credit Jobs creditN b f
Number ofAmount
Number ofAmo In,u
Number of AmountNumber
of Amount
um er otrust
s Amount
trust,
trust I trusts
trusts
(57) (58) (59) (60) (61) (62) (63) (64) (65f (661
All trusts, total ........................................ .................................... 26,060 76,012 7;252 5,599 19,348 16,004 899 517 17,351 39,534
No total income .......................................................................... 149 48,331 - - - - - - - -
Sl under S1,00O.. ........ ................ .......................................... 999 20 - t - 996 19 112 1 -
S1,000 under $2.000 ........................................ . ..... 1,429 300 225
11
1,055 65 - - -
S2.000 under S3,000 ............ __ .................................................. 1,252 63 225 4 1,027 59 - -
S3,000 under S4,000 ............. ................................................ __ 1,259 Ill 425 54 633 57 - - -
S4,000 under $5.000 .... ......... __ ..... .... I ...... I ........... 1,083 225 169
1
3 971 211 43 (1) -
$5.000 under $7,000 ... ............... .............................................. 1,932 364 668 45 1,402 264 105 56 -
$7.000 under S10,000 ........ . ....... I ........ ......................... 1.539 402 494 84
1
.080 318 35 - -
$10,000 under S15,000 ...................................... ........... __ - 2.670 477 751 1 135 1,884 326 105 6 35 16
S15,000 under $25,000 .......................................... ......... _ ......... 3,290 1,346 1,248 228 2,305 743 115 13 196 95
S25,000 under $50,000 ................................................... ...... __ 4,280 3.421 1.411 405 2,952 2,878 181 90 1,252 748
S50,000 under $100,000 ................................................. .. .. ...... 2,813 3,550 742 1,150 2,140 2,088 89 38 5,731 548
1S100.000 under S200,000 ......................................................... __ 1,662 4.548 459 431 1,
2
73 1,675 50 196 5,208 9:059
$200,000 under S500,000 ................................... ; ...................... _ 1.072 6,087 289 289 868 3,465 32 61 3.275 9,338
$500,000 under SI.000.000 ...................... .................................. 361 3,046 84 1,187 309 1,724 17 11 936 4,740
S1.000.000 or more. ....................................... _ ............... ..... 270 3,721 63 1,563 248 2,110 15 44 718 10,057
Taxable trusts, total ...................................................................... 22,916 19,296 6,776 3,615 16,901 14,832 777 404 17,351 39,534
No total income ..........................................................................
$1 under $1,000.. ..... .................. ..................................... 397 5 - 397 4 112
$1.000 under S2,000 ......... ........................................... - - - 790 24 169 11 621 13 -
$2,000 under S3,000 ..................................................... ....... 963 39 225 4 738 35
S3,000 under $4,000 ............................................................. . 1,058 83 281 42 777 42 -
$4,000 under $5.000 ................................................................ 883 110 169
1
3 770 97 43
S5,000 under S7.000 ................................................................... 1,441 105 459 38 982 66 35 (1)
S7,000 under $10.000 .................................................................. 1,401 210 494 84 942 126 35 (1) -
$10,000 under $15,000 ................................................................ 2,670 477 751 135
1,884
32 105 6 35 16
S15.000 under S25,000 ............................................... . ............. 3.157 849 1,248 228 2,205 615 98 6 196 95
$25,000 under S50,000 ................................................. ............. 4,097 3,295 1,361 377 2,818 2,805 147 66 1.252 748
S50,000 under $100,000 .............................................. .. . .... 2,753 2,491 732 .226 2,090 1,953 89 38 5.731 5,481
$100,000 under $200,000 ......... ................................... ... - 1,640 2,291 459 431 1,268 1.663 50 196 5,208 9,059
$200,000 under $500,000 ............................................................. 1,045 3,695 .286 271 856 3,279 30 35 3,275 9.338
$500,000 under $1,000,000 ........................................................... 352 1,900 81 192 304 1.697 17 11 936 4,740
$1,000.000 or more ........................................................ ......... 269 3,721 63 1,563 247 - 2,110 15 44 718 10.057
Nontaxable trusts, total ................................................................. 3,144 56,716 476 1,984 2,448 1,172 122 113 -
No total income .......................................................................... 149 48,331 - - - - - -
$1 under $1,000 .................................... . - - ............. .. 602 15 - 602 15 - -
S1,000 under $2,000 ................................................................... 638 276 56 1 434 52 - -
$2,000 under $3,000 ................................................................... 289 24
--
289 24 - -
3,000 under $4,000 ......... ........................................... _S 201 27 145 12 56 15
S4,000 under S5,000 ~ .............................................. . ..... .. ............ 201 115 - - 201 115 - -
$5,000 under S7,000 ......................... .................................. 491 259 209 6 420 97
i
70 56
STOOO under S10,000 .................................................... ..... 138 192 - - 138 92 - -
$10,000 under S15,000 ...........................................................-
- - - - - -
$15,000 under $25,000 ..................................................... 133 497 101 128 16 7
S25,000 under $50,000 ....................................................... ........ 183 126 50 29 133 73 "50
S50.000 under $100,000 ...................................................... ....... 60 1,059 10 924 50 135 -
$100,000 under S200,000 ............................................... I ............. 21 2,257 - 5 12
S200.000 under $500,000 .............................................. 26 2,392 3 18 !2 187 C V
S500,000 under S1,000,000 ......................................................... 10 3
9
95
.
6 '27
$1,000,000 or more ................................................................... .
See footnotes at end of table.
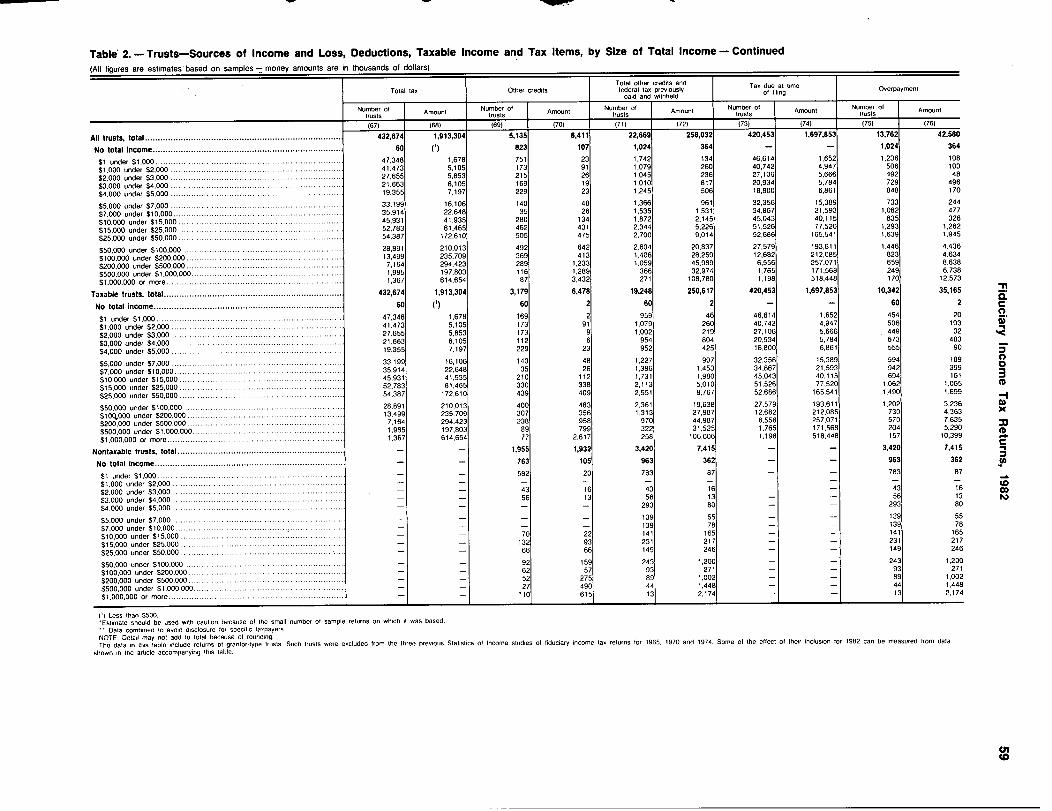
Table 2.- Trusts-Sources of Income and Loss, Deductions, Taxable Income and Tax Items, by Size of Total Income- Continued
(All figures are estimates 'based on samples -money amounts are in thousands of dollars)
Total tax Other creditsTotal other credits andfederal
taxpreviously
Tax due at timeof filing
Overpaymentpaid and withhold
Number of AmountNumber of Amount Number of Amount
Number of Amount Numberof
Amounttrusts trusts (rusts trust, trusts
(67) (68) (69) (70) (71) (72) (73) (74) (75) (76)
All trusts, total ............................................................................. 432,674 1,913,304 5,135 8,411 22,669 258,032 420,453 1,697,853 13,762 42,580
No total Income .......................................................................... 60 (1) 823 107 1,024 364 - - 1,024 364
$1 under $1.000 ............ - ........... . - . ...... 47,348 1,678 751 23 1,742 134 46,614 1,652 1,236 108
000 under $2,000 ................................. . . ............. ....$1 41.473 5,105 173 91 1,079 260 40,742 4,947 506 103,
S2,000 under S3.000 .................................. ...... ....... . .... 27.655 5,853 215 26 1,045 236 27,106 5,666 492 48
$3,000 under $4,000 ........................................ - - - .. - 21,663 6,105 169 19 1,010 817 20,934 5,784 729 496
$4,000 under $5,000 ...................................................... . 19,355 7.197 229 23 1,245 506 18,800 6,861 848 170
S5,000 under $7,000 .......................... ............ . ....... 33.199 16,106 140 48 1,366 961 32,356 15,389 733 244
$7,000 under $10.000 .......................... ........... . 35.914 22,648 35 26 1,535 1,531 34,867 21,593 1,082 477
000 under $15.000 .............. .................................................$10 45,931 41,935 280 134 1,872 2,145 45,043 40.115 835 326,000 under $25,000 ........................................ .......$15 52,783 81,465 462 431 2,344 5,226 51,526 77,520 1,293 1,282.
$25,000 under $50,000 ................................... ... ........ 54,387 172,610 505 475 2,700 9,014 52,686 165,541 1,639 1,945
S50,000 under $100,000 ............................ ...................... 28,891 210.013 492 642 2,604 20,837 27,579 193,611 1.446 4,436
$100,000 under $200,000 ........................................ . . .... 13,499 235,709 369 413 1,406 28,259 12,682 212.085 823 4,634
$200,000 under $500,000 .............................................. .... 7,164 294,423 289 1,233 1,059 45,989 6,556 257,071 659 8,638
S500,000 under S1.000.000... .................... ... . ... .. 1,985 197,803 116 1,289 366 32,974 1,765 171,568 249 6,738
S1,000,000 or more .................. . ........ .. . .... - . .. ...... 1,367 614,654 87 3,432 271 108,780 1,198 518,448 170 12,573
Taxable trusts, total ...................................................................... 432,674 1,913,304 3,179 6,478 19,248 250,617 420,453 1,697,853 10,342 35,165
No total income .......................................................................... 60 (1) 60 2 60 2 - - 60 2
$1 under S1,000 ........................... ........ 47,348 1,678 169 2 959 46 46,614 1,652 454 20
000 .............................. . ...... ..............000 under $2S1 41,473 5,105 173 91 1,079 260 40,742 4,947 506 103, .000 under $3,000 ...................................... ......................$2 27,655 5,853 173 9 1,002 219 27,106 5,666 449 32
,000 under S4,000 ............................... ..........................$3 21,663 6,105 112 6 954 804 20,934 5,784 673 483
,$4,000 under $5,000 .................................... .................. 19,355 7.197 229 23 952 425 18,800 6,861 555 90
000 under $7,000 ................................................. .......S5 33,199 16,106 140 48 1,227 907 32,356 15,389 594 189,000 under S10,000 ................................. ...... .....$7 35,914 22,648 35 26 1.396 1,453 34,867 21.593 942 399
,000 under $15,000 ....................... _ .................. ..$10 45,931 41,935 210 112 1,731 1,980 45,043 40,115 694 161
,000 under $25,000 ........................ . .................. .. . ....$15 52,783 81,465 330 338 2,113 5,010 51,526 77,520 1,062 1,065
.S25.000 under S50,000 .............................. _ .................. . .... 54,387 172.610 439 409 2.551 8,767 52,686 165,541 1.490 1,699
000 under $100,000 ........................... ........ .........S50 28,891 210,013 400 483 2,361 19.638 27.579 193,611 1,202 3,236,
Slo(~000 under $200,000 ................ 13,499 235,709 307 356 1,313 27,987 12,682 212,085 730 4.363
000 under $500,000...... ..................... . .................$200 7.164 294,423 238 958 970 44,987 6,556 257,071 570 7.635,000 under S1,000.000 .............. ................................. .......$500 1,985 197,803 89 799 322 31,525 1,765 171,568 204 5,290
,$1,000,000 or more .............................. .. ............. . 1,367 614,654 77 2,817 258 106.606 1,198 518.448 157 10.399
Nontaxable trusts, total ................................................................. - - 1,955 1,932 3,420 7,415 - - 3,420 7,415
No total income .......................................................................... - - 763 105 963 362 963 362
S1 under S1,000 ......................... ........... - - 582 20 783 87 783 87
S1.000 under $2,000 ....................................................... ........... - --
-43
-
16
-43
-16
--
--
-
43 16S2,000 under S3,000 ......................... ........... ............. -
- 56 13 56 13 - - 56 13S3,000 under S4,000 ........... .................. . ......................... -
293 80 - - 293 80$4.000 under S5.000 ................................. ............................. - - - -
000 under $7.000 ................................... . .................... .......S5- - 139 55 - - 139 55
,000 under S10.000 ..................... - ... .... ....$7
- - 139 78 - - 139 78,000 under S15,000 ...... ................... . ........ ......$10
- - 70 22 141 165 - - 141 165,000 under S25,000 ............ _ ................. ......................$15 - - 132 93 231 217 - - 231 217
.S25.000 under S50,000 _ ....................... .. ......... __ ..... . - - 66 66 149 246 - - 149 246
000 under S100,000 .............................. . ............................S50 - - 92 159 243 1,200 - - 243 1,200,000 under $200,000 ............................. ..................S100 - 62 57 93 271 - - 93 271
,000 under $500.000 ........... ........ ......................S200 - - 52 275 89 1,002 - - 89 1.002
,000 under $1,000,000 .........................................................S500 - - 27 490 44 1,448 - - 44 1,448
,S1,000,000 or more .................................. . .......... 615 13 2,174 - - 13 2,174
() Less than S500.'Estimate should be used with caution because of the small number of sample returns on which it was based... Data combined to avoid disclosure for specific taxpayersNOTE Detail may not add to total because of rounding.The data in this table include returns of grantor type trusts, Such trusts were excluded from the three previous Statistics of Income studies of fiduciary income tax returns for 1965, 1970 and 1974. Some of the effect of their inclusion for 1982 can be measured from data
shown in the article accompanying this table.
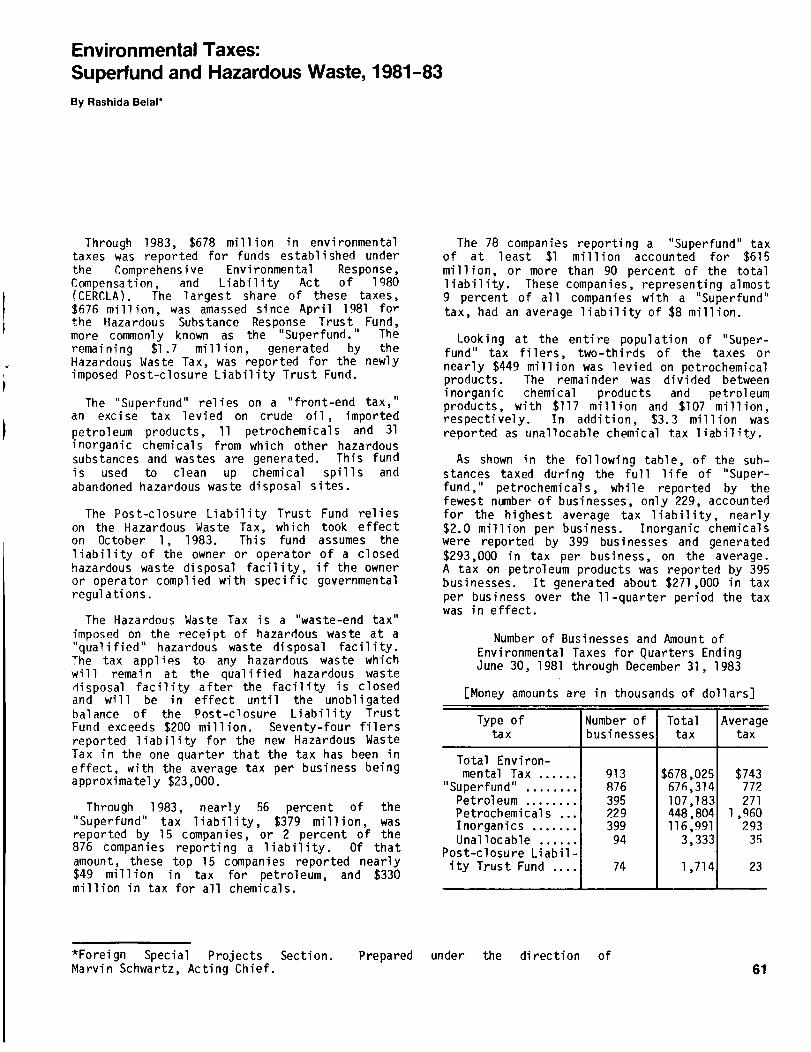
Environmental Taxes:Superfund and Hazardous Waste, 1981-83By Rashida Belal*
Through 1983, $678 million in environmentaltaxes was reported for funds established underthe Comprehensive Environmental Response,Compensation, and Liability Act of 1980(CERCLA). The largest share of these taxes,$676 million, was amassed since April 1981 forthe Hazardous Substance Response Trust Fund,more commonly known as the "Superfund." Theremaining $1.7 million, generated by theHazardous Waste Tax, was reported for the newlyimposed Post-closure Liability Trust Fund.
The "Superfund" relies on a "front-end tax,"an excise tax levied on crude oil, importedpetroleum products, 11 petrochemicals and 31inorganic chemicals from which other hazardoussubstances and wastes are generated. This fundis used to clean up chemical spills andabandoned hazardous waste disposal sites.
The Post-closure Liability Trust Fund relieson the Hazardous Waste Tax, which took effecton October 1, 1983. This fund assumes theliability of the owner or operator of a closedhazardous waste disposal facility, if the owneror operator complied with specific governmentalregulations.
The Hazardous Waste Tax is a "waste-end tax"imposed on the receipt of hazardous waste at a11qualified" hazardous waste disposal facility.The tax applies to any hazardous waste whichwill remain at the qualified hazardous wastedisposal facility after the facility is closedand will be in effect until the unobligatedbalance of the Post-closure Liability TrustFund exceeds $200 million. Seventy-four filersreported liability for the new Hazardous WasteTax in the one quarter that the tax has been ineffect, with the average tax per business beingapproximately $23,000.
Through 1983, nearly 56 percent of the"Superfund" tax liability, $379 million, wasreported by 15 companies, or 2 percent of the876 companies reporting a liability. Of thatamount, these top 15 companies reported nearly$49 million in tax for petroleum, and $330million in tax for all chemicals.
The 78 companies reporting a "Superfund" taxof at least $1 million accounted for $615million, or more than 90 percent of the totalliability. These companies, representing almost9 percent of all companies with a "Superfund"tax, had an average liability of $8 million.
Looking at the entire population of "Super-fund" tax filers, two-thirds of the taxes ornearly $449 million was levied on petrochemicalproducts. The remainder was divided betweeninorganic chemical products and petroleumproducts, with $117 million and $107 million,respectively. In addition, $3.3 million wasreported as unallocable chemical tax liability.
As shown in the following table, of the sub-stances taxed during the full life of "Super-fund," petrochemicals, while reported by thefewest number of businesses, only 229, accountedfor the highest average tax liability, nearly$2.0 million per business. Inorganic chemicalswere reported by 399 businesses and generated$293,000 in tax per business, on the average.A tax on petroleum products was reported by 395businesses. It generated about $271,000 in taxper business over the ll-quarter period the taxwas in effect.
Number of Businesses and Amount ofEnvironmental Taxes for Quarters EndingJune 30, 1981 through December 31, 1983
[Money amounts are in thousands of dollars]
Type oftax
Total Environ-mental Tax ......
"Superfund .. ........Petroleum ........Petrochemicals ...Inorganics .......Unallocable ......
Post-closure Liabil-ity Trust Fund
Number ofbusinesses
913876395229399
94
74
Totaltax
$678,025676,314107,183448,804116,991
3,333
1 714
Averagetax
$743772271
1 960293
35
23
*Forei gn Special Projects Secti on. Prepared under the direction ofMarvin Schwartz, Acting Chief. 61

62 Environmental Taxes, 1981-83
As business activity declined with the-reces-sion of 1981-82, the liability for "Superfund"decl i ned. As shown in the following table, thetax liability for the last three quarters of1983, was still approximately 5 percent belowthe tax liability reported in 1981. However,tax liability for'1983 increased by approxi-mately 9 percent or $20 million over theliability for 1982, a reflection of the turn-around occurring in the economy over that time.
The quarter ended September 1983 showed anincrease in every category for the first timesince the quarter ended- June 1982. Totalliability for September 1983 was $64.0 million,up by almost $10 million over the September1982 figures. For the quarter ended December1983, the tax liability increased by more than$10 million over the December 1982 figure.
"Superfund" Taxes by Category forQuarters Ending June 30, 1981,
through December 31, 1983
[Millions of dollars]
Quarterending Total
Petro-chemicals
Inorganift.chemicals Petroleun
--Total;- - -$676 ~-O- -$448-.8 - - --$1-1-7-.0- - -$1707-.-2 --June 1981 69.4 46.0 13.2 10.2Sept. 1981 60.9 40.0 11.6 9.3Dec. 1981 68.0 43.8 11.3 11.5
Mar. 1982 59.0 39.3 10.5 9.0June 1982, 60.6 40.1 10.7 9.8Sept. 1982 54.6 35.7 8.9 9.4Dec. 1982 55.4 36.4 9.6 9.2
Mar. 1983 59.5 -40.0 10.6 8.7June 1983 59.2 40.1 .9.5 9.4Sept. 1983 64
*0 42.0 11.1
Dec. 1983 65.7. 45.2 110.3 9.7
~ Includes liability for taxes not allocable toa specific category. For this reason and alsobecause of rounding, detail will not add tototal .
PETROCHEMICALS
As shown in' Figure A, since its inception in1981, the tax on petrochemicals was reported byapproximately 229 of the 876 businesses report-ing "Superfund" taxes. * Although just over 26percent of the businesses reported the tax onpetrochemicals, it generated 66 percent of thetotal tax liability. The petrochemical reportedmost commonly toluene, was reported by nearly38 percent of the businesses with a tax onpetrochemicals. However, less than 7 percentof the tax, on petrochemicals was generated fromthis source. In contrast, while the tax onethylene was reported by less than 20 percentof businesses reporting tax on petrochemicals,
it accounted for almost 40 percent' of theliability for petrochemicals. According toTable 2, the businesses reporting tax 'on -ethyl-ene, on. the average, reported $4.1 million, intax liability for that substance alone.
Figure A
Sources of Environmental Taxes,.Quarters Ending, June 30, 1981, throughDecember 31, 1983
Petroleum16%
Inorganicchemicals
17%
Not Allocabldand Hazardous
Waste less~han ._'/.
INORGANIC CHEMICALS
Petrochemicals66%
$678million
Tax on inorganic chemicals was reported by 46percent of the businesses reporting "Superfund"taxes. However, as shown in Figure A, theliability was only 17 percent of the "Superfund"taxes. Sulfuric acid, ammonia, and hydrochl*oricacid, reported by 27 percent, 22 percent and 22percent, respectively, of the companies' report-ing a tax liability for inorganic chemicals,were the most commonly taxed of these sub-stances. These chemicals represented only 26percent of the liability reported for inorganicchemicals. On the other hand, chlorine,reported by only 13 percent of the businessesreporting tax on inorganic chemica
Ils, accounted
for approximately 53 percent of the reportedliability for this group.
Returns are sometimes flled reporting a.total.tax on chemicals, without specifying type ofchemical s. Eight percent of the returns filedcoul d not be categorized by the type ofchemical for which they,were filed. However,tax re*ported on these returns represen'ted,le.tsthan 1 percent of the total tax liability
I

Environmental Taxes, 1981-83 63
PETROLEUM
Petroleum and petroleum products were reportedby 45 percent of the total businesses reporting"Superfund" liability. But, as shown in FigureA, the total tax on petroleum represented only16 percent of the total liability.
REQUIREMENTS FOR REPORTING TAXES
The requirements for filing and reporting atax on petroleum apply to the following:
1 ) operators of U.S. refineries receivingcrude oil;
2) importers of petroleum products forconsumption, use, or warehousing; and
3) users or exporters of crude oil on whichthe environmental tax has not been paid.
Since the tax is imposed only once on aproduct, once it has been paid it cannot beimposed again on another business that wouldotherwise be liable.
The requirements for filing and reporting thetax on chemicals apply to any importer, manufac-turer, or producer that sells or uses any of the42 taxable chemicals listed in Table 1. Thereare some exceptions to what is taxed, with thefollowing being nontaxable:
1) ammonia, if used directly as a fertilizer;
2) methane or butane used as a fuel (however,the business using the chemical for ataxable purpose is liable);
3) nitric acid, sulfuric acid, ammonia, ormethane used in the production of ammoniathat is used for fertilizer;
4) sulfuric acid produced solely as a by-product of, and on the same site as, airpollution control equipment; and
5) any substance derived from coal.
SUMMARY
Through 1983, $676 million in tax liabilitywas generated for the "Superfund." Of the 876companies reporting, the 78 with a tax liabilityof $1 million or more accounted for over 90percent of the total liability. Two-thirds ofthe "Superfund" tax liability was levied onpetrochemical products. Petrochemicals, whilereported by the fewest number of businesses,accounted for the highest average tax liability($2.0 million per business).
The new Hazardous Waste Tax, which funds thePost-closure Liabilty Trust Fund, went into
effect on October 1, 1983. For the one quarterit was in effect, $1.7 million in tax liabilitywas generated.
DATA SOURCES AND LIMITATIONS
The Quarterly Excise Tax Return, Form 720, isthe form on which environmental taxes arereported. Form 6627, Environmental Taxes, isthe supporting schedule on which the tax liabil-ity for petroleum, chemicals and hazardous wasteis computed. The tax as imposed by Congress islevied at different rates ranging from $.0079per barrel of crude oil or petroleum to as muchas $4.87 per ton of certain chemicals. Theaverage tax levied is $3.24 per medium.
Returns a,,e due for filing one month afterthe end of the quarter in which the business. isliable for environmental taxes. These returnsare the chief source of data for this study.Data in this article reflect informationreported on returns filed for the tax quartersending June 30, 1981 through December 31, 1983.
Any adjustments, credits, or refunds to envi-ronmental taxes either on the Form 720 or Form843, Claim, are not reflected in the data. Ataxpayer can take an adjustment or credit if ataxed chemical is later used to manufacture orproduce any other substance subject to the tax.If a tax is paid on a chemical subsequently usedto produce fertilizer, a credit or adjustmentcan also be claimed.
The Internal Revenue Service also releasesenvironmental tax statistics in a report onexcise taxes that is issued quarterly [1].These figures, taken from the Form 720, showthe total liability, after adjustments, ofreturns recorded on the computerized BusinessMaster File as part of routine tax administra-tion processing. There is, however, no distri-bution of tax by type of chemical . Returns aredue one month after the end of the calendarquarter. Also included are returns filed latebecause of routine filing extensions and otherreasons. Therefore, that report covers whatwas recorded during a quarter, regardless ofwhen the liability was incurred. Consequently,the two series of data are not directlycomparable.
Since no statistical sampling was involved,the data are not subject to sampling error, butmay be subject to nonsampling error. Attemptswere made to secure all returns filed. Inaddition, the returns were passed through aserie
's of validity checks to verify the accuracy
and completeness of the returns. For thosereturns supplying a total with no distributionby category, the amount was included in thestatistics under "unallocable chemicals."

64 Environmental Taxes, 1981-83
NOTES AND REFERENCES
[11 U.S. Department of the Treasury, InternalRevenue Service, Internal Revenue Report ofExcise Taxes.
[21 See also Barnhardt, Janet, "Superfund forEnvironmental Taxes," Statistics of IncomeBulletin, Fall 1982, pp-.-JT---3T. -
[3] See also Belal, Rashida, "Superfund f
-
or
Environmental Taxes, 1981 and 1982,"Statistics of--Income Bulletin, Fall 1983,
- - pp. 31-34.
I
I

Environmental Taxes, 1981-83
Table l.--EnvirorLmental Taxes Reported by Type of Substance, Quarters Ended June 30, 1981 -December 31, 1983
[Money amounts are in thousands of dollars]
Type of substanceTotal
todate
(1)
Petroleum................................
Petrochemicals, total ....................Acetylene ..............................Benzene................................Butane .................................Butylene ...............................Butadiene ..............................Ethylene ...............................Methane................................Naphthalene ............................Propylene ..............................Toluene................................Xylene .................................
Inorganics, total ........................Ammonia ................................Antimony ...............................Antimony trioxide......................Arsenic ................................Arsenic trioxide .......................Barium sulfide .........................Bromine ................................Cadmium ................................Chlorine ...............................Chromium...............................Chromite ...............................Potassium dichromate ...................Sodium dichromate ......................Cobalt .................................Cupric sulphate ........................Cupric oxide ...........................Cuprous oxide ..........................Hydrochloric acid ......................Hydrogen flouride ......................Lead oxide.............................Mercury ................................Nickel .................................
Phosphorus .............................Stannous chloride ......................Stannic chloride .......................Zinc chloride ..........................Zinc sulfate ...........................Potassium hydroxide ....................Sodium hydroxide .......................Sulfuric acid ..........................Nitric acid ............................
Unallocable chemicals ....................
Hazardous waste..........................
107,182
448,8041,648
55,4689,559
11,29918,104
177,52720,989
91380,84630,06442,388
116,99121,938
27190
1117220
2,04626
62,396233
1,213-1
5568
1596039
1,4772,9243,432
231,4204,500
1145
142144196
6,5536,568
905
3,332
1,714
June1981
(2)
10,186
45,966206
5,3221,2481,3341,832
17,0242,625
1399,5692,5644,103
13,1582,336
413
121
2053
7,35276
114
310
43
90328366
2120494
1151815
744704101
67- Z
Sept.1981
(3)
Quarter ended
9,293
40,010235
4,2251,0881,2471,483
15,2292,264
657,9652,3543,883
11,5612,138
217-1
23
1562
6,18636
182
174
1734
116337244
2157423
- -1
131313
65770093
28
-2
Dec.1981
(4)
11,542
43,834188
5,2651,0501,4422,015
15,9692,309
937,6612,6865,157
11,3412,191
224
123
3206
35,791
25247
44
211238393
2156420
211151516
650593
74
1,318
-2
March-1982
(5)
8,958
39,317120
4,5581,020
9261,454
15,2932,031
997,9941,9733,849
10,5092,118
220
122
35,540
2780
28
1174
148259330
2163409
14
121612
602567
68
221
-2
65
June1982
(6)
9,750
40,105135
4,5431,2181,2121,685
15,8812,004
536,8892,1434,343
10,7212,059
216
119
1432
5,6821081
61144
140274267
6124407
15
151614
599745
67
10

66 Environmental Taxes, 1981-83
Table l.--Envirorimental Taxes Reported by Type of Substance, Quarters Ended June 30, 1981 -December 31, 1983 - Continued -
[Money amounts are in thousands of dollars]
Type of substance
Petroleum................................
Petrochemicals, total .....................
-Acetylene.~-.; ...........................
Benzene.............. I..................
Butane .....................I.............
Butylene...............................
Butadiene .....................
Ethylene...............................
Methane ................................
Naphthalene .....
Propylene ........ 0 ...... ........
Toluene, ... o ............... o .......
Xylene. ............ o ...... o .........
Inorganics, total ... o ...................
Ammonia ........ o ......... o .............
Antimony ..... o ................ o ........
Antimony trioxide ..............
-Arsenic.-.-.
Arsenic trioxide .......................
Barium sulfide...... ............
Bromine ........
Cadmium....................
Chlorine ............ ............
Chromium ...... o ............... ........
Chromite ................ ...... ........
Potassium dichromate................ 0..
Sodium dichromate ..... o .................
Cobalt ......... ...................
Cupric sulphate ..... ...... 00- ..... 00
Cupric oxide ........ .... o.o_ .........
Cuprous oxide............. 01
........
Hydrochloric acid ... o .... o; ............
Hydrogen flouride ............
Lead oxide... ........................
Mercury ... o ........... oo ...... o ........
Nickel..................... o ...........
Phosphorus ......................
Stannous chloride.....o .... o ...... o....,
Stannic chloride .......................
Zinc chloride ......- ........ o .... o ...
Zinc sulfate ...........................
Potassium hydroxide ......o_ ..........
Sodium hydroxide .......................
Sulfuric acid .... ; .................... o.
Nitric acid ............ 0 ................
Unallocable chemicals ...................
Hazardous waste .........................
Sept.1982
(7)
9,351
35,724- 1125,097
831733
1,41315,1201,621
886,1292,0032,577
8,8781,924
212
13
1792
4,3968
50
32563
113220319
462
38414
1010
5470565
86
6002
Dec.1982
(8)
9,165
36,416
4,283728945
1 32416:4311,508
5,2632,1393,612
9,6191,552
113
12
3882
5,3137
118
15
104
1262042051
96380
311
312
493583
74
1542
Quarter ended - Continued
March1983
(9)
8,689
40,042
4,870721925
1,74216,7691,633
7,0452,6753,470
10,6011,901
417
10
1824
5,71311
108
29
2074
1522552881
152404
25
162068
578580
87
2042
June1983
(10)
9,407
40,099
5,455522
1,0471,664
14,4381,645
7,0354,6233,466
9,4781,959
318
152
1323
4,73313771
28
1475
115280271
1155428
15
141312-
518582
91
2352
Sept.1983
(11)
11,144
42,077132
5,168704680
1,65817,9351,609
7,4503,1483,525
10,8342,021
317-A
51
1862
6,07110591
127
1774
132261338
274
336
1101013
648504
79-1
2
Dec.1983
(12)
9,672
45,213
6,681428809
1,83317,4381,742
7,8743,7554,403
10,2921,739i
322
.81
200
5,619.10961
34
1174
133-270410
2160414
16
121015
595444
86
496
1,714
*This figure is not shown to avoid disclosure.of information for specific businesses. However, the
I
data are included in the appropriate totals.lLess than $1,000, however, the data are included in the appropriate totals.
12Tax not in effect until October 1, 1983.NOTE: Detail may not add to total because of rounding.

Environmental Taxes, 1981-83 67
Table 2.--Envirormental Taxes Reported by Type of Substance, Aggregate For The Quarters Ended June 30,1981, - December 31, 1983
Type of substanceNumber ofbusinesses
Number oftons
(000's)
Tax rateper ton(dollars)
Averagetax perbusiness
(dollars)
(2) (3) (4)
Petroleum......................................... 395 13,567,4311 0.00792
271,348
Petrochemicals, total ............................. 229 93,947 N/A 1,959,844Acetylene....................................... 49 338 4.87 33,637
Benzene ......................................... 65 11,390 4.87 853,351
Butane .......................................... 33 1,963 4.87 289,652
Butylene ........................................ 23 2,320 4.87 491,245
Butadiene....................................... 31 3,717 4.87 584,004
Ethylene ........................................ 43 36,453 4.87 4,128,542
Methane ......................................... 32 6,102 3.44 655,915
Naphthalene ..................................... 6 187 4.87 152,119
Propylene....................................... 54 16 601 4.87 1,497,145
Toluene ......................................... 87 6:173 4.87 345,560
Xylene .......................................... 72 8,704 4.87 588,725
Inorganics, total ................................. 399 94,446 N/A 293,210
Ammonia ......................................... 90 8,310 2.64 243,761
Antimony ........................................ 19 6 4.45 1,440
Antimony Trioxide ............................... 27 51 3.75 7,027
Arsenic ......................................... 15 3 4.45 762
Arsenic trioxide ................................ 20 50 3.41 8,596
Barium sulfide .................................. 4 9 2.30 4,988
Bromine ......................................... 9 460 4.45 227,315
Cadmium......................................... 24 6 4.45 1,071
Chlorine ........................................ 50 23,109 2.70 1,247,912
Chromium ........................................ 19 52 4.45 12,283
Chromite ........................................ 19 798 1.52 63,847
Potassium dichromate ............................ 6 -4 1.69 27
Sodium dichromate ............................... 12 30 1.87 4,611
Cobalt .......................................... 27 15 4.45 2,520
Cupric sulphate ................................. 30 85 1.87 5,287
Cupric oxide .................................... 15 17 3.59 3,990
Cuprous oxide ................................... 5 10 3.97 7,784
Hydrochloric acid ............................... 88 5,091 0.29 16,779
Hydrogen flouride ............................... 17 691 4.23 171,972
Lead oxide ...................................... 38 829 4.14 90,309
Mercury......................................... 11 5 4.45 2,029
Nickel .......................................... 28 319 4.45 50,703
Phosphorus ...................................... 12 11011 4.45 374,997
Stannous chloride ............................... 6 4 2.85 1,898
Stannic chloride ................................ 8 21 2.12 5,595
Zinc chloride ................................... 22 64 2.22 6,475
Zinc sulfate .................................... 26 76 1.90 5,529
Potassium hydroxide............................. 22 890 0.22 8,907
Sodium hydroxide ................................ 77 23,404 0.28 85,104
Sulfuric acid ................................... 107 25,261 0.26 61,382
Nitric acid ..................................... 39 3,769 0.24 23,195
Unallocable chemicals ............................. 94 N.A. N.A. 35,453
Hazardous waste ...................................1
741
8051
2.131
23,169
N/A - Not applicable.'Number of barrels.2Rate per barrel.
3Detail in column one may not add to any meaningful total because businesses may report more than
one of the indicated substances.4Less than 1,000 tons, however, the data are included in the appropriate totals.
NOTE: Detail may not add to total because of rounding.

Crude Oil Windfall Profit Tax,Second Quarter 1984By Ed Chung*
The second quarter of 1984 continued thedownward trend in the windfall profit tax thatexisted since the first quarter of 1981 (FigureA). The windfall profit tax liability afteradjustments for the quarter was $2.3 billion, a6 percent decline from the previous quarter.Through June 1984, the total amount of windfallprofit tax after adjustments reported since theenactment of the Crude Oil Windfall Profit TaxAct of 1980 was $67.9 billion.
The formula to calculate the windfall profit(WP) is:
WP = RP - (ABP + SST)
where:
RP Removal PriceABP Adjusted Base PriceSST State Severance Tax Adjustment
Figure A
The average windfall profit per barrelincreased by $0.09 from the previous quarter.This increase was the result of a $0.67 rise inthe removal price per barrel which wasaccompanied by a $0.58 gain in the adjustedbase price and state severance tax (Figure B).The total windfall profit tax reported for thequarter declined because the number of taxablebarrels of oil produced, as reported on Forms6047, fell by 39 million; daily productiondecreased by 419,000 barrels. However, inreality, actual domestic crude oil productionwas fairly stable through the first nine monthsof 1984 El 1. This discrepancy could be due toreporting errors that could not be resolved orto a decrease in taxable barrels of oil whichwere the result of falling oil prices.
In spite of the current quarter-to-quartergain in the average removal price to $26.65 perbarrel, June 1984 was still nowhere near the
Components' of Windfall Profit Tax Liability Before Adjustments:Aggregate Values By Quarter Oil RemovedBillions of Dollars30
25
20
15
10
5
0
Prior to Full Decontrol
Adjusted Base ValuePlus State Severance
Tax Adjustment
I I I I I I II
After Full Decontrol
Removal Value
Tax LiabilityBefore Adjustments
. . .. . . . . . .. . . .. . . . . . . . . .. . . .. . . . ... . . . . . .. .. ... . . . . . .
**** ...............................
I I I
Mar 8D2 Jun 80 Sep 80 Dec 80 Mar 81 Jun 81 Sep 81 Dec 81 Mar 82 June 82 Sep 82 Dec 82 Mar 83 Jun 83 Sep 83 Dec 83 Mar 84 Jun 84Quarter Oil Removed
'Some returns report windfall profit tax liability only; therefore, data for removal value, adjusted base value and state severance tax adjustment have been adjusted to reflecttotals as if all returns reported this detail.2One month only.
I I I I I I
*Foreign Special Projects Section. Prepared under the directionof Michael Alexander, Acting Chief. 69

70 Crude Oil Windfall Profit Tax, 1984
peak level of $33.09 reached in June 1981. Theincrease in the removal price had been a resultof both increased economic growth in the firsthal f of 1984 combined with a col de r-than- normalwinter in 1983/1984. The increased demandcoupled with a relatively stable supply ofdomestic crude oil pushed the price upward r2l.
The sum of the adjusted base price and thestate severance tax adjustment rose 21 percentfrom $16.69 per barrel for the quarter endingJune 1981 to $20.13 for the second quarter of1984. This increase was primarily a result ofan inflation adjustment -to - the adjusted baseprice r3l.
The following table is a summary, by quarter,,of tax liability before and after adjus
'tments
since the tax went into effect in 1980. Theadjustments were necessary because of errors bywithholding agents during previous quarters or
'more frequently, because of application of thenet income limitation.
Windfall Profit Tax Before and After Adjustments(Millions of Dollars)
Quarter Tax Before. Total Tax AfterEnding Adjustments Adjustments Adjustments
Total $72,786 -$4,851 $67,935
Mar. 19801 ... 788June 1980 2,842Sept. 1980 ... 3,413Dec. 1980 3,918Mar. 1981 6,953June 1981 .... 7,253Sept. 1981 ... 6,344Dec. 1981 .... 6,007Mar. 1982 .... 5,222June 1982 .... 4,283Sept. 1982 ... 4,404Dec. 1982 .... 4,440Mar. 1983 .... 3,320,June 1983 .... 2,951Sept. 1983 ... 2,822Dec. 1983 .... 2,736Mar. 1984 .... 2,622June 1984 .... 2,468
- 788-21 2,821-88 3,325
-927, 2,991.+242 7,195-107 7,146-251 6,093-497 5,510-221 5,001-295 3,988-445 3,959-634 3,806-193 3,127-203 2,748-300 2,522-465 2,271-228 2,394
2,250
'One month 'only.
The net income limitation generates anadjustment because 'it limits the windfallprofit to 90 percent of the net income perbarrel of oil and can be estimated by certaintaxpayers for the current quarter ending June198.4 (see following computation). 'Theadjustments to the previous quarter includeunder- or over-withholding from previousquarters that the depositing or withholdingagent (usually the first purchaser) corrects byadjusting the amounts withheld in succeedingquarters. Producers claim as a refund-or acredit on their income tax returns additionalover-withhol ding of windfall profit tax, due to
error or the net income limitation, that hasnot been corrected by the withholding agent [4].
Adjustments(Millions)
Net income limitation -$223Prior quarters +. 5Net __TM
Based on returns of taxpayers who providedcomplete detail on the windfall profit taxcomputation r5l*, tier one oil continued todominate production- for the quarter ended Jurfe-1984. Tier one oil (all domestically . producedcrude- oil other than- oil specificallyclassified as tier two or tier three, or oilexplicitly exempted from the tax) represented62 percent,of total production. Ti er two o
'il ,
which represented 9 percent of totalproduction, is oil -produced from stripper wellproperty not qual i fyi ng for' the stripperexemption and oil 'from economic interests in aNaval. Petroleum Reserve held by the UnitedStates. Tier three oil , which is heavy oil ,incremental tertiary oil and newly discoveredoil (62 percent of tier three), accounted for29 percent of total production. Tier threeoil , which is generally taxed at a rate lower
--th An -ti er- -66~eb-i 1 -, _a_cco_U~n ted- -f6 r- i- -steadi I_Y__increasing percentage of total production.
DATA SOURCES AND LIMITATIONS
The windfall profit tax is reported on theQuarterly Federal Excise Tax Return, Form 720.Form 6047, Windfall Profit Tax, shows how thetax is computed and is filed as an attachmentto Form 720. Tabulations in this article arebased on the - Form 6047. Returns-are, due 2months after the end of the, quarter in whichthe oil is removed. Data Are based on allreturns with a tax liabi,lity of, $1 million ormo
're before adjustments and a 10-peircent sample
of all other returns.
Sampling and nonsampling errors werecontrolled by a variety of' methods. Althoughefforts were made to secure miss.ing returns,some returns may have been omitted because oftime and resource constraints. Attempts weremade to correct imbalances in taxpayer entriesfor the components of windfall profit; if thisproved impossible, an out-of-balance return wastreated , as a return on which the componentswere not reported, and therefore only theliability for each tier was tabulated
*However, to account for returns not reportingth
*e tax computation detail (for Figure A only),
the components were adjusted using a factorderived from the relationship of the taxliability for those reporting all, taxcomputation
.detail to the - total reported
windfall profit tax liability. A number ofverification checks were * performed at allstages of manual data abstraction and computertabulation.

Crude Oil Windfall Profit Tax, 1984
Figure BComponents of Windfall Profit Tax Liability:Averages per Barrel by Quarter Oil RemovedDollars
35 1
Removal Price
25
15
10
5
0 1
71
OAMar 80' Jun 80 Sep 80 Dec 8 Mar 81 Jun 81 Sep 81 Dec 81 Mar 82 Jun 82 Sep 82 Dec 82 Mar 83 Jun 83 Sep 83 Dec 83 Mar 84 Jun 84Quarter Oil Removed
NOTE: Because of price controls during 1980, there were cases where the removal price was less than theadjusted base price and no Form 6047 was filed. The data in the figure are based on information reported.
'One month only.
The Statistics of Income Bul I eti n al soincludes Ta-ta-6n excise tax coM_cfi~ons. Theexcise tax collection figures show theliability after adjustments, as reported onForm 720, fv-om returns entered into theInternal Revenue Service computerized BusinessMaster File (BMF) each quarter. A number ofconsiderations affect comparisons of data fromthese two sources. Returns are not due until 2months after the close of the taxable quarter;however, the interval between the close of thetaxable period and the final recording of thereturn often varies, so that the quarterly BMFtotals usually represent several taxableperiods. On the other hand, the data presentedhere have been tabulated for specific taxableperiods. As a result, the two sets ofstatistics are not directly comparable.
DEFINITIONS
Brief definitions of the terms used in thetables are given.
Adjusted Base Price. --The base pricemultiplied by the inflation adjustment, whichis derived from the Gross National Product(GNP) "implicit price deflator."
Adjustments to Liability.--CorrectionsappTle-d--to the current quarter's liability tocorrect for the net income limitation and over-and under-withholding in previous quarters.
Windfall Profit
Adjusted Base PriceAnd State Severance Tax
Tax Liability Adjustment..............
.........................I
Prior to Full Decontrol i After Full DecontrolI I I I I I I I I I I I I I I I I I I
Base Price.--For tier one oil, the upper tierceiling price, as defined by Department ofEnergy price control regulations, which wouldhave applied to the oil had it been producedand sold in May 1979, reduced by $0.21. Fortiers two and three oil, the base prices were$15.20 and $16.55, respectively, adjusted forgrade and quality.
Crude Oil.--The term applies only to naturalcruTe--P-e-f-r-oleum and does not include syntheticpetroleum, such as oil from shale or tar sands.It does, however, include natural gas liquidstreated as crude oil under the June 1979 energypricing regulations issued by the Department ofEnergy.
Deposit Requirements.--The timing of anyfirst purchaser to deposit amounts withhelddepends on the identity of the firstpurchaser. Major refiners, other thanindependent refiners, are required to makesemi-monthly deposits of the withholding tax.All other first purchasers are required to makewithholding deposits no later than 45 daysafter the oil is removed from the premises,except independent refiners that purchase oilunder delayed payments contracts. The latterare required to make deposits by the first dayof the third month beginning after the month ofremoval.
Exempt Alaskan Oil.--Oil from a reservoirother than tFe---S-aZTe-rochit reservoir that has

7.2 Crude Oil Windfall Profit Tax, 1984
been commercially exploited by any well northof the Arctic Circle; and oil produced north ofthe divides of the Alaska and Aleutian Ranges,and at leasf 75 miles from the nearest point ofthe Trans-Alaskan Pipeline System.
Exempt Charitable Oil.--Oil prod6ced fromeconomic interests heTd--Fy qualified charitablemedical facilities, educational 'in'stitutions,and child care organizations (as defined inIn
't;6rnal Revenue Code section' 170), if such
interest was held on January 21, 1980, and atall times thereafter; and oil produced frominterests held by_a church on January.21, 1980,if, before January '22, 1980, the net proceedsfrom such oil were dedicated to the support ofa medical facility,, educational. institution, orchild care facility.
Exempt Governmental Oill.--Oil produced Jroman economic interes-F-fi-M by a- state , 'or . apolitical su
'bdivision (including agencies and
instrumentalities),. the net income from ..wh.ic6is-used for public purposes.
Exempt Indian' Oil.--Oil produced from mineralinterests neM-Yy-or on behalf of Indian tribesor individuals on January 21, 1980; which isone of the following:. (al production received
-by-Indian tribes and. -individuals from TribalTrust Lands (the title ~to such land is.held bythe United States in 'trust.for the tribes); (b)production from land or mineral interests
-held
by an Indian tribe eli,gible for servicesprovided to Indians *by the Secretary of theInterior; or (c) oil, the proceeds from whichare paid into the U.S. Treasury to the creditof tribal or native trust funds pursuant tolaw. This exemption also applies to productionof any Alaskan Native Corporation prior to1991, including wholly-owned subsidiaries ofthe native Indian corporation as clarified byIRS on September 3, 1982.
Exempt Royal ty Oil-.--Qualified royalty 'ownersare exempt from the windfall profit tax on twobarrels of oil per day for . each day of thecalendar quarter for oil removed after December31, 1981. For 1985 and thereafte'r, threebarrels per day will be exempt.
Exempt Stripper Oi l . --Oi.1 removed from'sf~ripper wells aft-e-F-1982 may -qualify forexemption from the windfall profit,tax if thefollowing conditions are met:
(I ) The oil must be removed from' a stripperwell property after 1982.
(2) The oil must be produced by an independentproducer.
(3) The-oil must be attributable to the.inde~pendent producer's working' interest inthe property.
(4) The stripper well property mus't not be aproperty transferred by a nonindependentproducer on or after July 23, 1981.,
Net Income Limitation. --The -windfall. -profiton-a barrel oT-6-7-may not-exceed 90 percent ofthe,net income,attributable to the barrel.
Net Revenue.--This equals the- gross revenuefrom the windfall profit tax, or excise tax.(excluding that amount attributable to U.S.government interests)," less the reduction ofincome tax resulting from taxpayers claimingdeductions for windfall profit tax paid.Figures presented in- this report are grossliabilities..
Removal Price.--Generally, -the- price for.which -a bar of oil is sold. In some'instances, a.constructive sale price is used.:
Oil.~-Crude. oil production -from,the sad] erocFi-treservoi r in the Prudhoe 'Bayoil field in Alaska.
State, Severance Tax Adjustment.--A taximposed by a iUafe-w-i Eli respect to- theextraction of oil. The windfall. profit -isreduced by the amount by which the severancetax exceeds that which would have been imposedhad- the oil . been valued at its adjusted baseprice.- I
I
-Stri-pper - Oi-1--. -- I n.-general-, -oil-- from- a -property-,-fo-r-w-WiTEIT-7fFe-av era ge daily production per well
has been 10 barrels or less for any consecutive12-month period after 1972.
Tier One Oil.--All domestically produced crudeol other than any oil classified in tier -twoor three, or explicitly exempted by law fromthe tax. This includes the bulk of domesticoil from reservoirs proven to be productivebefore 1979.
Tier Two Oil.--Any oil from a stripper wellproperty within the meaning of the June'1979Department of Energy pricing regulations and oilfrom a U
.S. economic interest in a Naval Petro-
leum Reserve. Note that the Crude Oil WindfallProfit Tax Act of 1980 defined tier two oil asfrom a "National" Petroleum Reserve. This wasamended to read' '.'Naval" Petroleum Reserve bythe Technical Corrections Act of 1982.
Ti er Three Oi 1 , Heavy Oi 1 . --Al 1 crude oi 1 0 )produced that had a weighFe-d average gravity of16.0 degrees or less on. the American PetroleumInstitute (API) scale, corrected to 60 degreesFahrenheit, for the Tast month of productionbefore July 1979, or (2) oil from a propertywith a weighted average gravity of 16.0 degreesAPI or less, corrected to 60 degrees Fahrenheit,for the taxable period..
.
.Tier Three Oil, Incremental Tertiary Oil.--Production in excess or a base re-V-61-65 aproperty on which a qualified tertiary recoveryproject (one using one of several specific

Crude Oil Windfall Profit Tax, 1984
chemical , fluid or gaseous recovery methods toextract oil not recoverable using standard tech-niques) has been undertaken. The nonincrementaloil (i.e., the amount of production up to thebase level) remains in the otherwise applicabletier.
Tier Three Oil, Newly Discovered Oil.--Crudeoil sold after May 31, 1979, and p ed f rom(1 ) an outer continental shelf area for whichthe lease was entered into on or after January1, 1979, and from which there was no productionin Calendar Year 1978 or (2) an on-shore pro-perty developed after Calendar Year 1978.
Windfall Profit.--The excess of the removalprice of the barrel of oil over the sum of theadjusted base price and the state severance taxadjustment.
NOTES AND REFERENCES
[11 Monthly Energy Review, December 1984,Energy Ih-fi~r-mifi'o-n--A-dmi-nistration, p.40.
[21 Beck, Robert J., "1984 Midyear Review andForecast," Oil & Gas Journal, July 30, 1984,p. 133.
E31 The inflation adjustment, calculated by theInternal Revenue Service, Research Division,
73
is published quarterly in the InternalRevenue Bulletin. (See Internal -Te-venud'f3u11etin-T9BFZ-TUT March 11,7985-7-
[41 See also Alexander, Michael, "Crude OilWindfall Profit Tax for 1983," Statisticsof Income Bulletin, Fall 1984, pp. 9-S-.T__
[51 At the inception of the windfall profit tax(March 1980), taxpayers were not requiredto complete the detail called for on theForm 6047, which shows how the tax iscomputed. However, taxpayers have beenrequired to provide full information as ofJanuary 1981.
[61 Staff of the Joint Committee on Taxation,General Explanation of the Crude OilWindtall Protit Tax Act o f IT;o_vernrRWf' Printing Oftice, 1981.
[71 See also Belal, Carol, and Clark, Phil,"Windfall Profit Tax Liability for 1980,"Statistics of Income Bulletin, Fall 1981,55.
[81 See also Alexander, Michael, "Crude OilWindfall Profit Tax, First Quarter 1984",Statistics of Income Bulletin, Winter1984-85, pp. 65-69.

74 Crude Oil Windfall Profit Tax, 1984
Table l.--Windfall Profit Tax Liability by Oil Tier, Tax Rate and Aggregate Components of Windfall Profit forQuarter Ending June 1984
[Money amounts are in millions of dollarsl
Oil tier and tax rateNumber ofbarrelsof oil(000's)
Removalvalue
Adjustedbasevalue
Stateseverance
taxadjustment
Windfallprofit
Taxliabilitybefore
adjustments
(1) (2) (3) (4) (5) (6)
Returns with tax liability shown by oiltier and tax rate, total ................... 605,444 16,137 11,988 205 3,944 2,397
Tier one, other than Sadlerochit oil:Taxed at 70 percent .................... 263,920 7,482 4,588 120 2,774 1,898
Taxed at 50 percent .................... 22,847 666 399 19 248 125
Tier one, Sadlerochit oil:Taxed at 70 percent .................... 90,006 1,592 1,544 11 37 27
Taxed at 50 percent .................... - - - - - -
Tier two oil:Taxed at 60 percent .................... 51,345 1,487 1,077 .21 389 221
Taxed at 30 percent .................... 2,114 62 45 1 16 5
Tier three oil (taxed at 30 perce*nt):
Newly discovered oil' .................. 108,320 3,194 .~2,808 26 360 82
Incremental tertiary oil ............... 35,714 1,009. 886 7 116 35
Heavy oi-1 .............................. 31,177 645 642 2) 3 5
-Returns -wi th- total- tax-l-iab-i-1 ity-only- 70
'Newly discovered oil is taxed at 22.5 percent beginning in 1984.2Less than $500,000.
NOTE: Detail my not add to total because of rounding.
Table 2.--Windfall Profit Tax Liability for Returns Reporting Components of Windfall Profit by Oil Tier and Tax
Rate for the Quarter Ending June 19841
Oil tier and tax rate
Averagedaily
production(000's)
(barrels)
Removalprice
Adjustedbaseprice
Stateseverance
taxadjustment
Windfallprofit
taxliability
beforeadjustments
(1) (2) (3) (4) (5) (6)
All returns, total .......................... 6,653 26.65 19.80 .33 6.52 3.95
Tier one, other than Sadlerochit oil:Taxed at 70 percent .................... 2,900 28.35 17.38 .45 lo.u 7.19
Taxed at 50 percent .................... 251 29.13 17.44 A3 10.86 5.45
Tier one, Sadlerochit oil:Taxed at 70 percent .................... 989 17.68 17.14 .11 .43 .30
Taxed at 50 percent .................... - - - - - -
Tier two oil:Taxed at 60 percent .................... 564 28.96 20.96 .41 7.59 4.30
Taxed at 30 percent .................... 23 29.16 21.28 .46 7.42 2.22
Tier three oil (taxed at 30 percent):Newly discovered oil2 .................. 1,190 29.48 25.92 .23 3.33 .75
Incremental tertiary oil ............... 392 28.26'
24.80 .19 3.27
Heavy oil .............................. 343 1 20.69 1 20.59 .10 .14
'All amounts are average dollars per barrel.2Newly discovered oil is taxed at 22.5 percent beginning in 1984.NOTE: Detail may not add to total because of rounding.

Crude Oil Windfall Profit Tax, 1984
Table 3.--Windfall Profit Tax Liability by Oil Tier, Tax Rate and Aggregate Components of Windfall.Profit forJanuary - June 1984
[Money amounts are in millions of dollars)
75
Oil tier and tax rateNumber ofbarrelsof oil(000's)
Removalvalue
Adjustedbase
value
Stateseverance
taxadjustment
Wind fal 1profit
Taxliabilitybefore
adjustments
(1) (2) (3) (4) (5) (6)
Returns with tax liability shown by oiltier and tax rate, total ................... 1,249,078 32,863 24,371 414 8,078 5,089
Tier one, other than Sadlerochit oil:Taxed at 70 percent .................... 533,389 15,107 9,220 240 5,648 3,879Taxed at 50 percent .................... 47,938 1,385 834 37 514 267
Tier one, Sadlerochit oil:Taxed at 70 percent ................... 206,470 3,627 3,520 22 85 63Taxed at 50 percent .................... - - - - -
Tier two oil:Taxed at 60 percent .................... 102,514 2,933 2,115 43 774 435Taxed at 30 percent .................... 4,406 128 93 2 34 11
Tier three oil (taxed at 30 percent):Newly discovered oil' .................. 217,245 6,397 5,571 56 771 175Incremental tertiary oil ............... 74,955 2,003 1,751 14 237 74Heavy oil .............................. 62,162 1,281 1,267 (2) 14 9
Returns with total tax liability only ....... -- - -
- 178
'Newly discovered oil is taxed at 25.0 percent beginning in 1983.2 Less $1 million.NOTE: Detail may not add to total because of rounding.
Table 4.--Windfall Profit Tax Liability for Returns Reporting Components of Windfall Profit by Oil Tier and TaxRate for January - June 19841
Oil tier and tax rate
Averagedaily
production(000's)
(barrels)
Removalprice
Adjustedbaseprice
Stateseverance
taxadjustment
Windfallprofit
Taxliability
beforeadjustments
(1) (2) (3) (4) (5) (6)
All returns, total .......................... 6,863 26.30 19.51 .32 6.47 3.92
Tier one, other than Sadlerochit oil:Taxed at 70 percent .................... 2,931 28.32 17.28 .44 10.60 7.27Taxed at 50 percent .................... 263 28.89 17.39 .77 10.73 5.55
Tier one, Sadlerochit oil:Taxed at 70 percent .................... 1,134 17.56 17.04 .10 .42 .30Taxed at 50 percent .................... - - - - - -
Tier two oil:Taxed at 60 percent .................... 563 28.61 20.63 .42 7.57 4.24Taxed at 30 percent .................... 24 29.16 21.05 .45 7.66 2.43
Tier three oil (taxed at 30 percent):Newly discovered oil' .................. 1,194 29.44 25.64 .25 3.56 .80Incremental tertiary oil ............... 412 26.72 23.36 .18 3.18 .97Heavy oil .............................. 342 20.61 20.38 .22 .14
'All amounts are average dollars per barrel.2Newly discovered oil is taxed at 25.0 percent beginning in 1983.NOTE: Detail may not add to total because of rounding.

76 Crude Oil Windfall Profit Tax, 1984
Table 5.--Exempt Oil Volume by Tier and-Category, Quarter Ending June 1984
[Thousands of barrels]
Total
(l )
Total .........................................
Exempt governmental interest ....................
Exempt charitable interest ......................
Exempt Indian oil ...............................
Exempt Alaskan oil ...............................
Exempt Royalty oil ..............................
Exempt Stripper oil .............................
74,373
-17,259
986
918
8,631
9,764
36,815
-NOTE: Detail may not add to total because of rounding.
Tierone
(2)
17,661
13,604
470
388
91
3,107
Ti ertwo
(3)
41,577
790
297
358
73
3,245
36,815
Table 6.--Exempt Oil Volume by Tier and Category, January June 1984,
[Thousands of barrels]
Total
(I )
Total .........................................
Exempt governmental interest ....................
Exempt charitable interest .......................
Exempt Indian oil .................................
Exempt Alaskan oil ...................... .........
Exempt Royalty oil ..............................
Exempt Stripper oil .............................
152,517
33,774
2,016
2,492
17,334
19,955
76,945
Tierone
(2)
35,206
26,865
948
813
142
6,439
Tiertwo
(3)
87 j043
1 515
624
1,205
73
6,680
76,945
Newlydiscovered
oil
(4)
13,497
1 790
172
137
8,466
2,932
Tier three
Incrementaltertiary
oil
(5)
977
577
-39
28
1
332
Tier three
Newlydiscovered
oil
(4)
27,227
3,542
340
396
17,119
5,830
Incrementaltertiary
oil
(5)
1,936
1,086
89
62
1
698
Heavyoil
(6)
662
497
8
148
-Heavyoil
(6)
1,103
765
15
16
308
NOTE: Detail may not add to total because of rounding.

Selected Statistical Series, 1970-1985
Table Page
1 - Individual Income Tax Returns: Selected Income and Tax Items forSelected Years, 1970-1983 ........................................ 78
2 - Individual Income and Tax Data by State, 1980 and 1983 ............... 79
3 - Number of Individual Returns, Income, Tax and Average Tax by Sizeof Adjusted Gross Income, Tax Years 1980-1983 ...................... 80
4 - Nonfarm Sole Proprietorship Returns: Selected Income and DeductionItems for Selected Years, 1970-1983 ................................ 82
5 - Partnership Returns: Selected Income Statement and Balance SheetItems for Selected Years, 1970-1982 ................................ 82
6 - Number of Business Income Tax Returns, by Size of Receipts andAssets, for Selected Years, 1970-1982 ............................... 83
7 - Corporation Income Tax Returns: Selected Balance Sheet, IncomeStatement, and Tax Items by Industrial Division for SelectedYears, 1970-1982 ................................................ 84
8 - Corporation Income Tax Returns: Selected Balance Sheet, IncomeStatement, and Tax Items for Selected Years, 1970-1982 ............... 86
9 - Gross Internal Revenue Collections: Amount Collected by Quarterand Fiscal Year, 1980-1985 ........................................ 87
10 - Internal Revenue Refunds: Amount Refunded by Quarterand Fiscal Year, 1980-1985 ........................................ 87
11 - Classes of Excise Taxes by Selected Fiscal Year, 1970-1985 ............ 88
12 - Selected Returns and Forms Filed During SelectedCalendar Years, 1970-1984 ........................................ 89
13 - Taxpayers Receiving Assistance, Paid and Unpaid .................... 89
Notes to Selected Statistical Series Tables .............................. 90
NOTICE
The data on the following pages are the latest and most accurateavailable at time of publication. However, they are subject tocontinuous revision as more information becomes available. Datalabeled as preliminary should be used with caution.
77

78 Selected Statistical Series, 1970-85
Table l.-Individual Income Tax Returns: Selected Income and Tax Items for Selected Years, 1970-1983[All figures are estimates based on samples-money amounts are In thousands of dollars]
Item 1970 1975 1980 1981 19821983
Preliminary
(1) (2) (3) (4) (5) (6)
Number of returns:All returns ........................ 74,2799831 82,229,332 93,902,469 95,396,123 95,3379432 96,293,634
Joint returns ...................... 42,376,365 44,140,085 45,243,211 4S,697,648 46,050,287 46,492920S
Total gross income, amount ........... 639,3S79791 962,886,872 1,642,345,SS8 1,804,046,591 1,917,022,S30 2,032,3809951Salaries and wages:Number of returns ................ 66,96S,659 73,520,046 83,802,109 84,2089807 839106,842 83,326,130
Amount ........................... S31,883,892 79S,399,462 1,349,842,802 1,486,100,497 I,S64,995,190 1,6SI,743,995Interest received:
-Number of returns ................ 32,630,355 40,3789240 49,0199S75 49 6S6 S501 52,841,721 57,138,219
Amount .......................... 22,021,267 43,433,SS4 102,009,444 140:SS9:366 1579021,475 152,932,OSOTaxable pensions and annuities:Number of returns ................ 3,249,SS8 S,088,937 7,373,704 8,lS7,475 89824,88S 10,1179032Amount ........................... 7,878,808 20,886,871 439339,736 51,886,406 60,123,166 70,080,6S3
Dividends:No. of returns before exclusion .. 12,4S2,227 139370,427 149640,139 16,482,018 17,186,673 179S77,701
Amount ........................... 1790189148 23,270,182 43,S679241 48,161,460 54,044,82S SO,795,668No. of returns after exclusion ... 7,729,939 8,8S39491 10,738,982 n.a. 139172,360 13,264,71S.Amount ........................... IS9806,924 21,892,126 36,761,2S3 n.a. S29142,410 48,940,107
Net capital gain less loss:Number of returns .............. 7,962,663 7,S74,823 8,929,474 9,484,987 9,636,414 9,4089400,Amount ........................... 9,006,683 14,071,893 2996S9,600 30,8189S35 34,403,728 4S,457,326
Business net income (less loss):Number of returns ................ 6,IS9,985 7,242,S42 8,881,119 9,571,409 1.0,092,322 109678,478
Amount ........................... 30,5549201 39,421,478 SS9129,IS4 S3,071,628 SO,S73,164 58"764,191
Total adjustments:Number of returns .................. 6,370,SS2 9,024,255 13,148,91.9 14,078,211 33,421,412 349966,644
Amount ............................. 7,665,251 15,101,999 28,614,061 31,442,288 64,887,06S 81,S92,462
Married couple who both work:-Number-of- returns -. . ; ~-. . v-. -N/A N/A- - - - N/A- - - ~ -N/A 21,690,SS8- 22,677-,S23--Amount ........................... N/A N/A N/A N/A 9,048,263 19,8849S83
Individual Retirement Arrangement:Number of returns ................ N/A 1,211,794 2-5649421 3,4159OS3 12,010,038 13,721,6S7
Amount ........................... N/A 1,436,443 3,430,894 4,7SO,190 28,273,852 329348,290Self-Employed Retirement (Keogh):Number of returns ................ 591,655 59S,892 S68,936 SS7,038 S59,011 663,247Amount .... *-------1 847,692 1,603,788 2,0079666 2,011,947 2,482,S94 2,938,703
:Adjusted gross income ................ 631,692,540 947,7849873 1,613,731,497 1,772,604,303 1,852,135,46S 1,950,788,489Exemptions:-
Total number ....................... 204,126,402 212,202,596 227,92S,098 231,222,374 232,191,56S 234,36S,569Number, age 65 or over ........... 8,904,331 9,937,208 11,847,168 13,118,926 13,9SS,570 14,777,422
Total amount ....................... 1279S31,204 159,140,845 227,569,280 231,119,11S 232,142,140 234,365,569Total deductions:Number of returns .................. 73,862,448 81,585,541 88,491,251 90,319,941 90,283,236 91,467,695Amount ............................. 120,549,7SS 233,181,778 346,000,15S 401,168,213 425,157,106 2 44S,740,986Total itemized deductions:Number of returns ................ 3S,4309047 26,074,061 28,950,282 31,S71,246 33,432,809 35,201,034
Amount ........................... 88,178,487 122,260,601 218,028,139 2S6,448,021 284,SO6,318 307,053j804Medical and dental expense ..... 10,S85,749 119422,312 14,972,082 17,878,680 21,70S,262 17,8SO,053Taxes paid ..................... 32,014,673 44,141,289 699404,275 79,698,519 88,037,196 100,1539384
Interest paid .................. 23,929,477 38,88S,282 919187,006 1089718,281 12198S2,419 132,468,327
Contributions .................. 12,892,732 IS,393,331 2S,809,608 30,800,722 33,471,694Taxable income:Number of returns .................. S9,S93,598 65,852,602 88,104,696 89,8SI,304 89,7179836 90,8SO,468
Amount ...............** ...
401,1,54,28S S95,492,866 19279,985,360 1,410,880,665 1,473,348,899 195519344,327Income tax before credit;:Number of returns .................. 59 S96,7SS 65,854,734 76,1359819 79,011,548 789349,842 80,651,S48
....................Amount ......... 84:156,695' 132,452,044 '256,294 31S 293,590,035 283,931,862 28290139019.Total tax credits .................... 369,610 8,069,846 7,215,839 11,288,005 7,854,493 7,866,028
General tax credit ................. N/A 5,020,477 N/A 3,382,7114 N/A N/A
Investment credit ................... 30,SS4 1,593,150 39288,41S 3,971,199 4,139,897 39905,048Foreign tax credit ................. 169,623 381,98S 1,341,645 1,233,S64 757,326 548,848Child care credit .................. N/A N/A 956,439 1,147,907 1,SO1,453 2,061,160
Credit for the elderly ............. 167,656 128,968 134,993 124,011 131,074 1IS9438
Residential energy credit .......... N/A N/A 5629141 600,831 582,8S7 SS2,311
Earned income credit ............... N/A 252,141 451,366 452,482 359,717 3149225
Income tax after credits ............. 83,787,323 124,382,197 2499078,475 2829302,029 276,077,369 274 146 992 5Additional tax for tax preferences ... 121,988 144,100 19262,964 1,826,960 1,519,921 1:938:998
Total income tax:Number of returns .................. S99317,371 61,490,737 73,906,244 76,7249724 77,035,300 78,080,885
Amount ............................. 83,9099311 1249S26,297 2SO,341,440 284,128,989 277,597,290 276,08S9990
Payment status:Returns with payment due ........ 169478,813 15,842,400 21,7S5,Sl6 23,007,970 20,326,807 17,984,S93
Returns with refund or credit due S5,273,38S 63,82S,188 699868,451 70,028,741 72,425,701 75,5029922
I
See notes following Table 13.

Selected Statistical Series, 1970-85
Table 2.-Individual Income and Tax Data by State, 1980 and 1983[All figures are estimates based on samples]
79
1980 1983 Preliminary'
Number Adjusted Income Tax Number Adjusted Income TaxState of gross of gross
3returnS2 income Total Average' returns' income Total Average
($000) ($000) ($) ($000) ($000) ($)
(1) (2) (3) (4) (5) (6) (7) (8)
United States, total4. 93,902,469 1,613,731,497 250,341,440 3,387 96,293,634 1,9SO,788,489 276,085,990 3,S36
Alabama ............... 1,397,132 21,478,922 2,993,120 2,923 1,416,9S9 2S,317,918 3,223,193 2,875
Alaska ................ 183,214 4,096,935 770,49S S,258 235,486 6,193,SS8 1,063,124 S,442
Arizona ............... 1,113,274 18,297,827 2,S97,397 3,031 1,204,624 23,164,833 2,99S,174 3,122
Arkansas .............. 812,491 11,272,836 1,SlS,S12 2,S98 818,332 13,389,432 1,713,141 2,666
California ............ 10,347,246 189,S84,745 28,731,981 3,478 10,773,707 234,046,434 32,574,7SI 3,731
Colorado .............. 1,296,849 22,812,04S 3,S44,984 3,397 1,367,273 28,831,288 4,048,718 3,610
Connecticut ........... 1,438,316 27,9S6,8S2 5,002,379 4,2S1 1,486,263 3S,232,996 S,707,526 4,S60
Delaware .............. 2S3,759 4,627,SSI 74S,043 3,682 263,758 5,620,417 791,069 3,640
District of Columbia 307,630 5,S83,948 967,2Sl 3,922 309,902 6,572,300 1,027,206 4,061
Florida ............... 4,158,577 67,126,444 10,852,200 3,3S8 4,644,964 89,972,121 13,36S,074 3,SSO
Georgia ............... 2,130,647 33,037,292 4,6S7,12S 2,888 2,2SO,999 43,018,398 S,735,300 3,IS6
Hawaii ................ 424,177 7,320,740 1,043,741 3,1.49 448,016 8,731,144 1,104,344 3,036
Idaho ................. 3S8,915 S,461,728 706,404 2,616 361,380 6,117,673 74S,377 2,603
Illinois .............. 4,833,700 90,OS4,783 15,221,014 3,906 4,726,101 100,816,1.64 15,069,3S3 3,926
Indiana ............... 2,202,492 37,209,694 S,862,416 3,40S 2,173,559 41,774,770 S,7SO,512 3,302
Iowa .................. 1,189,316 19,847,193 2,921,284 3,16S 1,IS6,727 20,999,653 2,894,9SS 3,100
Kansas ................ 99S,792 16,982,7S7 2,652,S76 3,429 992,190 19,611,667 2,844,017 3,502
Kentucky .............. 1,305,719 19,889,309 2,860,438 2,838 1,304,750 23,204,824 3,090,948 2,994
Louisiana ............. 1,57S,442 26,SO4,6S3 4,3S4,431 3,S61 1,608,624 31,760,787 4,714,223 3,716
Maine ................. 460,932 6,361,432 839,88S 2,415 473,630 7,979,S05 992,198 2,611
Maryland .............. 1,875,660 34,499,721 5,387,424 3,588 1,923,735 43,S74,958 6,179,826 3,8S7
Massachusetts ......... 2,S38,270 43,123,948 6,71S,Sll 3,306 2,632,976 SS,676,284 8,271,674 3,7S7
Michigan .............. 3,66S,336 66,797,OSO 10,418,234 3,627 3,553,081 74,287,976 9,983,877 3,489
Minnesota ............. 1,738,205 29,683,060 4,372,841 3,2S7 1,724,860 34,688,141 4,462,98S 3,1SS
Mississippi ........... 860,6S4 11,988,888 1,608,497 2,632 866,960 13,92S,118 1,740,446 2,645
Missouri .............. 1,976,184 32,188,4S2 4,909,363 3,196 1,991,400 38,4S7,844 S,450,628 3,379
Montana ............... 331,423 4,998,061 697,044 2,841 335,2S6 S,54S,897 735,962 2,820
Nebraska .............. 661,985 10,473,626 1,SOO,101 3,007 664,214 11,648,S48 1,619,879 3,016
Nevada ...... 393,931 6,786,431 1,103,441 3,378 41S,449 8,300,99S 1,221,S70 3,631
New Hampshire 412,482 6,751,8S7 1,019,017 2,9SS 438,117 8,829,8S4 1,269,167 3,49S
New Jersey ...*........ 3,3S4,7S3 62,909,704 10,389,9SO 3,760 3,SSS,517 81,151,436 12,379,2S4 4,119
New Mexico ............ S18,221 7,764,293 1,092,667 2,930 SSO,097 9,621,874 1,274,164 3,01.9
New York .............. 7,157,OOS 12(),S26,287 20,139,212 3,496 7,2S3,328 162,169,242 23,730,612 3,920
North Carolina ........ 2,339,466 34,490,41.9 4,720,993 2,6S1 2,439,599 43,347,301 S,438,038 2,763
North Dakota .......... 270,773 3,979,672 S61,83S 2,758 278,876 4,741,196 6S8,244 2,910
Ohio .................. 4,481,348 76,444,637 12,047,279 3,316 4,328,283 86,079,713 11,679,404 3,324
Oklahoma .............. 1,186,369 19 966,388 3,142,204 3,387 1,247,234 24,757,847 3,638,068 31628
Oregon ................ 1,128,676 18:S34,S35 2,660,962 3,022 1,086,626 20,129,601 2,538,666 2,937
Pennsylvania .......... 4,844,637 81,173,lSO 12,647,123 3,264 4,879,420 94,167,291 13,11Z,980 3,320
Rhode Island .......... 406,989 6,396,S60 9S9,9Sl 2,960 415,748 7,792,034 1,027,095 3,013
South Carolina ........ 1,183,782 17,339,729 2,263,462 2,479 1,220,SO3 21,497,689 2,612,077 2,686
South Dakota .......... 277,999 3,732,619 507,494 2,778 278,866 4,042,814 SS3,635 2,542
Tennessee ............. 1,761,757 26,S96,829 3,892,150 2,976 1,79S,982 31,920,SS7 4,326,902 3,034
Texas ................. S,844,966 103,9S3,686 17,914,779 3,896 6,270,690 133,318,836 21,187,143 4,203
Utah .................. S39,149 8,749,S69 1,109,2S3 2,734 SS9,273 10,764,841 1,2SI,387 2,820
Vermont ............... 210,066 3,041,963 410,S76 2,469 217,373 3,751,9S2 47S,448 2,693
Virginia .............. 2,227,IS4 38,794,066 5,941,Sll 3,351 2,323,7S8 49,465,168 6,836,717 3,S48
Washington ............ 1,789,302 32,732,130 S,410,251 3,697 1,803,079 37,409,29S 5,312,640 3,614
West Virginia ......... 674,367 10,89S,660 1,667,520 3,186 654,614 11,883,618 1,S75,761 3,048
Wisconsin ............. 1,968,908 32,7S6,618 4,644,436 3,042 1,946,287 36,879,071 4,690,784 2,991
Wyoming ............... 1 210,4141
3,949,0991
678,6501
4,0711
206,7811
4,210,9721
639,4981
3,853
See notes following Table 13.

I
80 Selected Statistical Series, 1970-85
Table 3.-Number of Individual Returns, Income, Tax and Average Tax by Size of Adjusted Gross Income, Tax Years 1980-1983[All figures are estimates based on samples-money amounts are In thousands of dollars]
Number of Total adjusted Taxable incomeSize of adjusted returns filed gross income
igross ncome1980 1981 1.980 1981 1980 1981
(1) (2) (3) (4) (S) (6)
Total. ....................... 93,902,469 95,396,123 1,613,731,497 1,772,604,303 1,279,985,360 1,410,880,665
Less than $1000 ............... 3,687,997 3,484,734 -11,063,711 -16,9S2,842 11,799 7,08431,000 under $3,000 ........... 8,673,301, 7,8SS,771 17,314,975 35,691,845 7,569,858 7,064,102$3,000 under 3S,000 ........... 7,694,231 7,405,871 30,654,346 29,S80,649 18,534,160 17,994,684$S,000 under $7,000 ........... 7,633,889 7,2SI,941 45,738,822 43,446,900 30,497,371 29,153,117$7,000 under $9,000 ........... 7,336,6SO 7,066,520 58,608,700 56,341,030 42,267,67S 40,597,471$9,000 under $11,000 .......... 6,605,618 6,S14,144 65,907,303 65,051,373 49,980,76S 49,147,621
$11,000 under $13,000 ......... 5,830,212 5,821,Z33 69,911,911 69,702,81S 54,591,487 S4,207,411$13,000 under $15,000 ......... S,267,669 S,190,200 73,S90,238 72,548,282 S8,114,413 S7,70S,230$15,000 under $17,000 ......... 4,654,783 4,648,986 74,387,702 74,2S6,678 S9,701,351 59,486,499$17,000 under $19,000 ......... 4,3SO,S22 4,291,557 78,267,330 77,161,287 63,009,244 62,OS6,343$19,000 under $22,000 ......... 5,925,162 S,967,094 121,233,104 122,IS7,450 97,261,921 98,703,45S$22,000 under $2S,000 ......... S,32S,787 S,207,693 12S,021,261 122,181,884 100,538,990 98,956,187
$25,000 under $30,000 ......... 6,783,466 7,205,282 18S,760,754 197,424,9S3 150,218,626 159,682,521$30,000 under $3S,000 ......... 4,729,899 5,294,687 IS2,927,369 171,601,299 124,032,123 138,893,019$3S,000 under $40,000 ......... 3,221,053 3,910,649 120,167,693 14S,814,841 97,276,738 118,288,891$40,000 under $SO,000 ......... 3,OS3,039 4,182,389 134,907,796 185,322,6SS 109,091,818 149,273,745$SO,000 under $7S,000 ......... 2,033,079 2,796,836 120,009,700 164,2S6,670 96,834,054 131,174,316$75,000 under $100,000 ........ S3S,348 645,884 45,918,079 S5,099,048 36,849,386 43,524,621
$100,000 imder $lSO,000 ....... 336,269 398,479 40,213,979 47,552,689 32,S28,035 37,518,693$150,000 under $200,000 ....... 107,24S 118,037 18,377,241 20,164,437 14,823,138 15,842,213$200,000 imder $300,000 ....... 68,422 80,94S 16,387,236 19,350,168 13,211,348 15,230,276$300,006 M-der-$W6,0-00-
'31
-947 37,147 11,9S6,4
-50-
13,-906
-S5
-S- -
9,505,-239 10,788,
-043
S500'000 linder $1,000,000 ..... 12,467 14,78 8,323,125 9,81S,188 6,S16,941 7,416,99331,000,000 or more ............ 4,414 5,286 9,210,09S 11,128,551 7,018,879 8,168,130
Filers with income tax liabilityPercent of filers
Size of adjusted Total income taxi with no income Aver'age tax Tax as percent of
gross income tax liability (whole dollars) adj. gross inc.
1980 1981 1980 1981 1980 1981 1980 1981
(7) (8) (9) (10) (11) (12) (13) (14)
Total ....................... 2SO,341,440 284,128,989 21.3 19.6 3,387 3,703 16.1 16.S
Less than $1,000 .............. 103,64S 137,840 99.7 99.S 10,091 2 8,626' - -$1,000 under $3,000 ........... 32,471 43,46S 96.9 9S.5 122 123 6.1 6.0$3,000 under $5,000 ........... 530,988 516,050 42.5 41.7 120 120 2.9 2.9$S,000 under $7,000 ........... 1,864,897 1,761,464 32.1 32.0 360 357 6.0 5.9$7,000 under $9,000 ........... 3,494,441 3,306,387 17.8 18.1 579 571 7.2 7.1$9,000 under $11,000 .......... S,296,395 5,ISO,823 5.0 5.2 844 834 8.5 8.3
$11,000 under $13,000 ......... 6,586,710 6,531,708 2.S 3.2 1,159 1,160 9.7 9.7$13,000 under $15,000 ......... 7,633,561 7,601,053 2.1 2.2 1,480 1,498 10.7 10.7$15,000 under $17,000 M 1980 8,417,235 8,355,068 I.S 1.8 1,835 1,830 11.5 11.5$17,000 under $19,000 M 1981 9,351,972 9,226,778 1.1 1.3 2,173 2,179 12.1 12.13,19,000 under $22,000 ......... IS,189,223 15,609,261 1.0 1.1 2,589 2,64S 12.9 12.9.3 2 2, OW iffider .125,000 .... 16,620,372 16,563,264 .6 .9 3,138 3,209 13.7 13.7
$25,000 under $30,000 .........$30 000 d 335 000
26,635,97323 969 187
28,474,94S26 910 961
.4S
.64
3,9415 091
3,9765 103
14.4IS 7
14.51S 7, un er , ......... , , , , . , 9 . .
$3S,000 under $40,000 ......... 20,419,148 24v834,220 S 3 6,373 6,370 17.1 17.1$40,000 under $50,000 ......... 2S,56S,426 34,847,1.63 .4 .6 8,404 8,379 19.9 18.9$SO,000 under $7S,000 ......... 27,208,647 369299,4S4 .6 .5 13,463 13,050 22.8 22.2$75,000 under $100,000 ........ 12,549,071 14,715,26S .4 .4 23,S31 22,867 26.4 26.8
$100,000 under $ISO,000 ....... 12,868,433 14,61.9,378 .3 .4 38,368 36,828 32.1 30.9$150,000 under $200,000 ....... 6,S37,749 6,886,418 .3 .2 61,169 S8,439 3S.7 34.2$200,000 under $300,000 ....... 6,370,648 7,183 611 .1 .2 93,234 88,930 38.9 37.2$300,000 under $500,000 ....... 4,971,806 S,566:2182 .1 .1 ISS,797 149,990 41.6 40.1$SOO,000 under $1,000,000 3,713,691 4,100,676 .1 .1 298,169 278,182 44.7 41.8$1,000,000 or more ............ 4,409,751 4,887,4S6 .1
.1999,944 92S,65S 47.9
1.44.0
J
M - The median taxpayer was at this income level.See notes following Table 13.

Selected Statistical Series, 1970-85 81
Table 3. (Continued)-Number of Individual Returns, Income, Tax and Average Tax by Size of Adjusted Gross Income, Tax Years 1980-1983[All figures are estimates based on samples-money amounts are In thousands of dollars]
Number of Total adjusted Taxable incomeSize of adjusted returns filed gross income
gross income1982 1983 1982 1983 1982 1983
(1) (2) (3) (4) (5) (6)
Total ....................... 95,337,432 96,293,634 1,852,135,465 1,950,788,489 1,473,348,899 1,SS1,344,327
Less than $1000 ............... 3,412,105 3,380,202 -22,324,833 -21,697,383 29,646 72,SO1$1,000 under $3,000 ...........$3 000 d $5 000
7,S73,8256 966 104
7,274,2227 135 281
1S,122,10127 25692S
14,516,84428 44 7
6,717,217687 9
69777,0220, un er , ........... , , ,, , , ,5 1, 1 1 ,1 ,38 17,300,4 S
$S,000 under $7,000 ........... 6,682,490 6,668,SZ2 39,88S,078 39,918 881 26,709,472 26,218,922$7,000 under $9,000 ........... 7,176,962 6,84S,790 57,512,193 S4,772:037 40,904,714 39,035,018$9,000 under $11,000 .......... 6,421,66S 6,219,219 64,229,S20 629063,465 47,995,843 46,447,734
$11,000 under $13,000 ......... S,6SI,414 S,750,993 67,793,416 68,839,916 52,526,932 S29784,288$13,000 under $1S,000 ......... S,414,103 S,161,16S 7S,702,223 72,Z29,239 S9,6S2,891 S7,035,887$IS,000 under $17,000 ......... 4,734,479 4,61S,S19 75,S94,637 7~,686,012 60,9SI,45S S99389,608S17,000 under $19,000 ......... 3,964,008 4,289,285 71,295,728 77,056,070 S79689,S94 62,208,616$19,000 under 322,000 ......... S,36S,925 S,626,021 109,806,080 11S,228,822 88,8SS,846 93,567,648922,000 under $2S,000 ......... S,273,703 5,131,223 123,853,268 120,591,258 100,OS4,304 97,962,499
$2S,000 tinder $30,000 ......... 7,621,96S 7,348,043 209,572,367 201,487,88S 169,726,189 163,072,066$30,000 under $35,000 ......... S,646,966 6,028,491 3.82,6449120 195,216,772 146,947,632 lS7,067,303$3S,000 under $40,000 ......... 4,21S,6SO 4,417,952 157,391,914 164,964,S85 1.26,4719828 132,198,068$40,000 under $50,000 ......... 4,716,532 S,1449573 208,952,374 228,169,963 166,018,176 181,434,S34$50,000 under $7S,000 ......... 3,OS7,266 3,607,761 179,566,469 212,682,005 141,376,967 167,083,011$7S,000 under $100,000 ........ 702,064 818,051 59,748,095 69,S80,534 46,720,423 54,123,023
$100,000 under $ISO,000 ....... 432,7S7 474,421 S1,674,638 S6,795,376 40,228,978 44,114,139$lSO,000 under $200,000 ....... 138,082 154,OSO 23,616,649 26,4SS,S44 18,710,797 209671,S84$200,000 under $300,000 ....... 939033 111,284 22,323,087 26,6S2,166 17,807,227 21,380,999$300,000 under $SOO,000 ....... 47,245 53,942 17,650,665 20,114,062 14,IS3,3S8 16,151,077$500,000 under $1,000,000 ..... 20,681 26,098 13,830,843 17,S94,000 11,042 1S9 14,289,340$1,000,000 or more ............ 8,408 11,S26 18,769,578 2S,329,016 14,888:860 20,959,034
Filers with income tax liabilityPercent of filers
Size of adjusted Total income tax' with no income Average tax Tax as percent ofgross income tax liability (whole dollars) adj. gross inc.
1982 1983 1982 1983 1982 1983 1982 1983
(7) (8) (9) (10) (11) (12) (13) (14)
Total ....................... 277,597,301 276,085,990 19.2 18.9 3,604 39S36 IS.4 14.S
Less than $1,000 .............. 130,288 74,237 99.6 99.8 9,2982 9,332 -$1,000 under33,000 ........... 3S,182 49,932 95.0 93.5 92 106 5.0 S.6$3,000 under $5,000 ........... 475,448 408,032 41.9 42.1 117 99 2.8 2.4$S,000 tinder $7,000 ........... 1,473,139 1,297,117 31.4 33.6 321 293 S.4 4.9$7,000 under $9,000 ........... 2,967,854 2,S9S,819 20.7 21.2 S21 481 6.5 6.0$9,000 under $11,000 .......... 4,462,848 3,893,311 6.8 8.2 746 682 7.4 6.8
$11,000 under $13,000 .........$13 000 d $15 000
S,566,4527 002 69
S,033,0138 7
4.0 4.2 1,026 913 8.6 7.6, un er , ......... , , S 6,05 ,5 1 2.3 2.7 1,324 1,206 9.S 8.6
$15,000 under $17,000 ......... 7,766,398 6,8S8,77S 1.5 2.2 1,66S I'Sig 10.4 9.S$17,000 under $19,000 M ....... 7,786,372 7,659,320 1.8 1.6 2,001 1,814 11.1 10.1$19,000 under $22,000 ......... 12,725,118 12,199,486 1.2 1.2 2,399 2,194 11.7 10.7$22,000 under $25,000 ......... 15,378,094 13,612,486 1.3 1.3 2,9S6 2,687 12.6 11.4
$ZS,000 under $30,000 ......... 27,8529640 24,3389804 .6 .7 3,676 3,336 13.4 12.2$30,000 under $3S,000 ......... 2S,867,035 25,201,460 .5 .6 4,605 4,204 14.2 13.0$35,000 under $40,000 ......... 24,098,091 22,734,43S S .7 S,743 S,183 IS.4 13.9$40,000 under $50,000 ......... 35,029,801 34,843,954 .5 .4 7,468 6,798 16.9 1S.3$50,000 under $75,000 ......... 35,892,383 38,SS2,649 .5 .3 11,803 10,721 20.1 18.2$7S,000 under $100,000 ........ 14,594,818 1S,324,4SO .4 .3 20,865 18,790 24.5 22.1
$100,000 under $ISO,000 ....... 14,38S9740 14,611,194 .2 .2 33,321 30,871 27.9 25.8$150,000 under $200,000 ....... 7,483,lS5 7,808,31S .5 .1 S4,447 50,736 31.8 29.5$200,000 under $300,000 ....... 7,6SI,434 8,804,178 .2 .2 82,400 79,301 34.3 33.1$300,000 under 3SO0,000 ....... 6,380,687 7,209,2S7 .1 .2 135,233 133,8S9 36.2 3S.9ASOO,000 under $1,000,000 ..... S,222,845 6 713 977 .1 .1 2S2,7Sl 2S7 S46 37.8 38.2$1,000,000 or more ............ 1 7,368,787 110:203"216 1 .1 1 .2 8779132 886:774 39.3 40.3
M - The median taxpayer was at this income level for both 1982 and 1983.See notes foll.owing Table 13.

82 Selected Statistical Series, 1970-85
Table 4.-Nonfarm Sole Proprietorship Returns: Selected Income and Deduction Items for Selected Years, 1970-1983[All figures are estimates based on samples-money amounts are In thousands of dollars]
I tem 1970 197S 1980 i9811983
(Preliminary)
(1) (2) (3) (4) (5) (6)
Number of returns, total 5,769,741 7,221,346 8,931,712' 9,584,790' 10,105'sis, 10,698,OSONumber with net business income .... n.a. n.a. n.a. 6,S34,688 6,761,405 7,369,91S
Inventory, end of year ......... o ..... 11,060,77S IS,578,040 21,996,236 22,921,503 21,804,91S n.a.
Business receipts, total ............. 198,S82,172 273,954,741 411,205,713 427,063,05S 433,664,897 445,204,S88Income from sales and operations ... n.a. 272,342,S60 407,169,299 421,700,025 428,311,840 439,833,927
Total deductions ...... 168,044,746 234,318,288 3S6,2S8,495 373,991,426 383,091,734 386,449,988Cost of goods sold/opeations ...... 10(),148,811 146,261,43S 209,8RO,809 209,723,9SO 20S,471,499 20S,016,241
Purchases .............. o ......... 88,S85,913 117,722,3S2 168,301,SI7 167,751,431 161,295,256 n.aCost of labor .................... 7,704,285 8,791,083 10,922,221 10,923,120 11,424,639 8,911,424Materials and supplies ........... 6,216,057 9,090,638 12,909,222 12,081,423 12,73S,789 n.a.
Commissions ........................ 1,274,016 2,225,830 3,333,34S 3,S39,844 4,464,026 n.a.Salaries and wages .... o ............ 15,107,047 20,227,859 26,560,821 28,749,357 30,403,121 30,604,774Car and truck expenses ............. n.a. n.a. 13,378,289 12,3S8,478 . n.a. n.a.Rent paid .......................... 4,636,S28 6,676,314 9,636,290 10,71S,102 11,797,053 11,301,003Repairs .......... o ................. -2,444,607 3,044,175 5,031,573 S,414,IS6 6,006,403Taxes paid ......................... 3,77S,S02 S,423,961 7,672,4S9 6,661,OS4 7,747,S40 n.a.Utilities .......................... n.a. n.a. 4,790,337 8,275,517 n.a. n.a.Insurance ...o ........... o .......... 2,309,608 3,503,812 6,003,126 6,238,704 , 6,448,494 n.a.Interest paid ...................... 1,784,276 3,390,84S 7,190,2S7 9,052,338 10,143,489 8,710,143.Depreciation ....................... 5,451,S2S 7,9S8,143 13,9S2,703 1S,8S4,SI3 19,121,SS9 20,607,541Pension and profit sharing plans ... 72,741 125,296 141,463 152,S88 136,359 120,830
Net income (less loss) .......... 0 .... 30,S37,426 36,636,4S3 54,947,219 53,071,628 50,S73,164 58,764,191Net income,, businesses w/profit .... 33,73S,732 45,624,890 68,010,051 68,SS2,791 68,647,384 76,001,423Net loss, businesses w/o profit .... 3,198,306 5,988,437 13,062,832 _18,9!~4,~Z2Q 17,237,232
See notes following Table 13.
Table 5.-Partnership Returns: Selected Income Statement and Balance Sheet Items for Selected Years, 1970-1.982[All figures are estimates based on samples-money amounts are In thousands of dollars]
Item 1970 197S 1979 1.980 1981 1982
(1) (2) (3) (4) 6)
Total number of active partnerships 936,133 1,073,094 1,294,593 1,379,654 1,460,502 I S 14 212Number with net income ............. 639,79S 661,134 76S,575 774,173 749,222, ,791,117
Number with balance sheets ......... SSS,741 783,271 n.a. 1,194,236 1,193,792 1,217,386Number of partners ................... 3,697,818 4,9SO,634 6,954,767 8,419,899 9,448,361 9,764,667
Total assdts' ............-* ......
116,752,751 235,468,301 447;130,068 597,503,923 71S,232,726 84S,281"449Buildings/depreciable assets (net) n.a. 113,124,969 n.a. 239,139,823 367,270,IS2 310,846 376Inventories, end of year ........... n.a. 11,985,431 n.a. 33,218,272 59,649,950
,100,728,688
Land ............................... n.a. 36,731,9S8 n.a.- 70,241,248 76,336,446 84,820,308
Total liabilities .................... n.a. 193,87S,629 n.a. 488,734,023 S80,033,757 701,630 766Accounts payable ...................Short-term debt2
n.a. 12,302,OSS n.a. 33,899,048 29,092,4SI,
37,254,748....................n.a. 22,709,476 n.a. 48,001,839 S5,691,914 73,277,805
Long-term debt3 .................... n.a. 136,296,764 n.a. 178,044,406 196,508,937 236,218,378Nonrecourse loans .................. n.a. n.a. n.a. 118.910,380 138,134,304 154,508,961
Partners' capital accounts ........... n.a. 41,592,672 n.a. 108,769,900 135,198,969 143,6SO,646
Total receipts ....................... 93,348,080 148,417,S29 2S8,197,936 291,998,11S 272,129,807 296,690-303Business receipts .................. 90,208,834 142,505,781 242,653,710 271,108,832 230,027,336 2SI,6N:987Interest received 4 .................
942,304 2,477,173 7,246,,203 10,869,323 13,772,559 15,2S9,801
Total deductions ...................... 83,SS7,684 140,679,959 242,992,028 283,749,460 274,864,704 304,004,833Cost of goods sold/operations ...... 46,040,874 64,672,843 102,096,671 113,88S,668 130,043,609. 144,59S,lllPurchases ......................... 31,820,581 42,608,734 64,201,085 70,439,607 92,136,914 96,111.197Cost of labor .................... 4,146,927 4,58S,836 6,737,888 7,015,547 S,83S,683 7,183,86S
Salaries and wages ................. 8,129,233 12,489,039 19,392,819 22,336,337 21,136,914 23,204,883Taxes paid ......................... 3,IS9,2S8 S,770,918 8,328,583 9,SS3,14S S,040,336 5,288,971-Interest paid ......................
.4,470,206 12,097,100 21,27S,SSI 28,362,385 19,586,018 21,S17 044
Depreciations ...................... 4,S78,820 10,108,834 17,662,667 21,S76,189 27,263,184,
'32,361,640.,
Net income (less loss) ............... 9,790,396 7,737,S70 15,20S,908 81248,65S -2,734,897 -7,314,S87Net income, businesses w/profit .... 14,419,124 22,431,931 40,000,896 45,061.,7S6 SO,S67,190 S3,SS6,856Net loss, businesses w/o profit 4,628,,728 , 14,694,361 24,794,987 , 36,813,100
153,302,086
160,871,442
See notes following Table 13.

Selected Statistical Series, 1970-85
Table 6.-Number of Business Income Tax Returns, by Size of Receipts and Assets, for Selected Years, 1970-1982[All figures are estimates based on samples-money amounts are In thousands of dollars]
Number of businesses reporting
Size of business
CORPORATIONS
Receipt size
Under $25,000 ...............................$2S,000 - $49,999 ...........................$SO'OOO - $99,999 ...........................
$100,000 - $199,999 .........................$200,000 - $499,999 .........................$SOO,000 - $999,9()9 .........................$1,000,000 or more ..........................
Asset size
Under $100,000 ..............................$100,000 - $1 million .......................$1 million - $10 million ....................$10 million - VS million ...................
$25 million - $SO million ...................$SO million - $100 million ..................$100 million - $2SO million .................$2SO million and over .......................
PARTNERSHIPS'
Receipt size
Under $25,000 ...............................$2S,000 - $49,999 ...........................$SO'OOO - $99,999 ...........................
$100,000 - $199,999 .........................$200,000 - $499,999 .........................3SO()'OOO - $999,()99 .........................$1,000,000 or more ..........................
Asset size
Under $2S,000 ...............................$2S,000 - $49,999 ...........................$50,000 - $99,999 ...........................
$100 000 - $249,999 .........................$2SO:000 - $499,999 .........................$SOO'0OO - $9992999 .........................$1,000,000 or more ..........................
NONFARM SOLE PROPRIETORSHIPS
Receipt size
Under $2,500 ................................$2,SOO under $S,000 .........................$S,000 under $10,000 ........................
$10,000 under $2S,OOO .......................$2S,000 under $SO,00O .......................$SO,OOO tinder $100,000 ......................
$100,000 under 200,000 ......................$200,000 under 9500,000 .....................$SOO,000 tinder $1,000,000 ...................$1,000,000 or more ..........................
1970
(1)
4S1.9170.7219.8
S16.9141.116S.0
961.0S99.187.09.8
3.92.11.41.2
501.7125.2119.6
97.26S.217.010.3
63S.780.873.S
74.733.819.318.3
1,894.381S.1891.S
1,137.4746.4S62.0
297.4122.320.86.6
1975
(2)
468.9186.4260.7
673.91.84.2249.5
1,177.7704.6116.412.2
S.63.12.11.9
S49.7141.0133.7
114.090.62S.518.6
611.0IOS.9106.8
116.0S6.93S.341.2
2,299.9959.4
1,041.7
1,325.7849.5644.S
380.9209.235.313.S
1979
(3)
S22.0198A296.5
380.4497.2262.9399.S
1,403.2940.3180.S15.3
7.34.43.02.7
603.3174.2168.7
149.S126.344.233.5
592.2133.1150.6
185.1101.761.S75.3
2,609.91,137.41,237.1
1,597.11,039.6821.3
523.4283.S68.42S.8
1980
(4)
SS7.0207.7322.7
SS8.4367.3279.8417.7
I,S14.6968.9191.816.6
7.84.83.22.9
638.0181.8183.6
1SS.2135.648.137.4
S41.9IS6.3180.2
219.1117.972.192.2
2,783.1I,IS8.61,262.9
1,711.81,079.1
83S.6
795.8
73.929.2
1981
(S)
585.3210.231I.S
569.1404.4291.6440.3
1,S69.S1,004.1
201.217.S
8.4S.23.43.1
748..22163.6180.2
147.1131.3SO.839.2
612.5154.6173.6
211.5122.083.4103.0
n.a.n.a.n.a.
n.a.n.a.n.a.
n.a.n.a.n.a.n.a.
83
1982
(6)
620.0217.5324.7
593.4427.9296.0446.4
1,646.61,033.S
206.S18.3
8.9S.53.S3.2
7S8.82
178.1190.6
15S.0137.8S2.141.9
3SO.6143.8186.9
209.6132.283.711S.9
2,882.01,220.91,361.4
1,738.S1,117.1
843.6
838.3
68.135.6
See notes following Table 13.
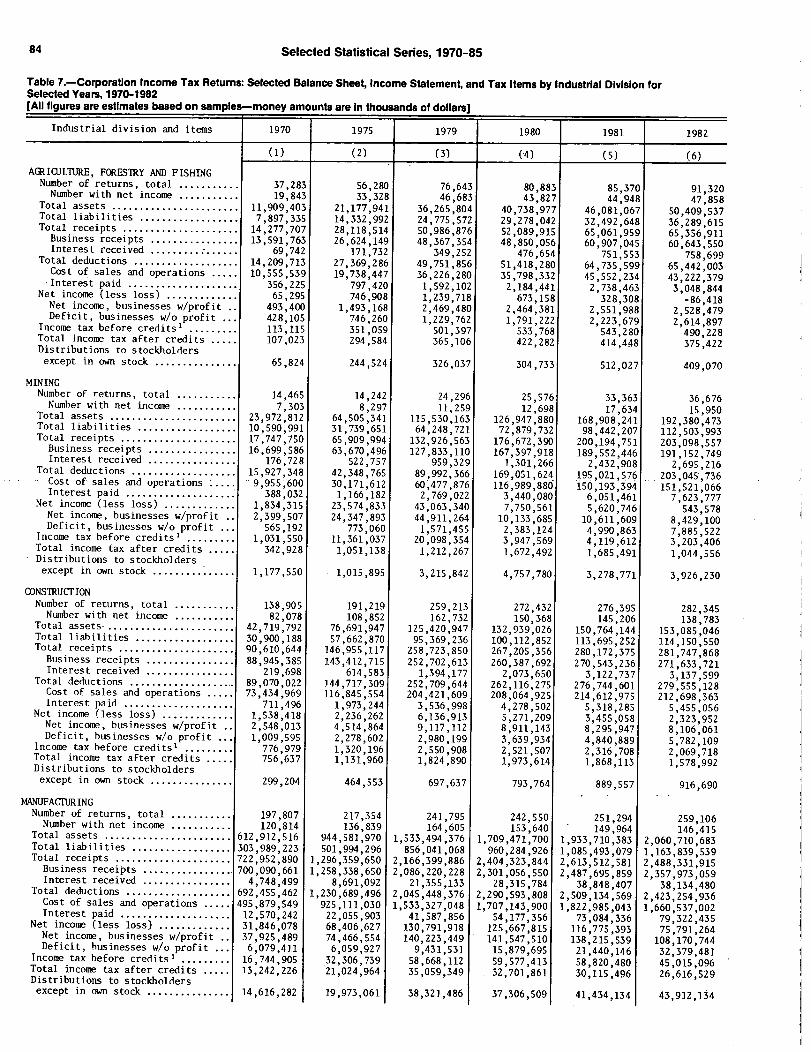
84 Selected Statistical Series, 1970-85
Table 7.-Corporation Income Tax Returns: Selected Balance Sheet, Income Statement, and Tax Items by Industrial Division forSelected Years, 1970-1982[All figures are estimates based on samples-money amounts are In thousands of dollars]
Industrial division and items 1970 1975 1979 1980 1981 1982
(1) (2) (3) (A) (5) (6)
AGRICULTURE, FORESTRY AND FISHINGNumber of returns, total ...........
Number with net income ...........37,28319,843
56,28033,328
76,64346,683
80,88343,827
8S,37044,948
91,32047 858Total assets ........................
Total liabilities ..................11,909,4037,897,33S
21,177,94114,332,992
36,26S,80424,77S,572
40,738,97729,278,042
46,081,06732,492,648
,SO,409,S3736 289 615Total receipts .....................
Busin i14,277,707 28,118,SI4 50,986,876 S2,089,91S 65,061,9S9
, ,6S,3S6,911ess rece pts ................
Interest received ......... :......13,S91,763
69 74226,624,149
171 73248,367,3S4
349 25248,850,OS6
476 65460,907,045 60,643,SSO
Total deductions ...................,
14,209,713,
27,369,286,
49,7Sl,8S6,
S1,418,280751,SS3
64,735,S997S8,699
6S 442 003Cost of sales and operations ..... 10,55S,539 19,738,447 36,226,280 3S,798,332 45,S52,234, ,
43 222 379-Interest paid ....................Net income (less loss) .............
3S6,2256S,295
797,420746,908
1,S92,1021,239,718
2,184,441673,158
2,738,463328,308
, ,3,048,844
-86 418Net income, businesses w/profit 493,400 1,493,168 2,469,480 2,464,381 2,551,988,
2 S28 479Deficit, businesses w/o profit 428,105 746,260 1,229,762 1,791,222 2,223,679, ,
2 614 897Income tax before creditsi ......... 113,115 351,059 501,397 533,768 S43,280, ,490 228Total income tax after credits ..... 107,023 294,584 365,106 422,282 414,4,48
,375 422Distributions to stockholders ,
except in own stock ............... 65,824 244,524 326,037 304,733 S12,027 4099070
MININGNumber of returns, total ........... 14,465 14,242 24,296 2S,576 33,363 36 676Number with net income ........... 7,303 8,297 11,2S9 12,698 17,634
,ls 950
Total assets .......................Total liabilities ..................
23,972,81210,590,991
64,505,34131,739,651
115,S30,16364,248,721
126,947,88072,879,732
168,908,24198,442,207
,192,380,473112,503,993
Total receipts ..................... 17,747,750 65,909,994 132,926,563 176,672,390 200,194,751. 203 098 557Business receipts ................Interest received ..........
16,699,S86176 728
63,670,496522 757
127,833,110329959
167,397,9181 30 266
189,SS2,446, ,
191,152,749......
Total deductions ...................,
1S,927,348,
42,348,76S,
89,992,366, 1,
169,051,6242,432,908
195,021,S762,695,216
203 045 736-Cost-of- sales-and operations ........Interest aid-9,9S5,600
388 032-30 -171,612-
:- 60-,477,876 1169989,880 isb,193,394
, ,151,S21,066p ....................
Net income (less loss) .............,
1,834,31S1 166,182
23,574,8332,769,022
43,063,3403,440,08079750,561
6,051,461S,620,746
7,6239777S78S43Net income, businesses w/profit 2,399,507 24,347,893 44,911,264 10,133,685 .10,611,609
,8,429 100
Deficit, businesses w/o profit S65,192 773,060 1,S71,45S 2,383,124 4,990,863,
7 S22885Income tax before credits1
......... 1,031,SSO 11,361,037 209098,354 3,947,569 4,119,612,,
3,203 406Total income tax after credits ..... 342,928 I,OS1,138 1,212,267 1,672,492 1,685,491
,1 044 556Distributions to stockholders
, ,
except in own stock ................ 1,177,SSO 1,015,895 3,21S,842 4,757,780 3,278,771 3,926,230
CONSTRUCTIONNumber of returns, total ........... 138,905 191,219 259,213 272,432 276,395 282 345Number with net income ........... 82,078 108,8S2 162,732 150,368 145,206
,138,783Total assets........................ 42,719,792 76,691,947 12S,420,947 132,939,026 150,764,144 153,085 046Total liabilities .................. 30,900,188 57,662,870 9S,369,236 100,112,852 113,69S,2S2
,114 lSO 550Total receipts ..................... 90,610,644 146,955,117 258,723,850 267,205,356 280,172,37S
, ,281,747,868
Business receipts ................ 88,94S,38S 143,412,715 252,702,613 260,387,692 270,S43,236 271,633 721Interest received ................ 219,698 6149583 1,394,177 2,073,650 3,122,737,
3,137 599Total deductions ................... 89,070,022 144,717,309 252,709,644 262,116,27S 276,744,601,
279 555 128Cost of sales and operations ..... 73$434,969 116,845,SS4 204,421,609 208,064,925 214,612,975, ,
212,698,363Interest paid ....................Net income (less loss) .............
711,4961,538,418
1,973,2442,236,262
3,536,9986,136,913
4,278,SO25,271,209
S,318,28S3,4SS,OS8
5$4SS,OS62 323 9S2Net income, businesses w/profit 2,S48,013 4,SI4,864 9,117,112 8,911,143 8,295,947
, ,8,106 061Deficit, businesses w/o profit 1,009,59S 2,278,602 2,980,199 3,639,934 4,840,889
,5 782 109
Income tax before credits' ......... 776,979 1,320,196 2,550,908 2,521,SO7 2,316,708, ,
2 069 718Total income tax after credits ..... 7S6,637 1,131,960 1,824,890 1,973,614 1,868,113, ,
1 578 992Distributions to stockholders, ,
except in own stock ............... 299,204 464,553 697,637 793,764 889,S57 916,690
1ANUFACTURINGNumber of returns, total ........... 197,807 217,3S4 241,795 242,5SO 251,294 2S9 106Number with net income ........... 120,814 136,839 164,60S 1S3,640 149,964
,146 41STotal assets ....................... 612,912,S16 944,S81,970 1,533,494,376 1,709,471,700 1,933,710,383
,2,060 710 683Total liabilities .................. 303,989,223 S01,994,296 856,041,068 960,284,926 1,085,493,079
, ,1,163 839 S39Total receipts ..................... 722,952,890 1,296,359,6SO 2,166,399,886 2,404,323,844 2,613,S12,581
, ,2,488,331 91SBusiness receipts ................. 700,090,661 1,258,338,6SO 2,0869220,228 2,301,OS6,5SO 2,487,69S,859
,2,3S7,973,OS9
Interest received ................ 4,748,499 8,691,092 21,3SS,133 28,31S,784 38,848,407 38,134 480Total deductions ................... 692,455,462 1,230,689,496 2,045,448,376 2,290,593,808 2,SO9,134,569,
2 423 254 936Cost of sales and operations ..... 4959879,549 925,111,030 1,533,327,048 1,7079143,900 1,822,985,043, , ,
1,660 002S37Interest paid .................... 12,570,242 22,05S,903 41,S87,856 54,177,356 73,084,336,,
32279 435Net income (less loss) ............. 31,846,078 68,406,627 -1.30,791,918 12S,667,815 116,775,393, ,
75,791 264Net income, businesses w/profit .. 37,925,489 74,466,554 140,223,449 141,547,510 138,215,539,
108,170 744Deficit, businesses w/o profit ... 6,079,411 6,059,927 9,431,531 15,879,69S 21,440,146
,32,379 481Income tax before credits' ......... 16,744,90S .32,306,739 58,668,112 59,577,413 S8,820,480
,09645,015
Total income tax after credits ..... 13,242,226 219024,964 3S,059,349 32,701,861 30,IIS,496,
26 616 S29Distributions to stockholders, ,
except in own stock ............... 14,616,282 19,973,061 38,321,486 37,306,509 41,434,134 43,912,134

Selected Statistical Series, 1970-85
Table 7. (Continued)-Corporation Income Tax Returns: Selected Balance Sheet, Income Statement, and Tax Items by IndustrialDivision for Selected Years, 1970-1982[All figures are estimates based on samples-money amounts are In thousands of dollars]
85
Industrial division and items 1970 197S 1979 1980 1981 1982
(1) (2) (3) (4) (S) (6)
TRANSPORTATION AND PUBLIC UTILITIESNumber of returns, total ......... 67,398 80,701 106,824 111,324 109,127 115,470Number with net income ......... 38,204 4S,360 61,583 62,232 S6,480 59,793
Total assets ..................... 287,740,207 443,236,797 670,186,972 7S8,364,400 8379300,816 919,861,069Total liabilities ................ 166,535,18S 26697929390 411,531,388 467,708,707 S16,438,230 566,980,444Total receipts ................... 135,495,271 243,4809637 448,140,811 523,807,396 598,SO7,994 632,294,442
Business receipts .............. 131,463,171 234,689,427 434,427,319 507,372,820 57S,602,089 606,039,657Interest received .............. 930,266 1,S20,913 4,067,66S S,760,072 8,048,746 9,138,892
Total deductions ................. 127,931,131 233,409,166 429,849,123 S03,9S4,28S S79,172,068 614,397,320Cost of sales and operations ... 77,743,359 143,932,463 284,041,578 336,868,172 3S8,354,SI2 338,796,961Interest paid .................. 7,364,200 139761,062 21,631,167 27,638,S91 34,085,384 36,839,460
Net income (less loss) ........... 7,S43,718 10,099,S71 18,462,903 20,046,ISS 19,S73,717 18,335,959Net income, businesses w/profit. 9,471,59S 12,088,189 22,OS8,598 24,917,293 2S,7399287 27,378,633Deficit, businesses w/o profit.. 1,927,877 1,988,618 3,S95,69S 4,871,138 6,165,S70 9,042,673
Income tax before credits' ........ 4,342,334 S,107,158 9,IIS,461 10,532,722 10,481,203 11,3S6,073Total income tax after credits ... 4,036,6SO 2,836,470 4,834,026 S,322,990 5,065,S29 4,92S,936Distributions to stockholdersexcept in own stock ............. 5,837,S6S 8,900,353 IS,1175,029 17,329,807 19,622,705 21,438,500
WHDLESAIE AND RETAIL TRADENumber of returns, total ......... 518,062 614,632 776,661 799,628 816,836 839,547
Number with net income ......... 339,987 399,668 502,947 487,300 476,877 468,108Total assets ..................... 192,181,800 323,496,726 S73,310,389 646,901,005 708,060,408 7S3,351,132Total liabilities ................ 115,1799668 200,846,992 376,719,434 424,611,318 472,256,895 501,934,034Total receipts ................... 522,547,923 969,938,872 1,7SO,SS9,063 1,9SS9S23,778 29039,628,384 2,017,701,364
Business receipts .............. S11,316,883 951,463,SSO 19711,773,627 1,919,347,689 1,997,262,710 1,972,30S,3S6Interest received .............. 1,291,906 3,857,318 89243,949 10,503,989 14,319,277 14,373,589
Total deductions ................. 512,910,193 947,SII,780 1,711,496,089 1,919,454,218 2,006,891,471 1,989,739,286Cost of sales and operations ... 3929391,856 745,299,204 1,361,550,632 1,S38,128,634 1,594,256,679 1,556,263,179Interest paid .................. 4,309,663 8,587,173 19,931,751 25,64S,8SS 30,997,865 30,429,310
Net income (less loss) ........... 9,671,044 22,4899430 40,242,601 38,309,671 33,320,403 28,442,678Net income, businesses w/profit. 12,395,411 27,681,721 48,246,345 49,426,SOO 47,657,374 45,747,936Deficit, businesses w/o rofit.. 2,724,367 5,192,291 8,003,744 11,116,829 14,336,971 17,305,258
Income tax before credits ....... 4,476,047 8,103,316 13,313,992 13,SIS,6S3 12,329,212 11,372,087Total income tax after credits ... 4,237,181 7,348,619 10,772,309 10,S50,2S5 10,282,S98 9,379,328Distributions to stockholdersexcept in own stock ............. 2,068,SO1 5,029,897 8,821,280 10,343,087 10,034,841 12,069,01S
FINANCE, INSURANCE AND REAL ESTATENumber of returns, total ......... 406,235 411,846 471,227 493,426 469,79S 461,630Number with net income ......... 248,S86 243,409 281,19S 273,8S3 2S8,622 2S2,689
Total assets ..................... 1,40191S3,520 2,321,96S,956 3,630,04S,296 4,022,206,073 4,486,191,441 4,987,466,401Total liabilities ................ 1,204,673,072 2,OS2,19S,429 3,187,436,102 3,491,664,7S6 3,830,001,863 4,22O9S27,191Total receipts ................... 17793219173 31S,79S,981 S60,968,442 697,460,846 877,808,946 949,867,877
Business receipts .............. 929091,887 15791269715 254,722,667 2569892,475 330,631,846 337,493,098Interest received .............. 63,6949046 127,040,303 250,979,245 31S,146,11S 421,1599015 456;333,537
Total deductions ................. 161,630,060 2979963,817 S149086,140 6S2,637,787 838,764,803 915,164,762Cost of sales and operations ... 48,4349362 84,614,209 123,367,688 129,644,330 162,447,596 169,435,694Interest paid .................. 34,S48,509 77,677,659 164,365,541 2199167,684 314,128,780 340,960,344
Net income (less loss) ........... 12,2149079 119663,330 37,011,262 33,122,792 26,346,494 21,804,088Net income, btisinesses w/profit. IS9081,939 18982S,003 43,27S,518 46,040,390 S3,018,OOS S7,745,07SDeficit, businesses w/o profit.. 2,867,860 7,161,673 6,264,256 12,917,S99 26,671,SIO 3S,940,986
Income tax before credi.tsi ........ 4,404,449 S,5589647 11,S95,112 9,680,7SS 7,968,422 7,643,631Total income tax after credits ... 4,150,009 4,673,705 9,601,617 7,698,134 6,037,489 59497,997Distributions to stockholdersexcept in own stock ............. 7,387,211 89729,977 18,348,769 249692,146 41,998,2952 46,504,963
SERVICESNumber of returns, total ......... 281,218 435,672 609,103 671,338 75Z,813 819,706Number with net income ......... 150,525 249,641 3649IS6 408,716 4419100 472,799
Total assets ..................... 61,87S,140 90,S349067 153,219,483 178,163,737 2139724,531 2379876,895Total liabilities ................ 42,346,078 63,678,693 108,1329469 12S,298,224 152,6739683 170,0919SIO
Total receipts ................... 69,S72,626 131,377,364 2449542,893 279,883,187 346,846,723 380,767,394Business receipts .............. 66,4599SIS 12S,747,462 234,4979897 266,088,619 328,OS39889 35S,090,610Interest received .............. 435,070 87S,506 2,196,467 3,269,412 4,696,008 S,120,807
Total deductions ................. 68,384,4S2 127,996,443 236,3S9,966 271,792,974 338,790,049 373,717,841Cost of sales and operations ... 37,733,747 639724,869 117,OS7,S22 129,352,692 157,886,393 135,273,962Interest paid .................. 1,802,802 3,279,438 6,0829021 8,033,612 10,472,892 11,26S,412
Net income (less loss) ........... 1,198,703 3,396,744 8,2529805 8,193,903 8,197,916 7,199,2S8Net income, businesses w/profit. 3,384,869 6,025,S92 12,0609033 13,246,601 15,182,552 16,061,222Deficit, businesses w/o profit.. 2,1869166 2,628,848 3,807,228 5,02,698 6,984,635 8,861,964
Income tax before creditsl ........ 1,0589264 1,625,093 3,276,011 3,497,265 4,029,725 3,88S,618Total income tax after credits ... 1,003,130 1,323,637 29419,382 2,613,888 2,943,149 2,617,390Distributions to stockholdersexcept in awn stock .............
a55894S2 8SS9402 1,816,177
I1,841,94S
12,491,324 3,269,28S
1
See notes following Table 13.

86 Selected Statistical Series, 1970-85
Table 8.-Corporation Income Tax Returns: Selected Balance Sheet Income Statement, and Tax Items for Selected Years,1970-1982[All figures are estimates based on samples-money amounts are In thousands of dollars]
Item 1970 1975 1979 1980 1981 1982
rl) (2) (3) - -(14) (S) (6)
Number of returns, total ............. 1,665,477 2,023,647 2,S77,801 2,710,S38 2,812,420 2,92S,933Number with net income ............. 1,008,337 1,226,208 1,599,322 1,596,632 1,S97,298 1,608,363Small Business Corp. returns ....... 257,47S 3S8,413 S18,SSO S4S,389 541,489 S64,219DISC returns ....................... N/A 6,431 8,066 8,665 9,408 9,663
Total assets ......................... 2,634,706,S64 4,286,SS6,273 6,844,891,231 7,617,238,403 8,547,161,872 9,3S7,7849804Notes and accIts receivable ........ 614,667,376 I,OSlqS42,806 1,817,469,863 1,984,601,790 2,239,832,960 2,420,475,398Inventories ........................ 190,401,642 317,718,545 S04,315,590 S34,806,S47 S889219,956 581,241,4SSInvestments in Gov't obligations ... 196,625,390 316,131,699 421,441,738 472,OS9,737 S14,837,697 605,S13,662Net capital assets, except land' ... SS2,838,384 82S9107,002 19264,8729322 1,418,605,742 1,591,843,868 1,761,860,SS7
Total liabilities .................... 1,882,295,401 3,189,491,468 5,12S,337,041 S,672,8SO,147 6,303,221,090 6,888,211,820Accounts payable ................... 148,812,S97 263,417,584 482,SS8,29S 542,172,368 619,969,292 678,630,282Short-term debt7 ................... 170,884,261 272,123,SSI 4S2,9S8,194 S04,802,288 S85,947,678 667,0609956Long-term debt2 .................... 362,700,303 S86,703,526 .88S S IS 693 986,663,932 I,OS8,070,877 19224,277,72S
Net worth ............................ 7S2,411,163 19097,064,806 1,719,SS4,190 1,944,388,2S6 2,243,940,782 2,469,S72,984
Total receipts ....................... 1,7SO,776,503 3,198,627,860 S,61S,6259519 6,361,284,012 7,026,351,839 7,024,097,766Business receipts .................. 1,620,88S,S76 2,()61,729,640 S,152,613,019 5,731,6169337 6,244,678,064 6,156,9949009Interest on Gov't obligations ...... 9,687,116 17,264,405 309420936S 38,061,S92 509S19,SS2 n.a.State and Local .................. 3,77S,917 6,711,606 10,878,916 12,620,876 13,881,460 14,124,877United States .................... 5,911,199 109SS2,799 19,S419449 2S,440,716 36,638,092 S151628,874
Other interest ..................... 61,883,309 126,034,505 2S9,1.46,298 328,802,9S8 442,919,194Rents and royalties ................ 16,S24,889 269932,271 409303,671 53,821,391 67,S22,636 839OS1,S13Net short-term capital gain lessnet long-term-capital loss-......-.. - -190,439 - 301,601- 1,209,842- 2,013,510- -2,478,S72 2,882,-207
Net long-term capital gain lessnet short-term capital loss ....... 5,481,580 89364,S23 20,005,538 24,910,957 29,064,630 26,318,184
Net gain, sales of nancap. assets S,31S,562 7,7S7,287 IS,397,176 209117,61S 16,639,271 20,992,023Dividends received from domesticcorporations ...................... 5,238,421 89818,282 16,863,766 18,654,800 17,442,112 18,15S,559Dividends received from foreigncorporations ...................... 3,466,515 S,467,726 12,715,084 149S63,353 13,790,320 13,9SO9906
Total deductions ..................... 1,682,778,847 3,052,674,597 S,331,970,825 6,12S,36S,ISS 6,813,841,356 6,869,267,462Cost of sales and operations ....... 1,146,2639273 2,129,928,467 3,721,782,971 4,204,905,90S 4,SO9,198,199 4,270,8SO9310Bad debts .......................... 6,479,814 13,781,147 17,486,107 18,769,771 22,286,81S 269690,963Taxes paid ......................... 49,S23,243 81,S30,302 128,172,063 163,003,622 1701,470,926 16S,888,353Interest paid ...................... 62,OSS,010 129,307,921 261,530,8SO 344,612,S42 476,964,684 51S,032,667Contributions or gifts ............. 797,029 1,202,130 2,294,7SS 2,3S8,SS4 2,514,425 2,9069476Depreciation ....................... S2,941,266 86,295,664 138,490,396 157,34S,828 186,19S,048 2139179,160Depletion .......................... S96239339 S,3419489 7,828,973 8,871,993 7,929,396 7,021,176Pension, profit-sharing, stockbonus, and annuity plans .......... 12,22S,912 26,526,129 46,S83,431 S1,529,310 52,952,S83 S4,232,011
Net loss, sales of noncap. assets .. 1,289,30S 1,804,079 4,074,8S8 S9903,104 7,943,607 10,367,020
Net income (less loss) ............... 6S,901,614 142,636,826 285,300,630 239,006,S42 213,648,962 154,3349143Net income, businesses w/profit .... 83,710,924 169,483,336 322,SI.7,5SO 296,787,201 301,440,778 274,3S2,942Net loss, businesses w/o profit .... 17,809,310 26,846,510 379216,920 S7,780,659 87,791,816 120,018,799
Income subject to tax ................ 72,374,437 146,S89,287 280,155,ISS 246,598,486 240,422,626 20S,17S,407
Income tax before credits . ........... 32,949,937 6S,769,822 119,IS79964 103,831,172 100,644,417 85,077,493
Tax credits, total ................... S,414,940 26,4S2,791 S4,229,274 42,167,741 43,813,131 39,694,245Foreign tax credit ................. 4,548,986 19,987,724 36,828,057 24,861,315 21,828,686 19,137,201Possessions tax credit ............. N/A N/A 1,376,124 1,S65,681 1,94S,637 2,026,980.Investment credit .................. 86S,9S4 6,4S9,746 149678,306 1S,102,812 18,887,286 17,312,702Jobs credit ........................ N /A N/A 1,318,837 601,444 472,89S 327,285Research credit .................... N/A N/A N/A N/A 639,302 839,220
Income tax after credits . ............ 27,534,997 39,317,031 64,928,690 61,663,431 S6,831,286 4S,383,248Additional tax for tax preferences ... 265,249 1S6,740 433,649 438,820 S24,851 478,457Total income tax ..................... 27,878,078 39,691,S17 66,120,672 62,974,695 S8,444,720 47,071,909
Distributions to stockholders,except in own stock .................
132,012,677
145,224,392
186,833,911
197,378,617
1120,29S,338 132,478,411
See notes following Table 13.

Selected Statistical Series, 1970-85
Table 9.-Gross Internal Revenue Collections: Amount Collected by Quarter and Fiscal Year, 1981-1985[Money amounts are In millions of dollars]
Amount collected by type of return
Quarter and fiscal year
FISCAL YEAR 1981 TOTAL ...............October 1980 - December 1980 .......January 1981 - March 1981 ..........April 1981 - June 1981 .............July 1981 - September 1981 .........
FISCAL YEAR 1982 TOTAL ...............October 1981 - December 1981 .......January 1982 - March 1982 ..........April 1982 - June 1982 .............July 1982 - September 1982 .........
FISCAL YEAR 1983 TOTAL ...............October 1982 - December 1982 .......January 1983 - March 1983 ..........April 1983 - June 1983 .............July 1983 - September 1983 .........
FISCAL YEAR 1984 TOTAL ...............October 1983 - December 1983 .......January 1984 - March 1984 ..........April 1984 - June 1984 .............July 1984 - September 1984 .........
FISCAL YEAR 1985October 1984 - December 1984 .......
See notes following Table 13.
Total
(1)
606,799118,804143,899196,970147,126
632,241137,570IS4,128196,SO6144,036
627,247132,20S150,019194,431150's9l
680,475141,849164,681208,81416S,131
l5s,919
Individualincome taxes'
(2)
332,8SO67,08177,467108,60079,702
3S2,60971,5268S,930113,8S281,301
349,62870,31286,853111,72180,742
362,89273,37989,316114,S2S8S,672
79,77S
Corporationincome taxes
(3)
73,73314,S2714,84429,204ISJS8
6S,99115,89814,72223,11S12,2S6
61,78013,40411,49422,02714,8SS
74,17916,20814,3372S,99017,644
17,S46
Excisetaxes2
(4)
40,4207,30S10,08211,96311,069
36,77910,5779,4268,3898,387
3S,7668,4988,2228,947
10,097
38,1799,6548,8629,6809,822
9,732
Table 10.-Internal Revenue Refunds: Amounts Refunded by Quarter and Fiscal Year, 1981-1985[Money amounts are In millions of dollars]
Employmenttaxe S 3
(5)
TS2,88628,19339,8784S,S1039,304
168,71837,65441,7S149,16S40,148
173,84838,40441,930SO,21943,294
199,21041,132SO,S45S7,06150,472
47,286
Amount refunded by type of return
Quarter and fiscal year
FISCAL YEAR 1981 TOTAL ................October 1980 - December 1980 ........January 1981 - March 1981 ...........April 1981 - June 1981 ..............July 1981 - September 1981 ..........
FISCAL YEAR 1982 TOTAL ................October 1981 - December 1981 ........January 1982 - March 1982 ...........April 1982 - June 1982 ..............July 1982 - September 1982 ..........
FISCAL YEAR 1983 TOTAL ................October 1982 - December 1982 ........January 1983 - March 1983 ...........April 1983 - June 1983 ..............July 1983 - September 1983 ..........
FISCAL YEAR 1984 TOTAL ................October 1983 - December 1983 ........January 1984 - March 1984 ...........April 1984 - June 1984 ..............July 1984 - September 1984 ..........
Total
(1)
63,3034,21S
21,98830,3526,749
7S,2025,S30
2490243S,7939,85S
89,7619,41123992846,71S9,705
8S98727,201
2S,28S44,8S98,S27
Individual.income taxes'
(2)
48,4094971
18,28S26,0273,12S
S5,10251,34719,33830,4813,936
61,198s1,87S16,S4838,3414,434
64,62952906419,61338,1614,790
FISCAL YEAR 1985October 1.984 - December 1984 ........
16,729 2,24S6
See notes following Table 1.3.
Corporationincome taxes
(3)
13,2943,0473,6873,1603,400
17,97439920491974,298S,Ssg
26,0127,0306,8387,4214,723
17,8894,S484,8SOS,4523,039
4,177
ExcisetaxeS2
(4)
3434976
16355
3674276
16386
493S8
108194133
6S719S129230103
122
Employmenttaxes'
(S)
1,114116-99967128
1,S7818S377796220
1,849397372721359
2948632S646968547
138
87
Estate andgift taxes
(6)
6,9101,6981,6281,6921,893
8,1431,91S2,2991,9861,943
6,2261,S88l'sig1,5161,602
6,1771,4761,622I,SS8I'S21
I'S80
Estate andgift taxes
(6)
14332393440
1813736S453
208S2623856
21169474748
46

88 Selected Statistical Series, 1970-85
Table 11.-Classes of Excise Taxes by Selected Fiscal Year, 1970-1985[Money amounts are In thousands of dollars]
Taxes collected by Fiscal Year
Selected class of tax1970 197S 1980 1982 1983 1984
(1) (2) (3) (4) (S) (6)
ALODHDL TAXES, TOTAL ............... 4,746,382 5,3SO,858 S,704,768 S,4S9,810 S,634,853 S,402,467Distilled spirits ................ 3,S01,538 3,865,162 3,945,377 3,634,519 3,798,148 3,566,482
Wine ............................. 163,337 177,113 211,S38 218,987 239,329 319,920Beer ............................. 1,081,07 1,308,583 1,547,8S3 1,606,303 1,S97,37S 1,S16,064
TOBACCO TAXES, TOTAL ............... 2,0942212 2,31S,090 2,446,416 2,S39,49S 4,1392810 4,663,610Cigarettes ....................... 2,036,101 2,261,116 2,402,8S7 2,499,046 4,099j226 42623,288
Cigars ........................... . S6,834 SI,226 39,SOO 35,666 33,716 30,372
MANUFACTURERS EXCISE TAXES, TOTAL .. 6,683,061 S,S16,611 6,487,421 6,382,900 6,776,023 10,097,242
Gasoline and lubricating oil' .... 3,517,S86 4,071,465 4,326,549 .4,320,856 4,953,267 9,020,413
Tires, tubes and tread rubber2 ... 614,795 697,660 682,624 6682902 677,966 423,31S
Motor vehicles, bodies, parts3 ... 1,753,327 662,S56 1,088,696 914,S24 516,872 -14,777Recreational products ............ S3,427 84,946 136,S21 158,OS4 132,672 132,448
Black Lung taxes ................. N/A N/A 2SI,288 237,097 490,731 52S,422
SPECIAL FUELS, AM RETAILERS 1AXES,TOTAL4 ............................ 257,820 404,187 S60,144 S87,486 831,196 2,619,S70
Diesel and special motor fuels ... 2S7,712 370,489 S12,718 SS3,107 742,380 1,S71,437
Trucks and buses ................. N/A N/A N/A N/A N/A 932,64S
MISCELLANEOUS EXCISE TkXES, TOTAL .. 2,084,730 3,306,077 6,3S9,198 19,773,803 19,228,685 13,290,186
Telephone and teletypel .......... 1,469,562 2,023,744 1,117,834 998,503 1,048,317 2,034296S
Air transportation ............... 250,802 850,567 1,748,837 1,326,829 1,898,786 2,456,712
_1jighway use-tax.
135,086 207,663_ 263,272-
266,22S-- -
287,457- - - -
175,054-. .Foreign insurance6 . . . . . . . . . . . . . 8,614 T9,4S8 74,630 74,882 - 44
'
440 -56)037-
Exempt organizations netinvestment income ............... N/A 63,828 6S,280 84,045 112,380 146,806
Crude oil windfall profit ...... N/A N/A 3,OSI,719 1.6,930,548 15,660,081 8,120,274
Environmental taxes (superfund) N/A N/A N/A 61,264 2352954 75,389
Fiscal year quarter endingSelected class of tax
Sept. 1983 Dec. 1983 Mar. 1984 , June 1984
pt- 1984
Dec.,1984
(7) (8) (9) (10) (11) (12)
ALODHDL TAXES, TOTAL ............... 1,646,888 1,250,919 1,360,213 12349,85S 1,441,480 1,298,724Distilled spirits ................ 1,04S,906 892,S7S 92S,751 880,320 867,837 888,691Wine ............................. 4S,933 64,331 88,292 60,189 107,108 109,603
Beer ............................. SS5,050 294,013 346,170 409,346 466,535 300,430
TOBACCO TAXES, TOTAL ............... 1,361,SO8 1,147,900 1,15S,892 1,126,S64 1,233,254 724,3S7Cigarettes ....................... 1,34822S3 1,140,023 1,144,380 1,116,732 1,222,152 719,34S
Cigars ........................... 11,181 S,426 9,196 7,682 8,069 5,384
MANUFACTURERS EXCISE TAXES, TOTAL .. 2,406,147 2,814,04 2,477,790 2,327,6S6 2,477,293 2,SSI,347
Gasoline and lubricating oil' .... 1,983,17S 2,488,842 2,181,613 2,107,117 2,242,842 2,300,865
Tires, tubes and tread rubber2 . . . 183,624 187,793 133,924 50,2SS S1,343 S1,738
Motor vehicles, bodies, parts' ... 8S,46S -18,8027 7,7397 -3,4967 -2187 -2,32S7
Recreational products ............ 32,133 35,042 24,5!2 34,887 - 38,007 - 44,031
Black Lung taxes ................. 118,664 121,18S 128,S41 136,044 139,651 IS2,S77
SPECIAL FUELS AND RETAILERS TAM,TOTAL4 ............................ 320,319 588,675 638,989 632,227 7S9,680 89S,374
Diesel and special motor fuels 294,813 411,280 376,065 379,273 404,819 S48,847
Trucks and buses, chassis,bodies, etc . .................... N/A 149,064 234,213 224,099 325,269 318,282
MISCELLANBDUS EXCISE TAXES, TOTAL .. 3,145,046 4,285,278 2,889,908 3,349,216 2,765,78S 2,678,732
Telephone and teletype . .......... 301,532 6772149 399,012 333,386 62S,417 S21,220
Air transportation ............... S03,103 587,384 S98,922 S92,SO8 677,897 647,672Highway use tax .................. 168,440 2S,66S SI,845 37,495 60,048 103,260
Foreign insurance6 . . . . . . . . . . . . . . . -16,769 8,010 1S,822 15,241 16,964 18,876
Exempt organizations netinvestment income ............... 3S,900 9,445 24,279 S8,289 54,794 14,6SS
Crude oil windfall profit ........ 2,084,685 2,909,803 1,727,718 2,236,882 1,24S,871 1,289,421
Environmental taxes (superfund) . .I
S9,203 63,72S 6S,475 69,S30 76,6S8 70,415
I
See notes following Table 13.

Selected Statistical Series, 1970-85
Table 12.-Selected Returns and Forms Filed During Selected Calendar Years, 1970-1984
Calendar Year
Type of return or form
Individual income' .................Form 1040 ........................
Nonbusiness ...................Business ......................
Schedule C .................Schedule F .................
Form 1040A .......................Form 1040EZ ......................
Corporation income:Form 11.20 ........................Form 112OA2 ......................
Form 1120S .......................
Partnership, Form 106S .............
Fiduciary, Form 10413 ..............
Estate Tax, Forms 706 and 706NA ....
Gift Tax, Form 709 .................
Exempt Organization:Form 9901 ........................Form 990-PF ......................Form 990-T .......................
See notes on following Table 13.
Table 13.-Taxpayers Receiving Assistance, Paid and Unpaid, by Tax Year of Return[Some estimates based on samples-all amounts are In thousands]
Type of assistance1981
(1)
1982
(4)
9S,S74,23057,800,6274S,480,SSS12,320,0729,877,3722,442,70037,618,8SS
N/A
2,346,203
S66,787
1,SS2,73S
1,962,48S
127,OSI
849364
368,27831,83123,720
Returns with paid preparer signatureAll returns (000) ............................................................
1040EZ ...................................................................1040A ....................................................................1040, total ..............................................................
1.040 Business, total .................................................Nonfarm ..........................................................Farm .............................................................
1040 Non business, total .............................................With itemized deductions .........................................Without itemized deductions ......................................
Assistance provided by IRS'Telephone inquiries ..........................................................Recorded telephone information ...............................................Office walk-ins, information .................................................Preparation/review of returns ................................................Written inquiries ............................................................Special programs
Community classes and seminars (taxpayers assisted) ......................Volunteer Income Tax Assistance (VITA) (returns repared) ................Tax Counseling for the Elderly (returns prepared~ ........................
See notes on following page.
1970
(1)
77,281,38477,143,2SI68,129,3SI9,013,9006,351,3042,662,596
N/AN/A
1,487,244
248,936
991,904
1,149,44S
141,IS6
146,338
377,030N/A
S,041
1975
(2)
84,026,78561,450,279ST,377,lS310,073,1267,438,9682,6349IS822,462,776
N/A
1,70S,789
367,219
1,132,839
1,SS8,570
22S,827
273,184
346,62729,63719,683
Number Filed
1980
(3)
93,194,916SS,360,03043,9S7,14111,402,8898,944,2982,4S8,S91
37,692,282N/A
2,030,092
S289070
1,401,S67
1,876,392
147,303
214,389
362,63233,13723,4SS
39,S34N/A
6,4S233,0826,762S,1301,631
26,32113,95812,363
39,203N/A
8,0931,560
138
N/A304116
1983
(5)
9S,698,801S9,S80,12346,631,87612,948,24710,S07,20S2,441,04221,045,26614,915,949
2,461,461
616,719
1,613,493
2,019,483
106,409
93,260
344,21633,2322S,S98
1984Preliminary
(6)
97,198,70061,19S,00047,8S9,00013,366,00010,930,0002,406,000
19,90S,600IS,937,400
2,58S,900
70S,100
1,673,300
2,071,900
8S,600
96,600
342,80034,40026,600
Tax Year
1982
(2)
42,116428
S,70135,9879,1917,3631,828
26,79615,33411,462
39,8631,85S7,1661,420
148
4026614S
89
1985Projected
(7)
101,710,70063,519,40049,399,00014,120,40011,731,4002,389,000
20,747,60017,279,000
1,710,4001,000,000
764,800
1,7SO,700
2,126,SOO
76,100
109,400
346,3003S,20027,300
1983(Preliminary)
(3)
43,115697
5,16137,2579,S487,7451,803
27,71016,42011,289
42,2123,4067,6991,264
163
313285185
90
General notations
N/A Not applicable
n.a. Not available
p - Preliminary
r - Revised
Table 1
Notes to Selected Statistical Series Tables
[11 The 1981 data for interest and dividendsare before exclusion. The combined amountof interest and dividends in adjustedross income (after the exclusion) was178,097,705,000, reported on 34,144,410
returns.
[21 Includes total itemized deductions, chari-table contributions for non-itemizers, andzero bracket amounts *on nonitemizedreturns.
[31 Includes surcharge of $2,018,078,000.
[41 For 1981 only, this was the 1.25 percentrate reduction credit applicable to allreturns -with i-ncome--tax -before- credits-,- as- -provided by the Economic Recovery Tax Actof 1981.
r5l For Tax Year 1983, the alternative minimumtax was revised and the minimum tax wasabolished. The revised alternativeminimum tax covered many of the taxpreference items that had previously beencovered by the minimum tax and raised thealternative minimum tax rate to a flat 20percent of alternative minimum taxableincome. For 1983 tax data, only prior taxyear returns could reflect claims for theminimum tax.
SOURCE: Statistics of Income--IndividualIncome Tax Returns, appropriate years. I ax -rdiWchanges have a ted the comparability of thedata. See the specific Statistics of Incomereports for a description of those law changes.
Table 2
[11 For 1983, state figures are f rom theIndividual Master File, adjusted to U.S.totals in Statistics of Income data.
[2] Total returns filed include both taxablereturns and returns without tax liability.
[31 Average tax applies only to returns withtax liability. The number of returns withtax liabil'ity can be derived by divi'dingtotal tax by average tax.
[41 Detail does not add to total whichincludes data for returns by U.S. citizensliving abroad, U.S. citizens with APO orFPO addresses, and residents of PuertoRico.
SOURCE: Statistics of Income--Individual IncomeTax Returns, appropriate years. Tax -5-angeshave attected the comparability of the data.See the specific Statistics of Income reportsfor a description of those law changes.
Table 3
[11 Includes income tax after credits and theadditional tax for tax preferences, i.e.,minimum tax and alternative minimum tax.
[21 For many taxpayers at this level , includeslarge amounts of additional tax for taxpreferences.
SOURCE: Statistics of Income--Individual IncomeTax Returns, appropriate years. Tax law cc angeshave affected the comparability of the data.See the specific Statistics of Income reportsfor a description of those law changes.
Table 4
[11 Includes breakeven businesses.
SOURCE:, Statistics of Income--Sole Propri-etorship urns, appro-p-ri ate- yea. rs. Tax awchanges have affected the comparability of thedata. See the specific Statistics of Incomereports for a description of those law changes.
Table 5
[11 Total assets, total . liabilities andpartners capital accounts are somewhatunderstated because not all partnershipreturns filed contained a completedbalance sheet.
r2l Short-term debt is the abbreviated titlegiven to mortgages, notes and bondspayable in less than 1 year.
[31 Long-term debt is the abbreviated titlegiven to mortgages, notes and bondspayable in 1 year or more. In addition,for Tax Year 1975 long-term debt includednonrecourse loans.
[41 Beginning for 1982, this figure includesboth interest and dividends.
E51 Beginning for 1981 , this figure was takenfrom Form 4562, which resulted in somewhathigher figures than reported for earlieryears.

Notes to Selected Statistical Series Tables
SOURCE: Statistics of Income--PartnershipReturns, appropriate years. Tax law changesFaWe-7affected the comparability of the data.See the specific Statistics of Income reportsfor a description of those law changes.
Table 6
[11 Prior to 1979, balance sheets completed bypartnerships which liquidated during theyear were assigned to the "under $25,000"category regardless of asset size.Beginning in 1979, balance sheets ofliquidating partnerships were treated inthe same manner as all other balancesheets.
[21 For 1981 and years following, a reductionin data available for receipts caused anincrease in the number of returnsarbitrarily assigned to the "under$25,000" size class.
SOURCE: Statistics of Income--CorporationIncome Tax Returns, appropriate years,Statistics ot ncome--Partnership Returns,appro-pria e years, and StatistTc-sofIncome--Sole Proprietorship Returns,appropriate years. Tax law changes haveaffected the comparability of the data. Seethe appropriate Statistics of Income reportsfor a description of those law changes.
Table 7
[11 Consists of normal tax, surtax, andalternative tax for Tax Years 1970 through1978, and regular tax and alternative taxfor Tax Years 1979-1981.
rL21 The 109-percent increase by the regulatedinvestment companies industry accountedfor almost 62 percent of the increase from1980 to 1981.
SOURCE: Statistics of Income--CorporationIncome Tax Returns, appropriate years. lax lawc anges have affected the comparability of thedata. See the appropriate Statistics of Incomereports for a description of those law changes.
Table 8
[11 The review of the data was not complete attime of publication.
[21 Net capital assets, except land, consistedof depreciable, depletable, and intangibleassets less accumulated depreciation,depletion and amortization.
[31 Short-term debt is the abbreviated titlegiven to mortgages, notes and bonds
91
payable in less than I year. Long-termdebt is the abbreviated title given tomortgages, notes and bonds payable in 1year or more.
[41 Consists of normal tax, surtax, andalternative tax for Tax Years 1970 through1978, and regular tax and alternative taxfor Tax Years 1979-1981. Tax Year 1970includes surcharge of $784,437,000.
SOURCE: Statistics of Income--CorporationIncome Tax Keturns, appropriate years. Taxchanges have affeEted the comparability of thedata. See the appropriate Statistics of Incomereports for a description of those law changes.
Tables 9 and 10
[11 Includes estimated tax payments or amountswithheld by employers prior to returnfiling, payments made with the return, andany subsequent payments.
[21 Includes taxes imposed on selectedproducts, services, and activities, suchas those on alcohol and tobacco productsand the windfall prof i t tax ondomestically produced crude oil.
[31 Includes payroll taxes levied on salariesand wages, such as social security,railroad retirement, and unemploymenttaxes.
[41 Includes earned income credits refunded,amounting to $1.3 billion.
[51. Includes earned income credits refunded,amounting to $1.2 billion.
NOTE: Detail may not add to total because ofrounding.
SOURCE: Internal Revenue Service, ReturnsProcessing and Accounting Division, Revenue andAccounting Branch.
Table 11
[11 Includes a one-time tax of 5 cents pergallon on gasoline and 4 cents per gallonon gasohol imposed on inventories ofdealers as of April 1 , 1983. Taxes onlubricating oil were repealed effectiveJanuary 5, 1983.
r2) Effective January 1, 1984, taxes on tubesand tread rubber were repealed, anddealers holding taxable tires wereassessed a one-time floor stock tax.
[31 Effective January 7, 1983, the excisetaxes on parts and accessories for trucks
92 Notes to Selected Statistical Series Tables
and buses , which are included in thi sclassification, were repealed. Beginningwith the quarter ending December 1983,motor vehicles are excluded.
[41 Special fuels, total includes diesel andspecial motor fuels which were classifiedas miscellaneous excise taxes in 1970.Beginning with the quarter ending December1983, motor vehicles are included.
[51 Effective January 1, 1983, the excise taxincreased from I percent to 3 percent.
r6l The negative amounts are due to refunds ofthis tax under the United States - UnitedKingdom Income Tax Treaty, which providesfor an exemption from the tax retroactiveto January 1, 1975. Also, a similarUnited States - France treaty provides foran exemption retroactive to January 1,1979.
[71.This amount reflects adjustments made forprior quarters.
Table 12
[11 Includes Forms 1040C, PR and SS.
(21 Form 1120A will be introduced in 1985.
[31 Includes Form 1041A in 1970 and 1975.
[41 Includes Form 990A in 1970.
SOURCE: Internal Revenue Service, ResearchDivision, Projections and Forecasting Group.
Table 13
[11 Data on IRS Taxpayer Service Programs arecollected on a Fiscal-Year basis. Ingeneral, assistance rendered in a givenFiscal Year is relative to the returnscovering the prior Tax Year. The data inTable 13, which are presented on aTax-Year basis, are actually derived fromFiscal-Year reports.
NOTE: Data on IRS assistance representNOTES: For . 1970 and 1975, fiscal year was taxpayer contacts. Some taxpayers are involveddefined as July of the previous year through in more than one contact. The number ofJune of the year noted. For 1980, 1981, 1982, different taxpayers_a~sisted is not known.
-'a_nd__1983,_fiscdl -year was-defih-ed-es-Ott-ober of-the previous year through September of the yearnoted.
Additional detai 1 is published in theAnnual Report of the Commissioner of InternalRevenue.
SOURCE: Internal Revenue Service, ReturnsProcessing and Accounting Division, Revenue andAccounting Branch.
SOURCE: Data on paid preparers obtained fromStatistics of Income and Taxpayer Usage Studysampl es. Data on IRS assistance compiled bythe Taxpayer Service Division.
.5

Appendix
General Description of Statistics of IncomeSample Procedures and Data Limitations
This appendix discusses typical sampling proceduresused in most Statistics of Income (SOI) programs.Aspects covered briefly include sampling criteria,selection techniques, methods of estimation, andsampling variability. Some of the nonsampling errorlimitations of the data are also described, as wellas the tabular conventions employed.
Additional information on sample design and datalimitations for specific SOI studies can be found inthe separate SOI publications (see References). Moretechnical information is available, upon request, fromthe Statistics of Income Division.
SAMPLE CRITERIA AND SELECTION OF RETURNS
Statistics compiled for the SOI studies are gener-ally based on stratified probability samples of incometax returns or other forms filed with the InternalRevenue Service (IRS). The statistics do not reflectany changes made by the taxpayer through an amendedreturn or by the IRS as a result of an audit. Thesamples are based on such criteria as: principalbusiness activity; presence or absence of a schedule;State from which filed; size of adjusted gross income(or deficit) or largest of specific income (or loss)items; total assets or size of business and farmreceipts.
The probability of a return being designated dependson its sample class or stratum and may range from afraction of one percent to one hundred percent. Con-siderations in determining the selection probabilityfor each stratum include the number of returns in thestratum, the diversity of returns in the stratum, andinterest in the stratum as a separate subject ofstudy. All this is subject to constraints on theallowable total cost or total sample size for theprogram.
For most SOI studies, returns are computer desig-nated based on the Taxpayer Identification Number(TIN) which is either the Social Security Number(SSN) or Employer Identification Number (EIN). Insome cases, the ending digits of each TIN are comparedto a set of numbers randomly selected for each sampleclass. If the TIN ending digits are in the set, thenthe return is designated for the sample. Otherwise,it is not designated.
Alternatively, a fixed and essentially random numberis associated with each possible TIN. If that randomnumber falls into a range of numbers specified forthe return's sample stratum, then it is designated.Otherwise, it is not.
Under either method of selection, the TIN'sdesignated from one year's study are for the mostpart selected for the next study, so that a largeproportion of the new sample are repeaters. Thislongitudinal character of the sample design improvesthe estimates of change from one study to the next.
METHOD OF ESTIMATION
In general, weighting factors are obtained bydividing the computer count of returns filed for asample stratum by the actual number of returnssecured for the sample. These weighting factors arethen used to inflate the sample results to totalpopulation levels. During sampling, lists of thereturns designated are checked against the returnssecured for the sample to insure that the sampledesignated is the same as the sample selected.Special searches are made for returns not initiallysecured so that any bias from nonresponse is minimal.
For the individual income tax returns sample,weighting factors are computed for each sample classwithin each Internal Revenue district, even thoughthe district is not used to designate the sample.This is an example of post-stratified estimation andis used to improve the estimates for the States.Usage of post-stratified estimation is being studiedfor other SOI studies.
SAMPLING VARIABILITY
The particular sample used in a study is only oneof a large number of possible random samples thatcould have been selected using the same sample designEstimates derived from the different samples
w.ul~
usually vary. The standard error of the estimate isa measure of the variation among the estimates fromall possible samples and is used to measure the pre-cision with which an estimate from a particular sampleapproximates the average result of the possiblesamples. The sample estimate and an estimate of itsstandard error permit the construction of intervalestimates wi th prescribed confidence that thisinterval includes the actual population value.
In SOI reports the standard error is not directlypresented. Instead, the ratio of the standard errorto the estimate itself is presented in decimal form.This ratio is called the coefficient of variation(CV). The user of SOI data may multiply an estimateby its coefficient of variation to recreate thestandard error and to construct confidence intervals.
For example, if a sample estimate of 150,000returns is known to have a coefficient of variationof 0.02, then the following arithmetic procedurewould be followed to construct a 68% confidenceinterval estimate:
150,000 (sample estimate)x 0.02 (coefficient of variation)= 3,000 (standard error of estimate)
150,000 (sample estimate)+ or - 3,000 (standard error)
= 147,000 - 153,000 (68% confidence interval)
Based on these data, the interval estimate is from147 to 153 thousand returns. A conclusion that the
93

94 S01 Sampling Methodology
average estimate of the number of returns lies withinan interval computed in this way would be correct forapproximately two-thirds of all possible similarlyselected samples. To obtain this interval estimatewith 95% confidence, multiply the standard error bytwo before adding to and subtracting from the sampleestimate. (In this particular case, the resultinginterval would be from 144 to 196 thousand returns*.)
Further details concerning confidence intervals,including the approximation of CV's for combinedsample estimates, may be obtained on request bywriting to the Statistics of Income Division, D:R:S,Internal Revenue Service, Washington, DC 20224.
NONSAMPLING ERROR CONTROLS AND LIMITATIONS
Although the previous discussion focuses on samplingmethods and the limitations of the :data caused bysampling errors, there- are other sources of errorswhich may be significant in evaluating the usefulnessof SOI data. These include-taxpayer reporting errorsjprocessing errors, early cut-off of sampling, etc.More extensive information on nonsampling errors ispresented in SOI reports, when appropriate.
In transcribing and tabulating the information fromthe returns or forms selected for the sample,,checksare imposed to improve the quality of the resultantestimates. Missing entries are inputed during statis-tical processing by utilizing other information onthe return and accompanying schedules. Data may bedisaggregated and recombined during editing to-achieveco6-s-is-tent 'statistical- definitions:-.,- In -the- futurej-SOT studies will make use of earlier returns of thesame taxpayer to check current data, for instance theindustry code. Also, research on better methods ofimputing missing data is being conducted.
Quality of the basic -data abstracted at the procies-sing centers is controlled by a continuous samplinverification system. In addition, the Statistics NIncome Division in the National Office conducts-anindependent reprocessing of a small subsample ofstatistically processed returns as a further check.Prior to tabulation, numerous computer tests areapplied to each return record to check for inconsis-tencies.
Finally, before publication, all statistics arereviewed for accuracy and reasonableness in light ofprovisions of the tax laws, taxpayer reportingvariations and limitations, economic conditions,comparability with other statistical series, andstatistical techniques used in data processing andestimating'.
TABULAR CONVENTIONS
Estimates of frequencies. and money amounts that areconsidered unreliable, due to the small sample sizeon which they are based, are noted by an asterisk (*)to the left of the data item(s) in the tabulations.The presence of an asterisk indicates that the samplerate is less than 100 percent of the population andthere are fewer than 10 sample observations availablefor estimation purposes.
A dash in place of a frequency or amount indicatesthat no sample return had that characteristic. Inaddition, a dash in place of a coefficient ofvariation for which there is an estimate indicatesthat all returns contributing to the estimate wereselected at the 100 percent rate.
Whenever a weighted frequency. i,n a data cell isless than 3, the estimate is either combined withother cells or deleted in order to avoid disclj6sureof information about individual taxpayers orbusinesses. - These combinations and deletions areindicated by a double asterisk (**).
REFERENCES
[1) Statistics of Income--1982, Indiv'idual Income TaxR_eFu_rn9__r9W especially pages 75-78T.----
-[21-Stati-sti.cs -'of- -Incom'e-71981-, Corporation- IncomeTax Returns Tseeeoecially pages 9-15j.
[31 Statistics of Income--1980,- Partnership Returns(see especially pages
[4] istati'stics ' of Income- -1981, S,Iole Proprietorship
Returns (see espec-i-arFy-pages 5-9).
[51 Statistics of Income--1976-1979, 'InternationalIncome and Taxes,. For _T_ncom~__ and TaxesReported.,on U.S. Tax Returns (see especiallypages 13-15 and 85-87).
r.61 Statistics of Income--1973,, Sales of CapitalAssets Reported on Indivi-65-a-F-5-coFe-Tax Returnstsee especially pages 17770T.
r7l StatisticsIof Income--1976 Estate Tax Returns
(see especially pages 11-17TT
Statistics of Income--1974-1978, Private1-oundations (see especially pages 9-16).

Form 6839 (Rev. 4-85)Department of the Treasury USER SURVEYInternal Revenue Service
ISOI BULLETIN Spring 1985
Please take a few moments to answer the following questions concerning this Statistics of Income publication. Yourresponses will enable us to direct our efforts to meeting the needs of our users. After indicating your responses,please cut, tape, and mail. No postage or envelope is required. Thank you for your cooperation.
1 . How did you obtain this publication?
0 Purchased from the Government Printing Office 0 Subscription El Single copyEl From a public libraryEl From a university or college library0 Other (Specify)
2. Have you ever used any other Statistics of Income publication?
0 Yes (Specify)El No
3. What subject matter in the report interests you particularly?
El Individual Income Tax Rates, El Fiduciary Income Tax Returns, El Crude Oil Windfall Profit Tax1982 1982
El Taxpayers Classified by Sex El Environmental Taxes, 1981-83 0 Selected Statistical Series
4. Which table(s) in the Selected Statistical Series did you find helpful to your needs?
El Individual income tax returns 0 Business returns 0 Classes of excise taxes• Income and tax data by state 11 Corporation industry statistics 0 Number of returns filed• Individual average tax rates El Corporation income tax returns 0 Taxpayers receiving• Sole proprietorship returns E] Gross Internal Revenue collections assistance• Partnership returns El Internal Revenue refunds
5. If microdata files on computer tape were available in these subject matter areas, would you be interested inpurchasing them?
El Yes El No
If yes, which area(s)? (Specify)
6. How would you describe the useability of the text?
1:1 Too technical 0 About right0 Not detailed enough 0 Did not use text
7. What type of organization are you connected with?
0 Federal government El Consulting firmEl State or local government El Accounting firm0 Trade association El University or college0 Other nonprofit organization EJ Legal firmEl Other (Specify)
8. What changes (additions, deletions, alterations) would you like to see in the contents or format of this publication?
9. Other comments (Use other side if needed.)
Form 6839 (Rev. 4-85)

9. Other comments
Internal Revenue ServiceWashington, DC 20224
OFFICIAL BUSINESSPENALTY FOR PRIVATEUSE,$300.
Fold Here .
Fold Here
BUSINESS REPLY MAILFIRSTCLASS PERMITNO.12686 WASH I N GTO N, DC
POSTAGE WILL BE PAID BY IRS
Internal Revenue ServiceStatistics of Income Division D:R:S:P1111 Constitution Avenue, NWWashington, DC 20224
NO POSTAGENECESSARYIF MAILED
IN THEUNITED STATES

Other
Sol
PUBLICATIONSAndInformationAvailable
Department of the Treasury Publications are for sale by the Superintendent of Documents, U.S. Government
Internal Revenue Service Printing Office, Washington, D.C. 20402
Annual Statistics of Income Reports
Individual Income Tax Returns Publication 79Presents information on-Sources of incomeAdjusted gross incomeAdjustments to incomeItemized deductions
Exemptions Income tax withheld Data classified by-Taxable income and estimated tax Size of adjusted gross incomeIncome tax payments StatesTax credits Tax due and overpayment Taxpayer's marital status and
refunded sex, Taxpayers age 65 or over
Corporation Income Tax Returns Publication 16
Presents information on-ReceiptsDeductionsNet income
Other Publications
Individual Income TaxRates, 1979-1982
Foreign Income andTaxes Reported onIndividual Income TaxReturns, 1972-1978
Taxable incomeIncome tax
Sole ProprietorshipReturns, 1981
Foreign Income andTaxes Reported on U.S.Income Tax Returns,1976-1979
Tax credits Data classfied by-Distributions to stockholders Industry; Accounting periodAssets and liabilities Size of total assets
Size of business receipts
Partnership Returns,1980
Private FoundationsExempt From IncomeTax, 1974-1978
Estate Tax Returns, 1976
Other Information Available
All the items listed below, as well as other unpublished or special tabulations from the STATISTICS OF INCOME PROGRAM, are available
on a cost-reimbursable basis. Further details, including ordering information can be obtained by writing to: Director, Statistics of Income
Division D:R:S, Internal Revenue Service, 1111 Constitution Avenue, N.W., Washington, D.C. 20224, Tape files indicated with an (A) are
available (on a reimbursable basis) through the Machine Readable Archives Division (NRR) of the National Archives and Records Service,
Washington, D.C. 20408.
Corporation Source Book Small Area Data Public-Use Tape Files
Presents detailed income Data on individual income Continuingand balanced sheet data tax returns, exemptions,and Individual Tax Model, 1966-78(A), 1979-81classified by industry and adjusted gross income are Corporation Source Book, 1965-76 (A), 1977-81size of total assets. A presented by State, county, Estate Tax Returns, 1972, 1976general description is and SMSA. Also, the Private Foundations, 1974 (A), 1979available upon request. number of persons who Sole Proprietorships, 1980
moved from one location toNew Migration Dataanother based on addresses
shown on the returns. A County Migration Data, 1980-82, 1982-83
general description is County Migration Flow Data, 1978-80, 1980-81
available upon request. County Income Data, 1982

Notes

INDEX OF PREVIOUSLY PUBLISHEDSOI BULLETIN ARTICLESOssue, Volume and Number)
Corporation Income tax returns:Balance sheet and industry statistics:
1979, Spring 1982 (1-4)1980, Winter 1982-83 (2-3)1981, Winter 1983-84 (3-3)1982, Winter 1984-85 (4-3)
Income statement and industrystatistics:
1978, Fall 1981 (1-2)1979, Spring 1982 (1-4)1980, Winter 1982-83 (2-3)1981, Winter 1983-84 (3-3)1982, Winter 1984-85 (4-3)
Investment tax credit:1980, Winter 1983-84 (3-3)
Domestic International SalesCorporations:
1980, Fall 1983 (3-2)
Employee benefit plans:1977, Spring 1982 (1-4)
Estate tax returns:1983, Fall 1984 (4-2)
Excise taxes:Environmental:
1981-1982, Fall 1982 (2-2),Fall 1983 (3-2)
Exempt organizations:Other than private, foundat ions:
1975-1978, Fall 1981 (1-2)Private foundations:
1979, Fall 1982 (2-2)
Foreign Income and taxes:Controlled Foreign Corporations:
1980, Spring 1984 (3-4),Fall 1984 -(4-2)
Possession corporations tax credit:1980, Spring 1983 (2-4)
U.S. corporation foreign tax credit.-1978, Winter 1982-83 (2-3)1980, Summer 1984 (4-1),
Winter 1984-85 (4-3)
Individual Income tax returns:Historical summary of income andtaxes:
19i3-1982, Winter 1983-84*(3-3)Income, deductions and taxes:
1979, Summer 1981 (1-1)1980 Winter 1981-82 (1-3)
1982, Winter 1983-84 (3-3)1983, Winter 1984-85 (4-3)
Income by ZIP code areas:1969-1979, Spring 1983 (2-4)
Investment tax credit:1981, Spring 1984 (3-4)
Life cycle of individual tax returns:Spring 1984 (3-4)
Marginal and average tax rates:1980, Winter 1982-83 (2-3)1981, Fall 1983 (3-2)
Residential energy credit:1978-1980, Fall 1982 (2-2)
Sales of capital assets:1973-1980, Summer 1982 (2-1)
Taxpayer characteristics:1980, Fall 1981 (1-2),1981, Summer 1982 (2-1)1982, Summer 1983 (3-1)1983, Summer 1984 (4-1)
Taxpayers age 65 or over:1977-1981, Summer,1984 (4-1)
Lumber and paper Industries:Financial characteristics:
1980, Summer 1983 (3-1)
Nonresident alien Income and taxwithhold:
1971-1979, Spring 1982 (1-4)1980, Summer 1982 (2-1)1981, Summer 1983 (3-1)1982, Fall 1984 (4-2)
Partnership returns:Employment and payroll:
1979, Spring 1984 (3-4)Income statement and industrystatistics:
1978, Summer 1981 (1-1),Fall 1981 (1-2)
1979, Winter 1981-82 (1-3)1980, Summer 1982 (2-1)1981, Winter 1983-84 (3-3)1982, Summer 1984 (4-1)
Personal wealth:Composition of assets, 1982:
Winter 1984-85 (4-3)Realized income and personal
Spring 1983 (2-4)Trends, 1976-1981:
Summer 1983 (3-1)
wealth:
I1981-Winter-1.982r83-12, Private activity tax-exempt bonds:
--1983-,SWffm`er 1984-(4--l)-
Projections of returns to be filed:1982-1990, Winter 1981-82 (1-3)1983-1990, Fall 1982 (2-2)1984-1991, Fall 1983 (3-2)1985-1992, Fall 1984 (4-2)
Safe Harbor Leasing:1981-1982, Fall 1983 (3-2)
Sales of capital assets(See individual income tax returns)
Sole proprietorship returns:Income statement and industrystatistics:
1978, Summer 1981 (1-1),Fail 1981 (1-2)
1979, Winter 1981-82 (1-3)1980, Summer 1982 (2-1)1981, Summer 1983 (3-1)1982, Summer 1984 (4-1)
Nonfarm proprietorships and sex ofowner:
1980, Spring 1983 (2-4)
Superfund for environmental taxes(See excise taxes)
Tax incentives for saving:Spring 1984 (3-4)
Underground economy:Informal suppliers:
Summer 1983 (3-1)Tip income in eating places:
1982, Winter 1983-84 (3-3)
Windfall profit tax:1980, Fall 1981 (1-2)1981, 1st quarter, Winter 1981-82 (1-3)1981, 2nd quarter, Spring 1982 (1-4)1981, 3rd quarter, Summer 1982 (2-1)1981, 4th quarter and year total,
Fall 1982 (2-2~1982, ist quarter, inter 1982-83 (2-3)1982, 2nd quarter, Spring 1983 (2-4)1982, 3rd quarter, Summer 1983 (3-1)1982, 4th quarter and year total,
Fall 1983 (3-2)1983, 1st quarter, Winter 1983-84 (3-3)1983, 2nd quarter, Spring 1984 (3-4)1983, 3rd quarter, Summer 1984 (4-1)1983, 4th quarter and year total,
Fall 1984 (4-2)1984, 1st quarter, Winter 1984-85 (4-3)