
Analysis of the 2001 lava flow eruption of Mt. Etna from three-dimensional mapping
Statistical properties of paleomagnetic directions in
Kerguelen lava flows: Implications for the late
Oligocene paleomagnetic field
P. Camps,1 B. Henry,2 K. Nicolaysen,3 and G. Plenier2
Received 24 July 2006; revised 25 January 2007; accepted 21 February 2007; published 23 June 2007.
[1] We present the results of a paleomagnetic study of seven new volcanic sections(146 flows) from Kerguelen Archipelago. For two of these sections, preliminary(40Ar/39Ar) ages are reported to aid in the calibration of the paleomagnetic results. Theprimary contribution of this report, however, is a compilation of these new data with thosealready published in order to describe statistically the characteristics of the paleomagneticfield as recorded by the Kerguelen flood basalts. In total, 258 paleomagnetic directionssampled at 13 stratigraphic sections through the lava pile are available and span anapproximately 5 Ma window: from 25 to 30 Ma. The composite section represents at least11 polarity zones that are correlated to the reference geomagnetic polarity timescale.Our approach is to investigate the average normal and reversed polarity field directionsover this 5 Ma window. We calculated a paleomagnetic pole found to be located atl = 85.5�N, f = 189.3�E (A95 = 2.3�, K = 16.5, N = 233). This pole is in close agreementwith the coeval paleomagnetic poles obtained from different worldwide places whenanalyzed in the Indo-Atlantic hot spot reference frame. In the statistical analysis we tacklethe specific question: Is the secular variation isotropic? This question is directly related tothe occurrence of a longitudinal confinement of the virtual geomagnetic poles, whichis still a matter of debate among paleomagnetists. By means of statistical tests we showthat the paleomagnetic data from Kerguelen agree with an isotropic model for paleosecularvariation. Finally, we present adjustments to Camps and Prevot’s (1996) statistical model,developed for some Northern Hemisphere latitudes, to the Southern Hemispherepaleomagnetic data from Kerguelen.
Citation: Camps, P., B. Henry, K. Nicolaysen, and G. Plenier (2007), Statistical properties of paleomagnetic directions in Kerguelen
lava flows: Implications for the late Oligocene paleomagnetic field, J. Geophys. Res., 112, B06102, doi:10.1029/2006JB004648.
1. Introduction
[2] During the past 10 years, significant advances havebeen made in numerical simulation of the Earth’s dynamo.Glatzmaier and Roberts [1995] showed for the first timethat a numerical model of convection-driven dynamo inspherical shells, based on the fundamental equations of themagnetohydrodynamics and relatively realistic physico-chemical properties of the Earth’s core, can generate amagnetic field with a morphology and behavior close tothat known for the Earth. Since then, several other numer-ical models were developed with the objective to be as closeas possible to Earth-like parameters [Kuang and Bloxham,1997; Olson et al., 1999; Sakuraba and Kono, 1999;Takahashi et al., 2005]. Even if none of these models can
claim to represent the geodynamo, and they will probablynever be able to do so [Holme, 2004], they, nevertheless,reached a degree of improvement, adding new insights toour knowledge of the Earth’s deep interior. For instance,models with imposed nonuniform core-mantle boundary(CMB) heat flow [Coe et al., 2000;Kutzner and Christensen,2004] simulate perfectly the longitudinal organization ofvirtual geomagnetic poles (VGP), one through North andSouth America and the other through eastern Asia andAustralia, as described by Laj et al. [1991] from sedimen-tary records of reversals over the last 12 Ma. An alternativemodel assumed a heterogeneous conducting layer at thebase of the mantle [Runcorn, 1992] which seems a morequestionable mechanism to influence the trajectory of VGPsduring reversals [Aurnou et al., 1996; Brito et al., 1999;Costin and Buffett, 2004].[3] Whatever the nature of CMB heterogeneities, the
fundamental question to be addressed is inherent in theinterpretation of Laj et al. [1991] observations; that is, dosediments properly record rapid geomagnetic events such asreversals or excursions? The complexity of the acquisitionof remanent magnetization by sediments is such that somerock magnetists could come to the conclusion that the
JOURNAL OF GEOPHYSICAL RESEARCH, VOL. 112, B06102, doi:10.1029/2006JB004648, 2007ClickHere
for
FullArticle
1Geosciences Montpellier, Centre National de la Recherche Scientifiqueand Universite de Montpellier 2, Montpellier, France.
2Institute de Physique du Globe, Paris, France.3Department of Geology, Kansas State University, Manhattan, Kansas,
USA.
Copyright 2007 by the American Geophysical Union.0148-0227/07/2006JB004648$09.00
B06102 1 of 14

transitional zones observed in some sedimentary sequencesare nothing more than artifacts [Rochette, 1990; Langereis etal., 1992]. In contrast, volcanic rocks are reliable recorders ofthe geomagnetic field. However, statistical analyses of thelocation of transitional VGPs recorded exclusively byvolcanic rocks from all around the world during the last20 Ma have proposed conflicting conclusions [Prevot andCamps, 1993; Love, 2000; Valet and Herrero-Bervera,2003].[4] Examination of paleosecular variation (PSV) provides
an alternative source of information into the possible controlof the configuration of the paleomagnetic field by the lowermantle. Constable [1992] pointed out that one of thepreferred longitudinal bands coincides with that expectedfrom reversal of a nonaxial dipole field exactly like thatpresent in the modern day field. Then, she argued that ifpersistent nonzonal terms exist, they may generate VGPpositions nonuniformly distributed in longitude even duringtimes of stable polarity, as seems to be supported by theglobal PSV volcanic records for the last 5 Ma [Constable,1992]. On the contrary, Camps and Prevot [1996] showedthat the PSV remains isotropic during the last 15 Ma atthe regional scale of Iceland. Thus, despite the largenumber of paleomagnetic studies devoted over the past20 years to the study of the geomagnetic field fluctua-tions, from PSV to reversals, the question of whether thelower mantle influences the core dynamo is still a matterof debate.[5] We believe that useful input to this issue may be
obtained by studying the statistical properties of the fieldfluctuation over several million years at a particular region,similar to previous studies of Iceland [Kristjansson, 1985;Camps and Prevot, 1996]. The French volcanic islands nearAntarctica (New Amsterdam, Crozet, and Kerguelen Archi-pelagos) located in the southern Indian Ocean represent anuncommon opportunity to carry out such a regional study.The subaerial volcanism is of different ages in these islands,younger than 1 Ma in Amsterdam, Plio-Pleistocene inCrozet, and mainly Oligocene in Kerguelen. Recent paleo-magnetic results obtained from this area deserve specialattention. First, PSV data for the last 5 Ma recorded in lavaflows from Possession Island (Crozet Archipelago) [Campset al., 2001] agree with the general anisotropic PSV modelproposed by Constable and Johnson [1999], which assumesthat the boundary conditions at the core-mantle interface aregeographically heterogeneous. Second, the transitional fieldof two distinct recent excursions (one recorded in Posses-sion Island [Camps et al., 2001] and the other recorded inAmsterdam Island [Carvallo et al., 2003], located 2300 kmnortheastward from Crozet Archipelago) would have revis-ited the same VGP location, which is within one of thepreferred longitudinal bands of Laj et al. [1991]. Both ofthese observations support the controversial hypothesis ofmantle influence on the dynamic of the outer core. Thoseseem, however, to be limited to the few last million yearsbecause the PSV data obtained on Kerguelen, a volcanicArchipelago located in the same part of the southern IndianOcean for which the subaerial flows are mainly of lateOligocene age, agree with an isotropic model for PSV[Plenier et al., 2002].[6] In the present study we address the statistical descrip-
tion of the paleomagnetic field fluctuations recorded on
Kerguelen by reporting 146 new paleodirection determina-tions to supplement previous studies [Henry and Plessard,1997; Plenier et al., 2002] and then by proposing astatistical model for the paleomagnetic field fluctuationscompatible with the whole data set (258 paleodirections).
2. Paleomagnetic Sampling
[7] A statistical description of the paleofield fluctuationsimposes some constraints on the way in which samplingmust be carried out. For instance, it has to be homogeneousover a period of time as long as possible. To accomplishthis, our field work strategy dictated that we avoid signif-icant temporal overlap between the different stratigraphicsections while taking care to leave a minimum of timeintervals unsampled. For each section we decided to sampleeach successive lava flow even if this choice is questionableand time consuming. On the one hand, the Camps andPrevot [1996] model requires inclusion of the full spectrumof field fluctuations, from secular variation to reversals;hence we want to recover any existing magnetic transitionaldirections. Moreover, because of the particular field tripconditions encountered on Kerguelen (difficulty and cost ofaccessing the Archipelago) combined with logistically fieldconditions, the possibility to later supplement a sampling isalways uncertain. On the other hand, in the absence of veryaccurate age estimates for each flow and because of theepisodicity of volcanism only the chronological order isknown for the instantaneous records of the paleomagneticfield provided by a succession of lava flows, not the timeelapsed between each flow and its captured reading of themagnetic field. Thus we have to assume, tentatively, thateach flow represents an independent reading of the geo-magnetic field, which is not true if several successive flowsare erupted in a short time interval.[8] We benefited from a very detailed geological knowl-
edge of the Archipelago [Nougier, 1970], intensive strati-graphic geochemical investigations (see Doucet et al.[2005] for a review), and numerous radiochronologic ages[Frey et al., 2000; Nicolaysen et al., 2000; Doucet et al.,2002] to make an initial selection of the sampling sites.Then, we kept only those not affected by significant tectonicevents and presumed to encompass a large time interval,e.g., recovering a maximum number of minimally alteredlava flows.[9] Paleomagnetic studies of the volcanic sequences very
often come up against the difficulty to know if, when thelavas in the section show a small dip, this dip is of tectonicor topographic origin. In the present case our choicewhether to apply a tectonic correction was determined fromgeological data [Nougier, 1970], our own field observations,and partly from studies of the magnetic fabric [Henry et al.,2003; Plenier et al., 2005] that can make it possible, incertain cases, to find the flow direction of the lava. We didnot apply corrections when the flow direction and theazimuth of the present dip are similar because we cannotexclude the hypothesis that this one is of topographic originand inherent to the flow. The contrary case, i.e., dipdirection and flow direction are not the same, indicateswithout any doubt that a postemplacement tilting occurs,and thus it was taken into account.
B06102 CAMPS ET AL.: STATISTICAL PROPERTIES OF PALEOMAGNETIC DIRECTIONS
2 of 14
B06102

[10] Seven new cross sections supplementing the formerstudies are presented below and located on Figure 1.Additional information may also be retrieved from theauxiliary material (Table S1).1
2.1. Port Jeanne d’Arc
[11] We continued the previous paleomagnetic samplingof Henry and Plessard [1997] at the Ravin du Charbon,starting at the next flow upward, and also sampled a secondsection at Ravin Jaune, 2 km east from Ravin du Charbon,where additional flows crop out stratigraphically beneaththose of the former published sampling. Interbedded con-glomerate deposits overlain by trachytic tuffs and brecciasprovide obvious stratigraphic correlations between thesestwo sections. Eruption of these lava are interpreted from40Ar/Ar39 dating to be synchronous at 25 Ma [Frey et al.,2000]. We present 25 paleomagnetic directions in a com-bined section of 400 m of cumulative thickness. Thesedirections have been corrected from a gentle postemplace-ment tilting, 5� toward the WNW, as recommended byHenry et al. [2003].
2.2. Ile Haute
[12] We sampled 22 lava flows through a 320 m thickvertical cross section. This site was selected because in aprevious paleomagnetic study, Derder et al. [1990] havesuggested the presence of intermediate field directions. Noradiochronological age is available as the plagioclase feld-spar and glassy groundmass, upon which the argon datingrelies, have begun alteration to clays. In this area, lava flowspresent a constant and very gentle dip of 2� toward the east.However, we did not correct for tilting the paleomagneticdirections obtained in this section since this dip is similar tothe flow direction inferred from field observations [Nougier,1970], and thus it is certainly of topographic origin.
2.3. Port Raymond
[13] We selected this 250 m thick vertical cross sectionbecause there is no doubt from field observations that itcorresponds to the direct downward continuity of the IleHaute section with little or no overlap. Nine lava flows havebeen sampled. Plenier et al. [2005] confirmed from anisot-ropy of magnetic susceptibility measurements that the flowdirection is eastward, e.g., similar to the present dip. Thusthe data for this section were not corrected for tilting.
2.4. Mont Bureau
[14] Watkins et al. [1974] reported a paleomagnetic studycarried out on the seven lower flows, but these directionsshould be regarded with caution as attested to by the largevalues of the 95% confidence limits for the mean directiona95. We resampled exactly the same flows plus 11 overlyingflows. The thickness of our section is about 400 m. Werecommend that our results do not complete but, instead,supersede the ones described by Watkins et al. [1974]. Thislava pile was emplaced between 29.3 Ma and 28.5 Ma[Nicolaysen et al., 2000]. Yang et al. [1998] did not findobvious evidences from petrographic observations andgeochemical analysis to constrain stratigraphic correlation
between this section and the coeval Mont Rabouilleresection [Plenier et al., 2002]. Again, we did not applycorrections for a postemplacement tilting since the verygentle dip of 2� toward the NE, that we directly measured,seems to correspond to the flow direction [Plenier et al.,2005].
2.5. Port Christmas
[15] Sixteen flows have been subject to a paleomagneticsampling. Unfortunately, owing to very difficult field work-ing conditions, we had to stop sampling before reaching thetop of this section, leaving about 10 flows unsampled. Anargon isotopic study failed to give reliable ages, probablybecause of a significant postmagmatic alteration. Lavaflows are subhorizontal.
2.6. Trois Menestrels
[16] To date, neither paleomagnetic nor geochemicalstudies have been carried out on volcanic rocks from thiswide area located in the southern part of the Archipelago.We sampled 42 lava flows through a 650 m thick section. Apreliminary Ar/Ar date for the top of the section is presentedbelow, and a geochemical study of this section is in progress(H. Diop, personal communication, 2005). Directions havebeen corrected for a tectonic postemplacement tilting (dip is8�, dip direction is 120�) estimated from field measurements
Figure 1. (a) Location of the sampling sites on aKerguelen Archipelago map. The numbered solid circles(this study) are 1, Port Jeanne d’Arc; 2, Ile Haute; 3, PortRaymond; 4, Mont Bureau; 5, Port Christmas; 6, TroisMenestrels; and 7, Sentinelles. The lettered open circles[Plenier et al., 2002] are a, Mont Amery; b, MontTourmente; c, Mont Rabouillere; d, Mont Tempete; and e,Mont des Ruches. The open square is Port Couvreux [Henryand Plessard, 1997]. The distributions of quaternarydeposits (light grey), flood basalts (medium grey), andplutonic complexes (dark grey) are also shown. (b) Locationin the Indian Ocean of the Kerguelen Archipelago (solidstar) and the Crozet Archipelago and New Amsterdam(solid circles).
1Auxiliary materials are available at ftp://ftp.agu.org/apend/jb/2006jb004648.
B06102 CAMPS ET AL.: STATISTICAL PROPERTIES OF PALEOMAGNETIC DIRECTIONS
3 of 14
B06102

of several apparent dips. This correction seems to bejustified since the present dip significantly differs from theflow direction assumed to be southward in this area [Nougier,1970].
2.7. Sentinelles
[17] Located just a few kilometers south of TroisMenestrels, we suspected from field observations that thissection partly overlaps the Trois Menestrels. Thus only14 volcanic units were sampled from a 160 m cumulativethickness. Preliminary Ar/Ar dates for the top and base ofthe section are presented below. Directions were trans-formed into tilt-adjusted coordinates (dip is 8�, dip directionis 103�). This correction is estimated, as for the TroisMenestrels section, from field measurements of severalapparent dips.[18] For each section the sampling was carried out
identically. We collected an average of seven cores for each
successive flow using a gasoline-powered portable drill.Samples were oriented using a magnetic compass correctedfor local and regional anomaly by sighting either the Sun ata known time or known landmarks.
3. Paleodirection Determinations
[19] We determined the paleodirections according to astandard procedure adopted in our laboratory. It consists oftreating two pilot samples from each flow in a null magneticfield environment, one by stepwise alternating fields (AF)and a second by stepwise heatings, using a very detailedexperimental procedure involving up to 18 steps. Assumingthat the remanence properties are homogeneous at a flowscale, the remaining samples for each flow are then treatedwith a reduced number of selected steps, between 7 and 10,according to the paleomagnetic treatment which seems to usthe best adapted to isolate the characteristic remanentmagnetization (ChRM). Examples of demagnetization dia-gram for normal, reverse, and intermediate polarity arepresented in Figure 2. We determined ChRM directionsby means of the principal component analysis using themaximum angular deviation (MAD) [Kirschvink, 1980] as ameasure of the inherent scatter in directions. We averagedthe directions thus obtained by flow and calculated thestatistical parameters assuming a Fisherian distribution[Fisher, 1953]. The complete results of these analysis aregiven in Table S1. The ChRMdirections cluster well for eachflow with rather small values of the 95% confidence limitsabout the mean direction (a95), 45% of determinations � 5�and 96% � 10�.
4. Additional 40Ar/39Ar Age Determinations
[20] Three samples were chosen for dating from TroisMenestrels and Sentinelles sections such that the greatestpossible stratigraphic range was obtained and that thesamples showed the least postemplacement alteration.K2S-1, K2S-17, and K2M-59 come from the bottom andtop of the sampled Sentinelles section and the top of theTrois Menestrels section, respectively. Unfortunately, thefour lowermost flows from the Trois Menestrels sectionshowed significant alteration, including calcite veins andabundant chlorite in the groundmass. The three datedsamples contain microphenocrysts of plagioclase, clinopyr-oxene, and abundant iron-titanium oxides and have a nearlyholocrystalline matrix. Vesicles are filled with chlorite, andthe olivine phenocrysts of KSM-59 have similarly altered tochlorite and other clays.[21] The samples were crushed and sieved to obtain 0.3–
1.0 mm size fractions, which were then handpicked toobtain a uniform whole rock separate that was sent to theNevada Isotope Geochronology Laboratory (NIGL) at theUniversity of Nevada, Las Vegas. After a final picking atNIGL, samples were packaged with Fish Canyon Tuffsanidine and CaF2 and K-rich glass fluence monitorsfollowed by irradiation for 7 hours at the McMaster Uni-versity Nuclear Reactor in Ontario. Fusion of three to fivecrystals of the fluence monitors yielded J values whosereproducibility was 0.05–0.35% throughout the 100 mmlong irradiation package and the neutron flux varied lessthan 4%. Other correction factors include (40Ar/39Ar)K =
Figure 2. Example of vector endpoint diagrams of (left)progressive thermal and (right) AF demagnetizations for(a, b) normal, (c, d) intermediate, and (e, f) reversedirections. Projections are in geographic coordinates forFigures 2a, 2c, 2e, and 2f or tilt-corrected coordinates forFigures 2b and 2d. Solid (open) symbols represent projectioninto horizontal (vertical) planes. Figures 2b, 2d, and 2f showthat the ChRM are easily isolated even when large secondarycomponents are present.
B06102 CAMPS ET AL.: STATISTICAL PROPERTIES OF PALEOMAGNETIC DIRECTIONS
4 of 14
B06102
0.0001 ± 100%, (36Ar/37Ar)Ca = 2.62 (±2.28%) � 10�4, and(39Ar/37Ar)Ca = 6.59 (±0.44%) � 10�4. At NIGL, standardlaser and furnace step-heating procedures were used [seeReiners et al. 2004, Appendix B], and during these analy-ses, 40Ar/36Ar = 291.24 ± 0.24%; thus a mass discrimina-tion correction of 1.01400 was applied to the data, whichwere reduced, and ages were calculated using LabSpecsoftware (B. Idleman, Lehigh University). During the datareduction at NIGL the Fish Canyon sanidine was assigned anage of 27.9 Ma [Steven et al., 1967; Cebula et al., 1986], butthe data were recalculated using an age of 28.02 Ma for thestandard so that these results may be compared consistentlywith those of previous studies [Nicolaysen et al., 2000].[22] Each of the samples resulted in a total gas age,
considered equivalent to a K-Ar age (Table S2). Neitherisochron nor plateau ages, as defined by McDougall andHarrison [1999] and Wendt and Carl [1991], were obtainedwithin the 1s confidence limits. Although plateaus were notobtained, the age spectra do not show evidence of partialdiffusive loss. The ages obtained for K2S-1 (28.95 ±0.22 Ma) and K2S-17 (27.02 ± 0.14 Ma) are consistentwith the stratigraphy; that is, the age of the base of thesection is older. K2M-59, the top of the Trois Menestrelssection, yields an age (27.84 ± 0.12 Ma) that overlaps withthe range of the Sentinelles section. These ages are youngerthan those measured on basalts exposed on the northern andnortheast peninsulas of the Archipelago (�29 Ma) butsignificantly older than those of the sections sampled atMont Crozier and at the Jeanne d’Arc peninsula (�25 Ma)[Frey et al., 2000; Nicolaysen et al., 2000; Doucet et al.,2002].
5. Kerguelen Paleomagnetic Data Set
[23] We gathered the data described in the present studywith those previously published by Plenier et al. [2002] andHenry and Plessard [1997]. We did not include in this newdata set the sections of Port Douzieme and Puy Saint-Theodule [Henry and Plessard, 1997], because their agesare unknown, and the Grande Cascade section [Watkins etal., 1974], because it was partly resampled last year in orderto determine its age and better specify some paleomagneticdirections. This study is still in progress. On the whole wecollected 258 directions sampled at 13 sections through thelava pile. This sampling represents about 4000 m ofcumulative thickness of Kerguelen flood basalts.
5.1. Stratigraphic Correlations
[24] We think it is important in a statistical analysis of thepaleomagnetic field fluctuations to have an elementaryknowledge of the temporal succession of field recording.Here this is achieved by tentatively correlating the measuredKerguelen polarity zones to the Oligocene geomagneticpolarity timescale (GPTS), using the same working hypoth-esis as Plenier et al. [2002]. First, they assumed that all thepolarity chrons spanning the emplacement of a section wererecorded. Second, when ages within the 2s uncertainty donot allow an unique interpretation, they kept the solutionclosest to the best available age. In this exercise it isimportant to keep in mind, as underlined by Riisager etal. [2005], that there are also uncertainties on the GPTSages. We chose arbitrarily to refer to Huestis and Acton’s
[1997] GPTS rather than that of Cande and Kent [1995].These two GPTS calculated from different magnetic anoma-lies differ from 0.260 Ma to the maximum during the lateOligocene, which is not really significant for our purpose.To be accurate, we adjusted Huestis and Acton’s [1997]GPTS +0.6% downward in age in accordance with therevision of the Fish Canyon sanidine reference standard(28.02 Ma) used for Kerguelen Ar isotopic studies[Nicolaysen et al., 2000], whereas the reported GPTS usedthe old value (27.84 Ma).[25] Hence the R-N transition recorded at Port Jeanne
d’Arc would coincide with the termination of the chronC7n-1r. Without a doubt the Trois Menestrels section spansan interval during the C9n chron, and the Mont Bureausection would partly overlap the Mont Rabouillere sectionduring the chrons C10r and C10n-2n (Figure 3). Among thesections for which at least one isotopic age is available, onlythe Mont de la Tourmente section poses a problem ofcorrelation already widely discussed by Plenier et al.[2002]. They had no basis to clearly assign this section toa specific chron, as four possibilities were statisticallyacceptable. Of course, the correlation of the sections forwhich we do not have an absolute age is clearly moredubious. We have, however, important reasons to think,according to our field observations and local geology knowl-edge, that the combined section Ile Haute/Port Raymond isstratigraphically located just under the Mont Amery section.For the same reasons we think that Port Couvreux section isjust below Port Raymond. The stratigraphic correlation ofPort Christmas section is also uncertain. From geologicalconsiderations, flood basalts in this area are presumed tohave erupted around 28 Ma (A. Giret, personal communi-cation, 2005), which leaves us few possibilities of correla-tions since three polarity chrons are present in this section.Our preferred interpretation is to consider this sectioncoeval to the chrons C10n-1n, C9r, and C9n. Unfortunately,it is not easy to compare volcanic data from different sites,even when they can be demonstrated to correspond to thesame reversal or the same polarity zone.[26] We believe that although some sections have the
same age, the distance between the sections and paleotopo-graphic controls on flow emplacement preclude the possi-bility that the exact flow sequence was sampled severaltimes at different locations. They usually provide comple-mentary paleomagnetic records. This could explain why, forall of these sections, we could not strengthen the proposedcorrelations using paleomagnetic direction.[27] To summarize, we believe that the Kerguelen data set
would cover at least 11 polarity zones of the 16 known forthe Late Oligocene, from 25 to 30 Ma (Figure 3).
5.2. Kerguelen Paleomagnetic Pole
[28] By definition a paleomagnetic pole has to be calcu-lated from data that are representative of the axial dipolemodel. There are no doubts that the Kerguelen sampling,which encompasses 5 Ma of field fluctuation recording, iswell suited to the calculation of a paleomagnetic pole withthe condition that we can isolate the transitional data. Thisproblem is not as simple as one would think. There ispresently no general agreement regarding the upper limit ofpaleosecular variation (PSV). Most commonly, VGP lati-tudes in the geographical reference frame, rather than local
B06102 CAMPS ET AL.: STATISTICAL PROPERTIES OF PALEOMAGNETIC DIRECTIONS
5 of 14
B06102

field directions, are used to delimit the PSV realm. Theproposed threshold to avoid inclusion of transitional datavaries between a maximum of 60� [Prevot and Camps,1993] and a minimum of 35� [Kristjansson, 1985], a 45�value being often used for the calculation of the VGP scatterrepresentative of paleosecular variation [McFadden et al.,1991]. Vandamme [1994] speculated that since the PSVdepends on the site latitude, the VGP cutoff should also belatitudinally dependent. Then, he proposed a numericalprocedure to calculate an optimum cutoff angle on the basisof the assumption that a given VGP distribution is describedby the sum of two contributions: a Fisherian distribution forthe PSV and a uniform distribution for the transitionalregime. The main drawback is that the PSV subset selectedin this procedure has to be Fisherian and thus has azimuthalsymmetry about the mean, which is one of the statisticalcharacteristics we want to investigate. As a result of this
uncertainty on the VGP cutoff, estimates of the paleomag-netic pole position and figures calculated for describing thedispersion ascribed to PSV are somewhat arbitrary. Paleo-secular variation in Kerguelen is of little interest untilcompared with a global model for the same time interval.Unfortunately, many statistical models for paleosecularvariation, such as the most recent one TK03 [Tauxe andKent, 2004], are constructed to fit the paleomagnetic datafor the last 5 Ma. To our knowledge, only one PSV modelexists for the Oligocene data [McFadden et al., 1991],which is fitted using a data set limited to the VGPs havinga paleolatitude greater than ±45�. Thus, in the presentanalysis the VGP cutoff is necessarily the same.[29] Now one other difficulty exists: The geographical
reference frame is estimated back through time only frommean global paleomagnetic poles that depend on models ofthe relative positions of tectonic plates. To overcome this
Figure 3. Magnetostratigraphic correlations with the global geomagnetic polarity timescale [Huestisand Acton, 1997]. The sections for which radiometric ages are available are marked with an asterisk. Weused geological and geochemical observations to correlate the remaining sections.
B06102 CAMPS ET AL.: STATISTICAL PROPERTIES OF PALEOMAGNETIC DIRECTIONS
6 of 14
B06102

difficulty, we will assume that the mean Kerguelen pole isrepresentative on the paleogeographic axis, and thus weconsider VGPs having a latitude less than ±45� in theKerguelen mean pole reference frame as transitional. Wecalculated the mean paleomagnetic axis from an iterativeeigenvector analysis, starting with all poles and removingstep by step the furthest VGP until all VGPs were located atan angular distance from the mean axis lower than or equalto 45�. In total, we excluded from the analysis 25 VGPsconsidered to be intermediate, e.g., indicating either apolarity reversal or a geomagnetic excursion.[30] VGPs locations have been analyzed for both normal
and reversed polarities (Table 1) in the present geographicalreference frame. The angle between the mean VGPs ofnormal and reversed polarities is 177.3�. That is, when oneof the mean poles is flipped to its antipode, each mean poleslies inside the 95% confidence region of the other. Thereversal test is necessarily positive. This conclusion isillustrated graphically (Figure 4) by means of the bootstraptest for a common mean [Tauxe, 1998] and furthermorevalidated with a formal statistical test [McFadden andMcElhinny, 1990], the angle of 2.7� found between thetwo mean poles being less than the critical angle of 4.8�. Apositive reversal test ensures that the paleomagnetic treat-ment successfully removed the secondary natural remanentmagnetization (NRM) and that the sampling adequatelyaveraged the PSV. We processed the combined data byreversing the VGPs of reversed polarity to calculate a
paleomagnetic pole found at 85.5�N, 189.3�E in the presentlatitude-longitude grid. This location is estimated with avery good statistical precision as attested by the low valueof A95, 2.3�. We deduced from this paleomagnetic resultthat the Kerguelen Archipelago latitude at the late Oligo-cene was about 51�S, e.g., less than 2� south of its presentlocation. Finally, we point out that this new Kerguelenpaleomagnetic pole is in perfect agreement, within 2�, withthe master apparent polar wander path for the Antarcticaplate [Besse and Courtillot, 2002].
5.3. Global Late Oligocene Paleomagnetic Pole
[31] An additional test for the reliability of the Kerguelenpaleomagnetic pole is to check whether this pole is in closeagreement with the coeval paleomagnetic poles obtainedfrom different locations worldwide. Eight poles (Table 2),for which the estimated ages within error falls in the interval25–30 Ma, have been selected using the same selectioncriteria as Prevot et al. [2000]. That is, the selected poles arerestricted to magmatic units, calculated from a minimum of10 sites with at least 5 samples per sites, and must have anassociated Fisher dispersion parameter K between 10 and100. Larger K are generally indicative of an inadequatesampling of PSV. We performed this comparison in theIndo-Atlantic hot spot reference frame. The finite rotationpoles used to transfer the paleomagnetic poles into this newreference frame are calculated from Royer et al.’s [1992]and Muller et al.’s [1993] reconstructions using a globalcircuit through central Africa. We used the mean ageassociated with each paleomagnetic pole to calculate thefinite rotation (Table 2) assuming a linear interpolation withtime between the total reconstruction poles yielded in theliterature at 20.5 and 35.5 Ma.[32] In the Indo-Atlantic hot spot reference frame the
Kerguelen paleomagnetic pole is located within the 95%confidence cone about the mean global late Oligocene pole(86.4�N, 160.1�E, A95 = 4.6�, K = 146.9, N = 8) (Figure 5).We conclude that this pole should be considered as veryreliable and thus can be combined with the eight others. Themean late Oligocene paleomagnetic pole is then estimated at(86.4�N, 162.6�E, A95 = 4.0�, K = 166.6, N = 9), e.g., atabout �4� from the Earth’s actual spin axis. Prevot et al.
Table 1. Statistical Analysis of Flow Average Dataa
Normal Polarity Reversed Polarity All
N 144 89 233Mean latitude 85.1 �85.8 85.5Mean longitude 177.6 31.5 189.3A95 3.0 3.8 2.3R 135.23 83.73 218.91K 16.3 16.7 16.5
aN is the number of lava flows, A95 is the 95% confidence limit aboutmeans in degrees, R is the vector sum of N unit vectors, and K is the Fisherconcentration parameter (N � 1)/(N � R).
Figure 4. Histograms of Cartesian coordinates of the mean bootstrapped normal (solid line) and reverse(dashed line) VGP and their 95% confidence intervals [Tauxe, 1998] for the PSV data set (N = 233). Inorder to directly compare the two distributions, VGPs of reversed polarity have been flipped to theirantipode. The two means cannot be distinguished at the 95% level of confidence since the confidenceintervals for the two distributions overlap for each Cartesian coordinate.
B06102 CAMPS ET AL.: STATISTICAL PROPERTIES OF PALEOMAGNETIC DIRECTIONS
7 of 14
B06102

[2000] and Besse and Courtillot [2002] have alreadyobserved this 4� difference, but their interpretations differ.Prevot et al. [2000] explained this difference as ‘‘secular’’wandering, induced by some transient modifications of theinertia tensor of the Earth, of the instantaneous geographicpole around its time-averaged position, whereas Besse andCourtillot [2002] proposed a change in the time-averagedposition of the rotation axis, what is literally called truepolar wander (TPW). A controversial debate exists on TPW;some authors consider that TPW as seen from the paleo-magnetic data is purely an artifact [Tarduno and Smirnov,2001]. Then, a further discussion on the explanation of thedifference between the global Oligocene pole calculated inthe present study and the actual Earth’s spin axis is beyondthe scope of the present study.
5.4. Late Oligocene Mean Magnetic Field
[33] In the section 5.3, we assumed that the time-averagedfield is purely dipolar. We propose now to check whetherthe averaged field during the late Oligocene includes asignificant zonal quadrupolar component (g2
0), as it wassuggested by Rochette et al. [1998] but not confirmed byRiisager et al.’s [2005] analysis. We performed the test bycalculating the local field directions from the nine selectedpoles and then recalculated each pole location assumingvarious contributions of an axial quadrupole component.In practice, we used the offset dipole model [Wilson andAde-Hall, 1970] in which the local field inclination I isrelated to the paleomagnetic colatitude q by
I ¼ tan�1 2 cot q sin�1 x sin qr
� �� �� �� sin�1 x sin q
r
� �
where r = (x2 + R2 � 2Rx cos q)1/2, R is the radius of theEarth, and x is the displacement positive northward of thedipole along the rotational axis. This displacement can beexpressed in term of harmonic coefficients by
x ¼ 1
2
g02g01
R
The test consists of searching for, through an iterativeprocess, the value of the dipole displacement that producesthe minimum scatter in the nine poles when analyzed in thehot spot reference frame. We found that the best grouping isobtained when the quadrupole/dipole field ratio is between3 and 4% (Figure 6), a value similar to the one suggested bypaleomagnetic data obtained from volcanic rocks less than5 Ma old [McElhinny et al., 1996; Carlut and Courtillot,1998]. In order to validate this observation further werepeated the same test nine times, removing in turn one poleat each run. Regardless of the eight poles subset used, thebest grouping is always found for a small positivequadrupole/dipole field ratio, between 2 and 5% (Figure 6).
Table 2. Global Paleomagnetic Pole Positions With Respect to the Indo-Atlantic Hot Spot Reference Framea
Study Age, Ma
Paleomagnetic Pole Finite Rotation Pole Rotated Pole
ReferenceN Plat Plong l f w Plat Plong
AntarcticaKerguelen 27 ± 3 233 85.5 189.3 80.83 8.10 �3.38 85.5 179.2 this study
AfricaPrıncipe 24 ± 4 25 82.8 96.6 47.14 316.10 �5.17 80.1 77.4 Piper and Richardson [1972]Yemen 29 ± 2 48 74.2 249.1 40.77 357.02 �12.59 82.3 213.9 Riisager et al. [2005]Ethiopia 30 ± 1 76 78.7 209.4 42.86 316.69 �6.59 83.1 191.6 Kidane et al. [2002]
AustraliaTweed 22.5 ± 2.5 75 77.4 290.9 26.28 31.19 �14.45 87.0 194.8 McElhinny et al. [1974]Liverpool 30 ± 5 52 68.9 272.4 23.92 30.45 �19.06 79.0 210.3 McElhinny et al. [1974]
North AmericaArizona 22.5 ± 2.5 35 86.1 188.7 37.12 111.67 3.78 88.9 158.0 Hagstrum et al. [1987]New Mexico 29.5 ± 6.5 61 81.9 143.6 41.74 110.22 5.22 83.3 118.7 Diehl et al. [1988]Colorado 26 ± 4 36 85.0 114.0 39.86 110.93 4.50 84.2 80.9 Beck et al. [1977]
aN is the number of sites and Plat and Plong are the latitude and longitude of the paleomagnetic pole. The finite rotation poles correspond to the Eulerianpoles used to transfer the paleomagnetic poles into the Indo-Atlantic hot spot reference frame. They are calculated from Royer et al.’s [1992] and Muller etal.’s [1993] reconstructions using a global circuit through central Africa.
Figure 5. Selected paleomagnetic pole positions withrespect to the Indo-Atlantic hot spot reference frame for the25–30 Ma time interval (open circles) and their average(solid circle) compared with the Kerguelen pole (solid star).Dashed curves are the 95% confidence limit for the meanpoles calculated assuming a Fisherian distribution.
B06102 CAMPS ET AL.: STATISTICAL PROPERTIES OF PALEOMAGNETIC DIRECTIONS
8 of 14
B06102

5.5. Paleosecular Variation Regime
[34] It is noteworthy to recall first that by defining thePSV domain by means of a VGP cutoff precludes anystatistical study of the paleomagnetic fluctuations on the
local field direction reference frame. Indeed, as expectedfrom geometrical considerations, the PSV domain is signif-icantly off center with respect to the mode of the distribu-tion of the local field direction as illustrated on Figure 7.[35] The quantity of principal interest in PSV study is the
between site angular standard deviation (ASD) SB, which iscalculated from the total ASD ST corrected for experimentalerror by removing the within-flow ASD SW:
S2B ¼ S2T � S2Wn
with
ST ¼ N � 1ð Þ�12
XNi¼1
d2i
!12
and
SW � 81ffiffiffik
p
where N is the number of data, di is the angle between theith VGP and the reference position, n is the mean number ofsamples per unit, and k is the mean precision parameter.Results of these calculations are reported in Table 3. Thevalue of SB is almost exactly the value of 20.9� predicted bythe PSV model of McFadden et al. [1991] for the given ageand paleolatitude. Of course, this result substantiates themodel hypotheses among which two are worth noting: ThePSV is assumed to be isotropic about the Earth’s spin axis,e.g., latitudinal dependent only, and symmetric about the
Figure 6. Fisher concentration parameter (k) computedfor the Oligocene poles represented in the Indo-Atlantic hotspot reference frame. The poles locations have beenrecalculated for various quadrupole (g2
0)/dipole (g10) field
ratio. The bold curve is computed for the nine selected poleslisted in Table 2. The nine dashed curves are obtained forsubset of eight poles, one different pole being removed inturn. Maximum values for k are found for a quadrupole/dipole field ratio of 5% when the Prıncipe volcanic pole(curve 1) or when the Liverpool volcano pole (curve 2) isremoved.
Figure 7. Whole data set (N = 258) for the Kerguelen local field directions with (a) negative and(b) positive inclinations plotted on equal-area diagrams. For both diagrams the data have been rotated tothe mean normal field direction calculated from the mean paleomagnetic pole. The dashed curves are thethreshold for the inclinations and declinations, which give VGP location at an angular distance larger than45� from the mean pole axis.
B06102 CAMPS ET AL.: STATISTICAL PROPERTIES OF PALEOMAGNETIC DIRECTIONS
9 of 14
B06102

equator. Moreover, it gives additional arguments to the ideathat the PSV has been sufficiently and properly sampled inthe present study.
5.6. Azimuthal Symmetry
[36] As mentioned in section 1, the azimuthal symmetryof VGP longitude distribution is one of the most contro-versial debates among the paleomagnetists. Usually, authorsgive an initial qualitative estimate of their azimuthal distri-bution by means of graphical diagrams, such as simplecircular histograms or rose diagrams of VGP longitudes[Constable, 1992; Prevot and Camps, 1993; Valet andHerrero-Bervera, 2003]. However, most of these diagramsinvolve an arbitrary choice of both the origin and the widthof intervals, which can significantly distort the informationif they are inappropriately chosen. That is not the case withthe kernel density estimate diagram [Fisher, 1993] as usedin the present study. In this method the density estimate in agiven longitude f (0 � f � 2p) is
f fð Þ ¼ 1
nh
Xni¼1
wf� fi
h
� �
where n is the number of data, h is a smoothing factor, andw is a quartic kernel function such as
w ¼0:9375 1� f2
� �2 �1 � f � 1
0 otherwise
8<:
The density estimate function was computed using thealgorithm given by Fisher [1993].[37] There is no obvious visual evidence either for a
major modal group or for two antipodal groups in theKerguelen VGP longitudes distribution (Figure 8). Severalsmall bumps suggest rather an azimuthal symmetry aboutthe mean VGP. These considerations can be made muchmore precisely and quantitatively with formal statisticaltests of hypothesis. We checked the hypothesis of unifor-mity for Kerguelen VGP longitudes against all possiblealternative distributions by means of the Kuiper’s statistic[Fisher, 1993], a Kolmogorov-type test that does notdepend on the choice of the zero direction. The criterionfor the Kuiper’s statistic is
Vn ¼ max Ui � i=nð Þ �min Ui � i=nð Þ þ 1=n
where Ui = fi/2p for each VGP longitude fi as arranged innumerical order, n being the number of data. Provided n is
large in the present case, we can calculate the modifiedKuiper’s statistic:
V*n ¼ n12 þ 0:155þ 0:24n�
12
� �Vn
which is compared with the critical values given in Table 7.1of Mardia [1972]. Results are given in Table 4 for severaldata subsets. The hypothesis of uniformity for VGPlongitude is strongly rejected when the VGPs are analyzedin the present geographical reference frame, and there is noevidence for a departure from an uniform distribution whenVGPs are rotated into the mean pole reference frame bothfor the PSV data set (N = 233) and the whole data set (N =258). These results call for several comments. First, giventhat the mean pole location is different from the geographicaxis, if a rotational symmetry about the mean pole isobserved, it is only normal that a bias toward the mean polelongitude exists when the test is performed in thegeographical reference frame. To illustrate this, wecalculated the mean longitude �f in the geographicalreference frame of the vector resultant of f1, . . ., fn forthe PSV data set
�f ¼ tan�1Xni¼1
sinfi
�Xni¼1
cosfi
!
and found 181.2�, which is close to 189.3�, the mean polelongitude (Table 1). We believe it important to keep thispoint in mind when such analyses are performed. Next, asthe difference between the mean pole and the geographicaxis is small in the present case (4.5�), the different answersfor the Kuiper test can be seen as proof of its strength, andthus its use is even more justified.[38] Finally, to assess this discussion, we can look into the
more precise question of whether the Kerguelen data setcould be consistent with the longitudinal organization ofVGP within two antipodal preferred bands. The Rayleigh
Table 3. Dispersion Statistic of Flow Average Data for PSV Data
Seta
ST SW SB 95%
Present geographic pole 20.65 5.34 20.55 19.3–22.0Oligocene geographic pole 20.22 5.34 20.12 18.9–21.5Mean VGP 20.17 5.34 20.07 18.8–21.4
aN = 233. ST, SW, and SB are the total, within, and between flow angularstandard deviation, respectively, and n = 7.185. The 95% confidence limitson SB is calculated using the table of Cox [1969].
Figure 8. Nonparametric density estimates calculated bymeans of a quartic kernel function for VGP longituderotated in the paleomagnetic pole (l = 85.5�, f = 189.3�)reference frame for the whole data set N = 258 (solid curve)and the PSV data set N = 233 (dashed curve).
B06102 CAMPS ET AL.: STATISTICAL PROPERTIES OF PALEOMAGNETIC DIRECTIONS
10 of 14
B06102
test is perfectly adapted for this purpose if we transformeach VGP longitude fi to f0
i by
f0i ¼ 2fið Þ mod2pð Þ
and treat f0i as observations from an unimodal distribution
for which the mean longitude is unknown. In this case, thecriterion of the Rayleigh test is �R, the mean resultant lengthassociated with the mean longitude �f0 [Fisher, 1993]:
�R ¼ 1
n
ffiffiffiffiffiffiffiffiffiffiffiffiffiffiffiffiffiffiffiffiffiffiffiffiffiffiffiffiffiffiffiffiffiffiffiffiffiffiffiffiffiffiffiffiffiffiffiffiffiffiffiffiffiffiffiffiffiffiffiffiffiffiXni¼1
cosf0i
!2
þXni¼1
sinf0i
!2vuut
To find the critical values, we allowed the approximation forlarge n that 2n�R2 is distributed as ’c2
2 [Mardia, 1972]. Theresults are a little more ambiguous than for the Kuiper test(Table 4). In this analysis of the PSV data set we found littleevidence to suggest a departure from the model ofuniformity when tested against a bimodal distribution;however, the significance level is only ’3.7% (found usingthe table given in Appendix A.2b of Fisher [1993]). On theother hand, we have no evidence to reject the hypothesis ofazimuthal symmetry about the mean when the whole dataset (N = 258) is considered.
5.7. Statistical Modeling
[39] In this section, we adapt Camps and Prevot’s [1996]statistical model, developed for some Northern Hemispherelatitudes, to the paleomagnetic data from Kerguelen. Thismodel considers the paleomagnetic local field vector to bethe sum of two independent set of vectors: the secularvariation (SV) vector set characterized by an uniform orien-tation and a magnitude defined by a Maxwell-Boltzmannprobability density function (pdf) and the axial (AD) vectorset characterized by a constant direction and magnitudedefined by a nonzero mean Gaussian pdf NAD(m, s
2). Inpractice, the SV vectors are generated from their Cartesiancoordinates which are distributed as three independentrandom Gaussian variables having the same NSV(0, s2)distribution. By means of a Monte Carlo simulation a largenumber of local field vectors are generated, 20,000 in thepresent case, and then transformed to VGP with theirassociated virtual dipole moment to be compared with theexperimental data.
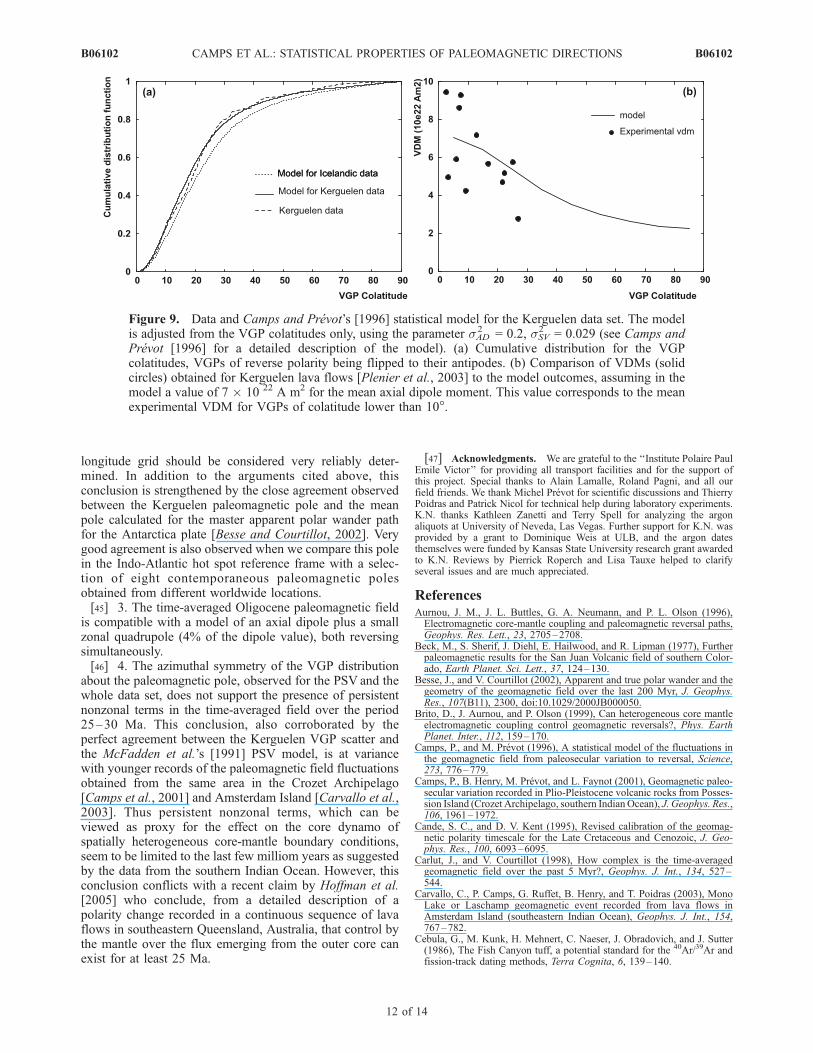
[40] In term of harmonic coefficients the axial vector setcorresponds to an axial dipole plus a small axial quadrupole,both reversing simultaneously. According to theoreticalinferences [Le Mouel, 1984] the fundamental assumptionin this model is that there is no transfer of the AD energyinto other harmonic coefficients, even when the ADdecreases to zero. Camps and Prevot [1996] showed thata correct statistical model requires a statistically represen-tative sampling of the full spectrum of field fluctuations,from secular variation to reversals, and both directional andintensity analysis. From this point of view, the volcanism inKerguelen is especially interesting because it encompasses5 Ma and because three transitions and several excursionsseem to be documented (Table S1). Unfortunately, only afew absolute paleointensity determinations exist [Plenier etal., 2003], and the average remanence intensities cannot beused as a proxy because of the presence of various second-ary remanent magnetizations observed in Kerguelen lavas.[41] We determined the model parameters by keeping the
same fluctuation for the AD vector as the one determinedfor the Icelandic data set [Camps and Prevot, 1996] and bymatching the SV fluctuation only to the VGP colatitude data(Figure 9). We found that the 258 Kerguelen VGPcolatitudes are well simulated with the model parametersNAD(m = 1, s2 = 0.2) and NSV (m = 0, s2 = 0.029). Thesecular variation appears to be latitudinally dependent anddecreases with the site latitude if compared to the valuefound for the Icelandic data set NSV (m = 0, s2 = 0.04)[Camps and Prevot, 1996]. We highlight this observation asit is a characteristic commonly reported in PSV models [see,e.g., McFadden et al., 1991]; however, we must be verycareful with further interpretation. Our modeling is not asprecise as if we had been able to use the paleointensity as aconstraint, and above all it is very speculative to comparestatistical properties of data of different ages; that is, theIcelandic data are of Miocene age.
6. Conclusions
[42] Thanks to the 146 new data reported in this papercombined with data from two previous studies [Henry andPlessard, 1997; Plenier et al., 2002], we gathered a data setof 258 paleomagnetic field directions as recorded by basal-tic lava flows from the Kerguelen Archipelago. Frommagnetostratigraphic correlations and absolute Ar/Ar radio-metric ages we showed that these data represent a ratherhomogeneous sampling of the paleomagnetic field fluctua-tions through the last 5 Ma of the Oligocene. A positivereversal test of class A [McFadden and McElhinny, 1990]guarantees further that the sampling adequately averagesthe PSV during both polarity intervals. Thus we believethat the Kerguelen data set is particularly well suited todescribe the characteristics of time-averaged paleomagneticfield and those of the PSV as observed from this part of thesouthern Indian Ocean between 25 and 30 Ma. From theseconsiderations we have shown the following:[43] 1. There is no statistically significant difference
between the late Oligocene time-averaged normal andreverse polarity as shown by a common mean and acommon concentration parameter k.[44] 2. The Kerguelen paleomagnetic pole, l = 85.5�N,
f = 189.3�E, A95 = 2.3�, K = 16.5, in the present latitude-
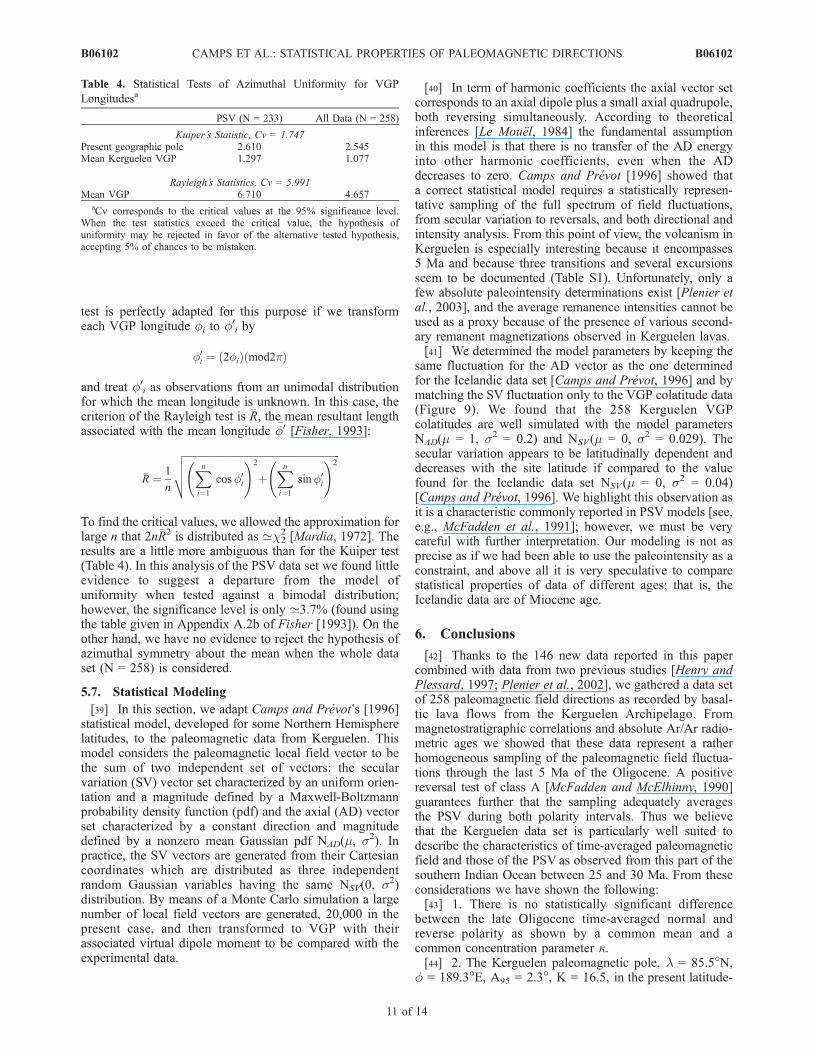
Table 4. Statistical Tests of Azimuthal Uniformity for VGP
Longitudesa
PSV (N = 233) All Data (N = 258)
Kuiper’s Statistic, Cv = 1.747Present geographic pole 2.610 2.545Mean Kerguelen VGP 1.297 1.077
Rayleigh’s Statistics, Cv = 5.991Mean VGP 6.710 4.657
aCv corresponds to the critical values at the 95% significance level.When the test statistics exceed the critical value, the hypothesis ofuniformity may be rejected in favor of the alternative tested hypothesis,accepting 5% of chances to be mistaken.
B06102 CAMPS ET AL.: STATISTICAL PROPERTIES OF PALEOMAGNETIC DIRECTIONS
11 of 14
B06102
longitude grid should be considered very reliably deter-mined. In addition to the arguments cited above, thisconclusion is strengthened by the close agreement observedbetween the Kerguelen paleomagnetic pole and the meanpole calculated for the master apparent polar wander pathfor the Antarctica plate [Besse and Courtillot, 2002]. Verygood agreement is also observed when we compare this polein the Indo-Atlantic hot spot reference frame with a selec-tion of eight contemporaneous paleomagnetic polesobtained from different worldwide locations.[45] 3. The time-averaged Oligocene paleomagnetic field
is compatible with a model of an axial dipole plus a smallzonal quadrupole (4% of the dipole value), both reversingsimultaneously.[46] 4. The azimuthal symmetry of the VGP distribution
about the paleomagnetic pole, observed for the PSV and thewhole data set, does not support the presence of persistentnonzonal terms in the time-averaged field over the period25–30 Ma. This conclusion, also corroborated by theperfect agreement between the Kerguelen VGP scatter andthe McFadden et al.’s [1991] PSV model, is at variancewith younger records of the paleomagnetic field fluctuationsobtained from the same area in the Crozet Archipelago[Camps et al., 2001] and Amsterdam Island [Carvallo et al.,2003]. Thus persistent nonzonal terms, which can beviewed as proxy for the effect on the core dynamo ofspatially heterogeneous core-mantle boundary conditions,seem to be limited to the last few milliom years as suggestedby the data from the southern Indian Ocean. However, thisconclusion conflicts with a recent claim by Hoffman et al.[2005] who conclude, from a detailed description of apolarity change recorded in a continuous sequence of lavaflows in southeastern Queensland, Australia, that control bythe mantle over the flux emerging from the outer core canexist for at least 25 Ma.
[47] Acknowledgments. We are grateful to the ‘‘Institute Polaire PaulEmile Victor’’ for providing all transport facilities and for the support ofthis project. Special thanks to Alain Lamalle, Roland Pagni, and all ourfield friends. We thank Michel Prevot for scientific discussions and ThierryPoidras and Patrick Nicol for technical help during laboratory experiments.K.N. thanks Kathleen Zanetti and Terry Spell for analyzing the argonaliquots at University of Neveda, Las Vegas. Further support for K.N. wasprovided by a grant to Dominique Weis at ULB, and the argon datesthemselves were funded by Kansas State University research grant awardedto K.N. Reviews by Pierrick Roperch and Lisa Tauxe helped to clarifyseveral issues and are much appreciated.
ReferencesAurnou, J. M., J. L. Buttles, G. A. Neumann, and P. L. Olson (1996),Electromagnetic core-mantle coupling and paleomagnetic reversal paths,Geophys. Res. Lett., 23, 2705–2708.
Beck, M., S. Sherif, J. Diehl, E. Hailwood, and R. Lipman (1977), Furtherpaleomagnetic results for the San Juan Volcanic field of southern Color-ado, Earth Planet. Sci. Lett., 37, 124–130.
Besse, J., and V. Courtillot (2002), Apparent and true polar wander and thegeometry of the geomagnetic field over the last 200 Myr, J. Geophys.Res., 107(B11), 2300, doi:10.1029/2000JB000050.
Brito, D., J. Aurnou, and P. Olson (1999), Can heterogeneous core mantleelectromagnetic coupling control geomagnetic reversals?, Phys. EarthPlanet. Inter., 112, 159–170.
Camps, P., and M. Prevot (1996), A statistical model of the fluctuations inthe geomagnetic field from paleosecular variation to reversal, Science,273, 776–779.
Camps, P., B. Henry, M. Prevot, and L. Faynot (2001), Geomagnetic paleo-secular variation recorded in Plio-Pleistocene volcanic rocks from Posses-sion Island (Crozet Archipelago, southern IndianOcean), J. Geophys. Res.,106, 1961–1972.
Cande, S. C., and D. V. Kent (1995), Revised calibration of the geomag-netic polarity timescale for the Late Cretaceous and Cenozoic, J. Geo-phys. Res., 100, 6093–6095.
Carlut, J., and V. Courtillot (1998), How complex is the time-averagedgeomagnetic field over the past 5 Myr?, Geophys. J. Int., 134, 527–544.
Carvallo, C., P. Camps, G. Ruffet, B. Henry, and T. Poidras (2003), MonoLake or Laschamp geomagnetic event recorded from lava flows inAmsterdam Island (southeastern Indian Ocean), Geophys. J. Int., 154,767–782.
Cebula, G., M. Kunk, H. Mehnert, C. Naeser, J. Obradovich, and J. Sutter(1986), The Fish Canyon tuff, a potential standard for the 40Ar/39Ar andfission-track dating methods, Terra Cognita, 6, 139–140.
Figure 9. Data and Camps and Prevot’s [1996] statistical model for the Kerguelen data set. The modelis adjusted from the VGP colatitudes only, using the parameter sAD
2 = 0.2, sSV2 = 0.029 (see Camps and
Prevot [1996] for a detailed description of the model). (a) Cumulative distribution for the VGPcolatitudes, VGPs of reverse polarity being flipped to their antipodes. (b) Comparison of VDMs (solidcircles) obtained for Kerguelen lava flows [Plenier et al., 2003] to the model outcomes, assuming in themodel a value of 7 � 10 22 A m2 for the mean axial dipole moment. This value corresponds to the meanexperimental VDM for VGPs of colatitude lower than 10�.
B06102 CAMPS ET AL.: STATISTICAL PROPERTIES OF PALEOMAGNETIC DIRECTIONS
12 of 14
B06102
Coe, R., L. Hongre, and G. Glatzmaier (2000), An examination of simu-lated geomagnetic reversals from a paleomagnetic perspective, Philos.Trans. R. Soc. London, Ser. A, 358, 1141–1170.
Constable, C. (1992), Link between geomagnetic reversal paths and secularvariation of the field over the past 5 Myr, Nature, 358, 230–233.
Constable, C., and C. Johnson (1999), Anisotropic paleosecular variationmodels: Implications for geomagnetic field observables, Phys. EarthPlanet. Inter., 115, 35–51.
Costin, S. O., and B. Buffett (2004), Preferred reversal paths caused by aheterogeneous conducting layer at the base of the mantle, J. Geophys.Res., 109, B06101, doi:10.1029/2003JB002853.
Cox, A. (1969), Confidence limits for the precision parameter k, Geophys.J. R. Astron. Soc., 18, 545–549.
Derder, M., C. Plessard, and L. Daly (1990), Mise en evidence d’unetransition de polarite du champ magnetique terrestre dans les basaltesMiocenes des ıles Kerguelen, C. R. Acad. Sci., Ser. II, 310, 1401–1407.
Diehl, J. F., K. M. McClannahan, and T. J. Bornhorts (1988), Paleomag-netic results from the Mogollon-Datil volcanic field, southwestern NewMexico, and a refined mid-Tertiary reference pole for North America,J. Geophys. Res., 93, 4869–4879.
Doucet, S., D. Weis, J. Scoates, K. Nicolaysen, F. Frey, and A. Giret (2002),The depleted mantle component in Kerguelen Archipelago basalts: Pet-rogenesis of tholeiitic-transitional basalts from the Loranchet Peninsula,J. Petrol., 43, 1341–1366.
Doucet, S., J. S. Scoates, D. Weis, and A. Giret (2005), Constraining thecomponents of the Kerguelen mantle plume: A Hf-Pb-Sr-Nd isotopicstudy of picrites and high-MgO basalts from the Kerguelen Archipelago,Geochem. Geophys. Geosyst., 6, Q04007, doi:10.1029/2004GC000806.
Fisher, N. (Ed.) (1993), Statistical Analysis of Circular Data, CambridgeUniv. Press, New York.
Fisher, R. (1953), Dispersion on a sphere, Proc. R. Soc. London, Ser. A,217, 295–305.
Frey, F., D. Weis, H.-J. Yang, K. Nicolaysen, H. Leyrit, and A. Giret (2000),Temporal geochemical trends in Kerguelen Archipelago basalts: Evi-dence for decreasing magma supply from the Kerguelen plume, Chem.Geol., 164, 61–80.
Glatzmaier, G., and P. Roberts (1995), A three-dimensional convectivedynamo solution with rotating and finitely conducting inner core andmantle, Phys. Earth Planet. Inter., 91, 63–75.
Hagstrum, J., D. Cox, and R. Miller (1987), Structural reinterpretation ofthe Ajo Mining District, Pima County, Arizona, based on paleomagneticand geochronologic studies, Econ. Geol., 82, 1348–1361.
Henry, B., and C. Plessard (1997), New paleomagnetic results from theKerguelen Islands, Geophys. J. Int., 128, 73–83.
Henry, B., G. Plenier, and P. Camps (2003), Post-emplacement tilting oflava flows inferred from magnetic study: Example of Oligocene lavas inthe Jeanne d’Arc peninsula (Kerguelen Islands), J. Volcanol. Geotherm.Res., 127, 153–164.
Hoffman, K., B. Singer, P. Camps, L. Hansen, K. Johnson, and C. Carvallo(2005), Early Miocene R-N reversal recorded in lavas from Queensland,Australia: Evidence for stationary mantle-held flux over the past 21 Ma,Eos Trans. AGU, 86, Jt. Assem. Suppl., Abstract GP13B-10.
Holme, R. (2004), A fuel-efficient geodynamo?, Nature, 429, 137.Huestis, S., and G. Acton (1997), On the construction of geomagnetictimescales from non-prejudicial treatment of magnetic anomaly data frommultiple ridges, Geophys. J. Int., 129, 176–182.
Kidane, T., B. Abebe, V. Courtillot, and E. Herrero-Bervera (2002), Newpaleomagnetic result from the Ethiopian flood basalts in the Abbay (BlueNile) and Kessem Gorges, Earth Planet. Sci. Lett., 203, 353–367.
Kirschvink, J. (1980), The least-squares line and plane and the analysis ofpaleomagnetic data, Geophys. J. R. Astron. Soc., 62, 699–718.
Kristjansson, L. (1985), Some statistical properties of paleomagnetic direc-tions in Icelandic lava flows, Geophys. J. R. Astron. Soc., 80, 57–71.
Kuang, W., and J. Bloxham (1997), An Earth-like numerical dynamomodel, Nature, 389, 371–374.
Kutzner, C., and U. Christensen (2004), Simulated geomagnetic reversalsand preferred virtual geomagnetic pole paths, Geophys. J. Int., 157,1105–1118.
Laj, C., A. Mazaud, R. Weeks, M. Fuller, and E. Herrero-Bervera (1991),Geomagnetic reversal paths, Nature, 541, 447.
Langereis, C., A. Van Hoof, and P. Rochette (1992), Longitudinal confine-ment of geomagnetic reversal paths as a possible sedimentary artefact,Nature, 358, 226–230.
Le Mouel, J. (1984), Outer-core geostrophic flow and secular variation ofEarth’s geomagnetic field, Nature, 311, 734–735.
Love, J. J. (2000), Statistical assessment of preferred transitional VGPlongitudes based on paleomagnetic lava data, Geophys. J. Int., 140,211–221.
Mardia, K. (Ed.) (1972), Statistics of Directional Data, Elsevier, NewYork.
McDougall, I., and M. Harrison (Eds.) (1999), Geochronology and Ther-mochronology by the 40Ar/39Ar Method, 2nd ed., 288 pp., Oxford Univ.Press, New York.
McElhinny, M., B. Embleton, and P. Wellman (1974), A synthesis of Aus-tralian Cenozoic paleomagnetic results, Geophys. J. R. Astron. Soc., 36,141–151.
McElhinny, M., P. McFadden, and R. Merrill (1996), The time-averagedpaleomagnetic field 0–5 Ma, J. Geophys. Res., 101, 25,007–25,027.
McFadden, P., and M. McElhinny (1990), Classification of the reversal testin paleomagnetism, Geophys. J. Int., 103, 725–729.
McFadden, P., R. Merrill, M. McElhinny, and L. Sunhee (1991), Reversalsof the Earth’s magnetic field and temporal variations of the dynamofamilies, J. Geophys. Res., 96, 3923–3933.
Muller, R., J.-Y. Royer, and L. Lawver (1993), Revised plate motion rela-tive to the hotspots from combined Atlantic and Indian Ocean hotspottracks, Geology, 21, 275–278.
Nicolaysen, K., F. Frey, K. Hodges, D. Weis, and A. Giret (2000), 40Ar/39Argeochronology of flood basalts from the Kerguelen Archipelago, south-ern Indian Ocean: Implications for Cenozoic eruption rates of the Ker-guelen plume, Earth Planet. Sci. Lett., 174, 313–328.
Nougier, J. (1970), Terres Australes et Antarctique francaises (T. A. A. F.),Kerguelen Islands reconnaissance map, 1:200 000, Inst. Geogr. Natl.,Paris.
Olson, P., U. Christensen, and G. Glaztmaier (1999), Numerical modelingof the geodynamo: Mechanisms of field generation and equilibration,J. Geophys. Res., 104, 10,383–10,404.
Piper, J., and A. Richardson (1972), The palaeomagnetism of the Gulf ofGuinea volcanic province, West Africa, Geophys. J. R. Astron. Soc., 29,147–171.
Plenier, G., P. Camps, B. Henry, and K. Nicolaysen (2002), Paleomagneticstudy of Oligocene (24–30 Ma) lava flows from the Kerguelen Archi-pelago (southern Indian Ocean): Directional analysis and magnetostrati-graphy, Phys. Earth Planet. Inter., 133, 127–146.
Plenier, G., P. Camps, R. Coe, and M. Perrin (2003), Absolute palaeoin-tensity of Oligocene (28–30 ma) lava flows from the Kerguelen Archi-pelago (southern Indian Ocean), Geophys. J. Int., 154, 877–890.
Plenier, G., P. Camps, B. Henry, and B. Ildefonse (2005), Determination offlow directions by combining ams and thin-section analyses: Implicationsfor Oligocene volcanism in the Kerguelen Archipelago (southern IndianOcean), Geophys. J. Int., 160, 63–78.
Prevot, M., and P. Camps (1993), Absence of preferred longitude sectors forpoles from volcanic records of geomagnetic reversals, Nature, 366, 53–57.
Prevot, M., E. Mattern, P. Camps, and M. Daignieres (2000), Evidence for a20� tilting of the Earth’s rotation axis 110 million years ago, EarthPlanet. Sci. Lett., 179, 517–528.
Reiners, P., T. Spell, S. Nicolescu, and K. Zanetti (2004), Zircon (U-Th)/Hethermochronometry: He diffusion and comparisons with 40Ar/39Ar dat-ing, Geochim. Cosmochim. Acta, 68, 1857–1887.
Riisager, P., K. Knight, J. Baker, I. Ukstins-Peate, M. Al-Kadasi, A. Al-Subbary,and P. Renne (2005), Paleomagnetism and Ar/Ar geochronology ofYemeni Oligocene volcanics: Implications for timing and duration ofAfro-Arabian traps and geometry of the Oligocene paleomagnetic field,Earth Planet. Sci. Lett., 237, 647–672.
Rochette, P. (1990), Rationale of geomagnetic reversals versus remanencerecording processes in rocks: A critical review, Earth Planet. Sci. Lett.,98, 33–39.
Rochette, P., et al. (1998), Magnetostratigraphy and timing of the OligoceneEthiopian traps, Earth Planet. Sci. Lett., 164, 497–510.
Royer, J.-Y., R. Muller, L. Gahagan, C. Mayes, D. Nurnberg, and J. Sclater(1992), A global isochron chart, Tech. Rep. 117, 38 pp., Univ. of Tex.Inst. for Geophys., Austin.
Runcorn, S. K. (1992), Polar paths in geomagnetic reversals, Nature, 356,654–656.
Sakuraba, A., and M. Kono (1999), Effect of the inner core on the numer-ical solution of the magnetohydrodynamic dynamo, Phys. Earth Planet.Inter., 111, 105–121.
Steven, T., H. Mehnert, and J. Obradovich (1967), Age of volcanic activityin the San Juan Mountains, Colorado, U.S. Geol. Surv. Prof. Pap., 575-D,47–55.
Takahashi, F., M. Matsushima, and Y. Honkura (2005), Simulations of aquasi-taylor state geomagnetic field including polarity reversals on theEarth simulator, Science, 309, 459–461.
Tarduno, J., and A. Smirnov (2001), Stability of the Earth with respect tothe spin axis for the last 130 million years, Earth Planet. Sci. Lett., 184,549–553.
Tauxe, L. (1998), Paleomagnetic Principles and Practice, Kluwer Acad.,Dordrecht, Netherlands.
Tauxe, L., and D. V. Kent (2004), A simplified statistical model for thegeomagnetic field and detection of shallow bias in paleomagnetic incli-
B06102 CAMPS ET AL.: STATISTICAL PROPERTIES OF PALEOMAGNETIC DIRECTIONS
13 of 14
B06102

nations: Was the ancient magnetic field dipolar, in Timescale of the Paleo-magnetic Field, Geophys. Monogr. Ser., vol. 145, edited by J. Channellet al., pp. 101–115, AGU, Washington D.C.
Valet, J.-P., and E. Herrero-Bervera (2003), Some characteristics of geo-magnetic reversals inferred from detailed volcanic records, C. R. Geosci.,335, 79–90.
Vandamme, D. (1994), A new method to determine paleosecular variation,Phys. Earth Planet. Inter., 85, 131–142.
Watkins, N., B. Gunn, J. Nougier, and A. Baksi (1974), Kerguelen: Con-tinental fragment or oceanic island?, Geol. Soc. Am. Bull., 85, 201–212.
Wendt, I., and C. Carl (1991), The statistical distribution of the meansquared weighted deviation, Chem. Geol., 86, 275–285.
Wilson, R., and J. Ade-Hall (1970), Paleomagnetic indications of a perma-ment aspect of the non-dipole field, in Palaeogeophysics, edited by S. K.Runcorn, pp. 307–312, Academic, New York.
Yang, H.-J., F. Frey, D. Weis, A. Giret, D. Pyle, and G. Michon (1998),Petrogenesis of the flood basalts forming the northern Kerguelen Archi-pelago: Implications for the Kerguelen plume, J. Petrol., 39(4), 711–748.
�����������������������P. Camps, Geosciences Montpellier, Universite Montpellier 2, cc 060,
Place Eugene Bartallon, F-34095 Montpellier Cedex, France. ([email protected])B. Henry and G. Plenier, Paleomagnetisme, IPGP and CNRS, 4 Avenue
de Neptune, F-94107 Saint Maur Cedex, France.K. Nicolaysen, Department of Geology, Kansas State University,
Manhattan, KS 66506, USA.
B06102 CAMPS ET AL.: STATISTICAL PROPERTIES OF PALEOMAGNETIC DIRECTIONS
14 of 14
B06102
Copyright © 2022 FDOKUMEN