Statistical model for predicting the air permeability of polyester/cotton-blended interlock knitted...
10
This article was downloaded by: [INASP - Pakistan (PERI)] On: 07 October 2013, At: 21:32 Publisher: Taylor & Francis Informa Ltd Registered in England and Wales Registered Number: 1072954 Registered office: Mortimer House, 37-41 Mortimer Street, London W1T 3JH, UK Journal of The Textile Institute Publication details, including instructions for authors and subscription information: http://www.tandfonline.com/loi/tjti20 Statistical model for predicting the air permeability of polyester/cotton-blended interlock knitted fabrics Ali Afzal a , Tanveer Hussain b , Mumtaz H. Malik c & Zafar Javed d a Department of Materials and Testing, National Textile University, Faisalabad, Pakistan. b Department of Textile Processing, National Textile University, Faisalabad, Pakistan. c Department of Yarn Manufacturing, National Textile University, Faisalabad, Pakistan. d Department of Garment Manufacturing, National Textile University, Faisalabad, Pakistan. Published online: 01 Oct 2013. To cite this article: Ali Afzal, Tanveer Hussain, Mumtaz H. Malik & Zafar Javed , Journal of The Textile Institute (2013): Statistical model for predicting the air permeability of polyester/cotton-blended interlock knitted fabrics, Journal of The Textile Institute, DOI: 10.1080/00405000.2013.834576 To link to this article: http://dx.doi.org/10.1080/00405000.2013.834576 PLEASE SCROLL DOWN FOR ARTICLE Taylor & Francis makes every effort to ensure the accuracy of all the information (the “Content”) contained in the publications on our platform. However, Taylor & Francis, our agents, and our licensors make no representations or warranties whatsoever as to the accuracy, completeness, or suitability for any purpose of the Content. Any opinions and views expressed in this publication are the opinions and views of the authors, and are not the views of or endorsed by Taylor & Francis. The accuracy of the Content should not be relied upon and should be independently verified with primary sources of information. Taylor and Francis shall not be liable for any losses, actions, claims, proceedings, demands, costs, expenses, damages, and other liabilities whatsoever or howsoever caused arising directly or indirectly in connection with, in relation to or arising out of the use of the Content. This article may be used for research, teaching, and private study purposes. Any substantial or systematic reproduction, redistribution, reselling, loan, sub-licensing, systematic supply, or distribution in any form to anyone is expressly forbidden. Terms & Conditions of access and use can be found at http:// www.tandfonline.com/page/terms-and-conditions
Transcript of Statistical model for predicting the air permeability of polyester/cotton-blended interlock knitted...

This article was downloaded by: [INASP - Pakistan (PERI)]On: 07 October 2013, At: 21:32Publisher: Taylor & FrancisInforma Ltd Registered in England and Wales Registered Number: 1072954 Registered office: Mortimer House,37-41 Mortimer Street, London W1T 3JH, UK
Journal of The Textile InstitutePublication details, including instructions for authors and subscription information:http://www.tandfonline.com/loi/tjti20
Statistical model for predicting the air permeability ofpolyester/cotton-blended interlock knitted fabricsAli Afzala, Tanveer Hussainb, Mumtaz H. Malikc & Zafar Javedd
a Department of Materials and Testing, National Textile University, Faisalabad, Pakistan.b Department of Textile Processing, National Textile University, Faisalabad, Pakistan.c Department of Yarn Manufacturing, National Textile University, Faisalabad, Pakistan.d Department of Garment Manufacturing, National Textile University, Faisalabad, Pakistan.Published online: 01 Oct 2013.
To cite this article: Ali Afzal, Tanveer Hussain, Mumtaz H. Malik & Zafar Javed , Journal of The Textile Institute (2013):Statistical model for predicting the air permeability of polyester/cotton-blended interlock knitted fabrics, Journal of TheTextile Institute, DOI: 10.1080/00405000.2013.834576
To link to this article: http://dx.doi.org/10.1080/00405000.2013.834576
PLEASE SCROLL DOWN FOR ARTICLE
Taylor & Francis makes every effort to ensure the accuracy of all the information (the “Content”) containedin the publications on our platform. However, Taylor & Francis, our agents, and our licensors make norepresentations or warranties whatsoever as to the accuracy, completeness, or suitability for any purpose of theContent. Any opinions and views expressed in this publication are the opinions and views of the authors, andare not the views of or endorsed by Taylor & Francis. The accuracy of the Content should not be relied upon andshould be independently verified with primary sources of information. Taylor and Francis shall not be liable forany losses, actions, claims, proceedings, demands, costs, expenses, damages, and other liabilities whatsoeveror howsoever caused arising directly or indirectly in connection with, in relation to or arising out of the use ofthe Content.
This article may be used for research, teaching, and private study purposes. Any substantial or systematicreproduction, redistribution, reselling, loan, sub-licensing, systematic supply, or distribution in anyform to anyone is expressly forbidden. Terms & Conditions of access and use can be found at http://www.tandfonline.com/page/terms-and-conditions

Statistical model for predicting the air permeability of polyester/cotton-blended interlockknitted fabrics
Ali Afzala*, Tanveer Hussainb, Mumtaz H. Malikc and Zafar Javedd
aDepartment of Materials and Testing, National Textile University, Faisalabad, Pakistan; bDepartment of Textile Processing, NationalTextile University, Faisalabad, Pakistan; cDepartment of Yarn Manufacturing, National Textile University, Faisalabad, Pakistan;
dDepartment of Garment Manufacturing, National Textile University, Faisalabad, Pakistan
(Received 4 June 2013; accepted 9 August 2013)
The aim of this study is to model the effect of knitting parameters on the air permeability (AP) of polyester/cottoninterlock fabrics. Fabric samples of areal densities ranging from 105 to 654 g/m2 were knitted using yarns of threedifferent polyester/cotton blends, each of the three different linear densities by systematically varying knitting looplengths for obtaining different cover factors. It was found that changing the polyester/cotton blend ratio from 65/35 to52/48 and 40/60 did not have a statistically significant effect on the fabric AP. AP sharply decreased with decrease inknitting loop length owing to increase in fabric areal density. Increase in yarn linear density (tex) resulted in a decreasein AP due to increase in fabric thickness as well as the areal density. It was concluded that response surface regressionmodeling could adequately model the effect of knitting parameters on the fabric AP. The model was validated by unseendata-set and found that predicted and actual values were in good agreement with each other with less than 5% absoluteerror. Sensitivity analysis was also performed to determine the relative contribution of each input variable on the AP ofthe interlock fabrics.
Keywords: air permeability; response surface regression; modeling; knitted fabric; polyester/cotton
Introduction
Aesthetics, comfort, and protection are three essentialfeatures of apparels, in addition to providing merely aphysical cover to humans. Fabric comfort characteristicsdepend upon fabric properties such as knitting structure,smoothness of the fabric surface, heat transmittance, airpermeability (AP), thermal resistance, water vapor per-meability, liquid vapor permeability, hydrophilicity, andpresence of biofinish (Das, Kothari, & Sadachar, 2007;Ibrahim, Khalifa, El-Hossamy, & Tawfik, 2010). AP isan important aspect of clothing comfort and is defined asthe rate of volume of air passed perpendicularly througha unit area of fabric at some pressure gradient over a unittime (Bedek, Salaün, Martinkovska, Devaux, & Dupont,2011). AP regulates the thermal balance of the wearer byallowing the air to pass through the clothing, especiallyafter exercise (Kar, Fan, Yu, & Wan, 2007).
The working on AP started at the end of thenineteenth century when the experimental methods fordetermining the hygienic properties of the fabric systemsbegan to be used (Das & Ishtiaque, 2004). Thereafter,various studies have been reported on the factorsaffecting the AP of knitted fabrics including fiber type,fiber fineness, fiber surface characteristics, yarn
geometry, yarn count, yarn hairiness, loop or stitchlength, tightness factor, fabric thickness, areal density,fabric porosity, size and shape of the fabric pores, envi-ronmental humidity, and laundering (Atwal, 1987; Bedeket al., 2011; Cimilli, Nergis, Candan, & Özdemir, 2010;Das & Ishtiaque, 2004; Hu, Li, & Yeung, 2006; Mavruz& Ogulata, 2010; Slater, 1977; Yoon & Buckey, 1984).
Fiber type and yarn structure had significant effecton AP of woven fabrics (Mahish, Punj, & Kothari,2010), while AP of knitted fabrics had no effect of fibertype (Demiroz Gun, Unal, & Unal, 2008). Fiber meanlength affected the AP of the knitted fabrics due toreduction in hairiness of the yarn which reduced the airfriction (Unal, Üreyen, & Mecit, 2012). The fiberfineness had significant negative correlation with AP ofknitted fabrics (Das, Das, Kothari, Fanguiero, & Araújo,2008; Gun, 2011a, 2011b). Fiber shape structure influ-enced the air passage through the fabric and resisted theair flow through unit area of fabric. By the change offiber shape from circular to triangular and trilobal, thefiber perimeter increases resulting in decrease in AP insame trend (Das et al., 2008). Fiber surface characteris-tics such as convolutions or striations also affected theAP of the fabric due to change in friction between fiber
*Corresponding author. Email: [email protected]
The Journal of The Textile Institute, 2013http://dx.doi.org/10.1080/00405000.2013.834576
� 2013 The Textile Institute
Dow
nloa
ded
by [
INA
SP -
Pak
ista
n (P
ER
I)]
at 2
1:32
07
Oct
ober
201
3

and air stream (Cimilli et al., 2010). Hygroscopic fibersswell after absorbing moisture at high humidityconditions, resulting in change in the AP of the fabric(Gibson, Rivin, Kendrick, & Schreuder-Gibson, 1999). Itwas reported that using finer yarns with lower hairinesscould increase the porosity of the fabric leading toimprovement in fabric AP (Cil, Nergis, & Candan, 2009;Unal et al., 2012). Fabrics made from Sirospun yarns aremore air permeable than those made from theconventional ring spun yarns (Önder, Kalao, & Özipek,2003), followed by textured spun yarn fabrics (Mahishet al., 2010). It was because of less dense structure,which due to reduced twist as compared to ring spunyarn as twist per inch had direct proportion with AP(Unal et al., 2012). Weft-knitted fabrics fabricated fromcompact spun yarns had higher AP than those madefrom ring spun yarn (Kane, Patil, & Sudhakar, 2007;Önder et al., 2003). Fabrics having finer yarn count,larger loop length, and lower courses per centimeter hadhigher AP values (Benltoufa, Fayala, Cheikhrouhou, &Ben Nasrallah, 2007; Gun, 2011a, 2011b; Marmarali,2003; Mavruz & Ogulata, 2010). In a previous study, itwas proved that AP had strong correlation with fabricthickness, tightness factor, areal density, and number ofcourses and wales (Mavruz & Ogulata, 2010; Unal et al.,2012).
AP is a function of porosity of the knitted fabrics(Cheng & Cheung, 1994; Cil et al., 2009; Hałgas,Danych, Więcek, & Kowalski, 2006). Different authorsreported that fabric thickness had significant negativecorrelation with AP of the knitted fabrics, irrespective ofthe fiber type used (Cimilli et al., 2010; Hałgas et al.,2006). In a research study, it was found that fabricporosity is dependent upon structural properties of thefabric design such as inter-thread channels, pores, andthe bulk density of the knitted fabric (Bedek et al.,2011). It was found that in 1�1 rib structure, AP of thefabric increases by increasing stitch length and fabricporosity (Oinuma, 1990). There is a strong correlationbetween AP and fabric areal density, and stitch densityand inter-yarn porosity (Mukhopadhyay, Ishtiaque, &Uttam, 2011; Urbas, Kostanjšek, & Dimitrovski, 2011).The AP of knitted fabric is mainly dependent uponinter-yarn porosity and had very little effect by overallporosity of the fabric, where inter-yarn porositysignificantly depends upon factors like yarn diameter,loop length, stitch density, and fabric thickness (Mavruz& Ogulata, 2010; Mukhopadhyay et al., 2011).
Although the effect of various fiber, yarn, and fabricproperties on the AP of knitted fabrics has been reportedin some previous studies, the relative influence ofindividual yarn and fabric parameters for interlock-knittedfabric structures has not been reported so far. Similarly, astatistical model for the prediction of AP of single jerseyfabrics has been reported (Unal et al., 2012), but there is
no prediction model available for the interlock-knitted fab-ric structures. The structural features of interlock fabricsare quite different from the single jersey fabrics and anymodel for the latter cannot be used for accurately predict-ing the AP of the former. The aim of this study is not onlyto establish the relative significance of different factorsaffecting the AP of interlock fabrics through sensitivityanalysis, but also to develop a statistical model for predict-ing the AP of interlock structures with good accuracy.
Experimental
Yarns used for knitting
Polyester/cotton blended yarns of 36.9 tex (Ne 16),29.5 tex (Ne 20), and 24.6 tex (Ne 24) with blendingratios of 40:60, 52:48, and 65:35 were used for knittingthe fabric samples. The properties of the yarns are givenin Table 1.
The twist multiplier for each yarn count of differentblend ratios was kept the same i.e. 3.43, 3.45, and 3.47for 36.9 tex, 29.5 tex, and 24.6 tex, respectively, withsame raw materials and spinning machines settings.
Fabric knitting
The as-spun yarns were used to produce double-jerseyinterlock fabrics with three different tightness levels(tight, medium, and slack) constituting loop lengths of0.32 ± 0.01, 0.35 ± 0.01, and 0.41 ± 0.01 cm. All thesamples were knitted on Jacquard circular interlockmachine with 18 gauge, 30 inches diameter, 1728 totalneedle count, and a positive yarn feeding system. Owingto knitting machine limits, tight fabric sample for36.9 tex yarns could not be knitted on the same machinedue to too dense fabric structure. Therefore, a totalnumber of 24 different samples were produced for thisstudy.
Fabric processing
The fabric samples were semi-bleached at 110 °C for10min using hydrogen peroxide 50% (0.5759 g/L),caustic soda (5 g/L), wetting agent (Viscavin FTC,0.1920 g/L), and stabilizing agents (Terminox ultra 50 L,0.0384 g/L, Novozymes, Denmark), followed by rinsing.
The dyeing of polyester content was carried out withdisperse dye, Terasil yellow W-6GS (by Terasil)(0.0549 g/L), Navy blue Eco 300% (by Techron)(0.0762 g/L), and Yellow Brown XF (by Dianix)(0.1755 g/L) in the presence of leveling agent (LevenolV-505N, 0.2688 g/L) at 130 °C for 35min. Afterpolyester dyeing, the fabric samples were reductioncleared in the presence of a wetting agent, caustic soda,and sodium hydrosulfite at 95 °C for 25min. The cottoncontent was then dyed with reactive dyes Drimagen E3R
2 A. Afzal et al.
Dow
nloa
ded
by [
INA
SP -
Pak
ista
n (P
ER
I)]
at 2
1:32
07
Oct
ober
201
3
(0.384 g/L), Everzol Yellow 3RS H/C (0.5485 g/L),Synozol Red K 3BS (0.0987 g/L), and Synozol Navyblue KBF (0.3017 g/L) in the presence of sequestrant(Alkaquest AM-700, 0.1536 g/L), anticrease (RucolineJes, 0.192 g/L), and soda ash (7.679 g/L)) at 60 °C for30min, followed by washing off with detergent(Cotoblanc STG-L, 0.384 g/L) at 95 °C for 10min, fol-lowed by rinsing and neutralization with acetic acid(0.95 g/L) at 50 °C for 10min. After dyeing, the fabricsamples were dried and stabilized in compactor at aspeed of 22m/min and 110 °C temperature.
Fabric testing
The samples were preconditioned in hot-air oven at 47 °Ctemperature and 20% relative humidity for four hoursbefore conditioning in standard atmosphere of 20 ± 2 °Ctemperature and 65 ± 2% relative humidity according toASTM D 1776 (ASTM, 2004). The AP was tested on SDLAtlas air permeability tester M021A (SDL-Atlas Inc., RockHill, SC, USA) according to ASTM D737-04 (ASTM,2012), using 20 cm2 testing head at 100 Pascal pressure(SDL, 2012). Totally, five specimens of each fabric samplewere tested at different places across the fabric width andthe mean results obtained were recorded in mm/s.
Results and discussion
The results obtained from the experiments are shown inTable 2. The correlation analysis of different fabricproperties with the AP is given in Table 3.
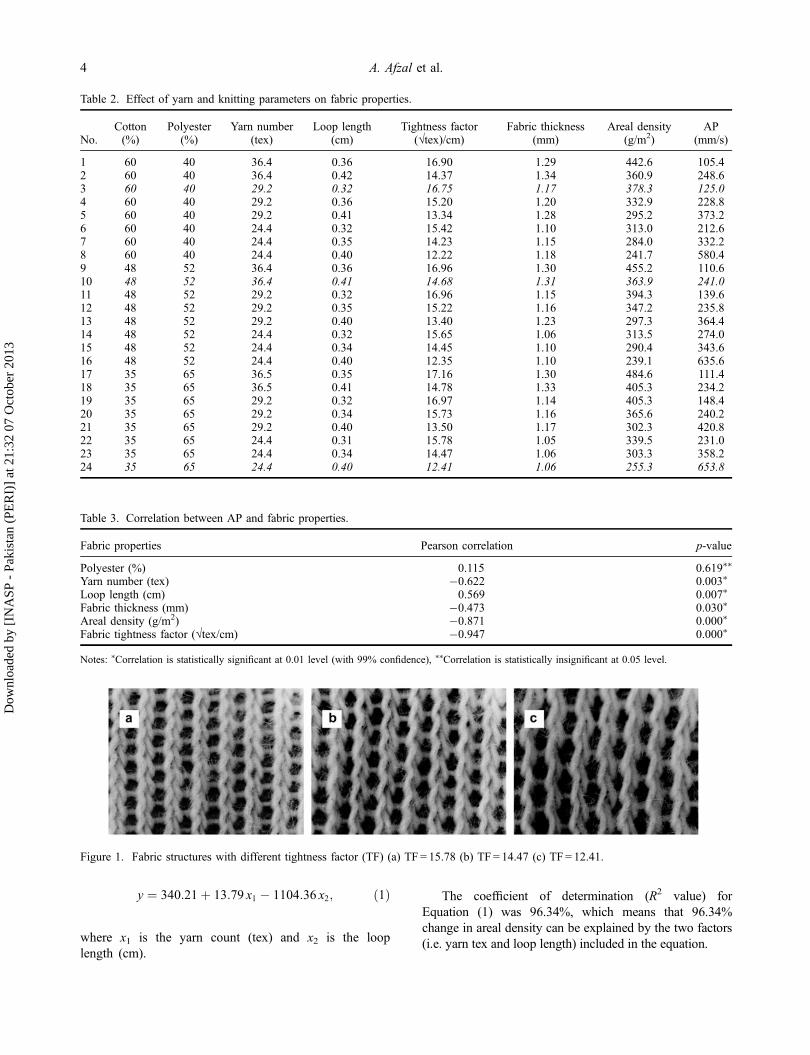
It is clear from the correlation analysis that increas-ing the percentage of polyester from 40 to 65% does notsignificantly affect the fabric AP (P-value > 0.05). ThePearson correlation coefficients depict that the fabrictightness factor has the strongest negative correlationwith the fabric AP followed by the areal density, yarncount, and fabric thickness. The change in fabricstructures with different tightness factors is evident fromFigure 1. The loop length has a strong positivecorrelation with the fabric AP, i.e. the AP increases withincrease in the yarn loop length.
Effect of yarn tex and loop length on fabric arealdensity
Figure 2 illustrates that the fabric areal density increaseswith increase in yarn tex and with decrease in the looplength. It is quite logical that the higher linear density ofyarns of higher tex would result in higher fabric arealdensity. Similarly, when the loop length is shorter, thenumber of yarn loops per unit area of the fabric ishigher, which leads to higher fabric areal density. Theregression equation for fabric areal density (g/m2) wasfound to be as follows.T
able
1.Yarnprop
erties.
Param
eters
Meanvalues
36.9tex
29.5tex
24.6tex
PES:CO
40:60
52:48
65:35
40:60
52:48
65:35
40:60
52:48
65:35
Actualcoun
t(tex)
36.45
36.41
36.57
29.23
29.19
29.25
24.40
24.42
24.39
Evenn
essU%
9.53
9.11
8.74
10.18
9.65
9.39
10.87
10.24
9.88
Thinplace(�
50%)/km
00
00
00
00
0Thick
places
(+50
%)/km
3534
2065
4742
108
9288
Neps(+20
0%)/km
5745
3892
7672
181
161
147
Hairiness
8.10
7.76
7.65
7.81
7.26
7.02
7.19
7.01
6.78
Tenacity
(cN/tex)
18.72
21.49
26.34
18.04
20.60
25.71
17.27
20.35
25.68
Breakingelon
gatio
n(%
)7.28
8.94
10.09
6.42
7.57
8.94
5.81
7.41
8.66
The Journal of The Textile Institute 3
Dow
nloa
ded
by [
INA
SP -
Pak
ista
n (P
ER
I)]
at 2
1:32
07
Oct
ober
201
3
y ¼ 340:21þ 13:79 x1 � 1104:36 x2; ð1Þ
where x1 is the yarn count (tex) and x2 is the looplength (cm).
The coefficient of determination (R2 value) forEquation (1) was 96.34%, which means that 96.34%change in areal density can be explained by the two factors(i.e. yarn tex and loop length) included in the equation.
Table 2. Effect of yarn and knitting parameters on fabric properties.
No.Cotton(%)
Polyester(%)
Yarn number(tex)
Loop length(cm)
Tightness factor(√tex)/cm)
Fabric thickness(mm)
Areal density(g/m2)
AP(mm/s)
1 60 40 36.4 0.36 16.90 1.29 442.6 105.42 60 40 36.4 0.42 14.37 1.34 360.9 248.63 60 40 29.2 0.32 16.75 1.17 378.3 125.04 60 40 29.2 0.36 15.20 1.20 332.9 228.85 60 40 29.2 0.41 13.34 1.28 295.2 373.26 60 40 24.4 0.32 15.42 1.10 313.0 212.67 60 40 24.4 0.35 14.23 1.15 284.0 332.28 60 40 24.4 0.40 12.22 1.18 241.7 580.49 48 52 36.4 0.36 16.96 1.30 455.2 110.610 48 52 36.4 0.41 14.68 1.31 363.9 241.011 48 52 29.2 0.32 16.96 1.15 394.3 139.612 48 52 29.2 0.35 15.22 1.16 347.2 235.813 48 52 29.2 0.40 13.40 1.23 297.3 364.414 48 52 24.4 0.32 15.65 1.06 313.5 274.015 48 52 24.4 0.34 14.45 1.10 290.4 343.616 48 52 24.4 0.40 12.35 1.10 239.1 635.617 35 65 36.5 0.35 17.16 1.30 484.6 111.418 35 65 36.5 0.41 14.78 1.33 405.3 234.219 35 65 29.2 0.32 16.97 1.14 405.3 148.420 35 65 29.2 0.34 15.73 1.16 365.6 240.221 35 65 29.2 0.40 13.50 1.17 302.3 420.822 35 65 24.4 0.31 15.78 1.05 339.5 231.023 35 65 24.4 0.34 14.47 1.06 303.3 358.224 35 65 24.4 0.40 12.41 1.06 255.3 653.8
Figure 1. Fabric structures with different tightness factor (TF) (a) TF = 15.78 (b) TF = 14.47 (c) TF = 12.41.
Table 3. Correlation between AP and fabric properties.
Fabric properties Pearson correlation p-value
Polyester (%) 0.115 0.619⁄⁄
Yarn number (tex) �0.622 0.003⁄
Loop length (cm) 0.569 0.007⁄
Fabric thickness (mm) �0.473 0.030⁄
Areal density (g/m2) �0.871 0.000⁄
Fabric tightness factor (√tex/cm) �0.947 0.000⁄
Notes: ⁄Correlation is statistically significant at 0.01 level (with 99% confidence), ⁄⁄Correlation is statistically insignificant at 0.05 level.
4 A. Afzal et al.
Dow
nloa
ded
by [
INA
SP -
Pak
ista
n (P
ER
I)]
at 2
1:32
07
Oct
ober
201
3

Effect of yarn tex and loop length on fabric thickness
It is evident from Figure 3 that the fabric thicknessincreases with increase in yarn tex and increase in looplength. This is because the yarns with a higher tex havehigher diameter, resulting in a higher fabric thickness.The number of yarn loops per unit area in the fabricstructure decreases by the increase in loop length. Thisdecrease in number of loops per unit area increases thesize of pores between the loops, which provides enoughspace for the fibers to swell on absorbing moisture fromthe atmosphere and to entrap air, leading to increase infabric thickness. The analysis of variance showed thatthe effect of both the yarn tex and loop length on fabricthickness was statistically significant. The regressionequation for fabric thickness (mm) is given in Equation(2), (R2 = 90%):
y ¼ 0:45þ 0:02 x1 þ 0:70 x2; ð2Þ
where x1 is the yarn count (tex) and x2 is the loop length(cm).
Effect of yarn tex and loop length on fabric AP
The effect of two primary knitting factors, i.e. the yarntex and the loop length on the fabric AP is illustrated inFigure 4. It is evident that the fabric AP decreases withincrease in yarn tex. This is because the inter-yarn spacesin the fabric decrease when it is made from yarns ofhigher tex, resulting in decrease in fabric porosity. Fur-thermore, as it has been demonstrated in the previoussection, the higher yarn tex results in higher areal densityas well as higher fabric thickness, both of which lead tolow AP. Hence, it could be concluded that the effect ofyarn tex on fabric AP is inverse. On the other hand, APwas found to be directly proportional to loop length, asshown in Figure 4. This is because with a higher looplength, the number of loops per unit area is less, whichleads to lower areal density and higher porosity. Theregression equation for AP (mm/s), taking yarn tex andloop length as factors, is given in Equation (3)(R2 = 92.03%):
y ¼ �169:5� 27:76 x1 þ 3500:86 x2; ð3Þ
where x1 is the yarn count (tex) and x2 is the loop length(cm).
Effect of fabric thickness and areal density on fabricAP
The fabric thickness and the areal density may be con-sidered as the secondary knitting parameters as they areprimarily dependent upon the yarn tex and the looplength. It is clear from Figure 5 that fabric AP exhibits adecreasing trend with increase in fabric thickness. Thismay be due to longer pores through which the air has totravel in case of thicker fabrics. The effect of fabric arealdensity on AP was found to be inversely proportional ina curvilinear fashion as shown in Figure 6. When arealdensity increases from low to medium level, there is asharp decrease in AP. However, the decrease in AP is
Figure 3. Effect of yarn tex and loop length on fabricthickness. Figure 4. Effect of yarn tex and loop length on fabric AP.
Figure 2. Effect of yarn tex and loop length on fabric arealdensity.
The Journal of The Textile Institute 5
Dow
nloa
ded
by [
INA
SP -
Pak
ista
n (P
ER
I)]
at 2
1:32
07
Oct
ober
201
3

more gradual with further increase in areal density of thefabric from medium to high level. Taking fabric thick-ness and areal density as the predictor variables, theregression equation was found to be as follows(R2 = 77.8):
y ¼ 750:07þ 272:80 x1;�2:29 x2; ð4Þ
where x1 is the fabric thickness (mm) and x2 is the arealdensity (g/m2).
Development of the model
Considering the nonlinear effect of some of the fabricvariables on the AP and to develop a prediction modelthat would more adequately fit the data, response surfaceregression analysis was done. The total data comprised of24 sets of input and output patterns. The data-sets weredivided into two groups, 21 data-sets were selected forthe development of the AP model, while 3 randomizedexperimental data-sets were separated and classified asvalidation data-sets. Response surface regression modelwas developed through Minitab® statistical software. Tak-ing into account only the statistically significant nonlin-earity, the estimated response surface regressioncoefficients in normalized units are given in Table 4.
It is clear from the coefficient values given in Table 4that among the primary knitting factors, the loop lengthhas the greatest positive influence on the fabric APfollowed by the negative influence of the fabric thicknessand yarn number (tex). The finalized response surfaceequation, in actual factor units, is given in Equation (5):
y ¼ �745:88� 15:99 x1 þ 9935:40 x2 � 899:97 x3
þ 1:28 x21 � 202:84 x1 x2; ð5Þ
where x1 is the yarn count (tex), x2 is the loop length(cm), and x3 is the thickness (mm).
The R2 value for the above equation was 98.84,which means that 98.84% variation in the fabric AP isexplained by the terms included in the equation. Forvalidation of the prepared model, validation analysis wasdone to evaluate the performance of the developedmodel. It was observed that actual and predicted APvalues showed good agreement with each other. Theabsolute error (AE) was calculated to determine thedeviation between predicted and actual values usingthe following Equation (6).
Table 4. Estimated regression coefficients for AP.
Term Coefficient SE coefficient T p
Constant 270.72 7.280 37.187 0.000Yarn number �85.35 15.880 �5.375 0.000Loop length 183.09 8.106 22.588 0.000Fabric thickness �113.23 20.863 �5.427 0.000Yarn number�Yarn number 42.75 9.282 �4.606 0.000Yarn number�Loop length �60.63 8.720 6.953 0.000
Figure 5. Interaction graph of fabric thickness (mm) and AP(mm/s) of knitted fabric.
Figure 6. Interaction graph of fabric areal density (g/m2) andAP (mm/s) of knitted fabric.
6 A. Afzal et al.
Dow
nloa
ded
by [
INA
SP -
Pak
ista
n (P
ER
I)]
at 2
1:32
07
Oct
ober
201
3

AE ¼ AV� PV
AV� 100; ð6Þ
where AE is the absolute error, AV is the actual value,and PV is the predicted value.
The average AE of 2.54% was yielded which showedvery good productivity of the model on unseen data-set.The actual and predicted values of the AP are shown inTable 5. The fitted line plot also shows good concor-dance of predicted and actual values of AP of interlock-knitted fabrics as shown in Figure 7. The R2 for thefitted line with value 0.99 was observed, whichexplained the good agreement between the predicted andactual values of the AP.
Sensitivity analysis
Sensitivity analysis was carried out to judge the relativeimportance of different factors on the AP of interlockfabrics by using response surface regression based model(Malik, Haleem, Malik, & Tanwari, 2012). The effect ofsingle input variable at maximum and minimum valueson AP was considered ensuring all other input variablesat their middle-level values. The range of the values ofAP obtained by changing single input variable explainedits relative importance on the response variable aspercentage of the full range of the AP values. The levelsof the input variables used in the sensitivity analysis aregiven in Table 6.
The range of the AP of data along with minimumand maximum values is shown in Table 7. The contribu-tion ratios (CR) of the input variables were calculated bydividing the range of single input variable by the overallrange of the AP of the data as mentioned in thefollowing Equation (7).
CR ¼ Predicted range of the AP by the variable
Overall range of AP: ð7Þ
The relative contribution percentage (CR (%)) of sin-gle variable was calculated considering the CRs of eachvariable with respect to other variables according to thefollowing formula:
CR ð%Þ ¼ CRof single variable
sum of all variable’s CR� 100: ð8Þ
The obtained CR% from Equation (8) was plotted inthe form of pie chart to illustrate the relative influence ofthe variables in percentage on AP of interlock fabricstructures as shown in Figure 8.
It was evident from the sensitivity analysis that thepercentage relative influence of yarn tex, loop length,and fabric thickness on AP of the interlock fabricstructure was 17, 51, and 32%, respectively. Theconcluded results affirm the established logic that looplength plays a pivotal role in the determination of coverfactor and slight variation, wherein it would cause a
Table 5. Predicted and actual values of AP.
Sample No. Yarn number (tex) Loop length (cm) Fabric thickness (mm) Actual AP (mm/s) Predicted AP (mm/s) AE (%)
3 29.2 0.32 1.17 125 112.9 9.710 36.4 0.41 1.31 241 240.5 0.224 24.4 0.40 1.06 653.8 668.8 �2.3
Figure 7. Fitted line plot between predicted and actual AP ofknitted fabrics.
Figure 8. CR% of input variables on AP as determined bysensitivity analysis.
The Journal of The Textile Institute 7
Dow
nloa
ded
by [
INA
SP -
Pak
ista
n (P
ER
I)]
at 2
1:32
07
Oct
ober
201
3

significant change in the AP of the fabric because of thechange in the porosity of the fabric structure. Similarly,the fabric thickness significantly affects the length of airchannel in the fabric structure, but its impact is relativelynot as influencing as that of tightness factor and due tothis reason its relative importance is lower than looplength. The quantification of input factors and their rela-tive influence on the AP can assist for accurate predic-tion and optimization of this authoritative comfortparameter of interlock fabrics.
Conclusions
It was concluded that the change in polyester/cottonblend ratio from 65/35 to 52/48 and 40/60 did not signif-icantly affect the AP of interlock-knitted fabrics. Theincrease in yarn linear density (tex) results in theincrease in fabric areal density and thickness leading topoor AP. The increase in the knitting loop length resultsin the decrease in the number of yarn loops per unit fab-ric area, leading to lower areal density and better AP.The relationship between the areal density and AP wasfound not to be linear and found as an insignificant fac-tor for modulation, whose effect was explained by yarnlinear density and loop length of the fabric in the pre-sented model. The AE was found to be 2.54%, whichexplained the good agreement between the predicted andactual value of AP of knitted fabric by the presentedmodel. Sensitivity analysis quantitatively explained therelative influence of each factor on the AP of fabric,which was found to be the highest for loop length fol-lowed by thickness and yarn linear density at 51%, 32%,and 17%, respectively. Therefore, it could be concludedthat loop length is the most predominant factor affectingthe AP of knitted fabrics. Further work can be carriedout on utilizing diversified materials for the developmentof generic model with the same technique for all theknitting structures.
ReferencesASTM. (2004). Standard practice for conditioning and testing
textiles. West Conshohocken, PA: ASTM International.ASTM. (2012). Standard test method for air permeability of
textile fabrics. West Conshohocken, PA: ASTMInternational.
Atwal, M. S. (1987). Factors affecting the air resistance ofnonwoven needle-punched fabrics. Textile ResearchJournal, 57, 574–579.
Bedek, G., Salaün, F., Martinkovska, Z., Devaux, E., &Dupont, D. (2011). Evaluation of thermal and moisturemanagement properties on knitted fabrics and comparisonwith a physiological model in warm conditions. AppliedErgonomics, 42, 792–800.
Benltoufa, S., Fayala, F., Cheikhrouhou, M., & Ben Nasrallah,S. (2007). Porosity determination of jersey structure.AUTEX Research Journal, 7, 63–69.
Cheng, K. P. S., & Cheung, Y. K. (1994). Comfort in clothing.Textile Asia, 24, 48–52.
Cil, M. G., Nergis, U. B., & Candan, C. (2009). An experimen-tal study of some comfort related properties ofcotton-acrylic knitted fabrics. Textile Research Journal, 79,917–923.
Cimilli, S., Nergis, B. U., Candan, C., & Özdemir, M. (2010).A comparative study of some comfort-related properties ofsocks of different fiber types. Textile Research Journal, 80,948–957.
Das, B., Das, A., Kothari, V. K., Fanguiero, R., & Araújo, M.(2008). Effect of fibre diameter and cross-sectional shapeon moisture transmission through fabrics. Fibers andPolymers, 9, 225–231. doi:10.1007/s12221-008-0036-y
Das, A., & Ishtiaque, S. M. (2004). Comfort characteristics offabrics containing twist-less and hollow fibrous assembliesin weft. Journal of Textile and Apparel, Technology andManagement, 3, 1–5.
Das, A., Kothari, V. K., & Sadachar, A. (2007). Comfort char-acteristics of fabrics made of compact yarns. Fibers andPolymers, 8, 116–122. doi:10.1007/bf02908169
Demiroz Gun, A., Unal, C., & Unal, B. T. (2008). Dimensionaland physical properties of plain knitted fabrics made from50/50 bamboo/cotton blended yarns. Fibers and Polymers,9, 588–592. doi:10.1007/s12221-008-0094-1
Gibson, P., Rivin, D., Kendrick, C., & Schreuder-Gibson, H.(1999). Humidity-dependent air permeability of textilematerials. Textile Research Journal, 69, 311–317.doi:10.1177/004051759906900501
Table 6. Input variables along with extreme levels and means for sensitivity analysis.
Input variable Minimum level Maximum level Mid-level (mean)
Yarn number (tex) 24.4 36.5 30.45Loop length (cm) 0.31 0.42 0.365Fabric thickness (mm) 1.05 1.34 1.195
Table 7. Output factor along with extreme levels and means for sensitivity analysis.
Output factor Minimum level Maximum level Range
AP of interlock fabric (mm/s) 105.4 635.6 530.2
8 A. Afzal et al.
Dow
nloa
ded
by [
INA
SP -
Pak
ista
n (P
ER
I)]
at 2
1:32
07
Oct
ober
201
3

Gun, A. (2011a). Dimensional, physical and thermal comfortproperties of plain knitted fabrics made from modal viscoseyarns having microfibers and conventional fibers. Fibers andPolymers, 12, 258–267. doi:10.1007/s12221-011-0258-2
Gun, A. (2011b). Dimensional, physical and thermal propertiesof plain knitted fabrics made from 50/50 blend of modal vis-cose fiber in microfiber form with cotton fiber. Fibers andPolymers, 12, 1083–1090. doi:10.1007/s12221-011-1083-3
Hałgas, B. W., Danych, R., Więcek, B., & Kowalski, K.(2006). Air and water vapour permeability in double-lay-ered knitted fabrics with different raw materials. Fibers &Textiles in Eastern Europe, 14, 77–80.
Hu, J. Y., Li, Y., & Yeung, K. W. (2006). Air Permeability. In Y.Li & A. S. W. Wong (Eds.), Clothing Biosensory Engineering(pp. 252–260). Cambridge: Woodhead Publishing.
Ibrahim, N. A., Khalifa, T. F., El-Hossamy, M. B., & Tawfik,T. M. (2010). Effect of knit structure and finishingtreatments on functional and comfort properties of cottonknitted fabrics. Journal of Industrial Textiles, 40, 49–64.
Kane, C. D., Patil, U. J., & Sudhakar, P. (2007). Studies on theinfluence of knit structure and stitch length on ring and com-pact yarn single jersey fabric properties. Textile ResearchJournal, 77, 572–582. doi:10.1177/0040517507078023
Kar, F., Fan, J., Yu, W., & Wan, X. (2007). Effects ofthermal and moisture transport properties of T-shirts onwearer’s comfort sensations. Fibers and Polymers, 8,537–542. doi:10.1007/bf02875877
Mahish, S. S., Punj, S. K., & Kothari, V. K. (2010).Comfort and handle related properties of P/V blendedair-jet textured yarn fabrics. Fibers and Polymers, 11,932–940. doi:10.1007/s12221-010-0932-9
Malik, Z. A., Haleem, N., Malik, M. H., & Tanwari, A. (2012).Predicting the tensile strength of polyester/cotton blendedwoven fabrics using feed forward back propagationartificial neural networks. Fibers and Polymers, 13,1094–1100. doi:10.1007/s12221-012-1094-8
Marmarali, A. B. (2003). Dimensional and physical propertiesof cotton/spandex single jersey fabrics. Textile ResearchJournal, 73, 11–14. doi:10.1177/004051750307300102
Mavruz, S., & Ogulata, R. T. (2010). Investigation of airpermeability of single jersey fabrics with different relaxa-tion states. Journal of The Textile Institute, 102, 57–64.doi:10.1080/00405000903474907
Mukhopadhyay, A., Ishtiaque, S. M., & Uttam, D. (2011).Impact of structural variations in hollow yarn on heat andmoisture transport properties of fabrics. Journal of TheTextile Institute, 102, 700–712. doi:10.1080/00405000.2010.515104
Oinuma, R. (1990). Effect of stitch length on some propertiesof cotton 1X1 rib knitted fabrics. Journal of the TextileMachinery Society of Japan, 36, 91–95.
Önder, E., Kalao, F., & Özipek, B. (2003). Influence of varyingstructural parameters on the properties of 50/50 wool/poly-ester blended fabrics. Textile Research Journal, 73,854–860. doi:10.1177/004051750307301002
SDL. (2012). Air permeability tester. Retrieved, from http://www.sdlatlas.com/product/58/Air-Permeability-Tester#
Slater, K. (1977). Comfort properties of textiles. TextileProgress, 9, 21–29.
Unal, P., Üreyen, M., & Mecit, D. (2012). Predicting proper-ties of single jersey fabrics using regression and artificialneural network models. Fibers and Polymers, 13, 87–95.doi:10.1007/s12221-012-0087-y
Urbas, R., Kostanjšek, K., & Dimitrovski, K. (2011). Impact ofstructure and yarn colour on UV properties and air perme-ability of multilayer cotton woven fabrics. Textile ResearchJournal, 81, 1916–1925. doi:10.1177/0040517511413326
Yoon, H. N., & Buckey, A. (1984). Improved comfort polyes-ter. Part I: Transport properties and thermal comfort ofpolyester/cotton blended fabrics. Textile Research Journal,54, 289–298.
The Journal of The Textile Institute 9
Dow
nloa
ded
by [
INA
SP -
Pak
ista
n (P
ER
I)]
at 2
1:32
07
Oct
ober
201
3