Porphyry Copper in Kerman Region, SE-Iran; A metallogenic Interpretation
Journal of Rangeland Science, 2013, Vol. 3, No. 3 Saadatfar et al. / 265
Contents available at ISC and SID
Journal homepage: www.rangeland.ir
Full Length Article:
Statistical Downscaling HadCM3 Model for Detection and
Perdiction of Seasonal Climatic Variations (Case Study: Khabr
Rangeland, Kerman, Iran)
Amir SaadatfarA, Hossein BaraniB, Abdol Reza BahremandC, Ali Reza Massah BavaniD, Adel SepehryE,
Ahmad Abedi ServestaniF APh.D Student, Dep. of Range Land Management, Agricultural Sciences & Natural Resources University of
Gorgan. (Corresponding Author). Email: [email protected]. BAssistant Professor, Dep. of Range Land Management, Agricultural Sciences & Natural Resources
University of Gorgan. CAssistant Professor, Dep. of Watershed and Arid Zone Management, Agricultural Sciences & Natural
Resources University of Gorgan. DAssistant Professor, Irrigation Group, Abureyhan University, Tehran. EProfessor, Dep. of Range Land Management, Agricultural Sciences & Natural Resources University of
Gorgan. FAssistant Professor, Dep. of Agricultural Exyension and Education, Agricultural Sciences & Natural
Resources University of Gorgan.
Received on: 14/08/2013
Accepted on: 05/01/2014
Abstract. Rangelands are one of the most vulnerable parts concerning the climate
changes‟ impacts. These impacts are even stronger in the arid and semi-arid areas where
rangeland ecosystems are in critical conditions. Therefore, it is crucial to figure out the
actual dynamics of climate variations on the rangelands. The aim of this research was to
determine climate changes in Khabr rangeland, Kerman, Iran. So, four meteorological data
sets of HadCM3 model including minimum and maximum temperature, precipitation and
radiation rates were used to assess climate changes in the region. In this regard, climate
changes during 2011-2039 were assessed by downscaling HadCM3 data using LARS-WG
model under three scenarios of B1, A2 and A1B. The results have showed that the rainfall
rates of spring and summer would have declining trends under all three scenarios.
Minimum and maximum temperature rates would increase in all seasons, and just radiation
one showed a decreasing trend for winter. Based on A1B scenario, minimum and
maximum temperature rates had the highest increasing trend. Radiation and precipitation
had the highest increasing and declining trends in the A2 scenario, respectively. Moreover,
the increase in maximum and minimum temperature rates was averagely greater than the
past and consequently despite the increasing trend in minimum and maximum temperature
rates, the increase in the mean temperature rate during this period would be expected.
According to the results, Khabr rangeland‟s climatic conditions will be significantly
different in the next 30 years and long-term and strategic planning is necessary in
consistent with the management policies with these conditions.
Key words: Climatic-Parameters, HadCM3, LARS-WG, Khabr rangelands
J. of Range. Sci., 2013, Vol. 3, No. 3 Statistical …/ 266
1. Introduction Climatic changes are ascribed to human
activities that change the structure of the
global atmosphere and to natural climate
variability observed over comparable
time periods (IPCC, 2007). Human
activities, particularly the burning of
fossil fuels and changes in land uses are
today believed to increase the
atmospheric accumulation of greenhouse
gases. This change of energy balance has
led to make the atmosphere warm and
consequently, climatic changes. Some
researches show that climatic parameters
such as mean annual global surface
temperature have increased by about 0.3 -
0.6oC since the late 19th century, and it is
anticipated to increase by 1-3.5 º
C over
the next 100 years (Solomon et al.,
2007). The most important impacts of
climatic changes on rangelands will
probably change both pasture
productivity and forage quality.
However, there are other impacts on
rangelands that managers will confront
including botanical changes in vegetation
composition, pests, diseases, soil erosion,
animal husbandry and health (Hall et al.,
1998). Currently, global climate models
are the only reliable tools available for
simulating the response of the universal
climate system to the increase of
greenhouse-gas concentrations (IPCC-
TGCIA, 2007). Therefore, the fourth
assessment report of AR4 was
constructed according to a huge dataset
about forthcoming climate-change
projects by 18 worldwide groups, and
climate experiences were run in several
Global Climate Models (GCMs), and
different scenarios (Semenov, 2008;
Semenov and Stratonovitch, 2010).
Scientists emphasize the needs for
appropriate model testing against the
observed data and the evaluation of
uncertainty in future projections.
Furthermore, climate models functions at
spatial scales are considerably larger than
those in which managerial decisions are
made on the desired ecosystems.
Downscaling allows data obtained from
global and regional models to be
estimated for finer spatial scales. There is
therefore a need to utilize the existing
methods or develop new ones as
appropriate ones from downscale climate
model estimates to scales that are more
relevant for site-specific decision-
making. By the help of downscaling
method, the GCM outputs can be
correctly changed into surface variables
in the scale of the basin under study. This
method is based on the statistical model
linking the climate simulated by the
GCM, and the current climate
characterized by instrumental data. This
method has been widely applied to derive
the daily and monthly precipitation rates
at higher spatial resolutions for the
impact assessments (Semenov and
Barrow, 2002; Wilby et al., 2002).
LARS-WG stochastic weather
generator simulates high-resolution
temporal (daily) and spatial (site) climatic
changes‟ scenarios for a number of
climate variables (e.g. precipitation,
maximum/minimum temperature, and
solar radiation rates). Scenarios have
combined the changes with climatic
variables such as duration of dry and wet
spells or temperature variability derived
from the daily output from GCMs
(Semenov and Barrow, 2002). Future
climate scenarios are stochastically
generated by adjusting the parameters
with respect to the directions proportion
to the changes projected by a GCM.
Further details of the LARS-WG can be
found in the user manual (Semenov and
Barrow, 2002). The main advantage of
weather generators is their ability to
generate multiple climate scenarios of
daily climatic variables at a local station
while making them very useful for the
risk assessment studies. Therefore, they
will be used within this study for the
manufacturing of future climatic
scenarios. The aim of this research was to
determine climatic change in Khabr
rangeland, Kerman, Iran. So, four
Journal of Rangeland Science, 2013, Vol. 3, No. 3 Saadatfar et al. / 267
meteorological datasets of HadCM3
model including minimum and maximum
temperature, precipitation and radiation
rates were used to assess climatic change
in the region.
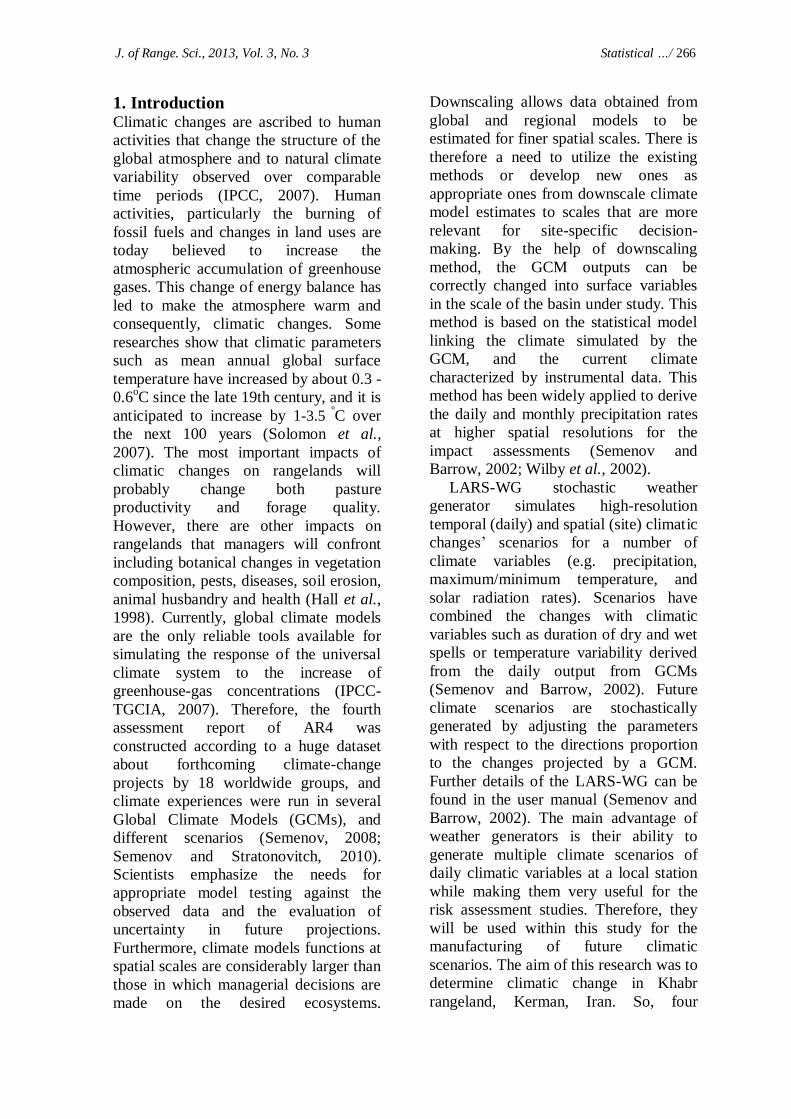
2. Materials and Methods The field research is a part of Khabr
National Park‟s rangelands located in
Kerman Province in the south-east of Iran
(29º 14' N, 56º 35' W, see Fig. 1).
According to Emberger method, the
region climate is arid frigid. The study
site receives about 261 mm of annual
precipitation that mostly occurs during
November and May. The annual mean
temperature is 17.6 ºC. According to
gaussen ambrothermic diagram, the
region aridity period is 7 months. Low
precipitation and high vapour-
transpiration in this area have led to a
severe drought in the recent decades.
Fig. 1. Location of case study, Khabr- Baft
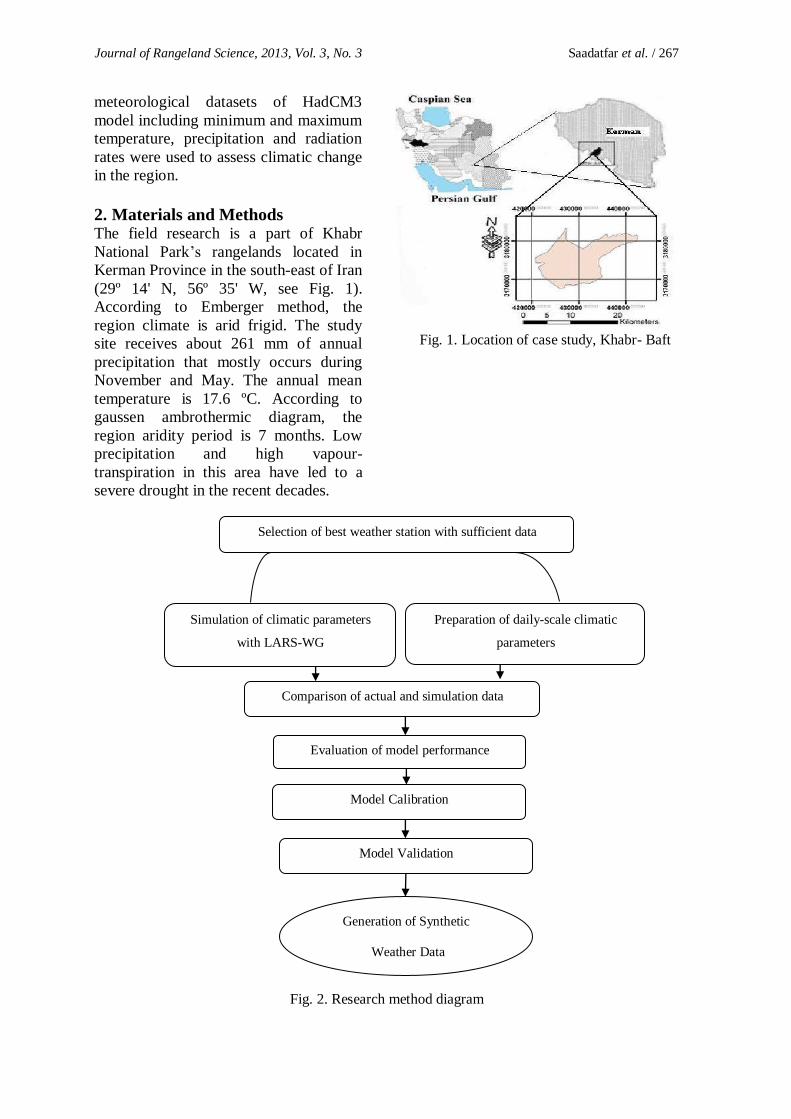
Fig. 2. Research method diagram
Selection of best weather station with sufficient data
Preparation of daily-scale climatic
parameters
Simulation of climatic parameters
with LARS-WG
Comparison of actual and simulation data
Evaluation of model performance
Generation of Synthetic
Weather Data
Model Calibration
Model Validation
J. of Range. Sci., 2013, Vol. 3, No. 3 Statistical …/ 268
2.1. Case study In this study, four main sources of data
were used which are as follow:
1- Daily historical temperature and
precipitation data of Baft
meteorological station during 1898-
2011 (minimum temperature (T-min),
maximum temperature (T-max),
precipitation (P) and sunshine hours).
2- Daily projected data of HadCM3
during 2011-2039 (T-min, T-max and
P and sunshiny hours) that were
resulted from GCM-runs for the Third
Assessment Report (TAR) based on
the IPCC-SRES scenario of A2.
3- Monthly projected data of HadCM3
during 2011-2039 (T-min, T-max, P
and sunny hours) based on the
scenario of B1.
4- Monthly projected data of HadCM3
during 2011-2039 (T-min, T-max, P
and sunny hours) based on the
scenario of A1B.
As it has been shown in the research
method diagram (see Fig. 2), LARS-WG
model was applied to simulate climatic
parameters. This model is one of the
weather generators which can be utilized
for the simulation of weather data at a
single site (Rasco et al., 1991) under
current and future climatic conditions.
These data are in the shape of daily time-
series for a set of climatic variables
namely, precipitation (mm), maximum
and minimum temperature and solar
radiation rates (MJm-2day-1).
LARS-WG is based on the series
weather generator described by Rasco et
al. (1991). It used semi-empirical
distributions for the lengths of wet and
dry day series, daily precipitation and
daily solar radiation. Suitable large-scale
predictors are selected using correlation
analyses and partial correlations between
predictors (large-scale atmospheric
variables) and predictants (local surface
variables) in the area under study.
The simulation of a precipitation event
is modelled as an alternate wet and dry
series where a wet day is defined to be a
day with the precipitation rate of > 0.0
mm. The length of each series is
randomly selected from the wet or dry
semi-empirical distributions for the
month when the series starts. In
determining the distributions, the
observed series are also allocated to the
month when they start. For a wet day, the
precipitation value is generated from the
semi-empirical precipitation distribution
for the particular month independent
from the length of the wet series or the
amount of precipitation in previous days.
Daily minimum and maximum
temperature rates are considered as
stochastic processes with daily means and
daily standard deviations in the wet or
dry status of the day. The technique used
to simulate the process is very similar to
that one presented by Rasco et al. (1991).
LARS-WG performs the process of
generating synthetic weather data with
three distinct steps:
1. Model Calibration - SITE ANALYSIS
– the observed weather data are analysed
to determine their statistical
characteristics. This information is stored
in two parameter files.
2. Model Validation - QTEST - the
statistical characteristics of the observed
and synthetic weather data are analysed
to determine whether there are any
significant differences statistically.
3. Generation of Synthetic Weather Data
- GENERATOR - the parameter files
derived from the observed weather data
during the model calibration process are
used to generate synthetic weather data
having the same statistical characteristics
as the original observed data, but they are
different on a day-to-day basis. Synthetic
data corresponding to a particular
climatic change scenario may also be
generated by applying global climate
model derived from the changes in
precipitation, temperature and solar
radiation rates for the LARS-WG
parameter files.
At the beginning, the processing and
sorting of climatic parameters were

Journal of Rangeland Science, 2013, Vol. 3, No. 3 Saadatfar et al. / 269
performed. Then, the model was run for
the base period and model calibration
was completed. The next step was
evaluated using statistical methods such
as NASH (Eq. 1), Root mean square error
(Eq. 2), Mean absolute error (Eq. 3) and
Bias model performance (Eq. 4).
(1)
n
1i
n
1i
i)2X(Xi
Xi)2(Yi1NA
(2) n
Yi)2(XiRSME
n
1i
(3) n
2YiXiMAE
n
1i
(4)
n
1i2)(
1 Bias YiXi
n
Where
Xi = observed data
Yi= Simulated data
n= Total number of samples
After reviewing the results of the
statistical methods, high performance of
Lars-WG Model was demonstrated. With
this model, daily value of meteorological
parameters during 2011-2039 was
simulated. The simulation was done
under A2, A1B and B1 scenarios.
Monthly normal climatic parameters
were calculated for 2011-2039 based on
three scenarios. Then, monthly and
seasonal variations of these parameters
were obtained under the scenarios of A2,
A1B and B1.
3. Results Comparison of results showed no
significant difference between the
modelled values and the actual values
(P<0.05). (Table 1), shows Pearson
correlation coefficient of all parameters.
These values represent the accuracy of
LARS-WG to simulate the climatic
parameters. In (Table 2), NASH (NA),
Root Means Square Error (RMSE), Mean
Absolute Error (MAE) and Bias show
high accuracy (when the value of NA is
closer to one, Bias is closer to zero,
RMSE and MAE have the minimum
values whereas the observed and
simulated values have more similarities).
Based on these results during 1989-
2010, the observed and simulated values
have high similarities. Observation and
modelling values of parameters such as
the absolute minimum temperature,
absolute maximum temperature,
precipitation and sunshine hours with a
standard deviation coefficient show that
this model can simulate the trends within
the data very well.
Table 1. Pearson correlation coefficients of the observed and simulated values in the model during
1989-2010 BAFT station Rainfall Min Tem Max Tem Sunshine Hours
Correlation 0.98** 0.99** 0.99** 0.98**
Weighted correlation 0.87 0.98 0.98 0.96 **=Significant at 1% probability level
Table 2. Evaluation indicators BAFT Station Rainfall Min Tem Max Tem Sunshine Hours
MAE 4.14 0.15 -0.02 -0.1 RSME 5.26 0.29 0.22 0.2
Bias 2.41 0.007 -0.07 -0.08
NA 0.95 0.99 0.99 0.96
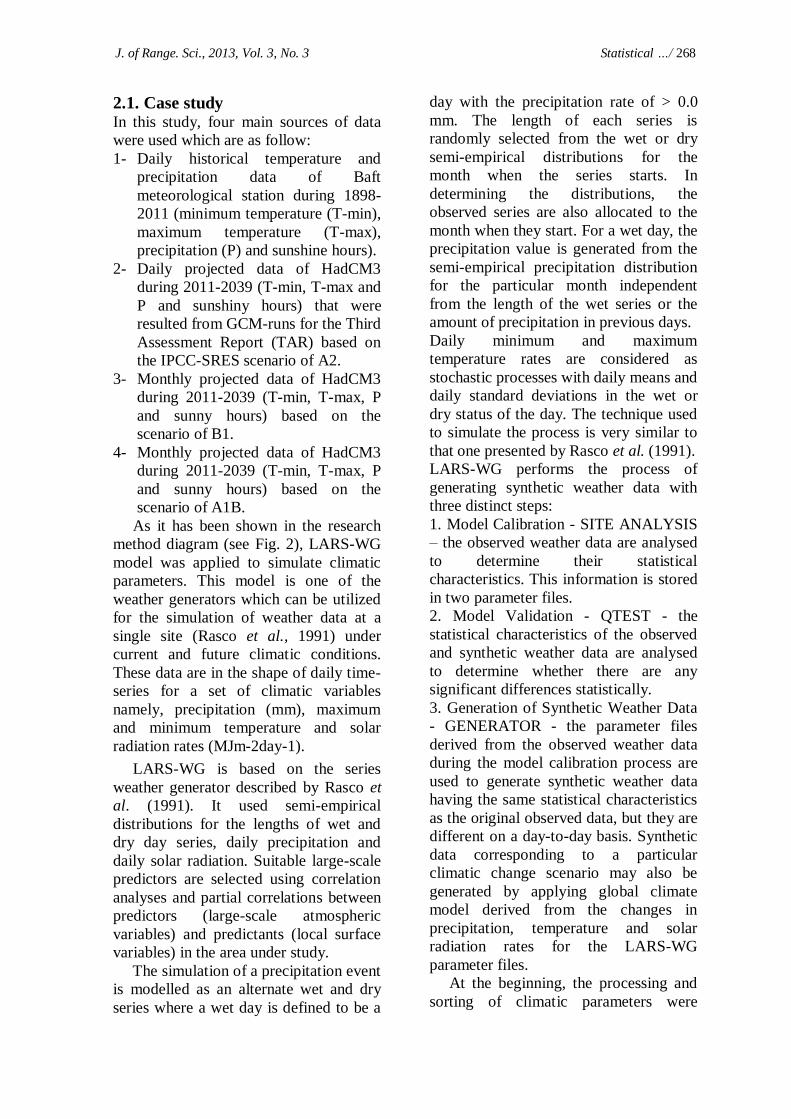
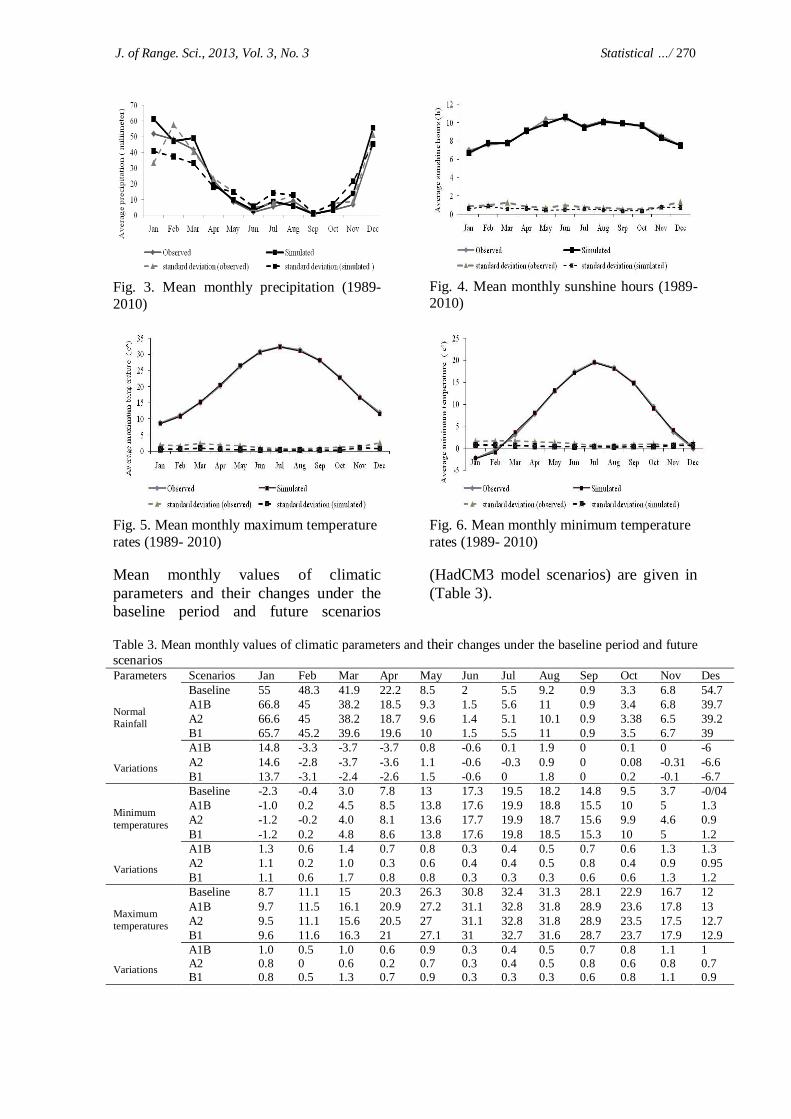
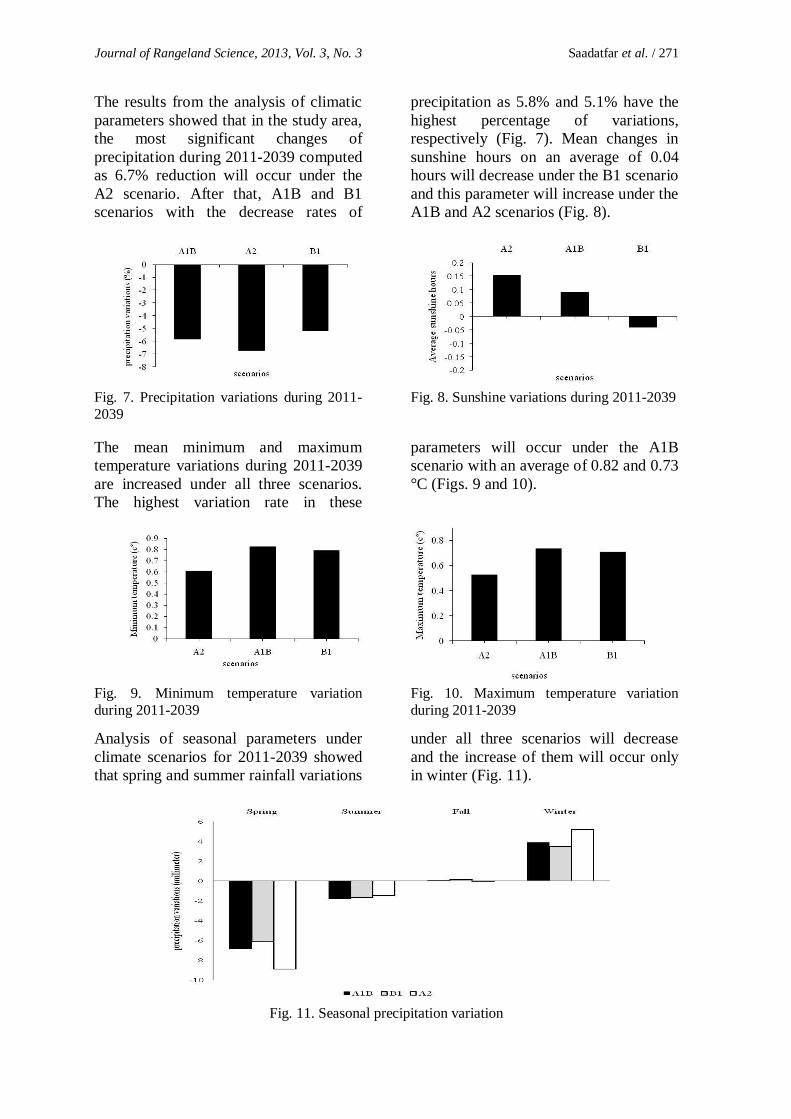
The observed and simulated climatic
parameters during 1989-2010 by LARS-
WG model are shown in (Figs. 3-6). It
represents the ability of the model to
generate daily data on climate parameters
which may be consistent with the
research conducted by Semenov (2007).
J. of Range. Sci., 2013, Vol. 3, No. 3 Statistical …/ 270
Fig. 3. Mean monthly precipitation (1989-
2010)
Fig. 4. Mean monthly sunshine hours (1989-2010)
Fig. 5. Mean monthly maximum temperature
rates (1989- 2010)
Fig. 6. Mean monthly minimum temperature
rates (1989- 2010)
Mean monthly values of climatic
parameters and their changes under the
baseline period and future scenarios
(HadCM3 model scenarios) are given in
(Table 3).
Table 3. Mean monthly values of climatic parameters and their changes under the baseline period and future
scenarios Parameters Scenarios Jan Feb Mar Apr May Jun Jul Aug Sep Oct Nov Des
Normal
Rainfall
Baseline 55 48.3 41.9 22.2 8.5 2 5.5 9.2 0.9 3.3 6.8 54.7
A1B 66.8 45 38.2 18.5 9.3 1.5 5.6 11 0.9 3.4 6.8 39.7
A2 66.6 45 38.2 18.7 9.6 1.4 5.1 10.1 0.9 3.38 6.5 39.2
B1 65.7 45.2 39.6 19.6 10 1.5 5.5 11 0.9 3.5 6.7 39
Variations
A1B 14.8 -3.3 -3.7 -3.7 0.8 -0.6 0.1 1.9 0 0.1 0 -6
A2 14.6 -2.8 -3.7 -3.6 1.1 -0.6 -0.3 0.9 0 0.08 -0.31 -6.6
B1 13.7 -3.1 -2.4 -2.6 1.5 -0.6 0 1.8 0 0.2 -0.1 -6.7
Minimum
temperatures
Baseline -2.3 -0.4 3.0 7.8 13 17.3 19.5 18.2 14.8 9.5 3.7 -0/04
A1B -1.0 0.2 4.5 8.5 13.8 17.6 19.9 18.8 15.5 10 5 1.3
A2 -1.2 -0.2 4.0 8.1 13.6 17.7 19.9 18.7 15.6 9.9 4.6 0.9
B1 -1.2 0.2 4.8 8.6 13.8 17.6 19.8 18.5 15.3 10 5 1.2
Variations
A1B 1.3 0.6 1.4 0.7 0.8 0.3 0.4 0.5 0.7 0.6 1.3 1.3
A2 1.1 0.2 1.0 0.3 0.6 0.4 0.4 0.5 0.8 0.4 0.9 0.95
B1 1.1 0.6 1.7 0.8 0.8 0.3 0.3 0.3 0.6 0.6 1.3 1.2
Maximum
temperatures
Baseline 8.7 11.1 15 20.3 26.3 30.8 32.4 31.3 28.1 22.9 16.7 12
A1B 9.7 11.5 16.1 20.9 27.2 31.1 32.8 31.8 28.9 23.6 17.8 13
A2 9.5 11.1 15.6 20.5 27 31.1 32.8 31.8 28.9 23.5 17.5 12.7
B1 9.6 11.6 16.3 21 27.1 31 32.7 31.6 28.7 23.7 17.9 12.9
Variations
A1B 1.0 0.5 1.0 0.6 0.9 0.3 0.4 0.5 0.7 0.8 1.1 1 A2 0.8 0 0.6 0.2 0.7 0.3 0.4 0.5 0.8 0.6 0.8 0.7 B1 0.8 0.5 1.3 0.7 0.9 0.3 0.3 0.3 0.6 0.8 1.1 0.9
Journal of Rangeland Science, 2013, Vol. 3, No. 3 Saadatfar et al. / 271
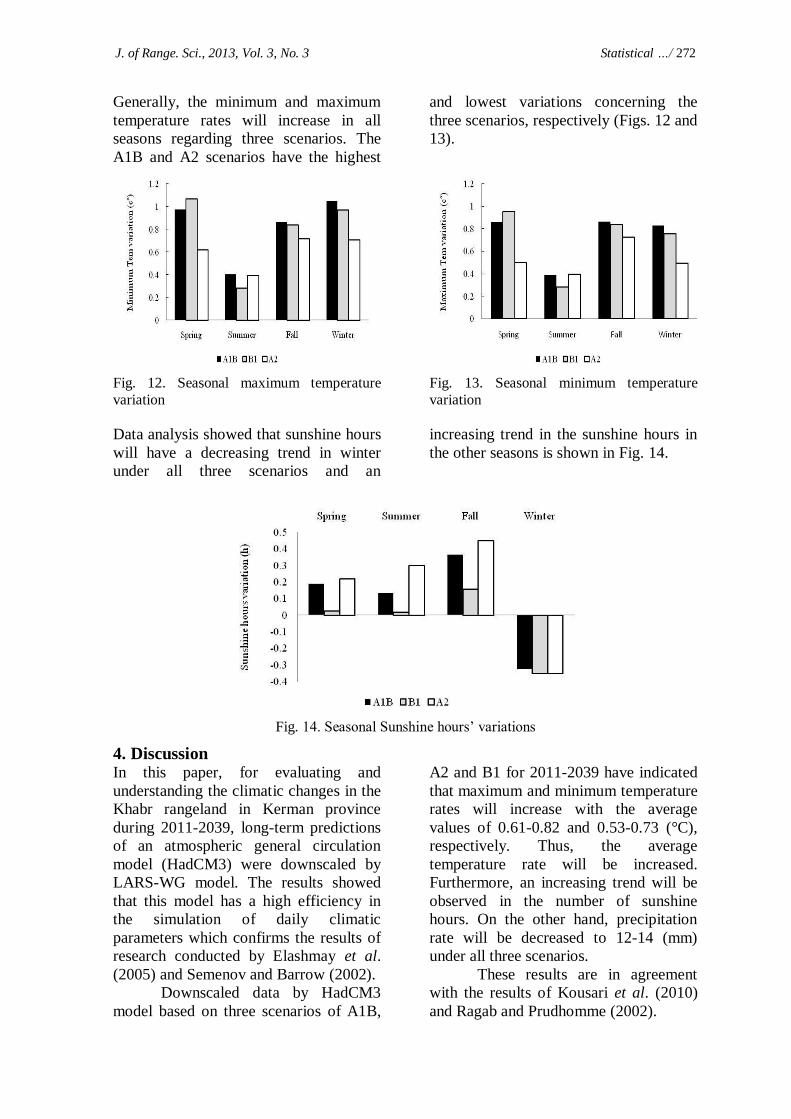
The results from the analysis of climatic
parameters showed that in the study area,
the most significant changes of
precipitation during 2011-2039 computed
as 6.7% reduction will occur under the
A2 scenario. After that, A1B and B1
scenarios with the decrease rates of
precipitation as 5.8% and 5.1% have the
highest percentage of variations,
respectively (Fig. 7). Mean changes in
sunshine hours on an average of 0.04
hours will decrease under the B1 scenario
and this parameter will increase under the
A1B and A2 scenarios (Fig. 8).
Fig. 7. Precipitation variations during 2011-
2039 Fig. 8. Sunshine variations during 2011-2039
The mean minimum and maximum
temperature variations during 2011-2039
are increased under all three scenarios.
The highest variation rate in these
parameters will occur under the A1B
scenario with an average of 0.82 and 0.73
°C (Figs. 9 and 10).
Fig. 9. Minimum temperature variation
during 2011-2039
Fig. 10. Maximum temperature variation
during 2011-2039
Analysis of seasonal parameters under
climate scenarios for 2011-2039 showed
that spring and summer rainfall variations
under all three scenarios will decrease
and the increase of them will occur only
in winter (Fig. 11).
Fig. 11. Seasonal precipitation variation
J. of Range. Sci., 2013, Vol. 3, No. 3 Statistical …/ 272
Generally, the minimum and maximum
temperature rates will increase in all
seasons regarding three scenarios. The
A1B and A2 scenarios have the highest
and lowest variations concerning the
three scenarios, respectively (Figs. 12 and
13).
Fig. 12. Seasonal maximum temperature
variation
Fig. 13. Seasonal minimum temperature
variation
Data analysis showed that sunshine hours
will have a decreasing trend in winter
under all three scenarios and an
increasing trend in the sunshine hours in
the other seasons is shown in Fig. 14.
Fig. 14. Seasonal Sunshine hours‟ variations
4. Discussion In this paper, for evaluating and
understanding the climatic changes in the
Khabr rangeland in Kerman province
during 2011-2039, long-term predictions
of an atmospheric general circulation
model (HadCM3) were downscaled by
LARS-WG model. The results showed
that this model has a high efficiency in
the simulation of daily climatic
parameters which confirms the results of
research conducted by Elashmay et al.
(2005) and Semenov and Barrow (2002).
Downscaled data by HadCM3
model based on three scenarios of A1B,
A2 and B1 for 2011-2039 have indicated
that maximum and minimum temperature
rates will increase with the average
values of 0.61-0.82 and 0.53-0.73 (°C),
respectively. Thus, the average
temperature rate will be increased.
Furthermore, an increasing trend will be
observed in the number of sunshine
hours. On the other hand, precipitation
rate will be decreased to 12-14 (mm)
under all three scenarios.
These results are in agreement
with the results of Kousari et al. (2010)
and Ragab and Prudhomme (2002).
Journal of Rangeland Science, 2013, Vol. 3, No. 3 Saadatfar et al. / 273
Based on the results, the climate in the
Khabr region for the next 30 years will
markedly be different from the current
situation as the largest decrease of
precipitation rate (4-6%) will occur in
spring and autumn as compared to the
baseline precipitation in each scenario.
Minimum and maximum temperature
rates also showed an increasing trend in
spring and autumn in all three scenarios.
This is consistent with the findings
reported by Abasi et al. (2010). They
stated that temperature rates would
increase to 0.3°C, and most of it will be
in winter. The observed trends in
precipitation and temperature may cause
snowfall to be reduced. In contrast, heavy
rains will be increased. The consequence
of that will be a reduction in the storage
and supply of water through the gradual
melting of snow in the mountainous
areas. This heavy rainfall leads to
increase the damage to natural ecosystem
and people; on the other hand, fertile
soils will be lost.
Undoubtedly, climatic changes are
affecting dry lands and pastoral
livelihoods. As a result, these areas will
tend to become drier, and the existing
water shortages will be worsened. In
addition, climatic changes are likely to
bring about even more erratic and
unpredictable rainfalls and most extreme
weather conditions such as longer and
more frequent droughts. Where this
happens, the delicate balance on which
pastoral systems depend is undermined.
Saadatfar et al. (2010) reported that
changes in climatic parameters may cause
to influence the growth behaviour of
plants and rangeland exploitations. The
changes in the number of freezing days
may cause to alter the plant regeneration.
Moreover, the earliest start of growing
period leads to the changes of
exploitation times as well as pastorals‟
calendar. Apart from temporal changes,
there are some impacts on spatial aspects
in the mountainous ecosystems due to the
mentioned thermal increase, i.e. changes
in the existence boundaries of plant
species and communities, their expansion
to higher altitudes and shrinkage of
meadows. Munanga et al. (2010)
suggested that it is essential to
amalgamate across information types (i.e.
weather, climate, socio-economy, policy
and ecology) to admonish those involved
in decision-making better for the
ecosystem management. The preparation
of climate information and an
understanding of ecosystem responses to
climate changes and variability need to
support all the planning and decision-
making processes for the future.
With assessing the rangeland climate
concerning the climatic changes‟
scenarios, it is possible to realize the rates
of changes in rainfall seasons and
periods, severe droughts, floods, pest
outbreaks, river flow decline, wetlands
drying and expansion and intensification
of dust storms in the future and based on
them, risk in the rangelands should be
effectively managed. This management
approach can reduce the rangeland
vulnerability and empower the rangeland
beneficiaries in coping and adapting the
critical situations.
Literature
Abassi, F., Malbusi, S., Babaeian, I., Asmari, M., and Borhani, R., 2010. Climate change
prediction of south Khorasan province during
2010-2039 by using statistical downscaling of
ECHO-G data. Jour. Water and Soil, 24(2):
218-233. (In Persian).
Elshamy, M. E., Wheater, H. S., Gedney, N. and
Huntingford, C., 2005. Evaluation of the
rainfall component of weather generator for
climate change studies. Jour. Hydrology. 326:
1-24.
Hall, W. B., McKeon, G. M., Carter, J. O., Day,
K. A., Howden, S. M., Scanlan, J., Johnston, P. and Burrows W. H., 1998. Climate change
in Queensland's grazing lands: II. An
assessment of the impact on animal
production from native pastures. Jour.
Rangeland. 20: 177-205.
J. of Range. Sci., 2013, Vol. 3, No. 3 Statistical …/ 274
IPCC-TGCIA, 2007. "General Guidelines on the
Use of Scenario Data for Climate Impact and
Adaptation Assessment. Version 2. Prepared
by T. R. Carter on Behalf of the
Intergovernmental Panel on Climate Change,
Task Group on Data and Scenario Support for
Impact and Climate Assessment. pp. 66.
Kousari, M. R., Ekhtesasi, M. R., Tazeh, M. and
Zarch, M. A. A., 2010. An investigation of the
Iranian climatic changes by considering the
precipitation, temperature, and relative humidity parameters. Jour. Theor Appl
Climatol. 23: 32-45. (In Persian).
Munanga, R., Rivingtonb, M., Taklec, E. S.,
Mackeyd, B., Thiawa, I. and Liua, J., 2010.
Climate Information and Capacity Needs for
Ecosystem Management under a Changing
Climate. Procedia Envir. Sci. 1: 206–227.
Ragab, R. and Prudhomme, C., 2002. Climate
change and water resources management in
arid and semi-arid regions: prospective and
challenges for the 21 st century. Jour. Biosys Eng. 81: 3-34.
Rasco, P., Szeidl, L. and Semenov, M. A., 1991.
A serial approach to local stochastic models.
Jour. Ecological Modelling, 57: 27-41.
Saadatfar, A., Barani, H. and Bahremand, A.,
2010. Thermal changes in Iran-Touranian
Region. The Effects on Rangeland.
International Workshop on Climate and
Environmental Change. Beijing, China Page
56-61. (In Persian).
Semenov, M. A., 2007. Development of high
resolution UKCIP02-based climate change scenarios in the UK. Jour. Agri, Meteoro.
144(1-2): 127-138.
Semenov, M. A., 2008. Simulation of extreme
weather events by a stochastic weather
generator. Clim, Res. 35(1): 203-212.
Semenov, M. A. and Barrow, E., 2002. Lars-WG
a Stochastic Weather Generator for Use in
Climate Impact Studies. Version 3.0. User
Manual. Climate Change Scenarios. Jour.
Climatic Change, 35: 397-414.
Semenov, M. A. and Stratonovitch, P., 2010. The use of multi-model ensembles from global
climate models for impact assessments of
climate change, Clim. Res. 41(1): 1-14.
Solomon, S., Qin, D., Manning, M., Chen, Z.,
Marquis, M., Averyt, K. B., Tignor, M. and
Miller, H. L., 2007. IPCC, Climate Change.
The Physical Science Basis. Contribution of
Working Group I to the Fourth Assessment
Report of the Intergovernmental Panel on
Climate Change, 1996. Cambridge, United
Kingdom and New York, NY, USA:
Cambridge University Press.
Wilby, R. L., Dawson, C. W. and Barrow, E. M.,
2002. SDSM - a Decision Support Tool for the Assessment of Regional Climate Change
Impacts. Jour. Environmental Modelling and
Software. 17: 147-59.
Journal of Rangeland Science, 2013, Vol. 3, No. 3 Saadatfar et al. / 275
بی بیی زازاؾتفبز اظ ضیع میبؼ ثبطاتغ ثیی تغییطات فهی پبضاتطبی الییپیف
طاتغ ذجط وطب( :)طبؼ ضزی HadCM3 س
ؿئ(س یؿزاكب ػ وكبضظی بثغ طجیؼی طب )طتؼساضی یازاكدی زوتط فط،ایط ؾؼبزت
اضی، زاكب ػ وكبضظی بثغ طجیؼی طبزاكیبض ط طتؼس حؿی ثبضای، زاكیبض ط آثریعزاضی، زاكب ػ وكبضظی بثغ طجیؼی طب س،ػجساطضب ثط
تطا زاكبپطزیؽ اثضیحب ط بثغ آة، زاكیبض ػیطضب ؿبح ثای، بثغ طجیؼی طب زاكب ػ وكبضظی اؾتبز ط طتؼساضی، ،ػبز ؾپطی
زاكب ػ وكبضظی بثغ طجیؼی طباؾتبزیبض ط تطیح آظـ وكبضظی، ،احس ػبثسی ؾطؾتبی چکیده
ثبقس. ای تأثیط، زض بطك ب، بقی اظ اثطات تغییط الی یپصیطتطی ثرفىی اظ آؾیتطاتغ ی
ثحطای لطاض زاضس، ثیكتط اؾت. ثبثطای قبذت ذكه، زض خبیی و طاتغ زض قطایطذكه ی
پیبیی الؼی، تغییط الی ثط طاتغ، ثؿیبض اؾت. سف اظ ای تحمیك، تؼیی تغییط الی زض طم
قب حساوثط HadCM3 بی اقبؾی سثبقس. زض ای ضاؾتب، چبض دػ اظ زازذجط وطب ی
ثطای تؼیی تغییط الی زض B1 ،A2 A1B تحت ؾ ؾبضیی ػبت آفتبثیؾب زب، حسال زب، ثبضـ
2011-2039زض زض طم ذجط ضز اؾتفبز لطاض طفت. زض ای تحمیك ث ظض اضظیبثی تغییط الی
ضیع B1 ،A2 A1Bتحت ؾبضیبی LARS-WGو ثب اؾتفبز اظ س HadCM3بی س زازاظ
طجك ط ؾ تبثؿتب ثبض فه اؾتفبز قس. تبیح كب زاز و یعا ثبضـ زض ز میبؼ طزیسس،
افعایكی ذاس زاقت فه ضس وی ثیكی زض زبی ؾبضی زاضای ضس وبكی اؾت.
زبی وی A1Bتب ؾبػبت آفتبثی زض فه ظؿتب ضس وبكی اظ ذز كب زاز. ثط اؾبؼ ؾبضی
ثیكی ثیكتطی ضس افعایكی ضا زاقتس. ؾبػبت آفتبثی مساض ثبضـ یع ث تطتیت ثیكتطی ضس
زاضا ثزس. ػال ثط ای، افعایف زض حساوثط حسال زضخ حطاضت ث A2افعایكی وبكی ضا زض ؾبضی
بی وی ثیكی، افعایف طض تؾط ثیكتط اظ صقت ثز اؾت زض تید ثب خز ضس افعایكی ز
30ذجط زض الیی طاتغ قطایط ای تبیح، ذاس ثز. طجك اتظبض لبث زبی تؾط ا زض ای زض
ثطای اؾتطاتػیه ثسست بیضیعیثطب زاقت ذاس فؼی قطایط ثب حؿؾی تفبت آتی ؾب
.سضؾظط ی ث ضطضی قطایط، سیطیت ؾبظبض ثب ای
، طاتغ ذجطHadCM3 ،LARS-WGپبضاتطبی الیی، : کلمات کلیدی
Copyright © 2022 FDOKUMEN