Prediction of variability of precipitation in the Yangtze River Basin under the climate change...
20
Prediction of variability of precipitation in the Yangtze River Basin under the climate change conditions based on automated statistical downscaling Jing Guo • Hua Chen • Chong-Yu Xu • Shenglian Guo • Jiali Guo Ó Springer-Verlag 2011 Abstract Many impact studies require climate change information at a finer resolution than that provided by general circulation models (GCMs). Therefore the outputs from GCMs have to be downscaled to obtain the finer resolution climate change scenarios. In this study, an automated statistical downscaling (ASD) regression-based approach is proposed for predicting the daily precipitation of 138 main meteorological stations in the Yangtze River basin for 2010–2099 by statistical downscaling of the outputs of general circulation model (HadCM3) under A2 and B2 scenarios. After that, the spatial–temporal changes of the amount and the extremes of predicted precipitation in the Yangtze River basin are investigated by Mann– Kendall trend test and spatial interpolation. The results showed that: (1) the amount and the change pattern of precipitation could be reasonably simulated by ASD; (2) the predicted annual precipitation will decrease in all sub- catchments during 2020s, while increase in all sub-catch- ments of the Yangtze River Basin during 2050s and during 2080s, respectively, under A2 scenario. However, they have mix-trend in each sub-catchment of Yangtze River basin during 2020s, but increase in all sub-catchments during 2050s and 2080s, except for Hanjiang River region during 2080s, as far as B2 scenario is concerned; and (3) the significant increasing trend of the precipitation intensity and maximum precipitation are mainly occurred in the northwest upper part and the middle part of the Yangtze River basin for the whole year and summer under both climate change scenarios and the middle of 2040–2060 can be regarded as the starting point for pattern change of precipitation maxima. Keywords Climate change Statistical downscaling Mann–Kendall trend Precipitation The Yangtze River basin 1 Introduction Global warming is an irrefutable fact and the global average surface temperature has increased by about 0.74 ± 0.18°C during the past 100 years and China is one of the countries experiencing the most significant effects of global warming (IPCC 2007; Bate et al. 2008). The Yan- gtze River is the longest river in China and the third longest river in the world and has an irreplaceable role in sup- porting sustainable development of the society and econ- omy in China. The water resources and the total productive value of industry and agriculture in the Yangtze River basin are 40% of the totals of that of China. The Yangtze River basin has about 400 million inhabitants, counting for about 1/3 of the population in the country. However, the J. Guo H. Chen (&) S. Guo J. Guo State Key Laboratory of Water Resources and Hydropower Engineering Science, Wuhan University, Wuhan 430072, People’s Republic of China e-mail: [email protected] J. Guo e-mail: [email protected] C.-Y. Xu Department of Geosciences, University of Oslo, P. O. Box 1047, Blindern, 0316 Oslo, Norway J. Guo HydroChina Huadong Engineering Corporation, Hangzhou 310014, People’s Republic of China C.-Y. Xu Department of Earth Sciences, Uppsala University, Uppsala, Sweden 123 Stoch Environ Res Risk Assess DOI 10.1007/s00477-011-0464-x
-
Upload
independent -
Category
Documents
-
view
3 -
download
0
Transcript of Prediction of variability of precipitation in the Yangtze River Basin under the climate change...

Prediction of variability of precipitation in the Yangtze RiverBasin under the climate change conditions based on automatedstatistical downscaling
Jing Guo • Hua Chen • Chong-Yu Xu •
Shenglian Guo • Jiali Guo
� Springer-Verlag 2011
Abstract Many impact studies require climate change
information at a finer resolution than that provided by
general circulation models (GCMs). Therefore the outputs
from GCMs have to be downscaled to obtain the finer
resolution climate change scenarios. In this study, an
automated statistical downscaling (ASD) regression-based
approach is proposed for predicting the daily precipitation
of 138 main meteorological stations in the Yangtze River
basin for 2010–2099 by statistical downscaling of the
outputs of general circulation model (HadCM3) under A2
and B2 scenarios. After that, the spatial–temporal changes
of the amount and the extremes of predicted precipitation
in the Yangtze River basin are investigated by Mann–
Kendall trend test and spatial interpolation. The results
showed that: (1) the amount and the change pattern of
precipitation could be reasonably simulated by ASD; (2)
the predicted annual precipitation will decrease in all sub-
catchments during 2020s, while increase in all sub-catch-
ments of the Yangtze River Basin during 2050s and during
2080s, respectively, under A2 scenario. However, they
have mix-trend in each sub-catchment of Yangtze River
basin during 2020s, but increase in all sub-catchments
during 2050s and 2080s, except for Hanjiang River region
during 2080s, as far as B2 scenario is concerned; and (3)
the significant increasing trend of the precipitation intensity
and maximum precipitation are mainly occurred in the
northwest upper part and the middle part of the Yangtze
River basin for the whole year and summer under both
climate change scenarios and the middle of 2040–2060 can
be regarded as the starting point for pattern change of
precipitation maxima.
Keywords Climate change � Statistical downscaling �Mann–Kendall trend � Precipitation � The Yangtze
River basin
1 Introduction
Global warming is an irrefutable fact and the global
average surface temperature has increased by about
0.74 ± 0.18�C during the past 100 years and China is one
of the countries experiencing the most significant effects of
global warming (IPCC 2007; Bate et al. 2008). The Yan-
gtze River is the longest river in China and the third longest
river in the world and has an irreplaceable role in sup-
porting sustainable development of the society and econ-
omy in China. The water resources and the total productive
value of industry and agriculture in the Yangtze River
basin are 40% of the totals of that of China. The Yangtze
River basin has about 400 million inhabitants, counting for
about 1/3 of the population in the country. However, the
J. Guo � H. Chen (&) � S. Guo � J. Guo
State Key Laboratory of Water Resources and Hydropower
Engineering Science, Wuhan University, Wuhan 430072,
People’s Republic of China
e-mail: [email protected]
J. Guo
e-mail: [email protected]
C.-Y. Xu
Department of Geosciences, University of Oslo, P. O. Box 1047,
Blindern, 0316 Oslo, Norway
J. Guo
HydroChina Huadong Engineering Corporation, Hangzhou
310014, People’s Republic of China
C.-Y. Xu
Department of Earth Sciences, Uppsala University, Uppsala,
Sweden
123
Stoch Environ Res Risk Assess
DOI 10.1007/s00477-011-0464-x
Yangtze River is also a storm-flood river with uneven
distribution of precipitation and frequent occurrence of
flood and drought. The influence of climate change on
water allocation in the Yangtze River, especially on flood,
has attracted increasing attention and concern.
According to the Yangtze Conservation and Develop-
ment Report 2007 (Yang et al. 2007), climate change is
closely correlated with frequent drought and flood disasters
especially extreme floods in the Yangtze basin. The fre-
quency of floods hazard which has been fed mainly by
precipitation in the Yangtze River is higher than elsewhere
in China. Owing to its vast territory, complicated topog-
raphy and typical monsoon climate, precipitation exhibits a
big variability both spatially and temporally, presenting a
decline tendency from southeast to northwest. Zhang et al.
(2005) detected an upward trend in summer precipitation
for the middle and lower reaches of the Yangtze River
basin in the second half of the last century. Su et al. (2004)
found significant upward trends in precipitation for the
middle and lower Yangtze reaches in the 1990s. In the
early years of twenty-first century, the fluctuations of pre-
cipitation became mild, but the time when extreme rainfall
events occurred had shown a dispersed trend. Su et al.
(2005) pointed that increasing precipitation extremes in
June in the Yangtze River would increase the probability of
flooding if the observed trends of the last 40 years continue
into the future.
Much attention has been paid to analyze the impact of
climate change on the variability of mean precipitation and
the precipitation extremes in the Yangtze River basin from
different viewpoints (Su et al. 2009; Xu et al. 2009; Zhang
et al. 2008; Huang et al. 2010). At present, general circu-
lation models (GCMs) and large-scale circulation predic-
tors are the most important and effective tools and
indicators for studying the impact of climate change. For
example, Xu et al. (2009) found that heavy precipitation
events for single days and pentads would increase in their
intensity over the Yangtze River basin by analyzing future
projections of climate extremes directly derived from an
ensemble of coupled general circulation models (CGCMs),
under a range of emission scenarios in the Yangtze River
basin. However, it is well-known that the spatial resolution
of GCMs grids is too coarse to resolve many important
sub-grid scale processes and GCM output is often unreli-
able at sub-grid scales (Wilby et al. 1999; Xu 1999;
Maraun et al. 2010), they perform poorly at smaller spatial
and temporal scales relevant to the regional impact anal-
yses (Wilby et al. 2008). To bridge the gap of mismatch of
scale between GCMs and the scale of interest for regional
impacts study, dynamical downscaling and statistical
downscaling methodologies have been developed by hy-
drometeorologists to convert GCMs outputs into local
meteorological variables (Fowler et al. 2007). Statistical
downscaling is aimed to derive empirical relationships that
can transform large-scale features of the GCMs (Predic-
tors) to regional-scale variables (Predictands) such as pre-
cipitation, temperature and streamflow (Tripathi et al.
2006). Compared with dynamical downscaling, statistical
downscaling has several advantages such as comparatively
cheap and computationally efficient, capable of estimating
local-scale climatic variables from GCMs outputs, and
easily transferable to other regions, etc. (Xu 1999). Due to
its low expenditure on usage and the equivalent power as
its dynamic competitor, the statistical downscaling tech-
nique has been widely employed in climate change impact
assessments (Wilby et al. 1999; Huth 2002; Wetterhall
et al. 2005; Tripathi et al. 2006; Ghosh and Mujumdar
2008; Chen et al. 2010). Statistical downscaling methods
are generally classified into three categories (Fowler et al.
2007): regression models, weather typing schemes and
weather generators (WGs). Among these statistical down-
scaling methods, regression models, which are used to
directly quantify relationships between the predictands and
a set of predictor variables, are possibly the most popular
ones.
SDSM is a hybrid of the WG and regression-based
downscaling model, which is developed by Wilby et al.
(1999, 2002). The stochastic component enables the gen-
eration of multiple simulations with slightly different time
series attributes, but the same overall statistical properties.
Many studies (Harpham and Wilby 2005; Dibike and
Coulibaly 2005; Khan et al. 2006, Chu et al. 2010) have
shown that this model has superior capability to evaluate
local scale climate change impact. However, the procedure
of predictors’ selection methods in SDSM is partly based
on user’s subjective judgment. Hessami et al. (2008)
developed a new tool under the Matlab environment named
ASD, which was inspired by SDSM and improved the
procedure in the selection of predictors.
The purposes of this study are (1) to evaluate the
applicability of the ASD model in the large geographic
region of the Yangtze River basin which includes Qinghai-
Tibet Plateau, Sichuan Basin and East China Plain area,
and (2) to analyze the long term trend of precipitation in
Yangtze River basin including future trends (2010–2099)
which are predicted by GCM outputs and downscaled by
the ASD method. To achieve the ultimate objectives, the
study will be performed in the following steps: (1) selec-
tion of appropriate atmospheric predictors in the wide
tempo-spatial space for the statistical downscaling model
(ASD); (2) evaluation of the performance of the ASD
method in downscaling precipitation in the Yangtze River
in terms of carefully selected statistical criteria; (3) pre-
diction of the future change of precipitation in the Yangtze
River basin by using ASD; and (4) investigation of the
future spatial and temporal changes of mean precipitation
Stoch Environ Res Risk Assess
123

and the precipitation extremes over the Yangtze River
basin under the climate change projections. The main
implications of the study are twofold: First, the skills and
problems of the ASD downscaling method in the large
geographical region with vast territory, complicated
topography and typical monsoon climate as exemplified by
the Yangtze River basin will be of both scientifically and
practically beneficial for other researchers in this field, and
second, the results will provide a valuable scientific basis
and background information for water resources planning
and management, including flood and drought prediction in
the Yangtze River basin.
2 Study area and data
The Yangtze River passes through nine provinces of China
and has a total drainage area of 1.8 9 106 km2 (Fig. 1).
Except for some areas located on the Tibet Plateau, most
parts of the basin have a sub-tropical monsoon climate, and
the southern part of the basin is close to tropical climate
and northern part is near to temperate climate. The mean
annual precipitation in the basin varies from 300 to
500 mm in the western region to 1,600–1,900 mm in the
southeastern region and the precipitation is mostly con-
centrated in the summer season (from June to August),
accounting for nearly half of the annual totals. To have a
brief idea on the climate of the study region, the Yangtze
River basin is divided into three parts along the longitude
from west to east, which correspond well with the decrease
in altitude (Xu et al. 2006). The upper, middle and lower
regions as shown in Fig. 1 have a mean altitude of 2,551,
627 and 113 m above sea level (m.a.s.l), respectively.
Furthermore, the Yangtze River basin is divided into 11
sub-catchments along the longitude from west to east
(Fig. 1).
Daily precipitation data of 138 meteorological stations
during 1961–2001 provided by the National Climatic
Centre of China were used in the current study. There are
26 different large-scale atmospheric variables (Table 1),
which were derived from the daily reanalysis dataset of
NCEP/NCAR for 1961–2001, as well as outputs of sce-
narios A2 and B2 of HadCM3 (Hadley Centre Coupled
Model, version 3) from 1961 to 2099, representing the
current climate condition and the future climate scenarios,
respectively. The NCEP/NCAR reanalysis daily data and
HadCM3 daily data both at a scale of 3.75� (long.) 9 2.5�(lat.) were downloaded freely from the internet sites, which
had been normalized with respect to their 1961–1990
means and standard deviations. The geographical domain,
86.125�E–125.625�E, 21.25�N–38.75�N with 70 grid-
boxes was chosen to include all areas with noticeable
influence on the circulation patterns that govern weather in
the Yangtze River basin. Figure 1 also showed grid-boxes
(3.75� lat. 9 2.5� long.) of large-scale atmospheric vari-
ables superposed on the map of the Yangtze River basin.
Fig. 1 Location of the Yangtze River basin and its sub-basins,
meteorological stations and the grid-boxes of HadCM3 outputs in the
Yangtze River basin. 1: Jinshajiang River; 2: Mintuojiang River; 3:
Jialingjiang River; 4: Wujiang River; 5: The upper mainstream
section; 6: Hanjiang River; 7: Dongtinghu Lake; 8: Poyanghu Lake;
9: The middle mainstream section; 10: the lower mainstream section;
11: Taihu Lake
Stoch Environ Res Risk Assess
123

3 Methodology
3.1 Automated statistical downscaling
3.1.1 Regression methods
As same to SDSM, the ASD model process can be con-
ditional on the occurrence of an event (e.g. precipitation) or
unconditional (e.g. temperature). Hence, the modeling of
daily precipitation involves the following two steps: pre-
cipitation occurrence and precipitation amounts, as
described by Hessami et al. (2008):
Oi ¼ a0 þXn
j¼1
ajpij; Ri ¼ b0 þXn
j¼1
bjpij þ ei ð1Þ
where Oi are the daily precipitation occurrences, Ri are
daily precipitation amounts, pij are predictors, n is number
of predictors, a and b are model parameters, ei is modeling
error and it is modeled under the assumption that it follows
a Gaussian distribution:
ei ¼ffiffiffiffiffiffiffiffiVIF
12
rZiSe þ b ð2Þ
where Zi are normally distributed random numbers, Se is
the standard error of estimate, b is the model bias and VIF
is the variance inflation factor. The NCEP reanalysis data
are used for calibrating the ASD model. When using NCEP
data, VIF and b are, respectively, set to 12 and 0. When
using GCM data for scenario generation, the VIF and the
bias can be set automatically using the following equations:
b ¼ Mobs �Md ð3Þ
VIF ¼ 12 Vobs � Vdð ÞS2
e
ð4Þ
where Vobs is the variance of observation during calibration
period, Vd is the variance of deterministic part of model
output during calibration period, Se is the standard error,
Mobs and Md are the mean of observation and the mean of
deterministic part of model output during calibration per-
iod, respectively. Regression-based downscaling methods
often use multiple linear regressions, however, the non-
orthogonality of the predictor vectors can make the least
squares estimates of the regression coefficients unstable. In
addition to multiple linear regressions, the present model
gives the possibility to use the ridge regression (Hoerl and
Kennard 1970) to alleviate the effect of the non-orthogo-
nality of the predictor vectors.
3.1.2 Predictor selection methods
Two methods are implemented based on backward step-
wise regression (McCuen 2003) and partial correlation
coefficients to select the predictors in ASD (Hessami et al.
2008). Partial correlation is the correlation between two
variables after removing the linear effect of the third or
more other variables. The partial correlation between
variables i and j while controlling for third variable k is:
Rij;k ¼Rij � RikRjkffiffiffiffiffiffiffiffiffiffiffiffiffiffiffiffiffiffiffiffiffiffiffiffiffiffiffiffiffiffiffiffiffiffiffiffiffiffi
1� R2ik
� �1� R2
jk
� �r ð5Þ
where Rij is the correlation coefficient between variables i
and j. For partial correlation method, the p value is used for
eliminating any one of the insignificant predictors. The p
value is computed by transforming the correlation R to
create a t-statistic having n - 2 degrees of freedom, where
n is the number of observations:
Table 1 The candidates of atmospheric variables for predictors
No. Variables Description No. Variables Description
1 mslp Mean sea level pressure 14 p5zh 500 hPa divergence
2 p_f Surface airflow strength 15 p8_f 850 hPa airflow strength
3 p_u Surface zonal velocity 16 p8_u 850 hPa zonal velocity
4 p_v Surface meridional velocity 17 p8_v 850 hPa meridional velocity
5 p_z Surface vorticity 18 p8_z 850 hPa vorticity
6 p_th Surface wind direction 19 p800 850 hPa geopotential height
7 p_zh Surface divergence 20 p8th 850 hPa wind direction
8 p5_f 500 hPa airflow strength 21 p8zh 850 hPa divergence
9 p5_u 500 hPa zonal velocity 22 rhum Near surface relative humidity
10 p5_v 500 hPa meridional velocity 23 r500 Relative humidity at 500 hPa
11 p5_z 500 hPa vorticity 24 r850 Relative humidity at 850 hPa
12 p500 500 hPa geopotential height 25 shum Near surface specific humidity
13 p5th 500 hPa wind direction 26 temp Mean temperature
Stoch Environ Res Risk Assess
123

t ¼ Rffiffiffiffiffiffiffiffi1�R2
n�2
q ð6Þ
The probability of the t-statistic indicates whether the
observed correlation occurred by chance when the true
correlation is zero.
3.2 Mann–Kendall test
The Mann–Kendall method was used to analyze historical
and future trends of climate variables (i.e. mean precipi-
tation, total precipitation and the precipitation extremes)
over the Yangtze River basin in this study. The Mann–
Kendall test was originally devised by Mann (1945) and
further derived by Kendall (1975) as a non-parametric test
for detecting trends and distribution of the test statistic. The
M–K method has been widely used for detecting a trend in
hydro-climatic time series (Zetterqvist 1991; Burn and
Elnur 2002; Yue et al. 2002; Arora et al. 2005; Aziz and
Burn 2006; Zhang et al. 2006; Chen et al. 2007). The
significance level of a = 5% is used in the study.
4 Downscaling precipitation
4.1 Selection of predictor variables and predictor
domain
The climatic system is influenced by the combined action
of multiple atmospheric variables in the wide tempo-spatial
space. Therefore, any single circulation predictor and/or
small tempo-spatial space are unlikely to be sufficient, as
they fail to capture key precipitation mechanisms based on
thermodynamics and vapor content (Wilby 1998). Wilby
and Wigley (2000) found that in many cases, maximum
correlations between precipitation and the circulation pre-
dictors occurred away from the location of the grid-box of
the downscaled station and suggested that selection of
predictor domain was a critical factor affecting the realism
and stability of downscaling models. The Yangtze River
basin is strongly controlled by the East Asian monsoon and
has different atmosphere circulation in different seasons.
So, it is one of the most important steps in a downscaling
exercise to select appropriate predictor variables and pre-
dictor domain from GCM in the wide tempo-spatial space.
For each meteorological station, the procedures of ASD for
selecting suitable predictor variables and domain were as
following: Firstly, all of the 26 atmospheric variables in the
grid-box, where the object station located in, and the sur-
rounding eight grid-boxes were taken as candidate pre-
dictors; secondly, the partial correlation method with the
significance level of 0.05 was employed in each grid-box of
nine, respectively, and the suitable predictors in each grid-
box were selected; thirdly, the most suitable four grid-
boxes in the nine were chosen based on the model
explained variance R2, which indicated the simulated
capability of the selected predictors of each grid-box; and
finally, the predictors in each grid-box of the selected 4
grid-boxes were further selected with partial correlation
coefficients greater than 0.15 based on the previous step,
and then the integrated predictors of the four grid-boxes for
the downscaling model were chosen.
The results of predictors’ selection by using ASD were
summarized in Table 2. From Table 2, it could be seen that
the final value of explained variance R2 after selecting
predictors was greater than or equal to the maximum value
of explained variance R2* of nine atmospheric grid-boxes
in 90 stations (accounting for 65.22% of all stations of the
Yangtze River Basin). So the predictors’ selection method
of ASD can improve the simulated capability of the sta-
tistical downscaling. Furthermore, it was also found that
most grid-boxes located by the stations were almost
included in most suitable grid of four grid-boxes for each
station, and the other three surrounding boxes respectively
located in the right-hand, the bottom-right and the bottom
of the station located grid-box. From the south-east of the
quadrate region for selecting predictors to the most mete-
orological stations, it could be inferred that the precipita-
tion of the Yangtze River basin is closely related to the
Western Pacific subtropical high and southeast monsoon.
4.2 Calibration and validation of the downscaling
model
Before downscaling of the future precipitation with GCM
predictors, the relationship between the selected predictors
and precipitation in all stations needs to be calibrated and
validated by using NCEP/NCAR predictors. The calibra-
tion period was from 1961 to 1990 and the validation
period was from 1991 to 2001. To evaluate the capacity of
ASD, the root mean square error (RMSE) between the
observed and ASD simulated series of the five statistics
indices and the coefficient of variation of the RMSE
(CV(R)) were used. The five statistics indices included mean
precipitation amount per days (Mean), standard deviation
value (Std), the 90th percentile of rain day amount (Per-
centile90), percentage of wet days (Wet) and maximum
number of consecutive dry days (Cod) (described in
Table 3). The CV(R) is a normalized measure of variability
between two sets of data and defined as:
CVðRÞ ¼RMSE
xð7Þ
where x is the mean of the observed values.
Stoch Environ Res Risk Assess
123

The calibration and validation results were shown in
Table 4. It could be seen that the mean values of the
estimated statistics indices in each sub-catchment of the
Yangtze River basin in calibration and validation periods
were close to those of observed series and the most relative
biases between them were about 10% except for Cdd index.
The RMSEs of most statistical indices were small in each
sub-catchment in the calibration period except for Cdd
index, and the CV(R) values of most statistical indices were
below 0.1. However, in the validation period, the RMSE of
most statistical indices were greater than the values in the
calibration period and the most CV(R) values were greater
than 0.2. The comparison of RMSE of the statistics indices
also showed that the Std and the Cdd were simulated
poorer than the other three statistics indices, which sug-
gested a relative weak capacity of ASD to capture the
extreme events of precipitation process, as in most other
statistical downscaling models (e.g. Srikanthan and
McMahon 2001), and this defect of stochastic precipitation
models will need to be remedied (Wilks 1989; Gregory
et al. 1993). According to Wilby et al. (2004), this might
attribute to the more stochastic nature of precipitation
Table 2 Results of ASD model before and after predictor selection in each station of the Yangtze River basin
Station R2* R2 Station R2* R2 Station R2* R2 Station R2* R2 Station R2* R2 Station R2* R2
52908 0.31 0.32* 56386 0.22 0.18 57178 0.28 0.25 57483 0.31 0.33* 57707 0.28 0.27 58236 0.32 0.30
56004 0.28 0.28* 56459 0.25 0.22 57206 0.28 0.28* 57494 0.34 0.36* 57713 0.27 0.28* 58238 0.32 0.28
56021 0.30 0.29 56462 0.28 0.28* 57232 0.35 0.37* 57504 0.25 0.27* 57722 0.28 0.24 58259 0.32 0.31
56029 0.27 0.28* 56475 0.23 0.24* 57237 0.33 0.36* 57516 0.27 0.29* 57731 0.25 0.22 58265 0.30 0.27
56034 0.32 0.31 56479 0.25 0.23 57245 0.33 0.39* 57537 0.26 0.32* 57741 0.26 0.25 58321 0.29 0.32*
56038 0.31 0.29 56485 0.29 0.25 57253 0.31 0.32* 57545 0.30 0.32* 57745 0.27 0.28* 58326 0.30 0.27
56096 0.21 0.21* 56492 0.22 0.22* 57259 0.30 0.30* 57554 0.30 0.32* 57766 0.29 0.27 58343 0.31 0.31*
56144 0.28 0.28* 56543 0.24 0.24* 57265 0.34 0.35* 57562 0.28 0.28* 57774 0.29 0.32* 58345 0.31 0.30
56146 0.23 0.24* 56565 0.25 0.22 57279 0.31 0.30 57574 0.29 0.33* 57776 0.28 0.33* 58358 0.28 0.34*
56152 0.31 0.31* 56571 0.20 0.20* 57306 0.27 0.28* 57583 0.32 0.33* 57793 0.31 0.29 58402 0.32 0.28
56167 0.27 0.27* 56586 0.25 0.25* 57313 0.30 0.31* 57584 0.29 0.29* 57799 0.29 0.29* 58407 0.34 0.27
56172 0.25 0.21 56651 0.24 0.21 57348 0.29 0.31* 57598 0.32 0.29 57803 0.29 0.29* 58424 0.31 0.29
56178 0.19 0.18 56671 0.28 0.30* 57355 0.30 0.31* 57602 0.21 0.23* 57816 0.28 0.31* 58436 0.35 0.35*
56182 0.25 0.22 56684 0.23 0.25* 57378 0.29 0.33* 57606 0.26 0.27* 57825 0.25 0.27* 58437 0.34 0.27
56188 0.24 0.25* 56691 0.30 0.31* 57385 0.29 0.30* 57608 0.22 0.24* 57832 0.29 0.32* 58464 0.28 0.29*
56193 0.25 0.26* 56768 0.29 0.31* 57399 0.32 0.26 57614 0.24 0.26* 57845 0.29 0.31* 58519 0.29 0.29*
56196 0.26 0.28* 56778 0.27 0.28* 57405 0.25 0.27* 57622 0.30 0.33* 57853 0.28 0.27 58527 0.34 0.34*
56247 0.23 0.20 57106 0.32 0.34* 57411 0.27 0.28* 57633 0.27 0.29* 57866 0.25 0.26* 58606 0.29 0.28
56251 0.27 0.26 57127 0.33 0.32 57426 0.31 0.32* 57649 0.29 0.30* 57872 0.28 0.28* 58608 0.31 0.28
56287 0.26 0.22 57134 0.32 0.33* 57447 0.34 0.37* 57655 0.27 0.28* 57896 0.27 0.28* 58626 0.31 0.31*
56294 0.24 0.26* 57143 0.31 0.34* 57458 0.29 0.27 57669 0.28 0.34* 57965 0.23 0.21 58634 0.33 0.32
56357 0.27 0.26 57144 0.30 0.34* 57461 0.28 0.30* 57671 0.27 0.25 57972 0.29 0.29* 58715 0.32 0.29
56385 0.30 0.29 57156 0.25 0.19 57476 0.28 0.32* 57682 0.31 0.33* 57993 0.26 0.25 58813 0.32 0.32*
Note: R2* is the maximum value of explained variance of ASD model in nine atmospheric grid-boxes and R2 is final value of explained variance
of ASD model after predictor selection for each station. Superscript ‘*’ indicates the R2 value equal or larger than R2* value
Table 3 Precipitation indices to evaluate the performance of statistical downscaling models
Indices Definition Unit Time scale
Mean Mean precipitation amount mm/day Month
Std Standard deviation value mm/day Month
Percentile90 90th percentile of rain day amount mm Month
Wet Percentage of wet days (threshold C 0.1 mm) % Month
Cdd Maximum number of consecutive dry days day Month
Stoch Environ Res Risk Assess
123

Ta
ble
4C
om
par
iso
no
fth
est
atis
tics
ind
ices
bet
wee
no
bse
rved
and
sim
ula
ted
resu
lts
for
each
sub
-cat
chm
ent
inth
eY
ang
tze
Riv
erb
asin
du
rin
gca
lib
rati
on
(19
61
–1
99
0)
and
val
idat
ion
(19
91
–2
00
1)
per
iod
sb
ased
on
NC
EP
pre
dic
tors
Su
b-c
atch
men
tsP
erio
ds
Mea
n(m
m/d
ay)
Std
(mm
/day
)P
erce
nti
le9
0(m
m/m
on
th)
Wet
(%)
Cd
d(d
ay/m
on
th)
OB
SS
IMR
MS
EC
V(R
)O
BS
SIM
RM
SE
CV
(R)
OB
SS
IMR
MS
EC
V(R
)O
BS
SIM
RM
SE
CV
(R)
OB
SS
IMR
MS
EC
V(R
)
Jin
shan
gji
ang
Riv
er
Cal
ibra
tio
n1
.91
1.9
00
.06
0.0
33
.74
3.7
80
.46
0.1
39
.74
9.4
20
.80
0.0
83
8.6
63
9.8
20
.65
0.0
21
0.2
28
.45
1.7
80
.18
Val
idat
ion
2.0
12
.03
0.3
90
.20
3.9
33
.87
0.7
70
.20
10
.65
9.7
62
.15
0.1
93
7.8
94
0.6
85
.91
0.1
61
0.2
38
.24
2.6
20
.26
Min
tuo
jian
g
Riv
er
Cal
ibra
tio
n2
.97
2.8
70
.15
0.0
56
.19
5.6
71
.16
0.1
71
3.4
51
3.0
31
.20
0.0
84
9.4
44
9.5
10
.41
0.0
16
.81
5.8
11
.27
0.1
9
Val
idat
ion
2.8
13
.54
0.6
20
.21
6.0
55
.71
1.5
00
.23
13
.45
13
.01
2.5
20
.18
46
.45
47
.11
5.8
40
.13
7.1
89
.09
2.0
60
.29
Jial
ing
jian
g
Riv
er
Cal
ibra
tio
n2
.63
2.5
00
.18
0.0
76
.94
6.1
51
.15
0.1
61
6.3
51
5.4
61
.64
0.1
03
8.3
83
8.7
30
.52
0.0
18
.10
7.1
21
.26
0.1
5
Val
idat
ion
2.3
72
.44
0.5
70
.24
6.5
36
.14
2.0
90
.35
16
.22
15
.62
3.4
50
.21
34
.38
37
.90
5.2
70
.16
8.9
87
.15
2.3
40
.26
Wu
jian
gR
iver
Cal
ibra
tio
n3
.09
2.9
80
.13
0.0
46
.97
6.4
90
.75
0.1
11
5.8
51
5.1
31
.25
0.0
85
3.2
45
3.2
30
.35
0.0
15
.80
4.8
81
.05
0.1
8
Val
idat
ion
3.1
03
.14
0.6
80
.22
7.2
16
.73
1.9
60
.27
16
.54
15
.57
3.6
40
.22
49
.51
53
.30
5.3
70
.11
6.4
24
.88
1.8
00
.28
Th
eu
pp
erm
ain
stre
amse
ctio
n
Cal
ibra
tio
n3
.15
3.0
40
.15
0.0
57
.58
7.1
20
.94
0.1
21
8.0
21
7.2
31
.49
0.0
84
7.2
04
7.5
10
.58
0.0
16
.49
5.6
81
.00
0.1
5
Val
idat
ion
2.9
22
.97
0.5
80
.20
7.2
36
.89
1.5
40
.22
17
.85
16
.98
3.3
40
.18
43
.64
46
.75
4.8
00
.11
7.1
95
.83
1.7
60
.25
Han
jian
gR
iver
Cal
ibra
tio
n2
.45
2.3
50
.15
0.0
66
.82
6.5
31
.47
0.2
21
8.0
41
6.8
61
.75
0.1
03
4.1
33
5.0
91
.12
0.0
39
.44
7.9
71
.83
0.1
9
Val
idat
ion
2.2
82
.27
0.5
30
.22
6.5
86
.87
1.9
50
.28
18
.90
16
.87
4.7
20
.23
30
.40
33
.54
4.2
10
.14
10
.33
8.1
12
.76
0.2
7
Do
ng
tin
gh
uL
ake
Cal
ibra
tio
n3
.80
3.6
30
.21
0.0
59
.24
8.7
71
.05
0.1
12
2.3
12
0.9
71
.98
0.0
94
7.6
64
7.9
50
.63
0.0
17
.19
5.8
71
.51
0.2
1
Val
idat
ion
3.8
43
.72
0.7
80
.22
9.2
98
.68
2.4
50
.29
23
.06
20
.89
4.9
30
.23
44
.10
45
.20
4.3
20
.10
7.8
88
.08
2.0
10
.26
Po
yan
gh
uL
ake
Cal
ibra
tio
n4
.39
4.2
70
.16
0.0
41
0.3
01
0.1
70
.95
0.0
92
5.4
32
4.6
51
.70
0.0
74
5.6
84
5.8
40
.60
0.0
17
.89
6.1
92
.02
0.2
6
Val
idat
ion
4.8
74
.50
0.9
20
.19
11
.21
11
.32
3.7
00
.34
29
.18
25
.47
5.6
50
.19
43
.81
45
.71
4.8
40
.11
8.2
56
.14
2.6
30
.32
Th
em
idd
le
mai
nst
ream
sect
ion
Cal
ibra
tio
n3
.56
3.4
00
.20
0.0
69
.52
9.0
10
.98
0.1
02
4.4
32
2.9
02
.19
0.0
93
9.6
24
0.1
90
.72
0.0
28
.47
6.8
71
.85
0.2
2
Val
idat
ion
3.5
23
.46
0.6
90
.20
9.5
59
.30
2.8
70
.29
25
.34
23
.38
5.0
00
.20
36
.72
39
.33
4.8
00
.13
9.0
66
.97
2.5
30
.28
Th
elo
wer
mai
nst
ream
sect
ion
Cal
ibra
tio
n3
.42
3.2
50
.21
0.0
69
.12
8.6
21
.18
0.1
32
3.5
12
1.8
32
.38
0.1
03
8.5
43
9.1
60
.77
0.0
28
.73
6.9
81
.98
0.2
3
Val
idat
ion
3.5
83
.43
0.8
70
.24
9.5
38
.81
2.0
50
.22
26
.06
22
.87
6.4
40
.25
34
.48
38
.84
5.7
60
.17
9.6
86
.99
3.0
90
.32
Tai
hu
Lak
eC
alib
rati
on
3.0
62
.90
0.2
10
.07
8.3
87
.82
1.2
40
.15
21
.61
20
.17
2.1
20
.10
38
.52
39
.25
0.8
10
.02
8.4
07
.21
1.3
10
.16
Val
idat
ion
3.3
42
.94
0.9
60
.28
8.8
37
.87
2.4
60
.27
24
.52
20
.69
6.7
40
.27
35
.90
38
.89
4.8
90
.14
9.3
47
.21
2.6
00
.28
Av
erag
eC
alib
rati
on
3.1
33
.01
0.1
60
.05
7.7
17
.28
1.0
30
.14
18
.98
17
.97
1.6
80
.09
42
.82
43
.30
0.6
50
.02
7.9
66
.64
1.5
30
.19
Val
idat
ion
3.1
53
.13
0.6
90
.22
7.8
17
.47
2.1
20
.27
20
.16
18
.28
4.4
20
.21
39
.75
42
.48
5.0
90
.13
8.5
97
.15
2.3
80
.28
Stoch Environ Res Risk Assess
123

occurrence and magnitude, and the regression-based sta-
tistical downscaling models often cannot explain entire
variance of the downscaled variable. In order to visually
show the skills of ASD in downscaling the precipitation in
the Yangtze River basin, the comparison of the simulated
and observed mean monthly values of the 5 indices in the
validation period is shown in Fig. 2 for three randomly
selected stations from upper, middle and lower reaches of
the river, respectively. It is seen that ASD could capture the
monthly values of the statistical indices of precipitation
reasonably well.
Above all, although ASD has some limitations in cap-
turing the extreme events of precipitation process, it can
reasonably well reflect the occurrence and the total amount
of precipitation and can be utilized for statistical
downscaling precipitation of the Yangtze River basin for
practical uses.
4.3 Downscaling precipitation under future emission
scenarios
The validated ASD was used to downscale the large-scale
predictor variables derived from A2 and B2 scenarios of
HadCM3 and daily precipitations were simulated for the
following periods: the current (1961–2001), 2020s
(2010–2039), 2050s (2040–2069) and 2080s (2070–2099).
Compared to the simulated current values, the devia-
tions of simulated annual precipitation in different periods
were calculated and listed in Table 5. Under the A2 sce-
nario, the predicted annual precipitation during 2020s
onitatS)gnijnaN(83285noitatS)gnahciY(16475noitatS)ehiuhsgniQ(43065
0
0.5
1
1.5
2
2.5
3
3.5
4
1 2 3 4 5 6 7 8 9 10 11 12
Month
Mea
n (m
m/d
ay)
OBS
SIM
0
1
2
3
4
5
6
7
8
9
1 2 3 4 5 6 7 8 9 10 11 12
Month
Mea
n (m
m/d
ay)
OBS
SIM
0
1
2
3
4
5
6
7
8
1 2 3 4 5 6 7 8 9 10 11 12
Month
Mea
n (m
m/d
ay)
OBS
SIM
0
1
2
3
4
5
6
1 2 3 4 5 6 7 8 9 10 11 12
Month
STC
D (
mm
/day
)
OBS
SIM
0
2
4
6
8
10
12
14
16
18
1 2 3 4 5 6 7 8 9 10 11 12
MonthS
TC
D (m
m/d
ay)
OBS
SIM
0
2
4
6
8
10
12
14
16
18
20
1 2 3 4 5 6 7 8 9 10 11 12
Month
ST
CD
(mm
/day
)
OBS
SIM
0
2
4
6
8
10
12
14
1 2 3 4 5 6 7 8 9 10 11 12
Month
PRE
C90
(m
m/d
ay)
OBS
SIM
0
5
10
15
20
25
30
35
40
45
1 2 3 4 5 6 7 8 9 10 11 12
Month
PRE
C90
(mm
/day
) OBS
SIM
0
10
20
30
40
50
60
1 2 3 4 5 6 7 8 9 10 11 12
Month
PRE
C90
(mm
/day
)
OBS
SIM
0
10
20
30
40
50
60
70
80
90
1 2 3 4 5 6 7 8 9 10 11 12
Month
Wet
(%
)
OBS
SIM
0
10
20
30
40
50
60
1 2 3 4 5 6 7 8 9 10 11 12
Month
Wet
(%
)
OBS
SIM
0
5
10
15
20
25
30
35
40
45
50
1 2 3 4 5 6 7 8 9 10 11 12
MonthW
et (
%)
OBS
SIM
0
2
4
6
8
10
12
14
16
1 2 3 4 5 6 7 8 9 10 11 12
Month
CD
D (
day)
OBS
SIM
0
2
4
6
8
10
12
14
16
1 2 3 4 5 6 7 8 9 10 11 12
Month
CD
D (
day)
OBS
SIM
0
2
4
6
8
10
12
14
16
1 2 3 4 5 6 7 8 9 10 11 12
Month
CD
D (
day)
OBS
SIM
Fig. 2 Validation results of ASD for precipitation in 56034 (Qingshuihe), 57461 (Yichang) and 58238 (Nanjing) stations, respectively
Stoch Environ Res Risk Assess
123
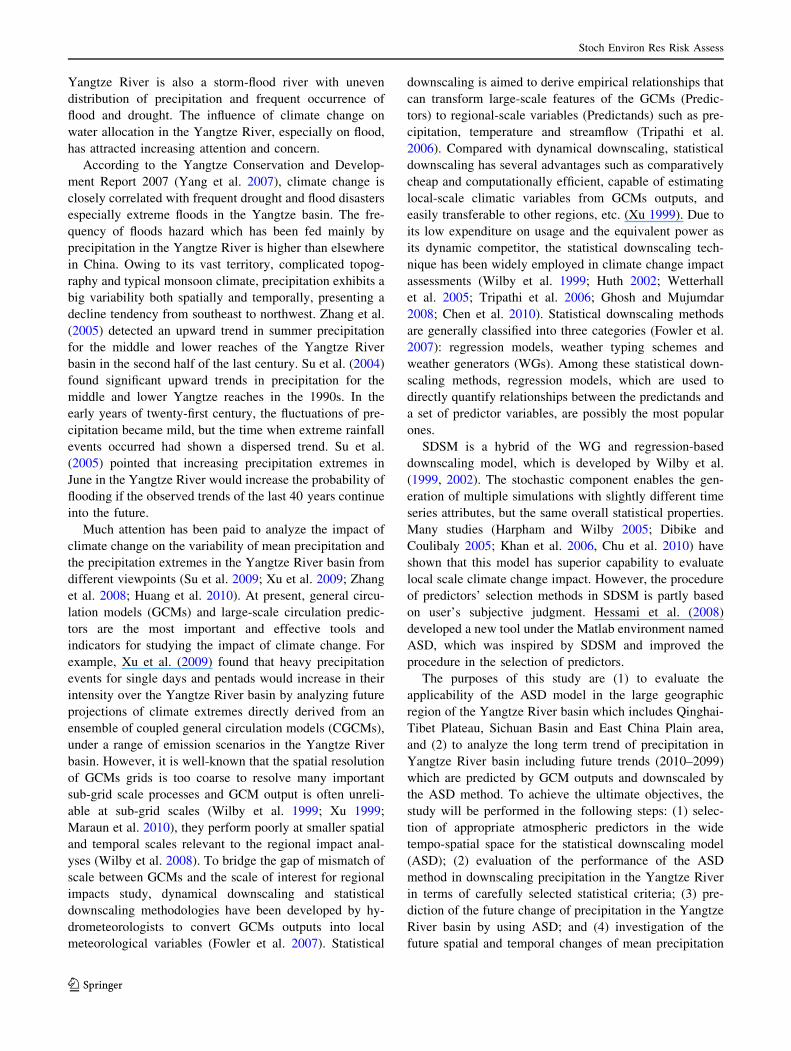
would decrease in most sub-catchments of the Yangtze
River basin except for Dongtinghu Lake and Poyanghu
Lake regions. However, during 2050s and 2080s the annual
precipitation is predicted to increase in all sub-catchments
of the Yangtze River basin by about 3.14–24.22% and
4.15–40.71%, respectively. Under B2 scenario, the pre-
dicted annual precipitation would have mix-trends in each
sub-catchment of Yangtze River basin during 2020s, but
increase in all sub-catchments by about 1.59–19.01%
during 2050s and 5.59–38.30% during 2080s, respectively;
with one exception for Hanjiang River region during 2080s
where a slight decrease was simulated. When Yangtze
River basin was considered as a whole, the predicted
annual precipitation would decrease by 0.35% during
2020s, but increase 8.96% during 2050s and 17.75% dur-
ing 2080s, respectively, under A2 scenario; while succes-
sively increase during the 3 future periods by about 2.26,
8.85 and 12.86%, respectively, as far as B2 scenario was
concerned. Above all, the amount of precipitation would be
upward in the future in the Yangtze River basin according
to these results.
Furthermore, the spatial distribution patterns of the
relative changes of mean annual precipitation of the Yan-
gtze River basin between current period and future periods
for the both climate change scenarios, were interpolated by
using the inverse distance weighting method (IDW), which
was based on the assumption that the interpolating surface
should be influenced mostly by nearby points and less by
more distant points. The interpolation results are geo-
graphically displayed in Fig. 3. It can be seen that the
predicted precipitation under A2 scenario would decrease
in most regions of the basin during 2020s, while increase in
most regions of the basin during 2050s and 2080s. Under
B2 scenario, the predicted precipitation would increase in
most regions of the basin during all three future periods.
The biggest increasing trend under both emission scenarios
in the future periods would mostly dominate in the eastern
part of the upper region and the southern and central parts
of the middle region.
5 Predicted trends of precipitation extremes
under future emission scenarios
According to the hydrometeorological characteristics of
the Yangtze River basin, extreme precipitation events are
the main causes for the flood hazards in the basin (Zhang
et al. 2005). In this section, the spatial and temporal pat-
terns of trends of precipitation extremes and precipitation
intensity over the Yangtze River basin for 2010–2099
based on downscaled daily precipitation by ASD would be
explored using Mann–Kendall trend test. In this study
two groups of statistics were used for exploring theTa
ble
5C
om
par
iso
no
fth
ech
ang
eso
fm
ean
ann
ual
pre
cip
itat
ion
un
der
futu
reem
issi
on
scen
ario
s
Su
b-c
atch
men
tA
2B
2
Cu
rren
t2
02
0s
Ch
ang
es2
05
0s
Ch
ang
es2
08
0s
Ch
ang
esC
urr
ent
20
20
sC
han
ges
20
50
sC
han
ges
20
80
sC
han
ges
(mm
)(m
m)
(%)
(mm
)(%
)(m
m)
(%)
(mm
)(m
m)
(%)
(mm
)(%
)(m
m)
(%)
Jin
shan
gji
ang
Riv
er7
18
.10
71
2.8
0-
0.7
47
48
.80
4.2
77
81
.20
8.7
97
19
.35
73
4.4
02
.09
73
0.8
01
.59
75
9.6
05
.59
Min
tuo
jian
gR
iver
11
56
.41
12
09
.60
4.6
01
38
9.6
02
0.1
71
62
7.2
04
0.7
11
14
7.4
81
23
8.4
07
.92
13
60
.80
18
.59
14
90
.40
29
.88
Jial
ing
jian
gR
iver
11
34
.49
11
30
.40
-0
.36
12
16
.80
7.2
61
31
0.4
01
5.5
11
11
8.8
81
10
5.2
0-
1.2
21
19
8.8
07
.14
12
56
.40
12
.29
Wu
jian
gR
iver
12
95
.74
12
85
.20
-0
.81
14
58
.00
12
.52
16
20
.00
25
.02
12
74
.45
13
46
.40
5.6
51
39
3.2
09
.32
15
01
.20
17
.79
Th
eu
pp
erm
ain
stre
amse
ctio
n1
40
5.4
21
36
8.0
0-
2.6
61
49
4.0
06
.30
16
63
.20
18
.34
13
72
.98
13
75
.20
0.1
61
45
0.8
05
.67
15
26
.40
11
.17
Han
jian
gR
iver
13
51
.49
13
39
.20
-0
.91
14
11
.20
4.4
21
40
7.6
04
.15
13
27
.93
12
34
.80
-7
.01
13
86
.00
4.3
71
30
6.8
0-
1.5
9
Do
ng
tin
gh
uL
ake
17
15
.97
17
28
.00
0.7
01
93
3.2
01
2.6
62
17
8.0
02
6.9
31
66
9.8
51
79
2.8
07
.36
18
68
.40
11
.89
19
58
.40
17
.28
Po
yan
gh
uL
ake
20
42
.01
20
48
.40
0.3
12
18
5.2
07
.01
22
89
.60
12
.12
20
11
.06
20
80
.80
3.4
72
19
2.4
09
.02
22
14
.00
10
.09
Th
em
idd
lem
ain
stre
amse
ctio
n1
81
3.9
71
76
4.0
0-
2.7
51
90
0.8
04
.79
19
94
.40
9.9
51
75
3.9
91
75
3.2
0-
0.0
51
89
0.0
07
.75
19
08
.00
8.7
8
Th
elo
wer
mai
nst
ream
sect
ion
18
18
.54
17
46
.00
-3
.99
18
75
.60
3.1
41
95
8.4
07
.69
17
72
.46
17
28
.00
-2
.51
19
04
.40
7.4
41
95
4.8
01
0.2
9
Tai
hu
Lak
e1
70
7.0
41
76
4.0
03
.34
21
20
.40
24
.22
23
50
.80
37
.71
16
60
.77
17
56
.80
5.7
81
97
6.4
01
9.0
12
29
6.8
03
8.3
0
Av
erag
e1
39
6.7
51
39
1.7
9-
0.3
51
52
1.9
18
.96
16
44
.70
17
.75
13
70
.37
14
01
.39
2.2
61
49
1.6
38
.85
15
46
.57
12
.86
Stoch Environ Res Risk Assess
123
characteristics of precipitation extremes: Group 1 includes
(1) maximum daily precipitation, (2) frequency of rainy
days, (3) precipitation intensity, and (4) frequency of non-
rainy days. And group 2 includes frequency of rainy days
and precipitation intensity for daily precipitation exceeding
90th percentiles. The one-day maximum precipitation
within a year and in summer denoted annual maxi-
mum precipitation and seasonal maximum precipitation
respectively.
5.1 Spatial distribution of MK trends
of the precipitation extremes
The precipitation in the Yangtze River basin has significant
regional differences due to its large area, various terrains
and vegetations, fickle climatic system and inconstant
urbanization condition. Figures 4, 5, 6 and 7 illustrate the
spatial distribution of MK trends of precipitation extremes
over the Yangtze River basin.
5.2 Precipitation extremes as measured by Group 1
statistical indices
The spatial distribution of MK trends of annual precipita-
tion extremes during the future period (2010–2099) under
A2 and B2 emission scenarios in the Yangtze River basin
was drawn in Fig. 4. Under A2 scenario, about 2/3 of
stations have no significant trends, while the rest 1/3 of
stations mainly lie in the middle region (Fig. 4 IA2) have
significant increasing trends in annual maximum precipi-
tation. As for the frequency of rainy days, the number of
stations with significant increasing/decreasing trend was
36.23/15.22% respectively, with 48.55% of the stations
have no significant changing trend (Fig. 4 JA2). For the
Fig. 3 Spatial distribution of relative changes of mean annual precipitation between the current period (1961–2001) and future periods (2020s,
2050s, 2080s) in the Yangtze River basin
Stoch Environ Res Risk Assess
123

precipitation intensity, the number of stations with signif-
icant increasing trend was 54.35%, with 43.48% of the
stations have no significant changing trend, and most of the
stations with significant precipitation increases locate in
the middle region (Fig. 4 KA2). Most stations showed
opposite sign for the change of frequency of non-rainy days
as compared with those of frequency of rainy days (Fig. 4
LA2). Under B2 scenario, most of stations show no sig-
nificant trends of daily maximum precipitation and pre-
cipitation intensity, while only 27 stations in the middle
and lower region show significant increasing trend in the
annual maximum precipitation and one station presents
significant decreasing trend in precipitation intensity,
which has similar changing trend as those under A2
Fig. 4 MK trend of annual extreme precipitation evens in the Yangtze River basin (2010–2099) calculated by 138 stations under A2 (IA2, JA2,
KA2, LA2) and B2 (IB2, JB2, KB2, LB2) scenarios
Stoch Environ Res Risk Assess
123

scenario (Fig. 4 IB2, KB2). As for the frequency of rainy
days, the number of stations with significant increasing/
decreasing trend was 13.04/15.94% respectively, with
71.01% of the stations have no significant changing trend,
which mainly lie in the upper Jinshajiang, Mintuojiang,
Jialingjiang, and Dongtinghu regions (Fig. 4 JB2). As for
the frequency of non-rainy days, the stations showed same
sign with no significant changing trend and showed
opposite sign with significant increasing/decreasing trend
as compared with those of frequency of rainy day (Fig. 4
LB2).
The spatial distribution of MK trends of the four indices
for summer precipitation extremes in the Yangtze River
basin was plotted in Fig. 5 and similar patterns exist as
Fig. 5 MK trend of summer extreme precipitation evens in the Yangtze River basin (2010–2099) calculated by 138 stations under A2 (IA2, JA2,
KA2, LA2) and B2 (IB2, JB2, KB2, LB2) scenarios
Stoch Environ Res Risk Assess
123

compared with those of the annual extremes. Under A2
scenario, 65.94% of stations have no significant trend,
while the 32.61% of stations, which mainly locate in the
middle region have significant increasing trends in summer
maximum precipitation (Fig. 5 IA2). As for the frequency
of rainy days, the number of stations showing significant
increasing/decreasing trend and no significant trend for
about 20.29/23.91 and 55.80%, respectively (Fig. 5 JA2).
As for the frequency of non-rainy days, the opposite
changing patterns can be observed (Fig. 5 LA2). For the
precipitation intensity, the number of stations with no
significant trend was 51.44%, with 46.38% of the stations
have significant increasing trend, which mainly locate in
the upper Jinshajiang, lower Mintuojiang, Wujiang, Don-
gtinghu Lake and Taihu Lake region (Fig. 5 KA2). Under
B2 scenario, more than 83.30% of the stations show no
significant trend in summer maximum precipitation, and
only 22 stations mainly locate in the middle region show
significant increasing trend and only one station also in the
middle region has a significant decreasing trend (Fig. 5
IB2). For the frequency of rainy days, the number of sta-
tions with significant increasing/decreasing trend was 7.25/
25.36% respectively, and the stations with increasing trend
mainly locate in Mintuojiang region, while 67.39% of the
stations have no significant changing trend (Fig. 5 JB2).
Most stations showed opposite change patterns for the
change of frequency of non-rainy days as compared with
those of frequency of rainy days (Fig. 5 LB2). For the
precipitation intensity, 63.77% of the stations show no
significant trend, and most of remaining stations, which
also mainly locate in the upper Jinshajiang, lower Mint-
uojiang, Wujiang, Dongtinghu Lake and Taihu Lake
region, have significant increasing trend (Fig. 5 KB2).
5.2.1 Precipitation extremes as measured by Group 2
statistical indices
Figures 6 illustrate the changes of annul precipitation
maxima defined by daily precipitation exceeding 90th
percentiles. Under A2 scenario, it could be detected that the
number of stations with increasing/decreasing trend and no
obvious trend was 35.51/14.49, and 50.00%, respectively
(Fig. 6 IA2), and the stations with increasing trend mainly
locate in the upper Jinshajiang, Mintuojiang and Don-
gtinghu region. As for the precipitation intensity exceeding
90th percentile, the number of stations with significant
increasing/decreasing trend and no significant trend was
47.83/1.45, and 50.72%, respectively (Fig. 6 JA2), and the
stations with increasing trend also mainly lie in the upper
Jinshajiang, Mintuojiang, Wujiang and Dongtinghu region.
Under B2 scenario, the similar changing pattern was
exhibited as compared with those under A2 scenario,
except that the number of stations with increasing trend
declined to 13.04% and the number of stations with no
obvious trend increased to 72.46% as for frequency of
rainy days (Fig. 6 IB2, JB2).
The spatial distribution of MK trends of the precipitation
maxima defined by 90th percentiles in summer was dis-
played in Fig. 7. It can be seen from Fig. 7 IA2 and IB2
that the stations showing significant decreasing trend of the
frequency of rainy days can be found in every sub-catch-
ments except Poyanghu Lake and Dongtinghu Lake, and
the proportions of these stations with decreasing trends
were 23.91 and 22.46%, respectively for A2 and B2 sce-
narios. The number of stations with increasing trend for the
frequency of rain days was 17.39% under A2 scenario
(mainly locate in the upper Jinshajiang, Mintuojiang, Ji-
alingjiang, Wujiang and Dongtinghu region) (Fig. 7 IA2),
while the number declined to 5.80% under B2 scenario
(mainly locate in the upper Jinshajiang, Mintuojiang and
Jialingjiang region) (Fig. 7 IB2). There were 37.7 and
24.6% of the total stations having significant upward trends
for the intensity of precipitation under A2 and B2 scenar-
ios, which mostly locate in the Dongtinghu Lake, Wujiang,
Mintuojiang and the upper of Jinshajiang region (Fig. 7
JA2, JB2). It can also be seen that only one station locates
in the upper mainstream section was dominated by the
significant decreasing trend of precipitation intensity under
both climatic scenarios (Fig. 7 JA2, JB2). As for the fre-
quency of rainy days and the intensity of precipitation,
Fig. 7 shows that the number of the stations with no
obvious trend exceeded 50% under the both climatic
scenarios.
5.3 Temporal changes of MK trends
of the precipitation extremes
In order to study the temporal variability of precipitation
extremes in future, the temporal changes of MK trends of
the annual and summer precipitation maxima in the upper,
middle and lower regions of Yangtze River basin were
respectively plotted in Figs. 8, 9, 10 and 11 which are
classified using the same statistical indices as before.
5.3.1 Precipitation extremes as measured by Group 1
statistical indices
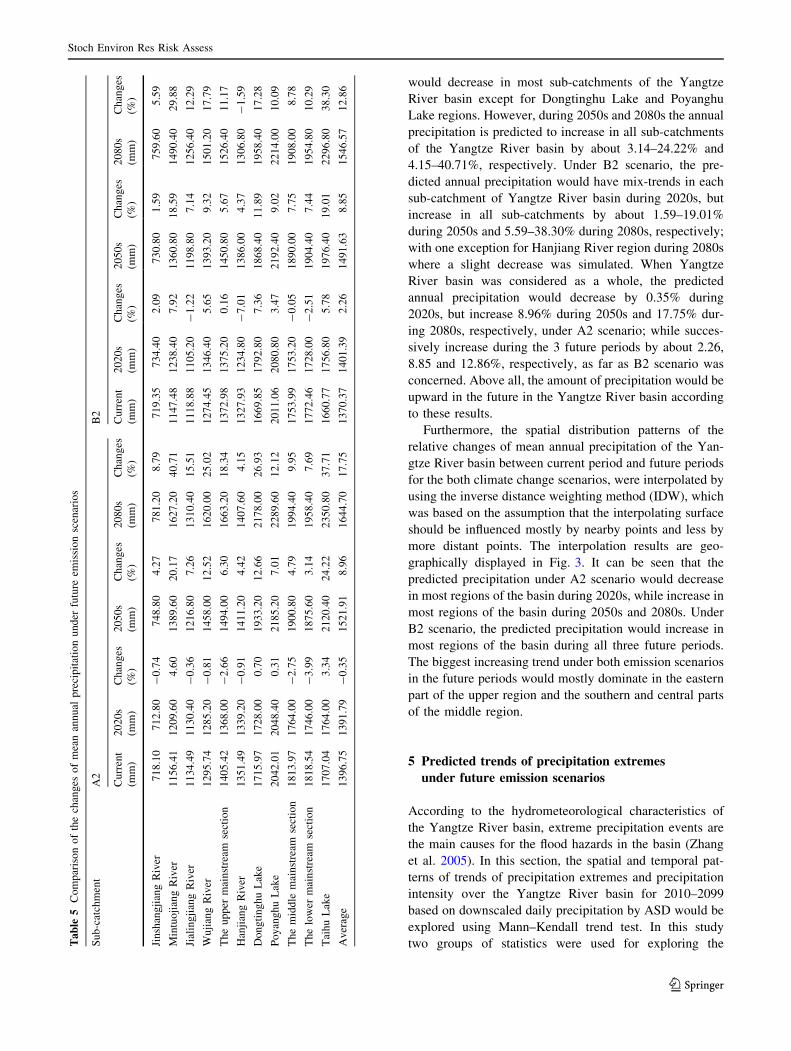
Figure 8 demonstrates temporal changes of MK trends of
the annual maximum precipitation under A2 and B2 sce-
narios in the Yangtze River basin. Under A2 scenario, the
annual maximum precipitation in the lower region is in
decreasing trend during 2010–2058 and in increasing trend
after 2058 but neither of them is significant at [95%
confidence level, while the changing patterns of the upper
and middle regions are in no obvious trend during the first
two decades, in increasing trend during 2030–2065 and in
Stoch Environ Res Risk Assess
123

Fig. 6 MK trend of annual precipitation extreme evens defined as daily precipitation exceeding 90th percentiles in the Yangtze River basin
(2010–2099) calculated by 138 stations under A2 (IA2, JA2) and B2 (IB2, JB2) scenarios
Fig. 7 MK trend of summer precipitation extreme evens defined as daily precipitation exceeding 90th percentiles in the Yangtze River basin
(2010–2099) calculated by 138 stations under A2 (IA2, JA2) and B2 (IB2, JB2) scenarios
Stoch Environ Res Risk Assess
123
significant increasing trend at[95% confidence level after
2065 (Fig. 8 IA2). Under B2 scenario, it is indicated that
the annual maximum precipitation has no obvious chang-
ing patterns during 2010–2045 in the whole Yangtze River
basin, while the changing patterns of middle region are in
significant increasing trend at[95% confidence level after
2050, and the same is true for upper and lower regions after
2075 (Fig. 8 IB2). As for the frequency of rainy days, the
upper region does not show any obvious trend during
2010–2050 and after 2050 is in increasing trend, while the
-6-5-4-3-2-10123456
Z v
alue
-6
-4
-2
0
2
4
6
Z v
alue
-4
-3
-2
-1
0
1
2
3
4
Z v
alue
-4
-3
-2
-1
0
1
2
3
4
Z v
alue
-8
-6
-4
-2
0
2
4
6
8
Z v
alue
-8
-6
-4
-2
0
2
4
6
8Z
val
ue
-4
-3
-2
-1
0
1
2
3
4
Z v
alue
-4
-3
-2
-1
0
1
2
3
4
2010 2020 2030 2040 2050 2060 2070 2080 2090 2010 2020 2030 2040 2050 2060 2070 2080 2090
2010 2020 2030 2040 2050 2060 2070 2080 2090 2010 2020 2030 2040 2050 2060 2070 2080 2090
2010 2020 2030 2040 2050 2060 2070 2080 2090 2010 2020 2030 2040 2050 2060 2070 2080 2090
2010 2020 2030 2040 2050 2060 2070 2080 2090 2010 2020 2030 2040 2050 2060 2070 2080 2090
Z v
alue
upper Yangtze River basin
middle Yangtze River basin
lower Yangtze River basin
95% confidence leveal
IA2, IB2: maximum annual precipitation
JA2, JB2: frequency of rain day
KA2, KB2: precipitation intensity
LA2, LB2: frequency of non-rain day
IA2
JA2
KA2
LA2
IB2
JB2
KB2
LB2
Fig. 8 Temporal changes of MK trend Z-value of areal-averaged annual extreme precipitations in the Yangtze River basin (2010–2099) under
A2 (IA2, JA2, KA2, LA2) and B2 (IB2, JB2, KB2, LB2) scenarios
Stoch Environ Res Risk Assess
123

middle and lower regions show increasing trend after
middle 2030s under A2 scenario (Fig. 8 JA2), but none of
them is significant; while under B2 scenario, the upper
region is in increasing trend during 2010–2025 but in
decreasing trend after 2025, and the middle and lower
regions are in decreasing trend from late 2020s to 2050
(Fig. 8 JB2). As for the number of non-rainy days, the
opposite changing patterns under A2 and B2 are found
-8
-6
-4
-2
0
2
4
6
8Z
val
ue
Z v
alue
Z v
alue
Z v
alue
Z v
alue
Z v
alue
Z v
alue
Z v
alue
-8
-6
-4
-2
0
2
4
6
8
-4
-3
-2
-1
0
1
2
3
4
-4
-3
-2
-1
0
1
2
3
4
-9
-6
-3
0
3
6
9
-8
-6
-4
-2
0
2
4
6
8
-4
-3
-2
-1
0
1
2
3
4
-4
-3
-2
-1
0
1
2
3
4
2010 2020 2030 2040 2050 2060 2070 2080 2090
2010 2020 2030 2040 2050 2060 2070 2080 2090
2010 2020 2030 2040 2050 2060 2070 2080 20902010 2020 2030 2040 2050 2060 2070 2080 2090
2010 2020 2030 2040 2050 2060 2070 2080 2090
2010 2020 2030 2040 2050 2060 2070 2080 2090 2010 2020 2030 2040 2050 2060 2070 2080 2090
upper Yangtze River basin
middle Yangtze River basin
lower Yangtze River basin
95% confidence leveal
IA2, IB2: maximum precipitation in summer
JA2, JB2: frequency of rain day
KA2, KB2: precipitation intensity
LA2, LB2: frequency of non-rain day
IA2
JA2
KA2
LA2
IB2
JB2
KB2
LB2
Fig. 9 Temporal changes of MK trend Z-value of areal-averaged summer extreme precipitations in the Yangtze River basin (2010–2099) under
A2 (IA2, JA2, KA2, LA2) and B2 (IB2, JB2, KB2, LB2) scenarios
Stoch Environ Res Risk Assess
123

(Fig. 8 LA2, LB2). As for the precipitation intensity, the
middle and lower regions are in increasing trend during
2018–2050 and the upper region is in decreasing trend
during 2010–2038 and in increasing trend during
2038–2050, and the increasing trend in the whole Yangtze
River basin becomes significant at [95% confidence level
after 2050 under A2 scenario (Fig. 8 KA2). Under B2
scenario, the middle region shows the same changing
pattern as under A2 scenario, and the upper and lower
regions do not show any trend in the first three decades and
are in increasing trend during 2040–2070 and these
increasing trends are significant at [95% confidence level
after 2070 (Fig. 8 KB2).
The results of similar study conducted for summer
precipitation extremes are shown in Fig. 9, which reveals a
similar changing pattern as the annual precipitation
extremes in some cases. Under both climatic scenarios, the
maximum precipitation in the lower region is in increasing
trend during the future 90 years and that of the middle
region after the middle of this century (Fig. 9 IA2, IB2).
The year when the increasing trend of the maximum pre-
cipitation in the lower region becomes significant is about
2050 under A2 and 2070 under B2 (Fig. 9 IA2, IB2). As
for the frequency of rain day, under A2 scenario, the upper
region is in decreasing trend during 2015–2040 and in
increasing trend thereafter but no significant trend is
detected in the middle and lower regions (Fig. 9 JA2);
under B2 scenario, the whole Yangtze River basin is in
increasing trend during 2010–2022 and in decreasing trend
after 2022 (Fig. 9 JB2). Meanwhile, these trends of fre-
quency of non-rainy days are opposite to what are shown in
Fig. 9 JA2 and JB2 (Fig. 9 LA2, LB2). As for the pre-
cipitation intensity, the lower region is in increasing trend
during the future 90 years under both climatic scenarios,
the middle region is in significant increasing trends until
the middle of this century under both climatic scenarios,
the upper region is in significant increasing trend after
2050s under A2 scenario and after middle 2070s under B2
scenario.
5.3.2 Precipitation extremes as measured by Group 2
statistical indices
Figures 10 and 11 show the frequency and intensity of
precipitation that exceeding 90th percentile under botJh
emission scenarios. For the annual events, the frequency of
precipitation exceeding 90th percentile will increase after
2038 in the middle and lower regions under A2 scenario
-4
-3
-2
-1
0
1
2
3
4Z
val
ue
-4
-3
-2
-1
0
1
2
3
4
Z v
alue
-8
-6
-4
-2
0
2
4
6
8
Z v
alue
-8
-6
-4
-2
0
2
4
6
8
2010 2020 2030 2040 2050 2060 2070 2080 2090
2010 2020 2030 2040 2050 2060 2070 2080 20902010 2020 2030 2040 2050 2060 2070 2080 2090
2010 2020 2030 2040 2050 2060 2070 2080 2090
Z v
alue
upper Yangtze River basin
middle Yangtze River basin
lower Yangtze River basin
95% confidence leveal
IA2, IB2: frequency
JA2, JB2: precipitation intensity
IA2
JA2
IB2
JB2
Fig. 10 Temporal changes of MK trend Z-value of areal-averaged annual precipitation extremes defined by 90th percentiles in the Yangtze
River basin (2010–2099) under A2 (IA2, JA2) and B2 (IB2, JB2) scenarios
Stoch Environ Res Risk Assess
123

(Fig. 10 IA2), and decrease after 2026 in the upper region
under B2 scenario (Fig. 10 IB2). For the summer extremes,
the frequency will increase after 2040 in the upper region
under A2 scenario (Fig. 11 IA2), and decrease after 2030 in
the whole basin under B2 scenario (Fig. 11 IB2). However,
all the change trends for the frequency of precipitation
exceeding 90th percentile mentioned above, were not sig-
nificant. Under A2 scenario, the precipitation intensity will
increase significantly after 2050 in the upper and middle
regions for the whole year and summer (Figs. 10 JA2, 11
JA2), respectively. Under B2 scenario, the significant
increasing trends of the annual precipitation intensity will
appear after 2048 in the middle region, and after 2070 in
the upper and lower regions for the whole year (Fig. 10
JB2), whereas, significant increasing trends only appear in
the middle region after 2044, as far as the summer pre-
cipitation intensity is concerned (Fig. 11 JB2).
6 Conclusion
In this paper, the applicability of the ASD statistical
downscaling model in downscaling daily precipitation in
the Yangtze River basin was evaluated, and the large scale
atmospheric variables from two GCMs were downscaled to
obtained daily precipitation for the basin. The spatial–
temporal changes of the amount and the extremes of pre-
cipitation in the Yangtze River Basin during 2010–2099
under A2 and B2 emission scenarios were investigated.
Some interesting conclusions can be described as follows:
(1) For selecting the predictor domain by ASD, it was
found that the most suitable four grid-boxes for each
station were almost situated at the south-east of the
quadrate region of predictor selection, which indi-
cated that the precipitation of the Yangtze River basin
was closely related to the Western Pacific subtropical
high and Southeast monsoon. According to the
summary of the selection of predictor variables, it
was clearly seen that precipitation in each sub-
catchment of the Yangtze River basin was sensitive
to wind direction, specific humidity and zonal
velocity.
(2) It has been proven that ASD is a successful statistical
downscaling method in the study region. It can be
seen that the mean values of the estimated statistics
indices in each sub-catchment of the Yangtze River
for both calibration and validation periods are similar
-4
-3
-2
-1
0
1
2
3
4Z
val
ue
-4
-3
-2
-1
0
1
2
3
4
Z v
alue
-10-8-6-4-202468
10
Z v
alue
-8
-6
-4
-2
0
2
4
6
8
2010 2020 2030 2040 2050 2060 2070 2080 2090 2010 2020 2030 2040 2050 2060 2070 2080 2090
2010 2020 2030 2040 2050 2060 2070 2080 20902010 2020 2030 2040 2050 2060 2070 2080 2090Z
val
ue
upper Yangtze River basin
middle Yangtze River basin
lower Yangtze River basin
95% confidence leveal
IA2, IB2: frequency
JA2, JB2: precipitation intensity
IA2
JA2
IB2
JB2
Fig. 11 Temporal changes of MK trend Z-value of areal-averaged summer precipitation extremes defined by 90th percentiles in the Yangtze
River basin (2010–2099) under A2 (IA2, JA2) and B2 (IB2, JB2) scenarios
Stoch Environ Res Risk Assess
123
to observed data and the relative bias between them is
generally within 10% and the simulation skill of ASD
for the daily precipitation is gradually increased from
the upstream to the downstream. Above all, the
variation characteristics of precipitation can be rea-
sonably produced.
(3) The results for downscaling precipitation under
scenario A2 showed that the predicted annual
precipitation would decrease in all sub-catchments
during 2020s, while increase in all sub-catchments of
the Yangtze River Basin during 2050s and 2080s,
respectively. However, the predicted annual precipi-
tation would have a mix-trend in each sub-catchment
of Yangtze River basin during 2020s, but increase in
all sub-catchments during 2050s and 2080s, respec-
tively, except for the Hanjiang Basin during 2080s, as
far as B2 scenario is concerned.
(4) The spatial and temporal change trends of precipita-
tion maxima and precipitation intensity were explored
by using Mann–Kendall test over the Yangtze River
basin for 2010–2099 based on downscaled daily
precipitation by ASD. The results revealed that the
significant increasing trend of the precipitation inten-
sity and maximum precipitation would mainly occur
in the northwest upper part and the middle part of the
Yangtze River basin for the whole year and summer
under both climate change scenarios. However, other
statistical indices for precipitation extremes showed
the inconsistent trends in all situations. Hence, the
northwest upper and middle Yangtze River basin
might encounter higher risk of flood hazards in future.
The extreme precipitation will be enhanced in the
Yangtze River Basin, generally after about 2050,
which was illuminated by significant increasing
maximum precipitation and precipitation intensity.
The period of 2040–2060 can be regarded as the
starting point for pattern change of precipitation
maxima. Extreme precipitation as measured by
intensity will be in significant increasing trend after
about mid-2040s in the upper part of the Yangtze
River basin and about 2060s in the middle and lower
parts of the Yangtze River basin.
Due to the uncertainties of GCMs, climatic scenarios,
downscaling methods, and also trend analysis methods, the
prediction of variability of precipitation in the Yangtze
River basin under the climate change conditions in this
study only serves as a reference for decision making and
for further studies.
Acknowledgments The study is financially supported by the
National Program on Key Basic Research Project (973 Program)
(2010CB428405) and National Natural Science Fund of China
(50809049). The authors are greatly appreciated the Canadian
Climate Change Scenarios Network (CCCSN) for providing the
downscaling tool (ASD) and the reanalysis products of the NCEP and
HadCM3 outputs for the downscaling tool. The authors also thank the
National Climate Centre of China for supplying the daily precipitation
data of meteorological stations in the Yangtze River Basin.
References
Arora M, Goel NK, Singh P (2005) Evalution of temperature trends
over India. J Hydrol Sci 50(1):81–93
Aziz OIA, Burn DH (2006) Trends and variability in the hydrological
regime of the Mackenzie River Basin. J Hydrol 319(1–4):282–
294
Bate BC, Kundzewicz ZW, Wu S, Palutikof J (eds) (2008) Climate
change and water. Technical paper of the Intergovernmental
panel on climate change. IPCC Secretariat, Geneva, pp 15–18
Burn DH, Elnur MAH (2002) Detection of hydrologic trends and
variability. J Hydrol 255:107–122
Chen H, Guo SL, Xu C-Y, Singh VP (2007) Historical temporal
trends of hydro-climatic variables and runoff response to climate
variability and their relevance in water resource management in
the Hanjiang basin. J Hydrol 344:171–184
Chen H, Guo J, Xiong W, Guo S-L, Xu C-Y (2010) Downscaling
GCMs using the Smooth Support Vector Machine method to
predict daily precipitation in the Hanjiang Basin. Adv Atmos Sci
27(2):274–284
Chu JT, Xia J, Xu C-Y, Singh VP (2010) Statistical downscaling of
daily mean temperature, pan evaporation and precipitation for
climate change scenarios in Haihe River of China. Theor Appl
Climatol 99:149–161
Dibike YB, Coulibaly P (2005) Hydrologic impact of climate change
in the Saguenay watershed: comparison of downscaling methods
and hydrologic models. J Hydrol 307:145–163
Fowler HJ, Blenkinsopa S, Tebaldib C (2007) Linking climate change
modelling to impacts studies: recent advances in downscaling
techniques for hydrological modelling. Int J Climatol 27:1547–
1578
Ghosh S, Mujumdar PP (2008) Statistical downscaling of GCM
simulations to streamflow using relevance vector machine. Adv
Water Resour 31(1):132–146
Gregory JM, Wigley TML, Jones PD (1993) Application of Markov
models to area-average daily precipitation series and interannual
variability in seasonal totals. Clim Dyn 8:299–310
Harpham C, Wilby RL (2005) Multi-site downscaling of heavy daily
precipitation occurrence and amounts. J Hydrol 312:235–255
Hessami M, Gachon P, Ouarda T, St-Hilaire A (2008) Automated
regression-based Statistical Downscaling Tool. Environ Model
Softw 23:813–834
Hoerl AE, Kennard RW (1970) Ridge regression: application to
nonorthogonal problems. Technometrics 12:69–82
Huang J, Zhang J, Zhang ZX, Xu C-Y, Wang B, Yao J (2010)
Estimation of future precipitation change in the Yangtze River
basin by using statistical downscaling method. Stoch Environ
Res Risk Assess. doi:10.1007/s00477-010-0441-9
Huth R (2002) Statistical downscaling of daily temperature in Central
Europe. J Clim 15:1731–1742
IPCC (2007) Climate change 2007: Synthesis Report Forth Assess-
ment Report of the Intergovernmental panel on climate change,
Geneva, Switzerland
Kendall MG (1975) Rank correlation methods. Griffin, London
Khan MS, Coulibaly P, Dibike Y (2006) Uncertainty analysis of
statistical downscaling methods. J Hydrol 319:357–382
Mann HB (1945) Non-parametric test against trend. Econometrica
13:245–259
Stoch Environ Res Risk Assess
123

Maraun D, Wetterhall F, Ireson AM, Chandler RE, Kendon EJ,
Widmann M, Brienen S Rust HW, Sauter T, Themeßl M,
Venema VKC, Chun KP, Goodess CM, Jones RG, Onof C, Vrac
M Thiele-Eic I (2010) Precipitation downscaling under climate
change: recent developments to bridge the gap between dynam-
ical models and the end user. Rev Geophys. doi:10.1029/
2009RG000314
McCuen RH (2003) Modeling hydrologic change. CRC Press, Boca
Raton, pp 261–263
Srikanthan R, McMahon TA (2001) Stochastic generation of annual,
monthly and daily climate data: a review. Hydrol Earth Syst Sci
5(4):653–670
Su BD, Jiang T, Shi YF, Becker S, Gemmer M (2004) Observed
precipitation trends in the Yangtze catchment from 1951 to 2002.
J Geogr Sci 2(14):204–218
Su BD, Xiao B, Zhu DM, Jiang T (2005) Trends in frequency of
precipitation extremes in the Yangtze River basin, China:
1960–2003. J Hydrol Sci 50(3):479–492
Su BD, Kundzewicz ZW, Jiang T (2009) Simulation of extreme
precipitation over the Yangtze River Basin using Wakeby
distribution. Theor Appl Climatol 96:209–219
Tripathi S, Srinivas VV, Nanjundiah RS (2006) Downscaling of
precipitation for climate change scenarios: a support vector
machine approach. J Hydrol 330(3–4):621–640
Wetterhall F, Halldin S, Xu C-Y (2005) Statistical precipitation
downscaling in Central Sweden with the analogue method.
J Hydrol 306:174–190
Wilby RL (1998) Statistical downscaling of daily precipitation using
daily airflow and seasonal teleconnection indices. Clim Res
10:163–178
Wilby RL, Wigley TML (2000) Precipitation predictors for down-
scaling: observed and general circulation model relationships. Int
J Climatol 20:641–661
Wilby RL, Hay LE, Leavesley GH (1999) A comparison of
downscaled and raw GCM output: implications for climate
change scenarios in the San Juan River basin, Colorado. J Hydrol
225(1–2):67–91
Wilby RL, Dawson CW, Barrow EM (2002) SDSM—a decision
support tool for the assessment of regional climate change
impacts. Environ Model Softw 17:147–159
Wilby RL, Charles SP, Zorita E, Timbal B, Whetton P, Mearns LO
(2004) The guidelines for use of climate scenarios developed
from statistical downscaling methods. Supporting material of the
Intergovernmental Panel on Climate Change (IPCC), prepared on
behalf of Task Group on Data and Scenario Support for Impacts
and Climate Analysis (TGICA). http://ipcc-ddc.cru.uea.ac.uk/
guidelines/StatDown_Guide.pdf
Wilby RL, Beven KJ, Reynolds N (2008) Climate change and fluvial
flood risk in the UK: more of the same? Hydrol Process
22(14):2511–2523
Wilks DS (1989) Conditioning stochastic daily precipitation models
on total monthly precipitation. Water Resour Res 25:1429–1439
Xu C-Y (1999) From GCMs to river flow: a review of downscaling
methods and hydrologic modelling approaches. Prog Phys Geogr
23:229–249
Xu C-Y, Gong LB, Jiang T, Chen DL (2006) Analysis of spatial
distribution and temporal trend of reference evapotranspiration
and pan evaporation in Changjiang (Yangtze River) catchment.
J Hydrol 327:81–93
Xu Y, Xu C, Gao X, Luo Y (2009) Projected changes in temperature
and precipitation extremes over the Yangtze River Basin of
China in the 21st century. Quat Int 208:44–52
Yang G, Weng L, Li L (2007) Yangtze Conservation and Develop-
ment Report 2007. Science Press, Beijing
Yue S, Pilon P, Cavadias G (2002) Power of the Mann–Kendall test
and the Spearman’s rho test for detecting monotonic trends in
hydrological time series. J Hydrol 259:254–271
Zetterqvist L (1991) Statistical estimation and interpretation of trends
in water quality time series. Water Resour Res 27(7):1637–1648
Zhang Q, Jiang T, Gemmer M, Becker S (2005) Precipitation,
temperature and discharge analysis from 1951 to 2002 in the
Yangtze Catchment, China. J Hydrol Sci 50(1):65–80
Zhang Q, Liu C-L, Xu C-Y, Xu YP, Jiang T (2006) Observed trends
of annual maximum water level and streamflow during past
130 years in the Yangtze River basin, China. J Hydrol 324:
255–265
Zhang Q, Xu C-Y, Zhang ZX, Chen DY, Liu C-L, Lin H (2008)
Spatial and temporal variability of precipitation maxima during
1960–2005 in the Yangtze River basin and possible association
with large-scale circulation. J Hydrol 353:215–227
Stoch Environ Res Risk Assess
123