Statistical Bulletin Office for National Statistics A brief description of Consumer Price Inflation
23
Statistical Bulletin Office for National Statistics | 1 Consumer Price Inflation, September 2014 Coverage: UK Date: 14 October 2014 Geographical Area: UK Theme: Economy Key points • The Consumer Prices Index (CPI) grew by 1.2% in the year to September 2014, down from 1.5% in August. • Falls in transport costs (notably sea fares and air fares) and prices for a range of recreational goods provided the largest contributions to the slowdown in the rate of inflation between August and September. • Housing & household services (including utility bills) accounted for a third of the rate of inflation in the year to September. If falling food and motor fuel prices were excluded, the rate of inflation would be a third higher. • CPIH (not a National Statistic) grew by 1.2% in the year to September 2014, down from 1.5% in August. A brief description of Consumer Price Inflation Consumer price inflation is the speed at which the prices of goods and services bought by households rise or fall. Consumer price inflation is estimated by using price indices. One way to understand a price index is to think of a very large shopping basket containing all the goods and services bought by households. The price index estimates changes to the total cost of this basket. ONS consumer price indices are published monthly. ONS has published a video and an infographic that explain how consumer price inflation is calculated. A price index can be used to measure inflation in a number of ways. The most common is to look at how the index has changed over a year. This is calculated by comparing the price index for the latest month with the same month a year ago. This is known as the 12-month inflation rate. This bulletin
Transcript of Statistical Bulletin Office for National Statistics A brief description of Consumer Price Inflation
Statistical Bulletin
Office for National Statistics | 1
Consumer Price Inflation,September 2014Coverage: UKDate: 14 October 2014Geographical Area: UKTheme: Economy
Key points
• The Consumer Prices Index (CPI) grew by 1.2% in the year to September 2014, down from 1.5%in August.
• Falls in transport costs (notably sea fares and air fares) and prices for a range of recreationalgoods provided the largest contributions to the slowdown in the rate of inflation between Augustand September.
• Housing & household services (including utility bills) accounted for a third of the rate of inflationin the year to September. If falling food and motor fuel prices were excluded, the rate of inflationwould be a third higher.
• CPIH (not a National Statistic) grew by 1.2% in the year to September 2014, down from 1.5% inAugust.
A brief description of Consumer Price Inflation
Consumer price inflation is the speed at which the prices of goods and services bought byhouseholds rise or fall. Consumer price inflation is estimated by using price indices. One way tounderstand a price index is to think of a very large shopping basket containing all the goods andservices bought by households. The price index estimates changes to the total cost of this basket.ONS consumer price indices are published monthly.
ONS has published a video and an infographic that explain how consumer price inflation iscalculated.
A price index can be used to measure inflation in a number of ways. The most common is to look athow the index has changed over a year. This is calculated by comparing the price index for the latestmonth with the same month a year ago. This is known as the 12-month inflation rate. This bulletin
Consumer Price Inflation, September 2014 | 14 October 2014
Office for National Statistics | 2
measures inflation to September 2014, so the 12-month rate measures changes in prices betweenSeptember 2013 and September 2014.
ONS publishes a range of measures of consumer price and other price inflation. A tale of many priceindices summarises information on the different measures.
Consumer Prices Index (CPI)
What is the CPI?
The CPI is a measure of consumer price inflation produced to international standards and in line withEuropean regulations. First published in 1997 as the Harmonised Index of Consumer Prices (HICP),the CPI is the inflation measure used in the Government’s target for inflation.
The CPI is also used for purposes such as uprating pensions, wages and benefits and can aid in theunderstanding of inflation on family budgets. For more information see Users and uses of consumerprice inflation statistics (100.5 Kb Pdf).
Latest figure and long-term trend
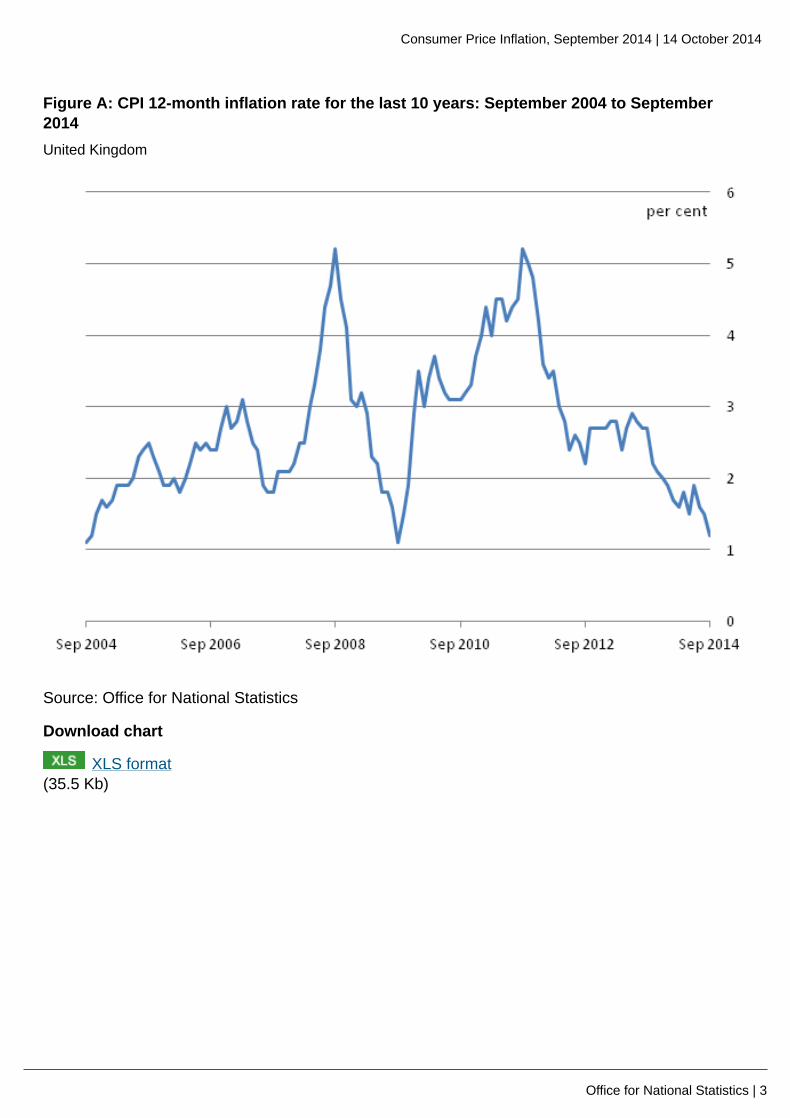
The CPI 12-month rate (the amount prices change over a year) between September 2013 andSeptember 2014 stood at 1.2%. This means that a basket of goods and services that cost £100.00in September 2013 would have cost £101.20 in September 2014.
Over the last five years, the three main contributors to the 12-month inflation rate have beenhousing, water, electricity, gas & other fuels, transport (including motor fuels), and restaurants &hotels. Combined, these three sectors have, on average, accounted for almost half of the 12-monthinflation rate each month.
In the year to September 2014, food prices fell by 1.5% and prices of motor fuels fell by 6.0%.Historically, these prices have been among the main causes of inflation, though this has graduallychanged over the course of 2014. These product groups provide the largest downward contributionsto the 12-month rate for September. While the inflation figures cannot definitively identify the causesof this change in trend, it seems plausible that increased supermarket competition, the impact ofa rise in the value of sterling on the prices of imported goods and falls in crude oil and petroleumprices could be factors.
If these product groups were excluded from the CPI, the 12-month rate would approximately bea third higher (ie 1.6% rather than 1.2%). In contrast housing, water, electricity, gas & other fuelsaccounted for around a third of inflation (0.4 percentage points of the 1.2%).
Figure A shows the CPI 12-month rate over the last 10 years. Table A shows the CPI 1-month rate(the amount prices change between two consecutive months), 12-month rate and index values forthe last year. A larger version of the chart can be viewed by clicking on it (HTML version only).
Consumer Price Inflation, September 2014 | 14 October 2014
Office for National Statistics | 3
Figure A: CPI 12-month inflation rate for the last 10 years: September 2004 to September2014United Kingdom
Source: Office for National Statistics
Download chart
XLS format(35.5 Kb)
Consumer Price Inflation, September 2014 | 14 October 2014
Office for National Statistics | 4
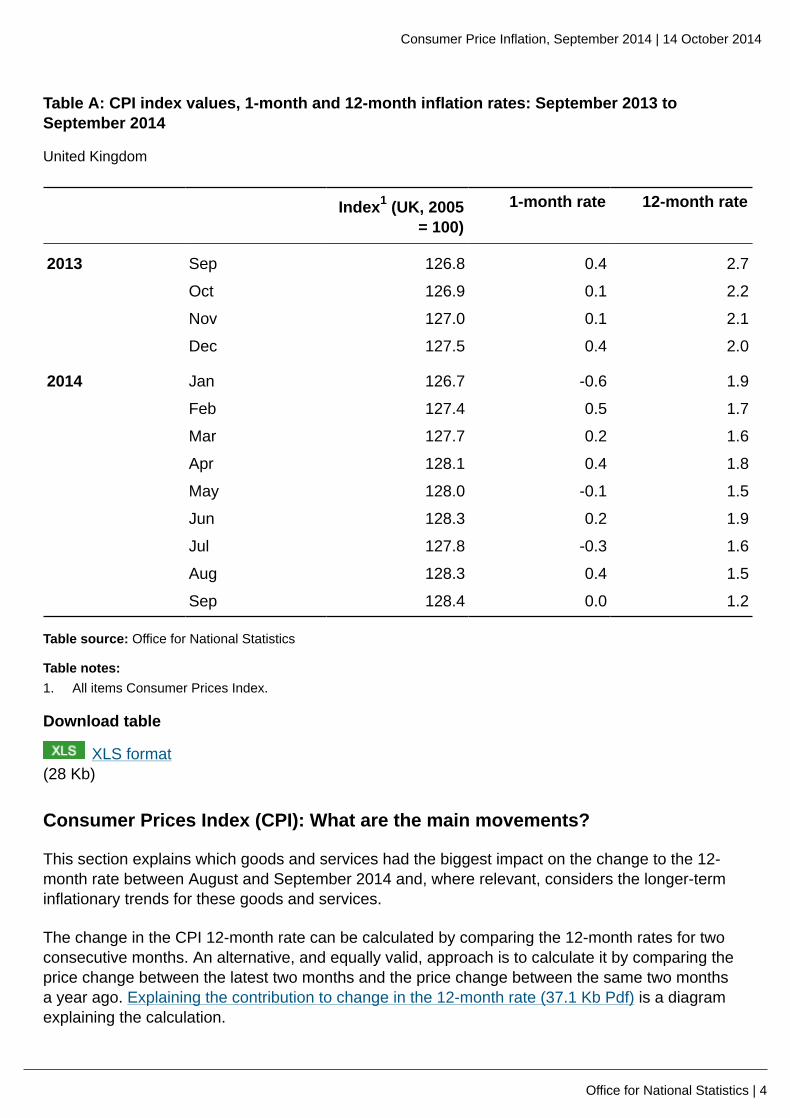
Table A: CPI index values, 1-month and 12-month inflation rates: September 2013 toSeptember 2014
United Kingdom
Index1 (UK, 2005= 100)
1-month rate 12-month rate
2013 Sep 126.8 0.4 2.7
Oct 126.9 0.1 2.2
Nov 127.0 0.1 2.1
Dec 127.5 0.4 2.0
2014 Jan 126.7 -0.6 1.9
Feb 127.4 0.5 1.7
Mar 127.7 0.2 1.6
Apr 128.1 0.4 1.8
May 128.0 -0.1 1.5
Jun 128.3 0.2 1.9
Jul 127.8 -0.3 1.6
Aug 128.3 0.4 1.5
Sep 128.4 0.0 1.2
Table source: Office for National Statistics
Table notes:1. All items Consumer Prices Index.
Download table
XLS format(28 Kb)
Consumer Prices Index (CPI): What are the main movements?
This section explains which goods and services had the biggest impact on the change to the 12-month rate between August and September 2014 and, where relevant, considers the longer-terminflationary trends for these goods and services.
The change in the CPI 12-month rate can be calculated by comparing the 12-month rates for twoconsecutive months. An alternative, and equally valid, approach is to calculate it by comparing theprice change between the latest two months and the price change between the same two monthsa year ago. Explaining the contribution to change in the 12-month rate (37.1 Kb Pdf) is a diagramexplaining the calculation.
Consumer Price Inflation, September 2014 | 14 October 2014
Office for National Statistics | 5
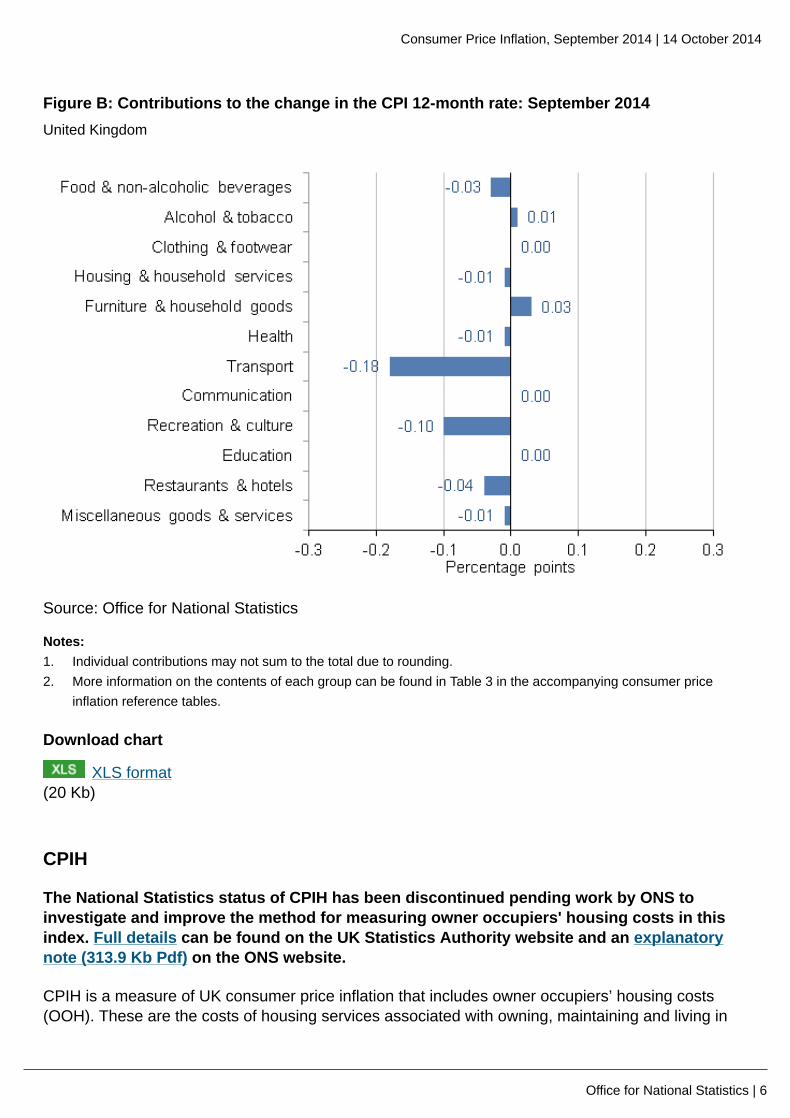
The CPI remained unchanged between August and September 2014, compared with a rise of 0.4%between the same two months in 2013. The 1-month movement was therefore 0.4 percentagepoints lower this year compared with last year. This led to the CPI 12-month rate falling from 1.5%in August to 1.2% in September. The 0.1 percentage point difference between the movements in theannual and monthly rates is due to rounding.
The largest downward contributions to the change in the CPI 12-month rate between August andSeptember 2014 came from:
• Transport: prices, overall, fell by 2.4% between August and September this year, compared witha more modest fall of 1.4% between the same two months a year ago. There were price fallsacross the sector – most notably from sea fares and air fares. Prices, overall, for these faresalways fall in September following the summer holiday period. The price falls for both were largerthis year than a year ago, though neither was out of line compared with previous years.
• Recreation & culture: prices, overall, fell slightly between August and September, comparedwith a rise between the same two months a year ago. Much of the downward contribution camefrom price movements for technological goods such as laptop and tablet computers, computeraccessories (eg printers and routers), games consoles and computer games. Prices for hardbackbooks and ebooks also contributed to the slowdown in the rate of inflation.
• Restaurants and hotels: prices, overall, rose at a slower rate between August and Septemberthis year when compared with the same two months a year ago. The downward contributioncame from price movements in restaurants, cafes and canteens.
There were no notable upward contributions to the change in the CPI 12-month rate between Augustand September 2014.
Figure B shows the contributions from each part of the CPI basket of goods and services. A largerversion of the chart can be viewed by clicking on it (HTML version only).
Consumer Price Inflation, September 2014 | 14 October 2014
Office for National Statistics | 6
Figure B: Contributions to the change in the CPI 12-month rate: September 2014United Kingdom
Source: Office for National Statistics
Notes:1. Individual contributions may not sum to the total due to rounding.2. More information on the contents of each group can be found in Table 3 in the accompanying consumer price
inflation reference tables.
Download chart
XLS format(20 Kb)
CPIH
The National Statistics status of CPIH has been discontinued pending work by ONS toinvestigate and improve the method for measuring owner occupiers' housing costs in thisindex. Full details can be found on the UK Statistics Authority website and an explanatorynote (313.9 Kb Pdf) on the ONS website.
CPIH is a measure of UK consumer price inflation that includes owner occupiers’ housing costs(OOH). These are the costs of housing services associated with owning, maintaining and living in
Consumer Price Inflation, September 2014 | 14 October 2014
Office for National Statistics | 7
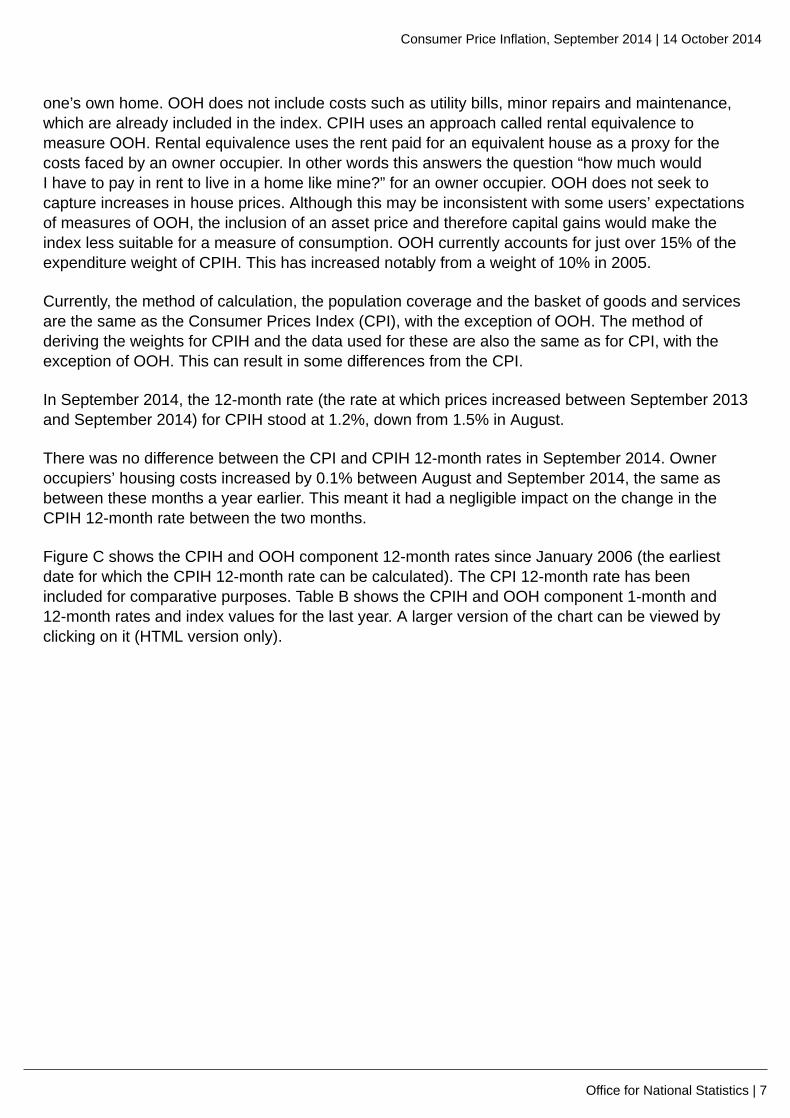
one’s own home. OOH does not include costs such as utility bills, minor repairs and maintenance,which are already included in the index. CPIH uses an approach called rental equivalence tomeasure OOH. Rental equivalence uses the rent paid for an equivalent house as a proxy for thecosts faced by an owner occupier. In other words this answers the question “how much wouldI have to pay in rent to live in a home like mine?” for an owner occupier. OOH does not seek tocapture increases in house prices. Although this may be inconsistent with some users’ expectationsof measures of OOH, the inclusion of an asset price and therefore capital gains would make theindex less suitable for a measure of consumption. OOH currently accounts for just over 15% of theexpenditure weight of CPIH. This has increased notably from a weight of 10% in 2005.
Currently, the method of calculation, the population coverage and the basket of goods and servicesare the same as the Consumer Prices Index (CPI), with the exception of OOH. The method ofderiving the weights for CPIH and the data used for these are also the same as for CPI, with theexception of OOH. This can result in some differences from the CPI.
In September 2014, the 12-month rate (the rate at which prices increased between September 2013and September 2014) for CPIH stood at 1.2%, down from 1.5% in August.
There was no difference between the CPI and CPIH 12-month rates in September 2014. Owneroccupiers’ housing costs increased by 0.1% between August and September 2014, the same asbetween these months a year earlier. This meant it had a negligible impact on the change in theCPIH 12-month rate between the two months.
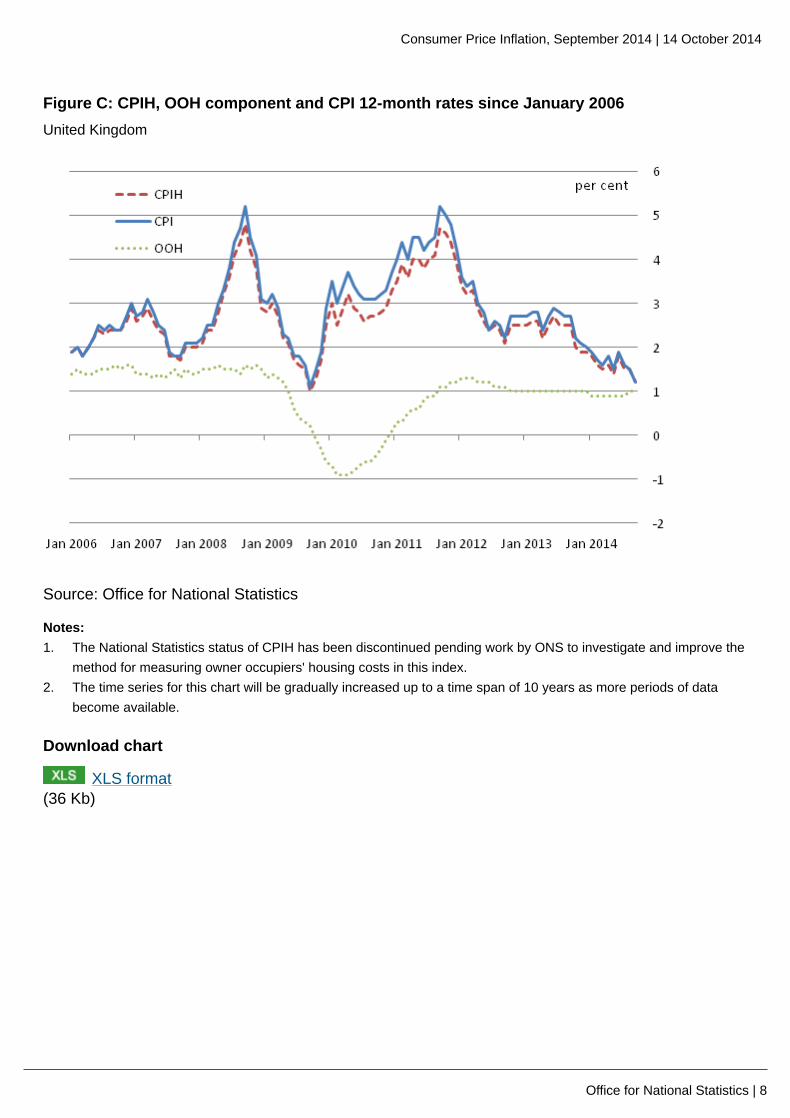
Figure C shows the CPIH and OOH component 12-month rates since January 2006 (the earliestdate for which the CPIH 12-month rate can be calculated). The CPI 12-month rate has beenincluded for comparative purposes. Table B shows the CPIH and OOH component 1-month and12-month rates and index values for the last year. A larger version of the chart can be viewed byclicking on it (HTML version only).
Consumer Price Inflation, September 2014 | 14 October 2014
Office for National Statistics | 8
Figure C: CPIH, OOH component and CPI 12-month rates since January 2006United Kingdom
Source: Office for National Statistics
Notes:1. The National Statistics status of CPIH has been discontinued pending work by ONS to investigate and improve the
method for measuring owner occupiers' housing costs in this index.2. The time series for this chart will be gradually increased up to a time span of 10 years as more periods of data
become available.
Download chart
XLS format(36 Kb)
Consumer Price Inflation, September 2014 | 14 October 2014
Office for National Statistics | 9
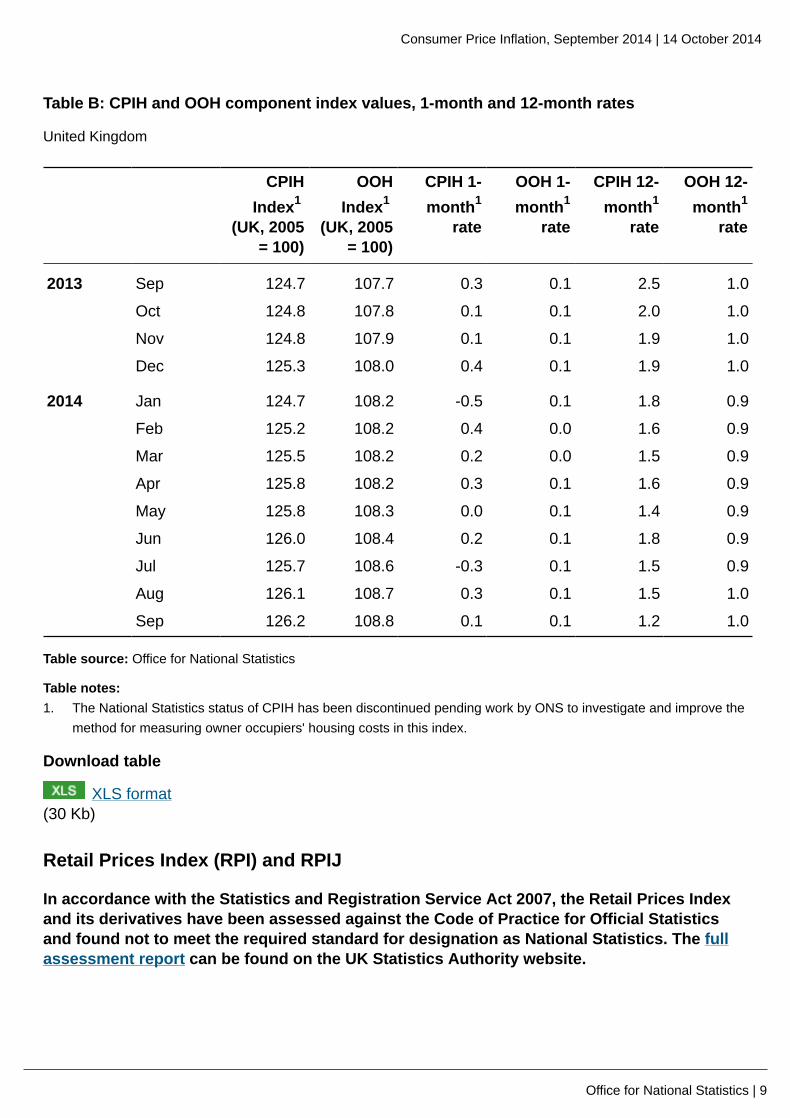
Table B: CPIH and OOH component index values, 1-month and 12-month rates
United Kingdom
CPIHIndex1
(UK, 2005= 100)
OOHIndex1
(UK, 2005= 100)
CPIH 1-month1
rate
OOH 1-month1
rate
CPIH 12-month1
rate
OOH 12-month1
rate
2013 Sep 124.7 107.7 0.3 0.1 2.5 1.0
Oct 124.8 107.8 0.1 0.1 2.0 1.0
Nov 124.8 107.9 0.1 0.1 1.9 1.0
Dec 125.3 108.0 0.4 0.1 1.9 1.0
2014 Jan 124.7 108.2 -0.5 0.1 1.8 0.9
Feb 125.2 108.2 0.4 0.0 1.6 0.9
Mar 125.5 108.2 0.2 0.0 1.5 0.9
Apr 125.8 108.2 0.3 0.1 1.6 0.9
May 125.8 108.3 0.0 0.1 1.4 0.9
Jun 126.0 108.4 0.2 0.1 1.8 0.9
Jul 125.7 108.6 -0.3 0.1 1.5 0.9
Aug 126.1 108.7 0.3 0.1 1.5 1.0
Sep 126.2 108.8 0.1 0.1 1.2 1.0
Table source: Office for National Statistics
Table notes:1. The National Statistics status of CPIH has been discontinued pending work by ONS to investigate and improve the
method for measuring owner occupiers' housing costs in this index.
Download table
XLS format(30 Kb)
Retail Prices Index (RPI) and RPIJ
In accordance with the Statistics and Registration Service Act 2007, the Retail Prices Indexand its derivatives have been assessed against the Code of Practice for Official Statisticsand found not to meet the required standard for designation as National Statistics. The fullassessment report can be found on the UK Statistics Authority website.
Consumer Price Inflation, September 2014 | 14 October 2014
Office for National Statistics | 10
The RPI is a long-standing measure of UK inflation that has historically been used for a wide rangeof purposes such as the indexation of pensions, rents and index-linked gilts. For further informationsee Users and uses of consumer price inflation statistics (100.5 Kb Pdf).
RPIJ is an improved variant of the Retail Prices Index, which is calculated using formulae that meetinternational standards. The rationale for creating RPIJ was to give users a better alternative to theRPI if their needs were for a measure of inflation based on the same population, classifications,weights etc as the RPI. Currently, RPIJ also acts as an analytical series in that it allows users to seethe impact of using the Jevons (which meets international standards) in place of the Carli formula(which does not meet international standards) in the RPI. The use of the different formulae at theelementary aggregate level is currently the only difference between the two indices. ONS does notproduce detailed goods and services indices for RPIJ.
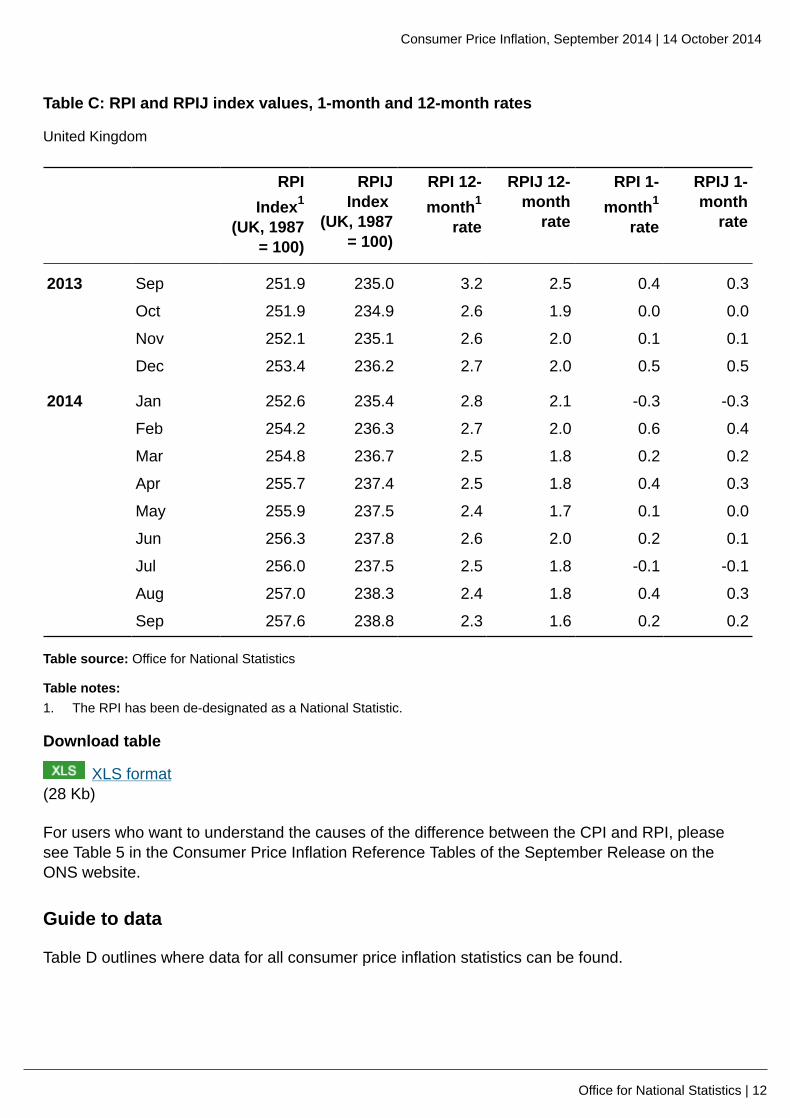
In September 2014, the 12-month rate for RPIJ stood at 1.6%, down from 1.8% in the year toAugust.
The RPI 12-month rate for September 2014 stood at 2.3%, meaning that it was 0.7 percentagepoints higher than it would have been had it used formulae that meet international standards.
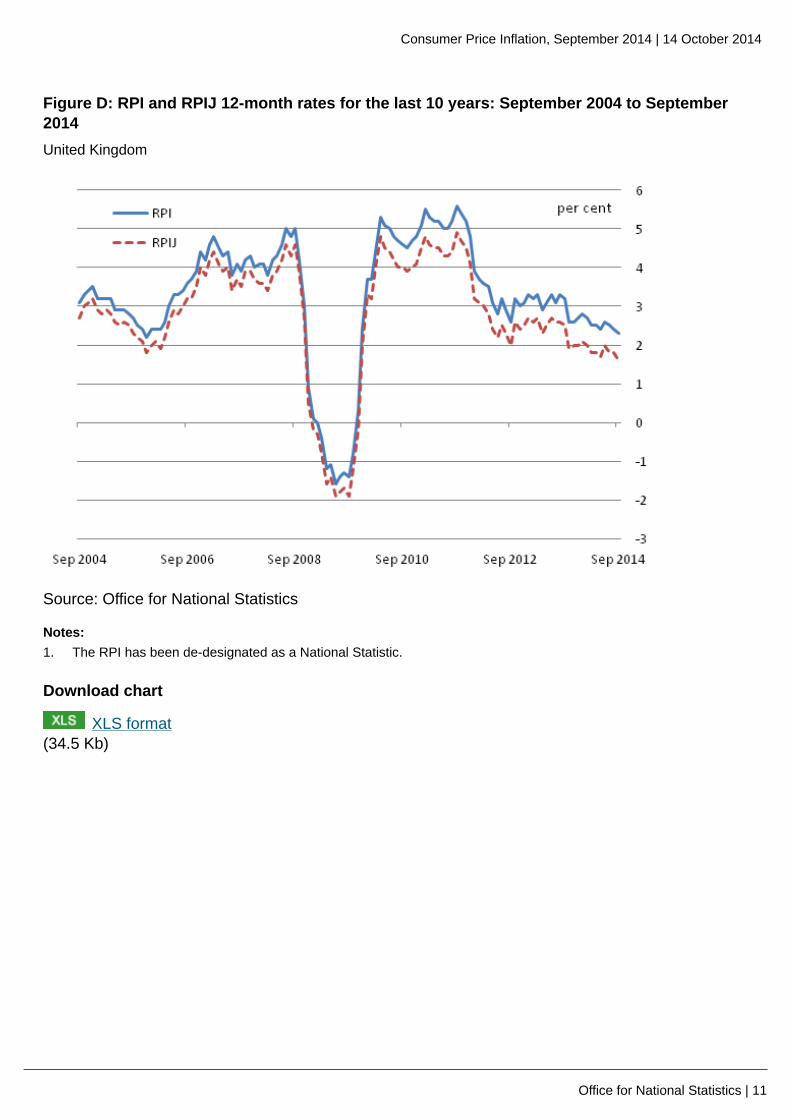
Figure D shows the RPI and RPIJ 12-month rates for the last 10 years. Over this period the RPIJ12-month rate has been, on average, 0.5 percentage points lower than the RPI but the differencehas increased to an average of 0.6 percentage points over the last 3 years. Cumulatively, inflationas measured by the RPI is 36.9% over the 10-year period, compared with 30.2% as measured bythe RPIJ. The use of the Carli formula has therefore added 6.7 percentage points to the change inprices over the last 10 years. A larger version of the chart can be viewed by clicking on it (HTMLversion only).
Table C shows the RPI and RPIJ 1-month and 12-month rates and index values for the last year.
Consumer Price Inflation, September 2014 | 14 October 2014
Office for National Statistics | 11
Figure D: RPI and RPIJ 12-month rates for the last 10 years: September 2004 to September2014United Kingdom
Source: Office for National Statistics
Notes:1. The RPI has been de-designated as a National Statistic.
Download chart
XLS format(34.5 Kb)
Consumer Price Inflation, September 2014 | 14 October 2014
Office for National Statistics | 12
Table C: RPI and RPIJ index values, 1-month and 12-month rates
United Kingdom
RPIIndex1
(UK, 1987= 100)
RPIJIndex
(UK, 1987= 100)
RPI 12-month1
rate
RPIJ 12-month
rate
RPI 1-month1
rate
RPIJ 1-month
rate
2013 Sep 251.9 235.0 3.2 2.5 0.4 0.3
Oct 251.9 234.9 2.6 1.9 0.0 0.0
Nov 252.1 235.1 2.6 2.0 0.1 0.1
Dec 253.4 236.2 2.7 2.0 0.5 0.5
2014 Jan 252.6 235.4 2.8 2.1 -0.3 -0.3
Feb 254.2 236.3 2.7 2.0 0.6 0.4
Mar 254.8 236.7 2.5 1.8 0.2 0.2
Apr 255.7 237.4 2.5 1.8 0.4 0.3
May 255.9 237.5 2.4 1.7 0.1 0.0
Jun 256.3 237.8 2.6 2.0 0.2 0.1
Jul 256.0 237.5 2.5 1.8 -0.1 -0.1
Aug 257.0 238.3 2.4 1.8 0.4 0.3
Sep 257.6 238.8 2.3 1.6 0.2 0.2
Table source: Office for National Statistics
Table notes:1. The RPI has been de-designated as a National Statistic.
Download table
XLS format(28 Kb)
For users who want to understand the causes of the difference between the CPI and RPI, pleasesee Table 5 in the Consumer Price Inflation Reference Tables of the September Release on theONS website.
Guide to data
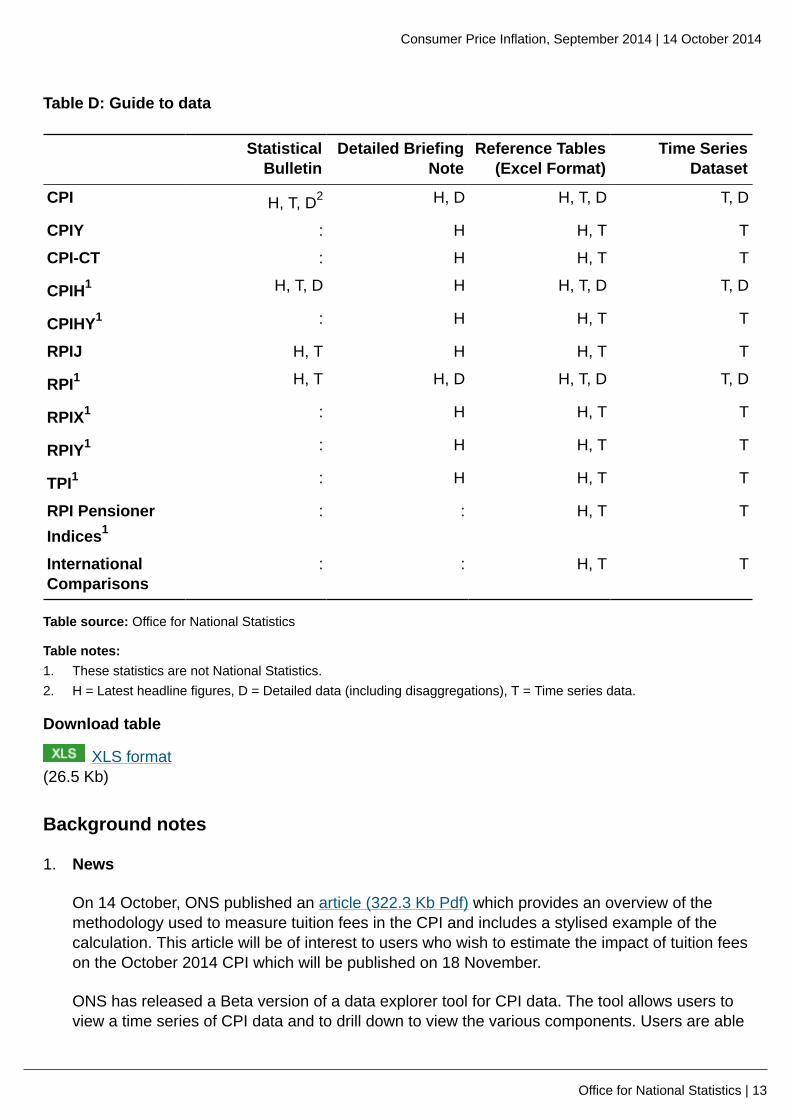
Table D outlines where data for all consumer price inflation statistics can be found.
Consumer Price Inflation, September 2014 | 14 October 2014
Office for National Statistics | 13
Table D: Guide to data
StatisticalBulletin
Detailed BriefingNote
Reference Tables(Excel Format)
Time SeriesDataset
CPI H, T, D2 H, D H, T, D T, D
CPIY : H H, T T
CPI-CT : H H, T T
CPIH1 H, T, D H H, T, D T, D
CPIHY1 : H H, T T
RPIJ H, T H H, T T
RPI1 H, T H, D H, T, D T, D
RPIX1 : H H, T T
RPIY1 : H H, T T
TPI1 : H H, T T
RPI PensionerIndices1
: : H, T T
InternationalComparisons
: : H, T T
Table source: Office for National Statistics
Table notes:1. These statistics are not National Statistics.2. H = Latest headline figures, D = Detailed data (including disaggregations), T = Time series data.
Download table
XLS format(26.5 Kb)
Background notes
1. News
On 14 October, ONS published an article (322.3 Kb Pdf) which provides an overview of themethodology used to measure tuition fees in the CPI and includes a stylised example of thecalculation. This article will be of interest to users who wish to estimate the impact of tuition feeson the October 2014 CPI which will be published on 18 November.
ONS has released a Beta version of a data explorer tool for CPI data. The tool allows users toview a time series of CPI data and to drill down to view the various components. Users are able
Consumer Price Inflation, September 2014 | 14 October 2014
Office for National Statistics | 14
to then create and download custom datasets based on the CPI components of interest to them.ONS would welcome feedback on this tool to guide its future development. Comments shouldbe sent via [email protected].
On 07 October, ONS published a consultation on the development of a definitive house priceindex for the UK (279.7 Kb Pdf). The consultation seeks users’ views regarding how theproposed methodology for a definitive house price index meets their requirements for officialhouse price data. Details on how to respond can be found on the ONS website (279.7 KbPdf) or by e-mailing [email protected]. The closing date for responses is 12December 2014.
2. Understanding and accessing the data
A full description of how consumer price indices are compiled is given in the Consumer PriceIndices Technical Manual (674.4 Kb Pdf). This is supplemented by video, infographics andtextual information available from the guidance and methodology section of the ONS website.
A more detailed quality report (141.9 Kb Pdf) for this statistical bulletin is available. The reportassesses consumer price inflation statistics against standard dimensions of quality such asrelevance, accuracy and accessibility. The report was last updated in October 2013.
The mini Triennial Review (1.75 Mb Pdf) of the CPI and RPI Central Collection of Prices isavailable.
The most efficient way to access the latest consumer price inflation data and briefing on theONS website is via the CPI key figure on the homepage.
In response to user feedback, all consumer price inflation data are available in one location. TheConsumer Price Inflation Reference Tables (1.49 Mb Excel sheet) are provided via an Excel file.
To help users further, very detailed CPI data are now available including the individual pricequotes and item indices that underpin the CPI. Please note, the data that are published are ata level which means that no individual retailer or service provider will be able to be identified.The data published cover January 1996 to June 2014. These data are updated once a quarterwith around a two-month lag with the latest CPI publication. For example, the data will next beupdated when the November CPI is published on 16 December 2014, at which point the detaileddata published will be extended to September 2014.
Internationally, the CPI is known as the Harmonised Index of Consumer Prices (HICP). HICPsare calculated in each Member State of the European Union according to rules specifiedin a series of European regulations developed by the European Commission (Eurostat) inconjunction with the EU Member States. Eurostat releases figures for the Harmonised Index ofConsumer Prices (HICP) for the month of September 2014 for EU Member States, together withan EU average, on 16 October 2014. A summary of the latest European data is available fromEurostat’s database tables. Further information on HICP for the European Union, Euro area andother EU Member States is available from Eurostat's HICP web page.
3. Methods - CPI and other measures of inflation
Consumer Price Inflation, September 2014 | 14 October 2014
Office for National Statistics | 15
The CPI, CPIH, RPIJ and RPI are compiled using the same underlying price data, based on alarge and representative selection of almost 700 individual goods and services for which pricemovements are measured in around 140 randomly selected areas throughout the UK. Around180,000 separate price quotations are used every month to compile the indices. The outlets inwhich the prices are collected are selected randomly. Expenditure weights are held constant forone year at a time.
The selection of goods and services that are priced to compile these indices is reviewedannually. The contents of the 2014 basket are described in an article Consumer PriceInflation: The 2014 Basket of Goods and Services (138.6 Kb Pdf). The expenditure weights usedto compile the indices are also updated each year. Additional details of the updated weights for2014 are available from the National Statistics website in an article published on 25 April 2014entitled Consumer Price Inflation Statistics - Updating Weights for 2014 (123.7 Kb Pdf).
Rates of change for the CPI and CPIH are calculated from unrounded index levels, rather thanfrom the published indices which are rounded to one decimal place. The use of unroundedindices increases the accuracy of the calculation. The unrounded index levels for the CPI andCPIH are available on request. By contrast, rates of change for the RPI and RPIJ are calculatedfrom the published rounded indices.
Further information on the methods used to construct the CPI, CPIH, RPI and RPIJ, includingdifferences in the methods used for each index can be found in the Consumer Price IndicesTechnical Manual (674.4 Kb Pdf). Users and uses of consumer price inflation statistics (100.5 KbPdf) provides further details of how consumer price statistics are used more generally.
4. Revisions Policy
On 15 October 2013, ONS published a revisions policy (49.6 Kb Pdf) for its suite of consumerprice inflation statistics. The policy reaffirms the existing practices for CPI and RPI and sets outthe policies for the new CPIH and RPIJ measures.
In summary, CPI, CPIH and RPIJ are revisable in theory though revisions only occur underexceptional circumstances. The RPI is never revised once published.
5. Publication Policy
This bulletin includes the September 2014 data, collected on and around 9 September 2014.Future publication dates for this statistical bulletin are available to January 2017 (the publicationof the December 2016 inflation figures). Publication dates from February 2016 onwards areprovisional.
Details of the policy governing the release of new data are available from the Media RelationsOffice. Also available is a list of the names of those given pre-release access to the contents ofthis release.
In line with the Consumer Price Inflation Pre-Release arrangements, an advanced estimateof the CPI was provided to the Governor of the Bank of England and the Chancellor of the
Consumer Price Inflation, September 2014 | 14 October 2014
Office for National Statistics | 16
Exchequer 4 working days ahead of publication. The Governor shared this information withthe MPC, and officials present at the MPC meeting, on Wednesday 8 October 2014. The pre-release access to the September CPI figures was extended to 4 working days from 3.5 workingdays due to the timing of the Monetary Policy Committee meeting being moved forward half aday.
Consumer price inflation for October 2013 to October 2014 will be published on 18 November2014.
Follow us on Twitter or join us at Facebook. View the latest podcasts on YouTube.
Media contact:
Tel: Luke Croydon +44 (0) 845 6041858
Out of hours media line: +44 (0) 7867 906553
Email: [email protected]
Statistical contact:
Tel: Richard Campbell +44 (0) 1633 651536
Email: [email protected]
Email: [email protected]
Consumer Price Inflation recorded message (available after 9.45am on release day):
Tel: +44 (0) 800 0113703
Consumer Price Inflation Enquiries:
Tel: +44 (0) 1633 456900
6. Details of the policy governing the release of new data are available by visitingwww.statisticsauthority.gov.uk/assessment/code-of-practice/index.html or from the MediaRelations Office email: [email protected]
These National Statistics are produced to high professional standards and released according tothe arrangements approved by the UK Statistics Authority.
Copyright
© Crown copyright 2014
You may use or re-use this information (not including logos) free of charge in any formator medium, under the terms of the Open Government Licence. To view this licence, visitwww.nationalarchives.gov.uk/doc/open-government-licence/ or write to the Information Policy Team,The National Archives, Kew, London TW9 4DU, or email: [email protected].

Consumer Price Inflation, September 2014 | 14 October 2014
Office for National Statistics | 17
This document is also available on our website at www.ons.gov.uk.
Statistical contacts
Name Phone Department EmailRichard Campbell +44 (0)1633 651536 Prices, ONS [email protected]
Next Publication Date:18 November 2014
Issuing Body:Office for National Statistics
Media Contact Details:Telephone: 0845 604 1858(8.30am-5.30pm Weekdays)
Emergency out of hours (limited service): 07867 906553
Email:[email protected]
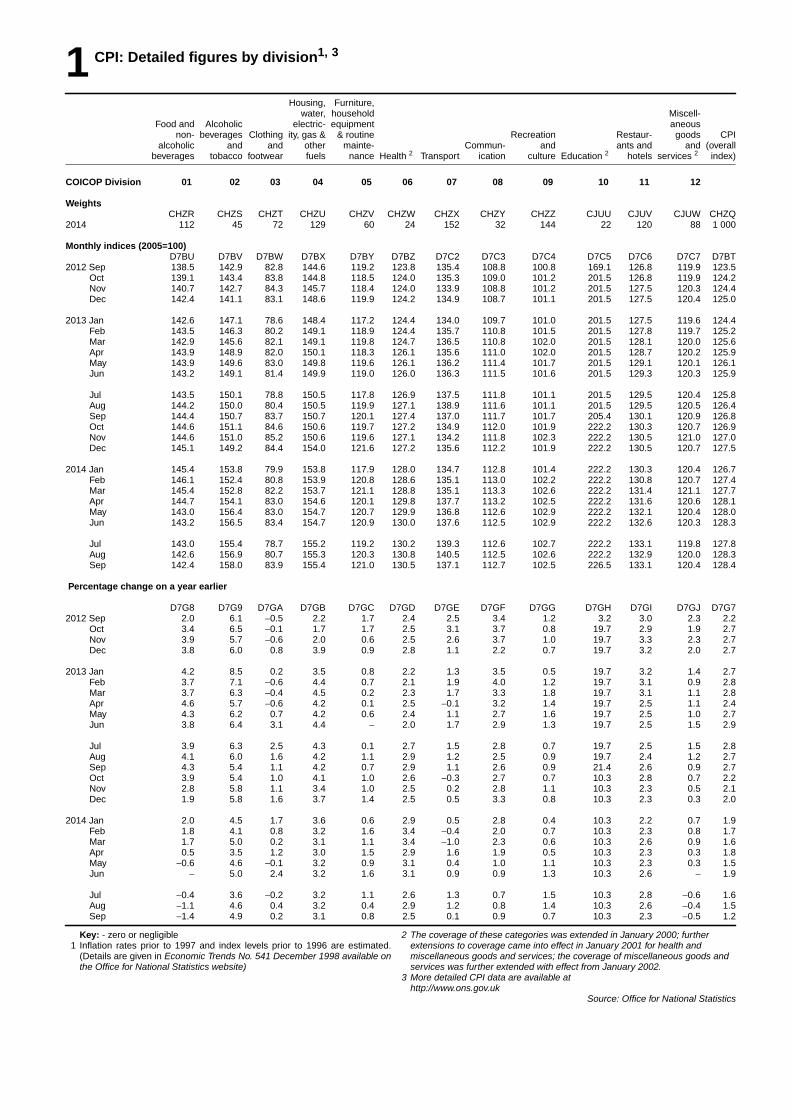
1 CPI: Detailed figures by division1, 3
Housing, Furniture,water, household Miscell-
Food and Alcoholic electric- equipment aneousnon- beverages Clothing ity, gas & & routine Recreation Restaur- goods CPI
alcoholic and and other mainte- Commun- and ants and and (overallbeverages tobacco footwear fuels nance Health 2 Tr anspor t ication culture Education 2 hotels services 2 index)
COICOP Division 01 02 03 04 05 06 07 08 09 10 11 12
WeightsCHZR CHZS CHZT CHZU CHZV CHZW CHZX CHZY CHZZ CJUU CJUV CJUW CHZQ
2014 112 45 72 129 60 24 152 32 144 22 120 88 1 000
Monthly indices (2005=100)D7BU D7BV D7BW D7BX D7BY D7BZ D7C2 D7C3 D7C4 D7C5 D7C6 D7C7 D7BT
2012 Sep 138.5 142.9 82.8 144.6 119.2 123.8 135.4 108.8 100.8 169.1 126.8 119.9 123.5Oct 139.1 143.4 83.8 144.8 118.5 124.0 135.3 109.0 101.2 201.5 126.8 119.9 124.2Nov 140.7 142.7 84.3 145.7 118.4 124.0 133.9 108.8 101.2 201.5 127.5 120.3 124.4Dec 142.4 141.1 83.1 148.6 119.9 124.2 134.9 108.7 101.1 201.5 127.5 120.4 125.0
2013 Jan 142.6 147.1 78.6 148.4 117.2 124.4 134.0 109.7 101.0 201.5 127.5 119.6 124.4Feb 143.5 146.3 80.2 149.1 118.9 124.4 135.7 110.8 101.5 201.5 127.8 119.7 125.2Mar 142.9 145.6 82.1 149.1 119.8 124.7 136.5 110.8 102.0 201.5 128.1 120.0 125.6Apr 143.9 148.9 82.0 150.1 118.3 126.1 135.6 111.0 102.0 201.5 128.7 120.2 125.9May 143.9 149.6 83.0 149.8 119.6 126.1 136.2 111.4 101.7 201.5 129.1 120.1 126.1Jun 143.2 149.1 81.4 149.9 119.0 126.0 136.3 111.5 101.6 201.5 129.3 120.3 125.9
Jul 143.5 150.1 78.8 150.5 117.8 126.9 137.5 111.8 101.1 201.5 129.5 120.4 125.8Aug 144.2 150.0 80.4 150.5 119.9 127.1 138.9 111.6 101.1 201.5 129.5 120.5 126.4Sep 144.4 150.7 83.7 150.7 120.1 127.4 137.0 111.7 101.7 205.4 130.1 120.9 126.8Oct 144.6 151.1 84.6 150.6 119.7 127.2 134.9 112.0 101.9 222.2 130.3 120.7 126.9Nov 144.6 151.0 85.2 150.6 119.6 127.1 134.2 111.8 102.3 222.2 130.5 121.0 127.0Dec 145.1 149.2 84.4 154.0 121.6 127.2 135.6 112.2 101.9 222.2 130.5 120.7 127.5
2014 Jan 145.4 153.8 79.9 153.8 117.9 128.0 134.7 112.8 101.4 222.2 130.3 120.4 126.7Feb 146.1 152.4 80.8 153.9 120.8 128.6 135.1 113.0 102.2 222.2 130.8 120.7 127.4Mar 145.4 152.8 82.2 153.7 121.1 128.8 135.1 113.3 102.6 222.2 131.4 121.1 127.7Apr 144.7 154.1 83.0 154.6 120.1 129.8 137.7 113.2 102.5 222.2 131.6 120.6 128.1May 143.0 156.4 83.0 154.7 120.7 129.9 136.8 112.6 102.9 222.2 132.1 120.4 128.0Jun 143.2 156.5 83.4 154.7 120.9 130.0 137.6 112.5 102.9 222.2 132.6 120.3 128.3
Jul 143.0 155.4 78.7 155.2 119.2 130.2 139.3 112.6 102.7 222.2 133.1 119.8 127.8Aug 142.6 156.9 80.7 155.3 120.3 130.8 140.5 112.5 102.6 222.2 132.9 120.0 128.3Sep 142.4 158.0 83.9 155.4 121.0 130.5 137.1 112.7 102.5 226.5 133.1 120.4 128.4
Percentage chang e on a year earlier
D7G8 D7G9 D7GA D7GB D7GC D7GD D7GE D7GF D7GG D7GH D7GI D7GJ D7G72012 Sep 2.0 6.1 −0.5 2.2 1.7 2.4 2.5 3.4 1.2 3.2 3.0 2.3 2.2
Oct 3.4 6.5 −0.1 1.7 1.7 2.5 3.1 3.7 0.8 19.7 2.9 1.9 2.7Nov 3.9 5.7 −0.6 2.0 0.6 2.5 2.6 3.7 1.0 19.7 3.3 2.3 2.7Dec 3.8 6.0 0.8 3.9 0.9 2.8 1.1 2.2 0.7 19.7 3.2 2.0 2.7
2013 Jan 4.2 8.5 0.2 3.5 0.8 2.2 1.3 3.5 0.5 19.7 3.2 1.4 2.7Feb 3.7 7.1 −0.6 4.4 0.7 2.1 1.9 4.0 1.2 19.7 3.1 0.9 2.8Mar 3.7 6.3 −0.4 4.5 0.2 2.3 1.7 3.3 1.8 19.7 3.1 1.1 2.8Apr 4.6 5.7 −0.6 4.2 0.1 2.5 −0.1 3.2 1.4 19.7 2.5 1.1 2.4May 4.3 6.2 0.7 4.2 0.6 2.4 1.1 2.7 1.6 19.7 2.5 1.0 2.7Jun 3.8 6.4 3.1 4.4 − 2.0 1.7 2.9 1.3 19.7 2.5 1.5 2.9
Jul 3.9 6.3 2.5 4.3 0.1 2.7 1.5 2.8 0.7 19.7 2.5 1.5 2.8Aug 4.1 6.0 1.6 4.2 1.1 2.9 1.2 2.5 0.9 19.7 2.4 1.2 2.7Sep 4.3 5.4 1.1 4.2 0.7 2.9 1.1 2.6 0.9 21.4 2.6 0.9 2.7Oct 3.9 5.4 1.0 4.1 1.0 2.6 −0.3 2.7 0.7 10.3 2.8 0.7 2.2Nov 2.8 5.8 1.1 3.4 1.0 2.5 0.2 2.8 1.1 10.3 2.3 0.5 2.1Dec 1.9 5.8 1.6 3.7 1.4 2.5 0.5 3.3 0.8 10.3 2.3 0.3 2.0
2014 Jan 2.0 4.5 1.7 3.6 0.6 2.9 0.5 2.8 0.4 10.3 2.2 0.7 1.9Feb 1.8 4.1 0.8 3.2 1.6 3.4 −0.4 2.0 0.7 10.3 2.3 0.8 1.7Mar 1.7 5.0 0.2 3.1 1.1 3.4 −1.0 2.3 0.6 10.3 2.6 0.9 1.6Apr 0.5 3.5 1.2 3.0 1.5 2.9 1.6 1.9 0.5 10.3 2.3 0.3 1.8May −0.6 4.6 −0.1 3.2 0.9 3.1 0.4 1.0 1.1 10.3 2.3 0.3 1.5Jun − 5.0 2.4 3.2 1.6 3.1 0.9 0.9 1.3 10.3 2.6 − 1.9
Jul −0.4 3.6 −0.2 3.2 1.1 2.6 1.3 0.7 1.5 10.3 2.8 −0.6 1.6Aug −1.1 4.6 0.4 3.2 0.4 2.9 1.2 0.8 1.4 10.3 2.6 −0.4 1.5Sep −1.4 4.9 0.2 3.1 0.8 2.5 0.1 0.9 0.7 10.3 2.3 −0.5 1.2
Key: - zero or negligible1 Inflation rates prior to 1997 and index lev els prior to 1996 are estimated.
(Details are given in Economic Trends No. 541 December 1998 available onthe Office for National Statistics website)
2 The coverage of these categories was extended in Januar y 2000; furtherextensions to coverage came into effect in Januar y 2001 for health andmiscellaneous goods and services; the coverage of miscellaneous goods andser vices was fur ther extended with effect from Januar y 2002.
3 More detailed CPI data are available athttp://www.ons.gov.uk
Source: Office for National Statistics
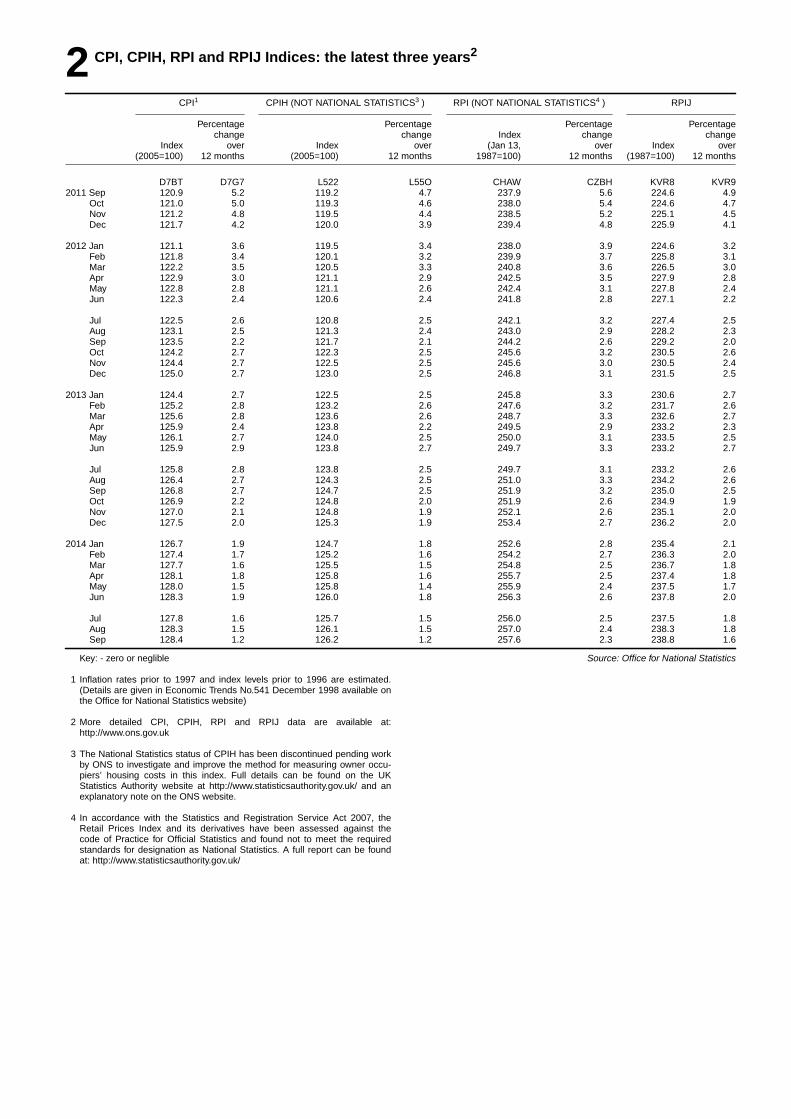
2 CPI, CPIH, RPI and RPIJ Indices: the latest three years2
CPI1 CPIH (NOT NATIONAL STATISTICS3 ) RPI (NOT NATIONAL STATISTICS4 ) RPIJ
Percentage Percentage Percentage Percentagechange change Index change change
Index over Index over (Jan 13, over Index over(2005=100) 12 months (2005=100) 12 months 1987=100) 12 months (1987=100) 12 months
D7BT D7G7 L522 L55O CHAW CZBH KVR8 KVR92011 Sep 120.9 5.2 119.2 4.7 237.9 5.6 224.6 4.9
Oct 121.0 5.0 119.3 4.6 238.0 5.4 224.6 4.7Nov 121.2 4.8 119.5 4.4 238.5 5.2 225.1 4.5Dec 121.7 4.2 120.0 3.9 239.4 4.8 225.9 4.1
2012 Jan 121.1 3.6 119.5 3.4 238.0 3.9 224.6 3.2Feb 121.8 3.4 120.1 3.2 239.9 3.7 225.8 3.1Mar 122.2 3.5 120.5 3.3 240.8 3.6 226.5 3.0Apr 122.9 3.0 121.1 2.9 242.5 3.5 227.9 2.8May 122.8 2.8 121.1 2.6 242.4 3.1 227.8 2.4Jun 122.3 2.4 120.6 2.4 241.8 2.8 227.1 2.2
Jul 122.5 2.6 120.8 2.5 242.1 3.2 227.4 2.5Aug 123.1 2.5 121.3 2.4 243.0 2.9 228.2 2.3Sep 123.5 2.2 121.7 2.1 244.2 2.6 229.2 2.0Oct 124.2 2.7 122.3 2.5 245.6 3.2 230.5 2.6Nov 124.4 2.7 122.5 2.5 245.6 3.0 230.5 2.4Dec 125.0 2.7 123.0 2.5 246.8 3.1 231.5 2.5
2013 Jan 124.4 2.7 122.5 2.5 245.8 3.3 230.6 2.7Feb 125.2 2.8 123.2 2.6 247.6 3.2 231.7 2.6Mar 125.6 2.8 123.6 2.6 248.7 3.3 232.6 2.7Apr 125.9 2.4 123.8 2.2 249.5 2.9 233.2 2.3May 126.1 2.7 124.0 2.5 250.0 3.1 233.5 2.5Jun 125.9 2.9 123.8 2.7 249.7 3.3 233.2 2.7
Jul 125.8 2.8 123.8 2.5 249.7 3.1 233.2 2.6Aug 126.4 2.7 124.3 2.5 251.0 3.3 234.2 2.6Sep 126.8 2.7 124.7 2.5 251.9 3.2 235.0 2.5Oct 126.9 2.2 124.8 2.0 251.9 2.6 234.9 1.9Nov 127.0 2.1 124.8 1.9 252.1 2.6 235.1 2.0Dec 127.5 2.0 125.3 1.9 253.4 2.7 236.2 2.0
2014 Jan 126.7 1.9 124.7 1.8 252.6 2.8 235.4 2.1Feb 127.4 1.7 125.2 1.6 254.2 2.7 236.3 2.0Mar 127.7 1.6 125.5 1.5 254.8 2.5 236.7 1.8Apr 128.1 1.8 125.8 1.6 255.7 2.5 237.4 1.8May 128.0 1.5 125.8 1.4 255.9 2.4 237.5 1.7Jun 128.3 1.9 126.0 1.8 256.3 2.6 237.8 2.0
Jul 127.8 1.6 125.7 1.5 256.0 2.5 237.5 1.8Aug 128.3 1.5 126.1 1.5 257.0 2.4 238.3 1.8Sep 128.4 1.2 126.2 1.2 257.6 2.3 238.8 1.6
Ke y: - zero or neglible
1 Inflation rates prior to 1997 and index lev els prior to 1996 are estimated.(Details are given in Economic Trends No.541 December 1998 available onthe Office for National Statistics website)
2 More detailed CPI, CPIH, RPI and RPIJ data are available at:http://www.ons.gov.uk
3 The National Statistics status of CPIH has been discontinued pending wor kby ONS to investigate and improve the method for measuring owner occu-piers’ housing costs in this index. Full details can be found on the UKStatistics Author ity website at http://www.statisticsauthor ity.gov.uk/ and anexplanator y note on the ONS website.
4 In accordance with the Statistics and Registration Service Act 2007, theRetail Prices Index and its derivatives have been assessed against thecode of Practice for Official Statistics and found not to meet the requiredstandards for designation as National Statistics. A full report can be foundat: http://www.statisticsauthor ity.gov.uk/
Source: Office for National Statistics
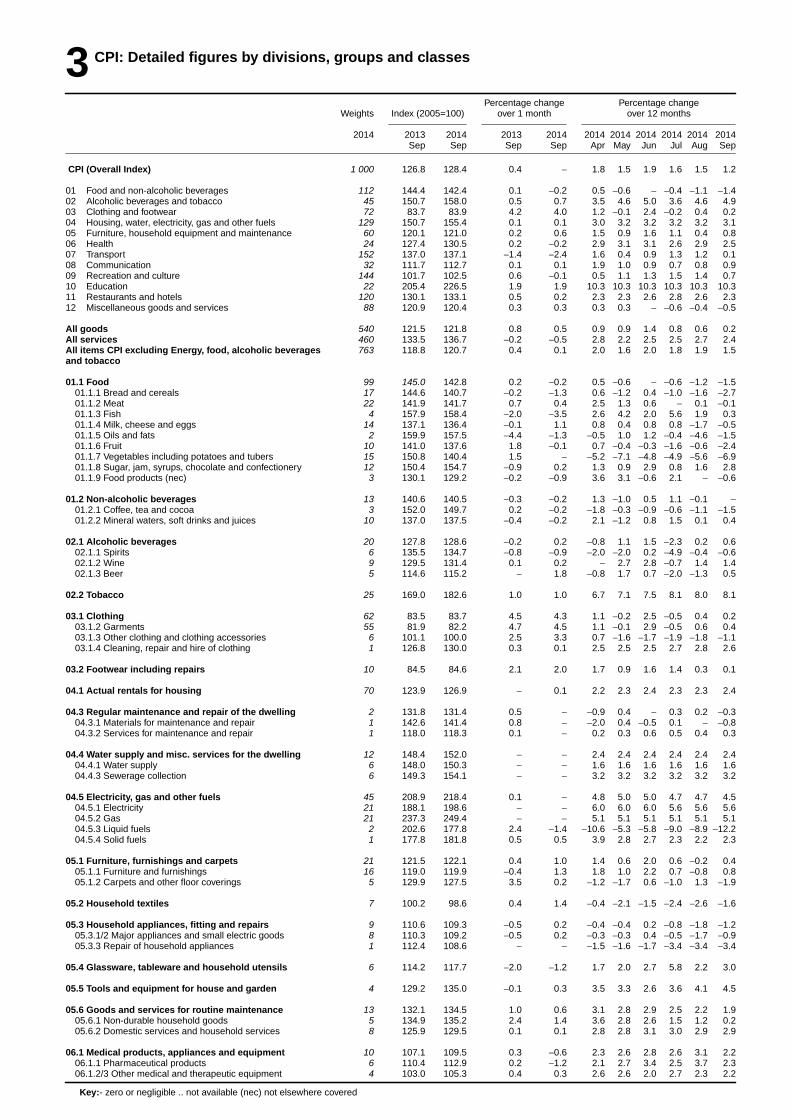
3 CPI: Detailed figures by divisions, groups and classes
Percentage change Percentage changeWeights Index (2005=100) over 1 month over 12 months
2014 2013 2014 2013 2014 2014 2014 2014 2014 2014 2014Sep Sep Sep Sep Apr May Jun Jul Aug Sep
CPI (Overall Index) 1 000 126.8 128.4 0.4 − 1.8 1.5 1.9 1.6 1.5 1.2
01 Food and non-alcoholic beverages 112 144.4 142.4 0.1 −0.2 0.5 −0.6 − −0.4 −1.1 −1.402 Alcoholic beverages and tobacco 45 150.7 158.0 0.5 0.7 3.5 4.6 5.0 3.6 4.6 4.903 Clothing and footwear 72 83.7 83.9 4.2 4.0 1.2 −0.1 2.4 −0.2 0.4 0.204 Housing, water, electr icity, gas and other fuels 129 150.7 155.4 0.1 0.1 3.0 3.2 3.2 3.2 3.2 3.105 Furniture, household equipment and maintenance 60 120.1 121.0 0.2 0.6 1.5 0.9 1.6 1.1 0.4 0.806 Health 24 127.4 130.5 0.2 −0.2 2.9 3.1 3.1 2.6 2.9 2.507 Transpor t 152 137.0 137.1 −1.4 −2.4 1.6 0.4 0.9 1.3 1.2 0.108 Communication 32 111.7 112.7 0.1 0.1 1.9 1.0 0.9 0.7 0.8 0.909 Recreation and culture 144 101.7 102.5 0.6 −0.1 0.5 1.1 1.3 1.5 1.4 0.710 Education 22 205.4 226.5 1.9 1.9 10.3 10.3 10.3 10.3 10.3 10.311 Restaurants and hotels 120 130.1 133.1 0.5 0.2 2.3 2.3 2.6 2.8 2.6 2.312 Miscellaneous goods and services 88 120.9 120.4 0.3 0.3 0.3 0.3 − −0.6 −0.4 −0.5
All goods 540 121.5 121.8 0.8 0.5 0.9 0.9 1.4 0.8 0.6 0.2All services 460 133.5 136.7 −0.2 −0.5 2.8 2.2 2.5 2.5 2.7 2.4All items CPI excluding Energy, food, alcoholic beverages 763 118.8 120.7 0.4 0.1 2.0 1.6 2.0 1.8 1.9 1.5and tobacco
01.1 Food 99 145.0 142.8 0.2 −0.2 0.5 −0.6 − −0.6 −1.2 −1.501.1.1 Bread and cereals 17 144.6 140.7 −0.2 −1.3 0.6 −1.2 0.4 −1.0 −1.6 −2.701.1.2 Meat 22 141.9 141.7 0.7 0.4 2.5 1.3 0.6 − 0.1 −0.101.1.3 Fish 4 157.9 158.4 −2.0 −3.5 2.6 4.2 2.0 5.6 1.9 0.301.1.4 Milk, cheese and eggs 14 137.1 136.4 −0.1 1.1 0.8 0.4 0.8 0.8 −1.7 −0.501.1.5 Oils and fats 2 159.9 157.5 −4.4 −1.3 −0.5 1.0 1.2 −0.4 −4.6 −1.501.1.6 Fruit 10 141.0 137.6 1.8 −0.1 0.7 −0.4 −0.3 −1.6 −0.6 −2.401.1.7 Vegetables including potatoes and tubers 15 150.8 140.4 1.5 − −5.2 −7.1 −4.8 −4.9 −5.6 −6.901.1.8 Sugar, jam, syrups, chocolate and confectioner y 12 150.4 154.7 −0.9 0.2 1.3 0.9 2.9 0.8 1.6 2.801.1.9 Food products (nec) 3 130.1 129.2 −0.2 −0.9 3.6 3.1 −0.6 2.1 − −0.6
01.2 Non-alcoholic beverages 13 140.6 140.5 −0.3 −0.2 1.3 −1.0 0.5 1.1 −0.1 −01.2.1 Coffee, tea and cocoa 3 152.0 149.7 0.2 −0.2 −1.8 −0.3 −0.9 −0.6 −1.1 −1.501.2.2 Mineral waters, soft drinks and juices 10 137.0 137.5 −0.4 −0.2 2.1 −1.2 0.8 1.5 0.1 0.4
02.1 Alcoholic beverages 20 127.8 128.6 −0.2 0.2 −0.8 1.1 1.5 −2.3 0.2 0.602.1.1 Spirits 6 135.5 134.7 −0.8 −0.9 −2.0 −2.0 0.2 −4.9 −0.4 −0.602.1.2 Wine 9 129.5 131.4 0.1 0.2 − 2.7 2.8 −0.7 1.4 1.402.1.3 Beer 5 114.6 115.2 − 1.8 −0.8 1.7 0.7 −2.0 −1.3 0.5
02.2 Tobacco 25 169.0 182.6 1.0 1.0 6.7 7.1 7.5 8.1 8.0 8.1
03.1 Clothing 62 83.5 83.7 4.5 4.3 1.1 −0.2 2.5 −0.5 0.4 0.203.1.2 Garments 55 81.9 82.2 4.7 4.5 1.1 −0.1 2.9 −0.5 0.6 0.403.1.3 Other clothing and clothing accessories 6 101.1 100.0 2.5 3.3 0.7 −1.6 −1.7 −1.9 −1.8 −1.103.1.4 Cleaning, repair and hire of clothing 1 126.8 130.0 0.3 0.1 2.5 2.5 2.5 2.7 2.8 2.6
03.2 Footwear including repairs 10 84.5 84.6 2.1 2.0 1.7 0.9 1.6 1.4 0.3 0.1
04.1 Actual rentals for housing 70 123.9 126.9 − 0.1 2.2 2.3 2.4 2.3 2.3 2.4
04.3 Regular maintenance and repair of the dwelling 2 131.8 131.4 0.5 − −0.9 0.4 − 0.3 0.2 −0.304.3.1 Materials for maintenance and repair 1 142.6 141.4 0.8 − −2.0 0.4 −0.5 0.1 − −0.804.3.2 Services for maintenance and repair 1 118.0 118.3 0.1 − 0.2 0.3 0.6 0.5 0.4 0.3
04.4 Water supply and misc. services for the dwelling 12 148.4 152.0 − − 2.4 2.4 2.4 2.4 2.4 2.404.4.1 Water supply 6 148.0 150.3 − − 1.6 1.6 1.6 1.6 1.6 1.604.4.3 Sewerage collection 6 149.3 154.1 − − 3.2 3.2 3.2 3.2 3.2 3.2
04.5 Electricity, gas and other fuels 45 208.9 218.4 0.1 − 4.8 5.0 5.0 4.7 4.7 4.504.5.1 Electricity 21 188.1 198.6 − − 6.0 6.0 6.0 5.6 5.6 5.604.5.2 Gas 21 237.3 249.4 − − 5.1 5.1 5.1 5.1 5.1 5.104.5.3 Liquid fuels 2 202.6 177.8 2.4 −1.4 −10.6 −5.3 −5.8 −9.0 −8.9 −12.204.5.4 Solid fuels 1 177.8 181.8 0.5 0.5 3.9 2.8 2.7 2.3 2.2 2.3
05.1 Furniture, furnishings and carpets 21 121.5 122.1 0.4 1.0 1.4 0.6 2.0 0.6 −0.2 0.405.1.1 Furniture and furnishings 16 119.0 119.9 −0.4 1.3 1.8 1.0 2.2 0.7 −0.8 0.805.1.2 Carpets and other floor coverings 5 129.9 127.5 3.5 0.2 −1.2 −1.7 0.6 −1.0 1.3 −1.9
05.2 Household textiles 7 100.2 98.6 0.4 1.4 −0.4 −2.1 −1.5 −2.4 −2.6 −1.6
05.3 Household appliances, fitting and repairs 9 110.6 109.3 −0.5 0.2 −0.4 −0.4 0.2 −0.8 −1.8 −1.205.3.1/2 Major appliances and small electric goods 8 110.3 109.2 −0.5 0.2 −0.3 −0.3 0.4 −0.5 −1.7 −0.905.3.3 Repair of household appliances 1 112.4 108.6 − − −1.5 −1.6 −1.7 −3.4 −3.4 −3.4
05.4 Glassware , tableware and household utensils 6 114.2 117.7 −2.0 −1.2 1.7 2.0 2.7 5.8 2.2 3.0
05.5 Tools and equipment for house and garden 4 129.2 135.0 −0.1 0.3 3.5 3.3 2.6 3.6 4.1 4.5
05.6 Goods and services for routine maintenance 13 132.1 134.5 1.0 0.6 3.1 2.8 2.9 2.5 2.2 1.905.6.1 Non-durable household goods 5 134.9 135.2 2.4 1.4 3.6 2.8 2.6 1.5 1.2 0.205.6.2 Domestic services and household services 8 125.9 129.5 0.1 0.1 2.8 2.8 3.1 3.0 2.9 2.9
06.1 Medical products, appliances and equipment 10 107.1 109.5 0.3 −0.6 2.3 2.6 2.8 2.6 3.1 2.206.1.1 Pharmaceutical products 6 110.4 112.9 0.2 −1.2 2.1 2.7 3.4 2.5 3.7 2.306.1.2/3 Other medical and therapeutic equipment 4 103.0 105.3 0.4 0.3 2.6 2.6 2.0 2.7 2.3 2.2
Key:- zero or negligible .. not available (nec) not elsewhere covered
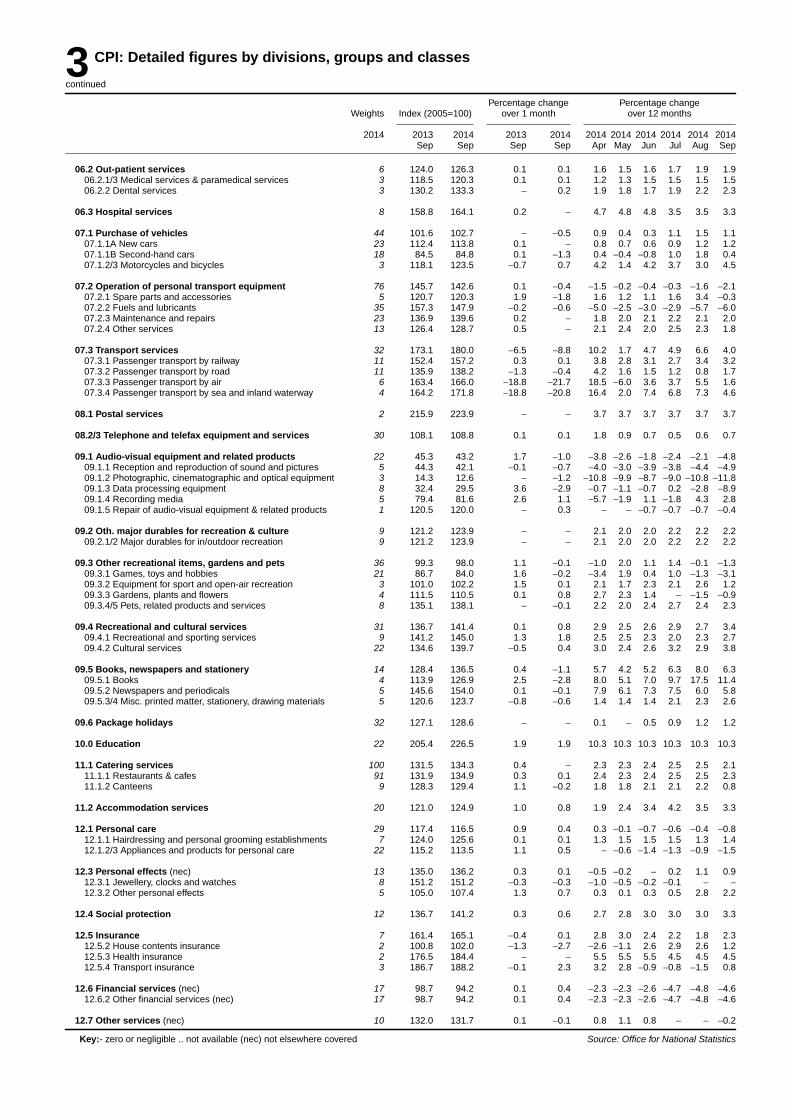
3 CPI: Detailed figures by divisions, groups and classes
continued
Percentage change Percentage changeWeights Index (2005=100) over 1 month over 12 months
2014 2013 2014 2013 2014 2014 2014 2014 2014 2014 2014Sep Sep Sep Sep Apr May Jun Jul Aug Sep
06.2 Out-patient services 6 124.0 126.3 0.1 0.1 1.6 1.5 1.6 1.7 1.9 1.906.2.1/3 Medical services & paramedical services 3 118.5 120.3 0.1 0.1 1.2 1.3 1.5 1.5 1.5 1.506.2.2 Dental services 3 130.2 133.3 − 0.2 1.9 1.8 1.7 1.9 2.2 2.3
06.3 Hospital services 8 158.8 164.1 0.2 − 4.7 4.8 4.8 3.5 3.5 3.3
07.1 Purchase of vehicles 44 101.6 102.7 − −0.5 0.9 0.4 0.3 1.1 1.5 1.107.1.1A New cars 23 112.4 113.8 0.1 − 0.8 0.7 0.6 0.9 1.2 1.207.1.1B Second-hand cars 18 84.5 84.8 0.1 −1.3 0.4 −0.4 −0.8 1.0 1.8 0.407.1.2/3 Motorcycles and bicycles 3 118.1 123.5 −0.7 0.7 4.2 1.4 4.2 3.7 3.0 4.5
07.2 Operation of personal transport equipment 76 145.7 142.6 0.1 −0.4 −1.5 −0.2 −0.4 −0.3 −1.6 −2.107.2.1 Spare parts and accessories 5 120.7 120.3 1.9 −1.8 1.6 1.2 1.1 1.6 3.4 −0.307.2.2 Fuels and lubricants 35 157.3 147.9 −0.2 −0.6 −5.0 −2.5 −3.0 −2.9 −5.7 −6.007.2.3 Maintenance and repairs 23 136.9 139.6 0.2 − 1.8 2.0 2.1 2.2 2.1 2.007.2.4 Other services 13 126.4 128.7 0.5 − 2.1 2.4 2.0 2.5 2.3 1.8
07.3 Transpor t ser vices 32 173.1 180.0 −6.5 −8.8 10.2 1.7 4.7 4.9 6.6 4.007.3.1 Passenger transpor t by railway 11 152.4 157.2 0.3 0.1 3.8 2.8 3.1 2.7 3.4 3.207.3.2 Passenger transpor t by road 11 135.9 138.2 −1.3 −0.4 4.2 1.6 1.5 1.2 0.8 1.707.3.3 Passenger transpor t by air 6 163.4 166.0 −18.8 −21.7 18.5 −6.0 3.6 3.7 5.5 1.607.3.4 Passenger transpor t by sea and inland waterway 4 164.2 171.8 −18.8 −20.8 16.4 2.0 7.4 6.8 7.3 4.6
08.1 Postal services 2 215.9 223.9 − − 3.7 3.7 3.7 3.7 3.7 3.7
08.2/3 Telephone and telefax equipment and services 30 108.1 108.8 0.1 0.1 1.8 0.9 0.7 0.5 0.6 0.7
09.1 Audio-visual equipment and related products 22 45.3 43.2 1.7 −1.0 −3.8 −2.6 −1.8 −2.4 −2.1 −4.809.1.1 Reception and reproduction of sound and pictures 5 44.3 42.1 −0.1 −0.7 −4.0 −3.0 −3.9 −3.8 −4.4 −4.909.1.2 Photographic, cinematographic and optical equipment 3 14.3 12.6 − −1.2 −10.8 −9.9 −8.7 −9.0 −10.8 −11.809.1.3 Data processing equipment 8 32.4 29.5 3.6 −2.9 −0.7 −1.1 −0.7 0.2 −2.8 −8.909.1.4 Recording media 5 79.4 81.6 2.6 1.1 −5.7 −1.9 1.1 −1.8 4.3 2.809.1.5 Repair of audio-visual equipment & related products 1 120.5 120.0 − 0.3 − − −0.7 −0.7 −0.7 −0.4
09.2 Oth. major durables for recreation & culture 9 121.2 123.9 − − 2.1 2.0 2.0 2.2 2.2 2.209.2.1/2 Major durables for in/outdoor recreation 9 121.2 123.9 − − 2.1 2.0 2.0 2.2 2.2 2.2
09.3 Other recreational items, gardens and pets 36 99.3 98.0 1.1 −0.1 −1.0 2.0 1.1 1.4 −0.1 −1.309.3.1 Games, toys and hobbies 21 86.7 84.0 1.6 −0.2 −3.4 1.9 0.4 1.0 −1.3 −3.109.3.2 Equipment for sport and open-air recreation 3 101.0 102.2 1.5 0.1 2.1 1.7 2.3 2.1 2.6 1.209.3.3 Gardens, plants and flowers 4 111.5 110.5 0.1 0.8 2.7 2.3 1.4 − −1.5 −0.909.3.4/5 Pets, related products and services 8 135.1 138.1 − −0.1 2.2 2.0 2.4 2.7 2.4 2.3
09.4 Recreational and cultural services 31 136.7 141.4 0.1 0.8 2.9 2.5 2.6 2.9 2.7 3.409.4.1 Recreational and sporting services 9 141.2 145.0 1.3 1.8 2.5 2.5 2.3 2.0 2.3 2.709.4.2 Cultural services 22 134.6 139.7 −0.5 0.4 3.0 2.4 2.6 3.2 2.9 3.8
09.5 Books, newspapers and stationery 14 128.4 136.5 0.4 −1.1 5.7 4.2 5.2 6.3 8.0 6.309.5.1 Books 4 113.9 126.9 2.5 −2.8 8.0 5.1 7.0 9.7 17.5 11.409.5.2 Newspapers and periodicals 5 145.6 154.0 0.1 −0.1 7.9 6.1 7.3 7.5 6.0 5.809.5.3/4 Misc. printed matter, stationer y, drawing materials 5 120.6 123.7 −0.8 −0.6 1.4 1.4 1.4 2.1 2.3 2.6
09.6 Package holidays 32 127.1 128.6 − − 0.1 − 0.5 0.9 1.2 1.2
10.0 Education 22 205.4 226.5 1.9 1.9 10.3 10.3 10.3 10.3 10.3 10.3
11.1 Catering services 100 131.5 134.3 0.4 − 2.3 2.3 2.4 2.5 2.5 2.111.1.1 Restaurants & cafes 91 131.9 134.9 0.3 0.1 2.4 2.3 2.4 2.5 2.5 2.311.1.2 Canteens 9 128.3 129.4 1.1 −0.2 1.8 1.8 2.1 2.1 2.2 0.8
11.2 Accommodation services 20 121.0 124.9 1.0 0.8 1.9 2.4 3.4 4.2 3.5 3.3
12.1 Personal care 29 117.4 116.5 0.9 0.4 0.3 −0.1 −0.7 −0.6 −0.4 −0.812.1.1 Hairdressing and personal grooming establishments 7 124.0 125.6 0.1 0.1 1.3 1.5 1.5 1.5 1.3 1.412.1.2/3 Appliances and products for personal care 22 115.2 113.5 1.1 0.5 − −0.6 −1.4 −1.3 −0.9 −1.5
12.3 Personal effects (nec) 13 135.0 136.2 0.3 0.1 −0.5 −0.2 − 0.2 1.1 0.912.3.1 Jeweller y, clocks and watches 8 151.2 151.2 −0.3 −0.3 −1.0 −0.5 −0.2 −0.1 − −12.3.2 Other personal effects 5 105.0 107.4 1.3 0.7 0.3 0.1 0.3 0.5 2.8 2.2
12.4 Social protection 12 136.7 141.2 0.3 0.6 2.7 2.8 3.0 3.0 3.0 3.3
12.5 Insurance 7 161.4 165.1 −0.4 0.1 2.8 3.0 2.4 2.2 1.8 2.312.5.2 House contents insurance 2 100.8 102.0 −1.3 −2.7 −2.6 −1.1 2.6 2.9 2.6 1.212.5.3 Health insurance 2 176.5 184.4 − − 5.5 5.5 5.5 4.5 4.5 4.512.5.4 Transpor t insurance 3 186.7 188.2 −0.1 2.3 3.2 2.8 −0.9 −0.8 −1.5 0.8
12.6 Financial services (nec) 17 98.7 94.2 0.1 0.4 −2.3 −2.3 −2.6 −4.7 −4.8 −4.612.6.2 Other financial services (nec) 17 98.7 94.2 0.1 0.4 −2.3 −2.3 −2.6 −4.7 −4.8 −4.6
12.7 Other services (nec) 10 132.0 131.7 0.1 −0.1 0.8 1.1 0.8 − − −0.2
Key:- zero or negligible .. not available (nec) not elsewhere covered Source: Office for National Statistics
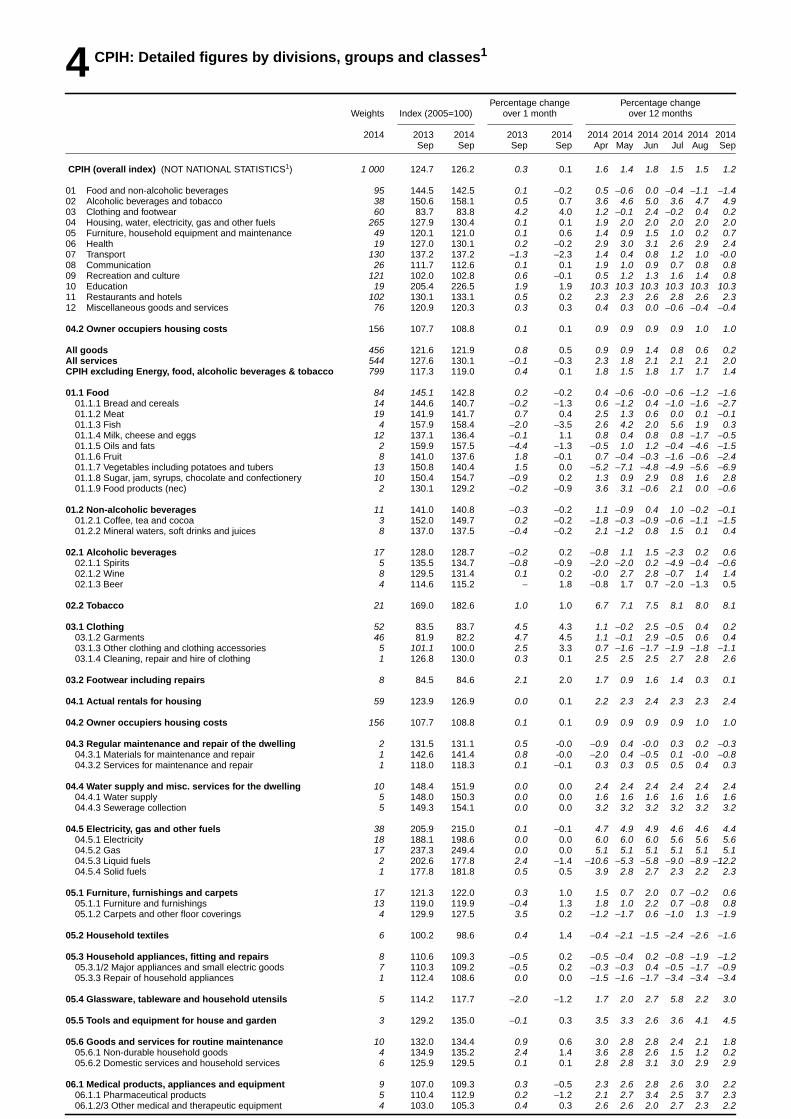
4 CPIH: Detailed figures by divisions, groups and classes1
Percentage change Percentage changeWeights Index (2005=100) over 1 month over 12 months
2014 2013 2014 2013 2014 2014 2014 2014 2014 2014 2014Sep Sep Sep Sep Apr May Jun Jul Aug Sep
CPIH (overall index) (NOT NATIONAL STATISTICS1) 1 000 124.7 126.2 0.3 0.1 1.6 1.4 1.8 1.5 1.5 1.2
01 Food and non-alcoholic beverages 95 144.5 142.5 0.1 −0.2 0.5 −0.6 0.0 −0.4 −1.1 −1.402 Alcoholic beverages and tobacco 38 150.6 158.1 0.5 0.7 3.6 4.6 5.0 3.6 4.7 4.903 Clothing and footwear 60 83.7 83.8 4.2 4.0 1.2 −0.1 2.4 −0.2 0.4 0.204 Housing, water, electr icity, gas and other fuels 265 127.9 130.4 0.1 0.1 1.9 2.0 2.0 2.0 2.0 2.005 Furniture, household equipment and maintenance 49 120.1 121.0 0.1 0.6 1.4 0.9 1.5 1.0 0.2 0.706 Health 19 127.0 130.1 0.2 −0.2 2.9 3.0 3.1 2.6 2.9 2.407 Transpor t 130 137.2 137.2 −1.3 −2.3 1.4 0.4 0.8 1.2 1.0 -0.008 Communication 26 111.7 112.6 0.1 0.1 1.9 1.0 0.9 0.7 0.8 0.809 Recreation and culture 121 102.0 102.8 0.6 −0.1 0.5 1.2 1.3 1.6 1.4 0.810 Education 19 205.4 226.5 1.9 1.9 10.3 10.3 10.3 10.3 10.3 10.311 Restaurants and hotels 102 130.1 133.1 0.5 0.2 2.3 2.3 2.6 2.8 2.6 2.312 Miscellaneous goods and services 76 120.9 120.3 0.3 0.3 0.4 0.3 0.0 −0.6 −0.4 −0.4
04.2 Owner occupiers housing costs 156 107.7 108.8 0.1 0.1 0.9 0.9 0.9 0.9 1.0 1.0
All goods 456 121.6 121.9 0.8 0.5 0.9 0.9 1.4 0.8 0.6 0.2All services 544 127.6 130.1 −0.1 −0.3 2.3 1.8 2.1 2.1 2.1 2.0CPIH excluding Energy, food, alcoholic beverages & tobacco 799 117.3 119.0 0.4 0.1 1.8 1.5 1.8 1.7 1.7 1.4
01.1 Food 84 145.1 142.8 0.2 −0.2 0.4 −0.6 -0.0 −0.6 −1.2 −1.601.1.1 Bread and cereals 14 144.6 140.7 −0.2 −1.3 0.6 −1.2 0.4 −1.0 −1.6 −2.701.1.2 Meat 19 141.9 141.7 0.7 0.4 2.5 1.3 0.6 0.0 0.1 −0.101.1.3 Fish 4 157.9 158.4 −2.0 −3.5 2.6 4.2 2.0 5.6 1.9 0.301.1.4 Milk, cheese and eggs 12 137.1 136.4 −0.1 1.1 0.8 0.4 0.8 0.8 −1.7 −0.501.1.5 Oils and fats 2 159.9 157.5 −4.4 −1.3 −0.5 1.0 1.2 −0.4 −4.6 −1.501.1.6 Fruit 8 141.0 137.6 1.8 −0.1 0.7 −0.4 −0.3 −1.6 −0.6 −2.401.1.7 Vegetables including potatoes and tubers 13 150.8 140.4 1.5 0.0 −5.2 −7.1 −4.8 −4.9 −5.6 −6.901.1.8 Sugar, jam, syrups, chocolate and confectioner y 10 150.4 154.7 −0.9 0.2 1.3 0.9 2.9 0.8 1.6 2.801.1.9 Food products (nec) 2 130.1 129.2 −0.2 −0.9 3.6 3.1 −0.6 2.1 0.0 −0.6
01.2 Non-alcoholic beverages 11 141.0 140.8 −0.3 −0.2 1.1 −0.9 0.4 1.0 −0.2 −0.101.2.1 Coffee, tea and cocoa 3 152.0 149.7 0.2 −0.2 −1.8 −0.3 −0.9 −0.6 −1.1 −1.501.2.2 Mineral waters, soft drinks and juices 8 137.0 137.5 −0.4 −0.2 2.1 −1.2 0.8 1.5 0.1 0.4
02.1 Alcoholic beverages 17 128.0 128.7 −0.2 0.2 −0.8 1.1 1.5 −2.3 0.2 0.602.1.1 Spirits 5 135.5 134.7 −0.8 −0.9 −2.0 −2.0 0.2 −4.9 −0.4 −0.602.1.2 Wine 8 129.5 131.4 0.1 0.2 -0.0 2.7 2.8 −0.7 1.4 1.402.1.3 Beer 4 114.6 115.2 − 1.8 −0.8 1.7 0.7 −2.0 −1.3 0.5
02.2 Tobacco 21 169.0 182.6 1.0 1.0 6.7 7.1 7.5 8.1 8.0 8.1
03.1 Clothing 52 83.5 83.7 4.5 4.3 1.1 −0.2 2.5 −0.5 0.4 0.203.1.2 Garments 46 81.9 82.2 4.7 4.5 1.1 −0.1 2.9 −0.5 0.6 0.403.1.3 Other clothing and clothing accessories 5 101.1 100.0 2.5 3.3 0.7 −1.6 −1.7 −1.9 −1.8 −1.103.1.4 Cleaning, repair and hire of clothing 1 126.8 130.0 0.3 0.1 2.5 2.5 2.5 2.7 2.8 2.6
03.2 Footwear including repairs 8 84.5 84.6 2.1 2.0 1.7 0.9 1.6 1.4 0.3 0.1
04.1 Actual rentals for housing 59 123.9 126.9 0.0 0.1 2.2 2.3 2.4 2.3 2.3 2.4
04.2 Owner occupiers housing costs 156 107.7 108.8 0.1 0.1 0.9 0.9 0.9 0.9 1.0 1.0
04.3 Regular maintenance and repair of the dwelling 2 131.5 131.1 0.5 -0.0 −0.9 0.4 -0.0 0.3 0.2 −0.304.3.1 Materials for maintenance and repair 1 142.6 141.4 0.8 -0.0 −2.0 0.4 −0.5 0.1 -0.0 −0.804.3.2 Services for maintenance and repair 1 118.0 118.3 0.1 −0.1 0.3 0.3 0.5 0.5 0.4 0.3
04.4 Water supply and misc. services for the dwelling 10 148.4 151.9 0.0 0.0 2.4 2.4 2.4 2.4 2.4 2.404.4.1 Water supply 5 148.0 150.3 0.0 0.0 1.6 1.6 1.6 1.6 1.6 1.604.4.3 Sewerage collection 5 149.3 154.1 0.0 0.0 3.2 3.2 3.2 3.2 3.2 3.2
04.5 Electricity, gas and other fuels 38 205.9 215.0 0.1 −0.1 4.7 4.9 4.9 4.6 4.6 4.404.5.1 Electricity 18 188.1 198.6 0.0 0.0 6.0 6.0 6.0 5.6 5.6 5.604.5.2 Gas 17 237.3 249.4 0.0 0.0 5.1 5.1 5.1 5.1 5.1 5.104.5.3 Liquid fuels 2 202.6 177.8 2.4 −1.4 −10.6 −5.3 −5.8 −9.0 −8.9 −12.204.5.4 Solid fuels 1 177.8 181.8 0.5 0.5 3.9 2.8 2.7 2.3 2.2 2.3
05.1 Furniture, furnishings and carpets 17 121.3 122.0 0.3 1.0 1.5 0.7 2.0 0.7 −0.2 0.605.1.1 Furniture and furnishings 13 119.0 119.9 −0.4 1.3 1.8 1.0 2.2 0.7 −0.8 0.805.1.2 Carpets and other floor coverings 4 129.9 127.5 3.5 0.2 −1.2 −1.7 0.6 −1.0 1.3 −1.9
05.2 Household textiles 6 100.2 98.6 0.4 1.4 −0.4 −2.1 −1.5 −2.4 −2.6 −1.6
05.3 Household appliances, fitting and repairs 8 110.6 109.3 −0.5 0.2 −0.5 −0.4 0.2 −0.8 −1.9 −1.205.3.1/2 Major appliances and small electric goods 7 110.3 109.2 −0.5 0.2 −0.3 −0.3 0.4 −0.5 −1.7 −0.905.3.3 Repair of household appliances 1 112.4 108.6 0.0 0.0 −1.5 −1.6 −1.7 −3.4 −3.4 −3.4
05.4 Glassware , tableware and household utensils 5 114.2 117.7 −2.0 −1.2 1.7 2.0 2.7 5.8 2.2 3.0
05.5 Tools and equipment for house and garden 3 129.2 135.0 −0.1 0.3 3.5 3.3 2.6 3.6 4.1 4.5
05.6 Goods and services for routine maintenance 10 132.0 134.4 0.9 0.6 3.0 2.8 2.8 2.4 2.1 1.805.6.1 Non-durable household goods 4 134.9 135.2 2.4 1.4 3.6 2.8 2.6 1.5 1.2 0.205.6.2 Domestic services and household services 6 125.9 129.5 0.1 0.1 2.8 2.8 3.1 3.0 2.9 2.9
06.1 Medical products, appliances and equipment 9 107.0 109.3 0.3 −0.5 2.3 2.6 2.8 2.6 3.0 2.206.1.1 Pharmaceutical products 5 110.4 112.9 0.2 −1.2 2.1 2.7 3.4 2.5 3.7 2.306.1.2/3 Other medical and therapeutic equipment 4 103.0 105.3 0.4 0.3 2.6 2.6 2.0 2.7 2.3 2.2
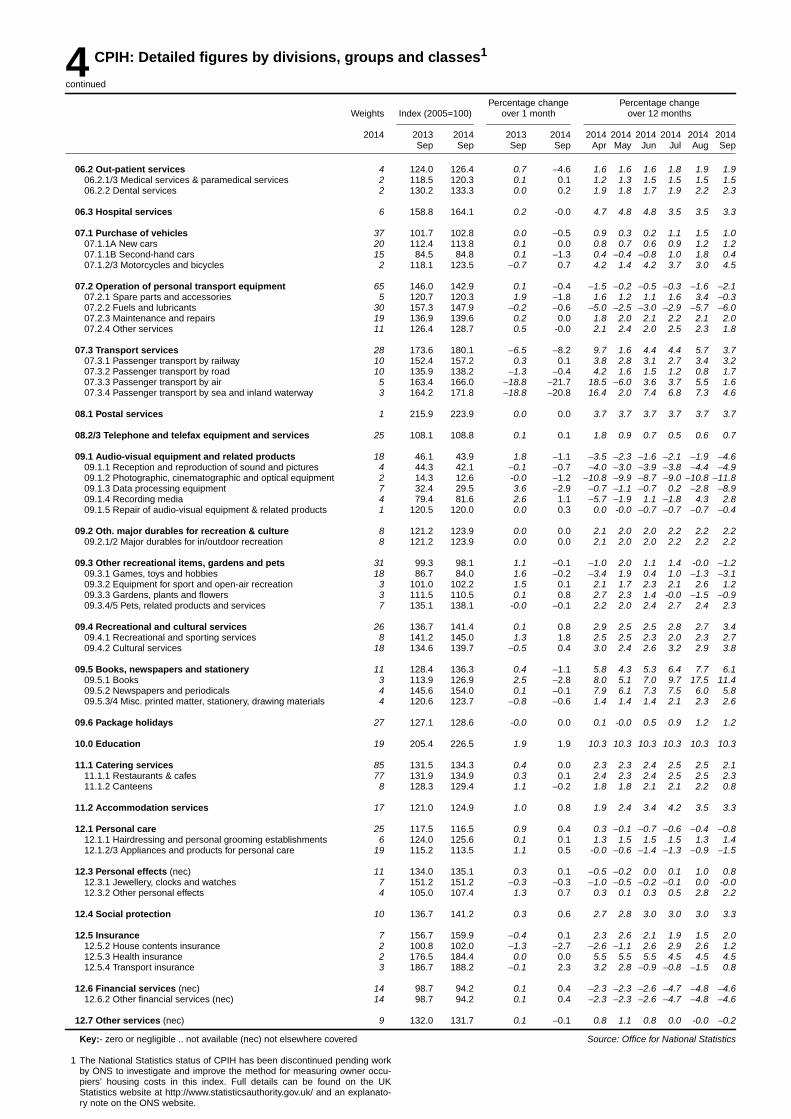
4 CPIH: Detailed figures by divisions, groups and classes1
continued
Percentage change Percentage changeWeights Index (2005=100) over 1 month over 12 months
2014 2013 2014 2013 2014 2014 2014 2014 2014 2014 2014Sep Sep Sep Sep Apr May Jun Jul Aug Sep
06.2 Out-patient services 4 124.0 126.4 0.7 −4.6 1.6 1.6 1.6 1.8 1.9 1.906.2.1/3 Medical services & paramedical services 2 118.5 120.3 0.1 0.1 1.2 1.3 1.5 1.5 1.5 1.506.2.2 Dental services 2 130.2 133.3 0.0 0.2 1.9 1.8 1.7 1.9 2.2 2.3
06.3 Hospital services 6 158.8 164.1 0.2 -0.0 4.7 4.8 4.8 3.5 3.5 3.3
07.1 Purchase of vehicles 37 101.7 102.8 0.0 −0.5 0.9 0.3 0.2 1.1 1.5 1.007.1.1A New cars 20 112.4 113.8 0.1 0.0 0.8 0.7 0.6 0.9 1.2 1.207.1.1B Second-hand cars 15 84.5 84.8 0.1 −1.3 0.4 −0.4 −0.8 1.0 1.8 0.407.1.2/3 Motorcycles and bicycles 2 118.1 123.5 −0.7 0.7 4.2 1.4 4.2 3.7 3.0 4.5
07.2 Operation of personal transport equipment 65 146.0 142.9 0.1 −0.4 −1.5 −0.2 −0.5 −0.3 −1.6 −2.107.2.1 Spare parts and accessories 5 120.7 120.3 1.9 −1.8 1.6 1.2 1.1 1.6 3.4 −0.307.2.2 Fuels and lubricants 30 157.3 147.9 −0.2 −0.6 −5.0 −2.5 −3.0 −2.9 −5.7 −6.007.2.3 Maintenance and repairs 19 136.9 139.6 0.2 0.0 1.8 2.0 2.1 2.2 2.1 2.007.2.4 Other services 11 126.4 128.7 0.5 -0.0 2.1 2.4 2.0 2.5 2.3 1.8
07.3 Transpor t ser vices 28 173.6 180.1 −6.5 −8.2 9.7 1.6 4.4 4.4 5.7 3.707.3.1 Passenger transpor t by railway 10 152.4 157.2 0.3 0.1 3.8 2.8 3.1 2.7 3.4 3.207.3.2 Passenger transpor t by road 10 135.9 138.2 −1.3 −0.4 4.2 1.6 1.5 1.2 0.8 1.707.3.3 Passenger transpor t by air 5 163.4 166.0 −18.8 −21.7 18.5 −6.0 3.6 3.7 5.5 1.607.3.4 Passenger transpor t by sea and inland waterway 3 164.2 171.8 −18.8 −20.8 16.4 2.0 7.4 6.8 7.3 4.6
08.1 Postal services 1 215.9 223.9 0.0 0.0 3.7 3.7 3.7 3.7 3.7 3.7
08.2/3 Telephone and telefax equipment and services 25 108.1 108.8 0.1 0.1 1.8 0.9 0.7 0.5 0.6 0.7
09.1 Audio-visual equipment and related products 18 46.1 43.9 1.8 −1.1 −3.5 −2.3 −1.6 −2.1 −1.9 −4.609.1.1 Reception and reproduction of sound and pictures 4 44.3 42.1 −0.1 −0.7 −4.0 −3.0 −3.9 −3.8 −4.4 −4.909.1.2 Photographic, cinematographic and optical equipment 2 14.3 12.6 -0.0 −1.2 −10.8 −9.9 −8.7 −9.0 −10.8 −11.809.1.3 Data processing equipment 7 32.4 29.5 3.6 −2.9 −0.7 −1.1 −0.7 0.2 −2.8 −8.909.1.4 Recording media 4 79.4 81.6 2.6 1.1 −5.7 −1.9 1.1 −1.8 4.3 2.809.1.5 Repair of audio-visual equipment & related products 1 120.5 120.0 0.0 0.3 0.0 -0.0 −0.7 −0.7 −0.7 −0.4
09.2 Oth. major durables for recreation & culture 8 121.2 123.9 0.0 0.0 2.1 2.0 2.0 2.2 2.2 2.209.2.1/2 Major durables for in/outdoor recreation 8 121.2 123.9 0.0 0.0 2.1 2.0 2.0 2.2 2.2 2.2
09.3 Other recreational items, gardens and pets 31 99.3 98.1 1.1 −0.1 −1.0 2.0 1.1 1.4 -0.0 −1.209.3.1 Games, toys and hobbies 18 86.7 84.0 1.6 −0.2 −3.4 1.9 0.4 1.0 −1.3 −3.109.3.2 Equipment for sport and open-air recreation 3 101.0 102.2 1.5 0.1 2.1 1.7 2.3 2.1 2.6 1.209.3.3 Gardens, plants and flowers 3 111.5 110.5 0.1 0.8 2.7 2.3 1.4 -0.0 −1.5 −0.909.3.4/5 Pets, related products and services 7 135.1 138.1 -0.0 −0.1 2.2 2.0 2.4 2.7 2.4 2.3
09.4 Recreational and cultural services 26 136.7 141.4 0.1 0.8 2.9 2.5 2.5 2.8 2.7 3.409.4.1 Recreational and sporting services 8 141.2 145.0 1.3 1.8 2.5 2.5 2.3 2.0 2.3 2.709.4.2 Cultural services 18 134.6 139.7 −0.5 0.4 3.0 2.4 2.6 3.2 2.9 3.8
09.5 Books, newspapers and stationery 11 128.4 136.3 0.4 −1.1 5.8 4.3 5.3 6.4 7.7 6.109.5.1 Books 3 113.9 126.9 2.5 −2.8 8.0 5.1 7.0 9.7 17.5 11.409.5.2 Newspapers and periodicals 4 145.6 154.0 0.1 −0.1 7.9 6.1 7.3 7.5 6.0 5.809.5.3/4 Misc. printed matter, stationer y, drawing materials 4 120.6 123.7 −0.8 −0.6 1.4 1.4 1.4 2.1 2.3 2.6
09.6 Package holidays 27 127.1 128.6 -0.0 0.0 0.1 -0.0 0.5 0.9 1.2 1.2
10.0 Education 19 205.4 226.5 1.9 1.9 10.3 10.3 10.3 10.3 10.3 10.3
11.1 Catering services 85 131.5 134.3 0.4 0.0 2.3 2.3 2.4 2.5 2.5 2.111.1.1 Restaurants & cafes 77 131.9 134.9 0.3 0.1 2.4 2.3 2.4 2.5 2.5 2.311.1.2 Canteens 8 128.3 129.4 1.1 −0.2 1.8 1.8 2.1 2.1 2.2 0.8
11.2 Accommodation services 17 121.0 124.9 1.0 0.8 1.9 2.4 3.4 4.2 3.5 3.3
12.1 Personal care 25 117.5 116.5 0.9 0.4 0.3 −0.1 −0.7 −0.6 −0.4 −0.812.1.1 Hairdressing and personal grooming establishments 6 124.0 125.6 0.1 0.1 1.3 1.5 1.5 1.5 1.3 1.412.1.2/3 Appliances and products for personal care 19 115.2 113.5 1.1 0.5 -0.0 −0.6 −1.4 −1.3 −0.9 −1.5
12.3 Personal effects (nec) 11 134.0 135.1 0.3 0.1 −0.5 −0.2 0.0 0.1 1.0 0.812.3.1 Jeweller y, clocks and watches 7 151.2 151.2 −0.3 −0.3 −1.0 −0.5 −0.2 −0.1 0.0 -0.012.3.2 Other personal effects 4 105.0 107.4 1.3 0.7 0.3 0.1 0.3 0.5 2.8 2.2
12.4 Social protection 10 136.7 141.2 0.3 0.6 2.7 2.8 3.0 3.0 3.0 3.3
12.5 Insurance 7 156.7 159.9 −0.4 0.1 2.3 2.6 2.1 1.9 1.5 2.012.5.2 House contents insurance 2 100.8 102.0 −1.3 −2.7 −2.6 −1.1 2.6 2.9 2.6 1.212.5.3 Health insurance 2 176.5 184.4 0.0 0.0 5.5 5.5 5.5 4.5 4.5 4.512.5.4 Transpor t insurance 3 186.7 188.2 −0.1 2.3 3.2 2.8 −0.9 −0.8 −1.5 0.8
12.6 Financial services (nec) 14 98.7 94.2 0.1 0.4 −2.3 −2.3 −2.6 −4.7 −4.8 −4.612.6.2 Other financial services (nec) 14 98.7 94.2 0.1 0.4 −2.3 −2.3 −2.6 −4.7 −4.8 −4.6
12.7 Other services (nec) 9 132.0 131.7 0.1 −0.1 0.8 1.1 0.8 0.0 -0.0 −0.2
Key:- zero or negligible .. not available (nec) not elsewhere covered
1 The National Statistics status of CPIH has been discontinued pending wor kby ONS to investigate and improve the method for measuring owner occu-piers’ housing costs in this index. Full details can be found on the UKStatistics website at http://www.statisticsauthor ity.gov.uk/ and an explanato-ry note on the ONS website.
Source: Office for National Statistics