Stata in the measurement and analysis of poverty in Mexico
23
1 Stata in the measurement and analysis of poverty in Mexico 2009 Mexican Stata Users Group Meeting April 2009, Mexico city
-
Upload
independent -
Category
Documents
-
view
0 -
download
0
Transcript of Stata in the measurement and analysis of poverty in Mexico

1
Stata in the measurement and analysis of poverty
in Mexico2009 Mexican Stata Users Group Meeting
April 2009, Mexico city
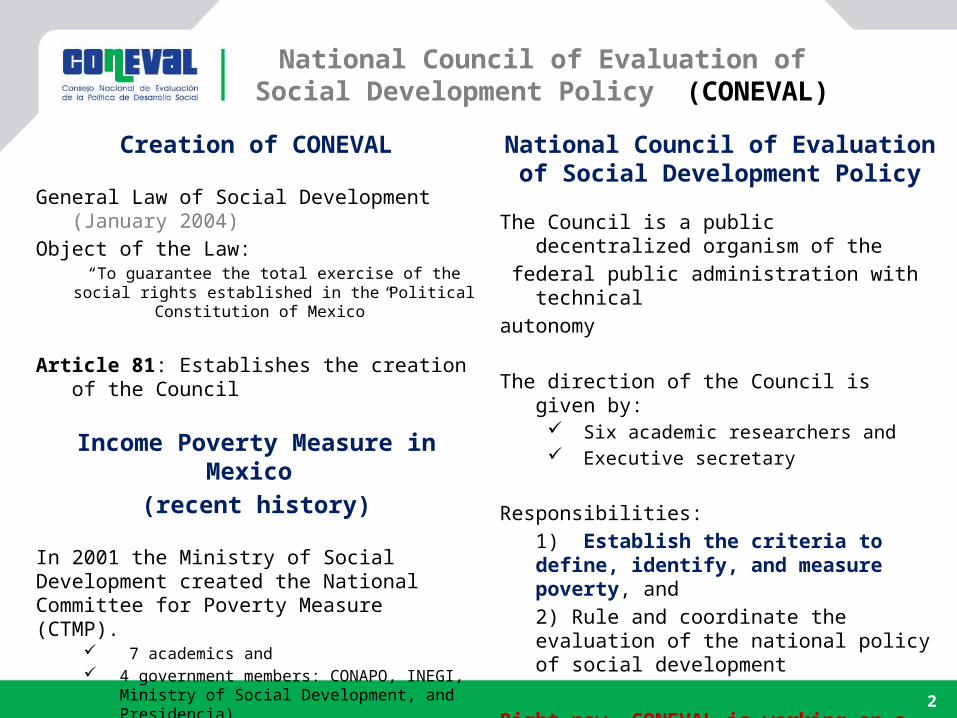
Creation of CONEVAL
General Law of Social Development (January 2004)
Object of the Law:“To guarantee the total exercise of the
social rights established in the Political Constitution of Mexico ”
Article 81: Establishes the creation of the Council
Income Poverty Measure in Mexico
(recent history)
In 2001 the Ministry of Social Development created the National Committee for Poverty Measure (CTMP).
7 academics and 4 government members: CONAPO, INEGI,
Ministry of Social Development, and Presidencia)
In 2002 The Committee proposed a methodology:http://www.sedesol.gob.mx/archivos/801588/file/Docu01.pdf
2
National Council of Evaluation of Social Development Policy (CONEVAL)
National Council of Evaluation of Social Development Policy
The Council is a public decentralized organism of the
federal public administration with technical
autonomy
The direction of the Council is given by: Six academic researchers and Executive secretary
Responsibilities:1) Establish the criteria to define, identify, and measure poverty, and2) Rule and coordinate the evaluation of the national policy of social development
Right now, CONEVAL is working on a new
methodology for multidimensional poverty measure

• Why do we use Stata?
To use survey and census data and generate inputs, indicators, and other relevant information to measure, characterize, and analyze the phenomenon of poverty; and help in the decision making process to alleviate it.
• Content of presentation:
1) Inputs in poverty measurement2) Construct poverty indicators3) Poverty analysis4) Poverty mapping
3
Stata and CONEVALStata and the measurement of poverty

4
Income poverty, 1992 -2006National, urban and rural
0.0
15.0
30.0
45.0
60.0
percentage
1992 1994 1996 1998 2000 2002 2004 2006years
National UrbanRural
Source: estim ates based on ENIG H 1992-2006
(food poverty line)Incom e poverty incidence, 1992 - 2006

5
1) Inputs in poverty measurement Construction of food poverty line (example)
Adjustment coefficient:AC = consumed calories/required
caloriesper household
Reference households stratum:
Used to construct an observed food
basket and determine the (food) poverty line
2006 Official (food) poverty line:
Urban: $809.87 (mxn pesos)Rural: $598.70 (mxn pesos)
.8.9
11.1
1.2
1.3
Adjus
tment coeffic
ient
1 11 21 31 41 51 61 71 81M oving quintiles
Reference households Adj. coeff.Adj. coeff. = 1
Source: estim ates based on ENIG H 2006
National levelAdjustm ent coefficient by m oving quintiles

6
1) Inputs in poverty measurement Non-food poverty lines: Inverse of Engel coefficient
Engel coefficient:Ratio that measures the expenses on
food in households as a proportion of the expenses needed
to cover:
- health and education: Capabilities line, and
- public transport, clothing, and housing: Assets line
The ratio is calculated for rural and urban areas in a
reference stratum

7
10.0
20.0
30.0
40.0
percentage
1992 1994 1996 1998 2000 2002 2004 2006years
Poverty Incidence 95% Conf. Int.95% Conf. Int.
Source: estim ates based on ENIG H 1992-2006
(food poverty line)Incom e poverty incidence, 1992 - 2006
1) Inputs in poverty measurement Standard errors and hypothesis testing
Standard errors:# delimit ;foreach x in 1992 1994 1996 1998
2000 2002 2004 2005
2006 { ;use “$data\poverty `x’.dta”,
clear ;svyset upm [w=factorp], strata(est)
vce(linearized) ;svy linear, level(95): mean povlp1 ;} ;Hypothesis testing:
8
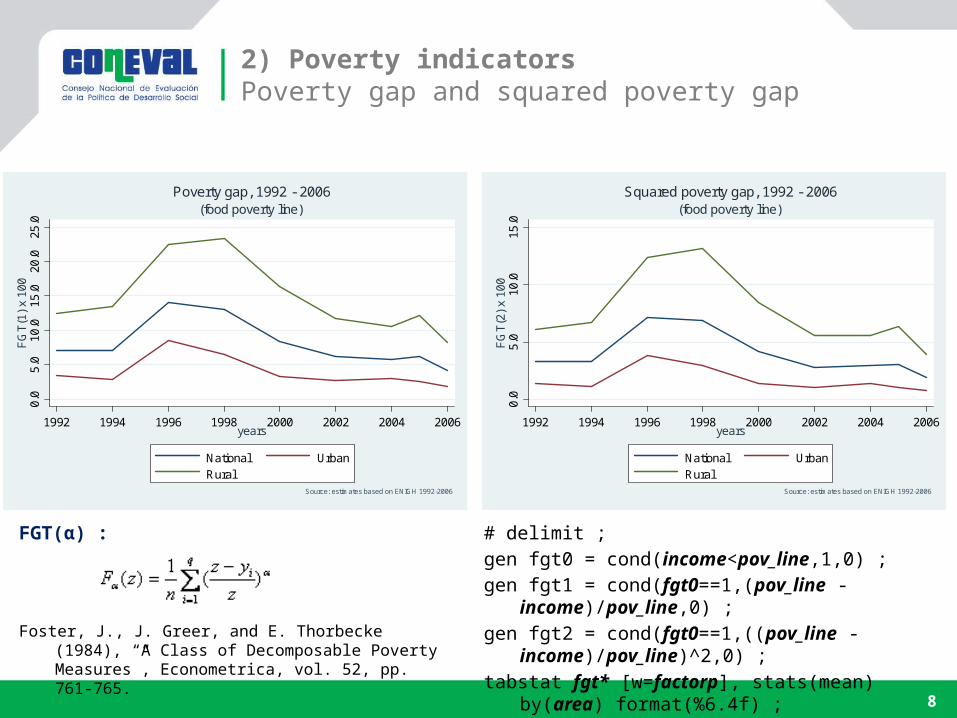
2) Poverty indicatorsPoverty gap and squared poverty gap
0.0
5.0
10.0
15.0
20.0
25.0
FGT(1) x 100
1992 1994 1996 1998 2000 2002 2004 2006years
National UrbanRural
Source: estim ates based on ENIG H 1992-2006
(food poverty line)Poverty gap, 1992 - 2006
0.0
5.0
10.0
15.0
FGT(2) x 100
1992 1994 1996 1998 2000 2002 2004 2006years
National UrbanRural
Source: estim ates based on ENIG H 1992-2006
(food poverty line)Squared poverty gap, 1992 - 2006
# delimit ;gen fgt0 = cond(income<pov_line,1,0) ;gen fgt1 = cond(fgt0==1,(pov_line -
income)/pov_line,0) ;gen fgt2 = cond(fgt0==1,((pov_line -
income)/pov_line)^2,0) ;tabstat fgt* [w=factorp], stats(mean)
by(area) format(%6.4f) ;
FGT(α) :
Foster, J., J. Greer, and E. Thorbecke (1984), “A Class of Decomposable Poverty Measures”, Econometrica, vol. 52, pp. 761-765.
9
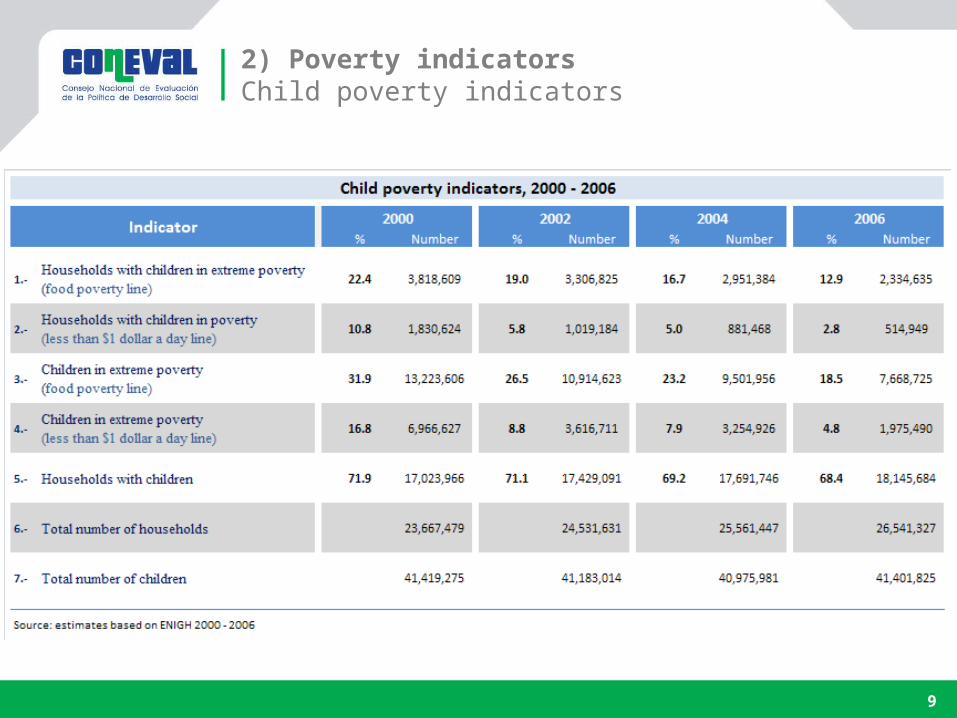
2) Poverty indicatorsChild poverty indicators

10
3) Poverty analysisPoverty profile
11
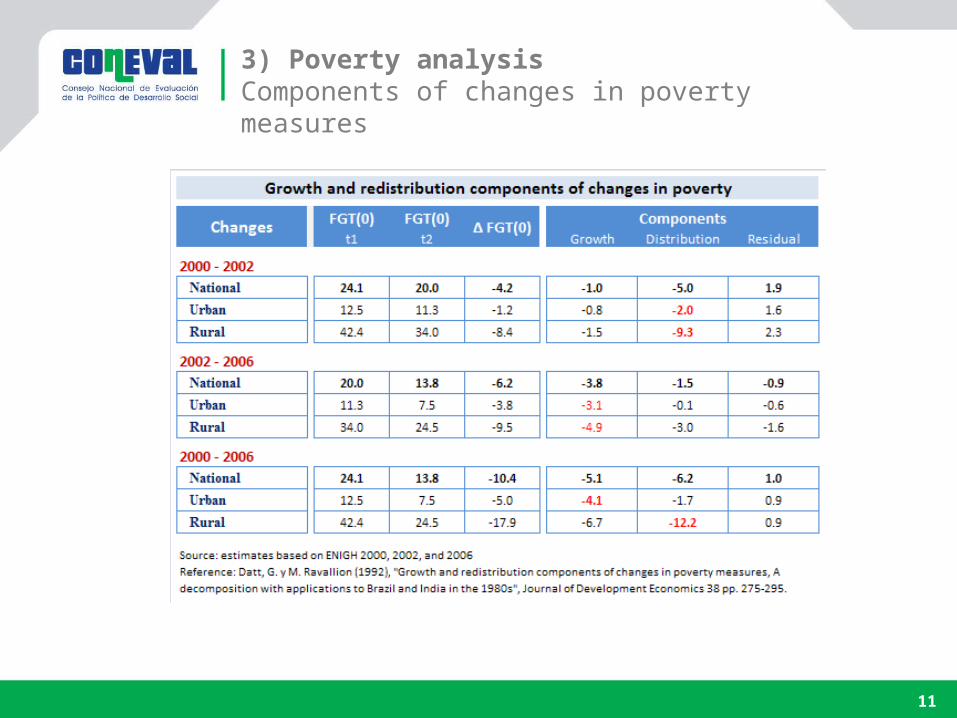
3) Poverty analysisComponents of changes in poverty measures

12
3) Poverty analysisMicrosimulation of an intervention (example)
.0001.0002.0003.0004.0005.0006
Density
0 200 598.7 800 1200Incom e
O bserved Sim ulatedSource: estim ates based on ENIG H 2006
Rural areas, 2006Incom e distribution, m icrosim ulation
0.0001
.0002
.0003
Density
0 200 600 809.87 1200Incom e
Observed Sim ulatedSource: estim ates based on ENIG H 2006
Urban areas, 2006Incom e distribution, m icrosim ulation
Microsimulation :Using the income and expenditure
survey of 2006, themicrosimulation consists in increasing
by $180 pesos the households’ income of a public
programme net
13
4) Poverty mappingStata and the income poverty maps
• Poverty mapping
National level indicators often hide important differences between regions or areas. The analysis of poverty interventions consequently requires a focus on poverty information that is more geographically disaggregated.
• Stata and poverty mapping
1) Social gap index2) Estimate income poverty and a set of indicators from survey data3) Generate the same set of indicators from census data (very hard work!)4) Validate poverty measures with other indices5) Compute changes in poverty

MethodologyPrincipal component analysis
(PCA) using Census data 2005
Variables defined in the General Law of Social
Development
Index stratification: Very low Low Medium High Very high
Disaggregation levels: Entities Municipalities Localities
Components1. Population over 15 years
illiterate2. Population between 6 and 14 that
doesn’t attend to school.3. Population over 15 years with
incomplete basic education4. Households with people between
15 and 29 years with at least one member with less than 9
years of education5. Population without health
security6. Dwellings without washing
machines7. Dwellings without refrigerator
8. Dwellings with sand floor9. Dwellings without toilets
10. Dwellings without tubed water of the public network
11. Dwellings without sewage12. Dwelling without electric
energy13. Overcrowding 14
4) Poverty mappingSocial gap index 2005

15
Social gap indexLocalities, 2005
Social Gap Degree
Very low
High
Very high
Low
Medium

16
Poverty mappingIncome poverty and other indicators
0.25
.5.75
1Income poverty FGT
(0)
.4 .6 .8 1HDI
M unicipalities Fitted valuesSource: estim ates based on CONEVAL and UNDP
M unicipalities, 2005Incom e poverty and Hum an Developm ent Index (HDI)
0.25
.5.75
1Income poverty FGT
(0)
-2.5 0 2.5 5SG I
M unicipalities Fitted valuesSource: estim ates based on CONEVAL
M unicipalities, 2005Incom e poverty and Social gap index (SG I)
Y = 2.13 – 2.39 Xadj. R2 = .7177
Y = 0.33 + 0.17 Xadj. R2 = .8032

17
Ranks Total m unicipalities
[1.6 - 20.6) 522
[20.6 - 39.7) 582
[39.7 - 58.7) 577
[58.7 - 77.8) 500
[77.8 - 96.8] 272
Food poverty mapMunicipalities, 2000

18
Food poverty mapMunicipalities, 2005
Ranks Total m unicipalities
[0.11 - 16.9) 562
[16.9 - 33.7) 848
[33.7 - 50.5) 552
[50.5 - 67.2) 355
[67.2 - 84.0] 137

19
025
5075
100
Income poverty 2005
0 25 50 75 100Incom e poverty 2000
M unicipalities 45° lineSource: estim ates based on CONEVAL
M unicipalities, 2000 - 2005Changes in poverty
Changes in income povertyMunicipalities, 2000 - 2005

20
Total m unicipalities
Significant decrease 933
Non significant increase 1474
Significant increase 46
Rank
Changes in food poverty mapMunicipalities, 2000 - 2005

21
San Pablo Cuatro VenadosPopulation: 1,267 Hab. Food poverty: 81.1%Social gap degree: Very high
Santiago el PinarPopulation: 2,854 Hab. Food poverty: 84.0%Social gap degree: Very high
ChalchihuitánPopulation: 13,295 Hab.Food poverty: 81.4%Social gap degree: Very high
San Juan CancucPopulation: 24,906 Hab.Food poverty: 83.7%Social gap degree: Very high
ChanalPopulation: 9,050 Hab.Food poverty: 83.1%Social gap degree: Very high
Income poverty and Social gap indexFive municipalities with highest poverty rates and very high social gap level

22
Ranks Total m unicipalities
[0.00 - 2,500) 1037
[2,500 - 15,000) 1083
[15,000 - 100,000) 327
[100,000 - 172,271) 7
Food poverty map (number of population in poverty)Municipalities, 2005

• Please visit us at:www.coneval.gob.mx
• Do files available at:http://www.coneval.gob.mx/coneval2/htmls/medicion_pobreza/HomeMedicionPobreza.jsp?categorias=MED_POBREZA,MED_POBREZA-med_pob_ingre
• Surveys available at:http://www.inegi.org.mx/est/contenidos/espanol/soc/sis/microdatos/enigh/default.aspx?s=est&c=14606
Authors:Héctor H. Sandoval ([email protected]) Rodrigo Aranda Balcazar ([email protected])
Martín Lima ([email protected])
23
CONEVAL online


![[GSW] Windows - Stata](https://static.fdokumen.com/doc/165x107/63274b65051fac18490e2cc7/gsw-windows-stata.jpg)