Stability of Tethered Proteins
8
pubs.acs.org/Langmuir Stability of Tethered Proteins Gaurav Anand, † Sumit Sharma, ‡ Sanat K. Kumar,* ,‡ and Georges Belfort* ,† † Howard P. Isermann Department of Chemical and Biological Engineering and Center for Biotechnology and Interdisciplinary Studies, Rensselaer Polytechnic Institute, Troy, New York 12180-3590, and ‡ Department of Chemical Engineering, Columbia University, New York, New York 10027 Received November 13, 2008. Revised Manuscript Received February 11, 2009 The stability of tethered globular proteins under denaturing conditions was interrogated with a hydrophobic surface, since conventional structural methods like circular dichroism (CD) and fluorescence or infrared spectroscopy could not be used because of the presence of an opaque solid substrate and extremely low surface concentrations. For free protein in solution, CD spectra gave well-known unfolding denaturing curves for lysozyme (LYS) and ribonuclease A (RNase A). The unfolding process for covalently tethered LYS and RNase A was followed, with multimolecular force spectroscopy (using an atomic force microscope in force-mode), via the adhesion energy between a functionalized self-assembled monolayer (CH 3 -SAM) probe and the protein molecules covalently bound to a carboxylic SAM on a gold-coated glass coverslip. The adhesion energy passed through a maximum for the tethered proteins during excursions with temperature or chemical denaturants. The initial rise in adhesion energy on increasing the temperature or GuHCl concentration was due to increasing exposure of the unfolded hydrophobic core of the proteins to the CH 3 -SAM tip, while the decrease in adhesion energy at high temperature or large concentrations of denaturant is attributed to interprotein association with nearest neighbors. Attempts to recover their folded state upon cooling (or reducing GuHCl concentration) were unsuccessful. Also, dilution of surface-tethered LYS reduced the aggregation with nearest neighbors about 6-fold. These results are in qualitative agreement with Monte Carlo simulations on a simple two-letter lattice protein model, especially for low concentrations of grafted proteins. Introduction The adsorption of proteins to surfaces is a topic that has received considerable interest in the past few years. 1,2 Recent reports have focused on searching for protein-resistant sur- faces, 3-5 conformational changes induced by different surface chemistries, 6 and on the effect of surfaces on protein aggrega- tion (amyloid fibrillation). 7,8 Little, to our knowledge, has been reported on the structural behavior of tethered proteins at interfaces, let alone their denaturing profiles and stability and how these properties compare with proteins in the bulk phase. This is somewhat surprising since, in vivo, many proteins are attached to biological surfaces such as the cell membrane, chaperones during folding, cornea, bones, and arteries. A com- plicating factor is the difficulty in measuring the conformational behavior of surface-associated proteins due to their low concen- trations. Techniques such as fluorescence and attenuated total reflection Fourier transform infrared (ATR-FTIR) spectroscopy have difficulty at such low interfacial concentrations, especially for monolayer coverage. 3 The goals of the research were to deter- mine the unfolding behavior of tethered proteins, to compare the denaturation behavior of proteins in solution with those tethered to a surface, and to develop an experimental measurement technique for measuring the destabilization of tethered proteins. Consequently, we present a method here, multimolecular force spectroscopy (MMFS) that allows one to probe the surface- associated protein layers. The method is similar to chemical force spectroscopy (CFS). In MMFS, an atomic force microscope (AFM) in force-mode, i.e., with a 10 μm diameter borosilicate sphere attached to a cantilever tip, is used. Two model globular proteins, hen egg lysozyme (LYS) and ribonuclease A (RNase A), were chosen because they exist as monomers, have a conserved hydrophobic core, and have been extensively studied. In order to compare the denaturing properties of natively folded proteins in bulk solution with those tethered to a surface, and to probe the connection between misfolded proteins and adhesion, we purpo- sely denatured covalently bound proteins using temperature or denaturant excursions. Then, the adhesion (binding) energy between the tethered proteins (on a gold-coated glass coverslip) and a layer of CH 3 -terminated self-assembled alkanethiol mono- layer (CH 3 -SAM) (on the sphere attached to the cantilever) was measured. To help explain the thermally or chemically induced denatura- tion of LYS and RNase A, Monte Carlo (MC) simulations on model lattice peptides tethered to a surface were undertaken. Two letter lattice models proposed by Dill 9 and tethered to a “hydro- philic” surface were used. These are then contacted with a hydro- phobic surface to simulate the laboratory experiments that used a CH 3 -SAM cantilever tip, and the number of protein-hydrophobic surface contacts as a function of temperature was estimated. We use this equilibrium measure as an indicator of the adhesion energy measured in the experiments. As is well understood in the *Corresponding author. E-mail: [email protected] (G.B.); sk2794@ columbia.edu (S.K.K.). (1) Malmsten, M. Biolpolymers at Interfaces; Surfactant Science Series; Marcel Dekker, Inc: New York, 2003; p 110. (2) Calonder, C; Tie, Y; Van Tassel, P. R. Proc. Natl. Acad. Sci. U.S.A. 2001, 98 (19), 10664–10669. (3) Sethuraman, A; Vedantham, G; Imoto, T; Przybycien, T; Belfort, G. Proteins 2004, 56(4), 669–678. (4) Kane, R. S.; Deschatelets, P; Whitesides, G. M. Langmuir 2003, 19(6), 2388–2391. (5) Ostuni, E; Chapman, R. G.; Liang, M. N.; Meluleni, G; Pier, G; Ingber, D. E.; Whitesides, G. M. Langmuir 2001, 17(20), 6336–6343. (6) Sethuraman, A; Belfort, G. Biophys. J. 2005, 88(2), 1322–1333. (7) Sluzky, V; Tamada, J. A.; Klibanov, A. M.; Langer, R. Proc. Natl. Acad. Sci. U.S.A. 1991, 88(21), 9377–9381. (8) Nayak, A; Dutta, A. K.; Belfort, G. Biochem. Biophys. Res. Commun. 2008, 369(2), 303–307. (9) Dill, K. A. Biochemistry 1990, 29(31), 7133–7155. Published on Web 3/31/2009 © 2009 American Chemical Society DOI: 10.1021/la803771d Langmuir 2009, 25(9), 4998–5005 4998
-
Upload
independent -
Category
Documents
-
view
1 -
download
0
Transcript of Stability of Tethered Proteins

pubs.acs.org/Langmuir
Stability of Tethered Proteins
Gaurav Anand,† Sumit Sharma,‡ Sanat K. Kumar,*,‡ and Georges Belfort*,†
†Howard P. Isermann Department of Chemical and Biological Engineering and Center for Biotechnology andInterdisciplinary Studies, Rensselaer Polytechnic Institute, Troy, New York 12180-3590, and ‡Department of
Chemical Engineering, Columbia University, New York, New York 10027
Received November 13, 2008. Revised Manuscript Received February 11, 2009
The stability of tethered globular proteins under denaturing conditions was interrogated with a hydrophobic surface,since conventional structural methods like circular dichroism (CD) and fluorescence or infrared spectroscopy could notbe used because of the presence of an opaque solid substrate and extremely low surface concentrations. For free proteinin solution, CD spectra gave well-known unfolding denaturing curves for lysozyme (LYS) and ribonuclease A (RNase A).The unfolding process for covalently tethered LYS and RNase A was followed, with multimolecular force spectroscopy(using an atomic force microscope in force-mode), via the adhesion energy between a functionalized self-assembledmonolayer (CH3-SAM) probe and the protein molecules covalently bound to a carboxylic SAM on a gold-coated glasscoverslip. The adhesion energy passed through amaximum for the tethered proteins during excursions with temperatureor chemical denaturants. The initial rise in adhesion energy on increasing the temperature or GuHCl concentration wasdue to increasing exposure of the unfolded hydrophobic core of the proteins to the CH3-SAM tip, while the decrease inadhesion energy at high temperature or large concentrations of denaturant is attributed to interprotein association withnearest neighbors. Attempts to recover their folded state upon cooling (or reducing GuHCl concentration) wereunsuccessful. Also, dilution of surface-tethered LYS reduced the aggregation with nearest neighbors about 6-fold. Theseresults are in qualitative agreement withMonte Carlo simulations on a simple two-letter lattice proteinmodel, especiallyfor low concentrations of grafted proteins.
Introduction
The adsorption of proteins to surfaces is a topic that hasreceived considerable interest in the past few years.1,2 Recentreports have focused on searching for protein-resistant sur-faces,3-5 conformational changes induced by different surfacechemistries,6 and on the effect of surfaces on protein aggrega-tion (amyloid fibrillation).7,8 Little, to our knowledge, has beenreported on the structural behavior of tethered proteins atinterfaces, let alone their denaturing profiles and stability andhow these properties compare with proteins in the bulk phase.This is somewhat surprising since, in vivo, many proteins areattached to biological surfaces such as the cell membrane,chaperones during folding, cornea, bones, and arteries. A com-plicating factor is the difficulty in measuring the conformationalbehavior of surface-associated proteins due to their low concen-trations. Techniques such as fluorescence and attenuated totalreflection Fourier transform infrared (ATR-FTIR) spectroscopyhave difficulty at such low interfacial concentrations, especiallyfor monolayer coverage.3 The goals of the research were to deter-mine the unfolding behavior of tethered proteins, to compare the
denaturation behavior of proteins in solution with those tetheredto a surface, and to develop an experimental measurementtechnique for measuring the destabilization of tethered proteins.Consequently, we present a method here, multimolecular forcespectroscopy (MMFS) that allows one to probe the surface-associated protein layers. The method is similar to chemical forcespectroscopy (CFS).
InMMFS, an atomic force microscope (AFM) in force-mode,i.e., with a 10 μm diameter borosilicate sphere attached to acantilever tip, is used. Two model globular proteins, hen egglysozyme (LYS) and ribonuclease A (RNase A), were chosenbecause they exist as monomers, have a conserved hydrophobiccore, and have been extensively studied. In order to comparethe denaturing properties of natively folded proteins in bulksolution with those tethered to a surface, and to probe theconnection between misfolded proteins and adhesion, we purpo-sely denatured covalently bound proteins using temperature ordenaturant excursions. Then, the adhesion (binding) energybetween the tethered proteins (on a gold-coated glass coverslip)and a layer of CH3-terminated self-assembled alkanethiol mono-layer (CH3-SAM) (on the sphere attached to the cantilever) wasmeasured.
To help explain the thermally or chemically induced denatura-tion of LYS and RNase A, Monte Carlo (MC) simulations onmodel lattice peptides tethered to a surface were undertaken. Twoletter lattice models proposed by Dill9 and tethered to a “hydro-philic” surface were used. These are then contacted with a hydro-phobic surface to simulate the laboratory experiments that used aCH3-SAMcantilever tip, and the number of protein-hydrophobicsurface contacts as a function of temperature was estimated. Weuse this equilibrium measure as an indicator of the adhesionenergy measured in the experiments. As is well understood in the
*Corresponding author. E-mail: [email protected] (G.B.); [email protected] (S.K.K.).(1) Malmsten, M. Biolpolymers at Interfaces; Surfactant Science Series; Marcel
Dekker, Inc: New York, 2003; p 110.(2) Calonder, C; Tie, Y; Van Tassel, P. R. Proc. Natl. Acad. Sci. U.S.A. 2001, 98
(19), 10664–10669.(3) Sethuraman, A; Vedantham, G; Imoto, T; Przybycien, T; Belfort, G.
Proteins 2004, 56(4), 669–678.(4) Kane, R. S.; Deschatelets, P; Whitesides, G. M. Langmuir 2003, 19(6),
2388–2391.(5) Ostuni, E; Chapman, R. G.; Liang, M. N.; Meluleni, G; Pier, G; Ingber, D.
E.; Whitesides, G. M. Langmuir 2001, 17(20), 6336–6343.(6) Sethuraman, A; Belfort, G. Biophys. J. 2005, 88(2), 1322–1333.(7) Sluzky, V; Tamada, J. A.; Klibanov, A.M.; Langer, R.Proc. Natl. Acad. Sci.
U.S.A. 1991, 88(21), 9377–9381.(8) Nayak, A; Dutta, A. K.; Belfort, G. Biochem. Biophys. Res. Commun. 2008,
369(2), 303–307. (9) Dill, K. A. Biochemistry 1990, 29(31), 7133–7155.
Published on Web 3/31/2009
© 2009 American Chemical Society
DOI: 10.1021/la803771d Langmuir 2009, 25(9),4998–50054998

polymer community, this approach ignores any viscoelastic con-tributions to adhesion. This is a serious shortcoming. Never-theless, this quantity’s temperature dependence agrees quali-tatively with experiments, and the protein’s adhesion energy ismaximized in the vicinity of the unfolding transition for thetethered protein. However, qualitative differences exist betweenthe experiments and the theory at high temperatures, and possiblereasons for these differences are discussed below.
Experimental Section
Materials. All materials and reagents were used as received.Glass coverslips (0.20 mm, Corning, New York) and AFMcantilevers were coated with 15 nm of titanium (Ti, 99.999%International AdvancedMaterials, Spring Valley, NY) followedby 50 nm of gold (99.999%, International Advanced Materials)using the electron beam evaporator under a pressure of lessthan 10-6 Torr. Hen egg LYS, N-hydroxysuccinimide (NHS),water-soluble 1-ethyl-3-(3-dimethylaminopropyl) hydrochlor-ide carbodiimide (EDC) were purchased from Sigma-AldrichChemicals, St. Louis, MO. Bovine pancreatic RNase A waspurchased from Worthington biochemical corporation, Lake-wood, NJ. All the solutions were filtered using 0.22 μm poly(vinylidine difluoride) (PVDF) membranes (Millipore corpora-tion, Bedford, MA).Methods. QCM-D. A quartz crystal microbalance with
dissipation (QCM-D) (D300 System, Q-Sense AB, G::oteborg,
Sweden) was used to follow the amount of protein grafted perunit area and the dissipation with time. QCM-D is an ultra-sensitive weighing device which can detect adsorbed mass to theresolution of less than 1 ng/cm2. The device consists of a thindisk of quartz with metal electrodes coated on the both faces ofthe disk. The crystals used in our study were gold-coated tofacilitate SAM formation and subsequent chemical functionali-zations. The crystal is connected to an external circuit thatinduces the crystal to oscillate in a shear mode at its resonantfrequency, f. The lateral amplitude of vibrating crystal is 1-2 nm.The mass adsorbed or desorbed from the gold surface induces afrequency shift, Δf, which is a function of change in mass, Δm.Also, any mass that adsorbs to the surface will oscillate with thesame lateral displacement and frequency as the underlyingcrystal. If the adsorbed film is elastic, it oscillates in phase withthe crystal, and there is no energy loss. If however, the film isinelastic (of soft matter like proteins, cells, lipid bilayers),energy is dissipated via shear waves. The dissipation factor D,is defined as
D ¼ EDissipated
2πEStoredð1Þ
where EDissipated is the energy dissipated during one oscillationperiod, and EStored is the energy stored during the oscillation. Incontrast to rigid films, the viscoelastic properties of soft mattergive rise to energy dissipation, i.e., ΔD> 0. For adsorbed masswith no slip, rigid attachment, and smallmass as compared to thecrystal mass, Sauerbrey10 derived a simple relationship betweenthe adsorbed mass Δm and the change in frequency Δf.
Δm ¼ -CΔfnn
ð2Þ
where C = 17.7 ng 3 cm-2
3Hz1-, n is the overtone number,n = 3,5,7, and f is the frequency of the overtone. Gold-coatedAT-cut quartz crystals with fundamental frequency of ∼5 MHzwere cleaned by immersion in a 1:1:5 mixture of H2O2 (30%),NH3 (25%), and distilled water at 60 �C for 20 min. The cleanedcrystals were then washed with a distilled water/ethanol mixture
(50:50) and then dried with nitrogen gas. The crystals werethen exposed to UV-ozone for 10 min and were thoroughlyrinsedwith ethanol and dried under nitrogen before use. Crystalswere soaked in 2 mM solution of HS(CH2)11COOH in ethanolfor 12 h, rinsed with ethanol and then dried under nitrogen.The terminal carboxylic groups were then equilibrated withdeionized water for 15 min followed by soaking into an equalvolume mixture of 0.1 M NHS and 0.4 M water-soluble carbo-diimide EDC for 30 min. The crystals were then washed withdeionized water in triplicate and installed inside the QCMchamber. Then, LYS and RNase A were chemically graftedonto the carboxy-SAM layer on the coverslips by the NHSchemistry. Four separate resonant frequencies (overtones, n = 1,3, 5, and 7) were used to detect the oscillation of the shear wavethrough the crystal at 5, 15, 25, and 35MHz, respectively.11 Thedata from the seventh overtone is reported as it has theminimumnoise.
Atomic Force Microscopy. The “molecular puller” was a one-dimensional (1-D) AFM (MEFP-1 Asylum Research, SantaBarbara, CA). Borosilicate glass spheres of 10 μm diameterswere attached to the AFM cantilever tips (Si3N4 Novascan,Ames, IA). The cantilever tip was modified with a gold-coated10 μm diameter borosilicate sphere and was coated with amonolayer of HS(CH2)11CH3 (Sigma-Aldrich Chemicals, St.Louis, MO) SAM. The spring constant (0.06 N/m) of eachcantilever was recalibrated before measuring the adhesionforces using a two step procedure. First, the slope of the contactregion during force-distance measurements was used to calcu-late the sensitivity of the lever in nanometers per volt, and thena “thermal tune” was performed to determine resonant fre-quency of the cantilever. An algorithm in IGOR (WavemetricsInc., Portland, OR) computed the spring constant using theEqui-partition theorem.12 Using the Deriaguin approxima-tion to convert adhesion forces, Fa, into energy, Ea, of interac-tion, between two flat surfaces (large sphere of radius, R, andflat substrate), the measured forces, Fa, were normalized bythe radius, R (5 μm), of the silica sphere, such that Ea = Fa/R.
13
Here the loading rates are kept constant for all runs. Theywere 1 mN/m, and the time period under constant compliancewas 1 s.
Protein Tethering. For alkanethiol SAM assembly, gold-coated coverslips and AFM probes were respectively soaked ina 2 mM solution of HS(CH2)11COOH (COOH-SAM, Sigma-Aldrich Chemicals, St. Louis, MO) and HS(CH2)11CH3 (CH3-SAM, Sigma-Aldrich Chemicals) in ethanol for 12 h, rinsed withethanol, and then dried under nitrogen. Then, LYS and RNaseA were chemically grafted onto the carboxy-SAM layer onthe coverslips by the NHS chemistry.14 Figure 1 is a schematicof the experimental set up and shows the interaction between theprobe (CH3-SAM) (top) and the tethered protein (bottom).
Protein Denaturation and MMFS. Intermolecular adhesionenergy measurements were generated between CH3-SAM sur-face on the cantilever tip and the protein covalently immobilizedto SAM-COOH on the glass coverslip. All the force measure-mentswere conducted in 10mMPBSbuffer at pH7.4.At pH7.4,the carboxylic acid group was ionized and negatively charged(pKa 5.5). Control experiments were performed without graftedprotein, and the adhesion between the CH3-SAM surface andthe SAM-COO- surface was negligible (data not shown). Thisresult is in agreement with the previous studies by Sethuramanet al.15 To chemically perturb the protein structure, proteingrafted substrates were soaked in phosphate-buffered saline(PBS buffer) at varying concentrations ofGuHCl (Sigma-Aldrich
(10) Sauerbrey, G. Z. Phys. A: Hadrons Nucl. 1959, 155(2), 206–222.
(11) Dutta, A. K.; Belfort, G. Langmuir 2007, 23(6), 3088–3094.(12) Hutter, J. L.; Bechhoefer, J. Rev. Sci. Instrum. 1993, 64(7), 1868–1873.(13) Derjaguin, B. V. Kolloid Z. 1934, 69, 155–164.(14) Lahiri, J; Isaacs, L; Tien, J; Whitesides, G. M. Anal. Chem. 1999, 71(4),
777–790.(15) Sethuraman, A; Han, M; Kane, R. S.; Belfort, G. Langmuir 2004, 20(18),
7779–7788.
DOI: 10.1021/la803771dLangmuir 2009, 25(9), 4998–5005 4999
ArticleAnand et al.

Chemicals) (0-6 M) for 12 h in a refrigerator (4 �C). Thesubstrates were thoroughly rinsed with clean PBS in triplicateto wash off any salt before taking the adhesion measurements.For the thermal experiments, 0.1 mg/mL LYS and RNase A in25 mM sodium phosphate buffer were grafted onto COOH-SAM-gold substrates and heated to different temperatures for30 min. Then, they were rapidly cooled to room temperature,and the adhesionmeasurements were immediately obtainedwithCH3-SAM on the gold coated borosilicate sphere, which in turnwas attached to the AFM cantilever tip.
Circular Dichroism (CD). To follow denaturation of bulkprotein solutions, CD experiments were performed. For thermaland chemical denaturation experiments, LYS andRNaseAweredissolved in 25 mM sodium phosphate buffer at a concentrationof 0.5 mg/mL. A quartz cuvette of path length 1 mm (Hellma,Inc., Denmark) was used to obtain the far-UV spectrum(190-260 nm) of different samples. Loss ofR-helix was recordedwith increasing temperature or GuHCl concentration by mea-suring the relative molar ellipticity at λ=222 nm.16 To comparethe tethered results (AFM) with those in solution (CD), excur-sions in both temperature and denaturant were pursued. Tochemically perturb the protein structure in bulk solution, vary-ing concentrations of GuHCl (0-6M) in PBS were added to theprotein solution, and the aliquots were stored for 12 h in arefrigerator (4 �C) before obtaining the CD spectra. Standardthermal denaturation curves of each protein in solution wereobtained, i.e., individual samples were heated to a certaintemperature for 30 min and then rapidly cooled down to roomtemperature before obtaining CD spectra. All the AFM and CDmeasurements were conducted at 22 ( 0.1 �C. Temperatures ashigh as 90 �C were used to denature proteins tethered on the
surface and in the bulk solution. In the AFM experiments suchhigh temperatures lead to various complications, e.g., thermalfrequency shifts, change in cantilever spring constant, changes indeflection sensitivity, enormous amount of noise, andmay causesubstantial evaporation of the buffer. Therefore the coated glasscoverslips were exposed to different temperatures in awater bathand then were rapidly cooled to room temperature before takingthe force measurements using the AFM. Although the CDinstrument is capable of automatically ramping the temperatureup to 95 �C, we still heated the samples separately and quenchedto room temperature before taking the CD measurement. Themelting temperature of LYS and RNase A did not change as aconsequence of rapid quenching as compared with unquenchedheating.17 This allowed comparison of the surface denaturation(monitored by MMFS) with the denaturation in bulk (moni-tored by CD).
Unfolding Reversibility. To probe the reversibility of unfold-ing and to explain the decrease in adhesion above Tmax and[GuHCl]max, two different experiments at two extreme tempera-tures and two extreme denaturant concentrations were chosen,respectively, on either side of the maximum values from theadhesion curves. After tethering LYS to the COOH-SAM asdescribed above, the swatch was immersed separately in (i) PBSand (ii) 6 M GuHCl in PBS for 12 h at 4 �C (on either side of[GuHCl]max), then washed with PBS to remove the GuHCl, andthe adhesion energy wasmeasured. The two samples were storedat 4 �C for 12 h in PBS and allowed to slowly refold; they werethen washed with PBS at room temperature (22 ( 0.1 �C), andagain the adhesion energy was measured. It has been reportedthat LYS refolds in bulk solution in about 4 h, but we chose 12 hbecause, in our case, the LYS molecules were tethered to thesurface and therefore have diminished entropy and degrees offreedom to refold.18 Next, the samples were exposed to theirmaximum, i.e., to [GuHCl]max = 4 M in PBS for 12 h at 4 �C(i.e., at themaximumpoint of [GuHCl]max), and adhesion energywas again recorded after washing with PBS buffer at roomtemperature.
In a second set of experiments, after tethering LYS to theCOOH-SAM as described above, the swatch was immersed inPBS at 22 and 90 �C (on either side of Tmax,) for 30 min, and theadhesion energies were measured between the CH3-SAM probeand the tethered proteins on each swatch. Then, both sampleswere stored at 4 �C for 12 h in PBS and allowed to slowly refold.Samples were then immersed in PBS at room temperature(22 ( 0.1 �C) and again the adhesion energy was measured.Next, the samples were reheated to their maximum, i.e., toTmax = 72 �C (LYS) for 30 min, cooled rapidly to roomtemperature through fast immersion in PBS (22 ( 0.1 �C), andadhesion energy was again recorded.
Dilution Experiment. The goal in this experiment was to testwhether interaction with nearest neighbors would be diminishedwhen the surface concentration of tethered proteins was reducedby 50%. The thermal denaturation of diluted surface-tetheredLYS was measured. LYS concentration on the surface wasreduced by 50% using poly(ethylene glycol) (PEG)-terminatedthiol as a diluent. The protocol was similar to that of Lahiri,et al., (1999).14 See Supporting Information for details.Simulations. MC simulations of lattice proteins tethered to
an athermal or noninteracting surface were performed. Thesimulations were aimed at understanding how tethered pro-teins interact with a hydrophobic surface, such as a SAM-covered AFM tip with a hydrophobic sphere, and with neigh-boring tethered proteins. The equilibrium simulations cannotcapture the contribution of viscoelastic effects to the adhesionenergy when an AFM tip is retracted from the surface.
Figure 1. Schematic of the MMFS experiment using an AFM.Two surfaces interact in the AFM; the top surface is amicrosphereof radius R=5 μm functionalized with CH3-SAM attached to theAFMcantilever, and the bottomsurface is a coverslip ontowhich alayer of covalently attached protein (LYS or RNase A) to COOH-SAM using NHS chemistry is fixed. The lysines on the exterior ofprotein molecules, shown by black patches, chemically bond withthe COOH-SAMbyEDC/NHS coupling chemistry. Gray patchesshow the conserved hydrophobic groupswithin the core (figure notto scale).
(16) Madison, V; Schellman, J. Biopolymers 1972, 11(5), 1041–1076.
(17) Pfeil W. Protein Stability and Folding: A Collection of ThermodynamicData, Supplement 1; Springer: New York, 2001.
(18) Gao, Y-G;Guan, Y-X; Yao, S-J; Cho,M-G.Korean J. Chem. Eng. 2002, 19(5), 871–875.
DOI: 10.1021/la803771d Langmuir 2009, 25(9),4998–50055000
Article Anand et al.

This phenomenon may play an important role in the experi-ments, and forms the basis of a subsequent study.
In the lattice protein model introduced by Dill,9 each bead ofthe lattice protein represents an amino acid. The protein modelhas two kinds of beads: hydrophobic and polar. In addition tothe constraint of single occupancy of a lattice site, which insuresthe hard core repulsion between beads, the hydrophobic beadswere assumed to have nearest-neighbor attractions with eachother of magnitude ε, while the interaction energy between twopolar beads or between a polar and a hydrophobic bead was setto zero. All the empty sites on the lattice correspond to solvent.Lattice proteins were tethered at random amino acids in thesequence and at random locations on an athermal surface. Theathermal or noninteracting surface represented the COOH-SAM on which the proteins were tethered during the laboratoryexperiments. After tethering, the proteins were quenched to alow temperature with interprotein interactions set to zero toobtain folded-like globular structures. (Temperature is definedin reduced units,T*= kBT/ε, where kB is Boltzmann’s constant,and T is the temperature.) Above the tethered proteins, ahydrophobic probe was placed, which represented the AFMsphere covered with CH3-SAM in the laboratory experiments.The magnitude of interaction between a hydrophobic proteinunit and the surface is equal to ε. Sequential canonical ensembleMC simulations were then performed, wherein each subsequentsimulationwas at a slightly higher temperature than the previousone. The MC simulations were conducted using the standardMetropolis method.19 At each temperature, 108 MC equilibra-tion cycles were performed, followed by 108 production cycles.The adhesion energy with the top hydrophobic probe wascalculated from the number of hydrophobic contacts betweenthe tethered proteins and the probe surface. Three proteinmodels;a 64 mer,20 a 124 mer,21 and a 248 mer lattice
proteins;were studied. The 248 mer protein consisted of two124 mer proteins joined end to end. A simulation of 2� 108 MCcycles took approximately 24 h of CPU time on aXeon dual coreCPU for four tethered 64-mer proteins.
Results
Protein Tethering. The tethering reaction of proteins (LYS,RNase A) to the gold-coated and COOH-SAM-covered cover-slips was followed by QCM-D. Changes in mass, using theSauerbrey equation to convert frequency change to mass,10 anddissipation for both LYS and RNase A are shown in Figure 2.Before introducing protein solutions, the activated crystals werestabilized with background buffer, 10 mM PBS, in which theproteins were dissolved, for more than an hour. After thecrystals were saturated with buffer and there was no furtherdrop in frequency, the data acquisition was restarted. In Fig-ure 2, at time t=0, the horizontal lines in the frequency and thedissipation plots correspond to the baseline obtained after thecrystal equilibrated with the buffer. After 5 min of data acquisi-tion, protein solutions were introduced at a concentration of1 μM in 10 mM PBS buffer. The sudden increase in mass anddissipation after about 5 min is due to the immobilization ofprotein molecules through lysine residues by displacement ofthe NHS group. The reaction proceeded for 60 min and then thenonspecifically adsorbed protein was removed by flushing thesensor with 10 mM PBS buffer. As can be seen from the figure,the covalent grafting of LYS and RNase A onto the COOH-SAMs appeared to reach a maximum grafted packing density ofapproximately 200 ( 20 ng/cm2 after washing at 60 min. Also,there was a decrease in mass and dissipation after the washat∼60min due to the removal of loosely bound protein. Voros 22
showed that the change in dissipation was less for rigid adsorbedfilms as compared with more flexible films. This is because the
Figure 2. Chemical immobilization of LYS (a,b) and RNase A (c,d) as monitored with QCM-D in sodium phosphate buffer at pH 8.5 on acarboxyl SAMongold activated byEDCandNHS. Protein solutionwas introduced at time t=5min, and unadsorbed solutionwaswashedoff at time t=65minwith the backgroundPBSbuffer inwhich theproteinsweredissolved.Mass of grafted (a)LYSand (c)RNaseA.Changein energy dissipation for grafted (b) LYS and (d) RNase A.
(19) Allen M. P., Tildesley D. J. Computer Simulation of Liquids; OxfordUniversity Press, Inc: New York, 1987.(20) Yue, K; Dill, K. A. Proc. Natl. Acad. Sci. U.S.A. 1995, 92(1), 146–150.(21) Lattman, E. E.; Fiebig, K. M.; Dill, K. A. Biochemistry 1994, 33(20),
6158–6166. (22) Voros, J. Biophys. J. 2004, 87(1), 553–561.
DOI: 10.1021/la803771dLangmuir 2009, 25(9), 4998–5005 5001
ArticleAnand et al.
rigid or less flexible adsorbedmolecules vibrate in phase with thecrystal and therefore dissipate less energy as compared withflexible molecules, which vibrate off-phase with the vibratingcrystal and therefore dissipate more energy. Thus, the smallerdissipation for the RNase A layer suggests that LYS moleculesare more flexible than RNase A molecules (Figure 2b,d).Adhesion Measurements with Chemical Denaturation.
The data in Figure 3 compare the structural stability (usingAFM for adhesion and CD for loss of helix at 222 cm-1) oftethered LYS (Figure 3a,b) and RNase A (Figure 3c,d) with thatin solution during exposure to an increasing concentration,C (M), of a destabilizing osmolyte, guanidiium hydrochloride(GuHCl) at pH 7.4 and 22( 0.1 �C. The literature values ofCm,defined as the molarity of chemical denaturant at which 50%of the protein structure is lost, for LYS is 3.62M andRNase A is3.0 M.17 From Figure 3a,c, the proteins in solution appear toretain 50% of their native structure, Cm, up to 4 M (LYS) and3M (RNase A) GuHCl. For the tethered proteins using MMFS(Figure 3b,d), we conjecture that the increase in normalizedadhesion energy is due to the exposure of the conserved hydro-phobic core of LYS and RNase A to the hydrophobic probewhen the protein molecules start to unfold in the presence ofincreasing concentrations of GuHCl. The reason for the declinein normalized binding energy above 4M (LYS) and 3M (RNaseA) GuHCl concentration has not been previously reported.We speculate that protein-protein interactions dominated oncethe unfolding process commenced on the surface. This questionis further addressed below. The data points and errors forFigure 3b,d were obtained from the mean and variance of aGaussian profile fitted to a histogram of adhesion energy
measurements between the CH3-SAM probe and the tetheredprotein at different concentrations of denaturant (see raw datain Figure 1S in the Supporting Information).AdhesionMeasurements with Thermal Denaturation. The
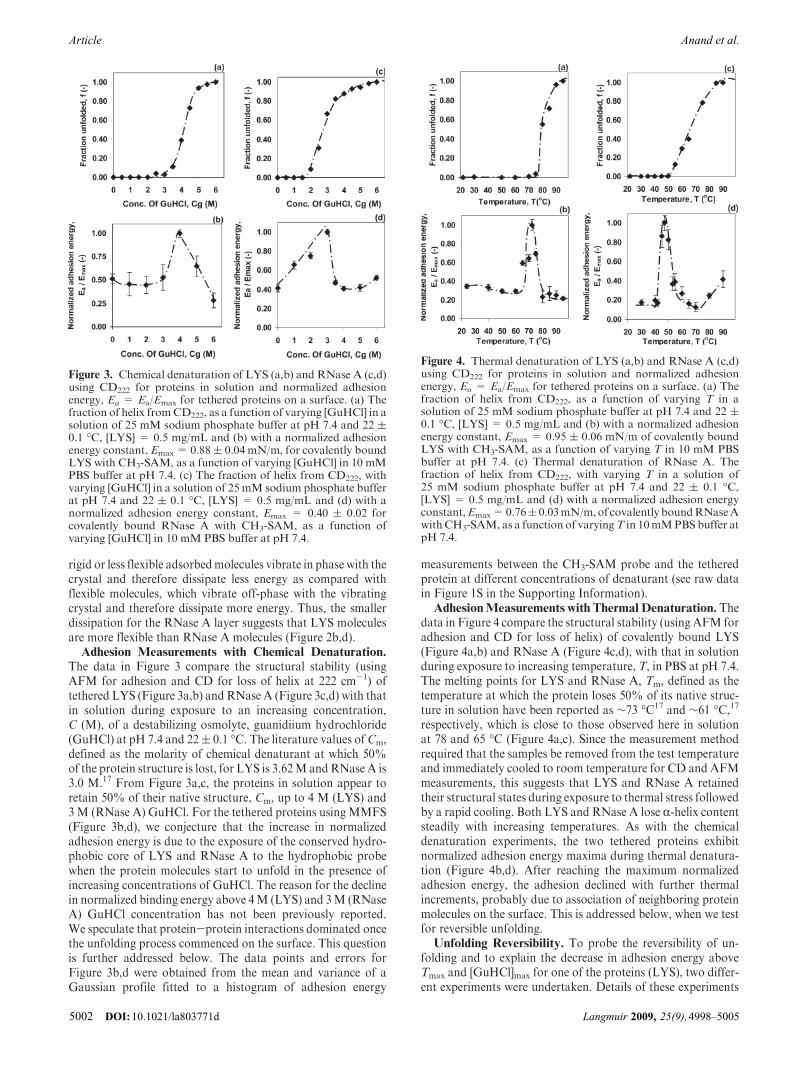
data in Figure 4 compare the structural stability (using AFM foradhesion and CD for loss of helix) of covalently bound LYS(Figure 4a,b) and RNase A (Figure 4c,d), with that in solutionduring exposure to increasing temperature, T, in PBS at pH 7.4.The melting points for LYS and RNase A, Tm, defined as thetemperature at which the protein loses 50% of its native struc-ture in solution have been reported as ∼73 �C17 and ∼61 �C,17respectively, which is close to those observed here in solutionat 78 and 65 �C (Figure 4a,c). Since the measurement methodrequired that the samples be removed from the test temperatureand immediately cooled to room temperature for CD and AFMmeasurements, this suggests that LYS and RNase A retainedtheir structural states during exposure to thermal stress followedby a rapid cooling. Both LYS and RNase A lose R-helix contentsteadily with increasing temperatures. As with the chemicaldenaturation experiments, the two tethered proteins exhibitnormalized adhesion energy maxima during thermal denatura-tion (Figure 4b,d). After reaching the maximum normalizedadhesion energy, the adhesion declined with further thermalincrements, probably due to association of neighboring proteinmolecules on the surface. This is addressed below, when we testfor reversible unfolding.Unfolding Reversibility. To probe the reversibility of un-
folding and to explain the decrease in adhesion energy aboveTmax and [GuHCl]max for one of the proteins (LYS), two differ-ent experiments were undertaken. Details of these experiments
Figure 3. Chemical denaturation of LYS (a,b) and RNase A (c,d)using CD222 for proteins in solution and normalized adhesionenergy, Ea = Ea/Emax for tethered proteins on a surface. (a) Thefraction of helix fromCD222, as a function of varying [GuHCl] in asolution of 25 mM sodium phosphate buffer at pH 7.4 and 22 (0.1 �C, [LYS] = 0.5 mg/mL and (b) with a normalized adhesionenergy constant,Emax= 0.88( 0.04 mN/m, for covalently boundLYS with CH3-SAM, as a function of varying [GuHCl] in 10 mMPBS buffer at pH 7.4. (c) The fraction of helix from CD222, withvarying [GuHCl] in a solution of 25 mM sodium phosphate bufferat pH 7.4 and 22 ( 0.1 �C, [LYS] = 0.5 mg/mL and (d) with anormalized adhesion energy constant, Emax = 0.40 ( 0.02 forcovalently bound RNase A with CH3-SAM, as a function ofvarying [GuHCl] in 10 mM PBS buffer at pH 7.4.
Figure 4. Thermal denaturation of LYS (a,b) and RNase A (c,d)using CD222 for proteins in solution and normalized adhesionenergy, Ea = Ea/Emax for tethered proteins on a surface. (a) Thefraction of helix from CD222, as a function of varying T in asolution of 25 mM sodium phosphate buffer at pH 7.4 and 22 (0.1 �C, [LYS] = 0.5 mg/mL and (b) with a normalized adhesionenergy constant, Emax = 0.95 ( 0.06 mN/m of covalently boundLYS with CH3-SAM, as a function of varying T in 10 mM PBSbuffer at pH 7.4. (c) Thermal denaturation of RNase A. Thefraction of helix from CD222, with varying T in a solution of25 mM sodium phosphate buffer at pH 7.4 and 22 ( 0.1 �C,[LYS] = 0.5 mg/mL and (d) with a normalized adhesion energyconstant,Emax=0.76(0.03mN/m,of covalently boundRNaseAwithCH3-SAM, as a function of varyingT in 10mMPBSbuffer atpH 7.4.
DOI: 10.1021/la803771d Langmuir 2009, 25(9),4998–50055002
Article Anand et al.

are given in the Experimental Section. The goal was to firstexpose LYS to a very high denaturant condition ([GuHCl] andT) for a period (12 h and 30 min, respectively) as defined by thedata in Figures 3b and 4b (Step 1). Then sufficient time (12 h)was allowed for refolding (Step 2), and finally the sampleswere placed at the maxima conditions ([GuHCl]max = 4 Mand Tmax = 72 �C) for a period (12 h at 4 �C, and 30 min,respectively) (Step 3). After each step listed above, the adhesionenergy between the tethered LYS and the CH3-SAM probe wasmeasured. In Figure 5, the results are referred to as (a), (c), and(e) (for Steps 1-3 for GuHCl addition, respectively) and as (b),(d), and (f) (for Steps 1-3 for T-change, respectively). Figurepanels 3b and 4b are redrawn as Figure 5a and 5b to facilitatebetter understanding of the experiments and results.
Comparing the results in Figure 5 within error, we concludethe following. Both chemical and temperature denaturant ex-cursions have similar effects on the behavior of tethered LYS.An increase in denaturant concentration or temperature to their
respective maxima (Figure 5a,b) resulted in the expected highadhesion energy (Figure 5c,d). However, exposure of tetheredLYS to very high denaturant concentrations (6M) or tempera-ture (90 �C) for 12 h and 30 min, respectively, did not allowLYS to attain maximum adhesion value (at [GuHCl]= 3MandT=72 �C), evenwhen allowed to refold in PBS buffer for 12 h at4 �C (Figure 5e,f).Dilution. Although the results in Figure 5 back the “interac-
tion-between-neighbors” hypothesis during denaturation, forfurther support, LYS was tethered to the surface at 50% of theprevious concentration (Figure 4b) and interdispersed withcovalently attached PEG moieties during denaturation withincreasing temperature. Thus, the lower availability of nearestneighbors should result in both a lower peak due to less proteinand a lower slope after the peak due to fewer interactions (FigureS2). Again, we observed a peak at ∼72 �C. However, the peakwas broader, and the fall in adhesion energy beyond the peakwas much shallower than that observed before, i.e., there was a6-fold decrease in negative slope between the two cases. Weinterpret this to mean that there were significantly less protein-protein interactions. Lowering the concentration further wasnot feasible with our method, as the peak was on the order of theerror and could not be observed.
Taken together, the unfolding irreversibility and the dilutionexperiments strongly support the “interaction-between-neigh-bors” hypothesis during denaturation.MC Simulations of Lattice Proteins. To explain the tem-
perature dependence of adhesion energy with a hydrophobicsurface from tethered proteins, MC simulations of tetheredproteins were performed. The simulation system and techniquehas been described above. The equilibrium adhesion energy withthe hydrophobic surface was defined as the average number ofhydrophobic beads-surface contacts. Figure 6 shows the adhe-sion energy with the hydrophobic surface as a function oftemperature for the three model proteins. The important fea-tures to observe are, first, that a peak in the adhesion energy isobserved for all proteins and the profiles are asymmetric. Thereis a sharp increase in the adhesion energy with the hydrophobicsurface at the temperature when the proteins unfold, but thedrop in the adhesion energy at higher temperatures is lesssharp, especially compared to experiments. However, the dropin adhesion energy at high temperatures is sharper for longermodel proteins.
In Figure 7, the radius of gyration square ÆRg2æ of the 64-mer
tethered proteins is compared with that in the bulk. The ÆRg2æ of
tethered proteins shows a sharp increase at the temperaturewhere themaximum in adhesion energy is observed (T*= 0.35),indicating that the proteins unfold at that temperature. Thisbehavior of ÆRg
2æ of tethered proteins shows that they are lessstable than those in the bulk, as observed in laboratory experi-ments.
The simulation result can be understood as follows. At lowtemperatures, the proteins maintain their globular structure anddo not interact with the hydrophobic probe surface. As thetemperature is increased, the proteins unfold and start interact-ing with the hydrophobic probe surface leading to a jump inadhesion energy. On further increase in temperature the proteinslose some hydrophobic contacts with the hydrophobic surface togain entropy and also the interprotein interactions increasewhen the proteins unfold. While our simulations qualitativelycapture the experimental trends, they are quantitatively inaccu-rate. Two possible reasons include: First, the simulations mea-sured the equilibrium number of hydrophobic monomer-surface contacts and use this quantity as a surrogate for the
Figure 5. Unfolding of surface-tethered LYS for (a) chemical and(b) thermal denaturation (Figures 3b and 4b) are included here tohelp align the new data in panels c-f with the master unfoldingcurves (a, b). The results for the control experiments are shown inpanels c and d for chemical and thermal denaturation, respectively.(c) Step 1: After grafting, the LYS-tethered coverslip (sample) wassoaked in PBS buffer for 12 h at 4 �C and adhesion was measured(solid); Step 2: Sample was again soaked in PBS buffer for 12 h at4 �C and adhesion was again measured (striped); Step 3: Samplewere soaked in 4MGuHCl for 12 h at 4 �C, and the adhesion wasmeasured (checkered). (d) Step 1: After grafting, adhesion wasmeasured at 22 �C (solid); Step 2: Sample was again soaked in PBSbuffer for 12 h at 4 �C, and adhesionwas againmeasured (striped);Step 3: Sample was exposed to 72 �C for 30 min, and the adhesionwas measured (checkered). (e) Step 1: After grafting, the swatchwas soaked in 6 M GuHCl for 12 h at 4 �C, and adhesion wasmeasured (solid); Step 2: Sample was soaked in PBS buffer tofacilitate refolding of LYS for 12 h at 4 �C, and adhesion wasmeasured (striped); Step 3: Sample was soaked in 4 M GuHClfor 12 h at 4 �C, and the adhesion was measured (checkered).(f) Step 1: After grafting, the sample was exposed to 90 �C for30 min, and adhesion was measured (solid); Step 2: Sample wassoaked in PBS buffer to facilitate refolding of LYS for 12 h at 4 �C,and adhesion was then measured (striped); Step 3: Sample wasagain exposed to 72 �C for 30min, and the adhesionwasmeasured(checkered).
DOI: 10.1021/la803771dLangmuir 2009, 25(9), 4998–5005 5003
ArticleAnand et al.

adhesion energy or the thermodynamic work of adhesion.Previous work in polymer adhesion has similarly shown thatthe thermodynamic work of adhesion underestimates the ex-perimentally measured work of adhesion by orders of magni-tude, with this difference being attributed to viscoelasticeffects.23 Since such viscoelastic effects are probably onlyrelevant when the chains are unfolded, this, could potentiallyexplain the discrepancy observed at high temperature. Second,our implicit solvent models, which do not account for water,thus, miss any changes in the magnitude of the hydrophobiceffect with temperature. Since these aspects may be expected toplay a large role at higher temperature, again, this might helprationalize the temperature discrepancy at high values. A relateddiscrepancy is that our model proteins do not undergo inter-molecular association, as has been deduced from the experi-ments. Preliminary results obtained by us, indeed suggest that
the peak in adhesion energy becomes sharper for longer chains.This result also could help resolve the differences between theexperiments and the simulations. Regardless of these differencesthis simple theory accounts qualitatively for the peak that isobserved in the experiments.
We have covered a larger parameter space in the simulationsthan that described above to explain the experimental results,but none of them have given a very satisfactory explanation.Wehave briefly discussed these in the appendix to the paper.
Conclusions
Proteins fold differently when in free solution and whenconfined by an external barrier.24 The folding and unfoldingbehavior of proteins confined in small volumes such as in thechaperone cavity25 the ribosome tunnel,26 on in polymeric poresduring synthetic membrane filtration27 is of great interest. Here,we are concerned with protein unfolding when confined to a flatsurface through tethering. Globular protein molecules havepredominantly hydrophobic residues within their core. As theGuHCl concentration increased to ∼4 M or the temperatureapproached ∼72 �C in separate denaturation studies, both LYSandRNaseA started to unfold. Possibly, their inner hydrophobiccore became exposed to the approaching hydrophobic AFM tip(CH3-SAM). The sudden jump in adhesion energy at these criticalconditions was likely due to the strong hydrophobic interactionbetween the hydrophobic probe and the increasingly exposedhydrophobic protein core. It appears that when tethered-globularprotein molecules started to unfold on the surface, individualhydrophobic moieties became accessible to the hydrophobicAFM cantilever tip and to nearest neighbors. This inducedattraction due to hydrophobic interactions and resulted in a jumpin the adhesion energy between the probe and the tetheredproteins. As this process proceeded with greater exposure ofhydrophobic residues with increasing denaturant (GuHCl) ortemperature, proximal tethered proteins began to associate re-sulting in a decrease in exposure of hydrophobic residues to thesolvent. This resulted in a lowering of the adhesion force with theCH3-SAM probe as observed here (Figures 3b,d and 4b,d). Boththe unfolding irreversibility and the dilution experiments stronglysupported the “interaction-between-neighbors” hypothesis dur-ing denaturation.
We demonstrated that MMFS using AFM is a direct methodto monitor unfolding of proteins tethered to solid substrates.When the denaturant concentration or temperature was raisedabove 4 M and∼72 �C, respectively, LYS quickly lost its tertiarystructure, inducing protein-protein association through hydro-phobic interactions and solvent exclusion.
MC simulations to study the dependence of thermodynamicwork of adhesion on temperature of tethered proteins on ahydrophobic AFM tip qualitatively agree with the results of theexperiments. The simulations showed amaximum in the adhesionenergy at a temperaturewhen the proteins unfolded, but theymissthe viscoelastic effects and the influence of water. The adhesionenergy measured in the simulations was the interaction energy oftethered proteins with a flat hydrophobic surface, similar to the
Figure 6. Adhesion energy in reduced units for different proteinlengths as determined using MC simulations. 0 represents the64-mer protein,O represents the 124-mer protein, and3 representsthe 248-mer protein.
Figure 7. A comparison of radius of gyration squared, ÆRg2æ, of
64-mer protein when tethered, O and when in bulk, 0.
(23) Baljon, A. R. C.; Robbins, M. O. Science 1996, 271(5248), 482–484.
(24) Mittal, J; Best, R. B. Proc. Natl. Acad. Sci. U.S.A. 2008, 105(51),20233–20238.
(25) Chan, H. S.; Dill, K. A. Proteins 1996, 24(3), 345–351.(26) Nissen, P; Hansen, J; Ban, N; Moore, P. B.; Steitz, T. A. Science 2000, 289
(5481), 920–930.(27) Belfort G, Zydney, A. L. Interactions of proteins with polymeric synthetic
membranes. In Biopolymers at Interfaces, 2nd ed.; Malmsten, M, Ed.; MarcelDekker, Inc: New York, 2003.
DOI: 10.1021/la803771d Langmuir 2009, 25(9),4998–50055004
Article Anand et al.

interaction energy measured between the hydrophobic SAM andthe tethered proteins in the experiments.
Acknowledgment. We acknowledge the support of U.S.Department of Energy, DOE (DE-FG02-90ER14114 andDOEDE-FG02-07ER46429) and theNational Science Founda-tion (Grant No. CTS-94-00610). We thank Amit K. Dutta
(Rensselaer Polytechnic Institute) for useful suggestions andcritical discussions.
Supporting Information Available: Raw data, adhesionmeasurements of LYS on a surface with reduced surfacedensity, and additional simulations. This material is avail-able free of charge via the Internet at http://pubs.acs.org.
DOI: 10.1021/la803771dLangmuir 2009, 25(9), 4998–5005 5005
ArticleAnand et al.