SR User Guide - Trustwave Support
440
M86 Security Reporter USER GUIDE Software Version: 3.1.0 Document Version: 04.01.11
-
Upload
khangminh22 -
Category
Documents
-
view
1 -
download
0
Transcript of SR User Guide - Trustwave Support
M86 Security Reporter
USER GUIDESoftware Version: 3.1.0
Document Version: 04.01.11
II
M86 SECURITY REPORTER USER GUIDE
© 2011 M86 SecurityAll rights reserved.
Version 1.01, published April 1, 2011
Printed in the United States of America
This document may not, in whole or in part, be copied, photo-copied, reproduced, translated, or reduced to any electronic medium or machine readable form without prior written con-sent from M86 Security.
Every effort has been made to ensure the accuracy of this document. However, M86 Security makes no warranties with respect to this documentation and disclaims any implied war-ranties of merchantability and fitness for a particular purpose. M86 Security shall not be liable for any error or for incidental or consequential damages in connection with the furnishing, performance, or use of this manual or the examples herein. Due to future enhancements and modifications of this product, the information described in this documentation is subject to change without notice.
The latest version of this document can be obtained from http://www.m86security.com/support/sr/documentation.asp
Trademarks
Other product names mentioned in this manual may be trade-marks or registered trademarks of their respective companies and are the sole property of their respective manufacturers.
Part# SR.3.1-UG_v1.01-1104
M86 SECURITY USER GUIDE
CONTENTSINTRODUCTORY SECTION .................................................. 1
Security Reporter ........................................................................1
About this User Guide ................................................................2
How to Use this User Guide .......................................................4Conventions ...................................................................................... 4Terminology ...................................................................................... 5
Overview ....................................................................................10
Components and Environment ................................................11Components .................................................................................... 11
Hardware .................................................................................. 11Software ................................................................................... 11
Environment .................................................................................... 12Network Requirements ............................................................. 12Administrator Workstation Requirements ................................. 12End User Workstation Requirements ....................................... 13
Getting Started ..........................................................................14Initial Setup ..................................................................................... 14Procedures for Logging In, Out ....................................................... 15
Log In ........................................................................................ 15Re-login............................................................................... 18Expired Passwords ............................................................ 19Forgot Your Password ....................................................... 20Single Sign-On Access ...................................................... 22
Default Usernames and Passwords ............................. 22User Interface Navigation . ........................................................ 23
Links in the Report Manager Navigation Toolbar................ 23Navigation Tips and Conventions ................................. 24Wildcard Searches........................................................ 26
Links in the System Configuration Navigation Toolbar ....... 26Log Out ..................................................................................... 27
Technical Support / Product Warranties ......................................... 28
M86 SECURITY USER GUIDE iii

CONTENTS
iv
SYSTEM CONFIGURATION SECTION .................................. 29
Introduction ...............................................................................29
Chapter 1: Access System Configuration ..............................30
Chapter 2: Configuring the Server ..........................................31Network Menu ................................................................................. 31
Box Mode screen ...................................................................... 32Live Mode............................................................................ 32Archive Mode ..................................................................... 33Change the Box Mode ........................................................ 33
Locked-out Accounts and IPs screen ....................................... 34View Locked Accounts, IP addresses ................................. 35Unlock Accounts, IP addresses .......................................... 35
Network Settings screen ........................................................... 36Set up/Edit IP Addresses ................................................... 37
Routing Table screen . .............................................................. 38View a List of Routers ......................................................... 38Add a Router ...................................................................... 39Delete a Router ................................................................... 39
Regional Setting screen . .......................................................... 40Specify the Time Zone ....................................................... 41Specify the Language Set ................................................... 41Specify Network Time Protocol Servers.............................. 41
Network Diagnostics screen . .................................................... 43Ping .................................................................................... 44Trace Route ........................................................................ 45
SNMP screen . .......................................................................... 47Enable SNMP ..................................................................... 48Set up Community Token for Public Access ....................... 48Create, Build the Access Control List.................................. 48Maintain the Access Control List......................................... 48
Server Menu .................................................................................... 49Backup screen . ......................................................................... 50
Backup and Recovery Procedures ..................................... 51Set up/Edit External Backup FTP Password....................... 52Execute a Manual Backup .................................................. 52Perform a Remote Backup.................................................. 53Perform a Restoration to the SR Server ............................. 54
Self Monitoring screen . ............................................................. 55
M86 SECURITY USER GUIDE
CONTENTS
View a List of Contact E-Mail Addresses ........................... 56Set up and Activate Self-Monitoring.................................... 56Remove Recipient from E-mail Notification List .................. 56Deactivate Self-Monitoring .................................................. 56
SMTP Server Setting screen . ................................................... 57Enter, Edit SMTP Server Settings....................................... 57Verify SMTP Settings .......................................................... 58
Server Status screen ................................................................ 59View the Status of the SR Server ....................................... 60
Secure Access screen . ............................................................. 61Activate a Port to Access the SR Server............................. 61Terminate a Port Connection .............................................. 62Terminate All Port Connections .......................................... 62
Software Update screen . .......................................................... 63View Software Update Criteria ............................................ 64
View Installed Software Updates .................................. 64View Available Software Updates................................. 64
Install a Software Update ................................................... 65General Software Installation Procedures .................... 65First Time LA/Beta Software Install Procedures ........... 68The steps in this sub-section pertain to the first accep-
tance and installation of Limited Availability or Beta software updates. .............. 68Uninstall the Most Recently Applied Update ....................... 70Download Available Updates .............................................. 70View Software Download Log ............................................. 71View Software Installation Log ............................................ 71
Software Update Setting screen . .............................................. 73Specify Proxy Settings ....................................................... 74Download LA, Beta Software Updates................................ 74
Enable LA Software Downloads ................................... 74Enable Beta Software Downloads ................................ 75
Save Settings ...................................................................... 75Shut Down screen . ................................................................... 76
Server Action Selections ..................................................... 76Perform a Server Action...................................................... 77
Report Manager screen . ........................................................... 78Restart the Report Manager................................................ 78Enable/Disable the Report Manager Scheduler ................. 79
Hardware Failure Detection screen . ......................................... 80View the Status of the Hard Drives ..................................... 81
Database Menu ............................................................................... 83
M86 SECURITY USER GUIDE v
CONTENTS
vi
User Name Identification screen ......................................... 83View the User Name Identification screen ......................... 86Configure the Server to Log User Activity ........................... 86
Page View Elapsed Time screen .............................................. 87Establish the Unit of Elapsed Time for Page Views ............ 87Elapsed Time Rules ........................................................... 88
Page Definition screen . ............................................................ 89View the Current Page Types ............................................. 89Remove a Page Type ........................................................ 90Add a Page Type ................................................................ 90
Tools screen . ............................................................................ 91View Diagnostic Reports .................................................... 92View Database Status Logs ................................................ 92Generate Technical Support Report Package .................... 94
Expiration screen . ..................................................................... 95Expiration Rules .................................................................. 96View Data Storage Statistics .............................................. 97
Optional Features screen ......................................................... 98Enable Search String Reporting ....................................... 100Enable Block Request Count ............................................ 100Enable Blocked Searched Keywords ................................ 100Enable Time Usage reports .............................................. 101Enable Page and/or Object Count .................................... 101Enable, Configure Password Security Option ................... 102
User Group Import screen . ..................................................... 105Import User Groups .......................................................... 106
REPORT MANAGER ADMINISTRATION SECTION .............. 107
Introduction ............................................................................. 107
Chapter 1: Group, Profile Management ................................ 109User Groups panel ........................................................................ 109
View User Group Information . ................................................ 111User group status key ....................................................... 111View a list of members in a user group ............................. 111
Add a User Group ................................................................... 113Patterns frame................................................................... 114
Add a new pattern....................................................... 114View users resolved by the pattern............................. 115Remove a pattern ....................................................... 115
M86 SECURITY USER GUIDE
CONTENTS
IP Ranges frame ............................................................... 116Specify an IP range .................................................... 117Remove an IP address range ..................................... 118
Single Users/Exclude frame ............................................. 119Add one or more individual users ............................... 120Remove users from the Add tab ................................. 121
Edit a User Group . .................................................................. 122Rebuild the User Group . ......................................................... 123Delete a User Group ............................................................... 123
Admin Groups panel ..................................................................... 124Add a Group ........................................................................... 125View, Edit an Admin Group’s Permissions . ............................ 127
View Admin Group settings............................................... 127Edit Admin Group settings ............................................... 128
Delete an Administrator Group ............................................... 128Admin Profiles panel ..................................................................... 129
Add an Administrator Profile . .................................................. 131View, Edit Admin Detail . ......................................................... 134
View Admin Details ........................................................... 134Edit Account Info ............................................................... 135
Delete Admin .......................................................................... 136
Chapter 2: Database Management ........................................ 137HTTPS Configuration panel .......................................................... 137
Generate a Self-Signed Certificate for the SR ........................ 138Create, Upload a Third Party Certificate ................................. 139
Step A: Create a CSR ....................................................... 139Step B: Download the CSR, Submit to Agency................. 140Step C: Upload the Signed SSL Certificate to SR ............ 141
Download, Delete a Third Party Certificate ............................. 142Download the SSL Certificate ........................................... 142Delete the SSL Certificate................................................. 142
User Profiles panel ........................................................................ 143Search the User Database ..................................................... 144
View End User Activity ...................................................... 144Activity View panel ........................................................................ 145
Perform a Search on a Specified Activity ............................... 145Search results ................................................................... 147
Device Registry panel ................................................................... 148Removing/adding Web Filter, SWG devices ........................... 150Web Filter Device Maintenance .............................................. 151
M86 SECURITY USER GUIDE vii
CONTENTS
viii
Add a Web Filter to the device registry ............................. 151View, edit Web Filter device criteria .................................. 151Delete a Web Filter from the device registry ..................... 152
Security Reporter Maintenance .............................................. 153View SR device criteria ..................................................... 153Add, remove a bandwidth range ....................................... 154
View Other Device Criteria ..................................................... 154View SMTP device criteria ................................................ 154View Patch Server device criteria ..................................... 155View Proxy Server device criteria ..................................... 155View NTP Server device criteria ....................................... 156
Refresh Settings ..................................................................... 156SWG Policy Server Device Maintenance ............................... 157
Add the first Policy Server to the device registry............... 157Add another Policy Server to the device registry .............. 158Edit Policy Server criteria, change password.................... 159Delete a Policy Server from the device registry ............... 161
LDAP Server Device Management ......................................... 161Add an LDAP Server to the device registry....................... 161Import LDAP Group profiles ............................................. 163View, edit LDAP Server device criteria ............................. 163Delete an LDAP Server from the device registry .............. 164
Database Processes List panel ..................................................... 165View Details on a Process . ..................................................... 166Terminate a Process .............................................................. 166
Server Information panel ............................................................... 167Mode ....................................................................................... 168
Registered Mode and Evaluation Mode ............................ 168Date Scopes . .......................................................................... 169Report Manager Startup Time ................................................ 169Server Info .............................................................................. 169Server Activity ......................................................................... 170Expiration Info ......................................................................... 174
Reset to Factory Defaults panel .................................................... 175Reset to Factory Default Settings frame ................................. 176Wizard panel ........................................................................... 177
Main Administrator ............................................................ 177Bandwidth Range and Web Filter Setup ........................... 178SWG Setup ....................................................................... 179Save Entries ..................................................................... 180
M86 SECURITY USER GUIDE

CONTENTS
Chapter 3: Report Configuration ........................................... 181Default Report Settings panel ....................................................... 181
Set New Defaults . ................................................................... 182Custom Category Groups panel .................................................... 184
Add a Custom Category Group . ............................................. 185Modify a Custom Category Group . ......................................... 186Delete a Category Group ........................................................ 186
PRODUCTIVITY REPORTS SECTION ................................. 187
Introduction ............................................................................. 187
Chapter 1: A High Level Overview ......................................... 188Dashboard ..................................................................................... 188Summary Reports ......................................................................... 190
Summary Report types ........................................................... 191Modify the Summary Report view ........................................... 193Download, Export a Summary Report . ................................... 194
PDF format........................................................................ 194Download the report in the PDF format ...................... 194
CSV format ....................................................................... 196Download the report in the CSV format ...................... 196
PNG format ....................................................................... 197Download the report in the PNG format...................... 197
Sample Reports ............................................................................ 198Sample Report types . ............................................................. 199View, Export a Sample Report . .............................................. 200
View Sample Report contents........................................... 200Export the Sample Report................................................. 201
PDF file window.......................................................... 201PDF opened in browser tab ........................................ 201
Chapter 2: Drill Down Reports ...............................................202Generate a Drill Down Report ....................................................... 203Summary Drill Down Report View ................................................. 204
Summary Report View Tools and Tips ................................... 205Report Type tabs............................................................... 205Summary Drill Down Report Settings menu...................... 205Report view option icons ................................................... 205Count columns and links ................................................... 206Bandwidth and Time columns ........................................... 208
M86 SECURITY USER GUIDE ix
CONTENTS
x
Column sorting tips .......................................................... 209Summary Drill Down Record exportation .......................... 209Other navigation tips ......................................................... 209
Detail Drill Down Report View ....................................................... 210Detail Report View Tools and Tips . ........................................ 211
Report Type tabs............................................................... 211Detail Drill Down Report Settings menu............................ 211Page/Object Detail columns.............................................. 211Column sorting tips ........................................................... 213Page/Object viewing tip..................................................... 213Truncated data viewing tip ................................................ 213Detail Drill Down Record exportation ............................... 214Other navigation tips ......................................................... 214
Report View Navigation and Usage .............................................. 215Navigation Tips ....................................................................... 215
Report view breadcrumb trail links .................................... 215Page navigation ................................................................ 215
Usage Tools . .......................................................................... 216Report Settings menu options........................................... 216
Modify a report via the Run option.............................. 217Save report option ...................................................... 218Limit Detail Result option ............................................ 221
Export records option ....................................................... 222Report View Components ............................................................. 224
Report Fields and Usage ........................................................ 224Type field........................................................................... 224Date Scope and date fields .............................................. 225# Records fields ............................................................... 227Filter and Filter String fields .............................................. 227Sort By fields ..................................................................... 227Limit Detail Results fields .................................................. 228Group By field .................................................................. 229Format field ....................................................................... 229Data to Export field............................................................ 229For additional-break reports only ..................................... 230
# Records field............................................................ 230Sort By field ................................................................ 230
For pie and bar charts only .............................................. 231Generate Using field ................................................... 231
Output type field ................................................................ 231Hide un-Identified IPs checkbox........................................ 231
M86 SECURITY USER GUIDE
CONTENTS
E-Mail / For e-mail output only fields................................. 232Detailed Info fields ............................................................ 233
Export a Productivity Report ......................................................... 235View and Print Options .................................................................. 236
View and Print Tools ............................................................... 236Sample Report File Formats ................................................... 237
MS-DOS Text ................................................................... 238PDF ................................................................................... 238Rich Text Format .............................................................. 239HTML ............................................................................... 240Comma-Delimited Text ..................................................... 240Excel (English) ................................................................. 241
Chapter 3: Customize, Maintain Reports .............................. 242Report Wizard ............................................................................... 242
Step A: Select the Report Option . .......................................... 243Step B: Specify the Report Type . ........................................... 244
Summary report ................................................................ 244Detail report....................................................................... 244
Step C: Specify Filters ............................................................ 244Step D: Specify Other Report Components ............................ 246Step E: Specify when to Generate the Report ........................ 247Step F: Save Report panel ..................................................... 248
Saved Reports .............................................................................. 252Edit a Report ........................................................................... 253
Edit a Drill Down Report.................................................... 253Edit a Security Report ...................................................... 254
Copy a Saved Report . ............................................................ 255Run a Saved Report ............................................................... 256Delete a Report . ..................................................................... 257
Report Schedule ........................................................................... 258View Details for a Scheduled Report Run Event .................... 259Edit a Scheduled Report Run Event ....................................... 260Add a Report Run Event to the Schedule ............................... 261Delete a Scheduled Report Run Event ................................... 262
Chapter 4: Specialized Reports ............................................. 263Executive Internet Usage Summary .............................................. 263
View, Edit Report Settings . ..................................................... 264Add a New Report . ................................................................. 265Sample Executive Internet Usage report ................................ 267
M86 SECURITY USER GUIDE xi
CONTENTS
xii
Blocked Request Reports ............................................................. 272Generate a Blocked Request Report ...................................... 273View the Blocked Request Report . ......................................... 275
Time Usage Reports ..................................................................... 276Generate a Time Usage Report . ............................................ 277View the Time Usage Report .................................................. 279Time Usage algorithm . ........................................................... 280
REAL TIME REPORTS SECTION ...................................... 281
Introduction ............................................................................. 281
Chapter 1: Gauge Components ............................................. 282Types of Gauges ........................................................................... 282
URL gauges ............................................................................ 282Bandwidth gauges . ................................................................. 283
Anatomy of a Gauge ..................................................................... 284How to Read a Gauge ................................................................... 285Bandwidth Gauge Components .................................................... 286Gauge Usage Shortcuts ................................................................ 288
Chapter 2: Custom Gauge Setup, Usage .............................. 290Add a Gauge ................................................................................. 292
Specify Gauge Information . .................................................... 293Define Gauge Components .................................................... 294Assign user groups ................................................................. 295Save gauge settings ............................................................... 296
Modify a Gauge ............................................................................. 297Edit gauge settings ................................................................. 297
Hide, Disable, Delete, Rearrange Gauges .................................... 299Hide a gauge . ......................................................................... 301Disable a gauge ...................................................................... 301Show a gauge ......................................................................... 301Rearrange the gauge display in the dashboard ...................... 301Delete a gauge ....................................................................... 302
View End User Gauge Activity ...................................................... 303View Overall Ranking ............................................................. 303View a Gauge Ranking table .................................................. 304
Monitor, Restrict End User Activity ................................................ 306View User Summary data ....................................................... 306Access the Category View User panel ................................... 307
M86 SECURITY USER GUIDE
CONTENTS
URL Gauges tab selection ................................................ 307Bandwidth Gauges tab selection ...................................... 309
Manually lock out an end user . ............................................... 310Low severity lockout.......................................................... 311Medium and High severity lockout ................................... 312End user workstation lockout ............................................ 312
Low severity URL, medium URL/bandwidth lockout... 312High severity URL, low/high bandwidth lockout.......... 313
Chapter 3: Alerts, Lockout Management .............................. 314Add an Alert .................................................................................. 316
Email alert function ................................................................. 317Configure email alerts ....................................................... 317Receive email alerts.......................................................... 318
System Tray alert function ...................................................... 318Lockout function . .................................................................... 319
View, Modify, Delete an Alert ........................................................ 320View alert settings . ................................................................. 321Modify an alert . ....................................................................... 322Delete an alert ........................................................................ 323
View the Alert Log ......................................................................... 324Manage the Lockout List ............................................................... 326
View a specified time period of lockouts ................................. 327Unlock workstations ................................................................ 328Access User Summary details ................................................ 328
Chapter 4: Analyze Usage Trends ......................................... 329View Trend Charts ........................................................................ 330
View activity for an individual gauge ....................................... 330View overall URL or bandwidth gauge activity ........................ 332Navigate a trend chart ............................................................ 333
View gauge activity for a different time period .................. 333Analyze gauge activity in a pie chart................................. 334Analyze gauge activity in a line chart ................................ 334View In/Outbound bandwidth gauge activity ..................... 336Print a trend chart from an IE browser window ................. 336
Chapter 5: Identify Users, Categories ................................... 337Perform a Custom Search ............................................................. 337
Specify Search Criteria . .......................................................... 338View URLs within the accessed category ........................ 340
M86 SECURITY USER GUIDE xiii
CONTENTS
xiv
SECURITY REPORTS SECTION ....................................... 341
Introduction ............................................................................. 341
Chapter 1: Security Reports ................................................... 342Security Report Format ................................................................. 343Security Report Types ................................................................... 345
Blocked Viruses report view ................................................... 345Security Policy Violations report view ..................................... 345Traffic Analysis report view ..................................................... 346Rule Transactions report view . ............................................... 347
Drill Down into a Security Report .................................................. 348Security Report Tools .................................................................... 349
Security Report Type tabs ...................................................... 349Report Settings menu ............................................................. 349Report view icons ................................................................... 349Security Report Exportation .................................................... 351Navigating Pages of Records ................................................. 351Detail Report Column visibility . ............................................... 352
Security Report Tips ...................................................................... 353Breadcrumb trail ..................................................................... 353Column sorting tips ................................................................. 353URL viewing tip ....................................................................... 353
Report Settings Options ................................................................ 354Run a Security Report ............................................................ 354Save a Security Report ........................................................... 357Schedule a Security Report to Run ........................................ 360
Export a Security Report ............................................................... 362Security Report Format ................................................................. 364
Chapter 2: Security Report Wizard ........................................ 366Create a Custom Security Report ................................................. 366
Specify Report Details ............................................................ 366Select Users ........................................................................... 367Specify Email Settings ............................................................ 369
Schedule, Run a Report using the Wizard .................................... 370
APPENDICES SECTION ................................................... 371
Appendix A .............................................................................. 371Disable Pop-up Blocking Software ................................................ 371
M86 SECURITY USER GUIDE

CONTENTS
Browser Pop-up Blockers ....................................................... 371Internet Explorer 7.0 and 8.0............................................. 371Mozilla Firefox 3.6 ............................................................ 372Google Chrome 9.0........................................................... 372Safari 4.0 and 5.0.............................................................. 372
Yahoo! Toolbar Pop-up Blocker . ............................................ 373Add the Client to the White List......................................... 373
Google Toolbar Pop-up Blocker . ............................................ 375Add the Client to the White List......................................... 375
AdwareSafe Pop-up Blocker . ................................................. 376Disable Pop-up Blocking ................................................... 376
Mozilla Firefox Pop-up Blocker . .............................................. 377Add the Client to the White List......................................... 377
Windows XP SP2 Pop-up Blocker . ......................................... 379Set up Pop-up Blocking..................................................... 379
Use the Internet Options dialog box ........................... 379Use the IE Toolbar...................................................... 380
Add the Client to the White List ........................................ 381Use the IE Toolbar...................................................... 381Use the Information Bar.............................................. 381
Appendix B .............................................................................. 383RAID and Hardware Maintenance ................................................ 383
Part 1: Hardware Components ............................................... 383Part 2: Server Interface . ......................................................... 384
Front Control Panel on a 300 model ................................. 384Front control panels on 500, 700, and 730 models........... 384Rear panel on 700 and 730 models ................................. 387
Part 3: Troubleshooting . ......................................................... 388Hard drive failure............................................................... 388
Step 1: Review the notification email.......................... 388Step 2: Verify the failed drive in the Admin console ... 388Step 3: Replace the failed hard drive.......................... 391Step 4: Rebuild the hard drive .................................... 392Step 5: Contact Technical Support ............................. 392
Power supply failure.......................................................... 392Step 1: Verify the power supply has failed.................. 392Step 2: Contact Technical Support ............................. 393Step 3: Unplug the power cord ................................... 393Step 4: Replace a failed hot swap power supply ........ 393
Fan failure ......................................................................... 394
M86 SECURITY USER GUIDE xv
CONTENTS
xvi
Identify a fan failure .................................................... 394
Appendix C .............................................................................. 395Evaluation Mode ........................................................................... 395
Report Manager Banner ......................................................... 395System Configuration Console ............................................... 396
Use the Server in the Evaluation Mode ............................ 397Expiration screen ........................................................ 397
Change the Evaluation Mode............................................ 398Activation Page........................................................... 399
Appendix D .............................................................................. 400System Tray Alerts: Setup, Usage ................................................ 400
LDAP server configuration ...................................................... 400Create the System Tray logon script................................. 400Assign System Tray logon script to administrators ........... 404
Administrator usage of System Tray ....................................... 406Use the System Tray Alert icon’s menu ............................ 406Status of the System Tray Alert icon................................. 407View System Tray alert messages.................................... 408
Appendix E .............................................................................. 409Glossary ........................................................................................ 409
INDEX ........................................................................... 413
M86 SECURITY USER GUIDE
INTRODUCTORY SECTION SECURITY REPORTER
INTRODUCTORY SECTION
Security ReporterThe Security Reporter (SR) from M86 Security consists of the best in breed of M86 Professional Edition reporting soft-ware consolidated into one application, with the capability to generate productivity reports of end user Internet activity from M86 Web Filter and/or M86 Secure Web Gateway (SWG) appliance(s), and security reports from SWG policy servers.
Logs of end user Internet activity from Web Filters and/or SWGs are fed into SR, giving you an overall picture of end user productivity in a bar chart dashboard, and the ability to interrogate massive datasets through flexible drill-down technology, until the desired view is obtained. This “view” can be memorized and saved to a user-defined report menu for repetitive, scheduled execution and distribution.
Web Filter logs provide content for dynamic, real time graphical snapshots of network Internet traffic. Drilling down into the URL categories or bandwidth gauges dashboard quickly identifies the source of user-generated Web threats. SWG logs provide content for bar charts detecting security threats on the network so that prompt action can be taken to terminate them before they become a liability on your network.
Using the SR, threats to your network are readily targeted, thus arming you with the capability to take immediate action to halt the source, secure your network, and protect your organization against lost productivity, network bandwidth issues, and possible legal problems that can result from the misuse of Internet and intranet resources.
M86 SECURITY USER GUIDE 1
INTRODUCTORY SECTION ABOUT THIS USER GUIDE
2
About this User GuideThe Security Reporter User Guide primarily addresses the network administrator designated to configure and manage the Security Reporter application on the network. This administrator is referred to as the “global administrator” throughout this user guide. In part, this user guide also addresses administrators who manage user groups on the network. These administrators are referred to as “group administrators” throughout this user guide. Additional infor-mation is provided for administrators of networks that use the SR with M86’s Web Filter or M86’s Secure Web Gateway (SWG) to obtain logs from these appliances for generating productivity reports and real time or security reports.
NOTE: See the M86 Web Filter User Guide at http://www.m86security.com/support/wf/documentation.asp for information on the Web Filter. See the M86 Secure Web Gateway User Guide at http://www.m86security.com/support/Secure-Web-Gateway/Documentation.asp for information on the SWG.
This User Guide is organized into the following sections:
• Introductory Section - This section introduces the SR product, explains how to access and use the SR and this user guide, and provides information on how to contact M86 Security technical support.
• System Configuration Section - This section pertains to information on configuring and maintaining the admin-istrator console of the SR application.
• Report Manager Administration Section - This section pertains to configuring and maintaining the administra-tion side of the SR’s Report Manager application.
• Productivity Reports Section - Refer to this section for reporting information if using log feeds from a Web Filter and/or Secure Web Gateway to generate productivity reports.
M86 SECURITY USER GUIDE

INTRODUCTORY SECTION ABOUT THIS USER GUIDE
• Real Time Reports Section - Refer to this section for real time report configuration and usage, if using a Web Filter appliance with the SR.
• Security Reports Section - Refer to this section for security report configuration and usage, if using a Secure Web Gateway appliance with the SR.
• Appendices - Appendix A of this section explains how to disable pop-up blocking software. Appendix B provides information on how to perform hardware maintenance and troubleshoot RAID on the SR chassis. Appendix C explains how to use the SR in the evaluation mode, and how to switch to the registered mode. Appendix D provides details on setting up and using the System Tray feature for real time gauge alerts. Appendix E features a glossary of technical terminology used in this user guide.
• Index - This section includes an index of subjects and the first page numbers where they appear in this user guide.
M86 SECURITY USER GUIDE 3
INTRODUCTORY SECTION HOW TO USE THIS USER GUIDE
4
How to Use this User Guide
ConventionsThe following icons are used throughout this user guide:
NOTE: The “note” icon is followed by italicized text providing additional information about the current topic.
TIP: The “tip” icon is followed by italicized text giving you hints on how to execute a task more efficiently.
WARNING: The “warning” icon is followed by italicized text cautioning you about making entries in the application, executing certain processes or procedures, or the outcome of specified actions.
IMPORTANT: The "important" icon is followed by italicized text informing you about important information or procedures to follow to ensure maximum uptime on the SR application.
M86 SECURITY USER GUIDE
INTRODUCTORY SECTION HOW TO USE THIS USER GUIDE
TerminologyThe following terms are used throughout this user guide. Sample images (not to scale) are included for each item.
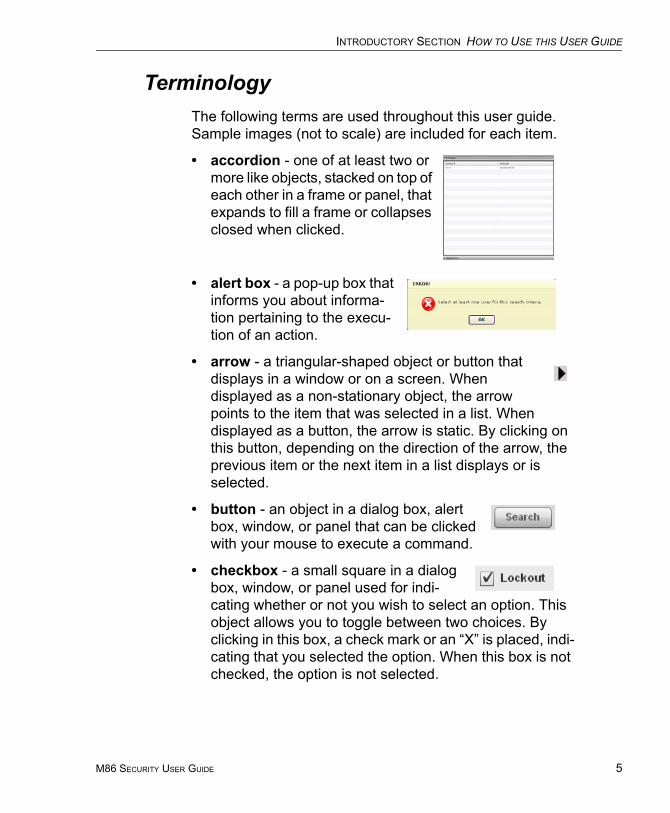
• accordion - one of at least two or more like objects, stacked on top of each other in a frame or panel, that expands to fill a frame or collapses closed when clicked.
• alert box - a pop-up box that informs you about informa-tion pertaining to the execu-tion of an action.
• arrow - a triangular-shaped object or button that displays in a window or on a screen. When displayed as a non-stationary object, the arrow points to the item that was selected in a list. When displayed as a button, the arrow is static. By clicking on this button, depending on the direction of the arrow, the previous item or the next item in a list displays or is selected.
• button - an object in a dialog box, alert box, window, or panel that can be clicked with your mouse to execute a command.
• checkbox - a small square in a dialog box, window, or panel used for indi-cating whether or not you wish to select an option. This object allows you to toggle between two choices. By clicking in this box, a check mark or an “X” is placed, indi-cating that you selected the option. When this box is not checked, the option is not selected.
M86 SECURITY USER GUIDE 5
INTRODUCTORY SECTION HOW TO USE THIS USER GUIDE
6
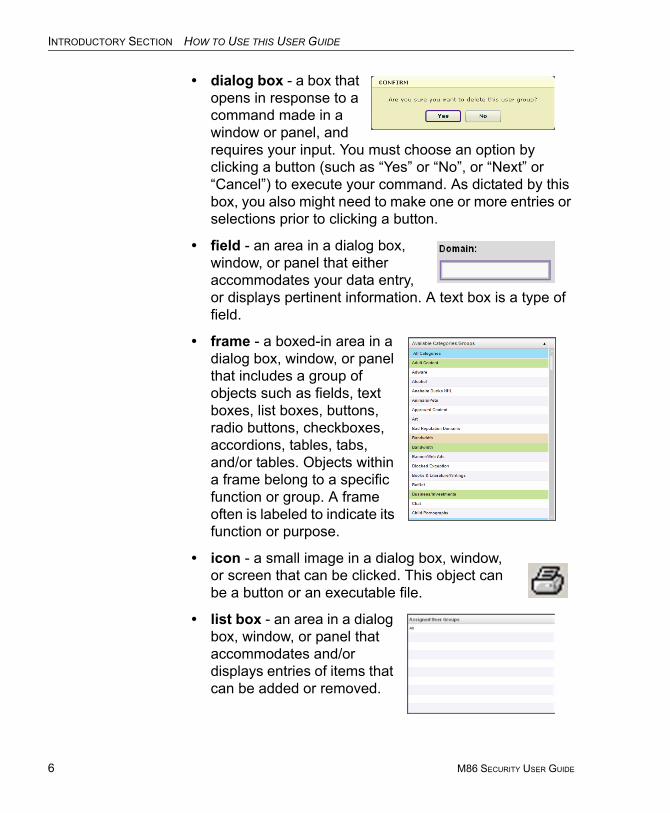
• dialog box - a box that opens in response to a command made in a window or panel, and requires your input. You must choose an option by clicking a button (such as “Yes” or “No”, or “Next” or “Cancel”) to execute your command. As dictated by this box, you also might need to make one or more entries or selections prior to clicking a button.
• field - an area in a dialog box, window, or panel that either accommodates your data entry, or displays pertinent information. A text box is a type of field.
• frame - a boxed-in area in a dialog box, window, or panel that includes a group of objects such as fields, text boxes, list boxes, buttons, radio buttons, checkboxes, accordions, tables, tabs, and/or tables. Objects within a frame belong to a specific function or group. A frame often is labeled to indicate its function or purpose.
• icon - a small image in a dialog box, window, or screen that can be clicked. This object can be a button or an executable file.
• list box - an area in a dialog box, window, or panel that accommodates and/or displays entries of items that can be added or removed.
M86 SECURITY USER GUIDE
INTRODUCTORY SECTION HOW TO USE THIS USER GUIDE
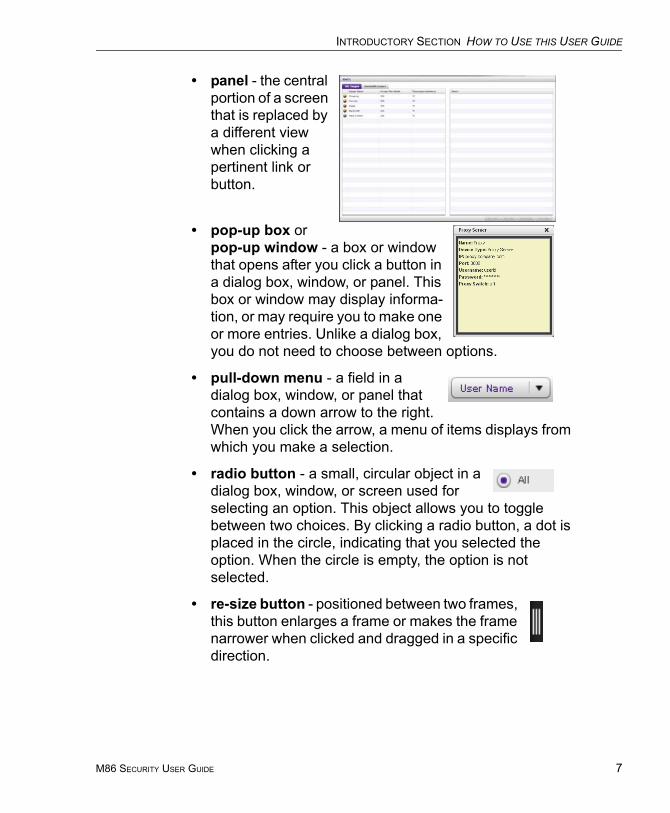
• panel - the central portion of a screen that is replaced by a different view when clicking a pertinent link or button.
• pop-up box or pop-up window - a box or window that opens after you click a button in a dialog box, window, or panel. This box or window may display informa-tion, or may require you to make one or more entries. Unlike a dialog box, you do not need to choose between options.
• pull-down menu - a field in a dialog box, window, or panel that contains a down arrow to the right. When you click the arrow, a menu of items displays from which you make a selection.
• radio button - a small, circular object in a dialog box, window, or screen used for selecting an option. This object allows you to toggle between two choices. By clicking a radio button, a dot is placed in the circle, indicating that you selected the option. When the circle is empty, the option is not selected.
• re-size button - positioned between two frames, this button enlarges a frame or makes the frame narrower when clicked and dragged in a specific direction.
M86 SECURITY USER GUIDE 7
INTRODUCTORY SECTION HOW TO USE THIS USER GUIDE
8
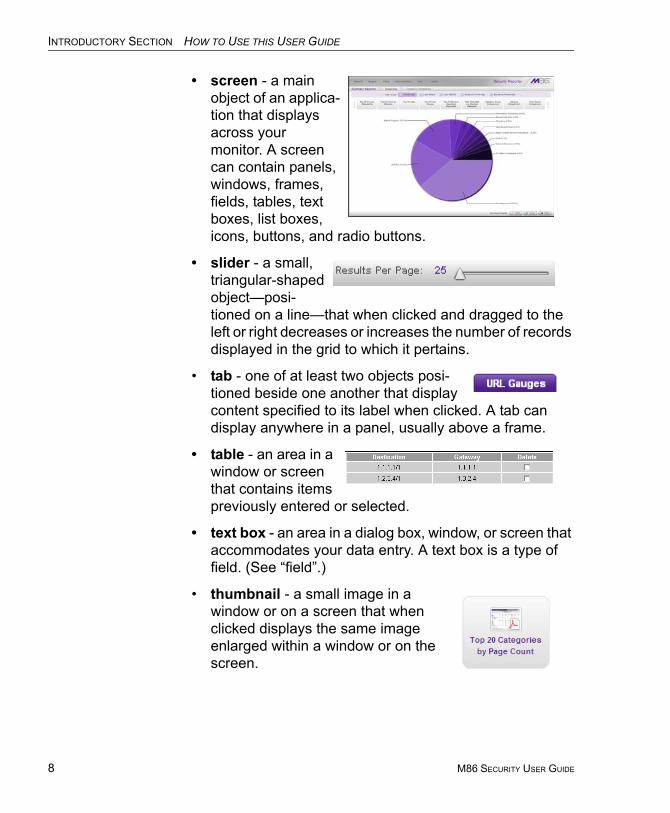
• screen - a main object of an applica-tion that displays across your monitor. A screen can contain panels, windows, frames, fields, tables, text boxes, list boxes, icons, buttons, and radio buttons.
• slider - a small, triangular-shaped object—posi-tioned on a line—that when clicked and dragged to the left or right decreases or increases the number of records displayed in the grid to which it pertains.
• tab - one of at least two objects posi-tioned beside one another that display content specified to its label when clicked. A tab can display anywhere in a panel, usually above a frame.
• table - an area in a window or screen that contains items previously entered or selected.
• text box - an area in a dialog box, window, or screen that accommodates your data entry. A text box is a type of field. (See “field”.)
• thumbnail - a small image in a window or on a screen that when clicked displays the same image enlarged within a window or on the screen.
M86 SECURITY USER GUIDE
INTRODUCTORY SECTION HOW TO USE THIS USER GUIDE
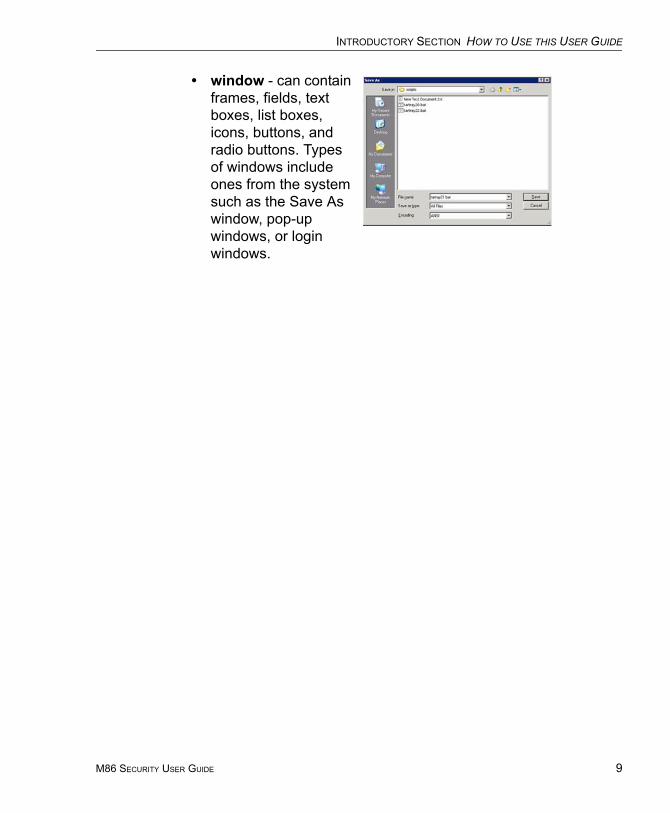
• window - can contain frames, fields, text boxes, list boxes, icons, buttons, and radio buttons. Types of windows include ones from the system such as the Save As window, pop-up windows, or login windows.
M86 SECURITY USER GUIDE 9
INTRODUCTORY SECTION OVERVIEW
10
OverviewThe Security Reporter is comprised of System Configura-tion administrator console and Report Manager application.
Using System Configuration screens, the global adminis-trator configures the SR to function on the network.
Using the Report Manager, the global administrator sets up group administrator accounts and grants these users access to designated sections in the Report Manager—and to the System Configuration console, as applicable—for managing and reporting on end user Internet and/or network activity.
M86 SECURITY USER GUIDE
INTRODUCTORY SECTION COMPONENTS AND ENVIRONMENT
Components and Environment
Components
Hardware
• High performance server equipped with RAID
• Two or four high-capacity hard drives
• Optional: One or more attached “NAS” storage devices (e.g. Ethernet connected, SCSI/Fibre Channel connected “SAN”)
NOTE: RAID is not used on an SR running as a virtual machine. The number of hard drives specified above is not applicable.
Software
• Linux OS
• Administrator Graphical User Interface (GUI) console utilized by an authorized administrator to configure and maintain the SR application
• MySQL database
M86 SECURITY USER GUIDE 11
INTRODUCTORY SECTION COMPONENTS AND ENVIRONMENT
12
Environment
Network Requirements
• Power connection protected by an Uninterruptible Power Supply (UPS)
• HTTPS connection to M86 Security’s software update server
• SR must be be fully configured, and the Structured Query Language (SQL) server must be installed on the network and connected to the Web access logging device(s) (e.g. Web Filter and/or Secure Web Gateway)
• High speed access to the SR server by authorized client workstations
• Ports 8443 and 8843 must be available for the SR user interface to use
Administrator Workstation Requirements
System requirements for the administrator include the following:
• Windows XP, Vista, or 7 operating system running:
• Internet Explorer (IE) 7.0 or 8.0• Firefox 3.6• Google Chrome 9.0
• Macintosh OS X Version 10.5 or 10.6 running:
• Safari 4.0• Firefox 3.6• Google Chrome 9.0
• JavaScript enabled
• Pop-up blocking software, if installed, must be disabled
M86 SECURITY USER GUIDE
INTRODUCTORY SECTION COMPONENTS AND ENVIRONMENT
• Session cookies from the SR server must be allowed in order for the System Configuration console to function properly
NOTE: Information about disabling pop-up blocking software can be found in Appendix A: Disable Pop-up Blocking Software.
End User Workstation Requirements
System requirements for the end user include the following:
• Windows XP, Vista, or 7 operating system running:
• Internet Explorer (IE) 7.0 or 8.0• Firefox 3.6• Google Chrome 9.0
• Macintosh OS X Version 10.5 or 10.6 running:
• Safari 4.0• Firefox 3.6• Google Chrome 9.0
• JavaScript enabled
• Pop-up blocking software, if installed, must be disabled
M86 SECURITY USER GUIDE 13
INTRODUCTORY SECTION GETTING STARTED
14
Getting Started
Initial SetupTo initially set up your M86 Security Reporter (SR), the administrator installing the unit should follow the instructions in the SR Appliance Installation Guide packaged with your SR appliance, or the SR Virtual Installation Guide—the latter if the SR image will be installed on an appliance in your network and running as a virtual machine. The Installa-tion Guide explains how to perform the initial configuration of the SR so that it can be accessed via an IP address or host name on your network, and communicate with the Web access logging device(s) (Web Filter and/or Secure Web Gateway) to receive logs of end user Internet/network activity.
NOTE: If you do not have the Installation Guide, contact M86 Security immediately to have a copy sent to you.
WARNING: In order to prevent data from being lost or corrupted while the SR is running, the server should be connected to a UPS or other battery backup system. Once you turn on the SR server, DO NOT interrupt the initial boot-up process. This process may take from five to 10 minutes per drive. If the process is inter-rupted, damage to key files may occur.
M86 SECURITY USER GUIDE

INTRODUCTORY SECTION GETTING STARTED
Procedures for Logging In, Out
Log In
After the SR is set up on the network, the designated global administrator of the server should be able to access the unit via its URL on the Internet, using the username and pass-word registered during the wizard hardware installation procedures.
NOTES: A maximum of eight users can use the SR user interface simultaneously. However, for optimum results, M86 Security recommends no more than four users generate reports at the same time.
If your browser is set to display in English, Simplified Chinese or Traditional Chinese, the SR user interface will display that language setting by default. However, this language selection can be changed for your user account as described in Chapter 1: Group, Profile Management of the Report Manager Administra-tion Section.
1. Launch an Internet browser window supported by the SR.
2. In the address line of the browser window, type in“https://” and the SR server’s IP address or host name, a colon “:” and port number “8443” for a secure network connection, appended by “/SR/”.
For example, if your IP address is 210.10.131.34, type in https://210.10.131.34:8443/SR/. Using a host name example, if the host name is logo.com, type in https://logo.com:8443/SR/.
With a secure connection, the first time you attempt to access the SR’s user interface in your browser you will be prompted to accept the security certificate. In order to accept the security certificate for your browser, follow the
M86 SECURITY USER GUIDE 15
INTRODUCTORY SECTION GETTING STARTED
16
instructions at: http://www.m86security.com/software/8e6/docs/ig/misc/sec-cert-sr3.1.pdf
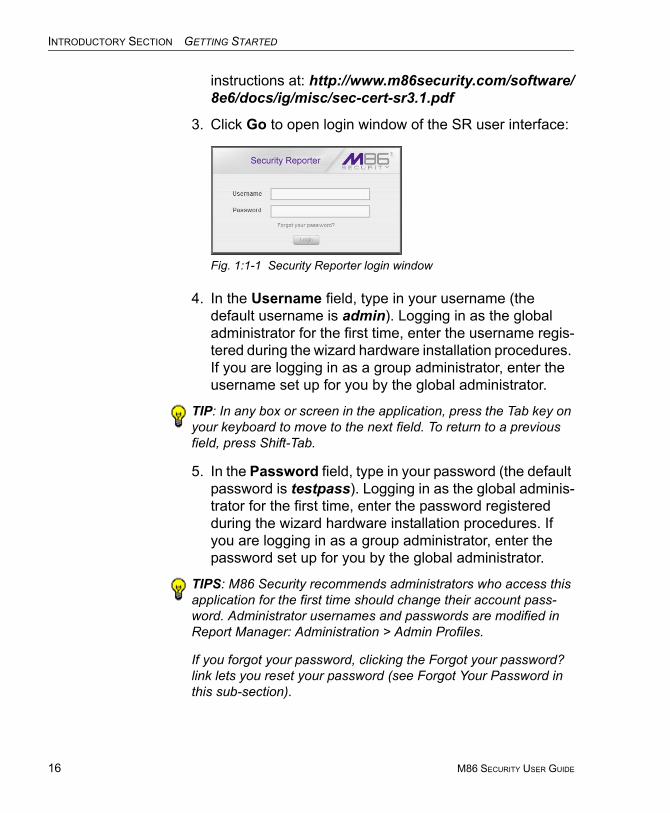
3. Click Go to open login window of the SR user interface:
Fig. 1:1-1 Security Reporter login window
4. In the Username field, type in your username (the default username is admin). Logging in as the global administrator for the first time, enter the username regis-tered during the wizard hardware installation procedures. If you are logging in as a group administrator, enter the username set up for you by the global administrator.
TIP: In any box or screen in the application, press the Tab key on your keyboard to move to the next field. To return to a previous field, press Shift-Tab.
5. In the Password field, type in your password (the default password is testpass). Logging in as the global adminis-trator for the first time, enter the password registered during the wizard hardware installation procedures. If you are logging in as a group administrator, enter the password set up for you by the global administrator.
TIPS: M86 Security recommends administrators who access this application for the first time should change their account pass-word. Administrator usernames and passwords are modified in Report Manager: Administration > Admin Profiles.
If you forgot your password, clicking the Forgot your password? link lets you reset your password (see Forgot Your Password in this sub-section).
M86 SECURITY USER GUIDE
INTRODUCTORY SECTION GETTING STARTED
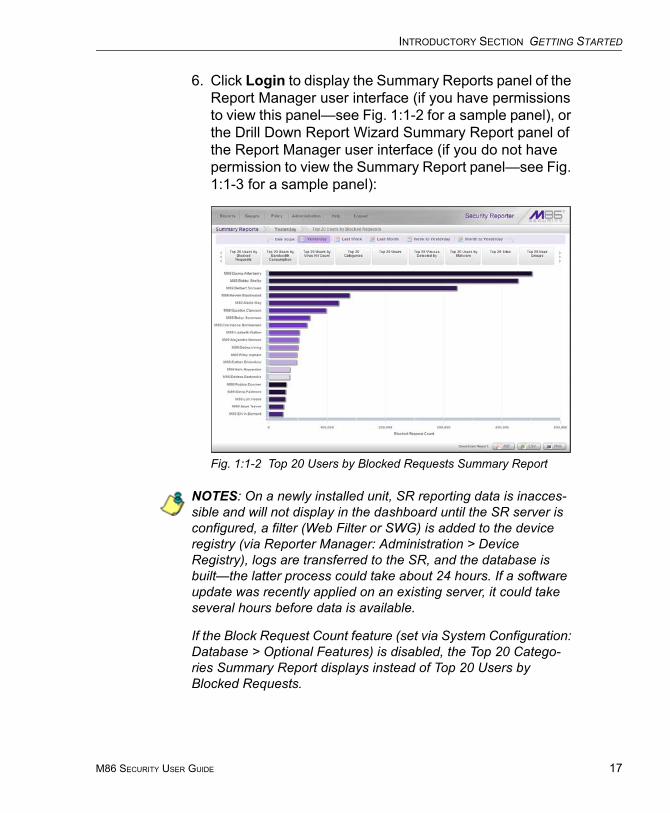
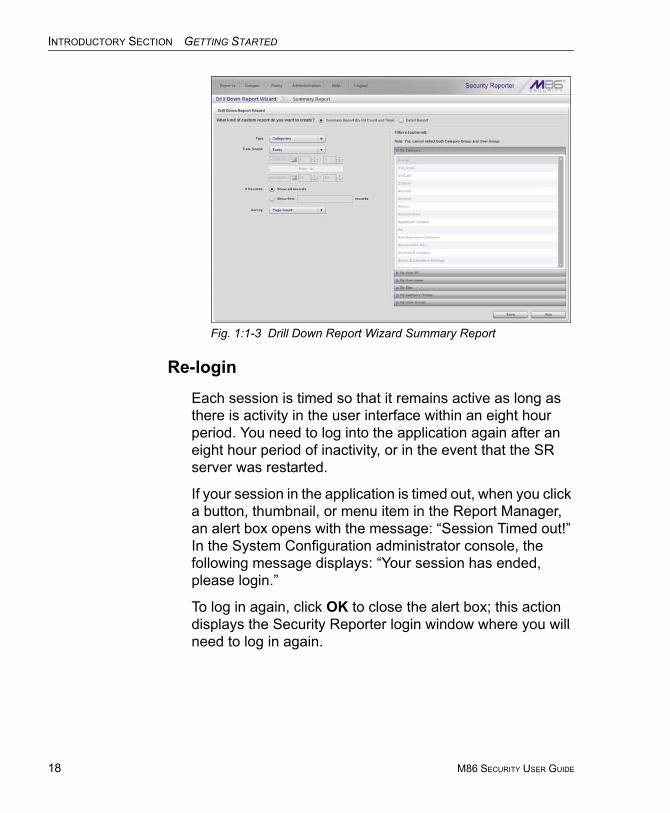
6. Click Login to display the Summary Reports panel of the Report Manager user interface (if you have permissions to view this panel—see Fig. 1:1-2 for a sample panel), or the Drill Down Report Wizard Summary Report panel of the Report Manager user interface (if you do not have permission to view the Summary Report panel—see Fig. 1:1-3 for a sample panel):
Fig. 1:1-2 Top 20 Users by Blocked Requests Summary Report
NOTES: On a newly installed unit, SR reporting data is inacces-sible and will not display in the dashboard until the SR server is configured, a filter (Web Filter or SWG) is added to the device registry (via Reporter Manager: Administration > Device Registry), logs are transferred to the SR, and the database is built—the latter process could take about 24 hours. If a software update was recently applied on an existing server, it could take several hours before data is available.
If the Block Request Count feature (set via System Configuration: Database > Optional Features) is disabled, the Top 20 Catego-ries Summary Report displays instead of Top 20 Users by Blocked Requests.
M86 SECURITY USER GUIDE 17
INTRODUCTORY SECTION GETTING STARTED
18
Fig. 1:1-3 Drill Down Report Wizard Summary Report
Re-login
Each session is timed so that it remains active as long as there is activity in the user interface within an eight hour period. You need to log into the application again after an eight hour period of inactivity, or in the event that the SR server was restarted.
If your session in the application is timed out, when you click a button, thumbnail, or menu item in the Report Manager, an alert box opens with the message: “Session Timed out!” In the System Configuration administrator console, the following message displays: “Your session has ended, please login.”
To log in again, click OK to close the alert box; this action displays the Security Reporter login window where you will need to log in again.
M86 SECURITY USER GUIDE
INTRODUCTORY SECTION GETTING STARTED
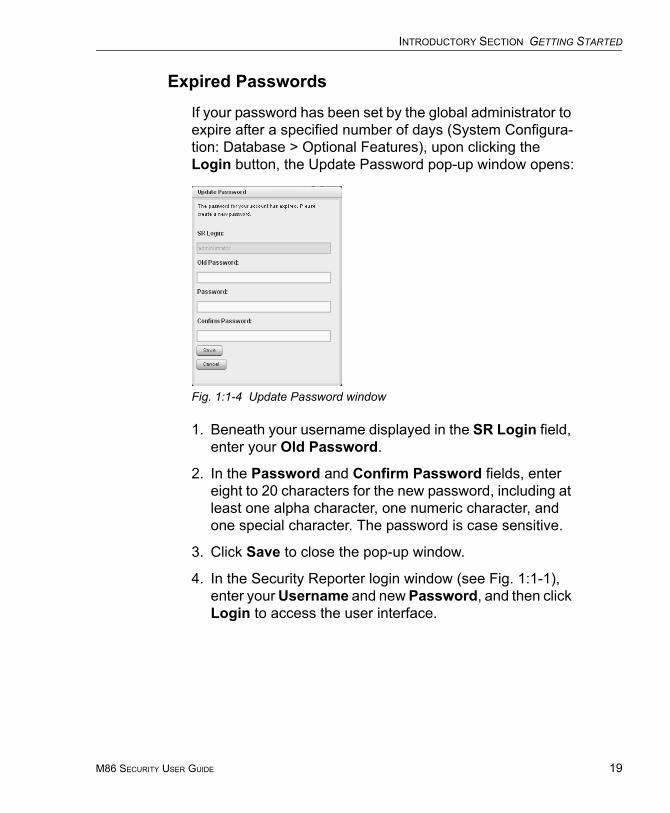
Expired Passwords
If your password has been set by the global administrator to expire after a specified number of days (System Configura-tion: Database > Optional Features), upon clicking the Login button, the Update Password pop-up window opens:
Fig. 1:1-4 Update Password window
1. Beneath your username displayed in the SR Login field, enter your Old Password.
2. In the Password and Confirm Password fields, enter eight to 20 characters for the new password, including at least one alpha character, one numeric character, and one special character. The password is case sensitive.
3. Click Save to close the pop-up window.
4. In the Security Reporter login window (see Fig. 1:1-1), enter your Username and new Password, and then click Login to access the user interface.
M86 SECURITY USER GUIDE 19
INTRODUCTORY SECTION GETTING STARTED
20
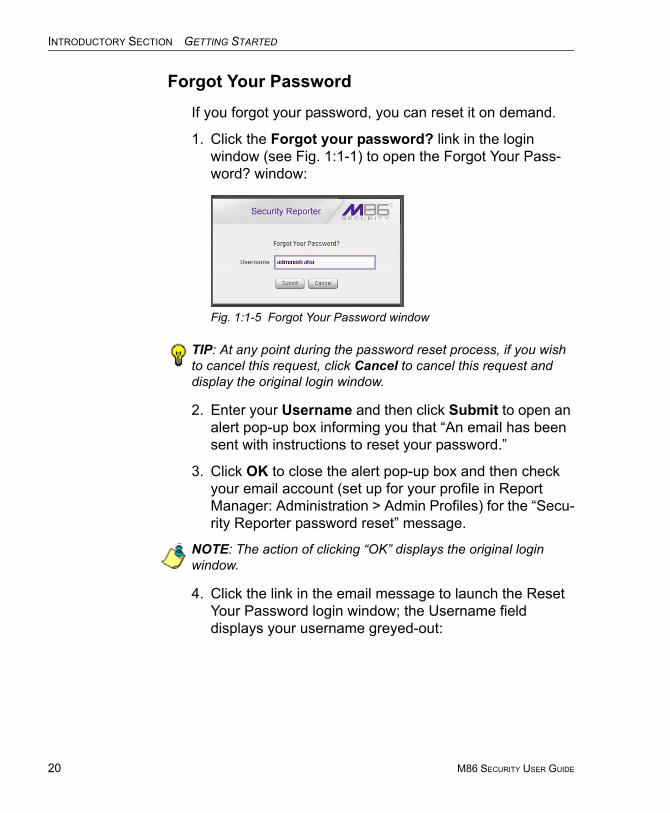
Forgot Your Password
If you forgot your password, you can reset it on demand.
1. Click the Forgot your password? link in the login window (see Fig. 1:1-1) to open the Forgot Your Pass-word? window:
Fig. 1:1-5 Forgot Your Password window
TIP: At any point during the password reset process, if you wish to cancel this request, click Cancel to cancel this request and display the original login window.
2. Enter your Username and then click Submit to open an alert pop-up box informing you that “An email has been sent with instructions to reset your password.”
3. Click OK to close the alert pop-up box and then check your email account (set up for your profile in Report Manager: Administration > Admin Profiles) for the “Secu-rity Reporter password reset” message.
NOTE: The action of clicking “OK” displays the original login window.
4. Click the link in the email message to launch the Reset Your Password login window; the Username field displays your username greyed-out:
M86 SECURITY USER GUIDE
INTRODUCTORY SECTION GETTING STARTED
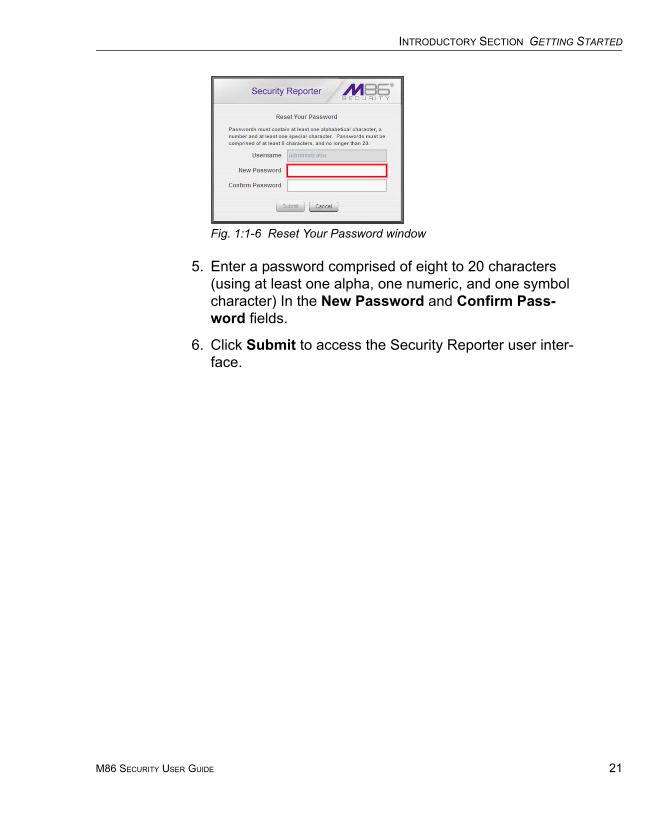
Fig. 1:1-6 Reset Your Password window
5. Enter a password comprised of eight to 20 characters (using at least one alpha, one numeric, and one symbol character) In the New Password and Confirm Pass-word fields.
6. Click Submit to access the Security Reporter user inter-face.
M86 SECURITY USER GUIDE 21
INTRODUCTORY SECTION GETTING STARTED
22
Single Sign-On Access
If using a Web Filter, the Single Sign-On (SSO) access feature is available for the global administrator account set up during the wizard hardware installation process. To enable this feature, be sure this same username and pass-word combination is saved in the Web Filter (System > Administrator) for an ‘Admin’ account type. Also be sure the host name for the SR server and Web Filter are entered in the hosts file. Thereafter, whenever accessing the Web Filter via the menu link in the SR user interface, the Web Filter splash screen displays, bypassing the Web Filter login window.
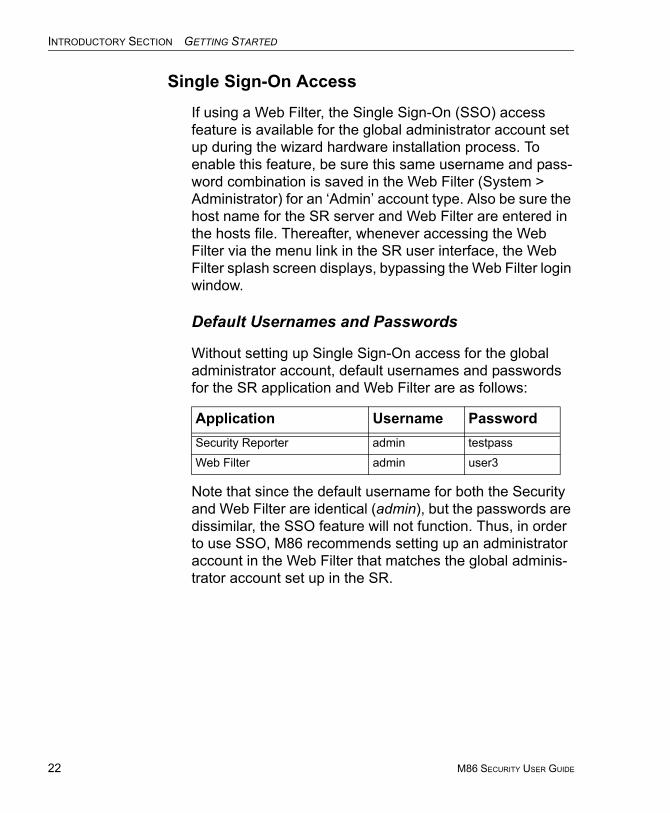
Default Usernames and Passwords
Without setting up Single Sign-On access for the global administrator account, default usernames and passwords for the SR application and Web Filter are as follows:
Note that since the default username for both the Security and Web Filter are identical (admin), but the passwords are dissimilar, the SSO feature will not function. Thus, in order to use SSO, M86 recommends setting up an administrator account in the Web Filter that matches the global adminis-trator account set up in the SR.
Application Username PasswordSecurity Reporter admin testpass
Web Filter admin user3
M86 SECURITY USER GUIDE

INTRODUCTORY SECTION GETTING STARTED
User Interface Navigation
Once you have logged into the Report Manager, use the navigation toolbar at the top of the screen to navigate to the section of the user interface you wish to use.
This toolbar provides a menu link to access the System Configuration administrator console (if permissions are granted by the global administrator). If an M86 Web Filter is set up to send logs to this SR, a link to Web Filter is also available via a menu link.
Clicking “Security Reporter” or the M86 Security logo in the banner accesses the M86 Security Web site.
NOTE: See Appendix C: Evaluation Mode for information about using the Security Reporter in evaluation mode and/or converting the application to registered mode.
Links in the Report Manager Navigation Toolbar
The navigation toolbar at the top of the Report Manager screen consists of the following links and menu topics for configuring and using the Report Manager:
• Reports - mouse over this link to open the Reports menu. Global and group administrators can click any Report menu item to view or generate a report, or schedule a report to run.
• Gauges (available for Web Filter) - mouse over this link to view menu options for setting and managing URL and bandwidth gauges, and end user Internet activity.
• Policy (available for Web Filter) - mouse over this link to view menu options for setting and maintaining policies used for triggering warnings when gauges approach their upper threshold limits.
• Administration - mouse over this link to view menu options for setting and maintaining administrator profiles
M86 SECURITY USER GUIDE 23
INTRODUCTORY SECTION GETTING STARTED
24
and groups, maintaining the Report Manager, and managing the SR.
• Help - mouse over this link to view menu options for assisting you in configuring this SR:
• Online Help - Clicking this link accesses the Web page at M86Security.com containing links to the latest documentation in the .pdf format for this application
• About... - Clicking this link opens a pop-up window containing information about the current software Version, and hardware Serial number if this SR is running on an M86 SR appliance. This criteria can be copied and pasted into an email or online form to be submitted to M86 Security for troubleshooting purposes. Click “Close” to close the pop-up window.
• Logout - click this link to log out of the SR (see Log Out for details on log out procedures).
Navigation Tips and Conventions
The following tips and list of conventions will help you navi-gate the Report Manager user interface:
• Move a pop-up window - Click the toolbar of a pop-up window and simultaneously move your mouse to relo-cate the pop-up window to another area in the current browser window.
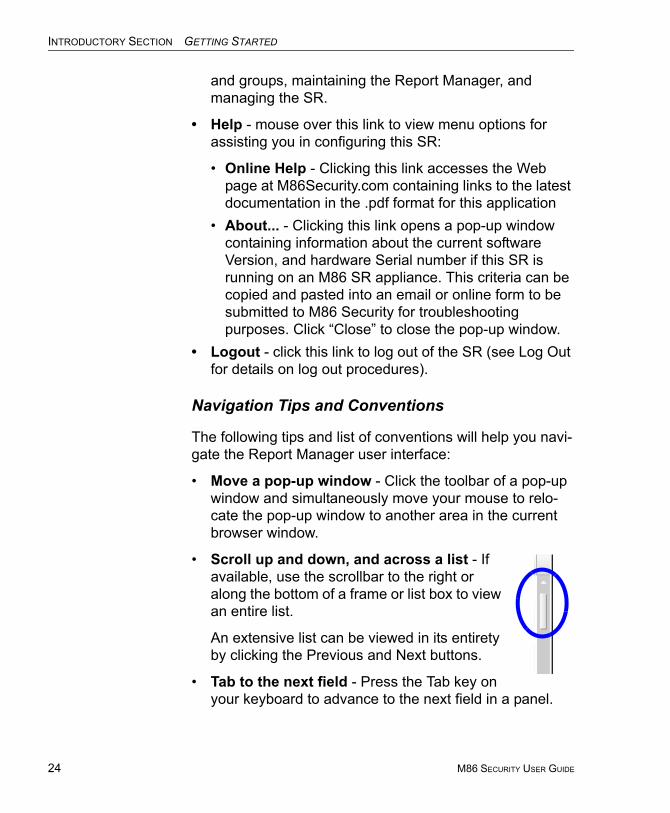
• Scroll up and down, and across a list - If available, use the scrollbar to the right or along the bottom of a frame or list box to view an entire list.
An extensive list can be viewed in its entirety by clicking the Previous and Next buttons.
• Tab to the next field - Press the Tab key on your keyboard to advance to the next field in a panel.
M86 SECURITY USER GUIDE
INTRODUCTORY SECTION GETTING STARTED
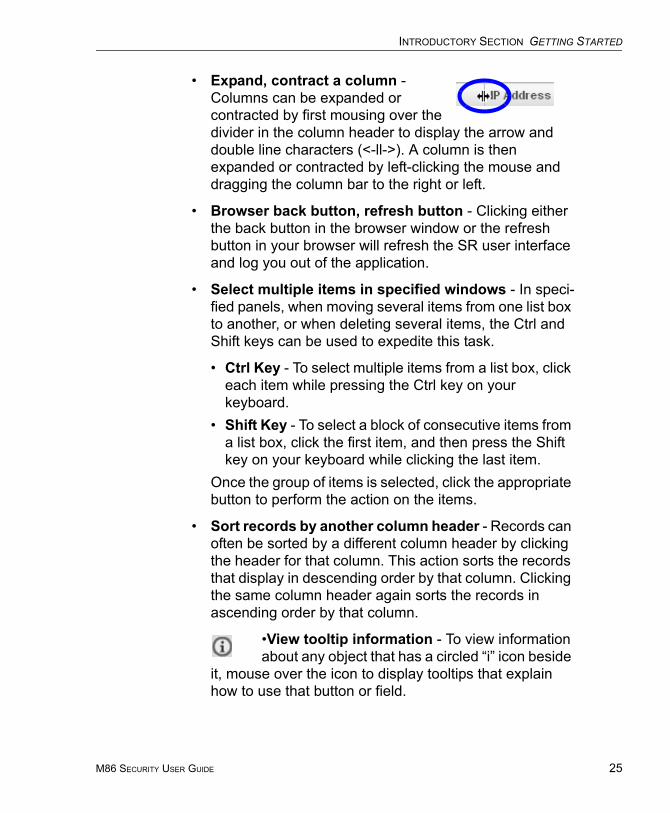
• Expand, contract a column - Columns can be expanded or contracted by first mousing over the divider in the column header to display the arrow and double line characters (<-ll->). A column is then expanded or contracted by left-clicking the mouse and dragging the column bar to the right or left.
• Browser back button, refresh button - Clicking either the back button in the browser window or the refresh button in your browser will refresh the SR user interface and log you out of the application.
• Select multiple items in specified windows - In speci-fied panels, when moving several items from one list box to another, or when deleting several items, the Ctrl and Shift keys can be used to expedite this task.
• Ctrl Key - To select multiple items from a list box, click each item while pressing the Ctrl key on your keyboard.
• Shift Key - To select a block of consecutive items from a list box, click the first item, and then press the Shift key on your keyboard while clicking the last item.
Once the group of items is selected, click the appropriate button to perform the action on the items.
• Sort records by another column header - Records can often be sorted by a different column header by clicking the header for that column. This action sorts the records that display in descending order by that column. Clicking the same column header again sorts the records in ascending order by that column.
•View tooltip information - To view information about any object that has a circled “i” icon beside
it, mouse over the icon to display tooltips that explain how to use that button or field.
M86 SECURITY USER GUIDE 25

INTRODUCTORY SECTION GETTING STARTED
26
Wildcard Searches
1. When performing a search with wildcard(s), enter text in the following format: %X%, %X, or X% (in which “X” represents a partial or complete user IP address, user-name, site URL, or other specified search query item).
Examples:• User IP: %200.10.100.51%, %100, or 192.168.%• Username: %jsmith%, %t, or %qa• Site: %yahoo%, %z, or cnn%
2. Click the designated button to perform the wildcard search.
3. Make your selection from records returned by the search.
Links in the System Configuration Navigation Toolbar
The navigation toolbar at the top of the System Configura-tion screen consists of the following menu topics and selec-tions for configuring and using the SR:
• Network - select a menu item to access its corre-sponding page used for creating and maintaining network configuration settings on the SR server.
• Server - select a menu item to access its corresponding page used for managing the SR server’s hardware and software.
• Database - select a menu item to access its corre-sponding page used for maintaining the SR database and Report Manager.
• Help - click this link to launch a separate browser window or tab displaying the page containing links to the latest user guides (in the .pdf format) for this application.
• Logout - click this link to log out of the SR (see Log Out for details on log out procedures).
M86 SECURITY USER GUIDE
INTRODUCTORY SECTION GETTING STARTED
Log Out
To log out of the SR, click the Logout button in the naviga-tion toolbar; this action re-displays the login window.
Click the “X” in the upper right corner of the logout window or tab to close the window/tab.
Exiting the SR application will log you out of the user inter-face, but will not log you out of the SR server, nor turn off the server.
WARNING: If you need to turn off the SR server, follow the shut down procedures outlined in the Shut Down screen sub-section under the Server Menu section in Chapter 2 of the System Config-uration Section of this User Guide. Failure to properly shut down the server can result in data being lost or corrupted.
M86 SECURITY USER GUIDE 27
INTRODUCTORY SECTION GETTING STARTED
28
Technical Support / Product WarrantiesFor technical assistance or warranty repair, please visit http://www.m86security.com/support/ .
M86 SECURITY USER GUIDE
SYSTEM CONFIGURATION SECTION INTRODUCTION
SYSTEM CONFIGURATION SECTION
IntroductionThis section of the user guide provides instructions to the global administrator on configuring and managing the SR server.
The authorized administrator of the SR server is responsible for integrating the server into the existing network, config-uring and maintaining the server. To attain this objective, the administrator performs the following tasks:
• executes Installation procedures defined in the Installa-tion Guide booklet
• provides a suitable environment for the server, including:
• high speed, HTTPS link to the current logging device• power connection protected by an Uninterruptible
Power Supply (UPS)• high speed access to the server by authorized client
workstations• sets up administrators for receiving automatic alerts
• updates the server with software updates supplied by M86 Security
• analyzes server statistics
• utilizes diagnostics for monitoring the server status to ensure optimum functioning of the server
• establishes and implements backup and restoration procedures for the server
M86 SECURITY USER GUIDE 29
SYSTEM CONFIGURATION SECTION CHAPTER 1: ACCESS SYSTEM CONFIGURATION
30
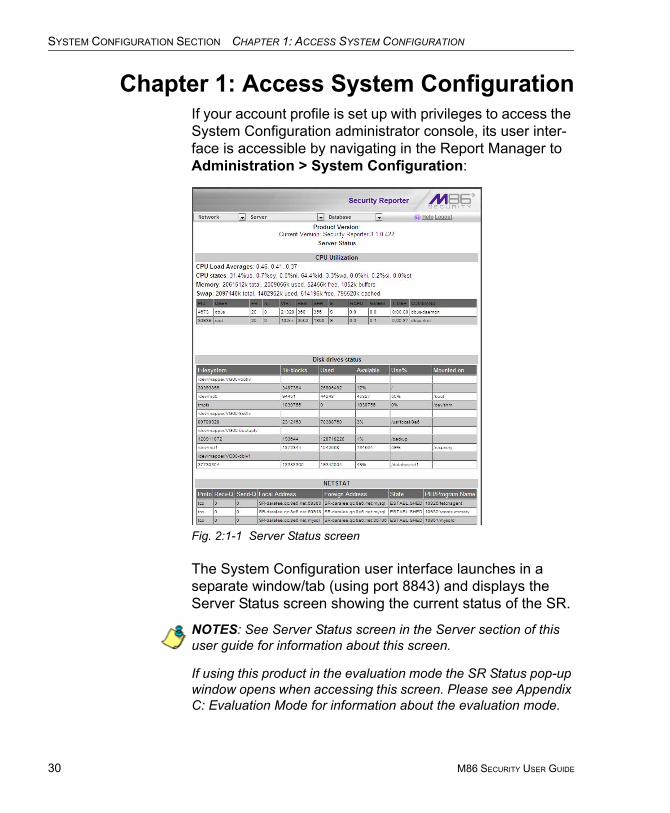
Chapter 1: Access System ConfigurationIf your account profile is set up with privileges to access the System Configuration administrator console, its user inter-face is accessible by navigating in the Report Manager to Administration > System Configuration:
Fig. 2:1-1 Server Status screen
The System Configuration user interface launches in a separate window/tab (using port 8843) and displays the Server Status screen showing the current status of the SR.
NOTES: See Server Status screen in the Server section of this user guide for information about this screen.
If using this product in the evaluation mode the SR Status pop-up window opens when accessing this screen. Please see Appendix C: Evaluation Mode for information about the evaluation mode.
M86 SECURITY USER GUIDE

SYSTEM CONFIGURATION SECTION CHAPTER 2: CONFIGURING THE SERVER
Chapter 2: Configuring the ServerThe System Configuration administrator console is comprised of Network, Server, and Database menu screens for configuring the SR server and maintaining the Report Manager.
TIP: When making a complete configuration in the System Configuration administrator console, M86 Security recommends you navigate from left to right (Network to Server to Database) in choosing your menu options.
Network MenuThe Network pull-down menu includes options for setting up and maintaining components to be used on the server’s network. These options are: Box Mode (for Web Filter), Lockouts, Network Setting, Routing Table, Regional Setting, Diagnostics, and SNMP.
M86 SECURITY USER GUIDE 31
SYSTEM CONFIGURATION SECTION CHAPTER 2: CONFIGURING THE SERVER
32
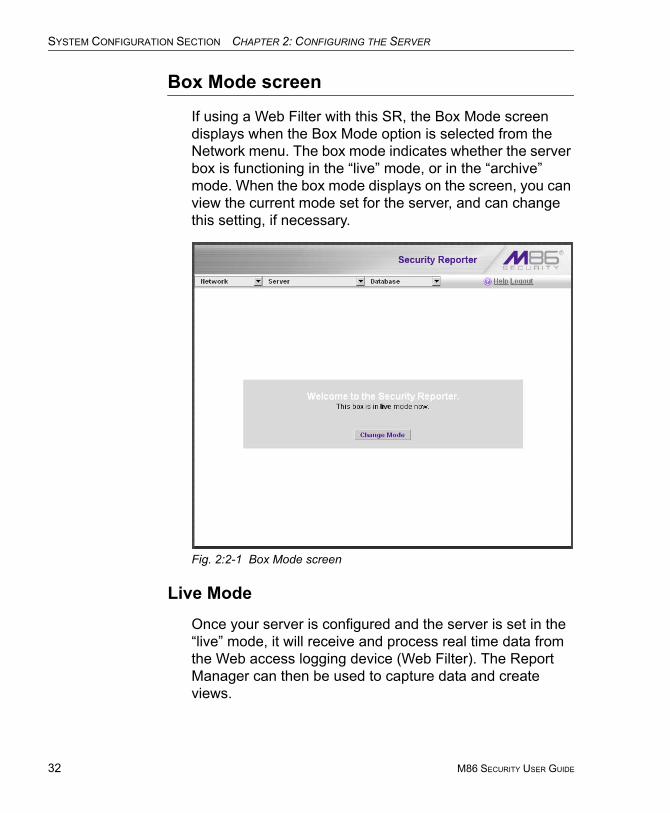
Box Mode screen
If using a Web Filter with this SR, the Box Mode screen displays when the Box Mode option is selected from the Network menu. The box mode indicates whether the server box is functioning in the “live” mode, or in the “archive” mode. When the box mode displays on the screen, you can view the current mode set for the server, and can change this setting, if necessary.
Fig. 2:2-1 Box Mode screen
Live Mode
Once your server is configured and the server is set in the “live” mode, it will receive and process real time data from the Web access logging device (Web Filter). The Report Manager can then be used to capture data and create views.
M86 SECURITY USER GUIDE
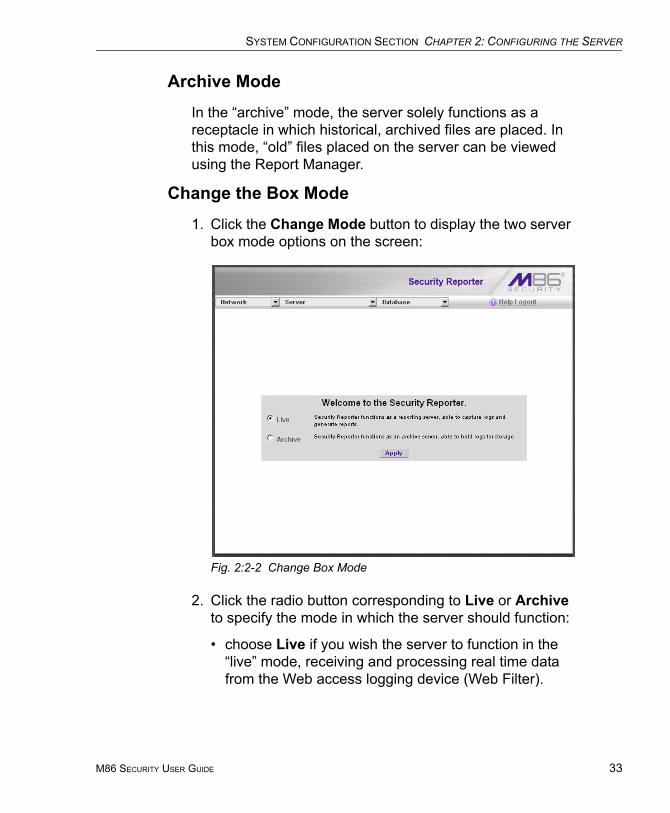
SYSTEM CONFIGURATION SECTION CHAPTER 2: CONFIGURING THE SERVER
Archive Mode
In the “archive” mode, the server solely functions as a receptacle in which historical, archived files are placed. In this mode, “old” files placed on the server can be viewed using the Report Manager.
Change the Box Mode
1. Click the Change Mode button to display the two server box mode options on the screen:
Fig. 2:2-2 Change Box Mode
2. Click the radio button corresponding to Live or Archive to specify the mode in which the server should function:
• choose Live if you wish the server to function in the “live” mode, receiving and processing real time data from the Web access logging device (Web Filter).
M86 SECURITY USER GUIDE 33
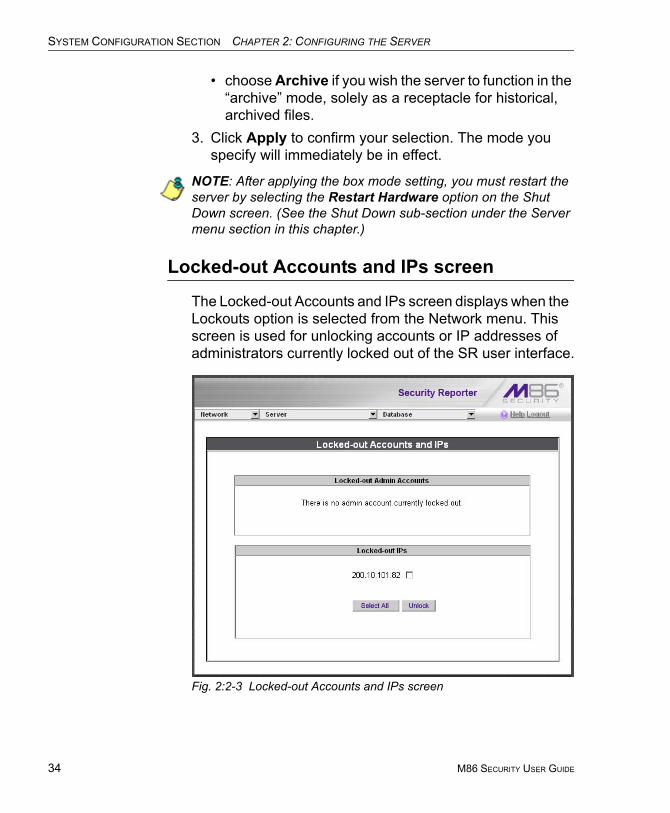
SYSTEM CONFIGURATION SECTION CHAPTER 2: CONFIGURING THE SERVER
34
• choose Archive if you wish the server to function in the “archive” mode, solely as a receptacle for historical, archived files.
3. Click Apply to confirm your selection. The mode you specify will immediately be in effect.
NOTE: After applying the box mode setting, you must restart the server by selecting the Restart Hardware option on the Shut Down screen. (See the Shut Down sub-section under the Server menu section in this chapter.)
Locked-out Accounts and IPs screen
The Locked-out Accounts and IPs screen displays when the Lockouts option is selected from the Network menu. This screen is used for unlocking accounts or IP addresses of administrators currently locked out of the SR user interface.
Fig. 2:2-3 Locked-out Accounts and IPs screen
M86 SECURITY USER GUIDE
SYSTEM CONFIGURATION SECTION CHAPTER 2: CONFIGURING THE SERVER
NOTE: An account or IP address becomes locked if the Pass-word Security Options feature is enabled in the Optional Features screen (see Optional Features screen in this chapter), and a user is unable to log into the SR user interface due to an expired pass-word, or having met the specified number of failed password attempts within the designated timespan.
View Locked Accounts, IP addresses
The frames in this screen display the following messages if there are no users currently locked out:
• Locked-out Admin Accounts - There is no adminis-trator account currently locked out.
• Locked-out IPs - There is no IP currently locked out.
If there are any locked accounts/IP addresses in a frame, each locked username/IP address displays on a separate line followed by a checkbox. The Select All and Unlock buttons display at the bottom of the frame.
Unlock Accounts, IP addresses
To unlock an account/IP address in a frame:
1. Click the checkbox corresponding to the username/IP address.
TIP: To unlock all accounts/IPs in a frame, click Select All to populate all checkboxes in the frame with check marks.
2. Click Unlock to unlock the specified accounts/IPs, and to display the message screen showing one of the following pertinent messages for each unlocked account/IP:
• Admin account: ‘xxx’ has been successfully unlocked.• IP: ‘x.x.x.x’ has been successfully unlocked.
NOTE: In the text above, ‘xxx’ and ‘x.x.x.x’ represents the unlocked username/IP address.
M86 SECURITY USER GUIDE 35

SYSTEM CONFIGURATION SECTION CHAPTER 2: CONFIGURING THE SERVER
36
3. Click OK to return to the Locked-out Accounts and IPs screen that no longer shows the accounts/IPs that have been unlocked.
Network Settings screen
The Network Settings screen displays when the Network Setting option is selected from the Network menu. This screen is used for setting up IP addresses so the server can communicate with your system.
Fig. 2:2-4 Network Settings screen
M86 SECURITY USER GUIDE

SYSTEM CONFIGURATION SECTION CHAPTER 2: CONFIGURING THE SERVER
Set up/Edit IP AddressesTIP: In order for the server to effectively communicate with your system, be sure all fields contain accurate information before saving your settings.
1. Enter or edit an IP address in each appropriate field:
• In the Host Name field, enter the address or URL that will be used for accessing the System Configuration administrator console. This entry should include the full, qualified domain name, and the “host” name for the box (i.e. reporter.myserver.com).
• In the LAN 1 IP field, enter the IP address of the SR server on your Local Area Network (LAN 1).
• In the Netmask field, enter the netmask that will define the traffic designated for the LAN.
• In the Gateway IP field, enter the IP address for the default router that will be the main gateway for the entire network segment.
• In the First DNS IP field, enter the IP address of the primary Domain Name System (name server). The server will use this IP address to identify other IP addresses on the system, including its own IP address.
• In the Second DNS IP field, enter the IP address of the fallback DNS.
2. Be sure each IP address is correct, and then click Save.
NOTE: After appropriate entries have been made in these fields and saved, you must restart the server to activate the IPs. To restart the server, select the Restart Hardware option on the Shut Down screen. (See the Shut Down sub-section under the Server menu section in this chapter.)
M86 SECURITY USER GUIDE 37
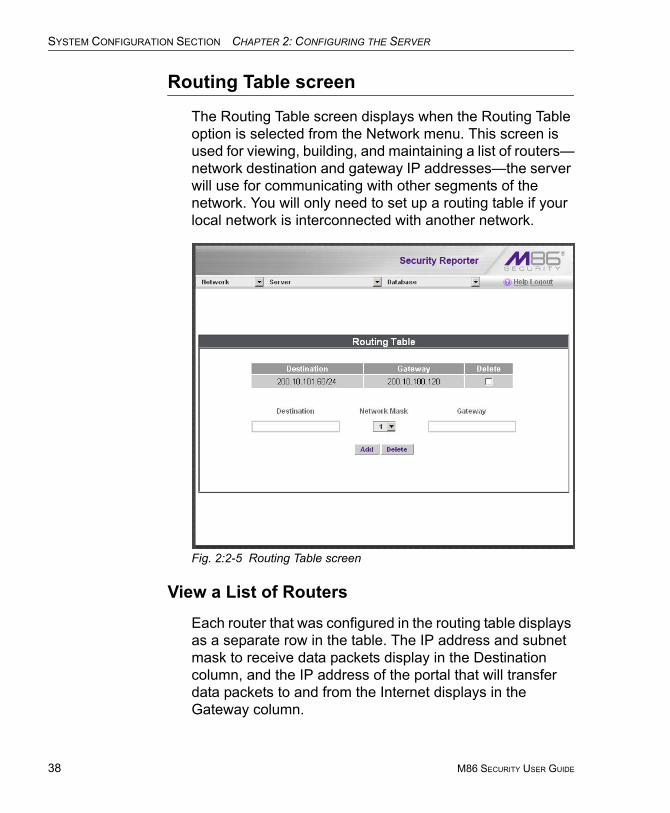
SYSTEM CONFIGURATION SECTION CHAPTER 2: CONFIGURING THE SERVER
38
Routing Table screen
The Routing Table screen displays when the Routing Table option is selected from the Network menu. This screen is used for viewing, building, and maintaining a list of routers—network destination and gateway IP addresses—the server will use for communicating with other segments of the network. You will only need to set up a routing table if your local network is interconnected with another network.
Fig. 2:2-5 Routing Table screen
View a List of Routers
Each router that was configured in the routing table displays as a separate row in the table. The IP address and subnet mask to receive data packets display in the Destination column, and the IP address of the portal that will transfer data packets to and from the Internet displays in the Gateway column.
M86 SECURITY USER GUIDE
SYSTEM CONFIGURATION SECTION CHAPTER 2: CONFIGURING THE SERVER
Add a Router
1. In the Destination field, enter the IP address of the network to which data packets will be forwarded.
2. At the Network Mask pull-down menu, specify the number (1-32) of the subnet mask that will be used for grouping IP addresses on the same local network.
3. In the Gateway field, enter the IP address of the portal to which data packets will be transferred to and from the Internet.
4. Click the Add button to include your entry in the table. If you have another router to add, follow steps 1-4.
5. Click the Back button on the confirmation screen to return to the Routing Table screen.
Delete a Router
1. Click in the Delete checkbox of the row corresponding to the router you wish to remove from the routing table.
2. Click the Delete button.
3. Click the Back button on the confirmation screen to return to the Routing Table screen.
M86 SECURITY USER GUIDE 39
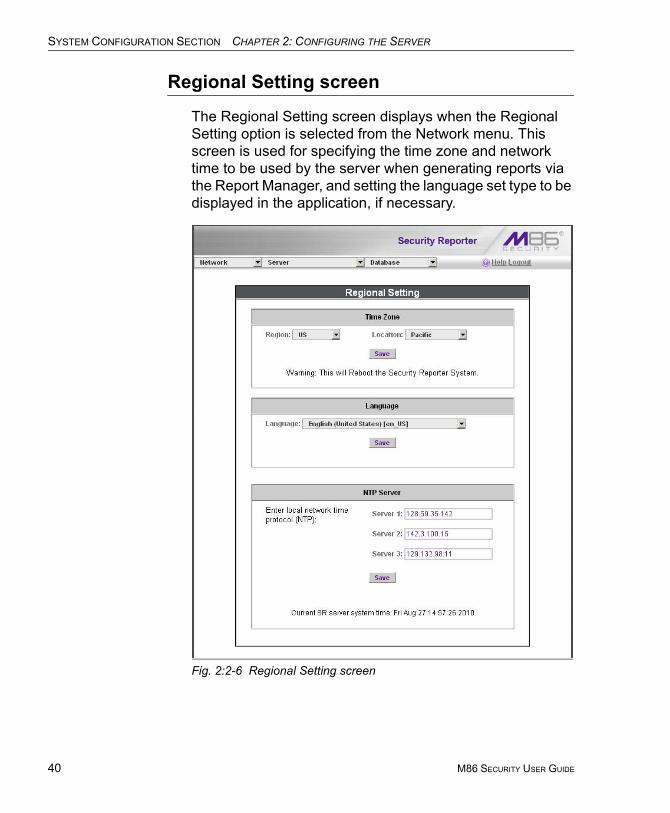
SYSTEM CONFIGURATION SECTION CHAPTER 2: CONFIGURING THE SERVER
40
Regional Setting screen
The Regional Setting screen displays when the Regional Setting option is selected from the Network menu. This screen is used for specifying the time zone and network time to be used by the server when generating reports via the Report Manager, and setting the language set type to be displayed in the application, if necessary.
Fig. 2:2-6 Regional Setting screen
M86 SECURITY USER GUIDE
SYSTEM CONFIGURATION SECTION CHAPTER 2: CONFIGURING THE SERVER
Specify the Time Zone
1. At the Region pull-down menu, select your country from the available choices.
2. At the Location pull-down menu, select the time zone for the specified region.
3. Click Save to apply your settings, and to restart the Web Client Server.
WARNING: The time zone set for the SR should be the same one set for each Web access logging device to be used by the SR. These “like” settings ensure consistency when tracking the logging times of all users on the network.
Specify the Language Set
1. If necessary, select a language set from the Language pull-down menu to specify that you wish to display that text in the console.
2. Click Save to apply your settings.
Specify Network Time Protocol Servers
IP addresses of servers running Network Time Protocol (NTP) software are entered in the Server fields, and the Current SR server system time (day, date, HH:MM:SS time format, and year) displays below. NTP is a time synchroni-zation system for computer clocks throughout the Internet. Your SR server will use the actual time from clocks at the IP addresses you’ve specified.
For the Enter local network time protocol (NTP) server fields, by default, the following IP addresses display in these three fields: 128.59.35.142, 142.3.100.15, and 129.132.98.11. If you wish to use different NTP servers, follow these steps:
M86 SECURITY USER GUIDE 41
SYSTEM CONFIGURATION SECTION CHAPTER 2: CONFIGURING THE SERVER
42
1. Enter or edit an IP address in each appropriate field:
• In the Server 1 field, enter the IP address of the primary NTP server to be used for clock settings on your server.
• In the Server 2 field, enter the IP address of the secondary NTP server. The time from this server will be used by your server if the IP address for the primary server fails to be accessed by your server.
• In the Server 3 field, enter the IP address of the tertiary NTP server. The time from this server will be used by your server if the IP addresses for the primary and secondary servers fail to be accessed by your server.
2. Click the Save button to save your entries.
M86 SECURITY USER GUIDE
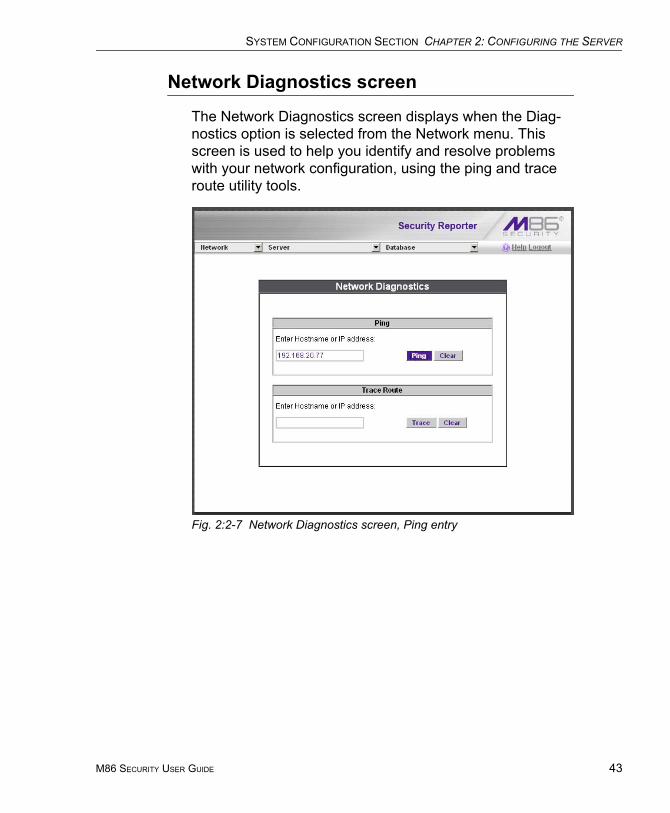
SYSTEM CONFIGURATION SECTION CHAPTER 2: CONFIGURING THE SERVER
Network Diagnostics screen
The Network Diagnostics screen displays when the Diag-nostics option is selected from the Network menu. This screen is used to help you identify and resolve problems with your network configuration, using the ping and trace route utility tools.
Fig. 2:2-7 Network Diagnostics screen, Ping entry
M86 SECURITY USER GUIDE 43
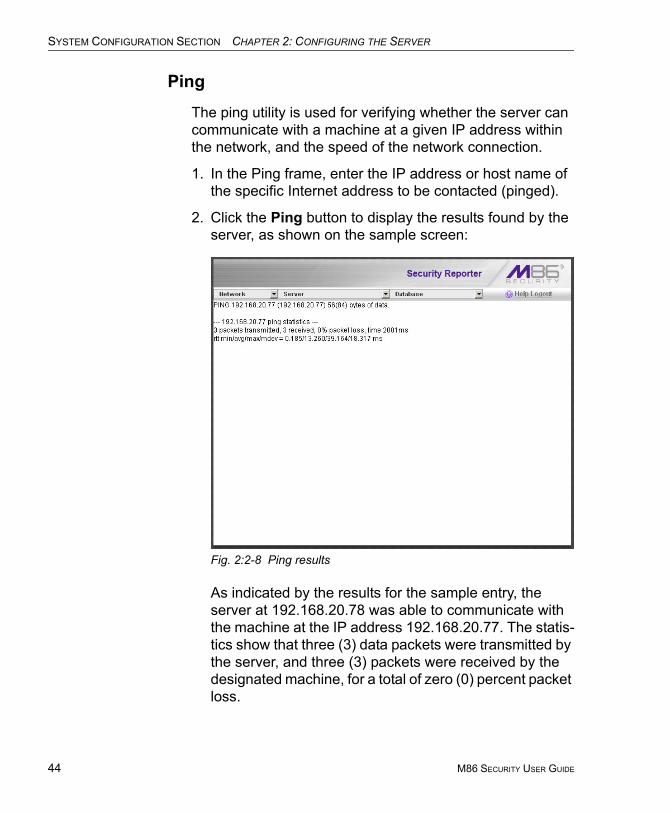
SYSTEM CONFIGURATION SECTION CHAPTER 2: CONFIGURING THE SERVER
44
Ping
The ping utility is used for verifying whether the server can communicate with a machine at a given IP address within the network, and the speed of the network connection.
1. In the Ping frame, enter the IP address or host name of the specific Internet address to be contacted (pinged).
2. Click the Ping button to display the results found by the server, as shown on the sample screen:
Fig. 2:2-8 Ping results
As indicated by the results for the sample entry, the server at 192.168.20.78 was able to communicate with the machine at the IP address 192.168.20.77. The statis-tics show that three (3) data packets were transmitted by the server, and three (3) packets were received by the designated machine, for a total of zero (0) percent packet loss.
M86 SECURITY USER GUIDE
SYSTEM CONFIGURATION SECTION CHAPTER 2: CONFIGURING THE SERVER
TIP: If the machine cannot be contacted, be sure the ping feature on that machine is turned on.
NOTE: To ping another IP address, click the Back button in your browser window, then click the Clear button in the Ping frame, and follow the procedures documented in this sub-section.
Trace Route
If the ping utility was not able to help you diagnose the problem with your network configuration, you should use the trace route utility. This diagnostic tool records each “hop” (trip from one router to another) the data packet made, iden-tifying the IP addresses of gateway computers where the packet stopped en route to its final destination, and the length of time of each hop.
NOTE: The trace route utility can be used after your routing table has been set up. To set up a routing table, see the Routing Table screen sub-section under the Network menu in this chapter.
1. In the Trace Route frame, enter the IP address or host name of the specific Internet address to be validated.
2. Click the Trace button to display the results found by the server, as shown on the sample screen:
M86 SECURITY USER GUIDE 45

SYSTEM CONFIGURATION SECTION CHAPTER 2: CONFIGURING THE SERVER
46
Fig. 2:2-9 Trace Route results
As indicated by the results for the sample entry, the packet made 30 hops. For each line in the report, the hop number displays, followed by the IP address or host name; the IP address in parentheses; and the maximum, minimum, and average response time in milliseconds.
TIP: To “trace” another IP address, click the Back button in your browser window, then click the Clear button in the Trace Route frame, and follow the procedures documented in this sub-section.
M86 SECURITY USER GUIDE
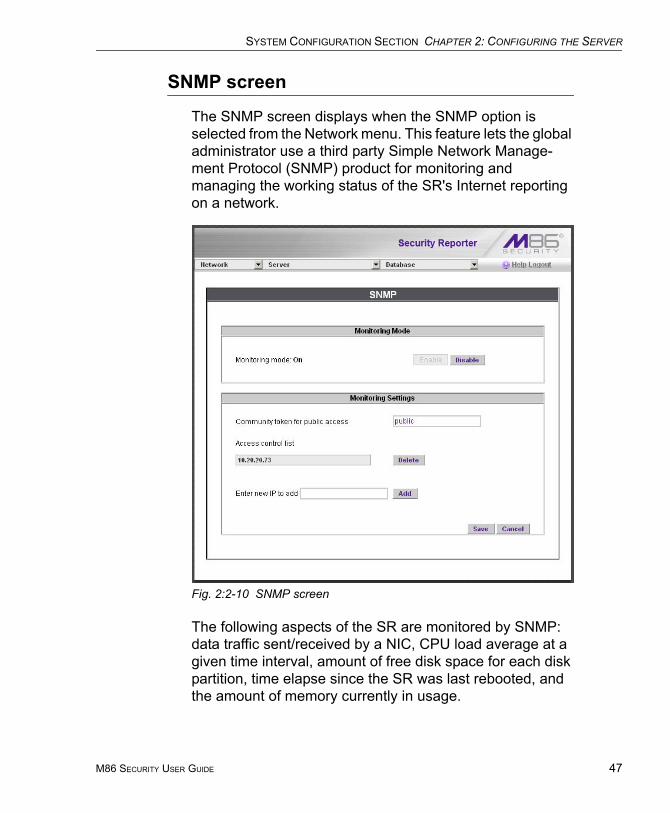
SYSTEM CONFIGURATION SECTION CHAPTER 2: CONFIGURING THE SERVER
SNMP screen
The SNMP screen displays when the SNMP option is selected from the Network menu. This feature lets the global administrator use a third party Simple Network Manage-ment Protocol (SNMP) product for monitoring and managing the working status of the SR's Internet reporting on a network.
Fig. 2:2-10 SNMP screen
The following aspects of the SR are monitored by SNMP: data traffic sent/received by a NIC, CPU load average at a given time interval, amount of free disk space for each disk partition, time elapse since the SR was last rebooted, and the amount of memory currently in usage.
M86 SECURITY USER GUIDE 47
SYSTEM CONFIGURATION SECTION CHAPTER 2: CONFIGURING THE SERVER
48
Enable SNMP
The Monitoring mode is “Off” by default. To enable SNMP, click Enable in the Monitoring Mode frame. As a result, all elements in this window become activated.
Set up Community Token for Public Access
Enter the password to be used as the Community token for public access. This is the password that the manage-ment console would use when requesting access.
Create, Build the Access Control List
1. In the Enter new IP to add field, enter the IP address of an interface from/to which the SNMP should receive/send data.
2. Click Add to include the entry in the Access control list box.
Repeat steps 1 and 2 for each IP address to be included in the list.
3. After all entries are made, click Save.
Maintain the Access Control List
1. To remove one or more IP addresses from the list, select each IP address from the Access control list, using the Ctrl key for multiple selections.
2. Click Delete.
3. Click Save.
M86 SECURITY USER GUIDE
SYSTEM CONFIGURATION SECTION CHAPTER 2: CONFIGURING THE SERVER
Server MenuThe Server pull-down menu includes options for setting up processes for maintaining the server. These options are: Backup, Self-Monitoring, SMTP Server Setting, Server Status, Secure Access, Software Update, Software Update Setting, Shut Down, Report Manager, and Hardware Failure Detection.
NOTE: If running the SR as a virtual machine, the Backup screen is not available, and the Hardware Failure Detection screen displays a message indicating the server is not a RAID server.
M86 SECURITY USER GUIDE 49
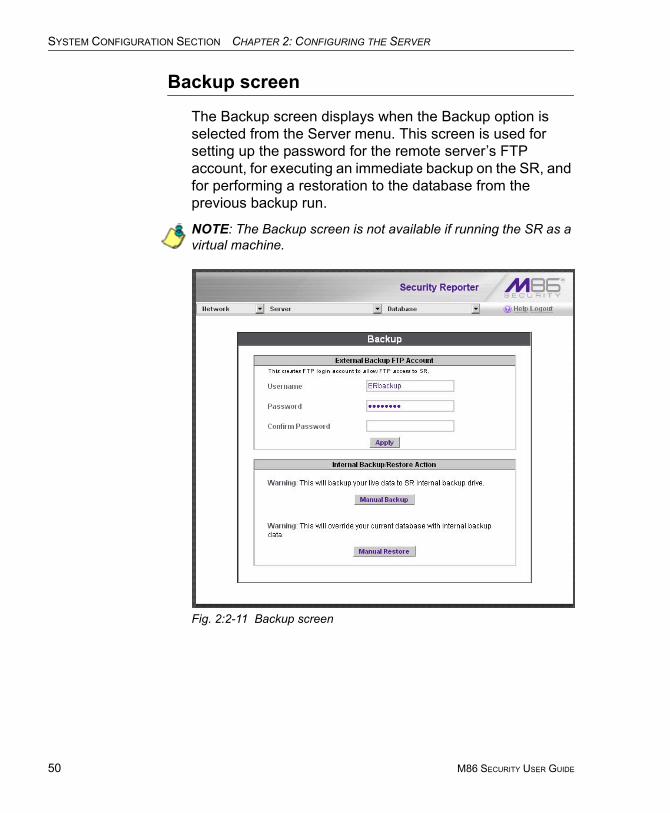
SYSTEM CONFIGURATION SECTION CHAPTER 2: CONFIGURING THE SERVER
50
Backup screen
The Backup screen displays when the Backup option is selected from the Server menu. This screen is used for setting up the password for the remote server’s FTP account, for executing an immediate backup on the SR, and for performing a restoration to the database from the previous backup run.
NOTE: The Backup screen is not available if running the SR as a virtual machine.
Fig. 2:2-11 Backup screen
M86 SECURITY USER GUIDE
SYSTEM CONFIGURATION SECTION CHAPTER 2: CONFIGURING THE SERVER
Backup and Recovery ProceduresIMPORTANT: M86 Security recommends establishing backup and recovery procedures when you first begin using the SR. Please follow the advice in this section to ensure your SR is prop-erly maintained in the event that data is lost and back up proce-dures need to be performed to recover data.
Although automatic backups to a local SR hard drive are scheduled weekly by default, it is important that the SR administrator implements a backup policy to ensure data integrity and continuity in the event of any possible failure scenario. This policy should include frequent, remote backups, such that raw logs and SR database files are available for restoration without relying on the SR’s hard drives.
In general, recovery plans involve (i) restoring the most recent backup of the database, and (ii) restoring raw logs to fill in the gap between the most recent backup of the data-base, and the current date and time.
Some scenarios and action plans to consider include the following:
• The SR database becomes corrupted - Correct the root problem. Restore the database from the most recent SR backup, and reprocess raw logs up to the current date and time.
• The data drive fails - Replace the data drive. Restore the database from the SR backup drive, and reprocess raw logs up to the current date and time.
• The backup drive fails - Replace the backup drive, and perform a manual backup.
• Both data and backup drives are damaged - Restore the database from the most recent remote backup, and reprocess raw logs up to the current date and time.
M86 SECURITY USER GUIDE 51
SYSTEM CONFIGURATION SECTION CHAPTER 2: CONFIGURING THE SERVER
52
As you can see, it is critical that raw logs are available to bridge the gap between the last database backup and the present time, and more frequent backups (local and remote) result in less “catch-up” time required for reprocessing raw logs.
Set up/Edit External Backup FTP Password
In order to back up the SR’s database to a remote server, an FTP account must be established for the remote server.
NOTE: In the External Backup FTP Account frame, the login name that will be used to access the remote server displays in the Username field. This field cannot be edited.
1. In the Password field, enter up to eight characters for the password. The entry in this field is alphanumeric and case sensitive.
2. In the Confirm Password field, re-enter the password in the exact format used in the Password field.
3. Click the Apply button to save your entries. The updated Account ID will be activated after two minutes.
Execute a Manual Backup
In addition to performing on demand backups in preparation for a disaster recovery, you may wish to execute a manual backup under the following circumstances:
• Power outage - If there is a power outage at your facility and your system uses a backup battery, you might want to back up data before the battery fails.
• Rolling blackout - If your facility is subjected to rolling blackouts, and a blackout is scheduled during the time of your daily backup, you should back up your data before the blackout period, when the SR will be down.
• Expiration about to occur - If a data expiration is about to occur, you might want to back up your data before
M86 SECURITY USER GUIDE
SYSTEM CONFIGURATION SECTION CHAPTER 2: CONFIGURING THE SERVER
losing the oldest data on the SR, prior to the daily backup process.
WARNING: If corrupted data is detected on the SR, do not backup your data, as you may back up and eventually restore a corrupted database.
When performing a manual backup, the SR’s database is immediately saved to the internal backup drive. From the remote server, the backup database can be retrieved via FTP, and then stored off site.
TIP: M86 Security recommends executing an on demand backup during the lightest period of system usage, so the server will perform at maximum capacity.
1. Click the Manual Backup button in the Internal Backup/ Restore Action frame to specify that you wish to back up live data to the SR’s internal backup drive.
2. On the Confirm Backup/Restore screen, click the Yes button to back up the database tables and indexes.
WARNING: M86 Security recommends that you do not perform other functions on the SR until the backup is complete. The time it will take to complete the backup depends on the size of all tables being saved.
Perform a Remote Backup
After executing the manual backup, a remote backup can be performed on your remote server.
NOTE: Before beginning this FTP process, be sure you have enough space on the remote server for storing backup data. The required space can be upwards of 200 gigabytes.
1. Log in to your FTP account.
2. Use FTP to download the SR’s backup database to the remote server. When you are in the DAILY, WEEKLY, or MONTHLY sub-directory, be sure to get all the *.gz data files to include in your backup. You can then go to the
M86 SECURITY USER GUIDE 53

SYSTEM CONFIGURATION SECTION CHAPTER 2: CONFIGURING THE SERVER
54
archive directory to get all the raw logs to include in your backup.
3. Store this backup data in a safe place off the remote server. If this backup database needs to be restored, it can be uploaded to the SR via FTP. (See Perform a Restoration to the SR Server.)
Perform a Restoration to the SR Server
There are two parts in performing a restoration of data to your SR. Part one requires data to be loaded on the remote server and then FTPed to the SR. Part two requires the FTPed data to be restored on the SR.
NOTE: Before restoring backup data to the SR, be sure you have enough space on the SR. Data that is restored to the SR will automatically include indexes.
Perform these steps on the remote server:
1. Load the *.gz file backup data on your remote server.
2. Log in to your FTP account.
3. FTP the backup data to the SR’s internal backup drive in the appropriate sub-directory: DAILY, WEEKLY, or MONTHLY.
On the SR Server’s Backup screen:
1. Click the Manual Restore button in the Internal Backup/ Restore Action frame to specify that you wish to over-write data on the live SR with data from the previous, internal backup run.
2. On the Confirm Backup/Restore screen, click the Yes button to restore database tables and indexes to the SR.
NOTE: The amount of time it will take to restore data to the SR depends on the combined size of all database tables being restored. M86 Security recommends that you do not perform other functions on the SR until the restoration is complete.
M86 SECURITY USER GUIDE
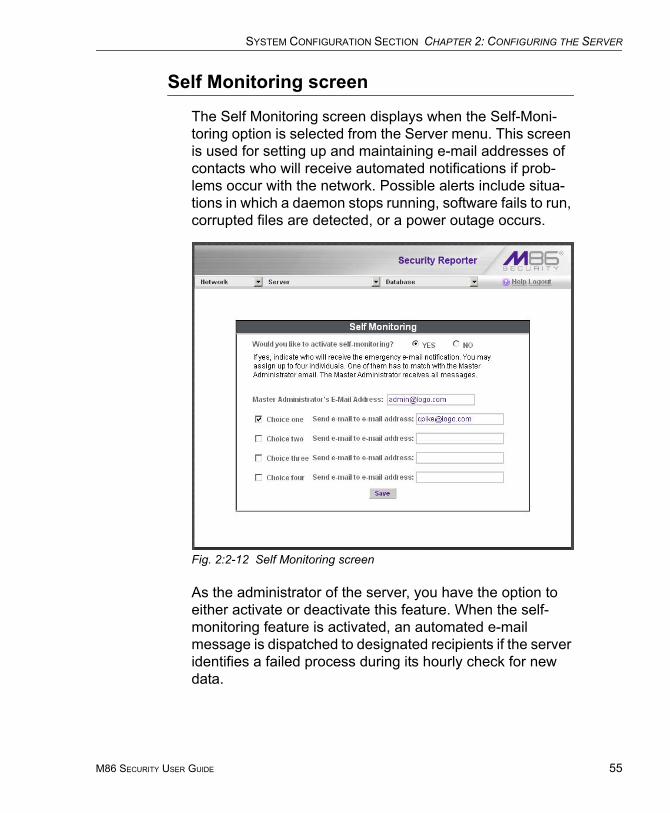
SYSTEM CONFIGURATION SECTION CHAPTER 2: CONFIGURING THE SERVER
Self Monitoring screen
The Self Monitoring screen displays when the Self-Moni-toring option is selected from the Server menu. This screen is used for setting up and maintaining e-mail addresses of contacts who will receive automated notifications if prob-lems occur with the network. Possible alerts include situa-tions in which a daemon stops running, software fails to run, corrupted files are detected, or a power outage occurs.
Fig. 2:2-12 Self Monitoring screen
As the administrator of the server, you have the option to either activate or deactivate this feature. When the self-monitoring feature is activated, an automated e-mail message is dispatched to designated recipients if the server identifies a failed process during its hourly check for new data.
M86 SECURITY USER GUIDE 55

SYSTEM CONFIGURATION SECTION CHAPTER 2: CONFIGURING THE SERVER
56
View a List of Contact E-Mail Addresses
If this feature is currently activated, the e-mail address of the Master Administrator displays on this screen, along with any other contacts set up as Choice one - four.
Set up and Activate Self-Monitoring
1. Click the radio button corresponding to YES.
2. Enter the Master Administrator’s E-Mail Address.
3. In the Send e-mail to e-mail address fields, enter at least one e-mail address of a person authorized to receive automated notifications. This can be the same address entered in the previous field. Entries in the three remaining fields are optional.
4. If e-mail addresses were entered in any of the four optional e-mail address fields, click in the Choice one - Choice four checkboxes corresponding to the e-mail address(es).
5. Click the Save button to activate self-monitoring.
Remove Recipient from E-mail Notification List
1. To stop sending emergency notifications to an e-mail address set up in the list, remove the check mark from the checkbox corresponding to the appropriate e-mail address.
2. Click the Save button to remove the recipient’s name from the e-mail list. The Master Administrator and any remaining e-mail addresses in the list will continue receiving notifications.
Deactivate Self-Monitoring
1. Click the radio button corresponding to NO.
2. Click the Save button to deactivate self-monitoring.
M86 SECURITY USER GUIDE
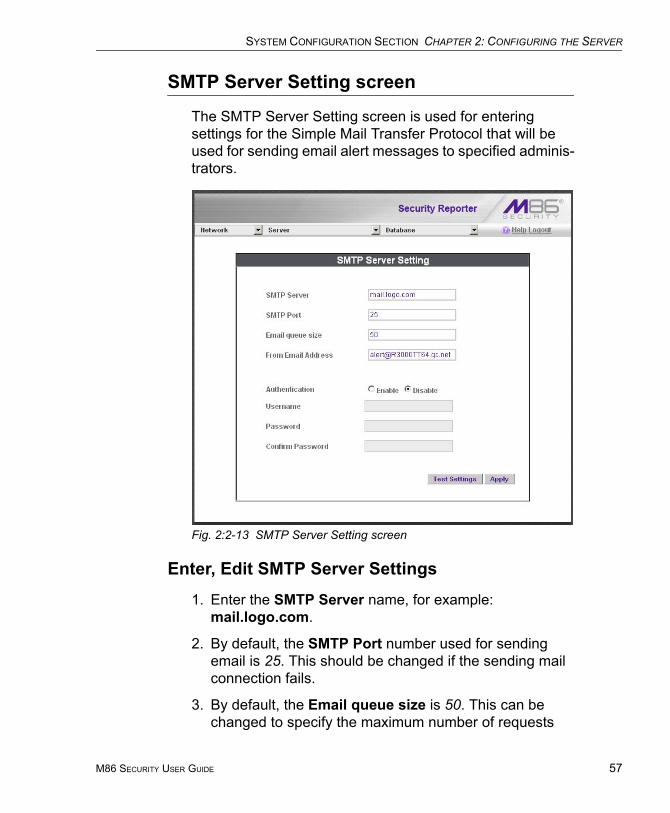
SYSTEM CONFIGURATION SECTION CHAPTER 2: CONFIGURING THE SERVER
SMTP Server Setting screen
The SMTP Server Setting screen is used for entering settings for the Simple Mail Transfer Protocol that will be used for sending email alert messages to specified adminis-trators.
Fig. 2:2-13 SMTP Server Setting screen
Enter, Edit SMTP Server Settings
1. Enter the SMTP Server name, for example: mail.logo.com.
2. By default, the SMTP Port number used for sending email is 25. This should be changed if the sending mail connection fails.
3. By default, the Email queue size is 50. This can be changed to specify the maximum number of requests
M86 SECURITY USER GUIDE 57
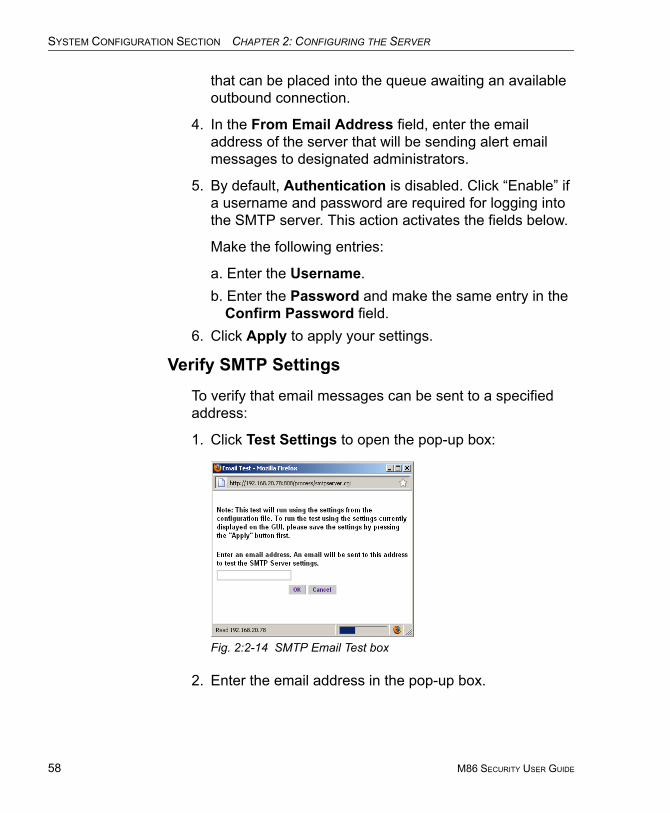
SYSTEM CONFIGURATION SECTION CHAPTER 2: CONFIGURING THE SERVER
58
that can be placed into the queue awaiting an available outbound connection.
4. In the From Email Address field, enter the email address of the server that will be sending alert email messages to designated administrators.
5. By default, Authentication is disabled. Click “Enable” if a username and password are required for logging into the SMTP server. This action activates the fields below.
Make the following entries:
a. Enter the Username.b. Enter the Password and make the same entry in the
Confirm Password field.6. Click Apply to apply your settings.
Verify SMTP Settings
To verify that email messages can be sent to a specified address:
1. Click Test Settings to open the pop-up box:
Fig. 2:2-14 SMTP Email Test box
2. Enter the email address in the pop-up box.
M86 SECURITY USER GUIDE
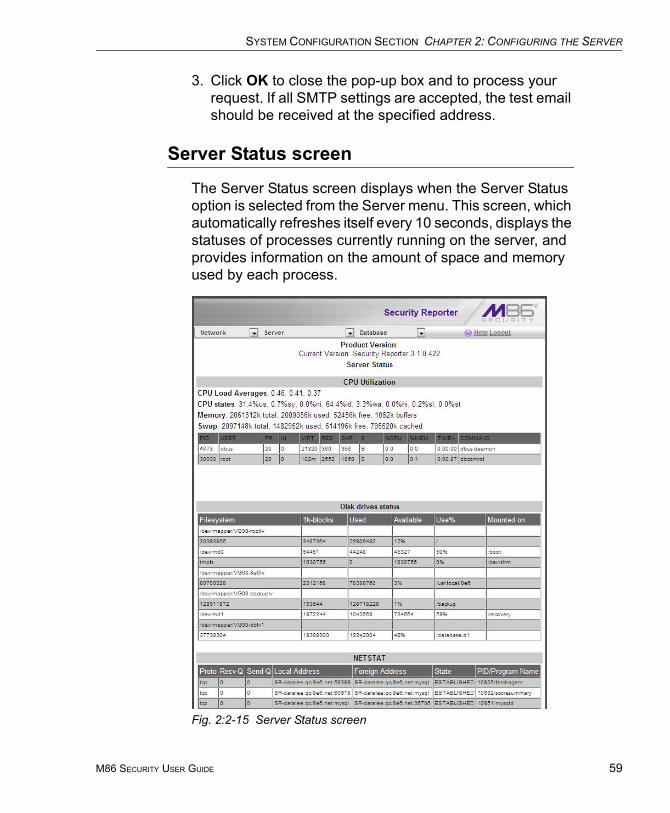
SYSTEM CONFIGURATION SECTION CHAPTER 2: CONFIGURING THE SERVER
3. Click OK to close the pop-up box and to process your request. If all SMTP settings are accepted, the test email should be received at the specified address.
Server Status screen
The Server Status screen displays when the Server Status option is selected from the Server menu. This screen, which automatically refreshes itself every 10 seconds, displays the statuses of processes currently running on the server, and provides information on the amount of space and memory used by each process.
Fig. 2:2-15 Server Status screen
M86 SECURITY USER GUIDE 59
SYSTEM CONFIGURATION SECTION CHAPTER 2: CONFIGURING THE SERVER
60
View the Status of the SR Server
The Product Version number of the software displays at the top of the screen, along with the date that software version was implemented. Status information displays in the following sections of this screen:
• CPU Utilization - includes CPU process data and infor-mation on the status of the top command
• Disk drives status - provides data on the status of each drive of the operating system
• NETSTAT - displays the status of a local IP address
M86 SECURITY USER GUIDE
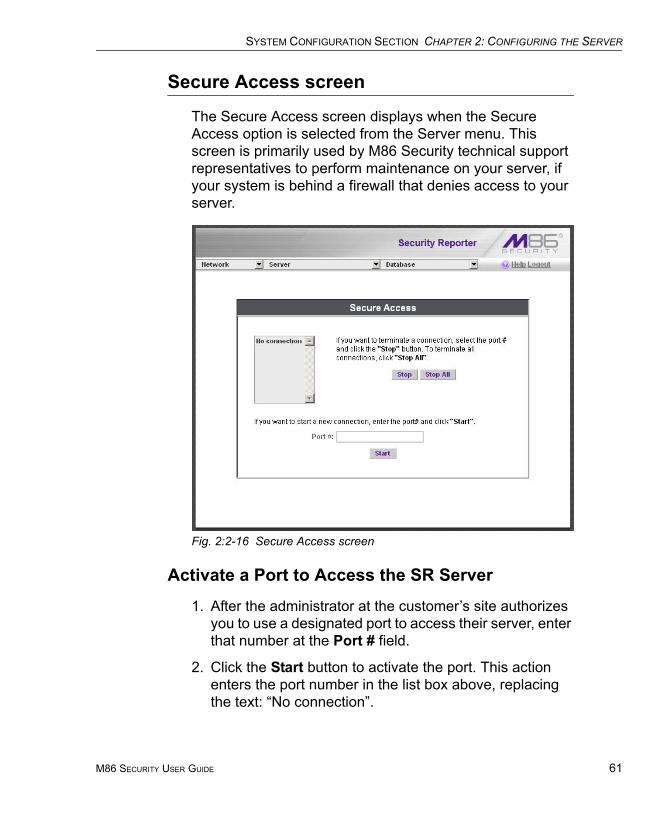
SYSTEM CONFIGURATION SECTION CHAPTER 2: CONFIGURING THE SERVER
Secure Access screen
The Secure Access screen displays when the Secure Access option is selected from the Server menu. This screen is primarily used by M86 Security technical support representatives to perform maintenance on your server, if your system is behind a firewall that denies access to your server.
Fig. 2:2-16 Secure Access screen
Activate a Port to Access the SR Server
1. After the administrator at the customer’s site authorizes you to use a designated port to access their server, enter that number at the Port # field.
2. Click the Start button to activate the port. This action enters the port number in the list box above, replacing the text: “No connection”.
M86 SECURITY USER GUIDE 61
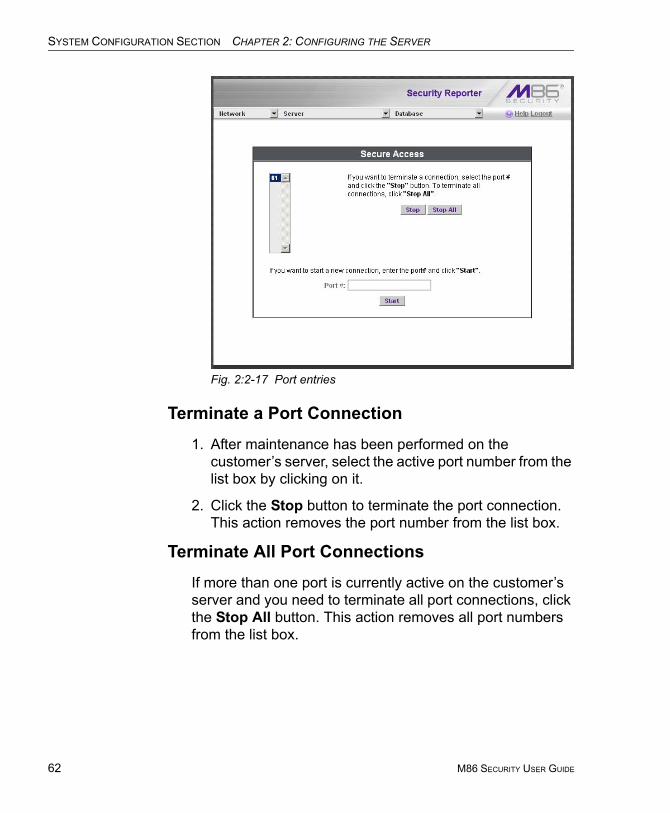
SYSTEM CONFIGURATION SECTION CHAPTER 2: CONFIGURING THE SERVER
62
Fig. 2:2-17 Port entries
Terminate a Port Connection
1. After maintenance has been performed on the customer’s server, select the active port number from the list box by clicking on it.
2. Click the Stop button to terminate the port connection. This action removes the port number from the list box.
Terminate All Port Connections
If more than one port is currently active on the customer’s server and you need to terminate all port connections, click the Stop All button. This action removes all port numbers from the list box.
M86 SECURITY USER GUIDE

SYSTEM CONFIGURATION SECTION CHAPTER 2: CONFIGURING THE SERVER
Software Update screen
The Software Update screen displays when the Software Update option is selected from the Server menu. This screen is used for updating the SR with software updates supplied by M86 Security, verifying the download and/or installation of software updates on the SR, and viewing a list of software updates currently available and/or previously installed on the SR. This screen is also used for accepting LA/Beta software downloads, if choosing to download Limited Availability (LA) and/or Beta updates for previewing software features to be included in the General Availability (GA) release to be distributed to all SRs.
Fig. 2:2-18 Software Update screen
M86 SECURITY USER GUIDE 63
SYSTEM CONFIGURATION SECTION CHAPTER 2: CONFIGURING THE SERVER
64
NOTE: Definitions for Software Update Types (GA, LA, and Beta) are provided in the frame at the bottom of this screen. General Availability (GA) software updates are supplied to all current SR units. Limited Availability (LA) and/or Beta software updates are available to SR units that have the feature to download LA and/or Beta software updates enabled, as described in this sub-section and the Software Update Setting screen sub-section.
View Software Update Criteria
View Installed Software Updates
Information about software updates previously installed on the server displays in the SR Software Update History frame. For each installed software update, the following displays: Date installed (YYYY/MM/DD); software update Name; Type of update (GA, LA, or Beta), and Description.
View Available Software Updates
NOTE: The SR Software Updates frame displays only if there is at least one software update available to install.
Any software update available for installation on the SR server displays in the SR Software Updates frame. The following information is included for each software update: Date the software update was made available (YYYY/MM/DD); software update Name; Type of update (GA, LA, or Beta), and Description (software version number and Prerequisite software version for installing the software update).
The Apply Now and README buttons display beneath the software update Name. (See Install a Software Update for information about these buttons.)
M86 SECURITY USER GUIDE

SYSTEM CONFIGURATION SECTION CHAPTER 2: CONFIGURING THE SERVER
Install a Software UpdateWARNING: All software updates must be installed in order from oldest to newest.
NOTE: Be sure to terminate all reports that are currently running or are scheduled to run before applying a software update, and that port 8084 is open on your network.
General Software Installation Procedures
The steps in this sub-section pertain to the installation of General Availability software updates, and the application of LA/Beta software updates following the initial LA/Beta software download acceptance procedures (described in First Time LA/Beta Software Install Procedures).
In the SR Software Updates frame (see Fig. 2:2-18), two buttons are available: README and Apply Now.
README:
1. Click README to open a pop-up box containing informa-tion about the software release:
Fig. 2:2-19 Readme box
2. After reading the contents of the software release, click Close to close the pop-up box.
M86 SECURITY USER GUIDE 65

SYSTEM CONFIGURATION SECTION CHAPTER 2: CONFIGURING THE SERVER
66
Apply Now:
1. Click Apply Now to open a dialog box containing infor-mation about the software release:
Fig. 2:2-20 Software update dialog box
2. Click Yes to open the EULA dialog box:
Fig. 2:2-21 EULA dialog box
M86 SECURITY USER GUIDE

SYSTEM CONFIGURATION SECTION CHAPTER 2: CONFIGURING THE SERVER
3. After reading the contents of the End User License Agreement, click Yes if you agree to its terms. This action closes the EULA dialog box and begins the soft-ware update application process, launching a pop-up box showing the progress of the software installation.
A successful software installation displays a completion message with notification that the Software Update screen needs to be refreshed via Server > Software Update in order to display the latest software update in the SR Software Update History frame:
Fig. 2:2-22 Software installation progress box
NOTE: After installing the software update, if a message displays that informs you to reboot the server, you should select the Restart Software option on the Shut Down screen.
M86 SECURITY USER GUIDE 67
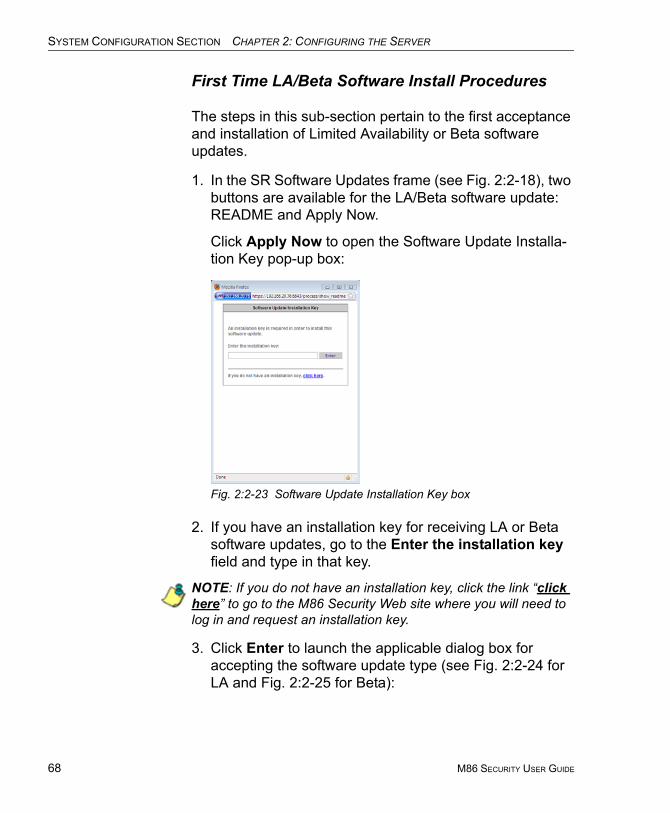
SYSTEM CONFIGURATION SECTION CHAPTER 2: CONFIGURING THE SERVER
68
First Time LA/Beta Software Install Procedures
The steps in this sub-section pertain to the first acceptance and installation of Limited Availability or Beta software updates.
1. In the SR Software Updates frame (see Fig. 2:2-18), two buttons are available for the LA/Beta software update: README and Apply Now.
Click Apply Now to open the Software Update Installa-tion Key pop-up box:
Fig. 2:2-23 Software Update Installation Key box
2. If you have an installation key for receiving LA or Beta software updates, go to the Enter the installation key field and type in that key.
NOTE: If you do not have an installation key, click the link “click here” to go to the M86 Security Web site where you will need to log in and request an installation key.
3. Click Enter to launch the applicable dialog box for accepting the software update type (see Fig. 2:2-24 for LA and Fig. 2:2-25 for Beta):
M86 SECURITY USER GUIDE

SYSTEM CONFIGURATION SECTION CHAPTER 2: CONFIGURING THE SERVER
Fig. 2:2-24 LA software acceptance box
Fig. 2:2-25 Beta software acceptance box
4. Read the description for the software type to be installed (LA or Beta), and then click the checkbox corresponding to “I understand and wish to proceed”.
5. Click Yes to close the software acceptance dialog box and to open the End User License Agreement dialog (see Fig. 2:2-21).
M86 SECURITY USER GUIDE 69
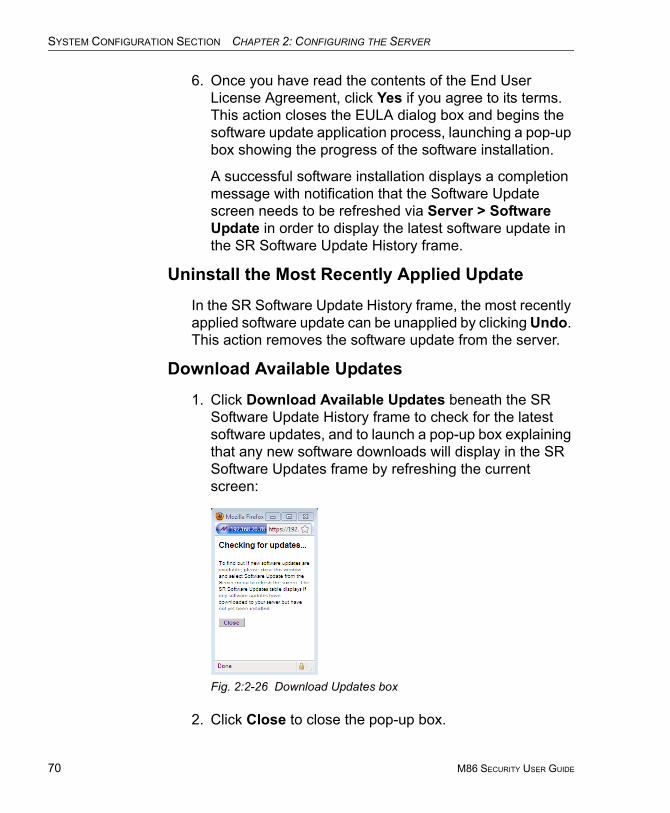
SYSTEM CONFIGURATION SECTION CHAPTER 2: CONFIGURING THE SERVER
70
6. Once you have read the contents of the End User License Agreement, click Yes if you agree to its terms. This action closes the EULA dialog box and begins the software update application process, launching a pop-up box showing the progress of the software installation.
A successful software installation displays a completion message with notification that the Software Update screen needs to be refreshed via Server > Software Update in order to display the latest software update in the SR Software Update History frame.
Uninstall the Most Recently Applied Update
In the SR Software Update History frame, the most recently applied software update can be unapplied by clicking Undo. This action removes the software update from the server.
Download Available Updates
1. Click Download Available Updates beneath the SR Software Update History frame to check for the latest software updates, and to launch a pop-up box explaining that any new software downloads will display in the SR Software Updates frame by refreshing the current screen:
Fig. 2:2-26 Download Updates box
2. Click Close to close the pop-up box.
M86 SECURITY USER GUIDE
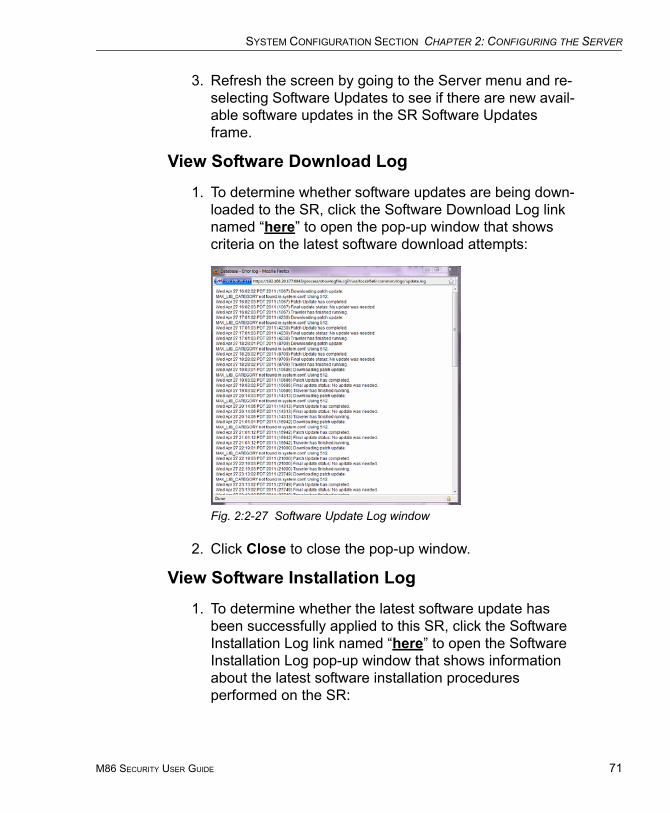
SYSTEM CONFIGURATION SECTION CHAPTER 2: CONFIGURING THE SERVER
3. Refresh the screen by going to the Server menu and re-selecting Software Updates to see if there are new avail-able software updates in the SR Software Updates frame.
View Software Download Log
1. To determine whether software updates are being down-loaded to the SR, click the Software Download Log link named “here” to open the pop-up window that shows criteria on the latest software download attempts:
Fig. 2:2-27 Software Update Log window
2. Click Close to close the pop-up window.
View Software Installation Log
1. To determine whether the latest software update has been successfully applied to this SR, click the Software Installation Log link named “here” to open the Software Installation Log pop-up window that shows information about the latest software installation procedures performed on the SR:
M86 SECURITY USER GUIDE 71

SYSTEM CONFIGURATION SECTION CHAPTER 2: CONFIGURING THE SERVER
72
Fig. 2:2-28 Software Installation Log window
2. After viewing the contents of this window, click Close to close this window.
M86 SECURITY USER GUIDE
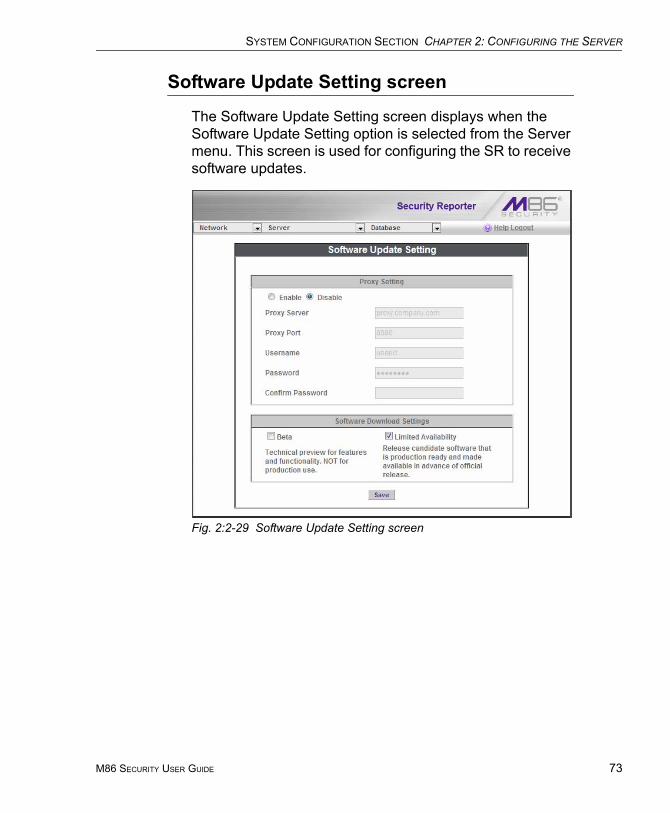
SYSTEM CONFIGURATION SECTION CHAPTER 2: CONFIGURING THE SERVER
Software Update Setting screen
The Software Update Setting screen displays when the Software Update Setting option is selected from the Server menu. This screen is used for configuring the SR to receive software updates.
Fig. 2:2-29 Software Update Setting screen
M86 SECURITY USER GUIDE 73
SYSTEM CONFIGURATION SECTION CHAPTER 2: CONFIGURING THE SERVER
74
Specify Proxy Settings
1. In the Proxy Setting frame, by default “Disable” is selected. Click “Enable” if the server is in a proxy server environment.
2. In the Proxy Server field, enter the host name of the proxy server.
3. In the Proxy Port field, enter the port number of the proxy server.
4. In the Username field, enter the username for the proxy account.
5. Enter the same password in the Password and Confirm Password fields.
TIP: When you are finished making edits to this screen, click Save to save your settings.
Download LA, Beta Software Updates
The Software Download Settings frame is used for speci-fying whether or not this SR will receive Limited Availability (LA) and/or Beta software updates that provide previews of software features currently being tested prior to the General Availability software release.
Enable LA Software Downloads
By default, the “Limited Availability” checkbox is enabled, indicating this SR will receive software updates recom-mended for use in a production environment only. With this feature enabled, the latest LA software update will automat-ically download and be available via the SR Software Updates table in the Software Update screen.
If this SR does not have the “Limited Availability” checkbox enabled, click the “Limited Availability” checkbox.
M86 SECURITY USER GUIDE
SYSTEM CONFIGURATION SECTION CHAPTER 2: CONFIGURING THE SERVER
Enable Beta Software Downloads
Click the “Beta” checkbox to enable this SR to receive Beta software updates on an SR used in a non-production envi-ronment.
Save Settings
Click Save to save your settings.
M86 SECURITY USER GUIDE 75
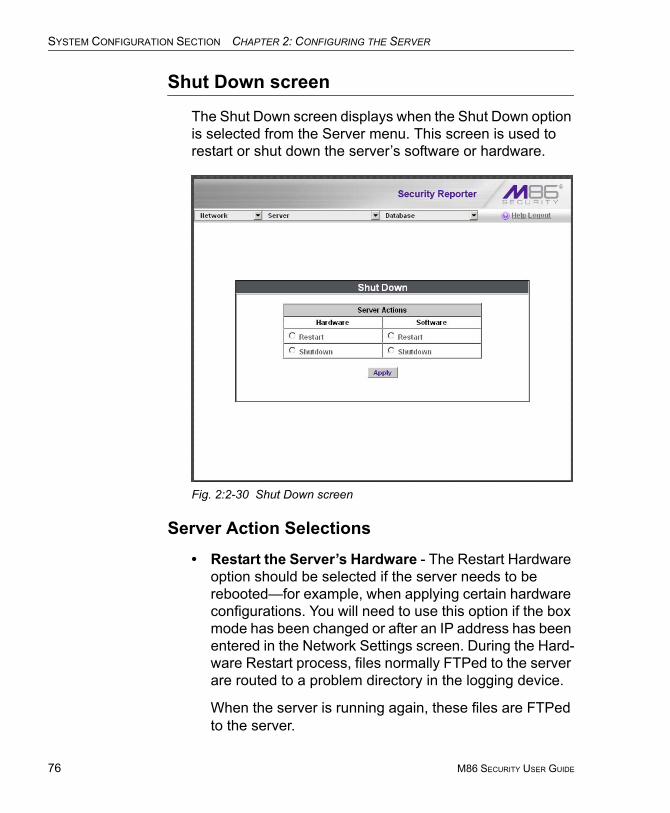
SYSTEM CONFIGURATION SECTION CHAPTER 2: CONFIGURING THE SERVER
76
Shut Down screen
The Shut Down screen displays when the Shut Down option is selected from the Server menu. This screen is used to restart or shut down the server’s software or hardware.
Fig. 2:2-30 Shut Down screen
Server Action Selections
• Restart the Server’s Hardware - The Restart Hardware option should be selected if the server needs to be rebooted—for example, when applying certain hardware configurations. You will need to use this option if the box mode has been changed or after an IP address has been entered in the Network Settings screen. During the Hard-ware Restart process, files normally FTPed to the server are routed to a problem directory in the logging device.
When the server is running again, these files are FTPed to the server.
M86 SECURITY USER GUIDE
SYSTEM CONFIGURATION SECTION CHAPTER 2: CONFIGURING THE SERVER
• Shut Down the Server’s Hardware - The Shutdown Hardware option should only be selected if the server’s hardware must be completely shut down—for example, if the server will be physically relocated. When this option is selected, the server shuts off, and files normally FTPed to the server will be routed to a problem directory in the logging device. When the server is rebooted, these files will be FTPed to the server.
• Restart the Server’s Software - The Restart Software option should be selected if daemons fail to run and/or the database needs to be started again. When this option is selected, the MySQL database is rebooted.
• Shut Down the Server’s Software - The Shutdown Software option should be selected if the MySQL data-base needs to be shut off and no files FTPed to the server.
Perform a Server Action
1. Click the radio button corresponding to the Server Action you wish to execute.
2. Click the Apply button to display the warning screen.
3. To proceed with your selection, click the RESTART or SHUTDOWN button on the warning screen. To change your selection, select the Shutdown from the Server menu again to return to the Shut Down screen.
NOTE: When the Restart Software option is selected, the server will take five to 10 minutes to reboot. After this time, you can go to another screen or log off.
M86 SECURITY USER GUIDE 77

SYSTEM CONFIGURATION SECTION CHAPTER 2: CONFIGURING THE SERVER
78
Report Manager screen
The Report Manager screen displays when the Report Manager option is selected from the Server menu. This screen is used for enabling specified features on the reporting side of the application.
Fig. 2:2-31 Report Manager screen
Restart the Report Manager
1. In the Restart Report Manager frame, click Restart to restart the Report Manager application.
As a result of this action, a screen displays with the following message: “The Report Manager will restart in a few minutes.”
2. Click OK to return to the Report Manager screen.
M86 SECURITY USER GUIDE
SYSTEM CONFIGURATION SECTION CHAPTER 2: CONFIGURING THE SERVER
Enable/Disable the Report Manager Scheduler
1. In the Enable/Disable Report Manager Scheduler frame, click the appropriate radio button to specify whether or not to automatically run scheduled reports:
• “ON” - Choose this option to let the Report Manager automatically run scheduled reports.
• “OFF” - Choose this option if you do not want the Report Manager to run scheduled reports.
2. Click Apply.
3. Click Restart to restart the Report Manager application.
M86 SECURITY USER GUIDE 79
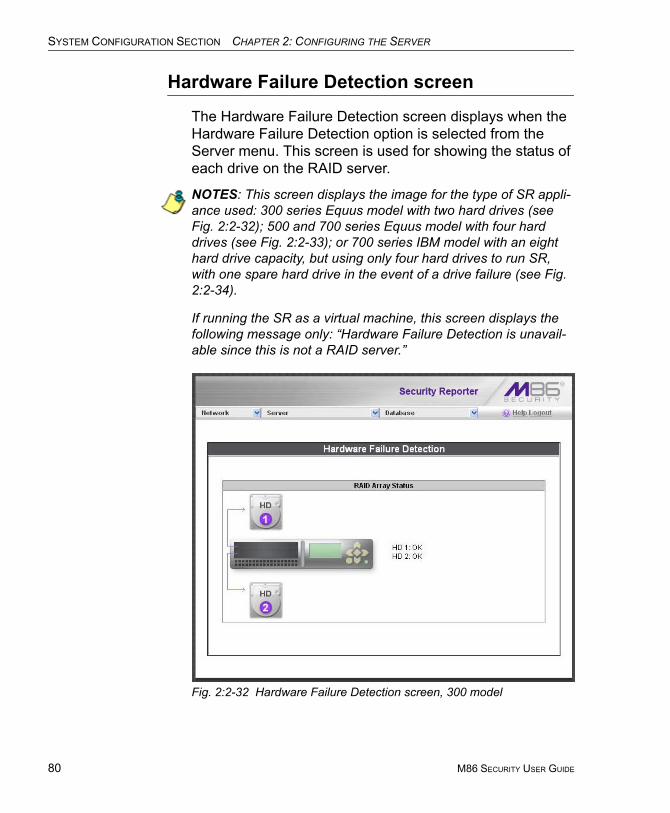
SYSTEM CONFIGURATION SECTION CHAPTER 2: CONFIGURING THE SERVER
80
Hardware Failure Detection screen
The Hardware Failure Detection screen displays when the Hardware Failure Detection option is selected from the Server menu. This screen is used for showing the status of each drive on the RAID server.
NOTES: This screen displays the image for the type of SR appli-ance used: 300 series Equus model with two hard drives (see Fig. 2:2-32); 500 and 700 series Equus model with four hard drives (see Fig. 2:2-33); or 700 series IBM model with an eight hard drive capacity, but using only four hard drives to run SR, with one spare hard drive in the event of a drive failure (see Fig. 2:2-34).
If running the SR as a virtual machine, this screen displays the following message only: “Hardware Failure Detection is unavail-able since this is not a RAID server.”
Fig. 2:2-32 Hardware Failure Detection screen, 300 model
M86 SECURITY USER GUIDE
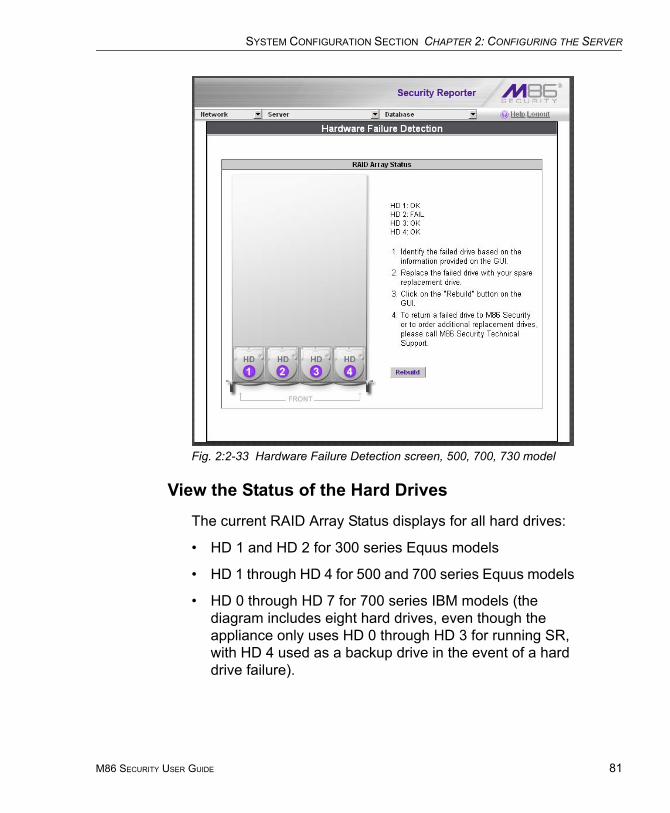
SYSTEM CONFIGURATION SECTION CHAPTER 2: CONFIGURING THE SERVER
Fig. 2:2-33 Hardware Failure Detection screen, 500, 700, 730 model
View the Status of the Hard Drives
The current RAID Array Status displays for all hard drives:
• HD 1 and HD 2 for 300 series Equus models
• HD 1 through HD 4 for 500 and 700 series Equus models
• HD 0 through HD 7 for 700 series IBM models (the diagram includes eight hard drives, even though the appliance only uses HD 0 through HD 3 for running SR, with HD 4 used as a backup drive in the event of a hard drive failure).
M86 SECURITY USER GUIDE 81
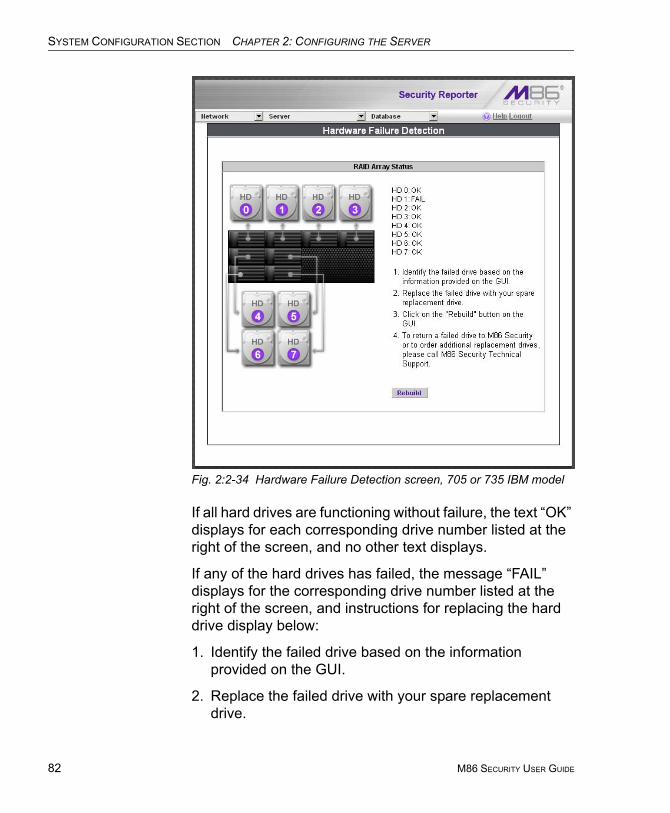
SYSTEM CONFIGURATION SECTION CHAPTER 2: CONFIGURING THE SERVER
82
Fig. 2:2-34 Hardware Failure Detection screen, 705 or 735 IBM model
If all hard drives are functioning without failure, the text “OK” displays for each corresponding drive number listed at the right of the screen, and no other text displays.
If any of the hard drives has failed, the message “FAIL” displays for the corresponding drive number listed at the right of the screen, and instructions for replacing the hard drive display below:
1. Identify the failed drive based on the information provided on the GUI.
2. Replace the failed drive with your spare replacement drive.
M86 SECURITY USER GUIDE
SYSTEM CONFIGURATION SECTION CHAPTER 2: CONFIGURING THE SERVER
3. Click on the “Rebuild” button on the GUI.
4. To return a failed drive to M86 or to order additional replacement drives, please call M86 Technical Support.
NOTE: For information on troubleshooting RAID, refer to Appendix B: RAID and Hardware Maintenance.
Database MenuThe Database pull-down menu includes options for config-uring the database. These options are: IP.ID (for Web Filter), Elapsed Time, Page Definition, Tools, Expiration, Optional Features, and User Group Import (for Web Filter).
User Name Identification screen
If using a Web Filter with this SR, the User Name Identifica-tion screen displays when the IP.ID option is selected from the Database menu. This screen is used for configuring the server to identify users based on the IP addresses of their machines, their usernames, and/or their machine names. Information set up on this screen is used by the Report Manager when logging a user’s Internet activity.
M86 SECURITY USER GUIDE 83
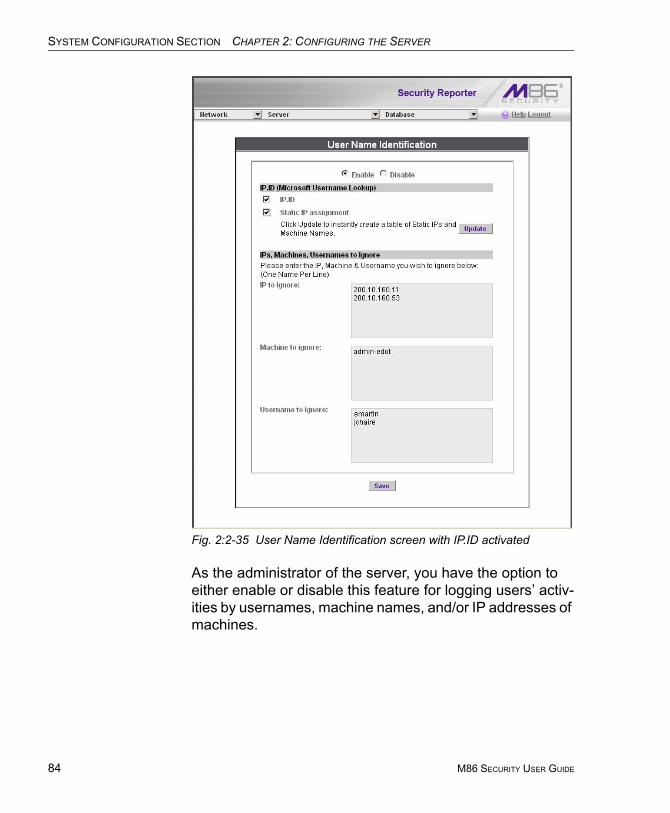
SYSTEM CONFIGURATION SECTION CHAPTER 2: CONFIGURING THE SERVER
84
Fig. 2:2-35 User Name Identification screen with IP.ID activated
As the administrator of the server, you have the option to either enable or disable this feature for logging users’ activ-ities by usernames, machine names, and/or IP addresses of machines.
M86 SECURITY USER GUIDE
SYSTEM CONFIGURATION SECTION CHAPTER 2: CONFIGURING THE SERVER
WARNINGS
The SR will generate NetBIOS requests outside the network if IP.ID is activated and if no segment settings have been specified in the configuration of the Web access logging device—causing it to log external traffic. To resolve this issue, the Web access logging device should be modified to log activity only within the network. If a firewall is used, it should be set up to prevent logging NetBIOS requests outside the network.
NOTE: Depending on the type of Web access logging device you are using, there may not be a configuration parameter for segment settings.
Be sure the time zone specified for the SR is the same for each Web access logging device the SR uses. Failure in executing this setup will cause inconsistencies when users’ logging times are reported, especially if IP.ID is activated. If multiple Web access logging devices are used, be sure to identify the subnets assigned to each of these devices, as users cannot be tracked solely by IP address.
If using IP.ID, note that user login times are established for set periods of 15 minutes, and if more than one user logs onto the same machine during that time period, the activity on that machine will be identified with the first user who logged onto that machine. For example, the first user logs on a machine for three minutes and then logs off. The second user logs on the same machine for 11 minutes and then logs off. The first user logs back on that machine for 16 minutes. All 30 minutes are logged as the first user’s activity.
M86 SECURITY USER GUIDE 85
SYSTEM CONFIGURATION SECTION CHAPTER 2: CONFIGURING THE SERVER
86
View the User Name Identification screen
If user name identification is enabled, specified IP.ID criteria displays, and IP, Machine, and Username frames will be populated if entries were previously made in them.
NOTE: If this feature is disabled, checkboxes in the IP.ID (Microsoft Username Lookup) section display greyed-out.
Configure the Server to Log User Activity
1. In the area above the IP.ID (Microsoft Username Lookup) section of the screen, click the radio button corresponding to Enable. This action opens an alert box informing you that if usernames are enabled, these user-names will overwrite those that are being imported from the shadow log.
2. Click OK to close the alert box, and to activate the IP.ID and Static IP assignment checkboxes.
3. in the IP.ID (Microsoft Username Lookup) section of the screen, select one or both of the following options by clicking in the designated checkbox(es):
• IP.ID - this option logs a user’s activity by username (login ID).
• Static IP assignment - this option logs a user’s activity by the IP address of the machine used. When selecting this option, the Update button becomes acti-vated.a. Click the Update button to automatically generate
a table of static IP addresses and machine names. After this table is created, the message screen displays to confirm the successful execution of this task.
b. Click the Back button to return to the User Name Identification screen.
M86 SECURITY USER GUIDE
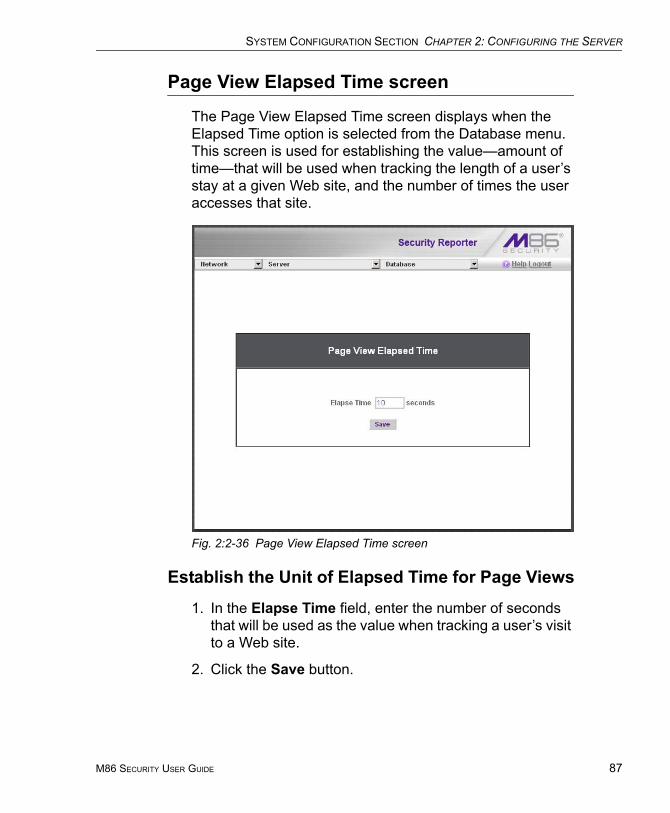
SYSTEM CONFIGURATION SECTION CHAPTER 2: CONFIGURING THE SERVER
Page View Elapsed Time screen
The Page View Elapsed Time screen displays when the Elapsed Time option is selected from the Database menu. This screen is used for establishing the value—amount of time—that will be used when tracking the length of a user’s stay at a given Web site, and the number of times the user accesses that site.
Fig. 2:2-36 Page View Elapsed Time screen
Establish the Unit of Elapsed Time for Page Views
1. In the Elapse Time field, enter the number of seconds that will be used as the value when tracking a user’s visit to a Web site.
2. Click the Save button.
M86 SECURITY USER GUIDE 87
SYSTEM CONFIGURATION SECTION CHAPTER 2: CONFIGURING THE SERVER
88
Elapsed Time Rules
Each time a user on the network accesses a Web site, this activity is logged as one or more visit(s) to that site. The amount of time a user spends on that site and the number of times he/she accesses that site is tracked according to the following rules:
• A user will be logged as having visited a Web site one time if the amount of time spent on any pages at that site is equivalent to the value entered at the Elapse Time field, or less than that value.
For example, if the value entered at the Elapse Time field is 10 seconds, and if the user is at a site between one to 10 seconds—on the same page or on any other page within the same site—the user’s activity will be tracked as one visit to that Web site.
• Each time the user exceeds the value entered at the Elapse Time field, the user will be tracked as having visited the site an additional time.
For example, if the value entered at the Elapse Time field is 10 seconds and the user remains at a Web site for 12 seconds, two visits to that site will be logged for him/her.
• Each session at a Web site is tracked as one or more visit(s), depending on the duration of the session. A session is defined as a user’s activity at a site that begins when the user accesses the site and ends when the user exits the site.
For example, if the value entered at the Elapse Time field is 10 seconds and the user spends five seconds on a Web site, then exits, then returns to the same site for another 15 seconds, the user will have two sessions or three visits to that site logged for him/her (5 seconds = 1 visit, 15 seconds = 2 visits, for a total of 3 visits).
M86 SECURITY USER GUIDE
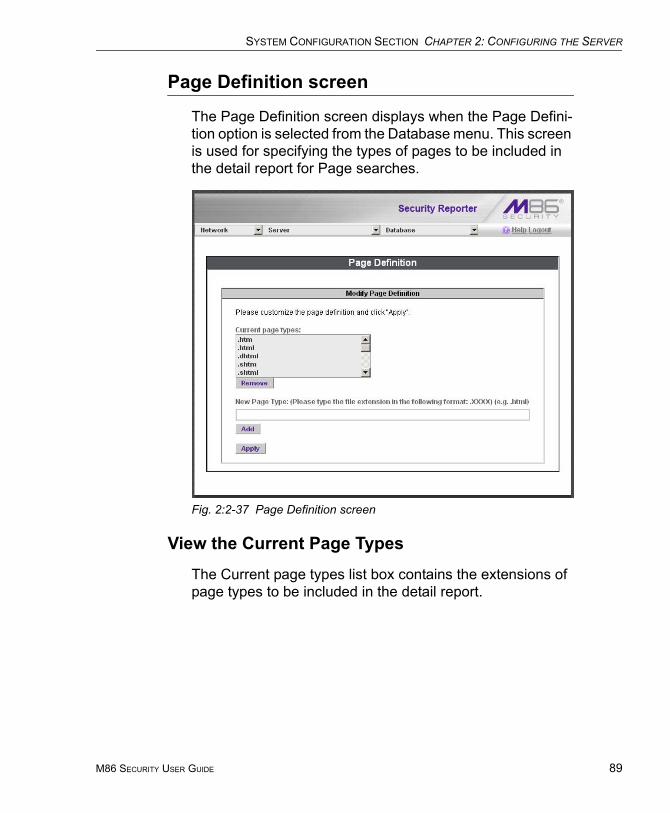
SYSTEM CONFIGURATION SECTION CHAPTER 2: CONFIGURING THE SERVER
Page Definition screen
The Page Definition screen displays when the Page Defini-tion option is selected from the Database menu. This screen is used for specifying the types of pages to be included in the detail report for Page searches.
Fig. 2:2-37 Page Definition screen
View the Current Page Types
The Current page types list box contains the extensions of page types to be included in the detail report.
M86 SECURITY USER GUIDE 89
SYSTEM CONFIGURATION SECTION CHAPTER 2: CONFIGURING THE SERVER
90
Remove a Page Type
To remove a page type from the detail report:
1. Select the page extension from the Current page types list box.
2. Click Remove.
3. Click Apply.
Add a Page Type
To add a page type in the detail report:
1. Enter the New Page Type extension.
2. Click Add to include the extension in the Current page types list box.
3. Click Apply.
M86 SECURITY USER GUIDE

SYSTEM CONFIGURATION SECTION CHAPTER 2: CONFIGURING THE SERVER
Tools screen
The Tools screen displays when the Tools option is selected from the Database menu. This screen is used for viewing reports and logs to help you troubleshoot problems with the Report Manager application.
Fig. 2:2-38 Tools screen
The following options are available on this screen:
• View Diagnostic Reports
• View Database Status Logs
• Technical Support Report Package
M86 SECURITY USER GUIDE 91
SYSTEM CONFIGURATION SECTION CHAPTER 2: CONFIGURING THE SERVER
92
View Diagnostic Reports
1. Choose a report from the pull-down menu (Table Status, Process List, Full Process List, Tables, or Daily Summary).
2. Click the View button to view the selected diagnostic report in a pop-up window:
• Table Status - This report contains a list of Client table names, and columns of statistics on each table, such as type, size, number of rows, and time created and updated.
• Process List - This report shows a list of current SQL queries in the database, in an abbreviated format.
• Full Process List - This report shows a list of current SQL queries in the database, in the full format that includes all columns of data.
• Tables - This report contains a list of the names of tables currently in the database.
• Daily Summary - This report shows the date range of summary tables currently in the database.
3. Click the “X” in the upper right corner of the pop-up window to close the window.
View Database Status Logs
1. Choose a database status log from the pull-down menu.
2. Click the View button to view the selected database status log in a pop-up window:
• db Active (for Web Filter) - This log indicates when client tables were last updated with hits_objects and hits_pages.
• db Backup - This log provides information about the MySQL backup/restore operation.
M86 SECURITY USER GUIDE

SYSTEM CONFIGURATION SECTION CHAPTER 2: CONFIGURING THE SERVER
• db Control (for Web Filter) - This log shows a list of actions performed by the SR process when processing log files.
• db Identify (for Web Filter) - This log provides informa-tion about the server’s action of obtaining user/machine names from name log files and populating the database with these names.
• db Logloader (for Web Filter) - This log provides infor-mation about log file parsing and the number of valid and invalid records that are processed.
• db Nbtlookup (for Web Filter) - This log provides a list of user/machine IP addresses from the NetBIOS lookup.
• db Split (for Web Filter) - This log contains information pertaining to the formation of the hits_objects/hits_pages tables.
• db Staticip (for Web Filter) - This log provides infor-mation about settings on the server for the static IP assignment option.
• db Summary - This log shows a summarization of activities from the dbsummary database tool.
• db Support (for Web Filter) - This log includes a list of temporary tables that were created for the formation of the hits tables.
• db Tool - This log shows information about system checks performed on disk usage, free memory, unprocessed files, and daemons.
• db Traffic - This log provides information about the daily traffic table.
• Error Entry - Web Filter (for Web Filter) - This log displays a list of Web Filter query errors.
• File Watch Log (for Web Filter) - This log shows a list of records that were imported from one machine to another.
M86 SECURITY USER GUIDE 93
SYSTEM CONFIGURATION SECTION CHAPTER 2: CONFIGURING THE SERVER
94
• MYSQL Log - This log provides information pertaining to the MySQL server.
• Partitioner Log - This displays results of server parti-tioning for database expiration.
• Software Installation Log - This log gives information about the most recently applied software update.
• Software Download Log - This log gives information about recent software updates that have downloaded to this SR.
• Vsimporter (for SWG) - This log displays results of SWG archive log importation.
3. Click the “X” in the upper right corner of the pop-up window to close the window.
Generate Technical Support Report Package
When troubleshooting the SR unit with M86 Security Tech-nical Support, a diagnostic report can be generated and submitted to M86 Security for further analysis. This report contains files with information about the ‘health’ of the unit.
1. At the Techncal Support Report Package field, click Generate to begin generating the report package.
2. After the package has generated, the “Successfully generated tech support log” pop-up window opens with the message: “Please download the file to email to M86 tech support.” Click Download to download the .tgz package to your machine.
3. Email the package to M86 Technical Support as instructed by your M86 technical support representative.
M86 SECURITY USER GUIDE
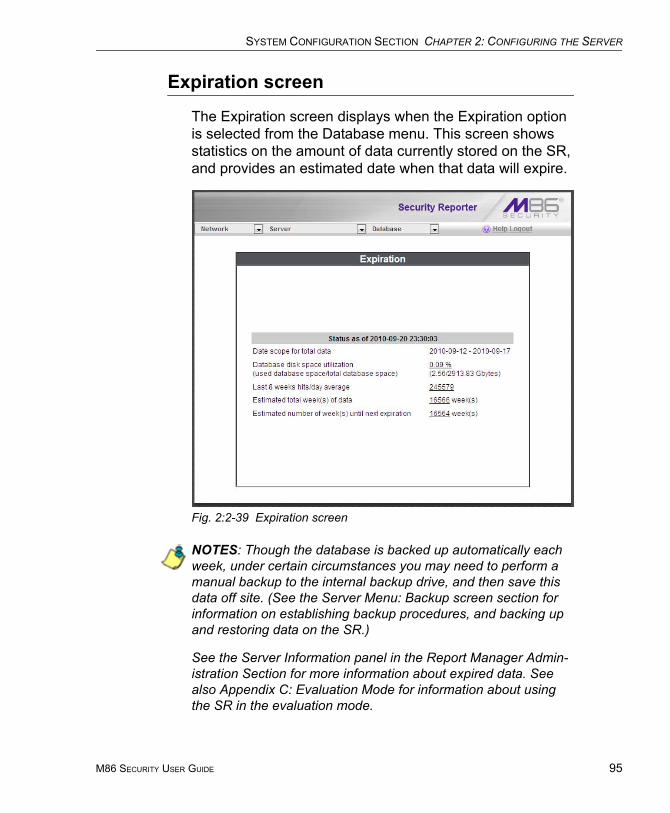
SYSTEM CONFIGURATION SECTION CHAPTER 2: CONFIGURING THE SERVER
Expiration screen
The Expiration screen displays when the Expiration option is selected from the Database menu. This screen shows statistics on the amount of data currently stored on the SR, and provides an estimated date when that data will expire.
Fig. 2:2-39 Expiration screen
NOTES: Though the database is backed up automatically each week, under certain circumstances you may need to perform a manual backup to the internal backup drive, and then save this data off site. (See the Server Menu: Backup screen section for information on establishing backup procedures, and backing up and restoring data on the SR.)
See the Server Information panel in the Report Manager Admin-istration Section for more information about expired data. See also Appendix C: Evaluation Mode for information about using the SR in the evaluation mode.
M86 SECURITY USER GUIDE 95
SYSTEM CONFIGURATION SECTION CHAPTER 2: CONFIGURING THE SERVER
96
Expiration Rules
The server calculates the maximum number of weeks of data it can store, based on the storage capacity of the hard drive and the average number of end user hits per day within the last eight weeks.
Each night at 11:30 p.m., the server checks to see if it will soon be running out of storage capacity—by finding the week with the highest end user hit activity and assuming this may be the trend for future end user activity—then deter-mines whether it will have enough storage space for the current week and the following week.
If the server anticipates it may run out of allocated data storage space by the next week, the oldest week’s data (Sunday through Saturday period) stored on the server is expired—i.e. deleted from the database.
Once data expires, it cannot be recovered.
WARNING: Storage capacity maintenance is performed each evening between 11:30 p.m. and midnight. During this period, the database will be locked.
M86 SECURITY USER GUIDE
SYSTEM CONFIGURATION SECTION CHAPTER 2: CONFIGURING THE SERVER
View Data Storage Statistics
In the Status section of this screen, the date and time of the last database expiration check displays in the Status bar. The date displays in the YYYY-MM-DD format, and the time displays in military time (01-24 hours) using the HH:MM:SS time format.
NOTE: The Status date and time does not display if the server is newly installed or has been reset to factory default settings. (See Reset to Factory Defaults panel in Chapter 2 of the Report Manager Administration Section for information about resetting the server to factory default settings.)
The following data that displays is current as of the most recent database expiration check:
• Date scope for total data - the first line in this field displays the range of weeks of data stored on the server, represented in the YYYY-MM-DD - YYYY-MM-DD format.
NOTE: If the server has not yet expired any data, the first date and time in the range is represented by “0” (zeroes).
• Database disk space utilization - the percentage of space currently being used on the hard drive for data storage.
• (used database space/total database space) - the amount of space in Gigabytes currently being used on the hard drive for data storage, and the total amount of space in Gigabytes (Gbytes) on the hard drive allocated to database storage.
• Last 8 weeks hits/day average - the average number of end user hits per day, based on the last eight weeks of data stored on the server.
NOTE: If the server has not yet expired any data, a “0” (zero) displays in this field.
M86 SECURITY USER GUIDE 97
SYSTEM CONFIGURATION SECTION CHAPTER 2: CONFIGURING THE SERVER
98
• Estimated total week(s) of data - the estimated number of weeks of data the server will store. This number is affected by end user hits/day and the storage capacity of the server.
• Estimated number of week(s) until next expiration - the estimated number of weeks from this week that data on the server will expire, based on the hits/day and storage capacity of the server.
NOTE: See Appendix C: Evaluation Mode for information about viewing the Expiration screen in the evaluation mode.
Optional Features screen
The Optional Features screen displays when Optional Features is selected from the Database menu. This screen is used for specifying the following types of reports and report elements to be available in the Report Manager: Search String Reporting, Block Request Count, Blocked Searched Keywords, Time Usage, and Log Import Settings. This screen also is used for configuring password security rules to affect users who access the SR user interface (see Fig. 2-2:40).
NOTE: Optional features can be enabled or disabled at any time.
M86 SECURITY USER GUIDE
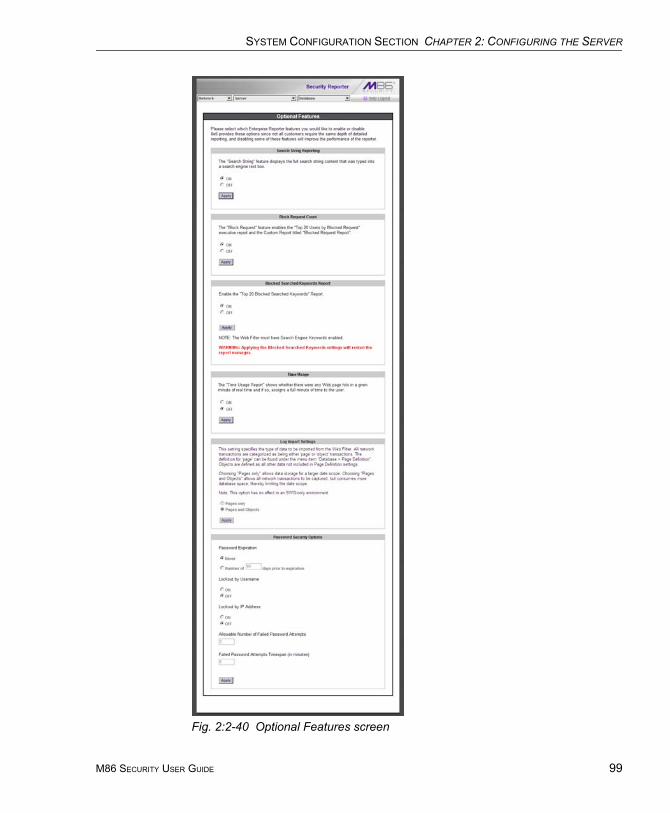
SYSTEM CONFIGURATION SECTION CHAPTER 2: CONFIGURING THE SERVER
Fig. 2:2-40 Optional Features screen
M86 SECURITY USER GUIDE 99

SYSTEM CONFIGURATION SECTION CHAPTER 2: CONFIGURING THE SERVER
100
Enable Search String Reporting
If Search String Reporting is enabled, detail drill down reports display the full search string content typed into a search engine text box for search sites such as Google, Bing, Yahoo!, MSN, AOL, Ask.com, YouTube.com, and MySpace.com.
1. Click the radio button corresponding to “ON” to let search string entries display in drill down reports.
2. Click Apply to apply your setting.
Enable Block Request Count
If Block Request Count is enabled, the Top 20 Users by Blocked Requests Summary Report can be generated by the administrator.
1. Click the radio button corresponding to “ON” to make the Top 20 Users by Blocked Request report selection avail-able in an administrator’s Summary Reports menu.
2. Click Apply to apply your setting.
NOTE: Since Summary Reports are processed each night, any changes made to settings today will not effective until the following day.
Enable Blocked Searched Keywords
If Blocked Seached Keywords is enabled, the Top 20 Blocked Searched Keywords Summary Report can be generated by the administrator.
1. Click the radio button corresponding to “ON” to make the Top 20 Users by Blocked Request report selection avail-able in an administrator’s Summary Reports menu.
2. Click Apply to apply your setting.
WARNING: Applying this setting restarts the Report Manager.
M86 SECURITY USER GUIDE
SYSTEM CONFIGURATION SECTION CHAPTER 2: CONFIGURING THE SERVER
NOTE: Since Summary Reports are processed each night, any changes made to settings today will not effective until the following day.
Enable Time Usage reports
If Time Usage Report is enabled, Time Usage reports can be generated by the administrator. These reports use the time usage algorithm to calculate the amount of time an end user spent accessing a given page or object—disregarding the number of seconds from each hit and counting each unique minute of Web time as one minute. Using this algo-rithm, an end user could never have more than 24 hours of Web time within a given 24-hour period.
1. Click the radio button corresponding to “ON” to make the Time Usage Report selection available in an adminis-trator’s Custom Reports menu.
2. Click Apply to apply your setting.
NOTE: Since Time Usage reports are processed each night, any changes made to settings today will not effective until the following day.
Enable Page and/or Object Count
If using a Web Filter, in the Log Import Settings frame, indi-cate whether drill down, Time Usage reports, and scheduled custom reports will include Web page hits only, or both Web page and object hits. Objects include images, graphics, multimedia items, and text item object files.
WARNING: If “Pages only” is selected, all records of objects accessed by end users will be lost for the time period in which this option was enabled. Even if there were objects accessed by end users during that time period, zeroes (“0”) will display for object activity in generated reports.
1. Select one of two radio buttons to specify the type of hits to be included in drill down, Time Usage reports, and scheduled custom reports:
M86 SECURITY USER GUIDE 101
SYSTEM CONFIGURATION SECTION CHAPTER 2: CONFIGURING THE SERVER
102
• “Pages only” - Choose this option to include only Web page hits in reports.
• “Pages and Objects” - Choose this option to include both Web page and object hits in reports.
2. Click Apply to apply your setting.
Enable, Configure Password Security Option
In the Password Security Options frame, passwords for accessing the SR user interface can be set to expire after a specified number of days, and/or lock out the user from accessing the SR after a specified number of failed pass-word entry attempts within a defined interval of time.
NOTE: User accounts can be manually unlocked via System Configuration: Network > Lockouts > Locked-out Accounts and IPs (see Locked-out Accounts and IPs screen in this chapter).
1. Enable any of the following options:
• At the Password Expiration field, click the radio button corresponding to either password expiration option:• Never - Choose this option if passwords will be set
to never expire.• Number of ‘x’ days prior to expiration - Choose
this option if password will be set to expire after ‘x’ number of days (in which ‘x’ represents the number of days the password will be valid).
NOTES: The maximum number of days that can be entered is 365.
If a user’s password has expired, when he/she enters his/her Username and Password in the login screen and clicks Login, he/she will be prompted to re-enter his/her Username and enter a new password in the Password and Confirm Password fields.
M86 SECURITY USER GUIDE
SYSTEM CONFIGURATION SECTION CHAPTER 2: CONFIGURING THE SERVER
• At the Lockout by Username field, click the radio button corresponding to either of the following options:• ON - Choose this option to lock out the user by
username if the incorrect password is entered—for the number of times specified in the Allowable Number of Failed Password Attempts field—within the interval defined in the Failed Password Attempts Timespan (in minutes) field.
• OFF - Choose this option if the user will not be locked out by username after entering the incorrect password.
• At the Lockout by IP Address field, click the radio button corresponding to either of the following options:• ON - Choose this option to lock out the user by IP
address if the incorrect password is entered—for the number of times specified in the Allowable Number of Failed Password Attempts field—within the interval defined in the Failed Password Attempts Timespan (in minutes) field.
• OFF - Choose this option if the user will not be locked out by IP address after entering the incorrect password.
• Allowable Number of Failed Password Attempts - With the Lockout by Username and/or Lockout by IP Address option(s) enabled, enter the number of times a user can enter an incorrect password during the interval defined in the Failed Password Attempts Timespan (in minutes) field before being locked out of the SR user interface.
NOTE: The maximum number of failed attempts that can be entered is 10.
M86 SECURITY USER GUIDE 103
SYSTEM CONFIGURATION SECTION CHAPTER 2: CONFIGURING THE SERVER
104
• Failed Password Attempts Timespan (in minutes) - With the Lockout by Username and/or Lockout by IP Address option(s) enabled, enter the number of minutes that defines the interval in which a user can enter an incorrect password—as specified in the Allowable Number of Failed Password Attempts field—before being locked out of the SR application.
NOTE: The maximum number of minutes that can be entered is 1440.
2. Click Apply to apply your settings.
M86 SECURITY USER GUIDE
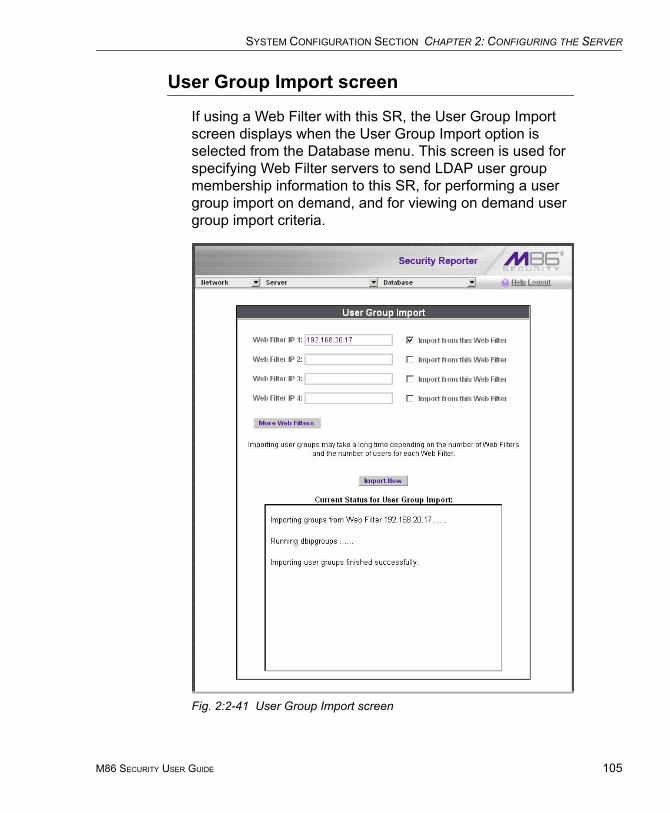
SYSTEM CONFIGURATION SECTION CHAPTER 2: CONFIGURING THE SERVER
User Group Import screen
If using a Web Filter with this SR, the User Group Import screen displays when the User Group Import option is selected from the Database menu. This screen is used for specifying Web Filter servers to send LDAP user group membership information to this SR, for performing a user group import on demand, and for viewing on demand user group import criteria.
Fig. 2:2-41 User Group Import screen
M86 SECURITY USER GUIDE 105
SYSTEM CONFIGURATION SECTION CHAPTER 2: CONFIGURING THE SERVER
106
Import User GroupsNOTE: Web Filter IP fields are populated by default if one or more Web Filter servers are connected to this SR.
1. Specify the Web Filter IP address of each Web Filter to send LDAP user group membership data to this SR.
2. Click the checkbox corresponding to “Import from this Web Filter”.
NOTE: If additional Web Filter servers need to be specified, click More Web Filters to display the next four sets of entry fields.
3. After specifying all Web Filter servers from which to import user group data, click Import Now to begin the data importation process. The status of this process displays in the Current Status for User Group Import box that opens at the bottom of this screen when the Import Now button is clicked.
NOTE: User groups will be imported in the exact format defined on the Web Filter.
M86 SECURITY USER GUIDE
REPORT MANAGER ADMINISTRATION SECTION INTRODUCTION
REPORT MANAGER ADMINISTRATION SECTION
IntroductionThis section of the user guide provides instructions to the global administrator on configuring and managing the administration portion of the Report Manager for use with a Web Filter and/or SWG appliance, and to the group admin-istrator on using the SR application to manage end user Internet and network activity.
NOTES: If using a Web Filter, the Report Manager displays all menu selections: Reports, Gauges, Policy, Administration, Help, and Logout. If using an SWG, the Report Manager does not include the Gauges and Policy menu selections.
Before configuring the Report Manager, the global administrator must fully configure the SR server via the System Configuration administrator console (as described in the previous section of this user guide), and the Structured Query Language (SQL) server must be installed on the network and connected to the Web access logging device(s).
The Report Manager’s Administration menu consists of the following options described in these chapters:
• Chapter 1: Group, Profile Management - This chapter explains how to set up user groups whose Internet activity will be monitored by group administrators; how to set up permissions so that an administrator in your group will only be able to access areas of the SR console that you specify; and how to set up a group administrator account.
• Chapter 2: Database Management - This chapter explains how to configure the server to use a secure network connection; view a list of user profiles (if using a Web Filter); view administrator activity; manage the
M86 SECURITY USER GUIDE 107
REPORT MANAGER ADMINISTRATION SECTION INTRODUCTION
108
profiles of devices connected to the server; maintain Report Manager processes; analyze data storage on the server; and remove all profiles and configuration settings in the Report Manager.
• Chapter 3: Report Configuration - This chapter explains how to create and manage Custom Category Groups used for monitoring end user Internet activity, and configure general report settings.
M86 SECURITY USER GUIDE
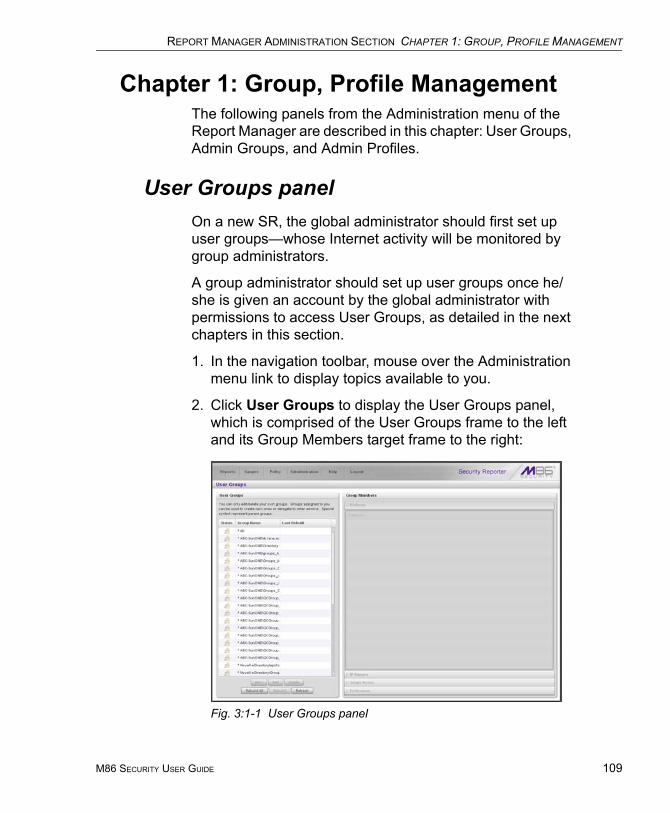
REPORT MANAGER ADMINISTRATION SECTION CHAPTER 1: GROUP, PROFILE MANAGEMENT
Chapter 1: Group, Profile ManagementThe following panels from the Administration menu of the Report Manager are described in this chapter: User Groups, Admin Groups, and Admin Profiles.
User Groups panelOn a new SR, the global administrator should first set up user groups—whose Internet activity will be monitored by group administrators.
A group administrator should set up user groups once he/she is given an account by the global administrator with permissions to access User Groups, as detailed in the next chapters in this section.
1. In the navigation toolbar, mouse over the Administration menu link to display topics available to you.
2. Click User Groups to display the User Groups panel, which is comprised of the User Groups frame to the left and its Group Members target frame to the right:
Fig. 3:1-1 User Groups panel
M86 SECURITY USER GUIDE 109
REPORT MANAGER ADMINISTRATION SECTION CHAPTER 1: GROUP, PROFILE MANAGEMENT
110
Names of user groups previously added by the adminis-trator display in black text in the User Groups frame. Imported user groups display preceded by an up arrow. For the global administrator, “All” displays as the first record in the list by default.
NOTE: A global administrator will see all user groups, and a group administrator will only see user groups assigned to him/her.
From this panel you can view information about an existing user group, or click a button to add a user group, modify or delete an existing user group, rebuild a user group on demand, or refresh the display of the current list.
NOTES: This version of SR will import user groups from a source Web Filter or SWG using IP group authentication or the following LDAP server types:
• Active Directory• Novell eDirectory• Sun One• Open Directory
If using a Web Filter:• Active Directory Mixed Mode and Active Directory Native Mode
are supported.• Open LDAP usernames will be included in user profiles only if
those users generate network traffic.
M86 SECURITY USER GUIDE
REPORT MANAGER ADMINISTRATION SECTION CHAPTER 1: GROUP, PROFILE MANAGEMENT
View User Group Information
For each group in the User Groups frame, the following information displays: Status icon, Group Name, and the date the user group was Last Rebuilt on demand (YYYY-MM-DD HH:SS)—if the latter is applicable.
NOTE: User groups are automatically rebuilt daily.
User group status key
- The user groups icon indicates the group has been updated and is ready to be rebuilt.
- The lock icon indicates the user group is currently being rebuilt.
- The user groups icon with an exclamation point indi-cates the user group cannot be rebuilt on demand.
View a list of members in a user group
To view a list of members that belong to an existing user group:
1. Select the user group from the User Groups frame by clicking its Group Name to highlight that record. Based on this selection, the Group Members frame to the right becomes activated along with the following buttons in the section below, based on the status of the user group:
• If the selected user group is ready to be rebuilt, this action activates all buttons (New, Edit, Delete, Rebuild, Rebuild All, Refresh).
• If the selected user group was not imported and cannot be rebuilt on demand, this action activates the New, Edit, Delete, Rebuild All, and Refresh buttons.
• If the selected user group was imported and cannot be rebuilt on demand, this action activates the New, Rebuild All, and Refresh buttons only.
M86 SECURITY USER GUIDE 111
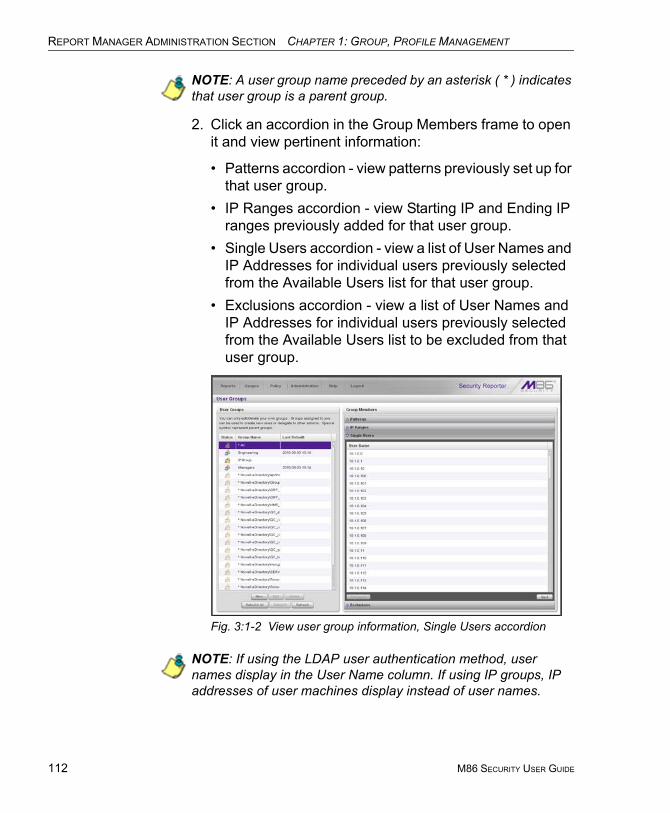
REPORT MANAGER ADMINISTRATION SECTION CHAPTER 1: GROUP, PROFILE MANAGEMENT
112
NOTE: A user group name preceded by an asterisk ( * ) indicates that user group is a parent group.
2. Click an accordion in the Group Members frame to open it and view pertinent information:
• Patterns accordion - view patterns previously set up for that user group.
• IP Ranges accordion - view Starting IP and Ending IP ranges previously added for that user group.
• Single Users accordion - view a list of User Names and IP Addresses for individual users previously selected from the Available Users list for that user group.
• Exclusions accordion - view a list of User Names and IP Addresses for individual users previously selected from the Available Users list to be excluded from that user group.
Fig. 3:1-2 View user group information, Single Users accordion
NOTE: If using the LDAP user authentication method, user names display in the User Name column. If using IP groups, IP addresses of user machines display instead of user names.
M86 SECURITY USER GUIDE
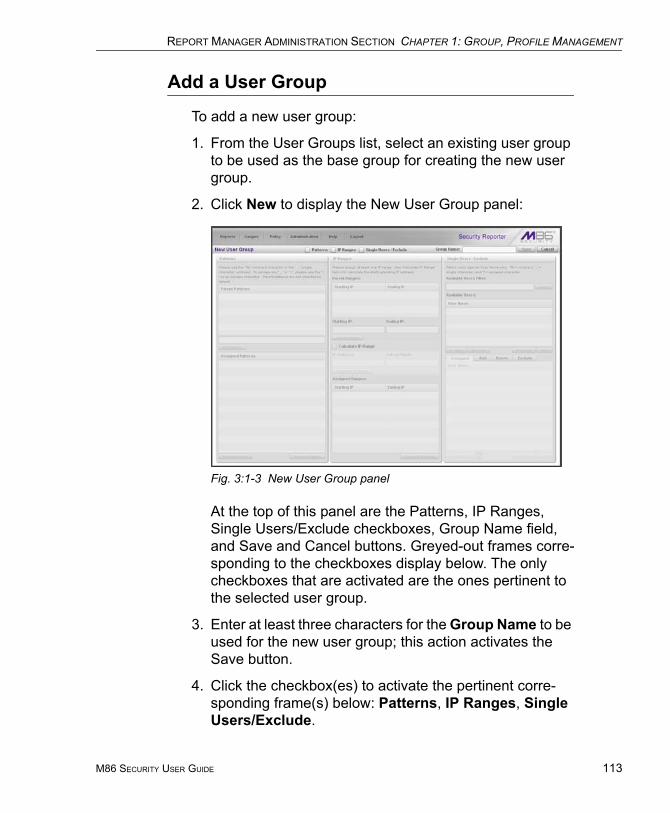
REPORT MANAGER ADMINISTRATION SECTION CHAPTER 1: GROUP, PROFILE MANAGEMENT
Add a User Group
To add a new user group:
1. From the User Groups list, select an existing user group to be used as the base group for creating the new user group.
2. Click New to display the New User Group panel:
Fig. 3:1-3 New User Group panel
At the top of this panel are the Patterns, IP Ranges, Single Users/Exclude checkboxes, Group Name field, and Save and Cancel buttons. Greyed-out frames corre-sponding to the checkboxes display below. The only checkboxes that are activated are the ones pertinent to the selected user group.
3. Enter at least three characters for the Group Name to be used for the new user group; this action activates the Save button.
4. Click the checkbox(es) to activate the pertinent corre-sponding frame(s) below: Patterns, IP Ranges, Single Users/Exclude.
M86 SECURITY USER GUIDE 113
REPORT MANAGER ADMINISTRATION SECTION CHAPTER 1: GROUP, PROFILE MANAGEMENT
114
TIP: At any time before saving the new user group, if you need to cancel the entry of the new user group, click the Cancel button to return to the main User Groups panel.
5. After making entries in the pertinent frames—as described in the following sub-sections—click Save to save your edits, and to redisplay the User Groups panel where the user group you added now displays in the User Groups frame.
Patterns frame
When creating a user group, the Patterns frame is used for adding one or more patterns in order to narrow the list of users to be included in the new group. A pattern consists of a wildcard, or a wildcard plus one or more alphanumeric characters.
Add a new pattern
To add a pattern to the new user group:
1. Do one of the following:
• To add a pattern included in the base group, select the pattern from the Parent Patterns box to display that pattern in the field below.
• To add a new pattern, enter the pattern in the field beneath the Parent Patterns box. For example: Enter 200.10.100.3% to include all IP addresses with ”200.10.100.3” as part of the IP address.
2. Click Add Pattern to include the pattern in the Assigned Patterns list box below.
TIP: Follow steps 1 and 2 above to include additional patterns for the new user group.
M86 SECURITY USER GUIDE
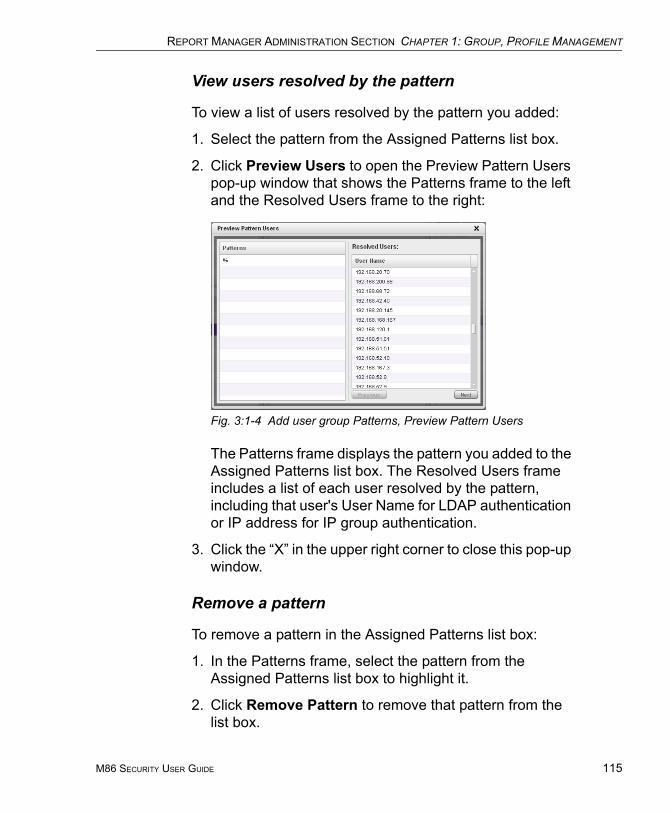
REPORT MANAGER ADMINISTRATION SECTION CHAPTER 1: GROUP, PROFILE MANAGEMENT
View users resolved by the pattern
To view a list of users resolved by the pattern you added:
1. Select the pattern from the Assigned Patterns list box.
2. Click Preview Users to open the Preview Pattern Users pop-up window that shows the Patterns frame to the left and the Resolved Users frame to the right:
Fig. 3:1-4 Add user group Patterns, Preview Pattern Users
The Patterns frame displays the pattern you added to the Assigned Patterns list box. The Resolved Users frame includes a list of each user resolved by the pattern, including that user's User Name for LDAP authentication or IP address for IP group authentication.
3. Click the “X” in the upper right corner to close this pop-up window.
Remove a pattern
To remove a pattern in the Assigned Patterns list box:
1. In the Patterns frame, select the pattern from the Assigned Patterns list box to highlight it.
2. Click Remove Pattern to remove that pattern from the list box.
M86 SECURITY USER GUIDE 115
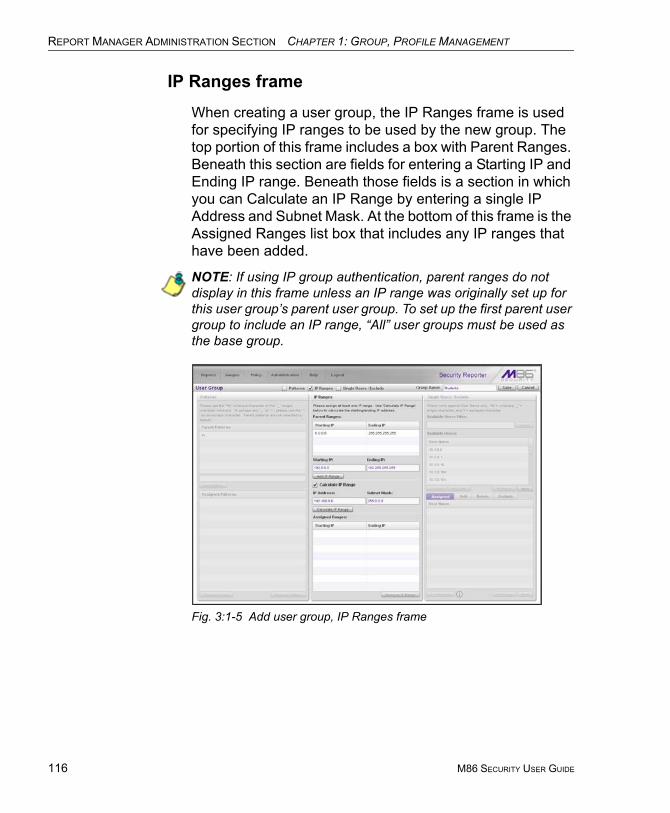
REPORT MANAGER ADMINISTRATION SECTION CHAPTER 1: GROUP, PROFILE MANAGEMENT
116
IP Ranges frame
When creating a user group, the IP Ranges frame is used for specifying IP ranges to be used by the new group. The top portion of this frame includes a box with Parent Ranges. Beneath this section are fields for entering a Starting IP and Ending IP range. Beneath those fields is a section in which you can Calculate an IP Range by entering a single IP Address and Subnet Mask. At the bottom of this frame is the Assigned Ranges list box that includes any IP ranges that have been added.
NOTE: If using IP group authentication, parent ranges do not display in this frame unless an IP range was originally set up for this user group’s parent user group. To set up the first parent user group to include an IP range, “All” user groups must be used as the base group.
Fig. 3:1-5 Add user group, IP Ranges frame
M86 SECURITY USER GUIDE
REPORT MANAGER ADMINISTRATION SECTION CHAPTER 1: GROUP, PROFILE MANAGEMENT
Specify an IP range
To add an IP address range:
1. Do one of the following:
• To make a selection from Parent Ranges, click the row in the Parent Ranges box to highlight and select that row, and also to add that Starting IP and Ending IP range in the Starting IP and Ending IP fields below. If necessary, edits can be made to these fields.
• To add an IP address range without selecting from the Parent Ranges frame:a. Enter the Starting IP address.b. Enter the Ending IP address.
• To calculate an IP address range:a. Click the Calculate IP Range checkbox to activate
the IP Address and Subnet Mask fields below.b. Enter the IP Address.c. Enter the Netmask which activates the Calculate
Range button.d. Click Calculate IP Range to display the Starting IP
and Ending IP in the fields above.2. Click Add IP Range to include that IP range in the
Assigned Ranges list box below:
M86 SECURITY USER GUIDE 117
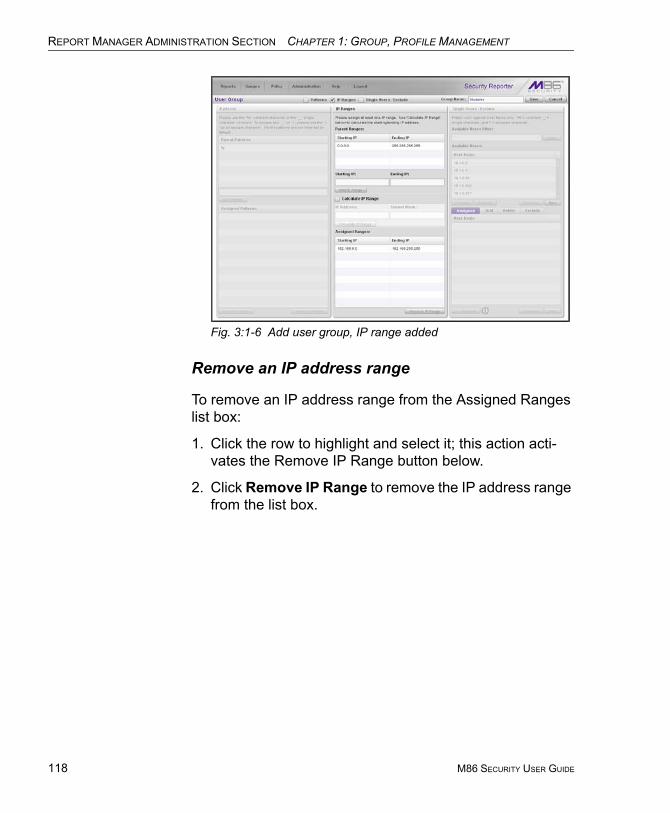
REPORT MANAGER ADMINISTRATION SECTION CHAPTER 1: GROUP, PROFILE MANAGEMENT
118
Fig. 3:1-6 Add user group, IP range added
Remove an IP address range
To remove an IP address range from the Assigned Ranges list box:
1. Click the row to highlight and select it; this action acti-vates the Remove IP Range button below.
2. Click Remove IP Range to remove the IP address range from the list box.
M86 SECURITY USER GUIDE

REPORT MANAGER ADMINISTRATION SECTION CHAPTER 1: GROUP, PROFILE MANAGEMENT
Single Users/Exclude frame
When creating a user group, the Single Users/Exclude frame is used for adding one or more users to the group. This frame includes the Available Users Filter to be used with the Available Users box that is populated with individual users from the base user group. For each record in the list, the User Name or IP address displays. The list box below includes the target Assigned, Add, Delete, and Exclude tabs. The Add tab displays by default and the Assigned tab displays greyed-out until the user group is saved.
NOTES: Only users previously selected from the base user group will be included in the Available Users list.
A user name preceded by an asterisk ( * ) indicates an auto-assigned user that can only be removed by adjusting the pattern or IP range for that user’s group.
Fig. 3:1-7 Add user group, Single Users frame
M86 SECURITY USER GUIDE 119

REPORT MANAGER ADMINISTRATION SECTION CHAPTER 1: GROUP, PROFILE MANAGEMENT
120
Add one or more individual users
To add users to the Assigned Users list, make your selec-tions from the Available Users list. If the Available Users list is long, you can reduce the number of results that display in this list by using the Available Users Filter.
Use the filter to narrow Available Users resultsTo use the Available Users Filter:
1. Enter filter terms to narrow the selection of Available Users. For example: Type in 150% to only display results matching an IP address that begins with “150”.
2. Click Apply to display filtered results in the Available Users box.
Select users to add to the Assigned Users listTo make selections from the Available Users box:
1. Select one or more IPs from the list to highlight the record(s).
2. Click [+] Add to include the selected user(s) in the Add tab.
NOTE: Users added to the Add tab will still be listed in the Avail-able Users list. After saving the entries in the New User Group panel, the users added to the Add tab display in the Assigned tab.
M86 SECURITY USER GUIDE
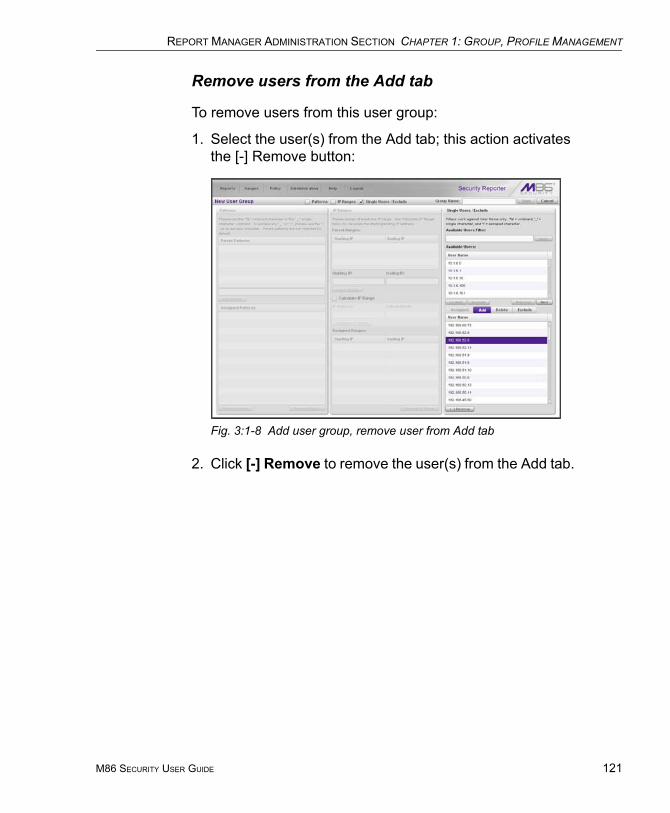
REPORT MANAGER ADMINISTRATION SECTION CHAPTER 1: GROUP, PROFILE MANAGEMENT
Remove users from the Add tab
To remove users from this user group:
1. Select the user(s) from the Add tab; this action activates the [-] Remove button:
Fig. 3:1-8 Add user group, remove user from Add tab
2. Click [-] Remove to remove the user(s) from the Add tab.
M86 SECURITY USER GUIDE 121
REPORT MANAGER ADMINISTRATION SECTION CHAPTER 1: GROUP, PROFILE MANAGEMENT
122
Edit a User GroupNOTE: Global and group administrators can only edit user groups they have created, and cannot edit their base groups or imported user groups.
To edit a user group:
1. From the main User Groups panel, select the user group from the list in the User Groups frame.
2. Click Edit to display the User Group panel showing acti-vated frames—i.e. if the Patterns frame had settings made in it, that frame is activated; if the Single Users frame was the only frame with settings made in it, that frame is activated. Any frame without settings made in it displays greyed-out.
3. Make any of these edits:
• To make entries in a frame that is not yet activated, click the available checkbox to activate that frame: Patterns, IP Ranges, Single Users/Exclude.
• Make any of these edits in a frame:• Patterns frame - add or remove a pattern.• IP Ranges frame - add or remove an IP address
range.• Single Users/Exclude frame - add or remove one or
more users.NOTE: When editing the Single Users/Exclude frame, users who are added display in the Add tab, and users who are removed display in the Delete tab.
• If necessary, edit the name of the user group in the Group Name field.
4. Click Save to save your edits and to return to the User Groups panel.
M86 SECURITY USER GUIDE
REPORT MANAGER ADMINISTRATION SECTION CHAPTER 1: GROUP, PROFILE MANAGEMENT
Rebuild the User Group
After editing the user group, the user group profile should be rebuilt.
1. In the User Groups panel, select the user group to be rebuilt.
2. Click Rebuild to initiate the rebuild process for that user group.
3. After a few minutes, click the Refresh button to refresh the display in the panel. Note that the Last Rebuilt column for user group you rebuilt now displays the date and time of the rebuild.
Delete a User GroupNOTES: A user group can only be deleted by the administrator who added it. A base group cannot be deleted.
To delete a user group:
1. In the User Groups panel, select the user group from the User Groups list.
2. Click Delete to open the Confirm dialog box with the message: "Are you sure you want to delete this user group?"
WARNING: If the user group to be deleted has been delegated to an administrator, that user group will be removed from that administrator’s User Groups list as well as your User Groups list.
TIP: Click No to close the dialog box and to return to the User Groups panel.
3. Click Yes to close the dialog box, and to remove the user group from the User Groups list.
M86 SECURITY USER GUIDE 123
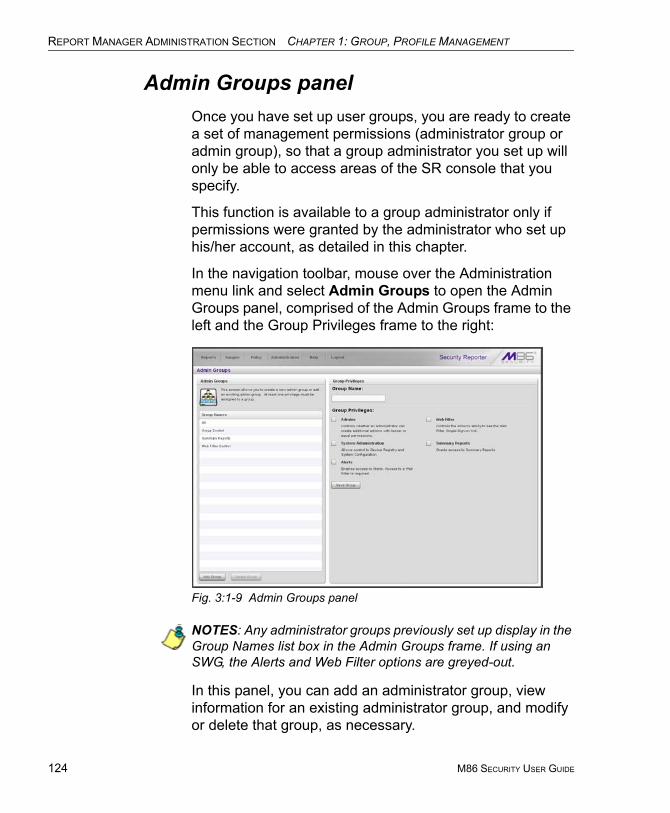
REPORT MANAGER ADMINISTRATION SECTION CHAPTER 1: GROUP, PROFILE MANAGEMENT
124
Admin Groups panelOnce you have set up user groups, you are ready to create a set of management permissions (administrator group or admin group), so that a group administrator you set up will only be able to access areas of the SR console that you specify.
This function is available to a group administrator only if permissions were granted by the administrator who set up his/her account, as detailed in this chapter.
In the navigation toolbar, mouse over the Administration menu link and select Admin Groups to open the Admin Groups panel, comprised of the Admin Groups frame to the left and the Group Privileges frame to the right:
Fig. 3:1-9 Admin Groups panel
NOTES: Any administrator groups previously set up display in the Group Names list box in the Admin Groups frame. If using an SWG, the Alerts and Web Filter options are greyed-out.
In this panel, you can add an administrator group, view information for an existing administrator group, and modify or delete that group, as necessary.
M86 SECURITY USER GUIDE
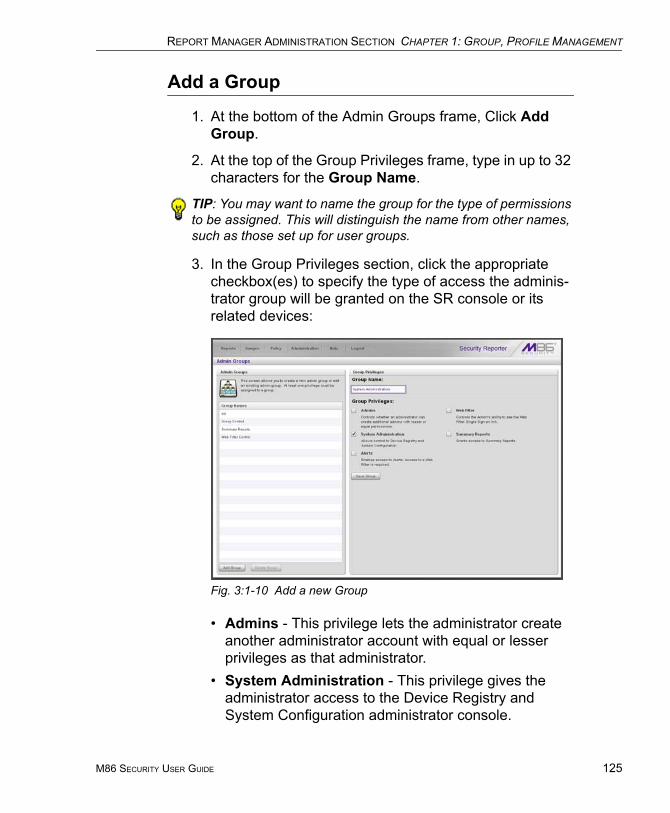
REPORT MANAGER ADMINISTRATION SECTION CHAPTER 1: GROUP, PROFILE MANAGEMENT
Add a Group
1. At the bottom of the Admin Groups frame, Click Add Group.
2. At the top of the Group Privileges frame, type in up to 32 characters for the Group Name.
TIP: You may want to name the group for the type of permissions to be assigned. This will distinguish the name from other names, such as those set up for user groups.
3. In the Group Privileges section, click the appropriate checkbox(es) to specify the type of access the adminis-trator group will be granted on the SR console or its related devices:
Fig. 3:1-10 Add a new Group
• Admins - This privilege lets the administrator create another administrator account with equal or lesser privileges as that administrator.
• System Administration - This privilege gives the administrator access to the Device Registry and System Configuration administrator console.
M86 SECURITY USER GUIDE 125
REPORT MANAGER ADMINISTRATION SECTION CHAPTER 1: GROUP, PROFILE MANAGEMENT
126
• Alerts - This privilege for Web Filter users lets the administrator manage alerts that indicate if URL or bandwidth gauges (driven by end user Internet/network activity) are close to—or have reached—their established upper thresholds.
• Web Filter - This privilege for Web Filter users gives the administrator access to the Web Filter via a link in the Administration menu.
• Summary Reports - This privilege lets the adminis-trator access Summary Reports from the Report menu.
TIP: To remove a checkmark from any active checkbox containing a checkmark, click the checkbox.
4. Click Save Group to save your entries and to add the new administrator group name in the Group Names list box.
M86 SECURITY USER GUIDE
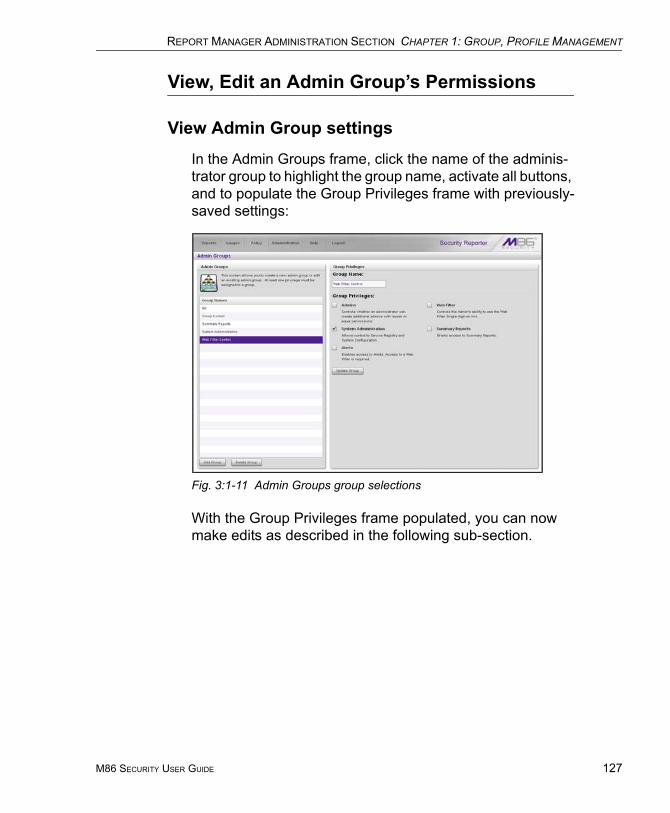
REPORT MANAGER ADMINISTRATION SECTION CHAPTER 1: GROUP, PROFILE MANAGEMENT
View, Edit an Admin Group’s Permissions
View Admin Group settings
In the Admin Groups frame, click the name of the adminis-trator group to highlight the group name, activate all buttons, and to populate the Group Privileges frame with previously-saved settings:
Fig. 3:1-11 Admin Groups group selections
With the Group Privileges frame populated, you can now make edits as described in the following sub-section.
M86 SECURITY USER GUIDE 127
REPORT MANAGER ADMINISTRATION SECTION CHAPTER 1: GROUP, PROFILE MANAGEMENT
128
Edit Admin Group settings
1. In the Group Privileges frame, perform any of the following actions:
• Modify the Group Name• Add functions to be monitored by the administrator
group• Remove functions to be monitored by the administrator
group2. Click Update Group to save your settings and to clear all
selections in the Group Privileges frame.
Delete an Administrator Group
1. In the Group Names list box, click the name of the admin-istrator group to highlight the group name, activate all buttons, and to populate the Group Privileges frame with previously-saved settings.
2. Click Delete Group to open the Confirm dialog box with the message: “Are you sure you want to delete this admin group?”
3. Click Yes to close the dialog box and to remove the administrator group from the Group Names list box.
NOTE: Clicking Cancel closes the dialog box without removing the administrator group.
M86 SECURITY USER GUIDE
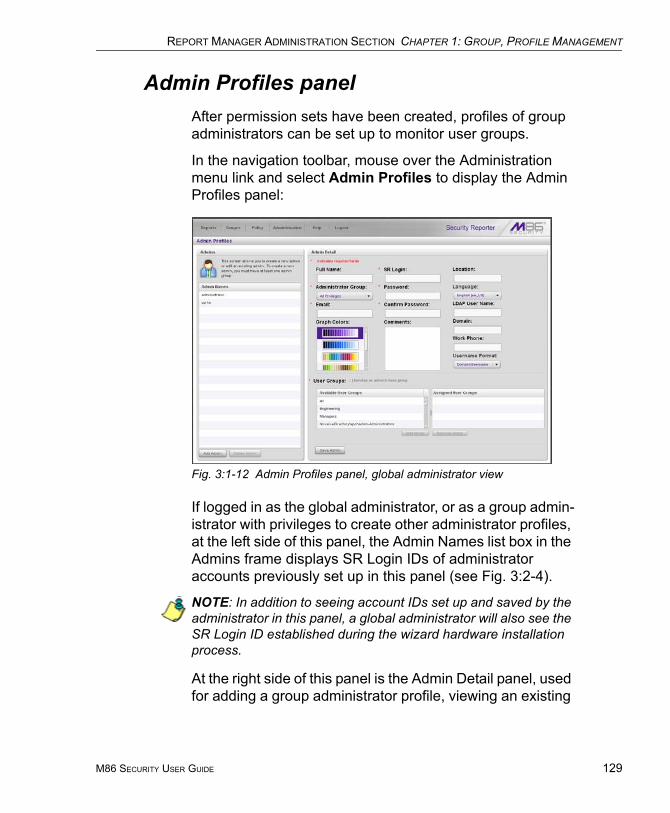
REPORT MANAGER ADMINISTRATION SECTION CHAPTER 1: GROUP, PROFILE MANAGEMENT
Admin Profiles panelAfter permission sets have been created, profiles of group administrators can be set up to monitor user groups.
In the navigation toolbar, mouse over the Administration menu link and select Admin Profiles to display the Admin Profiles panel:
Fig. 3:1-12 Admin Profiles panel, global administrator view
If logged in as the global administrator, or as a group admin-istrator with privileges to create other administrator profiles, at the left side of this panel, the Admin Names list box in the Admins frame displays SR Login IDs of administrator accounts previously set up in this panel (see Fig. 3:2-4).
NOTE: In addition to seeing account IDs set up and saved by the administrator in this panel, a global administrator will also see the SR Login ID established during the wizard hardware installation process.
At the right side of this panel is the Admin Detail panel, used for adding a group administrator profile, viewing an existing
M86 SECURITY USER GUIDE 129
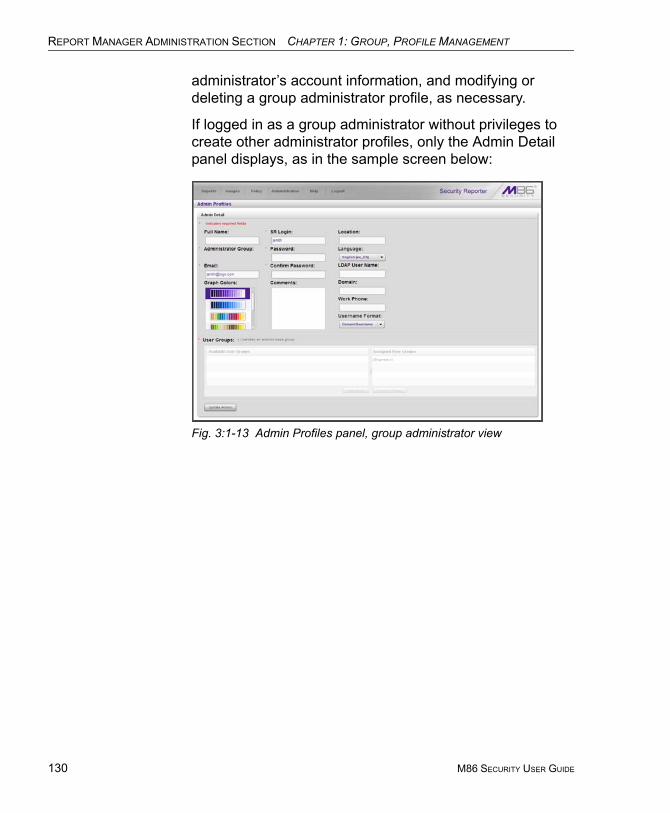
REPORT MANAGER ADMINISTRATION SECTION CHAPTER 1: GROUP, PROFILE MANAGEMENT
130
administrator’s account information, and modifying or deleting a group administrator profile, as necessary.
If logged in as a group administrator without privileges to create other administrator profiles, only the Admin Detail panel displays, as in the sample screen below:
Fig. 3:1-13 Admin Profiles panel, group administrator view
M86 SECURITY USER GUIDE

REPORT MANAGER ADMINISTRATION SECTION CHAPTER 1: GROUP, PROFILE MANAGEMENT
Add an Administrator Profile
1. If privileges are granted for you to create a group admin-istrator profile, at the bottom of the Admins frame, click Add Admin to clear and reset the Admin Detail frame.
2. In the Admin Detail frame, make the following entries or selections as appropriate:
Fig. 3:1-14 New administrator information entered but not yet saved
• Optional: Type in the group administrator’s Full Name.• Select the Administrator Group (previously set up in
the Admins Group panel) from the available choices in the pull-down menu.
• Type in the group administrator’s Email address.• Optional: Select another report color scheme from the
available Graph Colors choices.• Type in the SR Login ID the group administrator will
use to access the SR user interface. This entry will display in the Admin Names list when the record is saved.
M86 SECURITY USER GUIDE 131
REPORT MANAGER ADMINISTRATION SECTION CHAPTER 1: GROUP, PROFILE MANAGEMENT
132
• Type in the Password the group administrator will use in conjunction with the SR Login ID, and enter that same password again in the Confirm Password field. These entries display as asterisks for security purposes.
• Optional: Type in any Comments to be associated with the group administrator’s account.
• Optional: Type in identifying information about the group administrator’s physical office Location.
• Optional: If necessary, select the language from the Language menu (English, Simplified Chinese, Tradi-tional Chinese).
NOTE: If English, Simplified Chinese or Traditional Chinese is set to display in your browser, the SR user interface will display that language setting by default.
• Optional: If the administrator has an Active Directory LDAP account, user name, and domain, type in the alphanumeric group administrator’s LDAP User Name exactly as set up on the Active Directory domain in which he/she is registered.
• Optional: If an entry was made in the LDAP User Name field, type in the exact characters for the LDAP Active Directory Domain name in which the group administrator is registered.
NOTE: If the group administrator will be using the System Tray feature—that triggers an alert in his/her System Tray if an end user’s Internet usage has reached the upper threshold estab-lished for a gauge’s alert—the LDAP User Name and Domain entered in these fields should be the same as the login ID and password the group administrator uses to authenticate on his/her workstation. (See Real Time Reports Section: Alerts, Lockout Management and Appendix D: System Tray Alerts: Setup, Usage for details on setting up and using the System Tray feature.)
M86 SECURITY USER GUIDE
REPORT MANAGER ADMINISTRATION SECTION CHAPTER 1: GROUP, PROFILE MANAGEMENT
• Optional: Type in the group administrator’s Work Phone number, without entering special characters such as parentheses ( ), a hyphen (-), a period (.), or a left slash (/).
• Optional: If necessary, specify the Username Format used on the LDAP server by making a selection from the available choices—Domain\Username, User-name\Domain, Username, Domain.
3. In the User Groups section, select the user group(s) to be monitored by the group administrator:
• In the Available User Groups list box, click the user group(s) to highlight your selection(s), and to activate the Add Group button.
• Click Add Group to include the user group(s) in the Assigned User Groups list box.
TIP: To remove any user group from the Assigned User Groups list box, select the user group(s), and then click Remove Group to remove the user group(s).
4. After selecting each user group to be assigned to the group administrator, click Save Admin to add the SR Login ID for the new administrator to the Admin Names list box.
M86 SECURITY USER GUIDE 133
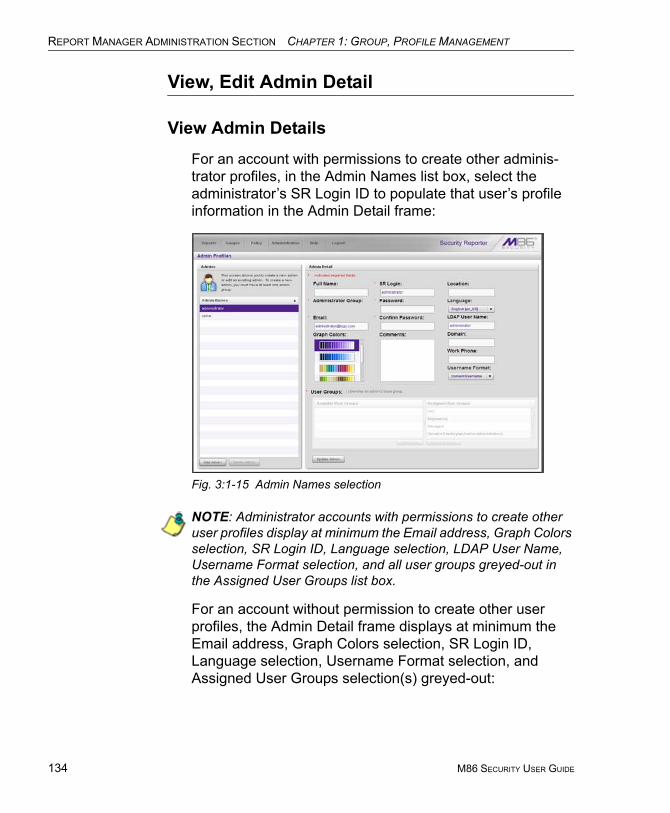
REPORT MANAGER ADMINISTRATION SECTION CHAPTER 1: GROUP, PROFILE MANAGEMENT
134
View, Edit Admin Detail
View Admin Details
For an account with permissions to create other adminis-trator profiles, in the Admin Names list box, select the administrator’s SR Login ID to populate that user’s profile information in the Admin Detail frame:
Fig. 3:1-15 Admin Names selection
NOTE: Administrator accounts with permissions to create other user profiles display at minimum the Email address, Graph Colors selection, SR Login ID, Language selection, LDAP User Name, Username Format selection, and all user groups greyed-out in the Assigned User Groups list box.
For an account without permission to create other user profiles, the Admin Detail frame displays at minimum the Email address, Graph Colors selection, SR Login ID, Language selection, Username Format selection, and Assigned User Groups selection(s) greyed-out:
M86 SECURITY USER GUIDE
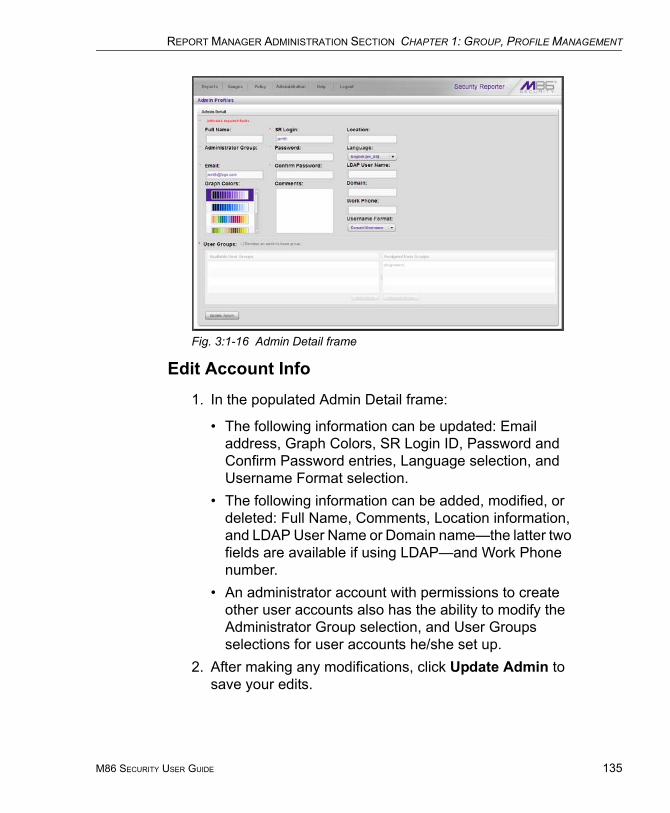
REPORT MANAGER ADMINISTRATION SECTION CHAPTER 1: GROUP, PROFILE MANAGEMENT
Fig. 3:1-16 Admin Detail frame
Edit Account Info
1. In the populated Admin Detail frame:
• The following information can be updated: Email address, Graph Colors, SR Login ID, Password and Confirm Password entries, Language selection, and Username Format selection.
• The following information can be added, modified, or deleted: Full Name, Comments, Location information, and LDAP User Name or Domain name—the latter two fields are available if using LDAP—and Work Phone number.
• An administrator account with permissions to create other user accounts also has the ability to modify the Administrator Group selection, and User Groups selections for user accounts he/she set up.
2. After making any modifications, click Update Admin to save your edits.
M86 SECURITY USER GUIDE 135
REPORT MANAGER ADMINISTRATION SECTION CHAPTER 1: GROUP, PROFILE MANAGEMENT
136
NOTE: If the administrator whose password was changed is currently logged into SR, he/she will need to log out and log back in again using the new password.
Delete Admin
Only an administrator with privileges to create another user profile can delete a user profile he/she created.
NOTE: The global administrator account established during the wizard hardware installation process can be modified but cannot be deleted.
1. In the Admin Names list box, select the group adminis-trator’s SR Login ID.
2. Click Delete Admin to open the Confirm dialog box with the message: “Are you sure you want to delete this admin?”
TIP: Clicking Cancel closes the dialog box without removing the group administrator profile.
3. Click Yes to close the dialog box and to remove the administrator’s SR Login ID from the list.
M86 SECURITY USER GUIDE
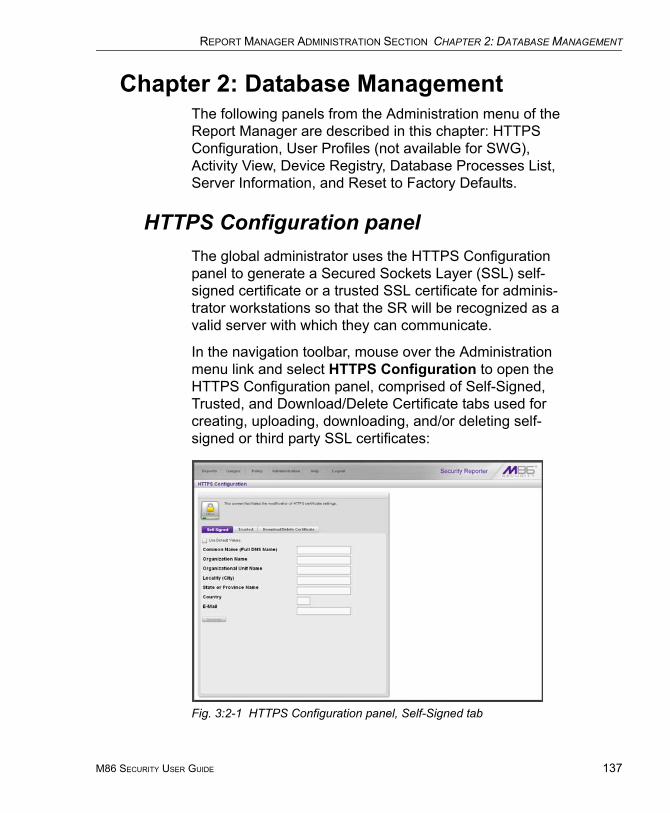
REPORT MANAGER ADMINISTRATION SECTION CHAPTER 2: DATABASE MANAGEMENT
Chapter 2: Database ManagementThe following panels from the Administration menu of the Report Manager are described in this chapter: HTTPS Configuration, User Profiles (not available for SWG), Activity View, Device Registry, Database Processes List, Server Information, and Reset to Factory Defaults.
HTTPS Configuration panelThe global administrator uses the HTTPS Configuration panel to generate a Secured Sockets Layer (SSL) self-signed certificate or a trusted SSL certificate for adminis-trator workstations so that the SR will be recognized as a valid server with which they can communicate.
In the navigation toolbar, mouse over the Administration menu link and select HTTPS Configuration to open the HTTPS Configuration panel, comprised of Self-Signed, Trusted, and Download/Delete Certificate tabs used for creating, uploading, downloading, and/or deleting self-signed or third party SSL certificates:
Fig. 3:2-1 HTTPS Configuration panel, Self-Signed tab
M86 SECURITY USER GUIDE 137
REPORT MANAGER ADMINISTRATION SECTION CHAPTER 2: DATABASE MANAGEMENT
138
Generate a Self-Signed Certificate for the SR
On the Self-Signed tab, you generate a Secure Socket Layer certificate that ensures secure exchanges between the SR and group administrator workstation browsers.
WARNING: Generating the self-signed certificate will restart the Report Manager. If the DNS name of the SR changes, a new certificate must be created and possibly added to each client workstation's trusted certificate list.
1. Do the following:
• click the checkbox corresponding to Use Default Values to grey-out the tab, or
• make entries in these fields:a. Common Name (Full DNS Name) - Host name of
the server, such as logo.com.b. Organization Name - Name of your organization,
such as Logo.c. Organizational Unit Name - Name of your
department, such as Administration.d. Locality (City) - Name of your organization’s city
or principality, such as Orange.e. State or Province Name - Full name of your state
or province, such as California.f. Country - Two-character code for your country,
such as US.g. E-Mail - Your email address.
2. Click Create to generate the SSL certificate to be stored on the SR, and to restart the Report Manager. Hereafter, group administrators must accept the security certificate on their workstations in order for their machines to communicate with the Report Manager and/or System Configuration administrator console.
M86 SECURITY USER GUIDE
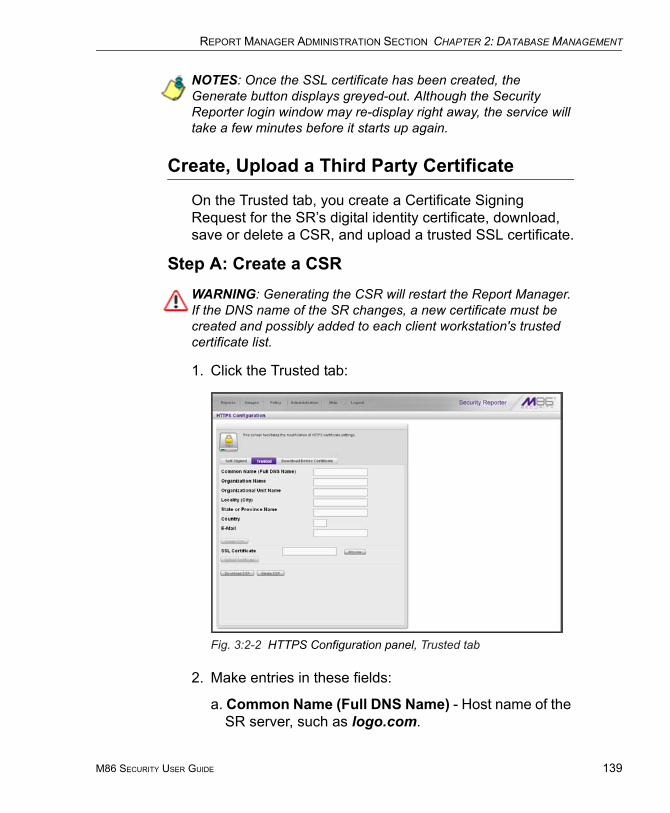
REPORT MANAGER ADMINISTRATION SECTION CHAPTER 2: DATABASE MANAGEMENT
NOTES: Once the SSL certificate has been created, the Generate button displays greyed-out. Although the Security Reporter login window may re-display right away, the service will take a few minutes before it starts up again.
Create, Upload a Third Party Certificate
On the Trusted tab, you create a Certificate Signing Request for the SR’s digital identity certificate, download, save or delete a CSR, and upload a trusted SSL certificate.
Step A: Create a CSRWARNING: Generating the CSR will restart the Report Manager. If the DNS name of the SR changes, a new certificate must be created and possibly added to each client workstation's trusted certificate list.
1. Click the Trusted tab:
Fig. 3:2-2 HTTPS Configuration panel, Trusted tab
2. Make entries in these fields:
a. Common Name (Full DNS Name) - Host name of the SR server, such as logo.com.
M86 SECURITY USER GUIDE 139

REPORT MANAGER ADMINISTRATION SECTION CHAPTER 2: DATABASE MANAGEMENT
140
b. Organization Name - Name of your organization, such as Logo.
c. Organizational Unit Name - Name of your depart-ment, such as Administration.
d. Locality (City) - Name of your organization’s city or principality, such as Orange.
e. State or Province Name - Full name of your state or province, such as California.
f. Country - Two-character code for your country, such as US.
g. E-Mail - Your email address.3. Click Create CSR to generate the Certificate Signing
Request and to restart the Report Manager.
NOTE: Once the CSR has been created, the Create CSR button displays greyed-out and the Browse, Save CSR, and Delete CSR buttons become activated.
Step B: Download the CSR, Submit to Agency
1. In the Trusted tab, click Download CSR to download the CSR you created to your machine.
When the CSR is downloaded to your machine, the Download CSR button toggles to Save CSR.
2. Click Save CSR to save the CSR to your machine.
TIP: Click Delete CSR to remove the CSR you created on your machine.
3. Submit the CSR to a trusted third party agency autho-rized to sign SSL certificates.
M86 SECURITY USER GUIDE
REPORT MANAGER ADMINISTRATION SECTION CHAPTER 2: DATABASE MANAGEMENT
Step C: Upload the Signed SSL Certificate to SR
When the SSL certificate is emailed back to you with the authorized signature, do the following:
1. Launch Notepad on your machine.
2. Copy and paste the contents of the certificate into Notepad in the following order:
a. SSL certificateb. Intermediate certificate(s)—this step is not required if
you have a Single Root SSL Certificatec. Root certificate
3. Save the contents of the Notepad file with a .cer exten-sion.
4. In the Trusted tab, go to the SSL certificate field and click Browse to find the .cer file you just saved.
5. Click Upload to load the certificate on the SR.
NOTE: Do not click this button until performing the actions in the following steps.
TIP: Click Cancel in the dialog box to cancel the procedure.
M86 SECURITY USER GUIDE 141
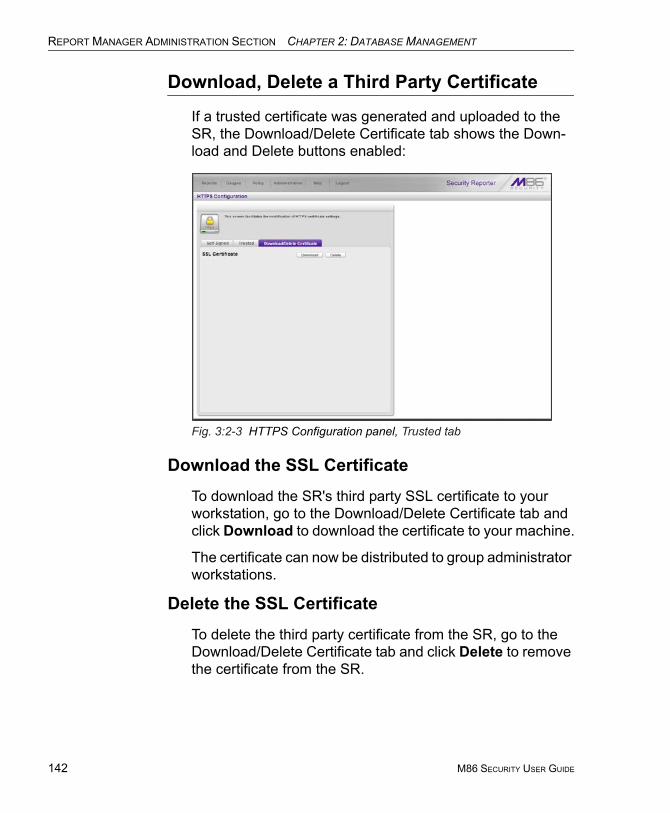
REPORT MANAGER ADMINISTRATION SECTION CHAPTER 2: DATABASE MANAGEMENT
142
Download, Delete a Third Party Certificate
If a trusted certificate was generated and uploaded to the SR, the Download/Delete Certificate tab shows the Down-load and Delete buttons enabled:
Fig. 3:2-3 HTTPS Configuration panel, Trusted tab
Download the SSL Certificate
To download the SR's third party SSL certificate to your workstation, go to the Download/Delete Certificate tab and click Download to download the certificate to your machine.
The certificate can now be distributed to group administrator workstations.
Delete the SSL Certificate
To delete the third party certificate from the SR, go to the Download/Delete Certificate tab and click Delete to remove the certificate from the SR.
M86 SECURITY USER GUIDE
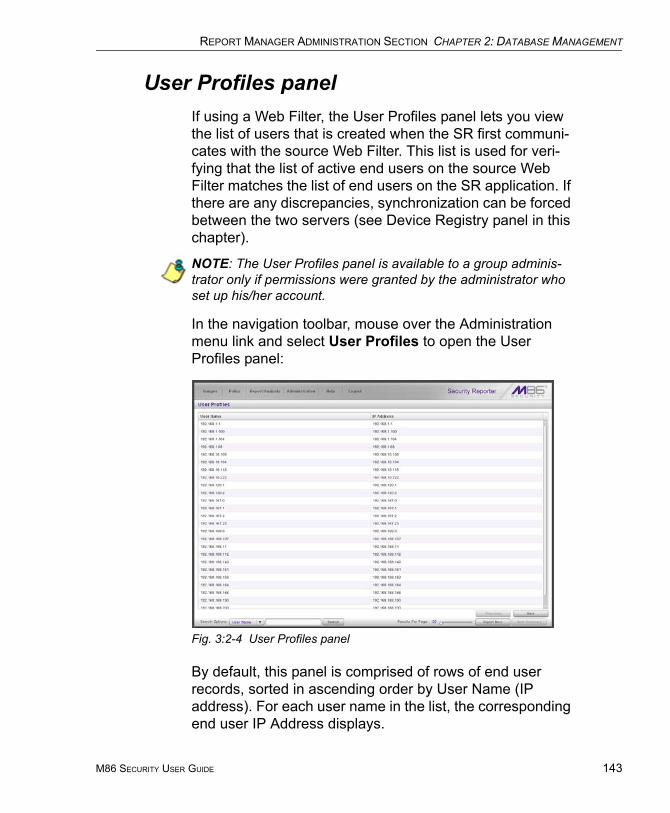
REPORT MANAGER ADMINISTRATION SECTION CHAPTER 2: DATABASE MANAGEMENT
User Profiles panelIf using a Web Filter, the User Profiles panel lets you view the list of users that is created when the SR first communi-cates with the source Web Filter. This list is used for veri-fying that the list of active end users on the source Web Filter matches the list of end users on the SR application. If there are any discrepancies, synchronization can be forced between the two servers (see Device Registry panel in this chapter).
NOTE: The User Profiles panel is available to a group adminis-trator only if permissions were granted by the administrator who set up his/her account.
In the navigation toolbar, mouse over the Administration menu link and select User Profiles to open the User Profiles panel:
Fig. 3:2-4 User Profiles panel
By default, this panel is comprised of rows of end user records, sorted in ascending order by User Name (IP address). For each user name in the list, the corresponding end user IP Address displays.
M86 SECURITY USER GUIDE 143

REPORT MANAGER ADMINISTRATION SECTION CHAPTER 2: DATABASE MANAGEMENT
144
At the bottom left of the panel is the Search Options menu that lets you search for a specific user by User Name or IP Address. At the bottom right of the panel is the User Summary button takes you to the User Summary panel for the selected user.
Search the User Database
1. Specify search criteria by making a selection from the Search Options pull-down menu:
• User Name - This selection performs a search by an end user’s user name.
• IP Address - This selection performs a search by an end user’s IP address.
2. Make an entry in the blank field to the right:
• If User Name was selected, enter a user name• If IP Address was selected, enter an IP address.
3. Click Search to display a record that matches your criteria.
TIPS: After performing a search, if you wish to re-display all end users records in the list again—or import new users and new user groups from the LDAP server—click Import Now.
To display more end user records at a time than the default 25 user records, move the slider to the right and specify the maximum number of records to display in the list: 50, 75, 100, 125, 150, 175, 200, 225, 250.
View End User Activity
1. To drill down and view additional information about an end user’s activity, select the user’s record to highlight it.
2. Click User Summary to open the User Summary panel, and perform any of the actions described for this panel in the Real Time Reports Section.
M86 SECURITY USER GUIDE
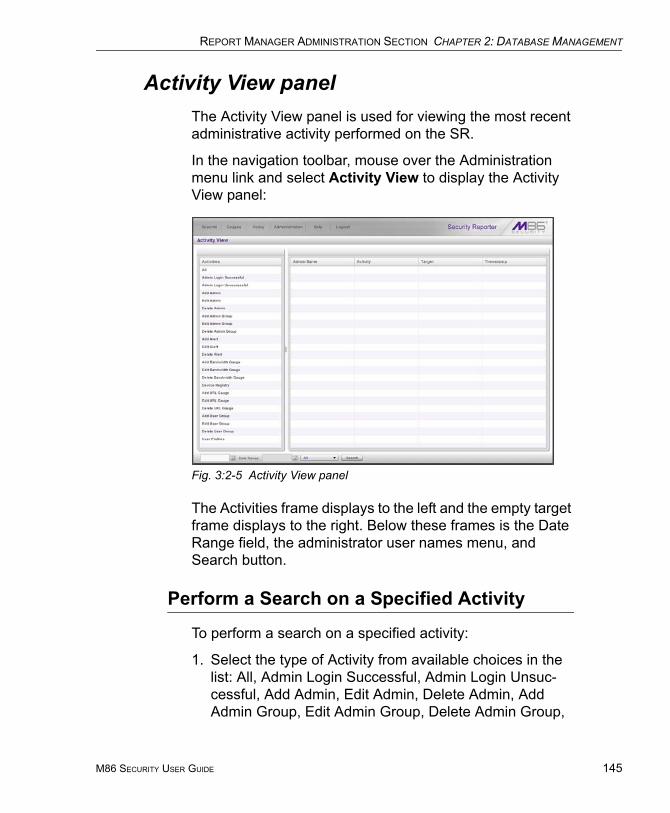
REPORT MANAGER ADMINISTRATION SECTION CHAPTER 2: DATABASE MANAGEMENT
Activity View panelThe Activity View panel is used for viewing the most recent administrative activity performed on the SR.
In the navigation toolbar, mouse over the Administration menu link and select Activity View to display the Activity View panel:
Fig. 3:2-5 Activity View panel
The Activities frame displays to the left and the empty target frame displays to the right. Below these frames is the Date Range field, the administrator user names menu, and Search button.
Perform a Search on a Specified Activity
To perform a search on a specified activity:
1. Select the type of Activity from available choices in the list: All, Admin Login Successful, Admin Login Unsuc-cessful, Add Admin, Edit Admin, Delete Admin, Add Admin Group, Edit Admin Group, Delete Admin Group,
M86 SECURITY USER GUIDE 145
REPORT MANAGER ADMINISTRATION SECTION CHAPTER 2: DATABASE MANAGEMENT
146
Add Alert, Edit Alert, Delete Alert, Add Bandwidth Gauge, Edit Bandwidth Gauge, Delete Bandwidth Gauge, Device Registry, Add URL Gauge, Edit URL Gauge, Delete URL Gauge, Add User Group, Edit User Group, Delete User Group, User Profiles.
NOTE: The Activities list will only display activity types performed on SR within the past 30 days.
2. In the Date Range field, click the calendar icon on the left to open the larger calendar for the current month, with today’s date highlighted.
TIP: To view the calendar for the previous month, click the left arrow. To view the calendar for the next month, click the right arrow.
3. Click the starting date to select it and to close the calendar pop-up window. This action populates the field to the left of the calendar icon with the selected date.
4. Click the calendar icon on the right to open the larger calendar for the current month, with today’s date high-lighted.
5. Click the ending date to select it and to close the calendar pop-up window. This action populates the field to the left of the calendar icon with the selected date.
6. To view the activity of a specified administrator, select the user name from the pull-down menu.
7. Click Search to display the specified records for the selected dates in the results list:
M86 SECURITY USER GUIDE

REPORT MANAGER ADMINISTRATION SECTION CHAPTER 2: DATABASE MANAGEMENT
Fig. 3:2-6 Activity View results
Search results
When populated with rows of records, the results list includes data in the following columns: Admin Name (entry from the Admin Name field in the login window); Activity; Target (administrator group name or group administrator name, if applicable), and Timestamp (using the YYYY-MM-DD HH:MM:SS format).
The information that displays in these columns differs depending on the type of search performed, and if an administrator name was selected from the drop-down menu.
The Target field displays information only as applicable for any of the following actions executed by the administrator (Admin Name), such as:
• administrator name for Add/Edit/Delete Admin
• group name for Add/Edit/Delete Admin Group
• alert name for Add/Edit/Delete Alert
• gauge name for Add/Edit/Delete URL/Bandwidth Gauge.
M86 SECURITY USER GUIDE 147
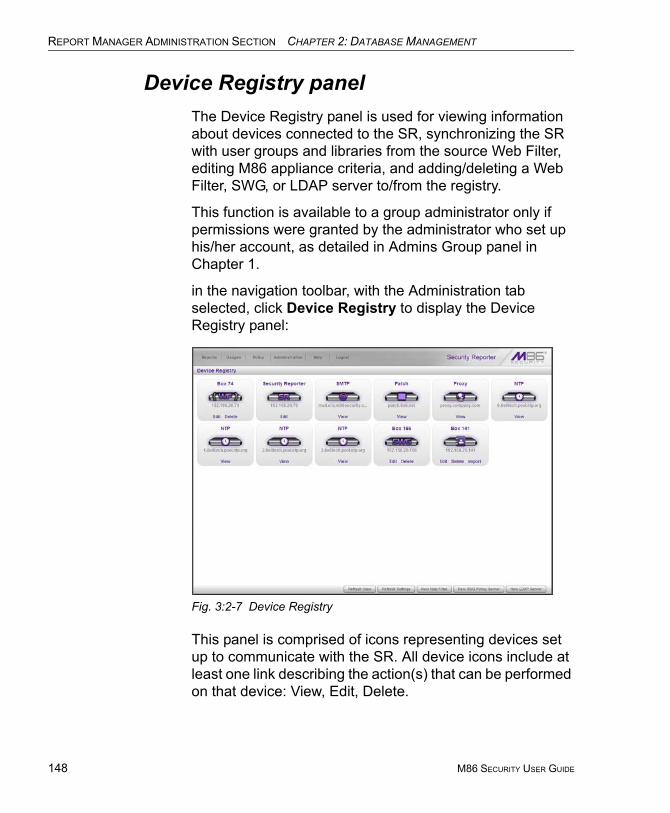
REPORT MANAGER ADMINISTRATION SECTION CHAPTER 2: DATABASE MANAGEMENT
148
Device Registry panelThe Device Registry panel is used for viewing information about devices connected to the SR, synchronizing the SR with user groups and libraries from the source Web Filter, editing M86 appliance criteria, and adding/deleting a Web Filter, SWG, or LDAP server to/from the registry.
This function is available to a group administrator only if permissions were granted by the administrator who set up his/her account, as detailed in Admins Group panel in Chapter 1.
in the navigation toolbar, with the Administration tab selected, click Device Registry to display the Device Registry panel:
Fig. 3:2-7 Device Registry
This panel is comprised of icons representing devices set up to communicate with the SR. All device icons include at least one link describing the action(s) that can be performed on that device: View, Edit, Delete.
M86 SECURITY USER GUIDE
REPORT MANAGER ADMINISTRATION SECTION CHAPTER 2: DATABASE MANAGEMENT
At the bottom of the panel the following buttons display:
• Refresh View - Click this button if any icon representing a device does not properly display in the user interface.
• Refresh Settings (displays only if using a Web Filter) - Click this button to synchronize Web Filter library Cate-gories, and/or User Groups.
• New Web Filter - Click this button to add a Web Filter to the device registry.
• New SWG Policy Server - Click this button to add an SWG policy server to the device registry.
• New LDAP Server (enabled only if an SWG has been added to the device registry) - Click this button to add an LDAP server to the device registry.
NOTE: A Web Filter or SWG policy server must be added to the device registry in order for the SR to generate reports. If a Web Filter or SWG policy server was not specified during the wizard installation process, please add this device now.
M86 SECURITY USER GUIDE 149
REPORT MANAGER ADMINISTRATION SECTION CHAPTER 2: DATABASE MANAGEMENT
150
Removing/adding Web Filter, SWG devices
Please note the following conditions that occur if removing a Web Filter and/or SWG device, and/or adding another device of either of these types:
WARNING: For any scenario specified above that would result in data being purged from the Security Reporter, M86 recommends backing up and saving current SR data off the server before adding or removing the designated device from the device registry. If this is an SR server with RAID, please refer to the Backup screen sub-section from Chapter 2 of the System Config-uration Section of this User Guide for information about backing up data.
Device(s) listed in registry
Change(s) made to registry
Result
SWG Remove SWG
All data for Time Usage Reports, Sum-mary Reports, Summary Drill Down Reports and Detail Drill Down Reports will be purged.
SWG Retain SWG and add Web Filter
All data for Time Usage Reports, Sum-mary Reports, Summary Drill Down Reports and Detail Drill Down Reports will be purged.
SWG and Web Filter
Retain Web Filter only
Web Filter productivity data will be retained, SWG and security report data will be purged.
Web Filter Remove Web Filter
All data for Time Usage Reports, Sum-mary Reports, Summary Drill Down Reports and Detail Drill Down Reports will be purged.
Web Filter Retain Web Filter and add SWG
No data will be purged.
Web Filter and SWG
Retain SWG only
All data for Time Usage Reports, Sum-mary Reports, Summary Drill Down Reports and Detail Drill Down Reports will be purged.
M86 SECURITY USER GUIDE
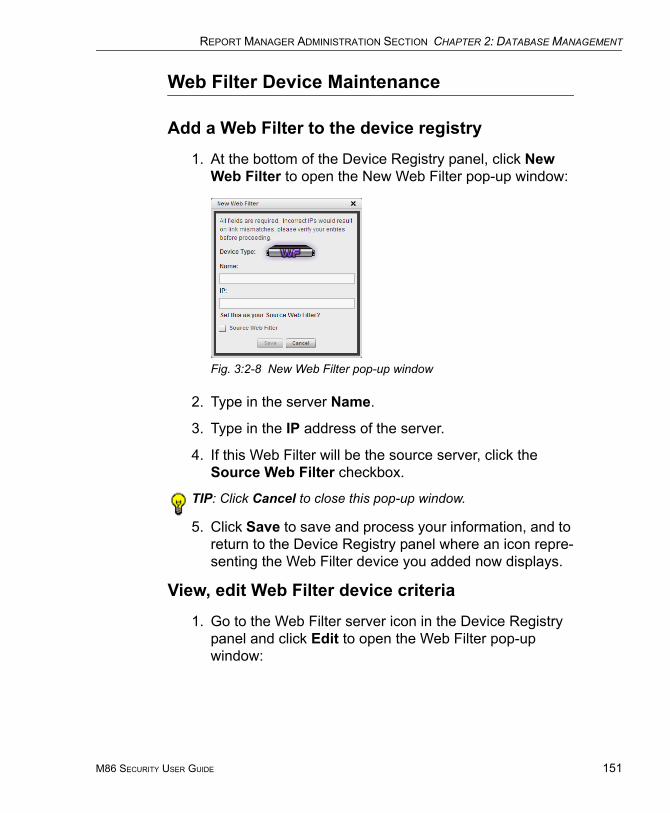
REPORT MANAGER ADMINISTRATION SECTION CHAPTER 2: DATABASE MANAGEMENT
Web Filter Device Maintenance
Add a Web Filter to the device registry
1. At the bottom of the Device Registry panel, click New Web Filter to open the New Web Filter pop-up window:
Fig. 3:2-8 New Web Filter pop-up window
2. Type in the server Name.
3. Type in the IP address of the server.
4. If this Web Filter will be the source server, click the Source Web Filter checkbox.
TIP: Click Cancel to close this pop-up window.
5. Click Save to save and process your information, and to return to the Device Registry panel where an icon repre-senting the Web Filter device you added now displays.
View, edit Web Filter device criteria
1. Go to the Web Filter server icon in the Device Registry panel and click Edit to open the Web Filter pop-up window:
M86 SECURITY USER GUIDE 151
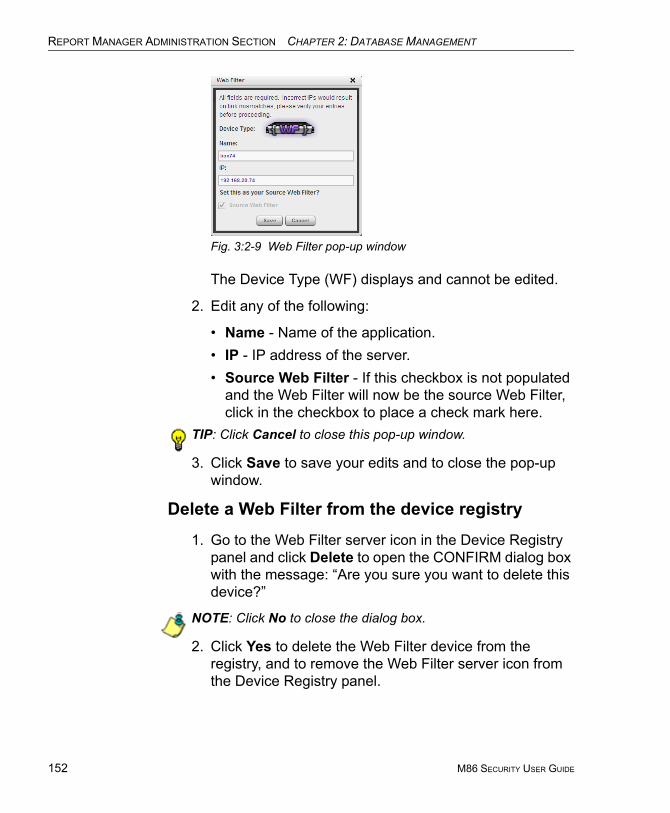
REPORT MANAGER ADMINISTRATION SECTION CHAPTER 2: DATABASE MANAGEMENT
152
Fig. 3:2-9 Web Filter pop-up window
The Device Type (WF) displays and cannot be edited.
2. Edit any of the following:
• Name - Name of the application.• IP - IP address of the server.• Source Web Filter - If this checkbox is not populated
and the Web Filter will now be the source Web Filter, click in the checkbox to place a check mark here.
TIP: Click Cancel to close this pop-up window.
3. Click Save to save your edits and to close the pop-up window.
Delete a Web Filter from the device registry
1. Go to the Web Filter server icon in the Device Registry panel and click Delete to open the CONFIRM dialog box with the message: “Are you sure you want to delete this device?”
NOTE: Click No to close the dialog box.
2. Click Yes to delete the Web Filter device from the registry, and to remove the Web Filter server icon from the Device Registry panel.
M86 SECURITY USER GUIDE
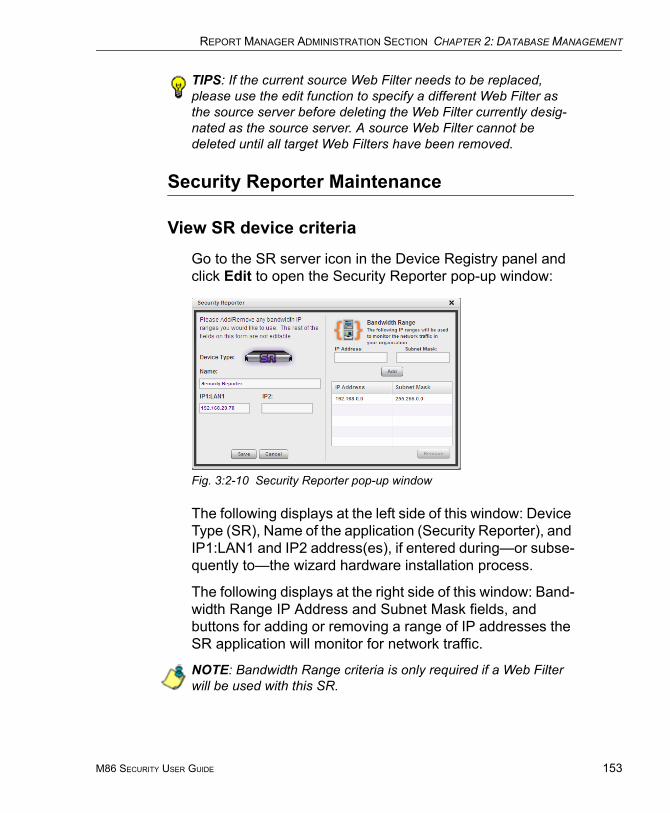
REPORT MANAGER ADMINISTRATION SECTION CHAPTER 2: DATABASE MANAGEMENT
TIPS: If the current source Web Filter needs to be replaced, please use the edit function to specify a different Web Filter as the source server before deleting the Web Filter currently desig-nated as the source server. A source Web Filter cannot be deleted until all target Web Filters have been removed.
Security Reporter Maintenance
View SR device criteria
Go to the SR server icon in the Device Registry panel and click Edit to open the Security Reporter pop-up window:
Fig. 3:2-10 Security Reporter pop-up window
The following displays at the left side of this window: Device Type (SR), Name of the application (Security Reporter), and IP1:LAN1 and IP2 address(es), if entered during—or subse-quently to—the wizard hardware installation process.
The following displays at the right side of this window: Band-width Range IP Address and Subnet Mask fields, and buttons for adding or removing a range of IP addresses the SR application will monitor for network traffic.
NOTE: Bandwidth Range criteria is only required if a Web Filter will be used with this SR.
M86 SECURITY USER GUIDE 153
REPORT MANAGER ADMINISTRATION SECTION CHAPTER 2: DATABASE MANAGEMENT
154
If an IP Address and Subnet Mask were previously entered in this window, that information displays in the list box.
Add, remove a bandwidth range
1. Do the following in the Bandwidth Range section:
• To add a bandwidth IP address range:a. Type in the IP Address.b. Type in the Subnet Mask.c. Click Add to add the bandwidth IP range in the list
box.• To remove a bandwidth IP address range:
a. Select the IP address range from the list box; this action activates the Remove button.
b. Click Remove to remove the IP address range.TIP: Click Cancel to close the pop-up window without saving your entries.
2. After making all modifications in this window, click Save to save your edits and to close the pop-up window.
View Other Device Criteria
View only actions are permitted in the Device Registry panel for the following devices: SMTP, Patch Server, NTP Server, and Proxy Server.
View SMTP device criteria
1. Go to the image of the SMTP server in the Device Registry panel and click View to open the SMTP Server pop-up window:
M86 SECURITY USER GUIDE
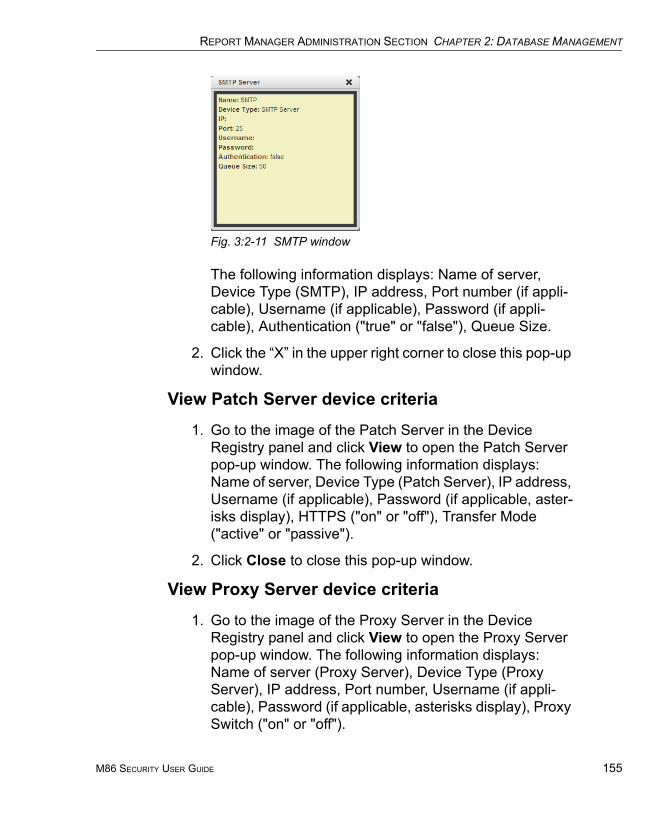
REPORT MANAGER ADMINISTRATION SECTION CHAPTER 2: DATABASE MANAGEMENT
Fig. 3:2-11 SMTP window
The following information displays: Name of server, Device Type (SMTP), IP address, Port number (if appli-cable), Username (if applicable), Password (if appli-cable), Authentication ("true" or "false"), Queue Size.
2. Click the “X” in the upper right corner to close this pop-up window.
View Patch Server device criteria
1. Go to the image of the Patch Server in the Device Registry panel and click View to open the Patch Server pop-up window. The following information displays: Name of server, Device Type (Patch Server), IP address, Username (if applicable), Password (if applicable, aster-isks display), HTTPS ("on" or "off"), Transfer Mode ("active" or "passive").
2. Click Close to close this pop-up window.
View Proxy Server device criteria
1. Go to the image of the Proxy Server in the Device Registry panel and click View to open the Proxy Server pop-up window. The following information displays: Name of server (Proxy Server), Device Type (Proxy Server), IP address, Port number, Username (if appli-cable), Password (if applicable, asterisks display), Proxy Switch ("on" or "off").
M86 SECURITY USER GUIDE 155
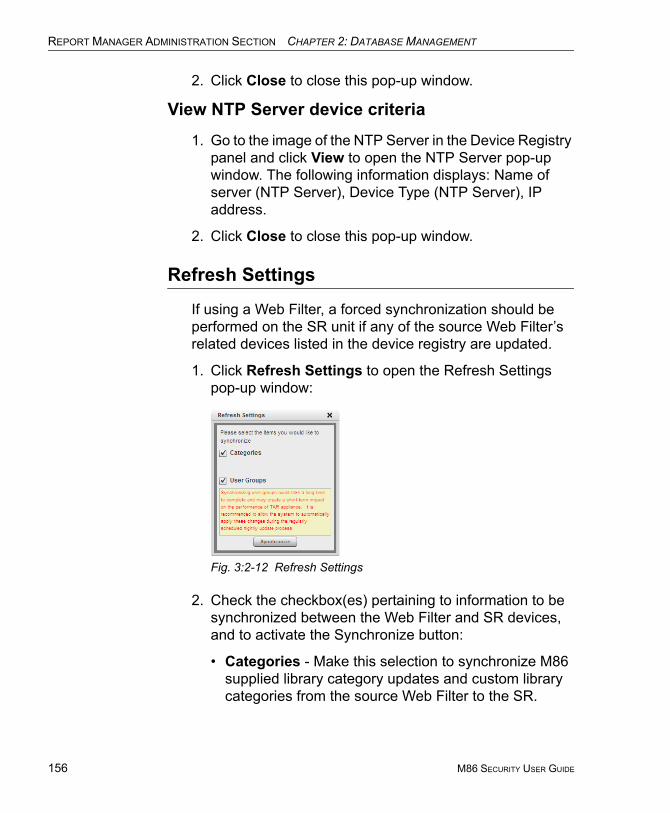
REPORT MANAGER ADMINISTRATION SECTION CHAPTER 2: DATABASE MANAGEMENT
156
2. Click Close to close this pop-up window.
View NTP Server device criteria
1. Go to the image of the NTP Server in the Device Registry panel and click View to open the NTP Server pop-up window. The following information displays: Name of server (NTP Server), Device Type (NTP Server), IP address.
2. Click Close to close this pop-up window.
Refresh Settings
If using a Web Filter, a forced synchronization should be performed on the SR unit if any of the source Web Filter’s related devices listed in the device registry are updated.
1. Click Refresh Settings to open the Refresh Settings pop-up window:
Fig. 3:2-12 Refresh Settings
2. Check the checkbox(es) pertaining to information to be synchronized between the Web Filter and SR devices, and to activate the Synchronize button:
• Categories - Make this selection to synchronize M86 supplied library category updates and custom library categories from the source Web Filter to the SR.
M86 SECURITY USER GUIDE

REPORT MANAGER ADMINISTRATION SECTION CHAPTER 2: DATABASE MANAGEMENT
• User Groups - Make this selection to synchronize LDAP user group information on the source Web Filter to the SR.
TIP: Click the “X” in the upper right corner of this pop-up window to close it.
WARNING: The User Groups synchronization process may be lengthy and thus may create an impact on the SR’s performance.
3. Click Synchronize to close the pop-up window and to begin the synchronization process.
SWG Policy Server Device Maintenance
Add the first Policy Server to the device registry
1. If an SWG Policy Server will be used with this SR and was not added during the SR Wizard installation process—nor subsequently added to this device registry—click New SWG Policy Server at the bottom of the Device Registry panel to open the New SWG Policy Server pop-up window:
Fig. 3:2-13 Add New SWG Policy Server
M86 SECURITY USER GUIDE 157
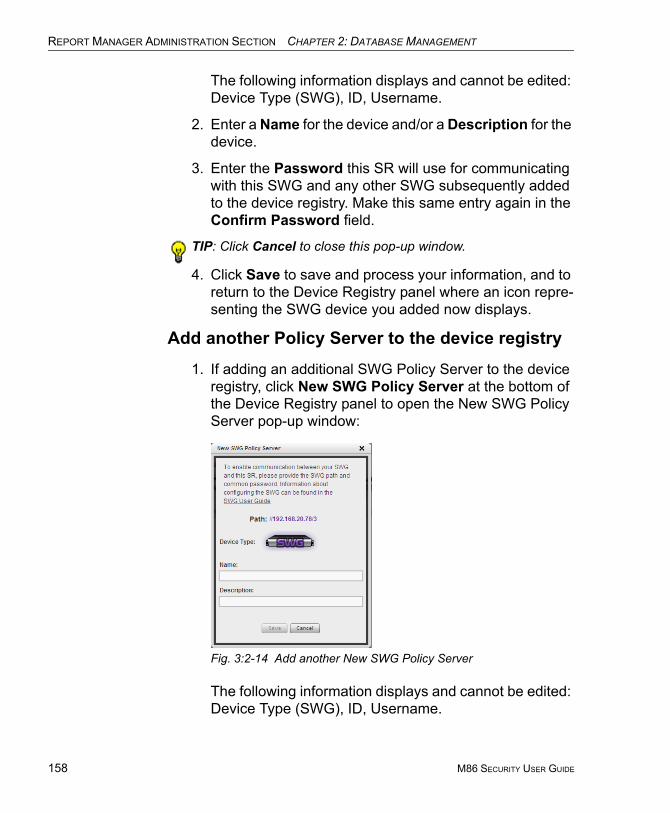
REPORT MANAGER ADMINISTRATION SECTION CHAPTER 2: DATABASE MANAGEMENT
158
The following information displays and cannot be edited: Device Type (SWG), ID, Username.
2. Enter a Name for the device and/or a Description for the device.
3. Enter the Password this SR will use for communicating with this SWG and any other SWG subsequently added to the device registry. Make this same entry again in the Confirm Password field.
TIP: Click Cancel to close this pop-up window.
4. Click Save to save and process your information, and to return to the Device Registry panel where an icon repre-senting the SWG device you added now displays.
Add another Policy Server to the device registry
1. If adding an additional SWG Policy Server to the device registry, click New SWG Policy Server at the bottom of the Device Registry panel to open the New SWG Policy Server pop-up window:
Fig. 3:2-14 Add another New SWG Policy Server
The following information displays and cannot be edited: Device Type (SWG), ID, Username.
M86 SECURITY USER GUIDE
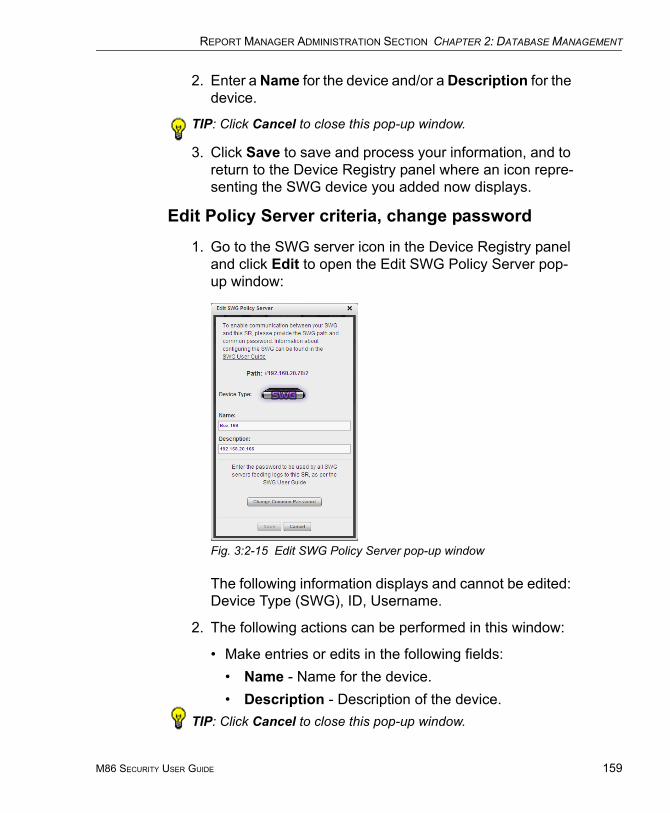
REPORT MANAGER ADMINISTRATION SECTION CHAPTER 2: DATABASE MANAGEMENT
2. Enter a Name for the device and/or a Description for the device.
TIP: Click Cancel to close this pop-up window.
3. Click Save to save and process your information, and to return to the Device Registry panel where an icon repre-senting the SWG device you added now displays.
Edit Policy Server criteria, change password
1. Go to the SWG server icon in the Device Registry panel and click Edit to open the Edit SWG Policy Server pop-up window:
Fig. 3:2-15 Edit SWG Policy Server pop-up window
The following information displays and cannot be edited: Device Type (SWG), ID, Username.
2. The following actions can be performed in this window:
• Make entries or edits in the following fields:• Name - Name for the device.• Description - Description of the device.
TIP: Click Cancel to close this pop-up window.
M86 SECURITY USER GUIDE 159
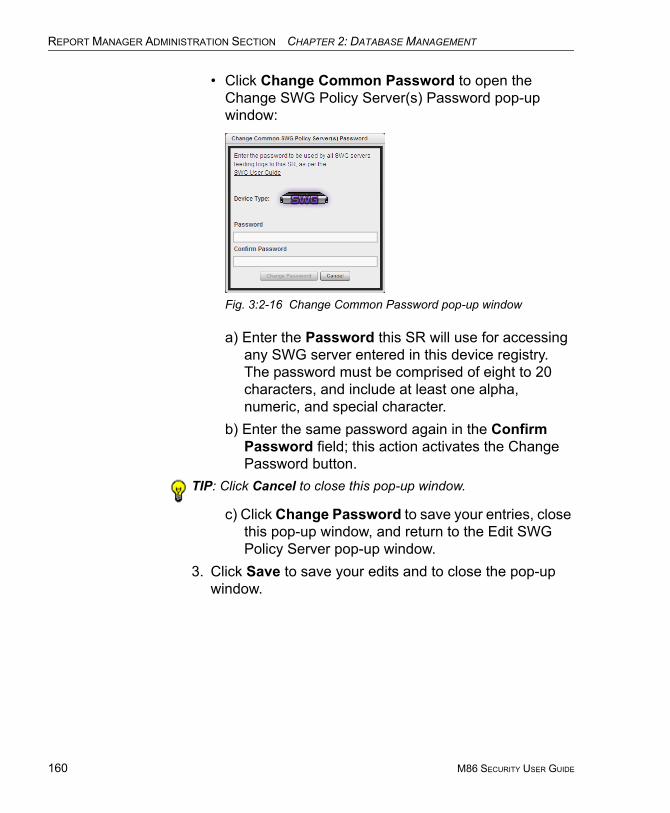
REPORT MANAGER ADMINISTRATION SECTION CHAPTER 2: DATABASE MANAGEMENT
160
• Click Change Common Password to open the Change SWG Policy Server(s) Password pop-up window:
Fig. 3:2-16 Change Common Password pop-up window
a) Enter the Password this SR will use for accessing any SWG server entered in this device registry. The password must be comprised of eight to 20 characters, and include at least one alpha, numeric, and special character.
b) Enter the same password again in the Confirm Password field; this action activates the Change Password button.
TIP: Click Cancel to close this pop-up window.
c) Click Change Password to save your entries, close this pop-up window, and return to the Edit SWG Policy Server pop-up window.
3. Click Save to save your edits and to close the pop-up window.
M86 SECURITY USER GUIDE
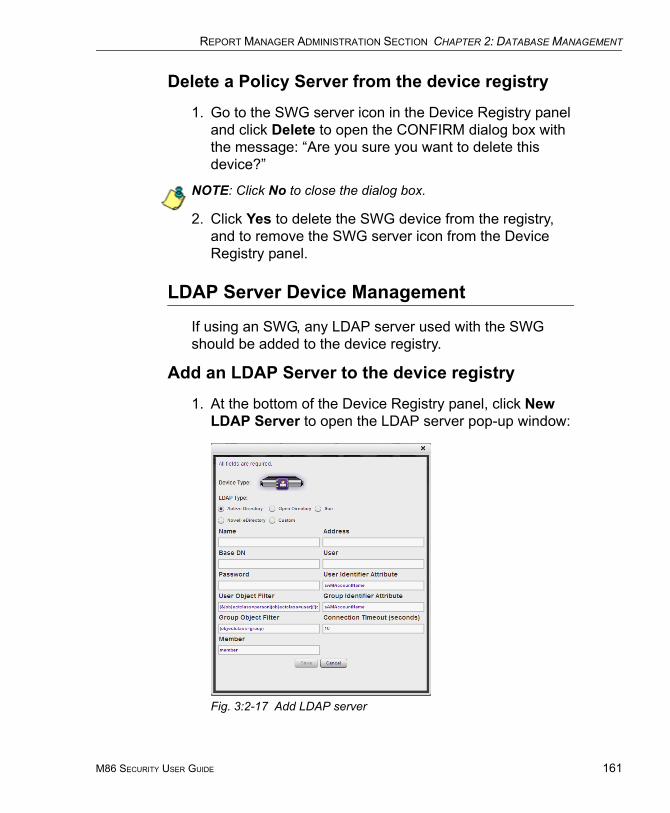
REPORT MANAGER ADMINISTRATION SECTION CHAPTER 2: DATABASE MANAGEMENT
Delete a Policy Server from the device registry
1. Go to the SWG server icon in the Device Registry panel and click Delete to open the CONFIRM dialog box with the message: “Are you sure you want to delete this device?”
NOTE: Click No to close the dialog box.
2. Click Yes to delete the SWG device from the registry, and to remove the SWG server icon from the Device Registry panel.
LDAP Server Device Management
If using an SWG, any LDAP server used with the SWG should be added to the device registry.
Add an LDAP Server to the device registry
1. At the bottom of the Device Registry panel, click New LDAP Server to open the LDAP server pop-up window:
Fig. 3:2-17 Add LDAP server
M86 SECURITY USER GUIDE 161
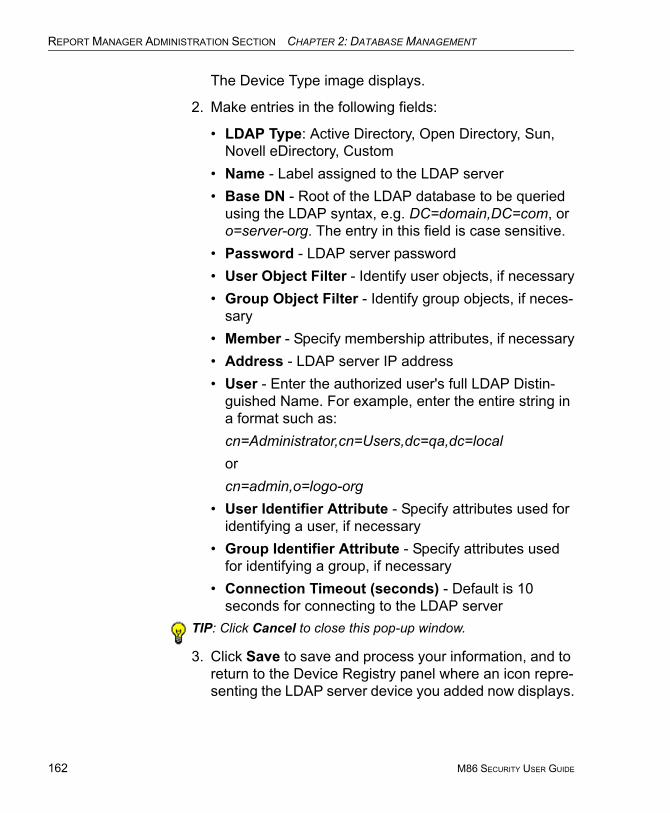
REPORT MANAGER ADMINISTRATION SECTION CHAPTER 2: DATABASE MANAGEMENT
162
The Device Type image displays.
2. Make entries in the following fields:
• LDAP Type: Active Directory, Open Directory, Sun, Novell eDirectory, Custom
• Name - Label assigned to the LDAP server• Base DN - Root of the LDAP database to be queried
using the LDAP syntax, e.g. DC=domain,DC=com, or o=server-org. The entry in this field is case sensitive.
• Password - LDAP server password• User Object Filter - Identify user objects, if necessary• Group Object Filter - Identify group objects, if neces-
sary• Member - Specify membership attributes, if necessary• Address - LDAP server IP address• User - Enter the authorized user's full LDAP Distin-
guished Name. For example, enter the entire string in a format such as:cn=Administrator,cn=Users,dc=qa,dc=localorcn=admin,o=logo-org
• User Identifier Attribute - Specify attributes used for identifying a user, if necessary
• Group Identifier Attribute - Specify attributes used for identifying a group, if necessary
• Connection Timeout (seconds) - Default is 10 seconds for connecting to the LDAP server
TIP: Click Cancel to close this pop-up window.
3. Click Save to save and process your information, and to return to the Device Registry panel where an icon repre-senting the LDAP server device you added now displays.
M86 SECURITY USER GUIDE
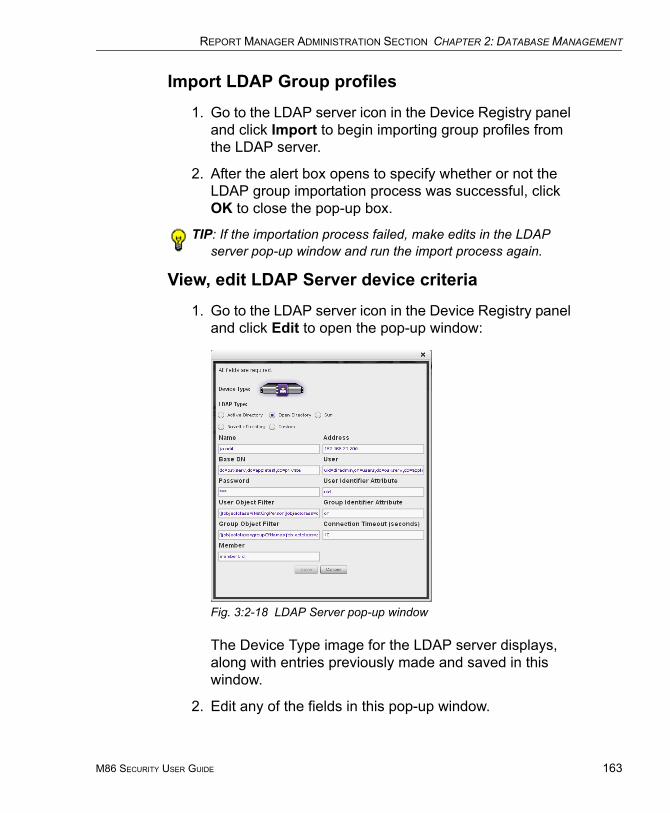
REPORT MANAGER ADMINISTRATION SECTION CHAPTER 2: DATABASE MANAGEMENT
Import LDAP Group profiles
1. Go to the LDAP server icon in the Device Registry panel and click Import to begin importing group profiles from the LDAP server.
2. After the alert box opens to specify whether or not the LDAP group importation process was successful, click OK to close the pop-up box.
TIP: If the importation process failed, make edits in the LDAP server pop-up window and run the import process again.
View, edit LDAP Server device criteria
1. Go to the LDAP server icon in the Device Registry panel and click Edit to open the pop-up window:
Fig. 3:2-18 LDAP Server pop-up window
The Device Type image for the LDAP server displays, along with entries previously made and saved in this window.
2. Edit any of the fields in this pop-up window.
M86 SECURITY USER GUIDE 163
REPORT MANAGER ADMINISTRATION SECTION CHAPTER 2: DATABASE MANAGEMENT
164
TIP: Click Cancel to close this pop-up window.
3. Click Save to save your edits and to close the pop-up window.
Delete an LDAP Server from the device registry
1. Go to the LDAP server icon in the Device Registry panel and click Delete to open the CONFIRM dialog box with the message: “Are you sure you want to delete this device?”
NOTE: Click No to close the dialog box.
2. Click Yes to delete the LDAP server device from the registry, and to remove the LDAP server icon from the Device Registry panel.
M86 SECURITY USER GUIDE
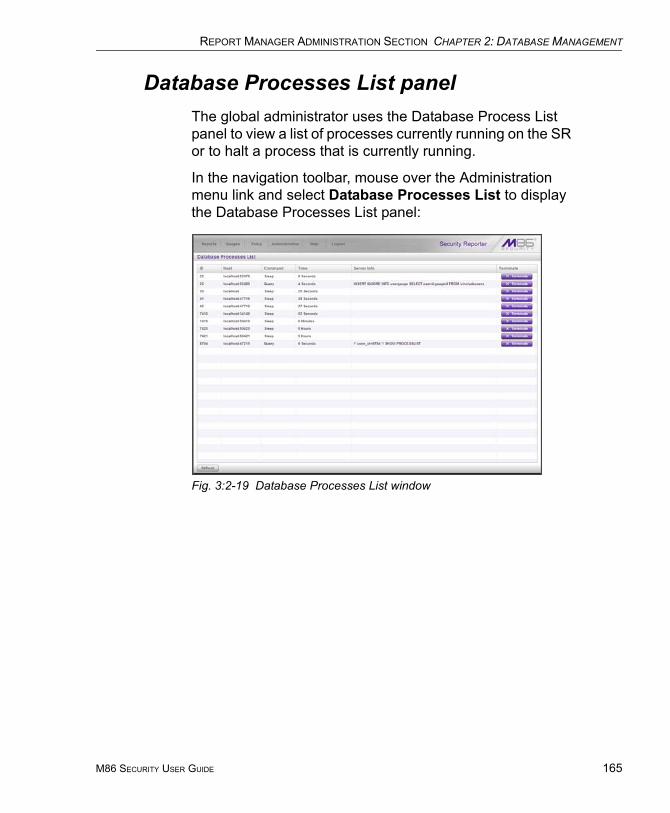
REPORT MANAGER ADMINISTRATION SECTION CHAPTER 2: DATABASE MANAGEMENT
Database Processes List panelThe global administrator uses the Database Process List panel to view a list of processes currently running on the SR or to halt a process that is currently running.
In the navigation toolbar, mouse over the Administration menu link and select Database Processes List to display the Database Processes List panel:
Fig. 3:2-19 Database Processes List window
M86 SECURITY USER GUIDE 165
REPORT MANAGER ADMINISTRATION SECTION CHAPTER 2: DATABASE MANAGEMENT
166
View Details on a Process
Each row in the list includes the following information: process identification number (ID) on the MySQL server; Host name or IP address of the server, and port connected to the database; the state of the last Command issued by the user (“Query” or “Sleep”); the amount of Time in seconds the process has remained in its current state, and SQL statement for a process currently running (Server Info). At the end of each row is the Terminate option.
TIP: Click the Refresh button to refresh the list of records.
Terminate a Process
Select the process to be terminated and click Terminate.
WARNING: Be sure that you do not terminate the wrong process.
M86 SECURITY USER GUIDE
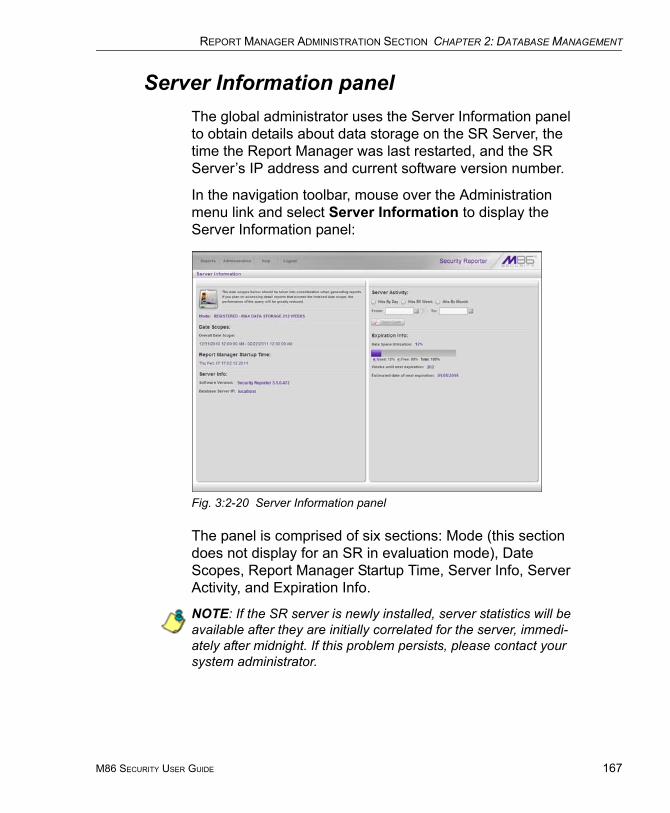
REPORT MANAGER ADMINISTRATION SECTION CHAPTER 2: DATABASE MANAGEMENT
Server Information panelThe global administrator uses the Server Information panel to obtain details about data storage on the SR Server, the time the Report Manager was last restarted, and the SR Server’s IP address and current software version number.
In the navigation toolbar, mouse over the Administration menu link and select Server Information to display the Server Information panel:
Fig. 3:2-20 Server Information panel
The panel is comprised of six sections: Mode (this section does not display for an SR in evaluation mode), Date Scopes, Report Manager Startup Time, Server Info, Server Activity, and Expiration Info.
NOTE: If the SR server is newly installed, server statistics will be available after they are initially correlated for the server, immedi-ately after midnight. If this problem persists, please contact your system administrator.
M86 SECURITY USER GUIDE 167

REPORT MANAGER ADMINISTRATION SECTION CHAPTER 2: DATABASE MANAGEMENT
168
Mode
Registered Mode and Evaluation Mode
The Mode section displays information about an SR in registered mode: “REGISTERED” followed by the maximum number of weeks of data storage (“MAX DATA STORAGE ‘X’ WEEKS”—in which ‘X’ represents the number of weeks).
Registered mode pertains to an SR server that has been activated online and registered by M86 Security. An SR in registered mode will store as much data as allocated for data storage on its hard drive—and on its attached storage device, if applicable to the hardware model of the SR server. When the SR is close to reaching its maximum capacity of data storage—as determined by the SR when making its routine 30-minute check of available storage space—the oldest week of data (from Sunday through Saturday) is dropped from the database.
Evaluation mode is used during the evaluation period of an SR, a maximum of three weeks by default. Since data is expired from the server in full weekly increments from Sunday through Saturday, if a newly installed SR is up and running on any day of the week after a Sunday (i.e. on a Monday through a Saturday), the evaluation period would be less than three weeks. For example, if the SR was installed on Wednesday, January 5, 2011, the evaluation period would run from that day until Saturday, January 22, 2011.
NOTES: See the Expiration screen in the System Configuration Section for more information about data expiration. See also Appendix C: Evaluation Mode for information about using the SR in the evaluation mode.
M86 SECURITY USER GUIDE
REPORT MANAGER ADMINISTRATION SECTION CHAPTER 2: DATABASE MANAGEMENT
Date Scopes
The Date Scopes section displays the Overall Date Scope of data stored on the SR. This date scope includes the range for the period of stored data, using the MM/DD/YYYY HH:MM:SS AM/PM format.
Report Manager Startup Time
The Report Manager Startup Time section contains the following information pertaining to the last time the Report Manager was restarted: Day of the week and month name abbreviation, day, military time (HH:MM:SS), and year (YYYY).
NOTE: This information is useful for troubleshooting manually generated reports. If your reports are not displaying, it may be that the Report Manager has restarted and terminated the report generation process.
Server Info
The Server Info section contains the following SR server information: Software Version number and Database Server IP address—or the label “localhost” that designates the SR as the host server for the Report Manager.
M86 SECURITY USER GUIDE 169

REPORT MANAGER ADMINISTRATION SECTION CHAPTER 2: DATABASE MANAGEMENT
170
Server Activity
In the Server Activity section, specify the type of chart you wish to generate that provides details on the number of hits within a designated time period. A “hit” is any page and/or object an end user accesses as the result of entering a URL in his/her browser window.
1. Specify the time period for the chart you wish to draw by doing the following:
a. Click the radio button corresponding to Hits By Day, Hits By Week, or Hits By Month.
b. At the From and To fields, make a selection for the date range using the calendar icons:
• Click the calendar icon to open the larger calendar for the current month, with today’s date highlighted.
TIP: To view the calendar for the previous month, click the left arrow. To view the calendar for the next month, click the right arrow.
• Click the date to select it and to close the calendar pop-up window. This action populates the field to the left of the calendar icon with the selected date.
2. Click the Draw Chart button to open a window that displays the chart of your selection in the PDF file format.
The header section includes the title of the chart and date range. The footer section includes the date and time the chart was generated (shown in the MM/DD/YYYY HH:MM AM/PM format), the login ID of the person who generated the chart (Generated by) and the Page number and page range.
The chart image includes a graph illustrating the general Number of Hits (in purple) and Number of IPs that gener-
M86 SECURITY USER GUIDE
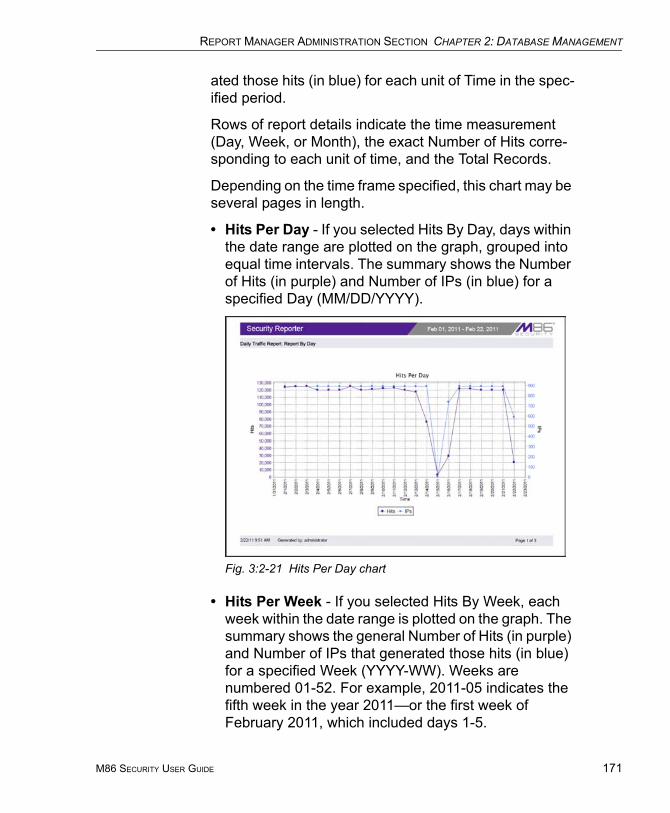
REPORT MANAGER ADMINISTRATION SECTION CHAPTER 2: DATABASE MANAGEMENT
ated those hits (in blue) for each unit of Time in the spec-ified period.
Rows of report details indicate the time measurement (Day, Week, or Month), the exact Number of Hits corre-sponding to each unit of time, and the Total Records.
Depending on the time frame specified, this chart may be several pages in length.
• Hits Per Day - If you selected Hits By Day, days within the date range are plotted on the graph, grouped into equal time intervals. The summary shows the Number of Hits (in purple) and Number of IPs (in blue) for a specified Day (MM/DD/YYYY).
Fig. 3:2-21 Hits Per Day chart
• Hits Per Week - If you selected Hits By Week, each week within the date range is plotted on the graph. The summary shows the general Number of Hits (in purple) and Number of IPs that generated those hits (in blue) for a specified Week (YYYY-WW). Weeks are numbered 01-52. For example, 2011-05 indicates the fifth week in the year 2011—or the first week of February 2011, which included days 1-5.
M86 SECURITY USER GUIDE 171
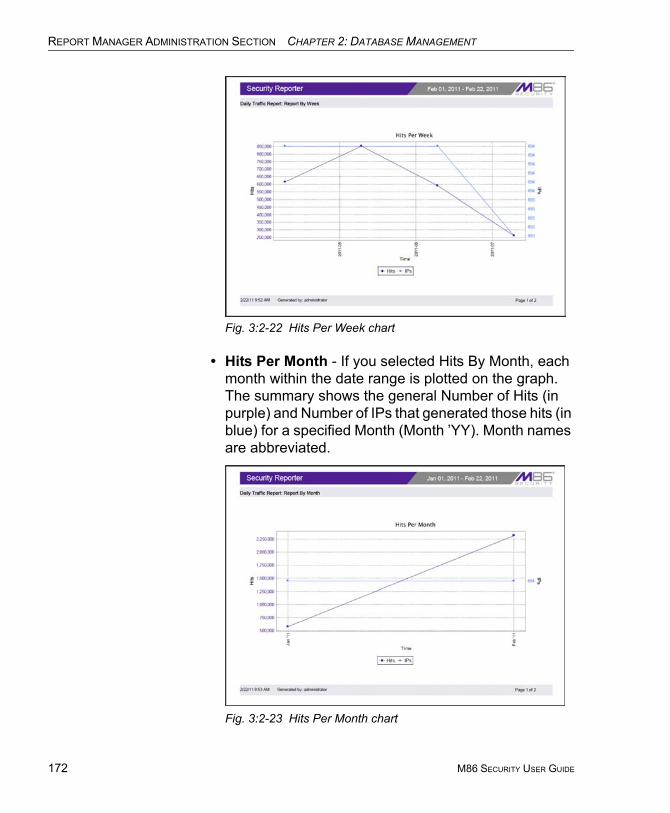
REPORT MANAGER ADMINISTRATION SECTION CHAPTER 2: DATABASE MANAGEMENT
172
Fig. 3:2-22 Hits Per Week chart
• Hits Per Month - If you selected Hits By Month, each month within the date range is plotted on the graph. The summary shows the general Number of Hits (in purple) and Number of IPs that generated those hits (in blue) for a specified Month (Month ’YY). Month names are abbreviated.
Fig. 3:2-23 Hits Per Month chart
M86 SECURITY USER GUIDE
REPORT MANAGER ADMINISTRATION SECTION CHAPTER 2: DATABASE MANAGEMENT
3. You now have the option to do any of the following:
• print the chart - click the print icon to open the Print dialog box, and proceed with standard print procedures.
• save the chart - click the save icon to open the Save a Copy dialog box, and proceed with standard save procedures.
• close the chart window - click the “X” in the upper right corner to close the chart window.
• generate a new chart - make new entries in the Server Information panel.
M86 SECURITY USER GUIDE 173
REPORT MANAGER ADMINISTRATION SECTION CHAPTER 2: DATABASE MANAGEMENT
174
Expiration Info
In the Expiration Info section, the following data displays:
• Data Space Utilization - The percentage of database storage space currently being used on the SR. Beneath this line is a colored bar depicting the percentage of data “Used” (purple) and “Free” (grey). A key displays beneath the colored bar to indicate the percentage of data both “Used” and “Free”, and “Total” data percentage.
• Weeks until next expiration - The number of weeks from this week that data on the SR will expire.
NOTE: If using the SR in evaluation mode, the text “(IF REGIS-TERED)” is included in the label to indicate the number of weeks of data that would be stored on the SR if the server was activated and running in registered mode. (See Registered Mode and Eval-uation Mode in this sub-section.)
• Estimated date of next expiration - the date scheduled for the next automatic database expiration (MM/DD/YYYY format).
NOTE: If using the SR in evaluation mode, the text “(IF REGIS-TERED)” is included in the label to indicate the number of weeks of data that would be stored on the SR if the server was activated and running in registered mode. (See Registered Mode and Eval-uation Mode in this sub-section.)
M86 SECURITY USER GUIDE

REPORT MANAGER ADMINISTRATION SECTION CHAPTER 2: DATABASE MANAGEMENT
Reset to Factory Defaults panelThe global administrator uses the Reset to Factory Defaults panel, if necessary, to restore the SR to default settings for the current software update level of the application.
In the navigation toolbar, mouse over the Administration menu link and select Reset to Factory Defaults to display the Reset to Factory Defaults panel:
Fig. 3:2-24 Reset to Factory Defaults panel
WARNING: When using this option, all settings made to the SR—including administrator, group, and real time gauge configuration settings and alerts—will be purged and cannot be restored. The SR will also be set to evaluation mode.
M86 SECURITY USER GUIDE 175
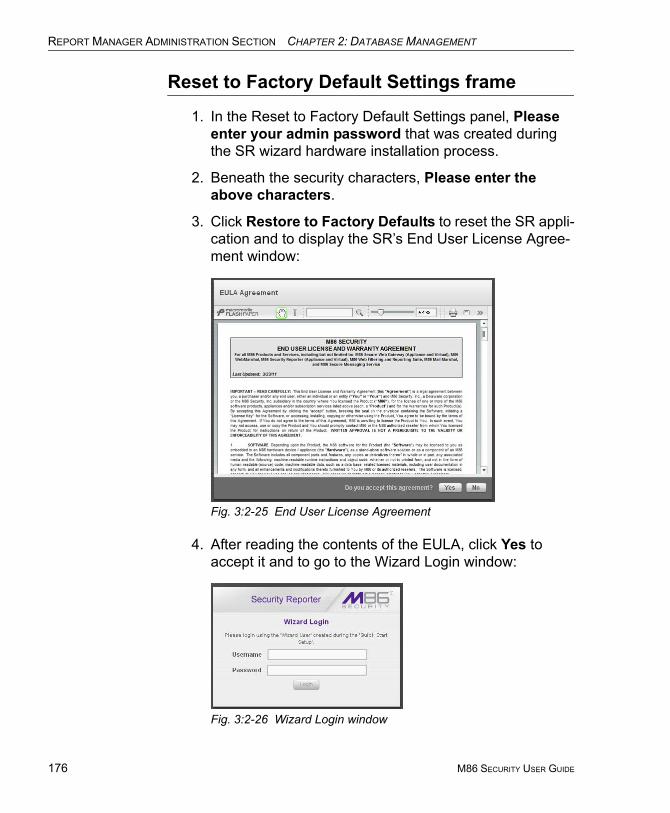
REPORT MANAGER ADMINISTRATION SECTION CHAPTER 2: DATABASE MANAGEMENT
176
Reset to Factory Default Settings frame
1. In the Reset to Factory Default Settings panel, Please enter your admin password that was created during the SR wizard hardware installation process.
2. Beneath the security characters, Please enter the above characters.
3. Click Restore to Factory Defaults to reset the SR appli-cation and to display the SR’s End User License Agree-ment window:
Fig. 3:2-25 End User License Agreement
4. After reading the contents of the EULA, click Yes to accept it and to go to the Wizard Login window:
Fig. 3:2-26 Wizard Login window
M86 SECURITY USER GUIDE
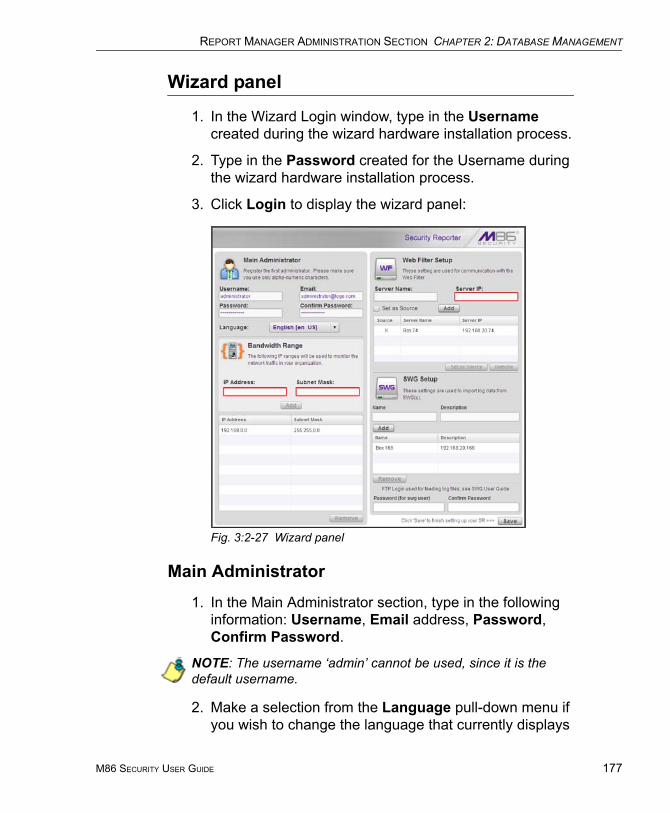
REPORT MANAGER ADMINISTRATION SECTION CHAPTER 2: DATABASE MANAGEMENT
Wizard panel
1. In the Wizard Login window, type in the Username created during the wizard hardware installation process.
2. Type in the Password created for the Username during the wizard hardware installation process.
3. Click Login to display the wizard panel:
Fig. 3:2-27 Wizard panel
Main Administrator
1. In the Main Administrator section, type in the following information: Username, Email address, Password, Confirm Password.
NOTE: The username ‘admin’ cannot be used, since it is the default username.
2. Make a selection from the Language pull-down menu if you wish to change the language that currently displays
M86 SECURITY USER GUIDE 177
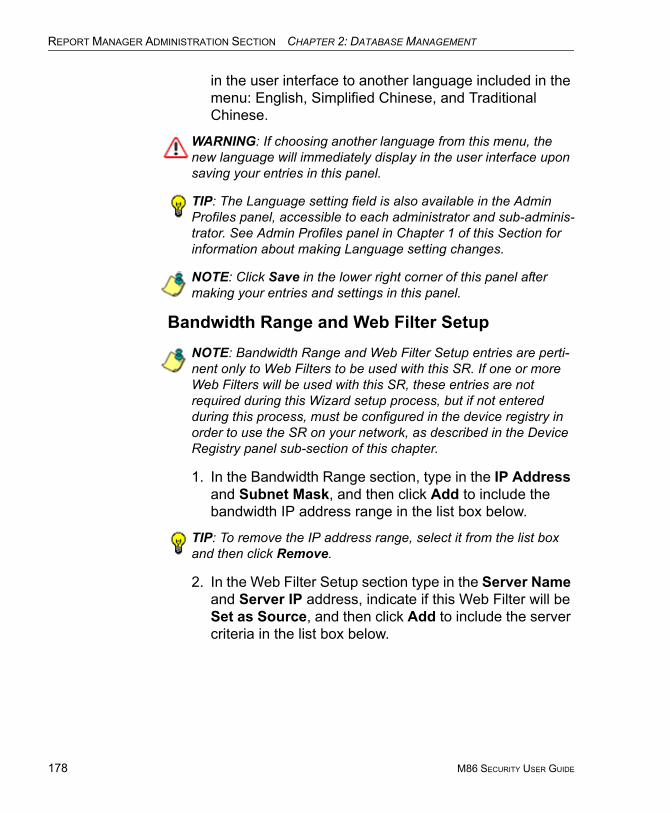
REPORT MANAGER ADMINISTRATION SECTION CHAPTER 2: DATABASE MANAGEMENT
178
in the user interface to another language included in the menu: English, Simplified Chinese, and Traditional Chinese.
WARNING: If choosing another language from this menu, the new language will immediately display in the user interface upon saving your entries in this panel.
TIP: The Language setting field is also available in the Admin Profiles panel, accessible to each administrator and sub-adminis-trator. See Admin Profiles panel in Chapter 1 of this Section for information about making Language setting changes.
NOTE: Click Save in the lower right corner of this panel after making your entries and settings in this panel.
Bandwidth Range and Web Filter SetupNOTE: Bandwidth Range and Web Filter Setup entries are perti-nent only to Web Filters to be used with this SR. If one or more Web Filters will be used with this SR, these entries are not required during this Wizard setup process, but if not entered during this process, must be configured in the device registry in order to use the SR on your network, as described in the Device Registry panel sub-section of this chapter.
1. In the Bandwidth Range section, type in the IP Address and Subnet Mask, and then click Add to include the bandwidth IP address range in the list box below.
TIP: To remove the IP address range, select it from the list box and then click Remove.
2. In the Web Filter Setup section type in the Server Name and Server IP address, indicate if this Web Filter will be Set as Source, and then click Add to include the server criteria in the list box below.
M86 SECURITY USER GUIDE

REPORT MANAGER ADMINISTRATION SECTION CHAPTER 2: DATABASE MANAGEMENT
TIPS: To add another Web Filter, follow the instructions in step 6 above. To remove a Web Filter from the list box, select it and then click Remove. To make a Web Filter the Source server—if no Web Filter in the list has yet been specified as the Source server, or if the IP address of the Source server has changed—select the Web Filter from the list box and then click Set as Source.
SWG SetupNOTE: SWG Setup entries are pertinent only to SWG Policy Servers to be used with this SR. If one or more Policy Servers will be used with this SR, these entries are not required during this Wizard setup process, but if not entered during this process, must be configured in the device registry in order to use the SR on your network, as described in the Device Registry panel sub-section of this chapter.
1. In the SWG Setup section, type in the Name and/or Description for the SWG, and then click Add to include the server criteria in the list box below.
TIP: To remove the SWG from the list box, select it and then click Remove.
2. Type in the Password (for swg user)—which is the password to be used by this SR and any SWG added to this SR’s device registry—and type this same password again in the Confirm Password field. The password entered in these fields will be used by all SWG Policy Servers set up in the Device Registry panel, so the SWGs can send logs to this SR.
NOTE: The password entered in this field must be added in the user interface of each SWG that will send logs to this SR, as explained in the SWG’s Management Console Reference Guide.
M86 SECURITY USER GUIDE 179
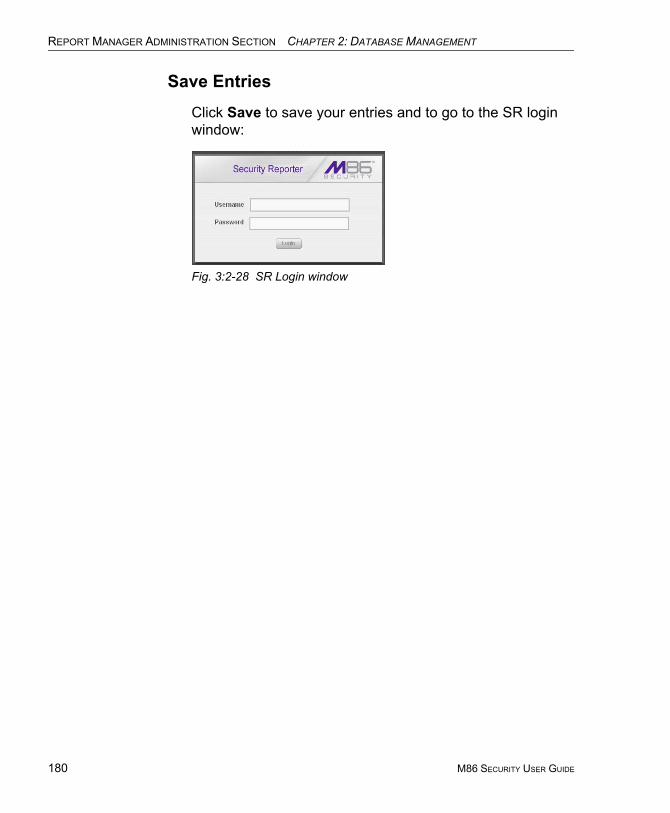
REPORT MANAGER ADMINISTRATION SECTION CHAPTER 2: DATABASE MANAGEMENT
180
Save Entries
Click Save to save your entries and to go to the SR login window:
Fig. 3:2-28 SR Login window
M86 SECURITY USER GUIDE
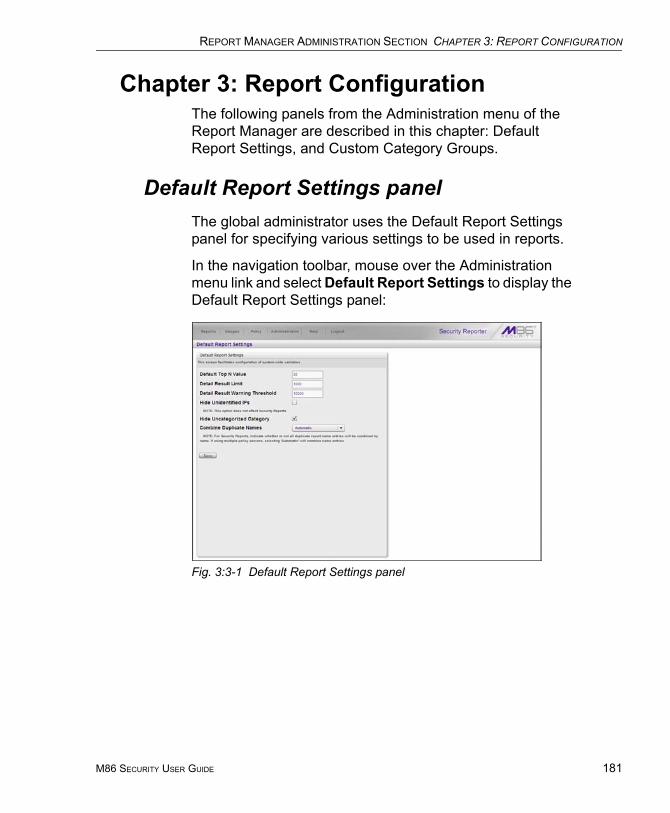
REPORT MANAGER ADMINISTRATION SECTION CHAPTER 3: REPORT CONFIGURATION
Chapter 3: Report ConfigurationThe following panels from the Administration menu of the Report Manager are described in this chapter: Default Report Settings, and Custom Category Groups.
Default Report Settings panelThe global administrator uses the Default Report Settings panel for specifying various settings to be used in reports.
In the navigation toolbar, mouse over the Administration menu link and select Default Report Settings to display the Default Report Settings panel:
Fig. 3:3-1 Default Report Settings panel
M86 SECURITY USER GUIDE 181
REPORT MANAGER ADMINISTRATION SECTION CHAPTER 3: REPORT CONFIGURATION
182
Set New Defaults
1. Enter the Default Top N Value of records that will be generated for summary reports. The default is “50” records.
2. Enter the maximum number of records that will be included in a detail report’s Detail Result Limit. If the number of records from a query exceeds the limit estab-lished in this field, the overflow will be included in the next set of records. The default is “1000” records per set.
3. Enter the maximum number of records that can be returned by a detail report query before triggering the Detail Result Warning Threshold message. This warning message indicates that the number of records exceeds the number specified in this field. The default is “10000” records.
4. By default, the Hide Unidentified IPs checkbox is de-selected. This feature for Web Filters only indicates that activity on machines not assigned to specific users will be included in reports.
If you wish to exclude activity from machines not assigned to specific users, click in the checkbox to enter a check mark.
5. If using a Web Filter with this SR being configured, the Hide Uncategorized Category checkbox displays and is selected by default. This indicates that uncategorized sites will not be displayed or counted in drill down reports.
If you wish to include uncategorized sites in drill down reports, click in the checkbox to remove the check mark.
6. If using one or more SWG policy servers with this SR being configured, make a selection from the Combine Duplicate Names pull-down menu:
M86 SECURITY USER GUIDE
REPORT MANAGER ADMINISTRATION SECTION CHAPTER 3: REPORT CONFIGURATION
• Automatic - This default selection indicates that dupli-cate name entries found in SWG log feeds will be combined under one record entry in the generated security report, whether from one SWG or multiple policy servers.
• Force combination - This selection indicates that dupli-cate name entries from log feeds of all SWGs collec-tively will be combined under one record entry in the generated report.
• Do not combine names - This selection indicates that duplicate name entries from log feeds of all SWGs collectively will remain as separate record entries in the generated report.
TIP: Click Cancel to exit without saving your entries.
7. Click the Save button to save your settings in the Default Report Settings panel.
M86 SECURITY USER GUIDE 183
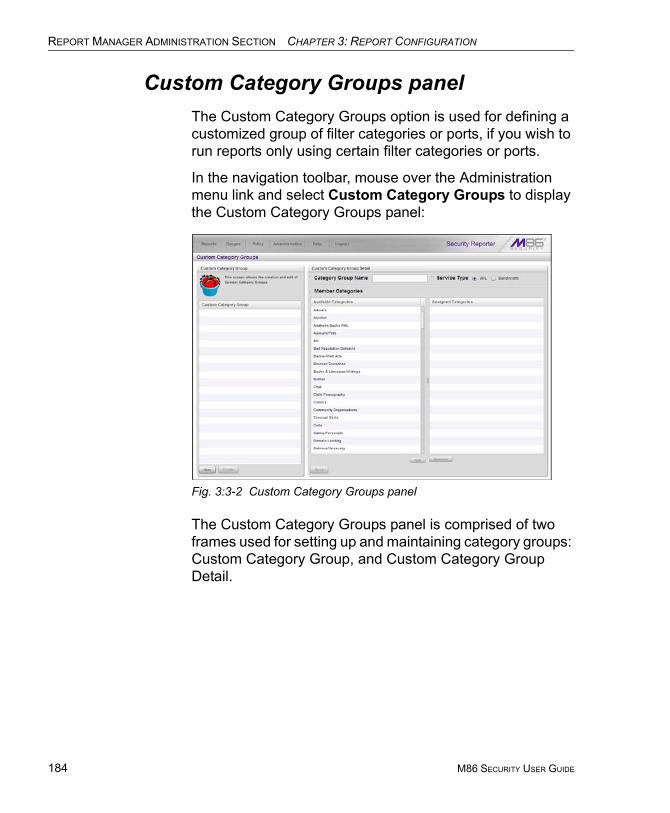
REPORT MANAGER ADMINISTRATION SECTION CHAPTER 3: REPORT CONFIGURATION
184
Custom Category Groups panelThe Custom Category Groups option is used for defining a customized group of filter categories or ports, if you wish to run reports only using certain filter categories or ports.
In the navigation toolbar, mouse over the Administration menu link and select Custom Category Groups to display the Custom Category Groups panel:
Fig. 3:3-2 Custom Category Groups panel
The Custom Category Groups panel is comprised of two frames used for setting up and maintaining category groups: Custom Category Group, and Custom Category Group Detail.
M86 SECURITY USER GUIDE
REPORT MANAGER ADMINISTRATION SECTION CHAPTER 3: REPORT CONFIGURATION
Add a Custom Category Group
1. At the bottom of the Custom Category Group frame, click Add.
2. In the Custom Category Group Detail frame, type in the Category Group Name.
3. Specify the Service Type to use: “URL” or “Bandwidth”.
4. Include the following Member Categories based on the Service Type selection:
• URL - Select Available Categories from the list and click Add > to move the selection(s) to the Assigned Categories list box.
• Bandwidth - In the Port Number field, type in a specific value in the pre-populated field, and/or use the up/down arrow buttons to increment/decrement the current value by one, and then click Add Port > to move the selection to the Assigned Ports list box.
NOTE: At least one library category/protocol/port must be selected when creating a gauge. The maximum number of library categories/ports that can be selected/added is 15.
TIP: To remove one or more library categories or ports from the Assigned Categories/Ports list box, make your selection(s), and then click Remove to remove the selection(s).
5. Click Save to save your settings and to include the name of the group you added in the Custom Category Group list.
M86 SECURITY USER GUIDE 185
REPORT MANAGER ADMINISTRATION SECTION CHAPTER 3: REPORT CONFIGURATION
186
Modify a Custom Category Group
1. Select the Custom Category Group name from the list box by clicking on your choice to highlight it.
2. Make your edits:
• To modify the Custom Category Group name, edit the Category Group Name in the Custom Category Group Detail frame.
• To update the assigned selections in the list box, select the item to select it, and then click Remove to remove it.
3. Click Update to save your modification(s).
Delete a Category Group
1. Select the Custom Category Group name from the list box by clicking on your choice to highlight it.
2. Click Delete to remove the Custom Category Group name from the list box.
M86 SECURITY USER GUIDE
PRODUCTIVITY REPORTS SECTION INTRODUCTION
PRODUCTIVITY REPORTS SECTION
IntroductionThis section of the user guide provides instructions to administrators on how to utilize the Report Manager to generate productivity report views and interpret results, whether using a Web Filter and/or SWG appliance.
Reports unique to environments that only use a Web Filter are addressed in the Real Time Reports Section. Reports unique to environments that only use an SWG are addressed in the Security Reports Section.
For Web Filter and SWG environments, the Reports menu consists of the following options described in these chap-ters:
• Chapter 1: A High Level Overview - This chapter shows you how to view productivity report data in the Dash-board, canned Summary Reports, and Sample Reports that provide a high level overview of end user Internet and network activity.
• Chapter 2: Drill Down Reports - This chapter provides instructions on using tools to generate summary and detail Drill Down Reports that give you more information on specific end user activity.
• Chapter 3: Customize, Maintain Reports - This chapter tells you how to generate customized reports using the Report Wizard, maintain Saved Reports for ongoing usage, and set up a Report Schedule for running reports on a regular basis.
• Chapter 4: Specialized Reports - This chapter informs you of three specialized types of reports you can generate: Executive Internet Usage Summary Reports, Blocked Request Reports, and Time Usage Reports.
M86 SECURITY USER GUIDE 187
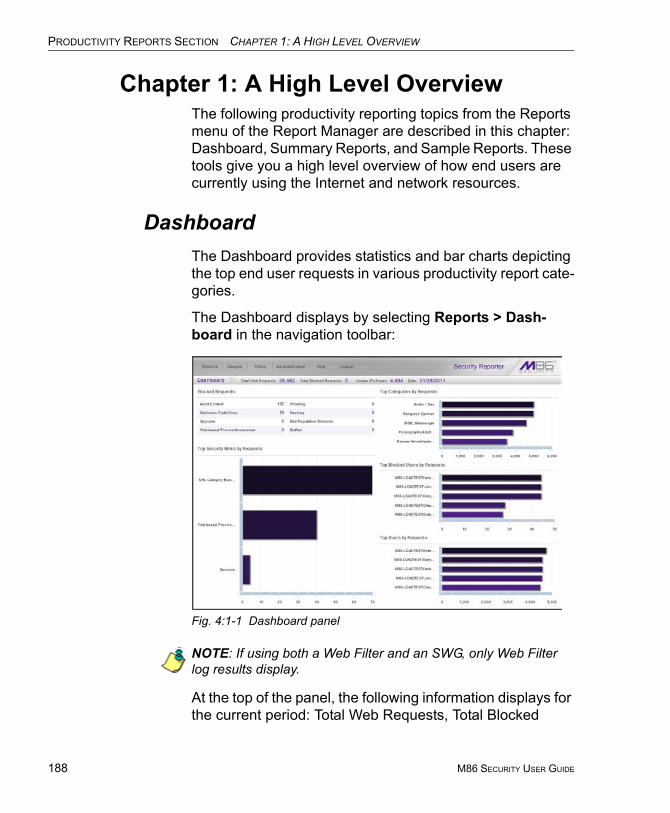
PRODUCTIVITY REPORTS SECTION CHAPTER 1: A HIGH LEVEL OVERVIEW
188
Chapter 1: A High Level OverviewThe following productivity reporting topics from the Reports menu of the Report Manager are described in this chapter: Dashboard, Summary Reports, and Sample Reports. These tools give you a high level overview of how end users are currently using the Internet and network resources.
DashboardThe Dashboard provides statistics and bar charts depicting the top end user requests in various productivity report cate-gories.
The Dashboard displays by selecting Reports > Dash-board in the navigation toolbar:
Fig. 4:1-1 Dashboard panel
NOTE: If using both a Web Filter and an SWG, only Web Filter log results display.
At the top of the panel, the following information displays for the current period: Total Web Requests, Total Blocked
M86 SECURITY USER GUIDE

PRODUCTIVITY REPORTS SECTION CHAPTER 1: A HIGH LEVEL OVERVIEW
Requests, Unique IPs/Users, and Date (MM/DD/YYYY format).
The following information displays in the center of the panel:
• Blocked Requests - Top eight blocked library catego-ries requested by end users, and the corresponding number of end user requests.
• Top Categories by Requests - Top five requested library categories and a bar chart depicting the number of end user requests.
• Top Security Risks by Requests - Top five requested Security group library categories and a bar chart depicting the number of end user requests.
• Top Blocked Users by Requests - Top five end users with blocked library category requests and a bar chart depicting the number of these end user requests.
• Top Users by Requests - Top five end users with library category requests and a bar chart depicting the number of these end user requests.
TIP: Mouse over each bar in the bar graph to view the name of graph entry and number of requests for that entry.
Once you have a high level overview of end user produc-tivity report activity on the network, you can use productivity reports to obtain more information about specific end user trends and activity.
M86 SECURITY USER GUIDE 189

PRODUCTIVITY REPORTS SECTION CHAPTER 1: A HIGH LEVEL OVERVIEW
190
Summary ReportsSummary Reports are “canned” productivity reports that use pre-generated data to display bar charts or pie charts of end user Internet/network activity for a specified report type within a designated period of time prior to today.
Summary Reports are available to group administrators assigned the privilege to access the Reports > Summary Reports menu selection. By default, yesterday’s report view showing the Top 20 Users by Blocked Request displays in the panel:
Fig. 4:1-2 Yesterday’s Top 20 Users by Blocked Requests Report
NOTES: On a newly installed SR unit, the panel will not show any thumbnail images or bar chart report. If there was no activity for a given report type, the message “No Data to display.” displays in the panel.
If the Blocked Requests Report feature is disabled in System Configuration > Database > Optional Features > Blocked Request Count frame, yesterday’s Top 20 Categories report view displays by default instead.
M86 SECURITY USER GUIDE
PRODUCTIVITY REPORTS SECTION CHAPTER 1: A HIGH LEVEL OVERVIEW
TIPS: Click the left arrows or right arrows at the edges of the dashboard to display thumbnail images that are currently hidden. Click the tab for the specified time period (Yesterday, Last Week, Last Month, Week to Yesterday, Month to Yesterday) to change the Date Scope. Mouse over each bar in the bar graph to view the name of graph entry and number of requests for that entry.
Summary Report types
Available Summary Reports are as follows by clicking the thumbnail for the corresponding report type:
• Top 20 Users by Blocked Requests - Bar chart report depicting each top end user’s total Page Count for Blocked and Warn Blocked requests. If using a Web Filter only, this report is available if the Block Request Count feature is enabled in the Optional Features screen in the System Configuration administrator console.
• Top 20 Users by Bandwidth Consumption (for SWG only environments) - Bar chart depicting each top end user’s total Mega Bytes for bandwidth requests.
NOTE: The thumbnail for this report will not display in any envi-ronment with a Web Filter.
• Top 20 Users by Virus Hit Count (for SWG) - Bar chart report depicting each top end user’s total Virus Count (both Blocked and Permitted) detected by the anti-virus engine.
• Top 20 Categories - Bar chart report depicting the total Page Count in the top requested filtering library catego-ries.
• Top 20 Users - Bar chart report depicting each top end user’s total Page Count.
• Top 20 Viruses Detected by (for SWG) - Bar chart report depicting the top viruses and Virus Count detected by the anti-virus engine.
M86 SECURITY USER GUIDE 191

PRODUCTIVITY REPORTS SECTION CHAPTER 1: A HIGH LEVEL OVERVIEW
192
• Top 20 Users by Malware - Bar chart report depicting each top end user’s total “Blocked” and “Permitted” Hit Count from the following categories in the Security, Internet Productivity, and Internet Communication (Instant Messaging) category groups: BotNet, Malicious Code/Virus, Bad Reputation Domains, Spyware, Adware, and IRC.
NOTE: For SWG users, results that display in the Top 20 Users by Malware report reflect library contents mapped to the M86 Supplied Categories.
• Top 20 Sites - Bar chart report depicting the total Page Count for the most popular sites accessed by end users.
• Top 20 User Groups - Bar chart report depicting the total Page Count for the top scoring user groups.
• Top 20 Blocked Searched Keywords - Bar chart report depicting the total blocked keyword requests Page Count. For Web Filter users, this report is only available if the Block Searched Keywords Report feature is enabled in the Optional Features screen in the System Configura-tion administrator console.
• Total Permitted vs. Blocked Requests - Pie chart report depicting the total Page Count for all filtering cate-gories Permitted to pass and all filtering categories set up to be Blocked.
• Category Group Comparison - Pie chart report depicting the total Page Count in each top scoring filtering category group.
• Category Comparison - Pie chart report depicting the total Page Count in each top scoring filtering category.
• User Group Comparison - Pie chart report depicting the total Page Count in each top scoring user group.
M86 SECURITY USER GUIDE
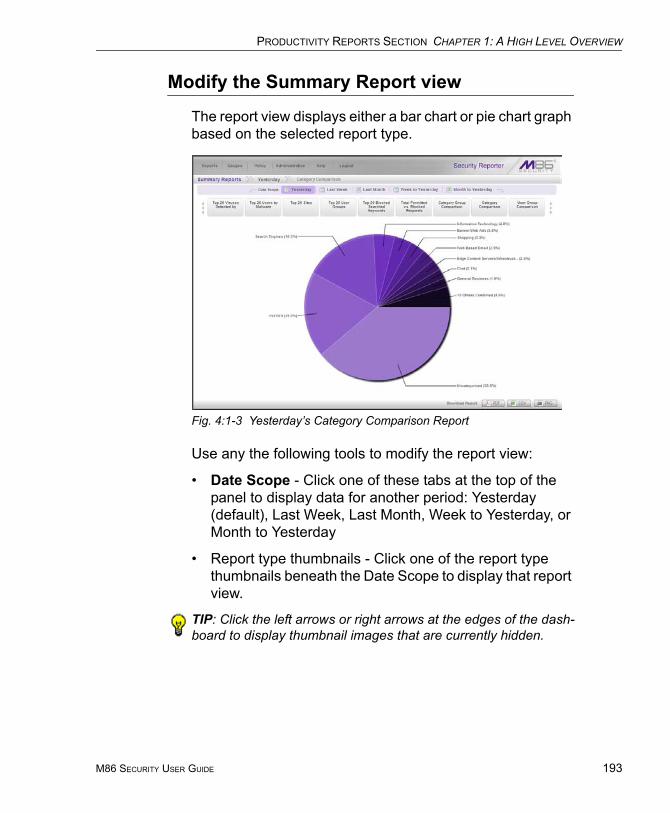
PRODUCTIVITY REPORTS SECTION CHAPTER 1: A HIGH LEVEL OVERVIEW
Modify the Summary Report view
The report view displays either a bar chart or pie chart graph based on the selected report type.
Fig. 4:1-3 Yesterday’s Category Comparison Report
Use any the following tools to modify the report view:
• Date Scope - Click one of these tabs at the top of the panel to display data for another period: Yesterday (default), Last Week, Last Month, Week to Yesterday, or Month to Yesterday
• Report type thumbnails - Click one of the report type thumbnails beneath the Date Scope to display that report view.
TIP: Click the left arrows or right arrows at the edges of the dash-board to display thumbnail images that are currently hidden.
M86 SECURITY USER GUIDE 193

PRODUCTIVITY REPORTS SECTION CHAPTER 1: A HIGH LEVEL OVERVIEW
194
Download, Export a Summary Report
At the bottom of the report view, click a Download Report option for PDF, CSV, or PNG to generate a report in the specified file format (.pdf, .csv, or .png).
PDF format
Download the report in the PDF format
Clicking the PDF button opens a separate browser window containing the Summary Report in the .pdf format:
Fig. 4:1-4 Sample Summary Report in the PDF format
The header of the generated report includes the date range, Report Type, and Details criteria.
The footer of the report includes the date and time the report was generated (M/D/YY, HH:MM AM/PM), administrator login ID (Generated by), and Page number and page range.
The body of the first page of the report includes the following information:
M86 SECURITY USER GUIDE
PRODUCTIVITY REPORTS SECTION CHAPTER 1: A HIGH LEVEL OVERVIEW
• Bar chart - Name of category, username, username path, URL or site IP address, user group name, or blocked user request, and corresponding bar graph. Beneath the bar graph are count indicators and a label describing the type of Count used in the report.
• Pie chart - Color-coded pie graph showing a maximum of 15 categories or user groups. Any categories or user groups with page counts totalling less than one percent are grouped together under the “Others Combined” label.
The body of the pages following the first page of the bar or pie chart report includes the following information:
• Top 20 Users by Blocked Request report - User NAME and corresponding BLOCKED REQUEST COUNT—which includes Blocked and Warn Blocked requests. Total Records and Total Number of Blocked Requests for this Date Scope display at the end of the report.
• Top 20 Blocked Searched Keywords report - Blocked Keywords and corresponding Blocked Count. A Grand Total of Blocked Count displays at the end of the report.
• All other reports - Count columns and corresponding totals for all reports. Grand Total and Count display at the end of the report.
The report can be exported by printing it or saving it to your machine.
M86 SECURITY USER GUIDE 195
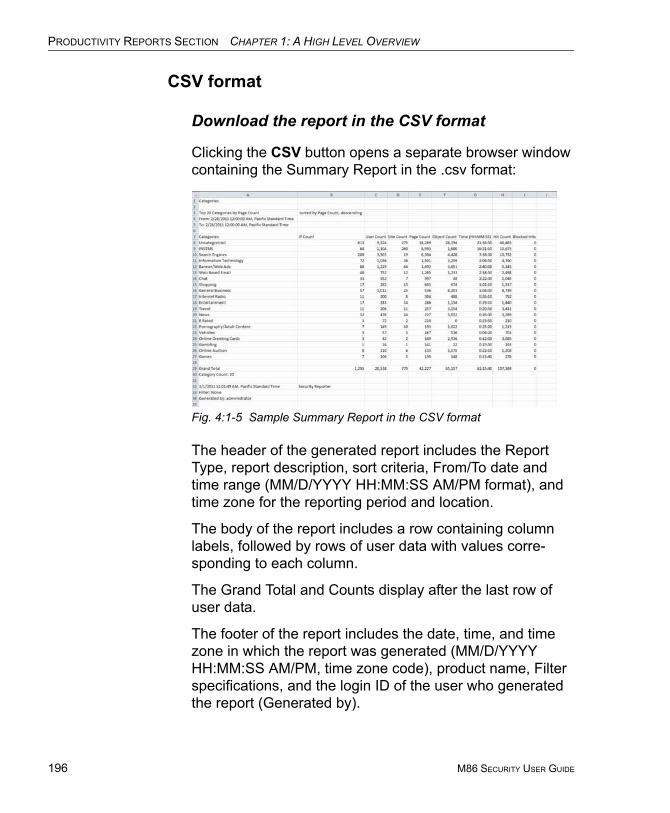
PRODUCTIVITY REPORTS SECTION CHAPTER 1: A HIGH LEVEL OVERVIEW
196
CSV format
Download the report in the CSV format
Clicking the CSV button opens a separate browser window containing the Summary Report in the .csv format:
Fig. 4:1-5 Sample Summary Report in the CSV format
The header of the generated report includes the Report Type, report description, sort criteria, From/To date and time range (MM/D/YYYY HH:MM:SS AM/PM format), and time zone for the reporting period and location.
The body of the report includes a row containing column labels, followed by rows of user data with values corre-sponding to each column.
The Grand Total and Counts display after the last row of user data.
The footer of the report includes the date, time, and time zone in which the report was generated (MM/D/YYYY HH:MM:SS AM/PM, time zone code), product name, Filter specifications, and the login ID of the user who generated the report (Generated by).
M86 SECURITY USER GUIDE

PRODUCTIVITY REPORTS SECTION CHAPTER 1: A HIGH LEVEL OVERVIEW
The report can be exported by printing it or saving it to your machine.
PNG format
Download the report in the PNG format
Clicking the PNG button opens a separate browser window containing the Summary Report in the .png format:
Fig. 4:1-6 Sample Summary Report in the PNG format
The generated report includes the report title followed by a graphical chart image:
• Bar chart - Name of category, username, username path, URL or site IP address, user group name, or blocked user request, and corresponding bar graph. Beneath the bar graph are count indicators and a label describing the type of Count used in the report.
• Pie chart - color-coded pie graph showing a maximum of 15 categories or user groups. Any categories or user groups with page counts totalling less than one percent are grouped together under the “Others Combined” label.
The report can be exported by printing it or saving it to your machine.
M86 SECURITY USER GUIDE 197
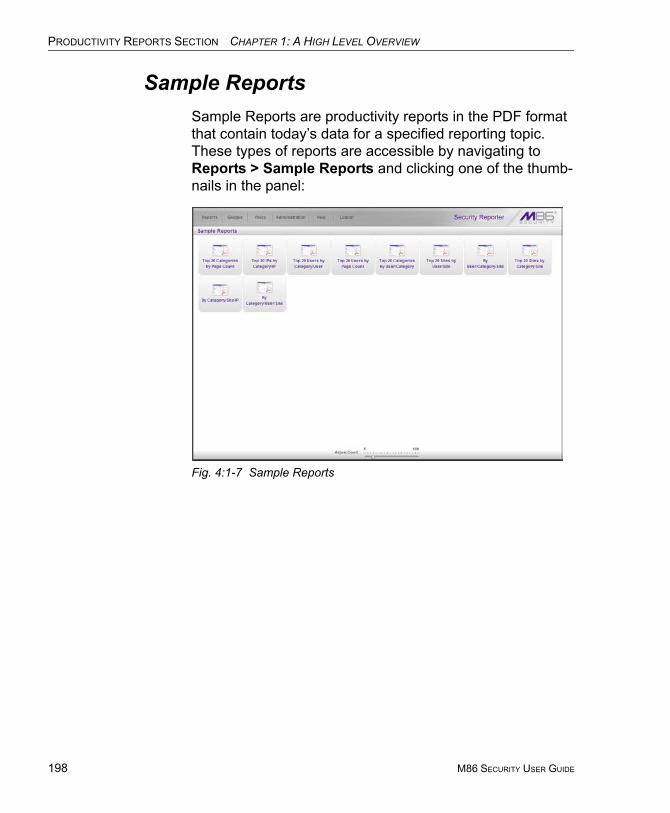
PRODUCTIVITY REPORTS SECTION CHAPTER 1: A HIGH LEVEL OVERVIEW
198
Sample ReportsSample Reports are productivity reports in the PDF format that contain today’s data for a specified reporting topic. These types of reports are accessible by navigating to Reports > Sample Reports and clicking one of the thumb-nails in the panel:
Fig. 4:1-7 Sample Reports
M86 SECURITY USER GUIDE
PRODUCTIVITY REPORTS SECTION CHAPTER 1: A HIGH LEVEL OVERVIEW
Sample Report types
Available Sample Report types are as follows:
• Top 20 Categories by Page Count - Top library catego-ries end users accessed
• Top 20 IPs by Category/IP - Top end user IP addresses in each library category
• Top 20 Users by Category/User - Top usernames in each library category
• Top 20 Users by Page Count - Top end users who accessed library categories
• Top 20 Categories by User/Category - Top library cate-gories each end user accessed
• Top 20 Sites by User/Site - Top sites each end user accessed
• By User/Category/Site - For each end user, the sites he/she visited in each library category
• Top 20 Sites by Category/Site - Top sites end users accessed in each library category
• By Category/Site/IP - For each library category, the sites end users accessed, and IP address of each end user
• By Category/User/Site - For each library category, the end users with activity in that library category, and the sites each end user accessed
M86 SECURITY USER GUIDE 199

PRODUCTIVITY REPORTS SECTION CHAPTER 1: A HIGH LEVEL OVERVIEW
200
View, Export a Sample Report
Fig. 4:1-8 Sample Categories report
View Sample Report contents
The report header contains the following information: “Secu-rity Reporter” and date range for today’s date; report name; description for that report type, including the sort order and Page Count, descending
The body of the report contains rows of records and is comprised of one or more sections.
For each record, end user statistics display in columns such as: Category Count, IP Count, Site Count, Bandwidth (GB or MB amounts display for SWG only), Page Count, Object Count, Time (HH:MM:SS), Hit Count, and Blocked Hits.
Total counts display at the end of each section.
The Grand Total and total Count for all sections display at the end of the report.
The footer on each page contains the following information: today’s date (M/D/YYYY), time (HH:MM:SS AM/PM), and
M86 SECURITY USER GUIDE
PRODUCTIVITY REPORTS SECTION CHAPTER 1: A HIGH LEVEL OVERVIEW
time zone in which the report was generated; Generated by: manager’s login ID; Filter: None; Page number and page range.
Export the Sample Report
PDF file window
1. From the open PDF file window, the Sample Report can be exported in some of the following ways:
• print the report - click the print icon to open the Print dialog box, and proceed with standard print procedures.
• save the report - navigate to File > Save a Copy to open the Save a Copy dialog box, and proceed with standard save procedures.
2. Click the “X” in the upper right corner of the PDF file window to close it.
PDF opened in browser tab
1. From the open PDF in the browser window tab, the Sample Report can be exported in some of the following ways:
• print the report - navigate to the Print selection to open the Print dialog box, and proceed with standard print procedures.
• save the report - navigate to the Save (Page) As... selection to open the Save As window, and proceed with standard save procedures.
2. Click the “X” in the upper right corner of the tab to close it.
M86 SECURITY USER GUIDE 201

PRODUCTIVITY REPORTS SECTION CHAPTER 2: DRILL DOWN REPORTS
202
Chapter 2: Drill Down ReportsThis chapter provides information about generating drill down productivity reports that let you query the database to access more detailed information about end user Internet activity.
The two basic productivity reports administrators can generate with customizations are the summary drill down report and the detail drill down report. Report views for these reports are executed via Reports > Drill Down Reports from the Report Manager user interface:
• Categories - Includes data in each filter category that was set up for monitoring user activity.
• IPs - Includes Internet activity by user IP address.
• Users - Includes Internet activity by username.
• Sites - Includes activity on Web sites users accessed.
• Category Groups - Includes activity by Category Groups.
• User Groups - Includes activity by User Groups.
NOTE: The Report Wizard feature for drill down reports is discussed in detail in Chapter 3: Customize, Maintain Reports.
Once you have generated a drill down report view, you can customize your view, save the view, export the view, and/or schedule the report to run at a designated time.
NOTE: Before you begin generating report views for these reports, we recommend that you review this chapter in order to become familiar with the organization of these report views, and how report view tools and components are used in creating summary drill down reports and detail drill down reports custom-ized to your specifications.
M86 SECURITY USER GUIDE
PRODUCTIVITY REPORTS SECTION CHAPTER 2: DRILL DOWN REPORTS
Generate a Drill Down ReportTo generate a drill down productivity report:
1. Choose one of the following topics from the Reports > Drill Down Reports menu for the type of summary drill down report you wish to view: Categories, IPs, Users, Sites, Category Groups, User Groups.
NOTES: As the report is generating, the “Processing...” message displays. After the report has finished being generated, if no records are available an alert box opens displaying the message “No records returned!”
2. Once the generated summary drill down report has loaded in the panel, use the tools in the panel to create the desired drill down view.
NOTE: A detail drill down report view is generated by clicking a link in the Page Count or Object Count column corresponding to a specific record displayed in the current summary drill down report view.
3. The drill down view can be exported, saved, modified and re-run, and/or scheduled to run at a specified time.
M86 SECURITY USER GUIDE 203
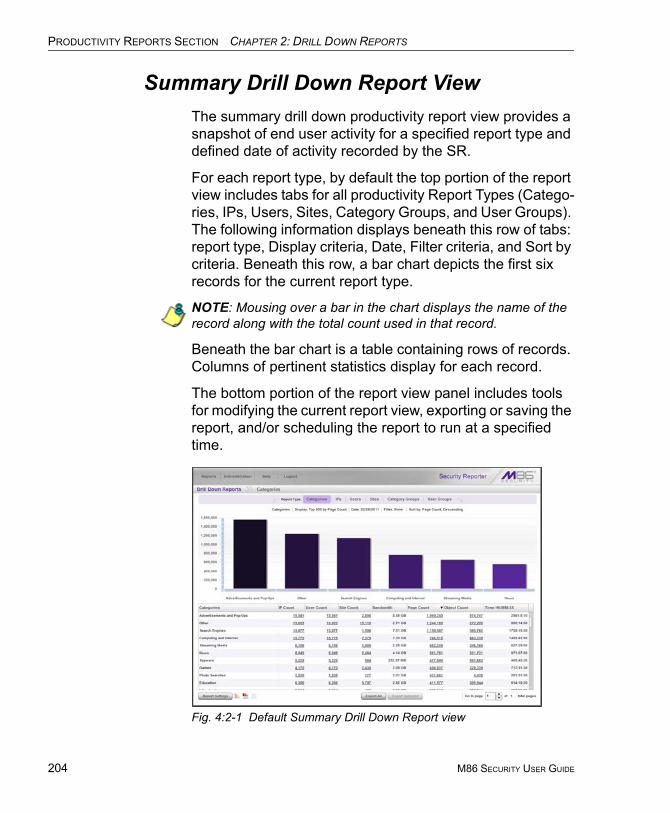
PRODUCTIVITY REPORTS SECTION CHAPTER 2: DRILL DOWN REPORTS
204
Summary Drill Down Report ViewThe summary drill down productivity report view provides a snapshot of end user activity for a specified report type and defined date of activity recorded by the SR.
For each report type, by default the top portion of the report view includes tabs for all productivity Report Types (Catego-ries, IPs, Users, Sites, Category Groups, and User Groups). The following information displays beneath this row of tabs: report type, Display criteria, Date, Filter criteria, and Sort by criteria. Beneath this row, a bar chart depicts the first six records for the current report type.
NOTE: Mousing over a bar in the chart displays the name of the record along with the total count used in that record.
Beneath the bar chart is a table containing rows of records. Columns of pertinent statistics display for each record.
The bottom portion of the report view panel includes tools for modifying the current report view, exporting or saving the report, and/or scheduling the report to run at a specified time.
Fig. 4:2-1 Default Summary Drill Down Report view
M86 SECURITY USER GUIDE
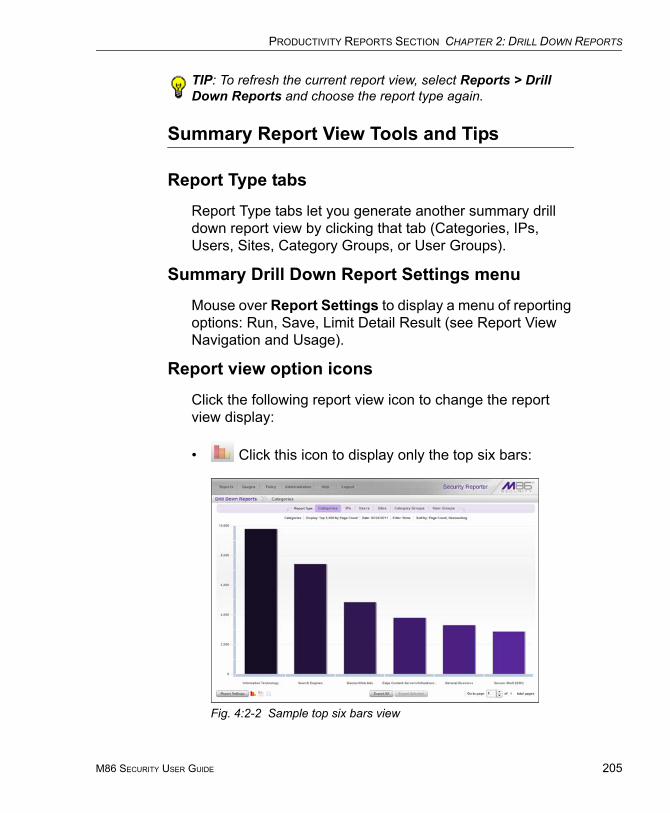
PRODUCTIVITY REPORTS SECTION CHAPTER 2: DRILL DOWN REPORTS
TIP: To refresh the current report view, select Reports > Drill Down Reports and choose the report type again.
Summary Report View Tools and Tips
Report Type tabs
Report Type tabs let you generate another summary drill down report view by clicking that tab (Categories, IPs, Users, Sites, Category Groups, or User Groups).
Summary Drill Down Report Settings menu
Mouse over Report Settings to display a menu of reporting options: Run, Save, Limit Detail Result (see Report View Navigation and Usage).
Report view option icons
Click the following report view icon to change the report view display:
• Click this icon to display only the top six bars:
Fig. 4:2-2 Sample top six bars view
M86 SECURITY USER GUIDE 205

PRODUCTIVITY REPORTS SECTION CHAPTER 2: DRILL DOWN REPORTS
206
• Click this icon to display the top six bars and table of records (see Fig. 4:2-1).
• Click this icon to display the table of records only:
Fig. 4:2-3 Sample records only view
Count columns and links
Count columns (Category Count, IP Count, User Count, Site Count, Page Count, Object Count) display after the column containing the record name. Clicking a specific link in a record’s Count column gives more in-depth analysis on a given record displayed in the current view. Clicking a link in the Page Count or Object Count column generates a detail drill down report view.
• Category Count - Displays the number of categories a user has visited, or the number of categories included within a given site. It is possible for a site to be listed in more than one category, so even if a user has visited only one site, this column may count the user’s visit in two or three categories.
M86 SECURITY USER GUIDE
PRODUCTIVITY REPORTS SECTION CHAPTER 2: DRILL DOWN REPORTS
• IP Count - Displays the number of sites or categories visited by the IP address for a user’s machines.
• User Count - Displays the number of individuals who have visited a specific site or category.
• Site Count - Displays the number of sites a user has visited, or the number of sites in a category. This figure is based on the root name of the site. For example, if a user visits www.espn.com, www.msn.com, and www.fox-sports.com, that user will have visited three pages. If that same user additionally visits www.espn.com/scores, the total number of sites visited would still count as three—and not as four—because the latter page is on the orig-inal ESPN site that was already counted.
• Page Count - displays the total number of pages visited. A user may visit only one site, but visit 20 pages on that site. If a user visits a page with pop-up ads, these items would add to the page count. If a page has banner ads that link to other pages, these items also would factor into the page count. In categories that use a lot of pop-up ads—porn, gambling, and other related sites—the page count usually exceeds the number of objects per page.
By clicking the link in this column, the detail report view displays data for all pages accessed, including hyper-links to those pages.
• Object Count - displays the number of objects on a Web page. All images, graphics, multimedia items, and text items count as objects. The number of objects on a page is generally higher than the number of pages a user visits.
However, if an advertisement or banner ad (an object on the page) is actually a page from another site, this item would not be classified as an object but as a page, since it comes from a different server.
M86 SECURITY USER GUIDE 207
PRODUCTIVITY REPORTS SECTION CHAPTER 2: DRILL DOWN REPORTS
208
By clicking the link in this column, the detail report view displays data for all objects accessed, including hyper-links to those objects.
NOTE: If “Pages only” was specified in the Log Import Settings frame of the Optional Features screen in the System Configura-tion user interface, all records of objects accessed by end users will be lost for the time period in which this option was enabled. Even if there were objects accessed by end users during that time period, zeroes (“0”) will display in the Object Count column in the report. See the Optional Features sub-section of the System Configuration Section for information about Log Import Settings frame options.
Bandwidth and Time columns
In a summary drill down report view, the Bandwidth and Time columns provide additional information about a record.
• Bandwidth - Displays the amount of bandwidth in GB or MB used for each record, if using an SWG only with this SR.
NOTE: The Bandwidth column does not display if a Web Filter is used with this SR—with or without an SWG.
• Time HH:MM:SS - Displays the amount of time a user spent at a given site. Each page detected by a user’s machine adds to the count. If a browser window is opened to a certain page and left there for an extended time period, and that page is refreshed by either the user or a banner ad, the counter starts again and continues as long as Web activity is detected. If that Web page contains an active banner ad that refreshes the page every 10 to 30 seconds, a user could show an incredibly high page count and many minutes, even though only one page was opened by that user.
M86 SECURITY USER GUIDE
PRODUCTIVITY REPORTS SECTION CHAPTER 2: DRILL DOWN REPORTS
Column sorting tips
To sort summary report view records in ascending/descending order by a specified column, click that column’s header: Category Count, IP Count, User Count, Site Count, Bandwidth (for SWG only environments), Page Count, Object Count, or Time HH:MM:SS.
Click the same column header again to sort records for that column in the reverse order.
Click another column header to sort records by that speci-fied column.
Summary Drill Down Record exportation
In a summary drill down report view, all records are selected for exportation by default. Clicking Export All opens the Export pop-up window in which you specify criteria for the report to be generated and distributed (see Export a Productivity Report).
To select only specific records to export, click the first column of selected record rows in the table, and then click Export Selected to open the Export pop-up window (see Export a Productivity Report).
Other navigation tips
See Report View Navigation and Usage for information about navigating the current report view using breadcrumb trails and the Go to page ‘x’ of ‘x’ total pages field.
M86 SECURITY USER GUIDE 209
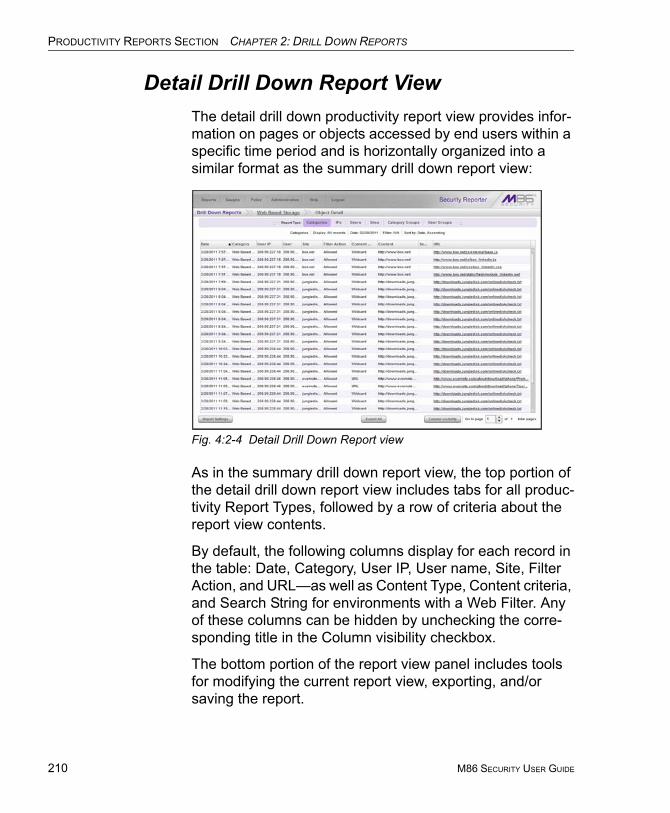
PRODUCTIVITY REPORTS SECTION CHAPTER 2: DRILL DOWN REPORTS
210
Detail Drill Down Report ViewThe detail drill down productivity report view provides infor-mation on pages or objects accessed by end users within a specific time period and is horizontally organized into a similar format as the summary drill down report view:
Fig. 4:2-4 Detail Drill Down Report view
As in the summary drill down report view, the top portion of the detail drill down report view includes tabs for all produc-tivity Report Types, followed by a row of criteria about the report view contents.
By default, the following columns display for each record in the table: Date, Category, User IP, User name, Site, Filter Action, and URL—as well as Content Type, Content criteria, and Search String for environments with a Web Filter. Any of these columns can be hidden by unchecking the corre-sponding title in the Column visibility checkbox.
The bottom portion of the report view panel includes tools for modifying the current report view, exporting, and/or saving the report.
M86 SECURITY USER GUIDE

PRODUCTIVITY REPORTS SECTION CHAPTER 2: DRILL DOWN REPORTS
Detail Report View Tools and Tips
Report Type tabs
Report Type tabs let you generate a summary drill down report view by clicking that tab (Categories, IPs, Users, Sites, Category Groups, or User Groups).
Detail Drill Down Report Settings menu
Mouse over Report Settings to display a menu of reporting options: Run, Save (see Report View Navigation and Usage).
Page/Object Detail columns
By default all Page/Object Detail column(s) display. Any of these columns can be hidden from view by clicking the Column visibility button at the bottom of the panel to open the Column visibility pop-up window, and de-selecting the checkbox corresponding to that column:
TIP: After making your modifications, click Close to close the Column visibility pop-up window.
• Date - Displays the date in the M/D/YYYY H:M:S AM/PM format
• Category - Displays the category name (e.g. “Alcohol”).
M86 SECURITY USER GUIDE 211
PRODUCTIVITY REPORTS SECTION CHAPTER 2: DRILL DOWN REPORTS
212
• User IP - Displays the IP address of the user’s machine (e.g. “200.10.101.80”).
• User - Displays any of the following information: user-name, user IP address, or the path and username (e.g. “logo\admin\jsmith”).
• Site - Displays the URL the user attempted to access (e.g. “coors.com”).
• Filter Action - Displays the type of filter action used by the Web Filter in creating the record: "Allowed", "Blocked", "Warn Blocked" (for the first warning page that displayed for the end user), "Warn Allowed" (for any subsequent warning page that displayed for the end user), “Quota Blocked” (if a quota blocked the end user), "X-Strike", or "N/A" if the filter action was unclassified at the time the log file was created.
• Content Type (for Web Filter only environments) - Displays the method used by the Web Filter in creating the record: “Search KW” (Search Engine Keyword), “URL KW” (URL Keyword), “URL”, “Wildcard”, “Https High” (HTTPS Filtering Level set at High), “X-strike” (X Strikes Blocking), “Pattern” (Proxy Pattern Blocking), “File Type”, “Https Medium” (HTTPS Filtering Level set at Medium), or “N/A” if the content was unclassified at the time the log file was created.
• Content (for Web Filter only environments) - Displays criteria used for determining the categorization of the record, or “N/A” if unclassified.
• Search String (for Web Filter only environments) - Displays the full search string the end user typed into a search engine text box in search sites such as Google, Bing, Yahoo!, MSN, AOL, Ask.com, YouTube.com, and MySpace.com—if the Search Engine Reporting option is enabled in the Optional Features screen of the System Configuration administrator console user interface.
M86 SECURITY USER GUIDE
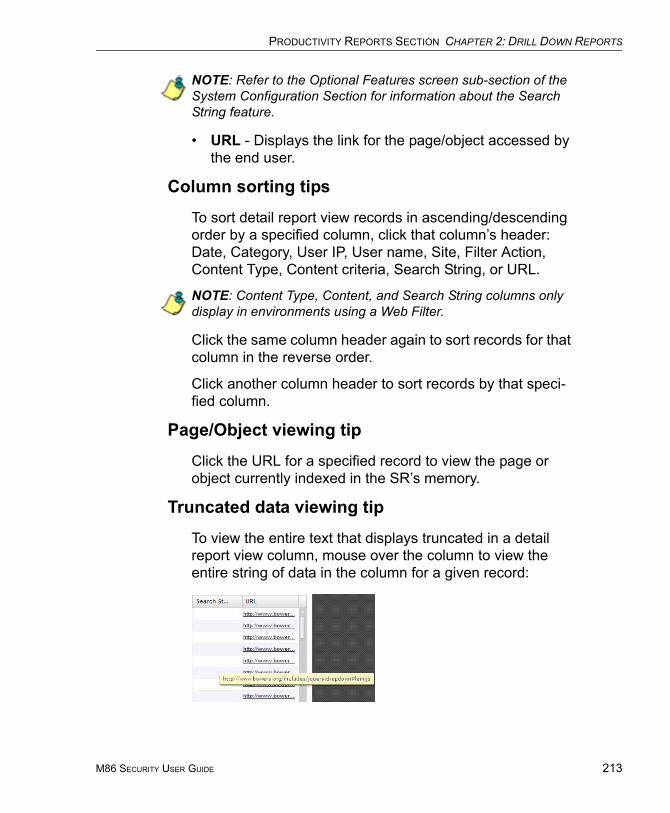
PRODUCTIVITY REPORTS SECTION CHAPTER 2: DRILL DOWN REPORTS
NOTE: Refer to the Optional Features screen sub-section of the System Configuration Section for information about the Search String feature.
• URL - Displays the link for the page/object accessed by the end user.
Column sorting tips
To sort detail report view records in ascending/descending order by a specified column, click that column’s header: Date, Category, User IP, User name, Site, Filter Action, Content Type, Content criteria, Search String, or URL.
NOTE: Content Type, Content, and Search String columns only display in environments using a Web Filter.
Click the same column header again to sort records for that column in the reverse order.
Click another column header to sort records by that speci-fied column.
Page/Object viewing tip
Click the URL for a specified record to view the page or object currently indexed in the SR’s memory.
Truncated data viewing tip
To view the entire text that displays truncated in a detail report view column, mouse over the column to view the entire string of data in the column for a given record:
M86 SECURITY USER GUIDE 213

PRODUCTIVITY REPORTS SECTION CHAPTER 2: DRILL DOWN REPORTS
214
Detail Drill Down Record exportation
In a detail drill down report view, all records are selected for exportation by default. Clicking Export All opens the Export pop-up window in which you specify criteria for the report to be generated and distributed (see Export a Productivity Report).
Other navigation tips
See Report Navigation and Usage for information about navigating the current report view using breadcrumb trails and the Go to page ‘x’ of ‘x’ total pages field.
M86 SECURITY USER GUIDE
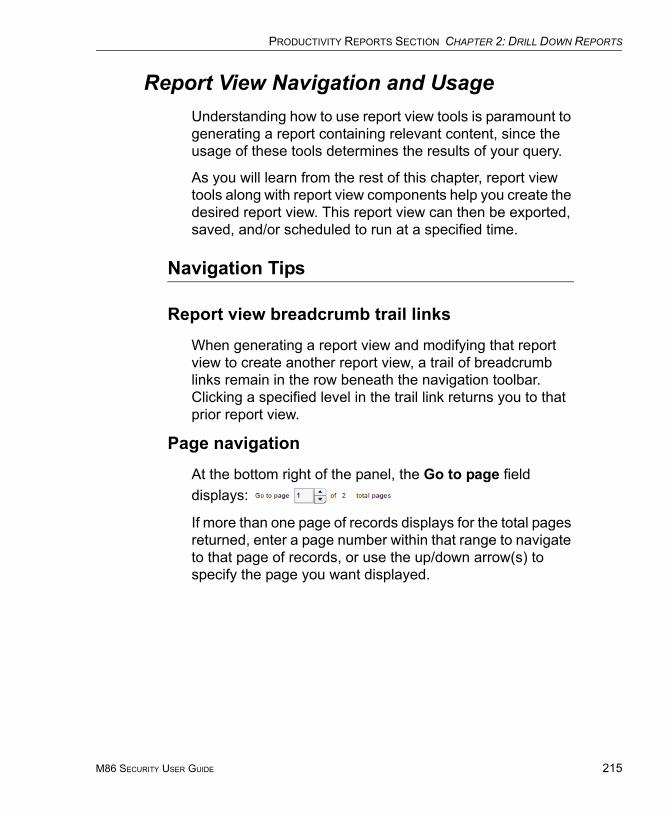
PRODUCTIVITY REPORTS SECTION CHAPTER 2: DRILL DOWN REPORTS
Report View Navigation and UsageUnderstanding how to use report view tools is paramount to generating a report containing relevant content, since the usage of these tools determines the results of your query.
As you will learn from the rest of this chapter, report view tools along with report view components help you create the desired report view. This report view can then be exported, saved, and/or scheduled to run at a specified time.
Navigation Tips
Report view breadcrumb trail links
When generating a report view and modifying that report view to create another report view, a trail of breadcrumb links remain in the row beneath the navigation toolbar. Clicking a specified level in the trail link returns you to that prior report view.
Page navigation
At the bottom right of the panel, the Go to page field displays:
If more than one page of records displays for the total pages returned, enter a page number within that range to navigate to that page of records, or use the up/down arrow(s) to specify the page you want displayed.
M86 SECURITY USER GUIDE 215

PRODUCTIVITY REPORTS SECTION CHAPTER 2: DRILL DOWN REPORTS
216
Usage Tools
The bottom panel contains objects that let you customize, export, and/or save the current report view using pop-up boxes and/or panels accessible via the Report Settings menu and the Export button(s).
NOTES: Information on using the fields in these pop-up boxes or panels can be found in the Report View Components sub-section. Information on using the Export and Export All pop-up boxes can be found in the Export a Productivity Report sub-section, and information about Column visibility can be found in Detail Report View Tools and Tips.
Report Settings menu options
Mouse over the Report Settings object at the bottom left of the panel to open its menu containing the following selec-tions:
• Run - Clicking this selection opens the Run Report pop-up box that lets you choose different criteria to display in the report view.
• Save - Clicking this selection opens the Save Report pop-up box that lets you modify the current report view and save it, and/or email the report or schedule it to run at a specified time.
• Limit Detail Result (available in summary drill down report menus) - Clicking this selection in a summary drill down report opens the Limit Detail Result pop-up box that lets you specify the default number of records to include in the report view for detail drill down reports.
M86 SECURITY USER GUIDE

PRODUCTIVITY REPORTS SECTION CHAPTER 2: DRILL DOWN REPORTS
Modify a report via the Run option
The Run option lets you modify the current report view by changing any of the following: Date Scope, maximum number of Records to be included other than the number entered in Default Report Settings, or sort column.
NOTE: For summary drill down reports, if specifying a Sort By the first column, summary results must be limited to the top count for another designated column.
Fig. 4:2-5 Summary drill down Run Report pop-up box
Selection of a different report Type or execution of a search for specific text can also be performed for summary drill down reports.
If the summary drill down report view is currently grouped by more than one report type, choosing the Run option opens a Run Report pop-up box that does not include the Type and Date Scope selections:
M86 SECURITY USER GUIDE 217
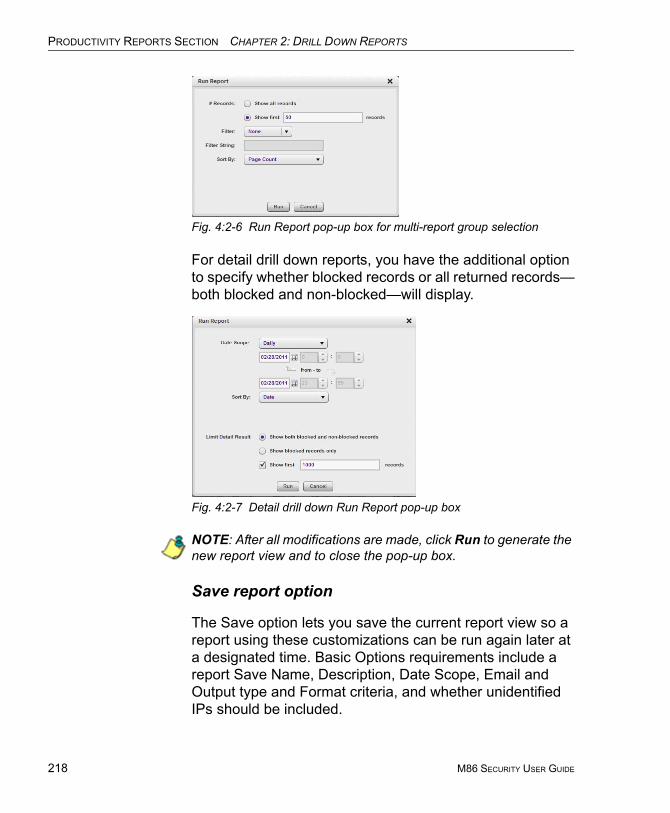
PRODUCTIVITY REPORTS SECTION CHAPTER 2: DRILL DOWN REPORTS
218
Fig. 4:2-6 Run Report pop-up box for multi-report group selection
For detail drill down reports, you have the additional option to specify whether blocked records or all returned records—both blocked and non-blocked—will display.
Fig. 4:2-7 Detail drill down Run Report pop-up box
NOTE: After all modifications are made, click Run to generate the new report view and to close the pop-up box.
Save report option
The Save option lets you save the current report view so a report using these customizations can be run again later at a designated time. Basic Options requirements include a report Save Name, Description, Date Scope, Email and Output type and Format criteria, and whether unidentified IPs should be included.
M86 SECURITY USER GUIDE
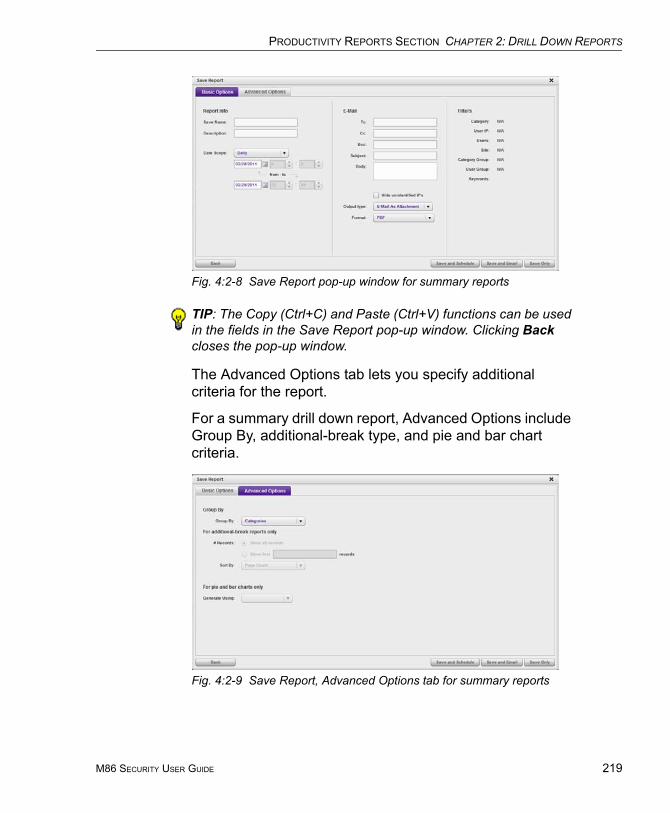
PRODUCTIVITY REPORTS SECTION CHAPTER 2: DRILL DOWN REPORTS
Fig. 4:2-8 Save Report pop-up window for summary reports
TIP: The Copy (Ctrl+C) and Paste (Ctrl+V) functions can be used in the fields in the Save Report pop-up window. Clicking Back closes the pop-up window.
The Advanced Options tab lets you specify additional criteria for the report.
For a summary drill down report, Advanced Options include Group By, additional-break type, and pie and bar chart criteria.
Fig. 4:2-9 Save Report, Advanced Options tab for summary reports
M86 SECURITY USER GUIDE 219

PRODUCTIVITY REPORTS SECTION CHAPTER 2: DRILL DOWN REPORTS
220
For a detail drill down report, Advanced Options include Group By, column selection, and record type criteria.
Fig. 4:2-10 Save Report, Advanced Options tab for detail reports
After all modifications are made, click one of the save option buttons:
• Save and Schedule to open the Schedule Report pop-up window where a schedule can be set up for running the report:
Fig. 4:2-11 Save Report, Schedule Report option
• Save and Email to save the report in the specified format and then email it to the designated email address(es).
M86 SECURITY USER GUIDE
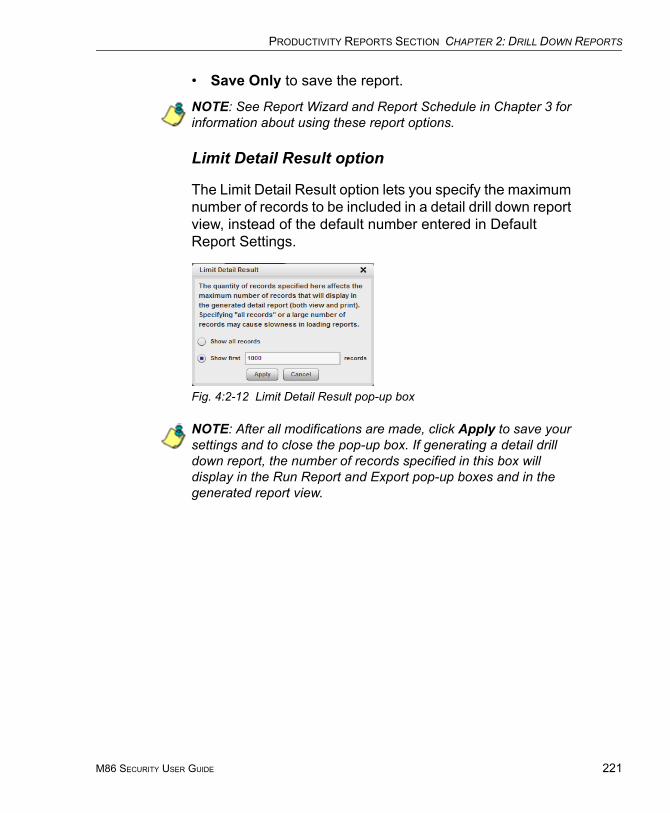
PRODUCTIVITY REPORTS SECTION CHAPTER 2: DRILL DOWN REPORTS
• Save Only to save the report.
NOTE: See Report Wizard and Report Schedule in Chapter 3 for information about using these report options.
Limit Detail Result option
The Limit Detail Result option lets you specify the maximum number of records to be included in a detail drill down report view, instead of the default number entered in Default Report Settings.
Fig. 4:2-12 Limit Detail Result pop-up box
NOTE: After all modifications are made, click Apply to save your settings and to close the pop-up box. If generating a detail drill down report, the number of records specified in this box will display in the Run Report and Export pop-up boxes and in the generated report view.
M86 SECURITY USER GUIDE 221
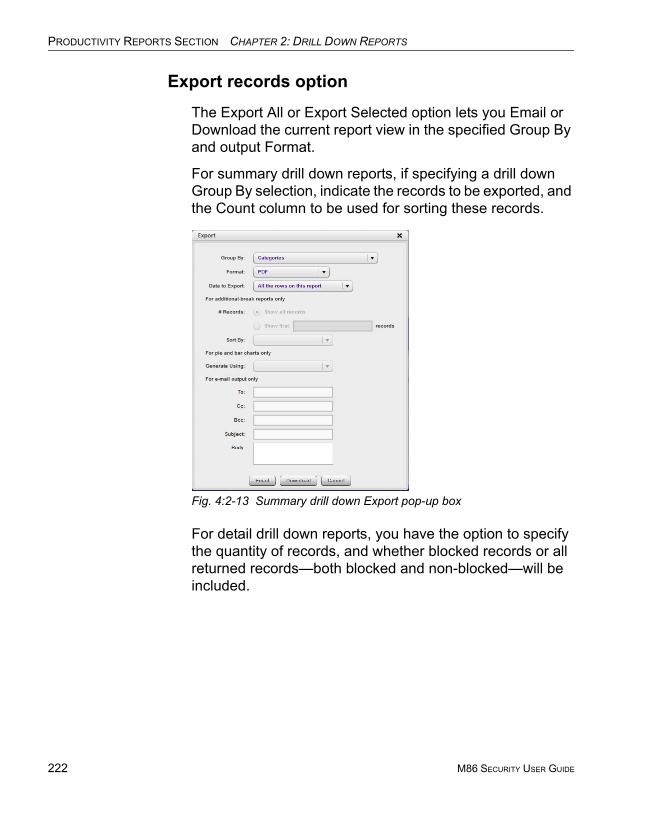
PRODUCTIVITY REPORTS SECTION CHAPTER 2: DRILL DOWN REPORTS
222
Export records option
The Export All or Export Selected option lets you Email or Download the current report view in the specified Group By and output Format.
For summary drill down reports, if specifying a drill down Group By selection, indicate the records to be exported, and the Count column to be used for sorting these records.
Fig. 4:2-13 Summary drill down Export pop-up box
For detail drill down reports, you have the option to specify the quantity of records, and whether blocked records or all returned records—both blocked and non-blocked—will be included.
M86 SECURITY USER GUIDE
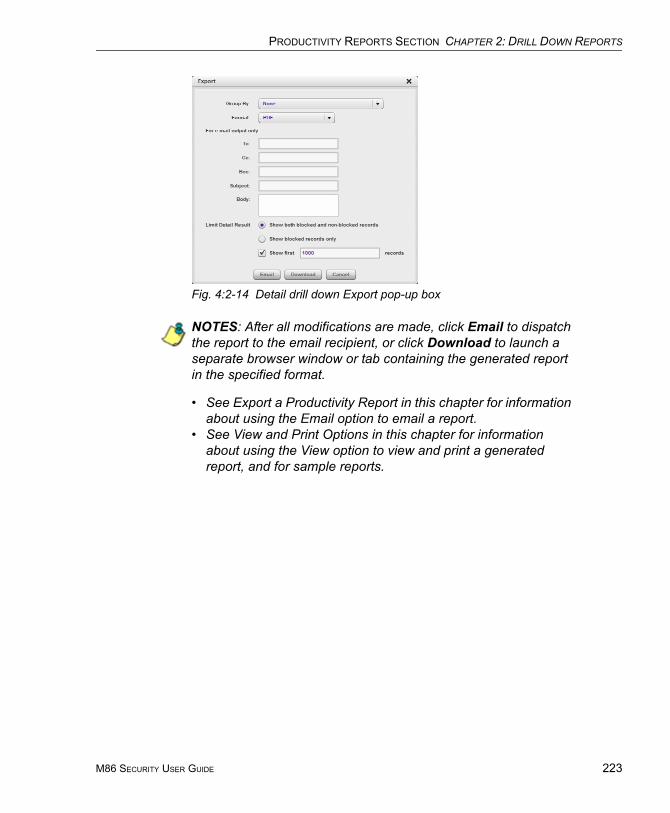
PRODUCTIVITY REPORTS SECTION CHAPTER 2: DRILL DOWN REPORTS
Fig. 4:2-14 Detail drill down Export pop-up box
NOTES: After all modifications are made, click Email to dispatch the report to the email recipient, or click Download to launch a separate browser window or tab containing the generated report in the specified format.
• See Export a Productivity Report in this chapter for information about using the Email option to email a report.
• See View and Print Options in this chapter for information about using the View option to view and print a generated report, and for sample reports.
M86 SECURITY USER GUIDE 223
PRODUCTIVITY REPORTS SECTION CHAPTER 2: DRILL DOWN REPORTS
224
Report View Components
Report Fields and Usage
The following fields are used in the summary and detail drill down productivity Report Wizard, Save Report, and/or summary or detail report views and pop-up boxes linked to report views.
Type field
The Type field is used for specifying the report type for the summary report to be generated.
At the Type field, make a selection from the pull-down menu for one of the following report types:
• Categories - This option performs a query on filter cate-gories accessed by end users.
• IPs - This option performs a query on Internet activity by end user IP address.
• Users - This option performs a query on end user Internet activity by username.
• Sites - This option performs a query on Web sites visited by end users.
• Category Groups - This option performs a query on end user Internet activity in Category Groups and Custom Category Groups, the latter which are set up using the Custom Category Groups option from the Administration menu.
• User Groups - This option performs a query on Internet activity of User Groups. User Groups are set up using the User Groups option from the Administration menu.
M86 SECURITY USER GUIDE
PRODUCTIVITY REPORTS SECTION CHAPTER 2: DRILL DOWN REPORTS
Date Scope and date fields
The Date Scope field is used for specifying the period of time to be included in the generated report view. Reports can be run for any data saved in the SR’s memory.
At the Date Scope field, make a selection from the pull-down menu for the time frame you wish to use in your query (depending on the scope selected, the from and to date fields are used in conjunction with this field):
• Today - This option generates the report view for today only, if logs from the Web access logging device have been received and processed.
• Month to Date - This option generates the report view for the range of days that includes the first day of the current month through today.
• Monthly - Selecting this option activates the from and to date fields where you specify the date range using the calendar icons.
• Year to Date - This option generates the report view for the range of days that includes the first day of the current year through today.
• Daily - Selecting this option activates the from and to date fields where you specify the date range using the calendar icons. The generated report view includes data for the specified days only, if the data for these days are stored on the SR.
• Yesterday - This option generates the report view for yesterday only.
• Month to Yesterday - This option generates the report view for the range of days that includes the first day of the current month through yesterday.
M86 SECURITY USER GUIDE 225
PRODUCTIVITY REPORTS SECTION CHAPTER 2: DRILL DOWN REPORTS
226
• Year to Yesterday - This option generates the report view for the range of days that includes the first day of the current year through yesterday.
• Last Week - This option generates the report view for all days in the past week, beginning with Sunday and ending with Saturday.
• Last Weekend - This option generates the report view for the past Saturday and Sunday.
• Current Week - This option generates the report view for today and all previous days in the current week, begin-ning with Sunday and ending with Saturday.
• Last Month - This option generates the report view for all days within the past month.
For detail reports, the following fields are additionally avail-able:
• Part of Today - This option generates the report view for today within a specified time range. Make a selection for the hour (1-24) and minutes (0-59).
• Part of Yesterday - This option generates the report view for yesterday, within a specified time range. Make a selection for the hour (1-24) and minutes (0-59).
• Part of Specific Day - This option generates the report view for the date specified via the calendar icon. In the time fields, make a selection for the hour (1-24) and minutes (0-59).
• User Defined - This option generates the report view for the specified time range within the specified date range. In the from and to fields, use the calendar icons to make selections for the date range. In the time fields, specify the hour (1-24) and minute (0-59) time ranges.
M86 SECURITY USER GUIDE
PRODUCTIVITY REPORTS SECTION CHAPTER 2: DRILL DOWN REPORTS
# Records fields
The # Records fields are used for specifying the number of records from the query you wish to include in the summary drill down report view, and how these records will be sorted.
In the # Records field, indicate whether the report view should “Show all records” or “Show first ‘x’ records”. If the latter selection is made, the value that displays in this field may have come from the Default Report Settings panel and can be modified.
NOTE: The Default Top N Value entry is modified in the Default Report Settings panel, accessible via the Administration menu. See the Default Report Settings panel sub-section in Chapter 3: Report Configuration from the Report Manager Administration Section for information about the Default Top N Value.
Filter and Filter String fields
The filter fields are used for narrowing results that display in the current summary drill down report view.
At the Filter field, make a selection from the pull-down menu for the filter term to be used: “None”, “Contains”, “Starts with”, “Ends with”.
The Filter String field displays greyed-out if “None” was selected at the Filter field. If any other selection was made at that field, enter text in this field corresponding to the type of filter term to be used.
Sort By fields
The sort fields are used for specifying the report view column by which the generated report will be sorted.
For summary drill down reports, at the Sort By field, make a selection from the pull-down menu for one of the available sort options: “Category Count”, “IP Count”, “User Count”, “Site Count”, “Page Count”, “Object Count”, “Time”, “Hit
M86 SECURITY USER GUIDE 227
PRODUCTIVITY REPORTS SECTION CHAPTER 2: DRILL DOWN REPORTS
228
Count”, “Bandwidth”—the latter available for an SWG only environment.
For detail drill down reports, at the Sort By field, make a selection from the pull-down menu for one of the available sort options: "Date", "Category", "User IP", "User", "Site", "Filter Action", "Content Type", "Content", "Search String", "URL".
NOTE: In an SWG only environment, the Content Type, Content, and Search String options are not applicable.
Limit Detail Results fields
Limit Detail Results fields are used for specifying the maximum number of records to be included in the detail report view.
Select the appropriate radio button:
• Show all records - Click this radio button to include all records returned by the report query.
• Show first ‘x’ records - Click this radio button to only include the first set of records returned by the report query, and make an entry to specify the maximum number of records in that set.
• Show both blocked and non-blocked records - Click this radio button to include records for URLs that were blocked, as well as those that were not blocked.
• Show blocked records only - Click this radio button to only include records for URLs that were blocked.
M86 SECURITY USER GUIDE
PRODUCTIVITY REPORTS SECTION CHAPTER 2: DRILL DOWN REPORTS
Group By field
The Group By field is used for indicating the manner in which records will display for the current report view when exported.
Choose from the available report selections at the Group By pull-down menu. Based on the current report view displayed, the selections in this menu might include the main report type such as “Sites”, double-combination report types such as “Users/Sites”, triple-combination report types such as “User/Category/IPs”, or pie or bar charts.
Format field
The Format field is used for specifying the manner in which text from the report view will be outputted.
At the Format pull-down menu, choose the format for the report: “MS-DOS Text”, “PDF”, “Rich Text Format”, “HTML”, “Comma-Delimited Text”, “Excel (Chinese)”, “Excel (English)”.
Data to Export field
The Data to Export field is used for specifying which records will be exported when the generated summary drill down report is emailed or viewed.
At the Data to Export field pull-down menu, specify the amount of data to be exported: “All the rows on this report”, “Only rows on this page”, or “Only selected rows on this page”.
M86 SECURITY USER GUIDE 229
PRODUCTIVITY REPORTS SECTION CHAPTER 2: DRILL DOWN REPORTS
230
For additional-break reports only
The # Records and Sort By fields are used when exporting multi-combination summary drill down reports and are deac-tivated by default.
# Records field
The # Records field is used for specifying the number of records that will display for the selected sort option. By default, this field displays greyed-out and becomes acti-vated when a different Group By option is selected.
In the activated # Records field, indicate whether to “Show all records” or “Show first ‘x’ records”.
Sort By field
The Sort By field is used for specifying the report view column by which the generated report will be sorted.
For summary drill down reports, at the Sort By field, make a selection from the pull-down menu for one of the available sort options: “Category Count”, “IP Count”, “User Count”, “Site Count”, “Page Count”, “Object Count”, “Time”, “Hit Count”, “Bandwidth”—the latter option available in an SWG only environment.
M86 SECURITY USER GUIDE
PRODUCTIVITY REPORTS SECTION CHAPTER 2: DRILL DOWN REPORTS
For pie and bar charts only
Generate Using field
The Generate Using field is used when exporting a drill down Categories, Category Group, or User Group pie chart or bar chart report, and determines by which column the report will be sorted. By default, the field displays greyed-out and becomes activated when a pie or bar chart report is selected from the Group By pull-down menu.
At the activated Generate Using field, make a selection from the pull-down menu for the sort option to be used: “Category Count”, IP Count”, “User Count”, “Site Count”, “Page Count”, “Object Count”, “Time”, “Hit Count”, “Band-width”—the latter option available in an SWG only environ-ment.
Output type field
The Output type field is used for specifying how the gener-ated report will be sent to the recipient(s).
At the Output type field, choose either “E-Mail As Attach-ment”, or “E-Mail As Link”.
Hide un-Identified IPs checkbox
The Hide un-Identified IPs checkbox is used for specifying whether or not IP addresses of workstations that are not assigned to a designated end user will be included in reports. This checkbox is deselected by default if the checkbox by this same name was de-selected in the Default Report Settings panel.
NOTE: The Default Report Settings panel is accessible via the Administration menu. See the Default Report Settings panel sub-section in Chapter 3 of the Report Manager Administration Section for more information about the Hide Unidentified IPs option.
M86 SECURITY USER GUIDE 231
PRODUCTIVITY REPORTS SECTION CHAPTER 2: DRILL DOWN REPORTS
232
To change the selection in this field, click the Hide un-iden-tified IPs checkbox to remove—or add—a check mark in the checkbox. By entering a check mark in this checkbox, activity on machines not assigned to specific end users will not be included in report views. Changing this selection will not affect the setting previously saved in the Default Report Settings panel.
E-Mail / For e-mail output only fields
E-Mail fields are used for entering email criteria pertinent to the report to be sent to the designated addressee(s).
Specify the following in the E-Mail or For E-Mail output only fields:
• To - Enter the email address of each intended report recipient, separating each address by a comma (,) and a space.
• Subject - Type in a brief description about the report.
• Cc (optional) - Enter the email address of each intended recipient of a carbon copy of this message, separating each address by a comma (,) and a space.
• Bcc (optional) - Enter the email address of each intended recipient of a blind carbon copy of this message, sepa-rating each address by a comma (,) and a space.
• Body - Type in text pertaining to the report.
M86 SECURITY USER GUIDE
PRODUCTIVITY REPORTS SECTION CHAPTER 2: DRILL DOWN REPORTS
Detailed Info fields
Detailed Info fields are used for specifying which columns of data will be excluded from detail drill down reports.
In the Detailed Info fields, by default all checkboxes corre-sponding to detail drill down report columns are selected. Click the checkbox corresponding to any of the following options to remove the check marks and thereby exclude those columns of information from displaying in the report:
• Category information - Click this checkbox to exclude the column that displays the library category name.
• IP information - Click this checkbox to exclude the column that displays the end user IP address.
• User information - Click this checkbox to exclude the column that displays the username.
• Site information - Click this checkbox to exclude the column that displays the IP addresses or URLs of sites.
• Filter Action information - Click this checkbox to exclude the column that displays the type of filter action used by the Web Filter in creating the record: "Allowed", "Blocked", "Warn Blocked" (for the first warning page that displayed for the end user), "Warn Allowed" (for any subsequent warning page that displayed for the end user), “Quota Blocked” (if a quota blocked the end user), "X-Strike", or "N/A" if the filter action was unclassified at the time the log file was created.
• Content Type information (for Web Filters) - Click this checkbox to exclude the column that displays the method used by the Web Filter in creating the record: “Search KW” (Search Engine Keyword), “URL KW” (URL Keyword), “URL”, “Wildcard”, “Https High” (HTTPS Filtering Level set at High), “X-strike” (X Strikes Blocking), “Pattern” (Proxy Pattern Blocking), or “N/A” if
M86 SECURITY USER GUIDE 233
PRODUCTIVITY REPORTS SECTION CHAPTER 2: DRILL DOWN REPORTS
234
the content was unclassified at the time the log file was created.
• Content information (for Web Filters) - Click this checkbox to exclude the column that displays criteria used for determining the categorization of the record, or “N/A” if unclassified.
• Search String information (for Web Filters) - Click this checkbox to exclude the column that displays the full search string the end user typed into a search engine text box. This column displays pertinent information only if the Search Engine Reporting option is enabled in the Optional Features screen of the System Configuration administrator console user interface.
NOTE: Refer to the Optional Features screen sub-section of the System Configuration Section for information about the Search String feature.
M86 SECURITY USER GUIDE

PRODUCTIVITY REPORTS SECTION CHAPTER 2: DRILL DOWN REPORTS
Export a Productivity ReportThe email option for exporting drill down reports lets you electronically send the report in the specified file format to designated personnel.
WARNING: If using a spam filter on your mail server, email messages or attachments might not be delivered if these messages contain keywords that are set up to be blocked. Consult with the administrator of the mail server for work around solutions between the spam filter and mail server.
1. In the Export pop-up box, enter the following information:
• To field - Type in the email address of each intended report recipient, separating each address by a comma (,) and a space.
• Subject field (optional) - Type in a brief description about the report.
• Cc field (optional) - Type in the email address of each intended recipient of a carbon copy of this message, separating each address by a comma (,) and a space.
• Bcc field (optional) - Type in the email address of each intended recipient of a blind carbon copy of this message, separating each address by a comma (,) and a space.
• Body field (optional) - Type in text pertaining to the report.
2. Click Email to send the report to the designated recip-ient(s).
WARNING: Large reports might not be sent due to email size restrictions on your mail server. The maximum size of an email message is often two or three MB. Please consult your mail server administrator for more information about email size restric-tions.
M86 SECURITY USER GUIDE 235
PRODUCTIVITY REPORTS SECTION CHAPTER 2: DRILL DOWN REPORTS
236
View and Print OptionsThe view and print options for exporting drill down reports let you view/print the report in the specified file format. The view option lets you make any necessary adjustments to your report file settings prior to printing the report. To print the report, you must have a printer configured for your work-station.
In the Export pop-up box, click the Download button to generate and download the report in the specified file format.
NOTE: Reports generated in the format for MS-DOS Text, Comma-Delimited Text, or Excel (Chinese or English) will display a single row of text for each record. Reports generated in all other formats (PDF, Rich Text Format, HTML) will display any lengthy string of text wrapped around below.
View and Print Tools
In the browser window containing the report, the tools avail-able via the toolbar let you perform some of the following actions on the open report file:
File:• Save (Ctrl+S) or Save (Page) As - Save the report file to
your local drive.
• Print (Ctrl+P) - Open the Print dialog box where specifi-cations can be made before printing the report file, such as changing the orientation of the printed page by selecting Portrait (vertical) or Landscape (horizontal).
Edit:• Select All - Hghlight the entire text (Ctrl+A), and then
Copy (Ctrl+C) and Paste (Ctrl+V) this text in an open file
• Perform a search for text > Find - Search for specific text in the file (Ctrl+F)
M86 SECURITY USER GUIDE

PRODUCTIVITY REPORTS SECTION CHAPTER 2: DRILL DOWN REPORTS
Sample Report File Formats
The following report file formats are available for emailing and viewing drill down reports: MS-DOS Text, PDF, Rich Text Format, HTML, Comma-Delimited Text, Excel (Chinese), Excel (English).
NOTES: M86 Security recommends using the PDF and HTML file formats over other file format selections—in particular for detail reports—since these files display and print in a format that is easiest to read. Lengthy text in PDF, HTML, and Rich Text Format files wraps around within the column so all text is captured without displaying truncated.
Comma-Delimited Text and Excel report columns may display with truncated text, but an entire column can be viewed by mani-pulating the column width in the generated report file. These reports can then be printed at a smaller percentage than normal size in order to accommodate all text.
For MS-DOS Text reports, text may display truncated—in parti-cular for lengthy usernames and URLs in detail reports—but an entire column can be viewed by scrolling to the right. Since there is no way to manipulate text in the generated report file, the printed report may display with truncated text. However, the maximum amount of text can be captured by printing the report in the landscape format.
M86 SECURITY USER GUIDE 237

PRODUCTIVITY REPORTS SECTION CHAPTER 2: DRILL DOWN REPORTS
238
MS-DOS Text
This is a sample of the Category Groups report in the MS-DOS Text format, saved with a .txt file extension:
Fig. 4:2-15 Category Groups report, MS-DOS Text file format
This is a sample of the Category Groups report in the PDF format, saved with a .pdf file extension:
Fig. 4:2-16 Category Groups report, PDF format
M86 SECURITY USER GUIDE
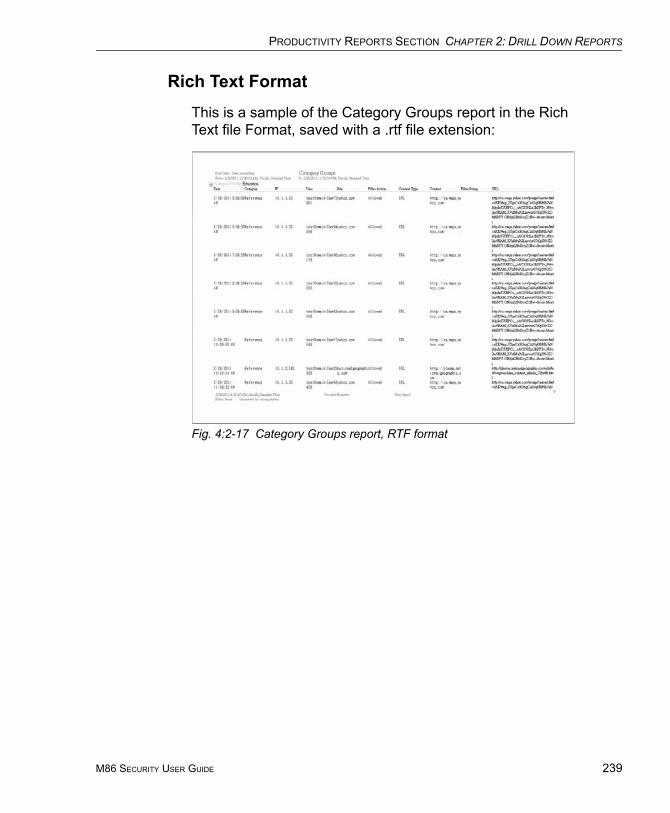
PRODUCTIVITY REPORTS SECTION CHAPTER 2: DRILL DOWN REPORTS
Rich Text Format
This is a sample of the Category Groups report in the Rich Text file Format, saved with a .rtf file extension:
Fig. 4:2-17 Category Groups report, RTF format
M86 SECURITY USER GUIDE 239

PRODUCTIVITY REPORTS SECTION CHAPTER 2: DRILL DOWN REPORTS
240
HTML
This is a sample of the Category Groups report in the HTML format, saved with a .html file extension:
Fig. 4:2-18 Category Groups report, HTML file format
Comma-Delimited Text
This is a sample of the Category Groups report in the Comma-Delimited Text format, saved with a .csv file exten-sion:
Fig. 4:2-19 Category Groups report, Comma-Delimited Text file
M86 SECURITY USER GUIDE
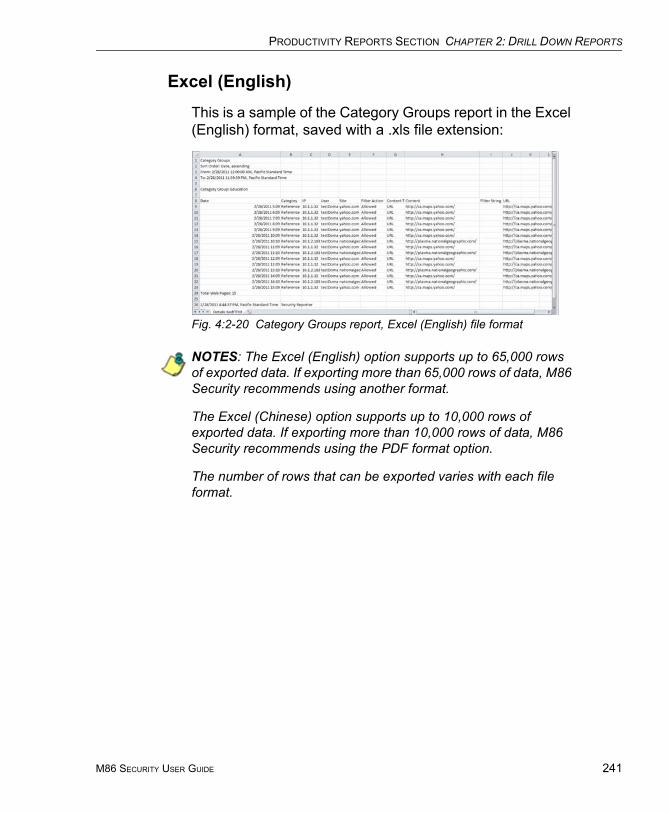
PRODUCTIVITY REPORTS SECTION CHAPTER 2: DRILL DOWN REPORTS
Excel (English)
This is a sample of the Category Groups report in the Excel (English) format, saved with a .xls file extension:
Fig. 4:2-20 Category Groups report, Excel (English) file format
NOTES: The Excel (English) option supports up to 65,000 rows of exported data. If exporting more than 65,000 rows of data, M86 Security recommends using another format.
The Excel (Chinese) option supports up to 10,000 rows of exported data. If exporting more than 10,000 rows of data, M86 Security recommends using the PDF format option.
The number of rows that can be exported varies with each file format.
M86 SECURITY USER GUIDE 241
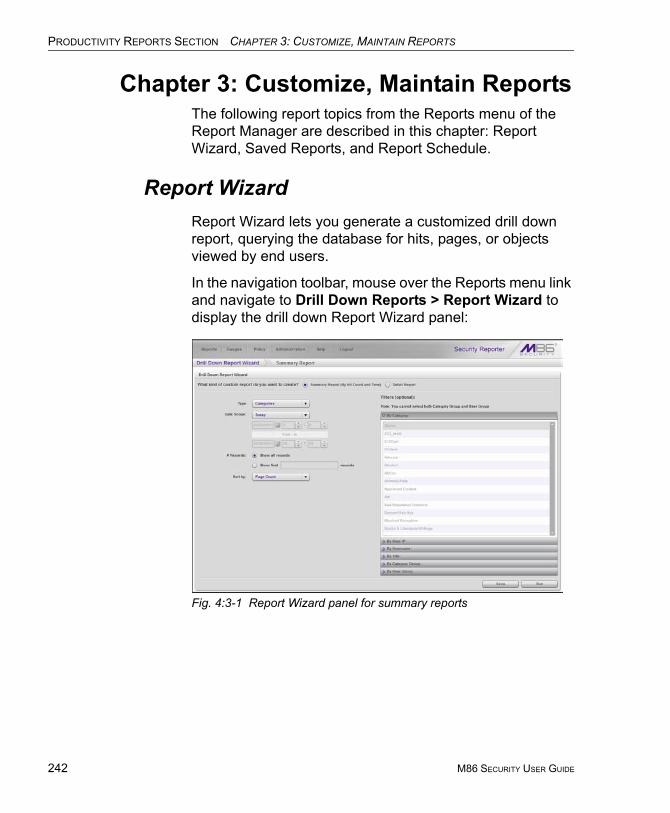
PRODUCTIVITY REPORTS SECTION CHAPTER 3: CUSTOMIZE, MAINTAIN REPORTS
242
Chapter 3: Customize, Maintain ReportsThe following report topics from the Reports menu of the Report Manager are described in this chapter: Report Wizard, Saved Reports, and Report Schedule.
Report WizardReport Wizard lets you generate a customized drill down report, querying the database for hits, pages, or objects viewed by end users.
In the navigation toolbar, mouse over the Reports menu link and navigate to Drill Down Reports > Report Wizard to display the drill down Report Wizard panel:
Fig. 4:3-1 Report Wizard panel for summary reports
M86 SECURITY USER GUIDE

PRODUCTIVITY REPORTS SECTION CHAPTER 3: CUSTOMIZE, MAINTAIN REPORTS
Step A: Select the Report Option
Select one of two available custom drill down report options:
• Summary Report (By Hit Count and Time) - This report provides a synopsis of specified end user Internet activity by hit count and time for a designated period.
• Detail Report - This report provides information about end user Web page or Web object access for a specified time period.
The fields that display in this panel depend upon whether a summary report or a detail report is selected.
Fig. 4:3-2 Report Wizard panel for detail reports
M86 SECURITY USER GUIDE 243
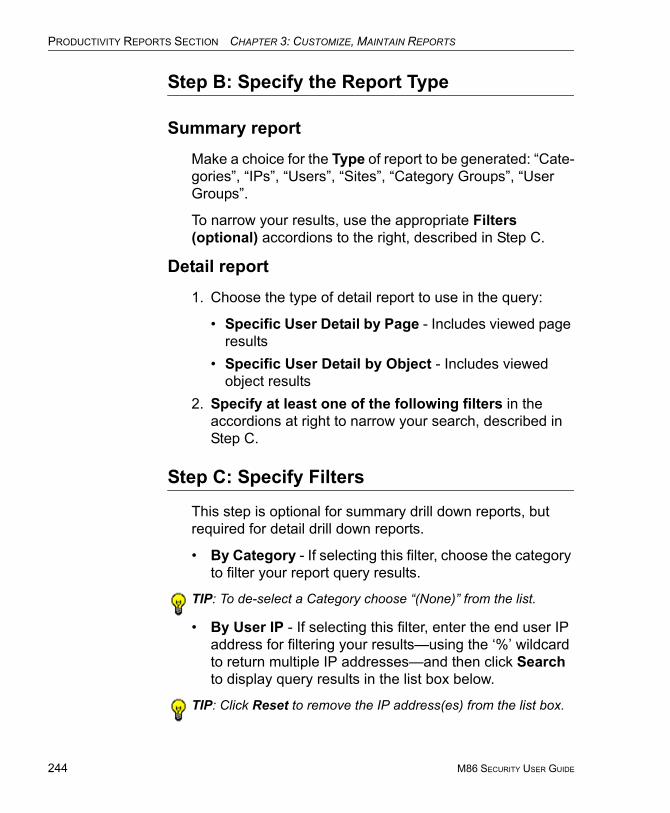
PRODUCTIVITY REPORTS SECTION CHAPTER 3: CUSTOMIZE, MAINTAIN REPORTS
244
Step B: Specify the Report Type
Summary report
Make a choice for the Type of report to be generated: “Cate-gories”, “IPs”, “Users”, “Sites”, “Category Groups”, “User Groups”.
To narrow your results, use the appropriate Filters (optional) accordions to the right, described in Step C.
Detail report
1. Choose the type of detail report to use in the query:
• Specific User Detail by Page - Includes viewed page results
• Specific User Detail by Object - Includes viewed object results
2. Specify at least one of the following filters in the accordions at right to narrow your search, described in Step C.
Step C: Specify Filters
This step is optional for summary drill down reports, but required for detail drill down reports.
• By Category - If selecting this filter, choose the category to filter your report query results.
TIP: To de-select a Category choose “(None)” from the list.
• By User IP - If selecting this filter, enter the end user IP address for filtering your results—using the ‘%’ wildcard to return multiple IP addresses—and then click Search to display query results in the list box below.
TIP: Click Reset to remove the IP address(es) from the list box.
M86 SECURITY USER GUIDE
PRODUCTIVITY REPORTS SECTION CHAPTER 3: CUSTOMIZE, MAINTAIN REPORTS
• By Username - If selecting this filter, enter the end user name to filter your results—using the ‘%’ wildcard to return multiple usernames—and then click Search to display query results in the list box below.
For a detail drill down report, select the username and click the right arrow ( > ) to move the username into the Added user names list box. Additional searches can be performed to include other usernames in the list box.
TIP: For a summary drill down report, click Reset to remove the username from the list box. For a detail drill down report, use the left arrow ( < ) to remove the username from the list box.
NOTE: If more than one username is entered, the following message displays at the bottom of this panel: ‘NOTE: This report is very processor and time intensive and may take several minutes to complete.’ The report must now be saved and run at a later time.
• By Site - If selecting this filter, enter the site name to filter your results—using the ‘%’ wildcard to return multiple site names—and then click Search to display query results in the list box below.
TIP: Click Reset to remove the site(s) from the list box.
• By Category Group - If selecting this filter, choose the Category Group to filter your report query results.
TIP: To de-select a Category Group, choose “(None)” from the list.
• By User Group - If selecting this filter, choose the User Group to filter your report query results.
TIP: To de-select a User Group, choose “(None)” from the list.
• By Keyword - This selection is available for detail drill down reports only. If selecting this filter, enter a keyword from three to 255 characters to filter your results, and then click Add to include your keyword term in the list
M86 SECURITY USER GUIDE 245
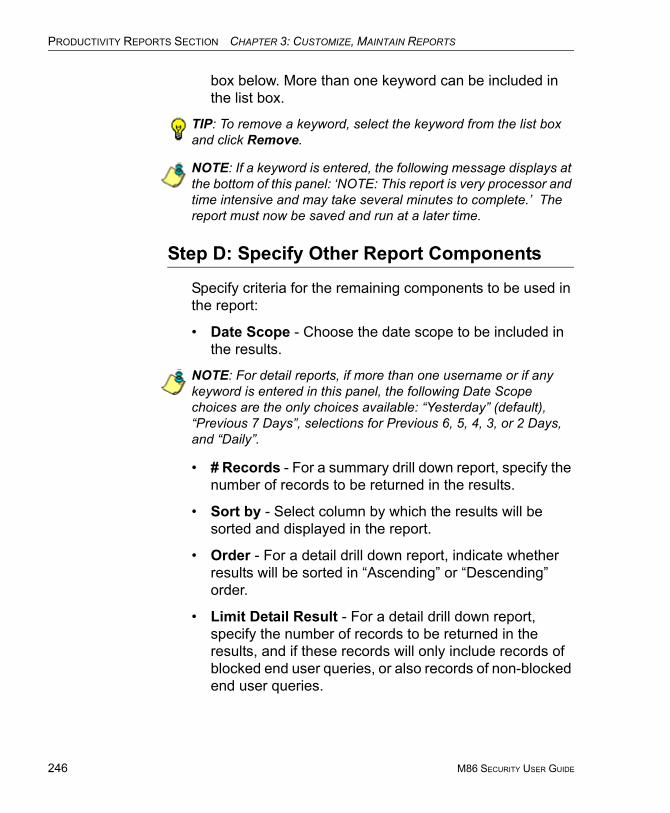
PRODUCTIVITY REPORTS SECTION CHAPTER 3: CUSTOMIZE, MAINTAIN REPORTS
246
box below. More than one keyword can be included in the list box.
TIP: To remove a keyword, select the keyword from the list box and click Remove.
NOTE: If a keyword is entered, the following message displays at the bottom of this panel: ‘NOTE: This report is very processor and time intensive and may take several minutes to complete.’ The report must now be saved and run at a later time.
Step D: Specify Other Report Components
Specify criteria for the remaining components to be used in the report:
• Date Scope - Choose the date scope to be included in the results.
NOTE: For detail reports, if more than one username or if any keyword is entered in this panel, the following Date Scope choices are the only choices available: “Yesterday” (default), “Previous 7 Days”, selections for Previous 6, 5, 4, 3, or 2 Days, and “Daily”.
• # Records - For a summary drill down report, specify the number of records to be returned in the results.
• Sort by - Select column by which the results will be sorted and displayed in the report.
• Order - For a detail drill down report, indicate whether results will be sorted in “Ascending” or “Descending” order.
• Limit Detail Result - For a detail drill down report, specify the number of records to be returned in the results, and if these records will only include records of blocked end user queries, or also records of non-blocked end user queries.
M86 SECURITY USER GUIDE
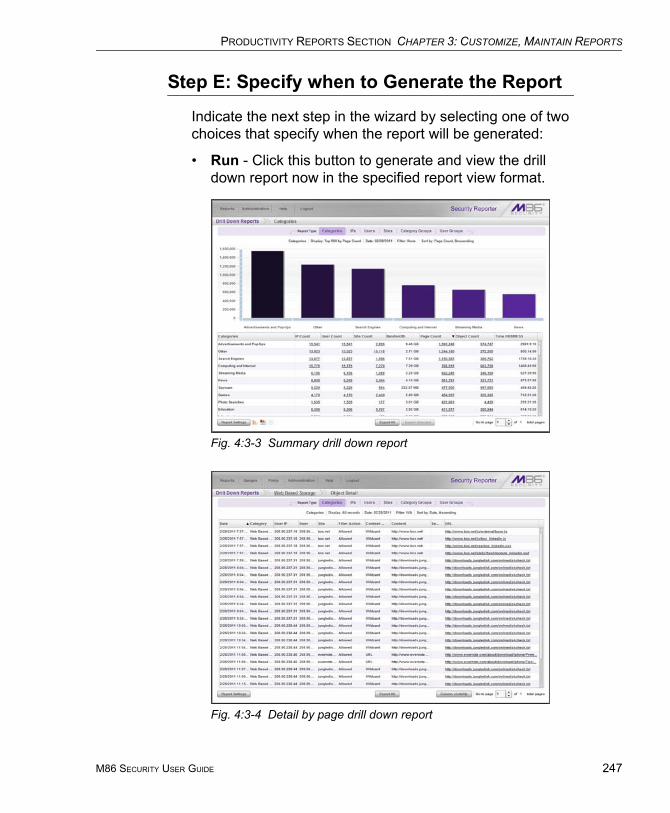
PRODUCTIVITY REPORTS SECTION CHAPTER 3: CUSTOMIZE, MAINTAIN REPORTS
Step E: Specify when to Generate the Report
Indicate the next step in the wizard by selecting one of two choices that specify when the report will be generated:
• Run - Click this button to generate and view the drill down report now in the specified report view format.
Fig. 4:3-3 Summary drill down report
Fig. 4:3-4 Detail by page drill down report
M86 SECURITY USER GUIDE 247

PRODUCTIVITY REPORTS SECTION CHAPTER 3: CUSTOMIZE, MAINTAIN REPORTS
248
• Save - Click this button to go to the Save Report panel where you save your report criteria now but generate your report later (see Step F and Saved Reports).
Step F: Save Report panel
1. Click the Save button to display the Basic Options tab of the Report Wizard > Save Report panel:
Fig. 4:3-5 Report Wizard’s Save Report panel Basic Options tab
This panel is similar in design to the Save Report pop-up window that displays when saving a drill down report (see Chapter 2: Drill Down Reports). However, the Date Scope does not display in this panel.
2. In the Save Name field, enter a name for the report. This name will display in the Reports > Saved Reports list box.
TIP: The Copy (Ctrl+C) and Paste (Ctrl+V) functions can be used in the fields in this screen.
3. In the Description field, enter the report description.
4. Specify E-Mail criteria:
M86 SECURITY USER GUIDE
PRODUCTIVITY REPORTS SECTION CHAPTER 3: CUSTOMIZE, MAINTAIN REPORTS
• To and Subject, and optional fields for Body, Cc, and Bcc.
• Hide un-identified IPs checkbox is de-selected by default if the “Hide Unidentified IPs” checkbox is de-selected in the Default Report Settings panel.
NOTE: The Default Report Settings panel is accessible via Administration > Default Report Settings. See the Default Report Settings sub-section in Chapter 3 of the Report Manager Admin-istration Section for more information about the Hide Unidentified IPs option.
• Output type - Choose either “E-Mail As Attachment”, or “E-Mail As Link”.
• Format - Choose from available output format selec-tions in the pull-down menu.
NOTE: Any selected filter options display to the right.
5. Click the Advanced Options tab for additional options:
• Group By - Available selections are based on the type of report specified.
• For summary drill down reports:• at the For additional-break reports only field, if a
selection was made in the Group By field, specify the top count option to be used in the # Records and Sort By fields.
• at the For pie and bar charts only section, the activated Generate using field lets you select the count column sort option.
• For detail drill down reports, specify any of the following options:• Detailed Info - Uncheck any checkbox
corresponding to a column that should not be included in the report.
• Limit Detail Result - Indicate the maximum number of records to be included in the report, and
M86 SECURITY USER GUIDE 249
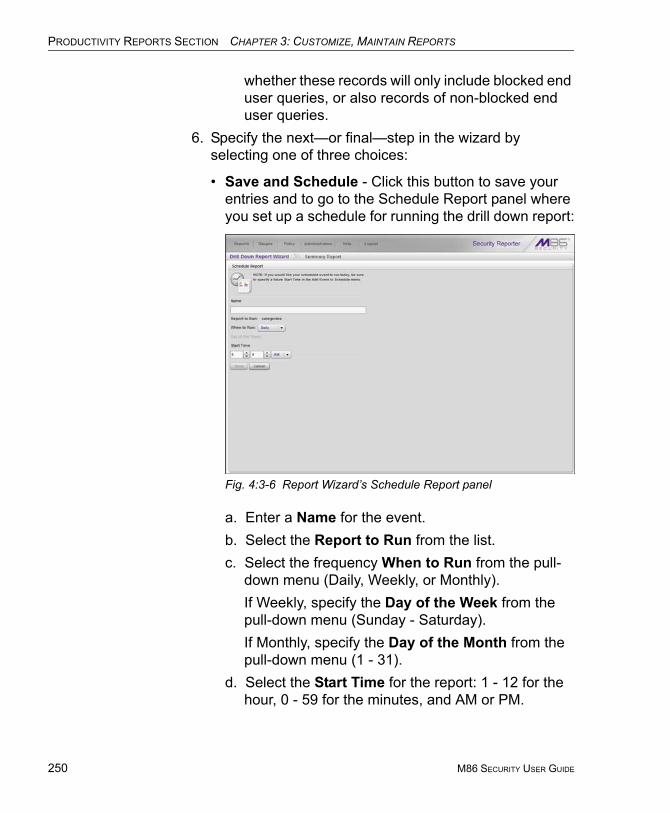
PRODUCTIVITY REPORTS SECTION CHAPTER 3: CUSTOMIZE, MAINTAIN REPORTS
250
whether these records will only include blocked end user queries, or also records of non-blocked end user queries.
6. Specify the next—or final—step in the wizard by selecting one of three choices:
• Save and Schedule - Click this button to save your entries and to go to the Schedule Report panel where you set up a schedule for running the drill down report:
Fig. 4:3-6 Report Wizard’s Schedule Report panel
a. Enter a Name for the event.b. Select the Report to Run from the list.c. Select the frequency When to Run from the pull-
down menu (Daily, Weekly, or Monthly).If Weekly, specify the Day of the Week from the pull-down menu (Sunday - Saturday).If Monthly, specify the Day of the Month from the pull-down menu (1 - 31).
d. Select the Start Time for the report: 1 - 12 for the hour, 0 - 59 for the minutes, and AM or PM.
M86 SECURITY USER GUIDE
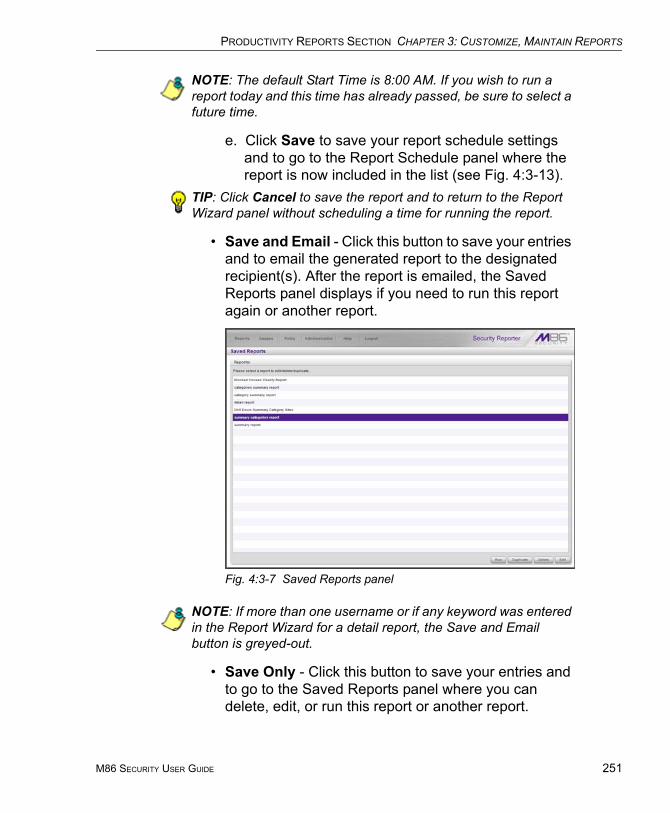
PRODUCTIVITY REPORTS SECTION CHAPTER 3: CUSTOMIZE, MAINTAIN REPORTS
NOTE: The default Start Time is 8:00 AM. If you wish to run a report today and this time has already passed, be sure to select a future time.
e. Click Save to save your report schedule settings and to go to the Report Schedule panel where the report is now included in the list (see Fig. 4:3-13).
TIP: Click Cancel to save the report and to return to the Report Wizard panel without scheduling a time for running the report.
• Save and Email - Click this button to save your entries and to email the generated report to the designated recipient(s). After the report is emailed, the Saved Reports panel displays if you need to run this report again or another report.
Fig. 4:3-7 Saved Reports panel
NOTE: If more than one username or if any keyword was entered in the Report Wizard for a detail report, the Save and Email button is greyed-out.
• Save Only - Click this button to save your entries and to go to the Saved Reports panel where you can delete, edit, or run this report or another report.
M86 SECURITY USER GUIDE 251
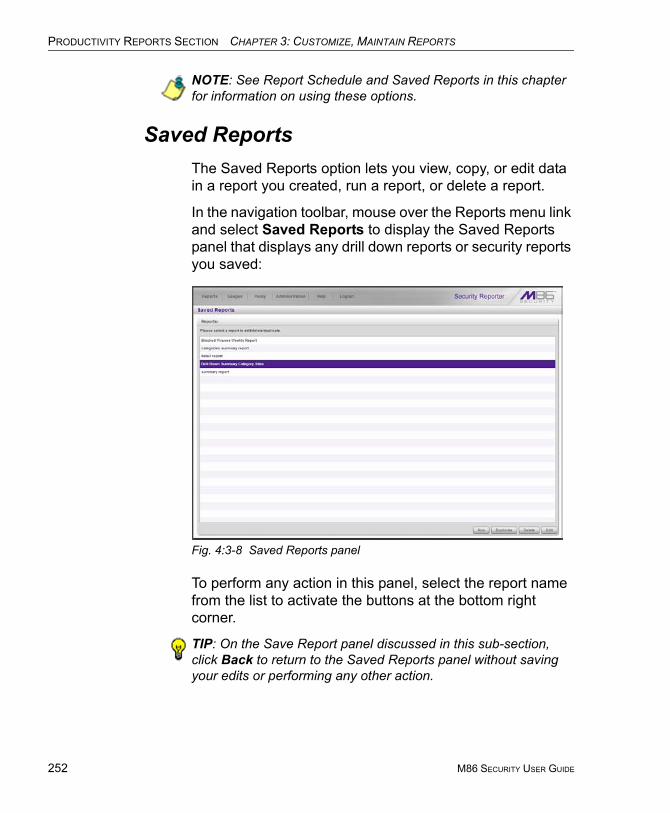
PRODUCTIVITY REPORTS SECTION CHAPTER 3: CUSTOMIZE, MAINTAIN REPORTS
252
NOTE: See Report Schedule and Saved Reports in this chapter for information on using these options.
Saved ReportsThe Saved Reports option lets you view, copy, or edit data in a report you created, run a report, or delete a report.
In the navigation toolbar, mouse over the Reports menu link and select Saved Reports to display the Saved Reports panel that displays any drill down reports or security reports you saved:
Fig. 4:3-8 Saved Reports panel
To perform any action in this panel, select the report name from the list to activate the buttons at the bottom right corner.
TIP: On the Save Report panel discussed in this sub-section, click Back to return to the Saved Reports panel without saving your edits or performing any other action.
M86 SECURITY USER GUIDE
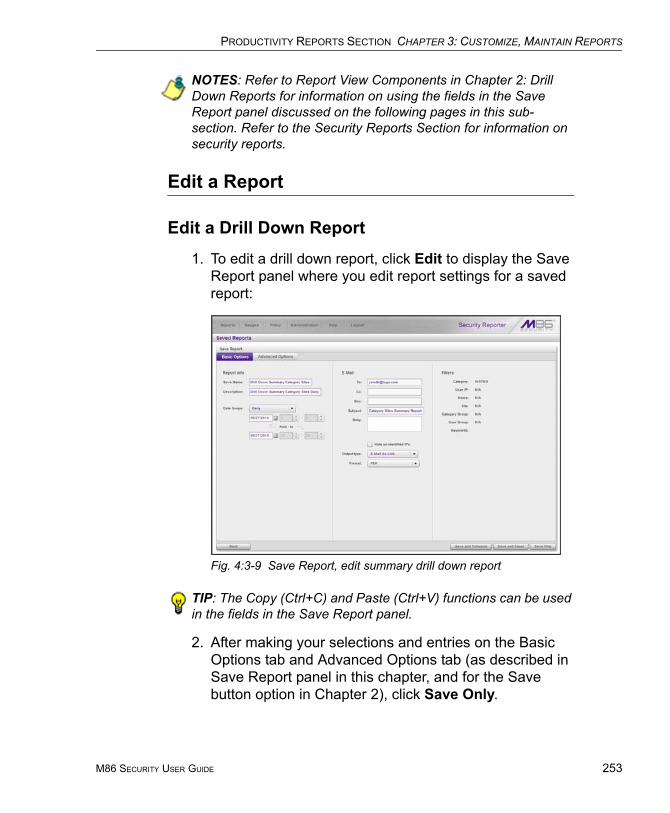
PRODUCTIVITY REPORTS SECTION CHAPTER 3: CUSTOMIZE, MAINTAIN REPORTS
NOTES: Refer to Report View Components in Chapter 2: Drill Down Reports for information on using the fields in the Save Report panel discussed on the following pages in this sub-section. Refer to the Security Reports Section for information on security reports.
Edit a Report
Edit a Drill Down Report
1. To edit a drill down report, click Edit to display the Save Report panel where you edit report settings for a saved report:
Fig. 4:3-9 Save Report, edit summary drill down report
TIP: The Copy (Ctrl+C) and Paste (Ctrl+V) functions can be used in the fields in the Save Report panel.
2. After making your selections and entries on the Basic Options tab and Advanced Options tab (as described in Save Report panel in this chapter, and for the Save button option in Chapter 2), click Save Only.
M86 SECURITY USER GUIDE 253
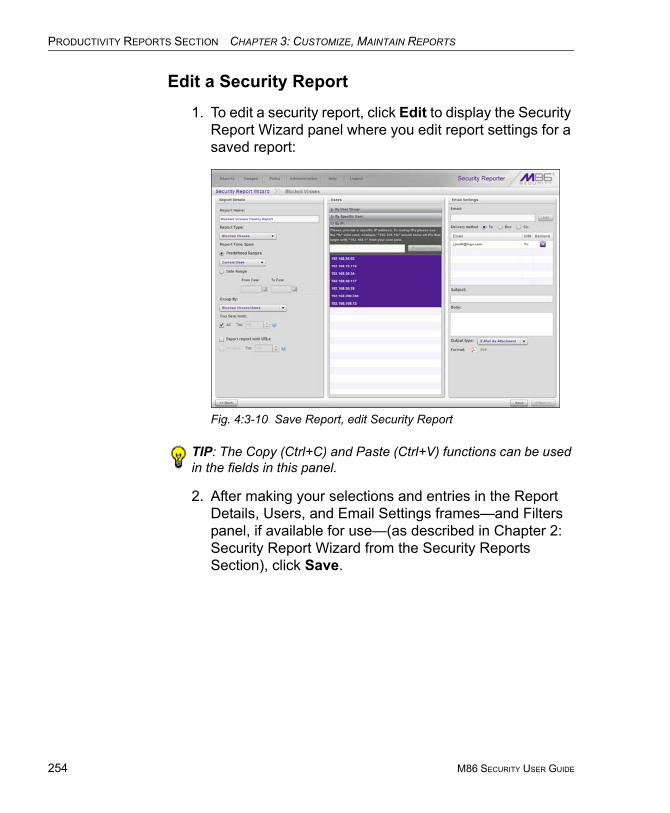
PRODUCTIVITY REPORTS SECTION CHAPTER 3: CUSTOMIZE, MAINTAIN REPORTS
254
Edit a Security Report
1. To edit a security report, click Edit to display the Security Report Wizard panel where you edit report settings for a saved report:
Fig. 4:3-10 Save Report, edit Security Report
TIP: The Copy (Ctrl+C) and Paste (Ctrl+V) functions can be used in the fields in this panel.
2. After making your selections and entries in the Report Details, Users, and Email Settings frames—and Filters panel, if available for use—(as described in Chapter 2: Security Report Wizard from the Security Reports Section), click Save.
M86 SECURITY USER GUIDE
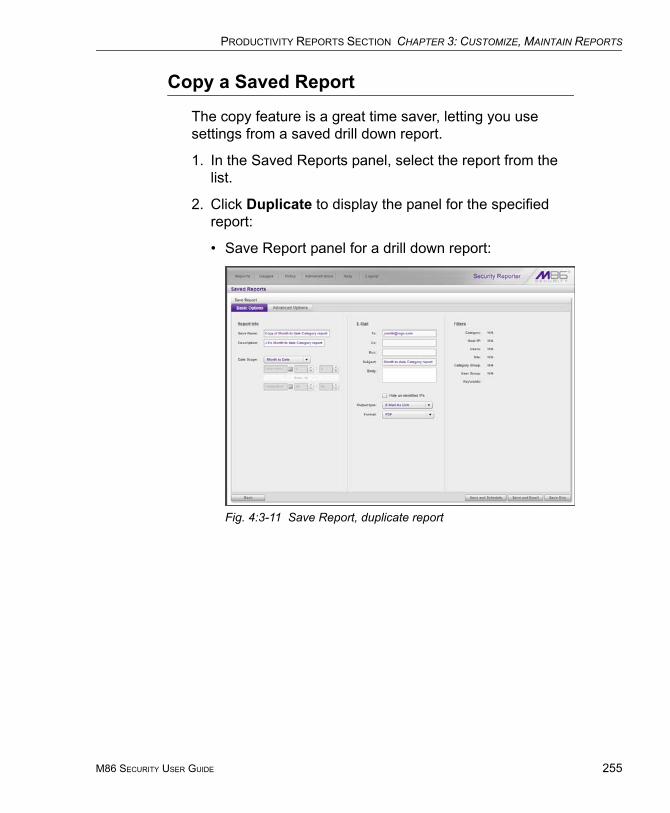
PRODUCTIVITY REPORTS SECTION CHAPTER 3: CUSTOMIZE, MAINTAIN REPORTS
Copy a Saved Report
The copy feature is a great time saver, letting you use settings from a saved drill down report.
1. In the Saved Reports panel, select the report from the list.
2. Click Duplicate to display the panel for the specified report:
• Save Report panel for a drill down report:
Fig. 4:3-11 Save Report, duplicate report
M86 SECURITY USER GUIDE 255
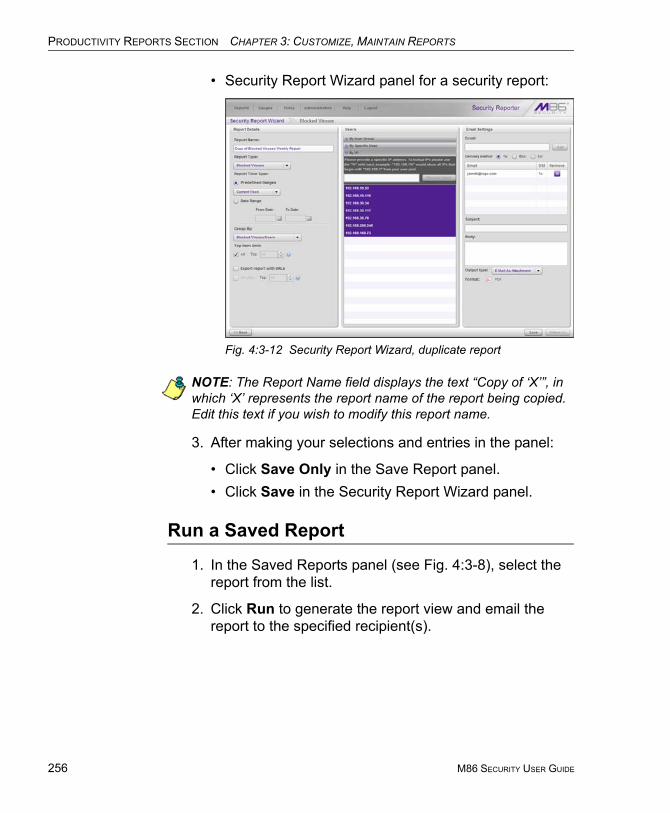
PRODUCTIVITY REPORTS SECTION CHAPTER 3: CUSTOMIZE, MAINTAIN REPORTS
256
• Security Report Wizard panel for a security report:
Fig. 4:3-12 Security Report Wizard, duplicate report
NOTE: The Report Name field displays the text “Copy of ‘X’”, in which ‘X’ represents the report name of the report being copied. Edit this text if you wish to modify this report name.
3. After making your selections and entries in the panel:
• Click Save Only in the Save Report panel.• Click Save in the Security Report Wizard panel.
Run a Saved Report
1. In the Saved Reports panel (see Fig. 4:3-8), select the report from the list.
2. Click Run to generate the report view and email the report to the specified recipient(s).
M86 SECURITY USER GUIDE
PRODUCTIVITY REPORTS SECTION CHAPTER 3: CUSTOMIZE, MAINTAIN REPORTS
Delete a Report
To remove the report from choices available in the Report Name list, and the list in the Report Schedule panel:
1. In the Saved Reports panel (see Fig. 4:3-8), select the report from the list.
2. Click Delete to open the Confirmation dialog box with the message: “Are you sure you wish to delete the report? Event schedules associated will also be deleted.”
3. Click Yes to close the dialog box and delete the report.
TIP: Click No to close the dialog box without deleting the report.
NOTE: If a report is scheduled to run via the Report Schedule option, deleting the report removes it from the Report Schedule list.
M86 SECURITY USER GUIDE 257
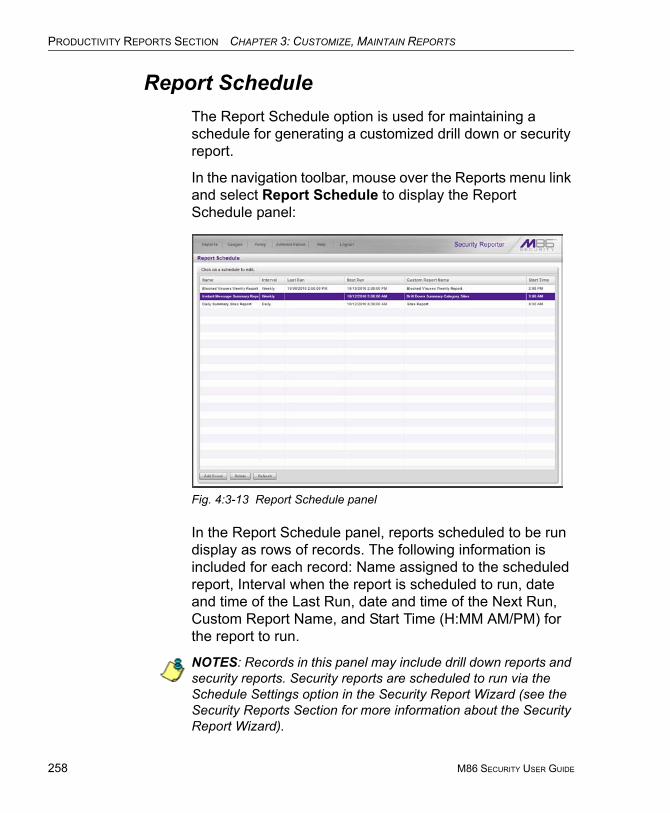
PRODUCTIVITY REPORTS SECTION CHAPTER 3: CUSTOMIZE, MAINTAIN REPORTS
258
Report ScheduleThe Report Schedule option is used for maintaining a schedule for generating a customized drill down or security report.
In the navigation toolbar, mouse over the Reports menu link and select Report Schedule to display the Report Schedule panel:
Fig. 4:3-13 Report Schedule panel
In the Report Schedule panel, reports scheduled to be run display as rows of records. The following information is included for each record: Name assigned to the scheduled report, Interval when the report is scheduled to run, date and time of the Last Run, date and time of the Next Run, Custom Report Name, and Start Time (H:MM AM/PM) for the report to run.
NOTES: Records in this panel may include drill down reports and security reports. Security reports are scheduled to run via the Schedule Settings option in the Security Report Wizard (see the Security Reports Section for more information about the Security Report Wizard).
M86 SECURITY USER GUIDE
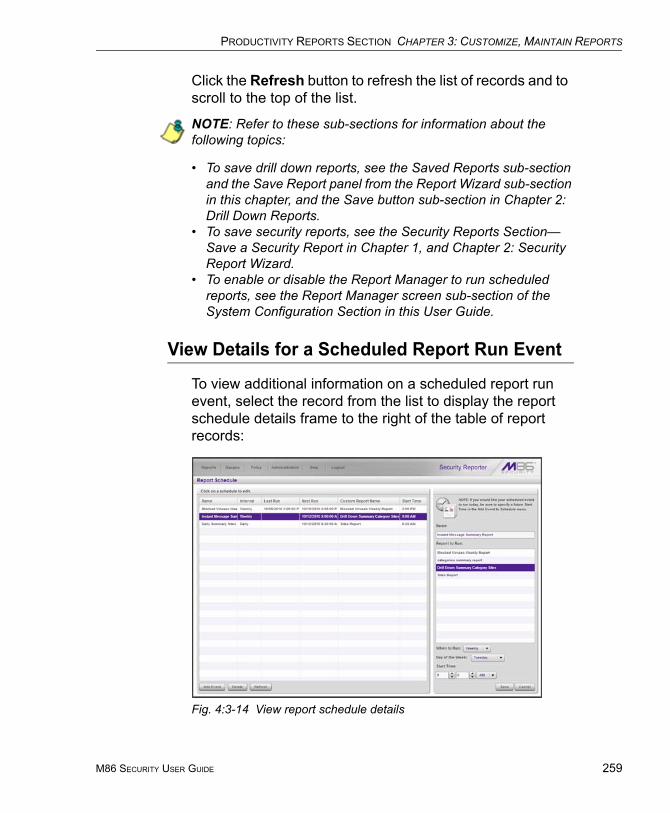
PRODUCTIVITY REPORTS SECTION CHAPTER 3: CUSTOMIZE, MAINTAIN REPORTS
Click the Refresh button to refresh the list of records and to scroll to the top of the list.
NOTE: Refer to these sub-sections for information about the following topics:
• To save drill down reports, see the Saved Reports sub-section and the Save Report panel from the Report Wizard sub-section in this chapter, and the Save button sub-section in Chapter 2: Drill Down Reports.
• To save security reports, see the Security Reports Section—Save a Security Report in Chapter 1, and Chapter 2: Security Report Wizard.
• To enable or disable the Report Manager to run scheduled reports, see the Report Manager screen sub-section of the System Configuration Section in this User Guide.
View Details for a Scheduled Report Run Event
To view additional information on a scheduled report run event, select the record from the list to display the report schedule details frame to the right of the table of report records:
Fig. 4:3-14 View report schedule details
M86 SECURITY USER GUIDE 259
PRODUCTIVITY REPORTS SECTION CHAPTER 3: CUSTOMIZE, MAINTAIN REPORTS
260
The following information displays in this frame: Name assigned to the scheduled event; selected Report to Run; interval When to Run the report; Day of the Week the report will run if the report is a daily report, or Day of the Month the report will run if the report is a monthly report, and Start Time to run.
TIP: To remove a report from the Report to Run list, go to the Saved Reports panel and delete that report from the list.
Edit a Scheduled Report Run Event
1. To edit criteria for a report scheduled to run, do the following in the report schedule details frame:
• change the Name of the report• make different selections as necessary from the pull-
down menus for Report to Run, When to Run, and/or Day of the Week or Day of the Month
• change the Start Time for running the reportTIP: Click Cancel if you wish to return to the Report Schedule panel without saving your edits.
2. Click Save to display the updated criteria in the Report Schedule panel.
M86 SECURITY USER GUIDE

PRODUCTIVITY REPORTS SECTION CHAPTER 3: CUSTOMIZE, MAINTAIN REPORTS
Add a Report Run Event to the Schedule
1. In the Report Schedule panel, click Add Event to display the report schedule details frame to the right side of the panel:
Fig. 4:3-15 Add an event to the schedule
2. Enter a Name for the report run event you are sched-uling.
3. Select the Report to Run from the list.
4. Select the frequency When to Run from the pull-down menu (Daily, Weekly, or Monthly).
If Weekly, specify the Day of the Week from the pull-down menu (Sunday - Saturday).
If Monthly, specify the Day of the Month from the pull-down menu (1 - 31).
5. Select the Start Time for the report: 1 - 12 for the hour, 0 - 59 for the minutes, and AM or PM.
M86 SECURITY USER GUIDE 261
PRODUCTIVITY REPORTS SECTION CHAPTER 3: CUSTOMIZE, MAINTAIN REPORTS
262
NOTE: The default Start Time is 8:00 AM. If you wish to run a report today and this time has already passed, be sure to select a future time.
TIP: Click Cancel to return to the Report Schedule panel without saving your edits.
6. Click Save to add the scheduled event to the list of reports to run.
Delete a Scheduled Report Run Event
1. In the Report Schedule panel, select the report record from the list and click the Delete; this action opens a dialog box with the message: “Are you sure you want to delete this event?”
2. Click Yes to close the dialog box and remove the record from the list.
TIP: Click Cancel to return to the Report Schedule panel without deleting the record from the list of reports scheduled to run.
M86 SECURITY USER GUIDE
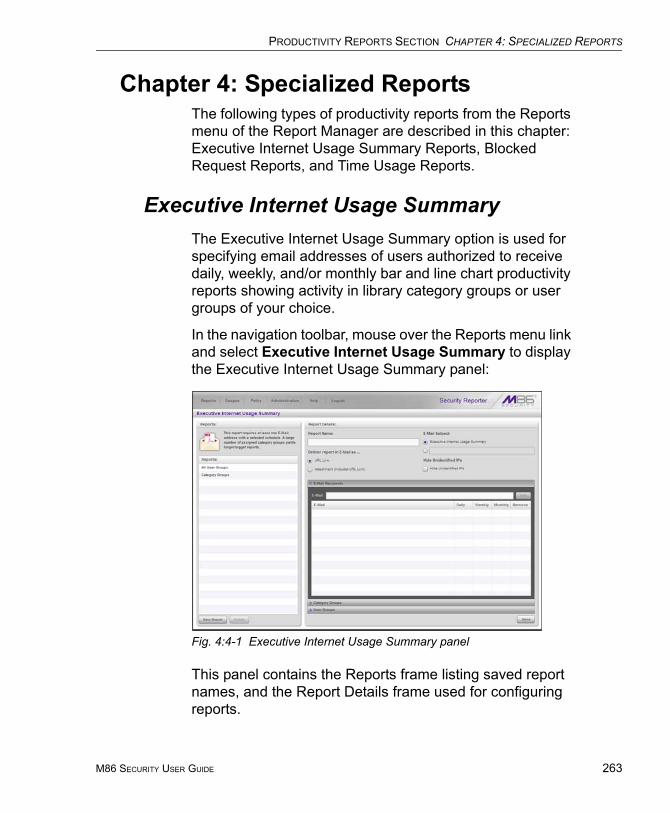
PRODUCTIVITY REPORTS SECTION CHAPTER 4: SPECIALIZED REPORTS
Chapter 4: Specialized ReportsThe following types of productivity reports from the Reports menu of the Report Manager are described in this chapter: Executive Internet Usage Summary Reports, Blocked Request Reports, and Time Usage Reports.
Executive Internet Usage SummaryThe Executive Internet Usage Summary option is used for specifying email addresses of users authorized to receive daily, weekly, and/or monthly bar and line chart productivity reports showing activity in library category groups or user groups of your choice.
In the navigation toolbar, mouse over the Reports menu link and select Executive Internet Usage Summary to display the Executive Internet Usage Summary panel:
Fig. 4:4-1 Executive Internet Usage Summary panel
This panel contains the Reports frame listing saved report names, and the Report Details frame used for configuring reports.
M86 SECURITY USER GUIDE 263
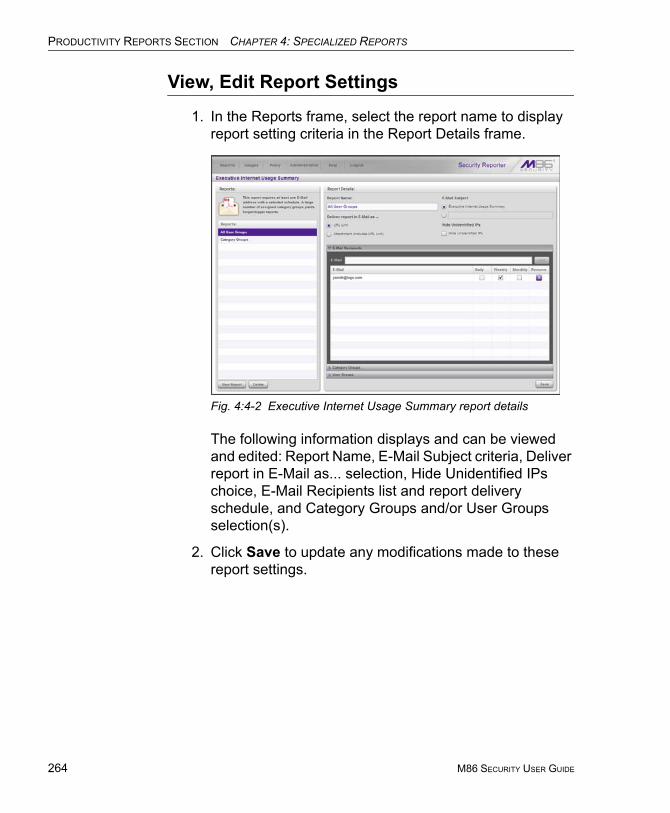
PRODUCTIVITY REPORTS SECTION CHAPTER 4: SPECIALIZED REPORTS
264
View, Edit Report Settings
1. In the Reports frame, select the report name to display report setting criteria in the Report Details frame.
Fig. 4:4-2 Executive Internet Usage Summary report details
The following information displays and can be viewed and edited: Report Name, E-Mail Subject criteria, Deliver report in E-Mail as... selection, Hide Unidentified IPs choice, E-Mail Recipients list and report delivery schedule, and Category Groups and/or User Groups selection(s).
2. Click Save to update any modifications made to these report settings.
M86 SECURITY USER GUIDE
PRODUCTIVITY REPORTS SECTION CHAPTER 4: SPECIALIZED REPORTS
Add a New Report
1. At the bottom of the Reports frame, click New Report to clear the panel.
2. At the top of the Report Details frame, enter the Report Name to be used.
3. In the Deliver report in E-Mail as... section, by default the “URL Link” option is selected, indicating the email will only include a URL link to the report.
To specify that both a URL link to the report and an attachment of the report will be included in the email, choose the “Attachment (includes URL Link)” option.
4. In the E-Mail Subject section, by default the “Executive Internet Usage Summary” option is selected, indicating the subject line to be used in the email.
To create a custom subject line for the email, select the radio button to the left of the blank field below, and make an entry in the text box for the subject line to be used in the email.
5. In the Hide Unidentified IPs section, by default the Hide Unidentified IPs checkbox is de-selected. This indicates that activity on machines not assigned to specific users will be included in reports.
If you wish to exclude activity from machines not assigned to specific users, click in the checkbox to enter a check mark.
NOTE: If enabling this feature, the generated report will only hide hit counts for IP addresses in sections of the report labeled “Users.” IP hit counts will be included for all other sections of the report, such as those labeled “Categories”, “Category Groups”, etc.
6. In the E-Mail Recipients accordion, specify the user(s) to receive the report and the frequency of delivery.
M86 SECURITY USER GUIDE 265
PRODUCTIVITY REPORTS SECTION CHAPTER 4: SPECIALIZED REPORTS
266
a. Click in the empty field and type in the E-Mail address.b. Click Add to clear the field and to add the email
address in the list box below.c. By default, checkmarks populate the frequency check-
boxes: Daily, Weekly, Monthly. This indicates reports will be emailed to the recipient at the specified inter-vals.To change these settings, click the checkbox to remove the selection.
Follow the steps above to add additional recipients.TIP: To remove a recipient from the list of users authorized to receive reports, click the ‘X’ in the Remove column.
7. Click to open the Category Groups and/or User Groups accordion(s) and specify groups for inclusion in the report:
• In the Category Groups accordion, select the category group(s) from the Available M86 Category Groups and Custom Category Groups, and then click Add Cate-gory Group to move the selection(s) to the Selected list box.By default, the following categories are included in the Selected list box: Adult Content, Security, and Illegal/Questionable.
TIPS: Multiple category groups can be selected by clicking each category group while pressing the Ctrl key on your keyboard. Blocks of category groups can be selected by clicking the first category group, and then pressing the Shift key on your keyboard while clicking the last category group.
To remove a category group from the Selected list box, select the category group and then click Remove Category Group.
• In the User Groups accordion, select the user group(s) from the Available User Groups, and then click Add User Group to move the selection(s) to the Selected list box.
M86 SECURITY USER GUIDE
PRODUCTIVITY REPORTS SECTION CHAPTER 4: SPECIALIZED REPORTS
TIPS: Multiple user groups can be selected by clicking each user group while pressing the Ctrl key on your keyboard. Blocks of user groups can be selected by clicking the first user group, and then pressing the Shift key on your keyboard while clicking the last user group.
To remove a user group from the Selected list box, select the user group and then click Remove User Group.
8. Click Save to save all settings made in this panel and to include the new report in the Reports list box.
Sample Executive Internet Usage report
The recipient of the Executive internet Usage Summary report receives an email containing a link to the report, and a .pdf attachment of the report, if specified (if the size of the .pdf file is within the limits).
Links are available for the following time frame:
• Daily reports (14 days)
• Weekly reports (30 days)
• Monthly reports (90 days)
The header of the generated report includes the title and date range. The footer includes the page number and page range.
The first page includes statistics for the following: Total Web Requests, Total Blocked Requests, Unique IPs/Users.
Total Blocked Requests are given for the following library categories: Malicious Code/Virus, Botnets/Malicious Code Command, Spyware, Bad Reputation Domains, Adult Content, Blended Threats, Phishing, Web-based Proxies/Anonymizers, Hacking.
NOTE: Blended Threats is not currently used and displays “N/A.”
M86 SECURITY USER GUIDE 267

PRODUCTIVITY REPORTS SECTION CHAPTER 4: SPECIALIZED REPORTS
268
Bar charts for Top Security Risks (library categories), Top Categories, Top Blocked Users, and Top Users show the top five categories/users and their corresponding total Requests.
Fig. 4:4-3 Executive Internet Usage Summary monthly report, page 1
The second page includes a pie chart depicting Total Web Requests for M86 Category Groups. Each category group in the chart is represented by a pie slice and shows the number of requests and overall percentage for that pie slice.
For Weekly and Monthly reports, the bottom half of the second page includes a line chart for Daily Web Requests by Category Groups. Each category group in the chart is represented by a colored symbol that can be identified by
M86 SECURITY USER GUIDE
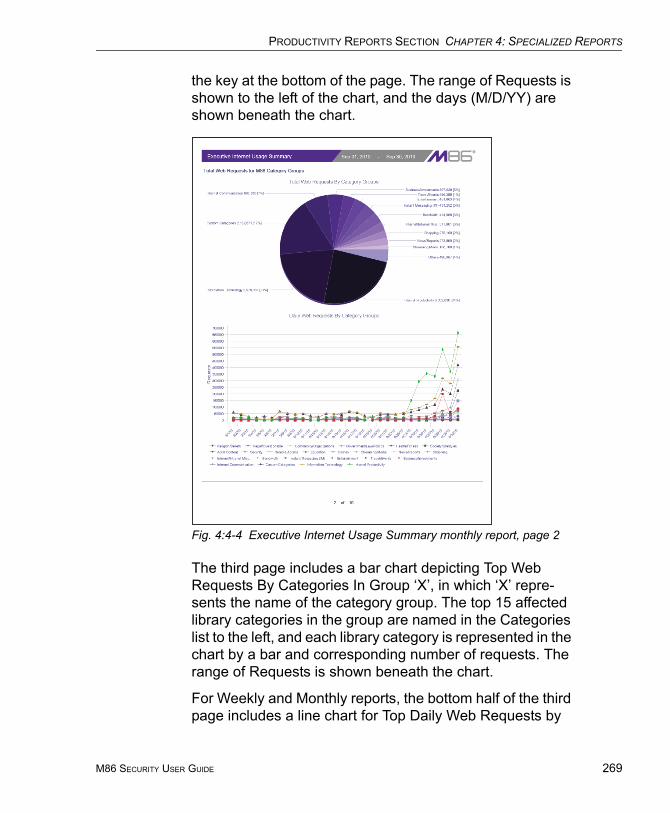
PRODUCTIVITY REPORTS SECTION CHAPTER 4: SPECIALIZED REPORTS
the key at the bottom of the page. The range of Requests is shown to the left of the chart, and the days (M/D/YY) are shown beneath the chart.
Fig. 4:4-4 Executive Internet Usage Summary monthly report, page 2
The third page includes a bar chart depicting Top Web Requests By Categories In Group ‘X’, in which ‘X’ repre-sents the name of the category group. The top 15 affected library categories in the group are named in the Categories list to the left, and each library category is represented in the chart by a bar and corresponding number of requests. The range of Requests is shown beneath the chart.
For Weekly and Monthly reports, the bottom half of the third page includes a line chart for Top Daily Web Requests by
M86 SECURITY USER GUIDE 269
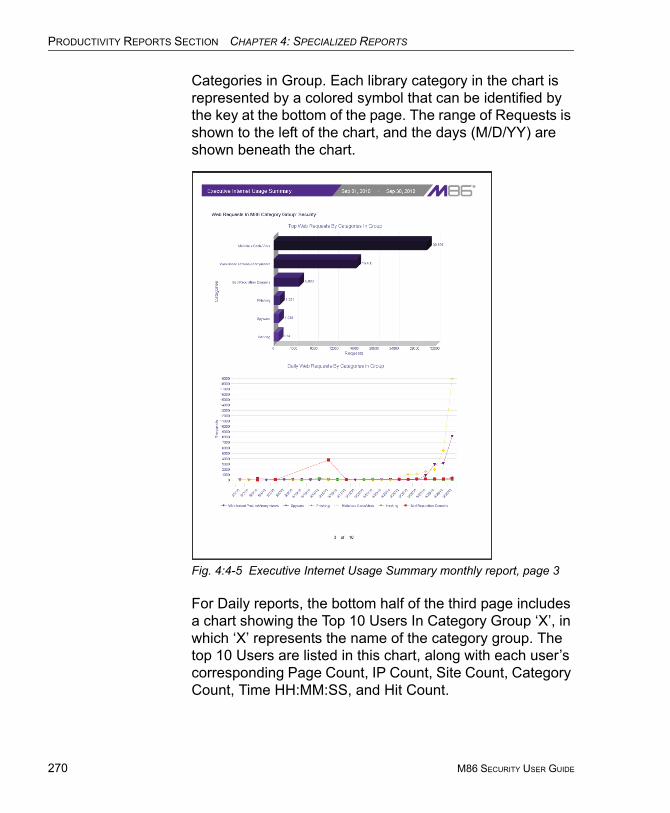
PRODUCTIVITY REPORTS SECTION CHAPTER 4: SPECIALIZED REPORTS
270
Categories in Group. Each library category in the chart is represented by a colored symbol that can be identified by the key at the bottom of the page. The range of Requests is shown to the left of the chart, and the days (M/D/YY) are shown beneath the chart.
Fig. 4:4-5 Executive Internet Usage Summary monthly report, page 3
For Daily reports, the bottom half of the third page includes a chart showing the Top 10 Users In Category Group ‘X’, in which ‘X’ represents the name of the category group. The top 10 Users are listed in this chart, along with each user’s corresponding Page Count, IP Count, Site Count, Category Count, Time HH:MM:SS, and Hit Count.
M86 SECURITY USER GUIDE
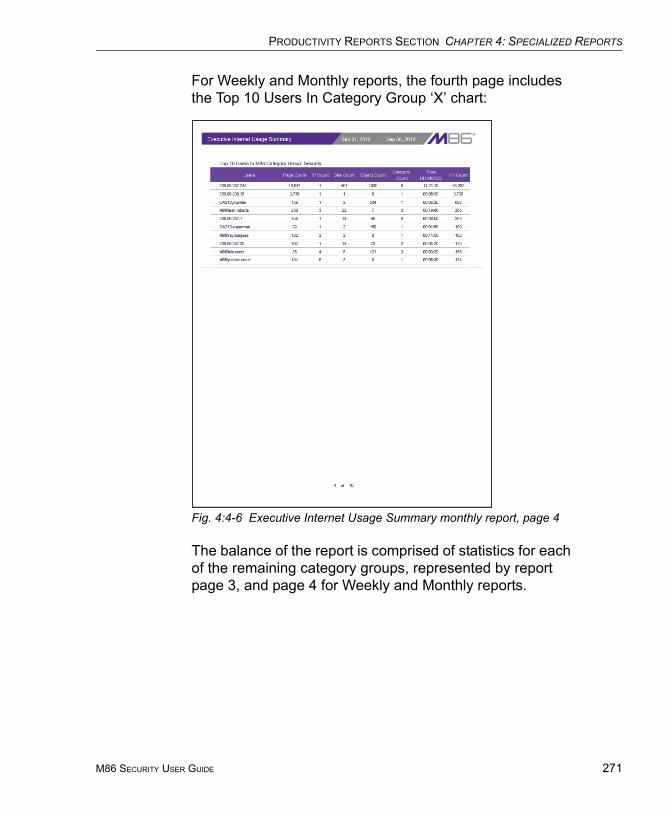
PRODUCTIVITY REPORTS SECTION CHAPTER 4: SPECIALIZED REPORTS
For Weekly and Monthly reports, the fourth page includes the Top 10 Users In Category Group ‘X’ chart:
Fig. 4:4-6 Executive Internet Usage Summary monthly report, page 4
The balance of the report is comprised of statistics for each of the remaining category groups, represented by report page 3, and page 4 for Weekly and Monthly reports.
M86 SECURITY USER GUIDE 271
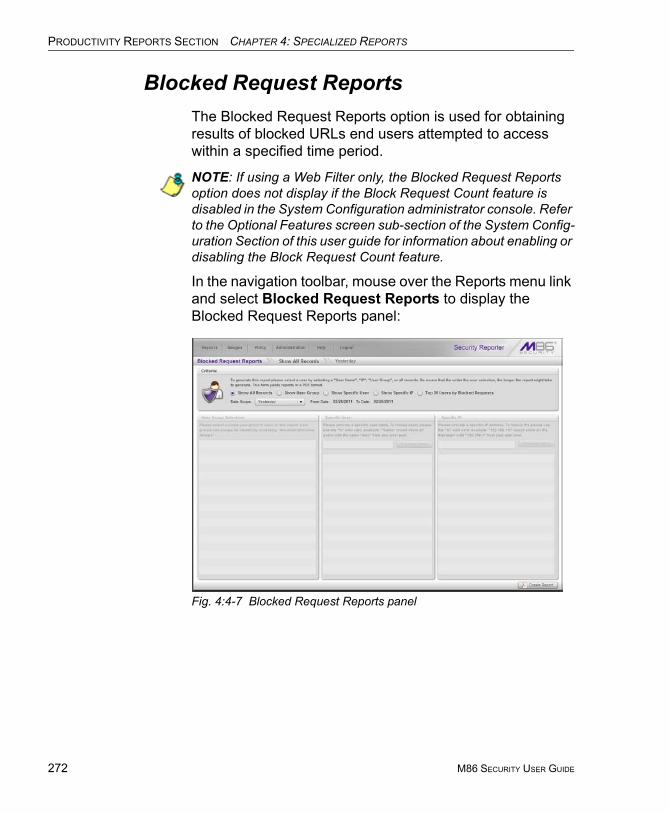
PRODUCTIVITY REPORTS SECTION CHAPTER 4: SPECIALIZED REPORTS
272
Blocked Request ReportsThe Blocked Request Reports option is used for obtaining results of blocked URLs end users attempted to access within a specified time period.
NOTE: If using a Web Filter only, the Blocked Request Reports option does not display if the Block Request Count feature is disabled in the System Configuration administrator console. Refer to the Optional Features screen sub-section of the System Config-uration Section of this user guide for information about enabling or disabling the Block Request Count feature.
In the navigation toolbar, mouse over the Reports menu link and select Blocked Request Reports to display the Blocked Request Reports panel:
Fig. 4:4-7 Blocked Request Reports panel
M86 SECURITY USER GUIDE
PRODUCTIVITY REPORTS SECTION CHAPTER 4: SPECIALIZED REPORTS
Generate a Blocked Request Report
To generate a Blocked Request Report:
1. In the Criteria frame, specify the type of report to be generated by clicking the radio button corresponding to that option, and—if necessary—making entries/selec-tions in pertinent fields:
• Show All Records - If choosing this option, the Date Scope field displays “Yesterday” and yesterday’s date.
• Show User Group - If choosing this option, select the user group from the User Group Selection list box below. The Date Scope field displays “Yesterday” and yesterday’s date.
• Show Specific User - If choosing this option, enter the username—or a portion of the username with the ‘%’ wildcard—in the Specific User frame, and then click Preview Users to display results in the list box below. Select the user, and then make a selection from the Date Scope field to display the date range for that time period: Yesterday, Last Week, Last Month, Week to Yesterday, Month to Yesterday.
• Show Specific IP - If choosing this option, enter the IP address—or a portion of the IP address with the ‘%’ wildcard—in the Specific IP frame, and then click Preview Users to display results in the list box below. Select the user IP address, and then make a selection from the Date Scope field to display the date range for that time period: Yesterday, Last Week, Last Month, Week to Yesterday, Month to Yesterday.
• Top 20 Users by Blocked Requests - If choosing this option, make a selection from the Date Scope field to display the date range for that time period: Yesterday, Last Week, Last Month, Week to Yesterday, Month to Yesterday.
M86 SECURITY USER GUIDE 273
PRODUCTIVITY REPORTS SECTION CHAPTER 4: SPECIALIZED REPORTS
274
2. Click Create Report to generate the report view in the PDF format.
As with other reports exported in the PDF format, this report can be saved and/or printed.
NOTES: If there is no data available—or if data is available for only a partial number of days within the date scope range—a message displays indicating that no records are available.
If a new user group with existing usernames or IP addresses was added, data for that user group will not be available for viewing on the current day. Data for the following viewing options are avail-able according to this schedule:
• Yesterday, Week to Yesterday, and Month to Yesterday - avail-able by the next day
• Last Week - available by the next Sunday• Last Month - available by the first of next month.
If a new user group with new users was added, by the next day only the “Yesterday” viewing option will contain data available for viewing. All other viewing options will not be available until the full length of time indicated by the viewing option has transpired.
M86 SECURITY USER GUIDE
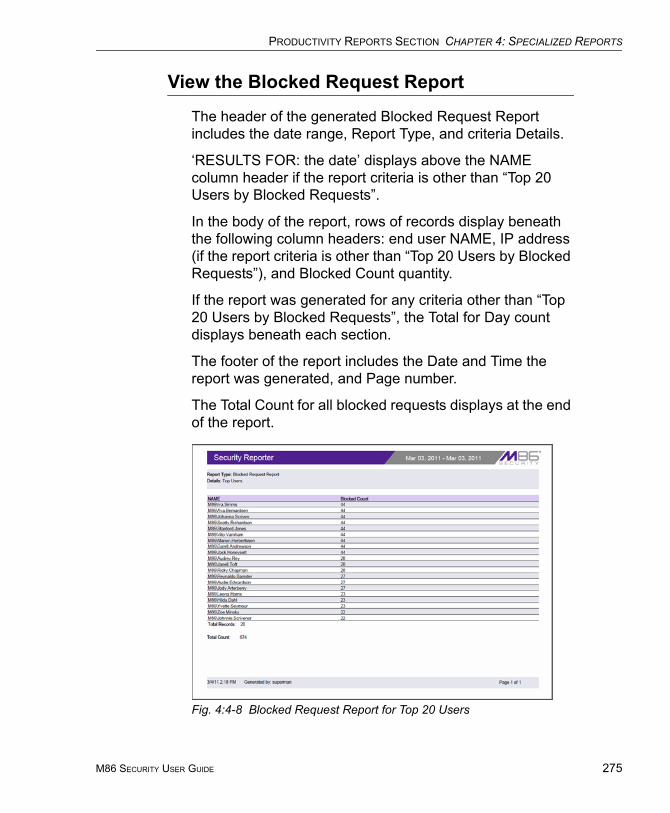
PRODUCTIVITY REPORTS SECTION CHAPTER 4: SPECIALIZED REPORTS
View the Blocked Request Report
The header of the generated Blocked Request Report includes the date range, Report Type, and criteria Details.
‘RESULTS FOR: the date’ displays above the NAME column header if the report criteria is other than “Top 20 Users by Blocked Requests”.
In the body of the report, rows of records display beneath the following column headers: end user NAME, IP address (if the report criteria is other than “Top 20 Users by Blocked Requests”), and Blocked Count quantity.
If the report was generated for any criteria other than “Top 20 Users by Blocked Requests”, the Total for Day count displays beneath each section.
The footer of the report includes the Date and Time the report was generated, and Page number.
The Total Count for all blocked requests displays at the end of the report.
Fig. 4:4-8 Blocked Request Report for Top 20 Users
M86 SECURITY USER GUIDE 275
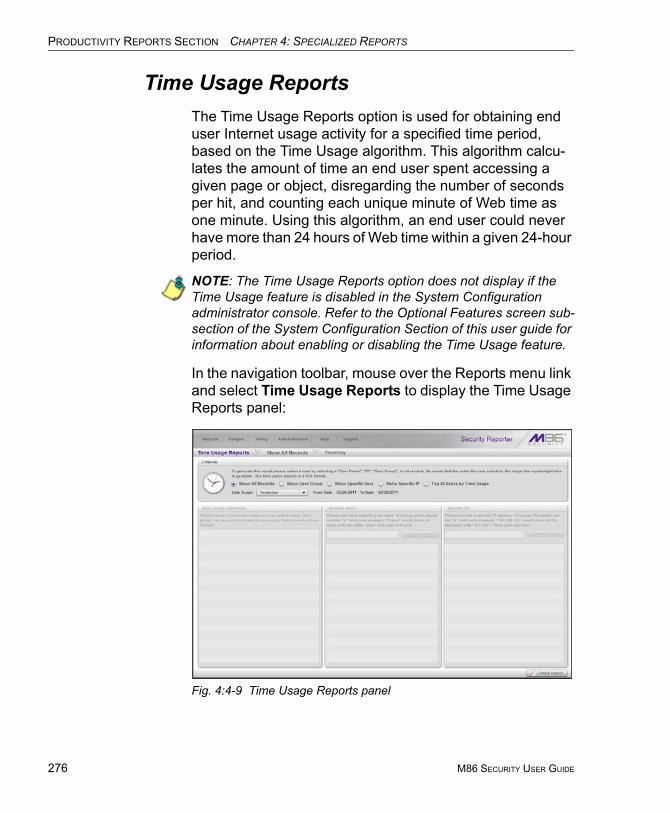
PRODUCTIVITY REPORTS SECTION CHAPTER 4: SPECIALIZED REPORTS
276
Time Usage ReportsThe Time Usage Reports option is used for obtaining end user Internet usage activity for a specified time period, based on the Time Usage algorithm. This algorithm calcu-lates the amount of time an end user spent accessing a given page or object, disregarding the number of seconds per hit, and counting each unique minute of Web time as one minute. Using this algorithm, an end user could never have more than 24 hours of Web time within a given 24-hour period.
NOTE: The Time Usage Reports option does not display if the Time Usage feature is disabled in the System Configuration administrator console. Refer to the Optional Features screen sub-section of the System Configuration Section of this user guide for information about enabling or disabling the Time Usage feature.
In the navigation toolbar, mouse over the Reports menu link and select Time Usage Reports to display the Time Usage Reports panel:
Fig. 4:4-9 Time Usage Reports panel
M86 SECURITY USER GUIDE
PRODUCTIVITY REPORTS SECTION CHAPTER 4: SPECIALIZED REPORTS
Generate a Time Usage Report
To generate a Time Usage report:
1. In the Criteria frame, specify the type of report to be generated by clicking the radio button corresponding to that option, and—if necessary—making entries/selec-tions in pertinent fields:
• Show All Records - If choosing this option, the Date Scope field displays “Yesterday” and yesterday’s date.
• Show User Group - If choosing this option, select the user group from the User Group Selection list box below. The Date Scope field displays “Yesterday” and yesterday’s date.
• Show Specific User - If choosing this option, enter the username—or a portion of the username with the ‘%’ wildcard—in the Specific User frame, and then click Preview Users to display results in the list box below. Select the user, and then make a selection from the Date Scope field to display the date range for that time period: Yesterday, Last Week, Last Month, Week to Yesterday, Month to Yesterday.
• Show Specific IP - If choosing this option, enter the IP address—or a portion of the IP address with the ‘%’ wildcard—in the Specific IP frame, and then click Preview Users to display results in the list box below. Select the user IP address, and then make a selection from the Date Scope field to display the date range for that time period: Yesterday, Last Week, Last Month, Week to Yesterday, Month to Yesterday.
• Top 20 Users by Time Usage - If choosing this option, make a selection from the Date Scope field to display the date range for that time period: Yesterday, Last Week, Last Month, Week to Yesterday, Month to Yesterday.
M86 SECURITY USER GUIDE 277
PRODUCTIVITY REPORTS SECTION CHAPTER 4: SPECIALIZED REPORTS
278
2. Click Create Report to generate the report view in the PDF format.
As with other reports exported in the PDF format, this report can be saved and/or printed.
NOTES: If there is no data available—or if data is available for only a partial number of days within the date scope range—a message displays indicating that no records are available.
If a new user group with existing usernames or IP addresses was added, data for that user group will not be available for viewing on the current day. Data for the following viewing options are avail-able according to this schedule:
• Yesterday, Week to Yesterday, and Month to Yesterday - avail-able by the next day
• Last Week - available by the next Sunday• Last Month - available by the first of next month.If a new user group with new users was added, by the next day only the “Yesterday” viewing option will contain data available for viewing. All other viewing options will not be available until the full length of time indicated by the viewing option has transpired.
M86 SECURITY USER GUIDE
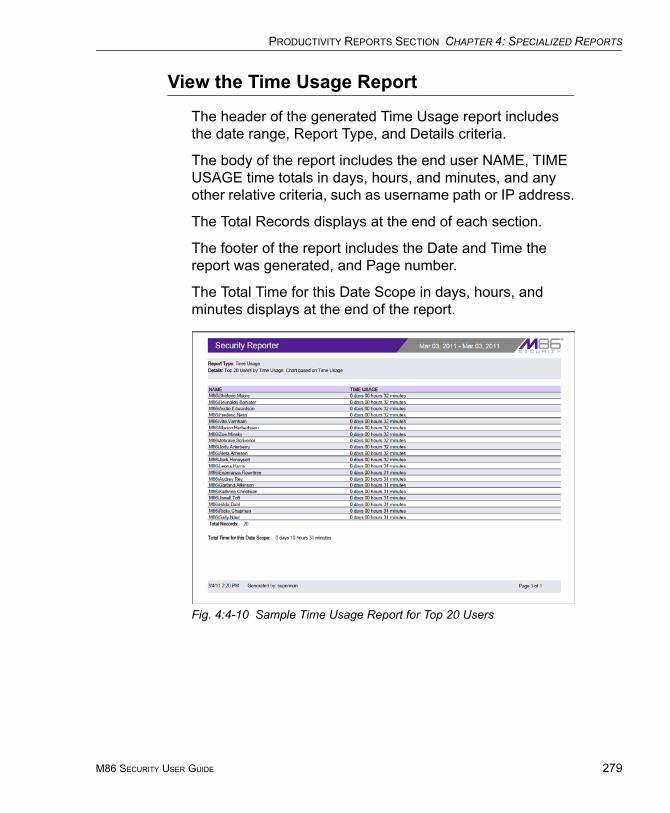
PRODUCTIVITY REPORTS SECTION CHAPTER 4: SPECIALIZED REPORTS
View the Time Usage Report
The header of the generated Time Usage report includes the date range, Report Type, and Details criteria.
The body of the report includes the end user NAME, TIME USAGE time totals in days, hours, and minutes, and any other relative criteria, such as username path or IP address.
The Total Records displays at the end of each section.
The footer of the report includes the Date and Time the report was generated, and Page number.
The Total Time for this Date Scope in days, hours, and minutes displays at the end of the report.
Fig. 4:4-10 Sample Time Usage Report for Top 20 Users
M86 SECURITY USER GUIDE 279
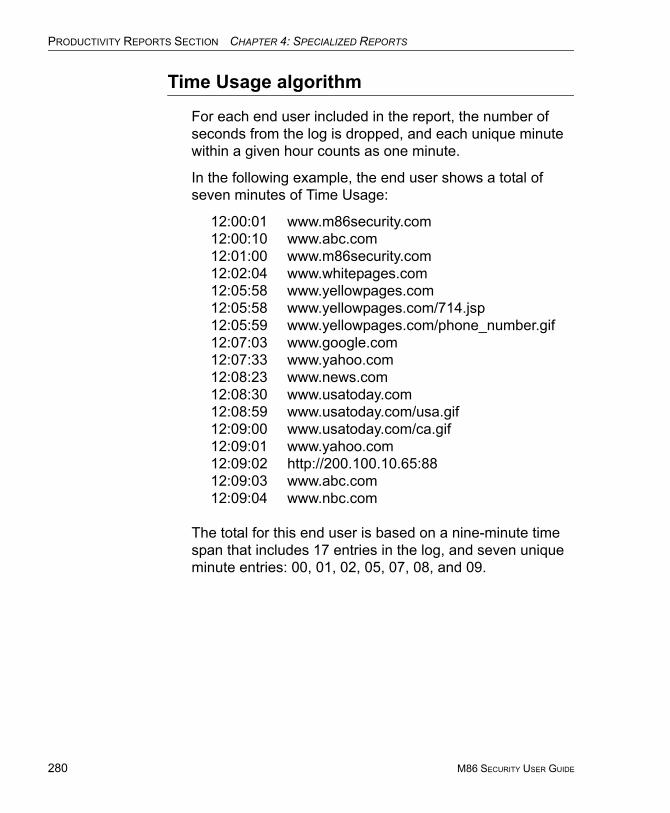
PRODUCTIVITY REPORTS SECTION CHAPTER 4: SPECIALIZED REPORTS
280
Time Usage algorithm
For each end user included in the report, the number of seconds from the log is dropped, and each unique minute within a given hour counts as one minute.
In the following example, the end user shows a total of seven minutes of Time Usage:
12:00:01 www.m86security.com12:00:10 www.abc.com12:01:00 www.m86security.com12:02:04 www.whitepages.com12:05:58 www.yellowpages.com12:05:58 www.yellowpages.com/714.jsp12:05:59 www.yellowpages.com/phone_number.gif12:07:03 www.google.com12:07:33 www.yahoo.com12:08:23 www.news.com12:08:30 www.usatoday.com12:08:59 www.usatoday.com/usa.gif12:09:00 www.usatoday.com/ca.gif12:09:01 www.yahoo.com12:09:02 http://200.100.10.65:8812:09:03 www.abc.com12:09:04 www.nbc.com
The total for this end user is based on a nine-minute time span that includes 17 entries in the log, and seven unique minute entries: 00, 01, 02, 05, 07, 08, and 09.
M86 SECURITY USER GUIDE
REAL TIME REPORTS SECTION INTRODUCTION
REAL TIME REPORTS SECTION
IntroductionThis section of the user guide provides instructions to administrators on how to utilize data from Web Filter logs for monitoring end user Internet and network activity in real time.
• Chapter 1: Gauge Components - This chapter describes the types of gauges, the components of a gauge, how to read a gauge, and how to perform shortcuts using gauges.
• Chapter 2: Custom Gauge Setup, Usage - This chapter explains how gauges are configured and monitored.
• Chapter 3: Alerts, Lockout Management - This chapter explains how alerts are set up and used, and how to manage end user lockouts.
• Chapter 4: Analyze Usage Trends - This chapter explains how trend charts are used for assessing end user Internet/network activity.
• Chapter 5: Identify Users, Categories - This chapter explains how to perform a custom search on Internet/network usage by a specified user, or for a specified category or category group.
M86 SECURITY USER GUIDE 281
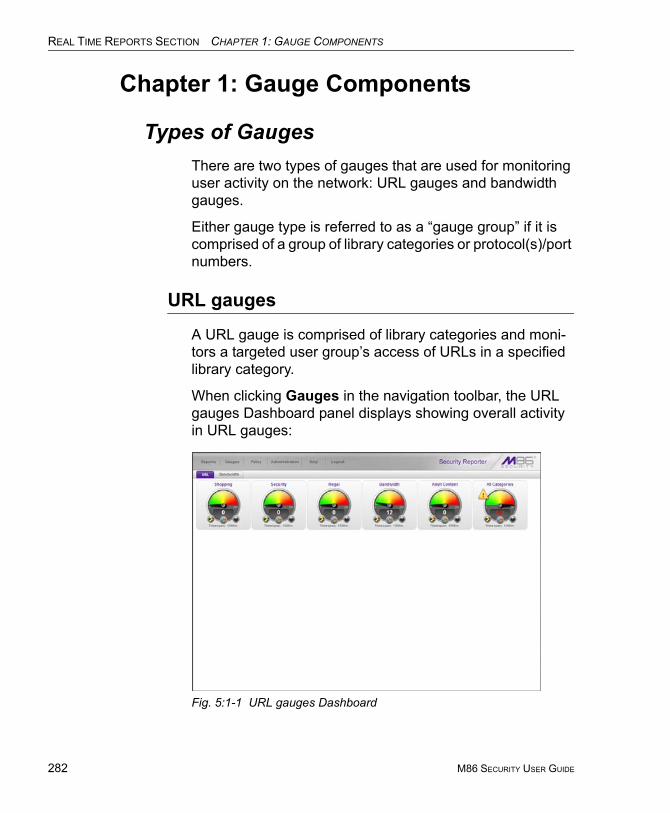
REAL TIME REPORTS SECTION CHAPTER 1: GAUGE COMPONENTS
282
Chapter 1: Gauge Components
Types of GaugesThere are two types of gauges that are used for monitoring user activity on the network: URL gauges and bandwidth gauges.
Either gauge type is referred to as a “gauge group” if it is comprised of a group of library categories or protocol(s)/port numbers.
URL gauges
A URL gauge is comprised of library categories and moni-tors a targeted user group’s access of URLs in a specified library category.
When clicking Gauges in the navigation toolbar, the URL gauges Dashboard panel displays showing overall activity in URL gauges:
Fig. 5:1-1 URL gauges Dashboard
M86 SECURITY USER GUIDE
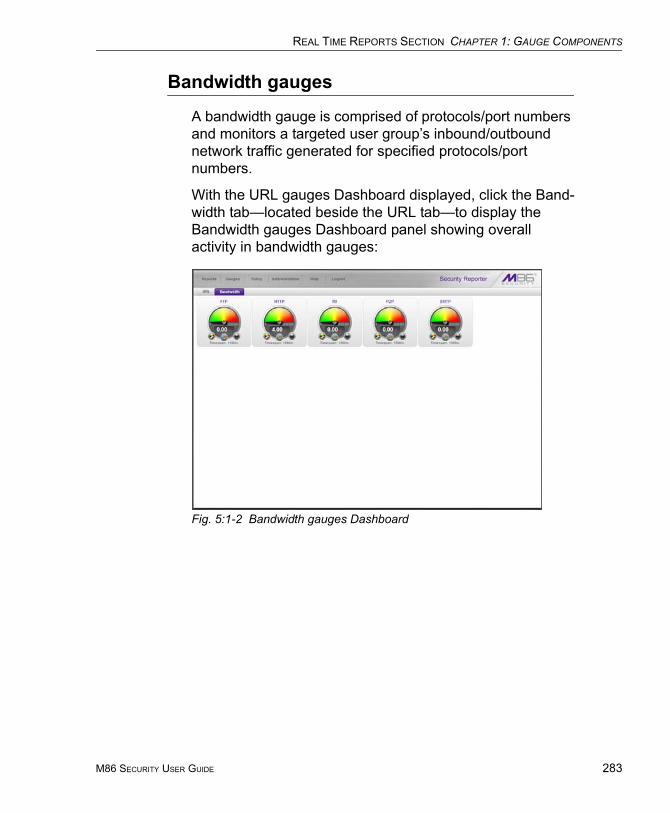
REAL TIME REPORTS SECTION CHAPTER 1: GAUGE COMPONENTS
Bandwidth gauges
A bandwidth gauge is comprised of protocols/port numbers and monitors a targeted user group’s inbound/outbound network traffic generated for specified protocols/port numbers.
With the URL gauges Dashboard displayed, click the Band-width tab—located beside the URL tab—to display the Bandwidth gauges Dashboard panel showing overall activity in bandwidth gauges:
Fig. 5:1-2 Bandwidth gauges Dashboard
M86 SECURITY USER GUIDE 283
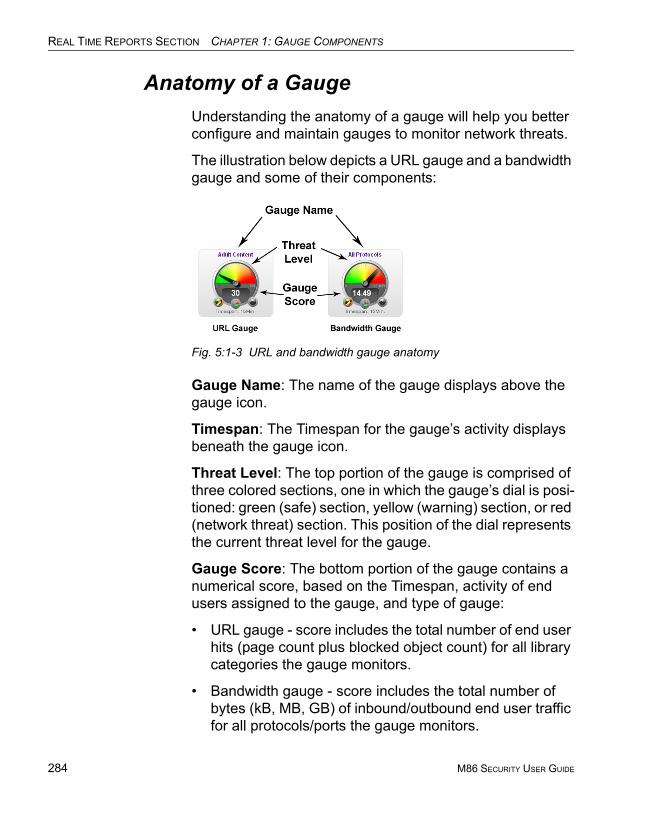
REAL TIME REPORTS SECTION CHAPTER 1: GAUGE COMPONENTS
284
Anatomy of a GaugeUnderstanding the anatomy of a gauge will help you better configure and maintain gauges to monitor network threats.
The illustration below depicts a URL gauge and a bandwidth gauge and some of their components:
Fig. 5:1-3 URL and bandwidth gauge anatomy
Gauge Name: The name of the gauge displays above the gauge icon.
Timespan: The Timespan for the gauge’s activity displays beneath the gauge icon.
Threat Level: The top portion of the gauge is comprised of three colored sections, one in which the gauge’s dial is posi-tioned: green (safe) section, yellow (warning) section, or red (network threat) section. This position of the dial represents the current threat level for the gauge.
Gauge Score: The bottom portion of the gauge contains a numerical score, based on the Timespan, activity of end users assigned to the gauge, and type of gauge:
• URL gauge - score includes the total number of end user hits (page count plus blocked object count) for all library categories the gauge monitors.
• Bandwidth gauge - score includes the total number of bytes (kB, MB, GB) of inbound/outbound end user traffic for all protocols/ports the gauge monitors.
M86 SECURITY USER GUIDE
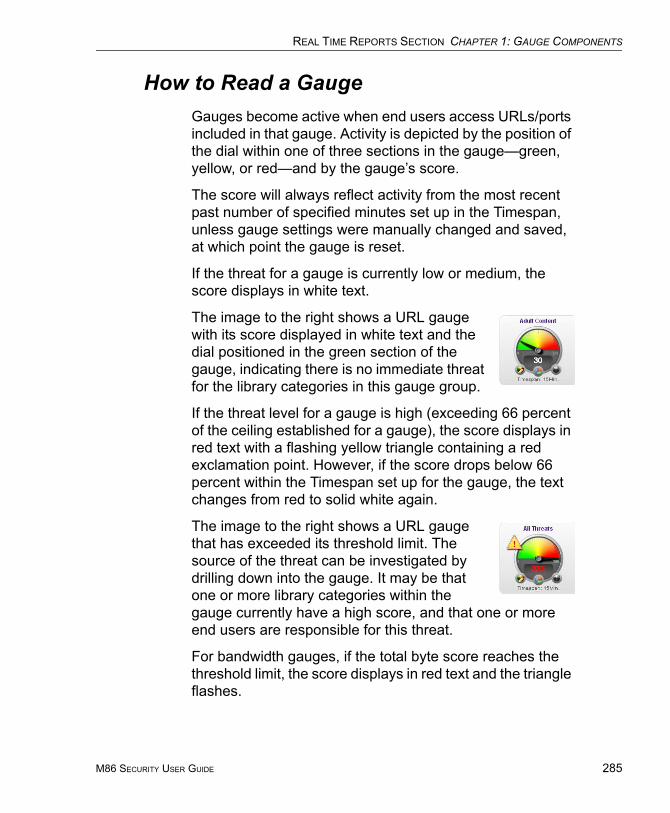
REAL TIME REPORTS SECTION CHAPTER 1: GAUGE COMPONENTS
How to Read a GaugeGauges become active when end users access URLs/ports included in that gauge. Activity is depicted by the position of the dial within one of three sections in the gauge—green, yellow, or red—and by the gauge’s score.
The score will always reflect activity from the most recent past number of specified minutes set up in the Timespan, unless gauge settings were manually changed and saved, at which point the gauge is reset.
If the threat for a gauge is currently low or medium, the score displays in white text.
The image to the right shows a URL gauge with its score displayed in white text and the dial positioned in the green section of the gauge, indicating there is no immediate threat for the library categories in this gauge group.
If the threat level for a gauge is high (exceeding 66 percent of the ceiling established for a gauge), the score displays in red text with a flashing yellow triangle containing a red exclamation point. However, if the score drops below 66 percent within the Timespan set up for the gauge, the text changes from red to solid white again.
The image to the right shows a URL gauge that has exceeded its threshold limit. The source of the threat can be investigated by drilling down into the gauge. It may be that one or more library categories within the gauge currently have a high score, and that one or more end users are responsible for this threat.
For bandwidth gauges, if the total byte score reaches the threshold limit, the score displays in red text and the triangle flashes.
M86 SECURITY USER GUIDE 285
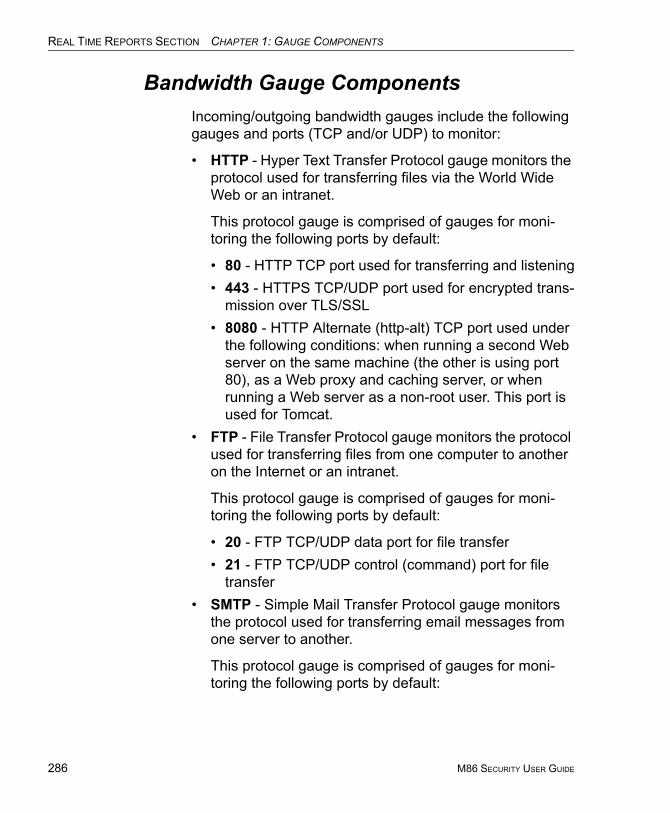
REAL TIME REPORTS SECTION CHAPTER 1: GAUGE COMPONENTS
286
Bandwidth Gauge ComponentsIncoming/outgoing bandwidth gauges include the following gauges and ports (TCP and/or UDP) to monitor:
• HTTP - Hyper Text Transfer Protocol gauge monitors the protocol used for transferring files via the World Wide Web or an intranet.
This protocol gauge is comprised of gauges for moni-toring the following ports by default:
• 80 - HTTP TCP port used for transferring and listening• 443 - HTTPS TCP/UDP port used for encrypted trans-
mission over TLS/SSL• 8080 - HTTP Alternate (http-alt) TCP port used under
the following conditions: when running a second Web server on the same machine (the other is using port 80), as a Web proxy and caching server, or when running a Web server as a non-root user. This port is used for Tomcat.
• FTP - File Transfer Protocol gauge monitors the protocol used for transferring files from one computer to another on the Internet or an intranet.
This protocol gauge is comprised of gauges for moni-toring the following ports by default:
• 20 - FTP TCP/UDP data port for file transfer• 21 - FTP TCP/UDP control (command) port for file
transfer• SMTP - Simple Mail Transfer Protocol gauge monitors
the protocol used for transferring email messages from one server to another.
This protocol gauge is comprised of gauges for moni-toring the following ports by default:
M86 SECURITY USER GUIDE

REAL TIME REPORTS SECTION CHAPTER 1: GAUGE COMPONENTS
• 25 - SMTP TCP/UDP port used for email routing between mail server email messages
• 110 - POP3 (Post Office Protocol version 3) TCP port used for sending/retrieving email messages
• P2P - Peer-to-Peer gauge monitors the protocol used for communication between computing devices—desktops, servers, and other smart devices—that are linked directly to each other.
This protocol gauge is comprised of gauges for moni-toring the following ports by default:
• 1214 - TCP/UDP port for Kazaa, Morpheous, Grokster, etc.
• 4662 - TCP/UDP port for eMule, eDonkey, etc.• 4665 - TCP/UDP port for eDonkey 2000• 6346 - TCP/UDP port for Gnutella file sharing (Frost-
Wire, LimeWire, BearShare, etc.)• 6347 - TCP/UDP port for Gnutella• 6699 - UDP port for Napster• 6881 - TCP/UDP port for BitTorrent
• IM - Instant Messaging gauge monitors the protocol used for direct connections between workstations either locally or across the Internet.
This protocol gauge is comprised of gauges for moni-toring the following ports by default:
• 1863 - TCP/UDP port for MSN Messenger• 5050 - TCP/UDP port for Yahoo! Messenger• 5190 - TCP/UDP port for ICQ and AOL Instant
Messenger (AIM)• 5222 - TCP/UDP port for Google Talk, XMPP/Jabber
client connection
M86 SECURITY USER GUIDE 287
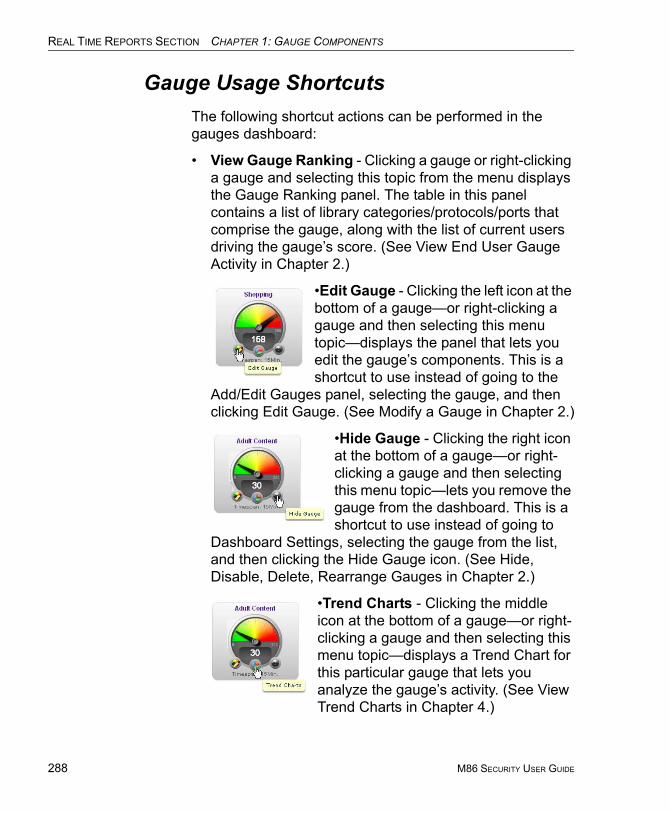
REAL TIME REPORTS SECTION CHAPTER 1: GAUGE COMPONENTS
288
Gauge Usage ShortcutsThe following shortcut actions can be performed in the gauges dashboard:
• View Gauge Ranking - Clicking a gauge or right-clicking a gauge and selecting this topic from the menu displays the Gauge Ranking panel. The table in this panel contains a list of library categories/protocols/ports that comprise the gauge, along with the list of current users driving the gauge’s score. (See View End User Gauge Activity in Chapter 2.)
•Edit Gauge - Clicking the left icon at the bottom of a gauge—or right-clicking a gauge and then selecting this menu topic—displays the panel that lets you edit the gauge’s components. This is a shortcut to use instead of going to the
Add/Edit Gauges panel, selecting the gauge, and then clicking Edit Gauge. (See Modify a Gauge in Chapter 2.)
•Hide Gauge - Clicking the right icon at the bottom of a gauge—or right-clicking a gauge and then selecting this menu topic—lets you remove the gauge from the dashboard. This is a shortcut to use instead of going to
Dashboard Settings, selecting the gauge from the list, and then clicking the Hide Gauge icon. (See Hide, Disable, Delete, Rearrange Gauges in Chapter 2.)
•Trend Charts - Clicking the middle icon at the bottom of a gauge—or right-clicking a gauge and then selecting this menu topic—displays a Trend Chart for this particular gauge that lets you analyze the gauge’s activity. (See View Trend Charts in Chapter 4.)
M86 SECURITY USER GUIDE
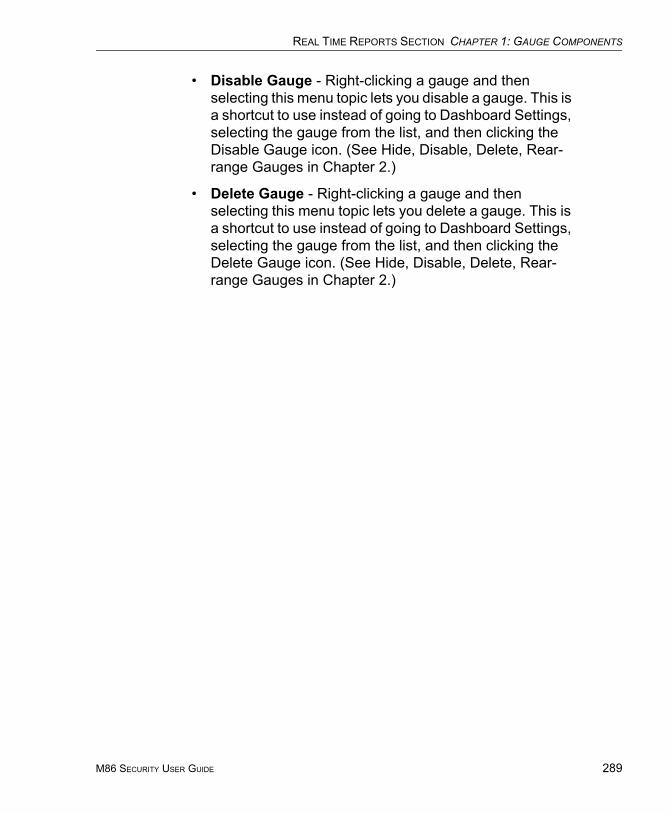
REAL TIME REPORTS SECTION CHAPTER 1: GAUGE COMPONENTS
• Disable Gauge - Right-clicking a gauge and then selecting this menu topic lets you disable a gauge. This is a shortcut to use instead of going to Dashboard Settings, selecting the gauge from the list, and then clicking the Disable Gauge icon. (See Hide, Disable, Delete, Rear-range Gauges in Chapter 2.)
• Delete Gauge - Right-clicking a gauge and then selecting this menu topic lets you delete a gauge. This is a shortcut to use instead of going to Dashboard Settings, selecting the gauge from the list, and then clicking the Delete Gauge icon. (See Hide, Disable, Delete, Rear-range Gauges in Chapter 2.)
M86 SECURITY USER GUIDE 289
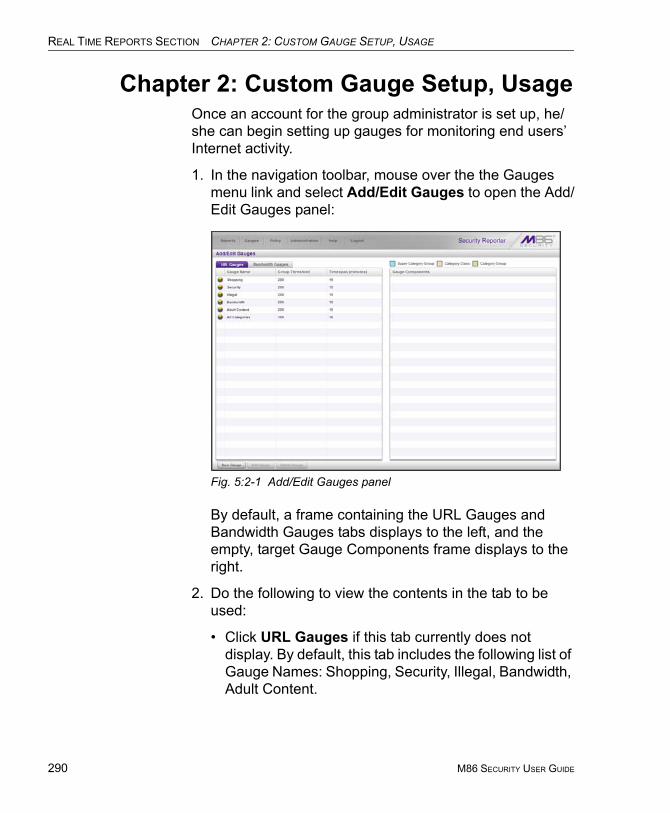
REAL TIME REPORTS SECTION CHAPTER 2: CUSTOM GAUGE SETUP, USAGE
290
Chapter 2: Custom Gauge Setup, UsageOnce an account for the group administrator is set up, he/she can begin setting up gauges for monitoring end users’ Internet activity.
1. In the navigation toolbar, mouse over the the Gauges menu link and select Add/Edit Gauges to open the Add/Edit Gauges panel:
Fig. 5:2-1 Add/Edit Gauges panel
By default, a frame containing the URL Gauges and Bandwidth Gauges tabs displays to the left, and the empty, target Gauge Components frame displays to the right.
2. Do the following to view the contents in the tab to be used:
• Click URL Gauges if this tab currently does not display. By default, this tab includes the following list of Gauge Names: Shopping, Security, Illegal, Bandwidth, Adult Content.
M86 SECURITY USER GUIDE
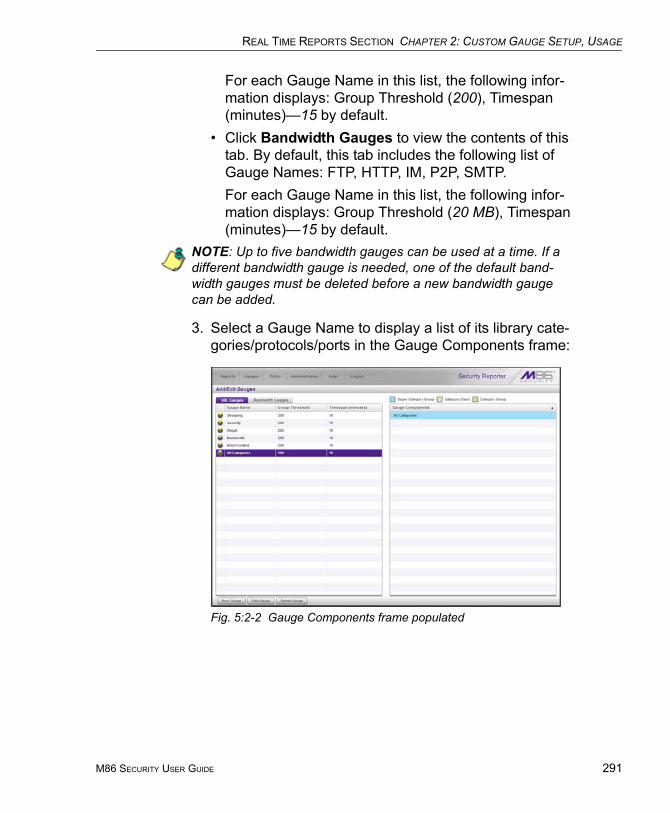
REAL TIME REPORTS SECTION CHAPTER 2: CUSTOM GAUGE SETUP, USAGE
For each Gauge Name in this list, the following infor-mation displays: Group Threshold (200), Timespan (minutes)—15 by default.
• Click Bandwidth Gauges to view the contents of this tab. By default, this tab includes the following list of Gauge Names: FTP, HTTP, IM, P2P, SMTP.For each Gauge Name in this list, the following infor-mation displays: Group Threshold (20 MB), Timespan (minutes)—15 by default.
NOTE: Up to five bandwidth gauges can be used at a time. If a different bandwidth gauge is needed, one of the default band-width gauges must be deleted before a new bandwidth gauge can be added.
3. Select a Gauge Name to display a list of its library cate-gories/protocols/ports in the Gauge Components frame:
Fig. 5:2-2 Gauge Components frame populated
M86 SECURITY USER GUIDE 291
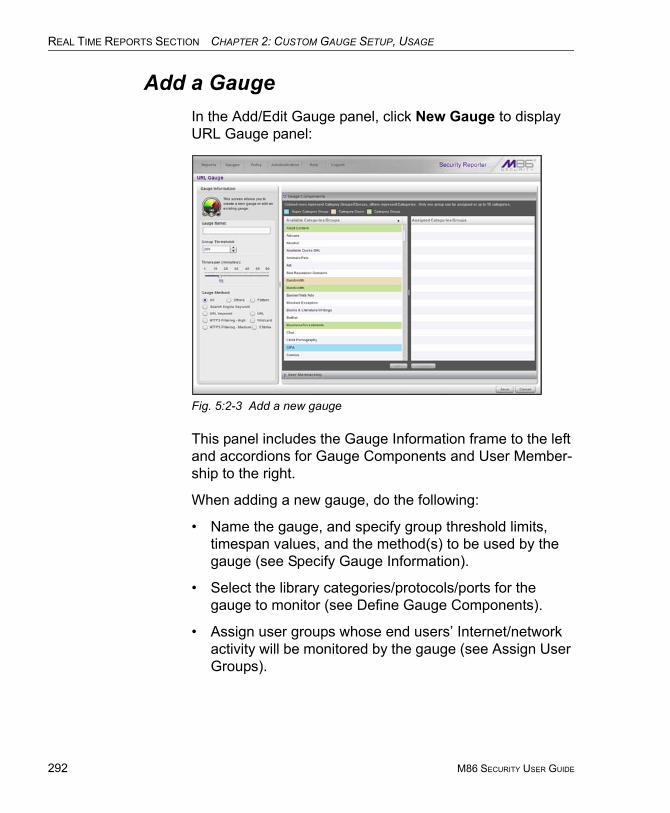
REAL TIME REPORTS SECTION CHAPTER 2: CUSTOM GAUGE SETUP, USAGE
292
Add a GaugeIn the Add/Edit Gauge panel, click New Gauge to display URL Gauge panel:
Fig. 5:2-3 Add a new gauge
This panel includes the Gauge Information frame to the left and accordions for Gauge Components and User Member-ship to the right.
When adding a new gauge, do the following:
• Name the gauge, and specify group threshold limits, timespan values, and the method(s) to be used by the gauge (see Specify Gauge Information).
• Select the library categories/protocols/ports for the gauge to monitor (see Define Gauge Components).
• Assign user groups whose end users’ Internet/network activity will be monitored by the gauge (see Assign User Groups).
M86 SECURITY USER GUIDE
REAL TIME REPORTS SECTION CHAPTER 2: CUSTOM GAUGE SETUP, USAGE
Specify Gauge Information
In the Gauge Information frame:
1. Type in at least two characters for the Gauge Name using upper and/or lowercase alphanumeric characters, and spaces, if desired.
2. Specify the Group Threshold ceiling of gauge activity. The default and recommended value is 200 for a URL gauge and 20 MB for a bandwidth gauge. This ceiling can be adjusted after using SR for awhile and evaluating activity levels at your organization.
To modify information in this field, type a specific value in the pre-populated field, and/or use the up/down arrow buttons to increment/decrement the current byte value by one. Make a selection from the pull-down menu if you need to change the byte unit (kB, MB, GB).
3. Use the slider tool to specify the Timespan (minutes) for tracking gauge activity (1 - 60 minutes). The default and recommended value is 15 minutes. The timespan will always keep pace with the current time period, so that if a timespan of 15 minutes is specified, the gauge will always reflect the most recent end user activity from the past 15 minutes.
4. If necessary, specify a different Gauge Method to be used for tracking gauge activity:
• For a URL gauge - All (default), Others (all gauge methods, not including Keywords or URLs), Pattern, Search Engine Keyword, URL Keyword, URL, HTTPS Filtering - High, HTTPS Filtering - Medium, Wildcard, XStrike.
• For a bandwidth gauge - Inbound, Outbound, Both (default).
M86 SECURITY USER GUIDE 293

REAL TIME REPORTS SECTION CHAPTER 2: CUSTOM GAUGE SETUP, USAGE
294
NOTE: If the selected gauge method is “Search Engine Keyword” or “URL Keyword”, Filter Options for end user profiles on the source Web Filter used with this SR must have "Search Engine Keyword Filter Control" or "URL Keyword Filter Control" enabled.
Define Gauge Components
Next, specify which library categories/protocols/ports the gauge will use for monitoring end user activity.
NOTE: At least one library category/protocol/port must be selected when creating a gauge. The maximum number of library categories/ports that can be selected/added is 15.
1. From the Available Categories/Groups list in the Gauge Components accordion, select an available Category Group/Class or library categories/ports the end user should not access.
For bandwidth gauges, to modify criteria in the Port Number field, type a specific value in the pre-populated field, and/or use the up/down arrow buttons to increment/decrement the current value by one.
NOTES: For the global administrator, Available Categories/Groups include All Categories and CIPA selections for URL gauges, and All Protocols and Common Protocols selections for bandwidth gauges, if these selections are not currently in use by another gauge. Common Protocols include: FTP, HTTP, IM, P2P, and SMTP.
Even though a group administrator does not have the Common Protocols bandwidth selection available when creating a gauge, this Super Category Group is available to him/her via the User Summary Panel. Thus, he/she will have the ability to lock out all users (assigned to him/her) who are currently using FTP, HTTP, IM, P2P and SMTP protocols. (See Monitor, Restrict End User Activity.)
M86 SECURITY USER GUIDE
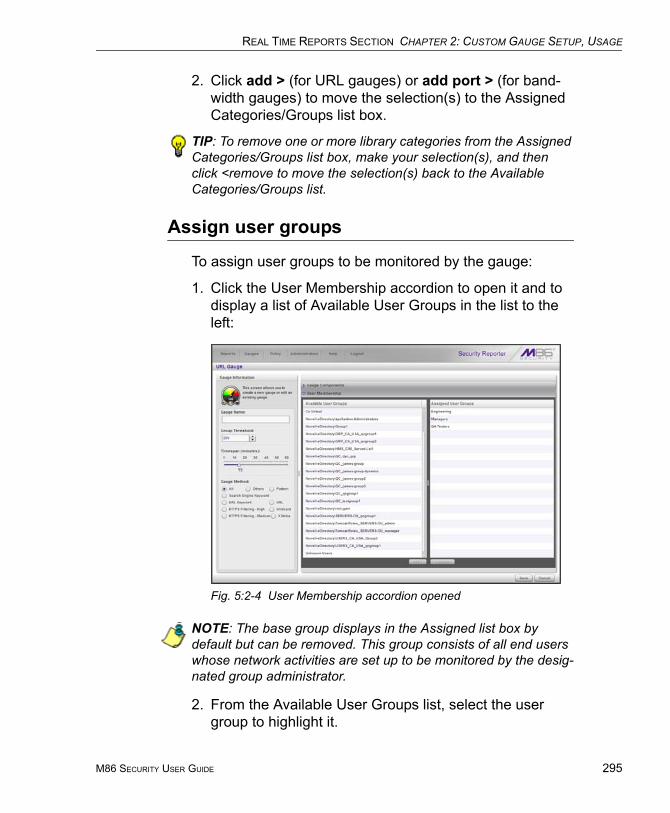
REAL TIME REPORTS SECTION CHAPTER 2: CUSTOM GAUGE SETUP, USAGE
2. Click add > (for URL gauges) or add port > (for band-width gauges) to move the selection(s) to the Assigned Categories/Groups list box.
TIP: To remove one or more library categories from the Assigned Categories/Groups list box, make your selection(s), and then click <remove to move the selection(s) back to the Available Categories/Groups list.
Assign user groups
To assign user groups to be monitored by the gauge:
1. Click the User Membership accordion to open it and to display a list of Available User Groups in the list to the left:
Fig. 5:2-4 User Membership accordion opened
NOTE: The base group displays in the Assigned list box by default but can be removed. This group consists of all end users whose network activities are set up to be monitored by the desig-nated group administrator.
2. From the Available User Groups list, select the user group to highlight it.
M86 SECURITY USER GUIDE 295
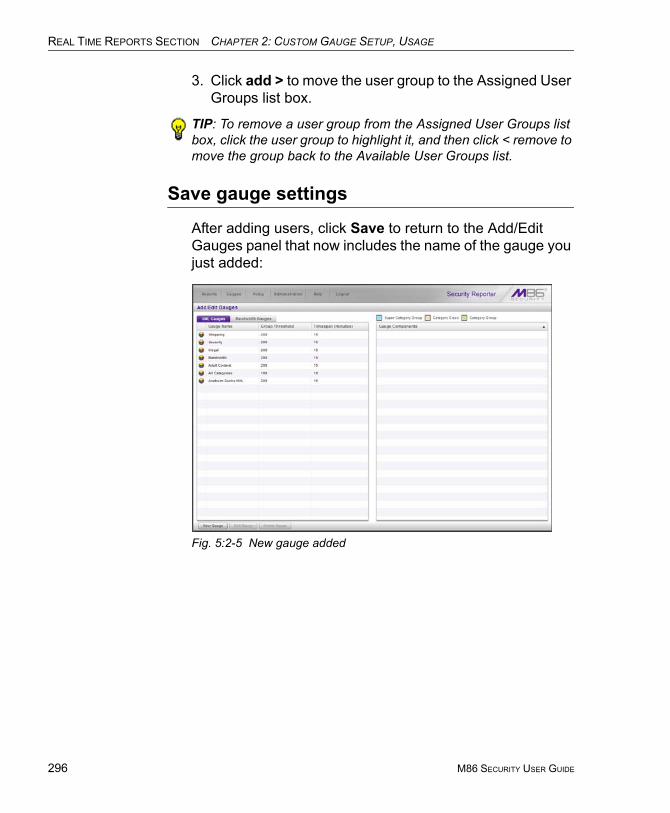
REAL TIME REPORTS SECTION CHAPTER 2: CUSTOM GAUGE SETUP, USAGE
296
3. Click add > to move the user group to the Assigned User Groups list box.
TIP: To remove a user group from the Assigned User Groups list box, click the user group to highlight it, and then click < remove to move the group back to the Available User Groups list.
Save gauge settings
After adding users, click Save to return to the Add/Edit Gauges panel that now includes the name of the gauge you just added:
Fig. 5:2-5 New gauge added
M86 SECURITY USER GUIDE
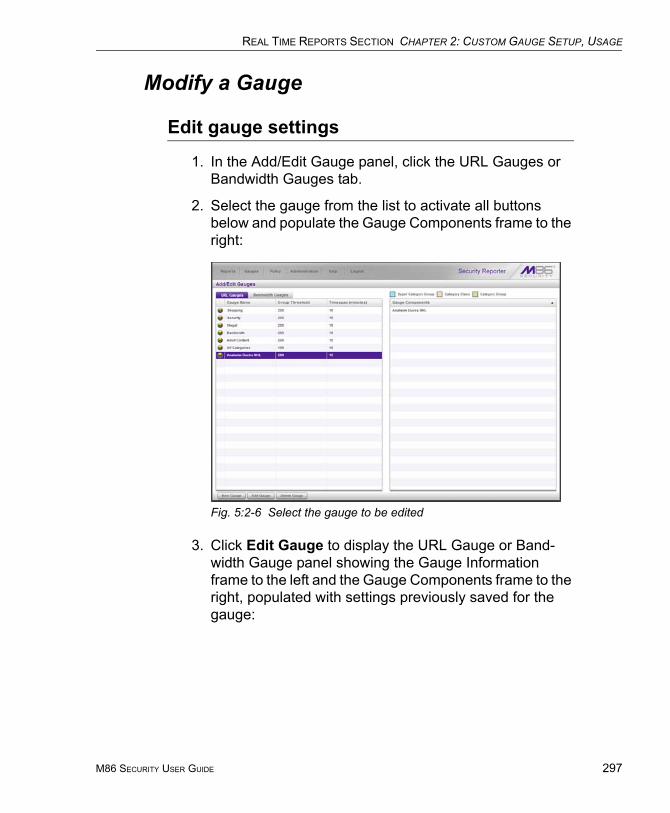
REAL TIME REPORTS SECTION CHAPTER 2: CUSTOM GAUGE SETUP, USAGE
Modify a Gauge
Edit gauge settings
1. In the Add/Edit Gauge panel, click the URL Gauges or Bandwidth Gauges tab.
2. Select the gauge from the list to activate all buttons below and populate the Gauge Components frame to the right:
Fig. 5:2-6 Select the gauge to be edited
3. Click Edit Gauge to display the URL Gauge or Band-width Gauge panel showing the Gauge Information frame to the left and the Gauge Components frame to the right, populated with settings previously saved for the gauge:
M86 SECURITY USER GUIDE 297

REAL TIME REPORTS SECTION CHAPTER 2: CUSTOM GAUGE SETUP, USAGE
298
Fig. 5:2-7 Edit gauge settings
TIP: This panel is also accessible from the gauges dashboard by clicking the Edit Gauge icon at the bottom left of the gauge.
4. Edit any of the following criteria, as necessary:
• Gauge Information - Gauge Name, Group Threshold, Timespan in minutes, Gauge Method (see Specify Gauge Information).
• Gauge Components (see Define Gauge Components).• User Membership (see Assign user groups).
5. Click Save to save your edits and return to the Add/Edit Gauges panel.
M86 SECURITY USER GUIDE
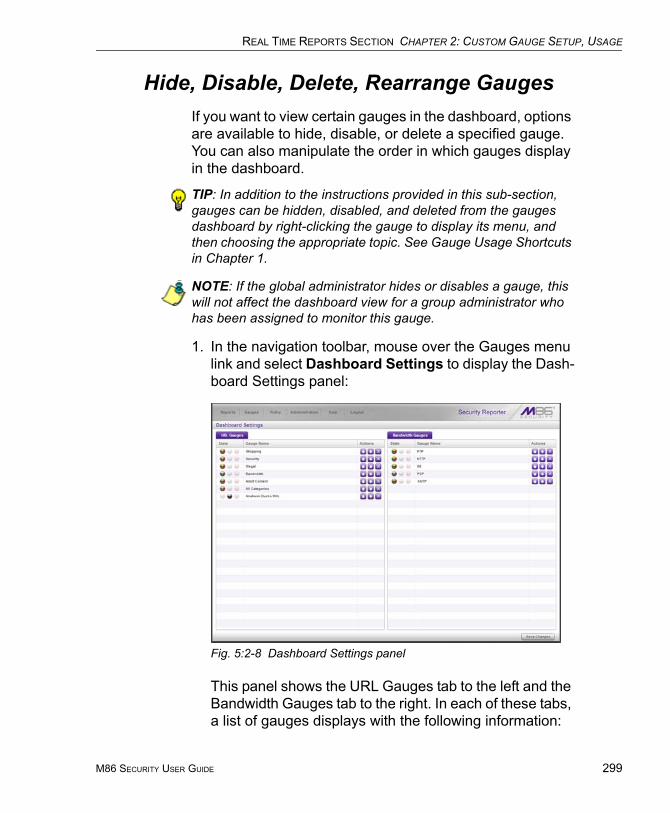
REAL TIME REPORTS SECTION CHAPTER 2: CUSTOM GAUGE SETUP, USAGE
Hide, Disable, Delete, Rearrange GaugesIf you want to view certain gauges in the dashboard, options are available to hide, disable, or delete a specified gauge. You can also manipulate the order in which gauges display in the dashboard.
TIP: In addition to the instructions provided in this sub-section, gauges can be hidden, disabled, and deleted from the gauges dashboard by right-clicking the gauge to display its menu, and then choosing the appropriate topic. See Gauge Usage Shortcuts in Chapter 1.
NOTE: If the global administrator hides or disables a gauge, this will not affect the dashboard view for a group administrator who has been assigned to monitor this gauge.
1. In the navigation toolbar, mouse over the Gauges menu link and select Dashboard Settings to display the Dash-board Settings panel:
Fig. 5:2-8 Dashboard Settings panel
This panel shows the URL Gauges tab to the left and the Bandwidth Gauges tab to the right. In each of these tabs, a list of gauges displays with the following information:
M86 SECURITY USER GUIDE 299
REAL TIME REPORTS SECTION CHAPTER 2: CUSTOM GAUGE SETUP, USAGE
300
• State - A gauge icon displays in one of three columns to indicate the current status of the gauge, with the other two columns greyed-out:
(visible) - This icon in the first column indicates the gauge displays in the dashboard.
(hidden) - This icon in the second column indicates the gauge does not display in the dashboard.
(disabled) - This icon in the third column indicates the gauge does not display in the dashboard. This gauge most likely has not been deleted because it will be used on a later occasion.
NOTE: Statistics for gauges that are hidden or disabled will not be included in trend reports.
• Gauge Name - The name given to the gauge.• Actions - Icons display for performing any one of the
following actions on the gauge as necessary: Move the gauge up or down in the current list in order to change the position in which that gauge displays the dash-board, or delete the gauge.
2. After making all necessary Dashboard Settings modifica-tions—hide, disable, show, rearrange, or delete a gauge—defined in the following sub-sections, click Save Changes to save your edits.
M86 SECURITY USER GUIDE

REAL TIME REPORTS SECTION CHAPTER 2: CUSTOM GAUGE SETUP, USAGE
Hide a gauge
To hide a gauge from displaying in the dashboard:
1. Select the gauge in the URL Gauges or Bandwidth Gauges tab.
2. In the State column, click the icon in the second column (Hide Gauge) to change the gauge’s status to “hidden.”
Disable a gauge
To disable a gauge:
1. Select the gauge in the URL Gauges or Bandwidth Gauges tab.
2. In the State column, click the icon in the third column (Disable Gauge) to change the gauge’s status to “disabled.”
Show a gauge
To re-display a gauge in the dashboard again:
1. Select the gauge in the URL Gauges or Bandwidth Gauges tab.
2. In the State column, click the icon in the first column (show Gauge) to change the gauge’s status to “show.”
Rearrange the gauge display in the dashboard
To rearrange the order in which gauges display in the dash-board:
1. Select the gauge in the URL Gauges or Bandwidth Gauges tab.
2. In the Actions column, perform any of the following actions:
M86 SECURITY USER GUIDE 301
REAL TIME REPORTS SECTION CHAPTER 2: CUSTOM GAUGE SETUP, USAGE
302
• Click the “up” arrow icon in the first column to move the Gauge Name up one row in this tab, and one position forward in the dashboard.
• Click the “down” arrow icon in the second column to move the Gauge Name down one row in this tab, and one position backward in the dashboard.
TIP: These actions can be performed multiple times in order to move the gauge to the desired position in the dashboard.
Delete a gauge
To delete a gauge:
1. Select the gauge in the URL Gauges or Bandwidth Gauges tab.
2. In the Actions column, click the “X” icon in the far right column to open the Confirm dialogue box with the message: “Deleting this gauge will remove all alerts that are associated with this gauge. Are you sure you want to delete this gauge?”
NOTE: Deleting a gauge also deletes any associated alerts set up for that gauge.
TIP: Clicking Cancel closes the dialog box without removing the gauge.
3. Click Yes to close the dialog box and to remove both the Gauge Name from the tab and the gauge from the dash-board.
M86 SECURITY USER GUIDE
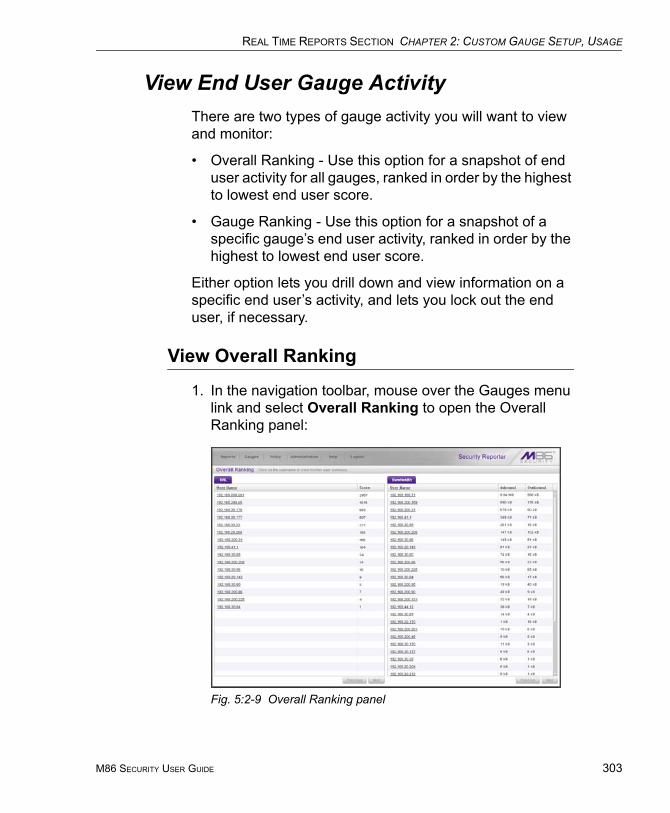
REAL TIME REPORTS SECTION CHAPTER 2: CUSTOM GAUGE SETUP, USAGE
View End User Gauge ActivityThere are two types of gauge activity you will want to view and monitor:
• Overall Ranking - Use this option for a snapshot of end user activity for all gauges, ranked in order by the highest to lowest end user score.
• Gauge Ranking - Use this option for a snapshot of a specific gauge’s end user activity, ranked in order by the highest to lowest end user score.
Either option lets you drill down and view information on a specific end user’s activity, and lets you lock out the end user, if necessary.
View Overall Ranking
1. In the navigation toolbar, mouse over the Gauges menu link and select Overall Ranking to open the Overall Ranking panel:
Fig. 5:2-9 Overall Ranking panel
M86 SECURITY USER GUIDE 303
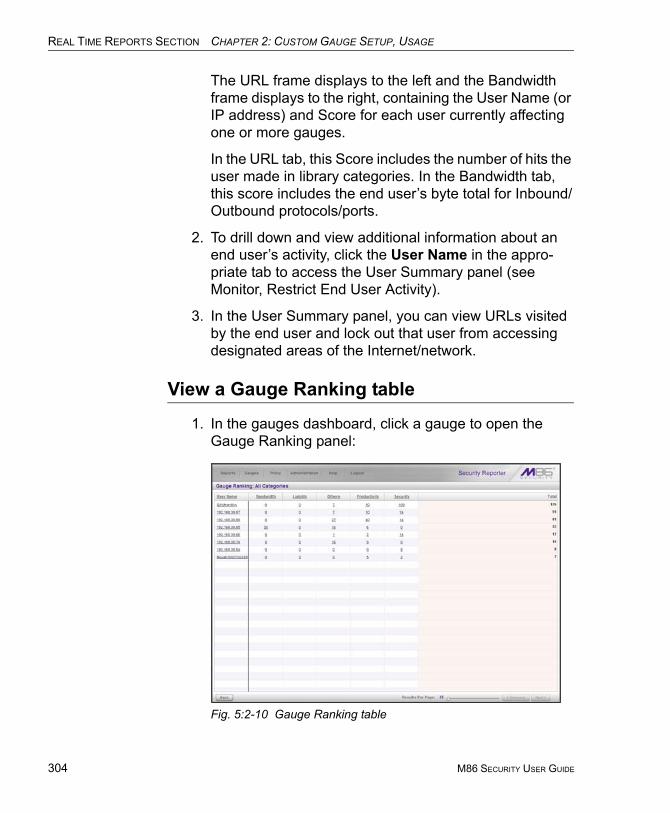
REAL TIME REPORTS SECTION CHAPTER 2: CUSTOM GAUGE SETUP, USAGE
304
The URL frame displays to the left and the Bandwidth frame displays to the right, containing the User Name (or IP address) and Score for each user currently affecting one or more gauges.
In the URL tab, this Score includes the number of hits the user made in library categories. In the Bandwidth tab, this score includes the end user’s byte total for Inbound/Outbound protocols/ports.
2. To drill down and view additional information about an end user’s activity, click the User Name in the appro-priate tab to access the User Summary panel (see Monitor, Restrict End User Activity).
3. In the User Summary panel, you can view URLs visited by the end user and lock out that user from accessing designated areas of the Internet/network.
View a Gauge Ranking table
1. In the gauges dashboard, click a gauge to open the Gauge Ranking panel:
Fig. 5:2-10 Gauge Ranking table
M86 SECURITY USER GUIDE
REAL TIME REPORTS SECTION CHAPTER 2: CUSTOM GAUGE SETUP, USAGE
NOTE: The Gauge Ranking panel is also accessible by right-clicking a dashboard gauge and then selecting View Gauge Ranking from the pop-up menu.
This panel includes rows of records for each end user who is affecting the gauge. For each record in the list, the following information displays: User Name (or IP address), gauge name and end user score, and the end user’s Total score for all gauges he/she affected. End users are ranked in descending order by their Total score.
2. Perform one of two drill-down actions from here:
• Access the User Summary panel by clicking the User Name (see Monitor, Restrict End User Activity: View User Summary data). In the User Summary panel, you can view URLs visited by the end user and lock out that user from accessing designated areas of the Internet/network.
• Access the Category View User panel by clicking a user’s score for a gauge (see Monitor, Restrict End User Activity: Access the Category View User panel). In the Category View User panel, you view current details for the gauge.
M86 SECURITY USER GUIDE 305
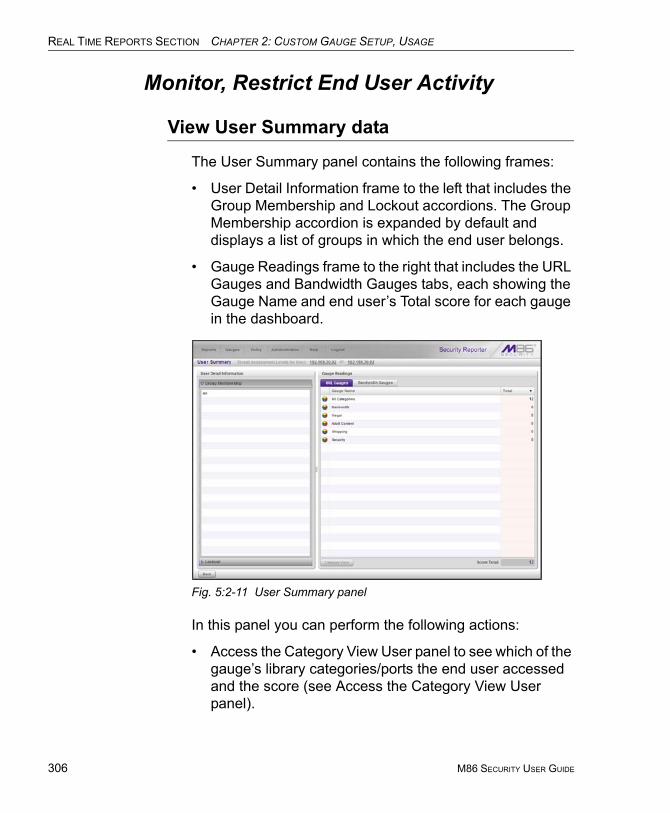
REAL TIME REPORTS SECTION CHAPTER 2: CUSTOM GAUGE SETUP, USAGE
306
Monitor, Restrict End User Activity
View User Summary data
The User Summary panel contains the following frames:
• User Detail Information frame to the left that includes the Group Membership and Lockout accordions. The Group Membership accordion is expanded by default and displays a list of groups in which the end user belongs.
• Gauge Readings frame to the right that includes the URL Gauges and Bandwidth Gauges tabs, each showing the Gauge Name and end user’s Total score for each gauge in the dashboard.
Fig. 5:2-11 User Summary panel
In this panel you can perform the following actions:
• Access the Category View User panel to see which of the gauge’s library categories/ports the end user accessed and the score (see Access the Category View User panel).
M86 SECURITY USER GUIDE
REAL TIME REPORTS SECTION CHAPTER 2: CUSTOM GAUGE SETUP, USAGE
• Access the Lockout option to lock out the end user from specified Internet/network privileges (see Manually lock out an end user).
Access the Category View User panel
1. In the User Summary panel, make sure the appropriate tab (URL Gauges or Bandwidth Gauges) is selected, then click a Gauge Name with a score to activate the Category View button.
2. Click Category View to display the Category View User panel which includes criteria that is based on the type of gauges to be viewed (URL or bandwidth).
URL Gauges tab selection
For URL gauges, the Category View User panel displays the Categories frame to the left, showing a list of current library categories that were accesssed and the Total score of each category for that end user. The target URLs frame displays to the right.
1. Select a category from the list, which populates the URLs frame with URLs accessed by that end user for that cate-gory:
M86 SECURITY USER GUIDE 307
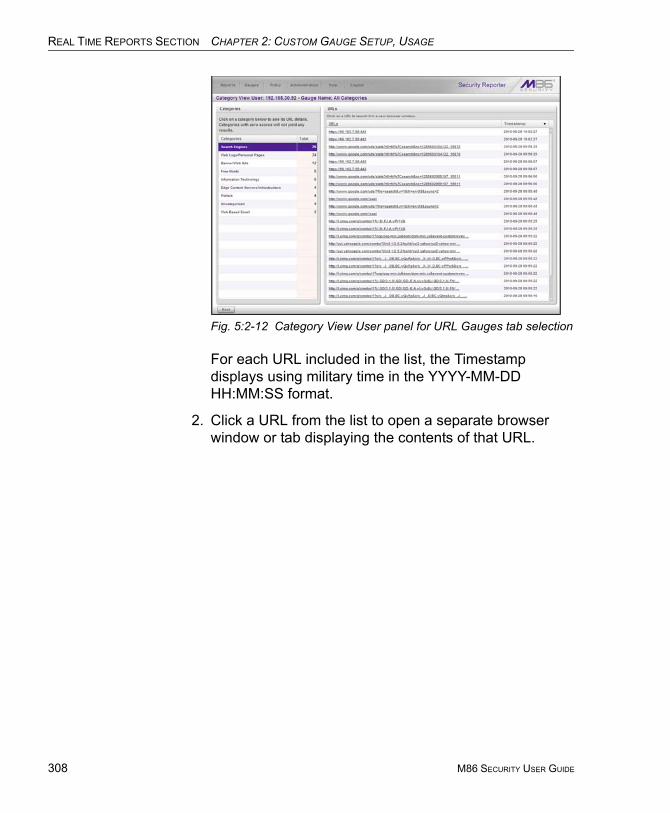
REAL TIME REPORTS SECTION CHAPTER 2: CUSTOM GAUGE SETUP, USAGE
308
Fig. 5:2-12 Category View User panel for URL Gauges tab selection
For each URL included in the list, the Timestamp displays using military time in the YYYY-MM-DD HH:MM:SS format.
2. Click a URL from the list to open a separate browser window or tab displaying the contents of that URL.
M86 SECURITY USER GUIDE
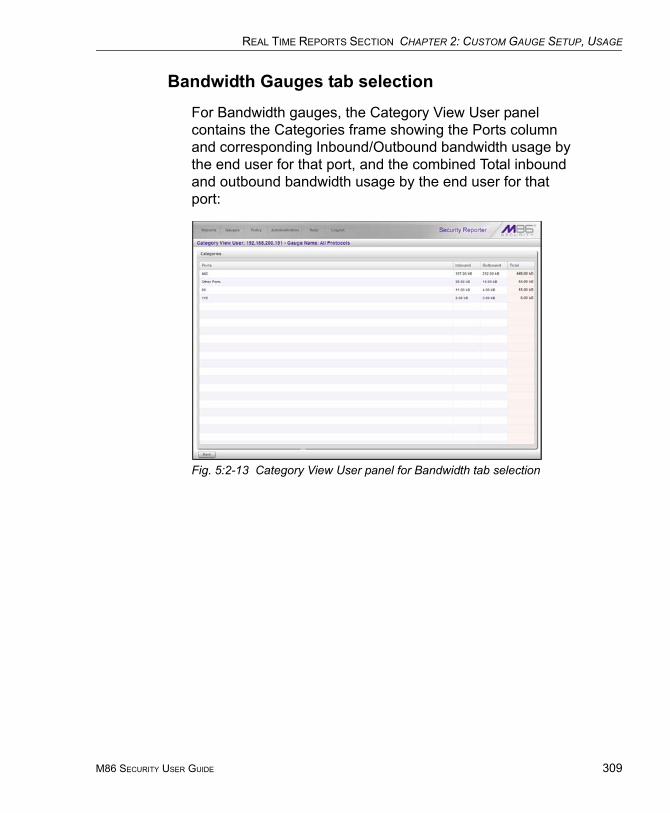
REAL TIME REPORTS SECTION CHAPTER 2: CUSTOM GAUGE SETUP, USAGE
Bandwidth Gauges tab selection
For Bandwidth gauges, the Category View User panel contains the Categories frame showing the Ports column and corresponding Inbound/Outbound bandwidth usage by the end user for that port, and the combined Total inbound and outbound bandwidth usage by the end user for that port:
Fig. 5:2-13 Category View User panel for Bandwidth tab selection
M86 SECURITY USER GUIDE 309
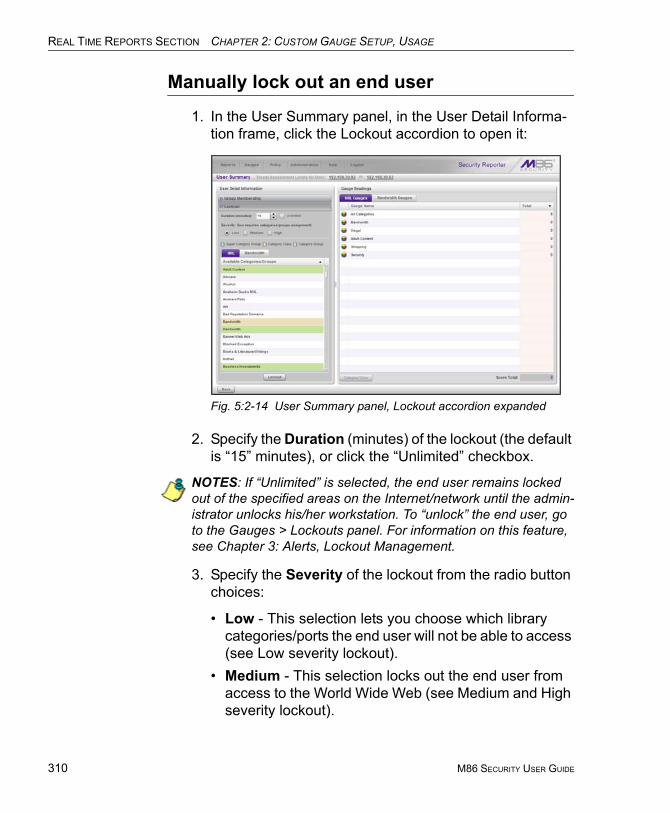
REAL TIME REPORTS SECTION CHAPTER 2: CUSTOM GAUGE SETUP, USAGE
310
Manually lock out an end user
1. In the User Summary panel, in the User Detail Informa-tion frame, click the Lockout accordion to open it:
Fig. 5:2-14 User Summary panel, Lockout accordion expanded
2. Specify the Duration (minutes) of the lockout (the default is “15” minutes), or click the “Unlimited” checkbox.
NOTES: If “Unlimited” is selected, the end user remains locked out of the specified areas on the Internet/network until the admin-istrator unlocks his/her workstation. To “unlock” the end user, go to the Gauges > Lockouts panel. For information on this feature, see Chapter 3: Alerts, Lockout Management.
3. Specify the Severity of the lockout from the radio button choices:
• Low - This selection lets you choose which library categories/ports the end user will not be able to access (see Low severity lockout).
• Medium - This selection locks out the end user from access to the World Wide Web (see Medium and High severity lockout).
M86 SECURITY USER GUIDE
REAL TIME REPORTS SECTION CHAPTER 2: CUSTOM GAUGE SETUP, USAGE
• High - This selection locks out the end user from all network access via a TCP connection (see Medium and High severity lockout).
4. After performing the additional steps based on the chosen lockout Severity level, click Lockout at the bottom of the frame to open the Info alert box with the message: “This user has been locked out.”
5. Click OK to close the alert box and to lock out the user from the designated library categories/ports for the spec-ified duration of time.
Low severity lockout
If a “Low” Severity lockout was selected, the Available Cate-gories/Groups box displays. Do the following:
• If using the URL tab, choose the library category/catego-ries from the list. Up to 15 categories or one category group/class can be added.
• If using the Bandwidth tab, make a selection from the protocols in the list.
You can also enter a port number in the Port Number field, or modify the value in that field by clicking the up/down arrows to increment/decrement the current value by one, and then click add port > to include the port number in the Assigned Categories/Groups frame. Up to 15 port numbers can be added.
NOTE: In the Available Categories/Groups box, a global adminis-trator will not see the “All Categories” selection for URL gauges, nor see the “All Protocols” selection available for bandwidth gauges. In order to lock out end users using either of these selec-tions, a “Medium” severity lockout should be used.
M86 SECURITY USER GUIDE 311
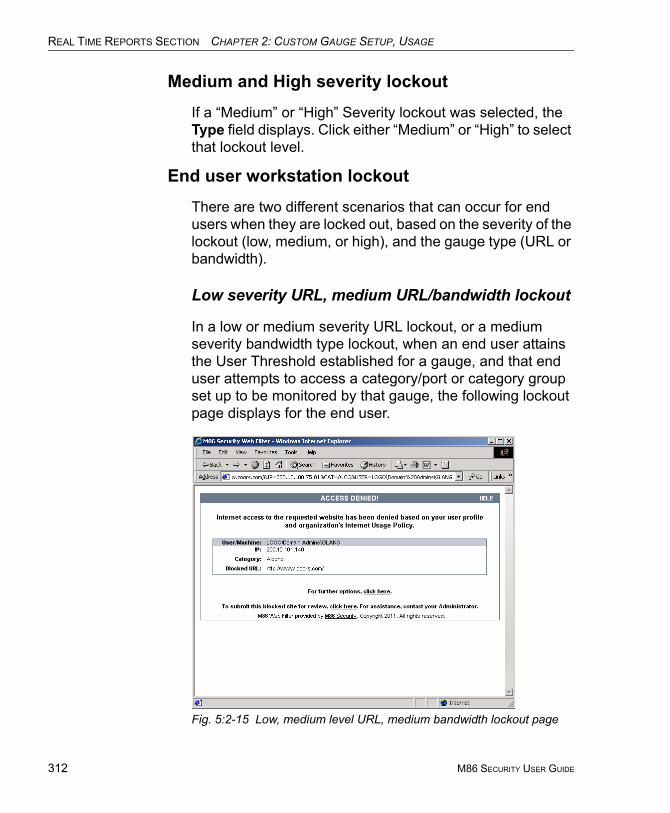
REAL TIME REPORTS SECTION CHAPTER 2: CUSTOM GAUGE SETUP, USAGE
312
Medium and High severity lockout
If a “Medium” or “High” Severity lockout was selected, the Type field displays. Click either “Medium” or “High” to select that lockout level.
End user workstation lockout
There are two different scenarios that can occur for end users when they are locked out, based on the severity of the lockout (low, medium, or high), and the gauge type (URL or bandwidth).
Low severity URL, medium URL/bandwidth lockout
In a low or medium severity URL lockout, or a medium severity bandwidth type lockout, when an end user attains the User Threshold established for a gauge, and that end user attempts to access a category/port or category group set up to be monitored by that gauge, the following lockout page displays for the end user.
Fig. 5:2-15 Low, medium level URL, medium bandwidth lockout page
M86 SECURITY USER GUIDE
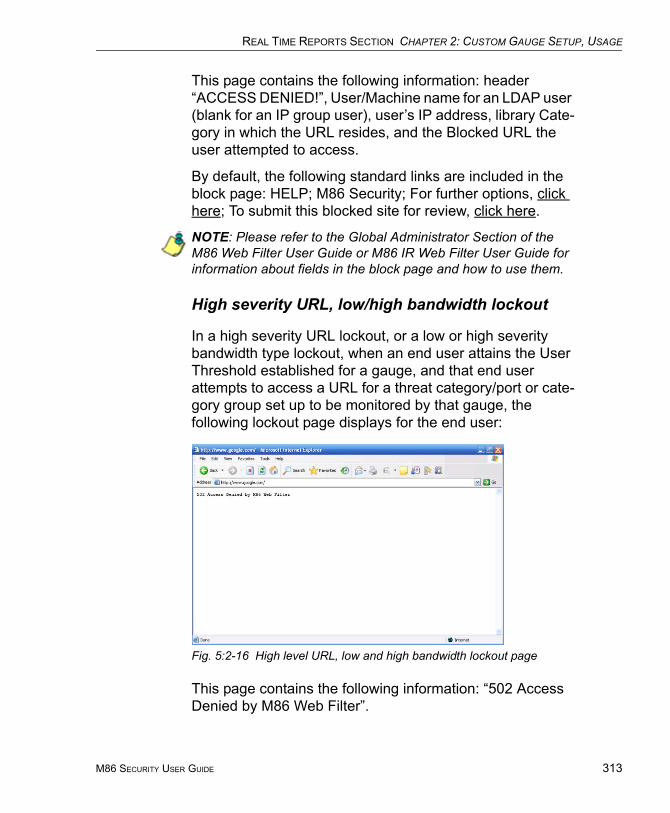
REAL TIME REPORTS SECTION CHAPTER 2: CUSTOM GAUGE SETUP, USAGE
This page contains the following information: header “ACCESS DENIED!”, User/Machine name for an LDAP user (blank for an IP group user), user’s IP address, library Cate-gory in which the URL resides, and the Blocked URL the user attempted to access.
By default, the following standard links are included in the block page: HELP; M86 Security; For further options, click here; To submit this blocked site for review, click here.
NOTE: Please refer to the Global Administrator Section of the M86 Web Filter User Guide or M86 IR Web Filter User Guide for information about fields in the block page and how to use them.
High severity URL, low/high bandwidth lockout
In a high severity URL lockout, or a low or high severity bandwidth type lockout, when an end user attains the User Threshold established for a gauge, and that end user attempts to access a URL for a threat category/port or cate-gory group set up to be monitored by that gauge, the following lockout page displays for the end user:
Fig. 5:2-16 High level URL, low and high bandwidth lockout page
This page contains the following information: “502 Access Denied by M86 Web Filter”.
M86 SECURITY USER GUIDE 313
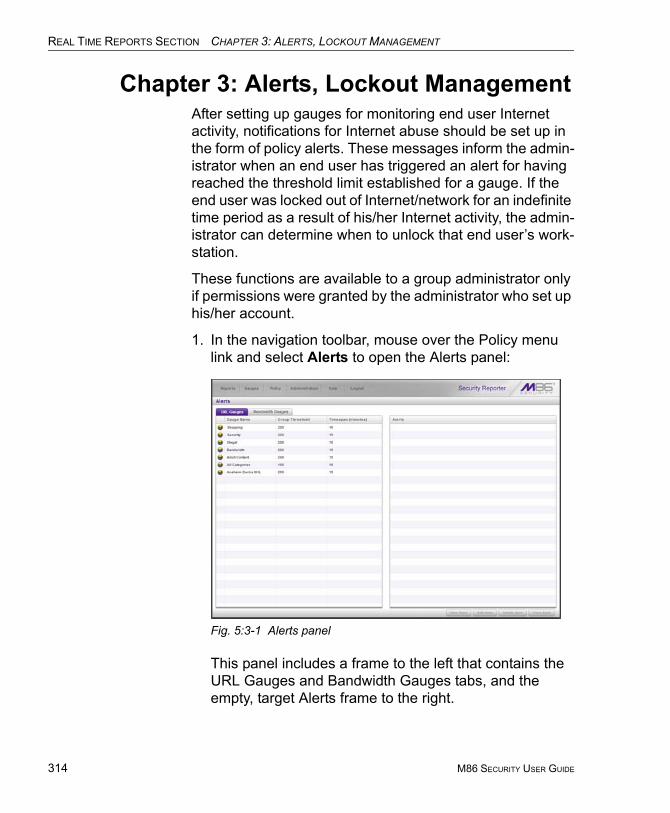
REAL TIME REPORTS SECTION CHAPTER 3: ALERTS, LOCKOUT MANAGEMENT
314
Chapter 3: Alerts, Lockout ManagementAfter setting up gauges for monitoring end user Internet activity, notifications for Internet abuse should be set up in the form of policy alerts. These messages inform the admin-istrator when an end user has triggered an alert for having reached the threshold limit established for a gauge. If the end user was locked out of Internet/network for an indefinite time period as a result of his/her Internet activity, the admin-istrator can determine when to unlock that end user’s work-station.
These functions are available to a group administrator only if permissions were granted by the administrator who set up his/her account.
1. In the navigation toolbar, mouse over the Policy menu link and select Alerts to open the Alerts panel:
Fig. 5:3-1 Alerts panel
This panel includes a frame to the left that contains the URL Gauges and Bandwidth Gauges tabs, and the empty, target Alerts frame to the right.
M86 SECURITY USER GUIDE
REAL TIME REPORTS SECTION CHAPTER 3: ALERTS, LOCKOUT MANAGEMENT
2. Do the following to view the contents in the tab to be used:
• Click URL Gauges if this tab currently does not display. By default, this tab includes the following list of Gauge Names: Shopping, Security, Illegal, Bandwidth, Adult Content.For each Gauge Name in this list, the following infor-mation displays: Group Threshold (200), Timespan (minutes)—15 by default.
• Click Bandwidth Gauges to view the contents of this tab. By default, this tab includes the following list of Gauge Names: FTP, HTTP, IM, P2P, SMTP.For each Gauge Name in this list, the following infor-mation displays: Group Threshold (20 MB—64 MB for “HTTP”), Timespan (minutes)—15 by default.
M86 SECURITY USER GUIDE 315
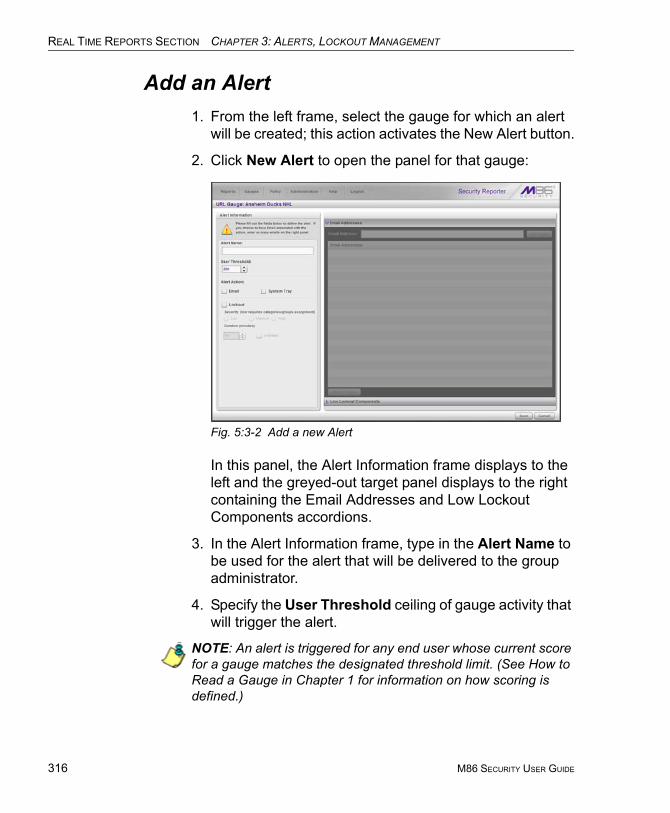
REAL TIME REPORTS SECTION CHAPTER 3: ALERTS, LOCKOUT MANAGEMENT
316
Add an Alert1. From the left frame, select the gauge for which an alert
will be created; this action activates the New Alert button.
2. Click New Alert to open the panel for that gauge:
Fig. 5:3-2 Add a new Alert
In this panel, the Alert Information frame displays to the left and the greyed-out target panel displays to the right containing the Email Addresses and Low Lockout Components accordions.
3. In the Alert Information frame, type in the Alert Name to be used for the alert that will be delivered to the group administrator.
4. Specify the User Threshold ceiling of gauge activity that will trigger the alert.
NOTE: An alert is triggered for any end user whose current score for a gauge matches the designated threshold limit. (See How to Read a Gauge in Chapter 1 for information on how scoring is defined.)
M86 SECURITY USER GUIDE
REAL TIME REPORTS SECTION CHAPTER 3: ALERTS, LOCKOUT MANAGEMENT
5. In the Alert Action section, specify the mode(s) to use when an alert is triggered:
• Email - An email alert notifies a group administrator via email if an end user has reached the threshold limit set up in a gauge alert.
• System Tray - An SR Alert message notifies a group administrator via his/her workstation’s System Tray if an end user has reached the threshold limit set up in a gauge alert.
• Lockout - The Lockout function locks out an end user from Internet/network access if he/she reaches the threshold limit set up in a gauge alert.
NOTE: The System Tray alert feature is only available for an administrator with an Active Directory LDAP account, user name, and domain, and is not available if using IP groups.
6. After making all entries in this panel, click Save to save your entries and to activate your alert.
Email alert function
Configure email alerts
To set up the email alert function:
1. In the Alert Action section of the Alert Information frame, click the checkbox corresponding to Email to open the Email Addresses accordion in the target frame to the right.
2. Type in the Email Address.
3. Click Add Email to include the address in the Email Addresses list box.
Follow steps 2 and 3 for each email address to be sent an alert.
M86 SECURITY USER GUIDE 317
REAL TIME REPORTS SECTION CHAPTER 3: ALERTS, LOCKOUT MANAGEMENT
318
TIP: To remove an email address from the list box, select the email address and then click Remove Email. Click Submit to save your settings.
Receive email alerts
If an alert is triggered, an email message is sent to the mailbox address(es) specified. This message includes the following information:
• Subject: Alert triggered by user (user name/IP address).
• Body of message: User (user name/IP address) has trig-gered the (Alert Name) alert with a threshold of ‘X’ (in which “X” represents the alert threshold) on the (gauge name) gauge.
Beneath this information, the date and time (YYYY-MM-DD HH:MM:SS), and clickable URL display for each URL accessed by the user that triggered this alert.
System Tray alert function
If using LDAP with an Active Directory user name, account, and domain, to set up the feature for System Tray alerts, click the checkbox corresponding to System Tray and follow the instructions in Appendix D: System Tray Alerts: Setup, Usage.
NOTE: In order to use this feature, the LDAP User Name and Domain set up in the administrator’s profile account must be the same ones he/she uses when logging into his/her workstation.
M86 SECURITY USER GUIDE
REAL TIME REPORTS SECTION CHAPTER 3: ALERTS, LOCKOUT MANAGEMENT
Lockout function
To set up the lockout function:
1. Click the checkbox corresponding to Lockout to activate the Severity and Duration (minutes) fields.
2. Specify the Severity of the end users’ lockout:
• Low - Choosing this option opens the Low Lockout Components accordion containing the Available Cate-gories/Groups and Assigned Categories/Groups frames.Select the library category/categories or protocol(s) the end user should not access.For bandwidth gauges, to specify a port number the user should not access, type a specific value in the Port Number field, and/or use the up/down arrow buttons to increment/decrement the current value by one.Click add > (for URL gauges) or add port > (for band-width gauges) to move the selection(s) to the Assigned Categories/Groups list box.
TIP: To remove one or more library categories/ports from the Assigned Categories/Groups list box, make your selection(s), and then click <remove to move the selection(s) back to the Available Categories/Groups list.
• Medium - Choosing this option will lock out an end user from World Wide Web access if he/she reaches the threshold limit set up for the gauge.
• High - Choosing this option will lock out an end user from network access via a TCP connection if he/she reaches the threshold limit set up for the gauge.
3. Specify the Duration (minutes) of the lockout (the default is “15” minutes), or click the “Unlimited” checkbox.
M86 SECURITY USER GUIDE 319
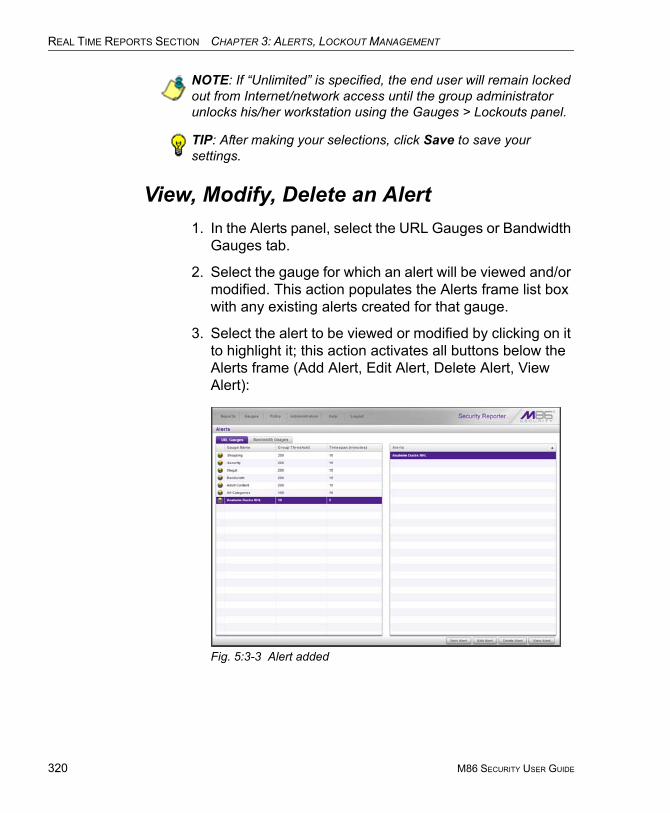
REAL TIME REPORTS SECTION CHAPTER 3: ALERTS, LOCKOUT MANAGEMENT
320
NOTE: If “Unlimited” is specified, the end user will remain locked out from Internet/network access until the group administrator unlocks his/her workstation using the Gauges > Lockouts panel.
TIP: After making your selections, click Save to save your settings.
View, Modify, Delete an Alert1. In the Alerts panel, select the URL Gauges or Bandwidth
Gauges tab.
2. Select the gauge for which an alert will be viewed and/or modified. This action populates the Alerts frame list box with any existing alerts created for that gauge.
3. Select the alert to be viewed or modified by clicking on it to highlight it; this action activates all buttons below the Alerts frame (Add Alert, Edit Alert, Delete Alert, View Alert):
Fig. 5:3-3 Alert added
M86 SECURITY USER GUIDE
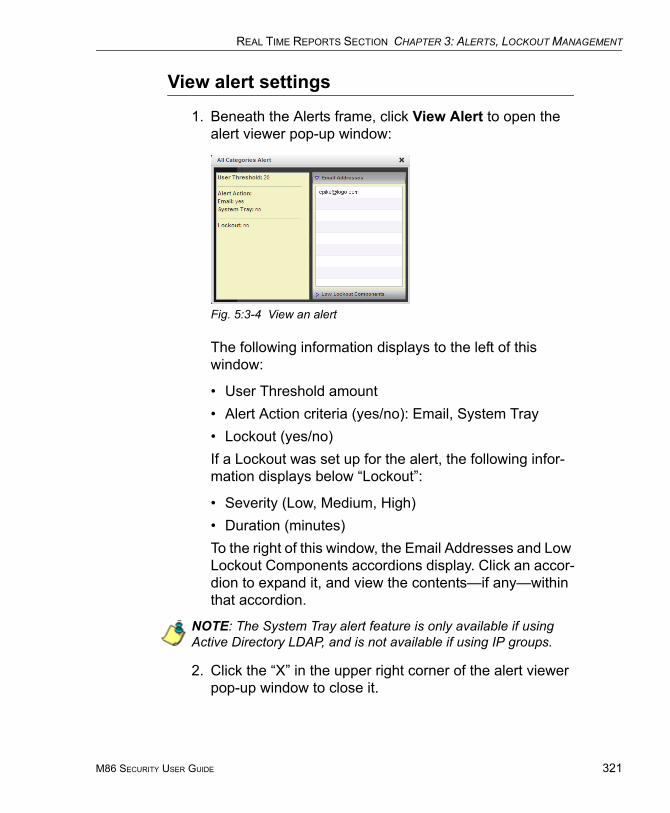
REAL TIME REPORTS SECTION CHAPTER 3: ALERTS, LOCKOUT MANAGEMENT
View alert settings
1. Beneath the Alerts frame, click View Alert to open the alert viewer pop-up window:
Fig. 5:3-4 View an alert
The following information displays to the left of this window:
• User Threshold amount• Alert Action criteria (yes/no): Email, System Tray• Lockout (yes/no)If a Lockout was set up for the alert, the following infor-mation displays below “Lockout”:
• Severity (Low, Medium, High)• Duration (minutes)To the right of this window, the Email Addresses and Low Lockout Components accordions display. Click an accor-dion to expand it, and view the contents—if any—within that accordion.
NOTE: The System Tray alert feature is only available if using Active Directory LDAP, and is not available if using IP groups.
2. Click the “X” in the upper right corner of the alert viewer pop-up window to close it.
M86 SECURITY USER GUIDE 321
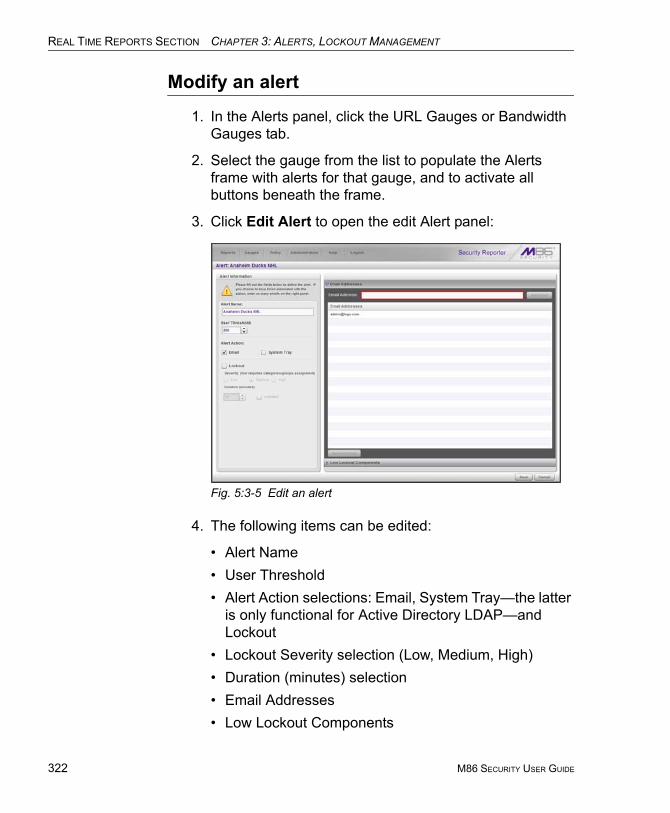
REAL TIME REPORTS SECTION CHAPTER 3: ALERTS, LOCKOUT MANAGEMENT
322
Modify an alert
1. In the Alerts panel, click the URL Gauges or Bandwidth Gauges tab.
2. Select the gauge from the list to populate the Alerts frame with alerts for that gauge, and to activate all buttons beneath the frame.
3. Click Edit Alert to open the edit Alert panel:
Fig. 5:3-5 Edit an alert
4. The following items can be edited:
• Alert Name• User Threshold• Alert Action selections: Email, System Tray—the latter
is only functional for Active Directory LDAP—and Lockout
• Lockout Severity selection (Low, Medium, High)• Duration (minutes) selection• Email Addresses• Low Lockout Components
M86 SECURITY USER GUIDE
REAL TIME REPORTS SECTION CHAPTER 3: ALERTS, LOCKOUT MANAGEMENT
5. Click Save to save your edits, and to return to the main Alerts panel.
Delete an alert
1. In the Alerts panel, click the URL Gauges or Bandwidth Gauges tab.
2. Select the gauge from the list to populate the Alerts frame with alerts for that gauge, and to activate all buttons beneath the frame.
3. Click Delete Alert to open the Confirm dialog box with the message: “Are you sure you want to delete this alert?”
NOTE: Clicking No closes the dialog box without removing the alert, and returns you to the main Alerts panel.
4. Click Yes to close the Confirm dialog box and to remove the alert from the list.
M86 SECURITY USER GUIDE 323
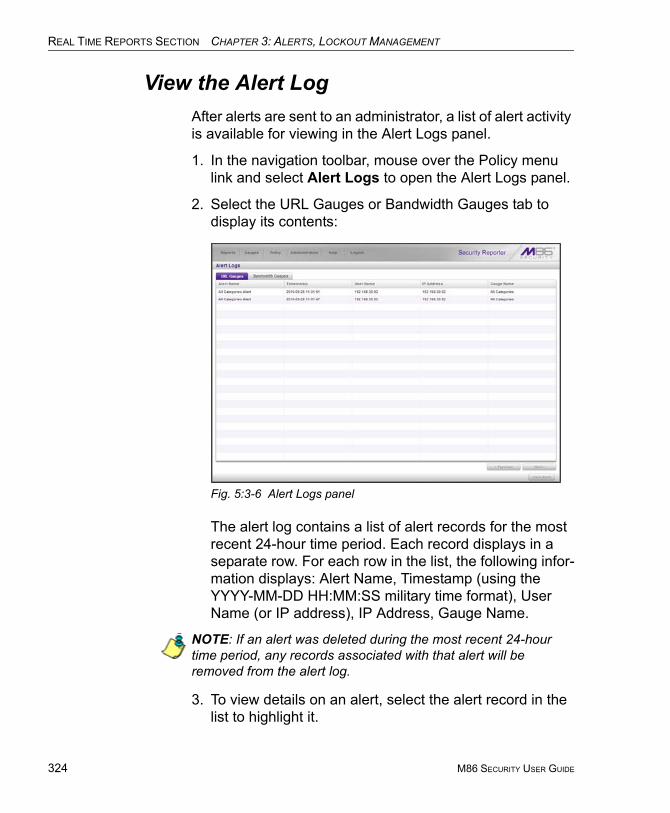
REAL TIME REPORTS SECTION CHAPTER 3: ALERTS, LOCKOUT MANAGEMENT
324
View the Alert LogAfter alerts are sent to an administrator, a list of alert activity is available for viewing in the Alert Logs panel.
1. In the navigation toolbar, mouse over the Policy menu link and select Alert Logs to open the Alert Logs panel.
2. Select the URL Gauges or Bandwidth Gauges tab to display its contents:
Fig. 5:3-6 Alert Logs panel
The alert log contains a list of alert records for the most recent 24-hour time period. Each record displays in a separate row. For each row in the list, the following infor-mation displays: Alert Name, Timestamp (using the YYYY-MM-DD HH:MM:SS military time format), User Name (or IP address), IP Address, Gauge Name.
NOTE: If an alert was deleted during the most recent 24-hour time period, any records associated with that alert will be removed from the alert log.
3. To view details on an alert, select the alert record in the list to highlight it.
M86 SECURITY USER GUIDE
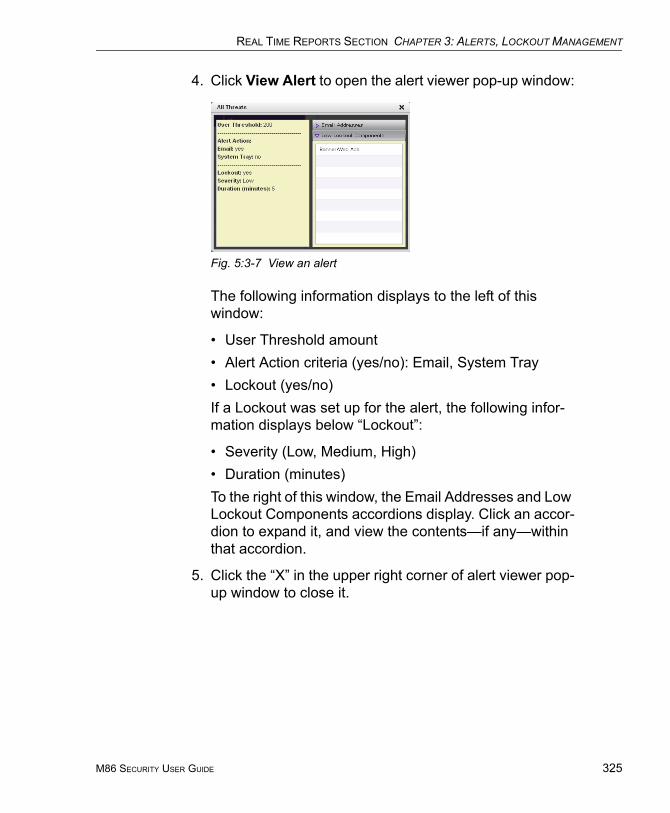
REAL TIME REPORTS SECTION CHAPTER 3: ALERTS, LOCKOUT MANAGEMENT
4. Click View Alert to open the alert viewer pop-up window:
Fig. 5:3-7 View an alert
The following information displays to the left of this window:
• User Threshold amount• Alert Action criteria (yes/no): Email, System Tray• Lockout (yes/no)If a Lockout was set up for the alert, the following infor-mation displays below “Lockout”:
• Severity (Low, Medium, High)• Duration (minutes)To the right of this window, the Email Addresses and Low Lockout Components accordions display. Click an accor-dion to expand it, and view the contents—if any—within that accordion.
5. Click the “X” in the upper right corner of alert viewer pop-up window to close it.
M86 SECURITY USER GUIDE 325
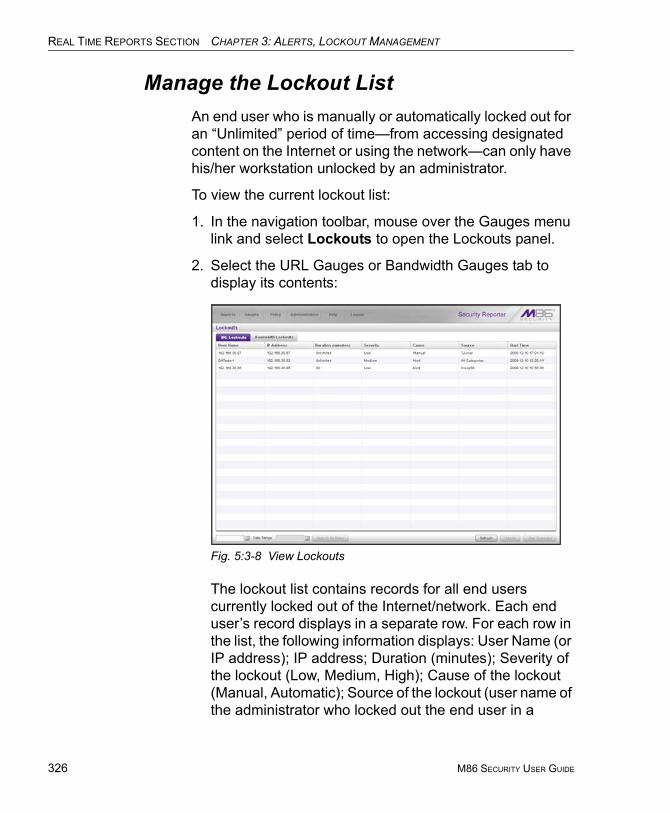
REAL TIME REPORTS SECTION CHAPTER 3: ALERTS, LOCKOUT MANAGEMENT
326
Manage the Lockout ListAn end user who is manually or automatically locked out for an “Unlimited” period of time—from accessing designated content on the Internet or using the network—can only have his/her workstation unlocked by an administrator.
To view the current lockout list:
1. In the navigation toolbar, mouse over the Gauges menu link and select Lockouts to open the Lockouts panel.
2. Select the URL Gauges or Bandwidth Gauges tab to display its contents:
Fig. 5:3-8 View Lockouts
The lockout list contains records for all end users currently locked out of the Internet/network. Each end user’s record displays in a separate row. For each row in the list, the following information displays: User Name (or IP address); IP address; Duration (minutes); Severity of the lockout (Low, Medium, High); Cause of the lockout (Manual, Automatic); Source of the lockout (user name of the administrator who locked out the end user in a
M86 SECURITY USER GUIDE

REAL TIME REPORTS SECTION CHAPTER 3: ALERTS, LOCKOUT MANAGEMENT
Manual lockout, or name of the alert in an Automatic lockout); Start Time for the alert (using the YYYY-MM-DD HH:MM:SS format).
View a specified time period of lockouts
If the lockout list is populated with many records, using the Date Range feature will only show you records within the range of dates you specify.
1. At the Date Range field, click the calendar icon located to the right of the first date field; this action opens the larger calendar for the current month, with today’s date highlighted:
TIP: To view the calendar for the previous month, click the left arrow at the top left of the box. To view the calendar for the next month, click the right arrow at the top right of the box.
2. Click the starting date to select it and to close the calendar pop-up window. This action populates the field with the selected date.
3. At the Date Range field, click the calendar icon located to the right of the second date field; this action opens the larger calendar for the current month, with today’s date highlighted.
4. Click the ending date to select it and to close the calendar pop-up window. This action populates the field with the selected date.
M86 SECURITY USER GUIDE 327
REAL TIME REPORTS SECTION CHAPTER 3: ALERTS, LOCKOUT MANAGEMENT
328
5. Click Search By Dates to display records for only the selected dates.
TIP: Click Refresh to clear all records returned by the search query, and to display the default records (all lockout records) in the panel.
Unlock workstations
1. In the populated Lockouts panel, click each record to highlight it.
2. Click Unlock to unlock the end user(s) and to remove the record(s) from the list.
NOTE: By unlocking an end user’s workstation, all records in this list pertaining to that end user are removed from the list.
Access User Summary details
1. To access details about an end user’s online activity, first click the user’s record to highlight it.
2. Next, click User Summary to display the User Summary panel where you can monitor that end user’s online activity and lock him/her out of designated areas of the Internet/network. (See Monitor, Restrict End User Activity for details about using the User Summary panel.)
M86 SECURITY USER GUIDE
REAL TIME REPORTS SECTION CHAPTER 4: ANALYZE USAGE TRENDS
Chapter 4: Analyze Usage TrendsWhen analyzing end user Internet usage trends, trend charts help you configure gauges and alerts so you can focus on current traffic areas most affecting the network.
If more information is required in your analysis, the Web Filter application, Report Manager tools, and System Configuration administrator console should be consulted so you can generate customized reports to run for a time period of your specifications.
M86 SECURITY USER GUIDE 329
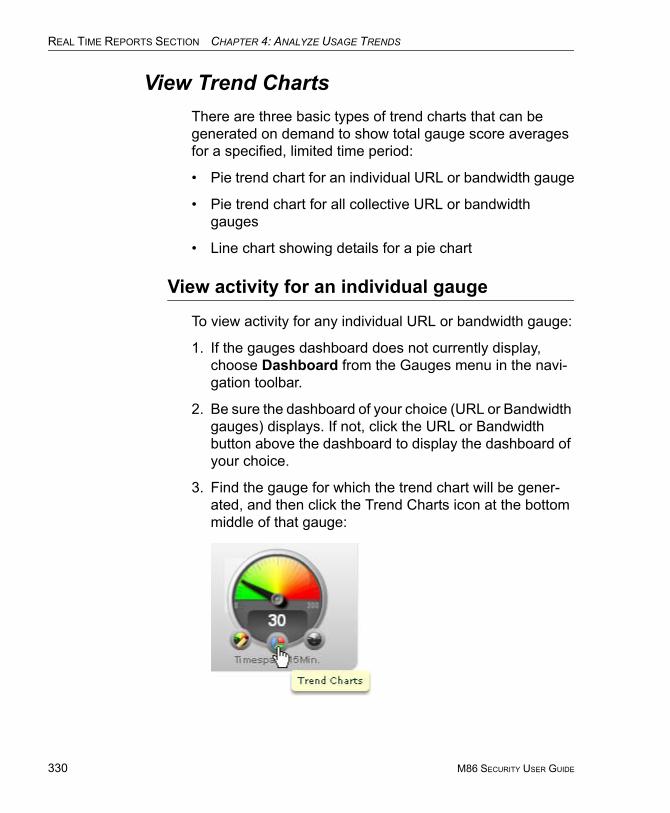
REAL TIME REPORTS SECTION CHAPTER 4: ANALYZE USAGE TRENDS
330
View Trend ChartsThere are three basic types of trend charts that can be generated on demand to show total gauge score averages for a specified, limited time period:
• Pie trend chart for an individual URL or bandwidth gauge
• Pie trend chart for all collective URL or bandwidth gauges
• Line chart showing details for a pie chart
View activity for an individual gauge
To view activity for any individual URL or bandwidth gauge:
1. If the gauges dashboard does not currently display, choose Dashboard from the Gauges menu in the navi-gation toolbar.
2. Be sure the dashboard of your choice (URL or Bandwidth gauges) displays. If not, click the URL or Bandwidth button above the dashboard to display the dashboard of your choice.
3. Find the gauge for which the trend chart will be gener-ated, and then click the Trend Charts icon at the bottom middle of that gauge:
M86 SECURITY USER GUIDE

REAL TIME REPORTS SECTION CHAPTER 4: ANALYZE USAGE TRENDS
This action of clicking the Trend Charts icon displays the Gauge Trend Chart panel:
Fig. 5:4-1 Pie trend chart for an individual URL gauge
The pie trend chart that displays in the middle of this panel includes the following information:
• For a URL gauge - By default, each slice of the pie represents the percentage of end user hits in a library category during the last hour; the total for all categories in that gauge equaling 100 percent.
• For a Bandwidth gauge - By default, each slice of the pie represents the percentage of end user traffic for a port during the last hour; the total for all ports in that gauge equaling 100 percent.
The top and bottom sections of this panel contain tabs.
Information about all actions that can be performed in this panel appears in the Navigate a trend chart sub-section.
M86 SECURITY USER GUIDE 331
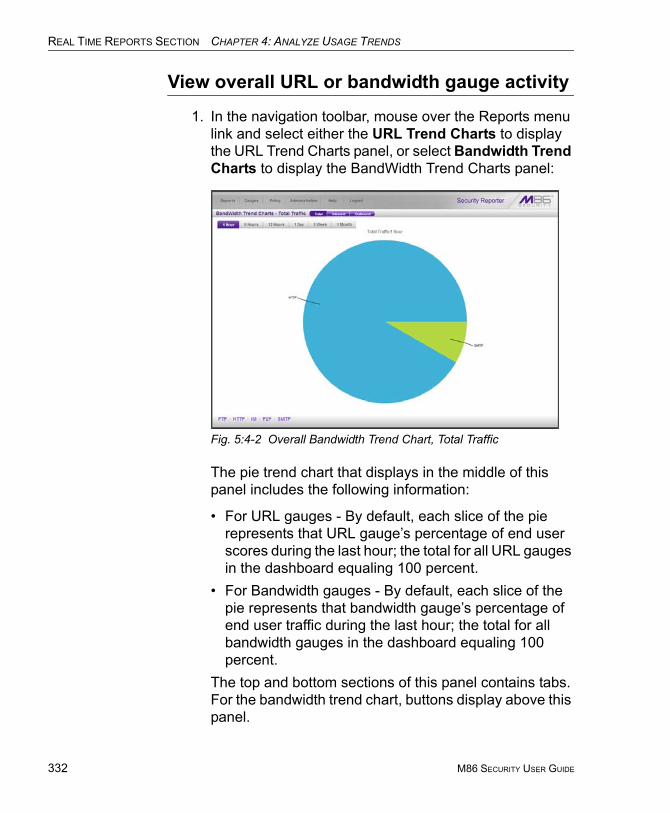
REAL TIME REPORTS SECTION CHAPTER 4: ANALYZE USAGE TRENDS
332
View overall URL or bandwidth gauge activity
1. In the navigation toolbar, mouse over the Reports menu link and select either the URL Trend Charts to display the URL Trend Charts panel, or select Bandwidth Trend Charts to display the BandWidth Trend Charts panel:
Fig. 5:4-2 Overall Bandwidth Trend Chart, Total Traffic
The pie trend chart that displays in the middle of this panel includes the following information:
• For URL gauges - By default, each slice of the pie represents that URL gauge’s percentage of end user scores during the last hour; the total for all URL gauges in the dashboard equaling 100 percent.
• For Bandwidth gauges - By default, each slice of the pie represents that bandwidth gauge’s percentage of end user traffic during the last hour; the total for all bandwidth gauges in the dashboard equaling 100 percent.
The top and bottom sections of this panel contains tabs. For the bandwidth trend chart, buttons display above this panel.
M86 SECURITY USER GUIDE
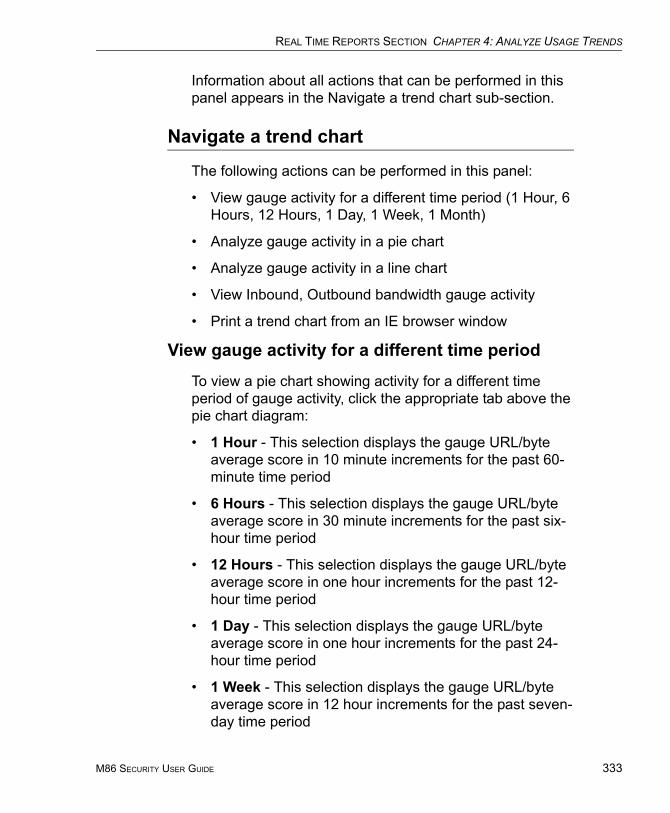
REAL TIME REPORTS SECTION CHAPTER 4: ANALYZE USAGE TRENDS
Information about all actions that can be performed in this panel appears in the Navigate a trend chart sub-section.
Navigate a trend chart
The following actions can be performed in this panel:
• View gauge activity for a different time period (1 Hour, 6 Hours, 12 Hours, 1 Day, 1 Week, 1 Month)
• Analyze gauge activity in a pie chart
• Analyze gauge activity in a line chart
• View Inbound, Outbound bandwidth gauge activity
• Print a trend chart from an IE browser window
View gauge activity for a different time period
To view a pie chart showing activity for a different time period of gauge activity, click the appropriate tab above the pie chart diagram:
• 1 Hour - This selection displays the gauge URL/byte average score in 10 minute increments for the past 60-minute time period
• 6 Hours - This selection displays the gauge URL/byte average score in 30 minute increments for the past six-hour time period
• 12 Hours - This selection displays the gauge URL/byte average score in one hour increments for the past 12-hour time period
• 1 Day - This selection displays the gauge URL/byte average score in one hour increments for the past 24-hour time period
• 1 Week - This selection displays the gauge URL/byte average score in 12 hour increments for the past seven-day time period
M86 SECURITY USER GUIDE 333

REAL TIME REPORTS SECTION CHAPTER 4: ANALYZE USAGE TRENDS
334
• 1 Month - This selection displays the gauge URL/byte average score in one-day increments for the past month’s time period
Once you’ve selected the time period you wish to view, you can analyze the activity for that gauge (see Analyze gauge activity in a pie chart), and drill down into a slice of the pie to view a line chart for that given time period (see Analyze gauge activity in a line chart).
Analyze gauge activity in a pie chart
Once a pie chart displays in the panel, its pieces can be analyzed by mousing over that slice of the pie chart.
The following information displays for that pie slice: gauge component name, percentage of that pie slice (based on a total of 100 percent for all pie slices), and total end user score for that pie slice.
That slice of the pie can be further analyzed by drilling down into it (see Analyze gauge activity in a line chart).
Analyze gauge activity in a line chart
1. To view a line chart showing activity for a slice of the pie chart, do either of the following:
• Click that slice of the pie chart• Click the specified tab beneath the pie chartEither action displays the line Trend Chart:
M86 SECURITY USER GUIDE
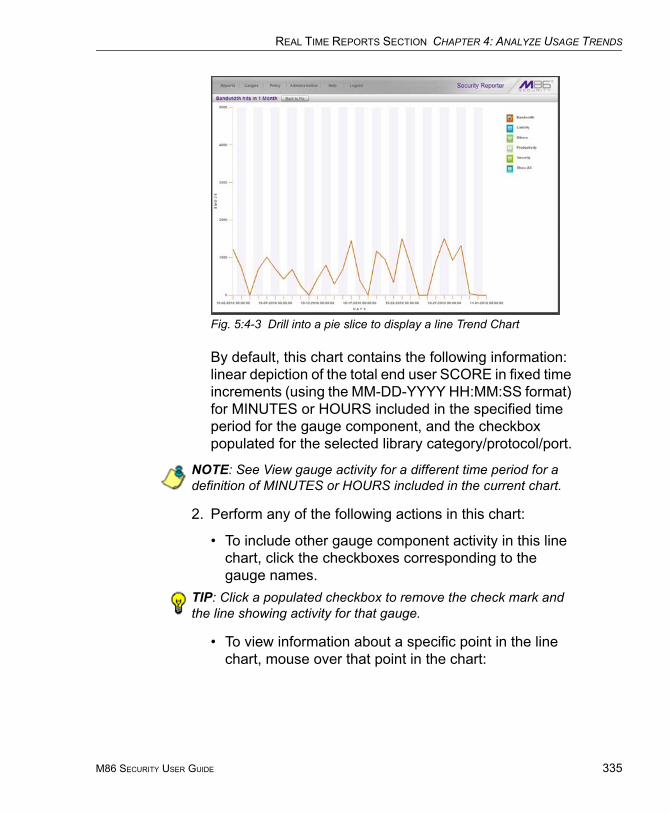
REAL TIME REPORTS SECTION CHAPTER 4: ANALYZE USAGE TRENDS
Fig. 5:4-3 Drill into a pie slice to display a line Trend Chart
By default, this chart contains the following information: linear depiction of the total end user SCORE in fixed time increments (using the MM-DD-YYYY HH:MM:SS format) for MINUTES or HOURS included in the specified time period for the gauge component, and the checkbox populated for the selected library category/protocol/port.
NOTE: See View gauge activity for a different time period for a definition of MINUTES or HOURS included in the current chart.
2. Perform any of the following actions in this chart:
• To include other gauge component activity in this line chart, click the checkboxes corresponding to the gauge names.
TIP: Click a populated checkbox to remove the check mark and the line showing activity for that gauge.
• To view information about a specific point in the line chart, mouse over that point in the chart:
M86 SECURITY USER GUIDE 335
REAL TIME REPORTS SECTION CHAPTER 4: ANALYZE USAGE TRENDS
336
If the chart includes more than one line, and more than one point is located in the area of the mouse pointer, a separate box appears for each point in that section of the chart.Each box includes the following information: gauge component name, Score for that point, and Minutes or Hours for that fixed time increment (using the MM-DD-YYYY HH:MM:SS format).
• To return to the pie chart, click Back to Pie in the upper right portion of the panel.
• To print this trend chart, if using an IE browser, see Print a trend chart from an IE browser window.
View In/Outbound bandwidth gauge activity
By default, the total inbound and outbound bandwidth activity is included in the overall Bandwidth Trend Chart. To view only Inbound or Outbound activity, click the Inbound or Outbound button above the pie chart, to the right of the Total button.
Print a trend chart from an IE browser window
A trend chart can be printed from an IE browser window by using the browser window’s toolbar and going to File > Print and proceeding with the print commands.
M86 SECURITY USER GUIDE
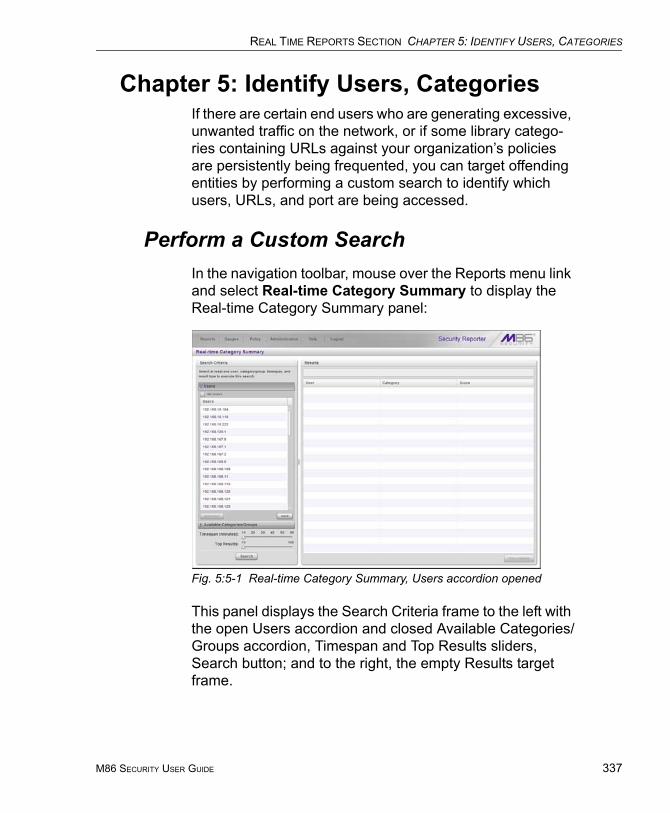
REAL TIME REPORTS SECTION CHAPTER 5: IDENTIFY USERS, CATEGORIES
Chapter 5: Identify Users, CategoriesIf there are certain end users who are generating excessive, unwanted traffic on the network, or if some library catego-ries containing URLs against your organization’s policies are persistently being frequented, you can target offending entities by performing a custom search to identify which users, URLs, and port are being accessed.
Perform a Custom SearchIn the navigation toolbar, mouse over the Reports menu link and select Real-time Category Summary to display the Real-time Category Summary panel:
Fig. 5:5-1 Real-time Category Summary, Users accordion opened
This panel displays the Search Criteria frame to the left with the open Users accordion and closed Available Categories/Groups accordion, Timespan and Top Results sliders, Search button; and to the right, the empty Results target frame.
M86 SECURITY USER GUIDE 337
REAL TIME REPORTS SECTION CHAPTER 5: IDENTIFY USERS, CATEGORIES
338
Specify Search Criteria
1. In the Users accordion, do one of the following:
• To identify users with the highest scores - Click the All Users checkbox to select all users in the list and to grey-out the list.
• To identify the activities of a specific user - Select the user name/IP address from the list to highlight it.
2. Click the Available Categories/Groups accordion to open it.
3. Select either the URL Categories or Bandwidth Cate-gories tab to display its list of library categories/proto-cols, and do either of the following:
• To identify library categories or protocols with the highest scores - Select a category group or protocol that includes as many of categories/ports as possible.
• To identify activities for a specific class/group - Select that class or group.For bandwidth gauges, to query activities for a specific port number, click the Port Number checkbox to acti-vate the port field and to deactivate the listed band-width protocol selections. Type a specific value in the pre-populated field, and/or use the up/down arrow buttons to increment/decrement the current value by one.
4. Use the Timespan (Minutes) slider to specify the time period in which the threat(s)/group(s) were accessed: last 10, 20, 30, 40, 50, 60 minutes.
5. If a user selection other than “All Users” was specified in the Users accordion, the Top Results slide becomes activated and you can make a selection for the maximum number of records to return in the results for that user: top 10, 20, 30, 40, 50, 60, 70, 80, 90, 100 records.
M86 SECURITY USER GUIDE
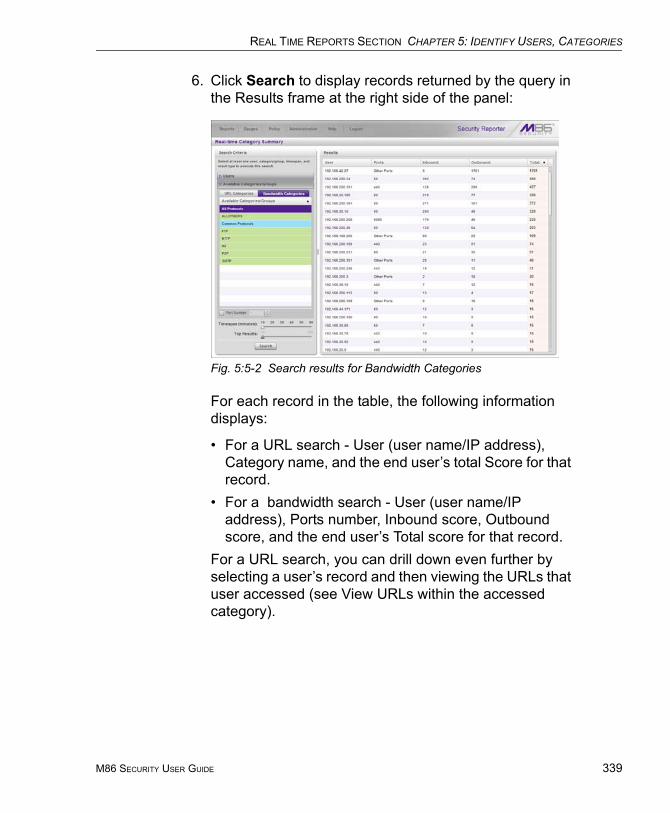
REAL TIME REPORTS SECTION CHAPTER 5: IDENTIFY USERS, CATEGORIES
6. Click Search to display records returned by the query in the Results frame at the right side of the panel:
Fig. 5:5-2 Search results for Bandwidth Categories
For each record in the table, the following information displays:
• For a URL search - User (user name/IP address), Category name, and the end user’s total Score for that record.
• For a bandwidth search - User (user name/IP address), Ports number, Inbound score, Outbound score, and the end user’s Total score for that record.
For a URL search, you can drill down even further by selecting a user’s record and then viewing the URLs that user accessed (see View URLs within the accessed category).
M86 SECURITY USER GUIDE 339
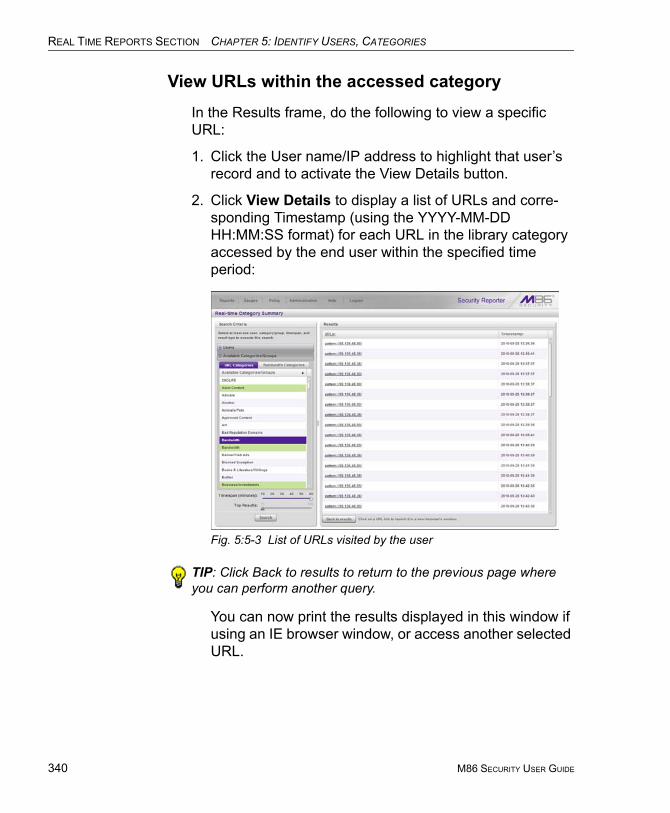
REAL TIME REPORTS SECTION CHAPTER 5: IDENTIFY USERS, CATEGORIES
340
View URLs within the accessed category
In the Results frame, do the following to view a specific URL:
1. Click the User name/IP address to highlight that user’s record and to activate the View Details button.
2. Click View Details to display a list of URLs and corre-sponding Timestamp (using the YYYY-MM-DD HH:MM:SS format) for each URL in the library category accessed by the end user within the specified time period:
Fig. 5:5-3 List of URLs visited by the user
TIP: Click Back to results to return to the previous page where you can perform another query.
You can now print the results displayed in this window if using an IE browser window, or access another selected URL.
M86 SECURITY USER GUIDE
SECURITY REPORTS SECTION INTRODUCTION
SECURITY REPORTS SECTION
IntroductionThis section of the user guide provides instructions to administrators on how to utilize data from SWG logs for monitoring end user Internet and network usage via security reports.
• Chapter 1: Security Reports - This chapter explains how to use the four basic security reports: Blocked Viruses, Security Policy Violations, Traffic Analysis, and Rule Transactions.
• Chapter 2: Security Report Wizard - This chapter explains how to use the Report Wizard to create your own customized security reports.
NOTES: If the SR is connected to an SWG running software version 9.2.X, reports may not be accurate since bypass transac-tions (e.g. streaming) are not logged for the SR to process.
WARNING: To prevent requested security reports from being blocked by your email client, be sure to whitelist the SR’s source email address in your email client. The source email address can be found in System Configuration > Server > SMTP Server Setting, in the “From Email Address” field.
M86 SECURITY USER GUIDE 341
SECURITY REPORTS SECTION CHAPTER 1: SECURITY REPORTS
342
Chapter 1: Security ReportsSecurity Reports are accessible by navigating to Reports > Security Reports and selecting the report type from the menu:
• Blocked Viruses - This report displays details for each instance of each blocked virus detected from end user Internet/network activity:
• Security Policy Violations - This report provides infor-mation on each instance in which an end user breached a security policy.
• Traffic Analysis - This report shows activity for end user access of objects utilizing an excessive amount of network bandwidth.
• Rule Transactions - This report lists each instance in which an end user triggered a threshold in an SWG Security Policy.
NOTE: Once you have generated one of the four basic security report views, you can use the Report Wizard to customize your view, save the view, export the view, and/or schedule the report to run at a designated time. The Report Wizard feature for secu-rity reports is discussed in detail in Chapter 2: Security Report Wizard.
M86 SECURITY USER GUIDE
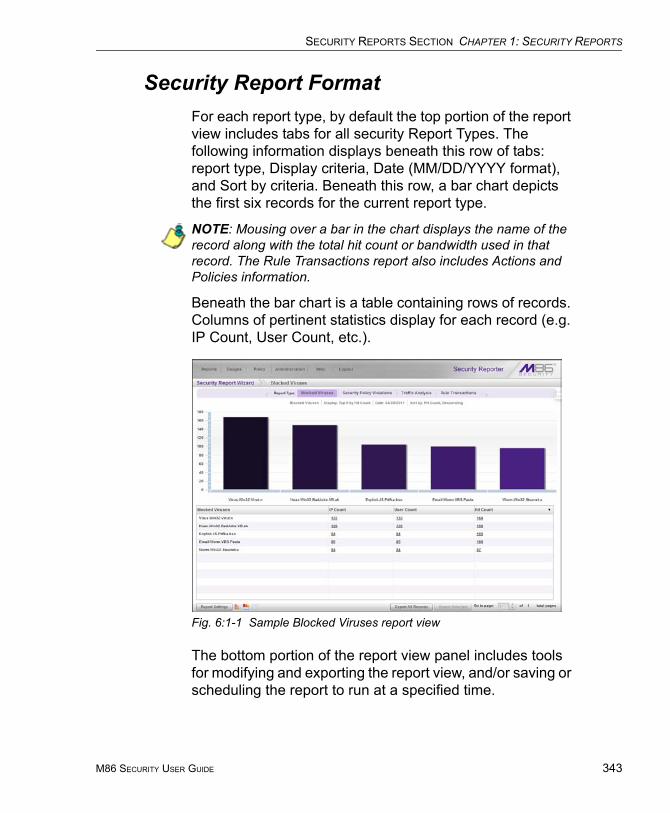
SECURITY REPORTS SECTION CHAPTER 1: SECURITY REPORTS
Security Report FormatFor each report type, by default the top portion of the report view includes tabs for all security Report Types. The following information displays beneath this row of tabs: report type, Display criteria, Date (MM/DD/YYYY format), and Sort by criteria. Beneath this row, a bar chart depicts the first six records for the current report type.
NOTE: Mousing over a bar in the chart displays the name of the record along with the total hit count or bandwidth used in that record. The Rule Transactions report also includes Actions and Policies information.
Beneath the bar chart is a table containing rows of records. Columns of pertinent statistics display for each record (e.g. IP Count, User Count, etc.).
Fig. 6:1-1 Sample Blocked Viruses report view
The bottom portion of the report view panel includes tools for modifying and exporting the report view, and/or saving or scheduling the report to run at a specified time.
M86 SECURITY USER GUIDE 343
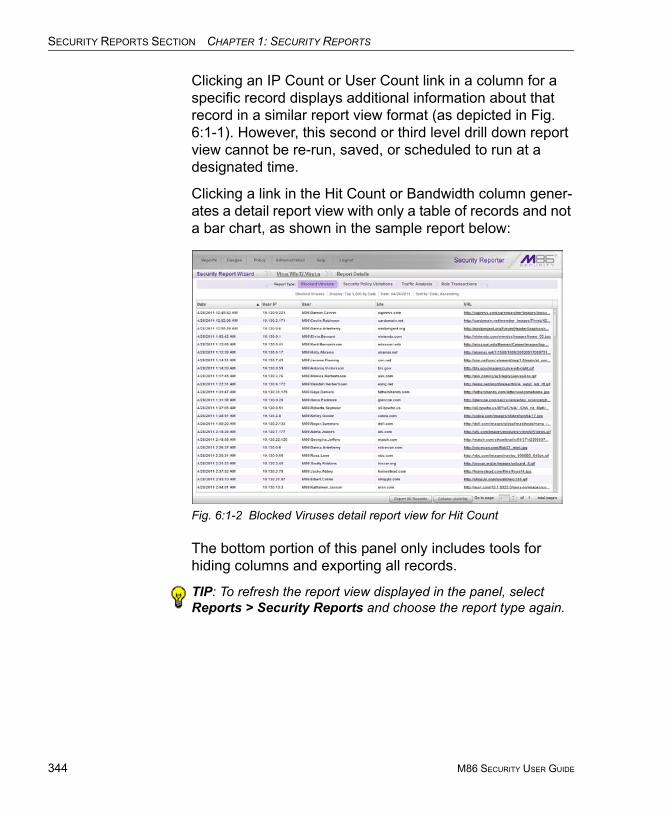
SECURITY REPORTS SECTION CHAPTER 1: SECURITY REPORTS
344
Clicking an IP Count or User Count link in a column for a specific record displays additional information about that record in a similar report view format (as depicted in Fig. 6:1-1). However, this second or third level drill down report view cannot be re-run, saved, or scheduled to run at a designated time.
Clicking a link in the Hit Count or Bandwidth column gener-ates a detail report view with only a table of records and not a bar chart, as shown in the sample report below:
Fig. 6:1-2 Blocked Viruses detail report view for Hit Count
The bottom portion of this panel only includes tools for hiding columns and exporting all records.
TIP: To refresh the report view displayed in the panel, select Reports > Security Reports and choose the report type again.
M86 SECURITY USER GUIDE
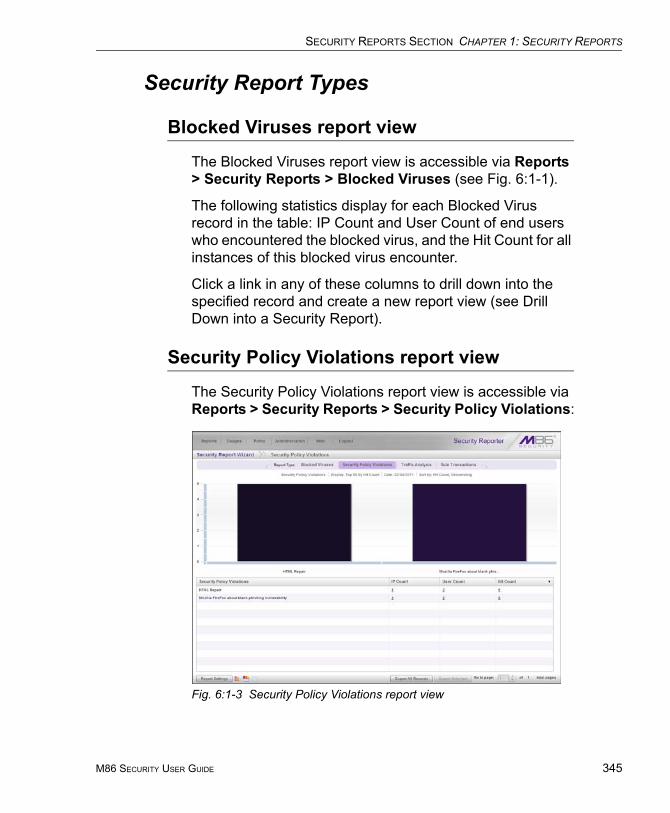
SECURITY REPORTS SECTION CHAPTER 1: SECURITY REPORTS
Security Report Types
Blocked Viruses report view
The Blocked Viruses report view is accessible via Reports > Security Reports > Blocked Viruses (see Fig. 6:1-1).
The following statistics display for each Blocked Virus record in the table: IP Count and User Count of end users who encountered the blocked virus, and the Hit Count for all instances of this blocked virus encounter.
Click a link in any of these columns to drill down into the specified record and create a new report view (see Drill Down into a Security Report).
Security Policy Violations report view
The Security Policy Violations report view is accessible via Reports > Security Reports > Security Policy Violations:
Fig. 6:1-3 Security Policy Violations report view
M86 SECURITY USER GUIDE 345

SECURITY REPORTS SECTION CHAPTER 1: SECURITY REPORTS
346
The following statistics display for each Security Policy Violation record in the table: IP Count, User Count, and Hit Count for end users who breached that security policy, and the Hit Count for all instances of this type of security breach.
Click a link in any of these columns to drill down into the specified record and create a new report view (see Drill Down into a Security Report).
Traffic Analysis report view
The Blocked Viruses report view is accessible via Reports > Security Reports > Traffic Analysis:
Fig. 6:1-4 Traffic Analysis report view
The following statistics display for each Traffic Analysis record in the table: IP Count and User Count of end users who accessed the high bandwidth usage object, and the Bandwidth used in all occurrences of accessing this object.
Click a link in any of these columns to drill down into the specified record and create a new report view (see Drill Down into a Security Report).
M86 SECURITY USER GUIDE

SECURITY REPORTS SECTION CHAPTER 1: SECURITY REPORTS
Rule Transactions report view
The Blocked Viruses report view is accessible via Reports > Security Reports > Rule Transactions:
Fig. 6:1-5 Rule Transactions report view
The following statistics display for each Rule Transactions record in the table: In the Actions column, the action performed by the SWG regarding the rule applied to that transaction; in the Policies column, the policy from the SWG applied to that transaction; the IP Count and User Count of end users who triggered that rule, and the Hit Count of all user encounters for that record.
Click a link in any of the Count columns to drill down into the specified record and create a new report view (see Drill Down into a Security Report).
M86 SECURITY USER GUIDE 347
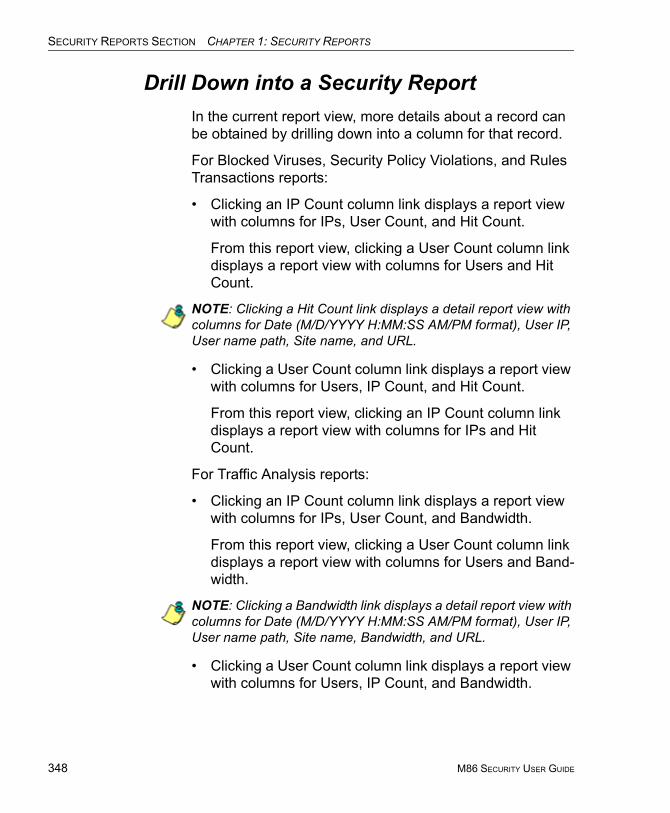
SECURITY REPORTS SECTION CHAPTER 1: SECURITY REPORTS
348
Drill Down into a Security ReportIn the current report view, more details about a record can be obtained by drilling down into a column for that record.
For Blocked Viruses, Security Policy Violations, and Rules Transactions reports:
• Clicking an IP Count column link displays a report view with columns for IPs, User Count, and Hit Count.
From this report view, clicking a User Count column link displays a report view with columns for Users and Hit Count.
NOTE: Clicking a Hit Count link displays a detail report view with columns for Date (M/D/YYYY H:MM:SS AM/PM format), User IP, User name path, Site name, and URL.
• Clicking a User Count column link displays a report view with columns for Users, IP Count, and Hit Count.
From this report view, clicking an IP Count column link displays a report view with columns for IPs and Hit Count.
For Traffic Analysis reports:
• Clicking an IP Count column link displays a report view with columns for IPs, User Count, and Bandwidth.
From this report view, clicking a User Count column link displays a report view with columns for Users and Band-width.
NOTE: Clicking a Bandwidth link displays a detail report view with columns for Date (M/D/YYYY H:MM:SS AM/PM format), User IP, User name path, Site name, Bandwidth, and URL.
• Clicking a User Count column link displays a report view with columns for Users, IP Count, and Bandwidth.
M86 SECURITY USER GUIDE

SECURITY REPORTS SECTION CHAPTER 1: SECURITY REPORTS
From this report view, clicking an IP Count column link displays a report view with columns for IPs and Band-width.
Security Report Tools
Security Report Type tabs
Report Type tabs (Blocked Viruses, Security Policy Viola-tions, Traffic Analysis, and Rule Transactions) display at the top of the panel. Click one of these tabs to display the spec-ified report view.
Report Settings menu
For basic Security Report types, mouse over Report Settings at the bottom of the panel to display a menu of reporting options: Run, Save, Schedule (see Report Settings Options).
NOTE: The Report Settings menu is not available for second and third level report views.
Report view icons
Click the following report view icon to change the report view display:
• Click this icon to display only the top six bars:
M86 SECURITY USER GUIDE 349
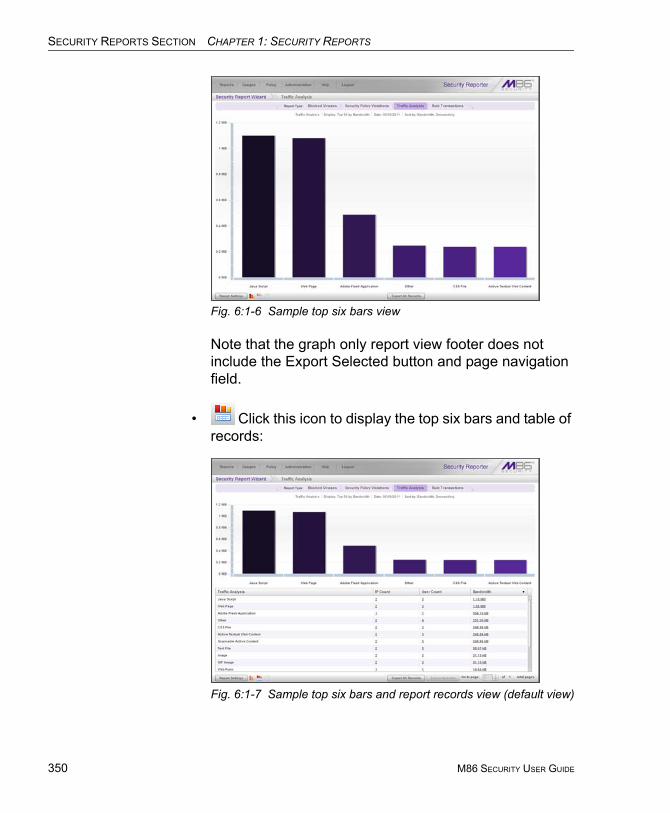
SECURITY REPORTS SECTION CHAPTER 1: SECURITY REPORTS
350
Fig. 6:1-6 Sample top six bars view
Note that the graph only report view footer does not include the Export Selected button and page navigation field.
• Click this icon to display the top six bars and table of records:
Fig. 6:1-7 Sample top six bars and report records view (default view)
M86 SECURITY USER GUIDE
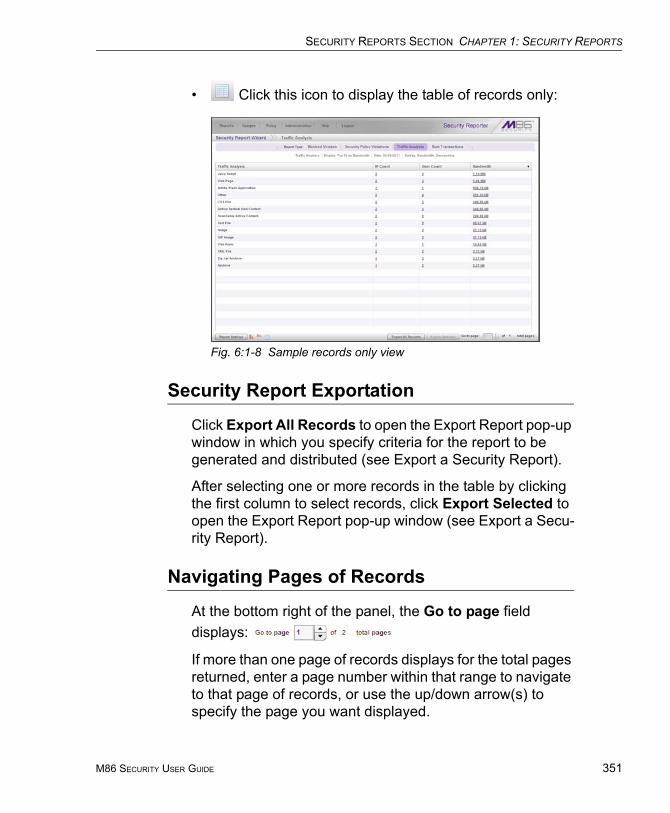
SECURITY REPORTS SECTION CHAPTER 1: SECURITY REPORTS
• Click this icon to display the table of records only:
Fig. 6:1-8 Sample records only view
Security Report Exportation
Click Export All Records to open the Export Report pop-up window in which you specify criteria for the report to be generated and distributed (see Export a Security Report).
After selecting one or more records in the table by clicking the first column to select records, click Export Selected to open the Export Report pop-up window (see Export a Secu-rity Report).
Navigating Pages of Records
At the bottom right of the panel, the Go to page field displays:
If more than one page of records displays for the total pages returned, enter a page number within that range to navigate to that page of records, or use the up/down arrow(s) to specify the page you want displayed.
M86 SECURITY USER GUIDE 351
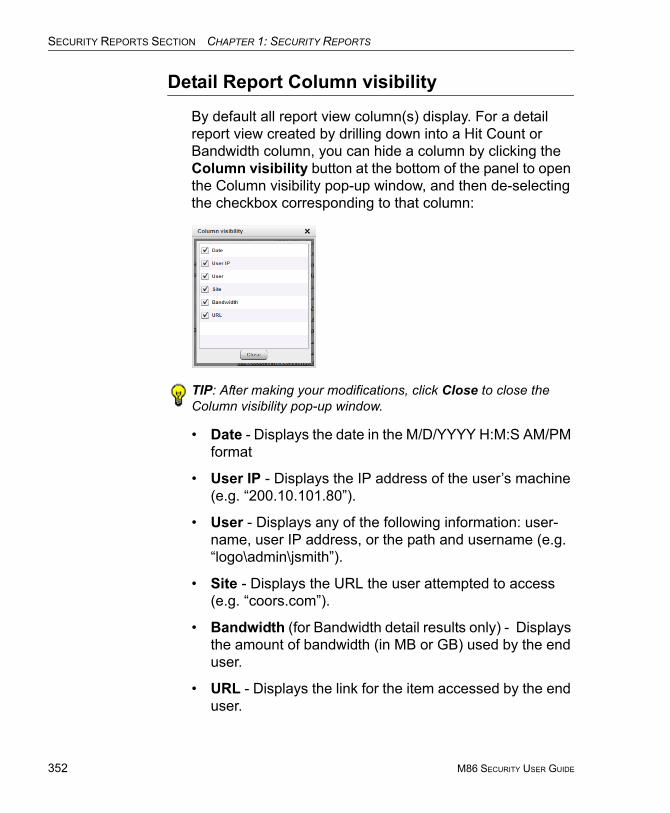
SECURITY REPORTS SECTION CHAPTER 1: SECURITY REPORTS
352
Detail Report Column visibility
By default all report view column(s) display. For a detail report view created by drilling down into a Hit Count or Bandwidth column, you can hide a column by clicking the Column visibility button at the bottom of the panel to open the Column visibility pop-up window, and then de-selecting the checkbox corresponding to that column:
TIP: After making your modifications, click Close to close the Column visibility pop-up window.
• Date - Displays the date in the M/D/YYYY H:M:S AM/PM format
• User IP - Displays the IP address of the user’s machine (e.g. “200.10.101.80”).
• User - Displays any of the following information: user-name, user IP address, or the path and username (e.g. “logo\admin\jsmith”).
• Site - Displays the URL the user attempted to access (e.g. “coors.com”).
• Bandwidth (for Bandwidth detail results only) - Displays the amount of bandwidth (in MB or GB) used by the end user.
• URL - Displays the link for the item accessed by the end user.
M86 SECURITY USER GUIDE
SECURITY REPORTS SECTION CHAPTER 1: SECURITY REPORTS
Security Report Tips
Breadcrumb trail
When generating a report view and modifying that report view to create another report view, a trail of breadcrumb links remain in the row beneath the navigation toolbar. Clicking a specified level in the trail link returns you to that prior report view.
Column sorting tips
To sort report view records in ascending/descending order by a specified column, click that column’s header: report type name, IP Count, User Count, Bandwidth, Hit Count, Rules, Actions, Policies, Date, User IP, User name, Site, or URL.
Click the same column header again to sort records for that column in the reverse order.
Click another column header to sort records by that speci-fied column.
URL viewing tip
In a URL column, click the URL for a specified record to view the item currently indexed in the SR’s memory.
M86 SECURITY USER GUIDE 353
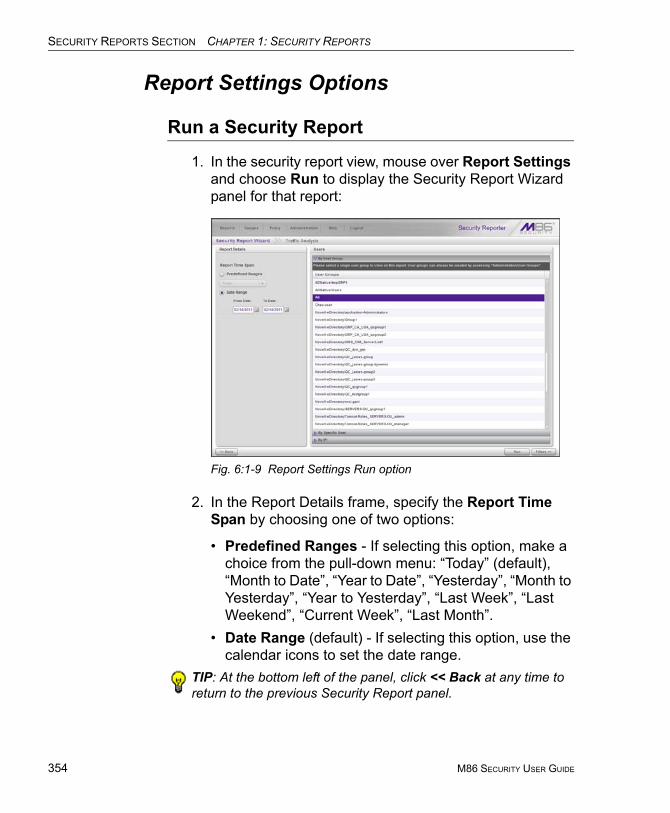
SECURITY REPORTS SECTION CHAPTER 1: SECURITY REPORTS
354
Report Settings Options
Run a Security Report
1. In the security report view, mouse over Report Settings and choose Run to display the Security Report Wizard panel for that report:
Fig. 6:1-9 Report Settings Run option
2. In the Report Details frame, specify the Report Time Span by choosing one of two options:
• Predefined Ranges - If selecting this option, make a choice from the pull-down menu: “Today” (default), “Month to Date”, “Year to Date”, “Yesterday”, “Month to Yesterday”, “Year to Yesterday”, “Last Week”, “Last Weekend”, “Current Week”, “Last Month”.
• Date Range (default) - If selecting this option, use the calendar icons to set the date range.
TIP: At the bottom left of the panel, click << Back at any time to return to the previous Security Report panel.
M86 SECURITY USER GUIDE

SECURITY REPORTS SECTION CHAPTER 1: SECURITY REPORTS
3. In the Users frame, select one of the accordions and indi-cate criteria to include in the report to be generated:
• By User Group - If selecting this option, choose the User Group for your report query results.
• By Specific User - If selecting this option, enter the end user name—using the ‘%’ wildcard to return multiple usernames—and then click Preview Users to display query results in the list box below.
• By IP - If selecting this option, enter the end user IP address for filtering your results—using the ‘%’ wild-card to return multiple IP addresses—and then click Preview Users to display query results in the list box below.
For a Traffic Analysis or Rule Transactions report, you can narrow your search result by including filters:
a. Click Filters >> at the bottom right of the panel to display the filter results panel:
Fig. 6:1-10 Report Filters option
M86 SECURITY USER GUIDE 355

SECURITY REPORTS SECTION CHAPTER 1: SECURITY REPORTS
356
b. Choose a filter type from an available accordion (Poli-cies, Rules, Action, Content Type) and indicate criteria to use in the filter:• Select one or more records from the Available list
box and click add > to move the record(s) to the Assigned list box.
TIPS: Multiple records can be selected by clicking each record while pressing the Ctrl key on your keyboard. Blocks of records can be selected by clicking the first record, and then pressing the Shift key on your keyboard while clicking the last record.
To remove the record(s), select the record(s) from the Assigned list box and click < remove.
• Click the “Assign All” checkbox to select all records and grey-out the panel.
c. Click << Back to return to the Security Report Wizard panel.
4. Click Run to generate the security report view:
Fig. 6:1-11 Generated Security Report view
The report can now be exported by selecting one of the export options (see Export a Security Report).
M86 SECURITY USER GUIDE
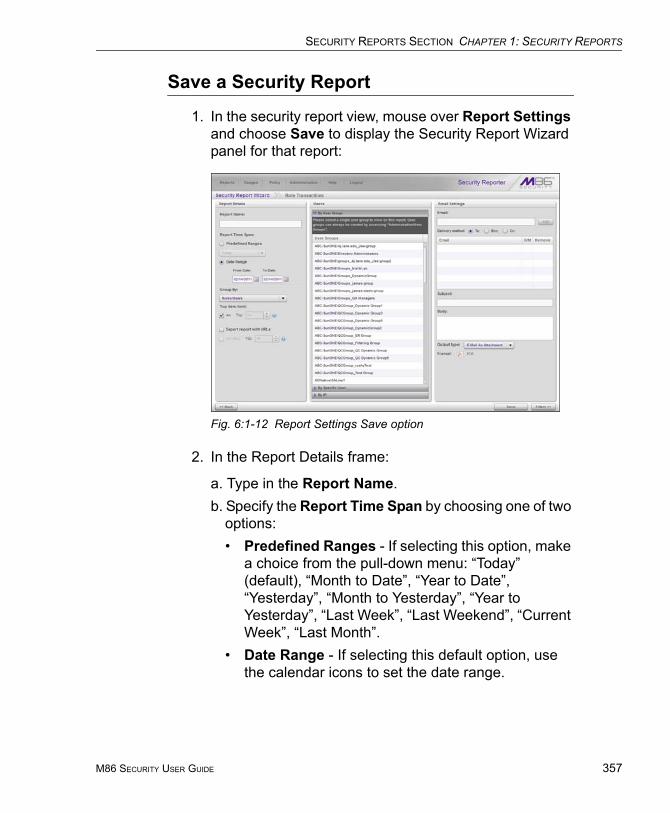
SECURITY REPORTS SECTION CHAPTER 1: SECURITY REPORTS
Save a Security Report
1. In the security report view, mouse over Report Settings and choose Save to display the Security Report Wizard panel for that report:
Fig. 6:1-12 Report Settings Save option
2. In the Report Details frame:
a. Type in the Report Name.b. Specify the Report Time Span by choosing one of two
options:• Predefined Ranges - If selecting this option, make
a choice from the pull-down menu: “Today” (default), “Month to Date”, “Year to Date”, “Yesterday”, “Month to Yesterday”, “Year to Yesterday”, “Last Week”, “Last Weekend”, “Current Week”, “Last Month”.
• Date Range - If selecting this default option, use the calendar icons to set the date range.
M86 SECURITY USER GUIDE 357
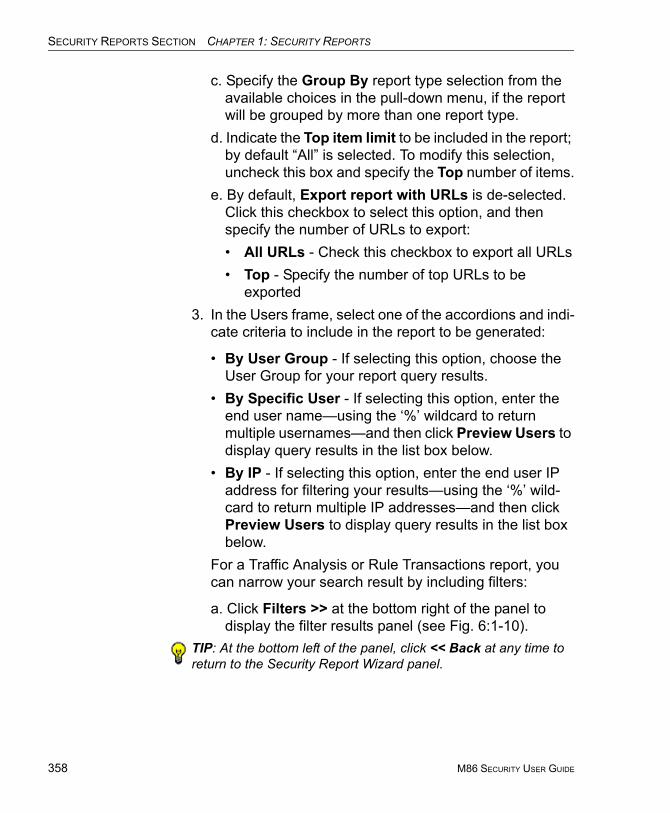
SECURITY REPORTS SECTION CHAPTER 1: SECURITY REPORTS
358
c. Specify the Group By report type selection from the available choices in the pull-down menu, if the report will be grouped by more than one report type.
d. Indicate the Top item limit to be included in the report; by default “All” is selected. To modify this selection, uncheck this box and specify the Top number of items.
e. By default, Export report with URLs is de-selected. Click this checkbox to select this option, and then specify the number of URLs to export:• All URLs - Check this checkbox to export all URLs• Top - Specify the number of top URLs to be
exported3. In the Users frame, select one of the accordions and indi-
cate criteria to include in the report to be generated:
• By User Group - If selecting this option, choose the User Group for your report query results.
• By Specific User - If selecting this option, enter the end user name—using the ‘%’ wildcard to return multiple usernames—and then click Preview Users to display query results in the list box below.
• By IP - If selecting this option, enter the end user IP address for filtering your results—using the ‘%’ wild-card to return multiple IP addresses—and then click Preview Users to display query results in the list box below.
For a Traffic Analysis or Rule Transactions report, you can narrow your search result by including filters:
a. Click Filters >> at the bottom right of the panel to display the filter results panel (see Fig. 6:1-10).
TIP: At the bottom left of the panel, click << Back at any time to return to the Security Report Wizard panel.
M86 SECURITY USER GUIDE

SECURITY REPORTS SECTION CHAPTER 1: SECURITY REPORTS
b. Choose a filter type from an available accordion (Poli-cies, Rules, Action, Content Type) and indicate criteria to use in the filter:• Select one or more records from the Available list
box and click add > to move the record(s) to the Assigned list box.
TIPS: Multiple records can be selected by clicking each record while pressing the Ctrl key on your keyboard. Blocks of records can be selected by clicking the first record, and then pressing the Shift key on your keyboard while clicking the last record. To remove the record(s), select the record(s) from the Assigned list box and click < remove.
• Click the “Assign All” checkbox to select all records and grey-out the panel.
c. Click << Back to return to the Security Report Wizard panel.
4. In the Email Settings frame:
a. Enter at least one Email address and then click Add to include the email address in the list box below.
b. Specify the Delivery method for the email address: “To” (default), “Bcc”, or “Cc”.
TIP: To remove an email address, click the “X” in the Remove column of the list box.
NOTE: Follow the above procedures for each email to be added.
c. Type in the Subject for the email message.d. If you wish, enter text to be included in the Body of the
message.e. Specify the Output type to be used for the PDF report
file in the email: “E-Mail As Attachment” or “E-Mail As Link”.
NOTE: The report will be generated in the PDF Format and emailed to the address(es) provided.
M86 SECURITY USER GUIDE 359
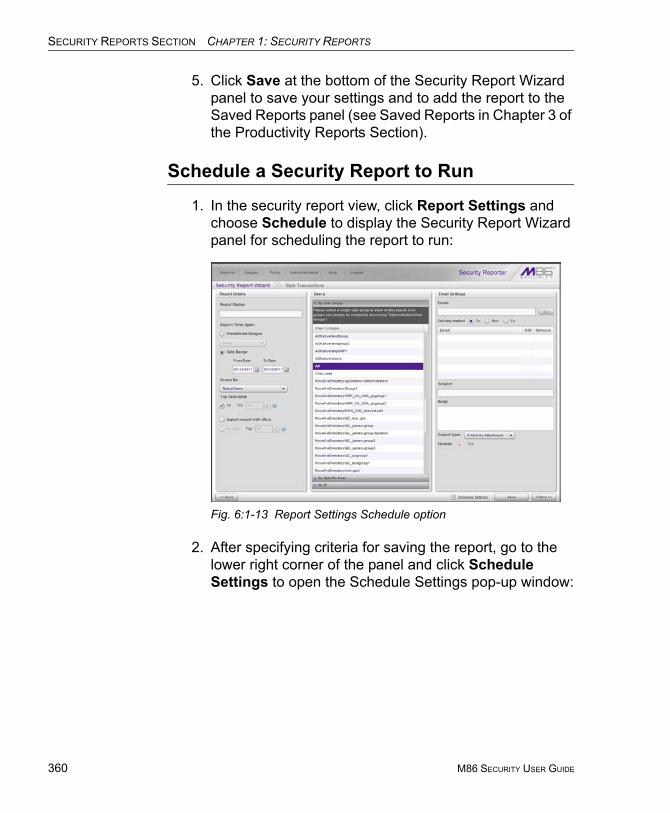
SECURITY REPORTS SECTION CHAPTER 1: SECURITY REPORTS
360
5. Click Save at the bottom of the Security Report Wizard panel to save your settings and to add the report to the Saved Reports panel (see Saved Reports in Chapter 3 of the Productivity Reports Section).
Schedule a Security Report to Run
1. In the security report view, click Report Settings and choose Schedule to display the Security Report Wizard panel for scheduling the report to run:
Fig. 6:1-13 Report Settings Schedule option
2. After specifying criteria for saving the report, go to the lower right corner of the panel and click Schedule Settings to open the Schedule Settings pop-up window:
M86 SECURITY USER GUIDE
SECURITY REPORTS SECTION CHAPTER 1: SECURITY REPORTS
Fig. 6:1-14 Schedule Settings
3. Enter a Name for the report run event you are sched-uling.
4. Select the frequency When to Run from the pull-down menu (Daily, Weekly, or Monthly).
If Weekly, specify the Day of the Week from the pull-down menu (Sunday - Saturday).
If Monthly, specify the Day of the Month from the pull-down menu (1 - 31).
5. Select the Start Time for the report: 1 - 12 for the hour, 0 - 59 for the minutes, and AM or PM.
NOTE: The default Start Time is 8:00 AM. If you wish to run a report today and this time has already passed, be sure to select a future time.
TIP: Click Cancel to close the pop-up window without saving a schedule.
6. Click Save at the bottom of the Security Report Wizard panel to save your settings and to add the report to the schedule to be run (see Report Schedule in Chapter 3 of the Productivity Reports Section).
M86 SECURITY USER GUIDE 361
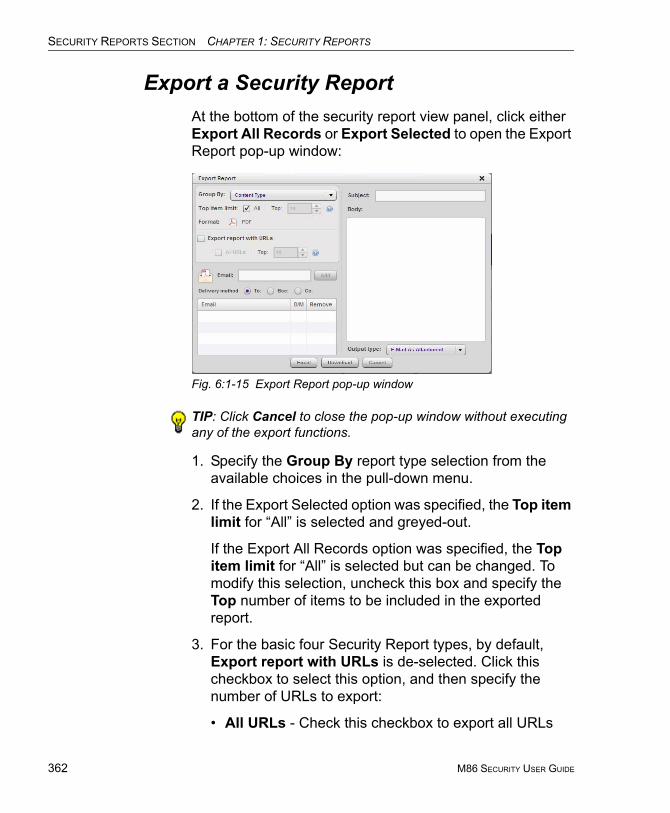
SECURITY REPORTS SECTION CHAPTER 1: SECURITY REPORTS
362
Export a Security ReportAt the bottom of the security report view panel, click either Export All Records or Export Selected to open the Export Report pop-up window:
Fig. 6:1-15 Export Report pop-up window
TIP: Click Cancel to close the pop-up window without executing any of the export functions.
1. Specify the Group By report type selection from the available choices in the pull-down menu.
2. If the Export Selected option was specified, the Top item limit for “All” is selected and greyed-out.
If the Export All Records option was specified, the Top item limit for “All” is selected but can be changed. To modify this selection, uncheck this box and specify the Top number of items to be included in the exported report.
3. For the basic four Security Report types, by default, Export report with URLs is de-selected. Click this checkbox to select this option, and then specify the number of URLs to export:
• All URLs - Check this checkbox to export all URLs
M86 SECURITY USER GUIDE

SECURITY REPORTS SECTION CHAPTER 1: SECURITY REPORTS
• Top - Specify the number of top URLs to be exportedFor Bandwidth or Hit Count detail drill down report views, the Export report with URLs checkbox displays selected and greyed-out.
For all other drill down report views, the Export report with URLs checkbox does not display.
4. To download the report in the PDF format without emailing it, click Download. To email the report, proceed to step 5.
5. If the report will be emailed instead of downloaded:
a. Enter at least one Email address and then click Add to include the email address in the list box below.
b. Specify the Delivery method for the email address: “To” (default), “Bcc”, or “Cc”.
TIP: To remove an email address, click the “X” in the Remove column of the list box.
NOTE: Follow the above procedures in step 5 for each email to be added.
c. Enter the Subject for the email message.d. If you wish, enter text to be included in the Body of the
message.e. Specify the Output type to be used for the PDF report
file in the email: “E-Mail As Attachment” or “E-Mail As Link”.
f. Click Email Report to send the report in the PDF format via email to the specified recipient(s).
M86 SECURITY USER GUIDE 363
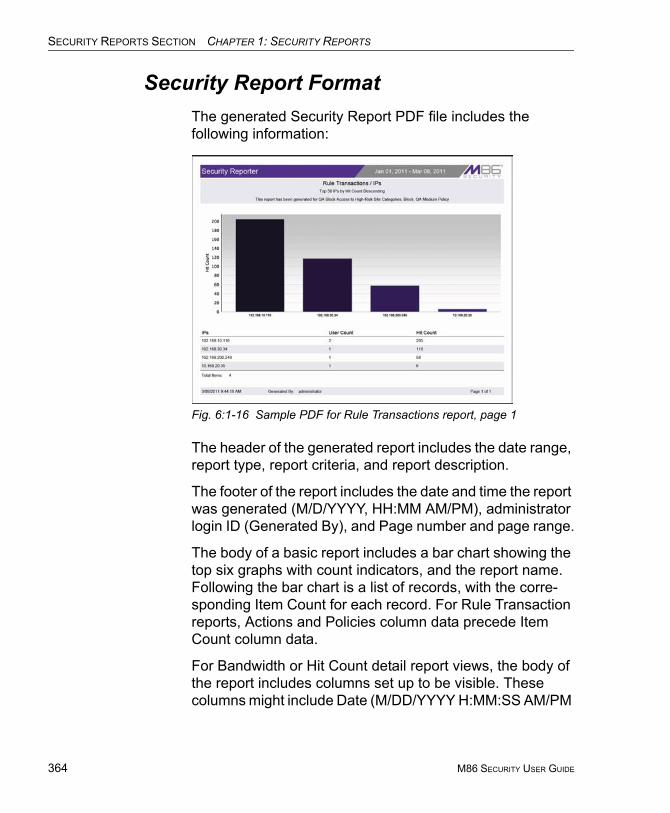
SECURITY REPORTS SECTION CHAPTER 1: SECURITY REPORTS
364
Security Report FormatThe generated Security Report PDF file includes the following information:
Fig. 6:1-16 Sample PDF for Rule Transactions report, page 1
The header of the generated report includes the date range, report type, report criteria, and report description.
The footer of the report includes the date and time the report was generated (M/D/YYYY, HH:MM AM/PM), administrator login ID (Generated By), and Page number and page range.
The body of a basic report includes a bar chart showing the top six graphs with count indicators, and the report name. Following the bar chart is a list of records, with the corre-sponding Item Count for each record. For Rule Transaction reports, Actions and Policies column data precede Item Count column data.
For Bandwidth or Hit Count detail report views, the body of the report includes columns set up to be visible. These columns might include Date (M/DD/YYYY H:MM:SS AM/PM
M86 SECURITY USER GUIDE
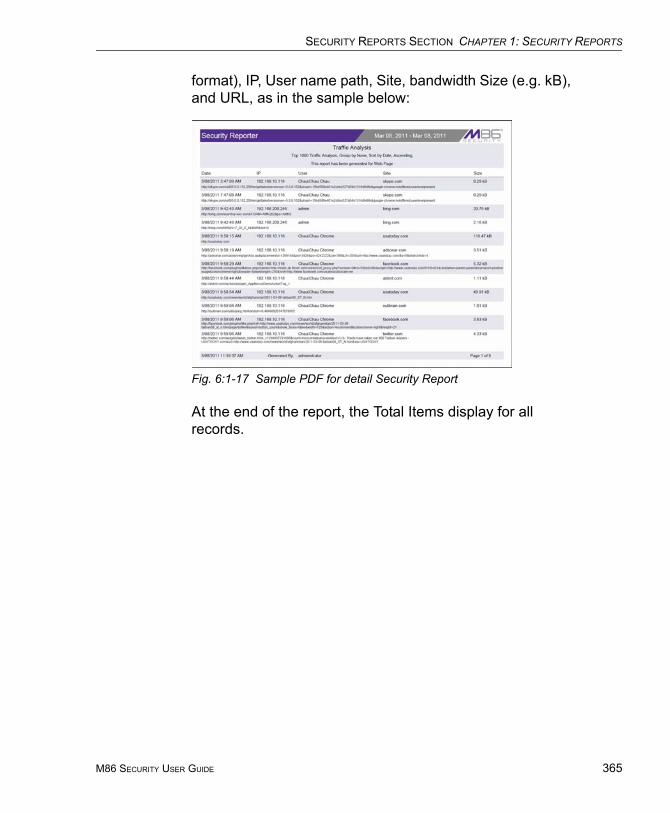
SECURITY REPORTS SECTION CHAPTER 1: SECURITY REPORTS
format), IP, User name path, Site, bandwidth Size (e.g. kB), and URL, as in the sample below:
Fig. 6:1-17 Sample PDF for detail Security Report
At the end of the report, the Total Items display for all records.
M86 SECURITY USER GUIDE 365
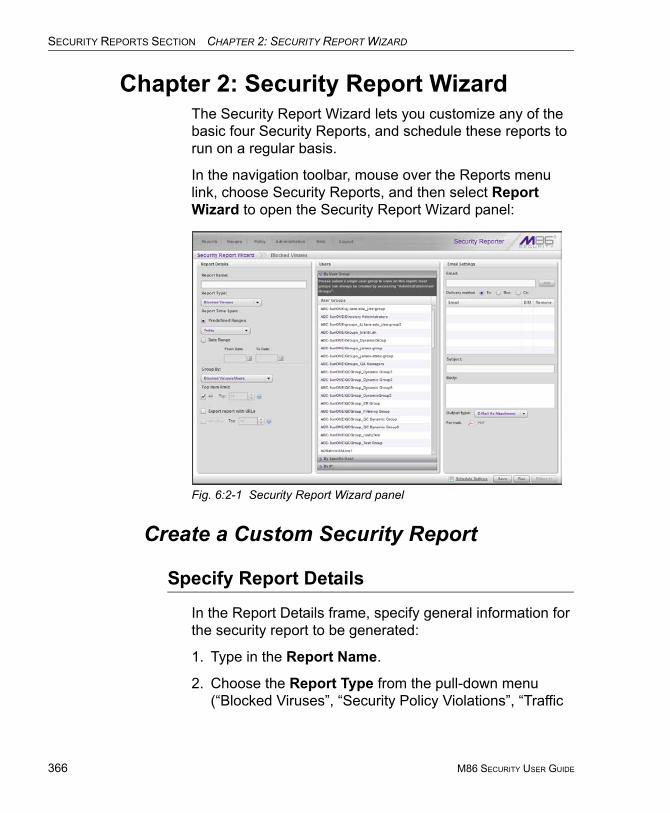
SECURITY REPORTS SECTION CHAPTER 2: SECURITY REPORT WIZARD
366
Chapter 2: Security Report WizardThe Security Report Wizard lets you customize any of the basic four Security Reports, and schedule these reports to run on a regular basis.
In the navigation toolbar, mouse over the Reports menu link, choose Security Reports, and then select Report Wizard to open the Security Report Wizard panel:
Fig. 6:2-1 Security Report Wizard panel
Create a Custom Security Report
Specify Report Details
In the Report Details frame, specify general information for the security report to be generated:
1. Type in the Report Name.
2. Choose the Report Type from the pull-down menu (“Blocked Viruses”, “Security Policy Violations”, “Traffic
M86 SECURITY USER GUIDE
SECURITY REPORTS SECTION CHAPTER 2: SECURITY REPORT WIZARD
Analysis”, “Rule Transactions”); by default “Blocked Viruses” displays.
3. Specify the Report Time Span by choosing one of two options:
• Predefined Ranges - If selecting this default option, make a choice from the pull-down menu: “Today” (default), “Month to Date”, “Year to Date”, “Yesterday”, “Month to Yesterday”, “Year to Yesterday”, “Last Week”, “Last Weekend”, “Current Week”, “Last Month”.
• Date Range - If selecting this option, use the calendar icons to set the date range.
4. If necessary, specify the Group By report type selection from the available choices in the pull-down menu.
5. Indicate the Top item limit to be included in the report; by default “All” is selected. To modify this selection, uncheck this box and specify the Top number of items.
6. By default, Export report with URLs is de-selected. Click this checkbox to select this option, and then specify the number of URLs to export:
• All URLs - Check this checkbox to export all URLs• Top - Specify the number of top URLs to be exported
Select Users
In the Users frame, select one of the accordions and indi-cate criteria to include in the report to be generated:
• By User Group - If selecting this option, choose the User Group for your report query results.
• By Specific User - If selecting this option, enter the end user name—using the ‘%’ wildcard to return multiple usernames—and then click Preview Users to display query results in the list box below.
M86 SECURITY USER GUIDE 367
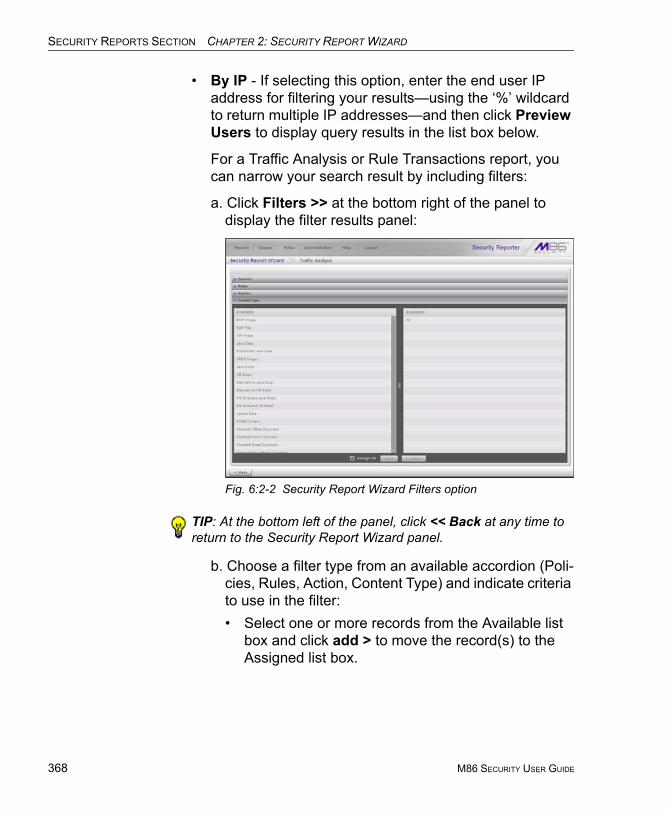
SECURITY REPORTS SECTION CHAPTER 2: SECURITY REPORT WIZARD
368
• By IP - If selecting this option, enter the end user IP address for filtering your results—using the ‘%’ wildcard to return multiple IP addresses—and then click Preview Users to display query results in the list box below.
For a Traffic Analysis or Rule Transactions report, you can narrow your search result by including filters:
a. Click Filters >> at the bottom right of the panel to display the filter results panel:
Fig. 6:2-2 Security Report Wizard Filters option
TIP: At the bottom left of the panel, click << Back at any time to return to the Security Report Wizard panel.
b. Choose a filter type from an available accordion (Poli-cies, Rules, Action, Content Type) and indicate criteria to use in the filter:• Select one or more records from the Available list
box and click add > to move the record(s) to the Assigned list box.
M86 SECURITY USER GUIDE
SECURITY REPORTS SECTION CHAPTER 2: SECURITY REPORT WIZARD
TIPS: Multiple records can be selected by clicking each record while pressing the Ctrl key on your keyboard. Blocks of records can be selected by clicking the first record, and then pressing the Shift key on your keyboard while clicking the last record.
To remove the record(s), select the record(s) from the Assigned list box and click < remove.
• Click the “Assign All” checkbox to select all records and grey-out the panel.
c. Click << Back to return to the Security Report Wizard panel.
Specify Email Settings
In the Email Settings frame:
1. Enter at least one Email address and then click Add to include the email address in the list box below.
2. Specify the Delivery method for the email address: “To” (default), “Bcc”, or “Cc”.
TIP: To remove an email address, click the “X” in the Remove column of the list box.
NOTE: Follow the above procedures for each email to be added.
3. Type in the Subject for the email message.
4. If you wish, enter text to be included in the Body of the message.
5. Specify the Output type to be used for the PDF report file in the email: “E-Mail As Attachment” or “E-Mail As Link”.
M86 SECURITY USER GUIDE 369
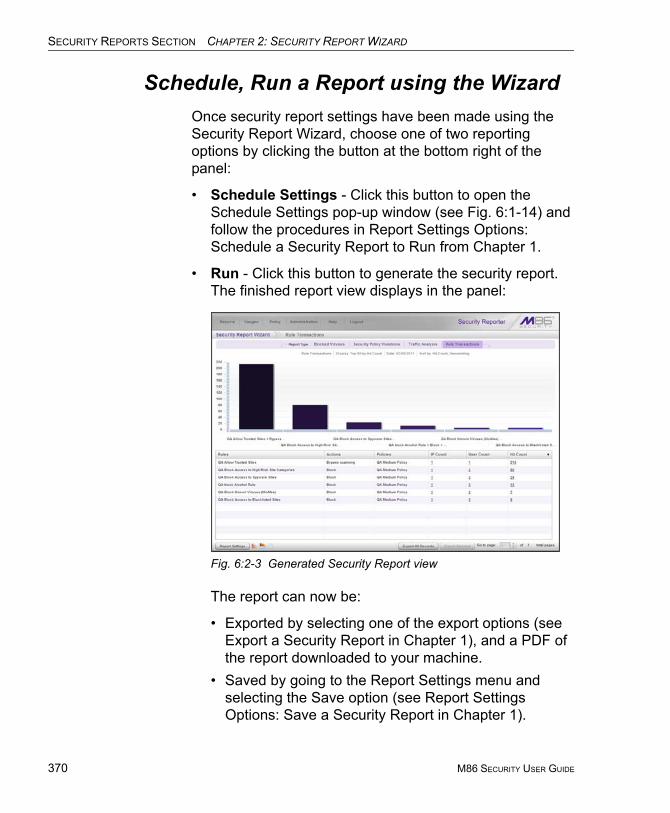
SECURITY REPORTS SECTION CHAPTER 2: SECURITY REPORT WIZARD
370
Schedule, Run a Report using the WizardOnce security report settings have been made using the Security Report Wizard, choose one of two reporting options by clicking the button at the bottom right of the panel:
• Schedule Settings - Click this button to open the Schedule Settings pop-up window (see Fig. 6:1-14) and follow the procedures in Report Settings Options: Schedule a Security Report to Run from Chapter 1.
• Run - Click this button to generate the security report. The finished report view displays in the panel:
Fig. 6:2-3 Generated Security Report view
The report can now be:
• Exported by selecting one of the export options (see Export a Security Report in Chapter 1), and a PDF of the report downloaded to your machine.
• Saved by going to the Report Settings menu and selecting the Save option (see Report Settings Options: Save a Security Report in Chapter 1).
M86 SECURITY USER GUIDE
APPENDICES SECTION APPENDIX A
APPENDICES SECTION
Appendix A
Disable Pop-up Blocking SoftwareAn administrator with pop-up blocking software installed on his/her workstation will need to disable pop-up blocking in order to use the System Configuration console.
This appendix provides instructions on how to disable pop-up blocking software for the supported browser types (Internet Explorer, Firefox, Chrome, and Safari) and the following products: Yahoo! Toolbar, Google Toolbar, AdwareSafe, and Windows XP Service Pack 2 (SP2).
Browser Pop-up Blockers
Internet Explorer 7.0 and 8.0
In the Internet Explorer toolbar, navigate to Tools > Pop-up Blocker.
If you wish to disable all pop-up blocking, be sure the Turn Off Pop-up Blocker selection is enabled.
If you wish to block all pop-ups except those from URLs you choose to whitelist, enable Turn On Pop-up Blocker and then navigate to Pop-up Blocker Settings, adding the SR's URL in the Allowed sites list box.
M86 SECURITY USER GUIDE 371
APPENDICES SECTION APPENDIX A
372
Mozilla Firefox 3.6
1. In the Firefox toolbar, navigate to Tools > Options... > Content tab.
2. Uncheck the “Block pop-up windows” checkbox, or click Exceptions... and then add the SR's URL in the Allowed Sites - Pop-ups window.
Google Chrome 9.0
1. In the Chrome toolbar, navigate to the ‘wrench’ icon > Options > Under the Hood tab.
2. Click Content settings... > Pop-ups.
3. Choose either:
• Allow all sites to show pop-upsor• Do not allow any site to show pop-ups (recom-
mended) > Exceptions..., adding the SR's URL to the Pop-up Exceptions box.
Safari 4.0 and 5.0
In the Safari toolbar, navigate to the Safari menu and de-select “Block Pop-Up Windows” to disable pop-up blocking.
M86 SECURITY USER GUIDE
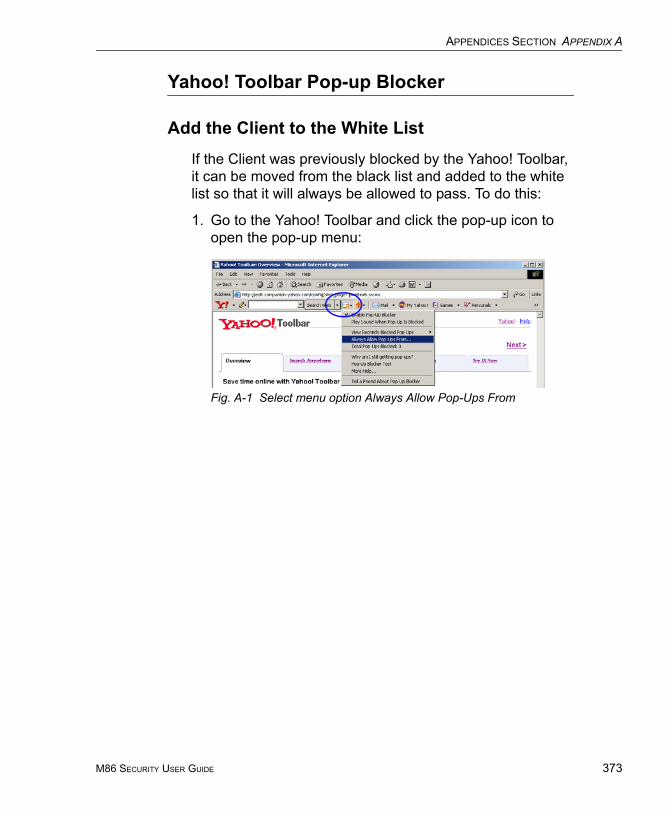
APPENDICES SECTION APPENDIX A
Yahoo! Toolbar Pop-up Blocker
Add the Client to the White List
If the Client was previously blocked by the Yahoo! Toolbar, it can be moved from the black list and added to the white list so that it will always be allowed to pass. To do this:
1. Go to the Yahoo! Toolbar and click the pop-up icon to open the pop-up menu:
Fig. A-1 Select menu option Always Allow Pop-Ups From
M86 SECURITY USER GUIDE 373
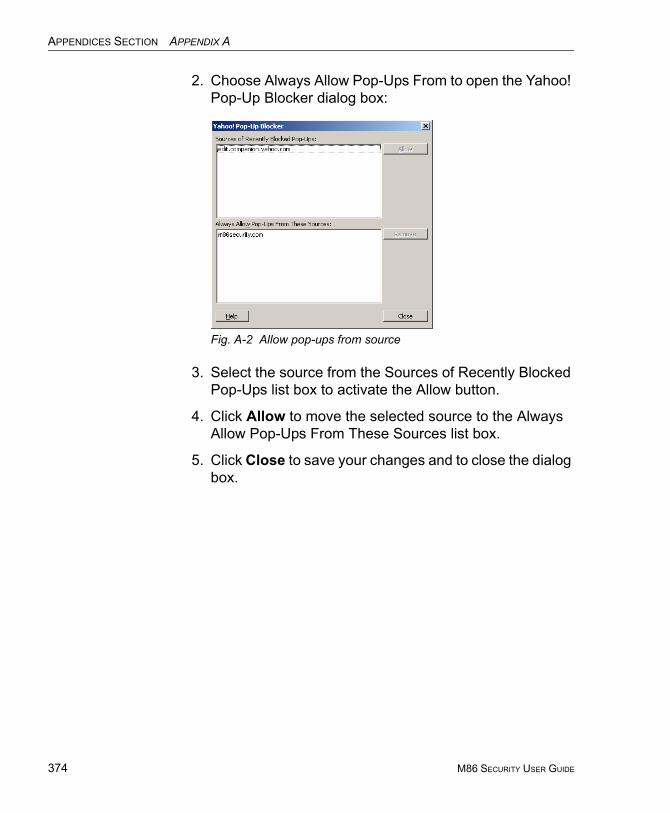
APPENDICES SECTION APPENDIX A
374
2. Choose Always Allow Pop-Ups From to open the Yahoo! Pop-Up Blocker dialog box:
Fig. A-2 Allow pop-ups from source
3. Select the source from the Sources of Recently Blocked Pop-Ups list box to activate the Allow button.
4. Click Allow to move the selected source to the Always Allow Pop-Ups From These Sources list box.
5. Click Close to save your changes and to close the dialog box.
M86 SECURITY USER GUIDE
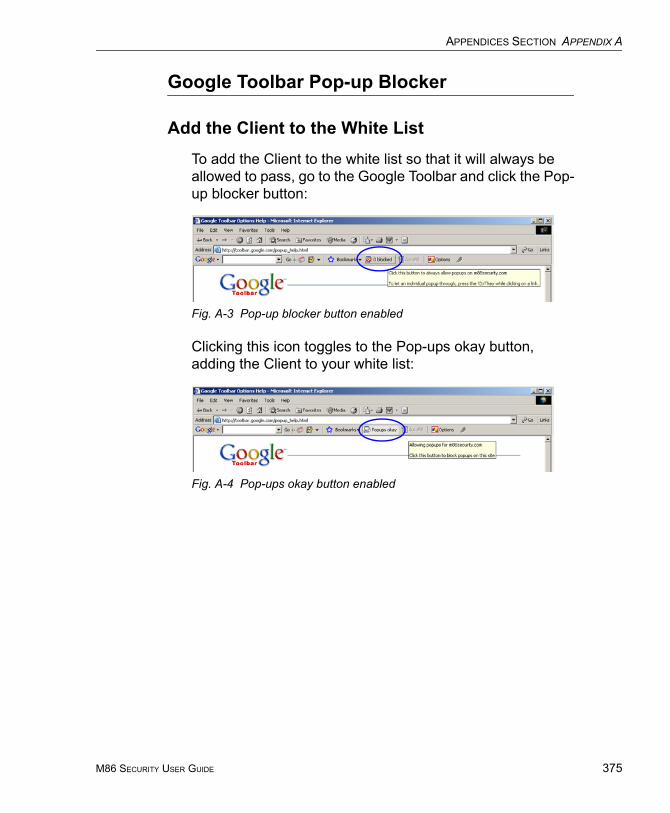
APPENDICES SECTION APPENDIX A
Google Toolbar Pop-up Blocker
Add the Client to the White List
To add the Client to the white list so that it will always be allowed to pass, go to the Google Toolbar and click the Pop-up blocker button:
Fig. A-3 Pop-up blocker button enabled
Clicking this icon toggles to the Pop-ups okay button, adding the Client to your white list:
Fig. A-4 Pop-ups okay button enabled
M86 SECURITY USER GUIDE 375
APPENDICES SECTION APPENDIX A
376
AdwareSafe Pop-up Blocker
Disable Pop-up Blocking
AdwareSafe’s SearchSafe toolbar lets you toggle between enabling pop-up blocking (# popups blocked) and disabling pop-up blocking (Popup protection off) by clicking the pop-up icon.
1. In the IE browser, go to the SearchSafe toolbar and click the icon for # popups blocked to toggle to Popup protec-tion off. This action turns off pop-up blocking.
2. After you are finished using the Client, go back to the SearchSafe toolbar and click the icon for Popup protec-tion off to toggle back to # popups blocked. This action turns on pop-up blocking again.
M86 SECURITY USER GUIDE
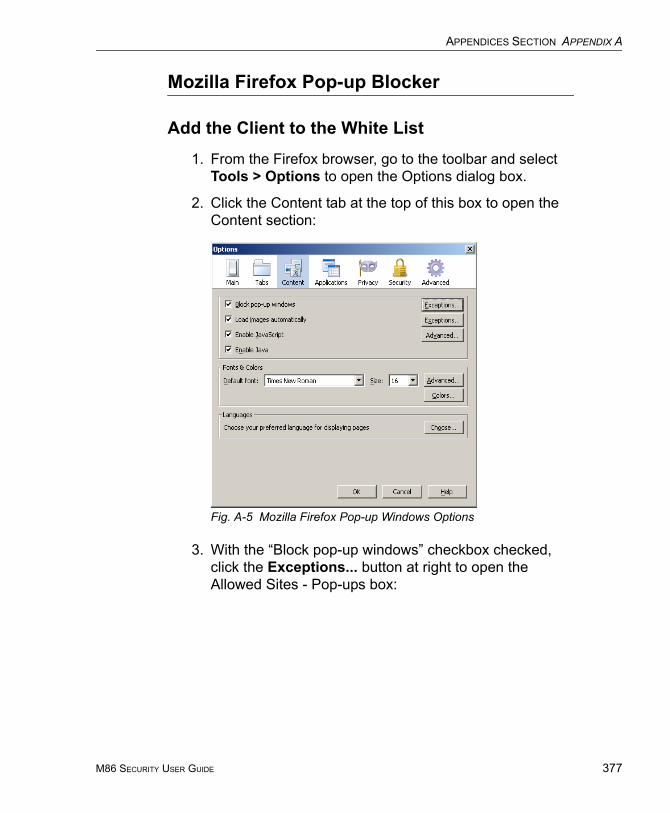
APPENDICES SECTION APPENDIX A
Mozilla Firefox Pop-up Blocker
Add the Client to the White List
1. From the Firefox browser, go to the toolbar and select Tools > Options to open the Options dialog box.
2. Click the Content tab at the top of this box to open the Content section:
Fig. A-5 Mozilla Firefox Pop-up Windows Options
3. With the “Block pop-up windows” checkbox checked, click the Exceptions... button at right to open the Allowed Sites - Pop-ups box:
M86 SECURITY USER GUIDE 377
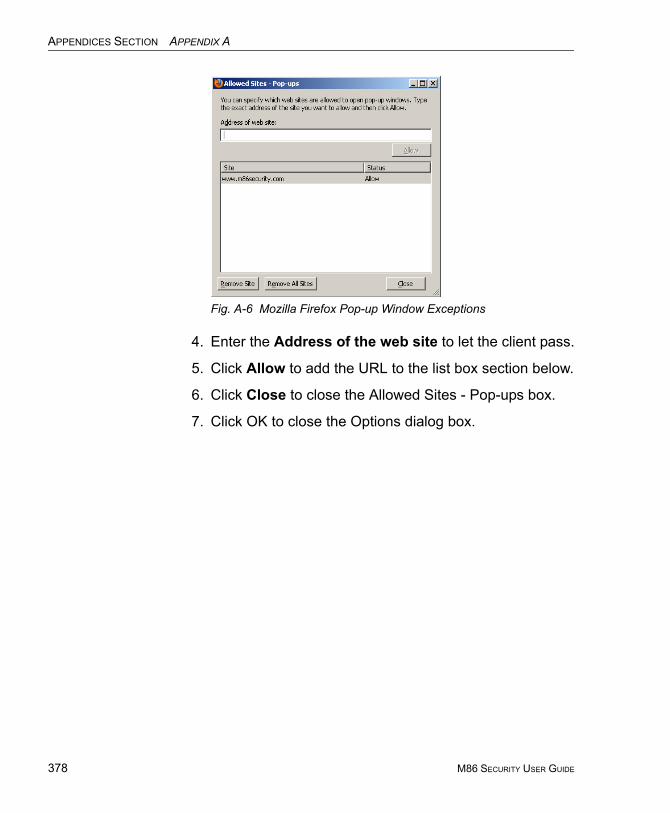
APPENDICES SECTION APPENDIX A
378
Fig. A-6 Mozilla Firefox Pop-up Window Exceptions
4. Enter the Address of the web site to let the client pass.
5. Click Allow to add the URL to the list box section below.
6. Click Close to close the Allowed Sites - Pop-ups box.
7. Click OK to close the Options dialog box.
M86 SECURITY USER GUIDE
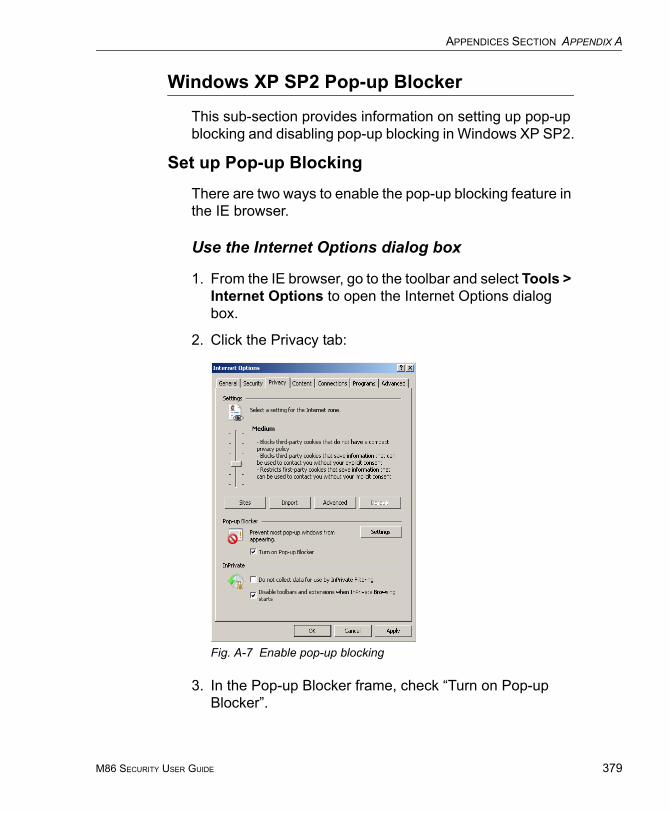
APPENDICES SECTION APPENDIX A
Windows XP SP2 Pop-up Blocker
This sub-section provides information on setting up pop-up blocking and disabling pop-up blocking in Windows XP SP2.
Set up Pop-up Blocking
There are two ways to enable the pop-up blocking feature in the IE browser.
Use the Internet Options dialog box
1. From the IE browser, go to the toolbar and select Tools > Internet Options to open the Internet Options dialog box.
2. Click the Privacy tab:
Fig. A-7 Enable pop-up blocking
3. In the Pop-up Blocker frame, check “Turn on Pop-up Blocker”.
M86 SECURITY USER GUIDE 379
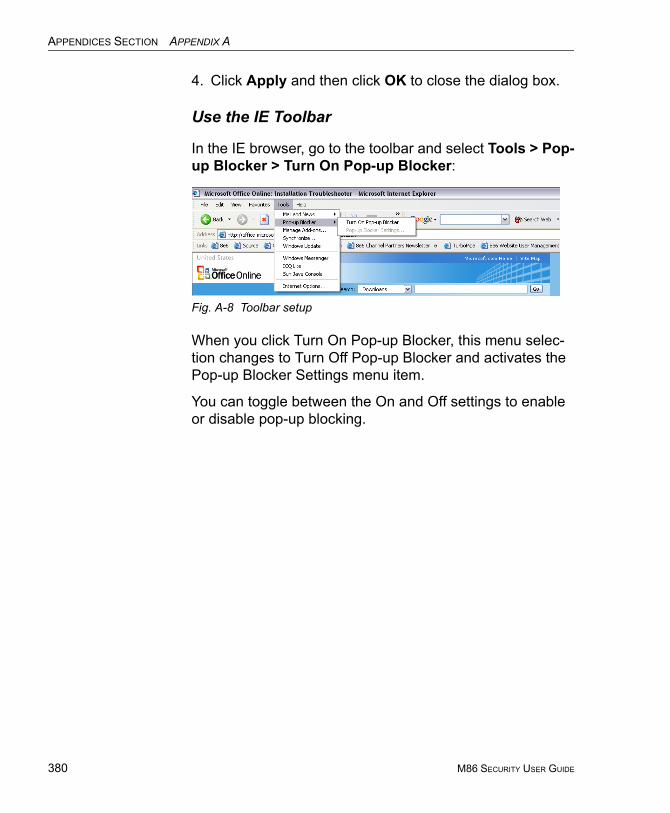
APPENDICES SECTION APPENDIX A
380
4. Click Apply and then click OK to close the dialog box.
Use the IE Toolbar
In the IE browser, go to the toolbar and select Tools > Pop-up Blocker > Turn On Pop-up Blocker:
Fig. A-8 Toolbar setup
When you click Turn On Pop-up Blocker, this menu selec-tion changes to Turn Off Pop-up Blocker and activates the Pop-up Blocker Settings menu item.
You can toggle between the On and Off settings to enable or disable pop-up blocking.
M86 SECURITY USER GUIDE
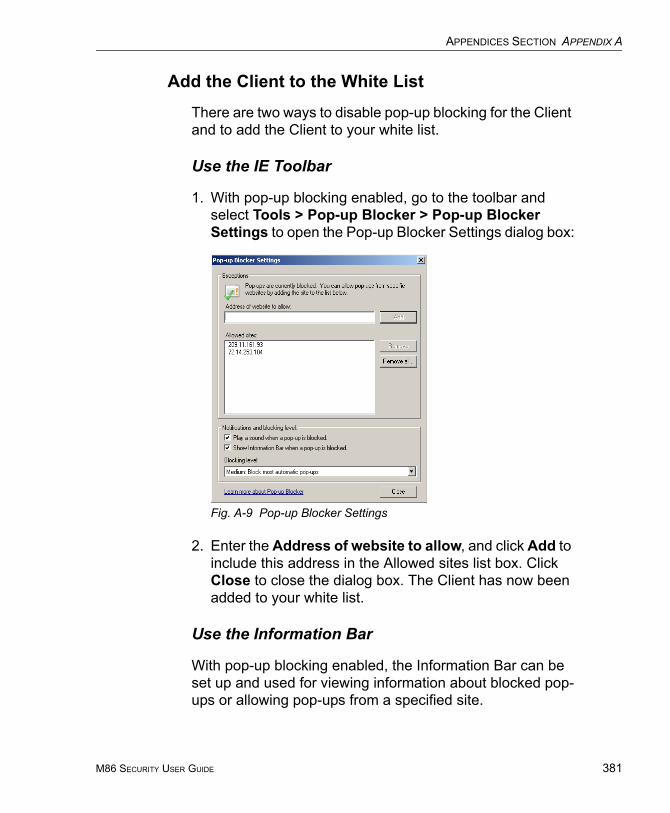
APPENDICES SECTION APPENDIX A
Add the Client to the White List
There are two ways to disable pop-up blocking for the Client and to add the Client to your white list.
Use the IE Toolbar
1. With pop-up blocking enabled, go to the toolbar and select Tools > Pop-up Blocker > Pop-up Blocker Settings to open the Pop-up Blocker Settings dialog box:
Fig. A-9 Pop-up Blocker Settings
2. Enter the Address of website to allow, and click Add to include this address in the Allowed sites list box. Click Close to close the dialog box. The Client has now been added to your white list.
Use the Information Bar
With pop-up blocking enabled, the Information Bar can be set up and used for viewing information about blocked pop-ups or allowing pop-ups from a specified site.
M86 SECURITY USER GUIDE 381
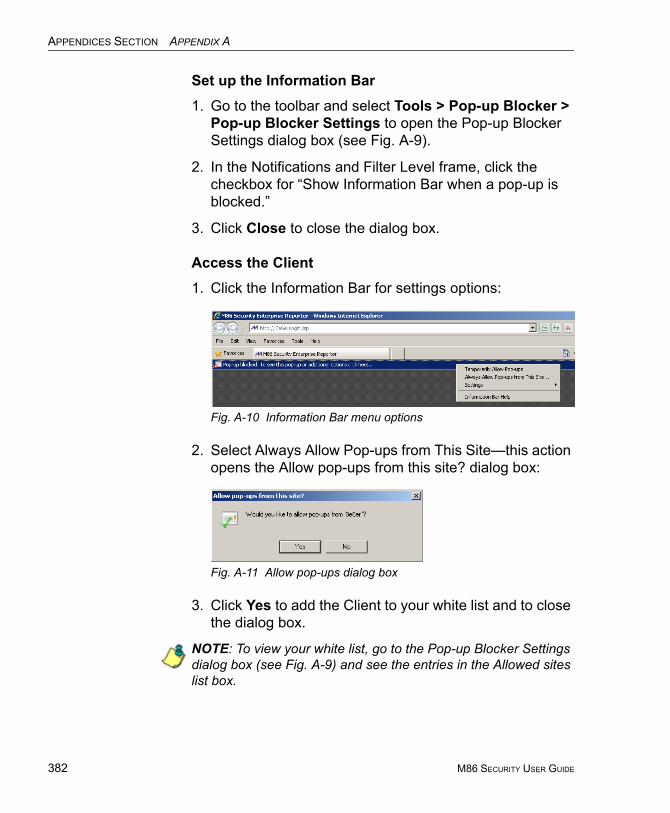
APPENDICES SECTION APPENDIX A
382
Set up the Information Bar1. Go to the toolbar and select Tools > Pop-up Blocker >
Pop-up Blocker Settings to open the Pop-up Blocker Settings dialog box (see Fig. A-9).
2. In the Notifications and Filter Level frame, click the checkbox for “Show Information Bar when a pop-up is blocked.”
3. Click Close to close the dialog box.
Access the Client1. Click the Information Bar for settings options:
Fig. A-10 Information Bar menu options
2. Select Always Allow Pop-ups from This Site—this action opens the Allow pop-ups from this site? dialog box:
Fig. A-11 Allow pop-ups dialog box
3. Click Yes to add the Client to your white list and to close the dialog box.
NOTE: To view your white list, go to the Pop-up Blocker Settings dialog box (see Fig. A-9) and see the entries in the Allowed sites list box.
M86 SECURITY USER GUIDE

APPENDICES SECTION APPENDIX B
Appendix B
RAID and Hardware MaintenanceThis appendix is divided into three parts: Hardware Compo-nents, Server Interface, and Troubleshooting—in the event of a failure in one of the drives, power supplies, or fans.
NOTE: As part of the ongoing maintenance procedure for your RAID server, M86 recommends that you always have a spare drive and spare power supply on hand.
Contact M86 Technical Support for replacement hard drives and power supplies.
Part 1: Hardware Components
The chassis of each model consists of the following compo-nents:
NOTES: If troubleshooting models 705 and 735, please visit IBM’s Systems Support Web site at http://www.ibm.com/systems/support/ . These models use IBM System x3620 M3 hardware, so your query should specify IBM System x > System x3620 M3 .
IBM System x3620 M3 Type 7376 Installation and User's Guide contains instructions on viewing and using LED indicators and buttons on SR models 705 and 735. As of September 2010, this document was made available at http://www-947.ibm.com/support/entry/portal/docdisplay?brand=5000008&lndocid= MIGR-5084233
300 Model 500 Models 700, 730 Models
2 hard drives 4 hard drives 4 hard drives
1 power supply 1 power supply 2 power supplies
1 cooling fan 3 cooling fans 4 cooling fans
M86 SECURITY USER GUIDE 383
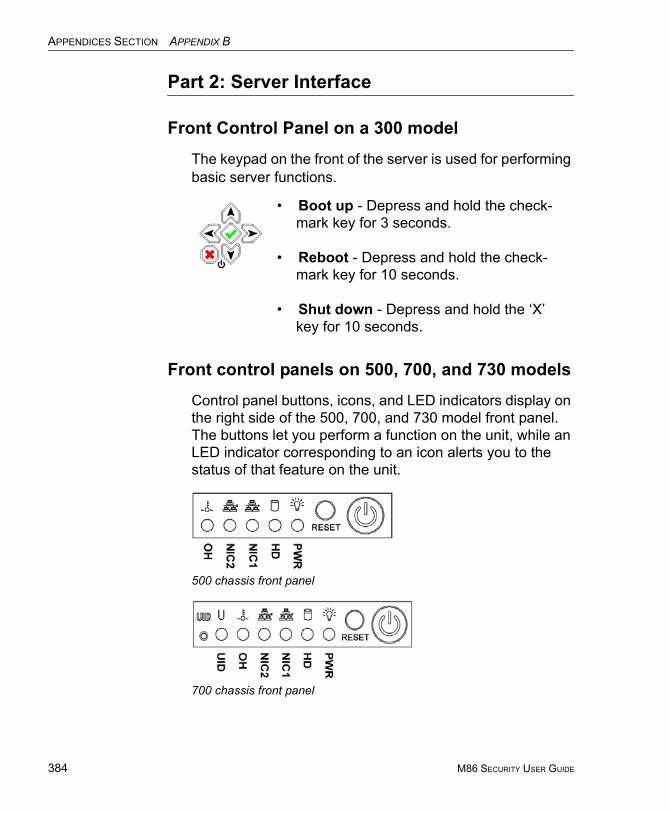
APPENDICES SECTION APPENDIX B
384
Part 2: Server Interface
Front Control Panel on a 300 model
The keypad on the front of the server is used for performing basic server functions.
Front control panels on 500, 700, and 730 models
Control panel buttons, icons, and LED indicators display on the right side of the 500, 700, and 730 model front panel. The buttons let you perform a function on the unit, while an LED indicator corresponding to an icon alerts you to the status of that feature on the unit.
• Boot up - Depress and hold the check-mark key for 3 seconds.
• Reboot - Depress and hold the check-mark key for 10 seconds.
• Shut down - Depress and hold the ‘X’ key for 10 seconds.
500 chassis front panel
700 chassis front panel
M86 SECURITY USER GUIDE
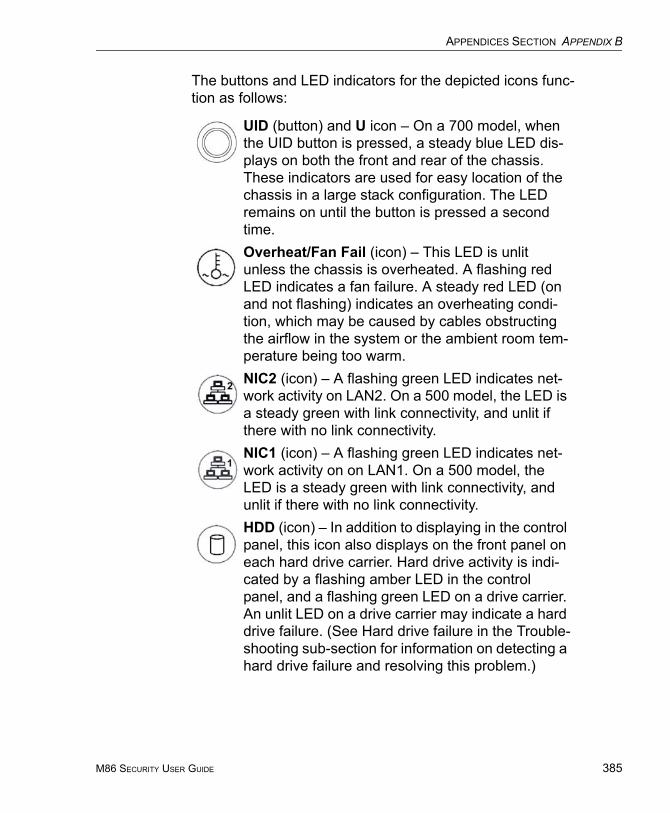
APPENDICES SECTION APPENDIX B
The buttons and LED indicators for the depicted icons func-tion as follows:
UID (button) and U icon – On a 700 model, when the UID button is pressed, a steady blue LED dis-plays on both the front and rear of the chassis. These indicators are used for easy location of the chassis in a large stack configuration. The LED remains on until the button is pressed a second time.Overheat/Fan Fail (icon) – This LED is unlit unless the chassis is overheated. A flashing red LED indicates a fan failure. A steady red LED (on and not flashing) indicates an overheating condi-tion, which may be caused by cables obstructing the airflow in the system or the ambient room tem-perature being too warm.NIC2 (icon) – A flashing green LED indicates net-work activity on LAN2. On a 500 model, the LED is a steady green with link connectivity, and unlit if there with no link connectivity.NIC1 (icon) – A flashing green LED indicates net-work activity on on LAN1. On a 500 model, the LED is a steady green with link connectivity, and unlit if there with no link connectivity.HDD (icon) – In addition to displaying in the control panel, this icon also displays on the front panel on each hard drive carrier. Hard drive activity is indi-cated by a flashing amber LED in the control panel, and a flashing green LED on a drive carrier. An unlit LED on a drive carrier may indicate a hard drive failure. (See Hard drive failure in the Trouble-shooting sub-section for information on detecting a hard drive failure and resolving this problem.)
M86 SECURITY USER GUIDE 385
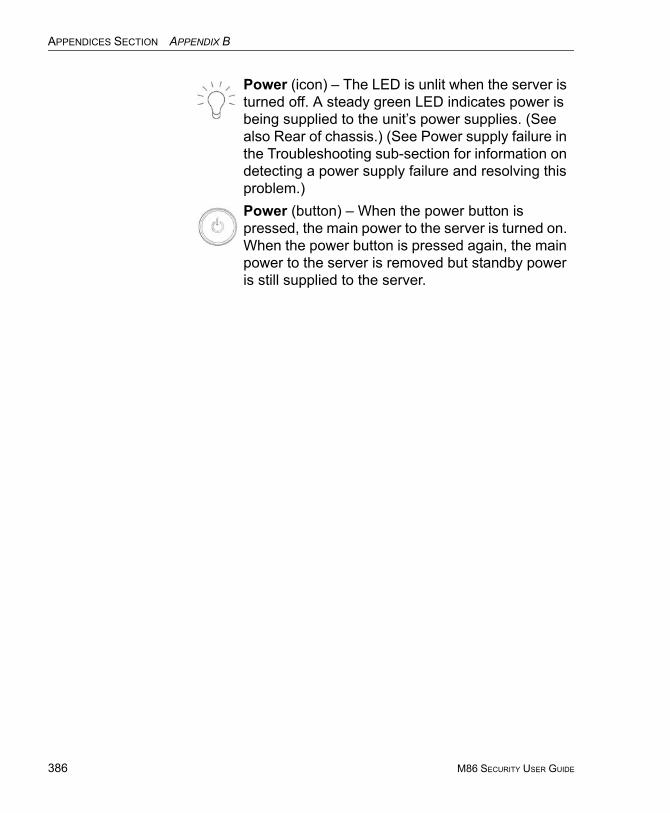
APPENDICES SECTION APPENDIX B
386
Power (icon) – The LED is unlit when the server is turned off. A steady green LED indicates power is being supplied to the unit’s power supplies. (See also Rear of chassis.) (See Power supply failure in the Troubleshooting sub-section for information on detecting a power supply failure and resolving this problem.)Power (button) – When the power button is pressed, the main power to the server is turned on. When the power button is pressed again, the main power to the server is removed but standby power is still supplied to the server.
M86 SECURITY USER GUIDE
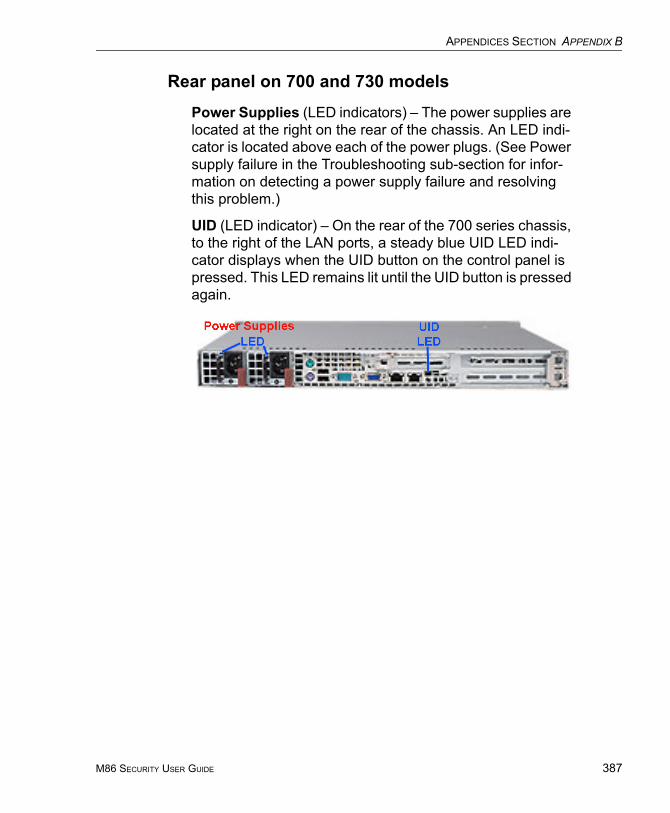
APPENDICES SECTION APPENDIX B
Rear panel on 700 and 730 models
Power Supplies (LED indicators) – The power supplies are located at the right on the rear of the chassis. An LED indi-cator is located above each of the power plugs. (See Power supply failure in the Troubleshooting sub-section for infor-mation on detecting a power supply failure and resolving this problem.)
UID (LED indicator) – On the rear of the 700 series chassis, to the right of the LAN ports, a steady blue UID LED indi-cator displays when the UID button on the control panel is pressed. This LED remains lit until the UID button is pressed again.
M86 SECURITY USER GUIDE 387

APPENDICES SECTION APPENDIX B
388
Part 3: Troubleshooting
The text in this section explains how the server alerts the administrator to a failed component, and what to do in the event of a failure.
Hard drive failure
Step 1: Review the notification email
If a hard drive fails, a notification email is sent to the admin-istrator of the server. This email identifies the failed hard drive by its number (HD ‘X’). Upon receiving this alert, the administrator should verify the status of the drives by first going to the Hardware Failure Detection screen in the System Configuration console.
WARNING: Do not attempt to remove any of the drives from the unit at this time. Verification of the failed drive should first be made in the System Configuration console before proceeding, as data on the server will be lost in the event that the wrong drive is removed from the unit.
Step 2: Verify the failed drive in the Admin console
The Hardware Failure Detection screen in the System Configuration console is accessible via the Server > Hard-ware Failure Detection menu selection:
M86 SECURITY USER GUIDE
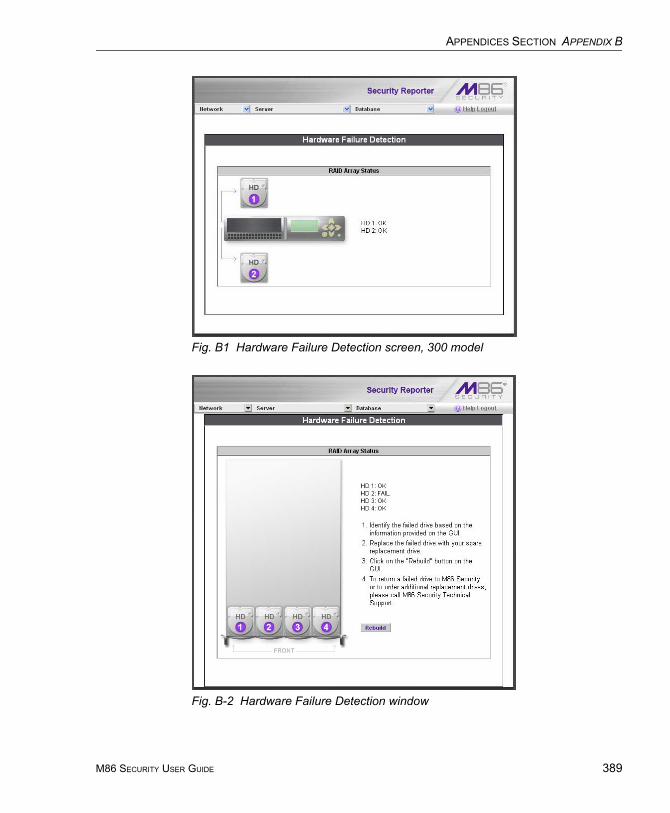
APPENDICES SECTION APPENDIX B
Fig. B1 Hardware Failure Detection screen, 300 model
Fig. B-2 Hardware Failure Detection window
M86 SECURITY USER GUIDE 389

APPENDICES SECTION APPENDIX B
390
Fig. B-3 Hardware Failure Detection screen, 705 or 735 IBM model
The Hardware Failure Detection window displays the current RAID Array Status for all the hard drives (HD) at the right side of the window.
Normally, when both hard drives are functioning without failure, the text “OK” displays to the right of the hard drive number, and no other text displays in the window.
However, if a hard drive has failed, the message “FAIL” displays to the right of the hard drive number.
Before taking any action in this window, proceed to Step 3.
NOTE: For SR models 705 and 735, please consult IBM System x3620 M3 Type 7376 Installation and User's Guide for hard drive replacement instructions.
M86 SECURITY USER GUIDE
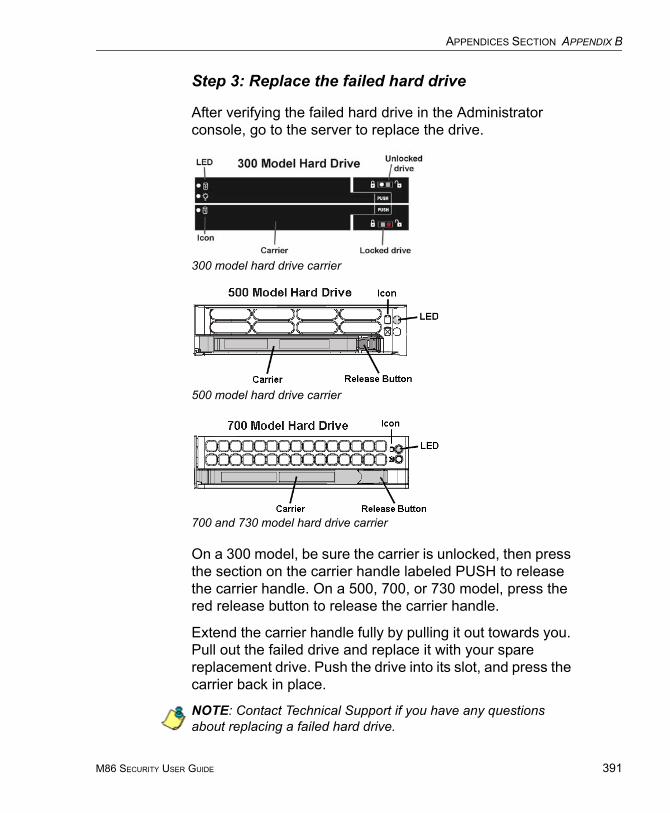
APPENDICES SECTION APPENDIX B
Step 3: Replace the failed hard drive
After verifying the failed hard drive in the Administrator console, go to the server to replace the drive.
On a 300 model, be sure the carrier is unlocked, then press the section on the carrier handle labeled PUSH to release the carrier handle. On a 500, 700, or 730 model, press the red release button to release the carrier handle.
Extend the carrier handle fully by pulling it out towards you. Pull out the failed drive and replace it with your spare replacement drive. Push the drive into its slot, and press the carrier back in place.
NOTE: Contact Technical Support if you have any questions about replacing a failed hard drive.
500 model hard drive carrier
700 and 730 model hard drive carrier
300 model hard drive carrier
M86 SECURITY USER GUIDE 391
APPENDICES SECTION APPENDIX B
392
Step 4: Rebuild the hard drive
Once the failed hard drive has been replaced, return to the Hardware Failure Detection screen in the System Configu-ration console, and click Rebuild to proceed with the rebuild process.
WARNING: When the RAID array reconstruction process begins, the System Configuration console will close and the hard drive will become inaccessible.
Step 5: Contact Technical Support
Contact Technical Support to order a new replacement hard drive and for instructions on returning your failed hard drive to M86.
Power supply failure
Step 1: Verify the power supply has failed
The administrator of the server is alerted to a power supply failure on the 500, 700, and 730 chassis by an audible alarm and an amber power supply LED—or an unlit LED—on the front of the chassis.
NOTES: A steady amber power supply LED on a 500, 700, or 730 chassis also may indicate a disconnected or loose power supply cord. Verify that the power supply cord is plugged in completely before removing a power supply.
For SR models 705 and 735, please consult IBM System x3620 M3 Type 7376 Installation and User's Guide for power supply replacement instructions.
M86 SECURITY USER GUIDE
APPENDICES SECTION APPENDIX B
Step 2: Contact Technical Support
Contact Technical Support for assistance with installing the replacement power supply, or to order a new replacement power supply, or for instructions on returning your failed power supply to M86.
If you have a 700 or 730 model and wish to replace this hot swappable power supply unit yourself, proceed to Step 3.
WARNING: Be sure the correct failed power supply has been identified. Removing the wrong power supply will cause the system to crash.
Step 3: Unplug the power cord
To prevent electrical shock to yourself and damage to the unit, unplug the power cord from the failed 700 series power supply module. Proceed to Step 4.
Step 4: Replace a failed hot swap power supply
Remove the failed 700 or 730 power supply by locating the red release tab and pushing it to the left (1), then pulling the curved metal handle on the power supply module towards you (2).
M86 SECURITY USER GUIDE 393
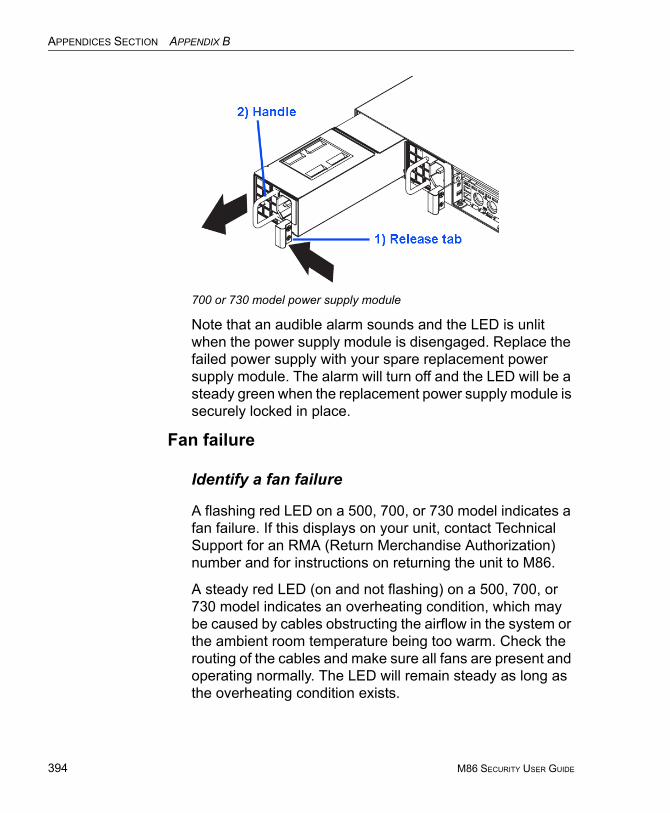
APPENDICES SECTION APPENDIX B
394
Note that an audible alarm sounds and the LED is unlit when the power supply module is disengaged. Replace the failed power supply with your spare replacement power supply module. The alarm will turn off and the LED will be a steady green when the replacement power supply module is securely locked in place.
Fan failure
Identify a fan failure
A flashing red LED on a 500, 700, or 730 model indicates a fan failure. If this displays on your unit, contact Technical Support for an RMA (Return Merchandise Authorization) number and for instructions on returning the unit to M86.
A steady red LED (on and not flashing) on a 500, 700, or 730 model indicates an overheating condition, which may be caused by cables obstructing the airflow in the system or the ambient room temperature being too warm. Check the routing of the cables and make sure all fans are present and operating normally. The LED will remain steady as long as the overheating condition exists.
700 or 730 model power supply module
M86 SECURITY USER GUIDE

APPENDICES SECTION APPENDIX C
Appendix C
Evaluation ModeBy default, the SR is set to evaluation mode. This appendix explains how to use the SR in evaluation mode, and how to register the SR to function in registered mode.
Report Manager Banner
In evaluation mode, the Report Manager banner displays ‘EVALUATION MODE’ beneath the Security Reporter name/link:
Fig. C-1 Server Information panel in evaluation mode
Mouse over the ‘EVALUATION MODE’ link to display a definition of ‘Evaluation Mode’. Click this link to launch the SR Server Status screen of the System Configuration administrator console and Status pop-up box (see Fig. C-2) as described in the next sub-section.
NOTE: The System Configuration administrator console is only available to users with permissions set up to access it.
M86 SECURITY USER GUIDE 395
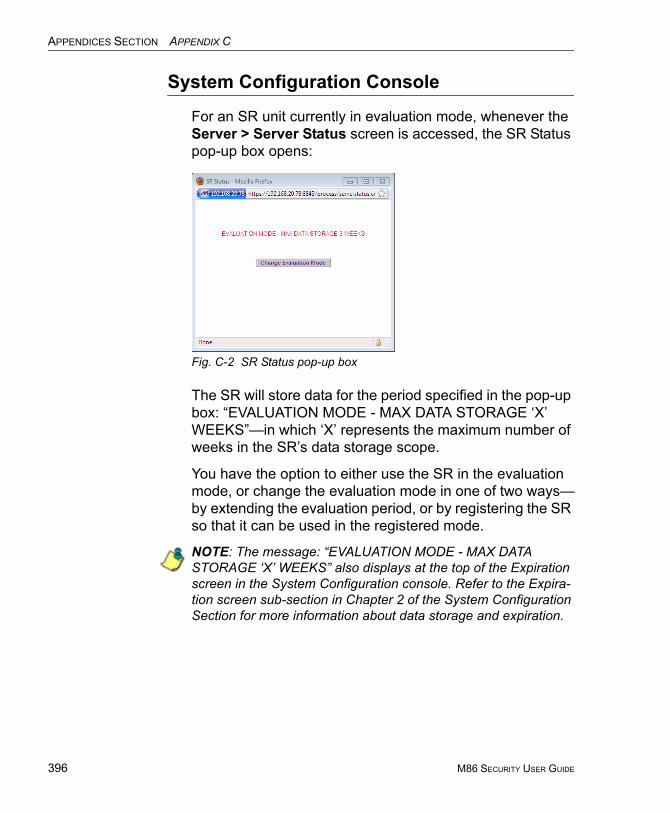
APPENDICES SECTION APPENDIX C
396
System Configuration Console
For an SR unit currently in evaluation mode, whenever the Server > Server Status screen is accessed, the SR Status pop-up box opens:
Fig. C-2 SR Status pop-up box
The SR will store data for the period specified in the pop-up box: “EVALUATION MODE - MAX DATA STORAGE ‘X’ WEEKS”—in which ‘X’ represents the maximum number of weeks in the SR’s data storage scope.
You have the option to either use the SR in the evaluation mode, or change the evaluation mode in one of two ways—by extending the evaluation period, or by registering the SR so that it can be used in the registered mode.
NOTE: The message: “EVALUATION MODE - MAX DATA STORAGE ‘X’ WEEKS” also displays at the top of the Expiration screen in the System Configuration console. Refer to the Expira-tion screen sub-section in Chapter 2 of the System Configuration Section for more information about data storage and expiration.
M86 SECURITY USER GUIDE
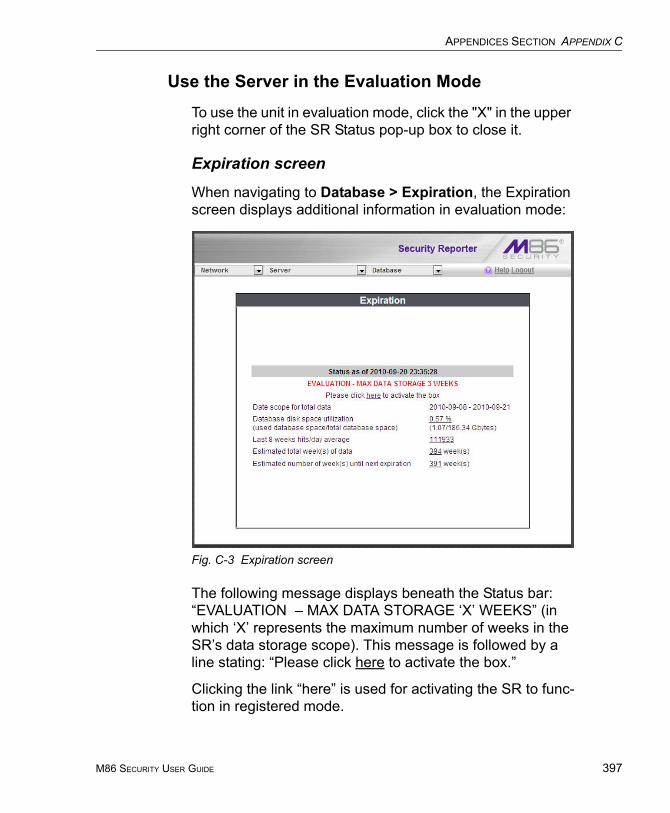
APPENDICES SECTION APPENDIX C
Use the Server in the Evaluation Mode
To use the unit in evaluation mode, click the "X" in the upper right corner of the SR Status pop-up box to close it.
Expiration screen
When navigating to Database > Expiration, the Expiration screen displays additional information in evaluation mode:
Fig. C-3 Expiration screen
The following message displays beneath the Status bar: “EVALUATION – MAX DATA STORAGE ‘X’ WEEKS” (in which ‘X’ represents the maximum number of weeks in the SR’s data storage scope). This message is followed by a line stating: “Please click here to activate the box.”
Clicking the link “here” is used for activating the SR to func-tion in registered mode.
M86 SECURITY USER GUIDE 397
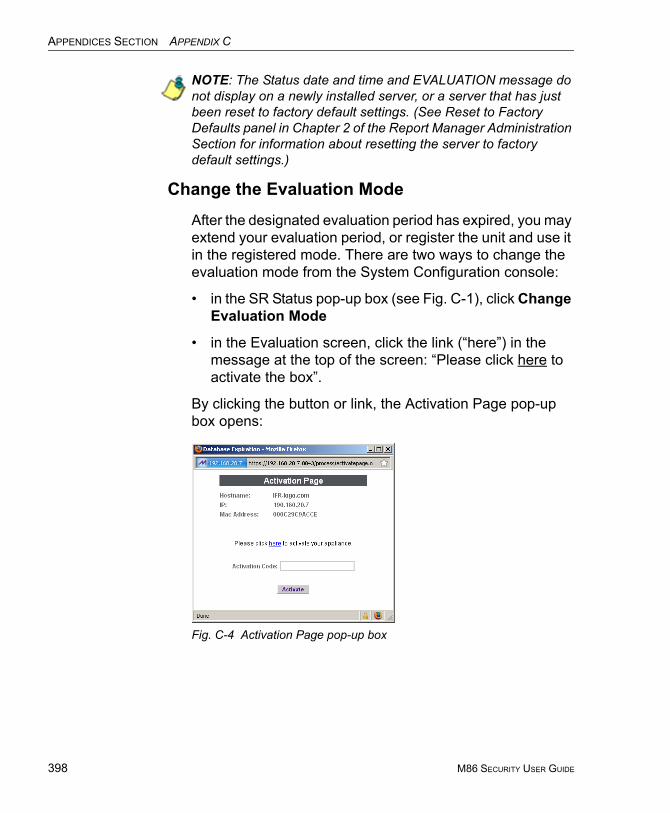
APPENDICES SECTION APPENDIX C
398
NOTE: The Status date and time and EVALUATION message do not display on a newly installed server, or a server that has just been reset to factory default settings. (See Reset to Factory Defaults panel in Chapter 2 of the Report Manager Administration Section for information about resetting the server to factory default settings.)
Change the Evaluation Mode
After the designated evaluation period has expired, you may extend your evaluation period, or register the unit and use it in the registered mode. There are two ways to change the evaluation mode from the System Configuration console:
• in the SR Status pop-up box (see Fig. C-1), click Change Evaluation Mode
• in the Evaluation screen, click the link (“here”) in the message at the top of the screen: “Please click here to activate the box”.
By clicking the button or link, the Activation Page pop-up box opens:
Fig. C-4 Activation Page pop-up box
M86 SECURITY USER GUIDE
APPENDICES SECTION APPENDIX C
Activation Page
1. In the Activation Page pop-up box, the Hostname of the Server, IP address, and Mac Address (Media Access Control address) display.
2. In the message “Please click here to activate your appli-ance.”, click the link ‘here’ to open the Product Activation page at the M86 Security Web site.
3. In this Web page:
a. Enter your following information: Contact Details, Company Information, and Security Reporter Informa-tion.
b. Choose the Activation Type: "Evaluation Extension" or "Full Activation."
4. Click Send Information. After M86 obtains your informa-tion, a technical support representative will issue you an activation code.
5. Return to the Activation Page (see Fig. C-4) and enter the activation code in the Activation Code field.
6. Click Activate to display the confirmation message in the Activation Page pop-up box:
• If extending the evaluation period for the unit, the following message displays: “It is now in evaluation mode (‘X’ weeks)!” in which ‘X’ represents the number of weeks in the new evaluation period.
• If registering the unit, the following message displays: “Your box has been activated!”
7. Click the ‘X’ in the upper right corner to close the Activa-tion Page pop-up box.
M86 SECURITY USER GUIDE 399
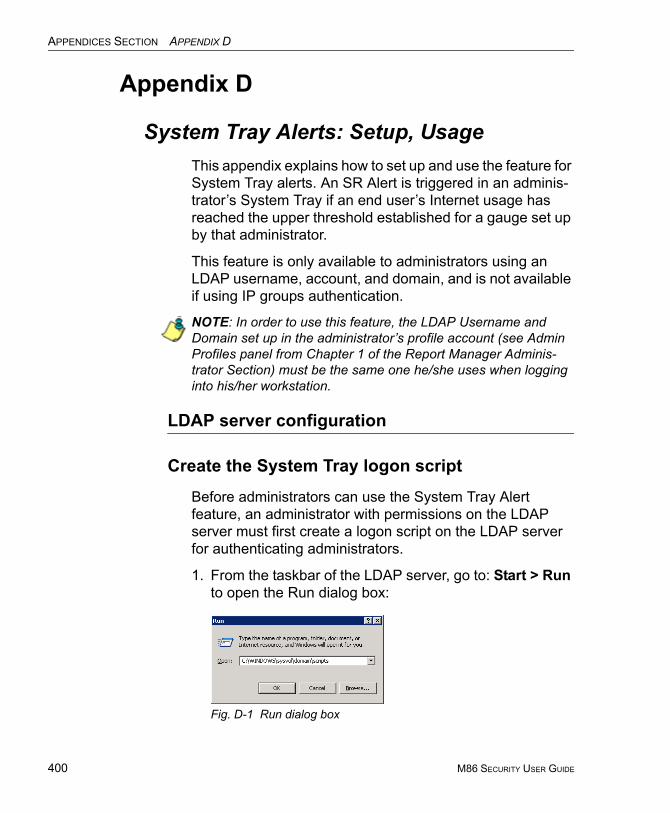
APPENDICES SECTION APPENDIX D
400
Appendix D
System Tray Alerts: Setup, UsageThis appendix explains how to set up and use the feature for System Tray alerts. An SR Alert is triggered in an adminis-trator’s System Tray if an end user’s Internet usage has reached the upper threshold established for a gauge set up by that administrator.
This feature is only available to administrators using an LDAP username, account, and domain, and is not available if using IP groups authentication.
NOTE: In order to use this feature, the LDAP Username and Domain set up in the administrator’s profile account (see Admin Profiles panel from Chapter 1 of the Report Manager Adminis-trator Section) must be the same one he/she uses when logging into his/her workstation.
LDAP server configuration
Create the System Tray logon script
Before administrators can use the System Tray Alert feature, an administrator with permissions on the LDAP server must first create a logon script on the LDAP server for authenticating administrators.
1. From the taskbar of the LDAP server, go to: Start > Run to open the Run dialog box:
Fig. D-1 Run dialog box
M86 SECURITY USER GUIDE
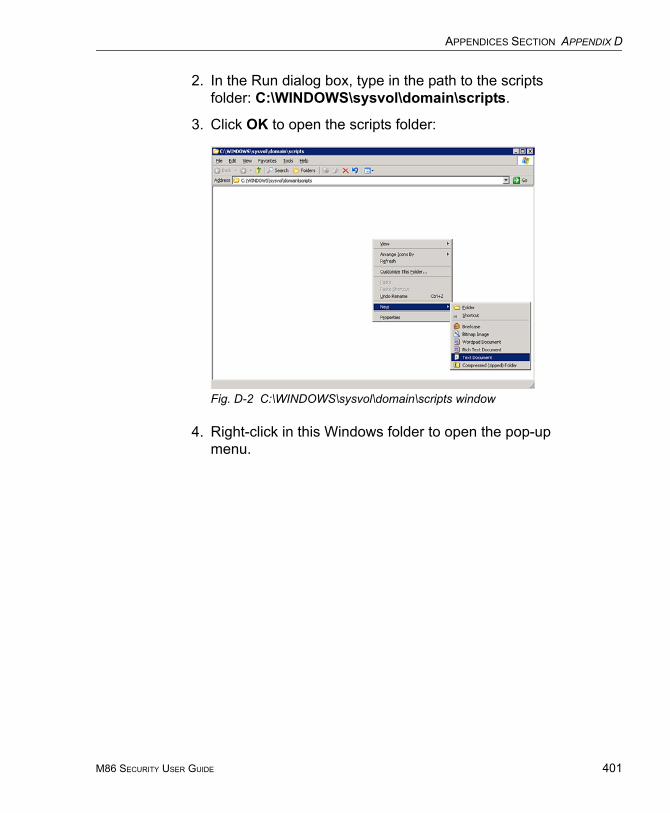
APPENDICES SECTION APPENDIX D
2. In the Run dialog box, type in the path to the scripts folder: C:\WINDOWS\sysvol\domain\scripts.
3. Click OK to open the scripts folder:
Fig. D-2 C:\WINDOWS\sysvol\domain\scripts window
4. Right-click in this Windows folder to open the pop-up menu.
M86 SECURITY USER GUIDE 401
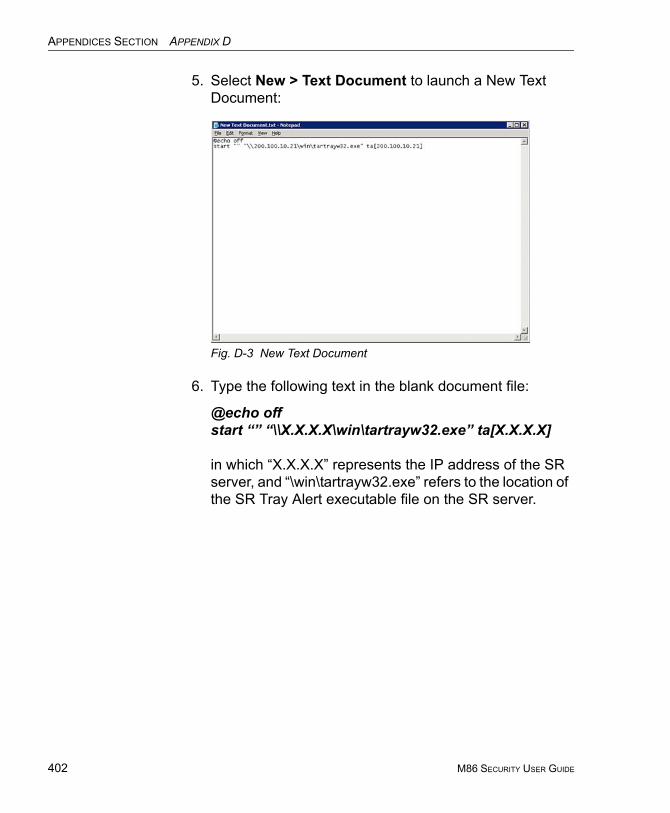
APPENDICES SECTION APPENDIX D
402
5. Select New > Text Document to launch a New Text Document:
Fig. D-3 New Text Document
6. Type the following text in the blank document file:
@echo offstart “” “\\X.X.X.X\win\tartrayw32.exe” ta[X.X.X.X]
in which “X.X.X.X” represents the IP address of the SR server, and “\win\tartrayw32.exe” refers to the location of the SR Tray Alert executable file on the SR server.
M86 SECURITY USER GUIDE
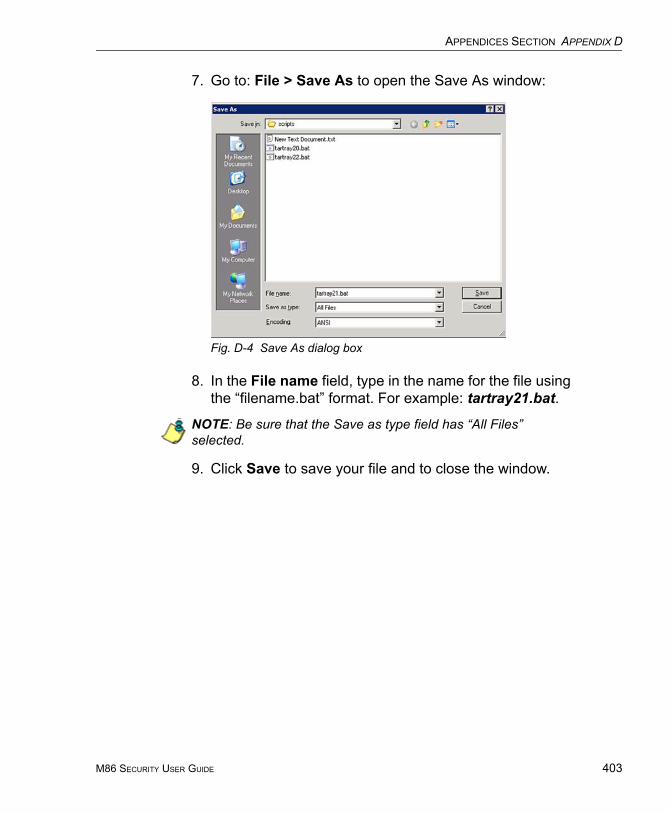
APPENDICES SECTION APPENDIX D
7. Go to: File > Save As to open the Save As window:
Fig. D-4 Save As dialog box
8. In the File name field, type in the name for the file using the “filename.bat” format. For example: tartray21.bat.
NOTE: Be sure that the Save as type field has “All Files” selected.
9. Click Save to save your file and to close the window.
M86 SECURITY USER GUIDE 403

APPENDICES SECTION APPENDIX D
404
Assign System Tray logon script to administrators
With the “.bat” file created, the administrator with permis-sions on the LDAP server can now begin to assign the System Tray logon script to as many administrators as needed.
1. From the taskbar of the LDAP server, go to: Start > Programs > Administrative Tools > Active Directory Users and Computers to open the Active Directory Users and Computers folder:
Fig. D-5 Programs > Administrative Tools > Active Directory Users
2. In the Active Directory Users and Computers folder, double-click the administrator’s Name in the Users list to open the Properties dialog box for his/her profile:
M86 SECURITY USER GUIDE
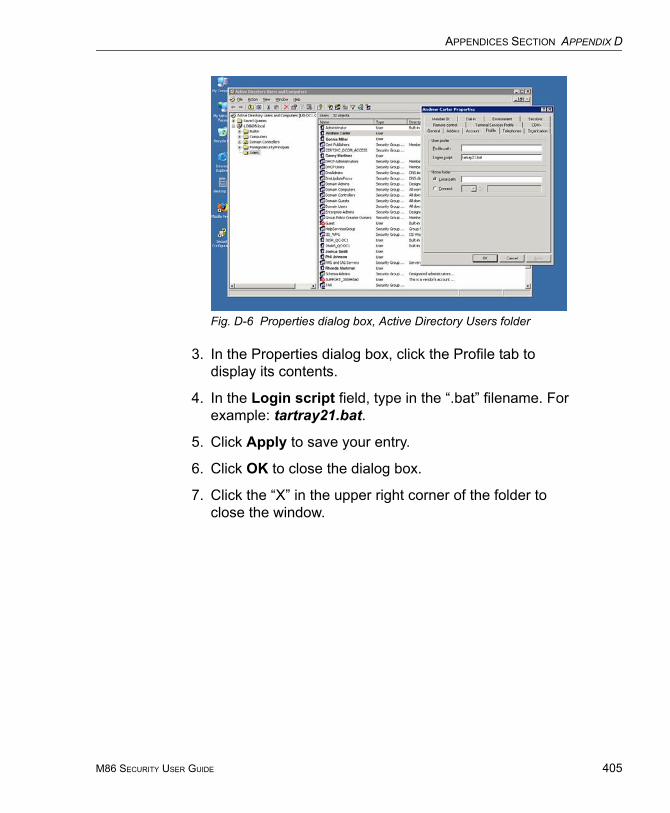
APPENDICES SECTION APPENDIX D
Fig. D-6 Properties dialog box, Active Directory Users folder
3. In the Properties dialog box, click the Profile tab to display its contents.
4. In the Login script field, type in the “.bat” filename. For example: tartray21.bat.
5. Click Apply to save your entry.
6. Click OK to close the dialog box.
7. Click the “X” in the upper right corner of the folder to close the window.
M86 SECURITY USER GUIDE 405
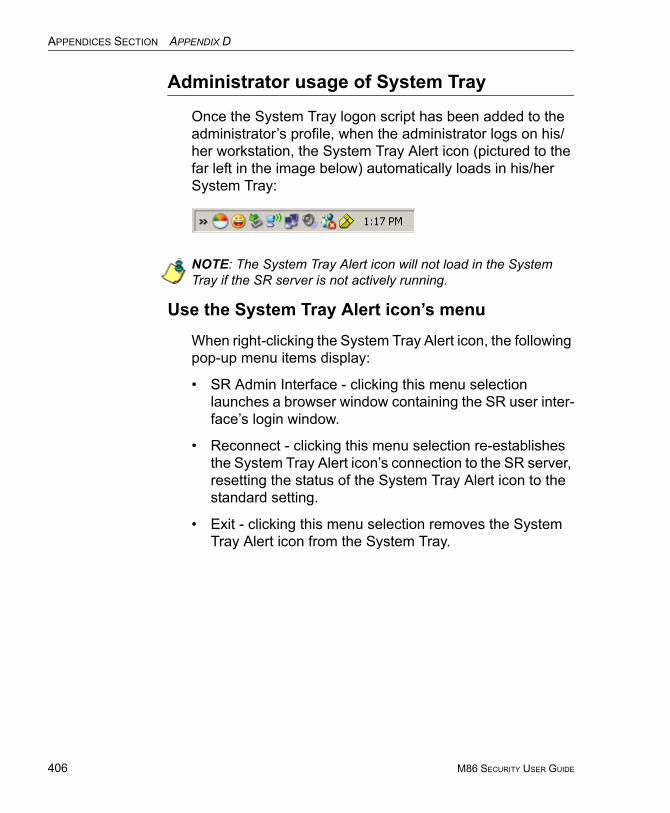
APPENDICES SECTION APPENDIX D
406
Administrator usage of System Tray
Once the System Tray logon script has been added to the administrator’s profile, when the administrator logs on his/her workstation, the System Tray Alert icon (pictured to the far left in the image below) automatically loads in his/her System Tray:
NOTE: The System Tray Alert icon will not load in the System Tray if the SR server is not actively running.
Use the System Tray Alert icon’s menu
When right-clicking the System Tray Alert icon, the following pop-up menu items display:
• SR Admin Interface - clicking this menu selection launches a browser window containing the SR user inter-face’s login window.
• Reconnect - clicking this menu selection re-establishes the System Tray Alert icon’s connection to the SR server, resetting the status of the System Tray Alert icon to the standard setting.
• Exit - clicking this menu selection removes the System Tray Alert icon from the System Tray.
M86 SECURITY USER GUIDE

APPENDICES SECTION APPENDIX D
Status of the System Tray Alert icon
If there are no alerts for any gauges set up by the adminis-trator, the following message displays when mousing over the standard System Tray Alert icon: “Connected. No Alerts.”
However, if an alert is triggered, the System Tray Alert icon changes in appearance from the standard gauge to a yellow gauge (pictured to the far left in the image below):
The following message appears briefly above the yellow gauge: “New M86 SR Alert!” The following message displays whenever mousing over this icon: “New M86 SR Alert”.
If more than one alert is triggered for the administrator, the message reads: “New M86 SR Alert! (X Total)”, in which “X” represents the total number of new alerts. The following message displays whenever mousing over this icon: “X New M86 SR Alerts”, in which “X” represents the total number of new alerts.
M86 SECURITY USER GUIDE 407
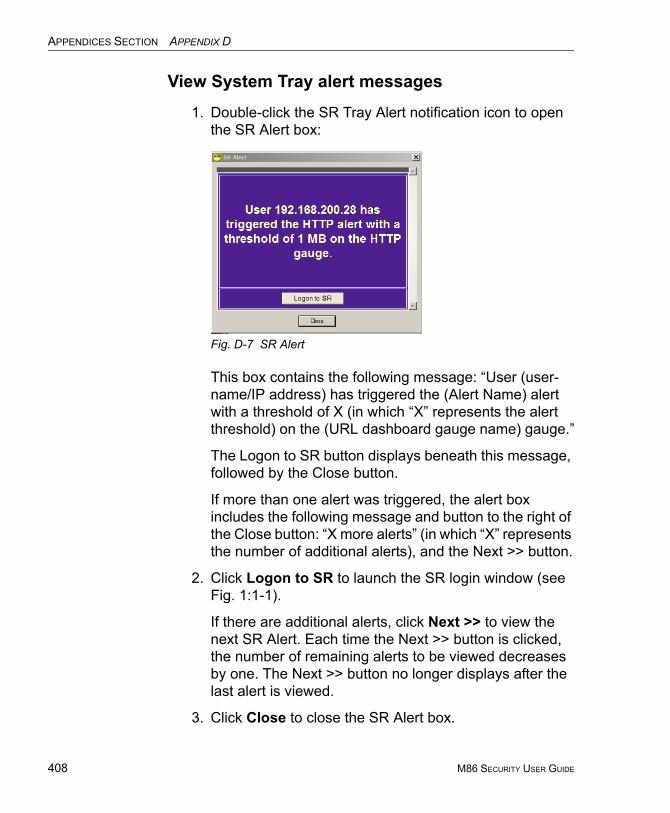
APPENDICES SECTION APPENDIX D
408
View System Tray alert messages
1. Double-click the SR Tray Alert notification icon to open the SR Alert box:
Fig. D-7 SR Alert
This box contains the following message: “User (user-name/IP address) has triggered the (Alert Name) alert with a threshold of X (in which “X” represents the alert threshold) on the (URL dashboard gauge name) gauge.”
The Logon to SR button displays beneath this message, followed by the Close button.
If more than one alert was triggered, the alert box includes the following message and button to the right of the Close button: “X more alerts” (in which “X” represents the number of additional alerts), and the Next >> button.
2. Click Logon to SR to launch the SR login window (see Fig. 1:1-1).
If there are additional alerts, click Next >> to view the next SR Alert. Each time the Next >> button is clicked, the number of remaining alerts to be viewed decreases by one. The Next >> button no longer displays after the last alert is viewed.
3. Click Close to close the SR Alert box.
M86 SECURITY USER GUIDE
APPENDICES SECTION APPENDIX E
Appendix E
GlossaryThis glossary includes definitions for terminology used in this user guide.
base group - A user group consisting of end users whose network activities are monitored by the designated group administrator(s). Only the creator of the base group can modify the base group, delegate the base group to another group administrator, or delete the base group.
canned report - A pre-processed report that includes statis-tics of end user Internet/network traffic prior to the current day.
custom category - A unique library category on the Web Filter that includes URLs, URL keywords, and/or search engine keywords to be blocked. On the SR, global adminis-trators can create and manage custom library categories and sync them to the source Web Filter.
detail drill down report - One of two types of basic reports—the other report type being a “summary drill down report”—that provides information on objects or pages an end user viewed within the specified time period.
FTP - File Transfer Protocol is used for transferring files from one computer to another on the Internet or an intranet.
global administrator - An authorized administrator of the network who maintains all aspects of the SR. The global administrator configures the SR, sets up user groups, administrator groups and group administrators, and performs routine maintenance on the server.
group administrator - An authorized administrator of the SR who maintains user group, administrator groups, group administrator profiles, and gauges.
M86 SECURITY USER GUIDE 409
APPENDICES SECTION APPENDIX E
410
group by report type - A report that includes two or more sets of report type criteria, such as User/Sites or Category/IPs or Category/Site/Users.
hit count - the number of pages and/or objects end users access as the result of entering URLs in a browser window.
HTTP - Hyper Text Transfer Protocol is used for transferring files via the World Wide Web or an intranet.
instant messaging - IM involves direct connections between workstations either locally or across the Internet.
library category - A list of URLs, URL keywords, and search engine keywords set up to be blocked.
LDAP - One of two authentication method protocols that can be used with the SR. Lightweight Directory Access Protocol (LDAP) is a directory service protocol based on entries (Distinguished Names). The other authentication method that can be used with the SR is IP groups.
object count - The number of objects end users access on a Web page, including images, graphics, multimedia items, and text items. The number of objects on a page is generally higher than the number of pages a user visits.
page count - The number of Web pages end users access, which can exceed the number of objects per page in catego-ries that use a lot of pop-up ads (porn, gambling, and other related sites). A user may visit only one site, but visit 20 pages on that site if the page has pop-up ads or banner ads that link to other pages.
peer-to-peer - P2P involves communication between computing devices—desktops, servers, and other smart devices—that are linked directly to each other.
protocol - A type of format for transmitting data between two devices. LDAP is a type of authentication method protocol.
M86 SECURITY USER GUIDE
APPENDICES SECTION APPENDIX E
search engine - A program that searches Web pages for specified keywords and returns a list of the pages or services where the keywords were found.
SMTP - Simple Mail Transfer Protocol is used for transfer-ring email messages between servers.
summary drill down report - One of two types of basic reports—the other report type being a “detail drill down report”—that provides a synopsis of end user Internet activity for the specified time period.
synchronization - A process by which two or more machines run in parallel to each other. User filtering profiles and library configurations on the source Web Filter can be set up to be synchronized between the source Web Filter and the SR.
TCP - An abbreviation for Transmission Control Protocol, one of the core protocols of the Internet protocol suite. Using TCP, applications on networked hosts can create connections to one another, over which streams of data can be exchanged.
time count - The amount of time end users spend on a given Web page, including the number of times that page is refreshed by either the user or a banner ad.
Time Usage Report count - The amount of time end users spend on the Internet, based on the Time Usage algorithm. For each user, the number of seconds from the log is dropped, and any unique minute within a given hour counts as one minute.
Traveler - M86 Security’s executable program that down-loads updates to the SR at a scheduled time.
UDP - An abbreviation for User Data Protocol, one of the core protocols of the Internet protocol suite. Using UDP, programs on networked computers can send short messages (sometimes known as datagrams) to one another.
M86 SECURITY USER GUIDE 411
APPENDICES SECTION APPENDIX E
412
URL - An abbreviation for Uniform Resource Locator, the global address of Web pages and other resources on the Internet. A URL is comprised of two parts. The first part of the address specifies which protocol to use (such as "http"). The second part specifies the IP address or the domain name where the resource is located (such as “203.15.47.23” or "m86security.com").
Web access logging device - The device feeding logs to the SR—e.g. M86 Web Filter or M86 Secure Web Gateway (SWG).
M86 SECURITY USER GUIDE
INDEX
Symbols# Records 227# Records field 230
Aaccordion, terminology 5Activity View panel 145Admin Groups panel 124Admin Profiles panel 129alert box, terminology 5arrow, terminology 5
Bback up data
to remote server 53back up SR data
internal on demand backup 52backup
procedures 51Backup screen 50bandwidth
gauge 282Bandwidth and Time columns 208Bandwidth gauges 283base group 113, 295
definition 409Beta 63, 74Block Request Count 100Blocked Request Reports 272Blocked Searched Keywords 100Blocked Viruses report view 345Box Mode screen 32button, terminology 5
M86 SECURITY USER GUIDE 413
INDEX
414
Ccanned report, definition 409charts
hits per day, week, month 170checkbox, terminology 5Column visibility 211, 352components 11Conventions 4Copy a Saved Report 255count columns 206Ctrl key 25custom category
definition 409Custom Category Groups panel 184
Ddata storage setup 95Data to Export field 229Database Menu 83database outage period 96Database Processes List panel 165database status logs 91Date Scope 225
Expiration screen 95Server Information 169username or keyword entries 246
Default Report Settings panel 181Default Top Value in reports 182delete a gauge 299detail drill down report, definition 409Detail Result Warning Limit 182Detailed Info fields 233Device Registry panel 148diagnostic reports 91Diagnostics 43dialog box, terminology 6disable a gauge 299disable pop-up blockers 371double-break report, definition 410Draw Chart button 170
M86 SECURITY USER GUIDE
INDEX
Eedit a Security Report 254edit a summary or detail report 253E-Mail fields 232End User License Agreement 176evaluation mode 395Executive Internet Usage Summary 263expand or contract a column 25expiration 96Expiration Info 174Expiration screen 95expire
data from server 95passwords 102
Export button 222export reports 209Exporting a Report 235
Ffield, terminology 6File Transfer Protocol (FTP) 52, 76Filter field 227Filter String field 227Firefox 12For additional-break reports only 230For e-mail output only field 232For pie and bar charts only 231Forgot Your Password 20Format field 229frame, terminology 6From Date field 225FTP
definition 409FTP (File Transfer Protocol) 52, 53, 54, 76FTP bandwidth gauge 286
GGeneral Availability 63, 74generate
M86 SECURITY USER GUIDE 415
INDEX
416
Blocked Request Report 273drill down report 203Server Activity charts 170static table of IP addresses, machine names 86Time Usage Report 277
Generate Using field 231global administrator 2
definition 409global administrator, definition 10Google Chrome 12group administrator 2
definition 409group administrator, definition 10Group By field 229
Hhardware 11Hardware Failure Detection screen 80hide a gauge 299Hide Un-Identified IPs 265Hide Unidentified IPs 182Hide un-Identified IPs 231hit count, definition 410hit, definition 170How to
access Saved Custom Reports 252access the Add/Edit Gauges panel 290add a Custom Category Group 185add a new alert 316add a new gauge 292add a user group 113create a custom Security Report 366create a detail Object Count report from a summary report 207create a detail Page Count report from a summary report 207create a new report from the current report view 225display only a specified number of records 227drill down into a gauge 304drill down into a Security Report 348edit a saved report 253email a productivity report 235
M86 SECURITY USER GUIDE
INDEX
email a report 235export a detail report 222export a Security Report 362export a summary Drill Down Report 222generate a Custom Category Group report 203generate a Drill Down Report 203generate a Summary Report 190modify a Drill Down Report 217run a Security Report 354save a productivity report 218save a Security Report 357schedule a report to run 261schedule a Security Report to run 360schedule or run a report in the Security Report Wizard 370set up email alert notifications 317use count columns and links 206use Gauges and Policy menu selections 281use Security Report tools 349use the four basic Security Report types 345use the Report Wizard to generate a productivity report 242view an email alert 318view and print a report 236view end user gauge activity 303view URLs a user visited 303
HTTPdefinition 410
HTTP bandwidth gauge 286HTTPS 12, 29
login 15HTTPS Configuration panel 137
Iicon, terminology 6IM bandwidth gauge 287install
software update 65Installation Guide 14instant messaging
definition 410Internet Explorer 12
M86 SECURITY USER GUIDE 417

INDEX
418
IP groupauthentication method 400
IP.ID 83
JJavaScript 12
LLDAP 105, 400
definition 410server types supported in SR 110user authentication in SR 112
library categoriesdefinition 410
Limit Detail Result 221Limit Detail Result pop-up box 216Limit Detail Results field 228Limited Availability 63, 74Linux OS 11list box, terminology 6Locked-out Accounts and IPs screen 34lockout 103, 132, 314
automatic lockout 319end user workstation 312list management 326manual lockout 311unlock workstations 328
logdatabase status 92
log in 15log out 27
MM86 Security Reporter 14Macintosh 12mail server 235Manual Backup button 52mouse
use to view truncated data 213
M86 SECURITY USER GUIDE
INDEX
MySQL 11, 77
NNAS 11Network Diagnostics screen 43Network Menu 31network requirements 12Network Settings screen 36Network Time Protocol (NTP) 41NTP (Network Time Protocol) 41
OObject Count 101object count, definition 410Optional Features screen 98Output type field 231
PP2P
definition 410P2P bandwidth gauge 287Page Count 101page count, definition 410Page Definition screen 89Page navigation 215, 351Page View Elapsed Time screen 87panel, terminology 7password
create for remote server’s FTP account 52expiration 19security option 102
Password reset 20peer-to-peer
definition 410Ping 44pop-up blocking, disable 371pop-up box/window, terminology 7port 8443 15port 8843 30
M86 SECURITY USER GUIDE 419
INDEX
420
Print report 236protocol
bandwidth gauge 282definition 410
Proxy Setting 74pull-down menu, terminology 7
Rradio button, terminology 7RAID 80rearrange the gauge display 299records
exportation 209sort by another column 209, 213, 353
Regional Setting screen 40Registered Mode and Evaluation Mode 168re-login 18remote server backup 53report
Date Scope field 225delete a report 257detail drill down report 210edit a report 253export 209run a saved report 256sample file formats 237sample, Comma-Delimited Text 240sample, Excel (English) 241sample, HTML 240sample, MS-DOS Text 238sample, PDF 238sample, Rich Text Format 239Server Activity 170summary drill down report 204
Report Manager screen 78Report Manager Startup Time 169Report Schedule 258Report Settings Options 354Report Wizard
Save Report panel 248
M86 SECURITY USER GUIDE
INDEX
reportsdiagnostic 92
Reset to Factory Defaults panel 175resize button, terminology 7restart the server 76restore data from previous backup 54Routing Table screen 38Rule Transactions report view 347rules
elapsed time 88expiration 96
Run Report pop-up box 216
SSafari 12Save report 218Save Report pop-up box 216screen, terminology 8search engine
definition 411Search String Reporting 100Secure Access screen 61Security Policy Violations report view 345Security Report
drill down results 348Security Report format 343, 364Self Monitoring screen 55Server
set up IP addresses 36server
add, maintain routers 38download software update 63perform manual backup 52restart 76set time 40shut down 76
Server Activity, hits on server 170Server Information panel 167Server Menu 49Server Status screen 59
M86 SECURITY USER GUIDE 421
INDEX
422
Shift key 25Shut Down screen 76shutdown
SR server 27Single Sign-On 22slider, terminology 8SMTP
definition 411SMTP bandwidth gauge 286SMTP Server Setting screen 57SNMP screen 47software 11
unapply 70Software Update screen 63Software Update Setting screen 73Sort By field 227, 230sort records 25, 209, 213, 353spam filter 235storage capacity maintenance 96summary drill down report, definition 411SWG Management Console Reference Guide 179synchronization
definition 411update device registry 148user list update 143
system requirements 12System Tray 400
Ttab, terminology 8table, terminology 8TCP
definition 411TCP port 286technical support 61Terminology 5text box, terminology 8thumbnail, terminology 8time count, definition 411Time Usage algorithm 280
M86 SECURITY USER GUIDE
INDEX
Time Usage Report count, definition 411Time Usage Reports 276Time Usage reports 101timed out session 18timespan 293timespan for gauges 298To Date field 225Tools screen 91tooltip information 25Trace Route 45Traffic Analysis report view 346Traveler
definition 411Type field 224
UUDP
definition 411UDP port 286UID 385update
NTP server settings 41routing table 39scheduled event 260server software 63
UPS 12URL gauges 282URL, definition 412User Group Import screen 105User Groups panel 109User Name Identification screen 83User Profiles panel 143usernames and passwords 22
Vview
diagnostic reports 92record data truncated in a column 213Server Activity charts 170
M86 SECURITY USER GUIDE 423
INDEX
424
View report 236virtual machine 11, 14, 49
WWeb access logging device 107, 225Web access logging device, definition 412Web Filter 105
end user lockout 319wildcard searches 26window, terminology 9Windows 7 12Windows Vista 12Windows XP 12wizard 15
installation procedures 16, 22, 129, 149, 153Wizard panel 177workstation requirements 12
M86 SECURITY USER GUIDE